In cooperation with The Sustainability Yearbook 2012

KPMG - Sustainability Yearbook 2012
Oct 24, 2014
Welcome message from author
This document is posted to help you gain knowledge. Please leave a comment to let me know what you think about it! Share it to your friends and learn new things together.
Transcript

SAM is a member of Robeco, which was established in 1929 and offers a broad
range of investment products and services worldwide. Robeco is a subsidiary
of the Rabobank Group which has the highest credit rating* of all privately owned
banks, awarded by rating agencies Moody’s, Standard & Poor’s, Fitch and DBRS.
SAM was founded in 1995, is headquartered in Zurich and employs over 100
professionals. As of June 30, 2011, SAM’s total assets amount to EUR 11.3 billion.
*This rating does not apply to managed products.
FOCUS
SAM focuses on exploiting sustainability insights to generate attractive
long-term investment returns.
METHODOLOGY
SAM is one of the market leaders when it comes to integrating financial
and sustainability insights into a structured investment process.
Our research underpins the globally recognized Dow Jones Sustainability
Indexes (DJSI).
DATABASE
SAM maintains one of the largest proprietary databases for corporate
sustainability – a database that forms an integral part of our investment
process.
EXPERIENCE
SAM has been one of the pioneers in Sustainability Investing since
1995.
PEOPLE
SAM maintains a unique, cross-disciplinary investment team combining
leading-edge financial analytical skills with in-house technology and
scientific know-how. Additionally, SAM is supported by an unparalleled
global sustainability network.
Disclaimer:The views expressed in this commentary reflect those of SAM as of the date of this commentary. Any such views are subject to change at any time based on market and
other conditions and SAM and Robeco disclaim any responsibility to update such views. These views may differ from those of other portfolio managers employed by SAM
or its affiliates. Past performance is not an indication of future results. Discussions of specific companies, market returns and trends are not intended to be a forecast of
future events or returns.
Copyright © 2012 SAM – all rights reserved.
SAM Sustainable Asset Management USA, Inc.909 Third Avenue · New York, NY 10022Phone +1 212 908 0188 · Fax +1 212 908 9672 [email protected] · www.robecoinvest.com
SAM Josefstrasse 218 · 8005 Zurich · SwitzerlandPhone +41 44 653 10 10 · Fax +41 44 653 10 [email protected] · www.sam-group.com
In cooperation with
The
Sust
ain
abili
ty Y
earb
oo
k 20
12
The SustainabilityYearbook2012

2 3
The Sustainability Yearbook 2012
2 3
Allergan, Inc.David Pyott,
Chairman, President and CEO
“For over 60 years, Allergan has been committed to the health, safety,
and well-being of the people who put their trust in our products.
Every day, we strive to better people’s lives in a wide range of ways — from
developing new treatments for complex and disabling medical conditions to
offering science-based medical aesthetic solutions. Our determination to make
a positive contribution extends to not only the people who benefit from our
products, but also to our employees and to the global community in which we
live and work. It remains our goal to ensure that our contribution to science
reflects our commitment to safe, healthful workplaces, strong communities
and responsible, ethical business practices in everything we do, from research
and development to sales and marketing. Allergan is committed to
sustainable development and appreciates the opportunity to match
our sustainable programs against the best in our industry as
well as best-in-class. This gives us the opportunity
to continuously improve
our performance.”
PepsiCoIndra K. Nooyi,
Chairman and CEO
“PepsiCo is proud to be the DJSI Food and Beverage
Supersector leader. The SAM Assessment helps us track
progress against our Performance with Purpose mission, which is to
deliver sustainable growth by investing in a healthier future for people and
our planet. We believe that our long-term profitable growth is intrinsically
linked to our ability to meet our social and environmental objectives. For
example, reducing our water and energy consumption generates cost
savings, and implementing sustainable agriculture models lowers supply
chain risks and costs. PepsiCo’s participation in the Assessment helps
us identify and address emerging sustainability issues
and enhances our ability to do business
responsibly in the communities
where we operate.”

The Sustainability Yearbook 2012Foreword
3
Foreword
Dear reaDer,
It has been 25 years since the publication of The Brundt-
land Commission’s groundbreaking report Our Common
Future, defining the now familiar concept of sustainable
development as “development that meets the needs of
the present without compromising the ability of future
generations to meet their own needs.”
Since then, as evidenced by the steady increase in
participation rates in the annual SAM Corporate
Sustainability Assessment (CSA), companies have come a
long way in recognizing the financial benefits of embracing
sustainability as a core component of their corporate
strategies. Yet, continued economic uncertainty caused
by the ongoing financial crisis points to the need for a
renewed emphasis on long-term thinking and a shift away
from short-sighted behavior. We remain convinced that
a long-term focus and sound management—hallmarks
of companies that excel in sustainability performance—
will prepare them to better weather turbulent economic
environments such as the one we face today, giving them
a competitive advantage.
The 2012 edition of The Sustainability Yearbook marks
the beginning of a global alliance between SAM and
KPMG, aimed at helping companies measure and en-
hance their corporate sustainability performance. To kick
off this collaboration, this year’s publication offers four
perspectives on current sustainability topics.
First, KPMG examines why sustainability has become in-
creasingly important to governments and companies in
some of the world’s fastest growing economies. The emerg-
ing markets now stand at a crossroads in which they must
decide whether they wish to emulate a century-old Western
model for development, or whether they prefer to chart a
more sustainable course to prosperity.
But a sustainable path to development that limits the
negative impact on the environment and future gener-
ations requires innovative solutions. Sustainability con-
siderations have continuously helped spark new ideas,
which is why innovation management is an important
component of the CSA. Therefore, in the second chap-
ter of The Sustainability Yearbook, SAM highlights
some preliminary findings from its evaluation of com-
panies’ approach to innovation management.
As an innovation-driven industry, the chemical sector
began addressing sustainability concerns as early as the
mid-1980’s and has made great strides since then. Based
on data collected through the CSA, SAM also explores
which sustainability factors distinguish the leaders from
the laggards in the chemical industry.
Finally, Frans van Houten, President and Chief Executive
Officer at Royal Philips Electronics explains how innova-
tion and sustainability play an integral role in advancing
his company’s mission of touching as many lives as pos-
sible with its green and social breakthroughs.
As always, The Sustainability Yearbook provides insights
into the 58 sectors examined by the 13th SAM Corporate
Sustainability Assessment, which determines the companies
that are included in this reference guide to the world’s
sustainability leaders. The leading companies in 58 sectors
are classified into three categories—SAM Gold Class, SAM
Silver Class and SAM Bronze Class—with special status
awarded to Sector Leaders and Sector Movers.
We hope you find The Sustainability Yearbook a useful
tool that provides fresh insights into one of the major
trends of our time, and which has been continuously
evolving over the last 25 years.
Michael Baldinger
Chief Executive Officer
SAM
Ted Senko
Global CEO
KPMG Climate Change &
Sustainability Services

The Sustainability Yearbook 2012
4
Repsol YPF, S.A.antonio Brufau, Chairman and CEO
“Society’s expectations with regard to a company’s contribution to
sustainable development have grown considerably. In order to meet
humanity’s long-term welfare and development needs, we must ensure that
our global economy shifts towards a more intelligent global energy model that is
universally accessible and compatible with the climatic stability of the planet.
This, in turn, requires the smart and sustainable management of our water,
energy and land resources.
As an energy company, we recognize the need to understand and share the concerns of
this increasingly interconnected global society. This means opening ourselves to public
scrutiny, being transparent, respecting human rights and fighting corruption. Thus
engaging in dialogue with civil society and participating in
initiatives such as the SAM Corporate Sustainability Assessment are not only
an effective risk management tool, but are above all, a way to create
partnerships and identify opportunities to ensure that we
continue to move towards developing
sustainable energy solutions.”
Alcoa Inc.Klaus Kleinfeld,
Chairman and CEO
“Sustainability drives everything we do at Alcoa, from
how we manufacture our products, to the way our employees
interact with the environment. At our core, the very metal
we make is uniquely sustainable. Aluminum is light, strong,
non-corrosive and infinitely recyclable, and Alcoa’s innovative material
solutions are making cars, trucks and planes lighter and more
fuel-efficient, buildings environmentally friendly, packaging greener,
and consumer electronics cooler. Every day we live our values
of accountability and responsibility, and continually seek to
improve our industry-leading practices in safety, natural
resource management, emissions reduction
and community partnership.”

The Sustainability Yearbook 2012Table of Contents
5
Table of Contents
ForeworD 3
1. KPMG: SuSTainaBiliTy DriverS in eMerGinG eConoMieS 7
2. innovaTion ManaGeMenT in The SaM CorPoraTe SuSTainaBiliTy aSSeSSMenT 17
3. SuSTainaBiliTy in The CheMiCal inDuSTry 31
4. inTerview wiTh PhiliPS 42
5. SaM SeCTor leaDerS 2012 49
6. SaM SeCTor MoverS 2012 52
7. SeCTor inSiGhTS: 58 SeCTorS aT a GlanCe 55
8. annex 116
8.1 SAM Profile 117
8.2 SAM Academic Activities 117
8.3 KPMG Profile 118
CoMPany overview 119

The Sustainability Yearbook 2012
6
CemigDjalma Bastos de Morais, CEO
“The importance of sustainability to Cemig can
be seen in the fact that sustainability is embedded in its business
strategies. Sustainability is an integral part of the company’s vision for
the future, of its strategic planning, of its decisions regarding the
acquisition of new assets, of its Declaration of Ethical Principles and of all
Cemig’s attitudes and activities.
Being listed in the DJSI World all these years means recognition by the
international market of the set of strategic actions adopted by Cemig that
aim at fostering new businesses, working in the interest of investors and
improving corporate sustainability practices. The annual assessment by SAM
provides us with the necessary benchmarking to review and improve
our programs and processes in a continuous quest for
sustainability-oriented improvements that ensure the
company’s performance in the three dimensions:
economic, environmental and social.”
Capital Shopping Centres Group PLC
alexander nicoll, Director of Corporate Responsibility
“Capital Shopping Centres Group PLC is the leading specialist
developer, owner and manager of pre-eminent UK regional shopping centers. We
are committed to working closely with the communities served by our businesses
and operating responsibly in terms of care for the environment, reduction in energy
consumption and promotion of increased recycling of waste. Benchmarking
against best practice as signposted by SAM’s Corporate Sustainability Assessment
ensures that we remain focused on current thinking about corporate
sustainability issues and such engagement supports our drive to improve the
sustainability of all aspects of our business year on year
for the benefit of our investors, customers
and employees.”

The Sustainability Yearbook 20121. KPMG: Sustainability Drivers in the Emerging Economies
7
1 SUSTAInABILITY DRIvERS In THE EMERGInG ECOnOMIES

The Sustainability Yearbook 20121. KPMG: Sustainability Drivers in the Emerging Economies
8
1. Sustainability Drivers in the Emerging Economies
while the definition of the world’s emerging markets has varied over the years, it is clear that
the rate at which they continue to grow is striking. according to The economist and the iMF, the
emerging economies have either overtaken or will overtake the developed economies anywhere
between 2008 and 20121, 2. according to the iMF, they already accounted for nearly half of global
growth in 20083.
Emerging economies accounted for nearly half the
world’s exports in 2010 according to the WTO and
it looks certain they will account for much of the
expected global growth in years to come4. According
to The Economist, “Western multinationals expect
to find 70% of their future growth in the emerging
economies, 40% of it in China and India alone.”5
They will not find these markets uncontested,
however. A new breed of nimble multinationals
is evolving from within the emerging economies.
These new players are spotting new markets and
innovating new business models, services and
products to serve the diverse needs of a rapidly
emerging global middle class.
At the same time as the emerging economies
continue to improve their competitive position,
some are also catching up fast with the
developed economies in terms of their approach
to sustainability. They have come a long way in a
short space of time and are increasingly aware of
the negative as well as the positive impacts of rapid
economic development and industrialization.
Many of the economies discussed in this article
also find themselves confronted with sustainability
issues as they bump up against pressing resource
constraints, such as water scarcity in South Africa
or a reliance on polluting energy sources in China.
As these economies mesh ever more deeply into
the wider global economy, their leading businesses
feel more pressure from overseas investors and
partner companies to grow sustainably. Legislation
is also driving the move towards sustainability in
every economy cited in this article, a trend being
driven in part by the growing concerns of many
of these nations’ emerging middle class and by
more active and engaged local communities eager
to pressure companies to act more sustainably.
The impetus to address sustainability is not com-
ing solely from external pressures but also from an
increasing, although by no means universal, aware-
ness that sustainability can also offer opportunity.
In the countries which form the focus of this article
—Brazil, China, India, Russia and South Africa—
increasing numbers of organizations are now citing
the chance to limit reputational risk and enhance
brand value as reasons for engaging more deeply
with sustainability issues.
But companies in many emerging economies
still lag behind their developed economy peers.
Opinions expressed by KPMG experts based in
these countries suggest relatively few organizations
in the emerging economies recognize that there
could be economic value in making sustainability an
integral part of corporate strategy. Few as yet see
a clear link between sustainability and long-term
profitability. It is apparent, however, that in most
emerging economies, sustainability as an issue has
taken root, many companies recognize the benefits
of addressing the topic and its importance is set
to grow.
1 IMF, World Economic Outlook, 2011.
2 http://www.economist.com/node/21525373
3 http://www.iadb.org/intal/intalcdi/PE/2011/08815.pdf
4 http://www.wto.org/english/news_e/pres11_e/pr628_e.htm
5 http://hbr.org/2011/01/new-business-models-in-emerging-
markets/ar/1

The Sustainability Yearbook 20121. KPMG: Sustainability Drivers in the Emerging Economies
9
FiGure 2: Co2 eMiSSionS Per CaPiTa 2009 (T Per CaPiTa)
Source: CO2 Emissions from fuel combustion 2011: International Energy Agency
12
10
8
6
4
2
0
t pe
r ca
pita
Brazil China India Russia South Africa
1.7
7.510.8
1.4
5.1
FiGure 3: CorruPTion PerCePTionS inDex 20118
Source: Corruption Perceptions Index 2011: Transparency International
0Highly
Corrupt
10very Clean3.8 Brazil
3.6 China
3.1 India
2.4 Russia 4.1 South Africa
6 Global Competitiveness Index 2011-2012 ranking:The Global Competitiveness Index provides a benchmark of the many factors that underpin national competitiveness. Competitiveness is defined as the set of institutions, policies, and factors that determine the level of productivity of a country.
7 Rank in the Un Human Development Index: a measure of a country’s achievements based on economic, health and social indicators, using measures such a GDP per capita, life expectancy, education and literacy rates.
8 Corruption Perceptions Index 2011:The Corruption Perceptions Index (CPI) ranks countries according to the perception of corruption in the public sector. The CPI is an aggregate indicator that combines different sources of information about corruption, making it possible to compare countries.
GDP ranKinG 2010 GloBal CoMPeTiTiveneSS
inDex ranK 2011-20126 un huMan DeveloPMenT
inDex ranK 20117
Brazil 7 53 84
China 2 26 101
India 9 56 134
Russia 11 66 66
South Africa 28 50 123
FiGure 1: CounTry ranK overview
Source: World Development Indicators database, World Bank, 1 July 2011.
The Global Competitiveness Index 2011-2012 rankings, World Economic Forum.
Human Development Report 2011, United nations Development Programme.

The Sustainability Yearbook 20121. KPMG: Sustainability Drivers in the Emerging Economies
10
1.1 Brazil
GDP Ranking 2010 7th
Global Competitiveness Index Rank 2011-2012 53rd
Un Human Development Index Rank 2011 84th
CO2 Emissions per capita 2009 (t per capita) 1.7
Corruption Perceptions Index Rank 2011 73rd
A paragon for the global economy, Brazil is fast
making the transition from a regional to global
power thanks to its consistently solid economic
performance, including growth in 2010 of 7.5%.
Its economy is already the world’s seventh-largest
by GDP and is expected to take fifth place in
coming years.9
Strong export growth and inward investment
together with extensive social programs have
helped lift millions of Brazilians out of poverty. A
majority of Brazilians are now middle-class, and
domestic consumption has become an important
growth driver. Brazil’s engagement in the global
economy is a significant factor in driving its
sustainability agenda. Brazilian companies export
high quantities of commodities such as minerals,
oil and gas and agriculture products to European
and Asian companies, many of which request
disclosure of environmental, social and governance
(ESG) information.10
According to KPMG’s International Survey of
Corporate Responsibility Reporting 2011 (KPMG CR
Report 2011), 88 of Brazil’s 100 largest companies
report on corporate responsibility performance in
the public domain. The chance to protect corporate
reputation and enhance brand value as well as
economic considerations such as cost savings are
the major reasons cited for this extensive level of
reporting.
Investors are also driving the sustainability agenda.
Before they invest, foreign investors (including pen-
sion funds, private funds, private equities and gen-
eral investors) are increasingly looking for effective
corporate governance as well as structures for ad-
dressing social and environmental responsibilities.
BOvESPA (the Brazilian Stock Exchange) already
has a Corporate Sustainability index.
Regulatory pressures, such as the recent solid
residues law, passed in 2010, which establishes
corporate responsibility for handling waste,
pollution and emissions, are also playing their part.
Under this law, certain environmental impacts
could make companies and their respective
managements guilty of a criminal offense. Media
scrutiny and public concerns about health, safety,
sweatshops, excessive working hours, local
community conditions and sexual and moral
harassment are also helping drive greater corporate
sustainability efforts.
As a consequence of these factors, many Brazilian
companies are bringing sustainability issues
and regulations to their boards of directors and
requiring management to address them in the
company´s risk management priorities.
The Rio+20 event in 2012, to be held in Rio de
Janeiro to mark the 20th anniversary of the 1992
United nations Conference on Environment and
Development (UnCED) will serve as an important
forum to further develop and build on Brazil’s path
to greater business sustainability.
9 Goldman Sachs, Global Economics Paper no. 153, 2007
10 http://www.state.gov/r/pa/ei/bgn/35640.htm
The Sustainability Yearbook 20121. KPMG: Sustainability Drivers in the Emerging Economies
11
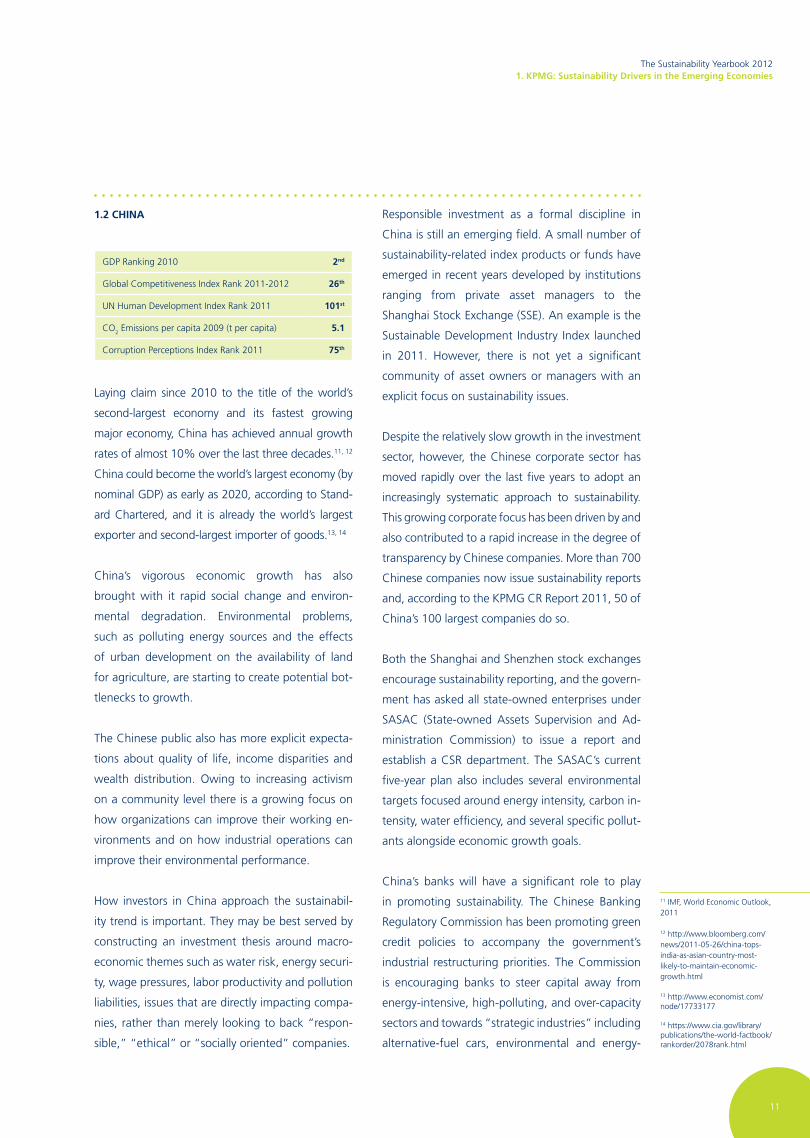
1.2 China
GDP Ranking 2010 2nd
Global Competitiveness Index Rank 2011-2012 26th
Un Human Development Index Rank 2011 101st
CO2 Emissions per capita 2009 (t per capita) 5.1
Corruption Perceptions Index Rank 2011 75th
Laying claim since 2010 to the title of the world’s
second-largest economy and its fastest growing
major economy, China has achieved annual growth
rates of almost 10% over the last three decades.11, 12
China could become the world’s largest economy (by
nominal GDP) as early as 2020, according to Stand-
ard Chartered, and it is already the world’s largest
exporter and second-largest importer of goods.13, 14
China’s vigorous economic growth has also
brought with it rapid social change and environ-
mental degradation. Environmental problems,
such as polluting energy sources and the effects
of urban development on the availability of land
for agriculture, are starting to create potential bot-
tlenecks to growth.
The Chinese public also has more explicit expecta-
tions about quality of life, income disparities and
wealth distribution. Owing to increasing activism
on a community level there is a growing focus on
how organizations can improve their working en-
vironments and on how industrial operations can
improve their environmental performance.
How investors in China approach the sustainabil-
ity trend is important. They may be best served by
constructing an investment thesis around macro-
economic themes such as water risk, energy securi-
ty, wage pressures, labor productivity and pollution
liabilities, issues that are directly impacting compa-
nies, rather than merely looking to back “respon-
sible,” “ethical” or “socially oriented” companies.
Responsible investment as a formal discipline in
China is still an emerging field. A small number of
sustainability-related index products or funds have
emerged in recent years developed by institutions
ranging from private asset managers to the
Shanghai Stock Exchange (SSE). An example is the
Sustainable Development Industry Index launched
in 2011. However, there is not yet a significant
community of asset owners or managers with an
explicit focus on sustainability issues.
Despite the relatively slow growth in the investment
sector, however, the Chinese corporate sector has
moved rapidly over the last five years to adopt an
increasingly systematic approach to sustainability.
This growing corporate focus has been driven by and
also contributed to a rapid increase in the degree of
transparency by Chinese companies. More than 700
Chinese companies now issue sustainability reports
and, according to the KPMG CR Report 2011, 50 of
China’s 100 largest companies do so.
Both the Shanghai and Shenzhen stock exchanges
encourage sustainability reporting, and the govern-
ment has asked all state-owned enterprises under
SASAC (State-owned Assets Supervision and Ad-
ministration Commission) to issue a report and
establish a CSR department. The SASAC’s current
five-year plan also includes several environmental
targets focused around energy intensity, carbon in-
tensity, water efficiency, and several specific pollut-
ants alongside economic growth goals.
China’s banks will have a significant role to play
in promoting sustainability. The Chinese Banking
Regulatory Commission has been promoting green
credit policies to accompany the government’s
industrial restructuring priorities. The Commission
is encouraging banks to steer capital away from
energy-intensive, high-polluting, and over-capacity
sectors and towards “strategic industries” including
alternative-fuel cars, environmental and energy-
11 IMF, World Economic Outlook, 2011
12 http://www.bloomberg.com/news/2011-05-26/china-tops-india-as-asian-country-most-likely-to-maintain-economic-growth.html
13 http://www.economist.com/node/17733177
14 https://www.cia.gov/library/publications/the-world-factbook/rankorder/2078rank.html

The Sustainability Yearbook 20121. KPMG: Sustainability Drivers in the Emerging Economies
12
saving technologies and alternative energy. In some
cases, this has led banks to look more carefully at
the environmental profile of individual clients.15
As with China’s overall development, the business
community’s journey on the sustainability path is
being compressed into a very short time period
compared to developed countries. As a whole,
sustainability themes are becoming material
business issues in China. Chinese companies tend
not to articulate sustainability value propositions
in the same manner as leading multinational
corporations, but the pressures are certainly visible.
Given the relatively low resource efficiency of much
of Chinese industry, there are plentiful opportunities
to cut costs though operational efficiency, as well
as, in certain sectors, growing opportunities to
benefit from improved market position through
green products and services.
1.3 inDia
GDP Ranking 2010 9th
Global Competitiveness Index Rank 2011-2012 56th
Un Human Development Index Rank 2011 134th
CO2 Emissions per capita 2009 (t per capita) 1.4
Corruption Perceptions Index Rank 2011 95th
The world’s second most populous country with 1.2
billion people and the world’s ninth-largest economy
by purchasing power parity according to the IMF,
India is set to continue on its growth trajectory.
It is expected to leapfrog China’s population by
2030 and to overtake Japan to become the world’s
third-largest economy by 2020.16, 17, 18
Despite this rapid development, sustainability as
a corporate concern in India is still in its infancy.
Reporting on sustainability performance has
increased in the last five years, although according
to the KPMG CR Report 2011, only 20 of the
top 100 Indian companies report on corporate
responsibility performance publicly and only 16
have a corporate responsibility strategy in place
with well-defined objectives.
Sustainability is not a priority for most Indian
investors either. Of those that do take sustainability
issues into account, community-based initiatives
and low carbon programs are priorities. A small
percentage of private equity firms take account of
environmental and health and safety liability. For
sectors that rely strongly on their social license to
operate, such as the manufacturing and mining
sectors, companies face strong pressure from local
governments to respond to community needs.
Otherwise India’s government, legal and financial
institutions are only starting to drive the country’s
organizations to become more mindful of their
environmental and social responsibilities.
In July 2011 the Ministry of Corporate Affairs in
association with the Indian Institute of Corporate
Affairs updated the 2009 national voluntary
Guidelines (nvG) on Social, Environmental and
Economic Responsibilities of Business. Its principles
cover transparency, governance, environmental
protection and social concerns.
15 Bank of China, 2010 CSR Report. http://pic.bankofchina.com/bocappd/report/201106/
P020110620680809691168.pdf
16 https://www.cia.gov/library/publications/the-world-factbook/
geos/in.html
17 http://blogs.ft.com/beyond-brics/2011/04/28/india-overtaking-china-not-so-fast/#axzz1h3WJjXyJ
18 http://www.imf.org/external/pubs/ft/weo/2011/01/weodata/
weorept.aspx?sy=2008&ey=2011&scsm=1&ssd=1&sort=country&ds=.&br=1&c=534&s=nGDPD%2CnGDPDPC%2CPPPGDP%2CPPPPC%2CLP&grp=0&a=&pr.x=49&pr.
y=13#cs5

The Sustainability Yearbook 20121. KPMG: Sustainability Drivers in the Emerging Economies
13
In the public sector19, the Department of Public
Enterprise in September 2011 issued its Guidelines
on Sustainable Development for Central Public
Sector Enterprises (CPSEs), which lay out
compulsory sustainable development initiatives for
CPSEs mainly focusing on environmental issues. As
part of its annual performance evaluation of CPSEs
during 2010-11, the sustainable development
parameter is given a weight of five percent. As
CPSEs currently account for 23.7% of the nation’s
total GDP, these guidelines can have a potentially
high impact on the sustainability performance of
India’s public sector.20
In the financial sector, in December 2007 the
Reserve Bank of India published a circular requiring
banks to consider promoting sustainability through
their own business practices and lending policies.
In addition, the Institute of Chartered Accountants
of India (ICAI) has undertaken a special project
to suggest a suitable framework for sustainability
reporting in Indian companies’ annual reports.
Other incentives driving Indian companies to take
sustainability into account revolve mainly around
maintaining brand reputation and increasing
visibility with sector peers internationally. The
KPMG CR Report 2011 has also identified that 75 of
India’s 100 largest companies report on corporate
responsibility to protect corporate reputation while
55 take into account ethical considerations.
Indian companies are expected to place increasing
importance on climate change issues. KPMG India’s
Corporate Reporting Survey 2011 shows that
26% of India’s 100 largest firms already identify
opportunities related to climate change, 21%
report their carbon footprint and 22% participate
in the Carbon Disclosure Project (CDP).
As the post-Kyoto carbon emissions trading
arrangements are still unclear, companies that
were actively investing in low-carbon initiatives
may begin to hesitate due to this uncertainty and
narrow their investments. As initiatives such as the
Carbon Disclosure Project become more common,
however, companies are beginning to take their
climate change impacts into account more seriously.
Although as a group they lag behind some of their
international peers in terms of the percentage
of companies reporting and engaging with
sustainability issues, it is nonetheless clear that
engagement is growing and Indian companies are
increasingly attentive to corporate responsibility
issues. While some large companies have started
to establish a clear link between corporate
responsibility and risk management, many still need
convincing of the business case for integrating
sustainability into their business strategies.
19 http://dpemou.nic.in/MOUFiles/Sustainable_Dev.pdf
20 http://www.kpmg.com/In/en/IssuesAndInsights/ThoughtLeadership/Public-Sector-Enterprises.pdf and Department of Public Enterprises

The Sustainability Yearbook 20121. KPMG: Sustainability Drivers in the Emerging Economies
14
1.4 ruSSia
GDP Ranking 2010 11th
Global Competitiveness Index Rank 2011-2012 66th
Un Human Development Index Rank 2011 66th
CO2 Emissions per capita 2009 (t per capita) 10.8
Corruption Perceptions Index Rank 2011 143rd
Russia’s economy is the world’s 11th-largest,
powered in large part by its abundant resource
riches including natural gas, oil, coal, and precious
metals. By 2020, Russia is tipped to become the
world’s sixth-largest economy.21, 22
Russia’s resources giants lead the way when it
comes to incorporating sustainability into the busi-
ness. The KPMG CR Report 2011 shows that 58 of
the country’s 100 largest companies are publishing
information on their corporate responsibility per-
formance, led by exporters in the mining and oil
and gas sectors. As might be expected they have
more advanced sustainability practices in areas
such as health and safety as well as environmen-
tal standards as they understand the need to meet
international expectations and to stay in line with
industry peers. Regulatory pressure relating to en-
ergy efficiency and environmental protection is also
increasing. Russian regulations introduced from
2009 to 2011 include requirements to introduce
mandatory energy and water metering and to label
the energy efficiency of buildings and goods. The
Russian government is also drafting legislation to
strengthen environmental laws which are currently
considered lenient. A package of six bills—covering
topics including government environmental moni-
toring, marine oil pollution prevention measures
and economic incentives for waste management—
present the largest environmental legislation re-
form of the last 20 years.
European regulations also affect Russian companies
seeking to export to Europe. For example, REACH,
the main European law regulating the production
and import of chemicals, incorporated new
amendments in 2010 that increase the amount
of information that needs to be submitted when
registering substances, such as a description of the
methods of use and risk management procedures of
different substances. To avoid the risk of exclusion
from the European market, Russian companies
must ensure compliance.
Russia’s 2002 corporate governance code requires
open joint stock companies and close joint stock
companies to report on their compliance in their
annual report, although few enforcement mecha-
nisms exist, and there is no developed system for
monitoring compliance. With respect to foreign
investors and creditors, Russian companies take
a more compliance-led approach to their sustain-
ability requirements by incorporating international
frameworks such as the Equator principles and
various international corporate governance best
practices.
While Russian investors do not tend to have
specific sustainability requirements when investing
in Russian companies, they do take corporate
governance issues seriously as they are keen to
protect their ownership rights.
According to the KPMG CR Report 2011, the main
business drivers for reporting on corporate respon-
sibility in Russia include ethical considerations as
well as protecting corporate reputation and en-
hancing brand value. As yet, however, few Russian
companies think sustainability policies could save
them money or see a business case for integrating
sustainability into their business strategies.
21 http://blog.euromonitor.com/2010/07/special-report-top-
10-largest-economies-in-2020.html
22 https://www.cia.gov/library/publications/the-world-factbook/
geos/rs.html

The Sustainability Yearbook 20121. KPMG: Sustainability Drivers in the Emerging Economies
15
1.5 SouTh aFriCa
GDP Ranking 2010 28th
Global Competitiveness Index Rank 2011-2012 50th
Un Human Development Index Rank 2011 123rd
CO2 Emissions per capita 2009 (t per capita) 7.5
Corruption Perceptions Index Rank 2011 64th
South Africa is Africa’s largest and the world’s
28th-largest economy, powered in large part by
its mining, energy and natural resources sectors.
Mining and minerals contribute almost 9% directly
and another 10% indirectly to GDP. They also
represent nearly a third of the Johannesburg Stock
Exchange’s market capitalization.23
The effects these industries have on the
environment and surrounding communities and
the often inherently hazardous working conditions
for employees have required companies in these
sectors to manage and account for their impacts
for many years and to respond to regulation,
stakeholders and industry best practices. This
reporting environment has spread to other sectors
in the country. The KPMG CR Report 2011 shows
that 97 of the country’s 100 largest companies now
publish their corporate responsibility performance,
a significantly greater number than in the other
emerging markets discussed in this article.
The 2009 King Code of Governance, also known
as the King III Report, which requires companies
listed on the Johannesburg Stock Exchange to
publish integrated reports (albeit on an apply-or-
explain basis), encourages companies to consider
integrating sustainability into their overall strategy
and reports. The KPMG CR Report 2011 shows
that 25 of the 100 largest South African companies
publish sustainability reports.
Although investors in South Africa may not yet
differentiate widely between companies with
average, good and exceptional reports, they are
paying closer attention and are more likely to be
wary of poorly performing organizations.
Energy security, carbon emissions and cost are
significant issues affecting sustainability strategies
and plans on a national and corporate level. South
Africa is currently adding new coal-fired stations to
meet its short-term needs24, although there is clear
concern about the carbon implications. Constraints
to building a more sustainable generation base,
however, include access to finance, technology
and skills.
As energy demands increase, energy costs are
expected to grow. The possible introduction of
an energy or carbon tax is another factor driving
concerns about carbon output. While South Africa’s
absolute carbon output is not considered high,
its economy is carbon-intensive relative to GDP.
Without moves towards a less carbon-intensive
economy, South Africa could become a significant
carbon emitter.
Water constraints in South Africa are becoming a
business imperative for water-intensive businesses,
such as power companies. Capacity and infrastructure
improvements will increase water costs, forcing
water-intensive businesses to take a closer look
at how they use and recycle water, an issue many
companies are already taking action on.
Health and safety is another critical sustainability is-
sue, primarily in South Africa’s mining and natural
resources sectors. A high number of injuries or a fa-
tality will stop operations while investigations are car-
ried out to identify causes and introduce preventa-
23 Facts and Figures 2010, Chamber of Mines of South Africa: http://www.bullion.org.za/Publications/Facts&Figures2010/F%20and%20F%202011-small.pdf
24 http://www.miningmx.com/news/energy/Eskom-plans-third-new-coal-station.htm

The Sustainability Yearbook 20121. KPMG: Sustainability Drivers in the Emerging Economies
16
tive measures. Mismanagement of health and safety
can have an immediate impact on a company’s bot-
tom line and investor profits. Companies, therefore,
know that managing health and safety issues in their
operations is essential to attract investors.
Future issues include how carbon emissions will
be dealt with as a result of COP17 in Durban and
the question of how companies continue on the
journey towards integrated reporting.
1.6 SuMMinG uP
The emerging economies’ rate of development
and economic growth is extraordinary and
unprecedented. It is pulling millions out of poverty
worldwide and offering them the means to catch
up with the developed economies.
Developing economies also have an opportunity
to outperform their developed economy peers by
growing their economies on a more sustainable
basis. The industrial era for most developed nations
came at the cost of widespread environmental
pollution and pressure on communities and
individuals. Developing nations are facing the
same kinds of choices and dilemmas today, but it
is clear their awareness of these choices and their
understanding of how to negotiate a way through
them more sustainably is growing. Investors and
companies that understand the nature and detail
of the opportunities this presents will be best
placed to profit from them.
The Sustainability Yearbook 20121.1 Título del capítulo
17
2 InnOvATIOn MAnAGEMEnT In THE SAM CORPORATE SUSTAInABILITY ASSESSMEnT

The Sustainability Yearbook 20122. Innovation Management in the SAM Corporate Sustainability Assessment
18
2. Innovation Management in the
SAM Corporate Sustainability Assessment
hybrid vehicles. Bio-plastics. online music purchasing platforms. Carbon fibers. laser-cutting
technologies. These are just a few examples of innovative products and processes that have helped
companies reach new markets, speed up production processes and transform how products are
delivered to consumers. But what are some of the key drivers leading to innovation, and what steps
are companies taking to ensure that their best ideas are implemented in the most effective manner?
Jvan Gaffuri, Senior Manager Sustainability Services, offers an overview on how companies that
participated in the SaM Corporate Sustainability assessment approach innovation management.
2.1 innovaTion anD SuSTainaBiliTy
Reconciling human development and economic
growth with our ecological footprint represents
one of this century’s greatest challenges. Improving
levels of human development places additional
pressures on the ecosystem and reduces the amount
of average biocapacity available per person. History
has shown that as countries progress on the Un
Human Development Index—a measure of a
country’s achievements based on GDP per capita,
life expectancy and education—they also increase
their environmental footprint.
FiGure 1: huMan DeveloPMenT inDex anD eColoGiCal FooTPrinTSource: UnDP Human Development Report, 2009, data from Global Footprint network national Footprint Accounts
High human developmentwithin the Earth’s limits
Un
DP
thre
shol
d fo
r hig
h hu
man
dev
elop
men
t
World average biocapacity per person in 1961
World average biocapacity per person in 2006
Innovation is required to
enable human development
by using less biocapacity
African countries
Asian countries
European countries
Latin American and Caribbean countries
north American countries
Oceanian countries
12
10
8
6
4
2
0
0.2 0.4 0.6 0.8 1.0
Ecol
ogic
al fo
otpr
int (
glob
al h
ecta
res
per p
erso
n)

The Sustainability Yearbook 20122. Innovation Management in the SAM Corporate Sustainability Assessment
19
Such increases are even more drastic once a country
has reached a high level of human development:
every marginal unit of improvement has an even
greater impact on the ecosystem. As a result, two
key macroeconomic challenges have emerged:
1. reducing the ecological footprint of developed
countries to sustainable levels, and
2. fostering economic growth in emerging coun-
tries while limiting the environmental impact of
their growing prosperity.
Clearly, many of society’s primary engines of eco-
nomic growth such as agriculture, energy genera-
tion, construction & housing, mobility, and materi-
als must shift away from unsustainable “business
as usual” practices towards sustained economic
growth that can support a growing population well
into the future.1 Such challenges require innovative
solutions, and companies that can address these
challenges will enjoy a competitive advantage in
the long run.
At the microeconomic level, striking a balance be-
tween economic efficiency and societal progress is
also required. Fearing a negative impact on their
bottom line, corporations are often hesitant to
embark on more sustainable growth strategies.
Although many companies are increasingly rec-
ognizing the financial benefits of implementing
corporate sustainability strategies, some corporate
executives still believe that societal benefits and
financial profits are mutually exclusive. This may
be true if a company’s strategy has a particularly
narrow time horizon that favors short-term finan-
cial returns over long-term goals. While a strong
focus on cost reduction may indeed generate im-
mediate benefits for companies, these fade once
environmental and social externalities are taken
into account.
One of the main goals of corporate innovation is
to remain competitive by gaining access to new
markets and reducing process costs. Innovation
enables companies to improve efficiencies by
reducing the amount of energy and material inputs
used, ultimately lowering production costs. It also
allows companies to update their range of products
and services, avoiding losses as earlier generations
of products and services become obsolete.
Thus, from the macroeconomic and the microeco-
nomic perspective, innovation is required in order
to enable both sustainable development and fi-
nancial success. For this reason, sustainability has
emerged as one of the key drivers of innovation.2
A sustainability strategy that considers societal
needs and aims to reduce the company’s ecological
footprint can provide companies with a framework
for developing innovations to their processes and
products, benefitting companies and society alike.
2.1.1 The role of environmental regulations
Though some may consider regulations to be too
restrictive by imposing limitations on companies’
activities, generating additional compliance-related
costs and reducing productivity, regulations have,
in fact, played an important role in encouraging
environmental innovations, even if mainly pro-
cess-related. This seemingly counterintuitive no-
tion is described by the Porter Hypothesis, which
argues that “…properly designed environmental
standards can trigger innovation that may partially
or more than offset the costs of complying with
them.” Thus, environmental regulation can indeed
stimulate innovation by making companies aware of
and willing to exploit otherwise missed opportuni-
ties.3, 4 Proactive company behavior that anticipates
future regulations, identifies opportunities arising
from these changes and implements and redesigns
products or processes to prevent negative environ-
mental impacts, not only benefits the environment,
but often also helps companies establish competi-
tive advantages.5, 6, 7
1 vision 2050, WBCSD, 2010
2 Ram nidumolu, C.K. Prahalad, and M.R. Rangaswami, Why Sustainability Is now the Key Driver of Innovation, Harvard Business Review, September 2009
3 Porter, M.E., van der Linde, C., 1995. Toward a new Conception of the Environment-Competitiveness Relationship. Journal of Economic Perspectives 9, 97-118
4 Bernauer, T., Engels, S., Kammerer, D. and nogareda, J.S., 2007. Explaining Green Innovation: Ten Years after Porter’s Win-Win Proposition: How to Study the Effects of Regulation on Corporate Environmental Innovation? In: Frank Biermann, P.-O.B., Peter, Henning Feindt, a.K.J. (Eds.), Politik und Umwelt. PvS verlag
5 Berry, M.A., Rondinelli, D.A., 1998. Proactive Corporate Environmental Management: A new Industrial Revolution. Academy of Management Executive 12, 38-50
6 Hart, S.L., Ahuja, G., 1996. Does it Pay to be Green? An Empirical Examination of the Relationship between Emission Reduction and Firm Performance. Business Strategy and the Environment 5, 30-37
7 Aragón-Correra, J.A., Sharma, S., 2003. A Contingent Resource-Based view of Proactive Corporate Environmental Strategy. Academy of Management Review 28, 71-88
“Innovation is required in order to enable both sustainable development and financial success. For this reason, sustainability has emerged as one of the key drivers of innovation.”
The Sustainability Yearbook 20122. Innovation Management in the SAM Corporate Sustainability Assessment
20
2.1.2 The importance of innovation
Although most executives agree that innovation
is a key contributor to their company’s success,
they also acknowledge that innovation is difficult
to generate, track and manage. According to a
McKinsey survey8 conducted in 2010, 84% of
top managers stated that innovation is one of
their top priorities. The economic recession has
not changed this view: the ability to convert new
ideas into products and services remains a key goal
for every company. Despite economic difficulties,
innovation continues to receive financial support
from company management; but a challenging
economic environment further underscores the
importance of carefully monitoring and managing
the innovation process. not surprisingly, challenges
arise—particularly in the early stages of innovation
process management when priorities need to be
defined, budgets allocated accordingly, targets
set, and metrics to measure success have to
be introduced. 42% of the respondents state
that improvements in the organization alone
would have a significant impact on innovation
performance. Thus, the growing strategic
importance of innovation requires companies to
implement a formalized process involving various
areas of the firm, as well as a set of indicators to
measure achievements.
2.2 MeaSurinG innovaTion ManaGeMenT
In order to evaluate companies’ innovation
management processes and tools for measuring
the outcomes of their innovation initiatives, SAM
introduced a range of innovation-related questions
into its annual Corporate Sustainability Assessment
in 2009. Each year, SAM invites 2,500 companies
to participate in the annual Corporate Sustainability
Assessment (CSA), which consists of an extensive
questionnaire containing over 100 general and
industry-specific questions covering the economic,
environmental and social dimensions.
Because the information collected through the
assessment is used in SAM’s valuation analysis,
the CSA focuses on sustainability factors that are
relevant to each industry, material to the companies’
financial performance and under-researched in
conventional financial analysis. By analyzing the
sustainability profile of companies, SAM can gain
a more comprehensive view of their quality of
management and ability to generate value.
8 McKinsey Global Survey results, Innovation and
commercialization, 2010
“The growing strategic
importance of innovation
requires companies to
implement a formalized
process involving various
areas of the firm, as well as a set of
indicators tomeasure
achievements.”

The Sustainability Yearbook 20122. Innovation Management in the SAM Corporate Sustainability Assessment
21
FiGure 2: innovaTion inDiCaTorS uSeD in The SaM CorPoraTe SuSTainaBiliTy aSSeSSMenTSource: SAM
innovation input: measures the amount of financial resources dedicated to the innovation process.
innovation Process Management: asks companies to state whether they have processes and systems in
place to manage innovation and whether they have defined relevant key performance indicators (KPIs).
innovation output: assesses the outcome of the innovation process. Examples include the number of
product and process innovations and success rates of different innovation steps.
innovation input• R&D Spending• Share of R&D budget
invested per innovation stage
• Open Innovation
innovation Process Management• Cycle, success rate and
KPIs for the different innovation stages
• Structures and Mechanism
innovation output• Product Innovations• Process Innovations• Environmental
Innovations• Social Innovations
Innovation is a complex and multidimensional
concept that cannot be measured directly or with
one single indicator. Therefore, SAM seeks to identify
more robust innovation metrics that look beyond
innovation inputs and also analyze innovation
process management and innovation outputs:
“Innovation is a complex and multidimensional concept that cannot be measured directly or with one single indicator.”

The Sustainability Yearbook 20122. Innovation Management in the SAM Corporate Sustainability Assessment
22
For the 2011 Corporate Sustainability Assessment,
a range of innovation management questions has
been incorporated into the sustainability question-
naire for industries in which innovation is expected
to have the greatest impact on companies’ com-
petitiveness. The specific questions used to assess
innovation management vary from industry to in-
dustry to reflect specific characteristics that are par-
ticularly relevant to each sector.
In 2011, SAM collected innovation data and
calculated scores for a total of 319 companies in
the following sectors:
FiGure 3: SeCTorS evaluaTeD aCCorDinG To SaM’S innovaTion ManaGeMenT CriTerionSource: SAM
Sector
Aerospace & Defense
Auto Parts & Tires
Automobiles
Beverages
Biotechnology
Chemicals
Clothing, Accessories & Footwear
Communication Technology
Computer Hardware & Electronic Office Equipment
Computer Services & Internet
Diversified Industrials
Durable Household Products
Electric Components & Equipment
Electronic Equipment
Fixed Line Communications
Sector
Food Producers
Furnishing
General Retailers
Healthcare Providers
Industrial Engineering
Leisure Goods
Medical Products
Mobile Telecommunications
nondurable Household Products
Personal Products
Pharmaceuticals
Semiconductors
Software
Waste & Disposal Services

The Sustainability Yearbook 20122. Innovation Management in the SAM Corporate Sustainability Assessment
23
2.3 reSulTS
The evaluation of the criterion began with an
analysis of the innovation management scores
calculated for 319 companies in 2011. These
companies were then organized into three groups
according to the score they received for the
innovation criterion:
excellent performance: companies with a high
innovation score of > 70 (out of a maximum of 100
points)
average performance: companies with an inno-
vation score of between 40 and 70
Poor performance: companies with an innovation
score < 40
Companies were then grouped at the supersector
level (a broader grouping of similar industries) in
order to identify which supersectors had the highest
percentage of top-performing companies. Similar
breakdowns were also carried out for selected
indicators within the innovation management
criterion such as R&D Spending, Open Innovation
and Environmental Innovation.
The results for the 2011 Innovation Management
criterion are summarized in the chart below:
FiGure 4: BreaKDown oF CoMPanieS By innovaTion ManaGeMenT SCoreSSource: SAM
Average Performance (score between 40-70)
Poor Performance (score < 40)
Excellent Performance (score > 70) 37%
39%
24%

The Sustainability Yearbook 20122. Innovation Management in the SAM Corporate Sustainability Assessment
24
By looking at the distribution of the scores among
the different supersectors for which the innovation
criterion applies, one can observe that the consumer
goods, healthcare and basic materials supersectors
have the highest percentage of companies receiving
an excellent score. Industrials are in line with the
average, while technology, telecommunications
and consumer services are slightly lagging.
It is somewhat surprising to see the below average
performance of the technology supersector. One of
the reasons for this is that technology companies
are often hesitant to disclose information on their
innovation management processes and outcomes.
Companies that are not transparent about their
processes and measurement tools tend to receive
lower scores.
A geographical breakdown of the companies
based on their country of domicile reflects a
high level of disclosure—and as a result, higher
average scores—for companies based in Europe
and Asia ex-Japan, while scores are lower in the
US and Japan. This is no coincidence, as many
technology companies, which were found to be
less transparent, are located in those two countries.
Asia ex-Japan, which is home to a large number
of IT companies, but has a higher percentage of
companies with an excellent innovation score, is an
exception to this trend.
FiGure 6: GeoGraPhiC BreaKDown oF CoMPanieS wiTh exCellenT innovaTion ManaGeMenT PerForManCeSource: SAM
number of Companies Analyzed % of Companies with Excellent Performance (score > 70)
FiGure 5: SuPerSeCTor BreaKDown oF CoMPanieS wiTh exCellenT innovaTion ManaGeMenT PerForManCeSource: SAM
number of Companies Analyzed % of Companies with Excellent Performance (score > 70)
100
90
80
70
60
50
40
30
20
10
0
num
ber
of C
ompa
nies
Consumer Goods Industrials Technology Healthcare
40%
30%
20%
10%
0%Basic Materials Telecommunications Consumer Services
86
30 3031
54
69
19
16%13%
30%29%
17%25%
29%
120
100
80
60
40
20
0
num
ber
of C
ompa
nies
Europe north America Japan Asia (ex-Japan, AUS and nZ)
100%
80%
60%
40%
20%
0%AUS and nZ Latin America
29%
6 444
60
19%
0%
36%
15%
93111
0%

The Sustainability Yearbook 20122. Innovation Management in the SAM Corporate Sustainability Assessment
25
2.3.1 innovation input
r&D Spending
Disclosure on research and development (R&D)
spending is one of the elements used to measure
the inputs to the innovation process. Companies
were asked to provide the total amount of
R&D expenditures over the last four years, the
breakdown between internal spending and
outsourced spending, personnel costs as well as
the total number of full-time employees dedicated
to R&D efforts.
Data for R&D expenditures was collected for the
288 companies in the sectors that were eligible for
this question. The results were once again clustered
according to their performance for this measure:
excellent (score > 70), average (score between 40
and 70) and poor (score < 40).
Based on the results of the 2011 assessment,
companies can be classified into two broad groups:
47% of the companies show excellent performance
for this measure, while 41% of the sample received
a poor score. Interestingly, the percentage of
companies achieving an average score is relatively
small. One reason for this is that companies
generally fall into one of two extremes: either
they prefer to report only minimal information on
R&D spending as required by minimum accounting
standards, or they choose to be fully transparent.
FiGure 7: BreaKDown oF CoMPanieS By r&D SPenDinG SCoreSource: SAM
Average Performance (score between 40-70)
Poor Performance (score < 40)
Excellent Performance (score > 70) 12%
41%
47%
Among the different supersectors, industrials and
basic materials contained the highest percentage
of companies with excellent performance, followed
by consumer goods, technology and telecommu-
nications.
However, it is important to note that measuring R&D
expenditures alone is not sufficient for managing
the innovation process. Such indicators offer limited
insights into a company’s innovation potential:
higher R&D expenditures do not necessarily lead to
more innovation.
FiGure 8: SuPerSeCTor BreaKDown oF CoMPanieS wiTh exCellenT r&D SPenDinG PerForManCeSource: SAM
number of Companies Analyzed % of Companies with Excellent Performance (score > 70)
Consumer Goods Industrials Technology Basic Materials
70%
60%
50%
40%
30%
20%
10%
0%Telecommu-
nicationsConsumer Services
45%
3019
30
54
62%
43%
57%
39%
698616%
100
90
80
70
60
50
40
30
20
10
0
num
ber
of C
ompa
nies
The Sustainability Yearbook 20122. Innovation Management in the SAM Corporate Sustainability Assessment
26
open innovation
Because innovation is not only generated inside
the company, the innovation management process
must also consider and integrate external sources
of innovation. new ideas frequently come from
consumers, suppliers, partners, research institutions
or even from regulators. Therefore, open innovation
approaches are becoming increasingly vital to
generating new ideas that can then be further
developed within the company.
For this reason, when analyzing inputs to the
innovation process, SAM also evaluates the
companies’ level of openness in their interactions
with the outside world as they seek to develop
new ideas. The assessment considers factors such
as research collaborations with external business
partners, distributed creativity, acquisitions,
corporate venture capital, spin-offs/start-ups,
technology licensing and open source.
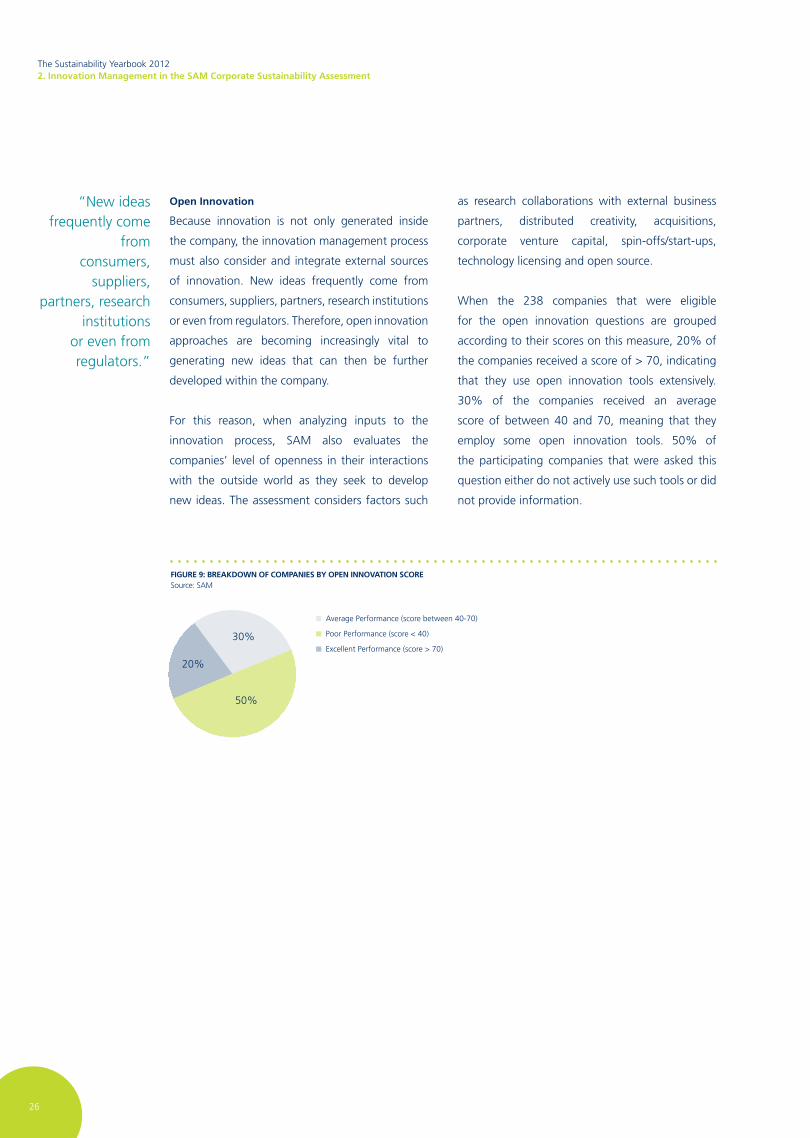
When the 238 companies that were eligible
for the open innovation questions are grouped
according to their scores on this measure, 20% of
the companies received a score of > 70, indicating
that they use open innovation tools extensively.
30% of the companies received an average
score of between 40 and 70, meaning that they
employ some open innovation tools. 50% of
the participating companies that were asked this
question either do not actively use such tools or did
not provide information.
FiGure 9: BreaKDown oF CoMPanieS By oPen innovaTion SCoreSource: SAM
Average Performance (score between 40-70)
Poor Performance (score < 40)
Excellent Performance (score > 70) 30%
50%
20%
“new ideas frequently come
fromconsumers,
suppliers, partners, research
institutionsor even from regulators.”

The Sustainability Yearbook 20122. Innovation Management in the SAM Corporate Sustainability Assessment
27
The technology and basic materials sectors, which
had a much higher proportion of companies
achieving excellent performance (score > 70) for this
indicator, are using open innovation more actively
than companies in other sectors. Industrials, on
the other hand, appear to be more cautious about
actively using open innovation tools.
FiGure 10: SuPerSeCTor BreaKDown oF CoMPanieS wiTh exCellenT oPen innovaTion PerForManCeSource: SAM
2.3.2 innovation Process Management
In order to identify state-of-the-art key performance
indicators (KPIs) used in innovation management,
companies were asked to provide the top three
measures used within each of the four main
stages of innovation: Core Research, Ideation/
Applied Research, Development and Product
Commercialization & Process Implementation.
FiGure 11: STaGeS oF innovaTion ProCeSS ManaGeMenTSource: SAM
number of Companies Analyzed % of Companies with Excellent Performance (score > 70)
innovation input• R&D Spending• Share of R&D budget invested
per innovation stage• Open Innovation
innovation Process Management• Cycle, success rate and KPIs for
the different innovation stages• Structures and Mechanism
innovation output• Product Innovations• Process Innovations• Environmental Innovations• Social Innovations
Stages of innovation
Process Management
Core research
ideation / applied research
Development
ProductCommercialization& Processimplementation
Consumer Goods Industrials Technology Basic Materials
30%
20%
10%
0%
27%
26%
86
90
80
70
60
50
40
30
20
10
0
num
ber
of C
ompa
nies
85
54
69 30
9%
22%

The Sustainability Yearbook 20122. Innovation Management in the SAM Corporate Sustainability Assessment
28
Core research: research or academic research
with no direct or immediate commercial benefits.
The results of the assessment confirm that the core
research phase is mainly driven by project planning
activities, which include conducting feasibility
studies, resource allocation and milestone definition.
Important innovation output indicators used by
companies to measure the success of their core
research phase are primarily related to intellectual
property such as the number of publications and
patents registered and an evaluation of the know-
how built up during this stage.
ideation/applied research: the systematic or
unsystematic generation of ideas.
Companies cited the importance of tracking
activities related both to ideation inputs such as
R&D expenditures, and outputs such as the number
of new ideas generated, the share of new ideas
that make it to the next phase of development
and the life-time of new products. Project planning
was also considered to be an important element
of the ideation stage and included activities such
as business plans and feasibility studies, all of
which are important during the early stages of the
innovation process.
What seems to be missing for most companies in
this stage are indicators showing that companies
foster innovation by encouraging creativity. For
example, companies could allocate budget or time
to “free” or unconstrained research and then track
how many innovations come out of these less
structured activities.
Development: refers to the development of spe-
cific Product Innovations and Process Innovations.
Product Innovations
Product innovations include goods and services
that are new to the company or that reflect major
technical improvements or upgrades to existing
products such as improved quality, functionality or
new packaging.
In order to evaluate the success of the development
stage, companies used financial indicators such
as R&D budget, revenue projections and pipeline
value to estimate the value of the new product.
Companies also cited a range of market research
indicators such as user tests, pilot projects,
market field test results, client feedback and the
estimated impact on the brand’s value in order to
gage the potential success of the product under
development.
Process Innovations
Process innovations refer to processes that are new
to the company. These include the introduction
of major or technical improvements to the
manufacturing technologies or processes used in
the production of goods or in the distribution of
goods and services.
Companies cited a number of technical and fi-
nancial indicators used to evaluate the benefits of
process innovations that emerge during the devel-
opment stage. Technical feasibility and monitor-
ing indicators used to track the new production
process include evaluating the success of pilot
projects, mass productivity tests, and measuring
process quality and manufacturing efficiency im-
provements. Financial indicators included a range
of cost–benefit analyses.
Product Commercialization and Process imple-
mentation: refers to the actual commercializa-
tion of a product or the implementation of a
new process.
The most important indicators companies use to
evaluate their product commercialization efforts
are related to marketing activities such as tracking
the creation of new marketing materials, event
promotions, marketing plans, media presence, and
customer and competitors’ reactions.

The Sustainability Yearbook 20122. Innovation Management in the SAM Corporate Sustainability Assessment
29
2.3.3 innovation output
A critical component of any innovation strategy is
a company’s ability to measure the outcomes of
its innovation initiatives against its stated targets.
Companies should be able to track the number
and effectiveness of their product or process
innovations, and whether any of their innovations
have led to positive environmental or social
outcomes.
Because many innovations are specifically devel-
oped to meet social or environmental goals, SAM’s
assessment of innovation outputs includes a sec-
tion focusing exclusively on social and environmen-
tal innovations. The CSA defines environmental
innovations as all process, product and organiza-
tional innovations that are beneficial to the envi-
ronment and whose primary objective is to improve
environmental performance.
For the 2011 assessment, 227 companies were
asked to provide information on environmental in-
novation. In order to identify the importance of en-
vironmental factors, companies were asked to state
their primary motivations for implementing envi-
ronmental innovations. Among others, companies
cited commitments to reducing their carbon foot-
print, or incorporating environmental design into
their products, substituting away from hazardous
substances, reducing energy and water consump-
tion, and recycling waste and by-products.
The companies were grouped based on their en-
vironmental innovation score. More than three-
fourths of the companies use quantitative measures
to track environmental innovations and consider
them to be an important element of their innova-
tion strategy. The outcome is consistent with recent
studies9 highlighting the importance of sustainabil-
ity as a key driving force behind innovation.
FiGure 12: BreaKDown oF CoMPanieS By environMenTal innovaTion SCoreSource: SAM
Average Performance (score between 40-70)
Poor Performance (score < 40)
Excellent Performance (score > 70)
55%
19%
26%
9 Ram nidumolu, C.K. Prahalad, and M.R. Rangaswami, Why Sus-tainability Is now the Key Driver of Innovation, Harvard Business Review, September 2009

The Sustainability Yearbook 20122. Innovation Management in the SAM Corporate Sustainability Assessment
30
Among the major supersectors, industrials and ba-
sic materials show the highest percentage of com-
panies with excellent performance on environmen-
tal innovation.
2.4 ConCluSion
Innovation is the process of translating a new
idea into a technological and commercial success
and is vital to ensuring the long-term growth of
companies. Because an effective sustainability
strategy can help companies create a competitive
advantage, it has evolved into an increasingly
important driver guiding the innovation process.
Environmental and social factors are becoming an
increasingly important element of the innovation
management process. Companies have recognized
that they can generate competitive advantages by
introducing environmental innovations because
they often enable the more efficient use of
resources, leading to significant cost savings. This
is one of the most compelling arguments for
introducing process changes. Further, pressure from
customers, suppliers, regulators and stakeholders
has continuously increased, pushing companies to
introduce measures that help them improve their
environmental footprint.
Analysis of the data submitted by companies re-
veals that innovation leaders, as identified by the
2011 Corporate Sustainability Assessment, actively
use a wide range of indicators to manage the ef-
fectiveness of their innovation strategies. However,
given that 39% of the participating companies
achieved a low innovation score, overall company
disclosure levels could be improved further.
Well-defined innovation performance indicators
are a useful management tool for tracking the
success of an innovation, and are therefore
an important component of a comprehensive
innovation management strategy aimed at
generating competitive advantages. However,
beyond simply measuring innovation inputs and
outputs, companies must also actively manage
their progress against stated targets.
FiGure 13: SuPerSeCTor BreaKDown oF CoMPanieS wiTh exCellenT environMenTal innovaTion PerForManCeSource: SAM
number of Companies Analyzed % of Companies with Excellent Performance (score > 70)
“Companies have recognized that
they can generate competitive
advantages by introducing
environmental innovations
because they often enable the more
efficient use of resources, leading to significant cost
savings.”
num
ber
of C
ompa
nies
80
70
60
50
40
30
20
10
0
40%
30%
20%
10%
0%
33%
25%
69
24%
30%
Industrials Technology Consumer Goods Basic Materials Telecommunications
54
3030
44
17%

The Sustainability Yearbook 20121.1 Título del capítulo
31
3 SUSTAInABILITY In THE CHEMICAL InDUSTRY

The Sustainability Yearbook 20123. Sustainability in the Chemical Industry
32
3. Sustainability in the Chemical Industry
3.1 inTroDuCTion
For well over a century, the chemical industry has
sourced oil-based raw materials and minerals and
turned them into products serving an impressive
range of applications and industries. Examples
span from dyes and additives for plastics, wood
and electronics to polymers for the automotive,
construction and consumer industries. From
fragrances to chemical intermediates that are
converted into high-value pharmaceuticals, and
from fertilizers and agrochemicals to soaps and
waxes, chemicals have transformed our lives.
Although society has welcomed the many benefits
that chemical products bring to daily life—ultimately
becoming accustomed to their added value and
taking them for granted—it has also become
increasingly aware that the growing presence
of chemical products and operations comes at a
price. Increased waste production and greenhouse
gas emissions, production of toxic intermediates,
concerns over the employee safety and the safety
of communities located near chemical facilities
have led to growing unease over the amount of
chemicals in the environment and their effect on
our health and well-being.
As growing awareness of the burden of chemical
operations has generated public distrust, it comes
as no surprise that sustainability thinking in the
industry originated in the form of a stronger
corporate commitment towards mitigating the
environmental impact of manufacturing operations,
the remediation of environmental damage caused
by accidents and the improvement of safety in the
work place.
To address these societal concerns, the chemical
industry founded Responsible Care1 in 1985 as a
voluntary initiative requiring signatory companies
to commit to improving their performance on
environmental, safety and product stewardship
matters. Today, the initiative is active in 52 countries
whose combined chemical operations account
for nearly 90% of global chemicals production.
Over the years, chemical companies have come
to realize that investments made to improve the
sustainability of their operations do have a positive
economic impact on their bottom line profitability,
for instance, in the form of lower energy costs or
health-related liabilities. 1 http://www.icca-chem.org/en/
Home/Responsible-care/
analyst andrea ricci, PhD, offers an overview of how the chemical industry’s approach to
sustainability has evolved over the years, and based on analysis of data from SaM’s Corporate
Sustainability assessment for the chemical industry, highlights some of the key sustainability
issues faced by the industry today.

The Sustainability Yearbook 20123. Sustainability in the Chemical Industry
33
The last few decades have also witnessed the rise
of product stewardship, which grew out of demand
for higher transparency on the composition of
chemical products and their long and short-term
effects on the environment and end-users. Today,
regulatory frameworks such as REACH,2 are in
place to protect consumers. At the same time,
non-governmental organizations have compiled
and published lists of chemicals whose use has
sparked concerns, in order to promote debate and
help the industry cleanse its product portfolio by
eliminating the use of certain substances that have
been deemed harmful.3 Beyond bearing the costs
of adhering to legislative frameworks, chemical
companies have recognized the importance of
avoiding the economic consequences of developing
products that run the risk of being banned in the
future. For instance, they have been increasingly
engaging in product life cycle analysis early on
during the innovation process, a practice that
greatly contributes to the improvement of their
sustainability footprint.4
The chemical industry is an innovation-driven
industry: starting with a relatively small spectrum
of raw materials, it devises innovative processes
and chemical reactions in order to produce novel
molecules designed to meet specific applications.
Over the decades, the research community has
come to recognize its unique position enabling
it to shape the sustainability agenda within the
chemical industry. In the late 1990’s, the “twelve
principles of green chemistry”5 were articulated by
Paul Anastas and John Warner. These principles
consist of a series of standards and objectives, and
are now broadly accepted by chemical companies
as an industry-wide benchmark for best sustainable
practices.
“Sustainability has been a key driver enabling the chemical industry to develop solutions for the future.
As an industry-wide initiative, Responsible Care provides the chemical industry with a unique framework
for developing continuous improvements throughout the industry’s operations and value chains in order
to meet society’s environmental, social and economic needs.”
John Geeraerts, Chairman, Responsible Care Europe
2 The Registration, Evaluation, Authorization and Restriction of Chemical Substances is the European Community’s regulation on chemicals and their use. The aim of REACH is to improve the protection of human health and the environment through the better and earlier identification of the intrinsic properties of chemical substances. http://ec.europa.eu/environment/chemicals/reach/reach_intro.htm
3 The SIn (Substitute It now!) List is an nGO driven project to speed up the transition to a toxic free world. The List consists of 378 chemicals that ChemSec has identified as Substances of very High Concern based on the criteria established by the EU chemical regulation, REACH. http://www.sinlist.org/
4 http://www.icca-chem.org/Home/news-and-press-releases/news-Archive/2009/G8-Chemical-Industry-proposes-effective-tools-for-climate-protection1/
5 Anastas, P. T.; Warner, J. C.; Green Chemistry Theory and Practice. Oxford: Oxford University Press, 2000.

The Sustainability Yearbook 20123. Sustainability in the Chemical Industry
34
Twelve PrinCiPleS oF Green CheMiSTry
1. Prevention
It is better to prevent waste than to treat or clean up waste after it has been created.
2. atom economy
Synthetic methods should be designed to maximize the incorporation of all materials used in the
process into the final product.
3. less hazardous Chemical Syntheses
Wherever practicable, synthetic methods should be designed to use and generate substances that
possess little or no toxicity to human health and the environment.
4. Designing Safer Chemicals
Chemical products should be designed to effect their desired function while minimizing their toxicity.
5. Safer Solvents and auxiliaries
The use of auxiliary substances (e.g., solvents, separation agents, etc.) should be made unnecessary
wherever possible and innocuous when used.
6. Design for energy efficiency
Energy requirements of chemical processes should be recognized for their environmental and
economic impacts and should be minimized. If possible, synthetic methods should be conducted at
ambient temperature and pressure.
7. use of renewable Feedstocks
A raw material or feedstock should be renewable rather than depleting whenever technically and
economically practicable.
8. reduce Derivatives
Unnecessary derivatization (use of blocking groups, protection/deprotection, temporary modification
of physical/chemical processes) should be minimized or avoided if possible, because such steps
require additional reagents and can generate waste.
9. Catalysis
Catalytic reagents (as selective as possible) are superior to stoichiometric reagents.
10. Design for Degradation
Chemical products should be designed so that at the end of their function they break down into
innocuous degradation products and do not persist in the environment.
11. real-time analysis for Pollution Prevention
Analytical methodologies need to be further developed to allow for real-time, in-process monitoring
and control prior to the formation of hazardous substances.
12. inherently Safer Chemistry for accident Prevention
Substances and the form of a substance used in a chemical process should be chosen to minimize the
potential for chemical accidents, including releases, explosions, and fires.
*Anastas, P. T.; Warner, J. C.; Green Chemistry: Theory and Practice, Oxford University Press, 2000.

The Sustainability Yearbook 20123. Sustainability in the Chemical Industry
35
More recently, the rise of long-term megatrends
has provided the chemical industry with added
incentives for unlocking its potential to deliver
sustainability-related innovations. Examples of
such innovations include new battery materials to
support electric-based mobility, lightweight and
nano-structured composites, catalysts and additives
for the production of renewable energies and the
development of industrial biotechnology and bio-
mass based processes to reduce our dependence
on oil.
Finally, for the chemical industry sustainability
has also taken the form of increased corporate
governance and transparency, thereby ensuring
that companies are managed with the best interests
of their shareholders in mind, while also respecting
stakeholders such as customers, employees and
suppliers. Integrity and transparency of corporate
operations and decisions are particularly relevant
for global chemical companies: because they
are active in different local markets, they must
simultaneously comply with international standards
and local regulations in order to establish successful
long-term business relationships. Local quality
standards or labor practices vary from country to
country, and companies must be willing and able
to show that they have gone beyond minimum
international standards and have made an effort to
adapt to local requirements. Thus, transparency is
particularly important if companies wish to maintain
their social license to operate in certain markets
and is a necessary requirement for engaging in
constructive dialogue with local stakeholders and
the communities in which they are active.
3.2 BaCKGrounD anD MeThoDoloGy
In order to inform the debate on sustainability topics
and identify key trends that are relevant to the
chemical industry, SAM has analyzed data collected
from chemical companies that participated in the
SAM Corporate Sustainability Assessment (CSA)
over the last three years.
SAM’s investment methodology is based on the
assessment of a company’s sustainability profile
and on the integration of this information into
standard financial analysis. The collection of
company-specific sustainability data is therefore
key to obtaining a comprehensive financial profile
for each company. For this reason, SAM invites
the largest 2,500 publicly traded companies to
participate in its annual Corporate Sustainability
Assessment. This questionnaire-based assessment
covers a range of financially relevant economic,
environmental and social criteria through over
1,000 data points. Because this information is
integrated into financial analysis, SAM focuses
on sustainability factors that can have an impact
on companies’ financial performance. At the
same time, the information collected through
the assessment provides a valuable overview of
sustainability practices in several industry sectors.
Similar to other sectors, the sustainability
questionnaire for the chemical industry is designed
to capture both general and industry-specific
criteria covering the economic, environmental and
social dimensions, as shown in Figures 1 & 2. Each
dimension consists of approximately 5-6 criteria,
and each criterion contains approximately 20
questions, totaling approximately 100 questions.
For each company, a total sustainability score of
up to 100 points is calculated using a weighted
average of the three dimensions.
“The rise of long-term megatrends has provided the chemical industry with added incentives for unlocking its potential to deliver sustainability-related innovations.”
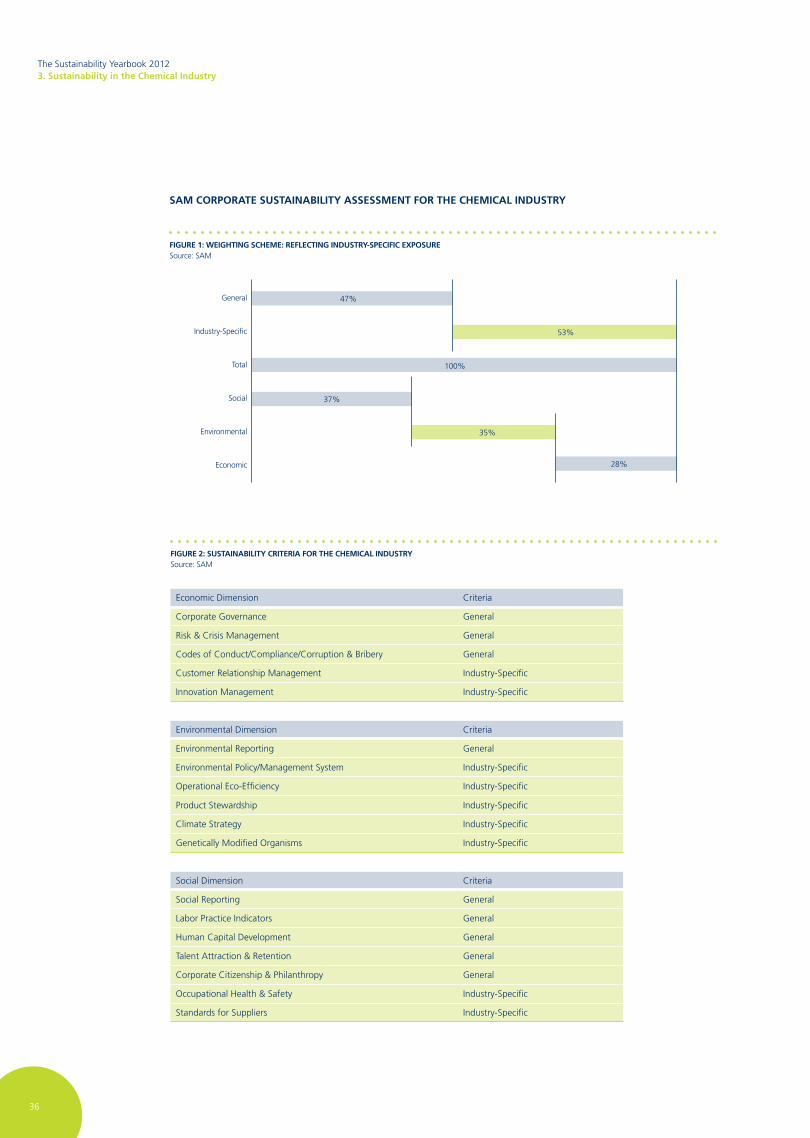
The Sustainability Yearbook 20123. Sustainability in the Chemical Industry
36
SaM CorPoraTe SuSTainaBiliTy aSSeSSMenT For The CheMiCal inDuSTry
FiGure 1: weiGhTinG SCheMe: reFleCTinG inDuSTry-SPeCiFiC exPoSureSource: SAM
General
Industry-Specific
Total
Social
Environmental
Economic
47%
35%
37%
100%
53%
28%
FiGure 2: SuSTainaBiliTy CriTeria For The CheMiCal inDuSTrySource: SAM
Economic Dimension Criteria
Corporate Governance General
Risk & Crisis Management General
Codes of Conduct/Compliance/Corruption & Bribery General
Customer Relationship Management Industry-Specific
Innovation Management Industry-Specific
Environmental Dimension Criteria
Environmental Reporting General
Environmental Policy/Management System Industry-Specific
Operational Eco-Efficiency Industry-Specific
Product Stewardship Industry-Specific
Climate Strategy Industry-Specific
Genetically Modified Organisms Industry-Specific
Social Dimension Criteria
Social Reporting General
Labor Practice Indicators General
Human Capital Development General
Talent Attraction & Retention General
Corporate Citizenship & Philanthropy General
Occupational Health & Safety Industry-Specific
Standards for Suppliers Industry-Specific

The Sustainability Yearbook 20123. Sustainability in the Chemical Industry
37
economic Dimension (28%)
Cross-industry criteria such as corporate govern-
ance, risk & crisis management, and codes of con-
duct are complemented by industry-specific criteria
that assess the chemical industry’s core offering:
chemical products—both from a customer relation-
ship management and innovation management
point of view.
environmental Dimension (35%)
Along with the general criterion environmental re-
porting, specific criteria have been tailored to the
chemical industry over the years to capture a com-
pany’s ability to measure its emissions (operational
eco-efficiency), assess the environmental impact
of its products (product stewardship) and measure
the impact of its operations on climate change (cli-
mate strategy).
Social Dimension (37%)
General criteria focus on assessing the relationship
between a company and its current and prospective
employees (social reporting, labor practice indica-
tors, human capital development and talent attrac-
tion & retention). Because of their relative impor-
tance to chemical operations, certain criteria have
been specifically tailored to the chemical industry to
assess occupational health & safety standards as well
as the company’s commitment towards establishing
quality standards for its suppliers.
For the purpose of this analysis, data was retrieved
from the annual SAM CSAs carried out over the
last three years (2009-2011), a period during
which the participation of chemical companies has
been relatively steady. For each of the three years
examined, sustainability scores for the top 20%
performing companies (sustainability leaders) and
the worst 20% performing companies (sustainability
laggards) were retrieved. Three-year average scores
were calculated at the total level, the dimension
level and the criteria level for both the group of
leaders and laggards. In order to carry out a gap
analysis and determine which criteria differentiate
the leaders from the laggards, the 3-year average
scores for the leaders were compared to those of
the laggards.
3.3 reSulTS anD DiSCuSSion
3.3.1 economic, environmental and Social Dimension
Figure 3 provides an overview of 3-year average
scores for sustainability leaders and laggards in the
chemical sector for the economic, environmental
and social dimensions. In addition, the 3-year aver-
age of the total sustainability score, which is calcu-
lated using a weighted average of the three dimen-
sions, is shown for the leaders and the laggards.
FiGure 3: DiMenSion level GaP analySiS BeTween SuSTainaBiliTy leaDerS anD SuSTainaBiliTy laGGarDS in The CheMiCal inDuSTrySource: SAM
100
90
80
70
60
50
40
30
20
10
0
3 -y
ear
ave
rage
Sco
re
Total Score Economic Dimension Environmental Dimension Social Dimension
Leaders
Laggards
33%
28%29% 27%

The Sustainability Yearbook 20123. Sustainability in the Chemical Industry
38
The 3-year average total score for the sustainability
leaders is higher than that of the sustainability
laggards by an average of 29 points, and a similar
difference can be observed for each of the three
dimensions: economic, environmental and social.
Most notably, both leaders and laggards achieve
the highest average score in the environmental
dimension and the lowest average score in the
social dimension.
Although the results at the dimension level are
somewhat predictable, analysis at the more
granular criteria level reveals some trends worthy
of further discussion: Figure 4 shows a gap analysis
for the criteria related to corporate governance,
environmental policy, occupational health & safety
and innovation management.
3.3.2 Corporate Governance, environmental Policy
and occupational health & Safety: Traditional
Sustainability Factors Go Mainstream
For the corporate governance, environmental
policy, and occupational health & safety criteria,
the average gap between the sustainability leaders
and laggards ranges between 10 and 18 points
and is much smaller than the average difference of
29 points at the total score level. In other words,
according to these sustainability criteria, even
though laggard companies may lack sustainable
practices in other corporate sustainability metrics—
thereby achieving a lower total sustainability
score—they have rather high standards in the
areas of corporate governance, operational safety
and environmental awareness. This suggests that
minimum standards for these three measures have
been widely adopted by the chemical sector and
have now become mainstream.
One possible explanation for this is that the
chemical industry’s relatively early awakening to the
importance of sustainability issues and Responsible
Care’s contributions have led to the development
of high industry standards over the decades. On
the other hand, one could also argue that because
customers demand high levels of transparency
on sustainability issues, these factors have now
become minimum business qualifiers, rather than
business winners or differentiators within the
chemical industry.
FiGure 4: GaP analySiS For SeleCTeD SuSTainaBiliTy CriTeria Source: SAM
100
90
80
70
60
50
40
30
20
10
0
3 -y
ear
ave
rage
Sco
re
Total Score Environmental Policy/Management System
Occupational Health & Safety
Innovation Management
Leaders
Laggards
17% 18%
29% 10%
42%
Corporate Governance
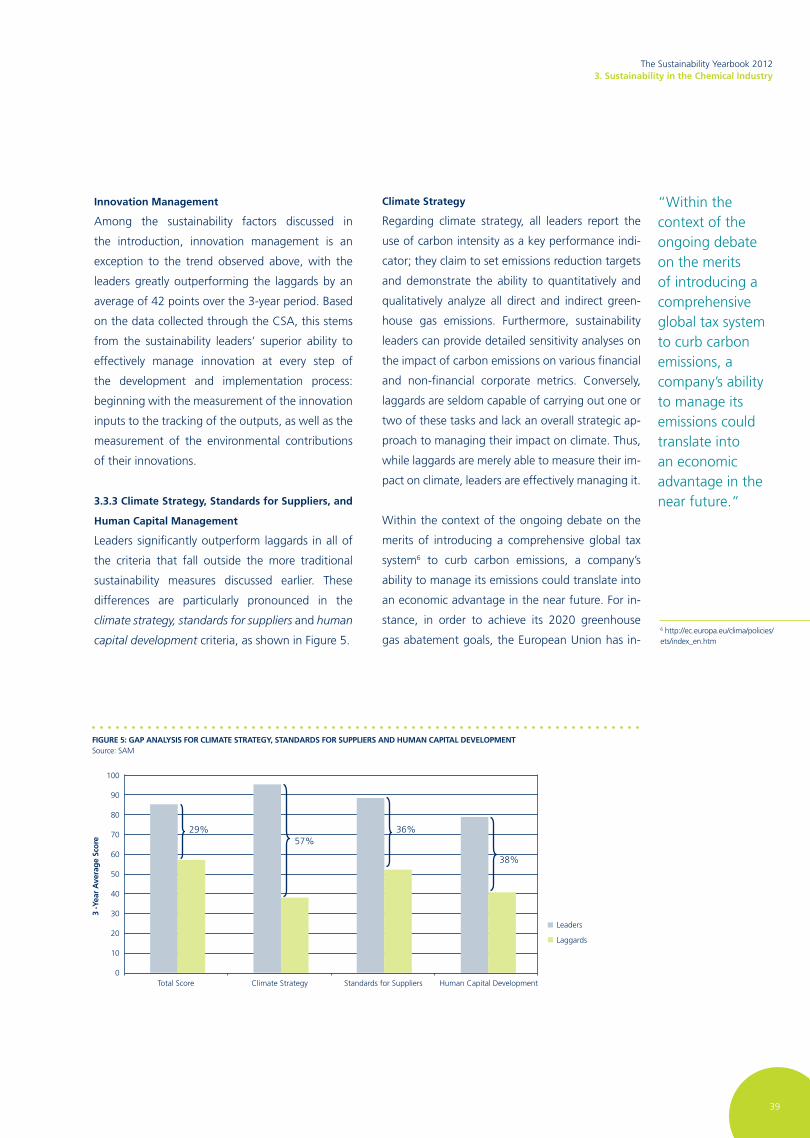
The Sustainability Yearbook 20123. Sustainability in the Chemical Industry
39
innovation Management
Among the sustainability factors discussed in
the introduction, innovation management is an
exception to the trend observed above, with the
leaders greatly outperforming the laggards by an
average of 42 points over the 3-year period. Based
on the data collected through the CSA, this stems
from the sustainability leaders’ superior ability to
effectively manage innovation at every step of
the development and implementation process:
beginning with the measurement of the innovation
inputs to the tracking of the outputs, as well as the
measurement of the environmental contributions
of their innovations.
3.3.3 Climate Strategy, Standards for Suppliers, and
human Capital Management
Leaders significantly outperform laggards in all of
the criteria that fall outside the more traditional
sustainability measures discussed earlier. These
differences are particularly pronounced in the
climate strategy, standards for suppliers and human
capital development criteria, as shown in Figure 5.
Climate Strategy
Regarding climate strategy, all leaders report the
use of carbon intensity as a key performance indi-
cator; they claim to set emissions reduction targets
and demonstrate the ability to quantitatively and
qualitatively analyze all direct and indirect green-
house gas emissions. Furthermore, sustainability
leaders can provide detailed sensitivity analyses on
the impact of carbon emissions on various financial
and non-financial corporate metrics. Conversely,
laggards are seldom capable of carrying out one or
two of these tasks and lack an overall strategic ap-
proach to managing their impact on climate. Thus,
while laggards are merely able to measure their im-
pact on climate, leaders are effectively managing it.
Within the context of the ongoing debate on the
merits of introducing a comprehensive global tax
system6 to curb carbon emissions, a company’s
ability to manage its emissions could translate into
an economic advantage in the near future. For in-
stance, in order to achieve its 2020 greenhouse
gas abatement goals, the European Union has in-
FiGure 5: GaP analySiS For CliMaTe STraTeGy, STanDarDS For SuPPlierS anD huMan CaPiTal DeveloPMenTSource: SAM
100
90
80
70
60
50
40
30
20
10
0
3 -y
ear
ave
rage
Sco
re
Total Score Climate Strategy Standards for Suppliers Human Capital Development
Leaders
Laggards
38%
29%57%
36%
6 http://ec.europa.eu/clima/policies/ets/index_en.htm
“Within the context of the ongoing debate on the merits of introducing a comprehensive global tax system to curb carbon emissions, a company’s ability to manage its emissions could translate into an economic advantage in the near future.”

The Sustainability Yearbook 20123. Sustainability in the Chemical Industry
40
troduced a trading system designed to encourage
carbon emission reductions by assigning a price
to each unit of emissions. As this scheme is ex-
pected to go into effect for some sub-sectors of
the chemical industry as early as 2013, companies
that can effectively manage their emissions will see
a positive impact in their bottom line profitability
and will have a competitive advantage over those
that do not.
Standards for Suppliers
When analyzing the results in standards for suppliers,
both leaders and laggards report relatively robust
guidelines for monitoring their suppliers from an
economic, social and environmental perspective.
Leaders nevertheless outperform laggards when
it comes to managing a comprehensive auditing
program or the handling of non-compliance. The
financial materiality of this sustainability factor
is straightforward: proactive engagement with
suppliers and the effective management of non-
compliance can prevent reputational damage and
unwanted or unexpected costly corrective actions.
human Capital Development
Because human ingenuity is the primary ingredient
for innovation, chemical companies have always
sought to attract and retain the best talent. This
has not always been an easy task given the level of
public distrust that has accompanied the industry
in the past. While it is not surprising that executives
in the chemical industry recently acknowledged
the role of a company’s sustainability profile in
attracting talent,7 it can be argued that effective
processes to ensure the development of human
capital also contribute to the retention of talented
employees.
In the field of human capital development, sustain-
ability leaders demonstrate the ability to implement
thorough skill mapping and develop processes that
cover all employee categories. In contrast, the lag-
gards often do not include top management in
this activity. Furthermore, an analysis of the data
from the CSA reveals that leaders foster environ-
ments that encourage broad organizational learn-
ing, while laggards lack appropriate channels to
transfer know-how within the company. Finally,
by developing an effective set of performance in-
dicators, sustainability leaders can more effectively
track and manage their ability to attract and retain
a talented workforce.
7 Accenture, “Sustainability Strategies for High Performance in the Chemicals Industry” page 12. http://www.accenture.com/us-en/Pages/insight-chemical-executive-series-driving-sustainability-sum-
mary.aspx
“Innovation continues to play a
key role, particularly for a knowledge
and research-driven industry such as the
chemical sector.”

The Sustainability Yearbook 20123. Sustainability in the Chemical Industry
41
3.4 ConCluSion
By analyzing the gaps between sustainability leaders
and laggards according to selected criteria within
the SAM CSA, we have identified some of the
specific factors that differentiate the sustainability
leaders from the laggards in the chemical industry.
Both leaders and laggards achieve high scores in
the more traditional sustainability measures such as
corporate governance, occupational health & safety
and environmental policy, largely as a result of
customer demand and the industry’s long-standing
efforts to tackle sustainability issues. Although
these results represent a great achievement for the
chemical industry in its efforts to adopt industry-
wide sustainable practices, they also suggest that
such criteria alone and in their current form can
no longer help distinguish the sustainability leaders
from the laggards. As SAM continuously seeks to
enhance its methodology, these results suggest
that a review of these criteria is necessary in order
to help understand whether more specific factors
within these traditional sustainability criteria still
differentiate the leaders from the laggards.
For the innovation management criteria, however,
the data showed a wide gap in average scores
between leaders and laggards. This confirms the
notion that innovation continues to play a key
role, particularly for a knowledge and research-
driven industry such as the chemical sector. The
chemical industry has been successfully introducing
innovations for over a century, and in order for
chemical companies to remain competitive, they
will need to continue to innovate to realign their
product portfolios towards sustainable products
and processes. Adopting green chemistry principles
and effectively managing products and projects
based on their life cycle assessment will need to
become standard practice. Rising personnel and
registration costs will favor an open approach to
innovation, which involves initiatives ranging from
outsourcing, bolt-on technology acquisitions,
collaborations with stakeholders across the value
chain, as well as the spin-off or sale of non-core
activities.
In line with the management maxim of “what gets
measured gets managed,” Accenture8 reported
that measurement is a key reflection of a company’s
sustainability initiatives in the chemical industry,
as it enables companies to monitor their progress
on the quantitative aspects of sustainability
reporting such as emission or waste production.
Our analysis of chemical companies’ performance
reveals that not only do sustainability leaders
measure their exposures to sustainability risks, but
more importantly, they also manage them. Thus,
by implementing comprehensive strategies to
actively manage their exposures to sustainability
risks and opportunities, companies can emerge as
sustainability leaders and further widen the gap
relative to the sustainability laggards.
8 Accenture, “Sustainability Strategies for High Performance in the Chemicals Industry” page 12. http://www.accenture.com/us-en/Pages/insight-chemical-executive-series-driving-sustainability-sum-mary.aspx
“Our analysis of chemical companies’ performance reveals that not only do sustainability leaders measure their exposures to sustainability risks, but more importantly, they also manage them.”

Interviewsam
42
4. Interview with Frans van Houten,
President and Chief Executive Officer, Royal Philips Electronics
Mr. van houten, thank you very much for
taking the time to share a few of your thoughts
on sustainability and innovation with us.
let’s begin with sustainability drivers. what
are the main drivers of innovation at Philips,
and how do you identify opportunities for
innovation?
Frans van Houten: Sure. Both the topics of sustain-
ability and innovation are absolutely close to our
heart. So, let me try to give you a picture. I think
everything begins with the mission that we have
set for ourselves as a company. Sustainability and
innovation cannot be an afterthought. They are an
integral part of what we are, who we are and how
we operate. In our mission we talk about “mean-
ingful innovation to improve people’s lives.” So you
can see already that we take both the words inno-
vation as well as the impact on society into account
in everything we do. We have chosen to operate
in three large markets that are influenced by so-
cietal trends and where we see a big need to act
responsibly.
In healthcare, we see a world that is driven by a
growing population, more chronic diseases, people
that are getting older and healthcare costs that are
spiraling out of control. And in that world, we’ve
stated that we want to touch more than 500
million people and improve their lives, and do so
in a manner that has better outcomes for patients
while making healthcare more affordable—also for
those at the base of the socio-economic pyramid.
So we are active in the healthcare market, which
is highly relevant for the world, and within that,
Philips has a social mission to reach a larger part
of society in every part of the world. That is one
big part of our business where you can see that
innovation and sustainability have been interwoven
into the entire mission.
“We are firmly convinced that the only way to truly achieve breakthroughs is if the requirement of sustainability comes at the very beginning of the product creation process.”
why is innovation important to companies? we spent thirty minutes with Frans van houten,
President and Chief executive officer at royal Philips electronics, to learn why innovation is
central to his company’s mission, and to find out how Philips integrates sustainability into its
overall innovation management strategy.
Frans van houten
President and Chief Executive Officer,
Royal Philips Electronics

Interviewsam
43
In the area of lighting, it’s a similar story. We see
a world in which many people still don’t have
access to lighting, who cannot be schooled, but
who want to improve their quality of life. At the
same time lighting is responsible for more than
20% of the world’s energy consumption. This,
again, is spiraling out of control. The only way
to have sustainable lighting in the world is to
combine energy efficiency with making lighting
accessible and available to all people. We have set
ourselves the goal of reducing the average energy
consumption of our product portfolio by 50%,
enabled by innovation in technology.
In the third pillar of our business, we talk about
the health and well-being of the consumer—in
the daily life of the average person. We focus our
product range on helping people live a healthy
lifestyle, for example, through oral care, personal
care and healthy food, all of which will make
people happy, but also healthier. And we make that
available both for the upscale segments as well as
for the other segments of the market.
So we have chosen to play in businesses that are
congruent to our mission. We would prefer not
to be in businesses where we would see a conflict
with our commitment to improving people’s lives.
It’s interesting that when you look deep into the
history of the company, my predecessors and
the people who founded Philips were already
very engaged in improving people’s lives. Philips
used to build schools and set up sports clubs
for its employees, essentially embracing social
responsibility. You could say that this heritage
makes us even more conscious of our responsibility
towards sustainability. So it’s not a fad of the last
few years, it’s something that we have been doing
forever, and in a more organized manner for almost
20 years, as we started with structural eco-design
already in the beginning of the 1990’s. And again,
eco-design combines the process of innovation
with our commitment to sustainability. We are
firmly convinced that the only way to truly achieve
breakthroughs is if the requirement of sustainability
comes at the very beginning of the product creation
process. So it’s not something we do after the fact.
It is an upfront requirement.
regarding stakeholder engagement and in-
volvement, how do you integrate the point of
views of your stakeholders into your innova-
tion strategy?
van Houten: Again, I go back to our mission:
“meaningful innovation to improve people’s
lives.” now, what is meaningful? The word
“meaningful” was carefully chosen. You cannot
do this only from within the inner core of your
company. You need to reach out to people; you
need to involve people so that whatever you do
in terms of innovation is meaningful to them. We
have several ways of doing that. First of all we, of
course, involve the customers. But customers do
not always know what they want, and therefore
you need to have a wider process. So we partner in
open innovation programs with universities, nGOs
and with individuals on the Internet through what
is often referred to as crowd sourcing. So you can
actually discuss your ideas about societal needs and
breakthroughs in sustainability with a lot of people
and together, you kind of prototype and come to
better ideas or meaningful innovation.
To give you a few numbers, our R&D people are in
many different locations throughout the world. In
the US, Europe, China, India and in several other
places, we have centers of innovation, which in
their own right bring us in closer touch with those
markets. We have partnerships with about 250
universities. We have more than 2,000 partnerships
in various open innovation programs, with both
small and medium-sized enterprises. And with
crowd sourcing, we can easily have the input from
“You need to reach out to people; youneed to involve people so that whatever you doin terms of innovation is meaningful to them.”

Interviewsam
44
a few hundred thousand people on a specific
subject. You know, Facebook, Twitter and other
social media can be really helpful there. You can
rapidly share ideas and get immediate feedback.
So this kind of open innovation approach that
touches so many different people will make us
more relevant in achieving breakthroughs.
you mentioned your research centers in China,
india and other emerging economies. how
important are emerging markets as a source
of innovation? Do you have examples of
innovations developed in response to specific
challenges in the emerging markets that were
later applied to other global markets?
van Houten: We have an innovation model that
revolves around the insights of the market. And
these can come from many different sources.
They can come from marketing or from research
people, and we typically involve people from many
countries in the gathering of these insights.
The allocation of projects is also an interesting
discussion. Ten years ago, we would have treated
the Bangalore R&D facility as an execution arm,
you know, as cheap labor, basically saying:
“Well, you execute someone else’s ideas.” This
has totally changed. now, they are a full partner,
and complete product responsibility can be
placed in our R&D facility in Bangalore. not only
is the execution carried out there, but also the
inception or innovation ideation. So by giving them
responsibility both for the local market but also for
developing ideas that can be exported to our other
markets, we find that we come to better ideas if we
have a distributed environment. I like to see Philips
as a networked organization. It’s not a centrally
controlled organization but more of a network
in which people throughout the organization
collaborate in knowledge networks.
One example is our range of food cleaning products
used for the removal of pesticides from fruits and
vegetables, developed in China. That’s a typical
innovation based on local insights developed for
the local situation, and will also become available
in other markets.
Another example is the blanket for jaundice, which
combines a blanket with blue LED lights for the
treatment of jaundice in infants. Its portability
allows infants to be treated for jaundice at home,
allowing the baby to be comforted by the parent
during treatment. It also reduces stress to the baby,
and reduces hospital visits and medical costs. That
idea also came out of Bangalore in India and again,
those products will become available globally.
From the corporate perspective, how do you
monitor the innovation process as all these
local entities provide inputs to innovation? Do
you have a formalized innovation management
process that steers your innovation projects?
how do you integrate the needs of emerging
markets into your innovation process, and
how do you balance them against the needs
of the firm?
van Houten: We operate a business market matrix
for the company, in which the market teams in the
various markets throughout the world have direct
influence on the roadmap of the products that we
create. Of course, there can be more demand for
new products than we can afford to make, so we
need to prioritize our resources. But, basically, all
the markets have a voice. And then we manage
our project portfolio to determine which ideas fit
our strategy and mission. So it’s a bottom-up / top-
down combination, where we look at the ideas and
the local market requirements versus the company
strategy. We also have a stated priority to penetrate
the emerging markets, and we use that as a criterion
to determine which projects are prioritized. So we

Interviewsam
45
measure how much we penetrate the emerging
markets and what percentage of our activities is in
those markets versus the mature markets.
Likewise, we measure projects against our
sustainability criteria. For example, we want to
make progress on our Ecovision1 program every
year. This means that the proposed products and
solutions need to fit our stringent sustainability
criteria, both in terms of green products as well as
in terms of reaching the middle and lower classes
of society, so that we have a balanced portfolio
and make progress every year to improve on our
Ecovision targets.
Do you view sustainability, and more specifi-
cally innovation, as a means to comply with
regulations, or is it primarily a means to stay
ahead of your competitors? or do you see
yourselves as driving the market/setting the
standard for certain areas?
van Houten: Actually, we do both; it’s always good
to learn from your competitors, but in our strategic
road mapping we use a five- to ten-year horizon
and an innovation portfolio mapping tool in which
we push the boundaries of what is possible. On one
axis, we push the barrier on green breakthroughs,
and on the other axis we look at business market
combinations, in other words, what part of the
population do we reach? As I mentioned in the
beginning, we have a goal to touch more than 500
million people with healthcare, and to do that, we
cannot look at the competition. We need to look
at what our society needs and how we can achieve
that. Some of the breakthrough innovations are
actually at the frontier of both axes in this tool.
So we have a very active ideation process that
searches for the breakthroughs on green and social
innovation.
FiGure 1: The PhiliPS SuSTainaBle innovaTion PorTFolio MaPPinG ToolSource: Philips
1 The Philips Ecovision program is the fifth structural program of a series started in 1994. The main target is to increase sales from Green products up to 50% of total sales in 2015. next to that, three leadership KPIs have been defined, bringing Philips’ com-petencies to bear, namely: ‘care,’ ‘energy efficiency’ and ‘materials.’ Corresponding targets for 2015 are respectively 500 million lives touched, 50% energy efficiency improvement of Philips products and double recycled content in products and global collection and recycling amounts, compared to 2009.
Gre
enbr
eakt
hrou
ghG
reen
impr
ovem
ents
Lega
l C
ompl
ianc
e
The rich & the globalmiddle class
The rich & the globalmiddle class & the poor
Socialimpact*The rich
Business Market Combinations
environmentalimpact**
Gre
en In
nova
tion
Most commonbusiness focus
SustainableInnovation
SustainableHealth & Well-being
Social Innovation
Sustainability Leadership KPIs
* Bringing care to pepople
** Energy efficiency of products
** Closing the material loop

Interviewsam
46
And of course, products have to be compliant.
We try to improve the environmental aspects
of a product, but a real breakthrough can be,
for example, the lighting example at our recent
innovation exhibition, in which we deliver energy
efficient LED street lighting that is automatically
dimmed, depending on the circumstances, traffic
intensity, and can also be controlled from a distance
in case of an accident, when more light is needed
at the spot. Furthermore, we are experimenting
with different financing concepts, such as pay-per-
lux and pay-by-the-mile. In those concepts, energy-
efficient solutions are combined with different
financing models. We also have the option to
maintain the ownership of the equipment. This
provides us the possibility to close loops, reuse
parts and materials during upgrading or renewal.
That’s really a kind of breakthrough thinking from
an environmental perspective.
So, it’s no longer simply about selling a product;
it’s selling an outcome, a solution. We remain
responsible for a product, and in certain business
models, upgrade it or even take it back when our
customer requires so.
From the perspective of the CFo and in terms
of financial materiality, at what point do
cost-return criteria come into play during the
innovation management process?
van Houten: You need to make money, otherwise
you cannot deliver on your mission, right? But at
the highest level, and to our shareholders, we have
declared that we would measure ourselves on both
financial and non-financial parameters. The financial
ones are typically sales, profitability and return
on invested capital. However, the non-financial
parameters include a measure of sustainability,
measured through our Ecovision program results.
We make that visible to our shareholders and it
also determines my own evaluation and that of
my Board Members. Therefore, the financial return
alone is not the only criterion at the highest level
in the company. And there we have deployed the
same set of balanced measures throughout the
company. Related to that, we have said to our
shareholders that we are in this game for long-
term value creation and not for quarterly earnings.
I’ve also said to the market, it may well be that we
actually miss a quarter or two as long as we reach
our longer-term goals, to get away from short-
term, opportunistic behavior. If we were too short-
term oriented, then suddenly we would no longer
be involved in many of these programs. There’s also
a benefit to being very opportunistic, but we’ve
said consciously that we don’t want to have that
kind of behavior in our company.
how do you decide whether to move forward
with an innovation idea? Do you use a mix of
financial and sustainability criteria?
van Houten: Yes, and our sustainability criteria
often have priority over short-term financials as our
brand value would be harmed if we deviate from
our mission. But interestingly, the profitability of
our green products is on average higher than that
of the traditional products.
regarding innovation outputs, how do you
measure the success of an innovation? what
are some of the tools and targets you use to
track success?
van Houten: We have a lot of KPIs/performance
indicators that are part of our Ecovision program.
For example, in healthcare, we measure the number
of people that we touch through our healthcare
solutions. In terms of energy efficiency—again
an output—we can compute what the installed
“Interestingly, the profitability of
our green products is on average
higher than that of the traditional
products.”

Interviewsam
47
base of our lighting products consumes in terms
of energy. And in our Ecovision program, we
have said that we want to reduce the energy
consumption of our products by 50% by 2015. We
have objectives on the closed loop of materials and
recycling: the cradle-to-cradle thinking. We also
have a target to double global collection/recycling
of our products by 2015. Again, compared to
2009, that’s a doubling in just 6 years. Of course,
those are lagging indicators; they are outcomes or
results.
We also have measures that we use in our
innovation pipeline. We ask ourselves whether
the product we are developing meets our internal
Ecovision or sustainability requirements. We look
at the cross-fertilization of innovative ideas. For
example, lighting influences the learning of children
in schools. Through better lighting we can achieve
better learning. That is different in Africa than in
the mature markets. In Africa, we just bring light
and people can study. In the Western world, we
see a lot of kids with ADHD2, that is, restlessness.
Lighting can actually influence that by calming
down the child and making him more susceptible
to learning. So there are many ways to do this and
as I mentioned earlier, we also use the innovation
portfolio mapping tool to evaluate our innovation
projects to determine whether they represent
enough of a breakthrough, and to measure our
success in achieving breakthroughs.
Do you track progress on your innovations
according to the un human Development
index3 indicators and do you communicate
this to your stakeholders? how do you
communicate the impact of your activities on
local communities?
van Houten: We use Leadership KPIs that we
developed along the ecological axis but also on
the social axis of our innovation mapping tool.
In fact, on the social axis we’ve used the Human
Development Index. But obviously, for a company to
measure its impact on a country’s total Un Human
Development Index is relatively difficult, which you
will understand, it’s also quite small. nevertheless,
we are also part of the Un Global Compact. We
report on what Philips has been doing towards
achieving the Millennium Development Goals, and
have been doing so for four years now. So these
are some of the more concrete elements that we
communicate publicly.
Beyond innovation, what are some of the key
sustainability challenges that Philips is facing
today?
van Houten: Almost 70% of our business is busi-
ness-to-business sales and 30% is directly to the
consumer. In the business-to-business segment,
you meet people that apply short-term criteria
when deciding what product to buy. We take a
much more holistic view, and we would like people
to judge based on total cost of ownership, includ-
ing the environmental impact, and use that as a de-
cision-making criterion. If they did so, then people
would reach different investment decisions. For ex-
ample, when you choose a lighting solution for the
street, maybe the initial cost of the more energy-
efficient option is higher, but because of the energy
savings and the economic and environmental im-
pact, it is still a better decision and over the life of
the product it would become more cost effective.
But not every community or government applies
these types of integral, holistic decision-making cri-
teria. So in terms of challenges, I think we all need
to help the world see the light in what is the best
way to sustainable investment decision making. So
I think that’s still a challenge. We engage in a lot of
stakeholder dialogue so that together, we educate
the world.
2 ADHD: Attention Deficit Hyperactivity Disorder
3 Un Human Development Index: a measure of a country’s achievements based on economic, health and social indicators, using measures such a GDP per capita, life expectancy, education and literacy rates.

Interviewsam
48
Finally, you have been participating in the
SaM Corporate Sustainability assessment for
a number of years now—how do you benefit
from participating in the assessment and how
does it help you as a firm to set targets and
compare yourselves to your peers?
van Houten: There’s a lot of value in participating
in benchmarks, in dialogs with all the stakeholders
as it helps educate the world about the importance
of sustainability. But it also keeps us honest, and
it helps us push the envelope more. Engagement
is important. It drives behavior. So if we don’t talk
about sustainability, hey, maybe we would forget
it. With 120,000 employees, we need to make sure
that the topic is continually alive, both internally and
externally. So benchmarking and participating in all
these initiatives is tremendously important to us.

The Sustainability Yearbook 20121.1 Título del capítulo
49
5 SAM SECTOR LEADERS 2012

The Sustainability Yearbook 20125. Sector Leaders
50
5. SAM Sector Leaders 2012
Company Sector Country
adidas AG Clothing, Accessories & Footwear Germany
Air France-KLM Airlines France
Alcatel-Lucent Communication Technology France
Alcoa Inc. Aluminum United States
AMEC plc Oil Equipment & Services United Kingdom
Amorepacific Corp. Personal Products South Korea
Au Optronics Corp. Computer Hardware & Electronic Office Equipment Taiwan
Baxter International Inc. Medical Products United States
Benesse Holdings Inc. Specialized Consumer Services Japan
BMW AG Automobiles Germany
British American Tobacco plc Tobacco United Kingdom
DSM n.v. Chemicals netherlands
EDP - Energias de Portugal S.A. Electricity Portugal
Electrolux AB Durable Household Products Sweden
Embraer S.A. Aerospace & Defense Brazil
Enagas S.A. Gas Distribution Spain
Fiat Industrial S.p.A. Industrial Engineering Italy
Fibria Celulose S.A. Forestry & Paper Brazil
Henkel AG & Co. KGaA nondurable Household Products Germany
Herman Miller Inc. Furnishing United States
Hyundai Engineering & Construction Co., Ltd. Heavy Construction South Korea
Itausa-Investimentos Itau S/A Financial Services Brazil
J Sainsbury plc Food & Drug Retailers United Kingdom
KT Corp. Fixed Line Communications South Korea
Lite-On Technology Corp. Electric Components & Equipment Taiwan
Lotte Shopping Co. Ltd. General Retailers South Korea
Marubeni Corp. Support Services Japan
nalco Holding Co. Waste & Disposal Services United States
novozymes A/S Biotechnology Denmark
Pearson plc Media United Kingdom
PepsiCo Inc. Beverages United States
Philips Electronics n.v. Leisure Goods netherlands
Pirelli & C. S.p.A. Auto Parts & Tires Italy
PostnL Industrial Transportation netherlands
Rautaruukki Oyj Steel Finland
Repsol YPF S.A. Oil & Gas Producers Spain
Roche Holding AG Pharmaceuticals Switzerland
Samsung Electronics Co. Ltd. Semiconductors South Korea
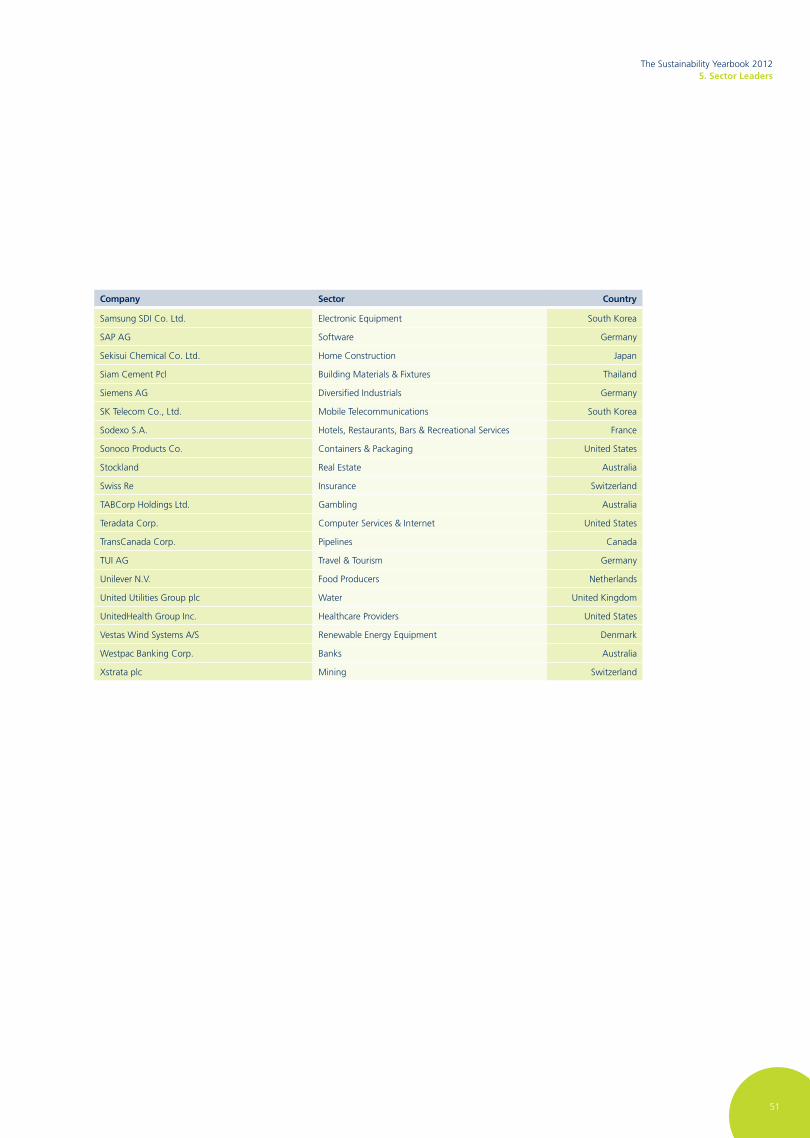
The Sustainability Yearbook 20125. Sector Leaders
51
Company Sector Country
Samsung SDI Co. Ltd. Electronic Equipment South Korea
SAP AG Software Germany
Sekisui Chemical Co. Ltd. Home Construction Japan
Siam Cement Pcl Building Materials & Fixtures Thailand
Siemens AG Diversified Industrials Germany
SK Telecom Co., Ltd. Mobile Telecommunications South Korea
Sodexo S.A. Hotels, Restaurants, Bars & Recreational Services France
Sonoco Products Co. Containers & Packaging United States
Stockland Real Estate Australia
Swiss Re Insurance Switzerland
TABCorp Holdings Ltd. Gambling Australia
Teradata Corp. Computer Services & Internet United States
TransCanada Corp. Pipelines Canada
TUI AG Travel & Tourism Germany
Unilever n.v. Food Producers netherlands
United Utilities Group plc Water United Kingdom
UnitedHealth Group Inc. Healthcare Providers United States
vestas Wind Systems A/S Renewable Energy Equipment Denmark
Westpac Banking Corp. Banks Australia
Xstrata plc Mining Switzerland

6 SAM SECTOR MOvERS 2012

The Sustainability Yearbook 20126. Sector Movers
53
Company Sector Country
3M Company Diversified Industrials United States
ACS Actividades de Construccion y Servicios S.A. Heavy Construction Spain
Alcatel-Lucent Communication Technology France
Alcoa Inc. Aluminum United States
Amgen Inc. Biotechnology United States
Asahi Glass Co. Ltd. Building Materials & Fixtures Japan
AstraZeneca plc Pharmaceuticals United Kingdom
Autodesk Inc. Software United States
Benesse Holdings Inc. Specialized Consumer Services Japan
Bombardier Inc. Aerospace & Defense Canada
British American Tobacco plc Tobacco United Kingdom
Capita Group plc Support Services United Kingdom
Compass Group plc Hotels, Restaurants, Bars & Recreational Services United Kingdom
ConAgra Foods Inc. Food Producers United States
Daimler AG Automobiles Germany
Danske Bank A/S Banks Denmark
Delta Electronics Inc. Electronic Equipment Taiwan
Dongbu Insurance Co. Ltd. Insurance South Korea
Electrolux AB Durable Household Products Sweden
Elekta AB Medical Products Sweden
EMC Corp. Computer Hardware & Electronic Office Equipment United States
Enagas S.A. Gas Distribution Spain
Fibria Celulose S.A. Forestry & Paper Brazil
Fraport AG Industrial Transportation Germany
Galp Energia, SGPS, S.A. Oil & Gas Producers Portugal
Henkel AG & Co. KGaA nondurable Household Products Germany
Hennes & Mauritz AB General Retailers Sweden
Herman Miller Inc. Furnishing United States
Hyundai Mobis Co. Ltd. Auto Parts & Tires South Korea
Iberdrola S.A. Electricity Spain
J Sainsbury plc Food & Drug Retailers United Kingdom
Keppel Land Ltd. Real Estate Singapore
Kinross Gold Corp. Mining Canada
KT Corp. Fixed Line Communications South Korea
Ladbrokes plc Gambling United Kingdom
Lanxess AG Chemicals Germany
LG Electronics Inc. Leisure Goods South Korea
LG Household & Health Care Ltd. Personal Products South Korea
6. SAM Sector Movers 2012

The Sustainability Yearbook 20126. Sector Movers
54
Company Sector Country
Lite-On Technology Corp. Electric Components & Equipment Taiwan
MAn SE Industrial Engineering Germany
Molson Coors Brewing Co. Beverages United States
Morgan Stanley Financial Services United States
nalco Holding Co. Waste & Disposal Services United States
Qantas Airways Ltd. Airlines Australia
Rautaruukki Oyj Steel Finland
Samsung Electronics Co. Ltd. Semiconductors South Korea
Sekisui Chemical Co. Ltd. Home Construction Japan
SK C&C Co. Ltd. Computer Services & Internet South Korea
SK Telecom Co., Ltd. Mobile Telecommunications South Korea
Sonoco Products Co. Containers & Packaging United States
Suez Environnement S.A. Water France
Technip S.A. Oil Equipment & Services France
Telenet Group Holding n.v. Media Belgium
TransCanada Corp. Pipelines Canada
TUI Travel plc Travel & Tourism United Kingdom
UnitedHealth Group Inc. Healthcare Providers United States
vestas Wind Systems A/S Renewable Energy Equipment Denmark
Woongjin Chemical Co. Ltd. Clothing, Accessories & Footwear South Korea

The Sustainability Yearbook 20121.1 Título del capítulo
55
7 SECTOR InSIGHTS:58 SECTORS AT A GLAnCE

The Sustainability Yearbook 20127. Sector Insights
56
7. Sector Insights: 58 Sectors at a Glance
On the following pages, SAM offers insights high-
lighting opportunities and risks deriving from eco-
nomic, environmental and social trends and devel-
opments that have an impact on the competitive
position of companies in each of the 58 sectors
analyzed. not only are the top 15% of the compa-
nies from each sector included in The Sustainabil-
ity Yearbook, but they are also classified into three
categories: SAM Gold Class, SAM Silver Class and
SAM Bronze Class. In addition, a Sector Leader and
a Sector Mover are identified for each sector.
SAM is pleased to see that over the years participa-
tion rates in the SAM Corporate Sustainability As-
sessment have continuously risen, indicating that
sustainability is increasingly rising to the top of cor-
porate agendas and becoming more mainstream.
Thus, in an effort to continuously raise the sustain-
ability bar, the eligibility criteria for receiving one
of the three SAM distinctions have been strength-
ened, further highlighting the significance of each
medalist’s sustainability achievements. As a result,
although a greater total number of companies was
eligible for inclusion in The Sustainability Yearbook,
a smaller percentage has received one of the three
SAM awards.
Finally, a qualitative screen has been introduced
based on SAM’s Media & Stakeholder Analysis
(MSA) process, which evaluates a company’s re-
sponse to critical sustainability issues that may
arise. This aligns eligibility for inclusion in the Year-
book with any decision by the DJSI Design Commit-
tee to exclude a company from the DJSI, which is
also based on the MSA.
Since 1999, SaM has been assessing and documenting the sustainability performance of over
2,000 corporations on a yearly basis. in the process, SaM has compiled one of the largest global
databases on corporate sustainability.
The world’s 2,500 largest companies (based on the Dow Jones Global Total Stock Market index) are
invited to participate in SaM’s Corporate Sustainability assessment every year. only the top 15%
from each of the 58 SaM sectors qualify for inclusion in The Sustainability yearbook.
For each sector, the company with the highest
score is named the SAM Sector Leader. This com-
pany is considered to be the one within its sector
that is best prepared to seize the opportunities and
manage the risks deriving from economic, environ-
mental and social developments.
Companies whose score is within 1% of the Sector
Leader’s score receive the SAM Gold Class award.
Consistent with our “Best–in–Class” methodology,
the Sector Leader from each sector also receives
the SAM Gold Class distinction, meaning that each
of the 58 sectors has at least one gold medalist.
2012sector leader
2012gold class

The Sustainability Yearbook 20127. Sector Insights
57
SuSTainaBiliTy leaDerS 2012As of December 31, 2011
Company Country
SAM Gold Class Company* Country
Company Country
SAM Silver Class Company Country
Company** Country
SAM Bronze Class Company Country
Company Country
Company Country
Company Country
* SAM Sector Leader** SAM Sector Mover
The SAM Sector Leader appears at
the top of the table. The other com-
panies follow in alphabetical order.
Out of the total of 433 companies
listed in this yearbook, the following
distinctions were awarded:
87 SAM Gold Class
41 SAM Silver Class
92 SAM Bronze Class
All companies receiving a score within a range of
1% to 5% from the score of the Sector Leader
receive the SAM Silver Class distinction.
Companies whose score is within a range of 5% to
10% from the score of the Sector Leader receive
the SAM Bronze Class distinction.
Within the top 15% of each sector, the company
that has achieved the largest proportional improve-
ment in its sustainability performance compared to
last year is named the SAM Sector Mover.
DrivinG ForCeS
Highlights current and future challenges shaping
the competitive landscape of each sector.
hiGhliGhTeD CriTeria
Highlight of both sector-specific and general criteria
applied in the 2011 SAM Corporate Sustainability
Assessment.
SeCTor STaTiSTiCS
This section displays the research coverage in 2011
for the respective sector.
reSulTS aT SeCTor level
Offers an overview of the 2011 SAM Corporate
Sustainability Assessment scores. For each sector
the average and the best score of the assessed
companies are displayed, as well as the average
score and the top score for the economic,
environmental and social dimensions. The relative
weight assigned to each of the three dimensions
is also shown.
Reading Instructions
The information below provides an explanation on how to interpret the various sections contained in each
of the Sector Insights on the following pages.
2012sector mover
2012bronze class
2012silver class

The Sustainability Yearbook 20127. Sector Insights
58
In the commercial airline space, the convergence of economic and regulatory
incentives has strengthened the link between environmental and economic
performance. As a result, there has been a sustained push for products and
technologies that lead to lower emissions and energy consumption, higher
overall efficiency and lower operating and maintenance costs. This trend is
likely to persist regardless of future macroeconomic developments, providing
an incentive for continued innovation.
On the weaponry and defense side of the business, the current geopolitical
situation has led to an increase in both traditional and new security challenges
that call for more flexible and intelligent technologies as well as solutions
providing for better integration of systems and resources. Given the increasing
focus on reputational and LTO (license to operate) issues, companies exposed
to the industry’s civilian and defense segments need to pay extra attention to
local and international regulatory and ethical issues.
DrivinG ForCeS
SuSTainaBiliTy leaDerS 2012As of December 31, 2011
reSulTS aT SeCTor levelTotal Score
0%
Average Score*
* Average score of all assessed companies in the sector
Best Score
25% 50% 75% 100%
SeCTor STaTiSTiCS
hiGhliGhTeD CriTeriaAerospace & Defense
eConoMiC DiMenSion
– Corporate Governance
– Customer Relationship Management
– Risk & Crisis Management
– Supply Chain Management
environMenTal DiMenSion
– Environmental Reporting
– Product Impact
– Product Stewardship
– Climate Strategy
SoCial DiMenSion
– Human Capital Development
– Stakeholder Engagement
– Standards for Suppliers
– Talent Attraction & Retention
Company Country
SAM Gold Class Embraer S.A. * Brazil
Bombardier Inc. ** Canada
Finmeccanica S.p.A. Italy
Rolls-Royce Group plc United Kingdom
SAM Bronze Class United Technologies Corp. United States
number of companiesin universe
31
number of companies assessedby SAM in 2011
19
Assessed companies to totalcompanies in universe (%)
61
Market capitalization of assessedcompanies to total market capitalization (%)
86
DimensionAverage Score *
Best Score
Weighting in Total Score
Economic 60% 88% 32%
Environmental 43% 88% 27%
Social 46% 78% 41%
* SAM Sector Leader** SAM Sector Mover

The Sustainability Yearbook 20127. Sector Insights
59
The airline industry has started to recover from its extended slowdown. In
recent years, declining business travel and rising fuel prices have put pressure
on companies to reduce costs, redesign route networks and increase fuel
efficiency. Regulatory pressure continues to force airlines to reduce their CO2
emissions and invest in fuel-saving measures such as refitting airplanes with
winglets, light-weight materials and advanced route-planning technology.
Through increased cooperation with governments, aircraft manufacturers and
developers of alternative fuels, airlines can reduce their exposure to rising
fuel prices and improve their environmental performance. Airlines that can
capitalize on such alliances will be able to offer their customers the most
competitive prices and efficient routes. The EU Emissions Trading Scheme
(ETS), which will take effect in 2012 and will affect virtually all airlines with
operations to, from and within Europe, offers airlines another incentive to
reduce their emissions and increase their operating efficiency.
DrivinG ForCeS
SuSTainaBiliTy leaDerS 2012As of December 31, 2011
reSulTS aT SeCTor levelTotal Score
0%
Average Score*
* Average score of all assessed companies in the sector
Best Score
25% 50% 75% 100%
SeCTor STaTiSTiCS
hiGhliGhTeD CriTeriaAirlines
eConoMiC DiMenSion
– Brand Management
– Corporate Governance
– Reliability
– Risk & Crisis Management
environMenTal DiMenSion
– Fleet Age
– Local Air Quality
– Environmental Policy/Management System
– Route network
SoCial DiMenSion
– Human Capital Development
– noise
– Standards for Suppliers
– Talent Attraction & Retention
Company Country
SAM Gold Class Air France-KLM * France
SAM Silver Class Qantas Airways Ltd. ** Australia
SAM Bronze Class Deutsche Lufthansa AG Germany
number of companiesin universe
19
number of companies assessedby SAM in 2011
13
Assessed companies to totalcompanies in universe (%)
68
Market capitalization of assessedcompanies to total market capitalization (%)
80
DimensionAverage Score *
Best Score
Weighting in Total Score
Economic 62% 91% 36%
Environmental 56% 84% 30%
Social 53% 80% 34%
* SAM Sector Leader** SAM Sector Mover

The Sustainability Yearbook 20127. Sector Insights
60
Energy consumption and climate change remain two of the most pressing
issues facing the aluminum industry. Today, coal and hydro dominate the
energy source of aluminum production. Although specific power consumption
(MWh/t) has been halved over the past 10 years, smelting remains a very
energy-intensive process that uses considerably more energy than steel
production. This ecological disadvantage is partly offset by the significantly
lower specific weight of aluminum and the moderate energy input required
for aluminum recycling. nevertheless, further decreases in specific energy
consumption and greenhouse gas emissions from anode consumption remain
a key challenge. In terms of social sustainability, occupational health and
safety dominate the agenda. However, as aluminum producers are becoming
vertically integrated, they are also increasingly faced with other sustainability
issues such as stakeholder engagement and mineral waste management.
DrivinG ForCeS
SuSTainaBiliTy leaDerS 2012As of December 31, 2011
reSulTS aT SeCTor levelTotal Score
0%
Average Score*
* Average score of all assessed companies in the sector
Best Score
25% 50% 75% 100%
SeCTor STaTiSTiCS
hiGhliGhTeD CriTeriaAluminum
eConoMiC DiMenSion
– Codes of Conduct/Compliance/ Corruption & Bribery
– Corporate Governance
– Transparency
– Risk & Crisis Management
environMenTal DiMenSion
– Biodiversity
– Climate Strategy
– Environmental Policy/Management System
– Environmental Reporting
SoCial DiMenSion
– Human Capital Development
– Occupational Health & Safety
– Social Impacts on Communities
– Standards for Suppliers
Company Country
SAM Gold Class Alcoa Inc. */** United States
number of companiesin universe
6
number of companies assessedby SAM in 2011
4
Assessed companies to totalcompanies in universe (%)
67
Market capitalization of assessedcompanies to total market capitalization (%)
80
DimensionAverage Score *
Best Score
Weighting in Total Score
Economic 58% 84% 26%
Environmental 51% 79% 31%
Social 57% 84% 43%
* SAM Sector Leader** SAM Sector Mover

The Sustainability Yearbook 20127. Sector Insights
61
Intense competition in the automotive sector requires suppliers of auto
parts & tires to offer an attractive range of high-quality products, preferably
with environmental benefits. At the same time, increasing competitive and
margin pressure forces auto parts & tires companies to continually reduce
their cost base and regularly launch new, innovative products. This makes
excellence in human capital development, talent attraction and retention a
key success factor. Supply chain management is another important challenge
as outsourcing to low-cost countries can increase companies’ exposure to
human rights violations and other supply issues.
DrivinG ForCeS
SuSTainaBiliTy leaDerS 2012As of December 31, 2011
reSulTS aT SeCTor levelTotal Score
0%
Average Score*
* Average score of all assessed companies in the sector
Best Score
25% 50% 75% 100%
SeCTor STaTiSTiCS
hiGhliGhTeD CriTeriaAuto Parts & Tires
eConoMiC DiMenSion
– Brand Management
– Codes of Conduct/Compliance/ Corruption & Bribery
– Corporate Governance
– Risk & Crisis Management
environMenTal DiMenSion
– Climate Strategy
– Emission Products
– Environmental Policy/Management System
– CO2 from Logistics
SoCial DiMenSion
– Human Capital Development
– Stakeholder Engagement
– Standards for Suppliers
– Talent Attraction & Retention
Company Country
SAM Gold Class Pirelli & C. S.p.A. * Italy
SAM Silver Class Johnson Controls Inc. United States
SAM Bronze Class Hyundai Mobis Co. Ltd. ** South Korea
Michelin France
Bridgestone Corp. Japan
Denso Corp. Japan
nSK Ltd. Japan
number of companiesin universe
43
number of companies assessedby SAM in 2011
19
Assessed companies to totalcompanies in universe (%)
44
Market capitalization of assessedcompanies to total market capitalization (%)
67
DimensionAverage Score *
Best Score
Weighting in Total Score
Economic 59% 89% 23%
Environmental 50% 94% 37%
Social 52% 90% 40%
* SAM Sector Leader** SAM Sector Mover

The Sustainability Yearbook 20127. Sector Insights
62
The key challenge faced by automotive companies is the need to define and
implement a clear market positioning strategy in an environment characterized
by overcapacities, cut-throat competition and cost pressure (through
higher R&D and raw material costs). Given increasingly tight regulations on
greenhouse gas emissions and air pollutants, as well as the sector’s reliance on
oil, carmakers need to improve fuel efficiency and lower the carbon intensity
of their product portfolio by introducing alternative propulsion systems
(such as electric motors). In this respect, talented, skilled and motivated
employees are directly responsible for bringing companies forward in terms of
innovative products, higher efficiencies and production quality. This makes it
indispensable for companies to employ progressive human resources policies
that include talent attraction and retention, human capital development,
occupational health & safety and group-wide ethical principles.
DrivinG ForCeS
SuSTainaBiliTy leaDerS 2012As of December 31, 2011
reSulTS aT SeCTor levelTotal Score
0%
Average Score*
* Average score of all assessed companies in the sector
Best Score
25% 50% 75% 100%
SeCTor STaTiSTiCS
hiGhliGhTeD CriTeriaAutomobiles
eConoMiC DiMenSion
– Brand Management
– Codes of Conduct/Compliance/ Corruption & Bribery
– Corporate Governance
– Risk & Crisis Management
environMenTal DiMenSion
– Climate Strategy
– Low Carbon Strategy
– Environmental Policy/Management System
– CO2 from Logistics
SoCial DiMenSion
– Human Capital Development
– Stakeholder Engagement
– Standards for Suppliers
– Talent Attraction & Retention
Company Country
SAM Gold Class BMW AG * Germany
Daimler AG ** Germany
Fiat S.p.A. Italy
volkswagen AG Germany
number of companiesin universe
28
number of companies assessedby SAM in 2011
17
Assessed companies to totalcompanies in universe (%)
61
Market capitalization of assessedcompanies to total market capitalization (%)
89
DimensionAverage Score *
Best Score
Weighting in Total Score
Economic 73% 94% 26%
Environmental 75% 99% 35%
Social 68% 92% 39%
* SAM Sector Leader** SAM Sector Mover

The Sustainability Yearbook 20127. Sector Insights
63
The banking sector remains under public scrutiny. Markets have lost faith in the
sustainability of sovereign debt levels and the adequacy of capital at, in particular,
European banks that have large exposures to troubled economies. The pressure to
de-risk and adopt new business models that are more concerned with long-term value
creation is higher than ever. As banks work to restore their credibility and contribute
to stable financial systems, leadership and accountability are key factors in building
a competitive advantage. Adherence to international best practices in corporate
governance, risk management and compliance standards remains a necessity.
Globalization, demographic shifts and climate change will continue to impact the
business environment. Leading banks are integrating environmental and social aspects
into their long-term strategies and performance reviews. A multi-stakeholder-driven
approach to developing innovative and prudent financial services and products is
essential. Motivated, highly educated and experienced employees are a key factor in
developing these financial services and products as well as in attracting and retaining
clients. All the while, climate change and resource scarcity are creating new business
opportunities, for example in the area of low-carbon mortgages or funding schemes
for innovative sectors that are paving the way toward a low-carbon economy.
DrivinG ForCeS
SuSTainaBiliTy leaDerS 2012As of December 31, 2011
reSulTS aT SeCTor levelTotal Score
0%
Average Score*
* Average score of all assessed companies in the sector
Best Score
25% 50% 75% 100%
SeCTor STaTiSTiCS
hiGhliGhTeD CriTeriaBanks
eConoMiC DiMenSion
– Corporate Governance
– Customer Relationship Management
– Risk & Crisis Management
– Stakeholder Engagement
environMenTal DiMenSion
– Business Risks Large Projects/Export Finance
– Climate Change Governance
– Environmental Reporting
– Business Opportunities Financial Services/Products
SoCial DiMenSion
– Financial Inclusion/Capacity Building
– Human Capital Development
– Labor Practice Indicators
– Talent Attraction & Retention
Company Country
SAM Gold Class Westpac Banking Corp. * Australia
Australia & new Zealand Banking Group Ltd. Australia
SAM Bronze Class Banco Bradesco S/A Brazil
Barclays plc United Kingdom
Itau Unibanco Holding S.A. Brazil
national Australia Bank Ltd. Australia
Banca Monte dei Paschi di Siena S.p.A. Italy
Banco Bilbao vizcaya Argentaria S.A. Spain
Banco do Brasil S/A Brazil
Banco Espirito Santo S/A Portugal
Banco Santander S.A. Spain
Bancolombia S.A. Colombia
Bank of nova Scotia Canada
BnP Paribas S.A. France
Canadian Imperial Bankof Commerce Canada
Citigroup Inc. United States
number of companiesin universe
199
number of companies assessedby SAM in 2011
105
Assessed companies to totalcompanies in universe (%)
53
Market capitalization of assessedcompanies to total market capitalization (%)
87
DimensionAverage Score *
Best Score
Weighting in Total Score
Economic 66% 97% 38%
Environmental 42% 88% 24%
Social 48% 91% 38%
Company Country
Commonwealth Bank of Australia Australia
Credit Agricole S.A. France
Credit Suisse Group Switzerland
Danske Bank A/S ** Denmark
Deutsche Bank AG Germany
DnB nOR ASA norway
HSBC Holdings plc United Kingdom
Intesa Sanpaolo S.p.A. Italy
Lloyds Banking Group PLC United Kingdom
nedbank Group Ltd. South Africa
Royal Bank of Canada Canada
Royal Bank of Scotland Group plc United Kingdom
Societe Generale S.A. France
Standard Chartered plc United Kingdom
UBS AG Switzerland
UniCredit S.p.A. Italy
* SAM Sector Leader** SAM Sector Mover

The Sustainability Yearbook 20127. Sector Insights
64
In the extremely competitive beverage industry, only innovative companies
can hope to gain market share. Carbonated soft drinks still account for the
majority of non-alcoholic beverages but have been in decline for years as
the market moves toward healthier and lower-calorie alternatives. Industry
participants are developing and marketing higher-quality and more diversified
products to meet new consumption patterns. Over the last few years, such
niche categories as energy drinks have emerged and expanded. Innovative
beverage companies can capture these new market trends that frequently
offer faster growth and higher margins. Fresh opportunities can also be tapped
in emerging markets where favorable demographic trends are boosting
consumption. Given the large proportion of calories consumed through
beverages, the industry’s ingredients and advertising policies have increasingly
come under scrutiny. Producers of alcoholic beverages, in particular, face the
challenge of implementing effective and responsible marketing strategies.
DrivinG ForCeS
SuSTainaBiliTy leaDerS 2012As of December 31, 2011
reSulTS aT SeCTor levelTotal Score
0%
Average Score*
* Average score of all assessed companies in the sector
Best Score
25% 50% 75% 100%
SeCTor STaTiSTiCS
hiGhliGhTeD CriTeriaBeverages
eConoMiC DiMenSion
– Brand Management
– Health & nutrition
– Strategy for Emerging Markets
– Risk & Crisis Management
environMenTal DiMenSion
– Environmental Policy/Management System
– Packaging
– Raw Material Sourcing
– Water Related Risks
SoCial DiMenSion
– Human Capital Development
– Responsibility for Alcoholic Products
– Talent Attraction & Retention
– Standards for Suppliers
Company Country
SAM Gold Class PepsiCo Inc. * United States
SAM Silver Class Coca-Cola Hellenic Bottling Co. S.A. Greece
Diageo plc United Kingdom
SAM Bronze Class Molson Coors Brewing Co. ** United States
Heineken n.v. netherlands
number of companiesin universe
30
number of companies assessedby SAM in 2011
24
Assessed companies to totalcompanies in universe (%)
80
Market capitalization of assessedcompanies to total market capitalization (%)
97
DimensionAverage Score *
Best Score
Weighting in Total Score
Economic 53% 86% 41%
Environmental 48% 90% 24%
Social 49% 75% 35%
* SAM Sector Leader** SAM Sector Mover

The Sustainability Yearbook 20127. Sector Insights
65
Biotechnology companies use technologies based on biological systems
to develop medical, agricultural and industrial products and processes. The
sector is characterized by extensive R&D efforts and a high risk of failure in
product development. Innovation and intellectual property are key drivers that
make highly qualified employees and effective human capital management
important success factors. Medical (red) biotechnology companies face
concerns about pricing and reimbursement of their products as well as
global patent protection and drug safety issues. The use of biotech products
in agriculture (green biotechnology) is widely criticized among certain
stakeholder groups. Public mistrust centers on the production, release and
use of genetically modified seeds and plants. The use of genetically modified
organisms in closed production processes (white biotechnology) to increase
the cost efficiency, speed and yield of industrial applications is far less criticized.
Building and maintaining stakeholders’ trust in their core technologies is a
general sustainability challenge faced by the biotechnology industry.
DrivinG ForCeS
SuSTainaBiliTy leaDerS 2012As of December 31, 2011
reSulTS aT SeCTor levelTotal Score
0%
Average Score*
* Average score of all assessed companies in the sector
Best Score
25% 50% 75% 100%
SeCTor STaTiSTiCS
hiGhliGhTeD CriTeriaBiotechnology
eConoMiC DiMenSion
– Corporate Governance
– Marketing Practices
– Research & Development
– Risk & Crisis Management
environMenTal DiMenSion
– Environmental Reporting
– Environmental Policy/Management System
– Climate Strategy
SoCial DiMenSion
– Human Capital Development
– Labor Practice Indicators
– Talent Attraction & Retention
– Health Outcome Contribution
Company Country
SAM Gold Class novozymes A/S * Denmark
SAM Silver Class Life Technologies Corp. United States
SAM Bronze Class Biogen Idec Inc. United States
Amgen Inc. ** United States
number of companiesin universe
26
number of companies assessedby SAM in 2011
14
Assessed companies to totalcompanies in universe (%)
54
Market capitalization of assessedcompanies to total market capitalization (%)
81
DimensionAverage Score *
Best Score
Weighting in Total Score
Economic 57% 86% 40%
Environmental 36% 98% 10%
Social 40% 87% 50%
* SAM Sector Leader** SAM Sector Mover

The Sustainability Yearbook 20127. Sector Insights
66
Rapid urbanization in emerging markets as well as rising awareness of
environmental issues and new building methods have made the building
materials sector a highly dynamic industry. The sector covers a diverse set of
producers engaged in the production of materials used in the construction
and refurbishment of buildings and structures, including bathroom and
kitchen fixtures, plumbing supplies and central air-conditioning and heating
equipment. The industry’s diverse nature results in varying competitive
environments. Cement manufacturing consumes large amounts of energy
and is a prime source of greenhouse gas emissions. As a result, reductions in
greenhouse gas emissions, environmental life cycle analyses and examinations
of reuse/recycling options will be top priorities in the sector. Increasingly
sophisticated building materials meet tighter energy- and water-efficiency
regulations while integrating innovative technologies such as solar cells. As
a result, the industry will become even more knowledge-driven than in the
past, making talent attraction, retention and development key sources of
competitive advantage.
DrivinG ForCeS
SuSTainaBiliTy leaDerS 2012As of December 31, 2011
reSulTS aT SeCTor levelTotal Score
0%
Average Score*
* Average score of all assessed companies in the sector
Best Score
25% 50% 75% 100%
SeCTor STaTiSTiCS
hiGhliGhTeD CriTeriaBuilding Materials & Fixtures
eConoMiC DiMenSion
– Antitrust Policy
– Corporate Governance
– Customer Relationship Management
– Risk & Crisis Management
environMenTal DiMenSion
– Biodiversity
– Climate Strategy
– Environmental Reporting
– Transport & Logistics
SoCial DiMenSion
– Human Capital Development
– Occupational Health & Safety
– Standards for Suppliers
– Talent Attraction & Retention
Company Country
SAM Gold Class Siam Cement Pcl * Thailand
SAM Silver Class CRH plc Ireland
Holcim Ltd. Switzerland
Owens Corning United States
SAM Bronze Class Asahi Glass Co. Ltd. ** Japan
Italcementi S.p.A. Italy
Lafarge S.A. France
Toto Ltd. Japan
Weyerhaeuser Co. United States
number of companiesin universe
49
number of companies assessedby SAM in 2011
25
Assessed companies to totalcompanies in universe (%)
51
Market capitalization of assessedcompanies to total market capitalization (%)
72
DimensionAverage Score *
Best Score
Weighting in Total Score
Economic 67% 87% 28%
Environmental 50% 91% 33%
Social 58% 81% 39%
* SAM Sector Leader** SAM Sector Mover

The Sustainability Yearbook 20127. Sector Insights
67
The chemical sector comprises companies that develop, manufacture and
distribute specialty and commodity chemicals, plastics, industrial gases,
agrochemicals and additives for the healthcare and wellness industries.
Innovative process and product developments remain key sectoral drivers.
nevertheless, growing awareness of the environmental impact of chemical
operations has resulted in legislative and consumer-driven pressure on the
industry to adopt more sustainable approaches, such as implementing strict
emission controls or corporate social responsibility initiatives. Also, new
product development requires more sustainable process designs involving (bio)
catalyzed reactions and the replacement of traditional solvents and hazardous
reagents with renewable materials. Finally, new product applications require
the implementation of comprehensive product stewardship management
systems that include product databases and client training.
DrivinG ForCeS
SuSTainaBiliTy leaDerS 2012As of December 31, 2011
reSulTS aT SeCTor levelTotal Score
0%
Average Score*
* Average score of all assessed companies in the sector
Best Score
25% 50% 75% 100%
SeCTor STaTiSTiCS
hiGhliGhTeD CriTeriaChemicals
eConoMiC DiMenSion
– Corporate Governance
– Customer Relationship Management
– Innovation Management
– Risk & Crisis Management
environMenTal DiMenSion
– Climate Strategy
– Environmental Reporting
– Environmental Policy/Management System
– Product Stewardship
SoCial DiMenSion
– Human Capital Development
– Occupational Health & Safety
– Standards for Suppliers
– Talent Attraction & Retention
Company Country
SAM Gold Class DSM n.v. * netherlands
Akzo nobel n.v. netherlands
Bayer AG Germany
SAM Silver Class BASF SE Germany
Dow Chemical Co. United States
Praxair Inc. United States
SAM Bronze Class Syngenta AG Switzerland
Teijin Ltd. Japan
Air Products & Chemicals Inc. United States
E.I. du Pont de nemours & Co. United States
Honam Petrochemical Corp. South Korea
Lanxess AG ** Germany
LG Chem Ltd. South Korea
Linde AG Germany
Potash Corp. of Saskatchewan Inc. Canada
Rhodia S.A. France
Umicore S.A. Belgium
number of companiesin universe
107
number of companies assessedby SAM in 2011
57
Assessed companies to totalcompanies in universe (%)
53
Market capitalization of assessedcompanies to total market capitalization (%)
81
DimensionAverage Score *
Best Score
Weighting in Total Score
Economic 61% 93% 28%
Environmental 58% 93% 35%
Social 54% 88% 37%
* SAM Sector Leader** SAM Sector Mover

The Sustainability Yearbook 20127. Sector Insights
68
The textile, footwear and accessories industry is characterized by limited
growth in the major developed markets and product categories. Constant
product innovation and expansion into new markets help to alleviate this
problem, but may require additional resources. Shorter product cycles not
only require innovative marketing strategies, but also sound sourcing models.
Additionally, the industry faces the challenge of integrating environmental
aspects into product design and development. At the same time, companies
must engage contractors and suppliers in sustainability issues, actively
monitor labor practices and disclose the results of these activities to ensure
fair working conditions as well as protect their reputation and thus their brand
and enterprise value.
DrivinG ForCeS
SuSTainaBiliTy leaDerS 2012As of December 31, 2011
reSulTS aT SeCTor levelTotal Score
0%
Average Score*
* Average score of all assessed companies in the sector
Best Score
25% 50% 75% 100%
SeCTor STaTiSTiCS
hiGhliGhTeD CriTeriaClothing, Accessories & Footwear
eConoMiC DiMenSion
– Brand Management
– Codes of Conduct/Compliance/ Corruption & Bribery
– Corporate Governance
– Risk & Crisis Management
environMenTal DiMenSion
– Environmental Policy/Management System
– Environmental Reporting
– CO2 from Logistics
– Product Stewardship
SoCial DiMenSion
– Talent Attraction & Retention
– Human Capital Development
– Stakeholder Engagement
– Standards for Suppliers
Company Country
SAM Gold Class adidas AG * Germany
SAM Silver Class nike Inc. United States
Puma AG Germany
SAM Bronze Class Christian Dior S.A. France
LvMH Moet Hennessy Louis vuitton France
Woongjin Chemical Co. Ltd. ** South Korea
number of companiesin universe
31
number of companies assessedby SAM in 2011
16
Assessed companies to totalcompanies in universe (%)
52
Market capitalization of assessedcompanies to total market capitalization (%)
75
DimensionAverage Score *
Best Score
Weighting in Total Score
Economic 65% 86% 29%
Environmental 52% 95% 22%
Social 55% 89% 49%
* SAM Sector Leader** SAM Sector Mover

The Sustainability Yearbook 20127. Sector Insights
69
Growing demand for integrated voice services and data applications has led
to shorter product life cycles and heightened competition for manufacturers
and providers of communication equipment. As a result, innovation and
intellectual property are key issues for this industry. Significant additional
investments in telecommunication infrastructure will be required to meet
the growing demand for cellular network capacity. Growing awareness of
the environmental impact of infrastructure and equipment over the entire
life cycle has raised demand for product designs that consider the use of
chemicals in production, energy efficiency, and waste issues. Moreover, take-
back programs, greater modularity, and extended producer responsibility are
becoming more and more relevant. Environmental and social standards for
suppliers are crucial issues as a large share of production is outsourced to
emerging economies. Additionally, there are increasing demands for reduced
exposures to electromagnetic fields, although their long-term health impact
remains difficult to assess.
DrivinG ForCeS
SuSTainaBiliTy leaDerS 2012As of December 31, 2011
reSulTS aT SeCTor levelTotal Score
0%
Average Score*
* Average score of all assessed companies in the sector
Best Score
25% 50% 75% 100%
SeCTor STaTiSTiCS
hiGhliGhTeD CriTeriaCommunication Technology
eConoMiC DiMenSion
– Codes of Conduct/Compliance/ Corruption & Bribery
– Corporate Governance
– Customer Relationship Management
– Risk & Crisis Management
environMenTal DiMenSion
– Climate Strategy
– Hazardous Substances
– Environmental Policy/Management System
– Product Stewardship
SoCial DiMenSion
– Human Capital Development
– Labor Practice Indicators
– Standards for Suppliers
– Talent Attraction & Retention
Company Country
SAM Gold Class Alcatel-Lucent */** France
SAM Silver Class nokia Corp. Finland
SAM Bronze Class Motorola Mobility Holdings Inc. United States
Motorola Solutions Inc. United States
number of companiesin universe
26
number of companies assessedby SAM in 2011
14
Assessed companies to totalcompanies in universe (%)
54
Market capitalization of assessedcompanies to total market capitalization (%)
89
DimensionAverage Score *
Best Score
Weighting in Total Score
Economic 60% 89% 36%
Environmental 41% 90% 31%
Social 49% 80% 33%
* SAM Sector Leader** SAM Sector Mover

The Sustainability Yearbook 20127. Sector Insights
70
The technology equipment sector is characterized by constant innovation,
increasing vertical integration and mass production of electronic equipment.
Shorter product life cycles and increasing demand from emerging economies
have resulted in high disposal volumes. To address the issue of electronic
waste, product design and sales need to take into account energy and
material conservation, modularity, take-back programs and extended
producer responsibility. Revenue streams can be diversified through a gradual
migration from sale to leasing, and from products to services provision.
For example, outsourcing of data storage to huge datacenters offers new
business opportunities that enable energy-efficient and cost-effective storage
for customers. Effective implementation of environmental standards and
monitoring of supplier compliance in such areas as the use of hazardous
materials and fair working conditions in emerging economies are particularly
relevant for the sector. Furthermore, information technology may increasingly
enable carbon emissions reductions.
DrivinG ForCeS
SuSTainaBiliTy leaDerS 2012As of December 31, 2011
reSulTS aT SeCTor levelTotal Score
0%
Average Score*
* Average score of all assessed companies in the sector
Best Score
25% 50% 75% 100%
SeCTor STaTiSTiCS
hiGhliGhTeD CriTeriaComputer Hardware & Electronic Office Equipment eConoMiC DiMenSion
– Corporate Governance
– Customer Relationship Management
– Risk & Crisis Management
– Supply Chain Management
environMenTal DiMenSion
– Climate Strategy
– Hazardous Substances
– Environmental Policy/Management System
– Product Stewardship
SoCial DiMenSion
– Human Capital Development
– Labor Practice Indicators
– Standards for Suppliers
– Talent Attraction & Retention
Company Country
SAM Gold Class Au Optronics Corp. * Taiwan
SAM Bronze Class FUJIFILM Holdings Corp. Japan
nEC Corp. Japan
Xerox Corp. United States
Dell Inc. United States
EMC Corp. ** United States
Lexmark International Inc. United States
number of companiesin universe
34
number of companies assessedby SAM in 2011
23
Assessed companies to totalcompanies in universe (%)
68
Market capitalization of assessedcompanies to total market capitalization (%)
94
DimensionAverage Score *
Best Score
Weighting in Total Score
Economic 56% 78% 36%
Environmental 48% 87% 30%
Social 47% 75% 34%
* SAM Sector Leader** SAM Sector Mover

The Sustainability Yearbook 20127. Sector Insights
71
The IT service sector helps companies run their businesses efficiently
through software applications and integration. A secure use of information
technology and a rigorously enforced code of conduct covering access to
confidential data provide client privacy protection. Companies need effective
knowledge management and training to attract and retain qualified staff.
Leading companies can access and share the knowledge base of a global
network to create customized solutions. Companies can restore shareholder
confidence in their corporate governance only by becoming more transparent,
particularly with regard to disclosures of business practices. The sector’s main
environmental impacts stem from its office operations, which can be addressed
through recycling and eco-efficiency programs. In addition, IT service providers
can help reduce their customers’ environmental impact through information
technology applications.
DrivinG ForCeS
SuSTainaBiliTy leaDerS 2012As of December 31, 2011
reSulTS aT SeCTor levelTotal Score
0%
Average Score*
* Average score of all assessed companies in the sector
Best Score
25% 50% 75% 100%
SeCTor STaTiSTiCS
hiGhliGhTeD CriTeriaComputer Services & Internet
eConoMiC DiMenSion
– Corporate Governance
– Customer Relationship Management
– Privacy Protection
– Risk & Crisis Management
environMenTal DiMenSion
– Climate Strategy
– Environmental Policy/Management System
– Environmental Reporting
SoCial DiMenSion
– Human Capital Development
– Labor Practice Indicators
– Standards for Suppliers
– Talent Attraction & Retention
Company Country
SAM Gold Class Teradata Corp. * United States
SAM Silver Class Indra Sistemas S.A. Spain
SAM Bronze Class IBM (International Business Machines Corp.) United States
SK C&C Co. Ltd. ** South Korea
Wipro Ltd. India
Tata Consultancy Services Ltd. India
number of companiesin universe
38
number of companies assessedby SAM in 2011
23
Assessed companies to totalcompanies in universe (%)
61
Market capitalization of assessedcompanies to total market capitalization (%)
91
DimensionAverage Score *
Best Score
Weighting in Total Score
Economic 49% 81% 47%
Environmental 38% 83% 20%
Social 38% 65% 33%
* SAM Sector Leader** SAM Sector Mover

The Sustainability Yearbook 20127. Sector Insights
72
Amid the continuing global downturn, this sector is faced with several
challenging issues including stagnating or declining demand in developed
markets; higher material, energy and capital costs, and shifts in client and
consumer demand. The markets in which these companies operate remain
highly competitive, with substantial downward pressure on both prices
and operating margins. Some players seek to set themselves apart through
innovative products and solutions while moving into emerging markets that
seem to offer superior growth potential.
At the same time, stakeholders are placing increasing importance on
environmental and social performance, as reflected in converging public
communication strategies. Leading companies integrate these aspects into
their growth strategies, continually improve and effectively communicate
them to their stakeholders. Overall, the sector remains characterized by a
trend toward greater energy and resource efficiency, innovative solutions and
the strengthening of companies’ reputation through greater transparency and
involvement.
DrivinG ForCeS
SuSTainaBiliTy leaDerS 2012As of December 31, 2011
reSulTS aT SeCTor levelTotal Score
0%
Average Score*
* Average score of all assessed companies in the sector
Best Score
25% 50% 75% 100%
SeCTor STaTiSTiCS
hiGhliGhTeD CriTeriaContainers & Packaging
eConoMiC DiMenSion
– Corporate Governance
– Customer Relationship Management
– Risk & Crisis Management
– Codes of Conduct/Compliance/ Corruption & Bribery
environMenTal DiMenSion
– Product Stewardship
– Environmental Reporting
– Environmental Policy/Management System
– Climate Strategy
SoCial DiMenSion
– Talent Attraction & Retention
– Human Capital Development
– Stakeholder Engagement
– Standards for Suppliers
Company Country
SAM Gold Class Sonoco Products Co. */** United States
MeadWestvaco Corp. United States
SAM Bronze Class Ball Corp. United States
number of companiesin universe
17
number of companies assessedby SAM in 2011
10
Assessed companies to totalcompanies in universe (%)
59
Market capitalization of assessedcompanies to total market capitalization (%)
73
DimensionAverage Score *
Best Score
Weighting in Total Score
Economic 73% 90% 29%
Environmental 54% 86% 29%
Social 58% 83% 42%
* SAM Sector Leader** SAM Sector Mover

The Sustainability Yearbook 20127. Sector Insights
73
Sound operational management under environmental considerations is a key
issue for the diversified industrials sector, but the industry’s main challenges
and opportunities are product-related. Important issues include efficiency,
safety, hazardous content and product disposal or recycling. Innovation and
the integration of environmental considerations into product development
are key criteria. In equipment markets, preparing for customers’ future
carbon constraints is an important factor in product development. For
consumer-facing businesses, the Eco-Design Framework is a key directive
to follow. Typically, diversified industrials have a global presence that also
includes emerging economies. To manage their workforce’s diverse cultural
background, companies must focus on common values, including policies and
compliance systems to prevent corruption and illegal market practices. High
health & safety standards must be met on all operational levels. Lengthening
supply chains in emerging markets increase companies’ potential exposure
to human rights abuses. Finally, stakeholder engagement is a key long-term
success factor.
DrivinG ForCeS
SuSTainaBiliTy leaDerS 2012As of December 31, 2011
reSulTS aT SeCTor levelTotal Score
0%
Average Score*
* Average score of all assessed companies in the sector
Best Score
25% 50% 75% 100%
SeCTor STaTiSTiCS
hiGhliGhTeD CriTeriaDiversified Industrials
eConoMiC DiMenSion
– Corporate Governance
– Customer Relationship Management
– Risk & Crisis Management
environMenTal DiMenSion
– Environmental Policy/Management System
– Water Related Risks
– Climate Strategy
– Product Stewardship
SoCial DiMenSion
– Human Capital Development
– Labor Practice Indicators
– Occupational Health & Safety
– Standards for Suppliers
Company Country
SAM Gold Class Siemens AG * Germany
SAM Bronze Class 3M Company ** United States
Toshiba Corp. Japan
Eaton Corp. United States
General Electric Co. United States
number of companiesin universe
35
number of companies assessedby SAM in 2011
20
Assessed companies to totalcompanies in universe (%)
57
Market capitalization of assessedcompanies to total market capitalization (%)
91
DimensionAverage Score *
Best Score
Weighting in Total Score
Economic 53% 94% 28%
Environmental 38% 90% 35%
Social 46% 86% 37%
* SAM Sector Leader** SAM Sector Mover

The Sustainability Yearbook 20127. Sector Insights
74
Innovation, quality and branding are the key differentiating factors in this sector.
In addition, leading companies actively manage safety and environmental
issues throughout the product life cycle. Take-back guarantees for used
products and customer-oriented services offer interesting opportunities from
a business and environmental perspective. Moreover, consumers increasingly
demand products tailored to their specific needs, including a high level of
comfort and adaptability, as well as transparent product information and
labeling. Brands that successfully consider the shift toward sustainable
consumption and offer attractive solutions may emerge as leaders in terms
of business model innovation. Additional long-term challenges arise from
integrating suppliers into the production chain.
DrivinG ForCeS
SuSTainaBiliTy leaDerS 2012As of December 31, 2011
reSulTS aT SeCTor levelTotal Score
0%
Average Score*
* Average score of all assessed companies in the sector
Best Score
25% 50% 75% 100%
SeCTor STaTiSTiCS
hiGhliGhTeD CriTeriaDurable Household Products
eConoMiC DiMenSion
– Brand Management
– Customer Relationship Management
– Innovation Management
– Risk & Crisis Management
environMenTal DiMenSion
– Product Stewardship
– Environmental Policy/Management System
– Environmental Reporting
SoCial DiMenSion
– Human Capital Development
– Stakeholder Engagement
– Standards for Suppliers
– Talent Attraction & Retention
Company Country
SAM Gold Class Electrolux AB */** Sweden
SAM Bronze Class Woongjin Coway Co., Ltd. South Korea
number of companiesin universe
13
number of companies assessedby SAM in 2011
8
Assessed companies to totalcompanies in universe (%)
62
Market capitalization of assessedcompanies to total market capitalization (%)
74
DimensionAverage Score *
Best Score
Weighting in Total Score
Economic 59% 81% 41%
Environmental 48% 83% 21%
Social 53% 76% 38%
* SAM Sector Leader** SAM Sector Mover

The Sustainability Yearbook 20127. Sector Insights
75
As high-tech providers, companies in this sector rely heavily on the knowledge,
qualification and training of their employees for their business success.
Companies whose technologies and products are used in the defense sector
should brace for increased reputational risks. In the medium term, companies
serving the communications and information technology sectors are expected
to benefit from balanced growth in these markets, after they absorb the
significant amount of overcapacity built up over the past years. Providers of
advanced industrial equipment also play a key role in the development and
provision of new products and technologies focusing on energy efficiency and
various aspects of environmental protection such as testing, measurement
and removal of pollutants.
DrivinG ForCeS
SuSTainaBiliTy leaDerS 2012As of December 31, 2011
reSulTS aT SeCTor levelTotal Score
0%
Average Score*
* Average score of all assessed companies in the sector
Best Score
25% 50% 75% 100%
SeCTor STaTiSTiCS
hiGhliGhTeD CriTeriaElectric Components & EquipmenteConoMiC DiMenSion
– Corporate Governance
– Customer Relationship Management
– Risk & Crisis Management
– Innovation Management
environMenTal DiMenSion
– Climate Strategy
– Product Stewardship
– Water Related Risks
– Environmental Policy/Management System
SoCial DiMenSion
– Human Capital Development
– Labor Practice Indicators
– Occupational Health & Safety
– Standards for Suppliers
Company Country
SAM Gold Class Lite-On Technology Corp. */** Taiwan
SAM Bronze Class Samsung Electro-Mechanics Co. Ltd. South Korea
Fuji Electric Co. Ltd. Japan
Ibiden Co., Ltd. Japan
LeGrand S.A. France
LG Innotek Co. Ltd. South Korea
Schneider Electric S.A. France
TDK Corp. Japan
number of companiesin universe
46
number of companies assessedby SAM in 2011
21
Assessed companies to totalcompanies in universe (%)
46
Market capitalization of assessedcompanies to total market capitalization (%)
74
DimensionAverage Score *
Best Score
Weighting in Total Score
Economic 48% 85% 29%
Environmental 39% 88% 37%
Social 46% 86% 34%
* SAM Sector Leader** SAM Sector Mover

The Sustainability Yearbook 20127. Sector Insights
76
The Fukushima disaster drew attention to energy strategies around the
world, placing electric utilities under increased scrutiny over their operational
performance. In the aftermath of the disaster, consumers’ awareness of
environmental issues and their desire for greener products is bound to
increase, while regulations and controls are tightened. This makes it ever
more important for companies to integrate sustainability aspects into their
operations. nonetheless, electric utilities face key challenges: In emerging
economies, industrialization and urbanization imply a huge need for additional
generation capacity. In developed economies, enormous efforts are required
to develop and replace an aging grid while integrating a growing share of
renewable energy into the power mix. Moreover, infrastructure developments
must factor in stakeholders’ concerns as these can hinder the progress of
a project. The austerity measures brought about by the financial crisis will
also make it more important for companies to offer their clients efficiency
enhancements and opportunities to cut their energy consumption while
generating additional revenues.
DrivinG ForCeS
SuSTainaBiliTy leaDerS 2012As of December 31, 2011
reSulTS aT SeCTor levelTotal Score
0%
Average Score*
* Average score of all assessed companies in the sector
Best Score
25% 50% 75% 100%
SeCTor STaTiSTiCS
hiGhliGhTeD CriTeriaElectricity
eConoMiC DiMenSion
– Corporate Governance
– Customer Relationship Management
– Market Opportunities
– Risk & Crisis Management
environMenTal DiMenSion
– Climate Strategy
– Electricity Generation
– Environmental Reporting
– Transmission & Distribution
SoCial DiMenSion
– Human Capital Development
– Occupational Health & Safety
– Stakeholder Engagement
– Talent Attraction & Retention
Company Country
SAM Gold Class EDP - Energias de Portugal S.A. * Portugal
Iberdrola S.A. ** Spain
TERnA S.p.A. Italy
SAM Bronze Class AGL Energy Ltd. Australia
Companhia Energetica de Minas Gerais - CEMIG Brazil
Duke Energy Corp. United States
E.On AG Germany
Endesa S.A. Spain
Enel S.p.A. Italy
Public Service Enterprise Group Inc. United States
RWE AG Germany
Fortum Oyj Finland
GDF Suez S.A. France
Red Electrica Corp. S.A. Spain
TransAlta Corp. Canada
verbund AG Austria
number of companiesin universe
104
number of companies assessedby SAM in 2011
59
Assessed companies to totalcompanies in universe (%)
57
Market capitalization of assessedcompanies to total market capitalization (%)
83
DimensionAverage Score *
Best Score
Weighting in Total Score
Economic 62% 90% 35%
Environmental 51% 93% 35%
Social 61% 88% 30%* SAM Sector Leader** SAM Sector Mover

The Sustainability Yearbook 20127. Sector Insights
77
Beyond the broad focus on efficiency for customers inherent in all engineering
and capital goods markets, a number of products from the electronic
equipment sector have specific sustainability applications. Providers of control
and automation solutions, for example, can tap opportunities resulting from
customers’ drive for energy and carbon efficiency. In addition, increasing safety
concerns present opportunities in the area of controls and sensors. Regulatory
requirements governing the protection of air, soil and water systems in
developed markets as well as in fast-growing new economies are driving the
markets for testing equipment, measurement and control technology, and
pollutant removal equipment. Increasing regulatory requirements governing
the energy efficiency of buildings have created new opportunities for
manufacturers of specialized products and services. As high-tech providers,
companies in this sector rely heavily on the knowledge, qualification and
training of their employees for their business success. Given the long-term
nature of B2B relationships, tools to monitor the quality of client management
are important.
DrivinG ForCeS
SuSTainaBiliTy leaDerS 2012As of December 31, 2011
reSulTS aT SeCTor levelTotal Score
0%
Average Score*
* Average score of all assessed companies in the sector
Best Score
25% 50% 75% 100%
SeCTor STaTiSTiCS
hiGhliGhTeD CriTeriaElectronic Equipment
eConoMiC DiMenSion
– Codes of Conduct/Compliance/ Corruption & Bribery
– Corporate Governance
– Customer Relationship Management
– Risk & Crisis Management
environMenTal DiMenSion
– Climate Strategy
– Environmental Reporting
– Environmental Policy/Management System
– Product Stewardship
SoCial DiMenSion
– Human Capital Development
– Occupational Health & Safety
– Standards for Suppliers
– Talent Attraction & Retention
Company Country
SAM Gold Class Samsung SDI Co. Ltd. * South Korea
Delta Electronics Inc. ** Taiwan
SAM Silver Class Hitachi Ltd. Japan
Agilent Technologies Inc. United States
number of companiesin universe
29
number of companies assessedby SAM in 2011
15
Assessed companies to totalcompanies in universe (%)
52
Market capitalization of assessedcompanies to total market capitalization (%)
80
DimensionAverage Score *
Best Score
Weighting in Total Score
Economic 51% 81% 30%
Environmental 38% 85% 33%
Social 45% 80% 37%
* SAM Sector Leader** SAM Sector Mover

The Sustainability Yearbook 20127. Sector Insights
78
The financial services sector consists of a heterogeneous group of companies such
as stock exchanges, asset managers and investment holdings. These companies
have been indirectly affected by the increased concerns about the health of the
banking sector through falling asset prices, shrinking volumes, high volatility,
fading risk appetite and regulatory pressure. Accountability and leadership are
crucial for building a competitive advantage. Adherence to international best-
practice standards in corporate governance, risk management and compliance is
a necessity. Globalization, regulation, demographic shifts and climate change will
continue to influence the business environment. Leading companies are integrating
environmental and social factors into their long-term strategies and performance
reviews. A multi-stakeholder-driven approach to developing innovative and
prudent financial services and products is essential. Motivated, highly educated
and experienced employees are crucial to developing these financial services and
products as well as in attracting and retaining clients. Examples include venture
capital investments focusing on new technologies that promote the transition to
a low-carbon economy or improve resource efficiency, as well as the integration
of environmental and social considerations into companies’ service portfolios.
DrivinG ForCeS
SuSTainaBiliTy leaDerS 2012As of December 31, 2011
reSulTS aT SeCTor levelTotal Score
0%
Average Score*
* Average score of all assessed companies in the sector
Best Score
25% 50% 75% 100%
SeCTor STaTiSTiCS
hiGhliGhTeD CriTeriaFinancial Services
eConoMiC DiMenSion
– Corporate Governance
– Customer Relationship Management
– Risk & Crisis Management
– Stakeholder Engagement
environMenTal DiMenSion
– Business Opportunities Financial Services/Products
– Business Risks Large Projects/Export Finance
– Climate Change Governance
– Environmental Reporting
SoCial DiMenSion
– Financial Inclusion/Capacity Building
– Human Capital Development
– Labor Practice Indicators
– Talent Attraction & Retention
Company Country
SAM Gold Class Itausa-Investimentos Itau S/A * Brazil
SAM Bronze Class Samsung Securities Co. Ltd. South Korea
3i Group plc United Kingdom
AMP Ltd. Australia
Criteria CaixaCorp S.A.1 Spain
Daiwa Securities Group Inc. Japan
Deutsche Boerse AG Germany
Grupo de Inversiones Suramericana S.A. Colombia
Investec Ltd. South Africa
Man Group plc United Kingdom
Morgan Stanley ** United States
nomura Holdings Inc. Japan
northern Trust Corp. United States
nYSE Euronext United States
Provident Financial plc United Kingdom
Redecard S/A Brazil
Schroders plc United Kingdom
State Street Corp. United States
number of companiesin universe
123
number of companies assessedby SAM in 2011
61
Assessed companies to totalcompanies in universe (%)
50
Market capitalization of assessedcompanies to total market capitalization (%)
79
DimensionAverage Score *
Best Score
Weighting in Total Score
Economic 57% 89% 38%
Environmental 24% 66% 24%
Social 33% 79% 38%
* SAM Sector Leader** SAM Sector Mover
1 In 2011, Criteria CaixaCorp has been restructured and renamed to CaixaBank

The Sustainability Yearbook 20127. Sector Insights
79
The fixed-line telecommunications industry operates in a highly competitive
environment characterized by a continuously blurred boundary between
fixed-line and wireless technology. This industry has the inherent potential to
significantly improve work habits and lifestyles, resulting in a reduction of travel
and transportation, as well as their corresponding environmental impacts. In
order to remain competitive in a market subject to rapid technological change,
companies will need to adopt flexible business models that enable them to
integrate new-generation technologies and services, such as voice-over-IP, Tv
and Internet services, into their offering. Energy efficiency and state-of-the-
art infrastructure remain the sector’s key environmental challenges. Successful
companies analyze the social impact of telecommunication services and act
on the results of their analyses. Providers of low-cost telecommunication
solutions that help reduce the digital divide and pursue an emerging markets
strategy are optimally positioned for sustainable sales growth.
DrivinG ForCeS
SuSTainaBiliTy leaDerS 2012As of December 31, 2011
reSulTS aT SeCTor levelTotal Score
0%
Average Score*
* Average score of all assessed companies in the sector
Best Score
25% 50% 75% 100%
SeCTor STaTiSTiCS
hiGhliGhTeD CriTeriaFixed Line Communications
eConoMiC DiMenSion
– Corporate Governance
– Customer Relationship Management
– Privacy Protection
– Risk & Crisis Management
environMenTal DiMenSion
– Climate Strategy
– Environmental Policy/Management System
– Environmental Reporting
SoCial DiMenSion
– Human Capital Development
– Labor Practice Indicators
– Stakeholder Engagement
– Talent Attraction & Retention
Company Country
SAM Gold Class KT Corp. */** South Korea
BT Group plc United Kingdom
Telecom Italia S.p.A. Italy
Telefonica S.A. Spain
SAM Silver Class KPn n.v. netherlands
Portugal Telecom SGPS S/A Portugal
number of companiesin universe
37
number of companies assessedby SAM in 2011
25
Assessed companies to totalcompanies in universe (%)
68
Market capitalization of assessedcompanies to total market capitalization (%)
92
DimensionAverage Score *
Best Score
Weighting in Total Score
Economic 69% 93% 44%
Environmental 57% 94% 16%
Social 63% 90% 40%
* SAM Sector Leader** SAM Sector Mover

The Sustainability Yearbook 20127. Sector Insights
80
Food & drug retail has always been characterized by intense competition and
battles for market share. This has resulted in industry consolidation over the
past few years with interest in M&A remaining high. The shift toward eating
at home should continue to favor those food retailers that have capitalized on
this trend with expanded offerings of private label or store brands that carry
higher margins than branded products. The health and wellness trend is also
clearly evident as traditional food and drug retailers increase their exposure
to natural and organic products and healthier formulations. International
sourcing has increased and food retailers need to make their supply chains
more transparent. Drug retailers are likely to play a greater role in managing
rising healthcare costs. Several key drug patents are set to expire and a wave of
generic drugs is expected to hit the market over the next few years, resulting
in significant cost savings. Consumers can also benefit from drug retailers’
convenient locations and in-store clinics, which offer affordable access to
basic care.
DrivinG ForCeS
SuSTainaBiliTy leaDerS 2012As of December 31, 2011
reSulTS aT SeCTor levelTotal Score
0%
Average Score*
* Average score of all assessed companies in the sector
Best Score
25% 50% 75% 100%
SeCTor STaTiSTiCS
hiGhliGhTeD CriTeriaFood & Drug Retailers
eConoMiC DiMenSion
– Corporate Governance
– Risk & Crisis Management
– Health & nutrition
– Codes of Conduct/Compliance/ Corruption & Bribery
environMenTal DiMenSion
– Environmental Policy/Management System
– Raw Material Sourcing
– Packaging
– Genetically Modified Organisms
SoCial DiMenSion
– Human Capital Development
– Labor Practice Indicators
– Talent Attraction & Retention
– Standards for Suppliers
Company Country
SAM Gold Class J Sainsbury plc */** United Kingdom
SAM Bronze Class Woolworths Ltd. Australia
Ahold n.v. netherlands
Kesko Oyj Finland
Metro AG Germany
Tesco plc United Kingdom
number of companiesin universe
40
number of companies assessedby SAM in 2011
23
Assessed companies to totalcompanies in universe (%)
58
Market capitalization of assessedcompanies to total market capitalization (%)
83
DimensionAverage Score *
Best Score
Weighting in Total Score
Economic 66% 81% 31%
Environmental 43% 83% 31%
Social 49% 77% 38%
* SAM Sector Leader** SAM Sector Mover
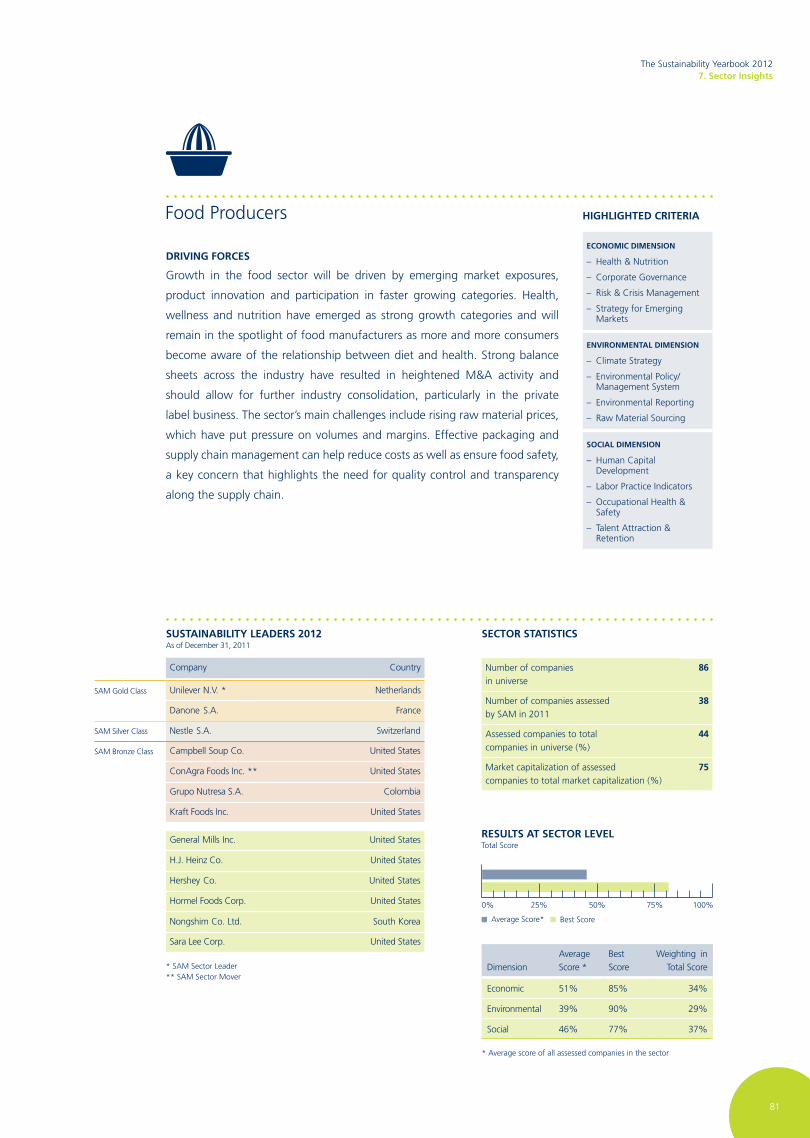
The Sustainability Yearbook 20127. Sector Insights
81
Growth in the food sector will be driven by emerging market exposures,
product innovation and participation in faster growing categories. Health,
wellness and nutrition have emerged as strong growth categories and will
remain in the spotlight of food manufacturers as more and more consumers
become aware of the relationship between diet and health. Strong balance
sheets across the industry have resulted in heightened M&A activity and
should allow for further industry consolidation, particularly in the private
label business. The sector’s main challenges include rising raw material prices,
which have put pressure on volumes and margins. Effective packaging and
supply chain management can help reduce costs as well as ensure food safety,
a key concern that highlights the need for quality control and transparency
along the supply chain.
DrivinG ForCeS
SuSTainaBiliTy leaDerS 2012As of December 31, 2011
reSulTS aT SeCTor levelTotal Score
0%
Average Score*
* Average score of all assessed companies in the sector
Best Score
25% 50% 75% 100%
SeCTor STaTiSTiCS
hiGhliGhTeD CriTeriaFood Producers
eConoMiC DiMenSion
– Health & nutrition
– Corporate Governance
– Risk & Crisis Management
– Strategy for Emerging Markets
environMenTal DiMenSion
– Climate Strategy
– Environmental Policy/Management System
– Environmental Reporting
– Raw Material Sourcing
SoCial DiMenSion
– Human Capital Development
– Labor Practice Indicators
– Occupational Health & Safety
– Talent Attraction & Retention
Company Country
SAM Gold Class Unilever n.v. * netherlands
Danone S.A. France
SAM Silver Class nestle S.A. Switzerland
SAM Bronze Class Campbell Soup Co. United States
ConAgra Foods Inc. ** United States
Grupo nutresa S.A. Colombia
Kraft Foods Inc. United States
General Mills Inc. United States
H.J. Heinz Co. United States
Hershey Co. United States
Hormel Foods Corp. United States
nongshim Co. Ltd. South Korea
Sara Lee Corp. United States
number of companiesin universe
86
number of companies assessedby SAM in 2011
38
Assessed companies to totalcompanies in universe (%)
44
Market capitalization of assessedcompanies to total market capitalization (%)
75
DimensionAverage Score *
Best Score
Weighting in Total Score
Economic 51% 85% 34%
Environmental 39% 90% 29%
Social 46% 77% 37%
* SAM Sector Leader** SAM Sector Mover

The Sustainability Yearbook 20127. Sector Insights
82
The forestry & paper sector comprises owners and operators of timber tracts,
forest tree nurseries and sawmills as well as producers, converters, merchants
and distributors of all grades of paper. The main challenge consists of
ensuring responsible management of forests and plantations and responsible
sourcing of wood fibers. Certification and chain of custody systems play an
important role in gaining customers’ trust and loyalty. The use of genetically
modified organisms is increasing and poses new challenges that need to be
addressed to minimize the risk of future liabilities. As paper becomes an even
more customized product fulfilling client-specific needs, product innovation
and customer focus will move up the corporate agenda. As a result, talent
attraction and retention as well as human capital development remain a key
source of competitive advantage. Technology-wise, room for considerable
improvements in resource efficiency remains, and companies that introduce
new technologies such as enzyme-based processes will secure a competitive
advantage.
DrivinG ForCeS
SuSTainaBiliTy leaDerS 2012As of December 31, 2011
reSulTS aT SeCTor levelTotal Score
0%
Average Score*
* Average score of all assessed companies in the sector
Best Score
25% 50% 75% 100%
SeCTor STaTiSTiCS
hiGhliGhTeD CriTeriaForestry & Paper
eConoMiC DiMenSion
– Codes of Conduct/Compliance/ Corruption & Bribery
– Corporate Governance
– Risk & Crisis Management
– Ecosystem Services
environMenTal DiMenSion
– Climate Strategy
– Product Stewardship
– Sustainable Fiber & Pulp Sourcing
– Sustainable Management of Forests
SoCial DiMenSion
– Human Capital Development
– Occupational Health & Safety
– Stakeholder Engagement
– Standards for Suppliers
Company Country
SAM Gold Class Fibria Celulose S.A. */** Brazil
SAM Bronze Class Stora Enso Oyj Finland
number of companiesin universe
13
number of companies assessedby SAM in 2011
9
Assessed companies to totalcompanies in universe (%)
69
Market capitalization of assessedcompanies to total market capitalization (%)
77
DimensionAverage Score *
Best Score
Weighting in Total Score
Economic 58% 89% 25%
Environmental 59% 91% 31%
Social 56% 82% 44%
* SAM Sector Leader** SAM Sector Mover
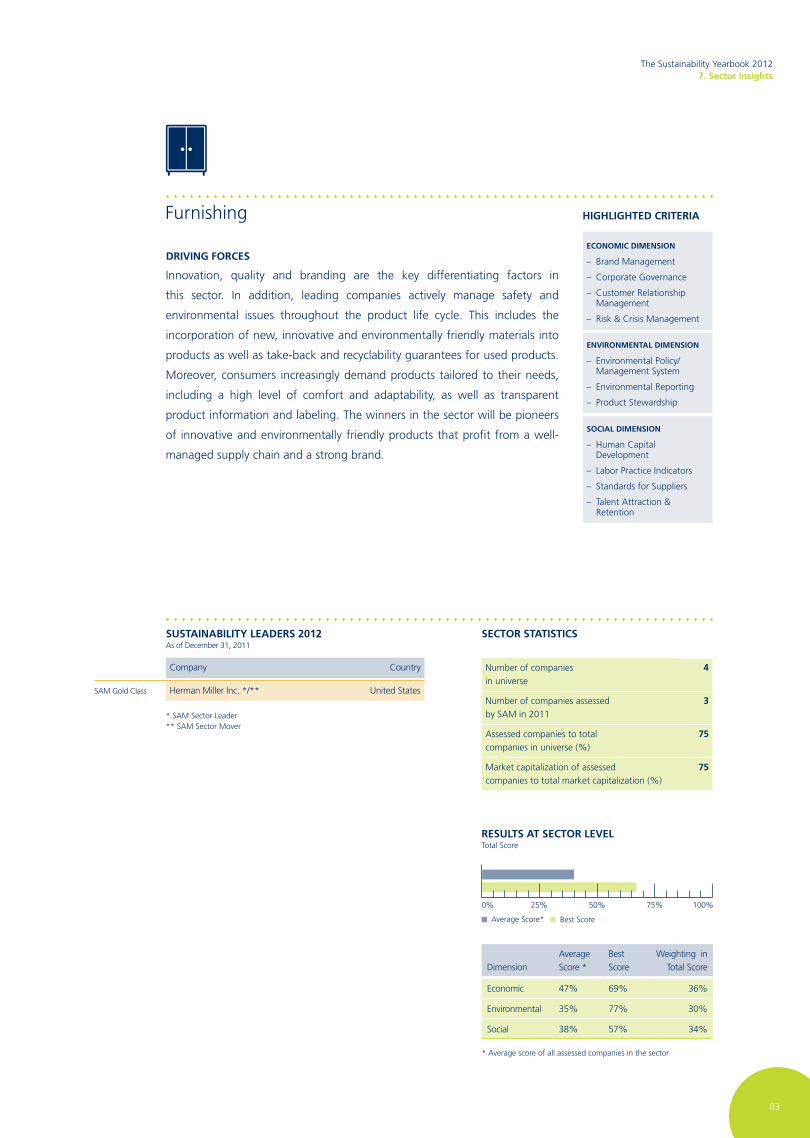
The Sustainability Yearbook 20127. Sector Insights
83
Innovation, quality and branding are the key differentiating factors in
this sector. In addition, leading companies actively manage safety and
environmental issues throughout the product life cycle. This includes the
incorporation of new, innovative and environmentally friendly materials into
products as well as take-back and recyclability guarantees for used products.
Moreover, consumers increasingly demand products tailored to their needs,
including a high level of comfort and adaptability, as well as transparent
product information and labeling. The winners in the sector will be pioneers
of innovative and environmentally friendly products that profit from a well-
managed supply chain and a strong brand.
DrivinG ForCeS
SuSTainaBiliTy leaDerS 2012As of December 31, 2011
reSulTS aT SeCTor levelTotal Score
0%
Average Score*
* Average score of all assessed companies in the sector
Best Score
25% 50% 75% 100%
SeCTor STaTiSTiCS
hiGhliGhTeD CriTeriaFurnishing
eConoMiC DiMenSion
– Brand Management
– Corporate Governance
– Customer Relationship Management
– Risk & Crisis Management
environMenTal DiMenSion
– Environmental Policy/Management System
– Environmental Reporting
– Product Stewardship
SoCial DiMenSion
– Human Capital Development
– Labor Practice Indicators
– Standards for Suppliers
– Talent Attraction & Retention
Company Country
SAM Gold Class Herman Miller Inc. */** United States
number of companiesin universe
4
number of companies assessedby SAM in 2011
3
Assessed companies to totalcompanies in universe (%)
75
Market capitalization of assessedcompanies to total market capitalization (%)
75
DimensionAverage Score *
Best Score
Weighting in Total Score
Economic 47% 69% 36%
Environmental 35% 77% 30%
Social 38% 57% 34%
* SAM Sector Leader** SAM Sector Mover

The Sustainability Yearbook 20127. Sector Insights
84
The gambling sector remains under intense scrutiny from the public and
regulators: Legal changes, barriers to entry and deregulation of markets as well
as compliance with anti-crime and money-laundering policies are key issues
that affect a company’s brand and license to operate. In addition, increased
competition from Internet-based platforms has added pressure to traditional
physical venues, which is compounded by a contraction in gambling-related
tourism and disposable incomes. An increasing focus on online platforms
and new markets to mitigate these demand shifts has raised concerns about
online security and control of under-age and compulsive gambling. Industry
leaders have profited from their proactive interaction with stakeholders and
their commitment to initiatives and policies that help to mitigate the negative
impact of gambling. In terms of environmental aspects, key challenges
include the bottom-line effects of energy costs and public attention to the
environmental impacts of infrastructure and operations.
DrivinG ForCeS
SuSTainaBiliTy leaDerS 2012As of December 31, 2011
reSulTS aT SeCTor levelTotal Score
0%
Average Score*
* Average score of all assessed companies in the sector
Best Score
25% 50% 75% 100%
SeCTor STaTiSTiCS
hiGhliGhTeD CriTeriaGambling
eConoMiC DiMenSion
– Anti-Crime Policy/Measures
– Brand Management
– Corporate Governance
– Risk & Crisis Management
environMenTal DiMenSion
– Environmental Reporting
– Environmental Policy/Management System
SoCial DiMenSion
– Human Capital Development
– Promoting Responsible Gaming
– Stakeholder Engagement
– Talent Attraction & Retention
Company Country
SAM Gold Class TABCorp Holdings Ltd. * Australia
SAM Silver Class Ladbrokes plc ** United Kingdom
International Game Technology United States
Kangwon Land Inc. South Korea
number of companiesin universe
20
number of companies assessedby SAM in 2011
12
Assessed companies to totalcompanies in universe (%)
60
Market capitalization of assessedcompanies to total market capitalization (%)
76
DimensionAverage Score *
Best Score
Weighting in Total Score
Economic 47% 89% 42%
Environmental 25% 60% 15%
Social 41% 81% 43%
* SAM Sector Leader** SAM Sector Mover

The Sustainability Yearbook 20127. Sector Insights
85
Key trends affecting gas utilities include the liberalization of gas markets,
increasing demand for natural gas in electricity generation, as well as
higher demand for transportation capacity driven in part by the expansion
of unconventional gas production. natural gas is the least carbon-intensive
fossil fuel and is therefore regarded as an effective option to replace coal
as a base- and mid-load fuel and to reduce CO2 emissions, depending on
fuel and carbon dioxide prices. After Fukushima and with the development of
unconventional resources, gas-fired power generation is expected to increase
dramatically, especially in emerging countries like China. Changes in gas
markets, combined with the effects of the Kyoto Protocol, are encouraging gas
companies to enhance both supply-side and demand-side energy efficiency.
The surge in gas demand and increased reliance on remote deposits also open
up new prospects for transportation infrastructure. However, gas utilities
remain exposed to intense competition, price volatility, potential opposition to
large infrastructure projects, failure of distribution networks, and liabilities of
former gas manufacturing sites.
DrivinG ForCeS
SuSTainaBiliTy leaDerS 2012As of December 31, 2011
reSulTS aT SeCTor levelTotal Score
0%
Average Score*
* Average score of all assessed companies in the sector
Best Score
25% 50% 75% 100%
SeCTor STaTiSTiCS
hiGhliGhTeD CriTeriaGas Distribution
eConoMiC DiMenSion
– Corporate Governance
– Customer Relationship Management
– Market Opportunities
– Price Risk Management
environMenTal DiMenSion
– Biodiversity
– Climate Strategy
– Environmental Reporting
– Transmission & Distribution
SoCial DiMenSion
– Human Capital Development
– Occupational Health & Safety
– Stakeholder Engagement
– Talent Attraction & Retention
Company Country
SAM Gold Class Enagas S.A. */** Spain
SAM Silver Class Gas natural SDG S.A. Spain
SAM Bronze Class Snam Rete Gas S.p.A. Italy
Spectra Energy Corp. United States
number of companiesin universe
21
number of companies assessedby SAM in 2011
13
Assessed companies to totalcompanies in universe (%)
62
Market capitalization of assessedcompanies to total market capitalization (%)
80
DimensionAverage Score *
Best Score
Weighting in Total Score
Economic 64% 92% 40%
Environmental 54% 87% 28%
Social 63% 85% 32%
* SAM Sector Leader** SAM Sector Mover

The Sustainability Yearbook 20127. Sector Insights
86
The retail market is characterized by a continued shift toward multinational
conglomerates with global supply and distribution systems, efficient
inventory management and wide-scale marketing plans. Successful retailers
continuously analyze customer information and habits to detect buying
patterns and operate more responsive and efficient customer relationship
management. E-commerce, home delivery services and pick-up systems are
gaining importance among distribution channels. On an operational level,
companies need to address the efficiency of their distribution systems and
the use and disposal of packaging. Ethical sourcing has gained significance
among various stakeholders and consumers have shown a willingness to pay
a premium for companies that adopt healthy environmental practices. Within
this context, retailers have to establish long-term relationships with suppliers
and provide for enhanced transparency to minimize economic, social and
reputational risks.
DrivinG ForCeS
SuSTainaBiliTy leaDerS 2012As of December 31, 2011
reSulTS aT SeCTor levelTotal Score
0%
Average Score*
* Average score of all assessed companies in the sector
Best Score
25% 50% 75% 100%
SeCTor STaTiSTiCS
hiGhliGhTeD CriTeriaGeneral Retailers
eConoMiC DiMenSion
– Brand Management
– Corporate Governance
– Customer Relationship Management
– Risk & Crisis Management
environMenTal DiMenSion
– Environmental Policy/Management System
– Environmental Reporting
– Packaging
SoCial DiMenSion
– Human Capital Development
– Labor Practice Indicators
– Stakeholder Engagement
– Standards for Suppliers
Company Country
SAM Gold Class Lotte Shopping Co. Ltd. * South Korea
SAM Silver Class Industria de Diseno Textil S.A. Spain
Aeon Co. Ltd. Japan
Gap Inc. United States
Hennes & Mauritz AB ** Sweden
Home Retail Group plc United Kingdom
Kingfisher plc United Kingdom
Marks & Spencer Group plc United Kingdom
Office Depot Inc. United States
Seven & I Holdings Co. Ltd. Japan
Staples Inc. United States
Target Corp. United States
Wal-Mart de Mexico S.A.B. de C.v. Mexico
Wesfarmers Ltd. Australia
Woolworths Holdings Ltd. South Africa
number of companiesin universe
89
number of companies assessedby SAM in 2011
40
Assessed companies to totalcompanies in universe (%)
45
Market capitalization of assessedcompanies to total market capitalization (%)
81
DimensionAverage Score *
Best Score
Weighting in Total Score
Economic 49% 91% 42%
Environmental 44% 96% 24%
Social 50% 85% 34%
* SAM Sector Leader** SAM Sector Mover

The Sustainability Yearbook 20127. Sector Insights
87
The healthcare sector includes health insurers as well as companies providing
healthcare services or products, such as hospitals or consumer goods
producers. Aging populations, unhealthy lifestyles in industrialized countries
and largely unmet medical needs in developing countries are key trends
affecting this sector. The fact that they result in higher use of healthcare
services makes them key economic drivers. However, exploding healthcare
costs and the growing divide in healthcare services among population groups
or entire nations present major societal challenges that are being tackled
through healthcare reform programs around the world. Leading companies
take an active role in searching for solutions and building effective, sustainable
healthcare systems by engaging with all the relevant stakeholder groups. The
focus is on preventive medicine and services, better compliance, continuous
improvement in customer-oriented services and strategic alliances across
traditional business boundaries.
DrivinG ForCeS
SuSTainaBiliTy leaDerS 2012As of December 31, 2011
reSulTS aT SeCTor levelTotal Score
0%
Average Score*
* Average score of all assessed companies in the sector
Best Score
25% 50% 75% 100%
SeCTor STaTiSTiCS
hiGhliGhTeD CriTeriaHealthcare Providers
eConoMiC DiMenSion
– Risk & Crisis Management
– Brand Management
– Corporate Governance
– Customer Relationship Management
environMenTal DiMenSion
– Climate Strategy
– Environmental Policy/Management System
– Environmental Reporting
SoCial DiMenSion
– Human Capital Development
– Labor Practice Indicators
– Standards for Suppliers
– Talent Attraction & Retention
Company Country
SAM Gold Class UnitedHealth Group Inc. */** United States
Fresenius Medical Care AG & Co. KGaA Germany
Humana Inc. United States
Quest Diagnostics Inc. United States
number of companiesin universe
28
number of companies assessedby SAM in 2011
14
Assessed companies to totalcompanies in universe (%)
50
Market capitalization of assessedcompanies to total market capitalization (%)
83
DimensionAverage Score *
Best Score
Weighting in Total Score
Economic 53% 75% 35%
Environmental 25% 65% 12%
Social 38% 69% 53%
* SAM Sector Leader** SAM Sector Mover

The Sustainability Yearbook 20127. Sector Insights
88
The heavy construction sector includes companies engaged in the construction
of commercial and residential buildings and infrastructure, as well as providers
of services to construction companies. Companies are increasingly challenged
by issues in such areas as operational health safety, energy efficiency
and the responsible use of resources. Because the construction industry
consumes massive amounts of resources to create the infrastructure and built
environment, resource efficiency is not only limited to compliance with legal
requirements, but also includes the active promotion of measures to reduce
resource depletion. In a resource-constrained world, the establishment of a
reputation as a resource-conscious construction services provider will be a
source of competitive advantage. Whether a company can establish itself as
a preferred contractor in future activities and projects also depends on its
ability to handle and avoid antitrust and bribery cases. This means that the
establishment and implementation of rigorous codes of conduct will be a key
success factor.
DrivinG ForCeS
SuSTainaBiliTy leaDerS 2012As of December 31, 2011
reSulTS aT SeCTor levelTotal Score
0%
Average Score*
* Average score of all assessed companies in the sector
Best Score
25% 50% 75% 100%
SeCTor STaTiSTiCS
hiGhliGhTeD CriTeriaHeavy Construction
eConoMiC DiMenSion
– Corporate Governance
– non-financial Project Evaluation
– Risk & Crisis Management
– Codes of Conduct/Compliance/ Corruption & Bribery
environMenTal DiMenSion
– Building Materials
– Water Related Risks
– Resource Conservation & Resource Efficiency
– Transport & Logistics
SoCial DiMenSion
– Human Capital Development
– Labor Practice Indicators
– Occupational Health & Safety
– Talent Attraction & Retention
Company Country
SAM Gold Class Hyundai Engineering & Construction Co., Ltd. * South Korea
SAM Silver Class GS Engineering & Construction Corp. South Korea
SAM Bronze Class Acciona S.A. Spain
Fomento de Construcciones y Contratas S.A. Spain
ACS Actividades de Construccion y Servicios S.A. ** Spain
Daelim Industrial Co. Ltd. South Korea
Ferrovial S.A. Spain
Hochtief AG Germany
number of companiesin universe
52
number of companies assessedby SAM in 2011
29
Assessed companies to totalcompanies in universe (%)
56
Market capitalization of assessedcompanies to total market capitalization (%)
72
DimensionAverage Score *
Best Score
Weighting in Total Score
Economic 66% 93% 23%
Environmental 54% 92% 38%
Social 53% 88% 39%
* SAM Sector Leader** SAM Sector Mover

The Sustainability Yearbook 20127. Sector Insights
89
Growth in the home construction sector is strongly tied to general economic
conditions. The prolonged downturn in the financial markets has impacted
conditions for access to capital and slowed the pace for new developments in
several regions of the globe. In addition, price pressures and tighter regulations
remain constant challenges for the sector. Companies have to ensure that
construction processes are run efficiently and in an environmentally friendly
manner. This includes avoiding the use of harmful substances and increasing
the recycling of generated waste. Companies that respond well to new
technology developments such as low-energy, passive and plus-energy
buildings are likely to remain at the forefront of this industry following
increasing legislative pressure in the energy efficiency area. Commuting time,
local amenities, green space, and energy conservation are all topics that
need to be addressed in the early planning stages of property development.
Occupational health & safety risks are high, requiring strict management
practices to reduce the injury rate among employees and external contractors.
DrivinG ForCeS
SuSTainaBiliTy leaDerS 2012As of December 31, 2011
reSulTS aT SeCTor levelTotal Score
0%
Average Score*
* Average score of all assessed companies in the sector
Best Score
25% 50% 75% 100%
SeCTor STaTiSTiCS
hiGhliGhTeD CriTeriaHome Construction
eConoMiC DiMenSion
– Codes of Conduct/Compliance/ Corruption & Bribery
– Corporate Governance
– Risk & Crisis Management
environMenTal DiMenSion
– Building Materials
– Environmental Reporting
– Environmental Policy/Management System
– Resource Conservation & Resource Efficiency
SoCial DiMenSion
– Human Capital Development
– Occupational Health & Safety
– Standards for Suppliers
– Talent Attraction & Retention
Company Country
SAM Gold Class Sekisui Chemical Co. Ltd. */** Japan
SAM Silver Class Sumitomo Forestry Co. Ltd. Japan
number of companiesin universe
13
number of companies assessedby SAM in 2011
9
Assessed companies to totalcompanies in universe (%)
69
Market capitalization of assessedcompanies to total market capitalization (%)
74
DimensionAverage Score *
Best Score
Weighting in Total Score
Economic 60% 69% 18%
Environmental 49% 82% 37%
Social 33% 61% 45%
* SAM Sector Leader** SAM Sector Mover

The Sustainability Yearbook 20127. Sector Insights
90
The key sustainability factors for the hotels, restaurants, bars & recreational
services sector are linked to its employees, who drive the business and are
the face of a company toward its customers. This makes it indispensable for
companies to employ progressive human resource policies that include talent
attraction and retention, human capital development, occupational health &
safety, and group-wide ethical principles that cover the entire supply chain.
Although environmental factors such as water and energy consumption play
an important role, they are not considered to be the sector’s key value drivers.
Restaurant chains in particular need to advocate a balanced lifestyle, educate
consumers and raise awareness of health risks associated with unbalanced diets.
DrivinG ForCeS
SuSTainaBiliTy leaDerS 2012As of December 31, 2011
reSulTS aT SeCTor levelTotal Score
0%
Average Score*
* Average score of all assessed companies in the sector
Best Score
25% 50% 75% 100%
SeCTor STaTiSTiCS
hiGhliGhTeD CriTeriaHotels, Restaurants, Bars & Recreational Services
eConoMiC DiMenSion
– Brand Management
– Corporate Governance
– Food Safety
– Risk & Crisis Management
environMenTal DiMenSion
– Environmental Policy/Management System
– Environmental Reporting
SoCial DiMenSion
– Human Capital Development
– Stakeholder Engagement
– Standards for Suppliers
– Talent Attraction & Retention
Company Country
SAM Gold Class Sodexo S.A. * France
SAM Silver Class Accor S.A. France
Compass Group plc ** United Kingdom
SAM Bronze Class McDonald’s Corp. United States
number of companiesin universe
27
number of companies assessedby SAM in 2011
14
Assessed companies to totalcompanies in universe (%)
52
Market capitalization of assessedcompanies to total market capitalization (%)
77
DimensionAverage Score *
Best Score
Weighting in Total Score
Economic 64% 88% 32%
Environmental 37% 73% 18%
Social 49% 82% 50%
* SAM Sector Leader** SAM Sector Mover

The Sustainability Yearbook 20127. Sector Insights
91
The main challenges and opportunities in the industrial equipment sector are
associated with the use of products. Key issues include energy efficiency, safe-
ty, clean internal combustion and lean disposal options. Leading companies
are increasingly focusing on product innovations and use life cycle analysis
during product development to capitalize on customers’ potential savings in
equipment life cycle costs. Preparing for customers’ present and future carbon
constraints is an important aspect of product development. The focus on ef-
ficiency improvements for customers is becoming a potential advantage for
companies selling into more resource-constrained markets, particularly in the
emerging markets. Lengthening supply chains in emerging markets increase
companies’ potential exposure to human rights abuses and occupational
health & safety issues. Sector leaders manage these risks as an integral com-
ponent of their supply chain management.
DrivinG ForCeS
SuSTainaBiliTy leaDerS 2012As of December 31, 2011
reSulTS aT SeCTor levelTotal Score
0%
Average Score*
* Average score of all assessed companies in the sector
Best Score
25% 50% 75% 100%
SeCTor STaTiSTiCS
hiGhliGhTeD CriTeriaIndustrial Engineering
eConoMiC DiMenSion
– Corporate Governance
– Customer Relationship Management
– Innovation Management
– Risk & Crisis Management
environMenTal DiMenSion
– Climate Strategy
– Product Stewardship
– Environmental Policy/Management System
– Water Related Risks
SoCial DiMenSion
– Human Capital Development
– Labor Practice Indicators
– Occupational Health & Safety
– Standards for Suppliers
Company Country
SAM Gold Class Fiat Industrial S.p.A. * Italy
SAM Bronze Class Alstom S.A. France
Atlas Copco AB Sweden
volvo AB Sweden
ABB Ltd. Switzerland
Caterpillar Inc. United States
Cummins Inc. United States
Daikin Industries Ltd. Japan
IMI plc United Kingdom
Ingersoll-Rand plc United States
Komatsu Ltd. Japan
Mahindra & Mahindra Ltd. India
MAn SE ** Germany
Metso Corp. Finland
Samsung Heavy Industries Co. Ltd. South Korea
Sandvik AB Sweden
SKF AB Sweden
STX Engine Co. Ltd. South Korea
Sulzer AG Switzerland
number of companiesin universe
117
number of companies assessedby SAM in 2011
54
Assessed companies to totalcompanies in universe (%)
46
Market capitalization of assessedcompanies to total market capitalization (%)
77
DimensionAverage Score *
Best Score
Weighting in Total Score
Economic 55% 87% 30%
Environmental 46% 81% 33%
Social 48% 86% 37%
* SAM Sector Leader** SAM Sector Mover
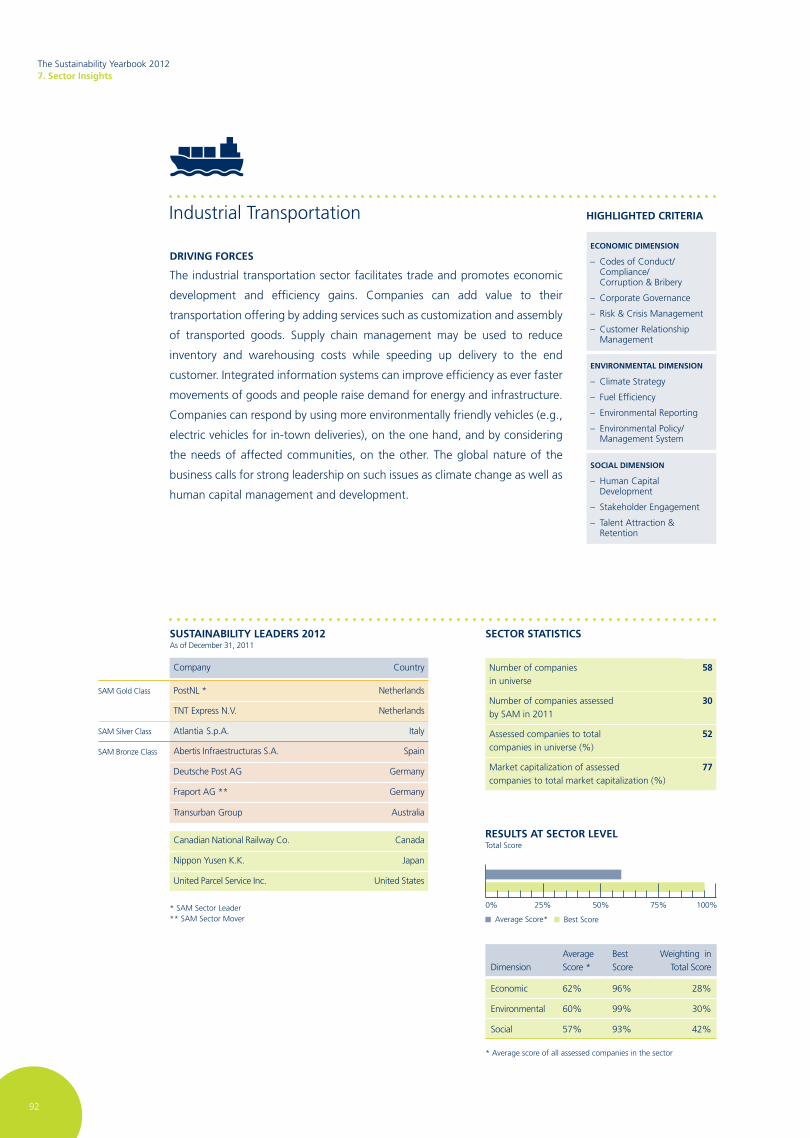
The Sustainability Yearbook 20127. Sector Insights
92
The industrial transportation sector facilitates trade and promotes economic
development and efficiency gains. Companies can add value to their
transportation offering by adding services such as customization and assembly
of transported goods. Supply chain management may be used to reduce
inventory and warehousing costs while speeding up delivery to the end
customer. Integrated information systems can improve efficiency as ever faster
movements of goods and people raise demand for energy and infrastructure.
Companies can respond by using more environmentally friendly vehicles (e.g.,
electric vehicles for in-town deliveries), on the one hand, and by considering
the needs of affected communities, on the other. The global nature of the
business calls for strong leadership on such issues as climate change as well as
human capital management and development.
DrivinG ForCeS
SuSTainaBiliTy leaDerS 2012As of December 31, 2011
reSulTS aT SeCTor levelTotal Score
0%
Average Score*
* Average score of all assessed companies in the sector
Best Score
25% 50% 75% 100%
SeCTor STaTiSTiCS
hiGhliGhTeD CriTeriaIndustrial Transportation
eConoMiC DiMenSion
– Codes of Conduct/Compliance/ Corruption & Bribery
– Corporate Governance
– Risk & Crisis Management
– Customer Relationship Management
environMenTal DiMenSion
– Climate Strategy
– Fuel Efficiency
– Environmental Reporting
– Environmental Policy/Management System
SoCial DiMenSion
– Human Capital Development
– Stakeholder Engagement
– Talent Attraction & Retention
Company Country
SAM Gold Class PostnL * netherlands
TnT Express n.v. netherlands
SAM Silver Class Atlantia S.p.A. Italy
SAM Bronze Class Abertis Infraestructuras S.A. Spain
Deutsche Post AG Germany
Fraport AG ** Germany
Transurban Group Australia
Canadian national Railway Co. Canada
nippon Yusen K.K. Japan
United Parcel Service Inc. United States
number of companiesin universe
58
number of companies assessedby SAM in 2011
30
Assessed companies to totalcompanies in universe (%)
52
Market capitalization of assessedcompanies to total market capitalization (%)
77
DimensionAverage Score *
Best Score
Weighting in Total Score
Economic 62% 96% 28%
Environmental 60% 99% 30%
Social 57% 93% 42%
* SAM Sector Leader** SAM Sector Mover
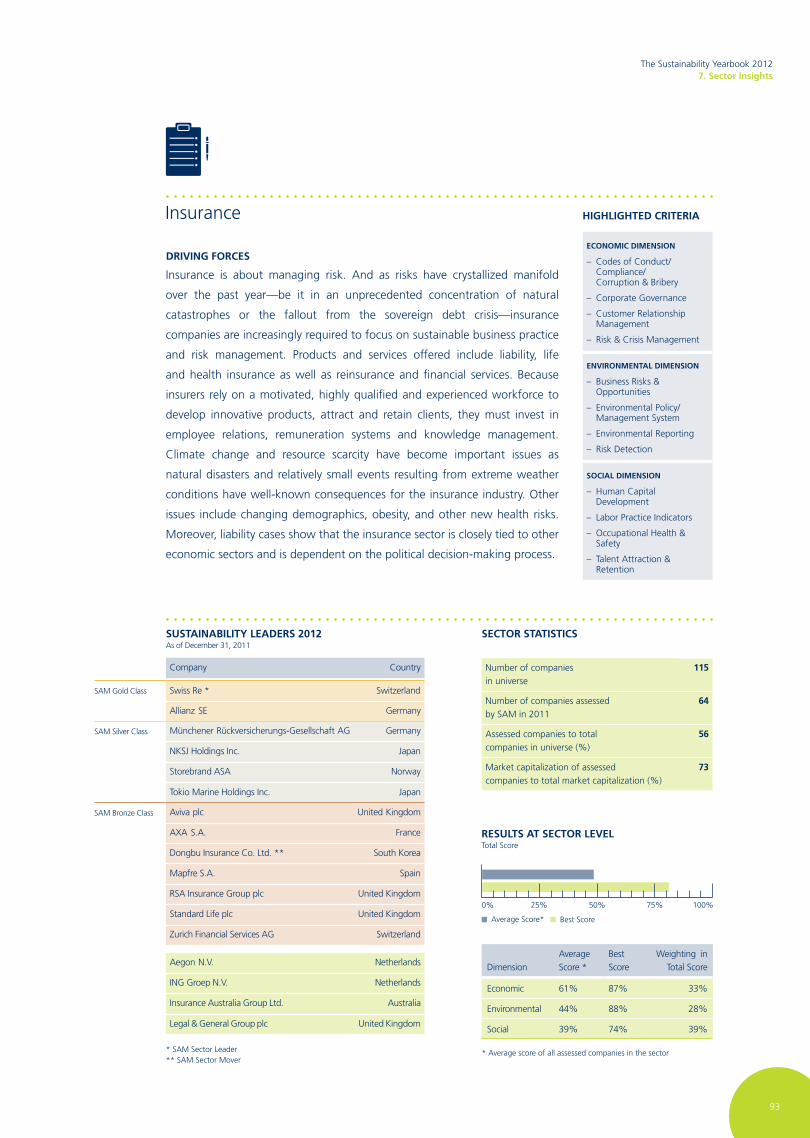
The Sustainability Yearbook 20127. Sector Insights
93
Insurance is about managing risk. And as risks have crystallized manifold
over the past year—be it in an unprecedented concentration of natural
catastrophes or the fallout from the sovereign debt crisis—insurance
companies are increasingly required to focus on sustainable business practice
and risk management. Products and services offered include liability, life
and health insurance as well as reinsurance and financial services. Because
insurers rely on a motivated, highly qualified and experienced workforce to
develop innovative products, attract and retain clients, they must invest in
employee relations, remuneration systems and knowledge management.
Climate change and resource scarcity have become important issues as
natural disasters and relatively small events resulting from extreme weather
conditions have well-known consequences for the insurance industry. Other
issues include changing demographics, obesity, and other new health risks.
Moreover, liability cases show that the insurance sector is closely tied to other
economic sectors and is dependent on the political decision-making process.
DrivinG ForCeS
SuSTainaBiliTy leaDerS 2012As of December 31, 2011
reSulTS aT SeCTor levelTotal Score
0%
Average Score*
* Average score of all assessed companies in the sector
Best Score
25% 50% 75% 100%
SeCTor STaTiSTiCS
hiGhliGhTeD CriTeriaInsurance
eConoMiC DiMenSion
– Codes of Conduct/Compliance/ Corruption & Bribery
– Corporate Governance
– Customer Relationship Management
– Risk & Crisis Management
environMenTal DiMenSion
– Business Risks & Opportunities
– Environmental Policy/Management System
– Environmental Reporting
– Risk Detection
SoCial DiMenSion
– Human Capital Development
– Labor Practice Indicators
– Occupational Health & Safety
– Talent Attraction & Retention
Company Country
SAM Gold Class Swiss Re * Switzerland
Allianz SE Germany
SAM Silver Class Münchener Rückversicherungs-Gesellschaft AG Germany
nKSJ Holdings Inc. Japan
Storebrand ASA norway
Tokio Marine Holdings Inc. Japan
SAM Bronze Class Aviva plc United Kingdom
AXA S.A. France
Dongbu Insurance Co. Ltd. ** South Korea
Mapfre S.A. Spain
RSA Insurance Group plc United Kingdom
Standard Life plc United Kingdom
Zurich Financial Services AG Switzerland
Aegon n.v. netherlands
InG Groep n.v. netherlands
Insurance Australia Group Ltd. Australia
Legal & General Group plc United Kingdom
number of companiesin universe
115
number of companies assessedby SAM in 2011
64
Assessed companies to totalcompanies in universe (%)
56
Market capitalization of assessedcompanies to total market capitalization (%)
73
DimensionAverage Score *
Best Score
Weighting in Total Score
Economic 61% 87% 33%
Environmental 44% 88% 28%
Social 39% 74% 39%
* SAM Sector Leader** SAM Sector Mover

The Sustainability Yearbook 20127. Sector Insights
94
This sector’s key drivers include product differentiation, quality, time-to-market,
and brand management. As a result, companies must focus on innovation and
R&D to maintain their competitiveness in the fast-changing electronics and
entertainment markets, where new products tend to become commoditized
after a certain time on the market. new technologies and the need to provide
ever-changing and more integrated product ranges are challenges that leading
companies are managing through strategic alliances and outsourcing of
operations. Excellent supply chain management that integrates environmental
and social aspects is increasingly important to minimize economic, social and
reputational risks. In this sense, companies must pay increasing attention to
working conditions, particularly with regard to suppliers and subcontractors in
developing countries. Environmental challenges arise throughout the product
life span, requiring life cycle analysis, product modularity, the avoidance of
toxic substances in both manufacturing processes and products, and effective
take-back programs for the disposal of obsolete products.
DrivinG ForCeS
SuSTainaBiliTy leaDerS 2012As of December 31, 2011
reSulTS aT SeCTor levelTotal Score
0%
Average Score*
* Average score of all assessed companies in the sector
Best Score
25% 50% 75% 100%
SeCTor STaTiSTiCS
hiGhliGhTeD CriTeriaLeisure Goods
eConoMiC DiMenSion
– Brand Management
– Corporate Governance
– Customer Relationship Management
– Risk & Crisis Management
environMenTal DiMenSion
– Climate Strategy
– Hazardous Substances
– Environmental Policy/Management System
– Product Stewardship
SoCial DiMenSion
– Human Capital Development
– Labor Practice Indicators
– Standards for Suppliers
– Talent Attraction & Retention
Company Country
SAM Gold Class Philips Electronics n.v. * netherlands
Panasonic Corp. Japan
SAM Bronze Class LG Electronics Inc. ** South Korea
Konica Minolta Holdings Inc. Japan
number of companiesin universe
26
number of companies assessedby SAM in 2011
15
Assessed companies to totalcompanies in universe (%)
58
Market capitalization of assessedcompanies to total market capitalization (%)
85
DimensionAverage Score *
Best Score
Weighting in Total Score
Economic 56% 90% 37%
Environmental 53% 92% 29%
Social 59% 88% 34%
* SAM Sector Leader** SAM Sector Mover

The Sustainability Yearbook 20127. Sector Insights
95
The heterogeneous and competitive publishing sector is becoming
increasingly dependent on emerging technologies as a key growth driver;
the digitization and electronic presentation of content is more important
than ever. new technologies, coupled with innovative thinking, content and
channel management are important factors in tapping new markets and
creating new opportunities. Companies that consistently invest in retaining a
talented, creative and motivated workforce while producing and continuously
replenishing unique, valuable publishing content have led the sector. Rising
literacy levels in the developing world offer the media industry a huge market
and strong growth potential over the coming years. Social aspects such as
non-discrimination of the workforce and cultural sensitivity toward clients and
communities remain at the center of public attention and scrutiny. Given the
media companies’ power to shape public opinion, accountability, transparency
and ethical advertising approaches are also important factors.
DrivinG ForCeS
SuSTainaBiliTy leaDerS 2012As of December 31, 2011
reSulTS aT SeCTor levelTotal Score
0%
Average Score*
* Average score of all assessed companies in the sector
Best Score
25% 50% 75% 100%
SeCTor STaTiSTiCS
hiGhliGhTeD CriTeriaMedia
eConoMiC DiMenSion
– Corporate Governance
– Customer Relationship Management
– Lobbying Activities
– Risk & Crisis Management
environMenTal DiMenSion
– Environmental Policy/Management System
– Environmental Reporting
– Hazardous Substances
SoCial DiMenSion
– Code of Ethics for Advertising
– Human Capital Development
– Labor Practice Indicators
– Talent Attraction & Retention
Company Country
SAM Gold Class Pearson plc * United Kingdom
SAM Bronze Class Reed Elsevier n.v. netherlands
Telenet Group Holding n.v. ** Belgium
Wolters Kluwer n.v. netherlands
British Sky Broadcasting Group plc United Kingdom
Dai nippon Printing Co. Ltd. Japan
ITv plc United Kingdom
JCDecaux S.A. France
McGraw-Hill Companies United States
Television Francaise 1 S.A. France
Walt Disney Co. United States
WPP plc United Kingdom
number of companiesin universe
73
number of companies assessedby SAM in 2011
42
Assessed companies to totalcompanies in universe (%)
58
Market capitalization of assessedcompanies to total market capitalization (%)
83
DimensionAverage Score *
Best Score
Weighting in Total Score
Economic 51% 83% 38%
Environmental 35% 94% 14%
Social 44% 83% 48%
* SAM Sector Leader** SAM Sector Mover

The Sustainability Yearbook 20127. Sector Insights
96
The medical equipment and service industry plays a critical role in improving
the quality of life for patients with chronic diseases and enabling disabled
individuals to lead a less restricted life by facilitating the detection and
effective treatment of chronic conditions. Product/service quality and safety
management as well as close relationships with different stakeholders, such
as prescribers, payers and patients are essential to gaining customers’ trust
and ensuring successful product development. The sector will be affected by
healthcare reform programs that will have an impact on reimbursement and
pricing. On the other hand, moves to broaden healthcare coverage in emerging
markets create new growth opportunities for this industry. Sustainable
companies will have to adopt consistent, value– and stakeholder–oriented
corporate strategies and governance systems based on effective human and
intellectual capital management and a transparent reporting framework.
DrivinG ForCeS
SuSTainaBiliTy leaDerS 2012As of December 31, 2011
reSulTS aT SeCTor levelTotal Score
0%
Average Score*
* Average score of all assessed companies in the sector
Best Score
25% 50% 75% 100%
SeCTor STaTiSTiCS
hiGhliGhTeD CriTeriaMedical Products
eConoMiC DiMenSion
– Customer Relationship Management
– Marketing Practices
– Research & Development
– Corporate Governance
environMenTal DiMenSion
– Climate Strategy
– Environmental Policy/Management System
– Environmental Reporting
SoCial DiMenSion
– Human Capital Development
– Labor Practice Indicators
– Occupational Health & Safety
– Talent Attraction & Retention
Company Country
SAM Gold Class Baxter International Inc. * United States
Becton Dickinson & Co. United States
Coloplast A/S Denmark
Elekta AB ** Sweden
Medtronic Inc. United States
Smith & nephew plc United Kingdom
number of companiesin universe
43
number of companies assessedby SAM in 2011
23
Assessed companies to totalcompanies in universe (%)
53
Market capitalization of assessedcompanies to total market capitalization (%)
80
DimensionAverage Score *
Best Score
Weighting in Total Score
Economic 56% 81% 40%
Environmental 39% 89% 10%
Social 37% 69% 50%
* SAM Sector Leader** SAM Sector Mover

The Sustainability Yearbook 20127. Sector Insights
97
The main sustainability issue facing the mining industry is that of declining ore
grades which implies that, over time, more mineral ore needs to be extracted
and processed in order to produce the same amount of metal. This is likely
to exacerbate many of the environmental and social issues facing the mining
& metals industry going forward. Prominent environmental issues include
mineral waste management as well as the management of key inputs such as
energy and water. Social issues mainly center on occupational health & safety
as well as general labor conditions. Issues such as land rights, population
relocations, use of private security forces to protect mining assets, and mine
closures also remain controversial. Finally, and similarly to other extractive
industries, the mining space is particularly susceptible to corruption, bribery,
and other breaches of codes of conduct.
DrivinG ForCeS
SuSTainaBiliTy leaDerS 2012As of December 31, 2011
reSulTS aT SeCTor levelTotal Score
0%
Average Score*
* Average score of all assessed companies in the sector
Best Score
25% 50% 75% 100%
SeCTor STaTiSTiCS
hiGhliGhTeD CriTeriaMining
eConoMiC DiMenSion
– Codes of Conduct/Compliance/ Corruption & Bribery
– Corporate Governance
– Risk & Crisis Management
– Transparency
environMenTal DiMenSion
– Biodiversity
– Climate Strategy
– Environmental Reporting
– Mineral Waste Management
SoCial DiMenSion
– Human Capital Development
– Occupational Health & Safety
– Stakeholder Engagement
– Standards for Suppliers
Company Country
SAM Gold Class Xstrata plc * United Kingdom
newmont Mining Corp. United States
SAM Silver Class Anglo American plc United Kingdom
Gold Fields Ltd. South Africa
SAM Bronze Class Barrick Gold Corp. Canada
BHP Billiton Group United Kingdom
Rio Tinto Group Australia
Teck Resources Ltd. Canada
Agnico-Eagle Mines Ltd. Canada
Anglo American Platinum Ltd. South Africa
AngloGold Ashanti Ltd. South Africa
Eramet S.A. France
Freeport-McMoRan Copper & Gold Inc. United States
Fresnillo plc United Kingdom
HudBay Minerals Inc. Canada
Kinross Gold Corp. ** Canada
Lonmin plc United Kingdom
number of companiesin universe
108
number of companies assessedby SAM in 2011
41
Assessed companies to totalcompanies in universe (%)
38
Market capitalization of assessedcompanies to total market capitalization (%)
68
DimensionAverage Score *
Best Score
Weighting in Total Score
Economic 58% 92% 23%
Environmental 40% 81% 30%
Social 48% 86% 47%
* SAM Sector Leader** SAM Sector Mover

The Sustainability Yearbook 20127. Sector Insights
98
The mobile communications sector has capitalized on the growth path paved
by increasing mobile penetration and substantial technological advances in
wireless computing. Customer-driven price pressure is becoming an increasing
challenge. Key success factors include innovation, operational excellence,
coherent service portfolios as well as a well-defined brand strategy capable of
creating a competitive edge in a fast-moving market environment. Growing
traffic must be reflected in network and capacity management strategies.
Companies must proactively address potentially adverse health implications of
electromagnetic fields resulting from wireless products. The ability to provide
customized services based on stable multi-purpose equipment is emerging as
a key differentiator. Efforts to bridge the digital divide have to be sustained by
seizing investment opportunities in emerging countries.
DrivinG ForCeS
SuSTainaBiliTy leaDerS 2012As of December 31, 2011
reSulTS aT SeCTor levelTotal Score
0%
Average Score*
* Average score of all assessed companies in the sector
Best Score
25% 50% 75% 100%
SeCTor STaTiSTiCS
hiGhliGhTeD CriTeriaMobile Telecommunications
eConoMiC DiMenSion
– Corporate Governance
– Customer Relationship Management
– Privacy Protection
– Risk & Crisis Management
environMenTal DiMenSion
– Climate Strategy
– Electromagnetic Fields
– Environmental Reporting
– Environmental Policy/Management System
SoCial DiMenSion
– Digital Inclusion
– Human Capital Development
– Labor Practice Indicators
– Talent Attraction & Retention
Company Country
SAM Gold Class SK Telecom Co., Ltd. */** South Korea
SAM Bronze Class Deutsche Telekom AG Germany
China Mobile Ltd. China
Telenor ASA norway
TeliaSonera AB Sweden
vodafone Group plc United Kingdom
number of companiesin universe
40
number of companies assessedby SAM in 2011
22
Assessed companies to totalcompanies in universe (%)
55
Market capitalization of assessedcompanies to total market capitalization (%)
89
DimensionAverage Score *
Best Score
Weighting in Total Score
Economic 56% 88% 42%
Environmental 32% 91% 18%
Social 45% 85% 40%
* SAM Sector Leader** SAM Sector Mover
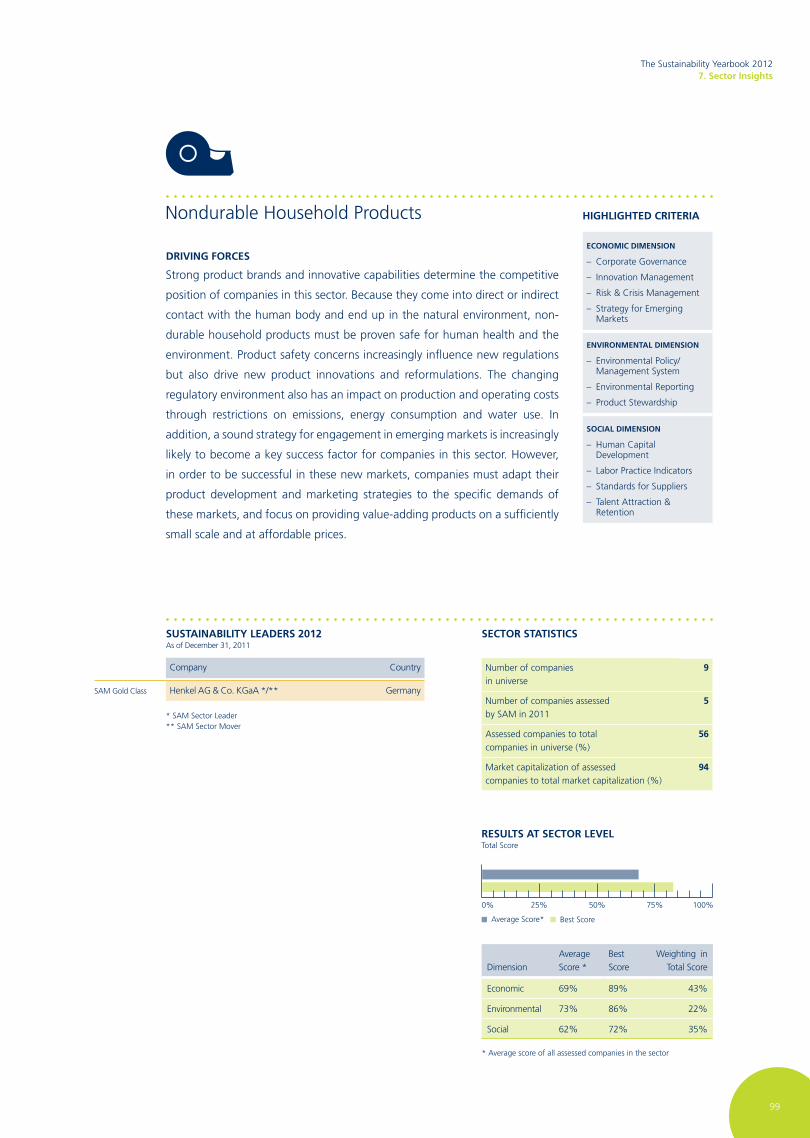
The Sustainability Yearbook 20127. Sector Insights
99
Strong product brands and innovative capabilities determine the competitive
position of companies in this sector. Because they come into direct or indirect
contact with the human body and end up in the natural environment, non-
durable household products must be proven safe for human health and the
environment. Product safety concerns increasingly influence new regulations
but also drive new product innovations and reformulations. The changing
regulatory environment also has an impact on production and operating costs
through restrictions on emissions, energy consumption and water use. In
addition, a sound strategy for engagement in emerging markets is increasingly
likely to become a key success factor for companies in this sector. However,
in order to be successful in these new markets, companies must adapt their
product development and marketing strategies to the specific demands of
these markets, and focus on providing value-adding products on a sufficiently
small scale and at affordable prices.
DrivinG ForCeS
SuSTainaBiliTy leaDerS 2012As of December 31, 2011
reSulTS aT SeCTor levelTotal Score
0%
Average Score*
* Average score of all assessed companies in the sector
Best Score
25% 50% 75% 100%
SeCTor STaTiSTiCS
hiGhliGhTeD CriTerianondurable Household Products
eConoMiC DiMenSion
– Corporate Governance
– Innovation Management
– Risk & Crisis Management
– Strategy for Emerging Markets
environMenTal DiMenSion
– Environmental Policy/Management System
– Environmental Reporting
– Product Stewardship
SoCial DiMenSion
– Human Capital Development
– Labor Practice Indicators
– Standards for Suppliers
– Talent Attraction & Retention
Company Country
SAM Gold Class Henkel AG & Co. KGaA */** Germany
number of companiesin universe
9
number of companies assessedby SAM in 2011
5
Assessed companies to totalcompanies in universe (%)
56
Market capitalization of assessedcompanies to total market capitalization (%)
94
DimensionAverage Score *
Best Score
Weighting in Total Score
Economic 69% 89% 43%
Environmental 73% 86% 22%
Social 62% 72% 35%
* SAM Sector Leader** SAM Sector Mover

The Sustainability Yearbook 20127. Sector Insights
100
As subcontractors to the oil and gas majors, drilling companies must adhere
to the strictest environmental, health & safety (EHS) standards in order to
win contracts. Given the concerns over reputational risk in the exploration
and production sector, drilling companies are by default safeguarding the
brand of the majors. As a result, EHS excellence and responsible management
of social and political issues in often highly sensitive areas represent critical
success factors. Technological innovation is driving the profitability of drilling
companies as advanced seismic and deep-water technologies become the
new frontier in oil exploration against the backdrop of increasingly smaller
and less accessible oil fields. The oil and gas sector continues to be challenged
on the human resources front, with an aging workforce, strong competition
for highly skilled experts, and an insufficient number of newly trained and
qualified graduates in oil-related fields. The boom-and-bust patterns that have
characterized the sector in the past have prompted many trained engineers to
leave the sector. As a result, a shortage of engineers is a real challenge today.
DrivinG ForCeS
SuSTainaBiliTy leaDerS 2012As of December 31, 2011
reSulTS aT SeCTor levelTotal Score
0%
Average Score*
* Average score of all assessed companies in the sector
Best Score
25% 50% 75% 100%
SeCTor STaTiSTiCS
hiGhliGhTeD CriTeriaOil Equipment & Services
eConoMiC DiMenSion
– Corporate Governance
– Customer Relationship Management
– Risk & Crisis Management
– Codes of Conduct/Compliance/ Corruption & Bribery
environMenTal DiMenSion
– Releases to the Environment
– Environmental Policy/Management System
– Environmental Reporting
SoCial DiMenSion
– Human Capital Development
– Labor Practice Indicators
– Occupational Health & Safety
– Talent Attraction & Retention
Company Country
SAM Gold Class AMEC plc * United Kingdom
SAM Bronze Class Technip S.A. ** France
CGG veritas France
Halliburton Co. United States
Saipem S.p.A. Italy
SBM Offshore n.v. netherlands
Schlumberger Ltd. United States
SembCorp Industries Ltd. Singapore
number of companiesin universe
49
number of companies assessedby SAM in 2011
23
Assessed companies to totalcompanies in universe (%)
47
Market capitalization of assessedcompanies to total market capitalization (%)
81
DimensionAverage Score *
Best Score
Weighting in Total Score
Economic 62% 82% 25%
Environmental 21% 78% 24%
Social 33% 73% 51%
* SAM Sector Leader** SAM Sector Mover

The Sustainability Yearbook 20127. Sector Insights
101
The ability to sustain long-term value creation for oil and gas companies will
depend in particular on access to next-generation assets. Companies are
struggling with increasing exploration and development costs from smaller
reserves with complex geology in deeper waters, rising taxes outside low-
risk OECD regions, and mounting costs of oil services and manpower. As a
result, keeping down the cost base will be crucial for the industry. As the
environment becomes more diverse and the challenges more complex, oil
and gas companies are increasingly faced with a shortage of skilled workers.
In addition, as exploration moves to remote and environmentally sensitive
locations, environmental, health & safety excellence, coupled with progressive
management of social issues, will remain important aspects of energy
companies’ long-term profitability. As for environmental issues, the carbon
challenge continues to top the agenda. Active corporate strategies that seek
out related business opportunities and mitigate carbon risks will be a driving
force in securing companies’ future competitiveness.
DrivinG ForCeS
SuSTainaBiliTy leaDerS 2012As of December 31, 2011
SeCTor STaTiSTiCS
hiGhliGhTeD CriTeriaOil & Gas Producers
eConoMiC DiMenSion
– Corporate Governance
– Exploration & Production
– Gas Portfolio
– Risk & Crisis Management
environMenTal DiMenSion
– Biodiversity
– Climate Strategy
– Environmental Reporting
– Refining/Cleaner Fuels
SoCial DiMenSion
– Human Capital Development
– Labor Practice Indicators
– Social Impacts on Communities
– Talent Attraction & Retention
Company Country
SAM Gold Class Repsol YPF S.A. * Spain
SAM Silver Class Woodside Petroleum Ltd. Australia
SAM Bronze Class EnI S.p.A. Italy
Sasol Ltd. South Africa
S-Oil Corp. South Korea
Total S.A. France
BG Group plc United Kingdom
Cenovus Energy Inc. Canada
Ecopetrol S.A. Colombia
Galp Energia, SGPS, S.A. ** Portugal
MOL Group Hungary
neste Oil Oyj Finland
nexen Inc. Canada
Petroleo Brasileiro S/A Brazil
PTT PCL Thailand
Santos Ltd. Australia
Statoil ASA norway
Suncor Energy Inc. Canada
number of companiesin universe
118
number of companies assessedby SAM in 2011
64
Assessed companies to totalcompanies in universe (%)
54
Market capitalization of assessedcompanies to total market capitalization (%)
86
reSulTS aT SeCTor levelTotal Score
0%
Average Score*
* Average score of all assessed companies in the sector
Best Score
25% 50% 75% 100%
DimensionAverage Score *
Best Score
Weighting in Total Score
Economic 60% 86% 39%
Environmental 41% 90% 27%
Social 48% 88% 34%
* SAM Sector Leader** SAM Sector Mover
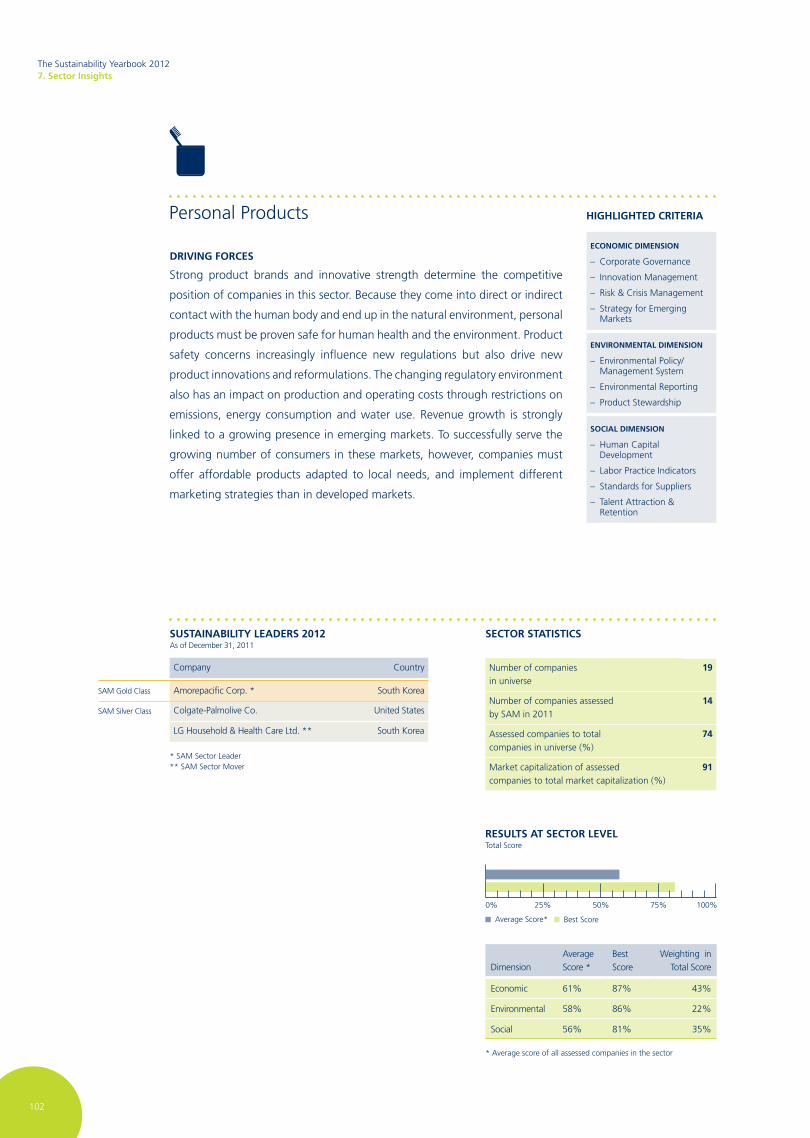
The Sustainability Yearbook 20127. Sector Insights
102
Strong product brands and innovative strength determine the competitive
position of companies in this sector. Because they come into direct or indirect
contact with the human body and end up in the natural environment, personal
products must be proven safe for human health and the environment. Product
safety concerns increasingly influence new regulations but also drive new
product innovations and reformulations. The changing regulatory environment
also has an impact on production and operating costs through restrictions on
emissions, energy consumption and water use. Revenue growth is strongly
linked to a growing presence in emerging markets. To successfully serve the
growing number of consumers in these markets, however, companies must
offer affordable products adapted to local needs, and implement different
marketing strategies than in developed markets.
DrivinG ForCeS
SuSTainaBiliTy leaDerS 2012As of December 31, 2011
reSulTS aT SeCTor levelTotal Score
0%
Average Score*
* Average score of all assessed companies in the sector
Best Score
25% 50% 75% 100%
SeCTor STaTiSTiCS
hiGhliGhTeD CriTeriaPersonal Products
eConoMiC DiMenSion
– Corporate Governance
– Innovation Management
– Risk & Crisis Management
– Strategy for Emerging Markets
environMenTal DiMenSion
– Environmental Policy/Management System
– Environmental Reporting
– Product Stewardship
SoCial DiMenSion
– Human Capital Development
– Labor Practice Indicators
– Standards for Suppliers
– Talent Attraction & Retention
Company Country
SAM Gold Class Amorepacific Corp. * South Korea
SAM Silver Class Colgate-Palmolive Co. United States
LG Household & Health Care Ltd. ** South Korea
number of companiesin universe
19
number of companies assessedby SAM in 2011
14
Assessed companies to totalcompanies in universe (%)
74
Market capitalization of assessedcompanies to total market capitalization (%)
91
DimensionAverage Score *
Best Score
Weighting in Total Score
Economic 61% 87% 43%
Environmental 58% 86% 22%
Social 56% 81% 35%
* SAM Sector Leader** SAM Sector Mover
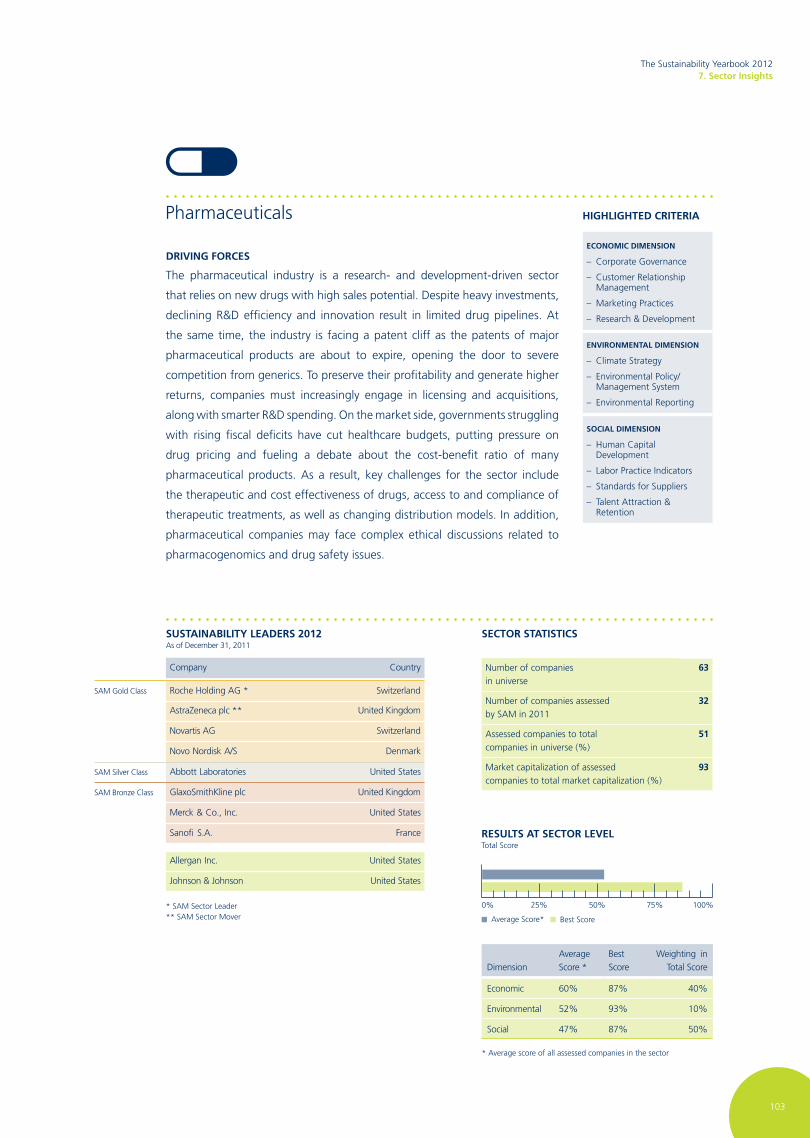
The Sustainability Yearbook 20127. Sector Insights
103
The pharmaceutical industry is a research- and development-driven sector
that relies on new drugs with high sales potential. Despite heavy investments,
declining R&D efficiency and innovation result in limited drug pipelines. At
the same time, the industry is facing a patent cliff as the patents of major
pharmaceutical products are about to expire, opening the door to severe
competition from generics. To preserve their profitability and generate higher
returns, companies must increasingly engage in licensing and acquisitions,
along with smarter R&D spending. On the market side, governments struggling
with rising fiscal deficits have cut healthcare budgets, putting pressure on
drug pricing and fueling a debate about the cost-benefit ratio of many
pharmaceutical products. As a result, key challenges for the sector include
the therapeutic and cost effectiveness of drugs, access to and compliance of
therapeutic treatments, as well as changing distribution models. In addition,
pharmaceutical companies may face complex ethical discussions related to
pharmacogenomics and drug safety issues.
DrivinG ForCeS
SuSTainaBiliTy leaDerS 2012As of December 31, 2011
reSulTS aT SeCTor levelTotal Score
0%
Average Score*
* Average score of all assessed companies in the sector
Best Score
25% 50% 75% 100%
SeCTor STaTiSTiCS
hiGhliGhTeD CriTeriaPharmaceuticals
eConoMiC DiMenSion
– Corporate Governance
– Customer Relationship Management
– Marketing Practices
– Research & Development
environMenTal DiMenSion
– Climate Strategy
– Environmental Policy/Management System
– Environmental Reporting
SoCial DiMenSion
– Human Capital Development
– Labor Practice Indicators
– Standards for Suppliers
– Talent Attraction & Retention
Company Country
SAM Gold Class Roche Holding AG * Switzerland
AstraZeneca plc ** United Kingdom
novartis AG Switzerland
novo nordisk A/S Denmark
SAM Silver Class Abbott Laboratories United States
SAM Bronze Class GlaxoSmithKline plc United Kingdom
Merck & Co., Inc. United States
Sanofi S.A. France
Allergan Inc. United States
Johnson & Johnson United States
number of companiesin universe
63
number of companies assessedby SAM in 2011
32
Assessed companies to totalcompanies in universe (%)
51
Market capitalization of assessedcompanies to total market capitalization (%)
93
DimensionAverage Score *
Best Score
Weighting in Total Score
Economic 60% 87% 40%
Environmental 52% 93% 10%
Social 47% 87% 50%
* SAM Sector Leader** SAM Sector Mover

The Sustainability Yearbook 20127. Sector Insights
104
The need to transport energy—both fossil fuels and renewables—from
politically and environmentally sensitive areas to demand-intensive geographic
regions is driving value creation in the pipeline sector. To minimize future
environmental costs, pipeline companies need to adopt state-of-the art
management systems to prevent leakages and emissions along their pipelines,
supported by modern risk and crisis management systems. Moreover, the
security of pipeline systems is vital to ensuring a constant energy supply from
politically sensitive regions. As a result, human rights issues and stakeholder
communication are becoming increasingly important in planning and operating
pipelines in emerging countries. By adopting progressive community relations
management systems, pipeline companies can reduce their exposure to
human rights risks and cut their operating costs, thereby gaining a sustainable
competitive advantage.
DrivinG ForCeS
SuSTainaBiliTy leaDerS 2012As of December 31, 2011
reSulTS aT SeCTor levelTotal Score
0%
Average Score*
* Average score of all assessed companies in the sector
Best Score
25% 50% 75% 100%
SeCTor STaTiSTiCS
hiGhliGhTeD CriTeriaPipelines
eConoMiC DiMenSion
– Corporate Governance
– Customer Relationship Management
– Diversification
– Risk & Crisis Management
environMenTal DiMenSion
– Environmental Policy/Management System
– Environmental Reporting
SoCial DiMenSion
– Human Capital Development
– Labor Practice Indicators
– Occupational Health & Safety
– Talent Attraction & Retention
Company Country
SAM Gold Class TransCanada Corp. */** Canada
number of companiesin universe
5
number of companies assessedby SAM in 2011
4
Assessed companies to totalcompanies in universe (%)
80
Market capitalization of assessedcompanies to total market capitalization (%)
94
DimensionAverage Score *
Best Score
Weighting in Total Score
Economic 67% 72% 31%
Environmental 32% 44% 24%
Social 52% 75% 45%
* SAM Sector Leader** SAM Sector Mover

The Sustainability Yearbook 20127. Sector Insights
105
The real estate industry is a heterogeneous sector that comprises developers
and maintenance professionals as well as residential and commercial property
managers and investors. Climate change and energy efficiency are of great
importance for this sector. Increasing energy costs have made the amount
of operational energy used in buildings a distinctive factor in determining
their attractiveness. Buildings with low energy intensity that use innovative
materials reduce the impact of volatile energy costs and prices, boosting
demand for residential, commercial and industrial green buildings. Commercial
tenants increasingly demand low-energy buildings to fulfill their sustainability
commitments. In addition, the development of strict energy-efficiency
regulations for buildings, including the introduction of energy performance
certificates in Europe, is driving demand for sustainable buildings. A similar
trend, though less significant, can be observed with regard to water efficiency
and greenhouse gas emissions.
DrivinG ForCeS
SuSTainaBiliTy leaDerS 2012As of December 31, 2011
reSulTS aT SeCTor levelTotal Score
0%
Average Score*
* Average score of all assessed companies in the sector
Best Score
25% 50% 75% 100%
SeCTor STaTiSTiCS
hiGhliGhTeD CriTeriaReal Estate
eConoMiC DiMenSion
– Codes of Conduct/Compliance/ Corruption & Bribery
– Corporate Governance
– Risk & Crisis Management
– Stakeholder Engagement
environMenTal DiMenSion
– Biodiversity
– Building Materials
– Environmental Reporting
– Resource Conservation & Resource Efficiency
SoCial DiMenSion
– Human Capital Development
– Labor Practice Indicators
– Social Integration
– Talent Attraction & Retention
number of companiesin universe
135
number of companies assessedby SAM in 2011
59
Assessed companies to totalcompanies in universe (%)
44
Market capitalization of assessedcompanies to total market capitalization (%)
67
DimensionAverage Score *
Best Score
Weighting in Total Score
Economic 65% 95% 26%
Environmental 39% 91% 39%
Social 38% 88% 35%
Company Country
SAM Gold Class Stockland * Australia
GPT Group Australia
SAM Bronze Class Hammerson plc United Kingdom
British Land Co. Plc United Kingdom
Capital Shopping Centres Group plc United Kingdom
CapitaLand Ltd. Singapore
CFS Retail Property Trust Australia
City Developments Ltd. Singapore
Commonwealth Property Office Fund Australia
CORIO n.v. netherlands
Company Country
Dexus Property Group Australia
Gecina France
Hysan Development Co. Ltd. Hong Kong
Keppel Land Ltd. ** Singapore
Klepierre S.A. France
Land Securities Group plc United Kingdom
Lend Lease Group Australia
SEGRO plc United Kingdom
Shaftesbury plc United Kingdom
Unibail-Rodamco S.A. France
* SAM Sector Leader** SAM Sector Mover
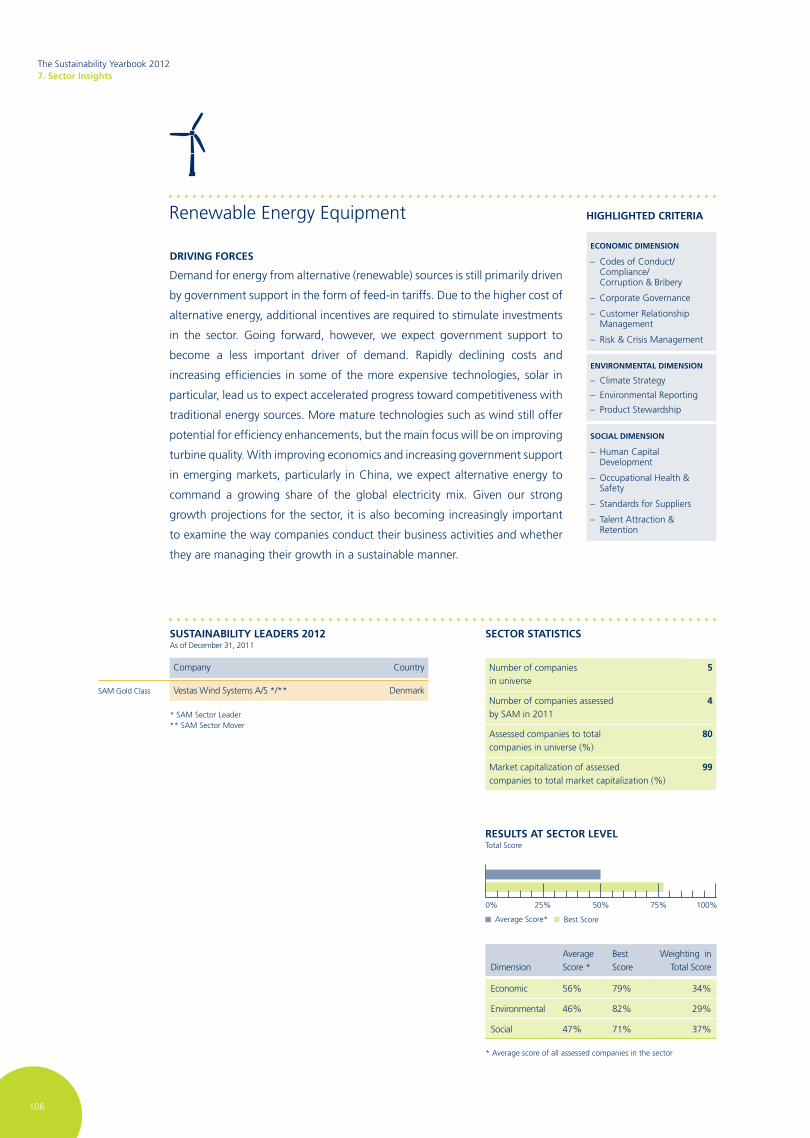
The Sustainability Yearbook 20127. Sector Insights
106
Demand for energy from alternative (renewable) sources is still primarily driven
by government support in the form of feed-in tariffs. Due to the higher cost of
alternative energy, additional incentives are required to stimulate investments
in the sector. Going forward, however, we expect government support to
become a less important driver of demand. Rapidly declining costs and
increasing efficiencies in some of the more expensive technologies, solar in
particular, lead us to expect accelerated progress toward competitiveness with
traditional energy sources. More mature technologies such as wind still offer
potential for efficiency enhancements, but the main focus will be on improving
turbine quality. With improving economics and increasing government support
in emerging markets, particularly in China, we expect alternative energy to
command a growing share of the global electricity mix. Given our strong
growth projections for the sector, it is also becoming increasingly important
to examine the way companies conduct their business activities and whether
they are managing their growth in a sustainable manner.
DrivinG ForCeS
SuSTainaBiliTy leaDerS 2012As of December 31, 2011
reSulTS aT SeCTor levelTotal Score
0%
Average Score*
* Average score of all assessed companies in the sector
Best Score
25% 50% 75% 100%
SeCTor STaTiSTiCS
hiGhliGhTeD CriTeriaRenewable Energy Equipment
eConoMiC DiMenSion
– Codes of Conduct/Compliance/ Corruption & Bribery
– Corporate Governance
– Customer Relationship Management
– Risk & Crisis Management
environMenTal DiMenSion
– Climate Strategy
– Environmental Reporting
– Product Stewardship
SoCial DiMenSion
– Human Capital Development
– Occupational Health & Safety
– Standards for Suppliers
– Talent Attraction & Retention
Company Country
SAM Gold Class vestas Wind Systems A/S */** Denmark
number of companiesin universe
5
number of companies assessedby SAM in 2011
4
Assessed companies to totalcompanies in universe (%)
80
Market capitalization of assessedcompanies to total market capitalization (%)
99
DimensionAverage Score *
Best Score
Weighting in Total Score
Economic 56% 79% 34%
Environmental 46% 82% 29%
Social 47% 71% 37%
* SAM Sector Leader** SAM Sector Mover

The Sustainability Yearbook 20127. Sector Insights
107
As a key segment of the electronic supply chain, the semiconductor sector
must continuously innovate in order to respond to the need for resource
efficiency and miniaturization. The main issues include energy-efficient
production processes and low energy consumption chips and processors.
Quality, performance and reliability need to be monitored throughout the
entire value chain. The sector must also address the environmental impacts
of its own operations, for example by reducing the use of chemicals and
hazardous substances and waste, enhancing the energy efficiency of ultra-
clean spaces, and by reducing consumption of ultra-pure water. High-quality
research and development are important success factors as shrinkage,
migration to new materials and the introduction of more efficient production
processes are the dominant trends. Considering the long lead time of capacity
extensions, the semiconductor sector’s extreme cyclicality is forcing companies
to pay close attention to strategic planning and business cycle management.
Companies have to continually attract new talent to ensure their long-term
innovative capabilities.
DrivinG ForCeS
SuSTainaBiliTy leaDerS 2012As of December 31, 2011
reSulTS aT SeCTor levelTotal Score
0%
Average Score*
* Average score of all assessed companies in the sector
Best Score
25% 50% 75% 100%
SeCTor STaTiSTiCS
hiGhliGhTeD CriTeriaSemiconductors
eConoMiC DiMenSion
– Corporate Governance
– Customer Relationship Management
– Product Quality & Recall Management
– Risk & Crisis Management
environMenTal DiMenSion
– Climate Strategy
– Environmental Policy/Management System
– Product Stewardship
SoCial DiMenSion
– Human Capital Development
– Labor Practice Indicators
– Standards for Suppliers
– Talent Attraction & Retention
Company Country
SAM Gold Class Samsung Electronics Co. Ltd. */** South Korea
Intel Corp. United States
SAM Bronze Class Hynix Semiconductor Inc. South Korea
Taiwan Semiconductor Manufacturing Co. Ltd. Taiwan
United Microelectronics Corp. Taiwan
ASML Holding n.v. netherlands
Infineon Technologies AG Germany
Rohm Co. Ltd. Japan
number of companiesin universe
56
number of companies assessedby SAM in 2011
31
Assessed companies to totalcompanies in universe (%)
55
Market capitalization of assessedcompanies to total market capitalization (%)
87
DimensionAverage Score *
Best Score
Weighting in Total Score
Economic 55% 88% 33%
Environmental 37% 90% 35%
Social 42% 86% 32%
* SAM Sector Leader** SAM Sector Mover

The Sustainability Yearbook 20127. Sector Insights
108
Higher productivity targets and increased data collection requirements
combined with a continuously changing regulatory framework increases
demand for information technology. The software sector is characterized by a
fast-paced market environment in which the speed of innovation represents
a key success factor. As innovation is closely linked to human capital, efficient
human resource management is vital for attracting and retaining qualified
staff. In view of rapidly broadening customer needs, software companies
need to adapt their solutions to fulfill more specific and customized tasks
while keeping development costs under control. Increasing competition from
emerging markets requires software companies to address intellectual property
issues. Given the ubiquity of software in daily life, innovative and differentiated
distribution models are gaining importance. Widespread Internet access, for
example, creates new opportunities in the area of “software as a service.”
In addition, software companies have to make increasing efforts to attract
external developers.
DrivinG ForCeS
SuSTainaBiliTy leaDerS 2012As of December 31, 2011
reSulTS aT SeCTor levelTotal Score
0%
Average Score*
* Average score of all assessed companies in the sector
Best Score
25% 50% 75% 100%
SeCTor STaTiSTiCS
hiGhliGhTeD CriTeriaSoftware
eConoMiC DiMenSion
– Corporate Governance
– Customer Relationship Management
– Privacy Protection
– Risk & Crisis Management
environMenTal DiMenSion
– Climate Strategy
– Environmental Policy/Management System
– Environmental Reporting
SoCial DiMenSion
– Human Capital Development
– Labor Practice Indicators
– Standards for Suppliers
– Talent Attraction & Retention
Company Country
SAM Gold Class SAP AG * Germany
Invensys plc United Kingdom
Autodesk Inc. ** United States
CA Inc. United States
Intuit Inc. United States
Symantec Corp. United States
Trend Micro Inc. Japan
number of companiesin universe
40
number of companies assessedby SAM in 2011
18
Assessed companies to totalcompanies in universe (%)
45
Market capitalization of assessedcompanies to total market capitalization (%)
87
DimensionAverage Score *
Best Score
Weighting in Total Score
Economic 52% 81% 47%
Environmental 32% 91% 20%
Social 36% 72% 33%
* SAM Sector Leader** SAM Sector Mover

The Sustainability Yearbook 20127. Sector Insights
109
Companies in this sector are service providers engaged in a wide range of
businesses. Sector-specific challenges include the need to attract new and
retain existing customers while expanding into new markets, continuously
training employees and improving customer satisfaction. Companies need to
strengthen their brand, improve their reputation and minimize any negative
social and environmental impacts. Technological advances—particularly
those related to Internet, electronic billing, privacy protection, real-time
service and customer information—present opportunities for companies in
this sector. Meanwhile, companies face the challenge of securing customer
identity, building trust and loyalty, while simultaneously improving operational
efficiencies.
DrivinG ForCeS
SuSTainaBiliTy leaDerS 2012As of December 31, 2011
reSulTS aT SeCTor levelTotal Score
0%
Average Score*
* Average score of all assessed companies in the sector
Best Score
25% 50% 75% 100%
SeCTor STaTiSTiCS
hiGhliGhTeD CriTeriaSpecialized Consumer Services
eConoMiC DiMenSion
– Brand Management
– Corporate Governance
– Customer Relationship Management
– Privacy Protection
environMenTal DiMenSion
– Environmental Policy/Management System
– Environmental Reporting
SoCial DiMenSion
– Human Capital Development
– Labor Practice Indicators
– Stakeholder Engagement
– Talent Attraction & Retention
Company Country
SAM Gold Class Benesse Holdings Inc. */** Japan
H&R Block Inc. United States
number of companiesin universe
13
number of companies assessedby SAM in 2011
7
Assessed companies to totalcompanies in universe (%)
54
Market capitalization of assessedcompanies to total market capitalization (%)
76
DimensionAverage Score *
Best Score
Weighting in Total Score
Economic 49% 74% 45%
Environmental 22% 55% 17%
Social 32% 54% 38%
* SAM Sector Leader** SAM Sector Mover

The Sustainability Yearbook 20127. Sector Insights
110
One of the challenges faced by the iron and steel producing sector is the
successful management of CO2 constraints and climate change risks.
numerous steel companies are developing technologies to reduce the CO2
intensity of the steel making process. Any breakthrough would represent a
considerable competitive advantage, not only within the industry itself, but
also in competition with the aluminum sector. In addition to greenhouse gas
emissions, a reduction of airborne emissions of heavy metals, dioxins and
furans, as well as recycling and reuse of waste, will feature prominently on
companies’ future agendas. The consolidation seen in the steel sector over the
last few years is likely to continue into the future. Competition will intensify
as new players from Russia and China enter the market. In this context,
successful supply chain management will become even more important as a
means of counteracting this competitive pressure.
DrivinG ForCeS
SuSTainaBiliTy leaDerS 2012As of December 31, 2011
reSulTS aT SeCTor levelTotal Score
0%
Average Score*
* Average score of all assessed companies in the sector
Best Score
25% 50% 75% 100%
SeCTor STaTiSTiCS
hiGhliGhTeD CriTeriaSteel
eConoMiC DiMenSion
– Codes of Conduct/Compliance/ Corruption & Bribery
– Corporate Governance
– Risk & Crisis Management
– Customer Relationship Management
environMenTal DiMenSion
– Climate Strategy
– Environmental Policy/Management System
– Environmental Reporting
SoCial DiMenSion
– Human Capital Development
– Labor Practice Indicators
– Occupational Health & Safety
– Standards for Suppliers
Company Country
SAM Gold Class Rautaruukki Oyj */** Finland
SAM Silver Class ArcelorMittal France
Outokumpu Oyj Finland
POSCO South Korea
Cliffs natural Resources Inc. United States
Hyundai Steel Co. South Korea
Tata Steel Ltd. India
Usinas Siderurgicas de Minas Gerais S/A Brazil
number of companiesin universe
49
number of companies assessedby SAM in 2011
22
Assessed companies to totalcompanies in universe (%)
45
Market capitalization of assessedcompanies to total market capitalization (%)
73
DimensionAverage Score *
Best Score
Weighting in Total Score
Economic 54% 84% 24%
Environmental 41% 87% 30%
Social 44% 73% 46%
* SAM Sector Leader** SAM Sector Mover

The Sustainability Yearbook 20127. Sector Insights
111
For companies engaged in providing industrial services, employees are the
main interface with customers and therefore play a critical role in the success
of the business. Clear policies for employees and contractors combined with
training programs, knowledge management and incentive schemes are
important for creating a motivating, successful, safe and healthy working
environment. Companies have to systematically measure and improve
customer satisfaction to maintain their competitive edge. Some companies in
the sector have a higher exposure to environmental and human rights issues.
Trading companies that acquire stakes in or operate large-scale projects such
as exploration activities should control risks by integrating environmental
and social impact assessments into their investment decisions and provide
transparent reporting about such engagements. Further, support services
companies may risk transferring reputational risks onto their customers if
their suppliers are found to be involved in any environmental or human rights
abuses, and should therefore proactively engage their suppliers on such topics.
DrivinG ForCeS
hiGhliGhTeD CriTeriaSupport Services
eConoMiC DiMenSion
– Corporate Governance
– Customer Relationship Management
– Risk & Crisis Management
– Codes of Conduct/Compliance/ Corruption & Bribery
environMenTal DiMenSion
– Environmental Policy/Management System
– Environmental Reporting
SoCial DiMenSion
– Human Capital Development
– Labor Practice Indicators
– Occupational Health & Safety
– Standards for Suppliers
SuSTainaBiliTy leaDerS 2012As of December 31, 2011
reSulTS aT SeCTor levelTotal Score
0%
Average Score*
* Average score of all assessed companies in the sector
Best Score
25% 50% 75% 100%
SeCTor STaTiSTiCS
Company Country
SAM Gold Class Marubeni Corp. * Japan
SAM Bronze Class Capita Group plc ** United Kingdom
Kepco Plant Service & Engineering Co. Ltd. South Korea
Mitsui & Co. Ltd. Japan
Adecco S.A. Switzerland
Experian plc United Kingdom
Itochu Corp. Japan
Mitsubishi Corp. Japan
Premier Farnell plc United Kingdom
Rentokil Initial plc United Kingdom
number of companiesin universe
68
number of companies assessedby SAM in 2011
39
Assessed companies to totalcompanies in universe (%)
57
Market capitalization of assessedcompanies to total market capitalization (%)
76
DimensionAverage Score *
Best Score
Weighting in Total Score
Economic 54% 87% 29%
Environmental 40% 82% 25%
Social 45% 74% 46%
* SAM Sector Leader** SAM Sector Mover

The Sustainability Yearbook 20127. Sector Insights
112
The tobacco sector is mature and global cigarette volumes are stable.
However, tobacco companies enjoy a unique position in the consumer sector
as they have strong pricing power and are able to raise cigarette prices. The
sector’s relationship to the public sector is of fundamental importance with
regard to tax policy and efforts to combat cigarette smuggling. Companies
will have to prove that they have a robust system in place to track their
product distribution. The sector is under constant scrutiny from legislators, the
media and nGOs, requiring a high level of transparency and well-managed
companies and supply chains. Following new smoke regulating legislation, it
will also be increasingly important for tobacco companies to partly move away
from traditional tobacco products and start exploring options in the area of
non-combustion tobacco, such as snus, and non-tobacco nicotine products,
both of which claim to have a lower health impact.
DrivinG ForCeS
SuSTainaBiliTy leaDerS 2012As of December 31, 2011
reSulTS aT SeCTor levelTotal Score
0%
Average Score*
* Average score of all assessed companies in the sector
Best Score
25% 50% 75% 100%
SeCTor STaTiSTiCS
hiGhliGhTeD CriTeriaTobacco
eConoMiC DiMenSion
– Combating Smuggling
– Corporate Governance
– Risk & Crisis Management
– Customer Relationship Management
environMenTal DiMenSion
– Environmental Policy/Management System
– Raw Material Sourcing
– Fuels for Tobacco Curing
– Environmental Reporting
SoCial DiMenSion
– Human Capital Development
– Labor Practice Indicators
– Responsible Marketing Policies
– Talent Attraction & Retention
Company Country
SAM Gold Class British American Tobacco plc */** United Kingdom
SAM Bronze Class KT&G Corp. South Korea
number of companiesin universe
12
number of companies assessedby SAM in 2011
10
Assessed companies to totalcompanies in universe (%)
83
Market capitalization of assessedcompanies to total market capitalization (%)
98
DimensionAverage Score *
Best Score
Weighting in Total Score
Economic 68% 93% 32%
Environmental 64% 93% 25%
Social 52% 83% 43%
* SAM Sector Leader** SAM Sector Mover

The Sustainability Yearbook 20127. Sector Insights
113
Companies in the travel and tourism sector generally benefit from the
development of the local economies in which they operate, and vice versa.
While it is essential for these companies to ensure environmentally friendly
operations, for example, by using and promoting alternative energies and
means of transport, key sustainability challenges lie in the social arena. It
is indispensable for companies in this sector to employ progressive human
resources policies that include talent attraction & retention, human capital
development, occupational health & safety and group-wide ethical principles
that prevent involvement in illegal practices. In view of continually increasing
transport flows, companies also need to consider the needs of local
communities in the tourist destinations in which they operate. Companies
must conduct careful analyses of locations and the supply chain to ensure
their long-term ability to deliver services.
DrivinG ForCeS
hiGhliGhTeD CriTeriaTravel & Tourism
eConoMiC DiMenSion
– Codes of Conduct/Compliance/ Corruption & Bribery
– Corporate Governance
– Risk & Crisis Management
environMenTal DiMenSion
– Climate Strategy
– Environmental Policy/Management System
– Environmental Reporting
SoCial DiMenSion
– Human Rights & Corruption
– Human Capital Development
– Stakeholder Engagement
– Occupational Health & Safety
SuSTainaBiliTy leaDerS 2012As of December 31, 2011
reSulTS aT SeCTor levelTotal Score
0%
Average Score*
* Average score of all assessed companies in the sector
Best Score
25% 50% 75% 100%
SeCTor STaTiSTiCS
Company Country
SAM Gold Class TUI AG * Germany
SAM Silver Class TUI Travel plc ** United Kingdom
SAM Bronze Class Firstgroup plc United Kingdom
MTR Corp. Ltd. Hong Kong
number of companiesin universe
27
number of companies assessedby SAM in 2011
14
Assessed companies to totalcompanies in universe (%)
52
Market capitalization of assessedcompanies to total market capitalization (%)
69
DimensionAverage Score *
Best Score
Weighting in Total Score
Economic 57% 82% 24%
Environmental 43% 84% 25%
Social 47% 80% 51%
* SAM Sector Leader** SAM Sector Mover
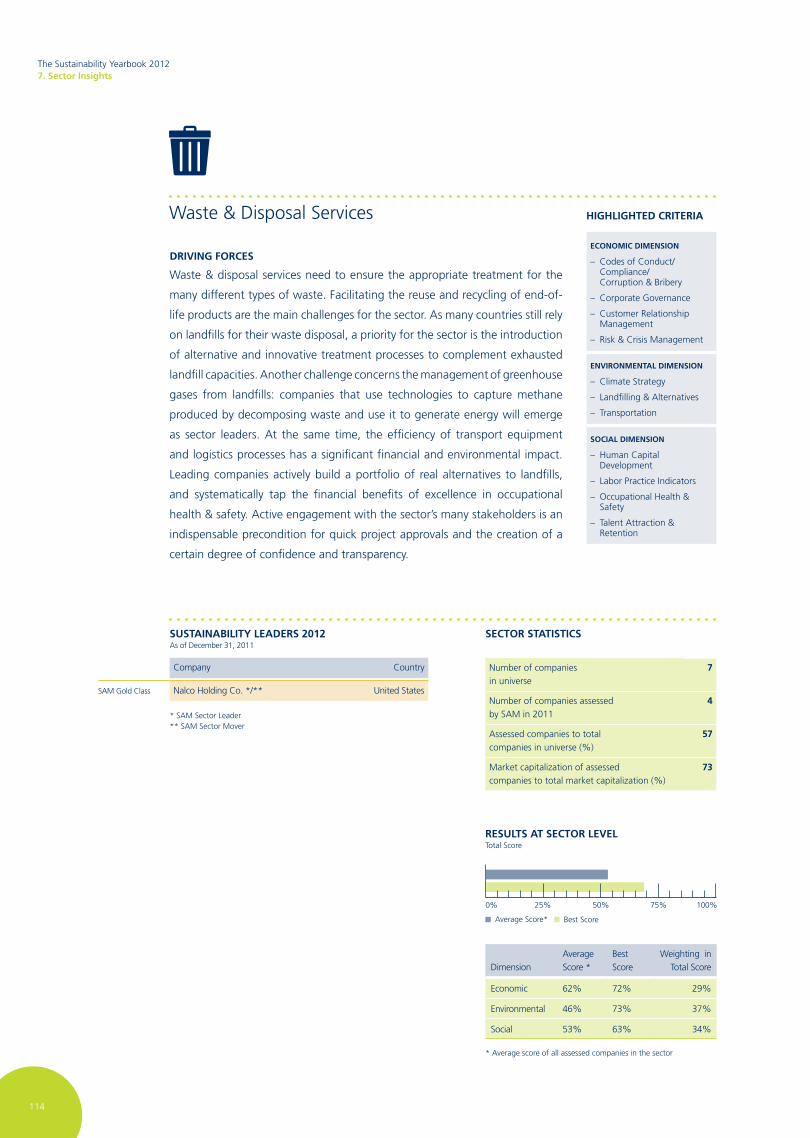
The Sustainability Yearbook 20127. Sector Insights
114
Waste & disposal services need to ensure the appropriate treatment for the
many different types of waste. Facilitating the reuse and recycling of end-of-
life products are the main challenges for the sector. As many countries still rely
on landfills for their waste disposal, a priority for the sector is the introduction
of alternative and innovative treatment processes to complement exhausted
landfill capacities. Another challenge concerns the management of greenhouse
gases from landfills: companies that use technologies to capture methane
produced by decomposing waste and use it to generate energy will emerge
as sector leaders. At the same time, the efficiency of transport equipment
and logistics processes has a significant financial and environmental impact.
Leading companies actively build a portfolio of real alternatives to landfills,
and systematically tap the financial benefits of excellence in occupational
health & safety. Active engagement with the sector’s many stakeholders is an
indispensable precondition for quick project approvals and the creation of a
certain degree of confidence and transparency.
DrivinG ForCeS
SuSTainaBiliTy leaDerS 2012As of December 31, 2011
reSulTS aT SeCTor levelTotal Score
0%
Average Score*
* Average score of all assessed companies in the sector
Best Score
25% 50% 75% 100%
SeCTor STaTiSTiCS
hiGhliGhTeD CriTeriaWaste & Disposal Services
eConoMiC DiMenSion
– Codes of Conduct/Compliance/ Corruption & Bribery
– Corporate Governance
– Customer Relationship Management
– Risk & Crisis Management
environMenTal DiMenSion
– Climate Strategy
– Landfilling & Alternatives
– Transportation
SoCial DiMenSion
– Human Capital Development
– Labor Practice Indicators
– Occupational Health & Safety
– Talent Attraction & Retention
Company Country
SAM Gold Class nalco Holding Co. */** United States
number of companiesin universe
7
number of companies assessedby SAM in 2011
4
Assessed companies to totalcompanies in universe (%)
57
Market capitalization of assessedcompanies to total market capitalization (%)
73
DimensionAverage Score *
Best Score
Weighting in Total Score
Economic 62% 72% 29%
Environmental 46% 73% 37%
Social 53% 63% 34%
* SAM Sector Leader** SAM Sector Mover
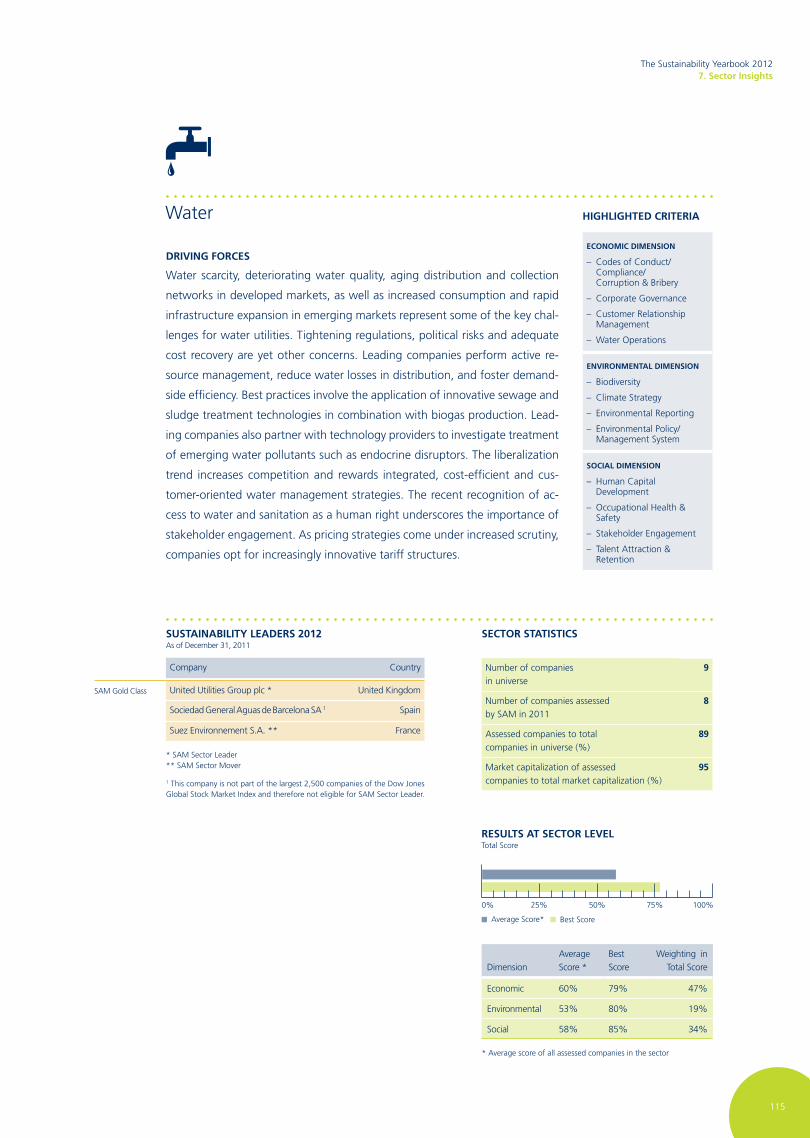
The Sustainability Yearbook 20127. Sector Insights
115
Water scarcity, deteriorating water quality, aging distribution and collection
networks in developed markets, as well as increased consumption and rapid
infrastructure expansion in emerging markets represent some of the key chal-
lenges for water utilities. Tightening regulations, political risks and adequate
cost recovery are yet other concerns. Leading companies perform active re-
source management, reduce water losses in distribution, and foster demand-
side efficiency. Best practices involve the application of innovative sewage and
sludge treatment technologies in combination with biogas production. Lead-
ing companies also partner with technology providers to investigate treatment
of emerging water pollutants such as endocrine disruptors. The liberalization
trend increases competition and rewards integrated, cost-efficient and cus-
tomer-oriented water management strategies. The recent recognition of ac-
cess to water and sanitation as a human right underscores the importance of
stakeholder engagement. As pricing strategies come under increased scrutiny,
companies opt for increasingly innovative tariff structures.
DrivinG ForCeS
hiGhliGhTeD CriTeriaWater
eConoMiC DiMenSion
– Codes of Conduct/Compliance/ Corruption & Bribery
– Corporate Governance
– Customer Relationship Management
– Water Operations
environMenTal DiMenSion
– Biodiversity
– Climate Strategy
– Environmental Reporting
– Environmental Policy/Management System
SoCial DiMenSion
– Human Capital Development
– Occupational Health & Safety
– Stakeholder Engagement
– Talent Attraction & Retention
SuSTainaBiliTy leaDerS 2012As of December 31, 2011
reSulTS aT SeCTor levelTotal Score
0%
Average Score*
* Average score of all assessed companies in the sector
Best Score
25% 50% 75% 100%
SeCTor STaTiSTiCS
Company Country
SAM Gold Class United Utilities Group plc * United Kingdom
Sociedad General Aguas de Barcelona SA 1 Spain
Suez Environnement S.A. ** France
number of companiesin universe
9
number of companies assessedby SAM in 2011
8
Assessed companies to totalcompanies in universe (%)
89
Market capitalization of assessedcompanies to total market capitalization (%)
95
DimensionAverage Score *
Best Score
Weighting in Total Score
Economic 60% 79% 47%
Environmental 53% 80% 19%
Social 58% 85% 34%
* SAM Sector Leader** SAM Sector Mover
1 This company is not part of the largest 2,500 companies of the Dow Jones Global Stock Market Index and therefore not eligible for SAM Sector Leader.

The Sustainability Yearbook 20128. Annex
116
8 AnnEX

The Sustainability Yearbook 20128. Annex
117
8.2 SaM aCaDeMiC aCTiviTieS
SAM has implemented a proactive approach to
developing its research partnerships with academia.
The purpose of its research collaborations is to
confirm SAM’s research leadership position in
the Sustainability Finance industry, capitalize on
the value of SAM’s proprietary database and
further develop its cutting edge methodology
for integrating sustainability into the investment
process. Within this framework, SAM focuses
on extensive collaboration with and sponsorship
of selected academic institutions. In all research
initiatives, SAM assumes an active role in designing,
leading and actively supervising the projects.
Over the past year, SAM has been involved
in research collaborations with the following
academic institutions:
• UQ Business School,
The University of Queensland
• School of Finance, Actuarial Studies and Applied
Statistics, The Australian national University
• IESE Business School, University of navarra
• School of Management,
University of St. Andrews
• Harvard Business School
• University of Cambridge
8. Annex
8.1 SaM ProFile
SAM is an investment boutique focused exclusively
on Sustainability Investing. The firm’s offering
comprises asset management, indexes and
private equity. Its asset management capabilities
include a range of single-theme, multi-theme
and core sustainability investment strategies
catering to institutional asset owners and financial
intermediaries in Europe, the United States, Asia-
Pacific and the Middle East. Through its index
activities, SAM has partnered with Dow Jones
Indexes for the publication and licensing of the
globally recognized Dow Jones Sustainability
Indexes (DJSI) as well as customized sustainability
benchmarks. Furthermore, SAM acts as the center
of expertise for Clean Growth Private Equity within
Robeco. SAM is a member of Robeco, which was
established in 1929 and offers a broad range of
investment products and services worldwide.
Robeco is a subsidiary of the Rabobank Group
which has the highest credit rating of all privately
owned banks, awarded by rating agencies Moody’s,
Standard & Poor’s, Fitch and DBRS.
Daniel wild, PhDHead of Research
Gabriela Grab hartmann Sector Head Consumer & Healthcare
Marc-olivier Buffle, PhDSector Head Industrials
Bojana BidovecResearch Coordinator Energy
Christophe ChuretResearch Coordinator Materials
Thomas GuenneguesResearch Coordinator Climate
Diederik Basch, CFaFood & Beverages
elsa Ben hamou DassonvilleConsumers
Mathias Büeler, CFaFinancials
Cécile ChuretIndustrials
urs Diethelm, CeFa Utilities & Water
Junwei hafner-CaiIndustrials
Matthias MüllerTechnology
andrea ricci, PhDIndustrials
Jürgen Siemer, PhD Food Producers & Farms
Giorgia valsesia, PhDHealthcare
Christopher Greenwald, PhDHead of Sustainability Operations
Manjit Jus Sustainability Operations
ida Karlsson Sustainability Operations
Paulo Morais Sustainability Operations
ConTaCT
SaM analysts
For additional information onSAM, please visitwww.sam-group.com
SaMPhone + 41 44 653 10 [email protected]
The Sustainability Yearbook 20128. Annex
118
8.3 KPMG ProFile
As sustainability and climate change issues move
to the top of corporate agendas, KPMG advises
organizations to better understand the complex
and evolving environment, helping them optimize
their sustainability strategy.
KPMG’s Climate Change and Sustainability Services
professionals provide sustainability and climate
change assurance, tax and advisory services to
organizations to help them apply sustainability as a
strategic lens to their business operations.
Our experienced teams assist organizations in the
following areas:
• Sustainability risk & opportunity analysis
• Corporate responsibility strategy assistance
• Corporate social responsibility/sustainability/
GHG information systems design and imple-
mentation
• Regulatory framework assessment and optimi-
zation, including tax and carbon emission re-
gimes
• Tax incentives and credits
• Sustainable supply chain enhancements
• Corporate responsibility reporting and assur-
ance, including pre-audit assessments and
greenhouse gas emissions verification.
For more information, please e-mail us at
[email protected] visit our website,
www.kpmg.com/sustainability
argentina Martín Mendivelzúa [email protected] armenia Andrew Coxshall [email protected] australia Adrian v. King [email protected] austria Peter Ertl [email protected] azerbaijan vugar Aliyev [email protected] Baltics Gregory Rubinchik [email protected]
Belgium Steven Callaars [email protected] Brazil Sidney Ito [email protected] Bulgaria Emmanuel Totev [email protected] Cambodia Jonathan Levitt [email protected]
Canada Bill J. Murphy [email protected] Chile Alejandro Cerda [email protected]
China/hong Kong Leah Jin [email protected]
Colombia Orlando Delgadillo A. [email protected] Cyprus Iacovos Ghalanos [email protected]
Czech republic Eva Rackova [email protected] Denmark Christian Honoré [email protected] Finland nathalie Clément [email protected]
France Philippe Arnaud [email protected] Georgia Andrew Coxshall [email protected] Germany Jochen Pampel [email protected] Greece Konstantina Passalari [email protected]
hungary Gabor Cserhati [email protected]
india Arvind Sharma [email protected] indonesia Iwan Atmawidjaja [email protected]
ireland Eoin O’Lideadha [email protected]
israel Oren Grupi [email protected] italy PierMario Barzaghi [email protected]
Japan Yoshitake Funakoshi [email protected] Japan Kazuhiko Saito [email protected]
Kazakhstan Alun Bowen [email protected] luxembourg Jane Wilkinson [email protected] Malaysia Lamsang Hewlee [email protected]
Malta Josianne [email protected]
Mexico Jesus Gonzalez [email protected]
netherlands Bernd Hendriksen [email protected]
new zealand Jamie [email protected] nigeria Dimeji Salaudeen [email protected]
norway Jan-Erik Martinsen [email protected]
Philippines Henry D. Antonio [email protected] Poland Krzysztof Radziwon [email protected] Portugal Cristina Tomé [email protected] romania Gheorghita [email protected] russia Igor Korotetskiy [email protected] Singapore Sharad Somani [email protected]
Slovakia Quentin Crossley [email protected] South africa neil Morris [email protected] South Korea Sungwoo Kim [email protected]
South Korea Joo Hoon Yoon [email protected] Spain Jose Luis Blasco vazquez [email protected] Sri lanka Ranjani [email protected]
Sweden Åse Bäckström [email protected]
Switzerland Hans-Ulrich [email protected] Taiwan Charles Chen [email protected]
Thailand Paul Flipse [email protected] u.a.e. Sudhir Arvind [email protected] u.a.e. and oman (lower Gulf) Andrew Robinson [email protected] uK vincent neate [email protected]
ukraine Olena Makarenko [email protected] uSa John R Hickox [email protected] venezuela Jose O. Rodrigues [email protected] vietnam Jonathan Levitt [email protected]
KPMG CounTry ConTaCTS For CliMaTe ChanGe & SuSTainaBiliTy ServiCeS

The Sustainability Yearbook 2012Company Overview
119
COMPAnY OvERvIEW

The Sustainability Yearbook 2012Company Overview
120
SAM
Sec
tor
Lead
er
SAM
Sec
tor
Mov
er
SAM
Gol
d C
lass
SAM
Silv
er C
lass
SAM
Bro
nze
Cla
ss
Page
Company name
3i Group plc 78
3M Company • • 73
ABB Ltd. 91
Abbott Laboratories • 103
Abertis Infraestructuras S.A. • 92
Acciona S.A. • 88
Accor S.A. • 90
ACS Actividades de Construccion y Servicios S.A. • 88
Adecco S.A. 111
adidas AG • • 68
Aegon n.v. 93
Aeon Co. Ltd. 86
Agilent Technologies Inc. 77
AGL Energy Ltd. • 76
Agnico-Eagle Mines Ltd. 97
Ahold n.v. 80
Air France-KLM • • 59
Air Products & Chemicals Inc. 67
Akzo nobel n.v. • 67
Alcatel-Lucent • • • 69
Alcoa Inc. • • • 60
Allergan Inc. 103
Allianz SE • 93
Alstom S.A. • 91
AMEC plc • • 100
Amgen Inc. • 65
Amorepacific Corp. • • 102
AMP Ltd. 78
Anglo American Platinum Ltd. 97
Anglo American plc • 97
AngloGold Ashanti Ltd. 97
ArcelorMittal • 110
Asahi Glass Co. Ltd. • • 66
ASML Holding n.v. 107
SAM
Sec
tor
Lead
er
SAM
Sec
tor
Mov
er
SAM
Gol
d C
lass
SAM
Silv
er C
lass
SAM
Bro
nze
Cla
ss
Page
Company name
AstraZeneca plc • • 103
Atlantia S.p.A. • 92
Atlas Copco AB • 91
Au Optronics Corp. • • 70
Australia & new Zealand Banking Group Ltd. • 63
Autodesk Inc. • 108
Aviva plc • 93
AXA S.A. • 93
Ball Corp. • 72
Banca Monte dei Paschi di Siena S.p.A. 63
Banco Bilbao vizcaya Argentaria S.A. 63
Banco Bradesco S/A • 63
Banco do Brasil S/A 63
Banco Espirito Santo S/A 63
Banco Santander S.A. 63
Bancolombia S.A. 63
Bank of nova Scotia 63
Barclays plc • 63
Barrick Gold Corp. • 97
BASF SE • 67
Baxter International Inc. • • 96
Bayer AG • 67
Becton Dickinson & Co. 96
Benesse Holdings Inc. • • • 109
BG Group plc 101
BHP Billiton Group • 97
Biogen Idec Inc. • 65
BMW AG • • 62
BnP Paribas S.A. 63
Bombardier Inc. • • 58
Bridgestone Corp. 61
British American Tobacco plc • • • 112
British Land Co. Plc 105
British Sky Broadcasting Group plc 95
Company Overview

The Sustainability Yearbook 2012Company Overview
121
SAM
Sec
tor
Lead
er
SAM
Sec
tor
Mov
er
SAM
Gol
d C
lass
SAM
Silv
er C
lass
SAM
Bro
nze
Cla
ss
Page
Company name
BT Group plc • 79
CA Inc. 108
Campbell Soup Co. • 81
Canadian Imperial Bank of Commerce 63
Canadian national Railway Co. 92
Capita Group plc • • 111
Capital Shopping Centres Group plc 105
CapitaLand Ltd. 105
Caterpillar Inc. 91
Cenovus Energy Inc. 101
CFS Retail Property Trust 105
CGG veritas 100
China Mobile Ltd. 98
Christian Dior S.A. • 68
Citigroup Inc. 63
City Developments Ltd. 105
Cliffs natural Resources Inc. 110
Coca-Cola Hellenic Bottling Co. S.A. • 64
Colgate-Palmolive Co. • 102
Coloplast A/S 96
Commonwealth Bank of Australia 63
Commonwealth Property Office Fund 105
Companhia Energetica de Minas Gerais - CEMIG • 76
Compass Group plc • • 90
ConAgra Foods Inc. • • 81
CORIO n.v. 105
Credit Agricole S.A. 63
Credit Suisse Group 63
CRH plc • 66
Criteria CaixaCorp S.A. 78
Cummins Inc. 91
Daelim Industrial Co. Ltd. 88
Dai nippon Printing Co. Ltd. 95
Daikin Industries Ltd. 91
Daimler AG • • 62
Daiwa Securities Group Inc. 78
SAM
Sec
tor
Lead
er
SAM
Sec
tor
Mov
er
SAM
Gol
d C
lass
SAM
Silv
er C
lass
SAM
Bro
nze
Cla
ss
Page
Company name
Danone S.A. • 81
Danske Bank A/S • 63
Dell Inc. 70
Delta Electronics Inc. • • 77
Denso Corp. 61
Deutsche Bank AG 63
Deutsche Boerse AG 78
Deutsche Lufthansa AG • 59
Deutsche Post AG • 92
Deutsche Telekom AG • 98
Dexus Property Group 105
Diageo plc • 64
DnB nOR ASA 63
Dongbu Insurance Co. Ltd. • • 93
Dow Chemical Co. • 67
DSM n.v. • • 67
Duke Energy Corp. • 76
E.I. du Pont de nemours & Co. 67
E.On AG • 76
Eaton Corp. 73
Ecopetrol S.A. 101
EDP - Energias de Portugal S.A. • • 76
Electrolux AB • • • 74
Elekta AB • 96
Embraer S.A. • • 58
EMC Corp. • 70
Enagas S.A. • • • 85
Endesa S.A. • 76
Enel S.p.A. • 76
EnI S.p.A. • 101
Eramet S.A. 97
Experian plc 111
Ferrovial S.A. 88
Fiat Industrial S.p.A. • • 91
Fiat S.p.A. • 62
Fibria Celulose S.A. • • • 82

The Sustainability Yearbook 2012Company Overview
122
SAM
Sec
tor
Lead
er
SAM
Sec
tor
Mov
er
SAM
Gol
d C
lass
SAM
Silv
er C
lass
SAM
Bro
nze
Cla
ss
Page
Company name
Finmeccanica S.p.A. • 58
Firstgroup plc • 113
Fomento de Construcciones y Contratas S.A. • 88
Fortum Oyj 76
Fraport AG • • 92
Freeport-McMoRan Copper & Gold Inc. 97
Fresenius Medical Care AG & Co. KGaA 87
Fresnillo plc 97
Fuji Electric Co. Ltd. 75
FUJIFILM Holdings Corp. • 70
Galp Energia, SGPS, S.A. • 101
Gap Inc. 86
Gas natural SDG S.A. • 85
GDF Suez S.A. 76
Gecina 105
General Electric Co. 73
General Mills Inc. 81
GlaxoSmithKline plc • 103
Gold Fields Ltd. • 97
GPT Group • 105
Grupo de Inversiones Suramericana S.A. 78
Grupo nutresa S.A. • 81
GS Engineering & Construction Corp. • 88
H&R Block Inc. 109
H.J. Heinz Co. 81
Halliburton Co. 100
Hammerson plc • 105
Heineken n.v. 64
Henkel AG & Co. KGaA • • • 99
Hennes & Mauritz AB • 86
Herman Miller Inc. • • • 83
Hershey Co. 81
Hitachi Ltd. • 77
Hochtief AG 88
Holcim Ltd. • 66
Home Retail Group plc 86
Honam Petrochemical Corp. 67
SAM
Sec
tor
Lead
er
SAM
Sec
tor
Mov
er
SAM
Gol
d C
lass
SAM
Silv
er C
lass
SAM
Bro
nze
Cla
ss
Page
Company name
Hormel Foods Corp. 81
HSBC Holdings plc 63
HudBay Minerals Inc. 97
Humana Inc. 87
Hynix Semiconductor Inc. • 107
Hysan Development Co. Ltd. 105
Hyundai Engineering & Construction Co., Ltd. • • 88
Hyundai Mobis Co. Ltd. • • 61
Hyundai Steel Co. 110
Iberdrola S.A. • • 76
Ibiden Co., Ltd. 75
IMI plc 91
Indra Sistemas S.A. • 71
Industria de Diseno Textil S.A. • 86
Infineon Technologies AG 107
InG Groep n.v. 93
Ingersoll-Rand plc 91
Insurance Australia Group Ltd. 93
Intel Corp. • 107
IBM (International Business Machines Corp.) • 71
International Game Technology 84
Intesa Sanpaolo S.p.A. 63
Intuit Inc. 108
Invensys plc • 108
Investec Ltd. 78
Italcementi S.p.A. • 66
Itau Unibanco Holding S.A. • 63
Itausa-Investimentos Itau S/A • • 78
Itochu Corp. 111
ITv plc 95
J Sainsbury plc • • • 80
JCDecaux S.A. 95
Johnson & Johnson 103
Johnson Controls Inc. • 61
Kangwon Land Inc. 84
Kepco Plant Service & Engineering Co. Ltd. • 111
Keppel Land Ltd. • 105

The Sustainability Yearbook 2012Company Overview
123
SAM
Sec
tor
Lead
er
SAM
Sec
tor
Mov
er
SAM
Gol
d C
lass
SAM
Silv
er C
lass
SAM
Bro
nze
Cla
ss
Page
Company name
Kesko Oyj 80
Kingfisher plc 86
Kinross Gold Corp. • 97
Klepierre S.A. 105
Komatsu Ltd. 91
Konica Minolta Holdings Inc. 94
KPn n.v. • 79
Kraft Foods Inc. • 81
KT Corp. • • • 79
KT&G Corp. • 112
Ladbrokes plc • • 84
Lafarge S.A. • 66
Land Securities Group plc 105
Lanxess AG • 67
Legal & General Group plc 93
LeGrand S.A. 75
Lend Lease Group 105
Lexmark International Inc. 70
LG Chem Ltd. 67
LG Electronics Inc. • • 94
LG Household & Health Care Ltd. • • 102
LG Innotek Co. Ltd. 75
Life Technologies Corp. • 65
Linde AG 67
Lite-On Technology Corp. • • • 75
Lloyds Banking Group PLC 63
Lonmin plc 97
Lotte Shopping Co. Ltd. • • 86
LvMH Moet Hennessy Louis vuitton • 68
Mahindra & Mahindra Ltd. 91
Man Group plc 78
MAn SE • 91
Mapfre S.A. • 93
Marks & Spencer Group plc 86
Marubeni Corp. • • 111
McDonald’s Corp. • 90
SAM
Sec
tor
Lead
er
SAM
Sec
tor
Mov
er
SAM
Gol
d C
lass
SAM
Silv
er C
lass
SAM
Bro
nze
Cla
ss
Page
Company name
McGraw-Hill Companies 95
MeadWestvaco Corp. • 72
Medtronic Inc. 96
Merck & Co., Inc. • 103
Metro AG 80
Metso Corp. 91
Michelin • 61
Mitsubishi Corp. 111
Mitsui & Co. Ltd. • 111
MOL Group 101
Molson Coors Brewing Co. • • 64
Morgan Stanley • 78
Motorola Mobility Holdings Inc. • 69
Motorola Solutions Inc. • 69
MTR Corp. Ltd. • 113
Münchener Rückversicherungs- Gesellschaft AG • 93
nalco Holding Co. • • • 114
national Australia Bank Ltd. • 63
nEC Corp. • 70
nedbank Group Ltd. 63
neste Oil Oyj 101
nestle S.A. • 81
newmont Mining Corp. • 97
nexen Inc. 101
nike Inc. • 68
nippon Yusen K.K. 92
nKSJ Holdings Inc. • 93
nokia Corp. • 69
nomura Holdings Inc. 78
nongshim Co. Ltd. 81
northern Trust Corp. 78
novartis AG • 103
novo nordisk A/S • 103
novozymes A/S • • 65
nSK Ltd. 61
nYSE Euronext 78

The Sustainability Yearbook 2012Company Overview
124
SAM
Sec
tor
Lead
er
SAM
Sec
tor
Mov
er
SAM
Gol
d C
lass
SAM
Silv
er C
lass
SAM
Bro
nze
Cla
ss
Page
Company name
Office Depot Inc. 86
Outokumpu Oyj • 110
Owens Corning • 66
Panasonic Corp. • 94
Pearson plc • • 95
PepsiCo Inc. • • 64
Petroleo Brasileiro S/A 101
Philips Electronics n.v. • • 94
Pirelli & C. S.p.A. • • 61
Portugal Telecom SGPS S/A • 79
POSCO • 110
PostnL • • 92
Potash Corp. of Saskatchewan Inc. 67
Praxair Inc. • 67
Premier Farnell plc 111
Provident Financial plc 78
PTT PCL 101
Public Service Enterprise Group Inc. • 76
Puma AG • 68
Qantas Airways Ltd. • • 59
Quest Diagnostics Inc. 87
Rautaruukki Oyj • • • 110
Red Electrica Corp. S.A. 76
Redecard S/A 78
Reed Elsevier n.v. • 95
Rentokil Initial plc 111
Repsol YPF S.A. • • 101
Rhodia S.A. 67
Rio Tinto Group • 97
Roche Holding AG • • 103
Rohm Co. Ltd. 107
Rolls-Royce Group plc • 58
Royal Bank of Canada 63
Royal Bank of Scotland Group plc 63
RSA Insurance Group plc • 93
RWE AG • 76
Saipem S.p.A. 100
SAM
Sec
tor
Lead
er
SAM
Sec
tor
Mov
er
SAM
Gol
d C
lass
SAM
Silv
er C
lass
SAM
Bro
nze
Cla
ss
Page
Company name
Samsung Electro-Mechanics Co. Ltd. • 75
Samsung Electronics Co. Ltd. • • • 107
Samsung Heavy Industries Co. Ltd. 91
Samsung SDI Co. Ltd. • • 77
Samsung Securities Co. Ltd. • 78
Sandvik AB 91
Sanofi S.A. • 103
Santos Ltd. 101
SAP AG • • 108
Sara Lee Corp. 81
Sasol Ltd. • 101
SBM Offshore n.v. 100
Schlumberger Ltd. 100
Schneider Electric S.A. 75
Schroders plc 78
SEGRO plc 105
Sekisui Chemical Co. Ltd. • • • 89
SembCorp Industries Ltd. 100
Seven & I Holdings Co. Ltd. 86
Shaftesbury plc 105
Siam Cement Pcl • • 66
Siemens AG • • 73
SK C&C Co. Ltd. • • 71
SK Telecom Co., Ltd. • • • 98
SKF AB 91
Smith & nephew plc 96
Snam Rete Gas S.p.A. • 85
Sociedad General Aguas de Barcelona SA 1 • 115
Societe Generale S.A. 63
Sodexo S.A. • • 90
S-Oil Corp. • 101
Sonoco Products Co. • • • 72
Spectra Energy Corp. • 85
Standard Chartered plc 63
Standard Life plc • 93
Staples Inc. 86
State Street Corp. 78
1 This company is not part of the largest 2,500 companies of the Dow JonesGlobal Stock Market Index and therefore not eligible for SAM Sector Leader.

The Sustainability Yearbook 2012Company Overview
125
SAM
Sec
tor
Lead
er
SAM
Sec
tor
Mov
er
SAM
Gol
d C
lass
SAM
Silv
er C
lass
SAM
Bro
nze
Cla
ss
Page
Company name
Statoil ASA 101
Stockland • • 105
Stora Enso Oyj • 82
Storebrand ASA • 93
STX Engine Co. Ltd. 91
Suez Environnement S.A. • • 115
Sulzer AG 91
Sumitomo Forestry Co. Ltd. • 89
Suncor Energy Inc. 101
Swiss Re • • 93
Symantec Corp. 108
Syngenta AG • 67
TABCorp Holdings Ltd. • • 84
Taiwan Semiconductor Manufacturing Co. Ltd. • 107
Target Corp. 86
Tata Consultancy Services Ltd. 71
Tata Steel Ltd. 110
TDK Corp. 75
Technip S.A. • • 100
Teck Resources Ltd. • 97
Teijin Ltd. • 67
Telecom Italia S.p.A. • 79
Telefonica S.A. • 79
Telenet Group Holding n.v. • • 95
Telenor ASA 98
Television Francaise 1 S.A. 95
TeliaSonera AB 98
Teradata Corp. • • 71
TERnA S.p.A. • 76
Tesco plc 80
TnT Express n.v. • 92
Tokio Marine Holdings Inc. • 93
Toshiba Corp. • 73
Total S.A. • 101
Toto Ltd. 66
TransAlta Corp. 76
TransCanada Corp. • • • 104
SAM
Sec
tor
Lead
er
SAM
Sec
tor
Mov
er
SAM
Gol
d C
lass
SAM
Silv
er C
lass
SAM
Bro
nze
Cla
ss
Page
Company name
Transurban Group • 92
Trend Micro Inc. 108
TUI AG • • 113
TUI Travel plc • • 113
UBS AG 63
Umicore S.A. 67
Unibail-Rodamco S.A. 105
UniCredit S.p.A. 63
Unilever n.v. • • 81
United Microelectronics Corp. • 107
United Parcel Service Inc. 92
United Technologies Corp. • 58
United Utilities Group plc • • 115
UnitedHealth Group Inc. • • • 87
Usinas Siderurgicas de Minas Gerais S/A 110
verbund AG 76
vestas Wind Systems A/S • • • 106
vodafone Group plc 98
volkswagen AG • 62
volvo AB • 91
Wal-Mart de Mexico S.A.B. de C.v. 86
Walt Disney Co. 95
Wesfarmers Ltd. 86
Westpac Banking Corp. • • 63
Weyerhaeuser Co. 66
Wipro Ltd. • 71
Wolters Kluwer n.v. • 95
Woodside Petroleum Ltd. • 101
Woolworths Holdings Ltd. 86
Woolworths Ltd. • 80
Woongjin Chemical Co. Ltd. • • 68
Woongjin Coway Co., Ltd. • 74
WPP plc 95
Xerox Corp. • 70
Xstrata plc • • 97
Zurich Financial Services AG • 93

The Sustainability Yearbook 2012
126
DiSClaiMer
Important legal information:
no offer: The information and opinions contained in this publication constitute neither a solicitation, nor a recommendation, nor an offer, nor an
invitation to make an offer to buy or sell any securities or any options, futures or other derivatives related to such securities and are for information
purposes only. The information described in this publication is not directed to persons in any jurisdiction where the provision of such information would
run counter to local laws and regulation.
no warranty: This publication is derived from sources believed to be accurate and reliable, but neither its accuracy nor completeness is guaranteed.
The material and information in this publication are provided “as is” and without warranties of any kind, either expressed or implied. KPMG
International Cooperative (“KPMG International”) and/or KPMG member firms and SAM and their related and affiliated companies disclaim all
warranties, expressed or implied, including, but not limited to, implied warranties of merchantability and fitness for a particular purpose. Any opinions
and views in this publication reflect the current judgment of the authors and may change without notice. It is each reader’s responsibility to evaluate
the accuracy, completeness and usefulness of any opinions, advice, services or other information provided in this publication.
limitation of liability: All information contained in this publication is distributed with the understanding that the authors, publishers and distributors
are not rendering legal, accounting or other professional advice or opinions on specific facts or matters and accordingly assume no liability whatsoever
in connection with its use. In no event shall KPMG International and/or KPMG member firms and SAM and their related, affiliated and subsidiary
companies be liable for any direct, indirect, special, incidental or consequential damages arising out of the use of any opinion or information expressly
or implicitly contained in this publication.
Copyright: Unless otherwise noted, text, images and layout of this publication are the exclusive property of KPMG International and/or KPMG
member firms, SAM and/or their related, affiliated and subsidiary companies and may not be copied or distributed, in whole or in part, without the
express written consent of KPMG International and/or KPMG member firms and SAM or their related and affiliated companies. Copyright © 2012
SAM – all rights reserved.
SAM services are offered in the US by Sustainable Asset Management USA Inc. (“SAM US“) an Investment Adviser registered with the Securities
and Exchange Commission under the Investment Advisers Act of 1940. SAM is a subsidiary of Robeco Groep n.v. (“Robeco“), a Dutch investment
management firm headquartered in Rotterdam, the netherlands. In connection with providing investment advisory services to its clients, SAM US
will utilize the services of certain personnel of SAM, and Robeco Investment Management, Inc. (“RIM“), each a subsidiary of Robeco. The securities
identified and described do not represent all of the securities purchased, sold or recommended. It should not be assumed that an investment in these
securities was or will be profitable.
This publication is
printed on paper from
sustainable sources
D.L.: M-49661-2011
RECYCLEDPaper made fromrecycled material

SAM is a member of Robeco, which was established in 1929 and offers a broad
range of investment products and services worldwide. Robeco is a subsidiary
of the Rabobank Group which has the highest credit rating* of all privately owned
banks, awarded by rating agencies Moody’s, Standard & Poor’s, Fitch and DBRS.
SAM was founded in 1995, is headquartered in Zurich and employs over 100
professionals. As of June 30, 2011, SAM’s total assets amount to EUR 11.3 billion.
*This rating does not apply to managed products.
FoCuS
SAM focuses on exploiting sustainability insights to generate attractive
long-term investment returns.
MeThoDoloGy
SAM is one of the market leaders when it comes to integrating financial
and sustainability insights into a structured investment process.
Our research underpins the globally recognized Dow Jones Sustainability
Indexes (DJSI).
DaTaBaSe
SAM maintains one of the largest proprietary databases for corporate
sustainability – a database that forms an integral part of our investment
process.
exPerIeNCe
SAM has been one of the pioneers in Sustainability Investing since
1995.
PeoPle
SAM maintains a unique, cross-disciplinary investment team combining
leading-edge financial analytical skills with in-house technology and
scientific know-how. Additionally, SAM is supported by an unparalleled
global sustainability network.
Disclaimer:The views expressed in this commentary reflect those of SAM as of the date of this commentary. Any such views are subject to change at any time based on market and other conditions and SAM and Robeco disclaim any responsibility to update such views. These views may differ from those of other portfolio managers employed by SAM or its affiliates. Past performance is not an indication of future results. Discussions of specific companies, market returns and trends are not intended to be a forecast of future events or returns.
Copyright © 2012 SAM – all rights reserved.
SaM Sustainable asset Management uSa, Inc.909 Third Avenue · new York, nY 10022Phone +1 212 908 0188 · Fax +1 212 908 9672 [email protected] · www.robecoinvest.com
SaM Josefstrasse 218 · 8005 Zurich · SwitzerlandPhone +41 44 653 10 10 · Fax +41 44 653 10 [email protected] · www.sam-group.com
Related Documents