Competitive Alternatives Special Report: Focus on Tax 2014 Edition CompetitiveAlternatives.com/Tax Corporate Sponsors

Welcome message from author
This document is posted to help you gain knowledge. Please leave a comment to let me know what you think about it! Share it to your friends and learn new things together.
Transcript

Competitive AlternativesSpecial Report: Focus on Tax
2014 Edition
CompetitiveAlternatives.com/Tax
Corporate Sponsors

ii | Competitive Alternatives, Focus on Tax 2014
Contents1. Summary 1
2. Measuring Total Tax Costs 6
3. Components of Total Tax Costs 7
4. Digital 11
5. Research & Development 13
6. Corporate Services 17
7. Manufacturing 20
8. Appendix A – Detailed Results 22
9. Appendix B – Our Approach 39
Competitive Alternatives, Focus on Tax 2014 | 1
This report is a supplement to the 2014 edition of Competitive Alternatives, KPMG’s guide to international business location costs. This report assesses the general tax competitiveness of the 107 cities in 10 countries featured in the main research report, with a focus on 51 major international cities. The 10 countries examined are Australia, Canada, France, Germany, Italy, Japan, Mexico, the Netherlands, the United Kingdom, and the United States. Details of all cities covered are included in Appendix A.
Our goal in preparing this supplement is to offer a comprehensive methodology to assess the numerous and complex factors affecting a company’s tax burden, in order to provide a simple and effective approach for cross-location comparisons based on the tax results of different business scenarios.
To this end, this report compares the total tax burden faced by companies in each country and city, including:
• Corporate income taxes
• Property taxes
• Capital taxes
• Sales taxes
• Miscellaneous local business taxes
• Statutory labor costs (i.e., statutory plan costs and other payroll-based taxes).
Total tax costs are compared between countries and cities using a Total Tax Index (TTI) for each location. The TTI is a measure of the total taxes paid by corporations in a particular location, expressed as a percentage of total taxes paid by corporations in the US. Thus, the United States has a TTI of 100.0, which represents the benchmark against which the other countries and cities are scored. (For details of the calculation, see Appendix B.)
This study compares a number of model business operations to assess the average annual tax costs faced by these businesses during their first 10 years of operation. The model businesses are assumed to be foreign-owned and newly located in each jurisdiction, giving rise to potential incentives for investment and/or new job creation. Incentives based on generally available incentive programs in each jurisdiction are included in this study.
The three major tax components analyzed in this study are as follows:
• Corporate income tax (CIT): Companies are assumed to have a standard level of net income before income tax (in US dollars) in all locations. In this way, the amount of income tax paid can be compared among locations both in absolute dollars and as effective tax rates.
• Other corporate taxes (OCT): Other corporate taxes include property taxes, capital taxes, sales taxes, and miscellaneous business taxes. These taxes are based on actual business costs that would be incurred by each business in each location. For example, property tax costs in each US city are calculated by applying the property tax assessment rules for each city to actual property values for that city.
• Statutory labor costs (SLC): These costs include both statutory plan costs and other payroll-based taxes. These costs are calculated based on rates and rules applicable in each jurisdiction, as applied to actual wage and salary levels for that jurisdiction. For example, labor taxes are based on Mexican wage rates in Mexico and German wage rates in Germany, reflecting actual costs incurred by companies operating in different jurisdictions.
The tax rates used in this study are those in effect as at January 1, 2014. Tax calculations over the 10-year analysis horizon incorporate future tax changes announced on or before January 1, 2014, that will come into force during the next 10 years.
Summary
© 2012 KPMG LLP, a Canadian limited liability partnership and a member firm of the KPMG network of independent member firms affiliated with KPMG International Cooperative (“KPMG International”), a Swiss entity. All rights reserved.
1

2 | Competitive Alternatives, Focus on Tax 2014
Key findingsIn addition to the observations in the rest of this report regarding the overall and sector-specific tax costs of the locations compared, our analysis of the study results has also led to the following general observations:
• Tax policy varies widely by country. Our study reveals that there is no standard approach in setting tax policy among the countries examined. Although the types of taxes used to raise government revenues are more or less the same among countries, there is a huge range in how these taxes are weighted and applied. Some countries have a tax policy focused on delivering a low corporate income tax rate in order to compete for more businesses. These countries may need to rely more heavily on other taxes, such as sales or payroll taxes, to derive their tax revenues. Similarly, some countries use their tax policies to attract certain types of businesses with targeted incentives for activities such as manufacturing or research & development (R&D). A country’s tax policy choices can significantly affect the tax cost of doing business in that country.
• Differences in how taxes are weighted and applied create complexity. While companies often use a country’s corporate income tax rate as a proxy for overall tax costs in a location, this rate does not tell the whole story. Variations in how taxes are weighted and applied complicate efforts to compare tax costs effectively and highlight the need to make comparisons based on the complete range of tax costs that apply in each location. Consider France and Mexico; as discussed in Chapter 3, these two countries rank 2nd and 10th respectively for their effective rates of corporate income tax. However, once all other taxes are considered, Mexico’s rank rises
to 3rd due to its low statutory labor costs and other corporate taxes, while France’s rank falls to 10th due to its heavy reliance on payroll and other taxes.
• Tax costs vary widely by industry. The overall results for each location combine the results of different types of business operations, and results among the different business sectors vary widely. For companies in service industries, labor costs generally represent a more significant cost factor than for other companies and, so, the impact of statutory labor costs on these companies is more of an issue. Companies in the manufacturing sector are more capital intensive, so the imposition of capital taxes, property taxes, and the availability of tax incentives for manufacturing activities are more important considerations for such firms. R&D operations see the largest variations in tax costs among countries, due to intense competition among many countries to attract R&D businesses by offering generous tax incentives.
• Tax costs vary more widely than most other costs. In the main Competitive Alternatives 2014 study, we noted that taxes (excluding statutory labor costs) typically represent up to 14 percent of location-sensitive costs. This cost is lower than other main business costs, such as labor (44-90 percent of location-specific costs), facilities (2-16 percent) and transportation (7-24 percent) costs. However, while taxes do not comprise the largest portion of total costs, tax costs can vary greatly between locations. Since tax costs are likely to range more widely than other costs, they can take on greater importance than other costs in business location decisions.
Results by countryThe overall results for all locations are based on average results from 7 different business-to-business service sector operations and 12 different manufacturing sector operations.
Among the countries studied, Canada has the lowest Total Tax Index at 53.6. In other words, total tax costs in Canada are 46.4 percent lower than in the United States, which has a TTI of 100.0 and represents the benchmark against which all locations are scored. The United Kingdom, Mexico, and the Netherlands also have a TTI score below the US, while at the other end of the spectrum, France’s TTI of 163.3 signifies that total tax costs in France are 63.3 percent higher than in the US.
The TTI rankings of countries in 2014 are broadly consistent with the 2012 rankings among the 10 countries. The United Kingdom has moved ahead of Mexico, and Australia has moved ahead of Germany, but all other countries rank consistently between the 2012 and 2014 standings. Even among the countries whose rankings have not changed, Japan, Italy, and France have seen significant improvements in their TTI scores. These changes in ranking relate to both changes in tax policy since 2012 and other sundry changes, including:
• The United Kingdom sees its TTI fall by 6.7 points between 2012 and 2014. This change is partly due to ongoing reductions in corporate income taxes in the UK, where the main tax rate is gradually being reduced to 20 percent by 2015.
• Meanwhile in Mexico, corporate income tax rate cuts scheduled for 2013 and 2014 were scrapped,and new restrictions imposed on the deductibility of employee benefits. These factors contribute to an increase in TTI of 6.6 points for Mexico in the current study.
Competitive Alternatives, Focus on Tax 2014 | 3
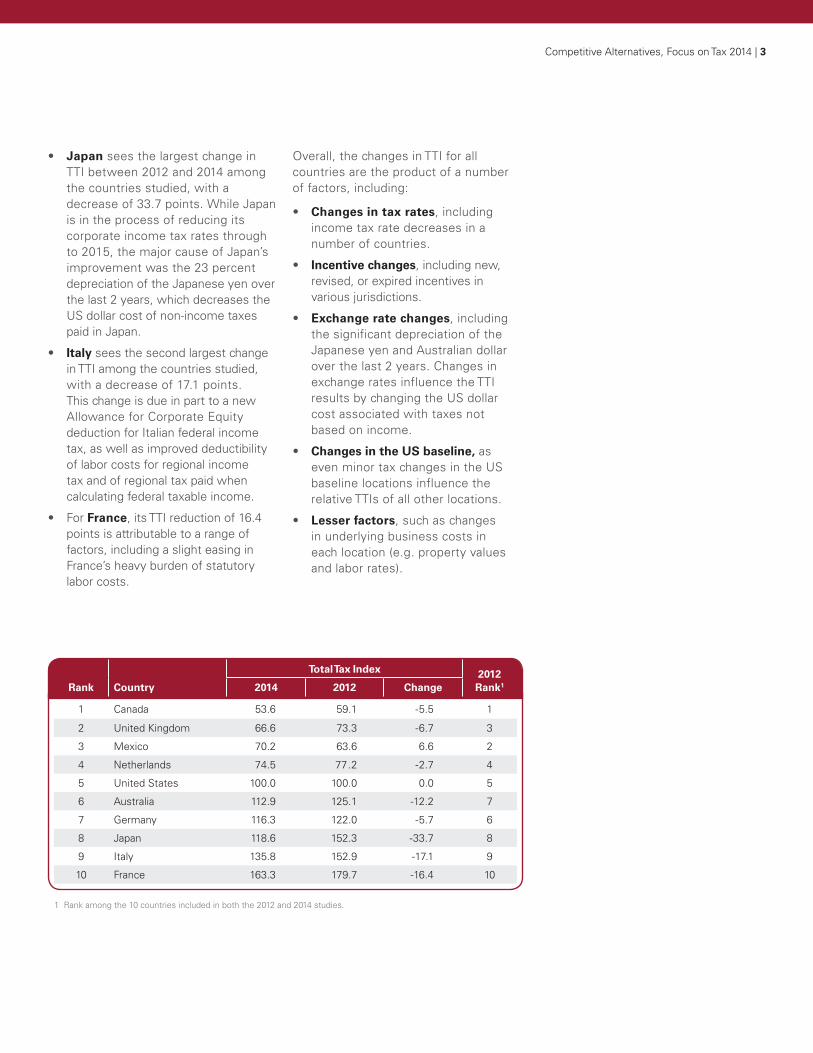
• Japan sees the largest change in TTI between 2012 and 2014 among the countries studied, with a decrease of 33.7 points. While Japan is in the process of reducing its corporate income tax rates through to 2015, the major cause of Japan’s improvement was the 23 percent depreciation of the Japanese yen over the last 2 years, which decreases the US dollar cost of non-income taxes paid in Japan.
• Italy sees the second largest change in TTI among the countries studied, with a decrease of 17.1 points. This change is due in part to a new Allowance for Corporate Equity deduction for Italian federal income tax, as well as improved deductibility of labor costs for regional income tax and of regional tax paid when calculating federal taxable income.
• For France, its TTI reduction of 16.4 points is attributable to a range of factors, including a slight easing in France’s heavy burden of statutory labor costs.
Overall, the changes in TTI for all countries are the product of a number of factors, including:
• Changes in tax rates, including income tax rate decreases in a number of countries.
• Incentive changes, including new, revised, or expired incentives in various jurisdictions.
• Exchange rate changes, including the significant depreciation of the Japanese yen and Australian dollar over the last 2 years. Changes in exchange rates influence the TTI results by changing the US dollar cost associated with taxes not based on income.
• Changes in the US baseline, as even minor tax changes in the US baseline locations influence the relative TTIs of all other locations.
• Lesser factors, such as changes in underlying business costs in each location (e.g. property values and labor rates).
Rank Country
Total Tax Index 2012 Rank12014 2012 Change
1 Canada 53.6 59.1 -5.5 1
2 United Kingdom 66.6 73.3 -6.7 3
3 Mexico 70.2 63.6 6.6 2
4 Netherlands 74.5 77.2 -2.7 4
5 United States 100.0 100.0 0.0 5
6 Australia 112.9 125.1 -12.2 7
7 Germany 116.3 122.0 -5.7 6
8 Japan 118.6 152.3 -33.7 8
9 Italy 135.8 152.9 -17.1 9
10 France 163.3 179.7 -16.4 10
1 Rank among the 10 countries included in both the 2012 and 2014 studies.

4 | Competitive Alternatives, Focus on Tax 2014
Results by cityFor the purposes of this study, we compared 107 cities from the 10 countries noted previously. In this report, we highlight 51 major international cities, representing those cities used in developing the international comparisons (2-4 cities per country) plus additional cities with metro area populations of at least 2 million (primarily in the United States). We believe that this group of cities will be of most interest to companies seeking to locate international business operations. Detailed results for all cities are presented in Appendix A.
The results for the 51 major cities generally follow the results by country above. However, the spread of results among cities in the various countries differs greatly from country to country:
• In the Netherlands and Germany, the spread of tax burdens between cities is relatively low, due to highly centralized tax systems. In the Netherlands, the tax burden spread between Eindhoven and Twente Region is only 0.5 points, and in Germany the spread between Frankfurt and Berlin is 0.6 points.
• The spread of tax burdens is 1.5 points between cities in Mexico and less than 5.5 points between cities in Italy and cities in Australia. In these countries, low internal variations in tax burden make taxes a relatively less significant consideration in the process of selecting business locations within the country.
• In comparison, countries with less centralized tax systems see much larger variations in tax burden among cities, and selection of an appropriate business location within the country can have a much greater impact on total tax costs. For example, in the United States, the tax burden spread between Cincinnati and New York City is 38.3 points, while in Japan the tax burden spread between Osaka and Tokyo is 17.5 points.
• The United Kingdom presents a different situation, with a 16.9 point spread between Manchester and London despite the UK having a highly centralized tax system. The UK’s standardized rates for local property taxes fail to reflect the huge gulf in property values that exists between London and other cities, resulting in a much higher burden for other corporate taxes in London than in Manchester.
Underlying business cost fundamentals also have a significant impact on tax costs. In the Competitive Alternatives 2014 study, this same group of cities was ranked based on total business costs. In most countries, cities are ranked in the same general order in those rankings of total business costs and this ranking of total tax costs, but exceptions include:
• In Canada the ranking of Montreal varies between the two studies, having the lowest total business costs but the highest total tax costs among the large Canadian cities.
• In the United States, Cincinnati has the lowest tax costs and second lowest total business costs, behind Atlanta, while New York City has the highest tax costs and second highest total business costs, ahead of only San Francisco. However, there are also cities with high business costs but low tax costs or vice versa. For example, St. Louis ranks 9th among the 31 large US cities for total business costs but 28th for total tax costs, while Philadelphia ranks 23rd among 31 US cities for total business costs but 6th for total tax costs.

Competitive Alternatives, Focus on Tax 2014 | 5
Results by sectorIn this chapter, the TTI results presented reflect the overall results for each location, based on average results from 7 service sector operations and 12 manufacturing sector operations. TTI results also vary among the business sectors and subsectors examined:
• Digital services (see Chapter 4) operations tend to see a lower impact of other corporate taxes than in other sectors. Targeted incentives for digital media production are also an important consideration in this subsector.
• R&D operations (see Chapter 5) are separately assessed due to the strong focus most countries and regions have on fostering innovation through the provision of tax incentives for R&D activities.
• Corporate services (see Chapter 6) operations are the most “pure” representation of the corporate income tax system in most locations, as fewer special tax incentives apply to these activities. Statutory labor costs are generally significant for these operations.
• Manufacturing (see Chapter 7) is characterized by the importance of taxes on capital and property, and the frequency of special incentives for investment or job creation being used to stimulate manufacturing.
RankMajor International Cities
Total Tax Index
1 Toronto, CA 51.6
2 Vancouver, CA 54.5
3 Montreal, CA 55.6
4 Manchester, UK 58.1
5 Monterrey, MX 69.4
6 Mexico City, MX 70.9
7 Cincinnati, US 73.5
8 Eindhoven, NL 74.2
9 Twente Region, NL 74.7
10 London, UK 75.0
11 Cleveland, US 80.2
12 Atlanta, US 81.1
13 Baltimore, US 81.2
14 Pittsburgh, US 81.9
15 Philadelphia, US 84.1
16 Charlotte, US 84.5
17 Minneapolis, US 88.1
18 Orlando, US 88.2
19 Tampa, US 89.1
20North Virginia (Metro DC), US
89.9
21 Detroit, US 90.0
22 Boston, US 90.0
23 Miami, US 91.7
24 Portland, US 92.5
25 Houston, US 93.2
26 Denver, US 93.4
RankMajor International Cities
Total Tax Index
27 Chicago, US 93.9
28 Dallas-Fort Worth, US 94.1
29 Seattle, US 95.4
30Riverside- San Bernardino, US
95.4
31 Phoenix, US 95.6
32 San Antonio, US 95.9
33 San Diego, US 96.3
34 Sacramento, US 96.6
35 Las Vegas, US 97.1
36 Los Angeles, US 100.1
37 St. Louis, US 100.7
38 Kansas City, US 101.4
39 San Francisco, US 102.1
40 Osaka, JP 109.8
41 Melbourne, AU 111.0
42 New York City, US 111.8
43 Brisbane, AU 112.9
44 Sydney, AU 114.9
45 Frankfurt, GE 116.0
46 Berlin, GE 116.6
47 Tokyo, JP 127.3
48 Milan, IT 133.2
49 Rome, IT 138.3
50 Marseille, FR 159.6
51 Paris, FR 166.9

6 | Competitive Alternatives, Focus on Tax 2014
This report uses two separate measures for total tax costs, with both measures incorporating all manner of taxes levied on corporations—broadly speaking, income taxes, property taxes, capital taxes, sales taxes, miscellaneous local business taxes, and statutory labor costs (statutory plan costs and other payroll-based taxes).
Total Tax Index (TTI) is the primary measure used throughout this report to compare tax burdens by comparing the total actual tax cost (in US dollars) for each jurisdiction. For calculating income taxes, net income before income tax has been standardized as a fixed dollar amount in all locations, so that total taxes paid can be realistically compared in absolute dollar terms.
Total Effective Tax Rate (TETR) expresses total tax costs as an effective rate and contextualizes tax burden relative to income. TETR is the sum of the effective rates of corporate income tax (net of incentives), other corporate taxes, and statutory labor costs, all expressed as a percentage of standardized net income before income taxes.
TTI and TETR rankings are identical.
In calculating taxes, the study includes income taxes imposed by all levels of government (national, regional, and/or local), reflecting specific income tax rules for each jurisdiction (as discussed further in Chapter 3). Other taxes are also calculated according to specific local rules.
Labor taxes and other non-income taxes are calculated to reflect actual business costs in each location using data on wage rates, real property values, and other relevant business cost factors from KPMG’s Competitive Alternatives 2014 comparison of international business costs. For example:
• Statutory labor costs are calculated using contribution rates and rules applicable to the statutory programs
in each country, based on local wage rates (e.g., Mexican wage rates in Mexico and German wage rates in Germany). In this way, the final costs reflect real world costs incurred by companies operating in different jurisdictions.
• Property tax costs are calculated using local property tax rates and rules applicable in each location, based on local property values (e.g., Japanese property values in Japan and US property values in the United States). Again, this reflects real world costs incurred by companies operating in different jurisdictions.
For more details, including a numerical example of how TTI and TETR are calculated, see Appendix B.
Measuring Total Tax Costs2

Competitive Alternatives, Focus on Tax 2014 | 7
Total tax costs analyzed in this study comprise three core components, as follows:
• Corporate income taxes
• Other corporate taxes (such as property, capital, sales, and miscellaneous local taxes)
• Statutory labor costs (representing the employer portion of required pension, unemployment, medical, workplace injury, or similar plan contributions, and/or other payroll-based taxes).
In the chart below, the main bars present the TTI for each of the 10 countries studied, and also illustrate the relative share of each tax component in total tax costs. The chart also presents (in green) the effective corporate income tax rate in each country. As seen in the chart, effective corporate income tax rates vary
directly with the share of income taxes in total tax costs, but do not provide any useful information regarding the total tax costs in each country. Full consideration of other corporate taxes and statutory labor costs is essential to obtain an understanding of the total tax burden in any country.
The importance of the three tax components varies quite significantly among countries:
• Effective corporate income tax rates are directly related to the share of income taxes in total tax costs. Corporate income taxes are lowest in Canada (7.2 percent effective rate), France (13.3 percent), and the United Kingdom (13.9 percent). At the other end of the scale, effective corporate income taxes exceed 30 percent in
Japan and Mexico (both at 32.1 percent). These effective income tax rates are significantly lower than the nominal tax rates in many countries due to the inclusion of various tax incentives, including R&D tax incentives, in these calculations.
• Other corporate taxes represent the smallest component of total tax costs in most countries examined. However, even here, the impact of these taxes varies widely between countries. The Netherlands, Mexico, and Australia are the countries with the lowest costs for other corporate taxes, while other corporate taxes are highest in France, the United States, and Japan.
• Statutory labor costs represent the tax component with the greatest variations among the study countries. Mexico, the United Kingdom, and Canada have the lowest statutory labor costs, while these costs are highest in Australia, Italy, and France.
These differences highlight the different ways in which countries collect taxes to fund required programs and services, and also highlight the importance of basing international (or inter-regional) tax comparisons on factors beyond the corporate income tax rate. To further highlight the impact of other corporate taxes and statutory labor costs, compare the results for Mexico and France. These two countries rank 10th and 2nd, respectively, for their effective corporate income tax rates, but rank 3rd and 10th, respectively, for total tax costs after considering other corporate taxes and statutory labor costs.
Components of Total Tax Costs3
Total Tax Index by Type of Tax, and Effective Corporate Income Tax Rates - Overall
0%
20%
40%
60%
80%
100%53.6 66.6 70.2 74.5 100.0 112.9 116.3 118.6 135.8 163.3
0
40
80
120
160
200
CA UK MX NL US AU GE JP IT FR
Effe
ctiv
e C
orpo
rate
Inco
me
Tax
Rat
e .
Tota
l Tax
Inde
x (T
TI)
Total Tax Index by Type of Tax, and Effective Corporate Income Tax Rates – Overall
Share of total taxes: Corporate income taxes, net of incentivesShare of total taxes: Other corporate taxesShare of total taxes: Statutory labor costs
Effective rate of corporate income tax, net of incentives (RHS)
TTI:
8 | Competitive Alternatives, Focus on Tax 2014
Income taxesIncome taxes represent the first major component of total tax costs. While countries are often compared based on the national corporate income tax rate, this falls far short of providing a comprehensive picture of actual income tax costs in a country. In some countries, such as Australia, France, and the United Kingdom, income tax only applies at the national level, while in other countries separate income taxes may also be levied by states or provinces (in Canada, Italy, and the United States), by local governments (such as in Germany), or by all three levels of government (in Japan and in certain US cities).
Also, there is the issue of whether an income tax actually exists at all in a jurisdiction, with some US states (e.g. Washington, Texas) claiming no income tax, but instead having taxes based on gross receipts with limited deductions. Clearly, such taxes are based on income—just gross income instead of net income—and give rise to the likelihood of a tax liability even if the company is in a net loss position. A move from net income taxes to gross receipts taxes was seen in several US states during the 2000’s, although Michigan’s reversion to a standard net income tax system in 2014 represents one move away from the gross receipts approach.
Stepping back to the beginning of the income tax calculation process, one must consider the actual base to which tax rates are applied. Most jurisdictions require some adjustments to net income before tax when determining taxable income. Some examples of the types of adjustments that need to be considered in the various countries are as follows:
• In the United States, rules regarding Qualified Productive Activities Income (QPAI or s. 199 Deduction) provide for a deduction equal to 9 percent of
net income derived from domestic manufacturing, limited to no more than 50 percent of wages paid. This works out to be effectively equivalent to a 3 percent tax rate reduction for manufacturers on their federal income taxes. Some states allow this additional deduction to flow through to state taxable income calculations, but many do not.
• In Italy, the regional income tax (regional tax on productive activities or IRAP) only allows a partial deduction for wage and salary costs. For most workers, deductible costs are limited to the first €7,500 of wages or salaries plus the employer’s share of social security payments. These rules result in a taxable income base that is far higher than net income before tax, especially for firms where payroll represents a major business cost.
• In Italy, the calculation of federal taxable income now includes a new Allowance for Corporate Equity, allowing companies a deduction for the notional return on new equity brought into (or re-invested in) the corporation.
• In Germany, the local income tax (local trade tax) disallows a deduction for 25 percent of interest paid and 20 percent of lease or rental payments on movable assets. This results in higher taxable income, especially for capital-intensive firms with significant equipment under lease.
• Different deductibility rules even exist for income taxes themselves. For example:
– In the US, state income taxes paid are deducted for federal income tax purposes. At the state level, a mix of rules exist, with some states allowing no deduction for income taxes, other states allowing deductions for taxes paid only to other states, others allowing a deduction only for taxes paid in
their own state, some allowing a deduction for federal taxes, and some allowing a combination of the above.
– In Italy, regional income tax paid is deductible when calculating federal taxable income only to the extent that the regional tax liability was due to non-deductible labor costs in the calculation of regional taxable income.
While the model business operations used in this study did not contain specific assumptions regarding items such as bad debts, provisions, asset sales, dividend distributions, and charitable donations, such items can cause further significant adjustments to taxable income.
Once taxable income has been determined, then calculation of gross income tax begins:
• While many countries impose a simple flat rate of corporate income tax, such as current rates of 30 percent in both Australia and Mexico, other countries adopt a variety of graduated tax rate structures. For example, the Netherlands has a relatively simple progressive tax structure: 20 percent on the first € 200,000 of taxable income and 25 percent on the excess. At the other end of the spectrum is Japan, which has a complex system in which three levels of government levy four separate taxes at varying rates based on net taxable income, corporate capital, and national corporate income tax paid.
• Once regular income tax has been determined, it is also necessary to consider the possibility of minimum tax rules. For example:
– In the United States, the Alternative Minimum Tax (AMT) system recalculates net taxable income with a number of adjustments, including less favorable depreciation write-offs.

Competitive Alternatives, Focus on Tax 2014 | 9
AMT income is subject to tax at a rate of 20 percent, and AMT is only payable if it exceeds regular income tax calculated for the year.
– France has a minimum tax payable by many companies (IFA), with fixed minimum tax amounts due based on turnover of the corporation. The IFA is intended to be abolished from 2014, although its abolition has been previously deferred.
– Mexico formerly had a minimum tax system called the Flat Rate Business Tax (IETU). However, recent tax reforms in Mexico saw the elimination of this tax for 2014 and subsequent years.
Finally, following the calculation of gross income tax and any minimum tax liability, income tax credits also need to be factored in to the calculation of net income tax costs. Examples of such credits are as follows:
• Many jurisdictions offer R&D tax credits, which are discussed in Chapter 5. Some jurisdictions also offer tax credits for digital media production and/or other IT activities, which are discussed in Chapter 4.
• In the United States, most states offer some form of income tax credit for new investment and/or job creation to help stimulate economic development. The scope of this study includes significant, commonly available tax credit programs with clearly defined eligibility criteria and
calculation formulas. Discretionary or negotiated tax credits are not included in this analysis.
• In Canada, federal income tax credits for investment in manufacturing facilities and equipment are available, but only in certain parts of the country.
• In countries that have minimum tax rules, minimum tax paid in prior years in excess of regular income tax for those years may also give rise to credits that can offset future income tax.
All of these issues need to be considered to effectively compare income tax burdens between countries and cities, and have been considered in this study.

10 | Competitive Alternatives, Focus on Tax 2014
Other corporate taxesThe other corporate taxes considered in this study include property, capital, sales, and miscellaneous local business taxes. The study disregards as immaterial any taxes where the estimated cost to the business is less than US$1,000 per year.
Property-based taxes apply in all countries and cities studied, although the applicable categories of assets, tax rates, tax bases, and administration of these taxes can vary significantly between locations. In this study, property taxes were calculated based on actual local tax rates and actual real estate values in each city, adjusted (where required) to reflect property assessment methods for each location. Property-based taxes on real estate are included in this analysis, as follows:
• For manufacturing operations all real estate property taxes are included in the analysis. (For the purposes of this analysis, manufacturing operations are assumed to locate in single-occupant industrial facilities, with all property taxes being paid by the occupant.)
• For service operations real estate property taxes are included in the analysis only where the tax is levied directly on the business occupant (tenant), rather than the property owner (landlord). (For the purposes of this analysis, service operations are assumed to locate in leased, multi-tenant office space.) In our broader Competitive Alternatives 2014 study of total business costs, property taxes passed on by a landlord to a tenant were captured indirectly as part of total office leasing costs (gross rent), but were not separately identifiable and cannot be included here in this Focus on Tax analysis.
Capital taxes only apply in certain countries and regions as follows:
• In the United States, capital taxes (in various forms) apply in about 40 percent of all locations examined.
• In Japan, prefectural and municipal capital taxes apply in the locations considered in this study.
• In Italy, a national tax applicable to relevant corporate borrowings imposes a minor one-time tax cost.
• In France, minor capital tax costs exist due to one-time taxes or fees on the issuance of share capital.
• In Canada, the last of the provincial capital taxes on general corporations has been eliminated since the prior 2012 edition of this study.
Sales and transaction taxes come in various forms in different countries and regions, and impact upon companies differently:
• Gross receipts taxes apply in a small number of jurisdictions in the United States, either instead of, or in addition to, state or local income taxes. In 2010, France also introduced a modified gross receipts tax based on gross value added.
• Non-refundable sales taxes apply in most US states and some Canadian provinces. Where non-refundable sales taxes apply, exemptions are often available for many of the costs incurred by manufacturers to avoid the compounding of taxes into the price of goods at each stage of the production process.
• Refundable value-added taxes (VAT or GST). These taxes apply in all of the countries included in this study, except for the United States. For this analysis, value-added taxes are generally excluded since their refundable nature means there is no net cost to a business once input tax credits (refunds) have been claimed.
While these taxes do impose a cost on companies in terms of cash flow timing and administration, such costs are not considered material to this study. Any net costs related to restrictions on claiming input tax credits are considered as non-refundable sales taxes.
• Land and share transfer taxes. These one-time transfer taxes have not been considered in this analysis due to the specific assumptions made for the model business operations examined.
Miscellaneous local business taxes. Most taxes levied by all levels of government are captured within one of the other broad tax definitions outlined in this chapter. However, some miscellaneous local business taxes do apply and have been considered in this analysis if material to the business operation. For example, in the United States, a local business tax of US$4.50 per employee per annum applies to many types of businesses located in Miami.
Statutory labor costsAll countries studied levy a variety of charges and taxes on payroll, which we refer to collectively as statutory labor costs. In some cases, such as the payroll taxes levied by Australian states, these taxes go to general revenue. However, in most cases, they relate to specific statutory plans, such as social security, medical care, unemployment insurance, and/or workplace injury insurance. The number, scope, rates, and complexity of these taxes can vary immensely between countries and regions.

Competitive Alternatives, Focus on Tax 2014 | 11
Results for the digital services sector are based on an analysis of two model business operations: a software development firm and a video game production studio.
Digital Services4
Results by countryThe ranking of countries for this sector is generally consistent with the overall results presented above, although several notable differences do exist.
Canada ranks first for digital services operations with a very low TTI of 17.1, primarily due to significant provincial incentives that provide financial support to video game producers and other digital media industries. (Canada is not alone in this regard; approximately one third of US states also offer significant incentives to the digital media industry.)
Mexico ranks fourth among the countries in this subsector, ranking below both its overall ranking in this study (3rd) and its 2012 ranking in this subsector (2nd). Mexico’s ranking is impacted by a 2014 tax reform that imposed new restrictions on the deductibility of many employee benefits for federal income tax purposes. The impact of this change is particularly noticeable in this subsector of highly paid professionals with significant costs associated with employee benefits.
Rank CountryTotal Tax
Index2012 Rank1
1 Canada 17.1 1
2 United Kingdom 69.1 3
3 Netherlands 86.9 4
4 Mexico 93.9 2
5 United States 100.0 5
6 Japan 111.2 7
7 Germany 124.2 6
8 Australia 128.3 8
9 Italy 170.3 9
10 France 190.9 10
1 Rank among the 10 countries included in both the 2012 and 2014 studies.
RankMajor International Cities
Total Tax Index
1 Montreal, CA 16.9
2 Toronto, CA 17.1
3 Vancouver, CA 44.4
4 Cincinnati, US 60.9
5 Cleveland, US 62.2
6 Manchester, UK 64.8
7 London, UK 73.4
8 Atlanta, US 75.1
9 Eindhoven, NL 86.8
10 Twente Region, NL 86.9
11 San Antonio, US 90.0
12 Orlando, US 90.1
13 Dallas-Fort Worth, US 90.4
14 Houston, US 90.5
15 Tampa, US 90.6
16 Miami, US 91.1
17 Monterrey, MX 92.8
RankMajor International Cities
Total Tax Index
18 Pittsburgh, US 93.5
19 St. Louis, US 94.0
20 Phoenix, US 94.3
21T1 Denver, US 94.5
21T1 Detroit, US 94.5
23 Mexico City, MX 95.0
24 Kansas City, US 95.2
25 Philadelphia, US 95.7
26 Minneapolis, US 95.8
27 Riverside-San Bernardino, US 96.6
28 San Diego, US 97.1
29 Sacramento, US 97.2
30 Charlotte, US 98.2
31 Los Angeles, US 98.6
32 Baltimore, US 99.8
33 San Francisco, US 100.3
34 Seattle, US 100.5
RankMajor International Cities
Total Tax Index
35 Las Vegas, US 102.2
36 Portland, US 102.3
37T1 Boston, US 103.9
37T1 North Virginia (Metro DC), US 103.9
39 Chicago, US 104.3
40 New York City, US 106.6
41 Osaka, JP 108.4
42 Tokyo, JP 114.0
43 Berlin, GE 122.6
44 Frankfurt, GE 125.8
45 Melbourne, AU 126.6
46 Brisbane, AU 127.9
47 Sydney, AU 129.9
48 Milan, IT 169.7
49 Rome, IT 170.7
50 Marseille, FR 184.3
51 Paris, FR 197.4
1 Exact ties exist between these pairs of cities. In other instances in this report, cities are shown with the same TTI rounded to one decimal place but with separate rankings, based on very small differences in total taxes paid in the underlying analysis.
12 | Competitive Alternatives, Focus on Tax 2014
Comparing the TTI rankings of countries in 2014 to 2012, the changes in ranking are generally consistent with the changes in overall rankings for the countries over the last two years. As explained for the overall results in Chapter 1, the United Kingdom now ranks ahead of Mexico overall, and the large improvement seen by Japan in its overall results allows it to move ahead of Germany in this subsector.
Results for major citiesThe results for the major international cities are generally consistent with the national results, with Montreal, Toronto, and Vancouver all exhibiting very low TTIs due to the impact of digital media incentives offered by the relevant Canadian provinces. State incentives for this industry, including new incentives in Ohio, also drive relatively strong results for a number of US cities in this sector, including Cincinnati, Cleveland, Atlanta, San Antonio, Orlando, Dallas-Fort Worth, Houston, Tampa, and Miami.
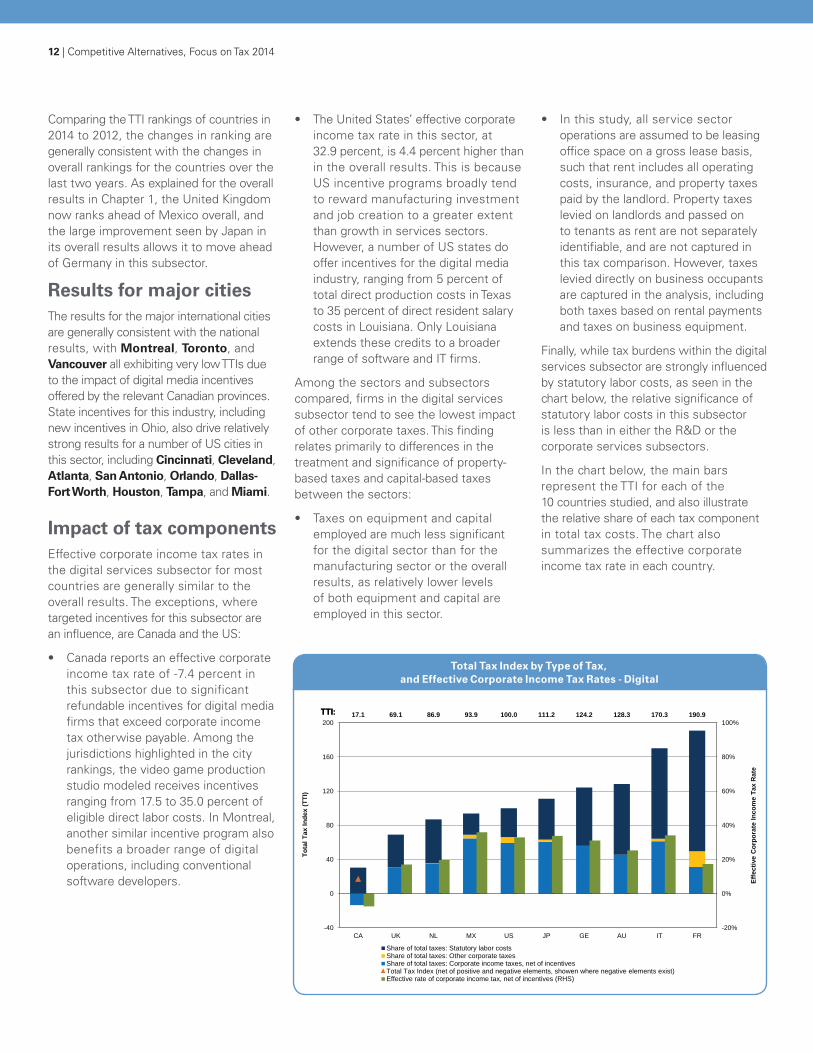
Impact of tax componentsEffective corporate income tax rates in the digital services subsector for most countries are generally similar to the overall results. The exceptions, where targeted incentives for this subsector are an influence, are Canada and the US:
• Canada reports an effective corporate income tax rate of -7.4 percent in this subsector due to significant refundable incentives for digital media firms that exceed corporate income tax otherwise payable. Among the jurisdictions highlighted in the city rankings, the video game production studio modeled receives incentives ranging from 17.5 to 35.0 percent of eligible direct labor costs. In Montreal, another similar incentive program also benefits a broader range of digital operations, including conventional software developers.
• The United States’ effective corporate income tax rate in this sector, at 32.9 percent, is 4.4 percent higher than in the overall results. This is because US incentive programs broadly tend to reward manufacturing investment and job creation to a greater extent than growth in services sectors. However, a number of US states do offer incentives for the digital media industry, ranging from 5 percent of total direct production costs in Texas to 35 percent of direct resident salary costs in Louisiana. Only Louisiana extends these credits to a broader range of software and IT firms.
Among the sectors and subsectors compared, firms in the digital services subsector tend to see the lowest impact of other corporate taxes. This finding relates primarily to differences in the treatment and significance of property-based taxes and capital-based taxes between the sectors:
• Taxes on equipment and capital employed are much less significant for the digital sector than for the manufacturing sector or the overall results, as relatively lower levels of both equipment and capital are employed in this sector.
• In this study, all service sector operations are assumed to be leasing office space on a gross lease basis, such that rent includes all operating costs, insurance, and property taxes paid by the landlord. Property taxes levied on landlords and passed on to tenants as rent are not separately identifiable, and are not captured in this tax comparison. However, taxes levied directly on business occupants are captured in the analysis, including both taxes based on rental payments and taxes on business equipment.
Finally, while tax burdens within the digital services subsector are strongly influenced by statutory labor costs, as seen in the chart below, the relative significance of statutory labor costs in this subsector is less than in either the R&D or the corporate services subsectors.
In the chart below, the main bars represent the TTI for each of the 10 countries studied, and also illustrate the relative share of each tax component in total tax costs. The chart also summarizes the effective corporate income tax rate in each country.
Total Tax Index by Type of Tax, and Effective Corporate Income Tax Rates - Digital
-20%
0%
20%
40%
60%
80%
100%17.1 69.1 86.9 93.9 100.0 111.2 124.2 128.3 170.3 190.9
-40
0
40
80
120
160
200
CA UK NL MX US JP GE AU IT FR
Effe
ctiv
e C
orpo
rate
Inco
me
Tax
Rat
e .
Tota
l Tax
Inde
x (T
TI)
Total Tax Index by Type of Tax, and Effective Corporate Income Tax Rates – Digital
Share of total taxes: Statutory labor costsShare of total taxes: Other corporate taxesShare of total taxes: Corporate income taxes, net of incentivesTotal Tax Index (net of positive and negative elements, showen where negative elements exist)Effective rate of corporate income tax, net of incentives (RHS)
TTI:TTI:

Competitive Alternatives, Focus on Tax 2014 | 13
Results for the R&D sector are based on an analysis of three model business operations: a biomedical R&D operation, a clinical trials management firm, and an electronic systems development/testing operation.
Results by countryThe TTI results of countries for R&D operations vary significantly from the other sectors and the overall results, primarily due to the impact of tax incentives that target R&D activities.
Canada, the United Kingdom, and the Netherlands all have particularly low TTI ratings, at less than 65, reflecting the effect of significant R&D incentives in those countries.
Even at the other end of the spectrum, France also offers significant R&D tax
credits, which are sufficient to cut France’s TTI rating to 148.1 for R&D, as compared to 190.9 in the digital sector. Thus, even in high-tax locations, R&D incentives can still have a significant impact in reducing total tax costs.
Comparing the TTI rankings of countries in 2014 to 2012 for the 10 countries, there is a ranking swap between the United Kingdom and the Netherlands, reversing a previous ranking flip between these two very competitive countries in 2012. Japan also moves ahead of Germany, for reasons already described in Chapter 1.
Research & Development5
Rank CountryTotal Tax
Index2012 Rank
1 Canada 30.6 1
2 United Kingdom 56.5 3
3 Netherlands 60.8 2
4 Mexico 99.8 4
5 United States 100.0 5
6 Australia 121.6 6
7 Japan 123.8 8
8 Germany 147.9 7
9 France 148.1 9
10 Italy 212.0 10
RankMajor International Cities
Total Tax Index
1 Montreal, CA 21.8
2 Vancouver, CA 36.1
3 Toronto, CA 39.3
4 Manchester, UK 52.5
5 London, UK 60.5
6 Eindhoven, NL 60.5
7 Twente Region, NL 61.1
8 Atlanta, US 83.0
9 Minneapolis, US 83.6
10 Cincinnati, US 86.4
11 Pittsburgh, US 88.0
12 Detroit, US 89.0
13 Portland, US 89.1
14 Baltimore, US 89.4
15 Cleveland, US 89.7
16 Phoenix, US 89.7
17 Philadelphia, US 90.2
RankMajor International Cities
Total Tax Index
18 Orlando, US 90.9
19 Charlotte, US 91.5
20 Tampa, US 92.2
21 Miami, US 93.0
22 Boston, US 94.2
23 Seattle, US 95.4
24 Riverside-San Bernardino, US 96.1
25 San Diego, US 96.9
26 Chicago, US 97.0
27 Sacramento, US 97.2
28 Denver, US 97.3
29 Monterrey, MX 98.5
30 St. Louis, US 98.6
31 Kansas City, US 99.3
32 Los Angeles, US 99.4
33 San Antonio, US 99.5
34 Dallas-Fort Worth, US 99.9
RankMajor International Cities
Total Tax Index
35 Houston, US 100.1
36 North Virginia (Metro DC), US 100.9
37 Mexico City, MX 101.3
38 San Francisco, US 101.8
39 Las Vegas, US 102.4
40 New York City, US 103.7
41 Osaka, JP 119.5
42 Melbourne, AU 119.6
43 Brisbane, AU 122.8
44 Sydney, AU 123.5
45 Tokyo, JP 128.2
46 Marseille, FR 140.7
47 Berlin, GE 146.8
48 Frankfurt, GE 149.0
49 Paris, FR 155.6
50 Milan, IT 211.9
51 Rome, IT 212.1
1 Rank among the 10 countries included in both the 2012 and 2014 studies.

14 | Competitive Alternatives, Focus on Tax 2014
Results for major citiesThe results for the major international cities are generally very consistent with the national results for R&D. In the national rankings, Mexico leads the US by just 0.2 TTI points. However, in the city results, two thirds of the US cities compared, including Chicago, rank ahead of both Monterrey and Mexico City. Higher tax costs in the other US baseline cities, especially New York City, result in the US placing marginally behind Mexico in the national rankings despite the advantages held by many individual US cities.
Impact of tax componentsMost of the countries examined in this study, along with many states and provinces within those countries, offer tax incentives to promote R&D activities.
The policy objective of governments in offering such incentives is to foster the growth of R&D and innovation in their respective jurisdictions. There is continual jockeying among jurisdictions seeking an R&D advantage, with many of the jurisdictions examined in this study have revised their R&D tax incentives in recent years. While some program enhancements have been seen, fiscally driven program contractions have also been seen over the last two years.
The nature and form of these tax incentives differ among the countries. Below is a quick summary of the main R&D tax incentives in each of the countries studied in this report. The R&D incentives detailed here and considered in this study apply to sizable domestic or foreign-owned companies undertaking in-house R&D. In some countries, even more favorable treatment may be available to small domestic corporations and/or for R&D contracted to research institutes or universities.
• Australia’s current R&D tax incentive program has been in place since 2011. Refundable tax credits of 45 percent are available to companies with group turnover less than AUD $20 million, with non-refundable credits of 40 percent available to larger corporations. Under this system, R&D expenses are not deductible in the calculation of taxable income, but the credits work to provide an effective deduction of 150 percent of R&D costs for small corporations or 133.3 percent of R&D costs for larger corporations.
• Canada offers federal income tax credits for R&D. The rates for these credits were reduced from 2014, and now equal 15 percent of total current R&D expenditures. The 2014 federal reforms also included the elimination of tax credits on R&D capital expenditures, and a reduction in overhead expenses eligible for tax credits. Most Canadian provinces also offer provincial R&D tax incentives at rates that vary from 10 to 20 percent, with some of these tax credits being refundable.
• France offers an income tax credit equal to 30 percent of the first €100 million of R&D expenditures in a year and 5 percent on excess expenditures. Previously, enhanced credit rates were available to firms utilizing the R&D program for the first time, but these enhanced rates were reduced in 2011 and have since been eliminated. Tax credits can be carried forward and refunded if not used after 3 years.
• Italy’s regional income tax system permits the full deduction of salaries for R&D personnel, as compared to a deduction limit of just € 7,500 per employee for non-R&D staff. This offers companies a significantly enhanced deduction for highly-paid R&D professionals.
• Japan offers an income tax credit of between 8 and 12 percent of total R&D expenditures, with the actual rate being determined based on the ratio of R&D spending to sales. However, the total income tax credit is limited to 20 percent of the corporate income tax liability for the year. For fiscal years starting between April 1, 2008, and March 31, 2014, additional R&D credits and a higher credit limit were made available to stimulate further short-term R&D activity. These enhancements were included in this analysis for the 2014 fiscal year.
• Mexico offers incentive support for R&D activities, but this program is discretionary with evaluation and approval required from the National Science and Technology Council. Given the discretionary nature of this assistance, this incentive was not included in the calculations for this study.
• The Netherlands offers an innovative R&D incentive program that allows the employer to retain a portion of the employee wage taxes deducted from the pay of R&D employees. For 2014, the amounts retained are 35 percent of the first € 250,000 of R&D payroll (50 percent for start-up firms) plus 14 percent of any excess R&D payroll. These amounts are retained by the employer rather than remitted to the taxation authorities, but the employee is still credited with having paid the full amount of personal wage (income) tax. Although the benefit to the employer R&D firm under this program is itself taxable, the benefit can significantly reduce the company’s effective income tax rate, and the benefit may even exceed corporate income tax paid by the company in a year.
Competitive Alternatives, Focus on Tax 2014 | 15
• The United Kingdom offers an R&D incentive system that combines additional tax deductions with potentially refundable credits. R&D expenses are eligible for a deduction equal to 130 percent of the actual expenditures, or 225 percent for small and medium sized-enterprises (SMEs, which can have up to 500 employees, subject to other financial criteria). SMEs that cannot utilize the additional deductions (due to being in a loss situation) may be able to surrender the losses in exchange for a cash payment equal to 11 percent of the allowed deduction (equivalent to 225 percent ×11 percent = 24.75 percent of the actual R&D expenditures).
• The United States’ federal R&D tax credit program is currently in limbo yet again, having passed its current sunset date of December 31, 2013. This situation has occurred numerous times in this program’s history and, each time, the program has been reactivated at a later date, generally with retroactive effect. This routine creates great uncertainty for US R&D firms. At this time, bipartisan support appears to exist to extend the credit, possibly permanently. A variety of changes and enhancements to the credit are also being suggested in various congressional and executive proposals to extend the R&D tax credit. Given the history of this credit, the wheels appear to be in motion to retroactively extend the credit once again, and hence it has been included in this analysis.
In addition to the federal program, many states offer R&D tax credit programs, which have been included in this analysis. Most state programs follow the federal definitions and calculation formulas, which primarily provide tax relief only for incremental R&D expenditures; however, some states take custom approaches to their R&D incentive programs.
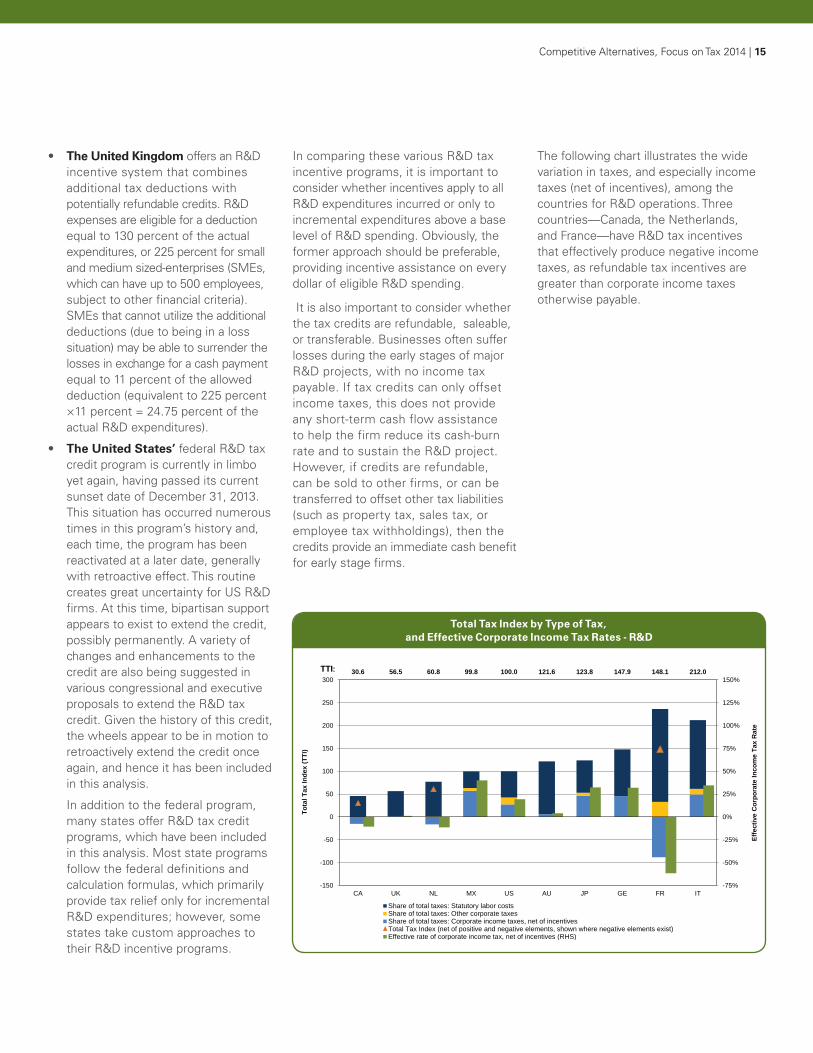
In comparing these various R&D tax incentive programs, it is important to consider whether incentives apply to all R&D expenditures incurred or only to incremental expenditures above a base level of R&D spending. Obviously, the former approach should be preferable, providing incentive assistance on every dollar of eligible R&D spending.
It is also important to consider whether the tax credits are refundable, saleable, or transferable. Businesses often suffer losses during the early stages of major R&D projects, with no income tax payable. If tax credits can only offset income taxes, this does not provide any short-term cash flow assistance to help the firm reduce its cash-burn rate and to sustain the R&D project. However, if credits are refundable, can be sold to other firms, or can be transferred to offset other tax liabilities (such as property tax, sales tax, or employee tax withholdings), then the credits provide an immediate cash benefit for early stage firms.
The following chart illustrates the wide variation in taxes, and especially income taxes (net of incentives), among the countries for R&D operations. Three countries—Canada, the Netherlands, and France—have R&D tax incentives that effectively produce negative income taxes, as refundable tax incentives are greater than corporate income taxes otherwise payable.
Total Tax Index by Type of Tax, and Effective Corporate Income Tax Rates - R&D
-75%
-50%
-25%
0%
25%
50%
75%
100%
125%
150%30.6 56.5 60.8 99.8 100.0 121.6 123.8 147.9 148.1 212.0
-150
-100
-50
0
50
100
150
200
250
300
CA UK NL MX US AU JP GE FR IT
Effe
ctiv
e C
orpo
rate
Inco
me
Tax
Rat
e .
Tota
l Tax
Inde
x (T
TI)
Total Tax Index by Type of Tax, and Effective Corporate Income Tax Rates – R&D
Share of total taxes: Statutory labor costsShare of total taxes: Other corporate taxesShare of total taxes: Corporate income taxes, net of incentivesTotal Tax Index (net of positive and negative elements, shown where negative elements exist)Effective rate of corporate income tax, net of incentives (RHS)
TTI:
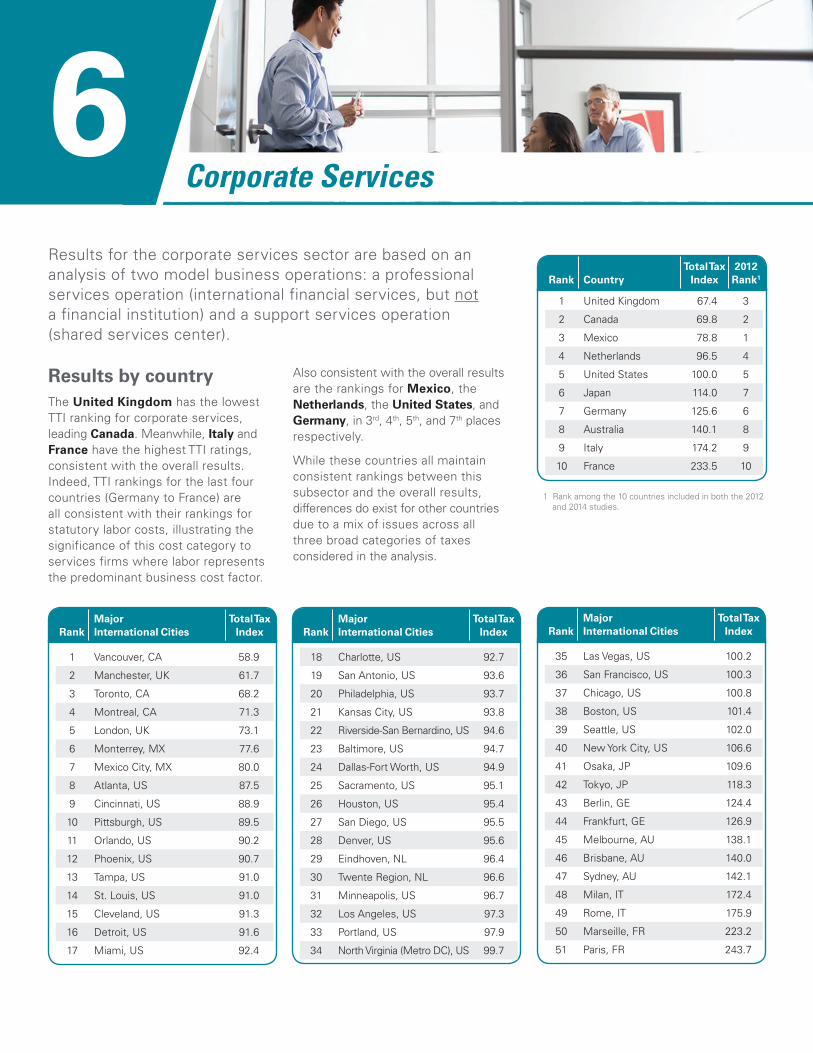
Results for the corporate services sector are based on an analysis of two model business operations: a professional services operation (international financial services, but not a financial institution) and a support services operation (shared services center).
Results by countryThe United Kingdom has the lowest TTI ranking for corporate services, leading Canada. Meanwhile, Italy and France have the highest TTI ratings, consistent with the overall results. Indeed, TTI rankings for the last four countries (Germany to France) are all consistent with their rankings for statutory labor costs, illustrating the significance of this cost category to services firms where labor represents the predominant business cost factor.
Also consistent with the overall results are the rankings for Mexico, the Netherlands, the United States, and Germany, in 3rd, 4th, 5th, and 7th places respectively.
While these countries all maintain consistent rankings between this subsector and the overall results, differences do exist for other countries due to a mix of issues across all three broad categories of taxes considered in the analysis.
Rank CountryTotal Tax
Index2012 Rank1
1 United Kingdom 67.4 3
2 Canada 69.8 2
3 Mexico 78.8 1
4 Netherlands 96.5 4
5 United States 100.0 5
6 Japan 114.0 7
7 Germany 125.6 6
8 Australia 140.1 8
9 Italy 174.2 9
10 France 233.5 10
1 Rank among the 10 countries included in both the 2012 and 2014 studies.
RankMajor International Cities
Total Tax Index
1 Vancouver, CA 58.9
2 Manchester, UK 61.7
3 Toronto, CA 68.2
4 Montreal, CA 71.3
5 London, UK 73.1
6 Monterrey, MX 77.6
7 Mexico City, MX 80.0
8 Atlanta, US 87.5
9 Cincinnati, US 88.9
10 Pittsburgh, US 89.5
11 Orlando, US 90.2
12 Phoenix, US 90.7
13 Tampa, US 91.0
14 St. Louis, US 91.0
15 Cleveland, US 91.3
16 Detroit, US 91.6
17 Miami, US 92.4
RankMajor International Cities
Total Tax Index
18 Charlotte, US 92.7
19 San Antonio, US 93.6
20 Philadelphia, US 93.7
21 Kansas City, US 93.8
22 Riverside-San Bernardino, US 94.6
23 Baltimore, US 94.7
24 Dallas-Fort Worth, US 94.9
25 Sacramento, US 95.1
26 Houston, US 95.4
27 San Diego, US 95.5
28 Denver, US 95.6
29 Eindhoven, NL 96.4
30 Twente Region, NL 96.6
31 Minneapolis, US 96.7
32 Los Angeles, US 97.3
33 Portland, US 97.9
34 North Virginia (Metro DC), US 99.7
RankMajor International Cities
Total Tax Index
35 Las Vegas, US 100.2
36 San Francisco, US 100.3
37 Chicago, US 100.8
38 Boston, US 101.4
39 Seattle, US 102.0
40 New York City, US 106.6
41 Osaka, JP 109.6
42 Tokyo, JP 118.3
43 Berlin, GE 124.4
44 Frankfurt, GE 126.9
45 Melbourne, AU 138.1
46 Brisbane, AU 140.0
47 Sydney, AU 142.1
48 Milan, IT 172.4
49 Rome, IT 175.9
50 Marseille, FR 223.2
51 Paris, FR 243.7
Corporate Services6

Competitive Alternatives, Focus on Tax 2014 | 17
Comparing the TTI rankings of countries in 2014 to 2012 for the 10 countries, the only changes in rankings are for the United Kingdom and Mexico, which have swapped 1st and 3rd rankings since 2012, and for Japan, which has moved ahead of Germany. The rationale for these changes is explained as part of the overall results in Chapter 1.
Results for major citiesThe results for the international cities are generally consistent with the national results for this subsector, except for the fact that Vancouver, Canada, tops the list of cities, even though the UK ranks first in the national results.
In addition, while the Netherlands ranks ahead of the US in the national results, two thirds of the US cities compared, including Dallas-Fort Worth, rank ahead of the two Dutch cities. Higher tax costs in the other three US baseline cities, Los Angeles, Chicago, and New York City, result in the US placing behind the Netherlands in the national rankings, despite the advantages held by many individual US cities.
Comparing the city rankings for this subsector to the overall results, several US cities see large changes in their rankings in this subsector:
• Phoenix, St. Louis, San Antonio, and Kansas City all rank at least 12 places higher for corporate services than in the overall results, due mainly to high property tax costs in these cities being a much less significant tax factor in this subsector.
• By contrast, relatively high statutory labor costs and the significance of these costs in this subsector result in Minneapolis, North Virginia (Metro DC), and Boston all ranking at least 12 places lower in this subsector than in the overall results.
Impact of tax componentsStatutory labor costs tend to represent a more important tax component for corporate services operations than for operations in other sectors, due to the very high significance of labor costs among total costs in this subsector.
As illustrated in the chart below, the impact of statutory labor costs varies greatly among the countries, with the impact being especially acute in the continental European countries. France and Italy have moderate wage costs but very high statutory plan rates, while Germany has higher base wages but more moderate statutory plan rates. This combination works to somewhat diminish the differentials in the statutory labor cost burden between these countries.
The Labor Cost Comparison table (next page) shows the differences among countries in terms of salaries and wages, statutory plans, and other employee benefits. Statutory labor costs, expressed as a percentage of payroll, range from a low of 9 percent in the United States,
to a high of 42 percent in France. Between these extremes, statutory labor costs in Italy represent 28 percent of payroll, while in all other countries statutory labor costs represent less than 20 percent of payroll.
There are also areas where statutory labor costs alone do not present a full picture. One key area in this regard is health care.
Public medical plans operate in most study countries, as compared to the predominantly private medical system in the United States. As a result, US employers cover significant non-statutory costs for private medical insurance. (This is evident in the Labor Cost Comparison table when comparing Employee Benefits in the US and Canada: at 36 percent versus 26 percent of payroll, respectively. This comparison is less clear for the European countries, which have significantly higher employee benefit costs related to paid time not worked—holidays and vacations—than does the US.)
Total Tax Index by Type of Tax, and Effective Corporate Income Tax Rates - Corporate Services
0%
25%
50%
75%
100%
125%67.4 69.8 78.8 96.5 100.0 114.0 125.6 140.1 174.2 233.5
0
50
100
150
200
250
UK CA MX NL US JP GE AU IT FR
Effe
ctiv
e C
orpo
rate
Inco
me
Tax
Rat
e .
Tota
l Tax
Inde
x (T
TI)
Total Tax Index by Type of Tax, and Effective Corporate Income Tax Rates – Corporate Services
Share of total taxes: Corporate income taxes, net of incentivesShare of total taxes: Other corporate taxesShare of total taxes: Statutory labor costs
Effective rate of corporate income tax, net of incentives (RHS)
TTI:TTI:TTI:TTI:TTI:

18 | Competitive Alternatives, Focus on Tax 2014
Even within the public medical system funding differs significantly between countries, influencing the cost to business. Canada’s public medical system is funded primarily from general tax revenues, while Australia funds its public medical system primarily from a specific tax levy on employees. However, in most European countries, medical care is funded primarily through statutory levies on the employer. (The former two tax costs are not captured in this analysis, as they do not directly burden the employer, while the latter cost is incorporated in this analysis.)
Looking at the other tax components for this subsector, the effective rates of corporate income tax seen in this subsector tend to provide the most “pure” representation of the corporate income tax system in most locations, as few special tax incentives apply to activities in this subsector.
Similar to the digital services subsector, other corporate taxes also have a low impact for corporate services operations. As explained in Chapter 4, this relates to the different treatment and significance of property and capital taxes between the sectors.
1 Average for services sector (7 business operations) and manufacturing sector (12 business operations), as per the overall results. Represents 42 different job positions, including professional and management positions.
Source: Competitive Alternatives 2014, KPMG’s Guide to International Business Location, page 33.
Labor Cost Comparison, Per Employee
Salaries & WagesBenefits
Total LaborStatutory Plans Employee Benefits
Average per Employee1
(US$) RankPercent of
Payroll RankPercent of
Payroll Rank
Average per Employee1
(US$) Rank
North America
Canada $65,504 6 10% 2 26% 6 $89,038 3
Mexico $29,105 1 13% 5 27% 7 $40,648 1
United States $70,125 7 9% 1 36% 10 $102,249 9
Europe
France $56,126 2 42% 10 24% 5 $93,450 6
Germany $75,715 10 17% 7 21% 3 $104,440 10
Italy $60,848 4 28% 9 24% 4 $92,287 4
Netherlands $64,433 5 15% 6 30% 8 $93,074 5
United Kingdom $58,925 3 10% 3 31% 9 $82,930 2
Asia Pacific
Australia $73,210 9 19% 8 16% 1 $99,093 8
Japan $71,607 8 12% 4 19% 2 $94,067 7

Competitive Alternatives, Focus on Tax 2014 | 19
Results for the manufacturing sector are based on an analysis of 12 different model business operations, as detailed in the main Competitive Alternatives 2014 study.
Results by country The ranking of countries for manufacturing are broadly consistent with the overall results presented above, but with two notable differences.
Mexico moves up in the rankings, surpassing Canada and the United Kingdom, to rank with the lowest TTI among all countries in this sector. Mexico’s generally moderate statutory labor costs are even lower in this sector, resulting in its lowest burden for statutory labor costs among the sectors examined. Mexico’s new restriction on the deductibility of
employee benefit costs is also less of an issue in this sector, resulting in Mexico’s lowest effective corporate income tax rate among the sectors and subsectors compared.
Italy moves up in the rankings for this sector as compared to the overall results, moving ahead of Germany and Japan. Italy’s regional tax restrictions on the deductibility of employee compensation are less significant in this sector, and its new Allowance for Corporate Equity (as referenced in Chapter 1) and moderately low levels of property tax both assist in this capital intensive sector.
Rank CountryTotal Tax
Index2012 Rank
1 Mexico 56.5 1
2 Canada 65.5 2
3 United Kingdom 67.4 3
4 Netherlands 69.0 4
5 United States 100.0 5
6 Australia 101.9 6
7 Italy 105.4 8
8 Germany 106.9 7
9 Japan 120.8 9
10 France 144.5 10
RankMajor International Cities
Total Tax Index
1 Monterrey, MX 56.0
2 Manchester, UK 56.4
3 Mexico City, MX 56.9
4 Vancouver, CA 59.9
5 Toronto, CA 60.9
6 Eindhoven, NL 68.7
7 Twente Region, NL 69.3
8 Montreal, CA 70.0
9 Baltimore, US 71.7
10 Cincinnati, US 72.3
11 Pittsburgh, US 75.9
12 Charlotte, US 77.7
13 Philadelphia, US 77.8
14 London, UK 78.3
15 Atlanta, US 81.4
16 Cleveland, US 81.9
17 North Virginia (Metro DC), US 82.0
RankMajor International Cities
Total Tax Index
18 Boston, US 83.0
19 Minneapolis, US 85.0
20 Orlando, US 86.8
21 Tampa, US 87.7
22 Detroit, US 88.4
23 Chicago, US 88.9
24 Portland, US 89.0
25 Miami, US 91.5
26 Denver, US 92.1
27 Houston, US 92.4
28 Seattle, US 92.6
29 Dallas-Fort Worth, US 94.1
30 Las Vegas, US 94.2
31 Riverside-San Bernardino, US 95.1
32 San Diego, US 96.1
33 Sacramento, US 96.6
34 San Antonio, US 97.4
RankMajor International Cities
Total Tax Index
35 Phoenix, US 97.9
36 Melbourne, AU 99.8
37 Los Angeles, US 101.2
38 Milan, IT 101.7
39 Brisbane, AU 101.8
40 San Francisco, US 103.1
41 Sydney, AU 103.9
42 St. Louis, US 104.8
43 Kansas City, US 105.0
44 Frankfurt, GE 105.5
45 Berlin, GE 108.3
46 Osaka, JP 108.7
47 Rome, IT 109.1
48 New York City, US 115.7
49 Tokyo, JP 132.9
50 Marseille, FR 143.6
51 Paris, FR 145.4
1 Rank among the 10 countries included in both the 2012 and 2014 studies.
Manufacturing7
20 | Competitive Alternatives, Focus on Tax 2014
The TTI rankings of countries in 2014 are also highly consistent with the 2012 rankings for the 10 countries. The only change in ranking since 2012 relates to Italy having nudged ahead of Germany in the current year, for the reasons identified above.
Results for major citiesThe results for the 51 major international cities are generally consistent with the national results.
Among the 51 cities, Milan sees the greatest change in ranking for manufacturing when compared to the overall results—moving up 10 places from 48th overall to 38th for manufacturing. This change reflects the same advantages for this sector as described for Italy in the previous section. Meanwhile, Osaka and New York City see the largest drops in ranking, both dropping 6 places in manufacturing relative to their overall results, due to relatively high property tax costs in these cities negatively impacting their total tax burden in this sector.
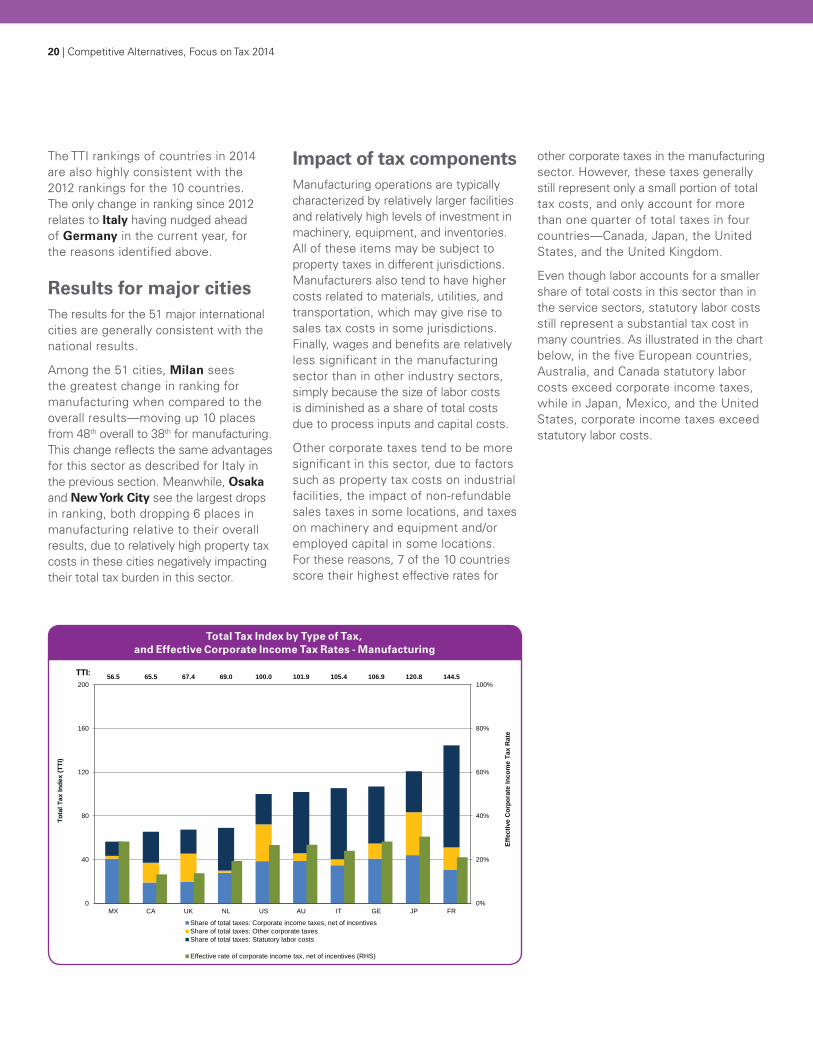
Impact of tax componentsManufacturing operations are typically characterized by relatively larger facilities and relatively high levels of investment in machinery, equipment, and inventories. All of these items may be subject to property taxes in different jurisdictions. Manufacturers also tend to have higher costs related to materials, utilities, and transportation, which may give rise to sales tax costs in some jurisdictions. Finally, wages and benefits are relatively less significant in the manufacturing sector than in other industry sectors, simply because the size of labor costs is diminished as a share of total costs due to process inputs and capital costs.
Other corporate taxes tend to be more significant in this sector, due to factors such as property tax costs on industrial facilities, the impact of non-refundable sales taxes in some locations, and taxes on machinery and equipment and/or employed capital in some locations. For these reasons, 7 of the 10 countries score their highest effective rates for
other corporate taxes in the manufacturing sector. However, these taxes generally still represent only a small portion of total tax costs, and only account for more than one quarter of total taxes in four countries—Canada, Japan, the United States, and the United Kingdom.
Even though labor accounts for a smaller share of total costs in this sector than in the service sectors, statutory labor costs still represent a substantial tax cost in many countries. As illustrated in the chart below, in the five European countries, Australia, and Canada statutory labor costs exceed corporate income taxes, while in Japan, Mexico, and the United States, corporate income taxes exceed statutory labor costs.
Total Tax Index by Type of Tax, and Effective Corporate Income Tax Rates - Manufacturing
0%
20%
40%
60%
80%
100%56.5 65.5 67.4 69.0 100.0 101.9 105.4 106.9 120.8 144.5
0
40
80
120
160
200
MX CA UK NL US AU IT GE JP FR
Effe
ctiv
e C
orpo
rate
Inco
me
Tax
Rat
e .
Tota
l Tax
Inde
x (T
TI)
Total Tax Index by Type of Tax, and Effective Corporate Income Tax Rates – Manufacturing
Share of total taxes: Corporate income taxes, net of incentivesShare of total taxes: Other corporate taxesShare of total taxes: Statutory labor costs
Effective rate of corporate income tax, net of incentives (RHS)
TTI:


22 | Competitive Alternatives, Focus on Tax 2014
8. Appendix A – Detailed ResultsDetailed tables of results. CIT = Corporate Income Tax, OCT = Other Corporate Taxes, SLC = Statutory Labor Costs, TETR = Total Effective Tax Rate, TTI = Total Tax Index
Detailed results by country
Rank Country
Effective Tax Rates Ranks
TTICIT OCT SLC TETR CIT OCT SLC TETR
OVERALL
6 Australia 24.5% 2.8% 48.5% 75.9% 5 3 8 6 112.9
1 Canada 7.2 % 7.4% 21.5% 36.0% 1 6 3 1 53.6
10 France 13.3% 14.8% 81.7% 109.7% 2 8 10 10 163.3
7 Germany 29.5% 5.6% 43.1% 78.2% 8 5 7 7 116.3
9 Italy 28.7% 3.8% 58.7% 91.3% 7 4 9 9 135.8
8 Japan 32.1% 16.9% 30.7% 79.7% 9 10 5 8 118.6
3 Mexico 32.1% 2.3% 12.8% 47.2% 10 2 1 3 70.2
4 Netherlands 17.0% 0.9% 32.2% 50.1% 4 1 6 4 74.5
2 United Kingdom 13.9% 10.4% 20.5% 44.7% 3 7 2 2 66.6
5 United States 28.5% 16.3% 22.5% 67.2% 6 9 4 5 100.0
DIGITAL SERVICES
8 Australia 25.3% 0.0% 46.0% 71.3% 5 1 8 8 128.3
1 Canada -7.4% 0.1% 16.9% 9.5% 1 4 2 1 17.1
10 France 17.3% 10.2% 78.5% 106.0% 3 10 10 10 190.9
7 Germany 31.1% 0.0% 37.9% 69.0% 6 1 7 7 124.2
9 Italy 34.1% 1.6% 58.9% 94.6% 9 7 9 9 170.3
6 Japan 33.8% 1.4% 26.6% 61.8% 8 6 5 6 111.2
4 Mexico 35.9% 2.4% 13.8% 52.1% 10 8 1 4 93.9
3 Netherlands 19.7% 0.2% 28.4% 48.3% 4 5 6 3 86.9
2 United Kingdom 17.1% 0.0% 21.3% 38.4% 2 1 4 2 69.1
5 United States 32.9% 3.8% 18.8% 55.6% 7 9 3 5 100.0

Competitive Alternatives, Focus on Tax 2014 | 23
Rank Country
Effective Tax Rates Ranks
TTICIT OCT SLC TETR CIT OCT SLC TETR
RESEARCH & DEVELOPMENT
6 Australia 4.0% 0.0% 81.0% 85.0% 5 1 8 6 121.6
1 Canada -10.6% 0.2% 31.9% 21.4% 3 4 2 1 30.6
9 France -61.7% 23.1% 142.1% 103.5% 1 10 10 9 148.1
8 Germany 31.9% 0.0% 71.4% 103.3% 7 1 7 8 147.9
10 Italy 34.6% 8.4% 105.2% 148.2% 9 8 9 10 212.0
7 Japan 32.3% 4.7% 49.5% 86.5% 8 7 5 7 123.8
4 Mexico 40.0% 4.2% 25.5% 69.7% 10 6 1 4 99.8
3 Netherlands -11.4% 0.8% 53.0% 42.5% 2 5 6 3 60.8
2 United Kingdom 1.2% 0.0% 38.3% 39.5% 4 1 3 2 56.5
5 United States 19.4% 10.5% 40.0% 69.9% 6 9 4 5 100.0
CORPORATE SERVICES
8 Australia 30.0% 0.0% 81.1% 111.0% 4 1 8 8 140.1
2 Canada 22.4% 0.1% 32.8% 55.3% 2 4 3 2 69.8
10 France 32.9% 19.4% 132.8% 185.1% 6 10 10 10 233.5
7 Germany 31.1% 0.0% 68.4% 99.6% 5 1 7 7 125.6
9 Italy 39.0% 4.3% 94.8% 138.1% 10 8 9 9 174.2
6 Japan 37.5% 2.7% 50.2% 90.4% 7 6 5 6 114.0
3 Mexico 38.8% 3.4% 20.2% 62.5% 9 7 1 3 78.8
4 Netherlands 24.9% 0.3% 51.2% 76.5% 3 5 6 4 96.5
1 United Kingdom 20.4% 0.0% 33.0% 53.4% 1 1 4 1 67.4
5 United States 38.5% 8.0% 32.8% 79.3% 8 9 2 5 100.0
MANUFACTURING
6 Australia 26.8% 4.8% 38.8% 70.5% 7 4 8 6 101.9
2 Canada 13.2% 12.5% 19.6% 45.3% 1 6 4 2 65.5
10 France 21.1% 14.3% 64.6% 100.0% 4 7 10 10 144.5
8 Germany 28.3% 9.5% 36.1% 74.0% 9 5 7 8 106.9
7 Italy 24.1% 3.8% 45.1% 72.9% 5 3 9 7 105.4
9 Japan 30.5% 27.1% 26.0% 83.6% 10 10 5 9 120.8
1 Mexico 28.3% 1.7% 9.1% 39.1% 8 2 1 1 56.5
4 Netherlands 19.4% 1.3% 27.0% 47.8% 3 1 6 4 69.0
3 United Kingdom 13.7% 17.7% 15.2% 46.6% 2 8 2 3 67.4
5 United States 26.7% 23.3% 19.2% 69.2% 6 9 3 5 100.0
24 | Competitive Alternatives, Focus on Tax 2014
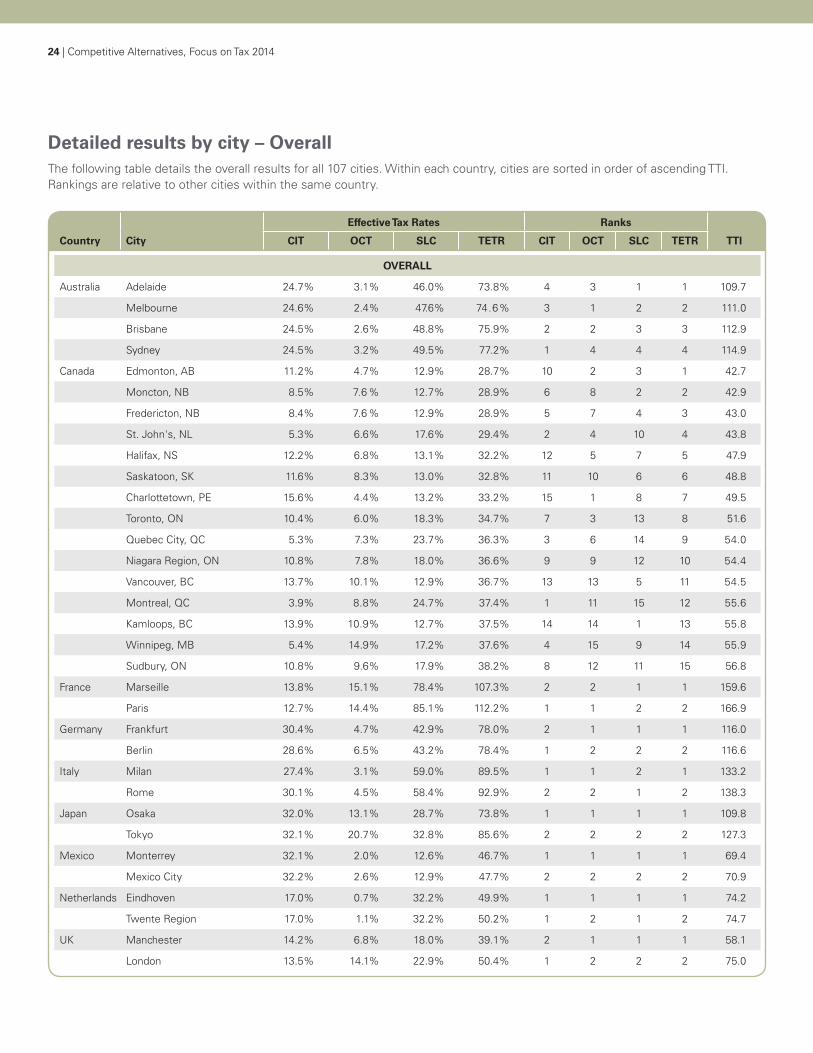
Detailed results by city – OverallThe following table details the overall results for all 107 cities. Within each country, cities are sorted in order of ascending TTI. Rankings are relative to other cities within the same country.
Country City
Effective Tax Rates Ranks
TTICIT OCT SLC TETR CIT OCT SLC TETR
OVERALL
Australia Adelaide 24.7% 3.1% 46.0% 73.8% 4 3 1 1 109.7
Melbourne 24.6% 2.4% 47.6% 74.6% 3 1 2 2 111.0
Brisbane 24.5% 2.6% 48.8% 75.9% 2 2 3 3 112.9
Sydney 24.5% 3.2% 49.5% 77.2% 1 4 4 4 114.9
Canada Edmonton, AB 11.2% 4.7% 12.9% 28.7% 10 2 3 1 42.7
Moncton, NB 8.5% 7.6 % 12.7% 28.9% 6 8 2 2 42.9
Fredericton, NB 8.4% 7.6 % 12.9% 28.9% 5 7 4 3 43.0
St. John's, NL 5.3% 6.6% 17.6% 29.4% 2 4 10 4 43.8
Halifax, NS 12.2% 6.8% 13.1% 32.2% 12 5 7 5 47.9
Saskatoon, SK 11.6% 8.3% 13.0% 32.8% 11 10 6 6 48.8
Charlottetown, PE 15.6% 4.4% 13.2% 33.2% 15 1 8 7 49.5
Toronto, ON 10.4% 6.0% 18.3% 34.7% 7 3 13 8 51.6
Quebec City, QC 5.3% 7.3% 23.7% 36.3% 3 6 14 9 54.0
Niagara Region, ON 10.8% 7.8% 18.0% 36.6% 9 9 12 10 54.4
Vancouver, BC 13.7% 10.1% 12.9% 36.7% 13 13 5 11 54.5
Montreal, QC 3.9% 8.8% 24.7% 37.4% 1 11 15 12 55.6
Kamloops, BC 13.9% 10.9% 12.7% 37.5% 14 14 1 13 55.8
Winnipeg, MB 5.4% 14.9% 17.2% 37.6% 4 15 9 14 55.9
Sudbury, ON 10.8% 9.6% 17.9% 38.2% 8 12 11 15 56.8
France Marseille 13.8% 15.1% 78.4% 107.3% 2 2 1 1 159.6
Paris 12.7% 14.4% 85.1% 112.2% 1 1 2 2 166.9
Germany Frankfurt 30.4% 4.7% 42.9% 78.0% 2 1 1 1 116.0
Berlin 28.6% 6.5% 43.2% 78.4% 1 2 2 2 116.6
Italy Milan 27.4% 3.1% 59.0% 89.5% 1 1 2 1 133.2
Rome 30.1% 4.5% 58.4% 92.9% 2 2 1 2 138.3
Japan Osaka 32.0% 13.1% 28.7% 73.8% 1 1 1 1 109.8
Tokyo 32.1% 20.7% 32.8% 85.6% 2 2 2 2 127.3
Mexico Monterrey 32.1% 2.0% 12.6% 46.7% 1 1 1 1 69.4
Mexico City 32.2% 2.6% 12.9% 47.7% 2 2 2 2 70.9
Netherlands Eindhoven 17.0% 0.7% 32.2% 49.9% 1 1 1 1 74.2
Twente Region 17.0% 1.1% 32.2% 50.2% 1 2 1 2 74.7
UK Manchester 14.2% 6.8% 18.0% 39.1% 2 1 1 1 58.1
London 13.5% 14.1% 22.9% 50.4% 1 2 2 2 75.0
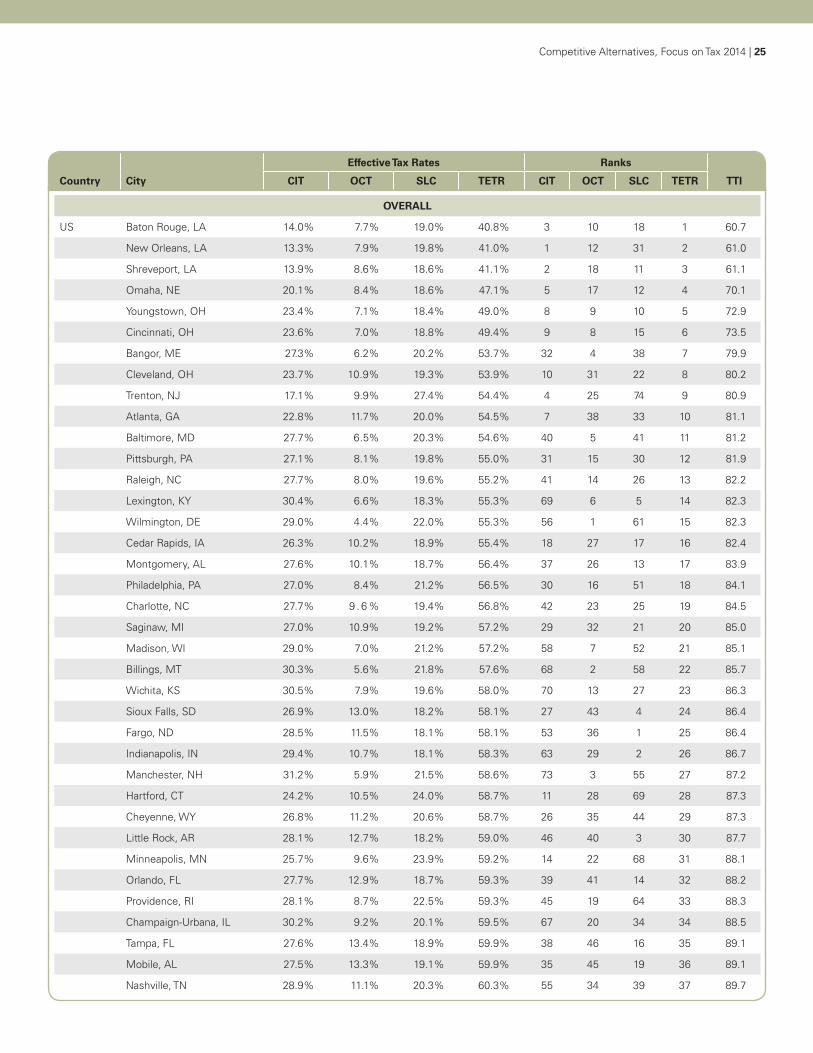
Competitive Alternatives, Focus on Tax 2014 | 25
Country City
Effective Tax Rates Ranks
TTICIT OCT SLC TETR CIT OCT SLC TETR
OVERALL
US Baton Rouge, LA 14.0% 7.7% 19.0% 40.8% 3 10 18 1 60.7
New Orleans, LA 13.3% 7.9% 19.8% 41.0% 1 12 31 2 61.0
Shreveport, LA 13.9% 8.6% 18.6% 41.1% 2 18 11 3 61.1
Omaha, NE 20.1% 8.4% 18.6% 47.1% 5 17 12 4 70.1
Youngstown, OH 23.4% 7.1% 18.4% 49.0% 8 9 10 5 72.9
Cincinnati, OH 23.6% 7.0% 18.8% 49.4% 9 8 15 6 73.5
Bangor, ME 27.3% 6.2% 20.2% 53.7% 32 4 38 7 79.9
Cleveland, OH 23.7% 10.9% 19.3% 53.9% 10 31 22 8 80.2
Trenton, NJ 17.1% 9.9% 27.4% 54.4% 4 25 74 9 80.9
Atlanta, GA 22.8% 11.7% 20.0% 54.5% 7 38 33 10 81.1
Baltimore, MD 27.7% 6.5% 20.3% 54.6% 40 5 41 11 81.2
Pittsburgh, PA 27.1% 8.1% 19.8% 55.0% 31 15 30 12 81.9
Raleigh, NC 27.7% 8.0% 19.6% 55.2% 41 14 26 13 82.2
Lexington, KY 30.4% 6.6% 18.3% 55.3% 69 6 5 14 82.3
Wilmington, DE 29.0% 4.4% 22.0% 55.3% 56 1 61 15 82.3
Cedar Rapids, IA 26.3% 10.2% 18.9% 55.4% 18 27 17 16 82.4
Montgomery, AL 27.6% 10.1% 18.7% 56.4% 37 26 13 17 83.9
Philadelphia, PA 27.0% 8.4% 21.2% 56.5% 30 16 51 18 84.1
Charlotte, NC 27.7% 9 . 6 % 19.4% 56.8% 42 23 25 19 84.5
Saginaw, MI 27.0% 10.9% 19.2% 57.2% 29 32 21 20 85.0
Madison, WI 29.0% 7.0% 21.2% 57.2% 58 7 52 21 85.1
Billings, MT 30.3% 5.6% 21.8% 57.6% 68 2 58 22 85.7
Wichita, KS 30.5% 7.9% 19.6% 58.0% 70 13 27 23 86.3
Sioux Falls, SD 26.9% 13.0% 18.2% 58.1% 27 43 4 24 86.4
Fargo, ND 28.5% 11.5% 18.1% 58.1% 53 36 1 25 86.4
Indianapolis, IN 29.4% 10.7% 18.1% 58.3% 63 29 2 26 86.7
Manchester, NH 31.2% 5.9% 21.5% 58.6% 73 3 55 27 87.2
Hartford, CT 24.2% 10.5% 24.0% 58.7% 11 28 69 28 87.3
Cheyenne, WY 26.8% 11.2% 20.6% 58.7% 26 35 44 29 87.3
Little Rock, AR 28.1% 12.7% 18.2% 59.0% 46 40 3 30 87.7
Minneapolis, MN 25.7% 9.6% 23.9% 59.2% 14 22 68 31 88.1
Orlando, FL 27.7% 12.9% 18.7% 59.3% 39 41 14 32 88.2
Providence, RI 28.1% 8.7% 22.5% 59.3% 45 19 64 33 88.3
Champaign-Urbana, IL 30.2% 9.2% 20.1% 59.5% 67 20 34 34 88.5
Tampa, FL 27.6% 13.4% 18.9% 59.9% 38 46 16 35 89.1
Mobile, AL 27.5% 13.3% 19.1% 59.9% 35 45 19 36 89.1
Nashville, TN 28.9% 11.1% 20.3% 60.3% 55 34 39 37 89.7
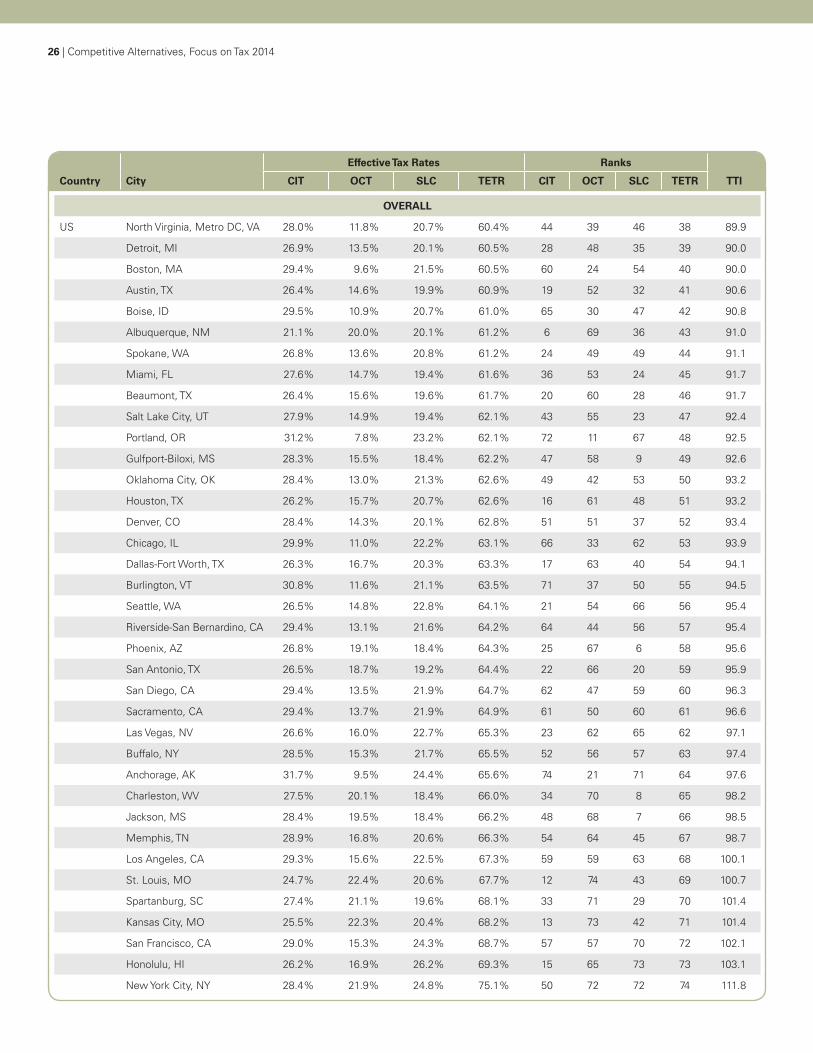
26 | Competitive Alternatives, Focus on Tax 2014
Country City
Effective Tax Rates Ranks
TTICIT OCT SLC TETR CIT OCT SLC TETR
OVERALL
US North Virginia, Metro DC, VA 28.0% 11.8% 20.7% 60.4% 44 39 46 38 89.9
Detroit, MI 26.9% 13.5% 20.1% 60.5% 28 48 35 39 90.0
Boston, MA 29.4% 9.6% 21.5% 60.5% 60 24 54 40 90.0
Austin, TX 26.4% 14.6% 19.9% 60.9% 19 52 32 41 90.6
Boise, ID 29.5% 10.9% 20.7% 61.0% 65 30 47 42 90.8
Albuquerque, NM 21.1% 20.0% 20.1% 61.2% 6 69 36 43 91.0
Spokane, WA 26.8% 13.6% 20.8% 61.2% 24 49 49 44 91.1
Miami, FL 27.6% 14.7% 19.4% 61.6% 36 53 24 45 91.7
Beaumont, TX 26.4% 15.6% 19.6% 61.7% 20 60 28 46 91.7
Salt Lake City, UT 27.9% 14.9% 19.4% 62.1% 43 55 23 47 92.4
Portland, OR 31.2% 7.8% 23.2% 62.1% 72 11 67 48 92.5
Gulfport-Biloxi, MS 28.3% 15.5% 18.4% 62.2% 47 58 9 49 92.6
Oklahoma City, OK 28.4% 13.0% 21.3% 62.6% 49 42 53 50 93.2
Houston, TX 26.2% 15.7% 20.7% 62.6% 16 61 48 51 93.2
Denver, CO 28.4% 14.3% 20.1% 62.8% 51 51 37 52 93.4
Chicago, IL 29.9% 11.0% 22.2% 63.1% 66 33 62 53 93.9
Dallas-Fort Worth, TX 26.3% 16.7% 20.3% 63.3% 17 63 40 54 94.1
Burlington, VT 30.8% 11.6% 21.1% 63.5% 71 37 50 55 94.5
Seattle, WA 26.5% 14.8% 22.8% 64.1% 21 54 66 56 95.4
Riverside-San Bernardino, CA 29.4% 13.1% 21.6% 64.2% 64 44 56 57 95.4
Phoenix, AZ 26.8% 19.1% 18.4% 64.3% 25 67 6 58 95.6
San Antonio, TX 26.5% 18.7% 19.2% 64.4% 22 66 20 59 95.9
San Diego, CA 29.4% 13.5% 21.9% 64.7% 62 47 59 60 96.3
Sacramento, CA 29.4% 13.7% 21.9% 64.9% 61 50 60 61 96.6
Las Vegas, NV 26.6% 16.0% 22.7% 65.3% 23 62 65 62 97.1
Buffalo, NY 28.5% 15.3% 21.7% 65.5% 52 56 57 63 97.4
Anchorage, AK 31.7% 9.5% 24.4% 65.6% 74 21 71 64 97.6
Charleston, WV 27.5% 20.1% 18.4% 66.0% 34 70 8 65 98.2
Jackson, MS 28.4% 19.5% 18.4% 66.2% 48 68 7 66 98.5
Memphis, TN 28.9% 16.8% 20.6% 66.3% 54 64 45 67 98.7
Los Angeles, CA 29.3% 15.6% 22.5% 67.3% 59 59 63 68 100.1
St. Louis, MO 24.7% 22.4% 20.6% 67.7% 12 74 43 69 100.7
Spartanburg, SC 27.4% 21.1% 19.6% 68.1% 33 71 29 70 101.4
Kansas City, MO 25.5% 22.3% 20.4% 68.2% 13 73 42 71 101.4
San Francisco, CA 29.0% 15.3% 24.3% 68.7% 57 57 70 72 102.1
Honolulu, HI 26.2% 16.9% 26.2% 69.3% 15 65 73 73 103.1
New York City, NY 28.4% 21.9% 24.8% 75.1% 50 72 72 74 111.8

Competitive Alternatives, Focus on Tax 2014 | 27
Detailed results by city – Digital ServicesThe following table details the overall results for all 107 cities. Within each country, cities are sorted in order of ascending TTI. Rankings are relative to other cities within the same country.
Country City
Effective Tax Rates Ranks
TTICIT OCT SLC TETR CIT OCT SLC TETR
DIGITAL SERVICES
Australia Adelaide 25.6% 0.0% 42.9% 68.5% 4 1 1 1 123.3
Melbourne 25.3% 0.0% 45.0% 70.4% 3 1 2 2 126.6
Brisbane 25.3% 0.0% 45.8% 71.1% 1 1 3 3 127.9
Sydney 25.3% 0.0% 46.9% 72.2% 1 1 4 4 129.9
Canada Montreal, QC -10.4% 0.1% 19.8% 9.4% 1 8 15 1 16.9
Toronto, ON -4.5% 0.1% 13.9% 9.5% 3 5 13 2 17.1
Sudbury, ON -3.5% 0.1% 13.8% 10.3% 4 5 12 3 18.6
Quebec City, QC -8.9% 0.1% 19.3% 10.4% 2 8 14 4 18.7
Niagara Region, ON -3.2% 0.1% 13.7% 10.6% 5 5 11 5 19.0
Edmonton, AB 13.3% 0.3% 9.5% 23.1% 9 11 7 6 41.6
Fredericton, NB 13.9% 0.0% 9.4% 23.2% 10 1 5 7 41.8
Moncton, NB 13.9% 0.0% 9.4% 23.3% 11 1 3 8 41.9
Vancouver, BC 12.6% 2.9% 9.2% 24.7% 7 13 2 9 44.4
Kamloops, BC 13.1% 2.9% 9.2% 25.2% 8 13 1 10 45.3
Saskatoon, SK 14.6% 2.1% 9.4% 26.0% 12 12 6 11 46.9
Halifax, NS 16.8% 0.0% 9.8% 26.6% 14 1 8 12 47.8
St. John's, NL 15.7% 0.0% 13.2% 28.9% 13 1 9 13 52.0
Winnipeg, MB 11.3% 4.0% 13.6% 29.0% 6 15 10 14 52.1
Charlottetown, PE 19.8% 0.1% 9.4% 29.3% 15 10 3 15 52.8
France Marseille 17.9% 9.2% 75.3% 102.4% 2 1 1 1 184.3
Paris 16.7% 11.2% 81.8% 109.7% 1 2 2 2 197.4
Germany Berlin 30.2% 0.0% 37.9% 68.1% 1 1 1 1 122.6
Frankfurt 32.0% 0.0% 37.9% 69.9% 2 1 1 2 125.8
Italy Milan 33.0% 1.5% 59.8% 94.3% 1 1 2 1 169.7
Rome 35.2% 1.6% 58.0% 94.9% 2 2 1 2 170.7
Japan Osaka 33.7% 1.3% 25.2% 60.2% 1 1 1 1 108.4
Tokyo 33.9% 1.3% 28.1% 63.3% 2 1 2 2 114.0
Mexico Monterrey 35.8% 2.1% 13.6% 51.5% 1 1 1 1 92.8
Mexico City 36.0% 2.8% 14.0% 52.8% 2 2 2 2 95.0
Netherlands Eindhoven 19.7% 0.1% 28.4% 48.2% 1 1 1 1 86.8
Twente Region 19.7% 0.2% 28.4% 48.3% 1 2 1 2 86.9
UK Manchester 17.4% 0.0% 18.6% 36.0% 2 1 1 1 64.8
London 16.7% 0.0% 24.1% 40.8% 1 1 2 2 73.4
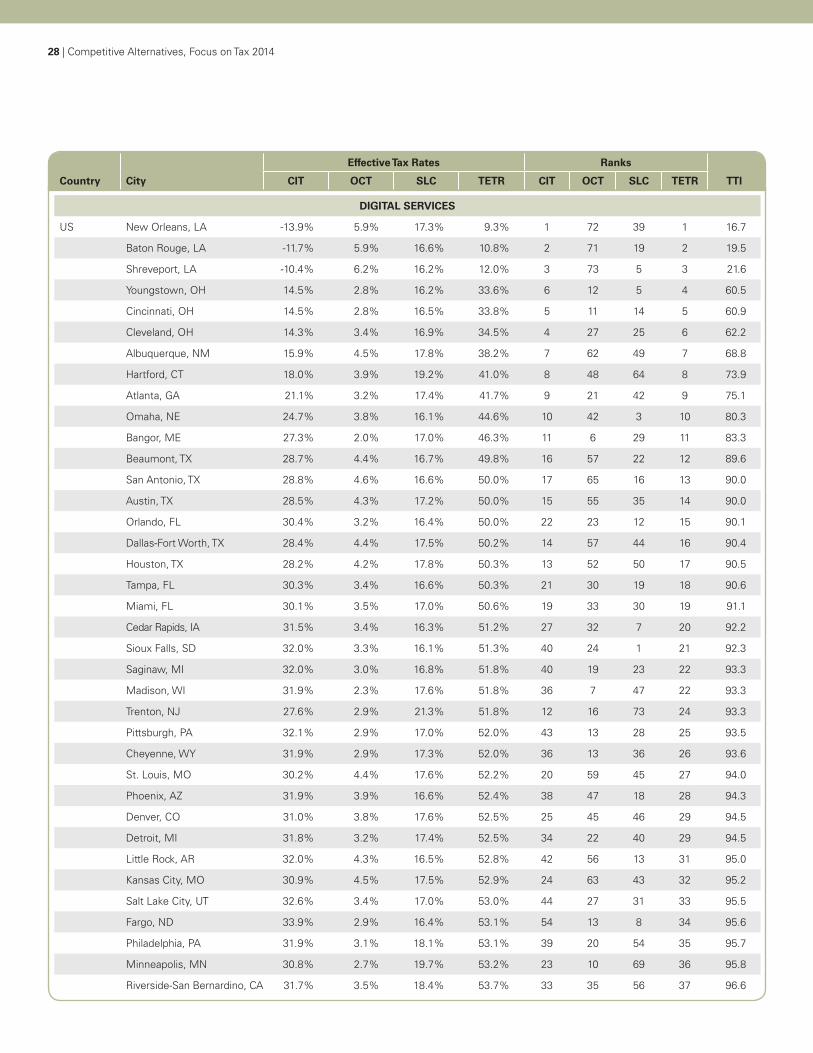
28 | Competitive Alternatives, Focus on Tax 2014
Country City
Effective Tax Rates Ranks
TTICIT OCT SLC TETR CIT OCT SLC TETR
DIGITAL SERVICES
US New Orleans, LA -13.9% 5.9% 17.3% 9.3% 1 72 39 1 16.7
Baton Rouge, LA -11.7% 5.9% 16.6% 10.8% 2 71 19 2 19.5
Shreveport, LA -10.4% 6.2% 16.2% 12.0% 3 73 5 3 21.6
Youngstown, OH 14.5% 2.8% 16.2% 33.6% 6 12 5 4 60.5
Cincinnati, OH 14.5% 2.8% 16.5% 33.8% 5 11 14 5 60.9
Cleveland, OH 14.3% 3.4% 16.9% 34.5% 4 27 25 6 62.2
Albuquerque, NM 15.9% 4.5% 17.8% 38.2% 7 62 49 7 68.8
Hartford, CT 18.0% 3.9% 19.2% 41.0% 8 48 64 8 73.9
Atlanta, GA 21.1% 3.2% 17.4% 41.7% 9 21 42 9 75.1
Omaha, NE 24.7% 3.8% 16.1% 44.6% 10 42 3 10 80.3
Bangor, ME 27.3% 2.0% 17.0% 46.3% 11 6 29 11 83.3
Beaumont, TX 28.7% 4.4% 16.7% 49.8% 16 57 22 12 89.6
San Antonio, TX 28.8% 4.6% 16.6% 50.0% 17 65 16 13 90.0
Austin, TX 28.5% 4.3% 17.2% 50.0% 15 55 35 14 90.0
Orlando, FL 30.4% 3.2% 16.4% 50.0% 22 23 12 15 90.1
Dallas-Fort Worth, TX 28.4% 4.4% 17.5% 50.2% 14 57 44 16 90.4
Houston, TX 28.2% 4.2% 17.8% 50.3% 13 52 50 17 90.5
Tampa, FL 30.3% 3.4% 16.6% 50.3% 21 30 19 18 90.6
Miami, FL 30.1% 3.5% 17.0% 50.6% 19 33 30 19 91.1
Cedar Rapids, IA 31.5% 3.4% 16.3% 51.2% 27 32 7 20 92.2
Sioux Falls, SD 32.0% 3.3% 16.1% 51.3% 40 24 1 21 92.3
Saginaw, MI 32.0% 3.0% 16.8% 51.8% 40 19 23 22 93.3
Madison, WI 31.9% 2.3% 17.6% 51.8% 36 7 47 22 93.3
Trenton, NJ 27.6% 2.9% 21.3% 51.8% 12 16 73 24 93.3
Pittsburgh, PA 32.1% 2.9% 17.0% 52.0% 43 13 28 25 93.5
Cheyenne, WY 31.9% 2.9% 17.3% 52.0% 36 13 36 26 93.6
St. Louis, MO 30.2% 4.4% 17.6% 52.2% 20 59 45 27 94.0
Phoenix, AZ 31.9% 3.9% 16.6% 52.4% 38 47 18 28 94.3
Denver, CO 31.0% 3.8% 17.6% 52.5% 25 45 46 29 94.5
Detroit, MI 31.8% 3.2% 17.4% 52.5% 34 22 40 29 94.5
Little Rock, AR 32.0% 4.3% 16.5% 52.8% 42 56 13 31 95.0
Kansas City, MO 30.9% 4.5% 17.5% 52.9% 24 63 43 32 95.2
Salt Lake City, UT 32.6% 3.4% 17.0% 53.0% 44 27 31 33 95.5
Fargo, ND 33.9% 2.9% 16.4% 53.1% 54 13 8 34 95.6
Philadelphia, PA 31.9% 3.1% 18.1% 53.1% 39 20 54 35 95.7
Minneapolis, MN 30.8% 2.7% 19.7% 53.2% 23 10 69 36 95.8
Riverside-San Bernardino, CA 31.7% 3.5% 18.4% 53.7% 33 35 56 37 96.6

Competitive Alternatives, Focus on Tax 2014 | 29
Country City
Effective Tax Rates Ranks
TTICIT OCT SLC TETR CIT OCT SLC TETR
DIGITAL SERVICES
US San Diego, CA 31.7% 3.7% 18.6% 54.0% 30 40 59 38 97.1
Sacramento, CA 31.7% 3.7% 18.6% 54.0% 32 41 58 39 97.2
Spokane, WA 31.8% 4.2% 18.0% 54.1% 34 54 52 40 97.3
Raleigh, NC 33.6% 3.4% 17.3% 54.3% 47 30 38 41 97.7
Gulfport-Biloxi, MS 33.8% 4.4% 16.2% 54.4% 51 60 4 42 97.9
Spartanburg, SC 33.2% 4.2% 17.1% 54.5% 45 52 33 43 98.1
Honolulu, HI 30.1% 2.6% 21.8% 54.5% 18 9 74 44 98.1
Charlotte, NC 33.6% 3.8% 17.2% 54.5% 48 44 34 45 98.2
Montgomery, AL 33.7% 4.5% 16.4% 54.6% 50 61 11 46 98.2
Billings, MT 36.3% 0.4% 17.9% 54.6% 67 1 51 47 98.3
Jackson, MS 33.8% 4.7% 16.1% 54.6% 51 66 2 48 98.4
Indianapolis, IN 34.6% 3.6% 16.6% 54.8% 56 36 17 49 98.6
Los Angeles, CA 31.6% 4.0% 19.2% 54.8% 29 50 65 50 98.6
Mobile, AL 33.6% 4.9% 16.9% 55.3% 49 67 24 51 99.6
Baltimore, MD 34.2% 3.6% 17.7% 55.5% 55 36 48 52 99.8
Wilmington, DE 35.1% 1.7% 18.7% 55.5% 58 5 60 53 100.0
Oklahoma City, OK 34.6% 3.8% 17.3% 55.6% 57 42 36 54 100.0
San Francisco, CA 31.3% 4.0% 20.4% 55.7% 26 49 71 55 100.3
Wichita, KS 36.2% 2.9% 16.6% 55.8% 66 17 19 56 100.5
Seattle, WA 31.5% 4.6% 19.8% 55.8% 27 64 70 57 100.5
Lexington, KY 37.5% 2.4% 16.4% 56.3% 73 8 9 58 101.3
Manchester, NH 36.8% 1.6% 18.2% 56.6% 72 4 55 59 101.9
Champaign-Urbana, IL 36.3% 3.4% 17.0% 56.6% 67 29 27 60 102.0
Las Vegas, NV 31.7% 5.8% 19.2% 56.8% 30 70 65 61 102.2
Providence, RI 33.9% 3.8% 19.1% 56.8% 53 45 63 62 102.2
Portland, OR 36.6% 0.7% 19.5% 56.8% 71 3 67 63 102.3
Boise, ID 35.9% 3.0% 18.0% 56.9% 65 18 53 64 102.4
Nashville, TN 35.5% 5.2% 16.4% 57.1% 62 68 9 65 102.7
Buffalo, NY 36.4% 3.6% 17.1% 57.2% 69 38 32 66 102.9
Burlington, VT 36.5% 3.3% 17.4% 57.3% 70 25 40 67 103.1
Charleston, WV 33.3% 7.7% 16.5% 57.5% 46 74 15 68 103.5
North Virginia, Metro DC, VA 35.3% 4.0% 18.4% 57.7% 60 51 57 69 103.9
Boston, MA 35.3% 3.5% 19.0% 57.7% 59 34 62 69 103.9
Memphis, TN 35.4% 5.5% 16.9% 57.8% 61 69 26 71 104.0
Chicago, IL 35.8% 3.3% 18.8% 58.0% 63 26 61 72 104.3
Anchorage, AK 37.6% 0.6% 20.8% 59.0% 74 2 72 73 106.1
New York City, NY 35.9% 3.6% 19.7% 59.2% 64 39 68 74 106.6
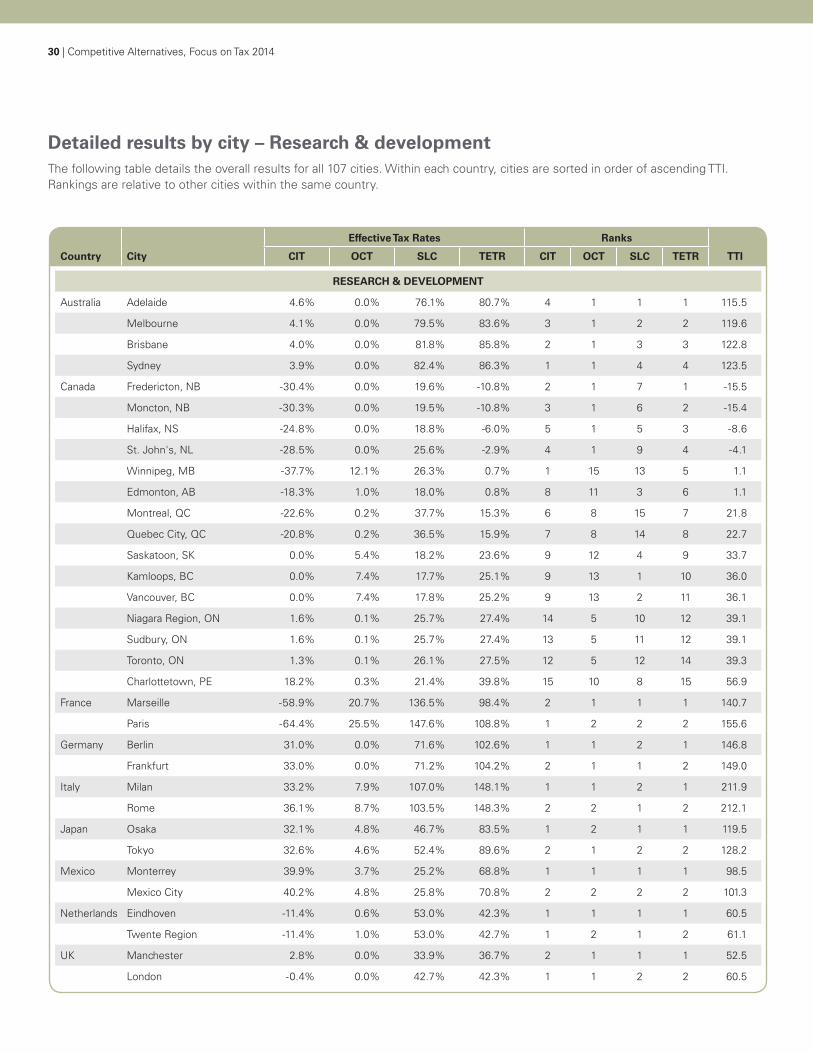
30 | Competitive Alternatives, Focus on Tax 2014
Detailed results by city – Research & developmentThe following table details the overall results for all 107 cities. Within each country, cities are sorted in order of ascending TTI. Rankings are relative to other cities within the same country.
Country City
Effective Tax Rates Ranks
TTICIT OCT SLC TETR CIT OCT SLC TETR
RESEARCH & DEVELOPMENT
Australia Adelaide 4.6% 0.0% 76.1% 80.7% 4 1 1 1 115.5
Melbourne 4.1% 0.0% 79.5% 83.6% 3 1 2 2 119.6
Brisbane 4.0% 0.0% 81.8% 85.8% 2 1 3 3 122.8
Sydney 3.9% 0.0% 82.4% 86.3% 1 1 4 4 123.5
Canada Fredericton, NB -30.4% 0.0% 19.6% -10.8% 2 1 7 1 -15.5
Moncton, NB -30.3% 0.0% 19.5% -10.8% 3 1 6 2 -15.4
Halifax, NS -24.8% 0.0% 18.8% -6.0% 5 1 5 3 -8.6
St. John's, NL -28.5% 0.0% 25.6% -2.9% 4 1 9 4 -4.1
Winnipeg, MB -37.7% 12.1% 26.3% 0.7% 1 15 13 5 1.1
Edmonton, AB -18.3% 1.0% 18.0% 0.8% 8 11 3 6 1.1
Montreal, QC -22.6% 0.2% 37.7% 15.3% 6 8 15 7 21.8
Quebec City, QC -20.8% 0.2% 36.5% 15.9% 7 8 14 8 22.7
Saskatoon, SK 0.0% 5.4% 18.2% 23.6% 9 12 4 9 33.7
Kamloops, BC 0.0% 7.4% 17.7% 25.1% 9 13 1 10 36.0
Vancouver, BC 0.0% 7.4% 17.8% 25.2% 9 13 2 11 36.1
Niagara Region, ON 1.6% 0.1% 25.7% 27.4% 14 5 10 12 39.1
Sudbury, ON 1.6% 0.1% 25.7% 27.4% 13 5 11 12 39.1
Toronto, ON 1.3% 0.1% 26.1% 27.5% 12 5 12 14 39.3
Charlottetown, PE 18.2% 0.3% 21.4% 39.8% 15 10 8 15 56.9
France Marseille -58.9% 20.7% 136.5% 98.4% 2 1 1 1 140.7
Paris -64.4% 25.5% 147.6% 108.8% 1 2 2 2 155.6
Germany Berlin 31.0% 0.0% 71.6% 102.6% 1 1 2 1 146.8
Frankfurt 33.0% 0.0% 71.2% 104.2% 2 1 1 2 149.0
Italy Milan 33.2% 7.9% 107.0% 148.1% 1 1 2 1 211.9
Rome 36.1% 8.7% 103.5% 148.3% 2 2 1 2 212.1
Japan Osaka 32.1% 4.8% 46.7% 83.5% 1 2 1 1 119.5
Tokyo 32.6% 4.6% 52.4% 89.6% 2 1 2 2 128.2
Mexico Monterrey 39.9% 3.7% 25.2% 68.8% 1 1 1 1 98.5
Mexico City 40.2% 4.8% 25.8% 70.8% 2 2 2 2 101.3
Netherlands Eindhoven -11.4% 0.6% 53.0% 42.3% 1 1 1 1 60.5
Twente Region -11.4% 1.0% 53.0% 42.7% 1 2 1 2 61.1
UK Manchester 2.8% 0.0% 33.9% 36.7% 2 1 1 1 52.5
London -0.4% 0.0% 42.7% 42.3% 1 1 2 2 60.5

Competitive Alternatives, Focus on Tax 2014 | 31
Country City
Effective Tax Rates Ranks
TTICIT OCT SLC TETR CIT OCT SLC TETR
RESEARCH & DEVELOPMENT
US Omaha, NE 3.9% 10.8% 32.3% 47.0% 1 45 4 1 67.3
Albuquerque, NM 8.8% 11.8% 35.6% 56.2% 4 53 38 2 80.4
Honolulu, HI 7. 2 % 6.5% 43.9% 57.5% 3 10 73 3 82.3
Atlanta, GA 13.6% 8.8% 35.7% 58.0% 6 26 40 4 83.0
Minneapolis, MN 12.5% 7.1% 38.8% 58.4% 5 12 62 5 83.6
Cedar Rapids, IA 16.0% 8.6% 33.9% 58.5% 7 23 22 6 83.7
Fargo, ND 20.2% 7. 5 % 30.8% 58.5% 40 16 1 7 83.8
Indianapolis, IN 19.6% 8.6% 31.3% 59.5% 27 25 2 8 85.1
Youngstown, OH 20.4% 7.2% 32.3% 59.9% 42 13 5 9 85.7
Trenton, NJ 5.1% 7. 5 % 47.6% 60.3% 2 16 74 10 86.3
Cincinnati, OH 20.6% 7.1% 32.7% 60.4% 49 11 8 11 86.4
Billings, MT 22.2% 1.6% 36.8% 60.6% 67 1 49 12 86.7
Bangor, ME 20.0% 5.5% 35.5% 61.0% 35 6 37 13 87.2
Saginaw, MI 19.4% 8 . 8 % 32.8% 61.0% 24 26 9 14 87.2
Sioux Falls, SD 20.2% 8.0% 32.9% 61.1% 37 20 12 15 87.4
Pittsburgh, PA 19.9% 7. 3 % 34.4% 61.5% 32 14 26 16 88.0
Cheyenne, WY 19.9% 7. 7 % 34.0% 61.6% 33 19 23 17 88.1
Wilmington, DE 21.0% 3.1% 37.8% 61.9% 51 5 56 18 88.5
Madison, WI 19.5% 5.9% 36.7% 62.2% 26 7 48 19 88.9
Detroit, MI 19.1% 9.4% 33.8% 62.2% 22 34 20 20 89.0
Portland, OR 21.4% 2.6% 38.3% 62.3% 58 3 58 21 89.1
Baltimore, MD 21.1% 6.3% 35.0% 62.5% 54 9 31 22 89.4
Cleveland, OH 20.6% 8.6% 33.5% 62.7% 47 24 16 23 89.7
Phoenix, AZ 19.3% 11.0% 32.4% 62.7% 23 48 6 24 89.7
Manchester, NH 22.1% 3.0% 37.8% 62.9% 66 4 57 25 90.0
Philadelphia, PA 18.9% 7.5% 36.6% 63.0% 19 15 47 26 90.2
Raleigh, NC 20.4% 8.6% 34.1% 63.0% 43 22 25 26 90.2
Lexington, KY 24.1% 6.2% 32.9% 63.2% 73 8 11 28 90.4
Salt Lake City, UT 19.6% 9.3% 34.6% 63.5% 28 31 30 29 90.8
Orlando, FL 21.6% 9.2% 32.8% 63.5% 60 30 10 30 90.9
Charlotte, NC 20.6% 9.5% 33.8% 63.9% 47 36 21 31 91.5
Spokane, WA 19.6% 11.1% 33.5% 64.2% 29 50 17 32 91.9
Tampa, FL 21.5% 9.8% 33.1% 64.4% 59 39 13 33 92.2
Miami, FL 21.0% 9.9% 34.0% 65.0% 52 40 24 34 93.0
Boston, MA 18.7% 10.3% 36.8% 65.8% 17 43 49 35 94.2
Champaign-Urbana, IL 21.1% 9.1% 35.6% 65.8% 54 29 39 36 94.2
Little Rock, AR 21.6% 12.3% 32.0% 65.9% 62 59 3 37 94.3
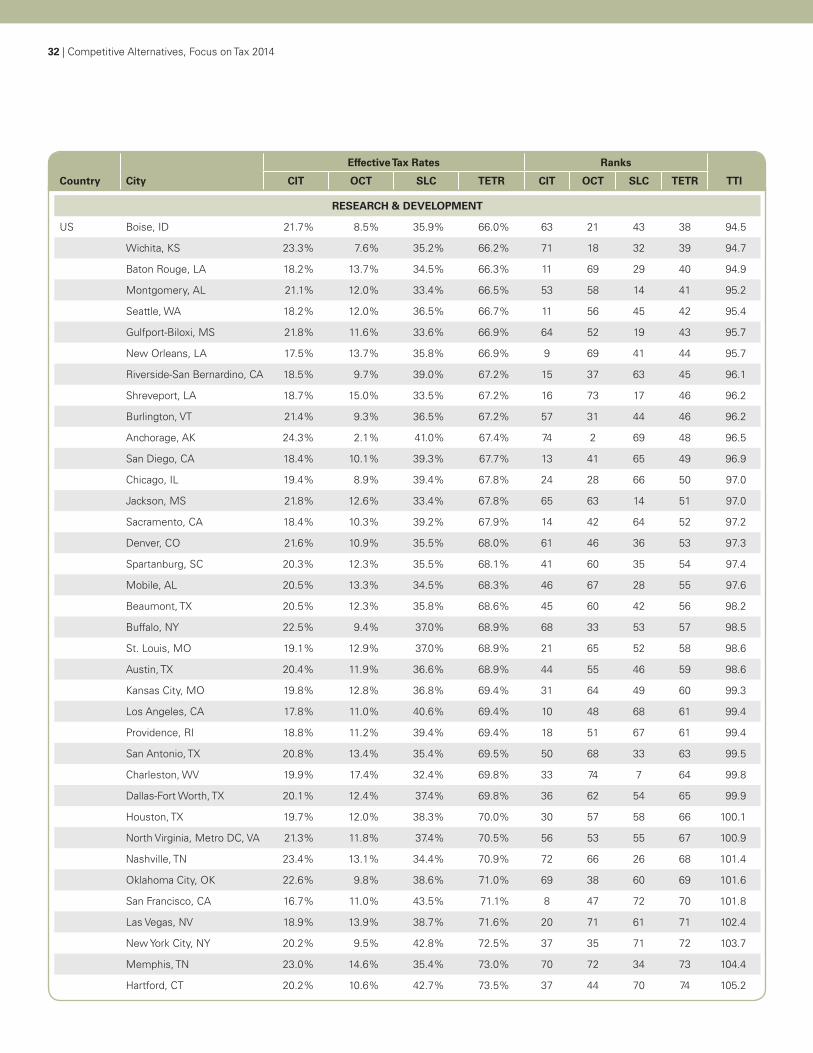
32 | Competitive Alternatives, Focus on Tax 2014
Country City
Effective Tax Rates Ranks
TTICIT OCT SLC TETR CIT OCT SLC TETR
RESEARCH & DEVELOPMENT
US Boise, ID 21.7% 8.5% 35.9% 66.0% 63 21 43 38 94.5
Wichita, KS 23.3% 7.6% 35.2% 66.2% 71 18 32 39 94.7
Baton Rouge, LA 18.2% 13.7% 34.5% 66.3% 11 69 29 40 94.9
Montgomery, AL 21.1% 12.0% 33.4% 66.5% 53 58 14 41 95.2
Seattle, WA 18.2% 12.0% 36.5% 66.7% 11 56 45 42 95.4
Gulfport-Biloxi, MS 21.8% 11.6% 33.6% 66.9% 64 52 19 43 95.7
New Orleans, LA 17.5% 13.7% 35.8% 66.9% 9 69 41 44 95.7
Riverside-San Bernardino, CA 18.5% 9.7% 39.0% 67.2% 15 37 63 45 96.1
Shreveport, LA 18.7% 15.0% 33.5% 67.2% 16 73 17 46 96.2
Burlington, VT 21.4% 9.3% 36.5% 67.2% 57 31 44 46 96.2
Anchorage, AK 24.3% 2.1% 41.0% 67.4% 74 2 69 48 96.5
San Diego, CA 18.4% 10.1% 39.3% 67.7% 13 41 65 49 96.9
Chicago, IL 19.4% 8.9% 39.4% 67.8% 24 28 66 50 97.0
Jackson, MS 21.8% 12.6% 33.4% 67.8% 65 63 14 51 97.0
Sacramento, CA 18.4% 10.3% 39.2% 67.9% 14 42 64 52 97.2
Denver, CO 21.6% 10.9% 35.5% 68.0% 61 46 36 53 97.3
Spartanburg, SC 20.3% 12.3% 35.5% 68.1% 41 60 35 54 97.4
Mobile, AL 20.5% 13.3% 34.5% 68.3% 46 67 28 55 97.6
Beaumont, TX 20.5% 12.3% 35.8% 68.6% 45 60 42 56 98.2
Buffalo, NY 22.5% 9.4% 37.0% 68.9% 68 33 53 57 98.5
St. Louis, MO 19.1% 12.9% 37.0% 68.9% 21 65 52 58 98.6
Austin, TX 20.4% 11.9% 36.6% 68.9% 44 55 46 59 98.6
Kansas City, MO 19.8% 12.8% 36.8% 69.4% 31 64 49 60 99.3
Los Angeles, CA 17.8% 11.0% 40.6% 69.4% 10 48 68 61 99.4
Providence, RI 18.8% 11.2% 39.4% 69.4% 18 51 67 61 99.4
San Antonio, TX 20.8% 13.4% 35.4% 69.5% 50 68 33 63 99.5
Charleston, WV 19.9% 17.4% 32.4% 69.8% 33 74 7 64 99.8
Dallas-Fort Worth, TX 20.1% 12.4% 37.4% 69.8% 36 62 54 65 99.9
Houston, TX 19.7% 12.0% 38.3% 70.0% 30 57 58 66 100.1
North Virginia, Metro DC, VA 21.3% 11.8% 37.4% 70.5% 56 53 55 67 100.9
Nashville, TN 23.4% 13.1% 34.4% 70.9% 72 66 26 68 101.4
Oklahoma City, OK 22.6% 9.8% 38.6% 71.0% 69 38 60 69 101.6
San Francisco, CA 16.7% 11.0% 43.5% 71.1% 8 47 72 70 101.8
Las Vegas, NV 18.9% 13.9% 38.7% 71.6% 20 71 61 71 102.4
New York City, NY 20.2% 9.5% 42.8% 72.5% 37 35 71 72 103.7
Memphis, TN 23.0% 14.6% 35.4% 73.0% 70 72 34 73 104.4
Hartford, CT 20.2% 10.6% 42.7% 73.5% 37 44 70 74 105.2

Competitive Alternatives, Focus on Tax 2014 | 33
Detailed results by city – Corporate servicesThe following table details the overall results for all 107 cities. Within each country, cities are sorted in order of ascending TTI. Rankings are relative to other cities within the same country.
Country City
Effective Tax Rates Ranks
TTICIT OCT SLC TETR CIT OCT SLC TETR
CORPORATE SERVICES
Australia Adelaide 30.0% 0.0% 76.5% 106.4% 1 1 1 1 134.2
Melbourne 30.0% 0.0% 79.5% 109.5% 1 1 2 2 138.1
Brisbane 30.0% 0.0% 81.0% 111.0% 1 1 3 3 140.0
Sydney 30.0% 0.0% 82.7% 112.7% 1 1 4 4 142.1
Canada Edmonton, AB 24.7% 0.5% 20.0% 45.2% 4 11 8 1 57.0
Moncton, NB 26.6% 0.0% 18.9% 45.5% 9 1 2 2 57.3
Fredericton, NB 26.6% 0.0% 19.1% 45.7% 9 1 3 3 57.6
Kamloops, BC 20.9% 6.1% 19.4% 46.3% 2 13 4 4 58.5
Vancouver, BC 20.9% 6.1% 19.7% 46.7% 2 13 6 5 58.9
Charlottetown, PE 30.6% 0.2% 18.8% 49.5% 14 10 1 6 62.5
Halifax, NS 30.6% 0.0% 20.0% 50.5% 14 1 7 7 63.7
Saskatoon, SK 26.6% 4.4% 19.5% 50.5% 9 12 5 7 63.7
Sudbury, ON 26.1% 0.1% 26.9% 53.1% 5 6 11 9 67.0
Niagara Region, ON 26.1% 0.1% 27.1% 53.3% 5 5 12 10 67.2
Toronto, ON 26.1% 0.1% 27.9% 54.1% 5 6 13 11 68.2
St. John's, NL 28.6% 0.0% 25.6% 54.2% 13 1 9 12 68.3
Montreal, QC 18.7% 0.1% 37.7% 56.5% 1 8 15 13 71.3
Winnipeg, MB 26.6% 8.6% 26.4% 61.7% 9 15 10 14 77.8
Quebec City, QC 26.5% 0.1% 35.9% 62.5% 8 8 14 15 78.8
France Marseille 32.9% 17.2% 126.9% 177.0% 1 1 1 1 223.2
Paris 32.9% 21.7% 138.7% 193.2% 1 2 2 2 243.7
Germany Berlin 30.2% 0.0% 68.5% 98.6% 1 1 2 1 124.4
Frankfurt 32.2% 0.0% 68.4% 100.6% 2 1 1 2 126.9
Italy Milan 37.3% 4.4% 95.0% 136.7% 1 2 2 1 172.4
Rome 40.6% 4.2% 94.6% 139.5% 2 1 1 2 175.9
Japan Osaka 37.3% 2.6% 46.9% 86.9% 1 1 1 1 109.6
Tokyo 37.6% 2.7% 53.5% 93.8% 2 2 2 2 118.3
Mexico Monterrey 38.7% 2.9% 19.9% 61.5% 1 1 1 1 77.6
Mexico City 39.0% 4.0% 20.5% 63.4% 2 2 2 2 80.0
Netherlands Eindhoven 24.9% 0.2% 51.2% 76.4% 1 1 1 1 96.4
Twente Region 24.9% 0.4% 51.2% 76.6% 1 2 1 2 96.6
UK Manchester 20.4% 0.0% 28.5% 48.9% 1 1 1 1 61.7
London 20.4% 0.0% 37.6% 58.0% 1 1 2 2 73.1

34 | Competitive Alternatives, Focus on Tax 2014
Country City
Effective Tax Rates Ranks
TTICIT OCT SLC TETR CIT OCT SLC TETR
CORPORATE SERVICES
US Omaha, NE 29.0% 7.7% 27.7% 64.4% 2 44 4 1 81.3
Trenton, NJ 21.9% 6.2% 38.5% 66.6% 1 17 73 2 84.0
Sioux Falls, SD 34.6% 7.1% 27.2% 68.9% 6 29 1 3 86.8
Youngstown, OH 35.9% 6.1% 27.2% 69.2% 25 16 2 4 87.3
Atlanta, GA 33.0% 6.5% 29.9% 69.4% 4 21 39 5 87.5
Bangor, ME 35.5% 4.3% 29.8% 69.6% 14 6 38 6 87.8
Cincinnati, OH 35.8% 6.1% 28.6% 70.5% 24 13 20 7 88.9
Saginaw, MI 35.8% 6.2% 28.7% 70.6% 23 18 21 8 89.1
Billings, MT 38.9% 0.8% 30.9% 70.7% 59 1 50 9 89.1
Cheyenne, WY 34.6% 5.9% 30.3% 70.8% 6 11 44 10 89.3
Pittsburgh, PA 35.7% 6.0% 29.3% 71.0% 20 12 28 11 89.5
Cedar Rapids, IA 35.7% 7. 4 % 28.1% 71.2% 20 38 10 12 89.8
Madison, WI 35.3% 4.8% 31.1% 71.2% 12 7 51 12 89.8
Orlando, FL 36.7% 6.6% 28.3% 71.5% 35 23 12 14 90.2
Fargo, ND 37.5% 6.1% 28.2% 71.8% 42 15 11 15 90.5
Phoenix, AZ 35.4% 7.8% 28.7% 71.9% 13 47 24 16 90.7
Tampa, FL 36.7% 7.0% 28.4% 72.1% 35 27 17 17 91.0
St. Louis, MO 32.6% 9.0% 30.6% 72.2% 3 58 49 18 91.0
Salt Lake City, UT 35.9% 7.0% 29.4% 72.3% 25 26 29 19 91.1
Cleveland, OH 35.9% 7.3% 29.2% 72.4% 27 36 27 20 91.3
Detroit, MI 36.0% 6.5% 30.1% 72.6% 28 22 42 21 91.6
Albuquerque, NM 33.5% 9.4% 30.0% 72.9% 5 64 41 22 91.9
Lexington, KY 40.2% 5.0% 27.9% 73.0% 71 8 7 23 92.1
Raleigh, NC 36.7% 6.6% 29.7% 73.1% 38 24 36 24 92.2
Miami, FL 36.7% 7.1% 29.4% 73.2% 35 31 31 25 92.4
Charlotte, NC 36.7% 7.3% 29.5% 73.5% 38 34 32 26 92.7
Gulfport-Biloxi, MS 37.9% 8.3% 27.6% 73.8% 47 52 3 27 93.1
Wichita, KS 39.1% 6.2% 28.5% 73.8% 62 19 18 28 93.1
Spartanburg, SC 37.2% 8.0% 28.7% 73.9% 40 48 22 29 93.3
Beaumont, TX 36.4% 9.0% 28.7% 74.1% 30 58 24 30 93.4
San Antonio, TX 36.4% 9.5% 28.4% 74.2% 32 65 14 31 93.6
Philadelphia, PA 36.3% 6.3% 31.7% 74.3% 29 20 54 32 93.7
Jackson, MS 37.9% 8.8% 27.7% 74.3% 47 54 4 33 93.8
Kansas City, MO 35.1% 9.0% 30.2% 74.3% 11 60 43 33 93.8
Oklahoma City, OK 37.4% 7.6% 29.6% 74.6% 41 40 35 35 94.1
Montgomery, AL 37.6% 9.2% 27.9% 74.7% 43 63 8 36 94.2
Austin, TX 36.4% 8.8% 29.5% 74.7% 33 55 34 37 94.3

Competitive Alternatives, Focus on Tax 2014 | 35
Country City
Effective Tax Rates Ranks
TTICIT OCT SLC TETR CIT OCT SLC TETR
CORPORATE SERVICES
US Indianapolis, IN 38.9% 7.3% 28.6% 74.8% 58 34 19 38 94.3
Manchester, NH 40.1% 2.8% 31.9% 74.8% 68 5 55 39 94.3
Riverside-San Bernardino, CA 35.6% 7.3% 32.1% 75.0% 15 36 57 40 94.6
Baltimore, MD 37.7% 7.1% 30.3% 75.1% 46 32 44 41 94.7
Wilmington, DE 40.2% 2.7% 32.2% 75.1% 70 4 59 41 94.7
Dallas-Fort Worth, TX 36.4% 8.9% 30.0% 75.3% 30 57 40 43 94.9
Spokane, WA 34.6% 9.1% 31.6% 75.3% 6 62 52 43 94.9
Sacramento, CA 35.6% 7.7% 32.1% 75.4% 15 44 57 45 95.1
Houston, TX 36.5% 8.6% 30.5% 75.6% 34 53 47 46 95.4
Mobile, AL 37.6% 10.0% 28.1% 75.7% 43 68 9 47 95.5
San Diego, CA 35.6% 7.6% 32.6% 75.7% 15 39 60 47 95.5
Denver, CO 37.6% 7.8% 30.4% 75.8% 43 46 46 49 95.6
Little Rock, AR 38.1% 9.1% 28.7% 75.8% 51 61 22 50 95.7
Nashville, TN 37.9% 9.8% 28.4% 76.2% 49 66 16 51 96.1
Champaign-Urbana, IL 39.7% 7.2% 29.4% 76.3% 65 33 29 52 96.3
Buffalo, NY 39.2% 7.7% 29.7% 76.6% 63 41 36 53 96.6
Minneapolis, MN 35.7% 5.7% 35.3% 76.6% 20 10 69 54 96.7
Shreveport, LA 38.3% 10.5% 27.8% 76.6% 53 71 6 54 96.7
Baton Rouge, LA 38.3% 10.0% 28.4% 76.7% 53 68 14 56 96.7
Boise, ID 39.0% 6.1% 31.6% 76.7% 60 13 53 57 96.7
Memphis, TN 38.0% 10.4% 28.8% 77.1% 50 70 26 58 97.3
Los Angeles, CA 35.6% 8.2% 33.4% 77.2% 15 51 63 59 97.3
Burlington, VT 40.1% 6.7% 30.6% 77.3% 68 25 48 60 97.5
Portland, OR 41.3% 1.3% 35.1% 77.6% 73 3 68 61 97.9
New Orleans, LA 38.3% 10.0% 29.5% 77.7% 53 67 32 62 98.0
North Virginia, Metro DC, VA 38.3% 8.8% 31.9% 79.0% 52 56 56 63 99.7
Anchorage, AK 40.6% 1.0% 37.6% 79.3% 72 2 72 64 100.0
Las Vegas, NV 34.6% 11.2% 33.6% 79.4% 6 73 64 65 100.2
San Francisco, CA 35.6% 8.2% 35.8% 79.5% 15 50 71 66 100.3
Chicago, IL 39.7% 7.1% 33.1% 79.9% 65 29 61 67 100.8
Providence, RI 39.3% 7.7% 33.3% 80.2% 64 41 62 68 101.2
Boston, MA 39.7% 7.0% 33.6% 80.4% 67 27 65 69 101.4
Seattle, WA 34.6% 10.8% 35.5% 80.8% 6 72 70 70 102.0
Charleston, WV 38.8% 14.1% 28.3% 81.2% 57 74 12 71 102.4
Hartford, CT 39.0% 8.1% 34.3% 81.4% 60 49 66 72 102.7
Honolulu, HI 38.3% 5.6% 39.4% 83.3% 53 9 74 73 105.0
New York City, NY 42.3% 7.7% 34.5% 84.5% 74 43 67 74 106.6
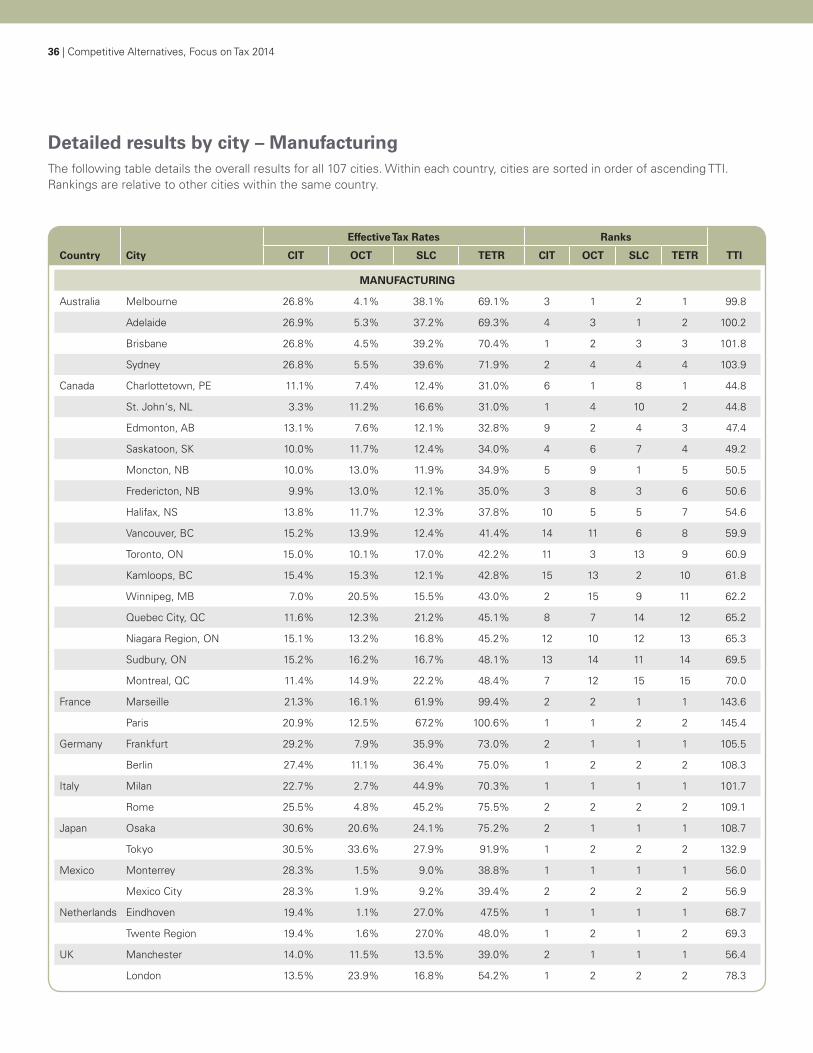
36 | Competitive Alternatives, Focus on Tax 2014
Detailed results by city – ManufacturingThe following table details the overall results for all 107 cities. Within each country, cities are sorted in order of ascending TTI. Rankings are relative to other cities within the same country.
Country City
Effective Tax Rates Ranks
TTICIT OCT SLC TETR CIT OCT SLC TETR
MANUFACTURING
Australia Melbourne 26.8% 4.1% 38.1% 69.1% 3 1 2 1 99.8
Adelaide 26.9% 5.3% 37.2% 69.3% 4 3 1 2 100.2
Brisbane 26.8% 4.5% 39.2% 70.4% 1 2 3 3 101.8
Sydney 26.8% 5.5% 39.6% 71.9% 2 4 4 4 103.9
Canada Charlottetown, PE 11.1% 7.4% 12.4% 31.0% 6 1 8 1 44.8
St. John's, NL 3.3% 11.2% 16.6% 31.0% 1 4 10 2 44.8
Edmonton, AB 13.1% 7.6% 12.1% 32.8% 9 2 4 3 47.4
Saskatoon, SK 10.0% 11.7% 12.4% 34.0% 4 6 7 4 49.2
Moncton, NB 10.0% 13.0% 11.9% 34.9% 5 9 1 5 50.5
Fredericton, NB 9.9% 13.0% 12.1% 35.0% 3 8 3 6 50.6
Halifax, NS 13.8% 11.7% 12.3% 37.8% 10 5 5 7 54.6
Vancouver, BC 15.2% 13.9% 12.4% 41.4% 14 11 6 8 59.9
Toronto, ON 15.0% 10.1% 17.0% 42.2% 11 3 13 9 60.9
Kamloops, BC 15.4% 15.3% 12.1% 42.8% 15 13 2 10 61.8
Winnipeg, MB 7.0% 20.5% 15.5% 43.0% 2 15 9 11 62.2
Quebec City, QC 11.6% 12.3% 21.2% 45.1% 8 7 14 12 65.2
Niagara Region, ON 15.1% 13.2% 16.8% 45.2% 12 10 12 13 65.3
Sudbury, ON 15.2% 16.2% 16.7% 48.1% 13 14 11 14 69.5
Montreal, QC 11.4% 14.9% 22.2% 48.4% 7 12 15 15 70.0
France Marseille 21.3% 16.1% 61.9% 99.4% 2 2 1 1 143.6
Paris 20.9% 12.5% 67.2% 100.6% 1 1 2 2 145.4
Germany Frankfurt 29.2% 7.9% 35.9% 73.0% 2 1 1 1 105.5
Berlin 27.4% 11.1% 36.4% 75.0% 1 2 2 2 108.3
Italy Milan 22.7% 2.7% 44.9% 70.3% 1 1 1 1 101.7
Rome 25.5% 4.8% 45.2% 75.5% 2 2 2 2 109.1
Japan Osaka 30.6% 20.6% 24.1% 75.2% 2 1 1 1 108.7
Tokyo 30.5% 33.6% 27.9% 91.9% 1 2 2 2 132.9
Mexico Monterrey 28.3% 1.5% 9.0% 38.8% 1 1 1 1 56.0
Mexico City 28.3% 1.9% 9.2% 39.4% 2 2 2 2 56.9
Netherlands Eindhoven 19.4% 1.1% 27.0% 47.5% 1 1 1 1 68.7
Twente Region 19.4% 1.6% 27.0% 48.0% 1 2 1 2 69.3
UK Manchester 14.0% 11.5% 13.5% 39.0% 2 1 1 1 56.4
London 13.5% 23.9% 16.8% 54.2% 1 2 2 2 78.3
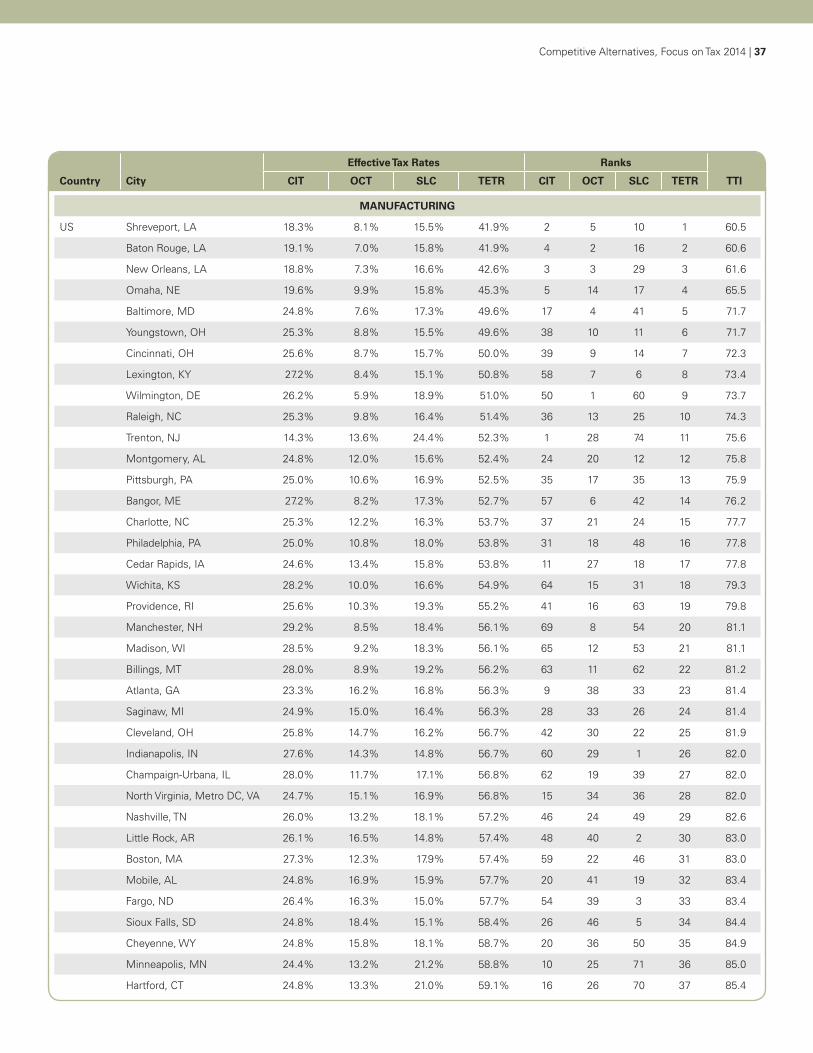
Competitive Alternatives, Focus on Tax 2014 | 37
Country City
Effective Tax Rates Ranks
TTICIT OCT SLC TETR CIT OCT SLC TETR
MANUFACTURING
US Shreveport, LA 18.3% 8.1% 15.5% 41.9% 2 5 10 1 60.5
Baton Rouge, LA 19.1% 7.0% 15.8% 41.9% 4 2 16 2 60.6
New Orleans, LA 18.8% 7.3% 16.6% 42.6% 3 3 29 3 61.6
Omaha, NE 19.6% 9.9% 15.8% 45.3% 5 14 17 4 65.5
Baltimore, MD 24.8% 7.6% 17.3% 49.6% 17 4 41 5 71.7
Youngstown, OH 25.3% 8.8% 15.5% 49.6% 38 10 11 6 71.7
Cincinnati, OH 25.6% 8.7% 15.7% 50.0% 39 9 14 7 72.3
Lexington, KY 27.2% 8.4% 15.1% 50.8% 58 7 6 8 73.4
Wilmington, DE 26.2% 5.9% 18.9% 51.0% 50 1 60 9 73.7
Raleigh, NC 25.3% 9.8% 16.4% 51.4% 36 13 25 10 74.3
Trenton, NJ 14.3% 13.6% 24.4% 52.3% 1 28 74 11 75.6
Montgomery, AL 24.8% 12.0% 15.6% 52.4% 24 20 12 12 75.8
Pittsburgh, PA 25.0% 10.6% 16.9% 52.5% 35 17 35 13 75.9
Bangor, ME 27.2% 8.2% 17.3% 52.7% 57 6 42 14 76.2
Charlotte, NC 25.3% 12.2% 16.3% 53.7% 37 21 24 15 77.7
Philadelphia, PA 25.0% 10.8% 18.0% 53.8% 31 18 48 16 77.8
Cedar Rapids, IA 24.6% 13.4% 15.8% 53.8% 11 27 18 17 77.8
Wichita, KS 28.2% 10.0% 16.6% 54.9% 64 15 31 18 79.3
Providence, RI 25.6% 10.3% 19.3% 55.2% 41 16 63 19 79.8
Manchester, NH 29.2% 8.5% 18.4% 56.1% 69 8 54 20 81.1
Madison, WI 28.5% 9.2% 18.3% 56.1% 65 12 53 21 81.1
Billings, MT 28.0% 8.9% 19.2% 56.2% 63 11 62 22 81.2
Atlanta, GA 23.3% 16.2% 16.8% 56.3% 9 38 33 23 81.4
Saginaw, MI 24.9% 15.0% 16.4% 56.3% 28 33 26 24 81.4
Cleveland, OH 25.8% 14.7% 16.2% 56.7% 42 30 22 25 81.9
Indianapolis, IN 27.6% 14.3% 14.8% 56.7% 60 29 1 26 82.0
Champaign-Urbana, IL 28.0% 11.7% 17.1% 56.8% 62 19 39 27 82.0
North Virginia, Metro DC, VA 24.7% 15.1% 16.9% 56.8% 15 34 36 28 82.0
Nashville, TN 26.0% 13.2% 18.1% 57.2% 46 24 49 29 82.6
Little Rock, AR 26.1% 16.5% 14.8% 57.4% 48 40 2 30 83.0
Boston, MA 27.3% 12.3% 17.9% 57.4% 59 22 46 31 83.0
Mobile, AL 24.8% 16.9% 15.9% 57.7% 20 41 19 32 83.4
Fargo, ND 26.4% 16.3% 15.0% 57.7% 54 39 3 33 83.4
Sioux Falls, SD 24.8% 18.4% 15.1% 58.4% 26 46 5 34 84.4
Cheyenne, WY 24.8% 15.8% 18.1% 58.7% 20 36 50 35 84.9
Minneapolis, MN 24.4% 13.2% 21.2% 58.8% 10 25 71 36 85.0
Hartford, CT 24.8% 13.3% 21.0% 59.1% 16 26 70 37 85.4
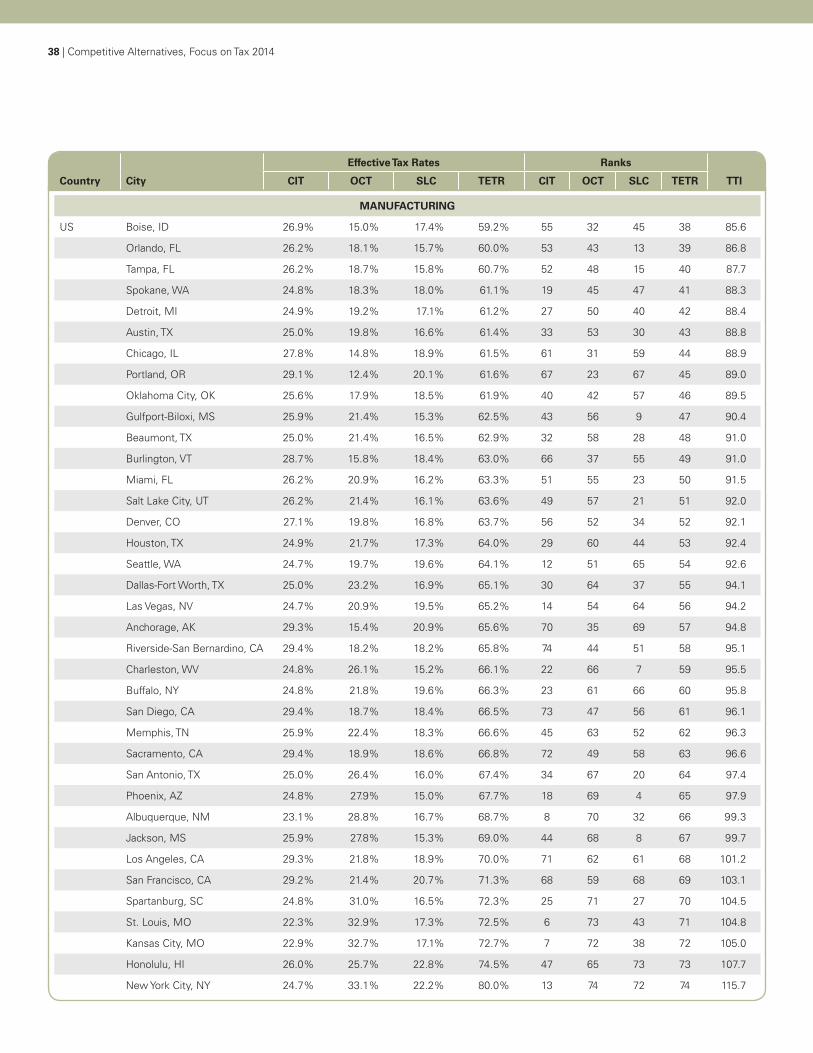
38 | Competitive Alternatives, Focus on Tax 2014
Country City
Effective Tax Rates Ranks
TTICIT OCT SLC TETR CIT OCT SLC TETR
MANUFACTURING
US Boise, ID 26.9% 15.0% 17.4% 59.2% 55 32 45 38 85.6
Orlando, FL 26.2% 18.1% 15.7% 60.0% 53 43 13 39 86.8
Tampa, FL 26.2% 18.7% 15.8% 60.7% 52 48 15 40 87.7
Spokane, WA 24.8% 18.3% 18.0% 61.1% 19 45 47 41 88.3
Detroit, MI 24.9% 19.2% 17.1% 61.2% 27 50 40 42 88.4
Austin, TX 25.0% 19.8% 16.6% 61.4% 33 53 30 43 88.8
Chicago, IL 27.8% 14.8% 18.9% 61.5% 61 31 59 44 88.9
Portland, OR 29.1% 12.4% 20.1% 61.6% 67 23 67 45 89.0
Oklahoma City, OK 25.6% 17.9% 18.5% 61.9% 40 42 57 46 89.5
Gulfport-Biloxi, MS 25.9% 21.4% 15.3% 62.5% 43 56 9 47 90.4
Beaumont, TX 25.0% 21.4% 16.5% 62.9% 32 58 28 48 91.0
Burlington, VT 28.7% 15.8% 18.4% 63.0% 66 37 55 49 91.0
Miami, FL 26.2% 20.9% 16.2% 63.3% 51 55 23 50 91.5
Salt Lake City, UT 26.2% 21.4% 16.1% 63.6% 49 57 21 51 92.0
Denver, CO 27.1% 19.8% 16.8% 63.7% 56 52 34 52 92.1
Houston, TX 24.9% 21.7% 17.3% 64.0% 29 60 44 53 92.4
Seattle, WA 24.7% 19.7% 19.6% 64.1% 12 51 65 54 92.6
Dallas-Fort Worth, TX 25.0% 23.2% 16.9% 65.1% 30 64 37 55 94.1
Las Vegas, NV 24.7% 20.9% 19.5% 65.2% 14 54 64 56 94.2
Anchorage, AK 29.3% 15.4% 20.9% 65.6% 70 35 69 57 94.8
Riverside-San Bernardino, CA 29.4% 18.2% 18.2% 65.8% 74 44 51 58 95.1
Charleston, WV 24.8% 26.1% 15.2% 66.1% 22 66 7 59 95.5
Buffalo, NY 24.8% 21.8% 19.6% 66.3% 23 61 66 60 95.8
San Diego, CA 29.4% 18.7% 18.4% 66.5% 73 47 56 61 96.1
Memphis, TN 25.9% 22.4% 18.3% 66.6% 45 63 52 62 96.3
Sacramento, CA 29.4% 18.9% 18.6% 66.8% 72 49 58 63 96.6
San Antonio, TX 25.0% 26.4% 16.0% 67.4% 34 67 20 64 97.4
Phoenix, AZ 24.8% 27.9% 15.0% 67.7% 18 69 4 65 97.9
Albuquerque, NM 23.1% 28.8% 16.7% 68.7% 8 70 32 66 99.3
Jackson, MS 25.9% 27.8% 15.3% 69.0% 44 68 8 67 99.7
Los Angeles, CA 29.3% 21.8% 18.9% 70.0% 71 62 61 68 101.2
San Francisco, CA 29.2% 21.4% 20.7% 71.3% 68 59 68 69 103.1
Spartanburg, SC 24.8% 31.0% 16.5% 72.3% 25 71 27 70 104.5
St. Louis, MO 22.3% 32.9% 17.3% 72.5% 6 73 43 71 104.8
Kansas City, MO 22.9% 32.7% 17.1% 72.7% 7 72 38 72 105.0
Honolulu, HI 26.0% 25.7% 22.8% 74.5% 47 65 73 73 107.7
New York City, NY 24.7% 33.1% 22.2% 80.0% 13 74 72 74 115.7
Competitive Alternatives, Focus on Tax 2014 | 39
9. Appendix B – Our Approach
Calculation of total tax costsThis report uses two separate measures for total tax costs, with both measures incorporating all manner of taxes levied on corporations—broadly speaking, income taxes, capital taxes, sales taxes, property taxes, miscellaneous local business taxes, and statutory labor costs (statutory plan costs and other wage-based taxes).
In calculating taxes, the study includes income taxes levied by all levels of government (national, regional, and/or local), reflecting specific tax income rules for each jurisdiction (as discussed further in Chapter 3). Other taxes are also calculated according to specific local rules. Labor taxes and other taxes not based on income are calculated to reflect actual business costs in each location, using data on wage rates, real property values, and other relevant business cost factors from KPMG’s Competitive Alternatives 2014 comparison of international business costs.
The calculated total tax costs are compared between countries and cities using a Total Tax Index (TTI) for each location. The TTI is a measure of the total taxes paid by corporations in a particular location, calculated as a percentage of total taxes paid by corporations in the US using the following formula:
Total taxes paid by a corporation in this location and industry
Total taxes paid by similar corporations in the US
To further examine the results of the TTI, and to explore the specific tax components that drive these results, this study defines a second measure of total taxes, which expresses tax costs as an effective rate, rather than an index of taxes actually paid.
This measure is the Total Effective Tax Rate (TETR), which is calculated as follows.
Total taxes paid by a corporation
Standardized net income before income tax
In the TETR formula, the denominator is a fixed dollar amount for each business operation in all locations—standardized net income before income taxes. This allows income taxes paid to be compared in absolute dollar terms using the TTI. As explained in Chapter 3, the TETR is the sum of the effective corporate income tax rate (net of incentives), the effective rate of other corporate taxes, and the effective rate of statutory labor costs. This formula produces the TETR, which allows other corporate taxes and statutory labor costs (which are not calculated based on income) to be compared in percentage terms. Rankings obtained using the TETR are the same as those obtained using the TTI.
Using the formula for TETR, it is possible for it to exceed 100 percent—sometimes by a wide margin. As the table on the following page shows, this does not mean that government taxes are forcing a company into a net loss situation. Because only income taxes are excluded from net income in the denominator, TETR can exceed 100 percent while the company still maintains a positive net income after tax. For example, in France, total tax costs are US$2.82 million per year as compared to net income before income tax of US$2.57 million, for a TETR of 109.7 percent. However, the company’s net profit after tax is still US$2.23M. This table also illustrates the calculation of the TTI, with total tax costs in the United States ($1.73 million) being indexed to 100.0, and total tax costs in France (US$2.82 million) being 63.3 percent higher, resulting in a TTI of 163.3.
Interpretation of resultsOur analysis is based on cost information collected primarily between July 2013 and January 2014. Taxes reflect tax rates in effect on January 1, 2014, and also incorporate any announced changes at that time to take effect at specified later dates. Tax rates and other tax-related information are also subject to further change as a result of new legislation, judicial decisions, and administrative pronouncements. Of course, exchange rates and other cost factors will change over time.
Additional backgroundCompetitive Alternatives represents KPMG’s guide to comparing business locations in the NAFTA marketplace, as well as leading mature market countries in Europe and Asia Pacific. With a primary focus on international business costs, the Competitive Alternatives report measures the combined impact of 26 significant cost components that are most likely to vary by location, as applied to specific industries and business operations. The Competitive Alternatives report also includes secondary comparisons of other factors that influence the competitiveness of international business locations.
The 6-month research program for Competitive Alternatives (July 2013 to January 2014) covered 131 cities in the same 10 countries as this report. More than 2,000 individual business scenarios were examined, analyzing more than 50,000 items of data. The basis for the business cost comparisons is the after-tax cost of startup and operation for representative business operations in 19 industries over a 10-year planning horizon. National results are based on the combined results for two major

40 | Competitive Alternatives, Focus on Tax 2014
business centers in each country (or, for the United States, the four largest business centers).
This Focus On Tax study complements the main Competitive Alternatives report and expands on the coverage of taxation issues in that study. This study shares much of the same methodology, modeling assumptions, and data sources developed for Competitive Alternatives 2014. Further information on study
methodology and scope, including key modeling assumptions, can be found in Chapter 1 of the Competitive Alternatives 2014 study report.
Full details of the specific tax rates applied for corporate income tax and other corporate taxes for each jurisdiction can be found in Appendix B of the Competitive Alternatives 2014 Volume II study report. Full details of data sources used for tax information
and the broader business cost factors (such as local wages and property values) that impact this study can be found in Appendix D of the Competitive Alternatives 2014 Volume II study report. All reports are available from the Downloads section of the study web site: CompetitiveAlternatives.com.
Example Calculation of Total Tax Index and Total Effective Tax Rate Based on Overall Average results1
USD$’000 per annum
France United States
Total revenue2 24,463 24,765
All non-tax operating expenses 19,421 21,205
Statutory labour costs SLC 2,097 576
Other corporate taxes OCT 379 418
Net income before income tax (standardized)3 NIBT 2,566 2,566
Corporate income taxes CIT 340 731
Net profit after tax 2,226 1,835
Total tax cost TTC=SLC+OCT+CIT 2,816 1,725
Total Tax Index TTI=TTCX/TTCUS x 100 163.3 100.0
Effective rates for:
Corporate income taxes (net of incentives) =CIT/NIBT 13.3% 28.5%
Other corporate taxes =OCT/NIBT 14.8% 16.3%
Statutory labor costs =SLC/NIBT 81.7% 22.5%
Total Effective Tax Rate TETR=TTC/NIBT 109.7% 67.2%
1 Average of services sector (7 business operations) and manufacturing sector (12 business operations).
2 Is assumed to vary by location to maintain standard net income before income tax. This reflects companies being able to charge higher prices for goods and services when located in higher-cost regions. This assumption can be found in some real-world situations, such as higher prices in London, England, and/or premium prices that can be obtained for German-made goods.
3 Standardized for all locations to provide a common denominator for measuring taxes not based on income.


These documents are available from CompetitiveAlternatives.com/download
Contact us
Elio Luongo +1 416 777 3586 [email protected]
The information contained herein is of a general nature and is not intended to address the circumstances of any particular individual or entity. Although we endeavor to provide accurate and timely information, there can be no guarantee that such information is accurate as of the date it is received or that it will continue to be accurate in the future. No one should act on such information without appropriate professional advice after a thorough examination of the particular situation.
© 2014 KPMG LLP, a Canadian limited liability partnership and a member firm of the KPMG network of independent member firms affiliated with KPMG International Cooperative (“KPMG International”), a Swiss entity. All rights reserved. Printed in Canada. 5838
The KPMG name, logo and “cutting through complexity” are registered trademarks or trademarks of KPMG International.
Related Documents


