2010 Comprehensive Annual Financial Report • fiscal year ended June 30, 2010 TRUSTED PARTNER K PERS Kansas Public Employees Retirement System a component unit of the State of Kansas

Welcome message from author
This document is posted to help you gain knowledge. Please leave a comment to let me know what you think about it! Share it to your friends and learn new things together.
Transcript

2010 Comprehensive Annual Financial Report • fiscal year ended June 30, 2010
TRUSTEDPARTNER
KPERS Kansas Public Employees Retirement System a component unit of the State of Kansas

The fiduciary standard is our driving force.
That means we put the interest of our members first.
It is the highest standard of care and accountability.
A fiduciary relationship is highlighted by good faith, loyalty and trust.
KPERS serves members as a fduciary by holding assets in trust for them,
growing those assets and delivering promised benefits when the time comes.
2010 Comprehensive Annual Financial Report Kansas Public Employees Retirement System
A component unit of the State of Kansas
Fiscal year ended June 30, 2010
Prepared by KPERS staff 611 S. Kansas Ave., Ste 100
Topeka, KS 66603-3869
Glenn Deck, Executive Director
Leland Breedlove, Chief Fiscal Officer
Table of ConTenTs
InTroduCTory
Transmittal letter 8
board of Trustees 12
our organization 12
KPers staf 13
consultants and advisors 14
Gfoa Certifcate 15
fInanCIal
Independent auditor’s report 18
Management’s discussion & analysis 20
Basic fnancial Statements
statement of Plan net assets 25
statement of Changes in Plan net assets 26
note 1: Plan description 27
note 2: summary of signifcant accounting Policies 28
note 3: funding Policy 39
note 4: other Post employment beneft Plan — KPers death and disability Plan 42
note 5: Commitments and Contingencies 43
note 6: subsequent events 43
Required Supplementary Information — Retirement Plan
schedule of employer Contributions 44
schedule of funding Progress 44
Required Supplementary Information — Death and Disability Plan
schedule of employer Contributions 45
schedule of funding Progress 45
schedule of Contributions 46
Other Supplementary Schedules
schedule of administrative expenses 47
schedule of Investment Income by asset Class 48
schedule of Investment Management fees and expenses 49
InvesTMenTs
Chief Investment ofcer’s review 52
equity Investments 53
fixed Income Investments 56
real return investments 57
real estate Investments 58
alternative Investments 60
alternative Investments Initiated on or after July 1, 1991 62
u.s. equity Commissions 64
list of largest Holdings 65
schedule of Investment summary 66
aCTuarIal
Retirement System
actuary’s Certifcation letter 68
actuarial overview 70
experience - all systems Combined 71
Projected Contribution rates 75
Contribution rates 76
summary of Change in ual 79
summary of Changes in ual Contribution rate by system 79
summary of Historical Changes in Total system ual 80
summary of Principal results
– KPers state 81
– KPers school 81
– KPers state/school 82
– Kansas Police and firemen’s retirement system 83
– retirement system for Judges 84
– all systems Combined 84
actuarial assumptions — KPers 85
actuarial assumptions – KP&f 89
actuarial assumptions - Judges 90
actuarial Methods 91
Plan Provisions — overview 91
Plan Provisions — KPers (state, local and school) 91
Plan Provisions — KP&f 94
Plan Provisions — Judges 96
short Term solvency Test 98
schedule of active Member valuation data 98
Membership Profle 99
retirants, benefciaries - Changes in rolls - all systems 99
summary of Membership data 100
schedule of employer Contribution rates 101
Death and Disability Plan
actuary’s Certifcation letter — death and disability Plan 102
actuarial overview — death and disability 104
actuarial valuation under Gasb 43 105
actuarial assumptions — death and disability 107
experience — death and disability 112
actuarial Methods 114
Plan Provisions overview 114
Key Provisions — long-Term disability 115
Key provisions — Group life Waiver of Premium 115
sTaTIsTICal
revenues by source 118
number of retired Members and survivors by Type
number of retired Members and survivors by Type of
average beneft by years of service - five year summary of
Principal Participating employers — death and disability
benefts by Type 119
expenses by Type 119
Changes in net assets 120
Changes in net assets (cont.) 121
Changes in net assets-death and disability Plan 122
beneft and refund deductions from net assets by Type 123
Highlights of operations — 10-year summary 124
of beneft 126
Payment option 127
new retirees 128
Principal Participating employers 129
Plan 130


2010 Comprehensive Annual Financial Report
INTRODUCTORYSECTION
KPERS
TransMITTal leTTer
KANSASKANSAS KAnSAS PuBLIC EmPLOyEES RETIREmEnT SySTEm
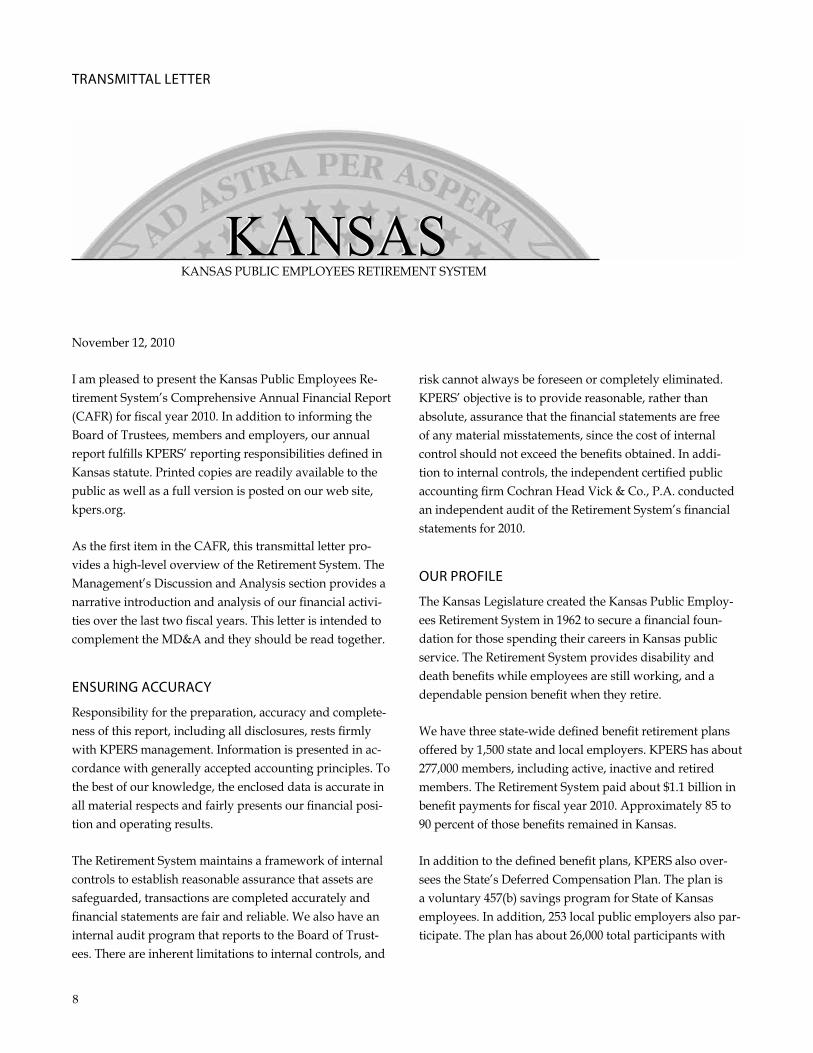
november 12, 2010
I am pleased to present the Kansas Public Employees Re-tirement System’s Comprehensive Annual Financial Report (CAFR) for fiscal year 2010. In addition to informing the Board of Trustees, members and employers, our annual report fulfills KPERS’ reporting responsibilities defined in Kansas statute. Printed copies are readily available to the public as well as a full version is posted on our web site, kpers.org.
As the first item in the CAFR, this transmittal letter pro-vides a high-level overview of the Retirement System. The management’s Discussion and Analysis section provides a narrative introduction and analysis of our financial activi-ties over the last two fiscal years. This letter is intended to complement the mD&A and they should be read together.
ensurInG aCCuraCy
Responsibility for the preparation, accuracy and complete-ness of this report, including all disclosures, rests firmly with KPERS management. Information is presented in ac-cordance with generally accepted accounting principles. To the best of our knowledge, the enclosed data is accurate in all material respects and fairly presents our financial posi-tion and operating results.
The Retirement System maintains a framework of internal controls to establish reasonable assurance that assets are safeguarded, transactions are completed accurately and financial statements are fair and reliable. We also have an internal audit program that reports to the Board of Trust-ees. There are inherent limitations to internal controls, and
risk cannot always be foreseen or completely eliminated. KPERS’ objective is to provide reasonable, rather than absolute, assurance that the financial statements are free of any material misstatements, since the cost of internal control should not exceed the benefits obtained. In addi-tion to internal controls, the independent certified public accounting firm Cochran Head Vick & Co., P.A. conducted an independent audit of the Retirement System’s financial statements for 2010.
our ProfIle
The Kansas Legislature created the Kansas Public Employ-ees Retirement System in 1962 to secure a financial foun-dation for those spending their careers in Kansas public service. The Retirement System provides disability and death benefits while employees are still working, and a dependable pension benefit when they retire.
We have three state-wide defined benefit retirement plans offered by 1,500 state and local employers. KPERS has about 277,000 members, including active, inactive and retired members. The Retirement System paid about $1.1 billion in benefit payments for fiscal year 2010. Approximately 85 to 90 percent of those benefits remained in Kansas.
In addition to the defined benefit plans, KPERS also over-sees the State’s Deferred Compensation Plan. The plan is a voluntary 457(b) savings program for State of Kansas employees. In addition, 253 local public employers also par-ticipate. The plan has about 26,000 total participants with
8
16,000 actively contributing. Total plan assets equaled $633 million at the end of fiscal year 2010.
A nine-member Board of Trustees oversees the Retirement System: four are appointed by the Governor, one is ap-pointed by the President of the Senate, one is appointed by the Speaker of the House of Representatives, two are elected by Retirement System members, and one is the elected State Treasurer. The Board appoints an executive director who manages a staff to carry out daily operations.
The Board approves the System’s annual operating budget. As a component unit of the State of Kansas, the budget is also approved by the Kansas Legislature and Governor as part of the regular legislative budgetary process.
InvesTMenTs
KPERS’ assets are invested according to the “prudent expert standard of care” for the sole purpose of providing benefits to our members. Our actuarial projections currently assume an average, long-term investment return of 8 percent. In some years, returns will be below that rate, and in others, returns will exceed it. Healthy returns over time are essen-tial for proper funding.
Fiscal year 2010 offered a significantly improved invest-ment environment compared to the financial market crisis experienced in the first three quarters of fiscal year 2009. However, difficulties continue to exist in the global eco-nomic environment and the outlook for continued recov-ery is muted compared to past economic recoveries. The investment portfolio realized a return of 15 percent for fiscal year 2010 compared to the S&P 500 return of 15 percent for the same period. This year’s returns put KPERS in the top quartile of return performance among pension peers.
The total portfolio outperformed the policy benchmark by approximately 240 basis points. Six of the eight sub-portfolios either met or outperformed their investment benchmarks.
For more information about KPERS diversified and disci-plined approach to executing our investment strategy and policies, please refer to the investment section in this report, beginning on page 52. This section also provides details about our asset allocation and specific yields.
fInanCIal PosITIon and fundInG ouTlooK
According to the Retirement System’s most recent actuarial valuation (dated December 31, 2009), the System’s un-funded actuarial liability (uAL) decreased by $600 million. The uAL went from $8.3 billion in 2008 to $7.7 billion as of December 31, 2009. This uAL amount is the gap between the actuarial value of assets and the actuarial liability for service already earned by public employees.
The valuation showed the System’s new funded ratio was 64 percent, up somewhat from 59 percent the previous year. The funded ratio is the ratio of assets to future liabilities. For public pension plans like KPERS, funding over 80 per-cent and rising is good. Funding below 60 percent is poor and needs prompt attention. While the System does not have an immediate crisis, long-term funding is in jeopardy.
Strong investment performance accounts for the modest, short-term improvement in funding status. However, even with a yearly 8 percent return, the unfunded liability will continue to increase in the coming years and the funded ratio will continue to decline. For detailed information on the System’s funding projections by plan and group, please see the actuarial section beginning on page 68.
While benefits are safe in the near-term, the System will not have enough assets to provide all the benefits already earned by members and to pay off the uAL in the adopted amortization period ending in 2033. The legislature and governor are ultimately responsible for benefits and fund-ing. Legislative action is needed to begin the process of addressing the shortfall, with additional employer contribu-tions as the basic element. Proactive steps are critical. The price of inaction will continue to grow along with the uAL.
The board is planning to take action on a proposed legisla-tive agenda for the 2011 session. As a fiduciary devoted to the best financial interest of members, we will continue to advocate for policies that promote the long-term financial health of the Retirement System.
MaJor InITIaTIves
SMART Implementation KPERS participated in the implementation of the State’s new financial management system (SmART). We contribut-ed extensive staff hours on interfaces with the KITS system
Introductory 9
for benefit payments, receipts, accounts payable, and other KPERS accounting requirements.
KPERS Tier 2 Our staff successfully implemented plan design changes for the new KPERS Tier 2, effective July 1, 2009. Implementation involved significant information system changes, new com-munications materials, employer training and a dedicated helpline for employers during the transition.
Long-Term Funding Addressing KPERS’ funding shortfall continues to require a heightened level of focus. In the fall of 2009, we developed a wide range of long-term funding alternatives and presented them to KPERS’ Board of Trustees and to the legislature’s Joint Committee on Pensions, Investments and Benefits.
We also prepared an extensive report for the Joint Commit-tee in early 2010 documenting the long-term funding issue and alternatives. The Joint Committee introduced SB 564 to raise employer and employee contribution rates. This bill was considered in the 2010 session, but did not pass. In our effort to educate KPERS’ stakeholders on the depth of the funding shortfall and respond to questions, we made numerous presentations during the fiscal year to other legis-lative committees and outside groups. Working on address-ing the funding shortfall will continue as a major initiative throughout the next fiscal year and beyond.
Member Service and Communication Initiatives relating to member service and communication included: • Released the member Web Portal to all active mem-
bers, providing them with secure, online access to their account information. Currently have approximately 20,000 members (approximately 13 percent of all active members) enrolled in the mWP.
• Began offering bilingual call center service and support to members and survivors who speak Spanish only or prefer discussing benefit issues in Spanish.
• Rolled out the “my Retirement Outlook” calcula-tor with the State’s deferred compensation plan. The calculator integrates retirement income projections for KPERS, Social Security, and personal savings/assets. KPERS and Social Security information is pre-loaded.
members do not need to be participants in the deferred compensation plan to use the calculator.
• Implemented two new career stage communications: A “new member” welcome packet and a letter notifying inactive members when they first become eligible for early and full retirement.
aWards & aCKnoWledGeMenTs
KPERS was nominated as one of three public plans for the Large Public Pension Plan of the year award for excel-lence in investment management by Institutional Investor’s money management Letter. While KPERS did not ultimate-ly win, the nomination recognized the efforts of the Board and investment staff.
The State’s deferred compensation plan received the Effec-tive Communication Leadership Award from the national Association of Government Defined Contribution Adminis-trators, Inc. (nAGDCA). The award honors excellence and innovation in retirement plan design, administration and effective communication methods in government defined contribution plans. The award was in recognition of the plan’s innovative my Retirement Outlook calculator.
KPERS participated in a benchmarking survey conducted by CEm Benchmarking, Inc. When compared with other public pensions in the 2010 survey, KPERS earned an over-all service score of 84 versus a peer median of 81. KPERS also measured very favorably with regard to cost. KPERS’ cost per member is $47, well below the peer median cost of $77. Benchmarking results continue to show KPERS delivering better than average customer service for a low, economical cost.
The Government Finance Officers Association of the united States and Canada (GFOA) awarded a Certificate of Achievement for Excellence in Financial Reporting to the Retirement System for the 2009 CAFR. The Certificate of Achievement is a prestigious national award, recognizing conformance with the highest standards for preparation of state and local government financial reports.
To be awarded a Certificate of Achievement, a government unit must publish an easily readable and efficiently orga-nized comprehensive annual financial report, the contents of which must conform to program standards. The compre-
10
hensive annual financial report must satisfy both generally accepted accounting principles and applicable legal require-ments. The Retirement System has received the Certificate of Achievement for each of the last 16 consecutive fiscal years. We believe our current report again conforms to the program requirements, and we will submit it to the GFOA for consideration.
This CAFR is the synthesis of work from KPERS staff and advisors under the Board’s leadership. The report is an as-set to our organization, providing reliable, accurate infor-mation on which we base important decisions. We thank those who contributed to this project. And more generally, thank our dedicated staff who complete the work every day that this report represents. I look forward to working in partnership with the Board and staff to continue to meet our fiduciary commitment and to provide excellent service.
Sincerely,
Glenn Deck
Executive Director
Introductory 11
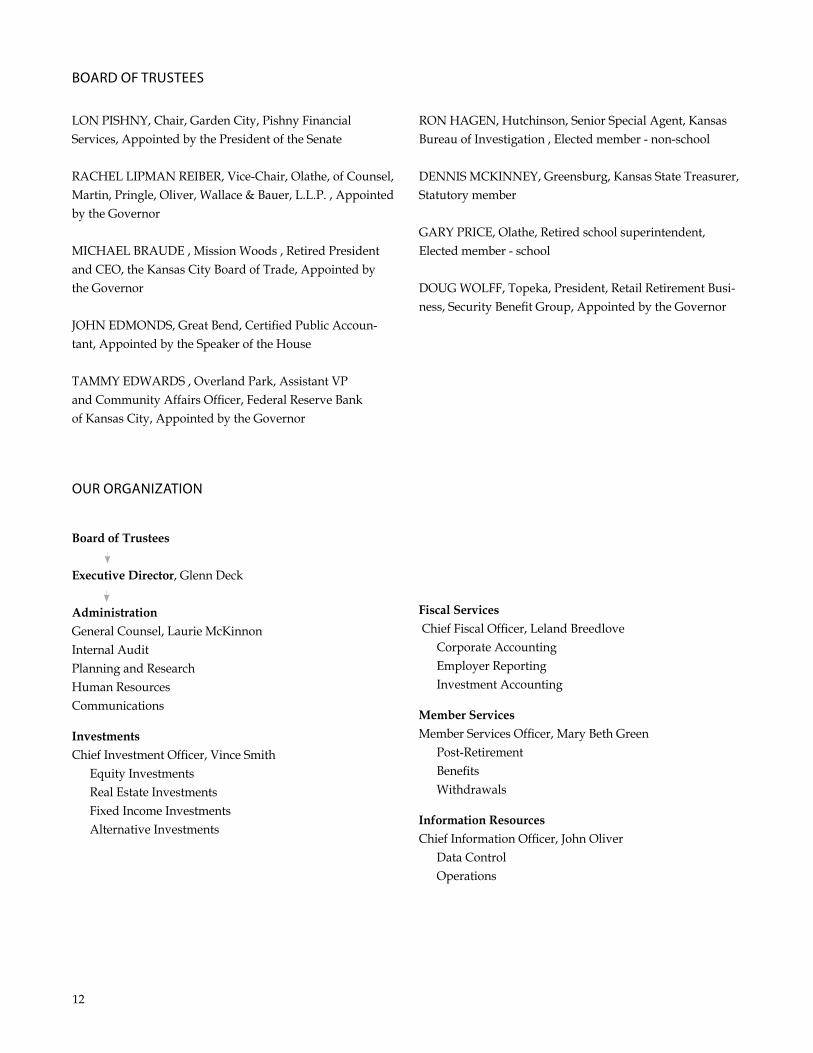
board of TrusTees
LOn PISHny, Chair, Garden City, Pishny Financial Services, Appointed by the President of the Senate
RACHEL LIPmAn REIBER, Vice-Chair, Olathe, of Counsel, martin, Pringle, Oliver, Wallace & Bauer, L.L.P. , Appointed by the Governor
mICHAEL BRAuDE , mission Woods , Retired President and CEO, the Kansas City Board of Trade, Appointed by the Governor
JOHn EDmOnDS, Great Bend, Certified Public Accoun-tant, Appointed by the Speaker of the House
TAmmy EDWARDS , Overland Park, Assistant VP
and Community Affairs Officer, Federal Reserve Bank
of Kansas City, Appointed by the Governor
our orGanIzaTIon
Board of Trustees
Executive Director, Glenn Deck
Administration General Counsel, Laurie mcKinnon
Internal Audit Planning and Research
Human Resources
Communications
Investments Chief Investment Officer, Vince Smith
Equity Investments
Real Estate Investments
Fixed Income Investments
Alternative Investments
ROn HAGEn, Hutchinson, Senior Special Agent, Kansas Bureau of Investigation , Elected member - non-school
DEnnIS mCKInnEy, Greensburg, Kansas State Treasurer, Statutory member
GARy PRICE, Olathe, Retired school superintendent, Elected member - school
DOuG WOLFF, Topeka, President, Retail Retirement Busi-ness, Security Benefit Group, Appointed by the Governor
Fiscal Services Chief Fiscal Officer, Leland Breedlove
Corporate Accounting
Employer Reporting
Investment Accounting
Member Services member Services Officer, mary Beth Green
Post-Retirement Benefits
Withdrawals
Information Resources Chief Information Officer, John Oliver
Data Control Operations
12

KPers sTaff
melvin Abbott
Julie Baker
yohonna Barraud
Kristen Basso
Dianna Berry
Kathleen Billings
Anita Bradley
Leland Breedlove
Greg Buchanan
Jason Carreno
Jenne Clark
Lorie Conklin
Tammy Cruz
Andrea Davenport
Glenn Deck
Don Deseck
yolanda Dickinson
Amy Dunton
Joyce Edington
Jill Emme
Heather Enos
yarlenis Ensley
Emily Facer
Daniel Fairbank
mitchell Fick
Renae Forque
Elaine Gaer
Sue Gamblian
Connie Gardner
Billie-Jo Gerisch
Kay Gleason
Lisa Gonzales
mary Beth Green
Earlene Hagenmaier
Lisa Hernandez
Denise Hilmes
John Hooker
Ellen Hurless
melva Janke
Teresa Jurgens
Julie Ketter
Casey Kidder
Brian King
Cheryl Koch
Shannon Kuehler
Annette Kuti
Donald Lennard
Debra Lewis
Vivian Liu
Faith Loretto
Joyce mark
Kimberley mason
Brian mcCammon
Heather mcHardie
Laurie mcKinnon
Judy mcneal
noble morrell
Beverly murray
Lisa ngole
Shawn nix
John Oliver
Diana Peters
Linda Porter
Alissa Powell
Pamela Price
Jami Quiett
Cathy Rafferty
Randy Rahberg
Kimberly Raines
Alberta Rea
nancy Richardson
megan Rogers
Steven Rush
Teresa Ryan
maryAnn Sachs
marilyn Sawyer
Alan Schuler
Rhonda Shumway
Julie Sieve
Robert Smith
mickey Smith
Julie Smith
michelle Stottlemire
Jaime Sturgeon
Amber Tarrant
Cindy Timmons
Carmen unselt
Christina VanWinkle
mary Walker
Craig Weltman
Steven Wesley
Christina Whitlow
Amy Whitmer
Alice Wietharn
max Williams
Carol Wilson
Deanna Winters
Cheri Woolsey
Pat Zimmerman
Introductory 13

ConsulTanTs and advIsors
Auditors: Cochran Head Vick & Co., P.A., Kansas City, Kansas
Actuary: milliman, Inc., Omaha, nebraska
Investment Consultants Pension Consulting Alliance, Inc., Encino, California
The Townsend Group, Cleveland, Ohio
LP Capital Advisors, Sacramento, California
Investment Managers Acadian Asset management, Boston, massachusetts
AEW Capital management, LP, Boston, massachusetts
Alliance Bernstein, new york, new york
Baillie Gifford Overseas Limited, Edinburgh Scotland
Baring Asset management Limited, London, uK
BlackRock Institutional Trust Company, San Francisco, California
Brookfield Redding, LLC, Chicago, Illinois Capital Guardian Trust Company, Los Angeles, California
Duff & Phelps Investment management Company, Chicago, Illinois
InG Investment management Company, Hartford, Connecticut JP morgan Investment management Inc., new york, new york
Lazard Asset management, LLC, new york, new york
Loomis, Sayles & Company, LP, Boston, massachusetts
macKay Shields, LLC, new york, new york
mellon Capital management Corporation, San Francisco, California
morgan Stanley Asset management Inc., new york, new york
morgan Stanley Real Estate Advisor Inc., Atlanta, Georgia
nomura Asset management, Inc., new york, new york
Pacific Investment management Company, newport Beach, California
Pareto Partners, new york, new york
Payden & Rygel Investment Counsel, Los Angeles, California
Principal Global Investors, Des moines, Iowa
Quantitative management Associates, newark, new Jersey
Russell Investment Group, Tacoma, Washington
Security Investors, LLC, Topeka, Kansas
Systematic Financial management, LP, Teaneck, new Jersey
TCW Asset management Company, Los Angeles, California
T. Rowe Price Associates, Inc., Baltimore, maryland
Templeton Investment Counsel, LLC, Ft. Lauderdale, Florida
Wellington management Company, LLP, Boston, massachusetts
Western Asset management Company, Pasadena, California
Investment Custodian: Bank of new york mellon, Everett, massachusetts
Life Insurance: minnesota Life Insurance Company, St. Paul, minnesota
Long-Term Disability: Self Insured, Administered by Disability Consulting Group LLC, Portland, maine
14
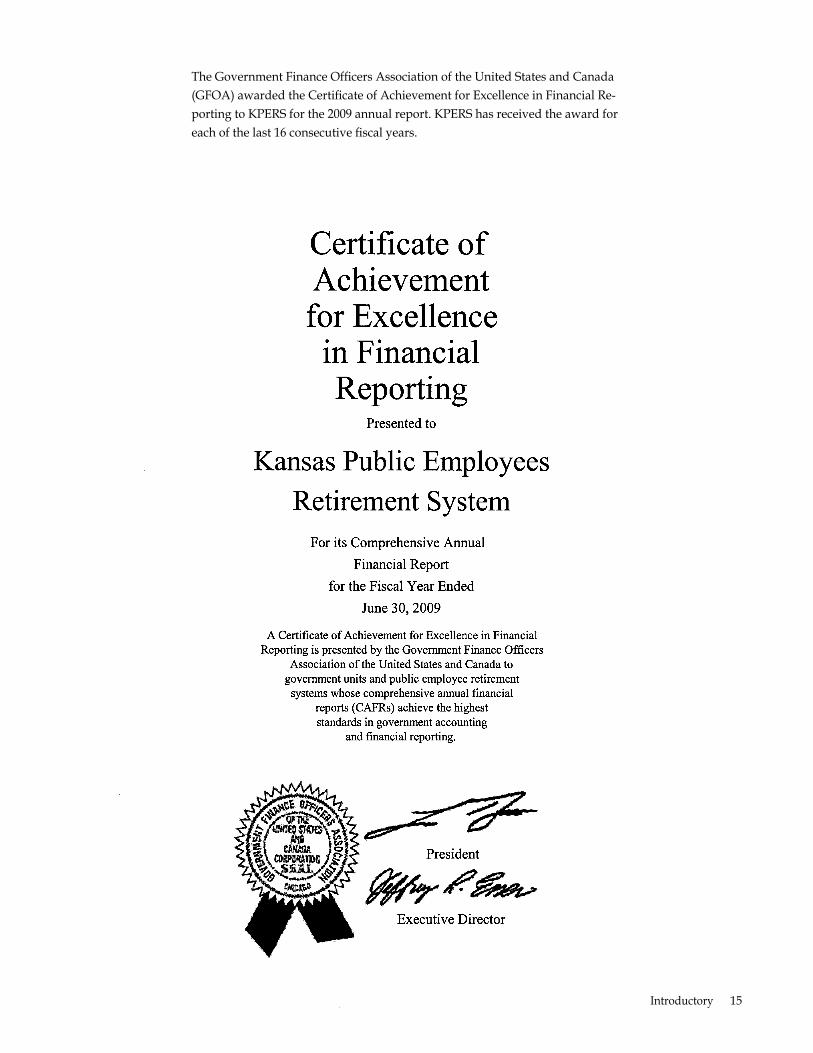
The Government Finance Officers Association of the united States and Canada (GFOA) awarded the Certificate of Achievement for Excellence in Financial Re-porting to KPERS for the 2009 annual report. KPERS has received the award for each of the last 16 consecutive fiscal years.
Introductory 15


2010 Comprehensive Annual Financial Report
FINANCIALSECTION
KPERS
18
Financial 19
ManaGeMenT’s dIsCussIon & analysIs
This section presents management’s discussion and analysis of the Kansas Public Employees Retirement System’s finan-cial performance during the fiscal year that ended June 30, 2010. It is presented as a narrative overview and analysis in conjunction with the Executive Director’s letter of transmit-tal.
The Kansas Public Employees Retirement System (KPERS, the Retirement System, or the System) is an umbrella organization administering the following three statewide pension groups under one plan, as provided by chapter 74, article 49 of the Kansas Statutes: • Kansas Public Employees Retirement System (KPERS) • Kansas Police and Firemen’s Retirement System
(KP&F) • Kansas Retirement System for Judges (Judges)
All three systems are part of a governmental, defined benefit, contributory plan covering substantially all Kan-sas public employees. The Kansas Retirement System for Judges is a single employer group, while the other two are multi-employer, cost-sharing groups. The State of Kansas and Kansas school districts are required to participate. Participation by local political subdivisions is optional but irrevocable once elected.
Financial Highlights • The System’s net assets increased by $1.1 billion or 11
percent from $10.3 billion to $11.4 billion.
• As of December 31, 2009, the date of the most recent actuarial valuation, the Retirement System’s funded ratio was 63.7 percent compared with a funded ratio of 58.8 percent for the prior year.
• The unfunded actuarial liability decreased from $8.3 billion at December 31, 2008, to $7.7 billion at December 31, 2009.
• On a market value basis, this year’s investment rate of return was a positive 14.9 percent, compared with last year’s return of a negative 19.6 percent.
• Retirement benefits paid to retirees and beneficiaries increased 6.0 percent from $1.0 billion in fiscal year 2009 to $1.06 billion in fiscal year 2010.
Overview of the Financial Statements This discussion and analysis is an introduction to the System’s basic financial statements, which comprise the fol-lowing components: 1) Basic financial statements
2) notes to the financial statements
3) Required supplementary information
4) Other supplementary schedules
The information available in each of these sections is sum-marized as follows.
Basic Financial Statements A Statement of Plan net Assets as of June 30, 2010, and a Statement of Changes in Plan net Assets for the fiscal year ended June 30, 2010, are presented with the previous year’s comparative information. These financial statements reflect the resources available to pay benefits to retirees and other beneficiaries as of year end, as well as the changes in those resources during the year.
Notes to the Basic Financial Statements The financial statement notes provide additional informa-tion that is essential to a full understanding of the data provided in the financial statements. Information available in the notes to the financial statements is described in the paragraphs to follow.
note 1 provides a general description of the Retirement System, as well as a description of the plan benefits and overview of the contributions that are paid by employers and members. Information regarding a breakdown of the number of participating employers and members is also provided.
note 2 provides a summary of significant accounting poli-cies, including the basis of accounting, investments, includ-ing investing authority, investment risk categorizations, and the method used to value investments, and additional information about cash, securities lending and derivatives. note 2 also contains information regarding the Retirement System’s required reserves. The various reserves include the members Accumulated Contribution Reserve, Retirement Benefit Accumulation Reserve, Retirement Benefit Payment Reserve, Group Insurance Reserve Fund, the Expense Re-serve and the Optional Term Life Insurance Reserve.
20
note 3 provides information about System funding poli-cies and employer contributions made to the System by the three different funding groups.
note 4 provides information about other post employment benefits that the System administers. The Governmental Accounting Standards Board issued GASB Statement no. 43, Financial Reporting for Postemployment Benefit Plans Other Than Pension Plans, which was effective for periods beginning after December 15, 2005. As part of the reporting requirements declared by this statement, the financial status and activity of the KPERS Death and Disability Plan are displayed separately in the Statement of net Assets and the Statement of Changes in Plan net Assets. Required supple-mental schedules display the funded status and funding progress of the plan, and the significant methods and as-sumptions used. As noted in the funding status schedules, the KPERS group insurance reserve fund is 10.9 percent funded as of June 30, 2008, the last date of the actuarial valuation of the Death and Disability Plan.
note 5 describes System capital expenditure commitments to real estate and alternative investments. This section also generally describes potential System contingencies.
note 6 provides the dates through which subsequent events have been evaluated and when the financial statements were available to be issued.
Required Supplementary Information The required supplementary information consists of sched-ules and related notes concerning the funded status of the pension plans administered by the Retirement System and other post employment benefits.
Other Supplementary Schedules Other schedules include detailed information on contribu-tions by employer coverage groups, administrative ex-penses, an investment income summary, and a schedule of investment fees and expenses.
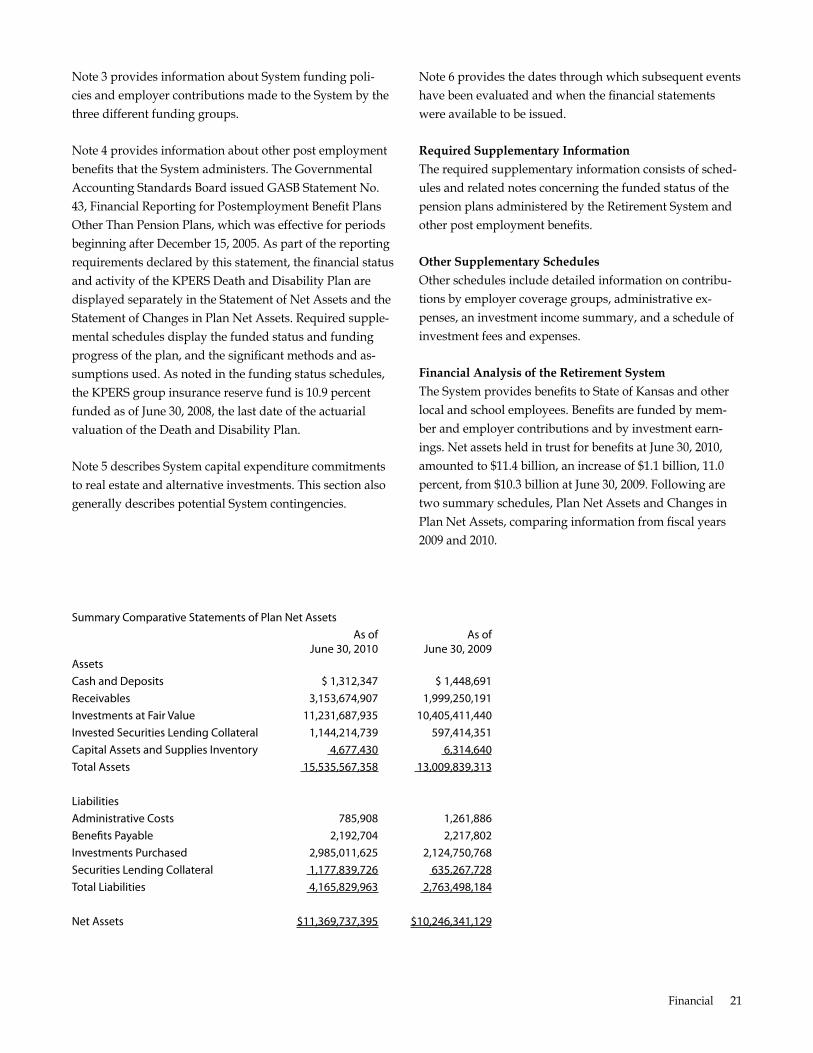
Financial Analysis of the Retirement System The System provides benefits to State of Kansas and other local and school employees. Benefits are funded by mem-ber and employer contributions and by investment earn-ings. net assets held in trust for benefits at June 30, 2010, amounted to $11.4 billion, an increase of $1.1 billion, 11.0 percent, from $10.3 billion at June 30, 2009. Following are two summary schedules, Plan net Assets and Changes in Plan net Assets, comparing information from fiscal years 2009 and 2010.
summary Comparative statements of Plan net assets as of as of
June 30, 2010 June 30, 2009 assets Cash and deposits $ 1,312,347 $ 1,448,691 receivables 3,153,674,907 1,999,250,191 Investments at fair value 11,231,687,935 10,405,411,440 Invested securities lending Collateral 1,144,214,739 597,414,351 Capital assets and supplies Inventory 4,677,430 6,314,640 Total assets 15,535,567,358 13,009,839,313
liabilities administrative Costs 785,908 1,261,886 benefts Payable 2,192,704 2,217,802 Investments Purchased 2,985,011,625 2,124,750,768 securities lending Collateral 1,177,839,726 635,267,728 Total liabilities 4,165,829,963 2,763,498,184
net assets $11,369,737,395 $10,246,341,129
Financial 21
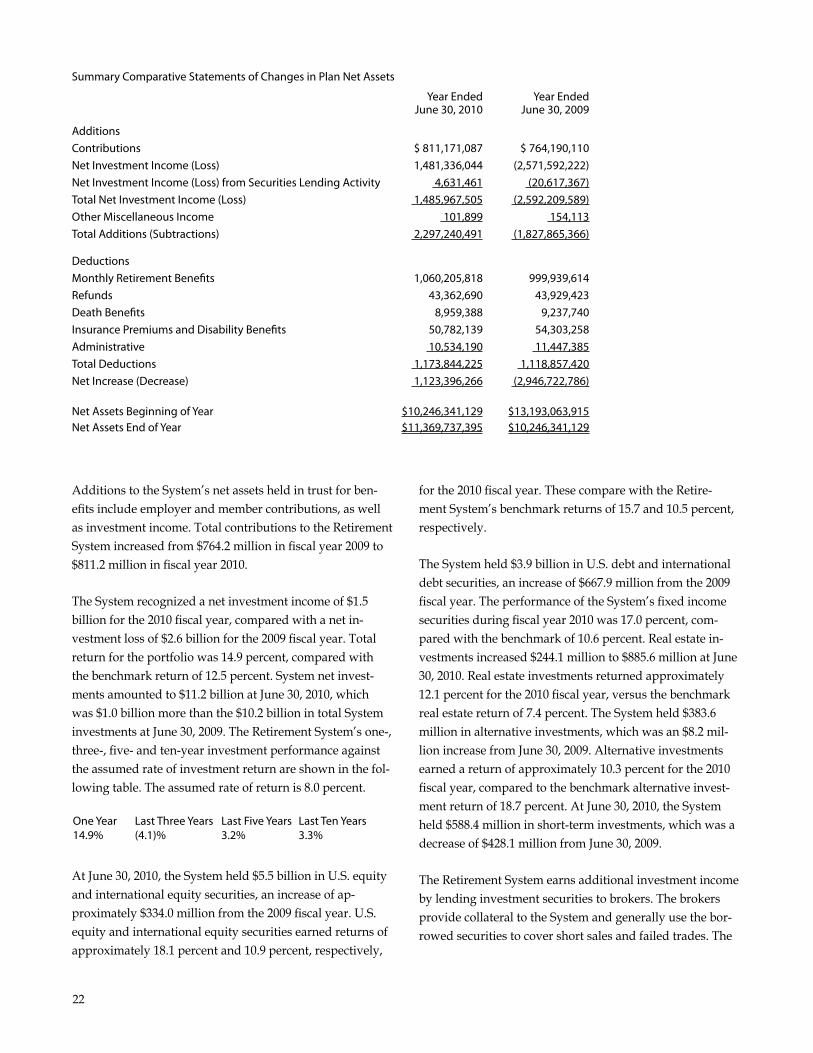
summary Comparative statements of Changes in Plan net assets
additions Contributions net Investment Income (loss) net Investment Income (loss) from securities lending activity Total net Investment Income (loss) other Miscellaneous Income Total additions (subtractions)
deductions Monthly retirement benefts refunds death benefts Insurance Premiums and disability benefts administrative Total deductions net Increase (decrease)
net assets beginning of year net assets end of year
Additions to the System’s net assets held in trust for ben-efits include employer and member contributions, as well as investment income. Total contributions to the Retirement System increased from $764.2 million in fiscal year 2009 to $811.2 million in fiscal year 2010.
The System recognized a net investment income of $1.5 billion for the 2010 fiscal year, compared with a net in-vestment loss of $2.6 billion for the 2009 fiscal year. Total return for the portfolio was 14.9 percent, compared with the benchmark return of 12.5 percent. System net invest-ments amounted to $11.2 billion at June 30, 2010, which was $1.0 billion more than the $10.2 billion in total System investments at June 30, 2009. The Retirement System’s one-, three-, five- and ten-year investment performance against the assumed rate of investment return are shown in the fol-lowing table. The assumed rate of return is 8.0 percent.
one year last Three years last five years last Ten years 14.9% (4.1)% 3.2% 3.3%
At June 30, 2010, the System held $5.5 billion in u.S. equity and international equity securities, an increase of ap-proximately $334.0 million from the 2009 fiscal year. u.S. equity and international equity securities earned returns of approximately 18.1 percent and 10.9 percent, respectively,
year ended year ended June 30, 2010 June 30, 2009
$ 811,171,087 $ 764,190,110 1,481,336,044 (2,571,592,222)
4,631,461 (20,617,367) 1,485,967,505 (2,592,209,589)
101,899 154,113 2,297,240,491 (1,827,865,366)
1,060,205,818 999,939,614 43,362,690 43,929,423
8,959,388 9,237,740 50,782,139 54,303,258 10,534,190 11,447,385
1,173,844,225 1,118,857,420 1,123,396,266 (2,946,722,786)
$10,246,341,129 $13,193,063,915 $11,369,737,395 $10,246,341,129
for the 2010 fiscal year. These compare with the Retire-ment System’s benchmark returns of 15.7 and 10.5 percent, respectively.
The System held $3.9 billion in u.S. debt and international debt securities, an increase of $667.9 million from the 2009 fiscal year. The performance of the System’s fixed income securities during fiscal year 2010 was 17.0 percent, com-pared with the benchmark of 10.6 percent. Real estate in-vestments increased $244.1 million to $885.6 million at June 30, 2010. Real estate investments returned approximately 12.1 percent for the 2010 fiscal year, versus the benchmark real estate return of 7.4 percent. The System held $383.6 million in alternative investments, which was an $8.2 mil-lion increase from June 30, 2009. Alternative investments earned a return of approximately 10.3 percent for the 2010 fiscal year, compared to the benchmark alternative invest-ment return of 18.7 percent. At June 30, 2010, the System held $588.4 million in short-term investments, which was a decrease of $428.1 million from June 30, 2009.
The Retirement System earns additional investment income by lending investment securities to brokers. The brokers provide collateral to the System and generally use the bor-rowed securities to cover short sales and failed trades. The
22
Retirement System invests cash collateral received from the brokers in order to earn interest. For the fiscal year 2010, net securities lending income amounted to $4.6 million, com-pared with a loss of $20.6 million in fiscal year 2009.
Deductions from net assets held in trust for benefits include retirement, death and survivor benefits, and administrative expenses. For the 2010 fiscal year, retirement, death and in-surance benefits amounted to $1,163 million, an increase of $55.9 million, 5.0 percent, from the 2009 fiscal year. The in-crease in benefit payments was a result of an increase in the number of retirees. For the 2010 fiscal year, System adminis-trative expenses amounted to $10.5 million compared with $11.5 million in fiscal year 2009. This decrease was mainly due to the completion of projects associated with develop-ing and securing the System’s new information system. The ratio of System administrative expenses to the number of members (approximately $47 per member) continues to be very cost-efficient compared to other statewide retirement plans.
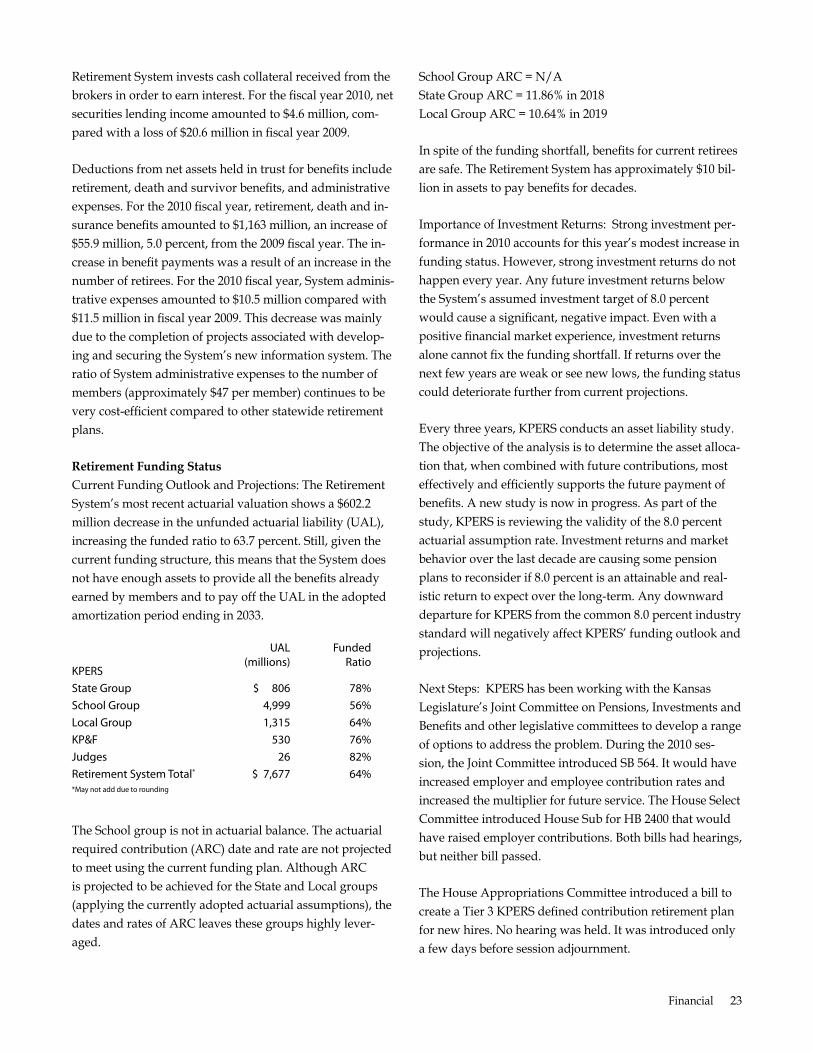
Retirement Funding Status Current Funding Outlook and Projections: The Retirement System’s most recent actuarial valuation shows a $602.2 million decrease in the unfunded actuarial liability (uAL), increasing the funded ratio to 63.7 percent. Still, given the current funding structure, this means that the System does not have enough assets to provide all the benefits already earned by members and to pay off the uAL in the adopted amortization period ending in 2033.
ual funded
KPers (millions) ratio
state Group $ 806 78% school Group 4,999 56% local Group 1,315 64% KP&f 530 76% Judges 26 82% retirement system Total* $ 7,677 64% *May not add due to rounding
The School group is not in actuarial balance. The actuarial required contribution (ARC) date and rate are not projected to meet using the current funding plan. Although ARC is projected to be achieved for the State and Local groups (applying the currently adopted actuarial assumptions), the dates and rates of ARC leaves these groups highly lever-aged.
School Group ARC = n/A
State Group ARC = 11.86% in 2018
Local Group ARC = 10.64% in 2019
In spite of the funding shortfall, benefits for current retirees
are safe. The Retirement System has approximately $10 bil-lion in assets to pay benefits for decades.
Importance of Investment Returns: Strong investment per-formance in 2010 accounts for this year’s modest increase in funding status. However, strong investment returns do not happen every year. Any future investment returns below the System’s assumed investment target of 8.0 percent would cause a significant, negative impact. Even with a positive financial market experience, investment returns alone cannot fix the funding shortfall. If returns over the next few years are weak or see new lows, the funding status could deteriorate further from current projections.
Every three years, KPERS conducts an asset liability study. The objective of the analysis is to determine the asset alloca-tion that, when combined with future contributions, most effectively and efficiently supports the future payment of benefits. A new study is now in progress. As part of the study, KPERS is reviewing the validity of the 8.0 percent actuarial assumption rate. Investment returns and market behavior over the last decade are causing some pension plans to reconsider if 8.0 percent is an attainable and real-istic return to expect over the long-term. Any downward departure for KPERS from the common 8.0 percent industry standard will negatively affect KPERS’ funding outlook and projections.
next Steps: KPERS has been working with the Kansas Legislature’s Joint Committee on Pensions, Investments and Benefits and other legislative committees to develop a range of options to address the problem. During the 2010 ses-sion, the Joint Committee introduced SB 564. It would have increased employer and employee contribution rates and increased the multiplier for future service. The House Select Committee introduced House Sub for HB 2400 that would have raised employer contributions. Both bills had hearings, but neither bill passed.
The House Appropriations Committee introduced a bill to create a Tier 3 KPERS defined contribution retirement plan for new hires. no hearing was held. It was introduced only a few days before session adjournment.
Financial 23
The legislature and the governor are ultimately responsible for benefits and funding. Legislative action is needed to be-gin the process of addressing the shortfall, with additional employer contributions as the basic element. Because the 2010 Legislature did not increase KPERS’ funding beyond the current 0.6 percent statutory increase, passing long-term funding legislation in the 2011 session is essential.
The longer we wait to begin to reverse the funding shortfall, the more it will cost. Our goal is for the KPERS’ board to take action on a proposed legislative agenda for the 2011 session. As a fiduciary devoted to the best financial interest of members, KPERS will continue to advocate for policies that promote the long-term financial health of the Retire-ment System.
24
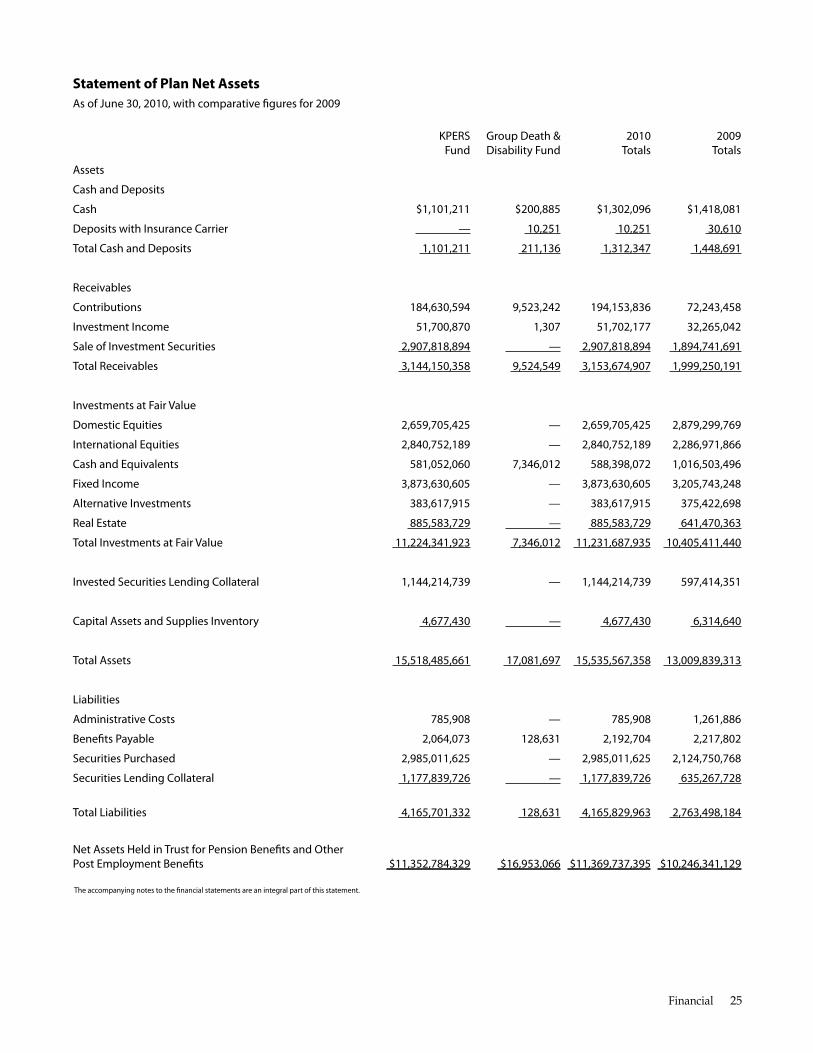
Statement of Plan Net Assets as of June 30, 2010, with comparative fgures for 2009
KPers Group death & 2010 2009 fund disability fund Totals Totals
assets
Cash and deposits
Cash $1,101,211 $200,885 $1,302,096 $1,418,081
deposits with Insurance Carrier — 10,251 10,251 30,610
Total Cash and deposits 1,101,211 211,136 1,312,347 1,448,691
receivables
Contributions 184,630,594 9,523,242 194,153,836 72,243,458
Investment Income 51,700,870 1,307 51,702,177 32,265,042
sale of Investment securities 2,907,818,894 — 2,907,818,894 1,894,741,691
Total receivables 3,144,150,358 9,524,549 3,153,674,907 1,999,250,191
Investments at fair value
domestic equities 2,659,705,425 — 2,659,705,425 2,879,299,769
International equities 2,840,752,189 — 2,840,752,189 2,286,971,866
Cash and equivalents 581,052,060 7,346,012 588,398,072 1,016,503,496
fixed Income 3,873,630,605 — 3,873,630,605 3,205,743,248
alternative Investments 383,617,915 — 383,617,915 375,422,698
real estate 885,583,729 — 885,583,729 641,470,363
Total Investments at fair value 11,224,341,923 7,346,012 11,231,687,935 10,405,411,440
Invested securities lending Collateral 1,144,214,739 — 1,144,214,739 597,414,351
Capital assets and supplies Inventory 4,677,430 — 4,677,430 6,314,640
Total assets 15,518,485,661 17,081,697 15,535,567,358 13,009,839,313
liabilities
administrative Costs 785,908 — 785,908 1,261,886
benefts Payable 2,064,073 128,631 2,192,704 2,217,802
securities Purchased 2,985,011,625 — 2,985,011,625 2,124,750,768
securities lending Collateral 1,177,839,726 — 1,177,839,726 635,267,728
Total liabilities 4,165,701,332 128,631 4,165,829,963 2,763,498,184
net assets Held in Trust for Pension benefts and other Post employment benefts $11,352,784,329 $16,953,066 $11,369,737,395 $10,246,341,129
The accompanying notes to the fnancial statements are an integral part of this statement.
Financial 25
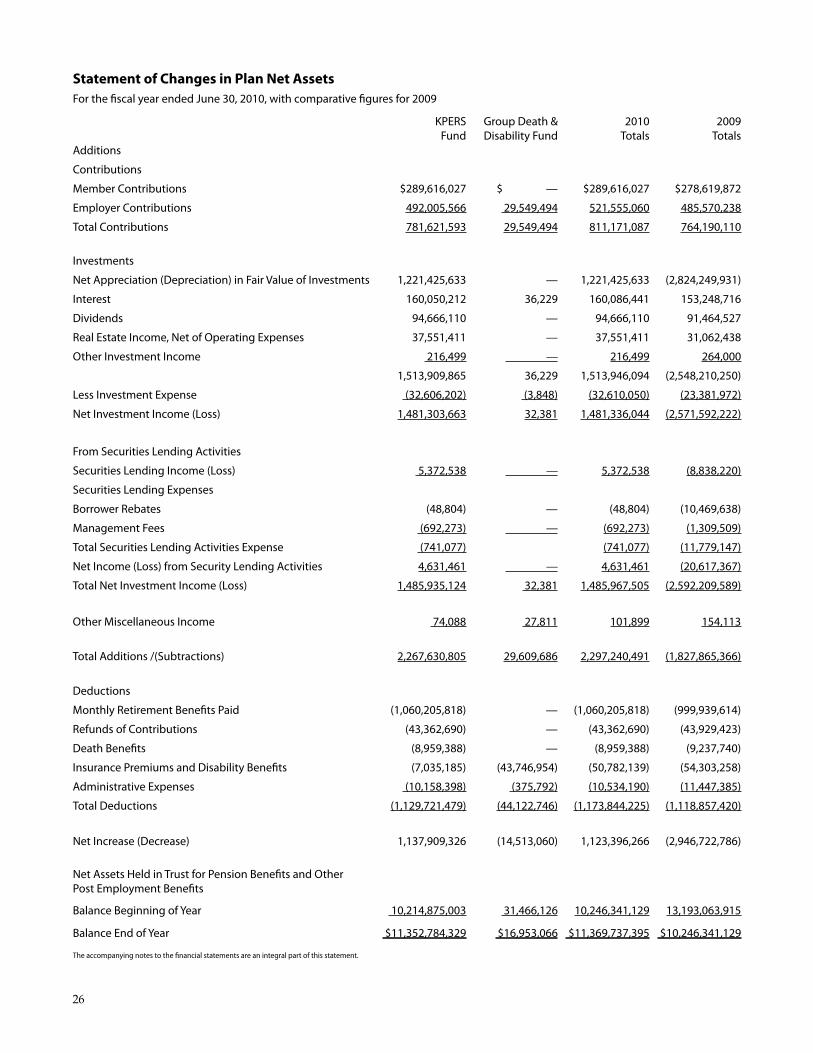
Statement of Changes in Plan Net Assets for the fscal year ended June 30, 2010, with comparative fgures for 2009
KPers Group death & 2010 2009 fund disability fund Totals Totals
additions
Contributions
Member Contributions $289,616,027 $ — $289,616,027 $278,619,872
employer Contributions 492,005,566 29,549,494 521,555,060 485,570,238
Total Contributions 781,621,593 29,549,494 811,171,087 764,190,110
Investments
net appreciation (depreciation) in fair value of Investments 1,221,425,633 — 1,221,425,633 (2,824,249,931)
Interest 160,050,212 36,229 160,086,441 153,248,716
dividends 94,666,110 — 94,666,110 91,464,527
real estate Income, net of operating expenses 37,551,411 — 37,551,411 31,062,438
other Investment Income 216,499 — 216,499 264,000
1,513,909,865 36,229 1,513,946,094 (2,548,210,250)
less Investment expense (32,606,202) (3,848) (32,610,050) (23,381,972)
net Investment Income (loss) 1,481,303,663 32,381 1,481,336,044 (2,571,592,222)
from securities lending activities
securities lending Income (loss) 5,372,538 — 5,372,538 (8,838,220)
securities lending expenses
borrower rebates (48,804) — (48,804) (10,469,638)
Management fees (692,273) — (692,273) (1,309,509)
Total securities lending activities expense (741,077) (741,077) (11,779,147)
net Income (loss) from security lending activities 4,631,461 — 4,631,461 (20,617,367)
Total net Investment Income (loss) 1,485,935,124 32,381 1,485,967,505 (2,592,209,589)
other Miscellaneous Income 74,088 27,811 101,899 154,113
Total additions /(subtractions) 2,267,630,805 29,609,686 2,297,240,491 (1,827,865,366)
deductions
Monthly retirement benefts Paid (1,060,205,818) — (1,060,205,818) (999,939,614)
refunds of Contributions (43,362,690) — (43,362,690) (43,929,423)
death benefts (8,959,388) — (8,959,388) (9,237,740)
Insurance Premiums and disability benefts (7,035,185) (43,746,954) (50,782,139) (54,303,258)
administrative expenses (10,158,398) (375,792) (10,534,190) (11,447,385)
Total deductions (1,129,721,479) (44,122,746) (1,173,844,225) (1,118,857,420)
net Increase (decrease) 1,137,909,326 (14,513,060) 1,123,396,266 (2,946,722,786)
net assets Held in Trust for Pension benefts and other Post employment benefts
balance beginning of year 10,214,875,003 31,466,126 10,246,341,129 13,193,063,915
balance end of year $11,352,784,329 $16,953,066 $11,369,737,395 $10,246,341,129
The accompanying notes to the fnancial statements are an integral part of this statement.
26
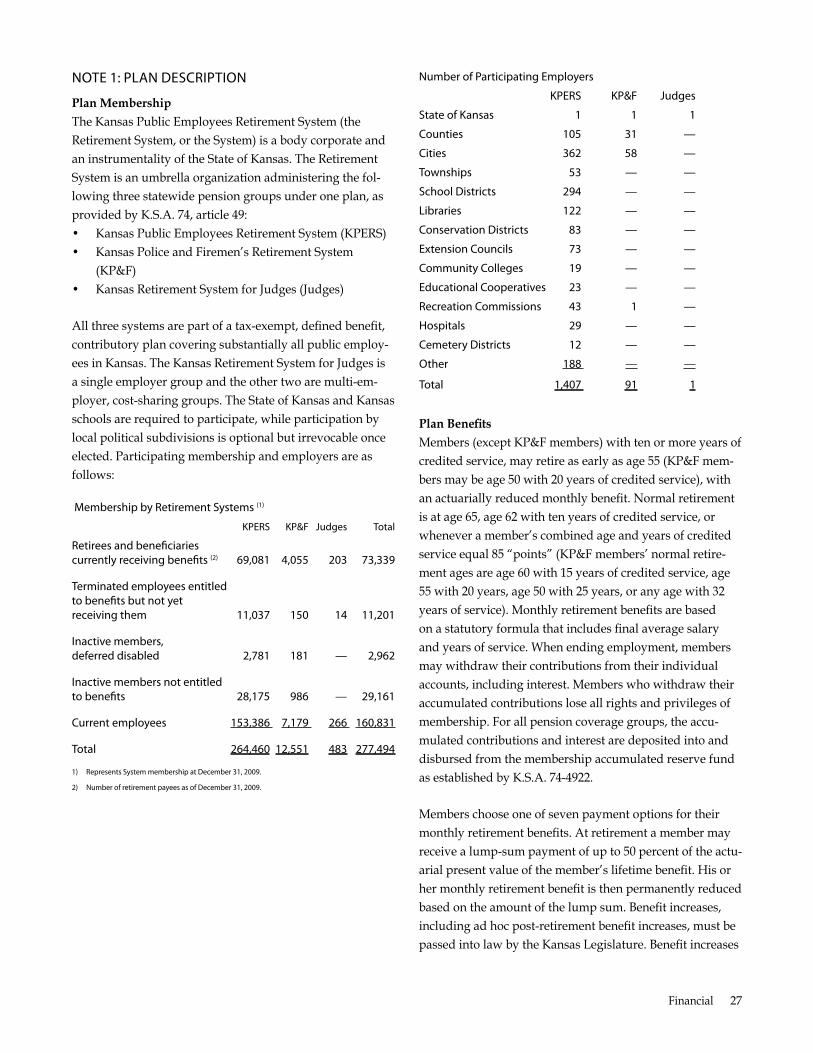
noTe 1: Plan desCrIPTIon
Plan Membership The Kansas Public Employees Retirement System (the Retirement System, or the System) is a body corporate and an instrumentality of the State of Kansas. The Retirement System is an umbrella organization administering the fol-lowing three statewide pension groups under one plan, as provided by K.S.A. 74, article 49: • Kansas Public Employees Retirement System (KPERS) • Kansas Police and Firemen’s Retirement System
(KP&F) • Kansas Retirement System for Judges (Judges)
All three systems are part of a tax-exempt, defined benefit, contributory plan covering substantially all public employ-ees in Kansas. The Kansas Retirement System for Judges is a single employer group and the other two are multi-em-ployer, cost-sharing groups. The State of Kansas and Kansas schools are required to participate, while participation by local political subdivisions is optional but irrevocable once elected. Participating membership and employers are as follows:
Membership by retirement systems (1)
KPers KP&f Judges Total
retirees and benefciaries currently receiving benefts (2) 69,081 4,055 203 73,339
Terminated employees entitled to benefts but not yet receiving them 11,037 150 14 11,201
Inactive members, deferred disabled 2,781 181 — 2,962
Inactive members not entitled to benefts 28,175 986 — 29,161
Current employees 153,386 7,179 266 160,831
Total 264,460 12,551 483 277,494
1) represents system membership at december 31, 2009.
2) number of retirement payees as of december 31, 2009.
number of Participating employers
KPers KP&f Judges
state of Kansas 1 1 1
Counties 105 31 —
Cities 362 58 —
Townships 53 — —
school districts 294 — —
libraries 122 — —
Conservation districts 83 — —
extension Councils 73 — —
Community Colleges 19 — —
educational Cooperatives 23 — —
recreation Commissions 43 1 —
Hospitals 29 — —
Cemetery districts 12 — —
other 188 — —
Total 1,407 91 1
Plan Benefits members (except KP&F members) with ten or more years of credited service, may retire as early as age 55 (KP&F mem-bers may be age 50 with 20 years of credited service), with an actuarially reduced monthly benefit. normal retirement is at age 65, age 62 with ten years of credited service, or whenever a member’s combined age and years of credited service equal 85 “points” (KP&F members’ normal retire-ment ages are age 60 with 15 years of credited service, age 55 with 20 years, age 50 with 25 years, or any age with 32 years of service). monthly retirement benefits are based on a statutory formula that includes final average salary and years of service. When ending employment, members may withdraw their contributions from their individual accounts, including interest. members who withdraw their accumulated contributions lose all rights and privileges of membership. For all pension coverage groups, the accu-mulated contributions and interest are deposited into and disbursed from the membership accumulated reserve fund as established by K.S.A. 74-4922.
members choose one of seven payment options for their monthly retirement benefits. At retirement a member may receive a lump-sum payment of up to 50 percent of the actu-arial present value of the member’s lifetime benefit. His or her monthly retirement benefit is then permanently reduced based on the amount of the lump sum. Benefit increases, including ad hoc post-retirement benefit increases, must be passed into law by the Kansas Legislature. Benefit increases
Financial 27
are under the authority of the Legislature and the Governor of the State of Kansas. For all pension coverage groups, the retirement benefits are disbursed from the retirement ben-efit payment reserve fund as established by K.S.A . 74-4922.
Active members (except KP&F members) are covered by basic group life insurance. The life insurance benefit is 150 percent of the annual compensation rate at the time of an active member’s death. Generally, in cases of death as a result of an on-the-job accident, for KPERS members there is a $50,000 lump-sum benefit and a monthly benefit pay-able to a spouse, minor children or dependent parents (in this order). Service-connected accidental death benefits are in addition to any life insurance benefit. There is a $4,000 death benefit payable to the beneficiary(ies) when a retired member dies under any of the systems.
Active members (except KP&F and Judges’ members) are also covered by the provisions of the disability income ben-efit plan. Since 2006, annual disability income benefits have been based on 60 percent of the annual rate of compensa-tion at the time of disability, less primary social security benefits, one-half of worker’s compensation, and any other employment-related disability benefit. members who were approved for disability benefits before 2006 have an annual benefit based on 66 percent of the annual compensation at the time of disability. For both groups, the minimum monthly benefit is $100. There is a waiting period of 180 continuous days from the date of disability before benefits can be paid. During the period of approved disability, the member continues to be eligible for group life insurance coverage and to accrue participating service credit.
Contributions member contributions (from 4.0 to 7.0 percent of gross compensation), employer contributions and net investment income fund Retirement System reserves. member contri-bution rates are established by state law, and are paid by the employee according to the provisions of section 414(h) of the Internal Revenue Code. State law provides that the employer contribution rates be determined based on the results of each annual actuarial valuation. The contributions and assets of all three systems are deposited in the Kansas Public Employees Retirement Fund established by K.S.A. 74-4921. All of the retirement systems are funded on an actuarial reserve basis (see note 3). For fiscal years begin-ning in 1995, Kansas legislation placed a statutory limit of 0.1 percent of payroll on increases in contribution rates for
KPERS employers. During the 1995 legislative session, the statutory limits were increased to 0.2 percent of payroll over the prior year for fiscal years beginning in 1996 for state and school employers. The statutory increase for local units of government was amended to limit increases to no more than 0.15 percent over the prior year for calendar years be-ginning in 1997. Annual increases in the employer contribu-tion rates related to subsequent benefit enhancements are not subject to these limitations. Legislation passed in 2003 amended the annual increases in future years. The statutory cap for the State/School group increased to 0.4 percent in fiscal year 2006, with subsequent increases of 0.5 percent in fiscal year 2007 and 0.6 percent in fiscal year 2008 and beyond. Legislation passed in 2004 amended the annual increases in future years for local employers. The statutory cap for the Local group increased to 0.4 percent in calendar year 2006, with subsequent increases of 0.5 percent in fiscal year 2007 and 0.6 percent in fiscal year 2008 and beyond. The amortization period for the unfunded liability of all three systems is 40 years from July 1, 1993.
noTe 2: suMMary of sIGnIfICanT aCCounTInG PolICIes
Reporting Entity The Retirement System is a component unit of the State of Kansas. A nine-member board of trustees administers the Retirement System: four trustees are appointed by the Governor, one by the President of the Senate, one by the Speaker of the House of Representatives, two are elected by Retirement System members, and one is the elected State Treasurer. The Board of Trustees appoints the executive director, who is the Retirement System’s managing officer.
Other Employee Benefit Plan The Board of Trustees of the Retirement System has over-sight responsibility, but little administrative involvement and no investment responsibility, for the Kansas Public Employees’ Deferred Compensation Plan (IRC Section 457) for state employees. Because the Board of Trustees neither owns the assets nor has custody of them, and their financial transactions are not recorded in the System’s accounting system, this program is not included in the System’s finan-cial statements.
Measurement Focus and Basis of Accounting The Retirement System’s financial statements are reported using the economic resource measurement focus and the
28
accrual basis of accounting. Contributions are due to KPERS when employee services have been performed and paid. Contributions are recognized as revenues when due pursu-ant to statutory requirements. Benefits and refunds are rec-ognized when due and payable and expenses are recorded when the corresponding liabilities are incurred, regardless of when contributions are received or payment is made.
Use of Estimates The Retirement System’s financial statement preparation conforms with accounting principles generally accepted in the united States. These principles require management to make estimates and assumptions that affect the reported amounts of assets and liabilities. This also includes disclos-ing contingent assets and liabilities at the date of the finan-cial statements and the reported amounts of revenues and expenses during the reporting period. Actual results could differ from those estimates.
Comparative Financial Information The basic financial statements include certain prior-year summarized comparative information in total but not at the level of detail required for a presentation in conformity with generally accepted accounting principles. Accordingly, such information should be read in conjunction with the Sys-tem’s financial statements for the year ended June 30, 2009, from which the summarized information was derived.
Cash and Deposits Custodial credit risk is when in the event a financial institu-tion or counterparty fails, the Retirement System would not be able to recover the value of deposits that are in the possession of an outside party. The System advances cash deposits to a disability administrator for monthly disability benefits and death benefits for members who are disabled. As of June 30, 2010, the Retirement System’s deposit with its disability administrator was $10,251. The Retirement System does not have a deposit policy for custodial credit risk associated with these deposits.
Method Used to Value Investments Investments are reported at fair value. Securities traded on a national or international securities exchange are valued at the last reported sales price at current exchange rates. The fair value of real estate investments is based on indepen-dent appraisals. Fair value of other securities is determined by the mean of the most recent bid and asked prices as obtained from dealers that make markets in such securities.
Fair values of the limited partnership investments are based on valuations of the underlying companies of the limited partnerships as reported by the general partner. Fair value of the commingled funds are determined based on the un-derlying asset values.
Investments Investments and the investment process are governed by K.S.A. 74-4921. The Board of Trustees maintains a formal Statement of Investment Policy, which addresses the gov-erning provisions of the law, as well as specifying addition-al guidelines for the investment process.
Statutory authority for the Retirement System’s investment program is provided in K.S.A. 74-4901 et seq., effective July 1, 1993. The Retirement Act addresses the following areas:
• Establishes the structure of the Board of Trustees, defines the Trustees’ responsibilities, imposing the pru-dent expert standard upon their actions with respect to managing the assets of the Retirement System.
• Requires that the assets be invested to preserve capital and solely to provide benefits to members and the members’ beneficiaries.
• Limits the possible allocation of common stock to 60.0 percent of the total book value of the fund.
• The annual allowance for new alternative (non-publicly traded) investments is limited to 1.0 percent of the mar-ket value of the total investment assets of the fund as measured from the end of the preceding calendar year.
• Establishes limits on the structure of future investments in real estate or alternative investments.
• Requires that the Board develop investment policies and objectives to invest fund assets.
• Authorizes the Board to hire qualified professionals/
firms to assist in investing the fund and requires that such professionals/firms obtain errors and omissions insurance coverage and fidelity bond insurance cover-age.
• Authorizes the Board to pay for the services of retained professionals/firms at the rates fixed by the Board,
Financial 29
excluding any reimbursement for expenses and subject to the provisions of the appropriations acts.
• Provides for an annual audit and requires that the Board annually examine the investment program, spe-cific investments, and its policies and practices.
In fulfilling its responsibilities, the Board of Trustees has contracted with 30 investment management firms and a master global custodian. The Retirement System has six permissible investment categories. 1) Equities 2) Real estate 3) Fixed income securities 4) Derivative products 5) Cash equivalents 6) Alternative investments.
Equities are considered to be common or preferred corpo-rate stocks; warrants or rights; corporate bonds, debentures or preferred stock which are convertible into common stock; investment trusts; or participation in commingled (equity) funds managed by a bank, insurance company or other pro-fessional equity investment manager. These stocks are listed on well recognized or principal exchanges of the united States or foreign countries.
Fixed income securities are considered to be u.S. and foreign Treasury or Government agency obligations; u.S. or foreign corporate bonds; asset backed securities such as CmOs, mortgage backed securities and segments of these types of vehicles; or participation in commingled (fixed income) funds, managed by a bank, insurance company or other professional fixed income investment manager. Subject to the Board’s limitations, these investments also include the debt of emerging markets. Emerging markets are considered to be those countries that are included in the JP morgan Emerging markets Index Global (EmBI Global).
Cash equivalent securities are u.S. dollar denominated securities with a duration of one year or less and an invest-ment grade rating by moody’s and Standard & Poor’s. A security’s duration is determined by a third-party pricing agency.
Derivative instruments are tools for use by the System’s investment managers for the purposes of: • Risk management: mitigating or managing portfolio
risks through hedging or otherwise modifying specific risk exposure.
• Substitution: In substitution for “cash market” securi-ties/positions, or for modifying portfolio positioning in lieu of cash market transactions.
• Derivative-based Strategies: As a structural part of an investment strategy.
• Efficiency/Cost Effectiveness: Efficiency and/or cost effectiveness in implementing: portfolio construction, trading, portfolio strategy or managing a portfolio’s risk/return profile.
Alternative investments are those investments that do not trade publicly on an organized exchange. Examples include but are not limited to partnership funds that focus on private equity, venture capital, buyout, mezzanine financ-ing or special situations, natural resources or hedge funds. Prospective investment in any alternative investments are subject to the following requirements: • There are at least two other sophisticated investors. • The System’s portion of an investment will not be more
than 20 percent of the total investment. • Any individual investment (standing alone or within a
pool) must not be more than 2.5 percent of the Fund’s total alternative investment commitments.
• A favorable recommendation has been received from an independent expert.
• The investment is consistent with the Investment Policy Statement.
• The Board has received and considered the due dili-gence findings regarding the investment.
• Criteria have been established that will be used as a guideline to determine when no additional investments will be made and when the investment will be liqui-dated.
Real estate investments are investments in real property on a direct ownership basis, through a realty holding corporation, joint partnership, public or private real estate investment trusts (REITs) (contained within the real estate portfolio), participation in commingled real estate funds (managed by a bank, insurance company or other profes-sional real estate investment manager) or through debt secured by real estate. Any real estate investment shall sup-port the System’s intent to hold a real estate portfolio which is diversified by geographic location, property type, stage of development and degree of leverage.
30
The Retirement System’s Statement of Investment Policy authorizes participation in a securities lending program ad-ministered by the master global custodian, Bank of new york mellon. The System receives income from the loan of the secu-rities, in addition to the income which accrues to the System as owner of the securities. The securities loans are open contracts and therefore could be terminated at any time by either party. The type of securities lent include u.S. government securi-ties, domestic and international equities, and domestic and international bonds. The borrower collateralizes the loan with either cash or government securities of 102.0 percent of fair value on domestic securities and 105.0 percent of fair value on international securities loaned. Cash collateral is invested in the Retirement System’s name in a dedicated short-term in-vestment fund consisting of investment grade debt securities. The System does not have the ability to pledge or sell collateral securities without a borrower default. At June 30, 2010, the maturities of securities in this dedicated bond portfolio are as follows: 46.3 percent of the fair value of the securities ma-ture within 30 days; 26.2 percent mature between 31 and 180 days; and 27.5 percent mature after 180 days. The custodian provides for full indemnification to the Retirement System for any losses that might occur in the event of borrower default. The Retirement System does incur credit risk as it relates to the credit quality of the securities in the collateral pool. The securities on loan are marked to market daily to ensure the adequacy of the collateral. The fair value of securities on loan as of June 30, 2010, and June 30, 2009, were $1,327,050,007 and $790,001,583, respectively. Collateral held by the Retirement System for June 30, 2010, and June 30, 2009, was $1,378,967,677 and $824,712,122, respectively. net income produced from securities lending activities for fiscal year 2010 was $4,631,461 and for fiscal year 2009 was negative $20,617,367.
Custodial Credit Risk. Custodial credit risk is when in the event a financial institu-tion or counterparty fails, the Retirement System would not be able to recover value of deposits, investments or collateral securities that are in the possession of an outside party. One hundred percent (100 percent) of the Systems investments are held in the System’s name and are not subject to creditors of the custodial bank.
Concentration Risk The System has investments in Federal national mortgage Association issued securities that represent 2.5 percent of the total net asset value, and u.S. Treasury securities representing 7.1 percent of net asset value. KPERS investment policy does
not prohibit holdings above 5 percent in the debt securities of u.S. government issuers. Government sponsored enterprises (GSEs, such as FnmA) are considered government issuers for the purpose of implementing KPERS investment policy. no other single issuer represents 1 percent or more of System assets.
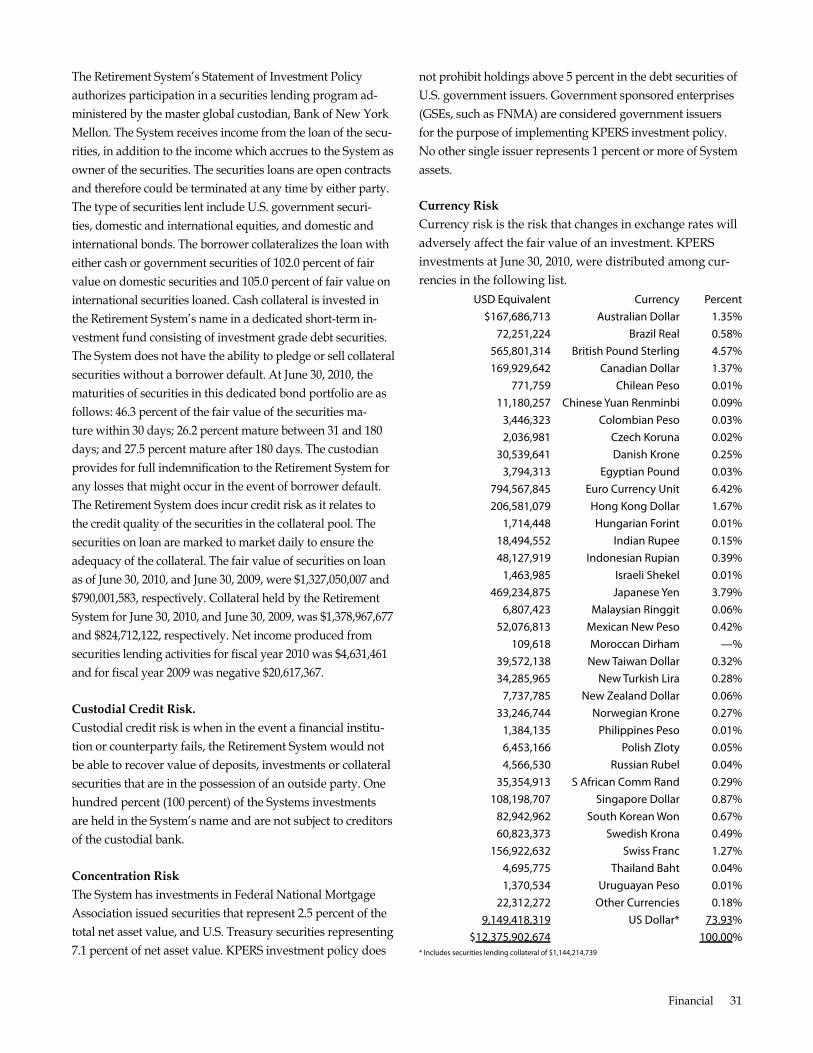
Currency Risk Currency risk is the risk that changes in exchange rates will adversely affect the fair value of an investment. KPERS investments at June 30, 2010, were distributed among cur-rencies in the following list.
usd equivalent Currency Percent $167,686,713 australian dollar 1.35%
72,251,224 brazil real 0.58% 565,801,314 british Pound sterling 4.57% 169,929,642 Canadian dollar 1.37%
771,759 Chilean Peso 0.01% 11,180,257 Chinese yuan renminbi 0.09%
3,446,323 Colombian Peso 0.03% 2,036,981 Czech Koruna 0.02%
30,539,641 danish Krone 0.25% 3,794,313 egyptian Pound 0.03%
794,567,845 euro Currency unit 6.42% 206,581,079 Hong Kong dollar 1.67%
1,714,448 Hungarian forint 0.01% 18,494,552 Indian rupee 0.15% 48,127,919 Indonesian rupian 0.39%
1,463,985 Israeli shekel 0.01% 469,234,875 Japanese yen 3.79%
6,807,423 Malaysian ringgit 0.06% 52,076,813 Mexican new Peso 0.42%
109,618 Moroccan dirham —% 39,572,138 new Taiwan dollar 0.32% 34,285,965 new Turkish lira 0.28%
7,737,785 new zealand dollar 0.06% 33,246,744 norwegian Krone 0.27%
1,384,135 Philippines Peso 0.01% 6,453,166 Polish zloty 0.05% 4,566,530 russian rubel 0.04%
35,354,913 s african Comm rand 0.29% 108,198,707 singapore dollar 0.87%
82,942,962 south Korean Won 0.67% 60,823,373 swedish Krona 0.49%
156,922,632 swiss franc 1.27% 4,695,775 Thailand baht 0.04% 1,370,534 uruguayan Peso 0.01%
22,312,272 other Currencies 0.18% 9,149,418,319 us dollar* 73.93%
$12,375,902,674 100.00% * Includes securities lending collateral of $1,144,214,739
Financial 31
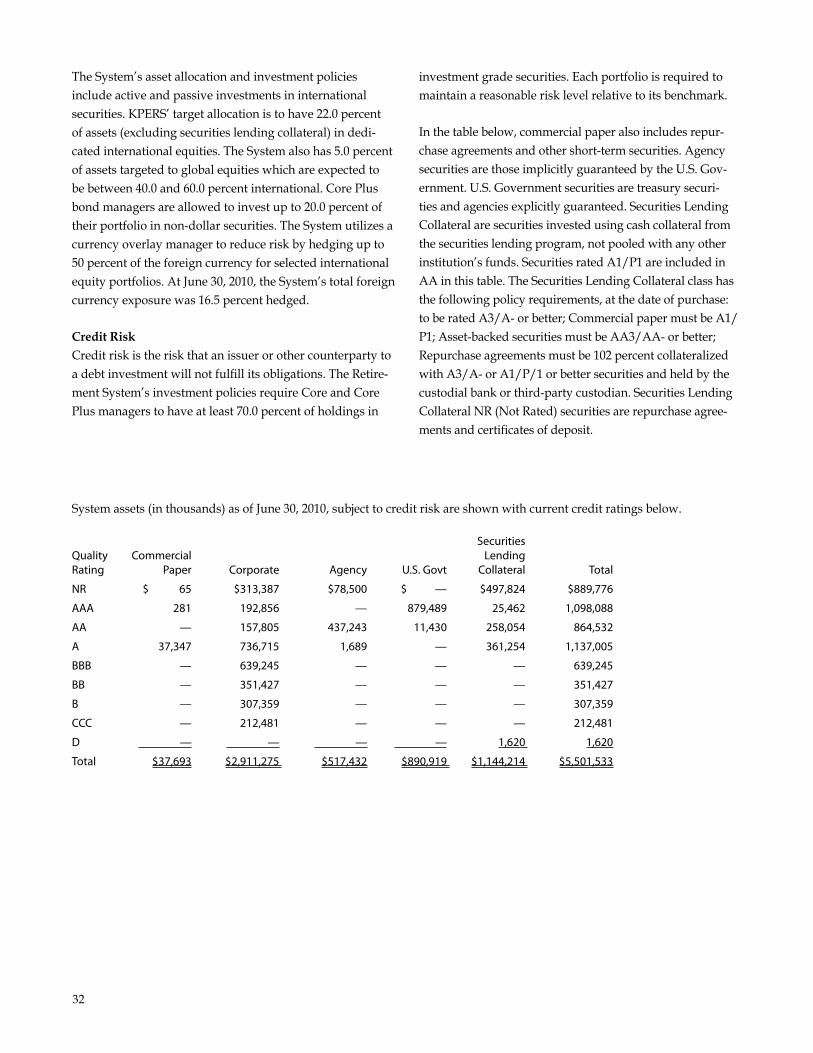
The System’s asset allocation and investment policies investment grade securities. Each portfolio is required to include active and passive investments in international maintain a reasonable risk level relative to its benchmark. securities. KPERS’ target allocation is to have 22.0 percent of assets (excluding securities lending collateral) in dedi- In the table below, commercial paper also includes repur-cated international equities. The System also has 5.0 percent chase agreements and other short-term securities. Agency of assets targeted to global equities which are expected to securities are those implicitly guaranteed by the u.S. Gov-be between 40.0 and 60.0 percent international. Core Plus ernment. u.S. Government securities are treasury securi-bond managers are allowed to invest up to 20.0 percent of ties and agencies explicitly guaranteed. Securities Lending their portfolio in non-dollar securities. The System utilizes a Collateral are securities invested using cash collateral from currency overlay manager to reduce risk by hedging up to the securities lending program, not pooled with any other 50 percent of the foreign currency for selected international institution’s funds. Securities rated A1/P1 are included in equity portfolios. At June 30, 2010, the System’s total foreign AA in this table. The Securities Lending Collateral class has currency exposure was 16.5 percent hedged. the following policy requirements, at the date of purchase:
to be rated A3/A- or better; Commercial paper must be A1/
Credit Risk P1; Asset-backed securities must be AA3/AA- or better; Credit risk is the risk that an issuer or other counterparty to Repurchase agreements must be 102 percent collateralized a debt investment will not fulfill its obligations. The Retire- with A3/A- or A1/P/1 or better securities and held by the ment System’s investment policies require Core and Core custodial bank or third-party custodian. Securities Lending Plus managers to have at least 70.0 percent of holdings in Collateral nR (not Rated) securities are repurchase agree-
ments and certificates of deposit.
System assets (in thousands) as of June 30, 2010, subject to credit risk are shown with current credit ratings below.
securities Quality Commercial lending rating Paper Corporate agency u.s. Govt Collateral Total
nr $ 65 $313,387 $78,500 $ — $497,824 $889,776
aaa 281 192,856 — 879,489 25,462 1,098,088
aa — 157,805 437,243 11,430 258,054 864,532
a 37,347 736,715 1,689 — 361,254 1,137,005
bbb — 639,245 — — — 639,245
bb — 351,427 — — — 351,427
b — 307,359 — — — 307,359
CCC — 212,481 — — — 212,481
d — — — — 1,620 1,620
Total $37,693 $2,911,275 $517,432 $890,919 $1,144,214 $5,501,533
32
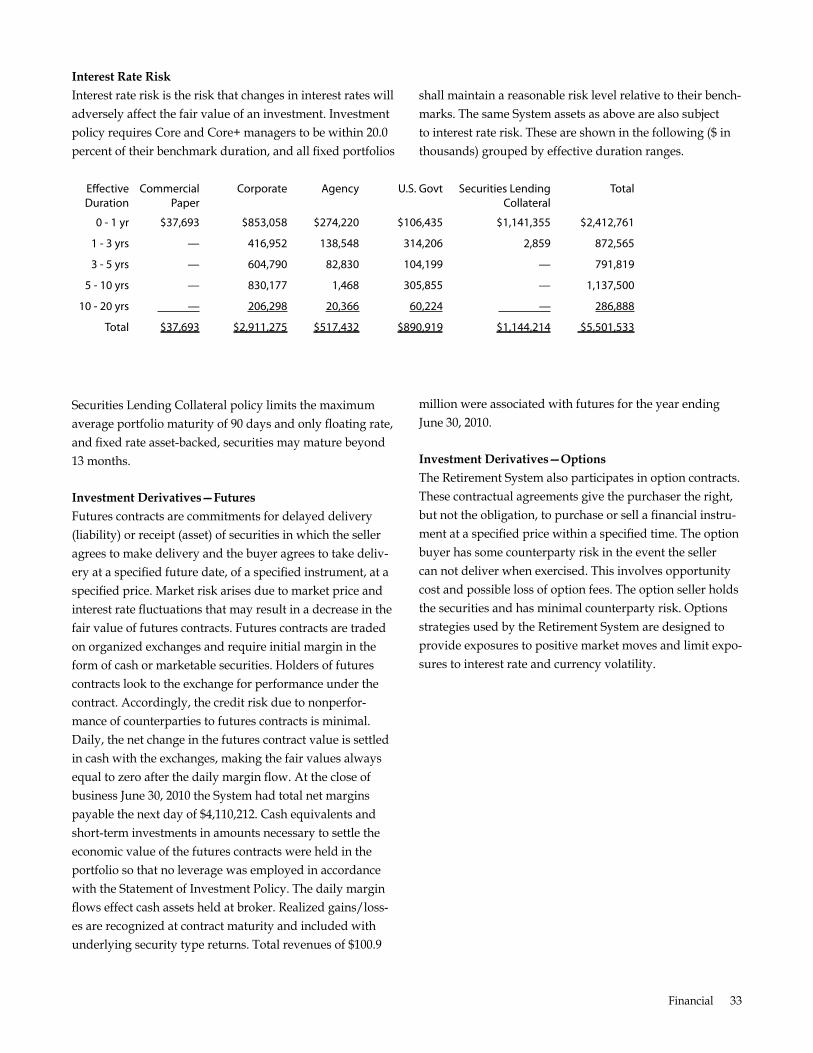
Interest Rate Risk Interest rate risk is the risk that changes in interest rates will adversely affect the fair value of an investment. Investment policy requires Core and Core+ managers to be within 20.0 percent of their benchmark duration, and all fixed portfolios
efective Commercial Corporate agency duration Paper
0 - 1 yr $37,693 $853,058 $274,220
1 - 3 yrs — 416,952 138,548
3 - 5 yrs — 604,790 82,830
5 - 10 yrs — 830,177 1,468
10 - 20 yrs — 206,298 20,366
Total $37,693 $2,911,275 $517,432
Securities Lending Collateral policy limits the maximum average portfolio maturity of 90 days and only floating rate, and fixed rate asset-backed, securities may mature beyond 13 months.
Investment Derivatives—Futures Futures contracts are commitments for delayed delivery (liability) or receipt (asset) of securities in which the seller agrees to make delivery and the buyer agrees to take deliv-ery at a specified future date, of a specified instrument, at a specified price. market risk arises due to market price and interest rate fluctuations that may result in a decrease in the fair value of futures contracts. Futures contracts are traded on organized exchanges and require initial margin in the form of cash or marketable securities. Holders of futures contracts look to the exchange for performance under the contract. Accordingly, the credit risk due to nonperfor-mance of counterparties to futures contracts is minimal. Daily, the net change in the futures contract value is settled in cash with the exchanges, making the fair values always equal to zero after the daily margin flow. At the close of business June 30, 2010 the System had total net margins payable the next day of $4,110,212. Cash equivalents and short-term investments in amounts necessary to settle the economic value of the futures contracts were held in the portfolio so that no leverage was employed in accordance with the Statement of Investment Policy. The daily margin flows effect cash assets held at broker. Realized gains/loss-es are recognized at contract maturity and included with underlying security type returns. Total revenues of $100.9
shall maintain a reasonable risk level relative to their bench-marks. The same System assets as above are also subject to interest rate risk. These are shown in the following ($ in thousands) grouped by effective duration ranges.
u.s. Govt securities lending Total Collateral
$106,435 $1,141,355 $2,412,761
314,206 2,859 872,565
104,199 — 791,819
305,855 — 1,137,500
60,224 — 286,888
$890,919 $1,144,214 $5,501,533
million were associated with futures for the year ending June 30, 2010.
Investment Derivatives—Options The Retirement System also participates in option contracts. These contractual agreements give the purchaser the right, but not the obligation, to purchase or sell a financial instru-ment at a specified price within a specified time. The option buyer has some counterparty risk in the event the seller can not deliver when exercised. This involves opportunity cost and possible loss of option fees. The option seller holds the securities and has minimal counterparty risk. Options strategies used by the Retirement System are designed to provide exposures to positive market moves and limit expo-sures to interest rate and currency volatility.
Financial 33
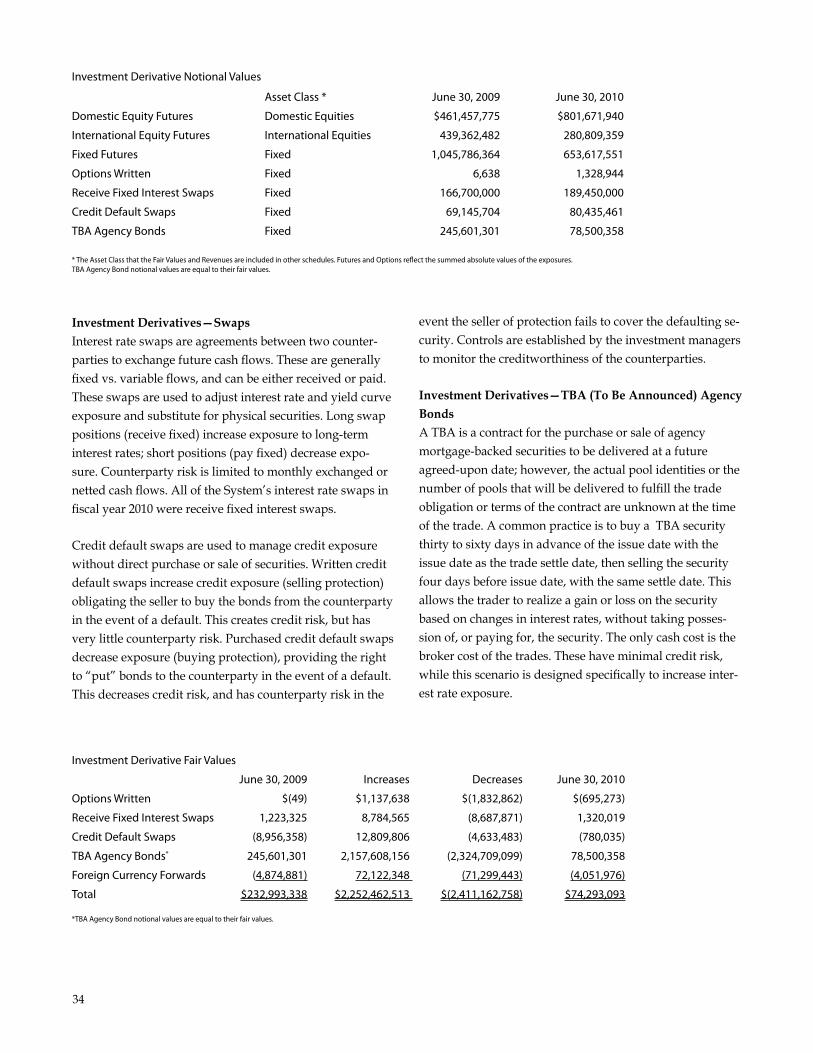
Investment derivative notional values
asset Class * June 30, 2009 June 30, 2010
domestic equity futures domestic equities $461,457,775 $801,671,940
International equity futures International equities 439,362,482 280,809,359
fixed futures fixed 1,045,786,364 653,617,551
options Written fixed 6,638 1,328,944
receive fixed Interest swaps fixed 166,700,000 189,450,000
Credit default swaps fixed 69,145,704 80,435,461
Tba agency bonds fixed 245,601,301 78,500,358
* The asset Class that the fair values and revenues are included in other schedules. futures and options refect the summed absolute values of the exposures. Tba agency bond notional values are equal to their fair values.
Investment Derivatives—Swaps Interest rate swaps are agreements between two counter-parties to exchange future cash flows. These are generally fixed vs. variable flows, and can be either received or paid. These swaps are used to adjust interest rate and yield curve exposure and substitute for physical securities. Long swap positions (receive fixed) increase exposure to long-term interest rates; short positions (pay fixed) decrease expo-sure. Counterparty risk is limited to monthly exchanged or netted cash flows. All of the System’s interest rate swaps in fiscal year 2010 were receive fixed interest swaps.
Credit default swaps are used to manage credit exposure without direct purchase or sale of securities. Written credit default swaps increase credit exposure (selling protection) obligating the seller to buy the bonds from the counterparty in the event of a default. This creates credit risk, but has very little counterparty risk. Purchased credit default swaps decrease exposure (buying protection), providing the right to “put” bonds to the counterparty in the event of a default. This decreases credit risk, and has counterparty risk in the
event the seller of protection fails to cover the defaulting se-curity. Controls are established by the investment managers to monitor the creditworthiness of the counterparties.
Investment Derivatives—TBA (To Be Announced) Agency Bonds A TBA is a contract for the purchase or sale of agency mortgage-backed securities to be delivered at a future agreed-upon date; however, the actual pool identities or the number of pools that will be delivered to fulfill the trade obligation or terms of the contract are unknown at the time of the trade. A common practice is to buy a TBA security thirty to sixty days in advance of the issue date with the issue date as the trade settle date, then selling the security four days before issue date, with the same settle date. This allows the trader to realize a gain or loss on the security based on changes in interest rates, without taking posses-sion of, or paying for, the security. The only cash cost is the
broker cost of the trades. These have minimal credit risk, while this scenario is designed specifically to increase inter-est rate exposure.
Investment derivative fair values
June 30, 2009 Increases decreases June 30, 2010
options Written $(49) $1,137,638 $(1,832,862) $(695,273)
receive fixed Interest swaps 1,223,325 8,784,565 (8,687,871) 1,320,019
Credit default swaps (8,956,358) 12,809,806 (4,633,483) (780,035)
Tba agency bonds* 245,601,301 2,157,608,156 (2,324,709,099) 78,500,358
foreign Currency forwards (4,874,881) 72,122,348 (71,299,443) (4,051,976)
Total $232,993,338 $2,252,462,513 $(2,411,162,758) $74,293,093
*Tba agency bond notional values are equal to their fair values.
34
Investment Derivatives—Foreign Currency Forwards two counterparties. The Retirement System could incur a The Retirement System’s international investment manag- loss if its counterparties failed to perform pursuant to the ers use forward contracts to obtain currencies necessary for terms of their contractual obligations. Since the System trade execution and manage the exposure of the inter- holds the offsetting currency in the contract, and controls national investments to fluctuations in foreign currency. are established by the investment managers to monitor the Active international investment managers use forward creditworthiness of the counterparties, risk of actual loss contracts to enhance returns or to control volatility. Cur- are minimized. The Retirement System also contracts with a rency risk arises due to foreign exchange rate fluctuations. currency overlay manager to hedge the currency exposure Forward foreign exchange contracts are negotiated between to the System’s international equity portfolio.
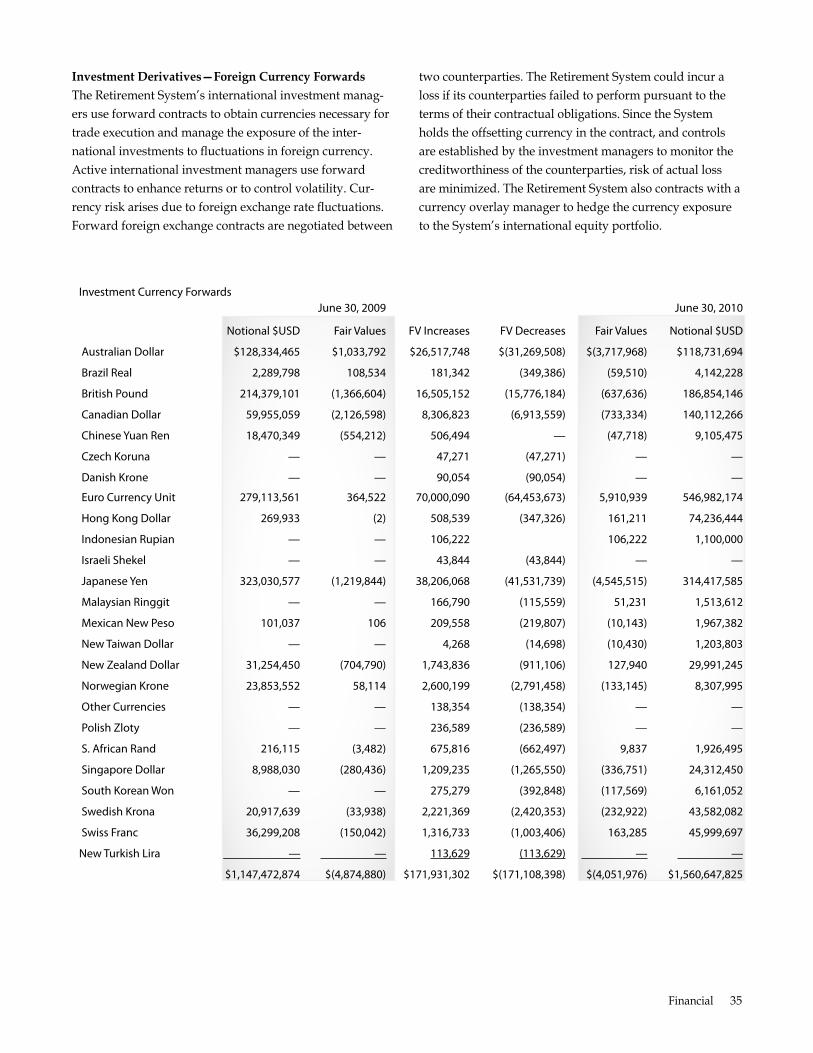
Investment Currency forwards June 30, 2009 June 30, 2010
notional $usd fair values fv Increases fv decreases fair values notional $usd
australian dollar $128,334,465 $1,033,792 $26,517,748 $(31,269,508) $(3,717,968) $118,731,694
brazil real 2,289,798 108,534 181,342 (349,386) (59,510) 4,142,228
british Pound 214,379,101 (1,366,604) 16,505,152 (15,776,184) (637,636) 186,854,146
Canadian dollar 59,955,059 (2,126,598) 8,306,823 (6,913,559) (733,334) 140,112,266
Chinese yuan ren 18,470,349 (554,212) 506,494 — (47,718) 9,105,475
Czech Koruna — — 47,271 (47,271) — —
danish Krone — — 90,054 (90,054) — —
euro Currency unit 279,113,561 364,522 70,000,090 (64,453,673) 5,910,939 546,982,174
Hong Kong dollar 269,933 (2) 508,539 (347,326) 161,211 74,236,444
Indonesian rupian — — 106,222 106,222 1,100,000
Israeli shekel — — 43,844 (43,844) — —
Japanese yen 323,030,577 (1,219,844) 38,206,068 (41,531,739) (4,545,515) 314,417,585
Malaysian ringgit — — 166,790 (115,559) 51,231 1,513,612
Mexican new Peso 101,037 106 209,558 (219,807) (10,143) 1,967,382
new Taiwan dollar — — 4,268 (14,698) (10,430) 1,203,803
new zealand dollar 31,254,450 (704,790) 1,743,836 (911,106) 127,940 29,991,245
norwegian Krone 23,853,552 58,114 2,600,199 (2,791,458) (133,145) 8,307,995
other Currencies — — 138,354 (138,354) — —
Polish zloty — — 236,589 (236,589) — —
s. african rand 216,115 (3,482) 675,816 (662,497) 9,837 1,926,495
singapore dollar 8,988,030 (280,436) 1,209,235 (1,265,550) (336,751) 24,312,450
south Korean Won — — 275,279 (392,848) (117,569) 6,161,052
swedish Krona 20,917,639 (33,938) 2,221,369 (2,420,353) (232,922) 43,582,082
swiss franc 36,299,208 (150,042) 1,316,733 (1,003,406) 163,285 45,999,697
new Turkish lira — — 113,629 (113,629) — —
$1,147,472,874 $(4,874,880) $171,931,302 $(171,108,398) $(4,051,976) $1,560,647,825
Financial 35
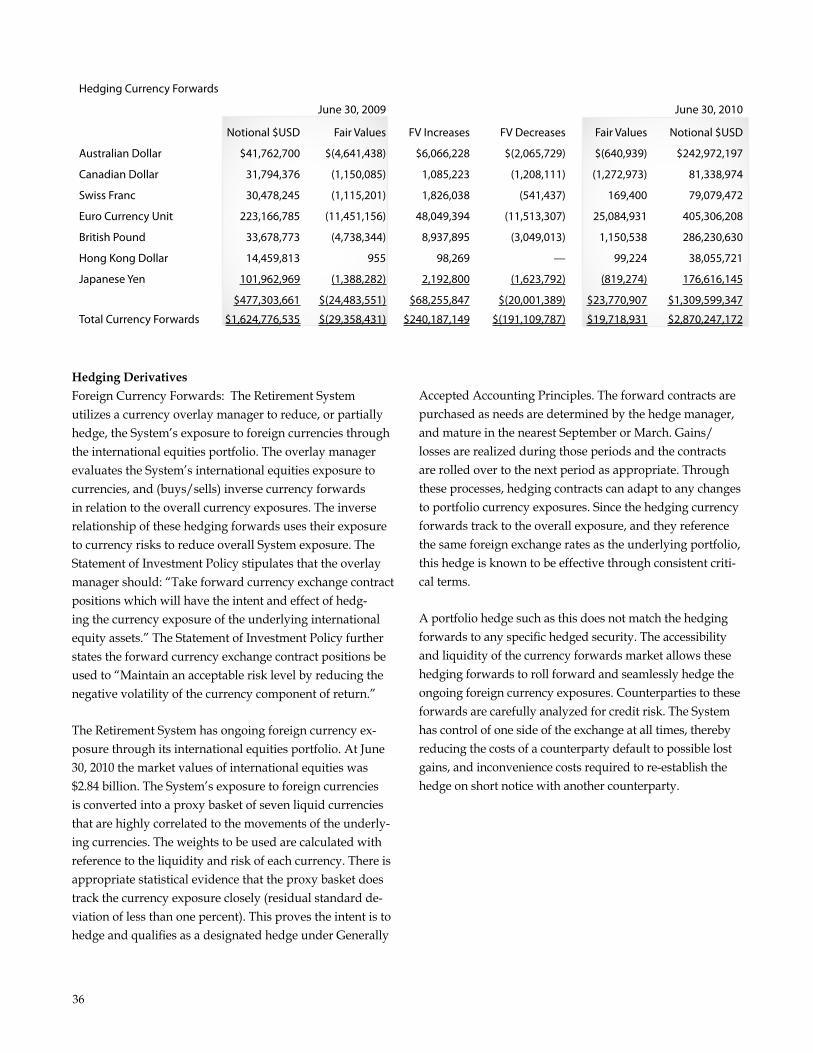
Hedging Currency forwards
June 30, 2009
notional $usd fair values
australian dollar $41,762,700 $(4,641,438)
Canadian dollar 31,794,376 (1,150,085)
swiss franc 30,478,245 (1,115,201)
euro Currency unit 223,166,785 (11,451,156)
british Pound 33,678,773 (4,738,344)
Hong Kong dollar 14,459,813 955
Japanese yen 101,962,969 (1,388,282)
$477,303,661 $(24,483,551)
Total Currency forwards $1,624,776,535 $(29,358,431)
Hedging Derivatives Foreign Currency Forwards: The Retirement System utilizes a currency overlay manager to reduce, or partially hedge, the System’s exposure to foreign currencies through the international equities portfolio. The overlay manager evaluates the System’s international equities exposure to currencies, and (buys/sells) inverse currency forwards in relation to the overall currency exposures. The inverse relationship of these hedging forwards uses their exposure to currency risks to reduce overall System exposure. The Statement of Investment Policy stipulates that the overlay manager should: “Take forward currency exchange contract positions which will have the intent and effect of hedg-ing the currency exposure of the underlying international equity assets.” The Statement of Investment Policy further states the forward currency exchange contract positions be used to “maintain an acceptable risk level by reducing the negative volatility of the currency component of return.”
The Retirement System has ongoing foreign currency ex-posure through its international equities portfolio. At June 30, 2010 the market values of international equities was $2.84 billion. The System’s exposure to foreign currencies is converted into a proxy basket of seven liquid currencies that are highly correlated to the movements of the underly-ing currencies. The weights to be used are calculated with reference to the liquidity and risk of each currency. There is appropriate statistical evidence that the proxy basket does track the currency exposure closely (residual standard de-viation of less than one percent). This proves the intent is to
hedge and qualifies as a designated hedge under Generally
June 30, 2010
fv Increases fv decreases fair values notional $usd
$6,066,228 $(2,065,729) $(640,939) $242,972,197
1,085,223 (1,208,111) (1,272,973) 81,338,974
1,826,038 (541,437) 169,400 79,079,472
48,049,394 (11,513,307) 25,084,931 405,306,208
8,937,895 (3,049,013) 1,150,538 286,230,630
98,269 — 99,224 38,055,721
2,192,800 (1,623,792) (819,274) 176,616,145
$68,255,847 $(20,001,389) $23,770,907 $1,309,599,347
$240,187,149 $(191,109,787) $19,718,931 $2,870,247,172
Accepted Accounting Principles. The forward contracts are purchased as needs are determined by the hedge manager, and mature in the nearest September or march. Gains/
losses are realized during those periods and the contracts are rolled over to the next period as appropriate. Through these processes, hedging contracts can adapt to any changes to portfolio currency exposures. Since the hedging currency forwards track to the overall exposure, and they reference the same foreign exchange rates as the underlying portfolio, this hedge is known to be effective through consistent criti-cal terms.
A portfolio hedge such as this does not match the hedging forwards to any specific hedged security. The accessibility and liquidity of the currency forwards market allows these hedging forwards to roll forward and seamlessly hedge the ongoing foreign currency exposures. Counterparties to these forwards are carefully analyzed for credit risk. The System has control of one side of the exchange at all times, thereby reducing the costs of a counterparty default to possible lost gains, and inconvenience costs required to re-establish the hedge on short notice with another counterparty.
36
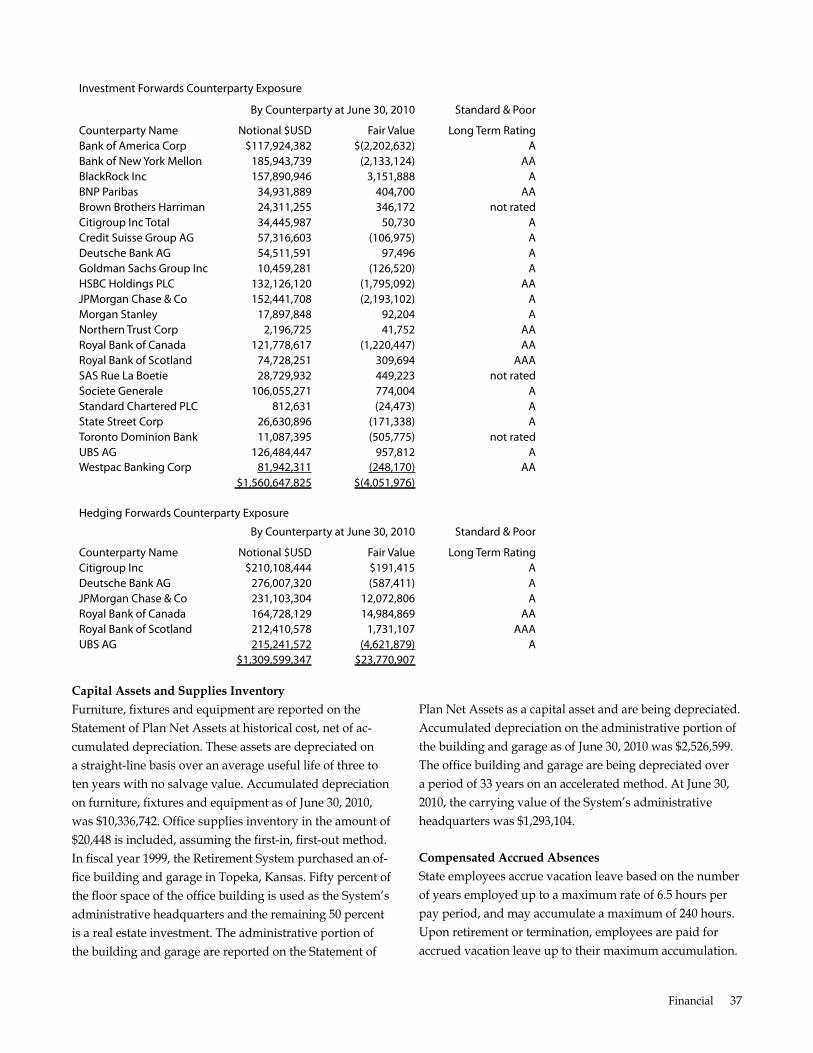
Investment forwards Counterparty exposure
by Counterparty at June 30, 2010
Counterparty name notional $usd fair value bank of america Corp $117,924,382 $(2,202,632) bank of new york Mellon 185,943,739 (2,133,124) blackrock Inc 157,890,946 3,151,888 bnP Paribas 34,931,889 404,700 brown brothers Harriman 24,311,255 346,172 Citigroup Inc Total 34,445,987 50,730 Credit suisse Group aG 57,316,603 (106,975) deutsche bank aG 54,511,591 97,496 Goldman sachs Group Inc 10,459,281 (126,520) HsbC Holdings PlC 132,126,120 (1,795,092) JPMorgan Chase & Co 152,441,708 (2,193,102) Morgan stanley 17,897,848 92,204 northern Trust Corp 2,196,725 41,752 royal bank of Canada 121,778,617 (1,220,447) royal bank of scotland 74,728,251 309,694 sas rue la boetie 28,729,932 449,223 societe Generale 106,055,271 774,004 standard Chartered PlC 812,631 (24,473) state street Corp 26,630,896 (171,338) Toronto dominion bank 11,087,395 (505,775) ubs aG 126,484,447 957,812 Westpac banking Corp 81,942,311 (248,170)
$1,560,647,825 $(4,051,976)
Hedging forwards Counterparty exposure
by Counterparty at June 30, 2010
Counterparty name notional $usd fair value Citigroup Inc $210,108,444 $191,415 deutsche bank aG 276,007,320 (587,411) JPMorgan Chase & Co 231,103,304 12,072,806 royal bank of Canada 164,728,129 14,984,869 royal bank of scotland 212,410,578 1,731,107 ubs aG 215,241,572 (4,621,879)
$1,309,599,347 $23,770,907
Capital Assets and Supplies Inventory Furniture, fixtures and equipment are reported on the Statement of Plan net Assets at historical cost, net of ac-cumulated depreciation. These assets are depreciated on a straight-line basis over an average useful life of three to ten years with no salvage value. Accumulated depreciation on furniture, fixtures and equipment as of June 30, 2010, was $10,336,742. Office supplies inventory in the amount of $20,448 is included, assuming the first-in, first-out method. In fiscal year 1999, the Retirement System purchased an of-fice building and garage in Topeka, Kansas. Fifty percent of the floor space of the office building is used as the System’s administrative headquarters and the remaining 50 percent is a real estate investment. The administrative portion of the building and garage are reported on the Statement of
standard & Poor
long Term rating a
aa a
aa not rated
a a a a
aa a a
aa aa
aaa not rated
a a a
not rated a
aa
standard & Poor
long Term rating a a a
aa aaa
a
Plan net Assets as a capital asset and are being depreciated. Accumulated depreciation on the administrative portion of the building and garage as of June 30, 2010 was $2,526,599. The office building and garage are being depreciated over a period of 33 years on an accelerated method. At June 30, 2010, the carrying value of the System’s administrative headquarters was $1,293,104.
Compensated Accrued Absences State employees accrue vacation leave based on the number of years employed up to a maximum rate of 6.5 hours per pay period, and may accumulate a maximum of 240 hours. upon retirement or termination, employees are paid for accrued vacation leave up to their maximum accumulation.
Financial 37
State employees earn sick leave at the rate of 3.7 hours per pay period. Employees who terminate are not paid for un-used sick leave. Employees who retire are paid a portion of their unused sick leave based on years of service and hours accumulated. The State uses the vesting method to compute the sick leave liability. The compensated absences liability will be liquidated by the State’s governmental and internal service funds.
Reserves K.S.A. 74-4922, K.S.A. 74-4927 and K.S.A. 74-49,110 define the title and use of the required Retirement System reserves. This law requires the actuary to. • make an annual valuation of the Retirement System’s
liabilities and reserves. • make a determination of the contributions required to
discharge the Retirement System’s liabilities. • Recommend to the Board of Trustees employer con-
tribution rates required to maintain the System on an actuarial reserve basis.
The members Accumulated Contribution Reserve rep-resents the accumulation of member contributions, plus interest, credited to individual member accounts of non-retired members. At the date of retirement the individual member’s account is transferred to the Retirement Benefit Payment Reserve. After ending employment and applying for withdrawal, employee contributions, plus accumulated interest, are charged to this reserve. Interest is credited to active member accounts on June 30 each year, based on the balance in the account as of the previous December 31. The interest crediting rate, defined by statute as the actu-arial interest assumption rate, is 8.0 percent for those who became members prior to July 1, 1993. For those who first became members after June 30, 1993, interest on employee contributions is credited at the rate of 4.0 percent per year. The balance at June 30, 2010, was $5,132,772,778, and was fully funded.
The Retirement Benefit Accumulation Reserve represents the accumulation of employer contributions, net investment income not credited to any other reserve, and the actuari-ally computed prior service liability not yet funded. The balance at June 30, 2010, was $5,417,496,698. The unfunded liability was $7,676,985,410. The Retirement Benefit Pay-ment Reserve represents the actuarially computed present value of future benefits for retired members plus interest credited for the current fiscal year, based upon information
as of the preceding January 1. The balance at June 30, 2010, was $8,459,191,163. The Expense Reserve represents invest-ment income which is sufficient to maintain a year end account balance at two times the most recent fiscal year’s administrative expense amount. The System’s administra-tive expenses are financed from this reserve. The balance at June 30, 2010, was $20,309,100, and was fully funded. The Optional Term Life Insurance Reserve accumulates employee contributions to pay premiums for optional life insurance coverage and is charged annually with the cost of administering the program.
Budget The Retirement System’s annual operating budget is devel-oped by the staff and approved by the Board of Trustees. It is sent to the State Budget Division for analysis and policy decisions and is included in the Governor’s budget message to the Legislature. The Legislature adopts appropriation and expenditure limitations. When that process is complete, the System has an approved budget.
Retirement System Employees’ Pension Plan As an employer, the Retirement System participates in KPERS, a cost sharing, multi-employer defined benefit pension plan. KPERS provides retirement, disability, with-drawal and death benefits to plan members and beneficia-ries as authorized by Kansas law. Funding is accomplished through member and employer contributions and invest-ment earnings, according to Kansas Law. Plan members contribute 4.0 or 6.0 percent of their annual salary. In fiscal year 2010, the regular employer contribution rate was 7.57 percent of covered payroll. In addition, KPERS contributed an additional 1.0 percent of covered payroll to the group insurance fund. Total payroll was $3,869,793, $4,132,578 and $4,190,789 for 2008, 2009 and 2010, respectively. KPERS contributed $258,696, $282,130 and $323,173 for 2008, 2009 and 2010 respectively, to the employees pension plan and group insurance fund. All contributions required by law were made in fiscal years 2008, 2009 and 2010.
Non-Retirement Fund Legislation passed in 2000 assigned to the Retirement System the investment responsibilities of non-retirement money. The Treasurer’s unclaimed Property Fund was es-tablished to provide investment earnings available for peri-odic transfer to the State Treasury for the credit of the State
General Fund. Legislation was also provided to defray the reasonable expenses of administrating these funds. Invest-
38
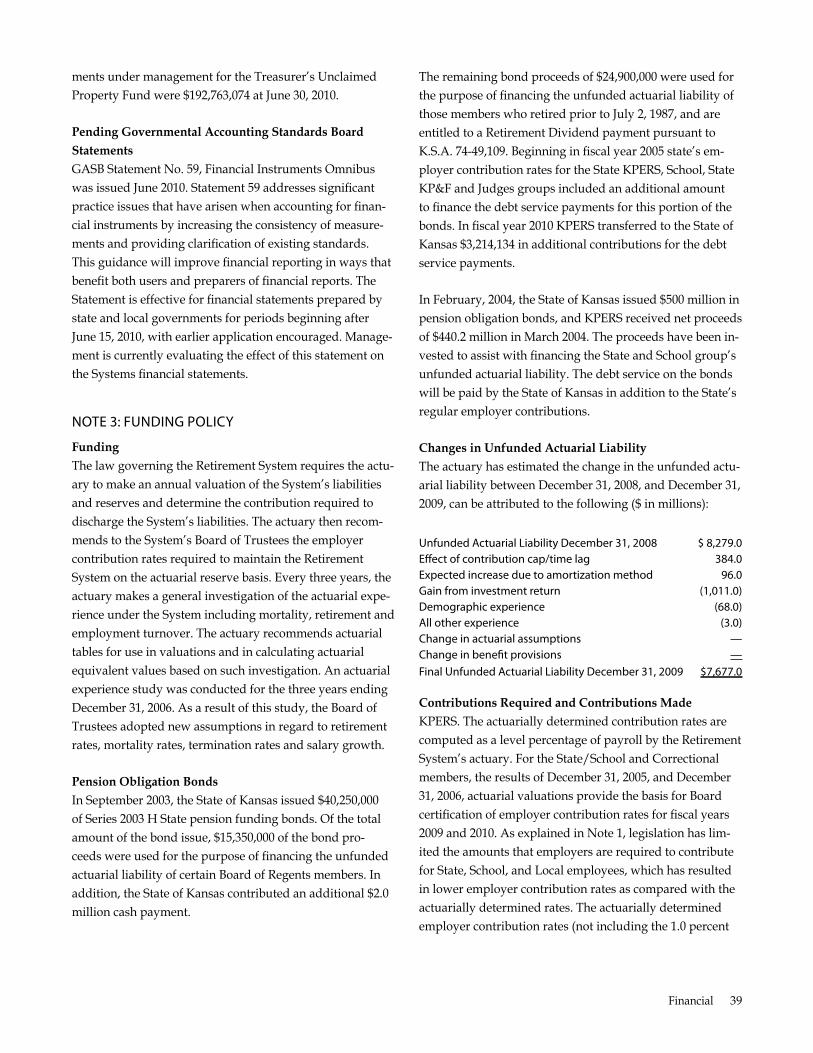
ments under management for the Treasurer’s unclaimed Property Fund were $192,763,074 at June 30, 2010.
Pending Governmental Accounting Standards Board Statements GASB Statement no. 59, Financial Instruments Omnibus was issued June 2010. Statement 59 addresses significant practice issues that have arisen when accounting for finan-cial instruments by increasing the consistency of measure-ments and providing clarification of existing standards. This guidance will improve financial reporting in ways that benefit both users and preparers of financial reports. The Statement is effective for financial statements prepared by state and local governments for periods beginning after June 15, 2010, with earlier application encouraged. manage-ment is currently evaluating the effect of this statement on the Systems financial statements.
noTe 3: fundInG PolICy
Funding The law governing the Retirement System requires the actu-ary to make an annual valuation of the System’s liabilities and reserves and determine the contribution required to discharge the System’s liabilities. The actuary then recom-mends to the System’s Board of Trustees the employer contribution rates required to maintain the Retirement System on the actuarial reserve basis. Every three years, the actuary makes a general investigation of the actuarial expe-rience under the System including mortality, retirement and employment turnover. The actuary recommends actuarial tables for use in valuations and in calculating actuarial equivalent values based on such investigation. An actuarial experience study was conducted for the three years ending December 31, 2006. As a result of this study, the Board of Trustees adopted new assumptions in regard to retirement rates, mortality rates, termination rates and salary growth.
Pension Obligation Bonds In September 2003, the State of Kansas issued $40,250,000 of Series 2003 H State pension funding bonds. Of the total amount of the bond issue, $15,350,000 of the bond pro-ceeds were used for the purpose of financing the unfunded actuarial liability of certain Board of Regents members. In addition, the State of Kansas contributed an additional $2.0 million cash payment.
The remaining bond proceeds of $24,900,000 were used for the purpose of financing the unfunded actuarial liability of those members who retired prior to July 2, 1987, and are entitled to a Retirement Dividend payment pursuant to K.S.A. 74-49,109. Beginning in fiscal year 2005 state’s em-ployer contribution rates for the State KPERS, School, State KP&F and Judges groups included an additional amount to finance the debt service payments for this portion of the bonds. In fiscal year 2010 KPERS transferred to the State of Kansas $3,214,134 in additional contributions for the debt service payments.
In February, 2004, the State of Kansas issued $500 million in pension obligation bonds, and KPERS received net proceeds of $440.2 million in march 2004. The proceeds have been in-vested to assist with financing the State and School group’s unfunded actuarial liability. The debt service on the bonds will be paid by the State of Kansas in addition to the State’s regular employer contributions.
Changes in Unfunded Actuarial Liability The actuary has estimated the change in the unfunded actu-arial liability between December 31, 2008, and December 31, 2009, can be attributed to the following ($ in millions):
unfunded actuarial liability december 31, 2008 $ 8,279.0 efect of contribution cap/time lag 384.0 expected increase due to amortization method 96.0 Gain from investment return (1,011.0) demographic experience (68.0) all other experience (3.0) Change in actuarial assumptions — Change in beneft provisions — final unfunded actuarial liability december 31, 2009 $7,677.0
Contributions Required and Contributions Made KPERS. The actuarially determined contribution rates are computed as a level percentage of payroll by the Retirement System’s actuary. For the State/School and Correctional members, the results of December 31, 2005, and December 31, 2006, actuarial valuations provide the basis for Board certification of employer contribution rates for fiscal years 2009 and 2010. As explained in note 1, legislation has lim-ited the amounts that employers are required to contribute for State, School, and Local employees, which has resulted in lower employer contribution rates as compared with the actuarially determined rates. The actuarially determined employer contribution rates (not including the 1.0 percent
Financial 39
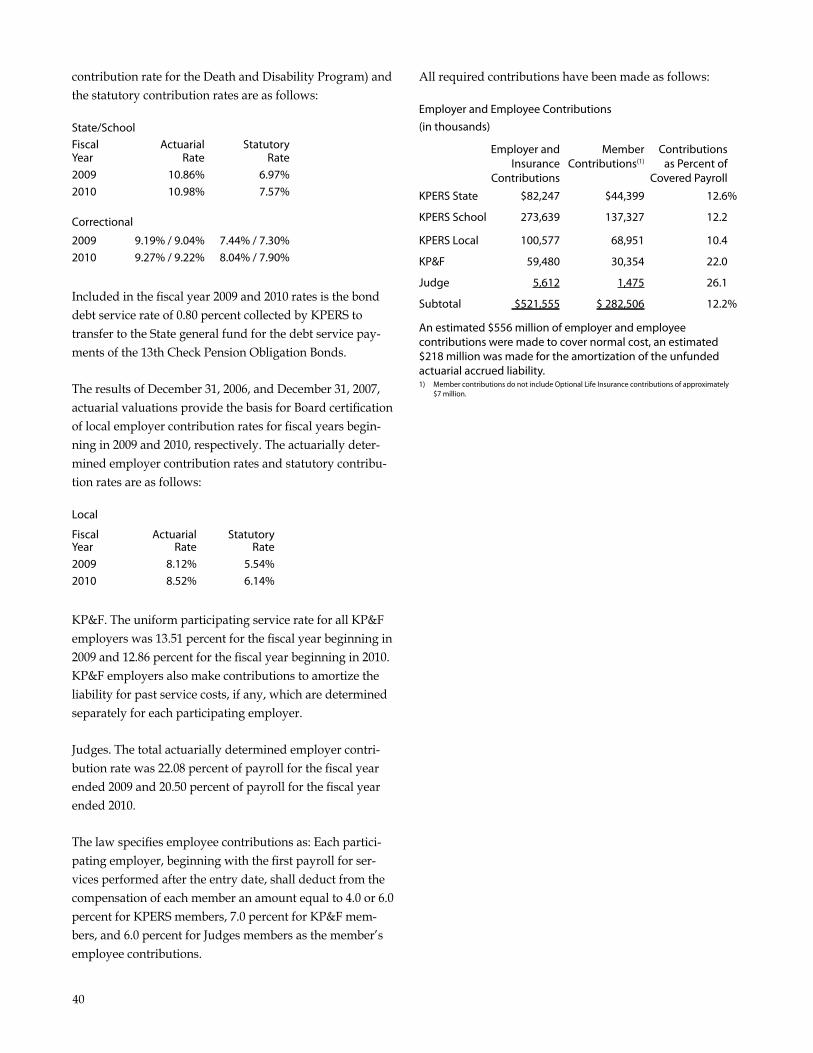
contribution rate for the Death and Disability Program) and the statutory contribution rates are as follows:
state/school fiscal actuarial statutory year rate rate 2009 10.86% 6.97% 2010 10.98% 7.57%
Correctional
2009 9.19% / 9.04% 7.44% / 7.30% 2010 9.27% / 9.22% 8.04% / 7.90%
Included in the fiscal year 2009 and 2010 rates is the bond debt service rate of 0.80 percent collected by KPERS to transfer to the State general fund for the debt service pay-ments of the 13th Check Pension Obligation Bonds.
The results of December 31, 2006, and December 31, 2007, actuarial valuations provide the basis for Board certification of local employer contribution rates for fiscal years begin-ning in 2009 and 2010, respectively. The actuarially deter-mined employer contribution rates and statutory contribu-tion rates are as follows:
local
fiscal actuarial statutory year rate rate 2009 8.12% 5.54% 2010 8.52% 6.14%
KP&F. The uniform participating service rate for all KP&F employers was 13.51 percent for the fiscal year beginning in 2009 and 12.86 percent for the fiscal year beginning in 2010. KP&F employers also make contributions to amortize the liability for past service costs, if any, which are determined separately for each participating employer.
Judges. The total actuarially determined employer contri-bution rate was 22.08 percent of payroll for the fiscal year ended 2009 and 20.50 percent of payroll for the fiscal year ended 2010.
The law specifies employee contributions as: Each partici-pating employer, beginning with the first payroll for ser-vices performed after the entry date, shall deduct from the compensation of each member an amount equal to 4.0 or 6.0 percent for KPERS members, 7.0 percent for KP&F mem-bers, and 6.0 percent for Judges members as the member’s employee contributions.
All required contributions have been made as follows:
employer and employee Contributions (in thousands)
employer and Member Contributions Insurance Contributions(1) as Percent of
Contributions Covered Payroll KPers state $82,247 $44,399 12.6%
KPers school 273,639 137,327 12.2
KPers local 100,577 68,951 10.4
KP&f 59,480 30,354 22.0
Judge 5,612 1,475 26.1
subtotal $521,555 $ 282,506 12.2%
an estimated $556 million of employer and employee contributions were made to cover normal cost, an estimated $218 million was made for the amortization of the unfunded actuarial accrued liability. 1) Member contributions do not include optional life Insurance contributions of approximately
$7 million.
40
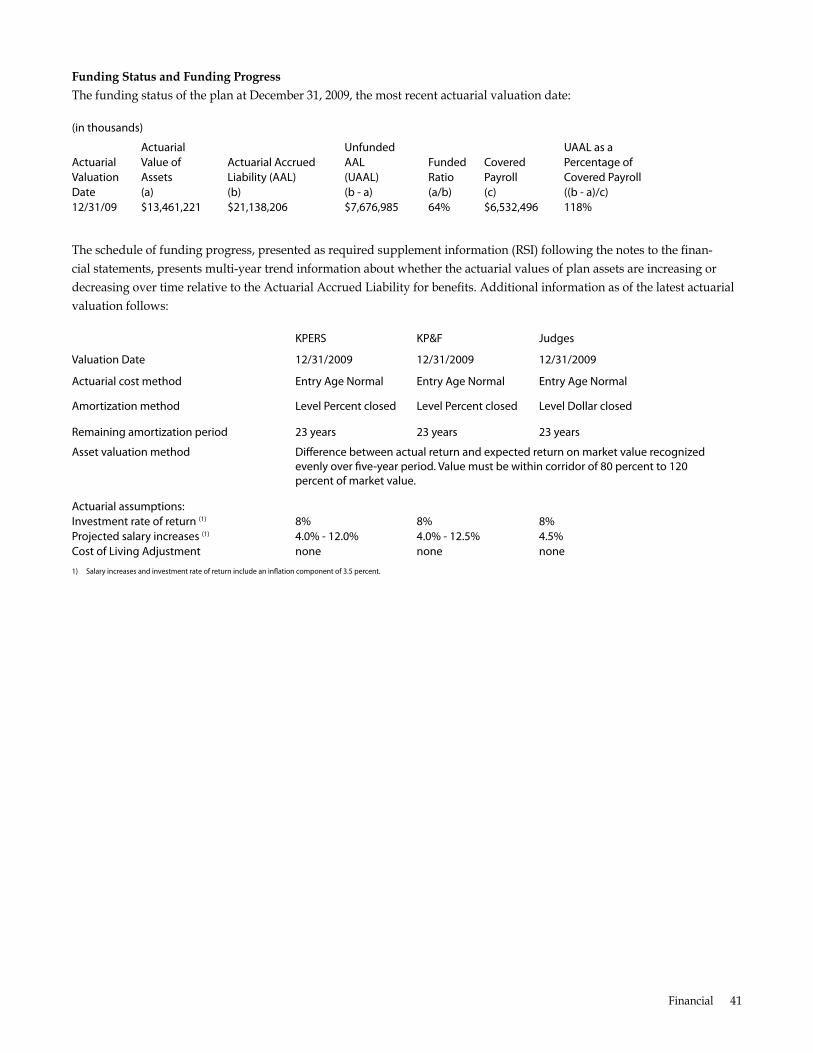
Funding Status and Funding Progress The funding status of the plan at December 31, 2009, the most recent actuarial valuation date:
(in thousands)
actuarial unfunded uaal as a actuarial value of actuarial accrued aal funded Covered Percentage of valuation assets liability (aal) (uaal) ratio Payroll Covered Payroll date (a) (b) (b - a) (a/b) (c) ((b - a)/c) 12/31/09 $13,461,221 $21,138,206 $7,676,985 64% $6,532,496 118%
The schedule of funding progress, presented as required supplement information (RSI) following the notes to the finan-cial statements, presents multi-year trend information about whether the actuarial values of plan assets are increasing or decreasing over time relative to the Actuarial Accrued Liability for benefits. Additional information as of the latest actuarial valuation follows:
KPers KP&f Judges
valuation date 12/31/2009 12/31/2009 12/31/2009
actuarial cost method entry age normal entry age normal entry age normal
amortization method level Percent closed level Percent closed level dollar closed
remaining amortization period 23 years 23 years 23 years
asset valuation method diference between actual return and expected return on market value recognized evenly over fve-year period. value must be within corridor of 80 percent to 120 percent of market value.
actuarial assumptions: Investment rate of return (1) 8% 8% 8% Projected salary increases (1) 4.0% - 12.0% 4.0% - 12.5% 4.5% Cost of living adjustment none none none
1) salary increases and investment rate of return include an infation component of 3.5 percent.
Financial 41
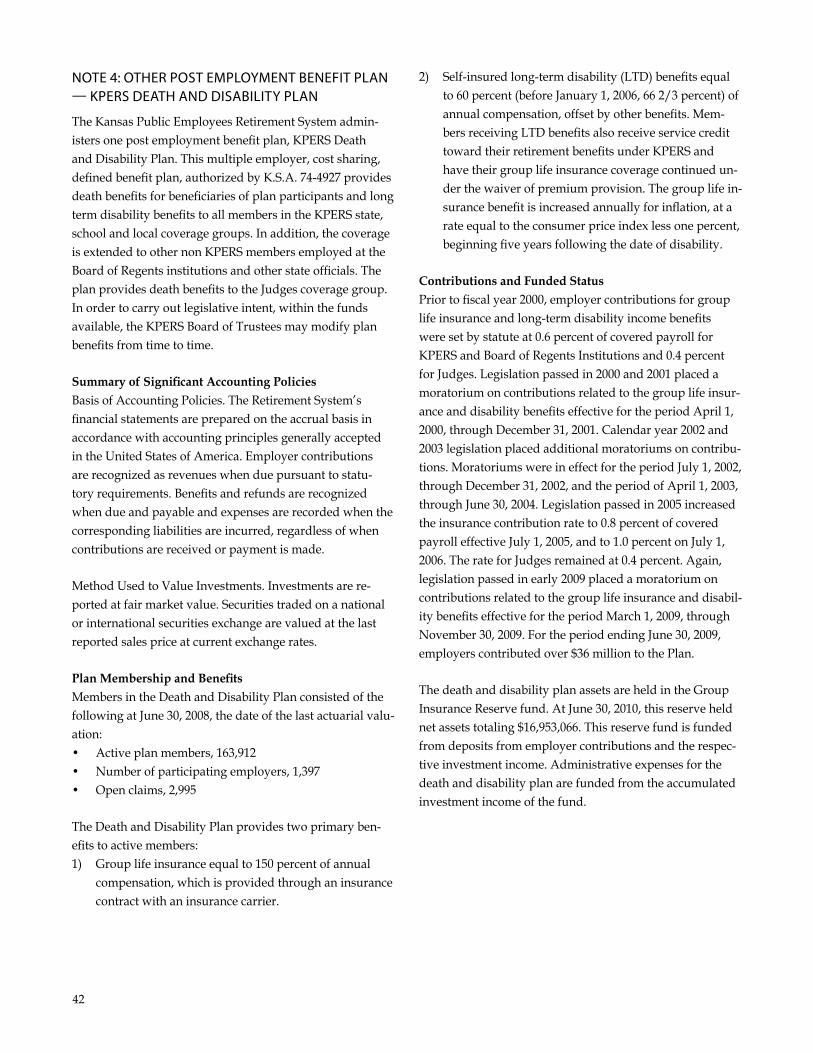
noTe 4: oTHer PosT eMPloyMenT benefIT Plan — KPers deaTH and dIsabIlITy Plan
The Kansas Public Employees Retirement System admin-isters one post employment benefit plan, KPERS Death and Disability Plan. This multiple employer, cost sharing, defined benefit plan, authorized by K.S.A. 74-4927 provides death benefits for beneficiaries of plan participants and long term disability benefits to all members in the KPERS state, school and local coverage groups. In addition, the coverage is extended to other non KPERS members employed at the Board of Regents institutions and other state officials. The plan provides death benefits to the Judges coverage group. In order to carry out legislative intent, within the funds available, the KPERS Board of Trustees may modify plan benefits from time to time.
Summary of Significant Accounting Policies Basis of Accounting Policies. The Retirement System’s financial statements are prepared on the accrual basis in accordance with accounting principles generally accepted in the united States of America. Employer contributions are recognized as revenues when due pursuant to statu-tory requirements. Benefits and refunds are recognized when due and payable and expenses are recorded when the corresponding liabilities are incurred, regardless of when contributions are received or payment is made.
method used to Value Investments. Investments are re-ported at fair market value. Securities traded on a national or international securities exchange are valued at the last reported sales price at current exchange rates.
Plan Membership and Benefits members in the Death and Disability Plan consisted of the following at June 30, 2008, the date of the last actuarial valu-ation: • Active plan members, 163,912
• number of participating employers, 1,397
• Open claims, 2,995
The Death and Disability Plan provides two primary ben-efits to active members: 1) Group life insurance equal to 150 percent of annual
compensation, which is provided through an insurance contract with an insurance carrier.
2) Self-insured long-term disability (LTD) benefits equal to 60 percent (before January 1, 2006, 66 2/3 percent) of annual compensation, offset by other benefits. mem-bers receiving LTD benefits also receive service credit toward their retirement benefits under KPERS and have their group life insurance coverage continued un-der the waiver of premium provision. The group life in-surance benefit is increased annually for inflation, at a rate equal to the consumer price index less one percent, beginning five years following the date of disability.
Contributions and Funded Status Prior to fiscal year 2000, employer contributions for group life insurance and long-term disability income benefits were set by statute at 0.6 percent of covered payroll for KPERS and Board of Regents Institutions and 0.4 percent for Judges. Legislation passed in 2000 and 2001 placed a moratorium on contributions related to the group life insur-ance and disability benefits effective for the period April 1, 2000, through December 31, 2001. Calendar year 2002 and 2003 legislation placed additional moratoriums on contribu-tions. moratoriums were in effect for the period July 1, 2002, through December 31, 2002, and the period of April 1, 2003, through June 30, 2004. Legislation passed in 2005 increased the insurance contribution rate to 0.8 percent of covered payroll effective July 1, 2005, and to 1.0 percent on July 1, 2006. The rate for Judges remained at 0.4 percent. Again, legislation passed in early 2009 placed a moratorium on contributions related to the group life insurance and disabil-ity benefits effective for the period march 1, 2009, through november 30, 2009. For the period ending June 30, 2009, employers contributed over $36 million to the Plan.
The death and disability plan assets are held in the Group Insurance Reserve fund. At June 30, 2010, this reserve held net assets totaling $16,953,066. This reserve fund is funded from deposits from employer contributions and the respec-tive investment income. Administrative expenses for the death and disability plan are funded from the accumulated investment income of the fund.
42
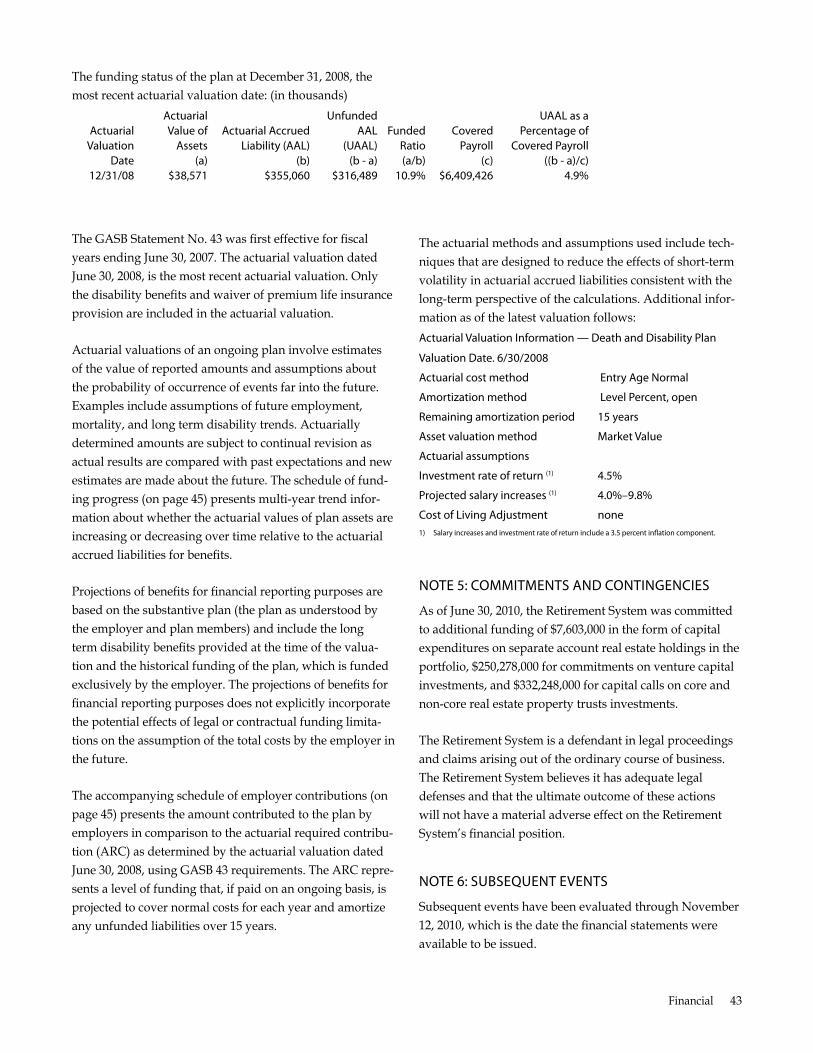
The funding status of the plan at December 31, 2008, the most recent actuarial valuation date: (in thousands)
actuarial unfunded uaal as a actuarial value of actuarial accrued aal funded Covered Percentage of
ratio Payroll Covered Payroll (a/b) (c) ((b - a)/c)
10.9% $6,409,426 4.9%
valuation assets liability (aal) (uaal) date (a) (b) (b - a)
12/31/08 $38,571 $355,060 $316,489
The GASB Statement no. 43 was first effective for fiscal years ending June 30, 2007. The actuarial valuation dated June 30, 2008, is the most recent actuarial valuation. Only the disability benefits and waiver of premium life insurance provision are included in the actuarial valuation.
Actuarial valuations of an ongoing plan involve estimates of the value of reported amounts and assumptions about the probability of occurrence of events far into the future. Examples include assumptions of future employment, mortality, and long term disability trends. Actuarially determined amounts are subject to continual revision as actual results are compared with past expectations and new estimates are made about the future. The schedule of fund-ing progress (on page 45) presents multi-year trend infor-mation about whether the actuarial values of plan assets are increasing or decreasing over time relative to the actuarial accrued liabilities for benefits.
Projections of benefits for financial reporting purposes are based on the substantive plan (the plan as understood by the employer and plan members) and include the long term disability benefits provided at the time of the valua-tion and the historical funding of the plan, which is funded exclusively by the employer. The projections of benefits for financial reporting purposes does not explicitly incorporate the potential effects of legal or contractual funding limita-tions on the assumption of the total costs by the employer in the future.
The accompanying schedule of employer contributions (on page 45) presents the amount contributed to the plan by employers in comparison to the actuarial required contribu-tion (ARC) as determined by the actuarial valuation dated June 30, 2008, using GASB 43 requirements. The ARC repre-sents a level of funding that, if paid on an ongoing basis, is projected to cover normal costs for each year and amortize any unfunded liabilities over 15 years.
The actuarial methods and assumptions used include tech-niques that are designed to reduce the effects of short-term volatility in actuarial accrued liabilities consistent with the
long-term perspective of the calculations. Additional infor-mation as of the latest valuation follows: actuarial valuation Information — death and disability Plan
valuation date. 6/30/2008
actuarial cost method
amortization method
remaining amortization period
asset valuation method
actuarial assumptions
Investment rate of return (1)
Projected salary increases (1)
Cost of living adjustment
entry age normal
level Percent, open
15 years
Market value
4.5%
4.0%–9.8%
none 1) salary increases and investment rate of return include a 3.5 percent infation component.
noTe 5: CoMMITMenTs and ConTInGenCIes
As of June 30, 2010, the Retirement System was committed to additional funding of $7,603,000 in the form of capital expenditures on separate account real estate holdings in the portfolio, $250,278,000 for commitments on venture capital investments, and $332,248,000 for capital calls on core and non-core real estate property trusts investments.
The Retirement System is a defendant in legal proceedings and claims arising out of the ordinary course of business. The Retirement System believes it has adequate legal defenses and that the ultimate outcome of these actions will not have a material adverse effect on the Retirement System’s financial position.
noTe 6: subseQuenT evenTs
Subsequent events have been evaluated through november 12, 2010, which is the date the financial statements were available to be issued.
Financial 43
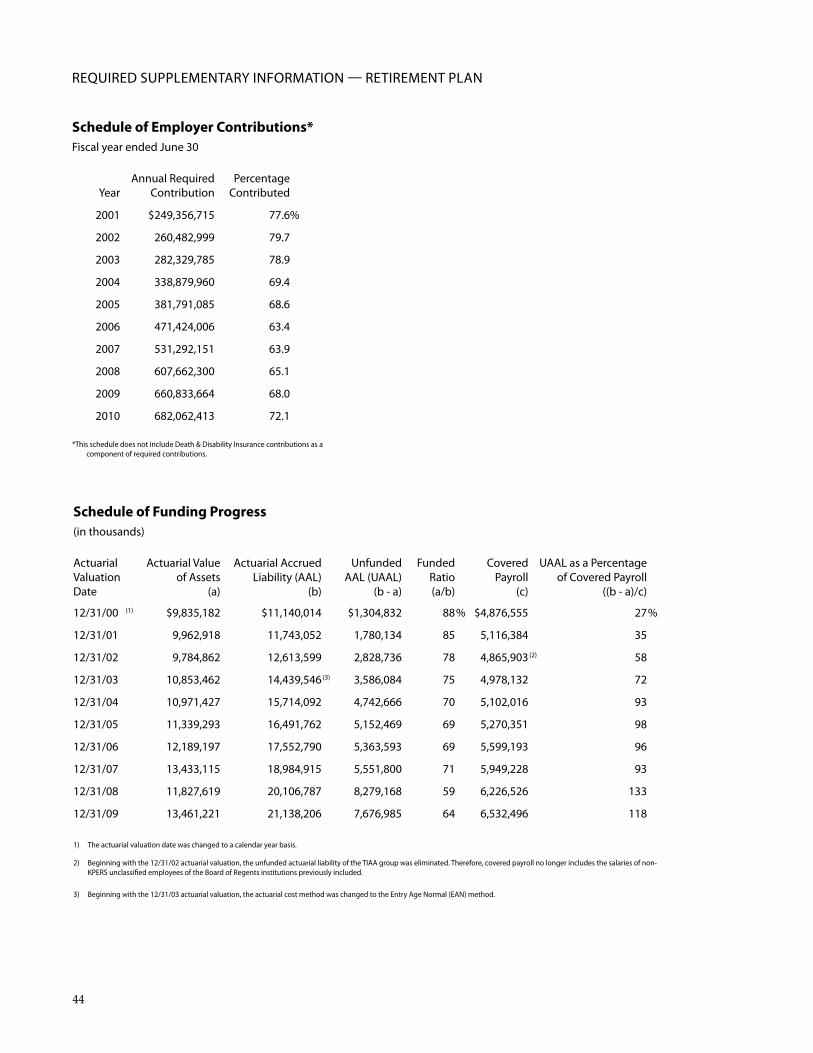
reQuIred suPPleMenTary InforMaTIon — reTIreMenT Plan
Schedule of Employer Contributions* fiscal year ended June 30
year
2001
2002
2003
2004
2005
2006
2007
2008
2009
2010
annual required Contribution
$249,356,715
260,482,999
282,329,785
338,879,960
381,791,085
471,424,006
531,292,151
607,662,300
660,833,664
682,062,413
Percentage Contributed
77.6%
79.7
78.9
69.4
68.6
63.4
63.9
65.1
68.0
72.1
*This schedule does not include death & disability Insurance contributions as a component of required contributions.
Schedule of Funding Progress (in thousands)
actuarial valuation date
(1)12/31/00
12/31/01
12/31/02
12/31/03
12/31/04
12/31/05
12/31/06
12/31/07
12/31/08
12/31/09
actuarial value of assets
(a)
$9,835,182
9,962,918
9,784,862
10,853,462
10,971,427
11,339,293
12,189,197
13,433,115
11,827,619
13,461,221
actuarial accrued liability (aal)
(b)
$11,140,014
11,743,052
12,613,599
14,439,546(3)
15,714,092
16,491,762
17,552,790
18,984,915
20,106,787
21,138,206
unfunded aal (uaal)
(b - a)
$1,304,832
1,780,134
2,828,736
3,586,084
4,742,666
5,152,469
5,363,593
5,551,800
8,279,168
7,676,985
funded ratio (a/b)
88%
85
78
75
70
69
69
71
59
64
Covered uaal as a Percentage Payroll of Covered Payroll
(c) ((b - a)/c)
$4,876,555 27%
5,116,384 35
4,865,903(2) 58
4,978,132 72
5,102,016 93
5,270,351 98
5,599,193 96
5,949,228 93
6,226,526 133
6,532,496 118
1) The actuarial valuation date was changed to a calendar year basis.
2) beginning with the 12/31/02 actuarial valuation, the unfunded actuarial liability of the TIaa group was eliminated. Therefore, covered payroll no longer includes the salaries of non-KPers unclassifed employees of the board of regents institutions previously included.
3) beginning with the 12/31/03 actuarial valuation, the actuarial cost method was changed to the entry age normal (ean) method.
44
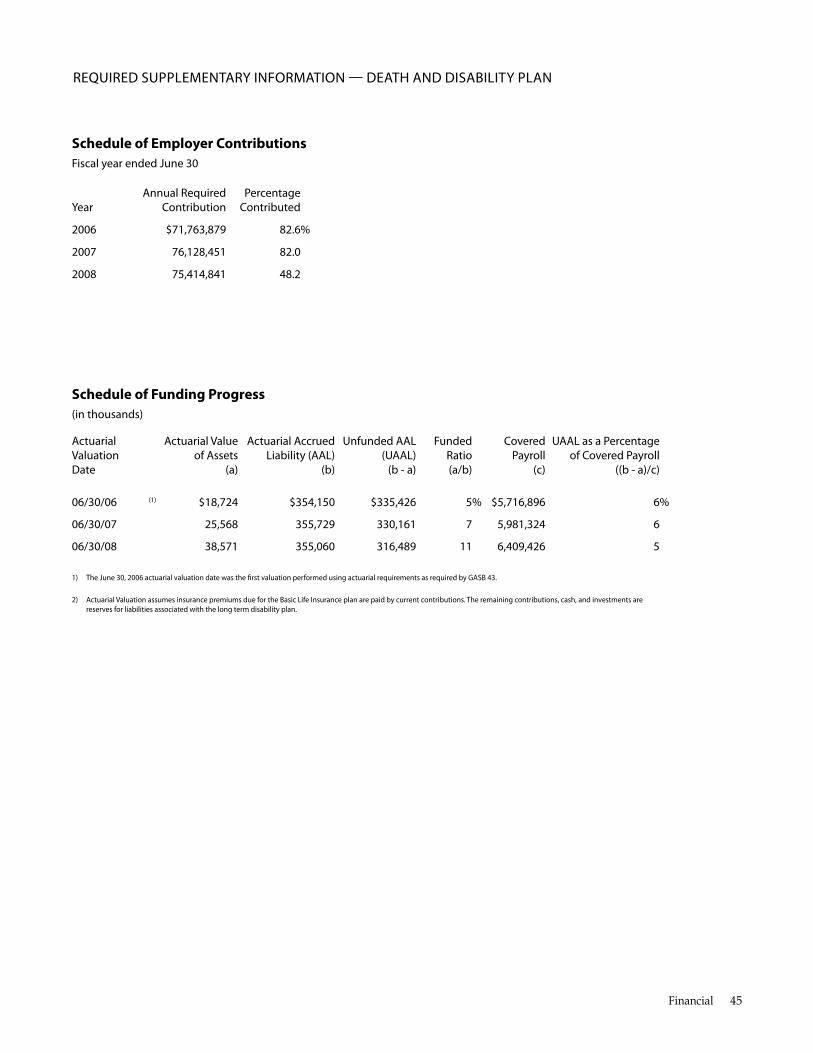
reQuIred suPPleMenTary InforMaTIon — deaTH and dIsabIlITy Plan
Schedule of Employer Contributions fiscal year ended June 30
annual required Percentage year Contribution Contributed
2006 $71,763,879 82.6 %
2007 76,128,451 82.0
2008 75,414,841 48.2
Schedule of Funding Progress (in thousands)
actuarial actuarial value actuarial accrued unfunded aal funded Covered uaal as a Percentage valuation of assets liability (aal) (uaal) ratio Payroll of Covered Payroll date (a) (b) (b - a) (a/b) (c) ((b - a)/c)
06/30/06
06/30/07
06/30/08
(1) $18,724
25,568
38,571
$354,150
355,729
355,060
$335,426
330,161
316,489
5%
7
11
$5,716,896
5,981,324
6,409,426
6%
6
5
1) The June 30, 2006 actuarial valuation date was the frst valuation performed using actuarial requirements as required by Gasb 43.
2) actuarial valuation assumes insurance premiums due for the basic life Insurance plan are paid by current contributions. The remaining contributions, cash, and investments are reserves for liabilities associated with the long term disability plan.
Financial 45
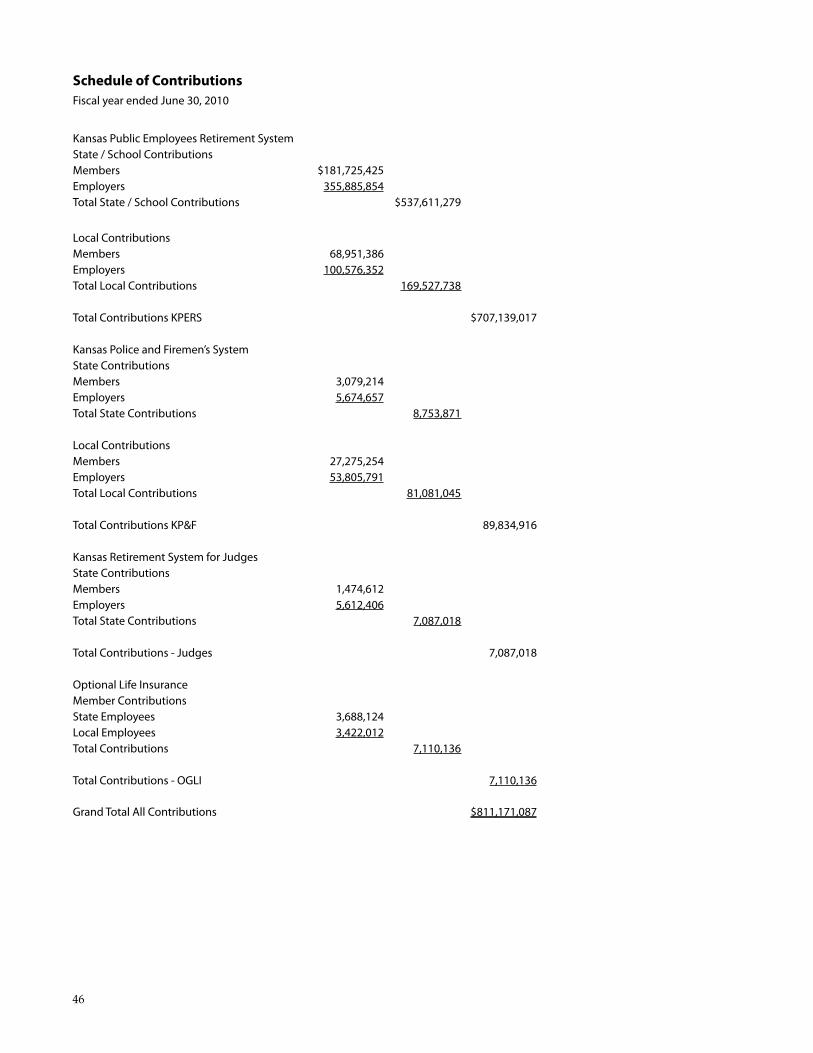
Schedule of Contributions fiscal year ended June 30, 2010
Kansas Public employees retirement system state / school Contributions Members employers Total state / school Contributions
$181,725,425 355,885,854
$537,611,279
local Contributions Members employers Total local Contributions
68,951,386 100,576,352
169,527,738
Total Contributions KPers $707,139,017
Kansas Police and firemen’s system state Contributions Members employers Total state Contributions
3,079,214 5,674,657
8,753,871
local Contributions Members employers Total local Contributions
27,275,254 53,805,791
81,081,045
Total Contributions KP&f 89,834,916
Kansas retirement system for Judges state Contributions Members employers Total state Contributions
1,474,612 5,612,406
7,087,018
Total Contributions - Judges 7,087,018
optional life Insurance Member Contributions state employees local employees Total Contributions
3,688,124 3,422,012
7,110,136
Total Contributions - oGlI 7,110,136
Grand Total all Contributions $811,171,087
46
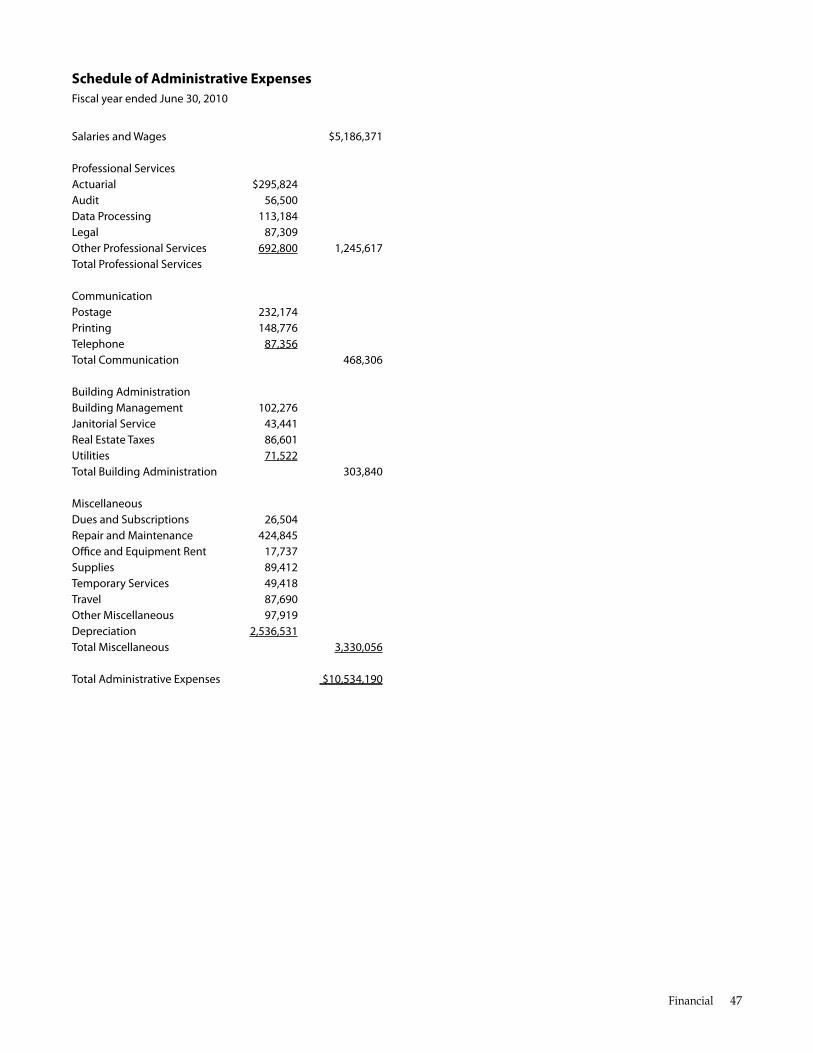
Schedule of Administrative Expenses fiscal year ended June 30, 2010
salaries and Wages $5,186,371
Professional services actuarialaudit data Processing legal other Professional services Total Professional services
$295,824 56,500
113,184 87,309
692,800 1,245,617
Communication Postage Printing Telephone Total Communication
232,174 148,776
87,356 468,306
building administration building Management Janitorial service real estate Taxes utilities Total building administration
102,276 43,441 86,601 71,522
303,840
Miscellaneous dues and subscriptions repair and Maintenance ofce and equipment rent supplies Temporary services Travel other Miscellaneous depreciation Total Miscellaneous
26,504 424,845
17,737 89,412 49,418 87,690 97,919
2,536,531 3,330,056
Total administrative expenses $10,534,190
Financial 47
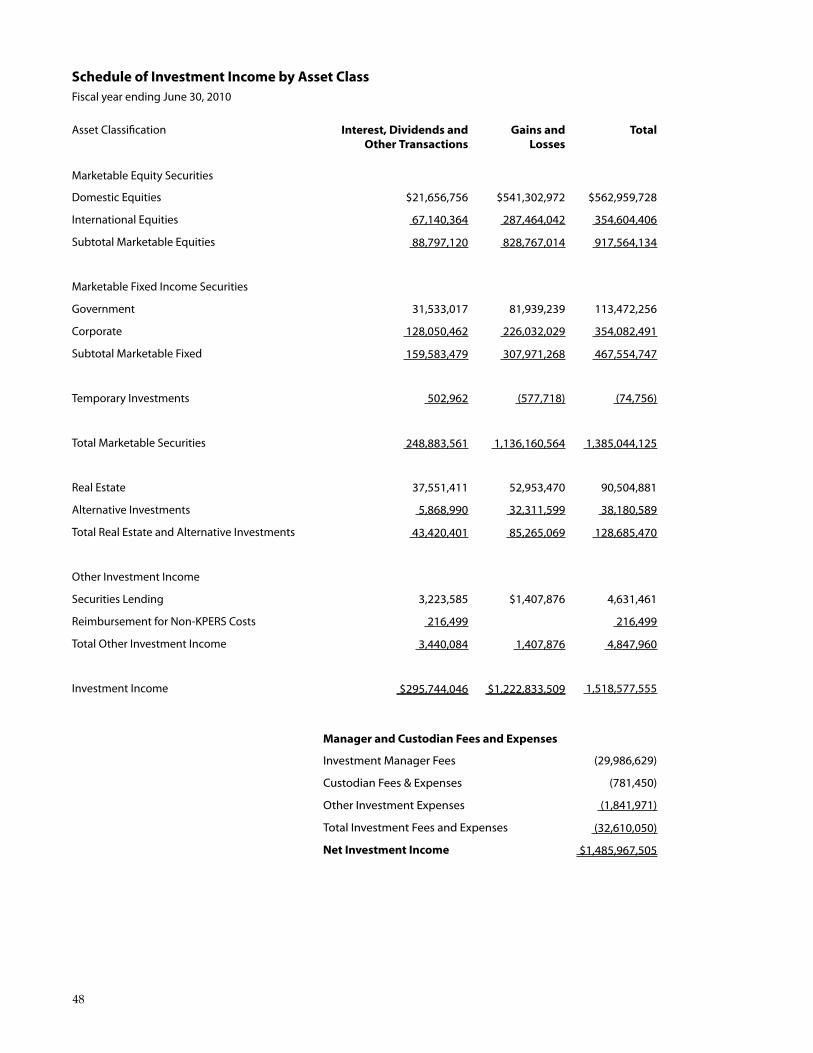
Schedule of Investment Income by Asset Class fiscal year ending June 30, 2010
asset Classifcation Interest, Dividends and Other Transactions
Gains and Losses
Total
Marketable equity securities
domestic equities
International equities
subtotal Marketable equities
$21,656,756
67,140,364
88,797,120
$541,302,972
287,464,042
828,767,014
$562,959,728
354,604,406
917,564,134
Marketable fixed Income securities
Government
Corporate
subtotal Marketable fixed
31,533,017
128,050,462
159,583,479
81,939,239
226,032,029
307,971,268
113,472,256
354,082,491
467,554,747
Temporary Investments 502,962 (577,718) (74,756)
Total Marketable securities 248,883,561 1,136,160,564 1,385,044,125
real estate
alternative Investments
Total real estate and alternative Investments
37,551,411
5,868,990
43,420,401
52,953,470
32,311,599
85,265,069
90,504,881
38,180,589
128,685,470
other Investment Income
securities lending
reimbursement for non-KPers Costs
Total other Investment Income
3,223,585
216,499
3,440,084
$1,407,876
1,407,876
4,631,461
216,499
4,847,960
Investment Income $295,744,046 $1,222,833,509 1,518,577,555
Manager and Custodian Fees and Expenses
Investment Manager Fees
Custodian Fees & Expenses
Other Investment Expenses
Total Investment Fees and Expenses
Net Investment Income
(29,986,629)
(781,450)
(1,841,971)
(32,610,050)
$1,485,967,505
48
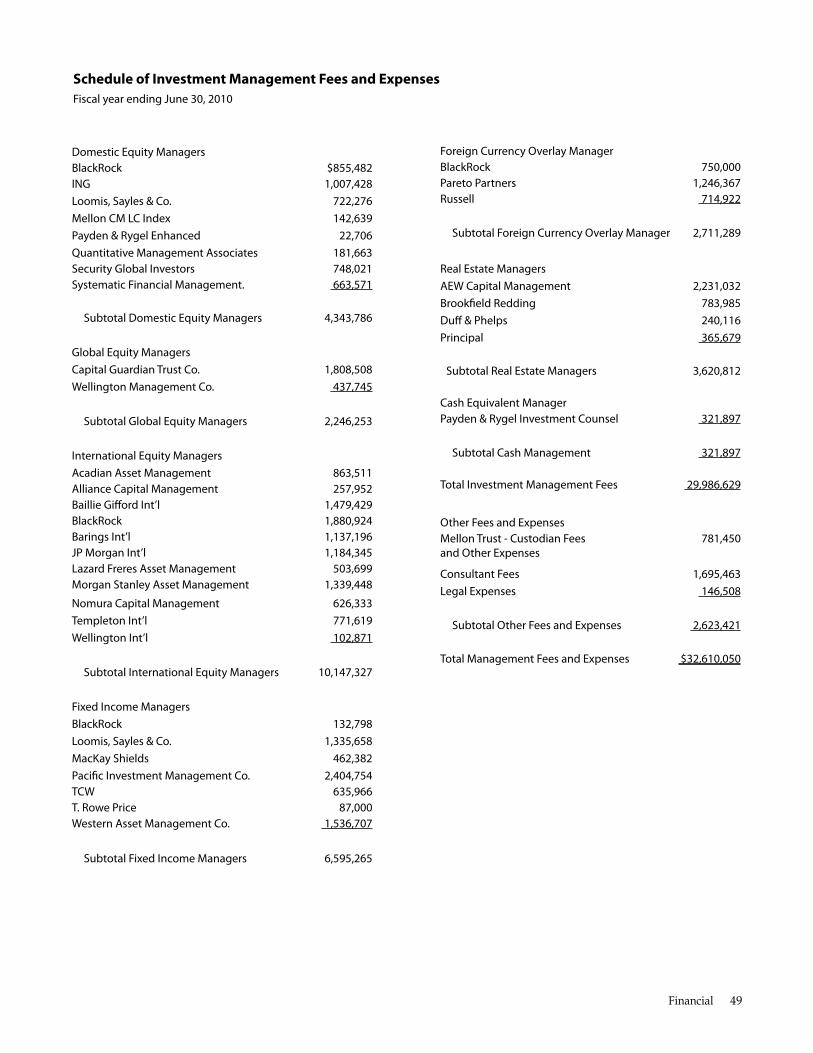
Schedule of Investment Management Fees and Expenses fiscal year ending June 30, 2010
domestic equity Managers blackrock InG loomis, sayles & Co. Mellon CM lC Index Payden & rygel enhanced Quantitative Management associates security Global Investors systematic financial Management.
subtotal domestic equity Managers
Global equity Managers Capital Guardian Trust Co. Wellington Management Co.
subtotal Global equity Managers
International equity Managers acadian asset Management alliance Capital Management baillie Giford Int’l blackrock barings Int’l JP Morgan Int’l lazard freres asset Management Morgan stanley asset Management
nomura Capital Management Templeton Int’l Wellington Int’l
subtotal International equity Managers
fixed Income Managers blackrock loomis, sayles & Co. MacKay shields Pacifc Investment Management Co. TCW T. rowe Price Western asset Management Co.
subtotal fixed Income Managers
$855,482 1,007,428
722,276 142,639
22,706 181,663 748,021 663,571
4,343,786
1,808,508 437,745
2,246,253
863,511 257,952
1,479,429 1,880,924 1,137,196 1,184,345
503,699 1,339,448
626,333 771,619 102,871
10,147,327
132,798 1,335,658
462,382 2,404,754
635,966 87,000
1,536,707
6,595,265
foreign Currency overlay Manager blackrock 750,000 Pareto Partners 1,246,367 russell 714,922
subtotal foreign Currency overlay Manager 2,711,289
real estate Managers aeW Capital Management 2,231,032 brookfeld redding 783,985 duf & Phelps 240,116 Principal 365,679
subtotal real estate Managers 3,620,812
Cash equivalent Manager Payden & rygel Investment Counsel 321,897
subtotal Cash Management 321,897
Total Investment Management fees 29,986,629
other fees and expenses Mellon Trust - Custodian fees 781,450 and other expenses
Consultant fees 1,695,463 legal expenses 146,508
subtotal other fees and expenses 2,623,421
Total Management fees and expenses $32,610,050
Financial 49


2010 Comprehensive Annual Financial Report
INVESTMENTSSECTION
KPERS
CHIef InvesTMenT offICer’s revIeW
The investment portfolio of the Kansas Public Employees Retirement System represents all contributions to the plan, from both members and their employers, as well as all net earnings on these assets. Total assets at the end of fiscal year
2010 were $11.2 billion. KPERS’ portfolio is managed for the long term in an effort to generate adequate returns to pay the benefits promised to members. To that end, the assets receive the benefit of a diversified, carefully monitored investment portfolio that includes stocks, bonds, real estate, alternative investments and cash.
Asset Allocation For investment allocation and performance purposes, portfolio investments are diversified among seven different asset classes and eight sub-portfolios: domestic equity; in-ternational equity, global equity, fixed income, “real return” assets, real estate, alternative investments and cash. (NOTE: For financial reporting purposes, as reported in the Financial Section and the Investment Summary in the Investment Section, investments are categorized by the underlying security.)
The allocation to equity investments (primarily publicly-traded stocks) constitutes the largest portion of the KPERS portfolio. This allocation reflects KPERS’ long-term invest-ment orientation as the System expects equities to provide higher relative returns over time. Equity investments allow KPERS to participate in the investment returns produced by companies seeking to grow and profit from their economic activities. KPERS equity investments are made globally, sourcing investment return from both domestic and foreign companies and diversifying the accompanying risk across a broad spectrum of economies, currencies and economic sectors. managing such a dynamic and diversified portfolio requires significant expertise, and the board of trustees has carefully selected several investment managers to construct and manage several sub-portfolios that blend together to provide risk-controlled exposure to equity returns on a global basis.
Fixed income investments, the next largest portion of the portfolio, are made in order to source investment returns from this large, stable conservative asset class; to help protect the System’s assets; to help diversify total portfolio investment risk and add stability to total returns; and to provide income. The fixed income portfolios are construct-ed using broad mandates and with global opportunities in mind. While these portfolios principally contain u.S.-based
and u.S.-dollar denominated assets, KPERS managers have significant latitude to seek out and capture fixed income re-turns globally, consistent with the System’s belief in global sourcing of return and diversification of risk.
Investments in real return assets, real estate, alternative investments and cash complete the portfolio. The real return asset category presently contains the treasury infla-tion protected securities (TIPS) and investment grade fixed income. Real estate investments generate returns in a differ-ent manner than equities or fixed income investments and also provide some inflation protection. KPERS’ alternative investments, primarily investments in private partnerships that make venture capital investments, pursue leveraged buyout strategies or own private debt. They pursue higher growth and provide diversification of investment risk to the overall portfolio.
Investment Policy To guide the implementation of the System’s broad in-vestment objectives, the board of trustees has adopted a Statement of Investment Policy, Objectives and Guidelines (the Statement). The Statement compliments KPERS statutes and documents the principles and standards that guide the management of assets of the System. It is binding upon all persons with authority over System assets, including invest-ment managers, custodians, consultants, staff and the board of trustees.
The Statement is the product of the Board’s careful and prudent study and is reviewed annually and updated as needed. It sets forth the investment policies, objectives, and guidelines which the board of trustees judges to be ap-propriate and prudent, in consideration of the needs of the System, and to comply with K.S.A. 74-4901 et seq., to direct the System’s assets. Although the System is not subject to the provisions of the Employee Retirement Income Secu-rity Act of 1974, as amended (ERISA), the board intends to abide by the provisions of ERISA to the greatest extent practicable. As such, this Statement is written to be consis-tent with ERISA.
Among other things, the Statement establishes the criteria against which the investment managers retained are to be measured. In addition, it serves as a review document to guide ongoing oversight of the investment of the Fund as a yardstick of compliance with K.S.A 74-4901 et seq.
52
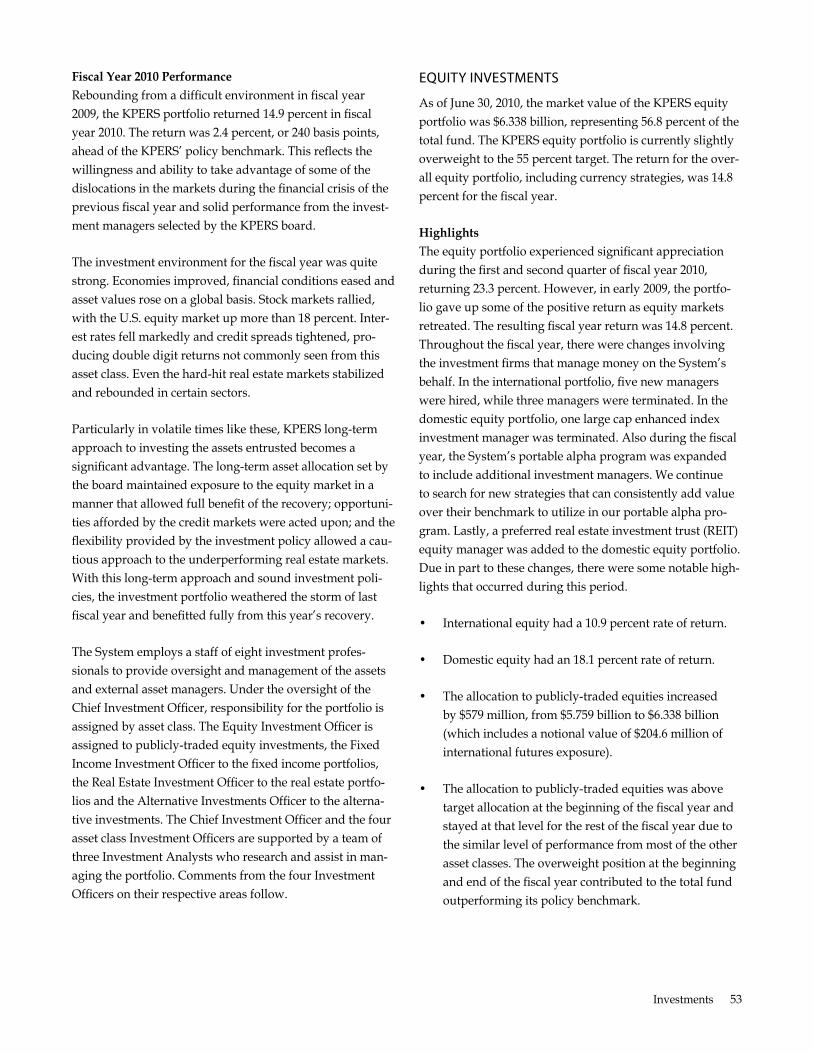
Fiscal Year 2010 Performance Rebounding from a difficult environment in fiscal year 2009, the KPERS portfolio returned 14.9 percent in fiscal year 2010. The return was 2.4 percent, or 240 basis points, ahead of the KPERS’ policy benchmark. This reflects the willingness and ability to take advantage of some of the dislocations in the markets during the financial crisis of the previous fiscal year and solid performance from the invest-ment managers selected by the KPERS board.
The investment environment for the fiscal year was quite strong. Economies improved, financial conditions eased and asset values rose on a global basis. Stock markets rallied, with the u.S. equity market up more than 18 percent. Inter-est rates fell markedly and credit spreads tightened, pro-ducing double digit returns not commonly seen from this asset class. Even the hard-hit real estate markets stabilized and rebounded in certain sectors.
Particularly in volatile times like these, KPERS long-term approach to investing the assets entrusted becomes a significant advantage. The long-term asset allocation set by the board maintained exposure to the equity market in a manner that allowed full benefit of the recovery; opportuni-ties afforded by the credit markets were acted upon; and the flexibility provided by the investment policy allowed a cau-tious approach to the underperforming real estate markets. With this long-term approach and sound investment poli-cies, the investment portfolio weathered the storm of last fiscal year and benefitted fully from this year’s recovery.
The System employs a staff of eight investment profes-sionals to provide oversight and management of the assets and external asset managers. under the oversight of the Chief Investment Officer, responsibility for the portfolio is assigned by asset class. The Equity Investment Officer is assigned to publicly-traded equity investments, the Fixed Income Investment Officer to the fixed income portfolios, the Real Estate Investment Officer to the real estate portfo-lios and the Alternative Investments Officer to the alterna-tive investments. The Chief Investment Officer and the four asset class Investment Officers are supported by a team of three Investment Analysts who research and assist in man-aging the portfolio. Comments from the four Investment Officers on their respective areas follow.
eQuITy InvesTMenTs
As of June 30, 2010, the market value of the KPERS equity portfolio was $6.338 billion, representing 56.8 percent of the total fund. The KPERS equity portfolio is currently slightly overweight to the 55 percent target. The return for the over-all equity portfolio, including currency strategies, was 14.8 percent for the fiscal year.
Highlights The equity portfolio experienced significant appreciation during the first and second quarter of fiscal year 2010, returning 23.3 percent. However, in early 2009, the portfo-lio gave up some of the positive return as equity markets retreated. The resulting fiscal year return was 14.8 percent. Throughout the fiscal year, there were changes involving the investment firms that manage money on the System’s behalf. In the international portfolio, five new managers were hired, while three managers were terminated. In the domestic equity portfolio, one large cap enhanced index investment manager was terminated. Also during the fiscal year, the System’s portable alpha program was expanded to include additional investment managers. We continue to search for new strategies that can consistently add value over their benchmark to utilize in our portable alpha pro-gram. Lastly, a preferred real estate investment trust (REIT) equity manager was added to the domestic equity portfolio. Due in part to these changes, there were some notable high-lights that occurred during this period.
• International equity had a 10.9 percent rate of return.
• Domestic equity had an 18.1 percent rate of return.
• The allocation to publicly-traded equities increased by $579 million, from $5.759 billion to $6.338 billion (which includes a notional value of $204.6 million of international futures exposure).
• The allocation to publicly-traded equities was above target allocation at the beginning of the fiscal year and stayed at that level for the rest of the fiscal year due to the similar level of performance from most of the other asset classes. The overweight position at the beginning and end of the fiscal year contributed to the total fund outperforming its policy benchmark.
Investments 53
Portfolio Structure The publicly-traded equity portfolio has a target allocation of 55 percent of the System’s total fund. The securities re-side in three separate categories based on geographic areas around the world.
The largest category is comprised of domestic equity securities and represents 28.4 percent of the total fund. The System uses several strategies within the domestic equity portfolio, most of which are designed to add a small amount of value while controlling risk relative to the benchmark. The overall portfolio is benchmarked against the Russell 3000 Index, a broad index made up of the largest 3,000 domestic stocks. The index can be broken down fur-ther by company size, with the Russell 1000 Index repre-senting the largest 1,000 stocks, the Russell mid Cap Index representing the smallest 800 companies in the Russell 1000 Index, the Russell 2500 Index representing the smallest 2500 companies in the Russell 3000 Index and the Russell 2000 Index representing a group of the smallest capitalization stocks. Each strategy is measured against either a large cap, mid cap, small-mid cap or small cap benchmark. While no individual strategy is benchmarked against the Russell 3000 Index, collectively the strategies are assembled in such a way to approximate the index in terms of company size and industry weight.
In terms of size, the second category is the international equity portfolio, which represents 23.4 percent of the total fund and includes a notional value of $204.6 million of international futures exposure. Within this portion of the portfolio, seven separate equity strategies are used in an at-tempt to outperform the benchmark while keeping risk at a reasonable level. Investing in international securities brings with it another exposure that must be considered – currency risk. Given the amount allocated to foreign markets, it is im-portant that the System consider how currency fluctuations impact the portfolio. To manage this exposure, the System utilizes two distinct strategies, one designed to hedge cur-rency risk and another designed to take advantage of inef-ficiencies with the currency markets. The benchmark used for the international equity portfolio is the morgan Stanley Capital International (mSCI) All Country World Index, excluding the united States (ex u.S.). This index has a total of 47 countries, 23 developed countries and 24 emerging countries, weighted by market capitalization. As of June 30, 2010, countries in this index accounted for over 71 percent
of the world’s equity capitalization, as reported by morgan Stanley.
Global equities make up the final category and represent 5.0 percent of the total fund. The global portfolio consists of both domestic and international assets. The System employs two managers, both with a fundamental bottom-up research approach, to identify and invest in the best companies, regardless of their location. The global portfolio is bench-marked against the mSCI All Country World Index.
Market Overview Equity markets around the world were generally up for the fiscal year ending June 30, 2010. Among the major devel-oped markets, Greece performed the worst, returning (47.9) percent and Indonesia performed the best, returning 67.1 percent according to the mSCI All Country World Index, ex u.S.
Returns for the domestic benchmark had a positive start for the first half of the fiscal year, returning 23.2 percent by the end of December. The international benchmark also started the fiscal year in positive territory, returning 24.2 percent by
the end of December. The strong domestic performance for the first half of the fiscal year was a result of a continuation of the market rebound that began in the fourth quarter of the previous fiscal year. With the help of government stimu-lus during the first half of the fiscal year, several economic measures were signaling that the economy may be continu-ing to emerge from recession. For example, the Standard & Poor’s/Case-Shiller housing index posted its first increase after 34 months of decline. u.S. productivity posted its biggest gain in six years. The Institute for Supply manage-ment (ISm) manufacturing index surpassed 50 for the first time in nine months, retail sales rose, and the International monetary Fund (ImF) raised the forecast for global growth. However, not all the news during the first half of the fiscal year was positive. Higher-than-expected job losses were reported with the unemployment rate eventually reaching higher than 10 percent, banks continued to fail at an alarm-ing rate with many more in danger of failure. u.S. federal budget deficit estimates through 2019 were increased by $2 trillion. Studies showed that 23 percent of u.S. homeowners were underwater on their mortgages. By the end of Decem-ber 2009, u.S. gross domestic product (GDP) growth from the third quarter was revised downward.
54
The international benchmark reflected the fact that the eco-nomic recovery was not contained to only the united States. The international benchmark’s positive return shows that the recovery experienced by the united States continued to spread into the global industrialized world as well.
The markets began calendar year 2010 with positive returns. The u.S. GDP growth was reported at a six-year high, and manufacturing in the u.S. was reported to be expanding at the fastest rate in five years. Retail sales were reported to be
up and employment was reported to be improving during the first quarter of 2010. International market returns were not as positive in the first quarter of calendar year 2010 as domestic market returns. Problems in the Euro zone, in par-ticular the Greece debt crisis as well as problems in Spain and Portugal, contributed to lower international returns in the first half of calendar year 2010.
The markets ended the fiscal year with positive perfor-mance, after closing the fiscal year fourth quarter with weak performance in part due to expiring stimulus. For the second half of fiscal year 2010, the domestic and interna-tional benchmarks returned (6.0) percent and (11.1) percent respectively.
Performance Overall, the publicly-traded equity portfolio, including currency strategies, returned 14.8 percent for the fiscal year. The returns for the equity components included:
domestic 18.1 percent
International 10.9 percent
Global 12.7 percent
In order to evaluate the returns of each equity component, it is useful to compare returns with an appropriate bench-mark. The System’s domestic equity portfolio had a value of $3.17 billion at the end of the fiscal year. For the fiscal year, the portfolio’s return was up 18.1 percent. mid capitaliza-tion securities outperformed large and small capitalization stocks, while small capitalization stocks outperformed large capitalization stocks with the Russell 1000 returning 15.2 percent, the Russell midcap Value returning 28.9 percent, the Russell 2500 returning 24.0 percent, and the Russell 2000 returning 21.5 percent. The portfolio outperformed the Rus-sell 3000 Index, which returned 15.7 percent. The majority of the outperformance was attributable to the expanded portable alpha program as well as allocations to small
capitalization, small-mid capitalization and mid capitaliza-tion stocks. Taking a longer-term view, the returns for the domestic equity portfolio for the three- and ten-year periods were even with the Russell 3000 Index while the five-year period slightly underperformed the Russell 3000 Index.
The international equity portfolio performed well, ending the fiscal year with a value of $2.61 billion, which includes a notional value of $204.6 million of international futures ex-posure. This portion of the portfolio returned 10.9 percent, compared to the broad mSCI All Country World Index, ex u.S., return of 10.5 percent. As previously mentioned, the System recently hired five new investment managers and terminated three investment managers during the fiscal year. Only two of the seven managers were in place for the full fiscal year and one of the two experienced underper-formance. Even though one of the two managers that were in place for the entire fiscal year experienced underperfor-mance, the addition of the five new managers during the fiscal year helped the international equity portfolio outper-form the mSCI All Country World Index, ex u.S. The re-turns for the three-, and five-year periods underperformed the benchmark but are improving.
The global equity strategy has been in place for a little more than five years. This component of the portfolio is staffed by two active managers, both of whom have built a team of analysts to invest in the best stocks regardless of where the company is domiciled. Over the last fiscal year, the global portfolio outperformed the mSCI All Country World Index, returning 12.7 percent compared to a return of 12.3 percent, respectively. Since the inception of the global mandates, one of the managers has underperformed by various degrees, but is improving.
equity Performance as of June 30, 2010 (gross of fees)
1-year 3-year 5-year
domestic equity Portfolio 18.1% (9.5)% (0.6)%
russell 3000 Index 15.7% (9.5)% (0.5)%
International equity Portfolio 10.9% (11.8)% 3.0%
MsCI aCWI ex us/eafe Custom benchmark 10.5% (10.4)% 3.5%
Global equity Portfolio 12.7% (10.4)% 0.7%
MsCI all Country World Index 12.3% (10.0)% 1.7%
Time-weighted total rate of return includes income and changes in market value.
Investments 55
Investment Advisors As of June 30, 2010, KPERS had contracts with 19 external investment advisors for the publicly traded equity portfolio.
domestic equity
Mellon Capital Management
blackrock
brookfeld redding
InG Investment Management
loomis sayles & Company
security Global Investors
systematic financial Management
domestic equity – Portable alpha Portfolios
russell Investments
nomura asset Management
Capital Guardian Trust Company
Western asset Management
baring International Investment
baillie Giford
International equity
blackrock
JP Morgan asset Management
Morgan stanley asset Management
baring International Investment
baillie Giford
Templeton Investment Counsel
lazard asset Management
Global equity
Wellington Management Company
Capital Guardian Trust Company
Currency Management/overlay
Pareto Partners
blackrock
fIxed InCoMe InvesTMenTs
As of June 30, 2010, KPERS fixed income portfolio had a market value of $2.4 billion, representing 19.8 percent of the total fund. This is above the target allocation of 14 percent and within the 7 percent bands around the target allocation. The return for the fixed income portfolio was 17 percent for the fiscal year.
Highlights At the January 2010 board meeting with staff recommenda-tion, the board voted to terminate a core plus fixed income manager due to significant changes to the firm’s owner-
ship structure and key personnel departures. In march, the board voted to hire a replacement manager, return-ing KPERS’ manager total to three core plus fixed income managers.
Portfolio Structure The fixed income portfolio contains two allocations: core plus and strategic. The “core plus” strategy offers manag-ers broad guidelines and consists primarily of traditional investment-grade securities. The “strategic” strategy allocates to more defined strategies, allowing staff and the System’s fixed income investment managers to better control and manage the risk/return profile of the portfolio. The core plus allocation uses the Barclays Capital universal Index as the benchmark, and the strategic allocation uses a 55%/45% blend of the Barclays Capital universal Index and the Barclays Capital u.S. High yield 2% Issuer Cap Index as its benchmark.
fixed Income strategy allocation as of June 30, 2010
Current Position Target aocation
Core Plus 64.3% 70%
strategic 35.7% 30%
Market Overview Federal Reserve policy responses to the financial crisis and economic downturn that began in the second half of 2008 helped stabilize the global economy in calendar year 2009. Interest rates generally rose in the first half of calendar year 2010 as investors’ risk appetites returned, decreasing demand for u.S. Treasuries and other sovereign bonds. The Federal Reserves’ initiatives that helped to stabilize the marketplace included purchasing mortgage and Treasury securities, the commitment to holding short-term rates near zero combined with government support for consumer finance markets.
Better than expected economic data near calendar year-end 2009 put upward pressure on intermediate and longer maturity Treasury yields. The ten-year Treasury yield closed the calendar year at 3.82 percent, up 29 basis points for the second half of the calendar year. Investment grade corporate credit spreads narrowed 131 basis points during the same period. The high yield sector dramatically im-proved with spreads narrowing 323 basis points ending the calendar year. Signs of improved consumer spending and incomes were among the indicators pointing to the possibil-ity of economic recovery.
56
During the first half of calendar year 2010, market volatil-ity spiked across global financial markets due to a range of macroeconomic events such as signs of the u.S. and China’s economies slowing and an increased sovereign debt risk in Europe that was initiated by fears of default in sovereign bonds issued by Greece, Portugal, Spain, Italy and Ireland. The ten-year Treasury yield fell 85 basis points (yielding 2.97 percent) during the second quarter of calendar year 2010 due to a flight to quality as a result of these events. Investment grade corporate credit spreads widened 18 basis points; with the high yield sector widening 78 basis points.
Performance The overall fixed income portfolio returned 17 percent for the fiscal year, outpacing its benchmark, the Barclays Capital universal Index, which returned 10.6 percent. The outperformance of the portfolio was primarily due to the corporate credit exposure (16 percent), high yield exposure (19 percent) and the emerging market debt exposure (4 per-cent) at the close of the fiscal year. These sectors underper-formed most dramatically during the credit crisis but made an impressive comeback in fiscal year 2010.
fixed Income Performance as of June 30, 2010 (gross of fees)
1-year 3-year 5-year
fixed Income Portfolio 17.0% 8.5% 6.4%
barclays Capital universal Index 10.6% 7.2% 5.6%
Time-weighted total rate of return includes income and changes in market value.
Investment Advisors As of June 30, 2010, KPERS had contracts with five external investment advisors for the publicly traded fixed income portfolio.
Core Plus
Pacifc Investment Management Co.
MacKay shields
T. rowe Price
strategic
loomis, sayles & Company, Inc.
Western asset Management
real reTurn InvesTMenTs
As of June 30, 2010, KPERS real return portfolio had a market value of $1.3 billion, representing 11.8 percent of the total fund. This allocation was below the target allocation of 14 percent and within the 4 percent bands around the
target. The portfolio had a 12.3 percent return for the fiscal year, 280 basis points above the benchmark.
The real return asset class is relatively new in the KPERS’ portfolio, receiving an allocation of 14 percent in the asset/
liability study concluded in January 2008. Formerly, this portfolio was a 10 percent allocation to long-dated TIPS. The real return portfolio has the similar objective of infla-tion protection with the context of the broader portfolio. But as compared to the previous TIPS allocation, the real return portfolio has the objective of broadening and diversifying the System’s exposure to inflation-related assets. It signifi-cantly reduces the interest rate exposure imposed by the previous TIPS portfolio as well as significantly increases the yield from these investments.
Highlights • KPERS has been invested in credit-related strategies in
the real return portfolio in order to take advantage of a 5.5 percent cash yield combined with the potential for capital appreciation.
• Significant time was spent researching and completing due diligence for the infrastructure and timber areas for potential investments. Two timber managers were hired and several timber investments were evaluated.
• Returns have been very positive since inception and well ahead of the benchmark.
Portfolio Structure and Allocations Long-term target allocations for the real return portfolio are 50 percent TIPS; 30 percent “real” assets (such as infrastruc-ture, timber, energy investments) and 20 percent absolute return strategies. As this portfolio is newer and these types of investments take longer to research, complete due dili-gence and acquire, the System expects this portfolio will be constructed over the next two to five years. At fiscal year end, the portfolio was allocated roughly 40 percent TIPS and 60 percent investment grade bonds, with a very small infrastructure investment.
Market Overview Declining interest rates and tightening credit spreads produced double-digit returns for this portfolio in the fiscal year.
Investments 57
Timber markets began to weaken during the fiscal year, and combined with financial distress of some holders, good prices are beginning to be seen. The System’s managers and staff have evaluated several properties, but as of the end of the fiscal year, had not yet found suitable investments. We believe patience will prevail, and solid opportunities will be acted upon when they arise.
The infrastructure markets remain very slow, but KPERS believes the real return investments will provide positive returns over the long-term. Staff and the System’s consul-tants continue to monitor these markets for sound invest-ments to bring to the board.
Performance The overall real return portfolio returned 12.3 percent, outperforming the benchmark of 9.5 percent. For the bulk of the fiscal year, the real return portfolio consisted of TIPS indexed to the Barclay’s u.S. TIPS index through a com-mingled investment fund, and an investment-grade bond portfolio managed by Western Asset management.
1-year 3-year 5-year
real return 12.3% 8.3% 4.2%
barclays Capital u.s. TIPs Index 9.5% 7.7% 3.9%
Time-weighted total rate of return includes income and changes in market value.
Investment Advisors As of June 30, 2010, KPERS had contracts with two external investment advisors for the real return portfolio.
TIPs (Index)
barclay’s Global Investors
Investment Grade Credit securities
Western asset Management
real esTaTe InvesTMenTs
For fiscal year 2010, the System targeted 10 percent of total portfolio assets to real estate. This target was unchanged from the prior fiscal year. As of June 30, 2010, the real estate
portfolio had a market value of $684.4 million, representing 6.1 percent of the total fund.
Highlights • KPERS made one tactical investment in Core real estate
specifically intended to take advantage of repricing commercial real estate markets. Additional commit-
ments were made to sector specific investments focused on student housing, senior housing, medical office and storage assets, each of which is expected to take advan-tage of positive demographic and/or demand trends.
• The System’s passive REIT strategy shifted to an active strategy during may 2009 and was fully funded in June 2009. As of June 2010, the strategy exceeded the benchmark index by 150 basis points. Two global REIT mandates transitioned to International mandates.
• $50 million in real estate capital was invested in a dedi-cated Preferred REIT strategy targeting yields in excess of 8 percent.
Portfolio Structure The real estate portfolio is divided into three segments, based on investment type.
The largest segment is “Core” real estate, which consists of a direct ownership of approximately 10 commercial proper-ties in the united States, investment in a senior housing strategy, a direct (and fully funded) investment in one open ended commingled real estate fund, as well as the previ-ously referenced commitment to a new open end commin-gled real estate fund. Core real estate investments currently comprise 53.8 percent of the System’s real estate assets. This segment of the portfolio is expected to produce steady income while serving as an inflation hedge. Capital appre-ciation is typically not a significant portion of Core portfolio
returns. The remaining 46.2 percent of the System’s real estate investments are divided between “non-Core” real estate and publicly-traded real estate securities.
The non-Core segment is implemented using investment funds with a variety of strategies and property types, both domestically and internationally. While also providing inflation protection, non-Core real estate investments are expected to produce meaningful capital appreciation. These strategies typically involve a higher element of develop-ment risk and carry higher levels of leverage (debt) than Core investments.
The publicly-traded real estate securities segment is imple-mented utilizing managers investing actively in domestic and international real estate investment trusts.
58
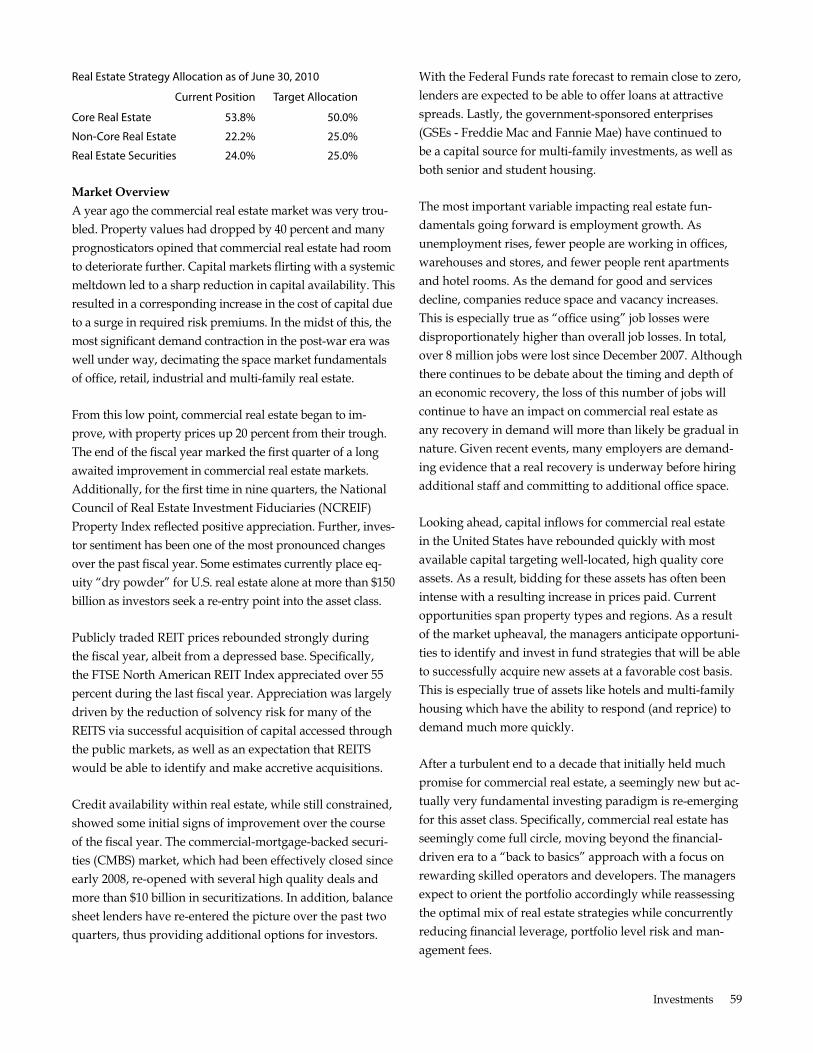
real estate strategy allocation as of June 30, 2010
Current Position Target allocation
Core real estate 53.8% 50.0%
non-Core real estate 22.2% 25.0%
real estate securities 24.0% 25.0%
Market Overview A year ago the commercial real estate market was very trou-bled. Property values had dropped by 40 percent and many prognosticators opined that commercial real estate had room to deteriorate further. Capital markets flirting with a systemic meltdown led to a sharp reduction in capital availability. This resulted in a corresponding increase in the cost of capital due to a surge in required risk premiums. In the midst of this, the most significant demand contraction in the post-war era was well under way, decimating the space market fundamentals of office, retail, industrial and multi-family real estate.
From this low point, commercial real estate began to im-prove, with property prices up 20 percent from their trough. The end of the fiscal year marked the first quarter of a long awaited improvement in commercial real estate markets. Additionally, for the first time in nine quarters, the national Council of Real Estate Investment Fiduciaries (nCREIF) Property Index reflected positive appreciation. Further, inves-tor sentiment has been one of the most pronounced changes over the past fiscal year. Some estimates currently place eq-uity “dry powder” for u.S. real estate alone at more than $150 billion as investors seek a re-entry point into the asset class.
Publicly traded REIT prices rebounded strongly during the fiscal year, albeit from a depressed base. Specifically, the FTSE north American REIT Index appreciated over 55 percent during the last fiscal year. Appreciation was largely driven by the reduction of solvency risk for many of the REITS via successful acquisition of capital accessed through the public markets, as well as an expectation that REITS would be able to identify and make accretive acquisitions.
Credit availability within real estate, while still constrained, showed some initial signs of improvement over the course of the fiscal year. The commercial-mortgage-backed securi-ties (CmBS) market, which had been effectively closed since early 2008, re-opened with several high quality deals and more than $10 billion in securitizations. In addition, balance sheet lenders have re-entered the picture over the past two quarters, thus providing additional options for investors.
With the Federal Funds rate forecast to remain close to zero, lenders are expected to be able to offer loans at attractive spreads. Lastly, the government-sponsored enterprises (GSEs - Freddie mac and Fannie mae) have continued to be a capital source for multi-family investments, as well as both senior and student housing.
The most important variable impacting real estate fun-damentals going forward is employment growth. As unemployment rises, fewer people are working in offices, warehouses and stores, and fewer people rent apartments and hotel rooms. As the demand for good and services decline, companies reduce space and vacancy increases. This is especially true as “office using” job losses were disproportionately higher than overall job losses. In total, over 8 million jobs were lost since December 2007. Although there continues to be debate about the timing and depth of an economic recovery, the loss of this number of jobs will continue to have an impact on commercial real estate as any recovery in demand will more than likely be gradual in nature. Given recent events, many employers are demand-ing evidence that a real recovery is underway before hiring additional staff and committing to additional office space.
Looking ahead, capital inflows for commercial real estate in the united States have rebounded quickly with most available capital targeting well-located, high quality core assets. As a result, bidding for these assets has often been intense with a resulting increase in prices paid. Current opportunities span property types and regions. As a result of the market upheaval, the managers anticipate opportuni-ties to identify and invest in fund strategies that will be able to successfully acquire new assets at a favorable cost basis. This is especially true of assets like hotels and multi-family housing which have the ability to respond (and reprice) to demand much more quickly.
After a turbulent end to a decade that initially held much promise for commercial real estate, a seemingly new but ac-tually very fundamental investing paradigm is re-emerging for this asset class. Specifically, commercial real estate has seemingly come full circle, moving beyond the financial-driven era to a “back to basics” approach with a focus on rewarding skilled operators and developers. The managers expect to orient the portfolio accordingly while reassessing the optimal mix of real estate strategies while concurrently reducing financial leverage, portfolio level risk and man-agement fees.
Investments 59
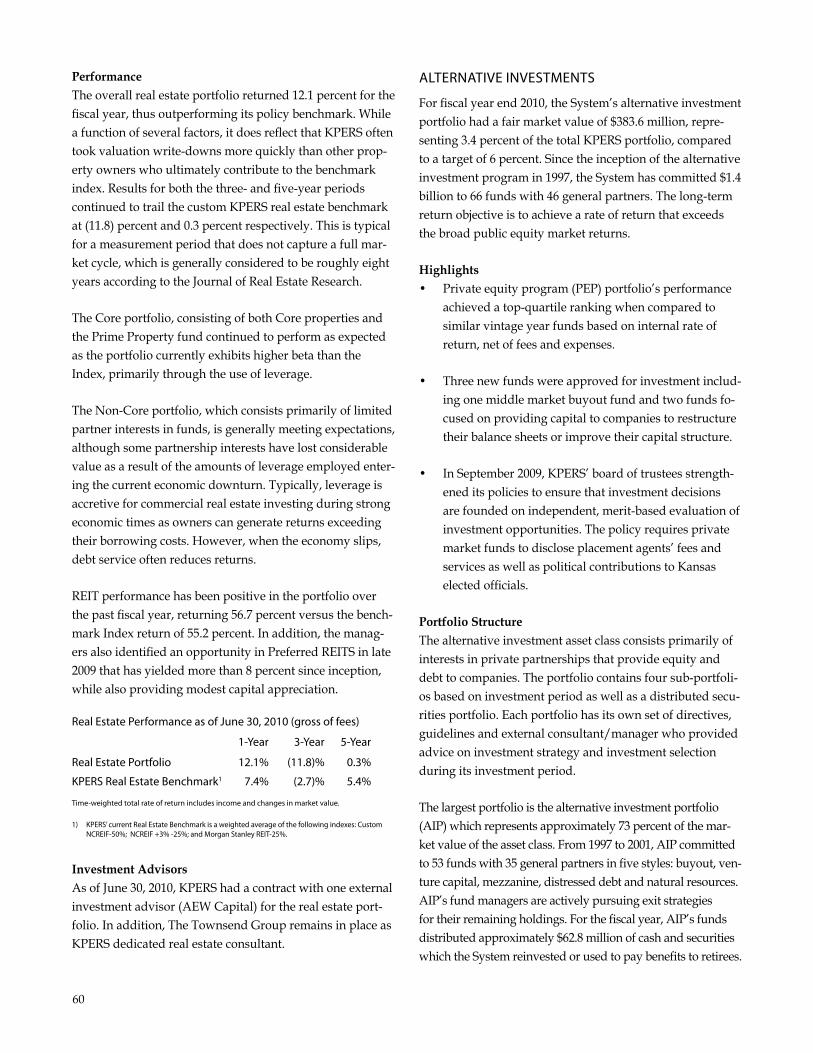
Performance The overall real estate portfolio returned 12.1 percent for the fiscal year, thus outperforming its policy benchmark. While a function of several factors, it does reflect that KPERS often took valuation write-downs more quickly than other prop-erty owners who ultimately contribute to the benchmark index. Results for both the three- and five-year periods continued to trail the custom KPERS real estate benchmark at (11.8) percent and 0.3 percent respectively. This is typical for a measurement period that does not capture a full mar-ket cycle, which is generally considered to be roughly eight years according to the Journal of Real Estate Research.
The Core portfolio, consisting of both Core properties and the Prime Property fund continued to perform as expected as the portfolio currently exhibits higher beta than the Index, primarily through the use of leverage.
The non-Core portfolio, which consists primarily of limited partner interests in funds, is generally meeting expectations, although some partnership interests have lost considerable value as a result of the amounts of leverage employed enter-ing the current economic downturn. Typically, leverage is accretive for commercial real estate investing during strong economic times as owners can generate returns exceeding their borrowing costs. However, when the economy slips, debt service often reduces returns.
REIT performance has been positive in the portfolio over the past fiscal year, returning 56.7 percent versus the bench-mark Index return of 55.2 percent. In addition, the manag-ers also identified an opportunity in Preferred REITS in late 2009 that has yielded more than 8 percent since inception, while also providing modest capital appreciation.
real estate Performance as of June 30, 2010 (gross of fees)
1-year 3-year 5-year
real estate Portfolio 12.1% (11.8)% 0.3%
KPers real estate benchmark1 7.4% (2.7)% 5.4%
Time-weighted total rate of return includes income and changes in market value.
1) KPers’ current real estate benchmark is a weighted average of the following indexes: Custom nCreIf-50%; nCreIf +3% -25%; and Morgan stanley reIT-25%.
Investment Advisors As of June 30, 2010, KPERS had a contract with one external investment advisor (AEW Capital) for the real estate port-folio. In addition, The Townsend Group remains in place as KPERS dedicated real estate consultant.
alTernaTIve InvesTMenTs
For fiscal year end 2010, the System’s alternative investment portfolio had a fair market value of $383.6 million, repre-senting 3.4 percent of the total KPERS portfolio, compared to a target of 6 percent. Since the inception of the alternative investment program in 1997, the System has committed $1.4 billion to 66 funds with 46 general partners. The long-term return objective is to achieve a rate of return that exceeds the broad public equity market returns.
Highlights • Private equity program (PEP) portfolio’s performance
achieved a top-quartile ranking when compared to similar vintage year funds based on internal rate of return, net of fees and expenses.
• Three new funds were approved for investment includ-ing one middle market buyout fund and two funds fo-cused on providing capital to companies to restructure their balance sheets or improve their capital structure.
• In September 2009, KPERS’ board of trustees strength-ened its policies to ensure that investment decisions are founded on independent, merit-based evaluation of investment opportunities. The policy requires private market funds to disclose placement agents’ fees and services as well as political contributions to Kansas elected officials.
Portfolio Structure The alternative investment asset class consists primarily of interests in private partnerships that provide equity and debt to companies. The portfolio contains four sub-portfoli-os based on investment period as well as a distributed secu-rities portfolio. Each portfolio has its own set of directives, guidelines and external consultant/manager who provided advice on investment strategy and investment selection during its investment period.
The largest portfolio is the alternative investment portfolio (AIP) which represents approximately 73 percent of the mar-ket value of the asset class. From 1997 to 2001, AIP committed to 53 funds with 35 general partners in five styles: buyout, ven-ture capital, mezzanine, distressed debt and natural resources. AIP’s fund managers are actively pursuing exit strategies for their remaining holdings. For the fiscal year, AIP’s funds distributed approximately $62.8 million of cash and securities which the System reinvested or used to pay benefits to retirees.
60
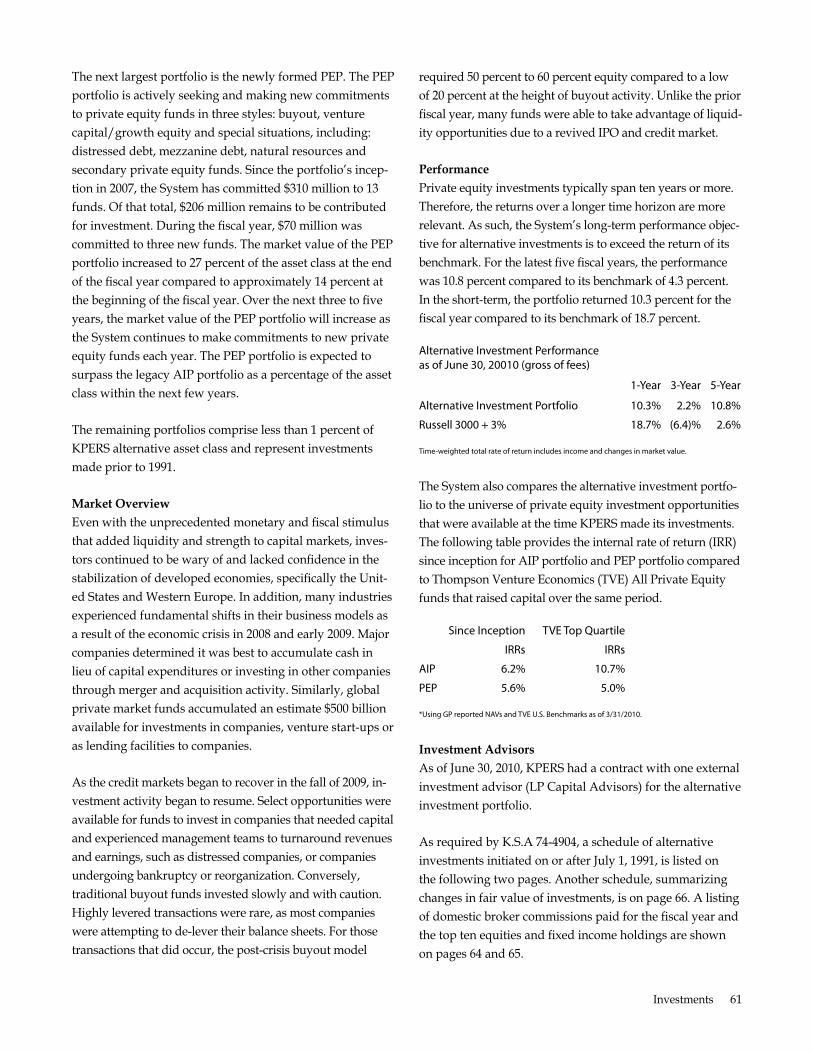
The next largest portfolio is the newly formed PEP. The PEP portfolio is actively seeking and making new commitments to private equity funds in three styles: buyout, venture capital/growth equity and special situations, including: distressed debt, mezzanine debt, natural resources and secondary private equity funds. Since the portfolio’s incep-tion in 2007, the System has committed $310 million to 13 funds. Of that total, $206 million remains to be contributed for investment. During the fiscal year, $70 million was committed to three new funds. The market value of the PEP portfolio increased to 27 percent of the asset class at the end
of the fiscal year compared to approximately 14 percent at the beginning of the fiscal year. Over the next three to five years, the market value of the PEP portfolio will increase as the System continues to make commitments to new private equity funds each year. The PEP portfolio is expected to surpass the legacy AIP portfolio as a percentage of the asset class within the next few years.
The remaining portfolios comprise less than 1 percent of KPERS alternative asset class and represent investments made prior to 1991.
Market Overview Even with the unprecedented monetary and fiscal stimulus that added liquidity and strength to capital markets, inves-tors continued to be wary of and lacked confidence in the stabilization of developed economies, specifically the unit-ed States and Western Europe. In addition, many industries experienced fundamental shifts in their business models as a result of the economic crisis in 2008 and early 2009. major companies determined it was best to accumulate cash in lieu of capital expenditures or investing in other companies through merger and acquisition activity. Similarly, global private market funds accumulated an estimate $500 billion available for investments in companies, venture start-ups or as lending facilities to companies.
As the credit markets began to recover in the fall of 2009, in-vestment activity began to resume. Select opportunities were available for funds to invest in companies that needed capital and experienced management teams to turnaround revenues and earnings, such as distressed companies, or companies undergoing bankruptcy or reorganization. Conversely, traditional buyout funds invested slowly and with caution. Highly levered transactions were rare, as most companies were attempting to de-lever their balance sheets. For those transactions that did occur, the post-crisis buyout model
required 50 percent to 60 percent equity compared to a low of 20 percent at the height of buyout activity. unlike the prior fiscal year, many funds were able to take advantage of liquid-ity opportunities due to a revived IPO and credit market.
Performance Private equity investments typically span ten years or more. Therefore, the returns over a longer time horizon are more relevant. As such, the System’s long-term performance objec-tive for alternative investments is to exceed the return of its benchmark. For the latest five fiscal years, the performance was 10.8 percent compared to its benchmark of 4.3 percent. In the short-term, the portfolio returned 10.3 percent for the fiscal year compared to its benchmark of 18.7 percent.
alternative Investment Performance as of June 30, 20010 (gross of fees)
1-year 3-year 5-year
alternative Investment Portfolio 10.3% 2.2% 10.8%
russell 3000 + 3% 18.7% (6.4)% 2.6%
Time-weighted total rate of return includes income and changes in market value.
The System also compares the alternative investment portfo-lio to the universe of private equity investment opportunities that were available at the time KPERS made its investments. The following table provides the internal rate of return (IRR) since inception for AIP portfolio and PEP portfolio compared to Thompson Venture Economics (TVE) All Private Equity funds that raised capital over the same period.
since Inception Tve Top Quartile
Irrs Irrs
aIP 6.2% 10.7%
PeP 5.6% 5.0%
*using GP reported navs and Tve u.s. benchmarks as of 3/31/2010.
Investment Advisors As of June 30, 2010, KPERS had a contract with one external investment advisor (LP Capital Advisors) for the alternative investment portfolio.
As required by K.S.A 74-4904, a schedule of alternative investments initiated on or after July 1, 1991, is listed on the following two pages. Another schedule, summarizing changes in fair value of investments, is on page 66. A listing of domestic broker commissions paid for the fiscal year and the top ten equities and fixed income holdings are shown on pages 64 and 65.
Investments 61
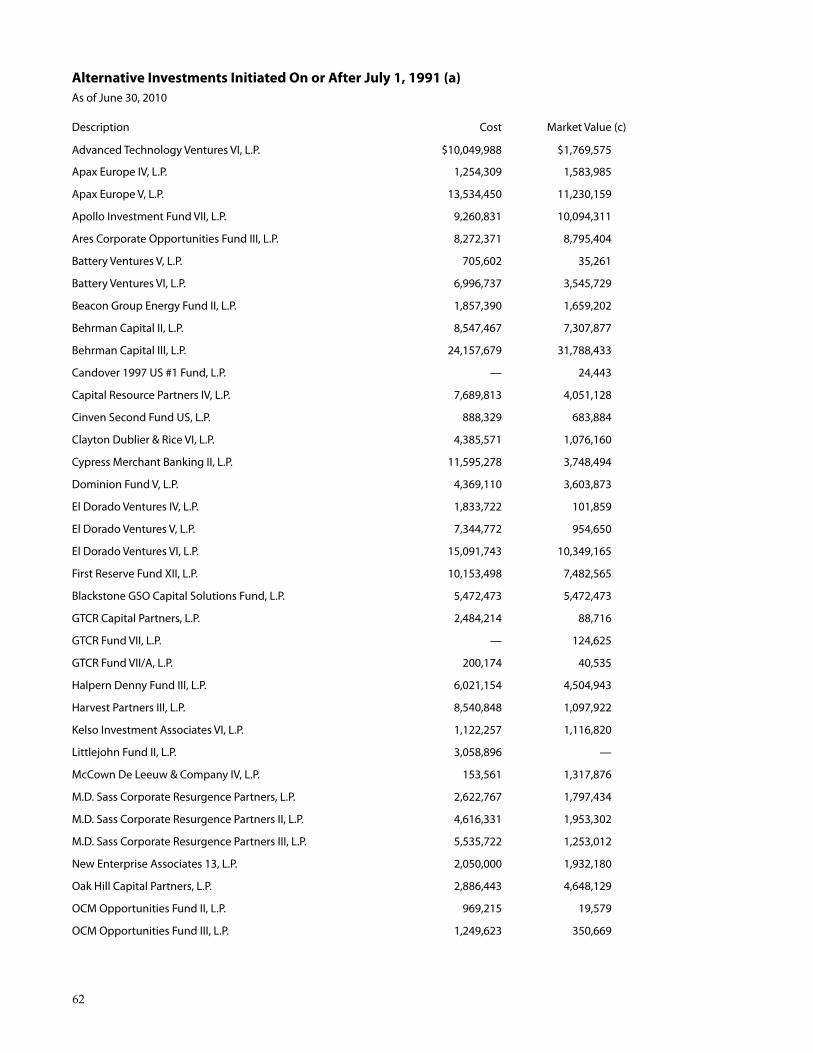
Alternative Investments Initiated On or After July 1, 1991 (a) as of June 30, 2010
description Cost Market value (c)
advanced Technology ventures vI, l.P. $10,049,988 $1,769,575
apax europe Iv, l.P. 1,254,309 1,583,985
apax europe v, l.P. 13,534,450 11,230,159
apollo Investment fund vII, l.P. 9,260,831 10,094,311
ares Corporate opportunities fund III, l.P. 8,272,371 8,795,404
battery ventures v, l.P. 705,602 35,261
battery ventures vI, l.P. 6,996,737 3,545,729
beacon Group energy fund II, l.P. 1,857,390 1,659,202
behrman Capital II, l.P. 8,547,467 7,307,877
behrman Capital III, l.P. 24,157,679 31,788,433
Candover 1997 us #1 fund, l.P. — 24,443
Capital resource Partners Iv, l.P. 7,689,813 4,051,128
Cinven second fund us, l.P. 888,329 683,884
Clayton dublier & rice vI, l.P. 4,385,571 1,076,160
Cypress Merchant banking II, l.P. 11,595,278 3,748,494
dominion fund v, l.P. 4,369,110 3,603,873
el dorado ventures Iv, l.P. 1,833,722 101,859
el dorado ventures v, l.P. 7,344,772 954,650
el dorado ventures vI, l.P. 15,091,743 10,349,165
first reserve fund xII, l.P. 10,153,498 7,482,565
blackstone Gso Capital solutions fund, l.P. 5,472,473 5,472,473
GTCr Capital Partners, l.P. 2,484,214 88,716
GTCr fund vII, l.P. — 124,625
GTCr fund vII/a, l.P. 200,174 40,535
Halpern denny fund III, l.P. 6,021,154 4,504,943
Harvest Partners III, l.P. 8,540,848 1,097,922
Kelso Investment associates vI, l.P. 1,122,257 1,116,820
littlejohn fund II, l.P. 3,058,896 —
McCown de leeuw & Company Iv, l.P. 153,561 1,317,876
M.d. sass Corporate resurgence Partners, l.P. 2,622,767 1,797,434
M.d. sass Corporate resurgence Partners II, l.P. 4,616,331 1,953,302
M.d. sass Corporate resurgence Partners III, l.P. 5,535,722 1,253,012
new enterprise associates 13, l.P. 2,050,000 1,932,180
oak Hill Capital Partners, l.P. 2,886,443 4,648,129
oCM opportunities fund II, l.P. 969,215 19,579
oCM opportunities fund III, l.P. 1,249,623 350,669
62
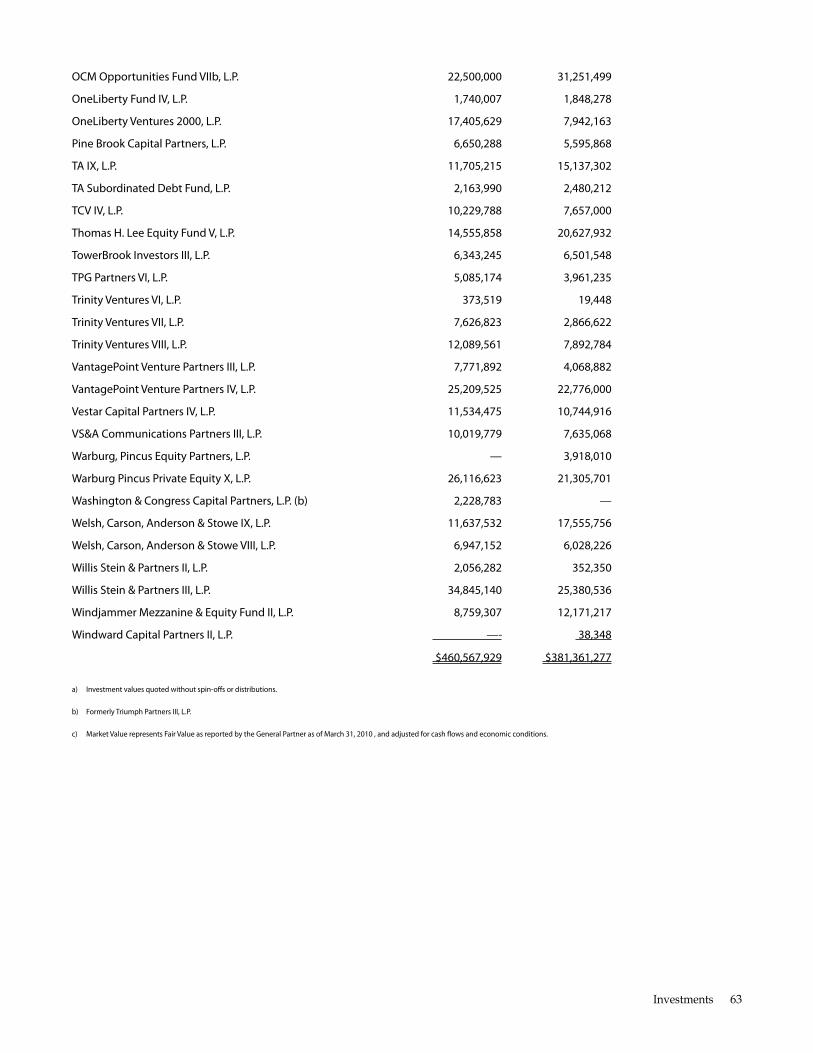
oCM opportunities fund vIIb, l.P. 22,500,000 31,251,499
oneliberty fund Iv, l.P. 1,740,007 1,848,278
oneliberty ventures 2000, l.P. 17,405,629 7,942,163
Pine brook Capital Partners, l.P. 6,650,288 5,595,868
Ta Ix, l.P. 11,705,215 15,137,302
Ta subordinated debt fund, l.P. 2,163,990 2,480,212
TCv Iv, l.P. 10,229,788 7,657,000
Thomas H. lee equity fund v, l.P. 14,555,858 20,627,932
Towerbrook Investors III, l.P. 6,343,245 6,501,548
TPG Partners vI, l.P. 5,085,174 3,961,235
Trinity ventures vI, l.P. 373,519 19,448
Trinity ventures vII, l.P. 7,626,823 2,866,622
Trinity ventures vIII, l.P. 12,089,561 7,892,784
vantagePoint venture Partners III, l.P. 7,771,892 4,068,882
vantagePoint venture Partners Iv, l.P. 25,209,525 22,776,000
vestar Capital Partners Iv, l.P. 11,534,475 10,744,916
vs&a Communications Partners III, l.P. 10,019,779 7,635,068
Warburg, Pincus equity Partners, l.P. — 3,918,010
Warburg Pincus Private equity x, l.P. 26,116,623 21,305,701
Washington & Congress Capital Partners, l.P. (b) 2,228,783 —
Welsh, Carson, anderson & stowe Ix, l.P. 11,637,532 17,555,756
Welsh, Carson, anderson & stowe vIII, l.P. 6,947,152 6,028,226
Willis stein & Partners II, l.P. 2,056,282 352,350
Willis stein & Partners III, l.P. 34,845,140 25,380,536
Windjammer Mezzanine & equity fund II, l.P. 8,759,307 12,171,217
Windward Capital Partners II, l.P. —- 38,348
$460,567,929 $381,361,277
a) Investment values quoted without spin-ofs or distributions.
b) formerly Triumph Partners III, l.P.
c) Market value represents fair value as reported by the General Partner as of March 31, 2010 , and adjusted for cash fows and economic conditions.
Investments 63
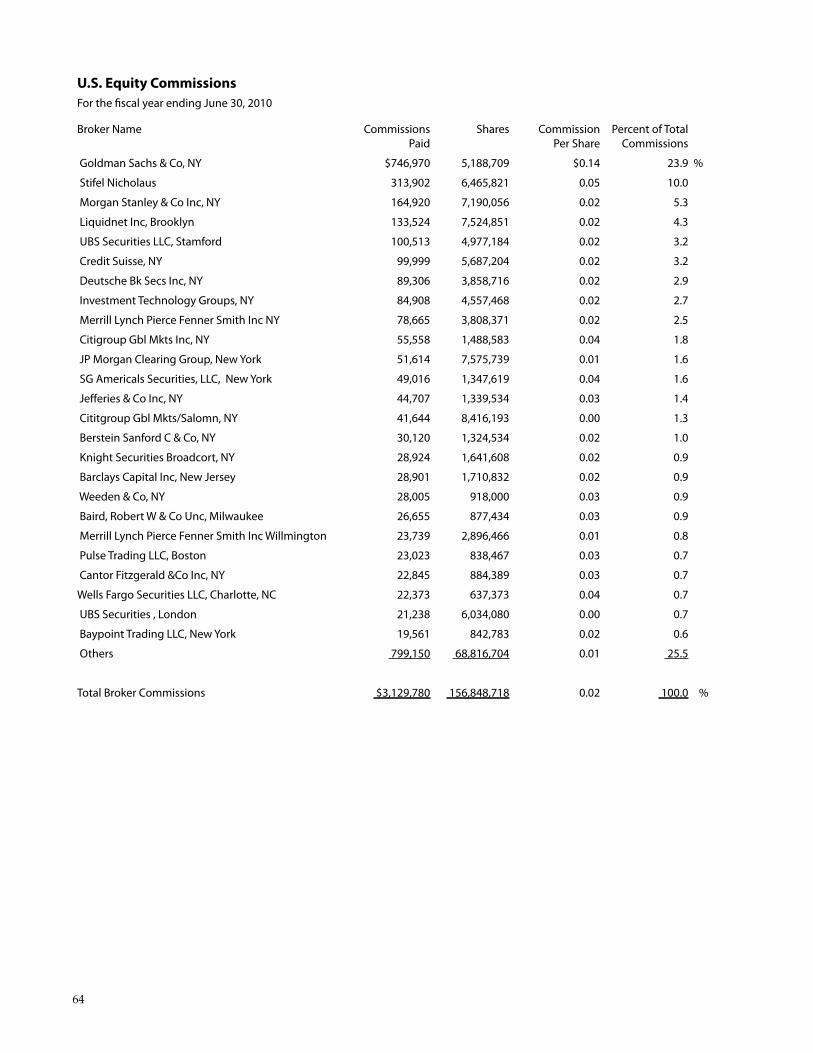
U.S. Equity Commissions for the fscal year ending June 30, 2010
broker name Commissions shares Commission Percent of Total Paid Per share Commissions
Goldman sachs & Co, ny $746,970 5,188,709 $0.14 23.9 %
stifel nicholaus 313,902 6,465,821 0.05 10.0
Morgan stanley & Co Inc, ny 164,920 7,190,056 0.02 5.3
liquidnet Inc, brooklyn 133,524 7,524,851 0.02 4.3
ubs securities llC, stamford 100,513 4,977,184 0.02 3.2
Credit suisse, ny 99,999 5,687,204 0.02 3.2
deutsche bk secs Inc, ny 89,306 3,858,716 0.02 2.9
Investment Technology Groups, ny 84,908 4,557,468 0.02 2.7
Merrill lynch Pierce fenner smith Inc ny 78,665 3,808,371 0.02 2.5
Citigroup Gbl Mkts Inc, ny 55,558 1,488,583 0.04 1.8
JP Morgan Clearing Group, new york 51,614 7,575,739 0.01 1.6
sG americals securities, llC, new york 49,016 1,347,619 0.04 1.6
Jeferies & Co Inc, ny 44,707 1,339,534 0.03 1.4
Cititgroup Gbl Mkts/salomn, ny 41,644 8,416,193 0.00 1.3
berstein sanford C & Co, ny 30,120 1,324,534 0.02 1.0
Knight securities broadcort, ny 28,924 1,641,608 0.02 0.9
barclays Capital Inc, new Jersey 28,901 1,710,832 0.02 0.9
Weeden & Co, ny 28,005 918,000 0.03 0.9
baird, robert W & Co unc, Milwaukee 26,655 877,434 0.03 0.9
Merrill lynch Pierce fenner smith Inc Willmington 23,739 2,896,466 0.01 0.8
Pulse Trading llC, boston 23,023 838,467 0.03 0.7
Cantor fitzgerald &Co Inc, ny 22,845 884,389 0.03 0.7
Wells fargo securities llC, Charlotte, nC 22,373 637,373 0.04 0.7
ubs securities , london 21,238 6,034,080 0.00 0.7
baypoint Trading llC, new york 19,561 842,783 0.02 0.6
others 799,150 68,816,704 0.01 25.5
Total broker Commissions $3,129,780 156,848,718 0.02 100.0 %
64
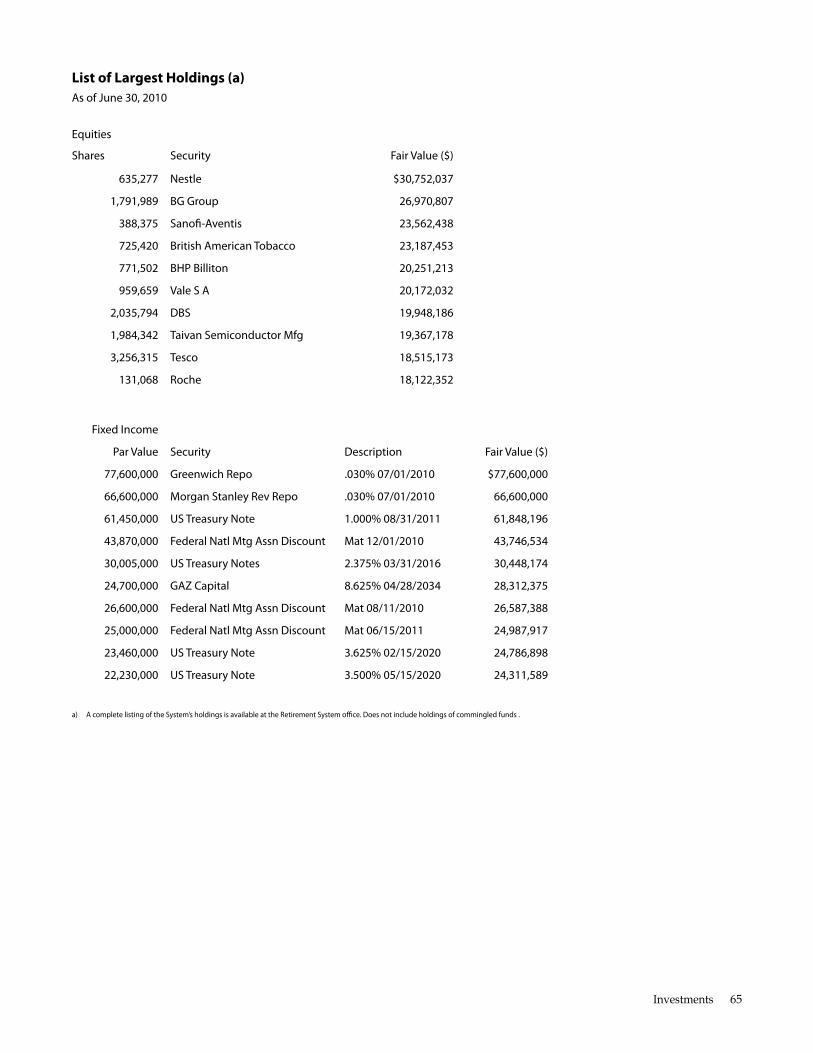
List of Largest Holdings (a) as of June 30, 2010
equities
shares security fair value ($)
635,277 nestle $30,752,037
1,791,989 bG Group 26,970,807
388,375 sanof-aventis 23,562,438
725,420 british american Tobacco 23,187,453
771,502 bHP billiton 20,251,213
959,659 vale s a 20,172,032
2,035,794 dbs 19,948,186
1,984,342 Taivan semiconductor Mfg 19,367,178
3,256,315 Tesco 18,515,173
131,068 roche 18,122,352
fixed Income
Par value security description fair value ($)
77,600,000 Greenwich repo .030% 07/01/2010 $77,600,000
66,600,000 Morgan stanley rev repo .030% 07/01/2010 66,600,000
61,450,000 us Treasury note 1.000% 08/31/2011 61,848,196
43,870,000 federal natl Mtg assn discount Mat 12/01/2010 43,746,534
30,005,000 us Treasury notes 2.375% 03/31/2016 30,448,174
24,700,000 Gaz Capital 8.625% 04/28/2034 28,312,375
26,600,000 federal natl Mtg assn discount Mat 08/11/2010 26,587,388
25,000,000 federal natl Mtg assn discount Mat 06/15/2011 24,987,917
23,460,000 us Treasury note 3.625% 02/15/2020 24,786,898
22,230,000 us Treasury note 3.500% 05/15/2020 24,311,589
a) a complete listing of the system’s holdings is available at the retirement system ofce. does not include holdings of commingled funds .
Investments 65
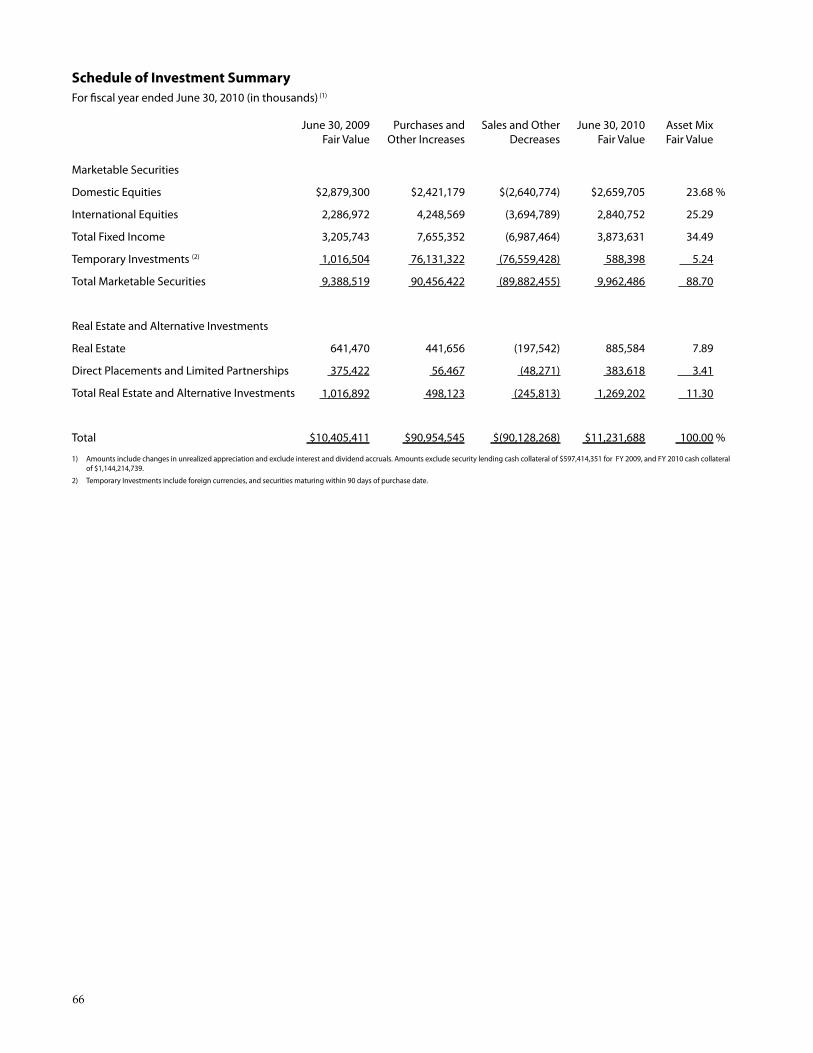
Schedule of Investment Summary for fscal year ended June 30, 2010 (in thousands) (1)
Marketable securities
domestic equities
International equities
Total fixed Income
Temporary Investments (2)
Total Marketable securities
real estate and alternative Investments
real estate
direct Placements and limited Partnerships
Total real estate and alternative Investments
Total
June 30, 2009 fair value
Purchases and other Increases
sales and other decreases
June 30, 2010 fair value
asset Mix fair value
$2,879,300
2,286,972
3,205,743
1,016,504
9,388,519
$2,421,179
4,248,569
7,655,352
76,131,322
90,456,422
$(2,640,774)
(3,694,789)
(6,987,464)
(76,559,428)
(89,882,455)
$2,659,705
2,840,752
3,873,631
588,398
9,962,486
23.68 %
25.29
34.49
5.24
88.70
641,470
375,422
1,016,892
441,656
56,467
498,123
(197,542)
(48,271)
(245,813)
885,584
383,618
1,269,202
7.89
3.41
11.30
$10,405,411 $90,954,545 $(90,128,268) $11,231,688 100.00 %
1) amounts include changes in unrealized appreciation and exclude interest and dividend accruals. amounts exclude security lending cash collateral of $597,414,351 for fy 2009, and fy 2010 cash collateral of $1,144,214,739.
2) Temporary Investments include foreign currencies, and securities maturing within 90 days of purchase date.
66
2010 Comprehensive Annual Financial Report
ACTUARIALSECTION
KPERS
aCTuary’s CerTIfICaTIon leTTer
August 20, 2010
Board of Trustees
Kansas Public Employees Retirement System
611 S. Kansas Ave., Suite 100
Topeka, KS 66603
Dear members of the Board:
At your request, we performed an actuarial valuation of the Kansas Public Employees Retirement System as of Decem-ber 31, 2009, for purposes of determining contribution rates for fiscal year 2013 for the State and 2012 for Local employ-ers. The valuation results reflect the benefit provisions in place on December 31, 2009. There was no change in the actuarial assumptions or methods from the prior valuation.
In preparing our report, we relied, without audit, on information (some oral and some in writing) supplied by the System’s staff. This information includes, but is not limited to, statutory provisions, member data and financial information. We found this information to be reasonably consistent and comparable with information used for other purposes. The valuation results depend on the integrity of this information. If any of this information is inaccurate or incomplete, our results may be different and our calcula-tions may need to be revised.
We further certify that all costs, liabilities, rates of interest and other factors for the System have been determined on the basis of actuarial assumptions and methods which are individually reasonable (taking into account the experience of the System and reasonable expectations); and which, in combination, offer our best estimate of anticipated experi-ence affecting the System. nevertheless, the emerging costs will vary from those presented in this report to the extent actual experience differs from that projected by the actuarial
1120 South 101st Street, Suite 400 Omaha, NE 68124 USA
Tel +1 402 393 9400 Fax +1 402 393 1037
milliman.com
assumptions. The Board of Trustees has the final decision regarding the appropriateness of the assumptions and ad-opted them as indicated in our valuation report.
Future actuarial measurements may differ significantly from the current measurements presented in the valuation report due to such factors as the following: plan experience differing from that anticipated by the economic or demo-graphic assumptions; changes in economic or demographic assumptions; increases or decreases expected as part of the natural operation of the methodology used for these measurements (such as the end of an amortization period or additional cost or contribution requirements based on the plan’s funded status); and changes in plan provisions or ap-plicable law. Due to the limited scope of our assignment, we did not perform an analysis of the potential range of future measurements.
The actuarial computations presented in the valuation report are for purposes of determining the recommended funding amounts for the System. Actuarial computations presented under GASB Statement no. 25 are for purposes of fulfilling financial accounting requirements. The compu-tations prepared for these two purposes may differ as dis-closed in the December 31, 2009 actuarial valuation report. The calculations have been made on a basis consistent with our understanding of the System’s funding requirements and goals, and of GASB Statement no. 25. Determinations for purposes other than meeting these requirements may be significantly different from the results shown in the De-cember 31, 2009 actuarial valuation report. Accordingly, ad-ditional determinations may be needed for other purposes.
milliman’s work product was prepared exclusively for KPERS for a specific and limited purpose. It is a complex, technical analysis that assumes a high level of knowledge concerning KPERS’ operations, and uses KPERS’ data,
68

which milliman has not audited. It is not for the use or ben-efit of any third party for any purpose. Any third recipient of milliman’s work product who desires professional guid-ance should not rely upon milliman’s work product, but should engage qualified professionals for advice appropri-ate to its own specific needs.
The actuary prepared the following supporting schedules for the Comprehensive Annual Financial Report: • Actuarial Section
• Summary of Change in unfunded Actuarial Liability
• Summary of Changes in Actuarial Contribution Rate
• Summary of Historical Changes to Total System uAL
• Summary of Principal Results
• Summary of Actuarial Assumptions and methods
• Summary of membership Data
We also provided the information used in the Schedules of Funding Progress and Changes in the unfunded Actuarial Liability in the Financial Section, and the employer contri-bution rates shown in the Schedule of Employer Contribu-tions in the Financial Section.
The consultants who worked on this assignment are pen-sion actuaries. milliman’s advice is not intended to be a substitute for qualified legal or accounting counsel.
We certify that, to the best of our knowledge and belief, the December 31, 2009, valuation is complete and accurate and has been prepared in accordance with generally recognized and accepted actuarial principles and practices. We are members of the American Academy of Actuaries and meet the Qualification Standards to render the actuarial opinion contained herein.
mILLImAn, Inc. Sincerely,
Patrice A. Beckham, FSA, mAAA
Consulting Actuary
Brent A. Banister, FSA, mAAA
Consulting Actuary
Actuarial 69
aCTuarIal overvIeW
The Kansas Public Employees Retirement System is an um-brella organization which administers the following three statewide pension groups: the Kansas Public Employees Re-tirement System (KPERS), the Kansas Police and Firemen’s Retirement System (KP&F) and the Kansas Retirement System for Judges (Judges). This report presents the results of the December 31, 2009 actuarial valuations for each of the Systems.
The primary purposes of performing actuarial valuations are to: • Determine the employer contribution rates required to
fund each System on an actuarial basis, • Determine the statutory employer contribution rates
for each System, • Disclose asset and liability measures as of the valuation
date, • Determine the experience of the System since the last
valuation date, and
• Analyze and report on trends in System contributions, assets, and liabilities over the past several years.
The valuation results provide a “snapshot” view of the System’s financial condition on December 31, 2009. The unfunded actuarial liability for the System as a whole decreased by $602 million due to various factors. A detailed analysis of the change in the unfunded actuarial liability from December 31, 2008 to December 31, 2009 is shown later in this section.
There were no changes in the actuarial assumptions or methods used in the valuation since last year. This is the first valuation to include members of KPERS Tier 2 who be-came members on or after July 1, 2009. There is no measur-able impact on the valuation results from the Tier 2 mem-bers because they are new members and account for a small proportion of the active membership. Over time, as Tier 1 members leave covered employment and are replaced with Tier 2 members, the employer contribution rate is expected to be lower than it would otherwise have been. In addition, the impact of the change to first day coverage (employees become members of KPERS on their date of hire), effective July 1, 2009, is also reflected in this valuation. As a result, the active member count increased 6.7 percent for the State group and 14 percent for the Local group. This is a one-time increase that reflects the participation of all members who
were in their one year of service waiting period as well as new hires after July 1, 2009. The School group already had first day coverage so there was no impact on that group.
In KPERS, State, School and Local employers do not neces-sarily contribute the full actuarial contribution rate. Based on legislation passed in 1993, the employer contribution rates certified by the Board may not increase by more than the statutory cap. The statutory cap, which has been changed periodically, is currently 0.60 percent for the State, School and Local groups.
A summary of actuarial and statutory employer contribu-tion rates for the Retirement System (excluding the statu-tory contribution for the Death and Disability Program) for the last two valuation dates follows:
December 31, 2009 Valuation
system actuarial statutory diference
state1 9.55% 9.37% 0.18%
school1 14.69% 9.37% 5.32%
local1 9.44% 7.34% 2.10%
KP&f 2 16.54% 16.54% —%
Judges 23.75% 23.75% —%
December 31, 2008 Valuation
system actuarial statutory diference
state1 11.13% 8.77% 2.36%
school1 14.96% 8.77% 6.19%
local1 10.42% 6.74% 3.68%
KP&f2 17.88% 14.57%3 3.31%
Judges 26.38% 21.28%3 5.10%
1) by statute, rates are allowed to increase by a maximum of 0.60 percent plus the cost of any beneft enhancements.
2) for KP&f, the statutory contribution rate is equal to the “uniform” rate. The rate shown is for local employers. The rate for state employers is 16.43 percent this year, which includes a payment of 0.51 percent for the debt service payment on the bonds issued for the 13th check. The uniform rate does not include the payment required to amortize the unfunded past service liability or any 15 percent excess beneft liability determined separately for each employer.
3) Contribution rates were recertifed to the rates shown after the valuation report was issued.
Over the last decade, much time and effort has been devoted to improving the long-term funding outlook for KPERS. As a result of legislative changes, Board action and investment performance from 2003 to 2007, the Sys-tem’s long-term funding outlook improved, although the positive results for the System were highly dependent on attaining the 8 percent assumption in future years. model-ing indicated that investment returns below the 8 percent assumption could change the long-term funding outlook,
70
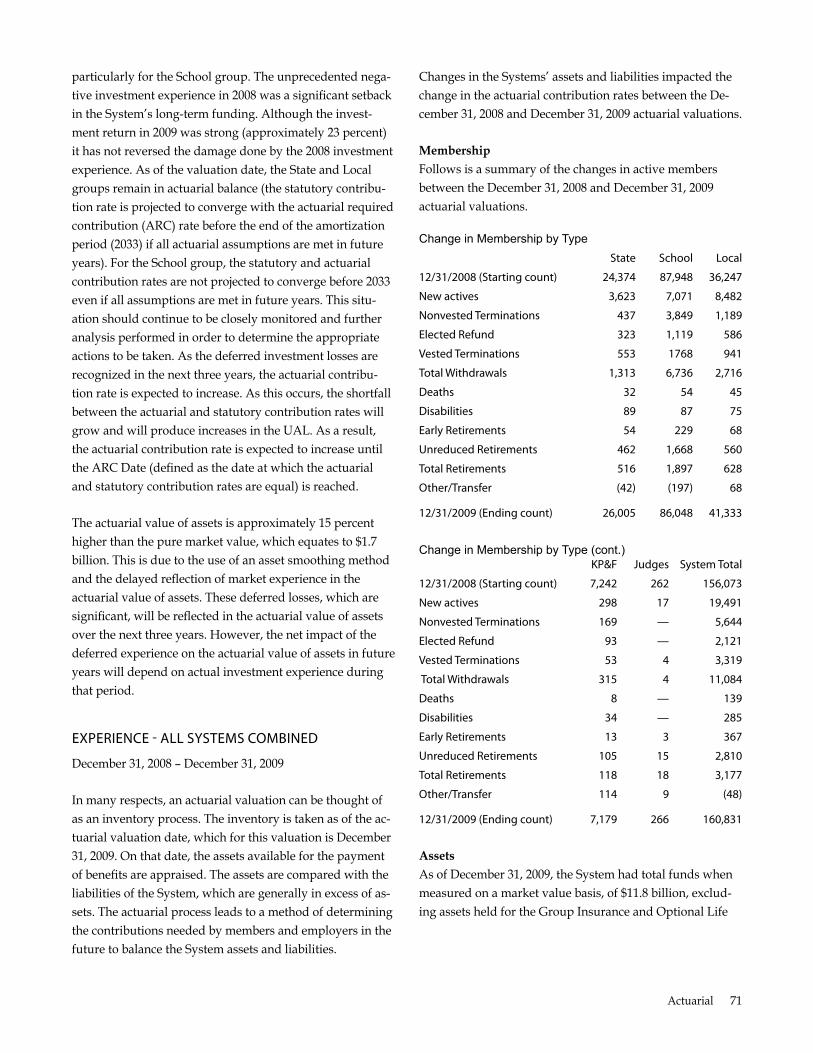
particularly for the School group. The unprecedented nega-tive investment experience in 2008 was a significant setback in the System’s long-term funding. Although the invest-ment return in 2009 was strong (approximately 23 percent) it has not reversed the damage done by the 2008 investment experience. As of the valuation date, the State and Local groups remain in actuarial balance (the statutory contribu-tion rate is projected to converge with the actuarial required contribution (ARC) rate before the end of the amortization period (2033) if all actuarial assumptions are met in future years). For the School group, the statutory and actuarial contribution rates are not projected to converge before 2033 even if all assumptions are met in future years. This situ-ation should continue to be closely monitored and further analysis performed in order to determine the appropriate actions to be taken. As the deferred investment losses are recognized in the next three years, the actuarial contribu-tion rate is expected to increase. As this occurs, the shortfall between the actuarial and statutory contribution rates will grow and will produce increases in the uAL. As a result, the actuarial contribution rate is expected to increase until the ARC Date (defined as the date at which the actuarial and statutory contribution rates are equal) is reached.
The actuarial value of assets is approximately 15 percent higher than the pure market value, which equates to $1.7 billion. This is due to the use of an asset smoothing method and the delayed reflection of market experience in the actuarial value of assets. These deferred losses, which are significant, will be reflected in the actuarial value of assets over the next three years. However, the net impact of the deferred experience on the actuarial value of assets in future years will depend on actual investment experience during that period.
exPerIenCe - all sysTeMs CoMbIned
December 31, 2008 – December 31, 2009
In many respects, an actuarial valuation can be thought of as an inventory process. The inventory is taken as of the ac-tuarial valuation date, which for this valuation is December 31, 2009. On that date, the assets available for the payment of benefits are appraised. The assets are compared with the liabilities of the System, which are generally in excess of as-sets. The actuarial process leads to a method of determining the contributions needed by members and employers in the future to balance the System assets and liabilities.
Changes in the Systems’ assets and liabilities impacted the change in the actuarial contribution rates between the De-cember 31, 2008 and December 31, 2009 actuarial valuations.
Membership Follows is a summary of the changes in active members between the December 31, 2008 and December 31, 2009 actuarial valuations.
Change in Membership by Type state school local
12/31/2008 (starting count) 24,374 87,948 36,247
new actives 3,623 7,071 8,482
nonvested Terminations 437 3,849 1,189
elected refund 323 1,119 586
vested Terminations 553 1768 941
Total Withdrawals 1,313 6,736 2,716
deaths 32 54 45
disabilities 89 87 75
early retirements 54 229 68
unreduced retirements 462 1,668 560
Total retirements 516 1,897 628
other/Transfer (42) (197) 68
12/31/2009 (ending count) 26,005 86,048 41,333
Change in Membership by Type (cont.) KP&f Judges system Total
12/31/2008 (starting count) 7,242 262 156,073
new actives 298 17 19,491
nonvested Terminations 169 — 5,644
elected refund 93 — 2,121
vested Terminations 53 4 3,319
Total Withdrawals 315 4 11,084
deaths 8 — 139
disabilities 34 — 285
early retirements 13 3 367
unreduced retirements 105 15 2,810
Total retirements 118 18 3,177
other/Transfer 114 9 (48)
12/31/2009 (ending count) 7,179 266 160,831
Assets As of December 31, 2009, the System had total funds when measured on a market value basis, of $11.8 billion, exclud-ing assets held for the Group Insurance and Optional Life
Actuarial 71
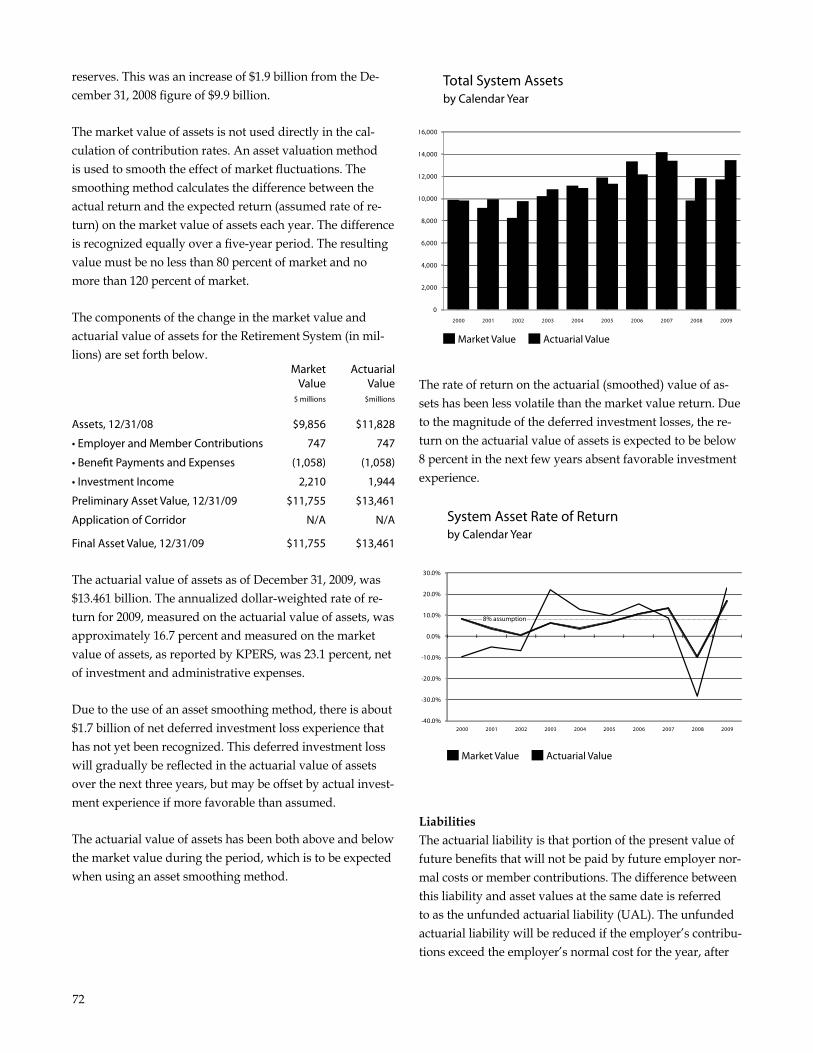
reserves. This was an increase of $1.9 billion from the De-cember 31, 2008 figure of $9.9 billion.
The market value of assets is not used directly in the cal-culation of contribution rates. An asset valuation method is used to smooth the effect of market fluctuations. The smoothing method calculates the difference between the actual return and the expected return (assumed rate of re-turn) on the market value of assets each year. The difference is recognized equally over a five-year period. The resulting value must be no less than 80 percent of market and no more than 120 percent of market.
The components of the change in the market value and actuarial value of assets for the Retirement System (in mil-lions) are set forth below.
Market actuarial value value
$ millions $millions
assets, 12/31/08 $9,856 $11,828
• Employer and Member Contributions 747 747
• Benefit Payments and Expenses (1,058) (1,058)
• Investment Income 2,210 1,944
Preliminary asset value, 12/31/09 $11,755 $13,461
application of Corridor n/a n/a
final asset value, 12/31/09 $11,755 $13,461
The actuarial value of assets as of December 31, 2009, was $13.461 billion. The annualized dollar-weighted rate of re-turn for 2009, measured on the actuarial value of assets, was approximately 16.7 percent and measured on the market value of assets, as reported by KPERS, was 23.1 percent, net of investment and administrative expenses.
Due to the use of an asset smoothing method, there is about $1.7 billion of net deferred investment loss experience that has not yet been recognized. This deferred investment loss will gradually be reflected in the actuarial value of assets over the next three years, but may be offset by actual invest-ment experience if more favorable than assumed.
The actuarial value of assets has been both above and below the market value during the period, which is to be expected when using an asset smoothing method.
Total System Assets by Calendar Year
16,000
14,000
12,000
10,000
8,000
6,000
4,000
2,000
0
Market Value Actuarial Value
The rate of return on the actuarial (smoothed) value of as-sets has been less volatile than the market value return. Due to the magnitude of the deferred investment losses, the re-turn on the actuarial value of assets is expected to be below 8 percent in the next few years absent favorable investment experience.
System Asset Rate of Return by Calendar Year
30.0%
20.0%
10.0%
0.0%
-10.0%
-20.0%
-30.0%
-40.0%
Market Value Actuarial Value
Liabilities The actuarial liability is that portion of the present value of future benefits that will not be paid by future employer nor-mal costs or member contributions. The difference between this liability and asset values at the same date is referred to as the unfunded actuarial liability (uAL). The unfunded actuarial liability will be reduced if the employer’s contribu-tions exceed the employer’s normal cost for the year, after
2000 2001 2002 2003 2004 2005 2006 2007 2008 2009
8% assumption
2000 2001 2002 2003 2004 2005 2006 2007 2008 2009
72
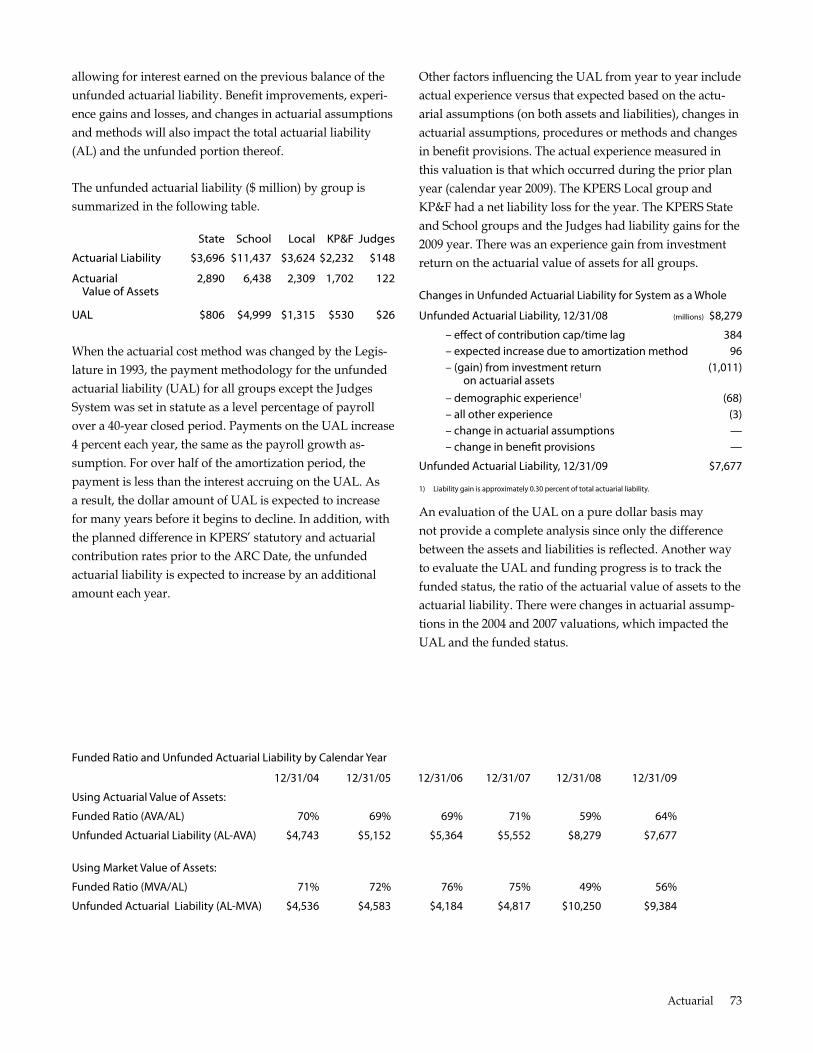
allowing for interest earned on the previous balance of the unfunded actuarial liability. Benefit improvements, experi-ence gains and losses, and changes in actuarial assumptions and methods will also impact the total actuarial liability (AL) and the unfunded portion thereof.
The unfunded actuarial liability ($ million) by group is summarized in the following table.
State School Local KP&F Judges
Actuarial Liability $3,696 $11,437 $3,624 $2,232 $148
Actuarial 2,890 6,438 2,309 1,702 122 Value of Assets
UAL $806 $4,999 $1,315 $530 $26
When the actuarial cost method was changed by the Legis-lature in 1993, the payment methodology for the unfunded actuarial liability (uAL) for all groups except the Judges System was set in statute as a level percentage of payroll over a 40-year closed period. Payments on the uAL increase 4 percent each year, the same as the payroll growth as-sumption. For over half of the amortization period, the payment is less than the interest accruing on the uAL. As a result, the dollar amount of uAL is expected to increase for many years before it begins to decline. In addition, with the planned difference in KPERS’ statutory and actuarial contribution rates prior to the ARC Date, the unfunded actuarial liability is expected to increase by an additional amount each year.
Other factors influencing the uAL from year to year include actual experience versus that expected based on the actu-arial assumptions (on both assets and liabilities), changes in actuarial assumptions, procedures or methods and changes in benefit provisions. The actual experience measured in this valuation is that which occurred during the prior plan year (calendar year 2009). The KPERS Local group and KP&F had a net liability loss for the year. The KPERS State and School groups and the Judges had liability gains for the 2009 year. There was an experience gain from investment return on the actuarial value of assets for all groups.
Changes in unfunded actuarial liability for system as a Whole
unfunded actuarial liability, 12/31/08 (millions) $8,279
– efect of contribution cap/time lag 384 – expected increase due to amortization method 96 – (gain) from investment return (1,011) on actuarial assets – demographic experience1 (68) – all other experience (3) – change in actuarial assumptions — – change in beneft provisions —
unfunded actuarial liability, 12/31/09 $7,677
1) liability gain is approximately 0.30 percent of total actuarial liability.
An evaluation of the uAL on a pure dollar basis may not provide a complete analysis since only the difference between the assets and liabilities is reflected. Another way to evaluate the uAL and funding progress is to track the funded status, the ratio of the actuarial value of assets to the actuarial liability. There were changes in actuarial assump-tions in the 2004 and 2007 valuations, which impacted the uAL and the funded status.
funded ratio and unfunded actuarial liability by Calendar year
12/31/04 12/31/05 12/31/06 12/31/07 12/31/08 12/31/09
using actuarial value of assets:
funded ratio (ava/al) 70% 69% 69% 71% 59% 64%
unfunded actuarial liability (al-ava) $4,743 $5,152 $5,364 $5,552 $8,279 $7,677
using Market value of assets:
funded ratio (Mva/al) 71% 72% 76% 75% 49% 56%
unfunded actuarial liability (al-Mva) $4,536 $4,583 $4,184 $4,817 $10,250 $9,384
Actuarial 73
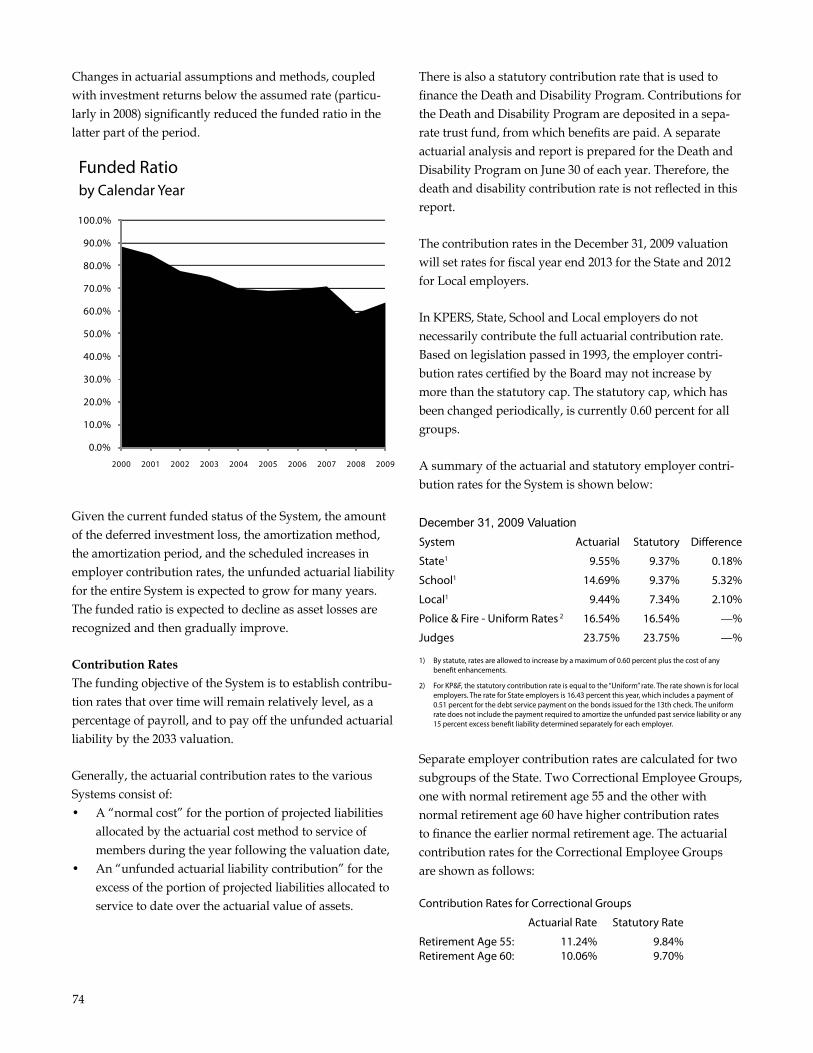
Changes in actuarial assumptions and methods, coupled with investment returns below the assumed rate (particu-larly in 2008) significantly reduced the funded ratio in the latter part of the period.
Funded Ratio by Calendar Year
100.0%
90.0%
80.0%
70.0%
60.0%
50.0%
40.0%
30.0%
20.0%
10.0%
0.0%
2000 2001 2002 2003 2004 2005 2006 2007 2008 2009
Given the current funded status of the System, the amount of the deferred investment loss, the amortization method, the amortization period, and the scheduled increases in employer contribution rates, the unfunded actuarial liability for the entire System is expected to grow for many years. The funded ratio is expected to decline as asset losses are recognized and then gradually improve.
Contribution Rates The funding objective of the System is to establish contribu-tion rates that over time will remain relatively level, as a percentage of payroll, and to pay off the unfunded actuarial liability by the 2033 valuation.
Generally, the actuarial contribution rates to the various Systems consist of: • A “normal cost” for the portion of projected liabilities
allocated by the actuarial cost method to service of members during the year following the valuation date,
• An “unfunded actuarial liability contribution” for the excess of the portion of projected liabilities allocated to service to date over the actuarial value of assets.
There is also a statutory contribution rate that is used to finance the Death and Disability Program. Contributions for the Death and Disability Program are deposited in a sepa-rate trust fund, from which benefits are paid. A separate actuarial analysis and report is prepared for the Death and Disability Program on June 30 of each year. Therefore, the death and disability contribution rate is not reflected in this report.
The contribution rates in the December 31, 2009 valuation will set rates for fiscal year end 2013 for the State and 2012 for Local employers.
In KPERS, State, School and Local employers do not necessarily contribute the full actuarial contribution rate. Based on legislation passed in 1993, the employer contri-bution rates certified by the Board may not increase by more than the statutory cap. The statutory cap, which has been changed periodically, is currently 0.60 percent for all groups.
A summary of the actuarial and statutory employer contri-bution rates for the System is shown below:
December 31, 2009 Valuation system actuarial statutory diference
state1 9.55% 9.37% 0.18%
school1 14.69% 9.37% 5.32%
local1 9.44% 7.34% 2.10%
Police & fire - uniform rates 2 16.54% 16.54% —%
Judges 23.75% 23.75% —%
1) by statute, rates are allowed to increase by a maximum of 0.60 percent plus the cost of any beneft enhancements.
2) for KP&f, the statutory contribution rate is equal to the “uniform” rate. The rate shown is for local employers. The rate for state employers is 16.43 percent this year, which includes a payment of 0.51 percent for the debt service payment on the bonds issued for the 13th check. The uniform rate does not include the payment required to amortize the unfunded past service liability or any 15 percent excess beneft liability determined separately for each employer.
Separate employer contribution rates are calculated for two subgroups of the State. Two Correctional Employee Groups, one with normal retirement age 55 and the other with normal retirement age 60 have higher contribution rates to finance the earlier normal retirement age. The actuarial contribution rates for the Correctional Employee Groups are shown as follows:
Contribution rates for Correctional Groups
actuarial rate statutory rate
retirement age 55: 11.24% 9.84% retirement age 60: 10.06% 9.70%
74
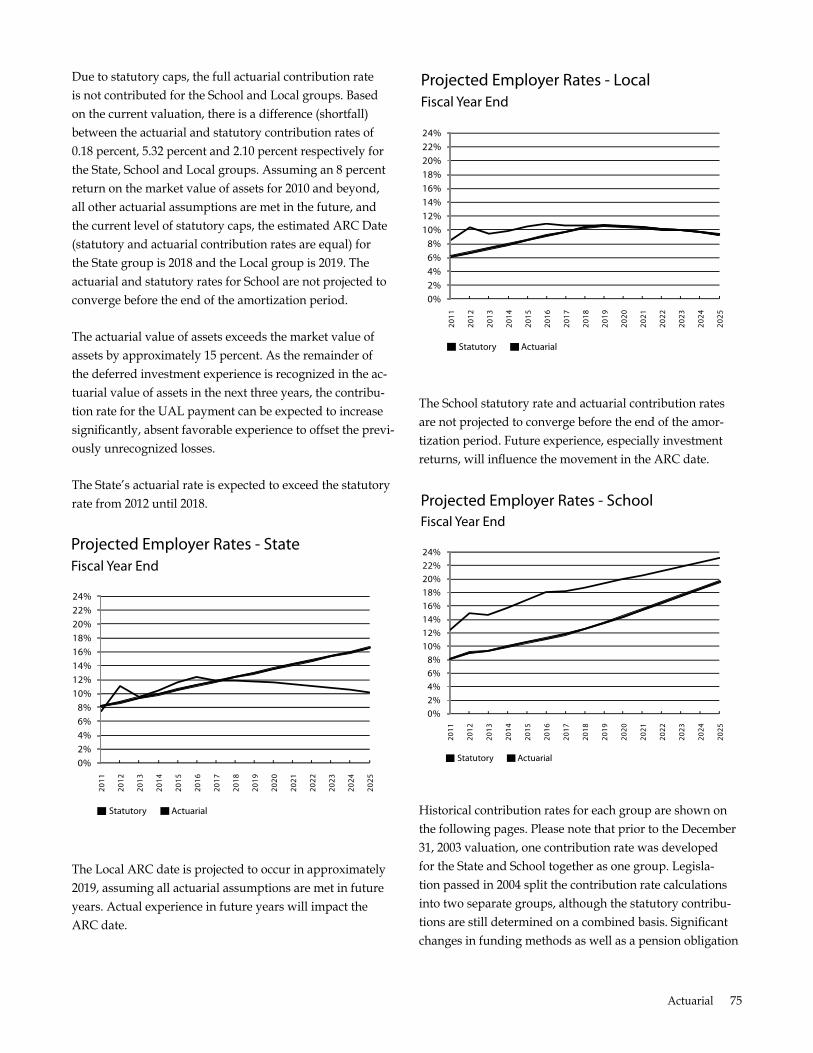
Statutory Actuarial
The Local ARC date is projected to occur in approximately 2019, assuming all actuarial assumptions are met in future years. Actual experience in future years will impact the ARC date.
2011
2012
2013
2014
2015
2016
2017
2018
2019
2020
2021
2022
2023
2024
2025
2011
Statutory Actuarial 0%
The actuarial value of assets exceeds the market value of assets by approximately 15 percent. As the remainder of the deferred investment experience is recognized in the ac-tuarial value of assets in the next three years, the contribu-tion rate for the uAL payment can be expected to increase significantly, absent favorable experience to offset the previ-ously unrecognized losses.
The State’s actuarial rate is expected to exceed the statutory rate from 2012 until 2018.
Projected Employer Rates - State Fiscal Year End
24% 22% 20% 18% 16% 14% 12% 10%
8% 6% 4% 2%
Due to statutory caps, the full actuarial contribution rate is not contributed for the School and Local groups. Based on the current valuation, there is a difference (shortfall) between the actuarial and statutory contribution rates of 0.18 percent, 5.32 percent and 2.10 percent respectively for the State, School and Local groups. Assuming an 8 percent return on the market value of assets for 2010 and beyond, all other actuarial assumptions are met in the future, and the current level of statutory caps, the estimated ARC Date (statutory and actuarial contribution rates are equal) for the State group is 2018 and the Local group is 2019. The actuarial and statutory rates for School are not projected to converge before the end of the amortization period.
2012
2013
2014
Statutory Actuarial
The School statutory rate and actuarial contribution rates are not projected to converge before the end of the amor-tization period. Future experience, especially investment returns, will influence the movement in the ARC date.
Projected Employer Rates - School Fiscal Year End
24% 22% 20% 18% 16% 14% 12% 10%
8% 6% 4% 2% 0%
2015
2016
2017
2018
2019
2020
2021
2022
2023
2024
2025
2011
2012
2013
2014
2015
2016
2017
2018
2019
2020
2021
2022
2023
2024
2025
Projected Employer Rates - Local Fiscal Year End
24% 22% 20% 18% 16% 14% 12% 10%
8% 6% 4% 2% 0%
Actuarial 75
Historical contribution rates for each group are shown on the following pages. Please note that prior to the December 31, 2003 valuation, one contribution rate was developed for the State and School together as one group. Legisla-tion passed in 2004 split the contribution rate calculations into two separate groups, although the statutory contribu-tions are still determined on a combined basis. Significant changes in funding methods as well as a pension obligation
bond issue occurred in 2003 and actuarial assumptions were changed in both the 2004 and 2007 valuations. These changes impact the comparability of contribution rates between various valuation dates.
The split of the State group into a separate group with the 2003 valuation, coupled with the bond issue, lowered the actuarial contribution rate. The State’s statutory contribu-tion rate in this valuation is less than the actuarial contribu-tion rate due to the impact of the 2008 investment experi-ence.
Employer Contribution Rates - State Calendar Year End
27%
24%
21%
18%
15%
12%
9%
6%
3%
0%
2000 2001 2002 2003 2004 2005 2006 2007 2008 2009
Statutory Actuarial
Due to investment experience, changes in actuarial meth-ods and assumptions, and the magnitude of the difference between the actuarial and statutory contribution rates, the funded status of the School group has declined and the actuarial contribution rate has increased.
Employer Contribution Rates - School Calendar Year End
27%
24%
21%
18%
15%
12%
9%
6%
3%
0%
2000 2001 2002 2003 2004 2005 2006 2007 2008 2009
Statutory Actuarial
The Local contribution rate has also been impacted by changes in actuarial assumptions and methods as well as investment performance. As a result, a significant difference still exists between the statutory and actuarial contribu-tion rate. Legislation passed in 2004 provided for increased statutory caps, under which the statutory and actuarial rates are expected to converge if all actuarial assumptions are met in future years.
Employer Contribution Rates - Local Calendar Year End
27%
24%
21%
18%
15%
12%
9%
6%
3%
0%
2000 2001 2002 2003 2004 2005 2006 2007 2008 2009
Statutory Actuarial
Investment experience, coupled with a change in actuarial methodology, dramatically increased the KP&F contribu-tion rates in the first half of the period. Investment expe-rience in 2008, which has still not been totally reflected, resulted in higher contribution rates in the last two valua-tions.
Employer Contribution Rates - KP&F Calendar Year End
27%
24%
21%
18%
15%
12%
9%
6%
3%
0%
2000 2001 2002 2003 2004 2005 2006 2007 2008 2009
Statutory Actuarial
76
Significant changes in the actuarial assumptions in the 2004 valuation and investment experience in 2008 resulted in higher contribution rates for the Judges plan.
Employer Contribution Rates - Judges Calendar Year End
27%
24%
21%
18%
15%
12%
9%
6%
3%
0%
2000 2001 2002 2003 2004 2005 2006 2007 2008 2009
Statutory Actuarial
Comments Over the last decade the development of a comprehensive plan to address the long-term funding of KPERS has been a high priority. HB 2014, which was passed by the 2003 Legislature, increased the statutory cap on the State/School employer contribution rate from 0.20 percent to 0.40 percent in Fy2006, 0.50 percent in Fy2007 and 0.60 percent in Fy
2008 and beyond. It also authorized the issuance of up to $500 million in pension obligation bonds (POBs). The POBs were sold and proceeds of $440.2 million were received on march 10, 2004. The debt service payments on the bonds are paid by the State in addition to the regular KPERS employer contribution rate.
The 2004 Legislature passed SB 520, which continued to ad-dress issues related to the long term funding of the System. It gave the KPERS Board of Trustees the authority to estab-lish the actuarial cost method and amortization method/
period. With this authority, the Board changed both the ac-tuarial cost method and the asset valuation method with the December 31, 2003 actuarial valuation. SB 520 also increased the statutory cap for Local employers from 0.15 percent to 0.40 percent in Fy2006, 0.50 percent in Fy2007 and 0.60 percent in Fy2008 and beyond.
The 2007 Legislature passed SB 362 which created a new benefit structure for members first employed on or after July 1, 2009. The change was made partially due to long
term funding considerations, but also in response to demo-graphic changes in the membership.
The strong investment performance of 23 percent in calen-dar year 2009 was a welcome change after the severe mar-ket decline in 2008, but it represents a modest improvement in the long-term funding of KPERS. While the investment return in 2009 was well above the 8 percent assumed rate, there are still significant deferred investment losses which have not been recognized in the valuation process. As of December 31, 2009, the actuarial value of assets exceeds the market value of assets by approximately 15 percent, or $1.7 billion. This deferred experience will flow through the asset valuation method in the next three years and be recognized in the valuation process, absent investment experience significantly above the 8 percent assumed rate of return. As the deferred losses are recognized, the funded ratio can be expected to decline and the uAL and the actuarial contribu-tion rate to increase. KPERS continues to face a significant long-term funding challenge, particularly with the School group. Action is necessary now in order to strengthen the System’s funding over the long term. Benefits are paid out of the System from two sources: contributions and invest-ment earnings. In order to improve the System’s long-term funding, contributions and/or investment earnings must increase, benefit payments must decrease, or both must occur. The options within the control of the plan sponsor include increasing contributions to the System or reducing benefits in future years. Both of these options typically take many years before an improvement in the funded ratio can be seen, particularly if the benefit reductions apply only to new hires. The other component of the long-term fund-ing equation is investment return. If returns exceed the 8 percent assumption in future years, it will result in higher funded ratios. In fact, due to the size of the assets, higher re-turns have the greatest potential to impact the funded ratio in the short term – both positive and negative. There seems to be little optimism that returns will consistently exceed the 8 percent assumption in the next ten years so this option does not appear to be a viable solution to the long-term funding shortfall.
Based on the December 31, 2009 actuarial valuation results and the current statutory caps, the statutory contribution rates for the State and Local groups are projected to con-verge with the actuarial required contribution (ARC) rate before the end of the amortization period. As a result, those groups are in long-term actuarial balance. However, these
Actuarial 77
projections assume that all actuarial assumptions are met exactly in each future year and the statutory contributions continually increase. To the extent that actual experience deviates from that expected, the ARC Date (date at which the statutory and actuarial rates are expected to converge), as well as the ARC rate, will vary. For the School group, the unfavorable experience in 2008 has created the situa-tion where the statutory contribution rate is not projected to reach the actuarial required contribution (ARC) rate before the end of the amortization period if assumptions are met. Future investment experience will be critical to the finan-cial health of all groups, but particularly the School group. Additional analysis with respect to long-term funding is expected to continue later this year.
The System utilizes an asset smoothing method in the valu-ation process. While this is a common procedure for public retirement systems, it is important to identify the potential impact of the deferred (unrecognized) investment experi-ence. To illustrate the impact of the deferred losses, the key valuation results are shown below for the State/School and KPF groups using both the actuarial value of assets and the pure market value. The impact would be similar for the other groups.
state/school KP&f
actuarial Market actuarial Market
actuarial liability $15,141 $15,141 $2,232 $2,232
asset value 9,329 8,130 1,702 1,485
ual 5,812 7,011 530 747
funded ratio 62% 54% 76% 67%
Contribution rate:
normal Cost rate 8.54% 8.54% 14.71% 14.71%
ual Payment 9.00% 10.79% 8.17% 11.61%
Total 17.54% 19.33% 22.88% 26.32%
employee rate 4.07% 4.07% 6.52% 6.52%
employer rate 13.47% 15.26% 16.36% 19.80%
The asset smoothing method impacts only the timing of when the actual market experience on the assets will be recognized. Despite a return of over 23 percent on market value, the actuarial value of assets still exceeds the pure market value by approximately 15 percent due to the de-ferred investment experience in 2008. If there are not signifi-cantly higher returns consistently over the next few years, the deferred investment experience will be recognized and the ultimate impact on the employer contribution rate can be expected to be similar to the column shown above based on the market value of assets. Also, see the earlier graphs of
projected contribution rates assuming an 8 percent rate of return in all future years.
Actual investment returns over the next few years will de-termine exactly how the System’s funding will be affected and the magnitude of the increase in the unfunded actuarial liability and the actuarial contribution rate. The negative return in 2008 had a substantial impact on the System’s long-term funding outlook. While investment experience was favorable in 2009 (23 percent actual versus 8 percent as-sumed), it has not offset the impact of the 2008 experience. While the System has sufficient assets to pay benefits for many years into the future, the long-term actuarial sound-ness of the System will be impacted if returns do not exceed 8 percent, contributions increase, benefits decrease, or some combination occurs. The System continues to face signifi-cant funding challenges, particularly if investment returns are below the 8 percent expected return. Studies on the long-term financial health of the System were performed last year and are continuing in the current year.
78
95.8
Summary of Change in UAL 12/31/09 valuation (millions)
state school local KP&f Judges Total
ual in 12/31/2008 valuation report $1,001.7 $5,238.5 $1,384.7 $618.7 $35.5 $8,279.21
• Effect of contribution cap/timing 42.0 258.9 76.2 5.7 0.9 383.7
• Expected increase due to method 10.9 62.5 16.1 6.8 (0.5)
• Actual vs. expected experience
• Investment return (232.0) (476.2) (162.7) (131.1) (9.1) (1,011.1)
• Demographic experience (7.1) (90.0) 18.3 21.4 (1.1) (58.5)
• All other experience (9.3) 5.1 (17.1) 8.8 0.4 (12.0)
• Change in assumptions — — — — — —
• Change in benefit provisions — — — — — —
ual in 12/31/2009 valuation report $806.2 $4,998.8 $1,315.5 $530.3 $26.1 $7,677.0
1) May not add due to rounding.
2) a new beneft structure was established for the Judges’ system in July, 1987. The normal cost rate is impacted by the change in the current beneft structure.
Actuarial 79
Summary of Changes in UAL Contribution Rate by System as of 12/31/09
Percentage of Payroll state school local KP&f1 Judges
actuarial Contribution rate in 12/31/2008 valuation 11.13% 14.96% 10.42% 17.88% 26.38%
Change due to amortization of ual
• effect of contribution cap/time lag 0.27 0.51 0.30 0.09 0.29
• amortization method — — — — (0.47)
• investment experience (1.47) (0.94) (0.65) (1.97) (2.94)
• liability experience (0.04) (0.18) 0.07 0.32 (0.36)
• all other experience (0.33) 0.40 (0.62) 0.21 0.26
• change in assumptions — — — — —
• change in benefit provisions — — — — —
Change in normal Cost rate
• change in benefit provisions — — — — —
• change in assumptions — — — — —
• all other experience (0.01) (0.06) (0.08) 0.01 0.592
actuarial Contribution rate in 12/31/2009 valuation 9.55% 14.69% 9.44% 16.54% 23.75%
1) Contribution rate for local employers only.
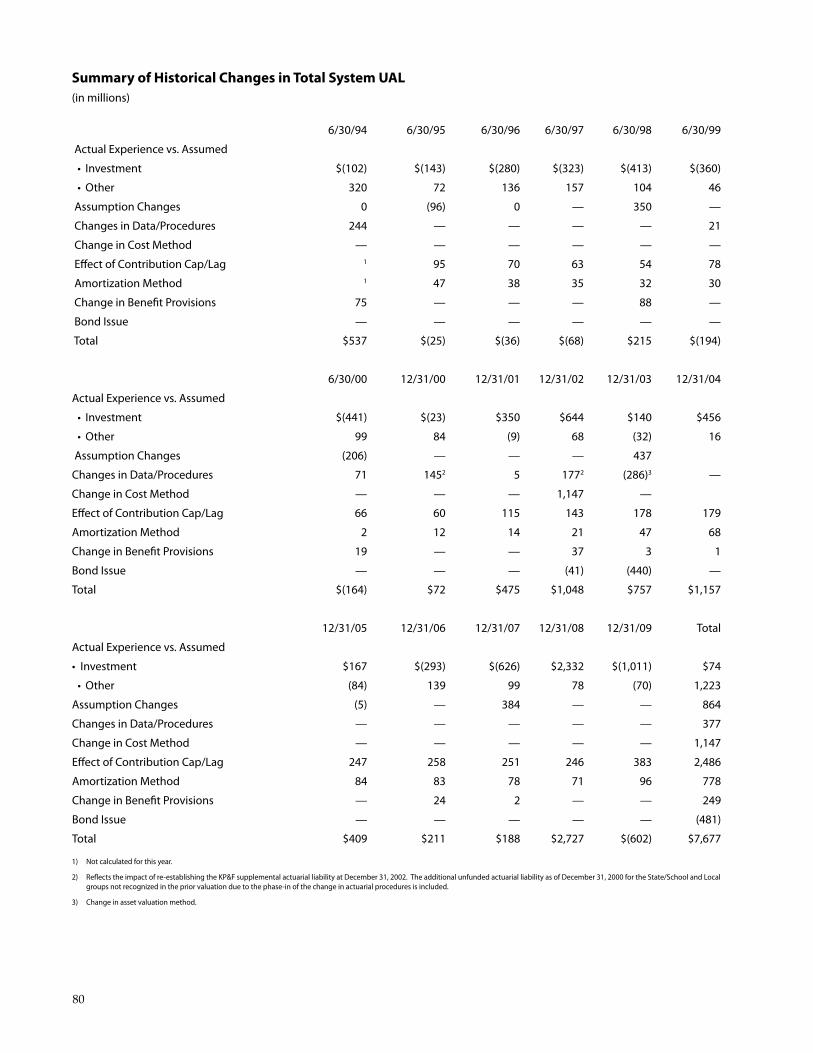
Summary of Historical Changes in Total System UAL (in millions)
6/30/94 6/30/95 6/30/96 6/30/97 6/30/98 6/30/99
actual experience vs. assumed
• Investment $(102) $(143) $(280) $(323) $(413) $(360)
• Other 320 72 136 157 104 46
assumption Changes 0 (96) 0 — 350 —
Changes in data/Procedures 244 — — — — 21
Change in Cost Method — — — — — —
efect of Contribution Cap/lag 1 95 70 63 54 78
amortization Method 1 47 38 35 32 30
Change in beneft Provisions 75 — — — 88 —
bond Issue — — — — — —
Total $537 $(25) $(36) $(68) $215 $(194)
6/30/00 12/31/00 12/31/01 12/31/02 12/31/03 12/31/04
actual experience vs. assumed
• Investment $(441) $(23) $350 $644 $140 $456
• Other 99 84 (9) 68 (32) 16
assumption Changes (206) — — — 437
Changes in data/Procedures 71 1452 5 1772 (286)3 —
Change in Cost Method — — — 1,147 —
efect of Contribution Cap/lag 66 60 115 143 178 179
amortization Method 2 12 14 21 47 68
Change in beneft Provisions 19 — — 37 3 1
bond Issue — — — (41) (440) —
Total $(164) $72 $475 $1,048 $757 $1,157
12/31/05 12/31/06 12/31/07 12/31/08 12/31/09 Total
actual experience vs. assumed
• Investment $167 $(293) $(626) $2,332 $(1,011) $74
• Other (84) 139 99 78 (70) 1,223
assumption Changes (5) — 384 — — 864
Changes in data/Procedures — — — — — 377
Change in Cost Method — — — — — 1,147
efect of Contribution Cap/lag 247 258 251 246 383 2,486
amortization Method 84 83 78 71 96 778
Change in beneft Provisions — 24 2 — — 249
bond Issue — — — — — (481)
Total $409 $211 $188 $2,727 $(602) $7,677
1) not calculated for this year.
2) refects the impact of re-establishing the KP&f supplemental actuarial liability at december 31, 2002. The additional unfunded actuarial liability as of december 31, 2000 for the state/school and local groups not recognized in the prior valuation due to the phase-in of the change in actuarial procedures is included.
3) Change in asset valuation method.
80
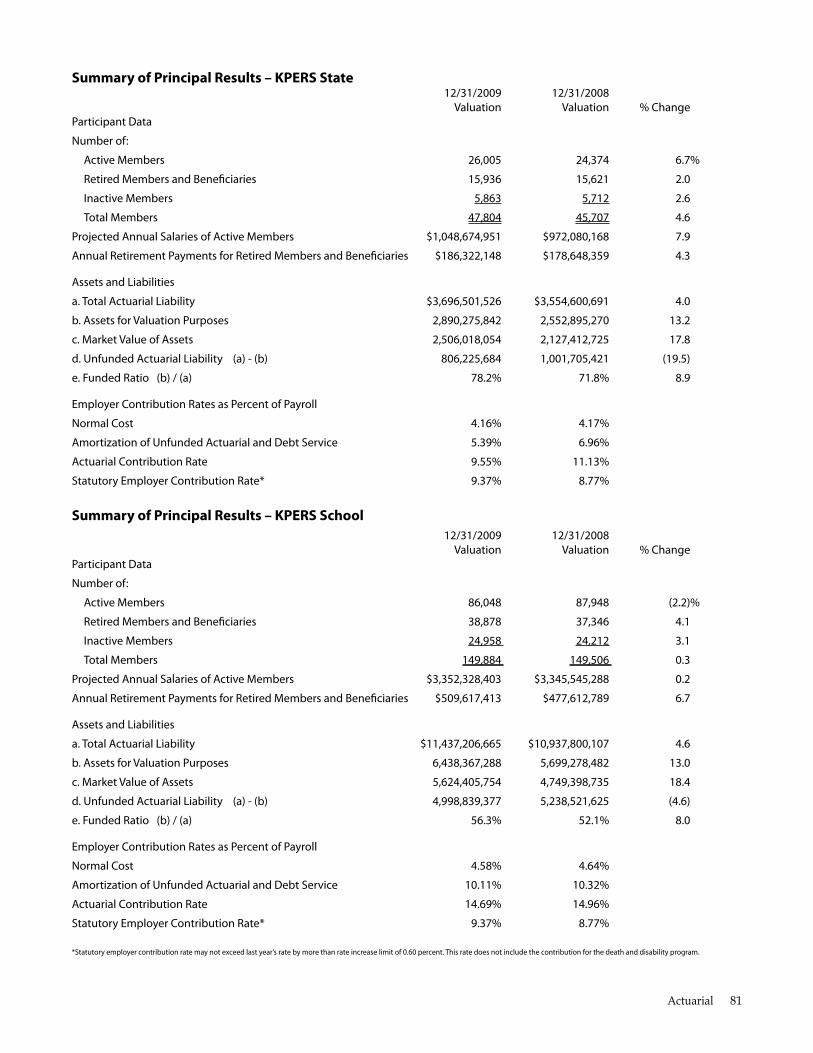
Summary of Principal Results – KPERS State 12/31/2009 12/31/2008
valuation valuation % Change Participant data
number of:
active Members 26,005 24,374 6.7%
retired Members and benefciaries 15,936 15,621 2.0
Inactive Members 5,863 5,712 2.6
Total Members 47,804 45,707 4.6
Projected annual salaries of active Members $1,048,674,951 $972,080,168 7.9
annual retirement Payments for retired Members and benefciaries $186,322,148 $178,648,359 4.3
assets and liabilities
a. Total actuarial liability $3,696,501,526 $3,554,600,691 4.0
b. assets for valuation Purposes 2,890,275,842 2,552,895,270 13.2
c. Market value of assets 2,506,018,054 2,127,412,725 17.8
d. unfunded actuarial liability (a) - (b) 806,225,684 1,001,705,421 (19.5)
e. funded ratio (b) / (a) 78.2% 71.8% 8.9
employer Contribution rates as Percent of Payroll
normal Cost 4.16% 4.17%
amortization of unfunded actuarial and debt service 5.39% 6.96%
actuarial Contribution rate 9.55% 11.13%
statutory employer Contribution rate* 9.37% 8.77%
Summary of Principal Results – KPERS School 12/31/2009 12/31/2008
valuation valuation % Change Participant data
number of:
active Members 86,048 87,948 (2.2)%
retired Members and benefciaries 38,878 37,346 4.1
Inactive Members 24,958 24,212 3.1
Total Members 149,884 149,506 0.3
Projected annual salaries of active Members $3,352,328,403 $3,345,545,288 0.2
annual retirement Payments for retired Members and benefciaries $509,617,413 $477,612,789 6.7
assets and liabilities
a. Total actuarial liability $11,437,206,665 $10,937,800,107 4.6
b. assets for valuation Purposes 6,438,367,288 5,699,278,482 13.0
c. Market value of assets 5,624,405,754 4,749,398,735 18.4
d. unfunded actuarial liability (a) - (b) 4,998,839,377 5,238,521,625 (4.6)
e. funded ratio (b) / (a) 56.3% 52.1% 8.0
employer Contribution rates as Percent of Payroll
normal Cost 4.58% 4.64%
amortization of unfunded actuarial and debt service 10.11% 10.32%
actuarial Contribution rate 14.69% 14.96%
statutory employer Contribution rate* 9.37% 8.77%
*statutory employer contribution rate may not exceed last year’s rate by more than rate increase limit of 0.60 percent. This rate does not include the contribution for the death and disability program.
Actuarial 81
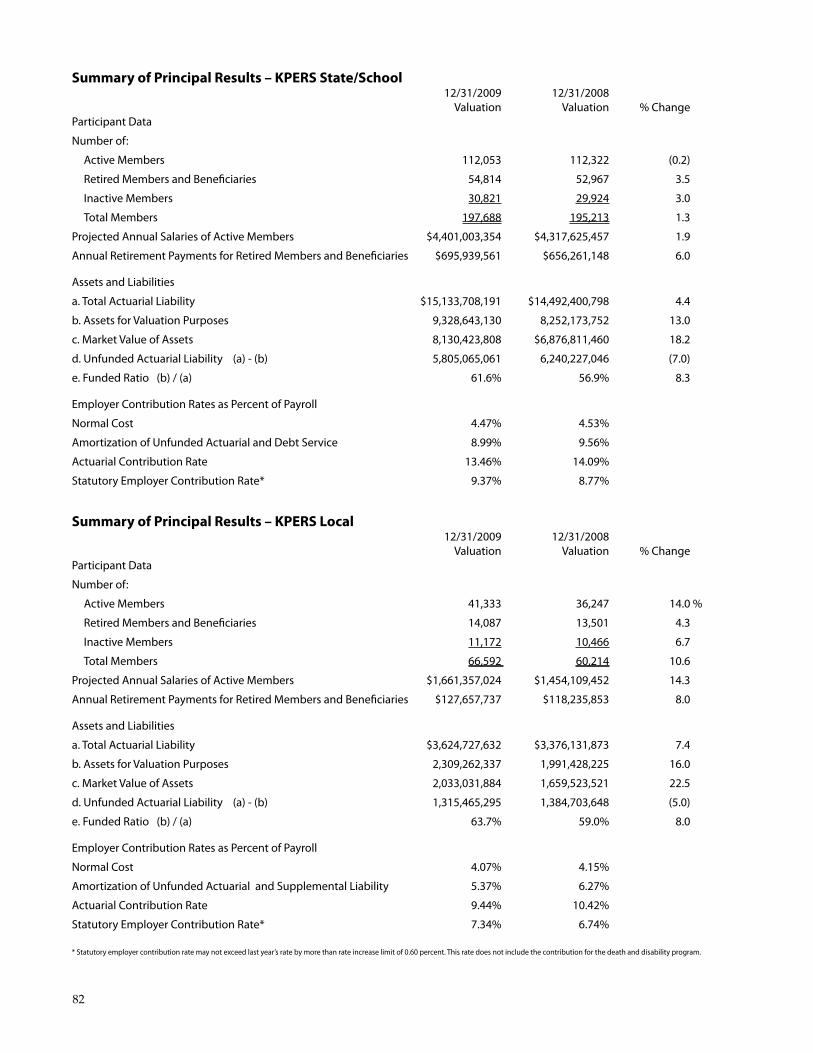
Summary of Principal Results – KPERS State/School 12/31/2009 12/31/2008
valuation valuation % Change Participant data
number of:
active Members 112,053 112,322 (0.2)
retired Members and benefciaries 54,814 52,967 3.5
Inactive Members 30,821 29,924 3.0
Total Members 197,688 195,213 1.3
Projected annual salaries of active Members $4,401,003,354 $4,317,625,457 1.9
annual retirement Payments for retired Members and benefciaries $695,939,561 $656,261,148 6.0
assets and liabilities
a. Total actuarial liability $15,133,708,191 $14,492,400,798 4.4
b. assets for valuation Purposes 9,328,643,130 8,252,173,752 13.0
c. Market value of assets 8,130,423,808 $6,876,811,460 18.2
d. unfunded actuarial liability (a) - (b) 5,805,065,061 6,240,227,046 (7.0)
e. funded ratio (b) / (a) 61.6% 56.9% 8.3
employer Contribution rates as Percent of Payroll
normal Cost 4.47% 4.53%
amortization of unfunded actuarial and debt service 8.99% 9.56%
actuarial Contribution rate 13.46% 14.09%
statutory employer Contribution rate* 9.37% 8.77%
Summary of Principal Results – KPERS Local 12/31/2009 12/31/2008
valuation valuation % Change Participant data
number of:
active Members 41,333 36,247 14.0 %
retired Members and benefciaries 14,087 13,501 4.3
Inactive Members 11,172 10,466 6.7
Total Members 66,592 60,214 10.6
Projected annual salaries of active Members $1,661,357,024 $1,454,109,452 14.3
annual retirement Payments for retired Members and benefciaries $127,657,737 $118,235,853 8.0
assets and liabilities
a. Total actuarial liability $3,624,727,632 $3,376,131,873 7.4
b. assets for valuation Purposes 2,309,262,337 1,991,428,225 16.0
c. Market value of assets 2,033,031,884 1,659,523,521 22.5
d. unfunded actuarial liability (a) - (b) 1,315,465,295 1,384,703,648 (5.0)
e. funded ratio (b) / (a) 63.7% 59.0% 8.0
employer Contribution rates as Percent of Payroll
normal Cost 4.07% 4.15%
amortization of unfunded actuarial and supplemental liability 5.37% 6.27%
actuarial Contribution rate 9.44% 10.42%
statutory employer Contribution rate* 7.34% 6.74%
* statutory employer contribution rate may not exceed last year’s rate by more than rate increase limit of 0.60 percent. This rate does not include the contribution for the death and disability program.
82
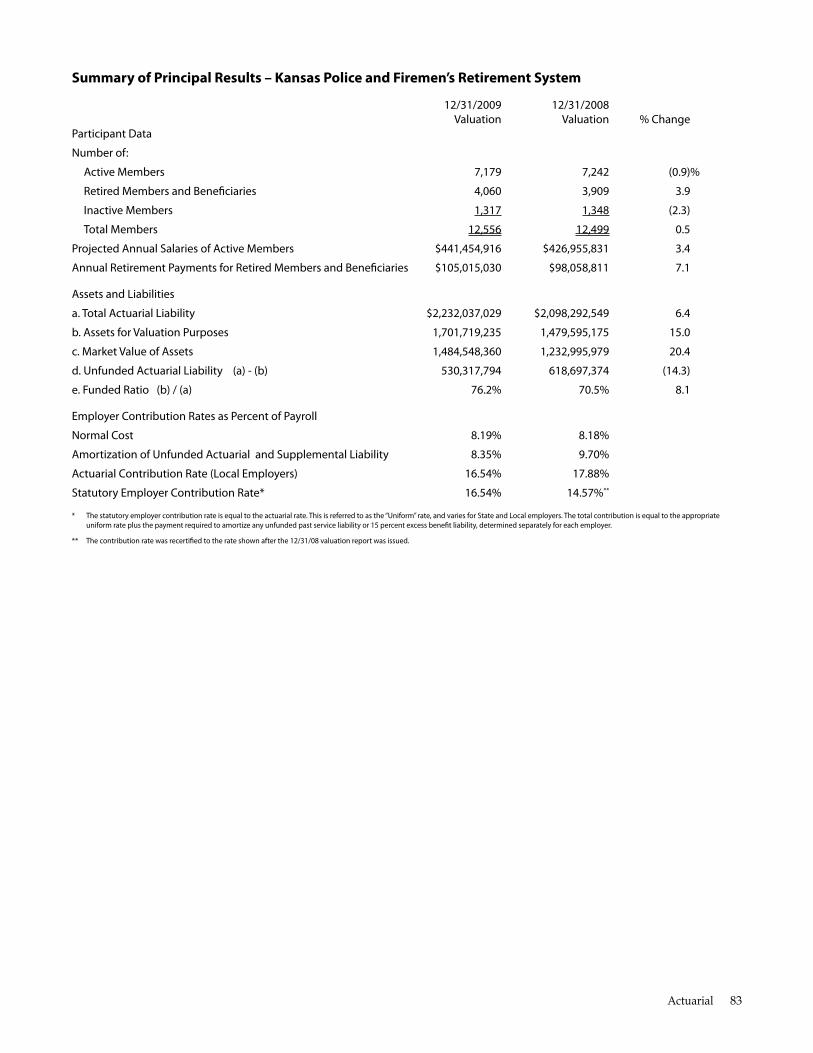
Summary of Principal Results – Kansas Police and Firemen’s Retirement System
12/31/2009 12/31/2008 valuation valuation % Change
Participant data
number of:
active Members 7,179 7,242 (0.9)%
retired Members and benefciaries 4,060 3,909 3.9
Inactive Members 1,317 1,348 (2.3)
Total Members 12,556 12,499 0.5
Projected annual salaries of active Members $441,454,916 $426,955,831 3.4
annual retirement Payments for retired Members and benefciaries $105,015,030 $98,058,811 7.1
assets and liabilities
a. Total actuarial liability $2,232,037,029 $2,098,292,549 6.4
b. assets for valuation Purposes 1,701,719,235 1,479,595,175 15.0
c. Market value of assets 1,484,548,360 1,232,995,979 20.4
d. unfunded actuarial liability (a) - (b) 530,317,794 618,697,374 (14.3)
e. funded ratio (b) / (a) 76.2% 70.5% 8.1
employer Contribution rates as Percent of Payroll
normal Cost 8.19% 8.18%
amortization of unfunded actuarial and supplemental liability 8.35% 9.70%
actuarial Contribution rate (local employers) 16.54% 17.88%
statutory employer Contribution rate* 16.54% 14.57%**
* The statutory employer contribution rate is equal to the actuarial rate. This is referred to as the “uniform” rate, and varies for state and local employers. The total contribution is equal to the appropriate uniform rate plus the payment required to amortize any unfunded past service liability or 15 percent excess beneft liability, determined separately for each employer.
** The contribution rate was recertifed to the rate shown after the 12/31/08 valuation report was issued.
Actuarial 83
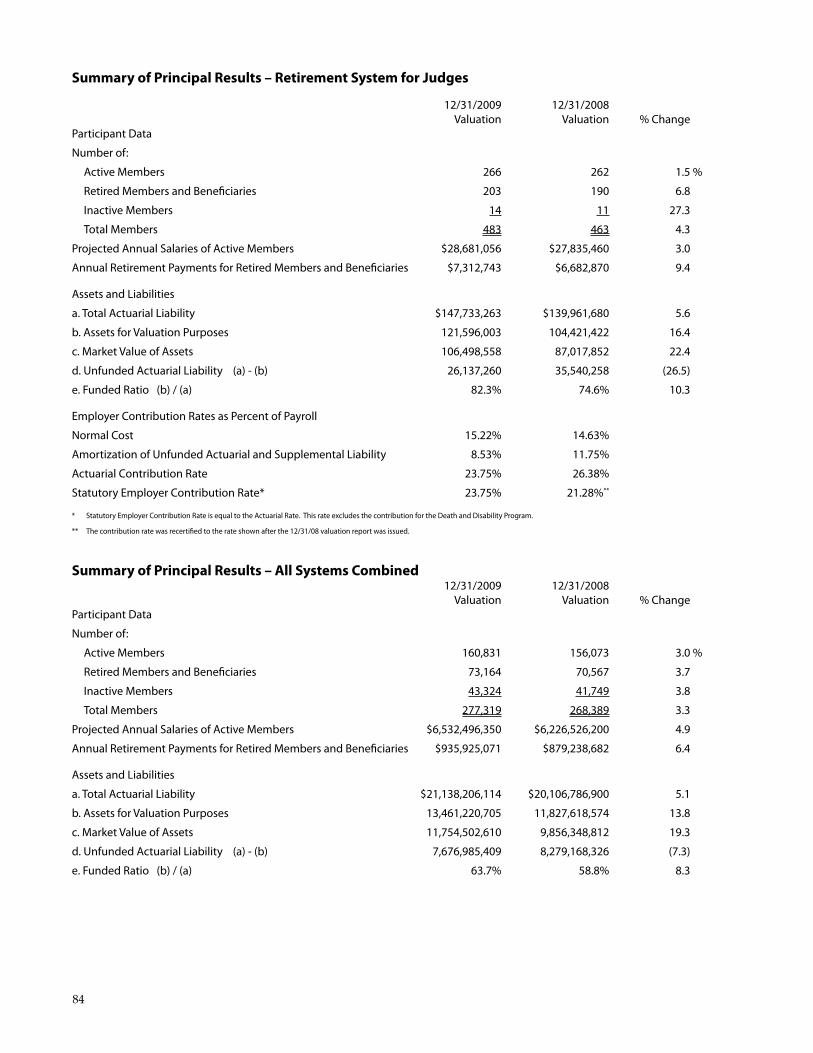
Summary of Principal Results – Retirement System for Judges
12/31/2009 12/31/2008 valuation valuation % Change
Participant data
number of:
active Members 266 262 1.5 %
retired Members and benefciaries 203 190 6.8
Inactive Members 14 11 27.3
Total Members 483 463 4.3
Projected annual salaries of active Members $28,681,056 $27,835,460 3.0
annual retirement Payments for retired Members and benefciaries $7,312,743 $6,682,870 9.4
assets and liabilities
a. Total actuarial liability $147,733,263 $139,961,680 5.6
b. assets for valuation Purposes 121,596,003 104,421,422 16.4
c. Market value of assets 106,498,558 87,017,852 22.4
d. unfunded actuarial liability (a) - (b) 26,137,260 35,540,258 (26.5)
e. funded ratio (b) / (a) 82.3% 74.6% 10.3
employer Contribution rates as Percent of Payroll
normal Cost 15.22% 14.63%
amortization of unfunded actuarial and supplemental liability 8.53% 11.75%
actuarial Contribution rate 23.75% 26.38%
statutory employer Contribution rate* 23.75% 21.28%**
* statutory employer Contribution rate is equal to the actuarial rate. This rate excludes the contribution for the death and disability Program.
** The contribution rate was recertifed to the rate shown after the 12/31/08 valuation report was issued.
Summary of Principal Results – All Systems Combined 12/31/2009 12/31/2008
valuation valuation % Change Participant data
number of:
active Members 160,831 156,073 3.0 %
retired Members and benefciaries 73,164 70,567 3.7
Inactive Members 43,324 41,749 3.8
Total Members 277,319 268,389 3.3
Projected annual salaries of active Members $6,532,496,350 $6,226,526,200 4.9
annual retirement Payments for retired Members and benefciaries $935,925,071 $879,238,682 6.4
assets and liabilities
a. Total actuarial liability $21,138,206,114 $20,106,786,900 5.1
b. assets for valuation Purposes 13,461,220,705 11,827,618,574 13.8
c. Market value of assets 11,754,502,610 9,856,348,812 19.3
d. unfunded actuarial liability (a) - (b) 7,676,985,409 8,279,168,326 (7.3)
e. funded ratio (b) / (a) 63.7% 58.8% 8.3
84
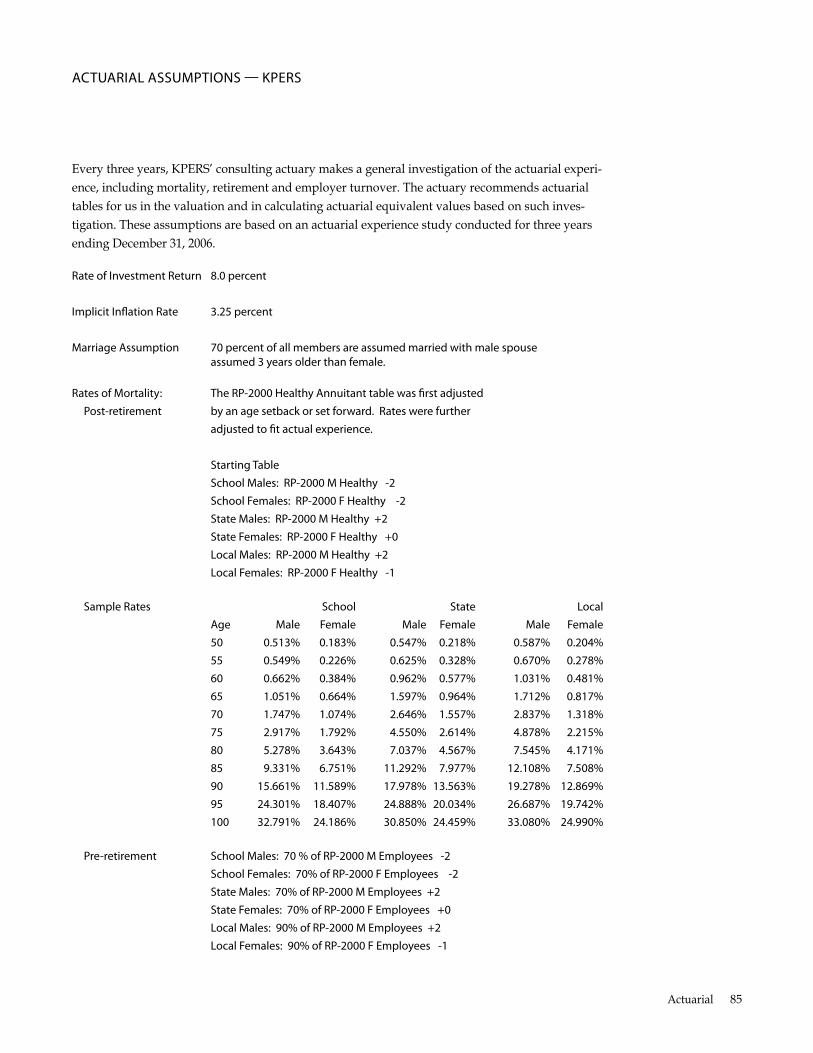
aCTuarIal assuMPTIons — KPers
Every three years, KPERS’ consulting actuary makes a general investigation of the actuarial experi-ence, including mortality, retirement and employer turnover. The actuary recommends actuarial tables for us in the valuation and in calculating actuarial equivalent values based on such inves-tigation. These assumptions are based on an actuarial experience study conducted for three years ending December 31, 2006.
rate of Investment return 8.0 percent
Implicit Infation rate 3.25 percent
Marriage assumption 70 percent of all members are assumed married with male spouse assumed 3 years older than female.
rates of Mortality: The rP-2000 Healthy annuitant table was frst adjusted Post-retirement by an age setback or set forward. rates were further
adjusted to ft actual experience.
starting Table school Males: rP-2000 M Healthy -2 school females: rP-2000 f Healthy -2 state Males: rP-2000 M Healthy +2 state females: rP-2000 f Healthy +0 local Males: rP-2000 M Healthy +2 local females: rP-2000 f Healthy -1
sample rates school state local age Male female Male female Male female 50 0.513% 0.183% 0.547% 0.218% 0.587% 0.204% 55 0.549% 0.226% 0.625% 0.328% 0.670% 0.278% 60 0.662% 0.384% 0.962% 0.577% 1.031% 0.481% 65 1.051% 0.664% 1.597% 0.964% 1.712% 0.817% 70 1.747% 1.074% 2.646% 1.557% 2.837% 1.318% 75 2.917% 1.792% 4.550% 2.614% 4.878% 2.215% 80 5.278% 3.643% 7.037% 4.567% 7.545% 4.171% 85 9.331% 6.751% 11.292% 7.977% 12.108% 7.508% 90 15.661% 11.589% 17.978% 13.563% 19.278% 12.869% 95 24.301% 18.407% 24.888% 20.034% 26.687% 19.742% 100 32.791% 24.186% 30.850% 24.459% 33.080% 24.990%
Pre-retirement school Males: 70 % of rP-2000 M employees -2 school females: 70% of rP-2000 f employees -2 state Males: 70% of rP-2000 M employees +2 state females: 70% of rP-2000 f employees +0 local Males: 90% of rP-2000 M employees +2 local females: 90% of rP-2000 f employees -1
Actuarial 85
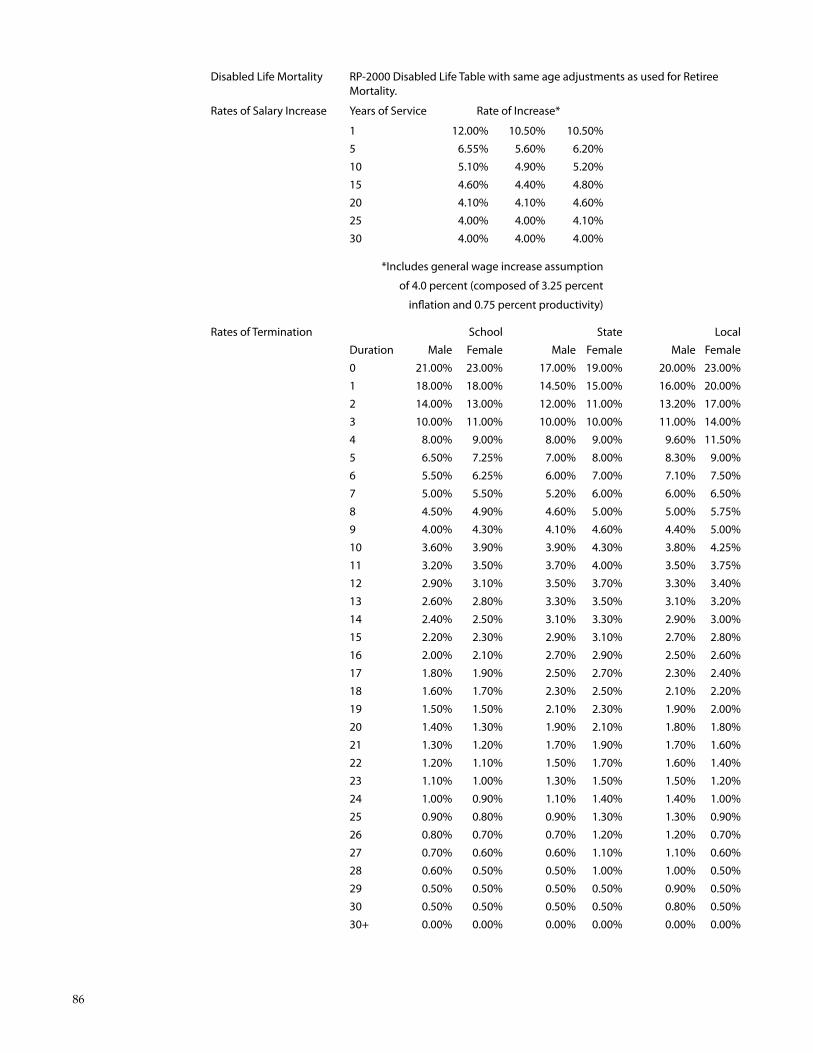
disabled life Mortality rP-2000 disabled life Table with same age adjustments as used for retiree Mortality.
rates of salary Increase years of service rate of Increase*
1 12.00% 10.50% 10.50% 5 6.55% 5.60% 6.20% 10 5.10% 4.90% 5.20% 15 4.60% 4.40% 4.80% 20 4.10% 4.10% 4.60% 25 4.00% 4.00% 4.10% 30 4.00% 4.00% 4.00%
*Includes general wage increase assumption
of 4.0 percent (composed of 3.25 percent
infation and 0.75 percent productivity)
rates of Termination school state local duration Male female Male female Male female 0 21.00% 23.00% 17.00% 19.00% 20.00% 23.00% 1 18.00% 18.00% 14.50% 15.00% 16.00% 20.00% 2 14.00% 13.00% 12.00% 11.00% 13.20% 17.00% 3 10.00% 11.00% 10.00% 10.00% 11.00% 14.00% 4 8.00% 9.00% 8.00% 9.00% 9.60% 11.50% 5 6.50% 7.25% 7.00% 8.00% 8.30% 9.00% 6 5.50% 6.25% 6.00% 7.00% 7.10% 7.50% 7 5.00% 5.50% 5.20% 6.00% 6.00% 6.50% 8 4.50% 4.90% 4.60% 5.00% 5.00% 5.75% 9 4.00% 4.30% 4.10% 4.60% 4.40% 5.00% 10 3.60% 3.90% 3.90% 4.30% 3.80% 4.25% 11 3.20% 3.50% 3.70% 4.00% 3.50% 3.75% 12 2.90% 3.10% 3.50% 3.70% 3.30% 3.40% 13 2.60% 2.80% 3.30% 3.50% 3.10% 3.20% 14 2.40% 2.50% 3.10% 3.30% 2.90% 3.00% 15 2.20% 2.30% 2.90% 3.10% 2.70% 2.80% 16 2.00% 2.10% 2.70% 2.90% 2.50% 2.60% 17 1.80% 1.90% 2.50% 2.70% 2.30% 2.40% 18 1.60% 1.70% 2.30% 2.50% 2.10% 2.20% 19 1.50% 1.50% 2.10% 2.30% 1.90% 2.00% 20 1.40% 1.30% 1.90% 2.10% 1.80% 1.80% 21 1.30% 1.20% 1.70% 1.90% 1.70% 1.60% 22 1.20% 1.10% 1.50% 1.70% 1.60% 1.40% 23 1.10% 1.00% 1.30% 1.50% 1.50% 1.20% 24 1.00% 0.90% 1.10% 1.40% 1.40% 1.00% 25 0.90% 0.80% 0.90% 1.30% 1.30% 0.90% 26 0.80% 0.70% 0.70% 1.20% 1.20% 0.70% 27 0.70% 0.60% 0.60% 1.10% 1.10% 0.60% 28 0.60% 0.50% 0.50% 1.00% 1.00% 0.50% 29 0.50% 0.50% 0.50% 0.50% 0.90% 0.50% 30 0.50% 0.50% 0.50% 0.50% 0.80% 0.50% 30+ 0.00% 0.00% 0.00% 0.00% 0.00% 0.00%
86
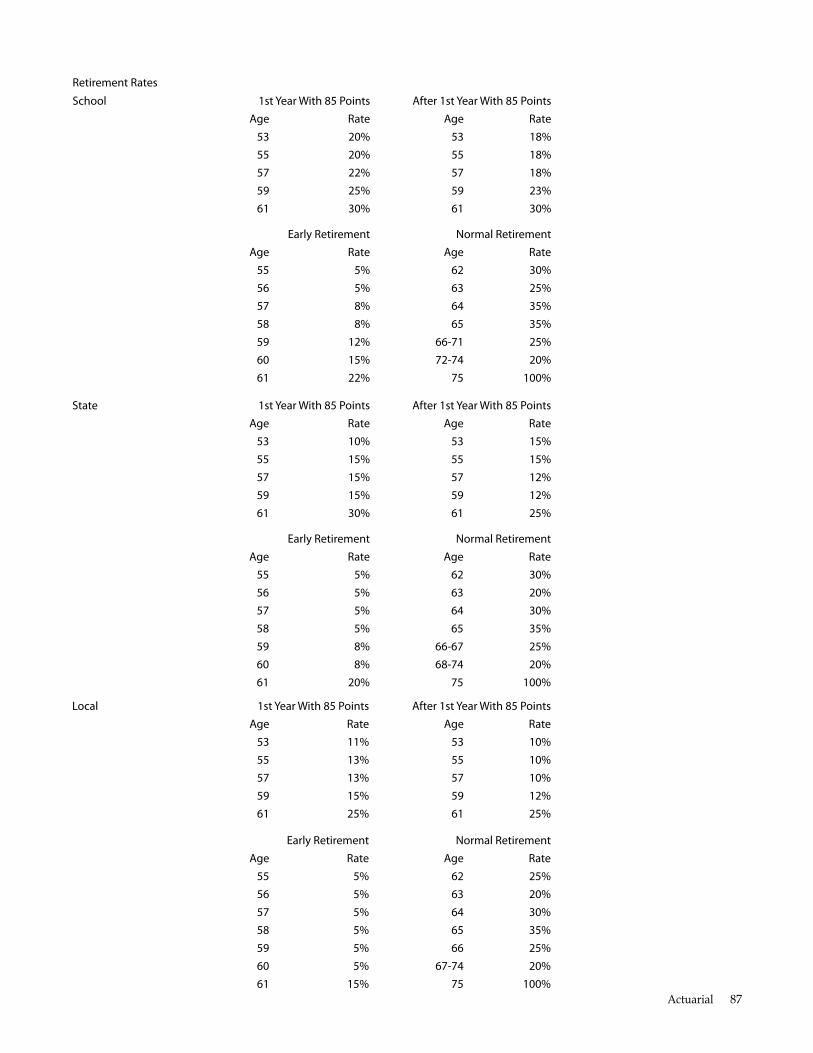
retirement rates
school 1st year With 85 Points after 1st year With 85 Points age rate age rate
53 20% 53 18% 55 20% 55 18% 57 22% 57 18% 59 25% 59 23% 61 30% 61 30%
early retirement normal retirement age rate age rate
55 5% 62 30% 56 5% 63 25% 57 8% 64 35% 58 8% 65 35% 59 12% 66-71 25% 60 15% 72-74 20% 61 22% 75 100%
state 1st year With 85 Points after 1st year With 85 Points age rate age rate
53 10% 53 15% 55 15% 55 15% 57 15% 57 12% 59 15% 59 12% 61 30% 61 25%
early retirement normal retirement age rate age rate
55 5% 62 30% 56 5% 63 20% 57 5% 64 30% 58 5% 65 35% 59 8% 66-67 25% 60 8% 68-74 20% 61 20% 75 100%
local 1st year With 85 Points after 1st year With 85 Points age rate age rate
53 11% 53 10% 55 13% 55 10% 57 13% 57 10% 59 15% 59 12% 61 25% 61 25%
early retirement normal retirement age rate age rate
55 5% 62 25% 56 5% 63 20% 57 5% 64 30% 58 5% 65 35% 59 5% 66 25% 60 5% 67-74 20% 61 15% 75 100%
Actuarial 87
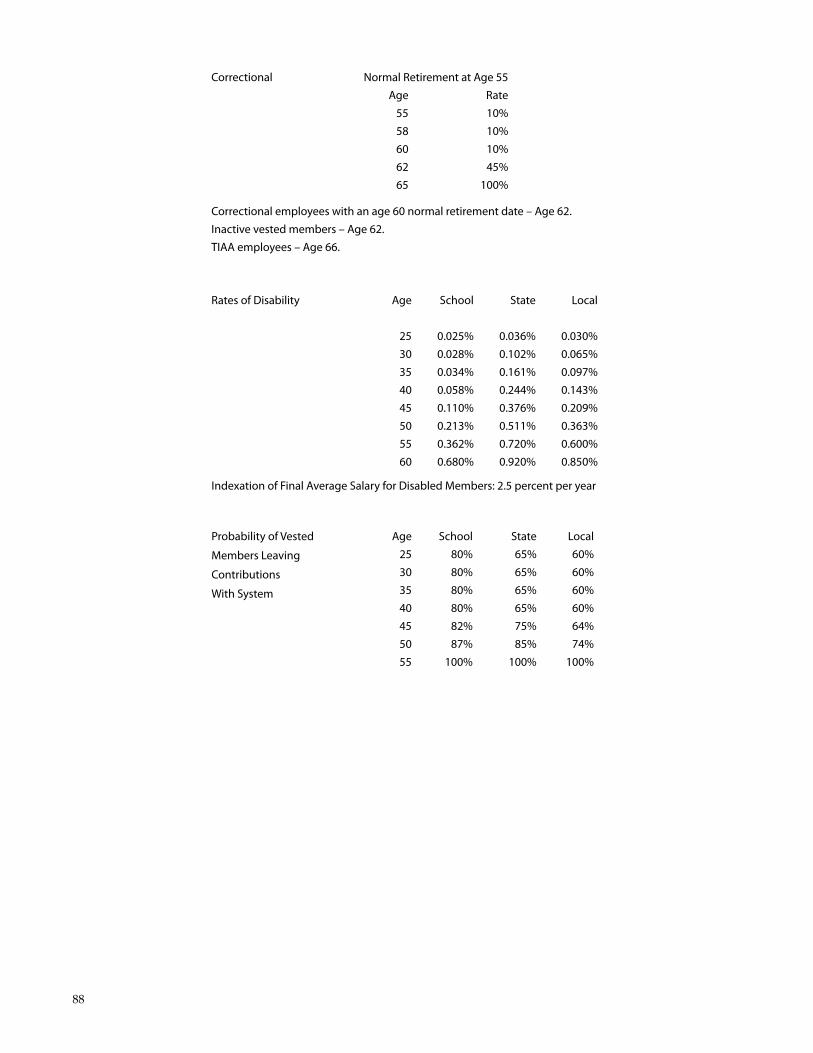
Correctional normal retirement at age 55 age rate
55 10% 58 10% 60 10% 62 45% 65 100%
Correctional employees with an age 60 normal retirement date – age 62. Inactive vested members – age 62. TIaa employees – age 66.
rates of disability age school state local
25 0.025% 0.036% 0.030% 30 0.028% 0.102% 0.065% 35 0.034% 0.161% 0.097% 40 0.058% 0.244% 0.143% 45 0.110% 0.376% 0.209% 50 0.213% 0.511% 0.363% 55 0.362% 0.720% 0.600% 60 0.680% 0.920% 0.850%
Indexation of final average salary for disabled Members: 2.5 percent per year
Probability of vested age school state local
Members leaving 25 80% 65% 60%
Contributions 30 80% 65% 60% 35 80% 65% 60%With system 40 80% 65% 60% 45 82% 75% 64% 50 87% 85% 74% 55 100% 100% 100%
88
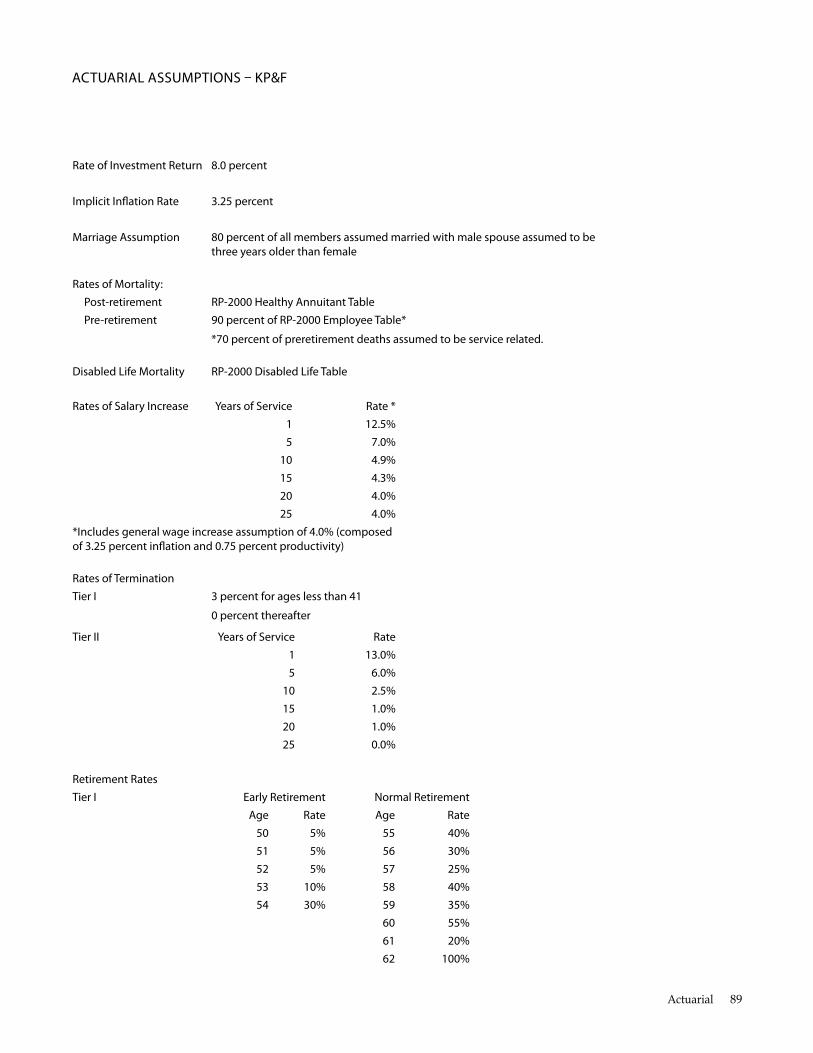
aCTuarIal assuMPTIons – KP&f
rate of Investment return 8.0 percent
Implicit Infation rate 3.25 percent
Marriage assumption 80 percent of all members assumed married with male spouse assumed to be three years older than female
rates of Mortality: Post-retirement rP-2000 Healthy annuitant Table Pre-retirement 90 percent of rP-2000 employee Table*
*70 percent of preretirement deaths assumed to be service related.
disabled life Mortality rP-2000 disabled life Table
rates of salary Increase years of service rate * 1 12.5% 5 7.0%
10 4.9% 15 4.3% 20 4.0% 25 4.0%
*Includes general wage increase assumption of 4.0% (composed of 3.25 percent infation and 0.75 percent productivity)
rates of Termination Tier I 3 percent for ages less than 41
0 percent thereafter
Tier II years of service rate 1 13.0% 5 6.0%
10 2.5% 15 1.0% 20 1.0% 25 0.0%
retirement rates Tier I early retirement normal retirement
age rate age rate 50 5% 55 40% 51 5% 56 30% 52 5% 57 25% 53 10% 58 40% 54 30% 59 35%
60 55% 61 20% 62 100%
Actuarial 89
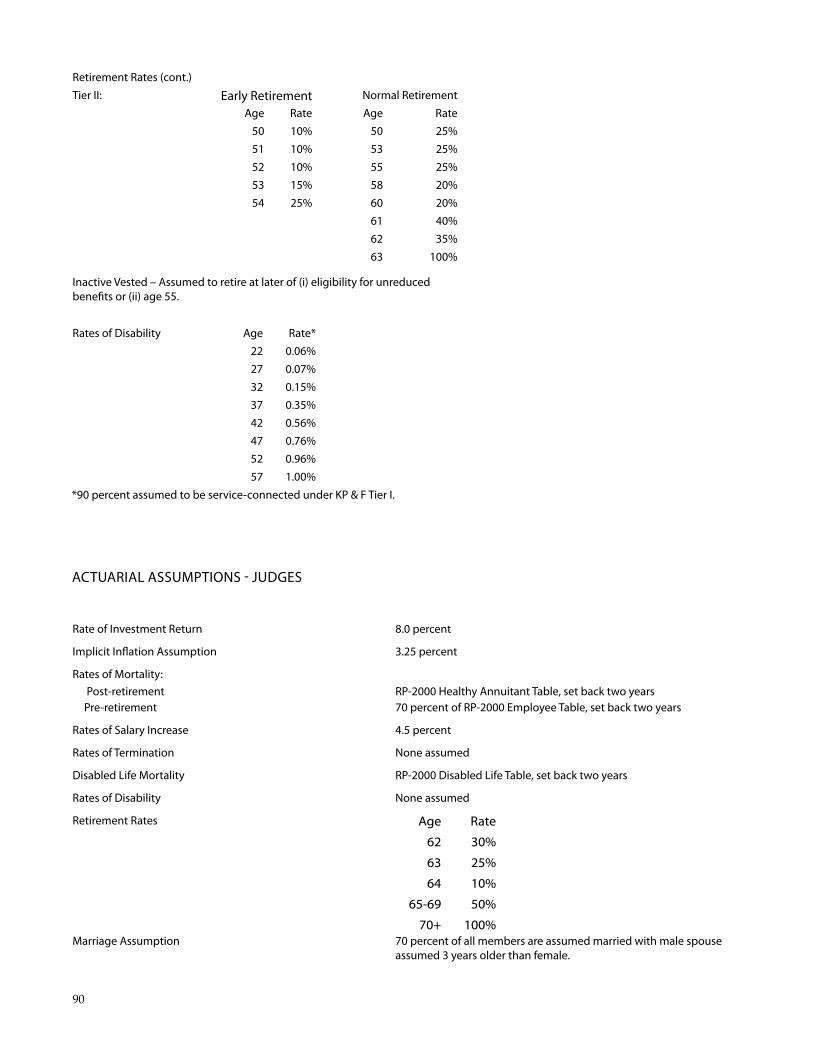
retirement rates (cont.) Tier II: early retirement normal retirement
age rate age rate 50 10% 50 25% 51 10% 53 25% 52 10% 55 25% 53 15% 58 20% 54 25% 60 20%
61 40% 62 35% 63 100%
Inactive vested – assumed to retire at later of (i) eligibility for unreduced benefts or (ii) age 55.
rates of disability age rate* 22 0.06% 27 0.07% 32 0.15% 37 0.35% 42 0.56% 47 0.76% 52 0.96% 57 1.00%
*90 percent assumed to be service-connected under KP & f Tier I.
aCTuarIal assuMPTIons - JudGes
rate of Investment return 8.0 percent
Implicit Infation assumption 3.25 percent
rates of Mortality: Post-retirement rP-2000 Healthy annuitant Table, set back two years Pre-retirement 70 percent of rP-2000 employee Table, set back two years
rates of salary Increase 4.5 percent
rates of Termination none assumed
disabled life Mortality rP-2000 disabled life Table, set back two years
rates of disability none assumed
retirement rates Age Rate
62 30%
63 25%
64 10%
65-69 50%
70+ 100% Marriage assumption 70 percent of all members are assumed married with male spouse
assumed 3 years older than female.
90
aCTuarIal MeTHods
Funding Method under the EAn cost method, the actuarial present value of each member’s projected benefits allocates on a level basis over the member’s compensation between the entry age of the member and the assumed exit ages. The portion of the actuarial present value allocated to the valuation year is called the normal cost. The actuarial present value of ben-efits allocated to prior years of service is called the actuarial liability. The unfunded actuarial liability represents the difference between the actuarial liability and the actuarial value of assets as of the valuation date. The unfunded actu-arial liability is calculated each year and reflects experience gains/losses.
There are several components of the unfunded actuarial liability which are amortized over different periods. The increase in the unfunded actuarial liability resulting from the 1998 cost-of-living adjustment is amortized over 15 years. The increase in the unfunded actuarial liability for Local employers resulting from 2003 legislation which made the 13th check for pre-July 2, 1987 retirees a permanent benefit is funded over a 10 year period beginning in 2005. The remain-der of the unfunded actuarial liability is amortized over a period originally set at 40 years beginning July 1, 1993.
The uAL is amortized as a level percentage of payroll for all groups except Judges, who use a level dollar payment. The payroll growth assumption is 4 percent so the annual amor-tization payments will increase 4 percent each year. As a result, if total payroll grows 4 percent per year, as assumed, the amortization payment will remain level as a percentage of total current payroll.
Asset Valuation Method For actuarial purposes, assets are valued using an asset smoothing method. The difference between the actual return and the expected return (based on the actuarial assumed rate of return) on the market value of assets is calculated each year and recognized equally over a five year period.
Plan ProvIsIons — overvIeW
nOTE: In the interest of simplicity, certain generalizations have been made. The law and the rules adopted by the Board of Trustees will control specific situations.
Membership The Kansas Public Employees Retirement System (the Retirement System, or the System), is a body corporate and an instrumentality of the State of Kansas. The Retirement System is an umbrella organization administering three statewide retirement systems: • Kansas Public Employees Retirement System (KPERS) • Kansas Police and Firemen’s Retirement System
(KP&F) • Kansas Retirement System for Judges (Judges)
All three systems are part of a qualified governmental, defined benefit, contributory plan covering substantially all public employees in Kansas. The Kansas Retirement System for Judges is a single employer plan, while the other two are cost-sharing, multi-employer plans. The State of Kansas is required to participate, but for local political subdivisions, participation is optional but irrevocable once elected. Cer-tain legislative employees also receive benefit payments.
Plan ProvIsIons — KPers (sTaTe, loCal and sCHool)
Employee Membership membership is mandatory for all employees in covered po-sitions, except elected officials. A covered position for non-school employees is one that is covered by Social Security, is not seasonal or temporary, and requires at least 1,000 hours of work per year. School employees who work at least 630 hours per year or 3.5 hours per day for 180 days are eligible for membership. Employees become members on their first day of employment in a KPERS-covered position. KPERS retirees may not become contributing members again.
Tier 1 members have Tier 1 coverage if they were employed before July 1, 2009, and were active, contributing members on that date.
Tier 2 members generally have Tier 2 coverage if they were first employed on or after July 1, 2009.
Board of Regents Plan Members (TIAA and equivalents) Board of Regents plan members (TIAA and equivalents) do not make contributions to KPERS. They receive prior service benefits for service before 1962. The benefit is 1 per-cent of final average salary (FAS) for each year of credited
Actuarial 91
prior service. Service after 1961 is counted for purposes of determining eligibility for vesting. These members are also covered by the KPERS Death and Disability Benefits Program.
Correctional Members Correctional employees, as certified to the Board of Trust-ees by the Secretary of Corrections, are defined in K.S.A. 74-4914a: a) Correctional officers
b) Certain directors and deputy directors of correctional institutions
c) Correctional power plant operators
d) Correctional industries employees
e) Correctional food service employees
f) Correctional maintenance employees
Tier 1 Correctional members: For groups (a) and (b) with at least three consecutive years of credited service in such positions immediately before retirement, normal retirement age is 55 and early retirement requirements are age 50 with ten years of credited service. For groups (c), (d), (e) and (f) with at least three consecutive years of service in such posi-tions immediately before retirement, normal retirement age is 60 and early retirement requirements are age 55 with ten years of credited service. Both groups are also eligible for full benefits when age and service equal 85 “points.”
Tier 2 Correctional members: For groups (a) and (b) with at least ten years of service including three years in such positions immediately before retirement, normal retirement age is 55 and early retirement age is 50. For groups (c), (d), (e) and (f) with at least ten years of service including three years in such positions immediately before retirement, nor-mal retirement age is 60 and early retirement age is 55.
Member Contributions Tier 1 members contribute 4 percent of their gross earnings; Tier 2 members contribute 6 percent. Interest is credited to members’ contribution accounts on June 30 each year, based on account balance as of the preceding December 31. Those who became members before July 1, 1993, earn 8 percent interest per year. Those who became members on and after July 1, 1993, earn 4 percent interest.
Employer Contributions Rates are certified by the Board of Trustees based on results of annual actuarial valuations; however, annual increases are capped by state statute.
Vesting Requirements A member vests with five years of credited service. Should the vested member end employment, the member must leave accumulated contributions on deposit with the Retire-ment System to be eligible for future benefits. If a vested member ends employment and withdraws accumulated contributions, the member loses all rights and privileges under the Retirement System. If a vested member who is married ends employment and wants to withdraw accu-mulated contributions, the member’s spouse must provide consent for the contribution withdrawal, since any benefits to which the spouse may have been entitled in the future would be lost as well. Retirement benefits are payable when the vested member reaches normal retirement age, or reduced benefits are payable when the vested member reaches a specified early retirement age.
Retirement Age and Service Requirements Tier 1 Eligibility
• Age 65 with one year of service
• Age 62 with ten years of credited service
• Any age when combined age and years of credited service equal 85 “points”
Tier 2 Eligibility
• Age 65 with five years of credited service
• Age 60 with 30 years of service
Age is determined by the member’s last birthday and is not rounded up.
Retirement Benefits
Benefits are based on the member’s years of credited ser-vice, FAS and a statutory multiplier. At retirement a mem-ber may receive a lump-sum payment of up to 50 percent of the actuarial present value of the member’s lifetime benefit. His or her monthly retirement benefit is then permanently reduced.
Tier 1 members may elect to receive 10, 20, 30, 40, or 50 percent of lifetime benefits in a lump sum. Tier 2 members may elect to receive 10, 20 or 30 percent of lifetime benefits in a lump sum.
92
Final Average Salary (FAS) Tier 1: For those hired on or after July 1, 1993, FAS is the average of their three highest years, excluding additional compensation, such as sick and annual leave.
For those who were hired before July 1, 1993, FAS is the greater of either a: • Four-year FAS including additional compensation,
such as sick and annual leave; or
• Three-year FAS excluding additional compensation, such as sick and annual leave.
Tier 2: FAS is an average of the five highest years of salary, excluding additional compensation, such as payments for unused sick and annual leave.
Participating service credit under both tiers is 1.75 percent of FAS. Prior service credit is 0.75 percent or 1 percent of FAS per year. School employees receive 0.75 percent FAS for each year of prior service that is not credited under the former Kansas School Retirement System (KSRS).
Early Retirement Eligibility is age 55 and ten years of credited service. The retirement benefit is reduced based on the member’s age at retirement.
Working After Retirement A member must wait 60 days after his or her retirement date before working for any employer who participates in KPERS. If a retired member then goes to work for an em-ployer he or she worked for during his or her last two years of KPERS participation, the member has a $20,000-per-year earnings limit.
For the three-year period from July 2009 through June 2012, the $20,000 annual earnings limit has been lifted for some licensed school members who return to work for the same employer. As a general rule, members must retire with full (i.e., not early) retirement benefits and must hold a licensed position when they return to work after retirement.
Withdrawal Benefit If members leave employment they can withdraw their account balance after 31 days. members lose any rights and benefits when they withdraw from KPERS, such as insur-ance coverage. members who return to covered employ-ment within five years will not have lost any membership
rights or privileges, if they haven’t withdrawn contribu-tions. The Retirement Act does not allow members to bor-row from contributions. The employer portion of contri-butions remains with the System when a member ends employment and withdraws contributions.
Disability Benefit KPERS Death and Disability Program provides disability income benefits, financed by employer contributions. A member must be totally disabled for 180 continuous days. Benefits accrue from the later of the 181st day of continuous disability or from the first day when compensation from the employer ceases. The current long-term disability benefit is 60 percent of the member’s annual compensation on the date disability begins, reduced by Social Security benefits (members must apply), workers’ compensation benefits and any other employment-related disability benefits. members disabled before January 1, 2006, receive a benefit based on two-thirds of their annual compensation on the date the disability began. The minimum monthly benefit is $100. members receiving disability benefits continue to receive service credit under KPERS and basic group life insurance coverage. members can also continue any optional insur-ance coverage. If a disabled member retires after receiving disability benefits for at least five years immediately before retirement, the member’s FAS is adjusted by statute.
Non-Service Connected Death Benefit The active member’s designated beneficiary receives the member’s account balance in a lump sum. If the member had reached age 55 with ten years of credited service and the spouse is the sole beneficiary, then the spouse may choose a lifetime benefit instead of receiving the returned contributions. If a member with ten or more years of service dies and was not of retirement age, and the spouse is the sole beneficiary, then the spouse can elect one of the survi-vor options at the time the member would have first been of retirement age.
Service-Connected Accidental Death Benefit The active member’s accumulated contributions plus inter-est, a $50,000 lump sum, and an annual benefit based on 50 percent of FAS (reduced by workers’ compensation benefits and subject to a minimum benefit of $100 a month) are payable to a spouse, minor children or dependent parents for life, or until the youngest child reaches age 18 (or up to age 23 if a full-time student), in this order of preference.
Actuarial 93
The monthly accidental death benefit is in lieu of any joint/
survivor benefit.
Basic Group Life Insurance for Active Members KPERS Death and Disability Program provides an insured death benefit equal to 150 percent of the active member’s annual compensation on the date of death. If a disabled member dies after receiving disability benefits for at least five years immediately before death, the member’s current annual rate of compensation is adjusted by statute.
Death Benefit for Retirees
The retiree’s beneficiary receives a $4,000 lump sum. The beneficiary may assign this benefit to a funeral establish-ment. The beneficiary for the $4,000 death benefit may be, but is not always, the same person as the member’s joint annuitant. A retiree may name a funeral establishment as beneficiary. If the member has selected a retirement option, benefits are paid to the joint annuitant or the designated beneficiary. under joint and survivor retirement options, if the joint annuitant dies before the retired member, the reduced benefit payment is increased to the amount the re-tired member would have received if no retirement option had been selected. Benefits payable to a joint annuitant stop at the joint annuitant’s death. If a member does not select an option, the designated beneficiary receives the excess, if any, of the member’s accumulated contributions, plus inter-est, over total benefits paid to date of death.
Plan ProvIsIons — KP&f
Employee Membership members have Tier I coverage if they were employed before July 1, 1989, and if they did not elect coverage under Tier II.
members have Tier II coverage if they were employed July 1, 1989, or later. This also includes members employed before July 1, 1989, who elected Tier II coverage.
Member Contributions members contribute 7 percent of their gross earnings. For members with 32 years service credit, the contribution rate is reduced to 2 percent of compensation. A few members employed before January 1, 1976, have contributions re-duced by their Social Security contributions, not including contributions for medicare. These members’ benefits are reduced by 50 percent of original Social Security benefits ac-cruing from employment with the participating employer.
Employer Contributions Rates are certified by the Board of Trustees based on results of annual actuarial valuations. KP&F employers contribute at the actuarially required rate.
Retirement Age and Service Requirements Tier I Eligibility
• Age 55 and 20 years of service
• Any age with 32 years of service
Tier II Eligibility
• Age 50 and 25 years of service
• Age 55 and 20 years of service
• Age 60 and 15 years of service
Benefits
Benefits are based on the member’s Final Average Salary (FAS) and years of service. At retirement a member may receive a lump-sum payment of up to 50 percent of the actuarial present value of the member’s lifetime benefit. His or her monthly retirement benefit is then permanently re-duced. Annual benefits at normal retirement age equal FAS x 2.5 percent x years of service (up to 32 years).
For those who were hired before July 1, 1993, FAS is the average of the highest three of the last five years of credited partici-pating service, including additional compensation, such as sick and annual leave.
For those who are hired on or after July 1, 1993, FAS is the aver-age of the highest three of the last five years of participating
service, excluding additional compensation, such as sick and annual leave.
Local Plan For members covered by local plan provisions on the em-ployer’s entry date, normal retirement is at age 50 with 22 years of credited service.
Working After Retirement A member must wait 30 days after his or her retirement date before working for any employer who participates in KP&F. If a retired member then goes to work for the same state agency or the same police or fire department he or she worked for during his or her last two years of KP&F partici-pation, the member has a $15,000-per-year earnings limit.
94

Early Retirement members must be at least age 50 and have 20 years of credited service. normal retirement benefits are reduced 0.4 percent per month under age 55.
Vesting Requirements Tier I Eligibility
The member must have 20 years of credited service; if end-ing employment, the member must leave contributions with the Retirement System to be eligible for future benefits.
Tier II Eligibility
The member must have 15 years of credited service to be considered vested. To draw a benefit before age 60, how-ever, the member must have 20 years of credited service. If ending employment, the member must leave contributions with the Retirement System to be eligible for future benefits.
Withdrawal Benefit If members leave employment before retirement they can withdraw their contributions, plus interest, after 30 days. When members withdraw from KP&F they lose any rights and benefits, such as insurance coverage.
If a married vested member ends employment and wants to withdraw accumulated contributions, the member’s spouse must consent to the withdrawal, since any of the spouse’s future benefits will be forfeited as well. members who return to covered employment within five years will not lose any membership rights or privileges if they haven’t withdrawn contributions. The Retirement Act does not al-low members to borrow from contributions. The employer contributions remain with the System when a member ends employment and withdraws. The Retirement System will refund contributions only after all contributions have been reported by the member’s former employer.
Disability Benefits for Tier I Members
Service-Connected Disability
There is no age or service requirement to be eligible for this benefit. A member receives a pension equal to the higher of 50 percent of FAS or 2.5 percent for each year, plus 10 per-cent of FAS for each dependent child under age 18 (or up to age 23 for full-time students), to a maximum of 75 percent of FAS. If dependent benefits aren’t payable, the benefit is 2.5 percent for each year, to a maximum of 80 percent of FAS. When a member receiving service-connected disability benefits dies, the spouse and dependent children receive
service-connected death benefits if the member dies within two years of retirement or after two years from the same service-connected cause. If service-connected death benefits aren’t payable, the spouse receives a lump-sum payment of 50 percent of the member’s FAS. Also, either the spouse or the dependent children receive a pension of half of the member’s benefit.
non Service-Connected Disability
This pension is calculated at 2.5 percent of FAS per year of service, to a maximum benefit of 80 percent of FAS (minimum benefit is 25 percent of FAS). When a member receiving non-service-connected disability benefits dies, the surviving spouse receives a lump-sum payment of 50 percent of FAS. Also, either the spouse or the dependent children receive a pension of half of the member’s benefit.
Disability Benefits for Tier II Members
There is no distinction between service-connected and non-service-connected disability benefits. Disability benefits equal 50 percent of FAS. Service credit is granted during the disability period. Disability benefits convert to age and service retirement as soon as the member is eligible for full retirement benefits. If the member is disabled for at least five years immediately before retirement, the member’s FAS is adjusted by statute.
Service Connected Death Benefit There is no age or service requirement, and a pension of 50 percent of FAS goes to the spouse, plus 10 percent of FAS goes to each dependent child under age 18 [or up to age 23 if full time student(s)], to a maximum of 75 percent of FAS.
non-Service-Connected Death
A lump sum of 100 percent of FAS goes to the spouse; and a pension of 2.5 percent of FAS per year of service (to a maximum of 50 percent) is payable to the spouse. If there is no spouse, the monthly benefit is paid to the dependent children. If there is no surviving spouse or children the lump-sum payment less refundable contributions and inter-est is paid to the beneficiary.
Death Benefit for Inactive Members
If an inactive member with 20 or more years of service dies and was not of retirement age, and the spouse is the sole beneficiary, then the spouse can elect one of the survivor options at the time the member would have first been of retirement age. If an inactive member is eligible to retire
Actuarial 95
when he or she dies, and the spouse is the sole beneficiary, the spouse may elect to receive benefits as a joint annuitant under any option instead of receiving the member’s contri-butions.
Death Benefit for Retirees
The retiree’s beneficiary receives a $4,000 lump sum. The beneficiary may assign this benefit to a funeral establish-ment. A retiree may also directly name a funeral establish-ment as beneficiary. If the member had selected an option with survivor benefits, benefits are paid to the joint annui-tant or to the member’s designated beneficiary.
under joint and survivor retirement options, if the joint an-nuitant dies before the retired member, the reduced benefit payment is increased to the amount the retired member would have received if no retirement option had been se-lected. Benefits payable to a joint annuitant stops at the joint annuitant’s death. If a member does not select an option, the designated beneficiary receives the excess, if any, of the member’s accumulated contributions, plus interest, over total benefits paid to date of death.
The surviving spouse of a transfer member (who was covered by a local plan on the employer’s entry date, who dies after retirement, and who had not elected a retirement benefit option), receives a lump-sum payment of 50 percent of FAS. Also, 75 percent of the member’s benefit is payable either to the spouse or to dependent children.
Plan ProvIsIons — JudGes
Member Contributions Judges contribute 6 percent of gross earnings. When an ac-tive member reaches the maximum retirement benefit level of 70 percent of FAS, the contribution rate is reduced to 2 percent.
Employer Contributions Rates are certified by the Board of Trustees, based on results of annual actuarial valuations. The State of Kansas makes employer contributions at the actuarially required rate.
Vesting Requirements Judges vest when appointed. There is no minimum service requirement. However, if ending employment, the member must leave contributions on deposit with the Retirement System in order to be eligible for future benefits. Eligible
judges who have service credited under KPERS have vested benefits under both KPERS and the Retirement System for Judges when the combined total credited service equals ten years.
Retirement Age and Service Requirements • Age 65 with one year of service
• Age 62 with ten years of credited service
• Any age when combined age and years of credited service equal 85 “points”
Age is determined by the member’s last birthday and is not rounded up.
Retirement Benefit The benefit is based on the member’s Final Average Salary (FAS), which is the average of the three highest years of of the last ten years of service as a judge. At retirement a mem-ber may receive a lump-sum payment of up to 50 percent of the actuarial present value of the member’s lifetime benefit. His or her monthly retirement benefit is then permanently reduced.
The basic formula for those who were members before July 1, 1987, is 5 percent of FAS for each year of service up to ten
years, plus 3.5 percent for each additional year, to a maxi-mum of 70 percent of FAS. For those who became members on or after July 1, 1987, the formula is 3.5 percent for each year, to a maximum benefit of 70 percent of FAS.
All judges, other than Supreme Court justices, must retire at the end of the term in which they reach age 75. Supreme Court justices must retire at the end of the term in which they reach age 70.
Early Retirement A member must be age 55 and have ten years of credited service to take early retirement. The retirement benefit is reduced 0.2 percent per month if the member is from age 60 to age 62, plus 0.6 percent per month if the member is from age 55 to age 60. normal benefit accrued at termination is payable at age 62 or in a reduced amount at age 55, provid-ed the member has ten years of service credit. Otherwise, benefits are not payable until age 65.
Working After Retirement Retired judges may enter into an agreement to work for up to 104 days at 25 percent of the current salary of a judge.
96
The agreement is for two years and may be renewed for up to 12 years. Retirement benefits will be suspended in any case where a retired judge is elected or appointed to a judgeship. The judge in that case resumes active participa-tion and will accrue additional service credit. When the judge retires again, the retirement benefit is recalculated.
Disability Benefits
These benefits are payable if a member is defined as perma-nently physically or mentally disabled. The disability ben-efit, payable until age 65, is 3.5 percent of FAS for each year of service. The minimum benefit is 50 percent of FAS. Ben-efits are recalculated when the member reaches retirement age. If a judge is disabled for at least five years immediately before retirement, the judge’s FAS is adjusted by statute.
Withdrawal Benefit If members leave employment they can withdraw their contributions, plus interest, after 30 days. When members withdraw from KPERS they lose any rights and benefits, such as insurance coverage. members who return to cov-ered employment within five years will not have lost any membership rights or privileges, if they haven’t withdrawn contributions. The Retirement Act does not allow members to borrow from contributions. The employer portion of con-tributions remains with the System when a member ends employment and withdraws contributions. KPERS will refund contributions only after all contributions have been reported by the member’s former employer.
Death Benefit for Active Members
A lump-sum insured death benefit equal to 150 percent of the active member’s annual compensation on the date of the member’s death is payable; plus a refund of the mem-ber’s accumulated contributions. In lieu of receiving the member’s accumulated contributions, the surviving spouse of a member who is eligible to retire at death, may elect to receive benefits under any survivor benefit option. The spouse must be the member’s sole designated beneficiary to exercise this option. If the member had at least ten years of credited service, but hadn’t reached retirement age at the time of death, the spouse may elect a monthly benefit to begin on the date the member first would have been eligible to retire.
Death Benefit for Retirees
The retiree’s beneficiary receives a $4,000 lump sum. The beneficiary may assign this benefit to a funeral establish-
ment. A retiree may also directly name a funeral establish-ment as beneficiary. If the member had selected an option with survivor benefits, benefits are paid to the joint annui-tant or to the member’s designated beneficiary. under joint and survivor retirement options, if the joint annuitant dies before the retired member, the reduced benefit payment is increased to the amount the retired member would have received if no retirement option had been selected. Benefits payable to a joint annuitant stop when the joint annuitant dies. If the member did not select an option, the designated beneficiary receives the excess, if any, of the member’s ac-cumulated contributions, plus interest, over total benefits paid to date of death.
Actuarial 97
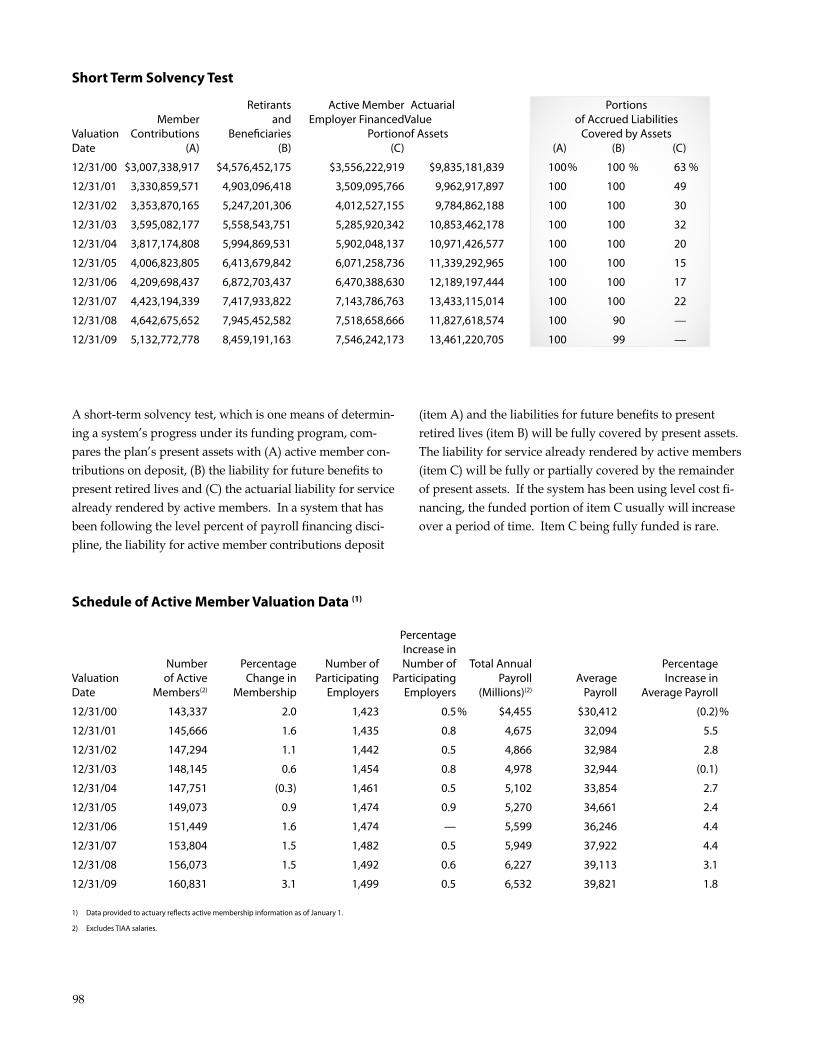
Short Term Solvency Test
retirants active Member actuarial Portions Member and employer financedvalue of accrued liabilities
valuation Contributions benefciaries Portionof assets Covered by assets date (a) (b) (C) (a) (b) (C)
12/31/00 $3,007,338,917 $4,576,452,175 $3,556,222,919 $9,835,181,839 100% 100 % 63 %
12/31/01 3,330,859,571 4,903,096,418 3,509,095,766 9,962,917,897 100 100 49
12/31/02 3,353,870,165 5,247,201,306 4,012,527,155 9,784,862,188 100 100 30
12/31/03 3,595,082,177 5,558,543,751 5,285,920,342 10,853,462,178 100 100 32
12/31/04 3,817,174,808 5,994,869,531 5,902,048,137 10,971,426,577 100 100 20
12/31/05 4,006,823,805 6,413,679,842 6,071,258,736 11,339,292,965 100 100 15
12/31/06 4,209,698,437 6,872,703,437 6,470,388,630 12,189,197,444 100 100 17
12/31/07 4,423,194,339 7,417,933,822 7,143,786,763 13,433,115,014 100 100 22
12/31/08 4,642,675,652 7,945,452,582 7,518,658,666 11,827,618,574 100 90 —
12/31/09 5,132,772,778 8,459,191,163 7,546,242,173 13,461,220,705 100 99 —
A short-term solvency test, which is one means of determin- (item A) and the liabilities for future benefits to present ing a system’s progress under its funding program, com- retired lives (item B) will be fully covered by present assets. pares the plan’s present assets with (A) active member con- The liability for service already rendered by active members tributions on deposit, (B) the liability for future benefits to (item C) will be fully or partially covered by the remainder present retired lives and (C) the actuarial liability for service of present assets. If the system has been using level cost fi-already rendered by active members. In a system that has nancing, the funded portion of item C usually will increase been following the level percent of payroll financing disci- over a period of time. Item C being fully funded is rare. pline, the liability for active member contributions deposit
Schedule of Active Member Valuation Data (1)
Percentage Increase in
number Percentage number of number of Total annual Percentage valuation of active Change in Participating Participating Payroll average Increase in date Members(2) Membership employers employers (Millions)(2) Payroll average Payroll
12/31/00 143,337 2.0 1,423 0.5% $4,455 $30,412 (0.2)%
12/31/01 145,666 1.6 1,435 0.8 4,675 32,094 5.5
12/31/02 147,294 1.1 1,442 0.5 4,866 32,984 2.8
12/31/03 148,145 0.6 1,454 0.8 4,978 32,944 (0.1)
12/31/04 147,751 (0.3) 1,461 0.5 5,102 33,854 2.7
12/31/05 149,073 0.9 1,474 0.9 5,270 34,661 2.4
12/31/06 151,449 1.6 1,474 — 5,599 36,246 4.4
12/31/07 153,804 1.5 1,482 0.5 5,949 37,922 4.4
12/31/08 156,073 1.5 1,492 0.6 6,227 39,113 3.1
12/31/09 160,831 3.1 1,499 0.5 6,532 39,821 1.8
1) data provided to actuary refects active membership information as of January 1.
2) excludes TIaa salaries.
98
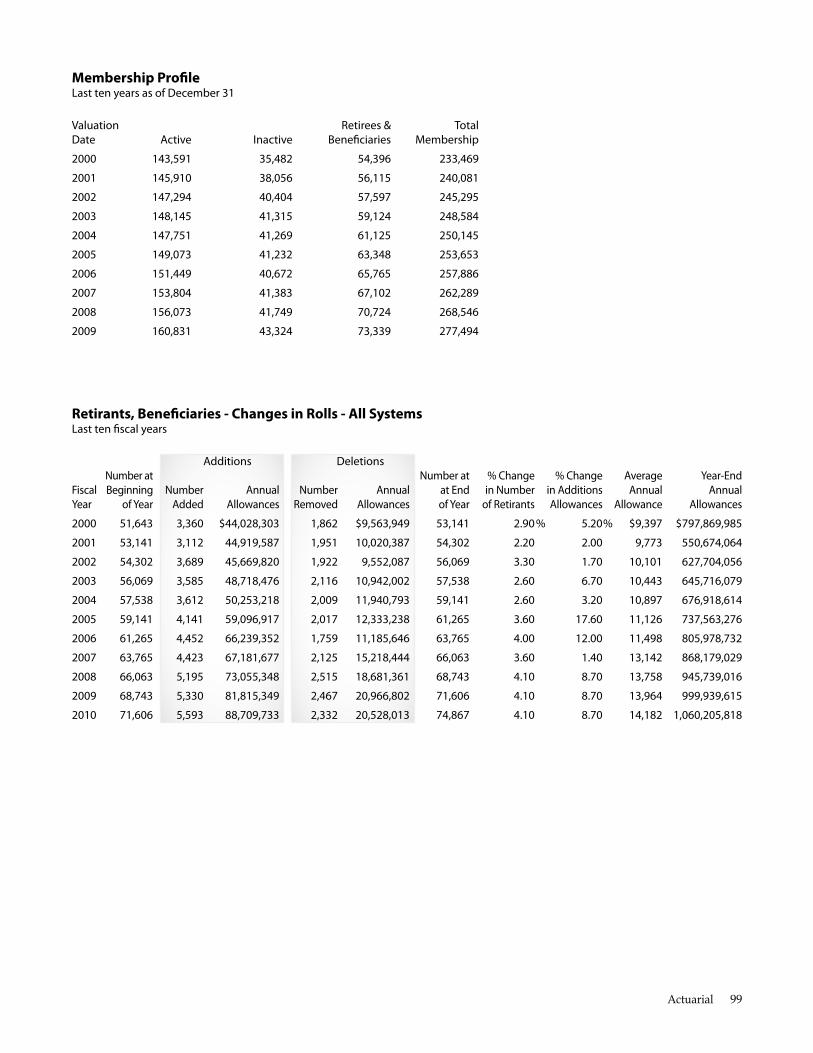
Membership Profle last ten years as of december 31
valuation retirees & Total date active Inactive benefciaries Membership
2000 143,591 35,482 54,396 233,469
2001 145,910 38,056 56,115 240,081
2002 147,294 40,404 57,597 245,295
2003 148,145 41,315 59,124 248,584
2004 147,751 41,269 61,125 250,145
2005 149,073 41,232 63,348 253,653
2006 151,449 40,672 65,765 257,886
2007 153,804 41,383 67,102 262,289
2008 156,073 41,749 70,724 268,546
2009 160,831 43,324 73,339 277,494
Retirants, Benefciaries - Changes in Rolls - All Systems last ten fscal years
number at additions deletions
number annual number annual added allowances removed allowances
3,360 $44,028,303 1,862 $9,563,949
3,112 44,919,587 1,951 10,020,387
3,689 45,669,820 1,922 9,552,087
3,585 48,718,476 2,116 10,942,002
3,612 50,253,218 2,009 11,940,793
4,141 59,096,917 2,017 12,333,238
4,452 66,239,352 1,759 11,185,646
4,423 67,181,677 2,125 15,218,444
5,195 73,055,348 2,515 18,681,361
5,330 81,815,349 2,467 20,966,802
5,593 88,709,733 2,332 20,528,013
number at % Change % Change average year-end fiscal beginning at end in number in additions annual annual year of year of year of retirants allowances allowance allowances
2000 51,643 53,141 2.90 % 5.20% $9,397 $797,869,985
2001 53,141 54,302 2.20 2.00 9,773 550,674,064
2002 54,302 56,069 3.30 1.70 10,101 627,704,056
2003 56,069 57,538 2.60 6.70 10,443 645,716,079
2004 57,538 59,141 2.60 3.20 10,897 676,918,614
2005 59,141 61,265 3.60 17.60 11,126 737,563,276
2006 61,265 63,765 4.00 12.00 11,498 805,978,732
2007 63,765 66,063 3.60 1.40 13,142 868,179,029
2008 66,063 68,743 4.10 8.70 13,758 945,739,016
2009 68,743 71,606 4.10 8.70 13,964 999,939,615
2010 71,606 74,867 4.10 8.70 14,182 1,060,205,818
Actuarial 99
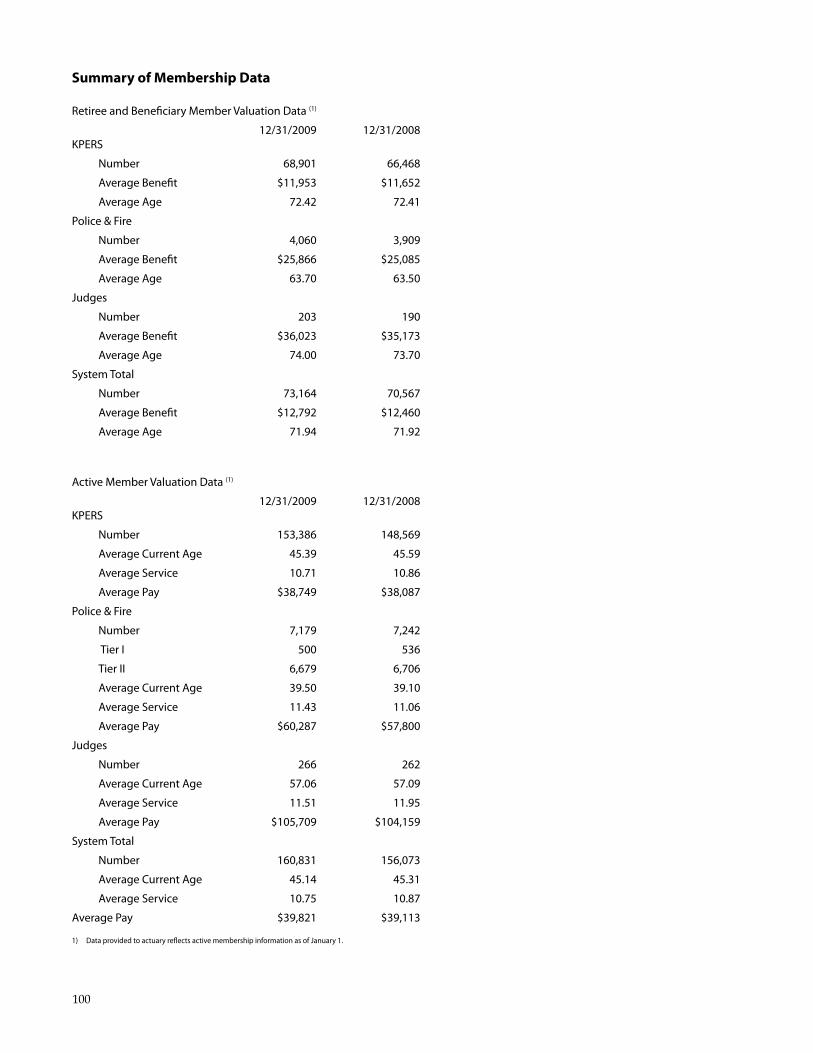
Summary of Membership Data
retiree and benefciary Member valuation data (1)
12/31/2009 12/31/2008 KPers
number 68,901 66,468
average beneft $11,953 $11,652
average age 72.42 72.41
Police & fire
number 4,060 3,909
average beneft $25,866 $25,085
average age 63.70 63.50
Judges
number 203 190
average beneft $36,023 $35,173
average age 74.00 73.70
system Total
number 73,164 70,567
average beneft $12,792 $12,460
average age 71.94 71.92
active Member valuation data (1)
12/31/2009 12/31/2008 KPers
number 153,386 148,569
average Current age 45.39 45.59
average service 10.71 10.86
average Pay $38,749 $38,087
Police & fire
number 7,179 7,242
Tier I 500 536
Tier II 6,679 6,706
average Current age 39.50 39.10
average service 11.43 11.06
average Pay $60,287 $57,800
Judges
number 266 262
average Current age 57.06 57.09
average service 11.51 11.95
average Pay $105,709 $104,159
system Total
number 160,831 156,073
average Current age 45.14 45.31
average service 10.75 10.87
average Pay $39,821 $39,113
1) data provided to actuary refects active membership information as of January 1.
100
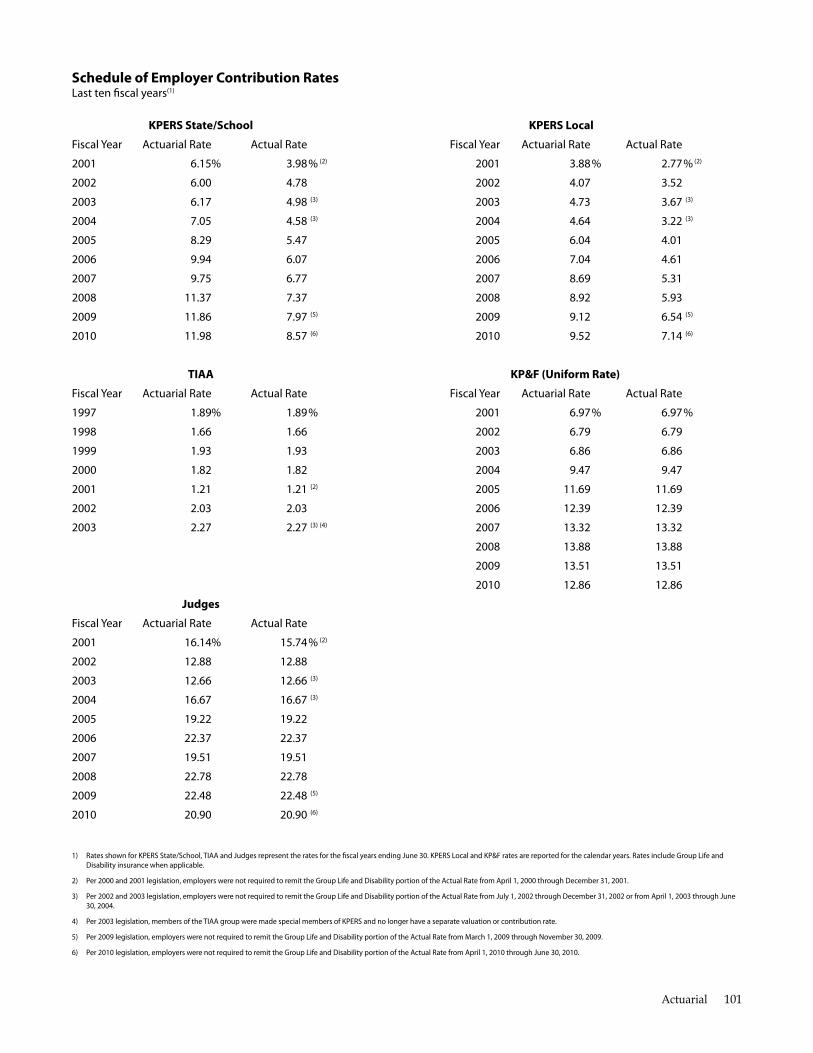
Schedule of Employer Contribution Rates last ten fscal years(1)
KPERS State/School KPERS Local
fiscal year actuarial rate actual rate fiscal year actuarial rate actual rate
2001 6.15% 3.98% (2) 2001 3.88% 2.77% (2)
2002 6.00 4.78 2002 4.07 3.52
2003 6.17 4.98 (3) 2003 4.73 3.67 (3)
2004 7.05 4.58 (3) 2004 4.64 3.22 (3)
2005 8.29 5.47 2005 6.04 4.01
2006 9.94 6.07 2006 7.04 4.61
2007 9.75 6.77 2007 8.69 5.31
2008 11.37 7.37 2008 8.92 5.93
2009 11.86 7.97 (5) 2009 9.12 6.54 (5)
2010 11.98 8.57 (6) 2010 9.52 7.14 (6)
TIAA KP&F (Uniform Rate)
fiscal year actuarial rate actual rate fiscal year actuarial rate actual rate
1997 1.89% 1.89% 2001 6.97% 6.97%
1998 1.66 1.66 2002 6.79 6.79
1999 1.93 1.93 2003 6.86 6.86
2000 1.82 1.82 2004 9.47 9.47
2001 1.21 1.21 (2) 2005 11.69 11.69
2002 2.03 2.03 2006 12.39 12.39
2.27 (3) (4) 2003 2.27 2007 13.32 13.32
2008 13.88 13.88
2009 13.51 13.51
2010 12.86 12.86
Judges
fiscal year actuarial rate actual rate
2001 16.14% 15.74 % (2)
2002 12.88 12.88
2003 12.66 12.66 (3)
2004 16.67 16.67 (3)
2005 19.22 19.22
2006 22.37 22.37
2007 19.51 19.51
2008 22.78 22.78
2009 22.48 22.48 (5)
2010 20.90 20.90 (6)
1) rates shown for KPers state/school, TIaa and Judges represent the rates for the fscal years ending June 30. KPers local and KP&f rates are reported for the calendar years. rates include Group life and disability insurance when applicable.
2) Per 2000 and 2001 legislation, employers were not required to remit the Group life and disability portion of the actual rate from april 1, 2000 through december 31, 2001.
3) Per 2002 and 2003 legislation, employers were not required to remit the Group life and disability portion of the actual rate from July 1, 2002 through december 31, 2002 or from april 1, 2003 through June 30, 2004.
4) Per 2003 legislation, members of the TIaa group were made special members of KPers and no longer have a separate valuation or contribution rate.
5) Per 2009 legislation, employers were not required to remit the Group life and disability portion of the actual rate from March 1, 2009 through november 30, 2009.
6) Per 2010 legislation, employers were not required to remit the Group life and disability portion of the actual rate from april 1, 2010 through June 30, 2010.
Actuarial 101
aCTuary’s CerTIfICaTIon leTTer — deaTH and dIsabIlITy Plan
march 12, 2009
Board of Trustees
Kansas Public Employees Retirement System
611 S. Kansas Ave., Suit 100
Topeka, KS 66603
Dear members of the Board:
In accordance with your request, we have performed an actuarial valuation of KPERS Death and Disability Program as of June 30, 2008 for determining contributions beginning July 1, 2008. The major findings of the valuation are con-tained in this report. This report reflects the benefit provi-sions and contribution rates in effect as of June 30, 2008.
In preparing this report, we relied, without audit, on in-formation (some oral and some in writing) supplied by the System’s staff. This information includes, but is not limited to, statutory provisions, employee data, and financial infor-mation. In our examination of these data, we have found them to be reasonably consistent and comparable with data used for other purposes. Since the valuation results are dependent on the integrity of the data supplied, the results can be expected to differ if the underlying data is incom-plete or missing. It should be noted that if any data or other
information is inaccurate or incomplete, our calculations may need to be revised.
On the basis of the foregoing, we hereby certify that, to the best of our knowledge and belief, this report is complete and accurate and has been prepared in accordance with generally recognized and accepted actuarial principles and practices which are consistent with the Actuarial Standards of Practice promulgated by the Actuarial Standards Board and the applicable Guides to Professional Conduct, ampli-
1120 South 101st Street, Suite 400 Omaha, NE 68124 USA
Tel +1 402 393 9400 Fax +1 402 393 1037
milliman.com
fying Opinions, and supporting Recommendations of the American Academy of Actuaries.
We further certify that all costs, liabilities, rates of interest, and other factors used or provided in this report have been determined on the basis of actuarial assumptions and meth-ods which are individually reasonable (taking into account the experience of the System and reasonable expectations); and which, in combination, offer our best estimate of antici-pated experience affecting the System.
nevertheless, the emerging costs will vary from those pre-sented in this report to the extent actual experience differs from that projected by the actuarial assumptions. The Board of Trustees has the final decision regarding the appropriate-ness of the assumptions and adopted them as indicated in the valuation report.
Future actuarial measurements may differ significantly from the current measurements presented in this report due to such factors as the following: plan experience differing from that anticipated by economic or demographic assump-tions; changes in economic or demographic assumptions; increases or decreases expected as part of the natural opera-tion of the methodology used for these measurements (such as the end of an amortization period or additional cost or contribution requirements based on the plan’s funded sta-
102
tus); and changes in plan provisions or applicable law. Due to the limited scope of our assignment, we did not perform an analysis of the potential range of future measurements.
Actuarial computations presented in this report are for pur-poses of analyzing the sufficiency of the statutory contribu-tion rate. Actuarial computations under GASB Statement no. 43, Financial Reporting for Postemployment Benefit Plans Other Than Pension Plans, are for purposes of fulfill-ing financial accounting requirements. The computations prepared for these two purposes may differ as disclosed in our report. The calculations in the enclosed report have been made on a basis consistent with our understanding of the System’s funding requirements and goals, and of GASB Statement 43. Determinations for purposes other than meeting these requirements may be significantly different from the results contained in this report. Accordingly, ad-ditional determinations may be needed for other purposes.
milliman’s work product was prepared exclusively for KPERS for a specific and limited purpose. It is a complex, technical analysis that assumes a high level of knowledge concerning KPERS operations, and uses KPERS data, which milliman has not audited. It is not for the use or benefit of any third party for any purpose. Any third party recipient of milliman’s work product who desires professional guid-ance should not rely upon milliman’s work product, but should engage qualified professionals for advice appropri-ate to its own specific needs.
We respectfully submit the following report, and we look forward to discussing it with you.
I, Daniel D. Skwire, F.S.A., am a consulting actuary for milliman, Inc. I am a member of the American Academy of Actuaries and meet the Qualification Standards of the American Academy of Actuaries to render the actuarial opinion contained herein.
I, Patrice A. Beckham, F.S.A., am a consulting actuary for milliman, Inc. I am a member of the American Academy of Actuaries and meet the Qualification Standards of the American Academy of Actuaries to render the actuarial opinion contained herein.
mILLImAn, Inc.
Sincerely,
Daniel D. Skwire, FSA
Consulting Actuary
Patrice A. Beckham, FSA, mAAA
Consulting Actuary
Actuarial 103
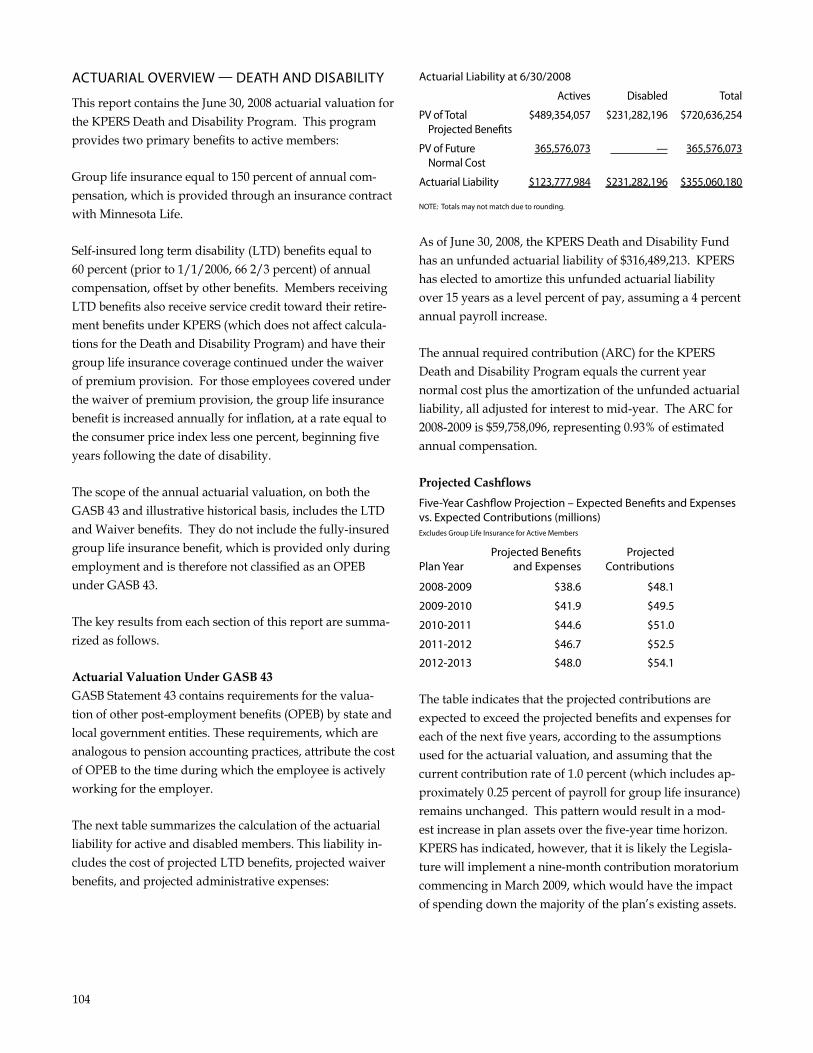
aCTuarIal overvIeW — deaTH and dIsabIlITy
This report contains the June 30, 2008 actuarial valuation for the KPERS Death and Disability Program. This program provides two primary benefits to active members:
Group life insurance equal to 150 percent of annual com-pensation, which is provided through an insurance contract with minnesota Life.
Self-insured long term disability (LTD) benefits equal to 60 percent (prior to 1/1/2006, 66 2/3 percent) of annual compensation, offset by other benefits. members receiving LTD benefits also receive service credit toward their retire-ment benefits under KPERS (which does not affect calcula-tions for the Death and Disability Program) and have their group life insurance coverage continued under the waiver of premium provision. For those employees covered under the waiver of premium provision, the group life insurance benefit is increased annually for inflation, at a rate equal to the consumer price index less one percent, beginning five years following the date of disability.
The scope of the annual actuarial valuation, on both the GASB 43 and illustrative historical basis, includes the LTD and Waiver benefits. They do not include the fully-insured group life insurance benefit, which is provided only during employment and is therefore not classified as an OPEB under GASB 43.
The key results from each section of this report are summa-rized as follows.
Actuarial Valuation Under GASB 43 GASB Statement 43 contains requirements for the valua-tion of other post-employment benefits (OPEB) by state and local government entities. These requirements, which are analogous to pension accounting practices, attribute the cost of OPEB to the time during which the employee is actively working for the employer.
The next table summarizes the calculation of the actuarial liability for active and disabled members. This liability in-cludes the cost of projected LTD benefits, projected waiver benefits, and projected administrative expenses:
actuarial liability at 6/30/2008
actives disabled Total
Pv of Total $489,354,057 Projected benefts
Pv of future 365,576,073 normal Cost
$231,282,196
—
$720,636,254
365,576,073
actuarial liability $123,777,984 $231,282,196 $355,060,180
noTe: Totals may not match due to rounding.
As of June 30, 2008, the KPERS Death and Disability Fund has an unfunded actuarial liability of $316,489,213. KPERS has elected to amortize this unfunded actuarial liability over 15 years as a level percent of pay, assuming a 4 percent annual payroll increase.
The annual required contribution (ARC) for the KPERS Death and Disability Program equals the current year normal cost plus the amortization of the unfunded actuarial liability, all adjusted for interest to mid-year. The ARC for 2008-2009 is $59,758,096, representing 0.93% of estimated annual compensation.
Projected Cashflows
five-year Cashfow Projection – expected benefts and expenses vs. expected Contributions (millions) excludes Group life Insurance for active Members
Projected benefts Projected Plan year and expenses Contributions
2008-2009 $38.6 $48.1
2009-2010 $41.9 $49.5
2010-2011 $44.6 $51.0
2011-2012 $46.7 $52.5
2012-2013 $48.0 $54.1
The table indicates that the projected contributions are expected to exceed the projected benefits and expenses for each of the next five years, according to the assumptions used for the actuarial valuation, and assuming that the current contribution rate of 1.0 percent (which includes ap-proximately 0.25 percent of payroll for group life insurance) remains unchanged. This pattern would result in a mod-est increase in plan assets over the five-year time horizon. KPERS has indicated, however, that it is likely the Legisla-ture will implement a nine-month contribution moratorium commencing in march 2009, which would have the impact of spending down the majority of the plan’s existing assets.
104
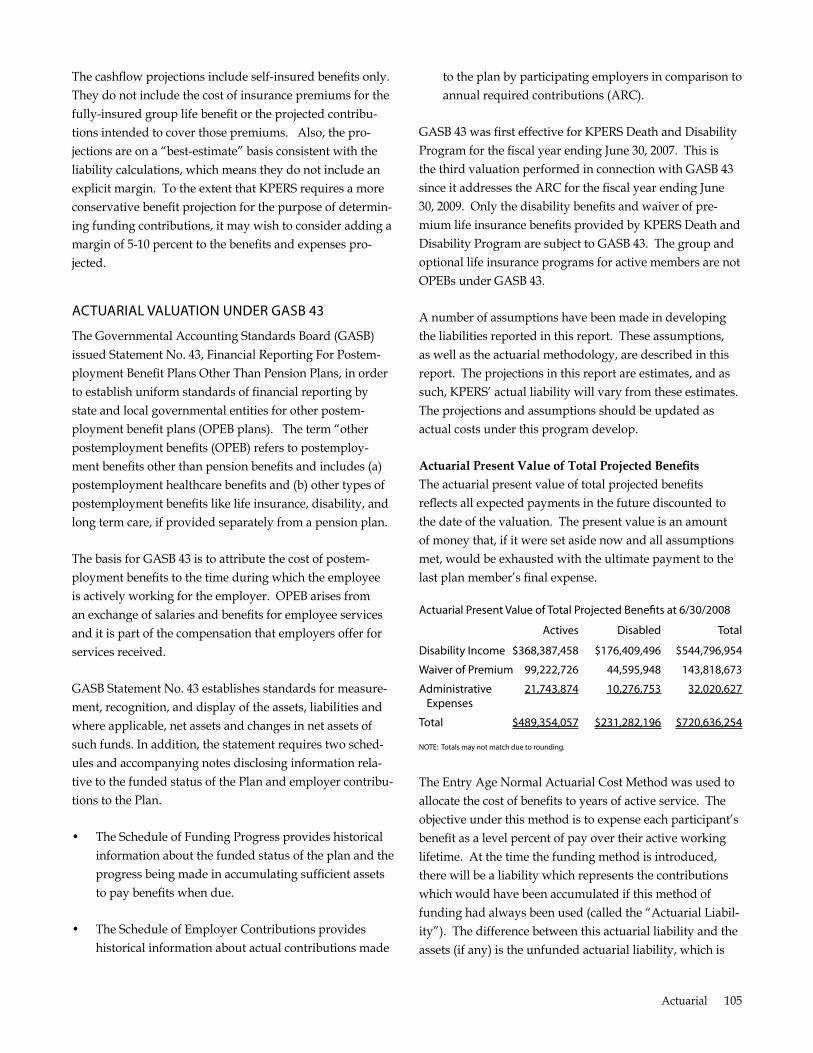
The cashflow projections include self-insured benefits only. They do not include the cost of insurance premiums for the fully-insured group life benefit or the projected contribu-tions intended to cover those premiums. Also, the pro-jections are on a “best-estimate” basis consistent with the liability calculations, which means they do not include an explicit margin. To the extent that KPERS requires a more conservative benefit projection for the purpose of determin-ing funding contributions, it may wish to consider adding a margin of 5-10 percent to the benefits and expenses pro-jected.
aCTuarIal valuaTIon under Gasb 43
The Governmental Accounting Standards Board (GASB) issued Statement no. 43, Financial Reporting For Postem-ployment Benefit Plans Other Than Pension Plans, in order to establish uniform standards of financial reporting by state and local governmental entities for other postem-ployment benefit plans (OPEB plans). The term “other postemployment benefits (OPEB) refers to postemploy-ment benefits other than pension benefits and includes (a) postemployment healthcare benefits and (b) other types of postemployment benefits like life insurance, disability, and long term care, if provided separately from a pension plan.
The basis for GASB 43 is to attribute the cost of postem-ployment benefits to the time during which the employee is actively working for the employer. OPEB arises from an exchange of salaries and benefits for employee services and it is part of the compensation that employers offer for services received.
GASB Statement no. 43 establishes standards for measure-ment, recognition, and display of the assets, liabilities and where applicable, net assets and changes in net assets of such funds. In addition, the statement requires two sched-ules and accompanying notes disclosing information rela-tive to the funded status of the Plan and employer contribu-tions to the Plan.
• The Schedule of Funding Progress provides historical information about the funded status of the plan and the progress being made in accumulating sufficient assets to pay benefits when due.
• The Schedule of Employer Contributions provides historical information about actual contributions made
to the plan by participating employers in comparison to annual required contributions (ARC).
GASB 43 was first effective for KPERS Death and Disability Program for the fiscal year ending June 30, 2007. This is the third valuation performed in connection with GASB 43 since it addresses the ARC for the fiscal year ending June 30, 2009. Only the disability benefits and waiver of pre-mium life insurance benefits provided by KPERS Death and Disability Program are subject to GASB 43. The group and optional life insurance programs for active members are not OPEBs under GASB 43.
A number of assumptions have been made in developing the liabilities reported in this report. These assumptions, as well as the actuarial methodology, are described in this report. The projections in this report are estimates, and as such, KPERS’ actual liability will vary from these estimates. The projections and assumptions should be updated as actual costs under this program develop.
Actuarial Present Value of Total Projected Benefits
The actuarial present value of total projected benefits reflects all expected payments in the future discounted to the date of the valuation. The present value is an amount of money that, if it were set aside now and all assumptions met, would be exhausted with the ultimate payment to the last plan member’s final expense.
actuarial Present value of Total Projected benefts at 6/30/2008
actives disabled Total
disability Income $368,387,458 $176,409,496 $544,796,954
Waiver of Premium 99,222,726 44,595,948 143,818,673
administrative 21,743,874 10,276,753 32,020,627 expenses
Total $489,354,057 $231,282,196 $720,636,254
noTe: Totals may not match due to rounding.
The Entry Age normal Actuarial Cost method was used to allocate the cost of benefits to years of active service. The objective under this method is to expense each participant’s benefit as a level percent of pay over their active working lifetime. At the time the funding method is introduced, there will be a liability which represents the contributions which would have been accumulated if this method of funding had always been used (called the “Actuarial Liabil-ity”). The difference between this actuarial liability and the
assets (if any) is the unfunded actuarial liability, which is
Actuarial 105
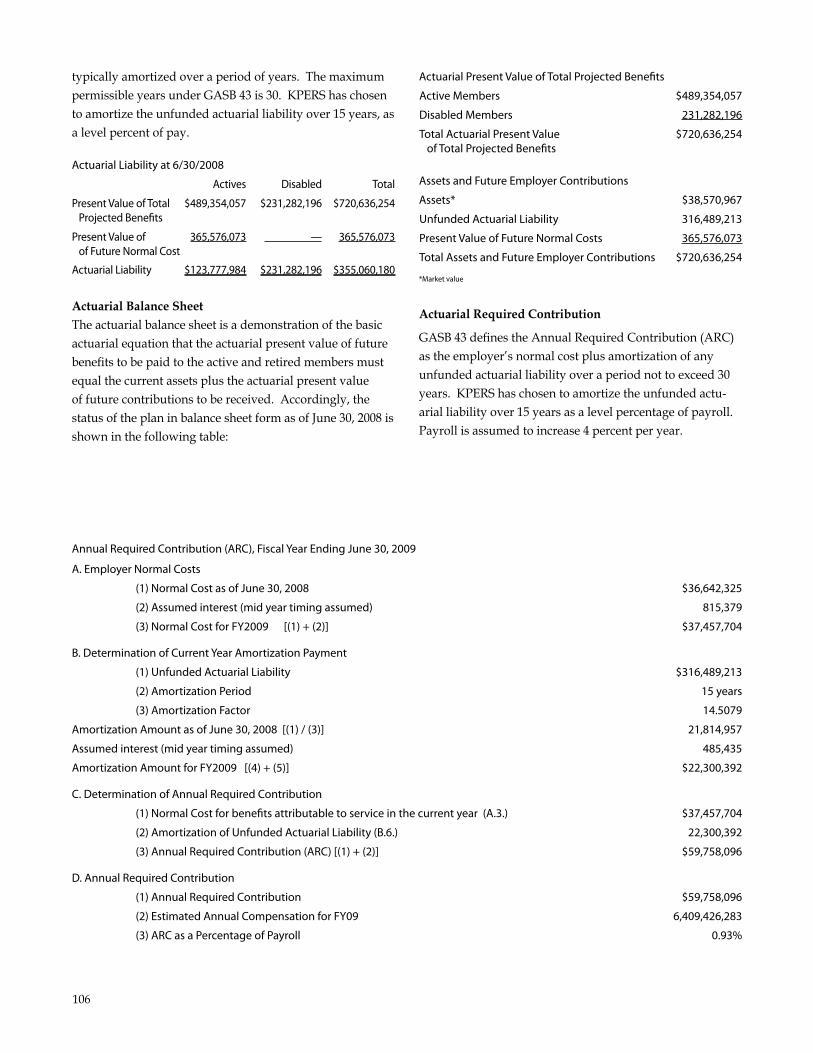
typically amortized over a period of years. The maximum permissible years under GASB 43 is 30. KPERS has chosen to amortize the unfunded actuarial liability over 15 years, as a level percent of pay.
actuarial liability at 6/30/2008
actives disabled Total
Present value of Total $489,354,057 $231,282,196 $720,636,254 Projected benefts
Present value of 365,576,073 — 365,576,073 of future normal Cost
actuarial liability $123,777,984 $231,282,196 $355,060,180
Actuarial Balance Sheet The actuarial balance sheet is a demonstration of the basic actuarial equation that the actuarial present value of future benefits to be paid to the active and retired members must equal the current assets plus the actuarial present value of future contributions to be received. Accordingly, the status of the plan in balance sheet form as of June 30, 2008 is
shown in the following table:
actuarial Present value of Total Projected benefts
active Members $489,354,057
disabled Members 231,282,196
Total actuarial Present value $720,636,254 of Total Projected benefts
assets and future employer Contributions
assets* $38,570,967
unfunded actuarial liability 316,489,213
Present value of future normal Costs 365,576,073
Total assets and future employer Contributions $720,636,254
*Market value
Actuarial Required Contribution
GASB 43 defines the Annual Required Contribution (ARC) as the employer’s normal cost plus amortization of any unfunded actuarial liability over a period not to exceed 30 years. KPERS has chosen to amortize the unfunded actu-arial liability over 15 years as a level percentage of payroll. Payroll is assumed to increase 4 percent per year.
annual required Contribution (arC), fiscal year ending June 30, 2009
a. employer normal Costs
(1) normal Cost as of June 30, 2008 $36,642,325
(2) assumed interest (mid year timing assumed) 815,379
(3) normal Cost for fy2009 [(1) + (2)] $37,457,704
b. determination of Current year amortization Payment
(1) unfunded actuarial liability $316,489,213
(2) amortization Period 15 years
(3) amortization factor 14.5079
amortization amount as of June 30, 2008 [(1) / (3)] 21,814,957
assumed interest (mid year timing assumed) 485,435
amortization amount for fy2009 [(4) + (5)] $22,300,392
C. determination of annual required Contribution
(1) normal Cost for benefts attributable to service in the current year (a.3.) $37,457,704
(2) amortization of unfunded actuarial liability (b.6.) 22,300,392
(3) annual required Contribution (arC) [(1) + (2)] $59,758,096
d. annual required Contribution
(1) annual required Contribution $59,758,096
(2) estimated annual Compensation for fy09 6,409,426,283
(3) arC as a Percentage of Payroll 0.93%
106
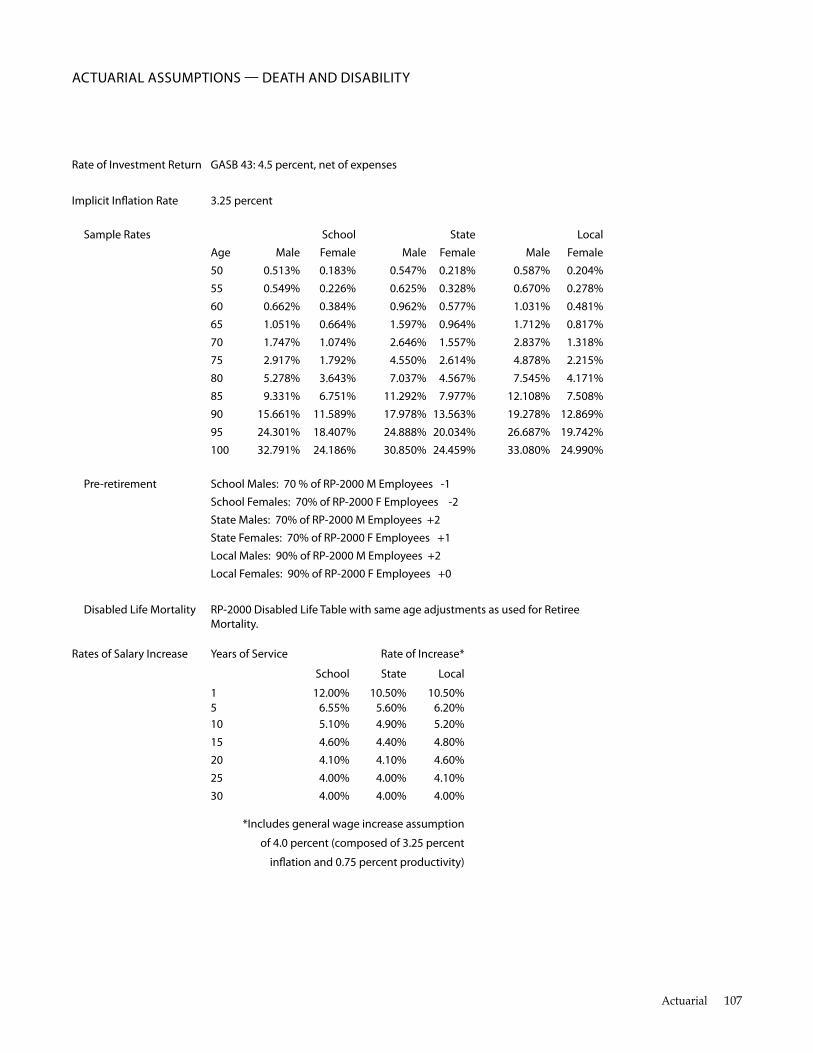
aCTuarIal assuMPTIons — deaTH and dIsabIlITy
rate of Investment return Gasb 43: 4.5 percent, net of expenses
Implicit Infation rate 3.25 percent
sample rates school state local age Male female Male female Male female 50 0.513% 0.183% 0.547% 0.218% 0.587% 0.204% 55 0.549% 0.226% 0.625% 0.328% 0.670% 0.278% 60 0.662% 0.384% 0.962% 0.577% 1.031% 0.481% 65 1.051% 0.664% 1.597% 0.964% 1.712% 0.817% 70 1.747% 1.074% 2.646% 1.557% 2.837% 1.318% 75 2.917% 1.792% 4.550% 2.614% 4.878% 2.215% 80 5.278% 3.643% 7.037% 4.567% 7.545% 4.171% 85 9.331% 6.751% 11.292% 7.977% 12.108% 7.508% 90 15.661% 11.589% 17.978% 13.563% 19.278% 12.869% 95 24.301% 18.407% 24.888% 20.034% 26.687% 19.742% 100 32.791% 24.186% 30.850% 24.459% 33.080% 24.990%
Pre-retirement school Males: 70 % of rP-2000 M employees -1 school females: 70% of rP-2000 f employees -2 state Males: 70% of rP-2000 M employees +2 state females: 70% of rP-2000 f employees +1 local Males: 90% of rP-2000 M employees +2 local females: 90% of rP-2000 f employees +0
disabled life Mortality rP-2000 disabled life Table with same age adjustments as used for retiree Mortality.
rates of salary Increase years of service rate of Increase*
school state local
1 12.00% 10.50% 10.50% 5 6.55% 5.60% 6.20% 10 5.10% 4.90% 5.20% 15 4.60% 4.40% 4.80% 20 4.10% 4.10% 4.60% 25 4.00% 4.00% 4.10% 30 4.00% 4.00% 4.00%
*Includes general wage increase assumption
of 4.0 percent (composed of 3.25 percent
infation and 0.75 percent productivity)
Actuarial 107
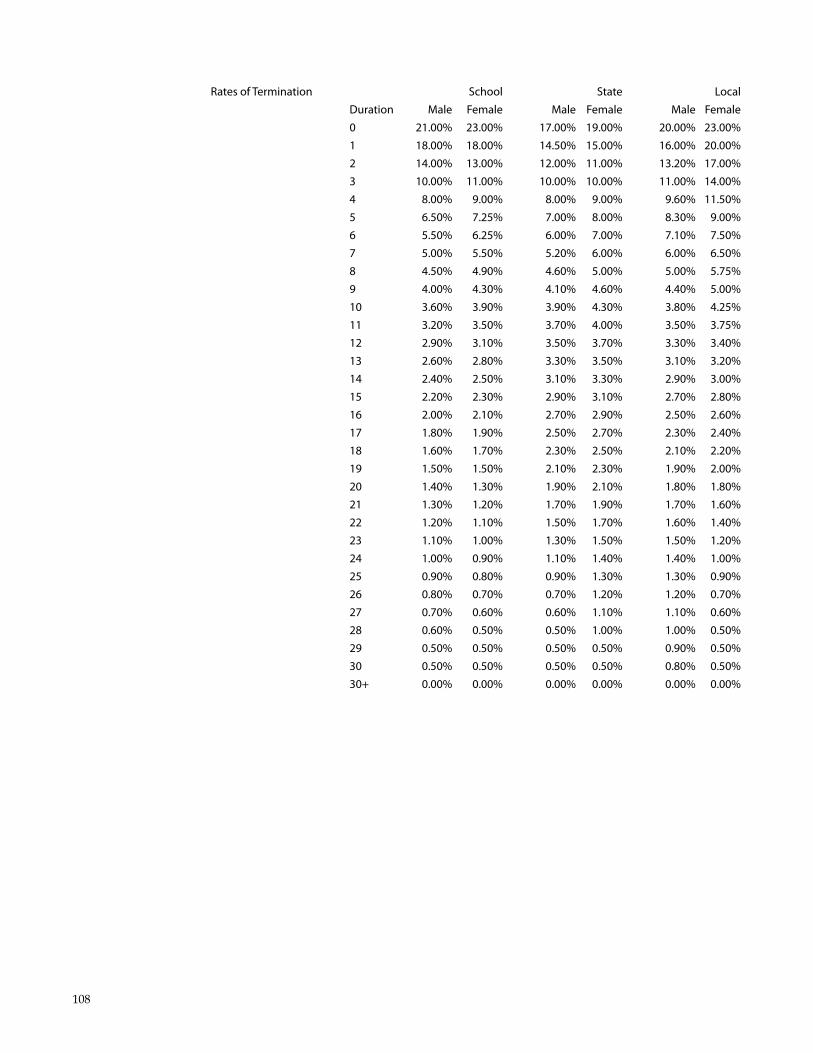
5
10
15
20
25
30
rates of Termination school state local duration Male female Male female Male female 0 21.00% 23.00% 17.00% 19.00% 20.00% 23.00% 1 18.00% 18.00% 14.50% 15.00% 16.00% 20.00% 2 14.00% 13.00% 12.00% 11.00% 13.20% 17.00% 3 10.00% 11.00% 10.00% 10.00% 11.00% 14.00% 4 8.00% 9.00% 8.00% 9.00% 9.60% 11.50%
6.50% 7.25% 7.00% 8.00% 8.30% 9.00% 6 5.50% 6.25% 6.00% 7.00% 7.10% 7.50% 7 5.00% 5.50% 5.20% 6.00% 6.00% 6.50% 8 4.50% 4.90% 4.60% 5.00% 5.00% 5.75% 9 4.00% 4.30% 4.10% 4.60% 4.40% 5.00%
3.60% 3.90% 3.90% 4.30% 3.80% 4.25% 11 3.20% 3.50% 3.70% 4.00% 3.50% 3.75% 12 2.90% 3.10% 3.50% 3.70% 3.30% 3.40% 13 2.60% 2.80% 3.30% 3.50% 3.10% 3.20% 14 2.40% 2.50% 3.10% 3.30% 2.90% 3.00%
2.20% 2.30% 2.90% 3.10% 2.70% 2.80% 16 2.00% 2.10% 2.70% 2.90% 2.50% 2.60% 17 1.80% 1.90% 2.50% 2.70% 2.30% 2.40% 18 1.60% 1.70% 2.30% 2.50% 2.10% 2.20% 19 1.50% 1.50% 2.10% 2.30% 1.90% 2.00%
1.40% 1.30% 1.90% 2.10% 1.80% 1.80% 21 1.30% 1.20% 1.70% 1.90% 1.70% 1.60% 22 1.20% 1.10% 1.50% 1.70% 1.60% 1.40% 23 1.10% 1.00% 1.30% 1.50% 1.50% 1.20% 24 1.00% 0.90% 1.10% 1.40% 1.40% 1.00%
0.90% 0.80% 0.90% 1.30% 1.30% 0.90% 26 0.80% 0.70% 0.70% 1.20% 1.20% 0.70% 27 0.70% 0.60% 0.60% 1.10% 1.10% 0.60% 28 0.60% 0.50% 0.50% 1.00% 1.00% 0.50% 29 0.50% 0.50% 0.50% 0.50% 0.90% 0.50%
0.50% 0.50% 0.50% 0.50% 0.80% 0.50% 30+ 0.00% 0.00% 0.00% 0.00% 0.00% 0.00%
108
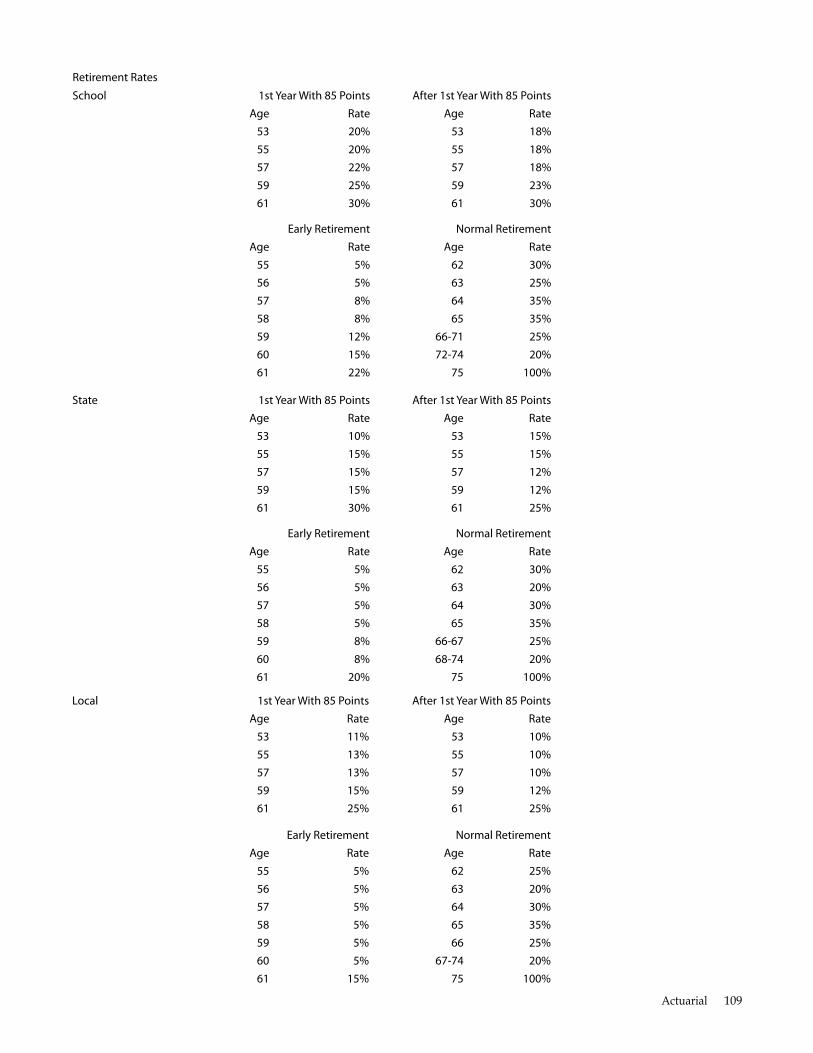
retirement rates
school 1st year With 85 Points after 1st year With 85 Points age rate age rate
53 20% 53 18% 55 20% 55 18% 57 22% 57 18% 59 25% 59 23% 61 30% 61 30%
early retirement normal retirement age rate age rate
55 5% 62 30% 56 5% 63 25% 57 8% 64 35% 58 8% 65 35% 59 12% 66-71 25% 60 15% 72-74 20% 61 22% 75 100%
state 1st year With 85 Points after 1st year With 85 Points age rate age rate
53 10% 53 15% 55 15% 55 15% 57 15% 57 12% 59 15% 59 12% 61 30% 61 25%
early retirement normal retirement age rate age rate
55 5% 62 30% 56 5% 63 20% 57 5% 64 30% 58 5% 65 35% 59 8% 66-67 25% 60 8% 68-74 20% 61 20% 75 100%
local 1st year With 85 Points after 1st year With 85 Points age rate age rate
53 11% 53 10% 55 13% 55 10% 57 13% 57 10% 59 15% 59 12% 61 25% 61 25%
early retirement normal retirement age rate age rate
55 5% 62 25% 56 5% 63 20% 57 5% 64 30% 58 5% 65 35% 59 5% 66 25% 60 5% 67-74 20% 61 15% 75 100%
Actuarial 109
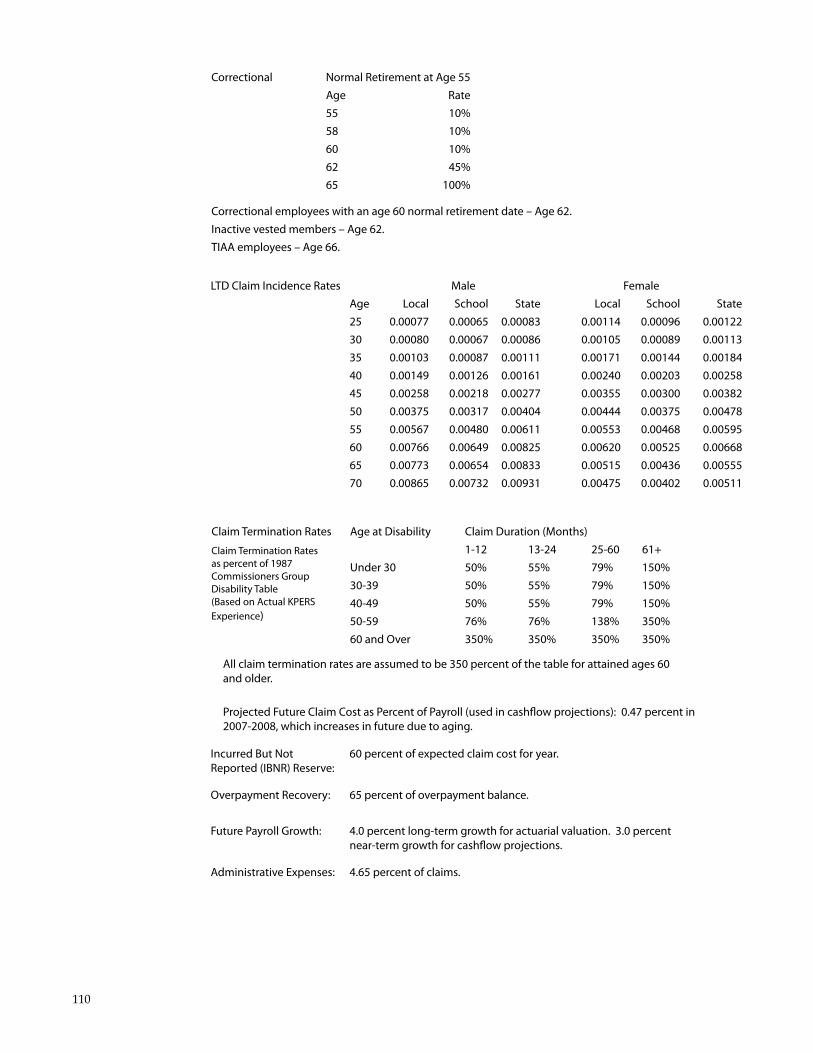
Correctional normal retirement at age 55 age rate 55 10% 58 10% 60 10% 62 45% 65 100%
Correctional employees with an age 60 normal retirement date – age 62. Inactive vested members – age 62. TIaa employees – age 66.
lTd Claim Incidence rates Male female age local school state local school state 25 0.00077 0.00065 0.00083 0.00114 0.00096 0.00122 30 0.00080 0.00067 0.00086 0.00105 0.00089 0.00113 35 0.00103 0.00087 0.00111 0.00171 0.00144 0.00184 40 0.00149 0.00126 0.00161 0.00240 0.00203 0.00258 45 0.00258 0.00218 0.00277 0.00355 0.00300 0.00382 50 0.00375 0.00317 0.00404 0.00444 0.00375 0.00478 55 0.00567 0.00480 0.00611 0.00553 0.00468 0.00595 60 0.00766 0.00649 0.00825 0.00620 0.00525 0.00668 65 0.00773 0.00654 0.00833 0.00515 0.00436 0.00555 70 0.00865 0.00732 0.00931 0.00475 0.00402 0.00511
Claim Termination rates age at disability Claim duration (Months)
Claim Termination rates 1-12 13-24 25-60 61+ as percent of 1987 under 30 50% 55% 79% 150% Commissioners Group
30-39 50% 55% 79% 150%disability Table (based on actual KPers 40-49 50% 55% 79% 150% experience) 50-59 76% 76% 138% 350%
60 and over 350% 350% 350% 350%
all claim termination rates are assumed to be 350 percent of the table for attained ages 60 and older.
Projected future Claim Cost as Percent of Payroll (used in cashfow projections): 0.47 percent in 2007-2008, which increases in future due to aging.
Incurred but not 60 percent of expected claim cost for year. reported (Ibnr) reserve:
overpayment recovery: 65 percent of overpayment balance.
future Payroll Growth: 4.0 percent long-term growth for actuarial valuation. 3.0 percent near-term growth for cashfow projections.
administrative expenses: 4.65 percent of claims.
110
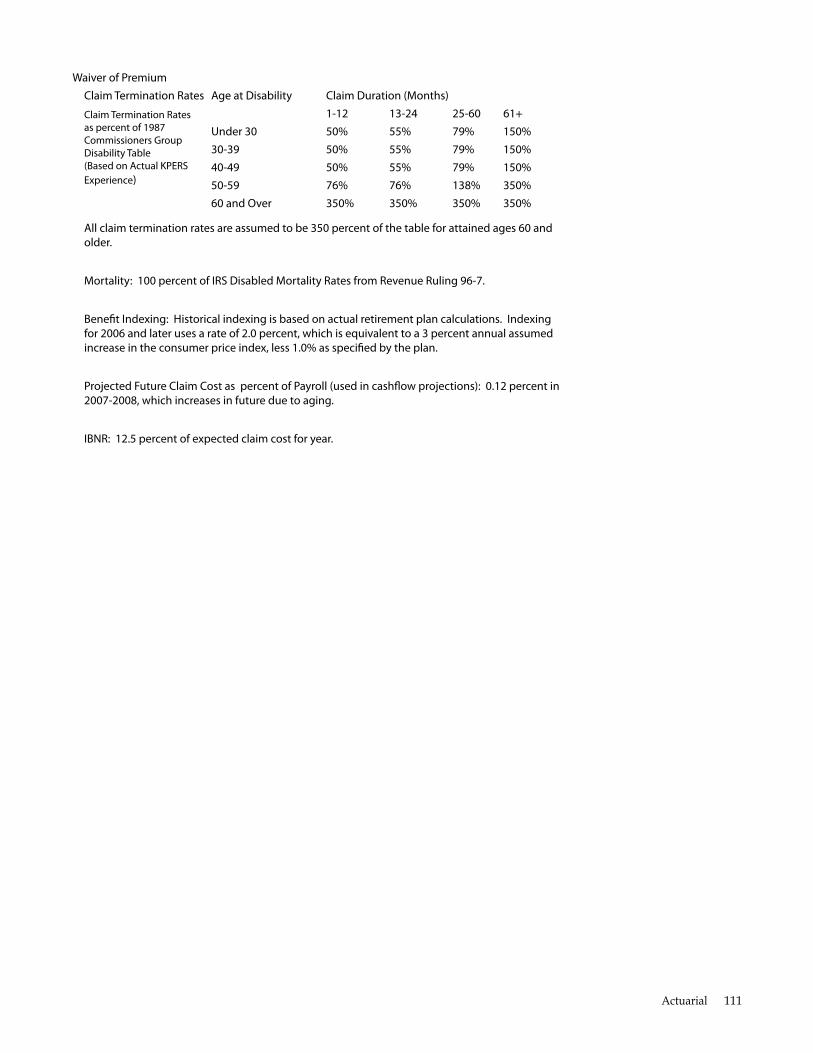
Waiver of Premium Claim Termination rates age at disability Claim duration (Months)
Claim Termination rates 1-12 13-24 25-60 61+ as percent of 1987 under 30 50% 55% 79% 150% Commissioners Group
30-39 50% 55% 79% 150%disability Table (based on actual KPers 40-49 50% 55% 79% 150% experience) 50-59 76% 76% 138% 350%
60 and over 350% 350% 350% 350%
all claim termination rates are assumed to be 350 percent of the table for attained ages 60 and older.
Mortality: 100 percent of Irs disabled Mortality rates from revenue ruling 96-7.
beneft Indexing: Historical indexing is based on actual retirement plan calculations. Indexing for 2006 and later uses a rate of 2.0 percent, which is equivalent to a 3 percent annual assumed increase in the consumer price index, less 1.0% as specifed by the plan.
Projected future Claim Cost as percent of Payroll (used in cashfow projections): 0.12 percent in 2007-2008, which increases in future due to aging.
Ibnr: 12.5 percent of expected claim cost for year.
Actuarial 111
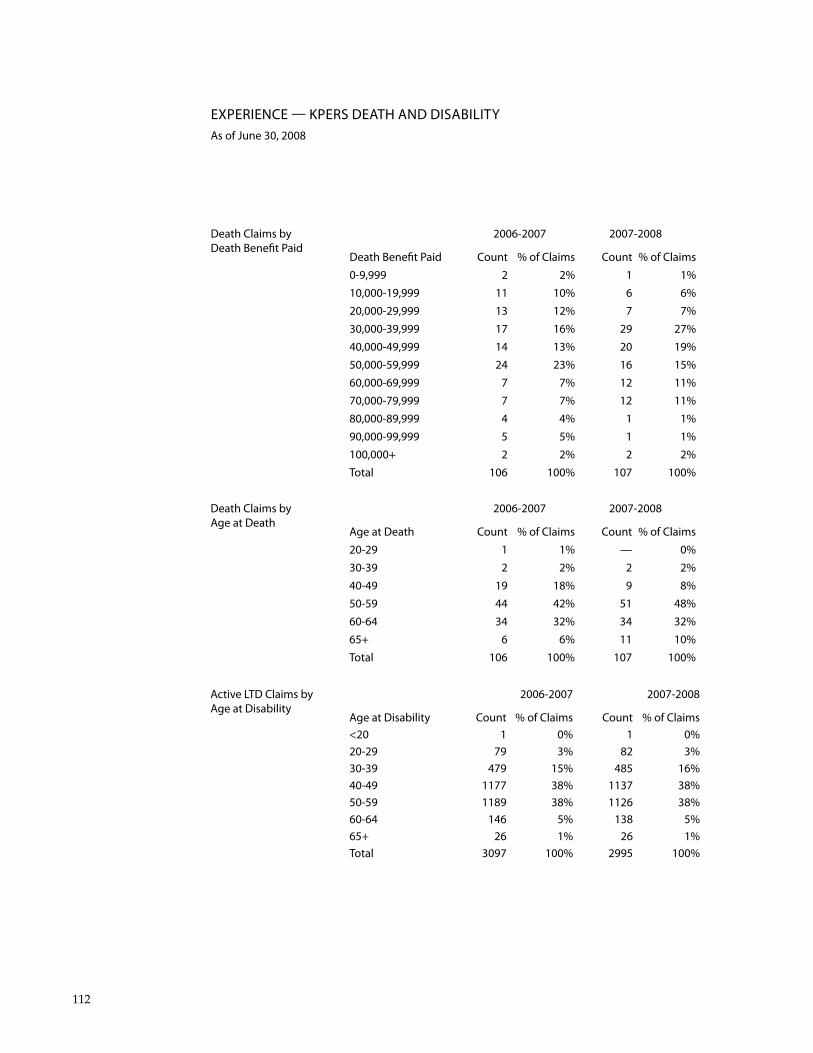
exPerIenCe — KPers deaTH and dIsabIlITy as of June 30, 2008
death Claims by death beneft Paid
death Claims by age at death
active lTd Claims by age at disability
death beneft Paid 0-9,999 10,000-19,999 20,000-29,999 30,000-39,999 40,000-49,999 50,000-59,999 60,000-69,999 70,000-79,999 80,000-89,999 90,000-99,999 100,000+ Total
age at death 20-29 30-39 40-49 50-59 60-64 65+ Total
age at disability <20 20-29 30-39 40-49 50-59 60-64 65+ Total
2006-2007 2007-2008
Count % of Claims Count % of Claims 2 2% 1 1%
11 10% 6 6% 13 12% 7 7% 17 16% 29 27% 14 13% 20 19% 24 23% 16 15%
7 7% 12 11% 7 7% 12 11% 4 4% 1 1% 5 5% 1 1% 2 2% 2 2%
106 100% 107 100%
2006-2007 2007-2008
Count % of Claims Count % of Claims 1 1% — 0% 2 2% 2 2%
19 18% 9 8% 44 42% 51 48% 34 32% 34 32%
6 6% 11 10% 106 100% 107 100%
2006-2007 2007-2008
Count % of Claims Count % of Claims 1 0% 1 0%
79 3% 82 3% 479 15% 485 16%
1177 38% 1137 38% 1189 38% 1126 38%
146 5% 138 5% 26 1% 26 1%
3097 100% 2995 100%
112
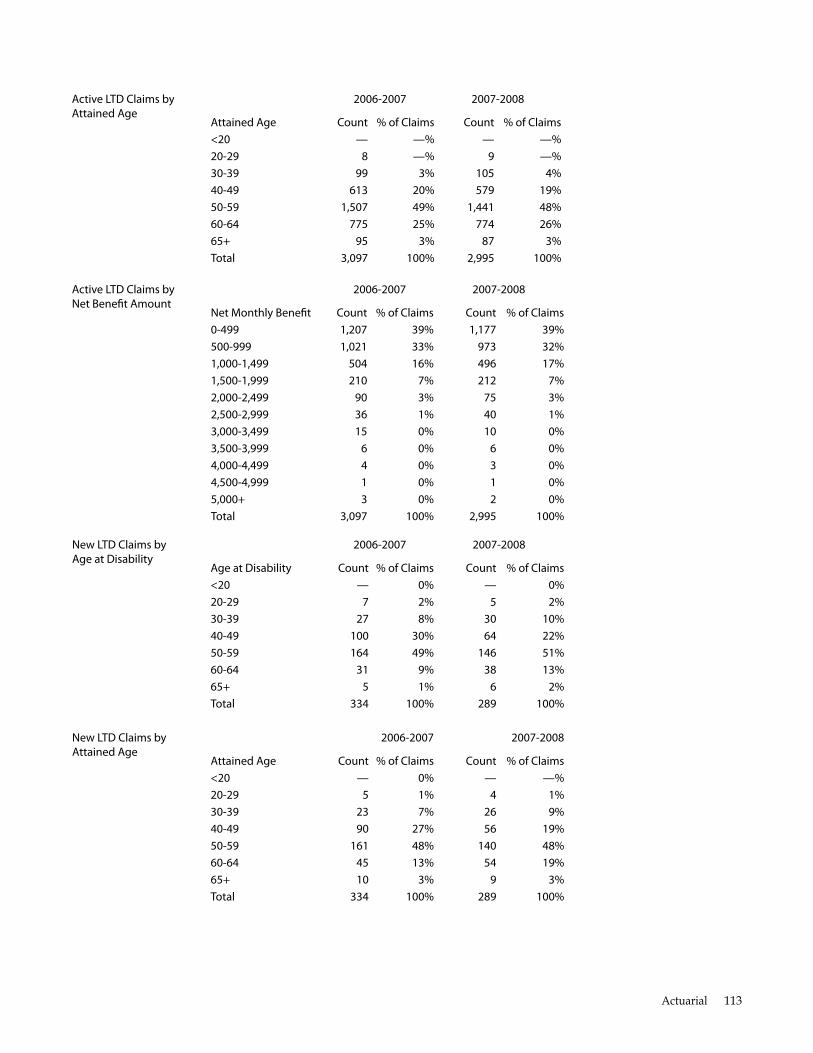
active lTd Claims by 2006-2007 2007-2008 attained age
attained age Count % of Claims Count % of Claims <20 — —% — —% 20-29 8 —% 9 —% 30-39 99 3% 105 4% 40-49 613 20% 579 19% 50-59 1,507 49% 1,441 48% 60-64 775 25% 774 26% 65+ 95 3% 87 3% Total 3,097 100% 2,995 100%
active lTd Claims by 2006-2007 2007-2008 net beneft amount
net Monthly beneft Count % of Claims Count % of Claims 0-499 1,207 39% 1,177 39% 500-999 1,021 33% 973 32% 1,000-1,499 504 16% 496 17% 1,500-1,999 210 7% 212 7% 2,000-2,499 90 3% 75 3% 2,500-2,999 36 1% 40 1% 3,000-3,499 15 0% 10 0% 3,500-3,999 6 0% 6 0% 4,000-4,499 4 0% 3 0% 4,500-4,999 1 0% 1 0% 5,000+ 3 0% 2 0% Total 3,097 100% 2,995 100%
new lTd Claims by 2006-2007 2007-2008 age at disability
age at disability Count % of Claims Count % of Claims <20 — 0% — 0% 20-29 7 2% 5 2% 30-39 27 8% 30 10% 40-49 100 30% 64 22% 50-59 164 49% 146 51% 60-64 31 9% 38 13% 65+ 5 1% 6 2% Total 334 100% 289 100%
new lTd Claims by 2006-2007 2007-2008 attained age
attained age Count % of Claims Count % of Claims <20 — 0% — —% 20-29 5 1% 4 1% 30-39 23 7% 26 9% 40-49 90 27% 56 19% 50-59 161 48% 140 48% 60-64 45 13% 54 19% 65+ 10 3% 9 3% Total 334 100% 289 100%
Actuarial 113
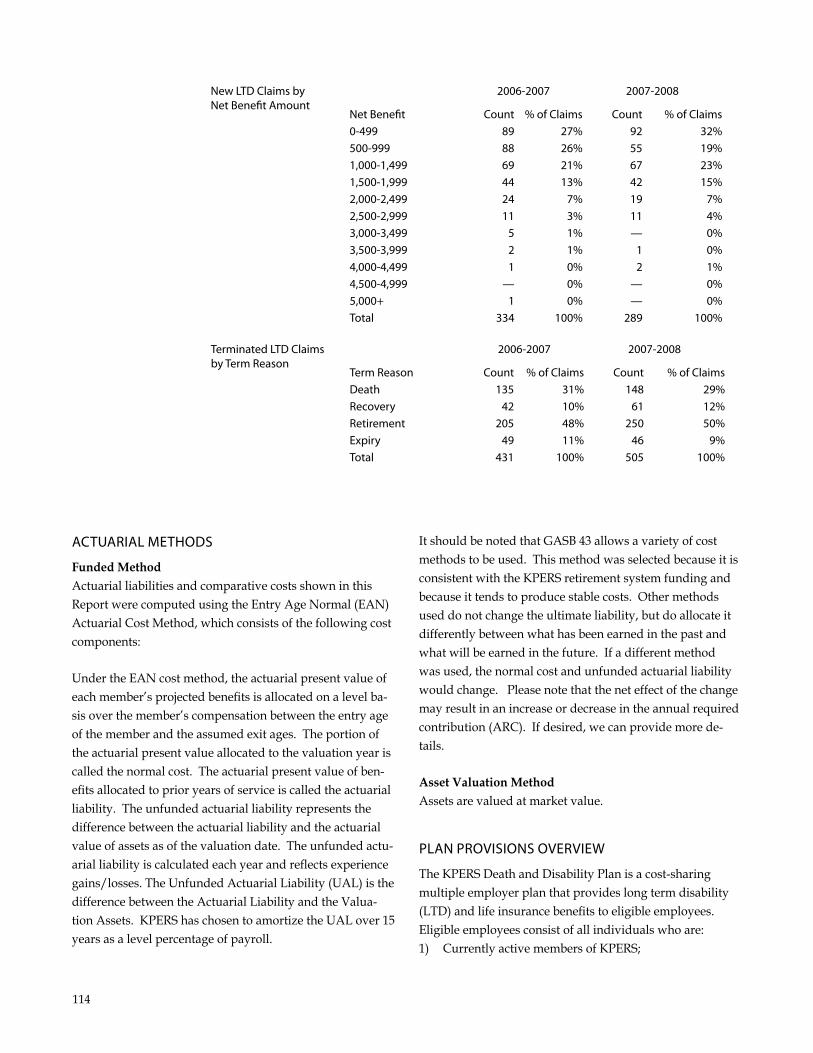
new lTd Claims by net beneft amount
net beneft 0-499 500-999 1,000-1,499 1,500-1,999 2,000-2,499 2,500-2,999 3,000-3,499 3,500-3,999 4,000-4,499 4,500-4,999 5,000+ Total
Terminated lTd Claims by Term reason
Term reason death recovery retirement expiry Total
aCTuarIal MeTHods
Funded Method Actuarial liabilities and comparative costs shown in this Report were computed using the Entry Age normal (EAn) Actuarial Cost method, which consists of the following cost components:
under the EAn cost method, the actuarial present value of each member’s projected benefits is allocated on a level ba-sis over the member’s compensation between the entry age of the member and the assumed exit ages. The portion of the actuarial present value allocated to the valuation year is called the normal cost. The actuarial present value of ben-efits allocated to prior years of service is called the actuarial liability. The unfunded actuarial liability represents the difference between the actuarial liability and the actuarial value of assets as of the valuation date. The unfunded actu-arial liability is calculated each year and reflects experience gains/losses. The unfunded Actuarial Liability (uAL) is the difference between the Actuarial Liability and the Valua-tion Assets. KPERS has chosen to amortize the uAL over 15 years as a level percentage of payroll.
2006-2007 2007-2008
Count % of Claims Count % of Claims 89 27% 92 32% 88 26% 55 19% 69 21% 67 23% 44 13% 42 15% 24 7% 19 7% 11 3% 11 4%
5 1% — 0% 2 1% 1 0% 1 0% 2 1%
— 0% — 0% 1 0% — 0%
334 100% 289 100%
2006-2007 2007-2008
Count % of Claims Count % of Claims 135 31% 148 29%
42 10% 61 12% 205 48% 250 50%
49 11% 46 9% 431 100% 505 100%
It should be noted that GASB 43 allows a variety of cost methods to be used. This method was selected because it is consistent with the KPERS retirement system funding and because it tends to produce stable costs. Other methods used do not change the ultimate liability, but do allocate it differently between what has been earned in the past and what will be earned in the future. If a different method was used, the normal cost and unfunded actuarial liability would change. Please note that the net effect of the change may result in an increase or decrease in the annual required contribution (ARC). If desired, we can provide more de-tails.
Asset Valuation Method Assets are valued at market value.
Plan ProvIsIons overvIeW
The KPERS Death and Disability Plan is a cost-sharing multiple employer plan that provides long term disability (LTD) and life insurance benefits to eligible employees. Eligible employees consist of all individuals who are: 1) Currently active members of KPERS;
114
2) Employees of an educational institution under the Kan-sas Board of Regents as defined in K.S.A. 74-4925;
3) Elected officials.
The plan provides a group life insurance benefit for active members through a fully-insured program with min-nesota Life Insurance Company. Because this benefit is fully-insured, it is not included in the scope of this actu-arial valuation. The plan also provides a self-funded LTD benefit and a self-funded life insurance benefit for disabled members (referred to as “group life waiver of premium”). These items are considered “Other Post-Employment Ben-efits” (OPEB) under GASB accounting rules, and they are included in this actuarial valuation.
Key ProvIsIons —lonG-TerM dIsabIlITy
Definition of Disability
For the first 24 months following the end of the benefit waiting period, a member is totally disabled if the member is unable to perform the material and substantial duties of his or her regular occupation due to sickness or injury. Thereafter, the member is totally disabled if the member is unable to perform the material and substantial duties of any gainful occupation due to sickness or injury.
Benefit Waiting Period
For approved claims, benefits begin on the later of (a) the date the member completes 180 continuous days of total disability; or (b) the date the member ceases to draw com-pensation from his or her employer.
Monthly Benefit The monthly benefit is 60 percent of the member’s monthly rate of compensation, with a minimum of $100 and a maxi-mum of $5,000. The monthly benefit is subject to reduction by deductible sources of income, which include Social Security primary disability or retirement benefits, worker’s compensa-tion benefits, other disability benefits from any other source by reason of employment, and earnings from any form of employment.
Maximum Benefit Period
If the disability begins before age 60, benefits are payable while disability continues until the member’s 65th birthday or retirement date, whichever first occurs. If the disability occurs at or after age 60, benefits are payable while disabil-
ity continues, for a period of five years or until the date of the member’s retirement, whichever first occurs.
Limitation for Mental Illnesses and Substance Abuse Benefit payments for disabilities caused or contributed to by substance abuse or non-biologically-based mental illnesses are limited to the term of the disability or 24 months per lifetime, whichever is less.
Cost-of-Living Increase There are no automatic cost-of-living increase provisions. KPERS has the authority to implement an ad hoc cost-of-living increase.
Key ProvIsIons — GrouP lIfe WaIver of PreMIuM
Benefit Amount upon the death of a member who is receiving monthly dis-ability benefits, the plan will pay a lump-sum benefit to eli-gible beneficiaries. The benefit amount will be 150 percent of the greater of (a) the member’s annual rate of compensa-tion at the time of disability, or (b) the member’s previous 12 months of compensation at the time of the last date on payroll. If the member had been disabled for five or more years, the annual compensation or salary rate at the time of death will be indexed before the life insurance benefit is computed. The indexing is based on the consumer price index, less one percentage point.
Accelerated Death Benefit If a member is diagnosed as terminally ill with a life ex-pectancy of 12 months or less, he or she may be eligible to receive up to 100 percent of the death benefit rather than having the benefit paid to the beneficiary.
Conversion Right If a member retires or disability benefits end, he or she may convert the group life insurance coverage to an individual life insurance policy.
Actuarial 115

2010 Comprehensive Annual Financial Report
STATISTICALSECTION
KPERS
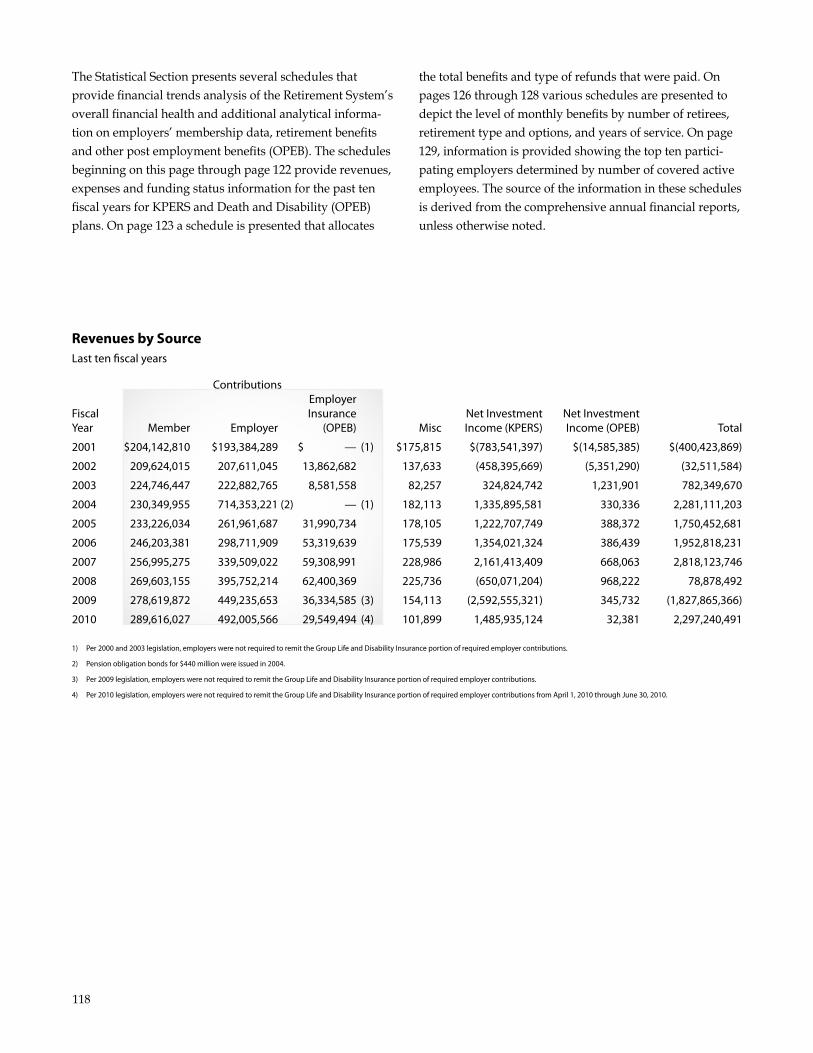
The Statistical Section presents several schedules that the total benefits and type of refunds that were paid. On provide financial trends analysis of the Retirement System’s pages 126 through 128 various schedules are presented to overall financial health and additional analytical informa- depict the level of monthly benefits by number of retirees, tion on employers’ membership data, retirement benefits retirement type and options, and years of service. On page and other post employment benefits (OPEB). The schedules 129, information is provided showing the top ten partici-beginning on this page through page 122 provide revenues, pating employers determined by number of covered active expenses and funding status information for the past ten employees. The source of the information in these schedules fiscal years for KPERS and Death and Disability (OPEB) is derived from the comprehensive annual financial reports, plans. On page 123 a schedule is presented that allocates unless otherwise noted.
Revenues by Source last ten fscal years
Contributions employer
fiscal Insurance net Investment net Investment year Member employer (oPeb) Misc Income (KPers) Income (oPeb) Total
2001 $204,142,810 $193,384,289 $ — (1) $175,815 $(783,541,397) $(14,585,385) $(400,423,869)
2002 209,624,015 207,611,045 13,862,682 137,633 (458,395,669) (5,351,290) (32,511,584)
2003 224,746,447 222,882,765 8,581,558 82,257 324,824,742 1,231,901 782,349,670
2004 230,349,955 714,353,221 (2) — (1) 182,113 1,335,895,581 330,336 2,281,111,203
2005 233,226,034 261,961,687 31,990,734 178,105 1,222,707,749 388,372 1,750,452,681
2006 246,203,381 298,711,909 53,319,639 175,539 1,354,021,324 386,439 1,952,818,231
2007 256,995,275 339,509,022 59,308,991 228,986 2,161,413,409 668,063 2,818,123,746
2008 269,603,155 395,752,214 62,400,369 225,736 (650,071,204) 968,222 78,878,492
2009 278,619,872 449,235,653 36,334,585 (3) 154,113 (2,592,555,321) 345,732 (1,827,865,366)
2010 289,616,027 492,005,566 29,549,494 (4) 101,899 1,485,935,124 32,381 2,297,240,491
1) Per 2000 and 2003 legislation, employers were not required to remit the Group life and disability Insurance portion of required employer contributions.
2) Pension obligation bonds for $440 million were issued in 2004.
3) Per 2009 legislation, employers were not required to remit the Group life and disability Insurance portion of required employer contributions.
4) Per 2010 legislation, employers were not required to remit the Group life and disability Insurance portion of required employer contributions from april 1, 2010 through June 30, 2010.
118
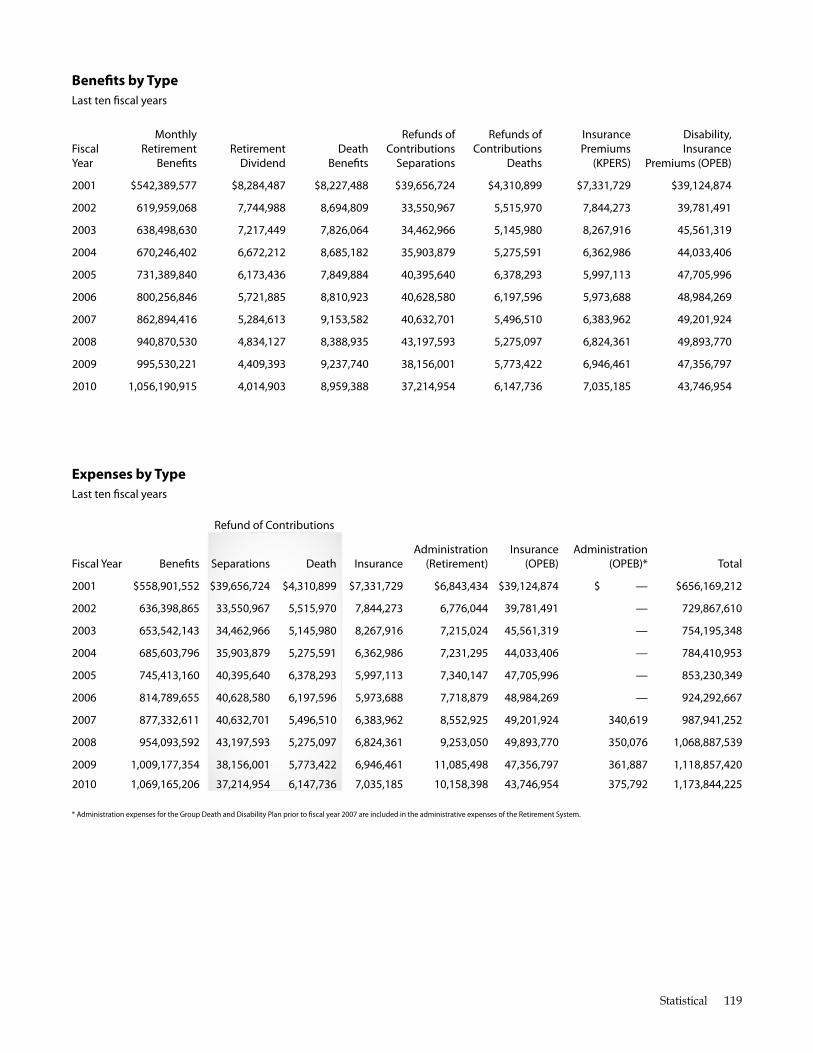
Benefts by Type last ten fscal years
Monthly refunds of refunds of Insurance disability, fiscal retirement retirement death Contributions Contributions Premiums Insurance year benefts dividend benefts separations deaths (KPers) Premiums (oPeb)
2001 $542,389,577 $8,284,487 $8,227,488 $39,656,724 $4,310,899 $7,331,729 $39,124,874
2002 619,959,068 7,744,988 8,694,809 33,550,967 5,515,970 7,844,273 39,781,491
2003 638,498,630 7,217,449 7,826,064 34,462,966 5,145,980 8,267,916 45,561,319
2004 670,246,402 6,672,212 8,685,182 35,903,879 5,275,591 6,362,986 44,033,406
2005 731,389,840 6,173,436 7,849,884 40,395,640 6,378,293 5,997,113 47,705,996
2006 800,256,846 5,721,885 8,810,923 40,628,580 6,197,596 5,973,688 48,984,269
2007 862,894,416 5,284,613 9,153,582 40,632,701 5,496,510 6,383,962 49,201,924
2008 940,870,530 4,834,127 8,388,935 43,197,593 5,275,097 6,824,361 49,893,770
2009 995,530,221 4,409,393 9,237,740 38,156,001 5,773,422 6,946,461 47,356,797
2010 1,056,190,915 4,014,903 8,959,388 37,214,954 6,147,736 7,035,185 43,746,954
Expenses by Type last ten fscal years
refund of Contributions
administration Insurance administration fiscal year benefts separations death Insurance (retirement) (oPeb) (oPeb)* Total
2001 $558,901,552 $39,656,724 $4,310,899 $7,331,729 $6,843,434 $39,124,874 $ — $656,169,212
2002 636,398,865 33,550,967 5,515,970 7,844,273 6,776,044 39,781,491 — 729,867,610
2003 653,542,143 34,462,966 5,145,980 8,267,916 7,215,024 45,561,319 — 754,195,348
2004 685,603,796 35,903,879 5,275,591 6,362,986 7,231,295 44,033,406 — 784,410,953
2005 745,413,160 40,395,640 6,378,293 5,997,113 7,340,147 47,705,996 — 853,230,349
2006 814,789,655 40,628,580 6,197,596 5,973,688 7,718,879 48,984,269 — 924,292,667
2007 877,332,611 40,632,701 5,496,510 6,383,962 8,552,925 49,201,924 340,619 987,941,252
2008 954,093,592 43,197,593 5,275,097 6,824,361 9,253,050 49,893,770 350,076 1,068,887,539
2009 1,009,177,354 38,156,001 5,773,422 6,946,461 11,085,498 47,356,797 361,887 1,118,857,420
2010 1,069,165,206 37,214,954 6,147,736 7,035,185 10,158,398 43,746,954 375,792 1,173,844,225
* administration expenses for the Group death and disability Plan prior to fscal year 2007 are included in the administrative expenses of the retirement system.
Statistical 119
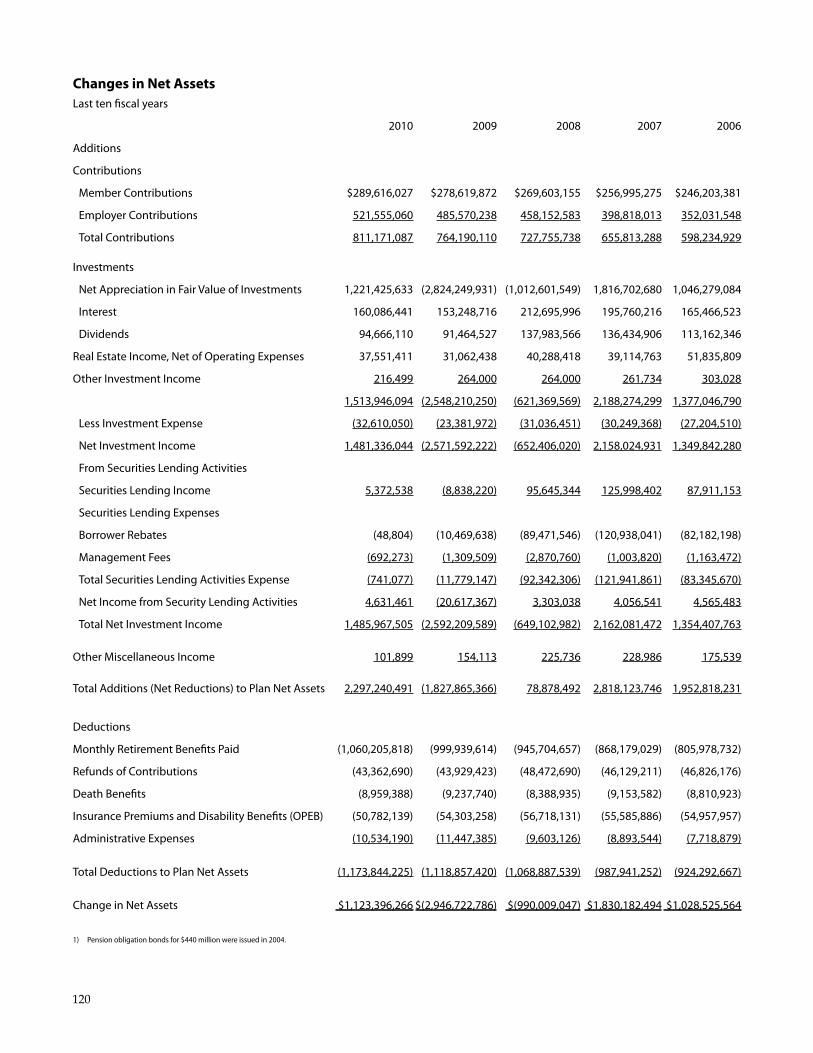
Changes in Net Assets last ten fscal years
2010 2009 2008 2007 2006
additions
Contributions
Member Contributions
employer Contributions
Total Contributions
$289,616,027
521,555,060
811,171,087
$278,619,872
485,570,238
764,190,110
$269,603,155
458,152,583
727,755,738
$256,995,275
398,818,013
655,813,288
$246,203,381
352,031,548
598,234,929
Investments
net appreciation in fair value of Investments
Interest
dividends
real estate Income, net of operating expenses
other Investment Income
less Investment expense
net Investment Income
from securities lending activities
securities lending Income
securities lending expenses
borrower rebates
Management fees
Total securities lending activities expense
net Income from security lending activities
Total net Investment Income
1,221,425,633
160,086,441
94,666,110
37,551,411
216,499
1,513,946,094
(32,610,050)
1,481,336,044
5,372,538
(48,804)
(692,273)
(741,077)
4,631,461
1,485,967,505
(2,824,249,931) (1,012,601,549)
153,248,716 212,695,996
91,464,527 137,983,566
31,062,438 40,288,418
264,000 264,000
(2,548,210,250) (621,369,569)
(23,381,972) (31,036,451)
(2,571,592,222) (652,406,020)
(8,838,220) 95,645,344
(10,469,638) (89,471,546)
(1,309,509) (2,870,760)
(11,779,147) (92,342,306)
(20,617,367) 3,303,038
(2,592,209,589) (649,102,982)
1,816,702,680
195,760,216
136,434,906
39,114,763
261,734
2,188,274,299
(30,249,368)
2,158,024,931
125,998,402
(120,938,041)
(1,003,820)
(121,941,861)
4,056,541
2,162,081,472
1,046,279,084
165,466,523
113,162,346
51,835,809
303,028
1,377,046,790
(27,204,510)
1,349,842,280
87,911,153
(82,182,198)
(1,163,472)
(83,345,670)
4,565,483
1,354,407,763
other Miscellaneous Income 101,899 154,113 225,736 228,986 175,539
Total additions (net reductions) to Plan net assets 2,297,240,491 (1,827,865,366) 78,878,492 2,818,123,746 1,952,818,231
deductions
Monthly retirement benefts Paid
refunds of Contributions
death benefts
Insurance Premiums and disability benefts (oPeb)
administrative expenses
(1,060,205,818)
(43,362,690)
(8,959,388)
(50,782,139)
(10,534,190)
(999,939,614)
(43,929,423)
(9,237,740)
(54,303,258)
(11,447,385)
(945,704,657)
(48,472,690)
(8,388,935)
(56,718,131)
(9,603,126)
(868,179,029)
(46,129,211)
(9,153,582)
(55,585,886)
(8,893,544)
(805,978,732)
(46,826,176)
(8,810,923)
(54,957,957)
(7,718,879)
Total deductions to Plan net assets (1,173,844,225) (1,118,857,420) (1,068,887,539) (987,941,252) (924,292,667)
Change in net assets $1,123,396,266 $(2,946,722,786) $(990,009,047) $1,830,182,494 $1,028,525,564
1) Pension obligation bonds for $440 million were issued in 2004.
120
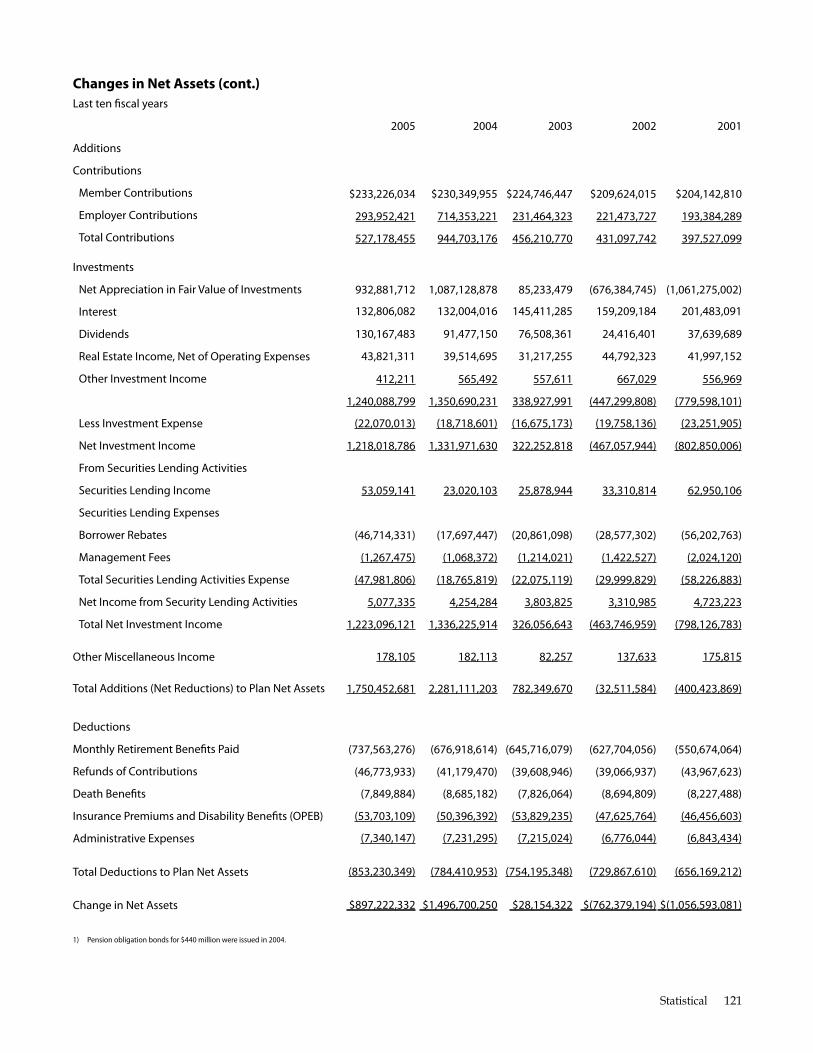
Changes in Net Assets (cont.) last ten fscal years
2005 2004 2003 2002 2001
additions
Contributions
Member Contributions
employer Contributions
Total Contributions
$233,226,034
293,952,421
527,178,455
$230,349,955
714,353,221
944,703,176
$224,746,447
231,464,323
456,210,770
$209,624,015
221,473,727
431,097,742
$204,142,810
193,384,289
397,527,099
Investments
net appreciation in fair value of Investments
Interest
dividends
real estate Income, net of operating expenses
other Investment Income
less Investment expense
net Investment Income
from securities lending activities
securities lending Income
securities lending expenses
borrower rebates
Management fees
Total securities lending activities expense
net Income from security lending activities
Total net Investment Income
932,881,712
132,806,082
130,167,483
43,821,311
412,211
1,240,088,799
(22,070,013)
1,218,018,786
53,059,141
(46,714,331)
(1,267,475)
(47,981,806)
5,077,335
1,223,096,121
1,087,128,878
132,004,016
91,477,150
39,514,695
565,492
1,350,690,231
(18,718,601)
1,331,971,630
23,020,103
(17,697,447)
(1,068,372)
(18,765,819)
4,254,284
1,336,225,914
85,233,479
145,411,285
76,508,361
31,217,255
557,611
338,927,991
(16,675,173)
322,252,818
25,878,944
(20,861,098)
(1,214,021)
(22,075,119)
3,803,825
326,056,643
(676,384,745)
159,209,184
24,416,401
44,792,323
667,029
(447,299,808)
(19,758,136)
(467,057,944)
33,310,814
(28,577,302)
(1,422,527)
(29,999,829)
3,310,985
(463,746,959)
(1,061,275,002)
201,483,091
37,639,689
41,997,152
556,969
(779,598,101)
(23,251,905)
(802,850,006)
62,950,106
(56,202,763)
(2,024,120)
(58,226,883)
4,723,223
(798,126,783)
other Miscellaneous Income 178,105 182,113 82,257 137,633 175,815
Total additions (net reductions) to Plan net assets 1,750,452,681 2,281,111,203 782,349,670 (32,511,584) (400,423,869)
deductions
Monthly retirement benefts Paid
refunds of Contributions
death benefts
Insurance Premiums and disability benefts (oPeb)
administrative expenses
(737,563,276)
(46,773,933)
(7,849,884)
(53,703,109)
(7,340,147)
(676,918,614) (645,716,079)
(41,179,470) (39,608,946)
(8,685,182) (7,826,064)
(50,396,392) (53,829,235)
(7,231,295) (7,215,024)
(627,704,056)
(39,066,937)
(8,694,809)
(47,625,764)
(6,776,044)
(550,674,064)
(43,967,623)
(8,227,488)
(46,456,603)
(6,843,434)
Total deductions to Plan net assets (853,230,349) (784,410,953) (754,195,348) (729,867,610) (656,169,212)
Change in net assets $897,222,332 $1,496,700,250 $28,154,322 $(762,379,194) $(1,056,593,081)
1) Pension obligation bonds for $440 million were issued in 2004.
Statistical 121
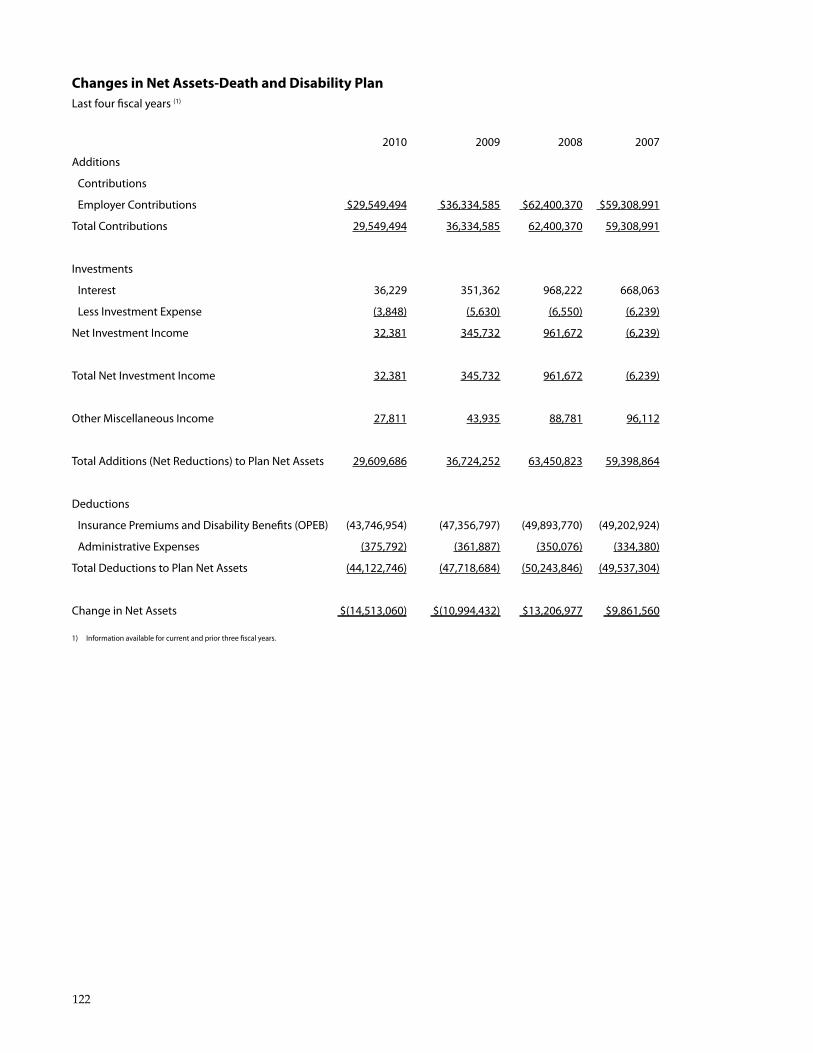
Changes in Net Assets-Death and Disability Plan last four fscal years (1)
2010 2009 2008 2007
additions
Contributions
employer Contributions $29,549,494 $36,334,585 $62,400,370 $59,308,991
Total Contributions 29,549,494 36,334,585 62,400,370 59,308,991
Investments
Interest 36,229 351,362 968,222 668,063
less Investment expense (3,848) (5,630) (6,550) (6,239)
net Investment Income 32,381 345,732 961,672 (6,239)
Total net Investment Income 32,381 345,732 961,672 (6,239)
other Miscellaneous Income 27,811 43,935 88,781 96,112
Total additions (net reductions) to Plan net assets 29,609,686 36,724,252 63,450,823 59,398,864
deductions
Insurance Premiums and disability benefts (oPeb) (43,746,954) (47,356,797) (49,893,770) (49,202,924)
administrative expenses (375,792) (361,887) (350,076) (334,380)
Total deductions to Plan net assets (44,122,746) (47,718,684) (50,243,846) (49,537,304)
Change in net assets $(14,513,060) $(10,994,432) $13,206,977 $9,861,560
1) Information available for current and prior three fscal years.
122
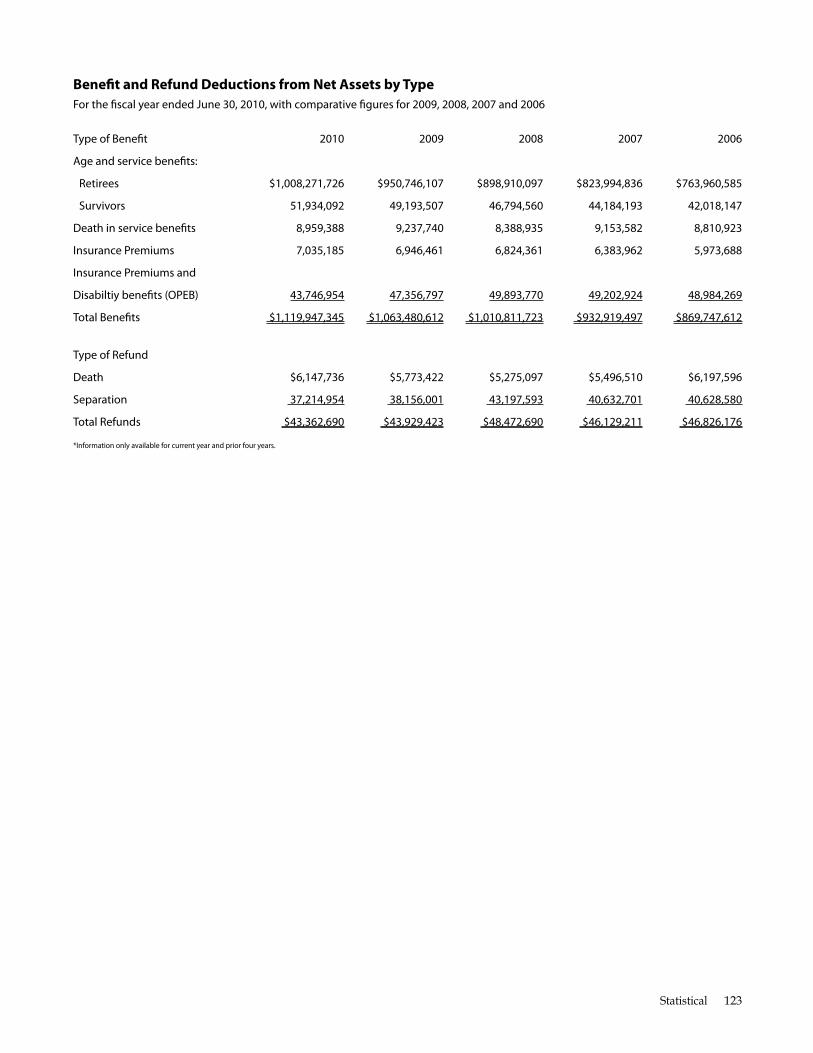
Beneft and Refund Deductions from Net Assets by Type for the fscal year ended June 30, 2010, with comparative fgures for 2009, 2008, 2007 and 2006
Type of beneft 2010 2009 2008 2007 2006
age and service benefts:
retirees $1,008,271,726 $950,746,107 $898,910,097 $823,994,836 $763,960,585
survivors 51,934,092 49,193,507 46,794,560 44,184,193 42,018,147
death in service benefts 8,959,388 9,237,740 8,388,935 9,153,582 8,810,923
Insurance Premiums 7,035,185 6,946,461 6,824,361 6,383,962 5,973,688
Insurance Premiums and
disabiltiy benefts (oPeb) 43,746,954 47,356,797 49,893,770 49,202,924 48,984,269
Total benefts $1,119,947,345 $1,063,480,612 $1,010,811,723 $932,919,497 $869,747,612
Type of refund
death $6,147,736 $5,773,422 $5,275,097 $5,496,510 $6,197,596
separation 37,214,954 38,156,001 43,197,593 40,632,701 40,628,580
Total refunds $43,362,690 $43,929,423 $48,472,690 $46,129,211 $46,826,176
*Information only available for current year and prior four years.
Statistical 123
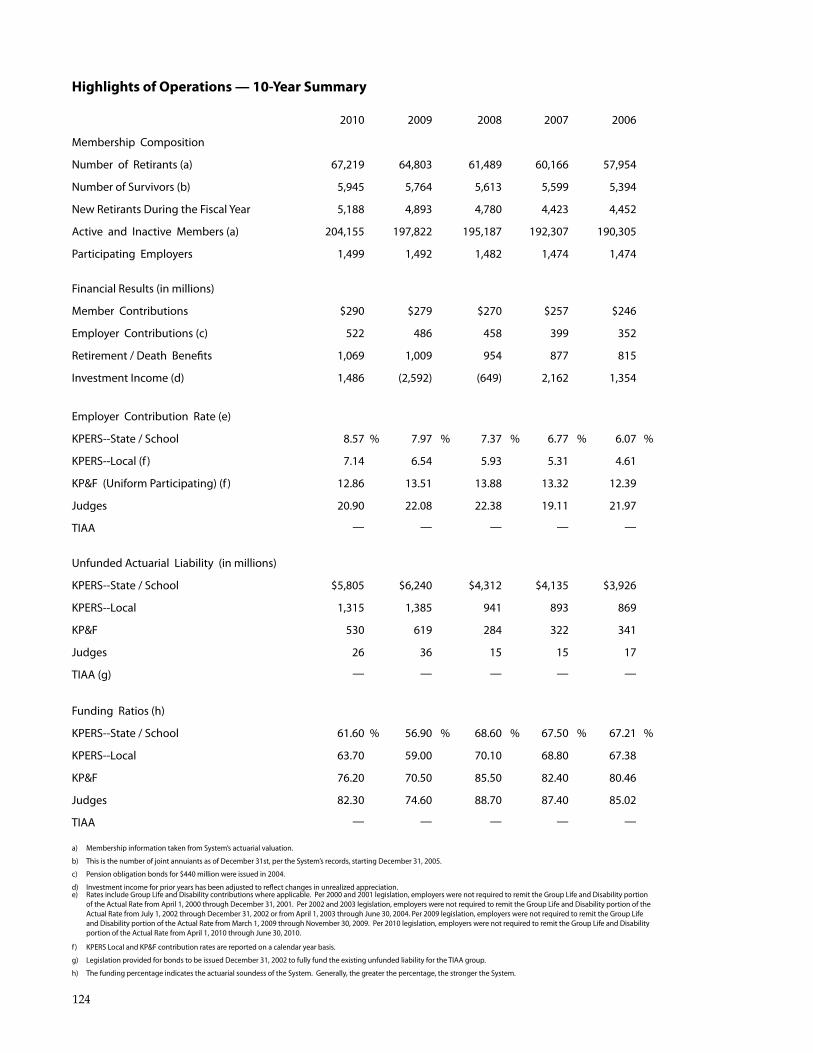
Highlights of Operations — 10-Year Summary
2010 2009 2008 2007 2006
Membership Composition
number of retirants (a) 67,219 64,803 61,489 60,166 57,954
number of survivors (b) 5,945 5,764 5,613 5,599 5,394
new retirants during the fiscal year 5,188 4,893 4,780 4,423 4,452
active and Inactive Members (a) 204,155 197,822 195,187 192,307 190,305
Participating employers 1,499 1,492 1,482 1,474 1,474
financial results (in millions)
Member Contributions $290 $279 $270 $257 $246
employer Contributions (c) 522 486 458 399 352
retirement / death benefts 1,069 1,009 954 877 815
Investment Income (d) 1,486 (2,592) (649) 2,162 1,354
employer Contribution rate (e)
KPers--state / school 8.57 % 7.97 % 7.37 % 6.77 % 6.07 %
KPers--local (f ) 7.14 6.54 5.93 5.31 4.61
KP&f (uniform Participating) (f ) 12.86 13.51 13.88 13.32 12.39
Judges 20.90 22.08 22.38 19.11 21.97
TIaa — — — — —
unfunded actuarial liability (in millions)
KPers--state / school $5,805 $6,240 $4,312 $4,135 $3,926
KPers--local 1,315 1,385 941 893 869
KP&f 530 619 284 322 341
Judges 26 36 15 15 17
TIaa (g) — — — — —
funding ratios (h)
KPers--state / school 61.60 % 56.90 % 68.60 % 67.50 % 67.21 %
KPers--local 63.70 59.00 70.10 68.80 67.38
KP&f 76.20 70.50 85.50 82.40 80.46
Judges 82.30 74.60 88.70 87.40 85.02
TIaa — — — — —
a) Membership information taken from system’s actuarial valuation.
b) This is the number of joint annuiants as of december 31st, per the system’s records, starting december 31, 2005.
c) Pension obligation bonds for $440 million were issued in 2004.
d) Investment income for prior years has been adjusted to refect changes in unrealized appreciation. e) rates include Group life and disability contributions where applicable. Per 2000 and 2001 legislation, employers were not required to remit the Group life and disability portion
of the actual rate from april 1, 2000 through december 31, 2001. Per 2002 and 2003 legislation, employers were not required to remit the Group life and disability portion of the actual rate from July 1, 2002 through december 31, 2002 or from april 1, 2003 through June 30, 2004. Per 2009 legislation, employers were not required to remit the Group life and disability portion of the actual rate from March 1, 2009 through november 30, 2009. Per 2010 legislation, employers were not required to remit the Group life and disability portion of the actual rate from april 1, 2010 through June 30, 2010.
f ) KPers local and KP&f contribution rates are reported on a calendar year basis.
g) legislation provided for bonds to be issued december 31, 2002 to fully fund the existing unfunded liability for the TIaa group.
h) The funding percentage indicates the actuarial soundess of the system. Generally, the greater the percentage, the stronger the system.
124
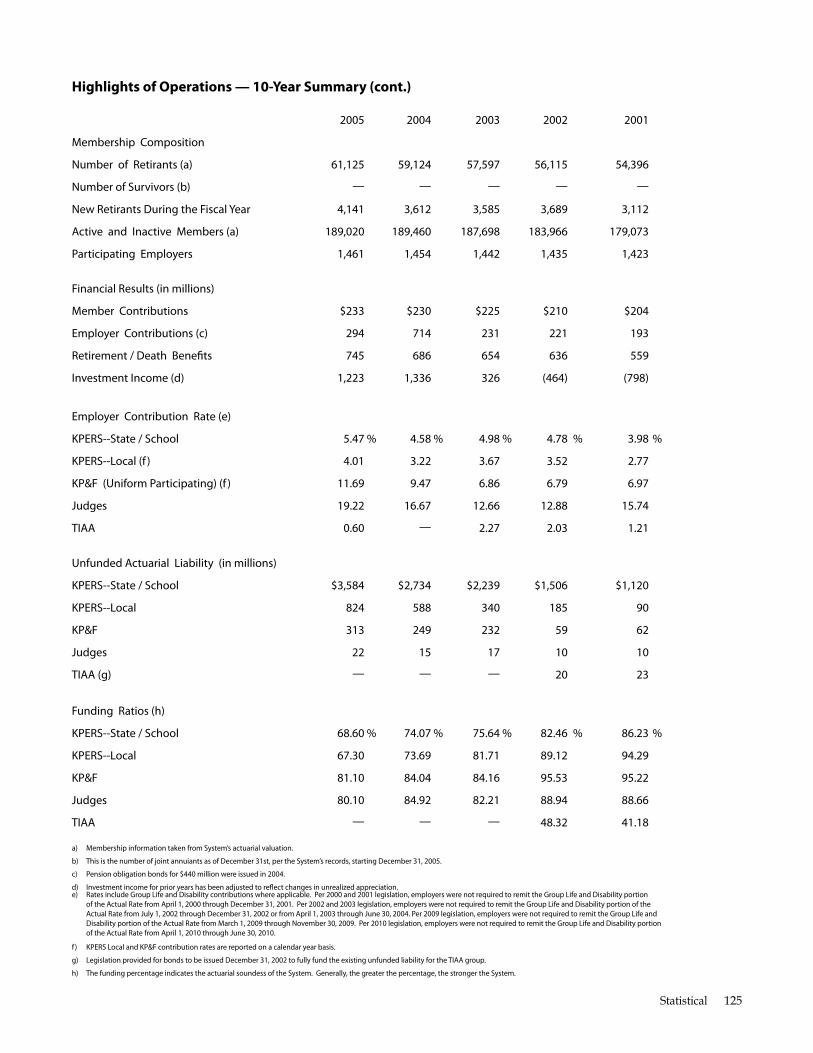
Highlights of Operations — 10-Year Summary (cont.)
2005 2004 2003 2002 2001
Membership Composition
number of retirants (a) 61,125 59,124 57,597 56,115 54,396
number of survivors (b) — — — — —
new retirants during the fiscal year 4,141 3,612 3,585 3,689 3,112
active and Inactive Members (a) 189,020 189,460 187,698 183,966 179,073
Participating employers 1,461 1,454 1,442 1,435 1,423
financial results (in millions)
Member Contributions $233 $230 $225 $210 $204
employer Contributions (c) 294 714 231 221 193
retirement / death benefts 745 686 654 636 559
Investment Income (d) 1,223 1,336 326 (464) (798)
employer Contribution rate (e)
KPers--state / school 5.47 % 4.58 % 4.98 % 4.78 % 3.98 %
KPers--local (f ) 4.01 3.22 3.67 3.52 2.77
KP&f (uniform Participating) (f ) 11.69 9.47 6.86 6.79 6.97
Judges 19.22 16.67 12.66 12.88 15.74
TIaa 0.60 — 2.27 2.03 1.21
unfunded actuarial liability (in millions)
KPers--state / school $3,584 $2,734 $2,239 $1,506 $1,120
KPers--local 824 588 340 185 90
KP&f 313 249 232 59 62
Judges 22 15 17 10 10
TIaa (g) — — — 20 23
funding ratios (h)
KPers--state / school 68.60 % 74.07 % 75.64 % 82.46 % 86.23 %
KPers--local 67.30 73.69 81.71 89.12 94.29
KP&f 81.10 84.04 84.16 95.53 95.22
Judges 80.10 84.92 82.21 88.94 88.66
TIaa — — — 48.32 41.18
a) Membership information taken from system’s actuarial valuation.
b) This is the number of joint annuiants as of december 31st, per the system’s records, starting december 31, 2005.
c) Pension obligation bonds for $440 million were issued in 2004.
d) Investment income for prior years has been adjusted to refect changes in unrealized appreciation. e) rates include Group life and disability contributions where applicable. Per 2000 and 2001 legislation, employers were not required to remit the Group life and disability portion
of the actual rate from april 1, 2000 through december 31, 2001. Per 2002 and 2003 legislation, employers were not required to remit the Group life and disability portion of the actual rate from July 1, 2002 through december 31, 2002 or from april 1, 2003 through June 30, 2004. Per 2009 legislation, employers were not required to remit the Group life and disability portion of the actual rate from March 1, 2009 through november 30, 2009. Per 2010 legislation, employers were not required to remit the Group life and disability portion of the actual rate from april 1, 2010 through June 30, 2010.
f ) KPers local and KP&f contribution rates are reported on a calendar year basis.
g) legislation provided for bonds to be issued december 31, 2002 to fully fund the existing unfunded liability for the TIaa group.
h) The funding percentage indicates the actuarial soundess of the system. Generally, the greater the percentage, the stronger the system.
Statistical 125
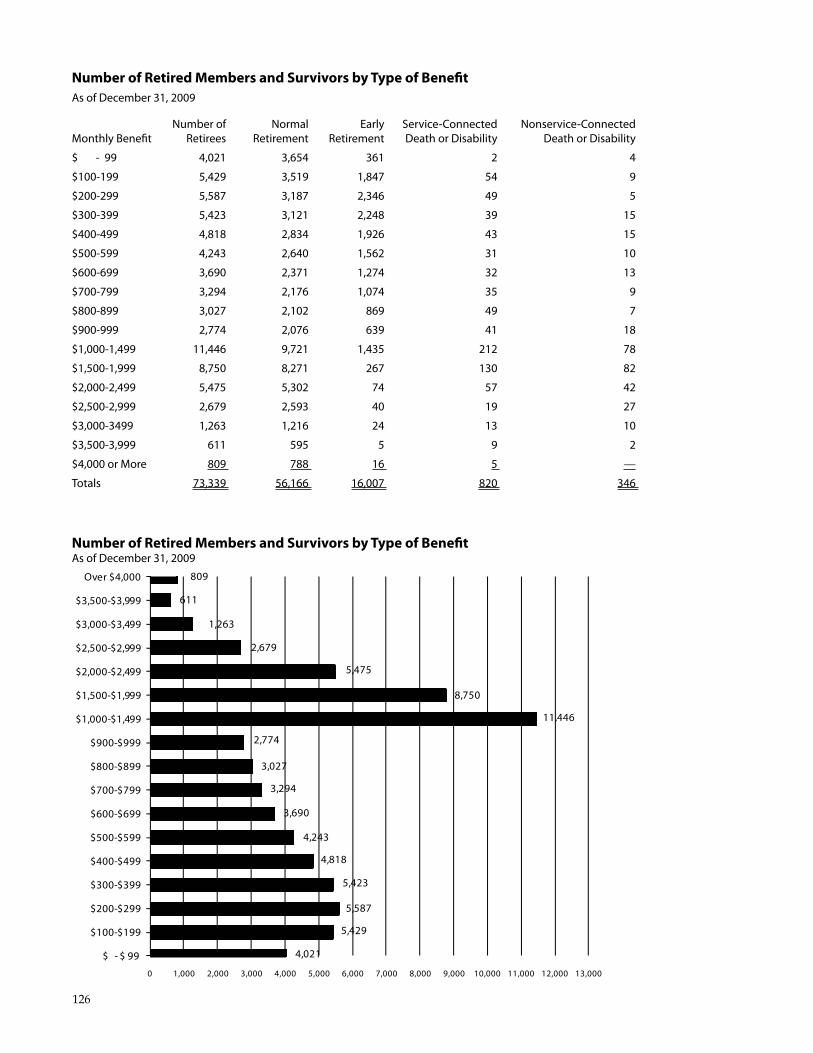
Number of Retired Members and Survivors by Type of Beneft as of december 31, 2009
number of normal early service-Connected nonservice-Connected Monthly beneft retirees retirement retirement death or disability death or disability
$ - 99 4,021 3,654 361 2 4
$100-199 5,429 3,519 1,847 54 9
$200-299 5,587 3,187 2,346 49 5
$300-399 5,423 3,121 2,248 39 15
$400-499 4,818 2,834 1,926 43 15
$500-599 4,243 2,640 1,562 31 10
$600-699 3,690 2,371 1,274 32 13
$700-799 3,294 2,176 1,074 35 9
$800-899 3,027 2,102 869 49 7
$900-999 2,774 2,076 639 41 18
$1,000-1,499 11,446 9,721 1,435 212 78
$1,500-1,999 8,750 8,271 267 130 82
$2,000-2,499 5,475 5,302 74 57 42
$2,500-2,999 2,679 2,593 40 19 27
$3,000-3499 1,263 1,216 24 13 10
$3,500-3,999 611 595 5 9 2
$4,000 or More 809 788 16 5 —
Totals 73,339 56,166 16,007 820 346
Number of Retired Members and Survivors by Type of Beneft as of december 31, 2009
Over $4,000
$3,500-$3,999
$3,000-$3,499
$2,500-$2,999
$2,000-$2,499
$1,500-$1,999
$1,000-$1,499
$900-$999
$800-$899
$700-$799
$600-$699
$500-$599
$400-$499
$300-$399
$200-$299
$100-$199
$ - $ 99
0 1,000 2,000 3,000 4,000 5,000 6,000 7,000 8,000 9,000 10,000 11,000 12,000 13,000
4,021
5,429
5,587
5,423
4,818
4,243
3,690
3,294
3,027
2,774
11,446
8,750
5,475
2,679
1,263
611
809
126
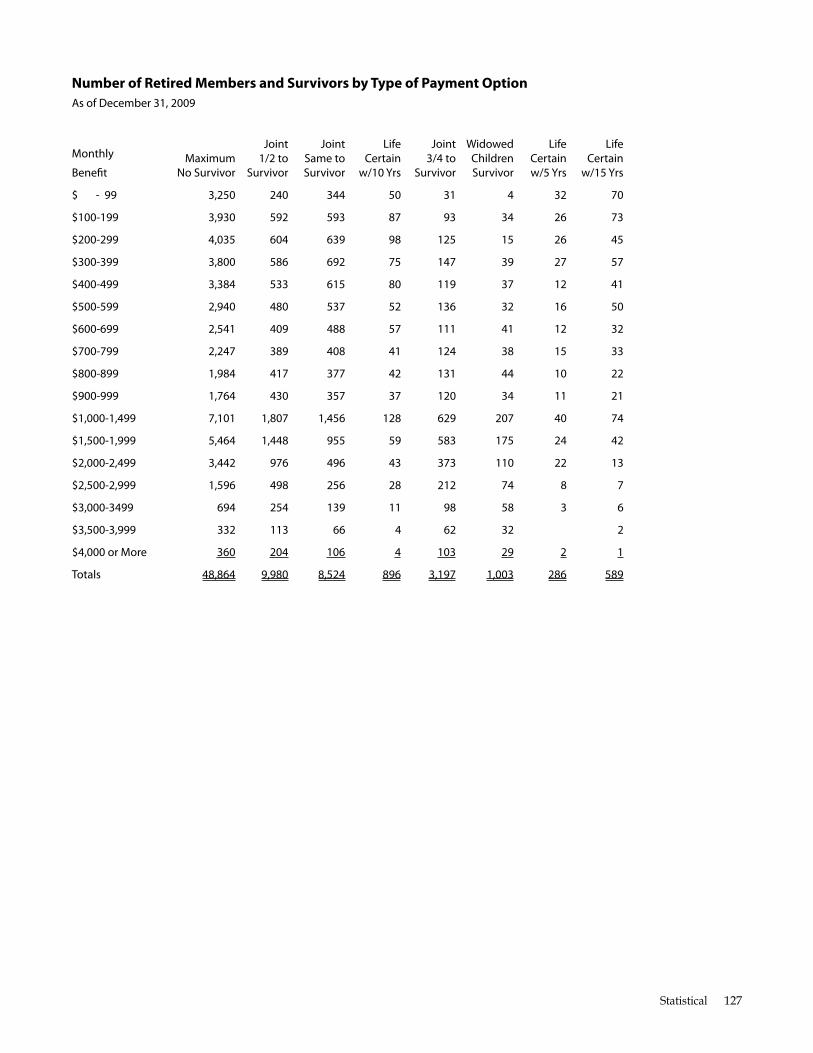
Number of Retired Members and Survivors by Type of Payment Option as of december 31, 2009
Joint Joint life Joint Widowed life life Monthly Maximum 1/2 to same to Certain 3/4 to Children Certain Certain beneft no survivor survivor survivor w/10 yrs survivor survivor w/5 yrs w/15 yrs
$ - 99 3,250 240 344 50 31 4 32 70
$100-199 3,930 592 593 87 93 34 26 73
$200-299 4,035 604 639 98 125 15 26 45
$300-399 3,800 586 692 75 147 39 27 57
$400-499 3,384 533 615 80 119 37 12 41
$500-599 2,940 480 537 52 136 32 16 50
$600-699 2,541 409 488 57 111 41 12 32
$700-799 2,247 389 408 41 124 38 15 33
$800-899 1,984 417 377 42 131 44 10 22
$900-999 1,764 430 357 37 120 34 11 21
$1,000-1,499 7,101 1,807 1,456 128 629 207 40 74
$1,500-1,999 5,464 1,448 955 59 583 175 24 42
$2,000-2,499 3,442 976 496 43 373 110 22 13
$2,500-2,999 1,596 498 256 28 212 74 8 7
$3,000-3499 694 254 139 11 98 58 3 6
$3,500-3,999 332 113 66 4 62 32 2
$4,000 or More 360 204 106 4 103 29 2 1
Totals 48,864 9,980 8,524 896 3,197 1,003 286 589
Statistical 127
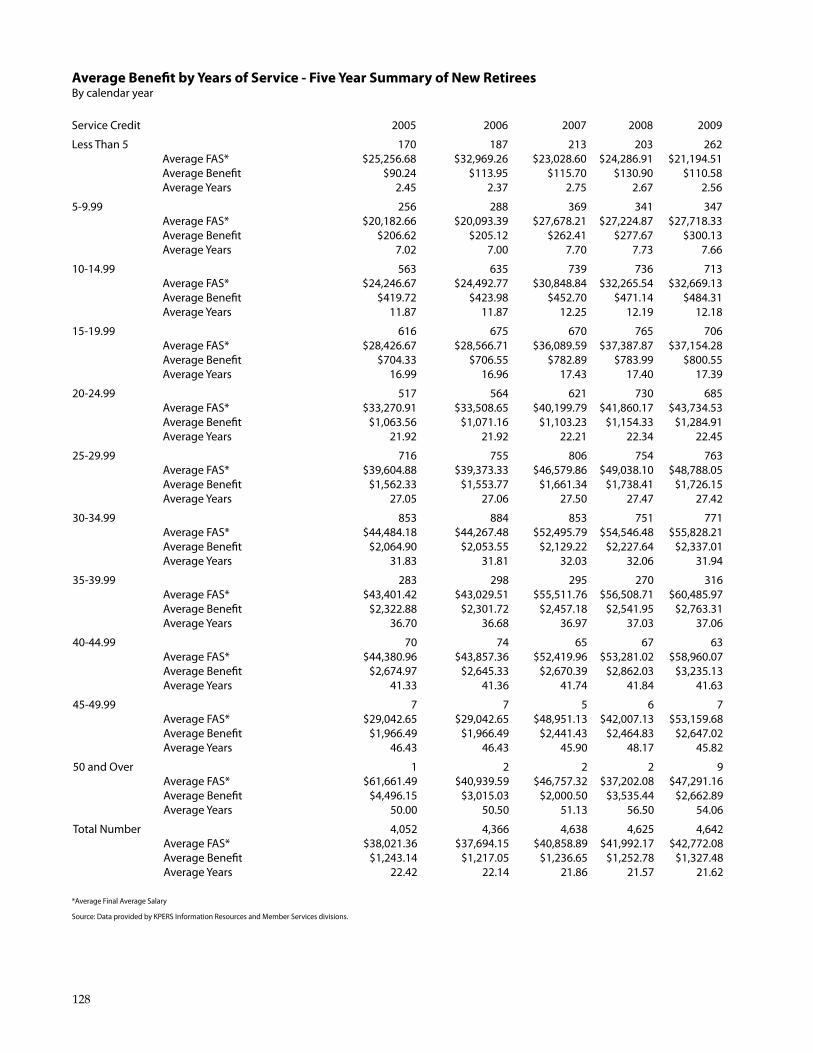
Average Beneft by Years of Service - Five Year Summary of New Retirees by calendar year
service Credit 2005 2006 2007 2008 2009
less Than 5 170 187 213 203 262 average fas* $25,256.68 $32,969.26 $23,028.60 $24,286.91 $21,194.51 average beneft $90.24 $113.95 $115.70 $130.90 $110.58 average years 2.45 2.37 2.75 2.67 2.56
5-9.99 256 288 369 341 347 average fas* $20,182.66 $20,093.39 $27,678.21 $27,224.87 $27,718.33 average beneft $206.62 $205.12 $262.41 $277.67 $300.13 average years 7.02 7.00 7.70 7.73 7.66
10-14.99 563 635 739 736 713 average fas* $24,246.67 $24,492.77 $30,848.84 $32,265.54 $32,669.13 average beneft $419.72 $423.98 $452.70 $471.14 $484.31 average years 11.87 11.87 12.25 12.19 12.18
15-19.99 616 675 670 765 706 average fas* $28,426.67 $28,566.71 $36,089.59 $37,387.87 $37,154.28 average beneft $704.33 $706.55 $782.89 $783.99 $800.55 average years 16.99 16.96 17.43 17.40 17.39
20-24.99 517 564 621 730 685 average fas* $33,270.91 $33,508.65 $40,199.79 $41,860.17 $43,734.53 average beneft $1,063.56 $1,071.16 $1,103.23 $1,154.33 $1,284.91 average years 21.92 21.92 22.21 22.34 22.45
25-29.99 716 755 806 754 763 average fas* $39,604.88 $39,373.33 $46,579.86 $49,038.10 $48,788.05 average beneft $1,562.33 $1,553.77 $1,661.34 $1,738.41 $1,726.15 average years 27.05 27.06 27.50 27.47 27.42
30-34.99 853 884 853 751 771 average fas* $44,484.18 $44,267.48 $52,495.79 $54,546.48 $55,828.21 average beneft $2,064.90 $2,053.55 $2,129.22 $2,227.64 $2,337.01 average years 31.83 31.81 32.03 32.06 31.94
35-39.99 283 298 295 270 316 average fas* $43,401.42 $43,029.51 $55,511.76 $56,508.71 $60,485.97 average beneft $2,322.88 $2,301.72 $2,457.18 $2,541.95 $2,763.31 average years 36.70 36.68 36.97 37.03 37.06
40-44.99 70 74 65 67 63 average fas* $44,380.96 $43,857.36 $52,419.96 $53,281.02 $58,960.07 average beneft $2,674.97 $2,645.33 $2,670.39 $2,862.03 $3,235.13 average years 41.33 41.36 41.74 41.84 41.63
45-49.99 7 7 5 6 7 average fas* $29,042.65 $29,042.65 $48,951.13 $42,007.13 $53,159.68 average beneft $1,966.49 $1,966.49 $2,441.43 $2,464.83 $2,647.02 average years 46.43 46.43 45.90 48.17 45.82
50 and over 1 2 2 2 9 average fas* $61,661.49 $40,939.59 $46,757.32 $37,202.08 $47,291.16 average beneft $4,496.15 $3,015.03 $2,000.50 $3,535.44 $2,662.89 average years 50.00 50.50 51.13 56.50 54.06
Total number 4,052 4,366 4,638 4,625 4,642 average fas* $38,021.36 $37,694.15 $40,858.89 $41,992.17 $42,772.08 average beneft $1,243.14 $1,217.05 $1,236.65 $1,252.78 $1,327.48 average years 22.42 22.14 21.86 21.57 21.62
*average final average salary
source: data provided by KPers Information resources and Member services divisions.
128
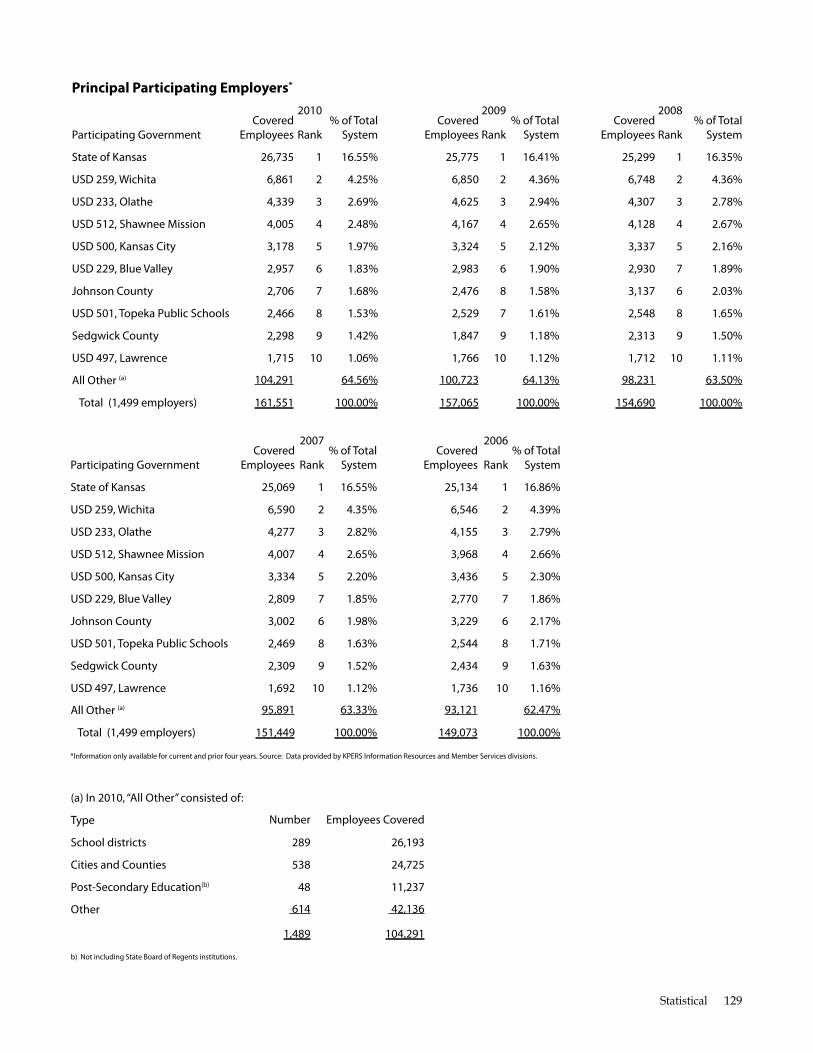
Principal Participating Employers*
2010 2009 2008 Covered % of Total Covered % of Total Covered % of Total
Participating Government employees rank system employees rank system employees rank system
state of Kansas 26,735 1 16.55% 25,775 1 16.41% 25,299 1 16.35%
usd 259, Wichita 6,861 2 4.25% 6,850 2 4.36% 6,748 2 4.36%
usd 233, olathe 4,339 3 2.69% 4,625 3 2.94% 4,307 3 2.78%
usd 512, shawnee Mission 4,005 4 2.48% 4,167 4 2.65% 4,128 4 2.67%
usd 500, Kansas City 3,178 5 1.97% 3,324 5 2.12% 3,337 5 2.16%
usd 229, blue valley 2,957 6 1.83% 2,983 6 1.90% 2,930 7 1.89%
Johnson County 2,706 7 1.68% 2,476 8 1.58% 3,137 6 2.03%
usd 501, Topeka Public schools 2,466 8 1.53% 2,529 7 1.61% 2,548 8 1.65%
sedgwick County 2,298 9 1.42% 1,847 9 1.18% 2,313 9 1.50%
usd 497, lawrence 1,715 10 1.06% 1,766 10 1.12% 1,712 10 1.11%
all other (a) 104,291 64.56% 100,723 64.13% 98,231 63.50%
Total (1,499 employers) 161,551 100.00% 157,065 100.00% 154,690 100.00%
2007 2006 Covered % of Total Covered % of Total
Participating Government employees rank system employees rank system
state of Kansas 25,069 1 16.55% 25,134 1 16.86%
usd 259, Wichita 6,590 2 4.35% 6,546 2 4.39%
usd 233, olathe 4,277 3 2.82% 4,155 3 2.79%
usd 512, shawnee Mission 4,007 4 2.65% 3,968 4 2.66%
usd 500, Kansas City 3,334 5 2.20% 3,436 5 2.30%
usd 229, blue valley 2,809 7 1.85% 2,770 7 1.86%
Johnson County 3,002 6 1.98% 3,229 6 2.17%
usd 501, Topeka Public schools 2,469 8 1.63% 2,544 8 1.71%
sedgwick County 2,309 9 1.52% 2,434 9 1.63%
usd 497, lawrence 1,692 10 1.12% 1,736 10 1.16%
all other (a) 95,891 63.33% 93,121 62.47%
Total (1,499 employers) 151,449 100.00% 149,073 100.00%
*Information only available for current and prior four years. source: data provided by KPers Information resources and Member services divisions.
(a) In 2010, “all other” consisted of:
Type number employees Covered
school districts 289 26,193
Cities and Counties 538 24,725
Post-secondary education(b) 48 11,237
other 614 42,136
1,489 104,291
b) not including state board of regents institutions.
Statistical 129
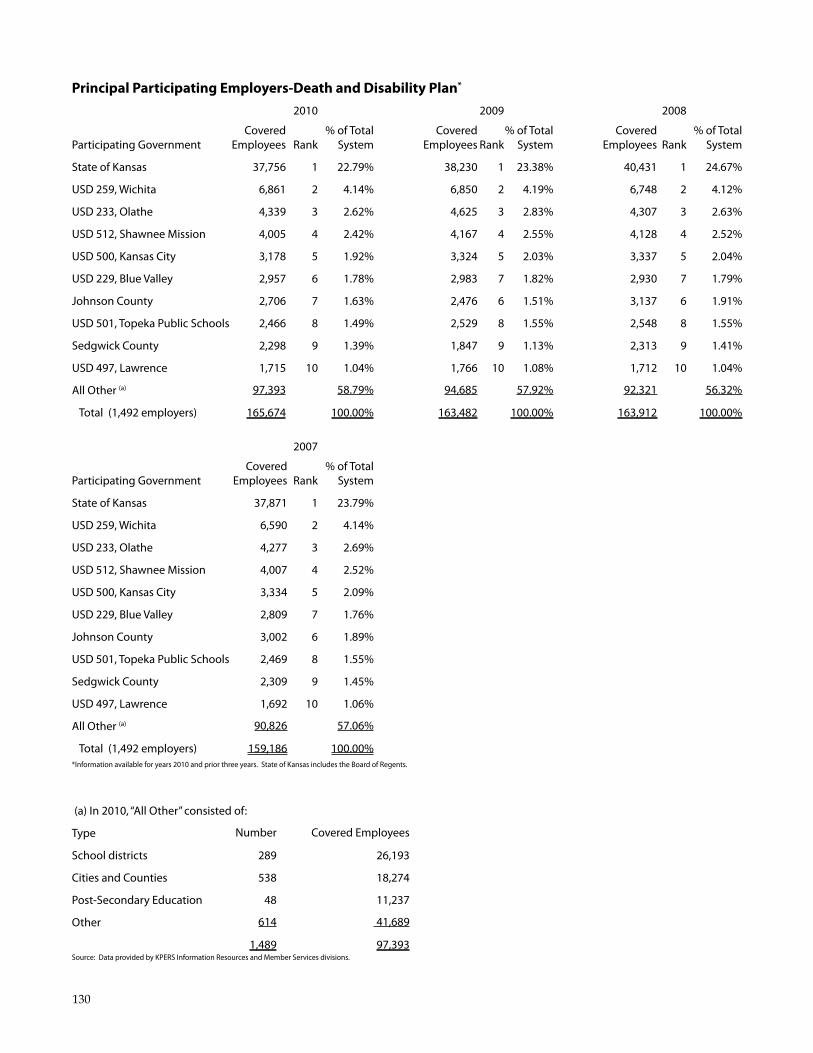
Principal Participating Employers-Death and Disability Plan*
2010 2009 2008
Covered % of Total Covered % of Total Covered % of Total Participating Government employees rank system employees rank system employees rank system
state of Kansas 37,756 1 22.79% 38,230 1 23.38% 40,431 1 24.67%
usd 259, Wichita 6,861 2 4.14% 6,850 2 4.19% 6,748 2 4.12%
usd 233, olathe 4,339 3 2.62% 4,625 3 2.83% 4,307 3 2.63%
usd 512, shawnee Mission 4,005 4 2.42% 4,167 4 2.55% 4,128 4 2.52%
usd 500, Kansas City 3,178 5 1.92% 3,324 5 2.03% 3,337 5 2.04%
usd 229, blue valley 2,957 6 1.78% 2,983 7 1.82% 2,930 7 1.79%
Johnson County 2,706 7 1.63% 2,476 6 1.51% 3,137 6 1.91%
usd 501, Topeka Public schools 2,466 8 1.49% 2,529 8 1.55% 2,548 8 1.55%
sedgwick County 2,298 9 1.39% 1,847 9 1.13% 2,313 9 1.41%
usd 497, lawrence 1,715 10 1.04% 1,766 10 1.08% 1,712 10 1.04%
all other (a) 97,393 58.79% 94,685 57.92% 92,321 56.32%
Total (1,492 employers) 165,674 100.00% 163,482 100.00% 163,912 100.00%
2007
Covered % of Total Participating Government employees rank system
state of Kansas 37,871 1 23.79%
usd 259, Wichita 6,590 2 4.14%
usd 233, olathe 4,277 3 2.69%
usd 512, shawnee Mission 4,007 4 2.52%
usd 500, Kansas City 3,334 5 2.09%
usd 229, blue valley 2,809 7 1.76%
Johnson County 3,002 6 1.89%
usd 501, Topeka Public schools 2,469 8 1.55%
sedgwick County 2,309 9 1.45%
usd 497, lawrence 1,692 10 1.06%
all other (a) 90,826 57.06%
Total (1,492 employers) 159,186 100.00% *Information available for years 2010 and prior three years. state of Kansas includes the board of regents.
(a) In 2010, “all other” consisted of:
Type number Covered employees
school districts 289 26,193
Cities and Counties 538 18,274
Post-secondary education 48 11,237
other 614 41,689
1,489 97,393 source: data provided by KPers Information resources and Member services divisions.
130


Related Documents