Prepared By Valuation for Mergers and Valuation for Mergers and Valuation for Mergers and Valuation for Mergers and Acquisitions Acquisitions Acquisitions Acquisitions Prepared By Ooi Kok Hwa MRR Consulting

Welcome message from author
This document is posted to help you gain knowledge. Please leave a comment to let me know what you think about it! Share it to your friends and learn new things together.
Transcript
Prepared By
Valuation for Mergers and Valuation for Mergers and Valuation for Mergers and Valuation for Mergers and
AcquisitionsAcquisitionsAcquisitionsAcquisitions
Prepared By
Ooi Kok Hwa
MRR Consulting
AgendaAgendaAgendaAgenda
�This seminar will explain: �Various valuation approaches for M&A exercises;
�Determine the value of target companies as well as post-merger valuations;
Valuation Approaches Valuation Approaches Valuation Approaches Valuation Approaches
�Enterprise Value/EBITDA
�Comparable company analysis
�Comparable transaction analysis�Comparable transaction analysis
�Discounted cash flow method
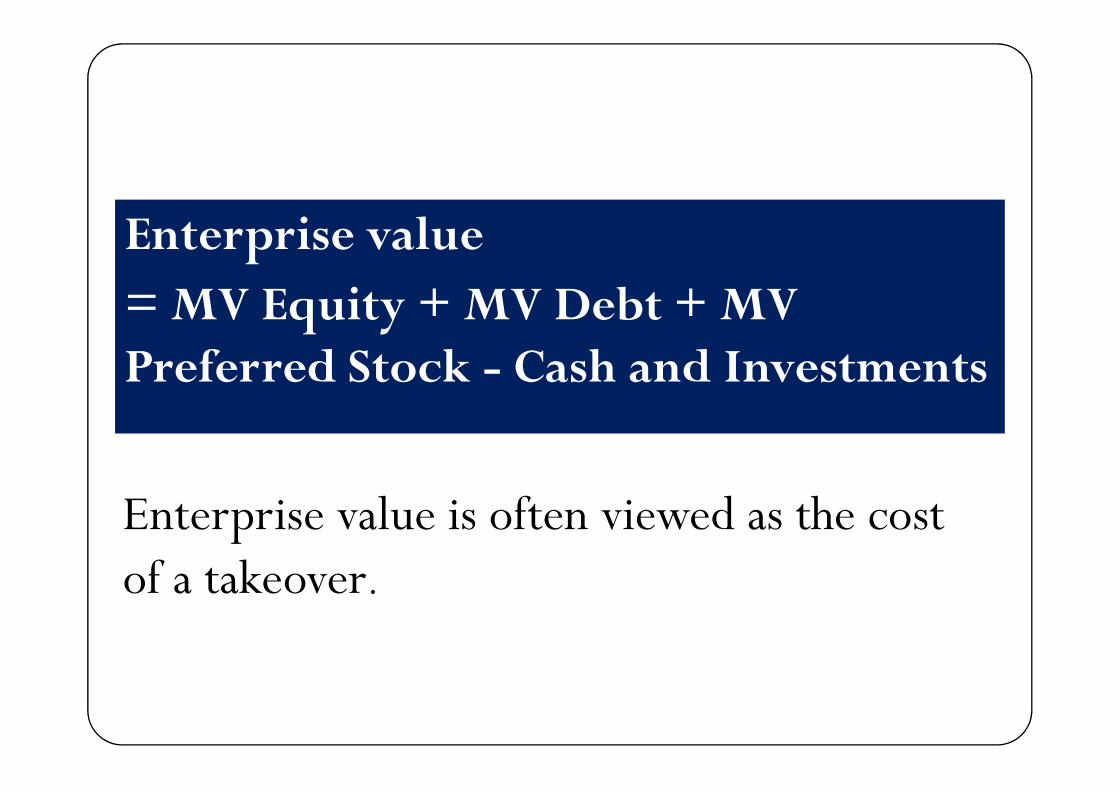
Enterprise value
= MV Equity + MV Debt + MV Preferred Stock - Cash and InvestmentsPreferred Stock - Cash and Investments
Enterprise value is often viewed as the cost of a takeover.
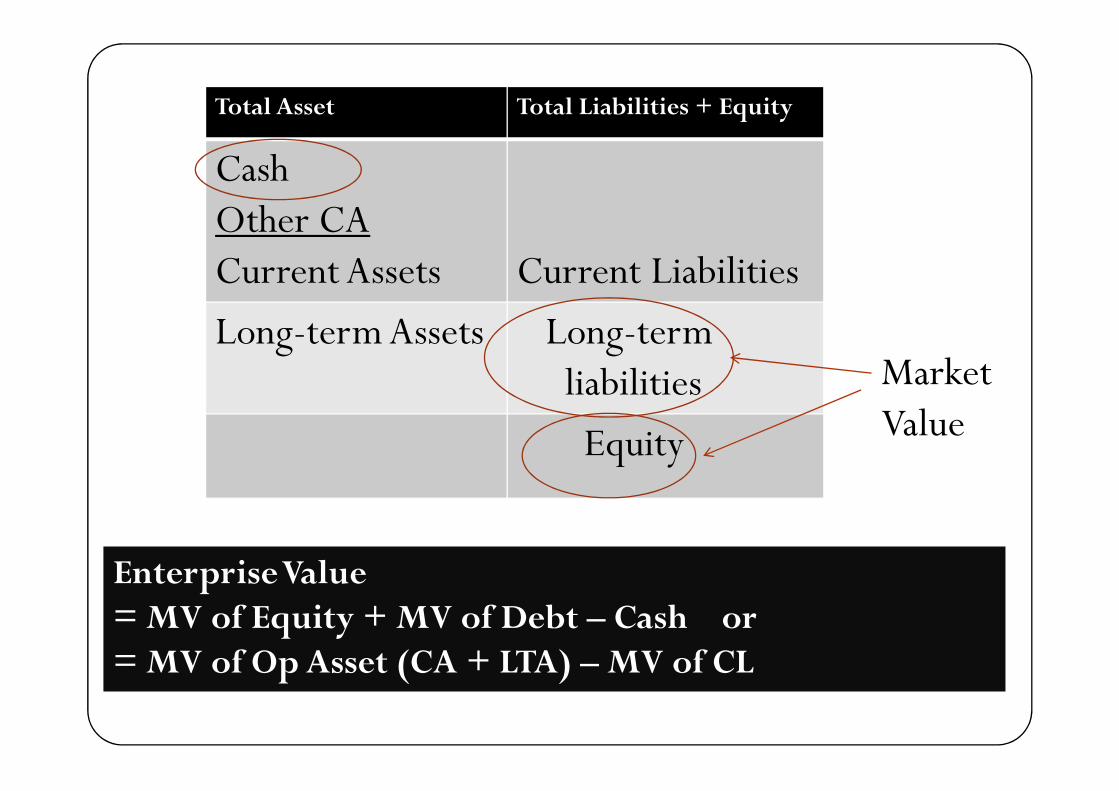
Total Asset Total Liabilities + Equity
CashOther CACurrent Assets Current Liabilities
Long-term Assets Long-termliabilities Market liabilities
Equity
Market Value
Enterprise Value = MV of Equity + MV of Debt – Cash or= MV of Op Asset (CA + LTA) – MV of CL
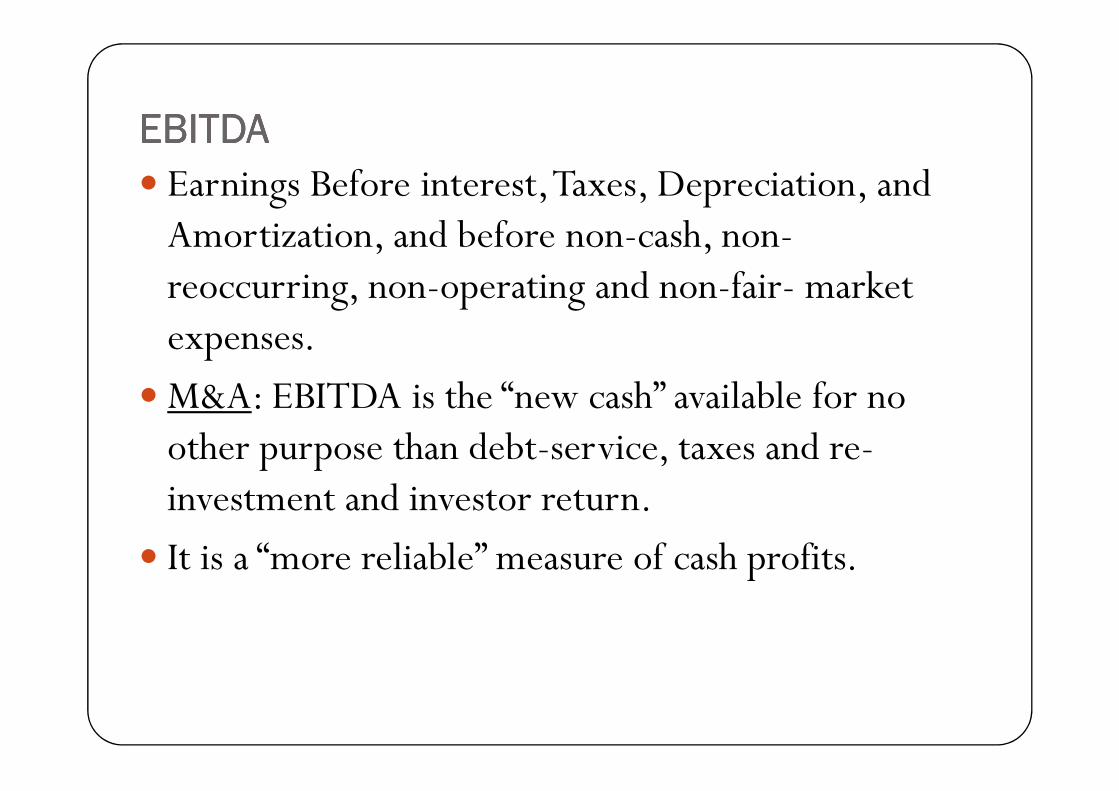
EBITDAEBITDAEBITDAEBITDA
� Earnings Before interest, Taxes, Depreciation, and Amortization, and before non-cash, non-reoccurring, non-operating and non-fair- market expenses.
�M&A: EBITDA is the “new cash” available for no �M&A: EBITDA is the “new cash” available for no other purpose than debt-service, taxes and re-investment and investor return.
� It is a “more reliable” measure of cash profits.
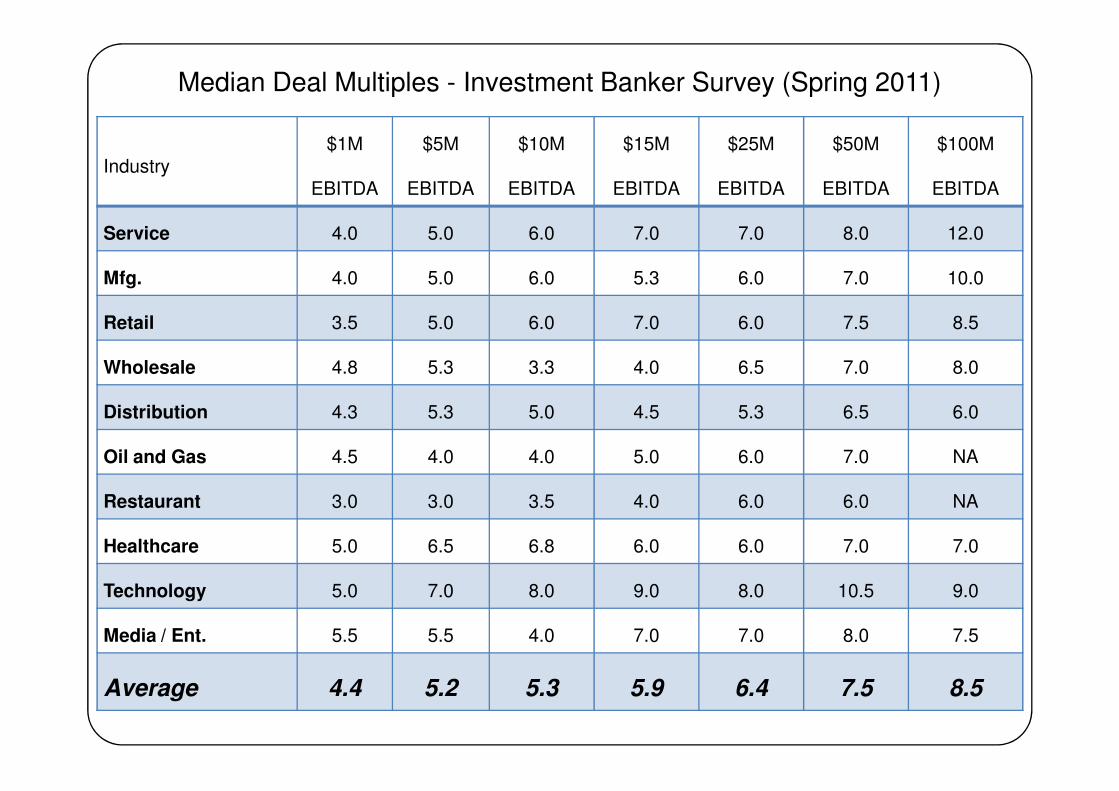
Median Deal Multiples - Investment Banker Survey (Spring 2011)
Industry$1M
EBITDA
$5M
EBITDA
$10M
EBITDA
$15M
EBITDA
$25M
EBITDA
$50M
EBITDA
$100M
EBITDA
Service 4.0 5.0 6.0 7.0 7.0 8.0 12.0
Mfg. 4.0 5.0 6.0 5.3 6.0 7.0 10.0
Retail 3.5 5.0 6.0 7.0 6.0 7.5 8.5
Wholesale 4.8 5.3 3.3 4.0 6.5 7.0 8.0
Distribution 4.3 5.3 5.0 4.5 5.3 6.5 6.0
Oil and Gas 4.5 4.0 4.0 5.0 6.0 7.0 NA
Restaurant 3.0 3.0 3.5 4.0 6.0 6.0 NA
Healthcare 5.0 6.5 6.8 6.0 6.0 7.0 7.0
Technology 5.0 7.0 8.0 9.0 8.0 10.5 9.0
Media / Ent. 5.5 5.5 4.0 7.0 7.0 8.0 7.5
Average 4.4 5.2 5.3 5.9 6.4 7.5 8.5
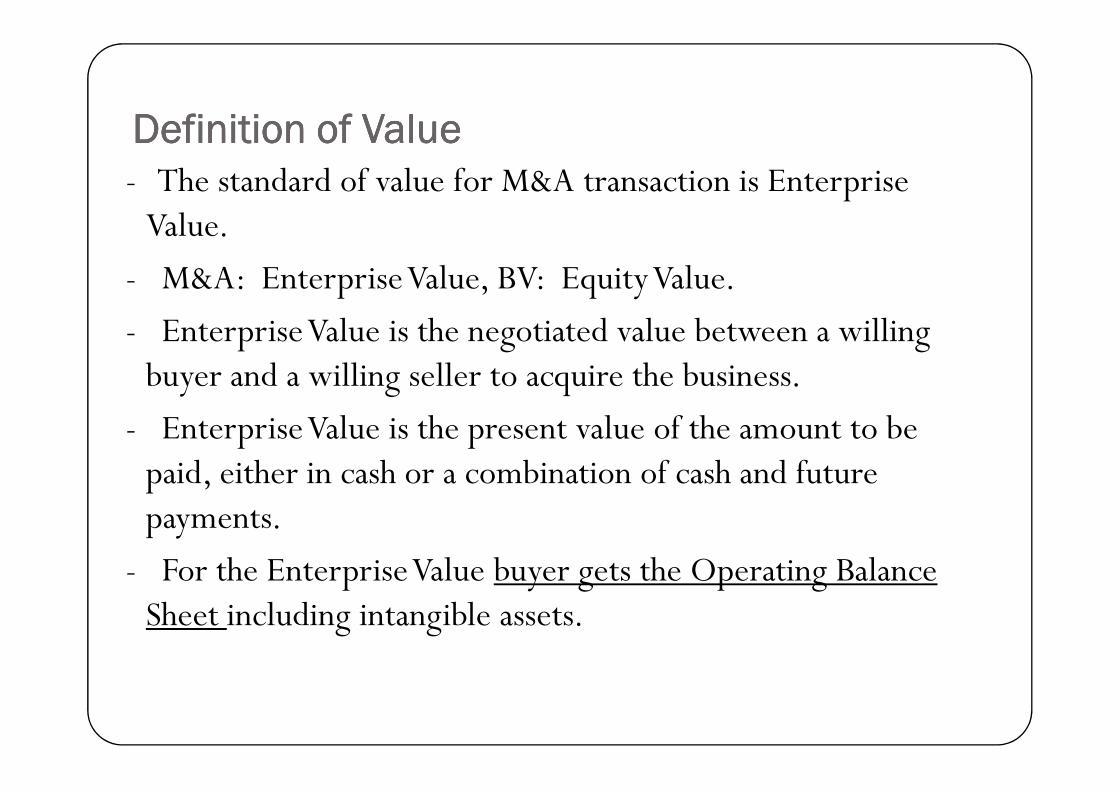
Definition of ValueDefinition of ValueDefinition of ValueDefinition of Value- The standard of value for M&A transaction is Enterprise Value.
- M&A: Enterprise Value, BV: Equity Value.
- Enterprise Value is the negotiated value between a willing buyer and a willing seller to acquire the business.buyer and a willing seller to acquire the business.
- Enterprise Value is the present value of the amount to be paid, either in cash or a combination of cash and future payments.
- For the Enterprise Value buyer gets the Operating Balance Sheet including intangible assets.
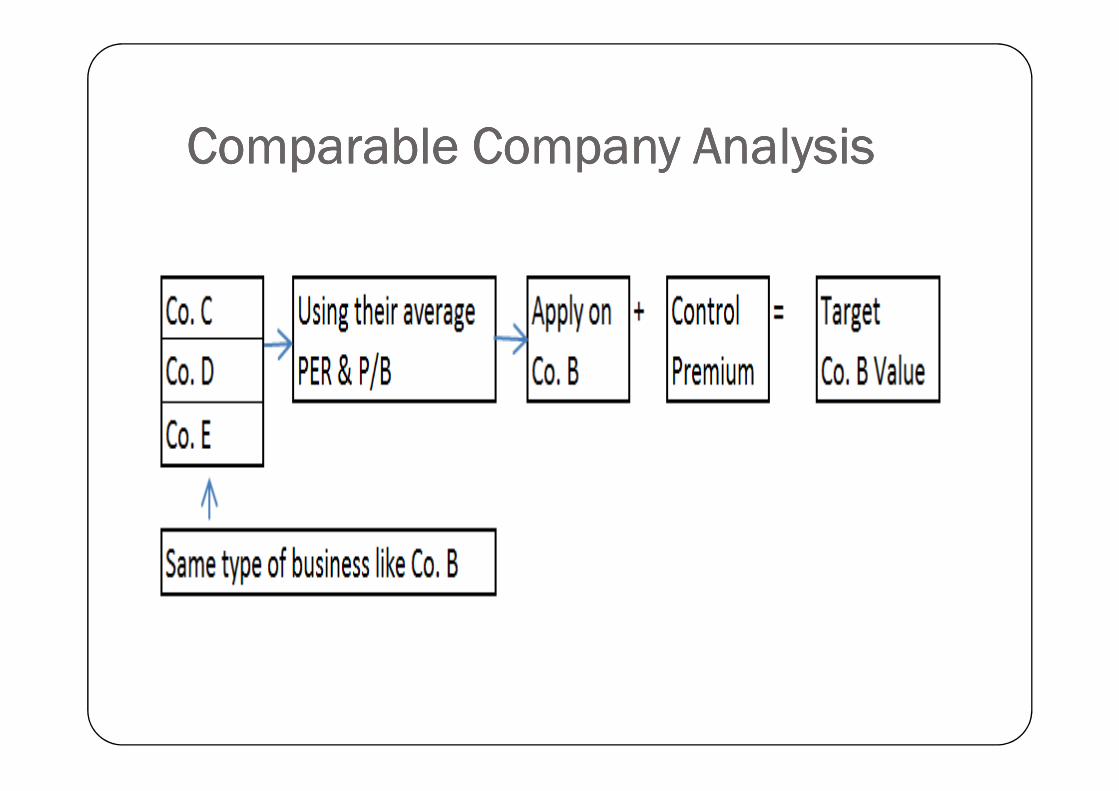
Comparable Company AnalysisComparable Company AnalysisComparable Company AnalysisComparable Company Analysis
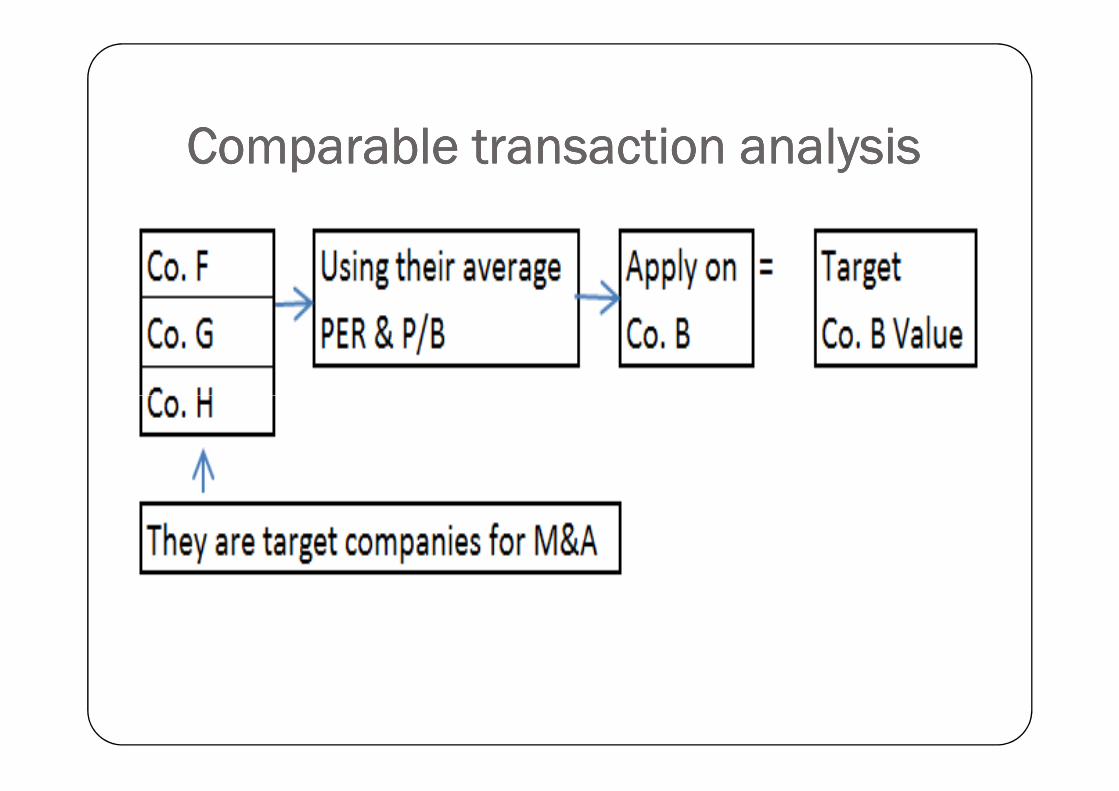
Comparable transaction analysisComparable transaction analysisComparable transaction analysisComparable transaction analysis
Comparable Company AnalysisComparable Company AnalysisComparable Company AnalysisComparable Company Analysis
Valuation variables Company C
Company D
Company E
TargetCompany
B
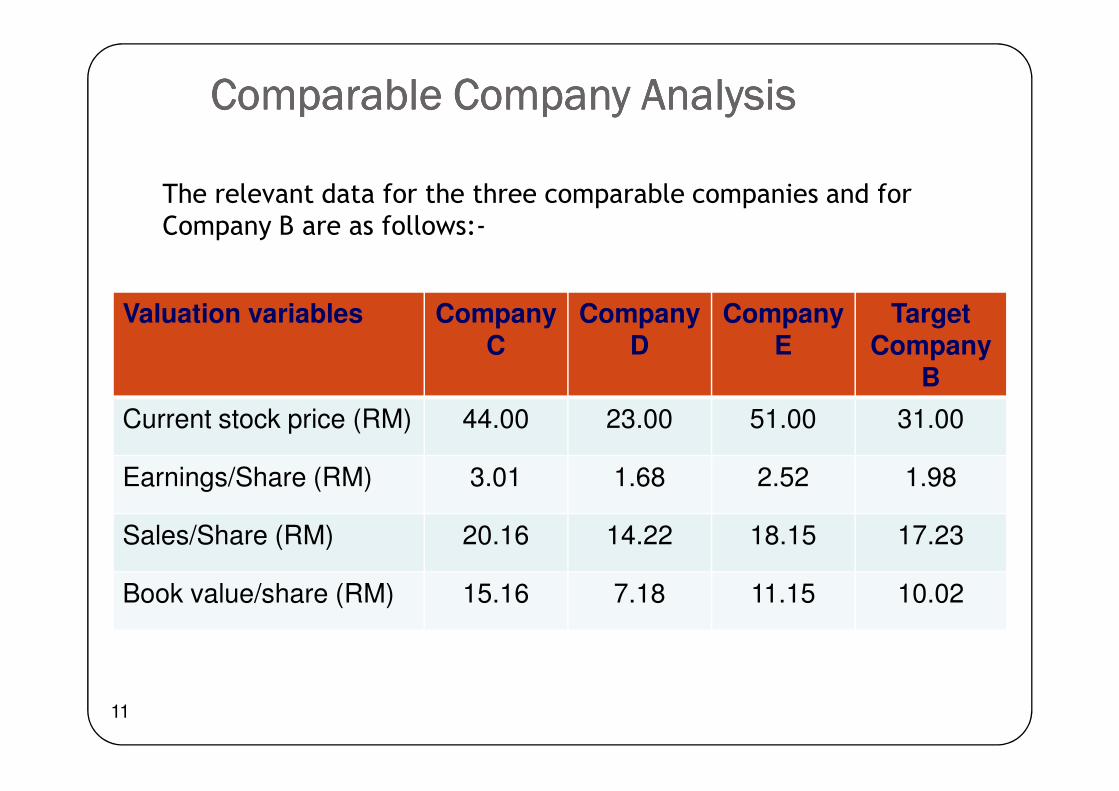
The relevant data for the three comparable companies and for
Company B are as follows:-
11
Current stock price (RM) 44.00 23.00 51.00 31.00
Earnings/Share (RM) 3.01 1.68 2.52 1.98
Sales/Share (RM) 20.16 14.22 18.15 17.23
Book value/share (RM) 15.16 7.18 11.15 10.02
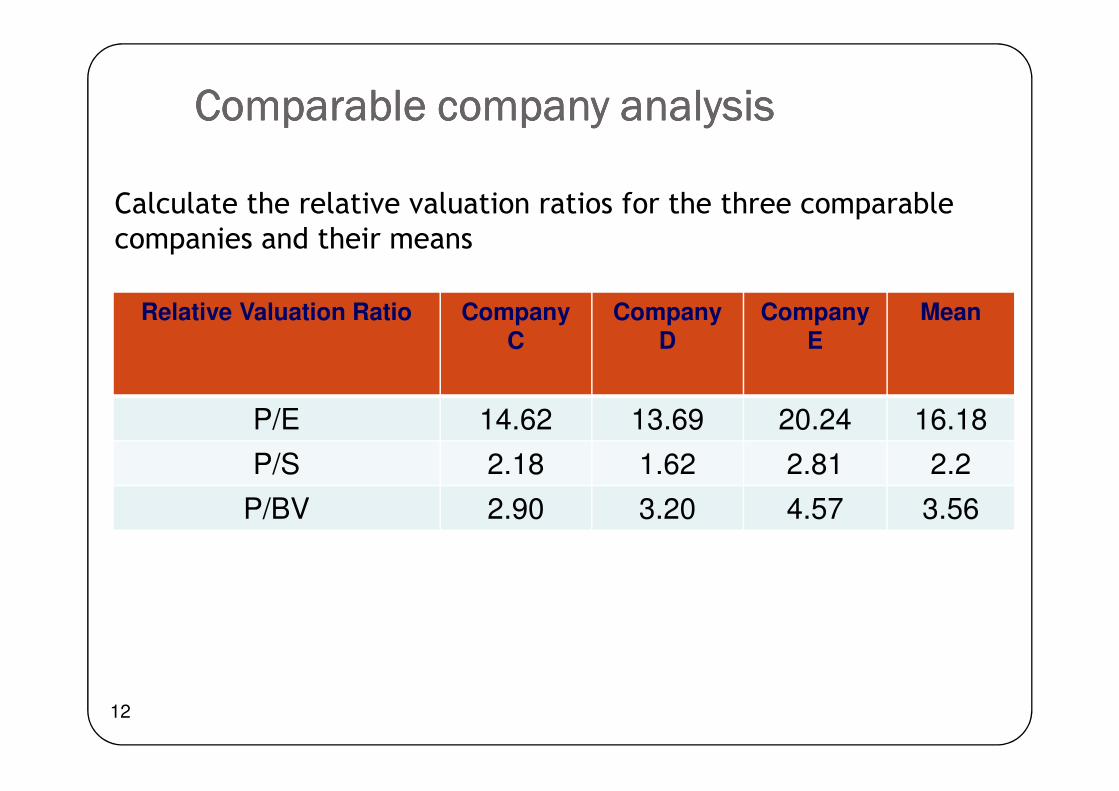
Comparable company analysisComparable company analysisComparable company analysisComparable company analysis
Relative Valuation Ratio Company C
Company D
Company E
Mean
Calculate the relative valuation ratios for the three comparable
companies and their means
12
P/E 14.62 13.69 20.24 16.18
P/S 2.18 1.62 2.81 2.2
P/BV 2.90 3.20 4.57 3.56
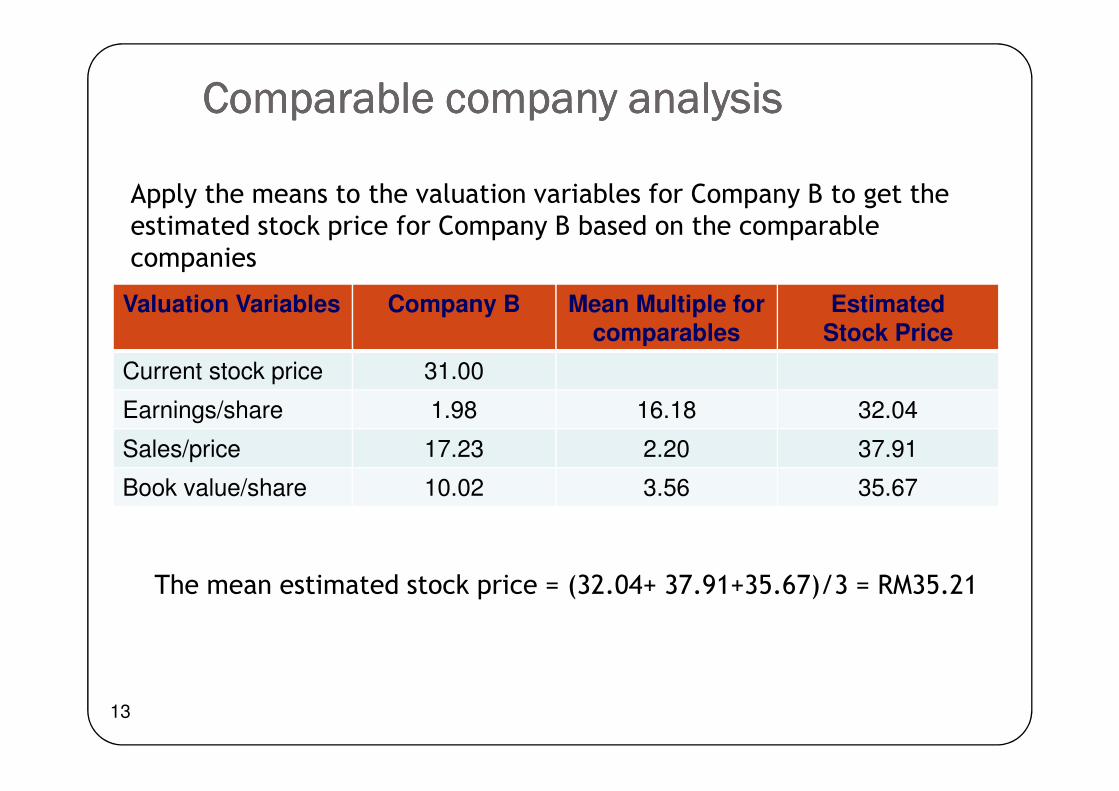
Valuation Variables Company B Mean Multiple for comparables
Estimated Stock Price
Current stock price 31.00
Comparable company analysisComparable company analysisComparable company analysisComparable company analysis
Apply the means to the valuation variables for Company B to get the
estimated stock price for Company B based on the comparable
companies
Earnings/share 1.98 16.18 32.04
Sales/price 17.23 2.20 37.91
Book value/share 10.02 3.56 35.67
13
The mean estimated stock price = (32.04+ 37.91+35.67)/3 = RM35.21
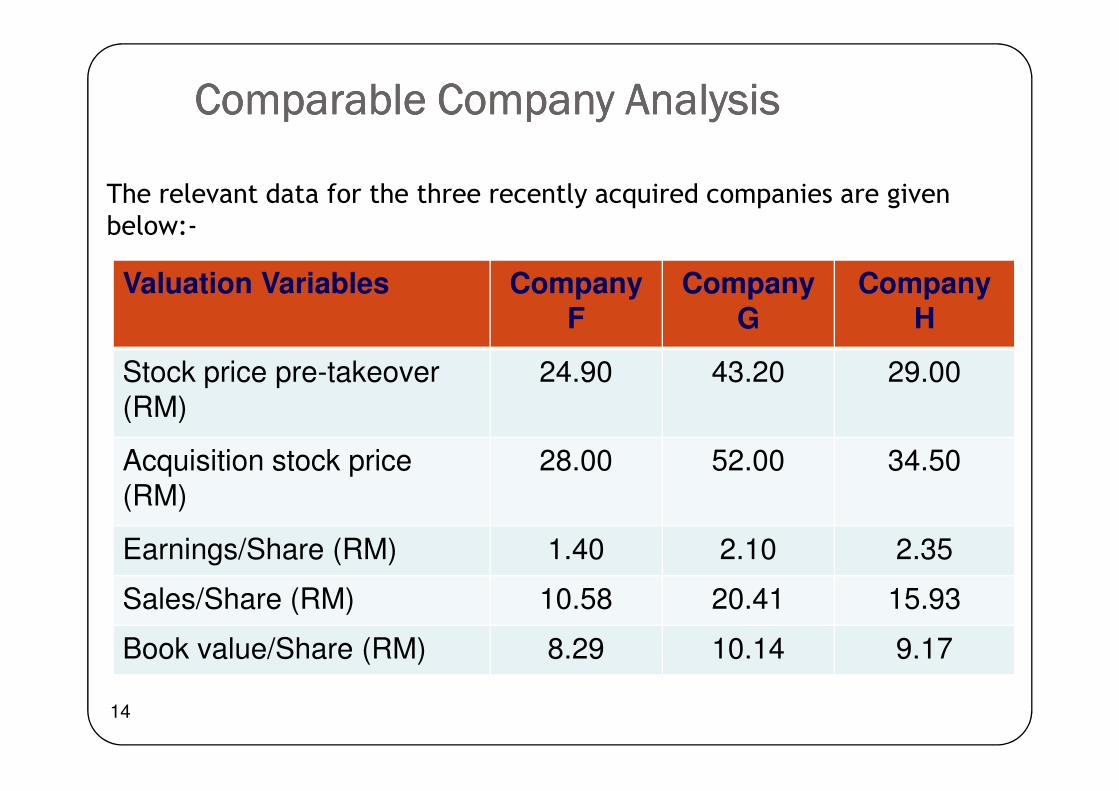
Comparable Company AnalysisComparable Company AnalysisComparable Company AnalysisComparable Company Analysis
Valuation Variables Company
F
Company
G
Company
H
Stock price pre-takeover (RM)
24.90 43.20 29.00
The relevant data for the three recently acquired companies are given
below:-
14
(RM)
Acquisition stock price (RM)
28.00 52.00 34.50
Earnings/Share (RM) 1.40 2.10 2.35
Sales/Share (RM) 10.58 20.41 15.93
Book value/Share (RM) 8.29 10.14 9.17
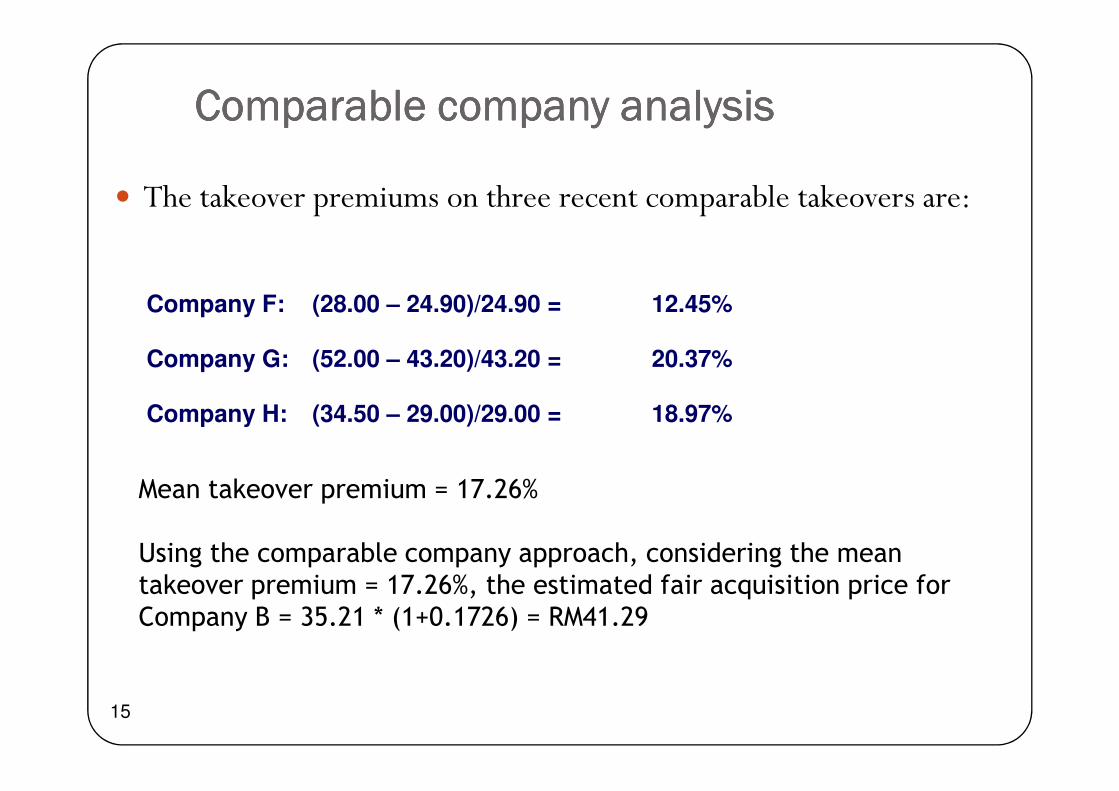
� The takeover premiums on three recent comparable takeovers are:
Comparable company analysisComparable company analysisComparable company analysisComparable company analysis
Company F: (28.00 – 24.90)/24.90 = 12.45%
Company G: (52.00 – 43.20)/43.20 = 20.37%
15
Company H: (34.50 – 29.00)/29.00 = 18.97%
Mean takeover premium = 17.26%
Using the comparable company approach, considering the mean
takeover premium = 17.26%, the estimated fair acquisition price for
Company B = 35.21 * (1+0.1726) = RM41.29
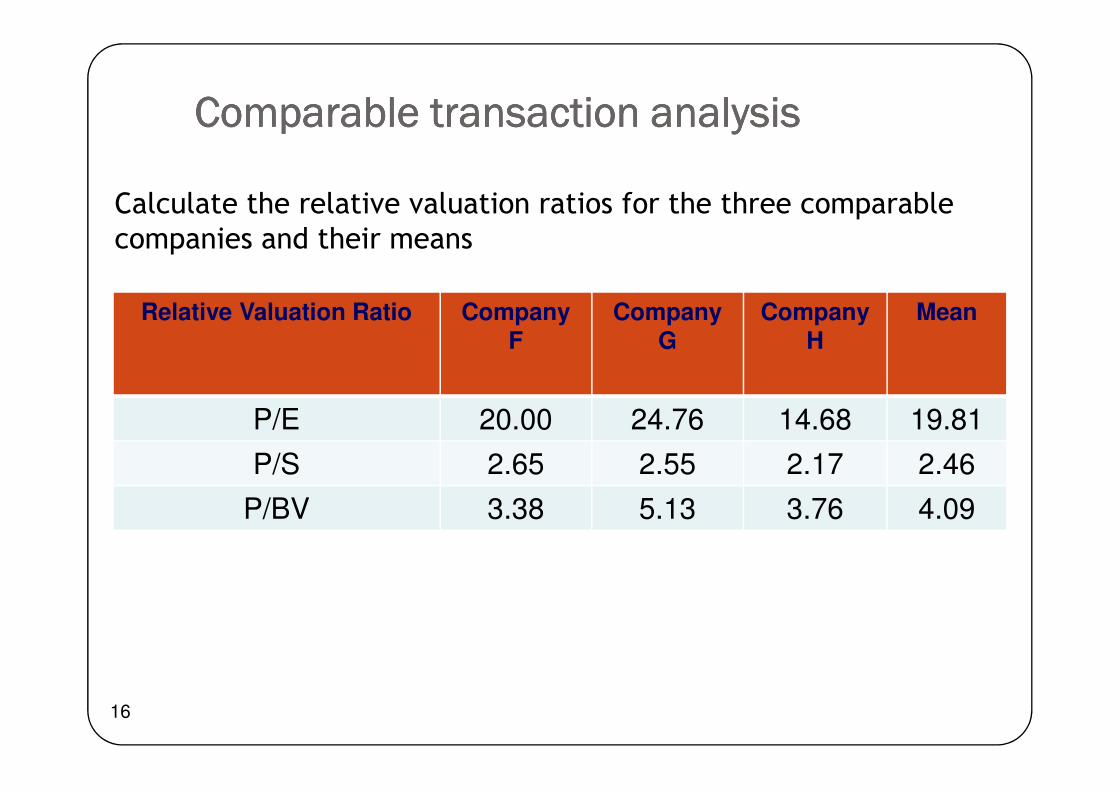
Comparable transaction analysisComparable transaction analysisComparable transaction analysisComparable transaction analysis
Relative Valuation Ratio Company F
Company G
Company H
Mean
Calculate the relative valuation ratios for the three comparable
companies and their means
16
P/E 20.00 24.76 14.68 19.81
P/S 2.65 2.55 2.17 2.46
P/BV 3.38 5.13 3.76 4.09
Valuation Variables Company B Mean Multiple for comparables
Estimated Acquisition Price
Current stock price 31.00
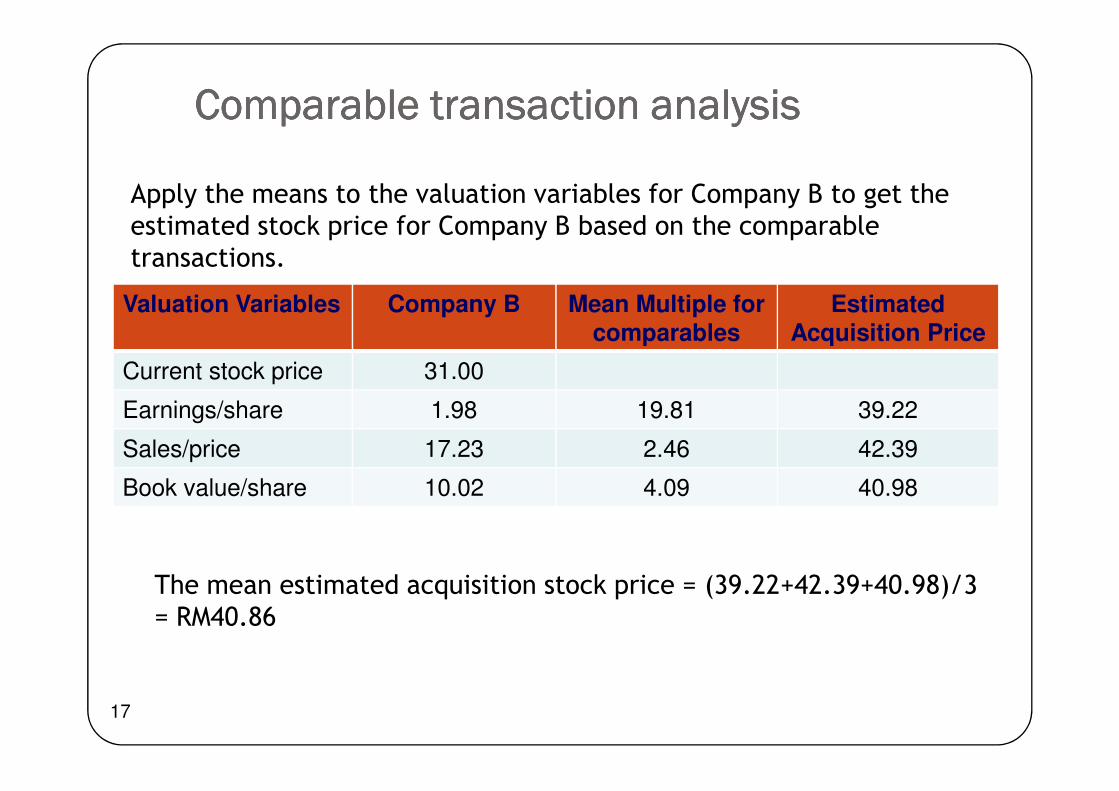
Comparable transaction analysisComparable transaction analysisComparable transaction analysisComparable transaction analysis
Apply the means to the valuation variables for Company B to get the
estimated stock price for Company B based on the comparable
transactions.
Earnings/share 1.98 19.81 39.22
Sales/price 17.23 2.46 42.39
Book value/share 10.02 4.09 40.98
17
The mean estimated acquisition stock price = (39.22+42.39+40.98)/3
= RM40.86
� Bootstrapping is a technique whereby a high P/E firm acquires a low P/E firm in an exchange of stock.
� The total earnings of the combined firm are unchanged, but the total shares outstanding are less than the two separate entities.
Bootstrapping EarningsBootstrapping EarningsBootstrapping EarningsBootstrapping Earnings
separate entities.
� The result is higher reported earnings per share, even though there may be no economic gains.
18
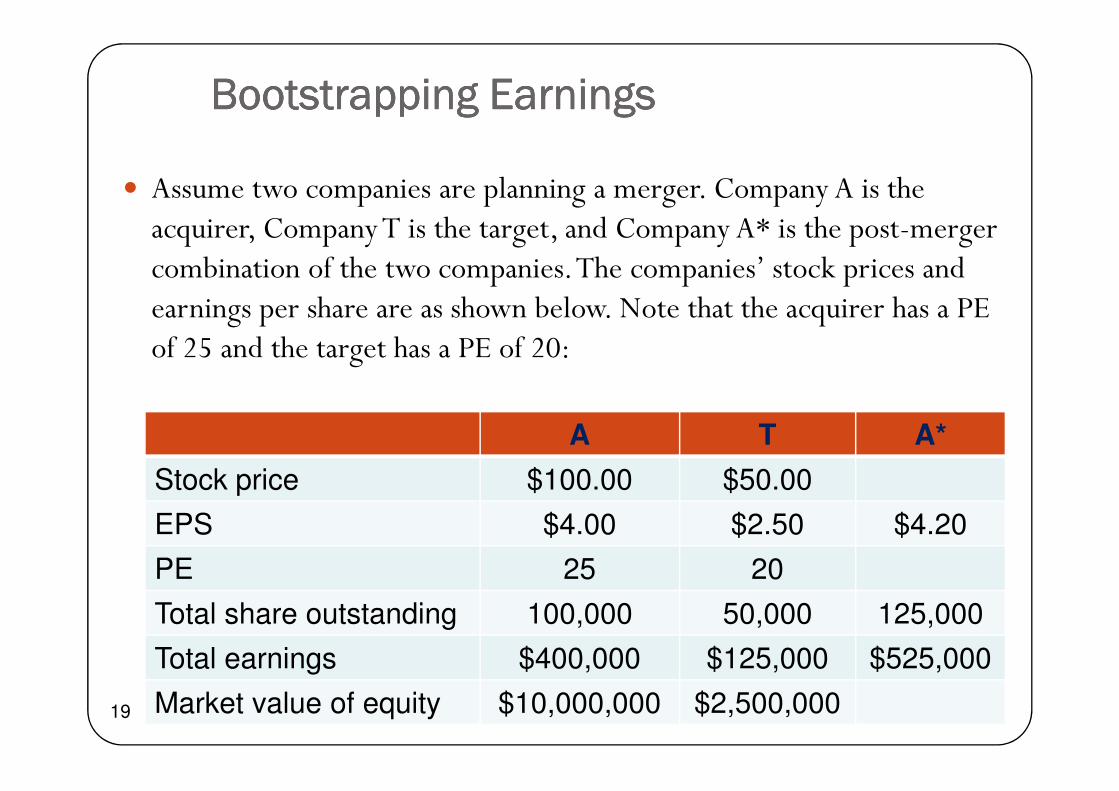
� Assume two companies are planning a merger. Company A is the acquirer, Company T is the target, and Company A* is the post-merger combination of the two companies. The companies’ stock prices and earnings per share are as shown below. Note that the acquirer has a PE of 25 and the target has a PE of 20:
Bootstrapping EarningsBootstrapping EarningsBootstrapping EarningsBootstrapping Earnings
19
A T A*
Stock price $100.00 $50.00
EPS $4.00 $2.50 $4.20
PE 25 20
Total share outstanding 100,000 50,000 125,000
Total earnings $400,000 $125,000 $525,000
Market value of equity $10,000,000 $2,500,000

� Given its stock price, the acquirer can issue 25,000 ($2,500,000/$100) of its own shares and use the proceeds to buy the target company.
� The total outstanding of the merged company will be 125,000 shares
Bootstrapping EarningsBootstrapping EarningsBootstrapping EarningsBootstrapping Earnings ((((contcontcontcont’)’)’)’)
� The new EPS = $525,000/125,000 = $4.20
(+$0.20 higher than original)
20
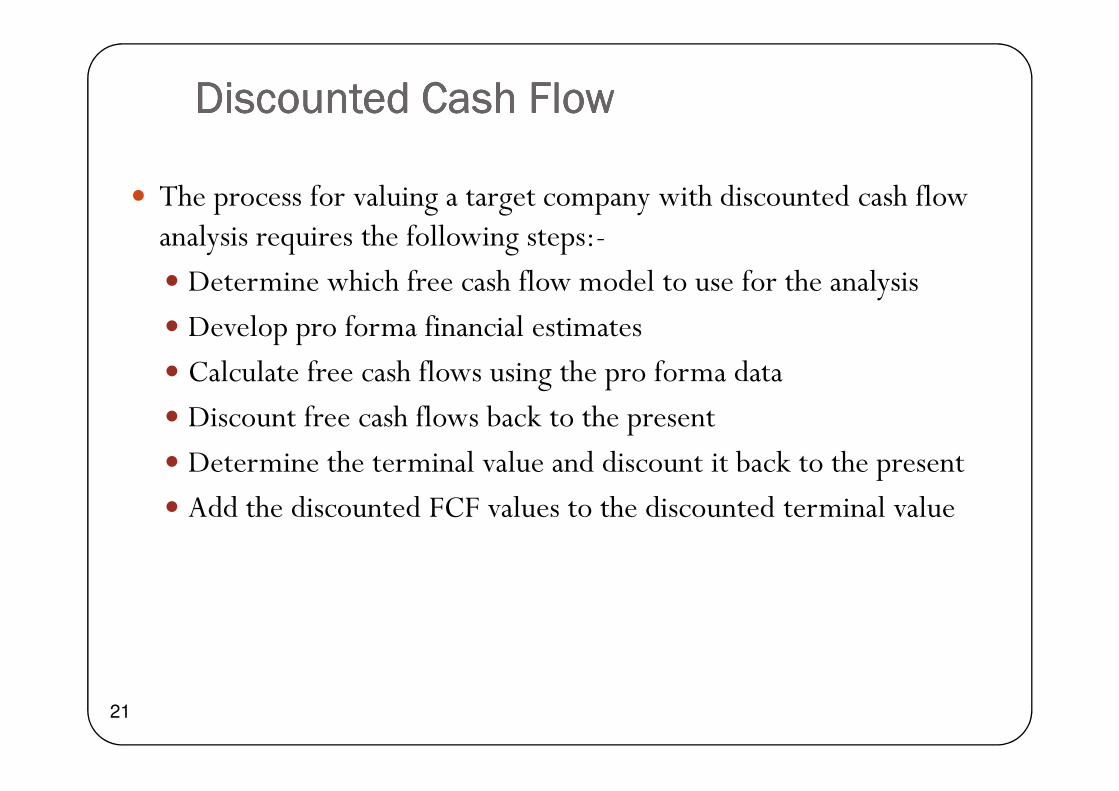
� The process for valuing a target company with discounted cash flow analysis requires the following steps:-
� Determine which free cash flow model to use for the analysis
� Develop pro forma financial estimates
� Calculate free cash flows using the pro forma data
Discounted Cash FlowDiscounted Cash FlowDiscounted Cash FlowDiscounted Cash Flow
� Discount free cash flows back to the present
� Determine the terminal value and discount it back to the present
� Add the discounted FCF values to the discounted terminal value
21
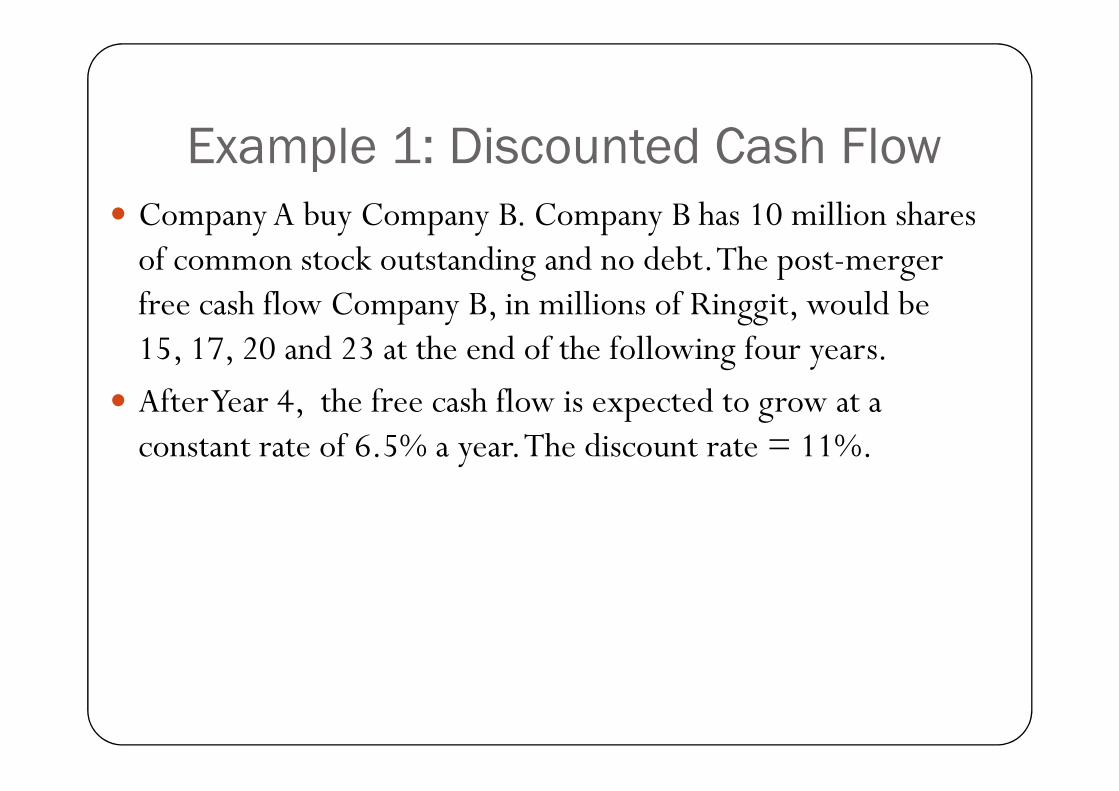
Example 1: Discounted Cash Flow� Company A buy Company B. Company B has 10 million shares of common stock outstanding and no debt. The post-merger free cash flow Company B, in millions of Ringgit, would be 15, 17, 20 and 23 at the end of the following four years.
� After Year 4, the free cash flow is expected to grow at a � After Year 4, the free cash flow is expected to grow at a constant rate of 6.5% a year. The discount rate = 11%.

Example 1: Discounted Cash Flow
(con’t)
The value of Company B
= total present value (PV) of free cash flows (FCF) during the first 4 years + PV of the terminal value at the end of the fourth year using the constant growth model
Total PV of free cash flows during the first 4 years
= 15/1.11 + 17/1.112 + 20/1.113 + 23/1.114 = RM57.09 million
Example 1: Discounted Cash Flow
(cont’)
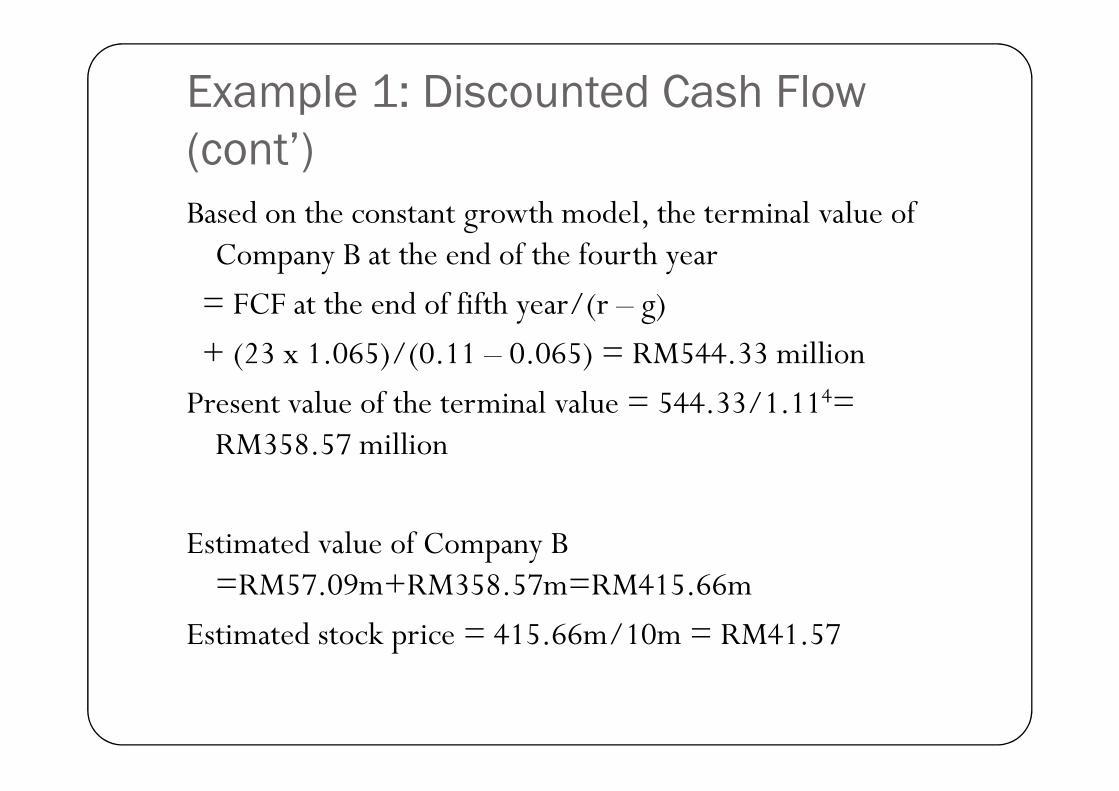
Based on the constant growth model, the terminal value of Company B at the end of the fourth year
= FCF at the end of fifth year/(r – g)
+ (23 x 1.065)/(0.11 – 0.065) = RM544.33 million
Present value of the terminal value = 544.33/1.114= Present value of the terminal value = 544.33/1.114= RM358.57 million
Estimated value of Company B =RM57.09m+RM358.57m=RM415.66m
Estimated stock price = 415.66m/10m = RM41.57
Related Documents