Kochi City Development Plan 1 1. INTRODUCTION Back Ground. Kochi, popularly known as the Commercial Capital of Kerala, is one of the two cities of Kerala State identified for being developed under Jawaharlal Nehru Urban Renewal Mission (JNNURM). A City Development Plan (CDP) for Kochi would serve as a basis for the Government of India to sanction funding under JNNURM. A City development Plan prepared for Kochi analyses the present status, assesses the future requirements based on growth potential and provides a systematic plan for a sustained growth of the city and its environs. Cities are the generators of economic momentum. They play a vital role in the development of the nation. In order to sustain the high economic growth, cities have to be efficient and competitive. In our country, urban population growth is almost 2½ times that of the population growth at national level. We also have an increase in the total number of urban poor. In order to cope with the massive problems that have emerged as a result of rapid urban growth, it has become imperative to formulate strategies for selected cities on a priority basis. Improving the physical and financial bases of the city, which necessitate additional urban investments, can equip the city to face the challenges of urbanization. The strategy should include provision of basic amenities and services and the introduction of a proper and efficient system to manage these. Improvement of the living conditions of the urban poor is considered crucial in the strategy for the overall improvement of the Quality of Life, which is the fundamental purpose of City Development Plan. Kochi, had recognized the need for planning and taking into account the responsibilities vested with the local bodies as a consequence of 73rd and 74th Constitutional Amendment Act, steps have been taken from 1997 onwards to obtain and consolidate the suggestions and aspirations of the different sections of the society with a view to arrive at a vision for the city. Sector wise workshops were held in environment, water supply, heritage, poverty alleviation etc. Aspirations of the people’s representative viz. the M.P, M.L.A.s, Corporation Councillors, Elected Representatives of Municipalities and Panchayats, Members of Residents Associations, Neighbourhood Units, Ward Committees and Gramasabhas were consolidated. Prior to this, a vision workshop was held in 2002 and arrived at a Vision Document. Institutions like KILA, CUSAT, CESS, Chambers of Commerce and news papers like MalayalaManorama and Mathrubhumi also had held seminars considering the growth potential of the city. In addition to this, the suggestions and proposals derived from representatives of various sections of society, the recommendations evolved during the workshops and seminars and the studies conducted by M/s. RITES, NATPAC, Rajagiri Institute of Social Sciences, Kerala Road Fund Board, Esteem Developers, Cochin Port Trust, Greater Cochin Development Authority, Goshree Island Development Authority, Roads and Bridges Corporation, the papers presented by experts in various fields and the guidance given by Sri. S.M. Vijayanand I.A.S, Sri. T.K. Jose I.A.S., Dr. Jayathilak IAS,Sri. Anand Singh I.A.S.& Sri.Muhammed Haneesh I.A.S. have been made use of in finalizing the vision. The list of meetings held prior to the formulation of CDP is appended (Refer Table 1A - Annexure 1) Subsequently several meetings with experts and stakeholders were held at different stages of preparation and, sector wise technical committees were constituted to draft the sector wise proposals. In addition a functional committee of experts was setup to coordinate the sector

Welcome message from author
This document is posted to help you gain knowledge. Please leave a comment to let me know what you think about it! Share it to your friends and learn new things together.
Transcript
Kochi City Development Plan
1
1. INTRODUCTION
Back Ground. Kochi, popularly known as the Commercial Capital of Kerala, is one of the
two cities of Kerala State identified for being developed under Jawaharlal Nehru Urban
Renewal Mission (JNNURM). A City Development Plan (CDP) for Kochi would serve as a
basis for the Government of India to sanction funding under JNNURM. A City development
Plan prepared for Kochi analyses the present status, assesses the future requirements based on
growth potential and provides a systematic plan for a sustained growth of the city and its
environs.
Cities are the generators of economic momentum. They play a vital role in the development
of the nation. In order to sustain the high economic growth, cities have to be efficient and
competitive. In our country, urban population growth is almost 2½ times that of the
population growth at national level. We also have an increase in the total number of urban
poor. In order to cope with the massive problems that have emerged as a result of rapid urban
growth, it has become imperative to formulate strategies for selected cities on a priority basis.
Improving the physical and financial bases of the city, which necessitate additional urban
investments, can equip the city to face the challenges of urbanization. The strategy should
include provision of basic amenities and services and the introduction of a proper and
efficient system to manage these. Improvement of the living conditions of the urban poor is
considered crucial in the strategy for the overall improvement of the Quality of Life, which is
the fundamental purpose of City Development Plan.
Kochi, had recognized the need for planning and taking into account the responsibilities
vested with the local bodies as a consequence of 73rd and 74th Constitutional Amendment
Act, steps have been taken from 1997 onwards to obtain and consolidate the suggestions and
aspirations of the different sections of the society with a view to arrive at a vision for the city.
Sector wise workshops were held in environment, water supply, heritage, poverty alleviation
etc. Aspirations of the people’s representative viz. the M.P, M.L.A.s, Corporation
Councillors, Elected Representatives of Municipalities and Panchayats, Members of
Residents Associations, Neighbourhood Units, Ward Committees and Gramasabhas were
consolidated. Prior to this, a vision workshop was held in 2002 and arrived at a Vision
Document. Institutions like KILA, CUSAT, CESS, Chambers of Commerce and news papers
like MalayalaManorama and Mathrubhumi also had held seminars considering the growth
potential of the city. In addition to this, the suggestions and proposals derived from
representatives of various sections of society, the recommendations evolved during the
workshops and seminars and the studies conducted by M/s. RITES, NATPAC, Rajagiri
Institute of Social Sciences, Kerala Road Fund Board, Esteem Developers, Cochin Port Trust,
Greater Cochin Development Authority, Goshree Island Development Authority, Roads and
Bridges Corporation, the papers presented by experts in various fields and the guidance given
by Sri. S.M. Vijayanand I.A.S, Sri. T.K. Jose I.A.S., Dr. Jayathilak IAS,Sri. Anand Singh
I.A.S.& Sri.Muhammed Haneesh I.A.S. have been made use of in finalizing the vision.
The list of meetings held prior to the formulation of CDP is appended (Refer Table 1A -
Annexure 1)
Subsequently several meetings with experts and stakeholders were held at different stages of
preparation and, sector wise technical committees were constituted to draft the sector wise
proposals. In addition a functional committee of experts was setup to coordinate the sector
Kochi City Development Plan
2
wise proposals and to finalize the City Development Plan formulation (Details appended as
Table 1-B Annexure 1). The Jawaharlal Nehru National Urban Renewal Mission is expected
to give the Kochi City an opportunity to translate the people’s vision into concrete proposals
and programmes to be implemented in a time bound manner.
1.1 City Development Plan Framework and Process
1.1.1 City Development Plan - Objectives The CDP aims at achieving equitable development by addressing the issues of economic
growth, infrastructure, poverty, good governance and service delivery to all through a
consultative process of strategizing and visioning. The action plan aims at improving urban
governance and management, increasing investments to ensure employment potential and
expand services including systematic and sustained urban poverty reduction.
The C.D.P. comprises of plans for the identified sectors of development with in a period up
to 2026 AD, outlining the policy framework and investment interventions with in a 7-year
period to achieve the vision. The objectives of CDP are:
• To develop a city development framework for Kochi City and environs;
• To formulate a Strategic Action Plan (SAP) and City Association Programme (CAP) based
on the city development framework;
• Prioritization of sectors and identification of short, medium and long-term goals; and
• Preparation of implementation plans.
1.1.2 Scope of CDP The C.D.P. outlines the strategic policy and investment interventions to achieve the vision for
Kochi. It includes formulation of plans for the identified sectors. The scope of work is to:
• Assess the present state of the city in respect of demographic and economic growth,
infrastructure, services, finance etc,;
• Identify the gaps in service delivery;
• Identify the issues faced by the urban poor;
• Prepare a vision and strategic framework outlining the goals, strategies, interventions and
projects to achieve the vision;
• Formulate a city investment plan with appropriate financing strategies and an
implementation action plan; and
• Focus on the reforms to be carried out on local level and state level in accordance with the
vision and a strategic plan outlined to sustain the planned interventions.
1.1.3 The Process The CDP outlines the critical issues of city development, undertakes a deficiency analysis
and formulates a management framework outlining strategies and guidelines for future
growth. The plan provides a distinctive thrust introducing restrictive regulatory mechanism
through realistic planning and management interventions within the overall regulatory and
institutional framework. A development implementation action plan comprising of
implementation schedule, role of stakeholders, regulation and institutional strengthening
mechanism are formulated. It also aims at regular and effective monitoring mechanism. The
CDP takes into account the current status of municipal services - its fiscal status, and
Kochi City Development Plan
3
operational and management procedures. The CDP also considers the works and plans of
other Govt. and Semi-Govt. organizations and agencies contributing towards the growth and
development of the city. The CDP is prepared after undertaking the following tasks.
• Visioning exercise;
• Formulation of goals and strategies;
• Situation analysis;
• Stakeholder discussions;
• Sectoral group workshop;
• Capital investment plan and project scheduling; and
• Action and operating plan and reform.
The entire exercise is carried out with stakeholders’ participation in various stages as
explained earlier.
1.1.4 Orientation to Key Stakeholders The Secretary to Local Self Government Department, Govt. of Kerala, initiated discussions
to familiarize to the key stakeholders the process and the expected outcome of the CDP and
build enthusiasm, understanding and commitment to the CDP. One-day session was
organized for this. This activity helped in familiarizing the process of evolving a structured
programme. This was followed by intensive consultative process to finalize the proposals of
CDP.
1.2 Kochi Profile Kochi, the commercial capital of Kerala lies at 9°58’ N latitude and a longitude of 76°16’E.
The development of Kochi as the commercial capital of Kerala is closely linked with the
political and administrative history of Malabar Coast.
1.2.1 Early History Kochi Port was formed in 1341, when the heavy floods of that year silted up the mouths of
the Musiris harbor and the surging waters forced a channel past the present inlet into the sea.
The old merchants of Musiris shifted to Kochi as soon as the new outlet became more or less
stable. As the harbour gained prominence, the then ruler of the region shifted his capital also
to Kochi, giving impetus to the growth of the town.
The early settlement of Kochi was at Mattanchery, facing the protected lagoons in the east,
which provided safe anchorage to country crafts in all seasons. Mattanchery was linked to the
entire coastal stretch of Kerala through this inland waters. Thus gradually it grew into a busy
settlement. Nicolo Conti recorded that, by 1440, Kochi was a city 5 miles in circumference
and that Chinese and Arabs carried on brisk trade with the natives of this town.
1.2.2 Colonial Settlement Fort Kochi From 16th Century, Kochi witnessed the rapid changes through the trading and colonizing
attempts of European powers. Portuguese were the first to arrive in Kochi. They founded Fort
Kochi established factories and warehouses, schools and hospitals and extended their domain
in the political and religious fronts. The fall of the Portuguese in Kochi came with take over
of the Fort by Dutch in 1663. The Dutch East India Company tried to persuade the local
rulers into giving them monopoly in pepper trade. In this attempt, they came across varied
Kochi City Development Plan
4
interests of other forces viz. English, French and the Dutch. For hundred years therefore
Kochi became the center of political and commercial battle. In 1795, The British took over
Kochi from the Dutch. Fort Kochi thus became British Kochi. It became a Municipality in
1866.
1.2.3 Market Town - Mattanchery Mattanchery, meanwhile, had developed as a typical oriental market town, with commercial
activities distributed along the waterfronts. The agricultural produce from the vast hinterland
flowed to its markets to be sold or exchanged for textiles, metals, and other products of
European Countries. Jews and Muslims had their settlements here. The trading communities
from Gujarat and the emigrants from Goa too established themselves in Mattanchery along
with the native Hindus and early Christians. As far as the rulers were concerned, this helped
to strike a balance of economic power with the European traders.
1.2.4 Administrative Centre - Ernakulam By 1840, Mattanchery was so much crowded that the Kochi rulers shifted their capital to
Ernakulam on the eastern side of the backwaters. Public buildings and educational
institutions were set up in Ernakulam befitting the splendor of Maharajas. Roads were laid
out. Markets were established. Temples were renovated. Railways came to Ernakulam in
1905. Ernakulam thus gradually started developing as an administrative town. Mattanchery
rose to the status of Municipality in 1912 and was followed by Ernakulam in 1913.
1.2.5 Development of Kochi Port In those decades the existence of a sand bar in the sea mouth prevented large ships from
entering safely into the backwaters of Kochi. With industrialization in the west there came
the revolution in overseas trade with the wrought iron ships of greater draught and the
consequent need for deeper and safer harbours and stronger moorings. The opening of Suez
Canal in 1869 further emphasized the importance of this port as a coaling station for this
route. The idea of making great harbour, out of the unique lagoons in Kochi was thus
originated as early as 1870. But Kochi presented a case for dredged channel leading to the
inland harbour, unfortunately the science and art of dredging was not fully developed in this
period. Hence it was only in 1920 that the port works were initiated. Under the direction of
Sir Robert Bristo, the sand bar at sea mouth was cut open and a deep shipping channel was
dredged to the backwaters. The spoils of the dredging was used to the reclaim Wellington
Island from the backwaters. Road connection to the main land on the west and road-rail
connection to the east from the island was completed in 1940 when the Government of India
declared Kochi as a major port. Wellington Island developed with its wharfs, quays and other
infrastructure as terminal complex of transportation.
Kochi port gradually became the focus of the city. Centered around the port facility grew
large number of business and commercial establishments providing the economic base to the
city and the environs.
1.2.6 Genesis of Kochi Corporation The industrialization inturn resulted in population increase and consequent urban growth.
Kochi thus witnessed unprecedented trends of urbanization during the past four decades. The
growth of population and activities has necessitated efforts to tackle urban problems, to
regulate city building and to guide future development. While the Municipal Govt.s of Fort
Kochi City Development Plan
5
Kochi, Mattanchery and Ernakulam were able to exercise their powers and evolve schemes in
their respective areas of jurisdiction, they were not in a position to perceive the problems of
urban growth as a whole and to plan for it. In order to streamline the municipal
administration, the Kochi Corporation was formed in 1967, incorporating the three
Municipalities (Fort Kochi, Mattanchery and Ernakulam). Wellington Island and few
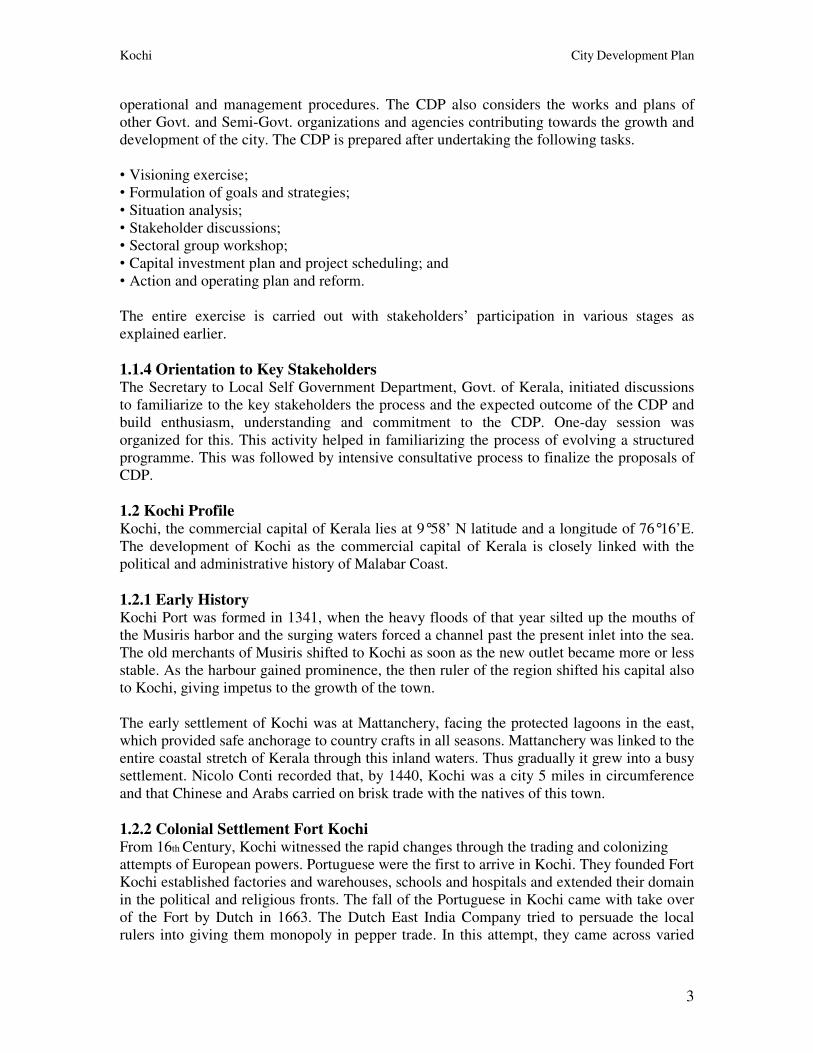
surrounding areas in the suburbs. Growth Pattern of Kochi is shown in Figure 1.1. Figure 1.1: Growth Pattern Kochi Region
Kochi City Development Plan
6
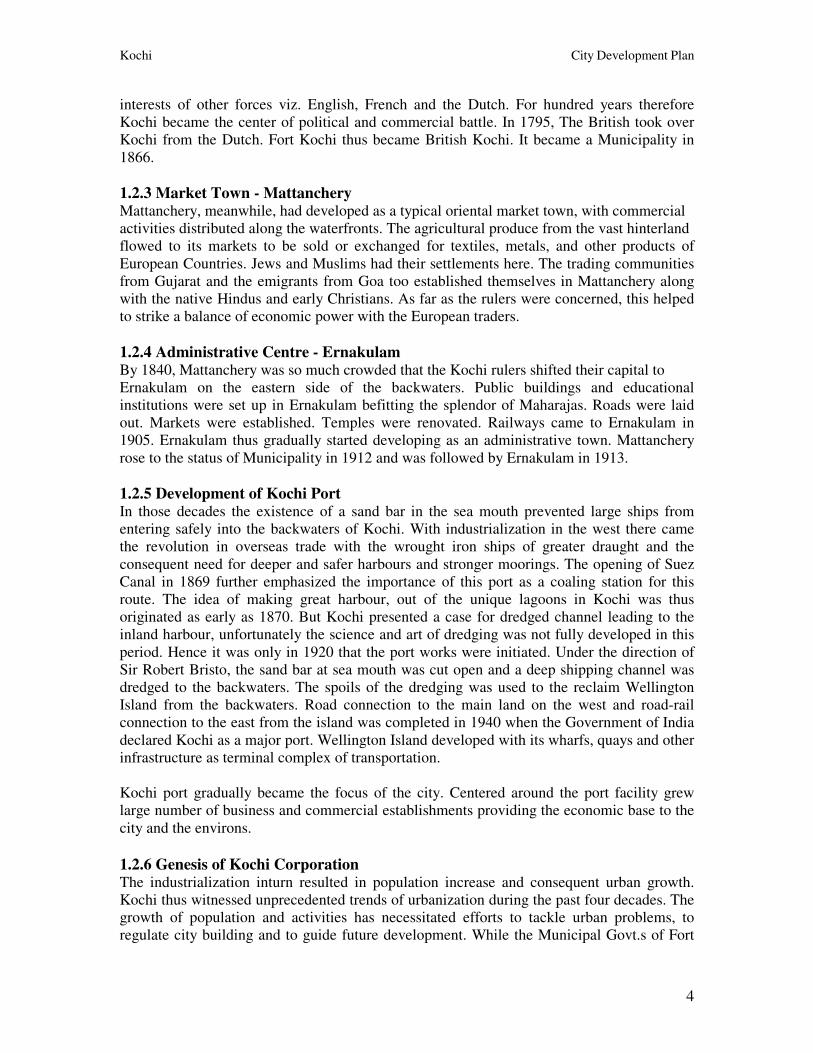
1.2.7 Regional Outlook A comprehensive approach to the planning of the urban areas of Kochi and its environs was
initiated after the Kerala state was reorganized (1956) and the Department of Town Planning
was constituted (1959). The Region was scientifically delineated to include the primary
influence zone of Kochi City consisting of 6 municipalities and 33 panchayaths. The
Development plan for Kochi Region was formulated in 1976, as a comprehensive policy
document to stimulate balanced growth of the Region with respect to its long term needs.
Figure 1.2: Greater Kochi Region
1.2.8 Concept of the Development Plan for Kochi Region Kochi Region as conceived in the Regional Development Plan was primarily an Urban
Vicinity Region delineated to encompass settlements lying within the primary influence zone
of Kochi City. The core area of Kochi Region is the Kochi City. Consequently urban
development has been more rapid in the City and in its immediate suburbs. Five other
Municipal towns included in the Region are small urban enclaves, as compared to the core
City. They are linked to the core city through the transportation corridors. Spatially the
intervening villages separated them.
The villages in the region present a dispersed settlement pattern with high density of
population. Many of the urban characteristics have diffused in these villages.
The Development Plan laid emphasis on evolving a settlement structure for the region. The
pattern conceived a central city confining concentrated urban development within its limit.
The central city was to be surrounded by a peripheral belt of planned panchayaths. The
secondary urban centers were to function as growth centers absorbing the overspill of urban
population of the region. A Structure Plan for the Central City was prepared and the same
Kochi City Development Plan
7
was published and sanctioned by Govt. in 1991. The map showing Greater Kochi Region is
given in Figure 1.2.
1.2.9 Delineation of the Kochi City for the Purpose of CDP Urban expansion during the past decades outgrew the limits of the central city. Census reveal
that growth trend of settlements of the region have been different from what was anticipated.
Primarily the population growth in some of the rural areas and the Municipalities adjacent to
the city Corporation exceeded that of the urban areas. The suburbs showed higher growth
rates than the city proper. Kochi Urban Agglomeration, as per 1981 census included the
Kochi Corporation, Trippunithura Municipality and census towns of Eloor and Kalamassery
and Thrikkakara an urban outgrowth.1991 census showed a larger area of Urban
Agglomeration. The Urban Agglomeration as identified by the 2001 census consists of the
following local bodies.
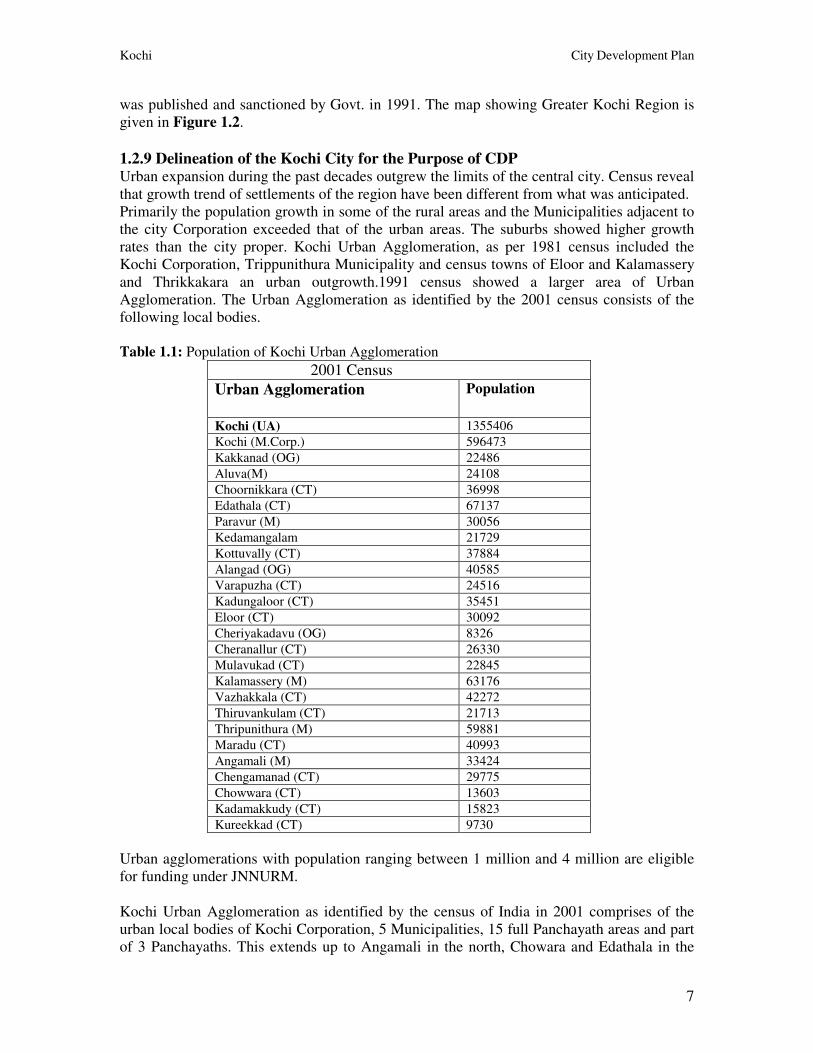
Table 1.1: Population of Kochi Urban Agglomeration
2001 Census
Urban Agglomeration Population
Kochi (UA) 1355406
Kochi (M.Corp.) 596473
Kakkanad (OG) 22486
Aluva(M) 24108
Choornikkara (CT) 36998
Edathala (CT) 67137
Paravur (M) 30056
Kedamangalam 21729
Kottuvally (CT) 37884
Alangad (OG) 40585
Varapuzha (CT) 24516
Kadungaloor (CT) 35451
Eloor (CT) 30092
Cheriyakadavu (OG) 8326
Cheranallur (CT) 26330
Mulavukad (CT) 22845
Kalamassery (M) 63176
Vazhakkala (CT) 42272
Thiruvankulam (CT) 21713
Thripunithura (M) 59881
Maradu (CT) 40993
Angamali (M) 33424
Chengamanad (CT) 29775
Chowwara (CT) 13603
Kadamakkudy (CT) 15823
Kureekkad (CT) 9730
Urban agglomerations with population ranging between 1 million and 4 million are eligible
for funding under JNNURM.
Kochi Urban Agglomeration as identified by the census of India in 2001 comprises of the
urban local bodies of Kochi Corporation, 5 Municipalities, 15 full Panchayath areas and part
of 3 Panchayaths. This extends up to Angamali in the north, Chowara and Edathala in the
Kochi City Development Plan
8
east, Maradu and Cheriyakadavu in the south. No part of the Vypin group of Islands is
included.
1.2.10 Basis of Delineation of Kochi City – CDP Area The proposed Kochi City/Region for the purpose of the CDP is to include the entire area of
the designated ‘Central City’ as per the Government sanctioned structure plan (Annexure 1)
plus the area lying contiguous to this core urban area and having potential for urban
development due to the additional infrastructural inputs already planned and the large scale
investments already committed which are likely to increase the urban characteristics. The
administrative/ geographical boundary is also taken into account for CDP area delineation.
The major investments proposed by Kochi Port Trust with a vision to emerge as the
International Maritime Gateway of the Indian Ocean Region are listed in Annexure 1, which
further justifies the delineation of CDP area.
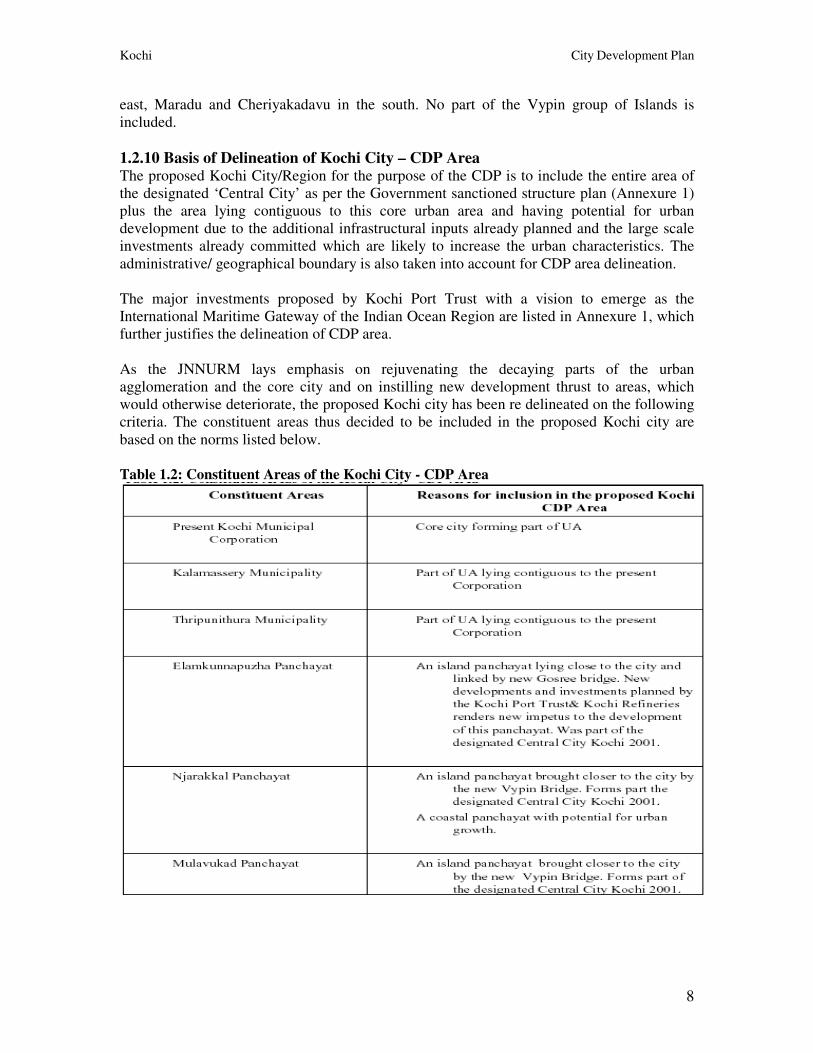
As the JNNURM lays emphasis on rejuvenating the decaying parts of the urban
agglomeration and the core city and on instilling new development thrust to areas, which
would otherwise deteriorate, the proposed Kochi city has been re delineated on the following
criteria. The constituent areas thus decided to be included in the proposed Kochi city are
based on the norms listed below.
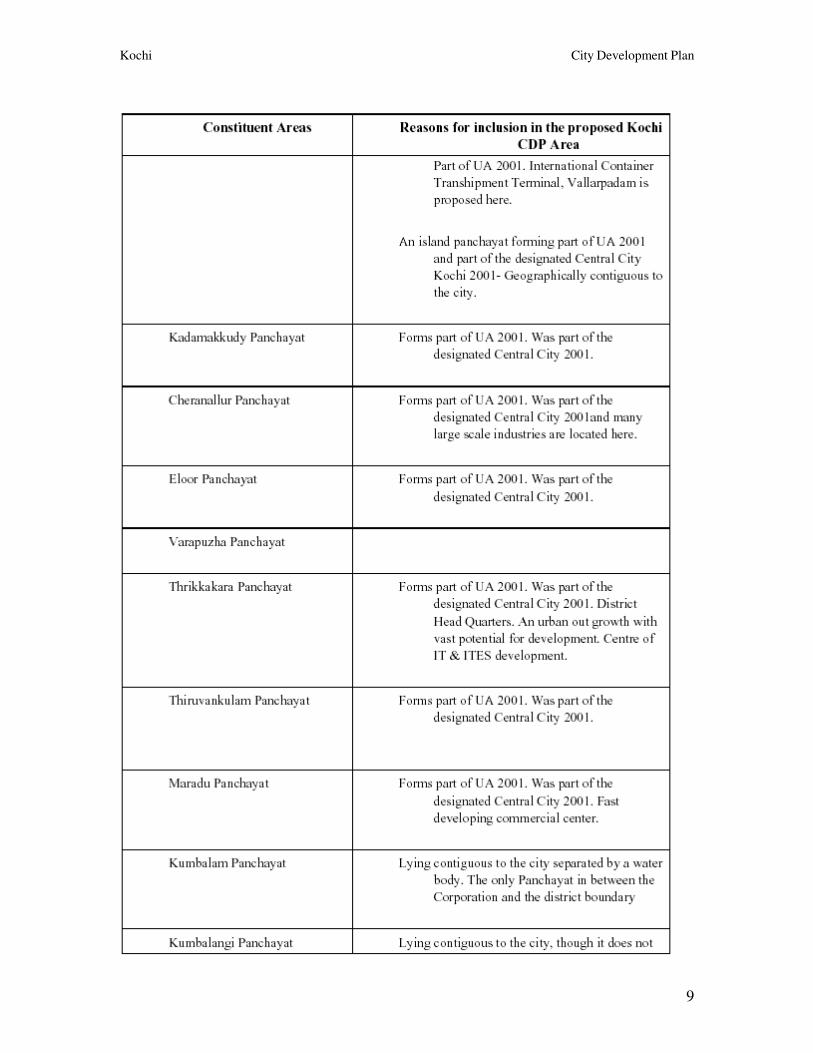
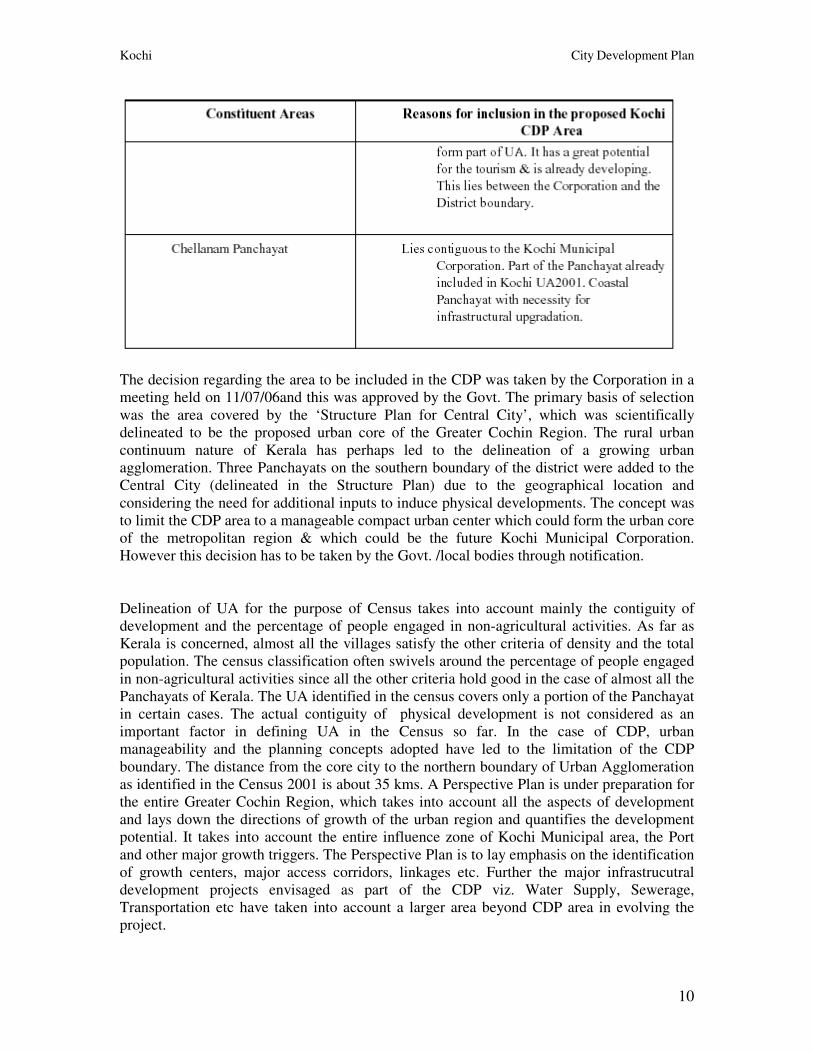
Table 1.2: Constituent Areas of the Kochi City - CDP Area
Kochi City Development Plan
9
Kochi City Development Plan
10
The decision regarding the area to be included in the CDP was taken by the Corporation in a
meeting held on 11/07/06and this was approved by the Govt. The primary basis of selection
was the area covered by the ‘Structure Plan for Central City’, which was scientifically
delineated to be the proposed urban core of the Greater Cochin Region. The rural urban
continuum nature of Kerala has perhaps led to the delineation of a growing urban
agglomeration. Three Panchayats on the southern boundary of the district were added to the
Central City (delineated in the Structure Plan) due to the geographical location and
considering the need for additional inputs to induce physical developments. The concept was
to limit the CDP area to a manageable compact urban center which could form the urban core
of the metropolitan region & which could be the future Kochi Municipal Corporation.
However this decision has to be taken by the Govt. /local bodies through notification.
Delineation of UA for the purpose of Census takes into account mainly the contiguity of
development and the percentage of people engaged in non-agricultural activities. As far as
Kerala is concerned, almost all the villages satisfy the other criteria of density and the total
population. The census classification often swivels around the percentage of people engaged
in non-agricultural activities since all the other criteria hold good in the case of almost all the
Panchayats of Kerala. The UA identified in the census covers only a portion of the Panchayat
in certain cases. The actual contiguity of physical development is not considered as an
important factor in defining UA in the Census so far. In the case of CDP, urban
manageability and the planning concepts adopted have led to the limitation of the CDP
boundary. The distance from the core city to the northern boundary of Urban Agglomeration
as identified in the Census 2001 is about 35 kms. A Perspective Plan is under preparation for
the entire Greater Cochin Region, which takes into account all the aspects of development
and lays down the directions of growth of the urban region and quantifies the development
potential. It takes into account the entire influence zone of Kochi Municipal area, the Port
and other major growth triggers. The Perspective Plan is to lay emphasis on the identification
of growth centers, major access corridors, linkages etc. Further the major infrastrucutral
development projects envisaged as part of the CDP viz. Water Supply, Sewerage,
Transportation etc have taken into account a larger area beyond CDP area in evolving the
project.
Kochi City Development Plan
11
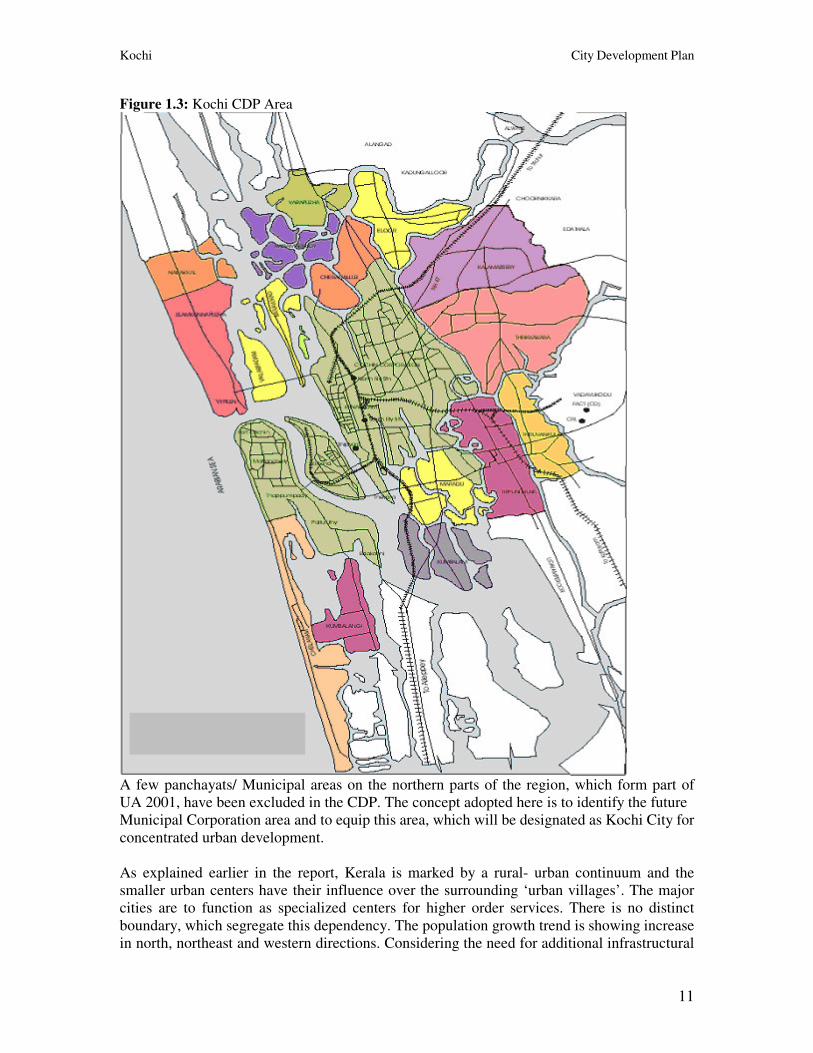
Figure 1.3: Kochi CDP Area
A few panchayats/ Municipal areas on the northern parts of the region, which form part of
UA 2001, have been excluded in the CDP. The concept adopted here is to identify the future
Municipal Corporation area and to equip this area, which will be designated as Kochi City for
concentrated urban development.
As explained earlier in the report, Kerala is marked by a rural- urban continuum and the
smaller urban centers have their influence over the surrounding ‘urban villages’. The major
cities are to function as specialized centers for higher order services. There is no distinct
boundary, which segregate this dependency. The population growth trend is showing increase
in north, northeast and western directions. Considering the need for additional infrastructural
Kochi City Development Plan
12
inputs to sustain the developments envisaged, the proposed city limit is redefined excluding
certain areas on the north & north east portions of the urban Agglomeration as these areas
show a greater dependency on the secondary urban centers closer to them than to the core
city, the central business district.
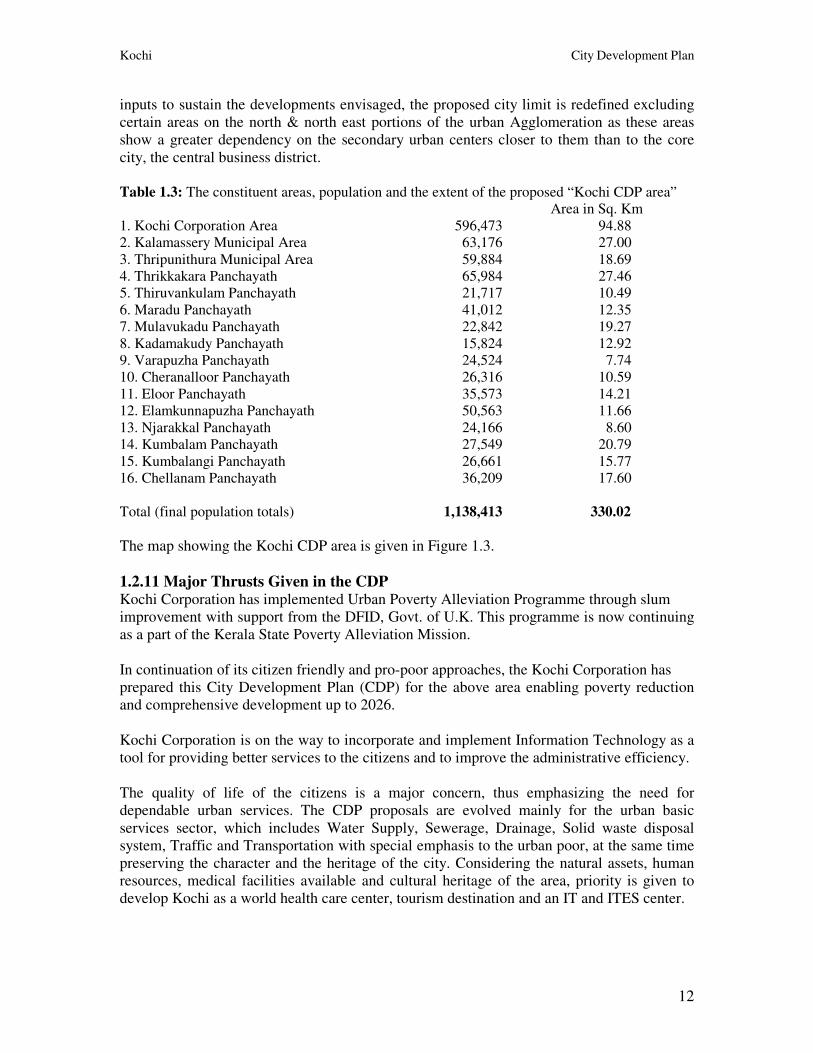
Table 1.3: The constituent areas, population and the extent of the proposed “Kochi CDP area”
Area in Sq. Km
1. Kochi Corporation Area 596,473 94.88
2. Kalamassery Municipal Area 63,176 27.00
3. Thripunithura Municipal Area 59,884 18.69
4. Thrikkakara Panchayath 65,984 27.46
5. Thiruvankulam Panchayath 21,717 10.49
6. Maradu Panchayath 41,012 12.35
7. Mulavukadu Panchayath 22,842 19.27
8. Kadamakudy Panchayath 15,824 12.92
9. Varapuzha Panchayath 24,524 7.74
10. Cheranalloor Panchayath 26,316 10.59
11. Eloor Panchayath 35,573 14.21
12. Elamkunnapuzha Panchayath 50,563 11.66
13. Njarakkal Panchayath 24,166 8.60
14. Kumbalam Panchayath 27,549 20.79
15. Kumbalangi Panchayath 26,661 15.77
16. Chellanam Panchayath 36,209 17.60
Total (final population totals) 1,138,413 330.02
The map showing the Kochi CDP area is given in Figure 1.3.
1.2.11 Major Thrusts Given in the CDP Kochi Corporation has implemented Urban Poverty Alleviation Programme through slum
improvement with support from the DFID, Govt. of U.K. This programme is now continuing
as a part of the Kerala State Poverty Alleviation Mission.
In continuation of its citizen friendly and pro-poor approaches, the Kochi Corporation has
prepared this City Development Plan (CDP) for the above area enabling poverty reduction
and comprehensive development up to 2026.
Kochi Corporation is on the way to incorporate and implement Information Technology as a
tool for providing better services to the citizens and to improve the administrative efficiency.
The quality of life of the citizens is a major concern, thus emphasizing the need for
dependable urban services. The CDP proposals are evolved mainly for the urban basic
services sector, which includes Water Supply, Sewerage, Drainage, Solid waste disposal
system, Traffic and Transportation with special emphasis to the urban poor, at the same time
preserving the character and the heritage of the city. Considering the natural assets, human
resources, medical facilities available and cultural heritage of the area, priority is given to
develop Kochi as a world health care center, tourism destination and an IT and ITES center.
Kochi City Development Plan
13
As Kochi has developed from a small market town to its present stage, it has a historic past
and the urban core areas are characterized by narrow lanes flanked by old buildings. Urban
renewal programmes are essential to rejuvenate the central core, at the same time conserving
its heritage value. Most of the markets in all the constituent areas of the Kochi city need
renovation and improvement. The urban renewal programme is also an important component
of the CDP. The spatial growth trend of the city has been analyzed and the need for a Master
Plan for the CDP area is felt with in the framework of a Perspective Plan for the Greater
Kochi Region in order to achieve the goals envisaged in the CDP.
The co-ordinated institutional support of the following departments/local bodies would be
mobilised to implement the proposals in the CDP.
• All local bodies in the CDP area;
• Greater Kochi Development Authority;
• Gosree Island Development Authority;
• Kerala Water Authority;
• Kerala Public Works Department & NHAI;
• Residential Associations;
• Kudumbasree;
• State Town Planning Department; and
• Kerala State Pollution control Board.
The city development plan would address all the thrust areas mentioned above to ensure the
implementation of the main ‘vision’ and the sub-vision and envisaged while preparation of
the plan.
Kochi City Development Plan
14
2. STRENGTHENING DECENTRALIZATION AND URBAN LOCAL GOVERNANCE
THE PIONEERING INITIATIVES OF KERALA
AND URBAN REFORMS UNDER JNNRUM
2.1 Introduction After the 73rd and 74th Amendments to the Indian Constitution, Kerala has achieved rapid
strides in realizing the constitutional vision of transforming Local Bodies into institutions of
Local Self Government. Among the States in the country, Kerala is the acknowledged leader
in strengthening and institutionalizing decentralized governance both in rural and urban
areas, with several pioneering innovations and basic reforms.
Kerala Municipality Act which came into being in 1994 was fundamentally restructured in
1999 to reflect the spirit of the 74th Amendment. It has made the elected Council the
executive authority of the Urban Local Governments. In addition to ensure that local
governments are not just creations of a single legislation and to give them space in different
Acts related to their area of functioning, thirty odd State Acts were amended in 2000. This
legislative innovation is a unique feature of Kerala’s decentralization.
As part of decentralization, in addition to the traditional functions of street lighting, water
supply, solid waste management and maintenance of secondary roads, a range of functions
has been transferred to Urban Local Governments. They manage primary and secondary
health institutions, primary and secondary schools, anganwadis, care institutions, krishi
bhavans and veterinary hospitals; i.e., the core of the human development responsibilities is
now vested with the Urban Local Governments including the City Corporations. In addition
poverty reduction, women and child development and a major portion of the responsibility
for development of the disadvantaged groups have become Local Government functions.
Local economic development is also fast becoming a subject of Local Governments.
In order to manage the functions indicated above, the functionaries previously carrying out
the functions have been placed under the control of the Local Governments. Also
commensurate funds have been transferred to them to discharge the functions effectively.
Thus beyond civic duties and running of utilities, Corporations have become veritable City
Governments in charge of overall development.
Kerala has used decentralization as a vehicle for bringing about fundamental reforms in
different spheres. These are outlined below:
2.1.1 Development Reforms Participatory budgeting has become a reality in Kerala and a sound methodology has been
Evolved which are applicable even in the urban environment including needs assessment
through Ward Sabhas, situation analysis through comprehensive Development Reports
Kochi City Development Plan
15
akin to City Development Plans, consultation with stakeholders, involvement of
professionals from within and outside the Government in plan and project preparation.
This has helped the Corporations in understanding the development issues confronting
them and given them capacity to deal with them strategically. An important component of
participatory development is poverty reduction. Every poor family within the City
Corporation is identified through a socially understood set of transparent non-monetary
criteria. At the local level all such families below poverty line are brought together into a
Neighbourhood Group (NHG), with each family being represented only by a woman,
making the system a vehicle for empowerment of women as well. NHGs in a Ward are
organized into an Area Development Society (ADS) and all the ADSs within a city are
federated into a registered organization called Community Development Society (CDS).
At each level of this three-tier networked organization there are a set of volunteers from
among the women who look after health, education, community infrastructure, economic
development and general management. Thus this inclusive organization of the poor has
become a powerful medium for poverty reduction. It has strengthened the poor to access
entitlements and gain capabilities to move towards social and economic empowerment. It is
this community based organization of the poor which plans from below for an integrated
Anti Poverty Sub-plan in the Corporation. It has succeeded in generating well-articulated
demand for pro-poor public services.
Ten percent of the Government grants given to a Corporation has to be set apart for a Women
Component Plan. This has opened up possibilities of engendering development at the local
level. Similarly a good portion of the allocation to the Corporation is earmarked for
development of Scheduled Castes for which it has to prepare a Special Component Plan. The
City has also to develop a proper plan for the children, the aged and the challenged. A new
initiative has just been launched to identify the destitute who constitute about two percent of
the population and prepare an integrated plan to tackle it. This initiative called “Asraya” has
the potential of inducing the City Corporation to be compassionate and caring.
All Corporations now have to prepare a Service Delivery Plan listing out the various services
which they provide to citizens, determining the present quality and quantity of the services,
setting realistic target for their improvement and developing a plan of action for attaining
them.
. In September 1995, GoK transferred powers and functions to local governments;
along with institutions, offices and functionaries. Key features of the decentralization
initiative comprises of:
• Transferring health related institutions (except medical colleges and regional specialty
hospitals) to local governments;
• Transferring all Government schools to Urban Local Bodies (ULBs);
• Planning and implementing centrally sponsored poverty alleviation schemes through ULBs;
• Planning social welfare schemes, implementing Integrated Child Development scheme
(ICDS), affecting payment of various social security pensions, and creating centers for care
of the disabled; and
Kochi City Development Plan
16
• Planning and providing urban basic services, including water supply, sanitation, storm
water drainage and urban roads (excluding those provided/ maintained by the State Public
Work Department). (While the KM Act, 1994, and amendments therein requires the MC to
maintain and arrange water and sewerage services, KWA continues to provide the said
services in Kochi).
GoK chose to operationalize the decentralization process through participatory local – level
planning initiated through the Peoples’s Plan Campaign or the Kerala Development Program.
The Annual Plan of the Municipal Corporation (MC) comprises of development projects
planned at the grassroot level and approved by the Council – financing of all approved
projects through ULB own funds and plan grants under State and Central schemes.
Since a lot of assets have been transferred from Government to the Corporations in addition
to their own assets, Corporations have been directed to prepare Maintenance Plans for
managing their physical assets in a scientific manner utilizing their own funds as well as the
earmarked Maintenance Fund devolved by Government.
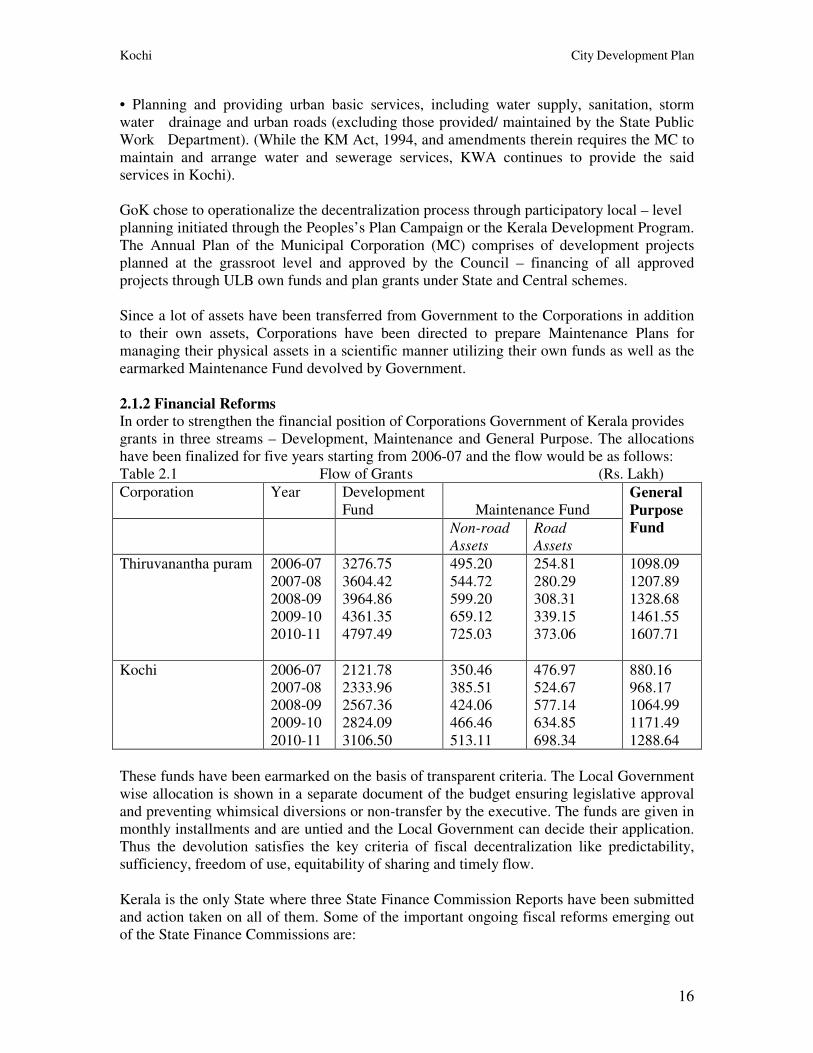
2.1.2 Financial Reforms In order to strengthen the financial position of Corporations Government of Kerala provides
grants in three streams – Development, Maintenance and General Purpose. The allocations
have been finalized for five years starting from 2006-07 and the flow would be as follows:
Table 2.1 Flow of Grant s (Rs. Lakh)
Corporation Year Development
Fund
Maintenance Fund
Non-road
Assets
Road
Assets
General
Purpose
Fund
Thiruvanantha puram 2006-07
2007-08
2008-09
2009-10
2010-11
3276.75
3604.42
3964.86
4361.35
4797.49
495.20
544.72
599.20
659.12
725.03
254.81
280.29
308.31
339.15
373.06
1098.09
1207.89
1328.68
1461.55
1607.71
Kochi 2006-07
2007-08
2008-09
2009-10
2010-11
2121.78
2333.96
2567.36
2824.09
3106.50
350.46
385.51
424.06
466.46
513.11
476.97
524.67
577.14
634.85
698.34
880.16
968.17
1064.99
1171.49
1288.64
These funds have been earmarked on the basis of transparent criteria. The Local Government
wise allocation is shown in a separate document of the budget ensuring legislative approval
and preventing whimsical diversions or non-transfer by the executive. The funds are given in
monthly installments and are untied and the Local Government can decide their application.
Thus the devolution satisfies the key criteria of fiscal decentralization like predictability,
sufficiency, freedom of use, equitability of sharing and timely flow.
Kerala is the only State where three State Finance Commission Reports have been submitted
and action taken on all of them. Some of the important ongoing fiscal reforms emerging out
of the State Finance Commissions are:
Kochi City Development Plan
17
i. Introduction of plinth area based Property Taxation to be effective from the second half of
2006-07;
ii. Introduction of seating capacity-linked taxation for Entertainment Tax;
iii. Introduction of presumptive taxes for certain categories of professions under Profession
Tax;
iv. Introduction of a new Service Tax to realize the cost of providing special services to
localities, as a kind of benefits tax;
v. Linking general non-tax revenues like rents, license fees to the value of money through a
system of graduated automatic increases linked to indices reflecting value of money;
vi. Linking devolution of a portion of the Development Fund to increased revenue efforts on
the part of the local governments;
vii. Tax mapping to reduce escaped tax; and
viii. Updation of asset registers.
As part of the ADB supported Kerala Sustainable Urban Development Product (KSUDP) a
Technical Assistance programme has just been approved to convert the cash based accounts
of City Corporations into a modified accrual system. This exercise is to be preceded by
updation of accounts.
In order to concurrently audit Local Governments a Performance Audit system is in vogue
headed by an officer of the Indian Audit and Accounts Service. It works within the Local Self
Government Department and audits, all Local Governments once in six months with the
primary objective of ensuring that the financial processes and procedures are adhered to and
registers and accounts are properly written up.
To enable the Local Governments to tap institutional finance as well as funds from the
market, the Local Authorities Loans Act is in force. Also there is a Kerala Urban and Rural
Development Finance Corporation (KURDFC) which was set up in the early seventies, the
first of its kind in the country exclusively for Local Governments. Now a policy decision has
been taken to restructure it into the Kerala Local Government Fund on the lines of the Tamil
Nadu Urban Development Fund.
In order to improve fiscal governance and ensure fiscal accountability certain important
initiatives are currently on. They include:
1. Preparation of modern manuals for budgeting, accounting and auditing; and
2. Preparation of a new procurement manual for local governments.
Government have decided in principle to set up a independent Audit Commission for Local
Governments on the lines of the Audit Commission for Local Governments in UK.
Thus the fiscal reforms of Local Governments undertaken in Kerala are fundamental and
pioneering with the potential of transforming fiscal governance.
2.1.3 Governance Reforms Several participatory structures have been set up as appropriate to the urban scenario. These
range from Neighbourhood Groups and Community Development Society to Ward Sabhas
and Ward Committees. The composition of Ward Committees is as follows:
Kochi City Development Plan
18
Composition of Ward committee. – The Ward Committee shall consist of the following
members, namely:-
1. The Councillor of that ward who shall be its Chairman;
2. Fifteen persons to be elected in the manner prescribed, from among the members of the
resident’s association of that Ward, which are registered in the Municipality;
3. Twenty members to be elected in the manner prescribed from among the members of the
registered neighbourhood groups of that Ward which are registered in the Municipality;
4. One person each nominated by every political party having representation in the
Municipality;
5. The Heads of all recognized educational institutions functioning in that Ward;
6. Twenty persons nominated jointly by the Chairperson and Councillor of the Ward, of
whom, -
• Ten shall be from the persons representing the cultural organizations, voluntary
organizations, educational institutions, industrial – commercial establishments
which are functioning in that Ward;
• Five shall be from persons representing those working in that Ward as professionals
(experts in agriculture, industry, health, education, engineering etc.); and
• Five shall be from persons in the registered trade unions:
Provided that, the members nominated under items (i) and (ii) need not be the residents of
that Ward.”This shows that Ward Committees are democratic institutions representing
different stakeholders and there is very less of nomination. Even in big cities Ward Sabhas
are held to elicit suggestions for development schemes akin to the Grama Sabhas in rural
areas. In order to ensure involvement of non-government professionals and activists in the
local planning process Working Groups are set up by the City Corporations consisting of
elected councilors, officials and experts from all walks of life including practitioners and
activists. This helps a kind of triangulation of development ideas and project proposals.
These mechanisms have enhanced Citizen engagements and improved citizen interface with
Urban Local Governments. But the quality of participation in urban areas still needs
considerable up gradation. To address this focus is on evolving city- specific models of
practice, through carefully- structured action research with special reference to micro-
planning, social audit and community- based monitoring.
Even before the Right to Information Act, the Kerala Municipality Act had provisions since
1999 for guaranteeing the right to information which is almost total. Matching this right is a
legal provision to come out with Citizen Charters. This process is undergoing refinement
with the involvement of the Centre for Good Governance Hyderabad. Naturally in such a
scenario service delivery assumes importance and all Corporations are experimenting with
the Service Delivery Plans. Social audit completes the picture of citizen control. Here again
an action research project is under way to evolve a suitable methodology facilitating easy and
effective practice.
The Kerala Municipality Act has provision for a Code of Conduct governing the relationship
between officials and elected members. The Code of Conduct is now being elaborated.
Interestingly it is an enforceable Code of Conduct. Formal engagement of NGOs in
Kochi City Development Plan
19
development matters is another innovative feature in the local government system in Kerala.
Eminent NGOs having expertise in different fields like water supply, sanitation, slum
development, nonconventional energy, cost effective engineering etc., are accredited after a
due process and such NGOs can take up implementation of works related to their expertise
on a no-profit no-loss basis without going through the open bidding process. The Community
Development Society of women below poverty line is deemed to be an NGO in this respect
so that it can take up small works for the development of the poor especially in slums.
As part of improving governance a system is under development for a modern Office
Management system. Also a new, Public Works Manual facilitating community contracting
and total transparency is under finalization. Gradually e-governance is being introduced in
Corporations. Already Birth and Death registration has been made almost on-line through the
system of hospital kiosks. Soon monitoring of development works and accounting would be
computerized. An interesting area of work taken up for electronic application is e-verification
of building plans.
The Trivandrum City Corporation has tied up with the Quality Circle Forum of India to
develop quality cirles and bring about an improvement in the overall functioning of the
office. This has had very promising initial results. The Government of Kerala as part of its
Modernizing Government Programme has launched an initiative called Sevana Mudra, akin
to the Charter Mark initiative of UK. This has been tried out in some Village Panchayats and
is to be up-scaled to be applied Corporations also.
The Local Governments in Kerala enjoy a high degree of autonomy. The Government has no
direct executive control over the Local Governments. In order to ensure accountability two
unique institutions are in place. The first is the Ombudsman for Local Self Government
institutions who is a High Court Judge. All issues related to mal-administration, corruption
and non-performance of duties are referred to Ombudsman who has sufficient power to direct
rectification and in cases involving corruption, even to disqualify elected members. Appeals
against administrative / regulatory decisions of Local Governments like issue of licenses,
permits and punitive action have to be preferred before the Appellate Tribunal who is a
District Judge. A recent initiative has been to develop a grievance redressal system in local
governments.
2.2 Functional Domain The functional domain of local bodies in the State is derived from the respective legislation.
In the State the Kerala Municipality Act 1994 and the Kerala Panchayat Raj Act 1994 are the
main legislations by which the local bodies are functioning. Both the above Acts give the
descriptionsof the “Powers, functions and responsibilities of the each kind of local bodies.” A
list of mandatory functions and general functions are provided in the respective Acts. The
above two enactments were passed by the Kerala Legislature Subsequent to the 74th
Constitution Amendment, the functions of the urban and rural local bodies are almost similar.
Mandatory Functions • Regulating building construction;
• Protection of public land from encroachment;
• Conservation of traditional drinking water sources;
• Preservation of ponds and other water tanks;
• Maintenance of waterways and canals under the control of Municipality;
Kochi City Development Plan
20
• Collection and dispersal of solid waste and regulation of disposal of liquid waste;
• Storm water drainage;
• Maintenance of environmental hygiene;
• Management of public markets;
• Vector control;
• Regulation of slaughtering of animals and sale of meat, fish and other easily perishable food
Stuffs etc.;
• Control of eating houses;
• Prevention of food adulteration;
• Maintenance of roads and other public properties;
• Street lighting and its maintenance;
• Adopt immunization measures;
• Effective implementation of National and State level strategies and programmes for
Prevention and control of diseases;
• Establishment and maintenance of burial and burning grounds;
• Issue of licenses to dangerous and offensive trades and industries;
• Registration of birth and deaths;
• Providing bathing and washing ghats;
• Arranging ferries;
• Providing parking places for vehicles;
• Construction of waiting sheds for travelers;
• Providing toilet facilities and bathing ghats at public places;
• Regulating the conduct of fairs and festivals;
• Issue of license to domestic dogs and destroy stray dogs;
• Providing basic facilities in slum areas;
• Amenities including footpath and road crossing facilities for pedestrians; and
• Preparation of detailed town planning and action plan for implementation in a phased
manner.
General Functions • Collection and updating of essential statistics;
• Organizing voluntary workers and make them participate in collective activities;
• Organize campaign for thrift;
• Awareness building against social evils like drinking, consumption of narcotics, dowry and
abuse of women and children;
• Ensuring maximum people’s participation in all stages of development;
• Organize relief activities during natural calamities;
• Inculcating environmental awareness and motivating local action for its up gradation;
• Development of Co-operative sector;
• Promoting communal harmony;
• Mobilizing local resources in cash or in kind including free surrender of land for
developmental purpose;
• Propagating legal awareness among the weaker section;
• Campaign against offenses;
• Organizing neighborhood groups and self-help groups with focus on the poor; and
• Awareness building on civil duties.
In addition to the above, the State and Central Government can also entrust other functions to
the Corporation whenever required.
Kochi City Development Plan
21
2.1.5 Policy Back-up
In order to improve the performance of local governments several policies have been
formally enunciated by the State. They include the following:
1. A Service Delivery Policy stipulating preparation of Service Delivery Plans through a
participatory process to improve the quality of delivery of public services;
2. A Social Audit Policy to facilitate transparency and accountability to citizens;
3. A Training Strategy to strengthen the capabilities of elected members and officials;
4. A Strategy for Community-Based Monitoring of poverty to track the performance of
antipoverty programme which empowers the poor by enabling them to track public
expenditure meant for their benefit;
5. An Asset Management Policy to ensure that every Local Government is able to ensure the
upkeep of its public assets including the one transferred by the Government through
preparation of proper Maintenance Plans;
6. A framework for Public-Private Participation in Local Governments has been developed
which enables Local Governments to enter into different kinds of Public Private
Partnership (PPP) arrangements; and
7. A Sanitation Policy is under preparation to provide for total sanitation covering different
aspects like solid and liquid waste management, environmental hygiene and overall
cleanliness.
2.1.6 Institutional Back-up Several institutions and mechanisms have been set up to ensure local level development and
help in strengthening of Local Governments. The constitutionally mandated institutions like
the State Election Commission, the State Finance Commission and the District Planning
Committee of Kerala have been rated as the most effective in the country. The State Election
Commission is in full control of the election process right from delimitation up to
disqualification of members for defection or non-submission of accounts. Even the DPC is
elected by the State Election Commission which also oversees conduct of no confidence
motions in Local Governments. As regards the State Finance Commission the State has so far
had three SFCs and the third one has also submitted its report, the first to do so in the
country. Practically every recommendation of the three SFCs has been accepted by
Government and the Action Taken Reports placed in the Legislature. As far as the DPC is
concerned it coordinates preparation of development plans by local governments and clears
them at its level without sending it to Government. DPCs in Kerala have been fully
functional from 1995.
In order to add to the technical expertise of Local Governments there are two Committees – a
Technical Advisory Committee which has experts drawn from different walks of life
including from outside government to vet the projects prepared by Corporations and a
Technical Committee which accords Technical Sanction. Technical Committees consist of
engineers drawn from Government, academic institutions and non-government organizations.
Issue of Technical Sanction by a joint Committee has the advantage of multiple check by
responsible professionals. These arrangements facilitate the induction of any professional to
upgrade the quality of technical vetting and approval of projects- a unique way of
strengthening Local Government capacity of Kudumbashree.
Kochi City Development Plan
22
The State Poverty Eradication Mission is a top quality organization of national acclaim which
acts as a live wire facilitator of anti-poverty programme in Local Governments. It has a team
of highly dedicated and competent officials. The Mission has been declared as the nodal
agency for IHSDP and will play a central role in the BSUP Sub-Mission under JNNURM. A
similar organization is the Information Kerala Mission which is dedicated solely for the
development of IT-based solutions and e-governance initiatives in Local Governments. It has
a rich domain expertise and has succeeded in developing 15 IT-based applications for Local
Governments. It is the key facilitator of computerization in the Corporations.
A new Mission to provide technical assistance to Local Governments in preparing an
implementing waste management plans is the Clean Kerala Mission.
For building capacity of elected members and officials, the State has a unique institution
called the Kerala Institute of Local Administration. It is rated as the best institution in the
country for providing training to elected representatives with special emphasis on
participatory planning and local governance. It is fast developing into an international
institution with regular tie up with the Government of Sri Lanka for training its Councillors.
Efforts are on to raise it to the level of a South Asian Centre of Excellence for capacity
building of Local Governments.
Kerala has a rich tradition of Local Government Associations which are gaining in
importance in acting as a collective of elected local governments. The Chamber of Municipal
Chairpersons and the Mayors Council are effective organizations, assigned an expanding role
in giving policy feed back to government and expressing the demand for capacity building.
Kerala also has a unique institution for Local Governments called the State Development
Council modeled on the lines of the National Development Council, headed by the Chief
inister. Its members include all the Cabinet Ministers, Vice Chairman of the State Planning
Board, Chief Secretary, all Mayors, Presidents of the District Panchayats and representatives
of Local Government associations at the Village Panchayat, Block Panchayat and
Municipality levels. This is a forum for discussing policy issues and coordination issues.
A very effective mechanism to sort out issues related to decentralization, almost on-line, is
the Coordination Committee headed by the Minister for Local Self Government and having
the Secretaries in charge of Local Self Government, Finance, Planning and SC/ST
Development as permanent members and other Ministers and Secretaries as invitees when
issues related to their portfolio are discussed. It has been empowered by the Council of
Ministers to take all decisions necessary to sort out issues related to decentralization and
Local Governments except creation of staff. This has been a very effective institution in
pushing decentralization to the current levels of achievement.
Kochi City Development Plan
23
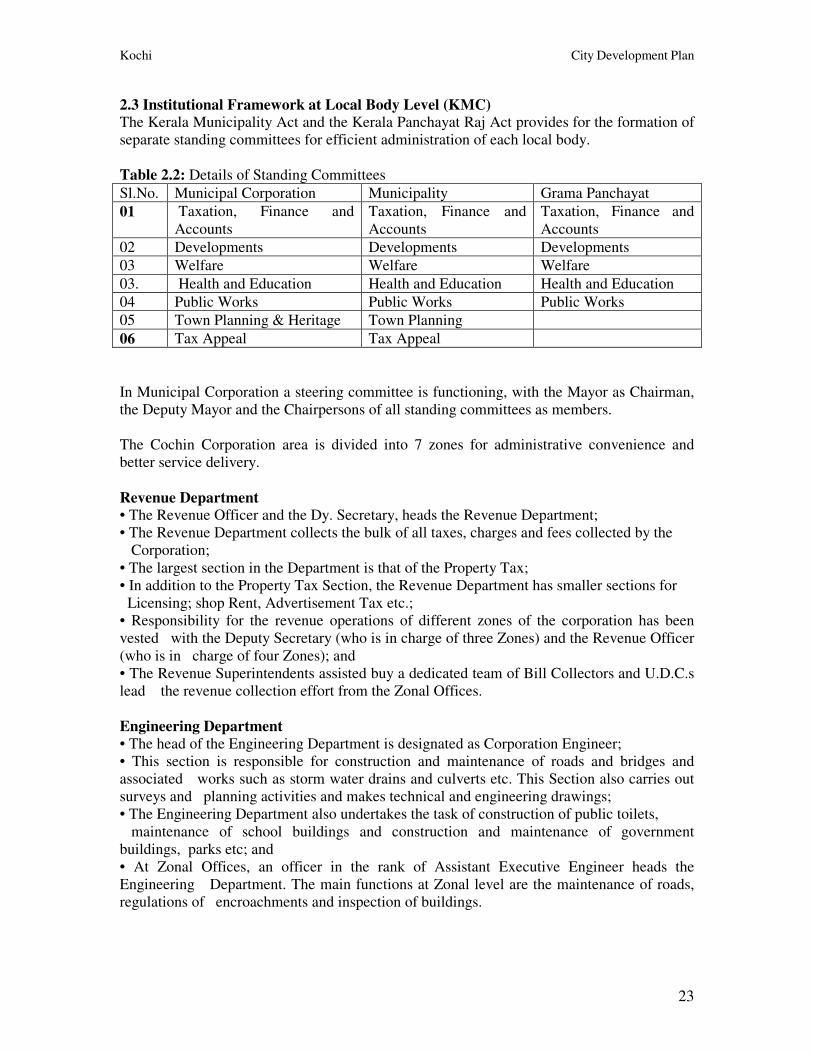
2.3 Institutional Framework at Local Body Level (KMC) The Kerala Municipality Act and the Kerala Panchayat Raj Act provides for the formation of
separate standing committees for efficient administration of each local body.
Table 2.2: Details of Standing Committees
Sl.No. Municipal Corporation Municipality Grama Panchayat
01 Taxation, Finance and
Accounts
Taxation, Finance and
Accounts
Taxation, Finance and
Accounts
02 Developments Developments Developments
03 Welfare Welfare Welfare
03. Health and Education Health and Education Health and Education
04 Public Works Public Works Public Works
05 Town Planning & Heritage Town Planning
06 Tax Appeal Tax Appeal
In Municipal Corporation a steering committee is functioning, with the Mayor as Chairman,
the Deputy Mayor and the Chairpersons of all standing committees as members.
The Cochin Corporation area is divided into 7 zones for administrative convenience and
better service delivery.
Revenue Department • The Revenue Officer and the Dy. Secretary, heads the Revenue Department;
• The Revenue Department collects the bulk of all taxes, charges and fees collected by the
Corporation;
• The largest section in the Department is that of the Property Tax;
• In addition to the Property Tax Section, the Revenue Department has smaller sections for
Licensing; shop Rent, Advertisement Tax etc.;
• Responsibility for the revenue operations of different zones of the corporation has been
vested with the Deputy Secretary (who is in charge of three Zones) and the Revenue Officer
(who is in charge of four Zones); and
• The Revenue Superintendents assisted buy a dedicated team of Bill Collectors and U.D.C.s
lead the revenue collection effort from the Zonal Offices.
Engineering Department • The head of the Engineering Department is designated as Corporation Engineer;
• This section is responsible for construction and maintenance of roads and bridges and
associated works such as storm water drains and culverts etc. This Section also carries out
surveys and planning activities and makes technical and engineering drawings;
• The Engineering Department also undertakes the task of construction of public toilets,
maintenance of school buildings and construction and maintenance of government
buildings, parks etc; and
• At Zonal Offices, an officer in the rank of Assistant Executive Engineer heads the
Engineering Department. The main functions at Zonal level are the maintenance of roads,
regulations of encroachments and inspection of buildings.
Kochi City Development Plan
24
Health Department The Corporation Health Officer heads the Health Department. It is the largest Department of
the Corporation in terms of staff strength, with the bulk of employees being utilized in
conservancy duties.
The executive functions of the Health Department are as follows:
• Cleaning of roads;
• Garbage of collection;
• Disposal of dead animals;
• Control of stray animals;
• Anti larval and anti malaria measures;
• Preventive vaccination
• Control of epidemic and infectious diseases;
• Bio-waste management; and
• Registration of births & deaths.
Its regulatory functions are:
• Enforcement of the Prevention of Food Adulteration (PFA) Act;
• Inspection of eating establishments;
• The Corporation operates 13 maternity and child welfare centers;
• At the Circle Office level a Health Inspector heads the Department. Three junior Health
Inspectors and around 20 – 30 sanitation workers in each zone assist the inspector; and
• Issuing of D&O trade licenses.
Accounts Department
At present the Department comprises of four executive sections and one administrative unit.
These are the Treasury, Establishment/ Salary, Pension and Provident Fund (sometimes
called “Contingency”) sections and the General Administration or Head Office unit.
The key functionaries of the accounts department are the Accounts Officer, Asst: Accounts
Officers, Senior Accountants and Accountants. The functions of the different sections of the
Accounts Department are as follows:
• The Accounts Section is responsible for making all the payments of the Corporation. It also
maintains records of Kochi Municipal Corporation’s accounts and bank transactions such
as loans, overdrafts etc… Within the accounts Section, each accountant and clerk has been
allotted specific roles;
• The Establishment of Salary Section calculates the salary of Kochi Municipal Corporation
employees based on attendance, leave records, loans taken etc… and prepares their salary
statements. The bills are then sent to the Accounts section, which then passes the bills for
payments to the employees of individual departments for further distributions; and.
• The accounts section also prepares the monthly and annual accounts.
Traditionally, the groundwork for preparing the budget has been done by the Accounts
Officer in consultation with the Secretary to the Council of Kochi Municipal Corporation,
who acts as an interface between the administrative and elected bodies of Kochi Municipal
Corporation.
Kochi City Development Plan
25
2.4The Reforms Agenda Reforms are to be carried out mainly in two areas at the local body level - the administrative
reforms and the tax reforms. Reforms and charges are critical elements in development
process of city.
Administrative Reforms. There is no adequate platform to provide the required information to
the citizens on all services. Lack of awareness and information is affecting the citizens’
access to grievances redressal.
There is a need to address these institutional and other challenges to provide good
governance to the city. Unless the hurdles are removed, economic developments are
tampered and efficient service delivery becomes difficult. This will have adverse impact on
the community-particularly the poor. Therefore there is a need to restructure the governance
framework, remove the roadblocks and streamline the line of accountability. The governance
reforms become more critical as Kochi is becoming more and more competitive as an
investment destination. The institutional strategies required includes:
• Spatial integration of Cochin Corporation, the nearby Municipalities and Panchayats for
better planning and service delivery;
• Establishing clear lines of accountability of all service delivery agencies;
• Constituting separate service delivery agencies in different sectors like water supply,
sewerage, sanitation, solid waste management, transport etc.;
• Performance based memorandum of understanding between the city administration and
various service delivery agents focusing on targets and outcome;
• Evolving inclusive E-Governance mechanism;
• Institutional integration;
• Establishing Co-ordination mechanisms to overcome spatial and functional fragmentation;
• Outsourcing of services;
• Rationalization of Municipal Man Power;
• Simplification of regulations and systems;
• Training to functionaries; and
• Basic accounting principles (It focus on shifting to accrual – based double entry system of
accounting).
The above innovations will be implemented in a phased manner.
Tax Reforms. The city need not introduce any new taxes, as it has a very good and well-
framed tax base. But the assessment and realization machinery are to be geared up to the
maximum available potential.
The main source of income for the city is Property tax, Profession tax, Entertainment tax, D
& O license fee, Rent etc., the present system of assessment and realization of property tax is
in vogue. There are ample chances for under assessment and evasion. No concrete criteria are
envisaged for the assessment in the act and rules. Specific criteria for the assessment of
property tax on the basis of Plinth area, type of construction and locations are to be
formulated by the Govt. of Kerala. A new method of self-assessment by the owners on the
basis of plinth area, type and location is prepared to be introduced from the next financial
year. The annual rent per Sq.m. for each type of building in different locations are to be fixed
from time to time. The owner needs to have an awareness of his property tax on the basis of
Kochi City Development Plan
26
plinth area before he starts to construct a building. If such a reform is implemented and the
entire structures are re-numbered using modern G.I.S data, the property tax demand is
expected to increase by more than 300%. There was a practice in Kerala to revise the
property tax in all local bodies every 4 years. But no revision of property tax has been done
during the last 13 years. This has created heavy shortfall in the income of local bodies. The
revision of the property tax is to be done in a scientific manner.
The Cochin Corporation has an average property tax demand of 2,350 lakhs annually. If the
proposed tax revision is done properly and scientifically additional revenue will be available
to the city, which can be utilized for sustainable city development activities. There will be no
more revenue deficit also in the city accounts.
Professional tax rates are fixed by the Govt. of Kerala through a notification. The tax from
employees of Govt. and other institutions are collected half yearly through their heads of
institutions and there fore there is not much evasion in that. But in case of traders,
professionals, legal practitioners, consultants and similar category the assessments are not
made in full. The tax evasion in this category is assessed to be above 20%. By enlisting the
entire persons in this category and bringing them in the tax frame the city can have additional
revenue to the tune of 100 lakhs. The revenue officials can manage this if they are provided
with required facilities. They need to visit door-by-door and enlist all persons without
omission. This can be continued with D & O License listing activity. The data can be
computerized once, the primary data are collected.
Another area where the city lacks in tapping the full potential is the collection of D & O
License fees. There is approximately 25% evasion in this area. The entire traders and
commercial institutions liable to take License need to be listed visiting door-by-door by the
Health staff. They can institute criminal prosecutions against defaulters. If this is done
properly and faithfully the city will get additional income.
Along with the above said changes in assessment the collection machinery are also to be
geared up to have 100% collection annually.
The present average collection rate of property tax and profession tax is around 75%. In the
case of property tax the collection of tax from govt. departments, and Govt. owned
autonomous bodies, the collection rate is very low. The case is similar in respect of collection
of rent of buildings owned by the City Corporation and leased out to private and Govt.
agencies. Strict measures will be taken up.
Tax reform innovations proposed to be undertaken include:
• Computerization of all demand and collection registers;
• Area, location and type based property tax revision using GIS platform, introducing
selfassessment system;
• Levy of user charges to ensure full O & M cost recovery in a phased manner within next 7
years; and
• Improvement of collection machinery.
Kochi City Development Plan
27
2.1.9 Other Reforms Other reforms proposed to be implemented include:
• Strengthening Urban Poverty Alleviations machinery with community participation;
• Utility mapping GIS platform;
• Formation of MIS;
• Developing Public-private partnership in service delivery;
• Promoting BOT projects;
• Public disclosure system;
• Establishment of performance monitoring unit;
• E- Governance initiatives; and
• Simplification of planning regulations.
Pro-Poor
• Preparation of Municipal Actions Plan for poverty reduction by ULBs;
• New citizen friendly street vendor policy; and
• Provision of basic services to urban poor as detailed in chapter BSUP.
The above reforms will be implemented in a phased manner. The administrative Efficiency
and the accountability will be substantially increased to provide high-level service delivery to
the citizens. The additional income derived due to the reforms will be utilized for
development programmes under JNNURM. The State level reforms are to be looked into and
implemented by the Govt. of Kerala.
2.2 Summing up
Continuous policy support in favour of decentralization right from 1995 spanning across
the ten years of different governments of different political persuasions has been the
strong point of Kerala’s decentralization. Though it followed a big bang approach the
State was quick to settle down to the tasks of developing suitable process and procedure,
and setting up appropriate systems and institutions. After deliberately adopting, a
‘learning by doing’ approach, now it has started crafting appropriate operating systems to
run its local governments efficiently. After a successful People’s Plan Campaign which
set the agenda, the institutionalization phase is on.
As clear from the above description, it is clear that the classical principles of devolution of
functionaries, powers and funds to Local Governments have been fully followed in Kerala-
and ONLY IN KERALA. Thus the state has gone a long way in realizing the core objectives
of JNNURM, that of transforming the 74th Amendment into a replicable and sustainable
model- with critical lessons for all states and cities in decentralization reforms. Following the
initiatives of the State Govt. KMC and the local bodies forming part of the CDP area have
moved in the right direction in taking over the functions and powers vested with them as a
consequence of the 73rd and 74th CAA. This is evident from the creation of separate
committees with necessary powers to deal with delivery of services.
The initiative shown by the KMC in understanding the essence and the core objectives of the
JNNURM, that is transforming the 74th Amendment into a replicable and sustainable model
Kochi City Development Plan
28
is a further step in achieving spatial and functional integration intended in the amendment
act. KMC has already taken steps in shifting to accrual based double entry system of
accounting. It has set examples in taking up public sector projects with private and
beneficiary participation.
The Local Governments of Kerala have attained adequate capacity for participatory
development and the JNNURM offers the right opportunity for attaining their full potential.
Kochi City Development Plan
29
3. DEMOGRAPHY AND ECONOMIC BASE
3.1 Decadal Growth of Population The state of Kerala is a green strip of land located in the southwest corner of India. It is only
1.18% of the total area of the country, but houses 3.43% of the country’s population. It is one
of the most densely populated states in the country with a density of population of 819
persons per Sq. Km. As per latest census figure, the state has registered a total population of
31.80 million and more than 25% of the population live in urban areas. Demographically the
state enjoys a very advanced status with rapidly declining birth and death rates, low infant
mortality and very high literacy and health delivery system.
Kochi, the largest urban agglomeration in Kerala, consists of the Municipal Corporation of
Kochi, adjoining Municipalities and GramaPanchayaths. The CDP area of Kochi city consists
of the Kochi Municipal Corporation, Two Municipalities and thirteen adjoining Panchayats
(refer Figure 1.3).
The Kochi City has a flat topography characterized by small and large islands scattered in the
area within the Vembanad Lake.
Kochi witnessed a rapid population growth during the past 30 years. The average decadal
growth in Kochi Corporation is 7.83% whereas the nearby municipal areas registered decadal
average of 18.65%, and the adjoining Panchayaths had an average decadal growth of 12.13%.
The Semi urban areas around the city is showing high rate of population growth and also fast
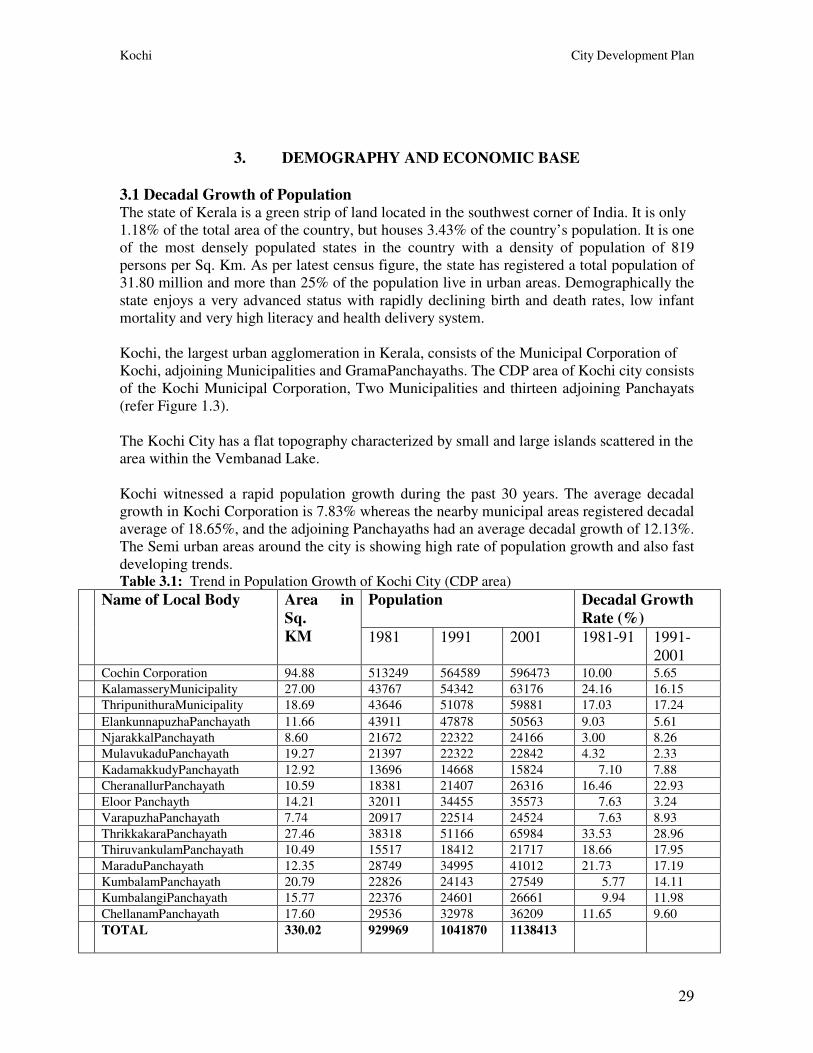
developing trends. Table 3.1: Trend in Population Growth of Kochi City (CDP area)
Population
Decadal Growth
Rate (%)
Name of Local Body Area in
Sq.
KM 1981 1991 2001 1981-91 1991-
2001 Cochin Corporation 94.88 513249 564589 596473 10.00 5.65
KalamasseryMunicipality 27.00 43767 54342 63176 24.16 16.15
ThripunithuraMunicipality 18.69 43646 51078 59881 17.03 17.24
ElankunnapuzhaPanchayath 11.66 43911 47878 50563 9.03 5.61
NjarakkalPanchayath 8.60 21672 22322 24166 3.00 8.26
MulavukaduPanchayath 19.27 21397 22322 22842 4.32 2.33
KadamakkudyPanchayath 12.92 13696 14668 15824 7.10 7.88
CheranallurPanchayath 10.59 18381 21407 26316 16.46 22.93
Eloor Panchayth 14.21 32011 34455 35573 7.63 3.24
VarapuzhaPanchayath 7.74 20917 22514 24524 7.63 8.93
ThrikkakaraPanchayath 27.46 38318 51166 65984 33.53 28.96
ThiruvankulamPanchayath 10.49 15517 18412 21717 18.66 17.95
MaraduPanchayath 12.35 28749 34995 41012 21.73 17.19
KumbalamPanchayath 20.79 22826 24143 27549 5.77 14.11
KumbalangiPanchayath 15.77 22376 24601 26661 9.94 11.98
ChellanamPanchayath 17.60 29536 32978 36209 11.65 9.60
TOTAL 330.02 929969 1041870 1138413
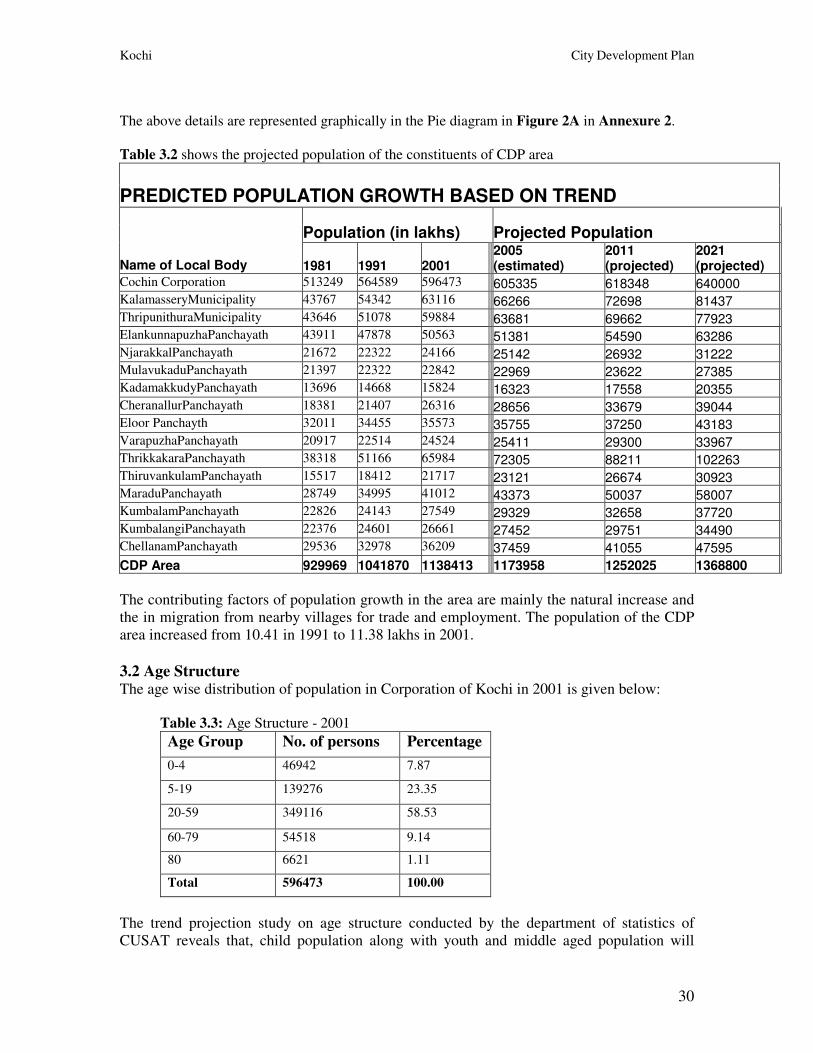
Kochi City Development Plan
30
The above details are represented graphically in the Pie diagram in Figure 2A in Annexure 2.
Table 3.2 shows the projected population of the constituents of CDP area
PREDICTED POPULATION GROWTH BASED ON TREND
Population (in lakhs) Projected Population
Name of Local Body 1981 1991 2001 2005 (estimated)
2011 (projected)
2021 (projected)
Cochin Corporation 513249 564589 596473 605335 618348 640000 KalamasseryMunicipality 43767 54342 63116 66266 72698 81437 ThripunithuraMunicipality 43646 51078 59884 63681 69662 77923 ElankunnapuzhaPanchayath 43911 47878 50563 51381 54590 63286 NjarakkalPanchayath 21672 22322 24166 25142 26932 31222 MulavukaduPanchayath 21397 22322 22842 22969 23622 27385 KadamakkudyPanchayath 13696 14668 15824 16323 17558 20355 CheranallurPanchayath 18381 21407 26316 28656 33679 39044 Eloor Panchayth 32011 34455 35573 35755 37250 43183 VarapuzhaPanchayath 20917 22514 24524 25411 29300 33967 ThrikkakaraPanchayath 38318 51166 65984 72305 88211 102263 ThiruvankulamPanchayath 15517 18412 21717 23121 26674 30923 MaraduPanchayath 28749 34995 41012 43373 50037 58007 KumbalamPanchayath 22826 24143 27549 29329 32658 37720 KumbalangiPanchayath 22376 24601 26661 27452 29751 34490 ChellanamPanchayath 29536 32978 36209 37459 41055 47595
CDP Area 929969 1041870 1138413 1173958 1252025 1368800
The contributing factors of population growth in the area are mainly the natural increase and
the in migration from nearby villages for trade and employment. The population of the CDP
area increased from 10.41 in 1991 to 11.38 lakhs in 2001.
3.2 Age Structure The age wise distribution of population in Corporation of Kochi in 2001 is given below: Table 3.3: Age Structure - 2001
Age Group No. of persons Percentage
0-4 46942 7.87
5-19 139276 23.35
20-59 349116 58.53
60-79 54518 9.14
80 6621 1.11
Total 596473 100.00
The trend projection study on age structure conducted by the department of statistics of
CUSAT reveals that, child population along with youth and middle aged population will
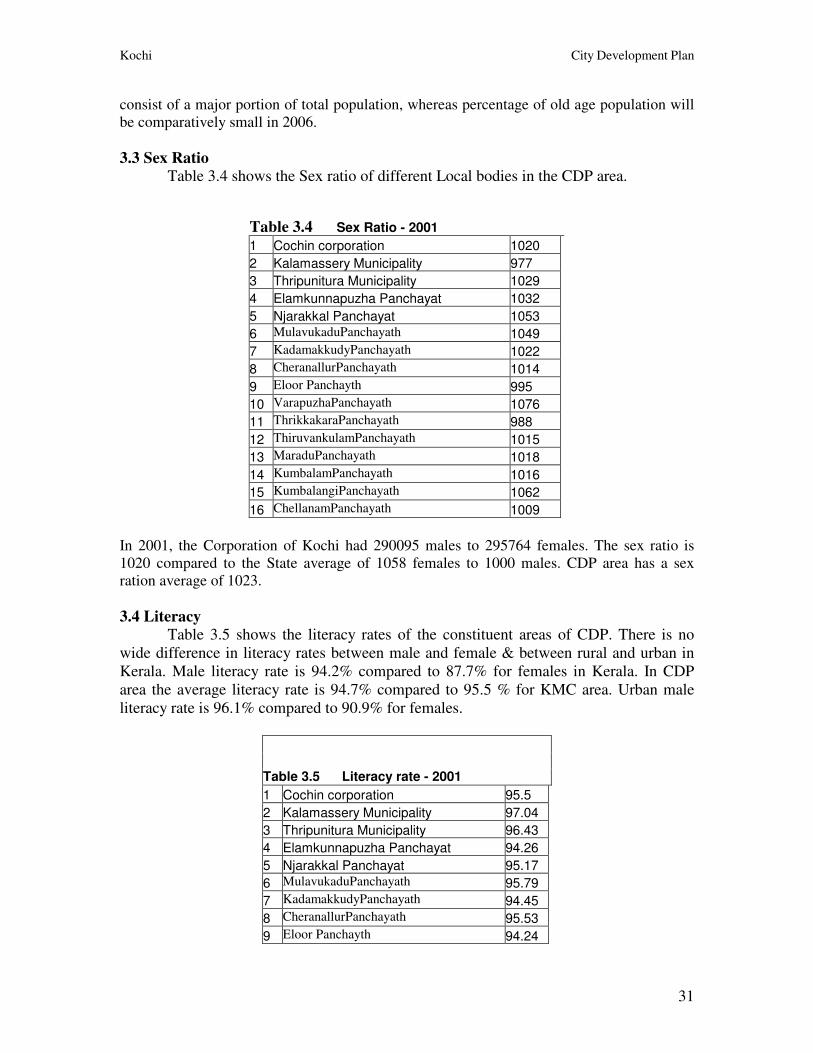
Kochi City Development Plan
31
consist of a major portion of total population, whereas percentage of old age population will
be comparatively small in 2006.
3.3 Sex Ratio Table 3.4 shows the Sex ratio of different Local bodies in the CDP area.
Table 3.4 Sex Ratio - 2001
1 Cochin corporation 1020
2 Kalamassery Municipality 977
3 Thripunitura Municipality 1029
4 Elamkunnapuzha Panchayat 1032
5 Njarakkal Panchayat 1053
6 MulavukaduPanchayath 1049
7 KadamakkudyPanchayath 1022
8 CheranallurPanchayath 1014
9 Eloor Panchayth 995
10 VarapuzhaPanchayath 1076
11 ThrikkakaraPanchayath 988
12 ThiruvankulamPanchayath 1015
13 MaraduPanchayath 1018
14 KumbalamPanchayath 1016
15 KumbalangiPanchayath 1062
16 ChellanamPanchayath 1009
In 2001, the Corporation of Kochi had 290095 males to 295764 females. The sex ratio is
1020 compared to the State average of 1058 females to 1000 males. CDP area has a sex
ration average of 1023.
3.4 Literacy Table 3.5 shows the literacy rates of the constituent areas of CDP. There is no
wide difference in literacy rates between male and female & between rural and urban in
Kerala. Male literacy rate is 94.2% compared to 87.7% for females in Kerala. In CDP
area the average literacy rate is 94.7% compared to 95.5 % for KMC area. Urban male
literacy rate is 96.1% compared to 90.9% for females.
Table 3.5 Literacy rate - 2001
1 Cochin corporation 95.5
2 Kalamassery Municipality 97.04
3 Thripunitura Municipality 96.43
4 Elamkunnapuzha Panchayat 94.26
5 Njarakkal Panchayat 95.17
6 MulavukaduPanchayath 95.79
7 KadamakkudyPanchayath 94.45
8 CheranallurPanchayath 95.53
9 Eloor Panchayth 94.24
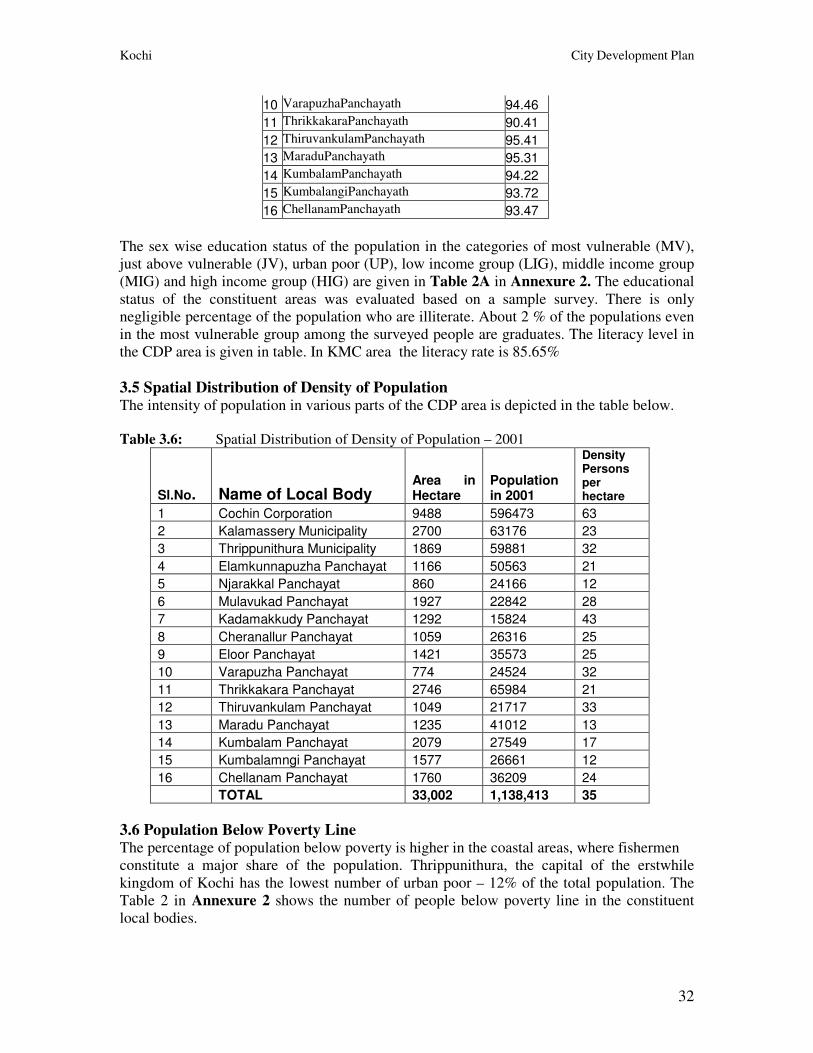
Kochi City Development Plan
32
10 VarapuzhaPanchayath 94.46
11 ThrikkakaraPanchayath 90.41
12 ThiruvankulamPanchayath 95.41
13 MaraduPanchayath 95.31
14 KumbalamPanchayath 94.22
15 KumbalangiPanchayath 93.72
16 ChellanamPanchayath 93.47
The sex wise education status of the population in the categories of most vulnerable (MV),
just above vulnerable (JV), urban poor (UP), low income group (LIG), middle income group
(MIG) and high income group (HIG) are given in Table 2A in Annexure 2. The educational
status of the constituent areas was evaluated based on a sample survey. There is only
negligible percentage of the population who are illiterate. About 2 % of the populations even
in the most vulnerable group among the surveyed people are graduates. The literacy level in
the CDP area is given in table. In KMC area the literacy rate is 85.65%
3.5 Spatial Distribution of Density of Population The intensity of population in various parts of the CDP area is depicted in the table below.
Table 3.6: Spatial Distribution of Density of Population – 2001
Sl.No. Name of Local Body Area in Hectare
Population in 2001
Density Persons per hectare
1 Cochin Corporation 9488 596473 63
2 Kalamassery Municipality 2700 63176 23
3 Thrippunithura Municipality 1869 59881 32
4 Elamkunnapuzha Panchayat 1166 50563 21
5 Njarakkal Panchayat 860 24166 12
6 Mulavukad Panchayat 1927 22842 28
7 Kadamakkudy Panchayat 1292 15824 43
8 Cheranallur Panchayat 1059 26316 25
9 Eloor Panchayat 1421 35573 25
10 Varapuzha Panchayat 774 24524 32
11 Thrikkakara Panchayat 2746 65984 21
12 Thiruvankulam Panchayat 1049 21717 33
13 Maradu Panchayat 1235 41012 13
14 Kumbalam Panchayat 2079 27549 17
15 Kumbalamngi Panchayat 1577 26661 12
16 Chellanam Panchayat 1760 36209 24
TOTAL 33,002 1,138,413 35
3.6 Population Below Poverty Line The percentage of population below poverty is higher in the coastal areas, where fishermen
constitute a major share of the population. Thrippunithura, the capital of the erstwhile
kingdom of Kochi has the lowest number of urban poor – 12% of the total population. The
Table 2 in Annexure 2 shows the number of people below poverty line in the constituent
local bodies.
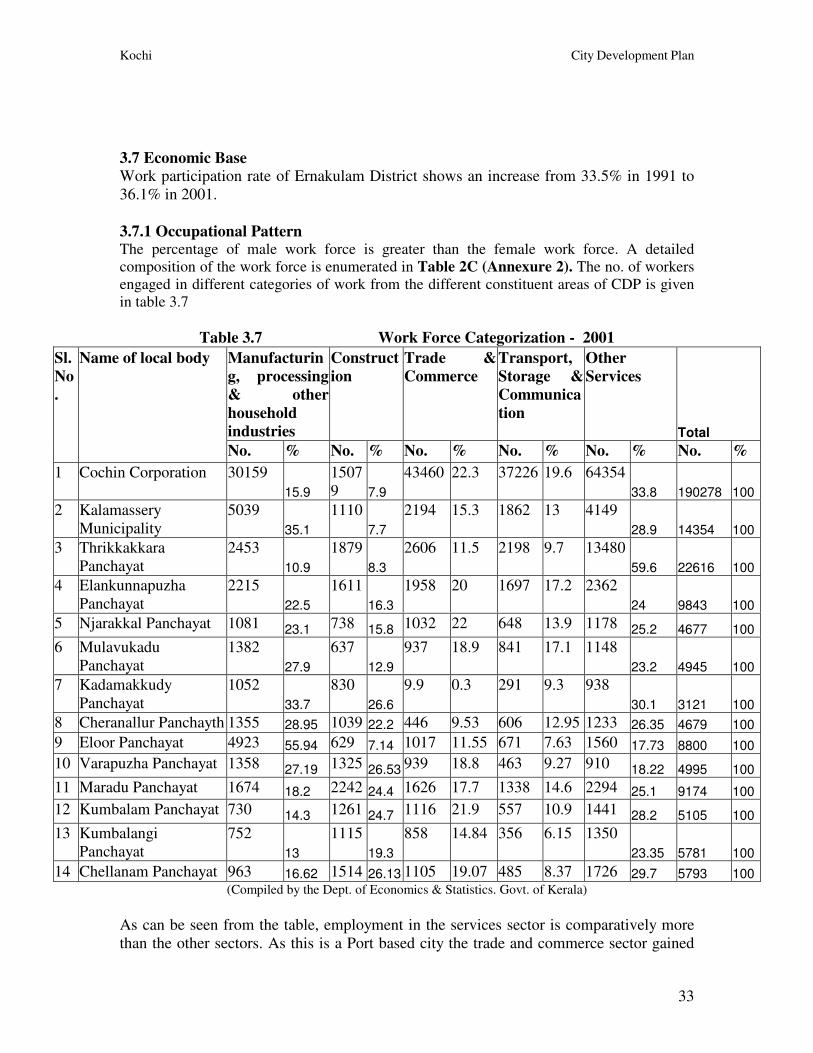
Kochi City Development Plan
33
3.7 Economic Base Work participation rate of Ernakulam District shows an increase from 33.5% in 1991 to
36.1% in 2001.
3.7.1 Occupational Pattern The percentage of male work force is greater than the female work force. A detailed
composition of the work force is enumerated in Table 2C (Annexure 2). The no. of workers
engaged in different categories of work from the different constituent areas of CDP is given
in table 3.7
Table 3.7 Work Force Categorization - 2001
(Compiled by the Dept. of Economics & Statistics. Govt. of Kerala)
As can be seen from the table, employment in the services sector is comparatively more
than the other sectors. As this is a Port based city the trade and commerce sector gained
Manufacturin
g, processing
& other
household
industries
Construct
ion
Trade &
Commerce
Transport,
Storage &
Communica
tion
Other
Services
Total
Sl.
No
.
Name of local body
No. % No. % No. % No. % No. % No. %
1 Cochin Corporation 30159
15.9
1507
9 7.9
43460 22.3 37226 19.6 64354
33.8 190278 100
2 Kalamassery
Municipality
5039
35.1
1110
7.7
2194 15.3 1862 13 4149
28.9 14354 100
3 Thrikkakkara
Panchayat
2453
10.9
1879
8.3
2606 11.5 2198 9.7 13480
59.6 22616 100
4 Elankunnapuzha
Panchayat
2215
22.5
1611
16.3
1958 20 1697 17.2 2362
24 9843 100
5 Njarakkal Panchayat 1081 23.1 738 15.8 1032 22 648 13.9 1178 25.2 4677 100
6 Mulavukadu
Panchayat
1382
27.9
637
12.9
937 18.9 841 17.1 1148
23.2 4945 100
7 Kadamakkudy
Panchayat
1052
33.7
830
26.6
9.9 0.3 291 9.3 938
30.1 3121 100
8 Cheranallur Panchayth 1355 28.95 1039 22.2 446 9.53 606 12.95 1233 26.35 4679 100
9 Eloor Panchayat 4923 55.94 629 7.14 1017 11.55 671 7.63 1560 17.73 8800 100
10 Varapuzha Panchayat 1358 27.19 1325 26.53 939 18.8 463 9.27 910 18.22 4995 100
11 Maradu Panchayat 1674 18.2 2242 24.4 1626 17.7 1338 14.6 2294 25.1 9174 100
12 Kumbalam Panchayat 730 14.3 1261 24.7 1116 21.9 557 10.9 1441 28.2 5105 100
13 Kumbalangi
Panchayat
752
13
1115
19.3
858 14.84 356 6.15 1350
23.35 5781 100
14 Chellanam Panchayat 963 16.62 1514 26.13 1105 19.07 485 8.37 1726 29.7 5793 100
Kochi City Development Plan
34
predominance. The major Port based developments proposed – The Inter national
Transshipment Terminal, Single Buoy Mooring, LNG Project, Special Economic Zone –
are sure to boost up the economic base of the CDP area. Large scale IT development is
envisaged in Thrikkakkara and Kalamassery. Port based developments are proposed
mainly in Elamkunnapuzha and Mulavukad (Vallarpadam) apart from KMC area.
Industrial developments is concentrated in Eloor. The island Panchayats of Kumbalangi ,
Chellanam, Kadamakkudy and Maradu show potential for tourism developments.
Thrikkakkara is the administrative headquarters of the district and it is a sprouting IT
hub. The average employment in an IT park which is being developed comes to 4000
with an annual turn over of Rs.66crore. The manufacturing sector within the Ernakulam
district contributes around 775 crores annually. The employment in the sector was 64815
in 2000-01 in the district. The per capita income is estimated to be 25199 rupees and the
growth in per capita income 12% annually. Almost 93% of industrial employment in the
district is concentrated in CDP area. The economy of the CDP area is depended on Port
Activities, related trade and commerce. The details of the major proposals (mega
projects) of the Port are given in Annexure 1.
3.8 Demography: Emerging Issues and Concerns Even though the natural growth rate of population does not show an exorbitant increase, the
floating population and the migration in Kochi is to be considered while earmarking the
infrastructural requirements. There had been no intensive migration to any of the cities in
Kerala mainly due to the following reasons.
• Employment opportunities in the main cities are not sufficient to exert a pulling effect
• High land values in cities prohibit establishment of residences in cities especially among the
middle and low-income categories.
• The homestead nature of holdings in sub urban areas allows fragmentation of property for
new family housing.
• Availability of transport facilities allows daily commutation to the city from out lying areas
and districts with in a radius of about 100 k.m.
Facility for daily commutation adds to the increased number of floating population
in the core city. A transportation study conducted has shown that nearly 2.5 lakhs of people
commute to the core city daily thereby increasing the pressure on civic amenities and
congestion on major traffic corridors.
The Kochi City (CDP area) is experiencing population growth higher than the state average.
In the next 2 decades it is expected to touch 2 million mark. Most of the growth is taking
place out of the Kochi Municipal Corporation boundary but within the CDP area. This
coupled with the high level of floating population, necessitates integrated planning,
development and service delivery.
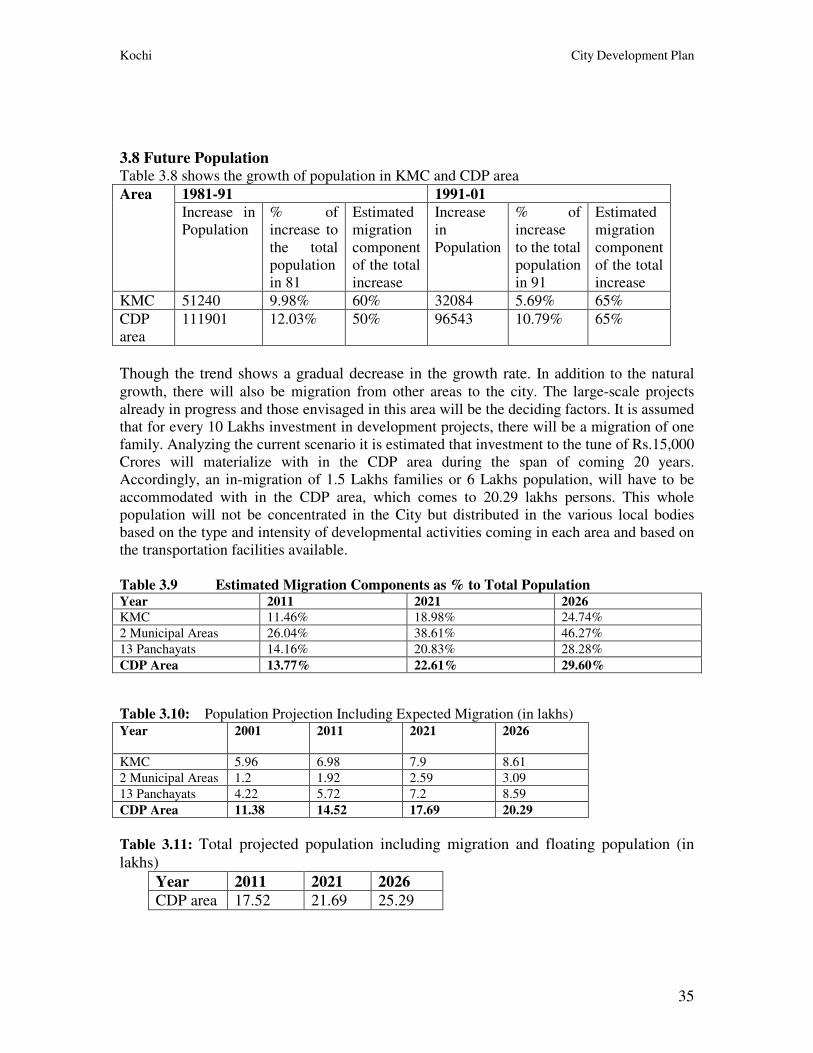
Kochi City Development Plan
35
3.8 Future Population Table 3.8 shows the growth of population in KMC and CDP area
1981-91 1991-01 Area
Increase in
Population
% of
increase to
the total
population
in 81
Estimated
migration
component
of the total
increase
Increase
in
Population
% of
increase
to the total
population
in 91
Estimated
migration
component
of the total
increase
KMC 51240 9.98% 60% 32084 5.69% 65%
CDP
area
111901 12.03% 50% 96543 10.79% 65%
Though the trend shows a gradual decrease in the growth rate. In addition to the natural
growth, there will also be migration from other areas to the city. The large-scale projects
already in progress and those envisaged in this area will be the deciding factors. It is assumed
that for every 10 Lakhs investment in development projects, there will be a migration of one
family. Analyzing the current scenario it is estimated that investment to the tune of Rs.15,000
Crores will materialize with in the CDP area during the span of coming 20 years.
Accordingly, an in-migration of 1.5 Lakhs families or 6 Lakhs population, will have to be
accommodated with in the CDP area, which comes to 20.29 lakhs persons. This whole
population will not be concentrated in the City but distributed in the various local bodies
based on the type and intensity of developmental activities coming in each area and based on
the transportation facilities available.
Table 3.9 Estimated Migration Components as % to Total Population Year 2011 2021 2026
KMC 11.46% 18.98% 24.74%
2 Municipal Areas 26.04% 38.61% 46.27%
13 Panchayats 14.16% 20.83% 28.28%
CDP Area 13.77% 22.61% 29.60%
Table 3.10: Population Projection Including Expected Migration (in lakhs) Year
2001 2011 2021 2026
KMC 5.96 6.98 7.9 8.61
2 Municipal Areas 1.2 1.92 2.59 3.09
13 Panchayats 4.22 5.72 7.2 8.59
CDP Area 11.38 14.52 17.69 20.29
Table 3.11: Total projected population including migration and floating population (in
lakhs)
Year 2011 2021 2026
CDP area 17.52 21.69 25.29
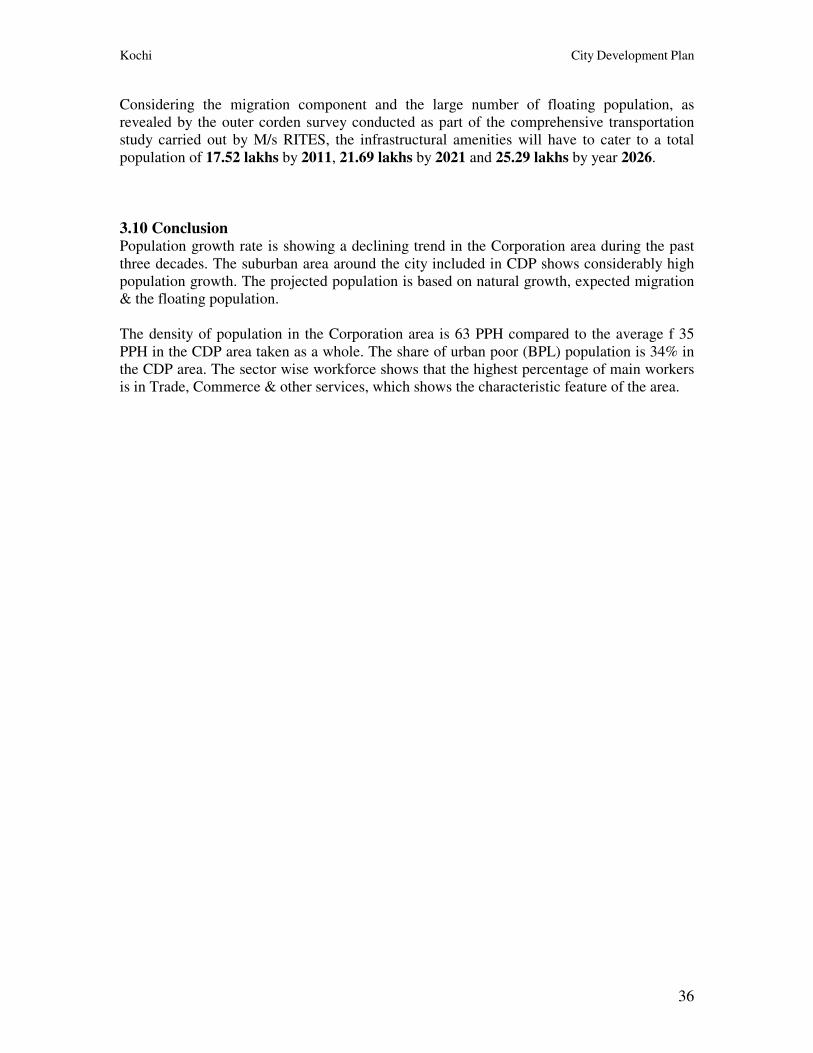
Kochi City Development Plan
36
Considering the migration component and the large number of floating population, as
revealed by the outer corden survey conducted as part of the comprehensive transportation
study carried out by M/s RITES, the infrastructural amenities will have to cater to a total
population of 17.52 lakhs by 2011, 21.69 lakhs by 2021 and 25.29 lakhs by year 2026.
3.10 Conclusion Population growth rate is showing a declining trend in the Corporation area during the past
three decades. The suburban area around the city included in CDP shows considerably high
population growth. The projected population is based on natural growth, expected migration
& the floating population.
The density of population in the Corporation area is 63 PPH compared to the average f 35
PPH in the CDP area taken as a whole. The share of urban poor (BPL) population is 34% in
the CDP area. The sector wise workforce shows that the highest percentage of main workers
is in Trade, Commerce & other services, which shows the characteristic feature of the area.
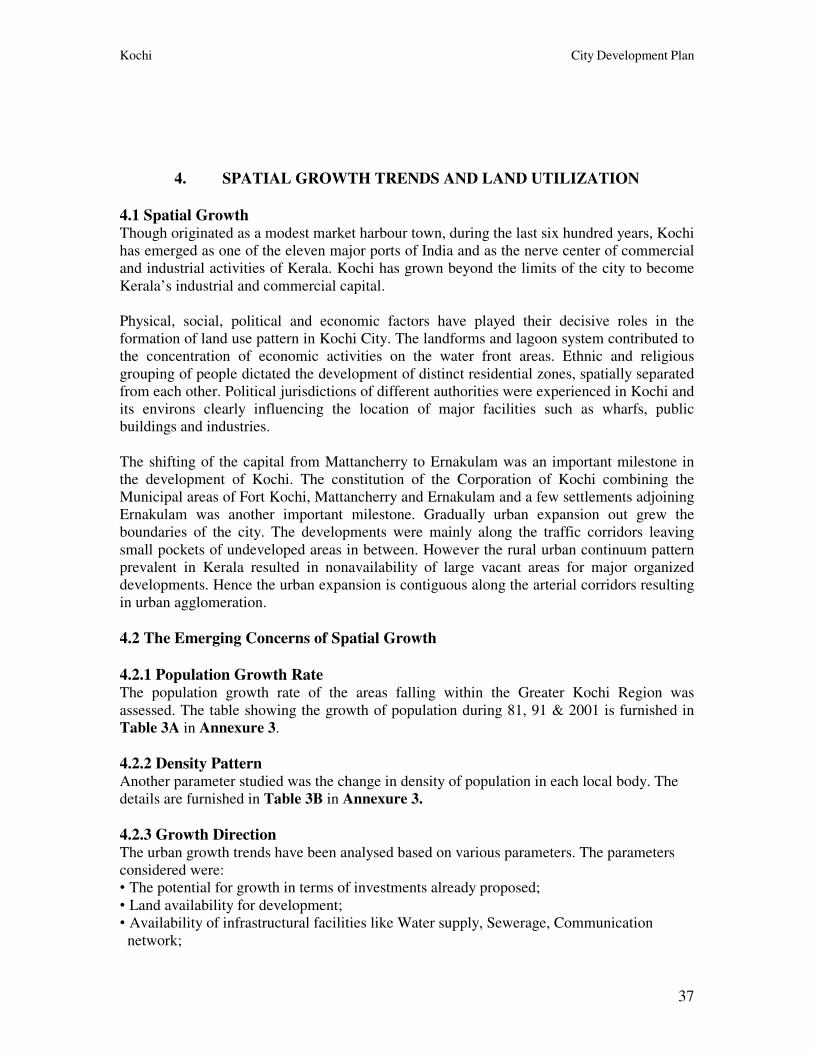
Kochi City Development Plan
37
4. SPATIAL GROWTH TRENDS AND LAND UTILIZATION
4.1 Spatial Growth Though originated as a modest market harbour town, during the last six hundred years, Kochi
has emerged as one of the eleven major ports of India and as the nerve center of commercial
and industrial activities of Kerala. Kochi has grown beyond the limits of the city to become
Kerala’s industrial and commercial capital.
Physical, social, political and economic factors have played their decisive roles in the
formation of land use pattern in Kochi City. The landforms and lagoon system contributed to
the concentration of economic activities on the water front areas. Ethnic and religious
grouping of people dictated the development of distinct residential zones, spatially separated
from each other. Political jurisdictions of different authorities were experienced in Kochi and
its environs clearly influencing the location of major facilities such as wharfs, public
buildings and industries.
The shifting of the capital from Mattancherry to Ernakulam was an important milestone in
the development of Kochi. The constitution of the Corporation of Kochi combining the
Municipal areas of Fort Kochi, Mattancherry and Ernakulam and a few settlements adjoining
Ernakulam was another important milestone. Gradually urban expansion out grew the
boundaries of the city. The developments were mainly along the traffic corridors leaving
small pockets of undeveloped areas in between. However the rural urban continuum pattern
prevalent in Kerala resulted in nonavailability of large vacant areas for major organized
developments. Hence the urban expansion is contiguous along the arterial corridors resulting
in urban agglomeration.
4.2 The Emerging Concerns of Spatial Growth
4.2.1 Population Growth Rate The population growth rate of the areas falling within the Greater Kochi Region was
assessed. The table showing the growth of population during 81, 91 & 2001 is furnished in
Table 3A in Annexure 3.
4.2.2 Density Pattern Another parameter studied was the change in density of population in each local body. The
details are furnished in Table 3B in Annexure 3.
4.2.3 Growth Direction The urban growth trends have been analysed based on various parameters. The parameters
considered were:
• The potential for growth in terms of investments already proposed;
• Land availability for development;
• Availability of infrastructural facilities like Water supply, Sewerage, Communication
network;
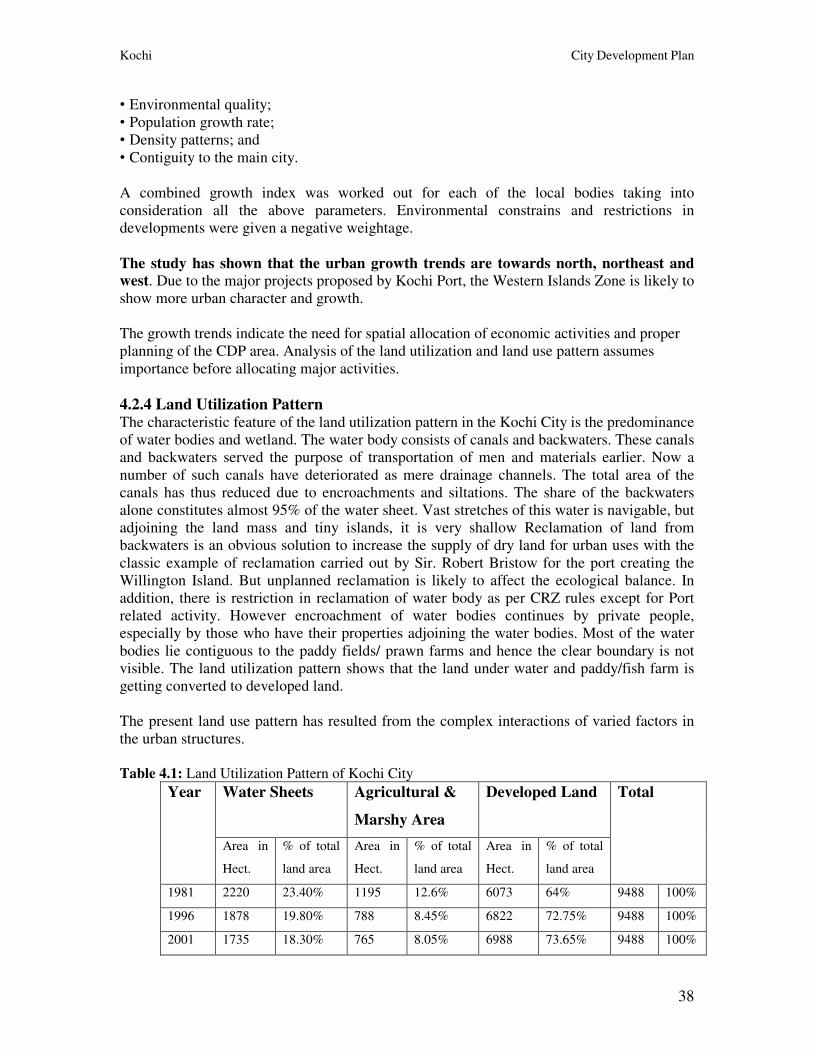
Kochi City Development Plan
38
• Environmental quality;
• Population growth rate;
• Density patterns; and
• Contiguity to the main city.
A combined growth index was worked out for each of the local bodies taking into
consideration all the above parameters. Environmental constrains and restrictions in
developments were given a negative weightage.
The study has shown that the urban growth trends are towards north, northeast and west. Due to the major projects proposed by Kochi Port, the Western Islands Zone is likely to
show more urban character and growth.
The growth trends indicate the need for spatial allocation of economic activities and proper
planning of the CDP area. Analysis of the land utilization and land use pattern assumes
importance before allocating major activities.
4.2.4 Land Utilization Pattern The characteristic feature of the land utilization pattern in the Kochi City is the predominance
of water bodies and wetland. The water body consists of canals and backwaters. These canals
and backwaters served the purpose of transportation of men and materials earlier. Now a
number of such canals have deteriorated as mere drainage channels. The total area of the
canals has thus reduced due to encroachments and siltations. The share of the backwaters
alone constitutes almost 95% of the water sheet. Vast stretches of this water is navigable, but
adjoining the land mass and tiny islands, it is very shallow Reclamation of land from
backwaters is an obvious solution to increase the supply of dry land for urban uses with the
classic example of reclamation carried out by Sir. Robert Bristow for the port creating the
Willington Island. But unplanned reclamation is likely to affect the ecological balance. In
addition, there is restriction in reclamation of water body as per CRZ rules except for Port
related activity. However encroachment of water bodies continues by private people,
especially by those who have their properties adjoining the water bodies. Most of the water
bodies lie contiguous to the paddy fields/ prawn farms and hence the clear boundary is not
visible. The land utilization pattern shows that the land under water and paddy/fish farm is
getting converted to developed land.
The present land use pattern has resulted from the complex interactions of varied factors in
the urban structures.
Table 4.1: Land Utilization Pattern of Kochi City
Water Sheets Agricultural &
Marshy Area
Developed Land Year
Area in
Hect.
% of total
land area
Area in
Hect.
% of total
land area
Area in
Hect.
% of total
land area
Total
1981 2220 23.40% 1195 12.6% 6073 64% 9488 100%
1996 1878 19.80% 788 8.45% 6822 72.75% 9488 100%
2001 1735 18.30% 765 8.05% 6988 73.65% 9488 100%
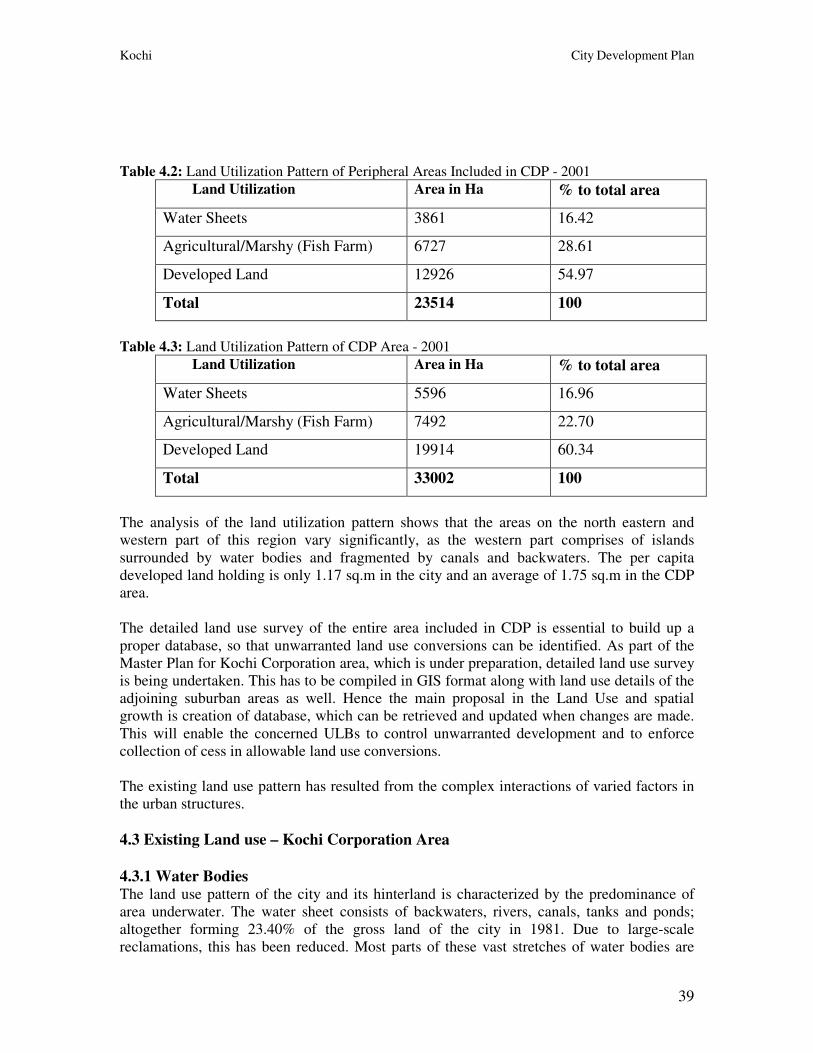
Kochi City Development Plan
39
Table 4.2: Land Utilization Pattern of Peripheral Areas Included in CDP - 2001
Land Utilization Area in Ha % to total area
Water Sheets 3861 16.42
Agricultural/Marshy (Fish Farm) 6727 28.61
Developed Land 12926 54.97
Total 23514 100
Table 4.3: Land Utilization Pattern of CDP Area - 2001
Land Utilization Area in Ha % to total area
Water Sheets 5596 16.96
Agricultural/Marshy (Fish Farm) 7492 22.70
Developed Land 19914 60.34
Total 33002 100
The analysis of the land utilization pattern shows that the areas on the north eastern and
western part of this region vary significantly, as the western part comprises of islands
surrounded by water bodies and fragmented by canals and backwaters. The per capita
developed land holding is only 1.17 sq.m in the city and an average of 1.75 sq.m in the CDP
area.
The detailed land use survey of the entire area included in CDP is essential to build up a
proper database, so that unwarranted land use conversions can be identified. As part of the
Master Plan for Kochi Corporation area, which is under preparation, detailed land use survey
is being undertaken. This has to be compiled in GIS format along with land use details of the
adjoining suburban areas as well. Hence the main proposal in the Land Use and spatial
growth is creation of database, which can be retrieved and updated when changes are made.
This will enable the concerned ULBs to control unwarranted development and to enforce
collection of cess in allowable land use conversions.
The existing land use pattern has resulted from the complex interactions of varied factors in
the urban structures.
4.3 Existing Land use – Kochi Corporation Area
4.3.1 Water Bodies The land use pattern of the city and its hinterland is characterized by the predominance of
area underwater. The water sheet consists of backwaters, rivers, canals, tanks and ponds;
altogether forming 23.40% of the gross land of the city in 1981. Due to large-scale
reclamations, this has been reduced. Most parts of these vast stretches of water bodies are
Kochi City Development Plan
40
navigable. But adjoining the major landmass and the tiny islands, it is very shallow due to
siltation. The % of water sheets in the CDP area is estimated to be 16.42%.
The city has a very flat terrain with a very gentle slope from East to West. Unlike in other
parts of the country, in Kerala, the residential use is widely spread out, intermingling with all
other uses, making it difficult to clearly demarcate the boundaries of residential area and
other uses. Within this limitation, is the land use analysis carried out.
4.3.2 Agricultural Use The percentage of land under agricultural use was 12.6% of the gross area in 1981 within the
Corporation area. Now it is reduced to less than 9%. Almost all the low-lying wetlands
within the city are left uncultivated. But in the coastal panchayats the fields are cultivated for
single crop and used for prawn farming during rest of the year. In developing parts of the
city, the low lands are getting filled up fast and converted to urban use, both by public and
private agencies. The percentage of land under agricultural use (including Marshy land and
area under Fish farm) is estimated to be 28.61% of the gross area.
4.3.3 Residential Use The percentage of residential land to the net dry land was 78.24% in 1981. Considering the
existing population, the gross density comes to 62.87 persons per hec. The net residential
density in the city is around 166.47 persons per hectare.
Residential areas are evenly distributed all over the area giving a spread pattern of settlement.
Most of the residential land is built over with isolated single storeyed/double storeyed
buildings. Apartment housing is a trend, which has come up in Kochi during the past 10
years; at present this trend confined to city and immediate surroundings viz., Kalamassery,
Thrikkakara, Thripunithura and Maradu only. Changes in the character of land use from
residential to commercial use are seen in the CBD area and slowly this tendency is spreading
to the planned residential areas as well, mainly near intersections of important roads.
Correspondingly, the residential densities also rise. The city is not yet geared to cope up with
increasing density in terms of services like water supply and sewerage.
4.3.4 Commercial Use Commercial use includes retail and wholesale, warehouses and storage professional
institutions and commercial establishments. The spatial distribution of commercial land
clearly indicates the concentration of this activity in the centre of the city and also at nodal
points of transportation network. The share of commercial land in the city has shown a
sudden jump during the last year due to conversion of other uses to special shopping
complexes and shopping malls.
4.3.5 Industrial Use A number of small, medium and large-scale industries are located in and around Kochi. In
the Kochi City the industrial use was only1.71% of the total land use in 1981. Medium scale
industries are concentrated along the foreshore areas and large-scale industries are
concentrated at the north – eastern and south – eastern areas, about 10 to 15 km. off the
central business district, in Eloor – Kalamasserry belt and Ambalamugal – Karimugal belt.
Small-scale industries are spread all over the area. With the establishment of Goshree Bridges
connecting the western islands to the mainland, large-scale industries with capital investment
Kochi City Development Plan
41
worth more than 15,000 crores are at various stages of implementation at Vallarpadom –
Puthuvyppu area, the islands north of Kochi gut. IT industries are concentrating more around
Kakkanad about 8 km. from the CBD. About 250 acres of land is being set apart for this.
4.3.6 Transport Roads, bus stations, garages, railway installations, dockyards, port areas, jetties and airports
come under this use. The percentage of use under this category was around 6% in 1981. But
it does not speak of a good transportation system or a traffic network in the city. The roads
are narrow and the streets are irregular lanes.
The railway line divides the city into two in the north-south direction. The landing facilities
for ferry services and for inland navigation services are inadequate. Creation of a road
network, widening of roads, improving the terminal facilities and expansion of railway
installations will require additional area to be brought under the transportation use. The
detailed road network and proposals are separately elaborated.
4.3.7 Public and Semipublic Use Educational medical, administrative, religious, cultural and utility service installations and
land under defence are brought under this use. The spatial pattern of this land use shows a
balanced distribution of public and semi-public uses all over the area. Over the past few
decades Kochi has developed into an established center of learning and health care. The
educational facilities available in Kochi especially for higher education has given Kochi the
status of Commonwealth University Centre for E-learning.
The total number of beds available in the 72 major hospital spread over CDP area comes to
6,848. In addition there are Ayurvedic & Homoeopathic hospitals and dispensaries, PH
centers, community welfare Centres etc. The health facilities available in proportion to the
total population is much above the norms fixed under UDPFI guidelines.
4.3.8 Parks, Open Spaces & Stadia There appears to be a conspicuous shortage of land under this category of use since only less
than 1% of the area of the city falls under this category. However the vast expanse of water
sheet and agricultural land provide the lung space requirements. But their use for passive and
active recreation is rather limited. There is need for city level parks and playgrounds as well
as zonal, community level and neighbourhood level open space. Detailed survey of land use
is being undertaken as part of the Kochi city Master Plan that is under preparation. Detailed
land use survey for the Corporation area is being done as part of the Master Plan.
But for the area outside the city limits, detailed land use is yet to be worked out
The land use pattern of Kochi Municipal Corporation area for 1981 and 2001 are
furnished for comparison.
Table4.4 Land use Pattern in Kochi Municipal Corporation (%)
Sl.No. Land Use 1981 2001 1 Residential 50.08 52.68
2 Commercial 1.65 3.29
3 Industrial 1.71 3.32
4 Public & Semi-Public 4.16 5.76
5 Open space & Recreation 0.67 1.27
6 Transport 5.73 7.33
Kochi City Development Plan
42
7 Paddy/Prawn farm/Wetland 12.6 8.05
8 Water body 23.4 18.3
Total 100% 100%
The land use analysis of KMC for the 2 periods show that the % of land use under water
body and wet land is getting reduced. Urban expansion and the need for land are likely to
further reduce the water bodies which will have repercussions on the environmental
characteristics of the area. Hence, a judicious approach is to be adopted in allowing land
use conversions. Though the % of open space is very low the vast expanse of water
bodies makes up this deficiency to an extent. It is imperative to conserve the available
water resources.
The current data regarding land use pattern in respect of Municipal and Panchayat areas
are being compiled for the preparation of Perspective Plan for the Greater Cochin Region
and Development Plan for CDP area. The 1st component of this is acquisition of GIS
based data.
4.4 Land Use
Table 4.5 Land use Pattern in CDP area
Any development project will have its impact on space and consequently on the land use of
that area. A judicious distribution of the land use is essential for the efficient functioning of
the city/region. In Kochi, town-planning efforts were active since late 1800s. A
comprehensive approach to the planning of the urban areas of Kochi was initiated when the
Department of Town Planning was constituted in 1959. They brought out an Interim
Development Plan, which conceived an urban form with a Central City of concentrated urban
development and satellite townships with in an urban Region. Subsequently the Region was
scientifically delineated. It comprised of Kochi City, 6 Municipalities and 33 Panchayats
covering the entire Greater Kochi Region. Greater Cochin Development Authority was
constituted to coordinate the development activities within the region and it undertook model
development schemes in various sectors. As per GO MS256/95/LAD dated 14.11.95 Kochi
Metropolitan area was designated which is the same as the Greater Cochin Region.The
department brought out a Regional Development Plan for this Greater Kochi Region in 1976.
Land use
Area in Ha.
%
Residential 15984 48.434%
Commercial 396 1.198%
Industrial 1070 3.243%
Public & Semi public 1293 3.918%
Open Space & Recreation 67 0.202%
Transport 1104 3.345%
Water body 5596 16.960%
Agricultural/Marshy 7492 22.700%
TOTAL 33002 100%
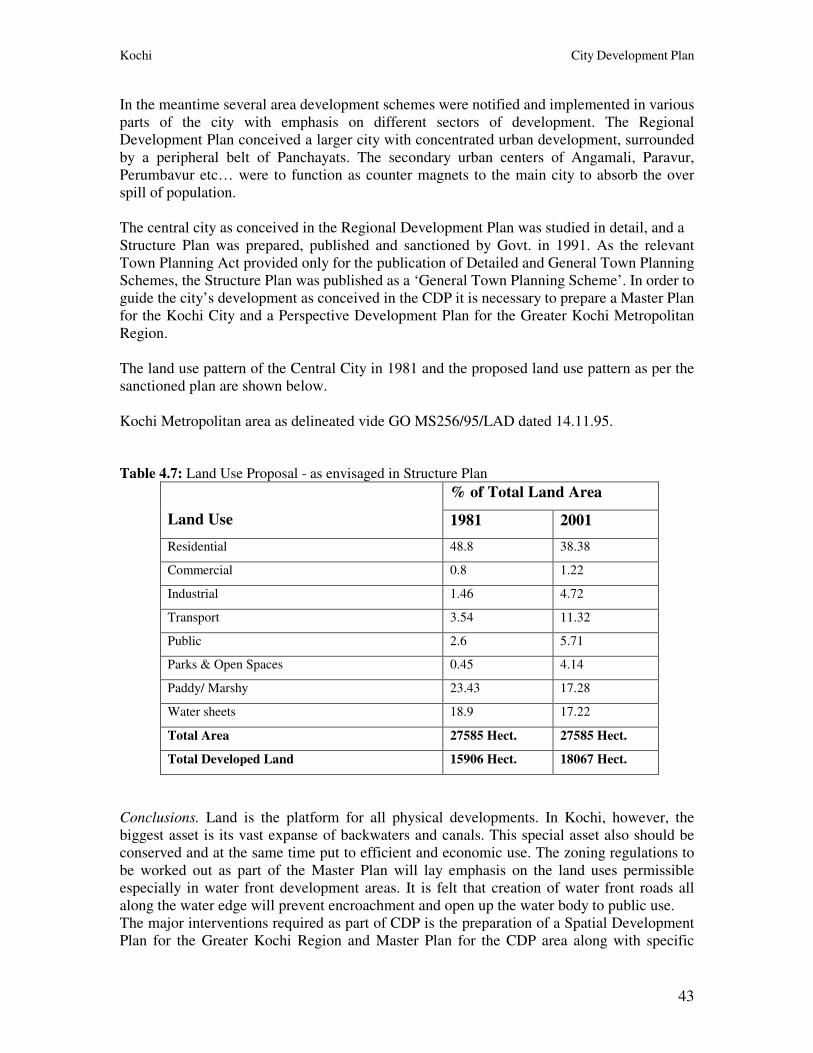
Kochi City Development Plan
43
In the meantime several area development schemes were notified and implemented in various
parts of the city with emphasis on different sectors of development. The Regional
Development Plan conceived a larger city with concentrated urban development, surrounded
by a peripheral belt of Panchayats. The secondary urban centers of Angamali, Paravur,
Perumbavur etc… were to function as counter magnets to the main city to absorb the over
spill of population.
The central city as conceived in the Regional Development Plan was studied in detail, and a
Structure Plan was prepared, published and sanctioned by Govt. in 1991. As the relevant
Town Planning Act provided only for the publication of Detailed and General Town Planning
Schemes, the Structure Plan was published as a ‘General Town Planning Scheme’. In order to
guide the city’s development as conceived in the CDP it is necessary to prepare a Master Plan
for the Kochi City and a Perspective Development Plan for the Greater Kochi Metropolitan
Region.
The land use pattern of the Central City in 1981 and the proposed land use pattern as per the
sanctioned plan are shown below.
Kochi Metropolitan area as delineated vide GO MS256/95/LAD dated 14.11.95.
Table 4.7: Land Use Proposal - as envisaged in Structure Plan
% of Total Land Area
Land Use 1981 2001
Residential 48.8 38.38
Commercial 0.8 1.22
Industrial 1.46 4.72
Transport 3.54 11.32
Public 2.6 5.71
Parks & Open Spaces 0.45 4.14
Paddy/ Marshy 23.43 17.28
Water sheets 18.9 17.22
Total Area 27585 Hect. 27585 Hect.
Total Developed Land 15906 Hect. 18067 Hect.
Conclusions. Land is the platform for all physical developments. In Kochi, however, the
biggest asset is its vast expanse of backwaters and canals. This special asset also should be
conserved and at the same time put to efficient and economic use. The zoning regulations to
be worked out as part of the Master Plan will lay emphasis on the land uses permissible
especially in water front development areas. It is felt that creation of water front roads all
along the water edge will prevent encroachment and open up the water body to public use.
The major interventions required as part of CDP is the preparation of a Spatial Development
Plan for the Greater Kochi Region and Master Plan for the CDP area along with specific
Kochi City Development Plan
44
zoning regulations and development parameters. Special emphasis is to be given to the
following aspects:
• Water front development planning including rehabilitation of encroachers on the public
land;
• Land use planning based on sound principles of planning;
• Beautification of specific water front areas - Can be taken up directly or on BOT / Public
Private partnership basis;
• Water based recreational facility creation (already included as part of Tourism);
• Creation of land and water based open space system; and
• Enhancement of the use of waterways for tourism and inland navigation.
Kochi City Development Plan
45
5. URBAN INFRASTRUCTURE
5.1 Water Supply
5.1.1 Background The state of Kerala is a green strip of land located in the southwest corner of India. It has
only 1.18% of the total area of the country, but houses 3.43 % of the country’s population. It
is one of the most densely populated states in the country with a density population of 819
persons per Sq. Km. As per latest census, the state has registered a total population of 31.80
million and more than 25% of the population lives in urban areas. Demographically the state
enjoys a very advanced status with rapidly declining birth and death rates, low infant
mortality and very high literacy and health delivery system.
In Kerala, all major public water supply systems are under the control of Kerala Water
Authority, a public undertaking for planning, implementing and maintaining water supply
and sewerage schemes for Government of Kerala.
In Kerala piped water supply systems started as early as in 1914 and the implementation of
the schemes received a significant boost during the International Drinking Water Supply and
Sanitation decade (1981 – 1990) with the support from domestic financial institutions like
LIC & HUDCO, foreign donors such as Dutch and Danish Governments and the World bank.
The trend continued during the nineties. But in view of the massive investment requirements,
the State could so far achieve only 78% coverage in urban areas and 57% in rural areas.
There are 991 Panchayats in the State having a total of 9776 wards / habitations out of which
994 habitations are still without protected drinking water facilities. 6889 habitations are only
partly covered. Inspite of the large assistance received from the Govt. of India for enhancing
the rural water supply coverage, the State Govt. has to explore alternate strategies for
implementing new schemes in the uncovered areas and augmentation schemes in partially
covered areas.
Kochi, “Queen of the Arabian sea” is the headquarters of Ernakulam district. The city is built
up on a cluster of islands and peninsulas joined by the bustling town on the main land,
Ernakulam. The island zone is going to become the prime commercial center of Kochi as
well as that of Kerala with the emergence of new international container transshipment
terminal at Vallarpadom and LNG terminal at Puthuvype. Besides Airport, oil refinery,
public & private sector industrial units & hill products trading centers make the city the
biggest commercial hub in Kerala.
5.1.2 Key Issues Based on the review of the current water supply scenario, the following key challenges are
identified. There is a huge gap in water supply due to lack of augmentation and enhancement
of production and distribution capacity and the required distribution net work to cater to the
increased demand due to urban growth. The city, the surrounding municipalities and
panchayaths or outgrowths are in short of adequate water supply network and access to piped
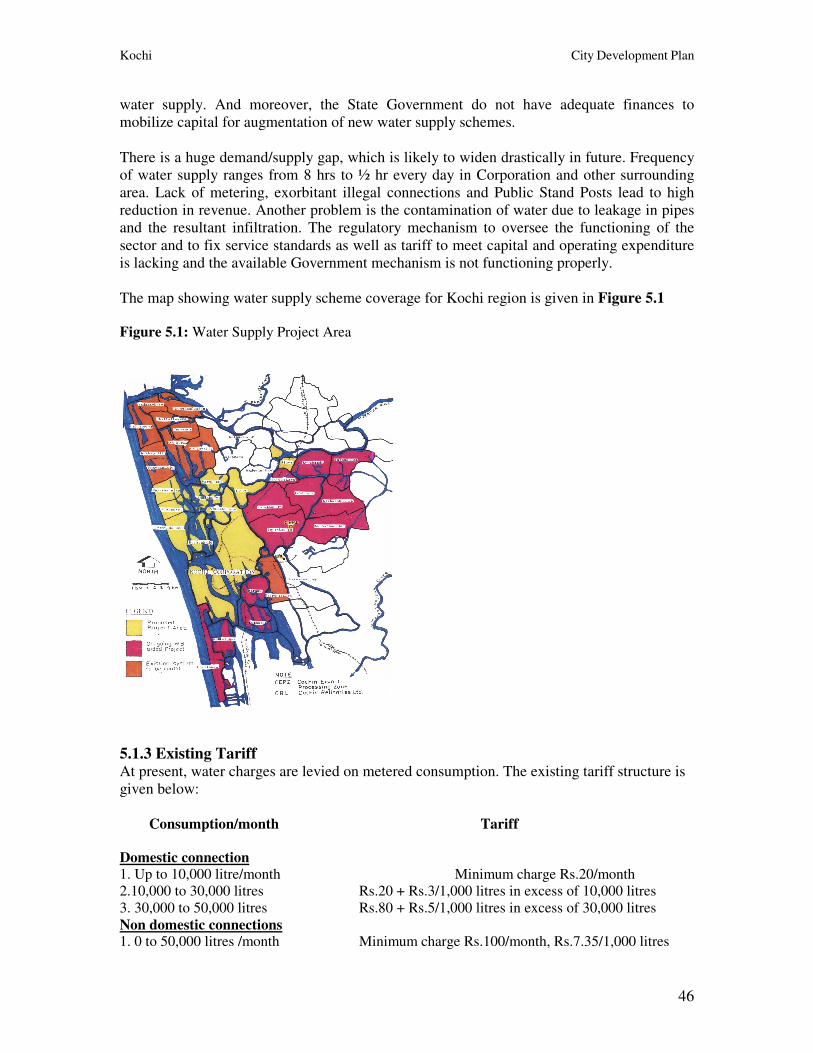
Kochi City Development Plan
46
water supply. And moreover, the State Government do not have adequate finances to
mobilize capital for augmentation of new water supply schemes.
There is a huge demand/supply gap, which is likely to widen drastically in future. Frequency
of water supply ranges from 8 hrs to ½ hr every day in Corporation and other surrounding
area. Lack of metering, exorbitant illegal connections and Public Stand Posts lead to high
reduction in revenue. Another problem is the contamination of water due to leakage in pipes
and the resultant infiltration. The regulatory mechanism to oversee the functioning of the
sector and to fix service standards as well as tariff to meet capital and operating expenditure
is lacking and the available Government mechanism is not functioning properly.
The map showing water supply scheme coverage for Kochi region is given in Figure 5.1 Figure 5.1: Water Supply Project Area
5.1.3 Existing Tariff At present, water charges are levied on metered consumption. The existing tariff structure is
given below:
Consumption/month Tariff Domestic connection 1. Up to 10,000 litre/month Minimum charge Rs.20/month
2.10,000 to 30,000 litres Rs.20 + Rs.3/1,000 litres in excess of 10,000 litres
3. 30,000 to 50,000 litres Rs.80 + Rs.5/1,000 litres in excess of 30,000 litres
Non domestic connections 1. 0 to 50,000 litres /month Minimum charge Rs.100/month, Rs.7.35/1,000 litres
Kochi City Development Plan
47
2. Above 50,000 litres Rs.368 + Rs.10.60/1,000 litre
Industrial Connection Rs.10.60/1000 litre with minimum charge Rs.200
Table 5.1.1 Total Revenue / Expenditure in Water Supply Sector (KWA)
5.1.4 Sub-Vision for Water Supply ‘Provide adequate quality water supply in an environmental friendly and sustainable manner’
5.1.5 Mission ‘Provide services at every doorstep with a performance of 100% satisfaction with financial
self sufficiency’.
5.1.6 Goals and Service Outcomes Considering the above challenges, the following goals have been identified.
The water supply coverage and access to piped water supply in Kochi city area at 150 lpcd
and required pressure to get 100% satisfaction level by the year 2011. The per capita water
supply as per CPHEEO norms, at 150 lpcd by 2011 will increase hours of supply to 8 hours a
day and finally achieve 24 X 7 by 2021. There is a need to lower the Non Revenue Water
(NRW) to 30% by the year 2011, 20% by the year 2016 and 15% by the year 2021. 100%
O&M cost recovery is to be achieved by the year 2011.
5.1.7 Objectives of the Project The objective of the project is to improve the water supply systems in Kochi Corporation,
Aluva & Kalamassery Municipalities and adjoining sixteen panchayaths to achieve the Goal
“Improve Health and living standards of the people in the project area through safe drinking
water at required pressure and hygienic practices”.
5.1.8 Need and Justification of the Project The present water supply service area of Aluva head works comprises of Kochi Corporation,
4 Municipalities and 27 panchayaths covering an area of 574 Sq. Km.
Kochi Metropolitan Area comprises Kochi Corporation, 6 municipalities 33 Panchayats as
per Notification G.O. (Ms) No.256/95/LAD. Dt. Tvm. 14th Nov. 1999. A major portion of
this area depends on the existing water supply system from Aluva Head Works taking raw
water from River Periyar. Photograph of water supply intake point at Periyar shown in
Figure 5.. Kochi Corporation consists of Fort Kochi, Mattancherry, Willington Island &
Ernakulam and has an area of 94.88 Sq.Km.
The Kochi Water Supply Scheme envisaged by KWA covers 3 additional Panchayats and
Aluva Municipality over and above the area covered by the CDP. Further, it does not
cover the Thripunithura Municipality, which is part of CDP. The reason for the change is
indicated below.
Year Expenditure in Rs/lakh Revenue in Rs/lakh
2002 – 03 3189 2430
03-04 3345 2475
04-05 3501 2588
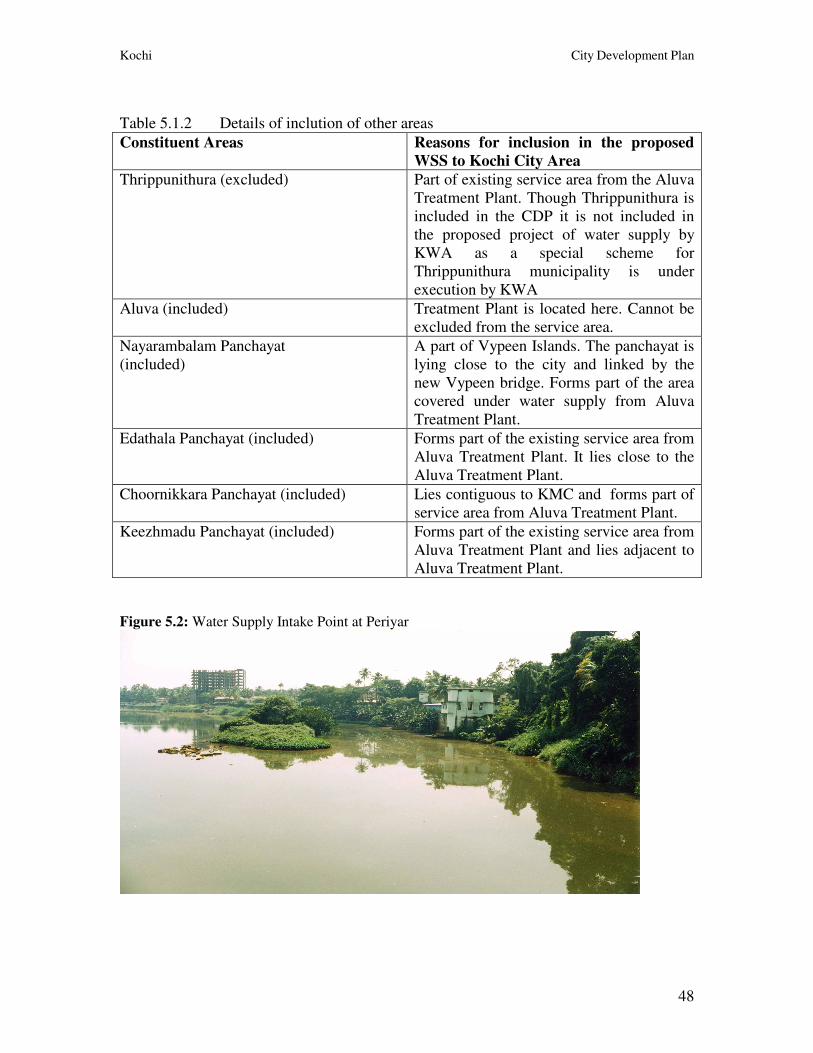
Kochi City Development Plan
48
Table 5.1.2 Details of inclution of other areas
Constituent Areas Reasons for inclusion in the proposed
WSS to Kochi City Area
Thrippunithura (excluded) Part of existing service area from the Aluva
Treatment Plant. Though Thrippunithura is
included in the CDP it is not included in
the proposed project of water supply by
KWA as a special scheme for
Thrippunithura municipality is under
execution by KWA
Aluva (included) Treatment Plant is located here. Cannot be
excluded from the service area.
Nayarambalam Panchayat
(included)
A part of Vypeen Islands. The panchayat is
lying close to the city and linked by the
new Vypeen bridge. Forms part of the area
covered under water supply from Aluva
Treatment Plant.
Edathala Panchayat (included) Forms part of the existing service area from
Aluva Treatment Plant. It lies close to the
Aluva Treatment Plant.
Choornikkara Panchayat (included) Lies contiguous to KMC and forms part of
service area from Aluva Treatment Plant.
Keezhmadu Panchayat (included) Forms part of the existing service area from
Aluva Treatment Plant and lies adjacent to
Aluva Treatment Plant.
Figure 5.2: Water Supply Intake Point at Periyar
Kochi City Development Plan
49
The population of the Corporation area as per 2001 census is 596473. Over and above there
is a great inflow of floating population to the Kochi due to the commercial, industrial, social
& defence importance.
The filtered water supply system for Kochi city was first introduced in the year 1914 with the
development of Chowara water works on river Periyar. The supply to Kochi was augmented
in 1965 by constructing new water works of 48 mld capacity at Aluva (situated at about 20
Km . from the city) with Periyar river as source. In 1969 additional facilities for treatment of
72 mld was provided at Aluva.During 1993 a new treatment plant of 70 mld was added to
meet the requirement of 12 neighbouring panchayaths under World Bank assistance. Another
35mld treatment plant is also constructed recently as a part of the HUDCO project. Thus the
total installed capacity of Aluva head works is 225 mld. Meanwhile supply from Chowara is
diverted for rural water supply schemes in surrounding areas. Since Separate schemes were
envisaged for two Municipalities (Paravoor and Thrippunithura) and eleven Panchayaths,
(Kottuvally ,Ezhikkara, Chendamangalam, Vadakkekara, Chittattukara, Pallippuram,
Kuzhuppilly, Edavanakkad, Kizhakkambalam, Kunnathunadu, Vazhakkulam) the service
area from Aluva Head works is reduced to Kochi Corporation, two Municipalities and sixteen
Panchayaths. The estimated water demand of the above service area in the year 2005 is 360
mld where as the total supply is only 225 mld leaving a gap of 135 mld even at present. The
projected demand in 2036 AD is 610 mld considering the domestic, commercial & industrial
demands. Detailed proposals for meeting this demand – supply gap have been formulated.
5.1.10 Water Demand The total water consumption comprises, domestic and non-domestic consumption, including
water requirements for industrial, commercial and institutional uses, hospitals, hotels,
theaters, gardens etc. To this total consumption, unaccounted water, which includes
requirement for fire fighting and an appropriate allowance for leakage losses, is added to
calculate the filtered water demand. Water Treatment Plant (WTP) losses are further added to
obtain the total raw water demand. As per JNNURM guide lines the domestic demand is
taken as 150 lpcd which is in line with the CPHEEO norms for clearing water supply and
sewerage projects funded by Government of India. The non –domestic, and other Industrial
demand and provision for losses are also as per JNNURM guidelines. All major Institutions
existing and proposed in the project area are considered in arriving at the number of
consumers to be included under the scope of this project.
Table 5.3 Proposed Service Area and Water Demand
Projected Water Demand (MLD) Name Area in
Sq. Km. 2001 2006 2011 2021 2031 2036
Corporation 94.88 193 168 189 227 272 285
Municipalities 34.18 22 24 27 33 39 41
16 Panchayats 223.92 143 167 188 225 270 284
Total 352.98 372 360 403 485 581 610
The list of households in the constituent areas of the CDP with domestic water
connection is given below:
Tbale 5.4 List of House holds with domestic water connection (CDP Area)
Kochi City Development Plan
50
Sl.No Panchayats/ Municipalities
covered by existing water
supply scheme
No. of
house
hold
No. of
domestic
connections
No. of
Street
taps
Reason for the
gap
1 Kochi Municipal Corporation 145476 99092 6259 Shortage of
production
2 Kalamassery Municipality 14206 8681 526 -do-
3 Aluva Municipality 5333 5062 98 -do-
4 Tripunithura Municipality 13925 7819 467 -do-
5 Elankunnapuzha Panchayat 10828 1926 431 -do-
6 Njarakkal Panchayat 5276 943 211 -do-
7 Mulavukad Panchayat 4976 2670 225 -do-
8 Kadamakkudy Panchayat 3465 1275 190 -do-
9 Cheranallur Panchayat 5873 2987 363 -do-
10 Eloor Panchayat 8245 3032 258 -do-
11 Varapuzha Panchayat 5465 2460 278 -do-
12 Thrikkakkara Panchayat 14950 9592 584 -do-
13 Nayarambalam Panchayat 5112 799 194 -do-
14 Maradu Panchayat 9123 6793 349 -do-
15 Kumbalam Panchayat 6040 3009 268 -do-
16 Kumbalangi Panchayat 5699 - 247 -do-
17 Chellanam Panchayat 7423 2049 345 -do-
18 Edathala Panchayat 7634 1802 235 -do-
19 Choornikkara Panchayat 6153 3297 273 -do-
20 Keezhmadu Panchayat 6786 1316 399 -do-
At present cost recovery is estimated to be 50% and the O & M recovery is about 60%.
State Govt. subsidy and State Govt. grant for salaries make up the remaining cost.
All the house connections are metered (100% metered house connections)
Working status of meters – 60%
There is no household supply of water without metering
In the case of non-working meters tariff is fixed based on the Average consumption of 3
previous months. The households are directed to repair the meters and report.
Percentage of revenue loss due to the leakage and illegal connections – 30%
Periodical inspection by field officers and vigilance wing of KWA is conducted and
illegal connections, if any, will be disconnected and penal action taken in such cases.
However strengthening of the present system, energy audit studies and leak detection
studies are proposed as part of the Detailed Project.
Kochi City Development Plan
51
5.1.11 Project Proposal At present water demand of the above service area is met from river Periyar. In this project
Muvattupuzha River is considered as alternative source, and to reduce the project cost by
avoiding the long transmission lines to western part of the project area. 100mld Treatment
plant is proposed at Maradu, in Central Store compound, taking water from Muvattupuzha
river at Pazhur near Piravom,and a 285 mld plant at HMT compound at Kalamassery taking
water from Periyar River.
5.1.12 Components of the Project
5.1.12.1 Project in Muvattupuzha River
Source & Intake Works. The Intake work is proposed at Pazhoor, Kottarappattu Kadavu near
Piravom town, which is about 20km away from Kochi Corporation. The proposed intake
works should have a capacity of 102.5 Mld. 30 cents of land required for the construction of
new intakewell is to be acquired at Pazhoor Padathole Mana compound. Raw water is
initially pumped to a GL sump of capacity 43lakhs liters at Arakkunnam where sufficient
land is available. For this purpose 2500m2 land is to be acquired. Raw water pump sets of
capacity 600HP- 4nos (with one being stand bye). Transformer and connected electrical
works are proposed at intake works. The intake well has inside diameter of 12 m and a depth
15 m.
5.1.12.2 Raw Water Transmission
The required quantity of 102.5mld raw water is drawn from Muvattupuzha River at Pazhoor
Kadavu, Piravom Panchayath . An intake well cum pumping station is proposed at this point
in the land to be acquired. Raw water is pumped to the GL sump proposed to be constructed
at Arakkunnam about 4910m from the intake point from where it is transmitted to the TP at
Maradu by Gravity. Total length of raw water transmission main will be 20960 m. Most of
the proposed alignment passes through PWD, and panchayath roads. Land acquisition is
proposed for a length of 5162 m with a width of 5 m in dry land and in 6 m width in marshy
area for a length of 2818 m in the alignment. The alignment includes Railway line crossing,
river crossings, and irrigation canal crossings etc. Land can be purchased on negotiation since
no eviction of households or major structures come along the proposed alignment.
5.1.12.3 Treatment Plant:
The Treatment plant is proposed to be constructed at Nettoor (Maradu), where KWA is
having 22 Acres of land. The capacity of the proposed plant is 100 mld.
5.1.13.4 Transmission & Distribution System
Detailed survey has not been conducted for clear water transmission main. Hence
approximate distance & levels has been taken for design purpose. Clear water produced at
Nettoor TP site is proposed to be distributed mainly to. Kumbalam, Kumbalangy, Chellanam,
Willington Island, Western Kochi, Maradu and Thammanam sump.
5.1.12.5 Project in Periyar River
Intake Works. Intake works is proposed for the ultimate stage demand of 2041.The proposed
intake works should have a capacity of 300 Mld. Land required for the construction of new
intake well is available at Aluva Head Works compound.
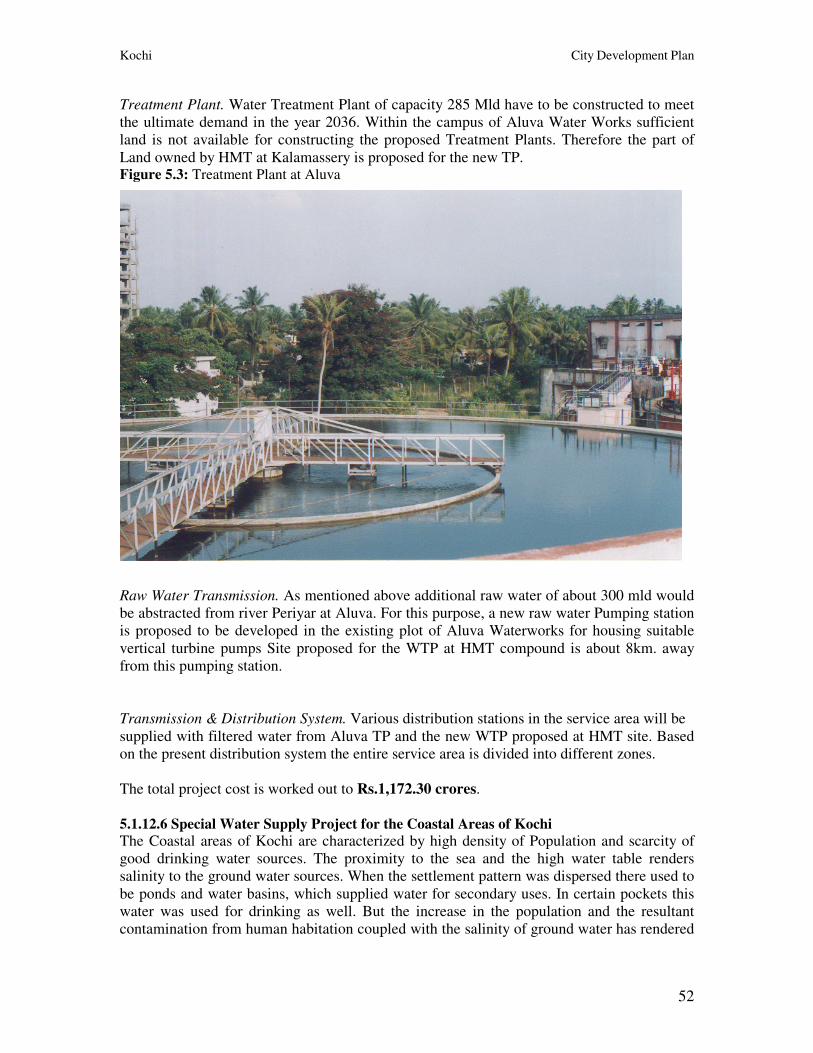
Kochi City Development Plan
52
Treatment Plant. Water Treatment Plant of capacity 285 Mld have to be constructed to meet
the ultimate demand in the year 2036. Within the campus of Aluva Water Works sufficient
land is not available for constructing the proposed Treatment Plants. Therefore the part of
Land owned by HMT at Kalamassery is proposed for the new TP. Figure 5.3: Treatment Plant at Aluva
Raw Water Transmission. As mentioned above additional raw water of about 300 mld would
be abstracted from river Periyar at Aluva. For this purpose, a new raw water Pumping station
is proposed to be developed in the existing plot of Aluva Waterworks for housing suitable
vertical turbine pumps Site proposed for the WTP at HMT compound is about 8km. away
from this pumping station.
Transmission & Distribution System. Various distribution stations in the service area will be
supplied with filtered water from Aluva TP and the new WTP proposed at HMT site. Based
on the present distribution system the entire service area is divided into different zones.
The total project cost is worked out to Rs.1,172.30 crores.
5.1.12.6 Special Water Supply Project for the Coastal Areas of Kochi
The Coastal areas of Kochi are characterized by high density of Population and scarcity of
good drinking water sources. The proximity to the sea and the high water table renders
salinity to the ground water sources. When the settlement pattern was dispersed there used to
be ponds and water basins, which supplied water for secondary uses. In certain pockets this
water was used for drinking as well. But the increase in the population and the resultant
contamination from human habitation coupled with the salinity of ground water has rendered
Kochi City Development Plan
53
this source unusefull for any purpose. Hence, the coastal people depend mainly on piped
water supply and water supply through barges and lorries.
As the coastal areas lie away from the water sources in Periyar, the supplied water does not
always reach these coastal areas. Hence, the supply is often limited to a few hours a day. One
can see long queues waiting for collection of water from the public taps located in this area.
The quality of water is also not good as it reaches the end point because of the infiltration of
dirt and contaminants through the worn-out pipe system.
The proposal put forth in the previous subsections is for supply of water through the pipe
system at 8 hours a day at 150 lpcd by 2011 and to achieve the final target of 24 hours a day
by 2021. At present there are areas in the coastal Panchayaths where supply of water is only
on alternate days and the supply is sometimes limited to half an hour a day. The coastal
people comprise of a major section of urban poor who do not have access to any other water
source. However, the recent survey conducted by Greater Kochi Development Authority has
shown that they are willing to pay a reasonable amount, if potable water is supplied to them
for the essential needs like drinking and cooking. This necessitates a supply of minimum 15
to 20 liters of water per family. The immediate solution is provision of Desalination Plants.
Advantages of Desalination Plants The plants can be erected with in a short span of time, say, 6 to 8 months;
As the sea/brackish water is treated there is no depletion of ground water sources;
Requires only minimum land area for setting up the plant and storage facility;
Can supply water of WHO standards;
Part of the production cost can be met by supply of water for commercial uses and the
local supply can be subsidized;
The cost per liter of water supplied will be less than the cost of supply through lorries or
tanks;
The innovative technologies developed elsewhere for treatment using Reverse Osmosis
Technology and energy recovery reduces the running cost of the plant; and
The product water supplied will be of bottled water quality.
Considering the above, it is proposed to set up desalination plants of specific capacities in the
coastal Panchayaths as detailed below. The price indicated is for modern reliable fully
automatic seawater plants with energy efficiency.
Estimated Production cost - Rs.0.05/ litre
Transportation cost - Rs.0.05/ litre (5 ps/ litre)
20 litres of water per family is considered to be the minimum requirement of drinking water
per day. For delivering at a distribution centre near the homes from where they have to
collect in their own containers, for 20 litres the cost comes to Rs.2/- If a portion of the water
is bottled and sold at Rs.20 per 20 litre instead of the market rate of Rs.40 per 20 litre/ can,
the water can be given to the local families at a subsidized rate of say Rs.1.50 per family per
day @ 20 litre /day
The complete solution to the water problem can be achieved by an Integrated Drinking Water
Management Scheme, which includes rainwater harvesting, conservation of ponds and tanks,
Kochi City Development Plan
54
desalination of seawater and the normal supply through water supply lines. The cost for
rainwater harvesting and for conservation of tanks and ponds is included in the sector on
environment.
5.1.13 Rain Water Harvesting Water scarcity is the most important problem of our country. “Drought – 2004” forcefully
brought out the need to have a holistic and continuous approach towards extraction, use,
conservation and management of water resources in Kerala. Although we have in Kerala
about 3,000mm rainfall, 250 openwells/Km2, 44 rivers and so much lakes and thodus we are
experiencing the above mentioned crisis. So a well-planned water management is needed to
overcome it. Kerala Rural Water Supply & Sanitation Agency put forward several small and
isolated initiatives in water management, which relates to harvesting and using rainwater at
the household and micro community level.
The various causes that lead to ground water depletion and water scarcity are:
1. The undulated topography sloping towards sea that the rainwater has high tendency to flow
towards sea;
2. Forest destruction, which leads to increased velocity of flow of rainwater;
3. Excessive consumption of water;
4. Use of pumping system;
5. Increased water pollution;
6. Removal of sand from river beds; and
7. Reclamation of water basins.
On the other side the good rainfall will make available good amount of water if harvested
properly. The following table gives this picture.
Table 5.5: Availability of Rainwater in Kerala
Season Availability of
rain water %
Quantity
1 Year (12 months)
Monsoon
Thulavarsham
Summer
100
60
25
15
3000 mm
1800mm
750mm
450mm
The table reveals the abundance of rainwater and effective rainwater harvesting could solve
the water availability problem to a great extent.
Considering that the area gets about 3metres of rain annually the Government have initiated
measures to ensure maximum harvesting of the rain. Further public tanks and ponds are also
proposed to be renovated to hold the maximum rainwater during the season. The local
governments are taking initiative in this regard. Rainwater harvesting has been made
mandatory in new constructions with effect from 1999, as this has been included as part of
Kerala Municipal Building rules 1999. Rainwater harvesting and storage mechanism is also
to be constructed along with the buildings. This is strictly being followed for all residential
building constructions of area more than 150 sq.m. Monitoring authority of the above project
is the local bodies. In addition awareness campaigns are being held all over Kerala by
Government and at the initiative of certain media / N.G.O group.
Kochi City Development Plan
55
Usual methods for rain water harvesting: 1. Ground water Recharge;
2. Roof water harvesting; and
3. Judicious management of available water resources.
Groundwater recharge can be achieved in many ways such as contour bunds, bench terracing,
stone pitched bunds, check dams etc. Roof water harvesting which has great importance in
urban areas. Judicious management of water is an important remedial measure, which can be
achieved by the awareness given to the people.
Roof water harvesting Methods
• Recharge pit. Roof water after collection directly enters into the ground through a
filter media consisting of aggregates of different grades. This helps to penetrate
the rainwater though soil there by raising the level of ground water table. The size
of the pit provided is 1mx1mx2m.
• Roof water collection through storage tanks. Water from roof is collected in tanks
of different capacities after passing through a filter and the surplus water is
directed to go into the nearby well or soil to raise the ground water table.
The tanks will be in different capacities such as 10000L, 15000L, 25000L, 1 lakh etc. Up to
10000L we can use ferrocement technology, which is cheaper. The size of tank depends upon
the storage duration i.e., weather, it is only for summer season or for the full year. The roof
may be made of GI sheet, Asbestos sheet, Tiles or Concrete. The storage tank normally
consists of (i) Roof; (ii) Drain pipe to collect water from roof; (iii) Roof washer to wash out
the roof; (iv) Filter; (v) tank to collect water; and (vi) tap to take water from tank.
Table 5.6: Cost Analysis
No
Roof Water Harvesting Unit
Cost
1
2
a)
b)
c)
Recharge Pit
Storage Tanks
Ferrocement tanks (upto 250000 L) below G L
Ferrocement tanks (upto 250000 L) above G L
Concreate Tanks
Rs. 4500/each
Rs. 2.00/ litre
Rs. 2.40/ litre
Rs. 6.00/ litre
Special Water Supply Scheme Proposed by Eloor Panchayat. Eloor Panchayat is surrounded
by water body – a branch of Periyar river, which is perennial source of water. The Panchayat
area is a predominantly industrial area where major industries such as FACT, TCC, HIL etc
are located. Considering the huge demand for water for these industries and for the local
population a separate project is proposed by the Panchayat. The raw water source is readily
available and land required for setting up the treatment plant is also available. The project
comprises of taking 25 mld of water and treating it to drinking water standard by setting up
the treatment plant. Laying of distribution lines to the two adjacent panchayats of
Kadamakudy and Cheranallur is also envisaged in addition to the supply to Eloor. This
facility can also cater to the demand for water by the ships visiting the ICTT at Vallarpadam.
Cost is estimated to be 10.30 crores and the O&M cost is proposed to be met by the
Panchayat directly as the operation is proposed to be handled directly by Eloor Panchayat.
Kochi City Development Plan
56
Special Water supply Scheme for Kalamassery. Kalamassery Municipality falls mainly in the
midland zone and the ground water sources are comparatively good in quality. However a
number of wells, ponds and water basins are neglected with the result that the people depend
mainly on piped water supplied by KWA. As the supply is intermittent and as the quantity is
not sufficient people now depend on water supplied by the tanker lorries by private
companies. The Municipality thus proposes the following scheme as additional water supply
scheme over and above the general scheme proposed by KWA. This project is proposed to
be run by Self Help Groups.
Estimated cost. Improvement of ponds, construction of wells, overhead tanks and purchase of
tanker lorries is estimated to be Rs.0.90crores.
Conclusion. Under this sector the major proposal is to provide piped water supply to all
families throughout the day. However the lack of pressure at the tail end prevents continuous
supply of water. Supply to certain areas will have to be interrupted to give water to certain
other areas and hence supply has to be limited to 8 hours a day until the entire project is
completed. Till then the target is supply at 150 lpcd for at least 8 hours a day (by 2011) with
the intention to raise the supply to 24 x 7 by 2021. The proposal is to tap the source from
Muvattupuzha river also & to construct treatment plants in HMT land & also at Maradu. The
project includes construction of intake arrangements, laying of distribution network,
rehabilitation of existing lines & modernization of the system. Total cost for this is worked
out as 1172.30 crores.
Special water supply scheme for Eloor and Kalamasssery are also proposed by the ULBs
themselves by tapping the Periyar branch river source.
For the coastal panchayats, Desalination plants are proposed for urgently meeting the demand
for getting at least minimum drinking water considering the acute shortage in these areas.
Another component under this sector is encouraging rainwater harvesting by making it
statutory and providing recharge pits and rainwater storage tanks.
The total project cost for the 4 components in the water supply sector is estimated to be
Rs.1,216.70 crores.
For effective implementation and monitoring of the different components in this sector
setting up of a Metro Water Authority is recommended.
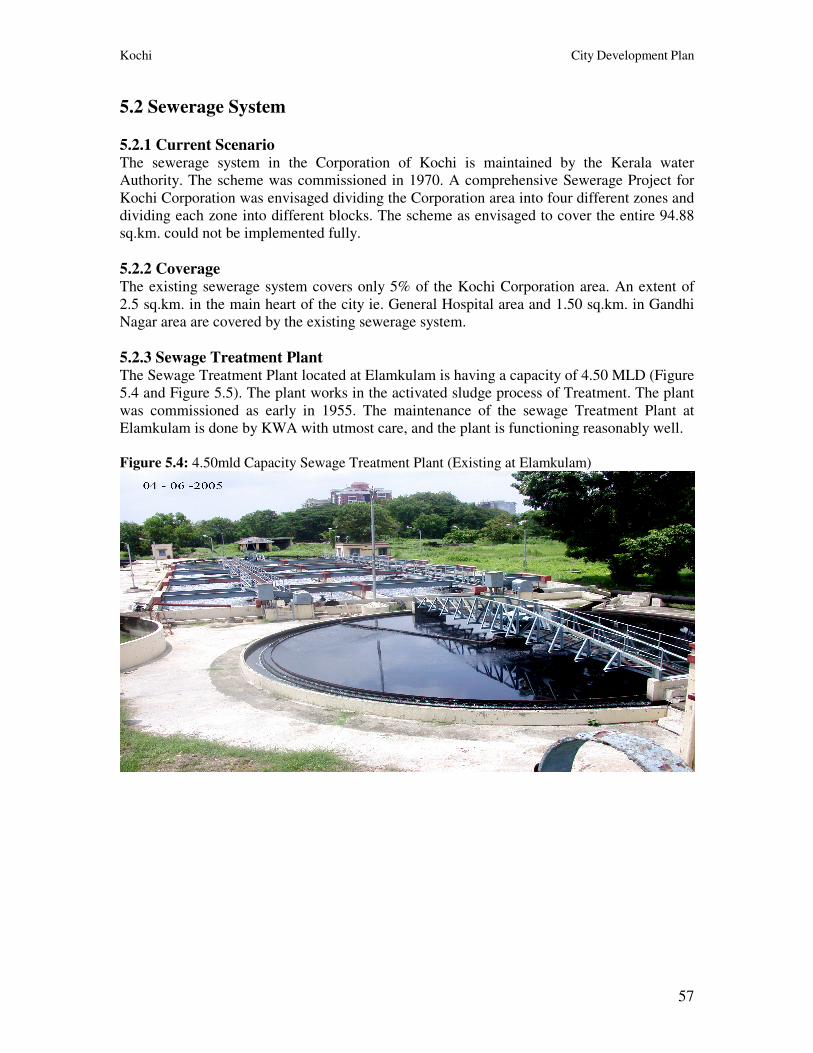
Kochi City Development Plan
57
5.2 Sewerage System
5.2.1 Current Scenario The sewerage system in the Corporation of Kochi is maintained by the Kerala water
Authority. The scheme was commissioned in 1970. A comprehensive Sewerage Project for
Kochi Corporation was envisaged dividing the Corporation area into four different zones and
dividing each zone into different blocks. The scheme as envisaged to cover the entire 94.88
sq.km. could not be implemented fully.
5.2.2 Coverage The existing sewerage system covers only 5% of the Kochi Corporation area. An extent of
2.5 sq.km. in the main heart of the city ie. General Hospital area and 1.50 sq.km. in Gandhi
Nagar area are covered by the existing sewerage system.
5.2.3 Sewage Treatment Plant The Sewage Treatment Plant located at Elamkulam is having a capacity of 4.50 MLD (Figure
5.4 and Figure 5.5). The plant works in the activated sludge process of Treatment. The plant
was commissioned as early in 1955. The maintenance of the sewage Treatment Plant at
Elamkulam is done by KWA with utmost care, and the plant is functioning reasonably well.
Figure 5.4: 4.50mld Capacity Sewage Treatment Plant (Existing at Elamkulam)
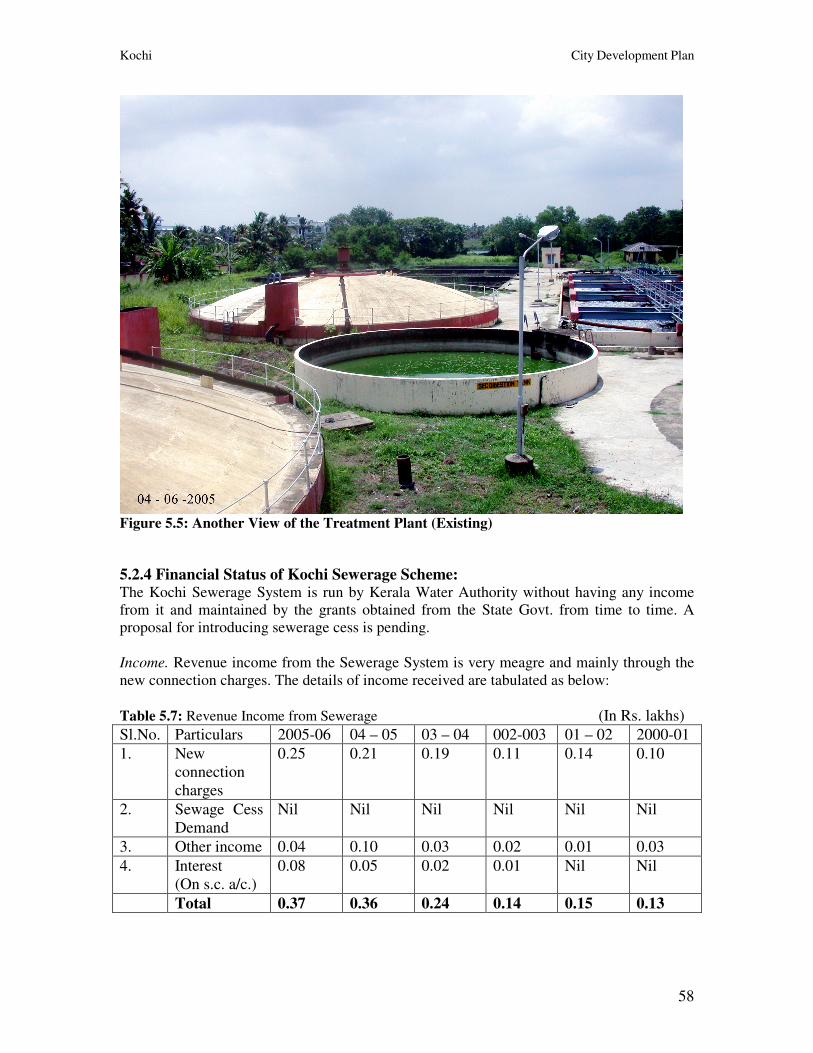
Kochi City Development Plan
58
Figure 5.5: Another View of the Treatment Plant (Existing)
5.2.4 Financial Status of Kochi Sewerage Scheme: The Kochi Sewerage System is run by Kerala Water Authority without having any income
from it and maintained by the grants obtained from the State Govt. from time to time. A
proposal for introducing sewerage cess is pending.
Income. Revenue income from the Sewerage System is very meagre and mainly through the
new connection charges. The details of income received are tabulated as below:
Table 5.7: Revenue Income from Sewerage (In Rs. lakhs)
Sl.No. Particulars 2005-06 04 – 05 03 – 04 002-003 01 – 02 2000-01
1. New
connection
charges
0.25 0.21 0.19 0.11 0.14 0.10
2. Sewage Cess
Demand
Nil Nil Nil Nil Nil Nil
3. Other income 0.04 0.10 0.03 0.02 0.01 0.03
4. Interest
(On s.c. a/c.)
0.08 0.05 0.02 0.01 Nil Nil
Total 0.37 0.36 0.24 0.14 0.15 0.13
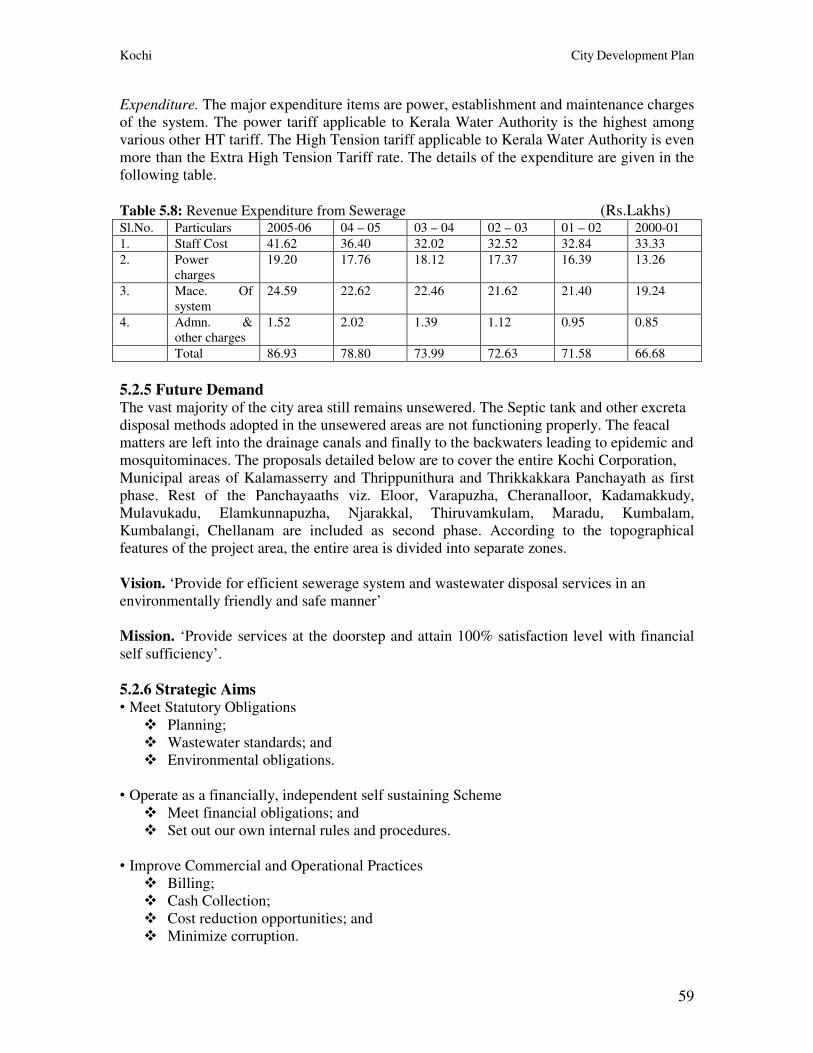
Kochi City Development Plan
59
Expenditure. The major expenditure items are power, establishment and maintenance charges
of the system. The power tariff applicable to Kerala Water Authority is the highest among
various other HT tariff. The High Tension tariff applicable to Kerala Water Authority is even
more than the Extra High Tension Tariff rate. The details of the expenditure are given in the
following table.
Table 5.8: Revenue Expenditure from Sewerage (Rs.Lakhs) Sl.No. Particulars 2005-06 04 – 05 03 – 04 02 – 03 01 – 02 2000-01
1. Staff Cost 41.62 36.40 32.02 32.52 32.84 33.33
2. Power
charges
19.20 17.76 18.12 17.37 16.39 13.26
3. Mace. Of
system
24.59 22.62 22.46 21.62 21.40 19.24
4. Admn. &
other charges
1.52 2.02 1.39 1.12 0.95 0.85
Total 86.93 78.80 73.99 72.63 71.58 66.68
5.2.5 Future Demand The vast majority of the city area still remains unsewered. The Septic tank and other excreta
disposal methods adopted in the unsewered areas are not functioning properly. The feacal
matters are left into the drainage canals and finally to the backwaters leading to epidemic and
mosquitominaces. The proposals detailed below are to cover the entire Kochi Corporation,
Municipal areas of Kalamasserry and Thrippunithura and Thrikkakkara Panchayath as first
phase. Rest of the Panchayaaths viz. Eloor, Varapuzha, Cheranalloor, Kadamakkudy,
Mulavukadu, Elamkunnapuzha, Njarakkal, Thiruvamkulam, Maradu, Kumbalam,
Kumbalangi, Chellanam are included as second phase. According to the topographical
features of the project area, the entire area is divided into separate zones.
Vision. ‘Provide for efficient sewerage system and wastewater disposal services in an
environmentally friendly and safe manner’
Mission. ‘Provide services at the doorstep and attain 100% satisfaction level with financial
self sufficiency’.
5.2.6 Strategic Aims • Meet Statutory Obligations
� Planning;
� Wastewater standards; and
� Environmental obligations.
• Operate as a financially, independent self sustaining Scheme
� Meet financial obligations; and
� Set out our own internal rules and procedures.
• Improve Commercial and Operational Practices
� Billing;
� Cash Collection;
� Cost reduction opportunities; and
� Minimize corruption.
Kochi City Development Plan
60
• Focus on Customer Services
� Customer-centred Organisation; and
� Improve public relations – community, image, consultation with other stakeholders
and media.
• Restructure KWA in line with Mission guidelines for operation and maintenance of
the system.
• Capacity building of the staff.
� Link organizational needs and performance targets.
• Plan, invest in and maintain Assets
� Create a full inventory of assets along with condition. A condition register for
continuous monitoring;
� Minimize cost overruns;
� Deliver investment projects on time and to budget; and
� Ensure proper project planning, monitoring and evaluation.
• Operate all our assets efficiently
� Process optimization;
� Introduction of new technology;
� Planned/preventative maintenance; and
� Supply chain management.
• Making full use of IT and IS for effective management
5.2.7 Objective and Goal The area coming under CDP for Water Supply and individual water connection to all with in
the project period.
Where as Sewerage System will be provided for 100% area in Kochi Corporation,
Kalamasserry Municipality, Thrippunithara Municipality and Thrikkakara Panchayath in the
first phase. All other Panchayaths will be covered under sewerage network as per site
condition in the second phase. In panchayaths, since the density of population is low when
compared to Corporation area, the sewer network system is not feasible or viable for 100 %
coverage. Instead, after site investigation suitable systems will be identified, either
conventional treatment system with sewerage system or low cost sanitation facilities as per
norms.
Project Description Phase 1 1. Kochi Corporation. The Kochi Corporation is divided into four zones, for implementing
the scheme and separate treatment systems are recommended for each zones to avoid
distant transportation of sewage. The different zones comprises:
(i) Ernakulam North. Includes Edappally - Vennala (part);
(ii) Erankulam South zone. Includes Vennala (part) and Vyttila;
(iii) Mattancherry, Fort Kochi. Includes Fort Kochi and Palluruthy zone, Mattancherry
Kochi City Development Plan
61
and Palluruthy area; and
(iv) Wellington Island. The total population under Kochi Corporation area worked out
to1,143,224 as on 2036. The demand calculation is based on this. All other factors
such as ground water infiltration peak factor, design period etc. are as per
CPHEEO manual and as per the guidelines of the JNNURM. The total cost of the
sewerage projects for Kochi Corporation is estimated to be Rs.1,565 crores.
2. Kalamasserry and Thrippunithura Municipalities. Kalamasserry Municipality comprises
a total population of 63176 as per 2001census.The projected population as on 2036 is
121086 and sewerage capacity is 18mld.The rough cost estimate for implementing
sewerage net work for 100% Municipal area based on the design population is worked out
to Rs.174 crores.
Thrippunithura Municipality comprises a total population of 59884 as per 2001 censes.
The projected population as on 2036 is 114776 and the sewerage capacity is 17 mld. The
rough cost estimate for implementing sewerage net work for 100% Municipal area based
on the design population is worked out to Rs.173 crores.
3. Thrikkakara Panchayath. Thrikkakara Panchayath which is the Administrative Centre of
Ernakulam District comprises a total population of 65984 as per 2001 censes. The
projected population as on 2036 is 126468 and the sewerage capacity is 19 mld. The
rough cost estimate for implementing sewerage system for 100% area based on the design
population is worked out to Rs.152 crores.
The cost of the Ist Phase of the total Sewerage Project works out to Rs.2064 Crores.
The user charges or sewerage cess is fixed at 60% of monthly water charges as user fee
and one time deposit of Rs.10000/-. Necessary reforms in this regard will be made by
suitably amending the Act. Since local bodies are also aware and keen on this the
introduction of water cess for sewerage can be implemented without any difficulties.
The access or connection cost for sewerage per house is fixed as Rs.2500/ connection.
Kochi Corporation, Thripunithura, Kalamassery and Aluva Municipalities are included in
the Sewerage Scheme Under JNNURM as the 1st phase. Schemes for other areas included
in CDP are to be worked out after detailed study.
Phase II For the adjoining panchayats coming under the CDP, proposals as mentioned in para above,
are to be investigated in details, and the technical feasibility is to be ascertained, for covering
the sewerage network. As the areas coming under these panchayats are highly undulated,
technical and financial viability for implementing 100% sewer network is to be studied in
detail. If not feasible, proposals such as low cost sanitation can be recommended in such
areas where sewerage network is not recommendable.
The total project cost is worked out as Rs.2,629 Crores.
The ULB wise estimate of population to be served and cost of improvements is given in the
Table 5.6.
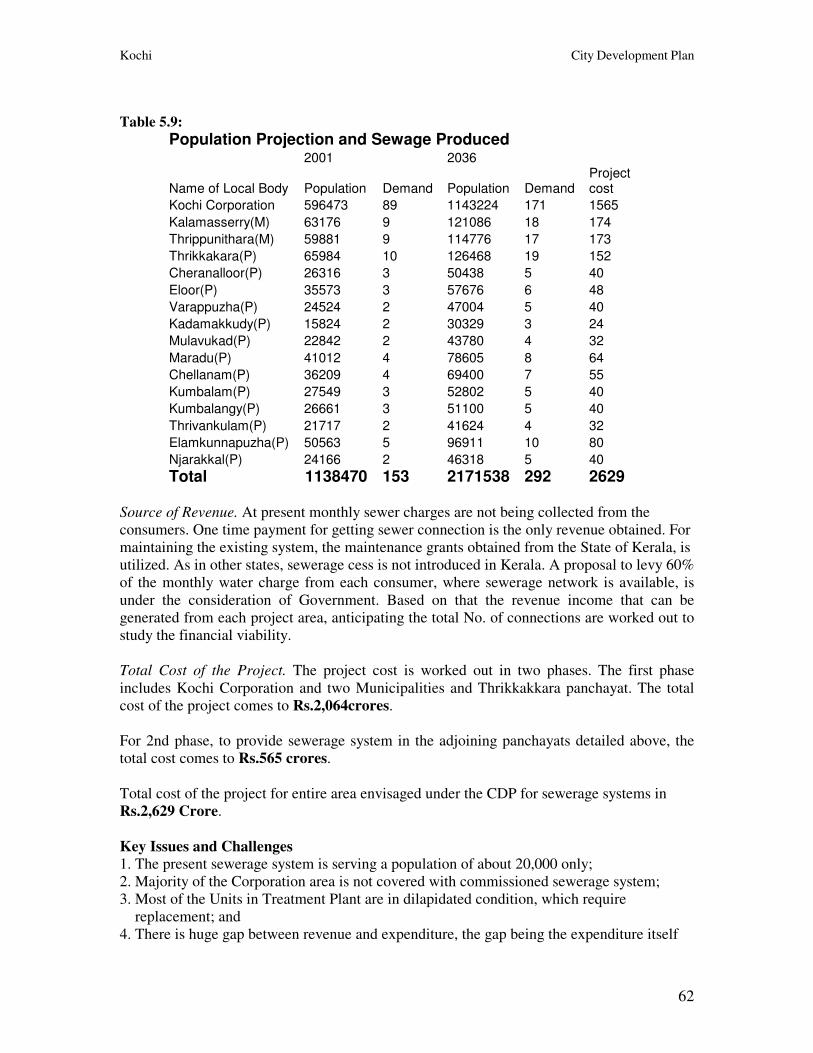
Kochi City Development Plan
62
Table 5.9:
Population Projection and Sewage Produced 2001 2036
Name of Local Body Population Demand Population Demand Project cost
Kochi Corporation 596473 89 1143224 171 1565
Kalamasserry(M) 63176 9 121086 18 174
Thrippunithara(M) 59881 9 114776 17 173
Thrikkakara(P) 65984 10 126468 19 152
Cheranalloor(P) 26316 3 50438 5 40
Eloor(P) 35573 3 57676 6 48
Varappuzha(P) 24524 2 47004 5 40
Kadamakkudy(P) 15824 2 30329 3 24
Mulavukad(P) 22842 2 43780 4 32
Maradu(P) 41012 4 78605 8 64
Chellanam(P) 36209 4 69400 7 55
Kumbalam(P) 27549 3 52802 5 40
Kumbalangy(P) 26661 3 51100 5 40
Thrivankulam(P) 21717 2 41624 4 32
Elamkunnapuzha(P) 50563 5 96911 10 80
Njarakkal(P) 24166 2 46318 5 40
Total 1138470 153 2171538 292 2629
Source of Revenue. At present monthly sewer charges are not being collected from the
consumers. One time payment for getting sewer connection is the only revenue obtained. For
maintaining the existing system, the maintenance grants obtained from the State of Kerala, is
utilized. As in other states, sewerage cess is not introduced in Kerala. A proposal to levy 60%
of the monthly water charge from each consumer, where sewerage network is available, is
under the consideration of Government. Based on that the revenue income that can be
generated from each project area, anticipating the total No. of connections are worked out to
study the financial viability.
Total Cost of the Project. The project cost is worked out in two phases. The first phase
includes Kochi Corporation and two Municipalities and Thrikkakkara panchayat. The total
cost of the project comes to Rs.2,064crores.
For 2nd phase, to provide sewerage system in the adjoining panchayats detailed above, the
total cost comes to Rs.565 crores.
Total cost of the project for entire area envisaged under the CDP for sewerage systems in
Rs.2,629 Crore.
Key Issues and Challenges 1. The present sewerage system is serving a population of about 20,000 only;
2. Majority of the Corporation area is not covered with commissioned sewerage system;
3. Most of the Units in Treatment Plant are in dilapidated condition, which require
replacement; and
4. There is huge gap between revenue and expenditure, the gap being the expenditure itself
Kochi City Development Plan
63
since practically nil revenue is obtained.
Conclusion. The 1st phase is to cover Corporation, 2 Municipalities and Thrikkakara
Panchayat. Here conventional sewerage system is proposed. In other rural areas appropriate
sewage disposal scheme is to be adopted. The total cost for 1st phase is 2064 crores & for the
2nd phase is 565 crores. The project proposal includes restructuring KWA in line with the
Mission guidelines. The flat terrain, barriers to drainage by the existing railway lines, low
level bridges & lack of co ordination are the key issues in the sector.
Kochi City Development Plan
64
5.3 Storm Water Drainage
5.3.1 Introduction Kochi city is the largest urban agglomeration in Kerala situated in the coastal plains with
extensive backwater system and tidal canals. Kochi CDP area consists of:
i. Highly urbanized Kochi corporation area;
ii. Two less urbanized municipalities; and
iii. 13 adjoining panchayaths.
The topography of Kochi is almost flat. The average altitude towards the eastern fringes is
about 7.5 m above M.S.L but towards west most part of the city is only about 1.00 m above
M.S.L. Kochi is characterized by sand bars running in north – south direction with tidal
canals in between. In the absence of sufficient wide drains and also because of the general
flatness of the terrain, the city is facing acute drainage problems. Several preliminary studies
were conducted regarding the drainage of the city, which clearly proved the inadequacy of
the primary, secondary and tertiary drains either because of the size, design or maintenance
level.
5.3.2 Climate, Rainfall, Run Off The city area falls with in the tropical climate. The average annual rainfall in the region is
about 3,099 mm. The southwest monsoon yields more than 60% of the total precipitation and
that of the north –east monsoon is about 25% of the total rainfall. According to hydrological
records maximum recorded high tide level for rainy months of mid May to mid November
works out as +0.44 m and maximum recorded low tide level is 0.155 m relative to MSL.
The recent study of the run off of the catchment and discharge efficiency of the drains in the
Kathrikadavu - Pullepady area (CBD) in Kochi Corporation, it was seen that, the average
efficiency of the drain is only 43.31%. Out of the 34 catchment areas studied, 12 have less
than 25% efficiency and only one has 100% efficiency among the secondary, tertiary drains.
The hydrological characteristics of the region make surface water drainage, an important
element of urban renewal efforts.
5.3.3 Present Scenario The present drainage system depends on canals as primary drainage source, secondary drains
which discharge to primary canals or backwaters, the drain along road sides are the area
drains with or without covering slabs. The drainage network is not based on a drainage study
/plan, but done in an ad hoc and piece-meal manner. The drains are built arbitrarily without
calculating run off. The area drains and drains from premises do not have silt pits to intercept
silt and solids. They discharge directly into road side area drains these drains are silted to
very high degree and clogged due to solid waste especially plastics. The photographs below
are examples of present scenario of drainage system in Kochi.
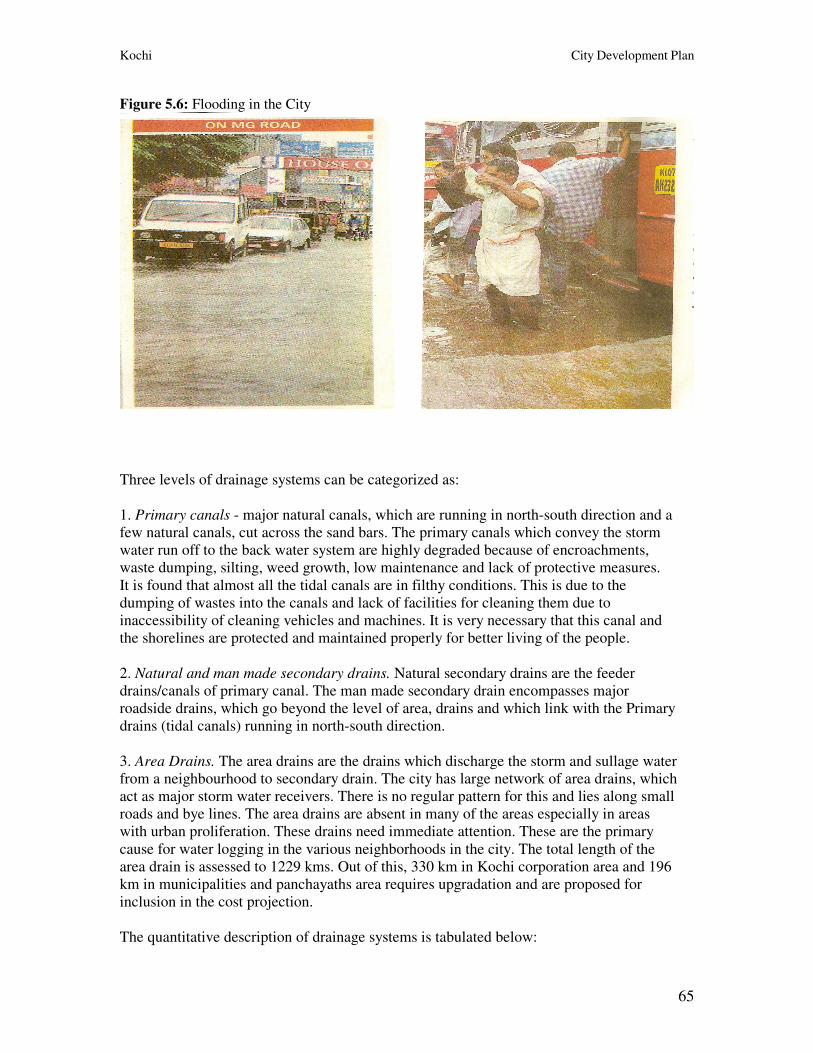
Kochi City Development Plan
65
Figure 5.6: Flooding in the City
Three levels of drainage systems can be categorized as:
1. Primary canals - major natural canals, which are running in north-south direction and a
few natural canals, cut across the sand bars. The primary canals which convey the storm
water run off to the back water system are highly degraded because of encroachments,
waste dumping, silting, weed growth, low maintenance and lack of protective measures.
It is found that almost all the tidal canals are in filthy conditions. This is due to the
dumping of wastes into the canals and lack of facilities for cleaning them due to
inaccessibility of cleaning vehicles and machines. It is very necessary that this canal and
the shorelines are protected and maintained properly for better living of the people.
2. Natural and man made secondary drains. Natural secondary drains are the feeder
drains/canals of primary canal. The man made secondary drain encompasses major
roadside drains, which go beyond the level of area, drains and which link with the Primary
drains (tidal canals) running in north-south direction.
3. Area Drains. The area drains are the drains which discharge the storm and sullage water
from a neighbourhood to secondary drain. The city has large network of area drains, which
act as major storm water receivers. There is no regular pattern for this and lies along small
roads and bye lines. The area drains are absent in many of the areas especially in areas
with urban proliferation. These drains need immediate attention. These are the primary
cause for water logging in the various neighborhoods in the city. The total length of the
area drain is assessed to 1229 kms. Out of this, 330 km in Kochi corporation area and 196
km in municipalities and panchayaths area requires upgradation and are proposed for
inclusion in the cost projection.
The quantitative description of drainage systems is tabulated below:
Kochi City Development Plan
66
Table 5.10: Canals in Kochi City Quantity (KM)
Sl.No Description of item Kochi
Corporation
Municipality &
Panchayat
1 Total length of the primary
canal 77 254
2
Total length of the natural
and man made secondary
drains
222 198
3 Total length of area drains 740 489 Source: Irrigation Division, Ernakulam, CoC, municipalities, Panchayaths.
The city is facing severe water logging problems. A number of places in the city suffer from
water logging and flooding due to heavy rainfall in the monsoon. During the period of water
logging, normal life and traffic movements of the city gets disrupted. Water logging in some
roads persists for few hours whereas flooding in certain lowlands continues for a few days.
The main reasons for flooding in the city are:
1. Flat topography of the area;
2. Clayey nature of the subsoil in most of the area, which prevent water percolation;
3. Lack of adequate slope of the drains and subsidence of the drains;
4. Tidal effect. If the rain occurs during high tide time intruding tidal waters prevents the
exits of storm water to the main canals;
5. Decreased carrying capacity of the drains due to the heavy silt deposition, discharge of
solid waste in the canals and growth of vegetation;
6. Reduction of canal width due to encroachment;
7. Inadequate vent way of the existing bridges and culverts;
8. Poor condition of the existing canals resulting in over flow and flooding in adjoining area;
9. Missing links in the existing network;
10. Obstruction due to the utility lines, such as water mains, power and communication
network cables etc crossing the canals and drains;
11. Lack of awareness among the people in maintaining public drains and canals;
12. Tendency of converting canals and water bodies to provide roads. etc;
13. Meandering of the primary canals which slow down the flow;
14. Irregular and inadequate maintenance of drains/canals; and
15. Inadequacy of existing cross drainage facilities;
5.3.4 Operation and Maintenance The existing city drainage system lacks proper maintenance. Concerned local bodies, State
Irrigation Dept.; National Highway; Southern Railways; State, P.W.D; Panchayats; and
municipality in the agglomeration area are jointly responsible for operation and maintenance
of the existing drainage system in the city. Better co-ordination among these agencies is
essential for maintenance of the over all drainage system. Kochi corporation takes up pre-
monsoon removal of water hyacinth, de-silting of major canals and secondary drains during
April / May by manual cleaning. The area drains are cleared engaging sanitary workers.
Kochi City Development Plan
67
5.3.5 Issues and Key Challenges Analysis from the drainage sector reveals that 60% of the Kochi city area lacks proper
drainage system. The existing network is inefficient, inadequate and majority of the drains
are in filthy conditions. A number of identified areas in the city are frequently flooding
during even moderate rains. The drainage systems empty their water and waste loads into
water bodies and backwaters through the fairly flat terrain subjected to tidal effects.
Key challenges taken into consideration are: i. Flatness of the terrain;
ii. High rainfall;
iii. Tidal effect;
iv. Non co-ordination of respective departments;
v. Absence of Comprehensive Planning;
vi. Absence of proper Solid waste management; and
vii. Inadequate capacity of Cross Drainage works especially across the N-S running
Railway lines.
Vision. A Clean and flood free city space with proper drainage system.
5.3.6 Strategies and Action Plan Strategies and action plans in this proposal are framed for achieving the above vision.
Probable solutions for improving primary canals.
• To be made free from siltation, encroachments, deepened, widened and side protected;
• Side roads and access facilities to be provided for maintenance, especially for using vehicle
and equipments;
• As the north-south running canals cannot be effective in draining off storm water rapidly,
providing intermediate outlets towards back waters are essential. These connections have to
be towards west in Ernakulam area, towards east in mattanchery area, fort Kochi area and to
east/west in Palluruthy area. The purpose of these is to provide multiple overflow outlets to
back waters, which will considerably reduce the storm water build up in lengthy N-S canals;
and
• Multiple over flow outlets. The main drains in Kochi are very long becoming deeper at out
fall end, out fall end may even be much lower than the high tide level. Due to increased time
of concentration, the drains get overloaded and overflow. This can be eliminated by
multiple outlets at different points.
Diversion of run off • Run off need to be diverted partly to relieve the pressure on existing drain; and
• Diversion of run off is also partially possible by interconnecting canals.
Improving existing canals • Improving the carrying capacity of existing drains by widening & increasing slope. Many
secondary drains need improvement.
Improving Cross Drainage Works • There are a number of cases where present cross drainage works are inadequate.
Kochi City Development Plan
68
Regulatory Pumping Systems • Provision of pumping facility may have to be resorted at certain problem areas where
natural flow alone cannot create rapid discharge. Pumps are more effective at drain mouths
discharging to back waters. Such pumping system can be used to pump water in during
summer to destroy mosquito larvae and to flush canals.
Providing Silt Pits • Escape of silt and solid waste can be prevented, stagnation can be brought down
considerably. Provisions of silt pits at all discharge end of tertiary, secondary drains to be
considered.
Controlling Land Development • Regulations to control land development is not being insisted properly.
• Formation levels of each Zone/sub zones to be fixed and land development to be regulated
to ensure positive area drainage.
• The backwater reclamation to be controlled.
Sewerage System • Drainage carrying sullage and effluent combined together can cause severe health and
environmental problems.80% of the septic tanks directly discharges the effluents by
overflow to open drainage due to high water table, low permeability of soil. Segregating
sullage and effluents from open drains by sewerage system has to be accorded priority.
Upgrading Solid Waste Management • Large quantity of solid waste contaminates and stagnates the drains now. Hence a system
for proper collection & management of solid waste has to be developed.
Eviction and Rehabilitation of Encroachment • The canal is encroached in a number of places along its stretch. Removal of encroachments
and providing resettlement / rehabilitation as required, to maintain the canal width.
In areas where there are no man made secondary drains of sufficient capacity, new drains are
to be provided. This is particularly so in the central area of Kochi corporation. A detailed
study of individual catchment area of secondary drains is required.
In the context of interlinking of the drainage network certain existing cross drainage facilities
will require to be modified. These works are in the jurisdiction of various central / state
agencies such as railways, National Highways etc. The modifications are generally
undertaken by the concerned agencies on deposit basis. A provision is made in the project
towards this expense.
Man made secondary drains and area drains need to be covered with slabs and the provisions
of manhole to facilitate the cleaning/ maintenance. About 587 km of drains in the city are
required to be covered.
5.3.7 Approach to Up-grading Drainage System Stage - I Preparation of Master Plan -Detailed study of the existing city drainage system and
preparation of drainage master plan for upgrading .The sub components of the study will be:
Kochi City Development Plan
69
• Preparation of base map of the city for drainage with contours; and
• Identification of missing links and prioritization of drain works.
Stage - II Preparation of Feasibility Report
• Review available data, maps and reports;
• Mark the drainage zones based on reports and study;
• Locate the problem areas;
• Prepare preliminary engineering proposals; and
• Prepare financial analysis based on implementation schedule.
Stage - III Detailed Engineering Studies
• Protection of both sides and provisions for desiltation before seasons;
• Construction and reconstruction of culverts; and
• Provision for fencing at identified canal-dumping area as case study.
5.3.8 Major canals requiring priority attention
5.3.8.1 Primary Canals
• Thevara-Perandoor canal and its major branches;
• Edappally thodu and its major branches;
• Rameswaram – Kalvathy canal;
• Chilavanoor puzha;
• Champakara canal;
• Changadam poku thodu;
• Karanakodam thodu;
• Ponnethuchal thodu;
• Koyithara canal;
• Railnagar thodu;
• Punchathodu;
• Valavikadavu thodu;
• Pallichal thodu;
• Pandarachal;
• Pushnithodu;
• Chitrapuzha; and
• Konothu puzha etc;
5.3.8.2 Natural Secondary Canals
• Kari thodu;
• Adimuri thodu;
• Karuveli thodu;
• Athirthi thodu;
• Thodu along Major road;
• Kathmbayil thodu;
• Mullassery canal;
• Market canal; and
• Seena thodu etc.
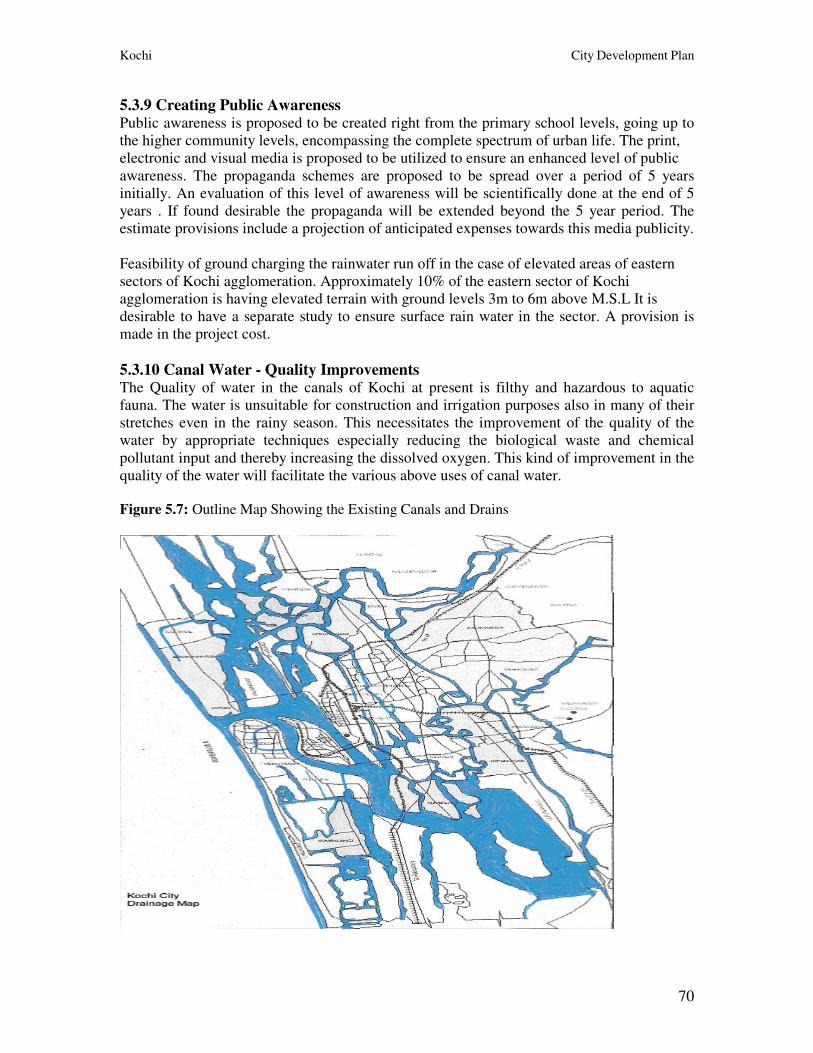
Kochi City Development Plan
70
5.3.9 Creating Public Awareness Public awareness is proposed to be created right from the primary school levels, going up to
the higher community levels, encompassing the complete spectrum of urban life. The print,
electronic and visual media is proposed to be utilized to ensure an enhanced level of public
awareness. The propaganda schemes are proposed to be spread over a period of 5 years
initially. An evaluation of this level of awareness will be scientifically done at the end of 5
years . If found desirable the propaganda will be extended beyond the 5 year period. The
estimate provisions include a projection of anticipated expenses towards this media publicity.
Feasibility of ground charging the rainwater run off in the case of elevated areas of eastern
sectors of Kochi agglomeration. Approximately 10% of the eastern sector of Kochi
agglomeration is having elevated terrain with ground levels 3m to 6m above M.S.L It is
desirable to have a separate study to ensure surface rain water in the sector. A provision is
made in the project cost.
5.3.10 Canal Water - Quality Improvements The Quality of water in the canals of Kochi at present is filthy and hazardous to aquatic
fauna. The water is unsuitable for construction and irrigation purposes also in many of their
stretches even in the rainy season. This necessitates the improvement of the quality of the
water by appropriate techniques especially reducing the biological waste and chemical
pollutant input and thereby increasing the dissolved oxygen. This kind of improvement in the
quality of the water will facilitate the various above uses of canal water. Figure 5.7: Outline Map Showing the Existing Canals and Drains
Kochi City Development Plan
71
Cost projection, investment plan, strategy to achieve the vision & strategy for implementation
are given in the section on estimate of cost.
1. Strom water drainage – Cost projection – Section - Estimate of Cost (Part 4 Table A).
2. Storm water drainage – Investment Plan – Section – Estimate of Cost (Part 4 Table B).
3. Storm water drainage – Strategy to achieve vision and goal 2006-2026 – Section –
Estimate of Cost (Part 4 Table C).
List of Drains and Estimated Cost (Local body wise) is given in Annexure 4.
Conclusion. The strategy involves desiltation of canals, provision of side roads, provision for
multiple overflow outlets, development of canal network system and regulatory pumping
systems. The project involves identification of all the Primary, Secondary & Area canals and
improvement of their quality to ensure proper drainage. This necessitates detailed contour
survey & preparation of a drainage master plan.
The city level Steering Committee which is proposed to be set up with the collector, the
Mayor and the ULB Presidents /Chairperson and the officers of the line departments will
look into the aspect of coordination.
The total project is estimated to be Rs.902 crores.
Kochi City Development Plan
72
5.4 Solid Waste Management
5.4.1 Introduction Rapid urbanization of Kochi and suburbs are leading to pollution and ecological imbalance.
The pressure on infrastructural facilities and core sector services is severely felt not only in
Kochi but also in the nearby Municipalities and Panchayats. Urban poor are the worst hit.
Solid Waste Management (SWM), which is an obligatory function of the Urban Local Body
(ULB), is in a pathetic state resulting in problems of flood, water logging, mosquito menace,
sanitation and environmental and health related problems.
A feed back survey conducted among the residents in the central Kochi, known as
Karikkamuri through a Data study, identified some of the major problem areas as under:
5.4.2 Areas of Concern 1. Improper Solid Waste management;
2. Water Logging;
3. Mosquito Menace;
4. Environmental Pollution;
5. Waste duping by a vast number of daily commuters;
6. Poor state of drains;
7. Plying of heavy vehicles through narrow roads;
8. Activities of anti-social elements;
9. Inadequate Sewage system;
10. Open Drains;
11. Unattended Vacant lands;
12. Poor condition of Roads;
13. Lack of proper pedestrian Pathway;
14. Corroded drinking water pipe lines and contaminated drinking water;
15. Frequent interruptions in Power supply;
16. Absence of quality services;
17. Availability of labour; and
18. Poor coordination and institutional mechanisms for implementing development work.
5.4.3 Solid Waste Management-A Thrust Area Stake holders identified Solid Waste Management as a thrust area, as it is found to be the
ROOTCAUSE for many other problem areas like Water Logging, Mosquito Menace,
Environmental Pollution etc.
Urban poor, who live in small houses, suffer due to flooding of their dwelling places as the
drainage system is clogged by solid wastes especially non-degradable waste. They are also
the main victims of various kinds of diseases. Most of them cannot afford to spend their
meager income on Mosquito repellants, mosquito curtains/nets, mosquito screens etc. Rat
menace is also rampant in such areas.
5.4.4 Present Situation The present pathetic conditions can be, understood from the Photographs below taken from
various places of Kochi.
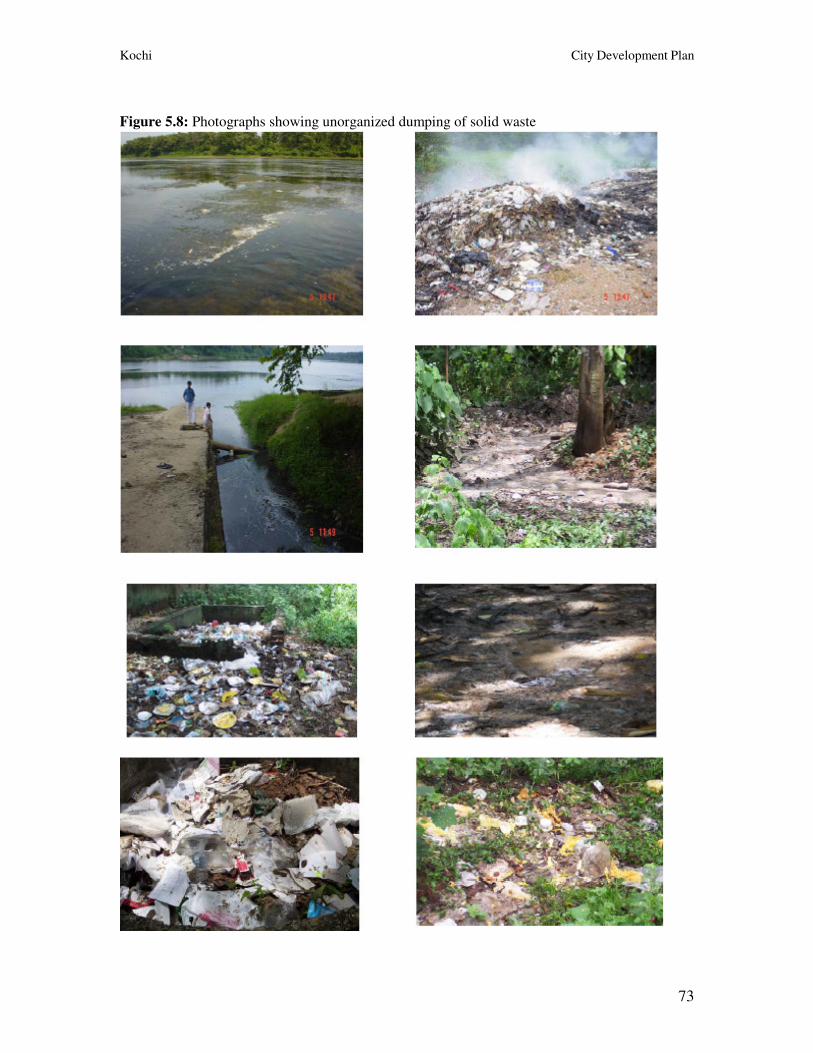
Kochi City Development Plan
73
Figure 5.8: Photographs showing unorganized dumping of solid waste
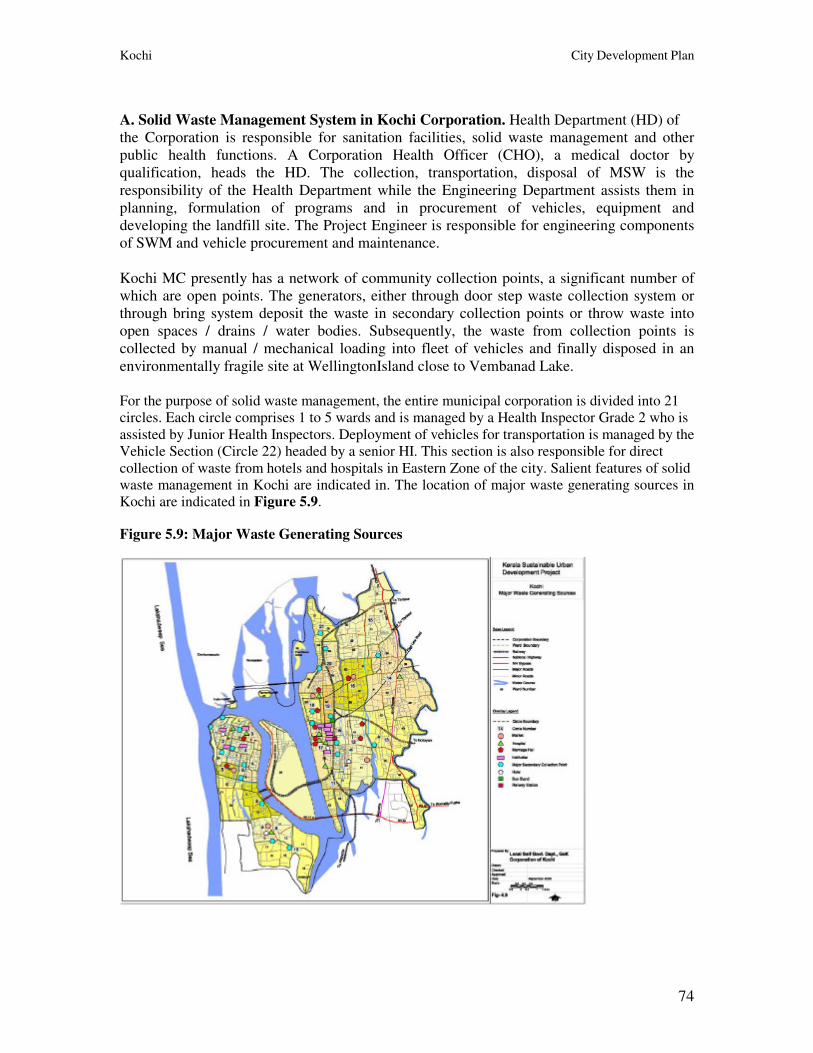
Kochi City Development Plan
74
A. Solid Waste Management System in Kochi Corporation. Health Department (HD) of
the Corporation is responsible for sanitation facilities, solid waste management and other
public health functions. A Corporation Health Officer (CHO), a medical doctor by
qualification, heads the HD. The collection, transportation, disposal of MSW is the
responsibility of the Health Department while the Engineering Department assists them in
planning, formulation of programs and in procurement of vehicles, equipment and
developing the landfill site. The Project Engineer is responsible for engineering components
of SWM and vehicle procurement and maintenance.
Kochi MC presently has a network of community collection points, a significant number of
which are open points. The generators, either through door step waste collection system or
through bring system deposit the waste in secondary collection points or throw waste into
open spaces / drains / water bodies. Subsequently, the waste from collection points is
collected by manual / mechanical loading into fleet of vehicles and finally disposed in an
environmentally fragile site at WellingtonIsland close to Vembanad Lake.
For the purpose of solid waste management, the entire municipal corporation is divided into 21
circles. Each circle comprises 1 to 5 wards and is managed by a Health Inspector Grade 2 who is
assisted by Junior Health Inspectors. Deployment of vehicles for transportation is managed by the
Vehicle Section (Circle 22) headed by a senior HI. This section is also responsible for direct
collection of waste from hotels and hospitals in Eastern Zone of the city. Salient features of solid
waste management in Kochi are indicated in. The location of major waste generating sources in
Kochi are indicated in Figure 5.9.
Figure 5.9: Major Waste Generating Sources
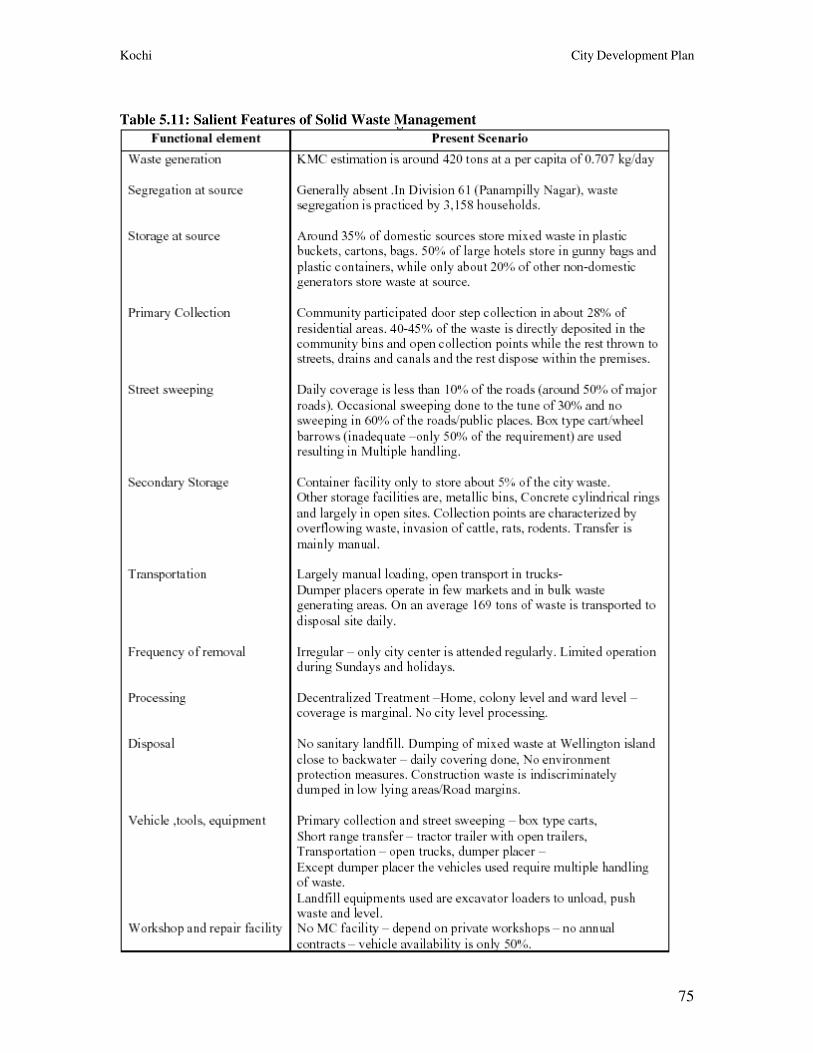
Kochi City Development Plan
75
Table 5.11: Salient Features of Solid Waste Management
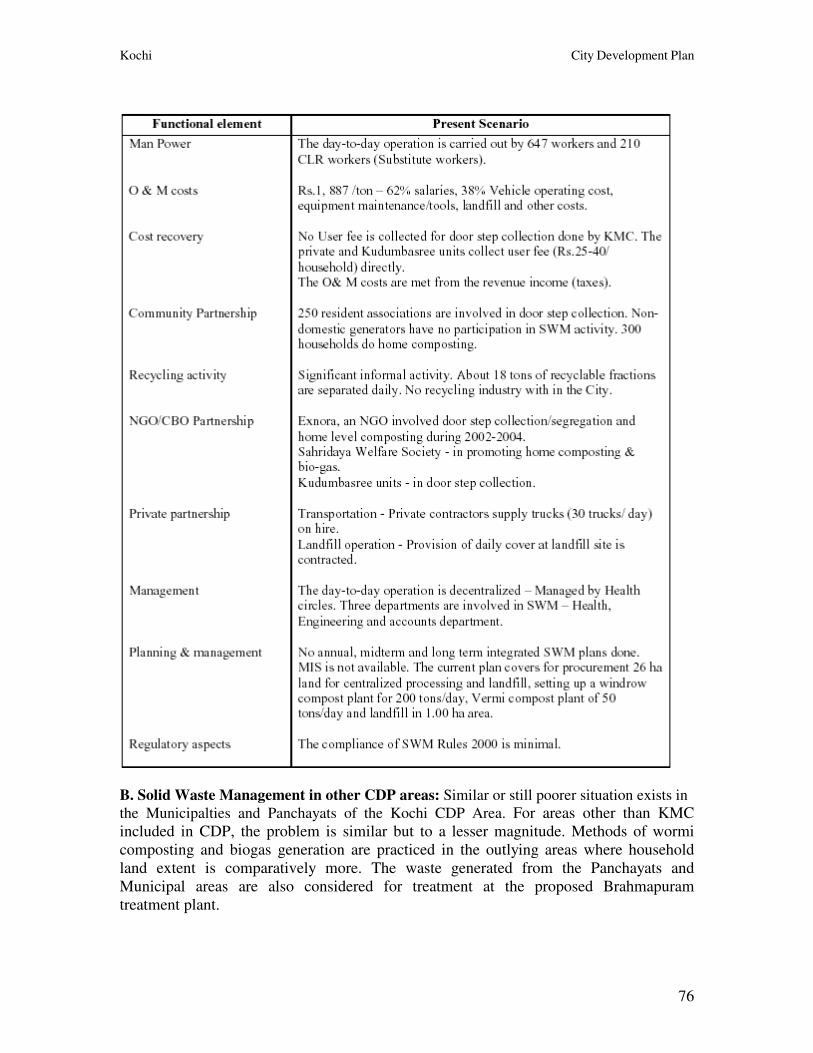
Kochi City Development Plan
76
B. Solid Waste Management in other CDP areas: Similar or still poorer situation exists in
the Municipalties and Panchayats of the Kochi CDP Area. For areas other than KMC
included in CDP, the problem is similar but to a lesser magnitude. Methods of wormi
composting and biogas generation are practiced in the outlying areas where household
land extent is comparatively more. The waste generated from the Panchayats and
Municipal areas are also considered for treatment at the proposed Brahmapuram
treatment plant.
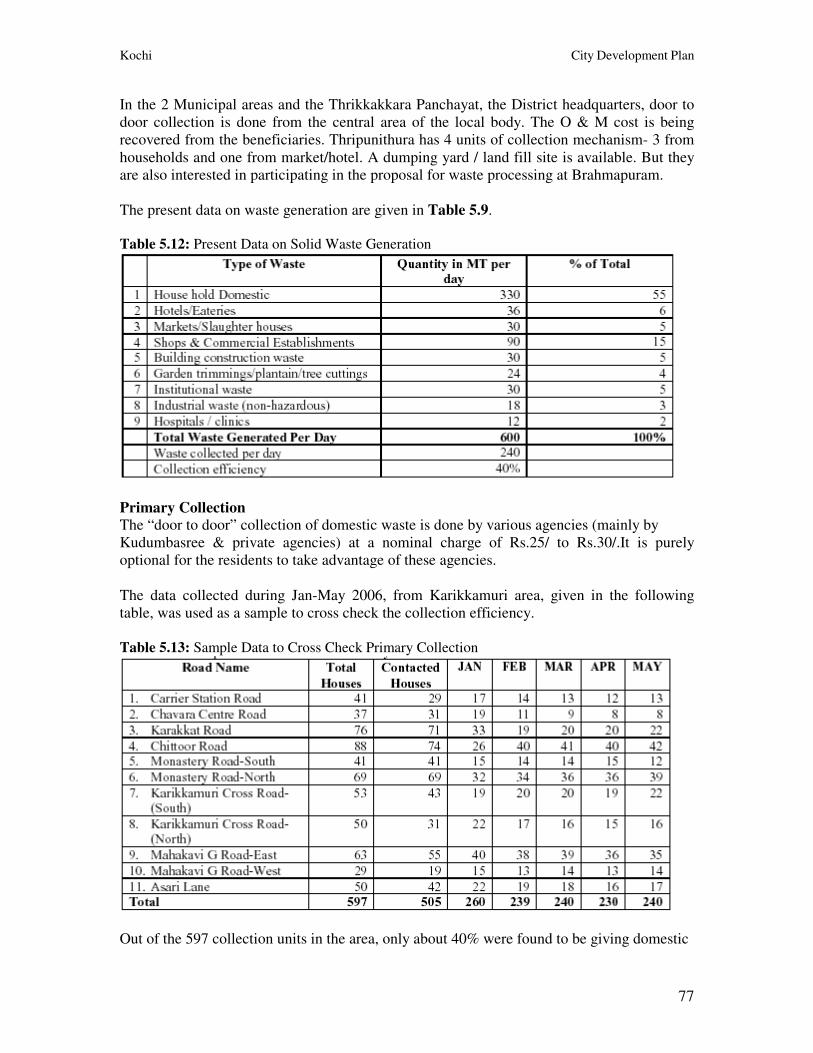
Kochi City Development Plan
77
In the 2 Municipal areas and the Thrikkakkara Panchayat, the District headquarters, door to
door collection is done from the central area of the local body. The O & M cost is being
recovered from the beneficiaries. Thripunithura has 4 units of collection mechanism- 3 from
households and one from market/hotel. A dumping yard / land fill site is available. But they
are also interested in participating in the proposal for waste processing at Brahmapuram.
The present data on waste generation are given in Table 5.9. Table 5.12: Present Data on Solid Waste Generation
Primary Collection The “door to door” collection of domestic waste is done by various agencies (mainly by
Kudumbasree & private agencies) at a nominal charge of Rs.25/ to Rs.30/.It is purely
optional for the residents to take advantage of these agencies.
The data collected during Jan-May 2006, from Karikkamuri area, given in the following
table, was used as a sample to cross check the collection efficiency.
Table 5.13: Sample Data to Cross Check Primary Collection
Out of the 597 collection units in the area, only about 40% were found to be giving domestic
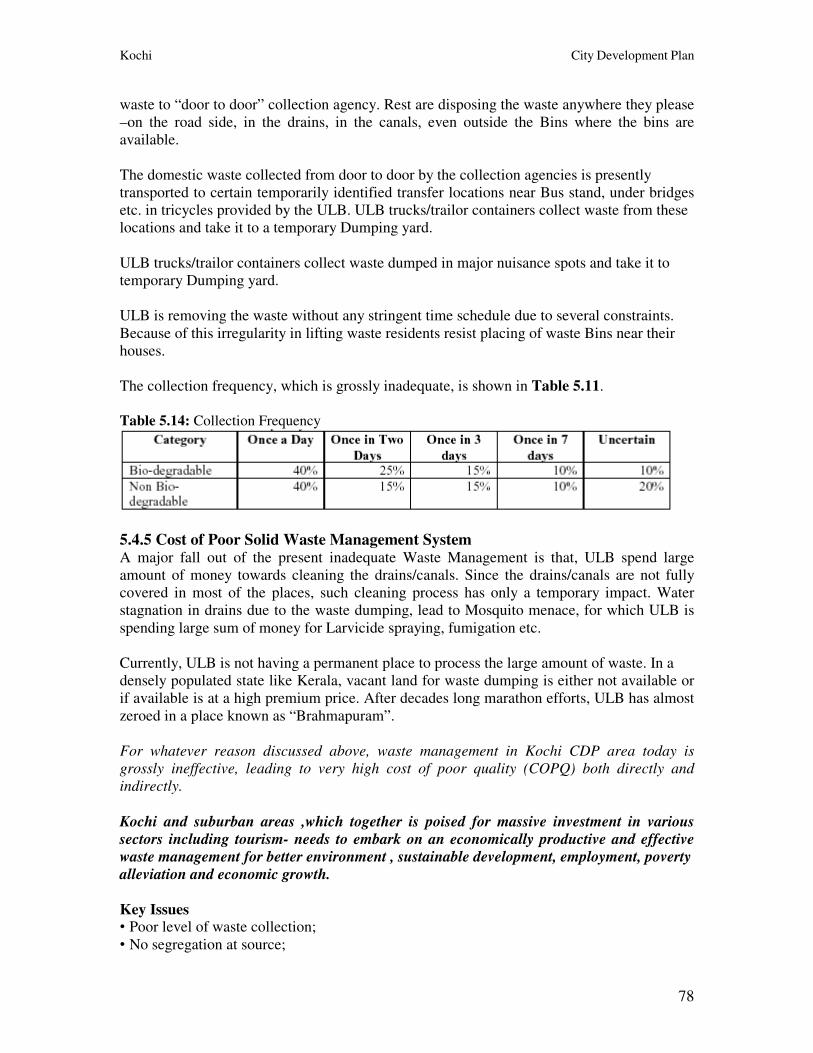
Kochi City Development Plan
78
waste to “door to door” collection agency. Rest are disposing the waste anywhere they please
–on the road side, in the drains, in the canals, even outside the Bins where the bins are
available.
The domestic waste collected from door to door by the collection agencies is presently
transported to certain temporarily identified transfer locations near Bus stand, under bridges
etc. in tricycles provided by the ULB. ULB trucks/trailor containers collect waste from these
locations and take it to a temporary Dumping yard.
ULB trucks/trailor containers collect waste dumped in major nuisance spots and take it to
temporary Dumping yard.
ULB is removing the waste without any stringent time schedule due to several constraints.
Because of this irregularity in lifting waste residents resist placing of waste Bins near their
houses.
The collection frequency, which is grossly inadequate, is shown in Table 5.11.
Table 5.14: Collection Frequency
5.4.5 Cost of Poor Solid Waste Management System A major fall out of the present inadequate Waste Management is that, ULB spend large
amount of money towards cleaning the drains/canals. Since the drains/canals are not fully
covered in most of the places, such cleaning process has only a temporary impact. Water
stagnation in drains due to the waste dumping, lead to Mosquito menace, for which ULB is
spending large sum of money for Larvicide spraying, fumigation etc.
Currently, ULB is not having a permanent place to process the large amount of waste. In a
densely populated state like Kerala, vacant land for waste dumping is either not available or
if available is at a high premium price. After decades long marathon efforts, ULB has almost
zeroed in a place known as “Brahmapuram”.
For whatever reason discussed above, waste management in Kochi CDP area today is
grossly ineffective, leading to very high cost of poor quality (COPQ) both directly and
indirectly.
Kochi and suburban areas ,which together is poised for massive investment in various
sectors including tourism- needs to embark on an economically productive and effective
waste management for better environment , sustainable development, employment, poverty
alleviation and economic growth.
Key Issues • Poor level of waste collection;
• No segregation at source;
Kochi City Development Plan
79
• No planned reuse/recycle;
• Poor frequency of waste collection;
• Inefficient collection and disposal at temporary transfer locations;
• Obsolete waste handling and transportation system;
• Street cleaning utterly inadequate;
• No scientific and modern waste processing at any stage;
• Water logging due to choking of drains with waste;
• Mosquito menace due to stagnation of water in drains;
• Filthy Environment not congenial to a tourists’ destination;
• Misery to the poor who are the worst affected due to poor waste management; and
• No shared vision for solid waste management.
5.4.6 To-Be Scenario- Where Do We Go? Considering the “as-is” condition and the related key issues, “to-be” scenario has been
envisioned in a medium term perspective.
A “shared vision” has been evolved for the core service of Waste Management” in
consultation with stakeholder representatives and voluntary technical experts.
5.4.7 Shared Vision for Solid Waste Management “To implement economically productive and effective Solid Waste Management with
accountability and transparency to transform Kochi and suburbs to one of the cleanest places
in the world by the year 2010.
5.4.8 Gap Analysis Where the Kochi and suburbs are today and where it wants to reach, there exists a big gap to
be bridged?
The Strategies,programmes and projects for waste management in a medium term perspective
is drawn out by the “SOLID WASTE MANAGEMENT TASK FORCE” consisting of
various convergent departments, community based organizations, civil society organizations,
voluntary technical experts. Highlights are as under:
1. A well structured comprehensive Solid Waste Management Plan.
i. Awareness Criteria:
• Starting from educational institutions. 100% of the students will be covered in a
phased
manner. This will also be part of the environment training;
• Other stake holders like house holds, institutions, trading, Industries, ULB etc will be
covered in batches with the help of NGOSs;
• Course design will be done by competent agencies;
• Legal programes to be conducted by experts in the field;
• ULB shall issue notice to Public;
• Citizen rights/duties/responsibilities on SWM will be published along with vigorous
campaign;
• Public warning to be issued by ULB and Police Commissioner; and
• Monitoring, review and modification mechanism.
Kochi City Development Plan
80
ii. Live model demonstration. Demonstration of live models of solid waste management
in schools. Besides the canteen waste and other normal solid waste produced in the
school and surroundings, night soil waste is also a fine input to the biogas plants
planned. About 400 such units are planned to cover about 4 lakhs of students. Efforts
will be made for sponsorship by the community/companies/commercial business
units.
iii. Institution level solid waste processing will be encouraged in
Hotels/Hostels/Multistoreyed Buildings etc. About 200 such initiatives are expected .Till
such time they put up the solid waste processing units, waste will be collected at applicable
rates fixed by ULB. Like Rain water harvesting, car parking etc. solid waste processing
will also be made mandatory in future.
iv. Residents’ Association/Community Public Comfort kiosks attached with solid waste
processing will be implemented. 103 Nos .Bio-gas Generation units are planned.71 in
Kochi City,10 in two Municipalities, 26 in thirteen Panchayats.
v. Community Biogas based Power Generation unit utilizing community waste and
comfort station waste. One number is planned between Ernakulam South railway
station and KSRTC Bus Stand to light up the pedestrian path way along the
Vivekananda road and to operate the water pump for watering the proposed public
garden in the area.
vi. Waste from KSRTC Bus Stand and South Railway stations can also be processed
here.
vii. Efforts will be made for sponsorship by the community/companies/ commercial
business units. Advertisement revenue will also be available on recurring basis from
this strategic area.
viii. Sludge Extraction and transport equipment for 1.3 to 1.5
2. Segregation of Solid Waste At Source
• Domestic Waste Bins: It is planned to get the domestic waste segregated at source
itself using two containers –one for biodegradable and other for non-bio-degradable.
Containers will be specially designed and standardized to prevent misuse. About
2,60,000 sets are estimated. Sponsors will be found to supply the same. Giving
advertisement rights will also be considered. BPL people will be given at nominal
cost.
• Domestic Vermi-composting units: These will be supplied at attractive rates to house
holds to encourage waste processing at home itself. To begin with 8000units - 7150
units in Kochi, 200 units in two Municipalities and 650 numbers in thirteen
Panchayats are planned.
• Door to door primary collection: Kudumbasree/Residents Associations/Self Help
Groups will be empowered to collect the domestic solid waste. Every domestic unit
shall declare their mode of disposal of solid waste.In any case, all residents shall pay
the “betterment levies” to the collecting agency in their respective areas. This will
Kochi City Development Plan
81
generate employment opportunities for urban poor, including rag pickers.
In other words, dumping of any kind of waste on the road side or some one else’s vacant land
will not be allowed. IN FACT, IT WILL BE A PUNISHABLE OFFENCE.
3. Special Purpose Vehicles (SPVS) for door to door primary waste collection:
• 3.1) Special Purpose Vehicles (SPVs) for door to door waste collection will be
encouraged with initial fund from ULB and to be returned in installments.
Maintenance/running expenses will be borne by the Kudumasree units/residents’
association/Self Help Groups, as the case may be. 260 such SPVs are estimated.
• 3.2) Cleaning Service for SPVs: After delivering the solid waste at the identified
transfer locations, it will be thoroughly cleaned. About 27 such transfer stations (10 in
Kochi city, 4 in two Municipalities and 13 in thirteen Panchayats) are planned. Private
participation will be encouraged with initial fund from ULB and to be returned in
instalments. Maintenance/running expenses will be borne by the private party.
4. Secondary collection:
• Secondary Collection of solid waste: Secondary transport vehicles, mostly tractor /
trailor container type, will be deployed at secondary collection centres. The peculiarity of
these stations are that the primary solid waste will be directly transferred to vehicles
carrying them to the main processing plant at Brahmapuram. 6 Tractors and 32 Trailor
containers are estimated Private participation will be encouraged with initial fund from
ULB and to be returned in installments. Maintenance/running expenses will be borne by
the private party. Private participation will be encouraged with payments based on actual
tonnage of solid waste transported at predetermined rates.
• Waste from institutions/Markets/Hotels/Hostels /Lodges etc will be collected directly
by ULB. Till such time they put up the solid waste processing units, waste will be
collected at applicable rates fixed by ULB. These wastes will be directly transported to
the main processing plant at Brahmapuram. The vehicles currently available with ULB
will be used. Private participation will be encouraged with payments based on actual
tonnage of solid waste transported at predetermined rates.
5. Slaughter House /Main Market Solid Waste. These will be collected and directly
transported to main processing plant at Brahmapuram. Specially designed covered vehicles
will be deployed to reduce foul smell. 4 such vehicles are planned.
Till such time they put up the solid waste processing units, waste will be collected at
applicable rates fixed by ULB.Private participation will be encouraged with payments based
on actual tonnage of solid waste transported at predetermined rates.
6. Litter Bins. Litter Bins will be standardized and sponsors will be found tosupply the same
with their advertisements. This will be installed by ULB and contents will be removed by
ULB. Only small paper pieces/ paper wrappers are expected to be put in these. Other than
Litter Bins, no other Bins/Containers are envisaged on the road sides.This will also make
pedestrian path neat and clean. In other words, dumping of any kind of waste on the road side
Kochi City Development Plan
82
will not be allowed. IN FACT, IT WILL BE A PUNISHABLE OFFENCE.
7. Incineration Units. Incineration units: Hopstals/cluster of hospitals will be forced to install
incinerators Incinerators have to be employed for treating bio-medical waste. Initial fund can
be given by ULB,to be returned in instalments. About 10 such incinerators are planned for
installation.
8. Main Solid Waste Processing Site at Brahmapuram:
a. Weighing Mechanism with Utility. Weighing mechanism with utility building, security
etc. is planned at Brahmapuram main sold waste processing site
b. Sorting of Non-Biodegradable Waste. Sorting of Bio-degradable waste into components
like plastic, glass, rubber porcelain, metals etc. by mechanical means is envisaged at
Brahmapuram main sold waste processing site.
c. Composting. Composting being slow process and require a lot of space is planned to be
done only in small units of (about 5mt/day capacity) at Brahmapuram main sold waste
processing site. 6 units are planned initially. The manure will be mainly used for the
gardens planned in Brahmapuram campus.
d. Bio-Methanation Plant. Bio-Methanation Plant using Slaughter house waste and market
waste is planned at Brahmapuram main sold waste processing site. Power will be
generated from this mainly to light up the locality.3 nos 20mt/day capacity biomethanation
plant cum power generation units are planned initially.
e. Secure Land Filling Facility. Secure Land Filling Facility at Brahmapuram main solid
waste processing site: About 4 to 5 Cubic Metres of Hazardous waste will have to be
buried every year.Aprox. 10 cents of land will be required to be prepared every year
going upto 20 years atleast. We are planning for 2 nos excavators also.
f. Effluent Treatment Plant. Effluent Treatment plant, Monitoring cell with laboratory etc
are planned at Brahmapuram main sold waste processing site.
g. Drinking Water Facility. Drinking water facility at Brahmapuram main solid waste
processing site is envisaged.
h. Green Belt. Green Belt at Brahmapuram main solid waste processing site: The vacant
areas will be converted into a beautiful picnic spot with Land scaping, wide roads,
gardens with fragrant flowering plants like Jasmines, medicinal plants, vegetation (special
bamboo etc), vegetable farms, integrated farming with diary, piggery etc, water park, Fish
ponds, entertainment facilities, conference cum recreation halls, Library with reference
books etc. All concerned stakeholders and experts will be consulted before finalizing the
facilities at Brahmapuram. It will be one of the best solid waste processing sites in the
world.
9. Enhancing the Role of ULB Staff. Accountability and responsibility with appropriate
authority to ULB staff is also envisaged to improve their motivation and effectiveness to
ensure cleanliness of the designated areas of each team. The team shall consist of the ULB
staff as well as representatives of Residents Association.
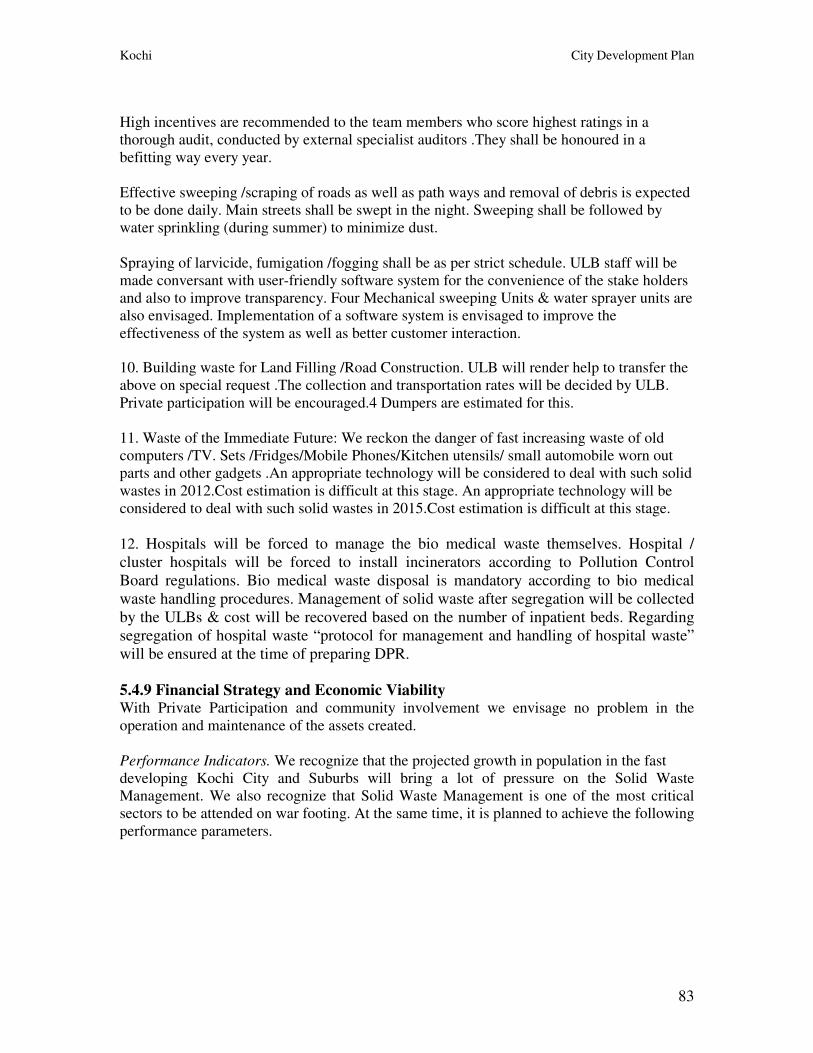
Kochi City Development Plan
83
High incentives are recommended to the team members who score highest ratings in a
thorough audit, conducted by external specialist auditors .They shall be honoured in a
befitting way every year.
Effective sweeping /scraping of roads as well as path ways and removal of debris is expected
to be done daily. Main streets shall be swept in the night. Sweeping shall be followed by
water sprinkling (during summer) to minimize dust.
Spraying of larvicide, fumigation /fogging shall be as per strict schedule. ULB staff will be
made conversant with user-friendly software system for the convenience of the stake holders
and also to improve transparency. Four Mechanical sweeping Units & water sprayer units are
also envisaged. Implementation of a software system is envisaged to improve the
effectiveness of the system as well as better customer interaction.
10. Building waste for Land Filling /Road Construction. ULB will render help to transfer the
above on special request .The collection and transportation rates will be decided by ULB.
Private participation will be encouraged.4 Dumpers are estimated for this.
11. Waste of the Immediate Future: We reckon the danger of fast increasing waste of old
computers /TV. Sets /Fridges/Mobile Phones/Kitchen utensils/ small automobile worn out
parts and other gadgets .An appropriate technology will be considered to deal with such solid
wastes in 2012.Cost estimation is difficult at this stage. An appropriate technology will be
considered to deal with such solid wastes in 2015.Cost estimation is difficult at this stage.
12. Hospitals will be forced to manage the bio medical waste themselves. Hospital /
cluster hospitals will be forced to install incinerators according to Pollution Control
Board regulations. Bio medical waste disposal is mandatory according to bio medical
waste handling procedures. Management of solid waste after segregation will be collected
by the ULBs & cost will be recovered based on the number of inpatient beds. Regarding
segregation of hospital waste “protocol for management and handling of hospital waste”
will be ensured at the time of preparing DPR.
5.4.9 Financial Strategy and Economic Viability With Private Participation and community involvement we envisage no problem in the
operation and maintenance of the assets created.
Performance Indicators. We recognize that the projected growth in population in the fast
developing Kochi City and Suburbs will bring a lot of pressure on the Solid Waste
Management. We also recognize that Solid Waste Management is one of the most critical
sectors to be attended on war footing. At the same time, it is planned to achieve the following
performance parameters.
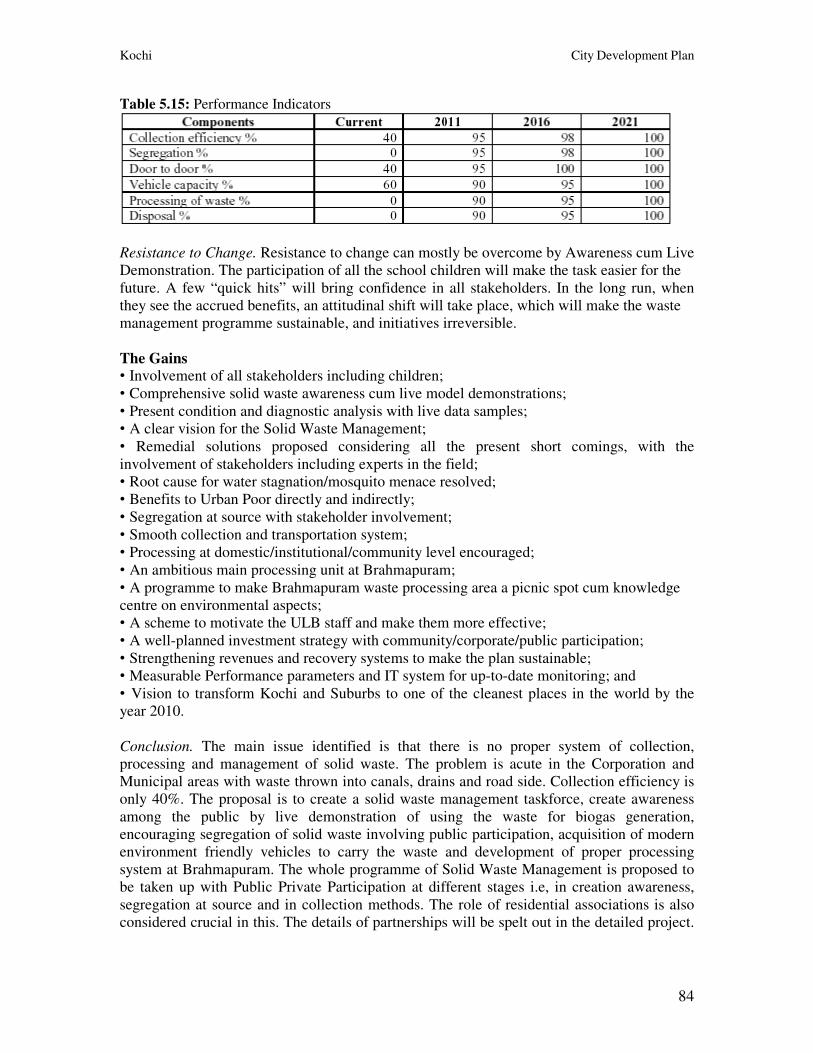
Kochi City Development Plan
84
Table 5.15: Performance Indicators
Resistance to Change. Resistance to change can mostly be overcome by Awareness cum Live
Demonstration. The participation of all the school children will make the task easier for the
future. A few “quick hits” will bring confidence in all stakeholders. In the long run, when
they see the accrued benefits, an attitudinal shift will take place, which will make the waste
management programme sustainable, and initiatives irreversible.
The Gains • Involvement of all stakeholders including children;
• Comprehensive solid waste awareness cum live model demonstrations;
• Present condition and diagnostic analysis with live data samples;
• A clear vision for the Solid Waste Management;
• Remedial solutions proposed considering all the present short comings, with the
involvement of stakeholders including experts in the field;
• Root cause for water stagnation/mosquito menace resolved;
• Benefits to Urban Poor directly and indirectly;
• Segregation at source with stakeholder involvement;
• Smooth collection and transportation system;
• Processing at domestic/institutional/community level encouraged;
• An ambitious main processing unit at Brahmapuram;
• A programme to make Brahmapuram waste processing area a picnic spot cum knowledge
centre on environmental aspects;
• A scheme to motivate the ULB staff and make them more effective;
• A well-planned investment strategy with community/corporate/public participation;
• Strengthening revenues and recovery systems to make the plan sustainable;
• Measurable Performance parameters and IT system for up-to-date monitoring; and
• Vision to transform Kochi and Suburbs to one of the cleanest places in the world by the
year 2010.
Conclusion. The main issue identified is that there is no proper system of collection,
processing and management of solid waste. The problem is acute in the Corporation and
Municipal areas with waste thrown into canals, drains and road side. Collection efficiency is
only 40%. The proposal is to create a solid waste management taskforce, create awareness
among the public by live demonstration of using the waste for biogas generation,
encouraging segregation of solid waste involving public participation, acquisition of modern
environment friendly vehicles to carry the waste and development of proper processing
system at Brahmapuram. The whole programme of Solid Waste Management is proposed to
be taken up with Public Private Participation at different stages i.e, in creation awareness,
segregation at source and in collection methods. The role of residential associations is also
considered crucial in this. The details of partnerships will be spelt out in the detailed project.
Kochi City Development Plan
85
Community contributions through user charges, privatization of certain components in the
whole system are intended.
The total project cost is estimated to be Rs.152.40 crores and the proposal is to get back the
money by beneficiary contribution and through sponsorship programmes.
Kochi City Development Plan
86
6. TRAFFIC AND TRANSPORTATION
6.1 Present Scenario Kochi is one of the few cites of India blessed with connection to other parts by all major
modes of transport like road, rail, air and water. NH 17, NH 47 and NH 49; 3 National
Waterways, an International Airport, Cochin Port located on strategic International Route and
broad guage lines linking Kochi to other States are the major intercity linkages.
The regional road linkages are supplemented by an extensive network of navigation routes
through the lagoon system, serving the movement of passengers and cargo.
As part of the preparation of a report on the comprehensive study for the transport system in
Greater Cochin area, RITES have done a survey in (2001). Its analysis reveals that:
• The buses contribute about 14% of the vehicular traffic and carry 73% of the Passenger
traffic;
• The share of cars in terms of vehicular trips is about 38% carrying 15% of passenger trips;
• Two wheelers contribute 35% of vehicular traffic and 8% of passenger traffic; and
• Auto rickshaws constitute about 13% of vehicular traffic and 4% of passenger trips.
As part of the comprehensive study for the transport system M/s RITES had undertaken O-D
survey, Volume count surveys, speed and delay surveys, parking survey; pedestrian volume
survey, travel characteristics etc. and the study results are utilized in the preparation of this
document. The relevant study results are included as tables in Annexure.5.
6.2 Traffic Flow and Travel Demand Increasing urbanization over the years has resulted in the development of vast areas as urban
extensions. Many roads were laid in an incremental manner to cater to the increased traffic
demand. The City has developed in a disintegrated urban form spreading along major traffic
corridors. Congestion on arterial roads is due to haphazard development, narrow streets,
congested junction, unorganized parking etc. which creates hindrance to the smooth flow of
traffic. Most of the bridges and major corridors are no longer able to cope up with even the
present traffic demand. High travel time and congestions have created an adverse effect on
the economic and environmental health of this city.
The running speed characteristics during peak and off-peak periods are presented in Table
(Ref. Annexure 5). The running speeds are relatively low in the study area network with
72% have running speed around 20 kmph during peak hours and greater than 30 kmph during
Off peak hours.
The major problems identified in road sector are listed below:
• Majority of traffic problems are concentrated along two east-west corridors of the city;
• The city is divided into two parts by the Railway line;
• Improper traffic junctions;
• Chronic parking problems in core areas, lack of parking space results in road side parking
causing bottle necks and creating traffic block;
• The pedestrian crossing across major corridors in city centre is a serious problem;
• The absence of bus bays causes considerable reduction in road capacity;
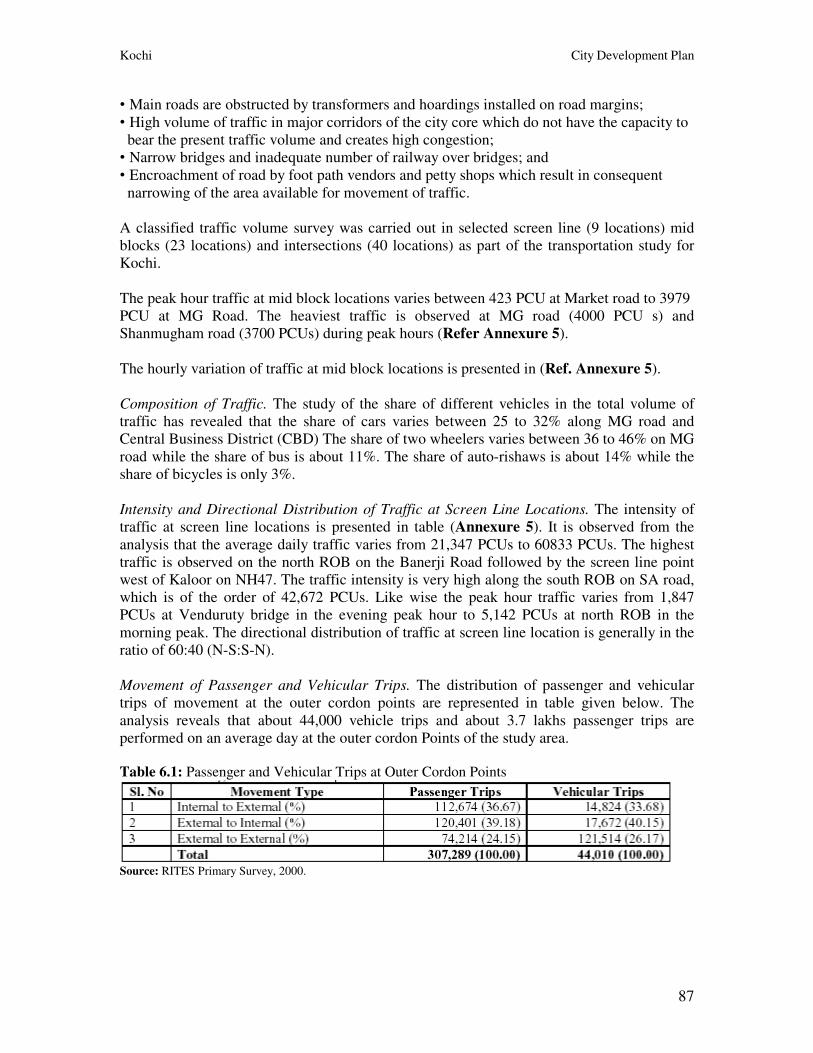
Kochi City Development Plan
87
• Main roads are obstructed by transformers and hoardings installed on road margins;
• High volume of traffic in major corridors of the city core which do not have the capacity to
bear the present traffic volume and creates high congestion;
• Narrow bridges and inadequate number of railway over bridges; and
• Encroachment of road by foot path vendors and petty shops which result in consequent
narrowing of the area available for movement of traffic.
A classified traffic volume survey was carried out in selected screen line (9 locations) mid
blocks (23 locations) and intersections (40 locations) as part of the transportation study for
Kochi.
The peak hour traffic at mid block locations varies between 423 PCU at Market road to 3979
PCU at MG Road. The heaviest traffic is observed at MG road (4000 PCU s) and
Shanmugham road (3700 PCUs) during peak hours (Refer Annexure 5).
The hourly variation of traffic at mid block locations is presented in (Ref. Annexure 5).
Composition of Traffic. The study of the share of different vehicles in the total volume of
traffic has revealed that the share of cars varies between 25 to 32% along MG road and
Central Business District (CBD) The share of two wheelers varies between 36 to 46% on MG
road while the share of bus is about 11%. The share of auto-rishaws is about 14% while the
share of bicycles is only 3%.
Intensity and Directional Distribution of Traffic at Screen Line Locations. The intensity of
traffic at screen line locations is presented in table (Annexure 5). It is observed from the
analysis that the average daily traffic varies from 21,347 PCUs to 60833 PCUs. The highest
traffic is observed on the north ROB on the Banerji Road followed by the screen line point
west of Kaloor on NH47. The traffic intensity is very high along the south ROB on SA road,
which is of the order of 42,672 PCUs. Like wise the peak hour traffic varies from 1,847
PCUs at Venduruty bridge in the evening peak hour to 5,142 PCUs at north ROB in the
morning peak. The directional distribution of traffic at screen line location is generally in the
ratio of 60:40 (N-S:S-N).
Movement of Passenger and Vehicular Trips. The distribution of passenger and vehicular
trips of movement at the outer cordon points are represented in table given below. The
analysis reveals that about 44,000 vehicle trips and about 3.7 lakhs passenger trips are
performed on an average day at the outer cordon Points of the study area. Table 6.1: Passenger and Vehicular Trips at Outer Cordon Points
Source: RITES Primary Survey, 2000.
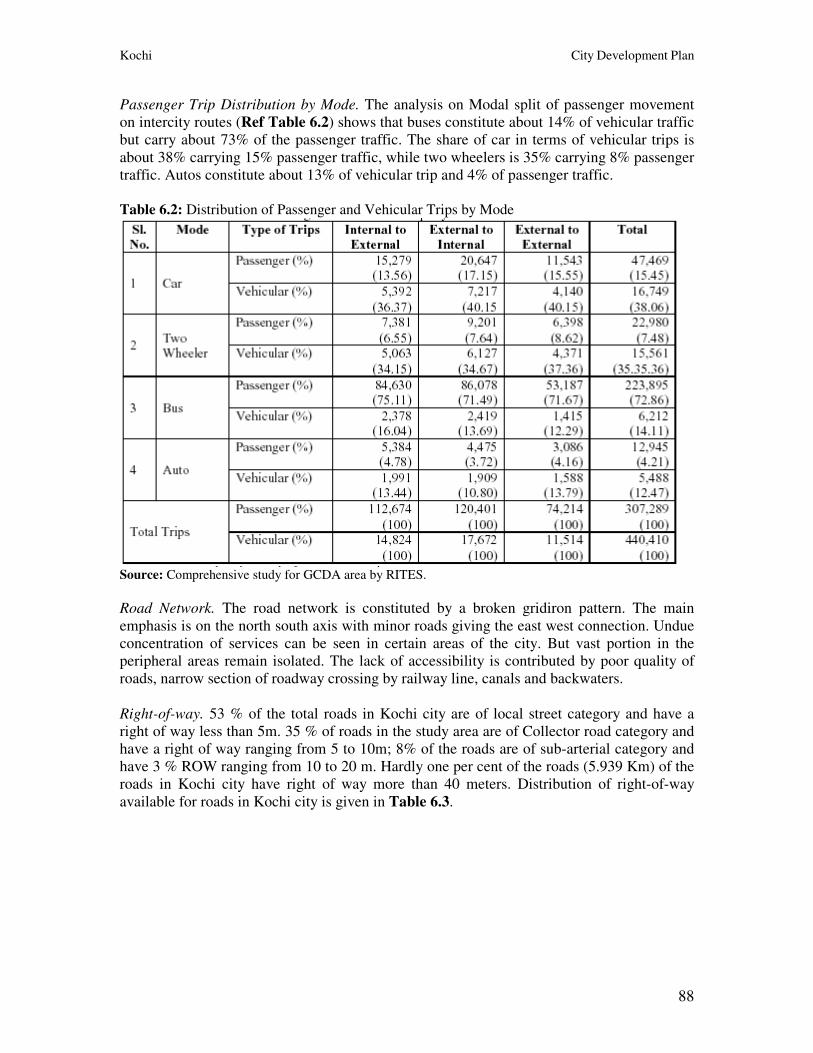
Kochi City Development Plan
88
Passenger Trip Distribution by Mode. The analysis on Modal split of passenger movement
on intercity routes (Ref Table 6.2) shows that buses constitute about 14% of vehicular traffic
but carry about 73% of the passenger traffic. The share of car in terms of vehicular trips is
about 38% carrying 15% passenger traffic, while two wheelers is 35% carrying 8% passenger
traffic. Autos constitute about 13% of vehicular trip and 4% of passenger traffic.
Table 6.2: Distribution of Passenger and Vehicular Trips by Mode
Source: Comprehensive study for GCDA area by RITES.
Road Network. The road network is constituted by a broken gridiron pattern. The main
emphasis is on the north south axis with minor roads giving the east west connection. Undue
concentration of services can be seen in certain areas of the city. But vast portion in the
peripheral areas remain isolated. The lack of accessibility is contributed by poor quality of
roads, narrow section of roadway crossing by railway line, canals and backwaters.
Right-of-way. 53 % of the total roads in Kochi city are of local street category and have a
right of way less than 5m. 35 % of roads in the study area are of Collector road category and
have a right of way ranging from 5 to 10m; 8% of the roads are of sub-arterial category and
have 3 % ROW ranging from 10 to 20 m. Hardly one per cent of the roads (5.939 Km) of the
roads in Kochi city have right of way more than 40 meters. Distribution of right-of-way
available for roads in Kochi city is given in Table 6.3.
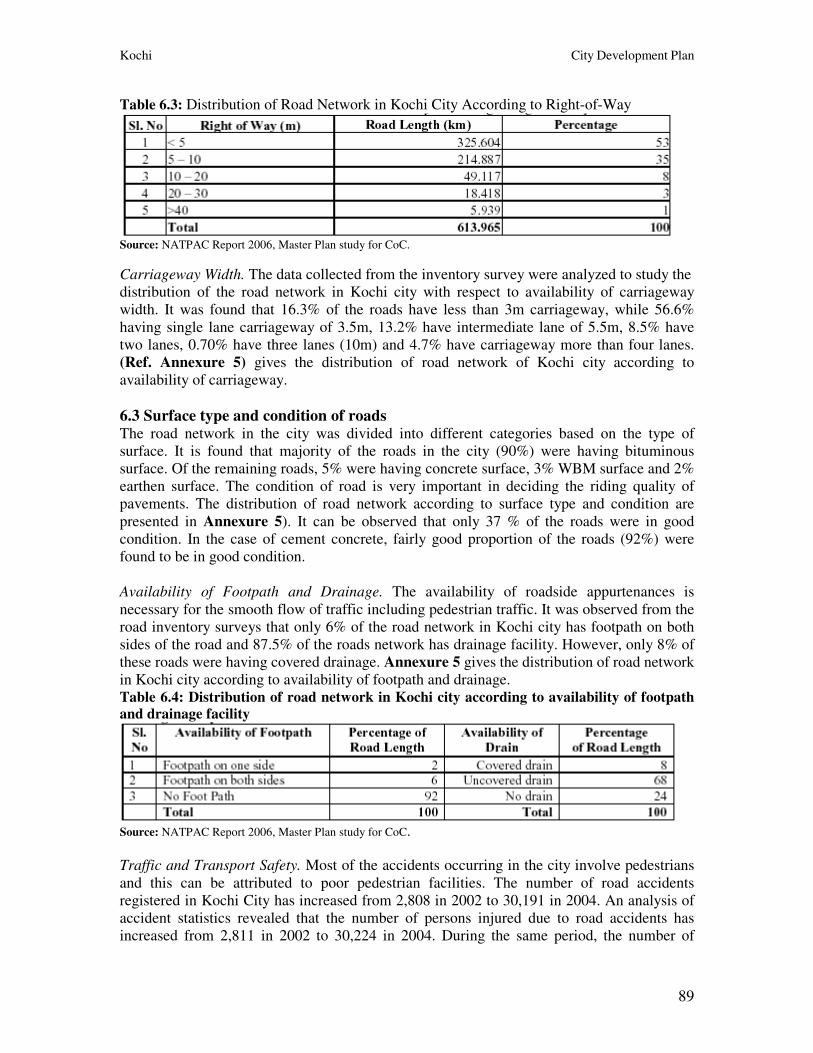
Kochi City Development Plan
89
Table 6.3: Distribution of Road Network in Kochi City According to Right-of-Way
Source: NATPAC Report 2006, Master Plan study for CoC.
Carriageway Width. The data collected from the inventory survey were analyzed to study the
distribution of the road network in Kochi city with respect to availability of carriageway
width. It was found that 16.3% of the roads have less than 3m carriageway, while 56.6%
having single lane carriageway of 3.5m, 13.2% have intermediate lane of 5.5m, 8.5% have
two lanes, 0.70% have three lanes (10m) and 4.7% have carriageway more than four lanes.
(Ref. Annexure 5) gives the distribution of road network of Kochi city according to
availability of carriageway.
6.3 Surface type and condition of roads The road network in the city was divided into different categories based on the type of
surface. It is found that majority of the roads in the city (90%) were having bituminous
surface. Of the remaining roads, 5% were having concrete surface, 3% WBM surface and 2%
earthen surface. The condition of road is very important in deciding the riding quality of
pavements. The distribution of road network according to surface type and condition are
presented in Annexure 5). It can be observed that only 37 % of the roads were in good
condition. In the case of cement concrete, fairly good proportion of the roads (92%) were
found to be in good condition.
Availability of Footpath and Drainage. The availability of roadside appurtenances is
necessary for the smooth flow of traffic including pedestrian traffic. It was observed from the
road inventory surveys that only 6% of the road network in Kochi city has footpath on both
sides of the road and 87.5% of the roads network has drainage facility. However, only 8% of
these roads were having covered drainage. Annexure 5 gives the distribution of road network
in Kochi city according to availability of footpath and drainage.
Table 6.4: Distribution of road network in Kochi city according to availability of footpath and drainage facility
Source: NATPAC Report 2006, Master Plan study for CoC.
Traffic and Transport Safety. Most of the accidents occurring in the city involve pedestrians
and this can be attributed to poor pedestrian facilities. The number of road accidents
registered in Kochi City has increased from 2,808 in 2002 to 30,191 in 2004. An analysis of
accident statistics revealed that the number of persons injured due to road accidents has
increased from 2,811 in 2002 to 30,224 in 2004. During the same period, the number of
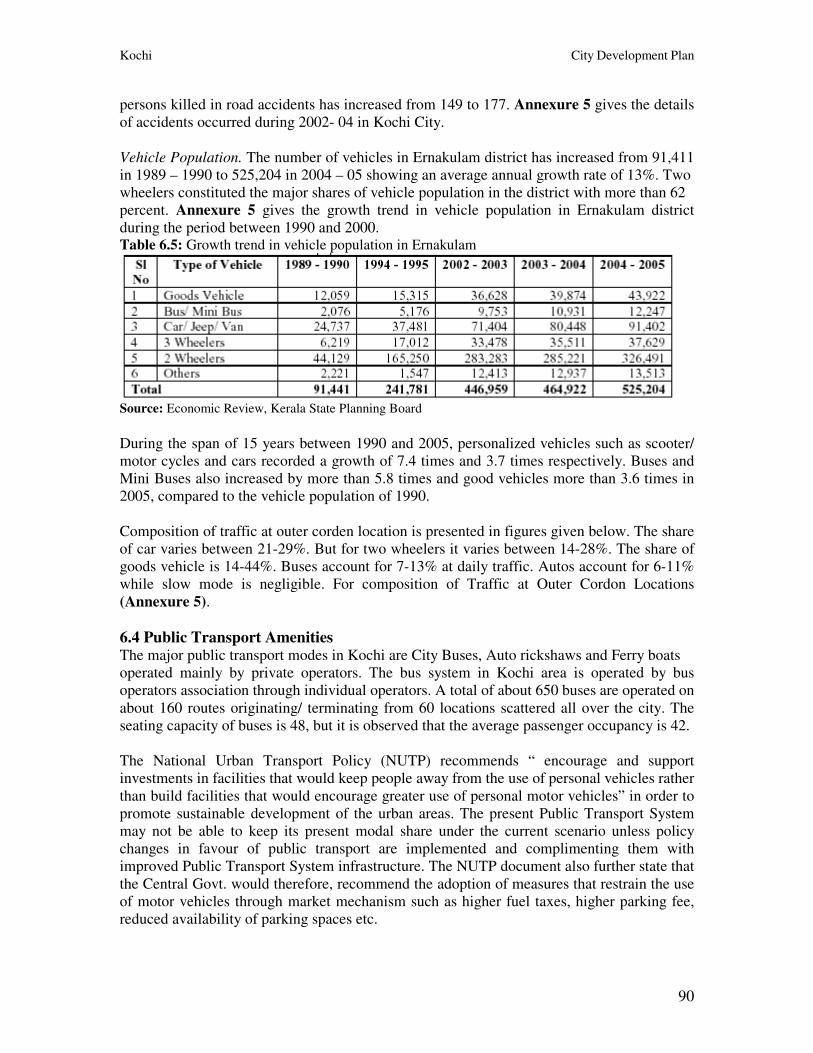
Kochi City Development Plan
90
persons killed in road accidents has increased from 149 to 177. Annexure 5 gives the details
of accidents occurred during 2002- 04 in Kochi City.
Vehicle Population. The number of vehicles in Ernakulam district has increased from 91,411
in 1989 – 1990 to 525,204 in 2004 – 05 showing an average annual growth rate of 13%. Two
wheelers constituted the major shares of vehicle population in the district with more than 62
percent. Annexure 5 gives the growth trend in vehicle population in Ernakulam district
during the period between 1990 and 2000. Table 6.5: Growth trend in vehicle population in Ernakulam
Source: Economic Review, Kerala State Planning Board
During the span of 15 years between 1990 and 2005, personalized vehicles such as scooter/
motor cycles and cars recorded a growth of 7.4 times and 3.7 times respectively. Buses and
Mini Buses also increased by more than 5.8 times and good vehicles more than 3.6 times in
2005, compared to the vehicle population of 1990.
Composition of traffic at outer corden location is presented in figures given below. The share
of car varies between 21-29%. But for two wheelers it varies between 14-28%. The share of
goods vehicle is 14-44%. Buses account for 7-13% at daily traffic. Autos account for 6-11%
while slow mode is negligible. For composition of Traffic at Outer Cordon Locations
(Annexure 5).
6.4 Public Transport Amenities The major public transport modes in Kochi are City Buses, Auto rickshaws and Ferry boats
operated mainly by private operators. The bus system in Kochi area is operated by bus
operators association through individual operators. A total of about 650 buses are operated on
about 160 routes originating/ terminating from 60 locations scattered all over the city. The
seating capacity of buses is 48, but it is observed that the average passenger occupancy is 42.
The National Urban Transport Policy (NUTP) recommends “ encourage and support
investments in facilities that would keep people away from the use of personal vehicles rather
than build facilities that would encourage greater use of personal motor vehicles” in order to
promote sustainable development of the urban areas. The present Public Transport System
may not be able to keep its present modal share under the current scenario unless policy
changes in favour of public transport are implemented and complimenting them with
improved Public Transport System infrastructure. The NUTP document also further state that
the Central Govt. would therefore, recommend the adoption of measures that restrain the use
of motor vehicles through market mechanism such as higher fuel taxes, higher parking fee,
reduced availability of parking spaces etc.
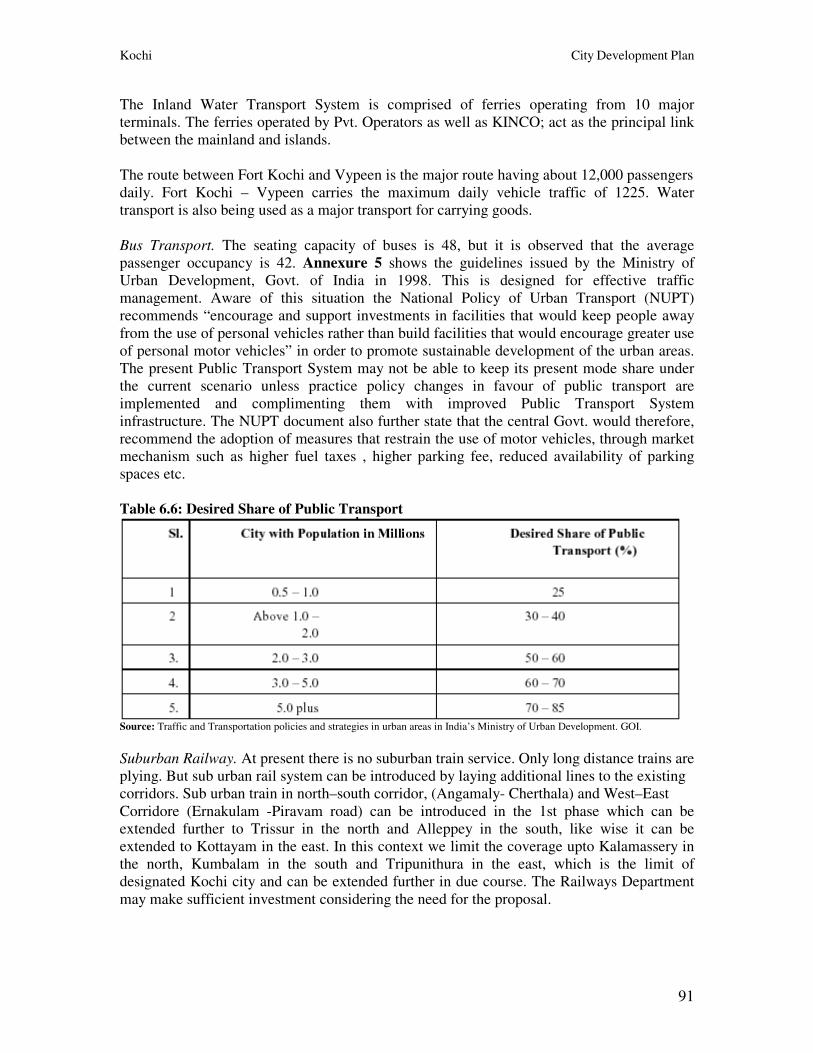
Kochi City Development Plan
91
The Inland Water Transport System is comprised of ferries operating from 10 major
terminals. The ferries operated by Pvt. Operators as well as KINCO; act as the principal link
between the mainland and islands.
The route between Fort Kochi and Vypeen is the major route having about 12,000 passengers
daily. Fort Kochi – Vypeen carries the maximum daily vehicle traffic of 1225. Water
transport is also being used as a major transport for carrying goods.
Bus Transport. The seating capacity of buses is 48, but it is observed that the average
passenger occupancy is 42. Annexure 5 shows the guidelines issued by the Ministry of
Urban Development, Govt. of India in 1998. This is designed for effective traffic
management. Aware of this situation the National Policy of Urban Transport (NUPT)
recommends “encourage and support investments in facilities that would keep people away
from the use of personal vehicles rather than build facilities that would encourage greater use
of personal motor vehicles” in order to promote sustainable development of the urban areas.
The present Public Transport System may not be able to keep its present mode share under
the current scenario unless practice policy changes in favour of public transport are
implemented and complimenting them with improved Public Transport System
infrastructure. The NUPT document also further state that the central Govt. would therefore,
recommend the adoption of measures that restrain the use of motor vehicles, through market
mechanism such as higher fuel taxes , higher parking fee, reduced availability of parking
spaces etc.
Table 6.6: Desired Share of Public Transport
Source: Traffic and Transportation policies and strategies in urban areas in India’s Ministry of Urban Development. GOI.
Suburban Railway. At present there is no suburban train service. Only long distance trains are
plying. But sub urban rail system can be introduced by laying additional lines to the existing
corridors. Sub urban train in north–south corridor, (Angamaly- Cherthala) and West–East
Corridore (Ernakulam -Piravam road) can be introduced in the 1st phase which can be
extended further to Trissur in the north and Alleppey in the south, like wise it can be
extended to Kottayam in the east. In this context we limit the coverage upto Kalamassery in
the north, Kumbalam in the south and Tripunithura in the east, which is the limit of
designated Kochi city and can be extended further in due course. The Railways Department
may make sufficient investment considering the need for the proposal.
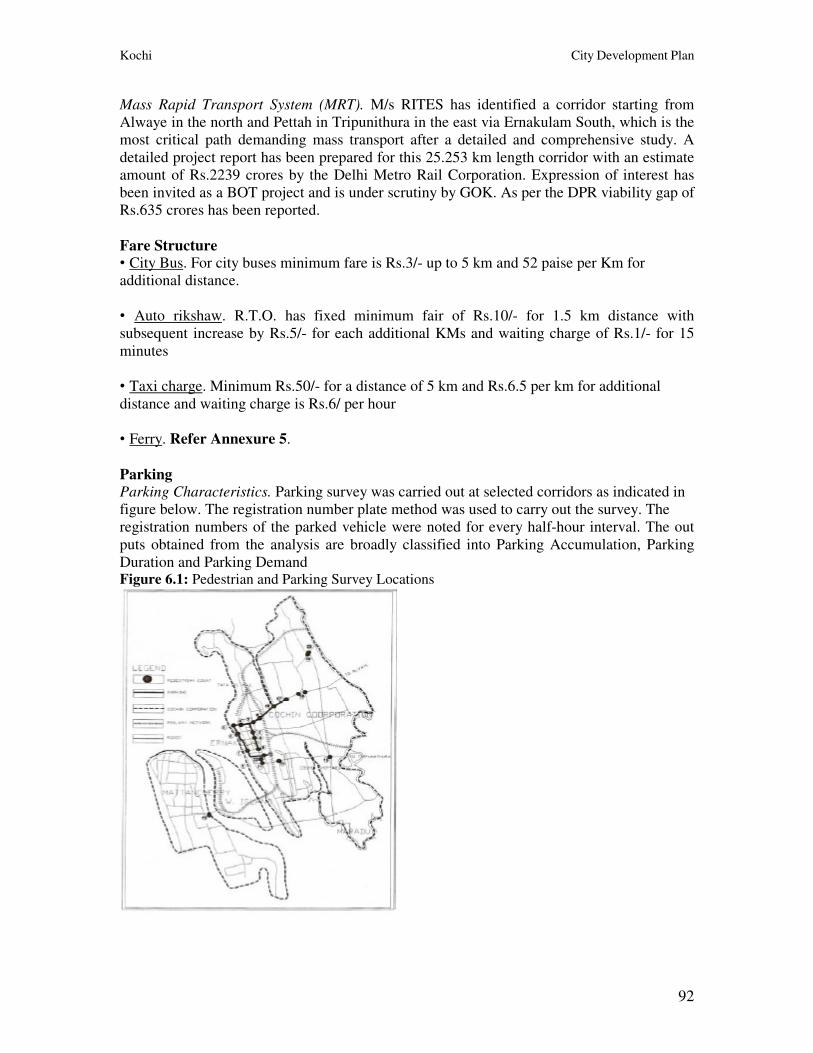
Kochi City Development Plan
92
Mass Rapid Transport System (MRT). M/s RITES has identified a corridor starting from
Alwaye in the north and Pettah in Tripunithura in the east via Ernakulam South, which is the
most critical path demanding mass transport after a detailed and comprehensive study. A
detailed project report has been prepared for this 25.253 km length corridor with an estimate
amount of Rs.2239 crores by the Delhi Metro Rail Corporation. Expression of interest has
been invited as a BOT project and is under scrutiny by GOK. As per the DPR viability gap of
Rs.635 crores has been reported.
Fare Structure • City Bus. For city buses minimum fare is Rs.3/- up to 5 km and 52 paise per Km for
additional distance.
• Auto rikshaw. R.T.O. has fixed minimum fair of Rs.10/- for 1.5 km distance with
subsequent increase by Rs.5/- for each additional KMs and waiting charge of Rs.1/- for 15
minutes
• Taxi charge. Minimum Rs.50/- for a distance of 5 km and Rs.6.5 per km for additional
distance and waiting charge is Rs.6/ per hour
• Ferry. Refer Annexure 5.
Parking Parking Characteristics. Parking survey was carried out at selected corridors as indicated in
figure below. The registration number plate method was used to carry out the survey. The
registration numbers of the parked vehicle were noted for every half-hour interval. The out
puts obtained from the analysis are broadly classified into Parking Accumulation, Parking
Duration and Parking Demand
Figure 6.1: Pedestrian and Parking Survey Locations
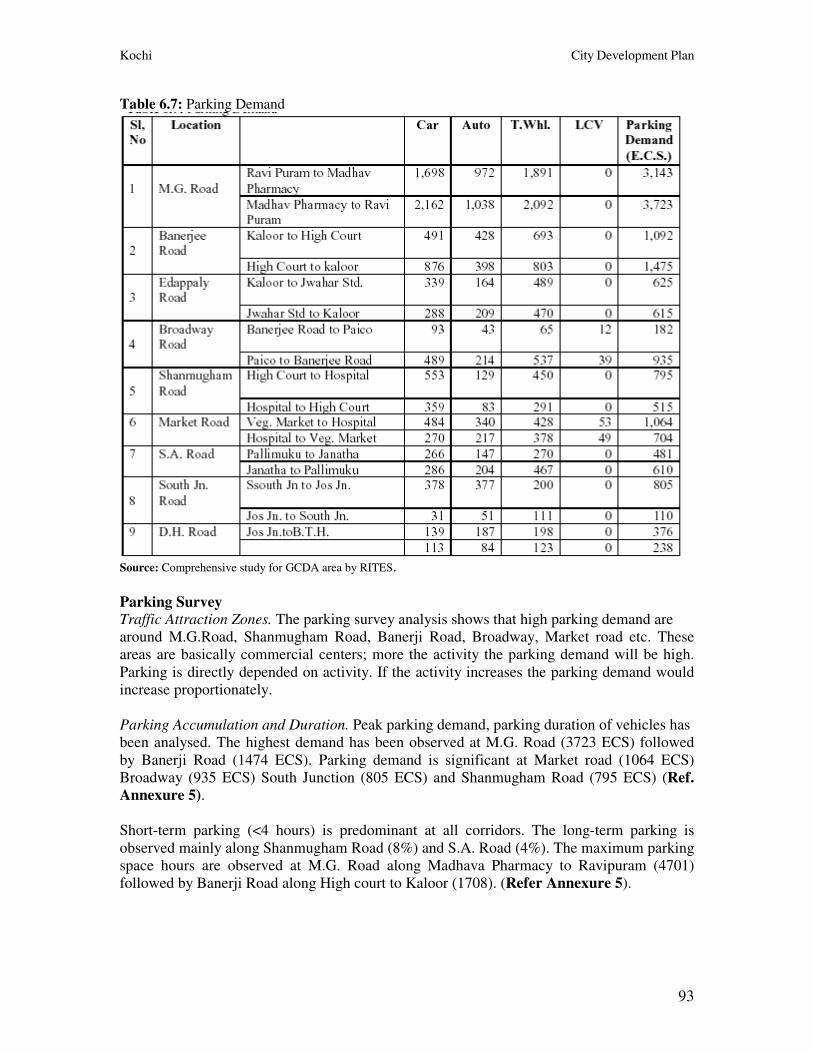
Kochi City Development Plan
93
Table 6.7: Parking Demand
Source: Comprehensive study for GCDA area by RITES.
Parking Survey Traffic Attraction Zones. The parking survey analysis shows that high parking demand are
around M.G.Road, Shanmugham Road, Banerji Road, Broadway, Market road etc. These
areas are basically commercial centers; more the activity the parking demand will be high.
Parking is directly depended on activity. If the activity increases the parking demand would
increase proportionately.
Parking Accumulation and Duration. Peak parking demand, parking duration of vehicles has
been analysed. The highest demand has been observed at M.G. Road (3723 ECS) followed
by Banerji Road (1474 ECS). Parking demand is significant at Market road (1064 ECS)
Broadway (935 ECS) South Junction (805 ECS) and Shanmugham Road (795 ECS) (Ref. Annexure 5).
Short-term parking (<4 hours) is predominant at all corridors. The long-term parking is
observed mainly along Shanmugham Road (8%) and S.A. Road (4%). The maximum parking
space hours are observed at M.G. Road along Madhava Pharmacy to Ravipuram (4701)
followed by Banerji Road along High court to Kaloor (1708). (Refer Annexure 5).
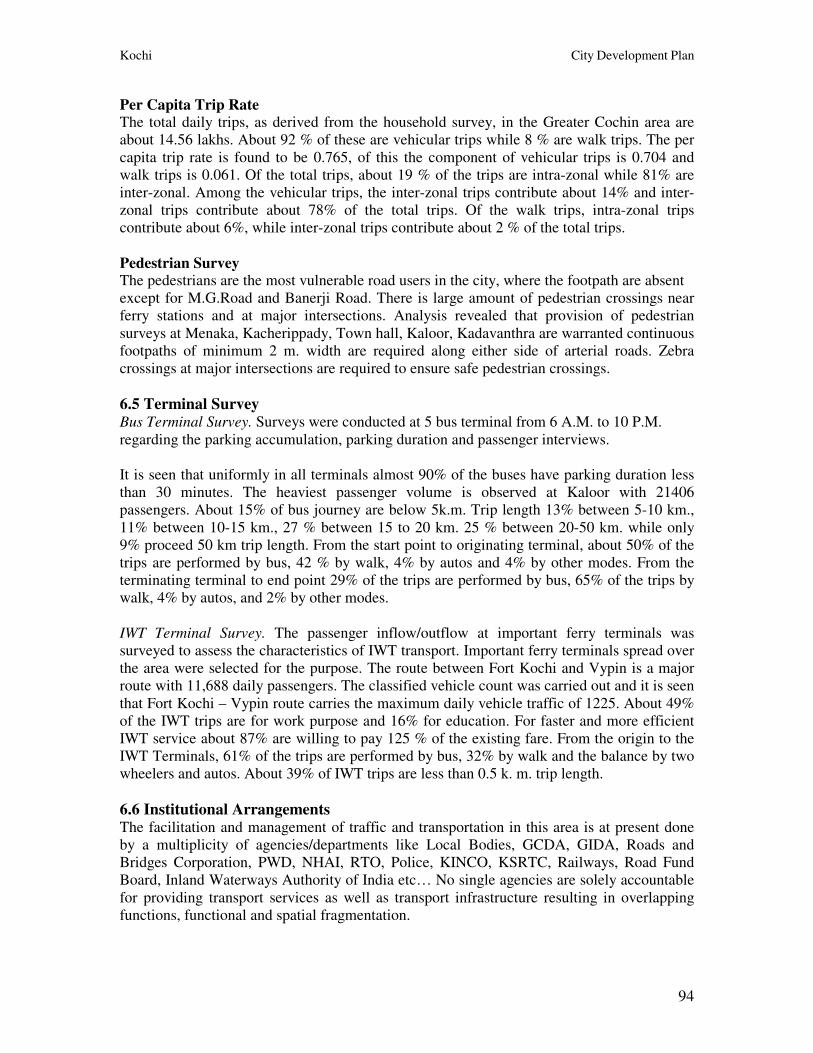
Kochi City Development Plan
94
Per Capita Trip Rate The total daily trips, as derived from the household survey, in the Greater Cochin area are
about 14.56 lakhs. About 92 % of these are vehicular trips while 8 % are walk trips. The per
capita trip rate is found to be 0.765, of this the component of vehicular trips is 0.704 and
walk trips is 0.061. Of the total trips, about 19 % of the trips are intra-zonal while 81% are
inter-zonal. Among the vehicular trips, the inter-zonal trips contribute about 14% and inter-
zonal trips contribute about 78% of the total trips. Of the walk trips, intra-zonal trips
contribute about 6%, while inter-zonal trips contribute about 2 % of the total trips.
Pedestrian Survey The pedestrians are the most vulnerable road users in the city, where the footpath are absent
except for M.G.Road and Banerji Road. There is large amount of pedestrian crossings near
ferry stations and at major intersections. Analysis revealed that provision of pedestrian
surveys at Menaka, Kacherippady, Town hall, Kaloor, Kadavanthra are warranted continuous
footpaths of minimum 2 m. width are required along either side of arterial roads. Zebra
crossings at major intersections are required to ensure safe pedestrian crossings.
6.5 Terminal Survey Bus Terminal Survey. Surveys were conducted at 5 bus terminal from 6 A.M. to 10 P.M.
regarding the parking accumulation, parking duration and passenger interviews.
It is seen that uniformly in all terminals almost 90% of the buses have parking duration less
than 30 minutes. The heaviest passenger volume is observed at Kaloor with 21406
passengers. About 15% of bus journey are below 5k.m. Trip length 13% between 5-10 km.,
11% between 10-15 km., 27 % between 15 to 20 km. 25 % between 20-50 km. while only
9% proceed 50 km trip length. From the start point to originating terminal, about 50% of the
trips are performed by bus, 42 % by walk, 4% by autos and 4% by other modes. From the
terminating terminal to end point 29% of the trips are performed by bus, 65% of the trips by
walk, 4% by autos, and 2% by other modes.
IWT Terminal Survey. The passenger inflow/outflow at important ferry terminals was
surveyed to assess the characteristics of IWT transport. Important ferry terminals spread over
the area were selected for the purpose. The route between Fort Kochi and Vypin is a major
route with 11,688 daily passengers. The classified vehicle count was carried out and it is seen
that Fort Kochi – Vypin route carries the maximum daily vehicle traffic of 1225. About 49%
of the IWT trips are for work purpose and 16% for education. For faster and more efficient
IWT service about 87% are willing to pay 125 % of the existing fare. From the origin to the
IWT Terminals, 61% of the trips are performed by bus, 32% by walk and the balance by two
wheelers and autos. About 39% of IWT trips are less than 0.5 k. m. trip length.
6.6 Institutional Arrangements The facilitation and management of traffic and transportation in this area is at present done
by a multiplicity of agencies/departments like Local Bodies, GCDA, GIDA, Roads and
Bridges Corporation, PWD, NHAI, RTO, Police, KINCO, KSRTC, Railways, Road Fund
Board, Inland Waterways Authority of India etc… No single agencies are solely accountable
for providing transport services as well as transport infrastructure resulting in overlapping
functions, functional and spatial fragmentation.
Kochi City Development Plan
95
Key Issues and Challenges • Inadequate lane width to carry the present / future traffic volumes;
• Insufficient East-West corridors and lack of ROB’s;
• Absence of properly configured intersections and junction flyovers;
• Chronic parking problems in CBD area;
• Poor pedestrian infrastructure (absence of subway, footpath, pedestrian crossing etc);
• Absence of bus bays;
• Bus terminal situated in CBD which compels the Buses to ply through the congested
corridors of CBD;
• Insufficient traffic management system;
• Absence of integrated terminals for different modes of transport (Road, Rail, Water, Air);
• Absence of truck/ transport terminal at present;
• Declining share of public transport;
• Poor road maintenance (As there is rain for nearly 6 months, roads are damaged very
quickly which incur heavy cost on maintenance of the roads);
• Signals, metro –usability funds;
• Vehicle carrying capacity of the road is not growing proportionate with the growth of
vehicles;
• Lack of organized Taxi / Auto Stand;
• Encroachment of Road / Footpath by street vendors / Bunk Shops;
• Lack of Public comfort Kiosks;
• Lack of Co ordination among departments; and
• Lack of utility ducts.
Kochi city is expecting enormous growth very shortly due to the coming up of International
Transshipment terminal at Vallarpadam, the LNG terminal at Puthuvipu, the SBM (Single
Buoy Mooring) of KRL at Vypin, the special economic zones at Vypin/ Vallarpadam,
Kakkanad, the internet cities, cruise terminals etc. Kochi is the Gateway for all the
international optical cable fibre net work. This will be an added advantage to Kochi to
become an IT hub of India. All the above will fuel the development of many international
business ventures in the city.
The current road network and public transport cannot handle the present travel demand. The
proposed projects will add fuel to the existing burning problem if not tackled properly. There
is no single agency accountable for the management monitoring and comprehensively
facilitating the overall transportation mechanism. Formulation of a Unified Metropolitan
Traffic and Transport Authority of Kochi is required to effectively co-ordinate all modes of
transport operating in this area.
6.7 Vision To attain an integrated, efficient and comfortable transport system with high priority to public
transport which is environment friendly and easily accessible to the challenged.
As 73% of the trips are undertaken using public transport and as there is availability of all
the modes of transport in Kochi, it is necessary to integrate them by improving the road
network, removing hindrances and developing terminal and interchange facilities to
achieve safe and comfortable journey.
Kochi City Development Plan
96
6.8 Strategies
6.8.1 Strategy for network improvement Widening and Strengthening of carriage way of Road Structures. With due consideration to
the growing traffic intensity, major roads, corridors, state highways and National Highways
running through the city are to be extended and expanded. This shall involve construction of
flyovers, bridges, subways/ foot over bridges, improvements to intersections etc. This shall
also involve removal of encroachments on road margins, shifting of electrical poles, trees etc.
and strengthening of road structures with pavements, footpaths and surface margins with a
provision for storm water drains, utility ducts etc.
Construction of New Radial Roads, which are the Missing Links in the Transport Network.
To connect the existing city area to the newly developing outskirts area, Ring roads and
radial roads are proposed in the Master Plan. This will provide for the planned connectivity
and proper road alignment to facilitate growth of peripheral areas.
6.8.2 Strategies for Planning, Reforms and Institutional Strengthening Constitution of Greater Cochin Transport Authority (GCTA). The issue of institutional
accountability can be addressed by formulating an apex authority “Greater Cochin Transport
Authority”. It establishes coordination between the line departments in providing an efficient
transport services. This acts as the single most authority that has administrative control of the
transport sector.
Comprehensive Traffic and Transport Study for the entire CUA Region. Greater Cochin
Development Authority initiated the comprehensive study of traffic and transportation system
for Greater Kochi area. This study was carried out by RITES and the study report was
submitted in 2001. The study report proposed various road infrastructure development
schemes to be taken up and one of the major improvement proposals pertained to the
development of Light Rail Transit system between Aluva and Thrippunithura. But this report
has to be updated considering mega projects like Container terminal project, IT projects etc
to be launched at Cochin soon.
This strategy is aimed to come out with sustained solutions for the entire Kochi and its
suburbs as a unit that has financial and environmental viability. This also includes the current
institutional analysis, policy, and financial and service delivery issues.
Constitution of the ‘Greater Cochin Transport Authority’ is envisaged to coordinate the
concerned agencies like private bus operators association, KINCO, KSRTC etc. It is
assumed that if this agency is set up with sufficient powers, the traffic management can
be efficiently handled. Regarding the different development departments priority in
implementation and coordination of activities can be achieved by timely intervention and
decision-making by the city level Steering Committee.
Traffic and Transportation Management using G.I.S. and GPS Technologies. Use of Global
Positioning System (GPS), a satellite based positioning and navigation technology, will help
track the position of the public transport vehicles from a central location. This data is very
useful in assessing the performance of the services offered. The same data can be beamed
back to the electronic information boards at bus stops that will display information on the
Kochi City Development Plan
97
location of the busses and the expected arrival time. Use of such service has additional
benefits in tracking the traffic conditions on the roadways, unauthorised roadside parking,
delays at intersections, passenger demand, as well as immediate notification to the control
centre in case of accidents, all without any involvement of the driver or conductor. This
strategy will also improve the share of public transport.
6.8.3 Strategy for Finance Urban Transportation Development Fund. Infrastructure development for efficient
functioning of transport system is a capital-intensive process and a substantial financial
burden will have to be shouldered by the government. The state government or the local
bodies do not have the required resources for financing such developments, thus delaying the
projects indefinitely. The Central Government in the National Urban Transport Policy
(NUTP) has recommended levy of direct taxes that would be credited to the account of the
‘Urban Transport Fund’ and used exclusively to meet the urban transportation needs. NUTP
has further specified that such direct taxes could be in the form of a supplement to the petrol
and diesel taxes, betterment charges on landowners or even in the form of employment tax on
employers. Such provisions will also result in making private vehicular transport more
expensive and result in a shift towards use of public transport systems. A similar approach is
recommended for implementation in Kochi.
6.8.4 Improve the Share of Public Transport Increasing the Fleet of Bus. As per the standards of GoI, a city should have at least 100 buses
per lakh of population. It is also mentioned that by 2020, this should go up to 250 buses per
lakh population. This is also supported by the prevailing over crowded buses specifically in
peak hours. With the introduction of MRTS and Suburban railway system the need for buses
can be reduced slightly. Hence a fleet of 100 buses per annum for the three consecutive years
will meet the demand. In addition mini luxury buses can be introduced to ply trough the city
centre linking the major residential areas of the city. This will reduce the use of personal
vehicles & thereby reduce traffic congestion.
Dedicated Bus corridors, Bus bays and Terminals. 100 bus bays have been identified for
provision of convenient stoppages for buses so that they do not cause inconvenience to the
traffic following through the major corridors. Further, dedicated bus corridors and
construction of bus terminals at major hubs will ease the traffic flow, significantly increase
the share of public transport and will also improve the comfort of the passengers through the
development of ‘hub and spoke’ system of transport.
Introduction of MRTS. Regarding the mass transport system, DPR for Kochi metro project
has been prepared by Delhi Metro Rail Corporation and the expression of interest as received
is under scruitiny. The total project cost is Rs.2,239 crores for a length of 25.25 KM starting
from Alwaye to Petta and Tripunithura. The project is proposed to be implemented on BOT
basis and as per the project report it is understood that an amount of Rs.635 crores is required
as viability gap fund.
6.8.5 Strategy for Better Transport Infrastructure Streamlining, regularising the heavy cargo transport. As the work of major projects like
Kochi City Development Plan
98
Container Transhipment terminals have already started in addition to the existing port
facilities, specific dedicated corridors along the important routes will be developed
extensively for the cargo transport along the important routes where such cargo transport
traffic is predominant. This traffic will be regularised in city core by introducing differential
timings. Adequate number of Truck terminals will be provided to prohibit the on road
parking of heavy cargo.
Junctions and Traffic Signal improvements. Cochin City has about 39 intersections, out of
which only a few on CBD area are manned. All of these intersections shall be scientifically
improved and provided with better LED controlled signal system.
Synchronized traffic control. There are more than 25 signalised intersections in the Cochin
city area alone. Unless all these signals are linked with suitable area traffic management
system, the overall delays may not come down. Optimisations of signals as an integrated
network will be able to give better results pertain to the core area. Hence the Synchronized
system with traffic sensors on the approaches, assisted by Video Cameras for incidence
detection and management shall be installed.
Traffic Signs and Markings. The traffic in Cochin City being mixed in nature and
carriageway being a non-standard format, the carriageways need extensive traffic signs and
road markings to provide guidance for disciplined and safe driving. It is observed that on
many important corridors traffic guidance in the form traffic signs and lane markings are not
up to the standards. It is necessary to standardize the lane markings, edge markings, median
markings, pedestrian crossings, parking zones etc, Locations for installing traffic delineators,
and traffic are identified on all important travel corridors extending over a length of 320 Km
and the same has to be implemented.
Parking Management. It is proposed to demarcate parking stalls and design the parking fee
structure to improve parking turnover. A proper parking policy, which looks at users–pay
principle, is imperative. Off street parking complexes (Elevated parking) for private vehicles
at 39 important nodal points in the city are required to ease traffic congestion by releasing
precious carriage way. Involvement of private partnership will be sought for such projects.
Underground paid parking lots are proposed to be developed in public open areas in CBD.
Besides there is urgent need to stream line the para-transit vehicles at major trip attraction
centres by provision of suitably designed para-transit hubs. As many as 5 locations have been
identified to implement this scheme. Similarly there is a need for providing parking spaces
for private bus operators. 16 such locations, on all major arterial roads are identified for this
purpose.
Parallel Roads. There are situations when alternative roads have to be developed to reduce
the traffic load on overburdened links. Finding space for such development is difficult in
densely built up areas of the Urban Area. Only possibility is to open up new corridors by
utilising the vacant land available at the peripheral areas of the city. Such a plan will have
dual benefits of providing alternate routes and also help in non-encroachment of important
lands.
Road widening. Given that the percentage area covered by roads in the city is less than 10 %
of the total area, road-widening programme improves channel capacity by adding more area
to the circulation channels. Cochin is one of the cities, which has been able to implement
Kochi City Development Plan
99
road-widening programme with the participation of nearby land owners, successfully, most
of them surrendering their land free of cost for the formation of road. 16 major congested
links have been identified for widening with some of them being already implemented.
The list of improvement works proposed under JNNURM is given in Annexure 5.
Conclusion. The growth in number of vehicles has far exceeded the growth and spread of the
roads in the study area during the past 15 years. The total number of registered vehicles in the
district is almost 5.75 times the number in 1990. Public transport, however, caters to the
major share of trips (72%). This has rendered the roads congested leading to traffic blocks.
Improper junctions, inadequate lane widths, narrow bridges, encroachment of roads and
absence of integrated terminals, all lead to inefficient traffic flow. The expected growth of
population in the light of major investments proposed is likely to worsen the situation. The
strategy is to improve the road network by providing missing links, improve the junctions,
integration of different modes of transport, full exploitation of the water transport facility,
creation of an Urban Transport Development Fund, constitution of a Grater Cochin Transport
Authority, rationalization of bus routes, provision of parking facilities (underground &
vertical) & development of Truck Terminals outside the city. Suburban railway system with
MEMU services can contribute towards decongesting the road network.
The total project cost under the Traffic and Transportation sector is estimated to be Rs.4,252 crores excluding the funds required for suburban rail service.
Kochi City Development Plan
100
7. BASIC SERVICES TO THE URBAN POOR
7.1 Introduction The policy of Govt. of Kerala towards urban poverty is defined in Kerala Municipalities Act
1994 which provides a strong framework for an integrated and city based approach including
the establishment of UPA cells in ULB’s to co ordinate all poverty alleviation programmes.
The State Poverty Eradication Mission (SPEM)- Kudumbashree started in the year 1998 aims
at eradicating absolute poverty within 10 years under the leadership of the Local Self Govts.
The mission launched by the State Govt. with the active support of Govt. of India and
NABARD has adopted a different Methodology in wiping out absolute poverty by organizing
the poor into Community Based Organizations. (CBO’s). The UPAD was initiating and
implementing the poverty reduction programmes in Kochi Corporation and UPA Cells in
Municipalities. From 1999 onwards the above two cells are merged with Kudumbashree. At
State level the poverty alleviation activities of ULBs and Panchayaths are Co-ordinated and
monitored by Kudumbashree.
As per the Section 284 of the Kerala Municipality Act 1994, 2% of the income of each ULB
is to be spent for Urban Poverty Alleviation Programme. The ULBs are transferring such
amount to the CDB annually, as its share for UPA budget. The other souces of income to the
CDS for UPA activities, include the transfer from GoK under S.P.E.M.(Kudumbasree),
centrally sponsored UPA programmes and institutional finance for Self Help Groups.
Exploring the multifarious possibilities of Kochi, every cross sections of people from the
adjacent localities come over here because of multifold reasons, especially for employment in
various organized/ unorganized sectors, trade, industries, for availing better standards of
living in terms of services like better transportation, electricity, water supply, education,
luxury, amusements…etc. Industrial and commercial development, the modernization of the
port, triggered urban migration to Kochi and unplanned urban expansion has contributed to
both growth in slums and urban poor population. Growth of Kochi is also marked with the
growth of slums. Mattancherry the word itself means ‘slum’ which is considered as one of
the major slum areas known not only in Kerala but widely familiar in India itself. The shift of
economic activities from the western part of Kochi to the east also accelerated poverty and
growth of slums in the western part. More than 280 slums are located in Kochi in which 70%
of the slums and urban poor are located in West Kochi. The suburban areas cover 32% of
urban poor.
7.2 Present Scenario Kochi Corporation, surrounding Municipalities and Panchayats (CDP Area) constitute a total
BPL population of 34 Percentage. The table given below illustrates the urban poor population
of Kochi Corporation and surrounding Municipalities and Panchayats.
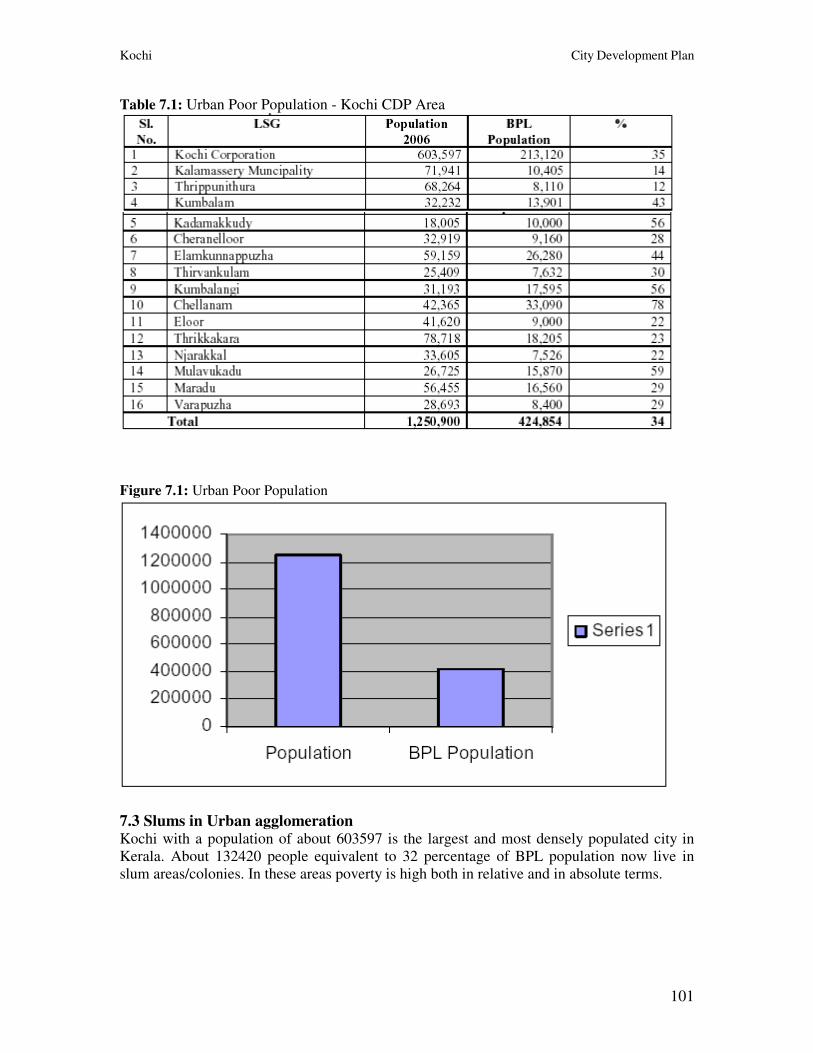
Kochi City Development Plan
101
Table 7.1: Urban Poor Population - Kochi CDP Area
Figure 7.1: Urban Poor Population
7.3 Slums in Urban agglomeration Kochi with a population of about 603597 is the largest and most densely populated city in
Kerala. About 132420 people equivalent to 32 percentage of BPL population now live in
slum areas/colonies. In these areas poverty is high both in relative and in absolute terms.
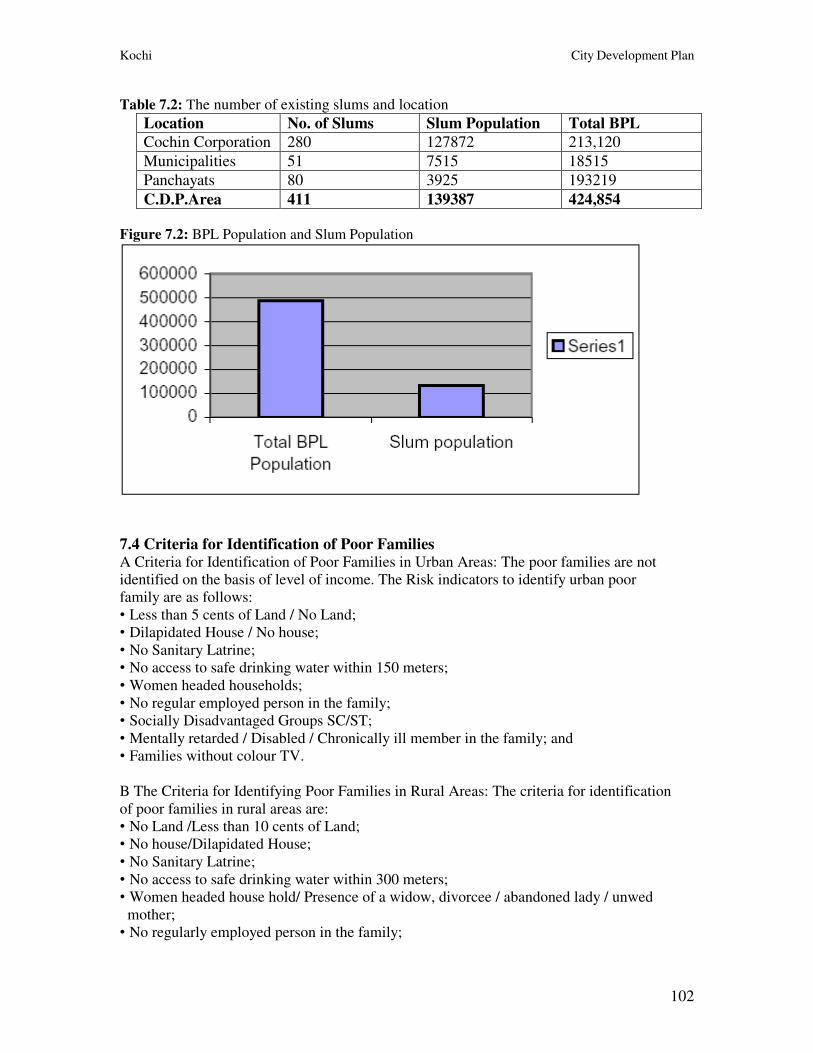
Kochi City Development Plan
102
Table 7.2: The number of existing slums and location
Location No. of Slums Slum Population Total BPL
Cochin Corporation 280 127872 213,120
Municipalities 51 7515 18515
Panchayats 80 3925 193219
C.D.P.Area 411 139387 424,854 Figure 7.2: BPL Population and Slum Population
7.4 Criteria for Identification of Poor Families A Criteria for Identification of Poor Families in Urban Areas: The poor families are not
identified on the basis of level of income. The Risk indicators to identify urban poor
family are as follows:
• Less than 5 cents of Land / No Land;
• Dilapidated House / No house;
• No Sanitary Latrine;
• No access to safe drinking water within 150 meters;
• Women headed households;
• No regular employed person in the family;
• Socially Disadvantaged Groups SC/ST;
• Mentally retarded / Disabled / Chronically ill member in the family; and
• Families without colour TV.
B The Criteria for Identifying Poor Families in Rural Areas: The criteria for identification
of poor families in rural areas are:
• No Land /Less than 10 cents of Land;
• No house/Dilapidated House;
• No Sanitary Latrine;
• No access to safe drinking water within 300 meters;
• Women headed house hold/ Presence of a widow, divorcee / abandoned lady / unwed
mother;
• No regularly employed person in the family;
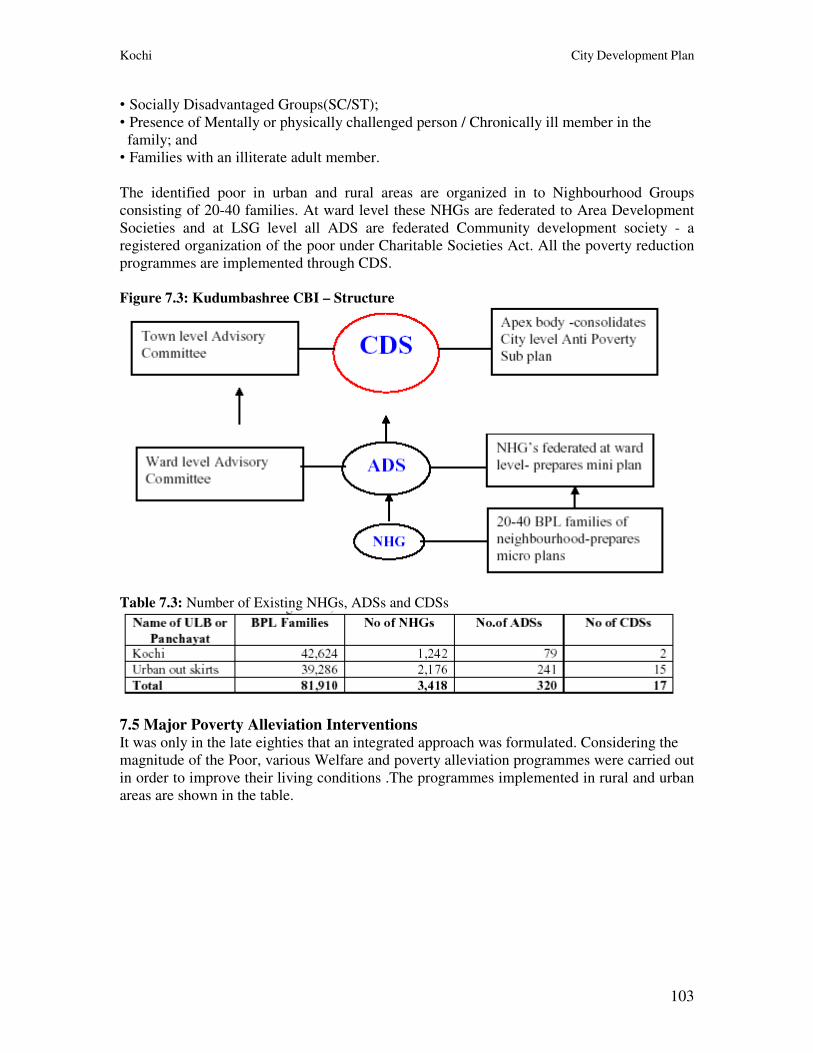
Kochi City Development Plan
103
• Socially Disadvantaged Groups(SC/ST);
• Presence of Mentally or physically challenged person / Chronically ill member in the
family; and
• Families with an illiterate adult member.
The identified poor in urban and rural areas are organized in to Nighbourhood Groups
consisting of 20-40 families. At ward level these NHGs are federated to Area Development
Societies and at LSG level all ADS are federated Community development society - a
registered organization of the poor under Charitable Societies Act. All the poverty reduction
programmes are implemented through CDS.
Figure 7.3: Kudumbashree CBI – Structure
Table 7.3: Number of Existing NHGs, ADSs and CDSs
7.5 Major Poverty Alleviation Interventions It was only in the late eighties that an integrated approach was formulated. Considering the
magnitude of the Poor, various Welfare and poverty alleviation programmes were carried out
in order to improve their living conditions .The programmes implemented in rural and urban
areas are shown in the table.
Kochi City Development Plan
104
The CUPR Project was aimed at securing better access for the poor of Kochi to improved
services and livelihood opportunities by improving their capacity to identify needs and plans
for improvement.It was a joint venture of COC and DFID. The project was implemented for
the years 1998 to 2004 and the total outlay was Rs.70.76 crores.
Components of the project. • Infrastructure- Inslum and citywide;
• Health care;
• Economic development;
• Land tenure;
• Capacity building;
• Community development; and
• Monitoring and evaluation.
Major Achievements • Rehabilitated 275 street children and 160 destitute with the support of NGOs;
• Legal Literacy and Legal awareness given to 35000 members with the support of NGOs;
• Support given to 260 destitute and mentally challenged persons through the PRS;
• Possession Certificate issued to 296 families, 300 tenants converted as title holders.
Rehabilitated 275 street children and 160 destitute with the support of NGOs;
• City wide and inslum improvement programmes;
• Strengthened CBO structure; and
Kochi City Development Plan
105
• Rebilitated 260 families by constructing multi dwelling units.
Poverty Alleviation for Mattancherry A special project under SJSRY,first in India for the poverty Eradication of Mattancherry area
started in 2004 with a central share of Rs.3.5 crores and state Share of 1.17 crores. The major
achievements of the scheme include initiation of 77 DWCUA units, 726 USEP units, Skill
training to 1056 members and renovation of 2 Govt.hospitals under UWEP.
Table 7.5: Socio-Economic Profile of Urban Poor
7.6 Challenges & Key Issues As a first stage in the analysis, general issues facing people in urban poor circumstances can
be identified. The study confirmed the range of problems facing the down trodden.
• Insecurity of tenure and housing;
• Poor sanitary facility;
• Acute scarcity of Potable water;
• Poor standards of Health & Nutrition;
• Social Security-Threat faced by women headed families, most vulnerable, physically
mentally challenged, bedridden, chronic ill patients and street children;
• Poor standards of Education and Literacy, which has a particular impact on women and
children., especially Muslim Women face particular problem because of levels of illiteracy;
• Poor transportation facilities from remote slum settlements to the mainstream;
• Extremely limited employment and income earning opportunities; and
• Limited provision of Environmental services and infrastructure.
Vision. “A slum free city by the year of 2016”.
A comprehensive and sustained strategy with the participation of all stakeholders designed
for the full fledged development of the potentials of the Urban poor by utilizing the existing
resources to tackle the multi fold problems related to infrastructure, environment and
livelihood to equip them for future threats.
Kudumbashree a mission started in 1998 aims to eradicate absolute poverty within 10
years. So by 2008, total poverty should have been eradicated. But, Nature of poverty and
target population varies with years. The definition of poverty itself changed. Now we are
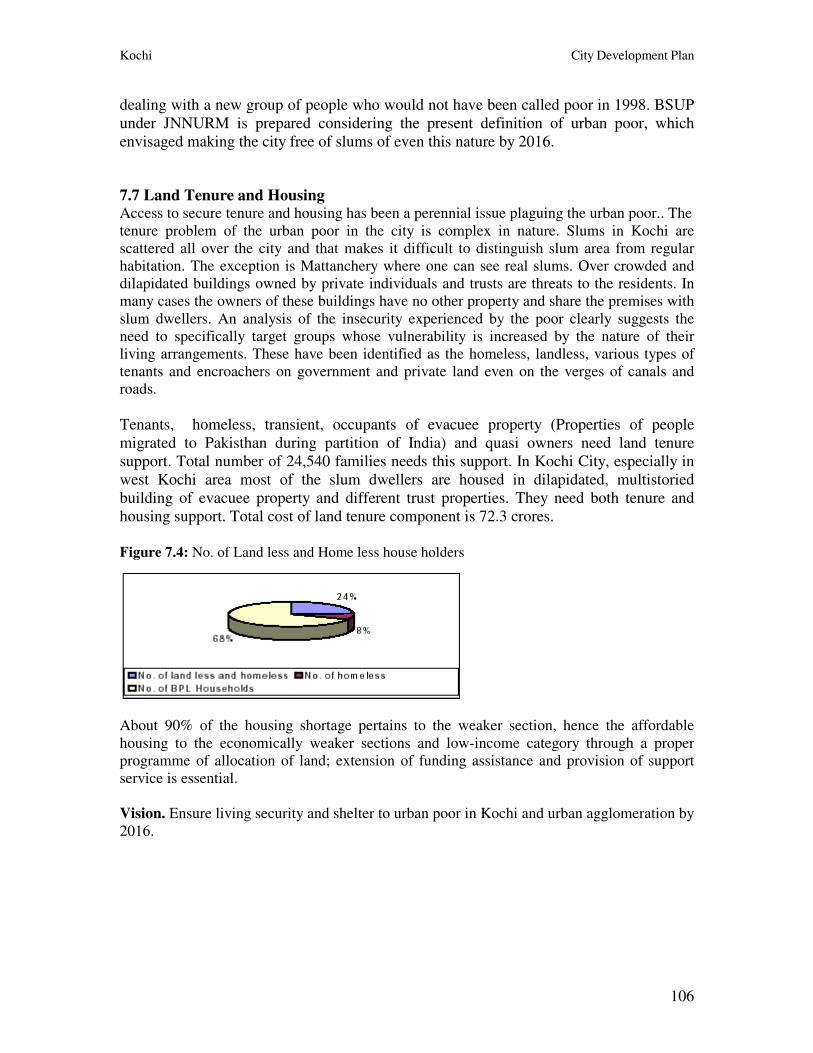
Kochi City Development Plan
106
dealing with a new group of people who would not have been called poor in 1998. BSUP
under JNNURM is prepared considering the present definition of urban poor, which
envisaged making the city free of slums of even this nature by 2016.
7.7 Land Tenure and Housing Access to secure tenure and housing has been a perennial issue plaguing the urban poor.. The
tenure problem of the urban poor in the city is complex in nature. Slums in Kochi are
scattered all over the city and that makes it difficult to distinguish slum area from regular
habitation. The exception is Mattanchery where one can see real slums. Over crowded and
dilapidated buildings owned by private individuals and trusts are threats to the residents. In
many cases the owners of these buildings have no other property and share the premises with
slum dwellers. An analysis of the insecurity experienced by the poor clearly suggests the
need to specifically target groups whose vulnerability is increased by the nature of their
living arrangements. These have been identified as the homeless, landless, various types of
tenants and encroachers on government and private land even on the verges of canals and
roads.
Tenants, homeless, transient, occupants of evacuee property (Properties of people
migrated to Pakisthan during partition of India) and quasi owners need land tenure
support. Total number of 24,540 families needs this support. In Kochi City, especially in
west Kochi area most of the slum dwellers are housed in dilapidated, multistoried
building of evacuee property and different trust properties. They need both tenure and
housing support. Total cost of land tenure component is 72.3 crores.
Figure 7.4: No. of Land less and Home less house holders
About 90% of the housing shortage pertains to the weaker section, hence the affordable
housing to the economically weaker sections and low-income category through a proper
programme of allocation of land; extension of funding assistance and provision of support
service is essential.
Vision. Ensure living security and shelter to urban poor in Kochi and urban agglomeration by
2016.
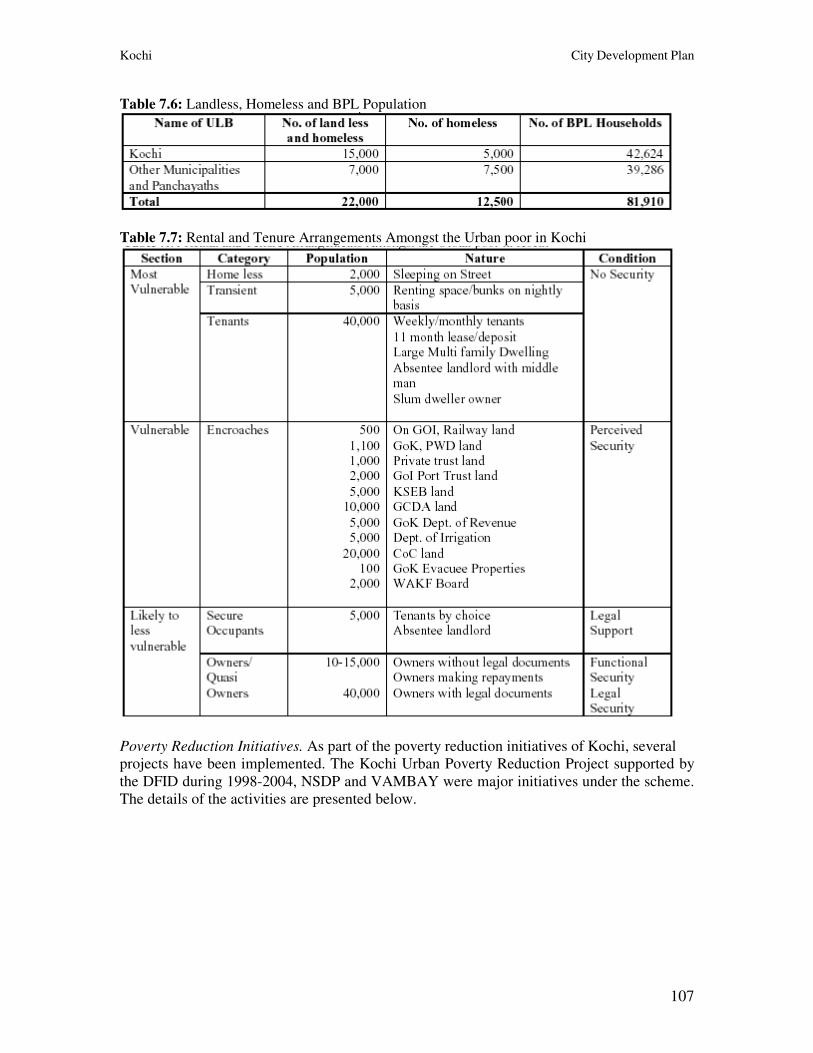
Kochi City Development Plan
107
Table 7.6: Landless, Homeless and BPL Population
Table 7.7: Rental and Tenure Arrangements Amongst the Urban poor in Kochi
Poverty Reduction Initiatives. As part of the poverty reduction initiatives of Kochi, several
projects have been implemented. The Kochi Urban Poverty Reduction Project supported by
the DFID during 1998-2004, NSDP and VAMBAY were major initiatives under the scheme.
The details of the activities are presented below.
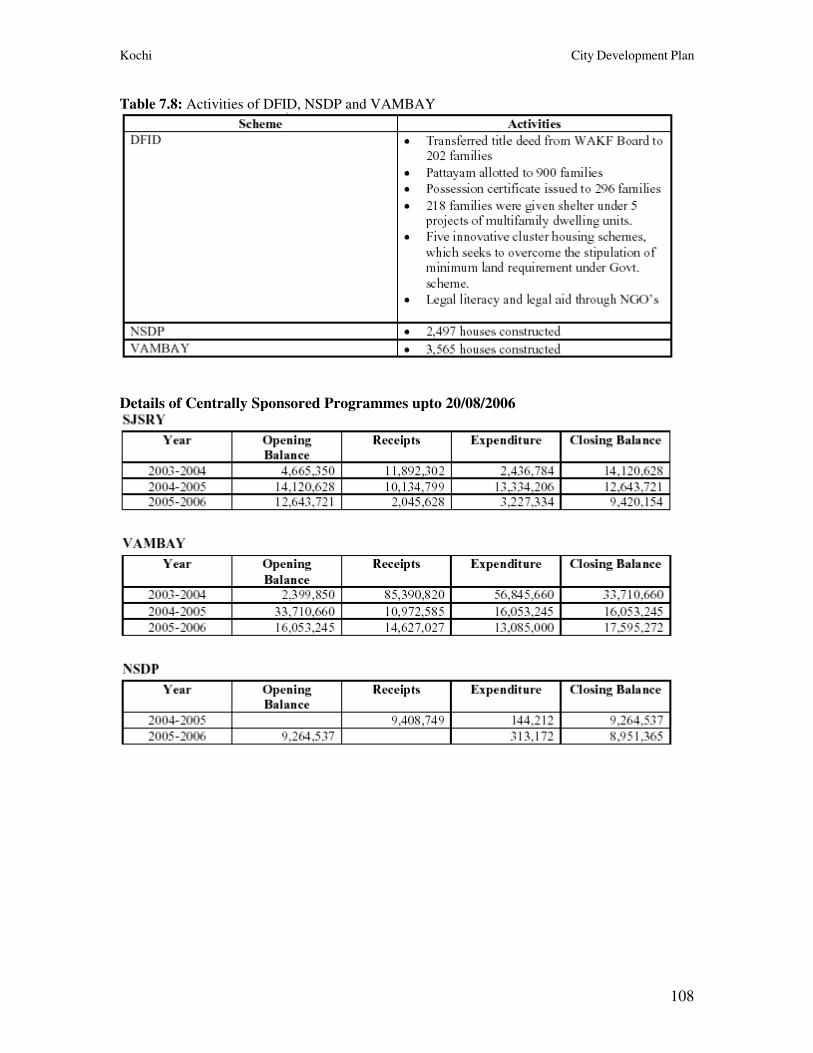
Kochi City Development Plan
108
Table 7.8: Activities of DFID, NSDP and VAMBAY
Details of Centrally Sponsored Programmes upto 20/08/2006
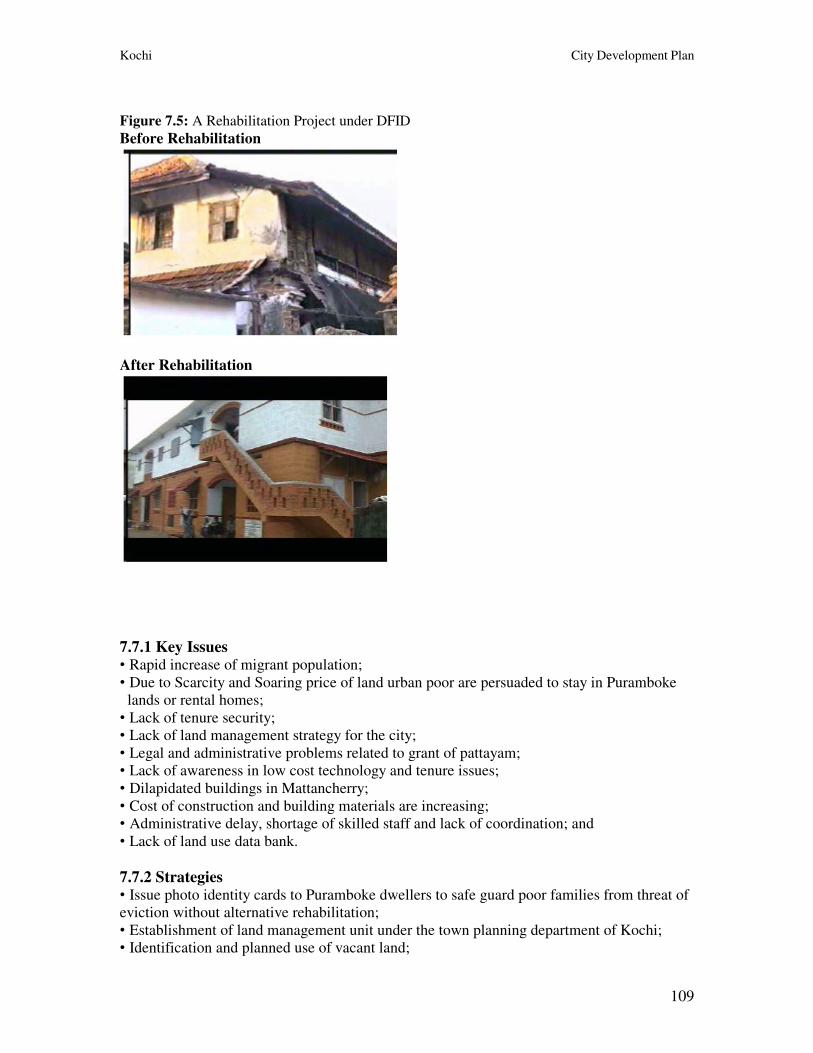
Kochi City Development Plan
109
Figure 7.5: A Rehabilitation Project under DFID
Before Rehabilitation
After Rehabilitation
7.7.1 Key Issues • Rapid increase of migrant population;
• Due to Scarcity and Soaring price of land urban poor are persuaded to stay in Puramboke
lands or rental homes;
• Lack of tenure security;
• Lack of land management strategy for the city;
• Legal and administrative problems related to grant of pattayam;
• Lack of awareness in low cost technology and tenure issues;
• Dilapidated buildings in Mattancherry;
• Cost of construction and building materials are increasing;
• Administrative delay, shortage of skilled staff and lack of coordination; and
• Lack of land use data bank.
7.7.2 Strategies • Issue photo identity cards to Puramboke dwellers to safe guard poor families from threat of
eviction without alternative rehabilitation;
• Establishment of land management unit under the town planning department of Kochi;
• Identification and planned use of vacant land;
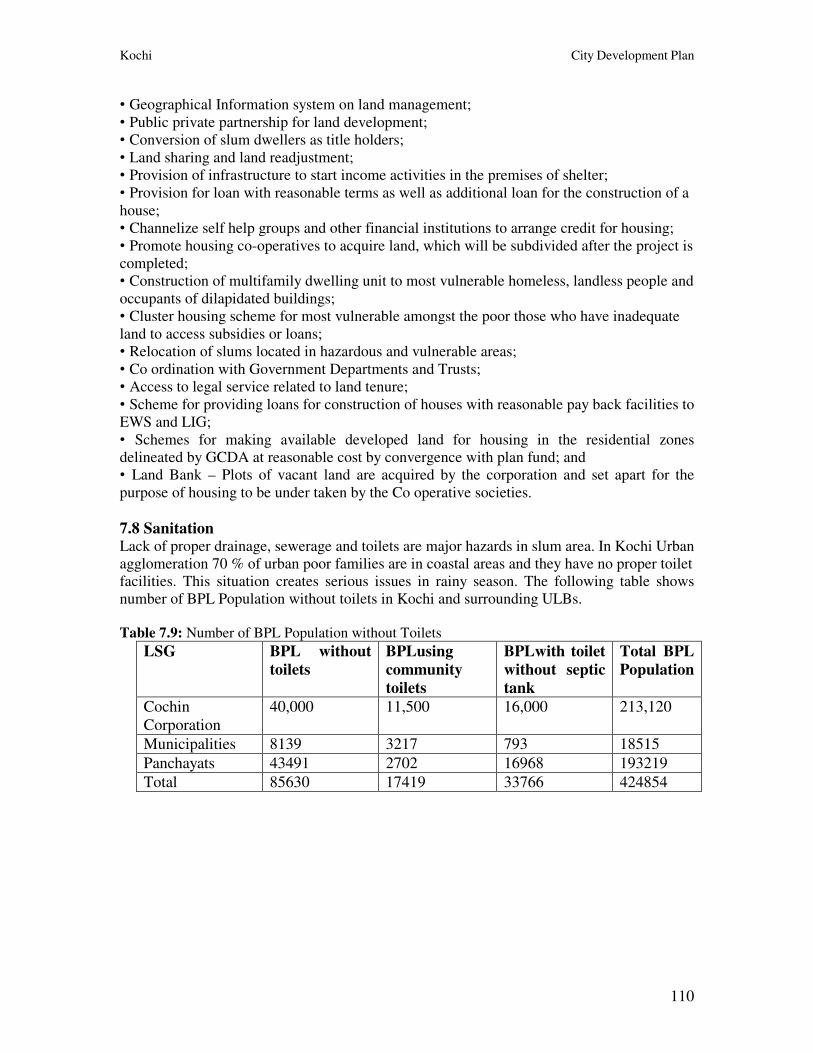
Kochi City Development Plan
110
• Geographical Information system on land management;
• Public private partnership for land development;
• Conversion of slum dwellers as title holders;
• Land sharing and land readjustment;
• Provision of infrastructure to start income activities in the premises of shelter;
• Provision for loan with reasonable terms as well as additional loan for the construction of a
house;
• Channelize self help groups and other financial institutions to arrange credit for housing;
• Promote housing co-operatives to acquire land, which will be subdivided after the project is
completed;
• Construction of multifamily dwelling unit to most vulnerable homeless, landless people and
occupants of dilapidated buildings;
• Cluster housing scheme for most vulnerable amongst the poor those who have inadequate
land to access subsidies or loans;
• Relocation of slums located in hazardous and vulnerable areas;
• Co ordination with Government Departments and Trusts;
• Access to legal service related to land tenure;
• Scheme for providing loans for construction of houses with reasonable pay back facilities to
EWS and LIG;
• Schemes for making available developed land for housing in the residential zones
delineated by GCDA at reasonable cost by convergence with plan fund; and
• Land Bank – Plots of vacant land are acquired by the corporation and set apart for the
purpose of housing to be under taken by the Co operative societies.
7.8 Sanitation Lack of proper drainage, sewerage and toilets are major hazards in slum area. In Kochi Urban
agglomeration 70 % of urban poor families are in coastal areas and they have no proper toilet
facilities. This situation creates serious issues in rainy season. The following table shows
number of BPL Population without toilets in Kochi and surrounding ULBs. Table 7.9: Number of BPL Population without Toilets
LSG BPL without
toilets
BPLusing
community
toilets
BPLwith toilet
without septic
tank
Total BPL
Population
Cochin
Corporation
40,000 11,500 16,000 213,120
Municipalities 8139 3217 793 18515
Panchayats 43491 2702 16968 193219
Total 85630 17419 33766 424854
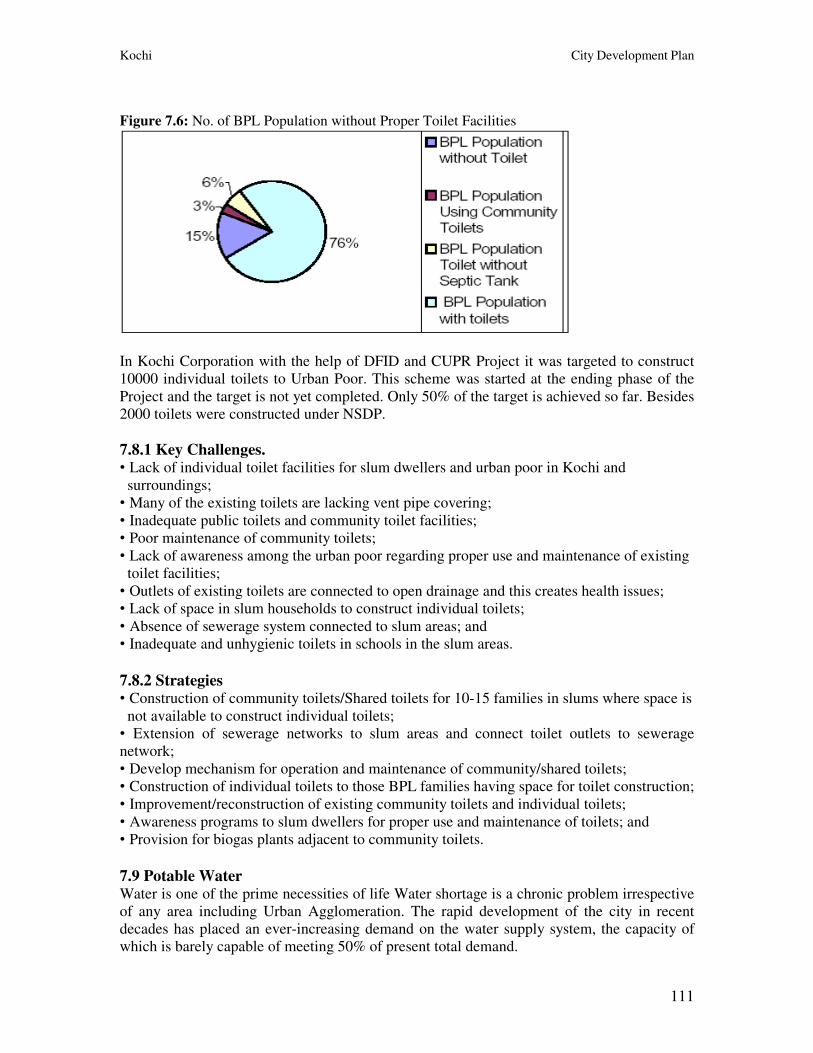
Kochi City Development Plan
111
Figure 7.6: No. of BPL Population without Proper Toilet Facilities
In Kochi Corporation with the help of DFID and CUPR Project it was targeted to construct
10000 individual toilets to Urban Poor. This scheme was started at the ending phase of the
Project and the target is not yet completed. Only 50% of the target is achieved so far. Besides
2000 toilets were constructed under NSDP.
7.8.1 Key Challenges. • Lack of individual toilet facilities for slum dwellers and urban poor in Kochi and
surroundings;
• Many of the existing toilets are lacking vent pipe covering;
• Inadequate public toilets and community toilet facilities;
• Poor maintenance of community toilets;
• Lack of awareness among the urban poor regarding proper use and maintenance of existing
toilet facilities;
• Outlets of existing toilets are connected to open drainage and this creates health issues;
• Lack of space in slum households to construct individual toilets;
• Absence of sewerage system connected to slum areas; and
• Inadequate and unhygienic toilets in schools in the slum areas.
7.8.2 Strategies • Construction of community toilets/Shared toilets for 10-15 families in slums where space is
not available to construct individual toilets;
• Extension of sewerage networks to slum areas and connect toilet outlets to sewerage
network;
• Develop mechanism for operation and maintenance of community/shared toilets;
• Construction of individual toilets to those BPL families having space for toilet construction;
• Improvement/reconstruction of existing community toilets and individual toilets;
• Awareness programs to slum dwellers for proper use and maintenance of toilets; and
• Provision for biogas plants adjacent to community toilets.
7.9 Potable Water Water is one of the prime necessities of life Water shortage is a chronic problem irrespective
of any area including Urban Agglomeration. The rapid development of the city in recent
decades has placed an ever-increasing demand on the water supply system, the capacity of
which is barely capable of meeting 50% of present total demand.
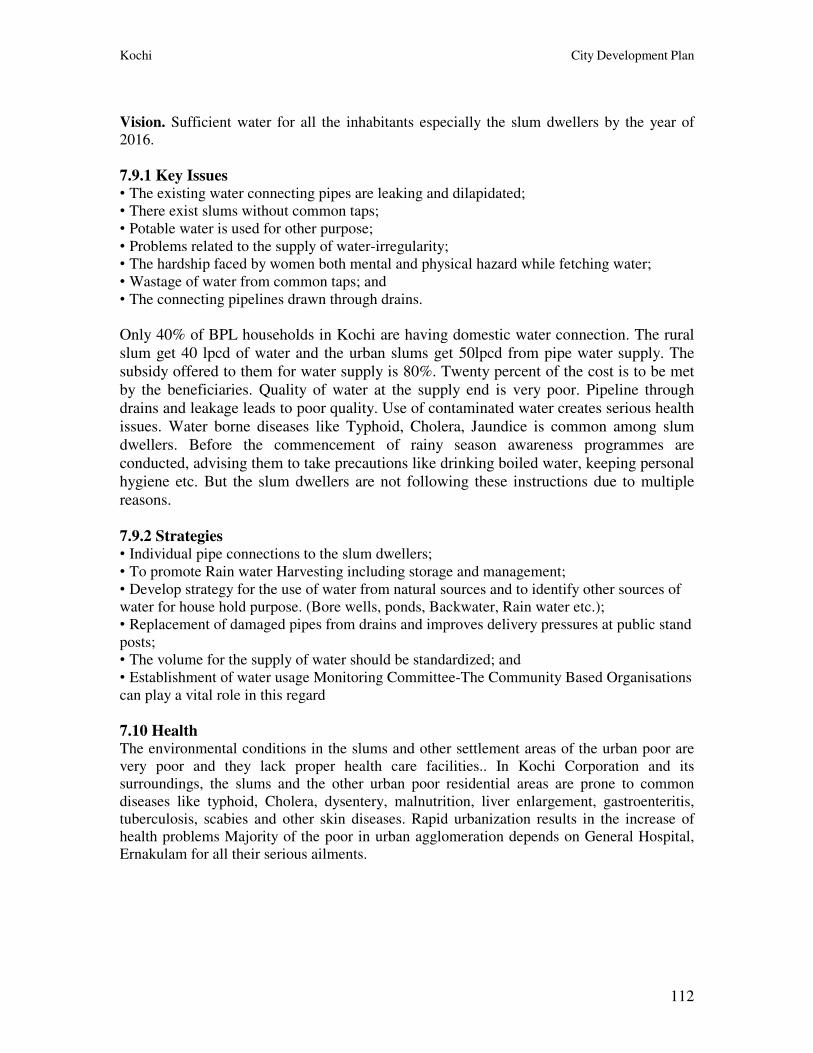
Kochi City Development Plan
112
Vision. Sufficient water for all the inhabitants especially the slum dwellers by the year of
2016.
7.9.1 Key Issues • The existing water connecting pipes are leaking and dilapidated;
• There exist slums without common taps;
• Potable water is used for other purpose;
• Problems related to the supply of water-irregularity;
• The hardship faced by women both mental and physical hazard while fetching water;
• Wastage of water from common taps; and
• The connecting pipelines drawn through drains.
Only 40% of BPL households in Kochi are having domestic water connection. The rural
slum get 40 lpcd of water and the urban slums get 50lpcd from pipe water supply. The
subsidy offered to them for water supply is 80%. Twenty percent of the cost is to be met
by the beneficiaries. Quality of water at the supply end is very poor. Pipeline through
drains and leakage leads to poor quality. Use of contaminated water creates serious health
issues. Water borne diseases like Typhoid, Cholera, Jaundice is common among slum
dwellers. Before the commencement of rainy season awareness programmes are
conducted, advising them to take precautions like drinking boiled water, keeping personal
hygiene etc. But the slum dwellers are not following these instructions due to multiple
reasons.
7.9.2 Strategies • Individual pipe connections to the slum dwellers;
• To promote Rain water Harvesting including storage and management;
• Develop strategy for the use of water from natural sources and to identify other sources of
water for house hold purpose. (Bore wells, ponds, Backwater, Rain water etc.);
• Replacement of damaged pipes from drains and improves delivery pressures at public stand
posts;
• The volume for the supply of water should be standardized; and
• Establishment of water usage Monitoring Committee-The Community Based Organisations
can play a vital role in this regard
7.10 Health The environmental conditions in the slums and other settlement areas of the urban poor are
very poor and they lack proper health care facilities.. In Kochi Corporation and its
surroundings, the slums and the other urban poor residential areas are prone to common
diseases like typhoid, Cholera, dysentery, malnutrition, liver enlargement, gastroenteritis,
tuberculosis, scabies and other skin diseases. Rapid urbanization results in the increase of
health problems Majority of the poor in urban agglomeration depends on General Hospital,
Ernakulam for all their serious ailments.
Kochi City Development Plan
113
Table 7.10: Methods of Treatment
Figure 7.7: Modes of treatment
Table 7.11: Medical Institutions
While considering the health status of the slums it is necessary to analyze the various existing
health care facilities accessible to the urban poor in the area.
Compared to the urban poor population, existing health care institutions accessible to them
are inadequate to meet their requirements. Studies show that health campaign Programmes
are very limited in Kochi and its peri-urban areas, especially that of the urban poor. The
usage of preventive vaccines is low due to ignorance. Economic instability is the major
reason for malnutrition in children and women. Since a good percentage of the male among
the urban poor, the sole bread winners of the family are under the wrath of such diseases it
has resulted in the disintegration of these families and hence the society.
Kochi City Development Plan
114
Table 7.12: No. of institutions in LBs
The ICDS feeding/pre school programmes for children make an important contribution to
their nutritional status, reducing their risks of ill health and malnutrition increasing their
learning ability and reducing the exposure of their households to treatment costs for ill health.
Institutions referred in tables 7.10, 7.11 & 7.12 are Government institutions and they are
utilized mainly by the urban poor. Table 7.13: Anganwadis
Through the CUPRP project, financial assistance was given to the victims of TB, Cancer, the
Kochi City Development Plan
115
Mentally challenged, and vulnerable families. The patients who need super specialty surgery
and investigation were given support. Under Kudumbashree this project also trained 1200
Community health volunteers in collaboration with Amritha Institute of Medical science, and
equipped them with medical kit.
Cochin Corporation started a “Blood Literacy Project” from 2002 onwards with the aim of
issuing health cards to the urban population.
Sexually transmitted diseases like HIV and AIDS have emerged as an important public health
problem and it is a developmental challenge. Ignorance about the diseases and its
transmission and intervenal drug abuse and indiscriminate sexual behavior leads, these
uneducated poor to contract these fatal diseases.
7.10.1 Key Issues. • Poor infrastructure in existing Govt. Hospitals PHCs, CHCs, and MCW centers, cancer
detection center, Kaloor, T.B Centre Karuvelippady;
• Lack of awareness about preventive medicines, nutrition, and other health care measures;
• Increase of alcohol/drug abuse, STD, AIDS etc.;
• Inadequate institutions and treatment for the mentally and physically challenged persons;
• Increase in life style diseases like diabetes, Blood pressure, cholesterol etc.;
• Use of contaminated drinking water;
• Improper drainage and absence of sewage system;
• Reluctance to use alternative treatment facilities like Ayurveda and Homeopathy; and
• Non Convergence of activities of various departments/bodies/ inadequate publicity to health
care programmes.
7.10.2 Strategies • Infrastructure development and adequate stock of medicines in all the existing Govt.
Hospitals, PHCs, CHCs, MCW Centres, Cancer Detection Centre,Kaloor,T.B.Centere
Karuvelipady, Anganwadies in the area and so on.
• Consistent health awareness programs through advertisements, print, and visual media in
selected areas;
• Supply of free medicine for the chronically ill through health centers;
• Strengthen the CHV’s with medical kits;
• Conduct monthly medical camps and immunization programs in slums;
• Issuing health cards to all the urban poor;
• Health assistance to victims of all chronic diseases among the urban poor;
• Start well equipped mobile clinics with ambulance service;
• Strengthening the distribution of supplementary nutrition through ICDS and community
health centers also include children up to three years in the Anganwadies with a minimum
fee. (Considering as day care centres);
• Convergence and Co-ordination of different community health care activities of different
Govt. and Non-Govt. institutions;
• Bring all urban poor under medical insurance scheme with an affordable beneficiary
contribution;
• Enhance voluntary counseling and testing centers (VCTC) in selected areas; and
• Promoting Ayurveda and Homeopathic systems of medicines.
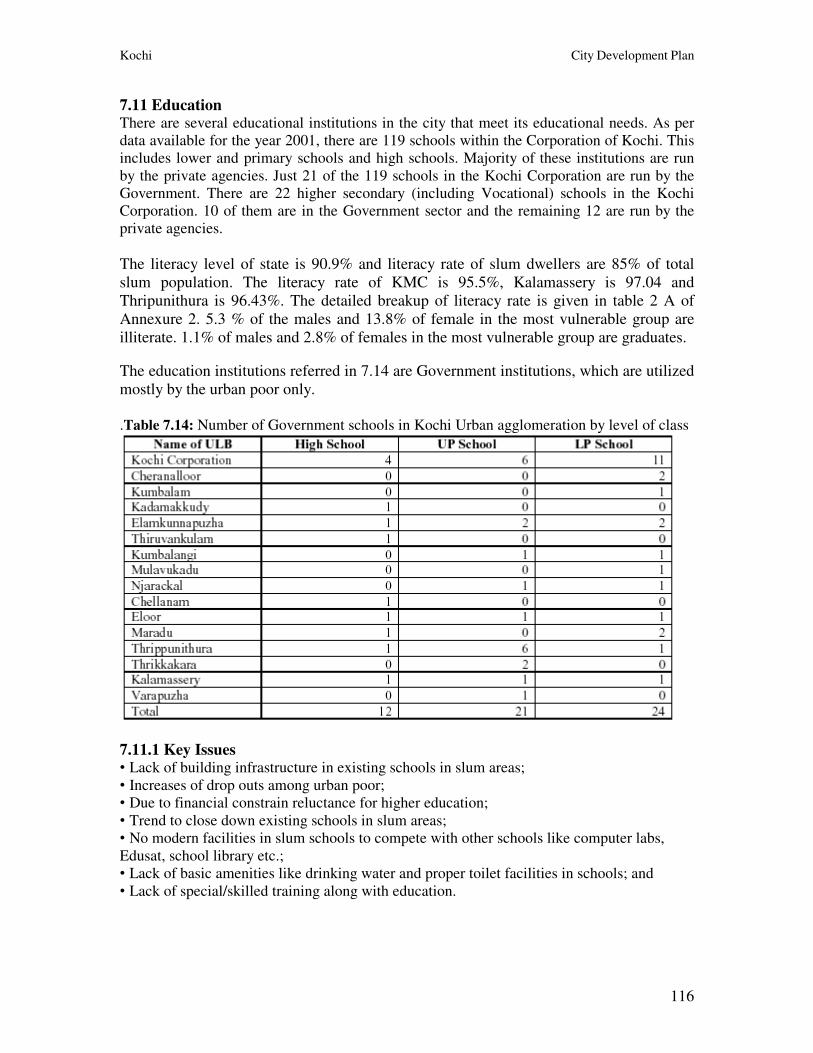
Kochi City Development Plan
116
7.11 Education There are several educational institutions in the city that meet its educational needs. As per
data available for the year 2001, there are 119 schools within the Corporation of Kochi. This
includes lower and primary schools and high schools. Majority of these institutions are run
by the private agencies. Just 21 of the 119 schools in the Kochi Corporation are run by the
Government. There are 22 higher secondary (including Vocational) schools in the Kochi
Corporation. 10 of them are in the Government sector and the remaining 12 are run by the
private agencies.
The literacy level of state is 90.9% and literacy rate of slum dwellers are 85% of total
slum population. The literacy rate of KMC is 95.5%, Kalamassery is 97.04 and
Thripunithura is 96.43%. The detailed breakup of literacy rate is given in table 2 A of
Annexure 2. 5.3 % of the males and 13.8% of female in the most vulnerable group are
illiterate. 1.1% of males and 2.8% of females in the most vulnerable group are graduates.
The education institutions referred in 7.14 are Government institutions, which are utilized
mostly by the urban poor only.
.Table 7.14: Number of Government schools in Kochi Urban agglomeration by level of class
7.11.1 Key Issues • Lack of building infrastructure in existing schools in slum areas;
• Increases of drop outs among urban poor;
• Due to financial constrain reluctance for higher education;
• Trend to close down existing schools in slum areas;
• No modern facilities in slum schools to compete with other schools like computer labs,
Edusat, school library etc.;
• Lack of basic amenities like drinking water and proper toilet facilities in schools; and
• Lack of special/skilled training along with education.
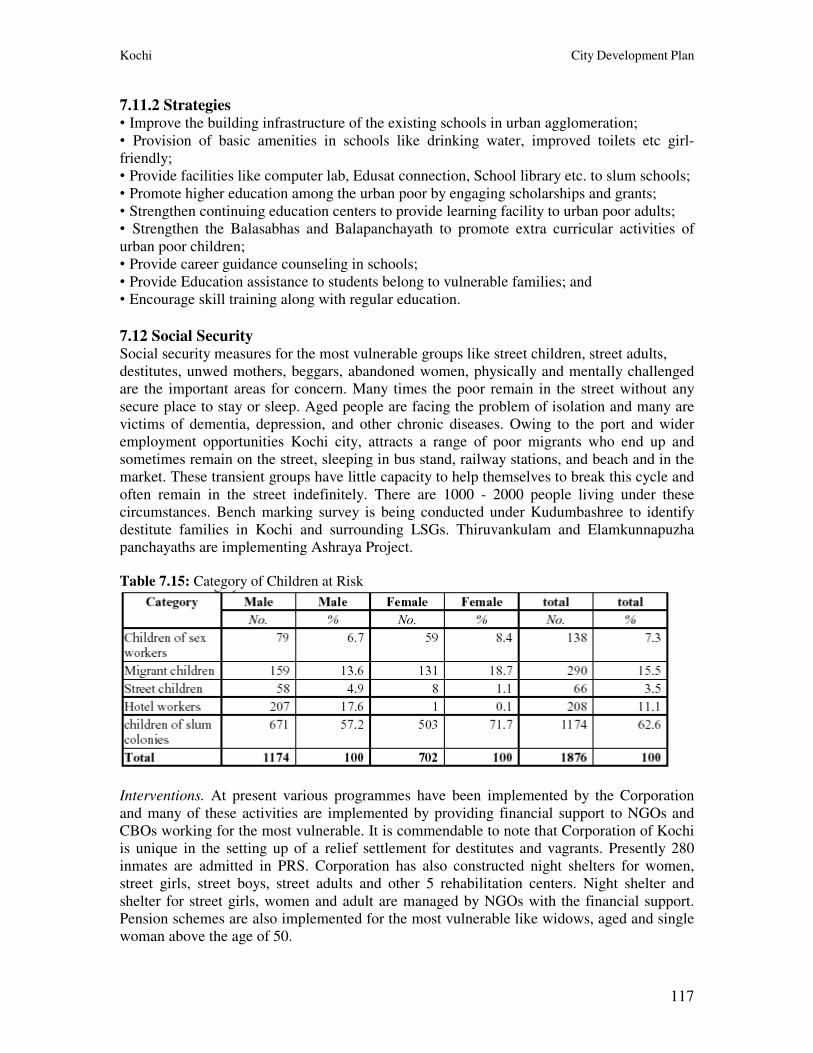
Kochi City Development Plan
117
7.11.2 Strategies • Improve the building infrastructure of the existing schools in urban agglomeration;
• Provision of basic amenities in schools like drinking water, improved toilets etc girl-
friendly;
• Provide facilities like computer lab, Edusat connection, School library etc. to slum schools;
• Promote higher education among the urban poor by engaging scholarships and grants;
• Strengthen continuing education centers to provide learning facility to urban poor adults;
• Strengthen the Balasabhas and Balapanchayath to promote extra curricular activities of
urban poor children;
• Provide career guidance counseling in schools;
• Provide Education assistance to students belong to vulnerable families; and
• Encourage skill training along with regular education.
7.12 Social Security Social security measures for the most vulnerable groups like street children, street adults,
destitutes, unwed mothers, beggars, abandoned women, physically and mentally challenged
are the important areas for concern. Many times the poor remain in the street without any
secure place to stay or sleep. Aged people are facing the problem of isolation and many are
victims of dementia, depression, and other chronic diseases. Owing to the port and wider
employment opportunities Kochi city, attracts a range of poor migrants who end up and
sometimes remain on the street, sleeping in bus stand, railway stations, and beach and in the
market. These transient groups have little capacity to help themselves to break this cycle and
often remain in the street indefinitely. There are 1000 - 2000 people living under these
circumstances. Bench marking survey is being conducted under Kudumbashree to identify
destitute families in Kochi and surrounding LSGs. Thiruvankulam and Elamkunnapuzha
panchayaths are implementing Ashraya Project. Table 7.15: Category of Children at Risk
Interventions. At present various programmes have been implemented by the Corporation
and many of these activities are implemented by providing financial support to NGOs and
CBOs working for the most vulnerable. It is commendable to note that Corporation of Kochi
is unique in the setting up of a relief settlement for destitutes and vagrants. Presently 280
inmates are admitted in PRS. Corporation has also constructed night shelters for women,
street girls, street boys, street adults and other 5 rehabilitation centers. Night shelter and
shelter for street girls, women and adult are managed by NGOs with the financial support.
Pension schemes are also implemented for the most vulnerable like widows, aged and single
woman above the age of 50.
Kochi City Development Plan
118
7.12.1 Key issues faced by the vulnerable groups • Inadequate food and medicine;
• Inadequate shelter to destitutes and vagrant;
• Lack of access to basic amenities and services;
• Lack of infrastructure and other facilities in existing rehabilitation centers;
• Lack of night shelter for women;
• Lack of counseling and proper guidance; and
• Insecurity and threat from antisocial elements.
7.12.2 Strategies • ASHRAYA (Destitute Identification Rehabilitation and Monitoring) project under
Kudumbashree for destitutes in Kochi and surrounding local bodies;
• Need based rehabilitation programmes suitable to the needs of various vulnerable groups;
• Rehabilitation centers for mentally and physically challenged people;
• Education for street children and school dropouts;
• Shelter for street children, adults and destitute;
• Construction and maintenance of Old age homes and day care centers for the aged;
• Counseling centers;
• Convergence of programmes of various departments and NGOs;
• Community based rehabilitation centers and community kitchen;
• Recreational centers for children, aged and destitutes;
• Short stay homes;
• Home placement programmes;
• Housing programmes for widows and women headed families and handicapped;
• Social insurance schemes including unemployment wages, insurance, income support, old
age pension, sickness and maternity benefit, injury and disability benefit and access to
education;
• Awareness program against sex abuse;
• Relocation and construction of Palluruthy Relief Settlement;
• Alzheimer’s care centers;
• Formation of Juvenile home; and
• Organizing livelihood and income generation programs for vulnerable urban poor.
7.13 Urban Poor and Livelihood All urban poor families depend on city’s economic activities for livelihood. Most of them
work in unorganized informal sectors like fishing, akry collection, construction work, cloth
selling or work as vegetable vendors, coolies, carpenters etc. Seasonal unemployment,
irregular employment and low payment are major hazards. The informal activities mainly
concentrate around major road network in the city such as road margins, foot paths, space in
small market areas etc. spread all over the corporation and surrounding municipalities and
Panchayaths. The major areas of informal activities in Kochi city are Shanmukhm Road,
Broadway, M. G Road etc.
7.13.1 Key Issues • Those Urban Poor families engaged in fishing occupation face the problem of seasonal
unemployment. More over they face threats to potential earnings due to changing technology
and depletion of fish stocks in rivers and seas;
Kochi City Development Plan
119
• Non- availability of fish landing centers at suitable locations;
• Non availability of commercial spaces for marketing products of micro-enterprise units is a
major constrain for urban poor entrepreneurs;
• Majority of Urban poor engaged in unskilled or semi skilled low paid work;
• Lack of marketing, quality checking facility to the products of urban poor entrepreneurs;
and
• Absence of database to co-ordinate the job opportunities available to urban poor.
7.13.2 Strategies • Construction of low cost workspace in different slum pockets and other market areas;
• Fix an affordable user charge for the work space;
• Develop a data base on job opportunities suitable for urban poor with Keralashree-a Virtual
employment exchange initiated under Kudumbashree in different employment generating
sectors like sea port, Vellarpadom Container Terminal, Kochi Special;
• Economic Zone, Info Park etc including Public/Private Sectors;.
• Set up a quality checking system for the products of urban poor entrepreneurs;
• Advanced EDP Training to eligible entrepreneurs; and
• Establishment of a marketing/resource/advisory centers. Major functions of the centers
would be following:
� Provide marketing opportunities to the products urban poor enterprises;
� Counseling to those entrepreneurs facing different constraints;
� Standardization of prizes of products of urban poor;
� Form a guild of urban poor who engaged in similar work and make networks with
larger business groups in the field to obtain subcontracts;
� Diversification of traditional work carried out by urban poor like fishing;
� Organize multi purpose job clubs of skilled and semiskilled workers among the urban
Poor including women;
� Promote new areas of income generation to urban poor like urban agriculture, fish
farms, domestic animal farms, horticulture etc within urban and peri-urban areas;
and Development of fish landing facilities.
�
7.14 Environmental Improvements The Urban Poverty Study Undertaken in late 1995 indicated that deficiencies in the city wide
services such as Flood Control and Protection, In slum Transportation, Street lighting, are
keenly felt by the urban poor, particularly the most Vulnerable Groups, who are least able to
adopt ‘coping strategies to reduce the adverse effects of inadequate provision of these
services.
7.14.1 Key Challenges • Flooding during Monsoon causes silting up of drainage channel and the restriction natural
flow caused by accumulated rubbish in channels;
• The poorest people have no means of escape from the consequences of flooding and it
presents a significant threat to health particularly for children;
• There are 37 slums in the city that are severely affected by flooding;
• Dilapidated Drains and Canals; and
• Lack of protection walls and culverts in order to ensure natural flow.
Kochi City Development Plan
120
7.14.2 Strategies • Raising and protecting canal banks;
• Construction of retaining walls wherever required;
• Placing land fill in critical low lying areas;
• Inserting culverts in key locations;
• Major canal maintenance including de silting;
• Purchase of slum friendly adequate equipments for de silting;
• Renovation of existing Drains; and
• Awareness to the public on O&M.
7.14.3 Roads and Transportation Better access of the poor to the public transport is of great significance related to their
poverty. Inaccessibility leads to lack of opportunity, growth and development. One of the
problems identified, related to this sector, is that the residential areas of slum dwellers are
inaccessible to public transportation facilities. Dilapidated and poor roads, sub roads and bye
lanes make their life pathetic.
7.14.4 Key Challenges • Existing dilapidated roads, sub roads, bye lanes etc.;
• Low lying roads (flood affected);
• Poor and unhygienic pedestrian lanes;
• Inaccessibility of urban poor to the work place and mainstream of the city;
• Shortage of water transportation facilities; and
• Lack of public transport facilities extending to slums.
7.14.5 Strategies • A demand led approach for the improvement of access to public transport;
• Realizing the geographical conditions and climate, choose appropriate technologies to build
roads. (Nature of areas – riverside, coastal, low-lying);
• Develop usable inland water transport facilities;
• Ensuring the mobility of slum dwellers, Project should intervene promotion of mini bus
services (Local area network), extension of existing bus routs to inner slum areas and
purchase of new vehicles for public transport;
• Construction of all weather roads to the pedestrians; and
• Ensure people’s participation in operation and maintenance of public transport.
7.14.6 Electricity and Streetlights There are urban poor families with no household electricity connection. KSEB is providing
free connections to below poverty line families but many of the BPL families do not use this
benefit due to financial constraints to finish wiring work. There is coverage of streetlights in
Kochi city but the peri-urban areas need special attention.
7.14.7 Key Challenges • Most of the Slum Households have no electricity connections;
• Lack of adequate streetlights in peri urban areas;
• Existing streetlight are not working properly;
• Financial constraints of urban poor to avail individual electricity connections; and
• Frequent voltage fluctuations in slum settlements.
Kochi City Development Plan
121
7.14.8 Strategies • Promotion of solar, and bio gas technologies to produce energy;
• Coverage of streetlights to all localities and scattered areas of urban poor including peri-
urban areas;
• Ensuring complete coverage of household electric connections to the urban poor;
• Promotion of streetlights using solar energy techniques; and
• Ensure electric connections in all civic amenities in slum like community hall centers,
reading rooms, public health centers, community toilets etc.
7.14.9 Civic Amenities The high density of population with limited space in slums makes the environment
congested. The co- ordination and harmony of the people are an essential component for the
smooth functioning of the society. Improved social awareness is a pre-requisite. The Social
behaviour of every individual can develop through the improvement of environment and
surroundings. When analyzing a slum situation it is generally considered as the place of
many social ills, all types of heterorganic amoral and asocial evils. A positive change is
effective when there are accelerated improvements in the environmental conditions.
7.14.10 Strategies • Development of existing community hall centers, community toilets, libraries, reading
rooms, and other recreational centers;
• Construct parks in appropriate vacant lands in and around slum settlement;
• Construction of new community hall centers/reading rooms;
• Development of new and existing plays grounds;
• Day care centers for Babies;
• Improve the condition and infra-structure of schools in slums;
• Construction of new community toilets and improvement of existing ones;
• Construction of Working Women Hostels; and
• As a part of environment improvements, promote social forestry attempts and strategies.
7.14.11 Solid Waste Management The urban poor do not generate large quantities of solid waste and tend to recycle any thing
of value. The remaining waste is either allowed to accumulate near their dwellings, or is
thrown in any convenient drain or canal. However, there are significant hazards to slum
communities in these practices. Decomposing of organic materials releases toxic gases and
foul smell, plastic and other inorganic materials block the drainage channels and cause
frequent health issues and flooding in rainy season. The slaughterhouses in slums dump their
waste to the nearby canals flowing to river. This practice creates blocks in the flow of canal
water and pollutes the environment and also creates a mosquito friendly atmosphere in the
areas.
Initiatives. In Corporation and surroundings Clean Kerala Units are started to collect solid
waste from households and hotels in the city through Kudumbashree units. At present there
are 21 units functioning. These units are doing collection and dump this waste to common
bins. In Corporation and surroundings there are very few units of biogas plants and vermi
compost units. But there is no provision for segregation/ treatment.
Kochi City Development Plan
122
7.14.12 Key Issues • City wide waste collection service does not reach most of the slums and urban poor
residential areas;
• Absence of efficient and effective primary waste collection in Kochi and Surroundings;
• Lack of awareness among the urban poor regarding proper solid waste disposal;
• Open drainage, canals and vacant land become waste dumping places;
• Inadequacy of waste bins in slums;
• No provision for daily removal of waste from existing bins creates environmental pollution;
• Urban poor have limited land premises to segregate or dispose waste; and
• Reluctance of slum dwellers and urban poor residence to pay a nominal collection Charges
or service charge.
7.14.13 Strategies • Provision of simple waste bins at convenient locations within the slums;
• Collection of waste by small ubiquitous collection vehicle capable of carrying up to 2.2
Cubic meters of waste and can traverse footpath not more than two meters wide;
• Door to door waste collection service to slum and urban poor residents;
• Generate employment opportunities to urban poor in collection of waste;
• Create awareness to urban poor regarding solid waste management through popular media;
• After segregated collection regular removal waste to secondary collection points outside
slums;
• Affordable collection charges can be introduced to urban poor;
• Promote Provision for disposal of bio wastes in building plans;
• Promote vermi composting in house holds;
• Provision for biogas plants within the slums and it will generate employment opportunity to
urban poor; and
• lums and it will generate employment opportunity to urban poor.
7.15 Financial Plan In order to decide the allocation of funds to the different local bodies for the projects
identified for them the data collected through a workshop conducted for this purpose was
utilized. Representatives of CBOs, Municipal councilors, Grama Panchayat and Block
Panchayat Presidents along with their members and Project officers of Kudumbasree
participated in this.Their aspirations were consolidated and based on the BPL population of
each LB and their need the allocations were arrived at. The table below shows distribution of
finance envisaged during the period of CDP.
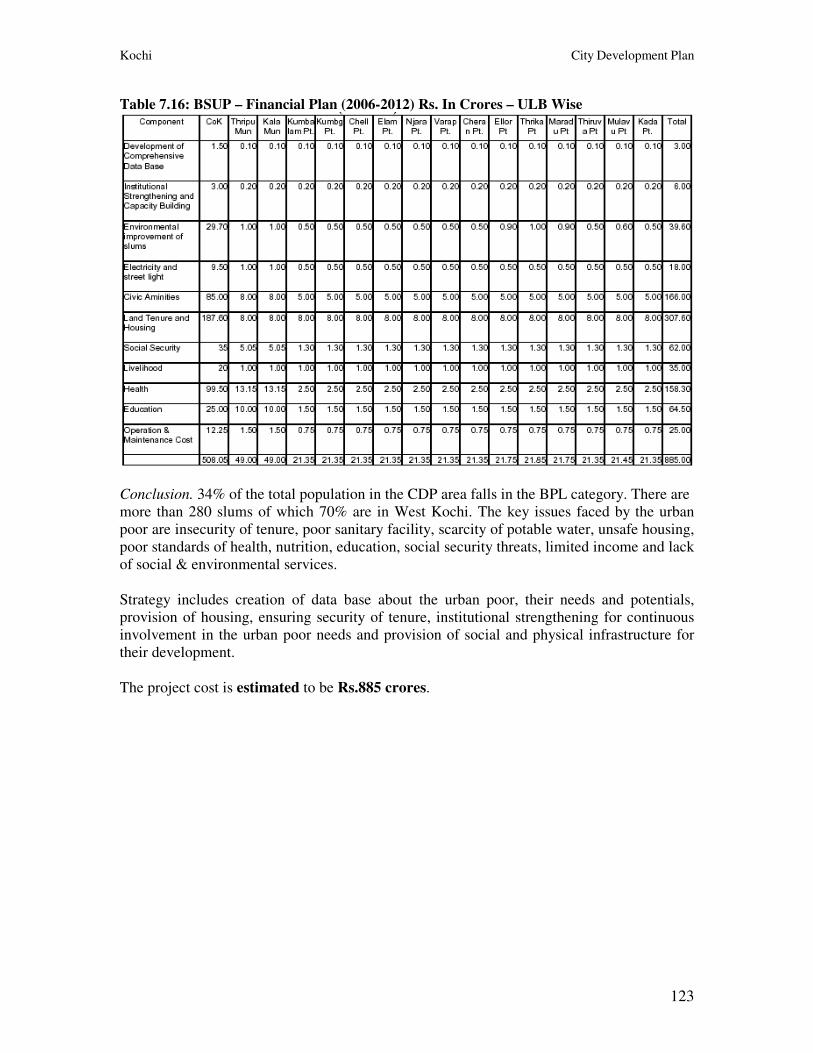
Kochi City Development Plan
123
Table 7.16: BSUP – Financial Plan (2006-2012) Rs. In Crores – ULB Wise
Conclusion. 34% of the total population in the CDP area falls in the BPL category. There are
more than 280 slums of which 70% are in West Kochi. The key issues faced by the urban
poor are insecurity of tenure, poor sanitary facility, scarcity of potable water, unsafe housing,
poor standards of health, nutrition, education, social security threats, limited income and lack
of social & environmental services.
Strategy includes creation of data base about the urban poor, their needs and potentials,
provision of housing, ensuring security of tenure, institutional strengthening for continuous
involvement in the urban poor needs and provision of social and physical infrastructure for
their development.
The project cost is estimated to be Rs.885 crores.
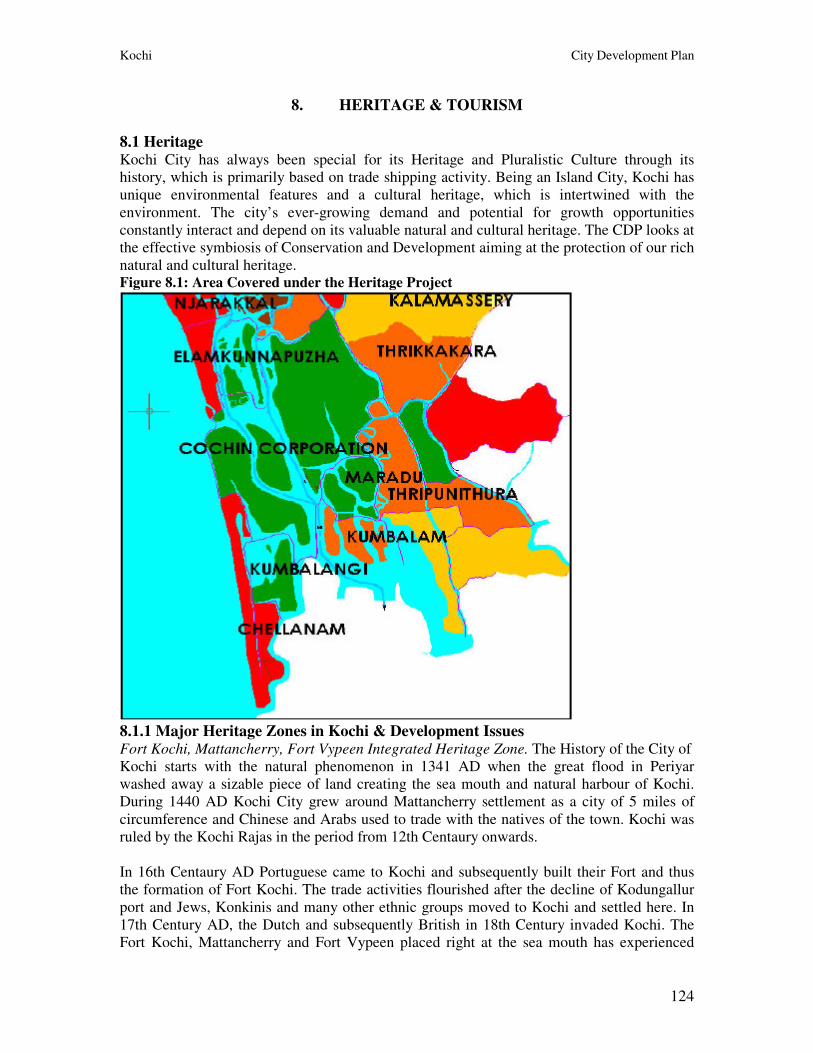
Kochi City Development Plan
124
8. HERITAGE & TOURISM
8.1 Heritage Kochi City has always been special for its Heritage and Pluralistic Culture through its
history, which is primarily based on trade shipping activity. Being an Island City, Kochi has
unique environmental features and a cultural heritage, which is intertwined with the
environment. The city’s ever-growing demand and potential for growth opportunities
constantly interact and depend on its valuable natural and cultural heritage. The CDP looks at
the effective symbiosis of Conservation and Development aiming at the protection of our rich
natural and cultural heritage. Figure 8.1: Area Covered under the Heritage Project
8.1.1 Major Heritage Zones in Kochi & Development Issues Fort Kochi, Mattancherry, Fort Vypeen Integrated Heritage Zone. The History of the City of
Kochi starts with the natural phenomenon in 1341 AD when the great flood in Periyar
washed away a sizable piece of land creating the sea mouth and natural harbour of Kochi.
During 1440 AD Kochi City grew around Mattancherry settlement as a city of 5 miles of
circumference and Chinese and Arabs used to trade with the natives of the town. Kochi was
ruled by the Kochi Rajas in the period from 12th Centaury onwards.
In 16th Centaury AD Portuguese came to Kochi and subsequently built their Fort and thus
the formation of Fort Kochi. The trade activities flourished after the decline of Kodungallur
port and Jews, Konkinis and many other ethnic groups moved to Kochi and settled here. In
17th Century AD, the Dutch and subsequently British in 18th Century invaded Kochi. The
Fort Kochi, Mattancherry and Fort Vypeen placed right at the sea mouth has experienced
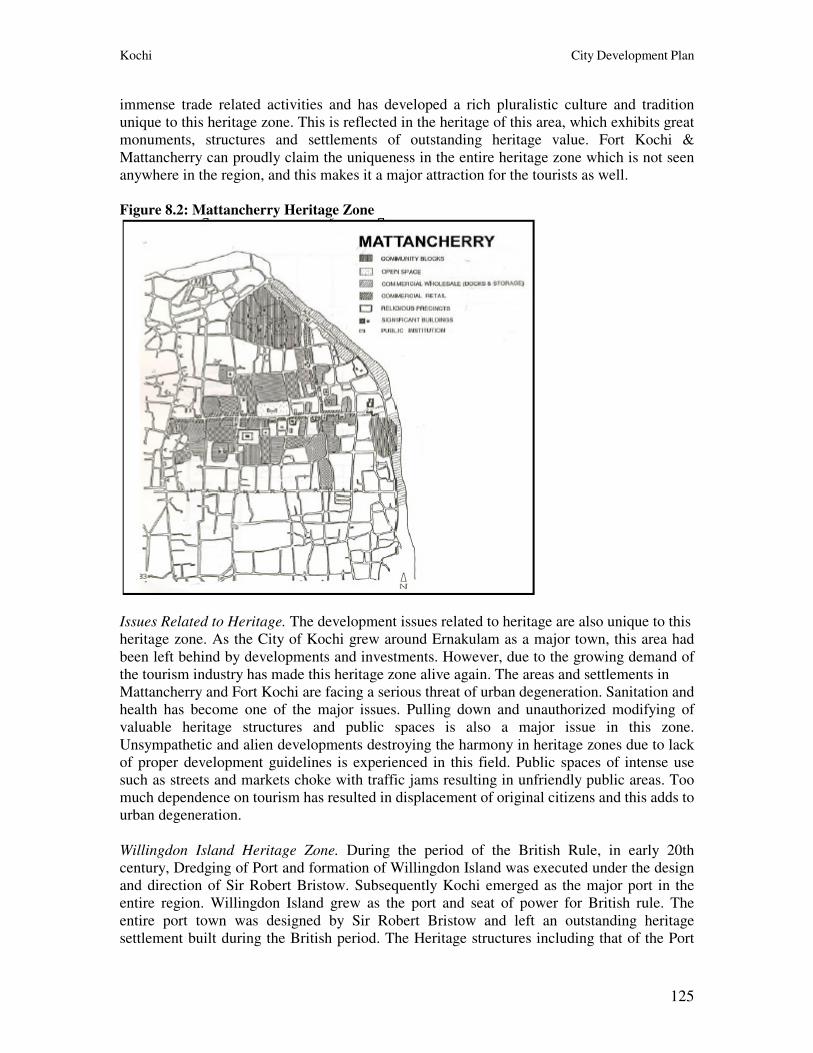
Kochi City Development Plan
125
immense trade related activities and has developed a rich pluralistic culture and tradition
unique to this heritage zone. This is reflected in the heritage of this area, which exhibits great
monuments, structures and settlements of outstanding heritage value. Fort Kochi &
Mattancherry can proudly claim the uniqueness in the entire heritage zone which is not seen
anywhere in the region, and this makes it a major attraction for the tourists as well.
Figure 8.2: Mattancherry Heritage Zone
Issues Related to Heritage. The development issues related to heritage are also unique to this
heritage zone. As the City of Kochi grew around Ernakulam as a major town, this area had
been left behind by developments and investments. However, due to the growing demand of
the tourism industry has made this heritage zone alive again. The areas and settlements in
Mattancherry and Fort Kochi are facing a serious threat of urban degeneration. Sanitation and
health has become one of the major issues. Pulling down and unauthorized modifying of
valuable heritage structures and public spaces is also a major issue in this zone.
Unsympathetic and alien developments destroying the harmony in heritage zones due to lack
of proper development guidelines is experienced in this field. Public spaces of intense use
such as streets and markets choke with traffic jams resulting in unfriendly public areas. Too
much dependence on tourism has resulted in displacement of original citizens and this adds to
urban degeneration.
Willingdon Island Heritage Zone. During the period of the British Rule, in early 20th
century, Dredging of Port and formation of Willingdon Island was executed under the design
and direction of Sir Robert Bristow. Subsequently Kochi emerged as the major port in the
entire region. Willingdon Island grew as the port and seat of power for British rule. The
entire port town was designed by Sir Robert Bristow and left an outstanding heritage
settlement built during the British period. The Heritage structures including that of the Port
Kochi City Development Plan
126
Trust, Palacial Bungalows, Commercial godowns and Public spaces of the Southern Naval
command area etc. become part of this heritage zone.
Issues Related to Heritage. This beautiful island of outstanding heritage value poses some
unique issues in the field of heritage. Kochi Port Trust and Indian Navy mostly own the
Island, which leave little regulations being effective in these areas. Unsympathetic and alien
developments destroying the harmony in heritage zone and water edge skyline due to lack of
power development guidelines is experienced in this area. The beautiful water edges and
public spaces associated to this island do not share it with the citizen of Kochi except in few
cases.
Ernakulam Central Area Heritage Zone. In 19th Century during the British Rule, Kochi
rulers shifted to Ernakulam. As a result, market and associated settlements flourished. The
Ernakulam Heritage Zone is in fact the heart of today’s City of Kochi. Most work places,
Administrative and institutional centers and market places are located here. Moreover the
City’s widely used parks and public open spaces are located defining the landward edge of
this zone, which connects the city to its natural heritage of backwaters. Institutions such as
the Kochi University on foreshore road, Maharaja’s College, Law College, St. Theresa’s
college and St. Albert’s College etc. Many cultural and religious institutions with some of the
oldest temples churches, mosques and synagogues also become part of this heritage zone.
Old commercial streets with buildings abutting roadsides are also seen in this area, especially
in Broadway. Re development of the area on conservative principles will increase the
productivity. Historical heritage structures, which represent many cultural and ethnic groups
who have come and settled here during its history, are spread all over. City level institutions
such as the Corporation of Kochi, GIDA etc culminate at the northern part along with the
High Court complex of the state. More to mention, the city’s breathing spaces such as the
Subhash Park, the walkway at Marine Drive and the Durbar Hall ground etc are the most
used and celebrated public spaces of the city.
Issues Related to Heritage. The development issues related to heritage are mostly to do with
the rapid urbanization and demand posed by the ever-growing needs of the city. This has
resulted in unsympathetic and alien developments destroying the harmony in heritage zone
due to lack of proper development guidelines. Pulling down and unauthorized modifying of
valuable heritage structures and public spaces is also a major issue in this zone. Public spaces
of intense use such as streets and markets choke with traffic jams resulting unfriendly public
areas. Lack of adequate Infrastructure and Sanitation has become one of the major issues in
areas like Ernakulam Market.
Canal & Backwater Network Heritage Zone. Canal Network is part of our regional traditional
heritage planning. These canal systems can be commonly experienced throughout in Kerala
in the low-lying coastal areas. They, once upon a time, used to be the drainage system,
transportation corridor & irrigation system of traditional development. The entire
development in the low-lying coastal areas has been dependent on such canal systems
integrated by backwaters, lagoons and Estuary and was instrumental for trade and
commercial activities. The Canals Network in Kochi is very much intertwined with rivers and
backwaters. Most of the traditional areas and heritage zones are connected by such canal
system. Most public spaces, settlements and institutions are also grown along them.
Kochi City Development Plan
127
Issues Related to Heritage. The canal Network is both a natural as well as cultural heritage of
our city. It has played an important role in the history of Kochi. The issues related to the
Canal Network are basically the major issues of Kochi City itself. Sanitation, mosquito
breeding, drainage etc. are the major issues of the City and all related very much to the Canal
Network. Accessibility to the canal is another issue of equity. Encroachment is another issue
related to the canal & Backwater precincts.
Mangalavanam Natural Heritage. Known for its small bird sanctuary, Mangalavanam
mangroves is situated in the Ernakulam District of Kerala State. This small mangrove area
comprising of a shallow tidal lake in the center with its edges covered with thick manger
vegetation and the lake here are connected to backwaters by a canal. Mangalavanam gained
importance because of the mangrove vegetation, and also due to the congregation of
commonly breeding birds. Apart from these, it is considered a ‘green lung’ of Ernakulam
City, which is polluted by many industries and motor vehicles.
Issues Related to Heritage. Major issues related to this Natural Heritage are associated with
the issues related to canals and backwaters. The quantity of water flowing into
Mangalavanam is extremely harmful for the species habitat in this zone. Lack of Urban
Development guidelines in the area surrounding this heritage zone is a serious threat to the
future of this small forest in Kochi.
8.1.2 Kochi Estuary Natural Heritage Zone Kochi Estuary is an important Natural Ecological Feature in the entire Vembanad Lake
Region.The Vembanad Lake Region, which extends about 70 Kms to the South of the Kochi
Sea mouth and 35 Kms to the North, flushes out 7 major rivers through Kochi Estuary. A
major transactional point for most of the marine species and habitat for many of them, Kochi
Estuary becomes a major zone of great environmental significance. This zone also becomes
Kochi City’s most important place with the location of Port and proposed Container
Transshipment, Navy etc.
Issues Related to Heritage. The major issues related to this zone are the absence of planning
for the Natural Heritage and marine habitat of this estuary. The water edge development
guidelines lack environmental sensitivity. Methods to effective reduction of pollution during
the port activity are also not ensured. Environmental guidelines for accretion and landfills are
also absent.
8.1.3 Thripunithura Heritage Zone This living fossil of Royal glory has an important place in the history of Kerala. It was the
capital of the Kingdom of Kochi from 1755 onwards.
The main area covers the following major heritage features like the Fort area, Hill Palace,
Temples, Palaces, Malikas, Churches, Christian settlement, Tamil Brahmin settlement and
Konkini settlement.
The temple forms the focal point of the city. The growth of the city started from around the
temple. The main spine, the heart of the Fort, passes through the temple in the east-west
direction starting from the east arch and ending at the west arch. The main spine runs from
the west Irumpanam iron bridge to the east Statue junction through the temple. The east is
guarded by arch. The spine forms the main element of the city. The fort is surrounded by
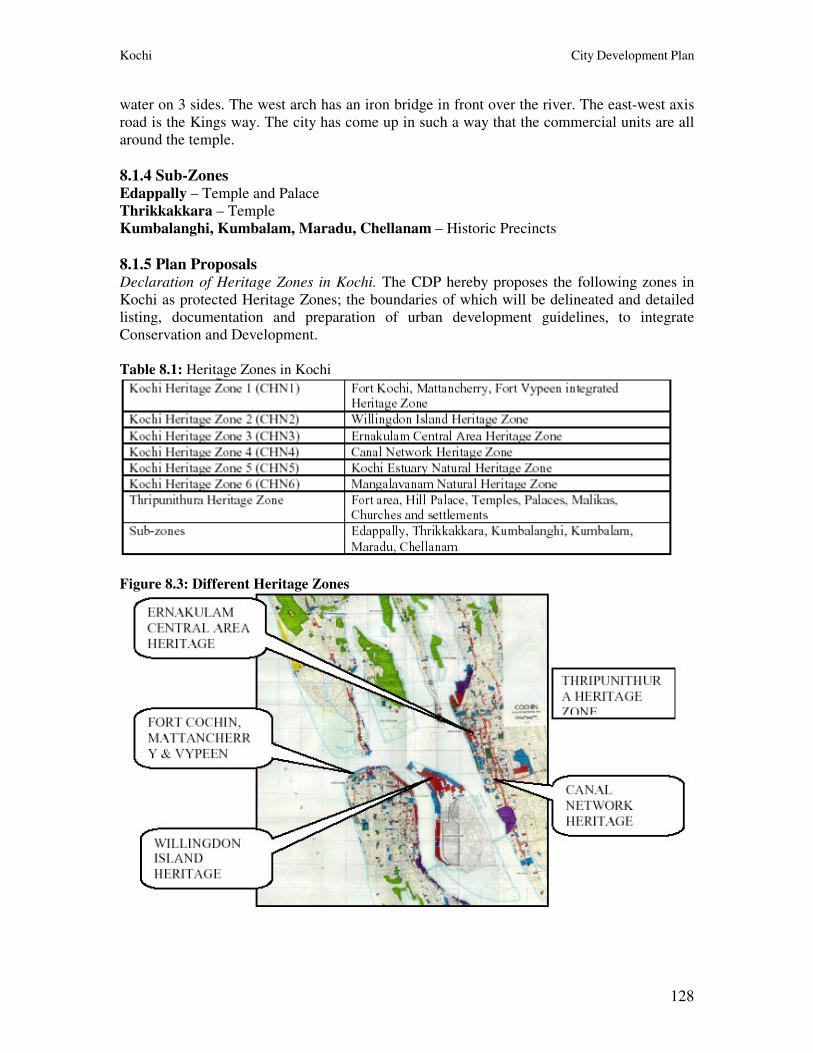
Kochi City Development Plan
128
water on 3 sides. The west arch has an iron bridge in front over the river. The east-west axis
road is the Kings way. The city has come up in such a way that the commercial units are all
around the temple.
8.1.4 Sub-Zones Edappally – Temple and Palace
Thrikkakkara – Temple
Kumbalanghi, Kumbalam, Maradu, Chellanam – Historic Precincts
8.1.5 Plan Proposals Declaration of Heritage Zones in Kochi. The CDP hereby proposes the following zones in
Kochi as protected Heritage Zones; the boundaries of which will be delineated and detailed
listing, documentation and preparation of urban development guidelines, to integrate
Conservation and Development.
Table 8.1: Heritage Zones in Kochi
Figure 8.3: Different Heritage Zones
Kochi City Development Plan
129
8.1.6 Listing and Documentation The detailed list of buildings structures and precincts of historic / architectural / aesthetic
cultural/ environmental significance shall be prepared. On site listing and documentation of
outstanding heritage in the city and inviting or organizing public hearing for suggestions,
additions, observations and objections etc. shall become part of the listing & documentation
work. A value based identification process is proposed for Heritage Listing.
It is important to have categorization and grading to the list being prepared. The following
categories shall be followed and they may be revised time to time as per the new
requirements.
• Heritage Areas and Settlements;
• Heritage Structures and Complexes;
• Cultural and Heritage Institutions;
• Arts and Crafts;
• Linguistic / Cultural / Livelihood /Ethnic /Religious Heritage Institutions and Communities;
• Precincts or features of outstanding environmental significance or natural beauty; and
• Natural Ecological Precincts or Features.
Invitation for enlistment for consideration of incentive for conservation for both heritage and
cultural structures / spaces / institutions shall be part of the scope of documentation and
listing works. The listing procedures shall aim at prioritizing action areas.
8.1.7 Urban Development Guidelines and Controls for Heritage Zones and Precincts The following shall become the thrust areas and objectives for preparation of guidelines and
controls for the Heritage Zone.
• Restriction on development, redevelopment, repairs etc. in the listed areas to protect natural
/
cultural heritage;
• Special regulations on high value areas of environmental significance and also for its
immediate surrounding region;
• Guidelines to ensure protection, preservation, maintenance and conservation of heritage
buildings and precincts;
• Guidelines to ensure equity & development rights;
• Guidelines and controls to ensure architectural harmony and maintaining the skyline;
• Regulations on infrastructure to ensure effective traffic / water / waste / energy
management;
• Regulations to avoid environmentally hazardous development in natural areas and sensitive
zones;
• Alter / modify/ relax other development rights for the protection of heritage;
• To grant transferable development rights for the protection of heritage;
• Incentives for the use reuse of heritage structures and funding for their maintenance in case
of public buildings;
• Incentives for promotion of art, craft, culture, language etc.;
• Regulations on public space design and treatment;
• Regulations and Controls for Canal and Backwater Edge Development;
• Regulations and Controls for regulating pollution levels due to port activity;
• Regulations to ensure protection of natural elements such as trees, birds life, marine species
in heritage zones;
Kochi City Development Plan
130
• Regulations for effective traffic management in intensely used old parts of the heritage
zone; and
• Regulation and controls on urban art such as signage, advertisement billboards, street
furniture, urban artifacts etc.
8.1.8 Policy Guidelines for Heritage Zones The City Development Plan proposes the following 5 principles as the cornerstones of Kochi
Heritage Zone Notification and Enforcement of Guidelines and Controls.
• Integrating Conservation and Development to accommodate Changes demanded by the
growing urban development activities in the city;
• Protection of Natural Heritage of outstanding environmental significance and natural
beauty;
• Protection of coastal areas and tidal zones and disaster mitigation planning towards possible
natural hazards;
• Ensuring safety, equity and adequate infrastructure in planning; and
• Tap Reuse, Renewal and Revitalization possibilities of heritage zones facing urban
degeneration.
Conclusion. The great flood in Periyar in 1341 A.D. pushed open the sea mouth creating the
natural harbour in Kochi. This induced development of trade in Mattancherry, Fort Kochi,
where Chinese, Arabs, Dutch, Portuguese & English carried out business. Jews, Konkinis and
many other ethnic groups settled here. A rich pluralistic culture unique to this heritage zone is
visible here. Willington Island, Ernakulam Central Area, Canals and backwater of the area,
Mangalavanam all are part of the rich heritage. Degeneration of old heritage areas, improper
modifications to them, lack of guidelines for conservation, water edges under private
ownerships, ill managed canal system etc are the main problems faced. Preparation of a
Heritage Master Plan, awareness creation programmes, formulating guidelines for renewal,
management programmes for preserving cultural heritage, legal provisions and projecting
heritage for economic benefit form the components of strategy.
Mission projects, mid term projects and long term projects are identified and estimated at a
total cost of Rs.76.10 crores.
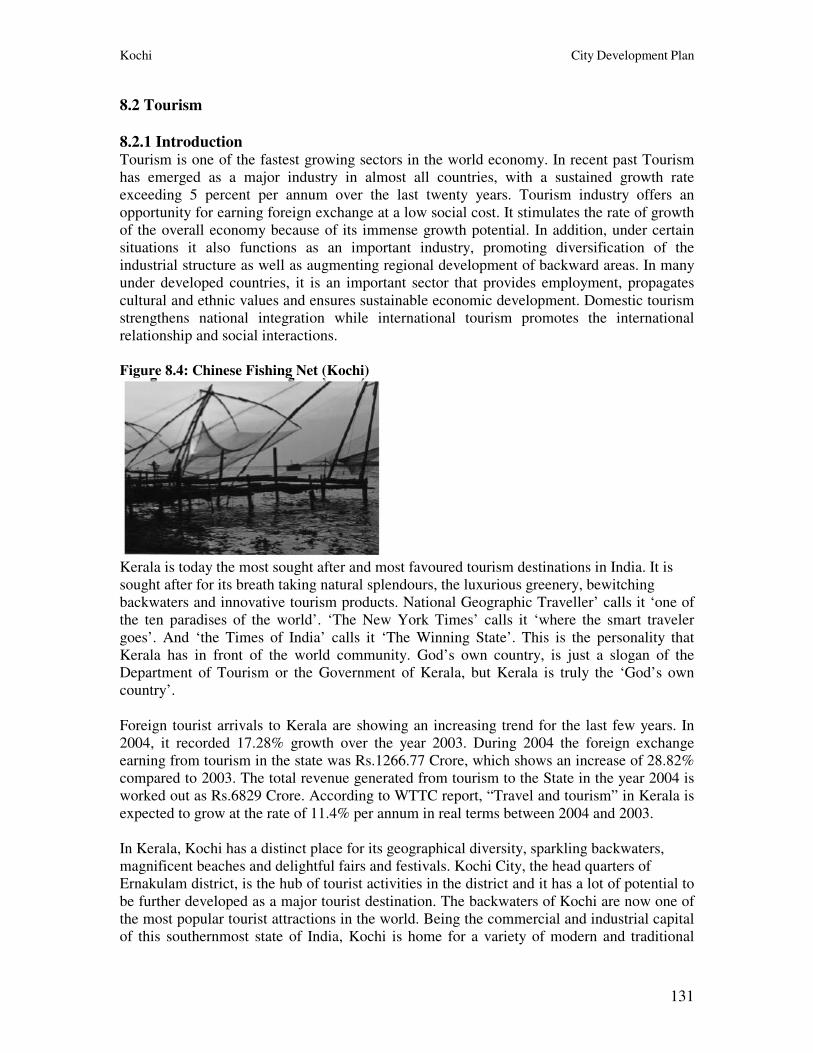
Kochi City Development Plan
131
8.2 Tourism
8.2.1 Introduction Tourism is one of the fastest growing sectors in the world economy. In recent past Tourism
has emerged as a major industry in almost all countries, with a sustained growth rate
exceeding 5 percent per annum over the last twenty years. Tourism industry offers an
opportunity for earning foreign exchange at a low social cost. It stimulates the rate of growth
of the overall economy because of its immense growth potential. In addition, under certain
situations it also functions as an important industry, promoting diversification of the
industrial structure as well as augmenting regional development of backward areas. In many
under developed countries, it is an important sector that provides employment, propagates
cultural and ethnic values and ensures sustainable economic development. Domestic tourism
strengthens national integration while international tourism promotes the international
relationship and social interactions.
Figure 8.4: Chinese Fishing Net (Kochi)
Kerala is today the most sought after and most favoured tourism destinations in India. It is
sought after for its breath taking natural splendours, the luxurious greenery, bewitching
backwaters and innovative tourism products. National Geographic Traveller’ calls it ‘one of
the ten paradises of the world’. ‘The New York Times’ calls it ‘where the smart traveler
goes’. And ‘the Times of India’ calls it ‘The Winning State’. This is the personality that
Kerala has in front of the world community. God’s own country, is just a slogan of the
Department of Tourism or the Government of Kerala, but Kerala is truly the ‘God’s own
country’.
Foreign tourist arrivals to Kerala are showing an increasing trend for the last few years. In
2004, it recorded 17.28% growth over the year 2003. During 2004 the foreign exchange
earning from tourism in the state was Rs.1266.77 Crore, which shows an increase of 28.82%
compared to 2003. The total revenue generated from tourism to the State in the year 2004 is
worked out as Rs.6829 Crore. According to WTTC report, “Travel and tourism” in Kerala is
expected to grow at the rate of 11.4% per annum in real terms between 2004 and 2003.
In Kerala, Kochi has a distinct place for its geographical diversity, sparkling backwaters,
magnificent beaches and delightful fairs and festivals. Kochi City, the head quarters of
Ernakulam district, is the hub of tourist activities in the district and it has a lot of potential to
be further developed as a major tourist destination. The backwaters of Kochi are now one of
the most popular tourist attractions in the world. Being the commercial and industrial capital
of this southernmost state of India, Kochi is home for a variety of modern and traditional
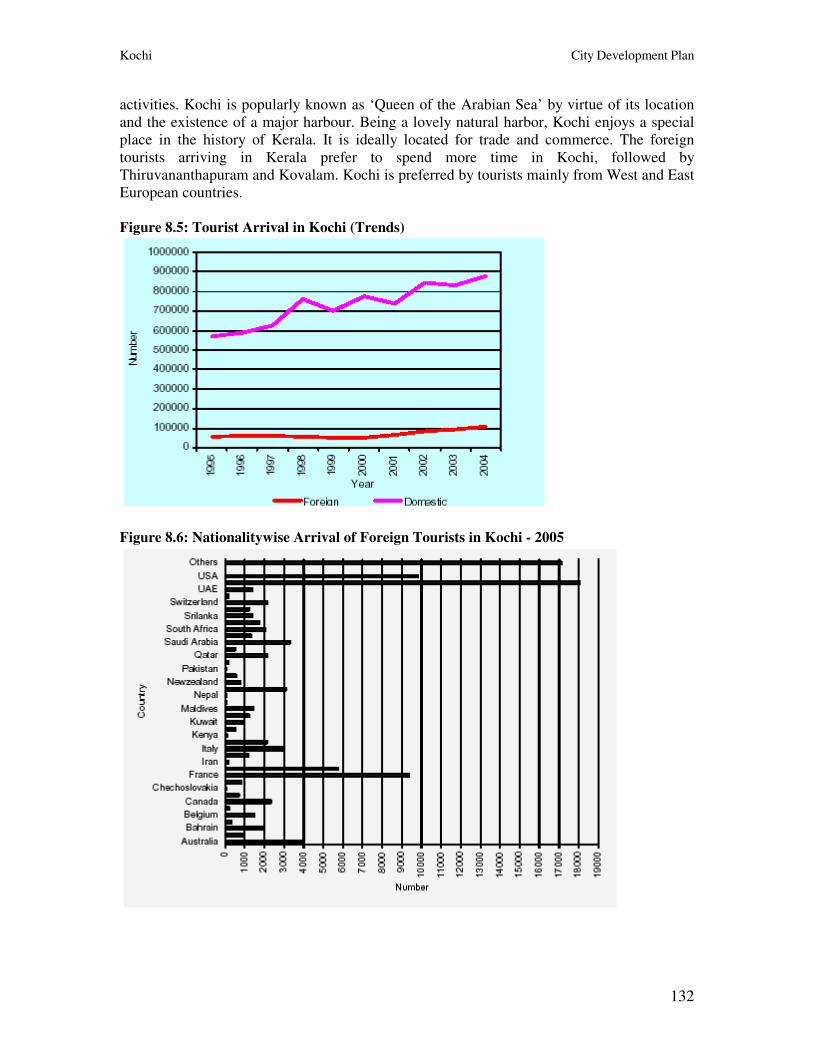
Kochi City Development Plan
132
activities. Kochi is popularly known as ‘Queen of the Arabian Sea’ by virtue of its location
and the existence of a major harbour. Being a lovely natural harbor, Kochi enjoys a special
place in the history of Kerala. It is ideally located for trade and commerce. The foreign
tourists arriving in Kerala prefer to spend more time in Kochi, followed by
Thiruvananthapuram and Kovalam. Kochi is preferred by tourists mainly from West and East
European countries.
Figure 8.5: Tourist Arrival in Kochi (Trends)
Figure 8.6: Nationalitywise Arrival of Foreign Tourists in Kochi - 2005
Kochi City Development Plan
133
The City Development Plan is prepared with a vision to make the Kochi Urban Region as
Asia’s best meeting destination, India’s first world class sea-side destination, South India’s
favorite art and Culture City, South India’s favorite Creative City and India’s favorite
Heritage City.
To achieve this vision, the region needs to succeed in five key areas that are Quality, Safety,
Cultural Investment, Transport and Marketing. The strategic framework of Tourism in Kochi
region is based on four principles to ensure Tourism Development that are Tourism
Industries should be profitable, visitors should have a positive experience, local people
should benefit from tourism and regions environment should be protected.
8.2.2 Tourism: Problems and Potentials of Kochi Region Problems: General. Even though the number of tourists is showing an increasing trend the percentage
share of foreign tourist arrivals is decreasing. The period of stay of tourist in Kochi is
decreasing as the other locations in the neighboring districts are getting popularized. Lack of
information and publicity about that tourist centres other than Fort Kochi ant Mattancherry.
Transportation. Transportation linkages connecting various tourism spots are weak.
Transportation facilities from terminals to tourist centres are insufficient. Absence of
signages, facilitation centres and complaint points at terminals tourist centres and travel
circuit. Inadequate off-street parking spaces at tourists centres. Disuse of inland waterways.
Inherent attractions. Underutilization of the extensive networks of rivers lakes and canals.
Destruction of heritage elements. Lack of performing arts centres recreational activities such
as golf course etc.
Tourism facilities. Absence of moderate hotels with good services near tourist centres.
Absence of eating places serving hygienic local food. Lack of wayside amenity centres and
comfort stations along travel circuits. Absence of enough conducted tours connecting various
tourist sites. Lack of qualified guides. Lacks of boats and coaches.
Image. The image of backwater city is not properly maintained. Uncontrolled water front
developed without considering the landscape and environment. Lack of marketing facilities
for the products from souvenir industries and traditional cottage industries. Health care sector
–especially Ayurveda – is not properly exploited. Non availability of good quality potable
water at tourist centers. Poor drainage and sanitation system. Inefficient solid waste
management system. Growing trend of slums.
Potentials. Presence of backwater. Presence of historical monuments. Availability of
road/rail/water transportation facilities. Presence of international airport. High literate
inhabitants. Personal security and safety.
8.2.3 Findings and Suggestions Transportation. Development of travel circuits for better accessibility and linkages.
Improvement of road, rail and water transport services. Signages in travel circuits.
Facilitation centres/complaint points at terminal and other selected points along travel
circuits. Identification of boat jetty locations to promote back water tourism.
Kochi City Development Plan
134
Inherent Attractions. Preservation and conservation of heritage monuments. Architectural
control in heritage areas to guide built form. Performing arts centres at major tourist centres.
Heritage fair to highlight ancient culture of Kerala. Museums and emporia of regional crafts.
Using of local culture, music, architecture, dance, crafts and food through careful planning.
Proper management and regulations of the multifarious coastal development and activities.
Regional level recreational elements such as botanical gardens, golf course, club houses with
indoor recreational facilities etc to prolong the stay of tourist. Theme parks activity centres.
Waterway based recreational activities protection of wild life sanctuaries.
Tourism facilities. Accommodation facilities with good services near tourist spots. Wayside
facilities like kiosks, rest spots, parking places, petrol pumps, tourist huts, souvenir shops,
comfort stations the along travel circuits at sustainable locations. Facilities for shopping,
eating, walking, site seeing etc near tourist spots. Foreign exchange facilities, Travel
agencies, tour operators, tourist transport operators. Improved flow of information about
tourist attractions – pamphlets, literature guides, application of modern IT, high quality
documentaries, festival calendar, video tapes, maps etc. Trained guides and interpreters.
Public relation cells at tourist centres. Attractive package tours.
Image. The unique identity of the coastal line should be protected through strict controls for
physical development in water front areas. Renovation and reactivation of canals and water
ways. Protection of heritage areas and environs. Protection of traditional structures and
conversion for tourist accommodation. Encouragement of souvenir industries. Display of
traditional life, artifacts, musical instruments, textiles, dresses, ornaments etc. Ayurvedic
health care centers with good quality and services at suitable locations. Identity and sanctity
of tourist sports. Improved water supply and drainage system. Control of litter and treatment
of sewage. Preservation of open spaces. Awareness campaign for host population to have
better care and courteous attention to tourist - ‘adhithi devo bhava’ in real sense. Control over
the growth of slums and squatter settlements.
Projects. In order to convert Kochi Urban Region into a major tourism destination for people
from all aver the world and also from within the country keeping in mind the above
mentioned strengths and weaknesses of the place in the City Development Plan the following
major projects and smaller projects are recommended.
Conclusion. The strategy to be adopted in respect of natural ,manmade and historical
precincts of kochi is linked to the mechanisms for conservation without sacrificing
economic productivity and harnessing the Tourism potential.Kochi Muncipal corporation
has already setup a center for Heritage Studies. It is necessary to make notifications
leading to the conservation process and listing the permissible activities. The center for
Heritage Studies can give guidance on façade treatment and general architectural
control..Projects utilizing public private partnership program are envisaged. Tourism and
Heritage projects can be combined for remuneration.
Kerala is one of the most favoured tourism destinations in India. In Kerala, Kochi has a
distinct place for its geographical diversity, sparkling backwaters, magnificent beaches and
delightful fairs and festivals. Lack of publicity leading to reduction in number of tourists,
lack of linkages among tourism spots, under utilization of canals, lack of performing art
Kochi City Development Plan
135
centers and recreational activities and absence of tourism facilities are the problems identified
by this sector. The strategy for action include creation of signages and tourists information
facilities in all transport terminals, creation of facilities for tourists - domestic and foreign,
proper marketing of the strengths and provision of different options of travel circuit planning.
The total cost of all the projects in this sector is estimated to be to Rs.284.75crores.
Conscious efforts to conserve this valuable heritage and to encourage tourism through these
projects are sure to give a new face to the city. Also, the opportunity to enjoy and learn this
beautiful heritage city will be extended to tourist’s world over.
Kochi City Development Plan
136
9. ENVIRONMENT
9.1 Vision and Objectives Vision. To make this gifted land an abode friendly to nature and salubrious to inhabitants
through activities with community participation.
Objective. Educate and empower urban communities on the guardianship of environmental
resource and make them an integral part of decision-making process in urban development.
9.2 Background and History of Urbanization
9.2.1 Geology and Physiography The Kochi City and the surrounding urbanizing area comprising of 330 Sq. km with varying
shades of urbanization which fall within the geographical co-ordinates 90 49’ to 100 14’N
and 760 10’ E to 760 31’E, are relevant in the present context.
The climate of the region, like the rest of costal Kerala is warm with gentle prevailing winds
and daily temperatures varying in the range 23 - 34oC. Humidity ranges from 65% and 95%
with diurnal and seasonal variations and the average annual rainfall is 2900 mm. There are
two distinct periods of higher than average rainfall from June to August and October to
November.
The Kochi Corporation, two municipalities and thirteen panchayaths fall in the present CDP.
It is located on the southwestern coastal strip of India. Kochi is inseparably linked with the
wetlands of Vembanad estuary.
The Vembanad Lake and the surrounding geological formation are the fruit of all the major
rivers of central Kerala, namely Chalakkudy puzha, Periyar, Muvattupuzha River,
Meenachilar, Manimalayar, Pampa River and Achancoil River and lesser rivers like
Keecheri, Karuvannur and Puzhackal. The silt and sand washed down by these rivers from
the Eastern highlands originally sculptured the landscape of the coastal belt on either side of
Kochi. Also the hinterland of Kochi comprising of Ernakulam, Idukki, Kottayam and
Pathanamthitta districts is watered and in a sense nurtured by these rivers. The oceanic wave
action and the unimpeded discharge of sediment load before the debut of civilization resulted
in the formation of a long sand bar from Arattupuzha to Kodungalloor along with a large
network of deltaic islets and lowlands in between braided streams. There are reasons enough
to conclude that the seashore began along the western fringe of the midlands well before the
emergence of the Vembanad Lake. In Kuttanad region, thick layers of calcareous shells of
extinct marine organisms are seen betraying a marine past of this region. Today the low lands
and the catchments of the seven rivers aforesaid are economically the most important region
of Kerala. And this part of the state, over the past one hundred years or so, has undergone
sweeping anthropogenic transformations.
Kochi, unlike other urban centers of India, is a region interspersed with tidal water bodies
and all developmental initiatives have to be streamlined giving due respect to the geological
and ecological fingerprints of the region.
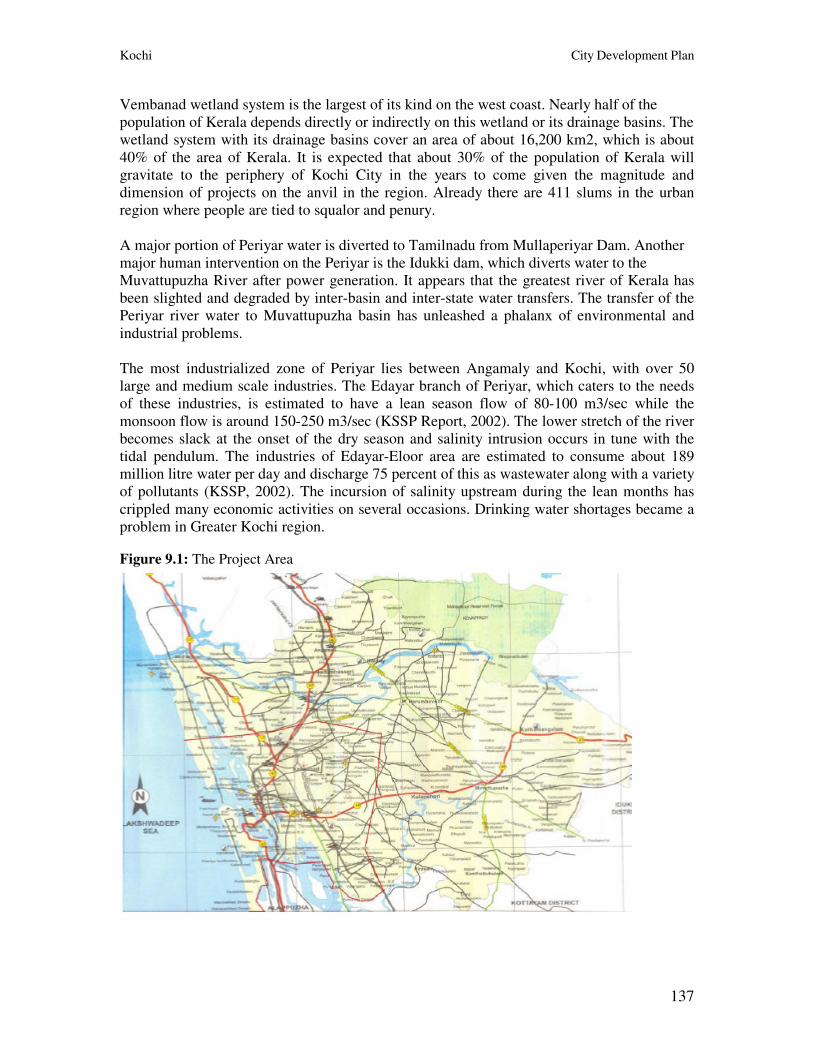
Kochi City Development Plan
137
Vembanad wetland system is the largest of its kind on the west coast. Nearly half of the
population of Kerala depends directly or indirectly on this wetland or its drainage basins. The
wetland system with its drainage basins cover an area of about 16,200 km2, which is about
40% of the area of Kerala. It is expected that about 30% of the population of Kerala will
gravitate to the periphery of Kochi City in the years to come given the magnitude and
dimension of projects on the anvil in the region. Already there are 411 slums in the urban
region where people are tied to squalor and penury.
A major portion of Periyar water is diverted to Tamilnadu from Mullaperiyar Dam. Another
major human intervention on the Periyar is the Idukki dam, which diverts water to the
Muvattupuzha River after power generation. It appears that the greatest river of Kerala has
been slighted and degraded by inter-basin and inter-state water transfers. The transfer of the
Periyar river water to Muvattupuzha basin has unleashed a phalanx of environmental and
industrial problems.
The most industrialized zone of Periyar lies between Angamaly and Kochi, with over 50
large and medium scale industries. The Edayar branch of Periyar, which caters to the needs
of these industries, is estimated to have a lean season flow of 80-100 m3/sec while the
monsoon flow is around 150-250 m3/sec (KSSP Report, 2002). The lower stretch of the river
becomes slack at the onset of the dry season and salinity intrusion occurs in tune with the
tidal pendulum. The industries of Edayar-Eloor area are estimated to consume about 189
million litre water per day and discharge 75 percent of this as wastewater along with a variety
of pollutants (KSSP, 2002). The incursion of salinity upstream during the lean months has
crippled many economic activities on several occasions. Drinking water shortages became a
problem in Greater Kochi region.
Figure 9.1: The Project Area
Kochi City Development Plan
138
Barrages were laid across the river to contain migration of salinity and the trapped water
bodies upstream became heavily polluted with acidic industrial effluents and fish kills
became regular. The inter-governmental panel for climate change (IPCC) has predicted in
1990 a 31cm rise in sea level (Lower scenario) induced by green house warming by the year
2100. In that case the sea would move several meters inland, permanently flooding a large
part of the highly urbanized coastal fringe of the city. The city, in any case will have to inch
eastwards in the decades to follow.
9.2.3 Kochi Watershed Kochi, for all practical purposes, is the gift of the water bodies it is braided with. Protection
conservation and sustainable environmental practices are the essential part of a desirable
integrated urban management approach.
Kochi is a coastal settlement interspersed with backwater system and fringed on the eastern
side by laterite capped low hills from which a number of streams originate and drain into the
backwater system. The western part of the study area is a flat coastal zone, which forms a
part of the coastal plains of Kerala, and the eastern low hills are part of the midland region.
The western flat land comprises of 52 drainage units covering an area of 115 km2 and islands
in the backwater system with a total area of 56.4 km2. The backwater extending to an area of
72.6 km2 also comes within this zone. The eastern low hills, covering an area of 291 km2,
comprises of 21 stream basins or micro catchments, each with independent watershed area
(Benjamin, 1998). These 21 major streams originating from the eastern low hills run mostly
west in between the low hills and drain into the tidal canals with a linkage to the back water
system. The drainage basins of these streams have laterite or lateritic soil with occasional
rock outcrops. The tidal water canals of Chithrappuzha, Karingachirapuzha and
Edappallythodu receive the waters from the east.
9.2.4 Kochi And The Back Water Lagoon System The estuary on the western parts of the city, stretching in the North South direction, has
suffered large-scale siltation in the heydays of the Periyar. This has resulted in the formation
of a number of mud bank islets, which are heavily populated. Overpopulation and industrial
activities further north have degraded the quality of this sensitive marginal marine
environment.
9.3 Growth of Kochi as an Important Urban Center and its Impact on the Tidal
Canals - a Historical Perspective Kochi originally developed as a converging point of water transport. Kochi had water
transport connections with Alappuzha, Quilon, Kottayam, Changanassery, Ambalappuzha,
Neelamperoor, Pulikeezhu, Mannar, Athirampuzha, Paippad and Neerettupuaram in the south
and Arattukara Canal and the Edathuruthy canal constructed in 19th century made water
transport possible between Kochi and Trissur. Mattancherry and Fort Kochi and the rest of
the region were by far rural. In 1905, Ernakulam got connected to the rest of the country by
railroads. Thereafter, the process of urbanization picked up momentum. The debut of Kochi
as a major port on the west coast, triggered urbanization and industrialization in the modern
lines, thus radically transforming the physiographic personality of this region. Road and rail
traffic facilities pushed canal transport systems to a humble backseat and urbanization inched
its way further east. Demography changed and traditional farming and fishing petered to near
extinction. The land use pattern underwent a dramatic change. Armed with an all weather
Kochi City Development Plan
139
harbor, cheep electricity from Pallivasal, railroad connection to Indian mainland across the
ghats and the availability of enough fresh water Kochi-Aluva belt turned all too ready to
become a significant industrial nerve center. Pressure on land increased and in the same
measure utility of the canals plummeted. Canals and wetlands were a casualty when greed for
dry lands increased.
9.3.1 Development of urban Kochi When road and rail traffic facilities improved, the center of gravity of the city shifted to the
eastern mainland. Fortunately, the city is still gravitating further east with a nose for more
fresh air. The tidal canals, which once served the purpose of modern roads, cannot be left to
decline and decay as water is growing more precious and dear in Kochi and elsewhere.
9.3.2 Impact of Urbanization on Environment The domestic sewage from Kochi and its satellite towns ends up in the tidal canals and the
estuary. Kochi City alone generates 255 million L/day of urban sewage that directly enters
the estuary. In Kochi, the sewage treatment plant covers only 1 % of the population (KSPCB,
1982). It is estimated that nearly 260 million liters of trade effluents reach the Periyar estuary
from the industrial belt daily. This discharge is fraught with heavy metals, nutrients and
insecticides.
9.3.3 Population Growth of Kochi and Urbanization In Kerala the rural-urban divide is not that sharp as far as basic amenities are concerned and
hence there is not an appreciable flux of humanity into the city. In 1875, the population of
Ernakulam town was 20,000. From 1875 to 1901, the population growth was very less. From
the turn of 20th century an explosive growth of population was observed. This tendency
persisted up to 1961 when the population reached 2,50,000 (Benjamin, 1998). Census of
2001 shows that the total population of Kochi Corporation is 5, 96,473, and the population of
Greater Kochi Region, is around two million. A remarkable shoot up in population is
expected in the years to come as the city is spreading itself thin to the east, transgressing the
city limits. A floating population of around 4,00,000 commutes to the city from the suburbs
(CUSAT and Oak Ridge National Laboratory Study, 2002).
The city consists of islands and parts of the mainland linked by water transport and bridges.
Kochi is dissected by numerous canals and backwaters. Managing the quality and quantity of
the waters in these tidal canals is of utmost importance in so far as the quality of life is
concerned. Insufficient drainage facilities and pressures of urbanization nag the city. Diffuse
urban liquid and solid wastes naturally find their way to the nearest watercourses. The main
threats from municipal sewage waste are anoxia and eutrophication. At present, the sanitary
waste disposal system is limited to a small portion, with only one treatment plant at
Elamkulam. The outlets of the septic tank and wash systems are directly connected to the
public drains and, as a result, a wide spectrum of degradable and biodegradable pollutants is
entering the drains and ultimately the water bodies. For most residents, the canals are the
easiest option to get rid of their refuse. Urban run off is the single great source of water
pollution and is an ecological problem threatening the long-term health of estuarine
ecosystems and local economy.
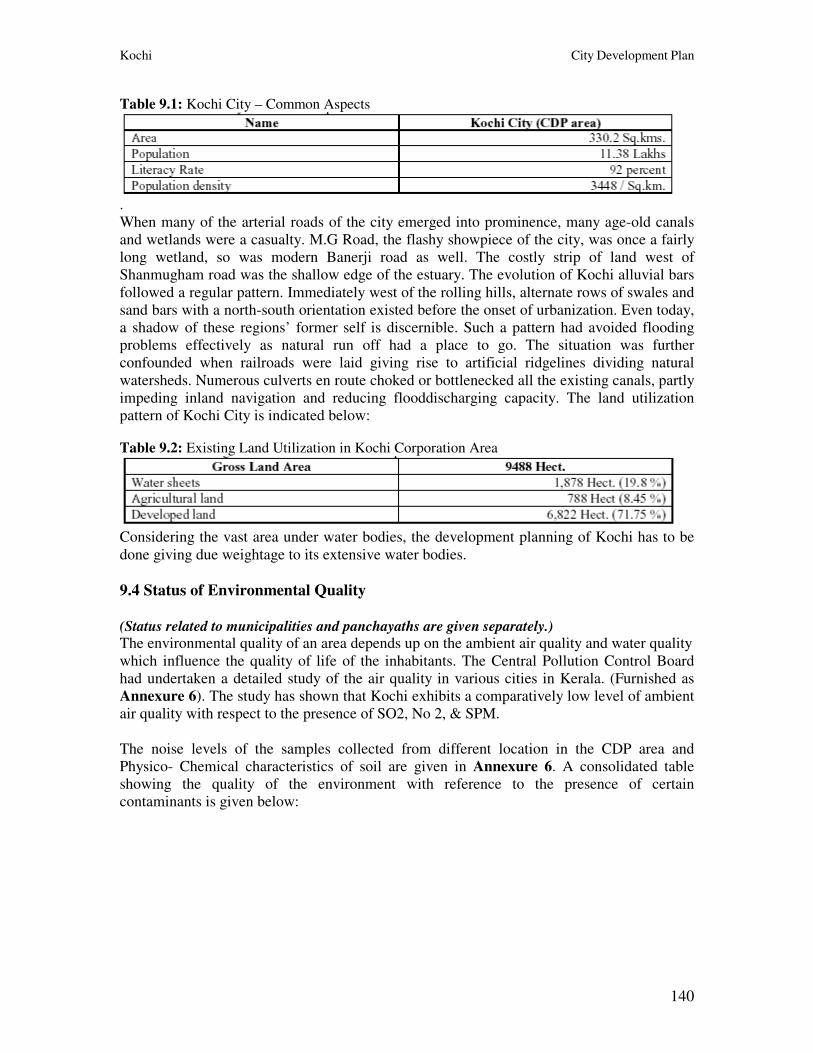
Kochi City Development Plan
140
Table 9.1: Kochi City – Common Aspects
.
When many of the arterial roads of the city emerged into prominence, many age-old canals
and wetlands were a casualty. M.G Road, the flashy showpiece of the city, was once a fairly
long wetland, so was modern Banerji road as well. The costly strip of land west of
Shanmugham road was the shallow edge of the estuary. The evolution of Kochi alluvial bars
followed a regular pattern. Immediately west of the rolling hills, alternate rows of swales and
sand bars with a north-south orientation existed before the onset of urbanization. Even today,
a shadow of these regions’ former self is discernible. Such a pattern had avoided flooding
problems effectively as natural run off had a place to go. The situation was further
confounded when railroads were laid giving rise to artificial ridgelines dividing natural
watersheds. Numerous culverts en route choked or bottlenecked all the existing canals, partly
impeding inland navigation and reducing flooddischarging capacity. The land utilization
pattern of Kochi City is indicated below:
Table 9.2: Existing Land Utilization in Kochi Corporation Area
Considering the vast area under water bodies, the development planning of Kochi has to be
done giving due weightage to its extensive water bodies.
9.4 Status of Environmental Quality
(Status related to municipalities and panchayaths are given separately.)
The environmental quality of an area depends up on the ambient air quality and water quality
which influence the quality of life of the inhabitants. The Central Pollution Control Board
had undertaken a detailed study of the air quality in various cities in Kerala. (Furnished as
Annexure 6). The study has shown that Kochi exhibits a comparatively low level of ambient
air quality with respect to the presence of SO2, No 2, & SPM.
The noise levels of the samples collected from different location in the CDP area and
Physico- Chemical characteristics of soil are given in Annexure 6. A consolidated table
showing the quality of the environment with reference to the presence of certain
contaminants is given below:
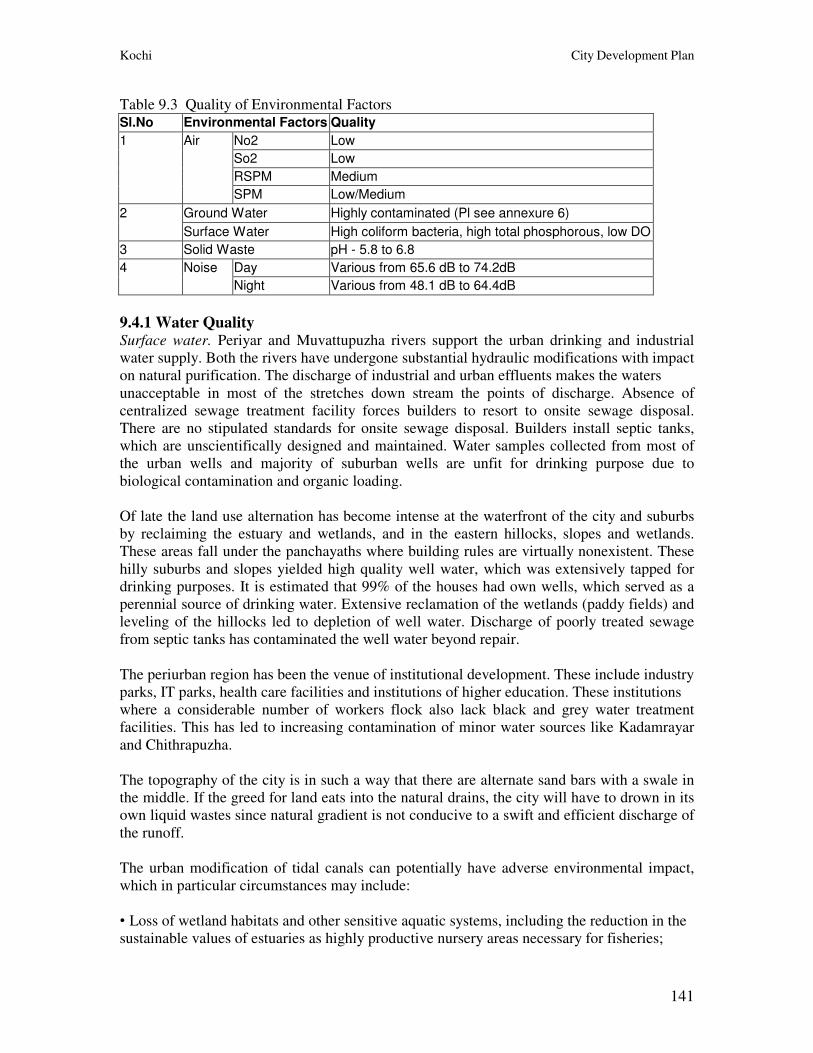
Kochi City Development Plan
141
Table 9.3 Quality of Environmental Factors
Sl.No Environmental Factors Quality
No2 Low
So2 Low
RSPM Medium
1 Air
SPM Low/Medium
Ground Water Highly contaminated (Pl see annexure 6) 2
Surface Water High coliform bacteria, high total phosphorous, low DO
3 Solid Waste pH - 5.8 to 6.8
Day Various from 65.6 dB to 74.2dB 4 Noise
Night Various from 48.1 dB to 64.4dB
9.4.1 Water Quality Surface water. Periyar and Muvattupuzha rivers support the urban drinking and industrial
water supply. Both the rivers have undergone substantial hydraulic modifications with impact
on natural purification. The discharge of industrial and urban effluents makes the waters
unacceptable in most of the stretches down stream the points of discharge. Absence of
centralized sewage treatment facility forces builders to resort to onsite sewage disposal.
There are no stipulated standards for onsite sewage disposal. Builders install septic tanks,
which are unscientifically designed and maintained. Water samples collected from most of
the urban wells and majority of suburban wells are unfit for drinking purpose due to
biological contamination and organic loading.
Of late the land use alternation has become intense at the waterfront of the city and suburbs
by reclaiming the estuary and wetlands, and in the eastern hillocks, slopes and wetlands.
These areas fall under the panchayaths where building rules are virtually nonexistent. These
hilly suburbs and slopes yielded high quality well water, which was extensively tapped for
drinking purposes. It is estimated that 99% of the houses had own wells, which served as a
perennial source of drinking water. Extensive reclamation of the wetlands (paddy fields) and
leveling of the hillocks led to depletion of well water. Discharge of poorly treated sewage
from septic tanks has contaminated the well water beyond repair.
The periurban region has been the venue of institutional development. These include industry
parks, IT parks, health care facilities and institutions of higher education. These institutions
where a considerable number of workers flock also lack black and grey water treatment
facilities. This has led to increasing contamination of minor water sources like Kadamrayar
and Chithrapuzha.
The topography of the city is in such a way that there are alternate sand bars with a swale in
the middle. If the greed for land eats into the natural drains, the city will have to drown in its
own liquid wastes since natural gradient is not conducive to a swift and efficient discharge of
the runoff.
The urban modification of tidal canals can potentially have adverse environmental impact,
which in particular circumstances may include:
• Loss of wetland habitats and other sensitive aquatic systems, including the reduction in the
sustainable values of estuaries as highly productive nursery areas necessary for fisheries;
Kochi City Development Plan
142
• Inadequate hydraulic functioning, which may reduce water quality through poor flushing,
cause sedimentation or affect structural integrity;
• Impact caused by storm water and urban runoff, including erosion and sedimentation away
from the site;
• Impacts associated with imported fill;
• Problems caused by disturbing acid sulfate soils;
• Pollution by wastes from vessels;
• Ongoing impacts from maintenance including maintenance dredging; and
• Loss of wetland plants alters the chemistry of water. Wetland plants have the ability to
release oxygen through the roots and could possibly increase the solubility of metals and
arsenic.
Most of the estuarine banks have already been urbanized and as a result the shores and the
network of tidal canals have forfeited their original morphology. The pre-urban tidal canals
were swales and braided rivulets in which interaction with the bottom sediment was
unimpeded. The construction of bathtub canals substantially decreased the inter-tidal zone in
the canals and sewage waste load denatured the quality of water. This is the general pattern
of all the urban tidal canals of the world. There rare significant water management issues and
areas of concern related to flow control measures in drainage basins in the inter tidal zone.
The following observations indicate the alarming state of environmental deterioration:
• Concentration of fecal Coliform bacteria commonly exceeded recommended standards for
contact recreation
• Concentrations of total phosphorus is generally high in urban streams leading to nuisance
plant growth
• Toxic compounds found in stream bed were also found in fish tissue
• Deteriorated water quality and sediment as well as habitat disturbances contribute to
degraded biological communities in urban streams.
Want of sufficient DO is the most crippling constraint in all of the tidal canals. At present,
there is not any strategy whatsoever to check the discharge of oxygen demanding wastes into
the water bodies of consequence. Industrial effluents play a very minor role in this
connection. Urban liquid and solid wastes are primarily responsible for oxygen depletion in
the canals. Again many of the canals have lost their dynamism that would otherwise have
facilitated the re-aeration of the stagnant stretches. All the canals are at sea level and natural
flow is sluggish or non- existent in non-rainy days. Tidal oscillation alone infuses some life
into the system. But intervention by bunds, loss of depth by siltation and bottlenecks created
in the channel by civil structures and dumping of solid waste isolate the canals into stagnant
wet patches.
Table below shows the number of slums, the slum population and the total BPL population in
Kochi.
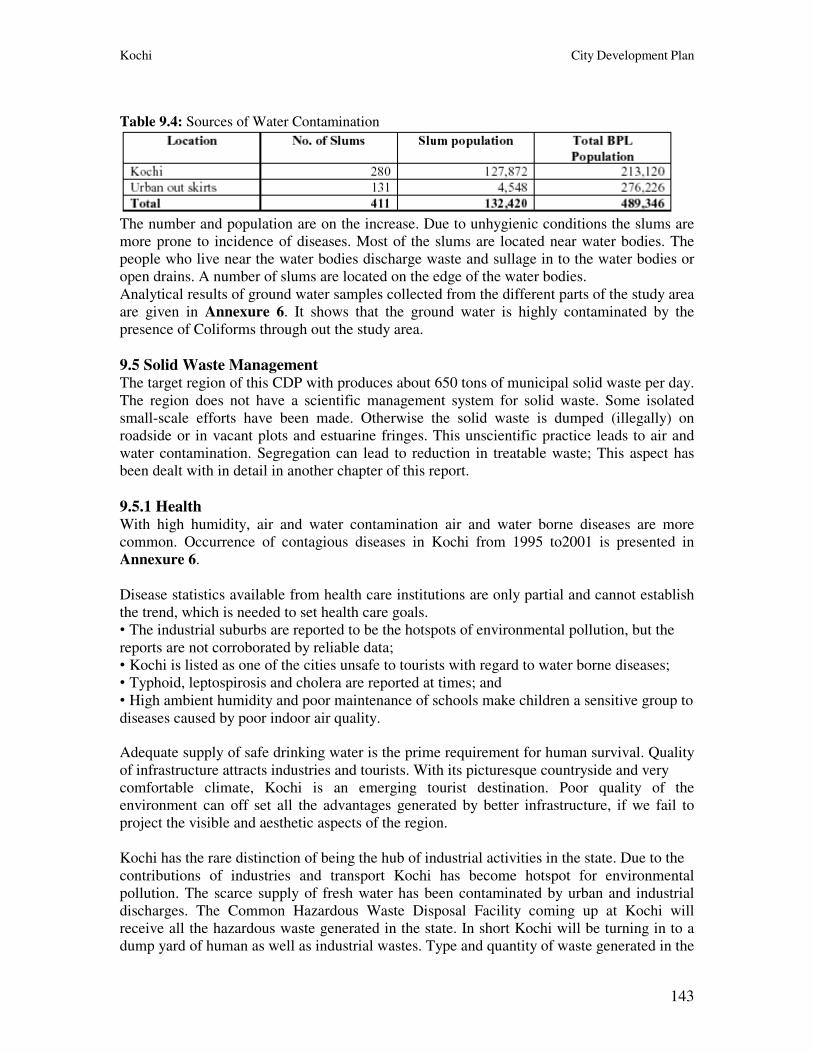
Kochi City Development Plan
143
Table 9.4: Sources of Water Contamination
The number and population are on the increase. Due to unhygienic conditions the slums are
more prone to incidence of diseases. Most of the slums are located near water bodies. The
people who live near the water bodies discharge waste and sullage in to the water bodies or
open drains. A number of slums are located on the edge of the water bodies.
Analytical results of ground water samples collected from the different parts of the study area
are given in Annexure 6. It shows that the ground water is highly contaminated by the
presence of Coliforms through out the study area.
9.5 Solid Waste Management The target region of this CDP with produces about 650 tons of municipal solid waste per day.
The region does not have a scientific management system for solid waste. Some isolated
small-scale efforts have been made. Otherwise the solid waste is dumped (illegally) on
roadside or in vacant plots and estuarine fringes. This unscientific practice leads to air and
water contamination. Segregation can lead to reduction in treatable waste; This aspect has
been dealt with in detail in another chapter of this report.
9.5.1 Health With high humidity, air and water contamination air and water borne diseases are more
common. Occurrence of contagious diseases in Kochi from 1995 to2001 is presented in
Annexure 6.
Disease statistics available from health care institutions are only partial and cannot establish
the trend, which is needed to set health care goals.
• The industrial suburbs are reported to be the hotspots of environmental pollution, but the
reports are not corroborated by reliable data;
• Kochi is listed as one of the cities unsafe to tourists with regard to water borne diseases;
• Typhoid, leptospirosis and cholera are reported at times; and
• High ambient humidity and poor maintenance of schools make children a sensitive group to
diseases caused by poor indoor air quality.
Adequate supply of safe drinking water is the prime requirement for human survival. Quality
of infrastructure attracts industries and tourists. With its picturesque countryside and very
comfortable climate, Kochi is an emerging tourist destination. Poor quality of the
environment can off set all the advantages generated by better infrastructure, if we fail to
project the visible and aesthetic aspects of the region.
Kochi has the rare distinction of being the hub of industrial activities in the state. Due to the
contributions of industries and transport Kochi has become hotspot for environmental
pollution. The scarce supply of fresh water has been contaminated by urban and industrial
discharges. The Common Hazardous Waste Disposal Facility coming up at Kochi will
receive all the hazardous waste generated in the state. In short Kochi will be turning in to a
dump yard of human as well as industrial wastes. Type and quantity of waste generated in the
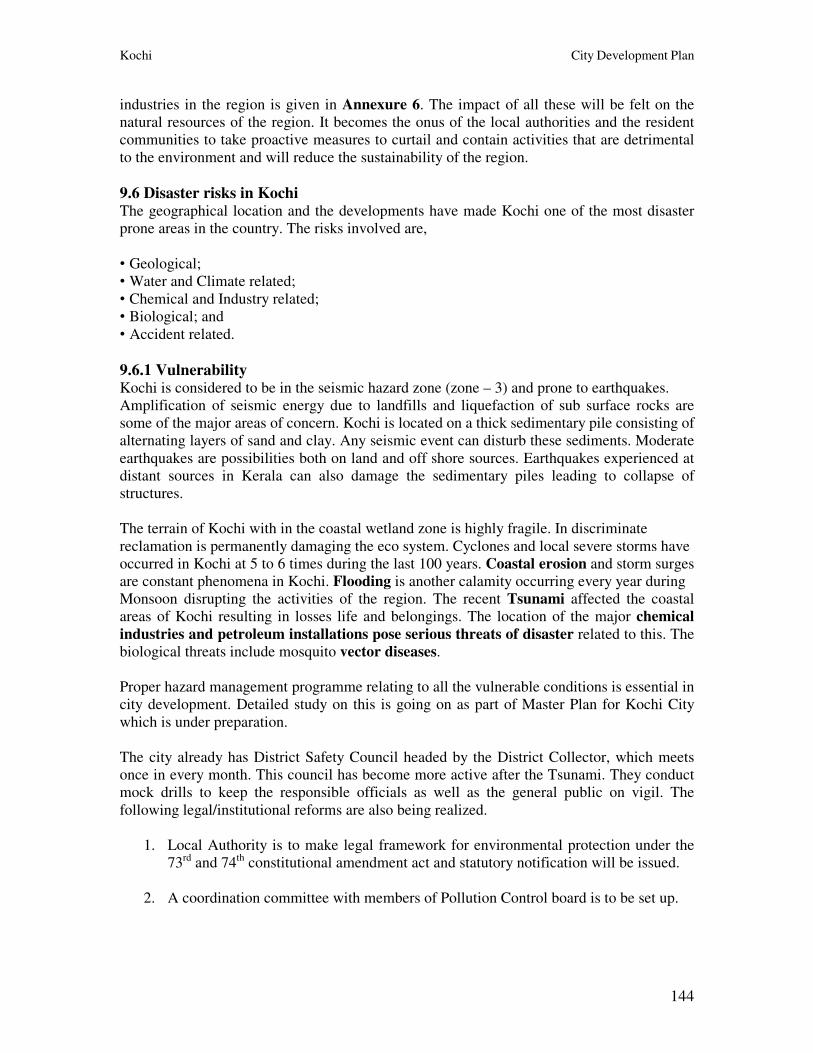
Kochi City Development Plan
144
industries in the region is given in Annexure 6. The impact of all these will be felt on the
natural resources of the region. It becomes the onus of the local authorities and the resident
communities to take proactive measures to curtail and contain activities that are detrimental
to the environment and will reduce the sustainability of the region.
9.6 Disaster risks in Kochi The geographical location and the developments have made Kochi one of the most disaster
prone areas in the country. The risks involved are,
• Geological;
• Water and Climate related;
• Chemical and Industry related;
• Biological; and
• Accident related.
9.6.1 Vulnerability Kochi is considered to be in the seismic hazard zone (zone – 3) and prone to earthquakes.
Amplification of seismic energy due to landfills and liquefaction of sub surface rocks are
some of the major areas of concern. Kochi is located on a thick sedimentary pile consisting of
alternating layers of sand and clay. Any seismic event can disturb these sediments. Moderate
earthquakes are possibilities both on land and off shore sources. Earthquakes experienced at
distant sources in Kerala can also damage the sedimentary piles leading to collapse of
structures.
The terrain of Kochi with in the coastal wetland zone is highly fragile. In discriminate
reclamation is permanently damaging the eco system. Cyclones and local severe storms have
occurred in Kochi at 5 to 6 times during the last 100 years. Coastal erosion and storm surges
are constant phenomena in Kochi. Flooding is another calamity occurring every year during
Monsoon disrupting the activities of the region. The recent Tsunami affected the coastal
areas of Kochi resulting in losses life and belongings. The location of the major chemical
industries and petroleum installations pose serious threats of disaster related to this. The
biological threats include mosquito vector diseases.
Proper hazard management programme relating to all the vulnerable conditions is essential in
city development. Detailed study on this is going on as part of Master Plan for Kochi City
which is under preparation.
The city already has District Safety Council headed by the District Collector, which meets
once in every month. This council has become more active after the Tsunami. They conduct
mock drills to keep the responsible officials as well as the general public on vigil. The
following legal/institutional reforms are also being realized.
1. Local Authority is to make legal framework for environmental protection under the
73rd and 74th constitutional amendment act and statutory notification will be issued.
2. A coordination committee with members of Pollution Control board is to be set up.
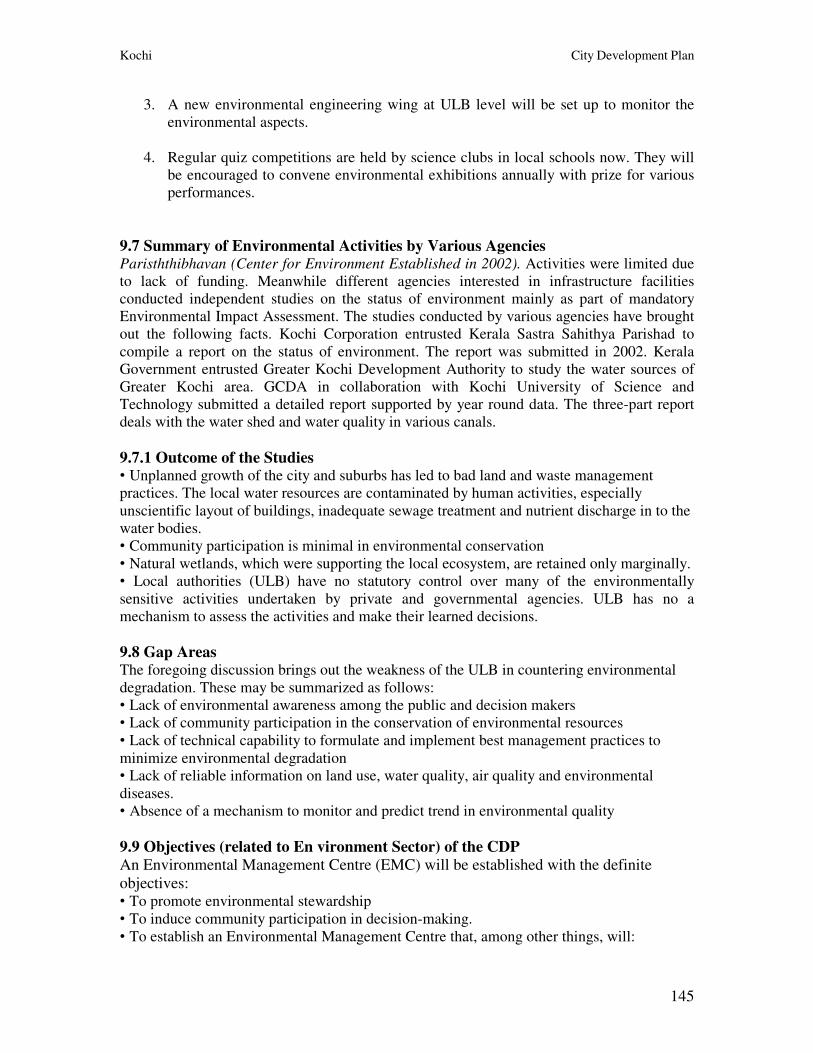
Kochi City Development Plan
145
3. A new environmental engineering wing at ULB level will be set up to monitor the
environmental aspects.
4. Regular quiz competitions are held by science clubs in local schools now. They will
be encouraged to convene environmental exhibitions annually with prize for various
performances.
9.7 Summary of Environmental Activities by Various Agencies Parisththibhavan (Center for Environment Established in 2002). Activities were limited due
to lack of funding. Meanwhile different agencies interested in infrastructure facilities
conducted independent studies on the status of environment mainly as part of mandatory
Environmental Impact Assessment. The studies conducted by various agencies have brought
out the following facts. Kochi Corporation entrusted Kerala Sastra Sahithya Parishad to
compile a report on the status of environment. The report was submitted in 2002. Kerala
Government entrusted Greater Kochi Development Authority to study the water sources of
Greater Kochi area. GCDA in collaboration with Kochi University of Science and
Technology submitted a detailed report supported by year round data. The three-part report
deals with the water shed and water quality in various canals.
9.7.1 Outcome of the Studies • Unplanned growth of the city and suburbs has led to bad land and waste management
practices. The local water resources are contaminated by human activities, especially
unscientific layout of buildings, inadequate sewage treatment and nutrient discharge in to the
water bodies.
• Community participation is minimal in environmental conservation
• Natural wetlands, which were supporting the local ecosystem, are retained only marginally.
• Local authorities (ULB) have no statutory control over many of the environmentally
sensitive activities undertaken by private and governmental agencies. ULB has no a
mechanism to assess the activities and make their learned decisions.
9.8 Gap Areas The foregoing discussion brings out the weakness of the ULB in countering environmental
degradation. These may be summarized as follows:
• Lack of environmental awareness among the public and decision makers
• Lack of community participation in the conservation of environmental resources
• Lack of technical capability to formulate and implement best management practices to
minimize environmental degradation
• Lack of reliable information on land use, water quality, air quality and environmental
diseases.
• Absence of a mechanism to monitor and predict trend in environmental quality
9.9 Objectives (related to En vironment Sector) of the CDP An Environmental Management Centre (EMC) will be established with the definite
objectives: • To promote environmental stewardship
• To induce community participation in decision-making.
• To establish an Environmental Management Centre that, among other things, will:
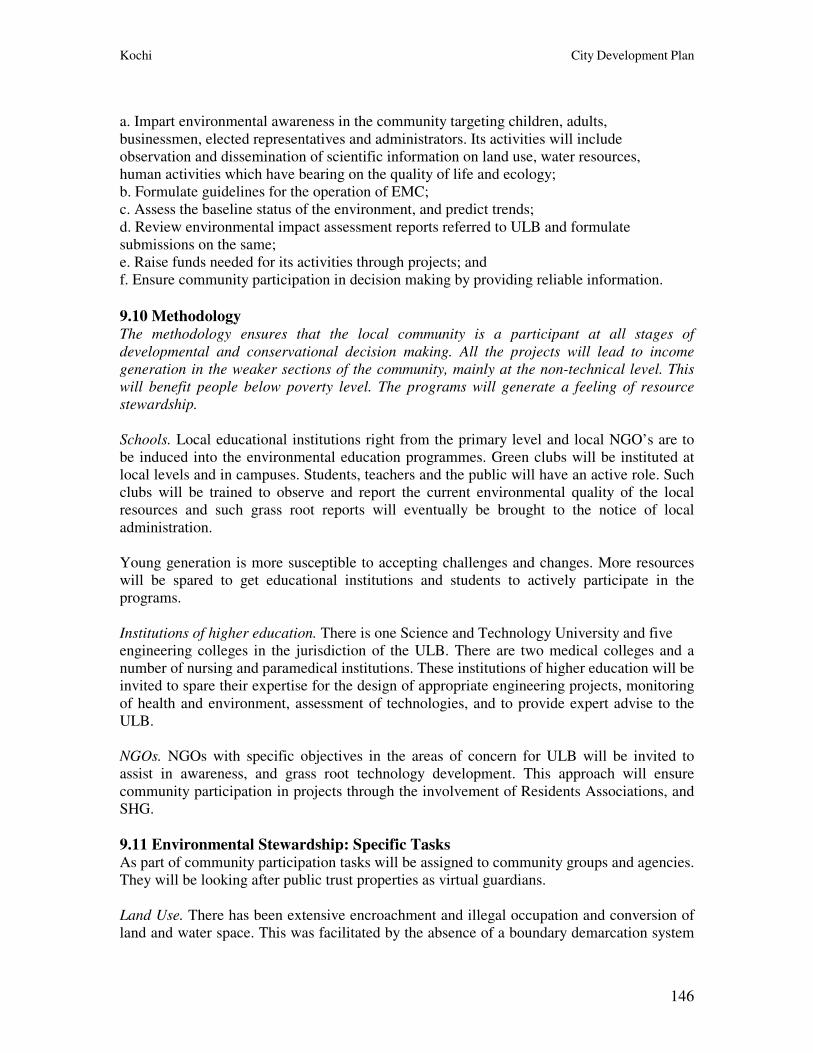
Kochi City Development Plan
146
a. Impart environmental awareness in the community targeting children, adults,
businessmen, elected representatives and administrators. Its activities will include
observation and dissemination of scientific information on land use, water resources,
human activities which have bearing on the quality of life and ecology;
b. Formulate guidelines for the operation of EMC;
c. Assess the baseline status of the environment, and predict trends;
d. Review environmental impact assessment reports referred to ULB and formulate
submissions on the same;
e. Raise funds needed for its activities through projects; and
f. Ensure community participation in decision making by providing reliable information.
9.10 Methodology The methodology ensures that the local community is a participant at all stages of
developmental and conservational decision making. All the projects will lead to income
generation in the weaker sections of the community, mainly at the non-technical level. This
will benefit people below poverty level. The programs will generate a feeling of resource
stewardship.
Schools. Local educational institutions right from the primary level and local NGO’s are to
be induced into the environmental education programmes. Green clubs will be instituted at
local levels and in campuses. Students, teachers and the public will have an active role. Such
clubs will be trained to observe and report the current environmental quality of the local
resources and such grass root reports will eventually be brought to the notice of local
administration.
Young generation is more susceptible to accepting challenges and changes. More resources
will be spared to get educational institutions and students to actively participate in the
programs.
Institutions of higher education. There is one Science and Technology University and five
engineering colleges in the jurisdiction of the ULB. There are two medical colleges and a
number of nursing and paramedical institutions. These institutions of higher education will be
invited to spare their expertise for the design of appropriate engineering projects, monitoring
of health and environment, assessment of technologies, and to provide expert advise to the
ULB.
NGOs. NGOs with specific objectives in the areas of concern for ULB will be invited to
assist in awareness, and grass root technology development. This approach will ensure
community participation in projects through the involvement of Residents Associations, and
SHG.
9.11 Environmental Stewardship: Specific Tasks As part of community participation tasks will be assigned to community groups and agencies.
They will be looking after public trust properties as virtual guardians.
Land Use. There has been extensive encroachment and illegal occupation and conversion of
land and water space. This was facilitated by the absence of a boundary demarcation system
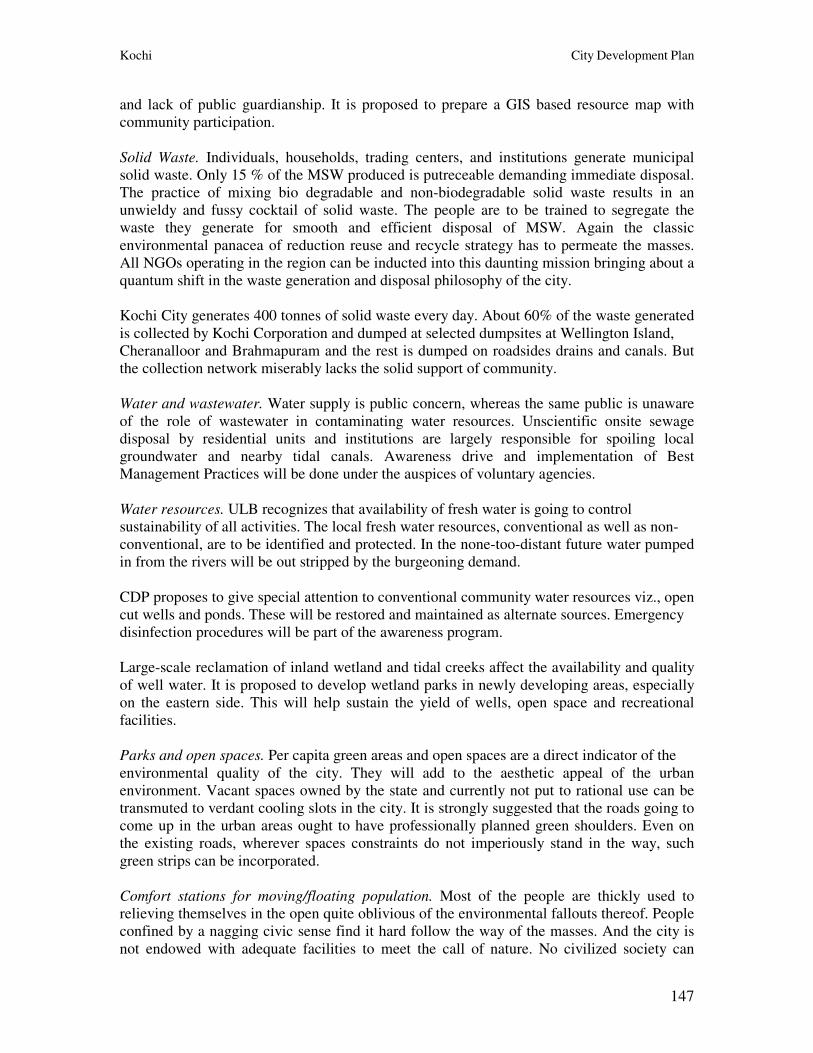
Kochi City Development Plan
147
and lack of public guardianship. It is proposed to prepare a GIS based resource map with
community participation.
Solid Waste. Individuals, households, trading centers, and institutions generate municipal
solid waste. Only 15 % of the MSW produced is putreceable demanding immediate disposal.
The practice of mixing bio degradable and non-biodegradable solid waste results in an
unwieldy and fussy cocktail of solid waste. The people are to be trained to segregate the
waste they generate for smooth and efficient disposal of MSW. Again the classic
environmental panacea of reduction reuse and recycle strategy has to permeate the masses.
All NGOs operating in the region can be inducted into this daunting mission bringing about a
quantum shift in the waste generation and disposal philosophy of the city.
Kochi City generates 400 tonnes of solid waste every day. About 60% of the waste generated
is collected by Kochi Corporation and dumped at selected dumpsites at Wellington Island,
Cheranalloor and Brahmapuram and the rest is dumped on roadsides drains and canals. But
the collection network miserably lacks the solid support of community.
Water and wastewater. Water supply is public concern, whereas the same public is unaware
of the role of wastewater in contaminating water resources. Unscientific onsite sewage
disposal by residential units and institutions are largely responsible for spoiling local
groundwater and nearby tidal canals. Awareness drive and implementation of Best
Management Practices will be done under the auspices of voluntary agencies.
Water resources. ULB recognizes that availability of fresh water is going to control
sustainability of all activities. The local fresh water resources, conventional as well as non-
conventional, are to be identified and protected. In the none-too-distant future water pumped
in from the rivers will be out stripped by the burgeoning demand.
CDP proposes to give special attention to conventional community water resources viz., open
cut wells and ponds. These will be restored and maintained as alternate sources. Emergency
disinfection procedures will be part of the awareness program.
Large-scale reclamation of inland wetland and tidal creeks affect the availability and quality
of well water. It is proposed to develop wetland parks in newly developing areas, especially
on the eastern side. This will help sustain the yield of wells, open space and recreational
facilities.
Parks and open spaces. Per capita green areas and open spaces are a direct indicator of the
environmental quality of the city. They will add to the aesthetic appeal of the urban
environment. Vacant spaces owned by the state and currently not put to rational use can be
transmuted to verdant cooling slots in the city. It is strongly suggested that the roads going to
come up in the urban areas ought to have professionally planned green shoulders. Even on
the existing roads, wherever spaces constraints do not imperiously stand in the way, such
green strips can be incorporated.
Comfort stations for moving/floating population. Most of the people are thickly used to
relieving themselves in the open quite oblivious of the environmental fallouts thereof. People
confined by a nagging civic sense find it hard follow the way of the masses. And the city is
not endowed with adequate facilities to meet the call of nature. No civilized society can
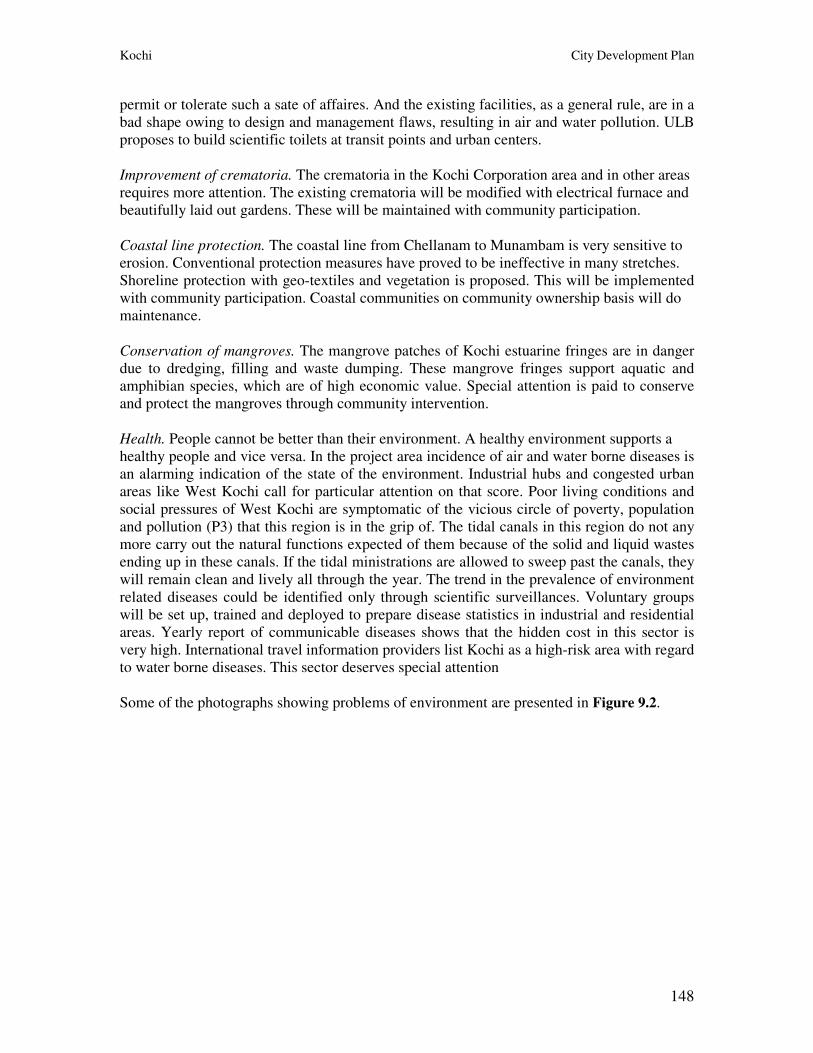
Kochi City Development Plan
148
permit or tolerate such a sate of affaires. And the existing facilities, as a general rule, are in a
bad shape owing to design and management flaws, resulting in air and water pollution. ULB
proposes to build scientific toilets at transit points and urban centers.
Improvement of crematoria. The crematoria in the Kochi Corporation area and in other areas
requires more attention. The existing crematoria will be modified with electrical furnace and
beautifully laid out gardens. These will be maintained with community participation.
Coastal line protection. The coastal line from Chellanam to Munambam is very sensitive to
erosion. Conventional protection measures have proved to be ineffective in many stretches.
Shoreline protection with geo-textiles and vegetation is proposed. This will be implemented
with community participation. Coastal communities on community ownership basis will do
maintenance.
Conservation of mangroves. The mangrove patches of Kochi estuarine fringes are in danger
due to dredging, filling and waste dumping. These mangrove fringes support aquatic and
amphibian species, which are of high economic value. Special attention is paid to conserve
and protect the mangroves through community intervention.
Health. People cannot be better than their environment. A healthy environment supports a
healthy people and vice versa. In the project area incidence of air and water borne diseases is
an alarming indication of the state of the environment. Industrial hubs and congested urban
areas like West Kochi call for particular attention on that score. Poor living conditions and
social pressures of West Kochi are symptomatic of the vicious circle of poverty, population
and pollution (P3) that this region is in the grip of. The tidal canals in this region do not any
more carry out the natural functions expected of them because of the solid and liquid wastes
ending up in these canals. If the tidal ministrations are allowed to sweep past the canals, they
will remain clean and lively all through the year. The trend in the prevalence of environment
related diseases could be identified only through scientific surveillances. Voluntary groups
will be set up, trained and deployed to prepare disease statistics in industrial and residential
areas. Yearly report of communicable diseases shows that the hidden cost in this sector is
very high. International travel information providers list Kochi as a high-risk area with regard
to water borne diseases. This sector deserves special attention
Some of the photographs showing problems of environment are presented in Figure 9.2.
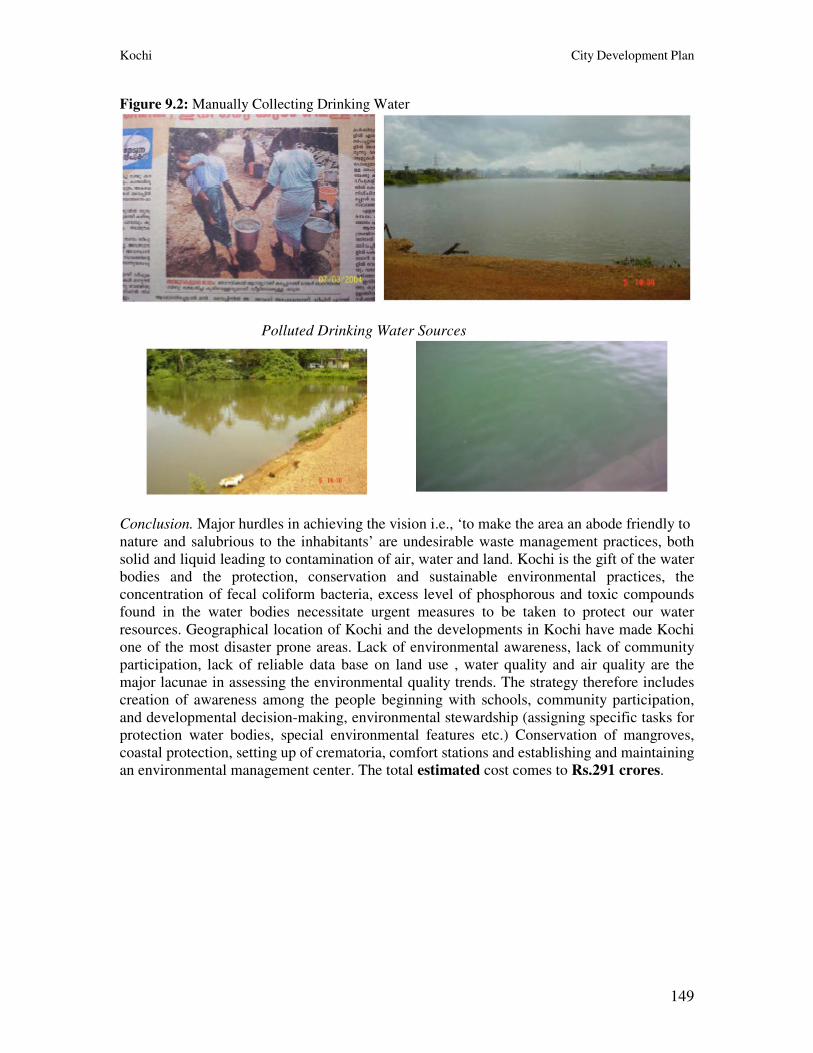
Kochi City Development Plan
149
Figure 9.2: Manually Collecting Drinking Water
Polluted Drinking Water Sources
Conclusion. Major hurdles in achieving the vision i.e., ‘to make the area an abode friendly to
nature and salubrious to the inhabitants’ are undesirable waste management practices, both
solid and liquid leading to contamination of air, water and land. Kochi is the gift of the water
bodies and the protection, conservation and sustainable environmental practices, the
concentration of fecal coliform bacteria, excess level of phosphorous and toxic compounds
found in the water bodies necessitate urgent measures to be taken to protect our water
resources. Geographical location of Kochi and the developments in Kochi have made Kochi
one of the most disaster prone areas. Lack of environmental awareness, lack of community
participation, lack of reliable data base on land use , water quality and air quality are the
major lacunae in assessing the environmental quality trends. The strategy therefore includes
creation of awareness among the people beginning with schools, community participation,
and developmental decision-making, environmental stewardship (assigning specific tasks for
protection water bodies, special environmental features etc.) Conservation of mangroves,
coastal protection, setting up of crematoria, comfort stations and establishing and maintaining
an environmental management center. The total estimated cost comes to Rs.291 crores.
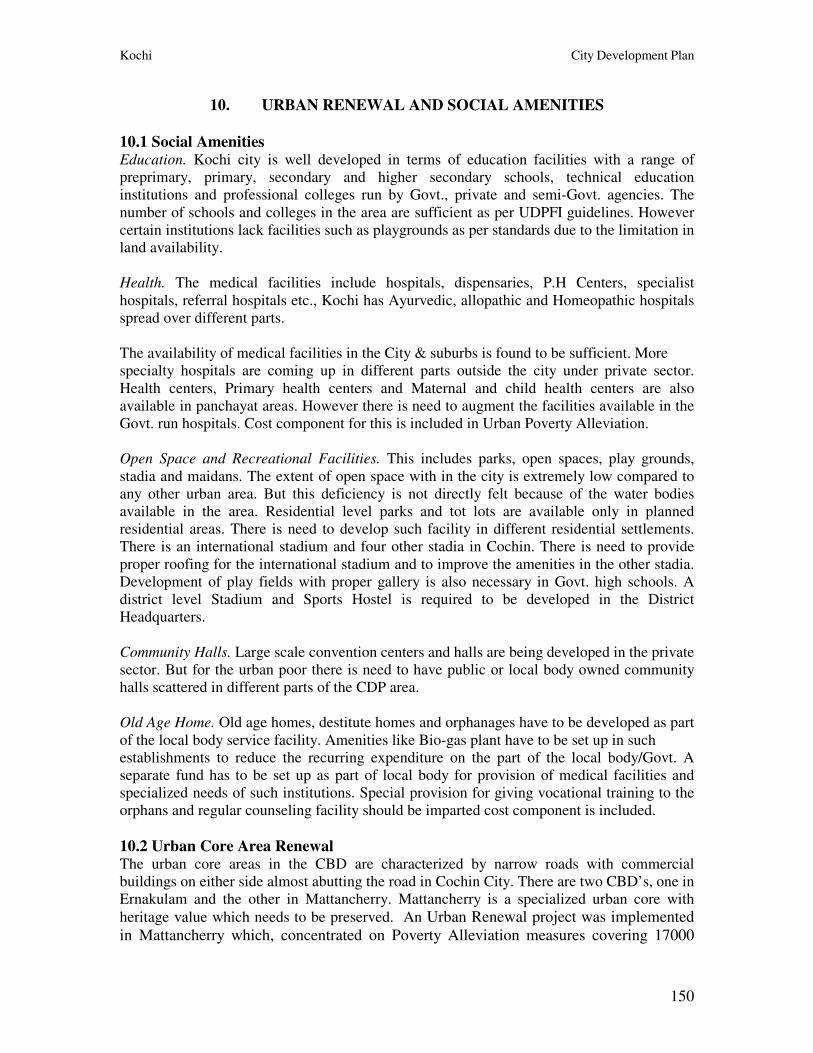
Kochi City Development Plan
150
10. URBAN RENEWAL AND SOCIAL AMENITIES
10.1 Social Amenities Education. Kochi city is well developed in terms of education facilities with a range of
preprimary, primary, secondary and higher secondary schools, technical education
institutions and professional colleges run by Govt., private and semi-Govt. agencies. The
number of schools and colleges in the area are sufficient as per UDPFI guidelines. However
certain institutions lack facilities such as playgrounds as per standards due to the limitation in
land availability.
Health. The medical facilities include hospitals, dispensaries, P.H Centers, specialist
hospitals, referral hospitals etc., Kochi has Ayurvedic, allopathic and Homeopathic hospitals
spread over different parts.
The availability of medical facilities in the City & suburbs is found to be sufficient. More
specialty hospitals are coming up in different parts outside the city under private sector.
Health centers, Primary health centers and Maternal and child health centers are also
available in panchayat areas. However there is need to augment the facilities available in the
Govt. run hospitals. Cost component for this is included in Urban Poverty Alleviation.
Open Space and Recreational Facilities. This includes parks, open spaces, play grounds,
stadia and maidans. The extent of open space with in the city is extremely low compared to
any other urban area. But this deficiency is not directly felt because of the water bodies
available in the area. Residential level parks and tot lots are available only in planned
residential areas. There is need to develop such facility in different residential settlements.
There is an international stadium and four other stadia in Cochin. There is need to provide
proper roofing for the international stadium and to improve the amenities in the other stadia.
Development of play fields with proper gallery is also necessary in Govt. high schools. A
district level Stadium and Sports Hostel is required to be developed in the District
Headquarters.
Community Halls. Large scale convention centers and halls are being developed in the private
sector. But for the urban poor there is need to have public or local body owned community
halls scattered in different parts of the CDP area.
Old Age Home. Old age homes, destitute homes and orphanages have to be developed as part
of the local body service facility. Amenities like Bio-gas plant have to be set up in such
establishments to reduce the recurring expenditure on the part of the local body/Govt. A
separate fund has to be set up as part of local body for provision of medical facilities and
specialized needs of such institutions. Special provision for giving vocational training to the
orphans and regular counseling facility should be imparted cost component is included.
10.2 Urban Core Area Renewal The urban core areas in the CBD are characterized by narrow roads with commercial
buildings on either side almost abutting the road in Cochin City. There are two CBD’s, one in
Ernakulam and the other in Mattancherry. Mattancherry is a specialized urban core with
heritage value which needs to be preserved. An Urban Renewal project was implemented
in Mattancherry which, concentrated on Poverty Alleviation measures covering 17000
Kochi City Development Plan
151
BPL families (SJSRY) with a total out lay of 4.67 crores. As part of the programme, 2
major Govt. hospitals in Mattancherry were renovated. Augmentation of facilities in
Govt. hospitals is included as part of Basic Service to the Urban Poor. As buildings and
precincts of heritage value characterize Mattancherry urban core area; conservation and
heritage tourism are relevant here.
In Ernakulam area of Kochi Municipal Corporation the urban core areas can be made
more productive by shifting certain non-conforming uses to the peripheral area and
renovating the core areas. Renovation of the Central Market is thus proposed and area
development scheme for the core area is envisaged.
In Ernakulam the market area is situated in the heart of the city and the roads leading to the
market are flanked by commercial buildings dealing with wholesale trade. Recently the
agricultural component of the whole sale market has been shifted to an outer area at Maradu
with the assistance of EEC. The whole sale building material market is still functioning with
in the core area which causes traffic bottlenecks all over the city. There is need to shift the
whole sale building material market away from the city center so that the existing market
area can be renovated to function efficiently as a central retail market. Special area
development schemes have to be notified to take up this work with beneficiary participation.
In the surrounding Panchayats and Municipalities also the markets situated in the core area
need to be renovated. They need to be improved and the quality of the environment can be
improved by taking up area development schemes. The cost for this is tentatively worked out
and indicated. In the Cochin City centre the old CBD are is characterized by buildings, which
are dilapidated. The land values are prohibitive and it will be economically beneficial if the
whole area comprising of such old structures is reorganized .It is proposed to construct multi-
storey buildings relocating the existing activities, which are location specific. This will render
large open spaces around such buildings and improve the environmental quality. Ernakulam
North Town area is considered for such development.
Conclusion. The core areas of the city and the old parts of the suburbs are characterized by
narrow roads flanked by old and dilapidated buildings. Location of certain activities like
wholesale trading in the heart of the city attracts trucks and other goods vehicles to these
narrow roads resulting in congestion. Decentralization of such activities to the peripheral
areas and renewal of the urban core areas by reconstitution of plots is proposed.
There are deficiencies in the delivery of services by the public sector as a consequence of
lack of facilities in the Govt. Hospitals, Govt. Schools and public recreational areas. The
urban poor are the most affected as they rely fully on these services. The project proposes to
augment the facilities in these institutions and create infrastructure wherever necessary.
Total estimated cost of the projects under this is Rs.259.5crore.
Kochi City Development Plan
152
11 MUNICIPAL FINANCES
This chapter focuses mainly on the finance of the Kochi Corporation and other local bodies
11.1 Structure of the City Finance
The review of the finances involves analysis of the income and expenditure of the local
bodies to ascertain the trends on the major sources and uses of funds.
The transactions of Kochi Corporation are carried out mainly under revenue sources and
expenditure. The revenue sources include taxes, non-taxes such as rents, fees, fines etc., and
grants. Details of the revenue from different sources for a financial year are indicated
separately. The taxes include property tax, profession tax, entertainment tax etc.
11.2 Sources of Fund
• Own source revenue which includes taxes, duties, cess and surcharge, fees from
licenses and permissions, income from municipal properties, and income from
miscellaneous items;
• Share of the taxes levied by the Government and transferred to the Local Bodies;
Grants to the Local Bodies from the Government for the implementation of schemes,
projects and plans formulated by them, under non-plan scheme;
• Grants realized to the municipal corporation by the Government for implementation
of schemes, projects and plans assigned or entrusted to the municipal corporation under
the KM Act 1994; and K.P.R Act 1994; and
• Money raised through donations and contributions from the public and non-
governmental agencies. The KM Act 1994 and the K.P.R Act 1994 mandates the publication, not later than the first
week of June, of the annual financial statement of the municipal corporation of the preceding
year showing a classified abstract of receipts and payments of the municipal corporation
under Revenue, Capital and Debt heads, a demand, collection and balance statement and a
statement of the general financial position of the institutions.
Overview of Finance Sources. Actual sources of the revenues for the Local Bodies for the last
5 years is analyzed and furnished below.
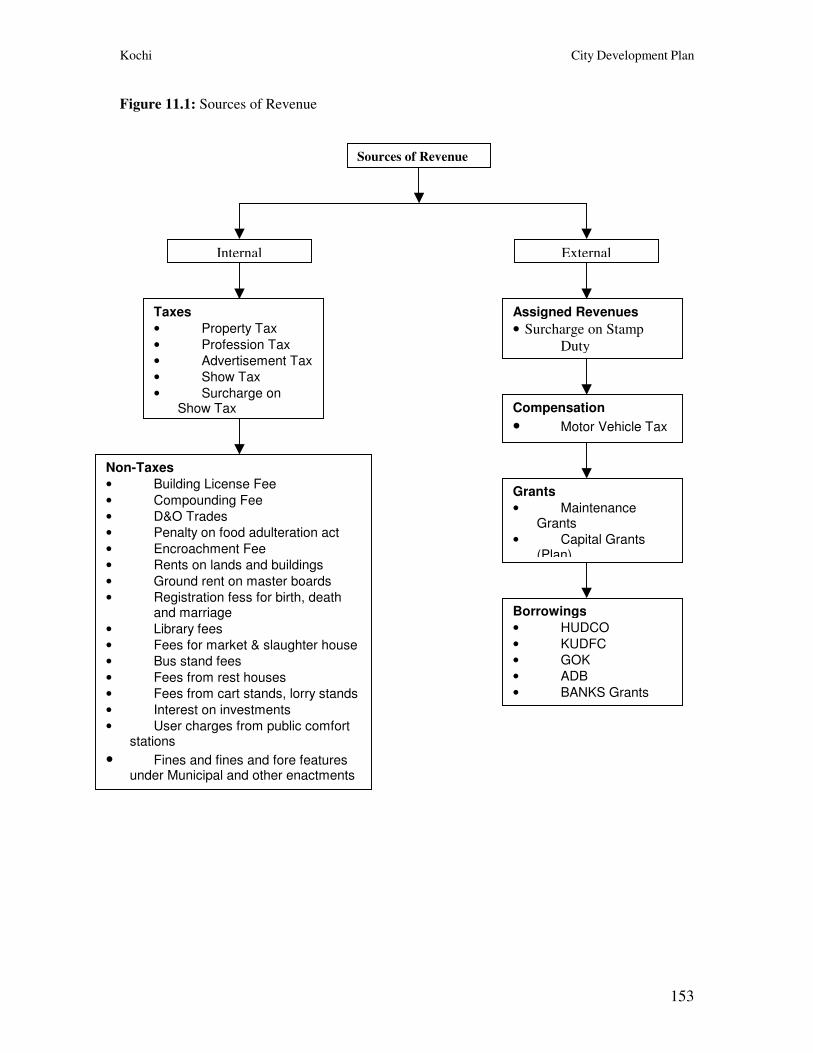
Kochi City Development Plan
153
Figure 11.1: Sources of Revenue
Internal External
Compensation
• Motor Vehicle Tax
Sources of Revenue
Taxes
• Property Tax
• Profession Tax
• Advertisement Tax
• Show Tax
• Surcharge on Show Tax
Assigned Revenues
• Surcharge on Stamp
Duty
Grants
• Maintenance Grants
• Capital Grants (Plan)
Non-Taxes
• Building License Fee
• Compounding Fee
• D&O Trades
• Penalty on food adulteration act
• Encroachment Fee
• Rents on lands and buildings
• Ground rent on master boards
• Registration fess for birth, death and marriage
• Library fees
• Fees for market & slaughter house
• Bus stand fees
• Fees from rest houses
• Fees from cart stands, lorry stands
• Interest on investments
• User charges from public comfort stations
• Fines and fines and fore features under Municipal and other enactments
Borrowings
• HUDCO
• KUDFC
• GOK
• ADB
• BANKS Grants
•
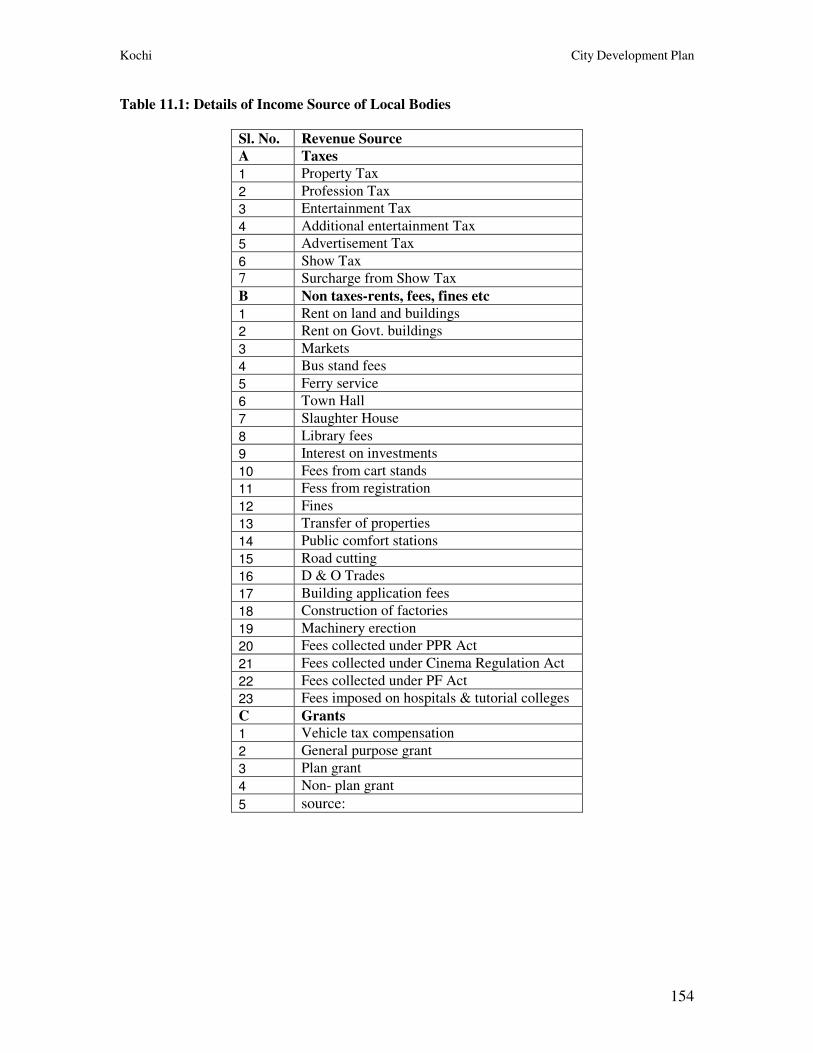
Kochi City Development Plan
154
Table 11.1: Details of Income Source of Local Bodies
Sl. No. Revenue Source
A Taxes
1 Property Tax
2 Profession Tax
3 Entertainment Tax
4 Additional entertainment Tax
5 Advertisement Tax
6 Show Tax
7 Surcharge from Show Tax
B Non taxes-rents, fees, fines etc
1 Rent on land and buildings
2 Rent on Govt. buildings
3 Markets
4 Bus stand fees
5 Ferry service
6 Town Hall
7 Slaughter House
8 Library fees
9 Interest on investments
10 Fees from cart stands
11 Fess from registration
12 Fines
13 Transfer of properties
14 Public comfort stations
15 Road cutting
16 D & O Trades
17 Building application fees
18 Construction of factories
19 Machinery erection
20 Fees collected under PPR Act
21 Fees collected under Cinema Regulation Act
22 Fees collected under PF Act
23 Fees imposed on hospitals & tutorial colleges
C Grants
1 Vehicle tax compensation
2 General purpose grant
3 Plan grant
4 Non- plan grant
5 source:
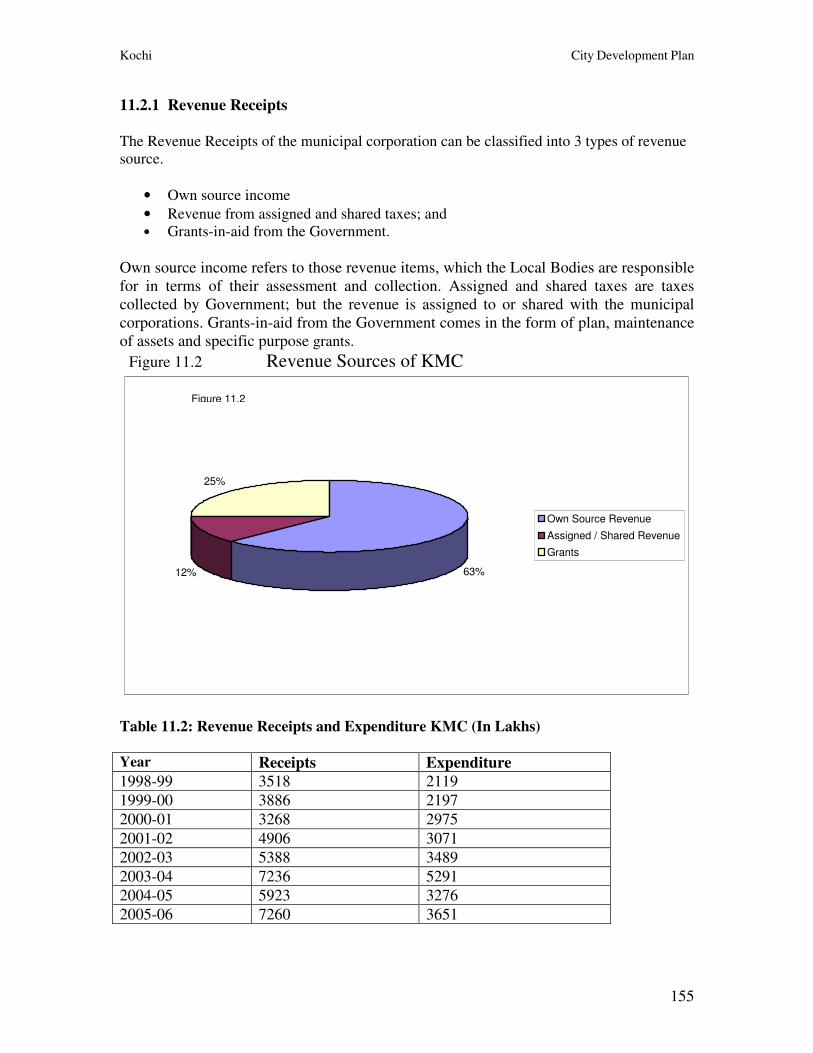
Kochi City Development Plan
155
11.2.1 Revenue Receipts
The Revenue Receipts of the municipal corporation can be classified into 3 types of revenue
source.
• Own source income
• Revenue from assigned and shared taxes; and
• Grants-in-aid from the Government.
Own source income refers to those revenue items, which the Local Bodies are responsible
for in terms of their assessment and collection. Assigned and shared taxes are taxes
collected by Government; but the revenue is assigned to or shared with the municipal
corporations. Grants-in-aid from the Government comes in the form of plan, maintenance
of assets and specific purpose grants.
Figure 11.2 Revenue Sources of KMC
63%12%
25%
Own Source Revenue
Assigned / Shared Revenue
Grants
Figure 11.2
Table 11.2: Revenue Receipts and Expenditure KMC (In Lakhs)
Year Receipts Expenditure
1998-99 3518 2119
1999-00 3886 2197
2000-01 3268 2975
2001-02 4906 3071
2002-03 5388 3489
2003-04 7236 5291
2004-05 5923 3276
2005-06 7260 3651
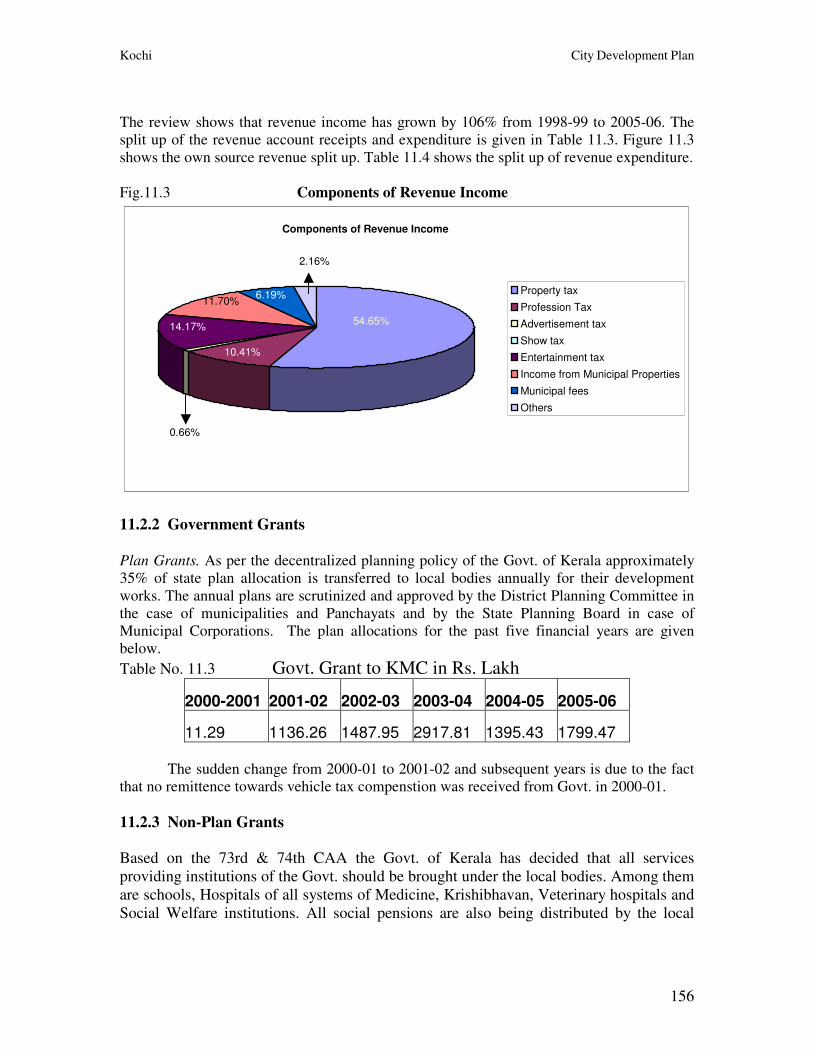
Kochi City Development Plan
156
The review shows that revenue income has grown by 106% from 1998-99 to 2005-06. The
split up of the revenue account receipts and expenditure is given in Table 11.3. Figure 11.3
shows the own source revenue split up. Table 11.4 shows the split up of revenue expenditure.
Fig.11.3 Components of Revenue Income
Property tax
Profession Tax
Advertisement tax
Show tax
Entertainment tax
Income from Municipal Properties
Municipal fees
Others
54.65%
10.41%
0.66%
14.17%
11.70%6.19%
2.16%
Components of Revenue Income
11.2.2 Government Grants
Plan Grants. As per the decentralized planning policy of the Govt. of Kerala approximately
35% of state plan allocation is transferred to local bodies annually for their development
works. The annual plans are scrutinized and approved by the District Planning Committee in
the case of municipalities and Panchayats and by the State Planning Board in case of
Municipal Corporations. The plan allocations for the past five financial years are given
below.
Table No. 11.3 Govt. Grant to KMC in Rs. Lakh
2000-2001 2001-02 2002-03 2003-04 2004-05 2005-06
11.29 1136.26 1487.95 2917.81 1395.43 1799.47 The sudden change from 2000-01 to 2001-02 and subsequent years is due to the fact
that no remittence towards vehicle tax compenstion was received from Govt. in 2000-01.
11.2.3 Non-Plan Grants
Based on the 73rd & 74th CAA the Govt. of Kerala has decided that all services
providing institutions of the Govt. should be brought under the local bodies. Among them
are schools, Hospitals of all systems of Medicine, Krishibhavan, Veterinary hospitals and
Social Welfare institutions. All social pensions are also being distributed by the local
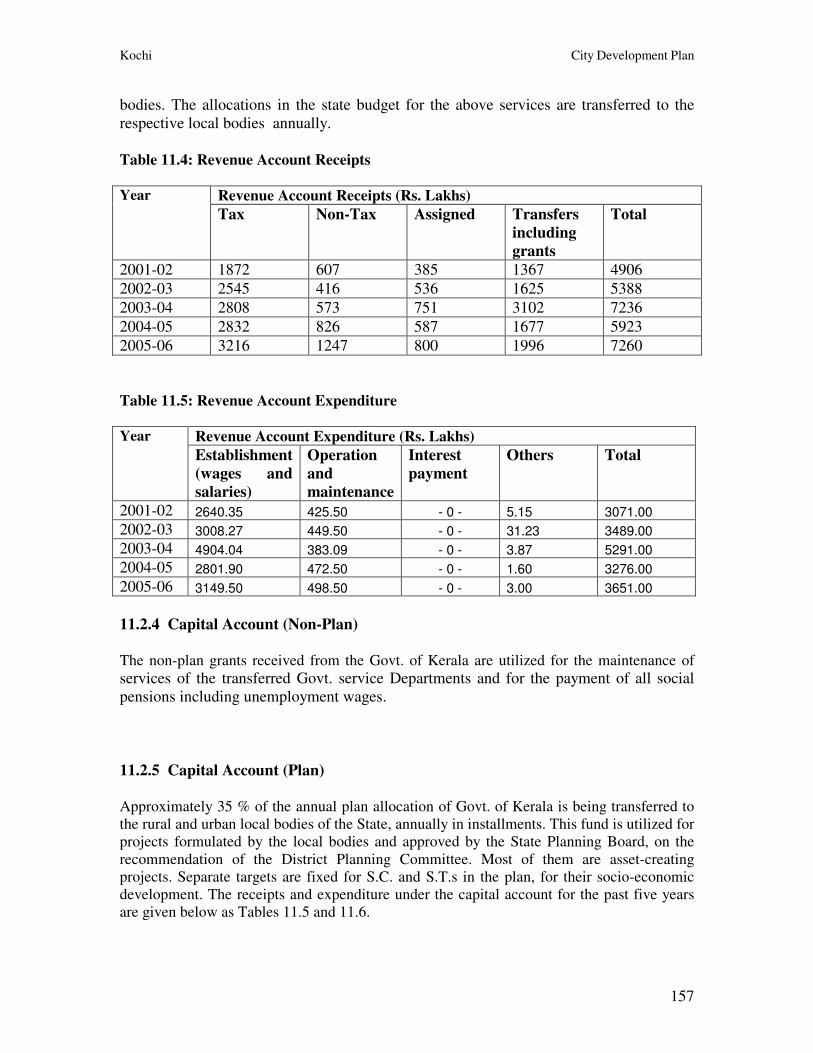
Kochi City Development Plan
157
bodies. The allocations in the state budget for the above services are transferred to the
respective local bodies annually.
Table 11.4: Revenue Account Receipts
Revenue Account Receipts (Rs. Lakhs) Year
Tax Non-Tax Assigned Transfers
including
grants
Total
2001-02 1872 607 385 1367 4906
2002-03 2545 416 536 1625 5388
2003-04 2808 573 751 3102 7236
2004-05 2832 826 587 1677 5923
2005-06 3216 1247 800 1996 7260
Table 11.5: Revenue Account Expenditure
Revenue Account Expenditure (Rs. Lakhs) Year
Establishment
(wages and
salaries)
Operation
and
maintenance
Interest
payment
Others Total
2001-02 2640.35 425.50 - 0 - 5.15 3071.00
2002-03 3008.27 449.50 - 0 - 31.23 3489.00
2003-04 4904.04 383.09 - 0 - 3.87 5291.00
2004-05 2801.90 472.50 - 0 - 1.60 3276.00
2005-06 3149.50 498.50 - 0 - 3.00 3651.00
11.2.4 Capital Account (Non-Plan)
The non-plan grants received from the Govt. of Kerala are utilized for the maintenance of
services of the transferred Govt. service Departments and for the payment of all social
pensions including unemployment wages.
11.2.5 Capital Account (Plan)
Approximately 35 % of the annual plan allocation of Govt. of Kerala is being transferred to
the rural and urban local bodies of the State, annually in installments. This fund is utilized for
projects formulated by the local bodies and approved by the State Planning Board, on the
recommendation of the District Planning Committee. Most of them are asset-creating
projects. Separate targets are fixed for S.C. and S.T.s in the plan, for their socio-economic
development. The receipts and expenditure under the capital account for the past five years
are given below as Tables 11.5 and 11.6.
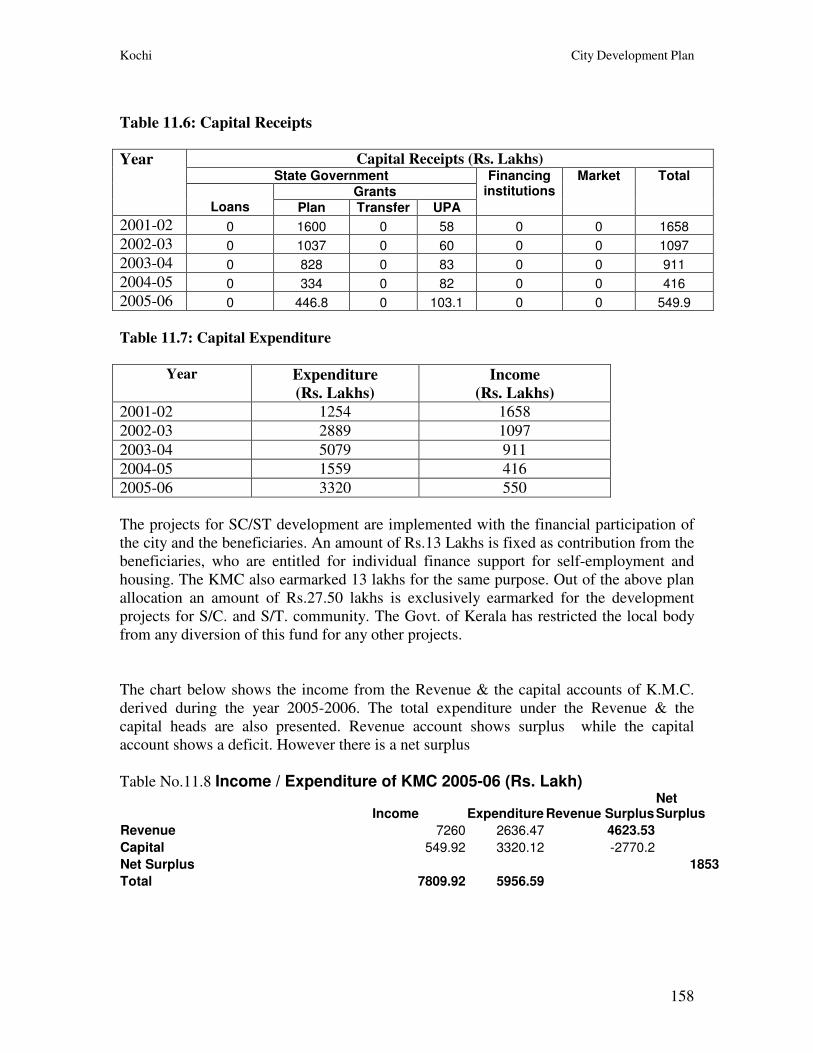
Kochi City Development Plan
158
Table 11.6: Capital Receipts
Capital Receipts (Rs. Lakhs) State Government
Grants
Year
Loans Plan Transfer UPA
Financing institutions
Market Total
2001-02 0 1600 0 58 0 0 1658
2002-03 0 1037 0 60 0 0 1097
2003-04 0 828 0 83 0 0 911
2004-05 0 334 0 82 0 0 416
2005-06 0 446.8 0 103.1 0 0 549.9
Table 11.7: Capital Expenditure
Year Expenditure
(Rs. Lakhs)
Income
(Rs. Lakhs)
2001-02 1254 1658
2002-03 2889 1097
2003-04 5079 911
2004-05 1559 416
2005-06 3320 550
The projects for SC/ST development are implemented with the financial participation of
the city and the beneficiaries. An amount of Rs.13 Lakhs is fixed as contribution from the
beneficiaries, who are entitled for individual finance support for self-employment and
housing. The KMC also earmarked 13 lakhs for the same purpose. Out of the above plan
allocation an amount of Rs.27.50 lakhs is exclusively earmarked for the development
projects for S/C. and S/T. community. The Govt. of Kerala has restricted the local body
from any diversion of this fund for any other projects.
The chart below shows the income from the Revenue & the capital accounts of K.M.C.
derived during the year 2005-2006. The total expenditure under the Revenue & the
capital heads are also presented. Revenue account shows surplus while the capital
account shows a deficit. However there is a net surplus
Table No.11.8 Income / Expenditure of KMC 2005-06 (Rs. Lakh)
Income Expenditure Revenue Surplus Net Surplus
Revenue 7260 2636.47 4623.53
Capital 549.92 3320.12 -2770.2
Net Surplus 1853
Total 7809.92 5956.59

Kochi City Development Plan
159
Figure 11.4 Income from Revenue & Capital accounts
-4000
-2000
0
2000
4000
6000
8000
10000
Income Expenditure Revenue Surplus
Net Surplus
Capital
Revenue
7.04%
92.96%
55.73%
44.27%
62.52%
-37.48%
Own Source Revenue The components of the revenue income presented in fig 11.3 indicate that property tax is
the critical component in the own source revenue.
The graph (Fig 11.5) shows the trend of increase in the property tax during the past 9
years. The analysis shows that there is scope for substantial increase in the income from
the property tax by changing the tax base from ARV to the assessment based on unit area,
by revising the tax, increasing the compliance in payment, by introducing
computerization in the assessment system, & by simplifying the collection procedure.
The efficiency of collection can also be increased to bring in more revenue.
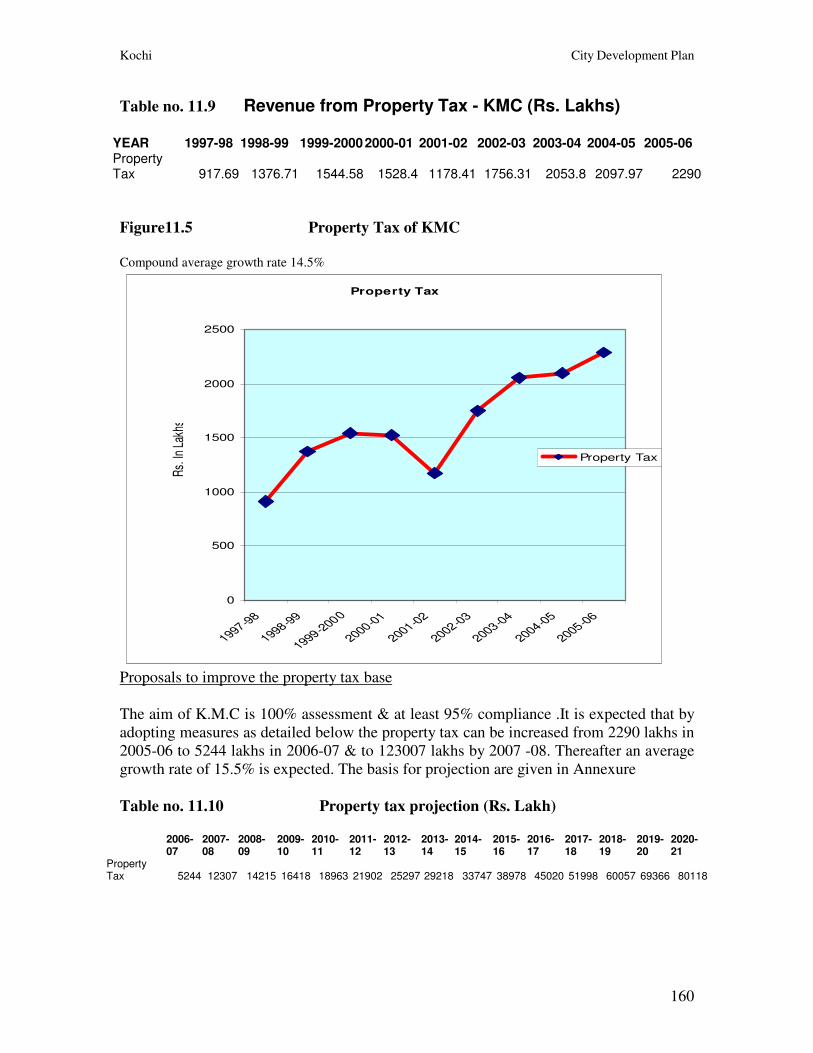
Kochi City Development Plan
160
Table no. 11.9 Revenue from Property Tax - KMC (Rs. Lakhs)
YEAR 1997-98 1998-99 1999-2000 2000-01 2001-02 2002-03 2003-04 2004-05 2005-06 Property Tax 917.69 1376.71 1544.58 1528.4 1178.41 1756.31 2053.8 2097.97 2290
Figure11.5 Property Tax of KMC
Compound average growth rate 14.5%
Property Tax
0
500
1000
1500
2000
2500
1997-98
1998-99
1999-2000
2000-01
2001-02
2002-03
2003-04
2004-05
2005-06
Property Tax
Rs.
In L
akhs
Proposals to improve the property tax base
The aim of K.M.C is 100% assessment & at least 95% compliance .It is expected that by
adopting measures as detailed below the property tax can be increased from 2290 lakhs in
2005-06 to 5244 lakhs in 2006-07 & to 123007 lakhs by 2007 -08. Thereafter an average
growth rate of 15.5% is expected. The basis for projection are given in Annexure
Table no. 11.10 Property tax projection (Rs. Lakh)
2006-07
2007-08
2008-09
2009-10
2010-11
2011-12
2012-13
2013-14
2014-15
2015-16
2016-17
2017-18
2018-19
2019-20
2020-21
Property Tax 5244 12307 14215 16418 18963 21902 25297 29218 33747 38978 45020 51998 60057 69366 80118
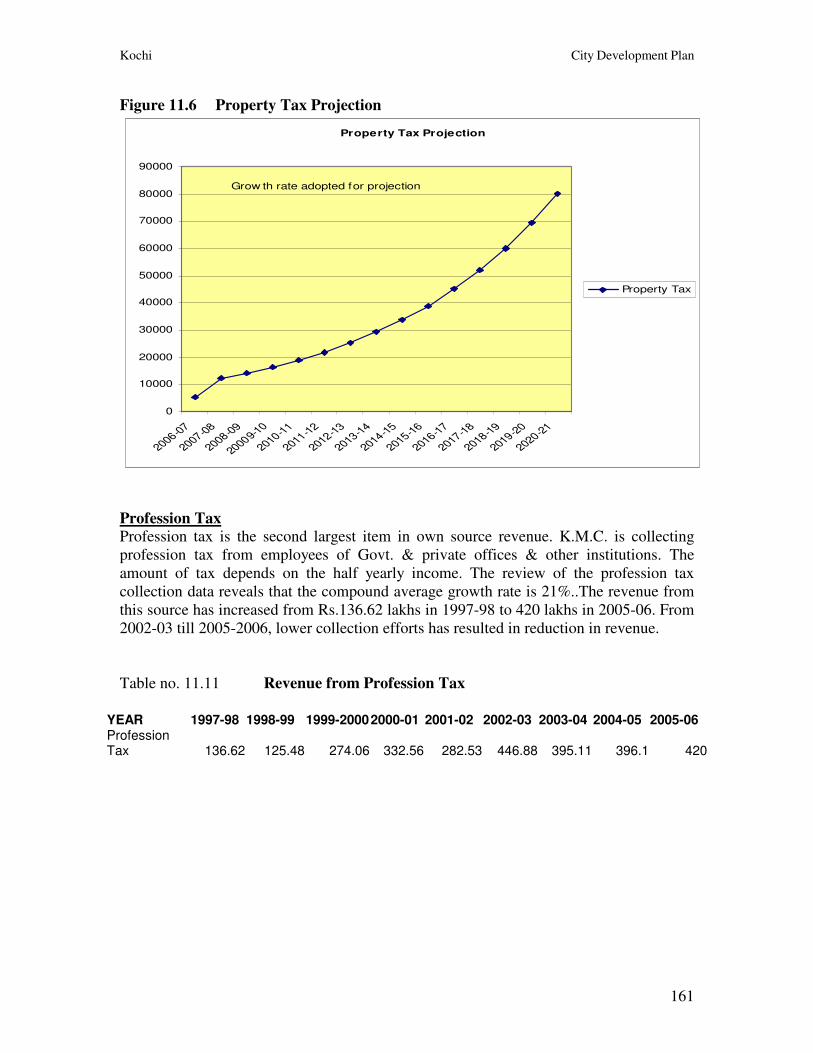
Kochi City Development Plan
161
Figure 11.6 Property Tax Projection
Property Tax Projection
0
10000
20000
30000
40000
50000
60000
70000
80000
90000
2006-07
2007-08
2008-09
20009-10
2010-11
2011-12
2012-13
2013-14
2014-15
2015-16
2016-17
2017-18
2018-19
2019-20
2020-21
Property Tax
Grow th rate adopted for projection
15.5%
Profession Tax Profession tax is the second largest item in own source revenue. K.M.C. is collecting
profession tax from employees of Govt. & private offices & other institutions. The
amount of tax depends on the half yearly income. The review of the profession tax
collection data reveals that the compound average growth rate is 21%..The revenue from
this source has increased from Rs.136.62 lakhs in 1997-98 to 420 lakhs in 2005-06. From
2002-03 till 2005-2006, lower collection efforts has resulted in reduction in revenue.
Table no. 11.11 Revenue from Profession Tax
YEAR 1997-98 1998-99 1999-2000 2000-01 2001-02 2002-03 2003-04 2004-05 2005-06 Profession Tax 136.62 125.48 274.06 332.56 282.53 446.88 395.11 396.1 420
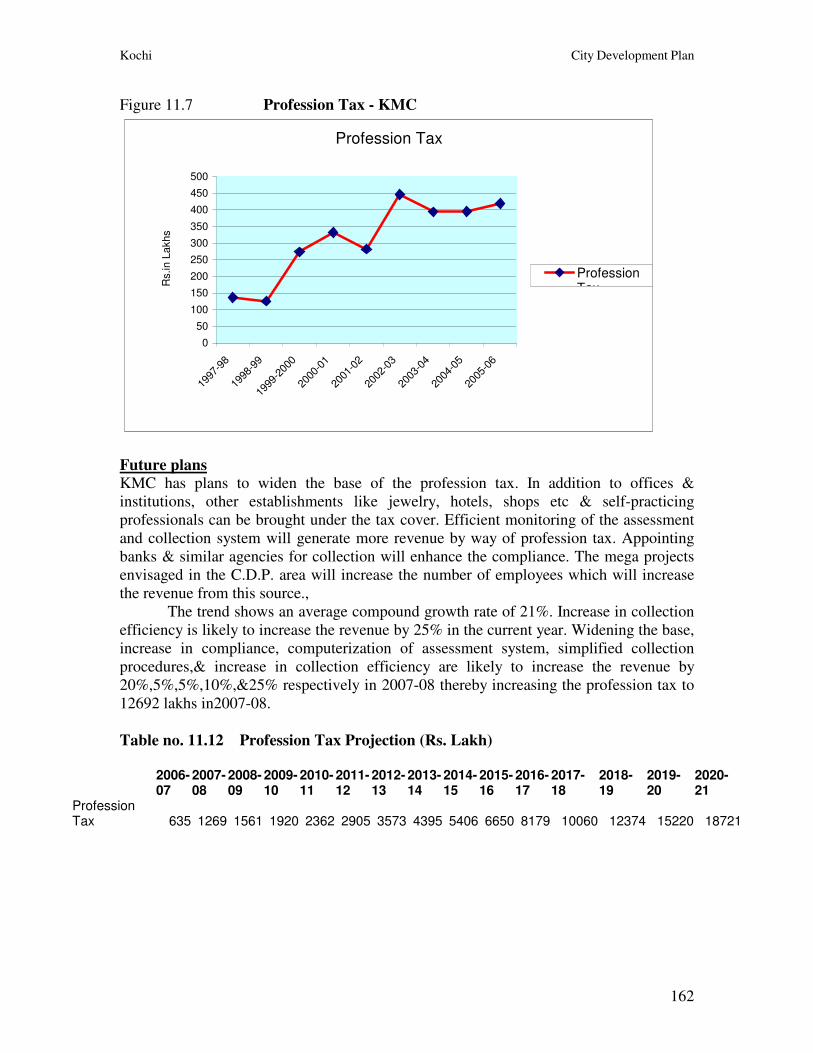
Kochi City Development Plan
162
Figure 11.7 Profession Tax - KMC
Profession Tax
0
50
100
150
200
250
300
350
400
450
500
1997
-98
1998
-99
1999
-200
0
2000
-01
2001
-02
2002
-03
2003
-04
2004
-05
2005
-06
ProfessionTaxR
s.in L
akhs
Future plans KMC has plans to widen the base of the profession tax. In addition to offices &
institutions, other establishments like jewelry, hotels, shops etc & self-practicing
professionals can be brought under the tax cover. Efficient monitoring of the assessment
and collection system will generate more revenue by way of profession tax. Appointing
banks & similar agencies for collection will enhance the compliance. The mega projects
envisaged in the C.D.P. area will increase the number of employees which will increase
the revenue from this source.,
The trend shows an average compound growth rate of 21%. Increase in collection
efficiency is likely to increase the revenue by 25% in the current year. Widening the base,
increase in compliance, computerization of assessment system, simplified collection
procedures,& increase in collection efficiency are likely to increase the revenue by
20%,5%,5%,10%,&25% respectively in 2007-08 thereby increasing the profession tax to
12692 lakhs in2007-08.
Table no. 11.12 Profession Tax Projection (Rs. Lakh)
2006-07
2007-08
2008-09
2009-10
2010-11
2011-12
2012-13
2013-14
2014-15
2015-16
2016-17
2017-18
2018-19
2019-20
2020-21
Profession Tax 635 1269 1561 1920 2362 2905 3573 4395 5406 6650 8179 10060 12374 15220 18721
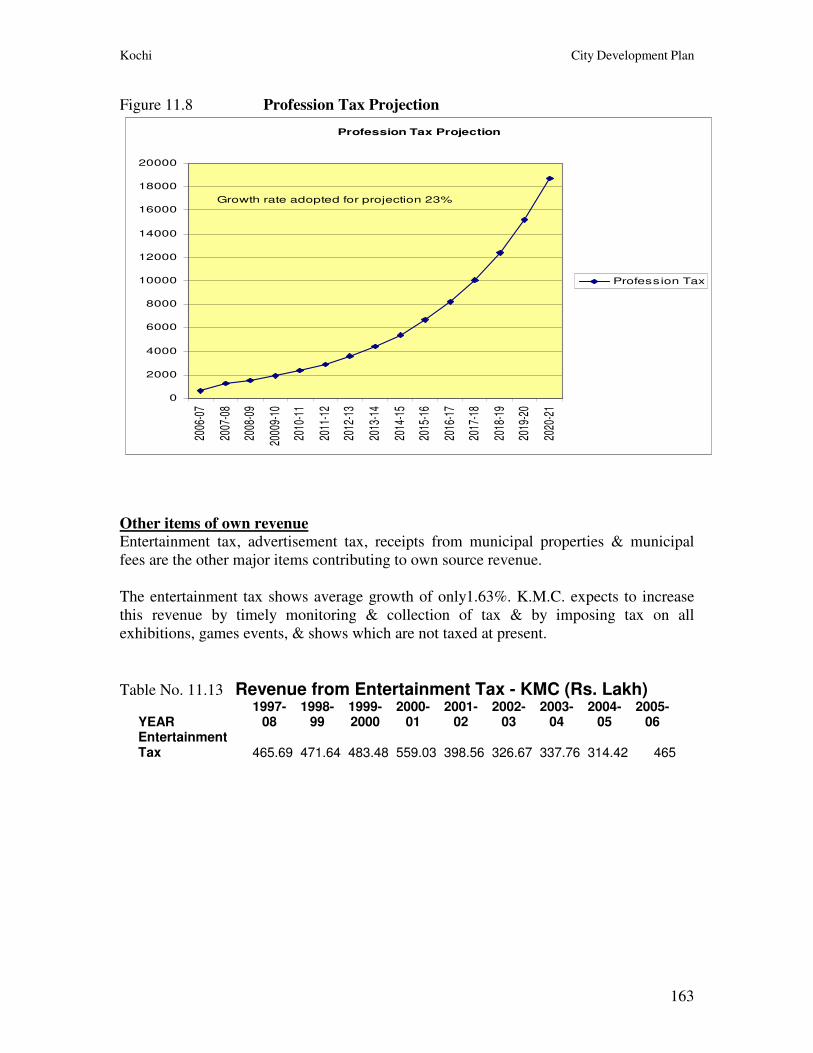
Kochi City Development Plan
163
Figure 11.8 Profession Tax Projection
Profession Tax Projection
0
2000
4000
6000
8000
10000
12000
14000
16000
18000
20000
2006
-07
2007
-08
2008
-09
2000
9-10
2010
-11
2011
-12
2012
-13
2013
-14
2014
-15
2015
-16
2016
-17
2017
-18
2018
-19
2019
-20
2020
-21
Profession Tax
Growth rate adopted for projection 23%
Other items of own revenue Entertainment tax, advertisement tax, receipts from municipal properties & municipal
fees are the other major items contributing to own source revenue.
The entertainment tax shows average growth of only1.63%. K.M.C. expects to increase
this revenue by timely monitoring & collection of tax & by imposing tax on all
exhibitions, games events, & shows which are not taxed at present.
Table No. 11.13 Revenue from Entertainment Tax - KMC (Rs. Lakh)
YEAR 1997-
08 1998-
99 1999-2000
2000-01
2001-02
2002-03
2003-04
2004-05
2005-06
Entertainment Tax 465.69 471.64 483.48 559.03 398.56 326.67 337.76 314.42 465
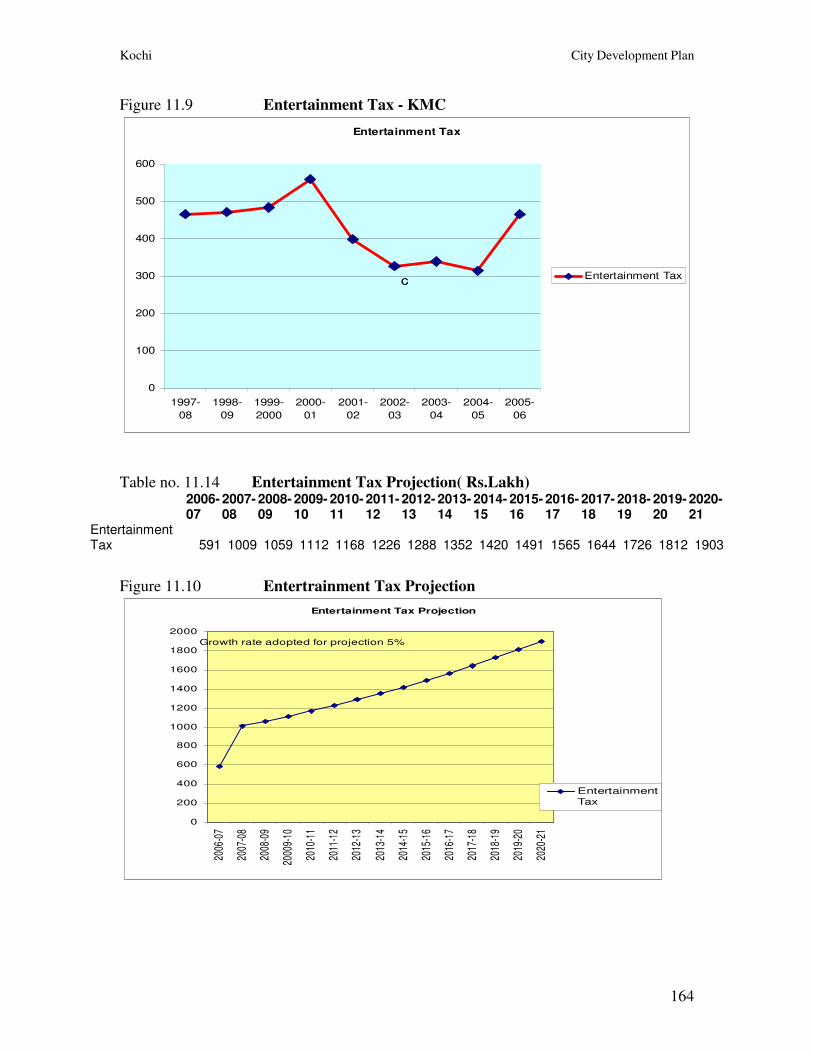
Kochi City Development Plan
164
Figure 11.9 Entertainment Tax - KMC
Entertainment Tax
0
100
200
300
400
500
600
1997-
08
1998-
09
1999-
2000
2000-
01
2001-
02
2002-
03
2003-
04
2004-
05
2005-
06
Entertainment TaxCC
Table no. 11.14 Entertainment Tax Projection( Rs.Lakh)
2006-07
2007-08
2008-09
2009-10
2010-11
2011-12
2012-13
2013-14
2014-15
2015-16
2016-17
2017-18
2018-19
2019-20
2020-21
Entertainment Tax 591 1009 1059 1112 1168 1226 1288 1352 1420 1491 1565 1644 1726 1812 1903
Figure 11.10 Entertrainment Tax Projection
Entertainment Tax Projection
0
200
400
600
800
1000
1200
1400
1600
1800
2000
2006
-07
2007
-08
2008
-09
2000
9-10
2010
-11
2011
-12
2012
-13
2013
-14
2014
-15
2015
-16
2016
-17
2017
-18
2018
-19
2019
-20
2020
-21
Entertainment
Tax
Growth rate adopted for projection 5%
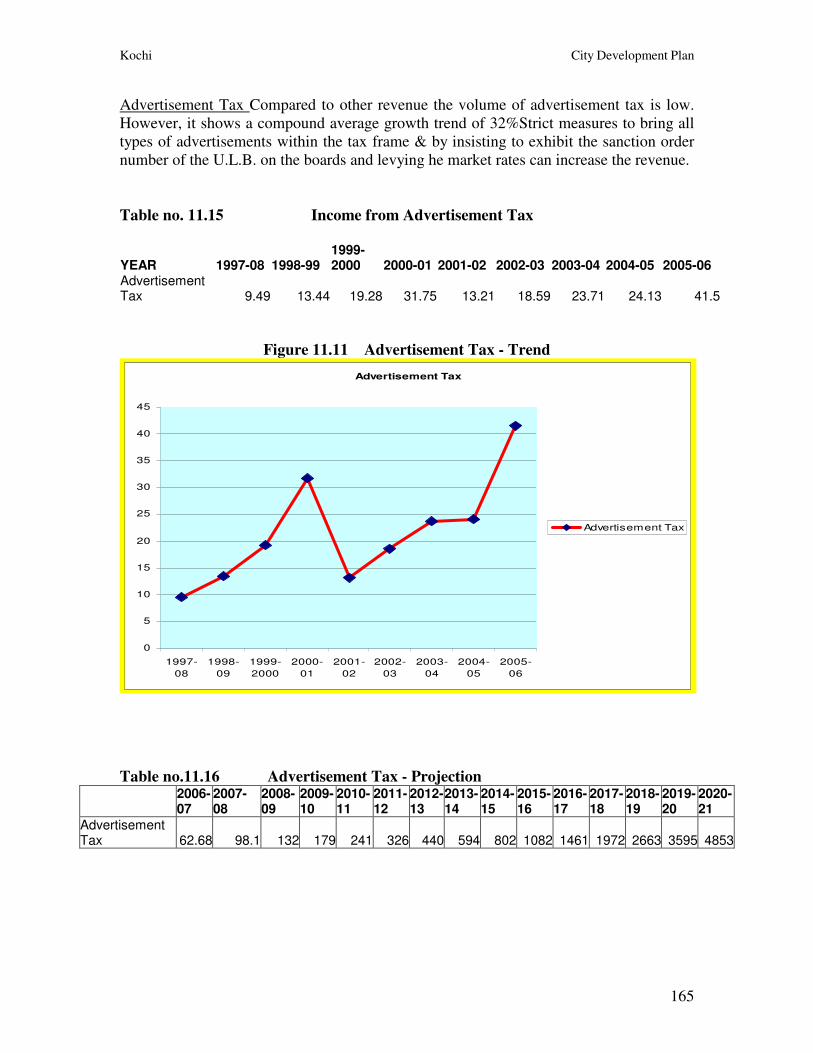
Kochi City Development Plan
165
Advertisement Tax Compared to other revenue the volume of advertisement tax is low.
However, it shows a compound average growth trend of 32%Strict measures to bring all
types of advertisements within the tax frame & by insisting to exhibit the sanction order
number of the U.L.B. on the boards and levying he market rates can increase the revenue.
Table no. 11.15 Income from Advertisement Tax
YEAR 1997-08 1998-99 1999-2000 2000-01 2001-02 2002-03 2003-04 2004-05 2005-06
Advertisement Tax 9.49 13.44 19.28 31.75 13.21 18.59 23.71 24.13 41.5
Figure 11.11 Advertisement Tax - Trend
Advertisement Tax
0
5
10
15
20
25
30
35
40
45
1997-
08
1998-
09
1999-
2000
2000-
01
2001-
02
2002-
03
2003-
04
2004-
05
2005-
06
Advertisement Tax
Table no.11.16 Advertisement Tax - Projection
2006-07
2007-08
2008-09
2009-10
2010-11
2011-12
2012-13
2013-14
2014-15
2015-16
2016-17
2017-18
2018-19
2019-20
2020-21
Advertisement Tax 62.68 98.1 132 179 241 326 440 594 802 1082 1461 1972 2663 3595 4853
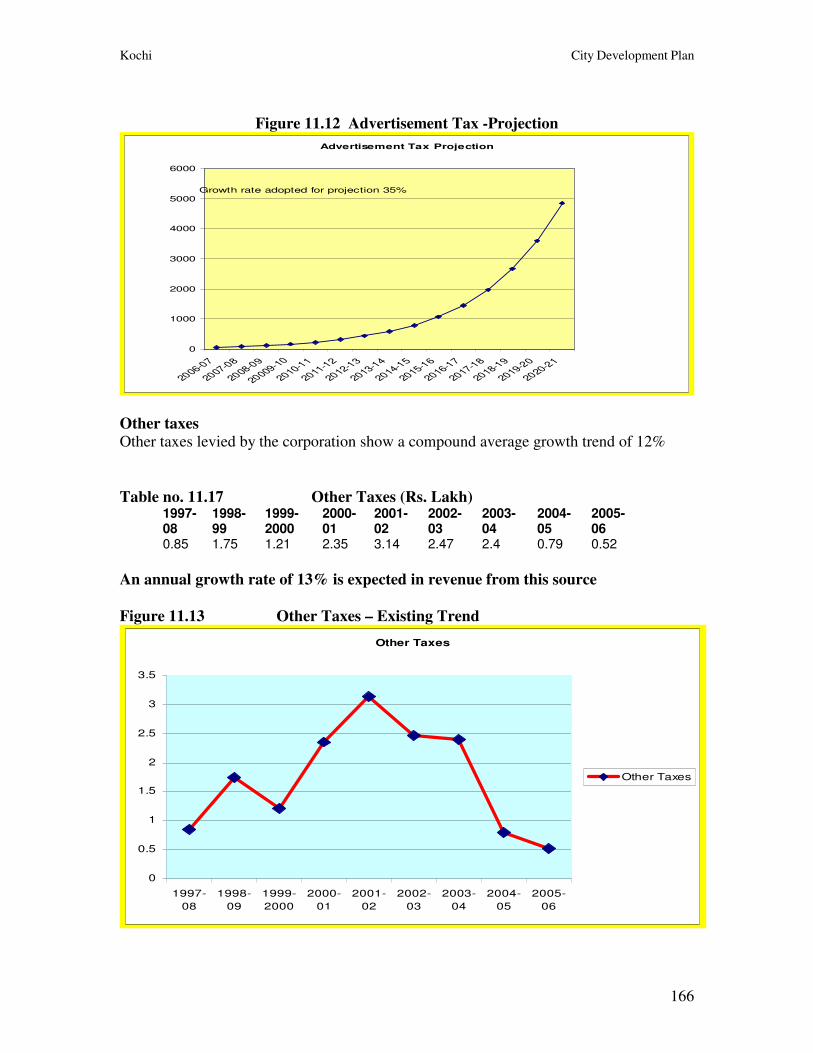
Kochi City Development Plan
166
Figure 11.12 Advertisement Tax -Projection
Advertisement Tax Projection
0
1000
2000
3000
4000
5000
6000
2006-07
2007-08
2008-09
20009-10
2010-11
2011-12
2012-13
2013-14
2014-15
2015-16
2016-17
2017-18
2018-19
2019-20
2020-21
Growth rate adopted for projection 35%
Other taxes Other taxes levied by the corporation show a compound average growth trend of 12%
Table no. 11.17 Other Taxes (Rs. Lakh) 1997-08
1998-99
1999-2000
2000-01
2001-02
2002-03
2003-04
2004-05
2005-06
0.85 1.75 1.21 2.35 3.14 2.47 2.4 0.79 0.52
An annual growth rate of 13% is expected in revenue from this source
Figure 11.13 Other Taxes – Existing Trend
Other Taxes
0
0.5
1
1.5
2
2.5
3
3.5
1997-
08
1998-
09
1999-
2000
2000-
01
2001-
02
2002-
03
2003-
04
2004-
05
2005-
06
Other Taxes
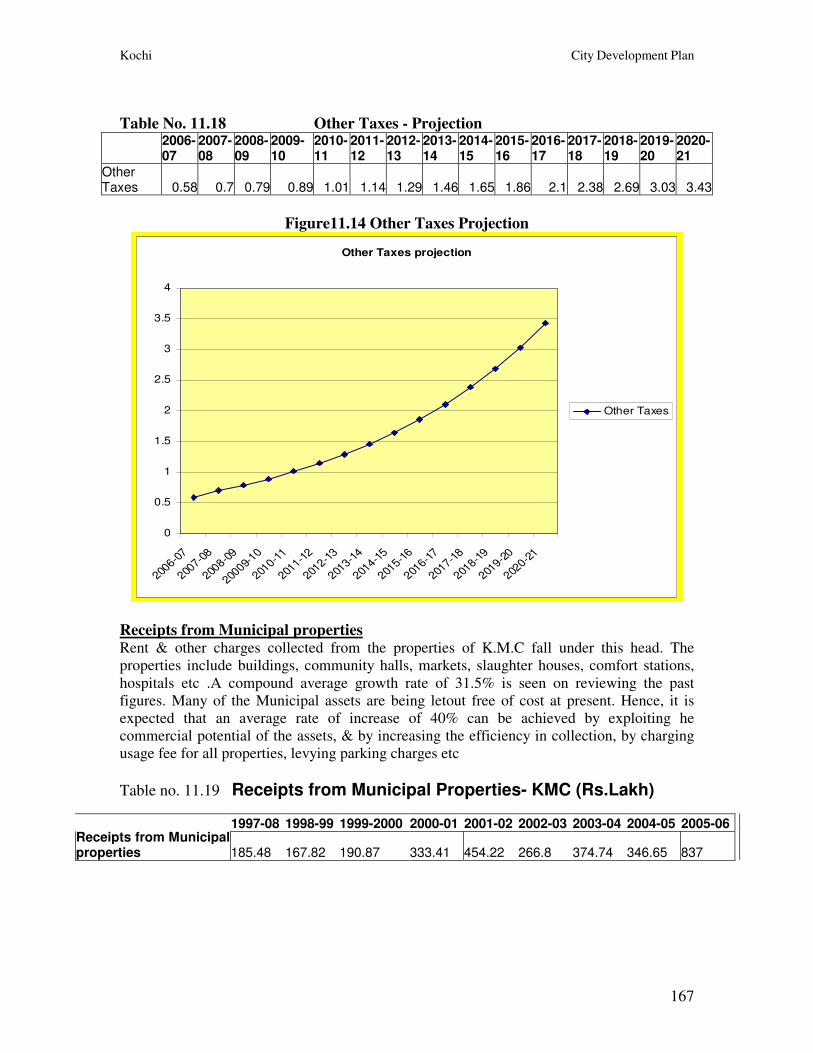
Kochi City Development Plan
167
Table No. 11.18 Other Taxes - Projection
2006-07
2007-08
2008-09
2009-10
2010-11
2011-12
2012-13
2013-14
2014-15
2015-16
2016-17
2017-18
2018-19
2019-20
2020-21
Other Taxes 0.58 0.7 0.79 0.89 1.01 1.14 1.29 1.46 1.65 1.86 2.1 2.38 2.69 3.03 3.43
Figure11.14 Other Taxes Projection
Other Taxes projection
0
0.5
1
1.5
2
2.5
3
3.5
4
2006-0
7
2007-0
8
2008-0
9
20009-
10
2010-1
1
2011-1
2
2012-1
3
2013-1
4
2014-1
5
2015-1
6
2016-1
7
2017-1
8
2018-1
9
2019-2
0
2020-2
1
Other Taxes
Receipts from Municipal properties Rent & other charges collected from the properties of K.M.C fall under this head. The
properties include buildings, community halls, markets, slaughter houses, comfort stations,
hospitals etc .A compound average growth rate of 31.5% is seen on reviewing the past
figures. Many of the Municipal assets are being letout free of cost at present. Hence, it is
expected that an average rate of increase of 40% can be achieved by exploiting he
commercial potential of the assets, & by increasing the efficiency in collection, by charging
usage fee for all properties, levying parking charges etc
Table no. 11.19 Receipts from Municipal Properties- KMC (Rs.Lakh)
1997-08 1998-99 1999-2000 2000-01 2001-02 2002-03 2003-04 2004-05 2005-06 Receipts from Municipal properties 185.48 167.82 190.87 333.41 454.22 266.8 374.74 346.65 837
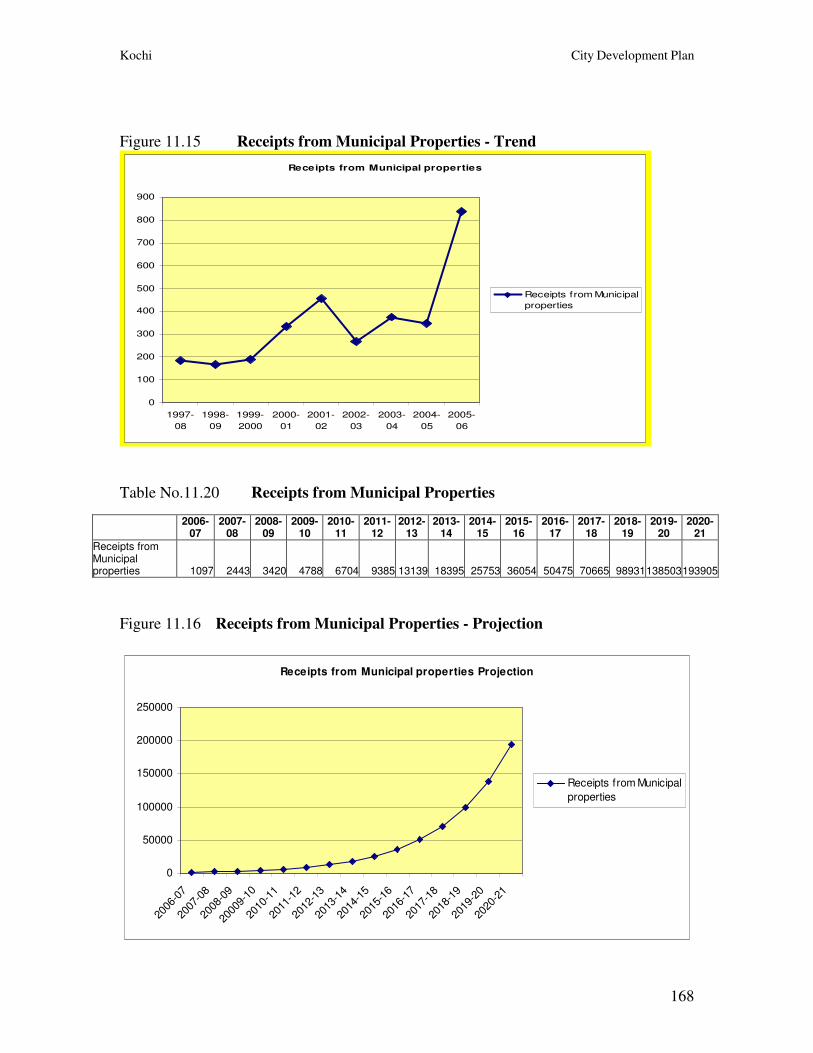
Kochi City Development Plan
168
Figure 11.15 Receipts from Municipal Properties - Trend
Receipts from Municipal properties
0
100
200
300
400
500
600
700
800
900
1997-
08
1998-
09
1999-
2000
2000-
01
2001-
02
2002-
03
2003-
04
2004-
05
2005-
06
Receipts from Municipal
properties
Table No.11.20 Receipts from Municipal Properties
Figure 11.16 Receipts from Municipal Properties - Projection
Receipts from Municipal properties Projection
0
50000
100000
150000
200000
250000
2006
-07
2007
-08
2008
-09
2000
9-10
2010
-11
2011
-12
2012
-13
2013
-14
2014
-15
2015
-16
2016
-17
2017
-18
2018
-19
2019
-20
2020
-21
Receipts from Municipal
properties
2006-
07 2007-
08 2008-
09 2009-
10 2010-
11 2011-
12 2012-
13 2013-
14 2014-
15 2015-
16 2016-
17 2017-
18 2018-
19 2019-
20 2020-
21
Receipts from Municipal properties 1097 2443 3420 4788 6704 9385 13139 18395 25753 36054 50475 70665 98931138503193905
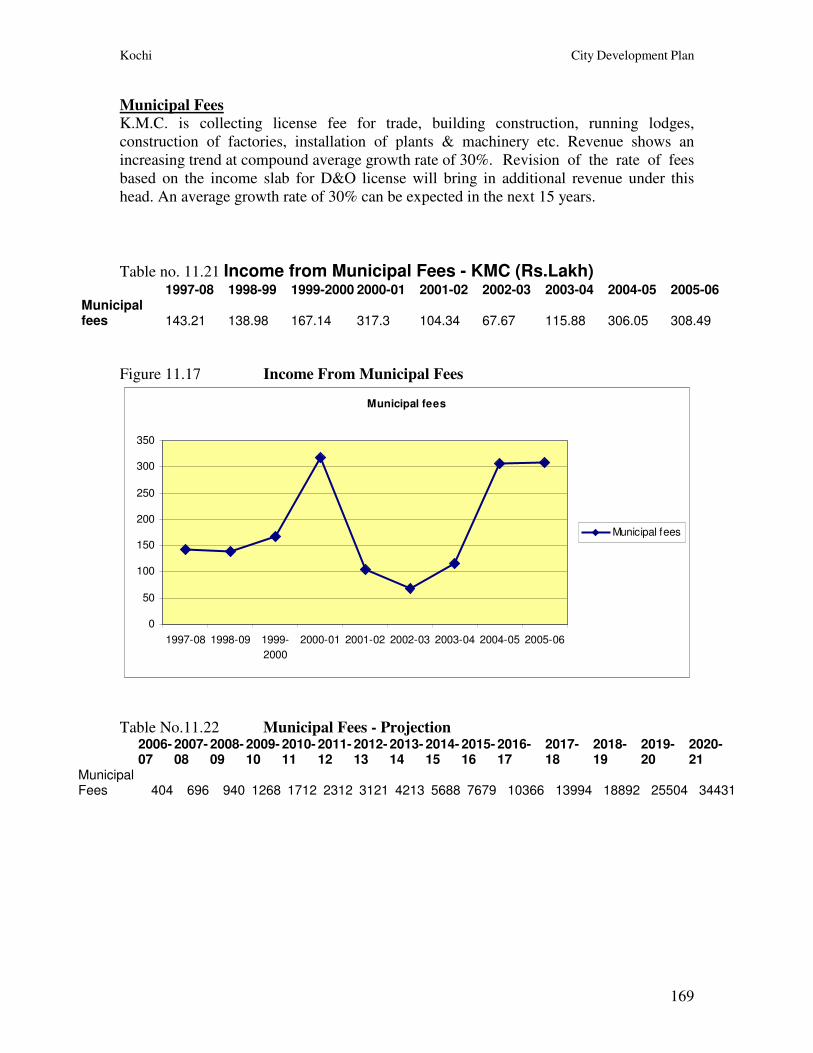
Kochi City Development Plan
169
Municipal Fees K.M.C. is collecting license fee for trade, building construction, running lodges,
construction of factories, installation of plants & machinery etc. Revenue shows an
increasing trend at compound average growth rate of 30%. Revision of the rate of fees
based on the income slab for D&O license will bring in additional revenue under this
head. An average growth rate of 30% can be expected in the next 15 years.
Table no. 11.21 Income from Municipal Fees - KMC (Rs.Lakh) 1997-08 1998-99 1999-2000 2000-01 2001-02 2002-03 2003-04 2004-05 2005-06 Municipal fees 143.21 138.98 167.14 317.3 104.34 67.67 115.88 306.05 308.49
Figure 11.17 Income From Municipal Fees
Municipal fees
0
50
100
150
200
250
300
350
1997-08 1998-09 1999-
2000
2000-01 2001-02 2002-03 2003-04 2004-05 2005-06
Municipal fees
Table No.11.22 Municipal Fees - Projection
2006-07
2007-08
2008-09
2009-10
2010-11
2011-12
2012-13
2013-14
2014-15
2015-16
2016-17
2017-18
2018-19
2019-20
2020-21
Municipal Fees 404 696 940 1268 1712 2312 3121 4213 5688 7679 10366 13994 18892 25504 34431
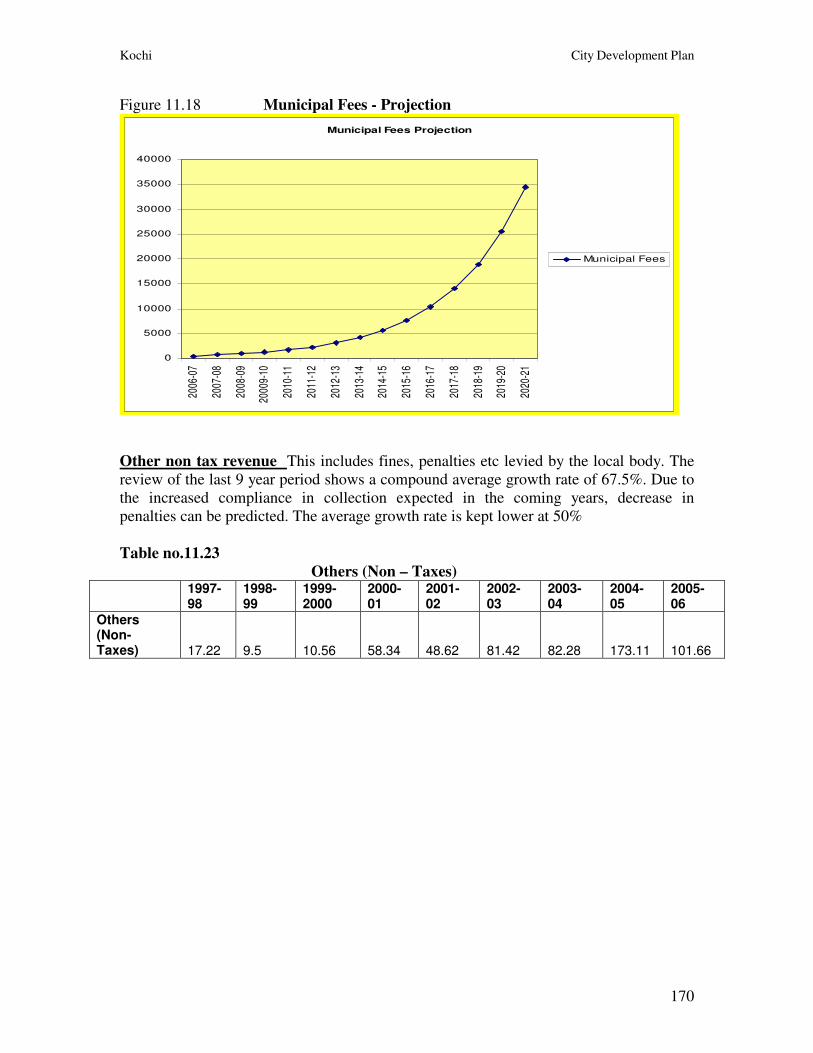
Kochi City Development Plan
170
Figure 11.18 Municipal Fees - Projection
Municipal Fees Projection
0
5000
10000
15000
20000
25000
30000
35000
40000
2006
-07
2007
-08
2008
-09
2000
9-10
2010
-11
2011
-12
2012
-13
2013
-14
2014
-15
2015
-16
2016
-17
2017
-18
2018
-19
2019
-20
2020
-21
Municipal Fees
Other non tax revenue This includes fines, penalties etc levied by the local body. The
review of the last 9 year period shows a compound average growth rate of 67.5%. Due to
the increased compliance in collection expected in the coming years, decrease in
penalties can be predicted. The average growth rate is kept lower at 50%
Table no.11.23
Others (Non – Taxes)
1997-98
1998-99
1999-2000
2000-01
2001-02
2002-03
2003-04
2004-05
2005-06
Others (Non-Taxes) 17.22 9.5 10.56 58.34 48.62 81.42 82.28 173.11 101.66
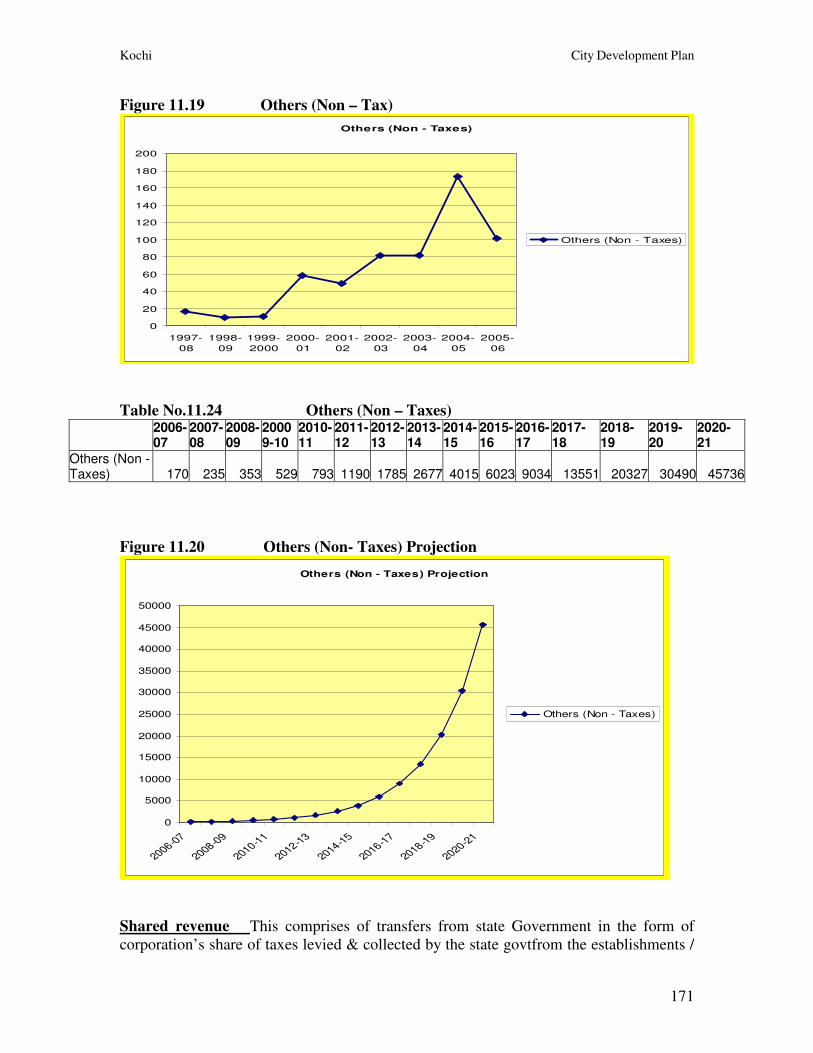
Kochi City Development Plan
171
Figure 11.19 Others (Non – Tax)
Others (Non - Taxes)
0
20
40
60
80
100
120
140
160
180
200
1997-
08
1998-
09
1999-
2000
2000-
01
2001-
02
2002-
03
2003-
04
2004-
05
2005-
06
Others (Non - Taxes)
Table No.11.24 Others (Non – Taxes)
2006-07
2007-08
2008-09
20009-10
2010-11
2011-12
2012-13
2013-14
2014-15
2015-16
2016-17
2017-18
2018-19
2019-20
2020-21
Others (Non - Taxes) 170 235 353 529 793 1190 1785 2677 4015 6023 9034 13551 20327 30490 45736
Figure 11.20 Others (Non- Taxes) Projection
Others (Non - Taxes) Projection
0
5000
10000
15000
20000
25000
30000
35000
40000
45000
50000
2006-07
2008-09
2010-11
2012-13
2014-15
2016-17
2018-19
2020-21
Others (Non - Taxes)
Shared revenue This comprises of transfers from state Government in the form of
corporation’s share of taxes levied & collected by the state govtfrom the establishments /
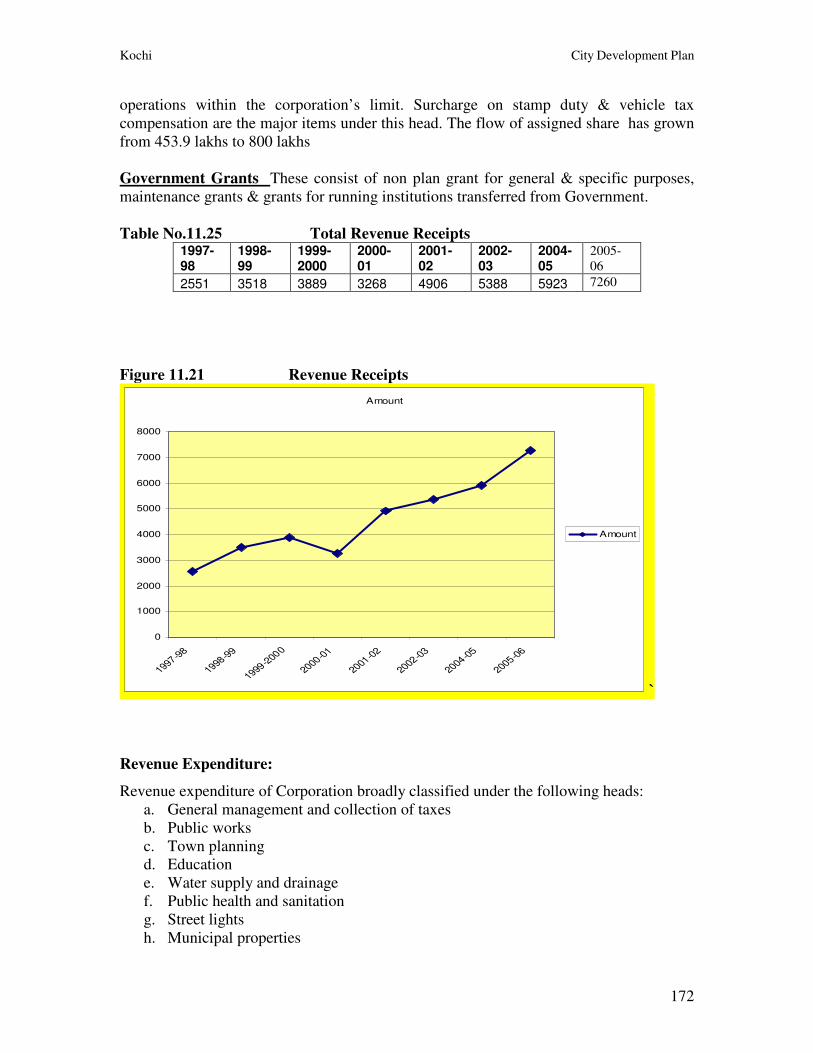
Kochi City Development Plan
172
operations within the corporation’s limit. Surcharge on stamp duty & vehicle tax
compensation are the major items under this head. The flow of assigned share has grown
from 453.9 lakhs to 800 lakhs
Government Grants These consist of non plan grant for general & specific purposes,
maintenance grants & grants for running institutions transferred from Government.
Table No.11.25 Total Revenue Receipts 1997-98
1998-99
1999-2000
2000-01
2001-02
2002-03
2004-05
2005-
06
2551 3518 3889 3268 4906 5388 5923 7260
Figure 11.21 Revenue Receipts
Amount
0
1000
2000
3000
4000
5000
6000
7000
8000
1997-98
1998-99
1999-2000
2000-01
2001-02
2002-03
2004-05
2005-06
Amount
`
Revenue Expenditure:
Revenue expenditure of Corporation broadly classified under the following heads:
a. General management and collection of taxes
b. Public works
c. Town planning
d. Education
e. Water supply and drainage
f. Public health and sanitation
g. Street lights
h. Municipal properties
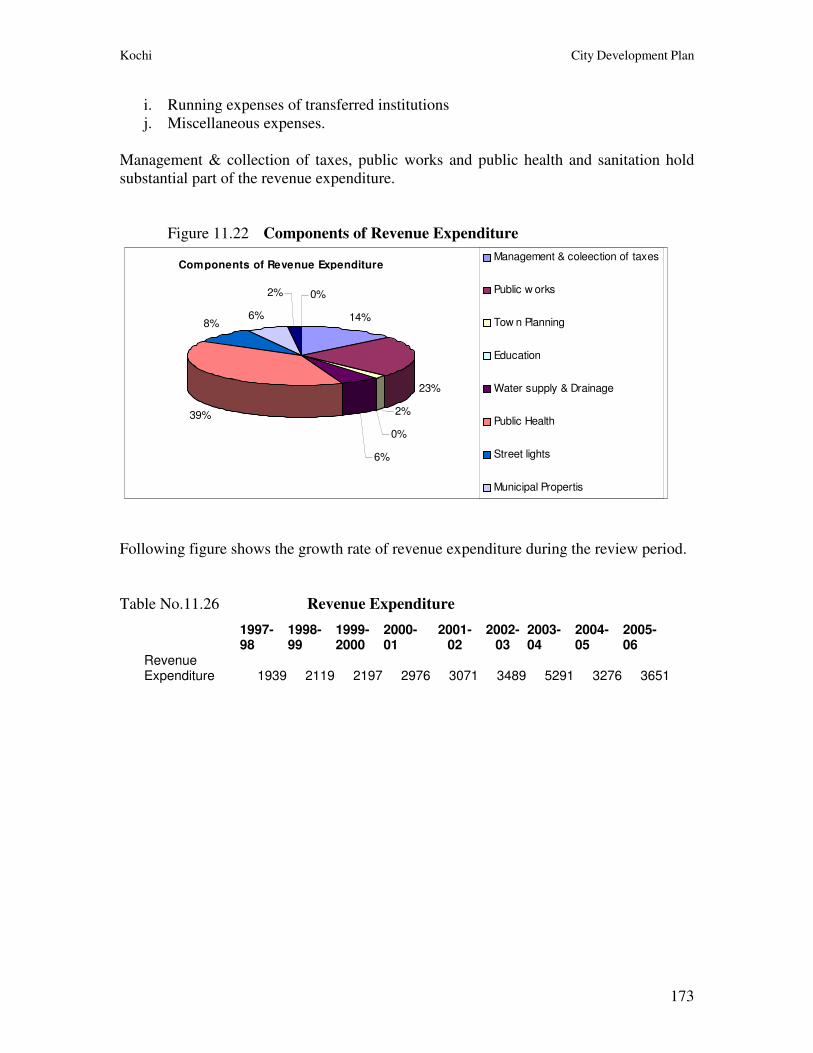
Kochi City Development Plan
173
i. Running expenses of transferred institutions
j. Miscellaneous expenses.
Management & collection of taxes, public works and public health and sanitation hold
substantial part of the revenue expenditure.
Figure 11.22 Components of Revenue Expenditure
14%
23%
2%
0%
6%
39%
8%6%
2% 0%
Management & coleection of taxes
Public w orks
Tow n Planning
Education
Water supply & Drainage
Public Health
Street lights
Municipal Propertis
Components of Revenue Expenditure
Following figure shows the growth rate of revenue expenditure during the review period.
Table No.11.26 Revenue Expenditure
1997-98
1998-99
1999-2000
2000-01
2001-02
2002-03
2003-04
2004-05
2005-06
Revenue Expenditure 1939 2119 2197 2976 3071 3489 5291 3276 3651
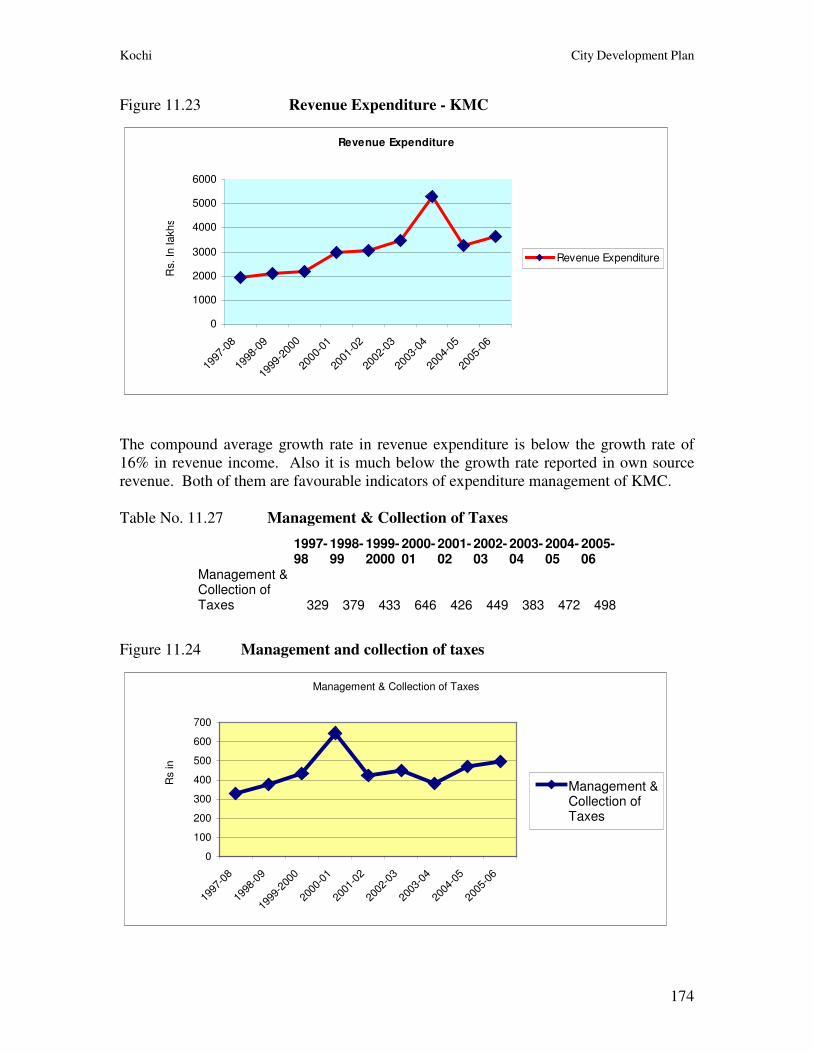
Kochi City Development Plan
174
Figure 11.23 Revenue Expenditure - KMC
Revenue Expenditure
0
1000
2000
3000
4000
5000
6000
1997
-08
1998
-09
1999
-200
0
2000
-01
2001
-02
2002
-03
2003
-04
2004
-05
2005
-06
Revenue Expenditure
Rs. In
lakhs
The compound average growth rate in revenue expenditure is below the growth rate of
16% in revenue income. Also it is much below the growth rate reported in own source
revenue. Both of them are favourable indicators of expenditure management of KMC.
Table No. 11.27 Management & Collection of Taxes
1997-98
1998-99
1999-2000
2000-01
2001-02
2002-03
2003-04
2004-05
2005-06
Management & Collection of Taxes 329 379 433 646 426 449 383 472 498
Figure 11.24 Management and collection of taxes
Management & Collection of Taxes
0
100
200
300
400
500
600
700
1997
-08
1998
-09
1999
-200
0
2000
-01
2001
-02
2002
-03
2003
-04
2004
-05
2005
-06
Management &Collection ofTaxes
Rs in
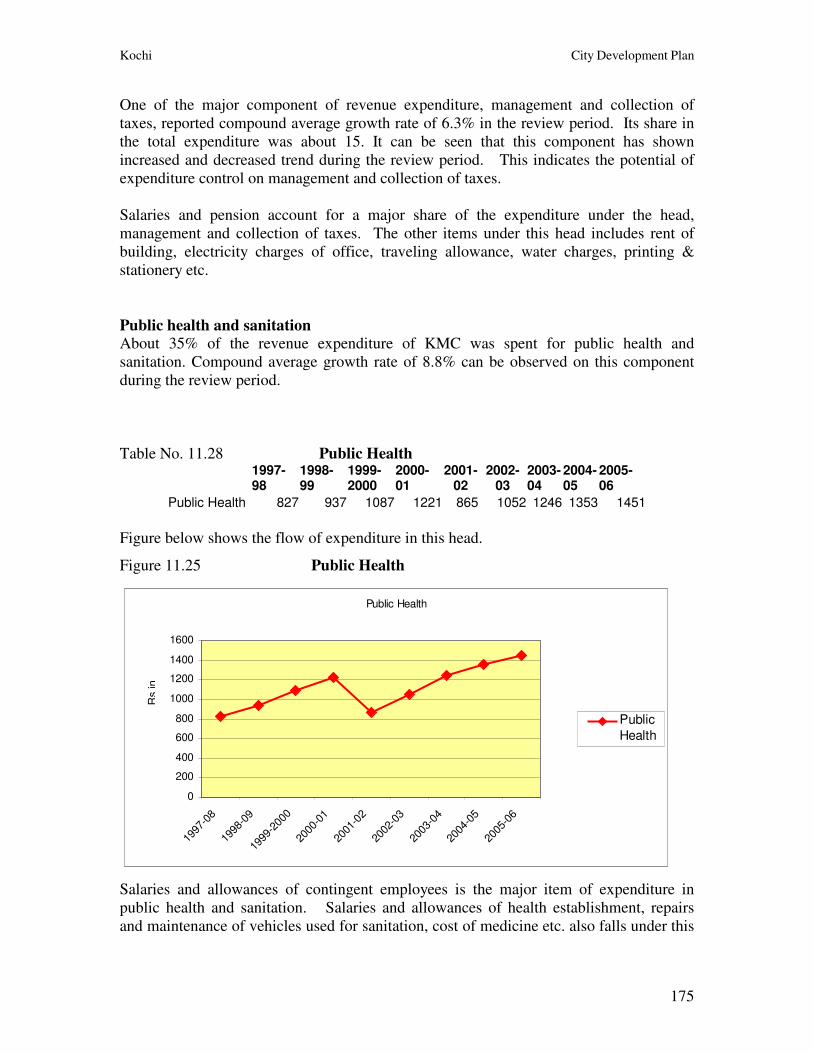
Kochi City Development Plan
175
One of the major component of revenue expenditure, management and collection of
taxes, reported compound average growth rate of 6.3% in the review period. Its share in
the total expenditure was about 15. It can be seen that this component has shown
increased and decreased trend during the review period. This indicates the potential of
expenditure control on management and collection of taxes.
Salaries and pension account for a major share of the expenditure under the head,
management and collection of taxes. The other items under this head includes rent of
building, electricity charges of office, traveling allowance, water charges, printing &
stationery etc.
Public health and sanitation About 35% of the revenue expenditure of KMC was spent for public health and
sanitation. Compound average growth rate of 8.8% can be observed on this component
during the review period.
Table No. 11.28 Public Health
1997-98
1998-99
1999-2000
2000-01
2001-02
2002-03
2003-04
2004-05
2005-06
Public Health 827 937 1087 1221 865 1052 1246 1353 1451
Figure below shows the flow of expenditure in this head.
Figure 11.25 Public Health
Public Health
0
200
400
600
800
1000
1200
1400
1600
1997
-08
1998
-09
1999
-200
0
2000
-01
2001
-02
2002
-03
2003
-04
2004
-05
2005
-06
Public
Health
Rs in
Salaries and allowances of contingent employees is the major item of expenditure in
public health and sanitation. Salaries and allowances of health establishment, repairs
and maintenance of vehicles used for sanitation, cost of medicine etc. also falls under this
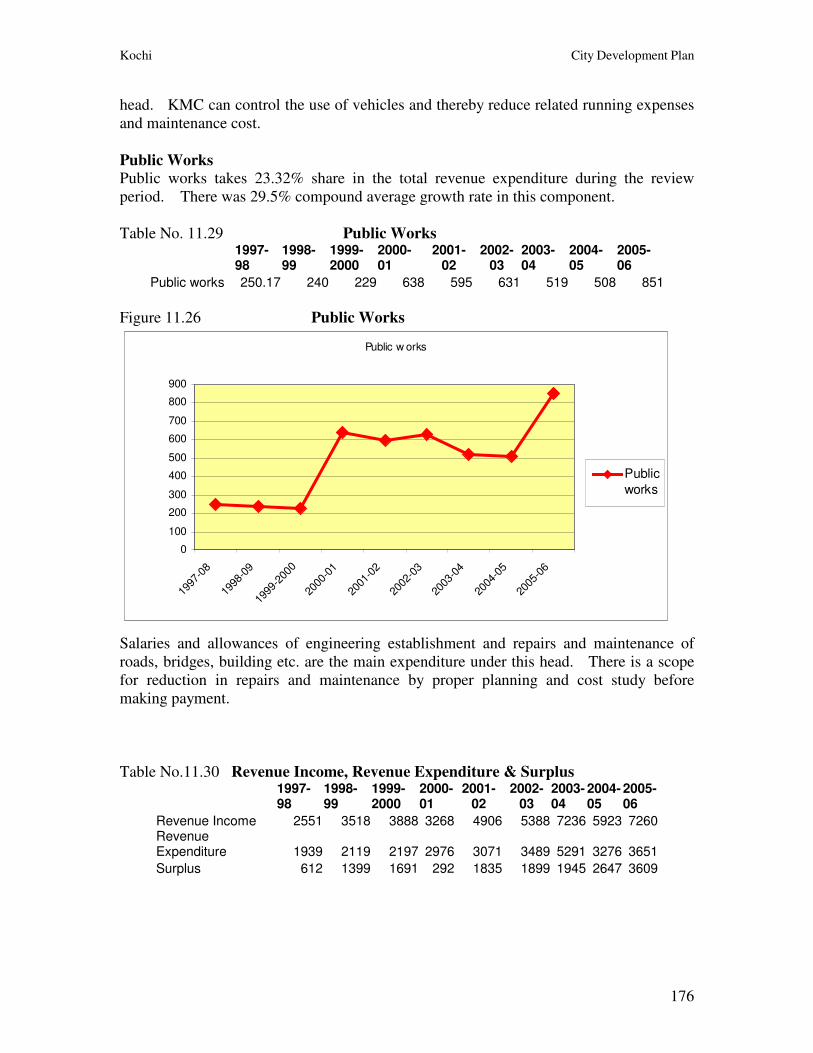
Kochi City Development Plan
176
head. KMC can control the use of vehicles and thereby reduce related running expenses
and maintenance cost.
Public Works Public works takes 23.32% share in the total revenue expenditure during the review
period. There was 29.5% compound average growth rate in this component.
Table No. 11.29 Public Works
1997-98
1998-99
1999-2000
2000-01
2001-02
2002-03
2003-04
2004-05
2005-06
Public works 250.17 240 229 638 595 631 519 508 851
Figure 11.26 Public Works
Public w orks
0
100
200
300
400
500
600
700
800
900
1997
-08
1998
-09
1999
-200
0
2000
-01
2001
-02
2002
-03
2003
-04
2004
-05
2005
-06
Public
works
Salaries and allowances of engineering establishment and repairs and maintenance of
roads, bridges, building etc. are the main expenditure under this head. There is a scope
for reduction in repairs and maintenance by proper planning and cost study before
making payment.
Table No.11.30 Revenue Income, Revenue Expenditure & Surplus
1997-98
1998-99
1999-2000
2000-01
2001-02
2002-03
2003-04
2004-05
2005-06
Revenue Income 2551 3518 3888 3268 4906 5388 7236 5923 7260Revenue Expenditure 1939 2119 2197 2976 3071 3489 5291 3276 3651
Surplus 612 1399 1691 292 1835 1899 1945 2647 3609
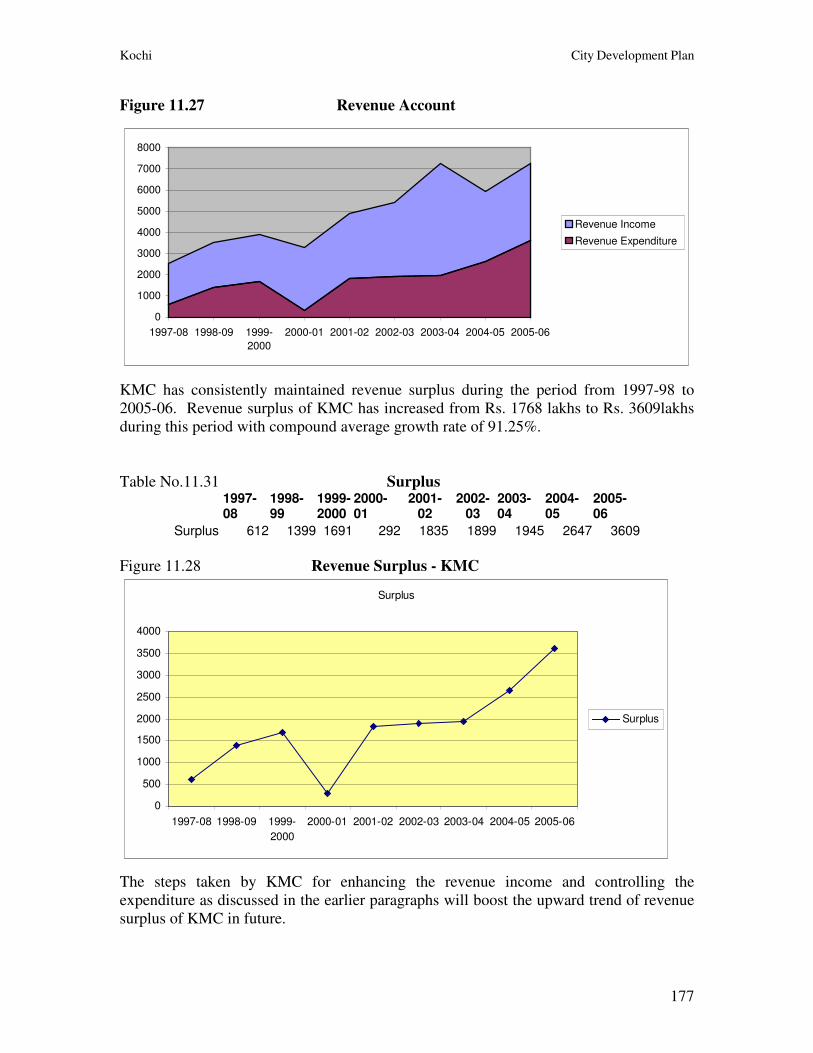
Kochi City Development Plan
177
Figure 11.27 Revenue Account
0
1000
2000
3000
4000
5000
6000
7000
8000
1997-08 1998-09 1999-
2000
2000-01 2001-02 2002-03 2003-04 2004-05 2005-06
Revenue Income
Revenue Expenditure
KMC has consistently maintained revenue surplus during the period from 1997-98 to
2005-06. Revenue surplus of KMC has increased from Rs. 1768 lakhs to Rs. 3609lakhs
during this period with compound average growth rate of 91.25%.
Table No.11.31 Surplus
1997-08
1998-99
1999-2000
2000-01
2001-02
2002-03
2003-04
2004-05
2005-06
Surplus 612 1399 1691 292 1835 1899 1945 2647 3609
Figure 11.28 Revenue Surplus - KMC
Surplus
0
500
1000
1500
2000
2500
3000
3500
4000
1997-08 1998-09 1999-
2000
2000-01 2001-02 2002-03 2003-04 2004-05 2005-06
Surplus
The steps taken by KMC for enhancing the revenue income and controlling the
expenditure as discussed in the earlier paragraphs will boost the upward trend of revenue
surplus of KMC in future.
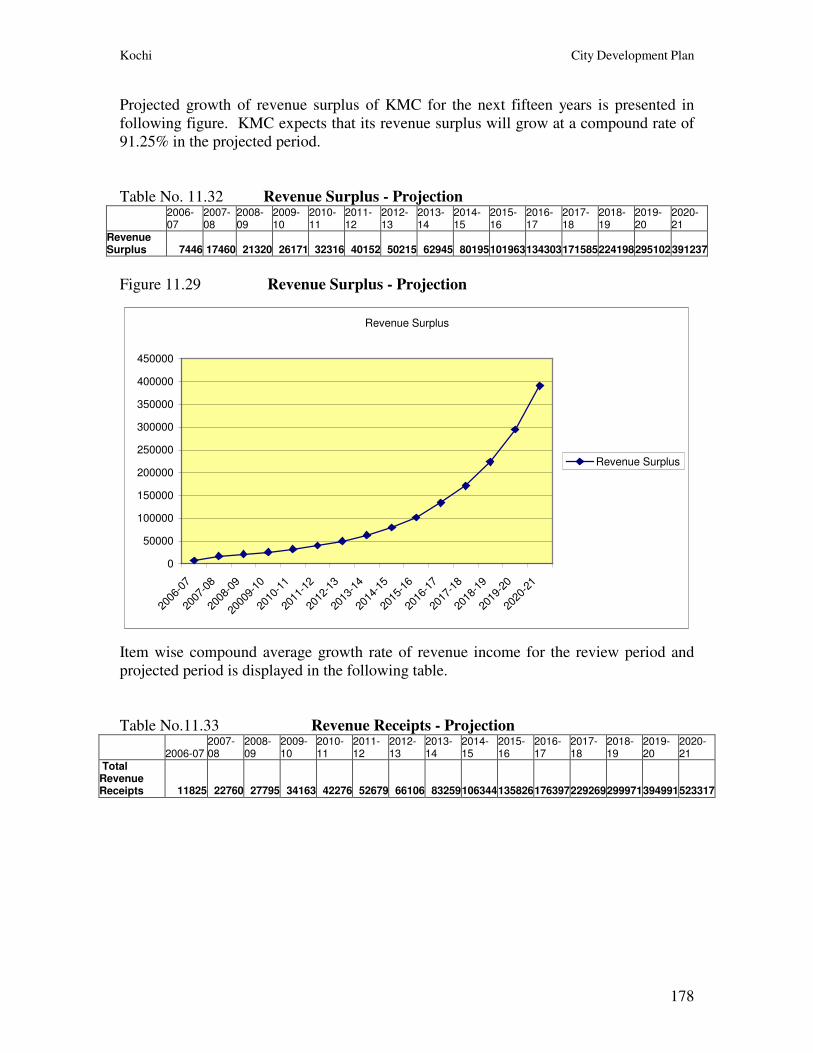
Kochi City Development Plan
178
Projected growth of revenue surplus of KMC for the next fifteen years is presented in
following figure. KMC expects that its revenue surplus will grow at a compound rate of
91.25% in the projected period.
Table No. 11.32 Revenue Surplus - Projection
2006-07
2007-08
2008-09
2009-10
2010-11
2011-12
2012-13
2013-14
2014-15
2015-16
2016-17
2017-18
2018-19
2019-20
2020-21
Revenue Surplus 7446 17460 21320 26171 32316 40152 50215 62945 80195101963134303171585224198295102 391237
Figure 11.29 Revenue Surplus - Projection
Revenue Surplus
0
50000
100000
150000
200000
250000
300000
350000
400000
450000
2006
-07
2007
-08
2008
-09
2000
9-10
2010
-11
2011
-12
2012
-13
2013
-14
2014
-15
2015
-16
2016
-17
2017
-18
2018
-19
2019
-20
2020
-21
Revenue Surplus
Item wise compound average growth rate of revenue income for the review period and
projected period is displayed in the following table.
Table No.11.33 Revenue Receipts - Projection
2006-07 2007-08
2008-09
2009-10
2010-11
2011-12
2012-13
2013-14
2014-15
2015-16
2016-17
2017-18
2018-19
2019-20
2020-21
Total Revenue Receipts 11825 22760 27795 34163 42276 52679 66106 83259106344 135826176397229269299971394991523317
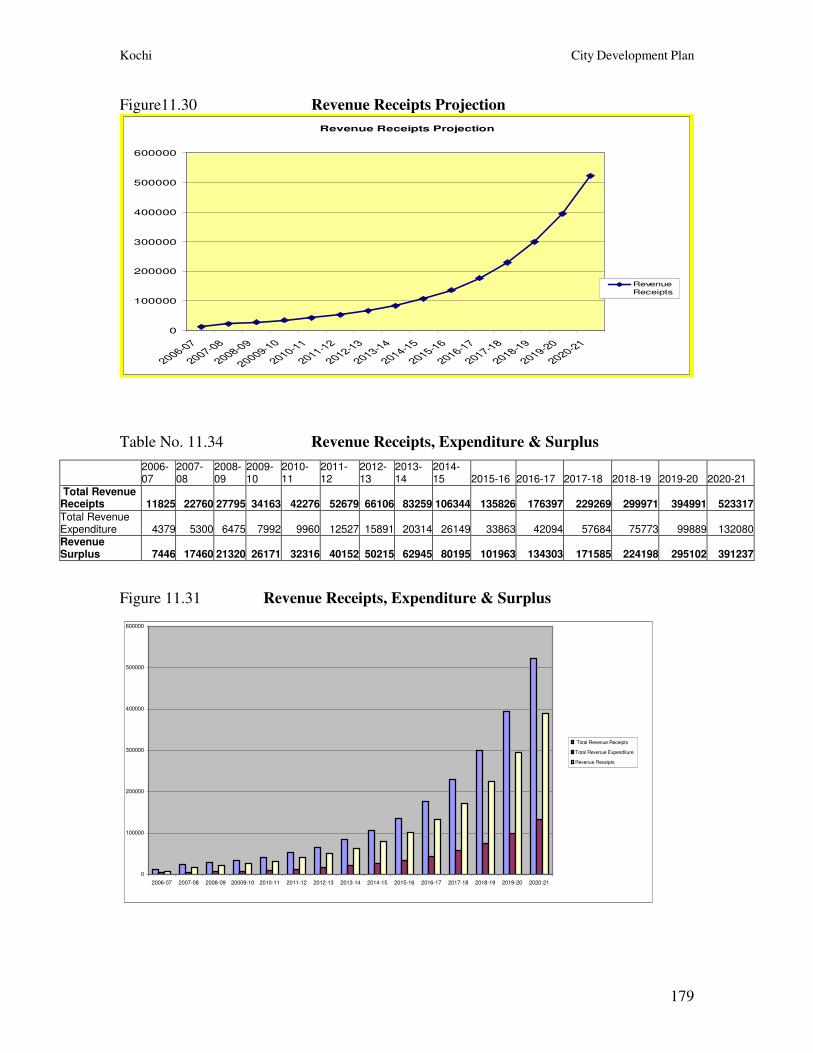
Kochi City Development Plan
179
Figure11.30 Revenue Receipts Projection
Revenue Receipts Projection
0
100000
200000
300000
400000
500000
600000
2006-07
2007-08
2008-09
20009-10
2010-11
2011-12
2012-13
2013-14
2014-15
2015-16
2016-17
2017-18
2018-19
2019-20
2020-21
Revenue
Receipts
Table No. 11.34 Revenue Receipts, Expenditure & Surplus
2006-07
2007-08
2008-09
2009-10
2010-11
2011-12
2012-13
2013-14
2014-15 2015-16 2016-17 2017-18 2018-19 2019-20 2020-21
Total Revenue Receipts 11825 22760 27795 34163 42276 52679 66106 83259 106344 135826 176397 229269 299971 394991 523317
Total Revenue Expenditure 4379 5300 6475 7992 9960 12527 15891 20314 26149 33863 42094 57684 75773 99889 132080 Revenue Surplus 7446 17460 21320 26171 32316 40152 50215 62945 80195 101963 134303 171585 224198 295102 391237
Figure 11.31 Revenue Receipts, Expenditure & Surplus
0
100000
200000
300000
400000
500000
600000
2006-07 2007-08 2008-09 20009-10 2010-11 2011-12 2012-13 2013-14 2014-15 2015-16 2016-17 2017-18 2018-19 2019-20 2020-21
Total Revenue Receipts
Total Revenue Expenditure
Revenue Receipts
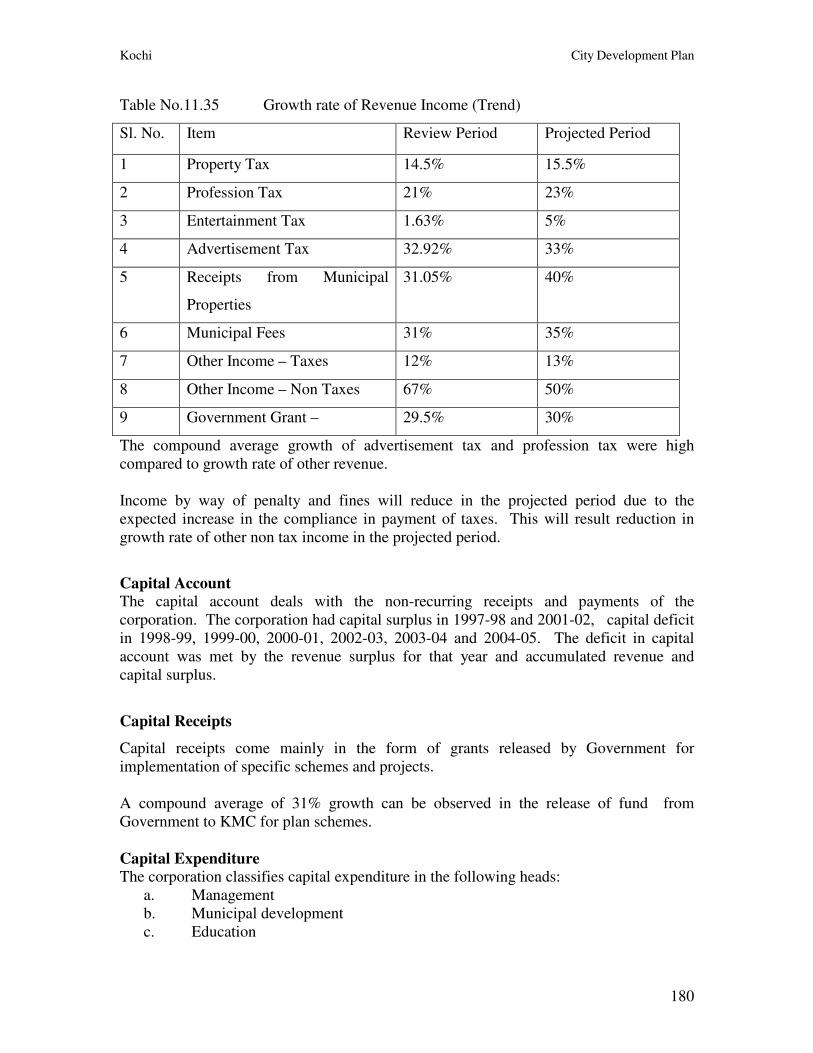
Kochi City Development Plan
180
Table No.11.35 Growth rate of Revenue Income (Trend)
Sl. No. Item Review Period Projected Period
1 Property Tax 14.5% 15.5%
2 Profession Tax 21% 23%
3 Entertainment Tax 1.63% 5%
4 Advertisement Tax 32.92% 33%
5 Receipts from Municipal
Properties
31.05% 40%
6 Municipal Fees 31% 35%
7 Other Income – Taxes 12% 13%
8 Other Income – Non Taxes 67% 50%
9 Government Grant – 29.5% 30%
The compound average growth of advertisement tax and profession tax were high
compared to growth rate of other revenue.
Income by way of penalty and fines will reduce in the projected period due to the
expected increase in the compliance in payment of taxes. This will result reduction in
growth rate of other non tax income in the projected period.
Capital Account The capital account deals with the non-recurring receipts and payments of the
corporation. The corporation had capital surplus in 1997-98 and 2001-02, capital deficit
in 1998-99, 1999-00, 2000-01, 2002-03, 2003-04 and 2004-05. The deficit in capital
account was met by the revenue surplus for that year and accumulated revenue and
capital surplus.
Capital Receipts
Capital receipts come mainly in the form of grants released by Government for
implementation of specific schemes and projects.
A compound average of 31% growth can be observed in the release of fund from
Government to KMC for plan schemes.
Capital Expenditure The corporation classifies capital expenditure in the following heads:
a. Management
b. Municipal development
c. Education
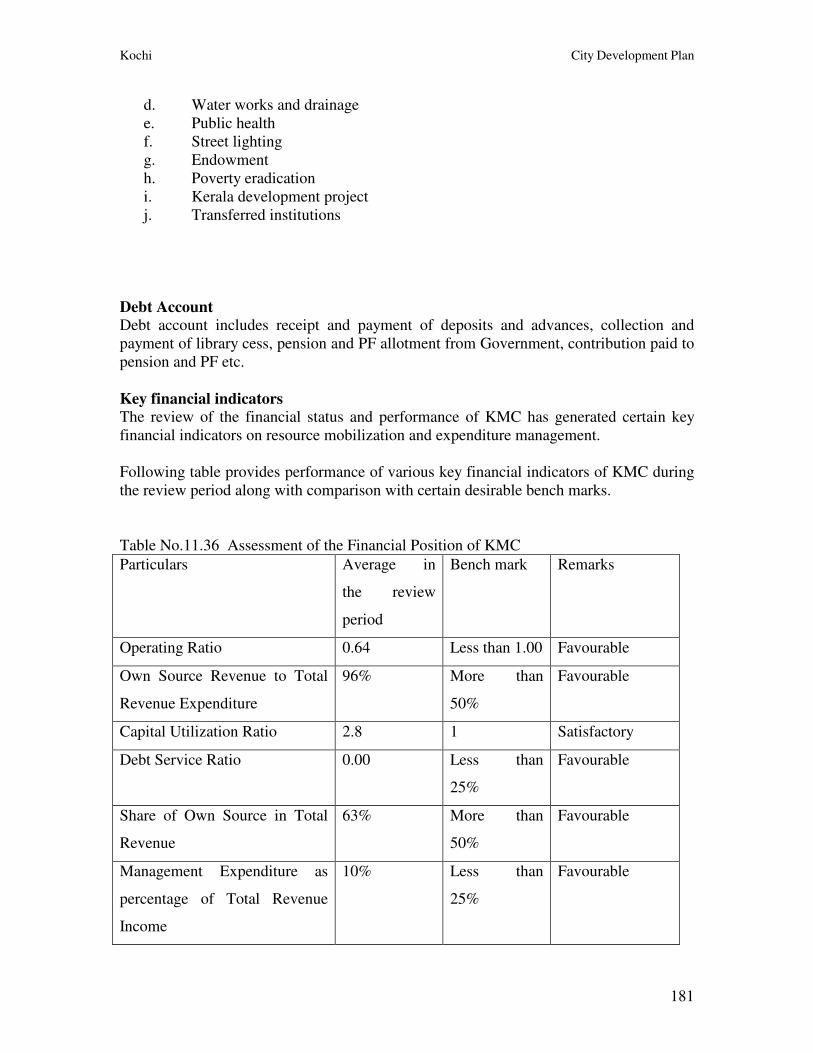
Kochi City Development Plan
181
d. Water works and drainage
e. Public health
f. Street lighting
g. Endowment
h. Poverty eradication
i. Kerala development project
j. Transferred institutions
Debt Account Debt account includes receipt and payment of deposits and advances, collection and
payment of library cess, pension and PF allotment from Government, contribution paid to
pension and PF etc.
Key financial indicators The review of the financial status and performance of KMC has generated certain key
financial indicators on resource mobilization and expenditure management.
Following table provides performance of various key financial indicators of KMC during
the review period along with comparison with certain desirable bench marks.
Table No.11.36 Assessment of the Financial Position of KMC
Particulars Average in
the review
period
Bench mark Remarks
Operating Ratio 0.64 Less than 1.00 Favourable
Own Source Revenue to Total
Revenue Expenditure
96% More than
50%
Favourable
Capital Utilization Ratio 2.8 1 Satisfactory
Debt Service Ratio 0.00 Less than
25%
Favourable
Share of Own Source in Total
Revenue
63% More than
50%
Favourable
Management Expenditure as
percentage of Total Revenue
Income
10% Less than
25%
Favourable
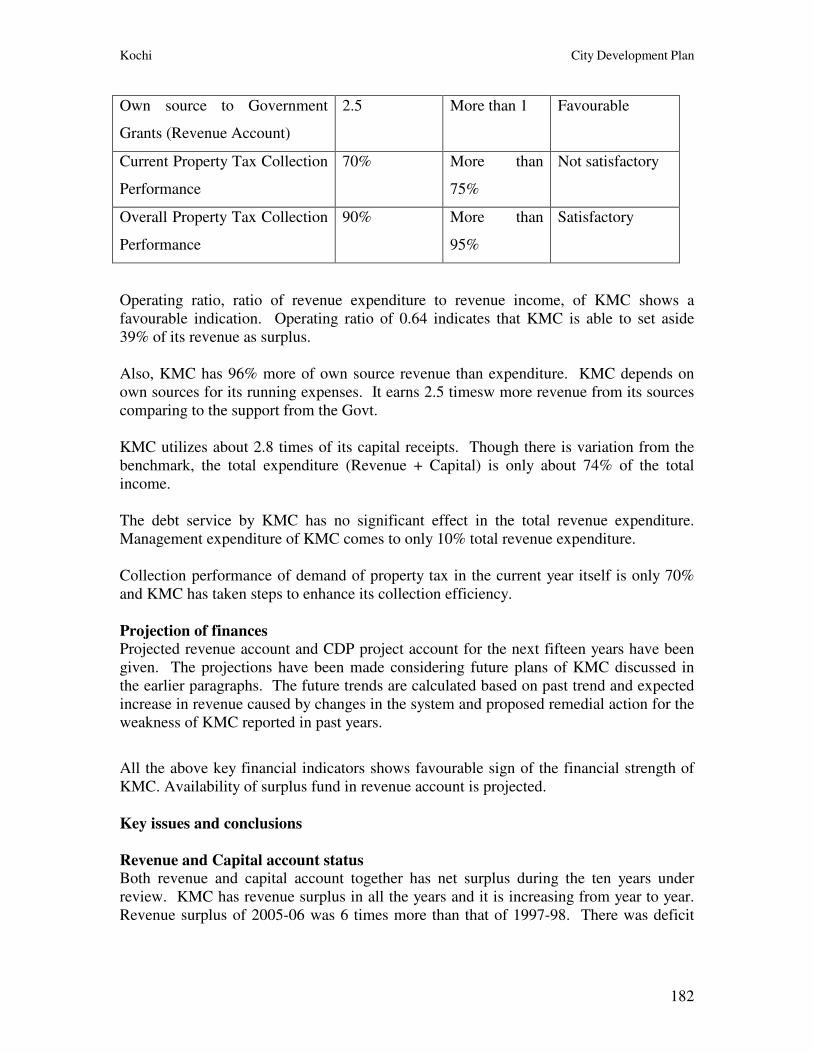
Kochi City Development Plan
182
Own source to Government
Grants (Revenue Account)
2.5 More than 1 Favourable
Current Property Tax Collection
Performance
70% More than
75%
Not satisfactory
Overall Property Tax Collection
Performance
90%
More than
95%
Satisfactory
Operating ratio, ratio of revenue expenditure to revenue income, of KMC shows a
favourable indication. Operating ratio of 0.64 indicates that KMC is able to set aside
39% of its revenue as surplus.
Also, KMC has 96% more of own source revenue than expenditure. KMC depends on
own sources for its running expenses. It earns 2.5 timesw more revenue from its sources
comparing to the support from the Govt.
KMC utilizes about 2.8 times of its capital receipts. Though there is variation from the
benchmark, the total expenditure (Revenue + Capital) is only about 74% of the total
income.
The debt service by KMC has no significant effect in the total revenue expenditure.
Management expenditure of KMC comes to only 10% total revenue expenditure.
Collection performance of demand of property tax in the current year itself is only 70%
and KMC has taken steps to enhance its collection efficiency.
Projection of finances Projected revenue account and CDP project account for the next fifteen years have been
given. The projections have been made considering future plans of KMC discussed in
the earlier paragraphs. The future trends are calculated based on past trend and expected
increase in revenue caused by changes in the system and proposed remedial action for the
weakness of KMC reported in past years.
All the above key financial indicators shows favourable sign of the financial strength of
KMC. Availability of surplus fund in revenue account is projected.
Key issues and conclusions
Revenue and Capital account status Both revenue and capital account together has net surplus during the ten years under
review. KMC has revenue surplus in all the years and it is increasing from year to year.
Revenue surplus of 2005-06 was 6 times more than that of 1997-98. There was deficit
Kochi City Development Plan
183
and surplus in capital account during the past ten years. However the net result in capital
account during the ten years comes with surplus.
Revenue Realisation KMC is able to generate revenue from its own sources, without depending government
grants, nearly to meet the total revenue expenditure. Own source revenue combined with
the government grants gives surplus to revenue account. However there is potential for
enhancement of revenue collection.
Areas, which require improvement:
� Collection efficiency of tax: -
There were redeployment of the entire staff for organizing ward level meetings,
preparation of project plans and compilation of annual plans as stipulated in the
guidelines issued by government under the decentralized planning process. The
staff untrained to take up this task under the People’s Planning Campaign and
preparation of participatory plans was regularly trained for this purpose. In view
of this, their services could not be effectively utilised for normal functions like
collection of taxes, fees etc. Now the system of decentralized planning process
has been regularized. KMC is now in a position to strengthen its regular
functions. It is expected that with energized tax collection process KMC would
be able to enhance the collection of its demanded tax.
� Simplification of collection procedures:-
The present system of collection of taxes is inconvenient to the tax payer. A few
of the tax assessees are not remitting the tax due to this inconvenience. The
proposed action of KMC to appoint banks and other agencies as tax collection
agencies and introduction of self assessment system will take away the
inconvenience of the tax payer.
� Tax assessment system:-
The present system of valuation and assessment of tax fails to identify the
properties modified after original assessment and thereby shortage of demand is
occurring. It is roughly estimated that around twenty thousand buildings have
escaped assessment. The earlier Municipality Act envisaged revision of tax in
every 5 years. Such a revision based on physical verification of building was
carried out in 1988. At the next revision in 1993 due to various reasons the
physical verifications could not be carried out and what is generally termed as
‘table revisoin’ was done with just 25% increase in the earlier assessment. Such a
process helped a number of properties, which, had undergone area and structural
change, escape taxation. It is hoped that with the present proposed revision in
2006 all the buildings within the city would be physically verified and assessed.
It will substantially increase the tax demand.
Kochi City Development Plan
184
� Monitoring system
At present, there is no monitoring system for making appropriate demand and
collect the tax in time. KMC has taken steps to enhance the system by making
persons responsible for the timely demand and collection. The computerization
of the assessment system will support to make the demand of tax in time.
Budgeting The present budgeting system of the Corporation does not achieve its desired targets.
Data used for budgeting may not tally with actual results. At present, there is no system
to study the variance of actual figures with budgets and take corrective action. Budget
for receipts and payments for each fiscal year have to be prepared based on previous year
actual results and anticipated events in the coming year. The results of the current year
have to be compared with the budget figures. The shortcomings, if any, should be
studied carefully and corrective action should be taken eventually. A separate expert
team has to be set up to prepare budgets, compare actuals with budgets and suggest
remedial actions.
Bank and Treasury Accounts The present system of control on bank and treasury accounts is not sufficient to prevent
the possible loss, if any, to the KMC by way of errors and mistakes. Timely
reconciliation of bank and treasury accounts with books maintained by the Corporation
will help to monitor the receipts and payments from the bank and treasury accounts. This
will help to rectify errors and mistakes, which may occur in the bank and treasury
accounts.
Conclusion. The analysis of the income and expenditure of the local bodies for the past 3
years under Revenue, (Taxes, rents, fees, fines etc. and grants) and expenditure (Salaries,
wages, electricity charges, fuel charges, street lighting etc.) reveal that the expenditure is
increasing considerably. Plan grants are utilized mainly for asset creating projects
formulated by local bodies and approved by the State Planning Board / District Planning
Committee. The non-plan grants are utilized for the maintenance of services of
transferred Govt. Departments and for the payment of social pensions. In order to meet
the long term financial strategy the revenue income of the Corporation needs to be
substantially improved in comparison with the expenditure to have a cash balance of at
least 30%. The measures to bring about this includes, Overall expenditure control, Private
sector participation in projects & service delivery, Debt management and Maximization of
equity and efficiency.
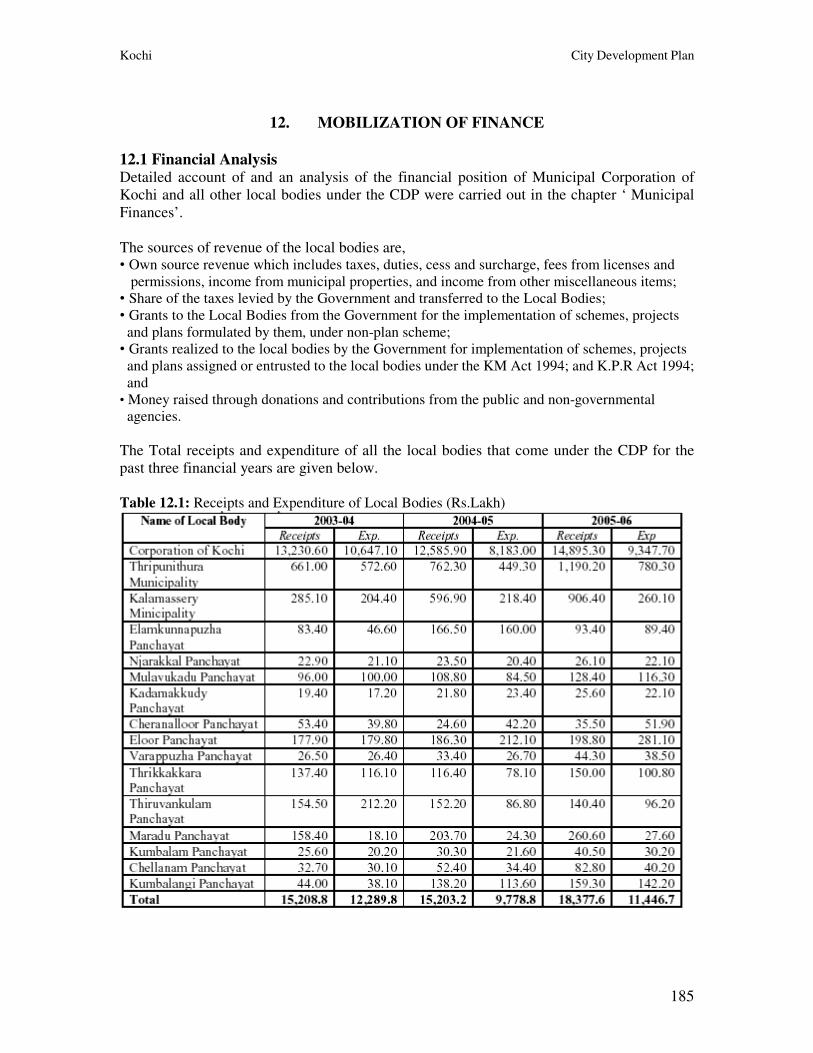
Kochi City Development Plan
185
12. MOBILIZATION OF FINANCE
12.1 Financial Analysis Detailed account of and an analysis of the financial position of Municipal Corporation of
Kochi and all other local bodies under the CDP were carried out in the chapter ‘ Municipal
Finances’.
The sources of revenue of the local bodies are, • Own source revenue which includes taxes, duties, cess and surcharge, fees from licenses and
permissions, income from municipal properties, and income from other miscellaneous items;
• Share of the taxes levied by the Government and transferred to the Local Bodies;
• Grants to the Local Bodies from the Government for the implementation of schemes, projects
and plans formulated by them, under non-plan scheme;
• Grants realized to the local bodies by the Government for implementation of schemes, projects
and plans assigned or entrusted to the local bodies under the KM Act 1994; and K.P.R Act 1994;
and
• Money raised through donations and contributions from the public and non-governmental
agencies.
The Total receipts and expenditure of all the local bodies that come under the CDP for the
past three financial years are given below.
Table 12.1: Receipts and Expenditure of Local Bodies (Rs.Lakh)
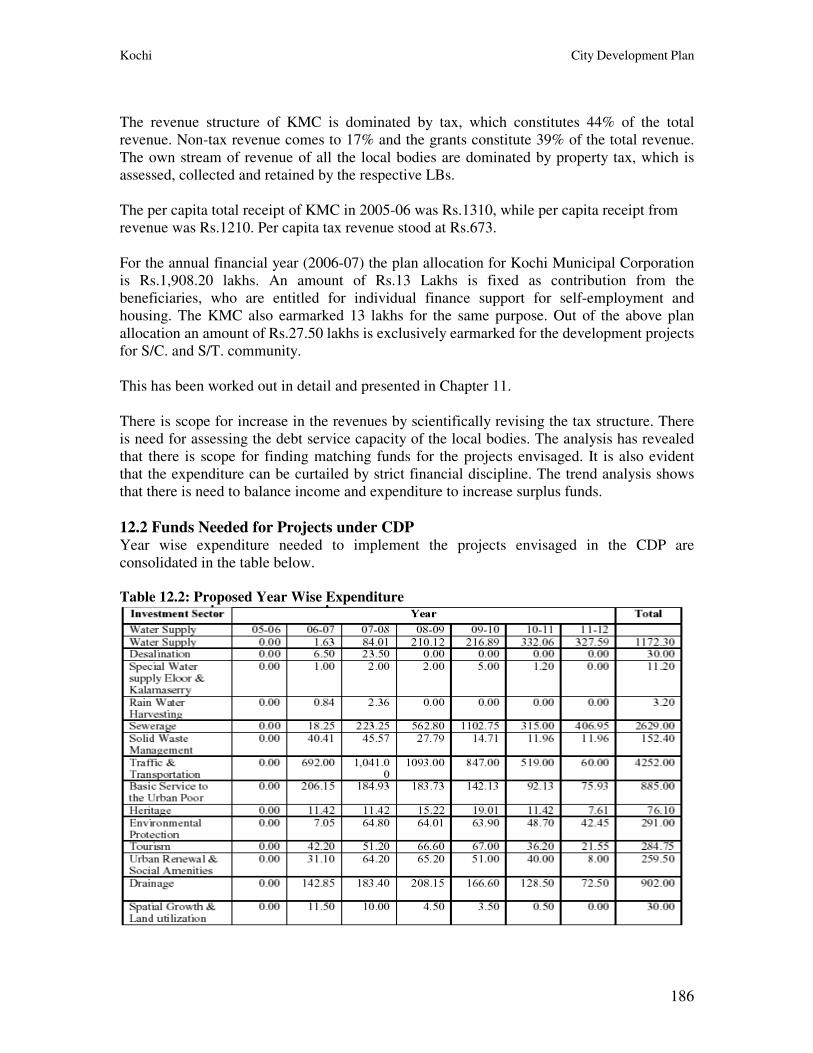
Kochi City Development Plan
186
The revenue structure of KMC is dominated by tax, which constitutes 44% of the total
revenue. Non-tax revenue comes to 17% and the grants constitute 39% of the total revenue.
The own stream of revenue of all the local bodies are dominated by property tax, which is
assessed, collected and retained by the respective LBs.
The per capita total receipt of KMC in 2005-06 was Rs.1310, while per capita receipt from
revenue was Rs.1210. Per capita tax revenue stood at Rs.673.
For the annual financial year (2006-07) the plan allocation for Kochi Municipal Corporation
is Rs.1,908.20 lakhs. An amount of Rs.13 Lakhs is fixed as contribution from the
beneficiaries, who are entitled for individual finance support for self-employment and
housing. The KMC also earmarked 13 lakhs for the same purpose. Out of the above plan
allocation an amount of Rs.27.50 lakhs is exclusively earmarked for the development projects
for S/C. and S/T. community.
This has been worked out in detail and presented in Chapter 11.
There is scope for increase in the revenues by scientifically revising the tax structure. There
is need for assessing the debt service capacity of the local bodies. The analysis has revealed
that there is scope for finding matching funds for the projects envisaged. It is also evident
that the expenditure can be curtailed by strict financial discipline. The trend analysis shows
that there is need to balance income and expenditure to increase surplus funds.
12.2 Funds Needed for Projects under CDP Year wise expenditure needed to implement the projects envisaged in the CDP are
consolidated in the table below.
Table 12.2: Proposed Year Wise Expenditure
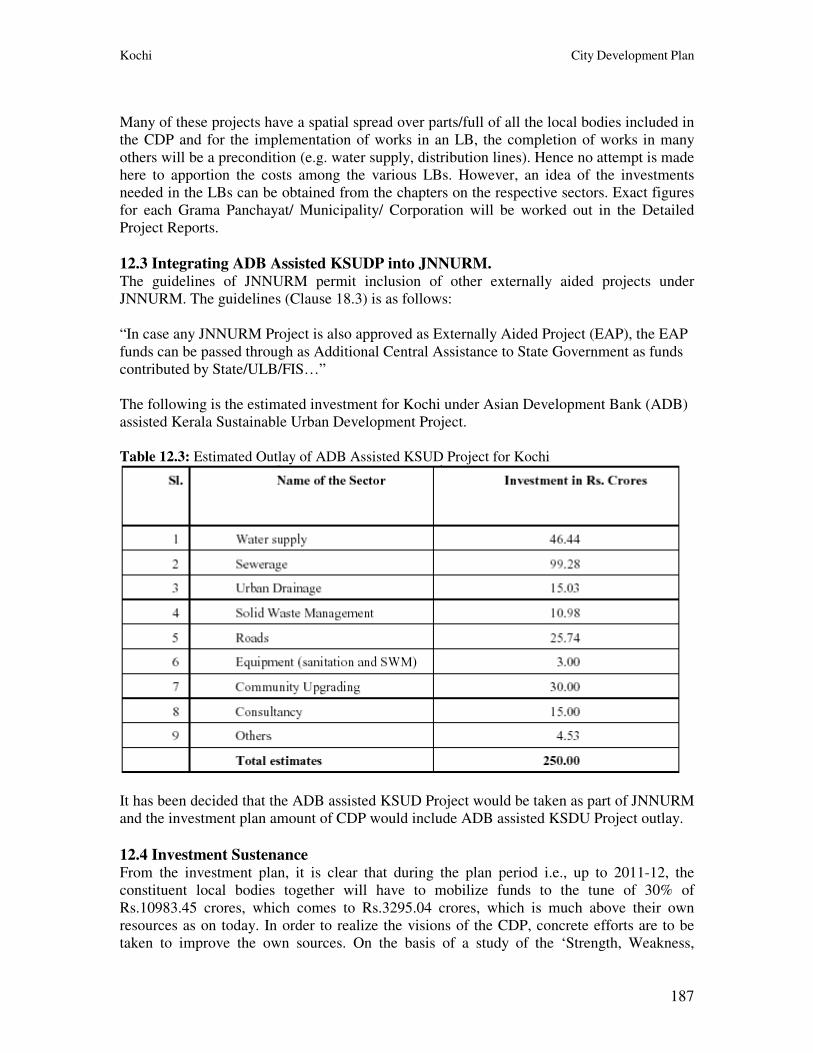
Kochi City Development Plan
187
Many of these projects have a spatial spread over parts/full of all the local bodies included in
the CDP and for the implementation of works in an LB, the completion of works in many
others will be a precondition (e.g. water supply, distribution lines). Hence no attempt is made
here to apportion the costs among the various LBs. However, an idea of the investments
needed in the LBs can be obtained from the chapters on the respective sectors. Exact figures
for each Grama Panchayat/ Municipality/ Corporation will be worked out in the Detailed
Project Reports.
12.3 Integrating ADB Assisted KSUDP into JNNURM. The guidelines of JNNURM permit inclusion of other externally aided projects under
JNNURM. The guidelines (Clause 18.3) is as follows:
“In case any JNNURM Project is also approved as Externally Aided Project (EAP), the EAP
funds can be passed through as Additional Central Assistance to State Government as funds
contributed by State/ULB/FIS…”
The following is the estimated investment for Kochi under Asian Development Bank (ADB)
assisted Kerala Sustainable Urban Development Project.
Table 12.3: Estimated Outlay of ADB Assisted KSUD Project for Kochi
It has been decided that the ADB assisted KSUD Project would be taken as part of JNNURM
and the investment plan amount of CDP would include ADB assisted KSDU Project outlay.
12.4 Investment Sustenance From the investment plan, it is clear that during the plan period i.e., up to 2011-12, the
constituent local bodies together will have to mobilize funds to the tune of 30% of
Rs.10983.45 crores, which comes to Rs.3295.04 crores, which is much above their own
resources as on today. In order to realize the visions of the CDP, concrete efforts are to be
taken to improve the own sources. On the basis of a study of the ‘Strength, Weakness,
Kochi City Development Plan
188
Opportunities and Threats’ of the local bodies, the following assumptions are arrived at
regarding the future financial scenario.
12.4.1 Financial Plan Under JNNURM for Providing GoK and ULB Share of
Contribution: • The broad estimated cost for the project components envisaged under various sectors in
CDP for JNNURM Projects – Rs.10983.45 crores;
• The share expected from GoI as grants is 50% - Rs.5491.73 crores;
• 20% contribution by GoK, which would be made by budgetary allocation – Rs.2196.68;
• 30% contribution by Kochi Corporation and constitutent ULBs – Rs.3295.04.
JNNURM guidelines permit integration of other externally aided projects (ADB assisted
KSUDP with JNNURM for considering such funds as the share of GoK and KMC):
ADB assisted KSUDP (Receipt from ADB) Rs.175.00 crores (would be taken as ULB
contribution). The share of contribution expected from Kochi and other ULBs is Rs.3120.04
crores.
It would be possible to mobilize funds by identifying components which can be considered
for implementation under public private partnership (PPP). Projects which can be considered
for PPP can be identified when (DPRs) are prepared after approval of CDP by GoI. It would
also be possible to seek share of support from Local Area Development (LAD) funds of MPs
and MLAs. KMC and ULBs may also borrow from Finance institutions during project period
2006-2011 or float development bonds to raise funds.
State Government Revenue Transfers. Assigned and shared taxes and grants-in-aid are
estimated to increase.
Other own Source Income. Profession tax, entertainment tax, other municipal taxes, receipts
from municipal properties, license fees and other miscellaneous own source income are
projected to increase much above the assumed inflation rate.
In addition to this, non-conventional sources of revenue like vacant land tax, street tax, front
footage levy and betterment levy are to be imposed.
Apart from the above, to strengthen the financial position of the corporations Government of
Kerala provides grants in three streams – Development, Maintenance and General purpose.
Some of the important ongoing fiscal reforms emerging out of State Finance Commissions
would make available additional resources to the Kochi Corporation as detailed in Chapter 2
- 2.1.2. The main reforms are:
i. Introduction of plinth area based Property Taxation to be effective from the second half of
2006-07;
ii. It is envisaged that the number of taxable properties will increase by 1.0% annually;
iii. It is envisaged that increase in number of properties can bring in additional tax revenue by
undertaking property survey and increasing tax coverage to all properties.
iv. Introduction of seating capacity-linked taxation for Entertainment Tax;
Kochi City Development Plan
189
v. Introduction of presumptive taxes for certain categories of professions under Profession
Tax;
vi. Introduction of a new Service Tax to realize the cost of providing special services to
localities, as a kind of benefits tax;
vii. Linking general non-tax revenues like rents, license fees to the value of money through a
system of graduated automatic increases linked to indices reflecting value of money;
viii. Linking devolution of a portion of the Development Fund to increased revenue efforts on
the part of the local governments;
ix. Tax mapping to reduce escaped tax; and
x. Updation of asset registers.
In addition to this, non-conventional sources of revenue like vacant land tax, street tax, front
footage levy and betterment levy are envisaged to be imposed.
Revenue Expenditures. Projected salaries, establishment costs, operation and maintenance
costs of existing Municipal services and facilities are based on actual and budgeted financial
data. These existing costs are estimated to increase equivalent to the assumed inflation rate of
6% over the forecast period. The operation and maintenance costs for the new works are
based on engineering estimates. Operation and maintenance unit costs for the new works are
estimated to increase equivalent to the assumed inflation rate of 6% over the forecast period.
The Financial Statement is enclosed vide Annexure 7.
12.5 Alternate Sources Even with all the above improvement measures, the ULBs will not be able to mobilize funds
towards 30% of the project costs from own resources immediately. Hence, alternate sources
of finance will have to be identified. The following options either single or in combination,
will be adopted based on the merits of individual projects.
Raising Municipal Infrastructure Bonds, City Development Bond, Loan from financial
institutions like HUDCO, KUDFC, GoK, ADB and ILFS and resorting to PPP on a
sustainable level will have to be adopted based on the merits of each project. The proposal is
therefore to mobilize maximum resources to meet the KMC’s share of expense towards the
project. From 2014 onwards the surplus fund of KMC will be available for paying off the
debts / interests, if any, drawn from other sources, The income from projects taken up by
other para-statal agencies like KWA and by other local bodies in their respective areas has
not been taken into account to arrive at the financial surplus.
Conclusion. The projects envisaged in the CDP are the result of detailed discussions of
aspirations at stakeholders’ level, technical and financial viability evaluation by experts and
acceptance by people’s representatives. There is gap between the funds required and
available. But projects like these should not be held up due to lack of finance. These projects
for the development of basic infrastructure are to lay the ground for a sustainable
development of the city. The return there of are not always tangible. The social aspects are to
be given due weightage. Firm determination and strict discipline adhering to the institutional
reforms are needed to achieve the vision. Strengthening the financial base of the local bodies
and resorting to the alternate sources of finance mentioned above wherever necessary are
tools to realize the vision of this City Development Plan for Kochi.
Kochi City Development Plan
190
13 IMPLEMENTATION ARRANGEMENTS
13.1 Project Management and Implementation Mechanism Government of Kerala had earlier constituted a Project Management and Implementation
Mechanism for the Asian Development Bank (ADB) assisted Kerala Sustainable Urban
Development Project (KSUDP) which has been approved as a multi-component urban
development project for the five cities of Thiruvananthapuram, Kollam, Kochi, Thrissur and
Kozhikode in the State of Kerala. This Project Implementation Mechanism has been
approved by Government of India.
As laid out in the norms of JNNURM, the KSUDP as the Externally Assisted project (EAP)
has been brought under the JNNURM. In this context GOK has proposed to appoint the same
Project management and Implementation Unit as the State level Nodal Agency for
JNNURM. This is as per the JNNURM Guidelines issued by the Ministry of Urban
development, Government of India. The implementation mechanism proposed through this
Nodal Agency is detailed subsequently.
13.2 Implementing Agencies JNNURM is conceived as a multi-component, multi-sectoral programme. The
implementation of the projects would necessitate involvement of a number of sectoral
agencies, both Government Departments and Quasi- Government Organizations. In addition
to this, there are a few projects which need participation of private sector and Voluntary
Organizations. Therefore the Project Nodal Agency has to interact with a large number of
organizations and also with the State and Central Governments.
The task would be much more important in the Project Cities, where arranging for
preparation of Detailed Project reports, arranging for implementation through the responsible
organization, mobilizing participation of people, implementation monitoring, channeling of
funds to the responsible organization, project accounting etc. would be tasks to be undertaken
diligently. Given the multiplicity of functions and the overlap in service provision,
identifying the implementing agency is critical for smooth operations.
The Municipal Corporations will be the implementing agencies conforming to GoK’s policy
of decentralizing planning and service delivery. A City-level Steering Committee (CSC)
would be constituted for overcoming any bottlenecks in project progress. The CSC would
consist of the Mayor of the KMC, the District Collector, the Secretary of KMC,
representatives of State-level Departments in the city (Public Works Department, Kerala
Water Authority, NATPAC, GIDA, GCDA, Department of Tourism, Irrigation Department,
Department of Town & Country Planning, Kerala State Pollution Control Board etc.), and
representatives of Kochi Chamber of Commerce, representatives from Industry and NGOs /
CBOs. Besides reviewing project progress, the CSC would also sort out local issues and
would provide guidance on policy matters. Kudumbashree set up will continue to play an
active role in advising and monitoring activities facilitating poverty alleviation.
Kochi City Development Plan
191
13.3 Project Management
13.3.1 Project Management Unit The PMU would be responsible for –
i. Appointing project management consultants, arranging for preparation of detailed design
/ project reports and appointment of construction supervision consultants, mobilization of
private sector participation, appointment of public support mobilization groups, and
ensuring participation of voluntary organizations;
ii. Approving the design of the investment components in consultation with KMC (Kochi
Municipal Corporation and other ULBs);
iii. Pre-qualifying contractors;
iv. Implementing public relations and community awareness programs;
v. Preparing standard bid documents;
vi. Monitoring the tendering process and guiding the project cities in bid evaluation and
preparing bid evaluation reports for approval by GoK and GoI;
vii. Procuring equipment at the state-level;
viii. Coordinating with GoK and GoI on matters related to disbursements;
ix. Conducting the training and capacity building programs;
x. Providing support under the institutional development assistance; and
xi. Maintaining project documents and submitting timely reports (including monthly project
performance reports, quarterly progress reports, etc.) to GoK and GoI.
The PMU will be headed by a Project Director and supported by deputies, based on the
project size. The PMU will be staffed with senior level technical, financial, social, capacity
building/management and procurement officers to manage all technical and funding account
administration. An accounting and administrative unit will manage funding account
administration.
13.3.2 Project Implementation Units PIU would be established within Kochi Municipal Corporation. The responsibilities of the
PIU would include:
i. Carrying out detailed surveys, investigations and engineering designs of individual city
components;
ii. Tendering, evaluating bids and awarding works, contract administration, supervision and
quality control;
iii. Measuring works carried out by the contractors and certifying payments;
iv. Conducting public awareness campaigns and participation programs,
v. Carrying out the Benefit Monitoring and Evaluation (BME) studies;
vi. Carrying out inventory of environmental assessments;
vii. Ensuring compliance with funding amount and loan covenants, if any; and
viii. Preparing monthly reports.
The Design Supervision Consultant (DSC) supports the PIU in all the aforesaid activities. A
Project Manager will head the PIU and will be supported by sector specialists in
environmental and civil engineering, as appropriate. The PIU will also comprise of staff
involved in procurement, accounts and community development. Staff deputed from the
Revenue Department shall handle all land acquisition and resettlement and rehabilitation
issues, wherever required. The Project Manager at the PIU will report to the Secretary /
Kochi City Development Plan
192
Mayor, Kochi Municipal Corporation, and the Project Director at the PMU. All
administrative and project co-ordination related issues will be handled by Additional
Secretary of the KMC, who will be a senior officer appointed by Government. The
Additional Secretary of the KMC will also be authorized to release payments to contractors
based on the approval / certification of the Project Manager, PIU, and subject to fund release
by the PMU. The Additional Secretary shall interface with the Municipal Corporation
Council and the PMU regarding Project progress.
13.3.3 Project Management and De sign Consulting Services Consultancy services are required for project management, engineering design, construction
supervision, procurement of goods and services, and public relations and awareness.
Consultants would be selected and engaged in accordance with accepted guidelines approved
by international funding agencies and Government of India.
Project Management Consultant (PMC). A Consultancy Group for Project Management will
assist the PMU in project management activities including reviewing engineering designs,
procurement, and implementation. The Project Management Consultants (PMC) will also
assist the Project Management Unit (PMU) and the Project Implementation Unit (PIU) in
project formulations, management, monitoring and evaluation, financial and environmental
management aspects, public relations and awareness, training and capacity building, and
institutional development / strengthening.
Design and Supervision Consultant (DSC). The main objectives of the DSC is to update
maps and plans, undertake surveys & investigations and to prepare detailed designs of
various project components for Kochi CDP area, prepare technical specifications and contract
documents, assist in construction supervision and quality control, and undertake works
measurement.
Public Relations Consultant (PRC). A domestic Public Relations Consultant firm appointed
will facilitate public relations and arrange awareness programs (PRAP) on project related
issues. The Information, Education and Communication (IEC) materials developed by the
PRC would be utilized in public awareness campaigns. This Consultancy group would also
be responsible for assessment of benefits accruing out of the proposed projects and
continuous monitoring of the implementation process on the socio-economic and
environmental impact.
Non-Governmental Organizations (NGOs). Accredited NGOs based on their past
performance and past experience in related aspects would be empanelled for participation in
project detailing and implementation of the various components of the JNNURM Project.
The following figure indicates the proposed project management structure.
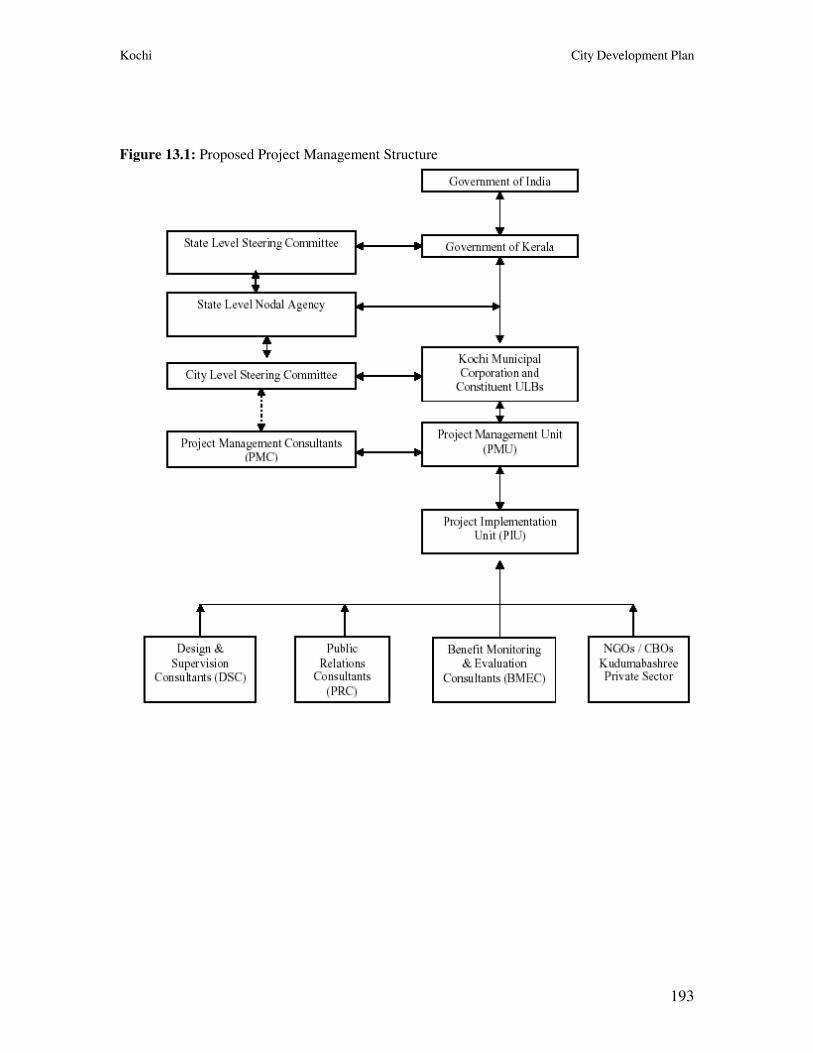
Kochi City Development Plan
193
Figure 13.1: Proposed Project Management Structure
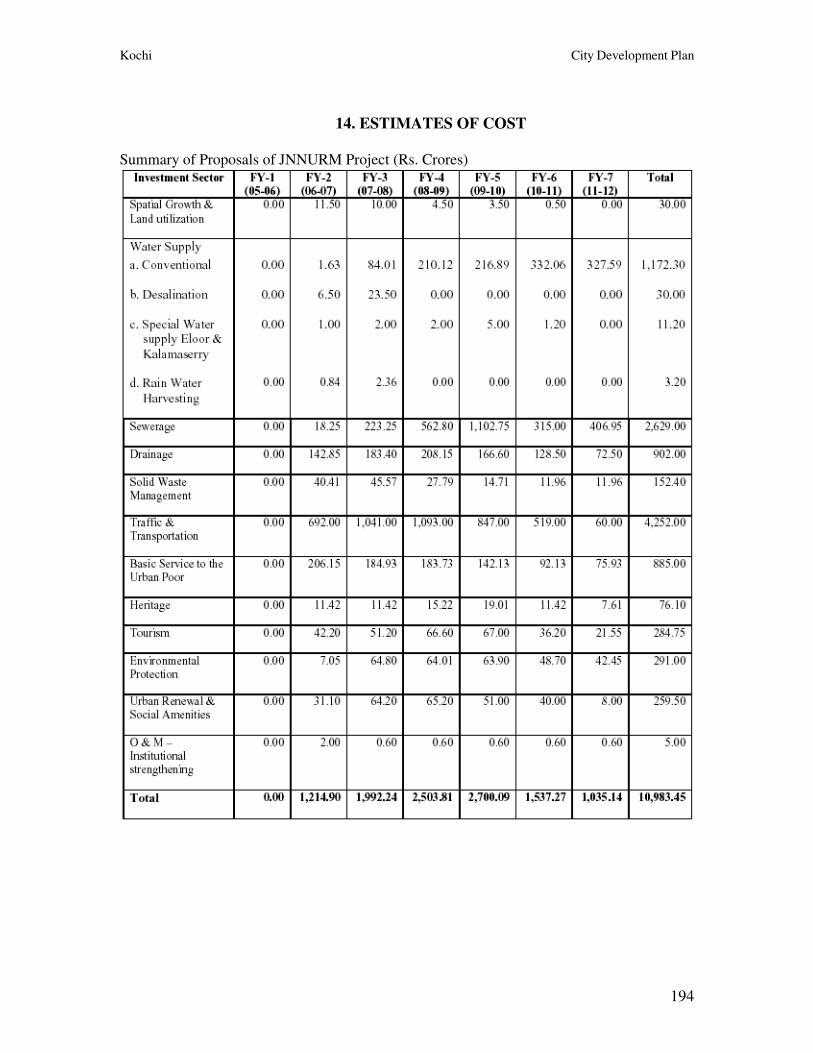
Kochi City Development Plan
194
14. ESTIMATES OF COST
Summary of Proposals of JNNURM Project (Rs. Crores)
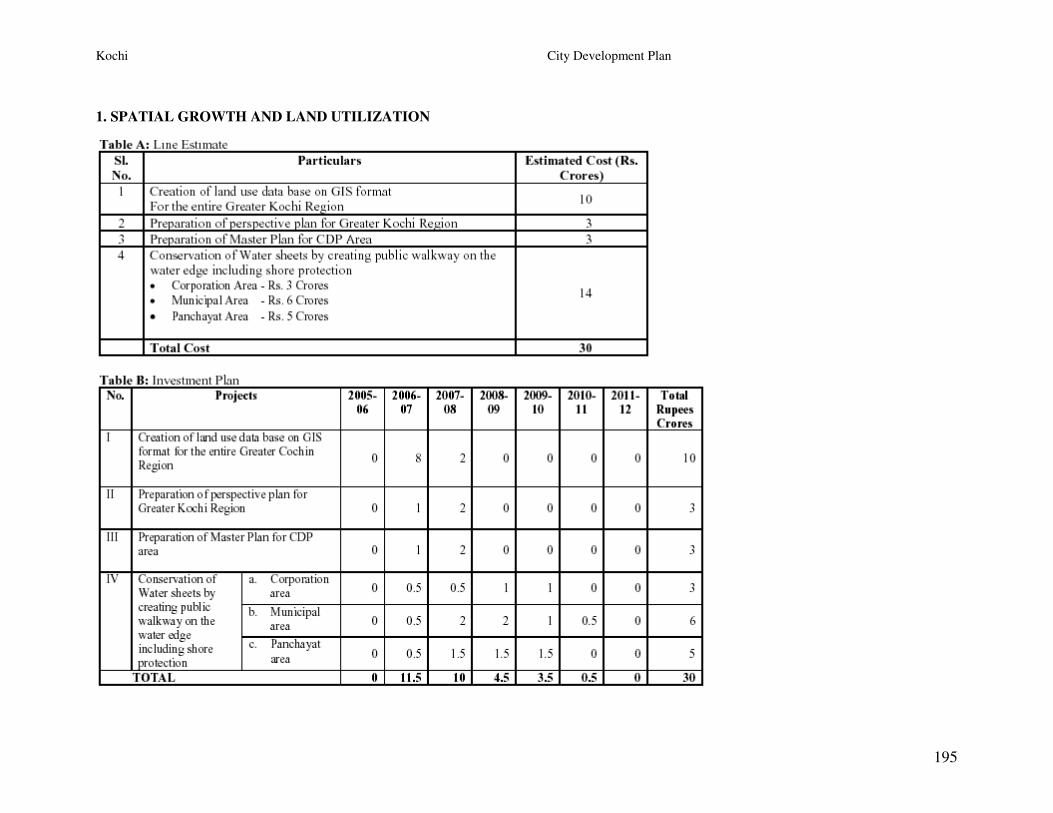
Kochi City Development Plan
195
1. SPATIAL GROWTH AND LAND UTILIZATION

Kochi City Development Plan
196
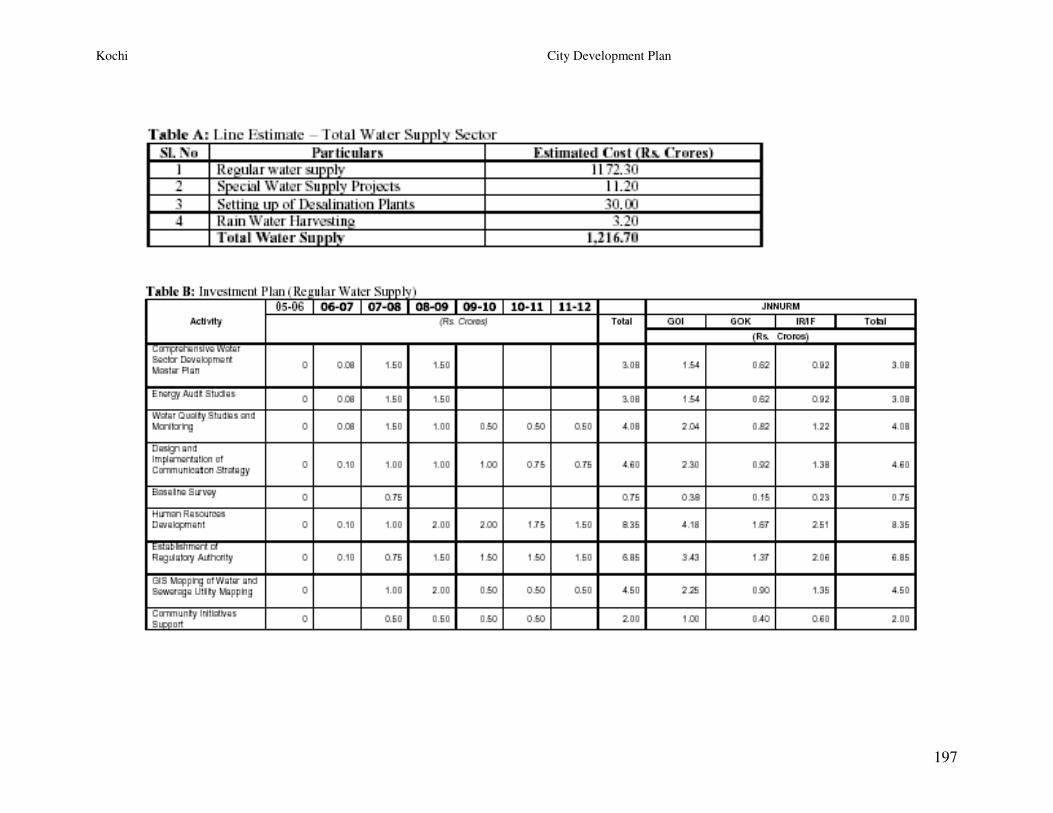
Kochi City Development Plan
197
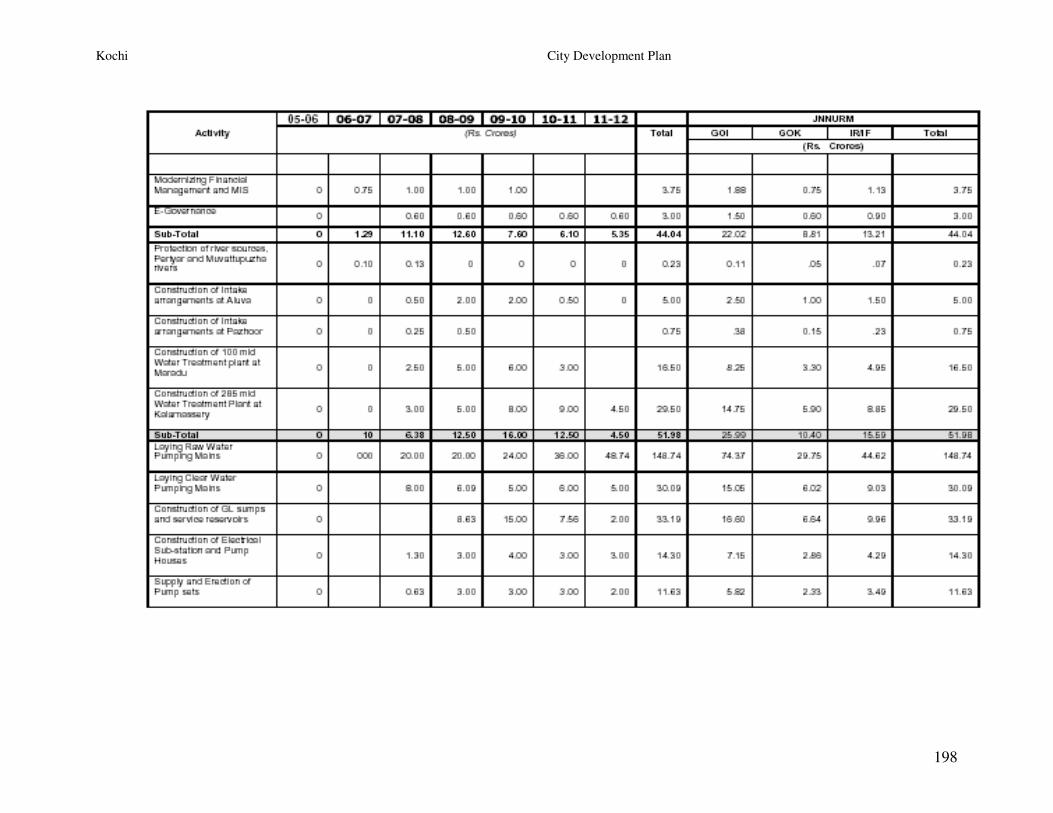
Kochi City Development Plan
198
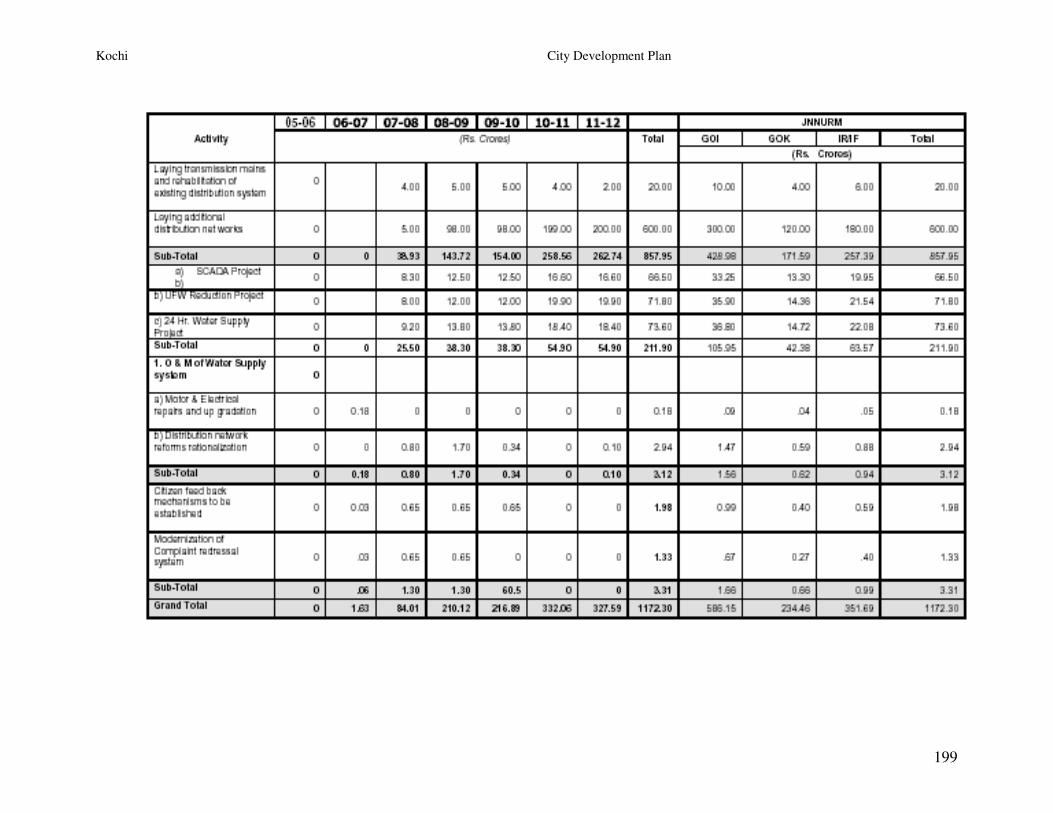
Kochi City Development Plan
199

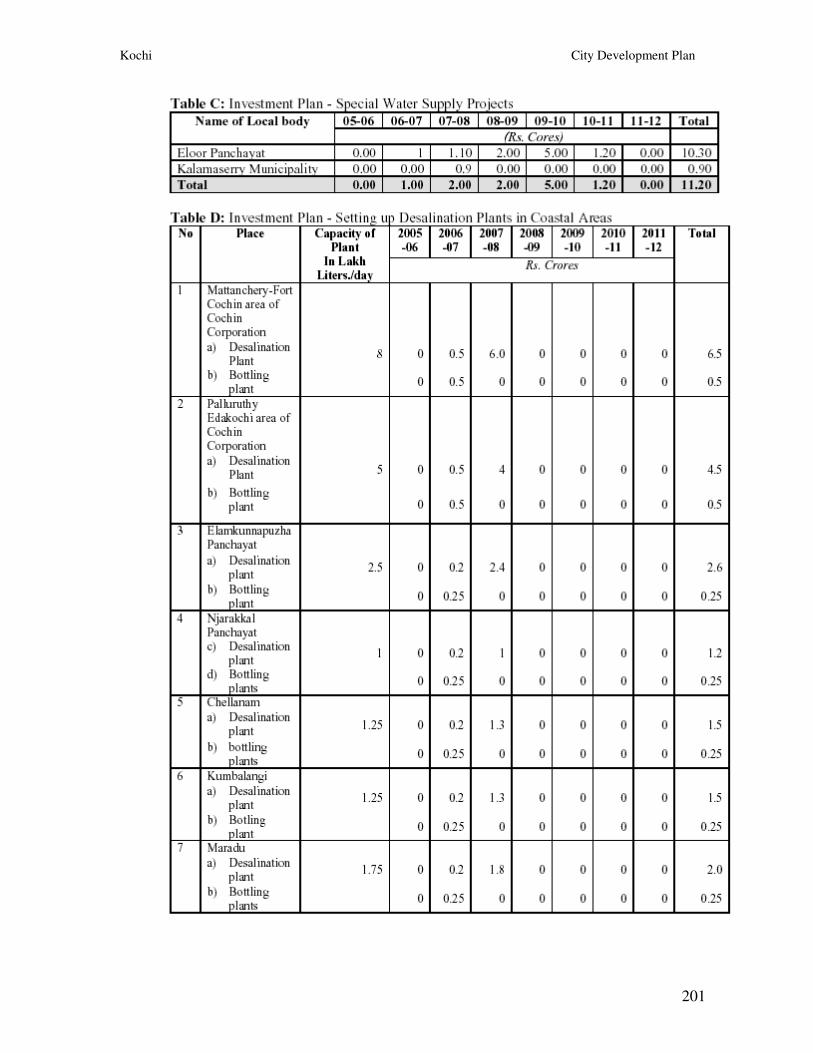
Kochi City Development Plan
201
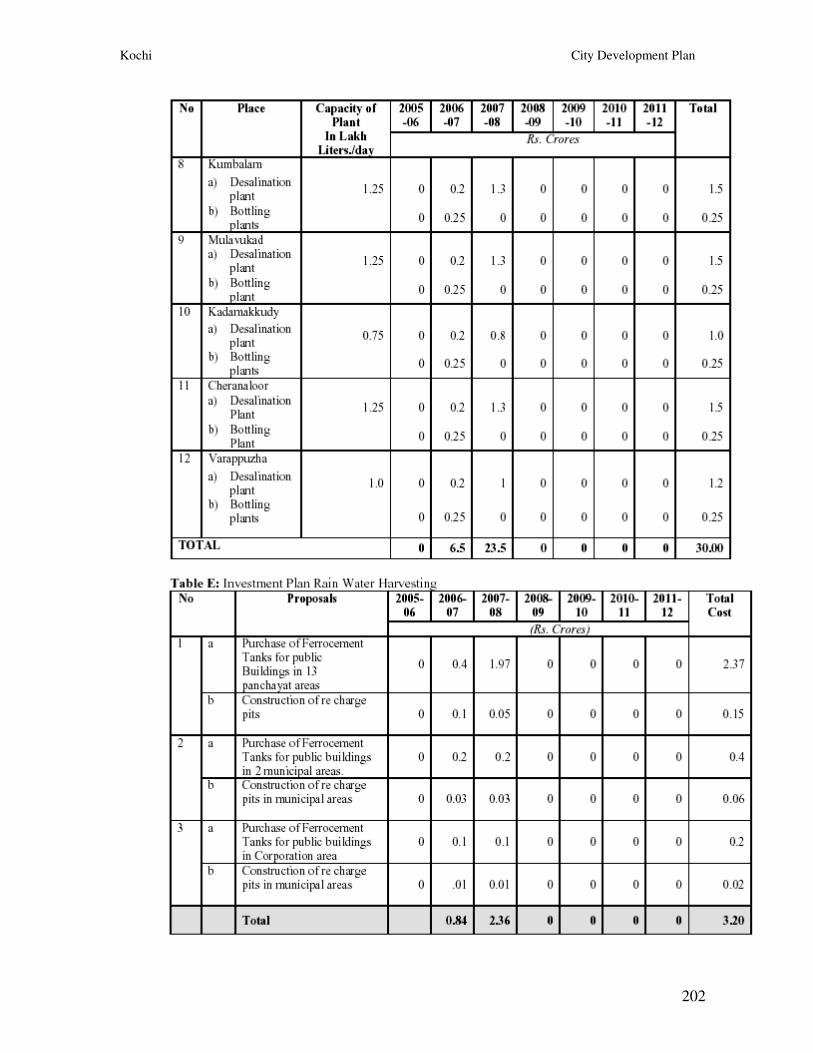
Kochi City Development Plan
202
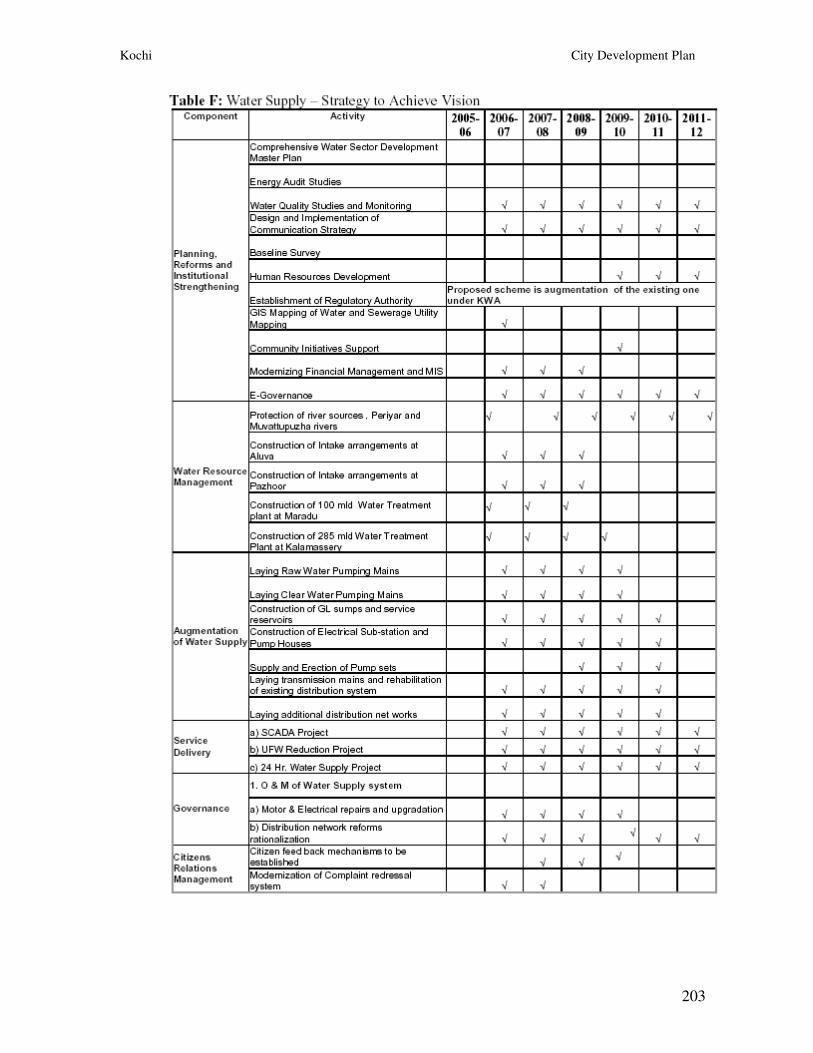
Kochi City Development Plan
203
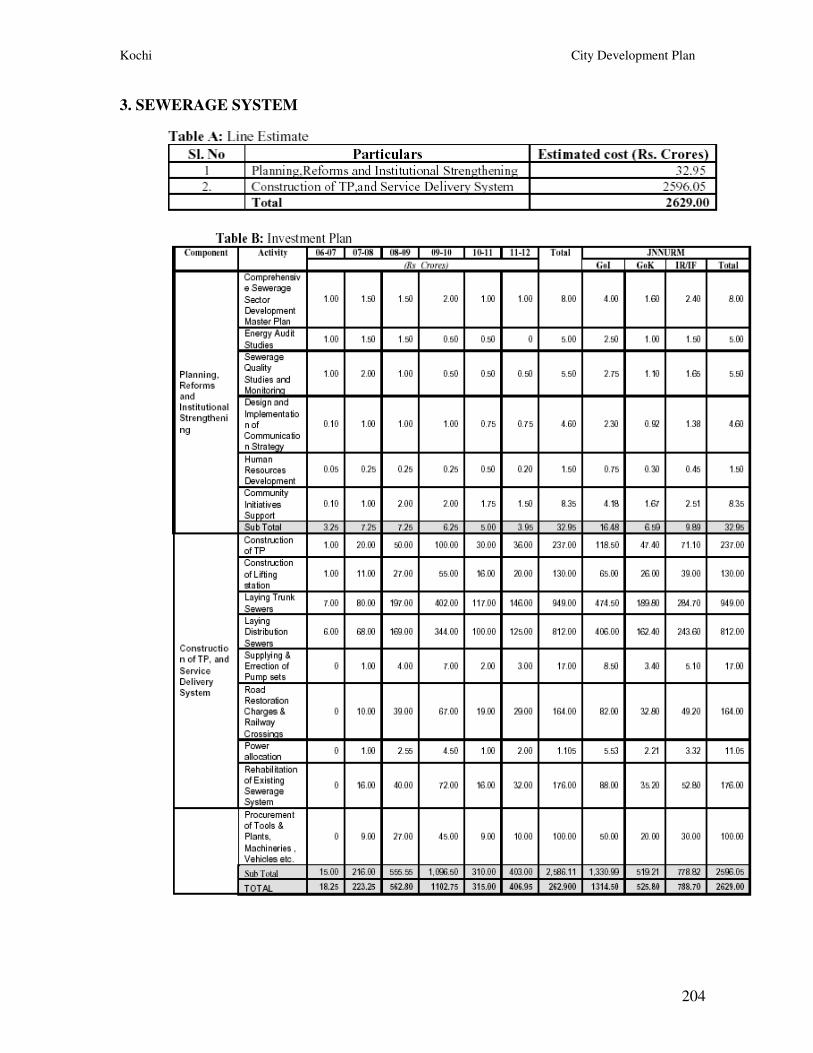
Kochi City Development Plan
204
3. SEWERAGE SYSTEM
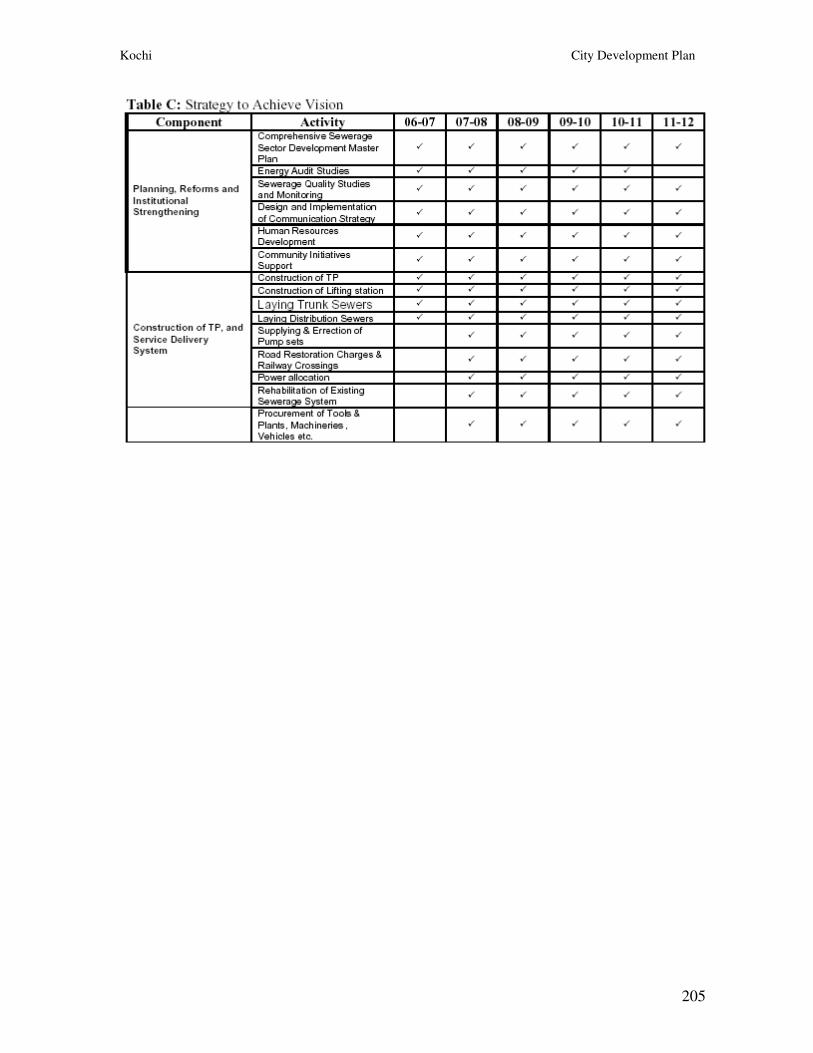
Kochi City Development Plan
205
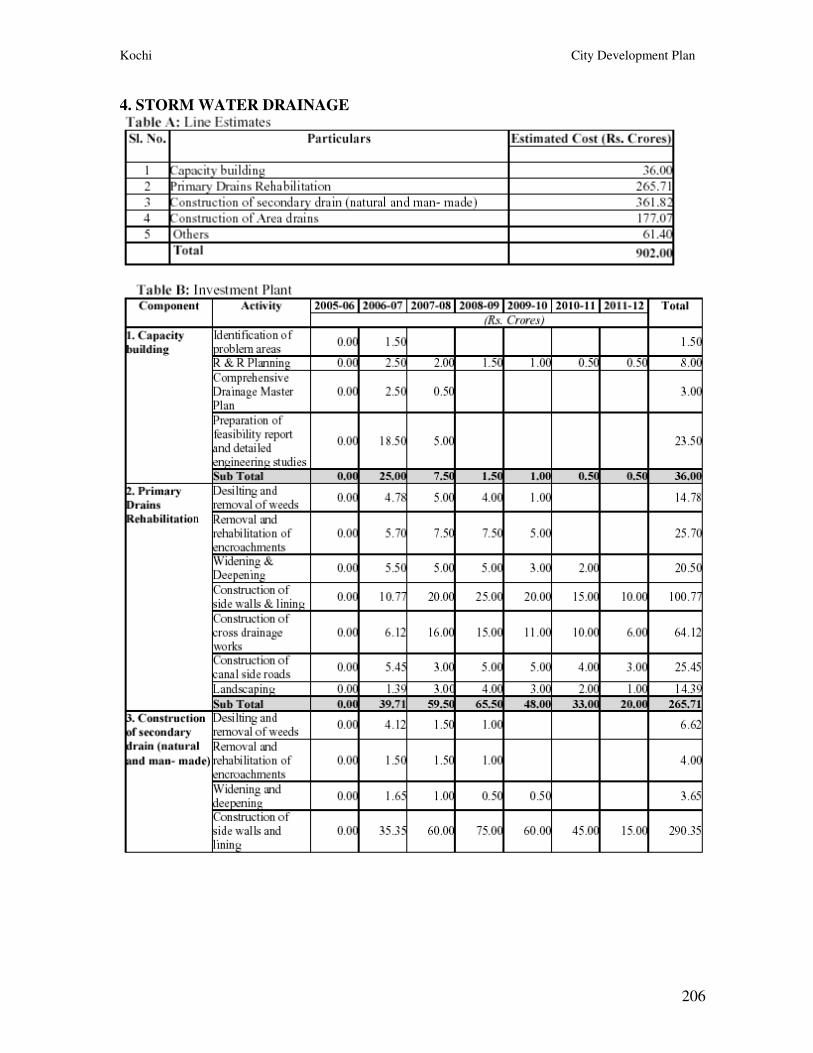
Kochi City Development Plan
206
4. STORM WATER DRAINAGE
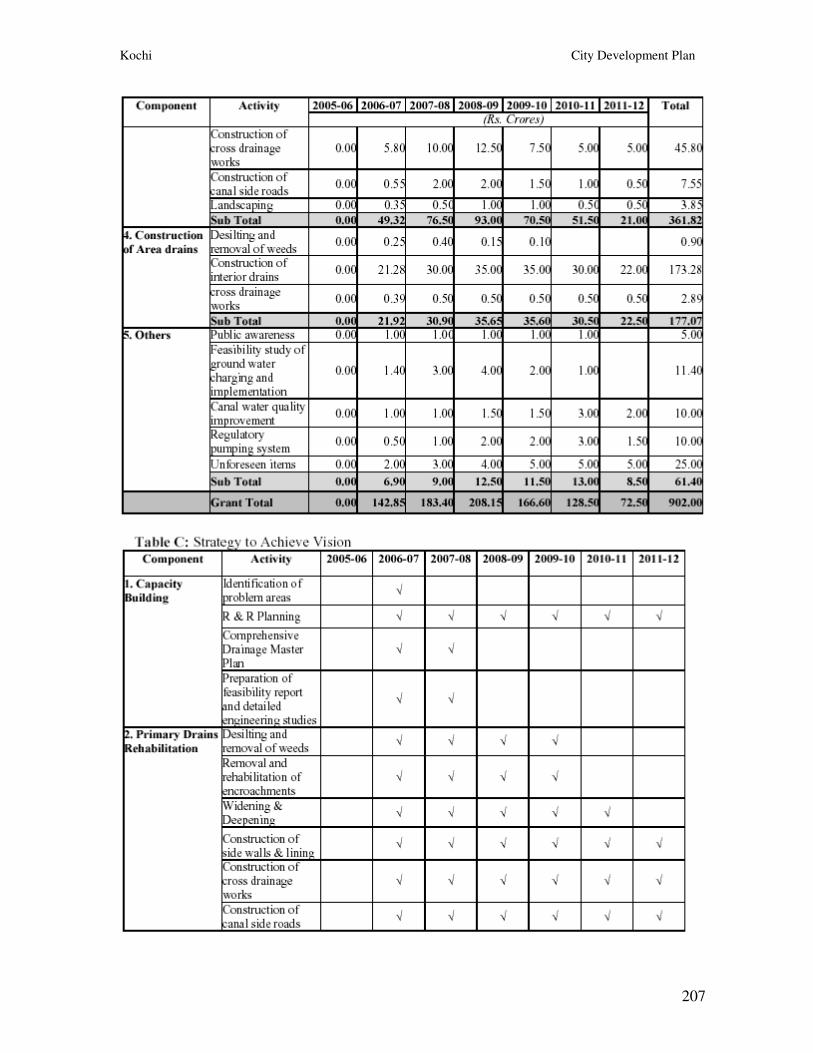
Kochi City Development Plan
207
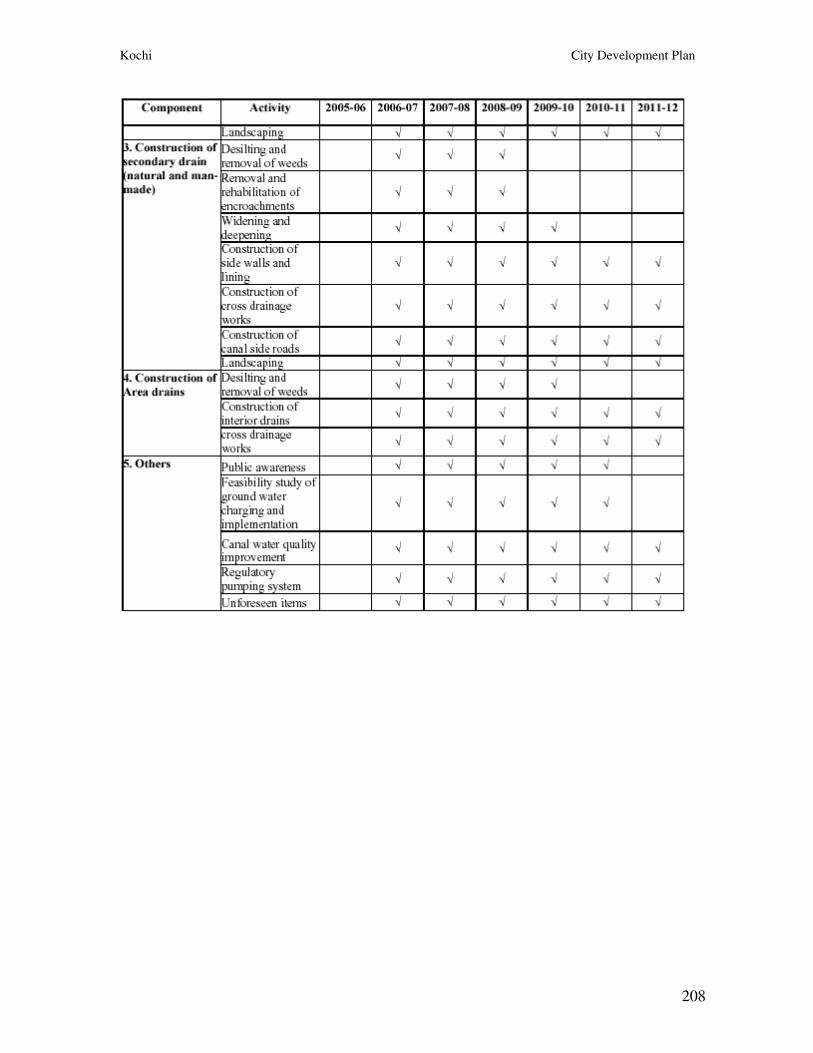
Kochi City Development Plan
208
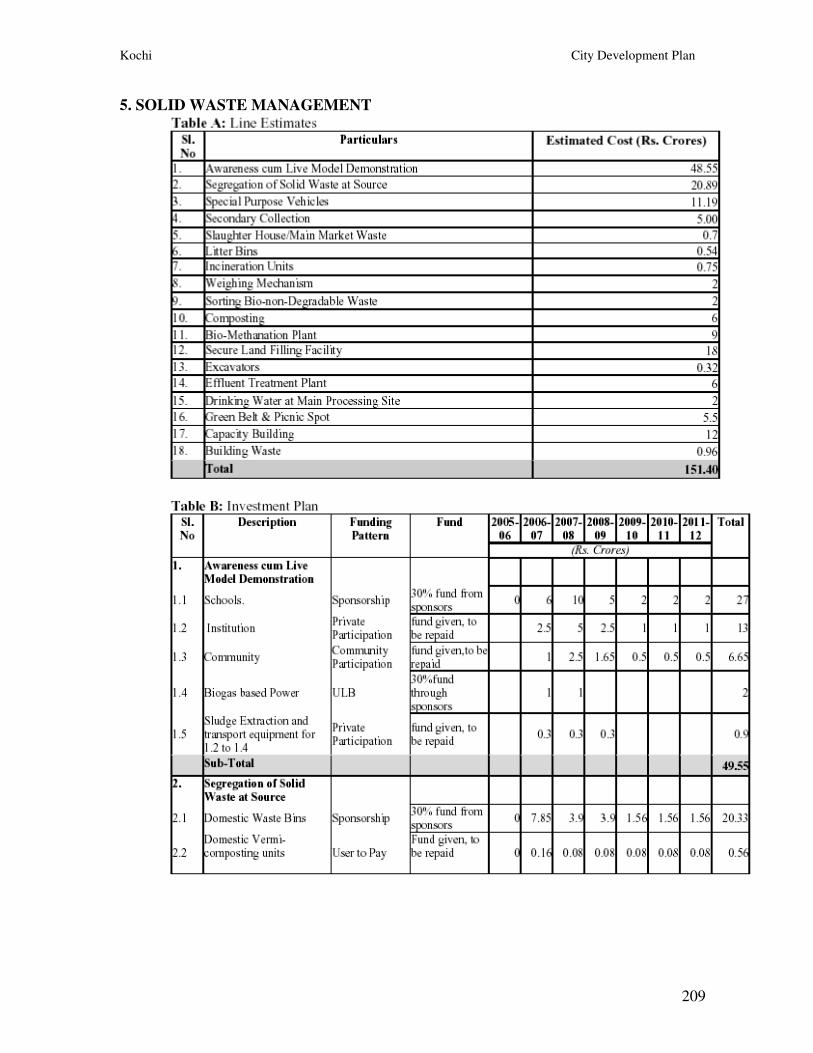
Kochi City Development Plan
209
5. SOLID WASTE MANAGEMENT
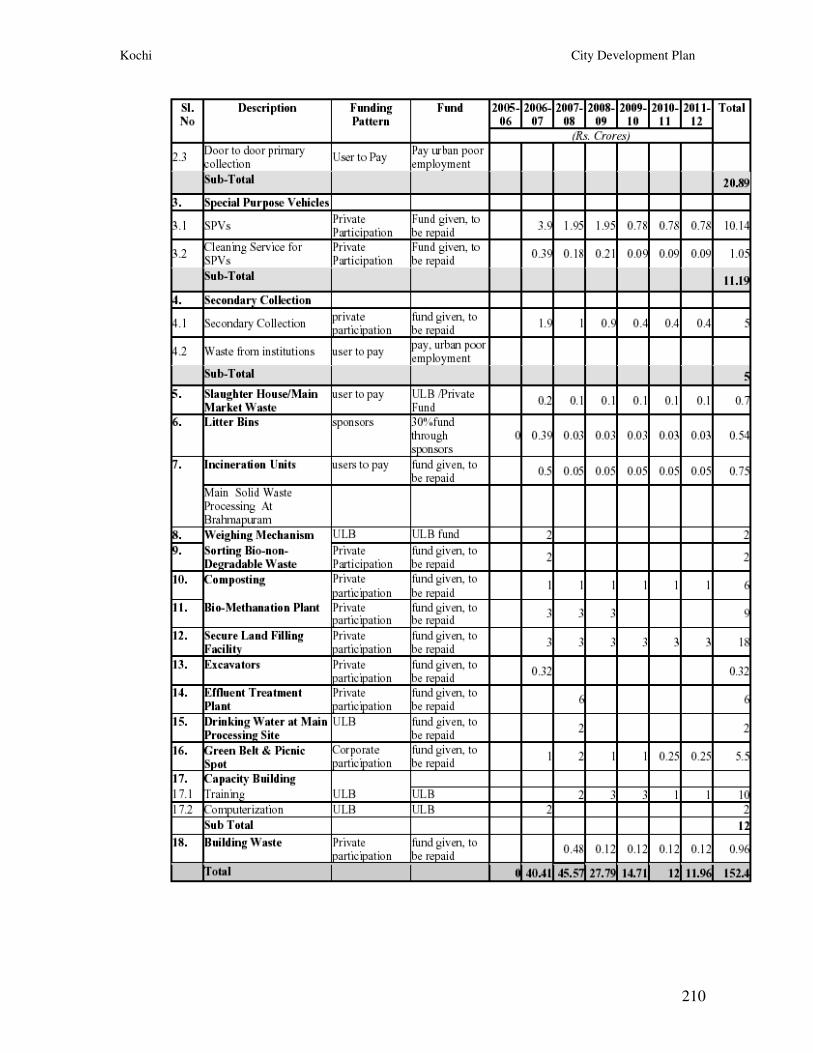
Kochi City Development Plan
210
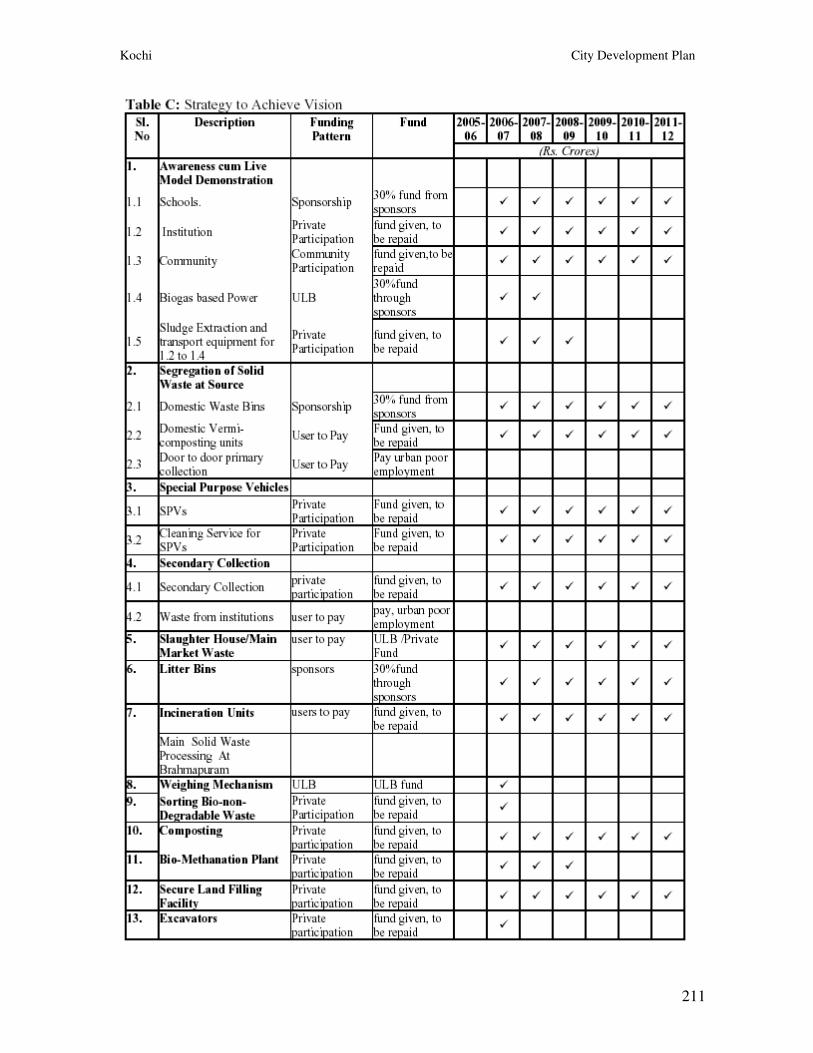
Kochi City Development Plan
211
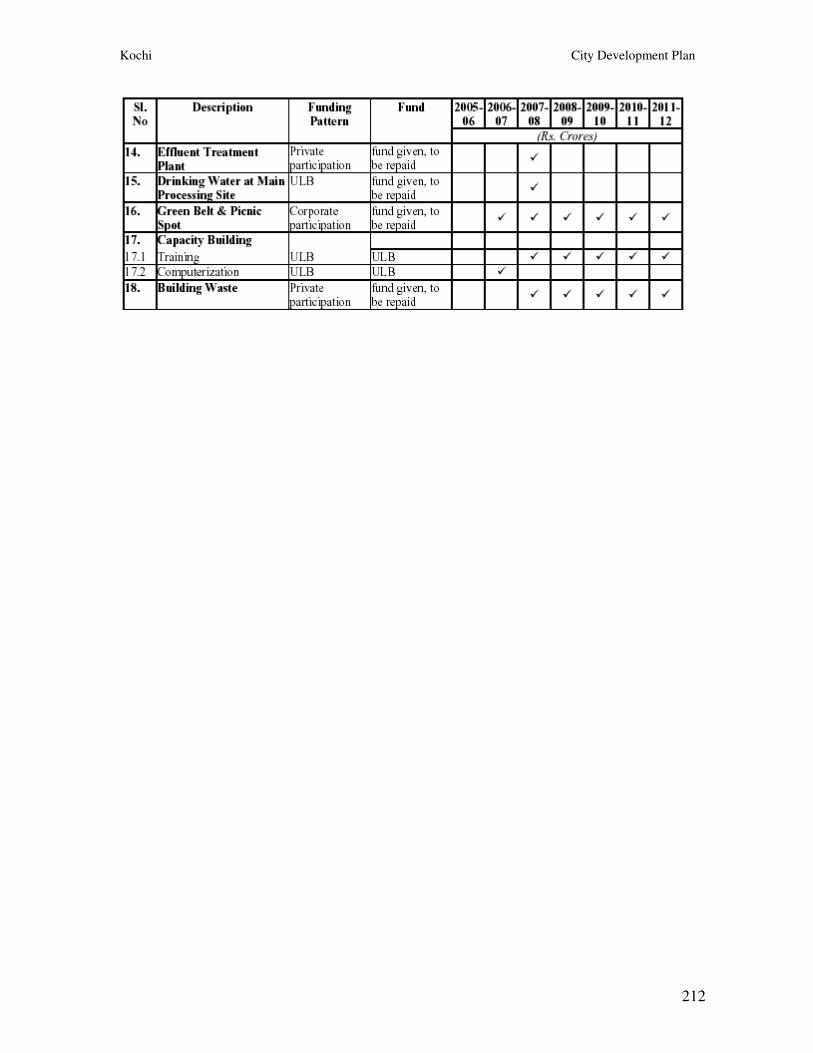
Kochi City Development Plan
212
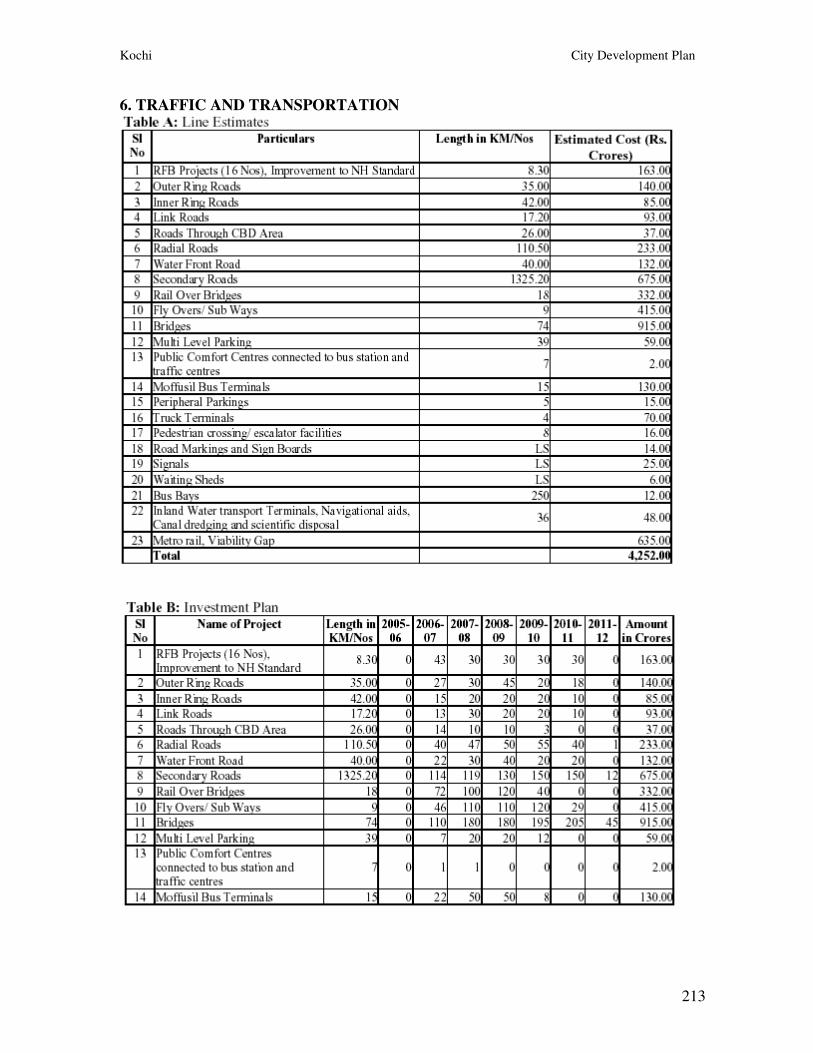
Kochi City Development Plan
213
6. TRAFFIC AND TRANSPORTATION
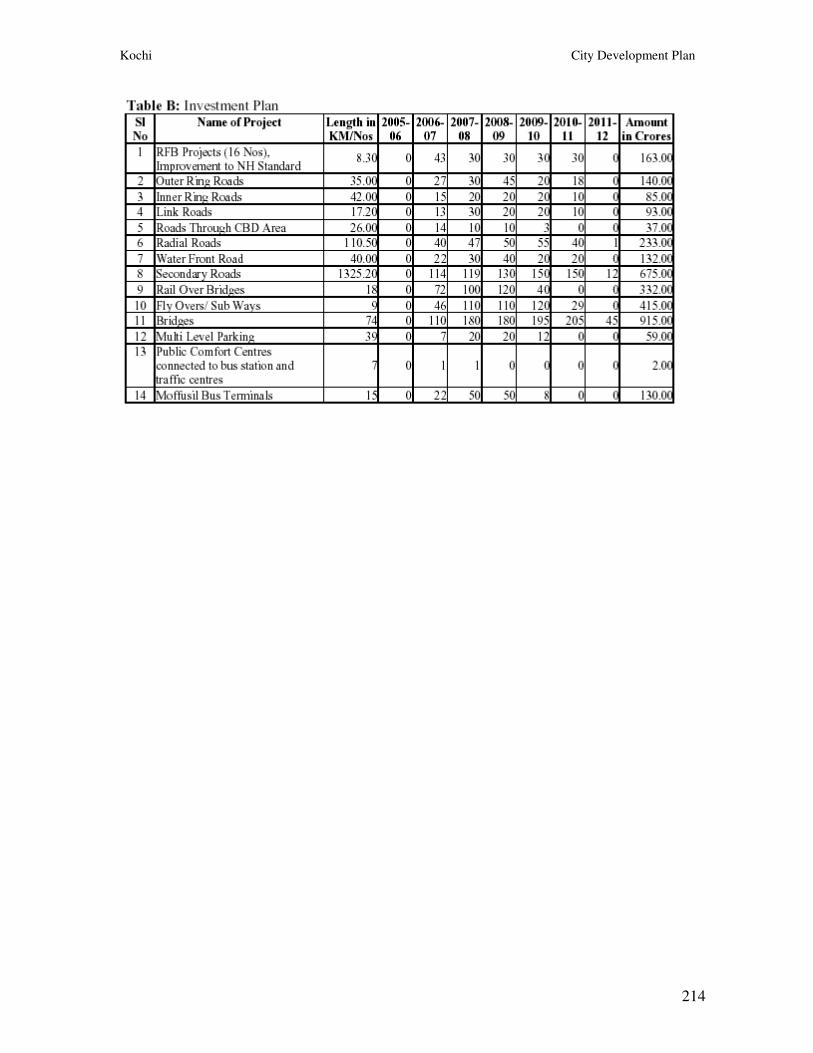
Kochi City Development Plan
214
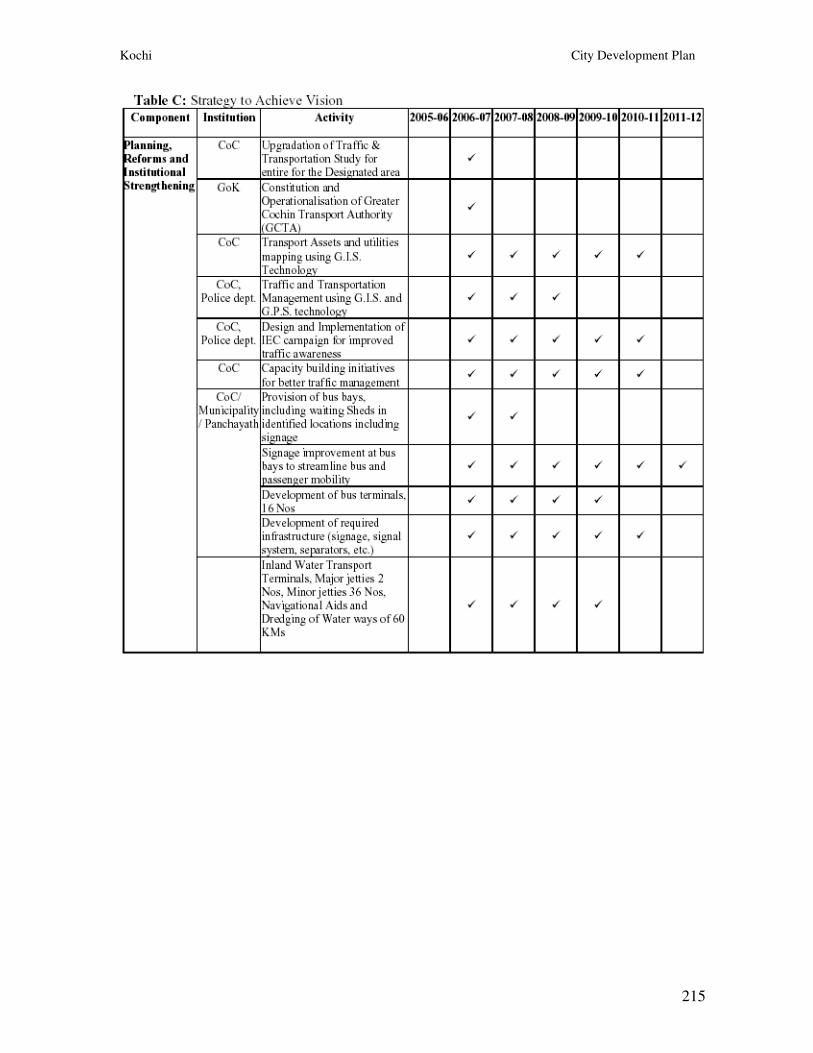
Kochi City Development Plan
215
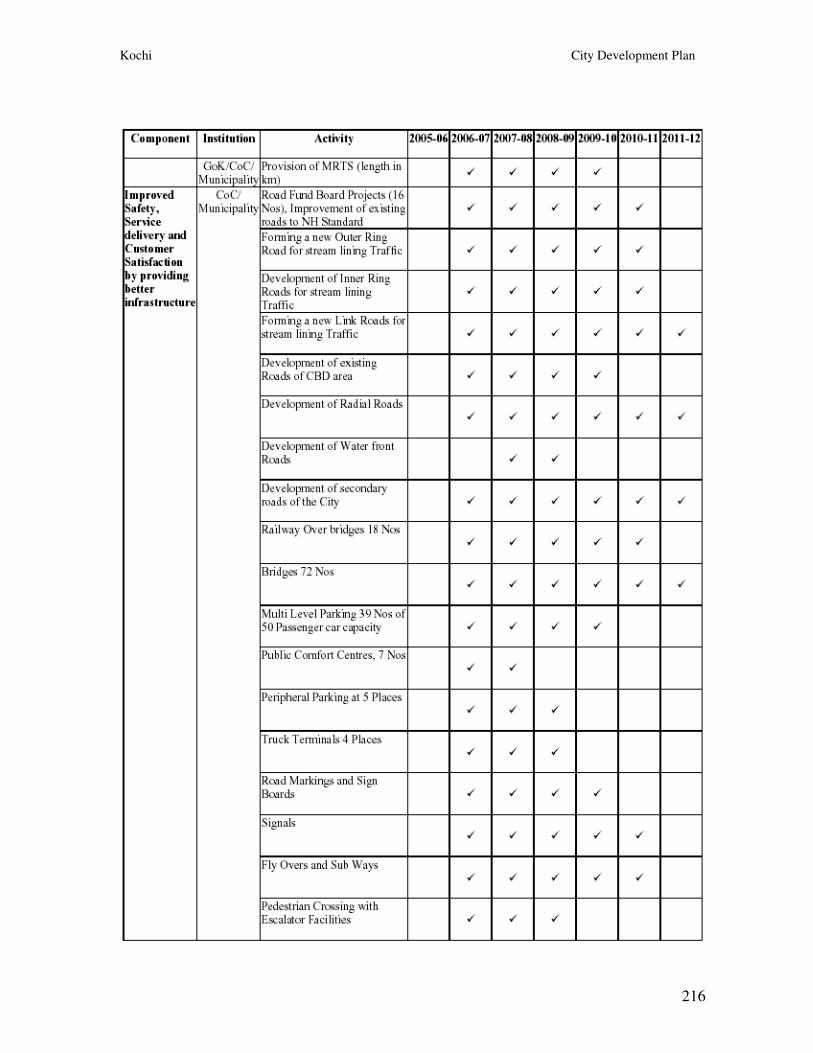
Kochi City Development Plan
216
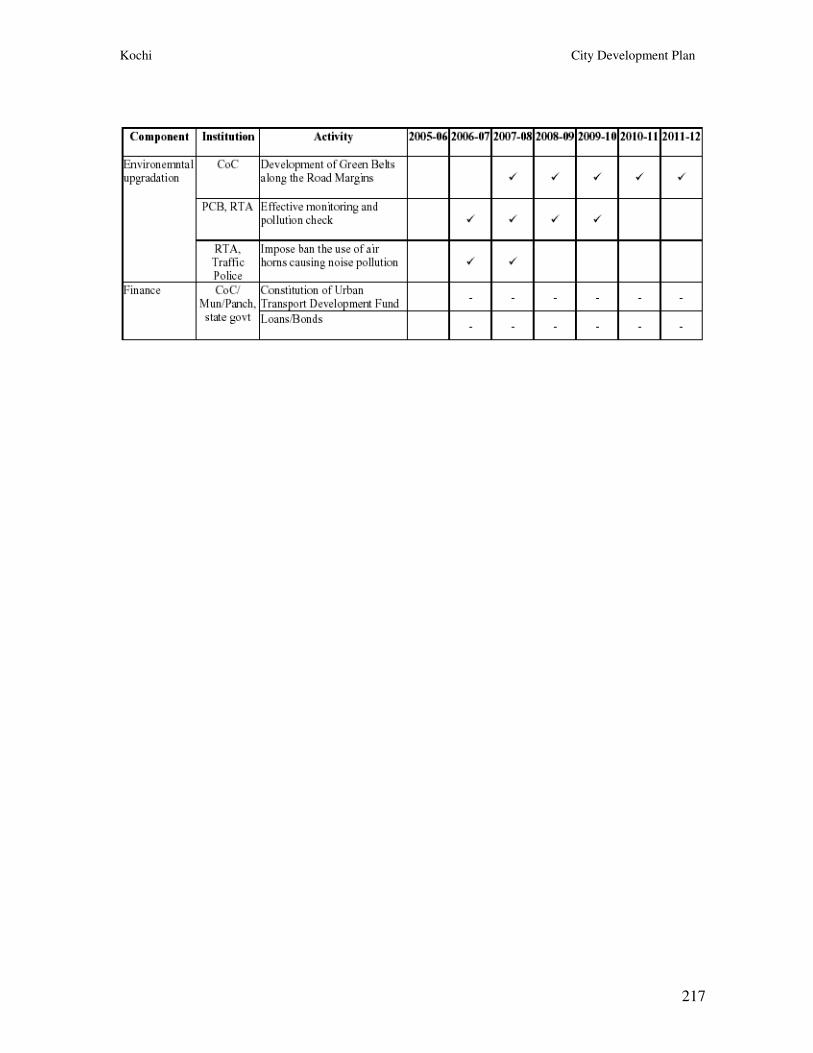
Kochi City Development Plan
217
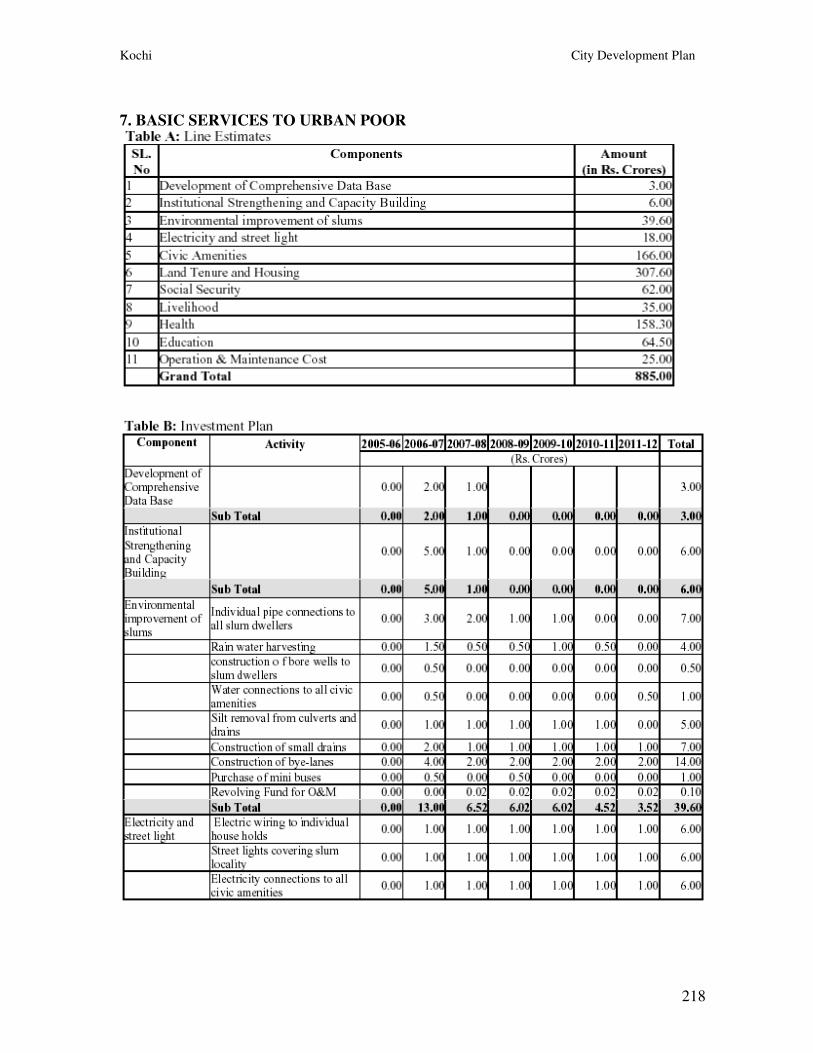
Kochi City Development Plan
218
7. BASIC SERVICES TO URBAN POOR
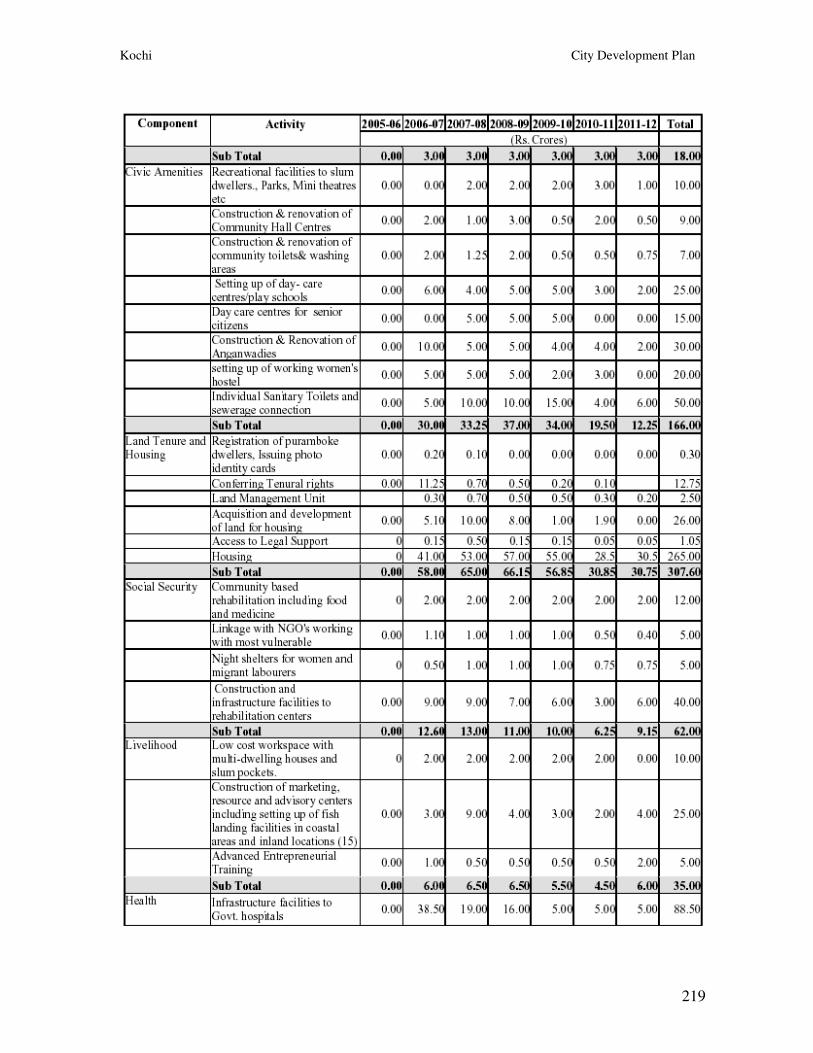
Kochi City Development Plan
219
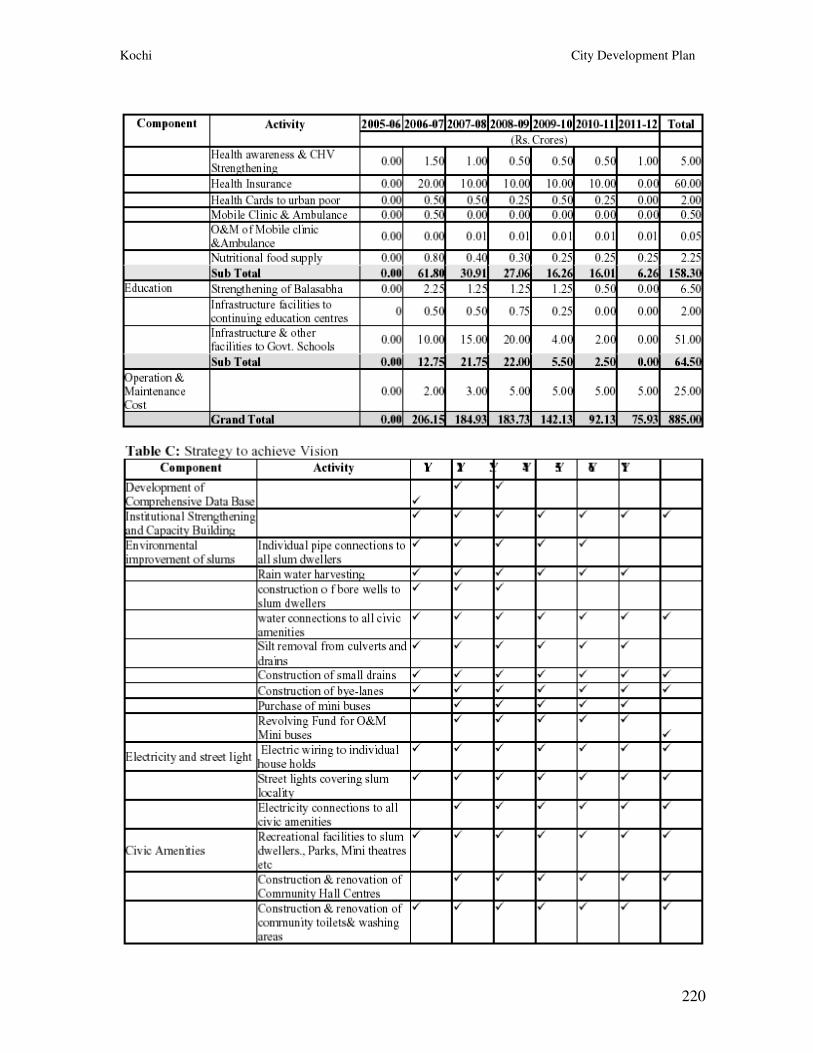
Kochi City Development Plan
220
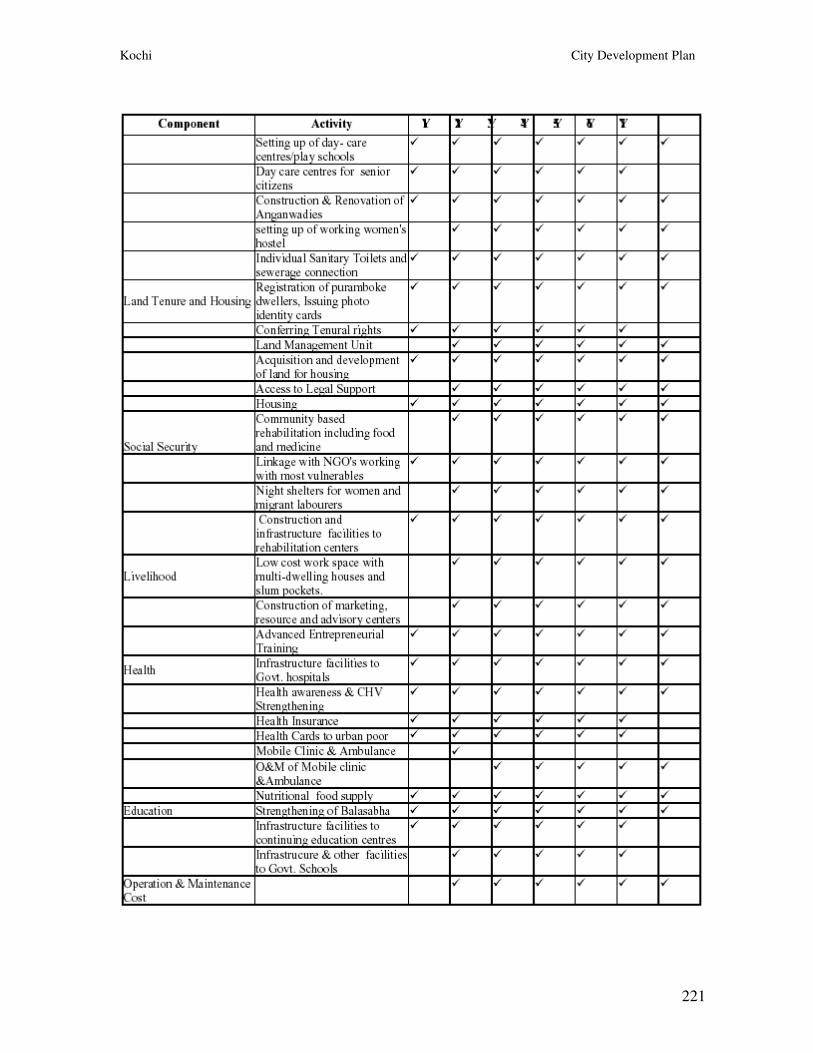
Kochi City Development Plan
221
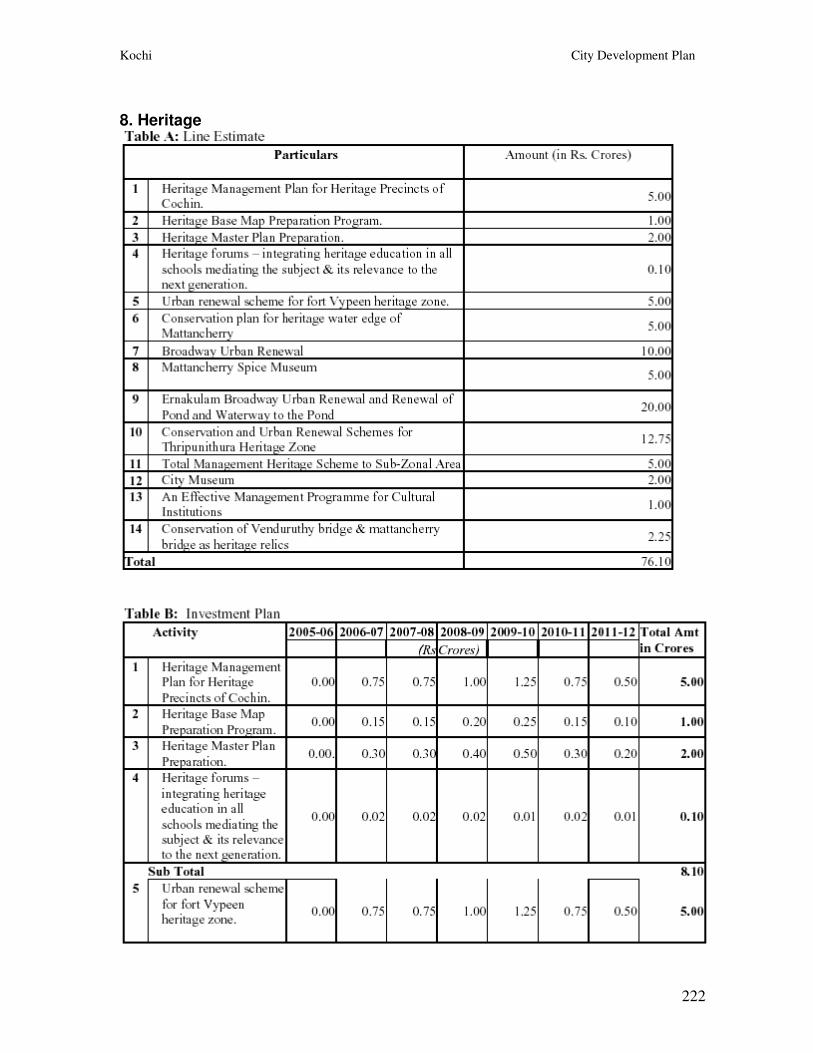
Kochi City Development Plan
222
8. Heritage
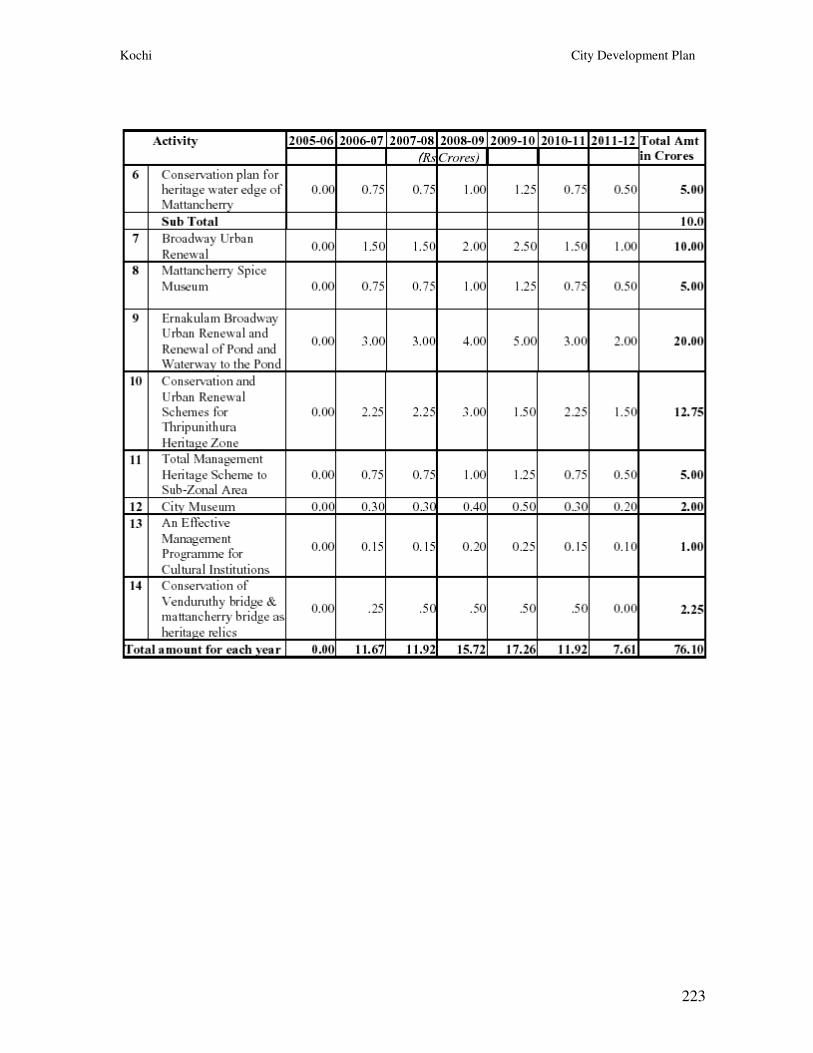
Kochi City Development Plan
223
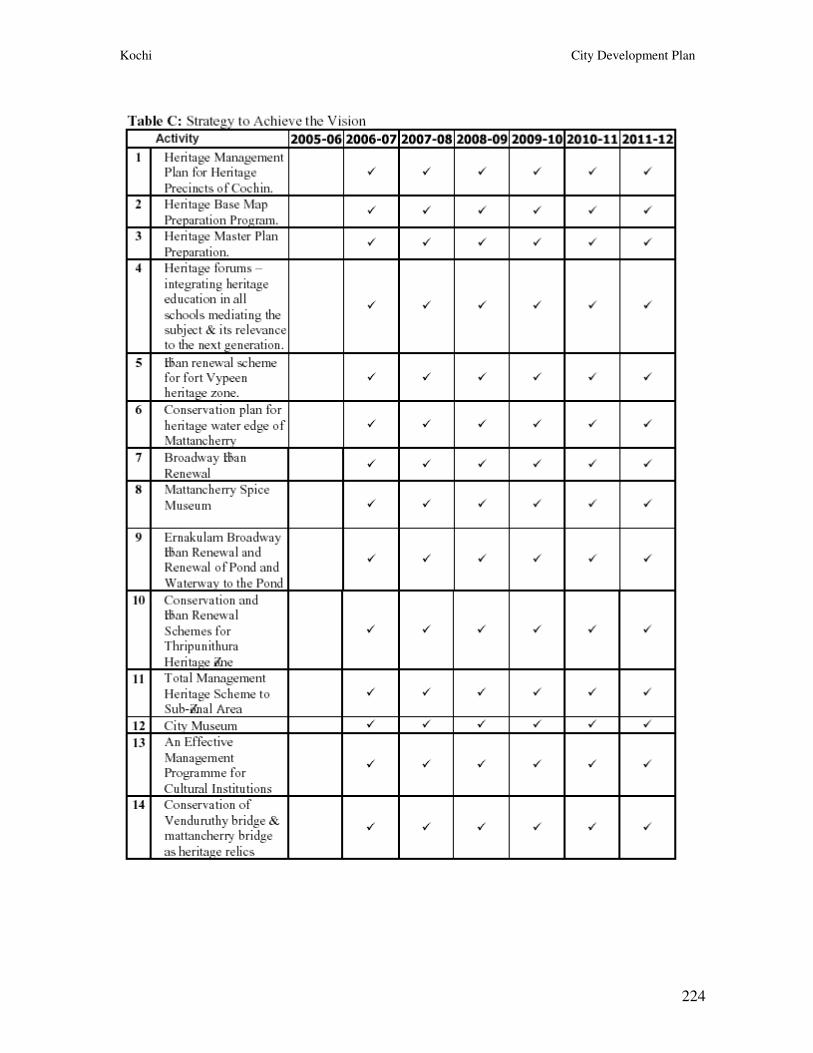
Kochi City Development Plan
224
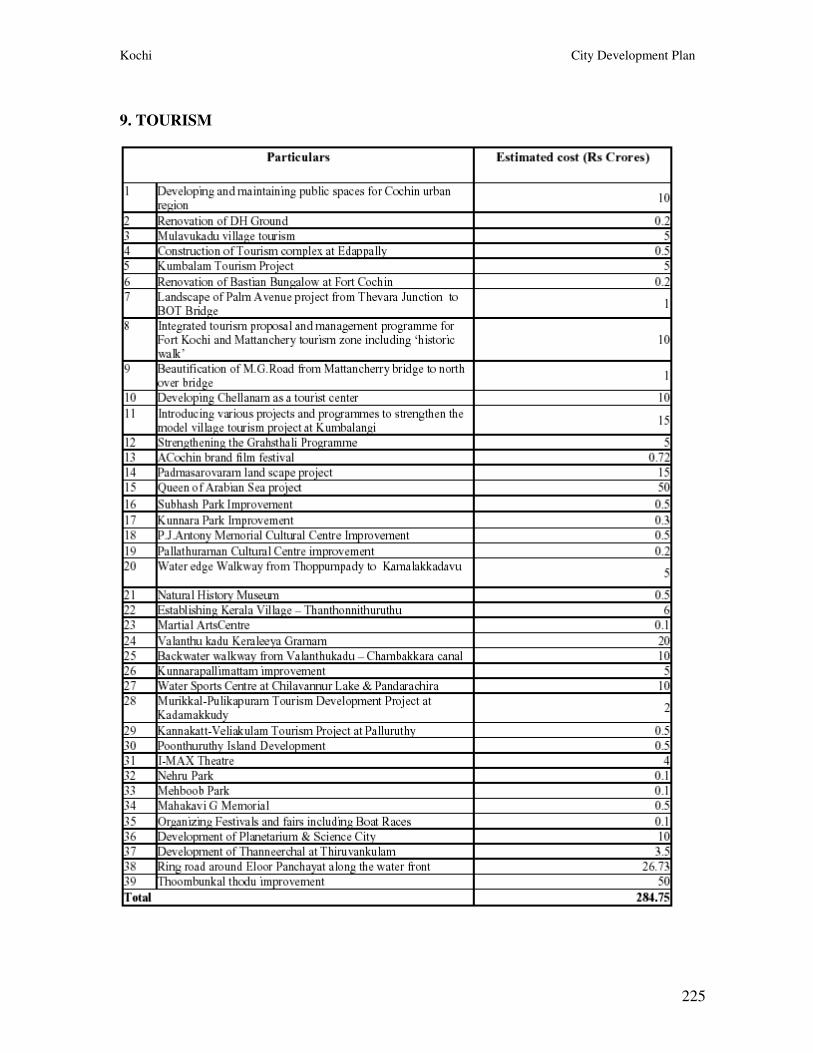
Kochi City Development Plan
225
9. TOURISM
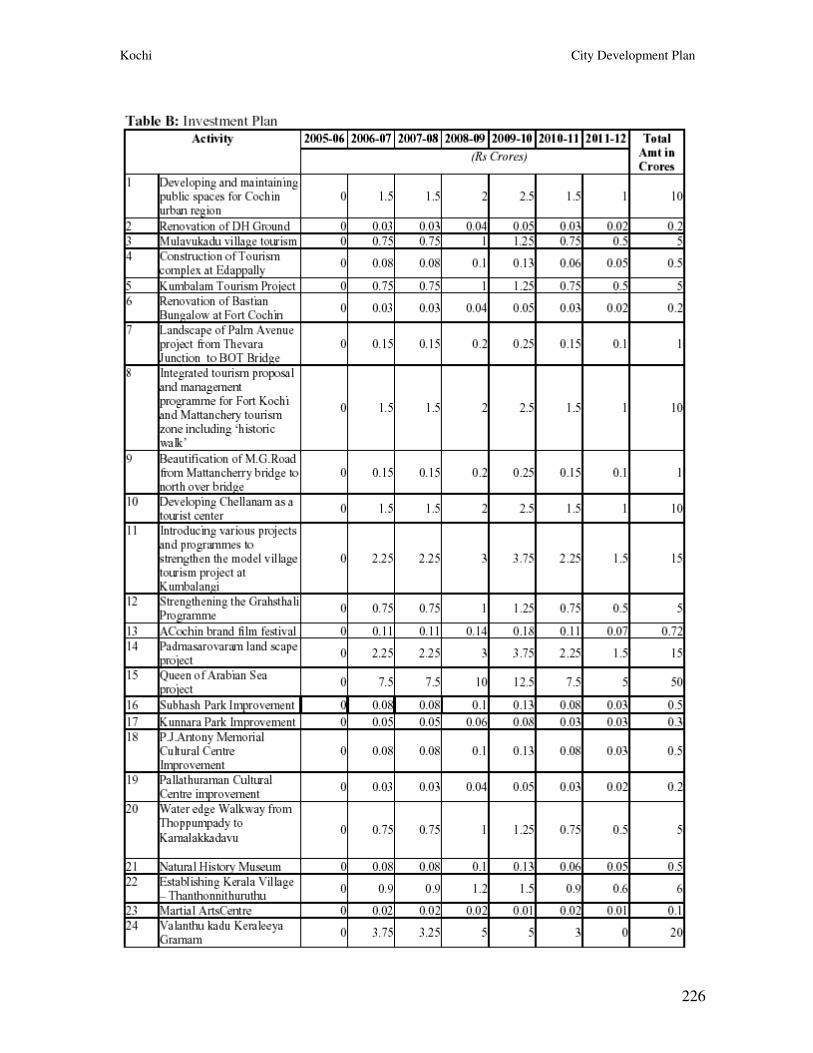
Kochi City Development Plan
226
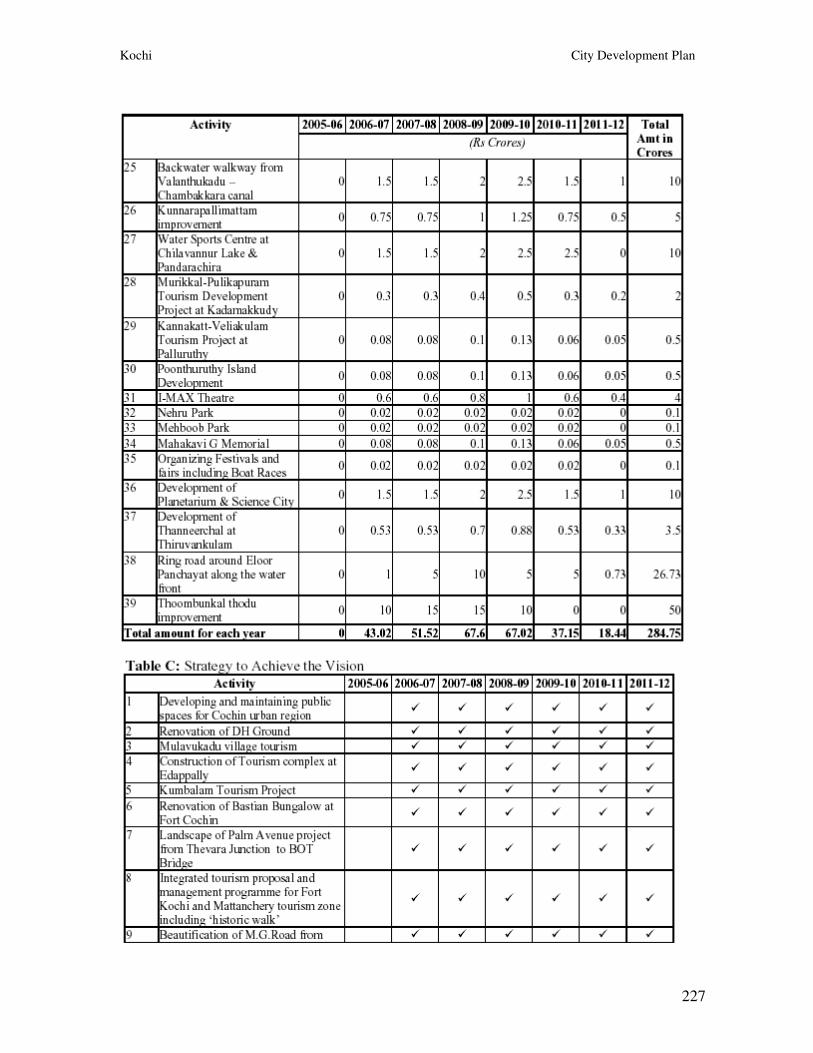
Kochi City Development Plan
227
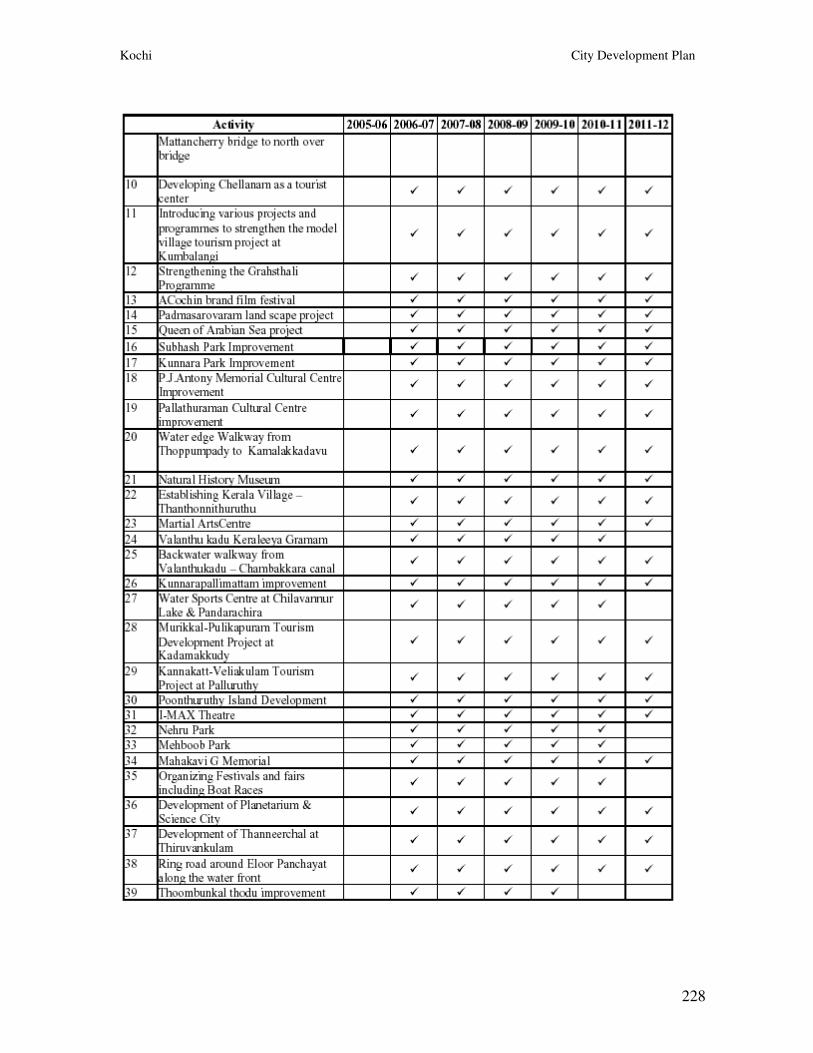
Kochi City Development Plan
228
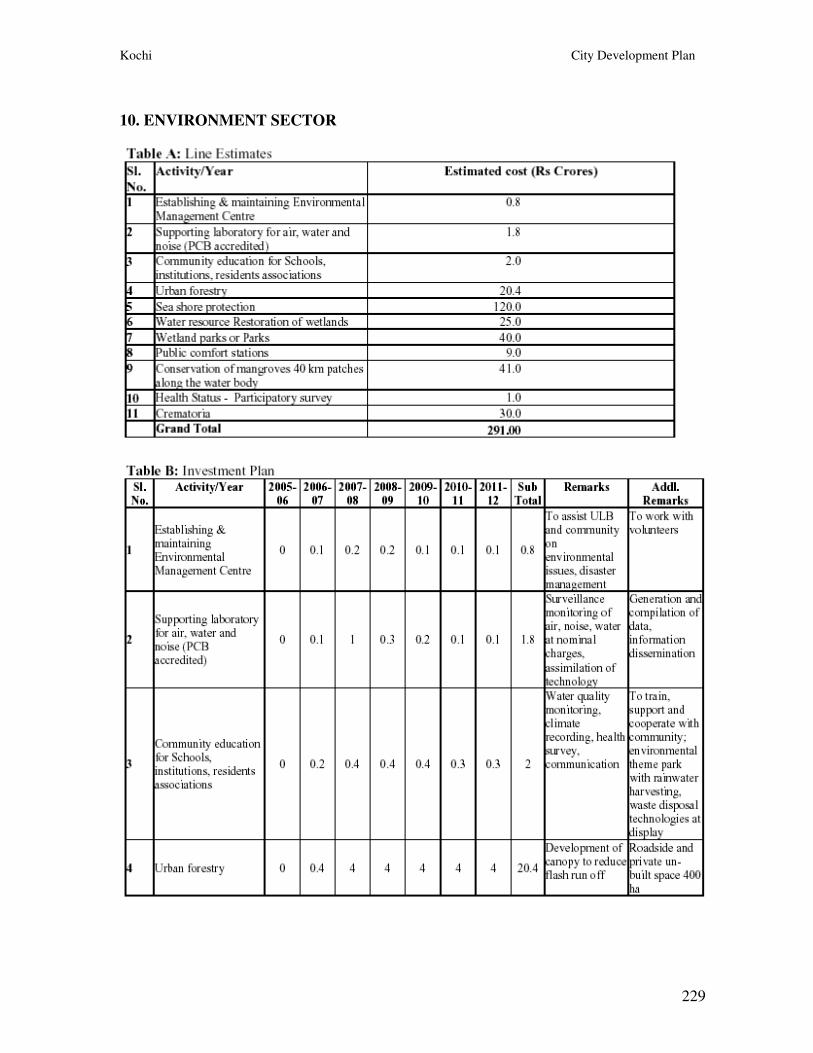
Kochi City Development Plan
229
10. ENVIRONMENT SECTOR
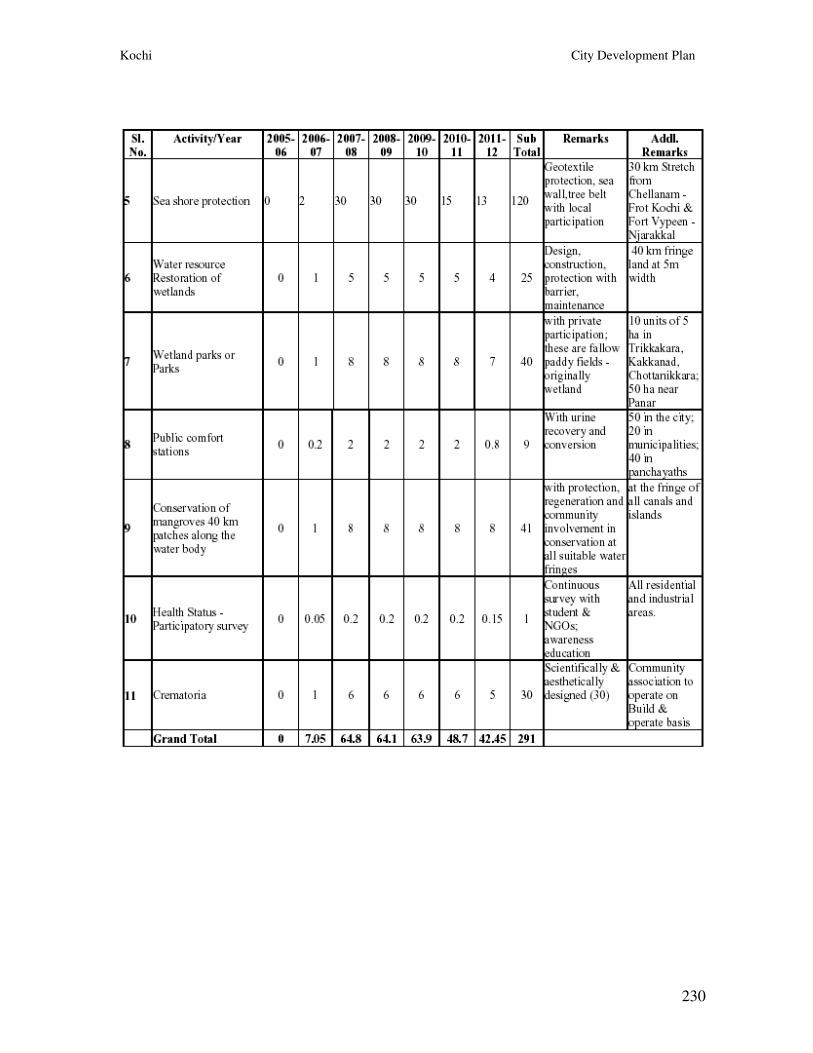
Kochi City Development Plan
230
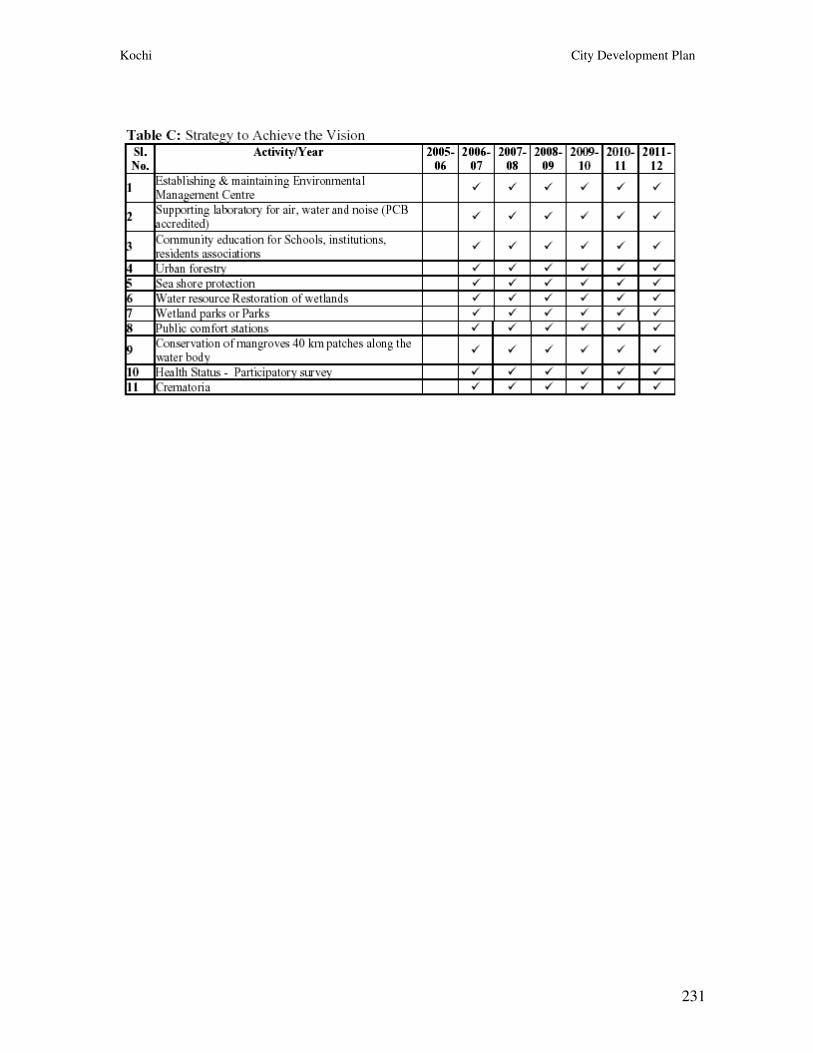
Kochi City Development Plan
231
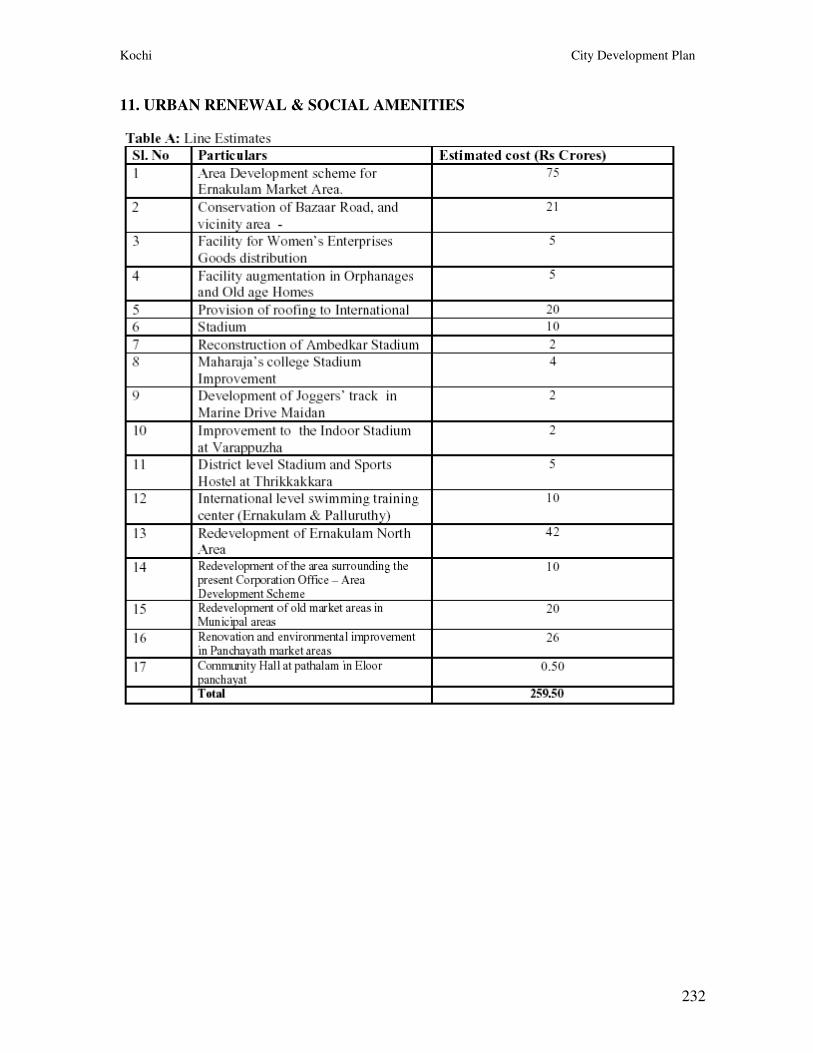
Kochi City Development Plan
232
11. URBAN RENEWAL & SOCIAL AMENITIES
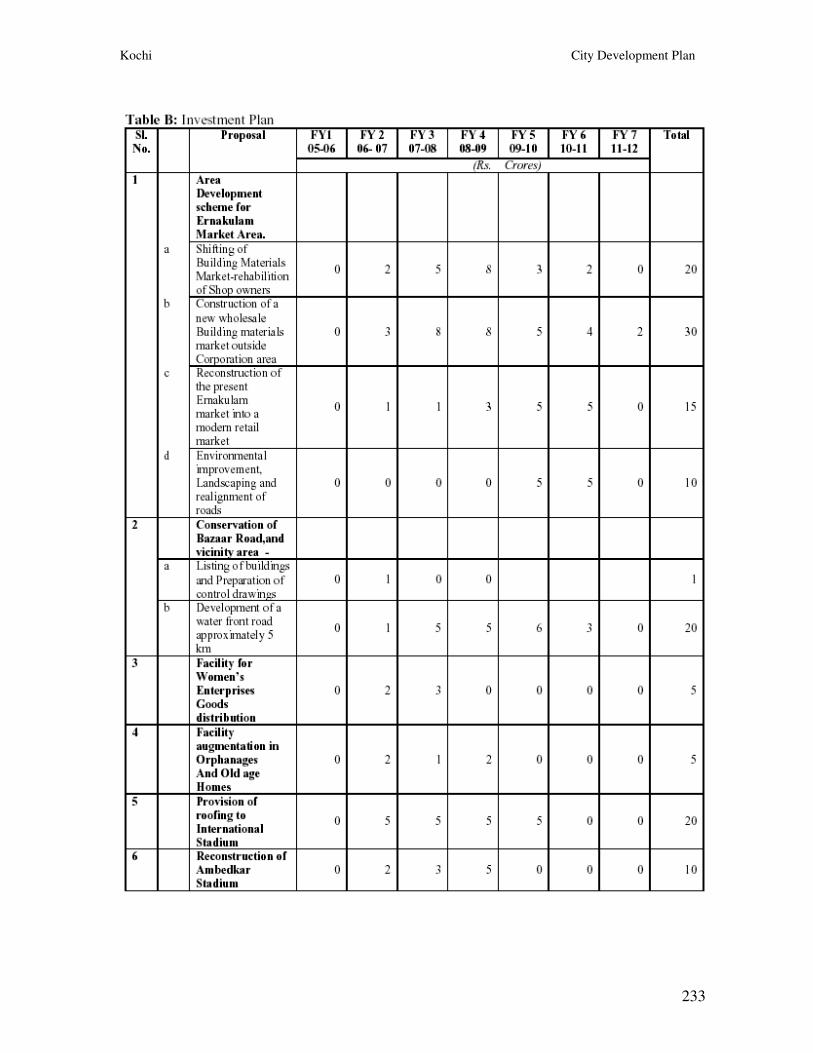
Kochi City Development Plan
233
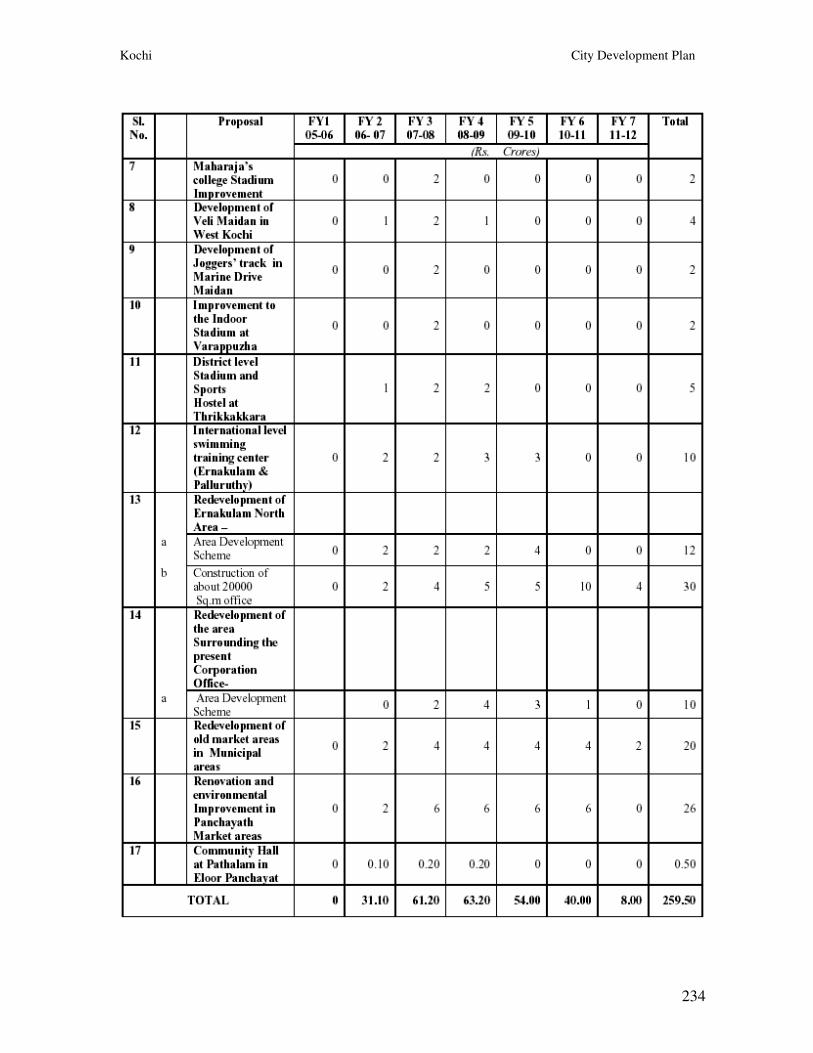
Kochi City Development Plan
234
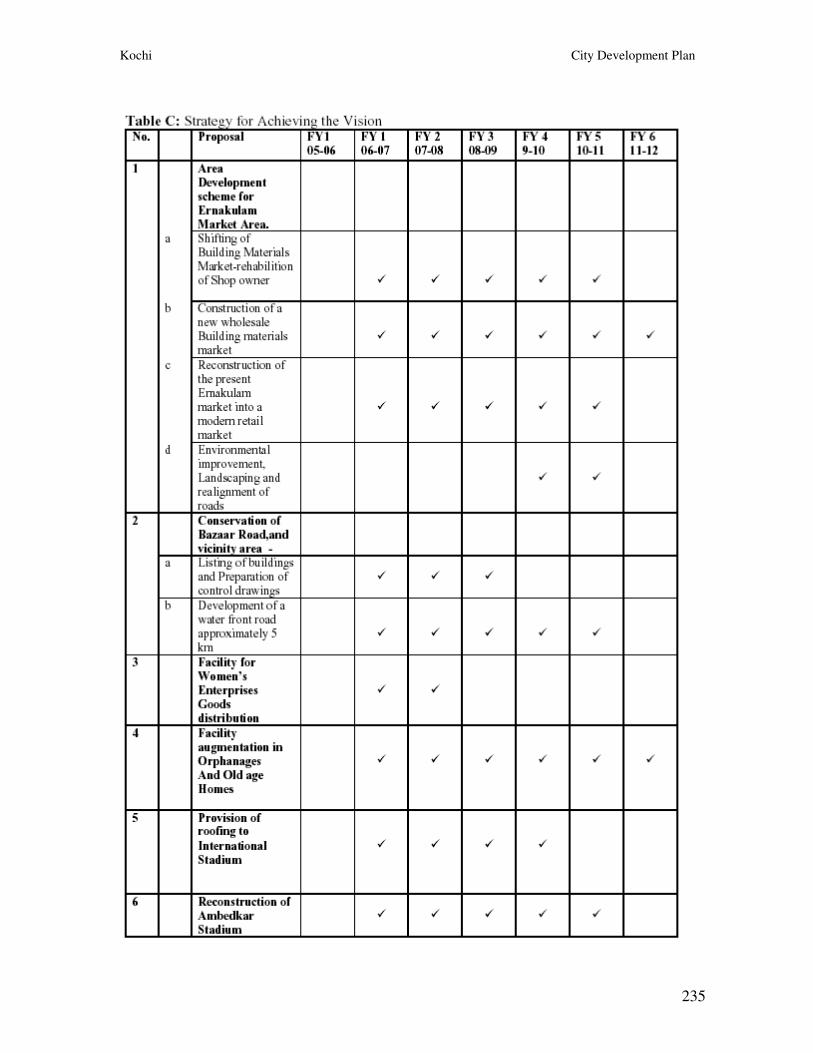
Kochi City Development Plan
235
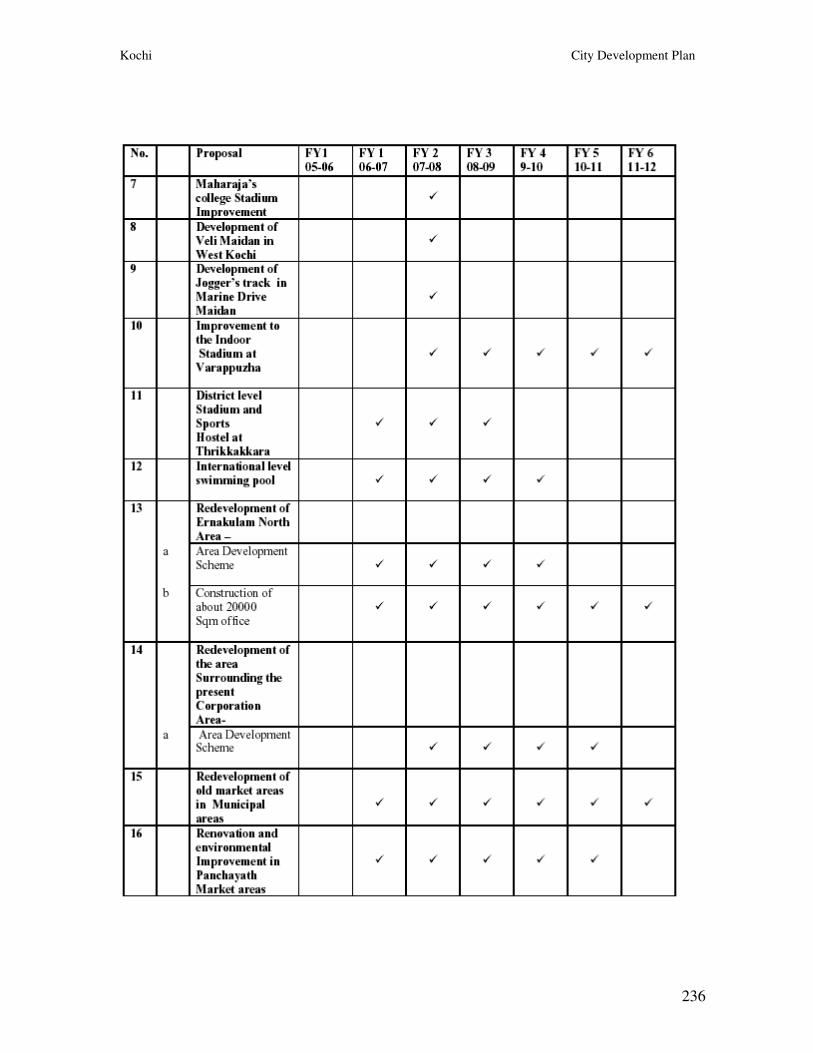
Kochi City Development Plan
236
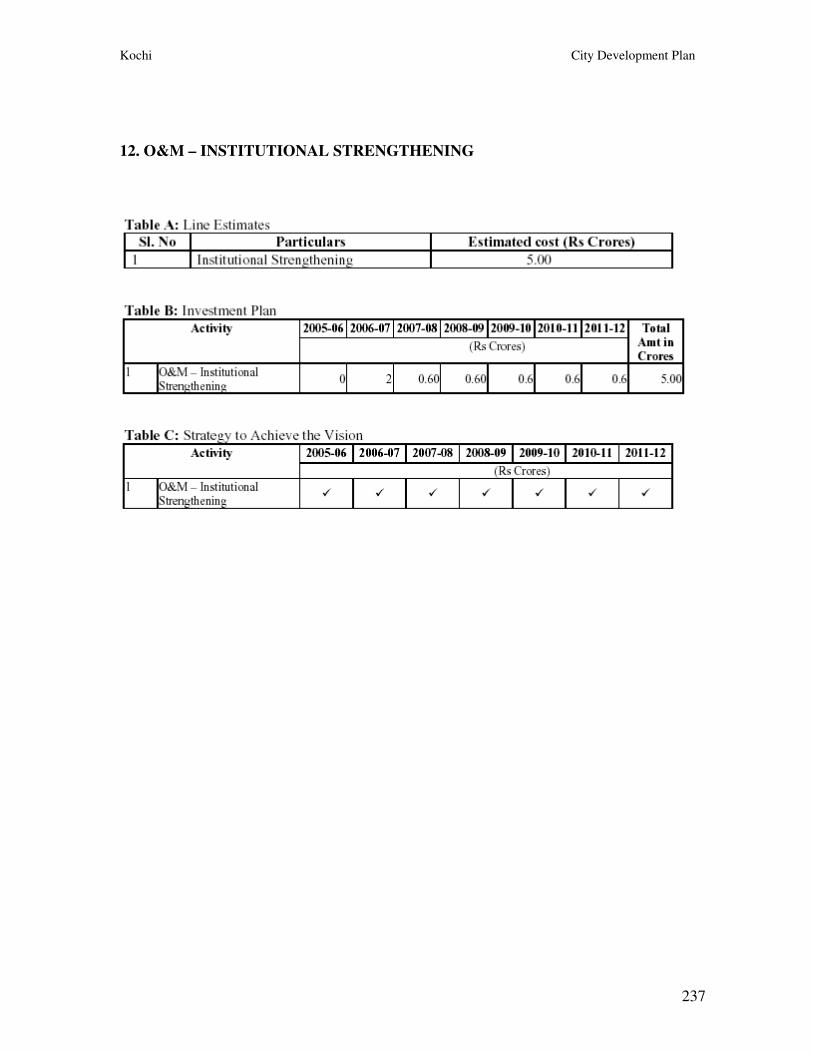
Kochi City Development Plan
237
12. O&M – INSTITUTIONAL STRENGTHENING

Kochi City Development Plan
238
Annexure – 1
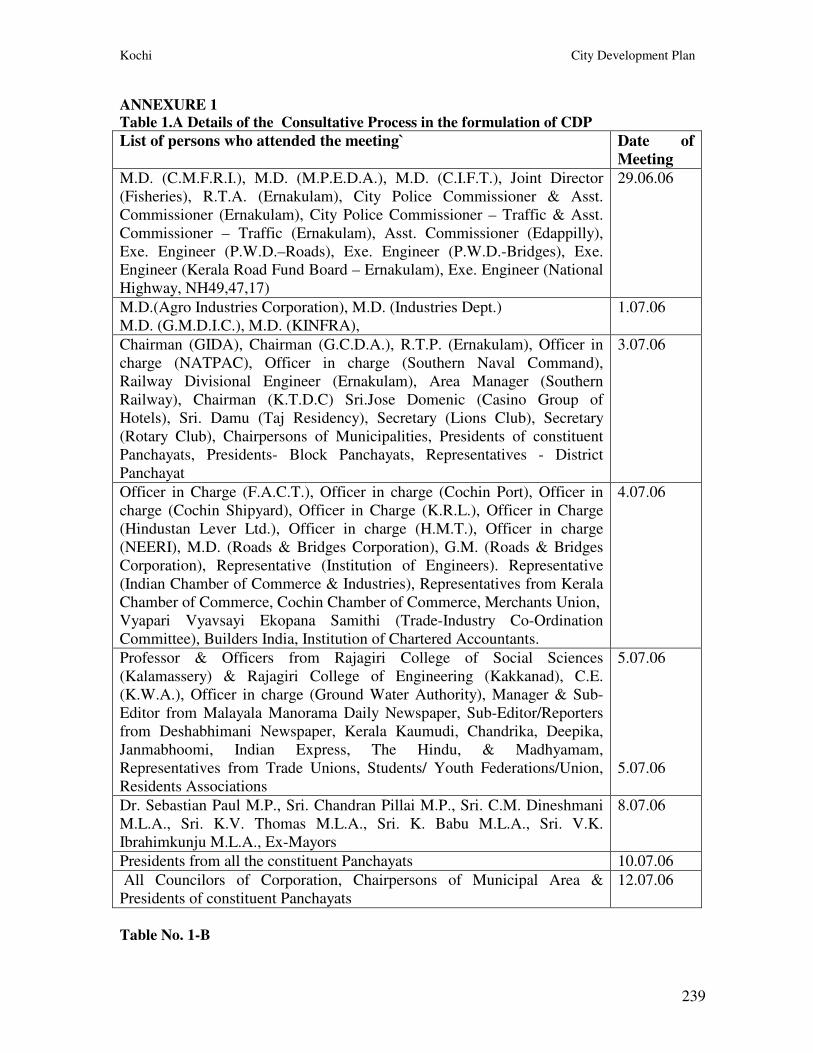
Kochi City Development Plan
239
ANNEXURE 1 Table 1.A Details of the Consultative Process in the formulation of CDP
List of persons who attended the meeting` Date of
Meeting
M.D. (C.M.F.R.I.), M.D. (M.P.E.D.A.), M.D. (C.I.F.T.), Joint Director
(Fisheries), R.T.A. (Ernakulam), City Police Commissioner & Asst.
Commissioner (Ernakulam), City Police Commissioner – Traffic & Asst.
Commissioner – Traffic (Ernakulam), Asst. Commissioner (Edappilly),
Exe. Engineer (P.W.D.–Roads), Exe. Engineer (P.W.D.-Bridges), Exe.
Engineer (Kerala Road Fund Board – Ernakulam), Exe. Engineer (National
Highway, NH49,47,17)
29.06.06
M.D.(Agro Industries Corporation), M.D. (Industries Dept.)
M.D. (G.M.D.I.C.), M.D. (KINFRA),
1.07.06
Chairman (GIDA), Chairman (G.C.D.A.), R.T.P. (Ernakulam), Officer in
charge (NATPAC), Officer in charge (Southern Naval Command),
Railway Divisional Engineer (Ernakulam), Area Manager (Southern
Railway), Chairman (K.T.D.C) Sri.Jose Domenic (Casino Group of
Hotels), Sri. Damu (Taj Residency), Secretary (Lions Club), Secretary
(Rotary Club), Chairpersons of Municipalities, Presidents of constituent
Panchayats, Presidents- Block Panchayats, Representatives - District
Panchayat
3.07.06
Officer in Charge (F.A.C.T.), Officer in charge (Cochin Port), Officer in
charge (Cochin Shipyard), Officer in Charge (K.R.L.), Officer in Charge
(Hindustan Lever Ltd.), Officer in charge (H.M.T.), Officer in charge
(NEERI), M.D. (Roads & Bridges Corporation), G.M. (Roads & Bridges
Corporation), Representative (Institution of Engineers). Representative
(Indian Chamber of Commerce & Industries), Representatives from Kerala
Chamber of Commerce, Cochin Chamber of Commerce, Merchants Union,
Vyapari Vyavsayi Ekopana Samithi (Trade-Industry Co-Ordination
Committee), Builders India, Institution of Chartered Accountants.
4.07.06
Professor & Officers from Rajagiri College of Social Sciences
(Kalamassery) & Rajagiri College of Engineering (Kakkanad), C.E.
(K.W.A.), Officer in charge (Ground Water Authority), Manager & Sub-
Editor from Malayala Manorama Daily Newspaper, Sub-Editor/Reporters
from Deshabhimani Newspaper, Kerala Kaumudi, Chandrika, Deepika,
Janmabhoomi, Indian Express, The Hindu, & Madhyamam,
Representatives from Trade Unions, Students/ Youth Federations/Union,
Residents Associations
5.07.06
5.07.06
Dr. Sebastian Paul M.P., Sri. Chandran Pillai M.P., Sri. C.M. Dineshmani
M.L.A., Sri. K.V. Thomas M.L.A., Sri. K. Babu M.L.A., Sri. V.K.
Ibrahimkunju M.L.A., Ex-Mayors
8.07.06
Presidents from all the constituent Panchayats 10.07.06
All Councilors of Corporation, Chairpersons of Municipal Area &
Presidents of constituent Panchayats
12.07.06
Table No. 1-B
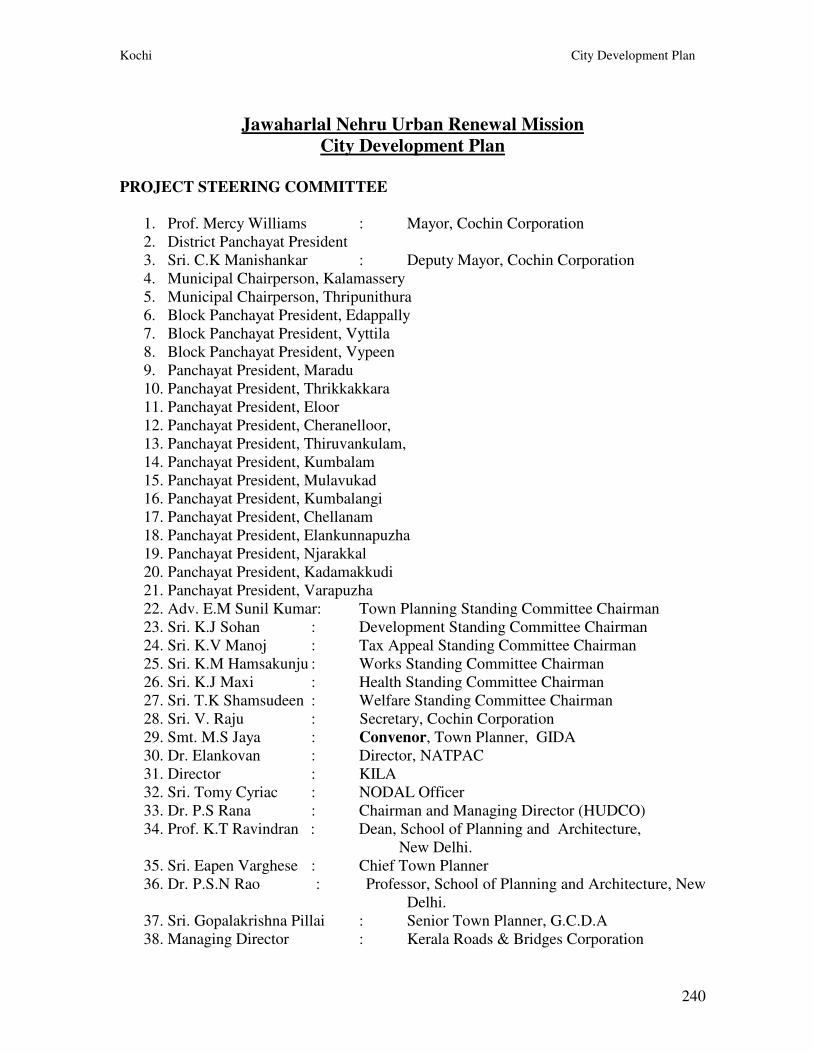
Kochi City Development Plan
240
Jawaharlal Nehru Urban Renewal Mission City Development Plan
PROJECT STEERING COMMITTEE
1. Prof. Mercy Williams : Mayor, Cochin Corporation
2. District Panchayat President
3. Sri. C.K Manishankar : Deputy Mayor, Cochin Corporation
4. Municipal Chairperson, Kalamassery
5. Municipal Chairperson, Thripunithura
6. Block Panchayat President, Edappally
7. Block Panchayat President, Vyttila
8. Block Panchayat President, Vypeen
9. Panchayat President, Maradu
10. Panchayat President, Thrikkakkara
11. Panchayat President, Eloor
12. Panchayat President, Cheranelloor,
13. Panchayat President, Thiruvankulam,
14. Panchayat President, Kumbalam
15. Panchayat President, Mulavukad
16. Panchayat President, Kumbalangi
17. Panchayat President, Chellanam
18. Panchayat President, Elankunnapuzha
19. Panchayat President, Njarakkal
20. Panchayat President, Kadamakkudi
21. Panchayat President, Varapuzha
22. Adv. E.M Sunil Kumar: Town Planning Standing Committee Chairman
23. Sri. K.J Sohan : Development Standing Committee Chairman
24. Sri. K.V Manoj : Tax Appeal Standing Committee Chairman
25. Sri. K.M Hamsakunju : Works Standing Committee Chairman
26. Sri. K.J Maxi : Health Standing Committee Chairman
27. Sri. T.K Shamsudeen : Welfare Standing Committee Chairman
28. Sri. V. Raju : Secretary, Cochin Corporation
29. Smt. M.S Jaya : Convenor, Town Planner, GIDA
30. Dr. Elankovan : Director, NATPAC
31. Director : KILA
32. Sri. Tomy Cyriac : NODAL Officer
33. Dr. P.S Rana : Chairman and Managing Director (HUDCO)
34. Prof. K.T Ravindran : Dean, School of Planning and Architecture,
New Delhi.
35. Sri. Eapen Varghese : Chief Town Planner
36. Dr. P.S.N Rao : Professor, School of Planning and Architecture, New
Delhi.
37. Sri. Gopalakrishna Pillai : Senior Town Planner, G.C.D.A
38. Managing Director : Kerala Roads & Bridges Corporation
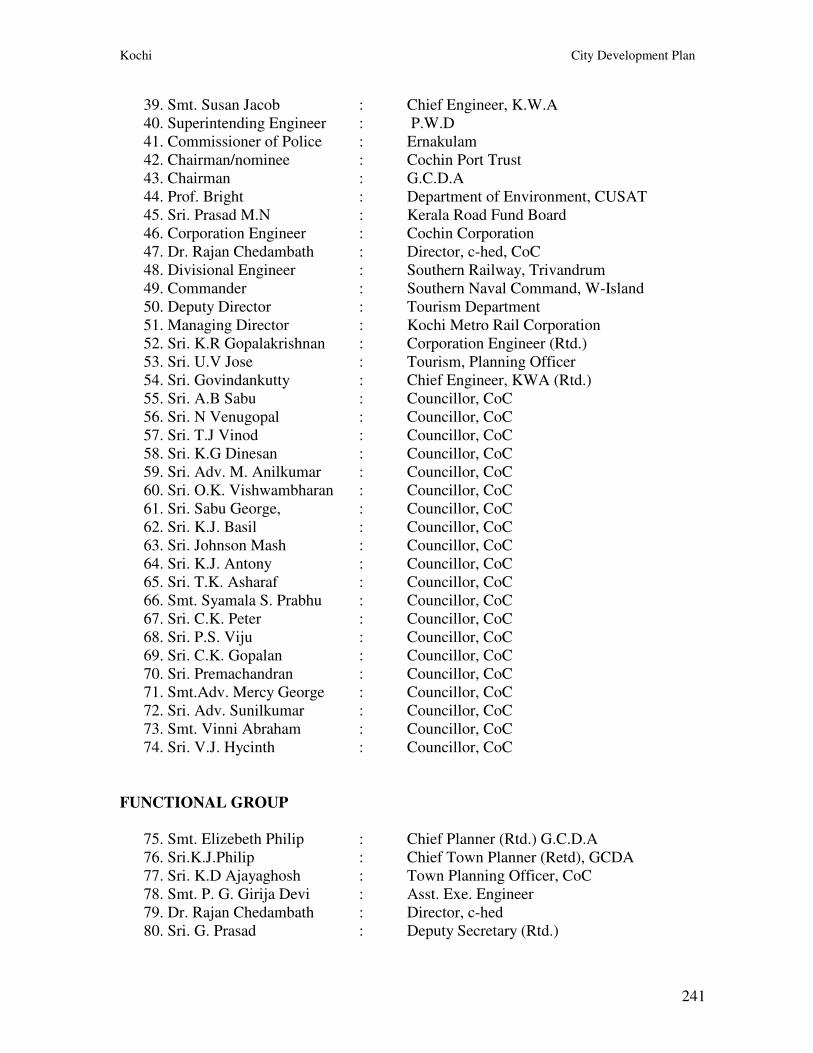
Kochi City Development Plan
241
39. Smt. Susan Jacob : Chief Engineer, K.W.A
40. Superintending Engineer : P.W.D
41. Commissioner of Police : Ernakulam
42. Chairman/nominee : Cochin Port Trust
43. Chairman : G.C.D.A
44. Prof. Bright : Department of Environment, CUSAT
45. Sri. Prasad M.N : Kerala Road Fund Board
46. Corporation Engineer : Cochin Corporation
47. Dr. Rajan Chedambath : Director, c-hed, CoC
48. Divisional Engineer : Southern Railway, Trivandrum
49. Commander : Southern Naval Command, W-Island
50. Deputy Director : Tourism Department
51. Managing Director : Kochi Metro Rail Corporation
52. Sri. K.R Gopalakrishnan : Corporation Engineer (Rtd.)
53. Sri. U.V Jose : Tourism, Planning Officer
54. Sri. Govindankutty : Chief Engineer, KWA (Rtd.)
55. Sri. A.B Sabu : Councillor, CoC
56. Sri. N Venugopal : Councillor, CoC
57. Sri. T.J Vinod : Councillor, CoC
58. Sri. K.G Dinesan : Councillor, CoC
59. Sri. Adv. M. Anilkumar : Councillor, CoC
60. Sri. O.K. Vishwambharan : Councillor, CoC
61. Sri. Sabu George, : Councillor, CoC
62. Sri. K.J. Basil : Councillor, CoC
63. Sri. Johnson Mash : Councillor, CoC
64. Sri. K.J. Antony : Councillor, CoC
65. Sri. T.K. Asharaf : Councillor, CoC
66. Smt. Syamala S. Prabhu : Councillor, CoC
67. Sri. C.K. Peter : Councillor, CoC
68. Sri. P.S. Viju : Councillor, CoC
69. Sri. C.K. Gopalan : Councillor, CoC
70. Sri. Premachandran : Councillor, CoC
71. Smt.Adv. Mercy George : Councillor, CoC
72. Sri. Adv. Sunilkumar : Councillor, CoC
73. Smt. Vinni Abraham : Councillor, CoC
74. Sri. V.J. Hycinth : Councillor, CoC
FUNCTIONAL GROUP
75. Smt. Elizebeth Philip : Chief Planner (Rtd.) G.C.D.A
76. Sri.K.J.Philip : Chief Town Planner (Retd), GCDA
77. Sri. K.D Ajayaghosh : Town Planning Officer, CoC
78. Smt. P. G. Girija Devi : Asst. Exe. Engineer
79. Dr. Rajan Chedambath : Director, c-hed
80. Sri. G. Prasad : Deputy Secretary (Rtd.)
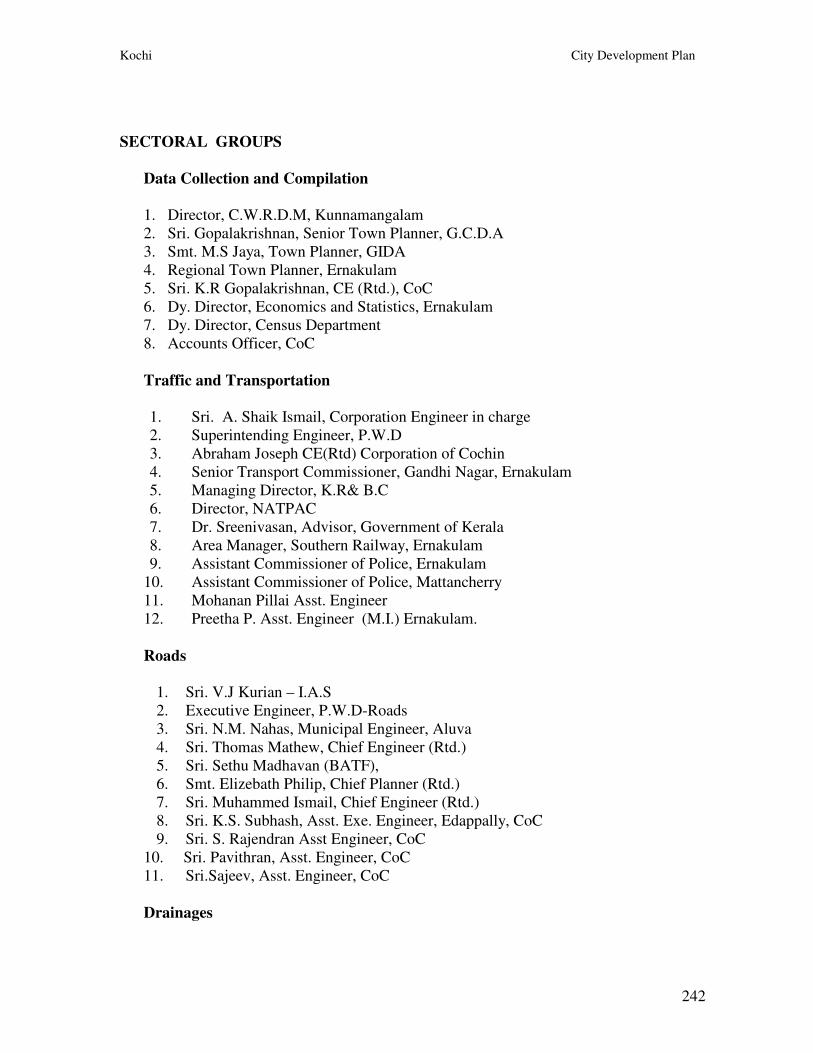
Kochi City Development Plan
242
SECTORAL GROUPS
Data Collection and Compilation
1. Director, C.W.R.D.M, Kunnamangalam
2. Sri. Gopalakrishnan, Senior Town Planner, G.C.D.A
3. Smt. M.S Jaya, Town Planner, GIDA
4. Regional Town Planner, Ernakulam
5. Sri. K.R Gopalakrishnan, CE (Rtd.), CoC
6. Dy. Director, Economics and Statistics, Ernakulam
7. Dy. Director, Census Department
8. Accounts Officer, CoC
Traffic and Transportation
1. Sri. A. Shaik Ismail, Corporation Engineer in charge
2. Superintending Engineer, P.W.D
3. Abraham Joseph CE(Rtd) Corporation of Cochin
4. Senior Transport Commissioner, Gandhi Nagar, Ernakulam
5. Managing Director, K.R& B.C
6. Director, NATPAC
7. Dr. Sreenivasan, Advisor, Government of Kerala
8. Area Manager, Southern Railway, Ernakulam
9. Assistant Commissioner of Police, Ernakulam
10. Assistant Commissioner of Police, Mattancherry
11. Mohanan Pillai Asst. Engineer
12. Preetha P. Asst. Engineer (M.I.) Ernakulam.
Roads
1. Sri. V.J Kurian – I.A.S
2. Executive Engineer, P.W.D-Roads
3. Sri. N.M. Nahas, Municipal Engineer, Aluva
4. Sri. Thomas Mathew, Chief Engineer (Rtd.)
5. Sri. Sethu Madhavan (BATF),
6. Smt. Elizebath Philip, Chief Planner (Rtd.)
7. Sri. Muhammed Ismail, Chief Engineer (Rtd.)
8. Sri. K.S. Subhash, Asst. Exe. Engineer, Edappally, CoC
9. Sri. S. Rajendran Asst Engineer, CoC
10. Sri. Pavithran, Asst. Engineer, CoC
11. Sri.Sajeev, Asst. Engineer, CoC
Drainages
Kochi City Development Plan
243
1. Director, NEERI
2. Superintend Engineers, P.W.D-Irrigation
3. Dr. Benjamin, Land scape architect G.C.D.A
4. Sri. T.P Gopinath, CE (Rtd.) CoC
5. Asst. Exe. Engineer, Fort Kochi
6. Sri. Jayagopal, Architect, Inspiration
7. Sri. Gopalakrishnan, Esteem Developers
8. Sri. Ramachandran, AE CoC
9. Sri. Mathew, AE, CoC
Solid Waste Management
1.Sri. Shaik Ismail, Project Engineer, CoC
2.Corporation Health Officer
3.Dr. Chandra Mohan Kumar, CUSAT
4.Dr. M.P Sukumaran Nair, FEDO
5.Smt Satyavathi, Environmentalist, Ernakulam
6.Environmental Engineer, Pollution Control Board, Ernakulam
7.Municipal Engineer, Kalamassery
8.Sri. Shibu, Assistant Engineer, CoC
9.Sri. Brily Manual, Agricultural Engineer, Technical manager, Rajagiri Social
Institute
10. Dr.Sivaraman, OUTREACH, Rajagiri College of Social Sciences
11. Sri. Sethumadhavan,
Environment
1. Prof. M.K Prasad, Environmentalist
2. Head, Department of Environmental Sciences, CUSAT
3. Senior Environmental Engineers, K.S.P.C Board
4. Dr. Sivasankara Pilla, CUSAT
5. Smt Jyothi Narayanan, Environmentalist
6. Smt. K. Renuka, Asst. Exe. Engineer, CoC
7. Sri. Nizar Asst. Engineer, Vyttila
Service Institutions
1. Project Engineer, CoC
2. Corporation Health Officer
3. District Education Officer
4. Prof. P.K Muhamed, Rajagiri College of Social Sciences
5. President/Secretary Kerala Builders Forum
6. Revenue Officer, CoC
Industries and Establishments
Kochi City Development Plan
244
1.Sri. G.C Gopalakrishna Pillai, Managing Director, FACT
2.Managing Director, H.M.T
3.Secretary, Cochin Port Trust
4.Manager, Cochin Shipyard Limited
5.Director, C.M.F.R.I
6.Director, M.P.E.D.A
7.Director, C.I.F.T
8.Director, K.R.L
9.Managing Director, KITCO
10. Corporation Health Officer
11. Manager, District Industries Centre
12. Ernakulam Merchants Union
13. Kerala Chamber of Commerce
14. Confederation of Indian Industry
15. Indian Chamber of Commerce and Industry
16. Kerala Vyapara Vyavasaya Ekopana Samithi
Urban Design and Land Use
1. Regional Chief, HUDCO
2. Sri. C.K Thomas, Chief Town Planner (Rtd.)
3. Sri. Gopalakrishna Pillai, Senior Town Planner, G.C.D.A
4. Regional Town Planner
5. Smt. M.S. Jaya, Town Planner, GIDA
6. Sri.Kasturi Rangan,Chief Town Planner(Rtd)
7. Sri. Joseph Alexander, Managing Director (Rtd.), KUDFC
8. Sri. V.K. Abdul Salam, Asst. Exe Engineer, Palluruthy, CoC
Poverty Alleviation & Social Improvement
1. Sri. C.M Yoshit, District Social Welfare Officer
2. Smt. Girija, Kudumbasree
3. Smt. Nissa, UPAD
4. Sri. D.M. Devarajan, Project Officer, PAM
5. Smt. Chitra, UPAD
6. Smt. Ajitha, UPAD
7. Smt. Siji Mol, UPAD
Heritage
1. Sri. C.K Thomas, Chief Planner (Rtd.)
2. Dr. Rajan Chedambath, Director, c-hed
3. Town Planner, R.T.P Office
4. Sri. Biley E. Menon, Architect
5. Sri. Simon Mathew, GIDA
Kochi City Development Plan
245
Water Supply & Sewerage
1. Smt. Susan Jacob, Chief Engineer, K.W.A
2. Superinting Engineer, KWA, Ernakulam.
3. Sri. P. Balakrishnan, Project Manager, K.R.W.S.A, EKM.
4. Sri. P.G..Rajeev, Asst. Exe. Engineer, Project-CoC
5. Sri. Madhavan Pillai, Rtd. EE KWA
6. Dt. Officer, Ground Water Department, Kakkanad
7. President, Institution of Engineers
8. Smt. Sheeja, AE, CoC
Finance & City Investment Plan
1. Head, Department of Management Studies, CUSAT
2. Sri. Krishna Iyer, Chartered Accountant
3. Sri. P.T. Vijayan, Accounts Officer, CoC
4. Smt. P.N. Jaya, Revenue Officer, CoC
5. Technical Officer, HUDCO
6. Manager, District Co-operative Bank
7. Secretary, Institute of Charted Accounts of India
8. Sri. K.G .Dinesan Treasury officer(Rtd).
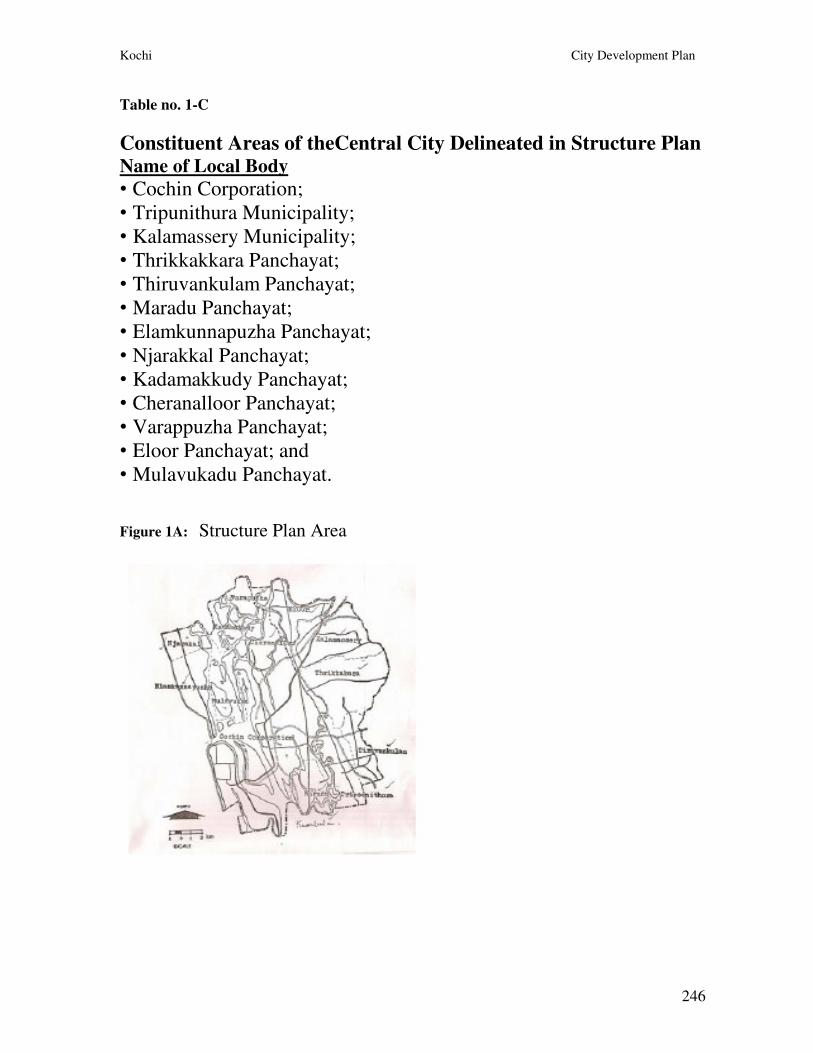
Kochi City Development Plan
246
Table no. 1-C
Constituent Areas of theCentral City Delineated in Structure Plan Name of Local Body
• Cochin Corporation;
• Tripunithura Municipality;
• Kalamassery Municipality;
• Thrikkakkara Panchayat;
• Thiruvankulam Panchayat;
• Maradu Panchayat;
• Elamkunnapuzha Panchayat;
• Njarakkal Panchayat;
• Kadamakkudy Panchayat;
• Cheranalloor Panchayat;
• Varappuzha Panchayat;
• Eloor Panchayat; and
• Mulavukadu Panchayat.
Figure 1A: Structure Plan Area
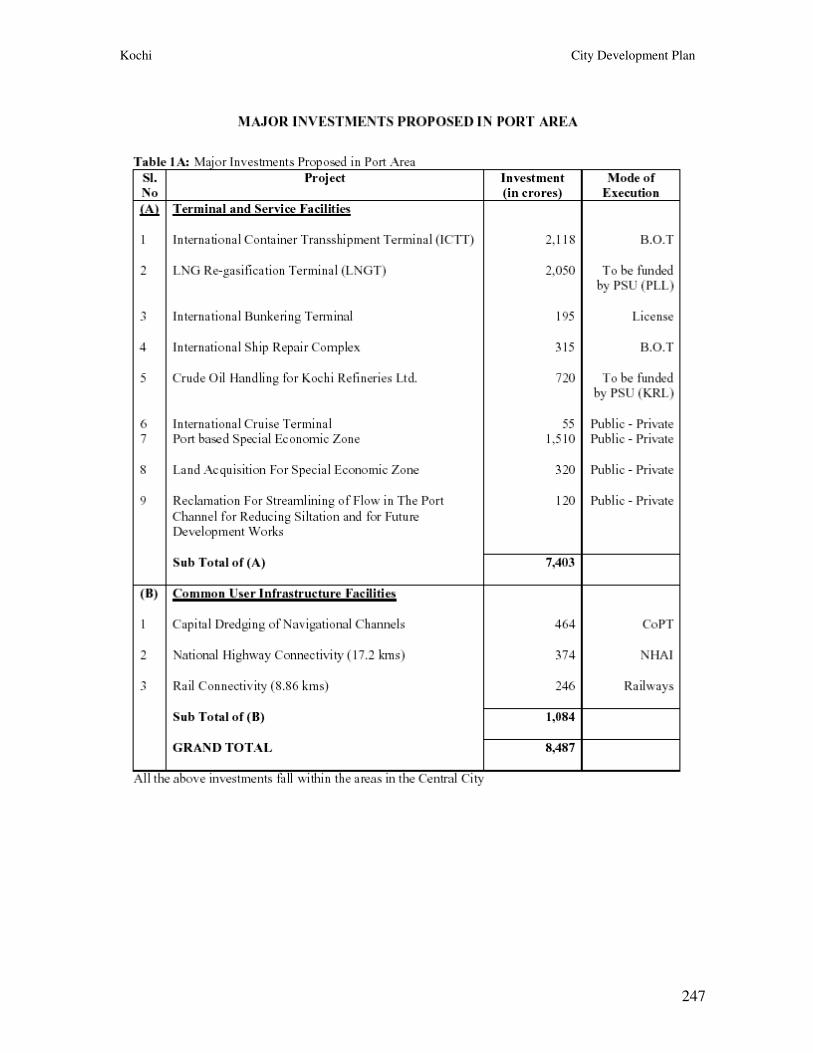
Kochi City Development Plan
247
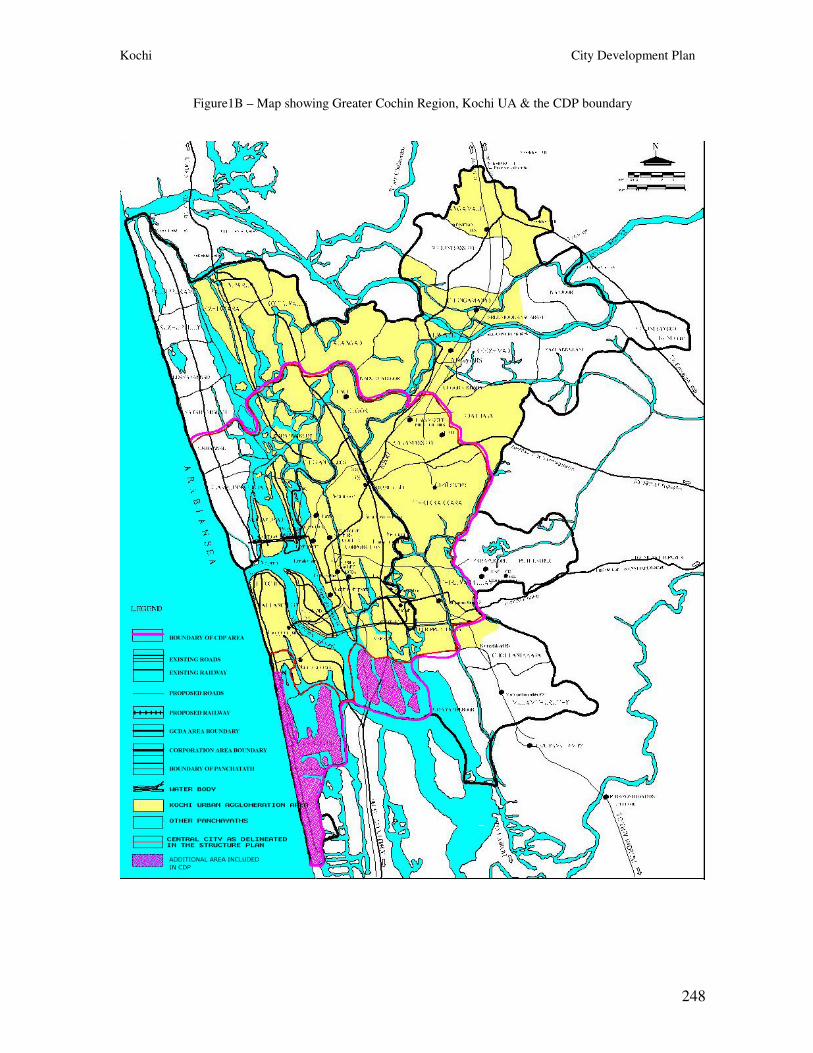
Kochi City Development Plan
248
Figure1B – Map showing Greater Cochin Region, Kochi UA & the CDP boundary
Kochi City Development Plan
249
Annexure - 2
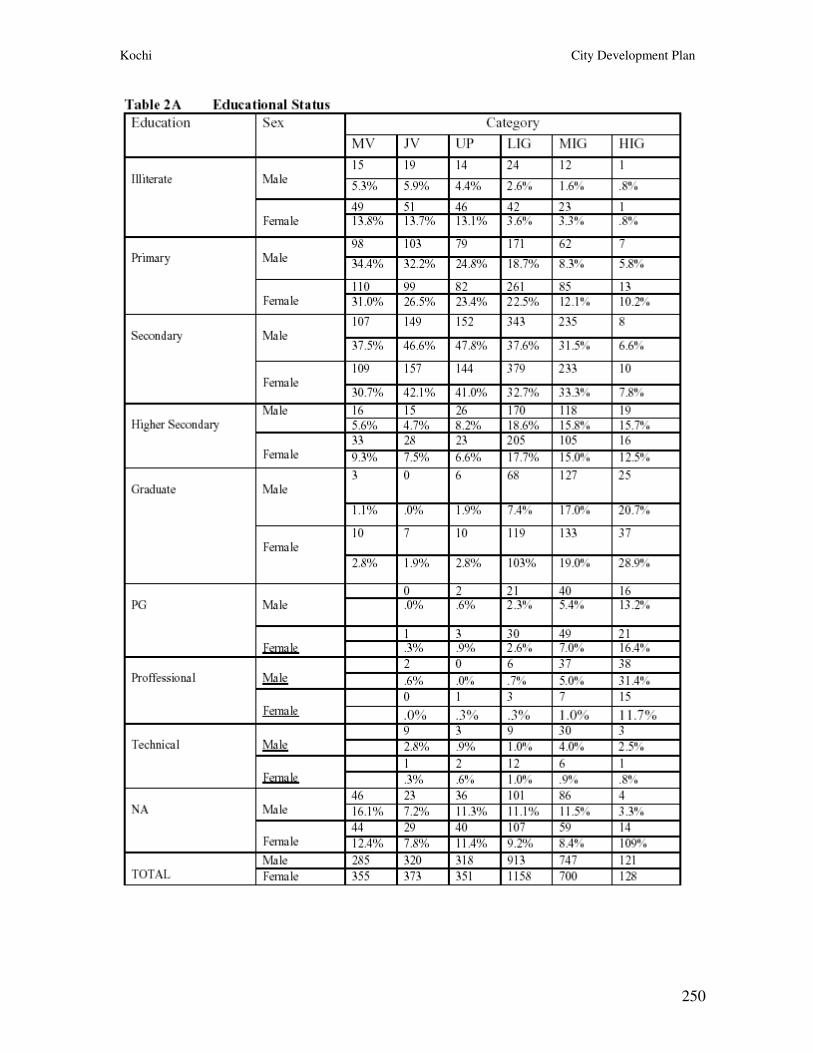
Kochi City Development Plan
250
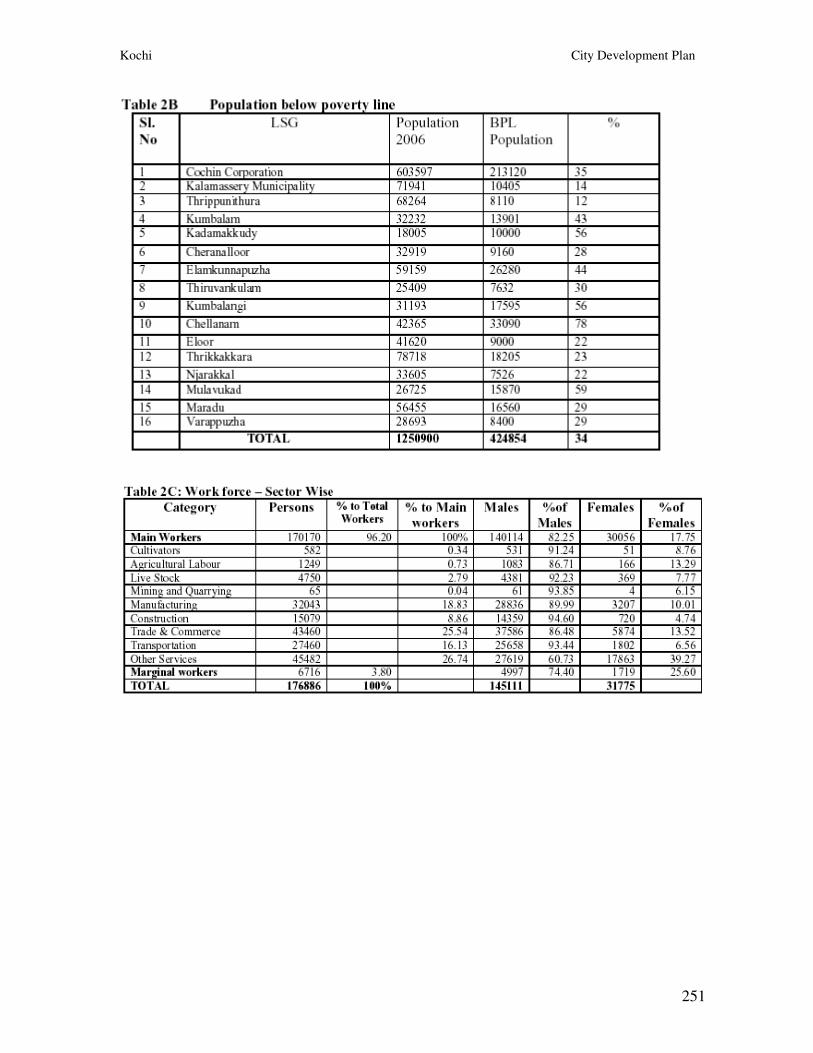
Kochi City Development Plan
251

Kochi City Development Plan
252
Annexure – 3
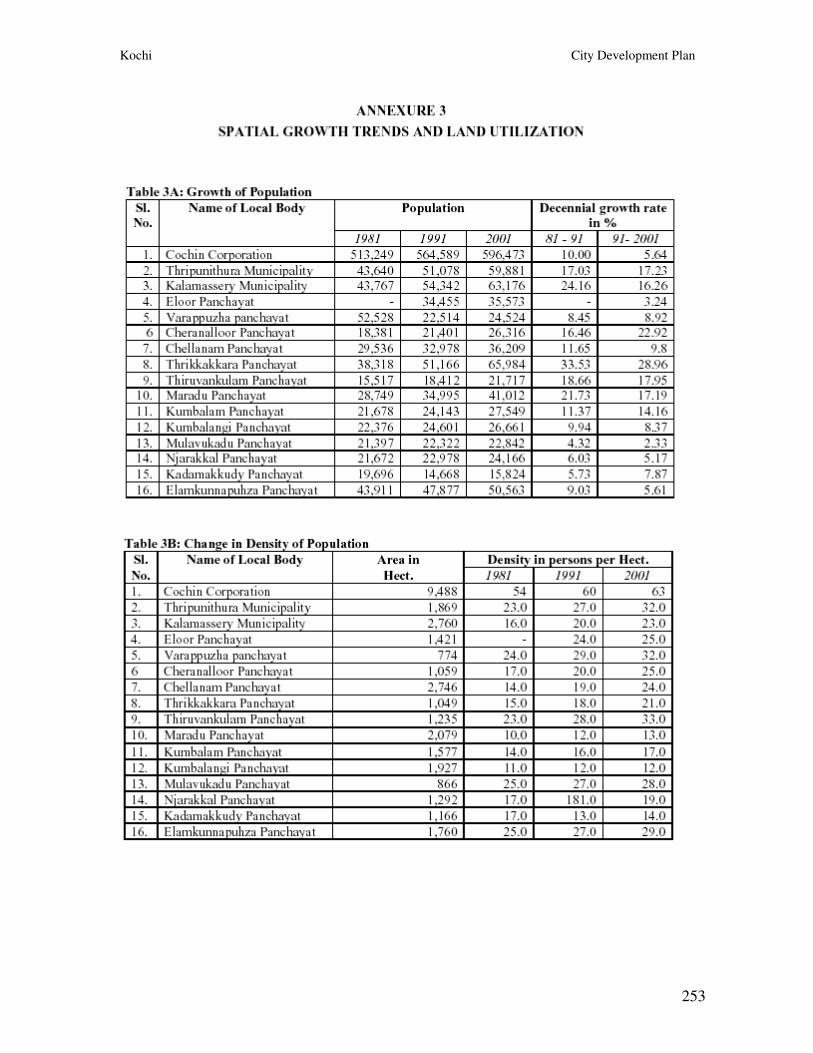
Kochi City Development Plan
253
Kochi City Development Plan
254
Annexure – 4
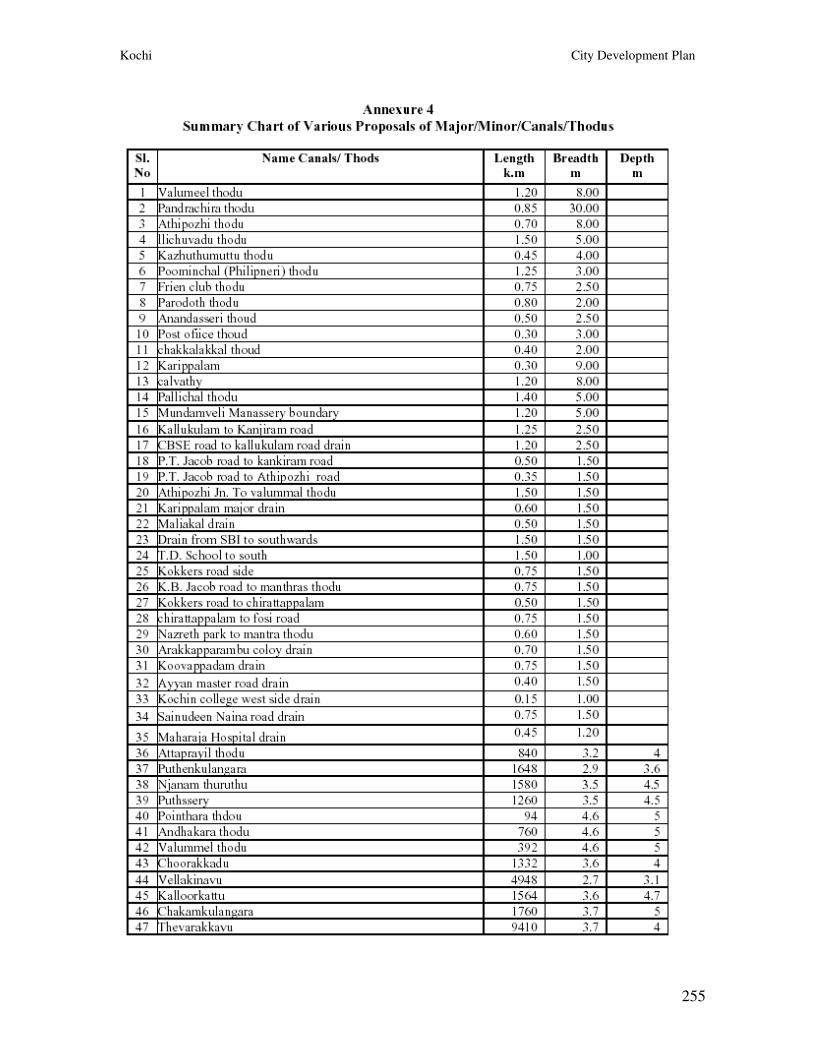
Kochi City Development Plan
255
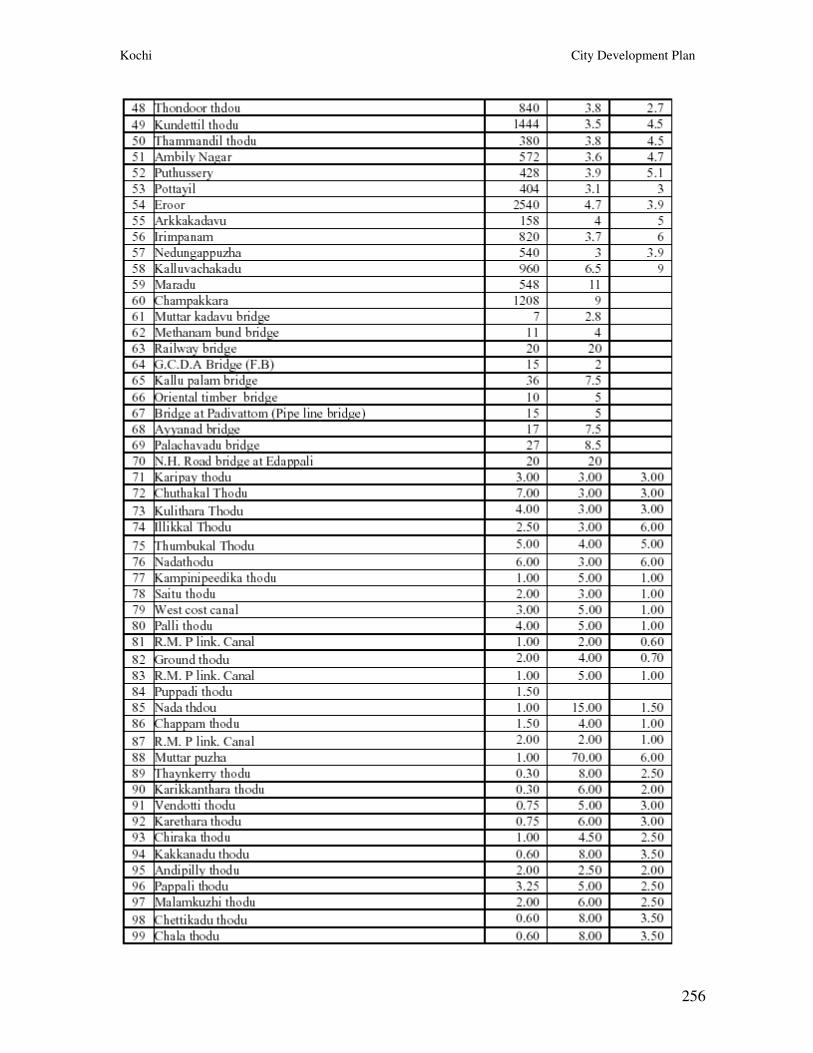
Kochi City Development Plan
256
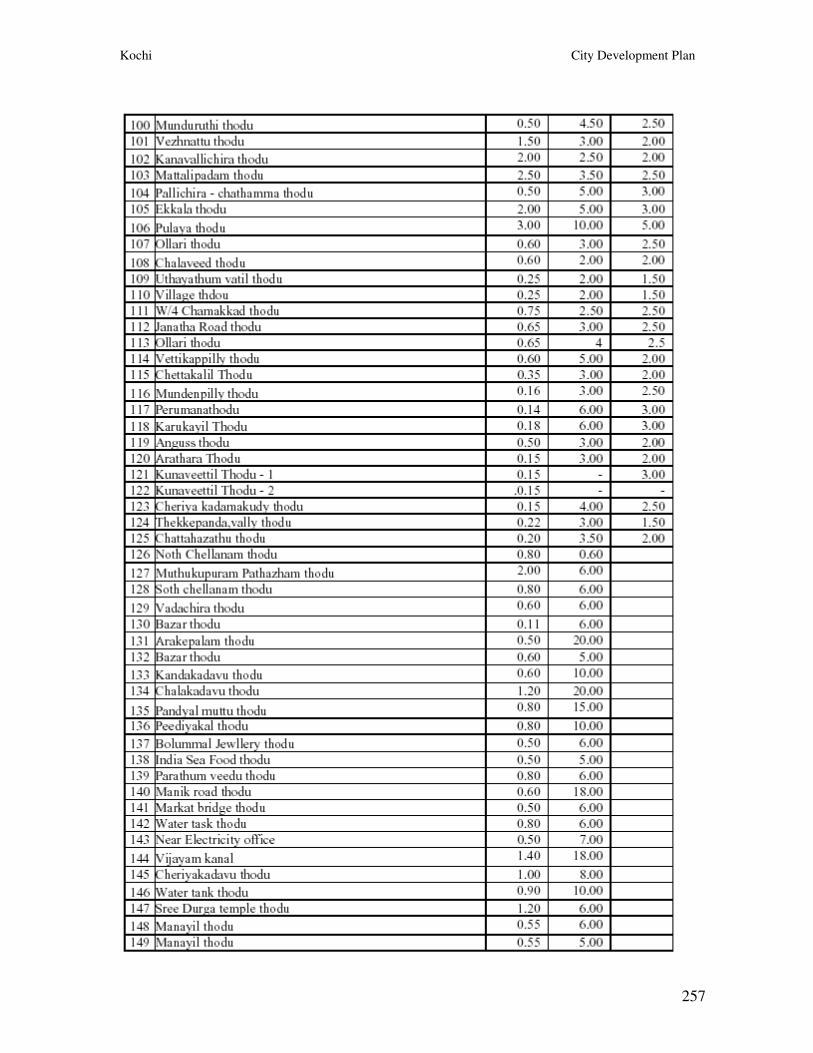
Kochi City Development Plan
257
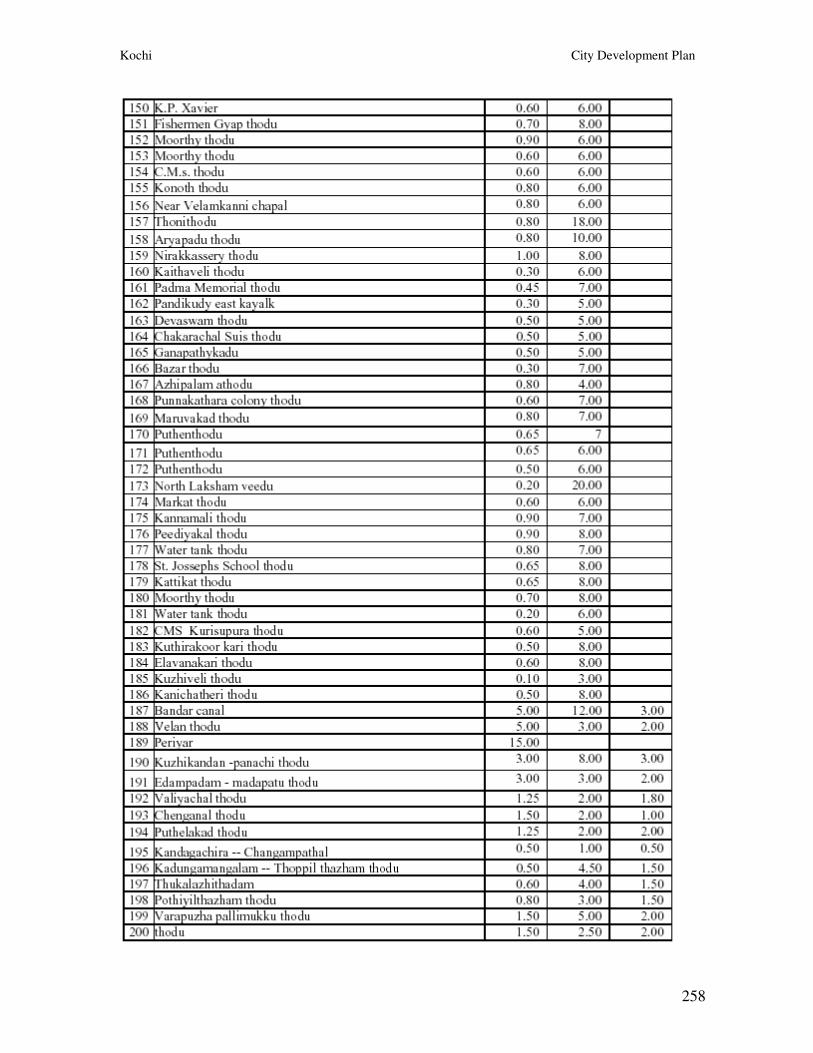
Kochi City Development Plan
258
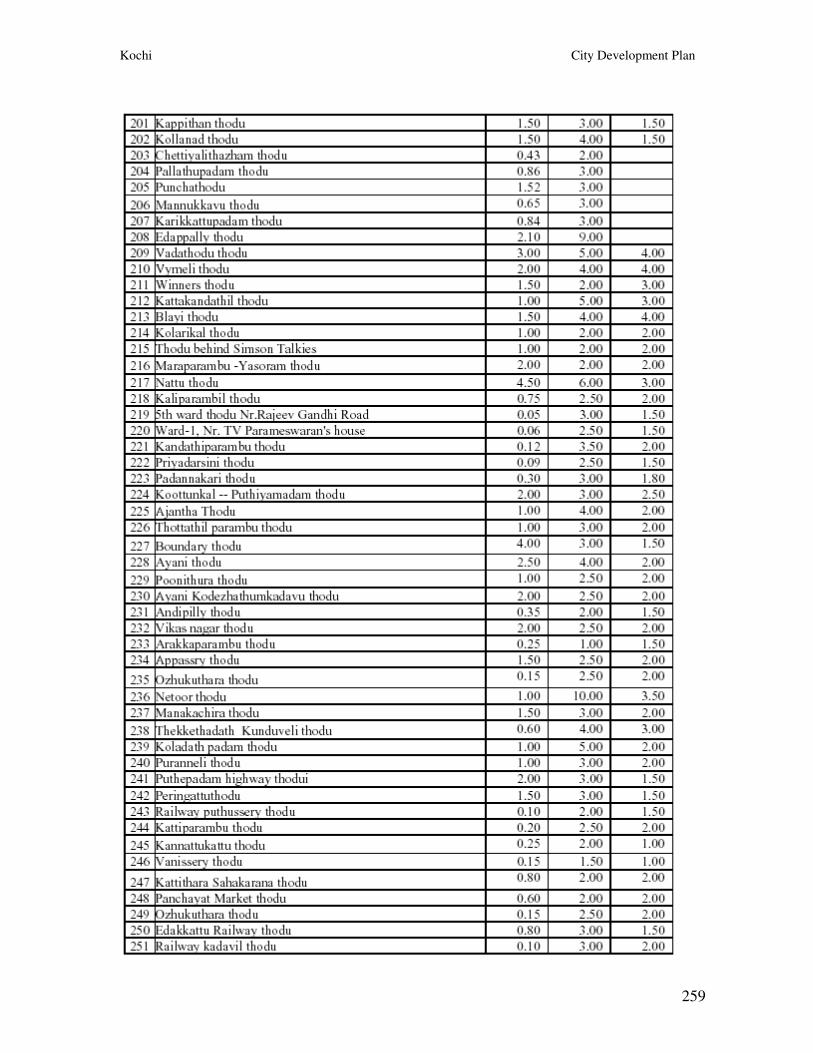
Kochi City Development Plan
259
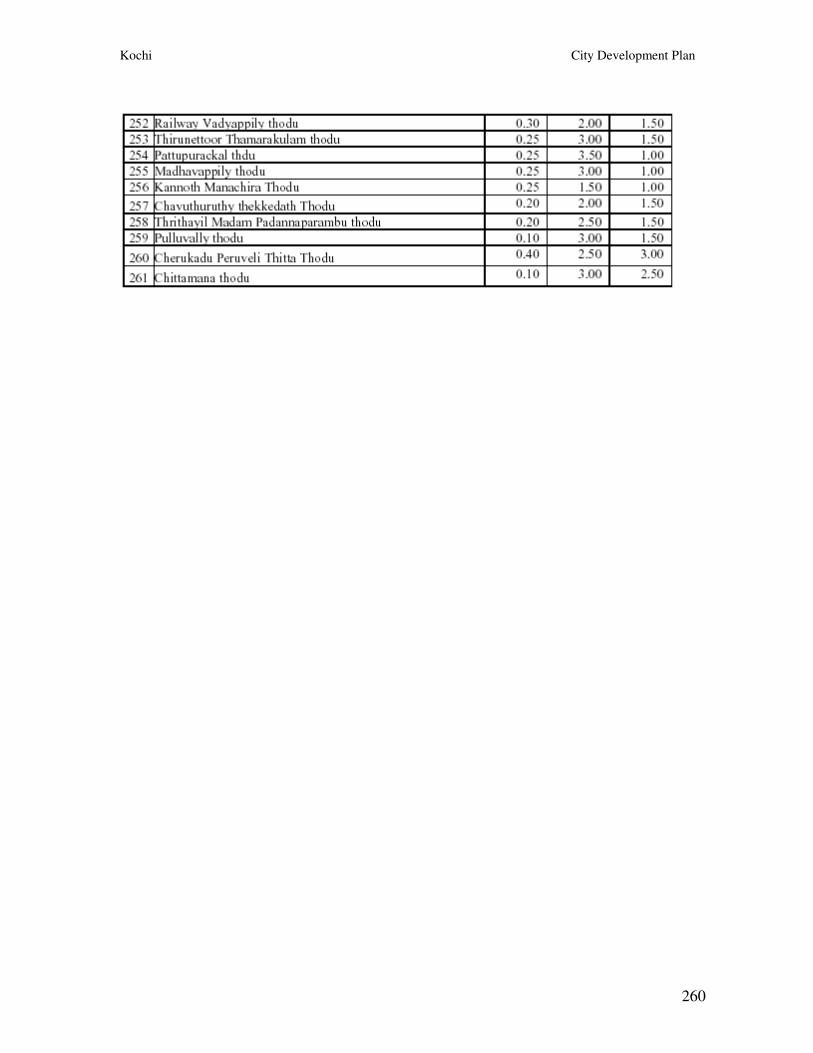
Kochi City Development Plan
260
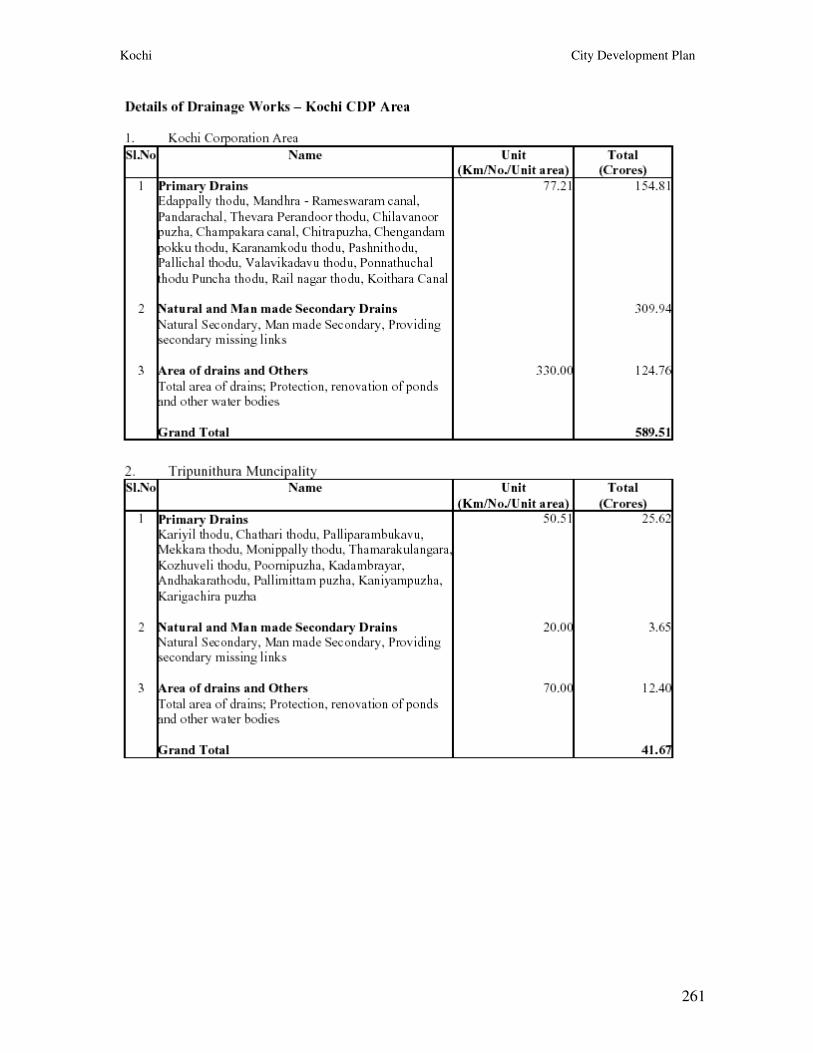
Kochi City Development Plan
261
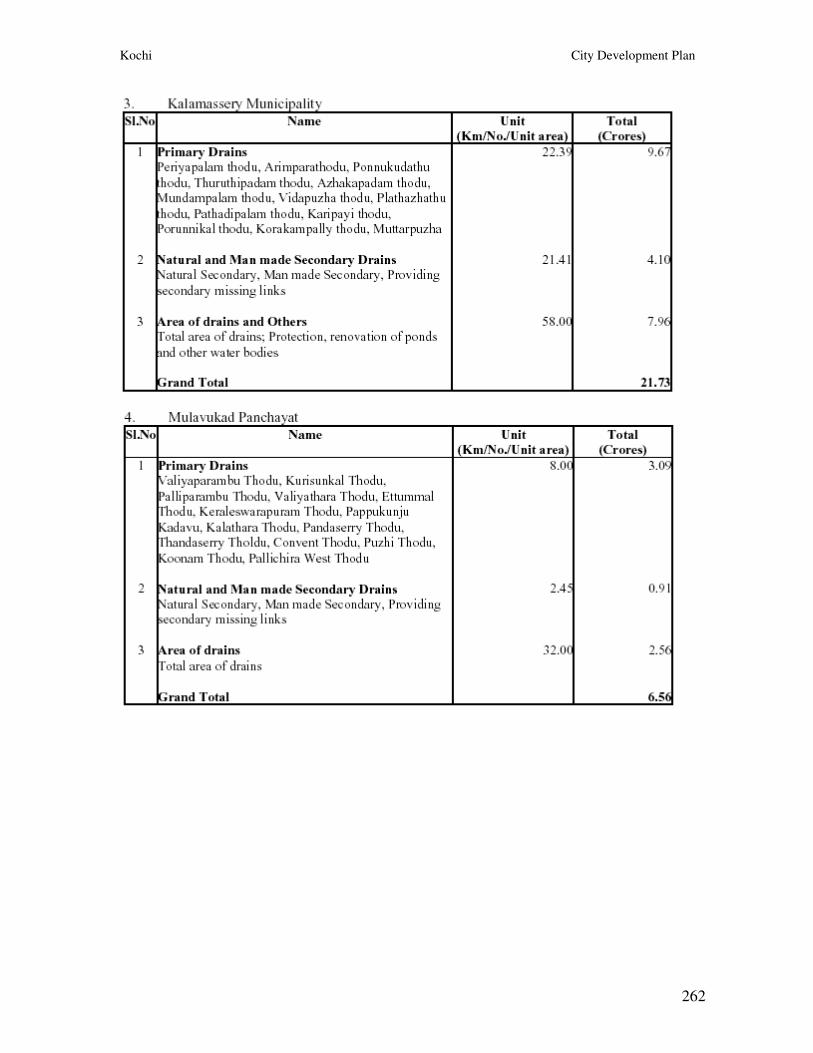
Kochi City Development Plan
262
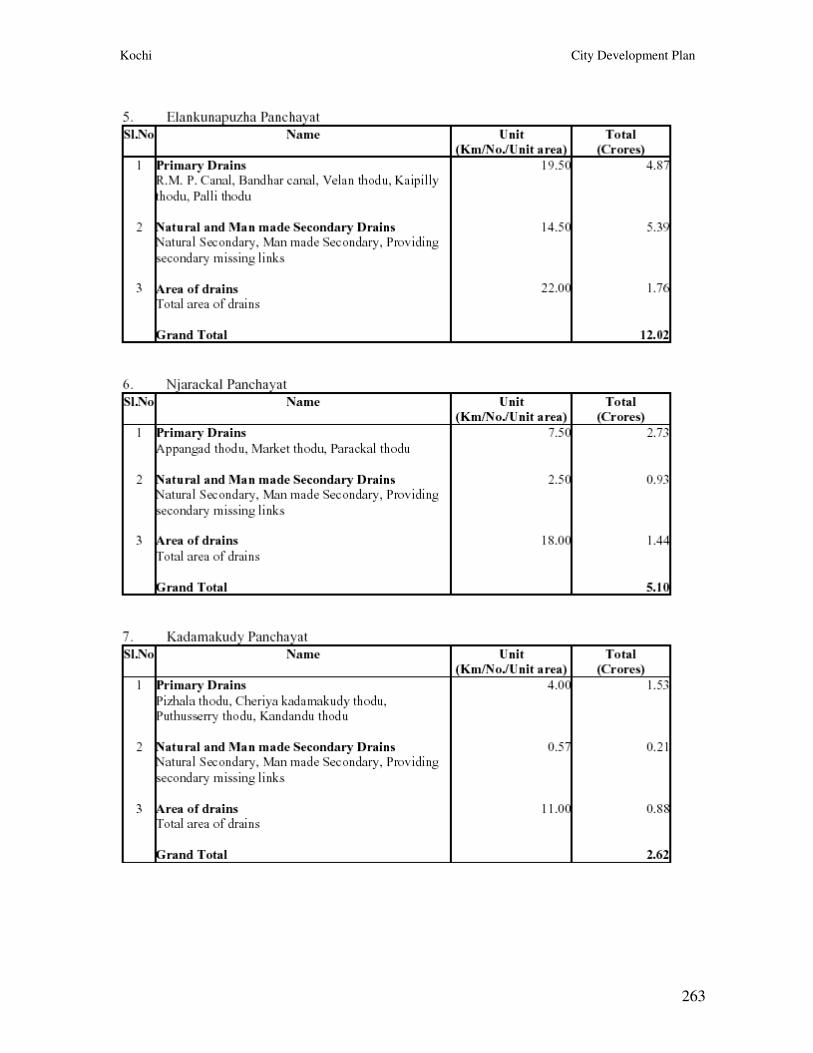
Kochi City Development Plan
263
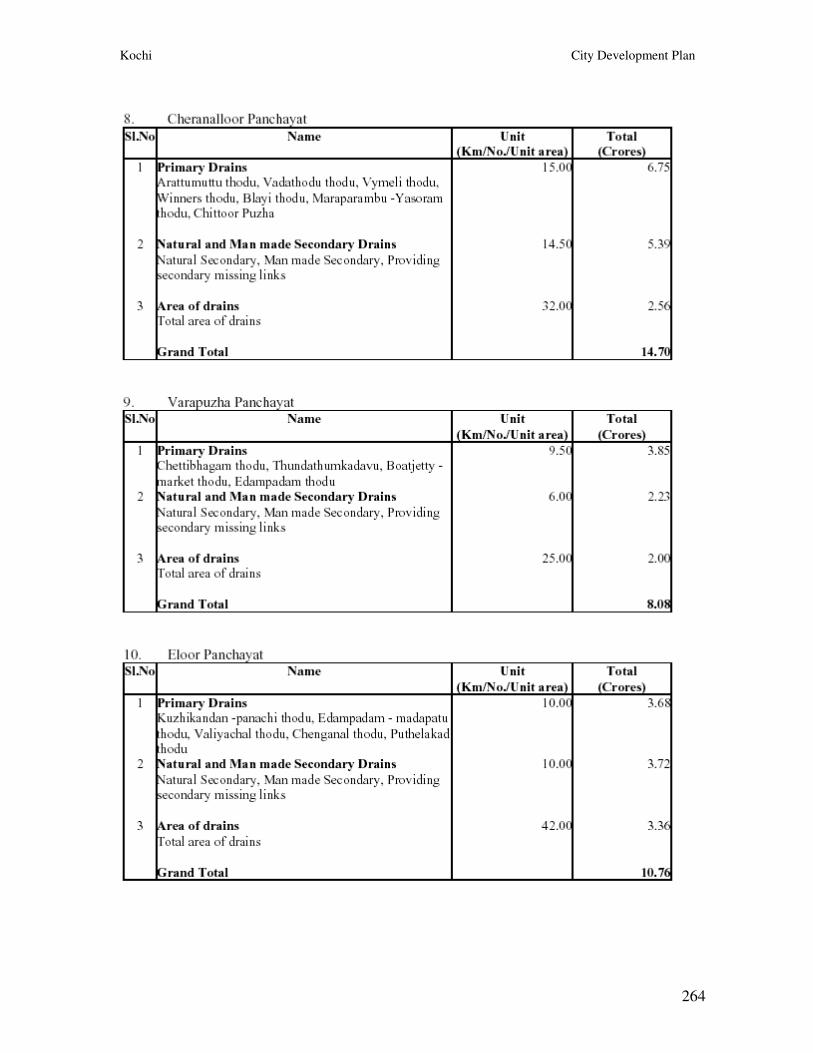
Kochi City Development Plan
264
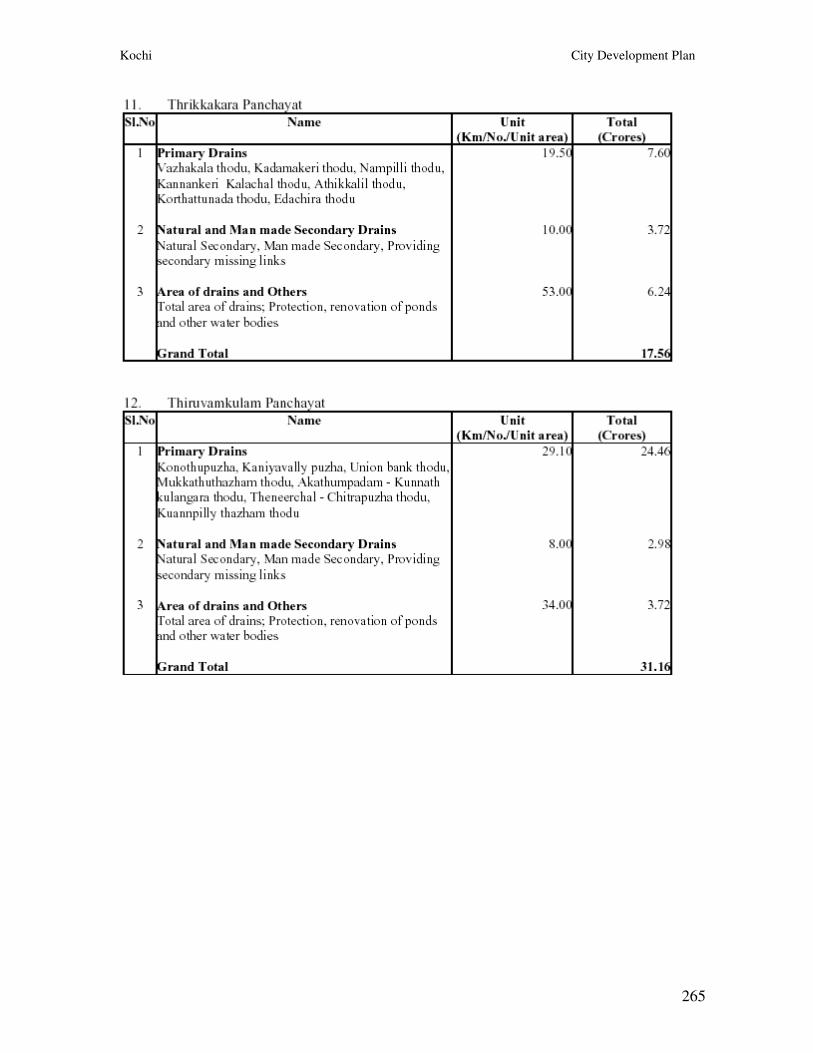
Kochi City Development Plan
265
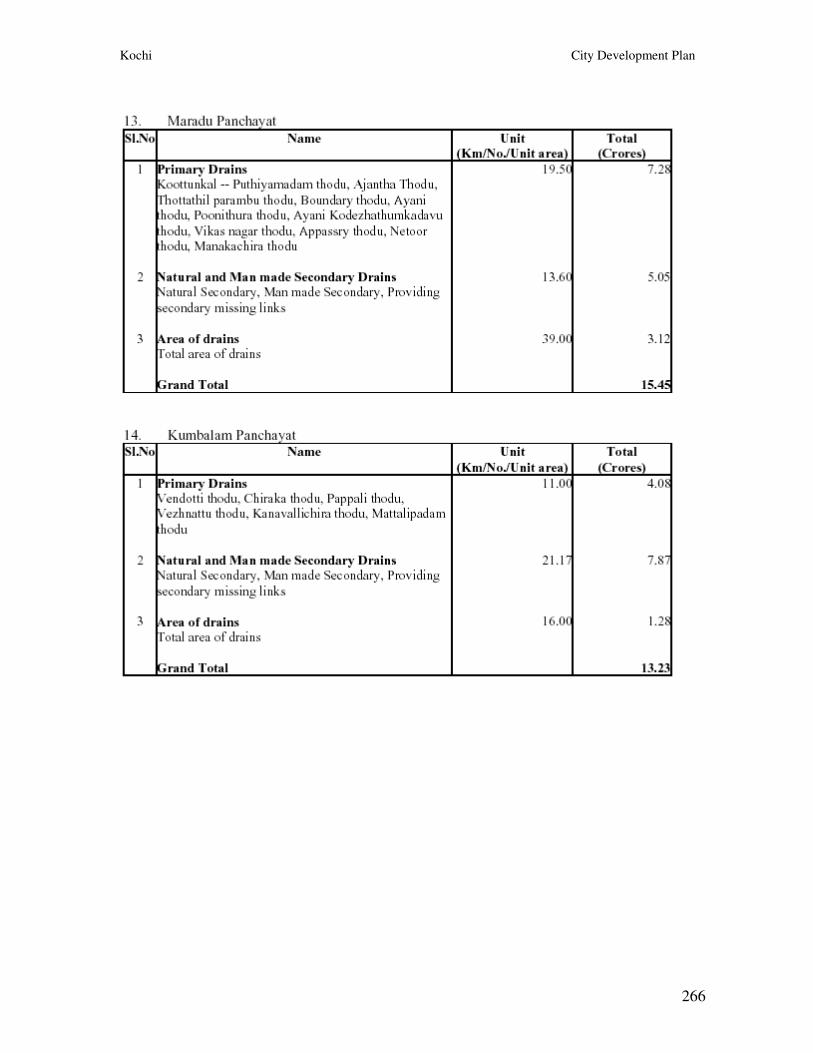
Kochi City Development Plan
266
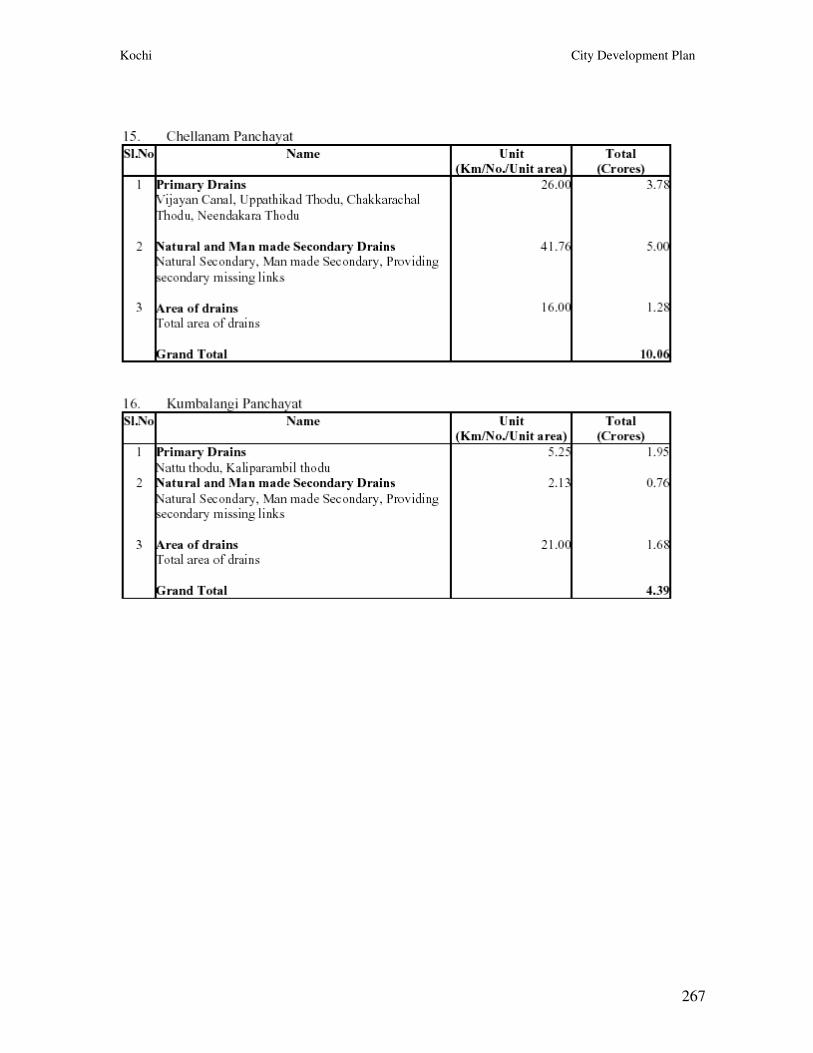
Kochi City Development Plan
267
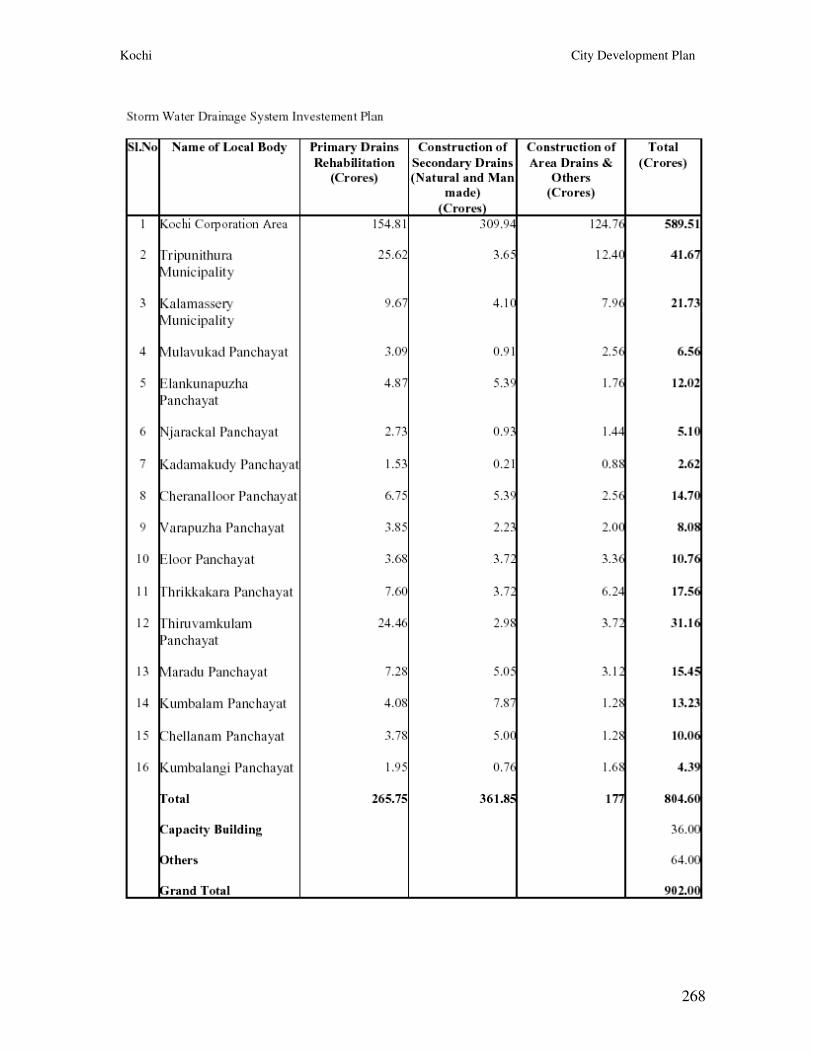
Kochi City Development Plan
268
Kochi City Development Plan
269
ANNEXURE - 5
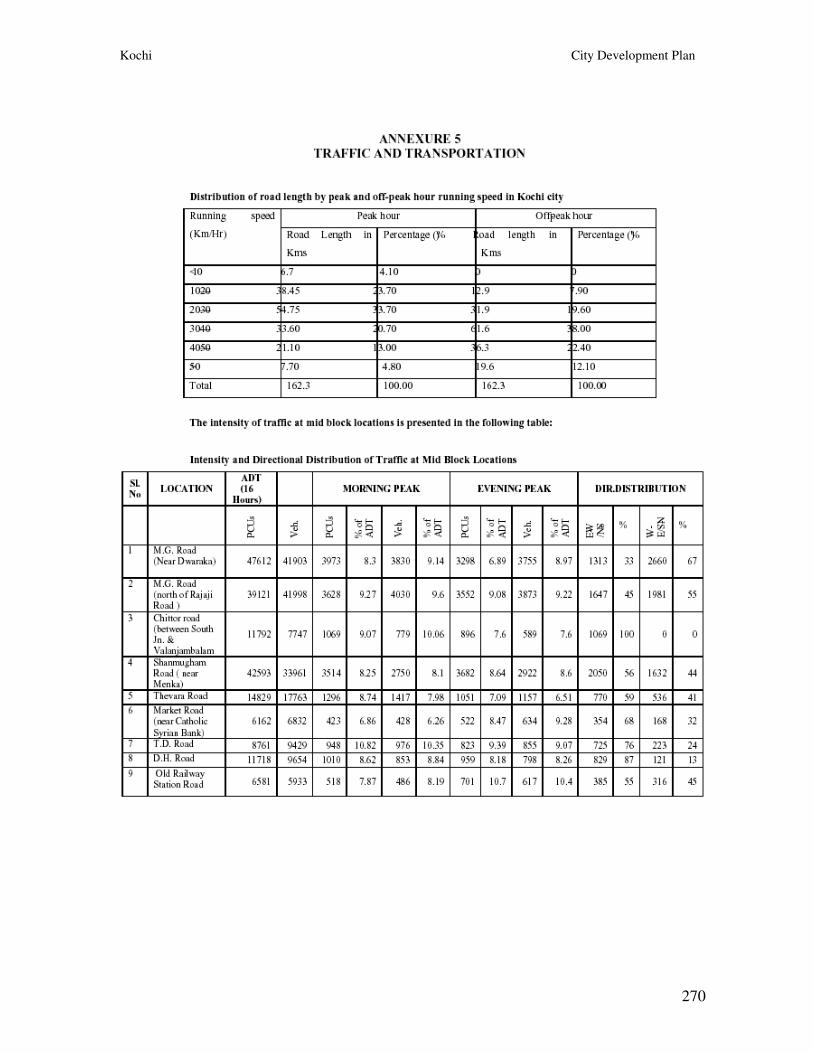
Kochi City Development Plan
270
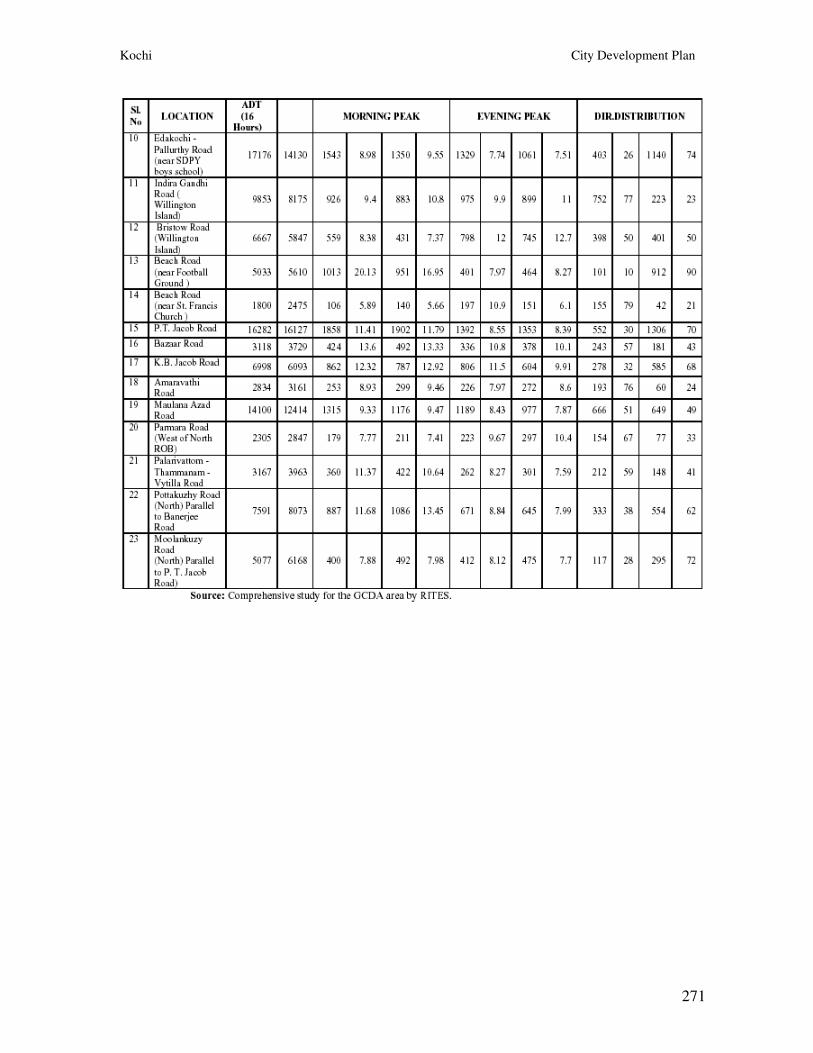
Kochi City Development Plan
271
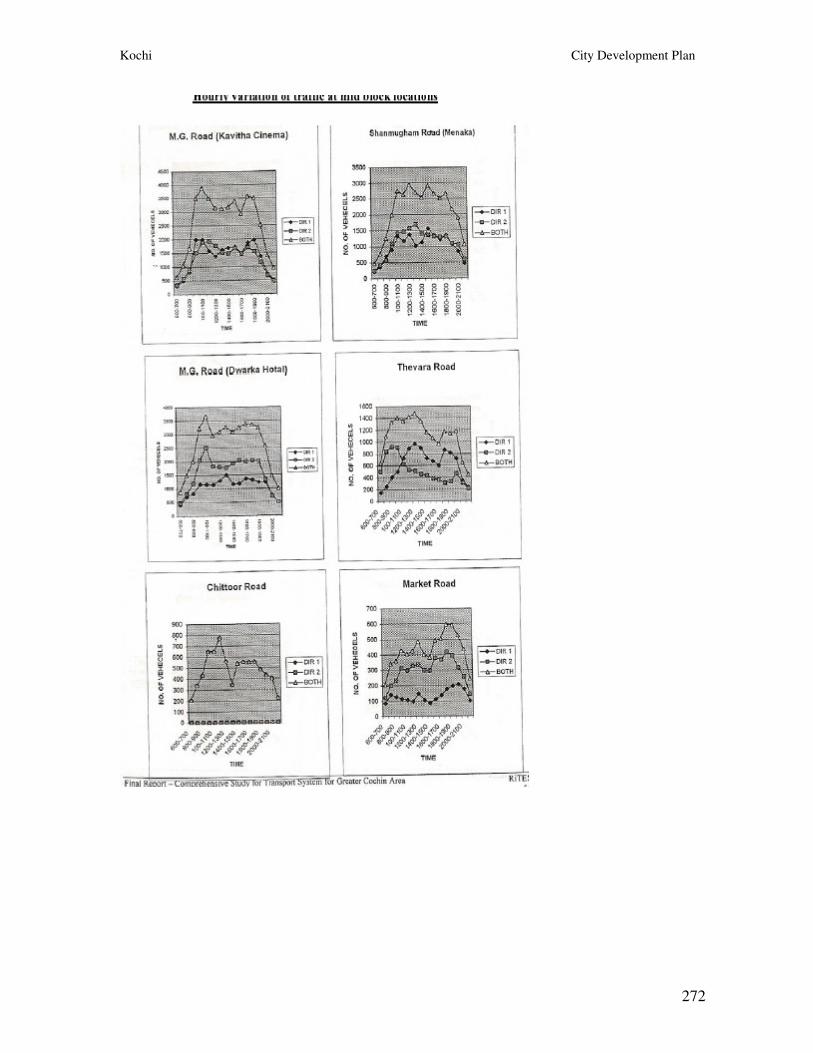
Kochi City Development Plan
272
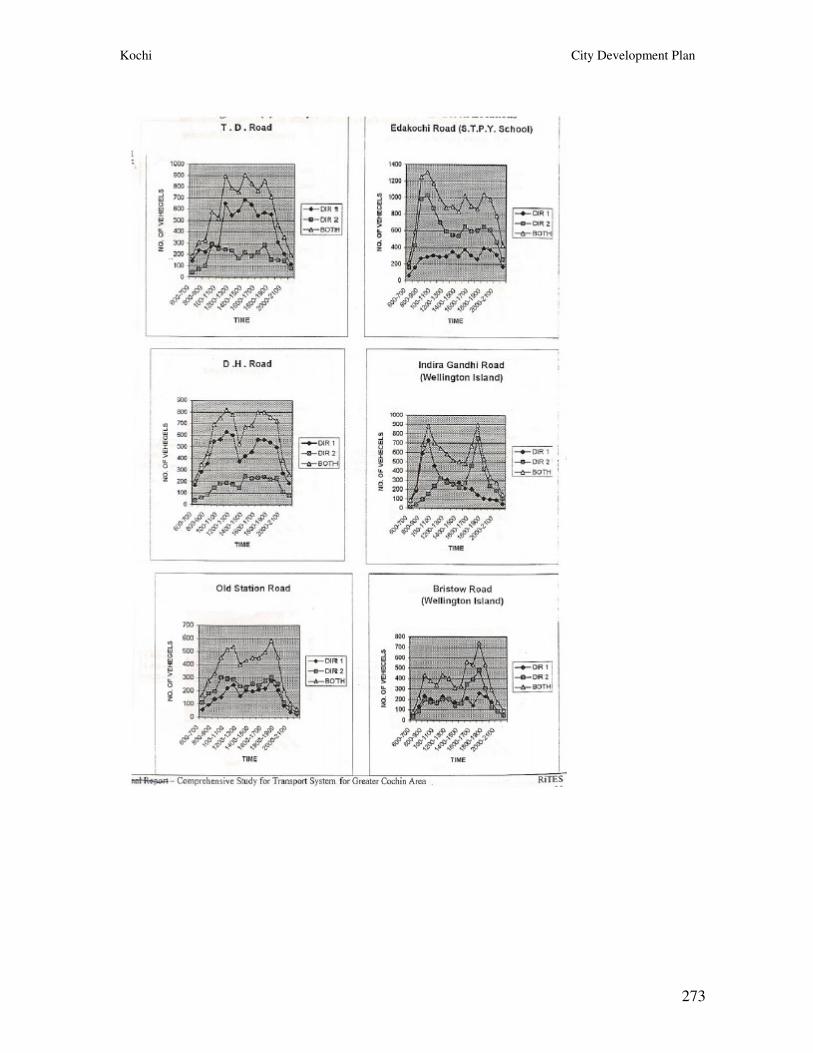
Kochi City Development Plan
273
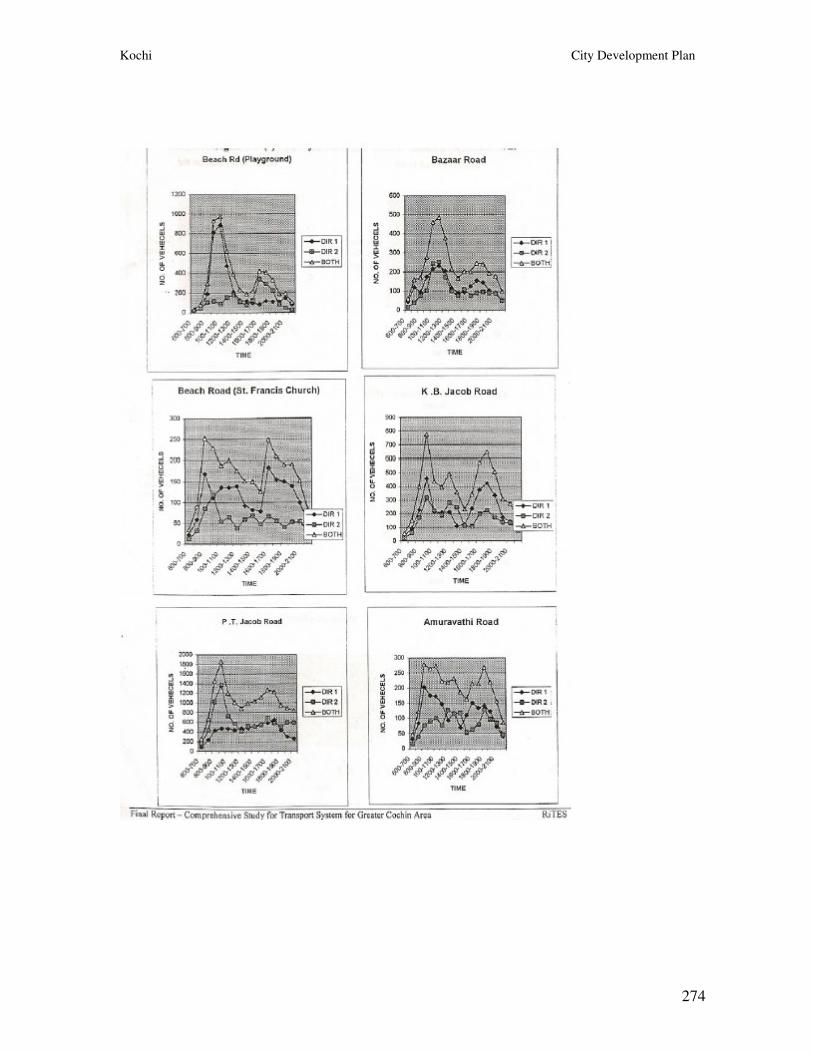
Kochi City Development Plan
274
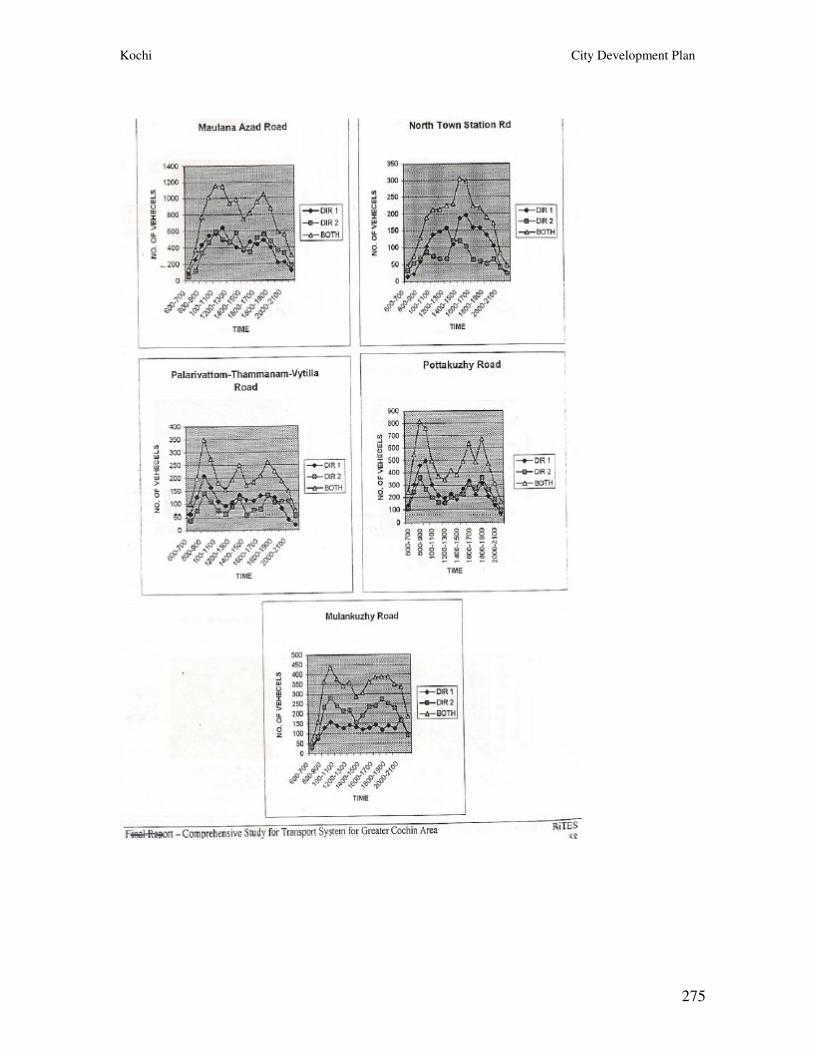
Kochi City Development Plan
275
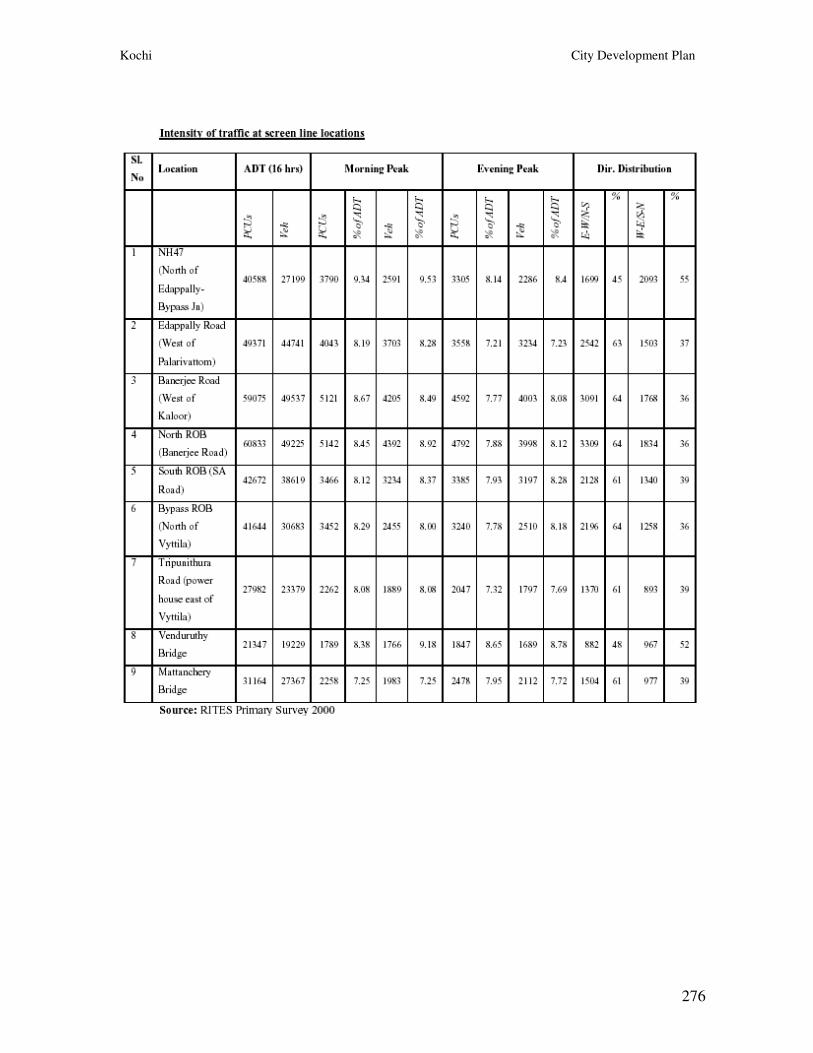
Kochi City Development Plan
276
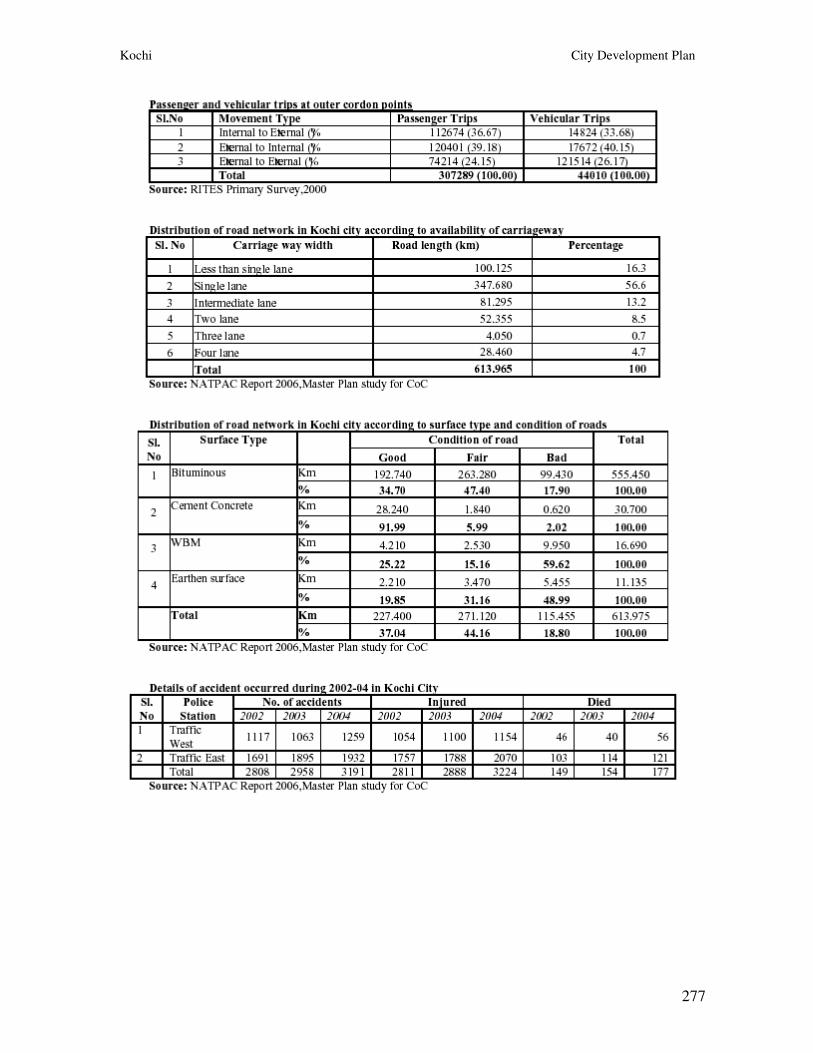
Kochi City Development Plan
277
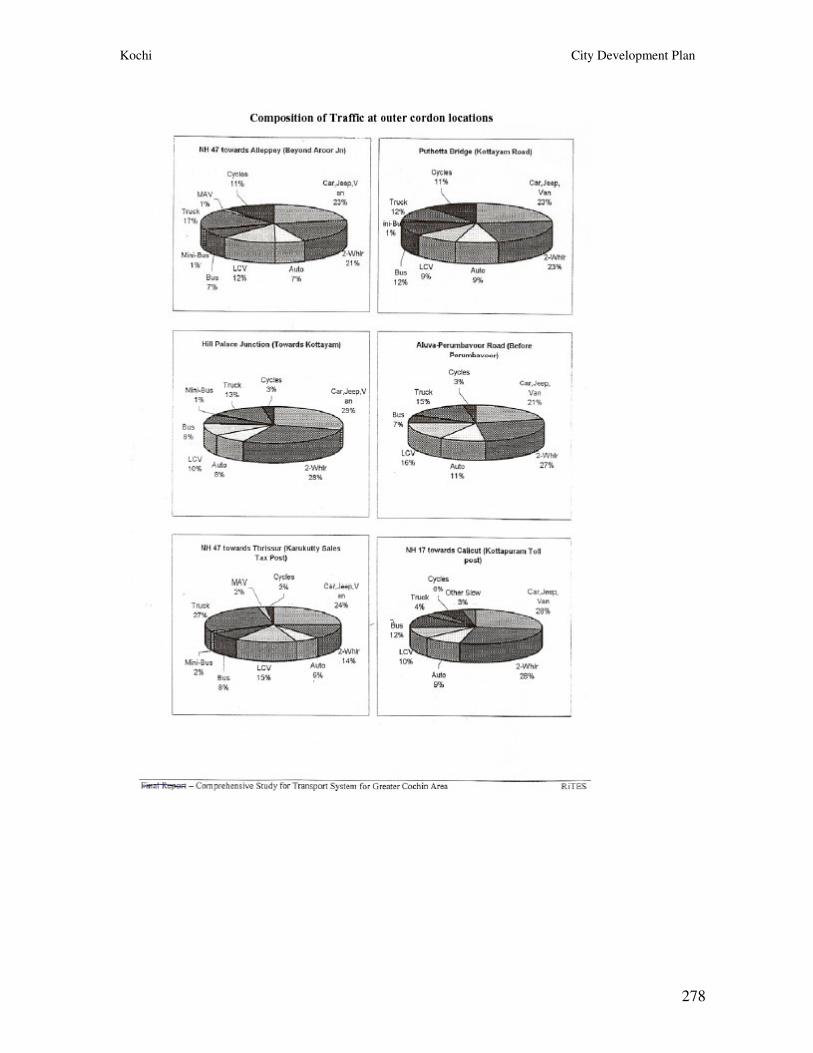
Kochi City Development Plan
278
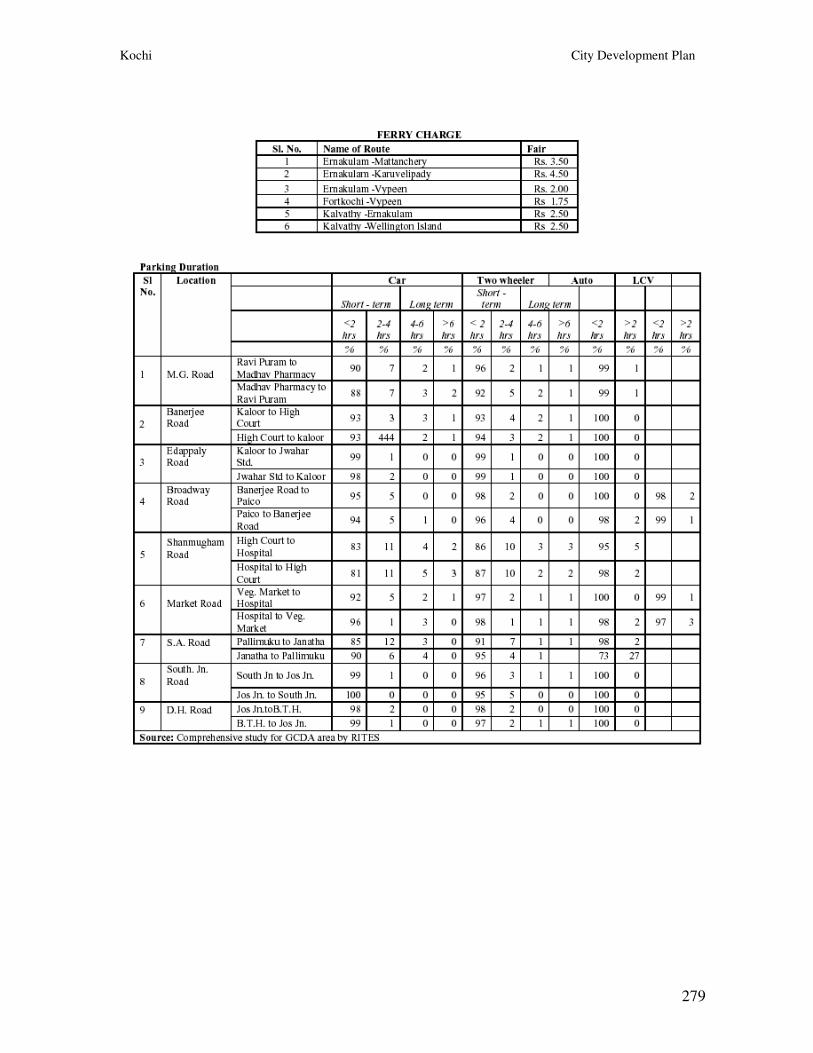
Kochi City Development Plan
279
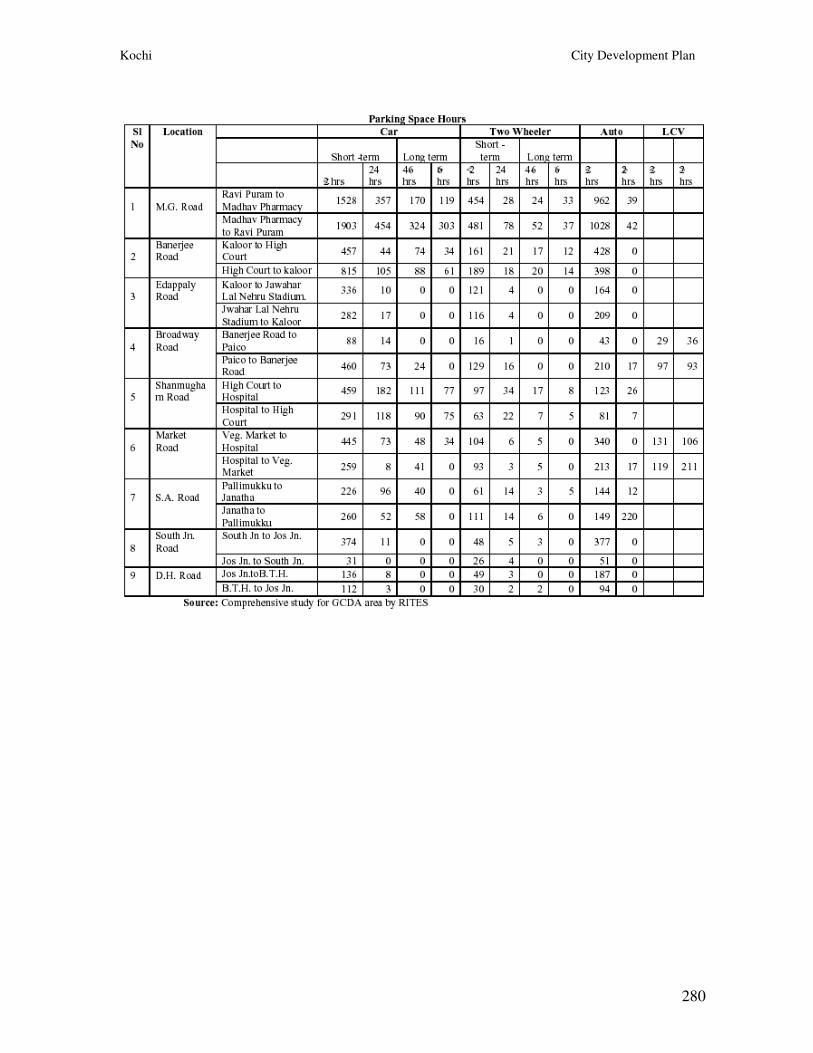
Kochi City Development Plan
280
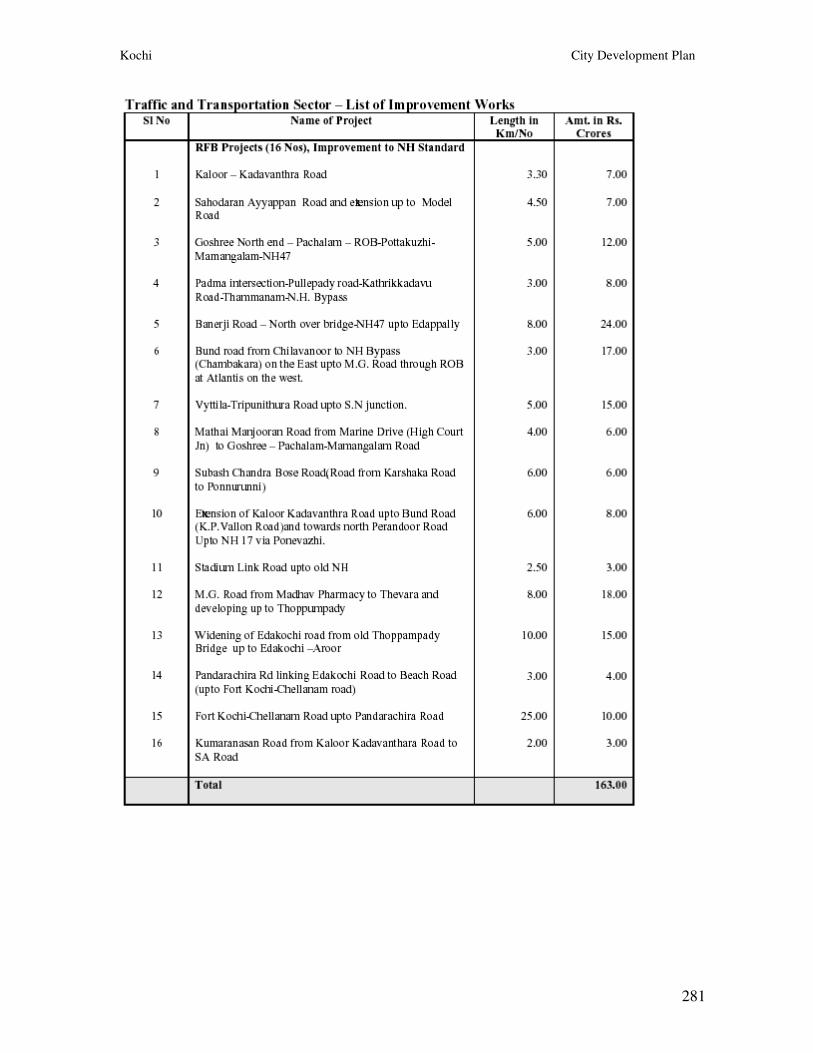
Kochi City Development Plan
281
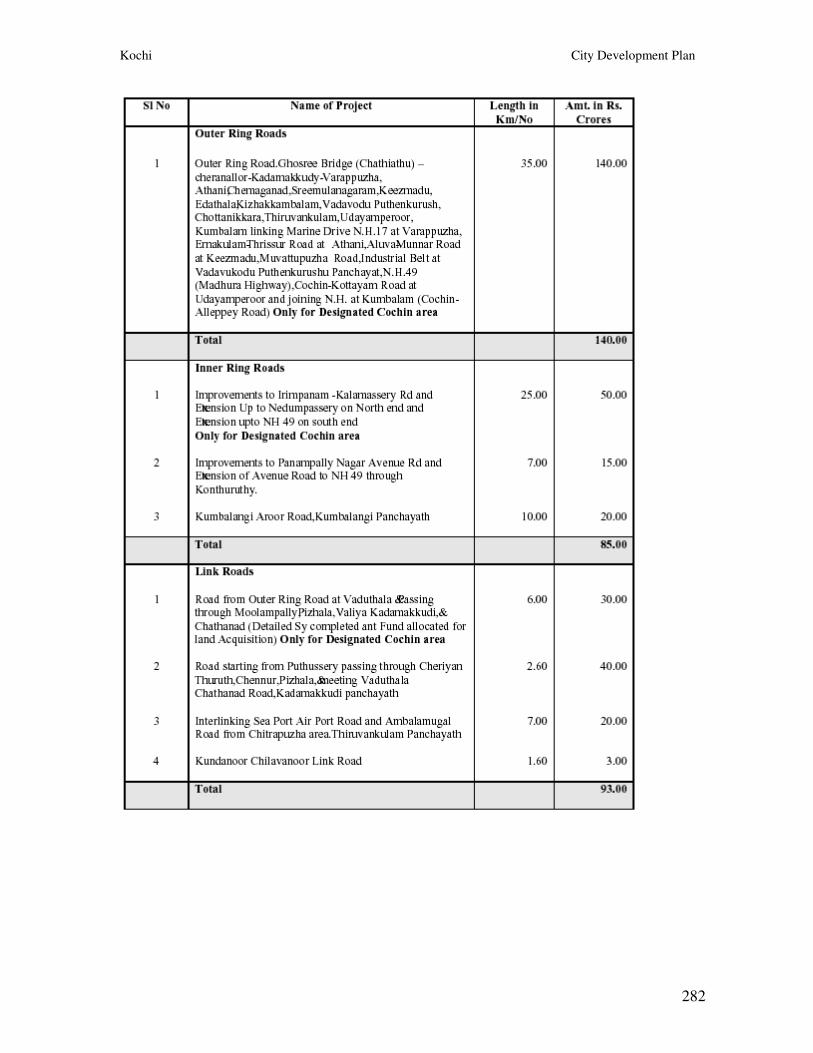
Kochi City Development Plan
282
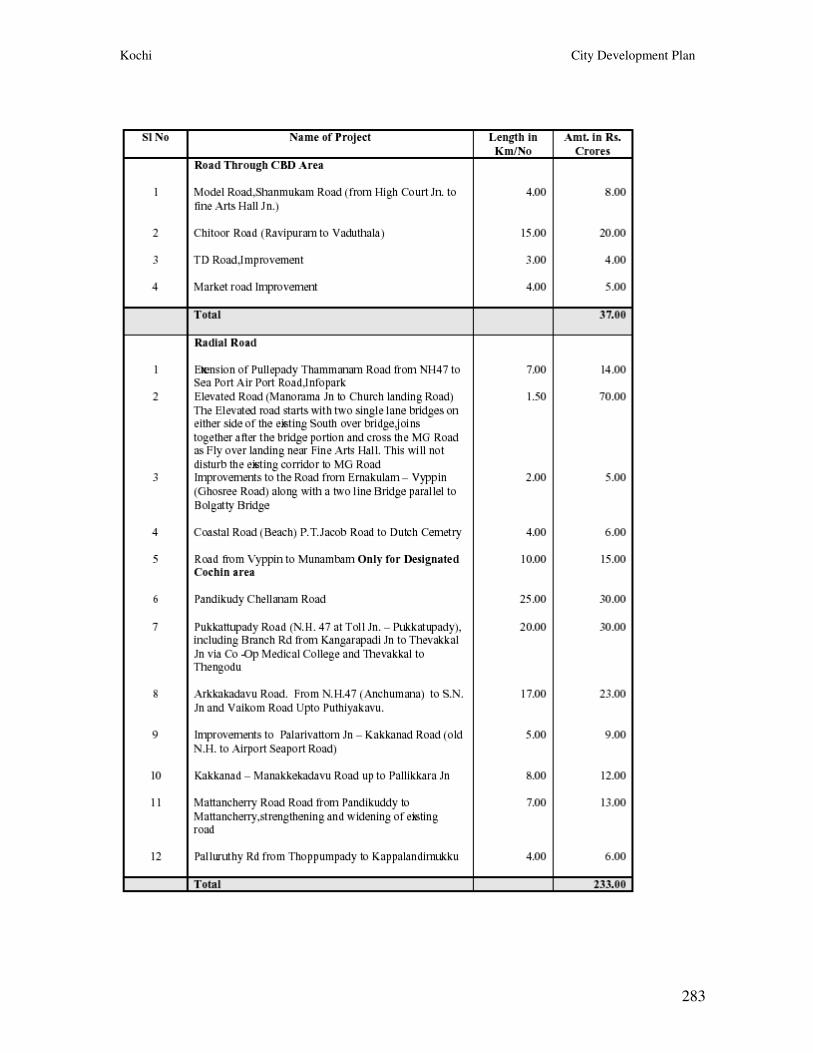
Kochi City Development Plan
283
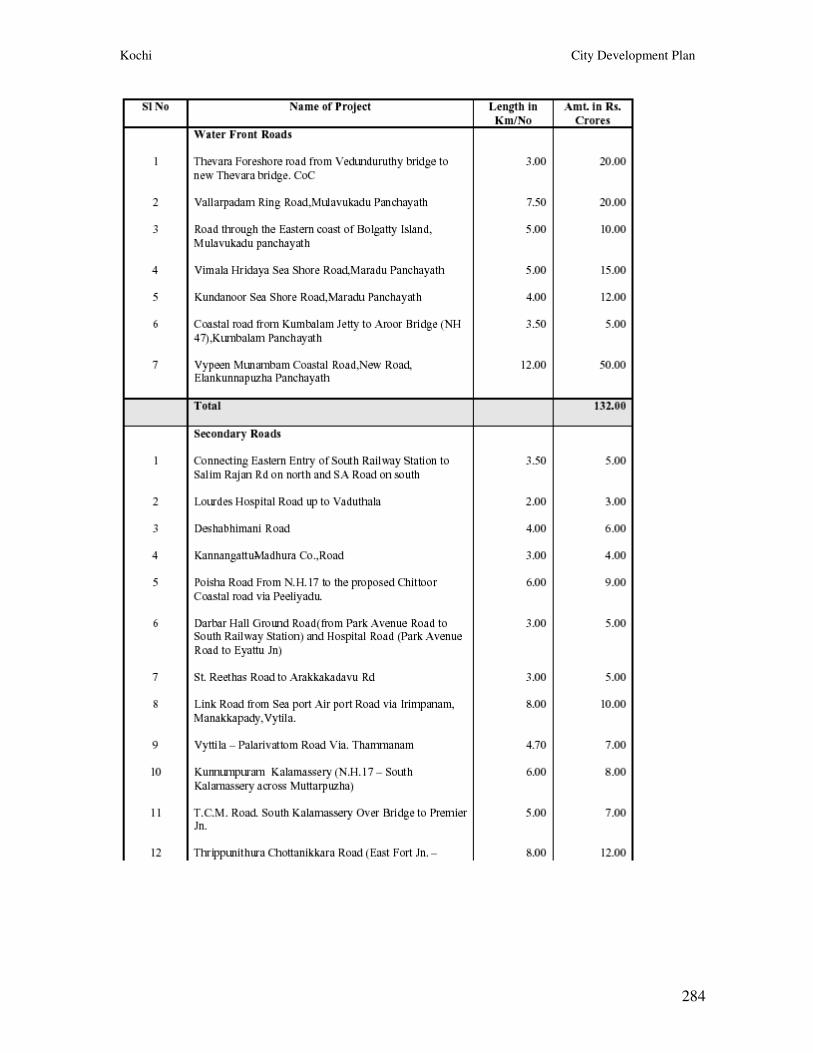
Kochi City Development Plan
284
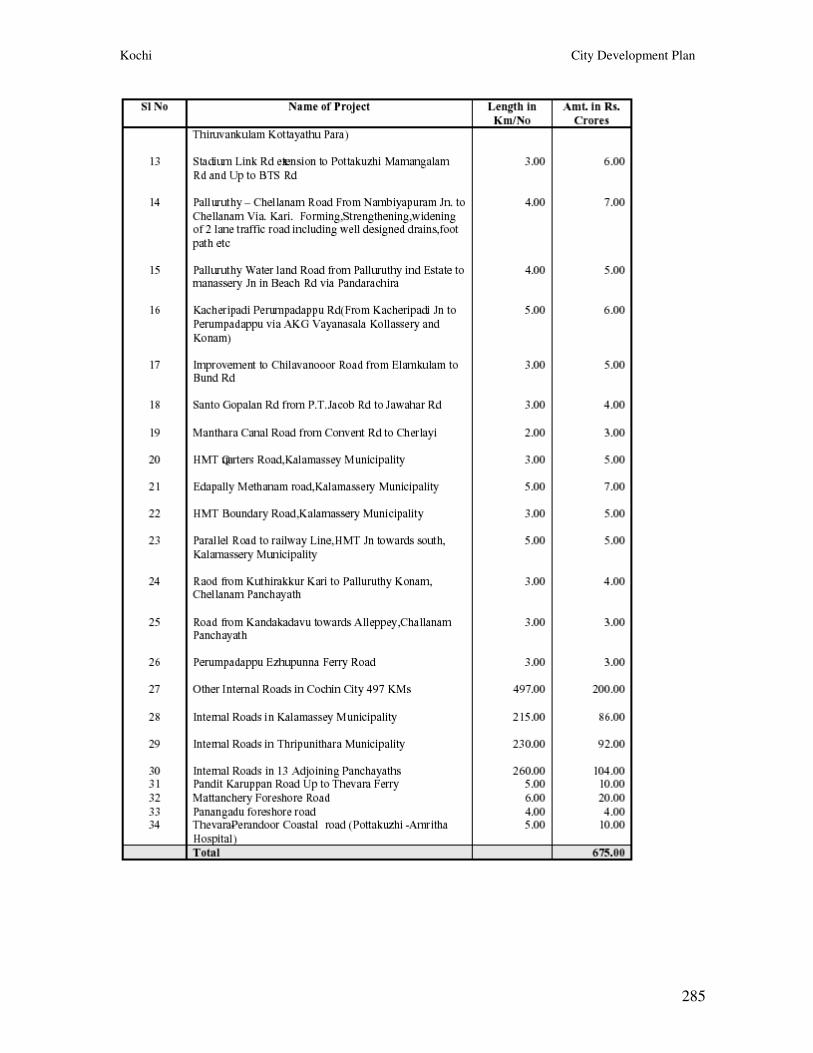
Kochi City Development Plan
285
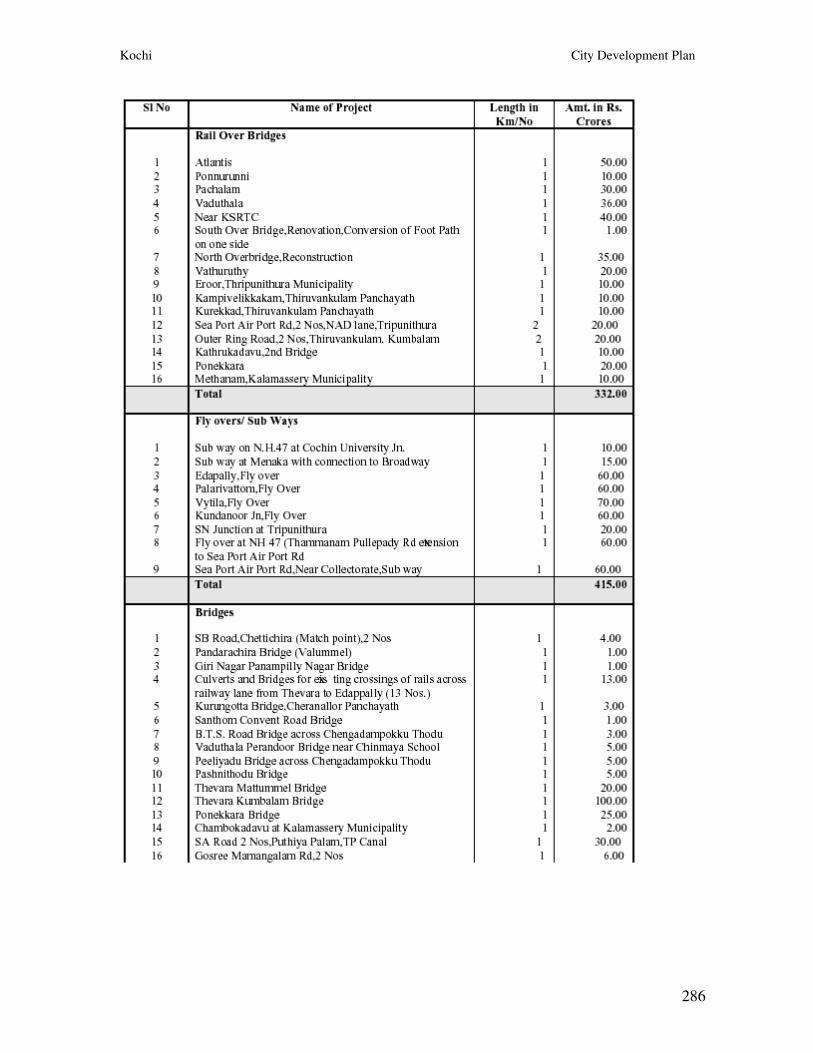
Kochi City Development Plan
286
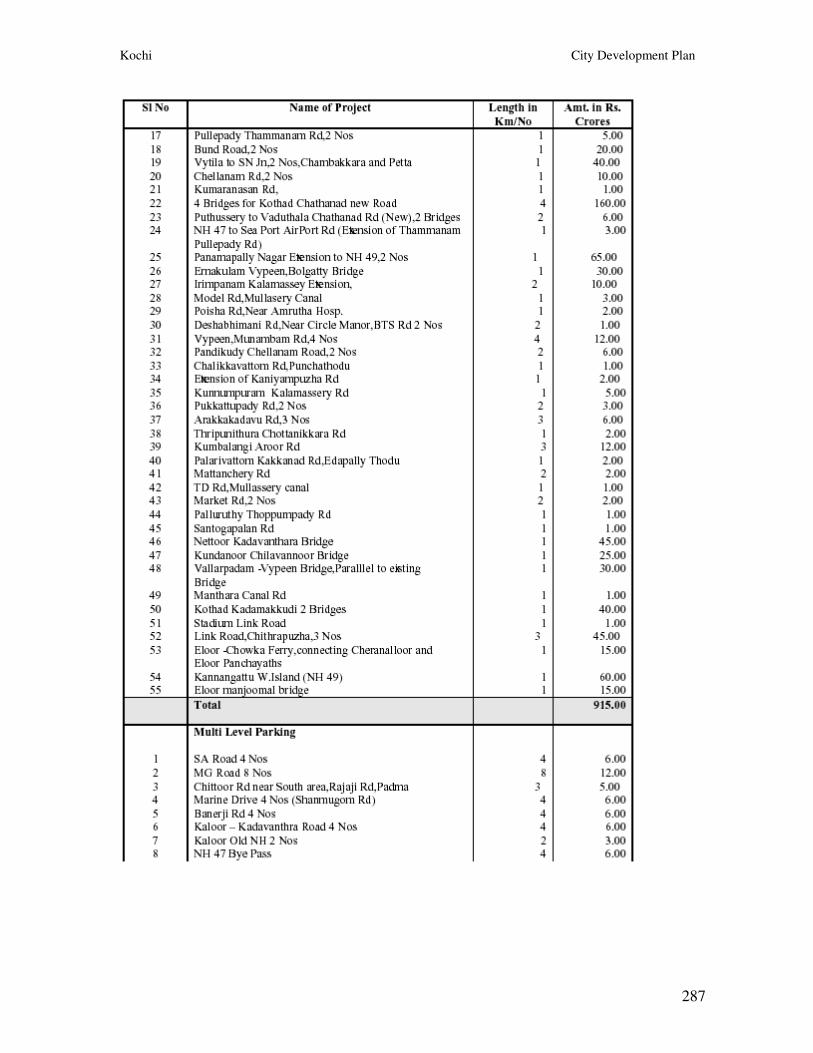
Kochi City Development Plan
287
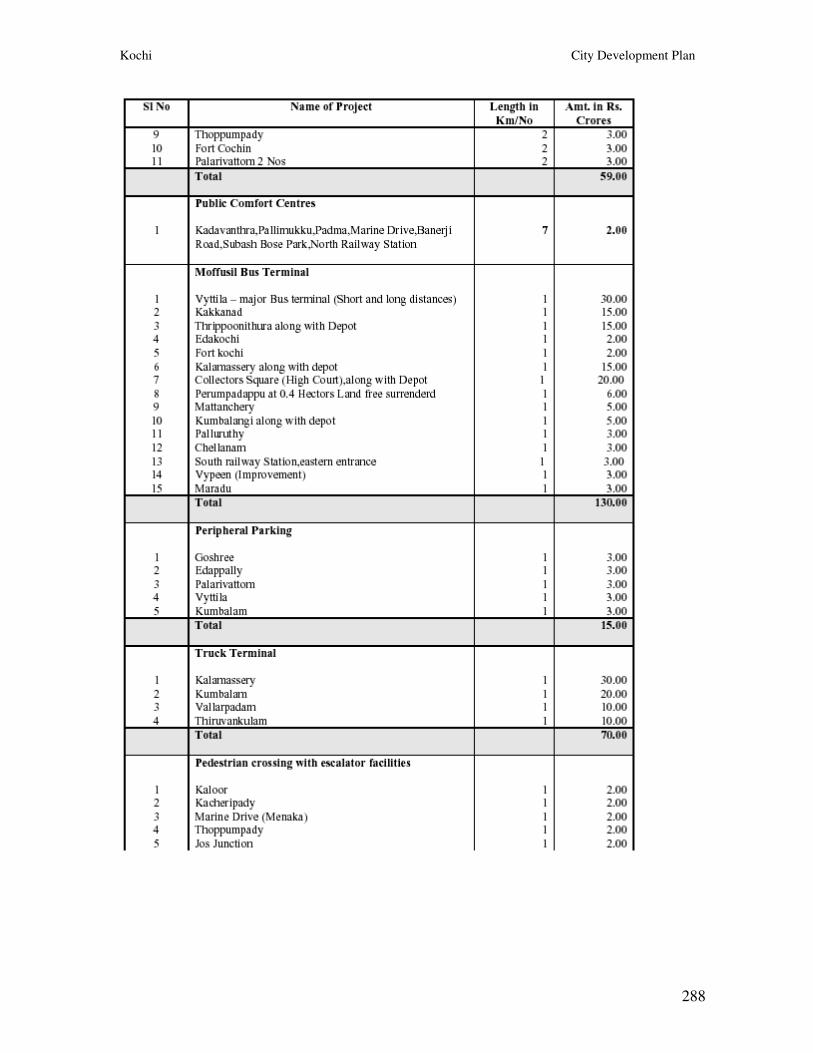
Kochi City Development Plan
288
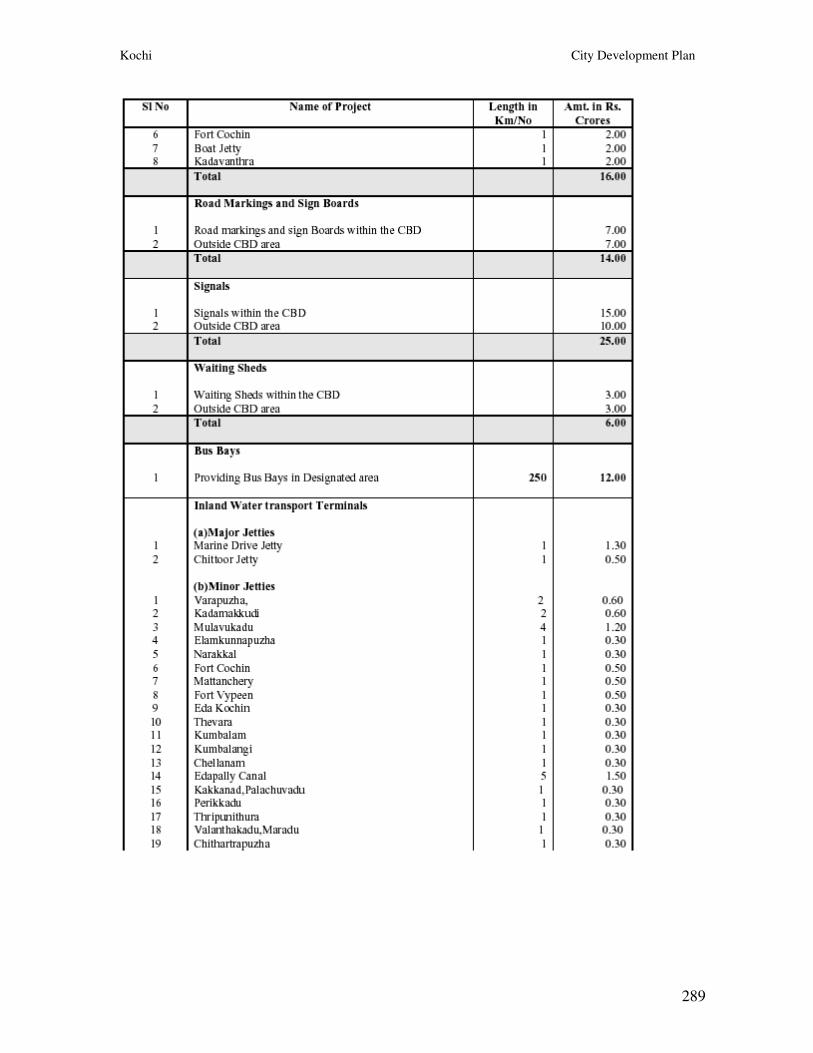
Kochi City Development Plan
289
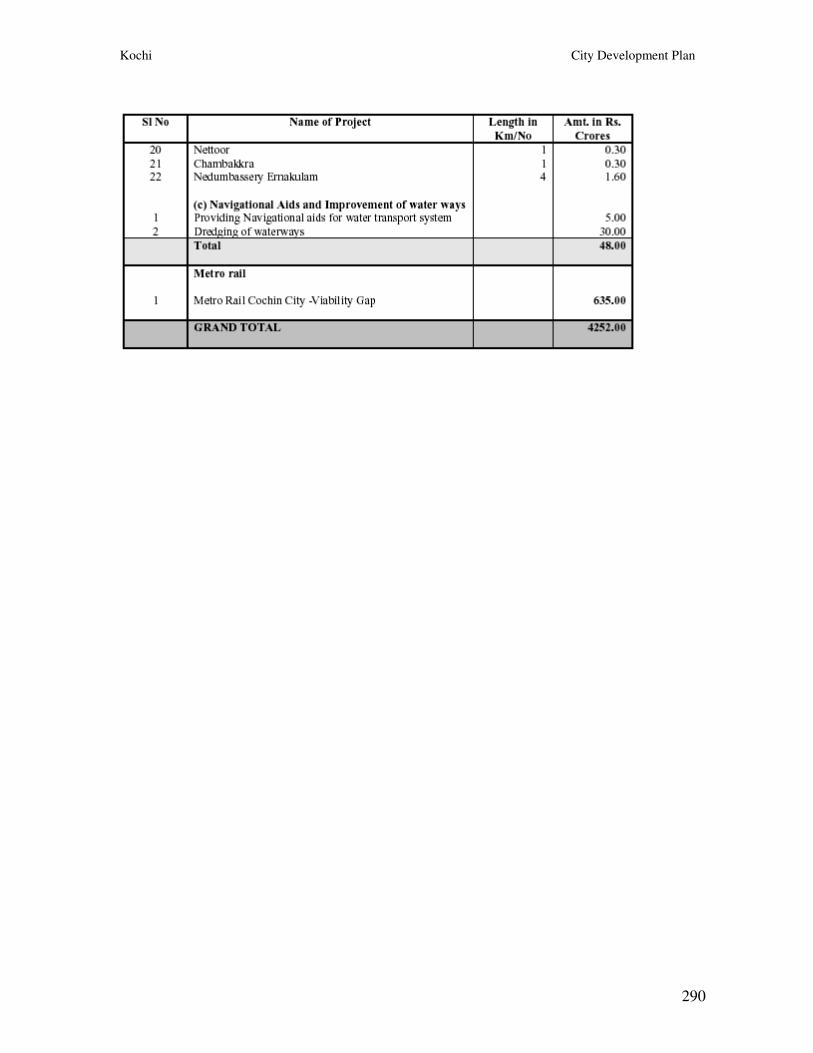
Kochi City Development Plan
290
Kochi City Development Plan
291
ANNEXURE - 6
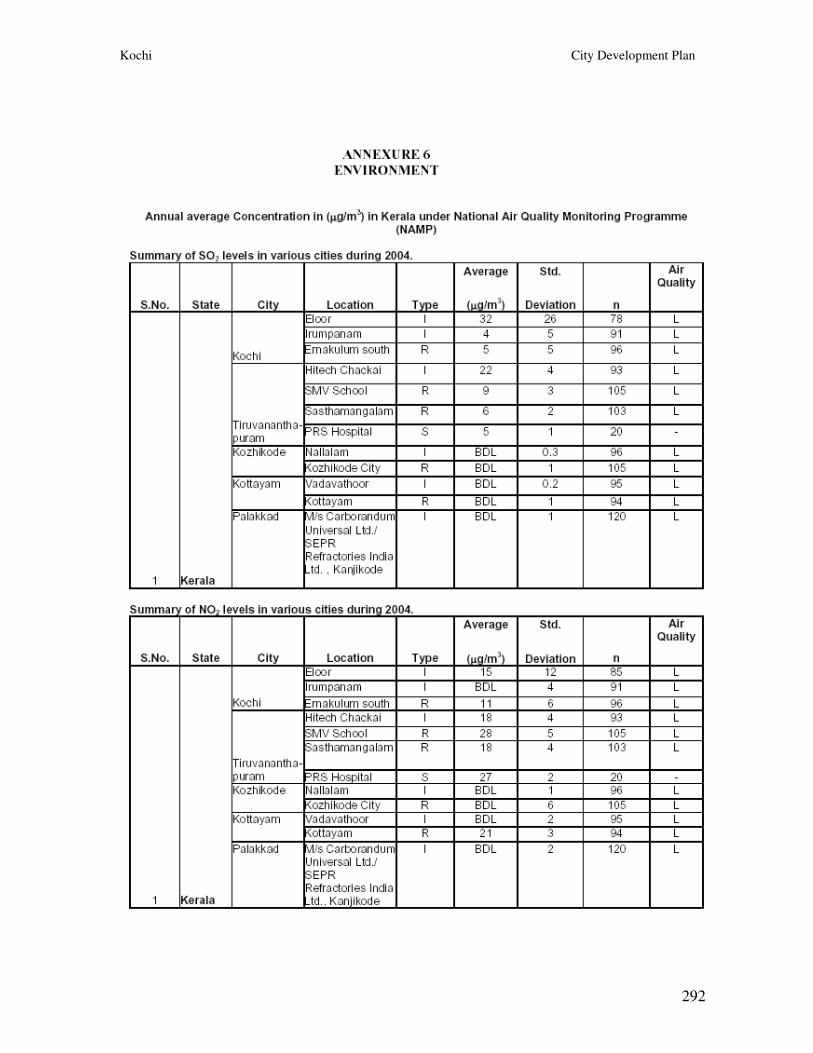
Kochi City Development Plan
292
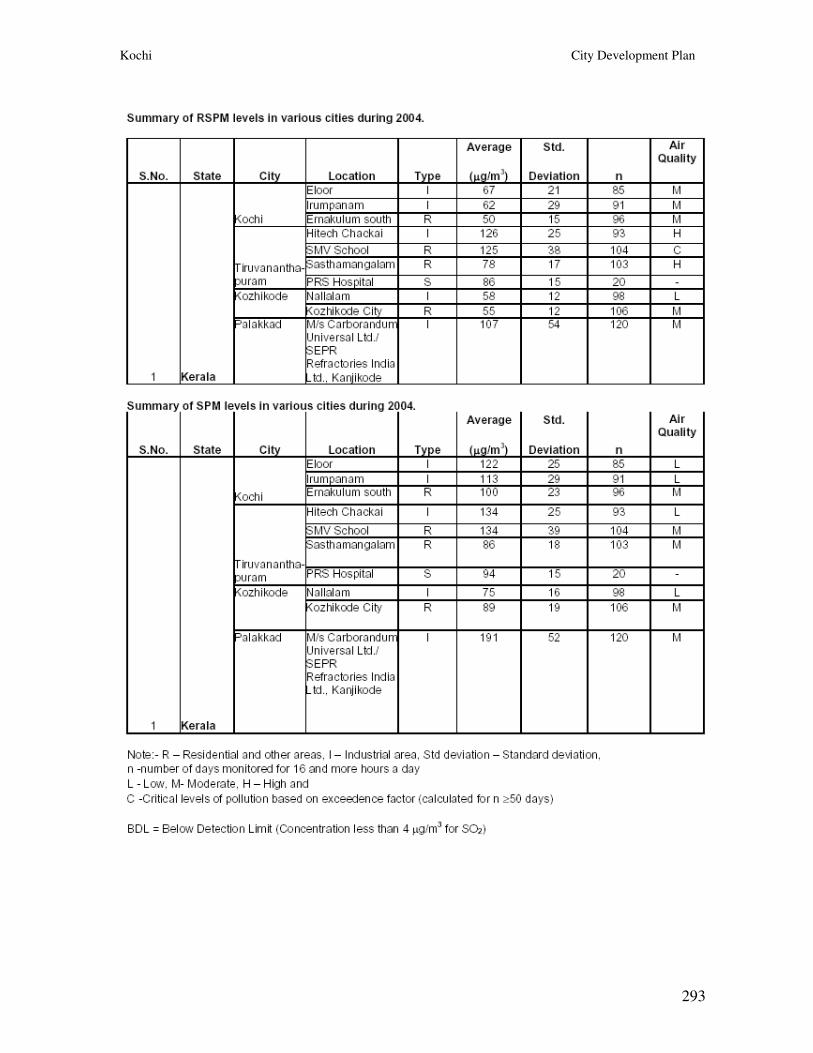
Kochi City Development Plan
293
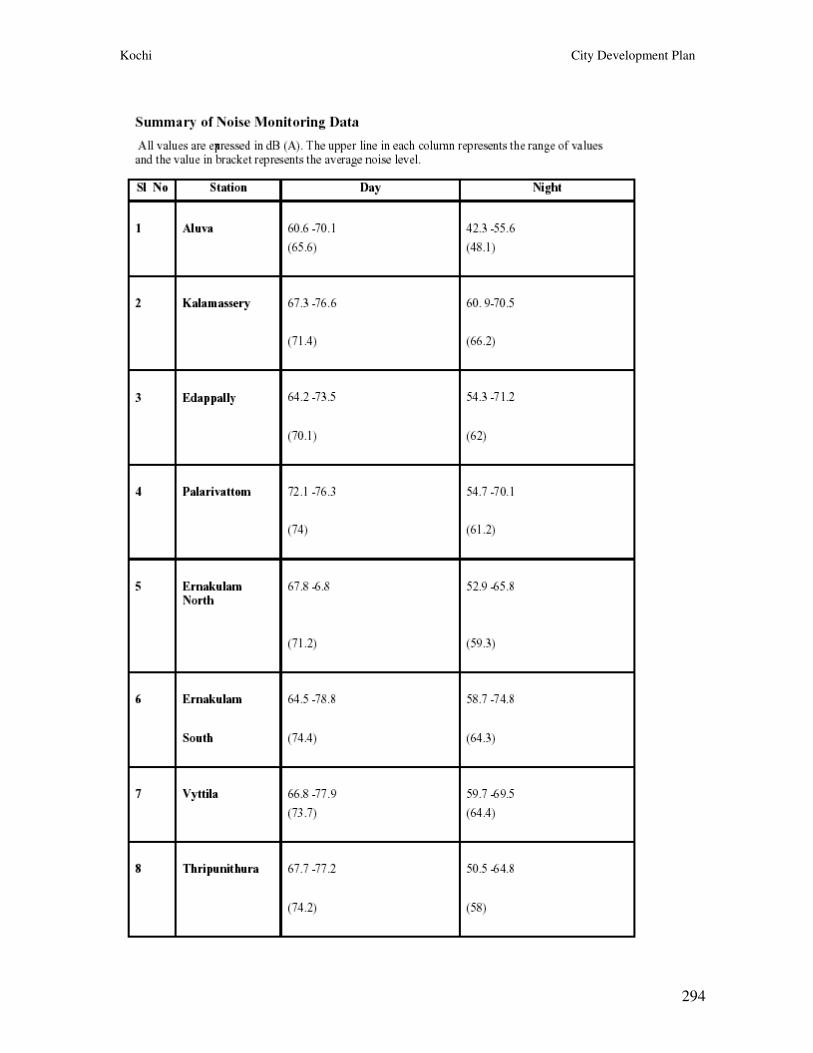
Kochi City Development Plan
294
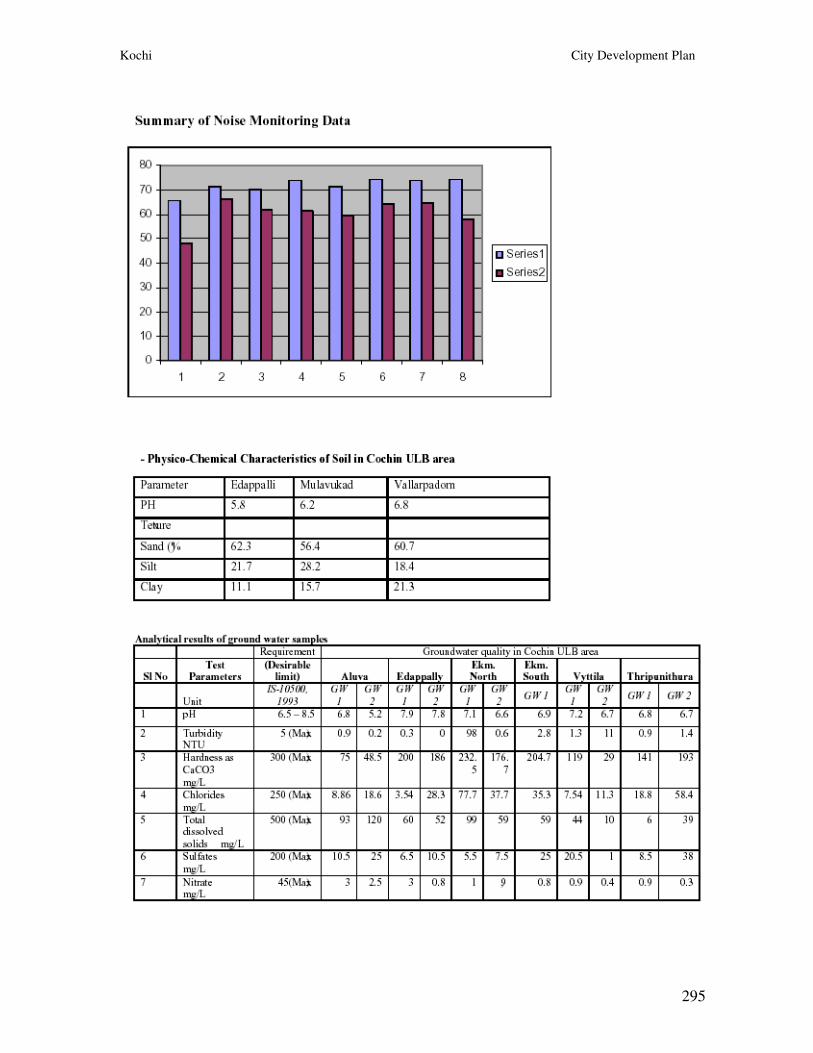
Kochi City Development Plan
295
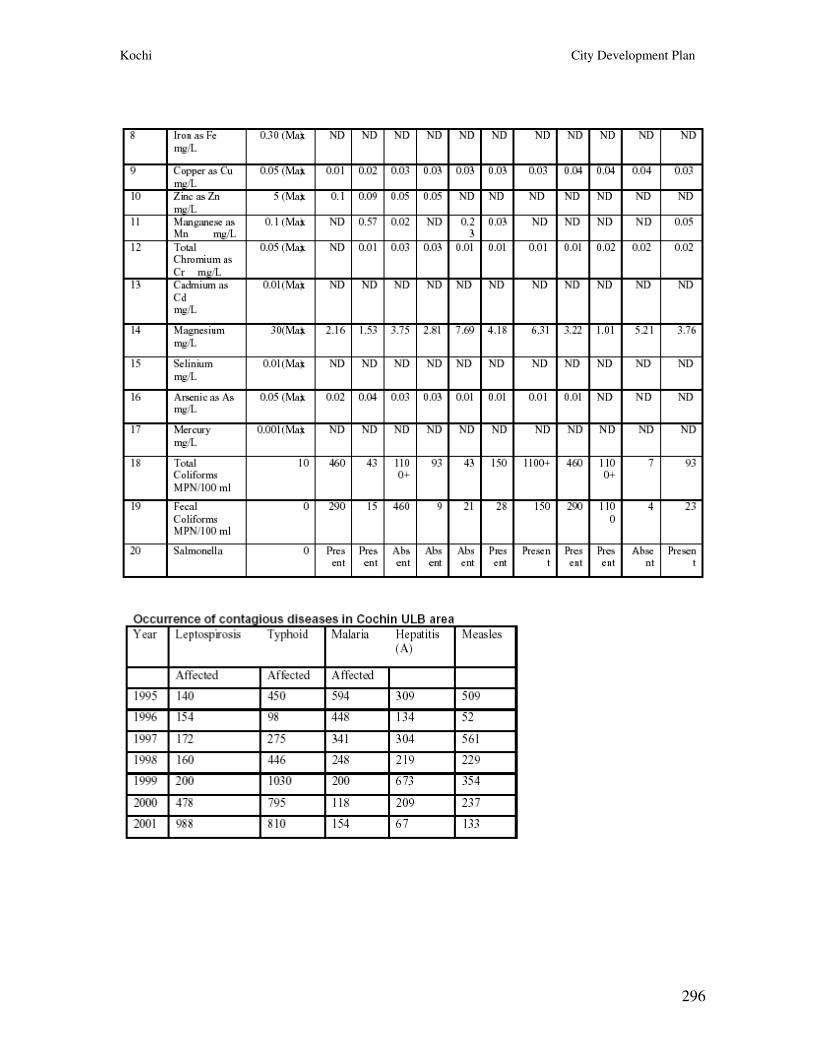
Kochi City Development Plan
296
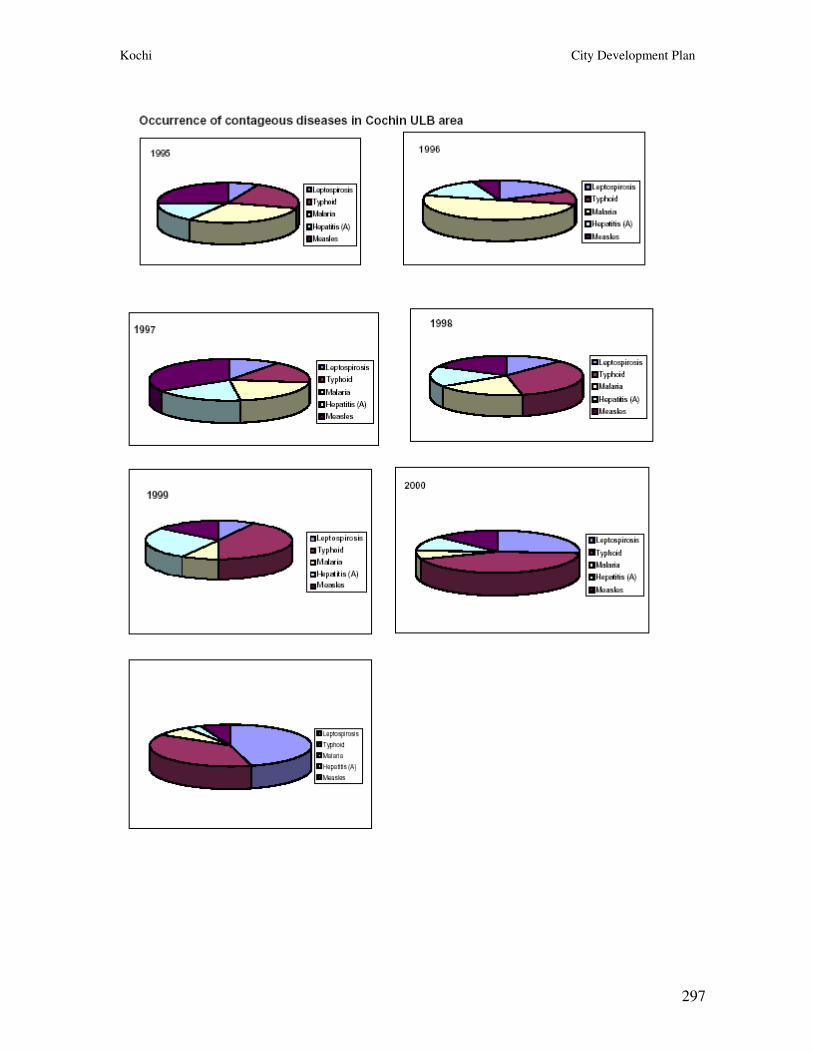
Kochi City Development Plan
297
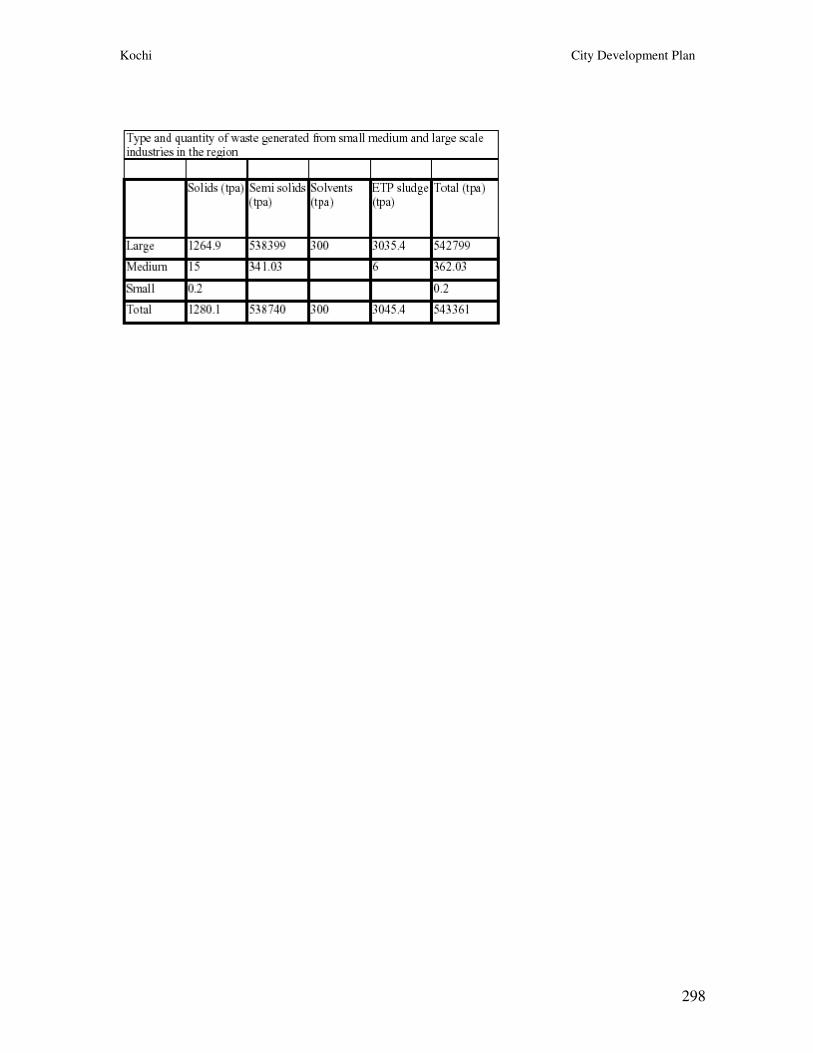
Kochi City Development Plan
298

Kochi City Development Plan
299
Annexure 7
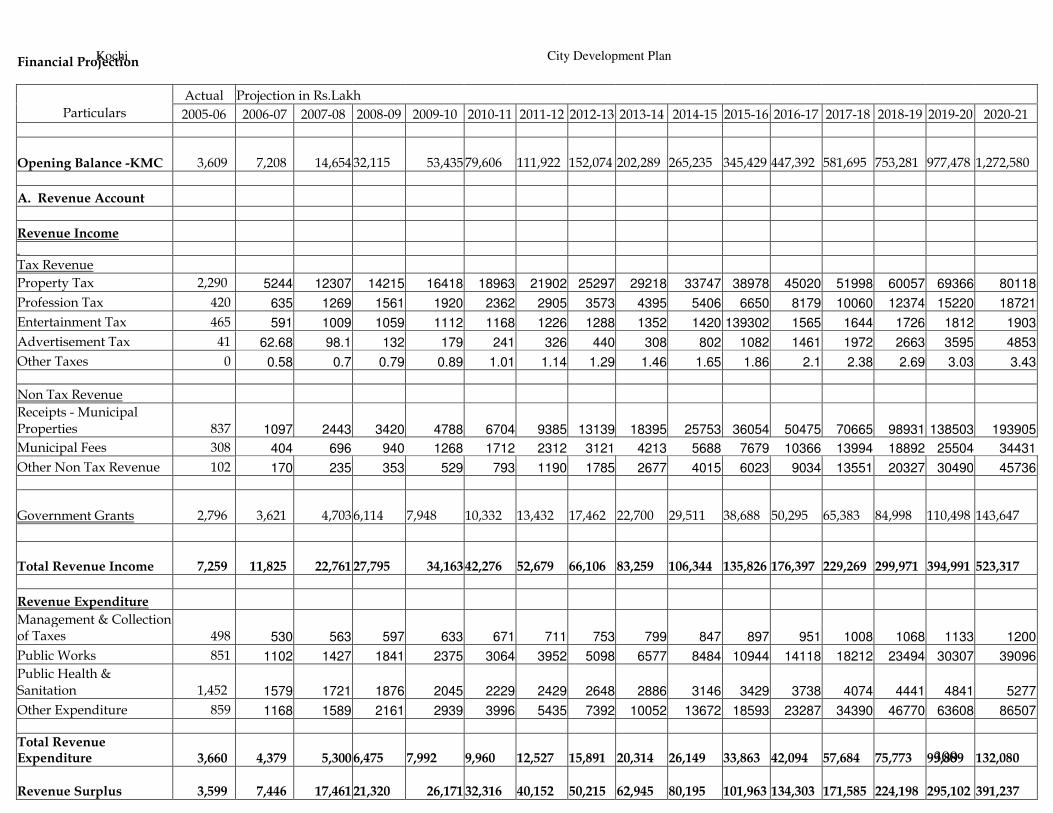
Kochi City Development Plan
300
Financial Projection
Actual Projection in Rs.Lakh
Particulars 2005-06 2006-07 2007-08 2008-09 2009-10 2010-11 2011-12 2012-13 2013-14 2014-15 2015-16 2016-17 2017-18 2018-19 2019-20 2020-21
Opening Balance -KMC 3,609 7,208 14,654 32,115 53,435
79,606
111,922
152,074
202,289
265,235
345,429
447,392
581,695
753,281
977,478
1,272,580
A. Revenue Account
Revenue Income
Tax Revenue
Property Tax 2,290 5244 12307 14215 16418 18963 21902 25297 29218 33747 38978 45020 51998 60057 69366 80118
Profession Tax 420 635 1269 1561 1920 2362 2905 3573 4395 5406 6650 8179 10060 12374 15220 18721
Entertainment Tax 465 591 1009 1059 1112 1168 1226 1288 1352 1420 139302 1565 1644 1726 1812 1903
Advertisement Tax 41 62.68 98.1 132 179 241 326 440 308 802 1082 1461 1972 2663 3595 4853
Other Taxes 0 0.58 0.7 0.79 0.89 1.01 1.14 1.29 1.46 1.65 1.86 2.1 2.38 2.69 3.03 3.43
Non Tax Revenue
Receipts - Municipal Properties 837 1097 2443 3420 4788 6704 9385 13139 18395 25753 36054 50475 70665 98931 138503 193905
Municipal Fees 308 404 696 940 1268 1712 2312 3121 4213 5688 7679 10366 13994 18892 25504 34431
Other Non Tax Revenue 102 170 235 353 529 793 1190 1785 2677 4015 6023 9034 13551 20327 30490 45736
Government Grants 2,796 3,621 4,703 6,114
7,948
10,332
13,432
17,462
22,700
29,511
38,688
50,295
65,383
84,998
110,498
143,647
Total Revenue Income 7,259 11,825 22,761 27,795 34,163
42,276
52,679
66,106
83,259
106,344
135,826
176,397
229,269
299,971
394,991
523,317
Revenue Expenditure
Management & Collection of Taxes 498 530 563 597 633 671 711 753 799 847 897 951 1008 1068 1133 1200
Public Works 851 1102 1427 1841 2375 3064 3952 5098 6577 8484 10944 14118 18212 23494 30307 39096
Public Health & Sanitation 1,452 1579 1721 1876 2045 2229 2429 2648 2886 3146 3429 3738 4074 4441 4841 5277
Other Expenditure 859 1168 1589 2161 2939 3996 5435 7392 10052 13672 18593 23287 34390 46770 63608 86507
Total Revenue Expenditure 3,660 4,379 5,300
6,475
7,992
9,960
12,527
15,891
20,314
26,149
33,863
42,094
57,684
75,773
99,889
132,080
Revenue Surplus 3,599 7,446 17,461 21,320 26,171
32,316
40,152
50,215
62,945
80,195
101,963
134,303
171,585
224,198
295,102
391,237
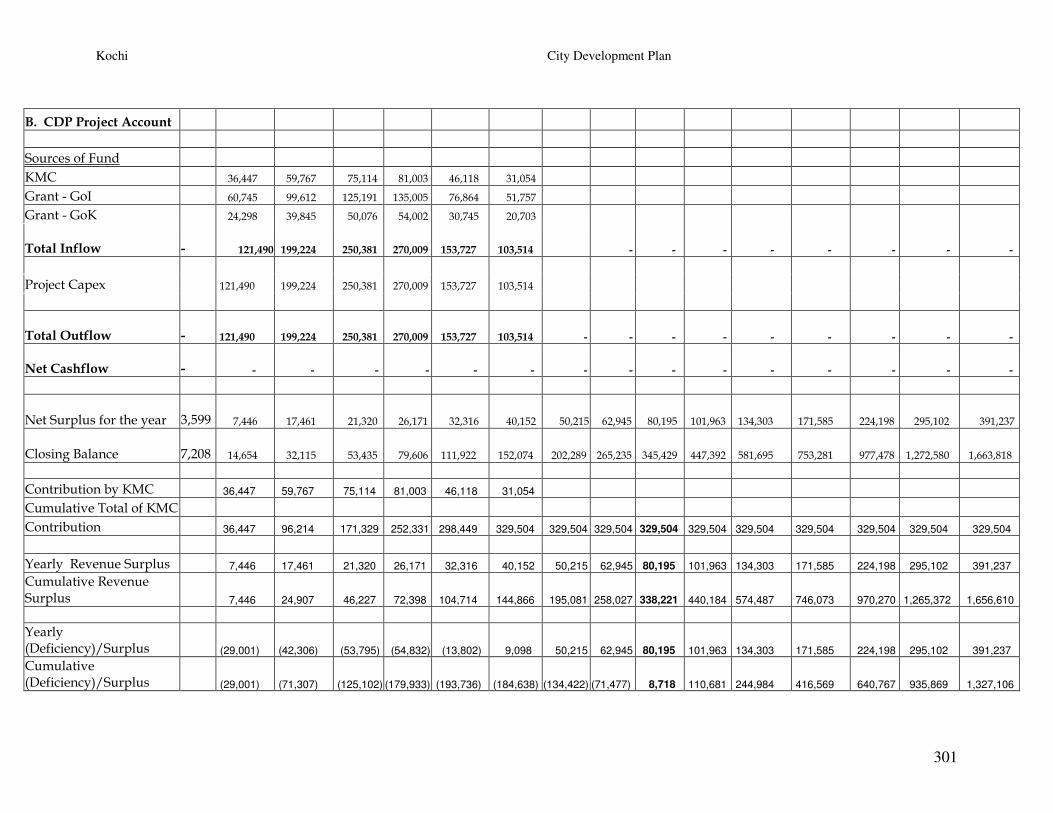
Kochi City Development Plan
301
B. CDP Project Account
Sources of Fund
KMC 36,447 59,767 75,114 81,003 46,118 31,054
Grant - GoI 60,745 99,612 125,191 135,005 76,864 51,757
Grant - GoK 24,298 39,845 50,076 54,002 30,745 20,703
Total Inflow - 121,490 199,224 250,381 270,009 153,727 103,514 - - - - - - - -
Project Capex 121,490 199,224 250,381 270,009 153,727 103,514
Total Outflow - 121,490 199,224 250,381 270,009 153,727 103,514 - - - - - - - - -
Net Cashflow - - - - - - - - - - - - - - - -
Net Surplus for the year 3,599 7,446 17,461 21,320 26,171 32,316 40,152 50,215 62,945 80,195 101,963 134,303 171,585 224,198 295,102 391,237
Closing Balance 7,208 14,654 32,115 53,435 79,606 111,922 152,074 202,289 265,235 345,429 447,392 581,695 753,281 977,478 1,272,580 1,663,818
Contribution by KMC 36,447 59,767 75,114 81,003 46,118 31,054
Cumulative Total of KMC
Contribution 36,447 96,214 171,329 252,331 298,449 329,504 329,504 329,504 329,504 329,504 329,504 329,504 329,504 329,504 329,504
Yearly Revenue Surplus 7,446 17,461 21,320 26,171 32,316 40,152 50,215 62,945 80,195 101,963 134,303 171,585 224,198 295,102 391,237
Cumulative Revenue Surplus 7,446 24,907 46,227 72,398 104,714 144,866 195,081 258,027 338,221 440,184 574,487 746,073 970,270 1,265,372 1,656,610
Yearly (Deficiency)/Surplus (29,001) (42,306) (53,795) (54,832) (13,802) 9,098 50,215 62,945 80,195 101,963 134,303 171,585 224,198 295,102 391,237
Cumulative (Deficiency)/Surplus (29,001) (71,307) (125,102)
(179,933) (193,736) (184,638)
(134,422)
(71,477) 8,718 110,681 244,984 416,569 640,767 935,869 1,327,106
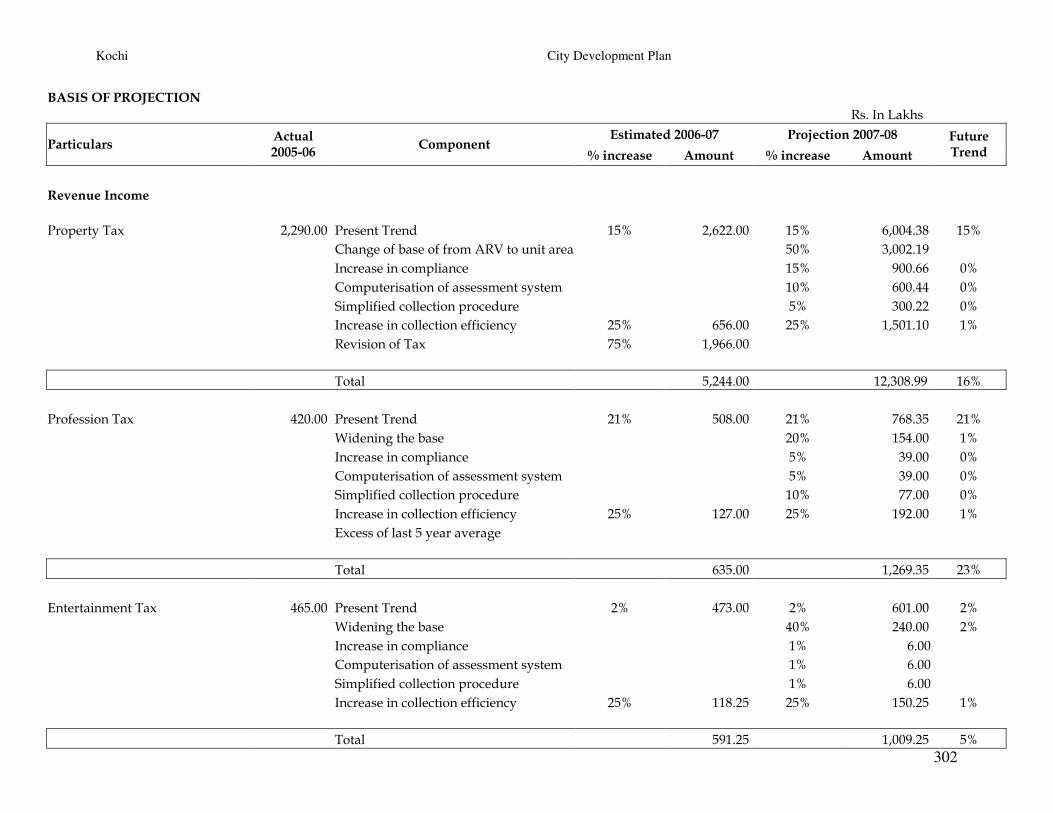
Kochi City Development Plan
302
BASIS OF PROJECTION
Rs. In Lakhs
Estimated 2006-07 Projection 2007-08 Particulars
Actual 2005-06
Component % increase Amount % increase Amount
Future Trend
Revenue Income
Property Tax 2,290.00 Present Trend 15% 2,622.00 15% 6,004.38 15%
Change of base of from ARV to unit area 50% 3,002.19
Increase in compliance 15% 900.66 0%
Computerisation of assessment system 10% 600.44 0%
Simplified collection procedure 5% 300.22 0%
Increase in collection efficiency 25% 656.00 25% 1,501.10 1%
Revision of Tax 75% 1,966.00
Total 5,244.00 12,308.99 16%
Profession Tax 420.00 Present Trend 21% 508.00 21% 768.35 21%
Widening the base 20% 154.00 1%
Increase in compliance 5% 39.00 0%
Computerisation of assessment system 5% 39.00 0%
Simplified collection procedure 10% 77.00 0%
Increase in collection efficiency 25% 127.00 25% 192.00 1%
Excess of last 5 year average
Total 635.00 1,269.35 23%
Entertainment Tax 465.00 Present Trend 2% 473.00 2% 601.00 2%
Widening the base 40% 240.00 2%
Increase in compliance 1% 6.00
Computerisation of assessment system 1% 6.00
Simplified collection procedure 1% 6.00
Increase in collection efficiency 25% 118.25 25% 150.25 1%
Total 591.25 1,009.25 5%
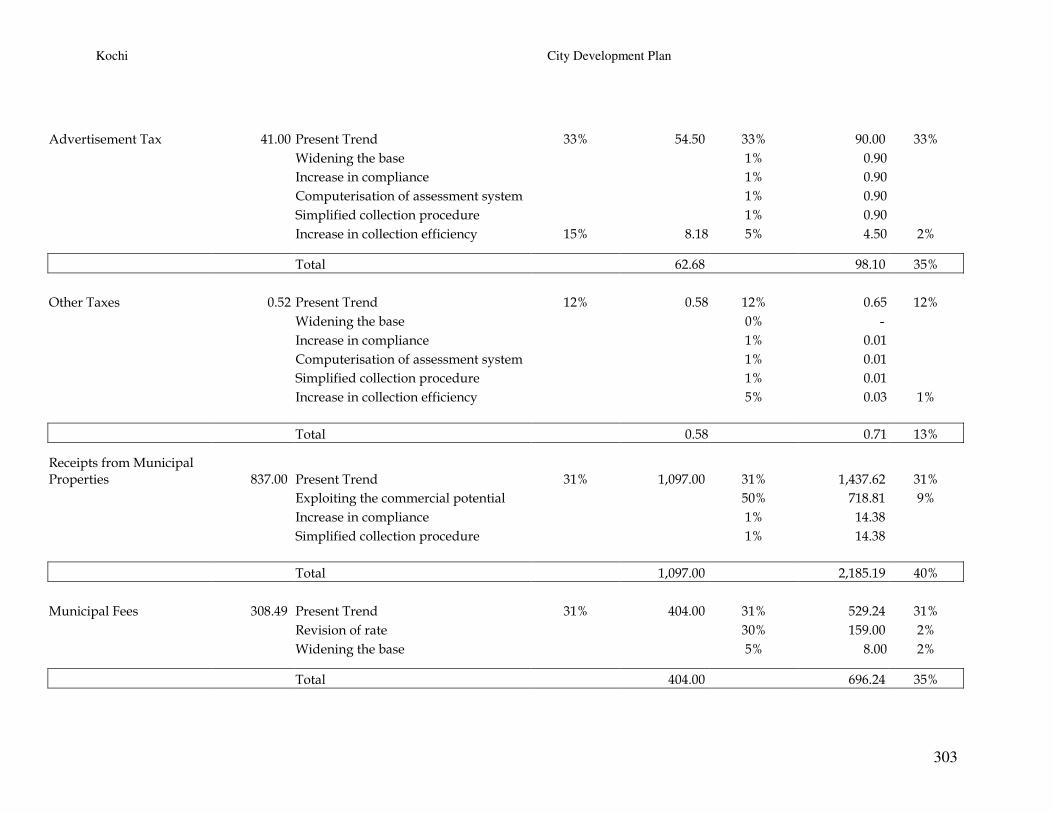
Kochi City Development Plan
303
Advertisement Tax 41.00 Present Trend 33% 54.50 33% 90.00 33%
Widening the base 1% 0.90
Increase in compliance 1% 0.90
Computerisation of assessment system 1% 0.90
Simplified collection procedure 1% 0.90
Increase in collection efficiency 15% 8.18 5% 4.50 2%
Total 62.68 98.10 35%
Other Taxes 0.52 Present Trend 12% 0.58 12% 0.65 12%
Widening the base 0% -
Increase in compliance 1% 0.01
Computerisation of assessment system 1% 0.01
Simplified collection procedure 1% 0.01
Increase in collection efficiency 5% 0.03 1%
Total 0.58 0.71 13%
Receipts from Municipal Properties 837.00 Present Trend 31% 1,097.00 31% 1,437.62 31%
Exploiting the commercial potential 50% 718.81 9%
Increase in compliance 1% 14.38
Simplified collection procedure 1% 14.38
Total 1,097.00 2,185.19 40%
Municipal Fees 308.49 Present Trend 31% 404.00 31% 529.24 31%
Revision of rate 30% 159.00 2%
Widening the base 5% 8.00 2%
Total 404.00 696.24 35%
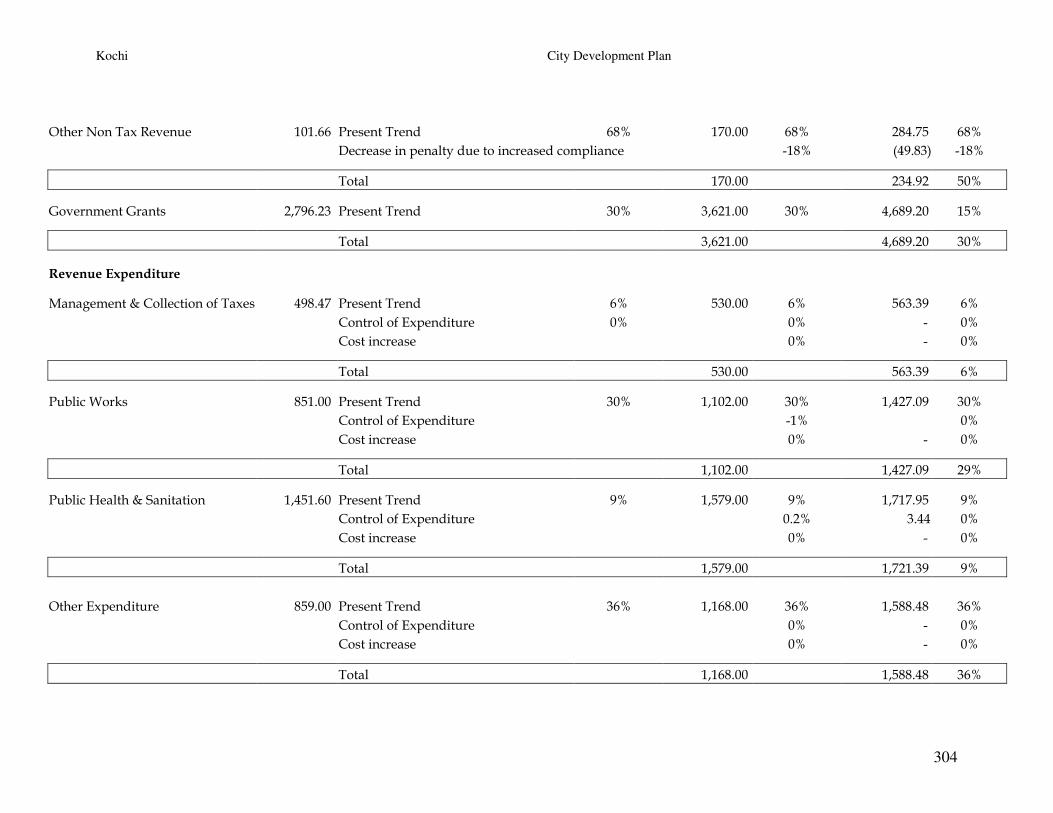
Kochi City Development Plan
304
Other Non Tax Revenue 101.66 Present Trend 68% 170.00 68% 284.75 68%
Decrease in penalty due to increased compliance -18% (49.83) -18%
Total 170.00 234.92 50%
Government Grants 2,796.23 Present Trend 30% 3,621.00 30% 4,689.20 15%
Total 3,621.00 4,689.20 30%
Revenue Expenditure
Management & Collection of Taxes 498.47 Present Trend 6% 530.00 6% 563.39 6%
Control of Expenditure 0% 0% - 0%
Cost increase 0% - 0%
Total 530.00 563.39 6%
Public Works 851.00 Present Trend 30% 1,102.00 30% 1,427.09 30%
Control of Expenditure -1% 0%
Cost increase 0% - 0%
Total 1,102.00 1,427.09 29%
Public Health & Sanitation 1,451.60 Present Trend 9% 1,579.00 9% 1,717.95 9%
Control of Expenditure 0.2% 3.44 0%
Cost increase 0% - 0%
Total 1,579.00 1,721.39 9%
Other Expenditure 859.00 Present Trend 36% 1,168.00 36% 1,588.48 36%
Control of Expenditure 0% - 0%
Cost increase 0% - 0%
Total 1,168.00 1,588.48 36%

Kochi City Development Plan
306
ANNEXURE - 8
Kochi City Development Plan
307
List of Abbreviations
1) ADS Area Development Society
2) BCDC Backward Class Development Corporation
3) BOT Build Operate and Transfer
4) BPL Below Poverty Line
5) CBD Central Business District
6) CBO Community Based Organization
7) CDS Community Development Society
8) CESS Centre for Earth Science Studies
9) CHC Community Health Centre
10) CoPT Cochin Port Trust
11) CPHEEO Central Public Health Engineering and Environmental
12) CRZ Coastal Regulation Zone
13) CT Census Town
14) CUPRP Cochin Urban Poverty Reduction Programme
15) CUSAT Cochin University of Science and Technology
16) DFID Department for International Development (UK)
17) DPR Detailed Project Report
18) DWCUA Development of Woman and Children in Urban Area
19) DWF Dry Weather Flow
20) EMC Environmental Management Centre
21) G.O.K. Govt of Kerala
22) GCDA Greater Cochin Development Authority
23) GIDA Gosree Island Development Authority
24) GIS Geographical Information System
25) HMT Hindustan Machine Tools
26) HUDCO Housing and Urban Development Corporation
27) ICDS Integrated Child Development Scheme
28) IWTA Inland Water Transport Authority
29) K.U.A. Kochi Urban Agglomeration
30) KILA Kerala Institute of Local Administration
31) KINCO Kerala Inland Navigation Corporation
32) KMC Kochi Municipal Corporation
33) KRL Kochi Refineries LTD
34) KSEB Kerala State Electricity Board
35) KSRTC Kerala State Transport Corporation
36) KSSP Kerala Sasthra Sahithya Parishath
37) KSWDC Kerala State Women’s Development Corporation
38) KUDFC Kerala Urban Development Finance Corporation
39) KWA Kerala Water Authority
40) L.N.G. Liquified Natural Gas
41) L.S.G. Local Self Govts
42) LIC Life Insurance Corporation of India
43) LCV Light Cargo Vehicle
44) LPCD Litre Per Consumer Per Day
Kochi City Development Plan
308
45) M Municipality
46) MCW Maternity and Child Welfare
47) mld million litre per day
48) MRTS Mass Rapid Transport System
49) MSL Mean Sea Level
50) NABARD National Bank for Agricultural and Rural
Development
51) NATPAC National Transportation Planning and Research
Centre
52) NGO Non – Governmental Organization
53) NHAI National Highway Authority of India
54) NHG Neighbourhood Group
55) NSDP National Slum Development Programme
56) NUTP National Urban Transportation Policy Organization
57) P.R.S. Palluruthy Relief Settlement
58) P.W.D. Public Works Department
59) PCU Passenger Car Unit
60) PHC Primary Health Centre
61) PLL Petronet LNG LTD
62) PMRY Prime Minister’s Rozgar Yojana
63) PSU Public Sector Undertakings
64) RITES Rail India Technical and Economic Services
65) ROB Road Over Bridge
66) RTO Regional Transport Office
67) S.W.D. Social Welfare Department
68) SCADA System Control And Data Acquisition
69) SJSRY Swarna Jayanthi Shahari Rozgar Yojana
70) SJSY Swarna Jayanthi Swarosgar Yogana
71) SPEM State Poverty Eradication Mission
72) SWM Storm Water Management / Solid Waste Management
73) UA Urban Agglomeration
74) ULB Urban Local Body
75) UPAD Urban Poverty Alleviation Dept.
76) USEP Urban Self Employment Programme
77) UWEP Urban Wage Employment Programme
78) VAMBAY Valmiki Ambedkar Malinavasthi Avaz Yojana
79) W.B.M. Water Bound Macaudum
80) WTP Water Treatment Plant
Related Documents