This article appeared in a journal published by Elsevier. The attached copy is furnished to the author for internal non-commercial research and education use, including for instruction at the authors institution and sharing with colleagues. Other uses, including reproduction and distribution, or selling or licensing copies, or posting to personal, institutional or third party websites are prohibited. In most cases authors are permitted to post their version of the article (e.g. in Word or Tex form) to their personal website or institutional repository. Authors requiring further information regarding Elsevier’s archiving and manuscript policies are encouraged to visit: http://www.elsevier.com/copyright

Welcome message from author
This document is posted to help you gain knowledge. Please leave a comment to let me know what you think about it! Share it to your friends and learn new things together.
Transcript

This article appeared in a journal published by Elsevier. The attachedcopy is furnished to the author for internal non-commercial researchand education use, including for instruction at the authors institution
and sharing with colleagues.
Other uses, including reproduction and distribution, or selling orlicensing copies, or posting to personal, institutional or third party
websites are prohibited.
In most cases authors are permitted to post their version of thearticle (e.g. in Word or Tex form) to their personal website orinstitutional repository. Authors requiring further information
regarding Elsevier’s archiving and manuscript policies areencouraged to visit:
http://www.elsevier.com/copyright

Author's personal copy
Fisheries Research 100 (2009) 140–147
Contents lists available at ScienceDirect
Fisheries Research
journa l homepage: www.e lsev ier .com/ locate / f i shres
Diel interactions between sprat and mackerel in a marine lough and their effectsupon acoustic measurements of fish abundance
Frank R. Knudsen a,∗, Anthony Hawkins b, Rob McAllen c, Olav Sand d
a Fisheries Research, Simrad, Kongsberg Maritime, PO Box 111, N-3191 Horten, Norwayb Loughine Ltd, Kincraig, Blairs, Aberdeen AB12 5YT, United Kingdomc University College Cork, Enterprise Centre, Distillery Fields, North Mall, Cork City, Irelandd Department of Molecular Biosciences, University of Oslo, P.O. Box 1041 Blindern, N-0316 Oslo, Norway
a r t i c l e i n f o
Article history:Received 28 April 2009Received in revised form 8 June 2009Accepted 9 June 2009
Keywords:Diel changesSprattus sprattusScomber scombrusFish abundanceTarget strengthSwim bladder
a b s t r a c t
We have investigated how diel changes in fish behaviour may affect acoustic estimates of fish abundancein a marine system. Studies in Lough Hyne (Ireland), a marine lake with only a narrow and shallow con-nection to the sea, showed the presence of large numbers of sprat (Sprattus sprattus), mackerel (Scomberscombrus), and zooplankton. Fish species were identified from regular rod and line fishing. Zooplanktonwere identified from net hauls. Acoustic measures of zooplankton were low with little diel variation. Thesprat formed dense schools during the day and dispersed into the water column at night. The acousticestimate of sprat abundance at night, obtained by means of a standard hydroacoustic technique and pro-tocol, was more than double the estimated biomass during the day. We have considered whether thelower fish estimate during daytime resulted from acoustic shadowing due to aggregation of the fish intodense schools. However, no decrease in echo energy was evident from the top to the bottom of the schools,and there was no reduction in the seabed echo beneath the schools. Acoustic shadowing was thereforenot responsible for the diel differences in the estimates of abundance. Instead, we suggest that the targetstrength of individual sprat diminished during the day as a result of attacks from predatory mackerel. Weobserved echoes from gas released by the sprat as they gathered into dense plumes close to the seabed.Compression of the gas remaining within the swim bladder as the fish were moving deeper would alsoreduce swim bladder volume. Finally, negative buoyancy due to reduced swim bladder volume may inaddition have forced the fish to change tilt angle to compensate for sinking. All these effects will reducethe target strengths of individual fish and lead to underestimation of fish abundance based on daytimesurveys.
© 2009 Elsevier B.V. All rights reserved.
1. Introduction
Acoustic assessment of fish abundance is central to the manage-ment of pelagic fish populations. Echo integration (Dragesund andOlsen, 1965) has become a standard method for assessing pelagicfish stocks both in marine- and freshwater systems (Simmonds andMacLennan, 2005).
Physical and behavioural factors can complicate acoustic esti-mates of fish abundance (Aglen, 1994; Fréon et al., 1993a). Therehas been extensive research on the effects of vessel avoidance(Olsen et al., 1983a; Ona et al., 2007; Vabø et al., 2002; Sand etal., 2008), surface- and bottom echosounder blind zones (Kubeckaand Wittingerova, 1998; Ona and Mitson, 1996), acoustic shadow-
∗ Corresponding author. Tel.: +47 3303 4001; fax: +47 3304 2987.E-mail addresses: [email protected] (F.R. Knudsen),
[email protected] (A. Hawkins),[email protected] (R. McAllen), [email protected] (O. Sand).
ing (Foote et al., 1992; Røttingen, 1976; Toresen, 1991), variationin swim bladder volume (Edwards and Armstrong, 1984; Ona,2003), and changes in fish aspect relative to the acoustic beam(Huse and Ona, 1996; Kubecka and Duncan, 1998; Nakken andOlsen, 1977). Studies have also indicated that diel and seasonalchanges in fish distribution can affect stock assessments (Fréonet al., 1993b; Hjellvik et al., 2004; Huse and Korneliussen, 2000;Johnsen and Godø, 2007; Lawson and Rose, 1999; Malinen et al.,2005a; Michalsen et al., 1996; Orlowski, 2001; Winfield et al., 2007).Diel vertical migration of invertebrates can also introduce a bias inacoustic estimates of fish (Eckmann, 1998; Jurvelius et al., 2008;Malinen et al., 2005b).
Horizontal fish migrations may cause short-term variability offish abundance in a surveyed area. This phenomenon was studiedby Gerlotto and Petitgas (1991), who observed that the biomassestimated by echo integration could vary greatly between succes-sive recordings along the same transect as fish schools moved intoand out of the area. Repeated day and night surveys of the samearea may show great variability, making it difficult to study effects
0165-7836/$ – see front matter © 2009 Elsevier B.V. All rights reserved.doi:10.1016/j.fishres.2009.06.015
Author's personal copy
F.R. Knudsen et al. / Fisheries Research 100 (2009) 140–147 141
of diel changes in behaviour upon acoustic measurements of fishabundance in the sea.
By standardising and pooling data from a large number of acous-tic surveys at different locations, Fréon et al. (1993b) concluded thatthe highest estimates of fish abundance tended to be obtained fromdata collected during the night, although this is not the case forall species. Abundance estimates for the Atlantic cod seem to givehigher values during daytime surveys (Hjellvik et al., 2004; Lawsonand Rose, 1999).
There is potential for increasing the accuracy of stock abundanceestimates through better knowledge of how diel changes in fishbehaviour may affect them. The problem of changes in true fishabundance over the observation period can be overcome by per-forming the survey in a confined area, where fish may neither enternor leave. If the survey covers the complete body of water, short-term changes in true fish abundance are then excluded. Accordingly,complete acoustic surveys of confined populations in lakes showno significant differences in fish density estimates on consecutivedays (Gangl and Whaley, 2004), in marked contrast to the situationin the sea (Gerlotto and Petitgas, 1991). Furthermore, estimates oftotal fish biomass in a moderately sized lake or reservoir may beobtained from data collected within a few hours.
These factors make lakes and reservoirs ideal locations fortesting and comparing acoustic methods of stock assessment inorder to develop reliable techniques and routines (Baroudy andElliott, 2006; Guillard and Vergès, 2007; Knudsen and Sægrov,2002; Kubecka and Wittingerova, 1998; Wanzenböck et al., 2003).In lakes and reservoirs, fish are typically dispersed in the openwater at night, yielding higher acoustic abundance estimates thanwhen they are aggregated in schools during the day (Appenzellerand Leggett, 1992; Eckmann, 1991; Knudsen and Sægrov, 2002;Malinen and Tuomaala, 2005; Kubecka and Wittingerova, 1998).Appenzeller and Leggett (1992) concluded that the lower acousticestimates obtained when fish aggregated during the day resultedfrom acoustic shadowing.
Unfortunately, similar tests of acoustic methods for abundanceassessments are difficult to perform on marine fish populationsbecause of a lack of suitable locations. The aim of the present studywas to investigate how diel changes in fish behaviour may affectestimates of fish abundance in a marine system. We emphasise thepotential of Lough Hyne in Ireland in this context. This lough isessentially a marine lake with a narrow entrance, and within thelough we expect little short-term variation in the abundance ofpelagic fish. We demonstrate that diel changes in the behaviourof sprat and mackerel, associated with predation on the former bythe latter, greatly affect the estimated biomass of sprat. We providean explanation for the diel variation in estimated biomass, and rec-ommend that under similar circumstances acoustic surveys are bestcarried out at night.
2. Materials and methods
2.1. Location
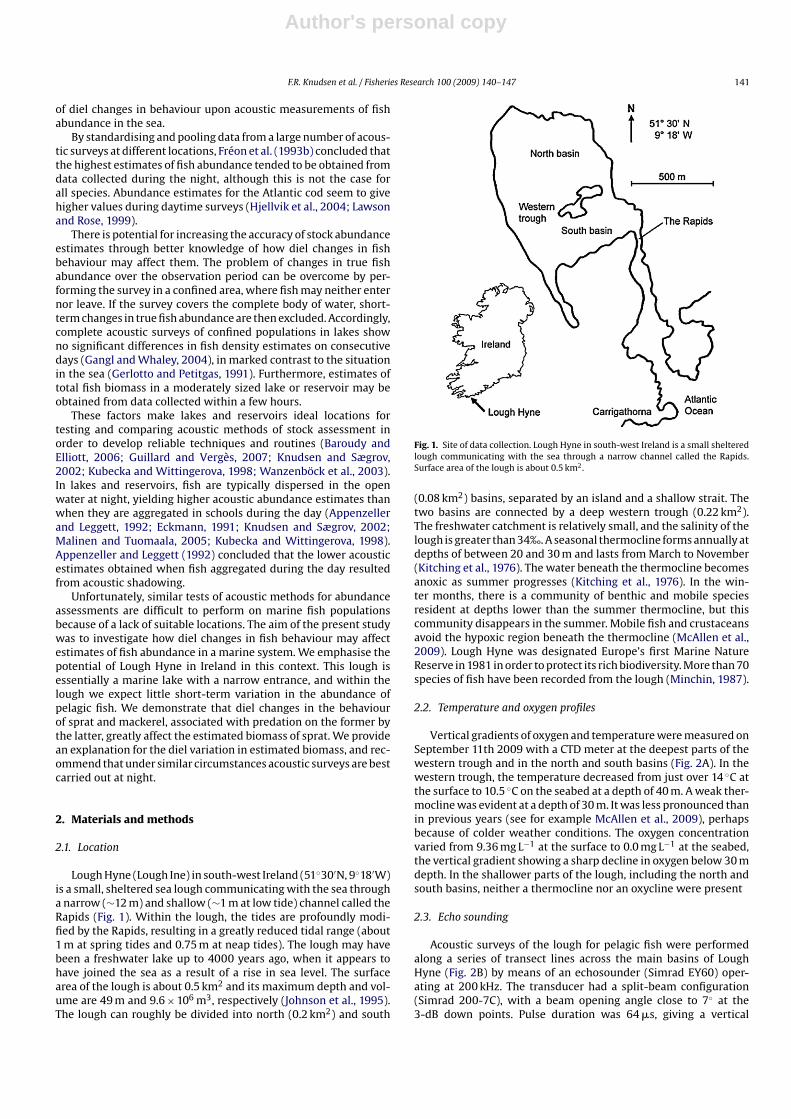
Lough Hyne (Lough Ine) in south-west Ireland (51◦30′N, 9◦18′W)is a small, sheltered sea lough communicating with the sea througha narrow (∼12 m) and shallow (∼1 m at low tide) channel called theRapids (Fig. 1). Within the lough, the tides are profoundly modi-fied by the Rapids, resulting in a greatly reduced tidal range (about1 m at spring tides and 0.75 m at neap tides). The lough may havebeen a freshwater lake up to 4000 years ago, when it appears tohave joined the sea as a result of a rise in sea level. The surfacearea of the lough is about 0.5 km2 and its maximum depth and vol-ume are 49 m and 9.6 × 10⁶ m3, respectively (Johnson et al., 1995).The lough can roughly be divided into north (0.2 km2) and south
Fig. 1. Site of data collection. Lough Hyne in south-west Ireland is a small shelteredlough communicating with the sea through a narrow channel called the Rapids.Surface area of the lough is about 0.5 km2.
(0.08 km2) basins, separated by an island and a shallow strait. Thetwo basins are connected by a deep western trough (0.22 km2).The freshwater catchment is relatively small, and the salinity of thelough is greater than 34‰. A seasonal thermocline forms annually atdepths of between 20 and 30 m and lasts from March to November(Kitching et al., 1976). The water beneath the thermocline becomesanoxic as summer progresses (Kitching et al., 1976). In the win-ter months, there is a community of benthic and mobile speciesresident at depths lower than the summer thermocline, but thiscommunity disappears in the summer. Mobile fish and crustaceansavoid the hypoxic region beneath the thermocline (McAllen et al.,2009). Lough Hyne was designated Europe’s first Marine NatureReserve in 1981 in order to protect its rich biodiversity. More than 70species of fish have been recorded from the lough (Minchin, 1987).
2.2. Temperature and oxygen profiles
Vertical gradients of oxygen and temperature were measured onSeptember 11th 2009 with a CTD meter at the deepest parts of thewestern trough and in the north and south basins (Fig. 2A). In thewestern trough, the temperature decreased from just over 14 ◦C atthe surface to 10.5 ◦C on the seabed at a depth of 40 m. A weak ther-mocline was evident at a depth of 30 m. It was less pronounced thanin previous years (see for example McAllen et al., 2009), perhapsbecause of colder weather conditions. The oxygen concentrationvaried from 9.36 mg L−1 at the surface to 0.0 mg L−1 at the seabed,the vertical gradient showing a sharp decline in oxygen below 30 mdepth. In the shallower parts of the lough, including the north andsouth basins, neither a thermocline nor an oxycline were present
2.3. Echo sounding
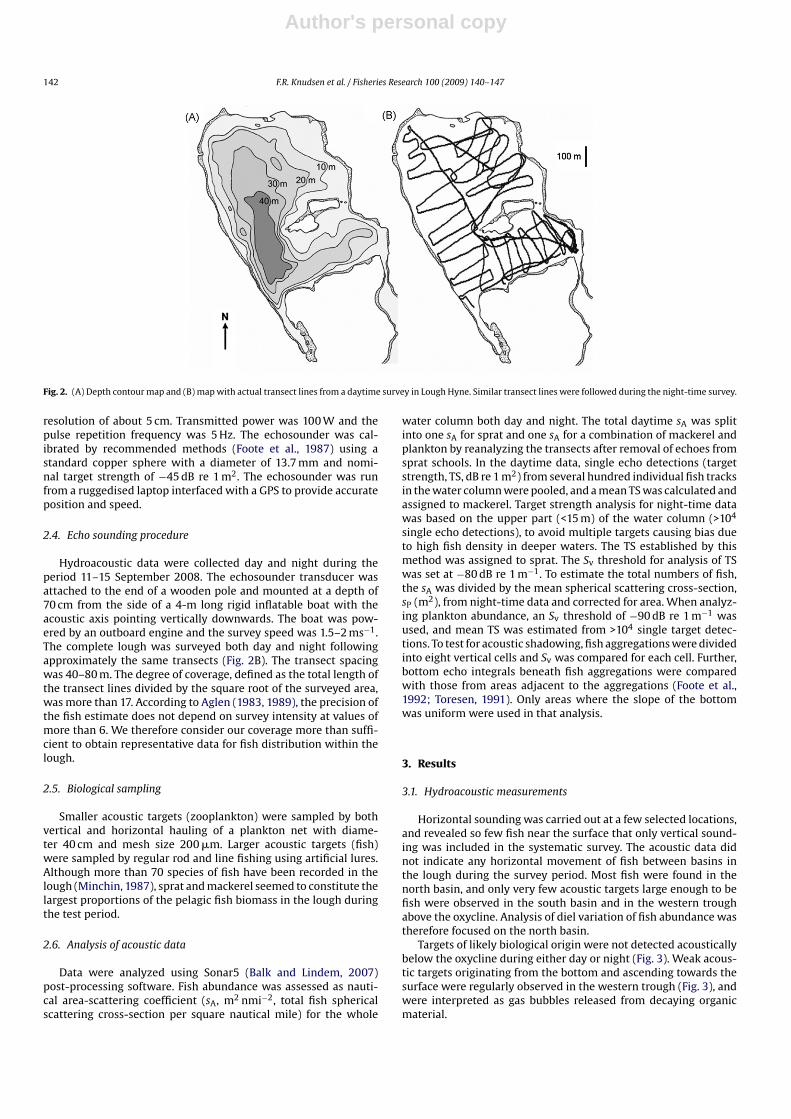
Acoustic surveys of the lough for pelagic fish were performedalong a series of transect lines across the main basins of LoughHyne (Fig. 2B) by means of an echosounder (Simrad EY60) oper-ating at 200 kHz. The transducer had a split-beam configuration(Simrad 200-7C), with a beam opening angle close to 7◦ at the3-dB down points. Pulse duration was 64 �s, giving a vertical
Author's personal copy
142 F.R. Knudsen et al. / Fisheries Research 100 (2009) 140–147
Fig. 2. (A) Depth contour map and (B) map with actual transect lines from a daytime survey in Lough Hyne. Similar transect lines were followed during the night-time survey.
resolution of about 5 cm. Transmitted power was 100 W and thepulse repetition frequency was 5 Hz. The echosounder was cal-ibrated by recommended methods (Foote et al., 1987) using astandard copper sphere with a diameter of 13.7 mm and nomi-nal target strength of −45 dB re 1 m2. The echosounder was runfrom a ruggedised laptop interfaced with a GPS to provide accurateposition and speed.
2.4. Echo sounding procedure
Hydroacoustic data were collected day and night during theperiod 11–15 September 2008. The echosounder transducer wasattached to the end of a wooden pole and mounted at a depth of70 cm from the side of a 4-m long rigid inflatable boat with theacoustic axis pointing vertically downwards. The boat was pow-ered by an outboard engine and the survey speed was 1.5–2 ms−1.The complete lough was surveyed both day and night followingapproximately the same transects (Fig. 2B). The transect spacingwas 40–80 m. The degree of coverage, defined as the total length ofthe transect lines divided by the square root of the surveyed area,was more than 17. According to Aglen (1983, 1989), the precision ofthe fish estimate does not depend on survey intensity at values ofmore than 6. We therefore consider our coverage more than suffi-cient to obtain representative data for fish distribution within thelough.
2.5. Biological sampling
Smaller acoustic targets (zooplankton) were sampled by bothvertical and horizontal hauling of a plankton net with diame-ter 40 cm and mesh size 200 �m. Larger acoustic targets (fish)were sampled by regular rod and line fishing using artificial lures.Although more than 70 species of fish have been recorded in thelough (Minchin, 1987), sprat and mackerel seemed to constitute thelargest proportions of the pelagic fish biomass in the lough duringthe test period.
2.6. Analysis of acoustic data
Data were analyzed using Sonar5 (Balk and Lindem, 2007)post-processing software. Fish abundance was assessed as nauti-cal area-scattering coefficient (sA, m2 nmi−2, total fish sphericalscattering cross-section per square nautical mile) for the whole
water column both day and night. The total daytime sA was splitinto one sA for sprat and one sA for a combination of mackerel andplankton by reanalyzing the transects after removal of echoes fromsprat schools. In the daytime data, single echo detections (targetstrength, TS, dB re 1 m2) from several hundred individual fish tracksin the water column were pooled, and a mean TS was calculated andassigned to mackerel. Target strength analysis for night-time datawas based on the upper part (<15 m) of the water column (>104
single echo detections), to avoid multiple targets causing bias dueto high fish density in deeper waters. The TS established by thismethod was assigned to sprat. The Sv threshold for analysis of TSwas set at −80 dB re 1 m−1. To estimate the total numbers of fish,the sA was divided by the mean spherical scattering cross-section,sP (m2), from night-time data and corrected for area. When analyz-ing plankton abundance, an Sv threshold of −90 dB re 1 m−1 wasused, and mean TS was estimated from >104 single target detec-tions. To test for acoustic shadowing, fish aggregations were dividedinto eight vertical cells and Sv was compared for each cell. Further,bottom echo integrals beneath fish aggregations were comparedwith those from areas adjacent to the aggregations (Foote et al.,1992; Toresen, 1991). Only areas where the slope of the bottomwas uniform were used in that analysis.
3. Results
3.1. Hydroacoustic measurements
Horizontal sounding was carried out at a few selected locations,and revealed so few fish near the surface that only vertical sound-ing was included in the systematic survey. The acoustic data didnot indicate any horizontal movement of fish between basins inthe lough during the survey period. Most fish were found in thenorth basin, and only very few acoustic targets large enough to befish were observed in the south basin and in the western troughabove the oxycline. Analysis of diel variation of fish abundance wastherefore focused on the north basin.
Targets of likely biological origin were not detected acousticallybelow the oxycline during either day or night (Fig. 3). Weak acous-tic targets originating from the bottom and ascending towards thesurface were regularly observed in the western trough (Fig. 3), andwere interpreted as gas bubbles released from decaying organicmaterial.
Author's personal copy
F.R. Knudsen et al. / Fisheries Research 100 (2009) 140–147 143
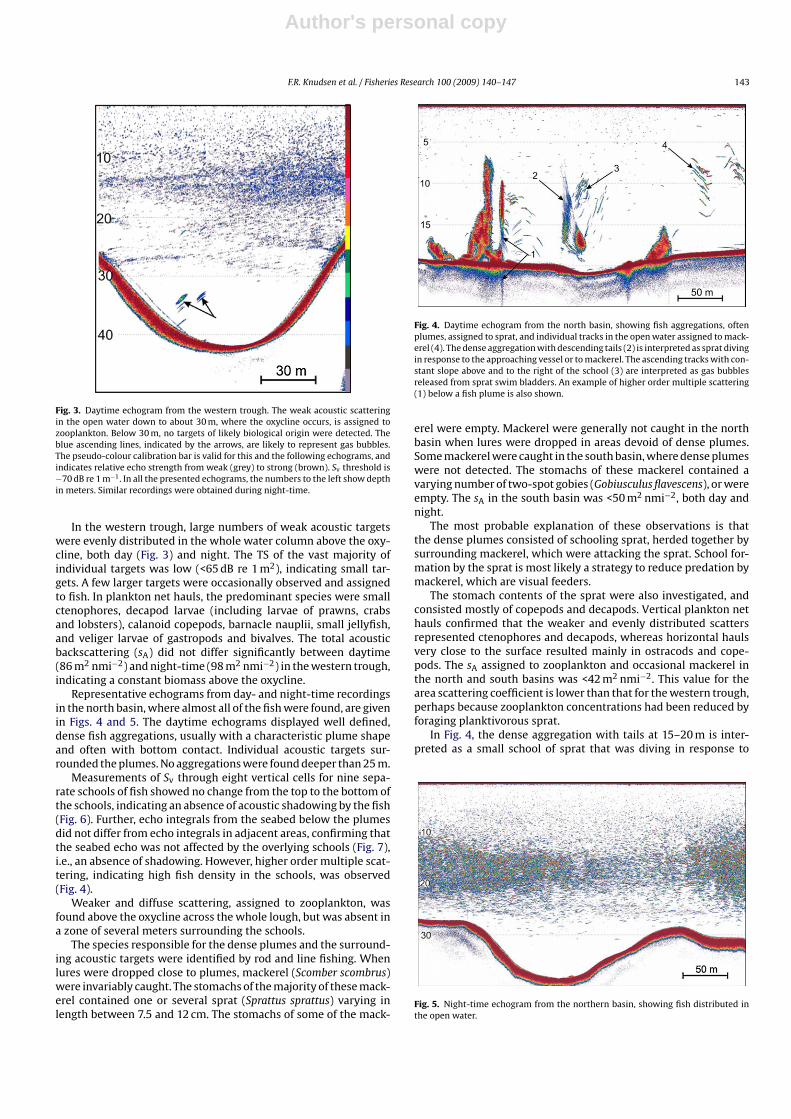
Fig. 3. Daytime echogram from the western trough. The weak acoustic scatteringin the open water down to about 30 m, where the oxycline occurs, is assigned tozooplankton. Below 30 m, no targets of likely biological origin were detected. Theblue ascending lines, indicated by the arrows, are likely to represent gas bubbles.The pseudo-colour calibration bar is valid for this and the following echograms, andindicates relative echo strength from weak (grey) to strong (brown). Sv threshold is−70 dB re 1 m−1. In all the presented echograms, the numbers to the left show depthin meters. Similar recordings were obtained during night-time.
In the western trough, large numbers of weak acoustic targetswere evenly distributed in the whole water column above the oxy-cline, both day (Fig. 3) and night. The TS of the vast majority ofindividual targets was low (<65 dB re 1 m2), indicating small tar-gets. A few larger targets were occasionally observed and assignedto fish. In plankton net hauls, the predominant species were smallctenophores, decapod larvae (including larvae of prawns, crabsand lobsters), calanoid copepods, barnacle nauplii, small jellyfish,and veliger larvae of gastropods and bivalves. The total acousticbackscattering (sA) did not differ significantly between daytime(86 m2 nmi−2) and night-time (98 m2 nmi−2) in the western trough,indicating a constant biomass above the oxycline.
Representative echograms from day- and night-time recordingsin the north basin, where almost all of the fish were found, are givenin Figs. 4 and 5. The daytime echograms displayed well defined,dense fish aggregations, usually with a characteristic plume shapeand often with bottom contact. Individual acoustic targets sur-rounded the plumes. No aggregations were found deeper than 25 m.
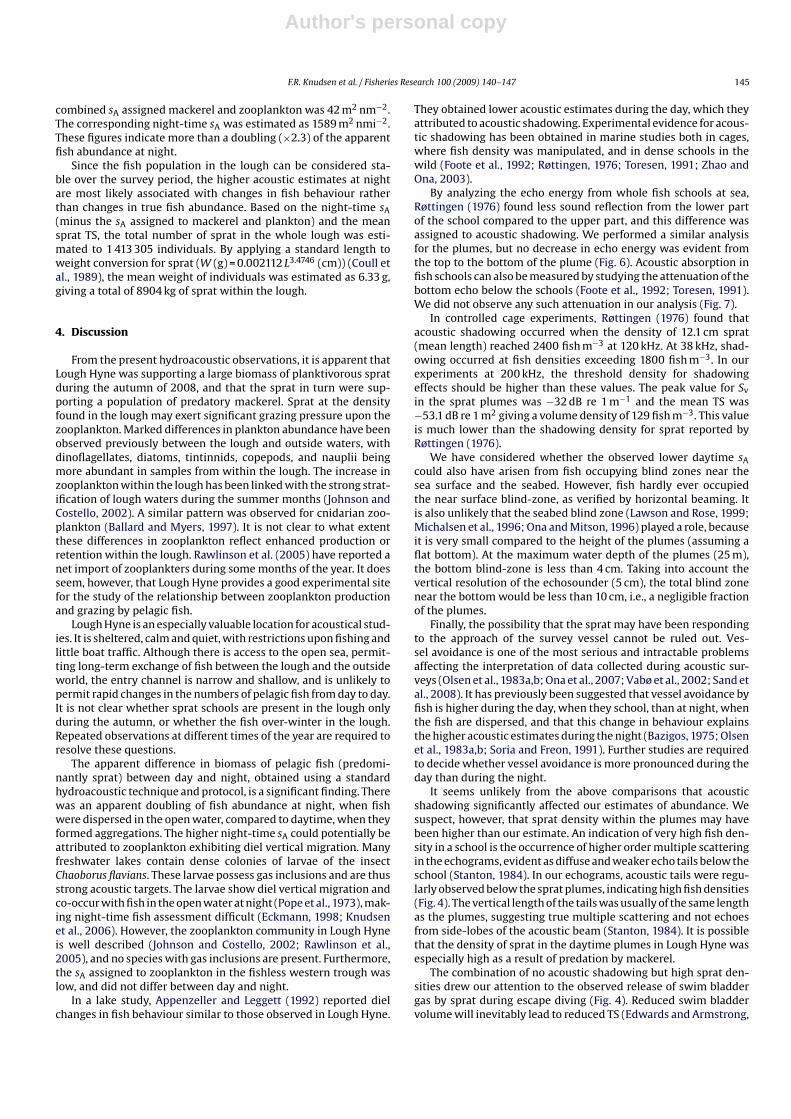
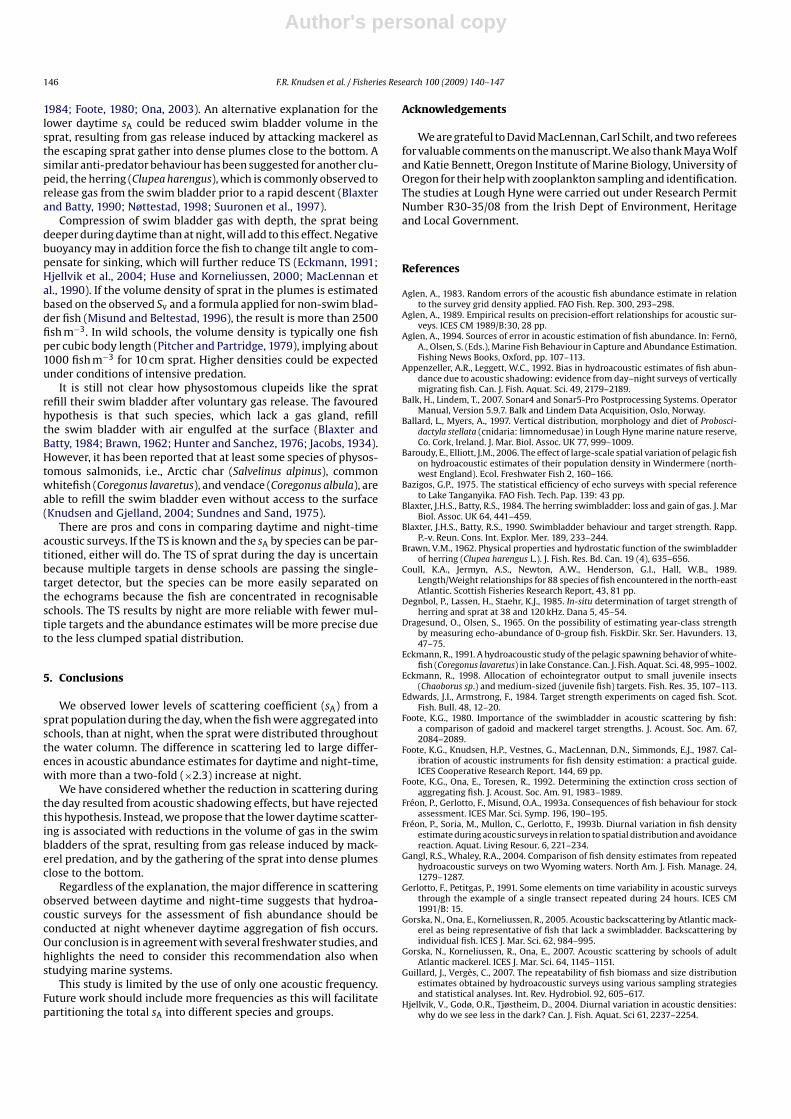
Measurements of Sv through eight vertical cells for nine sepa-rate schools of fish showed no change from the top to the bottom ofthe schools, indicating an absence of acoustic shadowing by the fish(Fig. 6). Further, echo integrals from the seabed below the plumesdid not differ from echo integrals in adjacent areas, confirming thatthe seabed echo was not affected by the overlying schools (Fig. 7),i.e., an absence of shadowing. However, higher order multiple scat-tering, indicating high fish density in the schools, was observed(Fig. 4).
Weaker and diffuse scattering, assigned to zooplankton, wasfound above the oxycline across the whole lough, but was absent ina zone of several meters surrounding the schools.
The species responsible for the dense plumes and the surround-ing acoustic targets were identified by rod and line fishing. Whenlures were dropped close to plumes, mackerel (Scomber scombrus)were invariably caught. The stomachs of the majority of these mack-erel contained one or several sprat (Sprattus sprattus) varying inlength between 7.5 and 12 cm. The stomachs of some of the mack-
Fig. 4. Daytime echogram from the north basin, showing fish aggregations, oftenplumes, assigned to sprat, and individual tracks in the open water assigned to mack-erel (4). The dense aggregation with descending tails (2) is interpreted as sprat divingin response to the approaching vessel or to mackerel. The ascending tracks with con-stant slope above and to the right of the school (3) are interpreted as gas bubblesreleased from sprat swim bladders. An example of higher order multiple scattering(1) below a fish plume is also shown.
erel were empty. Mackerel were generally not caught in the northbasin when lures were dropped in areas devoid of dense plumes.Some mackerel were caught in the south basin, where dense plumeswere not detected. The stomachs of these mackerel contained avarying number of two-spot gobies (Gobiusculus flavescens), or wereempty. The sA in the south basin was <50 m2 nmi−2, both day andnight.
The most probable explanation of these observations is thatthe dense plumes consisted of schooling sprat, herded together bysurrounding mackerel, which were attacking the sprat. School for-mation by the sprat is most likely a strategy to reduce predation bymackerel, which are visual feeders.
The stomach contents of the sprat were also investigated, andconsisted mostly of copepods and decapods. Vertical plankton nethauls confirmed that the weaker and evenly distributed scattersrepresented ctenophores and decapods, whereas horizontal haulsvery close to the surface resulted mainly in ostracods and cope-pods. The sA assigned to zooplankton and occasional mackerel inthe north and south basins was <42 m2 nmi−2. This value for thearea scattering coefficient is lower than that for the western trough,perhaps because zooplankton concentrations had been reduced byforaging planktivorous sprat.
In Fig. 4, the dense aggregation with tails at 15–20 m is inter-preted as a small school of sprat that was diving in response to
Fig. 5. Night-time echogram from the northern basin, showing fish distributed inthe open water.
Author's personal copy
144 F.R. Knudsen et al. / Fisheries Research 100 (2009) 140–147
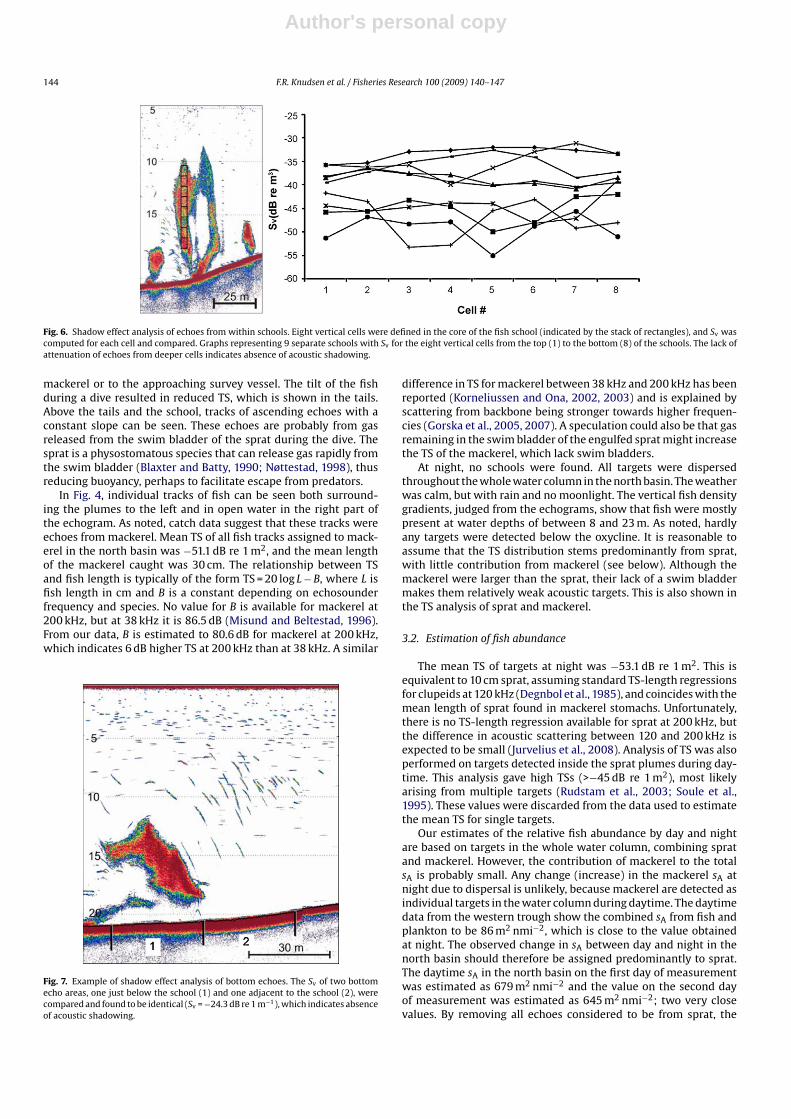
Fig. 6. Shadow effect analysis of echoes from within schools. Eight vertical cells were defined in the core of the fish school (indicated by the stack of rectangles), and Sv wascomputed for each cell and compared. Graphs representing 9 separate schools with Sv for the eight vertical cells from the top (1) to the bottom (8) of the schools. The lack ofattenuation of echoes from deeper cells indicates absence of acoustic shadowing.
mackerel or to the approaching survey vessel. The tilt of the fishduring a dive resulted in reduced TS, which is shown in the tails.Above the tails and the school, tracks of ascending echoes with aconstant slope can be seen. These echoes are probably from gasreleased from the swim bladder of the sprat during the dive. Thesprat is a physostomatous species that can release gas rapidly fromthe swim bladder (Blaxter and Batty, 1990; Nøttestad, 1998), thusreducing buoyancy, perhaps to facilitate escape from predators.
In Fig. 4, individual tracks of fish can be seen both surround-ing the plumes to the left and in open water in the right part ofthe echogram. As noted, catch data suggest that these tracks wereechoes from mackerel. Mean TS of all fish tracks assigned to mack-erel in the north basin was −51.1 dB re 1 m2, and the mean lengthof the mackerel caught was 30 cm. The relationship between TSand fish length is typically of the form TS = 20 log L − B, where L isfish length in cm and B is a constant depending on echosounderfrequency and species. No value for B is available for mackerel at200 kHz, but at 38 kHz it is 86.5 dB (Misund and Beltestad, 1996).From our data, B is estimated to 80.6 dB for mackerel at 200 kHz,which indicates 6 dB higher TS at 200 kHz than at 38 kHz. A similar
Fig. 7. Example of shadow effect analysis of bottom echoes. The Sv of two bottomecho areas, one just below the school (1) and one adjacent to the school (2), werecompared and found to be identical (Sv = −24.3 dB re 1 m−1), which indicates absenceof acoustic shadowing.
difference in TS for mackerel between 38 kHz and 200 kHz has beenreported (Korneliussen and Ona, 2002, 2003) and is explained byscattering from backbone being stronger towards higher frequen-cies (Gorska et al., 2005, 2007). A speculation could also be that gasremaining in the swim bladder of the engulfed sprat might increasethe TS of the mackerel, which lack swim bladders.
At night, no schools were found. All targets were dispersedthroughout the whole water column in the north basin. The weatherwas calm, but with rain and no moonlight. The vertical fish densitygradients, judged from the echograms, show that fish were mostlypresent at water depths of between 8 and 23 m. As noted, hardlyany targets were detected below the oxycline. It is reasonable toassume that the TS distribution stems predominantly from sprat,with little contribution from mackerel (see below). Although themackerel were larger than the sprat, their lack of a swim bladdermakes them relatively weak acoustic targets. This is also shown inthe TS analysis of sprat and mackerel.
3.2. Estimation of fish abundance
The mean TS of targets at night was −53.1 dB re 1 m2. This isequivalent to 10 cm sprat, assuming standard TS-length regressionsfor clupeids at 120 kHz (Degnbol et al., 1985), and coincides with themean length of sprat found in mackerel stomachs. Unfortunately,there is no TS-length regression available for sprat at 200 kHz, butthe difference in acoustic scattering between 120 and 200 kHz isexpected to be small (Jurvelius et al., 2008). Analysis of TS was alsoperformed on targets detected inside the sprat plumes during day-time. This analysis gave high TSs (>−45 dB re 1 m2), most likelyarising from multiple targets (Rudstam et al., 2003; Soule et al.,1995). These values were discarded from the data used to estimatethe mean TS for single targets.
Our estimates of the relative fish abundance by day and nightare based on targets in the whole water column, combining spratand mackerel. However, the contribution of mackerel to the totalsA is probably small. Any change (increase) in the mackerel sA atnight due to dispersal is unlikely, because mackerel are detected asindividual targets in the water column during daytime. The daytimedata from the western trough show the combined sA from fish andplankton to be 86 m2 nmi−2, which is close to the value obtainedat night. The observed change in sA between day and night in thenorth basin should therefore be assigned predominantly to sprat.The daytime sA in the north basin on the first day of measurementwas estimated as 679 m2 nmi−2 and the value on the second dayof measurement was estimated as 645 m2 nmi−2; two very closevalues. By removing all echoes considered to be from sprat, the
Author's personal copy
F.R. Knudsen et al. / Fisheries Research 100 (2009) 140–147 145
combined sA assigned mackerel and zooplankton was 42 m2 nm−2.The corresponding night-time sA was estimated as 1589 m2 nmi−2.These figures indicate more than a doubling (×2.3) of the apparentfish abundance at night.
Since the fish population in the lough can be considered sta-ble over the survey period, the higher acoustic estimates at nightare most likely associated with changes in fish behaviour ratherthan changes in true fish abundance. Based on the night-time sA(minus the sA assigned to mackerel and plankton) and the meansprat TS, the total number of sprat in the whole lough was esti-mated to 1 413 305 individuals. By applying a standard length toweight conversion for sprat (W (g) = 0.002112 L3.4746 (cm)) (Coull etal., 1989), the mean weight of individuals was estimated as 6.33 g,giving a total of 8904 kg of sprat within the lough.
4. Discussion
From the present hydroacoustic observations, it is apparent thatLough Hyne was supporting a large biomass of planktivorous spratduring the autumn of 2008, and that the sprat in turn were sup-porting a population of predatory mackerel. Sprat at the densityfound in the lough may exert significant grazing pressure upon thezooplankton. Marked differences in plankton abundance have beenobserved previously between the lough and outside waters, withdinoflagellates, diatoms, tintinnids, copepods, and nauplii beingmore abundant in samples from within the lough. The increase inzooplankton within the lough has been linked with the strong strat-ification of lough waters during the summer months (Johnson andCostello, 2002). A similar pattern was observed for cnidarian zoo-plankton (Ballard and Myers, 1997). It is not clear to what extentthese differences in zooplankton reflect enhanced production orretention within the lough. Rawlinson et al. (2005) have reported anet import of zooplankters during some months of the year. It doesseem, however, that Lough Hyne provides a good experimental sitefor the study of the relationship between zooplankton productionand grazing by pelagic fish.
Lough Hyne is an especially valuable location for acoustical stud-ies. It is sheltered, calm and quiet, with restrictions upon fishing andlittle boat traffic. Although there is access to the open sea, permit-ting long-term exchange of fish between the lough and the outsideworld, the entry channel is narrow and shallow, and is unlikely topermit rapid changes in the numbers of pelagic fish from day to day.It is not clear whether sprat schools are present in the lough onlyduring the autumn, or whether the fish over-winter in the lough.Repeated observations at different times of the year are required toresolve these questions.
The apparent difference in biomass of pelagic fish (predomi-nantly sprat) between day and night, obtained using a standardhydroacoustic technique and protocol, is a significant finding. Therewas an apparent doubling of fish abundance at night, when fishwere dispersed in the open water, compared to daytime, when theyformed aggregations. The higher night-time sA could potentially beattributed to zooplankton exhibiting diel vertical migration. Manyfreshwater lakes contain dense colonies of larvae of the insectChaoborus flavians. These larvae possess gas inclusions and are thusstrong acoustic targets. The larvae show diel vertical migration andco-occur with fish in the open water at night (Pope et al., 1973), mak-ing night-time fish assessment difficult (Eckmann, 1998; Knudsenet al., 2006). However, the zooplankton community in Lough Hyneis well described (Johnson and Costello, 2002; Rawlinson et al.,2005), and no species with gas inclusions are present. Furthermore,the sA assigned to zooplankton in the fishless western trough waslow, and did not differ between day and night.
In a lake study, Appenzeller and Leggett (1992) reported dielchanges in fish behaviour similar to those observed in Lough Hyne.
They obtained lower acoustic estimates during the day, which theyattributed to acoustic shadowing. Experimental evidence for acous-tic shadowing has been obtained in marine studies both in cages,where fish density was manipulated, and in dense schools in thewild (Foote et al., 1992; Røttingen, 1976; Toresen, 1991; Zhao andOna, 2003).
By analyzing the echo energy from whole fish schools at sea,Røttingen (1976) found less sound reflection from the lower partof the school compared to the upper part, and this difference wasassigned to acoustic shadowing. We performed a similar analysisfor the plumes, but no decrease in echo energy was evident fromthe top to the bottom of the plume (Fig. 6). Acoustic absorption infish schools can also be measured by studying the attenuation of thebottom echo below the schools (Foote et al., 1992; Toresen, 1991).We did not observe any such attenuation in our analysis (Fig. 7).
In controlled cage experiments, Røttingen (1976) found thatacoustic shadowing occurred when the density of 12.1 cm sprat(mean length) reached 2400 fish m−3 at 120 kHz. At 38 kHz, shad-owing occurred at fish densities exceeding 1800 fish m−3. In ourexperiments at 200 kHz, the threshold density for shadowingeffects should be higher than these values. The peak value for Sv
in the sprat plumes was −32 dB re 1 m−1 and the mean TS was−53.1 dB re 1 m2 giving a volume density of 129 fish m−3. This valueis much lower than the shadowing density for sprat reported byRøttingen (1976).
We have considered whether the observed lower daytime sAcould also have arisen from fish occupying blind zones near thesea surface and the seabed. However, fish hardly ever occupiedthe near surface blind-zone, as verified by horizontal beaming. Itis also unlikely that the seabed blind zone (Lawson and Rose, 1999;Michalsen et al., 1996; Ona and Mitson, 1996) played a role, becauseit is very small compared to the height of the plumes (assuming aflat bottom). At the maximum water depth of the plumes (25 m),the bottom blind-zone is less than 4 cm. Taking into account thevertical resolution of the echosounder (5 cm), the total blind zonenear the bottom would be less than 10 cm, i.e., a negligible fractionof the plumes.
Finally, the possibility that the sprat may have been respondingto the approach of the survey vessel cannot be ruled out. Ves-sel avoidance is one of the most serious and intractable problemsaffecting the interpretation of data collected during acoustic sur-veys (Olsen et al., 1983a,b; Ona et al., 2007; Vabø et al., 2002; Sand etal., 2008). It has previously been suggested that vessel avoidance byfish is higher during the day, when they school, than at night, whenthe fish are dispersed, and that this change in behaviour explainsthe higher acoustic estimates during the night (Bazigos, 1975; Olsenet al., 1983a,b; Soria and Freon, 1991). Further studies are requiredto decide whether vessel avoidance is more pronounced during theday than during the night.
It seems unlikely from the above comparisons that acousticshadowing significantly affected our estimates of abundance. Wesuspect, however, that sprat density within the plumes may havebeen higher than our estimate. An indication of very high fish den-sity in a school is the occurrence of higher order multiple scatteringin the echograms, evident as diffuse and weaker echo tails below theschool (Stanton, 1984). In our echograms, acoustic tails were regu-larly observed below the sprat plumes, indicating high fish densities(Fig. 4). The vertical length of the tails was usually of the same lengthas the plumes, suggesting true multiple scattering and not echoesfrom side-lobes of the acoustic beam (Stanton, 1984). It is possiblethat the density of sprat in the daytime plumes in Lough Hyne wasespecially high as a result of predation by mackerel.
The combination of no acoustic shadowing but high sprat den-sities drew our attention to the observed release of swim bladdergas by sprat during escape diving (Fig. 4). Reduced swim bladdervolume will inevitably lead to reduced TS (Edwards and Armstrong,
Author's personal copy
146 F.R. Knudsen et al. / Fisheries Research 100 (2009) 140–147
1984; Foote, 1980; Ona, 2003). An alternative explanation for thelower daytime sA could be reduced swim bladder volume in thesprat, resulting from gas release induced by attacking mackerel asthe escaping sprat gather into dense plumes close to the bottom. Asimilar anti-predator behaviour has been suggested for another clu-peid, the herring (Clupea harengus), which is commonly observed torelease gas from the swim bladder prior to a rapid descent (Blaxterand Batty, 1990; Nøttestad, 1998; Suuronen et al., 1997).
Compression of swim bladder gas with depth, the sprat beingdeeper during daytime than at night, will add to this effect. Negativebuoyancy may in addition force the fish to change tilt angle to com-pensate for sinking, which will further reduce TS (Eckmann, 1991;Hjellvik et al., 2004; Huse and Korneliussen, 2000; MacLennan etal., 1990). If the volume density of sprat in the plumes is estimatedbased on the observed Sv and a formula applied for non-swim blad-der fish (Misund and Beltestad, 1996), the result is more than 2500fish m−3. In wild schools, the volume density is typically one fishper cubic body length (Pitcher and Partridge, 1979), implying about1000 fish m−3 for 10 cm sprat. Higher densities could be expectedunder conditions of intensive predation.
It is still not clear how physostomous clupeids like the spratrefill their swim bladder after voluntary gas release. The favouredhypothesis is that such species, which lack a gas gland, refillthe swim bladder with air engulfed at the surface (Blaxter andBatty, 1984; Brawn, 1962; Hunter and Sanchez, 1976; Jacobs, 1934).However, it has been reported that at least some species of physos-tomous salmonids, i.e., Arctic char (Salvelinus alpinus), commonwhitefish (Coregonus lavaretus), and vendace (Coregonus albula), areable to refill the swim bladder even without access to the surface(Knudsen and Gjelland, 2004; Sundnes and Sand, 1975).
There are pros and cons in comparing daytime and night-timeacoustic surveys. If the TS is known and the sA by species can be par-titioned, either will do. The TS of sprat during the day is uncertainbecause multiple targets in dense schools are passing the single-target detector, but the species can be more easily separated onthe echograms because the fish are concentrated in recognisableschools. The TS results by night are more reliable with fewer mul-tiple targets and the abundance estimates will be more precise dueto the less clumped spatial distribution.
5. Conclusions
We observed lower levels of scattering coefficient (sA) from asprat population during the day, when the fish were aggregated intoschools, than at night, when the sprat were distributed throughoutthe water column. The difference in scattering led to large differ-ences in acoustic abundance estimates for daytime and night-time,with more than a two-fold (×2.3) increase at night.
We have considered whether the reduction in scattering duringthe day resulted from acoustic shadowing effects, but have rejectedthis hypothesis. Instead, we propose that the lower daytime scatter-ing is associated with reductions in the volume of gas in the swimbladders of the sprat, resulting from gas release induced by mack-erel predation, and by the gathering of the sprat into dense plumesclose to the bottom.
Regardless of the explanation, the major difference in scatteringobserved between daytime and night-time suggests that hydroa-coustic surveys for the assessment of fish abundance should beconducted at night whenever daytime aggregation of fish occurs.Our conclusion is in agreement with several freshwater studies, andhighlights the need to consider this recommendation also whenstudying marine systems.
This study is limited by the use of only one acoustic frequency.Future work should include more frequencies as this will facilitatepartitioning the total sA into different species and groups.
Acknowledgements
We are grateful to David MacLennan, Carl Schilt, and two refereesfor valuable comments on the manuscript. We also thank Maya Wolfand Katie Bennett, Oregon Institute of Marine Biology, University ofOregon for their help with zooplankton sampling and identification.The studies at Lough Hyne were carried out under Research PermitNumber R30-35/08 from the Irish Dept of Environment, Heritageand Local Government.
References
Aglen, A., 1983. Random errors of the acoustic fish abundance estimate in relationto the survey grid density applied. FAO Fish. Rep. 300, 293–298.
Aglen, A., 1989. Empirical results on precision-effort relationships for acoustic sur-veys. ICES CM 1989/B:30, 28 pp.
Aglen, A., 1994. Sources of error in acoustic estimation of fish abundance. In: Fernö,A., Olsen, S. (Eds.), Marine Fish Behaviour in Capture and Abundance Estimation.Fishing News Books, Oxford, pp. 107–113.
Appenzeller, A.R., Leggett, W.C., 1992. Bias in hydroacoustic estimates of fish abun-dance due to acoustic shadowing: evidence from day–night surveys of verticallymigrating fish. Can. J. Fish. Aquat. Sci. 49, 2179–2189.
Balk, H., Lindem, T., 2007. Sonar4 and Sonar5-Pro Postprocessing Systems. OperatorManual, Version 5.9.7. Balk and Lindem Data Acquisition, Oslo, Norway.
Ballard, L., Myers, A., 1997. Vertical distribution, morphology and diet of Probosci-dactyla stellata (cnidaria: limnomedusae) in Lough Hyne marine nature reserve,Co. Cork, Ireland. J. Mar. Biol. Assoc. UK 77, 999–1009.
Baroudy, E., Elliott, J.M., 2006. The effect of large-scale spatial variation of pelagic fishon hydroacoustic estimates of their population density in Windermere (north-west England). Ecol. Freshwater Fish 2, 160–166.
Bazigos, G.P., 1975. The statistical efficiency of echo surveys with special referenceto Lake Tanganyika. FAO Fish. Tech. Pap. 139: 43 pp.
Blaxter, J.H.S., Batty, R.S., 1984. The herring swimbladder: loss and gain of gas. J. MarBiol. Assoc. UK 64, 441–459.
Blaxter, J.H.S., Batty, R.S., 1990. Swimbladder behaviour and target strength. Rapp.P.-v. Reun. Cons. Int. Explor. Mer. 189, 233–244.
Brawn, V.M., 1962. Physical properties and hydrostatic function of the swimbladderof herring (Clupea harengus L.). J. Fish. Res. Bd. Can. 19 (4), 635–656.
Coull, K.A., Jermyn, A.S., Newton, A.W., Henderson, G.I., Hall, W.B., 1989.Length/Weight relationships for 88 species of fish encountered in the north-eastAtlantic. Scottish Fisheries Research Report, 43, 81 pp.
Degnbol, P., Lassen, H., Staehr, K.J., 1985. In-situ determination of target strength ofherring and sprat at 38 and 120 kHz. Dana 5, 45–54.
Dragesund, O., Olsen, S., 1965. On the possibility of estimating year-class strengthby measuring echo-abundance of 0-group fish. FiskDir. Skr. Ser. Havunders. 13,47–75.
Eckmann, R., 1991. A hydroacoustic study of the pelagic spawning behavior of white-fish (Coregonus lavaretus) in lake Constance. Can. J. Fish. Aquat. Sci. 48, 995–1002.
Eckmann, R., 1998. Allocation of echointegrator output to small juvenile insects(Chaoborus sp.) and medium-sized (juvenile fish) targets. Fish. Res. 35, 107–113.
Edwards, J.I., Armstrong, F., 1984. Target strength experiments on caged fish. Scot.Fish. Bull. 48, 12–20.
Foote, K.G., 1980. Importance of the swimbladder in acoustic scattering by fish:a comparison of gadoid and mackerel target strengths. J. Acoust. Soc. Am. 67,2084–2089.
Foote, K.G., Knudsen, H.P., Vestnes, G., MacLennan, D.N., Simmonds, E.J., 1987. Cal-ibration of acoustic instruments for fish density estimation: a practical guide.ICES Cooperative Research Report. 144, 69 pp.
Foote, K.G., Ona, E., Toresen, R., 1992. Determining the extinction cross section ofaggregating fish. J. Acoust. Soc. Am. 91, 1983–1989.
Fréon, P., Gerlotto, F., Misund, O.A., 1993a. Consequences of fish behaviour for stockassessment. ICES Mar. Sci. Symp. 196, 190–195.
Fréon, P., Soria, M., Mullon, C., Gerlotto, F., 1993b. Diurnal variation in fish densityestimate during acoustic surveys in relation to spatial distribution and avoidancereaction. Aquat. Living Resour. 6, 221–234.
Gangl, R.S., Whaley, R.A., 2004. Comparison of fish density estimates from repeatedhydroacoustic surveys on two Wyoming waters. North Am. J. Fish. Manage. 24,1279–1287.
Gerlotto, F., Petitgas, P., 1991. Some elements on time variability in acoustic surveysthrough the example of a single transect repeated during 24 hours. ICES CM1991/B: 15.
Gorska, N., Ona, E., Korneliussen, R., 2005. Acoustic backscattering by Atlantic mack-erel as being representative of fish that lack a swimbladder. Backscattering byindividual fish. ICES J. Mar. Sci. 62, 984–995.
Gorska, N., Korneliussen, R., Ona, E., 2007. Acoustic scattering by schools of adultAtlantic mackerel. ICES J. Mar. Sci. 64, 1145–1151.
Guillard, J., Vergès, C., 2007. The repeatability of fish biomass and size distributionestimates obtained by hydroacoustic surveys using various sampling strategiesand statistical analyses. Int. Rev. Hydrobiol. 92, 605–617.
Hjellvik, V., Godø, O.R., Tjøstheim, D., 2004. Diurnal variation in acoustic densities:why do we see less in the dark? Can. J. Fish. Aquat. Sci 61, 2237–2254.

Author's personal copy
F.R. Knudsen et al. / Fisheries Research 100 (2009) 140–147 147
Hunter, J.R., Sanchez, C., 1976. Diel changes in swim bladder inflation of the larvaeof the northern anchovy Engraulis mordax. Fish. Bull. US 74, 847–855.
Huse, I., Ona, E., 1996. Tilt angle distribution and swimming speed of overwinteringNorwegian spring spawning herring. ICES J. Mar. Sci. 53, 863–873.
Huse, I., Korneliussen, R., 2000. Diel variation in acoustic density measurements ofoverwintering herring (Clupea harengus L.). ICES J. Mar. Sci. 57, 903–910.
Jacobs, W., 1934. Untersuchungen zur Physiologie und Gassekretion bei Physos-tomen. Z. Vergl. Physiol. 20, 674–698.
Johnsen, E., Godø, O.R., 2007. Diel variation in acoustic recordings of blue whiting(Micromesistius poutassou). ICES J. Mar. Sci., 1202–1209.
Johnson, M.P., Costello, M.J., O’Donnell, D., 1995. The nutrient economy of a marineinlet: Lough Hyne, south west Ireland. Ophelia 41, 137–151.
Johnson, M.P., Costello, M.J., 2002. Local and external components of the summer-time plankton community in Lough Hyne, Ireland a stratified marine inlet. J.Plankt. Res. 24, 1305–1315.
Jurvelius, J., Knudsen, F.R., Balk, H., Marjomäki, T., Peltonen, H., Taskinen, J., Tuo-maala, A., Viljanen, M., 2008. Echo-sounding can discriminate between fish andmacroinvertebrates in freshwater. Freshwater Biol. 53, 912–923.
Kitching, J.A., Ebling, F.J., Gamble, J.C., Hoare, R., McLeod, A.A.Q.R., Norton, T.A., 1976.The ecology of Lough Hyne. XIX. Seasonal changes in the western trough. J. Anim.Ecol. 45, 731–758.
Knudsen, F.R., Sægrov, H., 2002. Benefits from horizontal beaming during acousticsurvey: application to three Norwegian lakes. Fish. Res. 56, 205–211.
Knudsen, F.R., Gjelland, K.Ø., 2004. Hydroacoustic observations indicating swim-bladder volume compensation during the diel vertical migration in coregonids(Coregonus lavaretus and Coregonus albula). Fish. Res. 66, 337–341.
Knudsen, F.R., Larsson, P., Jakobsen, P.J., 2006. Acoustic scattering from a larval insect(Chaoborus flavicans) at six echosounder frequencies: implication for acousticestimates of fish abundance. Fish. Res. 79, 84–89.
Korneliussen, R., Ona, E., 2002. An operational system for processing and visualizingmulti-frequency acoustic data. ICES J. Mar. Sci. 59, 293–313.
Korneliussen, R., Ona, E., 2003. Synthetic echograms generated from the relativefrequency response. ICES J. Mar. Sci. 60, 636–640.
Kubecka, J., Duncan, A., 1998. Acoustic size vs. real size relationships for commonspecies of riverine fish. Fish. Res. 35, 115–125.
Kubecka, J., Wittingerova, M., 1998. Horizontal beaming as a crucial component ofacoustic fish stock assessment in freshwater reservoirs. Fish. Res. 35, 99–106.
Lawson, G.L., Rose, G.A., 1999. The importance of detectability to acoustic surveys ofsemi-demersal fish. ICES J. Mar. Sci. 56, 370–380.
MacLennan, D.N., Magurran, A.E., Pitcher, T.J., Hollingworth, C.E., 1990. Behaviouraldeterminants of fish target strength. Rapp. P.-v. Reun. Cons. Int. Explor. Mer. 189,245–253.
Malinen, T., Tuomaala, A., 2005. Comparison of day and night surveys in hydroacous-tic assessment of smelt (Osmerus eperlanus) density in Lake Hiidenvesi. Arch.Hydrobiol. Spec. Issues Adv. Limnol. 59, 161–172.
Malinen, T., Tuomaala, A., Peltonen, H., 2005a. Vertical and horizontal distributionof smelt (Osmerus eperlanus) and implications of distribution patterns for stockassessment. Arch. Hydrobiol. Spec. Issues Adv. Limnol. 59, 141–159.
Malinen, T., Tuomaala, A., Peltonen, H., 2005b. Hydroacoustic stock assessment inthe presence of dense aggregations of Chaoborus larvae. Can. J. Fish. Aquat. Sci.62, 245–249.
McAllen, R., Davenport, J., Bredendieck, K., Dunne, D., 2009. Seasonal structuring ofa benthic community exposed to regular hypoxic events. J. Exp. Mar. Biol. Ecol.368, 67–74.
Michalsen, K., Godø, O.R., Fernö, A., 1996. Diel variation in the catchability of gadoidsand its influence on the reliability of abundance indices. ICES J. Mar. Sci. 53,389–395.
Minchin, D., 1987. Fishes of the Lough Hyne marine reserve. J. Fish Biol. 31, 343–352.Misund, O.A., Beltestad, A.K., 1996. Target strength estimates of schooling herring
and mackerel using the comparison method. ICES J. Mar. Sci. 53, 281–284.
Nakken, O., Olsen, K., 1977. Target strength measurements of fish. Rapp. P.-v. Réun.Cons. Int. Explor. Mer. 170, 52–69.
Nøttestad, L., 1998. Extensive gas bubble release in Norwegian spring-spawning her-ring (Clupea harengus) during predator avoidance. ICES J. Mar. Sci. 55, 1133–1140.
Olsen, K., Angell, J., Pettersen, F., Løvik, A., 1983a. Observed fish reactions to a sur-veying vessel with special reference to herring, cod, capelin and polar cod. FAOFish. Rep. 300, 131–138.
Olsen, K., Angell, J., Løvik, A., 1983b. Quantitative estimations of the influence offish behaviour on acoustically determined fish abundance. FAO Fish. Rep. 300,139–149.
Ona, E., 2003. An expanded target–strength relationship for herring. ICES J. Mar. Sci.60, 493–499.
Ona, E., Mitson, R.B., 1996. Acoustic sampling and signal processing near the seabed:the deadzone revisited. ICES J. Mar. Sci. 53, 677–690.
Ona, E., Godø, O.R., Handegard, N.O., Hjellvik, V., Patel, R., Pedersen, G., 2007. Silentresearch vessels are not quiet. J. Acoust. Soc. Am. 121, EL145–EL150.
Orlowski, A., 2001. Behavioural and physical effect on acoustic measurements ofBaltic fish within a diel cycle. ICES J. Mar. Sci. 58, 1174–1183.
Pitcher, T.J., Partridge, B.L., 1979. Fish school density and volume. Mar. Biol. 54,383–394.
Pope, G.F., Carter, J.H.C., Power, G., 1973. The influence of fish on the distributionof Chaoborus spp. (Diptera) and density of larvae in the Matamek River System,Quebec. Trans. Am. Fish. Soc. 4, 707–714.
Rawlinson, K.A., Davenport, J., Barnes, D.K.A., 2005. Tidal exchange of zooplanktonbetween Lough Hyne and the adjacent coast. Estuar. Coast. Shelf Sci. 62, 205–215.
Rudstam, L.G., Parker, S.L., Einhouse, D.W., Witzel, L.D., Warner, D.M., Stritzel, J.L.,Parrish, D.L., Sullivan, P.J., 2003. Application of in situ target-strength estimationin lakes: examples from rainbow-smelt surveys in Lakes Erie and Champlain.ICES J. Mar. Sci. 60, 500–5007.
Røttingen, I., 1976. On the relation between echo intensity and fish density. FiskDir.Skr. Ser. Havunders. 16, 301–314.
Sand, O., Karlsen, H.E., Knudsen, F.R., 2008. Comment on “Silent research vessels arenot quiet”. J. Acoust. Soc. Am. 123, 1831–1833.
Simmonds, E.J., MacLennan, D.N., 2005. Fisheries Acoustics, second ed. BlackwellScience Ltd., Oxford.
Soria, M., Freon, P., 1991. Diurnal variation in fish density during acoustic surveys inrelation to avoidance reaction. ICES Fisheries Acoustic Science and Technology(FAST) Working Group Meeting, Ancona, April 24–27, 1991.
Soule, M., Barange, M., Hampton, I., 1995. Evidence of bias in estimates of targetstrength obtained with a split beam echosounder. ICES J. Mar. Sci. 52, 139–144.
Stanton, T.K., 1984. Effects on second-order scattering on high resolution sonars. J.Acoust. Soc. Am. 76, 861–866.
Sundnes, G., Sand, O., 1975. Studies of a physostome swimbladder by resonancefrequency analyses. J. Cons. Perm. Int. Explor. Mer. 36, 176–182.
Suuronen, P., Lehtonen, E., Wallace, J., 1997. Avoidance and escape behaviour ofherring encountering midwater trawls. Fish. Res. 29, 13–24.
Toresen, R., 1991. Absorption of acoustic energy in dense herring schools studied bythe attenuation in the bottom echo signal. Fish. Res. 10, 317–327.
Vabø, R., Olsen, K., Huse, I., 2002. The effect of vessel avoidance of wintering Norwe-gian spring spawning herring. Fish. Res. 58, 59–77.
Wanzenböck, J., Mehner, T., Schulz, M., Gassner, H., Winfield, I.J., 2003. Quality assur-ance of hydroacoustic surveys: the repeatability of fish-abundance and biomassestimates in lakes within and between hydroacoustic systems. ICES J. Mar. Sci.60, 486–492.
Winfield, I.J., Fletcher, J.M., James, J.B., 2007. Seasonal variability on the abundanceof Arctic charr (Salvelinus alpinus (L.)) recorded using hydroacoustics in Win-dermere, UK and its implications for survey design. Ecol. Freshwater Fish 16,64–69.
Zhao, X., Ona, E., 2003. Estimation and compensation models for the shadowingeffect in dense fish aggregations. ICES J. Mar. Sci. 60, 155–163.
Related Documents