Knowledge-based Telecom Industry by Villeman Vinje and Marius Nordkvelde Research report 13/2011 BI Norwegian Business School Department of Strategy and Logistics

Welcome message from author
This document is posted to help you gain knowledge. Please leave a comment to let me know what you think about it! Share it to your friends and learn new things together.
Transcript

Knowledge-based Telecom Industry
by
Villeman Vinje and Marius Nordkvelde
Research report 13/2011
BI Norwegian Business School
Department of Strategy and Logistics

2
Villeman Vinje and Marius Nordkvelde Knowledge-based Telecom industry
Villeman Vinje and Marius Nordkvelde 2011
Research Report 13/2011 ISSN: 0803-2610
BI Norwegian Business School N-0442 Oslo Phone: 4641 0000 www.bi.no
Printing: Nordberg
BI’s Research Reports may be ordered from our website www.bi.no/en/research‐publications

3
Preface The BI Norwegian School of Management is conducting a national research project entitled “A knowledge-based Norway”. Thirteen major knowledge-based industries in Norway are being analyzed under the auspices of the project. The objective is to identify existing and emerging global knowledge hubs and recommend policy initiatives necessary to enable the further development and competitiveness of such hubs. Knowledge-based industrial development is argued to occur in global knowledge hubs or superclusters characterized by a high concentration of innovative industrial actors interacting closely with advanced research institutions, venture capital and competent ownership. The study is based on three simple premises. For industries to be competitive and sustainable in a high-cost location like Norway, they must compete globally, they have to be knowledge based and they have to be environmentally robust.

4
Content
1. Introduction: The Knowledge-based Telecom Industry ...................................................... 6
1.1 The global knowledge hub ............................................................................................. 7
2. The Telecom Industry – Past, Present and Future ............................................................ 9
2.1 Historical development .................................................................................................. 9
2.2 The global market .......................................................................................................... 12 2.2.1 Penetration ............................................................................................................. 12 2.2.2 Telephony .............................................................................................................. 15 2.2.3 Internet ................................................................................................................... 17 2.2.4 Broadcast ................................................................................................................ 20 2.2.5 Revenues, profits and investments ......................................................................... 24
2.3 Developments and trends ............................................................................................. 28 2.3.1 The big convergence .............................................................................................. 28 2.3.2. Dying revenue sources and the birth of new ones ................................................. 32 2.3.2 Connectivity – growth in Internet traffic and access ............................................. 34 2.3.3 The growing importance of mobile device operating systems .............................. 35
2.4 How is value created by telecom firms? ...................................................................... 40
2.5 Summary ....................................................................................................................... 46
3. Cluster Attractiveness ...................................................................................................... 48
3.1 Current Norwegian market structure: Major activities, players and size ..................... 48
3.3 Internationalization and globalization .......................................................................... 57
3.4 Cluster attractiveness: Conclusions .............................................................................. 59
4. Education Attractiveness ................................................................................................. 61
4.1 Educational attractiveness: Conclusions ...................................................................... 67
5. Talent Attractiveness ........................................................................................................ 68
5.1 Educational level .......................................................................................................... 68
5.2 Sources of formal education ......................................................................................... 71
5.3 Types of education per sector ....................................................................................... 73 5.3.1 Network operators .................................................................................................. 73 5.3.2 Equipment and service providers ........................................................................... 74
5.4 Foreign Labor ............................................................................................................... 75
5.5 Talent attractiveness: Conclusions ............................................................................... 77
6. R&D and Innovation Attractiveness ................................................................................ 79
6.1 Firm R&D .................................................................................................................... 79
6.3 The patent game ........................................................................................................... 83

5
6.4 R&D and innovation attractiveness: Conclusions ........................................................ 84
7. Ownership and Environmental Attractiveness ................................................................. 85
7.1 Ownership .................................................................................................................... 85
7.2 Environmental attractiveness ....................................................................................... 86
7.3 Ownership and Environmental attractiveness: Conclusions ........................................ 90
8. Cluster Dynamics ............................................................................................................. 91
8.1 Competitive linkages .................................................................................................... 91
8.2 Relationships with suppliers and customers ................................................................. 93
8.3 Collaborative linkages .................................................................................................. 97
8.4 Labor Dynamics ......................................................................................................... 100
8.5 Overlapping Networks ............................................................................................... 101
8.6 Indirect linkages: Competence development dynamics ............................................. 102
8.7 Cluster Dynamics: Conclusions ................................................................................. 105
9. Summary of findings, implications and recommendations ............................................ 106
9.1 Summary of findings .................................................................................................. 106 9.1.1 The telecom industry at a glance ......................................................................... 106 9.1.2 Cluster attractiveness ........................................................................................... 107 9.1.3 Educational attractiveness .................................................................................... 108 9.1.4 Talent attractiveness ............................................................................................. 108 9.1.5 R&D and innovation attractiveness ..................................................................... 109 9.1.6 Ownership attractiveness ..................................................................................... 109 9.1.7 Environmental Attractiveness .............................................................................. 110 9.1.8 Cluster dynamics .................................................................................................. 110
9.2 Strategic recommendations ........................................................................................ 111
9.3 Public policy recommendations ................................................................................. 113
References .............................................................................................................................. 116

6
1. Introduction: The Knowledge-based Telecom Industry
This study assesses the underlying properties of a global knowledge hub to examine the extent to which the Norwegian telecom industry – which encompasses all telecom firms located in Norway regardless of ownership – constitutes a global knowledge hub. It commences with a general discussion of the industry before presenting an examination of the underlying properties of the global knowledge hub: cluster attractiveness, education attractiveness, talent attractiveness, R&D and innovation attractiveness, ownership attractiveness, environmental attractiveness and cluster dynamics. The report concludes with recommendations for business and public policy.
Innovation in the telecom sector – extension of coverage
Maritime Communications Partner (MCP) is a UK-based global maritime telecommunication operator reaching thousands of ship passengers and crew members in the European, North American, South American and Asian markets. The company´s principal activity lies in the wireless communications business, where it offers a wireless network known as CellAtSea®. Although the company is fully owned by Telenor, this was not always the case.
In 2000, after recognizing the necessity of providing communication capabilities to vessels at sea, a group of engineers employed in Ericssons’ research and development facility in the Norwegian town of Grimstad created a model of a communications platform that would allow cruise ship and ferry passengers to use their own mobile phones while at sea.
In 2002, MCP was formally established, but it was the following year that marked the take-off point. In 2003, Ericsson closed its research and development facility in Grimstad, freeing the group of engineers to focus on MCP. The first demonstrations of the technology were held and three larger companies entered on the ownership side. Telenor became an owner in 2004, buying 25 percent of the company. Two years later, Telenor acquired the rest of the company, thereby ensuring operational control.
In 2004, the first call from ship to shore was conducted and the service went live in the Nordic area. By that point, the company had ensured that it met the formal requirements, including GSMA membership, and approved titles as an international operator and as a national operator in Norway. A commercial breakthrough occurred when the A-bis solution, an MCP technology, made it possible to move the transmission base station from ship to shore, cutting operating costs significantly. The year after, the Customer Console feature was developed, which allowed ship owners to view statistics and track ships. The technical solutions were often developed by MCP in close cooperation with Telenor and Ericsson.
The largest contract to date was signed with the Stena Line in 2004. MGP’s customer base and geographical reach grew significantly in the ensuing years, extending to the Americas, Asia and Africa. In 2008, MGP entered into an alliance with SingTel, Asia’s leading satellite service provider, to offer GSM communications at sea. In 2010, the services offered to cruise ships, ferries, commercial shipping and offshore installations were extended service to all private yachts in areas covered by VSAT.

7
1.1 The global knowledge hub For Norway to be able to sustain its wealth in the future, a process of adjustment should preferably start while the public finances are not yet constrained by the coming expenses of the demographic shift. Recently published innovation indexes raise concerns regarding the relative speed and comprehensiveness of the adjustment process in Norway. Tough decisions are required on the national level to address the shortfalls in the adjustment process. Such decisions are likely to affect Norwegian businesses and their representative organizations, as well as educational institutions and governmental agencies.
This study is based on tree simple premises. For industries to be competitive and sustainable in a high-cost location like Norway, they must compete globally, they have to be knowledge based and they must be environmentally robust. Within this context, nations and regions face the challenge of attracting the best talent and the best firms. Knowledge-based industrial development is argued to occur in global knowledge hubs characterized by a high concentration of innovative industrial actors interacting closely with advanced research institutions, venture capital firms and competent owners. Hence, firms, local authorities and national governments face the challenge of creating the conditions under which knowledge-based industrial development can occur.
Figure 1-1: The Emerald© model
Source: Amir Sasson, The Emerald© model
The Emerald© model presented in Figure 1-1 provides a framework for analyzing the attractiveness of localities. The surface of the hexagon represents the room for maneuvering available to public authorities and a decision set for firms. The model conceptualizes attractiveness as six dimensional. Localities differ in their attractiveness in accordance with their abilities to attract advanced educational institutions and departments, highly talented employees, advanced academic specialists, research and development projects, competent and

8
willing investors and owners, the creation and implementation of environmental solutions, and a diverse and sizeable group of related firms.
The effects of these dimensions on economic performance are moderated by the degree of knowledge dynamics. “Cluster dynamics” refers to the degree to which related firms compose their internal and external relationships. The objective is to identify existing and emerging global knowledge hubs, and recommend policy initiatives that will enable the further development of such hubs and support their competiveness.
The study commences with an overview of the development of the industry over the past decade. We then examine the underlying attractiveness properties that affect the success and failure of industrial initiatives within the Norwegian telecom industry. The concluding chapter discusses implications for firm strategy and public policy.

9
2. The Telecom Industry – Past, Present and Future
2.1 Historical development One hundred years ago, it could take years to get a telephone line installed in your home.i
50 years later, it still took months. Today, consumers can pick up as many phones as they want while doing the shopping, and those phones are portable. Over the same time period, the telephone industry shifted from a plurality of network carriers towards a single, generally publicly owned carrier or a few carriers in each market. In the last twenty years, the number of carriers has increased, as national carriers have been privatized and private carriers have entered the market. Furthermore, the telecom industry has undergone a technological revolution. While it could take hours to place a long-distance call in the industry’s infancy, today customers can take advantage of a product range that includes the direct streaming of television and connections to the Internet via mobile phones, tablets or laptops.
In Norway, the state-run Televerket (called Telegrafverket until 1969 in reflection of its telegraph-based origins) acquired over 200 privately owned telephone companies. The nationalization process started in 1899 and was completed in 1974 with the acquisition of the privately owned telecompany Andebu Telefonforening in Vestfold.ii
In 1988, the Norwegian market for telecommunication terminals was opened to competition and monopoly over the sale of telephone sets ended. In 1999, NetCom became the first private telecom operator in the modern phase of the Norwegian telecom industry. It was established by Nora Industrier, Orkla and the Swedish group Kinnevik. It won a GSM license in 1991, beating out three other contenders, and it launched its network in 1993.iii
In 1994, Televerket was transformed into Telenor, a state-owned stock company. The last remnants of the monopoly were removed in 1998, at which time the Norwegian telecommunication market was fully opened to competition. Telenor was partially privatized in 2000 and NetCom was bought by the Swedish telephone company Telia that same year. These two companies remain, by far, the dominant players in the Norwegian telecommunication market, even after several virtual telecom service providers initiated operations and Network Norway established the third GSM network.
Telecom is an industry in which technological development is very important. Table 2-1 highlights important technological and commercial developments in the Norwegian telecom sector from the present day back to its origins in the nineteenth century when the telegraph was the state-of-the-art technology.

10
Table 2-1: Technological and commercial developments in the Norwegian telecom industry Year Event 2010 Telenor launches the music streaming service “Wimp” in Denmark and Norway 2009 NetCom introduces the world’s first 4G network in Oslo 2008 • The world's first authorized in-flight mobile phone calls on a commercial flight take place
on Emirates airline through the AeroMobile system, a joint venture between Telenor and ARINC, and the result of a research and innovation project at Telenor
• NetCom introduces the Apple iPhone 3G in Norway and sells it exclusively for one year 2007 • The Network Norway GSM network is opened to the public
• The digital terrestrial network opens in Norway • NetCom introduces HSDPA – turbo 3G
2006 • Network Norway is awarded Norway’s third GSM license • EDGE (enhanced data rates for GSM evolution) is introduced in the market
2004 • The commercial 3G UMTS service is launched in Norway and Sweden • NetCom introduces fixed prices for mobile data traffic
2002 The first trial UMTS (universal mobile telecommunication system) call takes place in Norway 2001 GPRS (general packet radio service), which provides mobile access to the Internet, is
launched by NetCom 2000 • Telenor offers leasing of access lines in the fixed network, which gives competitors direct
access to Telenor’s fixed-network subscribers • Telenor is partly privatized on December 4 • NetCom is bought by Swedish telecom operator Telia and taken off the Oslo stock
exchange 1999 • With the goal of stimulating increased competition, the portability of telephone numbers
when changing telecom services is introduced, so that a prefix is no longer needed when using services from companies other than Telenor
• WAP mobile service is introduced 1998 The last part of the monopoly on telecommunication is removed and the Norwegian
telecommunication market is opened to full competition 1997 • The Norwegian telecommunication network is fully digitalized
• NetCom introduce cash telephone cards 1996 The Internet makes its real breakthrough in the Norwegian market 1995 • Norwegian telecommunication is renamed Telenor
• Tele2 Norway is established; the company is owned by Tele2 AB, a Kinnevik company • SMS (short message service) from mobile phone to mobile phone is enabled
1994 • ISDN (integrated services digital network) is introduced • Norwegian Telecom becomes a public corporation • Oslonett publishes its first online newspaper
1993 Norwegian Telecom declares the GSM system officially opened; NetCom launches its own GSM network
1992 • The first short message service (SMS) is sent on December 4 via Vodafone’s GSM network in the UK and reads “Merry Christmas”
• Fiber-optic cable connects Norway and Denmark

11
• NetCom is awarded a GSM license, making it the first private telecom operator in the modern phase of the Norwegian telecom sector
1990 Standards for interconnecting the services are developed 1989 NetCom is established by Nora Industries, Orkla and Kinnevik 1988 The market for telecommunication terminals is opened to competition; Norwegian Telecom’s
monopoly over the sale of telephones ends 1985 Automation of the Norwegian telecommunication network is completed; the last manual
telephone exchange, located in Balsfjord, is closed 1984 Svalbard receives directly transmitted television via satellite 1981 • The mobile telephone is automated; NMT (Nordic Mobile Telephony) is launched
• The telefax is introduced in Norway 1979 94,000 names are on the waiting list for phone subscriptions; Norwegian Telecom is unable to
meet the demand for regular phone subscriptions 1975 Satellite services are developed in close cooperation with Norwegian industry; the Norsat
satellite connection is opened in 1976 1974 The last private telephone company, Andebu Telephone Association, is taken over by
Norwegian Telecom 1972 As one of the last countries in Europe, the first official color broadcast goes on the air in
Norway 1970 50 percent of Norwegian households have a telephone connection 1969 • The Norwegian Telegraph Administration changes its name to Norwegian
telecommunication (Televerket); it employs 17,250 people • The unique cooperation between the Nordic countries to create a common standard results
in Nordic Mobile Telephony (NMT) • Transmissions of data over the network are initiated
1966 • Direct distance dialing from Norway is enabled • The first manual mobile telephone is launched in Norway
1965 A satellite telephone connection between Norway and the US opens 1960 Norwegian Television (NRK TV) opens for television broadcasts 1946 Telex services are introduced to the Norwegian market 1933 The Norwegian Broadcasting Corporation (NRK) is established 1932 The first red telephone kiosks appear in Norway 1928 The telephone connection between Norway and the US opens 1925 The first radio broadcast is transmitted in Norway 1920 As the first city in Scandinavia, the Norwegian city of Skien opens an automatic telephone
exchange 1899 The Telegraph Act is passed, giving the state exclusive rights to offer telephone services; the
Norwegian state is authorized to take over the private telephone companies – this process lasted until 1974
1893 The first international telephone line connects Kristiania (Oslo), Norway with Stockholm, Sweden
1881 The Norwegian government passes the Monopolies Act, which gives the state exclusive rights to convey messages by means of telegraph lines and similar installations
1878 The Norwegian cities of Arendal and Tvedestrand are connected via telephone cables

12
1877 The first known public demonstration of the Bell telephone in Norway takes place 1867 The first international telegraph cable is opened, connecting Norway and Denmark 1855 The Norwegian Telegraph Administration (Det norske telegrafverk) is founded by the state 1853 Norway’s first telegraph cable opens along the railway tracks leading from Strømmen to
Christiania (Oslo) 1839 The first commercial electrical telegraph is constructed by Sir Charles Wheatstone and Sir
William Fothergill Cooke; it runs along the Great Western Railway over 21km from Paddington station to West Drayton in the UK
1837 Cooke and Wheatstone obtain a patent on the telegraph; Samuel Morse publicly demonstrates his telegraph
Source: Telenor.com, NetCom.no, tele2.no, networknorway.no, st.meld. nr. 1 (1999-2000)iv
2.2 The global market 2.2.1 Penetration Today there are about as many people in the world as there are telephones (fixed lines and mobile subscriptions). OECD estimates indicate that more than two-thirds of everyone in the world own a mobile phone. Just a decade ago, the majority of telephones were found in OECD countries. Today, however, there are 4.1 billion telephones in non-OECD countries, which is more than double the 1.7 billion telephones in the OECD area.v
The communication revolution that the world has witnessed in the last two decades
has had a particularly strong impact on developing countries.
In 1960, only three countries – Canada, Sweden and the United States – had more than one telephone for every four persons. In the majority of the countries in what became the OECD area a year later, less than one in ten had a telephone. Furthermore, 93 percent of all telephones could be found in these the OECD countries. See figure 2-1 for development regarding fixed telephone lines and mobile subscriptions for OECD countries and the rest of the world, from 1960-2009.
The luxury origins of telecom
50 years ago, telephones were widely considered a luxury item, as using them for local calls was expensive, while long distance or international calls were even more costly. When the transatlantic telephone cable between Canada and Britain was opened in 1961, the event was considered so historic that the first call made was from Canadian Prime Minister John Diefenbaker to Queen Elizabeth.

13
Figure 2-1: Fixed telephone lines and mobile subscriptions, OECD and the rest of the world, 1960-2009
Source: OECD
Norway scores among the top-ten countries in terms of the combined development of information and communication technologies. In an index compiled by ITU (the United Nations’ specialized agency for information and communication technologies) to reflect the combined sophistication of the information and communication sectors in individual countries, Norway scored ninth out of 200 countries in 2008, while Sweden was ranked number one. However, in 2002 Norway was ranked fifth. This indicates that the improvements in information and communication technology have been slower in Norway than in other leading countries in this period.vi
See figure 2-2.
0
1 000
2 000
3 000
4 000
5 000
6 000
7 000
1960 1965 1970 1975 1980 1985 1990 1995 2000 2005 2009
Millions Rest of the world's fixed telephone lines and mobile subscriptions
OECD fixed telephone lines and mobile subscriptions

14
Figure 2-2: ITU information and communication technology development index, top-ten countries, 2008 (blue) and 2007 (red)
Source: ITU Figure 2-3 gives the total number of communication access paths (analogue, ISDN lines, DSL, cable modem, fiber and mobile subscribers) in the OECD area measured in relation to the population. Estonia has the most communication access paths, with 250 per 100 inhabitants. Norway is located in the lower-middle range, with 171 paths per 100 inhabitants, which is slightly above the OECD average of 163. Figure 2-3: Total communication access paths per 100 inhabitants, OECD, 2009
Source: OECD
6
6,2
6,4
6,6
6,8
7
7,2
7,4
7,6
7,8
8
Sweden Luxembourg Rep. Korea Denmark Netherlands Iceland Switzerland Japan Norway UK
244
230
205
203
202
201
200
198
198
196
196
191
185
185
180
177
176
174
173
171
169
166
163
163
163
158
156
152
150
147
132
128
119
0 50
100 150 200 250
Est
onia
G
reec
e Lu
xem
bour
g U
nite
d K
ingd
om
Ger
man
y D
enm
ark
Sw
eden
S
witz
erla
nd
Por
tuga
l Fi
nlan
d Is
rael
Ita
ly
Aus
tria
Icel
and
Net
herla
nds
Bel
gium
S
pain
N
ew Z
eala
nd
Aus
tralia
K
orea
N
orw
ay
Cze
ch R
epub
lic
Hun
gary
Ire
land
U
nite
d S
tate
s O
EC
D
Fran
ce
Can
ada
Pol
and
Slo
veni
a Ja
pan
Slo
vak
Rep
ublic
C
hile
Tu
rkey

15
2.2.2 Telephony The first decade of the new millennium saw an extreme increase in human connectivity. And this is predominant due to the increase in mobile phone coverage. In 2000 there were 714 million mobile phone subscribers, less than there were fixed telephone lines. In a decade this increased more than six fold, to 5.4 billion mobile phone subscribers by 2010. 78 out of 100 inhabitants in 2010 have a mobile phone subscription. The spectacular growth of mobile phones is shown in figure 2-4. The figure also shows the proportion of inhabitants that have access to the Internet. It is also growing fast, increasing from about 6 percent in 2000 to about 30 percent in 2010. With the Internet increasingly becoming available on mobile phones, Internet access can be expected to increase substantially in the future. The only communication access area that is experiencing a decline on the global scaled is fixed-telephone lines. Figure 2-4: Global penetration of fixed lines, mobile phones and Internet access, per 100 inhabitants, 2000-2010
Source: ITU World telecommunication
While developed countries have experienced a significant increase in the number of mobile phone subscribers, from 469 million in 2000 to 1,408 million in 2010, the most extreme growth has been evident in developing countries. In these countries, the number of mobile phone subscribers grew from 250 million in 2000 to 3,965 million in 2010. See figure 2-5.
0
10
20
30
40
50
60
70
80
90
100
2000 2001 2002 2003 2004 2005 2006 2007 2008 2009 2010
Per 1
00 in
habi
tant
s
Mobile cellular telephone subscriptions
Internet users
Fixed telephone lines
Active mobile broadband subscriptions
Fixed (wired) broadband subscriptions

16
Furthermore, the proportion of the world’s population that is covered by a mobile phone signal is increasing. In 2003, 61 percent of the world’s population was covered, while six years later the corresponding figure was 90 percent. Interestingly, this is a slightly higher coverage than the share of the world’s population that has access to electricity. With mobile phone coverage reaching into the far corners of the world, where other basic infrastructure might be lacking, mobile phone based infrastructures can be developed. One example is the mobile phone based banking infrastructure that for the first time has brought banking services to the public at large in East Africa.
Figure 2-5: Mobile phone subscriptions, by level of country development, 2000, 2005 and 2010
Source: ITU World Telecommunication In the OECD area, Estonia has the highest percentage of mobile phone subscriptions per inhabitant. Norway ranks in the middle. The number of fixed telephone lines per 100 people peaked in 2005. This figure had been falling in the developed world since the turn of the century, but starting in 2005, the number of fixed telephone lines stopped growing in the developing countries as well and has even declined marginally in recent years. The number of fixed telephone lines in the world reached a peak in 2005, as shown in figure 2-6. The penetration rate of fixed telephone lines had been falling in the developed world since the turn of the century, but was initially growing in developing countries. In 2006 the penetration of fixed telephone lines peaked in developing countries, and from 2007 to 2010 the penetration rate declined from 13.0 to 11.9 percent.
2000
Total 719 million
Developed
Developing
2010
Total 5.4 billion
Developing
Developed

17
Though the number of fixed telephone lines overall is declining, there are differences between countries. For instance, in 2009 there was 458 million fixed telephone access paths within the OECD area. The majority of the OECD-countries experienced a decline in fixed telephone access paths from 2007 to 2009. Only in Israel was there a significant growth, with 34 percent over the period. Four countries experienced a modest growth in the range of 1-4 percent. Denmark had the largest decline, with 29 percent, followed by Slovenia, Finland and Poland. Norway experienced the 5th largest decline, with 17 percent.
Figure 2-6: Fixed telephone lines per 100 inhabitants in the world, 2000-2010
2.2.3 Internet Over the last decade, there has been a substantial increase in the number of Internet users. In 2000, there were an estimated 394 million Internet users. By 2010, the figure had grown to an estimated 2,044 million. Measured per 100 inhabitants, this translates into growth from 6 in 2000 to 30 a decade later. Given the linear increase over the past decade, this indicates that about one-third of the world’s population today has access to the Internet.
An examination of the regions of the world reveals a significant difference in Internet access levels. In Europe, 41.3 percent of the inhabitants had active mobile broadband subscriptions in 2010, while in Africa the proportion was only 2.5 percent. A similar difference is found in fixed (wired) broadband subscriptions, where the percentages for Europe and Africa were 23.8 percent and 0.2 percent, respectively.
The percentage of the world’s population that has access to the Internet can reasonably be expected to grow substantially in the coming years. In just three years, from 2007 to 2010, the percentage of the population in the developed world that had active mobile broadband subscriptions more than doubled from 18.5 percent to 46.2 percent. The developing countries
41,6
17,2
11,9
0
10
20
30
40
50
60
2000 2001 2002 2003 2004 2005 2006 2007 2008 2009 2010
Per 1
00 in
habi
tant
s
Developed
World
Developing
The developed/developing country classifications are based on the United Nations M49 Source: ITU World Telecommunication

18
have also experienced a significant increase. In 2007, 0.8 percent of the population had active broadband subscriptions, while the figure was 5.3 percent in 2010.
Since 1984, Internet traffic has grown exponentially, even during the recent finance crisis. Cisco’s Visual Networking Index indicates that global IP traffic reached just over 20,000 petabytes (PB) per month in 2010 (1 petabyte equals 1,000 Terabytes, 1 million gigabytes or 1 billion megabytes).
Global IP traffic (i.e., traffic that is routed through the “public” Internet) accounted for 75% of all Internet traffic in 2010, having grown by nearly 50 percent per annum (CAGR) from 2005 to 2010. The remaining 25% of traffic was generated on private networks, including business networks, mobile data and video on demand (VoD). See figure 2-7.
Figure 2-7: Global IP traffic, PB/month, 2005-2010
Source: OECD
The level of IP traffic varies among countries and regions. North America generated the most IP traffic in 2010 with 34.7% of the world’s total (7,091 PB/month). It was followed by Asia Pacific at 33.8% (6,906 PB/month) and Western Europe at 23.6% (4 818 PB/month). Latin America, and Central and Eastern Europe generated 680 PB and 678 PB per month, respectively, accounting for 3.3% of the world’s total. The Middle East and Africa’s share of the world’s IP traffic was only 1% (223 PB/month).
The United States was the top traffic-generating country, with an estimated 31 percent of the world’s IP traffic (6,337 PB/month). Korea came in second place came with 10 percent (2,196 PB/month) and China was third with 6.3 percent (1,277 PB/month).
On a per-capita basis, Korea generated the highest amount of IP traffic with 4,555 TB per month per 100,000 inhabitants, followed by Canada (2, 288 TB/month) and the United States (2,110 TB/month). The United States’ share of VoD traffic was particularly high (60 percent), mainly due to the wide adoption of video-on-demand systems. Over time, other countries are likely to follow the lead of the United States in this area.
0
5 000
10 000
15 000
20 000
25 000
2005 2006 2007 2008 2009 2010
PB/m
onth
Mobile Data
Business IP WAN
VoD
Internet

19
The growth in IP traffic from the mid-1980s to the mid-1990s was much higher in the United States than in the rest of the world. By the second part of the 1990s, however, growth in the United States and the rest of the world combined was fairly even. For the last ten years, the combined growth in the rest of the world was higher than growth in the United States. The OECD expects this trend to continue. By 2014, IP traffic in the rest of the world is expected to be about 3.5 times higher than in the United States.
One indication of the spread in Internet usage in a country is the growth in the registration of domain names. Not surprisingly, the US is in the lead, with annual growth of 74 percent during this period. Norway is located just over the median with 27 percent annual growth.
In terms of the registration of domains per capital, Norway ranks ninth in the OECD area with just under 0.2 domains registered per capita. The Netherlands ranks highest, with just over 0.35 domains per capita. Of the Nordic countries, Denmark and Iceland are ranked higher than Norway, while Sweden is ranked tenth. See figure 2-8.
Figure 2-8: Domain name registrations per 1,000 inhabitants, mid-2010
Source: OECD
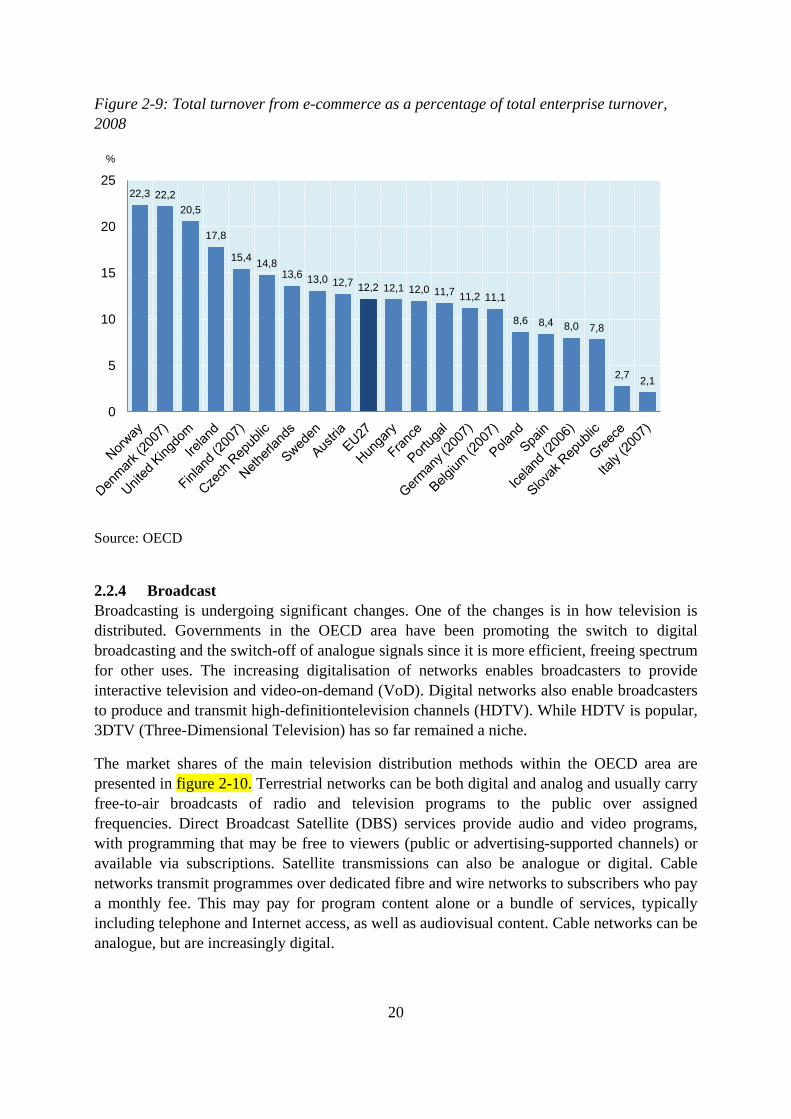
One area in which Norway is at the forefront is businesses adoption of e-commerce. In 2008, 22.3 percent of the revenue of all Norwegian enterprises came from e-commerce, the highest percentage in the OECD area. See figure 2-9.
0
50
100
150
200
250
300
350
400
ccTLDs per 1 000 inhabitants gTLDs per 1 000 inhabitants .eu per 1 000 inhabitants
20
Figure 2-9: Total turnover from e-commerce as a percentage of total enterprise turnover, 2008
Source: OECD
2.2.4 Broadcast Broadcasting is undergoing significant changes. One of the changes is in how television is distributed. Governments in the OECD area have been promoting the switch to digital broadcasting and the switch-off of analogue signals since it is more efficient, freeing spectrum for other uses. The increasing digitalisation of networks enables broadcasters to provide interactive television and video-on-demand (VoD). Digital networks also enable broadcasters to produce and transmit high-definitiontelevision channels (HDTV). While HDTV is popular, 3DTV (Three-Dimensional Television) has so far remained a niche.
The market shares of the main television distribution methods within the OECD area are presented in figure 2-10. Terrestrial networks can be both digital and analog and usually carry free-to-air broadcasts of radio and television programs to the public over assigned frequencies. Direct Broadcast Satellite (DBS) services provide audio and video programs, with programming that may be free to viewers (public or advertising-supported channels) or available via subscriptions. Satellite transmissions can also be analogue or digital. Cable networks transmit programmes over dedicated fibre and wire networks to subscribers who pay a monthly fee. This may pay for program content alone or a bundle of services, typically including telephone and Internet access, as well as audiovisual content. Cable networks can be analogue, but are increasingly digital.
22,3 22,2 20,5
17,8
15,4 14,8 13,6 13,0 12,7 12,2 12,1 12,0 11,7 11,2 11,1
8,6 8,4 8,0 7,8
2,7 2,1
0
5
10
15
20
25
%

21
Figure 2-10: Television access by distribution platform in OECD, 2009
Note: The data for Internet Protocol Television are limited and not included Source: OECD
In Norway in the first half of 2011 cable had the largest share of the market, with 44.3 percent of the subscribers. 30.6 percent used satellite, 13.6 percent the digital ground based network and 10,9 percent of the subscribers used fiber.
Telenor is the company that in the first half of 2010 had most subscribers for transfer of television when all access forms are counted. This is to a large extent due to its market leader position in cable TV, where it has over half the market. The second largest player when all access forms for television is considered is Get, followed by Riks-TV and Viasat.
Cable operators were among the early adopters of the so-called Multiple Play business model, providing television, telephone and Internet services in a single subscription package (also known as triple play). Television over Internet Protocol (IPTV) were developed by telecom companies to match the bundled offerings of cable companies. Early DSL networks could support no more than basic video services but as DSL improved and cable networks extended, IPTV became more competitive. IPTV is intended for viewing on televisions not computers and is delivered over a controlled network, similar to cable. While IPTV has typically been offered as a part of bundled subscription packages, it can also be made available on a pay-per-view or free basis. Within the OECD area penetration of IPTV is limited. Only in France was in in 2009 above 30 percent and in Slovenia above 20 percent of households with televisions. In Norway the penetration rate was about 10 percent. See figure 2-11

22
Figure 2-11: IPTV subscribers as a percentage of households with televisions, OECD area, 2009
Source: OECD
Audiovisual broadcasts and content can now be received on a wide range of devices, both in the home and/or elsewhere. Set-top boxes and a range of video and hard-disk recording devices have brought greater control overviewing, with recording for delayed viewing, television pause and rewind functions now widely available. This “time-shifting” has been complemented by “place-shifting”, enabling viewers to feed transmissions into the Internet and access them regardless of location
Audiovisual content is also available on portable devices, with an increasing range of content optimized for the mobile web and direct broadcasting to handsets. The growth of television and video viewing over mobile phones has so far been relatively modest, except in japan and Korea. But with consumers being increasingly accustomed to having access to all content types regardless of location combined with mobile data plans becoming more widespread and smartphones, handheld multimedia devices and tablet computers with larger screens and enhanced functionality becomes more common it is likely to be an increase in mobile video and television take-up.
The digitalization of broadcasting has made it possible to launch HDTV channels and new channels. There were around 1 650 national free-to-air, cable and satellite channels available in 28 of the OECD countries in 2006. Three years later this had increased to 7 930 channels in 26 of the OECD countries. In 2009 Norway had the second lowest channel availability. See figure 2-12.

23
Figure 2-12: Channel availability, number of channels in 2006 and 2009 in the OECD area
Source: OECD
Traditional broadcasting revenue models are under pressure. The main revenue model for terrestrial free-to-air broadcasters has for most countries predominantly been advertising, supported by license fees and public support for public television channels. The business models of cable and satellite broadcasters have been based on subscriptions, with viewers paying a monthly fee to access content. Pay-TV content may also carry advertising, which supplements subscription revenues. The proliferation of access platforms has also intensified competition for advertising and this has put pressure on advertising-supported television channels. In European OECD countries, total audiovisual revenues increased by 2 percent per annum, while television advertising revenue remained mostly flat and consumer pay-TV spending increased by 5 percent per annum from 2004 to 2009. See figure 2-13.
Figure 2-13: Broadcaster revenue trends in European OECD countries, indexed
Source: OECD

24
2.2.5 Revenues, profits and investments The shift in telecom’s status as a luxury item decades ago to a basic commodity today means that telecom revenues are fairly resilient to economic shocks. GDP growth in the OECD area fell below 2 percent per year in the economic downturn of 2000-2001, but telecom revenues in most OECD countries continued to increase. However, telecom revenues are not immune to the most severe economic crisis. In the financial crisis of 2008-2009, global telecom revenues fell by about 3.7 percent. Estimates for 2010, indicate that the reduction will be reversed in just one year and that revenues in the coming years will continue to grow at a close-to-pre-crisis level. See figure 2- 14.
Several characteristics of the telecommunication sector might explain the resilience of telecom revenues in economic downturns. One factor might be the fact that communication services are increasingly viewed as non-discretionary spending items. Long contract durations and bundled services are also relevant explanations for why both telecom and broadband operators are relatively well insulated from economic downturns. Consumers typically face steep penalties if they choose to cancel a subscription before the end of a contract. Another characteristic of telecommunication markets that may explain their resiliency is the growth in bundled services, where operators bundle voice with video and data services as a way of increasing revenues and fostering service loyalty.
Figure 2-14: Global and regional telecom revenues, USD billion, 2003-2013 (estimated 2010-2013)
Source: Telecom Industry Association One area of the telecom industry that is sensitive to economic downturns is investments. At the height of the IT bubble in 2000, telecommunication investments peaked at USD 243
0
1000
2000
3000
4000
5000
6000
0
1000
2000
3000
4000
5000
6000
2003
2004
2005
2006
2007
2008
2009
2010
2011
2012
2013
Africa and other
Asia‐Pacific
Latin America
Europe
US
Global

25
billion. The next year, investments fell by 10 percent. The level of investments declined further in 2002, falling by 31 percent. Investments began to grow again in 2004, but at relatively lower rates than before the bubble. Investments also declined, albeit more modestly, during the 2008-2009 financial crisis. See figure 2-15.
Figure 2-15: Subscriber, revenue and investment growth in the OECD area, 1980-2009
Source: OECD
An examination of public telecom investments reveals significant variety among countries when measured per capita. One would expect the wealthier countries to be ranked high. Furthermore, countries that have recently undertaken large investments projects, such as Slovenia and Iceland in 2008, could be expected to rank lower. Norway ranked in the middle of the OECD countries in terms of telecommunication investments per capita in both 2008 and 2009. See figure 2-16.
0
500
1 000
1 500
2 000
2 500
0
200
400
600
800
1 000
1 200
1 400
Acce
ss p
aths
(mill
ions
)
Rev
enue
and
inve
stm
ent
(cur
rent
USD
bill
ions
)
Revenue (left scale)
Investment (left scale)
Total communication access paths (analogue lines + ISDN lines + DSL + cable modem + fibre + mobile) (right scale)

26
Figure 2-16: Public telecommunication investments per capita, OECD, USD, 2008 and 2009
Source: OECD
An examination of the average revenue per employee for the 250 largest information and communication firms reveals that revenue per employee is highest for Internet companies at around USD 800,000 on average. This is two to four times higher than the corresponding figures for other sectors in the information and communication technology (ICT) field. Average revenue per employee for telecom firms was USD 378,000in 2009, an increase from USD 253,000 in 2000. This figure makes telecom the third-highest of the eight sectors in the information and communication technology field. Average revenue per employee in the communications equipment sector for the 250 largest firms declined from USD 361,000 in 2000 to USD 349,000 in 2009.
Revenue trends for the 100 largest global telecommunication firms constitute a key indicator of the health of the industry. These 100 firms include firms offering services such as telephony, Internet and broadband access (e.g., cable television networks), and they are found in countries around the world. Equipment manufacturers are excluded. Between 2000 and 2009, these 100 firms experienced a compound annual growth rate (CAGR) of 8 percent in terms of revenue and a CAGR of 12 percent in terms of net profit.
From 2000 to 2010, the telecom industry experienced two global financial crises. The first occurred between 2001 and 2003 in the aftermath of the IT bubble. The second covered the period from September 2008 through 2010. Interestingly, these two crises played out differently in the telecom sector. In the first crisis, net income declined but revenues did not. The last crisis resulted in a slowdown in revenue growth in 2008 and a decline in 2009, but net income remained stable.
Between 2006 and 2009, net income remained relatively flat. The largest 100 telecom firms inside the OECD area experienced subscription growth in such areas as Internet broadband and wireless access, while revenues from traditional telephony and public switched telephone network (PSTN) lines declined. In developing countries, growth was dominated by wireless technologies but fixed-line services were not displaced to the same extent.
347
345
286
260
247
208
202
201
189
177
158
145
143
141
138
137
130
129
128
124
123
112
109
102
94
92
87
84
75
73
72
67
52
25
0
50
100
150
200
250
300
350
400
Aus
tralia
Lu
xem
bour
g D
enm
ark
Sw
itzer
land
N
ew …
C
anad
a U
nite
d …
Bel
gium
Ja
pan
Net
herla
nds
Gre
ece
Sw
eden
Ita
ly
Nor
way
P
ortu
gal
Irela
nd
Uni
ted …
S
pain
Fr
ance
Is
rael
S
love
nia
Finl
and
Icel
and
Ger
man
y E
ston
ia
Kor
ea
Chi
le
Aus
tria
Hun
gary
C
zech
…
Slo
vak …
P
olan
d Tu
rkey
M
exic
o
2008 2009
USD

27
Figure 2-17 presents profitability in the various sectors in the ICT industry among the 250 largest firms. Of these, Internet firms experienced a net loss in 2000 and semiconductor firms experienced a loss in 2009. The other sectors broke even or experienced a profit in these two years. The profitability of telecommunication firms was 7 percent in 2000 and 10 percent in 2009. Software was the overall profit leader in the ICT sector, with a margin of around 20 percent.
Figure 2-17: Top 250 information and communication technology firms, profitability by sector, 2000 and 2009
Source: OECD
When measured as a percentage of GDP for the whole of the OECD area, revenues in the telecom sector were relatively flat at just over 2 percent from the mid-1980s to the early 1990s. The late 1990s brought a period of growth until the economic downturn that followed the IT crash after the turn of the century. From 2001 to 2008, revenues as a percentage of GDP declined modestly. In the crisis year of 2009, revenues again increased somewhat, indicating that telecommunication services are a viewed as a commodity – a service that is given priority in challenging economic situations.
19%
5%
4%
4%
9%
7%
‐21%
20%
‐7%
0%
3%
6%
7%
10%
14%
21%
‐30% ‐20% ‐10% 0% 10% 20% 30%
Semiconductors
Electronics & components
IT equipment
Communications equipment
IT services
Telecommunications
Internet
Software
2009 2000

28
2.3 Developments and trends 2.3.1 The big convergence Convergence in the telecom sector is a concept that can trace its origins to work done by AT&T engineer Harry Nyquist in 1928 but it has evolved in the twenty-first century to dominate the market positioning of telecom operators.vii
It is reflected in the product portfolio offered by operators (vertical integration), and in the channels through which their products are sold and serviced (horizontal integration). Telecommunication convergence is a disruptive technology.
Communication media, including electronic media, telecommunication media and broadcast media, used to be compartmentalized business operations providing distinct services. Broadcasting, voice telephony and on-line computer services operated on different platforms, and TV and radio sets, telephones and computers and were managed by different business support systems. In most countries, different broadcasting media were regulated by different regulators. Telecom media convergence is about the interaction of multiple industries – companies are no longer confined to their own markets. Fixed, mobile and IP service providers can offer content and media services, and equipment providers can offer services directly to the end user. Content providers are continually looking for new distribution channels. Convergence is the combination of all of these media into one operating platform. It refers to the merger of telecom, data processing and imaging technologies. This convergence is ushering in a new epoch of multimedia, in which voice, data and images are combined to render services to the user. The key result of convergence at a macro-business level is the merger of the telecommunication and media/entertainment industries. One illustration of the big convergence is given by examining the historic development of computing growth drivers. Going back 50 years mechanical computing were conducted using large mainframes and there existed around 1 million units. The computing industry at that time had fairly little direct relevance for the telecom industry. Going forward, each of the next generations of computing power increases the market by approximately a factor of 10 and reduces the physical size of the computing unit. There were approximately 10 million minicomputers around 1980, 100 million PCs around 1990 and 1 billion mobile phones/desktop internet units around 2000. The stage we currently are entering has by Morgan Stanley been labeled mobile consumers, with computing and communication power being found in a large variety of items. Examining figure 2-18 also illustrates that the speed of change from one generation to the next is increasing.

29
Figure 2-18: Computing growth drivers over time, 1960 – 2020 (estimate)
Source: Morgan Stanley Examining the revenue of the 250 biggest information and communication firms can give another picture on the big convergence. Telecommunication firms account for the largest part of the revenues of these 250 companies, with 36 percent. The other revenue shares are electronics and components with 27 percent, IT equipment with 15 percent, IT services with 8 percent, communication and equipment with 6 percent, software and semiconductors both have 3 percent and, finally, internet with 2 percent. These are all industries where the demand is increasingly interdependent, and where the competition exposure from firms in these related industries are increasing, much more so than in earlier times. See figure 2-19.

30
Figure 2-19: Top 250 information and communication technology firms in the world, revenue by sector, 2009
Source: OECD
Communications equipment
6 %
Electronics and components
27 %
Internet 2 %
IT equipment 15 % IT services
8 %
Semiconductors 3 %
Software 3 %
Telecommuni cations
36%

31
Opera Software: Compressing the mobile Web
One company that has benefited from the convergence in information and communication technology is Opera Software, which was established in 1995 as an offshoot of Telenor R&D. The company’s only product was the Opera browser, an early competitor to Netscape and Microsoft’s Internet Explorer. Although technically highly sophisticated and a favorite of advanced users, the browser never captured a market share of more than a few percent. The company’s influence in technical circles belied its tiny size – Sun offered to buy Opera Software for NOK 100m when it had only four employees, and Microsoft was worried enough about the competition to implement anti‐Opera features in its server technology, a practice that allegedly led to an out‐of‐court settlement and much animosity between Microsoft and Jon S. von Tetzchner, Opera Software’s CEO (until 2009) and co‐founder (with Geir Ivarsøy).
An efficient code base – the browser code was the same for all versions – and disciplined development allowed Opera to migrate its browser from the web over to PDAs, set‐top boxes and, eventually, to mobile phones in the early 2000s. The company was well positioned when mobile phones started to take off, particularly in Asia. In this regard, the fact that the company was not Microsoft was an important selling point when talking to network operators, who would buy Opera’s technology to facilitate their users’ surfing as well as talking. Opera Mini, a mobile phone browser launched in 2008, could speed up mobile browsing by rendering images on centralized servers, and by reducing the data traffic between handsets and the web by as much as 90% through compression.
Opera Mini quickly garnered more than 150 million users, leading Opera’s revenues to double from 2007 to 2010 and providing healthy profits. As a result, the company lost its relative obscurity. As mobile phone use in Asia continues to rise, the company faces good growth prospects, as well as the threat of becoming a commoditized service. Opera Software’s value offering to customers and operators alike is that it reduces load (and, as long as customers pay per Mb downloaded, price). As the capacity of mobile data networks increases, Opera’s service in this regard will be less useful. In a world where knowing what people are interested in, compressing the information that end users use has an increasing value since it gives insight that on an aggregated level can be shared with the advertising industry and other third party actors.
In the meantime, the company aims to attract the next billion users – those that, as CEO Boilesen phrases it, equate the Internet with Opera Mini. Furthermore, the company is working towards positioning Opera as the central connecting hub on smart TVs. In June 2011, Jon von Tetzchner announced that he would be leaving the company, which creates the possibility that the company could become an acquisition target.

32
2.3.2. Dying revenue sources and the birth of new ones
Dying revenue sources
Though a slow process, many of the traditional revenue sources in telecom are dying or under pressure. One area where this is a mature development is fixed line telephony. With the explosion in mobile phone usage it is not a surprise that the demand for fixed line telephony is reduced. The volume of fixed line telephony was flat in the first half of 2001. It then started to decline. In the first half of 2006 the volume change in traffic was -22.4 percent. The decline rate is currently less steep, at -13.9 percent in the first half of 2011, but the trend is unchanged. Revenue from fixed line telephony is not falling quite as quickly due to the ability so far of charging more for fixed line subscription and access.
Figure 2-39: Revenue from fixed line telephony, million NOK. First half of 2001 to first half of 2011
Source: Norwegian Post and Telecom Authorities
One other major revenue source that is under pressure is sms-traffic, where volume in Norway now is declining, having peaked in 2009. Revenue from sms-traffic was in the first half of 2011 891 million NOK. This is a decline of 110 million from the year before and the lowest revenue from sms-traffic in a decade. With the increasing ease of sending messages within social media platforms like Facebook, the decline is likely to continue
The volume of voice over mobile phone is still increasing. But with free or significantly cheaper alternative ways of calling increasingly being provided for, this might change. For instance, Facebook now offer data based voice services through their social platform, which normally is much cheaper to use than regular voice services offered by the network operators.
‐
1 000
2 000
3 000
4 000
5 000
6 000
7 000
1. half
2001
1. half
2002
1. half
2003
1. half
2004
1. half
2005
1. half
2006
1. half
2007
1. half
2008
1. half
2009
1. half
2010
1. half
2011
Income from traffic to abroad
Income from traffic to fixed line in Norway
Income from trafic to mobile phones
Income from subscriptions, access, movage and additional services

33
The birth of new revenue sources
The last decade has witnessed the mobile phone revolution, with mobile phones moving from being owned by a few to being owned by the majority of the world’s population. Mobile phones are primarily a device for human to human communication. In many ways this can be described as being phase one of the revolution in mobile communication.
Phase two of the mobile communication revolution entails communication with the swarm of items in our lives that today are not hooked up, both inhuman to item communication and in item to item communication. The latter is also known machine to machine communication (M2M). Examples of first can be remote health monitoring of a patient. Examples of the latter can be automatic dial up for assistance by a car if it is involved in an accident or the electric system of a residence communicating its electricity usage in real time.
The growth in the M2M market has started, but is already in its infancy. As of the first half of 2011 there were 600 000 sim cards for machine to machine communications in activity. The growth in the coming years is expected to be significant. The limit to the active subscription base is in reality one per person in a country, not counting the youngest children. But the limit to M2M and human to machine communication is almost limitless.
Figure 2-20: Sim cards for Machine to Machine communication in Norway
Source: Norwegian Post and Telecom Authority Another area which is likely to witness a mobile revolution is finance and payment. The infrastructure for using the mobile phone for purchases in shops is being rolled out in the west in these days, with many solutions being based on near field communication abilities. The huge potential for using the phone as a finance service is illustrated by the success Telenor
0
100 000
200 000
300 000
400 000
500 000
600 000
700 000
2007 2008 2009 2010 1. half 2011
34
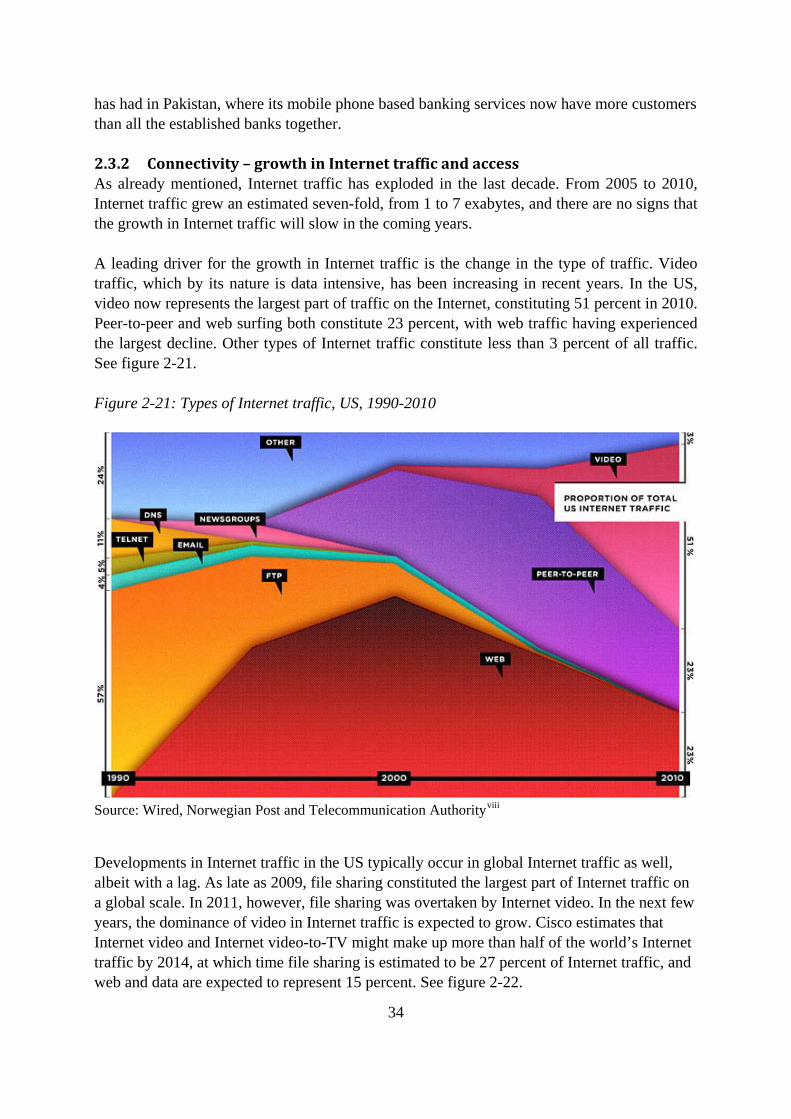
has had in Pakistan, where its mobile phone based banking services now have more customers than all the established banks together. 2.3.2 Connectivity – growth in Internet traffic and access As already mentioned, Internet traffic has exploded in the last decade. From 2005 to 2010, Internet traffic grew an estimated seven-fold, from 1 to 7 exabytes, and there are no signs that the growth in Internet traffic will slow in the coming years. A leading driver for the growth in Internet traffic is the change in the type of traffic. Video traffic, which by its nature is data intensive, has been increasing in recent years. In the US, video now represents the largest part of traffic on the Internet, constituting 51 percent in 2010. Peer-to-peer and web surfing both constitute 23 percent, with web traffic having experienced the largest decline. Other types of Internet traffic constitute less than 3 percent of all traffic. See figure 2-21. Figure 2-21: Types of Internet traffic, US, 1990-2010
Source: Wired, Norwegian Post and Telecommunication Authorityviii
Developments in Internet traffic in the US typically occur in global Internet traffic as well, albeit with a lag. As late as 2009, file sharing constituted the largest part of Internet traffic on a global scale. In 2011, however, file sharing was overtaken by Internet video. In the next few years, the dominance of video in Internet traffic is expected to grow. Cisco estimates that Internet video and Internet video-to-TV might make up more than half of the world’s Internet traffic by 2014, at which time file sharing is estimated to be 27 percent of Internet traffic, and web and data are expected to represent 15 percent. See figure 2-22.

35
Figure 2-22: Global growth in Internet traffic by category, 2009-2014 (estimates)
Source: Cisco VNI Forecast, Norwegian Post and telecommunication Authorityix
The exponential growth in Internet traffic, combined with the growing importance of video and TV traffic creates a challenge for the communication companies responsible for the broadband infrastructure. A substantial number of households still only have access to low-speed Internet.
2.3.3 The growing importance of mobile device operating systems Developments in the smart phone segment and the related tablet segment are shaping the telecom sector. A few years ago, a mobile phone’s operating system was generally not something about which the average user was conscious. Today, the choice of a phone is as much a choice about which application family and communication ecosystem the user wishes to utilize.
Although it is not the dominant player in terms of mobile phone sales, Apple has rewritten the rules of the game, forcing its competitors to adapt their strategies and products. Apple’s share of the global smart phone market grew from the 2.7 percent it held after the launch of the iPhone in June 2007 to 15.7 percent in 2010.
Apple’s main competitor in terms of operating systems is Google’s Android system. Android’s share of the smart phone market grew from 0.5 percent in 2008 to 22.7 percent in 2010, and its growth has reportedly been even stronger in 2011. RIM has also experienced notable expansion, with its market share increasing from 9.6 percent in 2007 to 16 percent in 2010.
The expansion of the operating systems from Google, Apple and RIM has primarily come at the expense of the Symbian (Nokia) operating system. Symbian’s market share declined from

36
63.5 percent in 2007 to 37.6 percent in 2010. Microsoft’s Windows Mobile share also declined, moving from 12 percent in 2007 to 4.2 percent in 2010. See figure 2-23.
In 2011, Nokia and Microsoft entered into an alliance, in which Nokia is to shift its focus from Symbian-based phones to the production of mobile phones using Microsoft’s Windows Mobile system. However, it is too early to determine how this partnership will develop.
Figure 2-23: Worldwide smart phone sales to end users, by operating system
Source: Gartner
The global market shares presented in Figure 2-24 hide the fact that Apple’s operating system (OS) is much more prevalent than other systems in some markets, typically developed countries, in which users are less sensitive to price. For instance, in the US, the Android OS is the most common at 37 percent, followed by the Apple OS with 27 percent, the RIM BlackBerry OS with 22 percent and Microsoft Windows Mobile with 10 percent. The Symbian OS only has 2 percent of the US market.
63,5 %
52,4 % 46,9 %
37,6 %
9,6 %
16,6 % 19,9 %
16,0 %
2,7 % 8,3 % 14,4 %
15,7 %
12,0 % 11,8 % 8,7 %
4,2 %
9,60% 7,60% 4,70%
0,5 % 3,9 %
22,7 %
2,5 % 2,9 % 1,3 % 3,8 %
0%
10%
20%
30%
40%
50%
60%
70%
80%
90%
100%
2007 2008 2009 2010
Other OS
Android
Linux
Microsoft Windows Mobile
iPhone OS
RIM
Symbian

37
Figure 2-24: US smart phone market share by mobile phone operating system, March 2011
Source: The Nielsen Companyx
An examination of purchases from October 2010 to March 2011 reveals that the Android OS’s position is even stronger, with Android stealing market share, primarily from the RIM BlackBerry OS and other non-Apple operating systems. This indicates that although Apple might have rewritten the rules of the game starting in 2007, it is no longer alone in doing so. This has important implications for consumer and carrier choice, and the dynamics of the innovation race. See figure 2-25.
Figure 2-25: US smart phone market share by mobile phone OS, purchases from October 2010 to March 2011
Source: The Nielsen Company

38
In Norway, Android is the preferred operating system for smart phones. Numbers from the telecom operator NetCom indicate that Android currently holds about half the market. The most sold phone model is the iPhone 4, but eight of the ten most popular phones are Android based. Nearly 90 percent of all phones NetCom sold in the first half of 2011 were smart phones. In June 2011, 55 percent of these were Android-based phones, while 36 percent used Apple’s iOS-platform. The former market leader, Nokia, only held a market share of 9 percent with its Symbian platform. Android strengthened its market share in the preceding months, which was also reflected in Telenor’s sales figures for March 2011.xi
The growing importance of the operating system also has implications for the market share of producers of mobile phones. Nokia is still the producer that sells the most mobile phones worldwide, but it has been losing ground for several years, particularly in the smart phone segment. The Korean mobile phone producers LG Electronics and Samsung have increased their market shares. Some producers, like Siemens, have left the market, and the biggest loser in terms of market share is Motorola. See figure 2-26.
Figure 2-26: Worldwide mobile device sales to end users, percentage of all units sold, by producer
Source: Gartner
Another indication of the power of the various smart phone operating systems is given by the size and maturity of the application stores (APP stores). Apple was the inventor of the APP store and still holds a dominant position. Figure 2-27 illustrates the size differences among the six-largest device manufacturer APP stores: Apple App Store, BlackBerry App World, Google Android Market, Nokia Ovi Store, Palm App Catalog and Windows Marketplace for Mobile. Apple and Android are the leaders, but Apple has a stronger position than the graph
0%
10%
20%
30%
40%
50%
60%
70%
80%
90%
100%
2002 2003 2004 2005 2006 2007 2008 2009 2010
Others
Huawei
HTC
ZTE
Motorola
Sony Ericsson
Apple
RIM
LG Electronics
Samsung
Nokia

39
indicates. In the graph, Apple’s APP store is divided among applications for iPad, iPhone and Mac, whereas Android applications for both tablets and phones are lumped together. Another important element is the number of applications that can be bought, as this is an indication of the maturity and quality of the applications that are available. That said, there are some differences in payment systems between Android OS and Apple OS. A somewhat larger percentage of applications are provided free of charge and generate their income from advertising on the Android OS than on the Apple OS. For instance, the popular game Angry Birds (downloaded 140 million times in its first 16 months) is offered as a paid application on the Apple OS but is provided as a free application on the Android OS.xii
Figure 2-27: The number of free and paid applications in the APP stores of the six largest device manufacturers, US, February 2011
Source: Distimo.com

40
The application stores drastically lower the barriers to entry into the value‐added‐services market. This makes it possible for persons with a good idea but little or no previous experience in application development to enter the market. Håkon Bertheussen is one example of one such person.
In August 2010, Bertheussen released Wordfeud, an interactive word game based on the classical game Scrabble, as an Android application. The game was developed as a hobby project and Bertheussen had no idea that it would be possible to rely on the development of applications as a sole source of income. However, he was able to quit his job soon after Wordfeud’s release.
Wordfeud exists in both a free, advertisement‐based version and in an advertisement‐free version that costs NOK 21. It has been downloaded nearly seven million times worldwide, creating an estimated NOK 6‐7 million in revenues in the first year for Bertheussen’s one‐man company. Daily income is around NOK 65,000, while the running costs are around NOK 30,000 per month. When the game is distributed through Apple’s iTunes application store, Apple charges 30 percent in transaction costs. Google initially used the same price structure when it started its Android Market application store but has since reduced the transaction fee to 5 percent. Bertheussen is working on extending the number of languages in which the game is available and to include game statistics on wins and losses. The long‐term goal is to better connect the game to various forms of social media.xiii
2.4 How is value created by telecom firms? A value system consists of all of the activities and firms that create and deliver value to the end customer. The value system describes the division of labor among firms and defines the exchanges relevant for the integration of end value. Value system properties are potentially important determinants of inter-firm relations because the organization of exchanges is likely to depend on the properties of the objects exchanged. For example, the exchange of knowledge or skills is more likely to occur in networks, whereas the transfer of tangible items more commonly occurs through market transactions. Building on Thompson’s (1967) distinction between long-linked, intensive and mediating value-creating technologies, Stabell and Fjeldstad (1998) suggest that Porter’s (1985) value chain is one of three value-creation logics, where the others are value networks and value shops. Value-shop firms solve customer or client problems using intensive, cyclical and sequential interdependent activities. Value networks create value by linking customers – the larger the network, the more value it offers its users.
The leading value-creation logic in the telecom sector is the value network. Value networks in which firms use a mediating technology have three parallel activities: a) network promotion

41
and contract management, b) service provisioning, and c) infrastructure operations. Firms modeled as value networks exchange physical objects, information and financial instruments among customers. The value network model for a mobile network operator is depicted in Figure 2-28.
Figure 2-28: Value network for a mobile operator
Source: E. Andersen and Ø.D. Fjeldstad (2003) The division of labor for primary activities in mediation industries is two dimensional. First, firms specialize in terms of the customers served. In this regard, value creation is integrated through connections that allow customers to utilize networks outside that with which they have their primary relationship. Second, firms specialize in providing different forms of linkages through their services. For example, telecommunication firms provide services that allow customers to exchange information. Banks provide services whereby customers can exchange money. The services are layered when one exchange service uses another exchange service as its medium. In the first case, firms cooperate with their direct competitors. In the second case, firms may both offer multiple levels of services through bundling (Shapiro & Varian, 1999) and provide competitors with access to their networks. Telecommunication companies in the Norwegian market, such as Telenor and NetCom, offer end-user services and make their networks available to their competitors. Both of the primary inter-actor relationships are reciprocal. The value of a product is determined by a network externality when it increases with the number of product users. Network externalities lead to demand-side economies of scale. In mediation, size is a measure of the connectivity a network can offer. The relevance of size to a particular customer also depends on the network composition in terms of which nodes can be connected. Customers form self-fulfilling expectations of network size. These expectations determine, in part, the ultimate value of products or services because customers choose the networks that offer the size (Katz & Shapiro, 1985) or connectivity for which they

42
are willing to pay. Firms with large existing networks or good reputations will be against compatibility or cooperation with competitors, while smaller firms will favor compatibility (Katz & Shapiro, 1985). The service layers in the mediation value system described above are complementary and the mediators providing the services are complementors. Complement effects lead to demand-side economies of scope in that the value of a product increases with the availability of complementary products. Complementors cooperate to make the components of a system work together, and to ensure that component properties and pricing maximize demand for the overall system. Complementors also “compete” to extract the value of their combined offerings. They play a cooperative and competitive game where the distribution of gains is determined by how the total value created depends on the contributions of the respective actors, taking into consideration the alternatives the other actors have into consideration (Nalebuff & Brandenburger, 1997). Actors upon whom the others depend get greater proportions of the total value. A firm with a monopoly in one of the components can increase its pay for this component by vertically integrating into the supply of the other components to lower their prices or force improvements in quality without corresponding price increases. Although such actions may offer short-term benefits to the monopolist, the long-term consequences may be negative because such actions discourage investments in the complementing industries. At the core of the mobile communication industry is a set of actors providing mediation services to businesses, governments and consumers. The value system, which consists of the mediation actors and their activities, can be modeled as a set of interconnected, layered services, as shown in Figure 2-29. This simplified conceptual model shows the main interrelationships among the various providers of services, which together enable the customer to exchange information, coordinate activities or conduct transactions via the mobile phone network.

43
Figure 2-29: Mediation value system in mobile services
Source: E. Andersen and Ø.D. Fjeldstad (2003) The layers in the model are: • The mobile network operators (MNOs) that the operate radio base stations that give
customers access, and the landlines, radio-link or satellite-powered backbone networks that connect the radio base stations.
• Mobile virtual network operators (MVNOs) that offer mobile services to end users using the networks of mobile network operators. The activities of MVNOs may range from reselling services to operating a full range of activities over the MNOs’ radio frequencies.
• SMS or WAP hosts that offer the processing and transmission of messages and information via the short message service (SMS) or wireless application protocol (WAP). Some hosts increase the connectivity offered to users by operating gateways to other networks, such as Internet mail and messaging services, internal corporate IT systems, or broadband.
• Payment providers that offer mobile network payment or billing services. Payment may be charged to mobile phone subscriptions, bank accounts, credit card accounts or accounts held by specialized payment companies, such as PayPal.
• Merchant service providers that offer the exchange of products or services over the mobile phone network.
The telecom sector has developed significantly in the years since this model was published. For instance, the position of SMS and WAP services in the model could today be substituted with phone- and cloud-based applications. Nevertheless, the model provides a good illustration of the interlinkages that characterize the telecom industry.
The arrival of application stores is a fundamental factor that has changed the business dynamics and competitive strength of the actors in the mobile phone industry. Before Apple launched its iPhone and application store in 2007, telephone carriers had a dominant position
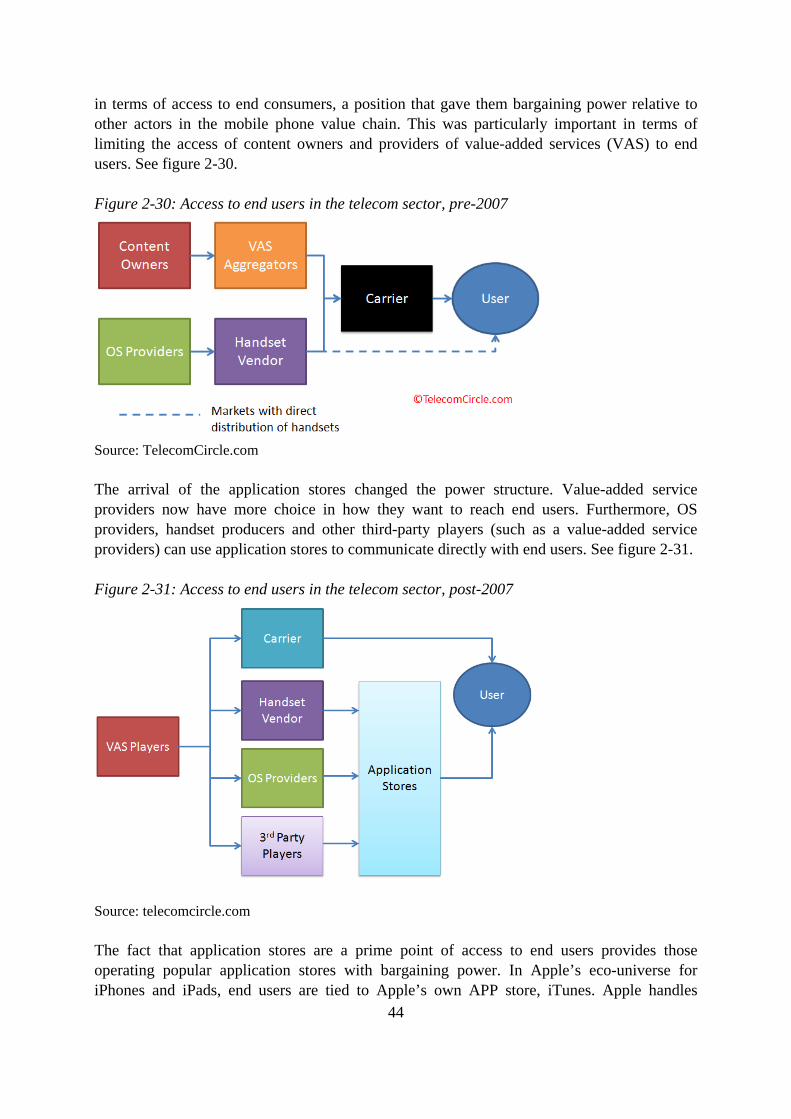
44
in terms of access to end consumers, a position that gave them bargaining power relative to other actors in the mobile phone value chain. This was particularly important in terms of limiting the access of content owners and providers of value-added services (VAS) to end users. See figure 2-30. Figure 2-30: Access to end users in the telecom sector, pre-2007
Source: TelecomCircle.com The arrival of the application stores changed the power structure. Value-added service providers now have more choice in how they want to reach end users. Furthermore, OS providers, handset producers and other third-party players (such as a value-added service providers) can use application stores to communicate directly with end users. See figure 2-31.
Figure 2-31: Access to end users in the telecom sector, post-2007
Source: telecomcircle.com The fact that application stores are a prime point of access to end users provides those operating popular application stores with bargaining power. In Apple’s eco-universe for iPhones and iPads, end users are tied to Apple’s own APP store, iTunes. Apple handles

45
transactions for third-party providers of applications and charges those providers a fee equal to 30 percent of the sale price. Microsoft has also stated that it intends to charge a fee equal to 30 percent of sales in its application store when its new touch-based operating system, Windows 8, goes live.xiv Google, in contrast, only charges developers a fee of 5 percent. In the Android world, other application stores also exist and Google does not try to inhibit their existence. The only way around paying Apple a cut is for third-party developers to avoid making a free-standing application by basing their product on the latest web versions. The web browser standard HTML 5 enables application-like features and also allows for instant updates of content or published material. This reduces the bargaining power of the most popular application stores. The Financial Times was the first newspaper to pull out of Apples’ iTunes after it decided to base its offering on HTML 5. Robert Andrews, Financial Times’ online managing director in Financial Times have given the following explanation for the change: “We started off not knowing what could be achieved (in HTML). But, one by one, we found that all the things that could be done in a native app actually could be done in a HTML5 app - and we haven’t had to compromise on anything, though we were expecting to…. whilst we will lose some exposure through not being in the App Store, we will also gain the opportunity to do a whole bunch of things that, previously, we weren’t able to do”.xv
From the launch of Apples App store to July 2011 200 million iOS users have downloaded 15 billion applications, according to Apple. Apple is not so forthcoming about the gross profit it has made from this, but one estimate place it at US$ 583 million, with net profit after expenses of about US$ 290 million. The average App sold in Apples Appstore cost about US$ 1.44. Figure 2-32 present the revenue breakdown of such an app. The developer gets the largest part of the revenue, about 70 percent. The remaining 30 percent is initially charged by Apple, but over half is used to cover transaction and storage costs. Figure 2-32. The revenue breakdown of an average priced Apple app (US$ 1.44), July 2011
Source: Pipper Jaffrayxvi

46
2.5 Summary
In 1988, the Norwegian market for telecommunication terminals was opened to competition and monopoly over the sale of telephone sets ended. In 1999, NetCom became the first private telecom operator in the modern phase of the Norwegian telecom industry. It was established by Nora Industrier, Orkla and the Swedish group Kinnevik. It won a GSM license in 1991, beating out three other contenders, and it launched its network in 1993. In 1994, Televerket was transformed into Telenor, a state-owned stock company. The last remnants of the monopoly were removed in 1998, at which time the Norwegian telecommunication market was fully opened to competition. Telenor was partially privatized in 2000 and NetCom was bought by the Swedish telephone company Telia that same year. These two companies remain, by far, the dominant players in the Norwegian telecommunication market, even after several virtual telecom service providers initiated operations and Network Norway established the third GSM network. Globally, the usage of mobile phones is growing substantially. ITU estimates that about 78 percent of the world’s population owned a mobile phone in 2010. The proportion of inhabitants that have access to the Internet is also growing, increasing from less than 10 percent in 2000 to about 30 percent in 2010. With the Internet increasingly becoming available on mobile phones, Internet access can be expected to increase substantially in the future. The first decade of the new millennium saw an extreme increase in human connectivity. The 714 million mobile phone subscribers in 2000 grew to 5.4 billion in just 10 years. On average, 78 of every 100 people had a mobile phone subscription in 2010. When measured as a percentage of GDP for the whole of the OECD area, revenues in the telecom sector were relatively flat at just over 2 percent from the mid-1980s to the early 1990s. The late 1990s brought a period of growth until the economic downturn that followed the IT crash after the turn of the century. From 2001 to 2008, revenues as a percentage of GDP declined modestly. In the crisis year of 2009, revenues again increased somewhat, indicating that telecommunication services are a viewed as a commodity – a service that is given priority in challenging economic situations. Telecom media convergence is an important trend about the interaction of multiple industries – companies are no longer confined to their own markets. Fixed, mobile and IP service providers can offer content and media services, and equipment providers can offer services directly to the end user. Content providers are continually looking for new distribution channels. Convergence is the combination of all of these media into one operating platform. It refers to the merger of telecom, data processing and imaging technologies. This convergence is ushering in a new epoch of multimedia, in which voice, data and images are combined to render services to the user. The key result of convergence at a macro-business level is the merger of the telecommunication and media/entertainment industries. The leading value-creation logic in the telecom sector is the value network. Value networks in which firms use a mediating technology have three parallel activities: a) network promotion and contract management, b) service provisioning, and c) infrastructure operations.

47
What do you do when the feature you require has not been invented? You invent it yourself.
Bipper is a company founded by a mother of three, Silje Vallestad. When a friend and classmate of her six‐year‐old daughter was given a mobile phone in 2006, the topic of mobile phones and children was introduced to her own family. Vallestad found that no services were available that addressed her need as a parent to make mobile phones safe for children.
Vallestad had no knowledge about the mobile industry or its technology. Her background and interest lay in volunteer and idealistic work, and a career in the mobile industry was something she had never considered. Without any relevant competence, she started illustrating what she dreamed of developing. She had no idea if it was possible to realize this dream but her vision was clear. She researched the market extensively and obtained feedback from other parents. She participated in a business plan competition called Venture CUP and was able to define a strategy for how the product should be developed. After winning the competition and receiving USD 20,000, the decision was made – she had to realize her dream.
Based on a loan of NOK 200,000, Bipper was founded in August 2007. An engineer with telecom experience confirmed that Vallestad’s desired security services were viable but that the development costs would be higher than Vallestad had envisioned. In April, additional finances were secured from a business angel, Svein Johnsen, who had founded and sold Chess together with Idar Vollvik.
Two persons were hired in the spring of 2008: a project leader and a person with extensive experience from the telecom industry. Then came the financial crisis. Bipper survived, but only barely. One employee had to be laid off. Bipper was technically bankrupt in May 2009 but the company survived on private loans taken out by the employees, and on investments from Sparebanken Vest and others.
The summer of 2009 was the turning point for the company. It was contacted by Motorola, which had software developers in Bulgaria who had a thin SIM card on which Bipper could place its software. Shortly thereafter, the company also entered into a partnership with Tele2. The financial situation improved substantially due to new investors and support from Innovasjon Norge.
After almost four years of development and planning, Bipper security services were launched in the autumn of 2010. Based on a special SIM card that could be inserted into a child’s mobile phone, the services enable parents to use a web interface to decide to whom the child can communicate by defining allowed and blocked contacts (contact control); limits for calls, SMS, MMS and data (usage control); and when the phone can be used (time control). In addition, the services include a phone location feature that can be used several times per day. In the second part of 2011, Bipper will launch an application for Android, iPhone, Symbian and Blackberry, which will add control over which applications can be used and how often (application control), and which websites or web categories the child can visit (web filter). This will extend the market for Bipper to all of the world’s compatible smart phones.
Bipper and Silje Vallestad have won a number of awards, including:
• The Samsung Prize and Silver Award 2010 in SIMagine, an international competition for SIM‐based applications,
• The Mobile Premier Award 2010 at the Mobile World Congress in Barcelona, a reward for the most promising start‐up,
• The Bully Award 2010, an international investor prize for the most promising start‐up,
• The Rosingpris 2010, a reward for creativity given by Dataforeningen in Norway, and
• Årets Gründerkvinne 2011, a reward given by the Norwegian Trade and Commerce Department and Innovasjon Norge to further the growth of female‐owned start‐ups.
The prize money for Årets Gründerkvinne 2011 was NOK 1 million, which Bipper spent on developing a security alarm application, primarily for women. It was launched in the summer of 2011 for Androi with versions for iPhone and Blackberry to follow. Source: www.Bipper.com

48
3. Cluster Attractiveness
This chapter discusses the degree to which the Norwegian Telecom industry is attractive, particularly in terms of the extent to which it contains all relevant activities. In this respect, this section analyzes the industry’s completeness, the existence of a critical mass of firms in all parts of the telecom industry, its value-creation properties and its geographical distribution.
3.1 Current Norwegian market structure: Major activities, players and size In 2008, the Norwegian telecom market encompassed 868 companies, as classified by Statistics Norway (SSB). More than half of these (443) were companies with 0 or 1 employees. 143 companies had between 2 and 4 employees, 96 had 5 to 9 employees, 67 had 10 to 19 employees, 63 had 20 to 49 employees, 48 had 50 to 249 employees and only 8 had more than 250 employees. Measured as a percentage of GDP revenues, the Norwegian telecom sector has declined since the 1990s. In 1985, telecom revenues constituted 1.91 percent of GDP revenues, increasing to 2.28 percent in 1997. In 1998, the year the Norwegian telecommunication market was opened to full competition, the figure declined substantially to 1.63 percent of GDP. The percentage increased to 1.78 percent in 2003 before declining again to 1.37 percent in 2007. Compared to certain OECD countries and the OECD average, Norway and, to some extent, Sweden stand out in terms of a decline in the percentage of GDP that constitutes telecommunication revenues. From 1985 to 2007, the proportion of average telecom revenue to total GDP in the OECD increased from 2.13 percent to 2.92 percent. OECD uses the GDP for the entire Norwegian economy, including the offshore petroleum sector, which has increased substantially since the 1980s. See figure 3-1.

49
Figure 3-1: Telecommunication revenues as a percentage of GDP, selected OECD countries
Source: OECD After the liberalization of the telecom industry in 1998, the number of companies grew steadily, rising from 369 in 1999 to 873 in 2007. 2008 brought a slight decline in the number of companies. See figure 3-2.
0
1
1
2
2
3
3
4
4
5 19
85
1990
1995
1997
1998
1999
2000
2001
2002
2003
2004
2005
2006
2007
Norway
Sweden
Denmark
Finland
UK
Japan
USA
OECD-average

50
Figure 3-2: Number of firms in the telecom industry, by number of employees (left axis) and in total (right axis), 1999-2008
Source: Statistics Norway The general trend from 2006 to the first half of 2010 was a slight reduction in the number of companies offering various telecom services. However, an exception was evident among firms dedicated to providing Internet services on mobile phones. From 2006 to the first half of 2010, the number of companies offering fixed-line telephony fell by 6 percent, from 83 to 78 (a high of 93 was reached in 2007). There was also a 13 percent decline in the number of companies offering fixed-line IP telephony, which fell from 76 in 2006 to 69 in the first half of 2010. The number of companies offering mobile phone subscriptions also declined by 13 percent, from 31 to 27 (high of 35 in 2007). Furthermore, the number of companies offering fixed-location Internet access fell by 3 percent, from 163 in 2006 to 158 in the first half of 2010. In contrast, dedicated Internet subscriptions on mobile phones experienced growth, as the number of companies rose from 0 in 2007 to 12 in the first half of 2010. See figure 3-3.
369 428
481 566
636 715
777 863 873 868
0
100
200
300
400
500
600
700
800
900
1000
0
50
100
150
200
250
300
350
400
450
500
1999 2000 2001 2002 2003 2004 2005 2006 2007 2008
Total 0‐1 employees 2‐4 employees
5‐9 employees 10‐19 employees 20‐49 employees
50‐249 employees 250+ employees

51
Figure 3-3: Number of companies offering fixed-line telephony, fixed-line IP telephony, mobile phone, mobile Internet access and fixed-location Internet services, 2006 to H1 2010
Source: Norwegian Post and Telecommunication Authority The largest telecom operator in Norway is Telenor. One business area in which it has a dominant position is mobile phones, where it had 51 percent of subscribers, 54 percent of income and 52.5 percent of traffic minutes in mid-2010. NetCom was the second-largest operator at the time, with 18.3 percent of subscribers, 19.9 percent of income and 20.3 percent of traffic minutes. Chess was the third-largest telecom operator measured in terms of number of subscribers (8.5 percent). Both Chess and NetCom are owned by TeliaSonera and, combined, the two companies held a 26.8 percent market share in the mobile phone market in terms of the number of subscribers. Tele2 was the fourth-largest mobile phone operator, with 8.4 percent of the subscriber base. Network Norway, which focuses on the business segment, had 4.5 percent of the subscriber base. Network Norway also owns Lebara, with 3.3 percent of the subscriber base. Ventelo controlled 2.6 percent of the subscriber base, while other companies held the remaining 3.4 percent. See figure 3‐4.
83
76
31
163
93
84
35
154
87
77
29
9
156
90
78
25
13
160
78
69
27
12
158
0 20 40 60 80
100 120 140 160 180
Fixe
d lin
e, T
otal
Fixe
d Li
ne, I
P‐te
leph
ony
Mob
ile P
hone
, tot
al
Mob
ile p
hone
, ded
icat
ed
inte
rnet
Inte
rnet
/Bro
adba
nd
2006
2007
2008
2009
First half 2010

52
Figure 3-4: Market share of subscribers and income from end users of mobile phones in Norway, end-Q2 2010
Source: Norwegian Post and Telecommunication Authority xvii
There have been some slight changes in market share in recent years. From the first half of 2008 to the first half of 2010, both Telenor and NetCom lost 2 percentage points of their market share. Non-Telenor and NetCom subscribers accounted for 31 percent of the market by the first half of 2010. Mobile phone subscriptions have grown steady in Norway over the last decade, passing one subscription per capita, on average, in 2004. By 2009, it increased to 1.2 per capita, which was less than the corresponding levels in Finland, Denmark and Sweden, but more than in Iceland. From an international perspective, the Norwegian mobile phone market can be characterized as a low-cost market, when adjusted for purchasing power. When measured in terms of cost for an average user, The Norwegian Post and telecommunication Authority finds that the Norwegian market has the lowest price internationally. For high- and low-amount users, Norway ranks third. Although the price for communication services has fallen over time, the total revenues from phone and Internet usage have still increased. The exception is fixed-line telephony, where there has been a substantial decrease. From 2003 to 2010, revenues from fixed-line telephony fell by about 50 percent, from NOK 6,050 million to NOK 3,013 million. See figure 3-5.
0,0 %
10,0 %
20,0 %
30,0 %
40,0 %
50,0 %
60,0 %
Telenor NetCom Chess Tele2 Network Norway
Lebara Ventelo Others
Subscribers Income Traffic minuttes

53
Figure 3-5: Revenues from end users in total, and from fixed-line telephony, mobile phones, mobile Internet and Internet, NOK million, figures as of end of H1 each year
Source: Norwegian Post and Telecommunication Authority Demand for fixed-line telephony services is also changing. Almost one-third of the fixed-line subscribers in 2010 were Internet based. The rate of decline in fixed-line telephony has also increased in recent years, having passed -7 percent in 2010. When it comes to Broadcasting of television signals, cable operators holds the largest market share, with 44.3 percent of the subscribers. 30.6 percent used satellite, 13.6 percent the digital ground based network and 10.9 percent of the subscribers used fiber.
Telenor is the company that in the first half of 2010 had most subscribers for transfer of television when all access forms are counted. This is to a large extent due to its market leader position in cable TV, where it has over half the market. The second largest player when all access forms for television is considered is Get, followed by Riks-TV and Viasat. See. Figure 3-6.
0
2 000
4 000
6 000
8 000
10 000
12 000
14 000
16 000
2002
2003
2004
2005
2006
2007
2008
2009
2010
Total
Fixed line telephony
Mobile phone
Internet
Mobile internet

54
Figure 3-6: Market share transferal of television signal by number of subscribers, all access forms, first half of 2010
Source: Norwegian Postal and Telecom authorities The telecom sector is characterized by high technological innovation. As a result, value creation has increased significantly in recent decades. Employment has been relatively stable, declining slightly from 1980 to the mid-2000s, according to a study conducted by ECON. See figure 3-7. Figure 3-7: Teleservices, development in employment and value creation, 2002 prices, 1980-2004, 1980 = 100
Source: ECON Our data indicate that value creation per employee is high in the telecom industry, averaging NOK 1.4 million in 2009. This puts the industry among the top two industries in Norway in terms of value creation per employee in 2009. Value creation varied significantly during the
47,0 %
17,2 % 13,6 %
7,3 % 2,0 % 1,1 % 0,9 % 0,8 % 0,8 % 0,8 %
8,5 %
0,0 % 5,0 %
10,0 % 15,0 % 20,0 % 25,0 % 30,0 % 35,0 % 40,0 % 45,0 % 50,0 %
f Value creation Employment

55
dot.com era, when it dropped to NOK 0.26 million per employee in 2001. Since 2003, value creation per employee has remained relatively stable at around NOK 1.1 million. Data from SSB indicate that there has been a noticeable increase in employment in the telecom sector since 2000. In 2008, there were 20,000 employees in the sector, an increase from 13,900 in 2000. Employment in the sector is divided fairly equally between network operators and equipment and service providers. 6,500 people were employed by the equipment and service providers in 2000, a figure that increased to 9,900 in 2008. Over the same period, employment among network operators increased from 7,400 to 10,100. See figure 3-8. Figure 3-8: Employment in the Norwegian telecom industry in total (right axis), and in the subgroups network operators, and equipment and service providers (left axis), number of persons, 2000-2008
Source: Statistics Norway
An examination of the change in employment for the 250 largest information and communication technology firms in the world reveals a modest increase in employment. In 2009, employment in the telecom sector was 35 percent higher than in 2000. Employment among the largest producers of communication equipment increased by almost as much, rising by 30 percent from 2000 to 2009. See figure 3-9. The greatest increase in employment among the largest information and communication technology firms in the last decade was evident in firms focused on the Internet. In these firms, the number of employees expanded more than five-fold in the last decade.
0
5 000
10 000
15 000
20 000
25 000
0
2 000
4 000
6 000
8 000
10 000
12 000
2000 2001 2002 2003 2004 2005 2006 2007 2008
Network Operators (left axis)
Equipment and service providers (left axis)
Telecom in total (right axis)
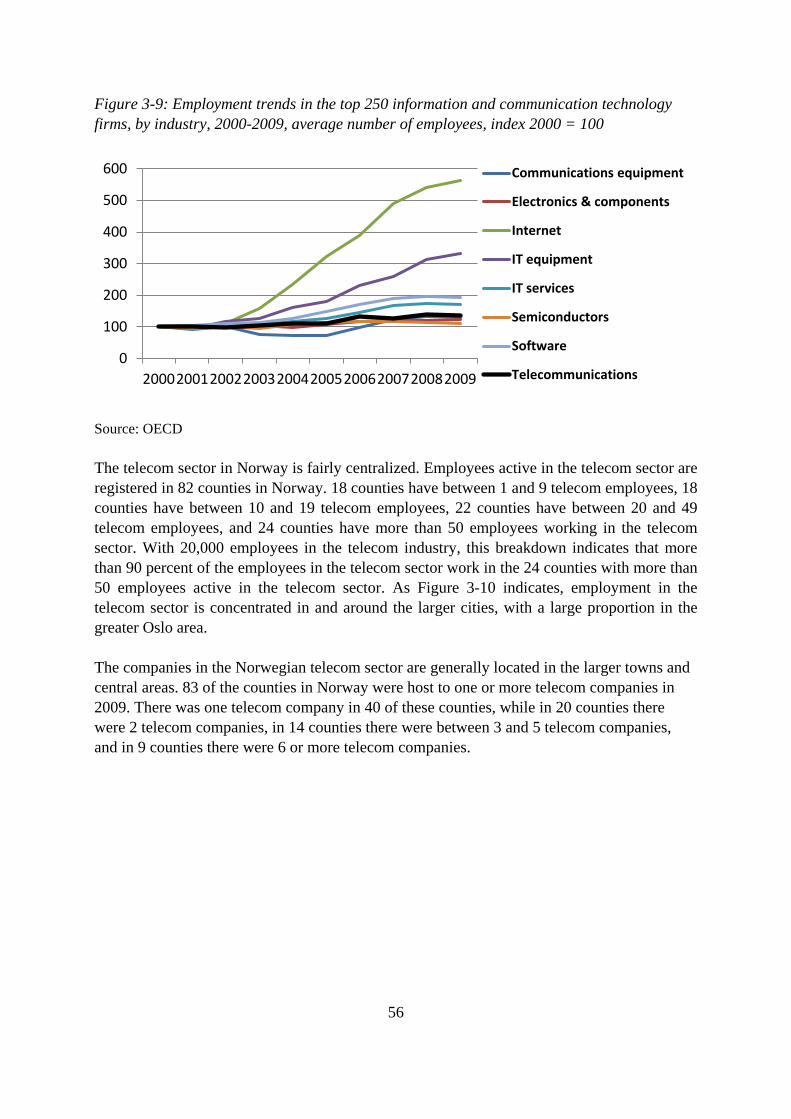
56
Figure 3-9: Employment trends in the top 250 information and communication technology firms, by industry, 2000-2009, average number of employees, index 2000 = 100
Source: OECD The telecom sector in Norway is fairly centralized. Employees active in the telecom sector are registered in 82 counties in Norway. 18 counties have between 1 and 9 telecom employees, 18 counties have between 10 and 19 telecom employees, 22 counties have between 20 and 49 telecom employees, and 24 counties have more than 50 employees working in the telecom sector. With 20,000 employees in the telecom industry, this breakdown indicates that more than 90 percent of the employees in the telecom sector work in the 24 counties with more than 50 employees active in the telecom sector. As Figure 3-10 indicates, employment in the telecom sector is concentrated in and around the larger cities, with a large proportion in the greater Oslo area. The companies in the Norwegian telecom sector are generally located in the larger towns and central areas. 83 of the counties in Norway were host to one or more telecom companies in 2009. There was one telecom company in 40 of these counties, while in 20 counties there were 2 telecom companies, in 14 counties there were between 3 and 5 telecom companies, and in 9 counties there were 6 or more telecom companies.
0
100
200
300
400
500
600
2000 2001 2002 2003 2004 2005 2006 2007 2008 2009
Communications equipment
Electronics & components
Internet
IT equipment
IT services
Semiconductors
Software
Telecommunications

57
Figure 3-10: Total number of employees (left map) and density of companies in the telecom sector (right map), by county
Source: Statistics Norway 3.3 Internationalization and globalization Has the Norwegian telecom industry internationalized, or is it an industry that focuses on the provision of services and the development of products for the benefit of the local market? To the extent to which firms have internationalized their operations, the industry is more attractive because firms are exposed to international competition in foreign markets and, hence, must outperform other firms to survive.

58
Roughly half of all companies in the Norwegian telecom industry compete in the international market. Equipment and service providers are the most internationally focused segment in the industry. Overall, Norway is a net importer of communication equipment (the same is true for the majority of countries in the OECD). In 2008, imports were USD 1,562 million, while exports were USD 851 million. See figure 3-11. Figure 3-11: Trade in communication equipment in the OECD countries, by net exports and imports, 2008, USD million
Source: OECD
When it comes to trade in communication services, the picture changes. In 2008, Norwegian exports of communication services totaled USD 669 million and imports were USD 509 million. However, when communication equipment and services are combined, Norway is a net importer. See figure 3-12.
85
1 1 5
62
0
5 000
10 000
15 000
20 000
25 000
30 000
35 000
Exports Imports
Net balance > 0

59
Figure 3-12: Trade in communication services in the OECD, by net exports and imports, 2008, USD million
Source: OECD
3.4 Cluster attractiveness: Conclusions The telecom sector is characterized by high technological innovation, which is vital to competitiveness. Furthermore, the companies in the Norwegian telecom industry are primarily located in the bigger cities, with the greater Oslo area being the main area. As it is geographically concentrated, one might expect the industry to develop a strong local supplier base. Employment in the telecom sector is also concentrated in and around the larger cities, with a large proportion in the greater Oslo area.
In 2008, the Norwegian telecom market consisted of 868 companies, as classified by Statistics Norway. From 2006 to the first half of 2010, the number of companies offering fixed-line telephony fell by 6 percent, moving from 83 to 78 with a high of 93 in 2007. There was also a 13 percent decline in the number of companies offering fixed-line IP telephony, which fell from 76 in 2006 to 69 in the first half of 2010. The number of companies offering mobile phone subscriptions also fell by 13 percent, from 31 to 27, with a high of 35 in 2007. The number of companies offering fixed-location Internet access fell by 3 percent, from 163 in 2006 to 158 in the first half of 2010.
Our data show that the value creation is high within the industry, with an average value creation per employee of NOK 1.4 million in 2009. This puts telecom among the top-two industries in Norway with regard to value creation per employee in 2009. Value creation within telecom firms in Norway varied significantly during the dot.com era, when it fell to NOK 0.26 million in 2001. Since 2003, value creation per employee has varied somewhat, averaging NOK 1.1 million.
66
9 50
9
0
1 000
2 000
3 000
4 000
5 000
6 000
7 000
8 000
9 000
10 000 Exports Imports
Net balance > 0

60
Overall, Norway is a net importer of communication equipment (the same is true for the majority of countries in the OECD). Te picture changes with regards to trade in communication services. In 2008, Norwegian exports of communication services totaled USD 669 million and imports were USD 509 million. However, when communication equipment and services are combined, Norway is a net importer.
61
4. Education Attractiveness The ability of an industry to successfully compete in its relevant market is increasingly dependent on investments in human capital. Clusters are specialists in translating generic education into productive use. While educational programs in various disciplines are found around the globe, we generally find only a few clusters for each discipline and these are located in just a few countries. The distribution of commercial activity based on knowledge of a specific discipline or, even more so, when the combination of knowledge of a number of disciplines is required is not uniform across countries or regions. Clusters can only excel in productively channeling knowledge if the human capital existing in educational institutions has the necessary basic knowledge and if that knowledge is increasing. Investments in human capital are first made by educational institutions outside the scope of control of industrial actors. Such investments enable the creation of industries. If they are lacking, they contribute to the disappearance of industrial activities (for example, the knowledge required to construct hydropower stations no longer resides within the human capital of the younger generation of Norwegians as a result of political factors, educational factors and a substantial reduction in the activity level). All else equal, if an industry is to be attractive over an extended period of time, it must be able to attract the best human capital into educational programs that provide the prerequisite knowledge upon which firms can build. In this section, therefore, we focus on the investments made by educational institutions. “Education attractiveness” is operationalized in the following manner: • Level and growth of university students studying in telecom-related fields, • Share of university students studying in telecom-related fields, • Level and growth of PhD students studying in telecom-related fields, and • Share of PhD students studying in telecom-related fields. A distinction is made among the Bachelor, Master and PhD levels. University students are therefore specifically categorized as Bachelor, Master or PhD students in telecom-related subject areas. To account for the lack of data on PhD students before 2002 and the impact of the Step I implementation of the Amendments to the University Acts in 2002,xviii
which followed the Bologna process on higher education, the analysis is conducted using annual figures for the period from 2005 to 2009.
Figure 4-1 presents the number of university students enrolled in telecom-related subjects. The annual growth rate for this student group has been about -4.4 percent. The number of students fell by 1,060 from 2005 to 2009, which represents a total decline of 17.4 percent.

62
Figure 4-1: Number of university students in telecom-related subjects, 2005-2009
Sources: NSD, BI Figure 4-2 illustrates the distribution of higher education over time. The share of Bachelor students is increasing, while the share of Master students is decreasing. The share of PhD students is stable. In 2005, 52 percent of the students in telecom-related subjects were on the Bachelor level. This figure increased to 68 percent in 2009. The share of the students on Master level declined from 45 percent in 2005 to 29 percent in 2009. The share enrolled in PhD programs stayed stable at 3 percent over the period.
6118
5435 5056
4979 5056
0
1000
2000
3000
4000
5000
6000
7000
2005 2006 2007 2008 2009
Graduate students Linear (Graduate students)

63
Figure 4-2: University students in telecom-related subjects, by level, 2005-2009
Sources: NSD, BI From 2005 to 2009, there was a small increase in the number of Bachelor students studying telecom-related subjects. Over this period, the average growth rate in the number of students was 2 percent per year, which is below the average growth rate for all Bachelor-level students of 4 percent. The largest telecom-related Bachelor programs in 2009 were “Informatics”, with 1,199 students, and “Information and communication technology” with 1,051 students. See figure 4.3.
52,1 % 60,5 % 64,7 % 66,9 % 67,9 %
45,0 % 36,4 % 32,1 % 30,3 % 29,3 %
2,8 % 3,0 % 3,2 % 2,8 % 2,8 %
0 %
10 %
20 %
30 %
40 %
50 %
60 %
70 %
80 %
90 %
100 %
2005 2006 2007 2008 2009
Bachelor level Master level PhD level

64
Figure 4-3: Number of Bachelor graduates in telecom-related subjects, 2005-2009
Sources: NSD, BI From 2005 to 2009, the number of Master students in telecom-related subjects declined from 2,754 to 1,478, which represents an average change of -14 percent per year. The number of students on the Master level in all other subjects also declined over this period, but at a much more modest rate of -0.4 percent per year. The largest telecom-related Master programs in 2009 were “Sivilingeniør – information and communication technology”, with 310 students, and “Master in informatics”, with 275 students. See figure 4-4.
3190 3290 3272 3332 3434
0
500
1000
1500
2000
2500
3000
3500
4000
2005 2006 2007 2008 2009
Bachelor students Linear (Bachelor students)

65
Figure 4-4: Number of Master graduates in telecom-related subjects, 2005-2009
Sources: NSD, BI The number of PhD students in telecom-related subjects also declined from 2005 to 2009. In 2005, 174 people enrolled in telecom-related PhD programs. This figure declined to 143 in 2009, giving an annual change of -4.5 percent. The development in telecom-related PhD programs stands in clear contrast to PhD programs in general, where there has been an increase in enrolment, on average, of 11 percent per year. In 2009, the biggest telecom-related PhD programs were in law, with 66 students, followed by chemistry, with 45 students, and natural sciences with 32. These programs, particularly the first two, have a fairly broad nature. No specialized telecom PhD programs are described in the data set.See figure 4-5.
2754
1981 1622 1510 1479
0
500
1000
1500
2000
2500
3000
2005 2006 2007 2008 2009
Master students Linear (Master students)

66
Figure 4-5: Number of Master graduates in telecom-related subjects, 2005-2009
Source: NSD, BI Figure 4-6 depicts the percentage of students in telecom-related subjects relative to the population of students by educational level. This provides an indication of the attractiveness of telecom-related studies compared to other subjects. A comparison of the totality of all subject areas in Norway reveals a decline in the overall number of students in telecom-related subjects. This decline is predominantly due to the significant decline (40 percent) at the Master level. In addition, telecom-related PhD programs experienced a decline, while the number of telecom-related Bachelor students fell only slightly.
174 164 162 137 143
0
20
40
60
80
100
120
140
160
180
200
2005 2006 2007 2008 2009
PhD students Linear (PhD students)

67
Figure 4-6: Attractiveness of telecom-related subjects, 2005-2009
Source: NSD, BI 4.1 Educational attractiveness: Conclusions Overall, educational programs that are related to the telecom industry declined in absolute and relative terms from 2005 to 2009. The biggest reduction can be observed on the Master level. On the Bachelor level, there has been a slight increase in the number of students, although when compared to other subjects, there has been a modest decline in share of students studying telecom-related subjects at this level. For doctoral studies, both the absolute number of students and the relative proportion of students are declining. Doctoral studies have the longest time horizon. Investments in such studies indicate that there are opportunities for either advanced employment or a career opportunity within academia in this specific area. The declining attractiveness of telecom-related doctoral programs might be an indication that opportunities for advanced R&D-based value addition in the telecom industry are declining.
0%
1%
2%
3%
4%
5%
6%
7%
8%
2005 2006 2007 2008 2009
Telecom‐related graduate students/Total graduate students
Telecom‐related Bachelor students/Total Bachelor students
Telecom‐related Master students/Total Master students
Telecom related PhD students/Total PhD students
68
5. Talent Attractiveness Educational institutions produce a unique type of resource: knowledge workers. Industries and firms compete in labor markets to attract the most talented individuals. To the extent that an industry can attract talented individuals, it is better positioned than an industry that cannot. Hence, the output of initial investments by educational institutions has to be attracted to specific industries. For an industry to be competitive over a long period of time, it must be able to attract highly competent human capital before committing resources to new technologies and competence development. In this section, we focus on the degree to which the telecom industry is successful in recruiting and retaining highly developed human capital. 5.1 Educational level Telecom is a technology-intensive and technology-driven industry. It should, therefore, not come as a surprise that the average educational level in the telecom industry is somewhat higher than in the entire privately employed workforce in all industries in Norway. Figure 5-1 displays the educational level of employees working within the telecom sector in Norway. A slightly higher percentage of employees in telecom obtained only a middle school education than the average for all private industries, at 16 and 15 percent, respectfully. However, a lower percentage of employees in the telecom industry (46 percent) have only a high-school education than the average for all industries (52 percent). The biggest difference between the telecom industry and Norwegian industry in general is observed in the percentage of employees holding a Bachelor degree: 27 percent of employees in the telecom industry have such a degree, while the average for all private industries is 20 percent. The percentages of employees holding Master and PhD degrees are similar to the national averages (11 percent and 0.5 percent, respectively).
If we further examine the distinction between the percentage of the workforce with university education and without university education, a similar picture appears. Nationally, 32 percent of the workforce in the private sector has a university degree. In telecom, 38 percent of the workforce has a university degree, of which 11 percent have postgraduate degrees (Master or PhD). On the one hand, the above-average percentage of employees with a Bachelor degree indicates the professionalization of the telecom industry. On the other hand, the fact that the distribution of employees with Master and PhD degrees mirrors the average distribution in the Norwegian private sector indicates that the professionalization only has gone so far. The fact that the telecom industry has a slightly higher percentage of employees who have completed only secondary school education than the corresponding percentage for all industries pulls in the opposite direction.

69
Figure 5-1: Distribution of the labor force by educational level, 2008
Sources: Statistics Norway and BI
If we look at the distribution among the five educational levels over time, which allows for inferences about major shifts in the industry with respect to professionalization. Groups with lower educational levels (middle and high school) and higher education levels (Bachelor, Master and PhD) show stable development over time. In 2000, 38 percent of the workforce had a university degree. This figure increased to 41 percent in 2006 before falling back to 38 percent in 2008.
The share of the total workforce that held a Bachelor degree increased from 26 percent in 2000 to 44 percent in 2008. A similar trend is observable for employees with a Master-level education (from 9 percent in 2000 to 12 percent in 2008). The percentage of employees holding a PhD degree remained constant at 1 percent.
An examination of the composition of the different educational levels within the telecom industry reveals a mixed picture of the overall change of employees with higher education. The change in number of employees holding a Master degree has increased, while the change of employees holding a Bachelor degree has been flat or negative. This can indicate that there has been a positive shift in the skill set that employers desire from their university-educated employees. The change in number of employees with a PhD followed a negative trend at the beginning of the period, which was marked by low economic growth, and a positive trend starting in 2004. The change in number of employees without a university education overall remained flat or declined, with the exception of growth for employees with only a middle school education, which was high in 2007 and 2008. See figure 5.2.
16%
46%
27%
11%
0,5 %
Middle School
High School
Bachelor
Master
PhD

70
Figure 5-2: Growth by educational level as a share of total employment in the telecom industry, 2000-2008
Source: Statistics Norway, BI The highest number of employees with a university or college background is evident among network operators (59 percent). 29 percent of operators’ employees hold a certificate or have participated in other forms of vocational training. Among the equipment and service providers, the two groups are more even, with 47 percent of the employees having a university or college background, and 37 percent holding a certificate or having taken part in other forms of vocational training. See figure 5-3. Figure 5-3: Percent of employees with a university or college background, or with a certificate or other vocational training, 2010
Source: BI Survey
‐40%
‐30%
‐20%
‐10%
0%
10%
20%
30%
40%
2000 2001 2002 2003 2004 2005 2006 2007 2008
Middle school High school Bachelor Master PhD
28,6
37,1
58,8
47,1
0 10 20 30 40 50 60 70
Network operators
Equipment and service providers
Percent of employees with university or collage background
Percent of employees with a certificate or other vocational training

71
The combination of the current distribution of the workforce with the growth rates for the various education levels leads to the conclusion that that the talent attractiveness of the telecom industry has remained stable. Within the group of employees with a university education, demand for employees with a Master degree has increased at the expense of demand for Bachelor-educated employees. This represents a small increase in the professionalization of the industry. However, the industry does not attract more specialized labor than is generally available in the population. 5.2 Sources of formal education The telecom industry is clearly engineering specialized. In 2008, 41 percent of university-educated employees in the industry had engineering degrees. The second-largest group of employees had business and economics degrees (26 percent). Scientists constituted a relatively small share of this industry, representing a mere 4 percent of the university-educated workforce in 2008. Finally, 29 percent of the workforce had backgrounds in other fields. From 2002 to 2008, the relative share of engineers declined by 4 percentage points, from 45 percent to 41percent. Over the same period, the relative share of employees with business and economics backgrounds increased by almost as much, from 23 percent to 26ercent. The number of scientists remained stable. See figure 5-4. Figure 5-4: Composition of higher-education backgrounds in the telecom sector, 2002 (left) and 2008 (right)
Source: Statistics Norway, IRIS/BI
Since 2000, the proportion of employees with a higher education in the Norwegian telecom industry has grown steadily, with the exception of the recession year of 2003. The highest growth has been in science, and in business and economics, with engineering growing at roughly half the pace.
45%
4%
23%
27%
Engineer Science Business and economics Other
41%
4% 26%
29%
Engineer Science
Business and economics Other

72
In 2008, total employment in the Norwegian telecom industry was evenly divided between the two main sectors: network operators, and equipment and service providers. When compared to 2000, employment among equipment and service providers had expanded a fraction relative to network providers, who then held 52 percent of the total employment in the industry.
Figure 5-5 displays the composition of employees with a higher education among network operators, and equipment and service providers. Just over 60 percent of those with a higher education are employed by network providers. Given that the total employment is evenly split between the two sectors, this indicates that the network providers are in need of roughly 50 percent more employees with a higher education than the equipment and service providers. Figure 5-5: Composition of higher education in telecom, by sector, 2000-2008
Source: Statistics Norway, IRIS/BI In 2000, 60 percent of all employees in the telecom industry were employed with network providers. From 2000 to 2008, the share of employees with a higher education at network providers increased relative to the share of such employees at equipment and service providers. This trend increased in the recession year 2003, held steady until 2005 and has declined somewhat since 2006. See figure 5-6.
0 %
10 %
20 %
30 %
40 %
50 %
60 %
70 %
80 %
90 %
100 %
2000 2001 2002 2003 2004 2005 2006 2007 2008
Network Operator Equipment and service provider

73
Figure 5-6: Relative growth rate of higher education workers in telecom categories, 2000-2008
Source: Statistics Norway, IRIS/BI 5.3 Types of education per sector Our attention now moves to the traits of the specific sectors that comprise the telecom industry. Our main focus is the composition of each sector in terms of employees’ higher-education backgrounds (including education on the Bachelor, Master or PhD levels) divided into: engineering, science, business and economics, and other fields. The growth rates for these educational fields are also presented. 5.3.1 Network operators In 2008, 38 percent of employees with a higher education at network operators were engineers, making them the largest employment group. Business and economics employees made up the second-largest group, with 29 percent. 4 percent of the employees with a higher education were scientists.
From 2000 to 2008, the relative size of the engineering group declined by 7 percentage points, from 45 percent to 38percent. Business and economics increased by 3 percentage points, from 26 percent to 29 percent. In addition, the relative size of the science group increased from 3 percent to 4 percent of all employees with a higher education. See figure 5.7.
‐20%
‐15%
‐10%
‐5%
0%
5%
10%
15%
2000 2001 2002 2003 2004 2005 2006 2007 2008
Network Operator Equipment and service provider
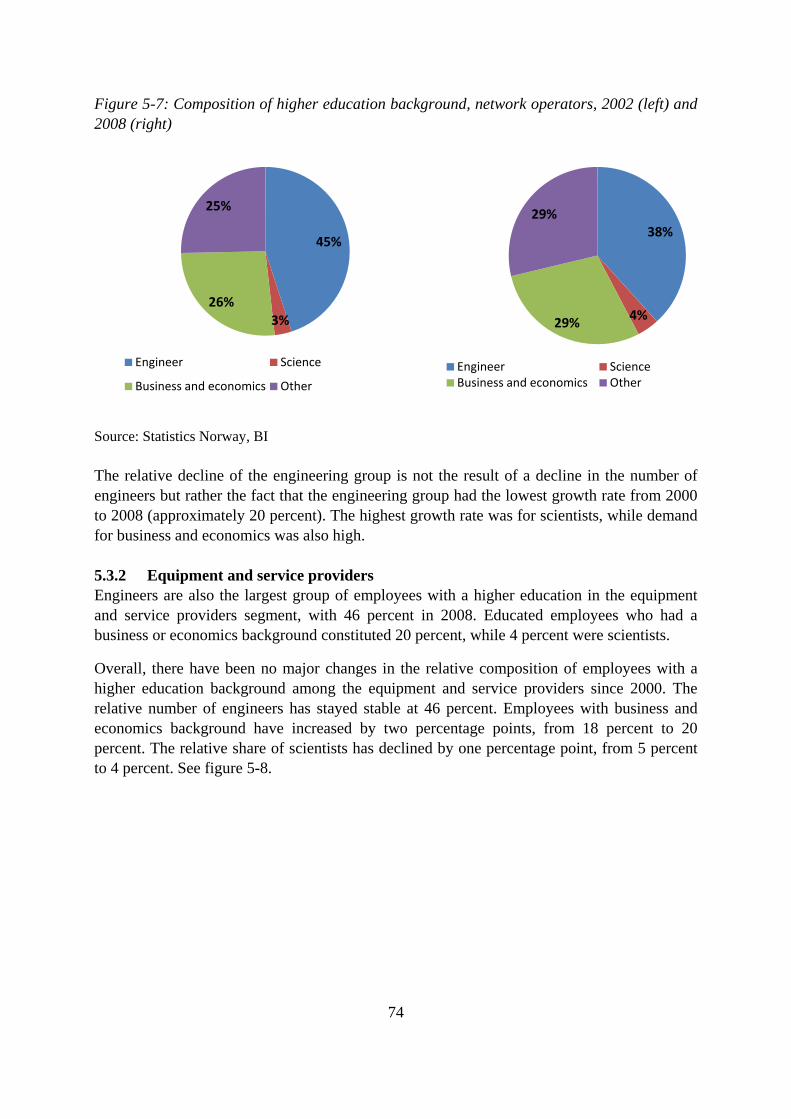
74
Figure 5-7: Composition of higher education background, network operators, 2002 (left) and 2008 (right)
Source: Statistics Norway, BI
The relative decline of the engineering group is not the result of a decline in the number of engineers but rather the fact that the engineering group had the lowest growth rate from 2000 to 2008 (approximately 20 percent). The highest growth rate was for scientists, while demand for business and economics was also high. 5.3.2 Equipment and service providers Engineers are also the largest group of employees with a higher education in the equipment and service providers segment, with 46 percent in 2008. Educated employees who had a business or economics background constituted 20 percent, while 4 percent were scientists.
Overall, there have been no major changes in the relative composition of employees with a higher education background among the equipment and service providers since 2000. The relative number of engineers has stayed stable at 46 percent. Employees with business and economics background have increased by two percentage points, from 18 percent to 20 percent. The relative share of scientists has declined by one percentage point, from 5 percent to 4 percent. See figure 5-8.
45%
3% 26%
25%
Engineer Science
Business and economics Other
38%
4% 29%
29%
Engineer Science Business and economics Other

75
Figure 5-8: Composition of higher education background, equipment and service providers, 2002 (left) and 2008 (right)
Source: Statistics Norway, BI Both engineers and employees with business and economics degrees are in demand among equipment and service providers. The demand for scientists fell in 2003 and did not turn neutral again until 2008. The decline of scientists in the relative composition of educational backgrounds among equipment and service providers is partly due to downsizing.
5.4 Foreign Labor An attractive industry is also able to recruit foreign talent. The composition of domestic and foreign workers therefore serves as an indication of how internationally oriented an industry is and how attractive it is on the global labor market. The employees in the Norwegian telecom industry are predominantly domestic workers. Only one in twenty (5 percent) of the employees are foreigners. See figure 5-9.
46%
5% 18%
31%
Engineer Science
Business and economics Other
46%
4% 20%
30%
Engineer Science Business and economics Other

76
Figure 5-9: Domestic and foreign workers, telecom, 2008
Source: Statistics Norway
However, this static picture might not tell the whole story. Starting in 2005, the foreign labor workforce began to increase substantially in the telecom industry.xix
Figure 5-10 plots the accumulated growth of both the domestic and foreign workforce in the telecom industry. Although the high recruitment of foreigners can be viewed as an indication that the telecom industry has strong talent attractiveness, the developments in Figure 5-10 should be evaluated in light of the strong growth experienced in the Norwegian economy from 2005 to 2008. In the years leading up to the financial crisis, employment in Norway increased by roughly 200,000 persons and the level of work-based immigration was high, particularly from the new, eastern member states of the European Union.
In 2008, the growth rate for foreign employees was over four times higher than the growth rate for nationals.
Figure 5-10: Accumulated growth of domestic and foreign workforce in the telecom industry, 2000-2008
Sources: Statistics Norway, BI
95%
5%
Domestic Foreign
0%
20%
40%
60%
80%
100%
120%
140%
160%
180%
200%
2000 2001 2002 2003 2004 2005 2006 2007 2008
Domestic Foreign

77
The foreign labor force in the telecom industry is a source of talent with high education levels. On average, a higher percentage of employees in the telecom sector have a higher education than in other industries, with telecom having just over twice as many foreign employees with a higher education than other industries. However, from 2005 to 2008, the growth rate for these employees was somewhat higher in other industries than in the telecom industry. See figure 5-11. The telecom industry is able to attract a higher percentage of foreign employees with a higher education than other industries on average, but trend has been on a decline from 2005 to 2008. Figure 5-11: Average workforce from abroad with a higher education, percent
Sources: Statistics Norway, BI
5.5 Talent attractiveness: Conclusions Telecom is a technology intensive and technology driven industry, which can be expected to be reflected in a better-educated workforce relative to other industries on average. This is, indeed, the case. In the telecom industry, the number of employees holding a Master degree has increased, while there has been fairly flat or negative trend for employees holding a Bachelor degree. This indicates that there has been a positive shift in the skill set that employers require from their university-educated employees. The change in the number of employees with a PhD was negative in the beginning of the period, which was marked by low economic growth, before turning positive in 2004. The change in the number of employees without a university education was generally flat or declining. The highest growth was evident among the number of employees holding a master or PhD, indicating that the telecom industry became increasingly professionalized from 2002 to 2008 and that the average skill level of the employees increased. Just over 60 percent of all employees in the telecom industry who have a higher education are employed by network providers. However, in 2008 total employment was evenly split between the two sectors in the telecom industry, indicating that network operators require a workforce with significantly more employees with a higher education. This implies that
0
0,5
1
1,5
2
2,5
3
3,5
2005 2006 2007 2008
Other industries
Tele

78
network operators are the technology and innovation drivers of the two main sectors in the Norwegian telecom sector. Five percent of the employees in the Norwegian telecom sector are foreigners and the share has increased in recent years, especially from 2005 to 2008. In 2008, 3 percent of the workforce in telecom was foreigners with a higher education, up from just under 2.5 percent in 2005.

79
6. R&D and Innovation Attractiveness Research and innovation play central roles in economic progress and in shaping the trajectory of societal development. In this chapter, we provide a systematic review of the most important R&D characteristics within the Norwegian telecom industry. 6.1 Firm R&D To what extent can firms tap into the knowledge base residing within dedicated R&D institutions? This analysis commences with an examination of the ratio of R&D investments to sales before it delves into firm investments in R&D personnel. The former is commonly used as an indicator of R&D intensity (March 1991). The higher the share of R&D relative to sales, the more likely a firm is to explore new territories. Lower R&D as a percentage of sales indicates a focus on the exploitation and incremental amendment of already developed solutions. One indication of the R&D activity level in the Norwegian telecom sector is given by the 2009 BI Survey. When asked whether their companies had conducted R&D projects themselves, 44 percent of survey respondents from network operators replied in the affirmative, while one-third of all equipment and service providers did the same. See figure 6-1. Figure 6-1: In-house R&D activity in the Norwegian telecom industry, 2010
Source: BI Some companies outsource or purchase R&D activities. In the BI Survey, 30 percent of respondents working for network operators stated that they had purchased R&D activities during 2009. Of the respondents working for equipment and service providers, 23 percent answered the same. See figure 6-2.
43,5 % 33,3 %
56,5 % 66,6 %
0 %
10 %
20 %
30 %
40 %
50 %
60 %
70 %
80 %
90 %
100 %
Nettwork Operators Equipment & Services Providers
No
Yes

80
Figure 6-2: Purchased R&D activities in Norwegian telecom industry, 2010
Source: BI The combination of responses to the two questions above gives the share of companies that have either conducted R&D activities themselves and/or have purchased R&D externally. In this respect, of the network operators that engage in R&D activities (52 percent), 44 percent conduct them in house. This illustrates that some companies outsource all of their R&D activities. The same is not true in the equipment and service providers segment, where the total percentage of firms engaged in research does not increase when externally purchased R&D activities are added to in-house R&D activities. See figure 6-3. Figure 6-3: Internal and/or external R&D activities in the Norwegian telecom industry, 2010
Source: BI
30,4 % 22,9 %
69,6 % 77,1 %
0 %
10 %
20 %
30 %
40 %
50 %
60 %
70 %
80 %
90 %
100 %
Nettwork Operators Equipment & Services Providers
No
Yes
52,2 %
33,3 %
47,8 %
66,7 %
0 %
10 %
20 %
30 %
40 %
50 %
60 %
70 %
80 %
90 %
100 %
Nettwork Operators Equipment & Services Providers
No
Yes
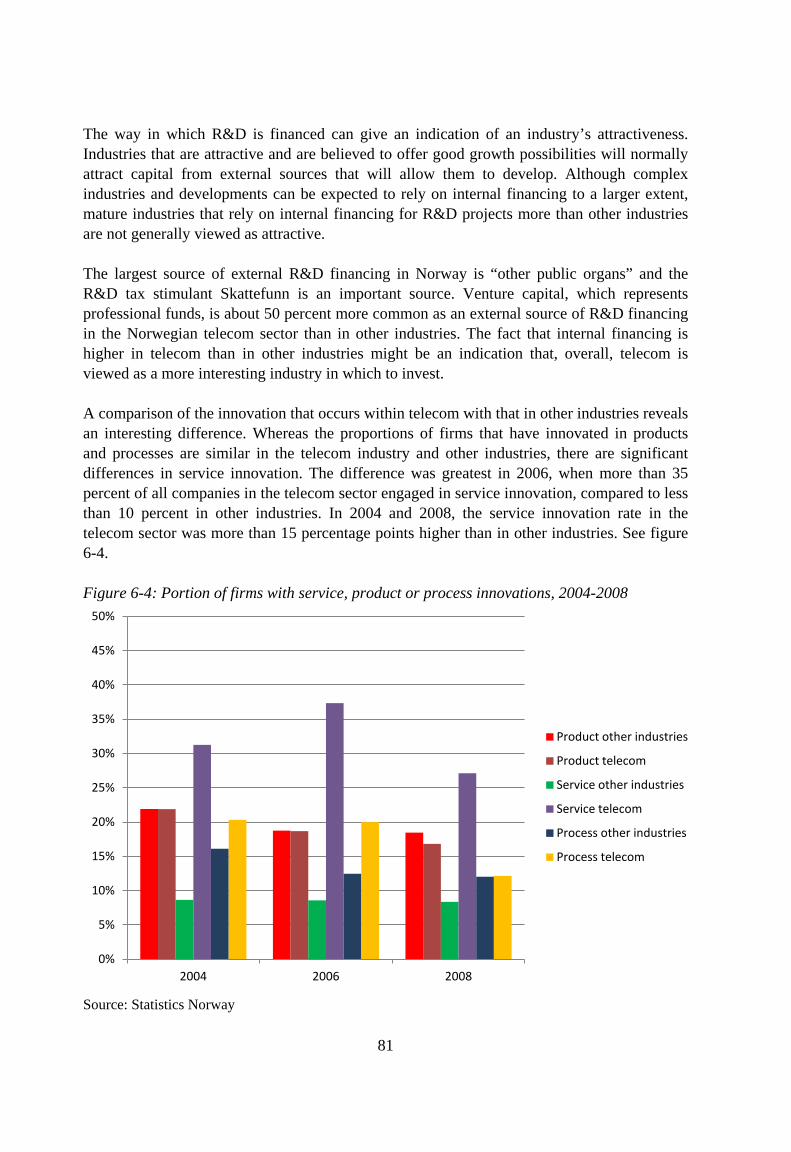
81
The way in which R&D is financed can give an indication of an industry’s attractiveness. Industries that are attractive and are believed to offer good growth possibilities will normally attract capital from external sources that will allow them to develop. Although complex industries and developments can be expected to rely on internal financing to a larger extent, mature industries that rely on internal financing for R&D projects more than other industries are not generally viewed as attractive. The largest source of external R&D financing in Norway is “other public organs” and the R&D tax stimulant Skattefunn is an important source. Venture capital, which represents professional funds, is about 50 percent more common as an external source of R&D financing in the Norwegian telecom sector than in other industries. The fact that internal financing is higher in telecom than in other industries might be an indication that, overall, telecom is viewed as a more interesting industry in which to invest. A comparison of the innovation that occurs within telecom with that in other industries reveals an interesting difference. Whereas the proportions of firms that have innovated in products and processes are similar in the telecom industry and other industries, there are significant differences in service innovation. The difference was greatest in 2006, when more than 35 percent of all companies in the telecom sector engaged in service innovation, compared to less than 10 percent in other industries. In 2004 and 2008, the service innovation rate in the telecom sector was more than 15 percentage points higher than in other industries. See figure 6-4. Figure 6-4: Portion of firms with service, product or process innovations, 2004-2008
Source: Statistics Norway
0%
5%
10%
15%
20%
25%
30%
35%
40%
45%
50%
2004 2006 2008
Product other industries
Product telecom
Service other industries
Service telecom
Process other industries
Process telecom
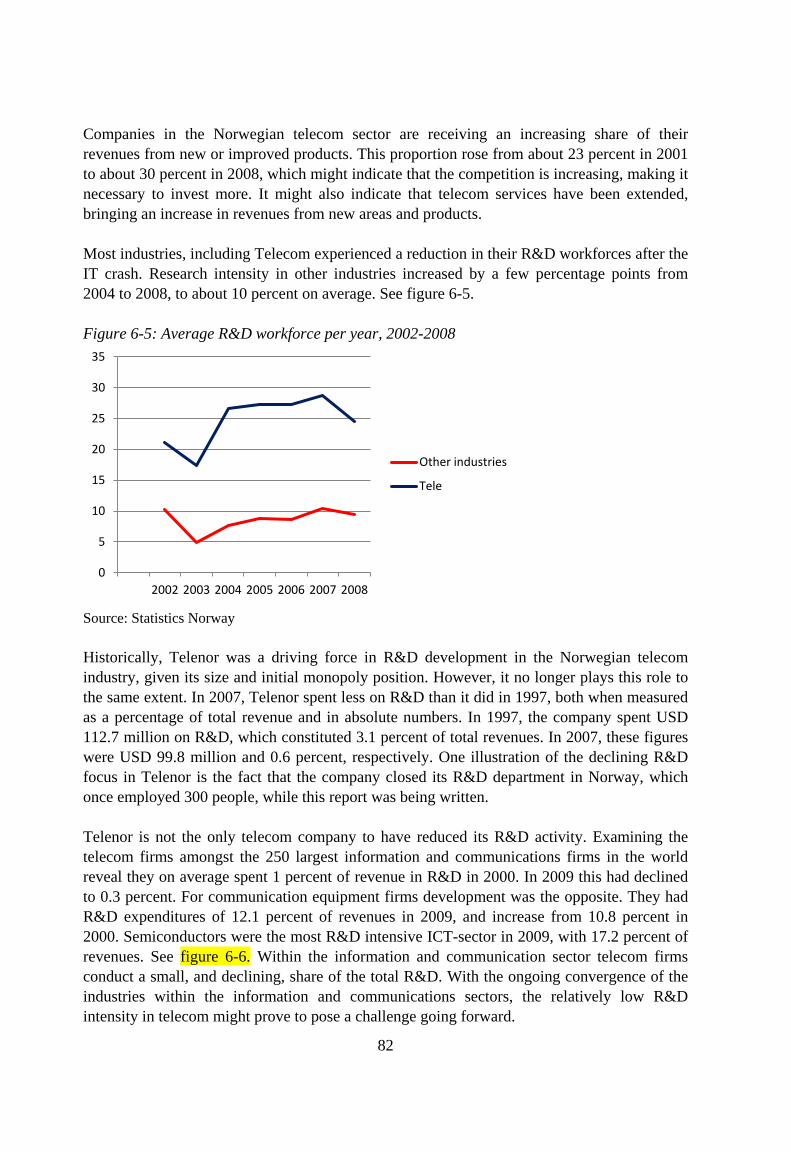
82
Companies in the Norwegian telecom sector are receiving an increasing share of their revenues from new or improved products. This proportion rose from about 23 percent in 2001 to about 30 percent in 2008, which might indicate that the competition is increasing, making it necessary to invest more. It might also indicate that telecom services have been extended, bringing an increase in revenues from new areas and products. Most industries, including Telecom experienced a reduction in their R&D workforces after the IT crash. Research intensity in other industries increased by a few percentage points from 2004 to 2008, to about 10 percent on average. See figure 6-5. Figure 6-5: Average R&D workforce per year, 2002-2008
Source: Statistics Norway Historically, Telenor was a driving force in R&D development in the Norwegian telecom industry, given its size and initial monopoly position. However, it no longer plays this role to the same extent. In 2007, Telenor spent less on R&D than it did in 1997, both when measured as a percentage of total revenue and in absolute numbers. In 1997, the company spent USD 112.7 million on R&D, which constituted 3.1 percent of total revenues. In 2007, these figures were USD 99.8 million and 0.6 percent, respectively. One illustration of the declining R&D focus in Telenor is the fact that the company closed its R&D department in Norway, which once employed 300 people, while this report was being written. Telenor is not the only telecom company to have reduced its R&D activity. Examining the telecom firms amongst the 250 largest information and communications firms in the world reveal they on average spent 1 percent of revenue in R&D in 2000. In 2009 this had declined to 0.3 percent. For communication equipment firms development was the opposite. They had R&D expenditures of 12.1 percent of revenues in 2009, and increase from 10.8 percent in 2000. Semiconductors were the most R&D intensive ICT-sector in 2009, with 17.2 percent of revenues. See figure 6-6. Within the information and communication sector telecom firms conduct a small, and declining, share of the total R&D. With the ongoing convergence of the industries within the information and communications sectors, the relatively low R&D intensity in telecom might prove to pose a challenge going forward.
0
5
10
15
20
25
30
35
2002 2003 2004 2005 2006 2007 2008
Other industries
Tele

83
Figure 6-6: Top 250 information and Communication Technology firms, R&D intensity by sector. Average R&D spending as a share of average revenue
Source: OECD 6.3 The patent game Patents play an important role in the telecom industry and their importance seems to be growing, particularly for producers of hardware. While this report was being written, numerous court cases between manufacturers of telecom hardware were underway. Often such cases are settled outside the courtroom, with one party agreeing to pay the other party compensation, or with an agreement to cross-license patents owned by both parties. Recently, Apple was supported by a ruling barring Samsung from selling its Samsung tablet 10.1 in the EU (with the exception of the Netherlands, where a separate court case was running). This ruling was later overturned by another judge. In the US, a judge barred sales of the Samsung Galaxy II phone, finding that it breached a patent Apple owns on the unlocking of phones. In such cases, the sued party typically counter-sues based on some of the patents it owns that the plaintiff is using. However, for new entrants to the market, the situation is different, as they do not own a portfolio of patents to use as a basis for counter-suing. Google, with its Android operating system, is the latest entrant into the market. It does not have a large, established portfolio of patents with which to protect itself. One of the main reasons for its recent acquisition of Motorola was Motorola’s very large portfolio of patents related to communication and mobile phones. Figure 6-7 presents the number of telecom patent applications filed at the European Patent Office from 1991 to 2005. It shows an increase in the total number of patents over the period. In 1991, 318 patents were filed. By 2005, this figure had risen to 7,581. Norwegian actors
1,0 %
4,4 %
4,3 %
4,7 %
8,7 %
10,8 %
15,1 %
10,7 %
0,3 %
2,8 %
3,0 %
4,1 %
11,1 %
12,1 %
14,7 %
17,2 %
0% 5% 10% 15% 20%
Telecommunications
IT equipment
IT services
Electronics & components
Internet
Communications equipment
Software
Semiconductors
2009 2000

84
filed for a maximum of 36 patents in any one year (2000). The Norwegian actors have decreased their percentage of total number of patents within OECD after the peak in1997. Figure 6-7 Telecom patent application at the European Patent Officer 1991-2005.
Source: OECD
6.4 R&D and innovation attractiveness: Conclusions An industry is attractive to the extent to which the firms operating in it can document a track record of innovative output. The nature of the relevant innovation – whether it is a product, service or organizational innovation – depends on industry-specific characteristics. In the Norwegian telecom industry, network operators are more research oriented than equipment and service providers. 44 percent of the network operators conducted in-house R&D activities in 2009, while only one-third of the equipment and service providers did the same. A similar spread between the two groups is found when examining the degree of outsourced R&D activities. 30 percent of the network operators and 23 percent of the services and equipment providers purchased R&D activities in 2009. The combination of these two figures gives the share of companies that conducted R&D activities themselves and/or purchased R&D externally. For network operators, the combined figure of 52 percent is higher than the 44 percent of firms that conduct these activities in house. This illustrates that some network operators outsource all of their R&D activities. The same is not true in the equipment and service providers segment, where the total percentage of firms engaged in research does not increase when externally purchased R&D activities are added to in-house R&D activities. The proportion of firms in telecom and other industries that have innovated in products and processes are fairly similar, but there are significant differences in levels of service innovation. Between 2004 and 2008, the service innovation rate within telecom was, on average, more than 20 percentages higher than in other industries in Norway. Patents play an important role in the telecom industry and their importance seems to be growing, particularly for producers of hardware. The total number of telecom patent applications filed at the European Patent Office increased from 1991 to 2005. Norwegian actors had, at most, filed for 36 patents (2000), with the number of patents at less than 30 in all other years. The patents have been decreasing since.
0,0 %
0,2 %
0,4 %
0,6 %
0,8 %
1,0 %
1,2 %
0
1 000
2 000
3 000
4 000
5 000
6 000
7 000
8 000
OCED patents Norwegian patents (%)

85
7. Ownership and Environmental Attractiveness 7.1 Ownership An industry’s ownership attractiveness is defined as the extent to which it can attract competent capital, either national or foreign, to finance its activities. Emerging industries, such as biotechnology applications within the health industry in Norway, typically suffer from a lack of competent owners that can competently evaluate new projects. In more mature industries, competent capital is crucial to the financing of innovative and novel projects, and to the injection of fresh capital into existing, growing firms. All else equal, a community of competent owners who are better positioned to offer and understand the benefits of narrow search, easier selection and foresight into the operation of the industry should support the growth and sustainability of an industry. In this chapter, we analyze the extent to which the Norwegian telecom industry manages to attract competent capital. The Norwegian telecom industry was shaped by Televerket, the publicly owned communications utility, until just a few decades ago. Throughout most of the twentieth century, the focus was on consolidating the initially numerous privately owned telecommunication centrals into Televerket, a process that lasted into the 1970s. As a result, the industry consisted of privately owned equipment manufacturers that sold to the state monopoly. Televerket built the infrastructure, and sold or rented out certified equipment, including switchboards, telefaxes, mobile phones and stationary phones, to users of various telecom services. Prices were set by the Norwegian Parliament in the annual budgets. As a result of the liberalization of the telecom market that began in the 1980s and was completed in 1998 with the European liberalization of telecom regulations across Europe, the nature of the Norwegian telecom industry changed significantly. It shifted from a monopoly dominated industry into a competitive sector. A competitive industry attracts more actors than a regulated monopoly. To increase competition, the regulating authorities have continually aimed to increase the number of network operators in the mobile phone sector. State-controlled Telenor and Swedish-owned NetCom have long been the only two operators to have a national network. Network Norway is the latest contender on the market and is currently in the process of building a third national mobile phone network. The regulatory authority’s policy of allowing new entrants to charge a higher effective price than the incumbents for a period is a strong stimuli for new network operators. Regulation has also been used to enable virtual mobile phone operators to establish themselves by offering mobile phone services on the networks of Telenor and NetCom. From 2002 to 2008, the number of registered companies increased from 254 to 359, an increase of 41 percent. During this period, the relative share of the companies in the telecom sector owned by foreigners increased from 16.5 percent in 2002 to 24.5 percent in 2008. Public ownership also increased, rising from 4.3 percent in 2002 to 11.4 percent in 2008. The relative share of privately owned companies declined from 52 percent in 2002 to 47.9 percent in 2008. The private ownership of telecom and media companies combined declined from 42

86
percent in 2003 to 28 percent in 2009. Over this period, telecom and media’s share of all industries’ total value creation in Norway also declined. An examination of revenue in the Norwegian telecom sector in terms of ownership highlights an increase in revenue for foreign-owned companies, which increased from 22.1 percent in 2002 to 32 percent in 2008. Although the number of publicly owned companies increased, this is not reflected in the revenue distribution, which indicates that the growth in the number of publicly owned companies might primarily reflect organizational changes, with bigger entities being divided into several smaller ones. Publicly owned companies’ share of the telecom market’s revenue declined from 58.9 percent in 2002 to 47 percent in 2008. Private companies, which grew in absolute number but declined as a relative share of the sector in terms of numbers, held a stable share of revenue over this period. In 2002, they represented 6.7 percent of revenues, a figure that had grown marginally to 6.8 percent by 2008. Norway has a community of “serial owners” in the telecom sector, i.e., owners that hold large stakes in many firms. In 2008, the largest owners of 15 percent of all companies were also owners of at least two other firms in the industry. Such multiple-firm owners control more than 70 percent of total income in the industry and account for just over 40 percent of the number of companies in the sector. The industries in which active-owner funds, such as venture funds and expansion/buyout funds, choose to invest is also an indication of the attractiveness of an industry relative to others. Roughly 1 percent of all companies in Norway are either telecom or media companies, but 2 percent of all companies have received investments from venture capital funds, while the corresponding figure was 3 percent for expansion/buyout funds. These figures indicate that telecom and media companies, as a group, are somewhat more interesting than the economy at large to professional owner funds. However, the interest of active-owner funds in the telecom and media sector is substantially lower than their interest in sectors such as IT, clean energy, oil and gas, and other knowledge-intensive businesses. 7.2 Environmental attractiveness An industry’s environmental attractiveness is primarily assessed on the basis of standardized CO2-equivalent levels and R&D investments into CO2 management. On the global scale, communication networks and equipment were responsible for 200 million tonnes of CO2 emissions in 2007. This accounted for 17 percent of all emissions within the broader information and communication technology sector. See figure 7-1.

87
Figure 7-1: Global greenhouse gas emissions, by information and communication technology product category, 2007
Note: Shares cover greenhouse gas emissions during the production and use phases of the ICT product lifecycle. Source: OECD Table 7-1 presents emissions statistics for the entire information and communication technology sector and selected manufacturing industries. The ICT sector accounts for about 0.6 percent of total emissions. As communication networks and equipment production account for less than 20 percent of the ICT sector, it can be roughly estimated that the telecom sector only accounts for a marginal share (approximately 0.1 percent) of global greenhouse gas emissions. Table 7-1: Shares of global greenhouse gas emissions in selected industries, 2007 or latest available year
Source: OECD information technology outlook 2010
TVs and peripherals
46 %
PCs and peripherals
22 %
Communications networks and
equipment 17%
Servers and data centres
15 %

88
It should be noted that reliable, comparable data on the impact of environmentally related projects in Norway is not available. Statistics Norway is attempting to produce such data but the standards as well as reporting systems have yet to be established. The measurements of CO2 emissions for the Norwegian telecom industry include postal services. This obscures the direct environmental impact of the telecom sector, as postal services are a transportation-oriented service. The telecom industry increases, by its very nature, communication. However, part of this increase reduces the need for travel. It is therefore fair to suspect that the pure CO2 impact of the telecom sector is lower than what is reported by Statistics Norway for the combined telecom and postal sector. Over the last decade, there has been a steady decline in CO2 emissions from the Norwegian post and telecommunication sector. From 2000 to 2008, the average annual change was about -8 percent, and the reduction was greatest in the second half of the period. From 2000 to 2008, there was a total decline of 49 percent. See figure 7-2. Figure 7-2: Emissions, CO2 equivalents, 1,000 tonnes, post and telecommunication industry in Norway, 2000-2008
Source: Statistics Norway It is interesting to see how CO2 emissions have developed at Telenor, the dominant network operator in the Norwegian market. For the whole Telenor group, including all activities abroad, CO2 emissions were flat from 2008 to 2009 at 750,000 tonnes and 747,000 tonnes, respectively. In 2010, emissions jumped to 1,084,000 tonnes, mainly due to the group’s increased activities in India. If the Indian subsidiary Uninor is excluded, CO2 emissions were 750,000 tonnes in 2008, 721,000 tonnes in 2009 and 736,000 tonnes in 2010.xx Given Telenor’s growing customer base and activity level, the group’s total emissions are declining,
336 333 326 303
275 249
229
191 173
0
50
100
150
200
250
300
350
400
2000 2001 2002 2003 2004 2005 2006 2007 2008
CO2 equivalent, 1000 tonnes

89
which provides a clear indication of the positive environmental development in the telecom sector. An examination of the breakdown of the CO2 emissions for the different operations within the Telenor group reveals that the dominant source of emissions is network operations, with 982,000 tonnes in 2010 (90.6 percent of the total). Travel and transportation resulted in 52,000 tonnes of emissions (4.8 percent), while buildings accounted for 50,000 tonnes (4.6 percent). Telenor also conducts various activities to improve its environmental imprint. One example is the collection of mobile phones for recycling or re-use, which resulted in 265,000 collections in 2010, an increase from 104,000 in 2008. It is also fair to assume that the telecommunication sector overall has a net positive impact on the environment due to its effect on the polluting activities of other sectors. For instance, when a video conference is conducted instead of participants travelling to a physical meeting, the environmental benefit is clear. If the video conference is a substitution for travel involving flying, the gain is substantial. However, such indirect environmental gains are not registered on the CO2 accounts for the telecom sector. One framework developed by the OECD for capturing these indirect effects is presented in Figure 7-3. The OECD views the information and communication sector as affecting the environment in three ways. First, direct impacts of ICTs on the environment (or “second-order effects”) refer to the positive and negative impacts arising from the physical existence of ICT goods, services and related processes. The sources of the direct environmental impacts of ICT products are ICT producers (manufacturing and service firms, including intermediate goods production), and final consumers and users of ICTs. Second, enabling impacts of ICTs (or “second-order effects”) arise from ICT applications that reduce environmental impacts across economic and social activities. ICTs affect how other products are designed, produced, consumed, used and disposed of. Positive effects make production and consumption more resource efficient. Potential negative effects need to be factored in when assessing “net” environmental impacts, such as greater use of energy by ICT-enabled systems compared to conventional systems. ICT products can affect the environmental footprint of other products and activities across the economy in four ways: Optimization: ICTs can reduce another product’s environmental impact. Dematerialization and substitution: Advances in ICTs and other technologies can facilitate the replacement of physical products and processes with digital products and processes. Induction effects can occur if ICT products change the demand for other products. Degradation can occur if ICT devices embedded in non-ICT products create difficulties for local waste-management processes.

90
Third, the systemic impacts of ICTs and their application on the environment (or “third-order effects”) are those involving behavioral changes and other non-technological factors. Systemic impacts include the intended and unintended consequences of wide application of green ICTs. Figure 7-3: Framework for a green information and communication technology sector
Source: OECD information technology outlook 2010 7.3 Ownership and Environmental attractiveness: Conclusions The telecom sector in Norway has undergone significant changes since the breakup of the state monopoly on network operations in the mid-1990s. The number of companies in the sector has increased. At the same time, foreign ownership and the industry’s share of total sales have risen. The industry’s ability to attract foreign capital and competence is a healthy sign. The number of privately owned companies has also grown, although the foreign-owned companies, rather than the privately owned companies, have been taking market share from publicly owned companies. All of these findings indicate that the Norwegian telecom sector is a fairly attractive sector in which to operate. However, active-ownership funds make a relatively low percentage of their investments in the telecom sector. This indicates that the attractiveness of the telecom sector, although positive overall, might be modest compared to the attractiveness of many other core sectors in the Norwegian economy. The telecom sector accounts for a marginal share of global greenhouse gas emissions. The data available for Norway indicate that emissions from the telecom and postal sector have been halved over the last decade. Direct contributions from the telecom sector to the resolution of the world’s environmental challenges are therefore significant. Furthermore, the telecom sector has a positive, indirect impact on the environment through its effect on behavior and business models in other industries. It is therefore safe to conclude that the telecom sector scores high in terms of environmental attractiveness.

91
8. Cluster Dynamics The dimensions previously reviewed describe the conditions under which firms can excel. The extent to which firms can utilize those dimensions to their benefit depends greatly on the degree to which they succeed in creating a dynamic environment. Previous literature (Reve and Jakobsen 2001) identifies four upgrading mechanisms through which clustered firms can experience increased innovation and productivity: innovation pressure arising from closeness to demanding customers, technologically leading suppliers and internal competition; critical mass (section 3); knowledge externalities, mainly in the form of labor mobility and strong business linkages; and transaction-cost reductions through the establishment of long-term relations. Dynamism is, therefore, a function of competitive and cooperative linkages; the degree of intra-industry labor mobility, which proxies for the extent of knowledge spillovers; and the degree of overlap among various industries. These linkages are examined in this section. 8.1 Competitive linkages Local competition has been theorized to drive firms to excel (Porter 1990; Burt 1992). Competing firms that locate in the same vicinity have been repeatedly observed to have an incentive to remain “on top of things” by continuously innovating, and by seeking out new technologies and customers. 74 percent of firms in the Norwegian telecom industry report having at least one direct competitor in the local region. This figure is substantially higher than for most other industries in Norway, such as the oil industry (56 percent). Such local competition may help to increase the level of innovation, as firms respond to this pressure by trying to stay ahead of the competition. The importance of local competition is relatively equal across the telecom sector, with 75 percent of network operators and 73 percent of equipment and service providers having at least one local competitor. The high scores partly reflect the centrality of the Oslo region for the telecom sector. See figure 8-1.

92
Figure 8-1: Local competition in the telecom industry, by subsector, percent, 2010
Note: Local competitor is defined as a competitor being located within one hour of travel. Source: BI The hardest competition in the Norwegian telecom sector comes from companies based in Norway. In the BI Survey, 71 percent of respondents state that a Norwegian company is their company’s main competitor. Most companies (53 percent) feel the toughest competition is on the national level. 29 percent indicate that they face the strongest competition from international competitors, while 18 percent report that local competitors are the strongest. There are some differences between the competition experienced by network operators, and by equipment and service providers. 67 percent of network operators find that national competitors pose the greatest challenge. These are also the strongest competitors according to equipment and service providers (46 percent). International competitors are reported as the strongest competitor by 31 percent of equipment and service providers, and by 25 percent of network operators, while 23 percent of equipment and service providers and 8 percent of network operators indicate that a local competitor is their main challenger. See figure 8-2.
75%
73%
25%
27%
0% 20% 40% 60% 80% 100% 120%
Network operators
Equipment and service providers
Has at least one local competitor Has no local competitor

93
Figure 8-2: Hardest competition by origin, 2010
Source: BI 8.2 Relationships with suppliers and customers Customers with high demands are an important source of innovation and development. Both network operators and equipment and service providers indicate that their customer bases are demanding and sophisticated. On a scale from 1 to 4, with 1 being “not at all” and 4 being “to a large extent”, these companies rate the sophistication of all customer types (local, domestic and international) between 3 and 4. Both network operators and equipment and service providers rate national customers as the most demanding. Network operators rate both international and local customers almost equally, with international customers ranking marginally lower. For equipment and service providers, local customers are rated as least demanding, with a score of 3.0. Although the presence of a demanding national customer base is positive, it is somewhat worrisome that international customers are not viewed as the most demanding customer group. One interpretation is that the Norwegian telecom industry is more a receiver of technology and knowledge than an exporter. See figure 8-3.
8%
23%
67%
46%
25%
31%
0% 20% 40% 60% 80% 100% 120%
Network operators
Equipment and service providers
Hardest competition from local competitors
Hardest competition from national competitors
Hardest competition from international competitors

94
Figure 8-3: To which extent do you experience the company’s customers as demanding/ sophisticated? 1 = not at all, 4 = to a large extent, 2010
Source: BI Survey Figure 8-4 also indicates that the Norwegian telecom sector is more inward looking and content with serving the national market than export oriented. In terms of the percentage of customers who are local, national or international, the predominant customer base for both network operators, and equipment and service providers is the Norwegian market, roughly split between the local (within one hour of travel time) and the national markets. For network providers, 41.7 percent of customers are local, 39 percent are national and 19.3 percent are international. For equipment and service providers, the corresponding figures are 42 percent, 43 percent and 15 percent.
3,4
3,0
3,5
3,4
3,4
3,3
0 1 2 3 4
Network operators
Equipment & services providers
International customers National customers Local customers

95
Figure 8-4: Distribution of customers among network operators, and equipment and service providers, 2010
Source: BI Survey The supplier base of the Norwegian telecom industry is also predominantly domestic. For network operators, 36.7 percent of suppliers are national, 35 percent are local and 28.2 percent are international. The largest supplier group for equipment and service providers is international suppliers, which constitute 35.8 percent. National suppliers are almost as important, at 35.2 percent, followed by local suppliers at 29 percent. See figure 8.5. Figure 8-5: Distribution of suppliers for network operators, and equipment and service providers, 2010
Source: BI Survey
41,7 42,0
39,0 43,0
19,3 15,0
0 % 10 % 20 % 30 % 40 % 50 % 60 % 70 % 80 % 90 %
100 %
Network operators
Equipment and service
providers
International customers
National customers
Local customers
35,0 29,0
36,7 35,2
28,2 35,8
0 %
10 %
20 %
30 %
40 %
50 %
60 %
70 %
80 %
90 %
100 %
Network operators
Equipment and service providers
International suppliers
National suppliers
Local suppliers

96
Suppliers can be an important source of knowledge. However, for domestic suppliers to be an integrated part of a national cluster, they must be competitive with their international rivals. A survey of the international competitiveness of the supplier base reveals some worrisome findings. On a scale ranging from 1 = not at all to 4 = to a large extent, Norwegian network providers estimate that their national suppliers score 3.4 in terms of being internationally competitive, which is a medium to fairly high score. This score indicates that suppliers still have some way to go before they are fully international competitive. Even more worrisome is the fact that the local supplier base scores a much more modest 2.8. Equipment and service providers give the national suppliers a score of 3.1 and their local suppliers a score of 2.7. These figures indicate that the Norwegian supplier base is not at the industry’s forefront in terms of knowledge. The telecommunication industry in Norway is located in the big cities to a large extent. As a centralized industry, the development of a dedicated supplier base, in which the leading companies would be clustered, should be possible. However, as the local suppliers score the lowest in competitiveness; knowledge-driven clustering does not appear to be a central feature of the industry. See figure 8-6. Figure 8-6: To which extent do you experience the company’s suppliers as internationally competitive? 1 = not at all, 4 = to a large extent, 2010
Source: BI Survey
Overall, the Norwegian supplier base is not a technological leader. On a scale ranking the technological leadership of the supplier base, where 4 = a leader and 1 = not at all, both network operators, and equipment and service providers rate international suppliers highest, at
2,8
2,7
3,4
3,1
0 1 2 3 4
Network operators
Equipment & services providers
Other suppliers in Norway Local suppliers

97
3.7 and 3.6, respectively. Both groups rate national suppliers 0.3 points lower. Local suppliers rank lowest as technology leaders. Network operators give local suppliers a score of 2.9, while the equipment and service providers give them a 2.7. These findings indicate that international suppliers are the main source of knowledge. Of the Norwegian suppliers, national suppliers are viewed as more important than local suppliers. These findings also indicate that local clustering is not shaping the industry. See figure 8-7. Figure 8-7: To which extent do you experience your suppliers as leaders in technology? 1 = not at all, 4 = to a large extent, 2010
Source: BI Survey 8.3 Collaborative linkages Innovations happen less and less in isolation, and R&D is increasingly more interconnected and globalized. Innovative linkages across firm and country boundaries allow for higher returns originating from the sharing of cross-boundary knowledge, the joining of complementary resources, and the transfer of effective governance of work and innovation processes (Dyer and Singh, 1998). With the increasing globalization of economic activities, cross-border linkages are of increasing importance (OECD, 2010). Norway, as a whole, underperforms in this regard. Only 5 percent of firms report international collaboration on innovation. In comparison, 17 percent of Finnish and 8 percent of Danish firms report international collaboration on innovation. Collaborations in the telecom industry take many forms, such as vertical relationships between customers and suppliers, horizontal relationships between companies on the same level in the
2,9
2,7
3,4
3,3
3,7
3,6
0 1 2 3 4
Network operators
Equipment & services providers
International suppliers Other suppliers i Norway Local suppliers

98
supply chain, or relationships between a company and a governmental agency, an R&D institution or a finance institution. For the telecom industry as a whole, relations among certain actors are more significant in the development of new ideas, processes or products. Figure 8-8 depicts telecom firms’ innovative linkages across firm boundaries to national and foreign actors. Finance institutions are the least important group, as 49 percent of firms view them as irrelevant for their own innovation. R&D institutions score almost as low, with 47 percent viewing them as irrelevant. In comparison, in the technology-based oil industry, 35 percent of firms indicate that national R&D institutions affect their innovative output but only 17 percent of the firms in the telecom sector view such institutions as important to their innovation activities. Public support organizations are another “unimportant” source, with 41 percent viewing them as irrelevant for their innovation. Consultants are also generally deemed to be of little importance (33 percent). The most important linkages for innovation in the telecom industry are with personal networks, customers and suppliers. For personal networks and contacts, national relationships are deemed to be the most important, with 53 percent of the respondents stating that they are an important source for their companies’ own innovation. International personal networks and contacts also score fairly high at 39 percent. National customers and national personal networks are viewed as equally important, with both scoring 53 percent. However, local customers are reported to be more important than international customers, at 38 and 33 percent, respectively. Suppliers are also a leading source for telecom firms’ innovation, although the international suppliers are ranked somewhat higher than national suppliers, at 48 and 44 percent, respectively. Another important factor for telecom firms’ innovation is found in their relationships with national (37 percent) and international (31 percent) alliance partners. Interest organizations (industry and network organizations) are reported to be a relatively important source for innovation on the national level (39 percent), but not nearly as important on the international or local arenas. See figure 8-8.

99
Figure 8-8: Innovative linkages across firm and country boundaries in the Norwegian telecom industry, 2010
Source: BI
Suppliers hold a central position in cluster theory as agents of adaptation and innovation. Figure 8-8 shows that international and national suppliers strengthened innovation in 48 percent and 44 percent of all telecom firms, respectively, in 2010. However, the breakdown of these figures to the sector level reveals significant differences in this regard between network operators, and equipment and service providers.
Suppliers hold significantly more importance for the innovation activities of network operators than for those of equipment and service providers. This is the case for all types of suppliers. Two-thirds of all network operators report that their international suppliers have strengthened their research activities. 54 percent report that national suppliers have had an impact on their innovation, while the corresponding figure for local suppliers is one-third. This supports the earlier finding in this report that international suppliers are viewed as the technological leaders.
National suppliers are the group that the most equipment and service providers feel has had an impact on their innovation activities (35 percent). International suppliers have been relevant for a slightly smaller percentage of these firms (29 percent). Only 14 percent of equipment and service providers report that local suppliers have been relevant for their innovation activities. See figure 8-9.
Overall, this analysis, together with the finding that foreign suppliers are technology leaders, clearly indicates a lack of competitiveness among national suppliers. This factor renders Norwegian firms even less able to innovate and outperform rivals. This is particularly the case for network operators, the segment that functions as the central hub in the telecom industry.
0% 10% 20% 30% 40% 50% 60%
Customers
Suppliers
Competitors
Alliance partners
R&D institutions
Other units in the company
Consultants
Financial institutions
Industry or network organisation
Public support organisations
Personal network
Not relevant
International
National
Local

100
Figure 8-9: Percentage of firms in the Norwegian telecom sector reporting that suppliers strengthen their innovation activities, by sector, 2010
Source: BI 8.4 Labor Dynamics Another source of industry dynamics is the labor market. Spillover effects have been identified as one of the three major mechanisms through which cluster advantages materialize (Marshall, 1920; Almeida and Kogut, 1999; Jaffe, Trajtenberg and Henderson, 1993). Spillover in labor markets occurs through the transfer of employees across firm boundaries. Figure 8-10 displays the degree of inter-sector labor flow among the two main sectors in the telecom industry as a percentage of total employment in the sector (reported in percentages within the circles). It should be noted that the figures exaggerate the actual number of moves because they include moves that are due to mergers and acquisitions, and moves caused by group-level restructuring (although organizational restructuring has no effects). These statistics show that there is low intra-sector mobility between network operators and their supplier base. There is marginally higher labor mobility from equipment and service providers to network operators. As the figure indicates, the degree of knowledge transfer between the sectors within the telecom industry is low.
67%
54%
33% 29%
35%
14%
0%
10%
20%
30%
40%
50%
60%
70%
80%
International suppliers National suppliers Local suppliers
Network Operators Equipment and service providers

101
Figure 8-10: Inter-sector labor mobility, all employees, 2008
Source: Statistics Norway and BI
The inter-sector movement of employees with a higher education can, on average, be expected to have a particularly high impact on knowledge transfer between sectors. An examination of the labor mobility of employees with a higher education reveals that the transfer of these employees between network operators and equipment and service providers is fairly low, at about 1 percent. See figure 8-11.
Figure 8-11: Inter-sector labor mobility, employees with a higher education, 2008
Source: Statistics Norway and BI
8.5 Overlapping Networks Clusters thrive in the presence of related clusters in the economy (Porter, 1990, 1998). Is the telecom industry a stand-alone industry, or does it have related clusters and, hence, complementary sources of competences and ideas to utilize in its operations?
Network operator
5%
1%
1%
Equipment and service provider
2%
Network operator
3%
1%
0%
Equipment and service
provider
1%

102
In Norway, the telecom industry is an integrated industry that works closely with several other industries, which supports the general trend of multi-industry convergence (see Chapter 2). Figure 8-12 depicts the flow of personnel among industries in Norway in 2008. A similar pattern is also evident in earlier years. The telecom sector exchanges the highest proportion of employees with the IT industry, which is as expected, but it also exchanges employees with the media and knowledge mediator sectors. There are also significant linkages to the maritime sector, as many suppliers provide communication solutions to that sector. Figure 8-12: Overlapping networks, 2008
Sources: Statistics Norway and BI
8.6 Indirect linkages: Competence development dynamics Firms can supplement the investments made by educational institutions, individual employment choices and spillovers from already acquired industrial knowledge by investing in employee competence development. We examine this element because investments in employee competence are semi-public goods. There is no guarantee that employees will remain with a particular firm and, hence, the benefits of investments in employee competence may be captured by other firms.

103
38 percent of network operators and 31 percent of equipment and service providers invest less than 2 percent of their turnover in developing employee competence. See figure 8-13. This figure is less the corresponding figures for oil and gas, tourism, construction, health, and metals and materials, as shown in figure 8-14. At the other end of the scale, relatively few telecom firms (around 3-4 percent) invest more than 15 percent of their turnover in competence development. This is also less than similar investments in the oil and health industries, at 7 and 13 percent, respectfully. It is, however, equivalent to the high-level competence investments in tourism, and higher than the high-level competence development investments found in the construction and metal industries. Combined, these figures imply that, in terms of competence development, the telecom sector in Norway is a medium-level industry in need of more employee competence than other industries. In general, it requires a fairly high basic level of competence, but has less need to fund the development of cutting-edge innovative and technical competence.

104
Figure 8-13: Estimate of the percentage of revenues used on development of competence, 2010
Source: BI Survey Figure 8-14: Revenues used to develop competence, by industry, 2010
Source: BI
37,5 % 31,1 %
29,2 %
26,2 %
16,7 % 26,2 %
12,5 % 13,1 %
4,2 % 3,3 %
0 %
10 %
20 %
30 %
40 %
50 %
60 %
70 %
80 %
90 %
100 %
Network operators Equipment & service providers
Less than 2 % 2‐4 % 4‐8% 8‐15 % More than 15 %

105
8.7 Cluster Dynamics: Conclusions Norwegian telecom firms experience the strongest degree of competition on the national level. Two-thirds of all network operators and just under half of all equipment and service providers face the strongest competition for their customers on the national level. International competitors provide the strongest competition for just under one-third of all equipment and service providers and one-quarter of all network operators. Although about three-quarters of both network operators, and equipment and service providers have at least one local competitor, local competition linkages are weak. Less than one-quarter of equipment and service providers and less than one-tenth of all network operators experience the toughest competition in the local market.
Demanding customers are an important source of innovation and development. Both network operators, and equipment and service providers find their customer base to be demanding and sophisticated, and network operators, and equipment and service providers rank national customers as the most demanding customer group within their customer bases. However, the existence of such a supplier base is not supported by our findings. In fact, the local supplier base is viewed as the least sophisticated in terms of knowledge. In relation to the strength and competitiveness of the Norwegian telecom sector, it is worrisome that the international suppliers are viewed as the technological leaders. On the positive side, 56 percent of the equipment and service providers and 46 percent of the network operators have export income.
Collaborative relations with customers, suppliers and personal networks are viewed as the most central for innovation. Personal networks and customer relationships on the national level score highest, with just over half of the respondents stating that they are an important source for their own innovation. Suppliers are also a central component in telecom firms’ innovation, with the international suppliers ranked marginally ahead of national suppliers in importance. Relationships with national and international alliance partners are also important for telecom firms’ innovation. The industry’s interest organizations are also reported to be a fairly important source of innovation on the national level but less so internationally and locally. Public support organizations, finance institutions and R&D institutions are not deemed to be important contributors to the telecom sector’s innovation. Viewed in light of the falling numbers of R&D personnel in the telecom sector, particularly among network operators, this might indicate that a large portion of the telecom industry is exploiting previously developed knowledge or relying on international suppliers to provide it.
Telecom firms perceive their international suppliers as leading on the technological front relative to national suppliers. This indicates a lack of competitiveness among local and national suppliers, which renders firms less able to innovate and outperform rivals. Furthermore, local suppliers are viewed as possessing substantially less technological leadership than their foreign counterparts. This most likely weakens the attractiveness of the telecom cluster in Norway by challenging its completeness and competitiveness throughout the value chain.
The telecom industry is linked to related industries, such as IT, media and knowledge mediation. There are also significant linkages between telecom and the maritime sector, as many companies provide communication solutions for that sector.

106
9. Summary of findings, implications and recommendations
This chapter provides recommendations for business strategy and public policy, which are primarily based on the findings summarized in each of the previous sections. Over the last two decades, the Norwegian telecom industry has changed from being dominated by a slow-moving, state-owned utility provider into a dynamic market for communication services. It is now undergoing a new transformation, which is shaped by the convergence of the information and communications industries into a single industry. This is a challenging transformation, as existing services are becoming obsolete. As a phase in which “everyone and everything” is being connected, it offers exciting possibilities for domestic and global growth based on new services, products and business models – both for the traditional telecommunication industry and for actors positioned in the extended communication industry. 9.1 Summary of findings This report focuses on the current status and emerging trends within the six dimensions of the Norwegian telecom industry as a global knowledge hub: cluster attractiveness, educational attractiveness, talent attractiveness, R&D and innovation attractiveness, ownership attractiveness and cluster dynamics. The main results are summarized below.
9.1.1 The telecom industry at a glance In 1988, the Norwegian market for telecommunication terminals was opened to competition and monopoly over the sale of telephone sets ended. In 1999, NetCom became the first private telecom operator in the modern phase of the Norwegian telecom industry. It was established by Nora Industrier, Orkla and the Swedish group Kinnevik. It won a GSM license in 1991, beating out three other contenders, and it launched its network in 1993. In 1994, Televerket was transformed into Telenor, a state-owned stock company. The last remnants of the monopoly were removed in 1998, at which time the Norwegian telecommunication market was fully opened to competition. Telenor was partially privatized in 2000 and NetCom was bought by the Swedish telephone company Telia that same year. These two companies remain, by far, the dominant players in the Norwegian telecommunication market, even after several virtual telecom service providers initiated operations and Network Norway established the third GSM network.
Globally, the usage of mobile phones is growing substantially. ITU estimates that about 78 percent of the world’s population owned a mobile phone in 2010. The proportion of inhabitants that have access to the Internet is also growing, increasing from less than 10 percent in 2000 to about 30 percent in 2010. With the Internet increasingly becoming available on mobile phones, Internet access can be expected to increase substantially in the future.
The first decade of the new millennium saw an extreme increase in human connectivity. The 714 million mobile phone subscribers in 2000 grew to 5.4 billion in just 10 years. On average, 78 of every 100 people had a mobile phone subscription in 2010.

107
Global telecom revenues grew from USD 2,500 billion in 2003 to USD 4,000 billion in 2008 and are expected to grow to almost USD 5,000 million by 2013 (Telecom Industry Association, 2010).
When measured as a percentage of GDP for the whole of the OECD area, revenues in the telecom sector were relatively flat at just over 2 percent from the mid-1980s to the early 1990s. The late 1990s brought a period of growth until the economic downturn that followed the IT crash after the turn of the century. From 2001 to 2008, revenues as a percentage of GDP declined modestly. In the crisis year of 2009, revenues again increased somewhat, indicating that telecommunication services are a viewed as a commodity – a service that is given priority in challenging economic situations.
The global telecommunication industry has shown itself to be resilient to global crises. While GDP growth fell in the OECD area following the IT crash at the turn of the century, telecommunication revenues continued to increase in most OECD counties. The financial crisis of 2008-2009 resulted in a decline in global telecom revenue of 3.7 % in 2009, but the industry is expected to recover and continue growing as previously projected. However, when measured as a percentage of GDP, revenues in the Norwegian telecom sector have declined since the 1990s. In 1985, telecom revenues constituted 1.91 percent of GDP. In 1998, the year the Norwegian telecommunication market was opened to full competition, the figure decline substantially to 1.63 percent. It declined again thereafter, falling to 1.37 percent by 2007. At the same time, the average of telecom revenues relative to GDP for other OECD countries has increased from 2.13% in 1985 to 2.92% in 2007.
The leading value-creation logic in the telecom sector is the value network. Value networks in which firms use a mediating technology have three parallel activities: a) network promotion and contract management, b) service provisioning, and c) infrastructure operations. Telecom is purely a knowledge industry with many strong ties with, and many of the same features as, the IT industry. The industry has also several similarities to the financial industry, which is also a typical network industry with regards to value-creation logic. Both of these industries play facilitator roles – one facilitates money, while the other facilitates communication – and both are active in a global market.
9.1.2 Cluster attractiveness The companies in the Norwegian telecom industry are primarily located in the bigger cities, with the greater Oslo area being the main area. As it is geographically concentrated, one might expect the industry to develop a strong local supplier base. Employment in the telecom sector is also concentrated in and around the larger cities, with a large proportion in the greater Oslo area.
In 2008, the Norwegian telecom market consisted of 868 companies, as classified by Statistics Norway. From 2006 to the first half of 2010, the number of companies offering fixed-line telephony fell by 6 percent, moving from 83 to 78 with a high of 93 in 2007. There was also a 13 percent decline in the number of companies offering fixed-line IP telephony, which fell from 76 in 2006 to 69 in the first half of 2010. The number of companies offering mobile phone subscriptions also fell by 13 percent, from 31 to 27, with a high of 35 in 2007. The

108
number of companies offering fixed-location Internet access fell by 3 percent, from 163 in 2006 to 158 in the first half of 2010.
Our data show that the value creation is high within the industry, with an average value creation per employee of NOK 1.4 million in 2009. This puts telecom among the top-two industries in Norway with regard to value creation per employee in 2009. Value creation within telecom firms in Norway varied significantly during the dot.com era, when it fell to NOK 0.26 million in 2001. Since 2003, value creation per employee has varied somewhat, averaging NOK 1.1 million. Overall, Norway is a net importer of communication equipment (the same is true for the majority of countries in the OECD). When it comes to trade in communication services, the picture changes. In 2008, Norwegian exports of communication services totaled USD 669 million and imports were USD 509 million. However, when communication equipment and services are combined, Norway is a net importer. 9.1.3 Educational attractiveness Overall, educational programs that are related to the telecom industry declined in absolute and relative terms from 2005 to 2009. The largest reduction was observed on the Master level. On the Bachelor level, there was a slight increase in the number of students. However, relative to the number of students studying other subjects, there has been a modest decline in the number of students studying telecom-related subjects at this level. For doctoral studies, both the absolute number of students and the relative proportion of students are declining. As doctoral studies have the longest time horizon, investments in such studies indicate that there are opportunities for either advanced employment or a career in academia within this area. The declining attractiveness of telecom-related doctoral programs might imply that the opportunities for advanced, R&D-based value addition in the telecom industry are believed to be declining.
9.1.4 Talent attractiveness Telecom is a technology-intensive and technology-driven industry. This is reflected in the fact that the workforce in the telecom industry is better educated than the workforces found in other industries, on average.
In the telecom industry, there has been an increase in employees holding a Master degree, while there has been fairly flat or negative trend for employees with a Bachelor degree. This indicates that there has been a positive shift in the skill set that employers require from their university-educated employees. The change in number of employees with a PhD was negative in the beginning of the period from 2000, which was marked by low economic growth, but increased from 2004 and onwards. In general, the numbers of employees without a university education has been constant or declining. The highest growth was evident among employees holding a Master or PhD degree, indicating that the telecom industry experienced some professionalization from 2002 to 2008, which has raised the average skill level among employees.
Just over 60 percent of all employees in the telecom industry who have a higher education are employed by network providers. Total employment in 2008 was evenly split between the two

109
sectors in the telecom industry. Network operators appear to be the technology and innovation drivers of the two main sectors in the Norwegian telecom industry.
Five percent of the employees in the Norwegian telecom sector are foreign and this share has increased in recent years, particularly from 2005 to 2008. In 2008, 3 percent of employees in telecom were foreigners with a higher education, up from just under 2.5 percent in 2005.
9.1.5 R&D and innovation attractiveness An industry is attractive to the extent to which the firms operating in it can document a record of innovative output. The nature of the relevant innovation – whether it is a product, service or organizational innovation – depends on industry-specific characteristics.
In the Norwegian telecom industry, network operators are more research oriented than equipment and service providers. 44 percent of the network operators conducted in-house R&D activities in 2009, while only 33% of the equipment and service providers did the same. The same quantitative lead in innovation is found when examining the degree of outsourced R&D activities. 30 percent of the network operators and 23 percent of the services and equipment providers purchased R&D activities in 2009. When combined, these figures give the share of companies that have conducted R&D activities themselves and/or have purchased R&D out of house. For network operators, the total number of firms involved in R&D activities (52 percent) is slightly higher than the 44 percent of firms that conduct such activities in house. This implies that some companies outsource all of their R&D activities. This is not true for the equipment and service providers segment, where the total percentage of firms engaged in research does not increase when externally purchased R&D activities are added to in-house R&D activities.
Several significant differences in service innovation favor the telecom industry, while the proportions of firms that have innovated in products and processes are similar in the telecom industries and other industries.
Patents play an important role in the telecom industry and their importance seems to be growing, particularly for producers of hardware. The total number of telecom patent applications filed at the European Patent Office increased from 1991 to 2005. Norwegian actors had, at most, filed for 36 patents (2000), with the number of patents at less than 30 in all other years. The Norwegian actors have decreased their percentage of total number of patents within OECD after the peak in1997.
9.1.6 Ownership attractiveness The breakup of the state monopoly on network operations in the mid- 1990s allowed for free competition in the telecom sector in Norway. As in most developed countries, the sector has since undergone major changes. The number of companies in the sector have increased. At the same time, foreign ownership and the share of total sales has increased. The sector’s ability to attract foreign capital and competence is a positive sign. Furthermore, the number of privately owned companies has also grown, although foreign-owned companies, rather than privately held firms, have been taking market share from publicly owned companies. All of these developments indicate that the Norwegian telecom sector has become a fairly attractive sector in which to operate.

110
However, active-ownership funds hold a relatively low degree of their investments in the telecom sector. This indicates that the attractiveness of the telecom sector might be modest when compared to the attractiveness of many other core sectors in the Norwegian economy.
9.1.7 Environmental Attractiveness The telecom sector accounts for a marginal share of global greenhouse gas emissions. The data available for Norway indicate that emissions from the telecom and postal sector have been reduced by 50% over the past decade. The direct contributions from the telecom sector to the resolution of the world’s environmental challenges are, therefore, significant. The telecom sector also indirectly, but positively, affects the environment by changing behavior and business models in other industries. In general, therefore, it is safe to conclude that the telecom sector scores high on environmental attractiveness.
9.1.8 Cluster dynamics Norwegian telecom firms experience the strongest degree of competition on the national level. Two-thirds of all network operators, and just under half of all equipment and service providers face the greatest competition for customers on the national market. International competitors are the strongest competition for just under one-third of equipment and service providers, and one-quarter of network operators. Although about three-quarters of network operators and equipment and service providers have at least one local competitor, local competition linkages are weak. Less than one-quarter of equipment and service providers and less than one-tenth of all network operators experience the toughest competition in the local market.
Demanding customers are an important source of innovation and development. Both network operators, and equipment and service providers find their customer base to be demanding and sophisticated, and network operators, and equipment and service providers rank national customers as the most demanding customer group within their customer bases. However, the existence of such a supplier base is not supported by our findings. In fact, the local supplier base is viewed as the least sophisticated in terms of knowledge. In relation to the strength and competitiveness of the Norwegian telecom sector, it is worrisome that the international suppliers are viewed as the technological leaders. On the positive side, 56 percent of the equipment and service providers and 46 percent of the network operators have export income.
Collaborative relations with customers, suppliers and personal networks are viewed as vital for innovation. Personal networks and customers on the national level are rated as the most important, with just over half of all respondents stating that they are critical to their own innovation. Suppliers are also a central component in telecom firms’ innovation, with international suppliers ranked marginally ahead of national suppliers in importance. Relationships with national and international alliance partners are also important for telecom firms’ innovation. In addition, industry interest organizations are reported to be important for innovation on the national level, but less so internationally and locally. Public support organizations, finance institutions and R&D institutions are not deemed to be important contributors to innovation in the telecom sector. Viewed in light of the reduction of R&D personnel in the telecom sector, particularly among network operators, these findings might indicate that a large portion of the telecom industry is either exploiting previously developed knowledge or relying on international suppliers to provide it.

111
Telecom firms view their international suppliers, rather than their national supplies, as leaders in technological development. This indicates a lack of competitiveness among local and national suppliers, which renders firms even less able to innovate and outperform rivals. Furthermore, local suppliers are viewed as substantially weaker on the technological leadership front than their foreign counterparts. This is likely to weaken the attractiveness of the telecom cluster in Norway by challenging its completeness and competitiveness throughout the value chain.
The telecom industry is not a stand-alone industry but is linked to related industries, such as IT, media and knowledge mediation. There are also significant linkages between the telecom industry and the maritime sector.
9.2 Strategic recommendations Figure 9-1 describes the ambitions of firms operating within the Norwegian telecom industry. Assessing the industry as a whole we see that 32 percent of all the firms in the survey have international ambitions. They desire to succeed internationally or become world leaders in their respective markets. Overall network operators have the highest international ambitions in the Norwegian telecom industry. 39 percent of the network operators and 30 percent of equipment and service providers have high international ambitions.
Figure 9-1: Norwegian telecom firms’ ambitions the next 2-3 years, 2010
Source: BI survey
The telecom industry is faced with big challenges. The industry is merging with other industries in the broader information and communication sector. For instance, the IT-industry is increasingly becoming mobile. A smart phone today harnesses more computing power than a desktop PC a decade ago. Digitalization of the media industry is increasing the access to content and changing the way media is consumed. There is also close ties between telecom
0% 2% 1%
17%
31% 27%
43%
38% 39%
17%
13% 14%
22% 17% 18%
0 %
10 %
20 %
30 %
40 %
50 %
60 %
70 %
80 %
90 %
100 %
Network Operators
Equipment and service providers
Telecom industry in total
Become a world leader in our market
Succeed internationally
Growth & be a significant actor in the Norwegian market
Growth & profitability
Have a local job

112
and knowledge-based services. In short it, there is support for the view that the telecom industry is undergoing a paradigm shift. This place existing revenue sources within the telecom industry under pressure and there is demand for new competences to stay competitive. The changing times also present vast opportunities. Information and communications products and services are being tighter integrated with the lives of people. In the coming years communications services will increasingly be between consumers and non-communication items today, such as household items, cars or medical monitoring equipment or directly between machines. The telecom sector is positioned in the core of the paradigm shift that is unfolding. But the survivors and leaders of tomorrow will be those that best grasp the new opportunities that arise. Business as usual is not a viable long term strategy in changing times.
Furthermore, the telecom industry receives a relatively high number of employees from the IT sector, knowledge-intensive services and media industries, and sends a relatively high number of employees to knowledge-based services and IT. This is a significant source for knowledge acquisition. Firm strategies must be considered in the context of the reality just described, given its significant implications for how the industry and the firms within it should organize. Furthermore, telecom firms might wish to share many of the same strategies that are relevant for firms active in IT, media and knowledge-based services.
Come together: The Norwegian IT, telecom and media industries should launch an initiative to speed up and strengthen the ties they share, and develop an understanding of their substantial needs and contributions to Norwegian society. Together, companies within these industries can signal themselves as more attractive, and they can better illustrate how they create value. In order to do this, it is important to establish some form of long-term collaboration internally and across the relevant industries.
Focus on recruitment: Education within telecom-related topics has fallen rapidly, which undermines future competency-based on recruitment. This issue can be addressed today if the industry clarifies the type of knowledge it needs and from whom.
Increase innovation trough R&D investments: Telecom companies are innovative compared to other industries in Norway. However, when compared to other OECD countries, the proportion of Norwegian patents is decreasing. The industry is well on its way towards diluting world-class telecom knowledge. This trend will most likely inhibit the growth of the Norwegian telecom industry as a whole as well as the growth of the major firms within that industry. Going forward competition from firms in formerly unrelated industries will intensify. This increases the need for leading competences to stay competitive. Therefore, initiatives are required to encourage R&D investments.
Embrace the big convergence: Communication media, including electronic media, telecommunication media and broadcast media, used to be discrete business operations providing distinct services. Broadcasting, voice telephony and on-line computer services operated on different platforms, and TV and radio sets, telephones and computers were managed by different business support systems. Furthermore, in most countries, different broadcasting media were regulated differently by different agencies. In contrast, telecom media convergence crosses multiple industries and companies are no longer confined to their

113
own markets. For example, fixed, mobile and IP service providers can offer content and media services, and equipment providers can offer services directly to the end user. Content providers are continually looking for new distribution channels. Convergence is the combination of all these media into one operating platform. It reflects the merger of telecom, data processing and imaging technologies. This convergence is ushering in a new epoch of multimedia, in which voice, data and images are combined to render services to the user. The key result of convergence at the macro-business level is the merger of the telecommunication, IT and media/entertainment industries. Therefore if the linkages between IT, telecom and media are tight today, we would expect them to be even tighter in the future. This should lead to a further strategic shift regarding which people or organizations are of strategic importance in terms of alliances or employment.
Disruptive business models: One side of the big convergence is the opportunity for disruptive business models. Business model innovations have been central for the development of many global firms across a wide range of industries, such as IKEA. In the telecom sector, the traditional business model, with payment for communication usage is under pressure. Access and bundling of services is increasingly becoming an alternative. With the ever increasing integration of the information and communication sector and the movement towards the integrated world, there are opportunities for disruptive models, both in relation to existing telecom services and products and in other business areas. For instance, one area where the telecom sector posses a disruptive challenge to external established industries is payment solutions. With near field technology and other solutions in the process of being introduced in scale, a future where the mobile phone has replaced the wallet and its credit and debit cards is now a not unlikely near future possibility.
Capitalize on niche positions by relying on strong clusters in Norway: Many IT firms and knowledge-based services in Norway successfully compete on a global scale by adopting niche positions that rely on strong, established Norwegian clusters, such as the offshore oil and gas cluster, and the maritime cluster. The case of MCP, which was introduced at the beginning of this report, provides a perfect example of how a technology can be used to create innovative solutions at sea and within the maritime industry. We argue that by taking a niche position that is closely related to the strongest clusters, the chances of success will increase.
9.3 Public policy recommendations To increase competition, the regulatory authorities focused on increasing the number of network operators in the mobile phone sector. Previously, state-controlled Telenor and Swedish-owned NetCom were the only operators with a national network. Network Norway, which has started to construct a third national network, is the latest challenger in the market. The policy that allows newcomers to set a higher effective price, even if just for a short time, is a strong stimulus for new network operators. Regulation has also been used to allow the creation of virtual mobile phone services through the networks of Telenor and NetCom.
Telenor is one of the world's largest, most profitable mobile operators, and it has operations in many countries, including rapidly emerging economies such as Bangladesh, Pakistan, India, Russia and the Ukraine. However, Telenor has created a global position alone. Telenor can probably succeed with its strategy in the global carrier market, but in the long run they will

114
weaken the knowledge base in Norway, but also its ability to utilize R&D knowledge on a global scale, given its current focus on cutting back on R&D activities.
Telecom remains a relatively small industry in Norway because it has thus far failed to create a viable industry cluster. However, the creation of such a cluster can be encouraged and supported in several ways. The aim in the long run must be to create strong cluster characteristics that can shape the supply side of the industry. Neither the IT industry nor the telecom industry in Norway can be portrayed as knowledge clusters, but both can become knowledge clusters if they reach a critical mass. In order to do this, the public authorities must invest heavily in R&D programs and education, while supporting the development of a more collaborative industry that understands and can communicate its own needs and value contribution to the public authorities.
Increase private and public R&D investments: We recommend increasing R&D investments dramatically, not only within Telenor but also through R&D programs tailored to other fields in which information and telecommunication technologies can be used, such as offshore oil and gas, maritime and other competitive clusters in Norway. The knowledge base within telecom and IT is relatively high in Norway, but it could be moved to a world-class level within niche fields.
Make public services and data accessible: There exist significant opportunities if the public sector makes its services and data more accessible. The tax centered AltInn solution is a good example of a public service that lately has seen positive improvements. But other public areas are far behind. Much of the public interface has been moved onto the Internet, but the bureaucracy and public services are often paper based or not accessible. The quality of services and accessibility will improve if public services increasingly are made digital throughout and unified across the various public entities and geographical areas. This will lead to direct efficiency gains in the production of public services. But it will also enable new services, provided both by the public and private companies. For instance, one sector that would gain significantly from better information flow is the health care sector. The vision is a large share of remote monitoring and diagnostics of patients, using telemedicine. The reality today is significant internal communications challenges in the sector, for instance due to usage of different computer systems in various parts of the health sector. A common cloud based data storage system, ideally accessible for screened private companies, would represent a significant improvement.
Build up of risk capital (taxation and knowledge: The current taxation system does little in terms of providing incentives to invest in risky investments in general. This stands in clear contrast to the tax system for the oil industry. There the government’s pledge to refund the total tax value (78 percent) of investments for operators not in a tax-paying position provides a strong incentive for investments, exploration and R&D, and levels the playing field between existing and new operators. Investments in the “information society” are often very risky, with global competition and winner takes all characteristics. Many years of negative cash flow and uncertain outcome is often required. A revision of the tax system to stimulate the build-up of risk capital and coverage of losses would significantly strengthen the ability for the telecom and related sectors to profit from the big convergence and paradigm shift that is challenging the industry. Such a revision is also likely to stimulate the transfer of capital

115
from real estate (where a clear tax incentive exists) to more productive uses of capital (investments in knowledge that can be applied multiple times over a range of business activities).
Level playing field: Traditional media is supported by direct support over the state budget. But even stronger effect does the tax and VAT supportive rules have. Digital media and content is not given the same support, and has for instance to pay the highest VAT-rate of 25 percent. The different economic reality digital and traditional media faces slow down the changes that is undergoing. Though a slower pace of changes might be comfortable for those engaged in them, this dampens innovation and might make Norwegian based digital media and communications firms less competitive in the future. A level playing field is advised.
Face the reality: We also challenge the general policy of viewing telecom as an integrated part of the IT industry. A productive public IT and telecom policy would take the characteristics and needs that the two industries have in common into consideration.
– The centralization of telecom, information and technology firms in Oslo is positive, as it increases the likelihood of success. Therefore, public policy makers must address the real problem – knowledge is gravitating towards areas other than Oslo and, on an international scale, Norway.
– Only a tiny share of the telecom and IT firms in Norway compete internationally. Their chance of success is very small, given that much of the requisite knowledge lies elsewhere in the world.
– Even though there are some signs that Norway possesses a knowledge base for IT and telecom firms, those with the very best talent – who can develop technologies and innovate new ways to use that technology – are in short supply.
– Information, communication, and telecom firms typically offer significant value added to other industries.
– The number of employees in telecom will always be relatively low, given the nature of the industry.
– The number of people with an education tailored towards IT or telecommunication is decreasing in Norway, which must be interpreted as a negative sign. Educational programs that are related to the telecom industry declined in absolute and relative terms from 2005 to 2009.
116
References
Almeida, P. and Kogut, B. (1999) "Localization of Knowledge and the Mobility of Engineers in Regional Networks," Management Science 45(7): 905-917.
Barney, J. (1991) "Firm Resources and Sustained Competitive Advantage," Journal of Management 17(1): 99-120.
Bjorvatn, K., Norman, V.D., Orvedal, L. and Tenold, S. (2007) Globetrotterne. Norsk Økonomi I En Verden Med Fri Handel, Arbeidsinnvandring Og Internasjonaliserte Bedrifter, SNF-rapport 11/07.
Blau, Peter M. (1964) Exchange and power in social life, New York: Wiley.
Burt, R.S. (1992) Structural Holes, Cambridge: MA: Harvard University Press.
Creswell, J.W. (2009) Research design: Qualitative, quantitative and mixed methods approaches, 3rd ed. Thousand Oaks, CA: Sage.
Creswell, J.W., Plano Clark, V.L., Gutmann, M.L. and Hanson, W.E. (2003) Advanced mixed methods designs. In Handbook of mixed method research in the social and behavioral sciences, by A. Tashakkori and C. Teddlie (eds.). Thousand Oaks, CA: Sage.
D'aveni, R.A. (1995) "Coping with Hypercompetition: Utilizing the New 7's," Academy of Management Executive 9(3): 45-57.
Dierickx, I. and Cool, K. (1989) "Asset Stock Accumulation and Sustainability of Competitive Advantage," Management Science 35(12): 1504-1513.
Dillman, D.A. 2000. Mail and Internet surveys: The tailored design method, New York: Wiley.
Dillman, D.A., Smyth, J. D., and Christian, L.M. (2009) Internet, mail and mixed-mode surveys: The tailored design method, Hoboken, New Jersey: John Wiley & Sons, Inc.
Dyer, J.H. and Singh, H. (1998) "The Relational View: Cooperative Strategy and Sources of Interorganizational Competitive Advantage," Academy of Management Review 23(4): 660-680.
Grunfeld, L.A. and Jakobsen, E.W. (2006) Hvem Eier Norge? Eierskap Og Verdiskaping I Et Grenseløst Næringsliv, Oslo: Universitetsforlaget.
Heum, P., Kasande, R., Ekern, O.F. and Nyombi, A. (2011) Policy and Regulatory Framework to Enhance Local Content, SNF Working paper 2/2011.
Håkansson, H. and Snehota, I. (1995) Developing Relationships in Business Networks, London: Routledge.
Jaffe, A.B., Trajtenberg, M. and Henderson, R. (1993) "Geographic Localization of Knowledge Spillovers as Evidenced by Patent Citations," Quarterly Journal of Economics 63(3): 577-598.

117
Jøssang, L.G. (2004) Industrieventyret På Jæren, Oslo: Det Norske Samlaget.
Koch, P. and Hauknes, J. (2007) "Understanding the Norwegian Puzzle," Research Council of Norway.
Lieberman, M.B. and Montgomery, D.B. (1988) "First-Mover Advantages," Strategic management journal 9(Special issue): 41-58.
— (1998) "First-Mover (Dis)Advantages: Retrospective and Link with the Resource-Based View," Strategic management journal 19(12): 1111-1125.
Marshall, A. (1920) Principles of Economics, London: Macmillan.
NESTA (2007) Hidden Innovation: How Innovation Happens in Six 'Low Innovation' Sectors, National Endowment for Science, Technology and the Arts
OECD (2008) OECD Reviews of Innovation Policy: Norway,
— (2010) OECD Science, Technology and Industry Outlook 2010,
— (2011) OECD Communications Outlook 2011,
Peteraf, M. (1993) "The Cornerstone of Competitive Advantage. A Resource-Based View," Strategic management journal 41(3): 179-192.
Porter, M.E. (1990) The Competitive Advantage of Nations, New York: Free Press.
— (1998) "Clusters and the New Economics of Competition," Harvard Business Review 76(6): 77-90.
Reve, T. and Jakobsen, E.W. (2001) Et Verdiskapende Norge, Oslo: Universitetforlaget.
Reve, T., Lensberg, T. and Grønhaug, K. (1992) Et Konkurransedyktig Norge, Oslo: Tano.
TEKNA/OLF (2006) Kunnskap Om Kunnskap. Innspill Til En Norsk Verdiskapingsdebatt, Oslo: Oljeindustriens Landsforening (OLF) and Teknisk-naturvitenskaplig forening (TEKNA).
Vatne, E. (2007) Regional Fordeling Av Sysselsetting I Norsk Petroleumsrettet Leverandørindustri, SNF-arbeidsnotat 22/07.
von Hayek, F.A. (1945) The use of knowledge in society. American Economic Review 35 (4):519-530.
Yin, R.K. (1989) Case study research: design and methods, Newbury Park: Sage Publication.
i Post og teletilsynet, årsrapport 1999; http://www.npt.no/ikbViewer/Content/121073/arsrapport1999.pdf ii http://www.snl.no/Telenor_ASA; http://www.snl.no/Telenor_ASA; http://www.telenor.com/no/om-oss/var-historie/ iii https://netcom.no/omnetcom/virksomheten/historikk.html; http://no.wikipedia.org/wiki/NetCom iv www.Telenor.com/no/om-oss/var-historie/; no https://netcom.no/omnetcom/virksomheten/historikk.html; www.tele2.no; st. meld. nr. 1 (1999-2000); http://www.regjeringen.no/nb/dep/fin/dok/regpubl/stmeld/19992000/stmeld-nr-1-1999-2000-

118
/5/3/5.html?id=320654; http://www.networknorway.no/nb-NO/Toppmeny/Om_Network_Norway/Historien v OECD Communications Outlook 2011 vi ITU Measuring the information society 2010; http://www.itu.int/ITU-D/ict/publications/idi/2010/index.html vii Harry Nyquist, "Certain Topics in Telegraph Transmission Theory," Transactions of the American Institute of Electrical Engineers, April 1928 viii http://www.npt.no/ikbViewer/Content/126748/Prosjekt_presentasjon_110311.pdf ix http://www.npt.no/ikbViewer/Content/126632/multimedia%20samtrafikk%20090311%20Final.pdf x http://blog.nielsen.com/nielsenwire/?p=27418 xi Aftenposten.no, 8.7.2011; http://www.aftenposten.no/forbruker/digital/nyheter/mobil/article4167636.ece xii http://venturebeat.com/2011/04/27/angry-birds-hits-140m-downloads-poised-for-growth-in-china/ xiii http://technorati.com/technology/article/google-revamps-android-market-and-unleashes/; http://www.adressa.no/nyheter/okonomi/article1697982.ece; http://www.mobilen.no/artikler/haakon_ble_rik_paa_mobil-app/102276; http://www.mobilen.no/artikler/ukens_app_wordfeud/88721 xiv www.hw.no, 19. september 2011; http://www.hardware.no/artikler/microsoft_vil_kreve_30_-_avgift_fra_apps/102060 xv http://moconews.net/article/419-interview-financial-times-grimshaw-app-stores-are-not-a-panacea/ xvi http://www.businessinsider.com/chart-of-the-day-cost-of-an-app-2011-7 xviiPost og teletilsynet, Det norske marked for elektroniske kommunikasjonstjenester 1. Halvår 2010; http://www.npt.no/portal/page/portal/PG_NPT_NO_NO/PAG_NPT_NO_HOME/_PAG_NPT_NO_VIS_NYHET?p_d_i=-121&p_d_c=&p_d_v=123179 xviii The amendments in pursuance of the EU harmonization of educational programs to Bachelor, Master and PhD. xix A large proportion of foreign workers have not declared their educational level. Therefore, a conclusive verdict on the development of the foreign labor force’s educational level cannot be reached. xx http://www.telenor.com/en/corporate-responsibility/reporting/key-figures/
Related Documents