Knowledge Based Simulation: An Artificial Intelligence Approach to System Modeling and Automating the Simulation Life Cycle Mark S. Fox, Nizwer Husain, Malcolm McRoberts and Y.V.Reddy CMU-RI-TR-88-5 Intelligent Systems Laboratory The Robotics Institute Carnegie Mellon University Pittsburgh, Pennsylvania 13 April 1988 Copyright 0 1988 Carnegie Mellon University This research was supported, in part, by Digital Equipment Corporation, Westinghouse Electric Corporation, and the CMU Robotics Institute.

Welcome message from author
This document is posted to help you gain knowledge. Please leave a comment to let me know what you think about it! Share it to your friends and learn new things together.
Transcript
Knowledge Based Simulation: An Artificial Intelligence Approach to System
Modeling and Automating the Simulation Life Cycle
Mark S. Fox, Nizwer Husain, Malcolm McRoberts and Y.V.Reddy
CM U-R I-TR-88-5
Intelligent Systems Laboratory The Robotics Institute
Carnegie Mellon University Pittsburgh, Pennsylvania
13 April 1988
Copyright 0 1988 Carnegie Mellon University
This research was supported, in part, by Digital Equipment Corporation, Westinghouse Electric Corporation, and the CMU Robotics Institute.

i
Table of Contents 1. introduction 2. Corporate Distribution Domain 3. Model Building
3.1. Model Representation 3.2. Model Acquisition 3.3. Consistency and Completeness 3.4. Model Reduction
3.4.1. Static Abstraction 3.42. Dynamk Abstraction
4.1 .l. Goal Representatlon 4.1.2. instruments 4.1.3. An Example of Scenario Rating
4.2. Experiment Specification 4.3. Simulation Execution
4.3.1. Checkpoints and interrupts 4.3.2. Tracing 4.3.3. Stepping 4.3.4. Event Tracking 4.3.5. Simulation Animation 4.3.6. Report generation
4.4. Experiment Rating 5. Automatic Analysis of Data
5.1. Learning Rules Using Path Analysis 5.2. A Detailed Example
6. Automatlng the Simulation Life Cycle 7. Conclusions 8. Acknowledgements
4. Model Simulation 4.1. Goal Specificatlon and Instrumentation
2 3 5 5 7 7 8 9
10 10 11 11 12 14 16 18 19 19 20 20 21 22 24 26 27 28 34 37 38

ii
Figure 2-1 : Figure 3-1 : Figure 3-2: Figure 3-3: Figure 3-5: Figure 3-4: Figure 4-1 : Figure 4-2: Figure 4-3: Figure 4-4: Figure 4-5: Figure 4-6: Figure 4-7: Figure 4-8: Figure 4-9:
List of Figures Exampie of a Simplified CDS Model Example of a Reseller schema The Knowledge Craft Representation Building Interface Process pian and facility layout interface Example of Equivalent Node Aggregation Equivalent Node Aggregation Composite Goal Schema Constraint Schema Constraint Schema KBS-Instrument Schema Inventory Instrument Schema Inventory Data schema An example of CDS’s goal Retailer Satisfaction Goal Constraint Distribution Cost Reduction Goal Constraint
Figure 4-1 0: Specs for Customer Satisfaction Constraint Figure 4-1 1 : Specs for Distribution Goal Constraint Figure 4-1 2: Instrument to measure Stockouts Figure 4-13: Instrument to measure Total Orders Figure 4-1 4: Instrument to measure Distribution Costs Figure 4-1 5: Instrument to measure Manufacturing Costs Figure 4-1 6: The Run specification Figure 4-17: Expert System Run spec Figure 4-1 8: Specification of an Experiment Figure 4-1 9: An example Event Notice Figure 4-20: Tracing with Graphics in actual runs Figure 4-21 : Event Tracks Figure 4-22: Animation of the inet-pc model Figure 4-23: Example of Business Graphics Figure 4-24: Reports using windowed Displays Figure 4-25: Example of Goal Evaluation Figure 4-26: Complex Goals viewed Graphically Figure 5-1 : Simulation Craft Analysis and Treatment Figure 5-2: Causal Hypotheses in inet-pc model Figure 5-3: Causal Chain derived from Event Tracking Figure 5-4: Validating hypotheses Figure 5-5: Results of Experiments on inet-pc model Figure 5-6: An Example Causal Hypothesis Figure 5-7: An Example Causal node Figure 5-8: An Example Causal Path Figure 5-9: The Model variable schema Figure 5-1 0: Analyzing Hypotheses Figure 6-1 : Architecture of a KBS based Expert System Figure 6-2: Recommendation from Automatic Analysis Figure 6-3: Simulation Run Profile
5 6 8 9 9
10 12 12 12 13 13 14 14 14 14 15 15 15 15 15 16 17 17 18 18 20 21 22 23 24 25 26 27 29 29 30 31 31 32 32 32 33 35 36 37


1
Abstract
Abstract: This paper summarizes the past eight years of research in the application of Artificial Intelligence to Simulation. Our focus has been in two areas: the use of AI knowledge representation techniques for the modeling of complex systems, and the codification of simulation expertise so that it can be used to manage the simulation life cycle. The KBS system is an embodiment of this research. It provides a complete Simulation Decision Support Environment for the modeling, validation, simulation and analysis of complex systems. KBS has been applied to a variety of problems including factory and distribution system analysis.

2
1. Introduction Industry has been slow in adopting simulation as a means for analyzing complex decision problems.
One reason is that the complexity of the modeling language, and differences between simulation modeling concepts and the system to be modeled make model building a difficult and time consuming task. Early work in Knowledge Based Simulation [Klahr & Fought 80, McArthur & Sowizral 81, Reddy & Fox 82a, Reddy et al. 861 has attempted to remove this problem by using Artificial Intelligence (AI) knowledge representation techniques, such as frames, to represent the objects and their relationships, and rules, to represent the procedural behaviors of the objects', to create simulation models which are:
0 explicit, understandable, modiiiable, and self-explanatory.
By using a frame language to represent domain concepts, such as object structure, and goals, there is a one to one correspondence between the domain and the simulation model2. Secondly, by using rules to represent object behavior, the specification and modification of the behaviors become easier. Lastly, explanation techniques developed around rule based systems .provide the basis for explaining event behaviors.
While the AI approach has reduced the difficulty of model building, somewhat, more widespread use of simulation technology will not be achieved until the time it takes to perform the activities in the simulation life cycle:
0 Problem formulation 0 Modeling building 0 Data acquisition 0 Model translation 0 Verification 0 Validation 0 Experiment planning 0 Experimentation, and 0 Analysis of results
is reduced, while at the same time the quality of the results are enhanced. The barrier to achieving these goals is the lack of available expertise both in simulation theories and techniques and the domain of application. This lack of expertise results in:
inaccurate and incomplete models poor experiment designs
0 poor analysis 0 few ideas of how to alter the model to maximize the simulation goals
The representation and utilization of expertise has been one of the more important contributions of AI. Consequently, AI knowledge engineering tools, such as Knowledge CraftR [Knowledge Craft 851, provide an excellent environment for constructing a Knowledge Based Simulation Tool for supporting and managing the simulation life cycle and applying expertise at each stage of the cycle.
'Confusion exists around the use of a knowledge engineering tod to perform simulation and the we of knowledge representation. In the former, the powerful graphic fadtities provided by the tool and the underlying workstation provide a rich and powerful interface which does not necessarily have any AI content.
%ere is another confusion between the concepts of objects such as in SimuWObject Oriented Programming and knowledge representation. Knowledge representation, in addition to being able to represent objects and their procedural behavior [Rychener 82, Knowledge Crafl 851, focuses on the relations among objects and the deductions supported by them [fox79]. Even more so, knowledge representation research is directed towards the developement of a clear, concise and consistent semantics for the representation of knowledge. Consequently, standard representations have been developed for a number of domains such as factory scheduling [foxSS] and project management [sathiM].

3
In this chapter, we describe the knowledge based simulation system KBS. KBS has been a testbed for exploring the concept of AI in Simulation. Since 1980, we have been exploring issues such as:
0 Using an object oriented approach to model representation where objects have a one to one correspondence with domain objects, and the objects have methods which define their behavior. This provides flexibility in creating and altering entities and their behavior, without altering the simulation model interpreter [Fox & Reddy 821.
Extending the object oriented representation with concepts from semantic networks in order to provide a standard semantics for representing entities and their relationships [sathi85].
Representing an object‘s behavior (Le., events) in the form of rules which are easily understood by the user [Rychener 821.
Combining menus and graphics to provide interactive model building.
Verifying models by using logic programming to specifying verification axioms. Providing the capability to reduce a model’s complexity through the use of abstraction mechanisms so that a model can be represented at multiple levels of abstraction. The user specifies the level of simulation and the system automatically configures the model [McRoberts, Fox & Husain 85).
Focusing the gathering and analysis of simulation data according to goals specified by the user [Reddy, Fox & Husain 85, Venkataseshan & Reddy 841.
0 Enhancing the user’s understanding of a model’s dynamic behavior by providing a variety of simulation monitoring facilities including: stepping, tracing, the display of inter-event and intra-event communications, and intermpts and checkpoints to suspend a simulation run to investigate entities or take checkpoints so as to explore the effect of alternate decisions while preserving the option of restoring the system to any one of the several checkpointed model states.
Rating sirnulation results according to the goals provided by the user.
Heuristic (i.e., rule-based) analysis of simulation data and the specification of repairs to the model in order to better satisfy the predefined goals.
Automatic rule refinement using causal path analysis to determine the degree to which variation of a given effect is determined by each particular cause in the model, achieved by combining the qualitative knowledge regarding causal relations with the quantitative knowledge furnished by correlation and regression.
Managing the simulation life cycle by means of a goal directed rule system which examines the performance of a scenario with the help of diagnosidrepair rules which can suggest model modifications that may realize a simulation goal, thereby transforming simulations from being descriptive systems to prescriptive systems.
Section 2 describes the distribution domain which will be used as the primary example throughout the article. Section 3 describes the KBS methodologies for representing, creating and verifying models. Section 4 describes goal acquisition, model instrumentation, simulation execution and data gathering. Section 5 describes how KBS learns rule refinements from simulation data. Section 6 describes the overall goal directed architecture of KBS. Lastly, we conclude in section 7.
2. Corporate Distribution Domain In a large manufacturing organization the corporate distribution system plays an important role in
assuring adequate market penetration and retention for its products. This is accomplished by keeping transportation and warehousing costs low,and facilitating an aggressive pricing policy. In addition, it should provide a good level of service to its customers and resellers by providing products on time while not requiring a high level of customer inventory. In order to achieve this the corporate distribution system
4
should simultaneously deal with a number of mutually conflicting policies. For example, if a reseller is required to carry a high inventory level to minimize stockouts it will reduce the cost of transportation but will exact a penalty on the reseller’s ability to be competitive which may result in loss of market share for the corporation. In order to deal with issues such as this a corporate distribution system needs a tool to aid in decision making. Even though many analytical techniques for dealing with multi-echelon inventory systems do exist, we chose a simulation approach so that we can effectively incorporate many idiosyncratic policies that are normally part of complex distribution management systems. The following provides a more detailed description of the distribution system.
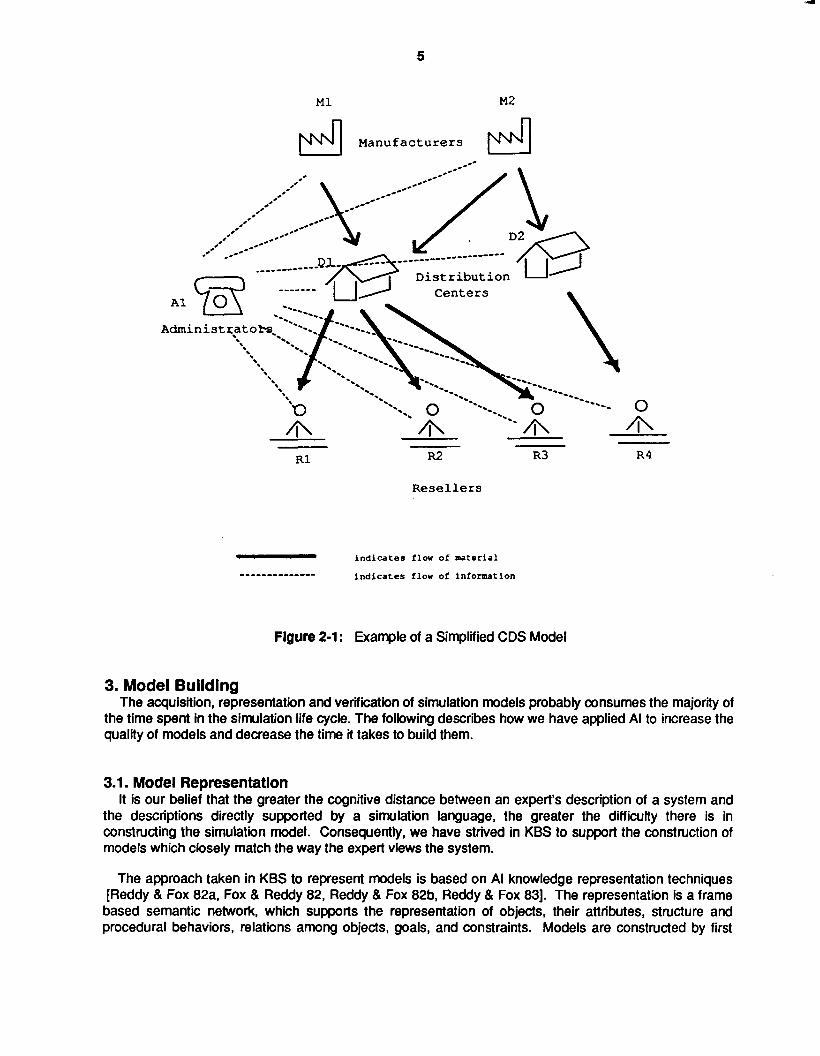
A manufacturer produces a number of products which consist of a large number of components and subassemblies some of which are produced by the manufacturer at widely distributed locations while others are purchased from vendors located worldwide. These components and subassemblies are transported to a number of distribution centers where they are stocked. Each distribution center serves customers located in its assigned area. The customer may be a reseller or special customer who can deal with the distribution center or the corporate business unitdirectly. Customer requests are processed by the business unit or the distribution center which results in shipment of products or components to be merged at the customer site. The distribution centers in turn depend on manufacturing centers and vendors to supply components and products to replenish their stock. This problem is further complicated by factors such as seasonal demands, varying lead times to build or expand manufacturing facilities, need to maintain uniform production levels, contractual agreements with vendors, effects of weather and labor problems on transportation schedules and myriad other problems. It can be easily seen that the corporate distribution problem puts tremendous demands on managers at all levels who are faced with decision making which has far reaching effects on the entire corporation.
Consider some of the decisions faced by managers at various levels in the Corporate Distribution System (CDS). The primary objectives of simulating a CDS is to be able answer questions similar to those listed below.
0 Where should we locate manufacturing plants for various components and what should their
For a given forecasted demand and its geographic distribution where should we locate
Should the products be merged at distribution centers or at customer sites?
What is the effect of transportation modes and schedules on customer stockouts and
What is the overall effect of a delay in vendor shipment of some key components?
Do we have enough manufacturing and distribution capacity to meet an anticipated increase
What is the effect of consolidation of manufacturing and distribution facilities?
What is the effect of a proposed order handling procedure on the corporation?
capacities be?
distribution centers and what should their capacities be?
satisfaction?
in demand for products?
This list illustrates the enormous complexity of the distribution domain and suggests the need for tools to aid in decision making at a number of levels. For example, low inventories can economize inventory carrying costs but lost sales resulting from frequent stockouts can reduce total profits. Because of this, the tool must inherently be able to deal with conflicting goals. The KBS approach to simulation will make it possible to deal with such issues.
A simplified model of a Corporate Distribution network is shown in Figure 2-1. (See [Reddy et al. 83) for the earlier work upon which this model is derived.)
5
M1 M2
Manufacturers
R2 R3 R4 R1
Rese 1 le r s
i n d i c a t e s flow of mater ia l
-------------- i n d i c a t e s flow of information
Figure 2-1 : Example of a Simplified CDS Model
3. Model Building The acquisition, representation and verification of simulation models probably consumes the majority of
the time spent in the simulation life cycle. The following describes how we have applied AI to increase the quality of models and decrease the time it takes to build them.
3.1. Model Representation It is our belief that the greater the cognitive distance between an expert‘s description of a system and
the descriptions directly supported by a simulation language, the greater the difficutty there is in constructing the simulation model. Consequently, we have strived in KBS to support the construction of models which closely match the way the expert views the system.
The approach taken in KBS to represent models is based on AI knowledge representation techniques [Reddy & Fox 82a, Fox & Reddy 82, Reddy & Fox 82b, Reddy & Fox 831. The representation is a frame based semantic network, which supports the representation of objects, their attributes, structure and procedural behaviors, relations among objects, goals, and constraints. Models are constructed by first

6
building a set of prototypical objects which are standard within a particular domain. In the case of distribution management, some standard objects are resellers, distribution centers, and manufacturing sites. A specific model is built by instantiating these prototypes and connecting them via relations.
Objects in KBS are represented as schemata3. A schema is represented as in Figure 3-1, with opening double braces followed by a schema name (printed in bold font) and a set of slot-value pairs,and finally terminated by closing double braces.
The plttsburgh-reseller schema defines a retail sales store containing two stock items a and b. It also defines who the manager is, its sales region, am
{{ plttsburgh-reseller INSTANCE: Reseller STOCK: stock-a stock-b
REGION: Allegheny MANAGER: Ramana Reddy ADDRESS: 123 Easy st.
ranger (type instance stock)
REORDER-PROCEDURE: Reorder-rule-1
I Flgure 3-1 : Example of a Reseller schema
its address.
In addition to values, each slot may have a set of associated facets or meta-Information (printed in italics). The Range facet restricts the type of values that may fill the slot. The Default facet defines the value of the slot if it is not present. The range facet restricts the types of values taken on by a slot.
The stock-a schema defines the status of the in stock part a and what has been ordered due to the art falling below its reorder point.
{{ stock-a INSTANCE: stock PART: a ON-HAND: I38 ON-ORDER: {{ INSTANCE: stock-order
PART: a AMOUNT: 200 SOURCE: Pittsburgh DATE-ORDERED: 1 aug 87 DATE-DUE: 15 aug 87 }}
MIN-STOCK: 200 RE-ORDER-AMOUNT: 500 }}
An important aspect of CRL is that schemata may form networks. Each slot in a schema may act as a relation tying the schema to others. The schema may inherit slots and their values along these relations. For example, Pittsburgh-reseller is related to reseller by the INSTANCE relation. It inherits its standard slots from reseller, but their values are defined locally.
The procedural behaviors of an object, such as the reorder procedures for pittsburgh-reseller, are defined by a slot which names the procedure, and by the values of the slots which define the actual
3Early versions of KBS were built on top of SRL [Wright 8 Fox 831, a knowledge engineering tool, subsequent verrions have been implemented in Knowledge Craft’s representation language CRL [Knowledge Craft 851.
7
behavior. Values can be lisp procedures or rules. A rule provides a means of specifying procedural knowledge which is easier to comprehend by the model builder. For example, the REORDER-PROCEDURE ‘or the Pittsburgh-Reseiier has its behavior defined I
{{ Reorder-ruie-l INSTANCE: rule IF: (less-than stock.on-hand stock.min-on-hand) THEN: (Send-meSSage 30 stocksource
:message reorder :part stock.part :amount stock.reorder-amount)
(create-reorder-record stock) }}
I the following rule:
The rules reorders a part when the on-hand stock is below the reorder point by sending a message to the object which is the source of the part for the reseller.
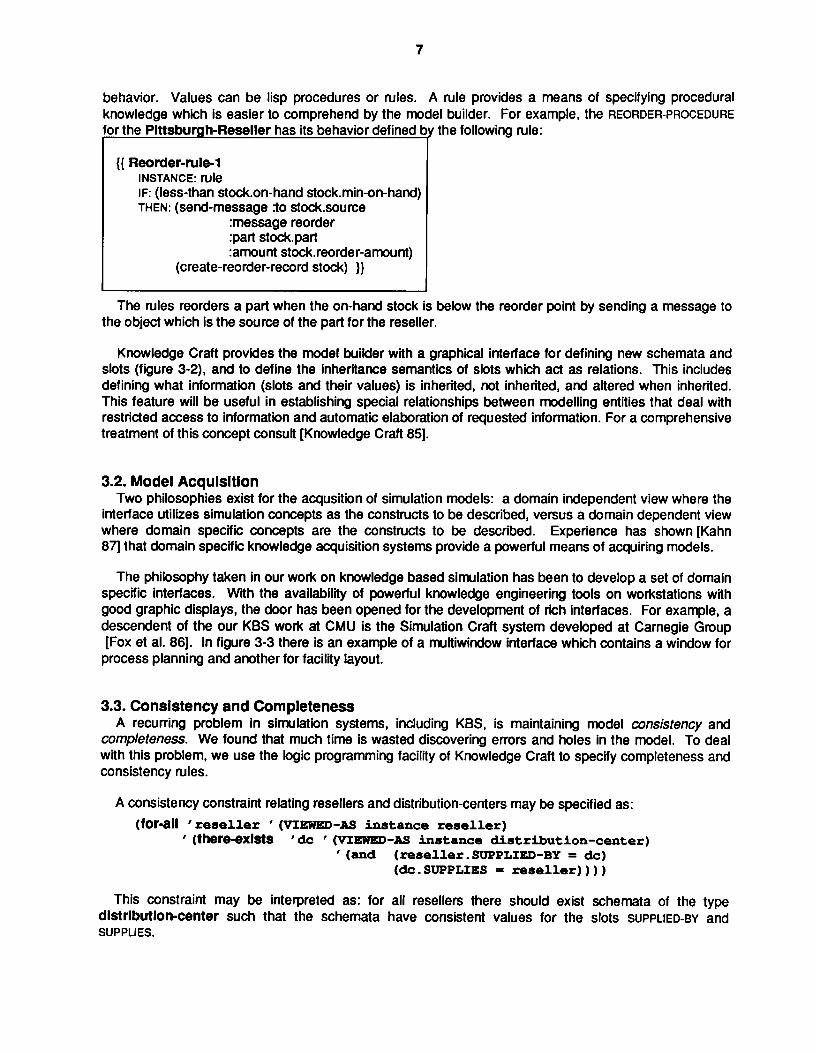
Knowledge Craft provides the model builder with a graphical interface for defining new schemata and slots (figure 3-2), and to define the inheritance semantics of slots which act as relations. This includes defining what information (slots and their values) is inherited, not inherited, and altered when inherited. This feature will be useful in establishing special relationships between modelling entities that deal with restricted access to information and automatic elaboration of requested information. For a comprehensive treatment of this concept consult [Knowledge Craft 851.
3.2. Model Acquisition Two philosophies exist for the acqusition of simulation models: a domain independent view where the
interface utilizes simulation concepts as the constructs to be described, versus a domain dependent view where domain specific concepts are the constructs to be described. Experience has shown [Kahn 871 that domain specific knowledge acquisition systems provide a powerful means of acquiring models.
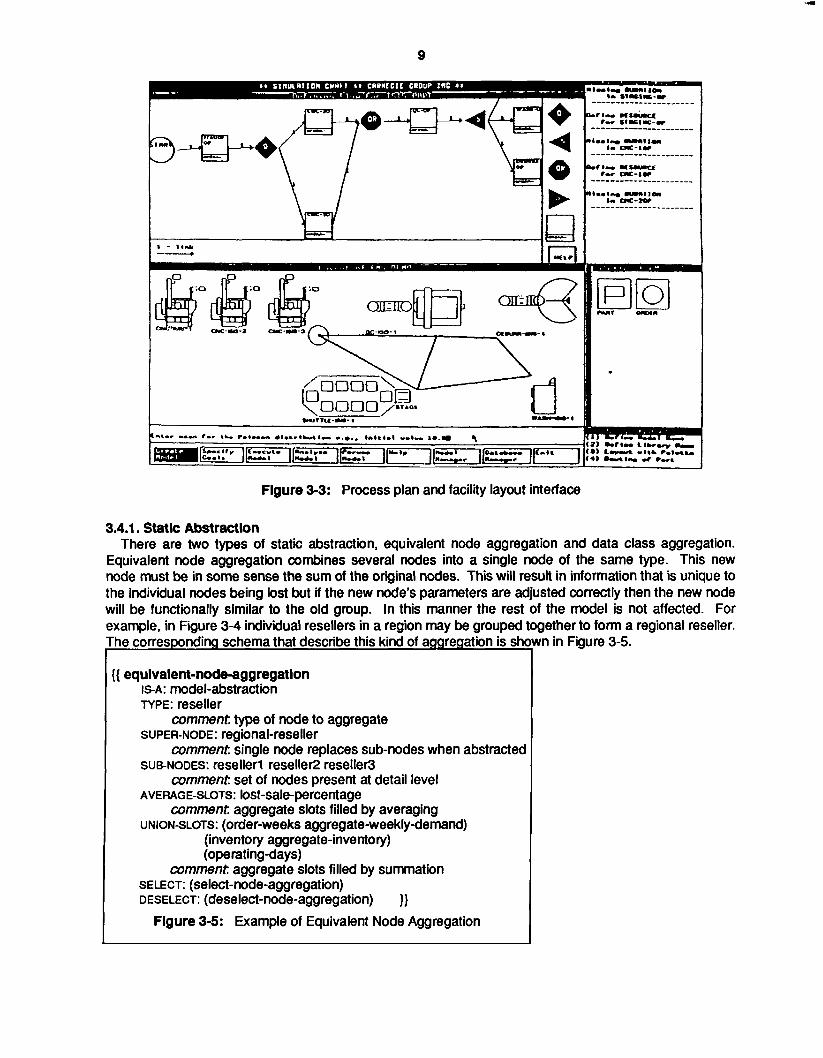
The philosophy taken in our work on knowledge based simulation has been to develop a set of domain specific interfaces. With the availability of powerful knowledge engineering tools on workstations with good graphic displays, the door has been opened for the development of rich interfaces. For example, a descendent of the our KBS work at CMU is the Simulation Craft system developed at Carnegie Group [Fox et al. 861. In figure 3-3 there is an example of a multiwindow interface which contains a window for process planning and another for facility layout.
3.3. Consistency and Completeness A recurring problem in simulation systems, including KBS, is maintaining model Consistency and
comp/e?eness. We found that much time is wasted discovering errors and holes in the model. To deal with this problem, we use the logic programming facility of Knowledge Craft to specify completeness and consistency rules.
A consistency constraint relating resellers and distribution-centers may be specified as: (for-all ‘ reseller ’ (VIEWED-AS instance r e s e l l e r )
’ (there-exists ‘ dc ’ (VIEWED-AS instance distribution-center) ’ ( a n d (re8d ler .SUPPLIED-BY = &)
(&.SUPPLIES = r e s e l l e r ) ) ) )
This constraint may be interpreted as: for all resellers there should exist schemata of the type distribution-center such that the schemata have consistent values for the slots SUPPLIED-BY and SUPPLIES.
8
Relation Keys: (1) IS-A
- Umcr Input
Figure 3-2: The Knowledge Craft Representation Building Interface
For each constraint, KBS evaluates it and reports whether it was satisfied or whether it failed. In case of a constraint failure the interpreter provides a trace facility to determine the source of failure.
3.4. Model Reduction The model we developed of a corporate distribution system was large in terms of the number of
facilities, and complex in terms of decision processes and levels of detail. In working with the distribution analysts, we found that the entire model was not necessary to answer every question. Instead, a question required a version of the model which is reduced in either breadth or depth. In particular, when focusing on a particular region’s distribution logic, only abstractions of other regions were required. Consequently, it was necessary to introduce a mechanism for abstracting selective portions of the model. These alterations can be performed automatically provided the model builder has created a knowledge framework for the task. These simplifications result in faster running models, increased model understanding, and simplified analysis.
Model simplification techniques fall into two main categories, static and dynamic. In static techniques both model structure and model parameters are altered; however, the event behaviors remain unchanged. Since only static aspects of the model are affected these are called static techniques. Dynamic techniques on the other hand alter a model’s dynamic processes. This means redefining some of the event behaviors.
9
0
Figure 3-3: Process plan and facility layout interface
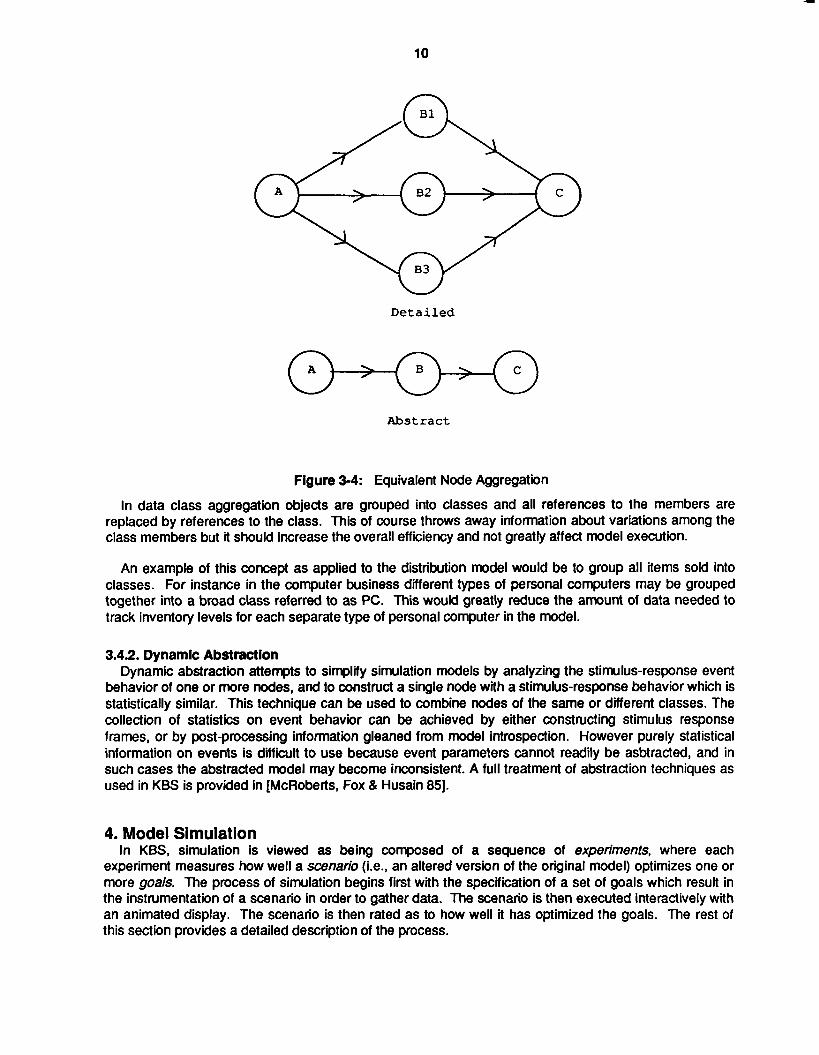
3.4.1. Static Abstraction There are two types of static abstraction, equivalent node aggregation and data class aggregation.
Equivalent node aggregation combines several nodes into a single node of the same type. This new node must be in some sense the sum of the original nodes. This will result in information that is unique to the individual nodes being lost but if the new node's parameters are adjusted correctly then the new node will be functionally similar to the old group. In this manner the rest of the model is not affected. For example, in Figure 3-4 individual resellers in a region may be grouped together to form a regional reseller. The &rresponding schema that describe this kind of aggregation is shc
{{ equlvalent-node-aggregation ISA: model-abstraction TYPE: reseller
comment type of node to aggregate SUPER-NODE: regional-reseller
comment single node replaces sub-nodes when abstracted SUENODES: resellerl reseller2 reseller3
comment set of nodes present at detail level AVERAGE-SLOTS: lost-sale-percentage
comment aggregate slots filled by averaging uNIONSLOTS: (order-weeks aggregate-weeklydemand)
comment aggregate slots filled by summation
(inventory aggregate-inventory) (operatingdays)
SELECT: (select-node-aggregation) DESELECT: (deselect-node-aggregation) }}
Figure 3-5: Example of Equivalent Node Aggregation
i n in F Q U ~ 3-5.
10
Detailed
Abstract
Figure 3-4: Equivalent Node Aggregation
In data class aggregation objects are grouped into classes and all references to the members are replaced by references to the class. This of course throws away information about variations among the class members but it should increase the overall efficiency and not greatly affect model execution.
An example of this concept as applied to the distribution model would be to group all items sold into classes. For instance in the computer business different types of personal computers may be grouped together into a broad class referred to as PC. This would greatly reduce the amount of data needed to track inventory levels for each separate type of personal computer in the model.
3.4.2. Dynamlc Abstraction Dynamic abstraction attempts to simplify simulation models by analyzing the stimulus-response event
behavior of one or more nodes, and to construct a single node with a stimulus-response behavior which is statistically similar. This technique can be used to combine nodes of the same or different classes. The collection of statistics on event behavior can be achieved by either constructing stimulus response frames, or by post-processing information gleaned from model introspection. However purely statistical information on events is difficult to use because event parameters cannot readily be asbtracted, and in such cases the abstracted model may become inconsistent. A full treatment of abstraction techniques as used in KBS is provided in [McRoberts, Fox & Husain 85).
4. Model Simulation In KBS, simulation is viewed as being composed of a sequence of experiments, where each
experiment measures how well a scenario (i.e., an altered version of the original model) optimizes one or more goals. The process of simulation begins first with the specification of a set of goals which result in the instrumentation of a scenario in order to gather data. The scenario is then executed interactively with an animated display. The scenario is then rated as to how well it has optimized the goals. The rest of this section provides a detailed description of the process.
11
4.1. Goal Specification and Instrumentation The primary purpose for constructing a simulation is to verify a hypothesis or optimize one or more
features of a system. Optimization can occur if we are able to measure the performance of a scenario. We introduce the concept of rating a scenario as a method of measuring the goodness or badness of simulation results. For example, if the goal is to utilize machines to their maximum (loo%), and if in a given simulation the average utilization of machines is 90% and when confronted with the question "have we reached the goal ?", we would like to give a better answer than no. To rate scenarios more smoothly we chose a continuous scale of rating from -1 to +1, -1 meaning the results are far from the goal and +1 to indicate the goal has been completely satisfied. Since goals are often complex and may be composed of conflicting sub-goals, we therefore describe here an approach to specification of goals of a simulation as a composite of a set of constraints4 on the performance of various entities of the system being modeled.
Following are the steps involved in the construction and evaluation of goals. 0 Represent each organizational goal as composed of a set of constraints.
0 Select and attach instruments to gather data.
0 Specify procedures for computing the performance measures from the raw data collected.
0 Execute the simulation for the given scenario.
0 Evaluate each constraint by computing a coefficient of constraint satisfaction, which may be positive to indicate reaching the desired goal, or negative, indicating falling short of the desired goal.
0 Evaluate the scenario by computing a coefficient of goal satisfaction as a weighted average of constraint satisfaction coefficients.
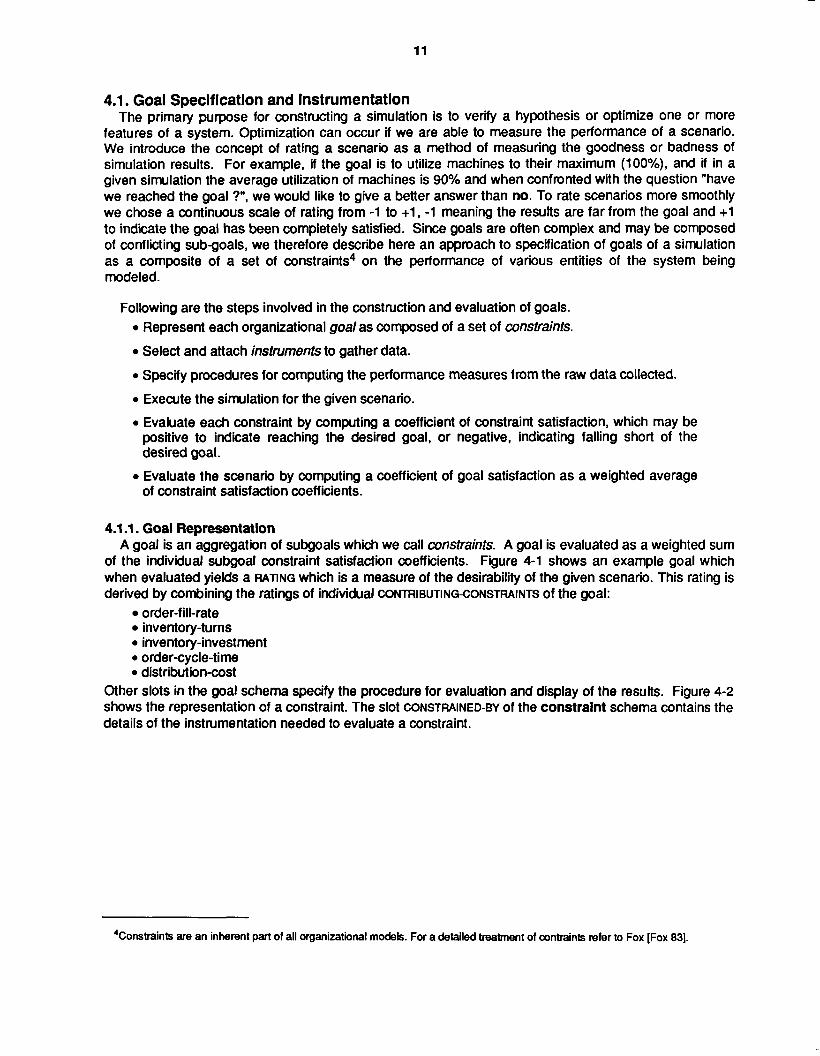
4.1 .l. Goal Representation A goal is an aggregation of subgoals which we call constraints. A goal is evaluated as a weighted sum
of the individual subgoal constraint satisfaction coefficients. Figure 4-1 shows an example goal which when evaluated yields a RATING which is a measure of the desirability of the given scenario. This rating is derived by combining the ratings of individual CONTR~BUTING-CONSTRAINTS of the goal:
order-fill-rate inventory-turns
0 inventory-investment 0 order-cycle-time 0 distribution-cost
Other slots in the goal schema specify the procedure for evaluation and display of the results. Figure 4-2 shows the representation of a constraint. The slot CONSTRAINED-BY of the constraint schema contains the details of the instrumentation needed to evaluate a constraint.
4Constraints are an inherent part of all organizational models. For a detailed treatment of contraints refer to Fox [Fox 831.
12
I
({lnet-pc-goal1 INSTANCE: KBS-goal RATING: 0.35
CONTRIBUTING-CONSTRAINTS: order-fill-rate inVentOry-tUmS comment a goodness or badness indicator
comment the individual goal constraints
comment whether active or inactive
comment a kiviat graph displays rating
comment governs when to evaluate goal
comment interprets evaluation schedule
comment goal evaluation function
commnt function to display goal state
inventory-investment order-cycle-time distribution-cost
STATUS: inactive
GRAPH: goal-report-kviat
EVALUATION-SCHEDULE: eVery-qUader
GOALSCH EDULER: scheduler
EVAL-FN: eval-KBS-goal
REPORT-FN: display-evaluated-goal )}
Flgure 4-1 : Composite Goal Schema
{{ order-flii-rate INSTANCE: @-constraint CONSTRAINED-BY: order-fill-rate-spec
comment specification for constraint CONTEXT: order-fill-rate-precondition comment decides if constraint applies IMPORTANCE: 0.25
RATING: 0.8
VALUE: 40000
comment relative importance of constraint
comment a goodness or badness indicator
commnt unrated raw value of constraint )} Figure 4-2: Constraint Schema
~ ~ ____
{{ order-fill-ratsspec INSTANCE: goal-constraint-spec APPLY: interpolate-linear-graph
INSTRUMENTS: measure-orders-filled }} Figure 4-3: Constraint Schema
CONSTRAINT-SPEC-OF: Ofder-fill-rak UTILITY-GRAPH: (1 00 -1 .o) (1 0000 0.0) (60000 1 .o)
4.1.2. instruments The task of data collection is concerned with recording the changes in the value of a parameter. This
can be accomplished by constantly monitoring the parameter and recording every change or by sampling. The former yields greater accuracy albeit with greater computational overhead whereas the latter
13
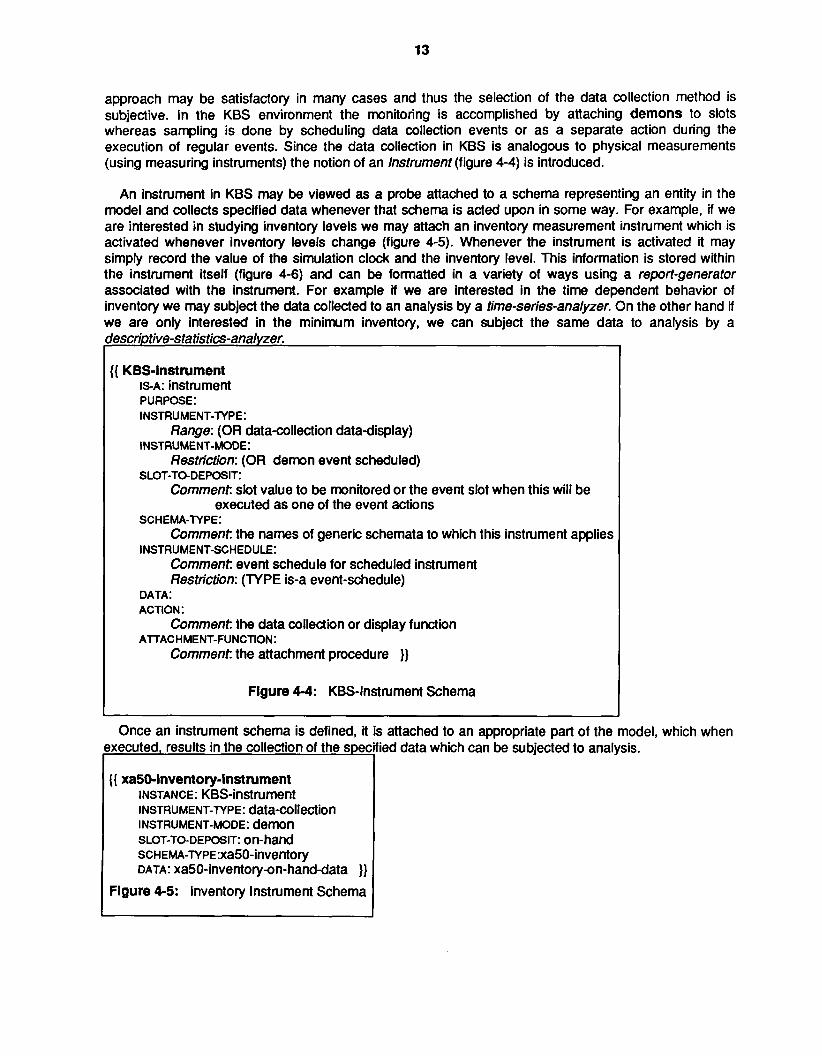
approach may be satisfactory in many cases and thus the selection of the data collection method is subjective. In the KBS environment the monitoring is accomplished by attaching demons to slots whereas sampling is done by scheduling data collection events or as a separate action during the execution of regular events. Since the data collection in KBS is analogous to physical measurements (using measuring instruments) the notion of an instrument (figure 4-4) is introduced.
An instrument in KBS may be viewed as a probe attached to a schema representing an entity in the model and collects specified data whenever that schema is acted upon in some way. For example, if we are interested in studying inventory levels we may attach an inventory measurement instrument which is activated whenever inventory levels change (figure 4-5). Whenever the instrument is activated it may simply record the value of the simulation clock and the inventory level. This information is stored within the instrument itself (figure 4-6) and can be formatted in a variety of ways using a report-generator associated with the instrument. For example if we are interested in the time dependent behavior of inventory we may subject the data collected to an analysis by a time-series-analyzer. On the other hand if we are only interested in the minimum inventory, we can subject the same data to analysis by a
'escriptive-statistics-analyzer.
[{ KBS-instrument ISA: instrument PURPOSE: I NSTRUMENT-TYPE
Range: (OR data-collection datadisplay)
Restriction: (OR demon event scheduled)
Comment slot value to be monitored or the event slot when this will be
Comment the names of generic schemata to which this instrument applies
Comment event schedule for scheduled instrument Restriction: (TYPE is-a event-schedule)
Comment the data collection or display function
Comment the attachment procedure }}
INSTRUMENT-MODE:
SLOT-TODEPOSIT:
executed as one of the event actions SCHEMA-TYPE:
INSTRUMENTSCHEDULE:
DATA: ACTlON
AlTAC H ME NT-FU NCTION
Figure 4-4: KBS-Instrument Schema
Once an instrument schema is defined, it is attached to an appropriate part of the model, which when executed, results in the collection of the spec
{{ xa50-inventory-instrument INSTANCE: KBS-instrument INSTRUMENT-TYPE: datacollection I NSTRUMENT-MODE: demon SLOT-TODEPOSIT: on-hand S C H E M A - T Y P E : X ~ ~ ~ - ~ ~ V ~ ~ ~ O ~ ~ DATA: xa5O-inventorya1-hand-data }}
I Figure 4-5: Inventory Instrument Schema
fied data which can be subjected to analysis.
14
{{ xa50-inventory-on-hand-data INSTANCE: setdata SCHEMA-SET: set of xa50 inventory schemata derived from the instrument SLOT: on-hand ANALYSIS: descriptive-stats DATA: to be filled by the instrument }}
Figure 4-6: Inventory Data schema
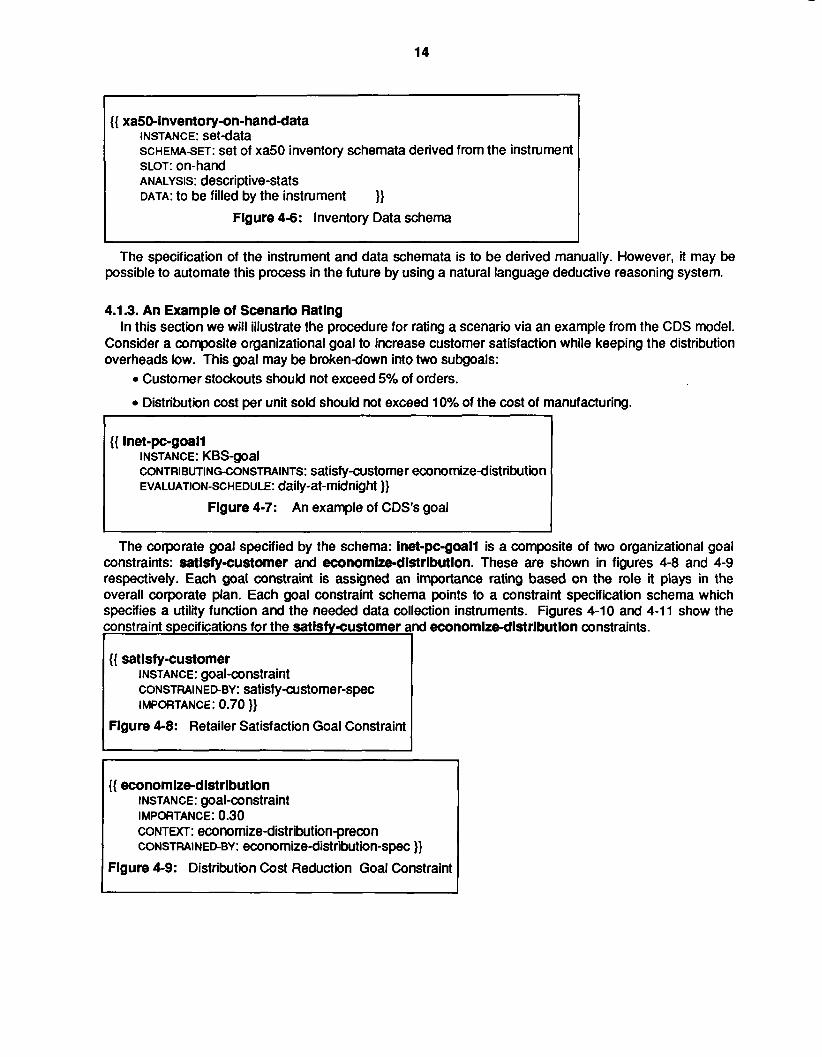
The specification of the instrument and data schemata is to be derived manually. However, it may be possible to automate this process in the future by using a natural language deductive reasoning system.
4.1.3. An Example of Scenario Rating In this section we will illustrate the procedure for rating a scenario via an example from the CDS model.
Consider a composite organizational goal to increase customer satisfaction while keeping the distribution overheads low. This goal may be brokendown into two subgoals:
0 Customer stockouts should not exceed 5% of orders.
0 Distribution cost per unit sold should not exceed 10% of the cost of manufacturing.
{{ inet-pc-goail INSTANCE : KBS-goal CONTRIBUTING-CONSTRAINTS: satisfycustomer economize-distribution EVALUATION-SCHEDULE: daily-at-midnight }}
Figure 4-7: An example of CDS’s goal
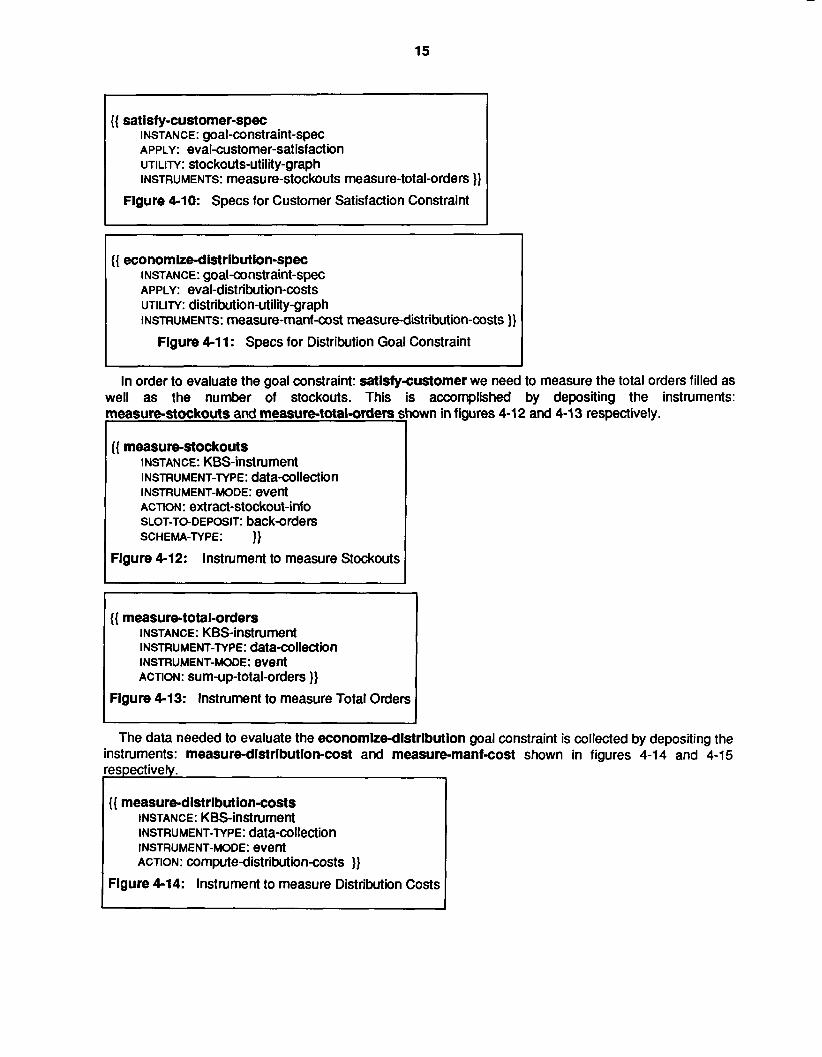
The corporate goal specified by the schema: inet-pc-goail is a composite of two organizational goal constraints: satisfy-customer and economize-dlstributlon. These are shown in figures 4-8 and 4-9 respectively. Each goal constraint is assigned an importance rating based on the role it plays in the overall corporate plan. Each goal constraint schema points to a constraint specification schema which specifies a utility function and the needed data collection instruments. Figures 4-10 and 4-1 1 show the constraint specifications for the satisfy-customer and economize-distrlbutlon constraints.
{{ satisfy-customer INSTANCE: goal-constraint CONSTRAINED-BY: Satkfy-UistOmer-SpeC IMPORTANCE: 0.70 }}
Figure 4-8: Retailer Satisfaction Goal Constraint
{ { eco nom ize-d 1st r ibut io n INSTANCE: goal-constraint
CONTEXT: economize-distributin-pream CONSTRAINEDBY: economize-distribution-spec }}
IMPORTANCE: 0.30
Figure 4-9: Distribution Cost Reduction Goal Constraint
15
measure-stockouts and measure-totaladem !
({ measure-stockouts INSTANCE: KBS-instrument INSTRUMENT-TYPE: data-collection I NSTRUMENT-MODE: event ACTION: extract-stockout-info SLOT-TODEPOSIT: back-orders SCHEMA-TYPE: }}
Figure 4-12: Instrument to measure Stockouts
1 I
{{ measure-distribution-costs INSTANCE: KBS-instrument I NSTRU MENT-TYP E: data-co llectio n INSTRUMENT-MODE: event ACTION: computedistributioncosts }}
Figure 4-14: Instrument to measure Distribution Costs
{{ satlsfy-customer-spec INSTANCE : goal-constraint-spec APPLY: eval-customer-satisfaction UTILITY: stockouts-utility-graph INSTRUMENTS: measure-stockouts measure-total-orders }}
Figure 4-1 0: Specs for Customer Satisfaction Constraint
{{ economize-distribution-spec INSTANCE: goal-constraint-spec APPLY: eval-distribution-costs UTILITY: distribution-utility-graph INSTRUMENTS: measure-manf-cost measure-distribution-costs }}
Figure 4-1 1 : Specs for Distribution Goal Constraint
In order to evaluate the goal constraint: satisfycustomer we need to measure the total orders filled as well as the number of stockouts. This is accomplished by depositing the instruments:
{{ measure-total-orders INSTANCE: KBS-instrument I NSTRU MENT-TYP E: dat a-collectio n INSTRUMENT-MODE: event ACTION: sum-up-total-orders }}
Figure 4-13: Instrument to measure Total Orders
wwn in figures 4-12 and 4-13 respectively.
16
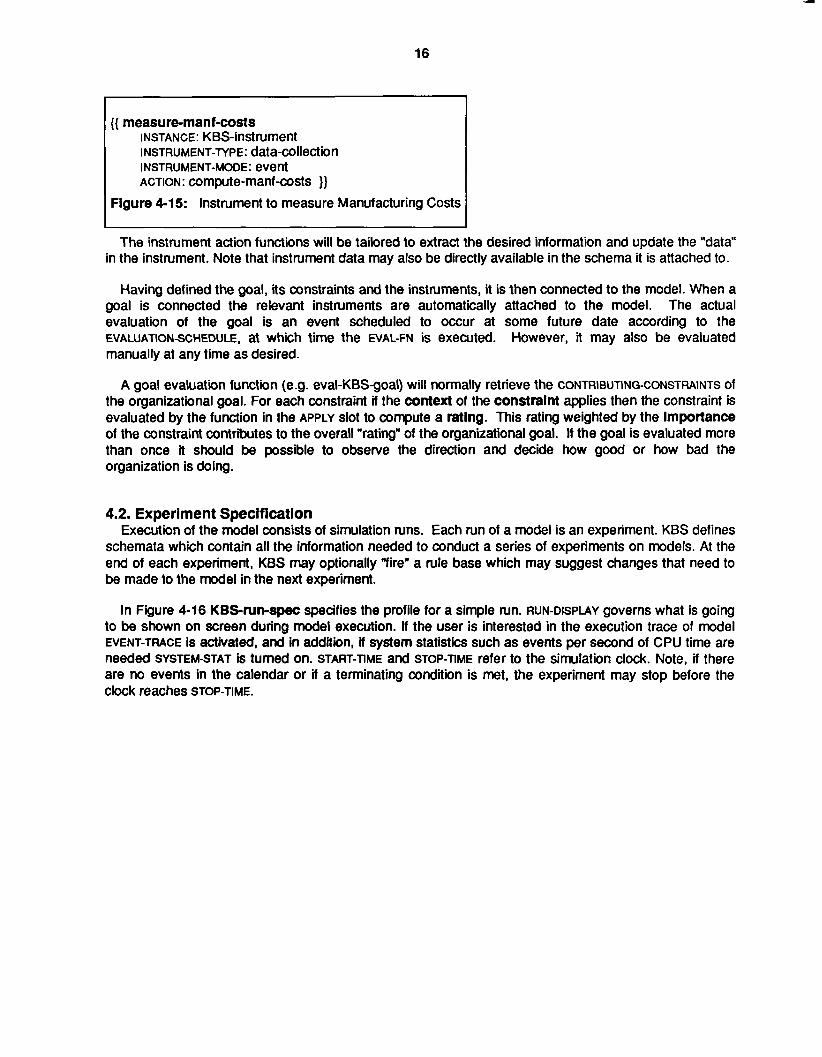
{{ measuremanf-costs INSTANCE: KBS-instrument I NSTRUMENT-TYP E: data-collectio n I NSTRUMENT-MODE: event ACTION: compute-manf-costs })
Figure 4-15: Instrument to measure Manufacturing Costs
The instrument action functions will be tailored to extract the desired information and update the "data" in the instrument. Note that instrument data may also be directly available in the schema it is attached to.
Having defined the goal, its constraints and the instruments, it is then connected to the model. When a goal is connected the relevant instruments are automatically attached to the model. The actual evaluation of the goal is an event scheduled to occur at some future date according to the EVALUATIONSCHEDULE, at which time the EVAL-FN is executed. However, it may also be evaluated manually at any time as desired.
A goal evaluation function (e.g. eval-KBS-goal) will normally retrieve the CONTRIBUTING-CONSTRAINTS of the organizational goal. For each constraint if the context of the constraint applies then the constraint is evaluated by the function in the APPLY slot to compute a rating. This rating weighted by the importance of the constraint contributes to the overall "rating" of the organizational goal. If the goal is evaluated more than once it should be possible to observe the direction and decide how good or how bad the organization is doing.
4.2. Experiment Specification Execution of the model consists of simulation runs. Each run of a model is an experiment. KBS defines
schemata which contain all the information needed to conduct a series of experiments on models. At the end of each experiment, KBS may optionally Yire" a rule base which may suggest changes that need to be made to the model in the next experiment.
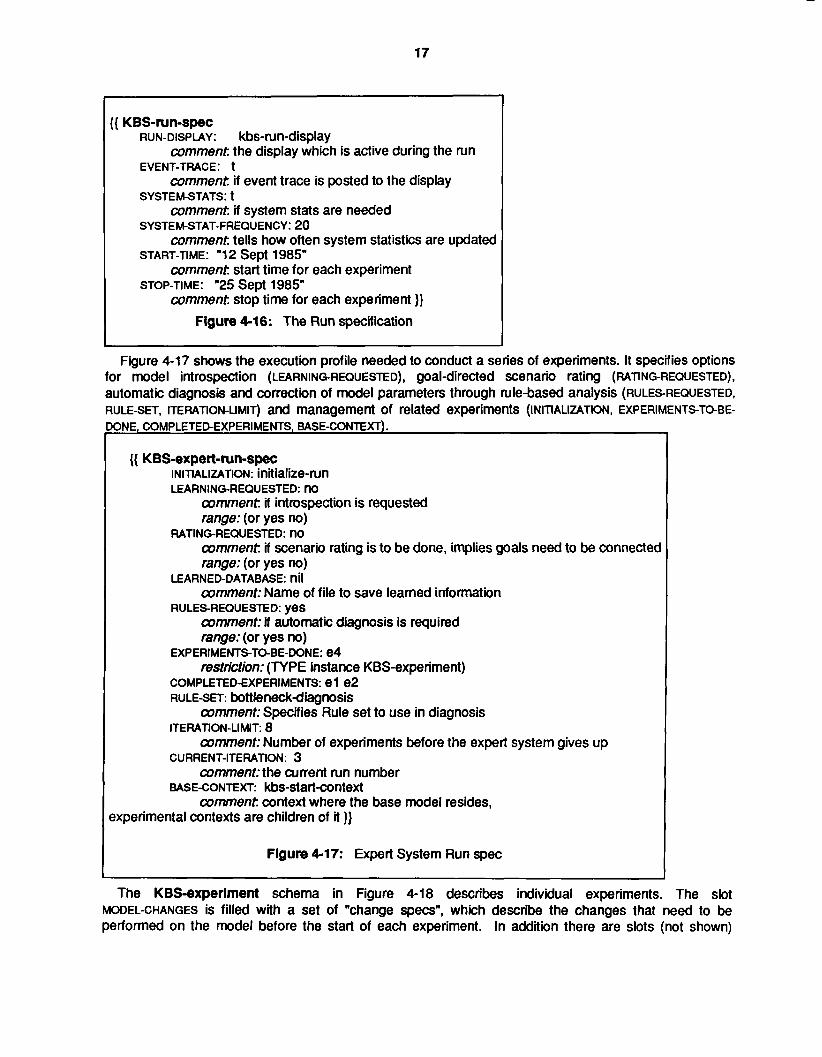
In Figure 4-16 KBS-run-spec specifies the profile for a simple run. RUN-DISPLAY governs what is going to be shown on Screen during model execution. If the user is interested in the execution trace of model EVENT-TRACE is activated, and in addition, if system statistics such as events per second of CPU time are needed SYSTEMSTAT is turned on. START-TIME and STOP-TIME refer to the simulation clock. Note, if there are no events in the calendar or if a terminating condition is met, the experiment may stop before the Clock reaches STOP-TIME.
17
{{ KBS-run-spec RUN-DISPLAY: kbs-run-display
EVENT-TRACE: t
SYSTEM-STATS: t
SYSTEMSTAT-FREQUENCY: 20
START-TIME: "12 sept 1985"
STOP-TIME: "25 sept 1985"
comment the display which is active during the run
comment if event trace is posted to the display
comment if system stats are needed
comment tells how often system statistics are updated
comment start time for each experiment
comment stop time for each experiment )} Figure 4-16: The Run specification
Figure 4-17 shows the execution profile needed to conduct a series of experiments. It specifies options for model introspection (LEARNING-REQUESTED), goal-directed scenario rating ( RATING-REQUESTED), automatic diagnosis and correction of model parameters through rule-based analysis (RULESREQUESTED, RULE-SET, ITERATION-LIMIT) and management of related experiments (INITIALIZATION, EXPERIMENTSTO-BE-
lONE, COMPLETED-EXPERIMENTS, BASE-CONTEXT).
{{ KBS-expert-Nn-spec INITIALIZATION: initialize-run LEARNING-REQUESTED: no
comment if introspection is requested range: (or yes no)
RATING-REQUESTED: no comment if scenario rating is to be done, implies goals need to be connected range: (or yes no)
LEARNED-DATABASE: nil comment: Name of file to save learned information
RULESREOUESTED: yes comment: if automatic diagnosis is required range: (or yes no)
resfrktion: (TYPE instance KBS-experiment)
comment: Specifies Rule set to use in diagnosis
comment: Number of experiments before the expert system gives up
comment: the current run number
comment context where the base model resides,
EXPERIMENTSTO-BE-DONE: 64
COMPLETED-EXPERIMENTS: 81 e2 RULESET: bottleneckdiagnosis
ITERATION-LIMIT: 8
CURRENT-ITERATION: 3
BASECONTEXT: kbs-startcontext
?xperimental contexts are children of it )}
Figure 4-17: Expert System Run spec
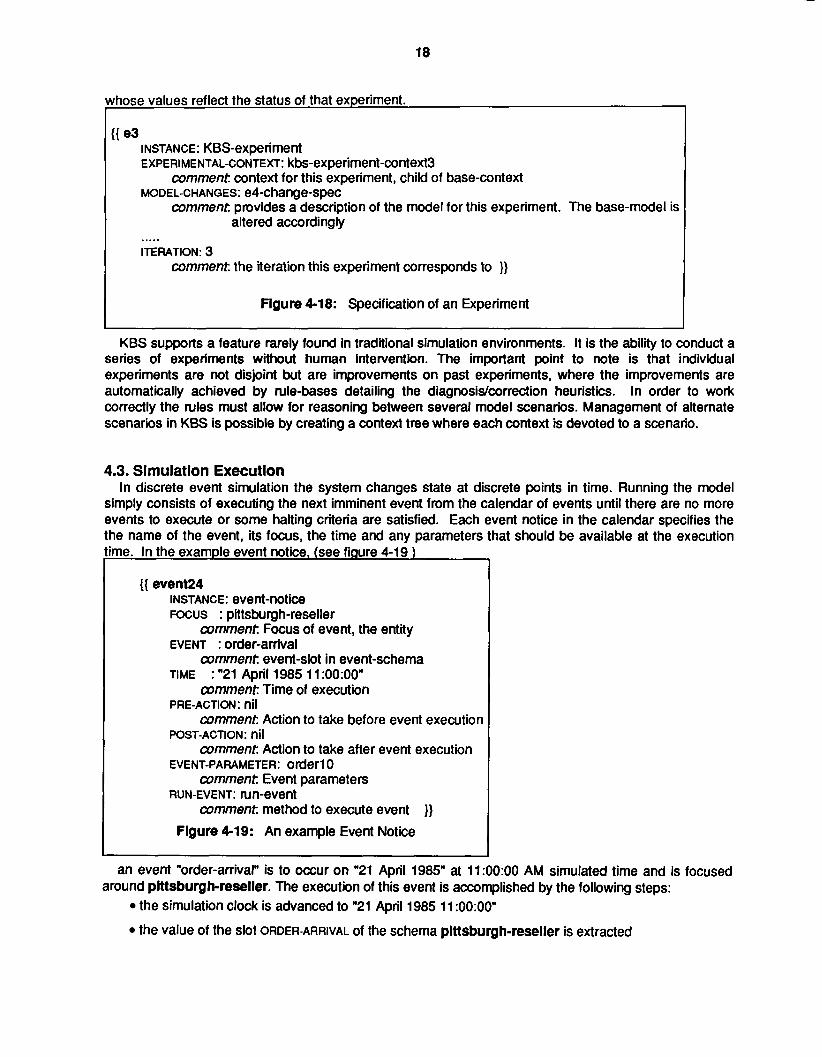
The KBS-experiment schema in Figure 4-18 describes individual experiments. The slot MODEL-CHANGES is filled with a set of "change specs", which describe the changes that need to be performed on the model before the start of each experiment. In addition there are slots (not shown)
18
whose values reflect the status of that experiment. I
11 e3 INSTANCE KBS-expe rime nt EXPERIMENTAL-CONTEXT: kbs-experiment-context3
MODEL-CHANGES: e4-change-spec comment context for this experiment, child of base-context
comment provides a description of the model for this experiment. The base-model is altered accordingly
..... ITERATION: 3
comment the iteration this experiment corresponds to }}
Figure 4-18: Specification of an Experiment I KBS supports a feature rarely found in traditional simulation environments. It is the ability to conduct a
series of experiments without human intervention. The important point to note is that individual experiments are not disjoint but are improvements on past experiments, where the improvements are automatically achieved by rule-bases detailing the diagnosidcorrection heuristics. In order to work correctly the rules must allow for reasoning between several model scenarios. Management of alternate scenarios in KBS is possible by creating a context tree where each context is devoted to a scenario.
4.3. Simulation Execution In discrete event simulation the system changes state at discrete points in time. Running the model
simply consists of executing the next imminent event from the calendar of events until there are no more events to execute or some halting criteria are satisfied. Each event notice in the calendar specifies the the name of the event, its focus, the time and any parameters that should be available at the execution ime. In the example event notice, (see fiaure 4-19 1
{{ event24 INSTANCE: eVent-nOtiCS FOCUS : pittsburgh-reseller
comment Focus of event, the entiiy
comment event-slot in event-schema : "21 April 1985 11 :OO:OO"
comment Time of execution
comment Action to take before event execution
comment Action to take after event execution
comment Event parameters
comment method to execute event )} Figure 4-19: An example Event Notice
EVENT OrdW-arrivai
TIME
PRE-ACTION: nil
POST-ACTION: nil
EVENT-PARAMETER: Order1 0
RUN-EVENT: mn-event
an event "order-arrival" is to occur on "21 April 1985" at 11:OO:OO AM simulated time and is focused around plttsburgh-reseller. The execution of this event is accomplished by the following steps:
the simulation clock is advanced to "21 April 1985 11 :OO:OO"
the value of the slot ORDER-ARRIVAL of the schema pittsburgh-reseiler is extracted
19
0 each item found in the list of values is interpreted
The items found in the list of values in the event slot may be representing a LISP function, a rule or an instrument which are designed to collect data, display some text or produce graphic side-eff ects. Simulation proceeds by successively executing event notices until a prespecified terminating condition is met.
4.3.1. Checkpoints and Interrupts Checkpoints are used in KBS to save the state of a model during the experiment along with run-time
system information such as the simulation clock, the calendar and other global variable bindings. Checkpoints are also implemented through the use of contexts. Before the experiment is initialized a new context kbs-run-context-n which is a child of the experiment context is created to protect that experiment from getting "corrupted" by subsequent modifications. After the prime event" (Le. the event that sets the simulation in motion) another context kbs-run-context-n+7 a child of kbs-run-context-n is spawned. In addition, the user may interrupt the simulation any number of times to checkpoint the model. This facility allows the user to backtrack to some previous point in execution to compare the differences between progressive scenarios. We refer to checkpoints as snapshots of models within the same experiment. Checkpoints are useful when comparing different scenarios in a single experiment.
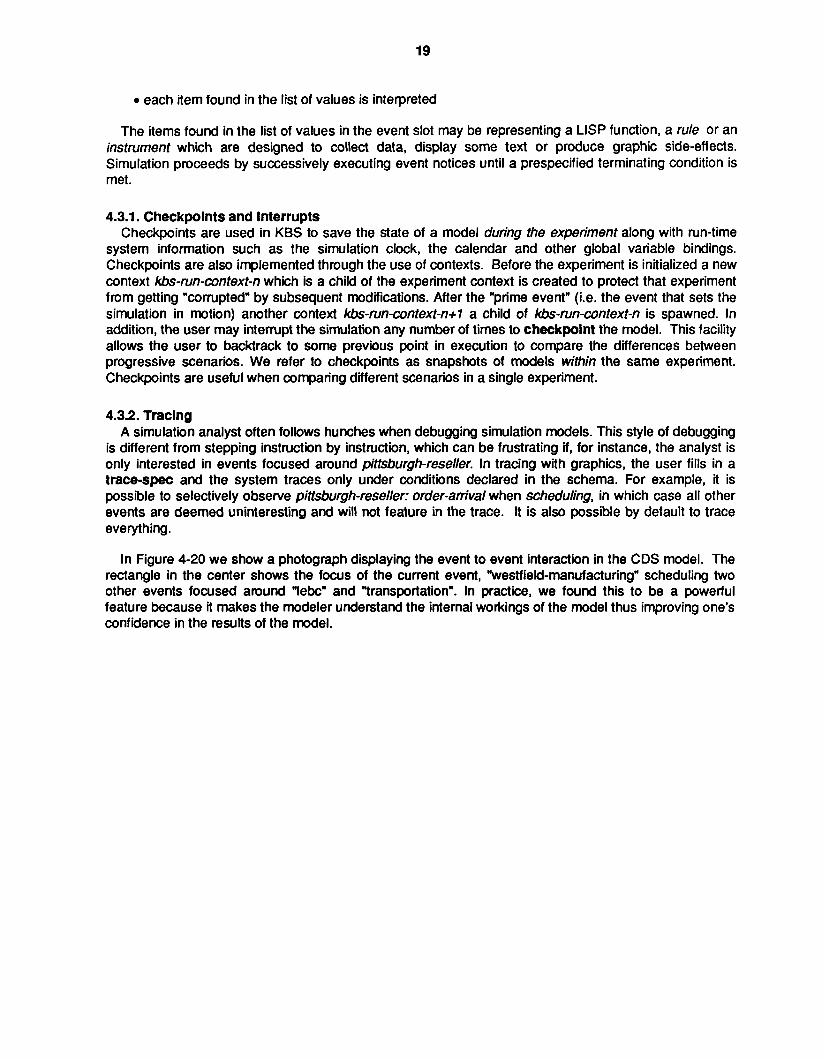
4.3.2. Tracing A simulation analyst often follows hunches when debugging simulation models. This style of debugging
is different from stepping instruction by instruction, which can be frustrating if, for instance, the analyst is only interested in events focused around Pittsburgh-reseller. In tracing with graphics, the user fills in a trace-spec and the system traces only under conditions declared in the schema. For example, it is possible to selectively observe pitfsburgh-reseller: order-anival when scheduling, in which case all other events are deemed uninteresting and will not feature in the trace. It is also possible by default to trace everything.
In Figure 4-20 we show a photograph displaying the event to event interaction in the CDS model. The rectangle in the center shows the focus of the current event, "westfield-manufacturing" scheduling two other events focused around "lek" and "transportation". In practice, we found this to be a powerful feature because it makes the modeler understand the internal workings of the model thus improving one's confidence in the results of the model.
Figure 4-20: Tracing with Graphics in actual runs
20
4.3.3. Stepping In tracing we saw how events are displayed while they execute. However, due to the limitations of the
screen or due to the unavailability of a graphics device, it is useful to have a stepping capability. As events are executed they change values of attributes and such state changes are observed step by step in a window dedicated to stepping. A step command is all that is needed to switch on this kind of trace. Stepping is similar to tracing everything, but, without the use of graphics. Attribute value bindings are also shown here because information is displayed textually. To summarize the difference between tracing and stepping, it is easier to detect event attribute chains in tracing, but it is not possible to observe individual event parameters which is better done by stepping.
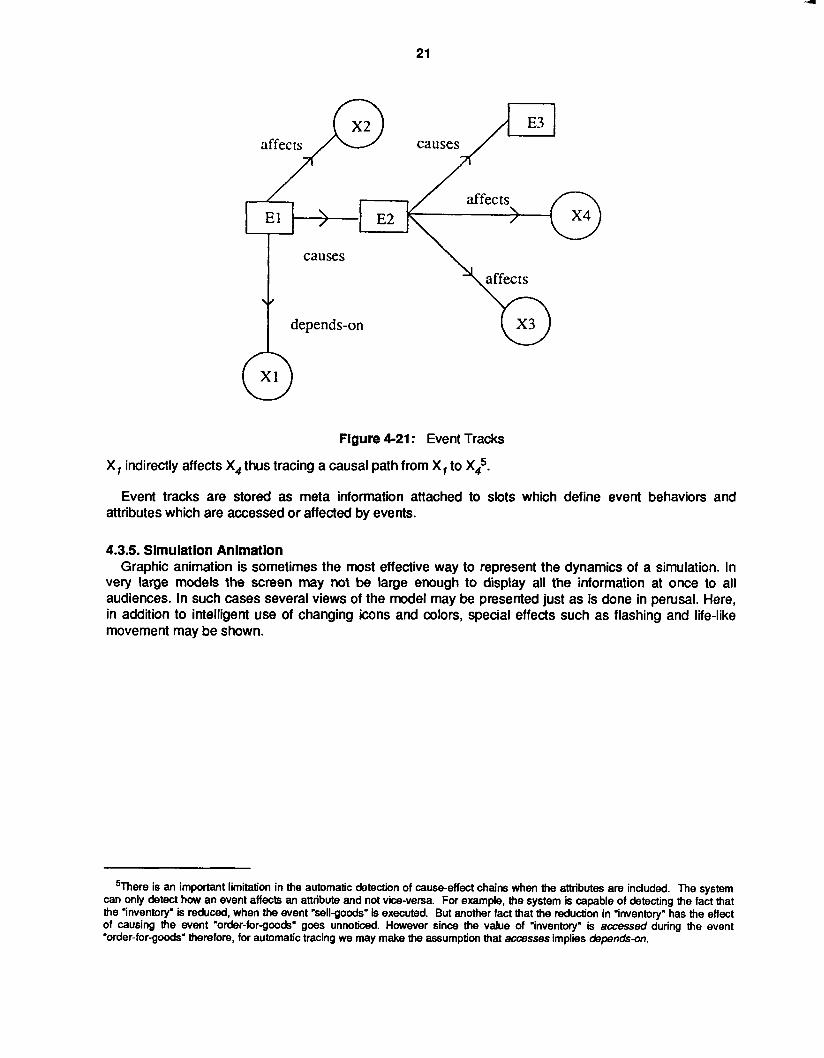
4.3.4. Event Tracking
their interaction with entities and their attributes. The automatic analysis of simulation data (section 5) requires the recording of event sequences and
For example, figure 4-21 is an example of an event track which includes events E,. and attributes X. If we declare that X, causes E, because E, depends-on X, then the system can automatically deduce tiat
21
affects E2 x4
causes
3.
Figure 4-21 : Event Tracks
X, indirectly affects X, thus tracing a causal path from X, to X45.
Event tracks are stored as meta information attached to slots which define event behaviors and attributes which are accessed or affected by events.
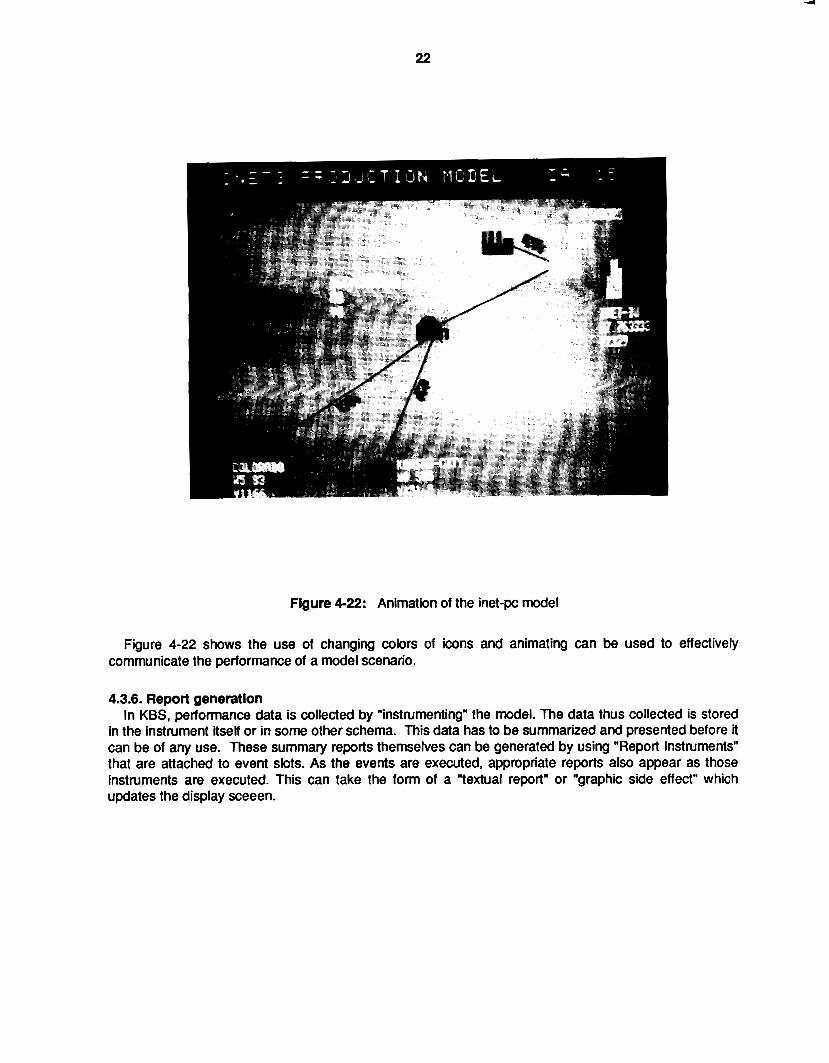
4.3.5. Simulation Animation Graphic animation is sometimes the most effective way to represent the dynamics of a simulation. In
very large models the screen may not be large enough to display all the information at once to all audiences. In such cases several views of the model may be presented just as is done in perusal. Here, in addition to intelligent use of changing icons and colors, special effects such as flashing and life-like movement may be shown.
%ere is an important limitation in the automatic detection of causeeffect chains when the attributes are included. The system can only detect how an event affects an attribute and not vice-versa. For example, the system is capable of detecting the fact that the "inventory' is reduced, when the event 'sellgoods' is executed. But another fact that the reduction in 'inventory" has the effect of causing the event "order-for-goods" goes unnoticed. However since the value of "inventory' is accessed during the event "order-forgoods' therefore, for automatic tracing we may make the assumption that accesses implies dependson.
22
Figure 4-22: Animation of the inet-pc model
Figure 4-22 shows the use of changing colors of icons and animating can be used to effectively communicate the performance of a model scenario.
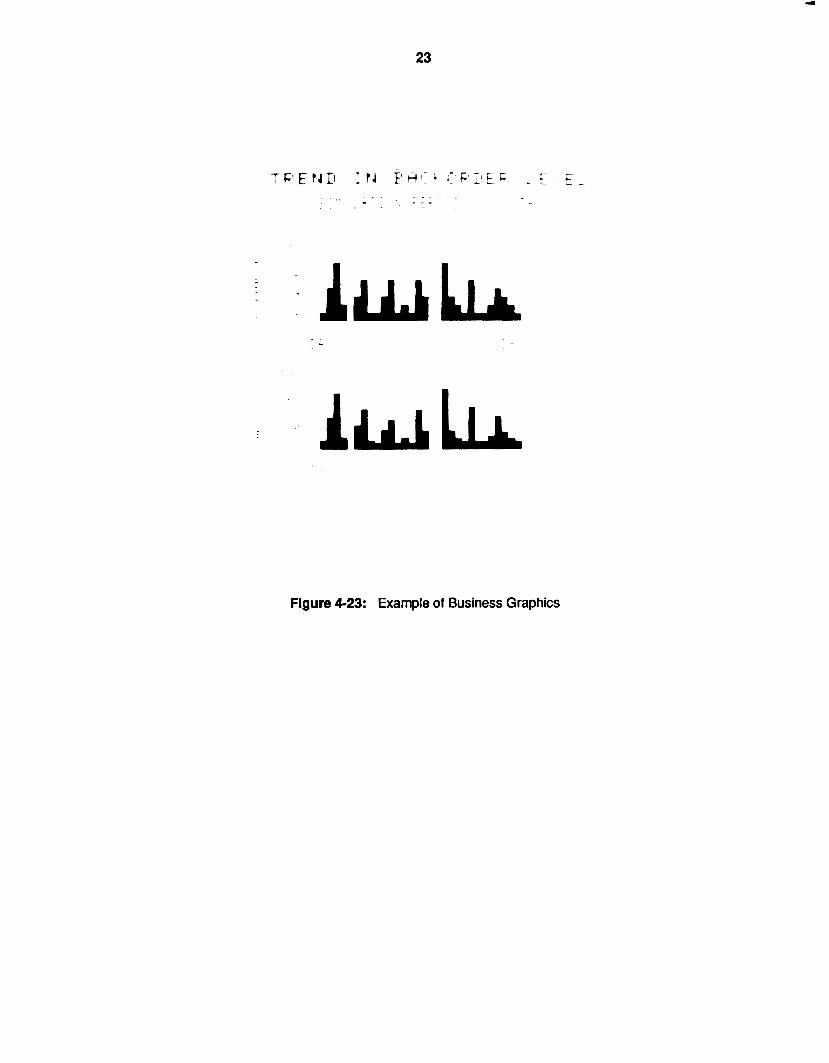
4.3.6. Report generation In KBS, performance data is collected by "instrumenting" the model. The data thus collected is stored
in the instrument itself or in some other schema. This data has to be summarized and presented before it can be of any use. These summary reports themselves can be generated by using "Report Instruments" that are attached to event slots. As the events are executed, appropriate reports also appear as those instruments are executed. This can take the form of a "textual report" or "graphic side effect" which updates the display sceeen.
23
Figure 4-23: Example of Business Graphics
24
Figure 4-24: Reports using windowed Displays
Figure 4-23 is a typical bar chart produced by KBS. Figure 4-24 shows how a summary report can be displayed using muttiple windows.
4.4. Experiment Rating
of a distribution network. After a few days of simulated time the goal was evaluated and reported. The inet-pc-goall discussed in the example on rating scenarios was actually implemented on a model
25
Figure 4-25: Example of Goal Evaluation
Figure 4-25 shows a goal evaluation report produced by KBS for the CDS model.
This result indicates that customer satisfaction was bad because it was rated negatively (-0.9) but the distribution costs were economical and were rated at 0.8 which is good. However the overall goal rating is still unsatisfactory because of its negative rating.
Overall goal rating = w t . avg. of individual constraint ratings = (0 .3 * 0 . 8 + 0 .7 * -0 .9 ) / (0 .3 + 0.7) = - 0 . 3 9
It has been shown in detail how goals, constraints and instruments work in harmony to rate model scenarios. This means we can collect data from a model run, define and connect goals to the model and be able to tell how good the model is behaving with respect to the organizational goals. The instruments, goals and constraints are constructed manually but data-collection and reporting are done automatically.
When goals are more complex, they may be viewed graphically with the help of a Kiviat chart like the one shown in Figure 4-26.
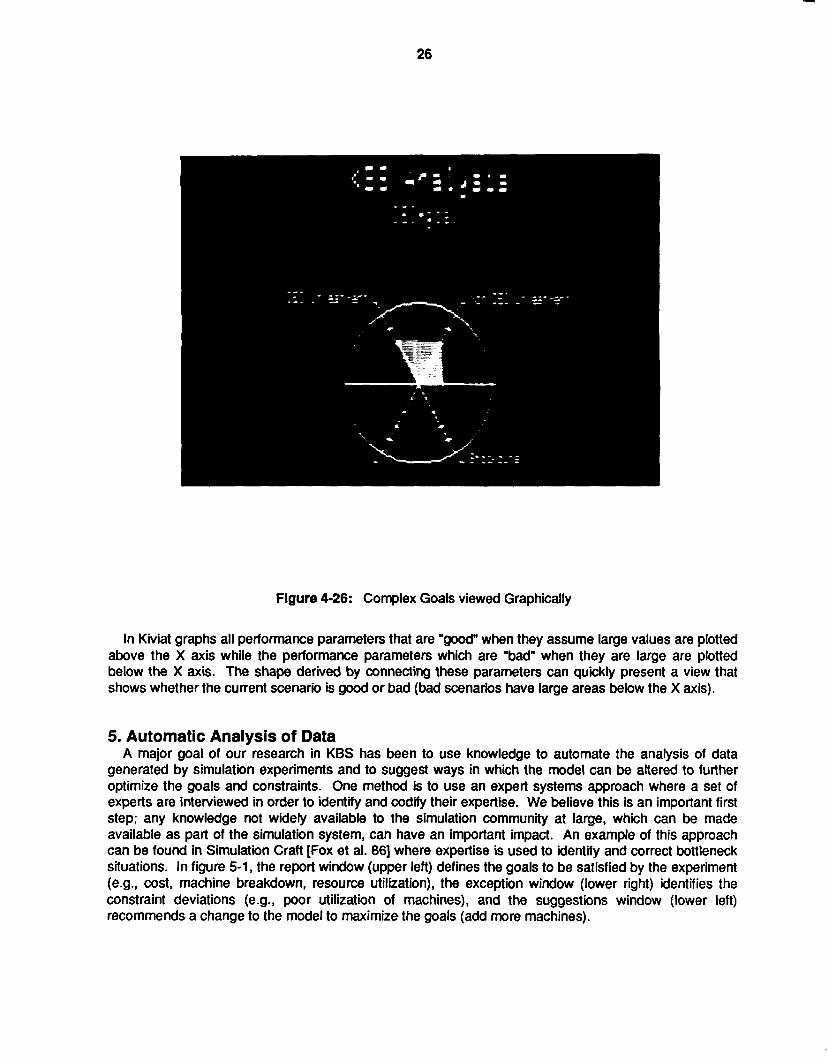
Figure 4-26: Complex Goals viewed Graphically
26
In Kiviat graphs all performance parameters that are "good" when they assume large values are plotted above the X axis while the performance parameters which are "bad" when they are large are plotted below the X axis. The shape derived by connecting these parameters can quickly present a view that shows whether the current scenario is good or bad (bad scenarios have large areas below the X axis).
5. Automatic Analysis of Data A major goal of our research in KBS has been to use knowledge to automate the analysis of data
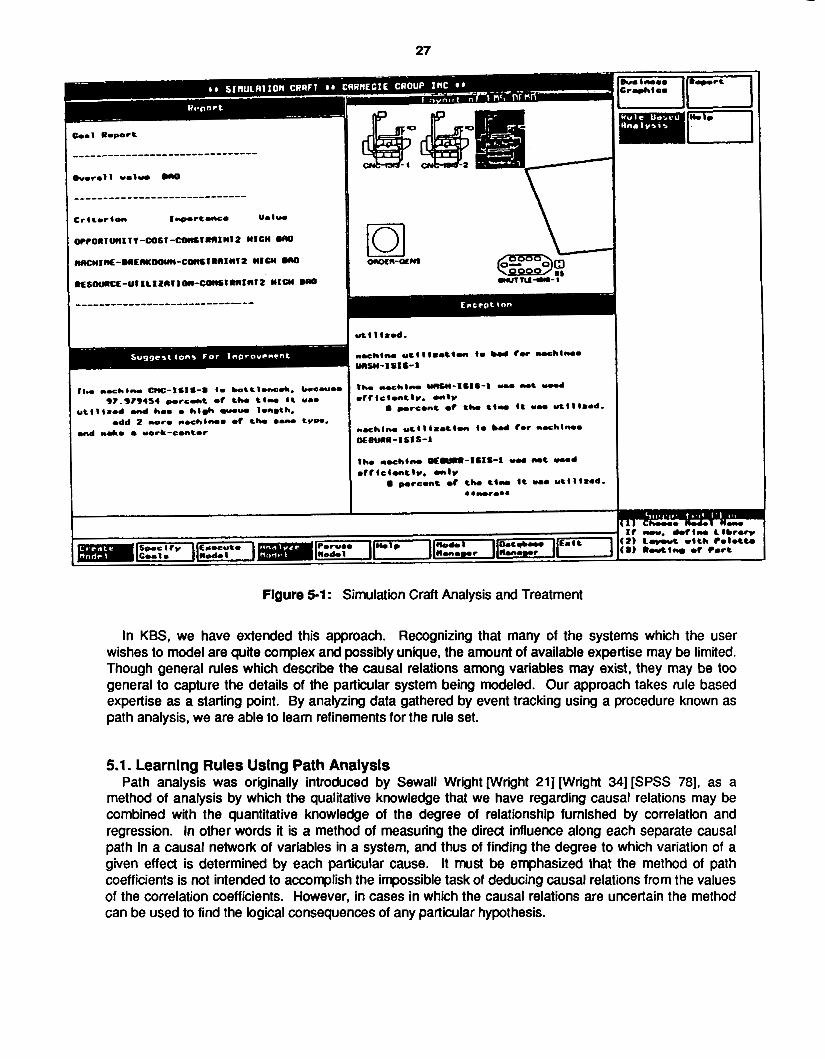
generated by simulation experiments and to suggest ways in which the model can be altered to further optimize the goals and constraints. One method is to use an expert systems approach where a set of experts are interviewed in order to identify and codify their expertise. We believe this is an important first step; any knowledge not widely available to the simulation community at large, which can be made available as part of the simulation system, can have an important impact. An example of this approach can be found in Simulation Craft [Fox et al. 861 where expertise is used to identify and correct bottleneck situations. In figure 5-1, the report window (upper left) defines the goals to be satisfied by the experiment (e.g., cost, machine breakdown, resource utilization), the exception window (lower right) identifies the constraint deviations (e.g., poor utilization of machines), and the suggestions window (lower left) recommends a change to the model to maximize the goals (add more machines).
27
Flgure 5-1: Simulation Craft Analysis and Treatment
In KBS, we have extended this approach. Recognizing that many of the systems which the user wishes to model are quite complex and possibly unique, the amount of available expertise may be limited. Though general rules which describe the causal relations among variables may exist, they may be too general to capture the details of the particular system being modeled. Our approach takes rule based expertise as a starting point. By analyzing data gathered by event tracking using a procedure known as path analysis, we are able to learn refinements for the rule set.
5.1. Learnlng Rules Using Path Analysis Path analysis was originally introduced by Sewall Wright [Wright 21 J [Wright 341 [SPSS 781, as a
method of analysis by which the qualitative knowledge that we have regarding causal relations may be combined with the quantitative knowledge of the degree of relationship furnished by correlation and regression. In other words it is a method of measuring the direct influence along each separate causal path in a causal network of variables in a system, and thus of finding the degree to which variation of a given effect is determined by each particular cause. It must be emphasized that the method of path coefficients is not intended to accomplish the impossible task of deducing causal relations from the values of the correlation coefficients. However, in cases in which the causal relations are uncertain the method can be used to find the logical consequences of any particular hypothesis.
28
In KBS, path analysis is used to refine the heuristic knowledge provided by an expert. In particular, it is used to elaborate the simple causal relations normally found in rules to include interactions among variables found "buried" in the model, and to refine the degree to which variables are causally related. In other words, KBS performs a type of learning where heurstic knowledge is refined based upon the outcome of simulation experiments. The following outlines the tasks in the learning process.
0 A Rule is proposed by the domain expert.
0 The causal assumptions on which the rule is based are validated against the running model. Validation implies detection of causal chains in KBS models. The rule may need to be modified if the initial causal assumptions were either erroneous or insufficient.
Alternate causal structures are then proposed and automatically analysed. The most appropriate causal structure is chosen, and the results summarized to yield an equation that reflects the sensitivity of the Output parameter with respect to the controllable Input parameters. Thus path analysis is used to find the degree to which variation of a given effect is determined by each particular cause in the system being modeled.
The sensitivity information is used to quantitatively refine the rules.
5.2. A Detailed Example In the CDS domain several areas for analysis were isolated, namely Inventory Policy, Capacity
Planning, Topology Planning, and Operational Planning. Of these Inventory Planning, has been singled out for Path Analysis mainly because the topic is familiar and numbers are easier to relate to. A typical example will best illustrate the series of steps that are taken to arrive at a refined rule starting from a more general rule proposed by the domain expert.
Example of a Diagnosis/Correction Rule:
IF The Goal is to minimize 8tOCkOUt8 and Average-Inventory is L o w and Stockout8 are High and Production Rates can be monitored
Increase the Production rate THEN
To be specific the Rule must refer to actual instances of objects in the model and we proceed with the inet-pc model of the CDS domain shown in Figure 2-1.
By concentrating on Manufacturer M, and Distribution center D, the Rule becomes a bit more specific expressed as:
IF The Goal is to minimize D1:stockouts and D1:Avg-Inventory is L o w and and M 1 :pmduction-rate can be altered
Increase M 1 prvduction-rate
D1:Stockouts are High
THEN
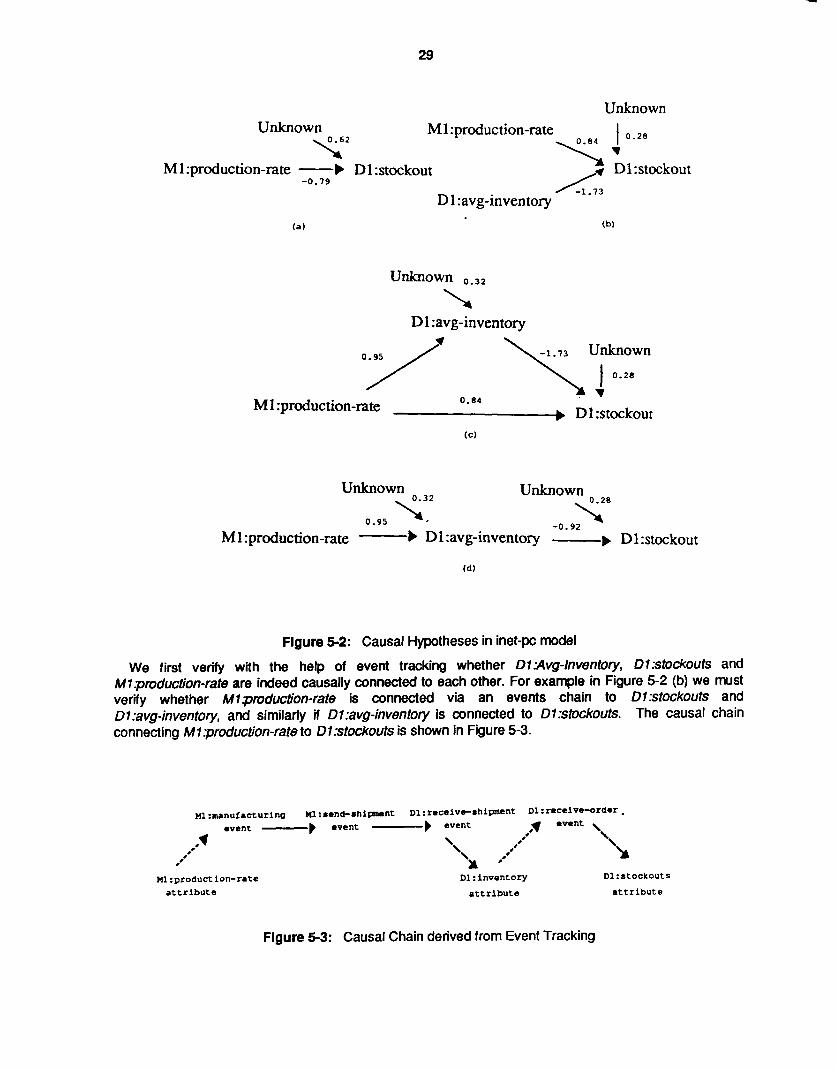
Drawing upon the CDS model D1:stockouts ("30 of orders not filled) is an Output parameter and Mlpmduction-rate is an Input parameter. A few causal structures, as shown in Figure 5-2, are then proposed which attempt to include the variables in the rule causally connected to each other along different paths.
29
Unknown Unknown M1 :production-rate T2 -% 47; ! D1:st~kout o - 2 8 M1:production-rate - b D1:stockout
-0.79
D 1 :avg-inventory ( a ) (b)
Unknown 0.32
\ D 1 :avg-inventory
\ -1 .73 Unknown
0.84 M 1 :productic
I 0.28 \. Unknown Unknown
-0 .92
D1:stockout 0 . 9 5 %:
M 1 :production-rate - b D 1 :avg-inventory
Figure 5-2: Causal Hypotheses in inet-pc model
We first verify with the help of event tracking whether DlAAvg-lnventory, D1:stockouts and Mlprvduction-rate are indeed causally connected to each other. For example in Figure 5-2 (b) we must verify whether Mlpmduction-rate is connected via an events chain to D1:stockouts and D1:avg-inventory, and similarly if D1:avg-inventory is connected to D1:stockouts. The causal chain connecting M 1 :production-rate to Dlstockouts is shown in Figure 5-3.
m:manufacturing W1:send-shipwnt Dl:receivt8hipment D1:receive-order, event --) event event f event ,
k v \ 08 / '\
0' m * '\ .e
08'
U1:production-rate D1:inventory D1:6tOckOUtS a t t r i b u t e a t t r i b u t e a t t r i b u t e
Figure 5-3: Causal Chain derived from Event Tracking
30
As can be seen from Figure 5-4 the causal assumptions for all Figures 5-2 (a) (b) (c) and (d), are valid.
Figure 5-4: Validating hypotheses
Figure 5-2 (a) is purposely included to show the naive approach which would be taken in the absence of Path Analysis, by ignoring the intermediate variable D1:avg-inven?ory. It must be stressed here that the search algorithm used to discover causal paths can find all paths existing between two model variables given time and resources but currently it returns with the first path found. Thus the causal chain in Figure 5-3 is not the only possible path between Mlpmduction-rate and Dlstockouts and it would be wrong to place great faith in that path and recommend that the correct causal structure from the several alternatives in Figure 5-2 is (d)6
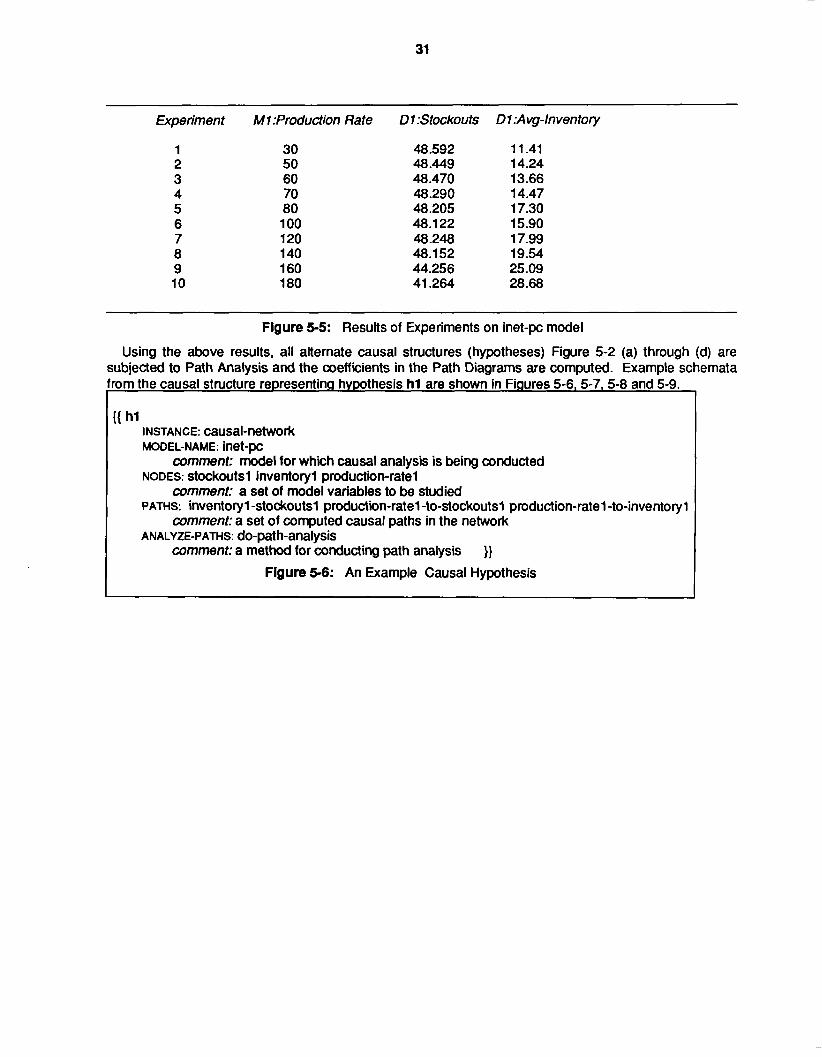
A series of experiments are then designed to measure D7:avg-inventory and D7:stockouts while changing M7.pfoducton-fate and results of these experiments are shown in Table 5-5.
% is a coincidence that in this example it turns out that it is the most appropriate hypothesis.
31
Experiment
1 2 3 4 5 6 7 8 9 10
M 1 :Production Rate
30 50 60 70 80 100 120 140 160 180
D 1 :Stockouts
48.592 48.449 48.470 48.290 48.205 48.122 48.248 48.152 44.256 41.264
D 1 :Avg-Inventory
11.41 14.24 13.66 14.47 17.30 15.90 17.99 19.54 25.09 28.68
~ ~ ~ ~
Figure 5-5: Results of Experiments on inet-pc model
Using the above results, all alternate causal structures (hypotheses) Figure 5-2 (a) through (d) are subjected to Path Analysis and the coefficients in the Path Diagrams are computed. Example schemata rom the causal structure representing hypothesis h l are shown in Fiaures 5-6,5-7,5-8 and 5-9.
INSTANCE: CaUSal-neWOrk MODEL-NAME: inet-pc
{{ hl
comment: model for which causal analysis is being conducted
comment: a set of model variables to be studied
comment: a set of computed causal paths in the network
comment: a method for conducting path analysis
NODES: stockouts1 inventoryl production-ratel
PATHS: inventoryl -stockouts1 production-ratel -to-stockoutsl production-rate 1 -to-inventory 1
ANALYZE-PATHS: do-path-analysis }}
Figure 5-6: An Example Causal Hypothesis
32
I I
{ stockoutsl INSTANCE: causal-node NODE-OF: h l
CAUSES: nil comment: The causal network this node belongs to
comment: The nodes caused by this node
comment: The nodes which cause this node
comment: The data schema which contains observations and information for mapping data in the model to data suitable for causal analysis
comment: A symbolic equation relating this node to all the lnput nodes on which it directly or indirectly depends on. An lnput node is a model variable which can be altered
comment: A symbolic equation relating this node to immediately preceding nodes on which it directly depends on.
comment: the unknown component expressed as a standardized path coefficient }}
CAUSED-BY: inventoryl production-ratel
DATA: StoCkOUt
PATH-EQN: 39.629 - 0.837 production-ratel
REGR-EQN: 48.62 - 0.45 inventoryl + 0.01 67 production-ratel
RESIDUE: 0.1 16
Figure 5-7: An Example Causal node
{{ Inventoryl-to-stockoutsl INSTANCE: causal-path FROMNODE: inventory1
TO-NODE: stocko~tsl comment: the causing node in the path
comment: the effect node in the path
comment: the standardized path co-efficient PATH-COEFFICIENT: -1 .I 52
}}
I Flgure 5-8: An Example Causal Path I
{{ stockout INSTANCE: model-variable OBSERVATIONS: 36.37 31.95 22.87 25.44
comment: a list of values of the translated model variable, one for each experiment
comment: a message to fill up the observations slot from the results of experiments
comment: name of model from where data is to be extracted }}
ACTUAL-VARIABLES: (D1 total-orders) (D1 back-orders) TRANSLATE-RESULTS: extract-stockouts
MODEL-NAME: inet-pc
Figure 5-9: The Model variable schema
33
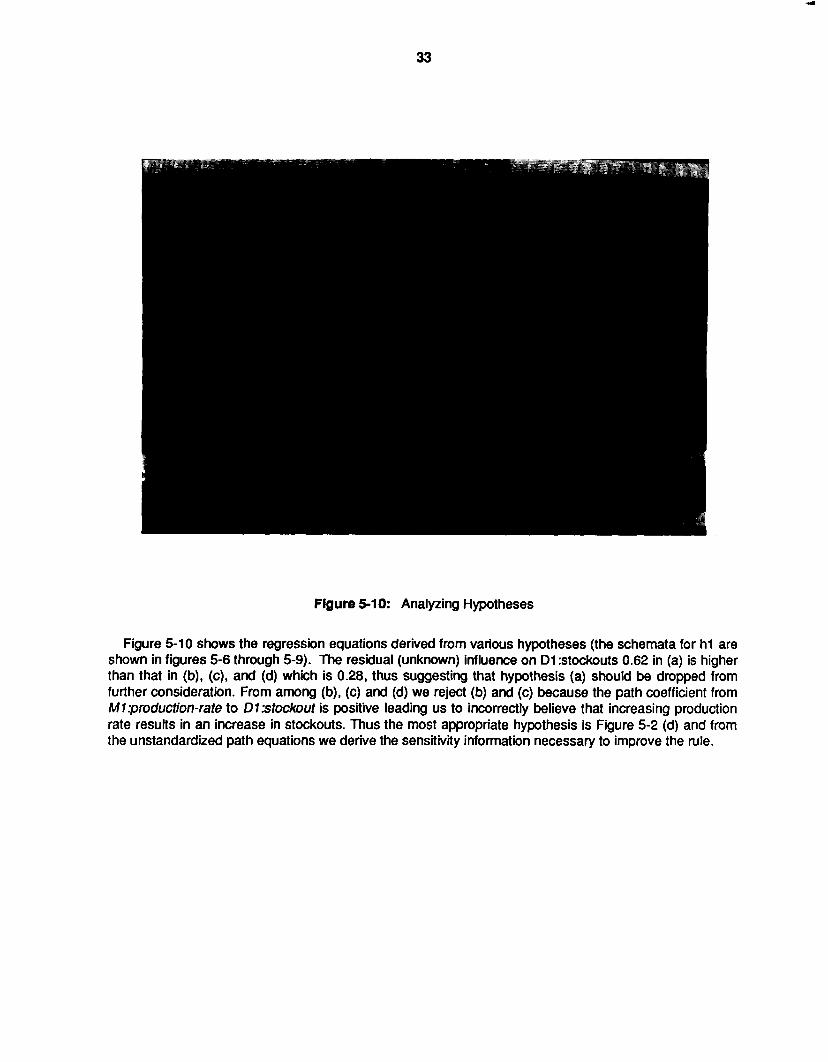
Figure 5-10: Analyzing Hypotheses
Figure 5-10 shows the regression equations derived from various hypotheses (the schemata for h l are shown in figures 5-6 through 5-9). The residual (unknown) influence on D1 :stockouts 0.62 in (a) is higher than that in (b), (c), and (d) which is 0.28, thus suggesting that hypothesis (a) should be dropped from further consideration. From among (b), (c) and (d) we reject (b) and (c) because the path coefficient from MI :production-rate to D7 stockout is positive leading us to incorrectly believe that increasing production rate results in an increase in stockouts. Thus the most appropriate hypothesis is Figure 5-2 (d) and from the unstandardized path equations we derive the sensitivity information necessary to improve the rule.
34
The Regression equations:
D 1 :stockouts = - 0 . 4 1 8 D1:avg-inventory + 5 4 . 6 5 D 1 :avg-inventory = 7 - 6 93 0 - 1 0 2 M 1 production-rate +
Summarized Path analysis:
D1:stockouts = - 0 .0428 Mlproduction-rate + 5 1 .44
Sensitivity :
6 (D1 stockouts) /6 (Mlproduction-rate) = - 0.0428 G(Ml:production-rate) /6(Dl:stockouts) = - 2 3 . 3 8 2
Without Path Analysis we would have assumed: D1:stockouts = - 0 .038 Mlproduction-rate + 5 1
Getting back to the rule, a possible refinement may be IF The Goal is to keep D1:stoCko~t~ below 40 % AND
D1:Avg-Inventory < 30 AND D1:Stockouts are in the range 40 % - 5 0 % AND Mlproduction-rate can be altered
M1 production-rate = M1 .production-rate + 2 3 . 3 8 (D1 :stockouts - 40) THEN
As seen above in simple cases Causal Path Analysis reduces to ordinary Linear Regression, and by plugging in the value of the Input (causing) variable into the regressed equation we can predict the expected value of the Output (caused) variable. However in a more complicated case such as that of Figure 5-2 (d) a Causal Correction is applied to the Regression coefficients before predictions can be made. For a detailed treatment on the subject of Path Analysis refer to [Wright-21] [Wright 341 [Li 751 [SPSS 781.
6. Automating the Simulation Life Cycle A important component of a knowledge based simulation system is the reasoning architecture used to
manage the simulation life cycle. Both KBS and Simulation Craft [Fox et al. 861 use a goal directed reasoning architecture where each stage of the simulation life cycle is defined as a separate goal with a set of rules which:
identify sub-tasks to be performed
initialize each sub-task at the appropriate time
identify when the sub-task is completed
signal when the entire goal is completed In figure 3-3, the bottom right window lists the current sequence of sub-tasks being managed by the system. In addition, unless required sub-tasks are completed in one stage, the user cannot move on to the next. For example, in figure 3-3, the upper right window defines a set of "pending activities" remaining to be completed before the model is complete enough to be simulated.
0' W:J:
1 &G- I' +O+
/
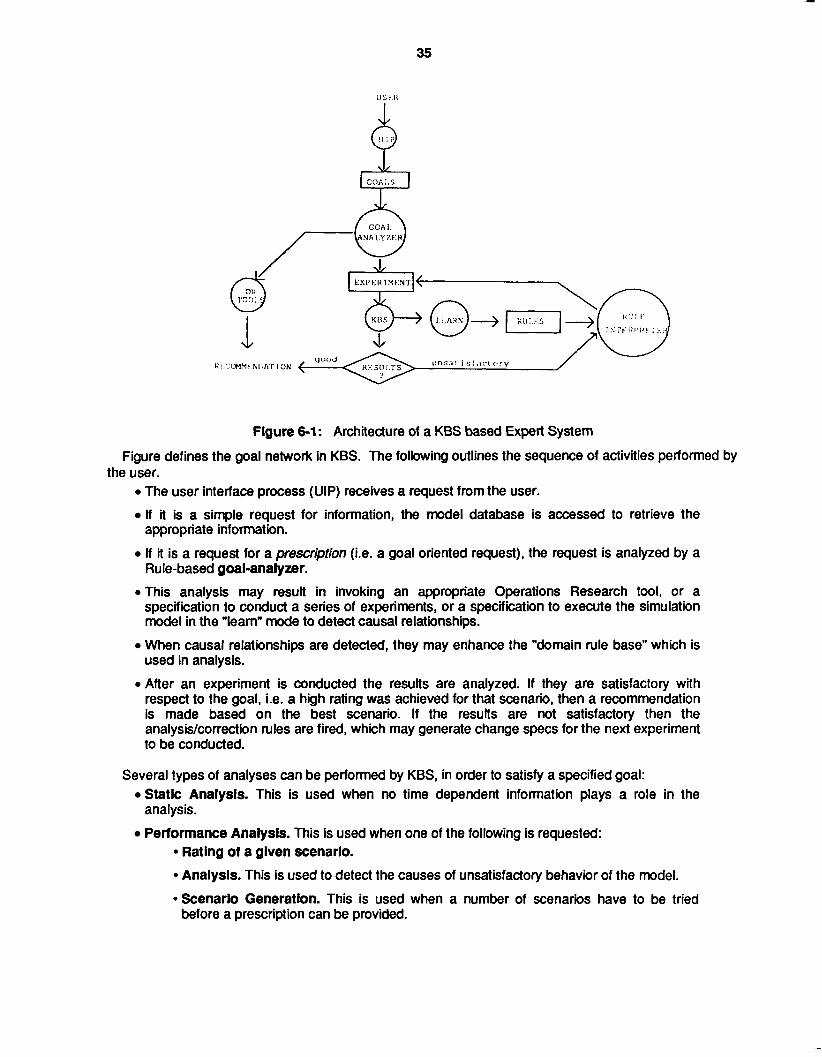
Figure 6-1 : Architecture of a KBS based Expert System
Figure defines the goal network in KBS. The following outlines the sequence of activities performed by the user.
0 The user interface process (UIP) receives a request from the user.
If it is a simple request for information, the model database is accessed to retrieve the appropriate information.
If it is a request for a prescr@tion (Le. a goal oriented request), the request is analyzed by a Rule-based goal-analyzer.
0 This analysis may result in invoking an appropriate Operations Research tool, or a specification to conduct a series of experiments, or a specification to execute the simulation model in the "learn" mode to detect causal relationships.
When causal relationships are detected, they may enhance the "domain rule base" which is used in analysis.
.After an experiment is conducted the results are analyzed. If they are satisfactory with respect to the goal, Le. a high rating was achieved for that scenario, then a recommendation is made based on the best scenario. If the results are not satisfactory then the analysidcorrection rules are fired, which may generate change specs for the next experiment to be conducted.
Several types of analyses can be performed by KBS, in order to satisfy a specified goal: Static Analysis. This is used when no time dependent information plays a role in the
Performance Analysis. This is used when one of the following is requested:
analysis.
Rating of a given scenario.
Analysis. This is used to detect the causes of unsatisfactory behavior of the model.
*Scenario Generation. This is used when a number of scenarios have to be tried before a prescription can be provided.
36
Trade-off. This is used when it is necessary to compare several given scenarios.
0 Learning. If the objective of executing the simulation model is to detect embedded causal relationships, the model is executed in the "learn" mode and subsequently processed by the causal analysis module.
Mathematical Analysis. If the goal-analyzer determines that the current request can be satisfied by a mathematical analysis rather than simulation, an appropriate analysis tool will be invoked.
Figure 6-2 shows a log of the execution of a simulation model which was automatically analyzed resulting in the construction of the improved scenario kbs-experiment-2.
Figure 6-2: Recommendation from Automatic Analysis
The run specifications that produced this analysis are shown being entered by the user in picture 6-3.
37
Figure 6-3: Simulation Run Profile
7. Conclusions Since 1980 KBS has been a testbed for experimenting with knowledge-based techniques for model
building, execution and analysis. As such, it has proved invaluable in identifying user needs and testing approaches to solving them. In retrospect, the first step of using a schema representation and a combined object and rule-based programming paradigm for representing simulation knowledge and behavior was perhaps the simplest and most intuitive. It made model creation more easy because models could be buitt using objects specific to the domain. It also made understanding the model easier. But there is a limit to both the ease of creation and understanding. As models became more complex the use of simple schema editors did not suffice for creation and perusal. Powerful graphics-based model building facilities were not explored due to the lack of facilities. By combining good graphics and knowledge-based techniques, such as model verification, interfaces may be constructed to support the building of more complex models.
Perhaps the most important aspect of KBS is its focus on automating the simulation life cycle. First, KBS provides a goal directed architecture which manages the life cycle enabling the clean interleaving of the reasoning performed by the user and the embedded expertise. Secondly, KBS provides an automated analysis capability where not only rule based expertise can identify and recommend

38
corrections for problems, but rule refinements can be learned by analyzing simulation data. The purpose of performing simulation is to produce data, which when analyzed will identify interesting aspects of the model. It is often the case that the data is voluminous and the analyst lacks requisite skills. By embedding knowledge into KBS to automate the analysis, such expertise can be uniformly and consistently applied across many applications.
The ultimate goals of applying knowledge-based systems to simulation should be to reduce the total time in the simulation life cycle, and to increase the quality of the results by making available expertise not readily available to the end user. KBS represents a good first step along this path.
8. Acknowledgements The authors thank Digital Equipment Corporation for supporting this and other related research projects
in the Intelligent Systems Laboratory. Thanks are also due to Dr. Donald Butcher and Dr. Stanley Wearden for suggesting the use of the Path Analysis approach to Causal Analysis.
39
References
[Fox 791 M.S. Fox, On Inheritance in Knowledge Representation. In Proceedings of the International Joint Conference on Artificial Intell@ence. 95 First
St., Los Altos, CA94022,1979.
[Fox 831 M.S. Fox. Constraint-Directed Search: A Case Study of Job-Shop Scheduling. Technical Report, Camegie-Mellon University, 1983. CMU-RI-TR-85-7,lntellgent Systems Laboratory,The Robotics Institute. Pittsburgh,PA.
Observations on the Role of Constraints in Problem Solving. In Annual Conference of the Canadian Society for the Computational Studies of
[Fox 861 M. S. Fox.
Intelligence. University of Quebec Press, 1986.
[Fox & Reddy 821 Fox, M.S., and Reddy, Y.V. Knowledge Representation in Organization Modeling and Simulation: Definition and
In Proceedings of the Thirteenth Annual Pittsburgh Conference on Modeling and Interpretation.
Simulation, pages 675-683. University of Pittsburgh School of Engineering, April, 1982.
[Fox et al. 861 M. S. Fox, N. Sathi, V. Baskaran, J. Bouer. Simulation Craft: An Expert System for Discrete Event Simulation. In Simulators 111: Proceedings of the SCS Simulators Conference. The Society for
Computer Simulation, San Oiego, CA, 1986.
[Kahn 8 7 Kahn, G.S. From Application Shell to Knowledge Acquisition System. In Proceedings of the International Joint Conference on Artifma1 lntell@ence, pages
355-359. Morgan Kaufmann Publishers, IN., 95 First Street, Los Altos, CA 94022, August, 1987.
[Klahr & Fought 80) P. Klahr and W.S. Fought. Knowledge-based Simulation. In Proceedings of the fitst Annual Conference of the Arne- Assodation for Artificial
lntell@em, pages 181-183. Stanford CA, 1980.
[Knowledge Craft 85) Knowledge Craft Camegie Group Inc, 650 Commerce Court, Station Square, Pittsburgh PA 15219,
1985.
[Li 751 C.C.Li. Path Analysis - a primer. Boxwood Press, 183 Ocean View Blvd, Pacific Grove, CA 93950,1975.
D. McArthur and H. Sowizral. An Object Oriented Language for Constructing Simulations. In Proceedings of the International Joint Conference on ArtiWal lntellgence. 95 First
[McArthur & Sowizral81)
St., Los Altos, CA94022,1981.
40
[McRoberts, Fox & Husain 851 McRoberts, M., Fox, M.S., and Husain, N. Generating Model Abstraction Scenarios in KBS. In Adificial Intelligence, Graphics, and Simulation: Proceedings of the 1985 SCS
Multiconference, pages 29-33. The Society for Computer Simulation, San Diego, CA, 1985.
[ Reddy & Fox 82a] Reddy, Y .V., and Fox, M.S. KBS: An Artificial lntell@ence Approach to flexible Simulation. Technical Report, Camegie-Mellon University. 1982. CMU-RI-TR-82-1 ,The Robotics Institute,Pittsburgh, Pa.
Knowledge Representation in Organization Modeling and Simulation: A Detailed
In Proceedings of the Thirteenth Annual Pittsburgh Conference on Modeling and
[Reddy & Fox 82b]Reddy, Y.V., and Fox, M.S.
Example.
Simulation, pages 685-691. University of Pittsburgh School of Engineering, April, 1982.
[Reddy & Fox 831 Reddy, Y.V., and Fox, M.S. KBS: A Knowledge Based Simulator - User's Manual. June, 1983 CMU Robotics Institute, Internal Working Document, June 1983.
[Reddy et al. 831 Reddy, Y.V., Fox, M.S., Doyle, K., and Arnold, J. INET: A Knowledge Based Simulation Model of a Corporate Distribution System. In Prooeedings of the /€E€ Conference on.+rends a n d ~ k a t b n s , pages 109-1 18.
IEEE. Gaithersburg, MD, May, 1983.
Reddy, Y.V., Fox, M.S., Husain, N., and McRoberts. M. The Knowledge-Based Simulation System. IEEE Software : 26-37, March, 1986.
Reddy, Y.V., Fox, M.S., and Husain, N. Automating the Analysis of Simulations in KBS. In SCS Multjcvnference on AI, Graphics and Simulation. January, 1985.
PSRL: An SRL-Based Production Rule System - Reference Manual for PSRL Version
Technical Report, Camegie-Mellon University, 1982. CMU-RI-TR-85-7, The Robotics Institute, Pittsburgh, PA.
Sathi, A, Fox, M.S., and Greenberg, M. Representation of Actiiity Knowledge for Project Management. IEEE Tiansaclions on Pattern Analysis and Machine 1ntelligenae PAMI-7( 5): 531 -552,
[Reddy et ai. 861
[Reddy, Fox 8 Husain 85)
[Rychener 821 M.D. Rychener.
1.2.
[Sathi, Fox & Greenberg 851
September, 1985.
[Sathi, Morton & Roth 861 A. Sathi, T. E. Morton, and S. Roth. Callisto: An Intelligent Project Management System. AI Magazine : 3442.1986.
[SPSS 781 SPSS Manual 1978.
41
[Venkataseshan & Reddy 84) Venkataseshan, B., Reddy, Y.V. An introspective environment for Knowledge Based Simulation. In Proceedings of the Wnter Simulation Conference. 1984.
Correlation and Causation. Journal of Agkulturai Research ,1921.
The Method of Path Coefficients. Annals of Ma#ematM StatMks. 1934.
SRU1.5 User Manual. Technical Report, Camegie-Mellon University, 1983. Intelligent Systems Laboratory,The Robotics Institute, Pittsburgh,PA.
[Wright 211 Sewall Wright.
[Wright 341 Sewall Wright.
[Wright & Fox 831 J.M. Wright, and M.S. Fox.
Related Documents


![Artificial Intelligence · Artificial Intelligence 2016-2017 Introduction [5] Artificial Brain: can machines think? Artificial Intelligence 2016-2017 Introduction [6] ... Deep Blue](https://static.cupdf.com/doc/110x72/5f0538917e708231d411e192/artificial-intelligence-artificial-intelligence-2016-2017-introduction-5-artificial.jpg)