Page | 1 K.M.K SYSTEMS Kevin Lam Keaton Avila Mitchell Yamada Khanh Doan

Welcome message from author
This document is posted to help you gain knowledge. Please leave a comment to let me know what you think about it! Share it to your friends and learn new things together.
Transcript

P a g e | 1
K.M.K SYSTEMS
Kevin Lam
Keaton Avila
Mitchell Yamada
Khanh Doan

P a g e | 2
Table of contents
Organization chart description…………………………………………………….....3
Organization chart ……………………………….............................................................4
People/component matrix description……………………………………………....5
People/component matrix………………………..............................................................6
Process model description…………………………………………………………...7
Process model ……………………………………………………………………....8
Workflow model description………………………………………………………...9
Workflow model…………………………………..........................................................10
UML class model description ……………………..........................................................11
UML class model ………………………………………….….....................................12
Use case and use case description……………………….………………………13-14
Use case model………………………………….............................................................15
Use case diagram…………………………………………………………………...16
System interfaces description……………………............................................................17
System interface…………………………………...........................................................18
UML activity diagram description………………………….....................................19-20
UML activity diagram………………………………………………………………21
UML sequence model description ……………………………………………...22-23
UML sequence model……………………………………………………………...24
Deployment model………………………………………………………………...25

P a g e | 3
Organization chart description
1. An organizational chart is diagramming methodology that visually provides the structure of an
organization. It displays ranks and relations among the positions within the organization. It creates a
clear understanding of responsibilities and relationships within the chart.
2. The organizational structure graphically shows the relations between official individuals to one
another within the company’s infrastructure. It also provides the functionality of one organization to
another. The organizational chart provides a visual concept regarding the overall organization that is
represented by a chart. It displays a diagram that defines the distribution of responsibility for
accurate company management, and creates a communication bridge amongst different
departments. The communication relationship that this structure creates solves the issues of aid in
securing an overall understanding of the organization.
3.
The content of the organizational structures uses boxes. The boxes
illustrate the title of a position, and the name of the individual that
occupies it. The information inside of the box analyzes position and
relationships within the system. It labels the position rank within a
class series.
The solid line connects the boxes in relation to hierarchy levels within an organization. It
indicates the direct supervision.
4. An example of how the model is applied in an actual client is by having information of
individuals within the entity stored in a boxed value. The box holds a value of the individual and
his/her position. It allows the business to have a displayed structure of both the individual and the
individual ranking within the company.
5. The model solves issues by allowing the audience associate to familiarize their colleagues. An
organizational chart can also provide visual illustration for structural development. The structure can
be created into different entities. These different entities each solve different structural issues.
Different organizational structures include a branch, workgroup, department, and an individual.
Diana Nguyen
Group Manager

P a g e | 4
Organization Chart
Name Role
Dianna Nguyen Group Manager
Latika Set Designer
Freida General manager
Richard Design Group Manager
Timon Brown Set Designer
Taimur Singh Production Group Manager
Kimberly Chao Manager
Suman Ali Production Workers
Anil Kaling Warehouse Clerk
Sng Evan Design Group Admin
Assistant, Prop Specialist

P a g e | 5
Organization Chart description
1. A matrix structure lists subsystems and functionality. The system is organized with elements
that are labeled in rows and columns. These rows and columns are known as cells. Elements are
placed in cells to store value
2. The matrix has elements within the structure. These elements can represent a few things
within a matrix. The elements can represents projects, project activities, organizational teams,
components, and product components. The elements on the top rows are organized to represent
descriptive information regarding the element’s characteristics. The cells across indicate
information dataflow.
3. The upper cells represent the descriptive element that indicates the business values within the
system.
The cells indicates a directed link between two elements and can represent
design relations or constraints between product components,
communication between teams, information flow or precedence relations
between activities. Reading across a row reveals the outputs that the
element in that row provides to other elements, and scanning a column
reveals the inputs that the element in column receives from other
elements.
4. The sub structural portions indicate the systems roles that can be applied in an actual client
case. The people/component matrix organizes individuals with similar skills into a matrix. The
matrix can be applied in businesses for project management. It allows a visual display of
individuals, their skills and how they are pooled into for their work assignments. For example, a
manager can use this matrix to understand cross-functional tasks among individuals.
5. The model can help the current issues by allowing individuals to be chosen according to the
project requirements. The matrix allows a project team to be viewed as specialists that were
brought together within a new environment. Together as an entity individuals can be assigned
different tasks to solve different issues within the infrastructure.
Name User Role Commitment Skills
Name
Diana
Nguyen
Latika
Freida

P a g e | 6
Name User Role Commitment SkillsDiana Nguyen user manager Group Manager Important Computer (manages the more administrative concerns)
Richard Design group
manager
Timon Brown end user set designer Replaceable Designer
Production group
manager
George Wong Production
Suman Ali Workers
Warehouse Clerk
Design Group
Admin assistant,
Prop specialist
Replaceable
Manager
general manager
user managerSng Evan
user managerFreida
Latika
entry level production
user manager
user manager
user managerTaimur Singh
Kimberly Chao
Anil Kaling end user
end user
user manager Important
Replaceable
Important Computer, management
Book Keeper (indicate the cost of all props)
Production (blueprint to generate Production plan)
set designer Marketing, Artist ( manages the artistic side of business)
Important
Important
Important
Important Management
Management (approves design bid before it is shown)
Accountant ( manages inventory and supervises the sales)
People/Component Matrix

P a g e | 7
Process model description
1. Process Model Diagram (Lv 0 and Lv 1) The process model diagram shows the flow of the data and the steps it flows through. At Lv 0, it shows the broad process model from beginning to end. At Lv 1, it breaks down each of the processes in a magnified view.
2. The purpose of the model is to be able to find out at where the data is being changed at the different processes. One of the problems that it solves is the problem of trying to find where the data got entered wrong. By looking at the Lv 0 and Lv 1 models, the problem can be solved by backtracking to the location of origin.
3. There are five parts to a process model diagram.
The rounded rectangle symbolizes the process. The process is designated a number within the process. In Lv 1, the process gets a an additional number to correlate it to the main process. The rectangle symbolizes the external entity. These are entities that are on the left side of the system boundary. They are entities that are part of the process, but are not located within the business. A dash line symbolizes the system boundary. This is where the data from the external entity crosses over into the process. A three sided rectangle symbolizes the database. This is where the information is stored or retrieved from. An arrow symbolizes the flow of the data. It connects from one process to another.
4. An example of how the model works is in the Lv 1 design budget. The data from the design flows through the different processes. It manipulates the data by getting certain information from the databases.
5. One of the problems that it solves is the ability to automate the process. By looking at where
the data is being manipulated, a manager can see where automation can be put into place to make it more efficient.

P a g e | 8
Process model

P a g e | 9
Workflow model description
1. This model shows the flow of information from one entity to another in the business.
2. The purpose of the model is to figure out where the information is coming from and to
whom the information is being sent to. One of the problems that the model solves is the
ability to know how the information flows through and who manipulates the information
at a certain point. The solution to the problem would be by looking at the model and
pinpointing the problem by seeing at what part of the workflow the problem occurs.
3. There are four parts to a workflow model.
A rectangle symbolizes an external entity. These are entities that
are on the left side of the system boundary. They are part of the
business process, but are not part of the overall business. Some
examples are a client or a bank.
An oval symbolizes an internal entity. These are entities that are on the
the right side of the system boundary. They are part of the business
process and located within the business itself. Some example include a
manager, employee, or an owner.
A dash line symbolizes the system boundary. This is where the
information from the external entity crosses to the internal entity.
An arrow symbolizes the flow of the information. It connects from
entity to another.
4. An example of this work is the information that Anil Kaling gets. She gets information
that was sent to her from Freida, who got the information from the client. The
information is then sent to the lead production worker to add additional information. It
comes back to Kaling to where she approved or disapproves the information, and then
send it to Freida for either scenario.
5. One of the problems that this model can solve is the problem of information taking to
long to reach the final destination. It can show which entities have the most information
coming through, thereby. Another problem that could be solved is the lack of automation.
It would show which entities are being inefficient so that way management can make
changes to make it more efficient.

P a g e | 10
Workflow model

P a g e | 11
UML class model description
1. UML Class Model Description: The class model is a model that shows the structure of a business through their class's relations and attributes.
2. The purpose of the class model is to be able to see what the relationships are between the different classes are. One of the problems they solve is the ability to see the relationship with the different classes. By being able to see the relationships, decisions can be made based of the relationships.
3. There are four parts to a class model.
Class Name
* Unique Modifier
Classifications
A. The class name is the name of the particular class. Classes are any/all of a set of persons, places, things, or events. Some examples are a parking lot, restaurant, or a parade.
B. The unique modifier is a way to distinguish an object within a class. It is symbolized by the * symbol. Examples of a unique modifier is an ID number or a name.
C. Classifications are what defines the class. Examples include the cost of a food item or a location of an apartment building.
D. The symbols, 1...*, * or 1, are ways to define the relationship between classes. It appears alongside of the line that connects two classes.
4. An example of the class model would be in the way the client class and the project class
interact. For every client there may be one or more projects. One the flip side, for every project there is only one client.
5. One of the problems that the class model fixes is the ability to help plan out a project. By seeing what classes are involved with a project, it will help create a more reliable plan It will help create a reliable plan by seeing who is involved with each project. It will also solve the problem of who is working with who. It will be easier to see employees work together, making it easier to schedule who for which project.
* 1...*
P a g e | 12
UML class model

P a g e | 13
Use case and use case diagram
1. A use case is a step-by-step guide of how a person interacts with a system, and how the system
interacts with the information and user. The diagram allows a user to visualize the system
interactions.
2. The use case’s main purpose is to give users simple, step-by-step instructions on how to interact
with the system and explain what actions the system will respond with when the user inputs certain
information or interacts with it in a certain way. The diagram portrays the external behavior or a
functional view of the system or business process. Use case descriptions and diagrams define the
requirements of each individual use case of the entire project.
3.
Use Case Name:
Primary Business Actor:
Primary System Actor:
Description:
Typical Course of Events
Actor Action System Response
Alternate Course of Events
Actor Action System Response
The use case name should describe the use case’s function through an appropriate title. The Primary
Business Actor is the primary user of the specific use case. The Primary System Actor is the business
or entity that the use case is for. The Description should elaborate on the use case’s function, further
detailing what the use case is detailing.
The Actor Action is the action the user performs, and the System Response is the system’s response
to the respective action of the user. The Alternate Actor Action is the secondary behavior of a user
action if the primary behavior is unable to be processed by the system, such as an IF error occurs.
The Alternate System Response is how the system responds to the alternate action, such as showing
an error message for a mistake.

P a g e | 14
4. The use case for the design bid would detail the user actions for inputting the client information,
the staff information, and how the system responds to those actions. In this case, the system saves
the input information into the design bid file. Then, the user inputs the bid information, such as the
location and beginning and end dates, which the system responds to by saving into the design bid
file. The user then inputs the prop and material requirements, which the system saves. Finally, the
user enters the labor requirements for the design bid and the system saves the information into the
design bid file.
5. Use case descriptions and diagrams would eliminate the problem of who the user is supposed to
report to and which tasks need to be completed. This would eliminate any wasted time trying to
determine who needs what information reported to them for work to continue. Use cases would cut
down the amount of stops information takes to the bare minimum necessary, without any
unnecessary tasks being done. They would reduce the amount of errors made or at the very least
would help workers narrow down which steps are the most time-consuming or confusing, which
would help give them ideas on how to alleviate these problems in the future. Use cases could be
used to establish formal lines of authority, so everybody knows who to report to and hat
information or tasks are expected of them.

P a g e | 15
Use case model
Use Case Name: New Order Placement
Primary Business actor: Project manager
Primary System actor:
Description: The use case explains the actual and estimated cost of each
project. The user selects a project that sparks interest for a
future purchase. When user has decided on the project, personal
information regarding financial payment will be processed for
validation. Once the project time and cost are esitmated, receipt
will be sent to production to launch project creation. Upon
creation of project, user will be required to agree to terms of
contract before start of production.
Typical course 1. User selects type of project. 2. System saves project
of Events type from user.
2. User selects extra service that 4. System saves data
project offers. for service.
5. User adds in name. 6. system registers name
into database
6. User inputs address information. 7. System saves address
information that user input
8. User inserts credit card number.
10. User inputs credit card expiration 9. System verifies credit
date, and 3 digit codes in back. card number.
12. User verifies conformation before 11. System updates data.
completition of form payment.
14. User inputs material required 13. System adds payment
for project. information into data.
System requires user to
16. User inputs information regarding fill out 2nd form.
colors required for project.
18. User selects color from list box 15. System updatesof form.
18. User selects color from list box 17. System allows user
of form. to select a selection of
color for the project.
20. User finalizes data and accepts. 19. Data is saved .
Alt- Step 3: If user account is not in good standing. The system will allow the user to have the option
of either cancelation or payment for a later date.
Alt-Step 5: If user selects credit card as payment then system creates invoice that requires user
to fill in credit card information.
Alt-Step 7: When user does not sign then system will cancel the project order.
KMK Systems

P a g e | 16
Use case diagram

P a g e | 17
System interface description
2. The class model is a model that shows the structure of a business through their class's
relations and attributes.
3. The purpose of the class model is to be able to see what the relationships are between the different classes are. One of the problems they solve is the ability to see the relationship with the different classes. By being able to see the relationships, decisions can be made based of the relationships.
4. There are four parts to a class model.
Class Name
* Unique Modifier
Classifications
A. The class name is the name of the particular class. Classes are any/all of a set of persons, places, things, or events. Some examples are a parking lot, restaurant, or a parade.
B. The unique modifier is a way to distinguish an object within a class. It is symbolized by the * symbol. Examples of a unique modifier is an ID number or a name. C. Classifications are what defines the class. Examples include the cost of a food item or
a location of an apartment building.
D. The symbols, 1...*, * or 1, are ways to define the relationship between classes. It appears alongside of the line that connects two classes.
5. An example of the class model would be in the way the client class and the project class
interact. For every client there may be one or more projects. One the flip side, for every project there is only one client.
One of the problems that the class model fixes is the ability to help plan out a project. By
seeing what classes are involved with a project, it will help create a more reliable plan it will
help create a reliable plan by seeing who is involved with each project. It will also solve the
problem of who is working with who. It will be easier to see.
* 1...*
P a g e | 18
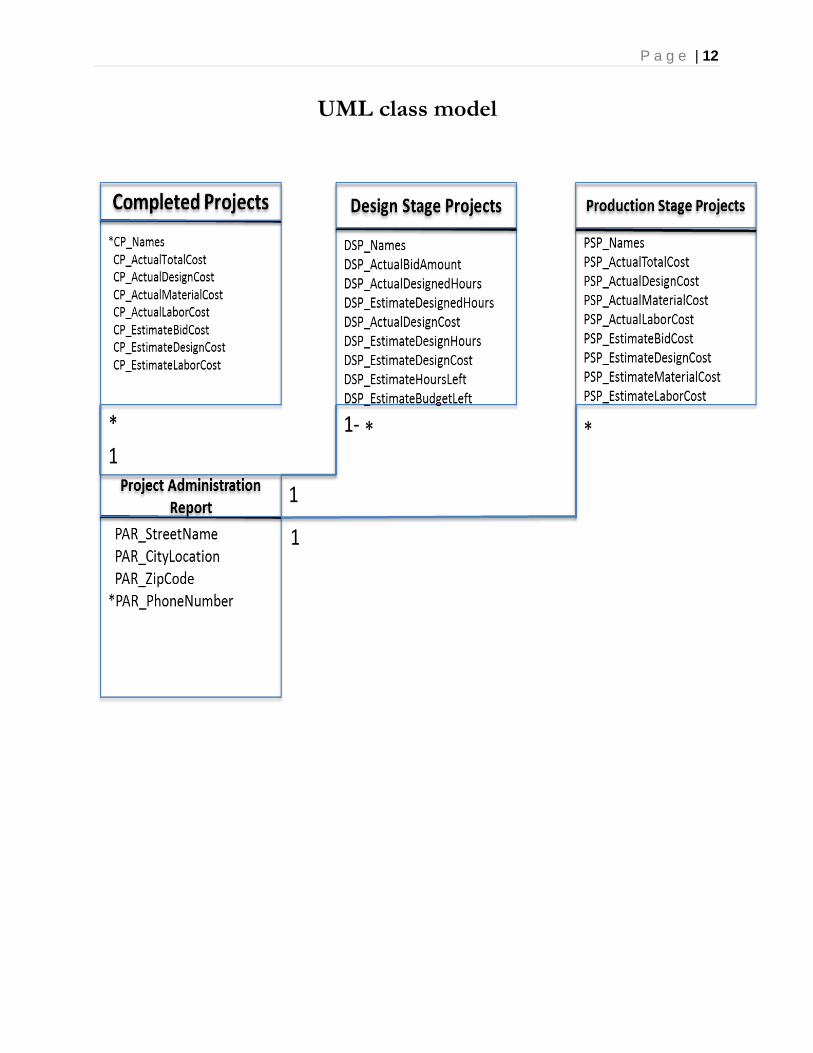
System Interfaces
P a g e | 19
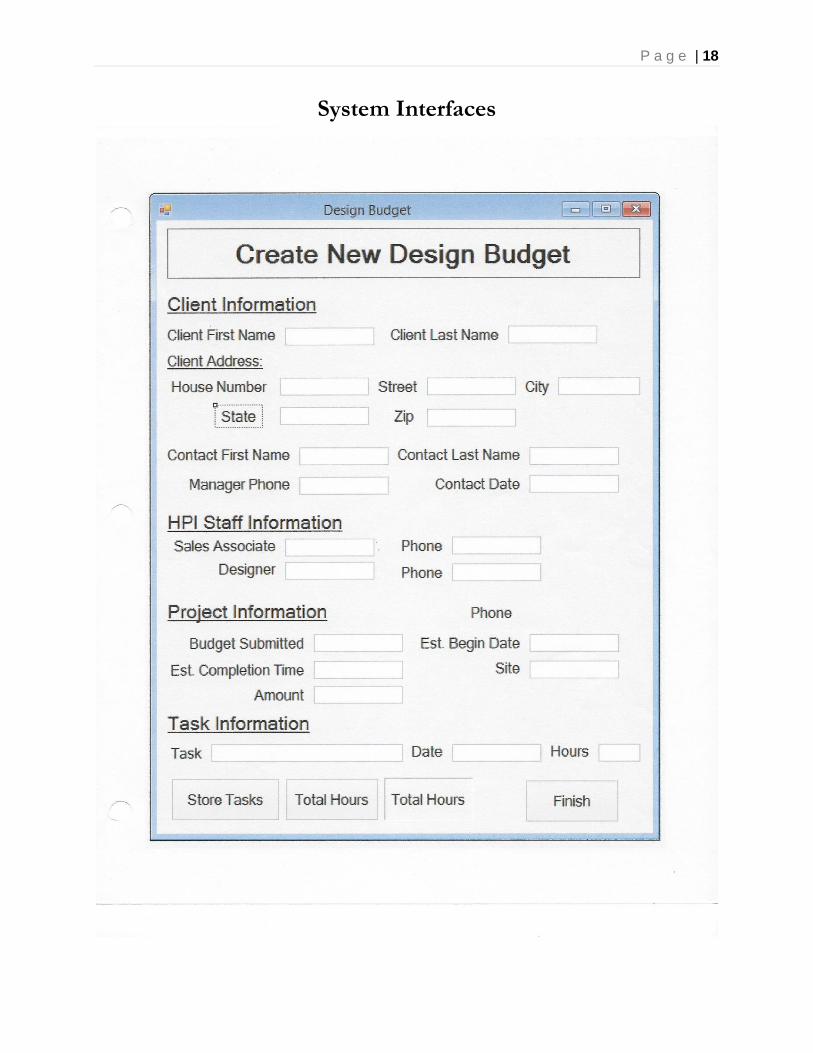
UML activity diagram description
1. The UML activity diagram is used to “model processes in an information system.” In other
words, it allows the user to visualize the workflow, use case, or decisions present in the system they
are modeling.
2. Activity diagrams can be used to supplement a use case description, helping the user visualize the
steps they are presented with and in which order they need to be done. Activity diagrams are known
as “logical models,” which means they describe a business’ activities without explicitly stating how
those activities are accomplished—whether they be manually done or computerized. Logical models
are the bare-bones version of a process, before they’re made into “physical models” and further
refined. They provide the overview of a process to get users started.
3. Start Button – indicates the beginning of the process that the activity model is modeling.
Stop Button – indicates the end of the process.
Activity – indicates the activity that is to be performed when appropriate.
Control flow – indicates the next step in the process model, shows which activity is
performed next.
Decision – a question with mutually exclusive and exhaustive conditions that split the
control flow
Concurrency – activities that are performed concurrently
4. The activity model of the design bid would begin with the start button indicating the beginning of
the process. The control flow would point to the activity to update the client information, which
would point to a decision asking if the client already exists. If the answer is “yes,” then it continues
on to updating the staff information. If the answer is “no,” then the next activity is to enter the
client information, which then continues on to updating the staff information, where the same
process is repeated. Once the staff information has been confirmed or entered, the proper bid dates
are entered. Finally, the individual prop and material requirement information is entered, along with
the labor requirements. The activity model ends with the stop button, indicating the end of the
process.
P a g e | 20
5. This model, along with the use case, helps alleviate problems by visualizing the steps that are
necessary for workers to take, and in which order they need to be performed. The activity model
would show exactly what information the worker needed to enter, so no redundant or unnecessary
information is entered, which would needlessly consume the time of the person entering the
information and the person reading the information. The activity model could also show who is
responsible for certain pieces of information or certain tasks, so everybody is on the same page and
everybody knows who to talk to if they need a specific piece of information or a certain task done.
This would also establish a formal line of authority if a decision branches and certain information
needs to be reported to higher ups. Alternately, it could explain what decision needed to be made
without causing the worker to lose time by finding higher ups who know what decisions need to be
made. It would also help workers narrow down the problem in the case of information being
mistakenly inputted or missing altogether.

P a g e | 21
UML activity diagram
P a g e | 22
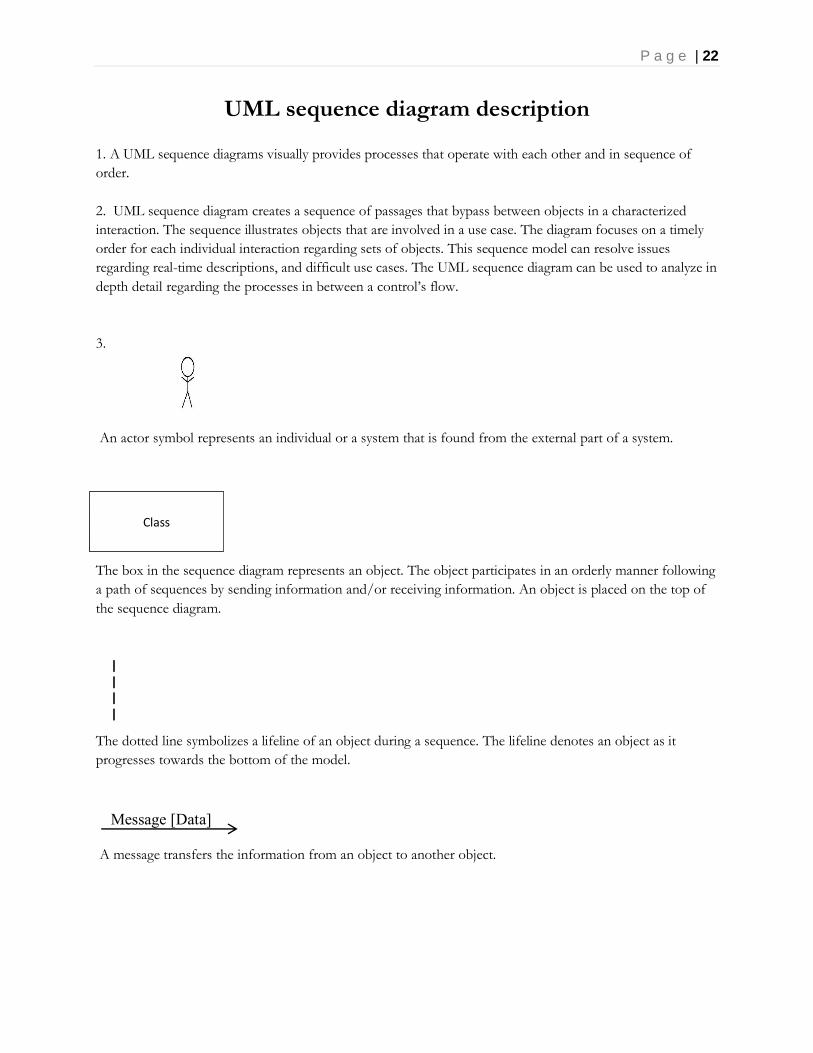
UML sequence diagram description
1. A UML sequence diagrams visually provides processes that operate with each other and in sequence of
order.
2. UML sequence diagram creates a sequence of passages that bypass between objects in a characterized
interaction. The sequence illustrates objects that are involved in a use case. The diagram focuses on a timely
order for each individual interaction regarding sets of objects. This sequence model can resolve issues
regarding real-time descriptions, and difficult use cases. The UML sequence diagram can be used to analyze in
depth detail regarding the processes in between a control’s flow.
3.
An actor symbol represents an individual or a system that is found from the external part of a system.
The box in the sequence diagram represents an object. The object participates in an orderly manner following
a path of sequences by sending information and/or receiving information. An object is placed on the top of
the sequence diagram.
The dotted line symbolizes a lifeline of an object during a sequence. The lifeline denotes an object as it
progresses towards the bottom of the model.
A message transfers the information from an object to another object.
Class
|
|
|
|
|
|
|
|
|
|
|
|
|
|
|
|
|
|
|
|
|
Message [Data]
P a g e | 23
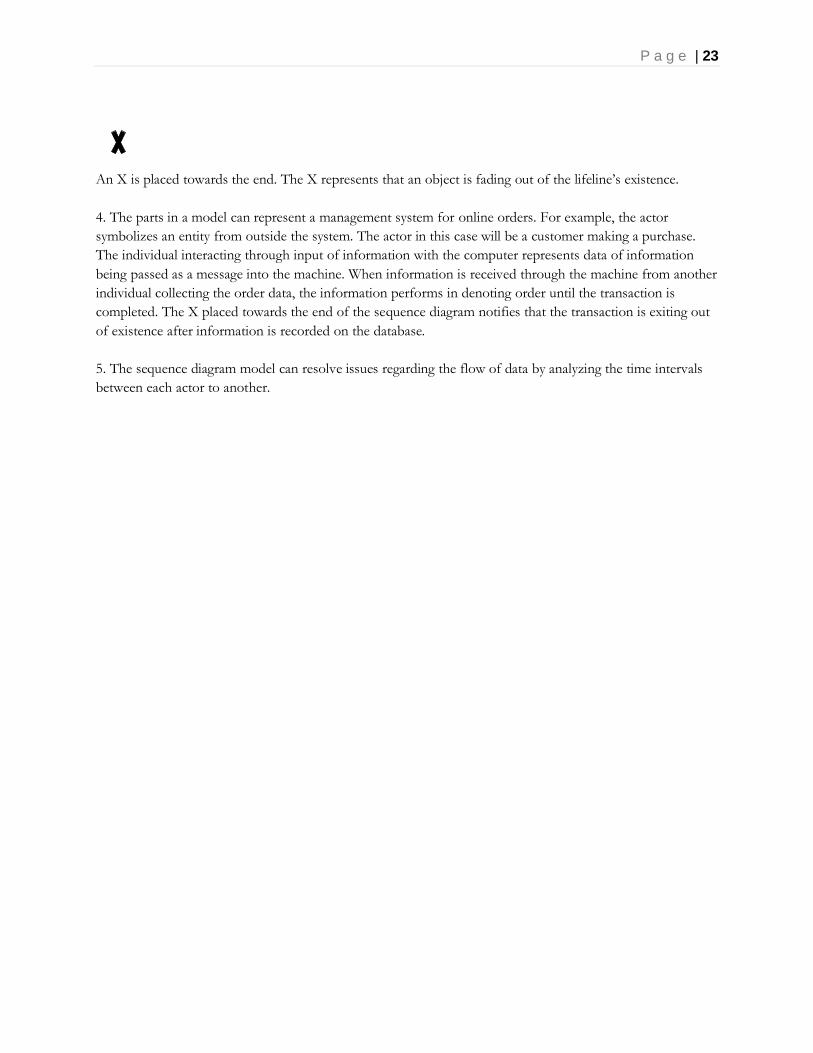
An X is placed towards the end. The X represents that an object is fading out of the lifeline’s existence.
4. The parts in a model can represent a management system for online orders. For example, the actor
symbolizes an entity from outside the system. The actor in this case will be a customer making a purchase.
The individual interacting through input of information with the computer represents data of information
being passed as a message into the machine. When information is received through the machine from another
individual collecting the order data, the information performs in denoting order until the transaction is
completed. The X placed towards the end of the sequence diagram notifies that the transaction is exiting out
of existence after information is recorded on the database.
5. The sequence diagram model can resolve issues regarding the flow of data by analyzing the time intervals
between each actor to another.

P a g e | 24
UML sequence diagram

P a g e | 25
Deployment model
Related Documents