Copyright by Lisa Kleinman 2010

Welcome message from author
This document is posted to help you gain knowledge. Please leave a comment to let me know what you think about it! Share it to your friends and learn new things together.
Transcript

Copyright
by
Lisa Kleinman
2010

The Dissertation Committee for Lisa Kleinman Certifies that this is the approved
version of the following dissertation:
Physically Present, Mentally Absent?
Technology Multitasking in Organizational Meetings
Committee:
Andrew P. Dillon, Supervisor
Randolph G. Bias
Gary K. Geisler
William E. Hefley
Sirkka L. Jarvenpaa

Physically Present, Mentally Absent?
Technology Multitasking in Organizational Meetings
by
Lisa Kleinman, B.S., M.B.A.
Dissertation
Presented to the Faculty of the Graduate School of
The University of Texas at Austin
in Partial Fulfillment
of the Requirements
for the Degree of
Doctor of Philosophy
The University of Texas at Austin
May 2010

Dedication
To my parents:
Theodore & Han Pun Kleinman

v
Acknowledgements
This dissertation transitioned from possibility to reality due to the guidance and
support extended by my committee members, family, and friends. My supervisor,
Andrew Dillon, diligently read and supplied feedback to all iterations of this work. Since
my first days at Texas, he has provided an indispensible collection of insights that shaped
my ability to think and write. The other members of my committee, Randolph Bias, Gary
Geisler, Bill Hefley, and Sirkka Jarvenpaa never wavered in their support of my efforts
and always offered thoughtful commentary.
My partner, Derek Walker, has been my best friend and sounding board
throughout this endeavor. My other good friends have all been an immense source of
encouragement: Maria Esteva, Maeve Garigan, Julie Guinn, Lance Hayden, Jason
Turner, Jeremy Wahl, and Jeremy Zelsnack. Finally, much appreciation is extended to all
of my other colleagues and the participants in this research who willingly shared their
own experiences and ideas that crafted this work.
vi
Physically Present, Mentally Absent?
Technology Multitasking in Organizational Meetings
Publication No._____________
Lisa Kleinman, Ph.D.
The University of Texas at Austin, 2010
Supervisor: Andrew Dillon
This research examines mixed reality meetings, a context where individuals
attend to both face-to-face group members while multitasking with technology. In these
meetings, members engage simultaneously with those physically present and those
outside of the meeting (virtual communication partners). Technology multitasking in
meetings has a dual effect: it not only impacts the individual user, it has the potential to
transform how collocated groups communicate and work together since attention
becomes fragmented across multiple competing tasks.
Qualitative and quantitative methods were used to investigate mixed reality
meetings across four themes: (1) the factors contributing to the likelihood to multitask
based on meeting type, polychronicity (one’s preference for multitasking), and cohesion
beliefs, (2) behavior during mixed reality assessed by copresence management, (3)
attitudes toward technology multitasking, and (4) subjective outcomes measured by
perceived productivity and meeting satisfaction. The qualitative data set consists of
fieldwork from a global software company and interviews with 8 information workers.

vii
The quantitative data are comprised of survey results from the fieldwork site (n=156) and
an online panel of information workers (n=110).
Results indicate that information workers perceive distinct meeting types that are
associated with implicit norms for appropriate technology multitasking. These norms
varied based on the relevance of a meeting segment and if a power figure was present. A
higher preference score for multitasking (high polychronicity) was significantly
correlated with increased technology multitasking and perceived productivity. Members
of cohesive teams exhibited the most technology multitasking and perceived their
teammates multitasking as appropriate. However, outsiders who exhibited the same
behaviors were viewed as rude and distracting. Overall, information workers who
multitasked during meetings did so with electronic communication tasks (e-mail and
instant messaging) as opposed to other computing tasks (e.g. writing documents,
researching information).
These findings are discussed in relation to psychological studies on multitasking,
computer-supported cooperative work, and social constructionist views of technology
use. This dissertation is a contribution to the assessment of technology use in social
settings, particularly in organizations where tasks are often interrupted and a reliance on
electronic communication tools impacts how people manage and accomplish work.
viii
Table of Contents
List of Tables ......................................................................................................... xi
List of Figures ...................................................................................................... xiv
CHAPTER 1: INTRODUCTION 1
Information Work & Mixed Reality ...............................................................1
Motivation & Significance of the Research ....................................................3
Research Overview & Questions ....................................................................6
Structure of Dissertation .................................................................................8
CHAPTER 2: LITERATURE REVIEW 10
Input-Process-Output Framework .................................................................10
Input: Meeting Types ....................................................................................17
Input: Polychronicity ....................................................................................23
Input: Cohesion Beliefs.................................................................................31
Process: Copresence Management ................................................................37
Process: Technology Multitasking ................................................................43
Output: Meeting Satisfaction ........................................................................44
Output: Perceived Productivity .....................................................................47
Conclusion ....................................................................................................49
CHAPTER 3: RESEARCH METHODOLOGY 52
Introduction ...................................................................................................52
Research Overview .......................................................................................53
Pilot Study – Phase 0: Methodology and Results .........................................56
Research Design - Phase 1: Case Study & In-Depth Interviews ..................66
Research Design - Phase 2: Survey at SoftwareCorp & Online Panel .........77
Alternative Methods Considered ..................................................................83
Limitations of the Research ..........................................................................85
Conclusion ....................................................................................................87
ix
CHAPTER 4: QUALITATIVE RESULTS (PHASE 1) 89
Theoretical Background & Conceptual Model .............................................89
Case Site Overview .......................................................................................91
Factors Contributing to Technology Multitasking (Theme 1) ....................113
Behaviors & Attitudes in Mixed Reality (Theme 2) ...................................121
Outcomes From Mixed Reality (Theme 3) .................................................125
Focused One-on-One Interview Summary .................................................129
Factors Contributing to Technology Multitasking (Theme 1) ....................131
Behaviors & Attitudes in Mixed Reality (Theme 2) ...................................142
Outcomes From Mixed Reality (Theme 3) .................................................150
Summary of Qualitative Data .....................................................................154
Conclusion ..................................................................................................156
CHAPTER 5: QUANTITATIVE RESULTS (PHASE 2) 157
Pilot Survey Instrumentation ......................................................................157
Pilot Survey Results ....................................................................................171
SoftwareCorp Survey (Wave 1) ..................................................................177
Data Overview & Re-Coding......................................................................183
Organization of SoftwareCorp – Wave 1 Survey Results ..........................184
Factors Contributing to Technology Multitasking (Theme 1) ....................185
Behavior in Mixed Reality Meetings (Theme 2) ........................................193
Attitudes Toward One’s Own Multitasking (Theme 3) ..............................194
Mixed Reality Meeting Outcomes (Theme 4) ............................................196
Summary of Findings (SoftwareCorp)........................................................197
ZoomTech Online Panel Survey (Wave 2) .................................................199
Summary of Findings (ZoomTech Panel)...................................................206
Conclusion ..................................................................................................218
CHAPTER 6: DISCUSSION AND CONCLUSION 220
Research Summary .....................................................................................220
Relationship to Other Research ..................................................................225
Conceptual Model & Relationship to Theory .............................................235

x
Managerial Contribution .............................................................................245
Limitations ..................................................................................................247
Broader Implications & Concluding Thoughts ...........................................252
Appendices ...........................................................................................................255
Appendix A: Interview Guideline for Qualitative Phase ............................255
Appendix B: Pilot Questionnaire Items ......................................................257
Appendix C: Survey Questionnaire - SoftwareCorp (Wave 1) ..................259
Appendix D: Survey Questionnaire - ZoomTech Panel (Wave 2) .............262
Appendix E: Survey Recruitment E-mail at SoftwareCorp ........................266
Appendix F: Supplementary Data ...............................................................267
References ............................................................................................................269
Vita……………………………………………………………………………...283

xi
List of Tables
Table 1: Summary of Research Hypotheses. ....................................................8
Table 2: Input-Process-Output Model of Mixed Reality. ...............................13
Table 3: Polychronicity Scales and Associated Reliability Score. .................25
Table 4: Group Environment Questionnaire (Carron et al., 1985). ................35
Table 5: Meeting Satisfaction Based on User Type & Group Norms .............47
Table 6: Research Questions and Associated Method. ...................................56
Table 7: Job Roles for Pilot Study Participants. .............................................57
Table 8: Job Role and Mixed Reality Experience. ..........................................60
Table 9: Summary of Interview Participants. .................................................76
Table 10: SoftwareCorp Participant Summary. ................................................96
Table 11: Summary of Observational Days at SoftwareCorp. ..........................97
Table 12: Example Time Log Segment for Case Site Participant. .................101
Table 13: Time Spent Working Alone vs. Spent Working with Others. ........107
Table 14: Sam’s Time/Task Log for Day 1. ...................................................110
Table 15: Charles’s Time/Task Log for Day 2. ..............................................110
Table 16: Overview of Sam’s Meetings at SoftwareCorp. .............................112
Table 17: Overview of Charles’s Meetings at SoftwareCorp. ........................113
Table 18: Sam’s Technology Multitasking Timeline in a Project Meeting. ...124
Table 19: Summary of Interview Participants. ...............................................129
Table 20: Data Coding for Qualitative Interview Data. ..................................130
Table 21: Meeting Types by Interview Participant. ........................................132
Table 22: Polychronicity Score and Multitasking in Meetings. ......................138
Table 23: Likelihood to Multitask Based on Need and Meeting Etiquette. ....141

xii
Table 24: Anticipated Impact of Changeover Zone on Research Constructs. 145
Table 25: Levels of Copresence Management. ...............................................148
Table 26: Perceived Productivity in Mixed Reality Meetings. .......................153
Table 27: Summary of Research Findings from Qualitative Phase. ...............155
Table 28: Related Scales to Research Constructs. ..........................................161
Table 29: Cronbach’s alpha Scores - Pilot 1 & Pilot 2. ..................................166
Table 30: Pilot Items for Technology Use Norms. ..........................................168
Table 31: Pilot Items for Cohesion Beliefs. ....................................................169
Table 32: Pilot Items for Copresence Management. .......................................170
Table 33: Pilot Items for Meeting Satisfaction. ..............................................171
Table 34: Pilot Items for Perceived Productivity. ...........................................171
Table 35: Demographic Characteristics - Pilot 1 & Pilot 2. ...........................173
Table 36: Statistical Correlations - Pilot 1 & Pilot 2. .....................................176
Table 37: Initial Cronbach’s alpha Values - SoftwareCorp (Wave 1). ...........178
Table 38: Low Communality Values - SoftwareCorp (Wave 1). ...................179
Table 39: Questionnaire Eigenvalues - SoftwareCorp (Wave 1). ..................180
Table 40: Factor Analysis Constructs - SoftwareCorp (Wave 1). ..................181
Table 41: Final Cronbach’s alpha Values - SoftwareCorp (Wave 1). ............182
Table 42: Construct Summary - SoftwareCorp (Wave 1). ..............................183
Table 43: Data Transformations - SoftwareCorp (Wave 1). ...........................184
Table 44: Research Hypotheses. .....................................................................185
Table 45: Cross-tab for Polychronicity Level & Laptop Use - SoftwareCorp188
Table 46: Std. Residuals for Polychronicity & Laptop Use - SoftwareCorp. .188
Table 47: Cross-tab for Cohesion Level & Laptop Use - SoftwareCorp. .......190
Table 48: Cohesion Beliefs & Laptop Use Analyses - SoftwareCorp. ...........191

xiii
Table 49: Cross-tab for Managerial Status & Laptop Use - SoftwareCorp. ...192
Table 50: Summary Statistical Correlations - SoftwareCorp (Wave 1). .........199
Table 51: Cohesion Beliefs Questionnaire Changes. ......................................201
Table 52: Copresence Management Questionnaire Changes. .........................201
Table 53: Final Cronbach’s alpha Values - ZoomTech (Wave 2). .................202
Table 54: Factor Analysis Constructs - ZoomTech (Wave 2). .......................203
Table 55: Questionnaire Eigenvalues - ZoomTech (Wave 2). ........................204
Table 56: Respondent Demographics - ZoomTech (Wave 2). .......................205
Table 57: Construct Summary - ZoomTech (Wave 2). ...................................206
Table 58: Multitasking Frequency by Meeting Type. .....................................207
Table 59: Wilcoxon Post-Hoc for Meeting Type & Multitasking Frequency.208
Table 60: Cross-tab for Polychronicity & Tech. Multitasking - ZoomTech...210
Table 61: Additional Polychronicity Analyses - ZoomTech (Wave 2). .........210
Table 62: Statistical Correlations - ZoomTech (Wave 2). ..............................217
Table 63: Overview of Hypotheses Supported - Wave 1 & Wave 2. .............219
Table 64: Prior Studies of Technology Use vs. Mixed Reality Research. ......220
Table 65: In-room & Electronic Copresence Scale Items. ..............................234
Table 66: Constructionist Frameworks and Mixed Reality. ...........................237
Table 67: Sam’s Time/Task Log for Day 2. ...................................................267
Table 68: Charles’s Time/Task Log for Day 1. ..............................................268

xiv
List of Figures
Figure 1: Conceptual Model for Mixed Reality. ..............................................14
Figure 2: Six Meeting Format Types (Volkema & Niederman, 1995). ...........18
Figure 3: Overview of Research Methodology. ...............................................54
Figure 4: Conceptual Model for Mixed Reality. ..............................................90
Figure 5: Researcher Position for Observations of Sam. .................................98
Figure 6: Sam’s Dual-Monitor Work Area. .....................................................98
Figure 7: Researcher Position for Observations of Charles. ............................99
Figure 8: Two Different Conference Room Configurations. .........................103
Figure 9: Figurative Graph of Technology Multitasking in Project Meeting.116
Figure 10: Decision Tree for Multitasking in Meetings. ..................................136
Figure 11: Polychronicity Scores for Qualitative Data. ...................................137
Figure 12: Level of Engagement with Technology and Group. .......................143
Figure 13: Polychronicity Score Chart - SoftwareCorp (Wave 1). ..................187
Figure 14: Cohesion Score Bar Chart - SoftwareCorp (Wave 1). ....................190
Figure 15: Polychronicity & Productivity Scatterplot - SoftwareCorp. ...........197
Figure 16: Polychronicity Score Bar Chart - ZoomTech (Wave 2). ................209
Figure 17: Cohesion Score Bar Chart - ZoomTech (Wave 2). .........................212
Figure 18: Cohesion and Productivity Scatterplot - ZoomTech. ......................216

1
CHAPTER 1: INTRODUCTION
INFORMATION WORK & MIXED REALITY
In the typical work day, information workers manage multiple activities at the
same time; they answer telephone calls, glance at e-mail, click to another program to
browse the web, and perhaps look around to notice who else is nearby. Information
workers are people whose daily work activities rely on the use of computing technologies
to manage and produce knowledge. One of the salient characteristics of information work
is that it often involves layering multiple activities or tasks. The act of switching between
tasks while concurrently working on them is called multitasking (Czerwinski, Horvitz, &
Wilhite, 2004; Wasson, 2004) and for simple activities people multitask without much
effort. It is rare for workers not to be multitasking, in fact, it is expected in most
organizations that people will manage their usage of time to handle different work
activities simultaneously (Kaufman-Scarborough & Lindquist, 1999).
Information work has become increasingly prevalent as a field of work due in part
to increased use of electronic communication (e.g. e-mail and instant messaging) and the
pervasiveness of portable technologies such as laptops and mobile phones. Electronic
mail is the primary online activity on the Internet (Pew Internet Research, 2003) and
instant messaging, which was originally perceived as a communication tool for casual
socializing, has now become an essential business tool (Forrester Research, 2007). This
increased reliance on technology for work tasks has changed the nature of multitasking in
the workplace. Previously, people were limited to working from their desks where
computers and phones were accessible. Today, technologies are no longer tethered to one
location and this leads workers to multitask in work contexts previously not possible. The
2
increased use and reliance on technology for work tasks in combination with access to
portable technologies leads some workers to habitually multitask throughout the day.
Definition of Technology Multitasking and Mixed Reality
One area of the work day that has been impacted by this continuous multitasking
is group meetings. Some workers use laptops or other portable devices like smartphones
(a mobile phone with additional features such as e-mail, access to web sites, and text
messaging) during meetings while simultaneously participating in the meeting.
Sometimes the technology is assisting the worker with the group meeting, and at other
times the technology is used to complete tasks unrelated to the group. This multitasking
has consequences both intended and unanticipated by the technology user. Rennecker &
Godwin (2005) describe these dual technological impacts as first- and second-order
effects, where the first-order effect is technology helps organize and improve workplace
communication, and the second-order effect is an increase in interruptions (and therefore
disorganization) to the workplace. When multitasking is used as a term in this
dissertation, it refers to these layered and interleaved work activities. If this multitasking
involves a portable technology, then it is identified as technology multitasking in this
research.
The fact that individuals multitask with technology in meetings is a complex issue
because the impacts are both beneficial and potentially distracting to group work. In this
dissertation, mixed reality is the term used to describe this context where group members
attenuate between both the physically present group and the use of technology. The term,
mixed reality, is borrowed from virtual reality researchers who use it to describe
environments where physical and digital objects exist together (Costanza, Kunz, & Fjeld,
2009). In this research, the term is applied to organizational groups where members may

3
be communicating with others both physically present and absent (electronic
communication partners). Individuals in this mixed reality environment work on a
mixture of tasks, some related to the group and others not. In mixed reality settings,
workers are faced with decisions on how to attend between information to be learned or
shared from face-to-face communication and information to be conveyed or processed
using technology. This research investigates how individual and group factors contribute
to creating mixed reality and the impact this new context has on the social processes and
behaviors of group members.
MOTIVATION & SIGNIFICANCE OF THE RESEARCH
The nature of technology use in group meetings has changed over the last ten
years. Through the mid-1990s most computing was confined to a user’s physical desk
space because technologies like the desktop computer are not easily portable. When
technology was being used in group settings, it was generally mandated as part of the
meeting. For example, a group leader would hold a meeting with a computer terminal
available for each team member to use for a pre-designated purpose (such as casting an
electronic vote). Another example of technology use in groups was a shared electronic
workspace that was controlled by a designated scribe; team members would contribute an
idea and the scribe would update the electronic workspace to reflect team inputs. In these
traditional uses of computing in groups, everyone in the meeting was using the same
technology in similar ways.
Prior Research on Technology Use in Group Settings
Electronic Meeting Support (EMS) and Group Support Systems (GSS) were the
two main research streams for investigating technology and group work in the late 1980s
through the mid-90s (e.g. Baecker, 1995 and Scott, 1999). Both EMS and GSS were

4
specific hardware and software systems that were developed to enhance face-to-face
meetings, but they differ in the type of group processes they intended to support. EMS
consisted of meeting rooms where each member was given a personal computer terminal
which was networked to a shared group computer and/or a large shared display. EMS
was developed to support collaborative work such as creating a group presentation or any
other tasks where multiple members needed to see and share information amongst each
other. Group Support Systems were developed to enhance group tasks such as decision
making, voting, and brainstorming. The typical GSS setup consisted of networked
computers in which members submitted their vote or idea which was then broadcast
anonymously on a large shared display using a software program designed for the task.
GSS studies differ from EMS research by enhancing a specific group task (e.g.
decision making) by modifying how group members contribute ideas, whereas Electronic
Meeting Support seek to augment the entire communication and collaboration processes
of the group. Another key difference between EMS and GSS is that EMS studies tended
to be exploratory and not experimental. The focus of most EMS studies was on the
development of networked technology-enhanced rooms; the study results were reported
as a description of events as people worked in these new settings (e.g. Halonen, Horton,
Kass, & Scott, 1990; Stefik et al., 1988). GSS studies, on the other hand, were typically
experiments in which specific aspects of group decision making were tested with the
purpose of improving teamwork using quantitative validity (see Scott, 1999 for a review
of GSS research). The relevance of these GSS and EMS research streams are further
discussed in the literature review (Chapter 2).
Since that time, the development of multiple types of portable technologies has
changed where computing takes place in the office and this has impacted organizational

5
meetings. Workers are now easily able to carry laptops, mobile phones, personal digital
assistants and other forms of technology into meetings where the use of technology is no
longer mandated or controlled by the meeting leader. And, the proliferation of wireless
networking and associated software applications now means that these technologies can
support more communication and information tasks than previously possible. Lyytinen &
Yoo (2002) describe cellular and wireless networks as nomadic information
environments since it allows people to connect to multiple sources of information
regardless of physical location both inexpensively and quickly.
Relevance of Collocated Group Work
With this increased access to information, the attention of group members may
begin to compete between the meeting at hand and the technology. When we
communicate face-to-face, individuals use non-verbal cues such as facial expressions and
posture, and verbal cues like tone of voice and cadence to convey information (Schober
& Brennan, 2003). There is also a feedback process between speakers and listeners with
structured patterns for how dialogue is acknowledged and proceeds. The presence of
portable technologies allows users to break from these traditional conversational cues,
creating new challenges for understanding group work. For example, technology users
may miss nonverbal cues such as a nodding of head when their attention is focused on the
technology.
While the use of technology in teams, particularly for distributed/virtual groups,
has become common with videoconferencing and online chatting, the need for collocated
team meetings persists. When group members are proximate to each other, they are able
to communicate more efficiently and with greater richness compared to distributed teams
(Kiesler & Cummings, 2002). Teams that are collocated have more continuous

6
communication which makes coordination and learning easier (Olson, Teasley, Covi, &
Olson, 2002). Field research by Olson et al. found that radically collocated teams (team
members who all work in a shared project room) are twice as productive as teams that are
―merely nearby.‖ However, when workers multitask with technology the concept of
collocation becomes fragmented as team members are no longer fully present as they
attend to both group members and technology. This change in team meetings to a mixed
reality environment elicits many questions for how group work is changed.
The issue of how people multitask in groups is significant to study because there
are currently few studies that explore the implications it has on individuals and group
processes. This research can help inform the design of technologies to support the way
people multitask across varying contexts. Previously, research on group work did not
need to consider the impact of technology multitasking as either an enhancement or
disruption to team meetings because it was presumed that everyone was working in
similar ways. As technologies began to enter group settings, the research that examined
group processes assumed that each group member worked simultaneously and in similar
ways with the technology. In mixed reality, there is no preordained manner in which
technology is used, and its use is not constant or necessarily predictable across group
members. This research will extend and contribute to our theoretical understanding of
group work by examining how technology multitasking occurs and how the social
processes and behaviors of individuals are impacted in group settings.
RESEARCH OVERVIEW & QUESTIONS
This research takes a broad approach to mixed reality by focusing on four main
areas of the phenomenon: 1) the individual and group factors that lead to technology
multitasking in meetings, 2) the behaviors of people during mixed reality meetings, 3) the

7
attitudes of group members in mixed reality, and 4) the productivity and satisfaction
outcomes of these meetings. These four areas are first united into a conceptual model that
is developed from the literature review and pilot study.
Then, there are two phases of research which aim to validate the conceptual
model: a qualitative phase consisting of fieldwork and interviews with real world
information workers, and a quantitative phase using survey data collected from
information workers from across the United States. The survey employs hypothesis
testing with questions developed from the conceptual model and qualitative results (see
Table 1 below). The first row in the table, Proposition 1 (P1), is defined as a proposition
and not a hypothesis because no specific prediction is made in advance about which types
of meetings contribute to technology multitasking.
Research Hypotheses
P1: The context of the meeting (the meeting type) will influence the decision to multitask with technology.
H1: Individuals high in polychronicity will multitask with technology more than those low in polychronicity.
H2: Individuals who are highly cohesive with their teams will multitask less.
H3: Managers will multitask with technology more than non-managers.
H4a: Individuals high in polychronicity will manifest greater electronic copresence.
H4b: Individuals low in polychronicity will manifest greater in-room copresence.
H5: Individuals who feel cohesive with their immediate team will have greater in-room copresence.
H6: Individuals who feel cohesive with their team will believe that others on their team multitask appropriately.

8
H7: Individuals high in polychronicity will have higher self-efficacy with technology multitasking.
H8: Individuals high in polychronicity will perceive meetings as more productive when technology multitasking occurs.
H9: Individuals who feel cohesive with their immediate team will perceive less productivity with technology multitasking.
Table 1: Summary of Research Hypotheses.
STRUCTURE OF DISSERTATION
This dissertation is organized into six chapters followed by the appendices
containing the interview protocol, survey questionnaires and supplementary data. A brief
overview of each chapter is presented here:
Chapter 1: Introduction. The phenomenon of mixed reality is defined and the
scope of the research is presented in brief and the research questions are introduced.
Chapter 2: Literature Review. A detailed review of existing work that pertains to
the research questions is examined. The relationship of this prior work is discussed as it
relates to mixed reality.
Chapter 3: Methodology. A description of the qualitative and quantitative
methodology used to investigate the topic. Chapter 3 includes the results from a pilot
study (15 interviews) as it relates to methodological implications and a presentation of
the conceptual model that is derived from the literature review and pilot work.
Chapter 4: Qualitative Results (Phase 1). The results from fieldwork at a software
corporation are presented and the data from 8 focused interviews with information
workers.
9
Chapter 5: Quantitative Results (Phase 2). The results from two survey waves are
discussed. The first survey wave (n=156) consists of data collected from the software
corporation used in Chapter 4, and the second survey wave (n=110) is obtained from an
online panel of information workers.
Chapter 6: Discussion & Conclusion. The results from both the qualitative and
quantitative phases are discussed and a case is built for the implications of this data.
Applications for this research are presented as it relates to theory and management, and
the limitations of this work are addressed.
Appendices. All research instruments are presented in the appendices including
interview protocols and survey questionnaires.

10
CHAPTER 2: LITERATURE REVIEW
In Chapter 2 the conceptual model used to address the research themes is
presented. The model uses an input-process-output framework that links the individual
and group factors contributing to mixed reality (inputs) to the behaviors and attitudes of
team members in these meetings (processes). These processes are then related to meeting
outcomes of productivity and satisfaction (outputs). This model is developed from the
literature review which analyzes the major theoretical constructs about individual
behaviors in groups as it relates to technology multitasking.
INPUT-PROCESS-OUTPUT FRAMEWORK
Relationship of Mixed Reality to Prior Research
In its most basic abstraction, mixed reality is a context where some people use
technology in group meetings. The study of technology use in group meetings is not a
new research area—it has been a well-established area of study since the feasibility of
using technology for group work has been possible. However, most of the prior research
on this topic has focused on how a specific technology given to all members improved
group work, such as studies on electronic voting systems (e.g. Baecker, 1995; Scott,
1999), groupware for editing documents collectively (e.g. Stefik et al., 1988) and
electronic meeting rooms (e.g. Halonen et al., 1990). In these previous studies of
technology use in meetings, every group member had access to the same technology and
generally worked collectively with the technology, which was viewed as an
embellishment to the group meeting. In mixed reality, the type of technologies used and
the tasks accomplished are not the same across group members. Furthermore, this

11
research does not assume that technology is an enhancement to the group since its use
also has the potential to detract from the group.
Another fundamental viewpoint difference between this research and many
previous studies about technology use in groups is that the focus is not on trying to
understand if technology use gives rise to an immediate performance outcome. In this
research, group performance is viewed from a social perspective meaning that technology
use is studied as it impacts member’s behaviors and interpersonal relationships in the
team dynamic. Successful group performance in this social perspective is a byproduct of
a team that works well together. Essentially, groups that work well are deemed to be
cohesive (for a review of social cohesion see Friedkin, 2004), which is defined here as
the combination of individual task commitment along with positive interpersonal
interactions between members which form a sense of bonding and unity across a team.
Input-Process-Output Constructs
To explain this diversity in how mixed reality meetings occur, seven constructs
will be used in this literature review to inform the conceptual model. In this review, these
constructs serve as guiding points to relate different theoretical perspectives in explaining
mixed reality. The purpose of the model is to:
explain how mixed reality occurs through a combination of individual factors
and group norms,
link these individual factors and group norms to the different ways technology
multitasking occurs in meetings, and to the different attitudes and behaviors of
group members, and
12
demonstrate how mixed reality can be assessed as it impacts the social
outcomes of individual team members through perceived productivity and
meeting satisfaction.
To understand the forces shaping mixed reality, this research framework starts by
utilizing the functional perspective of small group research (Poole, Hollingshead,
McGrath, Moreland, & Rohrbaugh, 2004; Wittenbaum et al., 2004). The purpose of the
functional perspective is to understand how goal-oriented groups work together with the
aim of explaining, predicting, and improving group effectiveness. As a point of contrast,
other key perspectives in small group research include psychodynamic (e.g. Rutan &
Stone, 1993) and temporal (e.g. Arrow, Poole, Henry, Wheelan, & Moreland, 2004)
perspectives which examine the emotional underpinnings of group dynamics and the
changes that occur in groups over time, respectively.
The functional perspective has been applied to a variety of topics in small group
research. For example, theories that fall under the functional perspective include the
reasons why groupthink can occur, the task setting and individual motivations for
effective group decision making, and understanding the different kinds of conflict that
occur in teams (Wittenbaum et al., 2004). The commonality that binds these different
research topics under the functional perspective is the conceptualization of group
effectiveness in terms of a set of inputs, processes, and outputs.
The functional perspective is the most appropriate theoretical starting point for
this research because it allows for a multitude of different constructs to be considered;
these constructs are organized as a set of relevant inputs, processes, and outputs (IPO).
Inputs to the model are characteristics about the team itself. The processes of interest are
any factors that occur while the group works together, and outputs are the outcomes to be

13
measured. In this research, the inputs, processes, and outputs are defined below in Table
2; each of the constructs listed will be reviewed in-depth in the literature review
following the definitional overview of the model.
Inputs Processes Outputs
Meeting Type Polychronicity Cohesion Beliefs
Technology Multitasking Copresence Management
Perceived Productivity Meeting Satisfaction
Table 2: Input-Process-Output Model of Mixed Reality.
Definitions of IPO Research Constructs
In this section, each of the IPO constructs is defined and an explanation is given
for how these constructs interrelate. Following this introduction to the model, the
literature review pursues an in-depth analysis of these constructs in relation to prior
research as it pertains to mixed reality.
Meeting Type: The format of the meeting based on its main purpose and
attendees. The main meeting types for information workers are: staff meetings,
sales/pitch meetings, internal project meetings, external project meetings and company-
wide meetings. See Chapter 3 for the pilot study which identified these common meeting
types.
Polychronicity: An individual's preference and belief that multitasking is the best
way to accomplish multiple tasks.
Cohesion Beliefs: An individual’s beliefs about the importance of positive group
member relationships and the individual’s commitment to the task.
Technology Multitasking: The type of work tasks for which an individual uses
portable technologies for during a meeting (either ―private‖ tasks or group tasks).

14
Copresence Management: The verbal and nonverbal signals individuals using
technology send toward others to indicate that they are attending to the collocated group
(in-room copresence). And, the verbal and nonverbal signals sent to electronic
communication partners to indicate availability for interaction (electronic copresence).
Perceived Productivity: The subjective assessment individuals have toward how
productive they felt during the meeting.
Meeting Satisfaction: The subjective assessment individuals have toward how
well their time was used during the meeting.
The IPO framework is outlined in Figure 1 and each of the seven constructs
defined briefly above will be given additional explanation and consideration in the
following sections.
Figure 1: Conceptual Model for Mixed Reality.
Research has demonstrated that common meeting types exist across various
organizations (Volkema & Niederman, 1995) and that groups develop norms that lead to
a set of typical and expected behaviors for people in given situations (Feldman, 1984).
Research has also shown that groups have specific ways in which they expect

15
technologies to be used (Postmes, Spears, & Lea, 2000). The first part of the conceptual
model is based on these general findings that, depending on the type of meeting, we
expect there to be a group norm for how technology is used. However, as adaptive
structuration theory models, group norms are not the only influence for how technologies
are used in organizations (Orlikowski, 2000). Individuals have their own motivations and
expectations which can differ from group norms, and it is the interplay between the
individual and group in specific work contexts which impacts technology use.
There are two parts to the structurational model that shape how technologies are
used in practice: embodied structures and user appropriation. Embodied structures are
features of the technology designed by the originators of the tool. Designers have
intentions and expectations for how the technology is supposed to be used from their
perspective; for example only allowing a particular sequence of actions to be taken by the
user in a given state. These structures are designed to guide users into a system that
matches organizational rules and operating procedures.
The second part of the structurational model accounts for how users decide to
change, bypass or ignore these technology structures. The embodied structures designed
into the technology are modified by users through practice; despite the expectations of
use built into the system by designers, users will find ways to make technology better
match their individual needs. The role of context shapes this appropriation too—users do
not use the same technology in the same way across situations. Technology use is re-
contextualized as situations change, and this idea works well for modeling mixed reality
since different meeting types will likely impact why and how someone decides to use
technology.

16
Depending on the type of meeting attended, some individuals may decide to
manage their level of copresence so that they appear more available to others in the same
room—for example, individuals who typically use technology may not to do so in certain
meeting types where they believe it may signal rudeness or not paying attention. The
conceptual model proposes that individuals who have positive cohesion beliefs are more
likely to manage copresence in a way that demonstrates that their focus of attention is
with the collocated group activity.
Cohesion beliefs in this model are defined as a combination of task commitment
and positive interpersonal interactions. When group members are highly committed to the
group task they may use technology for private work less because they are focusing their
attention on the group task. And, when individuals value positive interpersonal
interactions with other group members, this may result in managing copresence with
other group members in ways that signal they are available for interaction.
Individuals using technology in group meetings may try to manage how available
they appear to others who might contact them electronically (e.g. via instant messaging or
e-mail). Does copresence management occur with electronic others by changing
electronic status messages (e.g. ―away from desk‖ availability status in instant
messaging)? Some evidence from McCarthy et al. (2004) suggests that people announce
to others during electronic communication that they will be focusing their attention
elsewhere (so online messages will not be responded to as quickly).
During mixed reality meetings, technology may be used for either private work
(work that does not immediately pertain to the group task) or in ways that assist with the
goals of the group. Extrapolating from the research on polychronicity and task
satisfaction (Cotte & Ratneshwar, 1999), individuals who are polychronic should be more

17
satisfied during meetings because they can accomplish other work simultaneously.
However, other group members (who are not using technology) in the meeting may not
attribute the same positive value toward being in a meeting and multitasking, and they
may rate their satisfaction with the meeting lower due to other people’s technology use.
In the following sub-sections, each of the conceptual model constructs is explained in
more depth with supporting literature.
INPUT: MEETING TYPES
Intuitively we know that our interactions with other people changes depending on
the situational context. In some organizational meetings, individuals may be compelled to
change their behavior in such a way to be more attentive to the group’s needs. These
behavioral changes may occur, for example, because outsiders are present and a ―good
impression‖ is desired. Therefore, the conceptual model begins with the idea that the type
of meeting has an effect on how someone decides to use technology. Even when
outsiders are not present, group members who technology multitask may still want to
demonstrate to their meeting peers that they are actively engaged in the meeting.
Furthermore, the type of meeting may be an indicator of how relevant the meeting is to
the user; and less relevant meeting segments may be more prone to technology
multitasking.
Defining Meeting Types
Organizations have various kinds of meetings that differ in their purpose,
attendance, and behavioral expectations. However, across organizations there are
stereotypical meeting types that are common. Research by Volkema & Niederman (1995)
defines six main meeting formats as shown in Figure 2. Each meeting format is
distinguished by its overarching purpose and communication structure, but the formats
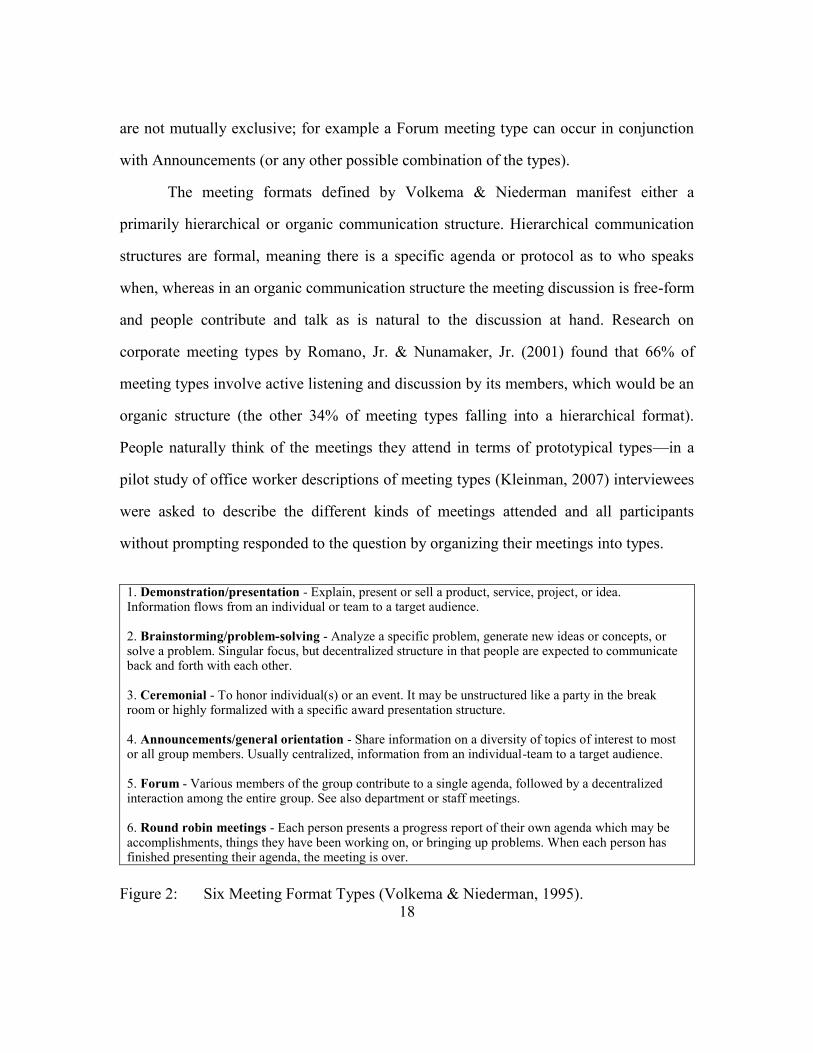
18
are not mutually exclusive; for example a Forum meeting type can occur in conjunction
with Announcements (or any other possible combination of the types).
The meeting formats defined by Volkema & Niederman manifest either a
primarily hierarchical or organic communication structure. Hierarchical communication
structures are formal, meaning there is a specific agenda or protocol as to who speaks
when, whereas in an organic communication structure the meeting discussion is free-form
and people contribute and talk as is natural to the discussion at hand. Research on
corporate meeting types by Romano, Jr. & Nunamaker, Jr. (2001) found that 66% of
meeting types involve active listening and discussion by its members, which would be an
organic structure (the other 34% of meeting types falling into a hierarchical format).
People naturally think of the meetings they attend in terms of prototypical types—in a
pilot study of office worker descriptions of meeting types (Kleinman, 2007) interviewees
were asked to describe the different kinds of meetings attended and all participants
without prompting responded to the question by organizing their meetings into types.
1. Demonstration/presentation - Explain, present or sell a product, service, project, or idea. Information flows from an individual or team to a target audience. 2. Brainstorming/problem-solving - Analyze a specific problem, generate new ideas or concepts, or solve a problem. Singular focus, but decentralized structure in that people are expected to communicate back and forth with each other. 3. Ceremonial - To honor individual(s) or an event. It may be unstructured like a party in the break room or highly formalized with a specific award presentation structure. 4. Announcements/general orientation - Share information on a diversity of topics of interest to most or all group members. Usually centralized, information from an individual-team to a target audience. 5. Forum - Various members of the group contribute to a single agenda, followed by a decentralized interaction among the entire group. See also department or staff meetings. 6. Round robin meetings - Each person presents a progress report of their own agenda which may be accomplishments, things they have been working on, or bringing up problems. When each person has finished presenting their agenda, the meeting is over.
Figure 2: Six Meeting Format Types (Volkema & Niederman, 1995).

19
When we consider the type of meeting that technology multitasking will likely
have the most impact, it is project meetings (as opposed to informal social meetings,
large ―all-hands‖ company-wide meetings, and general status update meetings). Project
meetings (similar to Volkema & Niederman’s Forum meeting type) are characterized by
a set of individuals (often in differing job roles) united by a common work goal. In
project meetings, communication and collaboration between group members is essential
to the success of the meeting, therefore if some group members are distracted by
technology use, this has the potential to impact how well the group works together.
A survey conducted with 165 executive MBA students by Kinney & Panko
(1996) summarized data on the characteristics of project meetings: they have a mean size
of 7.7 people, with a median of 7, and a range of 3 to 16 attendees. The duration of the
projects is a mean of 4.6 months and there is a mean of 16.5 meetings held per project.
The implication of these general characteristics about project meetings for mixed reality
research is that norms will develop over time because of the project length and that
meetings are an essential feature for how the project proceeds.
Group Norms and Meeting Type
For each meeting type, there will be both implicit and explicit rules developed by
each group for how the meeting proceeds in terms of behavioral expectations. People
have scripts that they develop which are internal guidelines for how they decide to
behave in particular settings. Originating from the work of cognitive psychologists,
Schank & Abelson (1977), the concept of a schema explains the cognitive mechanism for
how people understand and give meaning to social information or social situations.
Scripts are structured patterns of regular behaviors in a given context which allow people
to more easily understand social situations and serve as a guide to what is considered
20
appropriate behavior in that context. Script theory has been applied by Gioia & Poole
(1984) to organizational settings to explain how group meetings, performance appraisals,
and other common work interactions follow familiar and predictable patterns that enable
people to navigate meaning and reference. In their framework, they suggest that script
theory needs to account for people’s perceptions of their own behavior in addition to the
person’s interpretation of the same behaviors by others. These rules (or scripts) for
behavior are often described by other researchers as norms.
When people become socialized into groups, they learn to identify with the group
through interactions with other members. When this socialization is successful, people’s
sense of self begins to identify with the group and they act in ways that are considered
appropriate for the group’s norms (Cotte & Ratneshwar, 1999). When people fail to agree
with group norms, they may be obliged to follow the norm regardless, which is called
compliance (Fulk, 1993). Research has found that people comply with norms for a
number of reasons such as avoiding negative evaluations. Turner, Grube, Tinsley, Lee, &
O’Pell (2006) found support for employee performance evaluations being linked to the
organizational norms for technology use. In a survey by Turner et al., employees who
received a large number of e-mails but did not respond to these messages were rated
lower in their performance evaluation (where the organizational norm valued prompt
replies to electronic communication). When group members internalize norms, they
accept and incorporate these norms into their own attitudes and behaviors. However, in
other cases, compliance occurs when individuals are cognizant of the norms and do not
internally accept them, but follow the norms anyway to maintain harmony within the
group.

21
Group norms are expectations about behavior that influence how each member
regulates her or his actions in the group. For example, in many public social settings the
norm for mobile phones is that the ringing feature should be turned-off or very quiet. This
norm can be made explicit through physical signage or auditory messages that prompt
people to ―Please silence your mobile phone.‖ Implicitly, this norm is reinforced when
someone becomes visibly embarrassed by the ringing of his or her phone, or if another
person projects an unkind glance toward someone’s ringing phone. Every group has its
own norms for what types of technology use are acceptable for a given meeting type, and
these norms can impact group productivity because it influences how members behave
(Feldman, 1984). In the example, if norms were not followed about mobile phones
ringing, interruptions could occur so frequently in a face-to-face meeting as to make it
impossible to communicate effectively. While this example could be considered the
extreme, there is anecdotal evidence in popular business articles (e.g. ―Minding the
Meeting, or Your Computer?‖ in the New York Times, 2007), that discuss the
widespread sense of annoyance and rudeness that using a laptop can cause in a group
meeting.
Group norms are an essential part to understanding how members regulate
technology use in mixed reality settings, but these norms can be difficult to identify
because groups do not ―establish or enforce norms about every conceivable situation‖
(Feldman, 1984, p. 47). Additionally, these norms for technology use can be ambiguous
because technologies operate in multiple modes—someone ―surfing‖ the web for movie
show times is potentially quite different than this same person looking up information on
the web relevant to what the group is discussing. Given the mutability of a technology’s
22
functionality, other factors must determine the ways in which technology is understood as
a group norm.
Feldman describes four main ways in which most group norms develop:
(1) explicit statements by supervisors or co-workers (e.g. before the meeting
begins, the meeting leader asks everyone to turn off mobile phones)
(2) critical events in the group’s history (e.g. someone is publicly reprimanded
for technology multitasking in the meeting, or a memo is sent to everyone in the company
outlining a technology use policy for meetings)
(3) primacy (the first behavior pattern that emerges in a group sets the
expectation)
(4) carry-over behaviors from past situations (what we’ve experienced from
prior settings influences our expectations of appropriate behavior)
Given that the norms for technology use may be more subtle than just ―it’s used in
meetings or it’s not,‖ Ryan’s (2006) concept of information handling helps identify how
social expectations impact technology use. In Ryan’s model, social rules can override
technical possibility in the realm of information exchange—he gives as an example that a
wedding invitation is not sent via e-mail, even though it is technically feasible to do so.
The social norms of our culture prescribe what the proper form of communication should
be and for what kinds of information it is acceptable to share electronically.
Ryan posits that there is an information order for how information is acquired,
stored, concealed and disseminated and for how this information is distributed across
collective, public and private knowledge sources. Individuals and organizations make
decisions about how to share information and this occurs through a socialization process

23
that creates these norms. The implication of these norms for mixed reality is that the
social order may override what individuals want to do and the technological possibilities.
This section on meeting types identified the main organizational meeting formats
and how group norms for technology multitasking are anticipated to differ across these
types. In the next section, the individual characteristic of polychronicity is defined and its
role on shaping technology multitasking is described.
INPUT: POLYCHRONICITY
While the type of meeting may play a strong role in determining how technology
multitasking occurs, individual motivations may have an equally relevant role. In the
conceptual model, polychronicity is proposed as an individual factor that will also
determine if and how technology is used during meetings. There is an emerging body of
research which suggests that people who prefer to multitask as their work style (high
polychronicity) are more likely to use technology in meetings and evaluate others who
multitask in this way more favorably.
Defining Polychronicity
In mixed reality, individuals who technology multitask can be considered to have
a polychronic work style. Polychronicity is a term that describes people who prefer to
work on multiple activities or tasks simultaneously (Kaufman-Scarborough & Lindquist,
1999). A person who is oriented toward polychronicity perceives time as occurring in
such a way that different activities can be layered simultaneously. Conversely, a
monochronic individual is one who perceives time as discrete segments which are then
ideally allocated to one activity per given segment.
Individuals who prefer to work in a monochronic fashion will typically set up
activities to avoid interruptions (Kaufman-Scarborough & Lindquist, 1999). The

24
monochronic-polychronic scale is a continuum—an individual’s preference for a
particular time orientation is not only monochronic or polychronic, people can fall into a
middle range too. Lindquist & Kaufman-Scarborough’s (2007) survey of 375 non-
students in a Midwestern US city found a mean value of 4.72 for polychronicity
orientation on a 1 to 7 Likert scale. A score closer to 1 indicated a preference for
monochronic behavior and a score closer to 7 a preference for polychronicity.
Cotte & Ratneshwar (1999) propose that an individual’s
polychronicity/monochronicity orientation is derived primarily from the dominant culture
one lives in, but social and work groups and individual preferences also shape one’s
attitude toward polychronicity. The temporal pacing of work impacts people’s attitudes
and how they schedule and manage multiple activities at the same time. In most
workplaces people work polychronically, especially when using a computer which allows
for multiple work tasks to be available simultaneously on a single screen. However, while
people often work in a polychronic manner, people do not attribute the same value
toward working in this way. Cotte & Ratneshwar propose that some people will feel
negatively toward working polychronically; they will feel stressed and perceive that the
quality of their work is less because they cannot focus methodically on one thing at a
time. Other people, however, will feel that polychronic work is efficient and allows for a
smoother and more accomplished work day from which they derive satisfaction.
Individual attitudes toward polychronicity have been shown to impact how groups
perceive and use time. Waller, Giambatista, & Zellmer-Bruhn (1999) explain how
individual perceptions toward time use act as a pacing mechanism or catalyst for group
activities. Having different perceptions toward time can subsequently impact how groups
work together. In an experimental study using MBA students assigned to different ―time

25
urgency‖ project conditions, Waller et al. observed how individual group members
reacted to changes in the experiment’s project deadline by coding verbal statements about
time and the frequency of looking at a clock or watch. Waller et al. found that individuals
in group settings can act as catalysts to move a meeting along by comments such as
―Okay, let’s push through this and get to the next thing on the agenda.‖ These types of
comments can play a role in how the group completes their work. Similarly, for mixed
reality, one might expect that when individuals multitasking with technology are
perceived as the standard, that others may feel that working polychronically is the ―right
way‖ to work, and therefore may change their orientation toward polychronicity.
Measurement of Polychronicity
There have been multiple efforts to create a reliable measure of polychronicity as
shown in Table 3.
Polychronicity Scale Citation Cronbach’s alpha
1 Polychronic Attitude Index (PAI)
Kaufman et al., 1991 .67
Polychronic Attitude Index 3 (PAI3) Kaufman-Scarborough & Lindquist, 1999
.82
Modified Polychronic Attitude Index (MPAI)
Lindquist et al., 2001 .88
Inventory of Polychronic Values (IPV) Bluedorn et al., 1999
.86
Monochronic Work Behavior Frei et al., 1999
.50
Polychronic-Monochronic Tendency (PMTS)
Lindquist & Kaufman-Scarborough, 2007
.93
1 Nunnally (1978) recommends a Cronbach’s alpha value of at least .70 for reliability
Table 3: Polychronicity Scales and Associated Reliability Score.

26
The initial Polychronic Attitude Index (PAI) scale by Kaufman, Lane, &
Lindquist (1991) was developed using a survey of households where at least one adult
was employed full time. The Kaufman et al. study asked people about their attitudes
toward performing multiple tasks simultaneously, which were developed into the PAI
scale (shown below). The questionnaire asked participants about their preferences for
performing multiple activities (such as eating while driving, doing something else while
watching television, and so forth), with the goal of understanding if a person’s attitude
toward polychronicity could be linked to the likelihood they would manage their
everyday activities in a manner reflecting this attitude.
Polychronic Attitude Index (PAI) Scale 1) I do not like to juggle several activities at the same time 2) People should not try to do many things at once 3) When I sit down at my desk, I work on one project at a time 4) I am comfortable doing several things at the same time
The sample used to develop the PAI scale consisted of households from an urban
residential neighborhood in the United States. In-person survey data was collected from
every fifth household in designated neighborhood clusters, with final data collection
consisting of 310 questionnaires from 42% male, 58% female respondents. About sixty-
three per cent (63.2%) of the respondents worked at least 40 hours per week, median age
fell in the 26-35 years old range, and median income was in the $45,000-$49,000 range.
This initial test of the PAI scale resulted in a .67 reliability coefficient, which is below the
recommended .70 Cronbach’s alpha value.
Further refinement of the PAI occurred in Kaufman-Scarborough & Lindquist
(1999) using a similar population and sampling method, and the Cronbach’s alpha value
was improved when item number 3 was removed from the scale. PAI-3 (as it was called
in this iteration) omitted question 3 because the wording about ―sitting at a desk‖ seemed

27
to bias the results in such a way that participants did not understand or believe that this
question was relevant to their personal experience. When this question was removed, the
reliability of the PAI-3 was .87, well above the recommended value.
Lindquist, Knieling, & Kaufman-Scarborough (2001) then modified the PAI-3 to
test whether Japanese students perceive and use time differently than US students in a
cross-cultural survey of polychronicity. Fifty-two US students at the same university
volunteered to complete the modified PAI-3 questionnaire as part of a classroom activity,
and 68 Japanese students from this same university were recruited via activity clubs and
student centers and completed the questionnaire with an incentive. The three item scale
used for the new version of PAI-3 (now called the MPAI) were:
Modified Polychronic Attitude Index (MPAI) 1) I like to juggle several activities at the same time 2) People should try to do many activities at once 3) I am comfortable doing several activities at the same time
The first two statements were changed from negative to positive when compared
to the earlier version of PAI/PAI-3. Furthermore, the word "things" was changed to
"activities" in the first two items to provide consistency in wording for the respondents.
While the small and non-random sample makes the generalizability of this study weak,
the authors did find statistically significant support that Japanese students exhibit a
preference for working monochronically. These changes to the scale resulted in a
Cronbach’s alpha value of .88.
Other researchers have worked on the PAI scale in order to improve its reliability.
Bluedorn, Kalliath, Strube, & Martin (1999) created the Inventory of Polychronic Values
(IPV) scale which aimed to more reliably assess polychronicity compared to the original
PAI. An initial IPV scale was developed using the responses from 89% of the population
of employees who worked at a medium sized bank in the United States (the sample was
28
205 respondents across all organizational levels within the bank). This initial version of
the IPV was then further refined to improve internal consistency by adding additional
questions and testing a new sample of 115 college business majors. The resulting IPV
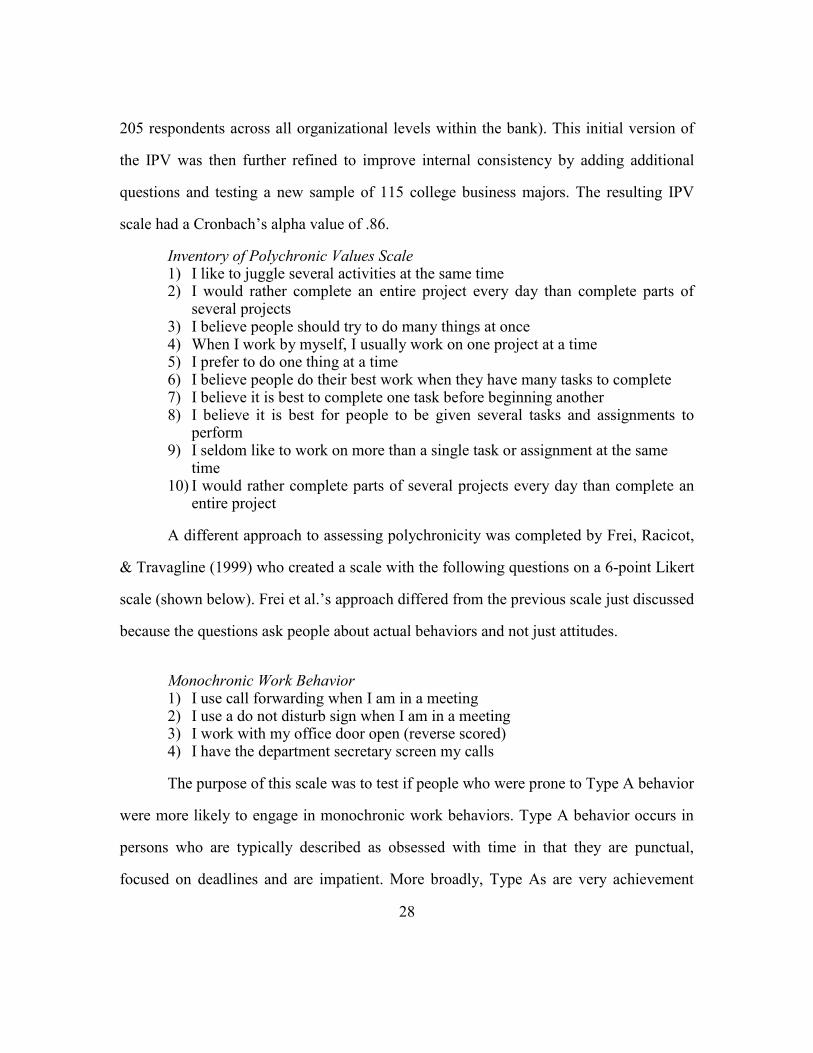
scale had a Cronbach’s alpha value of .86.
Inventory of Polychronic Values Scale 1) I like to juggle several activities at the same time 2) I would rather complete an entire project every day than complete parts of
several projects 3) I believe people should try to do many things at once 4) When I work by myself, I usually work on one project at a time 5) I prefer to do one thing at a time 6) I believe people do their best work when they have many tasks to complete 7) I believe it is best to complete one task before beginning another 8) I believe it is best for people to be given several tasks and assignments to
perform 9) I seldom like to work on more than a single task or assignment at the same
time 10) I would rather complete parts of several projects every day than complete an
entire project
A different approach to assessing polychronicity was completed by Frei, Racicot,
& Travagline (1999) who created a scale with the following questions on a 6-point Likert
scale (shown below). Frei et al.’s approach differed from the previous scale just discussed
because the questions ask people about actual behaviors and not just attitudes.
Monochronic Work Behavior 1) I use call forwarding when I am in a meeting 2) I use a do not disturb sign when I am in a meeting 3) I work with my office door open (reverse scored) 4) I have the department secretary screen my calls
The purpose of this scale was to test if people who were prone to Type A behavior
were more likely to engage in monochronic work behaviors. Type A behavior occurs in
persons who are typically described as obsessed with time in that they are punctual,
focused on deadlines and are impatient. More broadly, Type As are very achievement

29
oriented, set ambitious goals and expectations, and are highly competitive. The authors
wanted to examine the relationship between Type A behavior traits and whether this
personality type took specific steps to minimize distractions while working (the
monochronic work behavior). In this study, a sample of 147 college professors at a
technical college in the United States was used to create a scale for monochronic work
behaviors. Frei et al. asked psychology professors in their department ―What do you do to
minimize interruptions when you are working?‖ The responses to this question resulted in
the 4-item scale above. In this study, the Cronbach’s alpha value was .50 indicating that
the Monochronic Work Behavior scale is not the most promising measurement for
polychronicity.
In terms of the boundary conditions for polychronicity, the PAI (and its later
iterations) has been used to measure polychronicity across different contexts including
students use of time (Lindquist et al., 2001), the banking industry (Bluedorn, Kaufman, &
Lane, 1992) and as a construct related to culture and gender (Manrai & Manrai, 1995).
The IPV, on the other hand, is more specifically linked to work tasks and workplace
behaviors as reflected in the wording of its questions. The development of the
Polychronic-Monochronic Tendency Scale (Lindquist & Kaufman-Scarborough, 2007) is
a recent effort to define polychronicity as a trait independent of context.
To develop the Polychronic-Monochronic Tendency Scale (PMTS), the authors
created a survey instrument of 50 statements related to time-use and gathered responses
from 256 adults (50% male, 50% female). The results from this survey were used to
create the PMTS shown below, which was then further tested for internal consistency and
discriminant validity. The Cronbach’s alpha value for the PMTS is .93.

30
Polychronic-Monochronic Tendency Scale (PMTS) 1) I prefer to do two or more activities at the same time 2) I typically do two or more activities at the same time 3) Doing two or more activities at the same time is the most efficient way to use
my time 4) I am comfortable doing more than one activity at the same time 5) I like to juggle two or more activities at the same time
Based on these studies, it has been demonstrated that polychronicity is a
measurable set of attitudes that people hold in regards to multitasking. The scales with
the highest Cronbach’s alpha values were the PMTS, PAI-3, MPAI, and IPV. The next
sub-section will describe the research on polychronicity as it relates to technology
multitasking.
Polychronicity and Technology Use
The use of polychronicity to study individual differences in technology use is a
relatively new area of focus in organizational behavior research. Bell, Compeau, &
Olivera (2005) proposed a call for research that included polychronicity as a construct for
studying technology multitasking. They created a conceptual model and hypothesized
that people who multitask with technology are higher in polychronicity. Additionally,
they proposed that when group members are high in polychronicity, they will view other
group members as more competent, dedicated, and socially attractive when they
multitask with technology too.
Lee, Tan, & Hameed (2005) investigated if polychronicity impacted time spent
using the Internet and perceptions of Internet use with a telephone survey based on
responses from randomly dialed Singaporean residents. The authors’ theorized that the
ability to multitask with the Internet is suited toward polychronic individuals who would
also have a more positive assessment on the use of it (similar to the ideas of Bell et al.).
In the Singapore study, the original Kaufman et al. (1991) PAI scale was used to measure
31
polychronicity with a slight modification to question 3 (the desk question) changing it to
―[I] work on one project at a time.‖ This modification to the scale did not change the
reliability coefficient (both are .67).
The authors did not find a significant relationship between polychronicity level
(categorized in this study as low, medium, or high) and time spent on the Internet.
Unfortunately, time spent on the Internet may not be the best variable to reflect Internet
use since skill level may cause an interaction effect. Furthermore, it is likely that
monochronic individuals can spend just as much time on the Internet (perhaps using the
Internet serially in a focused manner). Despite not finding a correlation between Internet
use and polychronicity, positive perceptions about Internet use were significantly
correlated to high polychronicity levels. While the use of polychronicity to assess
differences in technology use is still in its beginning stages, there has been some evidence
to demonstrate that the polychronicity construct has merit in understanding mixed reality.
For example, Ophir, Nass, & Wagner (2009) found that people who prefer to multitask
with multiple types of media have a difficult time ignoring distracting information
compared to people who avoid multitasking. This research will aim to better assess if and
how high polychronicity individuals use technology differently than those with low or
medium polychronicity.
INPUT: COHESION BELIEFS
In the conceptual model, cohesion beliefs are considered as another individual-
level variable that impacts technology multitasking and copresence management. In this
research, cohesion beliefs are defined on two dimensions: the importance of positive
interpersonal relationships between group members and commitment to the task. While
there have been numerous definitions for cohesion which will be further explored in the

32
following sections, the general consensus amongst small group researchers (see Braaten,
1991 for a meta-review of cohesion dimensions) is that cohesion is a multidimensional
construct involving a social factor (social liking) and a task factor (task commitment). For
mixed reality, this means that individuals who have positive beliefs about the importance
of group cohesion may spend less time using technology for private tasks and if they do
use technology they will manage their level of copresence to reflect availability and
attention toward the collocated group. Cohesion is an important construct for assessing
group dynamics because high levels of cohesion are related to increased communication
amongst members, greater task commitment and better performance (e.g. Evans & Dion,
1991 and Shaw, 1983).
Defining & Measuring Group Cohesion
What exactly do researchers mean when they use the construct of cohesion?
While at first blush it seems obvious that cohesion is a property of the group that reflects
how well the group ―sticks together,‖ this characterization lacks precision in terms of the
mechanisms by which cohesion is achieved and what exactly it means to be bonded to a
group. Nevertheless, one of the most cited definitions for cohesion is that it’s ―the
resultant of all the forces acting on members to remain in the group‖ (Festinger, 1950).
Festinger and his colleagues originally developed their definition for cohesion by
studying housing complexes and examining communication patterns to see if there was a
relationship between cohesiveness of a group and the amount of influence members
exhibited. One of the ways they operationalized cohesion was by calculating the number
of friendships within someone’s immediate housing unit in relation to the friendships
held across all the housing units—the more friendship links that were within the same
unit, the higher the cohesion score.

33
There are two main criticisms of Festinger’s conceptualization of cohesion. First,
it is unclear what the ―forces‖ are that contribute to or reduce cohesion, and second the
method for operationalizing cohesion does not follow from its definition. This second
criticism is important to consider further since it reflects a long-standing problem in
cohesion research which is the tendency to use individual-level measurements for a
group-level phenomenon (Evans & Jarvis, 1980). For example, Libo (1953) and Israel
(1956) asked individuals to rate their ―attraction-to-group‖ on a given Likert scale, and
then took these individual scores and pooled them to calculate a mean level of group
cohesiveness. The problem with aggregating individual scores is that it does not
accurately reflect the group unless the individual scores are checked for agreement,
meaning that the individual scores are relatively homogenous and therefore can be
extrapolated to reflect the group’s cohesion level (Gully, Devine, & Whitney, 1995).
Furthermore, these pooled scores for cohesion tend to view cohesion as a unidimensional
construct which has traditionally only considered the social aspects of cohesion and are
only useful for specific types of groups (Mudrack, 1989).
To overcome these issues with defining and operationalizing cohesion, Carron,
Widmeyer, & Brawley (1985) developed a multidimensional model for the mechanisms
involved in cohesion and termed it the Group Environment Questionnaire. Carron et al.
define cohesion as ―a dynamic process that is reflected in the tendency for a group to
stick together and remain united in the pursuit of its instrumental objectives and/or for the
satisfaction of member affective needs.‖ The important facet of this definition is that
cohesion is organized across two areas of focus: individual-group and social-task. This
breakdown into four components (shown on next page) reflects cohesion across not only

34
individual opinions about the task and social liking of the group, but also perceptions of
how the group is working together. The four dimensions of cohesion by Carron et al. (1985):
Individual Attraction Task - How attractive the group task is to the individual
Individual Attraction Social - The individual’s attraction to want to be part of the group
Group Integration Task - Individual beliefs about the group’s willingness to achieve the group goal
Group Integration Social - Individual perceptions about how close and bonded the group is as a whole
While the model and questionnaire proposed by Carron et al. was developed for
sports teams, it has been considered one of the most promising efforts for assessing
cohesion in other types of groups (Evans & Dion, 1991; Cota, Evans, Dion, Kilik, &
Longman, 1995). In Carron & Brawley (2000) a process to adapt the Group Environment
Questionnaire to other contexts is described, specifically by changing wording and
eliminating non-relevant questions and then pilot testing the revised questionnaire to
ensure that construct validity is maintained. The Group Environment Questionnaire is
shown in Table 4; for the purposes of this review the questions are grouped into their sub-
components (e.g. Individual Attraction-Social) but the original ordering of the survey
questions is shown by the numbers (1, 2, 3…18).

35
INDIVIDUAL ATTRACTION-SOCIAL 1. I do not enjoy being a part of the social activities of this team. 3. I am not going to miss the members of this team when the season ends. 5. Some of my best friends are on this team. 7. I enjoy other parties more than team parties. 9. For me this team is one of the most important social groups to which I belong.
INDIVIDUAL ATTRACTION-TASK 2. I’m not happy with the amount of playing time I get. 4. I’m unhappy with my team’s level of desire to win. 6. This team does not give me enough opportunities to improve my personal performance. 8. I do not like the style of play on this team.
GROUP INTEGRATION-SOCIAL 11. Members of our team would rather go out on their own than together as a team. 13. Our team members rarely party together. 15. Our team would like to spend time together in the off season. 17. Members of our team do not stick together outside of practices and games.
GROUP INTEGRATION-TASK 12. We all take responsibility for any loss or poor performance by our team. 10. Our team is united in trying to reach its goals for performance. 14. Our team members have conflicting aspirations for the team’s performance. 16. If members of our team have problems in practice, everyone wants to help them so we can get back together again. 18. Our team members do not communicate freely about each athlete’s responsibilities during competition or practice.
Table 4: Group Environment Questionnaire (Carron et al., 1985).
This section provided an overview of the varying definitions for cohesion. The
rationale for defining cohesion as a multidimensional construct based on social liking and
task commitment was explained. In the next section, the use of cohesion for mixed reality
is reviewed.
Cohesion in Mixed Reality Research
This research will use the definition of cohesion that encompasses both social and
task dimensions. Using these two dimensions for cohesion provides a foundational
construct for the interplay between how well a work team communicates, develops norms
for technology use, and performs as a work group. The specific operationalization for

36
cohesion in this work is described in Chapter 5. When an individual has positive beliefs
about cohesion, members should hypothetically be less inclined to use technology
because they feel more compelled to work with collocated others.
In a group where members are emotionally bonded, social cohesion will be
strong. However, should the group perform poorly on tasks one would expect cohesion to
decrease (e.g. Ruder & Gill, 1982). On the other hand, a group where nobody feels
personally connected to each other could perform quite well on tasks, and team members
could feel cohesion based on the task dimension alone (imagine a distributed work team
that does not meet frequently yet has well defined roles and responsibilities that all group
members uphold). In other words, there is a degree of independence between social and
task cohesion but it is not yet clear how cohesion will be impacted by these dimensions in
mixed reality.
Hogg (1987) found that cohesion is increased by the mere act of assembling
people together. And, as group members spend more time together, cohesion is increased
(Manning & Fullerton, 1988). These findings on the ease in which cohesion is produced
indicate that working with others produces bonds that impact how people behave in a
group setting. Emotions also play a role in the development of cohesion as group
members who like each other also rate the group as more cohesive (Piper, Marrache,
Lacroix, Richardsen, & Jones, 1983). Also, groups that are seen as rewarding to its
members have stronger cohesion (Ruder & Gill, 1982 and Stokes, 1983). Members in
cohesive groups have higher participation rates, convince others to join the group, and
resist attempts to disrupt the group. Highly cohesive groups are also more likely to
conform to group norms.

37
Despite the numerous findings about the desirable outcomes produced by
cohesive groups, the mechanisms for increasing cohesion remain elusive. Does social
cohesion lead to increased communication levels and higher member satisfaction, or is
social cohesion a construct that reflects these attributes? Research has not favored one
interpretation over another; cohesion is represented throughout the literature as both a
multidimensional phenomenon and as a latent construct with multiple indicators
(Friedkin, 2004). However, despite the circularity in defining cohesion there are common
features to cohesion that can help in understanding mixed reality; highly cohesive groups
have the following attributes (Shaw, 1983):
Intra-group communication is more extensive
Interactions are more positively oriented
Groups exert greater influence over their members
Groups are more effective in achieving their respective goals
Members are usually better satisfied with the group
Based on these general findings about cohesion in groups, this research
anticipates that mixed reality meetings will be impacted in the following ways. Groups in
which members feel strongly bonded with other team members will moderate their
technology multitasking in favor of the collocated group activity. Furthermore, in highly
cohesive teams, the tasks performed with technology will support the needs of the group
and reflect activities pertaining to the meeting.
PROCESS: COPRESENCE MANAGEMENT
In the previous sections, meeting type, polychronicity, and cohesion beliefs were
introduced as the primary factors leading to technology multitasking in meetings and the
impact on copresence was established. Copresence is considered here as a factor that
influences behavioral processes in mixed reality. When people are managing copresence

38
levels, they are actively trying to change how they are perceived by others which affect
communication patterns and team member attitudes toward one another.
Defining Copresence Management
Copresence is a situational condition that occurs when individuals are ―accessible,
available, and subject to one another‖ (Goffman, 1963, p. 22). When individuals are
copresent, they are able to observe each other and interact. However, copresence does not
occur in the same ―amount‖ for all situations. One can imagine a situation when you’re
talking to someone and they begin staring off into the distance—you’re both in the same
room but the amount of copresence has decreased. When individuals use verbal or
nonverbal signals to change their presence level, they are managing their copresence. The
management of presence is important because it signals our availability to others as to
what social interactions are possible. People notice when communication partners avert
their eyes and attend to a new situation, and it changes how people approach and
converse amongst themselves.
When people interact with others their behaviors can be viewed as a performance
where actions and communication are based on socially defined expectations that fit the
given situation. This conceptualization of conversation and interaction as performance is
termed the dramaturgical perspective which is also based on the work of Goffman. In the
dramaturgical perspective of human interaction, one of the fundamental tenets is that
people act in ways to guide and control other people’s impression of them.
The act of controlling impressions and actions in front of others can occur in such
a way that someone is ―taken in by his own act‖ (Goffman, 1959, p. 19). However, one
can also be more cognizant and cynical about the impressions one is making on others.
Essentially, there exist two extremes for how people control impressions; it is either a

39
sincere act by people where they are unaware that their actions are serving to shape
interactions, or it can be more explicit and purposeful with an awareness that they are
trying to control how others perceive them. In this research, the conceptual model
proposes that individuals using technology extend this impression management, here
called copresence management, in order to manipulate how people view their
participation in the meeting activity and general status within the organization.
In Goffman’s dramaturgical framework for group performances, each individual
cooperates in team settings to create and maintain behaviors that promote the standards of
the group. Therefore, in mixed reality meetings, we anticipate that individuals who feel
cohesive with their team will present a front to others that maintains the standard that
they are listening and attending to the needs of the group. However, when the group is
meeting in front of an audience (such as outsiders like external clients or guests), an even
―less truthful‖ performance occurs. In effect, people are on their best behavior in front of
strangers to create an idealized impression, but when that audience disappears a more
truthful performance of behavior emerges. Goffman’s work provides a starting point for
understanding copresence management at a macrosociological perspective. The next
section reviews more specific instances of how people manage their copresence with
technology.
Copresence Management with Technology
In mixed reality there are two types of copresence that users can manage: 1)
copresence with those physically in the same room (in-room copresence) and 2)
copresence with electronic communication partners (electronic copresence). In both
instances, the socially desirable norm is to be as available as possible to the respective
communication partners. These partners may be either those team members in the

40
immediate meeting or the larger network of co-workers and clients available virtually
through e-mail and instant messaging. Being available means that individuals signal to
others that they are open for interaction through either verbal or non-verbal signals and
attend to ongoing signals from these communication partners.
Managing copresence with electronic partners appears somewhat
straightforward—one is either ―on‖ or ―off‖ the technology (e.g. your name appears in
your coworker’s instant messaging system as online or not). However, given the number
of different hardware systems and communication applications, electronic copresence is
not so simplistic. Chung, Zimmerman, & Forlizzi (2005) created a framework for the
multiple communication channels (mobile phones, instant messaging, and e-mail being
the most common) based on different communication modes (one-to-one, one-to-many)
and various format supports (text, audio, and video). These authors suggest that following
Goffman's framework on copresence, people will have different levels of presence that
they may want to manage across the varying channels. Additionally, individuals may
manage electronic copresence through less obvious social means—taking two hours to
respond to an instant message (where the expectation of typical response time is within
minutes) signals unavailability just as well as an ―I’m away from my desk‖ status
message.
Prior research on copresence and technology use with physically present others
has mainly centered on mobile phone etiquette in public situations. Geser (2004)
combined his own observations with prior literature on mobile phone usage to develop
three reactions for an individual who receives a mobile phone call when collocated with
someone else: flight, suspension, and persistence. With flight, the person retreats to a
separate area away from the collocated others to use the technology. With suspension

41
they remain in the same physical location yet stop communicating with the collocated
others in favor of using the technology, and with persistence, both activities (using the
technology and the collocated activity) continue simultaneously.
This model of three different reactions to incoming mobile phone calls assumes
that the technological device is set to a mode where ringing or a vibration is felt by the
user and that users always choose to attend to the technology. Given that some
individuals are likely to disregard a mobile ring or vibration when in a collocated setting,
copresence management must be defined beyond technological functionality to include
behavioral adaptations. The fact that someone will purposefully mute (or ignore) her or
his technological devices is an additional form of managing copresence, and one that
favors the collocated activity.
Neither the collocated situation nor the electronic communication need always be
at odds with each other; depending on the context, some users may be able to actively
engage both collocated and electronic communication partners seamlessly. One setting in
which the collocated and electronic activities are managed together without major
disruption occurs when neither activity demands full cognitive attention. This scenario is
realistic for mixed reality meetings where the user does not have to participate
continuously in the collocated meeting and therefore has attentional capacity to glance at
e-mails and respond to instant messages. Part of the research agenda will be to fully
describe and understand how users shift their copresence across the face-to-face and
electronic channels using polychronicity and cohesion beliefs as the drivers to copresence
management.
In another study about public behavior with mobile technology, Koskinen & Repo
(2006) investigated how people watched streaming video on mobile devices to see what

42
steps, if any, people used to manage face during this task. By face management, the
authors seek to explain how individuals want to preserve how they are judged so as to not
be considered a disruption to the shared environment. Face management is slightly
different than copresence in Koskinen & Repo’s study since the participants were not
intending to interact with physically present others; however the findings of this research
are relevant for understanding how people perceive each other when technology might
disrupt a shared setting.
Koskinen & Repo qualitatively analyzed face management using diary self-
reports from 9 users (6 women, 3 men) who were provided mobile streaming video
devices to use for one week. Participants were ―encouraged to watch videos in various
different situations‖ and record their experiences in a diary. Across all participants, 115
episodes about using the mobile video device were recorded and analyzed, averaging
about 2 episodes per day and person. In their findings, avoidance was one of the methods
used to manage face; some participants did not want to engender any unkind glances or
other social repercussions for watching a noisy video in public, so they would watch it at
a very low volume. People who did use the mobile video devices in more intrusive
manners (with audible volume) reported receiving ―weird‖ glances from bystanders. The
authors also reported on deviant uses of the mobile device where people sought a thrill
from using it to provoke envy or bewilderment from others. The device had karaoke
videos and some users would sing along to the video music out loud and hoped that
others would react in some surprised way. This study demonstrates that individuals are
aware that their use of technology can attract the attention of others and that this interest
can be manipulated based on how they use the technology. While the focus of this study
was on face management, it highlights issues about copresence too. People understand

43
that their use of technology has an impact on the way others perceive and interact with
them. In mixed reality, we expect users will be cognizant of their copresence level and
send either verbal or non-verbal indications of their availability to interact. Deviant uses
of technology multitasking in mixed reality are also conceivable; for example, users may
purposefully focus more attention on using technology in order to non-verbally express
dissatisfaction with their team or the meeting. In the next section, ways of technology
multitasking in meetings are identified and anticipated impacts are discussed.
PROCESS: TECHNOLOGY MULTITASKING
In the conceptual model, the combination of individual factors (polychronicity
and cohesion beliefs) and the type of meeting are hypothesized to impact the frequency of
technology multitasking in meetings. In this research, technology multitasking is defined
by the type of tasks completed on the technology, either ―private‖ or ―group‖ tasks.
Private tasks are not immediately relevant to the collocated group members such as
checking e-mail, while group tasks enhance or assist with the meeting such as electronic
notes. When the user is technology multitasking this may impact meeting satisfaction. If
individuals are high in polychronicity they may believe that they are more productive in
the meeting which leads to increased satisfaction. On the other hand, non-technology
users in the meeting may perceive technology multitasking as rude or disruptive,
especially if they believe the user is focusing on private tasks, therefore these members
may have decreased satisfaction.
Theories and models about the reasons for technology use typically account for
the user’s opinion about the technology itself, such as its ―perceived usefulness & ease of
use‖ (Davis, 1989) and ―communication richness‖ of the medium (Daft & Lengel, 1986).
However, in this research, the definition for technology multitasking does not include

44
specific features about the technology itself. In organizational work settings, most
workers do not make explicit decisions about which technology or software application
will be used for a given task. Instead, there are standards and practices for each
organization which generally take precedence for determining how technology is used to
accomplish work. In mixed reality, the reason someone selects a particular technology for
multitasking is often not based on a comparison of different options available, but rather
because they are used to using a given technology for a particular work task.
This dismissal of technological features is not intended to exclude functionalities
that impact the research analysis. For example, if a technology does not allow someone to
change their instant messaging availability status, this can influence electronic
copresence management. In another example, mobile phone technologies can be more
intrusive into collocated settings if someone forgets to silence the phone. Features of the
technology are important—they do encourage and allow particular behaviors by users.
However, for the purposes of this research on mixed reality, the definition of technology
multitasking based on tasks categorized as private or group is believed to have greater
relevance to the findings than an analysis based on technological features.
OUTPUT: MEETING SATISFACTION
Does meeting satisfaction differ across group members based on whether they are
the primary user of technology or not? In mixed reality meetings, group members can be
divided into two types: 1) the primary user(s) of technology and 2) the other people in the
meeting not directly interacting with technology. Even though some members may not
use technology during meetings, they are anticipated to be affected by others’ use. In
collocated team meetings, people are constantly assessing and monitoring their ability to

45
interact with others and technology multitasking may interfere with traditional group
communication structures.
As discussed previously in the polychronicity sub-section, it is hypothesized that
individuals high in polychronicity will be less disturbed by other group members’
technology multitasking. However, those who do not use technology may be bothered
when others do so because they may perceive it as rude or disruptive. If individual
members are dissatisfied with meetings due to different beliefs about the way technology
should be used, this in turn may affect how well the group works together.
Defining Meeting Satisfaction
Meeting satisfaction is defined in the literature as a subjective assessment made
by an individual that certain criteria have been met due to the meeting (Mejias, 2007).
Within the concept of meeting satisfaction are two sub-components: satisfaction with
outcome and satisfaction with process (Briggs, Reinig, & DeVreede, 2006). Outcome
satisfaction occurs when an individual feels positive about how well the group achieves
the meeting goals whereas process satisfaction focuses on an individual’s feelings about
how well the group worked together throughout the meeting.
In mixed reality settings, individuals may have conflicting goals; there are
objectives to attain with the collocated team and potentially competing needs occurring
from other work responsibilities available through technology multitasking. One of the
issues with assessing meeting satisfaction in mixed reality is establishing whose goals are
being met, either the individual or the group as a whole. For the purposes of this study,
meeting satisfaction is viewed as unrelated to the group goals, but focused rather on
individual feelings toward how well time was spent in the meeting. One of the common
criticisms about organizations is that there are too many meetings and that they are a

46
waste of time—does this belief become less meaningful due to people’s abilities to
transform time spent in meetings toward other work goals? Individuals who like to
multitask with technology may be more satisfied in meetings because they are able to
accomplish other tasks simultaneously. However, if these same individuals are in
meetings where the norm does not encourage technology use, they may be less satisfied
because their preferred behavior to multitask is being suppressed.
Technology multitasking also impacts others in the meeting who are not
multitasking with technology. It is conceivable that group members who are not using
technology will be less satisfied in meetings due to a perceived imbalance in the quality
and frequency of contributions. Essentially, some group members may believe that those
using technology make fewer contributions and are not paying as much attention to the
meeting as non-technology using members which results in a contribution inequity.
Contribution equity is positively associated with meeting satisfaction (Flanagin, Park, &
Seibold, 2004). In Table 5, a matrix of meeting satisfaction outcomes is shown based on
whether someone is a technology multitasker or not and the standard expectation the
group holds about technology use. The development of the group’s standard about
appropriate technology multitasking is based on the meeting type, polychronicity level of
each member and cohesion beliefs (as discussed earlier in the chapter). The following
impacts to meeting satisfaction are hypothesized:
(1) Individuals who technology multitask in a meeting with a group that
accepts the behavior will have increased meeting satisfaction
(2) Individuals who technology multitask in a group that does not accept the
behavior will have decreased meeting satisfaction

47
(3) Individuals who prefer not to use technology in meetings will have
decreased meeting satisfaction when the group accepts technology multitasking
(4) Individuals who prefer not to use technology in meetings will have
increased meeting satisfaction when the group does not accept technology multitasking
Group Norm Accepts
Technology Multitasking Group Norm Does Not Accept Technology Multitasking
Group Member Technology Multitasks
High Meeting Satisfaction Low or Medium Meeting Satisfaction
Group Member Does Not Use Technology
Low or Medium Meeting Satisfaction
High Meeting Satisfaction
Table 5: Meeting Satisfaction Based on User Type & Group Norms
This section defined meeting satisfaction based on an individual’s beliefs about
how well time was utilized in group meetings. A rationale for how polychronicity levels
and group norms for technology multitasking will impact satisfaction levels was
presented. The next section reviews how productivity will be analyzed in mixed reality
settings.
OUTPUT: PERCEIVED PRODUCTIVITY
Productivity in groups has traditionally been studied as it relates to quantifiable
outputs such as number of member contributions and ideas generated, and quantity of
work output (e.g. Putai, 1993 and Rosenberg & Rosenstein, 1980). However, given the
nature of information work, it is difficult to measure how productive a meeting is based
on metrics like these. Information work involves a series of decisions, knowledge
sharing, and information creation that for large scale projects occurs over a series of
months, if not years. Attempts to analyze productivity in mixed reality based on

48
enumerable outputs are inappropriate for this research because they cannot capture the
impact of technology multitasking on how well people work together.
Defining Perceived Productivity
In this research, perceived productivity is an outcome measurement defined by an
individual’s subjective belief about how productive he or she felt during the meeting.
Since the purpose of this work is to assess how technology multitasking impacts
behaviors and attitudes, a subjective metric for productivity is appropriate. Self-
assessments of productivity are considered a valid measurement and have been found to
correlate with quantifiable measures of productivity (Leaman & Bordass, 2000).
However, similar to the discussion presented on meeting satisfaction, productivity in
mixed reality may impact technology users differently than those in attendance who do
not multitask.
As demonstrated by the Hawthorne studies, social factors can have a strong
influence on people’s productivity (Schwartzman, 1993). In the early 20th
Century, at the
Hawthorne Works factory in the United States, a series of experiments were conducted to
identify the environmental variables that affect worker productivity. Lighting conditions
was one of the variables identified as a productivity enhancement; however, once the
research project was complete output levels dropped. One of the legacies from the
Hawthorne studies is that the presence of outside researchers unknowingly interfered
with people’s normal work patterns, leading them to be more motivated during the
research which temporarily raised productivity.
Similarly, in mixed reality the productivity beliefs of team members are expected
to be impacted by the behaviors of individual technology users. The presence of
technology multitasking may result in changes to productivity levels across all members
49
in the group, not just those directly using the technology. Team members who are merely
present in mixed reality meetings may become distracted by other’s technology use
leading to decreases in their perception of productivity. On the other hand, these same
members may decide to increase their participation based on a belief of under-
participation by those multitasking, and this could lead to increased perceived
productivity.
CONCLUSION
In this literature review, seven constructs for conceptualizing our understanding
of mixed reality were defined: meeting type, polychronicity, cohesion beliefs, technology
multitasking, copresence management, perceived productivity, and meeting satisfaction.
Prior research on these constructs was reviewed to explain the relationships and derive
research questions to advance our understanding of the theoretical underpinnings of
mixed reality.
The construct of meeting type was reviewed to identify common meeting
structures across organizations which are associated with specific forms of
communication, roles, and responsibilities. Most organizational meetings have an organic
communication structure where discussion is free-form and there is not systematic turn-
taking as to who speaks when. Along with these communication patterns, different
meetings have expectations of behavior by its members; these behaviors are learned
through social interactions with others and sometimes explicit rules for member conduct
are set forth by a meeting leader. Project meetings were determined to be the meeting
format where mixed reality would have the most impact because member contributions to
the meeting are essential for the success of the group. These project meetings involve

50
long term working relationships between members and rely on meetings to accomplish
the larger work task.
While meeting type provides a lens for understanding group norms in mixed
reality, polychronicity explains individual motivations for multitasking which may result
in differences in behavior between group members. Polychronicity, one’s preference for
working on multiple things and the belief that this mode is the best way to accomplish
work, was described as a measurable and stable trait of an individual. Multiple
measurements for polychronicity have been developed and the different scales were
described, with the most recent Polychronic-Monochronic Tendency scale being the most
promising in terms of validity and generalizability across contexts. Polychronicity
research suggests that polychronicity levels will impact people’s preference for how they
use technology in meetings and perceive other’s use of technology.
The concept of cohesion was introduced as an additional influence on technology
multitasking and its myriad of definitions were described: from a unidimensional
construct reflecting attraction to the group to a multidimensional set of beliefs an
individual holds in regards to both social and task dimensions of the group. Cohesion
beliefs reflect how committed people are to the group task and if group members like
each other; this construct is anticipated to influence how much attention an individual
spends focused on the collocated group.
Copresence management was explored as a lens to the performative behaviors of
people in group settings. Goffman’s dramaturgical framework was presented which
explains that people, in general, will act in ways to present a particular impression to
others as demonstrated through their behavior and communication. This presentation of
self becomes even more salient when outsiders are present which leads to an idealized

51
impression. In terms of mixed reality, this research predicts that technology multitaskers
will be cognizant that their use of technology has an impact on others’ perceptions and
that attempts will be made to control how people observe this multitasking.
Technology multitasking was defined based on two possible modes of interaction:
the use of technology for private work and its use for group related tasks. This distinction
was made to explain that the relevance of technology use in meetings is most
appropriately studied as it pertains to the tension between the individual and the group,
and not based on specific technological features.
The chapter concluded with a review of two outcome variables, meeting
satisfaction and perceived productivity. Both constructs are subjective measurements that
aim to assess how all members of a team are impacted by technology multitasking. In the
next chapter, the conceptual model presented in the beginning of this chapter is
formalized into research questions and a methodology is developed with additional
insights obtained from a pilot study consisting of interviews with office workers.

52
CHAPTER 3: RESEARCH METHODOLOGY
INTRODUCTION
This chapter describes the research methodology employed in studying the
phenomenon of mixed reality. Each phase of the process is discussed in detail and an
explanation is given for why the methodology appropriately addresses the research aims
and hypotheses. The development of the research instruments is presented along with an
assessment of reliability and validity issues. In brief, this research utilized a multi-method
approach based on qualitative fieldwork and interviews with information workers
followed by a quantitative analysis from survey data. By combining different methods, a
detailed description of real world behaviors and work patterns emerged from the
qualitative research which was then balanced against hypotheses tested from the
quantitative data.
Since mixed reality is a relatively new phenomenon, research to support this
emerging area needs grounding in the rich descriptions of behavior that qualitative data
can provide. An understanding of the organizational and technological context that
people work in is necessary for assessing how and why behaviors occur. An individual
can perform the same actions with very different reasons and outcomes depending on
situational factors. However, because qualitative data are highly contextual, it is weak in
generalizability to the larger population. Testing the relationships between mixed reality
constructs using a quantitative approach is an equally important contribution to the
research; the testable constructs allows other researchers to expand upon the ideas and
further refine the conceptual model.

53
RESEARCH OVERVIEW
The phenomenon of mixed reality is defined as face-to-face group work in which
some or all members multitask with portable technologies while simultaneously staying
involved with the team meeting. In this setting, group members are engaged to varying
degrees with both the immediate physical team and their own virtual tasks with
technology. More specifically, the organizational meetings studied in this research are
small group project meetings where there is an expectation that people are collocated for
a set purpose involving knowledge sharing about work tasks that require the efforts of the
entire group.
The main characteristics of small group project meetings are 1) team members are
all involved in a shared work goal (e.g. developing a software product), 2) the meeting
has specific information to share and/or issues to address regarding the project (typically
identified in advance by the meeting leader with an agenda), and 3) the communication
style is predominantly back and forth discussion between members. These project
meetings are in contrast to other common forms of organizational meetings such as large
―all hands‖ and presentation meetings where there is less expectation for participation
and the meeting is typically dominated by a set of pre-determined speakers.
This research took a funnel-like approach toward investigation, meaning that the
topic of mixed reality was broadly conceived in the beginning phases of research and
narrowed in scope and behaviors of interest as more was learned about the phenomenon.
This phased approach is depicted in Figure 3 and explained below.

54
Figure 3: Overview of Research Methodology.
Phase 0 – Pilot Study of Office Workers
An initial broad investigation of the topic from which the conceptual model was
developed. The pilot data aimed to respond to the following questions: In which
organizations does mixed reality occur? How does this phenomenon differ across
meeting types and with different types of portable technologies? Who experiences mixed
reality and what are people’s general reaction and opinions toward this topic?
Phase 1 – Qualitative Phase
This phase of research consisted of fieldwork with two information workers at a
Fortune 500 software corporation and eight in-depth interviews with information workers
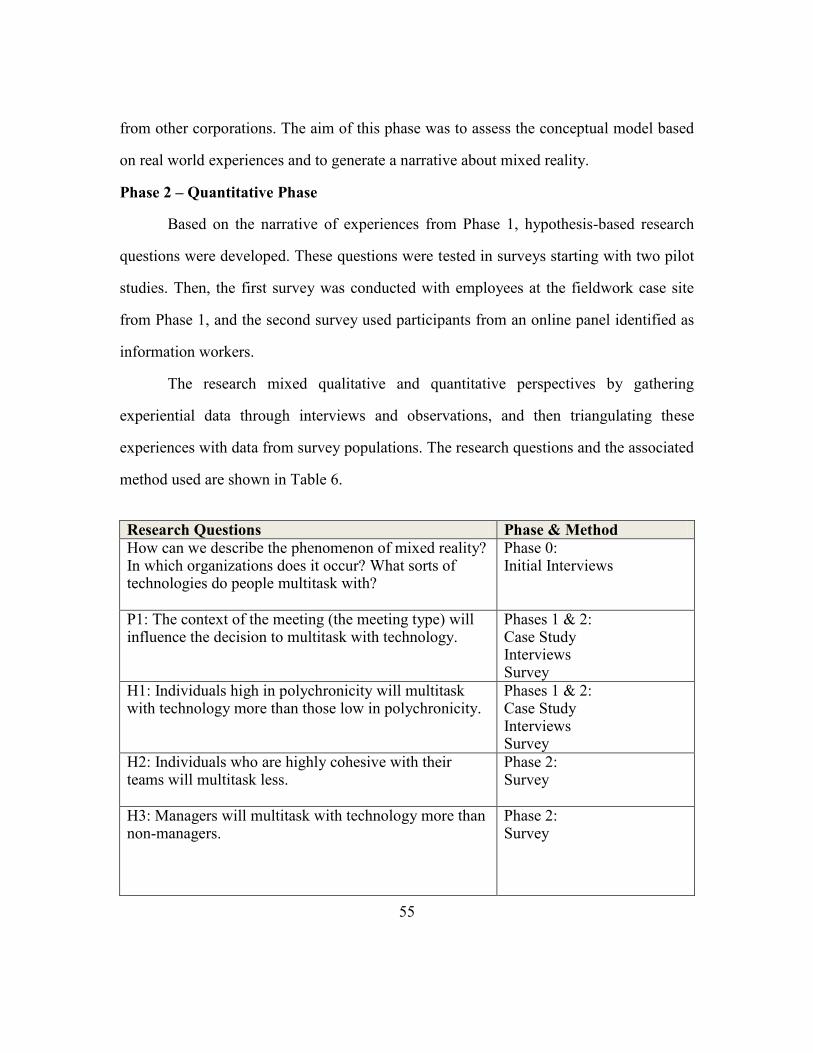
55
from other corporations. The aim of this phase was to assess the conceptual model based
on real world experiences and to generate a narrative about mixed reality.
Phase 2 – Quantitative Phase
Based on the narrative of experiences from Phase 1, hypothesis-based research
questions were developed. These questions were tested in surveys starting with two pilot
studies. Then, the first survey was conducted with employees at the fieldwork case site
from Phase 1, and the second survey used participants from an online panel identified as
information workers.
The research mixed qualitative and quantitative perspectives by gathering
experiential data through interviews and observations, and then triangulating these
experiences with data from survey populations. The research questions and the associated
method used are shown in Table 6.
Research Questions Phase & Method
How can we describe the phenomenon of mixed reality? In which organizations does it occur? What sorts of technologies do people multitask with?
Phase 0: Initial Interviews
P1: The context of the meeting (the meeting type) will influence the decision to multitask with technology.
Phases 1 & 2: Case Study Interviews Survey
H1: Individuals high in polychronicity will multitask with technology more than those low in polychronicity.
Phases 1 & 2: Case Study Interviews Survey
H2: Individuals who are highly cohesive with their teams will multitask less.
Phase 2: Survey
H3: Managers will multitask with technology more than non-managers.
Phase 2: Survey

56
H4a: Individuals high in polychronicity will manifest grater electronic copresence.
Phases 1 & 2: Case Study Survey
H4b: Individuals low in polychronicity will manifest grater in-room copresence.
Phases 1 & 2: Case Study Survey
H5: Individuals who feel cohesive with their immediate team will have greater in-room copresence.
Phases 1 & 2: Case Study Survey
H6: Individuals who feel cohesive with their team will believe that others on their team multitask appropriately.
Phase 2: Survey
H7: Individuals high in polychronicity will have higher self-efficacy with technology multitasking.
Phase 2: Survey
H8: Individuals high in polychronicity will perceive meetings as more productive when technology multitasking occurs.
Phases 1 & 2: Case Study Interviews Survey
H9: Individuals who feel cohesive with their immediate team will perceive less productivity with technology multitasking.
Phase 2: Survey
Table 6: Research Questions and Associated Method.
The next section presents Phase 0, the pilot study of initial interviews, from which
methodological implications are drawn. Following the pilot study, the methodologies for
Phase 1 and Phase 2 are described.
PILOT STUDY – PHASE 0: METHODOLOGY AND RESULTS
Pilot Study Methodology
In-person interviews were conducted with 15 people who work in a variety of
different workplaces and attend meetings. The selection criteria included being employed

57
full time, working in an office building (as opposed to being a telecommuter) and
attending at least 4 face-to-face meetings per month. These selections resulted in a
sample of 7 women and 8 men ages 25 to 58 who participated in a 30-minute interview
and received $30 compensation. A summary of the participants and job roles is shown in
Table 7 below.
Interviewee Job Role Participant Count
Software Engineer 3
Lawyer 2
Retail Manager 2
Telephone Customer Service Agent 2
Electrical Engineer 1
Television Producer 1
Hotel Conference Management Liaison 1
Human Resources Manager 1
Mailroom Supervisor 1
Property Manager 1
Table 7: Job Roles for Pilot Study Participants.
Participants were recruited by a market research company with a database of
25,000 people in the Austin, Texas area. Using a market research firm ensured greater
access to a representative sample compared to other recruiting methods such as posted
flyers/advertisements, approaching strangers on the street, and the use of the
investigator’s personal network of friends and family. The market research firm
scheduled 15 interviews for the investigator across a 2-week period. The interviews were
conducted at either the interviewee’s place of work, or a public coffee shop/restaurant of
the interviewee’s choice. The sample size of 15 interviewees is not reflective of every
type of industry, technology use, or attitude about mixed reality, but this sample did
provide sufficient diversity to help address the pilot study goals of ascertaining in which

58
organizations mixed reality occurs and the general behaviors and attitudes toward
technology multitasking in the workplace.
Pilot Study Interview Protocol
The pilot study interviews employed the following methodology. First,
participants were introduced to the study with an explanation that the research aim was to
understand how they use technology at work. The participants were informed that they
did not have to answer any questions that felt too personal and the participant’s
confidentiality was assured. Each participant signed informed consent paperwork and
then the interview began. The interviews were not electronically recorded, but the
researcher did take notes by hand throughout the session. At the conclusion of the
interview, the participants were paid an honorarium and were told that they could contact
the researcher via e-mail or telephone if they had any further questions.
The interview protocol was semi-structured; there were four main topic areas that
the researcher asked each participant. Depending on the responses to these main
questions, the researcher generated more specific follow-up questions that were germane
to each participant’s organizational and technological experience. The four main question
areas were:
1) Describe your job and the types of technologies you use in general for your job. 2) What kind of meetings do you typically attend? 3) Do you use technology in meetings? If so, when and why? 4) Do other people in your group use technology in meetings? If so, how do you feel
about their technology use?
Pilot Study Data Analysis
Each interview was captured as a detailed field note resulting in 25 pages of
interview summaries. The summaries were analyzed using the constant comparative
technique, which is the main analytical method used in grounded theory (Auerbach &

59
Silverstein, 2003). This technique involved taking each relevant statement from the field
notes, and systematically comparing it to all the other statements of other participants to
identify commonalities and differences.
To begin this process, the field notes were reviewed by the researcher and any
statement or idea relevant to the idea of mixed reality was input into a spreadsheet. From
the field notes, the researcher found 68 applicable statements and these were listed along
with the person (anonymized) whom it came from. The mean number of relevant
statements from each participant was four, with the low being two and the high being
eight statements. The number of statements attributed to a participant differed because of
the diversity in the sample. Some participants never experienced mixed reality meetings,
and some had jobs that did not facilitate or encourage technology use in meetings. The
participants who had minimal exposure to mixed reality meetings had fewer relevant
statements that addressed the research aims.
The next step in the coding process was to identify a theme to describe each of the
relevant statements. As mentioned above, the guiding interview protocol was to find out
which office environments experienced mixed reality, if and why people used technology
in meetings, and what opinions were about the impact of technology use in meetings.
Using these overarching themes, the statements were coded into specific categories to
create a detailed examination of behavior and attitudes. Since this was pilot data, no
formal inter-rater reliability measures were employed at this stage. However, the
resulting analysis that is presented next provides a basis for the methodological choices
made in the main research phases.

60
Pilot Study Results
Which organizations experience mixed reality?
The amount of technology available to workers was the primary indicator across
participants for whether they experienced mixed reality meetings. For offices where
portable technologies (e.g. laptops) were not readily available, organizational meetings
were not impacted by technology multitasking, since it did not occur. Seven of the 15
respondents worked in office environments where they did not encounter any technology
use in meetings. Furthermore, the respondents whose primary work tasks involved ―data
handling‖ as opposed to ―knowledge work,‖ tended not to experience mixed reality
meetings since computing technologies were not used as communication or collaboration
tools during meetings. Table 8 shows a count of which job roles experienced mixed
reality meetings.
Interviewee Job Role Participant Count
Experience Mixed Reality?
Yes No
Software Engineer 3 3 0
Lawyer 2 1 1
Retail Manager 2 1 1
Telephone Customer Service Agent 2 0 2
Electrical Engineer 1 1 0
Television Producer 1 1 0
Hotel Conference Management Liaison 1 0 1
Human Resources Manager 1 0 1
Mailroom Supervisor 1 1 0
Property Manager 1 0 1
TOTAL 15 8 7
Table 8: Job Role and Mixed Reality Experience.
For the 8 respondents who experienced technology multitasking, individual
reactions to mixed reality differed. For Software Engineer #1, technology multitasking

61
was the norm and accepted by others, but for Software Engineer #2, he found laptops so
distracting that he had specific rules for when they could be used during the meetings he
led. In a completely different work environment, the Mailroom Supervisor noted that
people answered mobile phone calls in the middle of meetings and that this behavior was
considered appropriate. Across all 15 participants, it was primarily the availability of
laptop computers and smartphones that indicated whether mixed reality meetings were
experienced.
Why multitask with technology in meetings?
For the 8 respondents who experienced mixed reality meetings, the following
three reasons emerged for why they used technology during meetings.
(1) Office Culture of Electronic Availability: Constant communication and
electronic availability were described as a necessary feature of the workplace.
Participants explained that there were few boundaries for when work occurred in their
life (e.g. checking work e-mail from home), and that they felt compelled to be online
often. In a particularly revealing statement, the Television Producer said, ―I don’t even
know what information I’d be missing, but I want to be online to make sure I don’t miss
anything.‖ This quote expresses how the organizational culture of constant availability
was an important driver for people’s technology use.
(2) Meeting Topic Not Relevant: Participants described meetings where they
had to just ―sit-in‖ and were only asked to participate by the group as needed. This
resulted in not wanting to waste time, so laptops were used to alleviate boredom during
the meeting and to also accomplish other work. Since these interviewees considered their
role in the meeting as non-essential, they were not concerned about missing any
information being said in the meeting due to technology multitasking.

62
(3) Information Available on Laptops: The participants encountered times
when they needed information during a meeting that was easily answered by looking up
information on a web site. Additionally, laptops were often used to show supplemental
pictures or prototypes during a meeting. However, the 8 participants who used
technology in meetings changed their behavior when someone of higher status was in the
meeting (e.g. a vice president) and there were explicit rules dictating how technology
could be used. These mitigating factors are discussed further in the next section.
What other factors influence mixed reality behavior?
Power and Status
If a person in a higher status position was leading the meeting or even just merely
present, this shifted how a participant technology multitasked. For the Mailroom
Supervisor, any meetings with high level directors meant that all mobiles phones would
be turned off. Power and status also changed the behavior of Software Engineer #1; he
typically used a laptop during all meetings he attended. However, when an outside client
was present, he would not use his laptop because he believed it rude to do so in this
context. Lawyer #2 similarly changed his behavior depending on the status of his
communication partner. If a senior ranked partner in the law firm was glancing at his
Blackberry smartphone, the lawyer would not say anything. But, if he was talking with a
lower ranked staff member who engaged in a similar behavior, he would use a phrase like
―I’ll just come back later if you’re busy…‖ in a tone of voice to imply that the staff
member should pay more attention to him. Participants recognized that they used
technology differently depending on who else was present and that their reactions to
technology multitasking changed based on status.
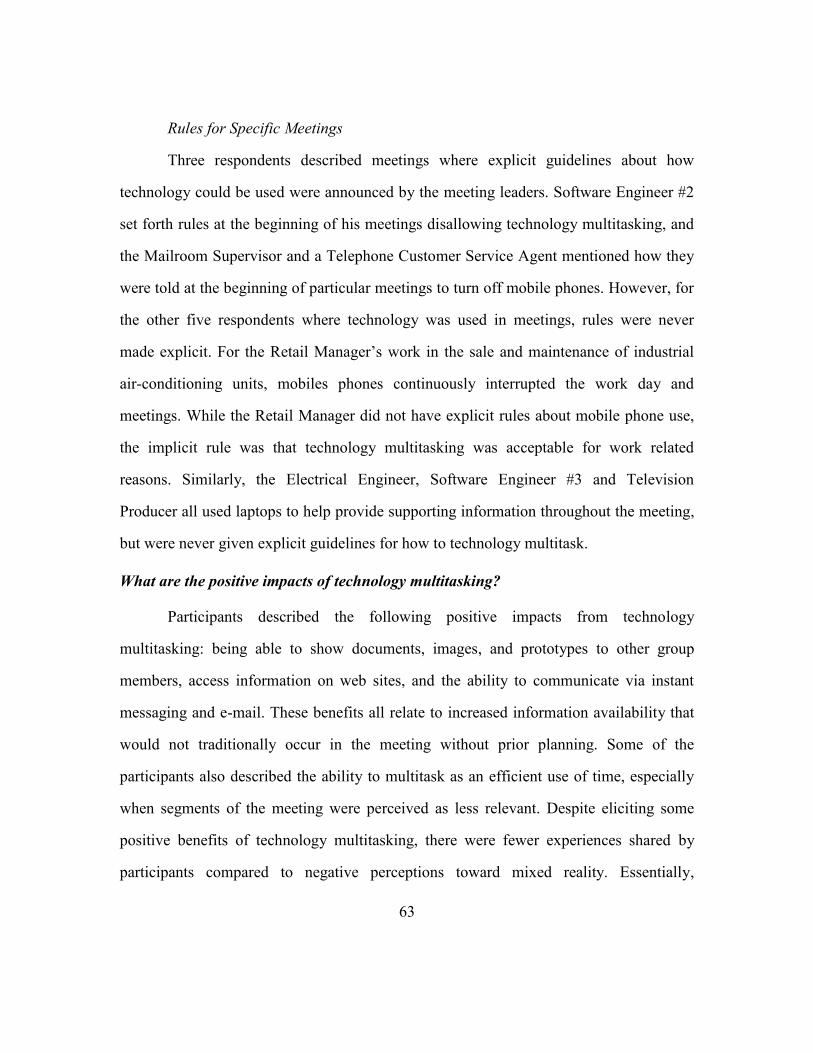
63
Rules for Specific Meetings
Three respondents described meetings where explicit guidelines about how
technology could be used were announced by the meeting leaders. Software Engineer #2
set forth rules at the beginning of his meetings disallowing technology multitasking, and
the Mailroom Supervisor and a Telephone Customer Service Agent mentioned how they
were told at the beginning of particular meetings to turn off mobile phones. However, for
the other five respondents where technology was used in meetings, rules were never
made explicit. For the Retail Manager’s work in the sale and maintenance of industrial
air-conditioning units, mobiles phones continuously interrupted the work day and
meetings. While the Retail Manager did not have explicit rules about mobile phone use,
the implicit rule was that technology multitasking was acceptable for work related
reasons. Similarly, the Electrical Engineer, Software Engineer #3 and Television
Producer all used laptops to help provide supporting information throughout the meeting,
but were never given explicit guidelines for how to technology multitask.
What are the positive impacts of technology multitasking?
Participants described the following positive impacts from technology
multitasking: being able to show documents, images, and prototypes to other group
members, access information on web sites, and the ability to communicate via instant
messaging and e-mail. These benefits all relate to increased information availability that
would not traditionally occur in the meeting without prior planning. Some of the
participants also described the ability to multitask as an efficient use of time, especially
when segments of the meeting were perceived as less relevant. Despite eliciting some
positive benefits of technology multitasking, there were fewer experiences shared by
participants compared to negative perceptions toward mixed reality. Essentially,

64
participants were able to list reasons why technology could be positive in a meeting, yet
were unable to share specific occurrences of these positive experiences. Benefits from
technology multitasking may not resonate in participant’s memories since negative
emotions tend to be more influential in evaluations (Ito, Larsen, Smith, & Cacioppo,
1998).
What are the negative impacts of technology multitasking?
One of the negative impacts anticipated was information loss due to people’s
inability to focus on both the meeting conversation and the use of technology. However,
none of the respondents expressed concern with retaining information or participating in
meetings when technology multitasking. Software Engineer #1 described his ability to
attend to his laptop and what was happening in a meeting as ―bifocal attention‖ as the
tasks he performed on the laptop were intentionally not complicated tasks (e.g. writing
software code), but lightweight tasks such as checking e-mail. He felt confident that he
could simultaneously listen to the meeting and technology multitask without detriment to
either activity. The negative reactions participants described were based around
perceptions of etiquette and normative multitasking behavior. Five of the respondents
described situations where it was disrespectful when people used technology in meetings.
For example, Lawyer #2 expressed his disappointment when trying to present
information to a room of his peers.
I‟ll be giving a presentation, and I‟ll look out into the crowd and all the lawyers have their heads down looking at their Blackberry‟s. It‟s so rude. Why do they even bother coming [to the meeting]?
The overall perception about negative outcomes from technology use in meetings
was that it did not cause any informational loss but rather engendered negative emotions
when it was deemed to be inappropriate. The fact that technology use was perceived as

65
rude was not based on the fact that the team was not able to accomplish the meeting goals
because some members multitasked. Instead, the negative perception was expressed by
participants as an emotional reaction due to an implicit belief about how others should
conduct themselves for a particular meeting.
Implications of Pilot Study on Research Methodology
Based on the results of the pilot study, mixed reality is a phenomenon that people
understand conceptually and that some people have experienced in their work
environment. Individual attitudes toward technology use shape how technology
multitasking occurs in meetings, along with organizational factors and group norms.
Organizations that emphasize continuous electronic availability (e.g. instant messaging
and e-mail) and make accessible portable technologies were prone to mixed reality
meetings. However, just because an interviewee worked at an organization with mixed
reality did not mean his or her reactions to technology multitasking was similar to others.
There were few explicit rules for how technology should be used in meetings, yet
participants were able to articulate a set of standards for what they considered appropriate
multitasking behavior. There was evidence that participants who used technology in
meetings were conscientious about how others might judge this behavior, especially
when outside clients or upper management were present in meetings. Overall, the pilot
data conclusions support the research aims and conceptual model in the following ways.
Strong support:
Mixed reality is a phenomenon that is experienced in real world settings.
The types of organizations that have mixed reality are those where wireless networks and laptops/smartphones are easily accessible.
Individuals whose job tasks primarily involve data processing tend not to experience mixed reality meetings.
Individual attitudes and group norms determine if and how technology is used in meetings.
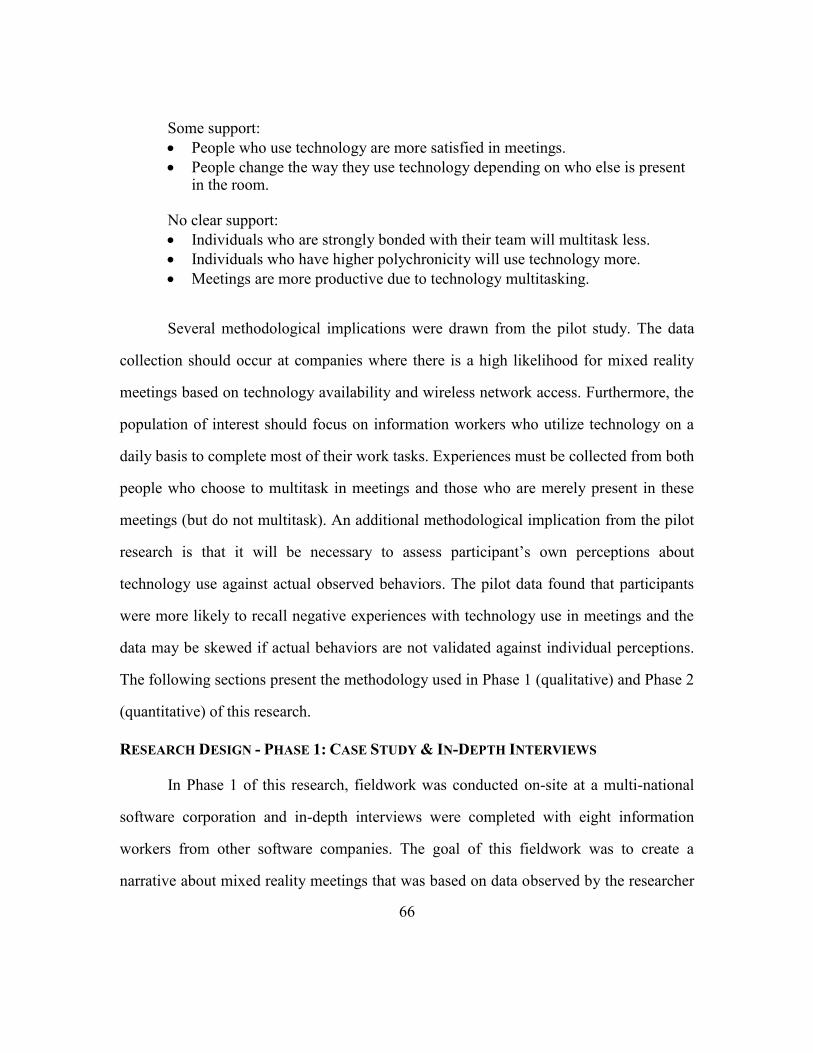
66
Some support:
People who use technology are more satisfied in meetings.
People change the way they use technology depending on who else is present in the room.
No clear support:
Individuals who are strongly bonded with their team will multitask less.
Individuals who have higher polychronicity will use technology more.
Meetings are more productive due to technology multitasking.
Several methodological implications were drawn from the pilot study. The data
collection should occur at companies where there is a high likelihood for mixed reality
meetings based on technology availability and wireless network access. Furthermore, the
population of interest should focus on information workers who utilize technology on a
daily basis to complete most of their work tasks. Experiences must be collected from both
people who choose to multitask in meetings and those who are merely present in these
meetings (but do not multitask). An additional methodological implication from the pilot
research is that it will be necessary to assess participant’s own perceptions about
technology use against actual observed behaviors. The pilot data found that participants
were more likely to recall negative experiences with technology use in meetings and the
data may be skewed if actual behaviors are not validated against individual perceptions.
The following sections present the methodology used in Phase 1 (qualitative) and Phase 2
(quantitative) of this research.
RESEARCH DESIGN - PHASE 1: CASE STUDY & IN-DEPTH INTERVIEWS
In Phase 1 of this research, fieldwork was conducted on-site at a multi-national
software corporation and in-depth interviews were completed with eight information
workers from other software companies. The goal of this fieldwork was to create a
narrative about mixed reality meetings that was based on data observed by the researcher
67
and experienced by the participants. There exist few in-depth investigations of the
phenomenon of mixed reality, therefore this research area is aided by a detailed
exploration that describes when and where it occurs and identifies people’s thoughts and
explanations on the subject.
The case study and interviews focused on four themes that stem from the
conceptual model previously proposed:
1) factors impacting the likelihood to multitask 2) people’s behaviors in mixed reality meetings 3) people’s attitudes toward mixed reality meetings 4) people’s beliefs about how meeting outcomes are impacted by technology
multitasking
From the data collected at the case site and interviews, the experiences of the
participants were compared and contrasted and then analyzed in relation to the conceptual
model themes. Based on this analysis, a narrative of mixed reality is presented in Chapter
4 that is grounded in real world experiences. The narrative and conceptual model were
then analyzed against the survey data collected in Chapter 5. The survey data allowed for
a comparison of the qualitative narratives against a larger population to improve the
validity of the results.
Case Study Definitions
The case study method is the investigation of a phenomenon in its real-world
context using multiple empirical methods (Yin, 2003). Case studies are highly contextual
in that they cover a specific time period of the phenomenon and involve a small number
of participants (VanWynsberghe & Khan, 2007). Researchers have typically used the
case study method to analyze how and why particular events unfold or to compare how
similar groups were impacted by a particular change. The rationale behind using the case

68
study method is that it allows the researcher to delve into a real life context and produce a
rich description from which to understand the situation—which then allows for the
opportunity to build theory.
A case study can consist solely of one single case for analysis, or be made up of
multiple cases which are then cross-compared. The methods used within the case study
are typically analyses of physical artifacts, interviews with case participants, and
observations made by the researcher. This flexibility in how the case study method can be
used is also its critical weak point in terms of evaluating it as a methodology. Few case
studies use the exact same set of methods, and even when similar methods are used for
similar cases, there is no standard against which to compare the data collection
procedures (there are no sets of controls in a case study like there are in an experiment).
Beyond the fact that case studies are not easily compared across different researchers, the
analysis and results also suffer from the same issues of validity. There is not a single
standard from which to evaluate the analysis and results of a case study (like in an
experiment where there are statistical regressions which can be used to demonstrate the
power of the data.)
However, researchers have offered solutions for these limitations (see especially
Eisenhardt, 1989). First, in regards to not being able to offer standards about the data
collection procedures, Eisenhardt (1989) and Riege (2003) argue that using multiple
observers and triangulating the data (by collecting the same data in multiple ways) can
reduce researcher biases and offer diverging points of view which strengthen the analysis.
When data is collected from additional sources its validity is improved by the fact that
there are multiple lenses from which to demonstrate the legitimacy of the data.

69
Furthermore, it is recommended that follow-up studies using quantitative analyses
can also augment the research as it helps gauge whether the patterns and relationships in
the qualitative data exist with statistical significance. A model for this type of research is
Cameron’s (2007) dissertation that examined how office workers participate in multiple
conversations using technology. Cameron began with a case study of five individuals
engaging in these behaviors from which conceptual models about multi-communication
were developed. These models were then tested using survey data to establish statistical
significance for the relationships proposed in the conceptual model. Similarly, this
research on mixed reality follows this same methodology of using multiple data sources
for the qualitative phase and validating these results using hypotheses testing from survey
results.
Theoretical Viewpoint of Case Study
The theoretical viewpoint that informs the data collection is adaptive structuration
theory (AST) which posits that technology use in organizations is best understood as a
dialectic between organizational norms, individual motivations, and the situated use of
specific features of the technology (Orlikowski, 2000). This means that technology use
cannot be understood as arising solely from one factor—each component (norms,
motivations, technological features) has a role in shaping its use. For example, the
original designer of a technology artifact had certain intentions and expectations for how
the technology should be used (called embodied structures in AST). However, when that
technology is used in real life, the user may utilize the technology in unexpected and
novel ways, or bypass features because it suits her or his individual needs and the
organizational context better (user appropriation). It is the interplay between the
embodied structures and user appropriation that explain how technologies become used

70
in context; this use is not static, it becomes re-contextualized as factors of the user’s
situation change too.
In line with the viewpoint of structuration, while the case study begins with a
particular set of focus areas, the data collected will take an individualistic approach in
understanding how the technology is used and why. For the portion of the case study
involving in-depth field work, specific hypotheses will not be tested, instead the analysis
will concentrate on comparing and contrasting individual behaviors in a way that
represents and matches the participant’s own experiences with mixed reality taking into
account the organizational context and how technology is used. The data analysis will
consist of coding the interview and observational data through grounded theory methods
(similar to the pilot study described earlier in this chapter). This coding process will
allow for a systematic analysis of the different participants experiences to find points of
commonality and divergence.
The process to analyze qualitative data will follow Creswell (2003); it begins by
the researcher reading through the field notes and interview data to get an overall
impression of the data and then dividing the relevant pieces of text into segments. These
segments are then coded into different themes or topics as they relate to the research
questions. These themes are then written into narratives. A strong qualitative narrative
uses multiple sources of data to examine the proposed themes (triangulation), have been
reviewed by the participants for agreement (member checking), the researcher’s personal
biases have been disclosed, and a discussion of negative or discrepant information that
runs counter to the proposed themes is examined and explained. From this analysis the
narrative of mixed reality will be written which assesses the experiences against the
71
conceptual model to improve our theoretical understanding of mixed reality. The next
sections present further details about the methodological process for Phase 1.
Case Study Site: SoftwareCorp
Gaining Research Access
A multi-national software corporation was recruited by the researcher to
participate in this project. To gain access, the researcher contacted SoftwareCorp’s
(pseudonym) Director of Corporate Communications via their e-mail address on
SoftwareCorp’s public web site. This director then forwarded the message to a liaison
within the company whose responsibilities include fostering university internships and
related projects. A one-page project pitch was submitted to the liaison who then obtained
the necessary approvals for the research from a Vice President at SoftwareCorp.
Representativeness of SoftwareCorp
SoftwareCorp develops computer software products for individuals and
businesses. The majority of product development and management happens within the
United States, but SoftwareCorp also has business units located globally. SoftwareCorp is
representative of many software corporations in the industry today who have cross-
functional teams that work together from around the world.
SoftwareCorp was selected as an ideal case site because they were listed as a
Fortune 500 company in 2008, its workers rely on information technologies to produce
and manage their work, and their offices were wirelessly networked and physically
accessible to the researcher. A Fortune 500 company is determined by an annual ranking
based on gross revenue of publicly traded organizations calculated by Fortune magazine.
The rationale behind selecting Fortune 500 ranking as a criterion is because these
organizations, by nature of their revenue, might be considered industry leaders. An
72
organization in this position is likely to rely on information technologies to operate on a
global level and help set standards for technology use in its daily operations.
Solicitation e-mails (to be a case site participant) were sent to 100 other
companies with whom the researcher was able to elicit contact information for; and out of
these 100 solicitations three other corporations expressed interest in being a part of the
project. However, the researcher was never able to successfully negotiate final
permissions or identify an appropriate liaison within these companies, so access to these
other sites was never granted. While ideally there would have been more than one case
site used in this research, this limitation was addressed by incorporating in-depth
interview data from individuals following the fieldwork at SoftwareCorp.
Individual Participants from SoftwareCorp
The case study at SoftwareCorp was based on data from two participants whose
daily activities involve information work and who take part in mixed reality meetings.
Information work is operationalized as a reliance on the use of information technologies
to produce, manage and capture information in performing daily work tasks. Examples of
information workers include computer programmers, business consultants, middle and
upper level management, and financial advisers. Job roles that deal with information
work but at the level of customer service representatives, data entry clerks and
administrative support staff are considered ―data handlers‖ and are excluded from this
operationalization of information work. Findings from the pilot study demonstrated that
data handlers did not typically experience technology multitasking in meetings.
The participants recruited at SoftwareCorp met the following criteria:
Employed full-time
Performs ―information work‖ as a common activity for their job
Age 18 or more
Attends at least 1 meeting per week
73
Regularly uses a laptop computer in meetings
Has worked with their current team for at least 1 year
Is not a telecommuter or virtually located employee
Additional details about the two participants from SoftwareCorp are described in
Chapter 4.
Instruments Used at SoftwareCorp Case Site
For the case study, a mix of semi-structured interviews and field observations
were used to understand how participants experience mixed reality in terms of meeting
type, polychronicity, cohesion beliefs, technology multitasking, copresence management,
perceived productivity, and meeting satisfaction. The data collection procedures are
outlined below:
1. In-depth introductory interview. A one-on-one interview was conducted in a
semi-structured format. The interview accomplished the following: a. Introduced the participant to the research topic and obtained informed consent. b. Completed questionnaire to verify polychronicity level. c. Obtained the participant’s initial opinions about mixed reality meetings. d. Prepared the participant for upcoming observation days.
2. Job shadowing. Shadowed the participant on two separate work days when
meetings were held. The researcher followed the participant throughout their entire work day and assessed: a. General organizational environment in regards to technology use. b. Technologies used throughout the work day. c. Tasks completed simultaneously, tasks completed singularly. d. General style and purpose of meetings. e. Technology use by participants and by others in the room.
3. Wrap-up interview. Closing interview via telephone for 20-30 minutes. A debriefing interview where participants asked questions and the researcher had an opportunity to follow-up about any points of clarification needed.
74
Data Analysis for Case Study
Data analysis followed the methods recommended by Eisenhardt (1989) and Yin
(2003) who propose concurrent coding and analysis. To analyze the data while collecting
means reflecting upon each day of observation/interviews by both coding the data and
writing a reflexive diary about the day. The purpose of writing and analyzing the data
immediately after collection is to take advantage of the fact that impressions and
observations are still fresh in memory. Additionally, performing clerical work on the data
during the process of data collection offsets the need to complete this time-consuming
task later. The software tools used to transform and code the data were Microsoft Word
and Excel.
The analysis process adopted Miles & Huberman’s (1994) three-step approach:
data reduction, data display, and conclusion drawing and verification. With data
reduction, the purpose is to transform the data into meaningful units—from the initial
field notes, to the coding of relevant text statements, and then to the final narrative; the
process of data reduction is constantly occurring as the researcher analyzes the data. For
data display, Miles & Huberman emphasize the importance of representing the data in
charts, graphs, tables, and any other visual representations that enlighten the analysis.
From the data reduction and displays, conclusions can be written which must then be
verified.
Ensuring Data Quality
To ensure the reliability of the data, the case study used multiple sources of data.
Each of the main research themes has two sources of data: the participant’s out of context
perspective (face-to-face interview) and the researcher’s observations (field
observations). Since the research constructs are examined using both the participant’s and

75
researcher’s perspectives, this helps ensure that the patterns of behavior believed to be
occurring are upheld over time (reliability) and that the researcher’s viewpoint is in line
with the participant’s own beliefs about mixed reality (validity).
One concern with participant observation methods is reactivity, which occurs
when participants act differently due to the researcher’s presence. To mitigate reactivity
during the field observations, the researcher met with the participant for a face-to-face
interview prior to job shadowing which helped build rapport and familiarity. In order to
frame the field research in a metaphor that the participant could relate to, the investigator
described the observational days as ―job shadowing‖ which is an understood concept for
job training. Furthermore, emphasis was placed in explaining the observations as a
learning experience for the researcher and not a critique of how the participant conducted
his daily work activities. To help further eliminate or address bias in the data due to
reactivity, in the follow-up interview over the phone, the researcher asked the participant
about his comfort level during the field observation days and what behaviors, if any, were
different than usual due to the presence of the researcher.
In summary, the case study was a study of two information workers who
experience mixed reality meetings at a software corporation. A combination of researcher
interviews and direct observations, in addition to participant self-reports, were used as the
primary sources of data. The data collection focused on the research themes proposed in
the conceptual model in order to assess the utility of the model. Following the case study,
interview data with eight other information workers was collected.
In-Depth Interviews
Eight (8) information workers, in particular people who design software and web
site products, were recruited for one-on-one interviews with the researcher. The
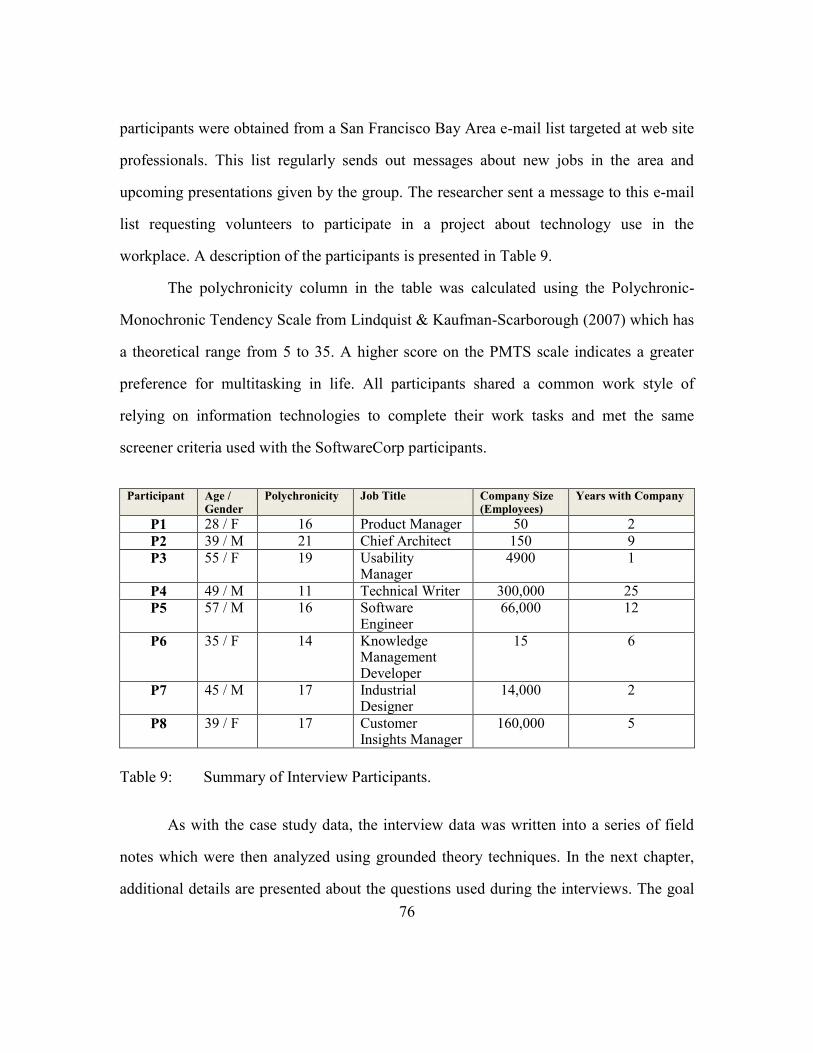
76
participants were obtained from a San Francisco Bay Area e-mail list targeted at web site
professionals. This list regularly sends out messages about new jobs in the area and
upcoming presentations given by the group. The researcher sent a message to this e-mail
list requesting volunteers to participate in a project about technology use in the
workplace. A description of the participants is presented in Table 9.
The polychronicity column in the table was calculated using the Polychronic-
Monochronic Tendency Scale from Lindquist & Kaufman-Scarborough (2007) which has
a theoretical range from 5 to 35. A higher score on the PMTS scale indicates a greater
preference for multitasking in life. All participants shared a common work style of
relying on information technologies to complete their work tasks and met the same
screener criteria used with the SoftwareCorp participants.
Participant Age /
Gender Polychronicity Job Title Company Size
(Employees) Years with Company
P1 28 / F 16 Product Manager 50 2
P2 39 / M 21 Chief Architect 150 9
P3 55 / F 19 Usability Manager
4900 1
P4 49 / M 11 Technical Writer 300,000 25
P5 57 / M 16 Software Engineer
66,000 12
P6 35 / F 14
Knowledge Management Developer
15 6
P7 45 / M 17 Industrial Designer
14,000 2
P8 39 / F 17 Customer Insights Manager
160,000 5
Table 9: Summary of Interview Participants.
As with the case study data, the interview data was written into a series of field
notes which were then analyzed using grounded theory techniques. In the next chapter,
additional details are presented about the questions used during the interviews. The goal
77
of Phase 1 was to create a narrative of mixed reality based on fieldwork and interview
data. Additional details on this process and the narrative are presented in Chapter 4. To
strengthen the findings from this qualitative phase, survey data was used to compare the
narrative results against testable hypotheses. The survey methodology is presented in the
next section.
RESEARCH DESIGN - PHASE 2: SURVEY AT SOFTWARECORP & ONLINE PANEL
To determine how the seven constructs of meeting type, polychronicity, cohesion
beliefs, technology multitasking, copresence management, perceived productivity, and
meeting satisfaction are related, the survey method was used to test the relationships. In
general, survey methods are used to generate data about characteristics, attitudes, and
behaviors on a wide range of topics. Some examples of common survey topics include
assessing people's opinions about politics, asking people to rate the performance of
others, and finding out how often and why people use different technologies. Survey data
is collected through a systematic series of questions which can be gathered in-person,
over a telephone, via e-mail/web site, or postal mail. The data for a survey are collected
from a sample of people from which the results are used to generalize to the larger
population (Babbie, 1995).
Participants in this survey were asked to respond to a questionnaire of
approximately 30 items on the topic of mixed reality using a web-based survey tool
offered by Zoomerang (http://www.zoomerang.com). Two populations were used for the
survey: information workers at SoftwareCorp (n=156) and an online panel of information
workers (n=110). The purpose of using these two samples was to validate the qualitative
experiences against larger sample sizes to assess the generalizability and validity of the
findings. Details about the hypotheses and questionnaire development are explained

78
further in Chapter 5. This chapter concentrates on a presentation of the methodological
issues with using web-based surveys and online panels. Aspects of the survey
implementation are discussed briefly, but the main purpose of this section is to identify
and address validity about the survey process in general.
Advantages of Web-Based Surveys
One of the main benefits of conducting web-based survey research is that it is less
expensive than paper-based and telephone surveys (Gunn, 2002). Cost estimates for
telephone surveys can range from $40 to $100 per completed response (Kraut et al.,
2004); while the approximate cost per response using an online panel can be about half
that. Additionally, online questionnaire data can be collected faster since the responses
are recorded immediately onto a web server and the researcher does not have to wait to
receive back a paper survey or wait for the telephone interviewers to individually reach
each participant at the right time. Other benefits include the fact that participants can
complete the questionnaire at their own pace and if the questions are written clearly, there
are no issues with miscomprehension or memory overload as participants do not have to
remember the question they are hearing out loud during a telephone survey. The
elimination of a compliance effect is another benefit of online surveys since respondents
have no pressure to be agreeable or respond in a way that they think the interviewer
would like best.
External Validity of Web Surveys
In web-based surveys, the validity of the responses is uncertain when the research
is focused on topics that are intended to generalize to everyone regardless of Internet
access. For example, web-based surveys on topics such as presidential elections or health
care exclude the responses of people who do not regularly use computers or have Internet

79
access. In this research on mixed reality, the population under investigation is specifically
people who work in offices where computing resources are available; therefore using a
web-based survey is likely to be advantageous since the population only includes
individuals who have access to computers. In the next section, the methodological issues
with using an online panel are examined further.
Online Panels
In brief, online panels are created from databases of individuals who have agreed
to participate in surveys (typically in exchange for gift cards or other rewards). Panelists
are profiled on demographic characteristics about themselves, their household, work, or
any other factor that would be of interest to researchers (such as political orientation).
These online panel databases are maintained by marketing companies who work with
researchers to select the appropriate sample based on the criteria desired for the project.
Zoomerang was selected as the best marketing company to partner with after
polling other academic researchers on the Information Systems World (ISWorld.org)
mailing list about the services they had used to obtain an online panel. After comparing
the service costs and database samples referred, and evaluating that against additional
research about marketing firms and survey tools, Zoomerang had the most appropriate
sample. Specifically, Zoomerang offered an online panel consisting only of technology
workers which matched the desired sample of information workers. Participants in
Zoomerang’s database earn points when they complete surveys and these points can then
be redeemed for gift certificates.
Survey Implementation
To conduct the survey, Zoomerang’s web-based interface was used to load the
survey questions into a series of clickable web pages. Zoomerang then sent a message to

80
participants in the sample requesting their participation in the study. Based on the
research budget, once the desired number of participants completed the questionnaire, the
researcher was given access to the raw data from which to conduct the analysis.
Precedence for the legitimacy of using online panels for academic research has been set
by Baltes & Heydens-Gahir (2003) who conducted a survey of the behaviors that impact
work-family balance, Piccolo & Colquitt (2006) who examined a model for the
relationship between job characteristics and transformational leadership, and Wallace
(2005) who developed and validated a model for cognitive failures in the workplace
using data from an online panel.
Validity of Online Panels
One major issue with the validity of online panels is the sampling techniques used
to find participants. Online panels are typically developed by for-profit companies though
some universities also maintain similar online panel databases (Syracuse, Michigan, and
Vanderbilt for example). These individuals are primarily recruited into the panel through
direct mail and online advertisements. Every individual in the panel is profiled so that
demographic information such as age and location, the type of work they do, in addition
to his or her lifestyle habits is recorded. When a researcher recruits from an online panel,
they select the demographic segments of interest in order to target the questionnaire to the
ideal sample.
Two major issues with recruiting from an online panel are the legitimacy of the
panelist’s identity and the representativeness of the panel database overall. For the first
issue, it is conceivable that individuals not only misrepresent information in their
demographic profile, but also hold multiple accounts in an effort to earn more rewards for
taking more surveys. The companies that maintain online panels address the issue of

81
panelist legitimacy by correlating e-mail addresses to physical mailing addresses to try
and ensure that people do not register into the panel under multiple e-mail accounts. In
regards to panelists misrepresenting their demographic information, there is little basis to
suggest that participants in online panels are any more likely to lie when creating their
demographic profiles compared to panelists in other avenues of research. For the second
issue on representativeness, a selection bias occurs with the online panel since
participants who agree to sign up for online panels have chosen to take the time to
complete profiles and earn rewards. These individuals may differ from others who do not
want to participant in an online panel and therefore may lead to survey results which do
not truly reflect the attitudes and behaviors of the intended population.
Daugherty, Lee, Gangadharbatla, Kim, & Outhavong (2005) conducted a survey
with 1,822 online panelists to elicit the reasons these individuals participate in web-based
research. Four sources of motivation to be an online panelist were tested: utilitarian (e.g.
financial incentives), knowledge (e.g. need to understand/learn), value-expressive (e.g.
individuals feel they are allowed to express their self-concepts/values) and ego-defensive
(e.g. to feel a sense of belonging or reduce feelings of guilt for not participating). The
results of their survey indicate that individuals with the most favorable attitude toward
being in an online panel were those who rated the knowledge and value-expressive
motivations as their greatest incentive to being in the panel. The fact that monetary or
material incentives have little impact on people’s motivation to participate is further
backed by Göritz (2006).
In an experiment using online panelists that measured their response rate and
retention, Göritz found that offering a cash lottery incentive did not significantly change
the response rate or retention of online panelists. The implication of this finding may be
82
that within the population of online panelists, respondents will be biased toward only
responding to surveys that match their own personal interests. However, it is important to
note that both the Daugherty et al. and Göritz studies were based on university-sponsored
online panels, and therefore the potential for emphasis to be on knowledge and
information sharing may be underscored more compared to a commercial market
research enterprise with an online panel.
While the issues of external validity and selection bias are two major drawbacks
with web-based surveys and online panels, it remains the case that the population under
investigation for mixed reality is not meant to generalize to everyone who works full-
time. And, since the ideal population will be difficult to reach otherwise, the use of an
online panel and web-based questionnaire is the best avenue for this survey. The
legitimacy of using online panels and web-based data collection has been spurred by the
growth in the creation and maintenance of online panels and a general trend toward
increased usage of online research as compared to traditional avenues such as direct mail,
polling at public places such as malls, and telephone surveys (James, 2000). Additionally,
academic researchers are turning to free online research services such as Online Social
Psychology Studies (http://www.socialpsychology.org/expts.htm) which allows any
academic researcher with institutionally approved research to post a survey on their web
site that fits into the genre of social psychology studies.
In terms of the validity of Zoomerang’s online panel, Zoomerang reports the
following maintenance techniques they utilize to improve their validity:
• Metrics are kept on each respondent’s responsiveness, tenure in the panel,
frequency of participation (so that the researcher’s study is balanced in terms of the types
of online panelists being sampled)

83
• Panelists are recruited from the widest range of sources possible (both online
and offline)
• Samples are balanced against US census data to reflect similar populations on
attributes such as gender, annual household income, and age
While consideration was given to creating an online panel using recruitment
methods such as e-mailing people at various organizations based on information available
from web sites, purchasing e-mail lists from marketing firms, posting online
advertisements, and newspaper/flyer advertisements, these procedures would likely be
invasive, difficult, time-consuming and cost-prohibitive along with the fact that the
respondent set would likely not differ significantly enough from the Zoomerang panel.
ALTERNATIVE METHODS CONSIDERED
Are the case study, interview, and survey methods proposed here the best way to
understand the phenomenon of mixed reality? Two alternate methods for data collection
are briefly proposed and then a rationale for the current methodological design is given.
Alternate Method #1: Videotape Analysis of Group Meetings
In this first alternate method, the investigator would videotape group meetings
where individuals use technology. Ten (10) meetings at different organizations would be
filmed. For each meeting, there would be one camera focused on all the participants in
the meeting, and a second camera capturing an up-close examination of one of the
member’s technology use. With these two views of the meeting the researcher would
have a visual record of all the verbal communication and behaviors of group members
along with a detailed view of how one individual member used technology.
The strengths of this method are that the researcher would have an unbiased
record that relates technology use to the events of the meeting; for example, if the user

84
decides to look up a definition for a word on her or his laptop based on what was just
spoken out loud, there is a clear record linking the meeting event and the technology use.
One of the drawbacks of this method is that most organizations would be uncomfortable
with giving permission to film a private company meeting. Even if an organization is
amenable to the filming, the presence of the camera, especially one focused on the
individual technology user would likely change the behavior of the group member so that
the meeting is unnatural and not reflective of normal practice.
Alternate Method #2: Experimental Groups
In the second alternate method, an experiment would be conducted with small
groups. Random subjects would be recruited to participate in an experiment about group
work and be placed in one of four experimental conditions:
• no technology use • confederate user – uses technology for group task only • confederate user – uses technology for private work and group task • confederate user – uses technology for private work only
Each group would consist of 6 participants and they would be asked to complete a
collaborative task requiring the effort of all participants. The type of technology
multitasking would differ across conditions, which would be manipulated through the
provision of a networked laptop computer to a confederate. The investigator would tell
the participants that in order to complete the collaborative task that they could use any
resources available in the room, even their own personal belongings.
Deception would occur in the three conditions where a laptop was present: a
confederate of the researcher who would be viewed as a peer to the other participants
would announce that she happened to have her laptop computer available. Depending on
the condition, the confederate would use the laptop in ways that help with the group task

85
or utilize it for private work (e.g. checking e-mail, playing a game). The groups would
then be scored on their performance on the collaborative task and a post-task survey
would ask participants to express their attitudes and opinions about the confederate’s use
of technology in the meeting.
While the experimental method allows for a highly controlled environment that
could capture the percentage and type of technology use by the confederate, this
artificiality is its greatest weakness for understanding mixed reality. Organizational
norms for technology use cannot be assessed in the experiment, and since the participants
have little incentive to build rapport or care about other people’s behaviors (since
everyone is a stranger), cohesion beliefs cannot be accurately gauged. Furthermore, an
experimental collaborative task does not have the same characteristics of a large scale
organizational work project.
The strengths of the proposed case study, interview, and survey methods outlined
previously are as follows: the case study and interviews provide a grounded real-world
description of the phenomenon from which the findings are then validated quantitatively
through the survey. This triangulation of the data provides multiple sources of evidence
that the behaviors exhibited by the small sample of case and interview participants can be
extrapolated to the larger population of information workers.
LIMITATIONS OF THE RESEARCH
While the strengths of the research have been described above, there are
limitations on the validity of the findings in the following areas.
Role of Time and Behavior Change
The behaviors of group members who have been together longer are different than
those of younger groups. As time spent together increases in a group, the level of social

86
cohesion increases (Manning & Fullerton, 1988) due to shared experiences and increased
comfort in the relationships. One of the limitations of this research is that changes in
mixed reality in a single group or individuals are not measured over a significant length
of time. In the case study, the participant data collection will occur over a 3-month period
(approximately), and with the survey data it will not be known if the respondents are
thinking about a team that they know well or not. It is certainly possible that in a group’s
history that the norms for technology use will change over time and this research does not
assess the mechanisms for changes over time and how this impacts technology
multitasking.
Differences in Technology Types
Another limitation of this research is that little emphasis is given to the different
affordances and uses that various portable technologies have. For example, does the use
of a mobile phone in a meeting have the same impacts as the use of a laptop computer on
perceived productivity and meeting satisfaction? This research approaches technology
only generally and does not capture if and how various media result in different
experiences for mixed reality settings. Specifically, the laptop computer is the technology
assessed as the main artifact in mixed reality meetings.
Furthermore, in regards to the different features of technology as it impacts mixed
reality, no distinction is made between the multiple types of tasks technology is used for
beyond ―used for group work‖ or ―used for private work.‖ The implication of this broad
categorization is that the task type differences are lost in the analysis. For example, a
laptop used in the meeting for checking private e-mails, drafting a document on a
separate work project, and exchanging instant messages with a coworker would all be
labeled as ―used for private work.‖ However, if these specific tasks are not analyzed
87
separately it is unclear whether these distinct tasks have varying levels of impact. While
the qualitative fieldwork will capture some of these task distinctions, the interview and
survey data will not be able to address this issue adequately since people will be
responding out of context.
CONCLUSION
In the first three chapters, mixed reality has been presented as a context where
some individuals participate simultaneously in group meetings while using technology. In
mixed reality meetings, collaborative group work can be enhanced by the technology
through increased access to information, but individuals using technology may also be a
distraction to the group task. In most traditional research on group meetings, the general
findings about group work have purported that face-to-face meetings are the most
communication rich and ideal context for accomplishing complex tasks (Daft & Lengel,
1986). This research attempts to extend our knowledge on group meetings to identify and
understand how today’s collocated groups may be impacted by technology multitasking.
A conceptual model was developed that proposed mixed reality occurs based on a
combination of meeting type, polychronicity, and cohesion beliefs. This combination of
factors determines the type of technology multitasking that occurs and whether
individuals try and manage their level of copresence. The evaluation criteria to assess the
impact of mixed reality was described as perceived productivity and meeting satisfaction.
The conceptual model was developed from a review of the literature and based on the
results from a pilot study with 15 office workers.
From this model, a two-phase methodology for investigating mixed reality was
proposed. In the first phase a case study of two individuals who use technology in
meetings and in-depth interviews with eight information workers is used to create a

88
narrative about mixed reality. In the second phase, the themes and findings developed
from the first phase are then statistically validated using a survey. This methodology
balances the need for detailed descriptions of mixed reality behavior against quantitative
data to assess the generalizability of the results.
In the next two chapters, Chapters 4 and 5, each research phase is presented in
greater methodological detail and the results are analyzed. In the final chapter, Chapter 6,
conclusions are drawn about our theoretical understanding of group work and the impacts
of technology multitasking on group meetings.
89
CHAPTER 4: QUALITATIVE RESULTS (PHASE 1)
Chapter 4 presents the qualitative phase research results from fieldwork data
collected at SoftwareCorp (a pseudonym for the organizational case site) and in-depth
interviews. Two senior managers from SoftwareCorp were interviewed and observed at
their jobs and eight information workers from eight different corporations participated in
1-hour one-on-one interviews.
Mixed reality is an emerging area of research and to date there exist few
systematic studies of this phenomenon in organizational contexts. The purpose and
contribution of this qualitative work is to describe and analyze mixed reality behaviors
and attitudes drawn from real world organizational experiences. These experiences are
systematically interpreted using a grounded theory approach. A framework for addressing
when and why mixed reality occurs and how people perceive its impacts is presented.
This outcome contributes to the nascent literature and also tests the soundness of the
conceptual model used in this research.
This chapter is organized by two main sections: the first describes the case study
at SoftwareCorp and associated results, and immediately following is the second section
which reports the interview data and findings. The chapter concludes with a summary
analysis and its implications for the conceptual model and quantitative phase.
THEORETICAL BACKGROUND & CONCEPTUAL MODEL
This qualitative research is based on the theoretical foundation that organizational
meetings are socially constructed contexts in which group interactions can be analyzed as
they represent larger organizational themes (Schwartzman, 1993). It is from these
detailed observations and analyses of routine behavior in meetings from which patterns

90
emerge that represent what is considered acceptable behavior, how information is
communicated, how people view themselves within the organizational hierarchy, and
how people work together.
Three themes are used to analyze the qualitative data on mixed reality meetings.
The conceptual model, shown in Figure 4 below, represents the relationship of the
research constructs. In the first theme, factors contributing to the likelihood to multitask
in meetings are reviewed (meeting type, polychronicity, and cohesion beliefs). Following
this, the second theme examines how individuals behave during mixed reality meetings
(technology multitasking and copresence management). And, the third theme looks at
individual outcomes from multitasking in meetings (meeting satisfaction and perceived
productivity).
Figure 4: Conceptual Model for Mixed Reality.
These themes are used as an organizing framework for discussing the results
presented in both sections of the qualitative research and are used in the following
sections for presentation of the survey results.
91
CASE SITE OVERVIEW
The case site overview is a detailed account of the researcher’s methodology and
description of the SoftwareCorp site. A description of SoftwareCorp and the two
participants is presented to give contextual background to the evidence in the case study
results section. In this overview, the context of this study is characterized by three main
factors: the physical layout of SoftwareCorp in general, the technological infrastructure
used by the participants, and the physical setup of the participant’s work cubicle.
The case site methodology is described and shortfalls with data collection are
examined, too. In brief, the methodology consisted of hand-written notes captured on-site
across six separate days in a time period spanning October 2008 to January 2009. These
data consisted of notes from 1) an in-depth interview with each of the two participants, 2)
observing each participant working at his desk, and 3) observations of face-to-face
meetings (with the participant and other meeting attendees) in conference rooms. The
following sub-sections describe this research process with greater detail along with the
contextual factors of SoftwareCorp that shape mixed reality behavior and attitudes.
Obtaining Research Access to SoftwareCorp
SoftwareCorp is a Fortune 500 software development company with headquarters
in California. It operates globally with approximately 15,000 employees around the
world. Its software products are used both by individuals on personal home computers
and they offer an enterprise-level product designed for businesses. To protect
organizational privacy, details of the company’s products and lines of business have been
omitted or are intentionally vague.
The researcher obtained access to interview and job shadow two employees at
SoftwareCorp’s California headquarters (this process was described previously in

92
Chapter 3). To solicit two employees for job shadowing, the SoftwareCorp liaison sent an
e-mail message to employees categorized as ―developers‖ or ―project managers‖ asking
for volunteers. These job categories were selected by the researcher as representative of
this study’s definition of information workers. Within minutes of sending out this
message there were 6 candidates who replied; the first development manager and the first
project manager to reply were selected as the participants. While the characteristics of the
non-selected candidates are unknown, if the two selected had not been able to meet the
criteria for participation they would have been replaced by another from the pool of
candidates.
Physical Description of SoftwareCorp
Fieldwork at SoftwareCorp took place in a 4-story office building in a major city
in California. Along with providing work cubicles for employees, the building includes a
corporate cafeteria, fitness facility, game/break rooms, and coffee/kitchen areas on each
floor. When visitors enter through the main entrance they are greeted by an attendant at a
central information desk. The main lobby has two separate waiting areas, both decorated
with product awards, plaques, and company signage/slogans. The inside of the building is
spacious with high ceilings and the interior design exudes a contemporary feel with
silver-toned fixtures, clean lines, and modern style furniture.
The building accommodates approximately 1,000 workers. The majority of
employees work on floors 2, 3, and 4 with each floor assigned by product functionality
(e.g. everyone who works on the home consumer product is on floor 3). Each floor
consists of sets of cubicles, though there are three cubicle sizes based on seniority. There
are also meeting rooms on each floor of various sizes and wireless Internet access is
93
available everywhere in the building. Access to work areas and meeting rooms are locked
and require electronic badges in order to pass through different parts of the building.
Based on the researcher’s experiences with 20 other office visits throughout this
dissertation work, the physical context of SoftwareCorp appeared typical for the industry.
The layout of work cubicles, amenities, security features, and modern interiors are
standard for software technology companies and SoftwareCorp’s physical premises are a
representative environment for this study. Representativeness is important because
people’s behavior and attitudes with technology are informed by the environmental
setting in which they work. For example, physical proximity to coworkers can influence
the use of communication technologies (e.g. Kraut, Fussell, Brennan, & Siegel, 2002).
Technological Description of SoftwareCorp
As with the physical layout, the technological environment is relevant for
understanding the work context of participants. Some corporations place restrictions on
an employee’s ability to personalize work computers; for example, not allowing
employees to install non-sanctioned software. In addition to controlling computing
applications, some corporations disallow how the installed software can be used by
placing filters that limit or block access to content deemed disruptive or inappropriate
(e.g. personal e-mail and job search web sites).
The technological infrastructure contributes to employee attitudes toward
technology use and can inhibit or promote work processes (Kanter, 2000). According to
the two participants, SoftwareCorp was not restrictive in how work computers and web
sites could be used. The participants were able to install any new software or web site
applications as they desired, and using the computers for personal matters was considered
acceptable. While the researcher did not review the SoftwareCorp official employee

94
handbook, both participants did not hesitate to complete personal tasks on their work
computers while being observed for this project.
Desktop computers, laptop computers, large flat screen monitors, and
smartphones were accessible to all product managers and developers at SoftwareCorp.
Both participants had three computers in their cubicle and they also had smartphones that
were issued by SoftwareCorp (a smartphone being a mobile phone that can also be used
to check e-mail and browse the Internet). Both participants also had personal mobile
phones. Pictures of the cubicle work areas are shown in Figure 5, Figure 6, and Figure 7
on pp. 98-99. All employees had a 2-monitor setup at their desks, meaning that multiple
windows could be opened and moved across both monitors. This type of dual monitor
setup provides additional screen space so that it is easier to see many computing
applications simultaneously.
SoftwareCorp’s technological access was perceived by the participants as being
encouraging of using new or different technologies as long as it supported or enhanced
their work. For example, on the first day the researcher arrived for observations, the
participant was excited to show a new computer that he had requested which would be
used as a testing environment for the software product. He further explained that he never
had difficulty obtaining approvals for technology purchase order requests.
The significance of SoftwareCorp’s allowance and promotion of technology use is
that work is not limited to physical location, time of day, or even a particular
technological object. The same e-mails and work documents can be accessed on a
smartphone, laptop, or desktop computer. The lines between work and personal time are
blurred as both are intertwined throughout the day. Mixed reality meetings are a natural
95
outgrowth of this technology-infused environment as people are expected to be available
to respond to e-mails and instant messages continuously throughout the day.
SoftwareCorp Participant Overview
This section presents the characteristics of the two participants from
SoftwareCorp. Both participants are similar in seniority, tenure, and cubicle layout but
differ in polychronicity level, the number of people they manage, and job responsibilities.
The analysis is serendipitously strengthened by the fact that the two participants are
similar on important surface characteristics, but diverge on work communication partners
and multitasking preferences.
Charles and Sam (pseudonyms) are both senior managers at SoftwareCorp with
each having been at the company just over ten years. Both Charles and Sam are leads for
their respective products and supervise the work of other employees. While their
immediate teams are all collocated together in the same building, due to the size of the
projects, both Charles and Sam work extensively with other teams who are distributed
across the US and internationally (primarily with India). Table 10 provides an overview
of each participant. Polychronicity score was captured via a paper-based questionnaire
collected during the introductory interview (using the Polychronic-Monochronic
Tendency Scale described in Chapter 2).

96
Charles Sam
Age 38 31
Years at SoftwareCorp 11 12
Polychronicity Level (Range = 5 – 35)
15 26
Business Unit Enterprise Level Product Home Consumer Product
Job Title Senior Product Manager Senior Manager of Development
# of People Managed 4 8
High Level Job Tasks Presents product demos and features to business clients in formal presentations Creates documents that explain the benefits and features of the software product Helps define scope and features of the product Builds and maintains SoftwareCorp’s business relationships
Manages the development of the home consumer product at the software code level Works with Quality Assurance team to fix software bugs Helps define scope of product and its technical specifications Works with product managers to ensure timeline for development is feasible
Table 10: SoftwareCorp Participant Summary.
The researcher met Charles and Sam for introductory one-on-one interviews in
October 2008. These 45-minute interviews took place in the participant’s cubicles. At
these initial meetings, the researcher introduced herself, obtained informed consent,
received responses to the polychronicity questionnaire, and explained the research
process in detail. Charles and Sam explained their motivation to participate based on
being personally interested in the issue of workplace multitasking. Charles had not even
noticed in the initial e-mail solicitation that there was a $200 honorarium for
participation. While Charles and Sam likely know each other because they have both
been with the company for a long time, they do not work with the same teams or on the
same projects, and they are physically located on different floors at SoftwareCorp.
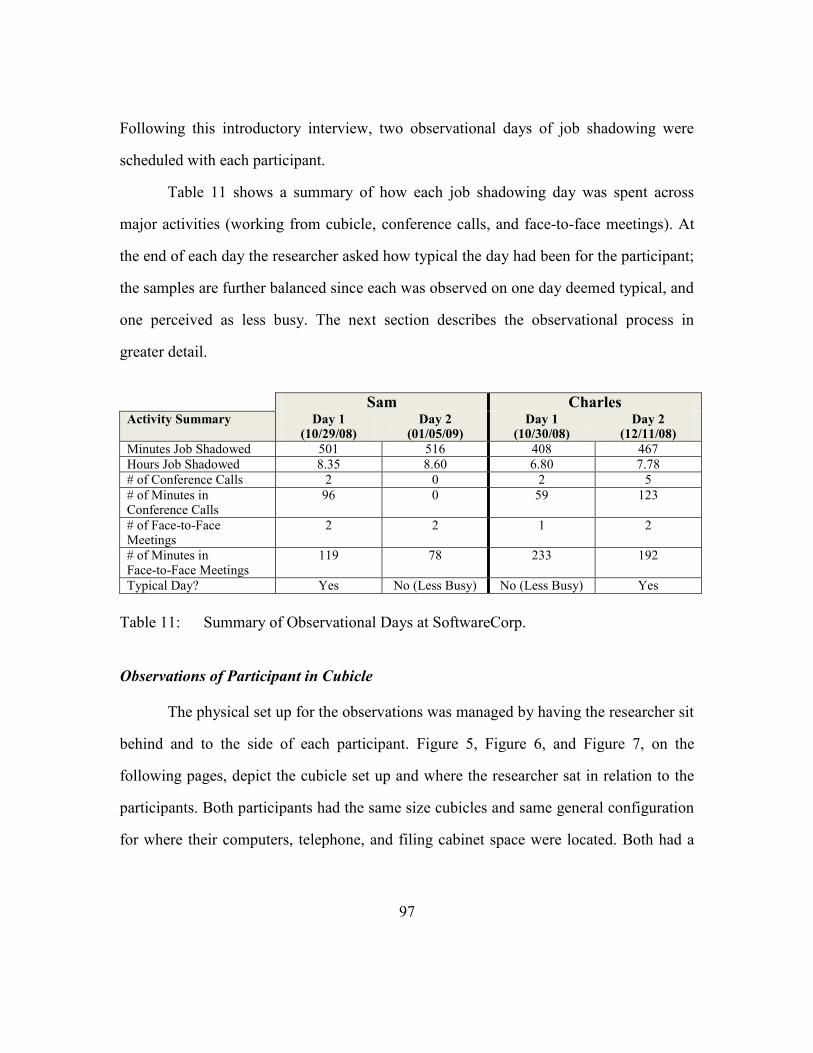
97
Following this introductory interview, two observational days of job shadowing were
scheduled with each participant.
Table 11 shows a summary of how each job shadowing day was spent across
major activities (working from cubicle, conference calls, and face-to-face meetings). At
the end of each day the researcher asked how typical the day had been for the participant;
the samples are further balanced since each was observed on one day deemed typical, and
one perceived as less busy. The next section describes the observational process in
greater detail.
Sam Charles Activity Summary Day 1
(10/29/08) Day 2
(01/05/09) Day 1
(10/30/08) Day 2
(12/11/08)
Minutes Job Shadowed 501 516 408 467
Hours Job Shadowed 8.35 8.60 6.80 7.78
# of Conference Calls 2 0 2 5
# of Minutes in Conference Calls
96 0 59 123
# of Face-to-Face Meetings
2 2 1 2
# of Minutes in Face-to-Face Meetings
119 78 233 192
Typical Day? Yes No (Less Busy) No (Less Busy) Yes
Table 11: Summary of Observational Days at SoftwareCorp.
Observations of Participant in Cubicle
The physical set up for the observations was managed by having the researcher sit
behind and to the side of each participant. Figure 5, Figure 6, and Figure 7, on the
following pages, depict the cubicle set up and where the researcher sat in relation to the
participants. Both participants had the same size cubicles and same general configuration
for where their computers, telephone, and filing cabinet space were located. Both had a

98
desk phone to their left, and one additional computer behind them which was used as
needed to test the SoftwareCorp product.
Figure 5: Researcher Position for Observations of Sam.
Figure 6: Sam’s Dual-Monitor Work Area.

99
Figure 7: Researcher Position for Observations of Charles.
The benefit of the researcher’s position for observations was that participants did
not feel stifled by the researcher’s presence and were able to move about normally within
their work space (as compared to if the researcher had sat within inches next to the
participant). Once the researcher was situated, she never had to move or re-locate herself
within the cubicle, indicating that the participant was able to access all of his work
artifacts without disruption. The researcher further verified that the participants were
comfortable by asking if her placement within the cubicle was acceptable—both
participants verbalized that they approved of the positioning.
The downside to this set up from the researcher’s perspective, however, was that
it was not possible to read everything that was being typed on the computer screen. The
researcher was always able to identify the given computing applications being used, but
text that was typed was sometimes illegible from the observational position. While the
on-screen text could not always be observed, this did not spoil the intended purpose of
100
the job shadowing; which was to notate how the participant completed his work tasks. It
was still possible for the researcher to capture the start and end times of the different
computing applications being used, when interruptions occurred to those tasks, and the
different forms of multitasking (e.g. talking on phone while browsing e-mail). The
researcher purposefully did not interrupt the participant to ask any questions during the
observational period since it would interfere with the natural work pattern. However, the
researcher did use breaks within the day such as lunch, time spent walking to meetings,
and the last minutes of the day to ask follow-up and clarification questions.
The hand-written notes from the interviews and fieldwork days were transcribed
into electronic notes in Microsoft Word and a time log of events in Microsoft Excel. The
electronic notes consisted of background information about the participant and other
general impressions and observations about being on site at SoftwareCorp. These notes
followed the ethnographic field note model (Emerson, Fretz, & Shaw, 1995). As
prescribed by Emerson et al., the researcher’s field notes should be a coherent telling of
the observed events with special care given to notating whose perspective is being
recounted and which details have been selected to be included. The field notes can also
be distinguished from the time log of events in that the former includes the researcher’s
subjective interpretation of the observations whereas the time log is an objective record
of every observable activity that occurred.
The time log data consisted of a list of the events that occurred in the participant’s
day and during meetings using time stamps (see Table 12 as an example segment of the
time log). This log captured to-the-minute activities of the participant at his desk and
during meetings. The only time segments that were not captured at a detailed level were
the participant’s lunch hours and private meetings where the participant requested that the

101
researcher not attend (Charles requested that the researcher not attend one internal staff
meeting due to his belief about the sensitivity of the topics to be discussed). These
minute-level notes were captured for 875 minutes (14.5 hours) with Charles and 1017
minutes (17 hours) with Sam across two separate work days each.
The columns labeled Activity A, B, and C designates that for any given event in a
particular time segment, participants were simultaneously engaged in one or more
additional activities (not necessarily related to the first activity). Segments where nothing
is recorded (e.g. 10:12 below) indicate that the activity from the time stamp above
continued or ended ―‖.
Time Activity A Activity B Activity C
10:08 Opening a parcel that contains a small computer
Small talk with researcher
10:09 Using bug tracking tool on left monitor
E-mail browser open on right monitor
10:10 Leaves cube to go get a coffee (down the hallway)
10:11 Turns on a laptop that is sitting to the left of the desk
Glancing over a project overview document on right monitor
Simultaneously glancing at bug tracking tool on right
10:12
10:13 Goes to corporate intranet and submits an electronic approval for vacation days on left monitor
A new e-mail notification pop up window appears (and then automatically disappears) in lower right of left monitor
Table 12: Example Time Log Segment for Case Site Participant.
The underlying purpose for capturing to-the-minute notations of the participants’
cubicle activities was to gather baseline data for how the participant worked. From an
understanding of the participant’s typical way of managing his activities when working
alone, an analysis comparing how he multitasks and manages himself in face-to-face
group meetings is possible. This comparison is useful for assessing how work behaviors
102
changed across different office settings. This baseline focused on the following themes
which are all related to the larger research aims on technology multitasking:
Communication o Who do they communicate with during the day? Via what methods
and for how long? o How often is e-mail checked? How quickly do they respond to
messages?
Work Tasks o Which work tasks are completed simultaneously? o Are there activities that they devote full attention to? o How long do they spend on different work tasks?
Technologies o Which software/web applications do they use? How many windows
are open on their computers? o How many different technologies (phone, computers, etc.) are used
throughout the day?
Organization of Activity o How does the participant keep track of their schedule? o How do they decide what to work on next?
Interruptions o How many people stop by to ask questions? How often do they get up
to ask someone a question? o How often does the phone ring? o Do they self-interrupt and lose track of what they are working on?
The data gathered on these themes are presented in the Participant Results section
which follows immediately after the following overview for how meeting observations
were conducted.
Observations of Participant in Meetings
For each of the seven (7) face-to-face meetings the researcher attended with the
two SoftwareCorp participants she was positioned at the conference table next to the
participant for five meetings, and just behind the participant against a wall for two

103
meetings. Figure 8 shows the conference table configuration for two meetings as an
example.
Figure 8: Two Different Conference Room Configurations.
The other meeting attendees were informed prior to the commencement of the
meeting that the researcher was present to observe the meeting for a university project on
technology use in the workplace. While the researcher kept her observations primarily
about Charles or Sam, any time another meeting attendee multitasked with technology
this was also captured in the data time logs. One of the shortcomings with data collection
during these meetings is that when 3 or more individuals were multitasking
simultaneously, it was difficult to accurately capture the start and end times of their
activity. Also, it was not possible for the researcher to see everyone’s laptop screen
during a meeting which limited the identification of multitasking for private versus
group-oriented tasks. However, since the main observational focus was Charles and Sam,
these limitations do not detract from the main findings.
An additional feature of the meeting time logs is the capturing of conversation
activity. This means that not only did the researcher observe and notate the activities of
Charles and Sam during the meeting, but also the topic being discussed and by whom for
any given minute segment. The purpose of capturing the meeting conversation was to
D + Laptop
Researcher
V + Laptop
Sam Researcher, Charles
SoftwareCorp External Client
Researcher
D + Laptop
E + Laptop
E + Laptop
104
create an analysis of the data that linked the meeting activity to any technology
multitasking that may have been occurring at the same time.
Participant Results
The case study results begin with an analysis of how Charles and Sam worked
alone in their cubicles. This baseline data for how the participants worked alone is then
compared to technology multitasking behaviors when working with others in team
meetings. To create this comparison, an in-depth examination of mixed reality meetings
at SoftwareCorp is discussed across three different themes drawing from the behaviors
observed and discussed with the participants.
Baseline Data in Cubicle (Working Alone)
The first observation that struck the researcher upon comparing Charles’s and
Sam’s cubicle spaces was the general organization of artifacts. Sam is a ―piler‖ with
scraps of paper and documents, food containers, books and office supplies all over his
main desk and the desk behind him—there is no apparent organization to the piles.
Charles’s cube has some office supplies and documents by his keyboard, but overall the
work space is sparse and not filled with anything extraneous.
When at their desks, both Charles and Sam face their two monitors and complete
most work tasks on the computer. The computers operate on a Windows operating
system, and the primary work applications used are Microsoft Outlook for e-mail,
calendar, and meeting scheduling, Yahoo Instant Messenger for instant messaging, and
Mozilla Firefox for web browsing. Sam’s main computing tasks involve communicating
and corresponding via e-mail, responding to instant messages, using SoftwareCorp’s
web-based company intranet to complete management tasks (e.g. approving time off and
performance evaluations), and editing information in the web-based software bug

105
tracking tool. Charles’s main tasks also rely on e-mail and instant messaging throughout
the day, but his other major work task involves creating PowerPoint presentations and
researching information to support his business development efforts with enterprise
clients. Excluding times when they are in meetings, on the telephone, or talking to
someone in-person, both Charles and Sam spend their entire workday using the computer.
Noise and Interruptions to Cubicle Work
The level of noise in their cubicles from walk-by traffic and other people working
from adjoining cubicles was minimal. Office noise can be disruptive and lead to tension
amongst employees. Evans & Johnson (2000) conducted an experimental study with
clerical workers by manipulating the level of random office noise and found that
participants in the noisy condition experienced greater levels of stress. Across the four
job shadowing days, each participant could overhear someone else’s phone conversation
(coming from another cubicle) once per day for 10 minutes or less.
While there was minimal office noise, the few noises that did occur were noticed
by both participants because the researcher observed their head move toward the noise
each time. The sounds of shuffling papers, typing, someone walking by, or office
conversations were indicators of who else was present. The researcher observed that
when footsteps could be heard, both participants would look up from their computers
momentarily as they quickly scanned the area to see if they could identify who was
passing by. For example, Sam noticed a co-worker walking past his cube and said out
loud, ―Hey, did you send me that instant message?‖ Also, if nearby cubicle mates were
known to be at their desks, Charles and Sam sometimes just talked loudly across the
cubicles to converse. Knowing who else was in the office was useful for determining to
what extent one could interact with other colleagues (e.g. walking over to have a

106
conversation with someone might be more effective than instant messaging, or vice
versa).
Stop by interruptions (people going to Charles’s or Sam’s cubicle to ask a quick
question) usually lasted about one-minute, though Charles did have two stop bys that
lasted 6 to 10 minutes, and Sam had two that lasted 6 to 7 minutes. The purpose of the
stop bys was predominantly work related where someone needed an answer to a question,
though sometimes they served a social function for people just to say hello or ask how
someone was doing. Sam encountered more interruptions from people coming by his
cube to ask a question than Charles: Sam had 18 stop bys across the 2 days of observation
while Charles had 9 stop bys. This difference is most likely attributable to the fact that
Sam manages a larger team of people on-site.
While Sam and Charles were job shadowed, on average, for just under 8 hours
each day (mean minutes job shadowed per day = 473), the majority of their days were
spent working with other people in the form of either scheduled meetings or stop by
interruptions. A time break-down of each job shadowing day is shown in Table 13, and as
can be seen in the last row, Sam and Charles typically had about 2 hours of their work
day in which they were not actively communicating with others and were working alone.
Day 2 with Sam, where he had 274 minutes (about 4.5 hours) of time to work alone was
unusual. Sam’s 4.5 hours of working alone time was higher than normal because this was
the first work day of the new calendar year following a holiday break of nearly two
weeks. Sam explained to the researcher that this work day had been unusually quiet and
he believed it was because of the vacation break.

107
Sam Charles Activity Breakdown (Minutes)
Day 1 (10/29/08)
Day 2 (01/05/09)
Day 1 (10/30/08)
Day 2 (12/11/08)
Job Shadow Time Length 501 516 408 467
Stop by Interruptions 11 18 12 11
Conference Calls 96 0 59 123
F2F Group Meetings 119 78 233 192
One-on-One Meetings 159 146 0 0
Working Alone in Cubicle
116 274 104 141
Table 13: Time Spent Working Alone vs. Spent Working with Others.
The implication of the table above suggests that time spent working alone is about
2 hours for a typical work day. This 2 hours of working alone time is not continuous, it is
interspersed between the time spent working with others. Excluding the outlier day (Sam
– Day 2) approximately 75% of their work is spent communicating or collaborating with
coworkers. One possible consequence of this time usage is that Charles and Sam must
find ways to monitor e-mail and instant messages while simultaneously participating in
other work activities (such as meetings). If participants used only e-mail and instant
messaging when they were working alone, they would not be accessible with enough
frequency to help manage and assist on their respective projects.
Participant Work Styles
During the time that they are working alone, Sam kept 20 or more windows open
which are layered on top of each other and there are about 10 ―tabs‖ on the bottom of his
monitor showing the different open applications. Sam constantly shifted windows around
and opened more—it was sometimes difficult to keep track of what he was doing at any
given moment because he shifted very quickly between tasks (and it appeared that he was
working on multiple different tasks at the same time too). For example, Sam would
quickly write an e-mail (less than 30 seconds), and seemingly simultaneously looked up

108
information on a web site (unrelated to the e-mail) and scanned his e-mail for new
messages. The researcher was able to distinguish that tasks were unrelated based on the
following: (1) reading the on-screen text, (2) Sam’s use of two different instant
messaging clients (one was for personal use), (3) Sam’s use of a separate e-mail client for
personal communication, and (4) verifying with Sam at the end of the day that he
completed distinct tasks nearly simultaneously throughout the day.
Whenever a new e-mail message arrived, it notified Sam with a pop-up in the
lower right of his left monitor, and typically Sam stopped whatever he was working on to
open that message and respond to it immediately. Instant messages were also responded
to immediately. There was a continuous flurry of layered activities and tasks when
watching Sam work. The researcher confirmed with Sam at the end of his work day that
this pattern of interleaving multiple work tasks was typical for him.
Charles, on the other hand, worked in a more linear manner; it was easy to
identify in any given moment his primary work task. Charles avoided working on
different projects at the same time and limited interference to his current work task. For
example, he would wait until he was at a natural stopping point in his current task before
checking new e-mail messages. And, where Sam had 20 windows layered on top of each
other across two monitors, Charles rarely had more than 3 windows open at any time, and
he would close them as soon as he was finished.
In Table 14 and Table 15, a summary of Sam’s and Charles’s work days are
summarized from the event log data. Day 1 of observations is shown for Sam, and Day 2
for Charles, since these were the work days deemed ―most typical‖ by the participants.
For completeness, the other two observation logs (for the ―less busy‖ days) are shown in
Appendix F. Each row represents 30 minutes of time and the main tasks accomplished
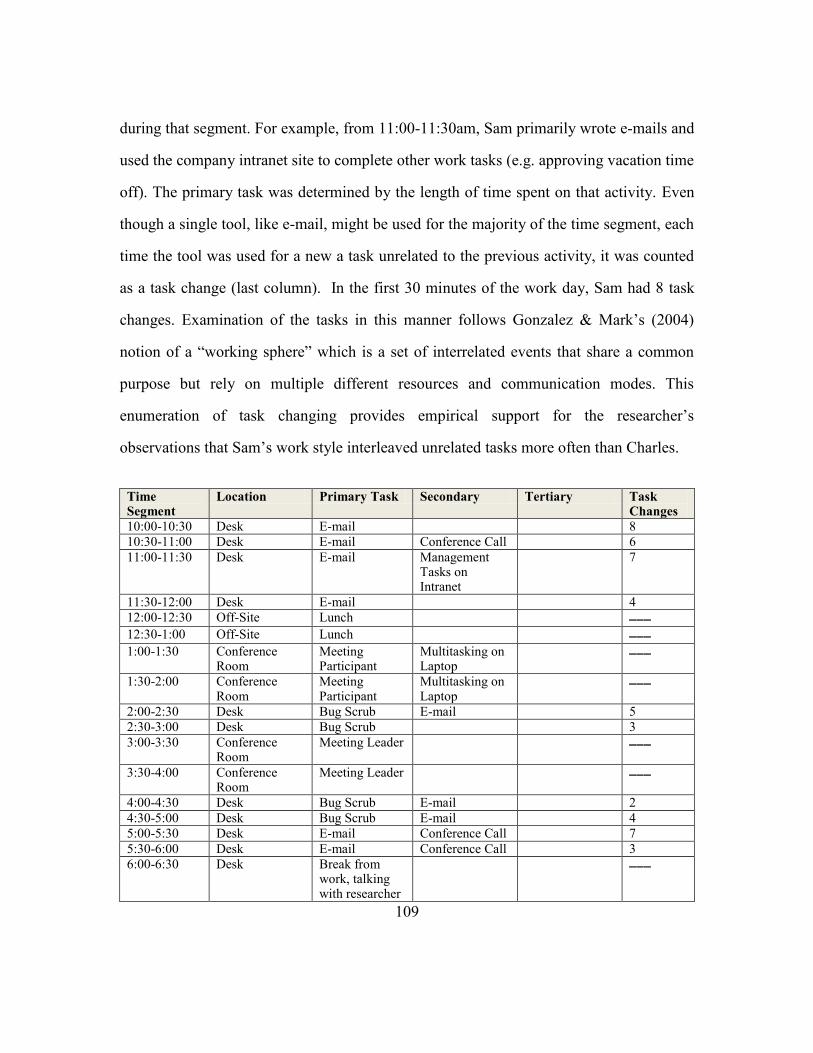
109
during that segment. For example, from 11:00-11:30am, Sam primarily wrote e-mails and
used the company intranet site to complete other work tasks (e.g. approving vacation time
off). The primary task was determined by the length of time spent on that activity. Even
though a single tool, like e-mail, might be used for the majority of the time segment, each
time the tool was used for a new a task unrelated to the previous activity, it was counted
as a task change (last column). In the first 30 minutes of the work day, Sam had 8 task
changes. Examination of the tasks in this manner follows Gonzalez & Mark’s (2004)
notion of a ―working sphere‖ which is a set of interrelated events that share a common
purpose but rely on multiple different resources and communication modes. This
enumeration of task changing provides empirical support for the researcher’s
observations that Sam’s work style interleaved unrelated tasks more often than Charles.
Time Segment
Location Primary Task Secondary Tertiary Task Changes
10:00-10:30 Desk E-mail 8
10:30-11:00 Desk E-mail Conference Call 6
11:00-11:30 Desk E-mail Management Tasks on Intranet
7
11:30-12:00 Desk E-mail 4
12:00-12:30 Off-Site Lunch 12:30-1:00 Off-Site Lunch
1:00-1:30 Conference Room
Meeting Participant
Multitasking on Laptop
1:30-2:00 Conference Room
Meeting Participant
Multitasking on Laptop
2:00-2:30 Desk Bug Scrub E-mail 5
2:30-3:00 Desk Bug Scrub 3
3:00-3:30 Conference Room
Meeting Leader
3:30-4:00 Conference Room
Meeting Leader
4:00-4:30 Desk Bug Scrub E-mail 2
4:30-5:00 Desk Bug Scrub E-mail 4
5:00-5:30 Desk E-mail Conference Call 7
5:30-6:00 Desk E-mail Conference Call 3
6:00-6:30 Desk Break from work, talking with researcher

110
6:30-7:00 Coworker’s Desk
Bug Scrub
7:00-7:30 Coworker’s Desk
Bug Scrub
7:30-8:00 Desk E-mail 3
Table 14: Sam’s Time/Task Log for Day 1.
Time Segment
Location Primary Task Secondary Tertiary Task Changes
8:00-8:30 Desk E-mail 2
8:30-9:00 Desk Conference Call
E-mail Instant Messaging
4
9:00-9:30 Desk Conference Call
E-mail Instant Messaging
4
9:30-10:00 Desk E-mail Phone Instant Messaging
3
10:00-10:30 Conference Room
Meeting Participant
10:30-11:00 Conference Room
Meeting Participant
11:00-11:30 Conference Room
Meeting Participant
Multitasking on Laptop
11:30-12:00 Conference Room
Meeting Participant
Multitasking on Laptop
12:00-12:30 Off-Site Lunch 12:30-1:00 Off-Site Lunch
1:00-1:30 Desk Phone Conference Call Instant Messaging
4
1:30-2:00 Desk Conference Call
E-mail Instant Messaging
3
2:00-2:30 Desk Stop by Interruption
Phone E-mail 4
2:30-3:00 Desk Conference Call
E-mail Instant Messaging
5
3:00-3:30 Desk E-mail Bug Track Conference Call 5
3:30-4:00 Desk E-mail 1:1 Conversation
4
4:00-4:30 Conference Room
Meeting Participant
4:30-5:00 Conference Room
Meeting participant
5:00-5:30 Conference Room
Meeting Participant
Table 15: Charles’s Time/Task Log for Day 2.

111
In summary, Charles and Sam have distinct work styles from each other. Charles
manifested little clutter at his desk and on his computer work space, and he made an
effort to minimize distractions (such as closing out applications immediately and only
checking e-mail at natural break points during his work). Sam’s work style, on the other
hand, is filled with constant layers of different activities. Sam does not devote time
segments to single tasks, but instead maintains a constant ebb and flow across multiple
unrelated activities throughout his day. Even when Sam purposefully focused his work on
more attention-intensive work tasks (e.g. his ―bug scrubs‖ where he had to review
technical problems and decide how to address the issue), he continued to check e-mail
and write instant messages. The next section addresses how this working alone style
compared to their behaviors in group meetings.
Comparison Analysis of SoftwareCorp Mixed Reality Meetings
How did participant work styles change between working alone compared to
amongst other people? The theory of social facilitation (Zajonc, 1965) states that when
people perform a task in the presence of others, arousal increases. For simple tasks, this
arousal leads to improved performance; for complex tasks, this arousal is detrimental.
Just being merely present in front of others changes our actions because individuals shift
into a performance mode where they purposefully modify their behavior based on how
they want to be perceived by others (see Chapter 2 discussion on Goffman and
impression management).
Based on the prior description of how the participants worked alone, the
researcher anticipated that Charles would multitask in meetings minimally, if at all, and
that Sam would have a propensity for technology multitasking. In Table 16 and Table 17,
the seven (7) face-to-face meetings observed with Sam and Charles are summarized. In

112
the first table below, Sam had two Internal Project Meetings and two Staff Meetings
across the observation days. In both instances the people attending each of these meeting
types were the same, meaning that both Staff Meetings involved the same set of attendees
(Sam’s team of engineers), and both Internal Project Meetings were attended by the same
members (product managers and technical leads). The column ―Types of Laptop Use‖
combines observations from any multitasking with technology that the researcher
observed from her field of view.
During the observations of meetings with Charles, he had one half-day long
meeting on the first observation day with external clients visiting at SoftwareCorp, and
then two Internal Project Meetings with two different teams on the second day. The
meetings observed with the SoftwareCorp participants are reflective of typical meetings
the participants had each week. The researcher verified that these were typical meetings
by asking Charles and Sam how common each meeting had been for their regular work
week.
Meeting Type
# of F2F Attendees
# People Dialed-in
Meeting Length
# of Laptops in
Meeting
Types of Laptop Use
Internal Project Meeting DAY 1
4 2 1 hour 2 -IM another colleague to see if he could attend the meeting -Taking electronic meeting notes -Electronic calendar for scheduling
Staff Meeting DAY 1
7 0 1 hour 1 -Showing a PowerPoint presentation
Internal Project Meeting DAY 2
6 5 1 hour 5 -Taking electronic meeting notes -Checking e-mail and instant messages throughout entire meeting
Staff Meeting DAY 2
8 0 30 minutes
1 -Not used during meeting
Table 16: Overview of Sam’s Meetings at SoftwareCorp.

113
Meeting Type
# of F2F Attendees
# People Dialed-
in
Meeting Length
# of Laptops in
Meeting
Types of Laptop Use
External Client Meeting DAY 1
14 0 4 hours 14 -Taking electronic meeting notes -Showing a PowerPoint presentation -Electronic calendar for scheduling -Looking up information to share with the meeting -Checking e-mail for other work reasons -Sending/receiving IMs for other work reasons
Internal Project Meeting DAY 2
12 5 1 ½ hours
5 -Checking e-mail and instant messages throughout entire meeting
Internal Project Meeting DAY 2
13 0 1 ½ hours
5 -Checking e-mail Reviewing the presentation being projected
Table 17: Overview of Charles’s Meetings at SoftwareCorp.
These meetings are explored in the next sections following the three themes
presented earlier in the chapter. Charles’s and Sam’s meetings are analyzed in the context
of what led to their technology multitasking (Theme 1), their behaviors and attitudes
during the meeting (Theme 2) and perception of mixed reality’s impacts (Theme 3).
FACTORS CONTRIBUTING TO TECHNOLOGY MULTITASKING (THEME 1)
In this section, the factors contributing to the likelihood to multitask with
technology in meetings is presented. Based on the conceptual model (see Figure 4, p. 90)
the role of meeting type and polychronicity were anticipated to impact the likelihood to
multitask.
Meeting Type & Likelihood to Multitask
Meeting type correlated with how and why participants multitasked with laptops.
Meetings which were based around work projects (project meetings) exhibited frequent

114
levels of multitasking compared to meetings that were meant to facilitate team building
and general status updates (staff meetings). Both Charles and Sam multitasked during
project meetings, but not in their staff meetings.
Staff Meetings
In staff meetings, laptop use did not occur except for presentations. The
researcher observed three main purposes for staff meetings: to relay team updates, plan
social activities (e.g. group lunches) and share general project or staffing information
amongst the group. Sam led his 1-hour staff meetings which were attended by the
developers who report to him. In each of the two staff meetings observed, Sam would
begin the meeting with introductory comments about the current state of the project
(approximately 20-30 minutes), and then each of the developers would take their turn
giving an update (30 minutes).
When the researcher asked Sam if anyone in the staff meeting ever multitasked
during the meeting, Sam explained that no one did. The goal of the staff meeting was to
learn about each other’s work status and share information that would be relevant to
everyone in the room, there would be no plausible reason for any of the developers to be
using a laptop.
Charles attended one staff meeting, but the researcher was not in attendance due
to the sensitivity of the topics being discussed. However, the researcher questioned
Charles afterwards about the general topics discussed and if any technology multitasking
occurred (none did as reported by Charles). Similar to Sam’s staff meetings, Charles
explained that ―there would be no reason to have a laptop in this meeting.‖ In contrast to
the staff meetings, internal project meetings exhibited frequent technology multitasking
by both participants.

115
Internal Project Meetings
For internal project meetings, the purpose was to share information and plan
specific aspects of the software projects. In Sam’s internal project meeting on Day 1, the
group set deadlines for the project and negotiated whether more staff could be hired. The
format of the meeting followed an agenda that had been sent out previously by the
meeting leader; each meeting topic discussed followed the outline on the agenda.
In this meeting there were four people (of which two had laptops) in the
conference room and two people dialed-in on the teleconference system. One laptop was
the facilitator’s, and he multitasked sparingly (for example, looking up a schedule date
related to the meeting). By nature of his role, the meeting facilitator could not use the
laptop with great frequency because his main task was to keep the meeting on topic and
organize/recap each of the agenda items. The facilitator’s meeting responsibilities were
determined by observing him in two staff meetings where he conducted both meetings in
the same manner and verifying how typical his behavior was by asking him later in the
day about his role in the meeting.
The second laptop was used by Sam’s boss, the Director of Engineering, who
multitasked throughout the entire meeting. It was not possible from the researcher’s
vantage point to see the Director’s laptop screen. However, it was possible to observe
where the Director’s eyes were focused, and if his hands were typing or using the mouse
on the laptop. His laptop use did not seem to interfere with his meeting participation—
when the Director had something to say, he would lean forward and close his laptop
slightly and speak, but then return to technology multitasking immediately.
Figure 9 below shows a figurative graph representing the researcher’s
observations of the Director’s technology multitasking in relation to his meeting

116
participation. The x-axis on the graph represents the meeting time, from 3:06pm is when
the Director started using his laptop, and he continued until 3:48pm. Every time the
researcher could hear or see the Director typing on his laptop or observe his eyes focused
on the laptop screen, she notated the start and end time. Similarly, when the Director
participated in the meeting conversation, this too was notated. On the graph, technology
multitasking is represented as an ―o‖ and the moments when the Director talked in the
meeting is shown as an ―x‖. As shown below, the Director interspersed his technology
multitasking and meeting participation.
Figure 9: Figurative Graph of Technology Multitasking in Project Meeting.
While the meeting facilitator and the Director both used their laptops during the
meeting, Sam did not multitask though it was anticipated that he normally would for this
specific meeting. Sam later explained to the researcher that based on a conversation he
and the Director had previously, Sam felt there was an expectation for him to participate
and lead the decision making in this meeting. Therefore, Sam believed it was prudent for
him not to be multitasking while the Director was present in order to demonstrate that he
was taking a more active role. Observations of Sam’s technology multitasking during the

117
second instance of this same weekly internal project meeting are discussed further in the
next section with Theme 2 results.
External Project Meetings
On the first day of observations with Charles, a 14-person external project
meeting was held that lasted four hours and exhibited technology multitasking behaviors.
This meeting with Charles was part of a 2-day set of events with a major client (this
client is a Fortune 100 information technology/software company). About half the people
in this meeting were the client and the other half were from SoftwareCorp. The purpose
of this meeting was to learn more about the client’s software needs and specifically
Charles was there to give a presentation about new features of the software. Everyone in
this meeting had a laptop in front of them, though at any given point in the meeting only
about half the laptops were open. While some of the people in the room had worked
together over the course of the business relationship, most of the attendees did not know
each other and everyone worked at different office locations around the US. The format
of the meeting consisted of sets of presentations and discussions, some led by
SoftwareCorp and some led by the client.
In the first 15 minutes of the meeting when introductions took place, no one used
their laptop and people focused their gaze at the speaker (each person took a turn giving a
brief description of themselves and her or his role). The client was the first to begin the
meeting discussion as they presented the current state of their workplace issues that
related to SoftwareCorp’s product solution. During the client’s presentation Charles took
electronic meeting notes in an e-mail message to himself—these notes were brief one line
comments. He took five lines of notes in the first hour. While 7 laptops were open during
this time of the meeting, no one was actively engaged with their laptops; people would
118
glance at their laptop, or type something quickly, but laptops were not used for any
prolonged period of time. People also occasionally peeked at their mobile phones during
this same time period, but these behaviors were subtle and quick.
For the next section of the meeting where Charles stood in front of the room and
presented, a shift in laptop use occurred. Charles’s assistant product manager, Eric
(pseudonym), began to use his laptop with intensity. The researcher was sitting next to
Eric at the table and was able to observe all of his technology multitasking. Previously
when the client had been speaking, Eric had not used his laptop except for an occasional
glance to see if new e-mail messages had arrived. Now during Charles’s presentation,
Eric was writing and reading e-mails in addition to corresponding with people via instant
messaging for periods of time lasting up to 5 minutes. During the lunch break, Eric
explained that the change in his laptop use was because he knew everything that Charles
was going to be presenting, therefore he felt comfortable using his laptop at that point.
Also, he clarified that he did not use his laptop while the client was speaking because he
wanted to hear what the client had to say.
When the meeting recommenced after a lunch break, there were 5 people (a
combination of both SoftwareCorp and the client) who were using their laptops in a
focused manner. With focused use, every time the researcher would glance around the
room, it was observed that their eyes were still intently gazing at the technology and not
at whoever was speaking. Charles was still in the front of the room presenting during this
time. After the meeting, Charles explained to the researcher that the focused laptop use
had not bothered him. He explained that some of the clients in attendance were involved
with high level strategy and some were developers who were more focused on the project
details. These different role types had dissimilar information needs in the meeting;

119
therefore technology multitasking did not bother him because parts of his presentation
were only pertinent to some of the attendees.
Overall, for the face-to-face meetings observed, there were no instances where
laptops caused any major disruption to the meeting. No one in the meeting ever made a
verbal comment about people’s technology multitasking and when Charles debriefed the
researcher about his feelings toward multitasking in the meeting, he stated that the
behaviors in the meeting had been typical and that the meeting had run smoothly. In fact,
the laptop was a positive supplemental tool to help record notes and look up information
that facilitated the meeting. When people did use their laptop for non-meeting reasons,
they limited it to when they were not needed in the meeting or when the meeting was on
break. People seemed to self-regulate their use of technology to fit the social and task
needs of the group as appropriate. When the meeting purpose was to share information at
a high level (staff meetings), laptops were not brought or used. When the meeting was a
―working meeting‖ (internal/external project meetings), laptops were brought to the
meeting by at least half the attendees, and varying levels of technology multitasking
occurred and were viewed as a normal occurrence by participants.
Polychronicity & Likelihood to Multitask
The second factor analyzed as an influence on the likelihood to multitask with
technology is polychronicity. Polychronicity is one’s preference for multitasking and
belief that this is the best way to work. Charles scored a 15 and Sam a 26 on the
Polychronic-Monochronic Tendency Scale. A higher score on the PMTS (theoretical
range of 5-35) equates to a greater preference for multitasking. Despite differing scores
for polychronicity, both Charles and Sam multitasked with laptops during meetings.

120
When their technology multitasking deviated from their normal practice, it was based on
who else was present in the meeting or the role they needed to take in the meeting.
Sam is high in polychronicity but did not bring a laptop to a meeting where his
boss (the Director discussed in the previous section) was present because ―he’s expecting
me to lead the decision making‖ meaning that Sam wanted to demonstrate engagement
and focus in the meeting by not multitasking. And, while Sam brought his laptop to the
staff meeting, he did so only to show a PowerPoint presentation. Since Sam was the
leader for the staff meeting, it would have been difficult to both facilitate the meeting
while multitasking with other work tasks. However, when Sam was in internal project
meetings (without his boss present), he multitasked continuously throughout the meeting
(see Table 18 for an event log of Sam’s frequency of laptop use in this meeting). The
researcher verified with Sam that his multitasking behavior without the boss was typical
for him during project meetings.
Charles, who is lower in polychronicity than Sam, brought his laptop to the
external project meeting and used it to take meeting notes and during breaks he would
check e-mail. Charles also multitasked with his laptop during internal project meetings
but did not use it during staff meetings. With these participants, a preference for
multitasking as measured by polychronicity, did not seem to account for whether one
technology multitasked in meetings since Charles’s polychronicity score was 15 and
Sam’s 26, yet both engaged in similar meeting behaviors.
Recalling each participant’s work behavior when at their desks, Sam completed
his work by interleaving multiple different tasks together in the same time period and
Charles exhibited a linear work style where each time segment was focused on one main
task. Their respective work styles are similarly reflected in how they multitasked. Sam

121
used his laptop to check e-mails and write instant messages throughout his second
internal project meeting, and these activities were not necessarily related to the meeting
conversation (as verified by asking Sam). Charles, on the other hand, only used his laptop
during meeting discussions to supplement the meeting task (e.g. by taking electronic
meeting notes). He would multitask with non-meeting tasks only during breaks. Based on
these participants, polychronicity reflected willingness to work on unrelated (non-
meeting) tasks simultaneously, but not one’s likelihood to multitask in meetings in
general. These meeting behaviors are examined further in the next section as the
mechanisms of copresence and cohesion beliefs are discussed.
BEHAVIORS & ATTITUDES IN MIXED REALITY (THEME 2)
Copresence Management
Copresence management as defined in this research is the mix of verbal and non-
verbal signals people use to indicate to others that they are paying attention and are
available for communication (either with individuals in the same room, or electronic
communication partners). One of the first instances of copresence management observed
was during the external project meeting with Charles. The researcher noted that each time
someone looked up after having used their laptop, their gaze went immediately to
whomever was speaking. For each instance that the researcher was watching someone
technology multitasking, she recorded where their focus of visual attention went after the
person looked up from their laptop. This behavior was noted approximately 20 times
across two hours of the external project meeting (7 attendees out of 14 had their laptops
open for use during this time period).
Gaze is an essential non-verbal behavior that directs the conversational flow,
influencing who keeps or takes the next speaking turn and who avoids it (Kendon, 1967).

122
This observation suggests that people may unconsciously try to re-engage into the face-
to-face activity after multitasking on their laptop. The other hypothetical points of visual
focus would be scanning all group members, looking off into space/down toward the
floor and focusing on another group member who was not currently speaking. Since
participants specifically gazed at the speaker after multitasking, people appear to want to
re-engage with the current conversational space.
While multitasking during meetings, participants did not try and minimize their
electronic availability. For example, neither Charles nor Sam changed their instant
messaging status (e.g. ―I’m away/I’m busy‖) and they did not close their e-mail
programs. In fact, besides Charles’s note taking, maintaining electronic copresence was
one of the key reasons to use a laptop during a meeting. Both participants responded to
incoming instant messages during meetings, and Sam would check his e-mail with the
same frequency as when he was working from his cubicle.
Copresence management was a behavior exhibited by all participants who
technology multitasked. Based on the observations of gaze, multitaskers demonstrated
that they were still a part of the meeting conversation by focusing their attention on
whoever was speaking immediately after they finished using their laptop. However,
multitaskers also chose to maintain their availability and communicate with others
outside of the meeting too. Laptops facilitated people’s ability to sustain a presence with
other co-workers despite being physically contained in the meeting space.
Cohesion Beliefs & Technology Multitasking
Cohesion is a combination of two factors: social liking amongst group members
and commitment to the work task. Based on the understanding of cohesion developed
from the literature review, it was anticipated that social liking amongst group members

123
would lead to decreases in multitasking since group members in cohesive teams would
want to demonstrate increased engagement with collocated members. However, social
cohesion did not affect how participants multitasked during meetings, but task cohesion
did. The observational data from SoftwareCorp explores how these two factors had
distinct impacts on technology multitasking.
Neither social nor task aspects of cohesion affected the way Sam typically used
his laptop during internal project meetings (his lack of multitasking when his boss was
present was atypical). Sam’s second internal project meeting was highly relevant to him
and there was high social liking (Sam had lunch with the meeting leader for multiple
times each week and they socialized together outside of work). During this meeting, Sam
multitasked frequently while still participating in the group discussion. Table 18 below
shows each minute of Sam’s behavior from 1:00pm to 1:41pm. Segments of the table that
are highlighted in gray represent the minutes in the meeting where Sam was talking out
loud. There are significantly more minute segments where Sam is technology
multitasking than he is talking out loud (29 minutes using laptop, 13 minutes talking).
Sam described his technology multitasking behavior as being typical for him, and he did
not believe that anyone else in the meeting was bothered by his behavior.
Sam’s belief that his multitasking was accepted seems plausible based on the
behavior of the other group members toward Sam during the meeting. The researcher
observed that when the meeting leader was anticipating asking a question of Sam, the
leader turned his body toward Sam, and while still talking, looked at Sam for 5 seconds
before asking his question (Sam’s focus was toward his laptop). While the meeting leader
used gaze to give Sam an indication that he would be speaking toward him, the other

124
meeting attendees simply used Sam’s name out loud as a preface to their question and did
not use any other signals.
1:00 Sam sitting in meeting with
laptop open, an IM arrives 1:21 An instant message arrives on Sam’s
laptop, he writes back immediately
1:01 Sam looking at his laptop 1:22 Sam back to e-mail
1:02 Sam adjust a setting on his laptop’s wireless network
1:23 Sam continuing to use e-mail
1:03 Sam opens up his e-mail client 1:24 Sam talks in the meeting
1:04 Sam writing an instant message while meeting leader talks
1:25 Another instant message arrives on Sam’s laptop
1:05 Sam browsing his e-mails 1:26 Sam writing instant messages
1:06 Sam continuing to use e-mail 1:27 Sam talking in meeting
1:07 Sam continuing to use e-mail 1:28 Sam talking in meeting
1:08 Sam continuing to use e-mail 1:29 Sam talking in meeting
1:09 Sam continuing to use e-mail 1:30 Sam talking in meeting
1:10 Sam continuing to use e-mail 1:31 Sam talking in meeting
1:11 Sam talks in meeting, answering a question from meeting leader
1:32 Sam goes back to checking e-mail
1:12 Sam talks 1:33 Sam receives a new instant message and replies
1:13 Sam talks, his eyes glance at his laptop as a new e-mail arrives
1:34 Sam continuing to use instant messaging
1:14 Back and forth meeting discussion between Sam and other attendees
1:35 Sam continuing to use instant messaging
1:15 Back and forth meeting discussion between Sam and other attendees
1:36 Sam checking e-mail
1:16 Sam back to checking e-mail 1:37 Sam checking e-mail
1:17 Sam continuing to use e-mail 1:38 Sam checking e-mail
1:18 Sam continuing to use e-mail 1:39 Sam checking e-mail
1:19 Sam answers another question in the meeting
1:40 Sam checking e-mail
1:20 Sam opens up the bug tracking tool and uses information from the program to answer a meeting question
1:41 Sam checking e-mail
Table 18: Sam’s Technology Multitasking Timeline in a Project Meeting.
While cohesion beliefs did not change Sam’s technology multitasking, the task
aspect of cohesion did affect behaviors in Charles’s internal project meeting. The purpose

125
of Charles’s meeting was to discuss the launch of a new version of the software product.
During the first thirty minutes of this meeting, 5 out of 13 people used their laptops in
short bursts every few minutes. However, laptop use amongst all 5 of these people
significantly changed as the meeting discussion turned serious. Critical issues were
discovered about the product that resulted in a heated discussion about whether the
product could be launched the next day or not. Once the meeting topic became
significant, laptop use ceased and all meeting attendees were actively engaged in the
group discussion and no longer technology multitasking.
From the observations of meetings at SoftwareCorp, cohesion beliefs have an
unclear impact on technology multitasking. Sam was highly committed to his project
meeting and liked the other members of the team, yet he spent most of his time in the
meeting checking e-mail. As task relevance of the meeting increased with Charles’s team,
it resulted in a shift from technology multitasking behavior to complete focus on the
group discussion. These results suggest that social liking and task factors may not
influence technology multitasking in the same manner. Task relevance, especially in
critical contexts, seems to influence behavior more so than social liking.
OUTCOMES FROM MIXED REALITY (THEME 3)
Did the SoftwareCorp participants find meetings more productive and satisfying
when they could multitask with technology? Charles and Sam did not express strong
attitudes toward being able to multitask during meetings. Technology multitasking was
viewed by both as a normal work behavior and neither voiced opinions about whether
they felt more accomplished in meetings when they could use laptops.
Since Charles and Sam always brought a laptop to meetings (except staff
meetings), this suggests that technology multitasking was a preferred behavior by both

126
participants. During the fieldwork period, there were no formal rules at SoftwareCorp
encouraging or discouraging technology multitasking in meetings. However, Charles told
the researcher that at least two times previously in the past year, a senior vice-president at
the company had mandated that laptop use in meetings cease. Charles described how this
rule would be brought up in a company-wide meeting, but that people eventually just
started using their laptops again and the rule was forgotten. While at a high-level,
organizational leaders at SoftwareCorp made attempts to ban technology multitasking, in
daily practice the behavior was viewed as a normal and necessary part of meetings.
Considering this normalcy surrounding the behavior and the fact that Charles and Sam
seemed unperturbed by mixed reality, the researcher questioned how well they observed
the multitasking behaviors of others. The purpose in trying to identify the extent to which
Charles and Sam noticed other’s multitasking was to assess whether mixed reality
behaviors left a memorable impression. If mixed reality behaviors are unnoticed, this
suggests that technology multitasking has no impact on other team members.
The researcher tested how perceptive the participants were toward other people’s
technology multitasking on the second day of observations. Charles and Sam were asked
at the end of their work day to describe how other people in the meetings that day had
used their laptops. The purpose of this line of questioning was to gather data about
Charles’s and Sam’s awareness of technology multitasking. Had they noticed who else
was using a laptop in the meeting? If so, could they identify what that person had used
her or his laptop for during the meeting?
These questions were purposefully asked on the last day of observations when
neither participant was expecting to be questioned on what other people had done during
the meeting. The researcher anticipated that neither participant would be able to answer

127
these questions, but this assumption was incorrect. When Charles was asked to identify
who had used a laptop during his internal project meeting, he was able to name each
person. Furthermore, when asked to describe for what tasks the laptop had been used, he
described the other’s activities based on the sounds of their typing during the meeting.
Charles: Well, I think Linda was writing IMs [instant messages] and browsing the web. She was writing IMs because I could hear the sounds of fast typing. If she was writing e-mail, the typing would be slower.
Sam was also able to name each person who had been using a laptop during his meetings.
However, Sam’s identification of laptop use was not based on sounds, but rather his
familiarity with the person’s multitasking behavior in general. Sam explained that he
thought the two people in the meeting using laptops were checking e-mail because ―that’s
what they usually do in meetings.‖ While mixed reality meetings were routine for Charles
and Sam, they had difficulty verbalizing whether they were more satisfied or productive
in meetings because of it. However, the technology multitasking behaviors of others did
not go unnoticed. The fact that Charles and Sam were cognizant of others multitasking
behaviors indicates that mixed has the potential to impact other individuals.
Case Study Results Summary
From the observations and discussions with Charles and Sam at SoftwareCorp,
multitasking with technology is common across the majority of face-to-face meeting
types except for staff meetings. Despite differing polychronicity scores, both Charles and
Sam multitasked with their laptops, modifying their behavior when they believed it might
be perceived as disruptive or when they needed to concentrate more on the meeting at
hand. Sam tended to multitask during internal project meetings more frequently than
Charles and his multitasking was continuous throughout the entire meeting (while
simultaneously participating in the meeting). Charles, on the other hand, generally limited
128
his multitasking to segments of meetings where he felt his participation was not
necessary. With the data gathered thus far, polychronicity does not seem to be a strong
indicator of whether one decides to technology multitask in meetings or not (since
Charles multitasked in the same types of meetings as Sam), but does reflect the
willingness of participants to multitask on unrelated tasks.
Sam maintained continuous copresence with electronic communication partners
throughout meetings where he multitasked. If an instant message or e-mail arrived, he
would respond to it immediately. Sam’s copresence management with his collocated
teammates was non-existent. While he was an active contributor to the meeting, even
when multitasking, Sam did not make an effort to look up from his laptop screen until he
was speaking. Charles was more conscientious about his copresence with those in the
meeting room. He mainly multitasked with tasks relevant to the meeting (e.g. meeting
notes) and used his laptop sparingly for e-mail.
The two factors of cohesion, social and task, impacted technology multitasking
differently across meetings. Despite having strong social liking and high task relevance in
his internal project meetings, Sam multitasked frequently. However, task relevance was
shown to disrupt multitasking behaviors in Charles’s meeting when the topic of
discussion was deemed to be of great import by participants. In summary, mixed reality
meetings at SoftwareCorp were common and neither Sam nor Charles reported it
disruptive for others to be multitasking. The next section discusses these same themes
with the addition of data from eight other information workers from different
corporations.
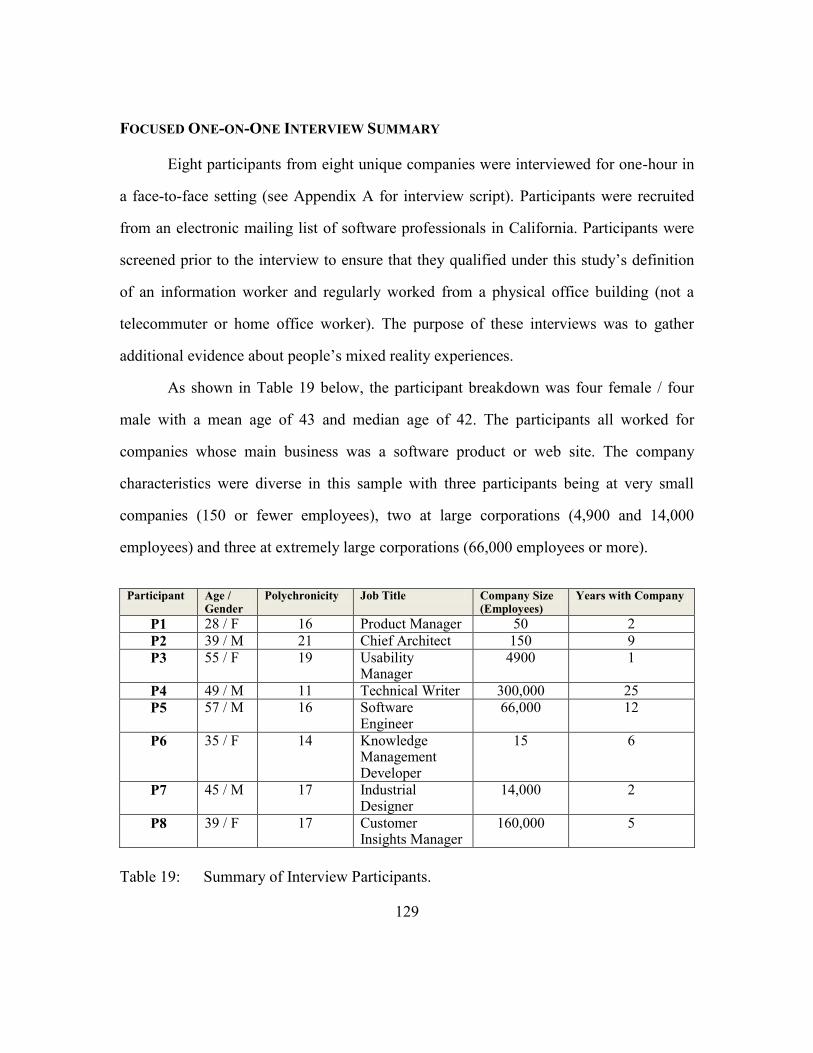
129
FOCUSED ONE-ON-ONE INTERVIEW SUMMARY
Eight participants from eight unique companies were interviewed for one-hour in
a face-to-face setting (see Appendix A for interview script). Participants were recruited
from an electronic mailing list of software professionals in California. Participants were
screened prior to the interview to ensure that they qualified under this study’s definition
of an information worker and regularly worked from a physical office building (not a
telecommuter or home office worker). The purpose of these interviews was to gather
additional evidence about people’s mixed reality experiences.
As shown in Table 19 below, the participant breakdown was four female / four
male with a mean age of 43 and median age of 42. The participants all worked for
companies whose main business was a software product or web site. The company
characteristics were diverse in this sample with three participants being at very small
companies (150 or fewer employees), two at large corporations (4,900 and 14,000
employees) and three at extremely large corporations (66,000 employees or more).
Participant Age /
Gender Polychronicity Job Title Company Size
(Employees) Years with Company
P1 28 / F 16 Product Manager 50 2
P2 39 / M 21 Chief Architect 150 9
P3 55 / F 19 Usability Manager
4900 1
P4 49 / M 11 Technical Writer 300,000 25
P5 57 / M 16 Software Engineer
66,000 12
P6 35 / F 14
Knowledge Management Developer
15 6
P7 45 / M 17 Industrial Designer
14,000 2
P8 39 / F 17 Customer Insights Manager
160,000 5
Table 19: Summary of Interview Participants.

130
Data from the interviews was captured as hand-written notes. After each interview
the researcher wrote a detailed account of the participant’s answers in the field note
format discussed previously. One limitation with the interview data is that no member
checking was employed, meaning that the field notes were not reviewed by the informant
to ensure agreement. However, the researcher reached theoretical saturation with the
participants; where the experiences and viewpoints described by the participants
converged on the same concepts which indicates credibility.
Interview Data Coding
The analysis used a grounded theory approach. The first step in coding the data
was to review the field notes and interview logs to identify any data that matched or
related to the constructs identified from the literature review and pilot study. These
constructs are listed below and the criteria are given for which data fit.
Code Description / Criteria
Meeting Type
What kinds of meetings do people attend? How does their technology use differ across meetings?
Group Norms for Technology Use
Both explicit and implicit rules for how people are expected to use technology in front of others.
Polychronicity Individual preferences for multitasking behavior.
Technology Multitasking – Related to Group
Instances of technology multitasking as it pertained to the group’s goals.
Technology Multitasking – Unrelated to Group
Instances of technology multitasking as it pertained to the individual’s needs.
Copresence Management
Verbal and non-verbal statements/gestures indicating that the individual who is multitasking was available to communicate.
Cohesion Beliefs How strongly the individual feels about the importance of the social dynamics of the group and the importance of the task.
Meeting Satisfaction
How satisfied individuals feel when they can technology multitask. How dissatisfied an individual feels by other people technology multitasking.
Perceived Productivity
How productive individuals believe they are when multitasking. How productive a meeting is when technology multitasking occurs.
Table 20: Data Coding for Qualitative Interview Data.

131
After coding the observations and notes into construct categories, the data
segments were analyzed using the constant comparative technique, which is the main
analytical method used in grounded theory (Auerbach & Silverstein, 2003). This
technique involves taking each relevant statement from the field notes, and systematically
comparing it to all the other statements from participants to identify commonalities and
differences.
FACTORS CONTRIBUTING TO TECHNOLOGY MULTITASKING (THEME 1)
Meeting Type
Participants were asked to describe the different kinds of meetings that they
typically attend for their job. The participants described meetings using their own
terminology and structure (some participants used day of the week to frame their
discussion whereas others reported their meetings based on which project it was
associated). While using their own terminology, the types of meetings that participants
were involved shared these basic characteristics:
Attendance between 4 and 10 people
Conference room location
Leader present
Agenda sent in advance
An additional 2 to 3 people on teleconference
Some people bring laptops (but rarely does everyone bring a laptop)
Everyone has a mobile phone (typically on silent/vibrate mode)
Two main discussion formats used: o Meeting leader follows agenda topics and the relevant meeting
members contribute to the topic as necessary. o One person presents on a topic (typically using PowerPoint slides),
and people are asked to contribute to the discussion following the presentation

132
These characteristics outlined above were developed from the interview
participant’s descriptions of their meetings and the observations of meetings attended by
the researcher at SoftwareCorp. The table below abstracts characteristics of the different
meetings described by the participants and the ―X‖ indicates that the given meeting type
was experienced by the participant.
Meeting Type Characteristics P1 P2 P3 P4 P5 P6 P7 P8
Staff Meeting: - 30 min to 1 hour - 10 to 15 people - No laptop multitasking
X X X X X X
Staff Meeting: - 30 min to 1 hour - 4 to 6 people - Laptop multitasking
X
Project Meeting – Internal: - 45 min to 1 hour - 4 to 6 people - Laptop multitasking
X X X X X X
Project Meeting – Internal: - 45 min to 1 hour - 4 to 6 people - No laptop multitasking
X X X
Project Meeting – Internal Large: - 45 min to 1 hour - 20 or more people - At least 5 people dialed in - Laptop multitasking
X X
Project Meeting – External: - 45 min to 1 hour - 4 to 6 people - Laptop multitasking
X X X
Table 21: Meeting Types by Interview Participant.
The meeting types listed in the table above are similar to two meeting types
developed by Volkema & Niederman (1995): ―Brainstorming/Problem Solving‖ and

133
―Round Robin‖. Project meetings are problem solving meetings where people have
gathered to analyze and work on specific project related issues. Staff meetings follow a
round robin format, where each person takes a turn giving an update to the group.
However, the Volkema & Niederman meeting typology is not robust enough to
explain technology multitasking in meetings. Their typology lacks contextual factors,
specifically who else is attending the meeting and the meeting’s relevance/importance to
the participant. These factors influenced participants’ decision to multitask during
meetings or not. Participant 3 (P3), a usability manager for a financial products web site
typically had meetings on Tuesdays and Thursdays and described herself as a ―heavy
multitasker‖. However, when P3’s boss was present in a meeting, she modified her
behavior: P3: In our staff meetings, my boss leads the meeting. I‟d like to be using my laptop during these meetings, but I don‟t out of politeness.
In staff meetings described by P4 (a knowledge management specialist at a small
software company), laptop multitasking occurred. However, the relevance of the meeting
topic changed the way she multitasked. She typically used her laptop to check e-mail or
work on other tasks unrelated to the meeting. But in staff meetings which she perceived
as more relevant based on the information that was shared, the laptop was only used in
―good ways‖ such as taking notes or looking up information related to the discussion.
While participants were able to recall the different types of meetings they
attended, self-reports of technology multitasking behaviors can be problematic as data.
Participants may have a difficult time remembering their typical behavior (and instead
recall only extremely memorable instances), additionally participants may be inclined to
describe their behavior in a socially desirable manner. Another cognitive bias that can
lead to skewed memories about meeting behaviors is the consistency bias (Schachter,

134
1999). The consistency bias purports that people will recall their past behavior in such a
way that it matches their current perception of attitudes and behaviors. For the interview
data, this bias could occur when participants are primed to talk about how they typically
use a laptop during meetings. Once the participants have described their behaviors in a
certain manner (e.g. ―I never bring a laptop to meetings unless I’m giving a
presentation‖), any future statements that would counter this initial framing would be less
likely to be revealed to the researcher.
In order to counteract this bias, the researcher tried to ground the participant’s
memories with real examples by having them walk-through the entire context of a
meeting. This context included asking what the topic and purpose of the meeting was,
how the meeting was initiated (who scheduled it, and by what means), where it was held
in the office, what documents/technologies the participant brought with them, and then
having them describe in detail how the meeting began (who talked first, how did people
know when to participate). Furthermore, the researcher also prompted the participant to
describe behaviors that were different or opposite to what the participant had previously
stated as their multitasking behavior. For example, when P1 (a product manager at a web
advertising firm) explained how she only used her laptop in project meetings to take
notes, the researcher later followed up by asking P1 ―Are there ever times in these project
meetings when you would need to use your laptop for other work or personal tasks?‖
An additional cognitive bias that has the potential to affect the interview data is
the recency effect (Miller & Campbell, 1959); with this bias participants are more likely
to recall their behavior from meetings they had that same day (of the interview) than they
are to recall their past behavior. This bias was noted when both P4 and P5 would respond
to the interview questions by referencing meetings that they had just attended earlier in
135
the day. The recency effect was also noticeable when P2, P4, and P5 (who had all been
with their respective companies the longest), were asked to recall what typical meetings
had been like at their company 7 to 10 years ago before wireless networking and laptops
were as ubiquitous. None of the participants were able to describe past meetings—this
finding is not surprising given that over the years the participants had been in many
different meetings and were unlikely to have given any special thoughts or placed any
significance on these meetings for their own lives.
The decision tree shown in Figure 10, developed by the researcher, shows how
and why the relational and contextual factors influenced an individual’s decision to
multitask in a meeting or not. This decision tree demonstrates how the majority of the
participants who did multitask thought about their technology multitasking in meetings.
While decision trees do not cover every possible scenario, they are intended to predict
decision making for 85-90% of cases (Gladwin, 1989). The researcher developed this
decision tree by examining the factors from the case study and interview data that
influenced people’s likelihood to technology multitask during a meeting.

136
Figure 10: Decision Tree for Multitasking in Meetings.
This section presented the results that meeting type, in conjunction with who else
was in attendance and how relevant the topic was to group members influenced the
occurrence of technology multitasking. In the next section, polychronicity is discussed as
it relates to one’s propensity to multitask in meetings.
Polychronicity
Polychronicity, one’s preference for multitasking, based on Lindquist &
Kaufman-Scarborough’s (2007) measurement was assessed using the PMTS
questionnaire for each of the eight interview participants. Figure 11 below shows each
score and Charles’s and Sam’s polychronicity levels are included too for comparison.
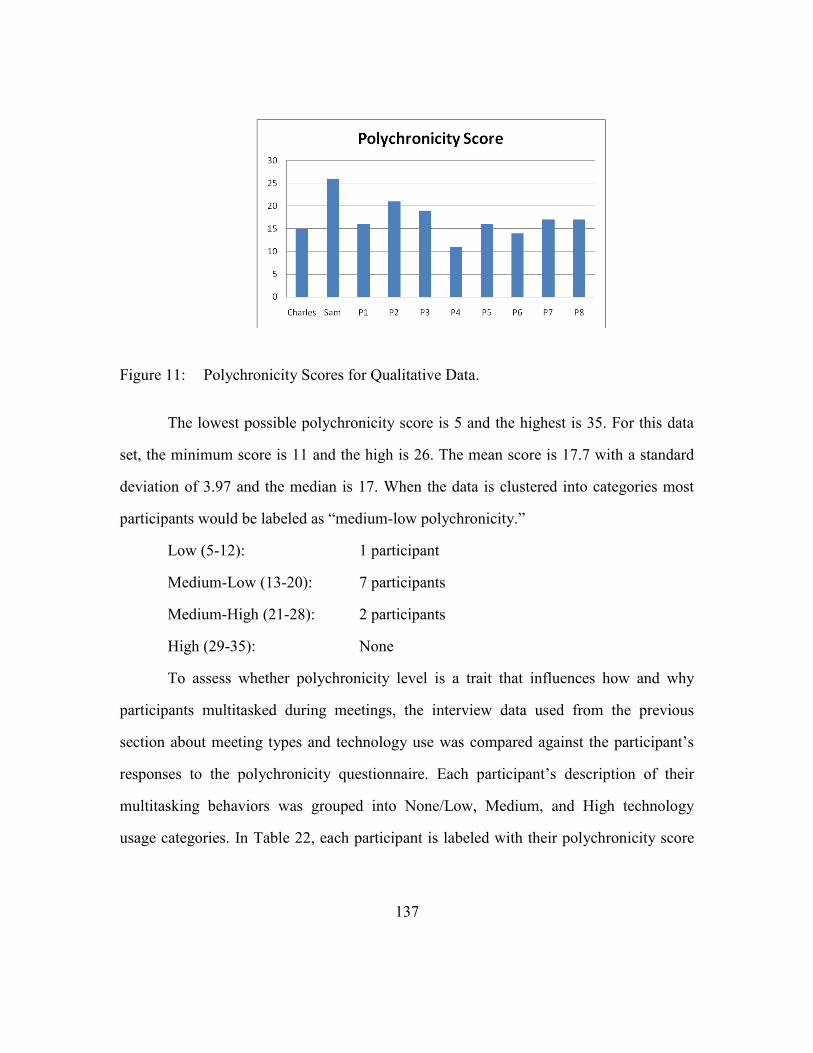
137
Figure 11: Polychronicity Scores for Qualitative Data.
The lowest possible polychronicity score is 5 and the highest is 35. For this data
set, the minimum score is 11 and the high is 26. The mean score is 17.7 with a standard
deviation of 3.97 and the median is 17. When the data is clustered into categories most
participants would be labeled as ―medium-low polychronicity.‖
Low (5-12): 1 participant
Medium-Low (13-20): 7 participants
Medium-High (21-28): 2 participants
High (29-35): None
To assess whether polychronicity level is a trait that influences how and why
participants multitasked during meetings, the interview data used from the previous
section about meeting types and technology use was compared against the participant’s
responses to the polychronicity questionnaire. Each participant’s description of their
multitasking behaviors was grouped into None/Low, Medium, and High technology
usage categories. In Table 22, each participant is labeled with their polychronicity score

138
in parentheses (##). The correlation coefficient for technology use in meetings and
polychronicity level was not significant: r=.469(10), p > .05.
Technology Use in Meetings
Characteristics of Technology Multitasking Participant
None/Low Rarely, if ever brings a laptop to a meeting Is bothered when others multitask during meetings
P2 (21) P4 (11) P5 (16) P8 (17)
Medium Laptop is used in a purposeful manner that relates to the group task (e.g. taking notes) E-mail or other non-meeting tasks might be checked toward the end of the meeting or at a times when the meeting seems less relevant
Charles (15) P1 (16) P6 (19)
High Continuously on laptop for the majority of the meeting Has a difficult time not attending to the technology Laptop is used for both meeting and non-meeting tasks
P3 (19) P7 (17) Sam (26)
Table 22: Polychronicity Score and Multitasking in Meetings.
Those in the None/Low technology use group were participants like P2 (the chief
architect at a 150-person software company) and P4 (a technical writer at a 50,000-person
multinational electronics and software firm) who both stated in similar words that they
―never bring a laptop to a meeting unless I have a very specific purpose for it.‖ When
prompted to describe the reasons they would need a laptop, it was explained that they
might need it to show a product demo or a PowerPoint presentation to the group (reasons
that were based strictly on the needs of the group/meeting task). Interestingly, P2 has a
high polychronicity score, yet not only did he limit his own multitasking, he reported that
when he ran his meetings: ―I tell everyone to put away their laptops.‖
P5, an engineer at a large multinational computer networking company, explained
his reason for not multitasking based on a self-assessment that he could not concentrate
139
as well when technology multitasking (though he was not bothered by other people’s
multitasking during meetings). And P8, a manager of website services for a national
bank, focused on the etiquette issues of multitasking during meetings. She felt it was
extremely rude to multitask on laptops or phones during meetings. P8 described how she
did not allow her subordinates to multitask in meetings and that she always tried to lead
by example by never checking her Blackberry smartphone until the meeting was over.
For the Medium technology use category, this cluster of participants multitasked
during meetings but did so in ways that they felt were relevant to the meeting (such as
taking notes or looking up information from online documents or web sites). However,
those in the Medium usage category were not opposed to using their laptops for non-
meeting (but still work related) tasks such as checking e-mail or answering instant
messages. But, these participants made efforts to only multitask with non-meeting
activities during meeting segments that they felt were not relevant to them and where
they perceived that it would not be a detriment to the other group members.
Charles, P1, and P6 all described their Medium usage in similar ways. They all
brought laptops to nearly every meeting they attended and while their laptops were
always accessible, they used them only occasionally to jot down some notes or check e-
mail when it would not detract from the meeting. If an instant message did come through
that they noticed, it was responded to – but generally their laptops were closed for most
of the meeting and it was not until the meeting was about to end (or in one case where
Charles was in a 4-hour meeting and he was no longer needed as frequently) did they
begin to check e-mail.
P6 even felt self-conscious about her multitasking: P6: I occasionally wonder if people think I‟m working on something else [unrelated to the meeting]. It makes me feel a bit self-conscious.

140
In the last category for technology usage, those in the High cluster continuously
used their laptops throughout the entire meeting. P7, a graphic designer at a large
multinational web search engine company described how he always was on his laptop
throughout meetings so that he could monitor incoming e-mails. He viewed meetings as
necessary, but time consuming: P7: Meetings don‟t need all of people‟s attention. There just may be a moment here or there where you‟re needed, but you have to be there for that moment.
Similarly, P3 discussed how she was often double-booked for meetings, and so being on
her laptop allowed her to simultaneously keep up with other work activities while
attending a meeting. Despite their willingness to multitask during meetings, P3 and P7
did not view their multitasking as an ideal way to accomplish work. P3: During my project meetings, I heavily multitask when the meeting‟s not relevant to me. I try to pay just enough attention so I know when to jump in. P7: I like to think that I have one ear open while multitasking, but I actually don‟t consider myself a great multitasker. I‟ll say something in the meeting because I want people to know that “Hey, just because I‟m on a laptop doesn‟t mean I‟m not paying attention.”
P7 explained that he tried to pay attention to the meeting and stop using his laptop
if he felt it might be perceived as being rude—but that he was not always successful at
meeting these two goals. Though the participants in the High usage category were attuned
to the idea that their multitasking might be considered rude at times (and potentially
distracting to their own abilities to participate in the meeting), they perceived their
organizational culture as permissive of this multitasking and this was a natural extension
of how people were expected to constantly be online and answering e-mails in their
workplace.

141
As shown in Table 22, polychronicity score did not correlate to one’s multitasking
behaviors. There was no indication that those who had high polychronicity scores were
more likely to multitask in meetings than those with lower scores. Based on the interview
and case study data, the reasons people attribute to their multitasking behavior are based
on a combination of the individual’s perceived need to use the technology (they need it to
take notes, they need it to check e-mail etc.) and their beliefs about the importance of
meeting etiquette. In the 2x2 matrix shown in Table 23, those who felt it necessary to
multitask with technology during meetings (High Need) and who simultaneously did not
perceive that they were breaking any etiquette norms resulted in High Technology Usage
throughout the meeting. However, should those with High Needs believe that
multitasking would be perceived as unacceptable by others, they stopped multitasking or
only did so during moments believed to be appropriate.
High Need to Use Laptop High Tech Use Low or Med Tech Use
Low Need to Use Laptop Low, Med, or High Tech Use Low Tech Use
Low Etiquette Meeting High Etiquette Meeting
Table 23: Likelihood to Multitask Based on Need and Meeting Etiquette.
From the interpretation of how individual’s described their use of technology as
compared against their polychronicity score, there is no significant correlation between
the two constructs. Individuals high in polychronicity (such as Sam, P2, P3, and P6) are
not similar in how they multitask during meetings. Likewise, individuals lower in
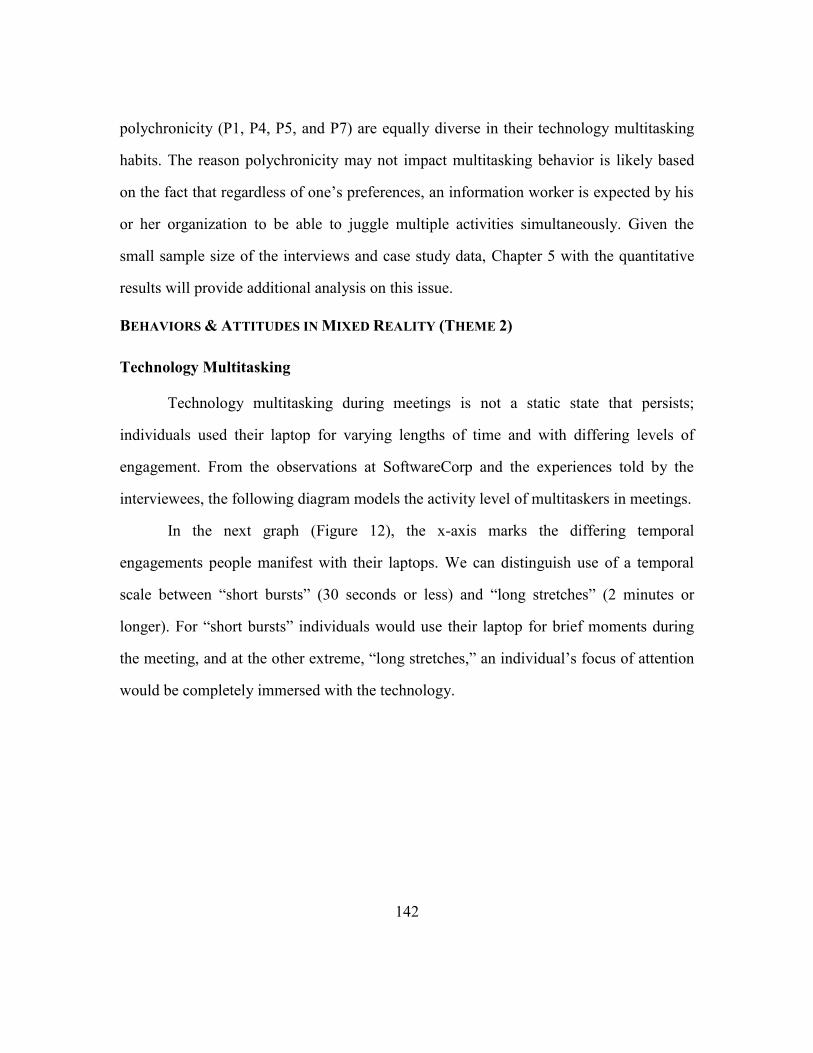
142
polychronicity (P1, P4, P5, and P7) are equally diverse in their technology multitasking
habits. The reason polychronicity may not impact multitasking behavior is likely based
on the fact that regardless of one’s preferences, an information worker is expected by his
or her organization to be able to juggle multiple activities simultaneously. Given the
small sample size of the interviews and case study data, Chapter 5 with the quantitative
results will provide additional analysis on this issue.
BEHAVIORS & ATTITUDES IN MIXED REALITY (THEME 2)
Technology Multitasking
Technology multitasking during meetings is not a static state that persists;
individuals used their laptop for varying lengths of time and with differing levels of
engagement. From the observations at SoftwareCorp and the experiences told by the
interviewees, the following diagram models the activity level of multitaskers in meetings.
In the next graph (Figure 12), the x-axis marks the differing temporal
engagements people manifest with their laptops. We can distinguish use of a temporal
scale between ―short bursts‖ (30 seconds or less) and ―long stretches‖ (2 minutes or
longer). For ―short bursts‖ individuals would use their laptop for brief moments during
the meeting, and at the other extreme, ―long stretches,‖ an individual’s focus of attention
would be completely immersed with the technology.
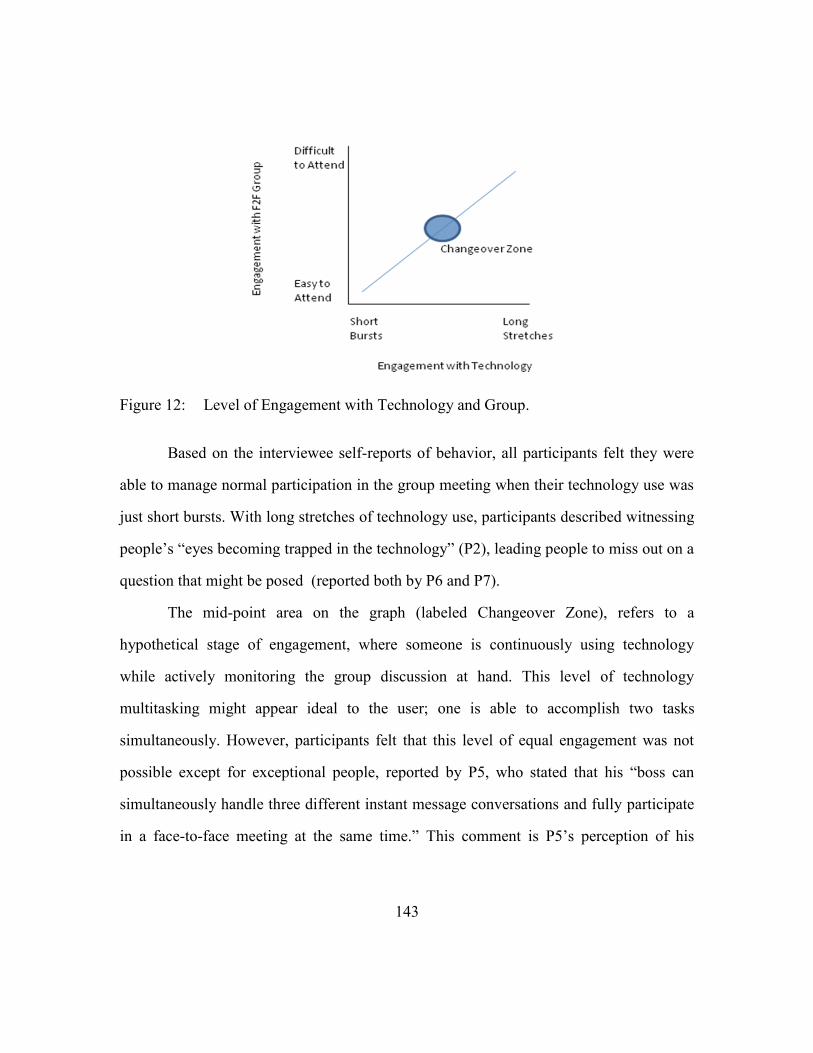
143
Figure 12: Level of Engagement with Technology and Group.
Based on the interviewee self-reports of behavior, all participants felt they were
able to manage normal participation in the group meeting when their technology use was
just short bursts. With long stretches of technology use, participants described witnessing
people’s ―eyes becoming trapped in the technology‖ (P2), leading people to miss out on a
question that might be posed (reported both by P6 and P7).
The mid-point area on the graph (labeled Changeover Zone), refers to a
hypothetical stage of engagement, where someone is continuously using technology
while actively monitoring the group discussion at hand. This level of technology
multitasking might appear ideal to the user; one is able to accomplish two tasks
simultaneously. However, participants felt that this level of equal engagement was not
possible except for exceptional people, reported by P5, who stated that his ―boss can
simultaneously handle three different instant message conversations and fully participate
in a face-to-face meeting at the same time.‖ This comment is P5’s perception of his

144
boss’s multitasking abilities and this study did not validate the boss’s skill to engage in
multiple activities without any detriment to the multiple communication acts.
While it is probable that there exist people with the cognitive capacity to manage
both meeting and technology tasks well in the Changeover Zone, it seems unlikely that
most people can maintain these multiple levels of engagement, especially over an
extended period of time. Participants P3, P6, and P7 all described their multitasking
during meetings as an act that broke down and became too cumbersome to continue due
to cognitive overload between what they needed to focus on in the meeting and what they
were working on with their laptops.
There appears to be a shift in technology multitasking use at the Changeover
Zone, below which the user is not totally engaged, and above which the user is taxed to
attend. The significance of this concept is that it impacts the analysis of cohesion beliefs,
copresence management, perceived productivity, and meeting satisfaction from the
conceptual model. On balance, the observational data from SoftwareCorp indicated that
most people who multitasked with technology did so in short bursts (below the
Changeover Zone) though observations were made at SoftwareCorp of one individual
who multitasked above the Changeover Zone. The research constructs are anticipated to
demonstrate differences in the following ways (see Table 24).
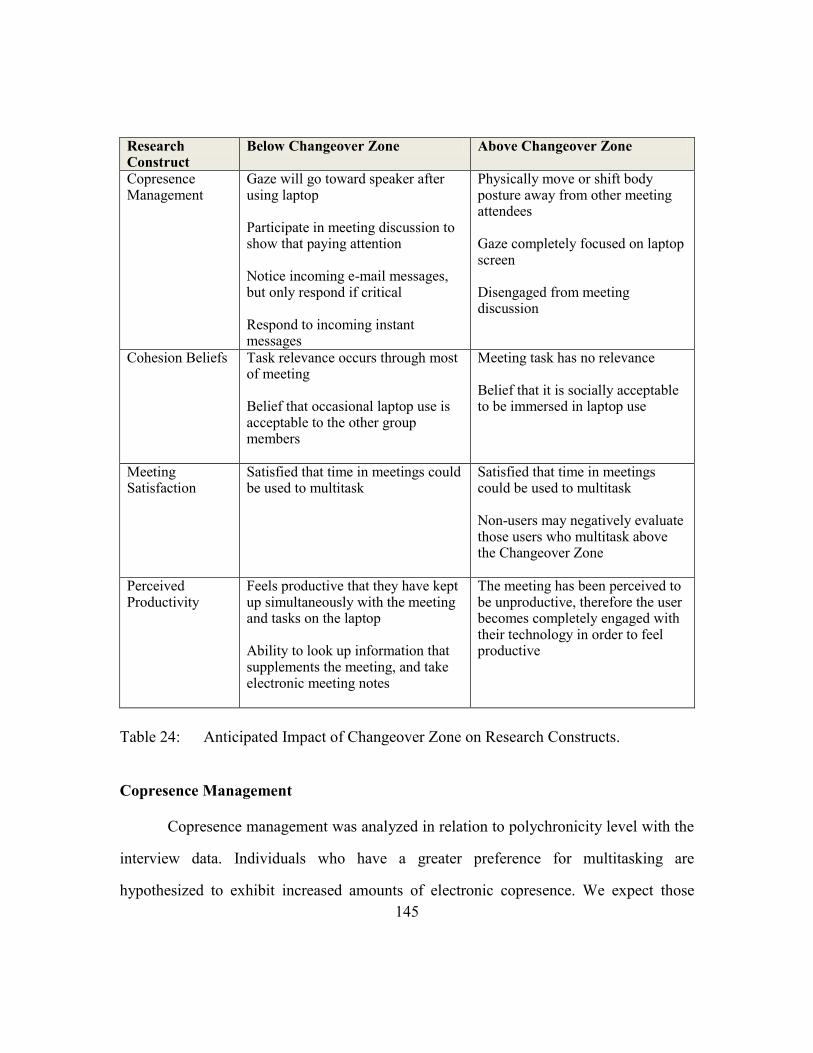
145
Research Construct
Below Changeover Zone Above Changeover Zone
Copresence Management
Gaze will go toward speaker after using laptop Participate in meeting discussion to show that paying attention Notice incoming e-mail messages, but only respond if critical Respond to incoming instant messages
Physically move or shift body posture away from other meeting attendees Gaze completely focused on laptop screen Disengaged from meeting discussion
Cohesion Beliefs Task relevance occurs through most of meeting Belief that occasional laptop use is acceptable to the other group members
Meeting task has no relevance Belief that it is socially acceptable to be immersed in laptop use
Meeting Satisfaction
Satisfied that time in meetings could be used to multitask
Satisfied that time in meetings could be used to multitask Non-users may negatively evaluate those users who multitask above the Changeover Zone
Perceived Productivity
Feels productive that they have kept up simultaneously with the meeting and tasks on the laptop Ability to look up information that supplements the meeting, and take electronic meeting notes
The meeting has been perceived to be unproductive, therefore the user becomes completely engaged with their technology in order to feel productive
Table 24: Anticipated Impact of Changeover Zone on Research Constructs.
Copresence Management
Copresence management was analyzed in relation to polychronicity level with the
interview data. Individuals who have a greater preference for multitasking are
hypothesized to exhibit increased amounts of electronic copresence. We expect those

146
high in polychronicity to manifest increased electronic copresence with frequent use of
instant messaging and e-mail. Those lower in polychronicity level are predicted to exhibit
increased verbal and non-verbal signals with those in the meeting (in-room copresence).
To obtain information about copresence, the eight interviewees were asked to
respond to a set of questions as follows (see interview script in Appendix A):
How conscientious did they feel when multitasking during a meeting?
Did the interviewee feel it was necessary to participate out loud in the meeting to
demonstrate engagement with the group?
Did they typically respond to incoming instant messages immediately?
How compelled did the interviewee feel to keep up with e-mail messages during
meetings?
This series of questions regarding copresence were difficult for the interview
participants. Participants had trouble remembering what their typical meeting behavior
was like. This difficulty is not surprising given that most people do not spend time
remembering and reflecting on their regular work day interactions. Generally only
extremely memorable (whether it be very positive or very negative) experiences are
recalled.
What emerged from the interview data on copresence was a set of beliefs about
categories of people being notorious for constantly multitasking and in turn, not
exhibiting any in-room copresence. People who were ―executives‖ or the ―sales guys who
always have their laptops‖ were cited by participants (P1, P2, P6, P7, and P8) as always
multitasking during meetings. In essence, copresence by the executives and sales people
was used not to indicate communication availability, but rather to minimize one’s
availability.

147
These participants believed that the rampant multitasking occurred because these
people liked to show-off, meaning that by multitasking in the meetings they were
demonstrating how important and essential they were within the company. Interestingly,
P6 and P7 also described how they multitasked during meetings themselves; yet their
behavior was described as necessary because of busyness or being acceptable because
everyone else in the group was doing it too.
This labeling of the executives and sales people’s multitasking as occurring
because of character flaws (egoism) whereas one’s own multitasking was due to
situational factors (busyness) represents the Fundamental Attribution Error bias (Ross,
1977). People view motivations for their own behavior differently than that of others
engaging in the same behavior. Others are perceived as having personality flaws for
partaking in the undesirable behavior, whereas one’s same behavior is due to situational
factors beyond one’s control.
At the other extreme of copresence were those in the high in-room copresence
management category, like P8, who described how she not only silenced her Blackberry
smartphone before entering meetings, but made sure that the blinking feature on the
device (that would light if a new message came through) was not visible to her field of
view at any point during the meeting. Had the phone’s status been visible to her, she felt
she would be compelled to quickly glance and see who had called or e-mailed, and she
did not want that temptation.

148
In Table 25 below, three levels of copresence are described (None/Low, Medium
and High), and participants’ perceptions of their copresence behaviors are categorized.
Copresence Management
Characteristics of Copresence Participant (Polychronicity)
None/Low Always on their laptop Potentially considered rude by others Oblivious to whether participation is needed or necessary
“Notorious multitaskers” described by P1, P2, P6, P7, and P8
Medium Try to be mindful of who else is present in the meetings and whether it is considered rude or not for a given situation Will respond to new IMs and e-mails when it does not seem to interfere with the meeting too much If everyone in the group is multitasking, they will likely do so too
Charles (15) Sam (26) P1 (16) P3 (19) P6 (19) P7 (17)
High It’s always perceived as being rude or obnoxious to be on the laptop Avoid using technology in meeting for multitasking
P2 (21) P4 (11) P5 (16) P8 (17)
Table 25: Levels of Copresence Management.
Overall, participants believed themselves to be conscientiousness toward other
individuals in group meetings. None of the interview participants felt that they exhibited
negative copresence (purposefully disengaging from the meeting) though they described
that this behavior occurred with notorious multitaskers. While the description of Sam’s
continuous multitasking behavior presented earlier in this chapter might suggest he
belongs in the ―None/Low‖ category, his own perception and that of his team members
leads him to be placed in the ―Medium‖ grouping.

149
Half of the interviewees made purposeful efforts at avoiding technology use
during meetings so that they were able to engage fully with the meeting at hand. The
other half of participants fell into a middle range of behaviors where they felt balanced
between monitoring their electronic copresence (via e-mail and instant messaging) while
remaining diligent toward the in-room communication needs.
Cohesion Beliefs & Technology Multitasking
Individuals who perceive a particular meeting to be highly relevant and who also
care about the social bonds within their team are expected to feel increased cohesion with
those in the meeting. These individuals would find it desirable to demonstrate that they
are engaged with the meeting at-hand, and therefore would act in ways to show that they
are paying attention and available for participation in the meeting.
The case study and interview data regarding cohesion and technology
multitasking indicate that social bonds amongst work colleagues of the same level are not
as strong an indicator for multitasking behavior as compared to task relevance. The only
social factors that people discussed as affecting their behavior were based on power
relationships and unfamiliarity. P1, P3, and P6 described how they were less likely to
multitask when senior management or external clients were present in the meeting.
Participants did not want to offend other meeting attendees with multitasking
when it was considered outside of the norm of acceptability for the group. For example,
when meeting with a client, P6 specifically changed her behavior by not multitasking in
front of them. However, P6 was much more likely to multitask when working with her
regular teammates with whom she was highly familiar. This finding suggests that
increased social cohesion based on closeness may lead to more multitasking (which is
contradictory to the finding originally anticipated by the researcher). Essentially, there is

150
greater comfort level to multitask in front of those we are already familiar with. Cohesion
as defined on the social dimension does not impact one’s multitasking behavior, but task
relevance does as P1 explained: P1: I‟ll always bring my laptop to meetings, but if I am really interested in what‟s being talked about in the meeting, of course I‟m not going to be sitting there checking my e-mail.
Behavior in mixed reality meetings was examined in this section by analyzing
how the interview participants described the style of their multitasking, if and how they
managed copresence and how their cohesion beliefs impacted use. Two main styles of
technology multitasking were identified, short bursts and long stretches; with short bursts
being the most typical way of multitasking. All participants believed that they maintained
copresence with their collocated team even when they multitasked. Cohesion beliefs
analyzed from the social dimension did not influence technology multitasking though the
task factor of cohesion did impact use (the greater the task relevance, the less likely
multitasking occurred).
OUTCOMES FROM MIXED REALITY (THEME 3)
Meeting Satisfaction
Similar to the findings with Charles and Sam, participants stated that they
typically had not given much thought to whether they enjoyed meetings more or less due
to technology multitasking. Three participants (P3, P5, and P7) described technology use
in meetings as ―the way things are now‖ and the fact that some people seemed caught up
in multitasking to be a ―sin we all take part in‖ (P7).
This finding suggests that people are habituated into their everyday routines and
are not reflecting on their attitudes toward this topic and how it impacts their work. While

151
participants were not able to express any satisfaction increase from multitasking, negative
moments from multitasking did stand out in the recollections. P4: I was just in a meeting this morning and I was annoyed by the woman next to me using her laptop. My eyes kept glancing over to her screen and it was very distracting. P1: My company instituted a $1 fine for multitasking in meetings. This one guy completely ignored the rule and would ceremoniously pay the fine before every meeting and use his laptop.
In P4’s comments, someone else’s laptop use detracts from his meeting
satisfaction because he feels compelled to keep glancing over. However, no other
participants described being similarly distracted or bothered by other people’s technology
multitasking. As P5 explained, ―Our [15 person start-up] doesn’t have any rules about
laptop use in meetings. And honestly, I don’t think anyone has ever brought this up as an
issue.‖
In P1’s comments she relays her perceptions of how someone in her company felt
about not being allowed to use technology. When the researcher asked P1 how the $1 fine
had become instituted, she used the phrase ―general consensus‖ amongst group members
to describe how the rule was initiated. However, as seen by the latter half of her quote
where one person makes a show of paying the fine each time in defiance, $1 was not a
severe enough (or seriously taken) penalty. In a study on monetary penalties and behavior
change by Gneezy & Rustichini (2000), parents having to pay a $3 fine when picking up
their child late from daycare was not a substantial enough amount to change behavior. In
fact this monetary penalty reduced any feelings of guilt parents felt about coming late
thereby leading to increases in the undesirable behavior (of arriving late).
Overall, meeting satisfaction in mixed reality was not a concept that participants
related to except in negative instances. P7’s experience below sums up the general

152
attitude of the participants: that multitasking was necessary and not particularly
problematic. P7: Multitasking in the end is okay. There may be a degradation in the richness of information that is shared, but there are enough checks and balances in the workplace that nothing is going to get ruined because of it.
Similar to the findings presented in the case study, interview participants were not
cognizant of how their own technology multitasking increased or decreased their
satisfaction with meetings. Despite the perceived normalcy of mixed reality (as also
recounted by Charles and Sam), other people’s technology multitasking behaviors did not
go unnoticed, especially for participants like P4, who found it disruptive to his
concentration.
Perceived Productivity
How did individuals perceive their own productivity when technology
multitasking in meetings? What were people’s opinions toward the productivity of the
meeting overall when technology multitaskers were present? Perceived productivity is a
subjective construct based on an individual’s beliefs about their behaviors. These
impressions are important because they represent how valuable the behavior is to the
multitasker. If one does not feel productive when multitasking, there is minimal incentive
to continue. On the other hand, if multitasking is valued as a means of accomplishing
increased amounts of work, we would expect people to articulate this notion.
Productivity was discussed by the participants based on how they multitasked
during meetings and whether technology multitasking was a distraction. In Table 26, half
of the interview participants described how laptops were productivity tools during
meetings when the topic was boring or no longer relevant to their needs.

153
As P6 explained: P6: I have this one meeting where we all go around the table and ask questions to the engineering lead. It takes forever to get to my turn, and typically other people‟s questions aren‟t relevant to me, so if I didn‟t have my laptop with me I‟d be incredibly bored.
While the laptop was also used to supplement the meeting (taking notes and
looking up information), this was discussed by fewer participants and was not perceived
as meaningful to their productivity compared to when laptops were used in the
boring/less relevant meeting segments. A third category of participants (P4 and P5) felt
that their productivity was negatively impacted by technology multitasking. P4 explained
how other people’s multitasking was distracting to him in meetings and he was not able
to concentrate as well. P5, on the other hand, was not bothered by other people’s
technology multitasking, but thought he was a terrible multitasker and therefore never
brought a laptop to meetings. As shown in Table 26 below, overall participants held
positive views toward technology multitasking; it was viewed as a productivity tool when
the meeting was no longer relevant, and as an enhancement to the meeting task through
meeting notes and increased access to information.
Meeting Productivity
Description of Productivity Participant (Polychronicity)
Productive for Other Work
Laptop is used when a meeting is boring or irrelevant
P1 (16) P3 (19) P6 (19) P7 (17)
Productive as Supplement of Meeting
Laptop is used to look up information or take notes
P1 (16) P8 (17)
Other People’s Use Distracting
Productivity is diminished by technology use P4 (11) P5 (16)
Table 26: Perceived Productivity in Mixed Reality Meetings.
154
In summary, productivity in meetings due to technology multitasking was based
primarily on the idea that the laptop provided useful access to other work during meeting
segments that were of less import to the participant. While laptops were used to
supplement meeting tasks and were a productivity tool in that regards too, this reason was
not as highly cited by participants.
SUMMARY OF QUALITATIVE DATA
In Table 27, a summary of the research findings is presented. Overall, mixed
reality meetings were viewed by the interview participants as a typical and expected
behavior in their workplaces. Due to the nature of information work, which relies heavily
on computing technologies (especially e-mail and instant messaging), most participants
felt compelled to constantly access their laptops to keep up with their online
communication needs. On the whole, participants who chose to multitask in meetings
believed that they did so reasonably well; meaning that they felt they could pay just
enough attention to the meeting discussion while using their laptop (P1, P3, P6, and P7).
However, there were conflicting attitudes about technology multitasking. Three
participants (P2, P4, and P8) all perceived multitasking in meetings as disruptive to
themselves and the larger team, and they specifically avoided the act and informed
employees below them to do the same (P4 and P8). But P5 maintained that he was
unperturbed by other’s laptop use in meetings, even though he also never multitasked.
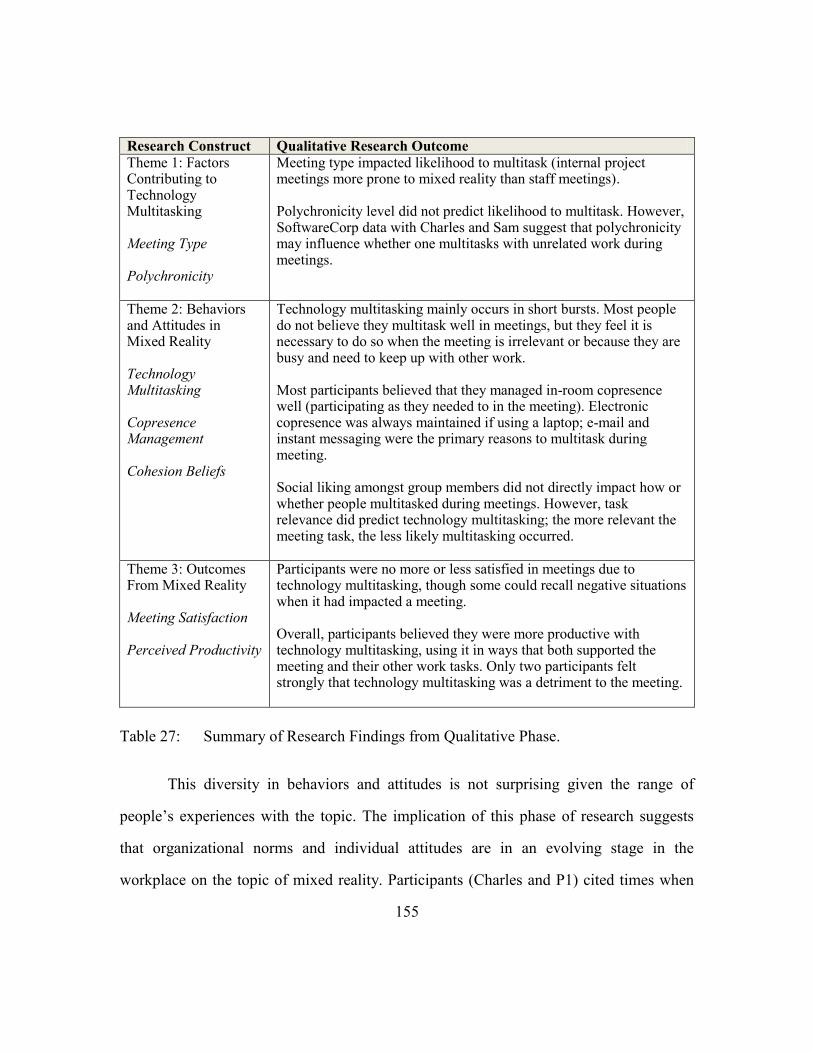
155
Research Construct Qualitative Research Outcome
Theme 1: Factors Contributing to Technology Multitasking Meeting Type Polychronicity
Meeting type impacted likelihood to multitask (internal project meetings more prone to mixed reality than staff meetings). Polychronicity level did not predict likelihood to multitask. However, SoftwareCorp data with Charles and Sam suggest that polychronicity may influence whether one multitasks with unrelated work during meetings.
Theme 2: Behaviors and Attitudes in Mixed Reality Technology Multitasking Copresence Management Cohesion Beliefs
Technology multitasking mainly occurs in short bursts. Most people do not believe they multitask well in meetings, but they feel it is necessary to do so when the meeting is irrelevant or because they are busy and need to keep up with other work. Most participants believed that they managed in-room copresence well (participating as they needed to in the meeting). Electronic copresence was always maintained if using a laptop; e-mail and instant messaging were the primary reasons to multitask during meeting. Social liking amongst group members did not directly impact how or whether people multitasked during meetings. However, task relevance did predict technology multitasking; the more relevant the meeting task, the less likely multitasking occurred.
Theme 3: Outcomes From Mixed Reality Meeting Satisfaction Perceived Productivity
Participants were no more or less satisfied in meetings due to technology multitasking, though some could recall negative situations when it had impacted a meeting. Overall, participants believed they were more productive with technology multitasking, using it in ways that both supported the meeting and their other work tasks. Only two participants felt strongly that technology multitasking was a detriment to the meeting.
Table 27: Summary of Research Findings from Qualitative Phase.
This diversity in behaviors and attitudes is not surprising given the range of
people’s experiences with the topic. The implication of this phase of research suggests
that organizational norms and individual attitudes are in an evolving stage in the
workplace on the topic of mixed reality. Participants (Charles and P1) cited times when

156
the company tried to mandate how technology could be used in meetings, yet this rule
proved difficult to enforce or was eventually forgotten as more individuals began to
multitask again. This breakdown in norms suggests that there may be a tension between
the culture of information work (one of being ―always-on‖ and accessible virtually) and
traditional views of face-to-face group work (everyone needs to participate equally to be
a part of the team). A balance between these competing values has yet to be achieved and
is reflected in the multitude of behavior and attitudes analyzed in this data.
CONCLUSION
This chapter presented the qualitative results from the case study fieldwork at
SoftwareCorp and the eight one-on-one focused interviews with information workers
from either other corporations. The research focus of this work was developed from the
themes identified originally in the literature review and the initial pilot study with office
workers (Chapter 3). The role of meeting type and polychronicity were explored as they
influenced the likelihood to multitask in meetings. Cohesion and copresence were
discussed as components leading to behavioral changes with multitasking, and outcomes
toward satisfaction and productivity in mixed reality meetings were examined.
The data gathered from SoftwareCorp and the eight interviewees was
complementary. The observations of behavior in SoftwareCorp meetings were supported
by the interviewee descriptions of their own experiences. These real world observations
and reflections of mixed reality meetings provide a background for this topic which are
validated in the next chapter using a survey methodology.

157
CHAPTER 5: QUANTITATIVE RESULTS (PHASE 2)
This chapter presents the results from Phase 2, the survey based examination and
extension of the qualitative studies of mixed reality reported in Phase 1 (Chapter 4). The
primary goal of the survey is to obtain a broader, statistically validated understanding of
participant experiences and attitudes towards mixed reality. Two pilot surveys (n=46 and
n=42) were conducted at the outset to validate the research constructs and survey
questionnaire. Following these pilots, surveys were administered to the California
employees of SoftwareCorp (n=156) and to an online panel of individuals from the
general public who self-identified as information workers (n=110). Throughout this
chapter, the survey with SoftwareCorp employees is identified as Wave 1 and the survey
with the online panel is Wave 2.
The complete data set (Pilots 1 & 2 and Waves 1 & 2) yields a validation of the
theoretical model constructs and support for 7 of the 10 research hypotheses. An
additional contribution of this survey was the development of statistically validated
research scales to measure cohesion beliefs, copresence management, and perceived
productivity. An examination of these survey results in relation to the qualitative analysis
is reported in Chapter 6.
PILOT SURVEY INSTRUMENTATION
The development and validation of the survey questionnaire is described through
two different iterations (Pilot 1 & Pilot 2). In Pilot 1, the researcher used a sample of
convenience to obtain responses from people within her personal network (n=46). To
reduce the bias of having similar respondents, Pilot 2 used a sample of participants
obtained from an online panel of technology workers from across the United States

158
provided by the Syracuse Study Response Project (n=42). These two sample sets
provided sufficient feedback for the revision of the questionnaire and identification of
general trends in the data. The pilot data was also used to identify the statistical
techniques employed in the analysis of survey Waves 1 & 2.
Questionnaire Development
The survey was created by developing questionnaire items that addressed the
research objectives. The questions were derived in two main ways: 1) reviewing and
incorporating existing scales that were related to the research constructs and 2) creating
questions based on the findings from the qualitative research phase reported in the
previous chapter. The findings from the qualitative phase were essential for providing
real-world behavioral and attitudinal survey questions about mixed reality.
Few validated scales existed that were appropriate for use in their entirety in this
research; these scales did not reflect the context of the organizational meeting
environment and/or did not include multitasking or technology use as part of the scale.
However, one scale that was used in its original format was the Polychronic-
Monochronic Tendency Scale (Lindquist & Kaufman-Scarborough, 2007) which served
as the measurement for polychronicity. Of the different polychronicity scales reviewed in
Chapter 2, PMTS was selected for this research because of its high validity. Lindquist &
Kaufman-Scarborough have refined the PMTS scale through multiple different research
studies and validated that it has strong internal consistency, discriminant validity and
nomological validity.
To develop the scales for cohesion beliefs, copresence management, perceived
productivity, and meeting satisfaction in mixed reality, the researcher was guided by the
following related scales as shown in Table 28. The researcher incorporated relevant
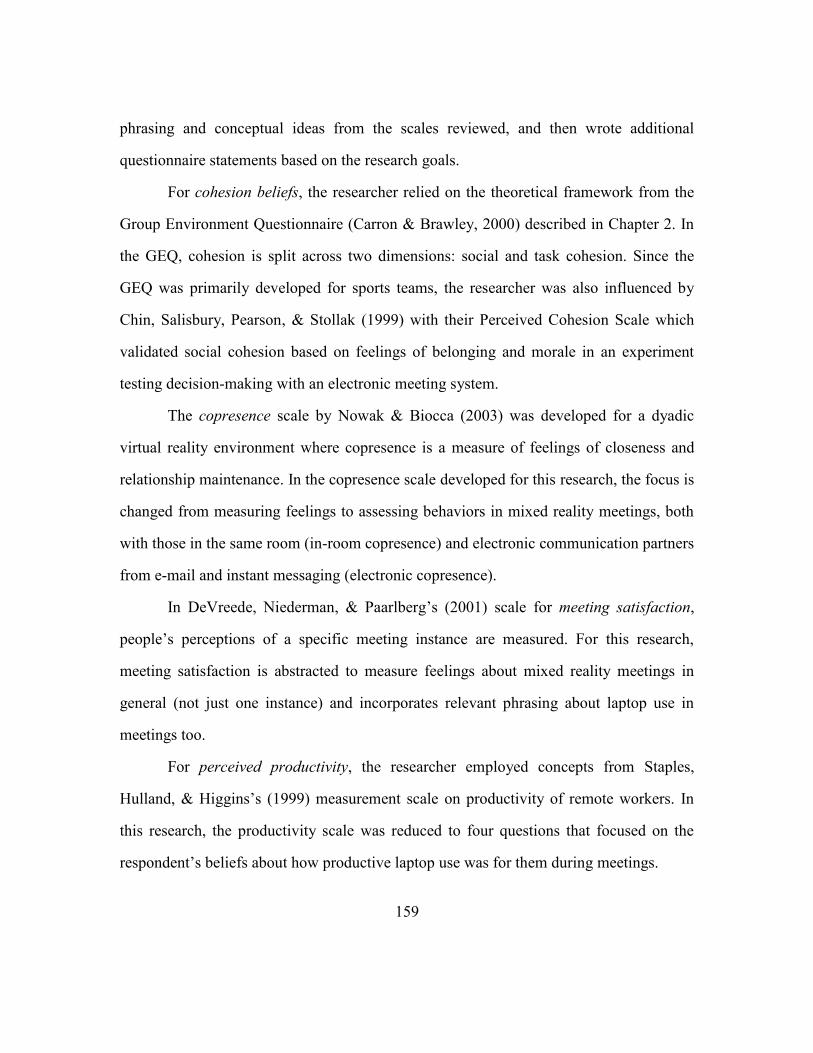
159
phrasing and conceptual ideas from the scales reviewed, and then wrote additional
questionnaire statements based on the research goals.
For cohesion beliefs, the researcher relied on the theoretical framework from the
Group Environment Questionnaire (Carron & Brawley, 2000) described in Chapter 2. In
the GEQ, cohesion is split across two dimensions: social and task cohesion. Since the
GEQ was primarily developed for sports teams, the researcher was also influenced by
Chin, Salisbury, Pearson, & Stollak (1999) with their Perceived Cohesion Scale which
validated social cohesion based on feelings of belonging and morale in an experiment
testing decision-making with an electronic meeting system.
The copresence scale by Nowak & Biocca (2003) was developed for a dyadic
virtual reality environment where copresence is a measure of feelings of closeness and
relationship maintenance. In the copresence scale developed for this research, the focus is
changed from measuring feelings to assessing behaviors in mixed reality meetings, both
with those in the same room (in-room copresence) and electronic communication partners
from e-mail and instant messaging (electronic copresence).
In DeVreede, Niederman, & Paarlberg’s (2001) scale for meeting satisfaction,
people’s perceptions of a specific meeting instance are measured. For this research,
meeting satisfaction is abstracted to measure feelings about mixed reality meetings in
general (not just one instance) and incorporates relevant phrasing about laptop use in
meetings too.
For perceived productivity, the researcher employed concepts from Staples,
Hulland, & Higgins’s (1999) measurement scale on productivity of remote workers. In
this research, the productivity scale was reduced to four questions that focused on the
respondent’s beliefs about how productive laptop use was for them during meetings.
160
Related Scale Scale Used in Mixed Reality Research
Group Environment Questionnaire (Carron & Brawley, 2000) - Questionnaire items in Table 4 on page 35.
Perceived Cohesion Scale (Chin et al., 1999)
- I feel that I belong to this group.
- I am happy to be part of this group.
- I see myself as part of this group.
- This group is one of the best anywhere.
- I feel that I am a member of this group.
- I am content to be part of this group.
Cohesion Beliefs - Team members make an effort to participate in meeting discussions. - Team members share the workload evenly. - Our team meetings are coordinated and organized well. - It is important for me to be liked by other members of the team. - Overall, I feel like I am an essential part of my team.
Copresence in Virtual Environments Scale
(Nowak & Biocca, 2003) Self-Reported Copresence - I did not want a deeper relationship with my
interaction partner.
- I wanted to maintain a sense of distance between us.
- I was unwilling to share personal information with my interaction partner.
- I wanted to make the conversation more intimate.
- I tried to create a sense of closeness between us.
- I was interested in talking to my interaction partner.
Copresence Management In-Room Copresence - I try and make occasional eye contact with whoever is speaking. - I make a point to participate in the meeting discussion. - I nod my head slightly when I hear something that I agree with. - I lower or close my laptop screen when I'm done multitasking. Electronic Copresence - I notice all new incoming e-mail messages when in a meeting. - I write and respond to e-mail messages during a meeting - I send instant messages to other people in the meeting who have laptops. - I send instant messages to work colleagues who are not in the meeting. - I won't initiate instant message conversations, but I will reply to incoming IMs. - I find it essential to be online throughout the meeting so that I can communicate with others who are not in the room.

161
Meeting Satisfaction (DeVreede, Niederman, & Paarlberg, 2001)
- The results of today's meeting (did not - did)
meet my personal needs.
- The value of the meeting's outcomes justifies our efforts. (disagree- agree)
- How satisfied were you with the work process
we used today? (dissatisfied - satisfied) - The outcomes of today's meeting were
(unsatisfactory- satisfactory).
Meeting Satisfaction - I am more satisfied in meetings when I can use my laptop. - It bothers me when other people in a meeting use laptops. - I feel self-conscious when I multitask with a laptop in a meeting. - I dislike it when other people in the meeting glance at what I'm doing on my laptop.
Overall Perceived Productivity & Remote Work Effectiveness (Staples, Hulland, &
Higgins, 1999) Overall Productivity - I believe I am an effective employee. - Among my work group, I would rate my
performance in the top quarter. - I am happy with the quality of my work output. I
work very efficiently. - I am a highly productive employee. - My manager believes I am an efficient worker. Remote Work Effectiveness - Working remotely is not a productive way to
work. - It is difficult to do the job being remotely
managed. - Working remotely is an efficient way to work. - Working remotely is an effective way to work. -
Perceived Productivity - Having a laptop in a meeting allows me to be
more productive.
- Having a laptop in a meeting leads me to be more efficient at my job.
- Having a laptop in a meeting makes me more effective at my job.
- Having a laptop in a meeting allows me to produce better quality work.
Table 28: Related Scales to Research Constructs.
Utilizing the qualitative results, the researcher also wrote questionnaire statements
that reflected the attitudes and experiences of the case study and interview participants.
For example, ―[When I’m in a meeting] I lower my laptop screen a little to show that I
am paying attention.‖ was drawn from the results with the interviewees. Approximately
50 different statements were written initially, and after reviewing these in relation to the
research goals, the statements deemed most reflective of the research constructs were
162
kept. The statements were checked to ensure that they were concise, not double-barreled
(asking two separate ideas in a single question), and relevant to the constructs.
Face validity of the questionnaire was reviewed by the researcher to ensure that
each questionnaire item could be linked to the research hypotheses and to the construct it
represented. Face validity was also reviewed by one Ph.D.- and one Master’s-level
researcher who both have experience being information workers and conducting social
science research projects. The reviewers were given an instruction sheet that listed each
research construct with a definition. The reviewers were asked to associate each of the
questionnaire items to the different constructs.
Content validity was checked by reviewing the qualitative research results to
ensure that the breadth of experiences reported in the qualitative analysis were reflected
in the survey questions. The researcher compared the raw interview data (quotes and field
note segments) to each of the construct items to ensure that all of the major issues
discussed by the interviewees were encapsulated by the questionnaire.
As required by the University of Texas Institutional Review Board, introductory
statements of consent were added to the questionnaire. In order to prime participants to
begin thinking about their work meetings, a set of questions addressing the frequency and
type of work meetings was asked first. Demographic questions about age, gender, job
role, and managerial status were placed at the end of the questionnaire. Following
Babbie’s (1995) survey ordering guidelines, the questions aimed to achieve a balance
between easy and difficult questions. The most challenging questions were placed on the
second and third web page of the questionnaire after the participant had gained
familiarity with the survey format with a set of easy questions on the first page.

163
Design Validity
To ensure that the web-based survey was in an optimal format for completing
online, the researcher followed the web-design guidelines for surveys as prescribed by
Schonlau, Fricker, Elliott, & Fricker, Jr. (2002). The following guidelines were utilized
to ensure optimal viewing: only listing three or fewer questions for each web screen,
showing the percentage progress complete, avoiding any graphics or extraneous
information, and using color in matrix format questions to increase readability. The
survey questionnaire was hosted online by a third-party survey hosting tool called
Surveymonkey (http://www.surveymonkey.com).
Sampling Validity in the Pilot Studies
In the first pilot survey (Pilot 1), the researcher used a sample of convenience
from her personal network of friends employed in industry. Additionally, snowball
sampling was used to increase the number of participants. Snowball sampling (Goodman,
1961) is defined as the recruitment of additional participants by current participants,
where each participant is asked to refer other people in their network into the research
(and the newly recruited participants are then asked to do the same). One major concern
with this form of sampling is the bias that can occur because participants tend to be
similar to the people they recruit. Therefore, the potential of the survey results to be
skewed in a particular direction is high with snowball sampling.
In order to obtain a broader sample compared to the first pilot, the second pilot
survey used an online panel provided by the Syracuse Study Response Project
(http://studyresponse.syr.edu/studyresponse). This university-based organization provides
academic researchers with a panel of survey participants based on the sampling criteria
desired. For this second pilot study, the researcher requested that the panelists work in

164
Telecommunications or Technology fields (these fields were pre-defined by the Study
Response Project database). These two job fields were selected because they best
represented the definition of people who are information workers. Each respondent in the
second pilot survey was paid $5 for participation.
While the participants in the second pilot survey have the potential to be more
diverse in attitudes and opinions since they are strangers from across the United States,
issues of validity and bias are still a concern with online panels. These individuals have
self-selected to be a part of web-based survey panels; this fact makes the respondents less
representative of the target population. This issue is not unique to online survey
participants, conventional paper or telephone-based recruiting methods have a similar
issue of self-selection in that only people amenable to completing the survey do so—
these individuals may have a particular interest in the topic which again could alter the
results toward one direction.
One of the methods to adjust for self-selection of online participants is propensity
scoring (Schonlau et al., 2002). With propensity scoring, demographic characteristics
such as socio-economic class and educational achievement are used to re-weight the
distribution of scores to more accurately reflect the population of interest. In this
research, propensity scoring was not used since it was not possible to identify how the
online panel differed from the population of information workers in general (insufficient
demographic characteristics were collected to attempt propensity scoring). However, in
the implementation of the survey in Wave 2, the respondent demographics are compared
against a similar sample used by Pew Internet Research (2008) to ensure
representativeness.

165
Construct Reliability
Table 29 shows the Cronbach’s alpha coefficients for each of the constructs
measured in the two pilot surveys. The associated survey questionnaire items (e.g. Q16a,
Q16b…) for each of the constructs is available in Appendix B. Cronbach’s alpha is a
measure of how internally consistent each of the questionnaire items is for a
unidimensional construct. A unidimensional construct is one in which the associated
questionnaire items are all explained by the same latent variable (Falissard, 1999). The
larger the coefficient alpha, the more one can attribute the variance in responses to
general and group factors, and not from the questionnaire items (Cortina, 1993). An alpha
value of .70 or greater is the standard recognized by most researchers for an acceptable
construct (Nunnally, 1978).
However, a large alpha value does not ensure unidimensionality; for example,
alpha values can be increased by adding additional items to the scale, therefore factor
analytic techniques must be used to identify that each questionnaire item is associated
with the intended construct. In the pilot surveys, it was not possible to use factor analysis
because of the small sample size; however factor analysis was completed with the data
from Waves 1 and 2.

166
Research Construct Cronbach’s alpha
Pilot 1 Cronbach’s alpha
Pilot 2
Polychronicity .914
(Q16a, Q16b, Q16c, Q16d, Q16e)
.960
(Q4a, Q4b, Q4c, Q4d, Q4e)
Technology Use Norms .730
(Q12a, Q12b, Q12c, q12d)
-.674
(Q7a, Q7brev)
Cohesion Beliefs .300
(Q14a, Q14brev, Q14c, Q14d, Q14erev, Q14f)
.681
(Q5a, Q5b, Q5crev, Q5d, Q5e)
Copresence Management .562
(Q13a, Q13b, Q13c, Q13drev)
.876
(Q8c, Q8d, Q9a)
Meeting Satisfaction .564
(Q15a, Q15crev, Q15erev)
.580
(Q10a, Q10brev, Q10crev)
Perceived Productivity .358
(Q15b, Q15drev)
.911
(Q10d, Q10e, Q10f, Q10g)
Table 29: Cronbach’s alpha Scores - Pilot 1 & Pilot 2.
The first pilot questionnaire achieved a .70 or higher coefficient alpha on the
constructs of polychronicity and technology use norms. In Pilot 2, the questions were
modified as described in the next section which improved the reliability scores of
cohesion, copresence management, and perceived productivity.
Re-Design of Questions Based on Pilot 1 Results
This section describes the changes to the questionnaire based on the results from
Pilot 1.
Survey Length:
In anticipation of needing a questionnaire that would take no longer than five
minutes to complete for Wave 1, the length of the questionnaire was evaluated. As part of
the agreement negotiated with SoftwareCorp for access to their employees, the company
leadership placed a limitation on the number of survey questions.
167
In Pilot 1, the mean survey completion time for the 46 respondents was 8 minutes
40 seconds with a standard deviation of 3 minutes and 38 seconds. The six fastest
respondents finished the survey in 4-5 minutes and the three slowest respondents
completed the survey in 15-20 minutes. For Pilot 2, the following question types were
removed based on their length and usefulness for the analysis:
Questions about the frequency of multitasking in a given meeting type
Questions about how easy it was to check e-mail messages at work
Questions about how ―tech-savvy‖ the workplace is perceived.
Since this survey took place chronologically after the researcher’s qualitative
fieldwork (described in Chapter 4), the researcher was confident that the removal of these
questions would not impact the main research goals since this data was known from the
fieldwork already. After removing these questions, the median time to complete Pilot 2
was 4 minutes 11 seconds which excludes the time of 2 participants who took 27 and 44
minutes to complete the survey, respectively. The extreme time duration that these 2
participants manifest suggests they left their computers or were interrupted for some time
before deciding to finish the survey. Fifteen respondents completed this survey in
approximately 2 minutes or shorter time.
Polychronicity: No change in the questions used.
Technology Use Norms: Pilot 1 had a .730 coefficient alpha value for technology
use norms. However, upon review of the questions associated with this construct, it was
determined by the researcher that the questions were not evaluating whether a team had
instilled norms for technology use amongst its members (see Table 30). Instead, Q12a,
Q12b, and Q12c were reflecting issues of group size and power structures. Two new
questions (Q7a and Q7b) were used for the second pilot instead, but they did not produce

168
a valid coefficient alpha (-.673). The negative alpha value indicates a problem with the
data or that the two items do not measure the same construct. Since it was not possible to
determine the exact problem at this stage, Q7a and Q7b were kept the same for Wave 1.
Pilot 1 Tech Use Norms Questions
Q12a. The more people there are in the meeting, the less I use my laptop. Q12b. When my boss or supervisor is in the meeting, I use my laptop less. Q12c. When upper/senior management is in a meeting, I use my laptop less. Q12d. If no one else is using a laptop in the meeting, I won't use one either.
Pilot 2 Tech Use Norms Questions
Q7a. Everyone on my project team knows when it is appropriate to multitask with a laptop. Q7b. I wish my team had more explicit rules about how laptops should be used during meetings.
Table 30: Pilot Items for Technology Use Norms.
Cohesion Beliefs: The coefficient alpha value for cohesion was improved in the
second pilot by removing the questions about importance of participation (Q14d),
spending time with the group (Q14e), and speaking freely in meetings (Q14f); see Table
31. Question Q14f was removed because the Cronbach’s alpha analysis showed that
removing this question increased the reliability of the other questions to .497. Question
Q14e was removed because it did not appear to represent the value of social cohesion
meaningfully (i.e., it did not specify a context for why one would or would not spend
time with other team members). Finally, Question Q14d was changed to question
individual participation in contrast to group participation (Q5a) in order to gauge how
well the individual felt the entire team participated overall, not just the relevance of his or
her own contributions.

169
Pilot 1 Cohesion Questions
Q14a. It is important for me to be liked by other team members. Q14b. The project meetings I attend are generally disorganized. Q14c. I can trust my teammates to do their fair share of the work. Q14d. My participation in project meetings is critical to the team's success. Q14e. I prefer not to spend time with members in the group. Q14f. We can say anything in the meeting without having to worry.
Pilot 2 Cohesion Questions
Q5a. Team members make an effort to participate in meeting discussions. Q5b. Team members share the workload evenly. Q5c. My team does not coordinate our meeting activities very well. Q5d. It is important for me to be liked by other members of the team. Q5e. Overall, I feel like I am an essential part of my team.
Table 31: Pilot Items for Cohesion Beliefs.
The disorganization question (Q14b) was re-worded to emphasize meeting
coordination (Q5c). This decision was made based on recognition that the concept of
coordination better represented the arrangement of work overall between group members.
However, this re-wording did not prove to be a successful change. In fact, removal of
question Q5c ―My team does not coordinate our meeting activities very well.‖ increased
the coefficient alpha from .470 to .681. It is possible that wording difficulties caused
people to misread the question.
Copresence Management: The questions about copresence were changed in their
entirety between Pilot 1 and 2 (see Table 32). In the first pilot, Q13a was removed based
on reviewing the qualitative interview data and determining that changing instant
message status was not a typical behavior. For Q13b, Q13c, and Q13d, these questions
were changed from asking about copresence with those in the meeting, to copresence
with electronic communication partners. This change was made based on the qualitative
data which showed that participants had better recall about how they used technology in
meetings compared to their memories about subtle non-verbal behaviors (in-room
copresence). However, in Wave 2, a set of questions about in-room copresence was

170
added back into the survey in a final attempt to validate the two types of copresence,
electronic and in-room. The construct reliability tests used in Wave 2 found both types of
copresence to have high reliability and validity.
Pilot 1 Copresence Questions
Q13a. Before going into a meeting, I change my instant message status to let people know that I’m busy. Q13b. While using my laptop in a meeting, I make sure to nod my head a little to show that I am paying attention. Q13c. When using a laptop in a meeting, I purposefully try and participate in the meeting to show that I am paying attention. Q13d. I usually leave my laptop entirely open for the entire meeting.
Pilot 2 Copresence Questions
Q8c. I respond to incoming instant messages while in a meeting. Q8d. I use my laptop during meetings to maintain communication with others outside of the meeting. Q9a. I tend to use my laptop for non-meeting related tasks (e.g. checking e-mail / working on other projects).
Table 32: Pilot Items for Copresence Management.
Meeting Satisfaction: The meeting satisfaction questions were modified between
Pilot 1 and 2 but the coefficient alpha remained approximately the same (from .564 to
.580); see Table 33. The question about laptop use being bothersome (Q15c) was
changed to identify disruption as a cause leading to dissatisfaction. And, the question
about being stressed because of multitasking (Q15e) was changed to specify feelings of
self-consciousness when using a laptop in meetings (Q10c). In the factor analysis for
Waves 1 and 2 it was determined that meeting satisfaction was not a unidimensional
construct, therefore satisfaction was removed in these two waves which limits the results
of evaluation of meeting satisfaction to rely strictly on the qualitative data.

171
Pilot 1 Meeting Satisfaction Questions
Q15a. I am more satisfied in meetings when I can use my laptop. Q15c. It bothers me when other people in a meeting use laptops. Q15e. I am stressed out in meetings because of multitasking.
Pilot 2 Meeting Satisfaction Questions
Q10a. I am more satisfied in meetings when I can use my laptop. Q10b. I find it disruptive when other people use laptops in a meeting. Q10c. I feel self-conscious when I multitask with a laptop in a meeting.
Table 33: Pilot Items for Meeting Satisfaction.
Perceived Productivity: The perceived productivity construct was significantly
improved in the second pilot study from a coefficient alpha .358 in Pilot 1 to .911 in Pilot
2 (see Table 34). Using Haynes’s (2007) review of organizational productivity, the
questions were changed to identify efficiency (Q10d) and effectiveness (Q10e) as
important facets of productivity.
Pilot 1 Perceived Productivity Questions
Q15b. Having a laptop in a meeting makes me more productive. Q15d. Meetings are less productive because people are distracted by technology.
Pilot 2 Perceived Productivity Questions
Q10d. Having a laptop in a meeting leads me to be more efficient at my job. Q10e. Having a laptop in a meeting makes me more effective at my job. Q10f. Having a laptop in a meeting allows me to be more productive. Q10g. Having a laptop in a meeting allows me to produce better quality work.
Table 34: Pilot Items for Perceived Productivity.
PILOT SURVEY RESULTS
Due to the small n (46 in Pilot 1 and 42 in Pilot 2), the analysis of the pilots is
limited to examination of general patterns in the data. The primary purpose for the pilot
studies was to design and validate the survey questionnaire. The secondary purpose was
to identify the appropriate statistical procedures to employ in the survey waves at

172
SoftwareCorp and with the online panel of information workers. In the following results
sections, these general trends in the pilot data are briefly reviewed and a discussion of
statistical analysis techniques is presented.
Respondent Characteristics
The demographic characteristics of the respondents are shown for both pilot
studies in Table 35. As can be seen, the samples were similar across most demographic
characteristics, except for gender, company type, and frequency of participants who
multitask with a laptop in meetings. Pilot 1 was predominantly more male, from larger
corporations, and had an increased number of people who multitasked with technology
during meetings.
The other main difference between the two pilot samples is in job role. In Pilot 1,
29 out of 46 respondents self-described their roles as being related to a computing
industry (e.g. Webmaster, Engineer, Programmer, etc.), and the other 17 respondents had
occupations such as Accountant, Attorney, Public Relations Manager, or an unspecific
role such as Consultant or Manager. Pilot 2, as mentioned previously, had participants
only from the Telecommunications and Technology fields. Pilot 2 is more representative
of the information worker population that is anticipated to participate in the final two
survey waves. However, the differences noted with the Pilot 1 characteristics do not
detract from using the data to test construct reliability and statistical techniques.

173
Characteristics Pilot 1
(n=46) Pilot 2 (n=42)
Gender Female
Male
14 (30%) 32 (70%)
22 (52%) 20 (48%)
Age Range 18 to 24 years old 25 to 34 years old 35 to 44 years old 45 to 54 years old 55 to 64 years old
0 (0%)
16 (35%) 15 (33%) 12 (26%)
3 (6%)
2 (5%)
11 (26%) 17 (40%) 9 (21%) 3 (7%)
Manager Status Manager
Non-Manager
21 (45%) 25 (55%)
18 (43%) 24 (57%)
Company Type Large Corporation
Medium Corporation Small Business
Other
30 (65%) 9 (20%) 5 (11%)
2 (4)
17 (40%) 14 (33%) 8 (19%) 3 (7%)
Length at Company 2 years or less
3 to 7 years 8 to 15 years
16 years or more
11 (24%) 16 (35%) 19 (41%)
0 (0%)
14 (33%) 8 (19%)
13 (31%) 7 (17%)
Length in Job Role 2 years or less
3 to 7 years 8 to 15 years
16 years or more
19 (41%) 25 (54%)
2 (4%) 0 (0%)
14 (33%) 17 (40%) 9 (21%) 2 (5%)
Typically Multitask with a Laptop in Meetings? Yes No
33 (72%) 13 (28%)
20 (48%) 22 (52%)
Table 35: Demographic Characteristics - Pilot 1 & Pilot 2.
Statistical Techniques Overview
The survey constructs use ordinal level data in the form of 7-point Likert scales
(Strongly Disagree to Strongly Agree). Since ordinal-level data is not continuous, it is
argued to be inappropriate to use parametric tests such as t-tests, analysis of variance and
regression analysis (Gardner & Martin, 2007). With ordinal data, the one-unit difference
between ―1 and 2‖ on the Likert scale cannot be assumed to be the same unit difference
as between ―3 and 4‖ on the same scale.

174
However, there is a tendency for many researchers to use parametric tests on
ordinal data. Harwell & Gatti (2001) suggest that researchers can re-scale ordinal
variables into interval variables using algorithmic transformations devised from item-
response theory. Dowling & Midgley (2006) compare survey data results in ordinal
format subjected to MANOVA and this same data after it was transformed into interval
data with MANOVA and reported no significant difference in the results. Dowling &
Midgley (along with others e.g. Labovitz, 1970) argue that the statistical power of
MANOVA and similar techniques is robust enough to handle the unknown unit
differences in ordinal data.
There are continuing theoretical and methodological arguments among
measurement scholars for using either non-parametric or parametric tests on ordinal data
(e.g. Anderson, 1961; Marcus-Roberts & Roberts, 1987; Knapp, 1990). However, this
research will rely on non-parametric statistical procedures. The non-parametric tests are
given primary standing in this research because they are more conservative and therefore
less prone to Type 1 errors. For reference, commonly used non-parametric tests and
parametric equivalents are listed below.
Non-Parametric Parametric Wilcoxon Paired t-test Mann-Whitney Independent t-test Kruskal-Wallis One-way ANOVA Friedman test Two-way ANOVA Spearman’s rho Pearson r
General Data Analysis of Pilot Surveys
The two sets of pilot data were analyzed to identify any patterns or trends in the
data. The mean, standard deviation, and score range for all of the major constructs
(polychronicity, cohesion beliefs, copresence management, perceived productivity, and
175
meeting satisfaction) were calculated and bar charts were made of the responses. Due to
the small sample size, the summary data were difficult to interpret unambiguously. Since
the future analysis of Waves 1 and 2 will be based on the correlations between the
constructs, a surface examination of the relationships was completed using SPSS
statistical software. The statistical findings described below were used to ensure that
improvements had been made to the questionnaire between the two pilot studies but are
not considered to be statistically valid for the final analysis due to the small sample size.
As shown in Table 36, with Pilot 1 only one hypothesis (Proposition 1) resulted in
a significant finding. Proposition 1 was not tested in Wave 2 because this set of questions
was removed to shorten the survey length as discussed on page 166. Participants in Pilot
1 rated how frequently they multitasked with a laptop for five different meeting types,
and the chi-square analysis (using a Friedman test) was significant. After the
questionnaire changes made to the constructs, Pilot 2 results identified Hypotheses 4 and
7 as significant and the researcher felt comfortable proceeding with using the Pilot 2
questionnaire in Wave 1 at SoftwareCorp.

176
Research Hypothesis Pilot 1 Pilot 2
P1: The context of the meeting (the meeting type) will influence the decision to multitask with technology.
2(4, N = 46) = 85.61, p
< .001
H1: Individuals high in polychronicity will multitask with technology more than those low in polychronicity.
2(3, N = 46) = 2.71, p
> .05
2(2, N = 42) = .305, p
> .05
H4a: Individuals high in polychronicity will manifest greater electronic copresence.
Spearman’s rho value = .086 with p > .05
Spearman’s rho value = .350 with p > .05
H8: Individuals high in polychronicity will perceive meetings as more productive when technology multitasking occurs.
Spearman’s rho value = .198 with p > .05
Spearman’s rho value
= .567 with p < .01
H5: Individuals who feel cohesive with their immediate team will have greater in-room copresence.
Spearman’s rho value = -.254 with p > .05
Spearman’s rho value = .219 with p > .05
H9: Individuals who feel cohesive with their immediate team will perceive less productivity with technology multitasking.
Spearman’s rho value = .247 with p > .05
Spearman’s rho value = .552 with p < .05
Table 36: Statistical Correlations - Pilot 1 & Pilot 2.
Summary of Methodological Lessons from Pilot Studies
Pilot 1 and Pilot 2 provided two opportunities for the researcher to test the
reliability of the survey constructs, the length of time to complete the questionnaire, and
identify validity issues. Based on these pilot studies, all of the questionnaire items for the
research constructs were improved by the second pilot. The survey length was shortened
to meet the requirements of SoftwareCorp and face and content validity issues were
addressed. Even with a small n, by Pilot 2, three of the constructs resulted in significant
effects.
The next section describes the implementation of the survey at SoftwareCorp
(Wave 1). Following a discussion of the Wave 1 results, additional changes were made to
the questionnaire and a final validation of the theoretical model and research hypotheses
is discussed with the results from Wave 2.

177
SOFTWARECORP SURVEY (WAVE 1)
The research design and survey implementation at SoftwareCorp is described in
the following sections. The goal of this survey was to collect additional evidence for how
people multitask with technology at SoftwareCorp in order to supplement the qualitative
case study data.
Participants
The SoftwareCorp participants were solicited via an e-mail message from the
SoftwareCorp manager who was assisting the researcher with this project. This e-mail
explained the general focus of the survey on the topic of laptop multitasking and
emphasized that participation was voluntary and anonymous (shown in Appendix E). The
solicitation e-mail was sent two separate times during June 2009. In exchange for
participation, respondents were allowed to request a copy of the executive report
prepared for SoftwareCorp that discussed these survey results.
The e-mail message was sent to approximately 800 employees in the Southern
California region of SoftwareCorp 179 responses were collected, but thirteen were
removed due to missing answers. The final participant count was 156 employees who
were primarily product managers, engineers, and quality assurance specialists. Due to
privacy issues emphasized by SoftwareCorp Human Resources, data about gender and
age of the participants were not obtained.
Construct Reliability
The internal consistency of each research construct was tested by calculating
Cronbach’s coefficient alpha in SPSS (Scale > Reliability Analysis command).
Cronbach’s alpha measures how well each of the questionnaire items represents the

178
overarching construct. For the previous discussion about Cronbach’s alpha, please refer
to the pilot studies section on page 165.
As shown in the Table 37 below, polychronicity, meeting satisfaction, and
perceived productivity exceed the .70 alpha level, but electronic copresence, technology
use norms, and cohesion beliefs do not. Since cohesion beliefs is approaching the .70
level, for the purposes of the current results it will be included as acceptable. While
electronic copresence and technology use norms will also be discussed in this set of
results, the findings will be considered exploratory and need additional confirmation from
Wave 2 with the online panel of respondents. The questionnaire items referred to under
each construct (e.g. Q5a) are shown in Appendix C.
Research Construct Cronbach’s alpha
Polychronicity (Q5a, Q5b, Q5c, Q5d, Q5e)
.934
Electronic Copresence (Q9c, Q9d, Q10a)
.588
Cohesion Beliefs (Q6a, Q6b, Q6d, Q6e)
.653
Meeting Satisfaction (Q11a, Q11brev, Q11crev)
.766
Perceived Productivity (Q11d, Q11e, Q11f, Q11g)
.870
Technology Use Norms (Q8a, Q8brev)
.581
Table 37: Initial Cronbach’s alpha Values - SoftwareCorp (Wave 1).
Validation of Constructs with Factor Analysis
To validate convergent and discriminant validity of the research constructs,
exploratory factor analysis using the principal components model was employed to
identify the load values of each of the questionnaire items against the construct (which
ensures unidimensionality). For convergent validity, the optimal finding would be that

179
items measuring the same construct are more highly correlated with each other than they
are with items from other constructs. And, for discriminant validity, we would expect
unrelated questionnaire items to have minimal correlation with each other. The
Dimension Reduction > Factor command was used in SPSS to complete this analysis in
the following 4-step process.
Step 1: KMO & Bartlett‟s Test
Before proceeding with the factor analysis, the data must meet a Kaiser-Meyer-
Olkin (KMO) value of .60 or greater and the Bartlett’s Test for Sphericity needs to be
significant (p < .05). The KMO value represents the proportion of common variance
across the items and Bartlett’s Test determines if the items are interrelated. This survey
data met the KMO criterion with a value of .678 and the Bartlett’s Test is significant with
p < .001.
Step 2: Communalities
The communalities of each of the items are examined which is a measure of the
proportion of variance accounted for within each item by the factors. Ideal communality
measurements are .60 or larger. In this questionnaire, five items had low communality as
shown in Table 38 below.
Questionnaire Item Communality
Overall, I feel like an essential part of my team. .462
When using a laptop in the meeting, I make a point to participate to show that I am paying attention.
.528
I respond to incoming instant messages while in a meeting. .516
I tend to use my laptop for non-meeting related tasks (e.g. checking e-mail/working on other projects).
.508
I tend to use my laptop for meeting related tasks (e.g. taking notes/looking up relevant information).
.598
Table 38: Low Communality Values - SoftwareCorp (Wave 1).
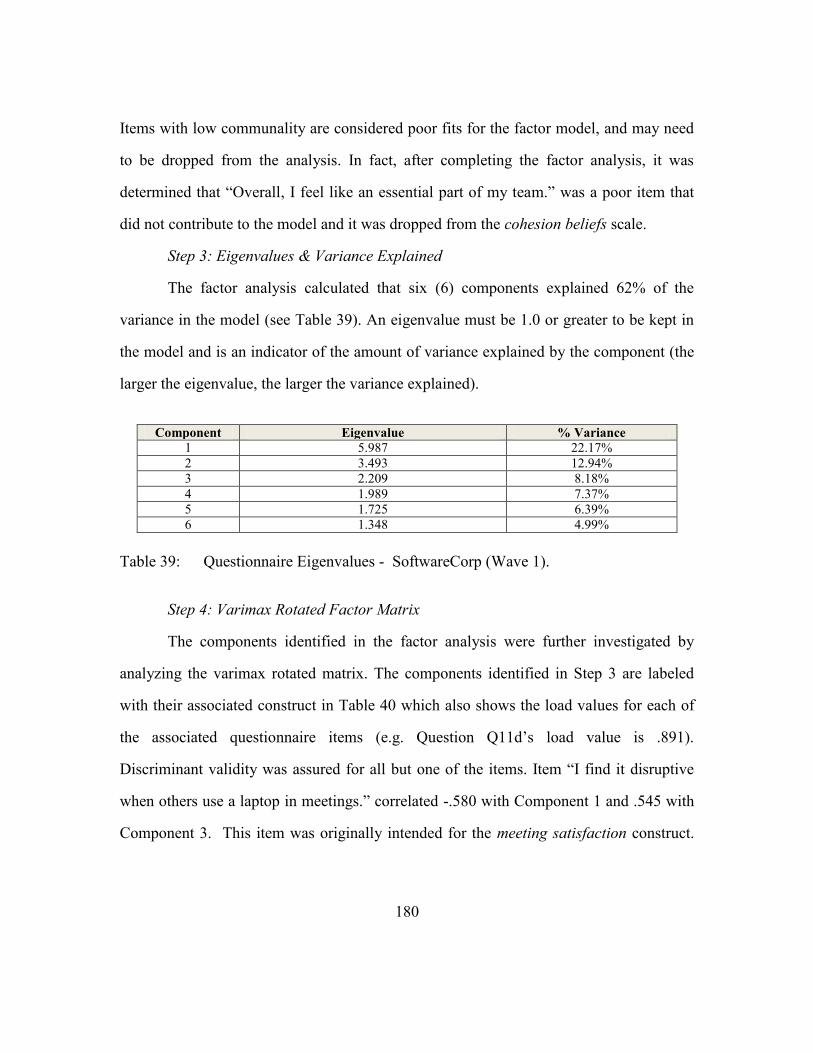
180
Items with low communality are considered poor fits for the factor model, and may need
to be dropped from the analysis. In fact, after completing the factor analysis, it was
determined that ―Overall, I feel like an essential part of my team.‖ was a poor item that
did not contribute to the model and it was dropped from the cohesion beliefs scale.
Step 3: Eigenvalues & Variance Explained
The factor analysis calculated that six (6) components explained 62% of the
variance in the model (see Table 39). An eigenvalue must be 1.0 or greater to be kept in
the model and is an indicator of the amount of variance explained by the component (the
larger the eigenvalue, the larger the variance explained).
Component Eigenvalue % Variance
1 5.987 22.17%
2 3.493 12.94%
3 2.209 8.18%
4 1.989 7.37%
5 1.725 6.39%
6 1.348 4.99%
Table 39: Questionnaire Eigenvalues - SoftwareCorp (Wave 1).
Step 4: Varimax Rotated Factor Matrix
The components identified in the factor analysis were further investigated by
analyzing the varimax rotated matrix. The components identified in Step 3 are labeled
with their associated construct in Table 40 which also shows the load values for each of
the associated questionnaire items (e.g. Question Q11d’s load value is .891).
Discriminant validity was assured for all but one of the items. Item ―I find it disruptive
when others use a laptop in meetings.‖ correlated -.580 with Component 1 and .545 with
Component 3. This item was originally intended for the meeting satisfaction construct.
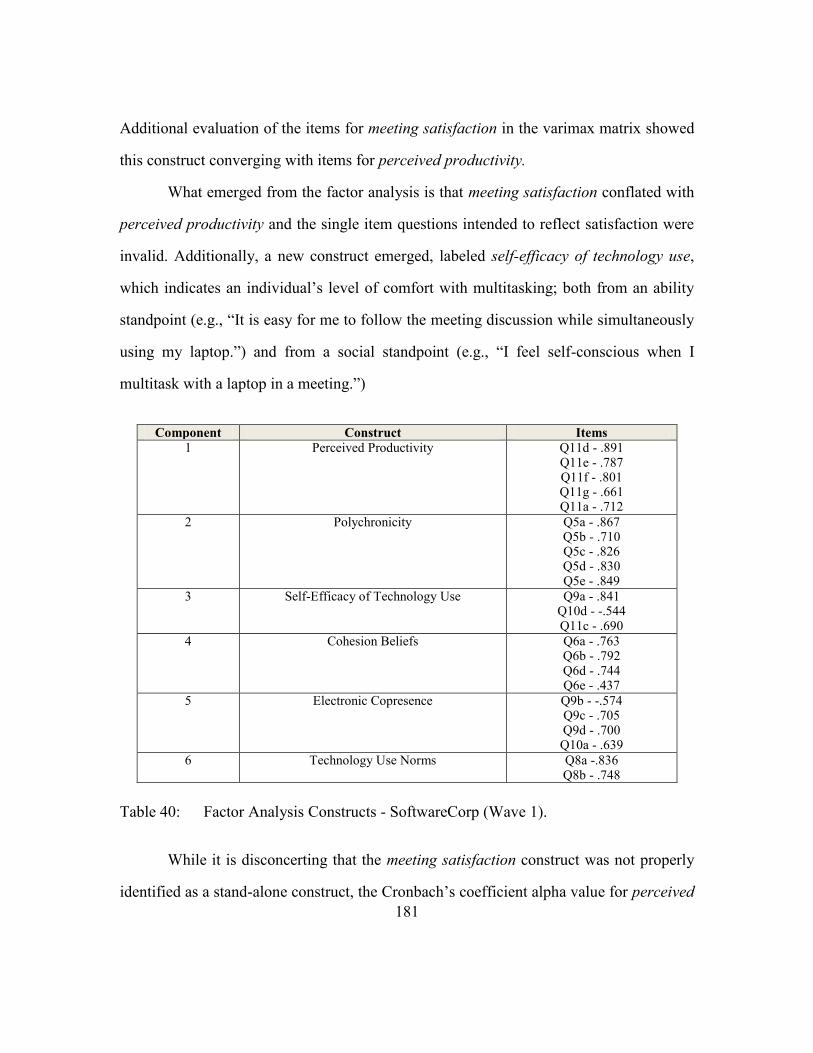
181
Additional evaluation of the items for meeting satisfaction in the varimax matrix showed
this construct converging with items for perceived productivity.
What emerged from the factor analysis is that meeting satisfaction conflated with
perceived productivity and the single item questions intended to reflect satisfaction were
invalid. Additionally, a new construct emerged, labeled self-efficacy of technology use,
which indicates an individual’s level of comfort with multitasking; both from an ability
standpoint (e.g., ―It is easy for me to follow the meeting discussion while simultaneously
using my laptop.‖) and from a social standpoint (e.g., ―I feel self-conscious when I
multitask with a laptop in a meeting.‖)
Component Construct Items
1 Perceived Productivity Q11d - .891 Q11e - .787 Q11f - .801 Q11g - .661 Q11a - .712
2 Polychronicity Q5a - .867 Q5b - .710 Q5c - .826 Q5d - .830 Q5e - .849
3 Self-Efficacy of Technology Use Q9a - .841 Q10d - -.544 Q11c - .690
4 Cohesion Beliefs Q6a - .763 Q6b - .792 Q6d - .744 Q6e - .437
5 Electronic Copresence Q9b - -.574 Q9c - .705 Q9d - .700 Q10a - .639
6 Technology Use Norms Q8a -.836 Q8b - .748
Table 40: Factor Analysis Constructs - SoftwareCorp (Wave 1).
While it is disconcerting that the meeting satisfaction construct was not properly
identified as a stand-alone construct, the Cronbach’s coefficient alpha value for perceived
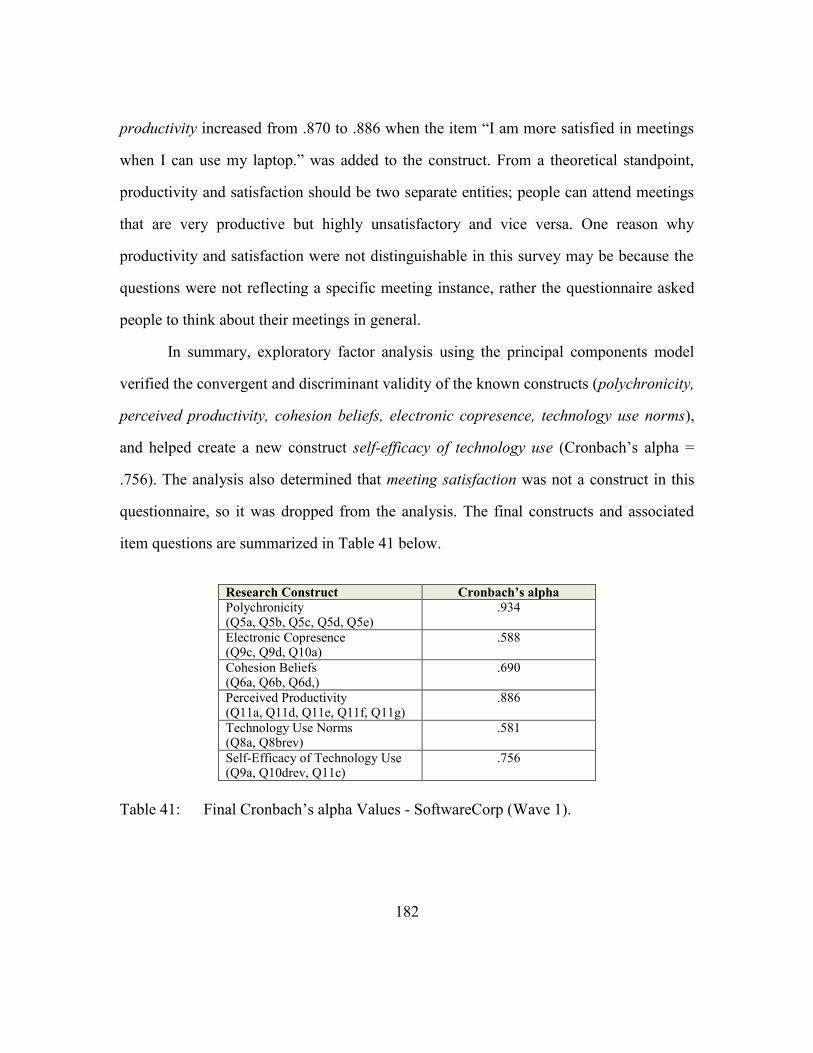
182
productivity increased from .870 to .886 when the item ―I am more satisfied in meetings
when I can use my laptop.‖ was added to the construct. From a theoretical standpoint,
productivity and satisfaction should be two separate entities; people can attend meetings
that are very productive but highly unsatisfactory and vice versa. One reason why
productivity and satisfaction were not distinguishable in this survey may be because the
questions were not reflecting a specific meeting instance, rather the questionnaire asked
people to think about their meetings in general.
In summary, exploratory factor analysis using the principal components model
verified the convergent and discriminant validity of the known constructs (polychronicity,
perceived productivity, cohesion beliefs, electronic copresence, technology use norms),
and helped create a new construct self-efficacy of technology use (Cronbach’s alpha =
.756). The analysis also determined that meeting satisfaction was not a construct in this
questionnaire, so it was dropped from the analysis. The final constructs and associated
item questions are summarized in Table 41 below.
Research Construct Cronbach’s alpha
Polychronicity (Q5a, Q5b, Q5c, Q5d, Q5e)
.934
Electronic Copresence (Q9c, Q9d, Q10a)
.588
Cohesion Beliefs (Q6a, Q6b, Q6d,)
.690
Perceived Productivity (Q11a, Q11d, Q11e, Q11f, Q11g)
.886
Technology Use Norms (Q8a, Q8brev)
.581
Self-Efficacy of Technology Use (Q9a, Q10drev, Q11c)
.756
Table 41: Final Cronbach’s alpha Values - SoftwareCorp (Wave 1).

183
DATA OVERVIEW & RE-CODING
Likert scale data was collected from 156 respondents and the response values
were loaded into SPSS. For the questionnaire items asking about how the respondent
used a laptop during meetings, only participants who answered that they typically
multitasked with a laptop were shown this set of questions. Therefore, as seen in Table
42, the constructs of copresence, perceived productivity, and self-efficacy have only 77
responses (which are from the 77 people who said they multitasked with laptops). With
this purposeful data reduction, there is no impact on the resulting analysis since the
associated hypotheses rely on assessing how technology multitaskers behave in meetings.
Construct n Mean Score SD Range
Polychronicity
156 23.72 7.75 5 – 35
Cohesion Beliefs 156 5.00 .928 1 – 7
Tech Use Norms 156 4.04 1.42 1 – 7
Electronic Copresence
77 4.90 1.11 2 – 7
Perceived Productivity
77 5.14 1.02 1 – 7
Self-Efficacy of Technology Use
77 3.84 1.29 1 – 7
Table 42: Construct Summary - SoftwareCorp (Wave 1).
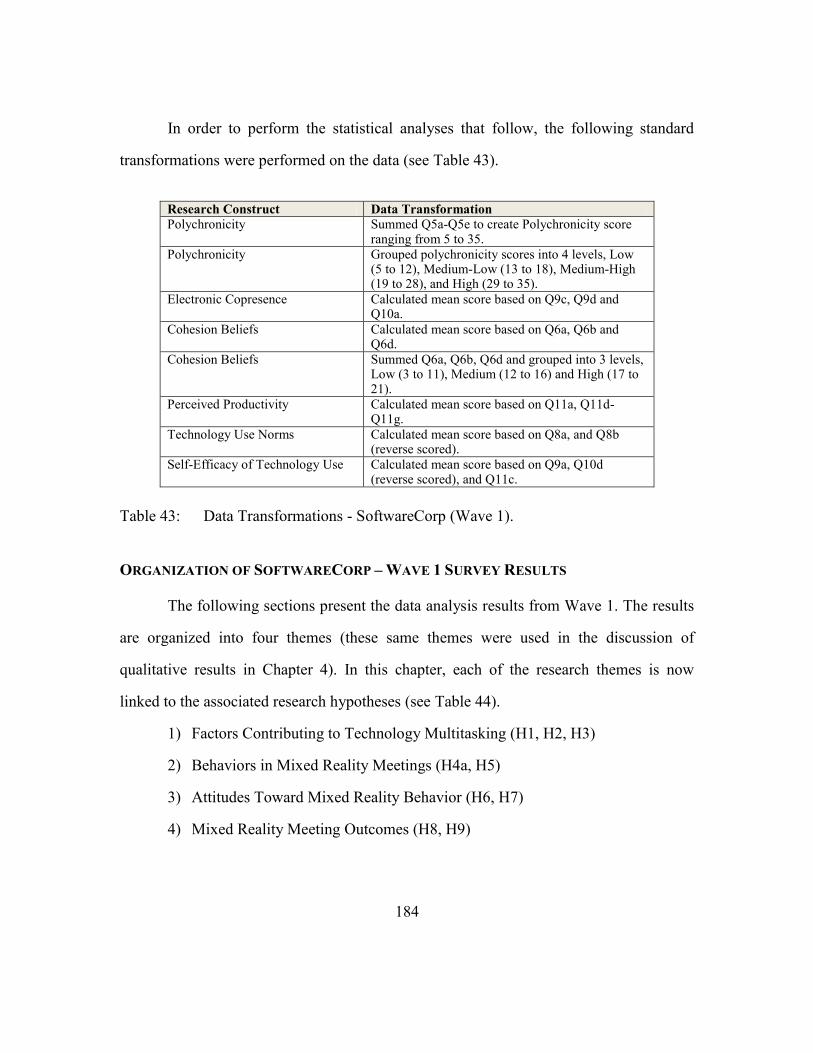
184
In order to perform the statistical analyses that follow, the following standard
transformations were performed on the data (see Table 43).
Research Construct Data Transformation
Polychronicity
Summed Q5a-Q5e to create Polychronicity score ranging from 5 to 35.
Polychronicity Grouped polychronicity scores into 4 levels, Low (5 to 12), Medium-Low (13 to 18), Medium-High (19 to 28), and High (29 to 35).
Electronic Copresence
Calculated mean score based on Q9c, Q9d and Q10a.
Cohesion Beliefs
Calculated mean score based on Q6a, Q6b and Q6d.
Cohesion Beliefs Summed Q6a, Q6b, Q6d and grouped into 3 levels, Low (3 to 11), Medium (12 to 16) and High (17 to 21).
Perceived Productivity
Calculated mean score based on Q11a, Q11d-Q11g.
Technology Use Norms
Calculated mean score based on Q8a, and Q8b (reverse scored).
Self-Efficacy of Technology Use Calculated mean score based on Q9a, Q10d (reverse scored), and Q11c.
Table 43: Data Transformations - SoftwareCorp (Wave 1).
ORGANIZATION OF SOFTWARECORP – WAVE 1 SURVEY RESULTS
The following sections present the data analysis results from Wave 1. The results
are organized into four themes (these same themes were used in the discussion of
qualitative results in Chapter 4). In this chapter, each of the research themes is now
linked to the associated research hypotheses (see Table 44).
1) Factors Contributing to Technology Multitasking (H1, H2, H3)
2) Behaviors in Mixed Reality Meetings (H4a, H5)
3) Attitudes Toward Mixed Reality Behavior (H6, H7)
4) Mixed Reality Meeting Outcomes (H8, H9)

185
Research Hypotheses
P1: The context of the meeting (the meeting type) will influence the decision to multitask with technology.
H1: Individuals high in polychronicity will multitask with technology more than those low in polychronicity.
H2: Individuals who are highly cohesive with their teams will multitask less.
H3: Managers will multitask with technology more than non-managers.
H4a: Individuals high in polychronicity will manifest greater electronic copresence.
H4b: Individuals low in polychronicity will manifest greater in-room copresence.
H5: Individuals who feel cohesive with their immediate team will have greater in-room copresence.
H6: Individuals who feel cohesive with their team will believe that others on their team multitask appropriately.
H7: Individuals high in polychronicity will have higher self-efficacy with technology multitasking.
H8: Individuals high in polychronicity will perceive meetings as more productive when technology multitasking occurs.
H9: Individuals who feel cohesive with their immediate team will perceive less productivity with technology multitasking.
Table 44: Research Hypotheses.
These themes encapsulate the entire experience of mixed reality beginning with
the individual and group drivers that lead to laptop multitasking, followed by an
examination of the behaviors and attitudes in these meeting contexts and ending with an
evaluation of its impact on organizational meetings. These same themes and hypotheses
will be used for the discussion of Wave 2 results, and the chapter will conclude with an
overall summary of the outcomes.
FACTORS CONTRIBUTING TO TECHNOLOGY MULTITASKING (THEME 1)
This section addresses the survey results by examining the constructs
hypothesized to impact the likelihood to multitask in meetings. Based on the literature
review analysis (see Chapter 2), polychronicity was predicted to correlate with an

186
increased likelihood to multitask with technology in meetings. Given that individuals
who are higher in polychronicity already prefer to multitask in their life in general, we
would expect them to do the same in meetings.
Beliefs about cohesion in the team were also hypothesized to impact the
likelihood to multitask. However, high cohesion beliefs (people who feel strongly bonded
to the team), are projected to negatively correlate with the likelihood to multitask. The
stronger one feels cohesion with their team, the less one will multitask because the needs
of the team meeting should be more important than other work.
For the third hypothesis, managers are anticipated to multitask with technology
more so than non-managers. Managers attend more meetings and spend more time
communicating and coordinating work tasks (Romano, Jr. & Nunamaker, Jr., 2001), and
therefore are expected to utilize time spent in meetings for technology multitasking. H1: Individuals high in polychronicity will multitask with technology more than those low in polychronicity. H2: Individuals who feel highly cohesive with their teams will multitask less.
H3: Managers will multitask with technology more than non-managers.
Polychronicity & Likelihood to Multitask (H1)
Does polychronicity level determine the likelihood that one multitasks in a
meeting with a laptop? Polychronicity scores can range from a low of 5 to a high of 35.
For the 156 participants at SoftwareCorp, 108 had a polychronicity score of 21 or higher
with a mean score of 23.72 (SD = 7.75). Figure 13 shows the distribution of scores which
skew to the left. This distribution of scores shows a tendency for SoftwareCorp
employees to have a strong preference for multitasking in their lives.

187
Figure 13: Polychronicity Score Chart - SoftwareCorp (Wave 1).
The scores were grouped into four nearly equal category levels: Low (5 to 12),
Medium-Low (13 to 20), Medium-High (21 to 28), and High (29 to 35). The researcher
split the polychronicity scores into four categories in order to maintain the most
variability in the scores while having a sufficient number of responses in each category to
run a meaningful chi-square analysis. Table 45 shows that those in the Low category are
unlikely to use laptops during meetings, whereas those in the High category are likely to
multitask with technology. For those individuals in the Medium range (Medium-Low &
Medium-High) polychronicity groupings, they are nearly equally divided between those
who use laptops in meetings and those who do not.

188
Polychronicity Level
Total 5 to 12 13 to 20 21 to 28 29 to 35
Q7. Do you typically use a laptop computer during project meetings?
Yes 3 13 26 35 77
No 15 17 29 18 79
Total 18 30 55 53 156
Table 45: Cross-tab for Polychronicity Level & Laptop Use - SoftwareCorp
A chi-square test for significance of polychronicity level and laptop use in meetings
found a significant result: 2(3, N = 156) = 14.13, p < .01. However, the chi-square test
does not determine which of the polychronicity levels is contributing to the significance.
A post-hoc test was completed using a contingency table with standardized residual
values calculated based on the expected responses to laptop use subtracted from the
observed responses. The standardized residual values for each of the polychronicity
levels are listed in Table 46 below.
Polychronicity Level
Total 5 to 12 13 to 20 21 to 28 29 to 35
Q7. Do you typically use a laptop computer during project meetings?
Yes Count 3 13 26 35 77
Expected Count
8.9 14.8 27.1 26.2 77.0
Residual -5.9 -1.8 -1.1 8.8
Std. Residual -2.0 -.5 -.2 1.7
No Count 15 17 29 18 79
Expected Count
9.1 15.2 27.9 26.8 79.0
Residual 5.9 1.8 1.1 -8.8
Std. Residual 1.9 .5 .2 -1.7 Total Count 18 30 55 53 156
Expected Count
18.0 30.0 55.0 53.0 156.0
Table 46: Std. Residuals for Polychronicity & Laptop Use - SoftwareCorp.

189
The standardized residual cells of interest in the contingency table are those with an
absolute value that meets or exceeds a chosen critical value. Under a 95% confidence
limit, the standardized residuals would need to be 1.96 or larger for significance, and with
a 90% confidence limit, the significant residuals would be 1.64 or larger. When
significance is achieved, the observed frequency count is statistically different from the
expected frequency (Sheskin, 2003).
As can be seen in the contingency table (Table 46), those Low in polychronicity
who used laptops in meetings met the 95% confidence limit (2.0 std. residual > 1.96
critical value), and those in the Low category who did not use laptops met the 90%
confidence limit (1.9 std. residual > 1.64). Respondents in the High grouping of
polychronicity exceeded the 1.64 critical value in both the ―yes‖ and ―no‖ conditions for
laptop use in meetings.
To ensure that the significant findings about polychronicity score and likelihood
to multitask were not a result of the four category split, an additional analysis was run
grouping the scores into 3 clusters: Low (5 to 14), Medium (15 to 25), and High (26 to
35). A significant result was maintained: 2(2, N = 156) = 7.65, p < .05. Therefore, it is at
the extreme levels of polychronicity in which laptop use in meetings is likely to occur
(High polychronicity) or not (Low polychronicity). For those individuals in the middle
ranges with polychronicity scores between 13 and 28, it is not predictable whether one
multitasks in meetings with laptops. This finding suggests that for those in the middle
range other factors are greater contributors to the likelihood of using a laptop in meetings.
Cohesion & Likelihood to Multitask (H2)
Cohesion was summed on Q6a, Q6b, and Q6d and the distribution of the scores is
shown in Figure 14. The mean score is 14.99, SD=2.78. The graph skews to the left

190
slightly, indicating that in general more people feel cohesive with their teams. The
conceptual model predicted that people who are more cohesive with their teams would be
less likely to multitask.
Figure 14: Cohesion Score Bar Chart - SoftwareCorp (Wave 1).
Similar to the analysis completed with polychronicity, the cohesion scores were
grouped into three categories: Low (3 to 11), Medium (12 to 16), and High (17 to 21).
The responses for typical laptop use in meetings organized by cohesion level are shown
in Table 47 below.
Cohesion Level (3 Groups)
Total Low 3 to 11 Medium 12 to 16 High 17 to 21
Q7. Do you typically use a laptop
computer during project meetings?
Yes 6 54 17 77
No 7 44 28 79
Total 13 98 45 156
Table 47: Cross-tab for Cohesion Level & Laptop Use - SoftwareCorp.

191
A chi-square test for significance of cohesion score and laptop use in meetings
found a non-significant result: 2(2, N = 156) = 3.76, p > .05. To ensure that the three
clusters used to group the cohesion scores were not impacting the results, additional
groupings were tested as shown in Table 48. The rationale for the additional analyses was
that the initial results might be skewed since 114 of the 156 participants had a score
between 14 and 18 for cohesion beliefs. In the first row in Table 48 below, the cohesion
scores were clustered based on the natural breaks in Figure 14, in the second row only
those scoring 11 or higher on cohesion were analyzed and in the third row all scores were
grouped into 4 clusters. However, none of these groupings affected the chi-square
analysis results, all were non-significant.
Cohesion Beliefs Groupings Chi-Square Results
Natural Breaks in Histogram: Low (3 to 13) Medium (14 to 16) High (17 to 21)
2(2, N = 156) = 4.01, p > .05
Removed Scores Below 11: Low (11 to 14) Medium (15 to 17) High (18 to 21)
2(2, N = 149) = 3.40, p > .05
Four Clusters: Low (3 to 7) Medium (8 to 12) High (13 to 16) Very High (17 to 21)
2(3, N = 156) = 4.82, p > .05
Table 48: Cohesion Beliefs & Laptop Use Analyses - SoftwareCorp.
Therefore, it is not possible to conclude with this survey wave that people’s
feelings of cohesion toward their team significantly impacted their decision to multitask
during meetings.

192
Managerial Status & Likelihood to Multitask (H3)
People who have managerial responsibilities must help coordinate the work of
others and communicate amongst their immediate team and with others in the
organization. Since managers have increased communication needs, Hypothesis 3
predicts that managers will be more likely to multitask in meetings than non-managers. A
chi-square test for significance of manager status and response to whether one typically
multitasks with a laptop produced a significant result: 2(1, N = 156) = 23.71, p < .001.
Of the 52 managers, 40 of them (77%) multitask in meetings. Of the 104 non-
managers who answered this same question, only 37 of them (35%) indicated
multitasking in meetings. The standard residuals in Table 49 shows all of them exceed
the 95% confidence level being larger than 1.96.
Q16. Do you supervise the work of other
employees on a day-to-day basis?
Total
Yes No
Q7. Do you typically use a laptop
computer during project meetings?
Yes Count 40 37 77
Expected Count 25.7 51.3 77.0
Residual 14.3 -14.3
Std. Residual 2.8 -2.0
No Count 12 67 79
Expected Count 26.3 52.7 79.0
Residual -14.3 14.3
Std. Residual -2.8 2.0
Total Count 52 104 156
Expected Count 52.0 104.0 156.0
Table 49: Cross-tab for Managerial Status & Laptop Use - SoftwareCorp.

193
Summary of Factors Impacting Likelihood to Multitask
For Theme 1, polychronicity and managerial status were found to significantly
correlate with the likelihood that one used a laptop during meetings. With polychronicity,
it was at the extreme ends of the scale (either High or Low) that predicted technology
multitasking. Those individuals in the middle range of polychronicity levels (scores
between 13 and 28) were equally likely to use their laptop in meetings or not.
Cohesion beliefs were hypothesized to lower the likelihood that one would
multitask in meeting, but no significant relationship was found. Since the Cronbach’s
coefficient alpha value for cohesion beliefs is .690 (lower than the standard .70
acceptability mark), the scale items for cohesion will be modified in Wave 2 in order to
re-assess the relationship between cohesion and likelihood to multitask.
BEHAVIOR IN MIXED REALITY MEETINGS (THEME 2)
How did SoftwareCorp employees change behaviorally when using their laptops
in meetings? This section explores how copresence management was impacted in mixed
reality. Hypothesis 4a predicts that individuals with a propensity for multitasking (high
polychronicity) will use their laptops to maintain communication with colleagues outside
of the meeting through e-mail and instant messaging (electronic copresence). High
polychronicity individuals are theorized to find it efficient to utilize their laptops to
maintain communication with work colleagues outside of the meeting.
In Hypothesis 5, however, in-room copresence is expected to increase for those
individuals who feel cohesive with the others in the meeting. In-room copresence
management is the verbal and non-verbal signals an individual uses to indicate that they
are engaged in the group meeting (such as nods of the head, eye contact and verbal
participation).

194
H4a: Individuals high in polychronicity will manifest greater electronic copresence. H5: Individuals who feel cohesive with their immediate team will have greater in-room copresence.
Polychronicity & Electronic Copresence (H4a)
People who prefer to multitask (high polychronicity) are anticipated to exhibit
greater levels of electronic copresence. Individuals who are comfortable multitasking are
likely to maintain e-mail and instant messaging communication when multitasking. A
non-significant result was found indicating that polychronicity and electronic copresence
have no relationship (Spearman’s rho value = .019 with p > .05).
Cohesion Beliefs & In-room Copresence (H5)
A non-significant result was found indicating that cohesion and in-room
copresence have no relationship (Spearman’s rho value = .080 with p > .05). Based on
not finding any support for hypotheses H4a and H5, the copresence management
construct will be revised in Wave 2.
ATTITUDES TOWARD ONE’S OWN MULTITASKING (THEME 3)
How did SoftwareCorp employees perceive their technology multitasking? This
section examines the attitudes of employees toward multitasking in terms of technology
use norms (H6) and self-efficacy of technology use (H7). Hypothesis 6 predicts that
individuals who feel strongly cohesive with their team will believe that others in their
team who technology multitask do so appropriately. The rationale for Hypothesis 6 is that
people will feel less perturbed by technology multitasking when it occurs from team
members with whom they feel cohesive.

195
Self-efficacy with technology multitasking was a newly derived construct from
the results of the factor analysis. In Hypothesis 7, people who are high in polychronicity
level, are anticipated to feel confident with their ability to technology multitask during
meetings. H6: Individuals who have high cohesion beliefs will perceive appropriate multitasking from others. H7: Individuals high in polychronicity will have higher self-efficacy about their technology multitasking.
Cohesion Beliefs & Technology Use Norms (H6)
A significant result was found indicating that cohesion beliefs and technology use
norms have a moderate relationship (Spearman’s rho value = .203 with p < .05). As
predicted, individuals who are highly cohesive with their teams will perceive others on
their team as multitasking appropriately and that the team has understood norms for this
behavior. However, the construct for technology use norms achieved a low coefficient
alpha score (.581) so this result should be considered exploratory.
Polychronicity & Self-Efficacy of Technology Use (H7)
Self-efficacy of technology use was a newly developed construct based on the
factor analysis results. It consists of three questions that assess the individual’s comfort
level with multitasking based on perceived ability and social appropriateness. The
questionnaire items for self-efficacy are as follows: Q9a. If my boss or upper management is also in the meeting, I multitask on my laptop less. Q10d. It is easy for me to follow the meeting discussion while simultaneously using my laptop. Q11c. I feel self-conscious when I multitask with a laptop in a meeting.

196
Theoretically we would expect that individuals high in polychronicity would have high
self-efficacy in regards to their ability to multitask during meetings. A significant result
was found indicating that polychronicity level and self-efficacy have a moderate linear
relationship (Spearman’s rho value = -.301 with p < .01). The correlation has a negative
value since the questions were not reverse scored.
MIXED REALITY MEETING OUTCOMES (THEME 4)
Are mixed reality meetings more productive than those without technology
multitasking? Hypotheses 8 and 9 examined perceived productivity in meetings based on
polychronicity level and cohesion beliefs. H8: Individuals high in polychronicity will perceive meetings as more productive when technology multitasking occurs. H9: Individuals who feel cohesive with their team will perceive lower productivity when technology multitasking occurs.
Polychronicity & Perceived Productivity (H8)
Do individuals higher in polychronicity believe that they are more productive in
meetings when they multitask with laptops? The summed polychronicity scores (ranging
from 5 to 35) were analyzed using Spearman’s rho with the perceived productivity score
that was calculated as the sum of Q11a, Q11d, Q11e, Q11f, and Q11g.
A significant result was found indicating that polychronicity score and
productivity have a moderate linear relationship (Spearman’s rho value = .316 with p <
.01). The direction of this relationship was verified using a scatterplot (see Figure 15).
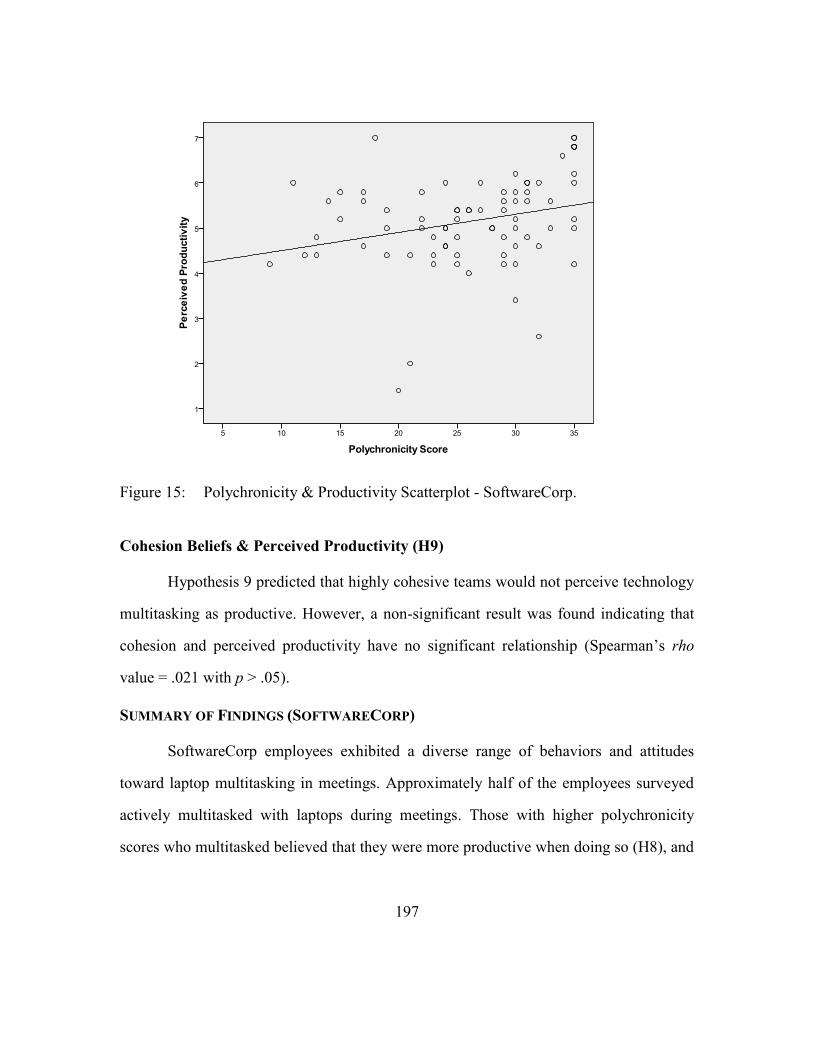
197
Figure 15: Polychronicity & Productivity Scatterplot - SoftwareCorp.
Cohesion Beliefs & Perceived Productivity (H9)
Hypothesis 9 predicted that highly cohesive teams would not perceive technology
multitasking as productive. However, a non-significant result was found indicating that
cohesion and perceived productivity have no significant relationship (Spearman’s rho
value = .021 with p > .05).
SUMMARY OF FINDINGS (SOFTWARECORP)
SoftwareCorp employees exhibited a diverse range of behaviors and attitudes
toward laptop multitasking in meetings. Approximately half of the employees surveyed
actively multitasked with laptops during meetings. Those with higher polychronicity
scores who multitasked believed that they were more productive when doing so (H8), and

198
likewise, the higher one’s polychronicity score the more confidence one felt when using a
laptop in the group (H7).
Likelihood to multitask was significantly correlated with polychronicity level
(H1) and managerial status (H3). Cohesion beliefs were anticipated to correlate with
copresence management, productivity and the likelihood to multitask, but no statistical
relationship was found. Cohesion beliefs and norms for technology use did produce a
statistically significant relationship; highly cohesive teams perceived technology use
amongst others to be appropriate (H6). However, since the construct of technology use
had low reliability, this finding is considered weak at this point in the research.
The outcomes of Wave 1 reveal a complicated pattern of relationships:
polychronicity proved a strong predictive construct, but cohesion beliefs and copresence
management were not. In Wave 2, cohesion beliefs and copresence management are
modified for a final time in order to increase their validity and reliability. These findings
are discussed in the next section on Wave 2 with the online panel from Zoomerang. To
summarize the final statistical correlations, Table 50 shows the findings for each of the
major constructs numbered from 1 to 8 in the first column. The heading numbered 2 to 7
correspond with the same constructs in the column; columns 1 and 8 are removed for
paper margin limitations.

199
2. 3. 4. 5. 6. 7.
1. Polychronicity rho = .316
p < .01** (H8)
rho = .019 p > .05 (H4a)
rho = -.301
p < .01** (H7)
2 = 14.13
p < .01** (H1)
2. Perceived Productivity
3. Cohesion Beliefs
rho = .021 p > .05 (H9)
rho = .080 p > .05 (H5)
rho = .203 p < .05*
(H6)
2 = 3.76
p > .05 (H2)
4. Electronic Copresence
5. Technology Use Norms
6. Self-Efficacy of Technology Use
7. Likelihood to Multitask
8. Managerial Status
2=23.71,
p < .001
*** (H3)
*Correlation is significant at the .05 level ** Correlation is significant at the .01 level *** Correlation is significant at the .001 level
Table 50: Summary Statistical Correlations - SoftwareCorp (Wave 1).
ZOOMTECH ONLINE PANEL SURVEY (WAVE 2)
This section discusses the results from the implementation of the survey with an
online panel of information workers from across the United States provided by the
Zoomerang Corporation, termed the ZoomTech panel here. The questionnaire (see
Appendix D) used in this wave was longer than the one executed at SoftwareCorp (Wave
1) since there was no time restrictions with using the online panelists. Additionally,
changes were made to the questionnaire on the constructs of cohesion beliefs and
copresence management to improve the validity of these items.

200
Survey Context
250 respondents were solicited for this survey with the help of the Zoomerang
Corporation and 110 complete responses were received. Zoomerang was selected as the
company to provide access to respondents because they specifically offered a panelist set
comprised only of people who work in technology fields. The sample size was chosen
based on the maximum number of people allowable under researcher’s budget.
Respondents received ―ZoomPoints‖ for participation which could be redeemed for gift
certificates or products. For additional background information about the methodological
issues with using online panels and Zoomerang, please see the limitations discussed in
Chapter 3.
Questionnaire Modifications Based on Wave 1
The constructs of cohesion beliefs and copresence management were revised for
this final survey as shown in Table 51 and Table 52, respectively. The cohesion construct
was modified slightly, with the question about meeting coordination changed to remove
the ―not‖ in the middle of Q6c and the addition of Q12e. Q12e was added to balance the
number of questions that dealt with task cohesion (Q12a, Q12b, and Q12c) compared to
social cohesion.
Copresence management was more significantly altered. Two separate sub-scales
were made in the new questionnaire, one to assess in-room copresence (Q5a-Q5d) and
one to evaluate electronic copresence (Q6a-Q6f). The success of these questionnaire
changes is discussed in the following sections on construct reliability and the factor
analysis results.

201
SoftwareCorp Cohesion Beliefs Questions
Q6a. Team members make an effort to participate in meeting discussions. Q6b. Team members share the workload evenly. Q6c. My team does not coordinate our meeting activities very well. Q6d. It is important for me to be liked by other members of the team.
ZoomTech Panel Cohesion Beliefs Questions
Q12a. Team members make an effort to participate in meeting discussions. Q12b. Team members share the workload evenly. Q12c. Our team meetings are coordinated well. Q12d. It is important for me to be liked by other members of the team. Q12e. Overall, I feel like I am an essential part of my team.
Table 51: Cohesion Beliefs Questionnaire Changes.
SoftwareCorp Copresence Management Questions
Q9c. I respond to incoming instant messages while in a meeting. Q9d.I use my laptop during meetings to keep up communication with others outside of the meeting. Q10a. I tend to use my laptop for non-meeting related tasks (e.g. checking e-mail / working on other projects).
ZoomTech Panel Copresence Management Questions
Q5a. I try and make occasional eye contact with whomever is speaking. Q5b. I make a point to participate in the meeting discussion. Q5c. I nod my head slightly when I hear something that I agree with. Q5d. I lower or close my laptop screen when I'm done multitasking. Q6a. I notice all new incoming e-mail messages when in a meeting. Q6b. I write and respond to e-mail messages during a meeting. Q6c. I send instant messages to other people in the meeting who have laptops. Q6d. I send instant messages to work colleagues who are not in the meeting. Q6e. I won't initiate instant message conversations, but I will reply to incoming IMs. Q6f. I find it essential to be online throughout the meeting so that I can communicate with others who are not in the room.
Table 52: Copresence Management Questionnaire Changes.
Construct Reliability
The internal consistency of each research construct was tested by calculating
Cronbach’s coefficient alpha in SPSS (Scale > Reliability Analysis command). Table 53
shows that all of the constructs exceed the .70 cut-off criterion for acceptability, except
for technology use norms and self-efficacy of technology use.
The technology use norms construct was also problematic in Wave 1, where it
achieved a .581 reliability score. This construct needs additional modifications in future

202
work since it appears to not represent the concept intended. Self-efficacy of technology
use had previously achieved a coefficient alpha of .756 in Wave 1. Since the alpha value
in Wave 2 is nearing the .70 mark, the construct is considered sufficient to continue to
use in this analysis.
Research Construct Cronbach’s alpha
Polychronicity (Q15a, Q15b, Q15c, Q15d, Q15e)
.933
In-room Copresence (Q5a, Q5b, Q5c, Q5d)
.840
Electronic Copresence (Q6a, Q6b, Q6c, Q6d, Q6e, Q6f)
.814
Cohesion Beliefs (Q12a, Q12b, Q12c, Q12d, Q12e)
.809
Perceived Productivity (Q9a, Q9b, Q9c, Q9d)
.924
Technology Use Norms (Q14arev, Q14b)
.296
Self-Efficacy of Tech Use (Q8b, Q8c, Q8d)
.691
Table 53: Final Cronbach’s alpha Values - ZoomTech (Wave 2).
Factor Analysis
The four-step factor analysis process used in Wave 1 was repeated with the Wave
2 data. The KMO test met the acceptability point of being larger than .70 and the
Bartlett’s Test for Sphericity was significant. The varimax rotated matrix identified 6
components from the questionnaire items, and these were organized into the following
constructs as shown in Table 54. The questionnaire items are available in Appendix D.
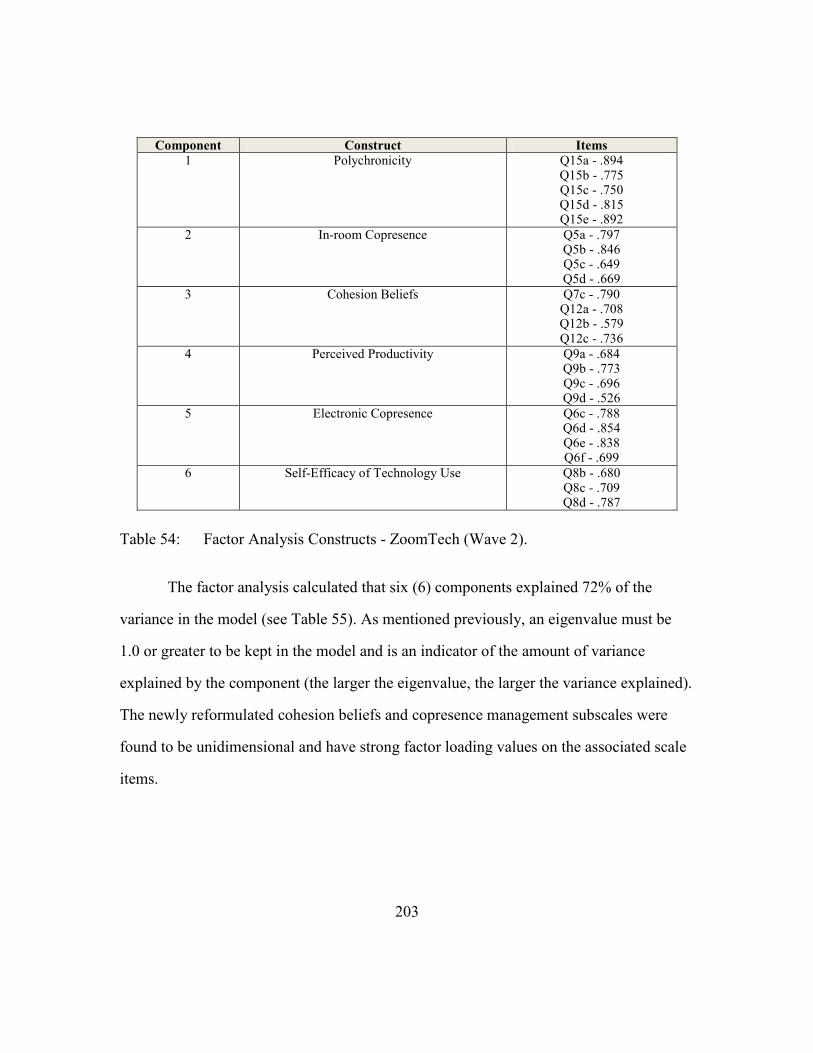
203
Component Construct Items
1 Polychronicity Q15a - .894 Q15b - .775 Q15c - .750 Q15d - .815 Q15e - .892
2 In-room Copresence Q5a - .797 Q5b - .846 Q5c - .649 Q5d - .669
3 Cohesion Beliefs Q7c - .790 Q12a - .708 Q12b - .579 Q12c - .736
4 Perceived Productivity Q9a - .684 Q9b - .773 Q9c - .696 Q9d - .526
5 Electronic Copresence Q6c - .788 Q6d - .854 Q6e - .838 Q6f - .699
6 Self-Efficacy of Technology Use Q8b - .680 Q8c - .709 Q8d - .787
Table 54: Factor Analysis Constructs - ZoomTech (Wave 2).
The factor analysis calculated that six (6) components explained 72% of the
variance in the model (see Table 55). As mentioned previously, an eigenvalue must be
1.0 or greater to be kept in the model and is an indicator of the amount of variance
explained by the component (the larger the eigenvalue, the larger the variance explained).
The newly reformulated cohesion beliefs and copresence management subscales were
found to be unidimensional and have strong factor loading values on the associated scale
items.

204
Component Eigenvalue % Variance
1 11.232 35.09%
2 3.919 12.25%
3 2.763 8.63%
4 2.090 6.53%
5 1.776 5.55%
6 1.418 4.43%
Table 55: Questionnaire Eigenvalues - ZoomTech (Wave 2).
Respondent Characteristics
The demographic characteristics of the ZoomTech respondents are shown in
Table 56. A comparison of these demographics to the 2008 Pew Internet report on
―Networked Workers‖ shows that the ZoomTech panel appears representative of today’s
information workers. This Pew report was selected as a comparison response set on the
basis of topic similarity and shared focus on how people use technologies at work and at
home.
The main differences with the ZoomTech panel are that it is skewed with having
more male respondents, and more respondents are from Medium and Large size
corporations. These demographic differences were expected since the screener criteria for
the ZoomTech panel specifically requested participants who had technology-related job
roles (which tend to be male-dominated) and worked at larger sized companies.

205
Characteristics ZoomTech
(n=110) Pew Internet Respondent
Characteristics
(n=2,134)
Gender Female
Male
37 (34%) 73 (66%)
1,110 (52%) 1,024 (48%)
Age Range 18 to 24 years old 25 to 34 years old 35 to 44 years old 45 to 54 years old 55 to 64 years old 65 years or older
1 (1%)
19 (17%) 40 (36%) 39 (35%) 11 (10%)
0 (0%)
256 (12%) 384 (18%) 427 (20%) 427 (20%) 299 (14%) 341 (16%)
Manager Status Manager
Non-Manager
51 (46%) 59 (54%)
896 (42%)
1,238 (58%)
Company Type Large Corporation
Medium Corporation Small Business
Governmental Organization Educational Organization Non-Profit Organization
35 (32%) 36 (33%) 13 (12%) 12 (11%)
9 (8%) 5 (4%)
640 (30%) 832 (39%) 598 (28%) Unknown Unknown Unknown
Length at Company 2 years or less
3 to 7 years 8 to 15 years
16 years or more
17 (15%) 48 (44%) 26 (24%) 19 (17%)
640 (30%) 598 (28%) 469 (22%) 427 (20%)
Length in Job Role 2 years or less
3 to 7 years 8 to 15 years
16 years or more
31 (28%) 51 (46%) 19 (17%)
9 (8%)
832 (39%) 619 (29%) 384 (18%) 277 (13%)
Typically Multitask with a Laptop in Meetings? Yes No
46 (42%) 64 (58%)
Table 56: Respondent Demographics - ZoomTech (Wave 2).
Data Overview
The same data process that was used in Wave 1 was used in Wave 2. The Likert
scale responses from 110 participants were entered into SPSS. Only 46 respondents in the
ZoomTech panel responded ―yes‖ to the statement that they typically multitasked in

206
meetings with a laptop; therefore the copresence, productivity and self-efficacy
constructs were limited to these participants.
The summary data in Table 57 is comparable to the same overview from Wave 1
(see Table 42 on page 56). Both the ZoomTech panelists and SoftwareCorp employees
scored similarly on average across all the major constructs. The SoftwareCorp employees
had a similar polychronicity level (mean = 23.72) though a slightly larger percentage
(49%) typically multitasked in meetings with laptops compared to 41% of the ZoomTech
respondents.
Construct n Mean Score SD Range
Polychronicity 110 24.31 6.65 7 – 35
Cohesion Beliefs 110 4.94 1.01 3 – 7
In-room Copresence
46 5.45 1.13 1 – 7
Electronic Copresence
46 4.26 1.52 1 – 7
Perceived Productivity
46 5.68 .90 4 – 7
Self-Efficacy 46 3.90 1.33 1 – 7
Table 57: Construct Summary - ZoomTech (Wave 2).
SUMMARY OF FINDINGS (ZOOMTECH PANEL)
The same hypotheses tested with the previous survey wave of SoftwareCorp
employees was used with the ZoomTech panel respondents. Since Wave 2 did not have
the same time restrictions, the researcher included the survey item addressing Proposition
1. Additionally, since copresence management had been modified to delineate between
in-room and electronic copresence, Hypothesis 4b was added to the analysis. To
minimize redundancy in the discussion, see Wave 1 discussion pp. 185-196, for the
rationales of the hypotheses.

207
Factors Contributing to Technology Multitasking (Theme 1)
Recalling both the qualitative research results and Pilot 1, there was indication in
the data that the type of meeting one attended impacted the likelihood to multitask.
Participants were asked to rate how frequently they multitasked across six meeting types:
Staff Meetings, Internal Project Meetings, External Project Meetings,
Lecture/Demonstration Meetings, Sales/Pitch, and Company ―All Hands‖ Meetings. P1: The context of the meeting (the meeting type) will influence the decision to multitask with technology.
A Friedman’s test compared the Likert scores of multitasking frequency across these
meeting types with a significant result: 2(4, N = 46) = 9.80, p < .05. The mean score for
participants’ responses to “How often do you multitask with a laptop computer during a
[MEETING TYPE]?” is shown in Table 58 below. The respondents rated Internal Project
Meetings, Lecture/Demonstration, and Staff Meetings as the meetings they most often
technology multitasked, and Sales/Pitch, Company “All Hands,” and External Project
Meetings were ranked with lowest frequency of multitasking
Meeting Type Mean Standard Deviation
Internal Project Meeting 5.30 1.26
Lecture/Demonstration 5.02 1.61
Staff Meeting 4.93 1.51
Sales/Pitch 4.67 2.15
Company ―All Hands‖ 4.18 2.19
External Project Meeting 4.14 1.84
Table 58: Multitasking Frequency by Meeting Type.
A post-hoc analysis with the Wilcoxon Signed Rank Test identified which meeting types
were significantly different in multitasking frequency. The z-scores and significance
values are shown for each significant paired comparison from the Wilcoxon results,

208
indicating that respondents differed in their frequency of multitasking between these two
meeting types. In Table 59 below, the meeting type listed first for each pair indicates the
meeting type with a higher multitasking frequency (e.g. Staff Meeting had higher rates of
multitasking as shown in the first two rows).
Meeting Type Comparison Z Score Significance
Staff Meeting External Project Meeting
-2.47 .013
Staff Meeting Company ―All Hands‖
-2.46 .014
Internal Project Meetings External Project Meetings
-4.04 .000
Lecture/Demonstrations External Project Meetings
-2.31 .021
Internal Project Meetings Company ―All Hands‖
-3.67 .000
Lecture/Demonstration Company ―All Hands‖
-2.23 .026
Table 59: Wilcoxon Post-Hoc for Meeting Type & Multitasking Frequency.
The Wilcoxon post-hoc analysis confirms the surface analysis based on the mean scores
in Table 58. Participants technology multitasked the least in External Project Meetings
and Company ―All Hands‖ while multitasking the most in Staff, Internal Project, and
Lecture/Demonstration meetings.
Transitioning from multitasking frequency based on meeting type, the next set of
variables looks at individual factors impacting the likelihood to multitask (polychronicity
and managerial status). Polychronicity scores were normally distributed in Wave 2,
excluding 12 respondents who reported a score of 35 as shown in Figure 16. H1: Individuals high in polychronicity will multitask with technology more than those low in polychronicity.

209
Figure 16: Polychronicity Score Bar Chart - ZoomTech (Wave 2).
A chi-square test for significance of polychronicity level and laptop use in meetings
found a non-significant result using the same 4-group category used in Wave 1: 2(3, N
= 110) = 5.58, p > .05. As shown in Table 60, only those in the Medium-Low (13 to 20)
category exhibit any significant difference in likelihood to multitask based on
polychronicity level. These results contradict the finding in Wave 1, where a linear
relationship was found (the higher the polychronicity score, the higher the likelihood to
multitasking during meetings).
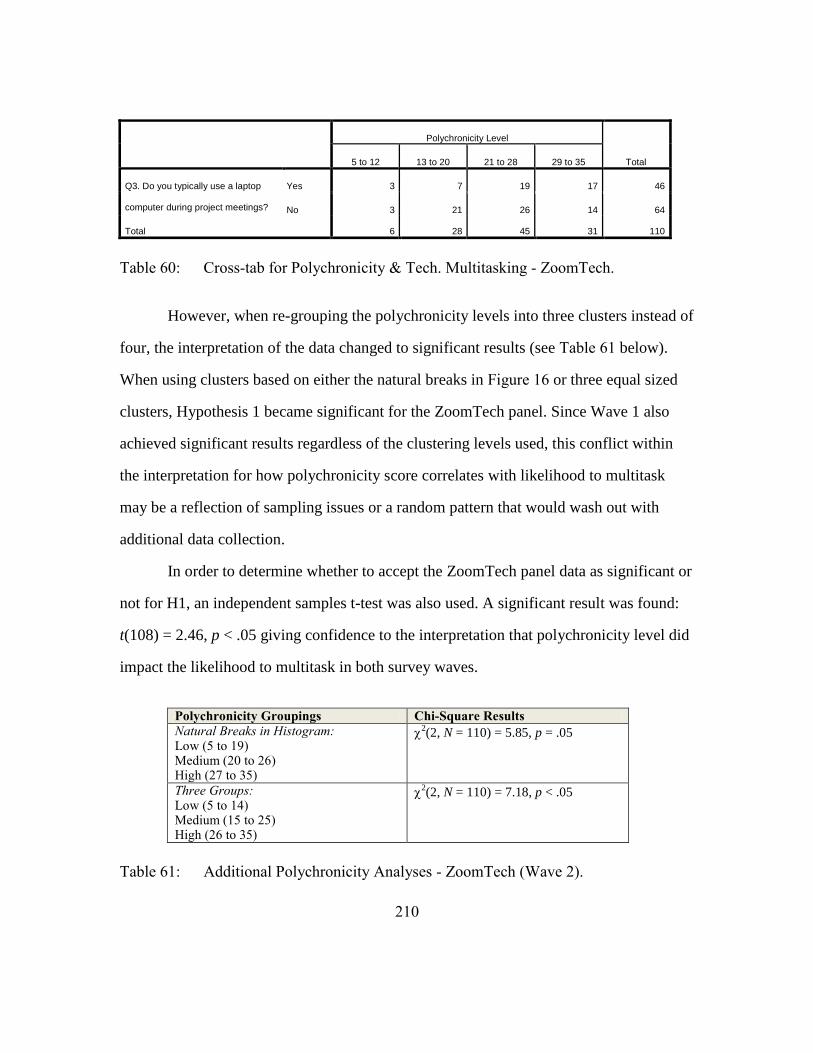
210
Polychronicity Level
Total 5 to 12 13 to 20 21 to 28 29 to 35
Q3. Do you typically use a laptop
computer during project meetings?
Yes 3 7 19 17 46
No 3 21 26 14 64
Total 6 28 45 31 110
Table 60: Cross-tab for Polychronicity & Tech. Multitasking - ZoomTech.
However, when re-grouping the polychronicity levels into three clusters instead of
four, the interpretation of the data changed to significant results (see Table 61 below).
When using clusters based on either the natural breaks in Figure 16 or three equal sized
clusters, Hypothesis 1 became significant for the ZoomTech panel. Since Wave 1 also
achieved significant results regardless of the clustering levels used, this conflict within
the interpretation for how polychronicity score correlates with likelihood to multitask
may be a reflection of sampling issues or a random pattern that would wash out with
additional data collection.
In order to determine whether to accept the ZoomTech panel data as significant or
not for H1, an independent samples t-test was also used. A significant result was found:
t(108) = 2.46, p < .05 giving confidence to the interpretation that polychronicity level did
impact the likelihood to multitask in both survey waves.
Polychronicity Groupings Chi-Square Results
Natural Breaks in Histogram: Low (5 to 19) Medium (20 to 26) High (27 to 35)
2(2, N = 110) = 5.85, p = .05
Three Groups: Low (5 to 14) Medium (15 to 25) High (26 to 35)
2(2, N = 110) = 7.18, p < .05
Table 61: Additional Polychronicity Analyses - ZoomTech (Wave 2).
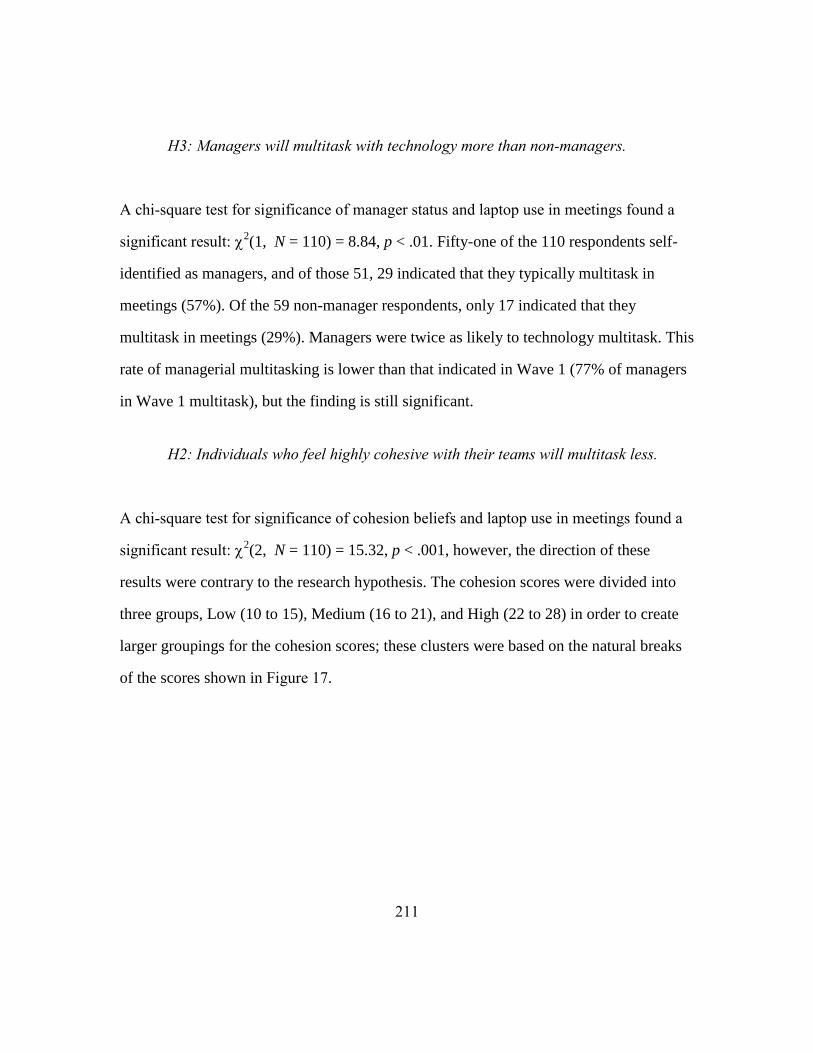
211
H3: Managers will multitask with technology more than non-managers.
A chi-square test for significance of manager status and laptop use in meetings found a
significant result: 2(1, N = 110) = 8.84, p < .01. Fifty-one of the 110 respondents self-
identified as managers, and of those 51, 29 indicated that they typically multitask in
meetings (57%). Of the 59 non-manager respondents, only 17 indicated that they
multitask in meetings (29%). Managers were twice as likely to technology multitask. This
rate of managerial multitasking is lower than that indicated in Wave 1 (77% of managers
in Wave 1 multitask), but the finding is still significant.
H2: Individuals who feel highly cohesive with their teams will multitask less.
A chi-square test for significance of cohesion beliefs and laptop use in meetings found a
significant result: 2(2, N = 110) = 15.32, p < .001, however, the direction of these
results were contrary to the research hypothesis. The cohesion scores were divided into
three groups, Low (10 to 15), Medium (16 to 21), and High (22 to 28) in order to create
larger groupings for the cohesion scores; these clusters were based on the natural breaks
of the scores shown in Figure 17.

212
Figure 17: Cohesion Score Bar Chart - ZoomTech (Wave 2).
The post-hoc analysis of the residuals indicated that those in the High cohesion beliefs
group were more likely to multitask in meetings than those in the Low and Medium
cohesion levels. An additional analysis was completed using four clusters (Low 10-14,
Medium 15-19, High 20-24, and Very High 25-28) and the same significant result was
maintained.
Hypothesis 2 originally predicted that those in the High cohesion group would be
less likely to multitask, but the opposite result was found. This suggests that individuals
who are cohesive with their teams feel more comfortable multitasking in front of them.
The cohesion results reported in Wave 2 cannot be directly compared to Wave 1 since the
questionnaire items were revised based on the previous low reliability score for cohesion.

213
Behavioral Changes in Mixed Reality (Theme 2)
In Wave 1, no significant results were found for how polychronicity and cohesion
beliefs correlated with copresence management. The copresence construct was revised in
Wave 2 to demarcate electronic copresence and in-room copresence as two separate
constructs. This change resulted in the following significant findings for Hypotheses H4a
and H5 in Wave 2.
H4a: Individuals high in polychronicity will manifest greater electronic copresence.
A significant result was found indicating that polychronicity and electronic
copresence have a moderate relationship (Spearman’s rho value = .346 with p < .05).
Electronic copresence questionnaire items asked respondents to rate their agreement level
on questions pertaining to noticing and responding to e-mails and instant messages during
a meeting. This finding suggests that individuals with a propensity to multitask will use
technology multitasking primarily for maintaining communication with those outside of
the meeting. The significance of this finding is that technology multitasking is not just
about getting other work done during a meeting, but specifically other work that requires
communication via electronic communication tools. H4b: Individuals low in polychronicity will manifest greater in-room copresence.
A non-significant result was found indicating that polychronicity and in-room
copresence have no relationship (Spearman’s rho value = .280 with p > .05). This finding
indicates that polychronicity does not impact one’s participation level in a meeting.
Comparing this finding to the qualitative results, the interview participants were similarly
not able to recall in-room copresence behaviors despite the researcher observing

214
instances of it during SoftwareCorp meetings. This suggests that in-room copresence may
not be a construct that is easily captured using recollection, and that future studies should
rely on observations of real world behaviors. H5: Individuals who feel cohesive with their immediate team will have greater in-room copresence.
A significant result was found indicating that cohesion and in-room copresence
have a strong relationship (Spearman’s rho value = .645 with p < .001). This finding
suggests that cohesion beliefs were an indicator of meeting relevancy. As discussed in
Chapter 4, meetings that were more relevant to the participant were more likely to
encounter increased participation by the user (in-room copresence). In summary, the
changes to the Wave 2 questionnaire, specifically for cohesion beliefs and copresence
management helped identify significant results in the way people perceive their behaviors
in mixed reality.
Attitudes Toward Mixed Reality Behavior (Theme 3)
In Wave 1, cohesion beliefs were found to significantly correlate to the attitude
that others in the team multitasked appropriately with technology. This same finding was
found in Wave 2, with an even more significant rho value which can be attributed to the
revision of the cohesion beliefs construct. H6: Individuals who have high cohesion beliefs will perceive appropriate multitasking from others.
A significant result was found indicating that cohesion and technology use norms
have a moderate relationship (Spearman’s rho value = .368 with p < .001).
For Hypothesis 7, Wave 1 resulted in a significant finding indicating that
individuals higher in polychronicity have higher self-efficacy in regards to their

215
technology use. This same finding was not supported in Wave 2, a non-significant result
was found indicating that polychronicity and self-efficacy have no relationship
(Spearman’s rho value = .232 with p > .05). H7: Individuals high in polychronicity will have higher self-efficacy about their technology multitasking.
One possible explanation for the lack of a significant finding in Wave 2 is due to
the fact that self-efficacy of technology use questions were not the same across the two
waves. Recalling that this construct was not identified until after data collection had been
completed (it was created during the factor analysis), the items associated with self-
efficacy in Wave 2 was missing: ―When my boss or supervisor is in the meeting, I use my
laptop less.‖ It was not known at the time Wave 2 was implemented that this item would
be used in a future construct. While the results for H7 are not comparable across the two
waves, since this construct emerged from the research and was not part of the original
focus, this result does not seriously impact the presentation.
Mixed Reality Meeting Outcomes (Theme 4)
In Wave 1, the respondents who were high in polychronicity significantly
correlated to perceiving increased productivity with technology multitasking. The same
result held in Wave 2.
H8: Individuals high in polychronicity will perceive meetings as more productive when technology multitasking occurs.
A significant result was found indicating that polychronicity and productivity
have a moderately strong relationship (Spearman’s rho value = .587 with p < .001).
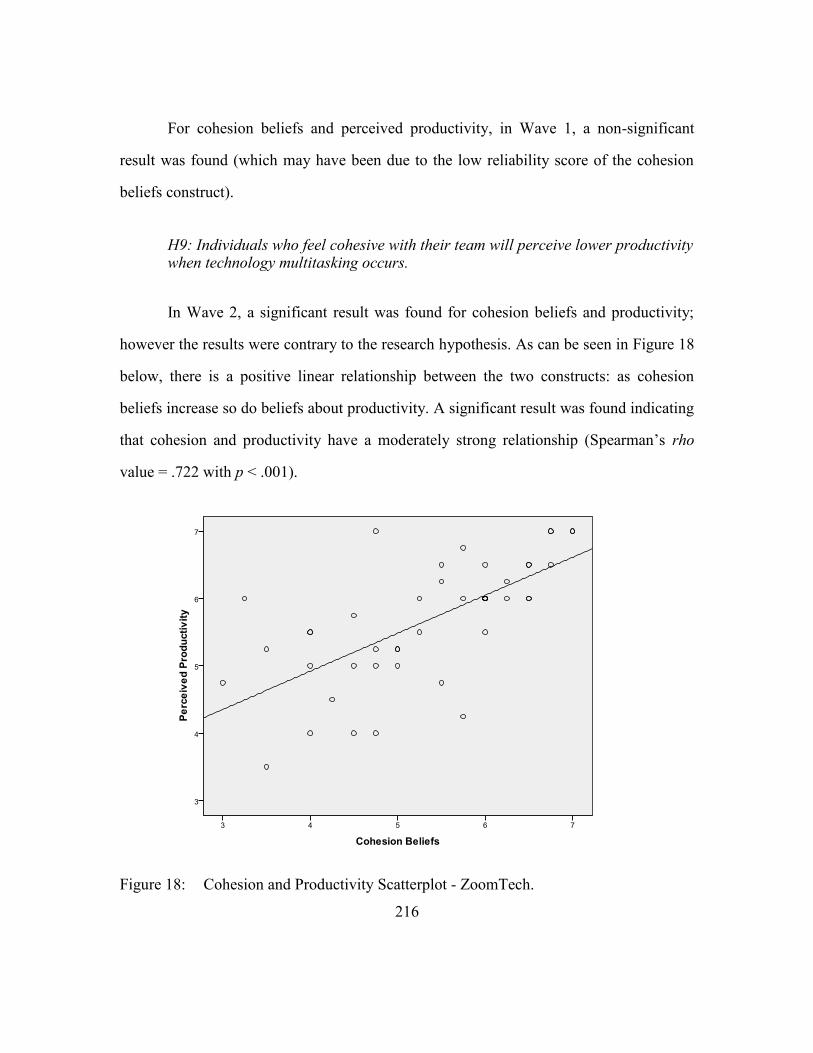
216
For cohesion beliefs and perceived productivity, in Wave 1, a non-significant
result was found (which may have been due to the low reliability score of the cohesion
beliefs construct). H9: Individuals who feel cohesive with their team will perceive lower productivity when technology multitasking occurs.
In Wave 2, a significant result was found for cohesion beliefs and productivity;
however the results were contrary to the research hypothesis. As can be seen in Figure 18
below, there is a positive linear relationship between the two constructs: as cohesion
beliefs increase so do beliefs about productivity. A significant result was found indicating
that cohesion and productivity have a moderately strong relationship (Spearman’s rho
value = .722 with p < .001).
Figure 18: Cohesion and Productivity Scatterplot - ZoomTech.
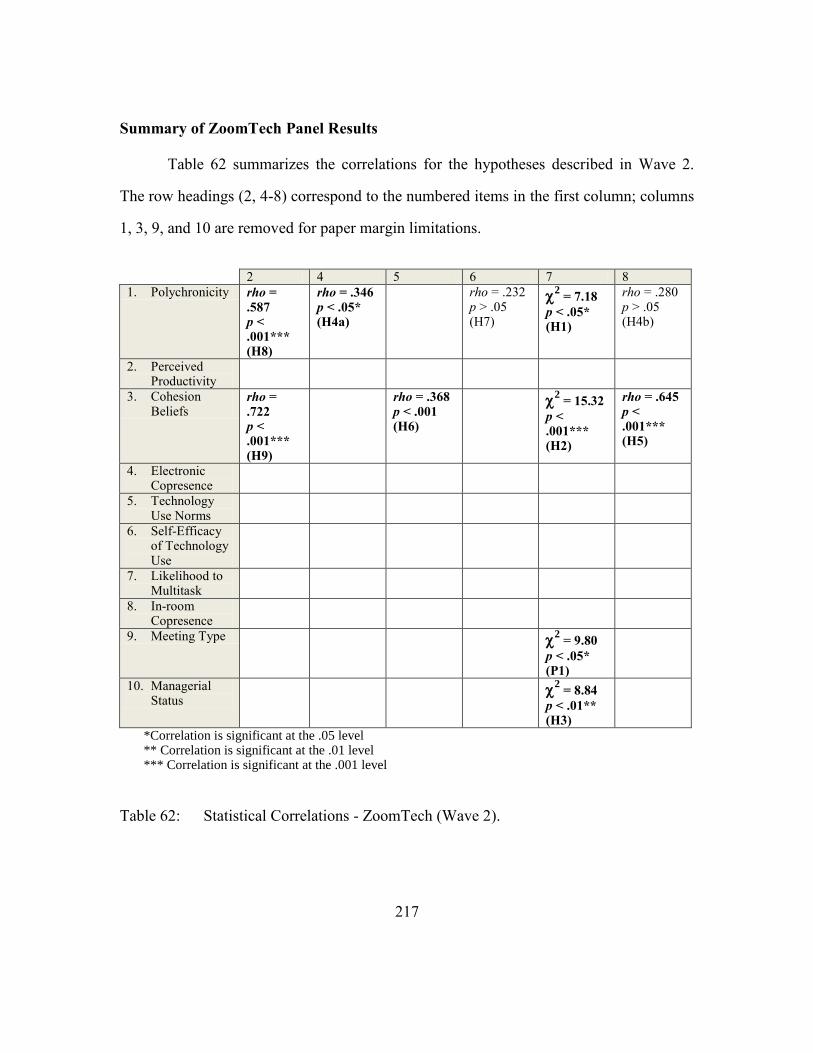
217
Summary of ZoomTech Panel Results
Table 62 summarizes the correlations for the hypotheses described in Wave 2.
The row headings (2, 4-8) correspond to the numbered items in the first column; columns
1, 3, 9, and 10 are removed for paper margin limitations.
2 4 5 6 7 8
1. Polychronicity rho =
.587 p < .001*** (H8)
rho = .346
p < .05* (H4a)
rho = .232 p > .05 (H7)
2 = 7.18
p < .05* (H1)
rho = .280 p > .05 (H4b)
2. Perceived Productivity
3. Cohesion Beliefs
rho =
.722 p < .001*** (H9)
rho = .368
p < .001 (H6)
2 = 15.32
p < .001*** (H2)
rho = .645
p < .001*** (H5)
4. Electronic Copresence
5. Technology Use Norms
6. Self-Efficacy of Technology Use
7. Likelihood to Multitask
8. In-room Copresence
9. Meeting Type 2 = 9.80
p < .05* (P1)
10. Managerial Status
2 = 8.84
p < .01** (H3)
*Correlation is significant at the .05 level ** Correlation is significant at the .01 level *** Correlation is significant at the .001 level
Table 62: Statistical Correlations - ZoomTech (Wave 2).

218
CONCLUSION
Chapter 5 presented the results from the survey data collection on the topic of
mixed reality. The complete data set comprised of four survey iterations, two pilots (Pilot
1 & Pilot 2) and data collection with two sets of information workers (Wave 1 at
SoftwareCorp and Wave 2 with an online panel from Zoomerang). The results yielded a
validation of 7 of the 10 research hypotheses as shown in Table 63.
The hypotheses which had unequivocal support across both survey waves are H1,
H3, H6, and H8. For hypotheses H1 and H3, polychronicity level and managerial status
were each positively correlated with a propensity to technology multitask in meetings.
Hypotheses H4a, H5, and H7 had conflicting results between the two survey
waves, with support found in one wave but not the other. H4a and H5 produced
significant results in Wave 2 because the constructs of cohesion beliefs and copresence
management were revised and the validity of these constructs was significantly improved.
H7 is not significant in Wave 2 because the construct technology use norms reliability
score was only .296 (whereas it had been .581 in Wave 1). The reliability score was not
strong in Wave 1 and proved further problematic in Wave 2 though no changes had been
made to the questions.
And finally, H2 and H9 were found to be significant in Wave 2 but the results
were contrary to the hypotheses. Cohesion beliefs had been anticipated to lower people’s
beliefs about multitasking frequency and perceptions of productivity, however, the
opposite was found. The contrary results of H2 and H9 do match findings from the
qualitative results at SoftwareCorp. During the fieldwork analysis, the researcher had
observed that Sam had high cohesion with his teams but multitasked frequently. The next
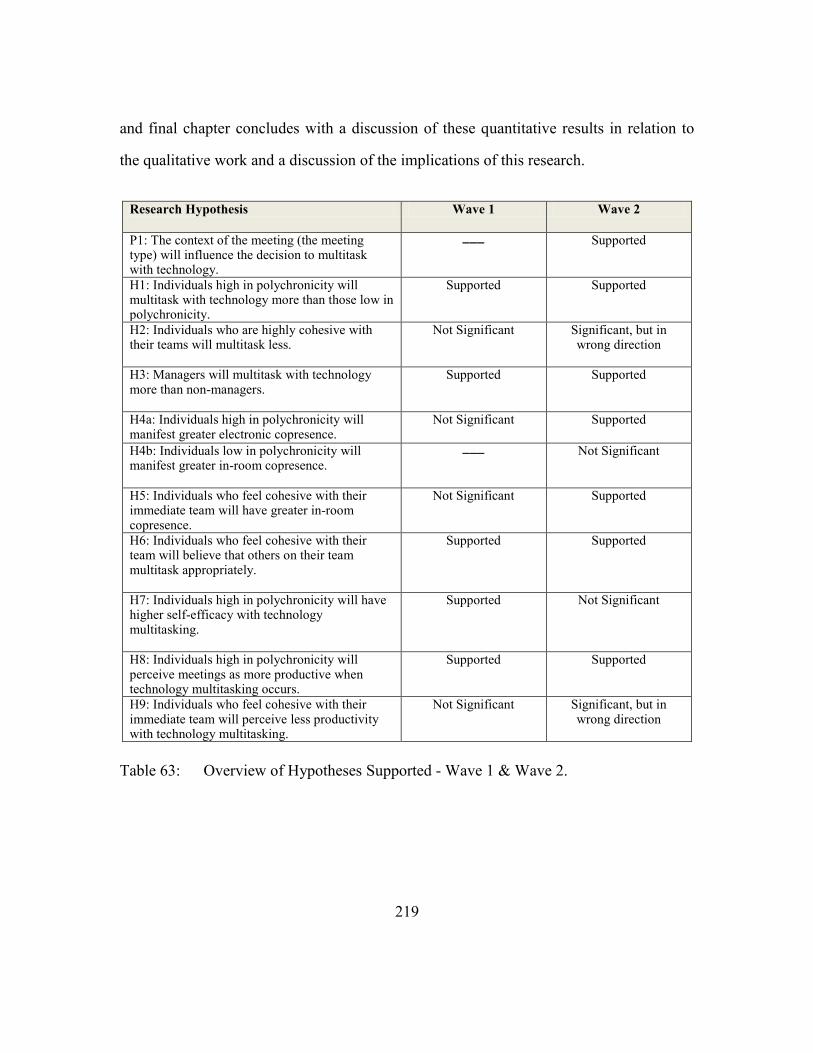
219
and final chapter concludes with a discussion of these quantitative results in relation to
the qualitative work and a discussion of the implications of this research.
Research Hypothesis Wave 1 Wave 2
P1: The context of the meeting (the meeting type) will influence the decision to multitask with technology.
Supported
H1: Individuals high in polychronicity will multitask with technology more than those low in polychronicity.
Supported Supported
H2: Individuals who are highly cohesive with their teams will multitask less.
Not Significant Significant, but in wrong direction
H3: Managers will multitask with technology more than non-managers.
Supported Supported
H4a: Individuals high in polychronicity will manifest greater electronic copresence.
Not Significant Supported
H4b: Individuals low in polychronicity will manifest greater in-room copresence.
Not Significant
H5: Individuals who feel cohesive with their immediate team will have greater in-room copresence.
Not Significant Supported
H6: Individuals who feel cohesive with their team will believe that others on their team multitask appropriately.
Supported Supported
H7: Individuals high in polychronicity will have higher self-efficacy with technology multitasking.
Supported Not Significant
H8: Individuals high in polychronicity will perceive meetings as more productive when technology multitasking occurs.
Supported Supported
H9: Individuals who feel cohesive with their immediate team will perceive less productivity with technology multitasking.
Not Significant Significant, but in wrong direction
Table 63: Overview of Hypotheses Supported - Wave 1 & Wave 2.

220
CHAPTER 6: DISCUSSION AND CONCLUSION
This chapter concludes the dissertation with a discussion of the contributions and
limitations of this research. The implications of the work are presented in terms of
theoretical placement, extending related research, and practical managerial application.
The limits of this research are identified and recommendations for future work are
proposed along with final concluding thoughts.
RESEARCH SUMMARY
This dissertation seeks to understand meeting settings where information workers
engage simultaneously in both face-to-face group activities and other work tasks
performed on laptops. This layering of multiple work activities incorporating the physical
engagement of meeting in combination with computer-based virtual tasks was termed
mixed reality. This mode of work is relatively understudied by researchers examining
technology use in meetings as outlined in Table 64 below; for a review of the studies
cited refer to the literature review in Chapter 2.
Prior Research on
Technology Use in Meetings Contrasting Mixed Reality
Meetings Research
All group members use the same technology (Baecker, 1995; Stefik et al., 1988)
Not all group members use technology
Common/explicit purpose for how technology is supporting the meeting (Halonen et al., 1990)
No explicit rules for how and when technology use occurs in the meeting
Little or no emphasis on how others are impacted by someone’s technology use (Scott, 1999)
Focus on how both the individual user and others are impacted by technology use
Technology is studied as it supports and helps the meeting task (Scott, 1999)
Technology both supports and distracts from the meeting task
Table 64: Prior Studies of Technology Use vs. Mixed Reality Research.

221
The research presented here on mixed reality advances our knowledge by
specifically exploring how individuals managed work tasks that both competed and
supplemented each other in a group environment. The research findings were organized
by four themes which encompassed a broad view of mixed reality by including: (1) the
motivating individual and group factors for when and why people multitask with
technology in meetings, (2) the behavior of group members in mixed reality, (3) attitudes
toward technology multitasking, and (4) the perceived outcomes of this behavior on
perceived productivity and meeting satisfaction.
This research identified meeting context (defined by the type of meeting one
attended based on purpose) as one of two primary factors influencing people’s decision to
use laptops during meetings. Workplace meetings are not a single category of activity
that are the same across an individual’s job; each of the meeting types identified by the
participants had a set of behavioral norms associated with them. Essentially, participants
entered into a given meeting type (e.g. an internal project meeting) with an implicit
understanding of perceived appropriate meeting behavior; however when contextual
details of the meeting type changed, particularly who else was present and the topics
being covered, people deviated from these norms.
Three main meeting types are most common to information workers in this study:
staff meetings, internal project meetings, and external project meetings. Of these three
meeting types, internal project meetings were cited as being the type with the most
technology multitasking. Participants reported there was an acceptable work-related
reason to multitask during internal project meetings, but not with staff meetings (even if
the same individuals in attendance overlapped amongst these types.) The decision to
222
multitask based on meeting type was shaped by social expectations of acceptability and
familiarity though relevance of the meeting topic could also shift behavior.
Highly relevant meeting topics resulted in a decrease in technology multitasking,
and less relevant topics resulted in increased multitasking as participants sought to utilize
their time more efficiently. Research has demonstrated a link between task relevance and
motivation to learn (Frymier & Shulman, 1995) and goal setting theories have identified
that when people have multiple competing goals, more resources are allocated to the
difficult goal (Erez, Gopher, & Arzi, 1990). These findings connect to the mixed reality
qualitative results; participants described how when meeting discussions were highly
relevant to their job they were less likely to multitask because they needed to learn from
the group conversation. And, when Charles’s internal project meeting was observed
struggling with a complex decision task, multitasking immediately decreased as attendees
focused all of their attention on the meeting discussion.
Following meeting type, the second major factor determining technology use was
individual differences based on multitasking preference (polychronicity). In survey Wave
1 at SoftwareCorp, individual differences mattered at the extremes. People categorized as
―high‖ in polychronicity almost always used laptops during meetings, while people ―low‖
in polychronicity rarely, if ever, multitasked with technology. The survey questionnaire
specifically asked people if they typically multitasked with a laptop in meetings, and not
just if they brought a laptop with them to the meeting. However, those individuals who
scored in the middle range of polychronicity level were equally likely to be in either
category (of multitasking with a laptop or not). In terms of how comfortable and
proficient multitaskers felt about their ability to multitask during meetings, those in the
higher polychronicity range in Survey Wave 1 rated high in self-efficacy, but the same

223
result was not found in Wave 2. High polychronicity individuals also believed they were
more productive when they multitasked with a laptop during meetings, though it must be
emphasized that this is a subjective belief not supported by empirical data. However,
previous research (e.g. Leaman & Bordass, 2000) has found that perceived productivity
does correlate with actual measurable productivity (measurable work outputs).
Polychronicity predicts the likelihood that one multitasks in a meeting and it
positively correlates with perceptions of productivity. In both survey waves, a significant
correlation was found for polychronicity and perceived productivity: in Wave 1, rho =
.316 and in Wave 2, rho = .722. However, previous research studies on the relationship
between polychronicity and performance have found no correlation between the two
variables, such as Conte, Rizzuto, & Steiner’s (1999) analysis of polychronicity
orientation and student college performance (measured by GPA). Bluedorn & Denhardt
(1988), on the other hand, found polychronicity can enhance productivity under certain
conditions (such as time constraints).
While not a primary factor in the conceptual model, job role also influences who
is likely to multitask during meetings. People whose roles involve communicating with
multiple different groups of people were more likely to multitask in meetings than those
who do not. In this research, information workers who had a managerial role (daily
supervision of multiple employees) multitasked during meetings significantly more than
those in non-managerial positions. This finding suggests that using electronic
communication tools such as instant messaging and e-mail are more common than using
other work tools while multitasking. However, additional research is needed to identify
whether e-mail and instant messaging are used more frequently while multitasking

224
because of managers numerous communication needs or because these activities are
suited to mixed reality due to the lower level of attention required.
Turning to examine behavior in mixed reality, participants who multitasked on
non-meeting tasks stated that they tended to do so only in sections of the meeting they
judged to be less relevant to them. This means that people made a conscious effort to
focus on the meeting when they felt it was relevant, and then utilize laptops in the ―down
time‖ of the meeting. In their view, this was not true multitasking, but rather task
switching in short bursts depending on what participants felt needed their focus at the
moment.
In terms of attitudes toward group relationships when technology multitasking, it
was hypothesized that the closer bond one felt toward one’s team, the less likely one
would be to multitask. However, the opposite finding occurred: team members who rated
themselves as feeling highly cohesive with their teams were more likely to technology
multitask during meetings. In essence, the more familiar you are with the people in the
meeting, the more comfortable you are with technology multitasking in that setting.
Furthermore, teams that were highly cohesive were more likely to rate that others on their
team knew how to appropriately multitask. The less familiar you were with someone, the
more likely you were to cite them as being inappropriate multitaskers; non-familiars were
believed to be showing off or pretending they were busy when multitasking. This
suggests multitasking operates under a group protocol, whereby a certain level of trust
and familiarity within the group is required and at which point, its occurrence is
sanctioned.
In studying the impact of technology multitasking on meeting outcomes, high
polychronicity individuals believe they are more productive during meetings. This is a
225
subjective belief about productivity and future research should address actual measurable
gains. In this research the measure of meeting satisfaction was conflated with perceived
productivity and hence it is not possible to ascertain whether people are happier in
meetings due to multitasking. Some of the interview data suggests that there are non-
multitaskers who find it extremely rude and distracting when others multitask during
meetings, however this finding was limited to two of the eight interview participants.
Do the outcomes from mixed reality meetings suffer as a result of task-switching
that occurs from technology multitasking? While interview participants discussed how
occasionally they missed hearing a piece of information in a meeting because they were
distracted, overall they perceived that the goals of the meeting were not adversely
impacted due to technology multitasking. Since the information relayed in meetings has
redundancy checks through multiple members and meeting leaders sending out follow-
ups afterwards, actual work outcomes do not seem to be negatively impacted by
distracted workers. In one meeting instance observed at SoftwareCorp, where critical
decision making was occurring, all multitasking stopped of people’s own accord.
Information workers seem to self-regulate their behavior when recognizing critical
meeting discussions. However, future work may want to consider how decision making
and groupthink are impacted when members do not realize that critical discussions are
occurring while they are task-switching. In the next section, a placement of the research
findings in relation to psychological studies of multitasking and computer-supported
cooperative work is presented.
RELATIONSHIP TO OTHER RESEARCH
There are two main bodies of research that relate to the findings presented in this
dissertation: psychological studies on the cognitive impacts of multitasking and research
226
in the area of computer-supported cooperative work (CSCW). This section discusses the
dissertation results in context of these related works by examining how this research
builds upon and differs from these works, specifically addressing these questions:
1. How do psychological studies of multitasking compare to the findings in this
research?
2. How are the constructs of cohesion and copresence different in mixed reality compared to prior work in CSCW?
Individual Differences in Multitasking Ability
This section discusses how individual differences toward technology multitasking
impact performance outcomes. Recalling the research findings, polychronicity proved to
be a significant construct in predicting the likelihood that one multitasked during
meetings, and based on the qualitative findings it further indicated the likelihood that one
would multitask on tasks unrelated to the meeting. Furthermore, individuals high in
polychronicity perceived themselves as being proficient at multitasking and as being
more productive in meetings. Studies which address the impact of multitasking on overall
cognitive functioning are presented first, followed by an examination of how individual
differences influence performance outcomes when multitasking.
Psychological research has examined cognitive functioning in relation to
fragmented tasks and reported negative outcomes for neurological functioning.
Experimental research on task-switching by Rubinstein, Meyer, & Evans (2001) found
that individuals are not only slower at switching between challenging tasks, but that it is
also fatiguing and stressful to the brain. Foerde, Knowlton, & Poldrack (2006) discovered
that learning is more difficult when multitasking because different parts of the brain are
used that hinder information storage and retrieval. The hippocampus of the brain is used

227
for storing and processing declarative memories, which are memories created from
factual information. The striatum, on the other hand, stores and processes procedural
memories such as how to ride a bike or play a familiar song on the piano. Information in
the striatum is task and context specific, whereas information in the hippocampus is
generalizable for multiple contexts. When individuals try to learn while multitasking,
only the striatum is activated and the learned information becomes linked to the specific
context and is less valuable outside of these contexts.
While the research just discussed focuses on multitasking in general, are there
classes of individuals who are more proficient at multitasking and if so, are they able to
overcome the pitfalls associated with multitasking? Research on multitasking and its
impact on cognitive ability by Ophir et al. (2009) found that people who were categorized
as ―heavy media multitaskers‖ had decreased task-switching ability than individuals who
were ―light media multitaskers‖. Media multitasker level was defined by the mean
number of media an individual consumes. This study tested participants’ cognitive
performance with experimental tasks using a computer simulation (example tasks
included identifying whether a rectangle shape had changed in orientation). High media
multitaskers were less able to ignore distracting information presented in the computer
simulation which the researchers concluded meant that HMMs were more likely to allow
irrelevant information into working memory. Therefore, Ophir et al. deduced that LMMs
were better able to ignore distracting information. However, these differences may also
be attributable to underlying cognitive styles which are merely reflected in media
consumption habits.
Research from Zhang, Goonetilleke, Plocher, & Liang (2005) further
demonstrates the contradictions toward analyzing performance based on individual

228
differences. Zhang et al. tested groups of polychronic and monochronic-oriented
individuals on visual search and math calculation tasks and found that there were no
differences between the two groups when the task pacing was controlled by the
participant. However, when a timed trial was introduced, polychronic individuals
demonstrated increased accuracy. The implication of this finding is that it appears under
certain conditions (perhaps based on task difficulty or heightened stress) that polychronic
individuals can perform better.
Overall, the psychological research on multitasking as it relates to individual
performance finds that multitasking decreases cognitive performance. However, when
studies categorized individuals based on their preference for multitasking, conflicting
results are found for performance outcomes. Ophir et al.’s work suggests that polychronic
individuals (labeled as high media multitaskers) have a difficult time ignoring distracting
information which leads to decreased performance. Zhang et al., on the other hand, find
that polychronic individuals have heightened functioning under time constraints and can
outperform those lower in polychronicity.
One issue with comparing psychological research on multitasking to this research
on mixed reality is that the task types do not compare directly. In the psychological
studies, participants perform two tasks that are unnatural to most information work
(example tasks include multiple sets of math calculations and visualizing abstract shape
transformations). In mixed reality, the cognitive capacity needed to listen to meeting
attendees while browsing e-mail does not require the same level of concentration nor
does it occur with the same time pressure or skill set. However, despite the task type
differences, this research extends the psychological experiments by identifying additional
variables and situational constraints for future research. This research can inform the

229
work of psychological researchers with recommendations to include the following:
How well do individuals perform listening tasks while browsing/scanning electronic information? Are certain classes of individuals, such as those high in polychronicity, more adept during this form of multitasking?
How long can individuals actively participate in a conversation while browsing/scanning electronic information before a decline in performance or attention?
What are the cognitive differences between participating in dyadic conversations while multitasking compared to participation in small group conversations (3 to 8 individuals)?
How much attention do bystanders give to the behavior of those who are multitasking? To what extent is the bystander’s performance impacted when others are multitasking?
While the current psychological studies that assess multitasking have identified
performance losses through increased stress, increased task time and deficient memory
storage, it is not possible to conclude at this time that these same outcomes occur in
mixed reality.
Cohesion and Copresence in Mixed Reality and CSCW
The underlying tenet of computer-supported cooperative work (CSCW) research
is that technology is an enhancement to group work (Greif, 1988). While CSCW focuses
on evaluating and analyzing groups and technology there remains a lack of consistency
amongst these studies. Contradictory findings exist in regards to group satisfaction,
meeting efficiency, team effectiveness, and whether decision-making is improved when
technologies are used by groups (Scott, 1999). This variety in the findings points to the
importance of context variables such as characteristics of team members, the type of
technology being used, and the nature of the task itself when discussing the results. The

230
purpose of this section is to compare the mixed reality research constructs of cohesion
beliefs and copresence management to the relevant bodies of work from CSCW
researchers.
Cohesion Beliefs
Cohesion beliefs were found to be a positive indicator with likelihood to multitask
and how comfortable one felt multitasking in front of others. The reason for this finding
is that highly cohesive groups already have established rapport with each other through
informal interactions and a shared history in their workplace. Familiarity with coworkers
allowed users to perceive multitasking as acceptable, because those who technology
multitasked had opportunities to demonstrate commitment and engagement with the
group task outside of the meeting context.
Groups that are cohesive demonstrate coordinated patterns of behavior and focus
more attention on each other (Thompson, 2002). However, in mixed reality settings,
technology multitasking diminished the similarity of behavior amongst group members
and the amount of visual attention between members. The observations at SoftwareCorp
and interview data found that for any small group meeting (ranging from 4 to 12 people),
only about half of the meeting attendees technology multitasked. And, in the minute-by-
minute breakdown of multitasking by Sam and his Director described in Chapter 4, the
majority of their time spent in the meeting was looking at the laptop; though both were
extremely committed to the goals of the group and the meeting at-hand.
This conflict in the findings suggests that group cohesion in face-to-face meetings
must be assessed beyond physical patterns of coordination and gaze. Physical behaviors
of group members have changed due to technology multitasking, and therefore cohesion

231
measured solely on meeting interactions will give a limited and inaccurate view in future
research.
Copresence Management
The behavior of individuals in mixed reality meetings consisted primarily of task
switching between using a laptop momentarily to check e-mail or answer instant
messages and attending to the meeting discussion. To a lesser extent, some individuals
were observed being fully disengaged from mixed reality meetings by immersing
themselves with technology for extended periods of time, however this was not typical.
Overall, participants who multitasked made attempts to demonstrate that they were still
involved with the meeting by participating out loud and looking up from their laptop
computers after every momentary use of the laptop. Why did copresence management
persist, even when participants had additional work contexts in which to demonstrate
their engagement with their role and projects (as noted in the previous section on
cohesion beliefs)?
Mixed reality meetings engender diverse attitudes on the appropriateness of the
behavior because people have conflicting goals and expectations about meeting protocol.
One of the key components of face-to-face meetings is the ceremonial or symbolic
function that they serve. Meetings are not just held to exchange information between
multiple individuals; they also serve as a way for people to demonstrate commitment to
the project and help build rapport amongst group members through small talk and
informal chatter (Jay, 1976; Nardi & Whittaker, 2002). Participant 8, a manager of web
services for a large bank, explained meetings were very important in her organization
because they served to harness everyone into committing to a course of action.

232
This tacit understanding of the social purpose of meetings means that in typical
bouts of multitasking, people felt compelled to show that they were engaged with the
group task. No participants believed it was appropriate to attend a meeting and not
participate (even if you were diligently listening the whole time). A tension between the
social needs of the group occurs with the informational needs of the user resulting in
people purposefully participating. Copresence management serves to facilitate increased
information exchange amongst group members and a common sharing of experience.
However, for those who multitask during meeting, electronic copresence management
also occurred throughout meetings as users felt obliged to respond to electronic
messages.
Turkle (2008) identifies the concept of a ―tethered self‖ – where one’s multiple
roles (professional information worker, mother/father, friend, mentor, and so on) are
available to everyone through the portable devices that are carried by most people. These
electronic connections can overshadow the needs of those physically present because of
the sense of urgency people attribute to electronic communication. The outcome of this
tethered self is that people can reach validation and have a ―back up‖ support system in
place at all times (and conversely these individuals must support incoming requests from
other tethered selves). For information workers, this means that electronic messages are
noticed and attended to more so than the topics being addressed in the physical realm.
Even in the early 1990s this pattern of favoring electronic communication over
verbal communication occurred. As exhibited in Markus’s (1994) work about the
unintended consequences of e-mail use, even when e-mail was not purposefully being
used in ―bad‖ ways (people were not trying to sabotage or avoid work tasks), e-mail
intruded on and impacted other forms of work communication. In the context of
233
Markus’s study, e-mail was intended to be used in the workplace to minimize phone
interruptions. However, if e-mails did not receive an immediate response, the sender
would then follow-up their request with a phone call, which negated the intended purpose
for e-mail. To avoid the follow-up phone call, people felt compelled to respond to e-mails
immediately, which in turn caused people to favor answering e-mails even over face-to-
face conversations.
As portable technologies continue to proliferate in face-to-face settings, it will
become even more relevant to assess the frequency and extent to which electronic
copresence occurs. This research has contributed to the field of CSCW by creating a
validated copresence management scale that measures both copresence with those
physically present and electronic copresence. As outlined in the literature review, the
copresence construct is primarily attributed to sociologist Erving Goffman (1959). It has
since been used in current technology-focused research as a measure of how individuals
in virtual reality environments perceive the ―salience of others in mediated
communication and consequent salience of their interpersonal interaction‖ (Short,
Williams, & Christie, 1976).
To date, there exist few scales that have made an attempt to measure the
frequency with which individual behavior contributes to the level of copresence. Previous
work, particularly Nowak & Biocca (2003), have measured copresence but not at the
behavioral level. Rather, the Nowak & Biocca scale measures impressions of how close
or distant a communication partner feels with the person they are interacting with.

234
Example questions from their scale include the following Likert-scale items:
I was interested in talking to my interaction partner.
My interaction partner acted bored by our conversation.
My interaction partner communicated coldness rather than warmth.
I wanted to maintain a sense of distance between us.
The questions used in this research, on the other hand, are not based on
impressions between communication partners as a representation of copresence, but
rather focus on the behavioral mechanisms by which this copresence is created or
maintained. The copresence scale developed here measures individual behaviors with
those who are present and also with virtual communication partners (see Table 65 below).
The Cronbach’s alpha value for in-room copresence was .840 and the value for electronic
copresence was .814.
Copresence Management Questions
Please rate your agreement level with the following statements when multitasking with a laptop during meeting: In-Room Copresence Q5a. I try and make occasional eye contact with whoever is speaking. Q5b. I make a point to participate in the meeting discussion. Q5c. I nod my head slightly when I hear something that I agree with. Q5d. I lower or close my laptop screen when I'm done multitasking. Electronic Copresence Q6a. I notice all new incoming e-mail messages when in a meeting. Q6b. I write and respond to e-mail messages during a meeting. Q6c. I send instant messages to other people in the meeting who have laptops. Q6d. I send instant messages to work colleagues who are not in the meeting. Q6e. I won't initiate instant message conversations, but I will reply to incoming IMs. Q6f. I find it essential to be online throughout the meeting so that I can communicate with others who are not in the room.
Table 65: In-room & Electronic Copresence Scale Items.
235
The copresence scale developed here is intended to be useful for any research that
wants to address communication availability in competing channels. The questions can be
modified to reflect new technologies or behaviors as it suits the context of the study.
However, it is important to note that one of the significant limitations of any subjective
measurement is the self-report bias. Use of this copresence scale should be supplemented
with observations and/or interview data to support research findings.
CONCEPTUAL MODEL & RELATIONSHIP TO THEORY
The conceptual model for mixed reality derives from the literature reviewed in
Chapter 2 and the results of the qualitative pilot research described in Chapter 3. This
model was based on an input-process-output (IPO) framework, where individual and
group factors were the inputs influencing mixed reality, process factors were technology
multitasking and copresence management, and the outputs were perceived productivity
and meeting satisfaction. The IPO model follows a cognitive perspective: people and
technology are analyzed as equal parts of an information processing system. Inputs and
outputs of information are exchanged between the two as the individual works to perform
a specific task with the technological artifact. While the IPO model is well-suited for an
individual-level view of mixed reality, it does not model the larger contextual features
that influence behavior as offered by social constructionist perspectives.
This difference between the IPO model of mixed reality and a constructionist
view is reflected in the qualitative and quantitative portions of this dissertation. In
Chapter 4, the qualitative discussion presented an ethnographic decision-tree that
modeled the multiple contextual details that individuals thought about before deciding to
multitask with technology in a meeting (see Figure 10, p. 136). The IPO framework
(reflected in Chapter 5, the quantitative survey results), on the other hand, reduced the

236
likelihood to multitask based on meeting type, polychronicity, and cohesion beliefs. The
importance of the social constructionist view is that it provides explanatory power for the
behaviors of interest. There exist three main constructionist perspectives which inform a
deeper analysis of mixed reality: genre systems, adaptive structuration theory, and
situated action. In particular, an analysis of the research findings using the constructionist
frameworks elicits responses to the following major questions surrounding this research
and not explicitly addressed previously:
1. Are the behaviors and impacts of mixed reality actually different from its
analog equivalents (any other face-to-face meeting where people multitask with non-technology artifacts)?
2. Why does technology multitasking persist as a behavior despite the recognition by workers that it can result in information processing losses and on occasion be perceived as rude?
Table 66 is a brief overview of the three theoretical lenses that will be used to
respond to these questions.
Constructionist View
Overview of Theoretical Framework Application to Mixed Reality Theory
Genre Systems in Organizational Communication (Yates, Orlikowski, & Rennecker, 1997)
Genres are a socially recognized communication form (e.g. a meeting, memo, resume) which have common characteristics for who, how, when and why they are used. Multiple genres are used together to form a genre system of communication which either (1) reinforces the common way of using the genre, or (2) changes the nature of the genre. If these changes to a genre become adopted by others, this turns into a genre variant or may be a new genre.
The traditional face-to-face meeting genre is changed by technology multitasking. A new genre variant emerges with mixed reality—communication is structured differently in mixed reality meetings compared to traditional meetings with analog multitasking.

237
Adaptive Structuration Theory (DeSanctis & Poole, 1994; Poole & DeSanctis, 1990)
Technology use occurs within a set of structures, primarily the group structure of norms and the technological structure of the system being used (its features). The maintenance of these social structures are reproduced by individual actions. AST is an analytical lens for identifying how individual technology use is an emergent behavior which is then linked to understanding group decision outcomes.
Mixed reality meetings allow individuals to transform parts of the meeting task into an electronic communication maintenance task. A subset of meeting attendees will always perceive technology multitasking as detraction to the face-to-face meeting. Some organizations try to control technology multitasking, but individuals persist in the behavior creating a new norm of acceptability.
Situated Action (Suchman, 1987)
Situated action analyzes user behavior through the emergent moment-by-moment actions of users during a particular activity. There is minimal intentionality in situated action, what happens is always developing ad hoc out of the situation. Structure (norms/rules) emerges after action, and is not pre-determined.
Individuals do not pre-plan how they technology multitask in meetings. Based on the segment of the meeting currently occurring (and adjusting for etiquette), individuals technology multitask.
Table 66: Constructionist Frameworks and Mixed Reality.
Mixed Reality Behavior vs. General Meeting Multitasking
Are the research findings about behavior in mixed reality meetings attributable to
technology multitasking, or is it conceivable that the same results would be observed with
any form of meeting multitasking? To respond to this question, genre systems are used as
an analytical lens to distinguish mixed reality as a unique context with behaviors and
outcomes not replicable with analog multitasking.

238
Genres are an analytical lens used to understand how socially recognized
communication forms (e.g. resumes, meetings, memos, e-mail) organize, structure, and
shape communication interactions (Yates, Orlikowski, & Rennecker, 1997). Multiple
genres interact to create a genre system from which social patterns emerge. For example,
the meeting genre is associated with the agenda genre: meeting attendees have an
expectation that an agenda will be provided by the meeting leader which will outline the
specific topics to be discussed. The agenda informs everyone about the format and topics
of the meeting and serves as the structure for shaping who will speak when and on what
subject matter. Communication amongst a team tends to organize itself into normative
modes that are often implicit and habitual (Yates & Orlikowski, 2002).
This distinction between the mixed reality genre and a face-to-face meeting with
other forms of multitasking as a genre can be identified first by organizational-level
attempts to control technology multitasking. At SoftwareCorp, there were two instances
discussed by Charles where top-level executives asked people to follow a company-wide
ban against laptop use during meetings. The executives characterized laptop multitasking
as a distraction in face-to-face meetings. Based on Charles’s memories, there had been no
similar bans against technology use in the workplace previously.
Prior to the proliferation of technology multitasking, managerial articles from the
Harvard Business Review (Jay, 1976 and Mankins, 2004) identified two main problems
with meetings: that there are too many unnecessary meetings and that meeting
communication is unfocused and/or imbalanced (e.g. contributions went on for too long
and issues of over- and under- participation of team members). An extensive reading of
popular business literature and academic research on meetings found no evidence that the
analog equivalents of being distracted or multitasking in meetings (such as doodling,

239
looking at other documents, passing notes) resulted in a significant negative impact that
would necessitate organizations issuing edicts banning the behavior. Furthermore, while
problematic group members were mentioned in the literature, it was always framed as an
issue with the specific member and not the behavior. An examination of the research on
counterproductive work behaviors (e.g. Robinson & Bennett, 1995 and Gruys & Sackett,
2003) focuses on modeling specific deviant behaviors by individuals (e.g. misuse of
company time for personal matters, property theft, co-worker aggression), but these
behaviors are all framed as uniformly undesirable. Mixed reality multitasking might be
considered a deviant behavior, but as was demonstrated in this research, it was often
beneficial to the organization (e.g. increased communication amongst workers via
electronic communication).
Jay’s 1976 article on how to run a good meeting identifies purposeful silence by
some group members as the only problematic behavior by meeting members; any other
issues with meetings are due to communication problems that stem from lack of
leadership within the meeting; not that individuals are engaging in distracting behaviors
themselves. However, attempts to control technology multitasking have met with limited
success; in all instances of this research where participants discussed that there had been
a ban, people on the whole preferred to technology multitask and the behavior became
the norm again.
240
Mixed reality meetings are further distinguished as a genre variant of traditional
face-to-face meetings because of the way it changes communication. The introduction of
technology multitasking into face-to-face meetings changes the communication structure
of the meeting in the following ways:
increased use of electronic communication as an additional channel
appropriation of non-relevant meeting segments for completing other tasks
increased access to electronic information to support the meeting task
Traditional meetings with analog multitasking only meet the second criterion –
appropriation of meeting time for completing other tasks. While people can create non-
electronic backchannels (whispering, paper notes, non-verbal gestures), these channels
cannot occur with the same level of privacy, speed, and information richness that
technology permits with e-mail and instant messaging. Furthermore, technology
multitasking allows the user to communicate with people and access information that are
not immediately available in the meeting space, which is not possible with the analog
equivalents (e.g. physical papers/artifacts which are outside the meeting space and people
who are not online).
Using genre systems as a lens for analyzing communicative practices provides an
organizing structure for understanding behavior by examining the why, how, with whom,
temporal, and spatial aspects of communication. Mixed reality meetings are distinct from
traditional face-to-face meetings as explained by organizational attempts to control the
behavior, and the additional access to information and communication that occurs both
within and beyond the confines of the meeting space.

241
The Current Nature of Information Work
The hyperbolic term ―info-mania‖ has been used in the media (e.g. BBC News
Online, 1995 and Seattle Post-Intelligencer, 1997) to describe people’s inability to resist
constantly checking e-mail or being online. While some of the participants in this
research mentioned feeling a compulsion to be online often, most participants described
the state of their work as requiring constant attention to e-mail and instant messaging
because of the sheer volume of communication that arrived each day. This section
discusses how organizational and group factors influence technology multitasking
behaviors.
Adaptive structuration theory (AST) posits that technology use can be analyzed as
it occurs within a set of organizational and group structures (DeSanctis, Poole, &
Dickson, 2000). The AST framework is based on three main variables: structure, task,
and interaction frequency, which impact how technologies are used within a group.
Technology’s impact on group work is not determined by the technology itself, it must be
assessed in combination with characteristics of the team and how the team actually uses
the tool. The impact of technology will vary across groups and technology use is a part of
the social interaction process of a group. These three variables are discussed in relation to
the research findings on how information workers perceive and enact technology
multitasking.
Structure at the Organizational Level: There were no organizational norms that
explicitly encouraged technology multitasking based on the research data collected. In
fact, as was discussed in the previous section, technology multitasking was explicitly
discouraged when high-level executives asked employees to not multitask during
meetings. In 1995, the global technology company, Hewlett-Packard, published a white

242
paper titled ―HP’s Guide to Avoiding Info-Mania‖ which encouraged employees to use e-
mail more thoughtfully (e.g. only send an e-mail if it is really necessary, being more
specific with e-mail subject lines). The organizational structure presents itself as
opposing mixed reality, yet there exists a mismatch between the expectations of how
information workers are expected to perform their work and bans on technology
multitasking. Essentially, a contradictory message occurs when upper management bans
technology multitasking, yet simultaneously there is an unspoken expectation that
employees need to be available to each other electronically for communication and
collaboration. The outcome of this contradiction is that structure at the group level
overrides organizational structure.
Structure at the Group Level: At the group level, this research found that each
individual understood a set of implicit norms for what was acceptable technology
multitasking in a given meeting type. These individual beliefs about appropriate behavior
in meetings were based on expectations of what the group considered appropriate based
on who else was present and how typical it was to witness multitasking amongst the
group. Greater familiarity with meeting members led to increased multitasking, but only
when there was a plausible work-related reason to use a laptop for a given meeting
(which is why no multitasking was reported in staff meetings, though team members
were highly familiar in that setting).
One of the reasons why technology multitasking persists as a valued behavior is
because of a general societal encouragement that skilled use of information technology
equates to increased success in society (DiMaggio & Bonikowski, 2008). Bertrand &
Mullainathan (2004) found a significant relationship between receiving a phone call from
a potential employer and having an e-mail address on a resume. Employers called

243
prospective job applicants more often when an e-mail address was present compared to
similarly qualified resumes without e-mail addresses. While this finding is interesting as
a reflection of the value placed on being Internet-savvy, we would expect this finding to
become obsolete as e-mail addresses become common across all applicants as this
convention diffuses across society. However, the perceived gains from being an Internet
user through increased social capital and information and networking opportunities
persists. The interview participants in this research discussed how being observed
multitasking was perceived positively because it meant that others knew you were valued
and needed within the workplace.
Task & Interaction Frequency: Task relevance played a key role in determining
the frequency and intensity of technology multitasking. Individuals who perceived that a
meeting segment was less relevant would utilize this time period to browse e-mails or
answer instant messages. While it is an individual choice to multitask or not, there is a
tension that persists between the individual balancing how they want to be perceived by
others in the group when multitasking, organizational expectations for communication
availability, and the individual’s desire to utilize time spent in meetings most effectively.
As a counterpoint toward the structurational view which emphasizes that pre-
determined structures (e.g. the features of the group) influence technology use, situated
action, on the other hand, views technology use as emergent. With situated action,
technology use occurs in the moment and is not pre-planned by the user. While structure
can be analyzed in situated action, structure emerges from action and does not exist
before.
There exists a ―chicken or the egg‖ debate when analyzing mixed reality using
AST and situated action. Do the structures of the organization and group influence

244
technology use, or is it individual behaviors which create the norm for groups and
organizations? This research found that typically people did not have a specific plan for
when they used their laptop during a meeting, which gives credence to the emergent
nature of technology use (situated action). However, structures about proper group
etiquette and organizational norms certainly influenced how people decided to use
technology. For example, before going in an internal project meeting with Sam at
SoftwareCorp, he specifically told the researcher that he would limit his multitasking
because his boss would be present in the meeting. While information workers do not pre-
plan the specific moment they will use technology in a meeting and for what specific
tasks, individuals do take into account organizational and group norms when deciding to
multitask.
Summary of Theoretical Perspective of Mixed Reality
This section discussed the results of this dissertation in relation to the social
constructionist perspectives of genre systems, adaptive structuration theory, and situated
action. The analytical viewpoints of these frameworks were used to respond to two
fundamental issues about mixed reality: 1) why it differs from traditional multitasking in
meetings and 2) how the culture of information work contributes to mixed reality
meetings.
First, the lens of genre systems of organizational communication was used to
demonstrate how the changing structure of communication in mixed reality makes it
wholly different than these same multitasking behaviors with analog equivalents. Second,
adaptive structuration was used to show that norms for technology multitasking are
enacted by individuals within the context of the team that they work in. And, situated

245
action was discussed as a counter-theory to the structurational view to show how
technology use is often emergent in a given moment, and not a pre-planned set of tasks.
MANAGERIAL CONTRIBUTION
This section provides a set of guidelines for multitasking with technology in
meetings. These guidelines are intended to help managers and meeting leaders understand
how to improve and structure mixed reality meetings. The recommendations are based on
the research findings from this dissertation, with additional triangulation of research on
meeting behaviors from Curtis, Hefley, & Miller (2009), Francisco (2007); McFadzen,
Somersall, & Coker (1999); Nixon & Littlepage (1992), and Presley & Keen (1975).
Only invite the most relevant people to the meeting
Inappropriate laptop multitasking mainly occurs when someone feels trapped in a
meeting where only a small portion or topic is perceived as relevant. If you anticipate
needing someone’s input on only one of the meeting topics, find out prior to the meeting
that person’s position and communicate this information as needed to others in the
meeting.
Do not place a complete ban on laptop multitasking in meetings
While it’s tempting to place a moratorium on laptop multitasking during
meetings, doing so is not effective over time as employees are used to accessing
technology continuously throughout the work day. Employees spend a majority of their
day without ever being told when they should or should not check their e-mail.
Employees want to feel trusted that they are responsible enough to organize their work
and complete tasks in the way they best see fit. If someone’s multitasking is causing a
problem for the team, it should be addressed on an individual basis and not by banning
the behavior completely.
246
Do ban or limit laptop multitasking when meeting with external clients
In project teams where everyone already knows each other, few people find it
rude when other team members multitask with laptops. However, when meeting with an
external client, laptop multitasking can be offensive in these contexts. The client may
have a completely different organizational culture and norm toward multitasking and you
do not want to leave a bad impression. If you need a laptop in these meetings for taking
notes or looking up information, explain why you’ll be using your laptop.
Do not be offended if people are multitasking throughout your meeting
In most cases, people are not purposefully trying to be rude when they multitask
during a meeting. Employees are juggling multiple projects and responsibilities, and
multitasking is just one of the strategies used to keep up with the information-intensive
work environment. Cover the most important agenda items first in the meeting when
people’s attention capacity is at their maximum.
Make meetings shorter, more productive
The longer a meeting spans in time, the more likely people begin to lose focus or
want to multitask in order to keep up with other work. Set an expected time length for
each of the meeting agenda items that is as short as possible. This suggestion is not
intended to rush people through the meeting, but rather as a method to get people to focus
their concentration into a manageable amount of effort.
Utilize laptops as a second channel of communication (the backchannel)
Encourage task-oriented use of laptops during meetings by using them as a second
channel for communication, typically known as a backchannel. If your team meetings are
prone to over-participators (where the meeting discussion is dominated by 1 or 2 people),
suggest to your entire team that they all bring laptops to future meetings. Create an

247
instant messaging channel where everyone in the meeting can add to the verbal out-loud
discussion through typed comments on the IM channel.
LIMITATIONS
Research Boundaries
Any study of human behavior at work has limitations in both method and analysis
given the complex dynamics of groups and organizations. It is important to recognize the
following limitations in this research. One concern with this study is that it did not assess
individual participants longitudinally which means there is no data in which to infer if
technology multitasking behavior or attitudes change over extended periods of time.
Changes in job roles and responsibilities or personal preferences for technology
multitasking may occur, but it is not possible from this research to identify to what extent
people change this behavior and the motivating factors for these changes. While
individual changes with technology multitasking was not addressed over multiple years,
the overall research presented did span an extended length of time. Across the three-year
period in which the dissertation data was collected, participants showed similarity in
technology multitasking behaviors and attitudes. This consistency helps support the
research conclusions and provides sufficient evidence that this phenomenon exhibits
common tendencies across the lives of information workers though future work should
address individual-level changes over time.
A second limitation of this research is its focus on standard laptop computers as
the technology of interest for studying mixed reality. Laptops were selected as the central
technology because they were the most common tool that people used during meetings to
multitask (this information stems from the initial pilot interview data first collected on the
topic). With this narrow focus on laptop multitasking, however, it is possible that the

248
behaviors and attitudes addressed in this study do not similarly apply to other portable
technologies such as smartphones, tablet-style laptops, personal digital assistants, or any
other myriad of Internet-enabled mobile work tools that currently or in the future will
exist.
The size of a laptop, its screen position, and keyboard all lead to particular
affordances for how they can be used and perceptions of its use by people in meetings
(see e.g. Bannister & Remenyi, 2008 and Kern & Schiele, 2003). Laptops can obscure a
full view of an individual (because the upright screen blocks part of the body), or cause
individual users to utilize more table space if the laptop is placed toward one side of the
body. Participants were conscious that others could view their laptop screens during
meetings, and this in turn impacted which applications they would multitask with during
meetings. The sound of typing was also noticed by others in the meeting, which annoyed
some people in meetings who never multitasked with technology. These particular
characteristics of laptops in meetings may differ from how other technologies are
perceived; future research needs to address whether the differences in technology
affordances lead to significant behavioral and attitudinal outcomes in group
environments.
Another particular and potentially limiting lens of this research is the focus on
information workers, specifically those involved in software and web technology
companies. These jobs tended to have individuals who remained in the same
building/location all day and who all relied heavily on using computers to complete the
majority of their work tasks. There are other information-intensive jobs in industries such
as finance, healthcare, advertising/sales, and manufacturing, and it is unclear from this
research whether the behaviors and attitudes outlined here are consistent for these other

249
work environments. There is also a particular culture associated with technology
companies that may shape attitudes toward how it is used and this could differ across
different industries.
Methodological Limitations
Methodological limitations with this research include the small number of
participants in the case study data. When this research was initially conceived, four case
sites were proposed which would have provided more extensive opportunities to observe
real world meeting behaviors and perform cross-case analyses. There were difficulties
encountered by the researcher in recruiting organizations to participate and achieving
permission from the appropriate management channels, so only one case site was
obtained. However, this research made an attempt to balance the limited case study data
by interviewing eight additional participants who worked at companies all involved in a
similar industry (software and web site production). This interview data provided
additional real-world contextual background for mixed reality and comparison
information for the case study data.
Additional issues with the case study included limited access to participants at
SoftwareCorp. Ideally, after each meeting observed with Charles and Sam, the researcher
would have implemented a post-meeting questionnaire to each of the other attendees.
This questionnaire would have asked participants to describe how they multitasked
during the meeting, their observations of other people’s multitasking, and how satisfied
and productive they felt about the meeting outcomes. This additional data would have
provided a more complete picture of the dynamics within the group. Instead, since the
researcher was limited with her agreement at SoftwareCorp to study only Charles and
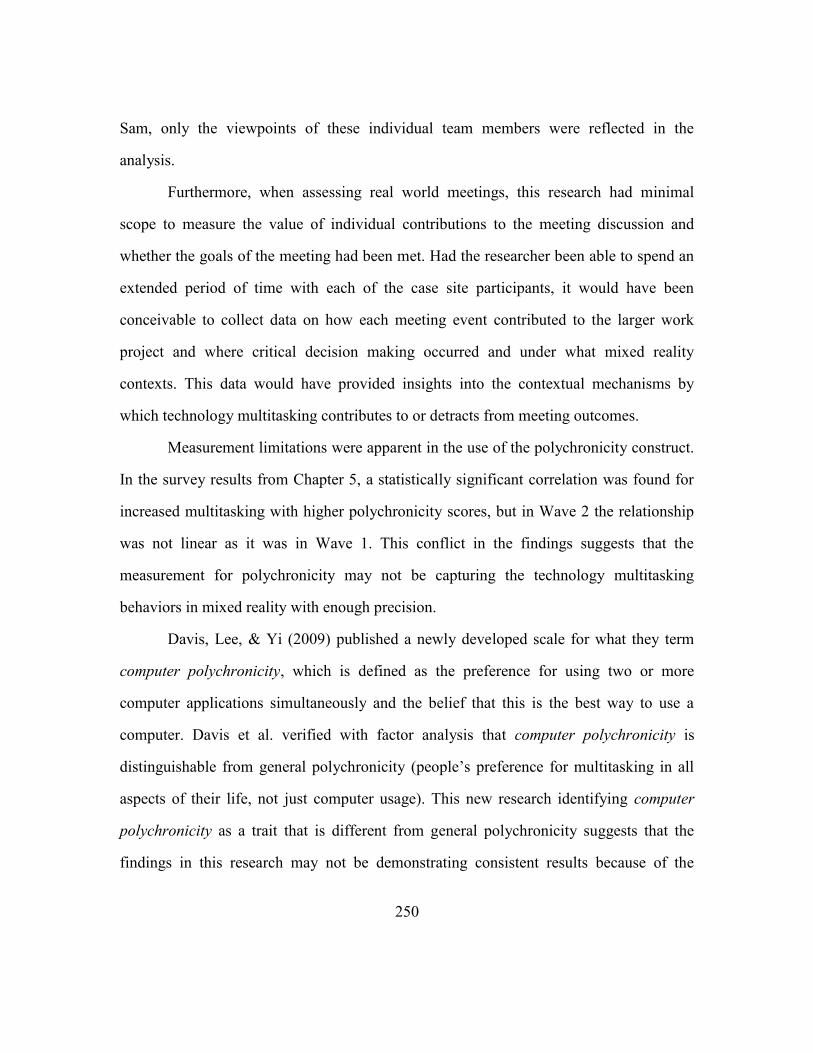
250
Sam, only the viewpoints of these individual team members were reflected in the
analysis.
Furthermore, when assessing real world meetings, this research had minimal
scope to measure the value of individual contributions to the meeting discussion and
whether the goals of the meeting had been met. Had the researcher been able to spend an
extended period of time with each of the case site participants, it would have been
conceivable to collect data on how each meeting event contributed to the larger work
project and where critical decision making occurred and under what mixed reality
contexts. This data would have provided insights into the contextual mechanisms by
which technology multitasking contributes to or detracts from meeting outcomes.
Measurement limitations were apparent in the use of the polychronicity construct.
In the survey results from Chapter 5, a statistically significant correlation was found for
increased multitasking with higher polychronicity scores, but in Wave 2 the relationship
was not linear as it was in Wave 1. This conflict in the findings suggests that the
measurement for polychronicity may not be capturing the technology multitasking
behaviors in mixed reality with enough precision.
Davis, Lee, & Yi (2009) published a newly developed scale for what they term
computer polychronicity, which is defined as the preference for using two or more
computer applications simultaneously and the belief that this is the best way to use a
computer. Davis et al. verified with factor analysis that computer polychronicity is
distinguishable from general polychronicity (people’s preference for multitasking in all
aspects of their life, not just computer usage). This new research identifying computer
polychronicity as a trait that is different from general polychronicity suggests that the
findings in this research may not be demonstrating consistent results because of the

251
reliance on a general polychronicity scale. It is conceivable that Davis et al.’s scale may
better assess people’s preference for technology multitasking, and therefore provide a
better starting point for assessing outcome variables in the future.
Future Research Ideas
The limitations addressed in this section provide ample opportunity for future
research ideas. First, in regards to examining information work longitudinally, research
that studies mixed reality meetings in relation to project lifecycles would be beneficial.
Do technology multitasking behaviors change depending on the stage of a work project
or is it a behavior that people exhibit consistently across time? This type of study would
provide a basis for addressing how stress, increased communication, and differing task
demands influence how workers maintain or change their multitasking behaviors.
For the limitation of focusing on laptop computer use only, there is still a need for
research that examines if specific technology tasks impact individual users and
bystanders more than others. For example, is instant messaging more disruptive to users
than e-mail because its communication exchanges generally occur more rapidly? Or,
perhaps e-mail is more detrimental while multitasking because it is typically associated
with longer and more formal communication structures which require increased cognitive
processing power.
How are bystanders to laptop multitasking impacted by these differences in tasks?
Are bystanders more prone to try and observe someone else’s behavior when it’s web
browsing instead of e-mail? To what extent do the noises or movements someone else
makes while technology multitasking impacting bystanders (e.g. the sounds of clicking,
or hand movements)? While the results from this research suggest that familiar team
members are not bothered from an etiquette standpoint by others who multitask within

252
their group, questions still remain whether other’s abilities or performance are impacted
in mixed reality settings.
Another possible study idea is a sociological examination that fully addresses the
conflicting norms and organizational structures surrounding technology multitasking as it
relates to issues of power. A sociological investigation of mixed reality would help elicit
a better understanding of why this phenomenon causes strife between individuals, groups,
and organizations. Also, action-oriented design research that implements a particular way
of technology multitasking into a work group and measures attitudes and outcome
changes would provide additional meaningful data about the impacts of mixed reality in
organizations.
BROADER IMPLICATIONS & CONCLUDING THOUGHTS
This research provides a contextually-grounded foundation for studies involving
group dynamics, technology multitasking, and social effects of technology use in human-
computer interaction and organizational behavior. One of the significant implications of
this research is its examination of how and why information workers place value on
electronic communication over face-to-face communication. As discussed earlier in this
chapter, information workers typically spend only a few minutes on each task before
switching to another. This continuous set of short-length activities may suggest changes
in not only the quality and depth of work produced by an individual, but also changes in
how groups work together.
Does the quality of work produced diminish as information work becomes
fragmented? Information workers spend the majority of their day using computing
technologies which are used not only as the tool to create and manage knowledge (e.g.
writing software code, creating presentations, editing documents), but also as the primary
253
tool to communicate and coordinate this work (e.g. e-mail, instant messaging, calendars).
When all facets of work are dependent on computing technologies, it can be challenging
to find a work space that is uninterrupted and provides opportunity for an information
worker to focus and immerse themselves into a complex task.
While the idea of information work being associated with information overload is
not a new concept (for a review of information overload research see Eppler & Mengis,
2004), what this research has attempted to distinguish and characterize is that the study of
information work cannot be confined to studying technologies without incorporating
other contextual features. Improvements in information work and management of work
tasks will come not only from enhancing technologies but must also be associated with
recognition of how interruptions and competing electronic and verbal communications
integrate and impact the state of work too. Future research must address how the quality
of work and the worker changes within this environment.
Furthermore, perceptions of productivity when multitasking may be harmful to
information workers. If individuals believe that they are skilled or talented at
multitasking, this may be detrimental because they do not have the foresight to modify
their own behavior because they believe they are successful at the act. As Dunning,
Johnson, Ehrlinger, & Kruger (2003) identified in their research on how people evaluate
their own skills, poor performers are unable to identify why they do not have the correct
answer (whereas high performers may not know the correct answer either, but they have
the meta-cognitive ability to recognize why they lack this knowledge.) If information
workers are not given insight into the impact of multitasking, they will not have the
capacity to judge how their use of technology affects work.
254
We live in a world that is engulfed by numerous information and communication
technologies that are intended to support our need to socialize, work and communicate
together. The impact of these technologies on our lives must be examined so that people
have insight on how to best utilize these tools. Our behaviors with technology require
reflection and assessment, and the results of this dissertation are a contribution to this
endeavor.

255
Appendices
APPENDIX A: INTERVIEW GUIDELINE FOR QUALITATIVE PHASE
Job Role 1. Tell me about the company you work for. 2. Tell me about your job.
a. How long have you held this role? b. How long have you been with the company? c. What did you do previously? d. How does your typical work day begin? e. What do you do first when you arrive to work?
3. Who do you work with? a. What is the reporting structure? b. Do you manage the work of others? c. What other teams do you interact with? How frequently? d. Who do you communicate with on a daily basis to accomplish work?
Work Projects
1. Tell me about the main projects you work on. a. What is your role within the project? b. How long does the project last? c. What are the typical tasks completed for the project? d. How do you organize your work tasks? e. Describe the layout of your desk area.
Technologies at Work
1. What types of technologies are provided to you at work? a. Describe your technological set-up. b. What software applications do you use most frequently? c. Does the company restrict the software you can use? d. Does the company restrict what web sites can be used?

256
Communication Patterns 1. How frequently do you check e-mail?
a. How do you organize your e-mail? b. How frequently do you search through older e-mails? Under what context?
2. How frequently do you receive instant messages? 3. How frequently do you send instant messages? 4. Why would you send an e-mail versus instant messaging (or vice versa)?
5. Tell me about the interruptions you have during your work day.
a. How frequently do people stop by your cube? 6. How frequently do you use your telephone at work?
Meetings
1. What are the typical meetings you have for work? a. For each of these meetings, how frequently do they occur? b. Who leads these meetings? c. Is there an agenda sent out in advance? d. How many people are in attendance?
2. Do you multitask during meetings? a. Do you use your laptop during meetings? b. Do you use your mobile phone during meetings? c. How many people in your project meetings also multitask?
3. Are there rules about multitasking during meetings? a. Who determines these rules? b. How do people learn these rules?
4. How do you feel about multitasking during meetings? a. Do you ever feel conscientious when doing so? b. Do you try and purposefully participate out loud when multitasking?
5. What do you do when technology multitasking? a. Are you answering emails? b. Are you answering instant messages? c. Are you working on other work projects? d. Are you taking meeting notes? e. Do you talk with other people in the meeting also on laptops?

257
APPENDIX B: PILOT QUESTIONNAIRE ITEMS
Pilot 1
Polychronicity Q16a. I prefer to do two or more activities at the same time Q16b. I typically do two or more activities at the same time. Q16c. Doing two or more activities at the same time is the most efficient way to use my time. Q16d. I am comfortable doing more than one activity at the same time. Q16e. I like to juggle two or more activities at the same time.
Technology Use Norms Q12a. The more people there are in the meeting, the less I use my laptop. Q12b. When my boss or supervisor is in the meeting, I use my laptop less. Q12c. When upper/senior management is in a meeting, I use my laptop less. Q12d. If no one else is using a laptop in the meeting, I won't use one either.
Cohesion Beliefs Q14a. It is important for me to be liked by other team members. Q14b. The project meetings I attend are generally disorganized. Q14c. I can trust my teammates to do their fair share of the work. Q14d. My participation in project meetings is critical to the team's success. Q14e. I prefer not to spend time with members in the group. Q14f. We can say anything in the meeting without having to worry.
Copresence Management Q13a. Before going into a meeting, I change my instant message status to let people know that I’m busy. Q13b. While using my laptop in a meeting, I make sure to nod my head a little to show that I am paying attention. Q13c. When using a laptop in a meeting, I purposefully try and participate in the meeting to show that I am paying attention. Q13d. I usually leave my laptop entirely open for the entire meeting.
Meeting Satisfaction Q15a. I am more satisfied in meetings when I can use my laptop. Q15c. It bothers me when other people in a meeting use laptops. Q15e. I am stressed out in meetings because of multitasking.
Perceived Productivity Q15b. Having a laptop in a meeting makes me more productive. Q15d. Meetings are less productive because people are distracted by technology.

258
Pilot 2
Polychronicity Q4a. I prefer to do two or more activities at the same time Q4b. I typically do two or more activities at the same time. Q4c. Doing two or more activities at the same time is the most efficient way to use my time. Q4d. I am comfortable doing more than one activity at the same time. Q4e. I like to juggle two or more activities at the same time.
Technology Use Norms Q7a. Everyone on my project team knows when it is appropriate to multitask with a laptop. Q7b. I wish my team had more explicit rules about how laptops should be used during meetings.
Cohesion Beliefs Q5a. Team members make an effort to participate in meeting discussions. Q5b. Team members share the workload evenly. Q5c. My team does not coordinate our meeting activities very well. Q5d. It is important for me to be liked by other members of the team. Q5e. Overall, I feel like I am an essential part of my team.
Copresence Management Q8c. I respond to incoming instant messages while in a meeting. Q8d. I use my laptop during meetings to maintain communication with others outside of the meeting. Q9a. I tend to use my laptop for non-meeting related tasks (e.g. checking e-mail / working on other projects).
Meeting Satisfaction Q10a. I am more satisfied in meetings when I can use my laptop. Q10b. I find it disruptive when other people use laptops in a meeting. Q10c. I feel self-conscious when I multitask with a laptop in a meeting.
Perceived Productivity Q10d. Having a laptop in a meeting leads me to be more efficient at my job. Q10e. Having a laptop in a meeting makes me more effective at my job. Q10f. Having a laptop in a meeting allows me to be more productive. Q10g. Having a laptop in a meeting allows me to produce better quality work.
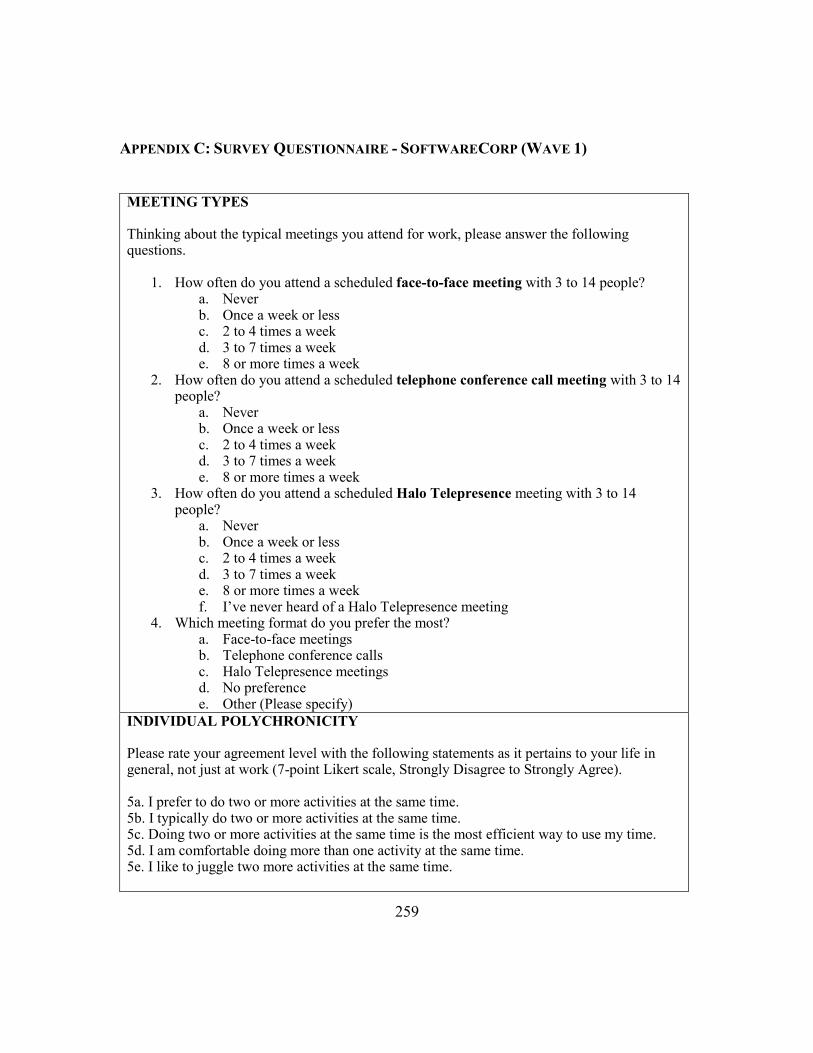
259
APPENDIX C: SURVEY QUESTIONNAIRE - SOFTWARECORP (WAVE 1)
MEETING TYPES Thinking about the typical meetings you attend for work, please answer the following questions.
1. How often do you attend a scheduled face-to-face meeting with 3 to 14 people? a. Never b. Once a week or less c. 2 to 4 times a week d. 3 to 7 times a week e. 8 or more times a week
2. How often do you attend a scheduled telephone conference call meeting with 3 to 14 people?
a. Never b. Once a week or less c. 2 to 4 times a week d. 3 to 7 times a week e. 8 or more times a week
3. How often do you attend a scheduled Halo Telepresence meeting with 3 to 14 people?
a. Never b. Once a week or less c. 2 to 4 times a week d. 3 to 7 times a week e. 8 or more times a week f. I’ve never heard of a Halo Telepresence meeting
4. Which meeting format do you prefer the most? a. Face-to-face meetings b. Telephone conference calls c. Halo Telepresence meetings d. No preference e. Other (Please specify)
INDIVIDUAL POLYCHRONICITY Please rate your agreement level with the following statements as it pertains to your life in general, not just at work (7-point Likert scale, Strongly Disagree to Strongly Agree). 5a. I prefer to do two or more activities at the same time. 5b. I typically do two or more activities at the same time. 5c. Doing two or more activities at the same time is the most efficient way to use my time. 5d. I am comfortable doing more than one activity at the same time. 5e. I like to juggle two more activities at the same time.

260
COHESION BELIEFS Thinking about the project meetings you spend the most time on right now, please rate your agreement level with the following statements (7-point Likert scale, Strongly Disagree to Strongly Agree). 6a. Team members make an effort to participate in meeting discussions. 6b. Team members share the workload evenly. 6c. My team does not coordinate our meeting activities very well. 6d. It is important for me to be liked by other members of the team. 6e. Overall, I feel like I am an essential part of my team. 7. Do you typically multitask with a laptop computer during project meetings? (Yes/No) 8a. Everyone on my project team knows when it is appropriate to multitask with a laptop. 8b. I wish my team had more explicit rules about how laptops should be used during meetings.
COPRESENCE MANAGEMENT Thinking about the project meetings you spend the most time on right now, please rate your agreement level with the following statements (7-point Likert scale, Strongly Disagree to Strongly Agree). 9a. If my boss or upper management is also in the meeting, I multitask on my laptop less. 9b. When using a laptop during meetings, I make a point to participate in the meeting to show that I am paying attention. 9c. I respond to incoming instant messages while in a meeting. 9d. I use my laptop during meetings to keep up communication with others outside of the meeting. 10a. I tend to use my laptop for non-meeting related tasks (e.g. checking e-mail / working on other projects). 10b. I tend to use my laptop for meeting related tasks (e.g. taking notes / looking up information relevant to the meeting). 10c. I only use my laptop during segments of the meeting that are less relevant to me. 10d. It is easy for me to follow the meeting discussion while simultaneously using my laptop.

261
MEETING SATISFACTION Thinking about the project meetings you spend the most time on right now, please rate your agreement level with the following statements (7-point Likert scale, Strongly Disagree to Strongly Agree). 11a. I am more satisfied in meetings when I can use my laptop. 11b. I find it disruptive when other people use laptops in a meeting. 11c. I feel self-conscious when I multitask with a laptop in a meeting. 11d. Having a laptop in a meeting leads me to be more efficient at my job. 11e. Having a laptop in a meeting makes me more effective at my job. 11f. Having a laptop in a meeting allows me to be more productive. 11g. Having a laptop in a meeting allows me to produce better quality work.
DEMOGRAPHICS 12. What is your employment status? (Full Time, Part Time, Other) 13. In which area is your job? (Accounting/Finance, Administrative, Development/Engineering, Human Resources, Legal, Marketing, Project Management, Quality Assurance, Sales, Other) 14. About how many years ago did you start work at SoftwareCorp? (2 years or less, 3 to 7 years, 8 to 15 years, 16 years or more) 15. About how many years ago did you start in your current position? (2 years or less, 3 to 7 years, 8 to 15 years, 16 years or more) 16. Do you supervise the work of other employees on a day-to-day basis? (Yes, No, Don’t Know) 17. If you have any additional thoughts or comments regarding technology multitasking at SoftwareCorp meetings, we would love to hear your opinions. (Optional, Open ended)

262
APPENDIX D: SURVEY QUESTIONNAIRE - ZOOMTECH PANEL (WAVE 2)
MEETING TYPES Thinking about the typical meetings you attend for work, please answer the following questions.
1. How often do you attend a scheduled face-to-face meeting with 3 to 14 people? a. Never b. Once a week or less c. 2 to 4 times a week d. 3 to 7 times a week e. 8 or more times a week
2. For the primary project you work on right now, where are the face-to-face meetings typically held? (Check all that apply)
a. Conference rooms at my company b. Conference rooms at another location of my company c. Conference rooms at a different company d. In public locations (e.g. coffee shops) e. On-site at the project’s location (e.g. construction site) f. Other _________________
3. Do you typically multitask with a laptop during meetings? a. Yes b. No
MEETING TYPE & COPRESENCE Please rate your frequency level with the following statements (7-point Likert scale, Never to Very Often).
4. How often do you multitask with a laptop computer during each of the following meeting types?
a. Staff Meeting b. Project Meeting with External Clients c. Project Meeting (Internal Only) d. Lecture/Demonstration Meeting e. Sales/Pitch Meeting f. Company ―All Hands‖ Meeting
5. Please rate how typical the following behaviors are for you when you're multitasking with your laptop in project meetings:
a. I try and make occasional eye contact with whomever is speaking. b. I make a point to participate in the meeting discussion. c. I nod my head slightly when I hear something that I agree with. d. I lower or close my laptop screen when I'm done multitasking.

263
ELECTRONIC COPRESENCE & TECHNOLOGY SELF-EFFICACY Please rate your agreement level with the following statements (7-point Likert scale, Strongly Disagree to Strongly Agree)
6. Thinking about the ways you use your laptop during a meeting, please rate your agreement level with the following statements:
a. I notice all new incoming e-mail messages when in a meeting. b. I write and respond to e-mail messages during a meeting c. I send instant messages to other people in the meeting who have laptops. d. I send instant messages to work colleagues who are not in the meeting. e. I won't initiate instant message conversations, but I will reply to incoming
IMs. f. I find it essential to be online throughout the meeting so that I can
communicate with others who are not in the room. 7. Thinking about the project meetings you spend the most time on right now, please
rate your agreement level with the following statements: a. It is easy for me to follow the meeting discussion while simultaneously using
my laptop. b. I tend to use my laptop for non-meeting related tasks (e.g. checking e-mail /
working on other projects). c. I tend to use my laptop for meeting related tasks (e.g. taking notes / looking
up information relevant to the meeting). d. I only use my laptop during segments of the meeting that are less relevant to
me.
MEETING SATISFACTION & PERCEIVED PRODUCTIVITY Please rate your agreement level with the following statements (7-point Likert scale, Strongly Disagree to Strongly Agree)
8. Thinking about the project meetings you spend the most time on right now, please rate your agreement level with the following statements:
a. I am more satisfied in meetings when I can use my laptop. b. It bothers me when other people in a meeting use laptops. c. I feel self-conscious when I multitask with a laptop in a meeting. d. I dislike it when other people in the meeting glance at what I'm doing on my
laptop. 9. Thinking about the project meetings you spend the most time on right now, please
rate your agreement level with the following statements: a. Having a laptop in a meeting allows me to be more productive. b. Having a laptop in a meeting leads me to be more efficient at my job. c. Having a laptop in a meeting makes me more effective at my job. d. Having a laptop in a meeting allows me to produce better quality work.
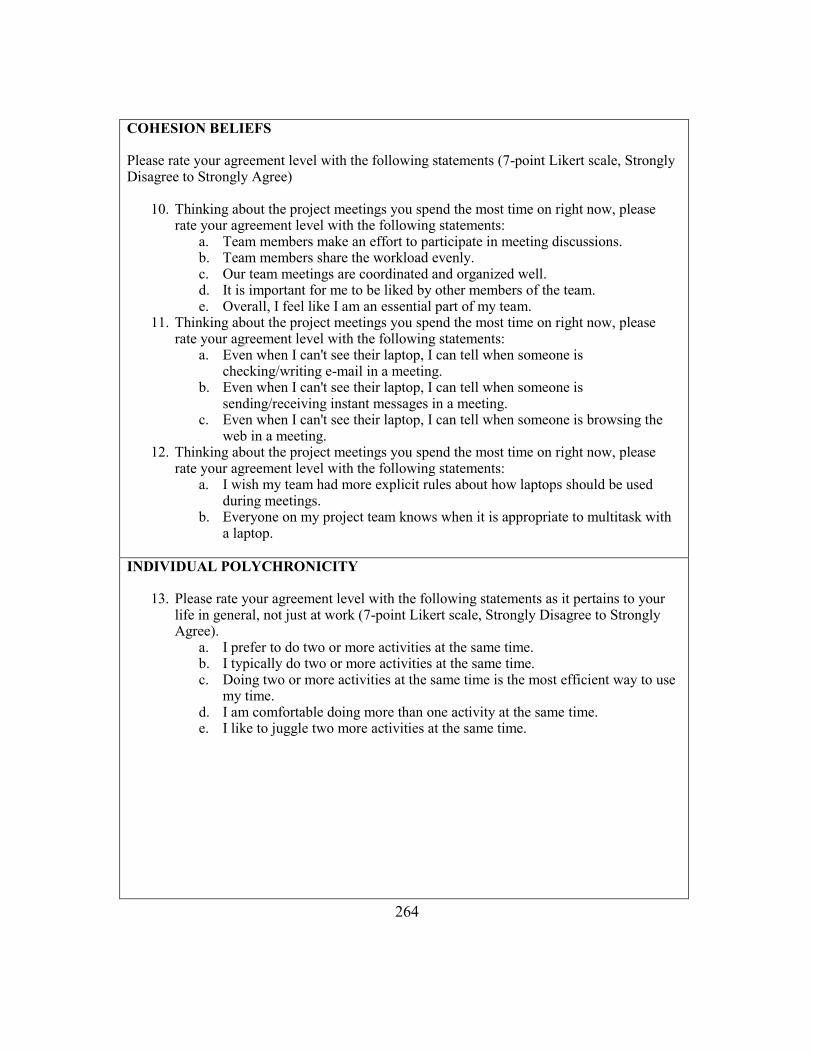
264
COHESION BELIEFS Please rate your agreement level with the following statements (7-point Likert scale, Strongly Disagree to Strongly Agree)
10. Thinking about the project meetings you spend the most time on right now, please rate your agreement level with the following statements:
a. Team members make an effort to participate in meeting discussions. b. Team members share the workload evenly. c. Our team meetings are coordinated and organized well. d. It is important for me to be liked by other members of the team. e. Overall, I feel like I am an essential part of my team.
11. Thinking about the project meetings you spend the most time on right now, please rate your agreement level with the following statements:
a. Even when I can't see their laptop, I can tell when someone is checking/writing e-mail in a meeting.
b. Even when I can't see their laptop, I can tell when someone is sending/receiving instant messages in a meeting.
c. Even when I can't see their laptop, I can tell when someone is browsing the web in a meeting.
12. Thinking about the project meetings you spend the most time on right now, please rate your agreement level with the following statements:
a. I wish my team had more explicit rules about how laptops should be used during meetings.
b. Everyone on my project team knows when it is appropriate to multitask with a laptop.
INDIVIDUAL POLYCHRONICITY
13. Please rate your agreement level with the following statements as it pertains to your life in general, not just at work (7-point Likert scale, Strongly Disagree to Strongly Agree).
a. I prefer to do two or more activities at the same time. b. I typically do two or more activities at the same time. c. Doing two or more activities at the same time is the most efficient way to use
my time. d. I am comfortable doing more than one activity at the same time. e. I like to juggle two more activities at the same time.

265
DEMOGRAPHICS
14. What is your gender. (Female / Male) 15. What is your age range?
a. 18 to 24 years old b. 25 to 34 c. 35 to 44 d. 45 to 54 e. 55 to 64 f. 65 years or older
16. In which US state or territory is your job located? 17. What is your employment status (Full Time / Part Time / Other) 18. What is your job title? 19. About how many years ago did you start work for your current employer? (2 years or
less, 3 to 7 years, 8 to 15 years, 16 years or more) 20. About how many years ago did you start in your current position for your current
employer? (2 years or less, 3 to 7 years, 8 to 15 years, 16 years or more) 21. Do you supervise the work of other employees on a day-to-day basis? (Yes, No, Don’t
Know) 22. How would you describe your place of work?
a. Large corporation b. Medium size company c. Small business d. Federal, state or local government e. School or educational institution f. Non-profit organization g. Other (Please specify)
23. Which of the following best describes your organization’s primary industry? a. Advertising/Public Relations b. Automotive c. Broadcasting d. Computer – Hardware e. Computer – Software f. Consumer Goods g. Education h. Financial i. Government j. Healthcare k. Insurance l. Internet/New Media m. Manufacturing n. Natural Resources o. Restaurant p. Utilities q. Other (Please specify)

266
APPENDIX E: SURVEY RECRUITMENT E-MAIL AT SOFTWARECORP
Dear SoftwareCorp Employee: I am a Ph.D. candidate at the University of Texas at Austin and I am conducting a study about multitasking during meetings. For example, have you ever been in a meeting where people are busy working on their laptop while participating in the meeting? Do you view this behavior as productive or distracting, or perhaps a little bit of both? We're interested in finding out the frequency of this kind of multitasking and your opinions on this topic. Through your participation, I hope to be able to analyze what motivates this behavior and the impact it has on team cohesion and productivity beliefs. The survey questionnaire is approximately 15 questions and the estimated completion time is between 3 and 6 minutes. Your responses will not be identified with you personally and participation is voluntary. Your participation is highly valued as you possess the experience and knowledge we are seeking to understand. The validity of the results is also greatly improved with a high response rate, so I appreciate the time you are taking from your busy day to participate. SoftwareCorp has given permission for this survey and in exchange is receiving a complimentary executive report with the results and analysis. A copy of this report is also available to you, just contact me at the e-mail address below and I will send you a message when it’s done. The researcher will be using the data as part of her doctoral dissertation. Thank you in advance for participating in this research project. Lisa Kleinman Ph.D. Candidate University of Texas at Austin, School of Information [email protected]

267
APPENDIX F: SUPPLEMENTARY DATA
Time Segment
Location Primary Task Secondary Tertiary Task Changes
9:00-9:30 Desk Bug Scrub E-mail 7
9:30-10:00 Desk Bug Scrub E-mail Instant Messaging
9
10:00-10:30 Desk Bug Scrub Stop By 5
10:30-11:00 Desk E-mail Instant Messaging
Performance Evaluations
8
11:00-11:30 Desk Bug Scrub Phone 5
11:30-12:00 Desk Bug Scrub 2
12:00-12:30 Off-Site Lunch 12:30-1:00 Off-Site Lunch
1:00-1:30 Conference Room
Meeting Participant
Multitasking on Laptop
1:30-2:00 Conference Room
Meeting Participant
Multitasking on Laptop
2:00-2:30 Desk Bug Scrub E-mail Instant Messaging
4
2:30-3:00 Desk Phone E-mail Instant Messaging
4
3:00-3:30 Conference Room
Meeting Leader
3:30-4:00 Desk Bug Scrub E-mail 5
4:00-4:30 Other Employee’s Desk
1 on 1 Meeting
4:30-5:00 Desk Bug Scrub E-mail 3
5:00-5:30 Desk / Other Desk
1 on 1 Meeting Bug Scrub 3
5:30-6:00 Desk Bug Scrub E-mail 1
6:00-6:30 Desk Bug Scrub E-mail 1
Table 67: Sam’s Time/Task Log for Day 2.
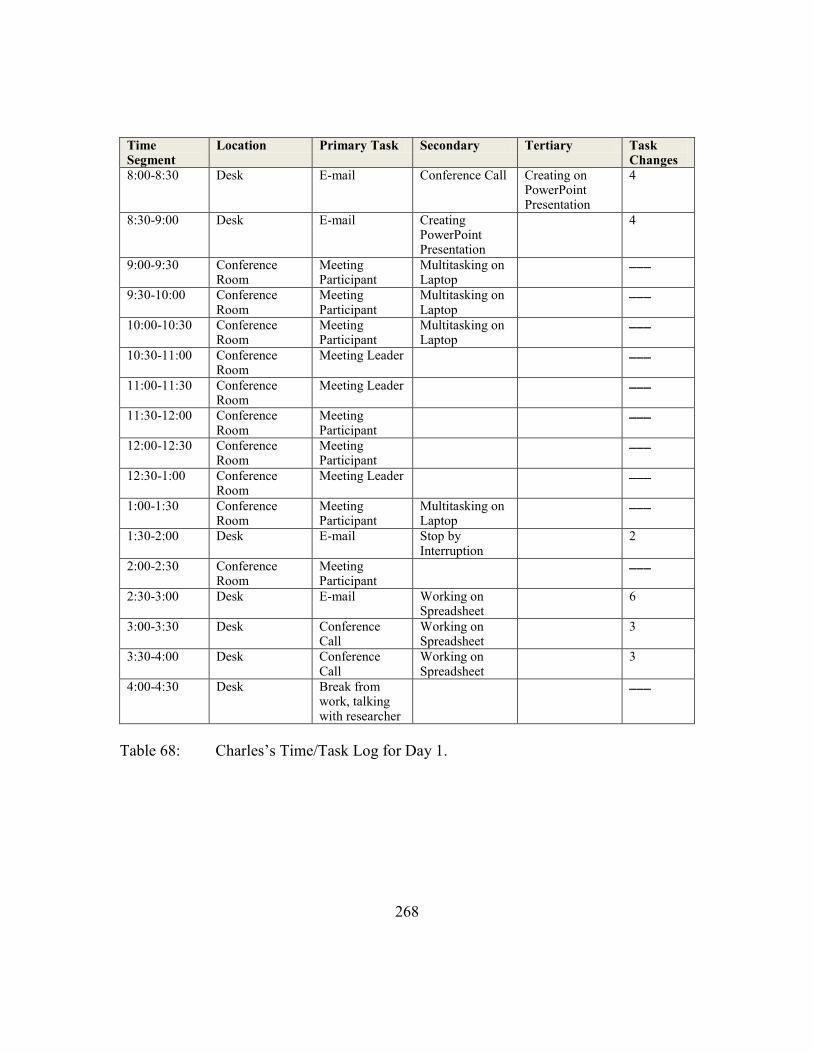
268
Time Segment
Location Primary Task Secondary Tertiary Task Changes
8:00-8:30 Desk E-mail Conference Call Creating on PowerPoint Presentation
4
8:30-9:00 Desk E-mail Creating PowerPoint Presentation
4
9:00-9:30 Conference Room
Meeting Participant
Multitasking on Laptop
9:30-10:00 Conference Room
Meeting Participant
Multitasking on Laptop
10:00-10:30 Conference Room
Meeting Participant
Multitasking on Laptop
10:30-11:00 Conference Room
Meeting Leader
11:00-11:30 Conference Room
Meeting Leader
11:30-12:00 Conference Room
Meeting Participant
12:00-12:30 Conference Room
Meeting Participant
12:30-1:00 Conference Room
Meeting Leader
1:00-1:30 Conference Room
Meeting Participant
Multitasking on Laptop
1:30-2:00 Desk E-mail Stop by Interruption
2
2:00-2:30 Conference Room
Meeting Participant
2:30-3:00 Desk E-mail Working on Spreadsheet
6
3:00-3:30 Desk Conference Call
Working on Spreadsheet
3
3:30-4:00 Desk Conference Call
Working on Spreadsheet
3
4:00-4:30 Desk Break from work, talking with researcher
Table 68: Charles’s Time/Task Log for Day 1.

269
References
Anderson, N. (1961). Scales and statistics: Parametric and nonparametric. Psychological Bulletin, 58(4), 305-316.
Arrow, H., Poole, M. S., Henry, K. B., Wheelan, S., & Moreland, R. (2004). Time, change and development: The temporal perspective on groups. Small Group Research, 35(1), 73-105.
Auerbach, C. & Silverstein, L. (2003). Qualitative data: An introduction to coding and analysis. New York: New York University Press.
Babbie, E. (1995). The practice of social research, 7th
edition. Belmont, CA: Wadsworth Publishing.
Baecker, R. (1995). Groupware and computer-supported cooperative work. In Human-computer interaction: Toward the year 2000 (pp. 741-754). San Francisco, CA: Morgan-Kaufmann.
Baltes, B. B. & Heydens-Gahir, H.A. (2003). Reduction of work-family conflict through the use of selection, optimization, and compensation behaviors. Journal of Applied Psychology, 88, 1005-1018.
Bannister, F. & Remenyi, D. (2009). Multitasking: The uncertain impact of technology on knowledge workers and managers. The Electronic Journal Information Systems Evaluation, 12(1), 1-12.
BBC News Online. (2005). Infomania worse than marijuana (April 22, 2005). Retrieved December 15, 2009, from: http://news.bbc.co.uk/2/hi/uk_news/4471607.stm
Bell, C., Compeau, D., & Olivera, F. (2005). Understanding the social implications of technological multitasking: A conceptual model. Fourth Annual Workshop on HCI Research in MIS, (December 10, 2005), 80-84, Las Vegas, NV.
Bertrand, M. & Mullainathan, S. (2004). Are Emily and Greg more employable than Lakisha and Jamal? A field experiment on labor market discrimination. The American Economic Review, 94(4), 991-1013.
Bluedorn, A. & Denhardt, R. (1988). Time and organizations. Journal of Management, 14(2), 299-320.

270
Bluedorn, A., Kalliath, T., Strube, M., & Martin, G. (1999). Polychronicity and the Inventory of Polychronic Values (IPV). Journal of Managerial Psychology, 14(3/4), 205-231.
Bluedorn, A., Kaufman, C., & Lane, P. (1992). How many things do you like to do at once? An introduction to monochronic and polychronic time. The Academy of Management Executive, 6(4), 17-26.
Braaten, L. (1991). Group cohesion: A new multidimensional model. Group, 15(1), 39-55.
Briggs, R. O., Reinig, B. A., & DeVreede, G. J. (2006) Meeting satisfaction for technology supported groups: An empirical validation of a goal-attainment model. Small Group Research, 37(6), 585-611.
Cameron, A. F. (2007). Juggling multiple conversations with communication technology: Towards a theory of multi-communicating impacts in the workplace. Dissertation Abstract International, 68(4). (UMI No. AAT NR26605).
Carron, A. V. & Brawley, L. R. (2000). Cohesion: Conceptual and measurement issues. Small Group Research, 31, 89-106.
Carron, A.V., Widmeyer, W.N., & Brawley, L. R. (1985). The development of an instrument to measure cohesion in sport teams: The Group Environment Questionnaire. Journal of Sport Psychology, 7, 244-266.
Chin, W., Salisbury, W., Pearson, A., & Stollak, M. (1999). Perceived cohesion in small groups: Adapting and testing the perceived cohesion scale in a small-group setting. Small Group Research, 30(6), 751-766.
Chung, Y., Zimmerman, J., & Forlizzi, J. (2005). Monitoring and managing presence in incoming and outgoing communication. Extended Proceedings of the Conference on Human Factors in Computing Systems CHI ‟05 (Portland, OR), 1284-1287. New York: ACM Press.
Conte, J., Rizzuto, T., & Steiner, D. (1999). A construct-oriented analysis of individual-level polychronicity. Journal of Managerial Psychology, 14 (3/4), 269-287.
Cortina, J. (1993). What is coefficient alpha? An examination of theory and applications. Journal of Applied Psychology, 78(1), 98-104.
Costanza, E., Kunz, A., & Fjeld, M. (2009). Mixed reality: A survey. In Lalanne, D. & Kohlas, J. (Eds.) Human machine interaction: Research results of the MMI program (pp. 47-68). Berlin, Germany: Springer-Verlag.
271
Cota, A., Evans, C., Dion, K., Kilik, L., & Longman, R. (1995). The structure of group cohesion. Personality and Social Psychology Bulletin, 21(6), 572-580.
Cotte, J. & Ratneshwar, S. (1999). Juggling and hoping: What does it mean to work polychronically? Journal of Managerial Psychology, 14(3/4), 184-205.
Creswell, J. (2003). Research design: Qualitative, quantitative and mixed methods approaches. Thousand Oaks, CA: Sage Publications.
Curtis, B., Hefley, W., & Miller, S. (2009). The People CMM: A framework for human capital management, 2
nd edition. Upper Saddle River, NJ: Addison-Wesley
Professional.
Czerwinski, M., Horvitz, E., & Wilhite, S. (2004). A diary study of task switching and interruptions. Proceedings of the Conference on Human Factors in Computing Systems CHI ‟04 (Vienna, Austria), 175-182. New York: ACM Press.
Daft, R. L. & Lengel, R. H. (1986). Organizational information requirements, media richness and structural design. Management Science 32(5), 554-571.
Daugherty, T., Lee, W., Gangadharbatla, H., Kim, K., & Outhavong, S. (2005). Organizational virtual communities: Exploring motivations behind online panel participation. Journal of Computer-Mediated Communication, 10(4), Article 9.
Davis, F. D. (1989). Perceived usefulness, perceived ease of use, and user acceptance of information technology. MIS Quarterly, 13(3), 319-340.
Davis, J., Lee, L., & Yi, M. (2009). Time-use preference and technology acceptance: Measure development of computer polychronicity. American Journal of Business, 24(2), 23-31.
DeSanctis, G. & Poole, M. (1994). Capturing the complexity in advanced technology use: Adaptive structuration theory. Organization Science, 5(2), 121-147.
DeSanctis, G., Poole, M., & Dickson, G. (2000). Teams and technology: Interactions over time. In Neale, M.A., Mannix, E.A., & Griffith, T.L. (Eds.) Research on managing groups and teams: Technology (Vol. 3, pp. 1-27). Stamford, CT: JAI Press.
DeVreede, G., Niederman, F., & Paarlberg, I. (2001). Measuring participants' perception on facilitation in group support systems meetings. Proceedings of the 2001 Conference on Computer Personnel Research SIGCPR '01 (San Diego, CA), 173-181, New York: ACM Press.

272
DiMaggio, P. & Bonikowski, B. (2008). Make money surfing the web? The impact of Internet use on the earnings of US workers. American Sociological Review, 73(2), 227-250.
Dowling, G. & Midgley, D. (2006). Using rank values as an interval scale. Psychology and Marketing, 8(1), 37-41.
Dunning, D., Johnson, K., Ehrlinger, J., & Kruger, J. (2003). Why people fail to recognize their own incompetence. Current Directions in Psychological Science, 12(3), 83-87.
Eisenhardt, K. (1989). Building theories from case study research. Academy of Management Review, 14(4), 532-550.
Emerson, R., Fretz, R., & Shaw, L. (1995). Writing ethnographic fieldnotes. Chicago, IL: University of Chicago Press.
Eppler, M. & Mengis, J. (2004). The concept of information overload: A review of literature from organization science, accounting, marketing, MIS, and related disciplines. The Information Society: An International Journal, 20(5), 1-20.
Erez, M., Gopher, D., & Arzi, N. (1990). Effects of goal difficulty, self-set goals, and monetary rewards on dual task performance. Organizational Behavior & Human Decision Processes, 47(2), 247-269.
Evans, C. & Dion, K. (1991). Group cohesion and performance: A meta-analysis. Small Group Research, 22(2), 175-186.
Evans, G. W. & Johnson, D. (2000). Stress and open-office noise. Journal of Applied Psychology, 85(5), 779-783.
Evans, N. & Jarvis, P. (1980). Group cohesion: A review and reevaluation. Small Group Behavior, 11, 359-370.
Falissard, B. (1999). The unidimensionality of a psychiatric scale: A statistical point of view. International Journal of Methods in Psychiatric Research, 8(3), 162-167.
Feldman, D. (1984). The development and enforcement of group norms. Academy of Management Review, 9(1), 47-53.
Festinger, L. (1950). Informal social communication. Psychological Review, 57, 271-282.
273
Flanagin, A. J., Park, H. S., & Seibold, D. R. (2004). Group performance and collaborative technology: A longitudinal and multilevel analysis of information quality, contribution equity, and members’ satisfaction in computer-mediated groups. Communication Monographs, 71, 352-372.
Foerde, K., Knowlton, B.J., & Poldrack, R.A. (2006). Modulation of competing memory systems by distraction. Proceedings of the National Academy of Sciences, 103, 11778-11783.
Forrester Research. (2007). It‟s not your kids‟ instant messaging: IM takes its place at the business table. Retrieved April 20, 2007, from: http://www.forrester.com/Research/Document/Excerpt/0,7211,41866,00.html
Francisco, J. (2007). How to create and facilitate meetings that matter. The Information Management Journal, 41(6), 54-58.
Frei, R., Racicot, B., & Travagline, A. (1999). The impact of monochronic and Type A behavior patterns on research productivity and stress. Journal of Managerial Psychology, 14(5), 374-387.
Friedkin, N. (2004). Social cohesion. Annual Review of Sociology, 30, 409-425.
Frymier, A. & Shulman, G. (1995). What’s in it for me? Increasing content relevance to enhance students’ motivation. Communication Education, 44(1) 40-50.
Fulk, J. (1993). Social construction of communication technology. Academy of Management Journal, 36(5), 921-951.
Gardner, H. & Martin, M. (2007). Analyzing ordinal scales in studies of virtual environments: Likert or lump it! Presence: Teleoperators and Virtual Environments, 16(4), 439-446.
Geser, H. (2004). Towards a sociological theory of the mobile phone. In Sociology in Switzerland: Sociology of the Mobile Phone. Online Publications, Zurich, March 2004 (Release 3.0). Retrieved March 30, 2005, from: http://socio.ch/mobile/t_geser1.htm
Gioia, D. & Poole, P. P. (1984). Scripts in organizational behavior. Academy of Management Review, 9, 449-459.
Gladwin, C. (1989). Ethnographic decision tree modeling. Newbury Park, CA: Sage Publications.
Gneezy, U. & Rustichini, A. (2000). A fine is a price. Journal of Legal Studies, 29(1), 1-18.
274
Goffman, E. (1959). The presentation of self in everyday life. Garden City, NY: Doubleday.
Goffman, E. (1963). Stigma: Notes on the management of spoiled identity. Englewood Cliffs, NJ: Prentice Hall.
Gonzalez, V. & Mark, G. (2004). Constant, constant multitasking craziness: Managing multiple working spheres. Proceedings of the Conference on Human Factors in Computing Systems CHI ‟04 (Vienna, Austria), 113-20. New York: ACM Press.
Goodman, L. (1961). Snowball sampling. Annals of Mathematical Statistics, 32, 148-170.
Göritz, A. (2006). Cash lotteries as incentives in online panels. Social Science Computer Review, 24(4), 445-459.
Greif, I. (1988). Computer-supported cooperative work: A book of readings. San Francisco, CA: Morgan Kaufmann.
Gruys, M. L. & Sackett, P. R. (2003). The dimensionality of counterproductive work behavior. International Journal of Selection and Assessment, 11(1), 30-42.
Gully, S., Devine, D. & Whitney, D. (1995). A meta-analysis of cohesion and performance: Effects of level of analysis and task interdependence. Small Group Research, 26, 497-520.
Gunn, H. (2002). Web-based surveys: Changing the survey process. First Monday, 7(12). Retrieved November 11, 2009, from: http://firstmonday.org/issues/issue7_12/gunn/index.html
Halonen, D., Horton, M., Kass, R., & Scott, P. (1990). Shared hardware: A novel technology for computer support of face to face meetings. Proceedings of the Conference on Office Information Systems SIGOIS „90 (Cambridge, MA). New York: ACM Press.
Harwell, M. & Gatti, G. (2001). Rescaling ordinal data to interval data in educational research. Review of Educational Research, 71(1), 105-131.
Haynes, B. (2007). An evaluation of office productivity measurement. Journal of Corporate Real Estate, 9(3), 144-155.
Hogg, J. (1987). Social identity and group cohesiveness. In J. C. Turner (Ed.), Rediscovering the Social Group. New York: Blackwell.
Israel, J. (1956). Self-evaluation and rejection in groups. Stockholm, Sweden: Almqvist & Wiskell.

275
Ito, T., Larsen, J., Smith, N. K., & Cacioppo, J. T. (1998). Negative information weighs more heavily on the brain: The negativity bias in evaluative categorizations. Journal of Personality and Social Psychology, 75(4), 887-900.
James, D. (2000). The future of online research. Marketing News, 34 (1), 1-11.
Jay, A. (1976). How to run a meeting. Harvard Business Review, 54(2), 43-57.
Kanter, R.M. (2000). When a thousand flowers bloom: Structural, collective, and social conditions for innovation in organization. In R. Swedberg (Ed.), Entrepreneurship: The social science view, Oxford/New York: Oxford University Press.
Kaufman, C., Lane, P., & Lindquist, J. (1991). Exploring more than twenty-four hours a day: A preliminary investigation of polychronic time use. Journal of Consumer Research, 18, 392-401.
Kaufman-Scarborough, C. & Lindquist, J. (1999). Time management and polychronicity: Comparisons, contrasts and insights for the workplace. Journal of Managerial Psychology, 14(3/4), 288-312.
Kendon, A. (1967). Some function of gaze direction in social interaction. Acta Psychologica 32, 1-25.
Kern, N. & Schiele, B. (2003). Context-aware notification for mobile computing. IEEE International Symposium on Wearable Computers, October 21-23, 2003, White Plains, NY.
Kiesler, S. & Cummings, J. (2002). What do we know about proximity and distance in work groups? A legacy of research. In P. Hinds & S. Kiesler (Eds.), Distributed work (pp. 57-80). Cambridge, MA: MIT Press.
Kinney, S. & Panko, R. (1996). Project teams: Profiles and member perceptions. Proceedings of 29th Hawaii International Conference on Systems Sciences HICSS ‟96, (January 3-6, 1996), 3, 128-137, Computer Society Press.
Kleinman, L. (2007). Physically present, mentally absent: Technology use in face-to-face meetings. Extended Proceedings of the Conference on Human Factors in Computing Systems CHI ‟07 (San Jose, CA), 2501-2506. New York: ACM Press.
Knapp, T. (1990). Treating ordinal scales as interval scales: An attempt to resolve the controversy. Nursing Research, 39(2), 121-123.

276
Koskinen, I. & Repo, P. (2006). Personal technology in public places: Face and mobile video. Finland National Consumer Research Center – Working Paper. Retrieved March 30, 2005, from: http://www.kuluttajatutkimuskeskus.fi/files/4866/94_2006_workingpapers_personal_technology.pdf
Kraut, R. E., Fussell, S. R., Brennan, S. E., & Siegel, J. (2002). Understanding effects of proximity on collaboration: Implications for technologies to support remote collaborative work. In P. Hinds & S. Kiesler (Eds.) Distributed work (pp. 137-162). Cambridge, MA: MIT Press.
Kraut, R. E., Olson, J., Banaji, M., Bruckman, A., Cohen, J., & Couper, M. (2004). Psychological research online. American Psychologist, 59, 105-117.
Labovitz, S. (1970). The assignment of numbers to rank order categories. American Sociological Review, 35, 515-524.
Leaman, A. & Bordass, W. (2000). Productivity in buildings: The killer variables. In D. Clements-Croome (Ed.) Creating the productive workplace, London: A & FN Spon.
Lee, W., Tan, T. M., & Hameed, S. S. (2005). Polychronicity, the internet and the mass media: A Singapore study. Journal of Computer-Mediated Communication, 11(1), 300-316.
Libo, L. M. (1953). Measuring Group Cohesiveness. Ann Arbor, MI: University of Michigan Institute for Social Research.
Lindquist, J. & Kaufman-Scarborough, C. (2007). The polychronic-monochronic tendency model. Time and Society, 16(2-3), 253-285.
Lindquist, J., Knieling, J., & Kaufman-Scarborough, C. (2001). Polychronicity and consumer behavior outcomes among Japanese and US students: A study of response to culture in a US university setting. Proceedings of the Tenth Biennial World Marketing Congress, 10(4.4), pp. 4, Coral Gables, FL: Academy of Marketing Science.
Lyytinen, K. & Yoo, Y. (2002). Research commentary: The next wave of nomadic computing. Information Systems Research, 13(4), 377-388.
Mankins, M. (2004). Stop wasting valuable time. Harvard Business Review, 82(9), 58-65.
Manning, F. & Fullerton, T. (1988). Health and well-being in highly cohesive units of the US Army. Journal of Applied Social Psychology, 18(6), 503-519.
277
Manrai, L. & Manrai, A. (1995). Effects of cultural-context, gender, and acculturation on perceptions of work versus social/leisure time usage. Journal of Business Research 32(2), 115-128.
Marcus-Roberts, H. & Roberts, F. (1987). Meaningless statistics. Journal of Educational Statistics, 12(4), 383-394.
Markus, M. (1994). Finding a happy medium: Explaining the negative effects of electronic communication on social-life at work. ACM Transactions on Information Systems, 12(2), 119-149.
McCarthy, J., Boyd, D., Churchill, E., Griwsold, W., Lawley, E., & Zaner, M. (2004). Digital backchannels in shared physical space: Attention, intention and contention. Proceedings of Computer-Supported Cooperative Work CSCW‟04 (Chicago, IL), 550-553. New York: ACM Press.
McFadzean, E., Somersall, L., & Coker, A. (1999). A framework for facilitating group processes. Strategic Change, 8(7), 421-431.
Mejias, R. J. (2007). The interaction of process losses, process gains and meeting satisfaction within technology supported environments. Small Group Research, 38(1), 156-194.
Miles, M. & Huberman, M. (1994). Qualitative data analysis: An expanded sourcebook. Thousand Oaks, CA: Sage Publications.
Miller, N. & Campbell, D. (1959). Recency and primacy in persuasion as a function of the timing of speeches and measurements. Journal of Abnormal and Social Psychology, 59, 1-9
Mudrack, P. (1989). Defining group cohesiveness: A legacy of confusion? Small Group Behavior, 20(1), 37-49.
Nardi, B. & Whittaker, S. (2002). The place of face to face communication in distributed work. In P. Hinds & S. Kiesler (Eds.), Distributed work (pp. 83-110). Cambridge, MA: MIT Press.
New York Times. (2007). Minding your meeting, or your computer? Retrieved August 27, 2007, from: http://www.nytimes.com/2007/08/26/business/yourmoney/26pre.html
Nixon, C. & Littlepage, G. (1992). Impact of meeting procedures on meeting effectiveness. Journal of Business & Psychology, 6(3), 361-369.
278
Nowak, K. & Biocca, F. (2003). The effect of the agency and anthropomorphism on users’ sense of telepresence, copresence, and social presence in virtual environments. Presence: Teleoperators and Virtual Environments, 12(5), 481-494.
Nunnally, J. C. (1978). Psychometric theory. New York: McGraw-Hill.
Olson, J., Teasley, S., Covi, L., & Olson, G. (2002). The (currently) unique advantages of collocated work. In P. Hinds & S. Kiesler (Eds.), Distributed work (pp. 113-135). Cambridge, MA: MIT Press.
Ophir, E., Nass, C., & Wagner, A. (2009). Cognitive control in media multitaskers. Proceedings of the National Academy of Sciences. Published online before print August 24, 2009.
Orlikowski, W. (2000). Using technology and constituting structures: A practice lens for studying technology in organizations. Organization Science, 11(4), 404-428.
Pew Internet Research. (2003). America's online pursuits: The changing picture of who's online and what they do. Retrieved March 20, 2005, from: http://www.pewinternet.org/Reports/2003/Americas-Online-Pursuits.aspx
Pew Internet Research. (2008). Networked workers. Retrieved November 20, 2008, from: http://www.pewinternet.org/Reports/2008/Networked-Workers.aspx
Piccolo, R. F. & Colquitt, J. A. (2006). Transformational leadership and job behaviors: The mediating role of core job characteristics. Academy of Management Journal, 49, 327-340.
Piper, W., Marrache, M., Lacroix, R., Richardsen, A., & Jones, B. (1983). Cohesion as a basic bond in groups. Human Relations, 36(2), 93-108.
Poole, M. S. & DeSanctis, G. (1990). Understanding the use of group decision support systems: The theory of adaptive structuration. In J. Fulk & C. Steinfeld (Eds.) Organizations and communication technology (pp. 175-195). Newbury Park, CA: Sage Publications.
Poole, M. S., Hollingshead, A. B., McGrath, J. E., Moreland, R., & Rohrbaugh, J. (2004). Interdisciplinary perspectives on small groups. Small Group Research, 35(1), 3-16.
Postmes, T., Spears, R., & Lea, M. (2000). The formation of group norms in computer-mediated communication. Human Communication Research, 26(3), 341-371.

279
Presley, J. & Keen, S. (1975). Better meetings lead to higher productivity: A case study. Management Review, 64(4), 16-22.
Putai, J. (1993). Work motivation and productivity in voluntarily formed work teams: A field study in China. Organizational Behavior and Human Decision Processes, 54(1), 133-155.
Rennecker, J. & Godwin, L. (2005). Delays and interruptions: A self-perpetuating paradox of communication technology use. Information and Organization, 15(3), 247-266.
Riege, A. (2003). Validity and reliability tests in case study research: A literature review with hands-on applications for each research phase. Qualitative Market Research: An International Journal, 6(2), 75-86.
Robinson, S. L. & Bennett, R. J. (1995). A typology of deviant workplace behaviors: A multidimensional scaling study. Academy of Management Journal, 38(2), 555-572.
Romano Jr., N. C. & Nunamaker Jr., J. (2001). Meeting analysis: Findings from research and practice. Proceedings of 34th Hawaii International Conference on Systems Sciences HICSS ‟01 (January 3-6, 2001), pp. 13, Computer Society Press.
Rosenberg, R. & Rosenstein, E. (1980). Participation and productivity: An empirical study. Industrial and Labor Relations Review, 33(3), 355-367.
Ross, L. (1977). The intuitive psychologist and his shortcomings: Distortions in the attribution process. In L. Berkowitz (Ed.), Advances in experimental social psychology (vol. 10, pp. 173–220). New York: Academic Press.
Rubinstein, J., Meyer, D., & Evans, J. (2001). Executive control of cognitive processes in task switching. Journal of Experimental Psychology: Human Perception and Performance, 27(4), 763-797.
Ruder, M. & Gill, D. (1982). Immediate effects of win-loss on perceptions of cohesion in intramural and intercollegiate volleyball teams. Journal of Sport Psychology, 4, 227-234.
Rutan, J. & Stone, W. (1993). Psychodynamic group psychotherapy. New York, NY: Guilford press.
Ryan, D. (2006). Getting the word out: Notes on the social organization of notification. Sociological Theory, 24(3), 228-254.

280
Schachter, D. (1999). The seven sins of memory: Insights from psychology and cognitive neuroscience. American Psychologist, 54(3), 182-203
Schank, R. C. & Abelson, R. P. (1977). Scripts, plans, goals and understanding: An inquiry into human knowledge structures. Hillsdale, NJ: Lawrence Erlbaum.
Schober, M. & Brennan, S. (2003). Processes of interactive spoken discourse. In A. Graesser, M. Gernsbacher, & S. Goldman (Eds.), Handbook of Discourse Processes (pp. 123-164). Mahwah, NJ: Lawrence Erlbaum.
Schonlau, M., Fricker, R., Elliott, M., & Fricker Jr., R. (2002). Conducting research surveys via e-mail and the web. Santa Monica, CA: RAND Corporation.
Schwartzman, H. (1993). Ethnography in organizations. Newbury Park, CA: Sage Publications.
Scott, C. R. (1999). Communication technology and group communication. In L. R. Frey (Ed.), D. S. Gouran, & M. S. Poole (Assoc. Eds.), The handbook of group communication theory & research (pp. 432-472). Thousand Oaks, CA: Sage Publications.
Seattle Post Intelligencer. (2007). It‟s time to fight back against infomania (January 23, 2007). Retrieved December 15, 2009, from: http://www.seattlepi.com/business/300740_msftinfomania23x.html
Shaw, M. (1983). Group composition. In H. H. Blumberg, A. P. Hare, V. Kent, M. F. Davies (Eds.), Small groups and social interaction, Vol. 1, (pp. 89-96). Chichester: John Wiley & Sons.
Sheskin, D. (2003). Handbook of parametric and nonparametric statistical procedures. Taylor & Francis e-Book. Published online August 27, 2003.
Short, J., Williams, E., & Christie, B. (1976). The social psychology of telecommunication. London, UK: John Wiley & Sons.
Staples, D., Hulland, J., & Higgins, C. (1999). A self-efficacy theory explanation for the management of remote workers in virtual organizations. Organization Science, 10(6), 758-776.
Stefik, M., Foster, G. Bobrow, D., Kahn, K., Lanning, S., & Suchman, L. (1988). Beyond the chalkboard: Computer support for collaboration and problem solving in meetings. In I. Greif (Ed.), Computer-supported cooperative work: A book of readings (pp. 335-366). San Mateo, CA: Morgan Kaufmann.

281
Stokes, J. (1983). Components of group cohesion: Intermember attraction, instrumental value, and risk taking. Small Group Behavior, 14(2), 163-173.
Suchman, L. A. (1987). Plans and situated actions: The problem of human-machine communication. Cambridge: Cambridge University Press.
Thompson, L. (2002). Making the team. Upper Saddle River, NJ: Prentice-Hall.
Turner, J., Grube, J., Tinsley, C., Lee, C., & O’Pell, C. (2006). Exploring the dominant media: How does media use reflect organizational norms and affect performance? Journal of Business Communication, 43(3), 230-250.
Turkle, S. (2008). Always-on/always-on-you: The tethered self. In J. Katz (Ed.), Handbook of mobile communication studies. Cambridge, MA: MIT Press.
VanWynsberghe, R. & Khan, S. (2007). Redefining case study. International Journal of Qualitative Methods, 6(2), 1-10.
Volkema, R. & Niederman, F. (1995). Organizational meetings: Formats and information requirements. Small Group Research, 26(1), 3-24.
Wallace, C. (2005). Development and validation of a work-specific measure of cognitive failure: Implications for occupational safety. Journal of Occupational and Organizational Psychology, 78, 615-632.
Waller, M., Giambatista, R., & Zellmer-Bruhn, M. (1999). The effects of individual time urgency on group polychronicity. Journal of Managerial Science, 14(3/4), 244-256.
Wasson, C. (2004). Multitasking in virtual meetings. Human Resource Planning, 27(4), 47-60.
Wittenbaum, G. M., Hollingshead, A. B., Paulus, P. B., Hirokawa, R. Y., Ancona, D. G., Peterson, R. S., Jehn, K. A., & Yoon, K. (2004). The functional perspective as a lens for understanding groups. Small Group Research, 35(1), 3-16.
Yates, J. & Orlikowski, W. (2002). Genre systems: Structuring interaction through communicative norms. Journal of Business Communication, 39(1), 13-35.
Yates, J., Orlikowski, W., & Rennecker, J. (1997). Collaborative genres for collaboration: Genre systems in digital media. Proceedings of 30th Hawaii International Conference on Systems Sciences HICSS ‟97, (January 7-10, 1997), 6, 50-59, Computer Society Press.
282
Yin, R. (2003). Case study research: Design and methods, 3rd
edition. Thousand Oaks, CA: Sage Publications.
Zajonc, R. (1965). Social facilitation. Science, 149, 269-274.
Zhang, Y., Goonetilleke, R., Plocher, T., & Liang S. (2005). Time-related behavior in multitasking situations. International Journal of Human-Computer Studies, 62, 425-455.
283
Vita
Lisa Kleinman was born in Portland, Oregon on December 7, 1977 to Theodore
and Han Pun Kleinman. She attended The Catlin Gabel School in Portland for her high
school education. In 1995, Lisa moved to Pittsburgh, Pennsylvania to attend Carnegie
Mellon University where she graduated with university honors and was granted a B.S. in
Information & Decision Systems with additional majors in Human-Computer Interaction
and Philosophy. She then moved to San Francisco, California and worked as a user
interface designer, specializing in information architecture and usability for large scale
e-commerce web sites.
Lisa returned to academia in 2001 at Portland State University to attend an
accelerated masters program and was granted a Master of Business Administration.
Immediately following, she entered the School of Information doctoral program in 2002.
During her time at the University of Texas at Austin, Lisa worked as a graduate
researcher on experimental studies of electronic text readability. She also regularly
published her research at the ACM Conference on Human Factors (CHI) and the
American Society for Information Science & Technology (ASIS&T). In 2010, Lisa
moved to San Diego, California to join Nokia Mobile Phones as a User Experience Lead.
Permanent address: 195 Scenic Ridge Court, Redmond, OR, 97756
This dissertation was typed by the author.
Related Documents