Private & Confidential Kitex Garments Limited – Well dressed for the leap 1 Management Meeting Note – September 2014

Welcome message from author
This document is posted to help you gain knowledge. Please leave a comment to let me know what you think about it! Share it to your friends and learn new things together.
Transcript
Private & Confidential
Kitex Garments Limited – Well dressed for the leap
1
Management Meeting Note – September 2014
Private & Confidential
Kitex Garments Limited – Well dressed for the leap
Tejash Shah | [email protected] | +91 22 4228 8155 Gnanasundaram | [email protected] | +91 44 4344 0062 Madhav PVR | [email protected] | +91 44 4344 0060
2
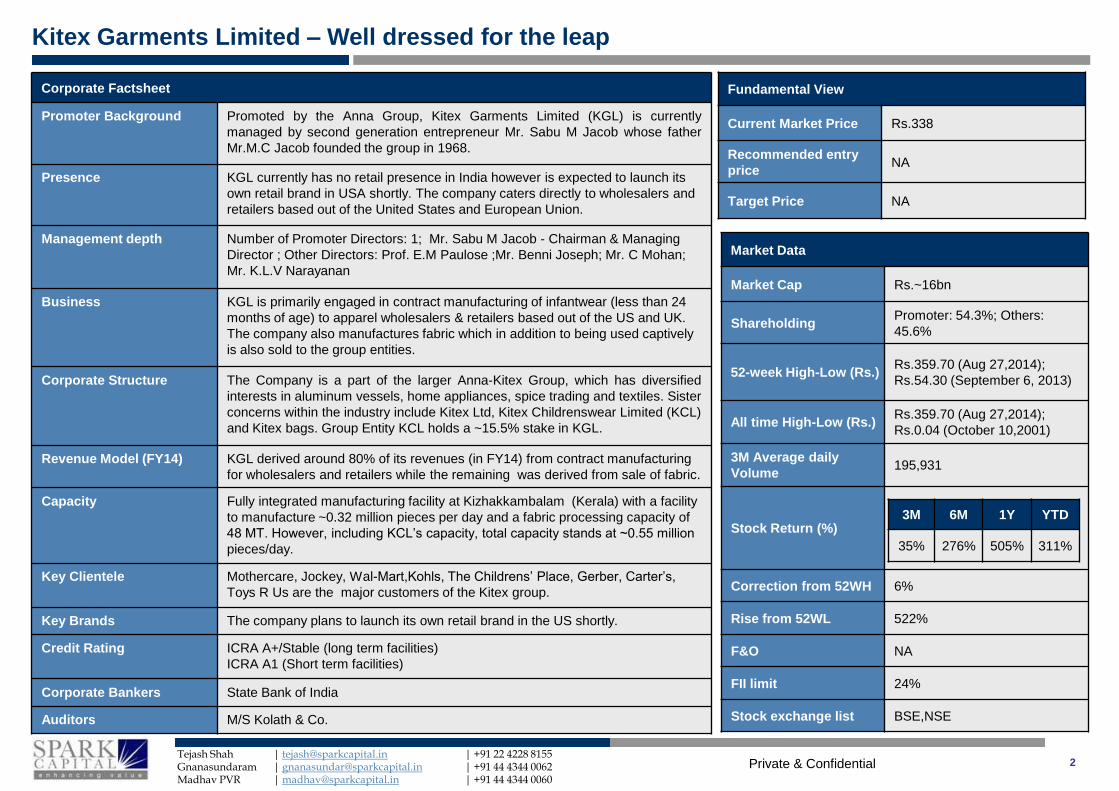
Corporate Factsheet
Promoter Background Promoted by the Anna Group, Kitex Garments Limited (KGL) is currently
managed by second generation entrepreneur Mr. Sabu M Jacob whose father
Mr.M.C Jacob founded the group in 1968.
Presence KGL currently has no retail presence in India however is expected to launch its
own retail brand in USA shortly. The company caters directly to wholesalers and
retailers based out of the United States and European Union.
Management depth Number of Promoter Directors: 1; Mr. Sabu M Jacob - Chairman & Managing
Director ; Other Directors: Prof. E.M Paulose ;Mr. Benni Joseph; Mr. C Mohan;
Mr. K.L.V Narayanan
Business KGL is primarily engaged in contract manufacturing of infantwear (less than 24
months of age) to apparel wholesalers & retailers based out of the US and UK.
The company also manufactures fabric which in addition to being used captively
is also sold to the group entities.
Corporate Structure The Company is a part of the larger Anna-Kitex Group, which has diversified
interests in aluminum vessels, home appliances, spice trading and textiles. Sister
concerns within the industry include Kitex Ltd, Kitex Childrenswear Limited (KCL)
and Kitex bags. Group Entity KCL holds a ~15.5% stake in KGL.
Revenue Model (FY14) KGL derived around 80% of its revenues (in FY14) from contract manufacturing
for wholesalers and retailers while the remaining was derived from sale of fabric.
Capacity Fully integrated manufacturing facility at Kizhakkambalam (Kerala) with a facility
to manufacture ~0.32 million pieces per day and a fabric processing capacity of
48 MT. However, including KCL’s capacity, total capacity stands at ~0.55 million
pieces/day.
Key Clientele Mothercare, Jockey, Wal-Mart,Kohls, The Childrens’ Place, Gerber, Carter’s,
Toys R Us are the major customers of the Kitex group.
Key Brands The company plans to launch its own retail brand in the US shortly.
Credit Rating ICRA A+/Stable (long term facilities)
ICRA A1 (Short term facilities)
Corporate Bankers State Bank of India
Auditors M/S Kolath & Co.
Market Data
Market Cap Rs.~16bn
Shareholding Promoter: 54.3%; Others:
45.6%
52-week High-Low (Rs.) Rs.359.70 (Aug 27,2014);
Rs.54.30 (September 6, 2013)
All time High-Low (Rs.) Rs.359.70 (Aug 27,2014);
Rs.0.04 (October 10,2001)
3M Average daily
Volume 195,931
Stock Return (%)
Correction from 52WH 6%
Rise from 52WL 522%
F&O NA
FII limit 24%
Stock exchange list BSE,NSE
3M 6M 1Y YTD
35% 276% 505% 311%
Fundamental View
Current Market Price Rs.338
Recommended entry
price NA
Target Price NA
Private & Confidential
Kitex Garments Limited – Well dressed for the leap
Tejash Shah | [email protected] | +91 22 4228 8155 Gnanasundaram | [email protected] | +91 44 4344 0062 Madhav PVR | [email protected] | +91 44 4344 0060
3
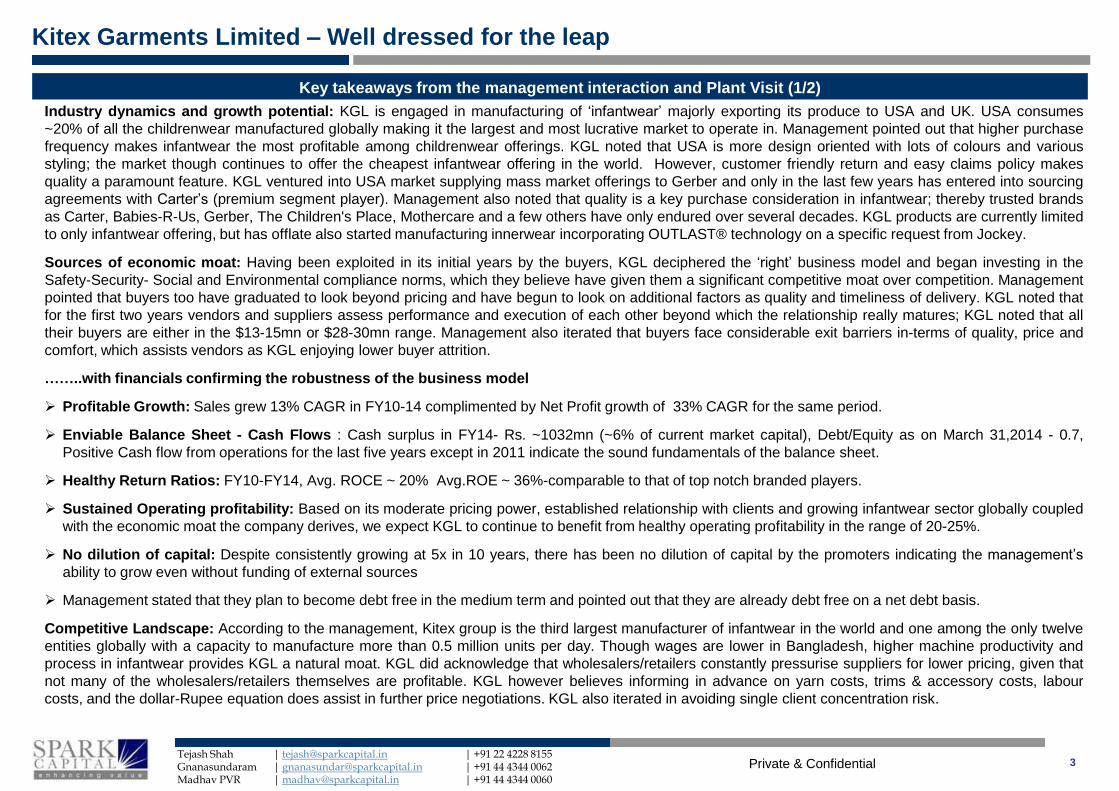
Key takeaways from the management interaction and Plant Visit (1/2)
Industry dynamics and growth potential: KGL is engaged in manufacturing of ‘infantwear’ majorly exporting its produce to USA and UK. USA consumes
~20% of all the childrenwear manufactured globally making it the largest and most lucrative market to operate in. Management pointed out that higher purchase
frequency makes infantwear the most profitable among childrenwear offerings. KGL noted that USA is more design oriented with lots of colours and various
styling; the market though continues to offer the cheapest infantwear offering in the world. However, customer friendly return and easy claims policy makes
quality a paramount feature. KGL ventured into USA market supplying mass market offerings to Gerber and only in the last few years has entered into sourcing
agreements with Carter’s (premium segment player). Management also noted that quality is a key purchase consideration in infantwear; thereby trusted brands
as Carter, Babies-R-Us, Gerber, The Children's Place, Mothercare and a few others have only endured over several decades. KGL products are currently limited
to only infantwear offering, but has offlate also started manufacturing innerwear incorporating OUTLAST® technology on a specific request from Jockey.
Sources of economic moat: Having been exploited in its initial years by the buyers, KGL deciphered the ‘right’ business model and began investing in the
Safety-Security- Social and Environmental compliance norms, which they believe have given them a significant competitive moat over competition. Management
pointed that buyers too have graduated to look beyond pricing and have begun to look on additional factors as quality and timeliness of delivery. KGL noted that
for the first two years vendors and suppliers assess performance and execution of each other beyond which the relationship really matures; KGL noted that all
their buyers are either in the $13-15mn or $28-30mn range. Management also iterated that buyers face considerable exit barriers in-terms of quality, price and
comfort, which assists vendors as KGL enjoying lower buyer attrition.
……..with financials confirming the robustness of the business model
Profitable Growth: Sales grew 13% CAGR in FY10-14 complimented by Net Profit growth of 33% CAGR for the same period.
Enviable Balance Sheet - Cash Flows : Cash surplus in FY14- Rs. ~1032mn (~6% of current market capital), Debt/Equity as on March 31,2014 - 0.7,
Positive Cash flow from operations for the last five years except in 2011 indicate the sound fundamentals of the balance sheet.
Healthy Return Ratios: FY10-FY14, Avg. ROCE ~ 20% Avg.ROE ~ 36%-comparable to that of top notch branded players.
Sustained Operating profitability: Based on its moderate pricing power, established relationship with clients and growing infantwear sector globally coupled
with the economic moat the company derives, we expect KGL to continue to benefit from healthy operating profitability in the range of 20-25%.
No dilution of capital: Despite consistently growing at 5x in 10 years, there has been no dilution of capital by the promoters indicating the management’s
ability to grow even without funding of external sources
Management stated that they plan to become debt free in the medium term and pointed out that they are already debt free on a net debt basis.
Competitive Landscape: According to the management, Kitex group is the third largest manufacturer of infantwear in the world and one among the only twelve
entities globally with a capacity to manufacture more than 0.5 million units per day. Though wages are lower in Bangladesh, higher machine productivity and
process in infantwear provides KGL a natural moat. KGL did acknowledge that wholesalers/retailers constantly pressurise suppliers for lower pricing, given that
not many of the wholesalers/retailers themselves are profitable. KGL however believes informing in advance on yarn costs, trims & accessory costs, labour
costs, and the dollar-Rupee equation does assist in further price negotiations. KGL also iterated in avoiding single client concentration risk.
Private & Confidential
Kitex Garments Limited – Well dressed for the leap
Tejash Shah | [email protected] | +91 22 4228 8155 Gnanasundaram | [email protected] | +91 44 4344 0062 Madhav PVR | [email protected] | +91 44 4344 0060
4
Key takeaways from the management interaction and Plant Visit (2/2)
Growth plans: Management indicated that the infantwear market in India, China and Middle East is rapidly growing and most of the global brands would
derive a significant portion of revenues from these markets in the medium term. Population and growth potential in emerging economies continue to present
attractive opportunities. Mothercare has established many stores in India under both the company owned model and franchisee operations. When the market
further opens up in India over the next 3-5 years, Management expects similar initiatives from the other players as Carter’s, Gerber and Walmart look to
establish their presence in India.
Geographical concentration and customer concentration in revenue profile: Three-fourths of KGL’s revenues are derived from US and rest from Europe.
However, management downplayed this geographical risk, as majority of customers to whom they supply have global presence. Though KGL faces significant
customer concentration with three players (Gerber, Jockey and Toys R US) accounting for majority of revenues till last year, the company’s recent addition of
major customers like Kohl’s and Children’s Place and management’s stance of not supplying more than $~30-40 million to a single customer should
addressed this concern.
Capex Plans: KGL confirmed that the current fabric capacity at 48 MT is sufficient to see through the targeted garmenting capacity of 1.1 Mn pieces/day in 2-3
years. The management plans to increase the capacity of the group from the current 0.55 million pieces to 1.1 million pieces over the medium term. In this
regard the company is expected invest heavily towards cutting and sewing machinery. The management expects capital outlay of Rs.300-400 million for the
group as a whole and Rs.150 million for KGL exclusively over the next 18-20 months. Management indicated that current utilisation/efficiency levels are close
to 50-60% with ~8000 employees (KGL and KCL).
Our views on KGL:
We commend KGL for doing a phenomenal job of scaling revenues ~6x in 10 years in a difficult B2B business without any capital dilution. Institutional
drivers provide strong economic moat and should reflect in healthy earnings growth. The management believes that revenues could grow ~20-25% in near
term, though weakening USD could be a dampener.
We however believe increasing competitive intensity from India and emergence of other outsourcing markets leads to challenging industry climate. While
clients constantly pressurizing on price could also lead to subdued revenue growth, we believe current economic moat established by KGL should assist
them in maintaining earnings momentum in medium term.
KGL’s sister entity KCL also operates in the infantwear industry supplying to players like Carter’s and Mothercare. Though there is a conflict of interest
given that both the entities operate in the same space and managed by the same team with KCL being unlisted; we take solace that management
underscored that KCL would be merged with KGL at the appropriate time. However, valuation, timing of merger and pay-out method (Cash/share swap )
remains ambiguous.
KGL plans to launch its own brand in the US which can further improve the business profile of the company, the risks and concerns in managing and
succeeding in the same are critical factors to watch out for adding to the fact that this might be detrimental to KGL’s relationship with its existing clients.
Private & Confidential
Kitex Garments Limited – Well dressed for the leap
Tejash Shah | [email protected] | +91 22 4228 8155 Gnanasundaram | [email protected] | +91 44 4344 0062 Madhav PVR | [email protected] | +91 44 4344 0060
5
Kitex revenues are based on demand for infantwear apparels
Source: Company, Spark Capital
Overview of Kitex Limited
Having established as a strong supplier, direct entry being mulled
Source: Company, Spark Capital
Revenues have been driven by acquisition of new clients
Source: Company, Spark Capital
Revenue profile currently hinges on developed markets infantwear
offtakes
Source: Company, Spark Capital
USA, 80.0%
UK, 20.0%
Contract Manufacturers
Apparel Wholesalers & Retailers
Customers
KGL (India), Wing Lu
(China), Gin Mill
(Singapore), Jay Jay
Mils (India), etc…
Gerber, Carter, Toys
R Urs, Jockey,
Mothercare, etc…
Across North
America and Europe
2014 •Expected to launch own brand in US market shortly
2005 •Company split face value of its shares from Rs.10 to Rs.1
2004 • Increased focus on recession proof Infantwear industry; garment unit began manufacturing infantwear only
1995 •KGL goes Public; listed on NSE and BSE
1992 • Incorporated as a public limited company by the Anna group
0.80 1.11
1.62 1.93 1.99
2.68 2.56 3.15 3.17
4.42
0.00
0.50
1.00
1.50
2.00
2.50
3.00
3.50
4.00
4.50
5.00
FY 05 FY 06 FY 07 FY 08 FY 09 FY 10 FY 11 FY 12 FY 13 FY 14
In R
s.b
n
Revenue
Private & Confidential
Kitex Garments Limited – Well dressed for the leap
Tejash Shah | [email protected] | +91 22 4228 8155 Gnanasundaram | [email protected] | +91 44 4344 0062 Madhav PVR | [email protected] | +91 44 4344 0060
India Population: ~1.27 billion
India Population growth rate:1.2%
India Kids and babywear Market Size: ~$8bn
Source: Carter Annual report and Industry sources ,Spark Capital
6
World Infant wear and Kidswear Market – Major Countries
Brazil Population: ~203 million
Brazil Population growth rate:0.9%
Brazil Baby and kidswear Market Size: NA
USA Population: ~323 million
USA Population growth rate:0.7%
USA Baby and kidswear Market Size: ~$19bn
UK Population: 64 million
UK Population growth rate:0.6%
UK Kids and babywear market Size: ~5.2bn
pounds
China Population: ~1.40 billion
China Population growth rate:0.5%
China Kids and babywear Market Size:
~RMB 116.4bn
World Population: ~7.26 billion
World population growth rate: 1.14%
World Baby and kidswear Market Size : ~$155 billion
Private & Confidential
Kitex Garments Limited – Well dressed for the leap
Tejash Shah | [email protected] | +91 22 4228 8155 Gnanasundaram | [email protected] | +91 44 4344 0062 Madhav PVR | [email protected] | +91 44 4344 0060
7
Industry sources peg childrenswear market to record ~6% CAGR (5 years)
Source: Bloomberg Business Intelligence, Spark Capital
Global childrenswear market to grow at a quicker pace in the next 6 years
Prominent players in the Infantwear market
Source: Industry sources, Spark Capital
10
30
50
70
90
110
130
150
170
190
210
2005
2006
2007
2008
2009
2010
2011
2012
2013
2014E
2015E
2016E
2017E
2018E
US
D b
n
Childrenswear market contribution to apparels to increase in near term
Source: Bloomberg Business Intelligence, Spark Capital
Baby and Toddler Wear 22%
Boys' Apparel 36%
Girls' Apparel 42%
Infantwear market currently is about ~22% of the childrenswear market
globally
Source: Bloomberg Business Intelligence, Spark Capital
89.1% 89.1% 89.0% 88.8% 88.9% 89.0% 89.0% 89.0% 88.9%
10.9% 10.9% 11.0% 11.2% 11.1% 11.0% 11.0% 11.0% 11.1%
0.0%
10.0%
20.0%
30.0%
40.0%
50.0%
60.0%
70.0%
80.0%
90.0%
100.0%
2005 2006 2007 2008 2009 2010 2011 2012 2013
Others as a % of apparels market Childrens Wear as a % of apparels market
Private & Confidential
Kitex Garments Limited – Well dressed for the leap
Tejash Shah | [email protected] | +91 22 4228 8155 Gnanasundaram | [email protected] | +91 44 4344 0062 Madhav PVR | [email protected] | +91 44 4344 0060
8
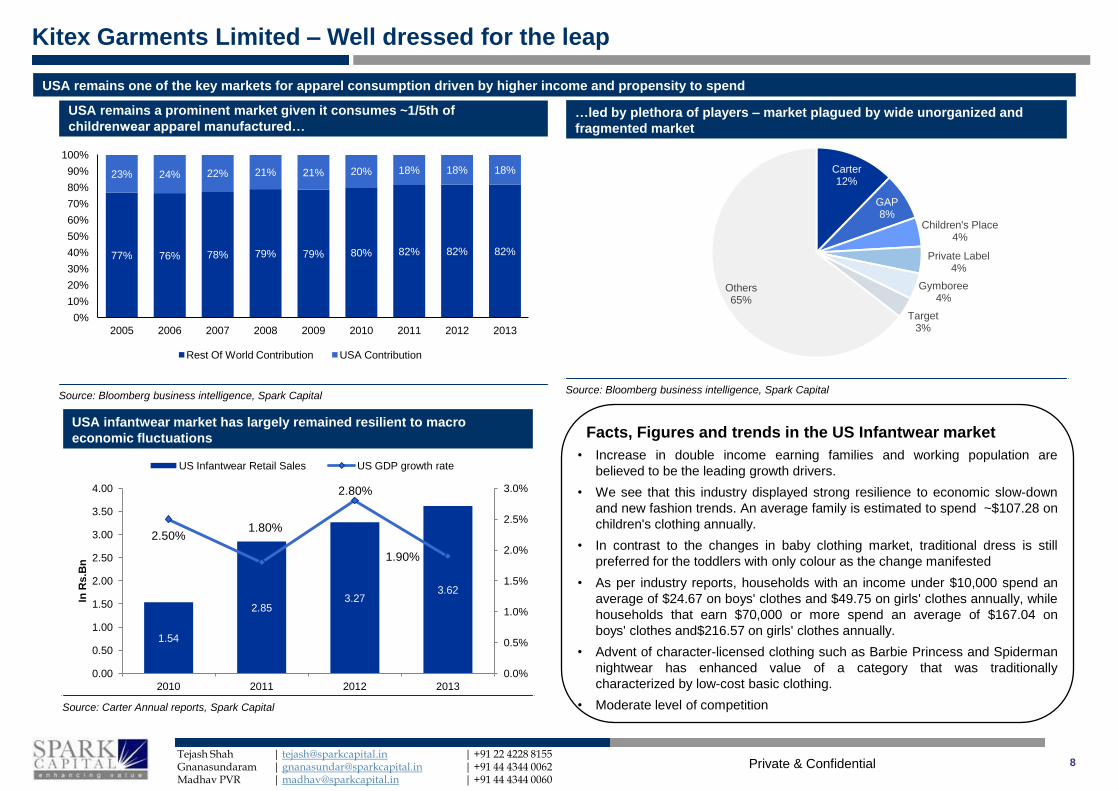
USA remains a prominent market given it consumes ~1/5th of
childrenwear apparel manufactured…
Source: Bloomberg business intelligence, Spark Capital
USA remains one of the key markets for apparel consumption driven by higher income and propensity to spend
USA infantwear market has largely remained resilient to macro
economic fluctuations
Source: Carter Annual reports, Spark Capital
…led by plethora of players – market plagued by wide unorganized and
fragmented market
Source: Bloomberg business intelligence, Spark Capital
Facts, Figures and trends in the US Infantwear market
• Increase in double income earning families and working population are
believed to be the leading growth drivers.
• We see that this industry displayed strong resilience to economic slow-down
and new fashion trends. An average family is estimated to spend ~$107.28 on
children's clothing annually.
• In contrast to the changes in baby clothing market, traditional dress is still
preferred for the toddlers with only colour as the change manifested
• As per industry reports, households with an income under $10,000 spend an
average of $24.67 on boys' clothes and $49.75 on girls' clothes annually, while
households that earn $70,000 or more spend an average of $167.04 on
boys' clothes and$216.57 on girls' clothes annually.
• Advent of character-licensed clothing such as Barbie Princess and Spiderman
nightwear has enhanced value of a category that was traditionally
characterized by low-cost basic clothing.
• Moderate level of competition
Carter 12%
GAP 8%
Children's Place 4%
Private Label 4%
Gymboree 4%
Target 3%
Others 65%
77% 76% 78% 79% 79% 80% 82% 82% 82%
23% 24% 22% 21% 21% 20% 18% 18% 18%
0%
10%
20%
30%
40%
50%
60%
70%
80%
90%
100%
2005 2006 2007 2008 2009 2010 2011 2012 2013
Rest Of World Contribution USA Contribution
1.54
2.85 3.27
3.62
2.50% 1.80%
2.80%
1.90%
0.0%
0.5%
1.0%
1.5%
2.0%
2.5%
3.0%
0.00
0.50
1.00
1.50
2.00
2.50
3.00
3.50
4.00
2010 2011 2012 2013
In R
s.B
n
US Infantwear Retail Sales US GDP growth rate
Private & Confidential
Kitex Garments Limited – Well dressed for the leap
Tejash Shah | [email protected] | +91 22 4228 8155 Gnanasundaram | [email protected] | +91 44 4344 0062 Madhav PVR | [email protected] | +91 44 4344 0060
9
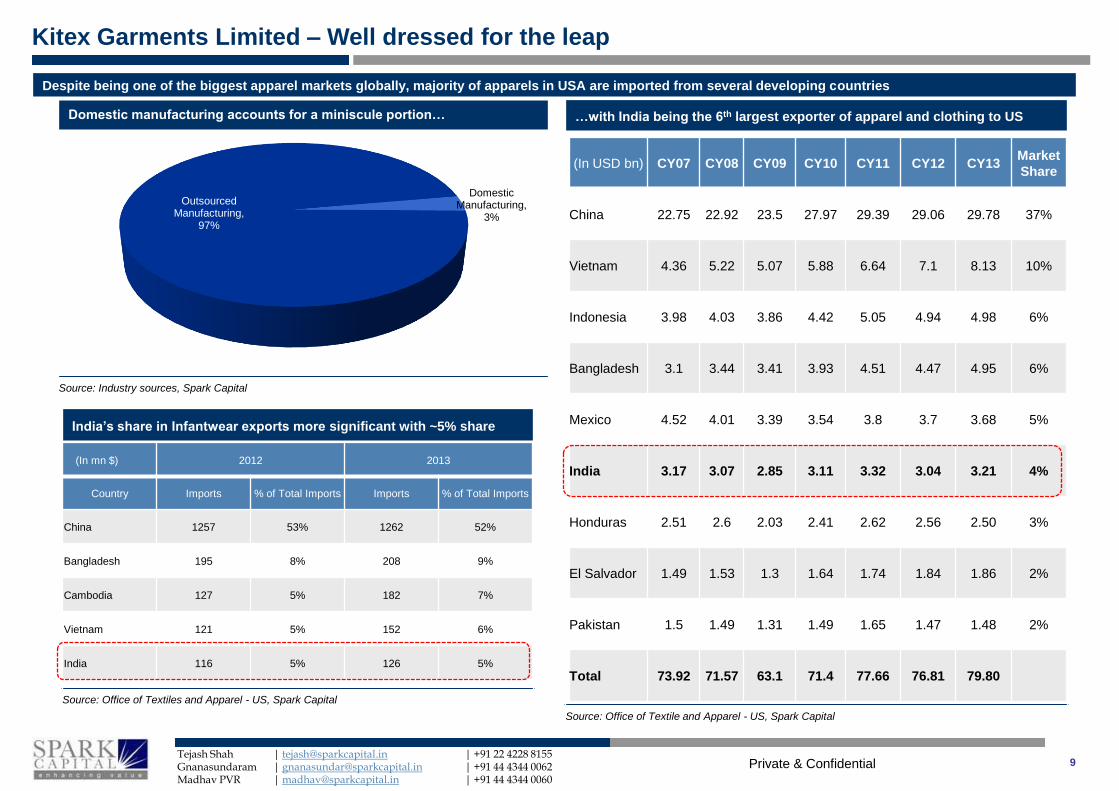
Domestic manufacturing accounts for a miniscule portion…
Source: Industry sources, Spark Capital
Despite being one of the biggest apparel markets globally, majority of apparels in USA are imported from several developing countries
India’s share in Infantwear exports more significant with ~5% share
Source: Office of Textiles and Apparel - US, Spark Capital
…with India being the 6th largest exporter of apparel and clothing to US
Source: Office of Textile and Apparel - US, Spark Capital
Domestic Manufacturing,
3%
Outsourced Manufacturing,
97%
(In mn $) 2012 2013
Country Imports % of Total Imports Imports % of Total Imports
China 1257 53% 1262 52%
Bangladesh 195 8% 208 9%
Cambodia 127 5% 182 7%
Vietnam 121 5% 152 6%
India 116 5% 126 5%
(In USD bn) CY07 CY08 CY09 CY10 CY11 CY12 CY13 Market
Share
China 22.75 22.92 23.5 27.97 29.39 29.06 29.78 37%
Vietnam 4.36 5.22 5.07 5.88 6.64 7.1 8.13 10%
Indonesia 3.98 4.03 3.86 4.42 5.05 4.94 4.98 6%
Bangladesh 3.1 3.44 3.41 3.93 4.51 4.47 4.95 6%
Mexico 4.52 4.01 3.39 3.54 3.8 3.7 3.68 5%
India 3.17 3.07 2.85 3.11 3.32 3.04 3.21 4%
Honduras 2.51 2.6 2.03 2.41 2.62 2.56 2.50 3%
El Salvador 1.49 1.53 1.3 1.64 1.74 1.84 1.86 2%
Pakistan 1.5 1.49 1.31 1.49 1.65 1.47 1.48 2%
Total 73.92 71.57 63.1 71.4 77.66 76.81 79.80
Private & Confidential
Kitex Garments Limited – Well dressed for the leap
Tejash Shah | [email protected] | +91 22 4228 8155 Gnanasundaram | [email protected] | +91 44 4344 0062 Madhav PVR | [email protected] | +91 44 4344 0060
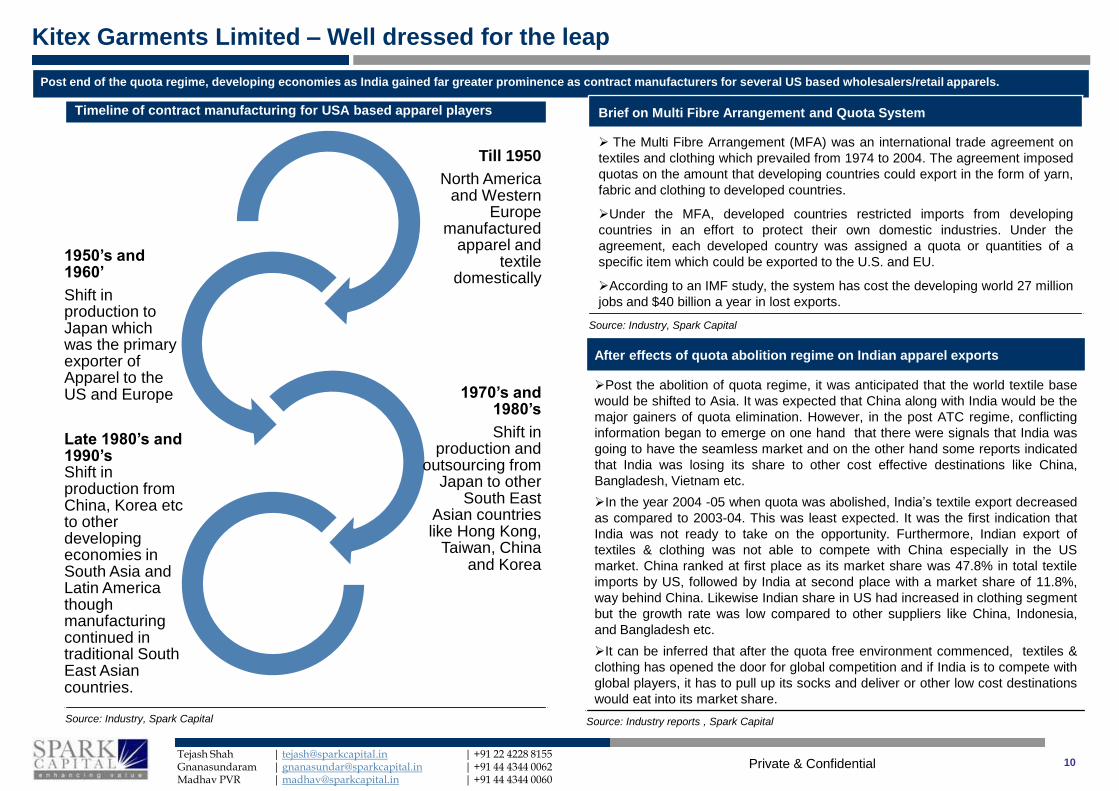
Timeline of contract manufacturing for USA based apparel players
Source: Industry, Spark Capital
10
Post end of the quota regime, developing economies as India gained far greater prominence as contract manufacturers for several US based wholesalers/retail apparels.
After effects of quota abolition regime on Indian apparel exports
Post the abolition of quota regime, it was anticipated that the world textile base
would be shifted to Asia. It was expected that China along with India would be the
major gainers of quota elimination. However, in the post ATC regime, conflicting
information began to emerge on one hand that there were signals that India was
going to have the seamless market and on the other hand some reports indicated
that India was losing its share to other cost effective destinations like China,
Bangladesh, Vietnam etc.
In the year 2004 -05 when quota was abolished, India’s textile export decreased
as compared to 2003-04. This was least expected. It was the first indication that
India was not ready to take on the opportunity. Furthermore, Indian export of
textiles & clothing was not able to compete with China especially in the US
market. China ranked at first place as its market share was 47.8% in total textile
imports by US, followed by India at second place with a market share of 11.8%,
way behind China. Likewise Indian share in US had increased in clothing segment
but the growth rate was low compared to other suppliers like China, Indonesia,
and Bangladesh etc.
It can be inferred that after the quota free environment commenced, textiles &
clothing has opened the door for global competition and if India is to compete with
global players, it has to pull up its socks and deliver or other low cost destinations
would eat into its market share.
Source: Industry reports , Spark Capital
Till 1950
North America and Western
Europe manufactured
apparel and textile
domestically
1950’s and 1960’
Shift in production to Japan which was the primary exporter of Apparel to the US and Europe 1970’s and
1980’s
Shift in production and
outsourcing from Japan to other
South East Asian countries like Hong Kong,
Taiwan, China and Korea
Late 1980’s and 1990’s Shift in production from China, Korea etc to other developing economies in South Asia and Latin America though manufacturing continued in traditional South East Asian countries.
Brief on Multi Fibre Arrangement and Quota System
The Multi Fibre Arrangement (MFA) was an international trade agreement on
textiles and clothing which prevailed from 1974 to 2004. The agreement imposed
quotas on the amount that developing countries could export in the form of yarn,
fabric and clothing to developed countries.
Under the MFA, developed countries restricted imports from developing
countries in an effort to protect their own domestic industries. Under the
agreement, each developed country was assigned a quota or quantities of a
specific item which could be exported to the U.S. and EU.
According to an IMF study, the system has cost the developing world 27 million
jobs and $40 billion a year in lost exports.
Source: Industry, Spark Capital
Private & Confidential
Kitex Garments Limited – Well dressed for the leap
Tejash Shah | [email protected] | +91 22 4228 8155 Gnanasundaram | [email protected] | +91 44 4344 0062 Madhav PVR | [email protected] | +91 44 4344 0060
11
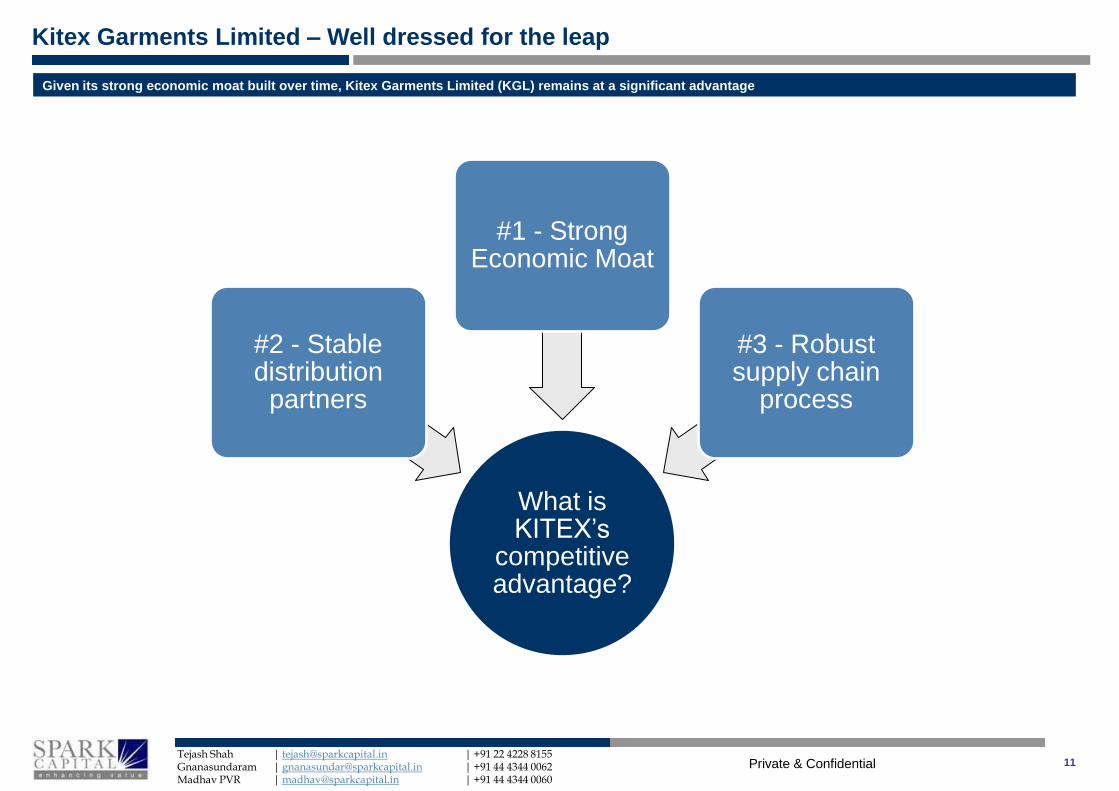
Given its strong economic moat built over time, Kitex Garments Limited (KGL) remains at a significant advantage
What is KITEX’s
competitive advantage?
#2 - Stable distribution
partners
#1 - Strong Economic Moat
#3 - Robust supply chain
process
Private & Confidential
Kitex Garments Limited – Well dressed for the leap
Tejash Shah | [email protected] | +91 22 4228 8155 Gnanasundaram | [email protected] | +91 44 4344 0062 Madhav PVR | [email protected] | +91 44 4344 0060
12
With time, KGL has managed to build long lasting relationship with
clients through its consistent quality adherence and sturdy capex
expansion
Source: Company, Spark Capital
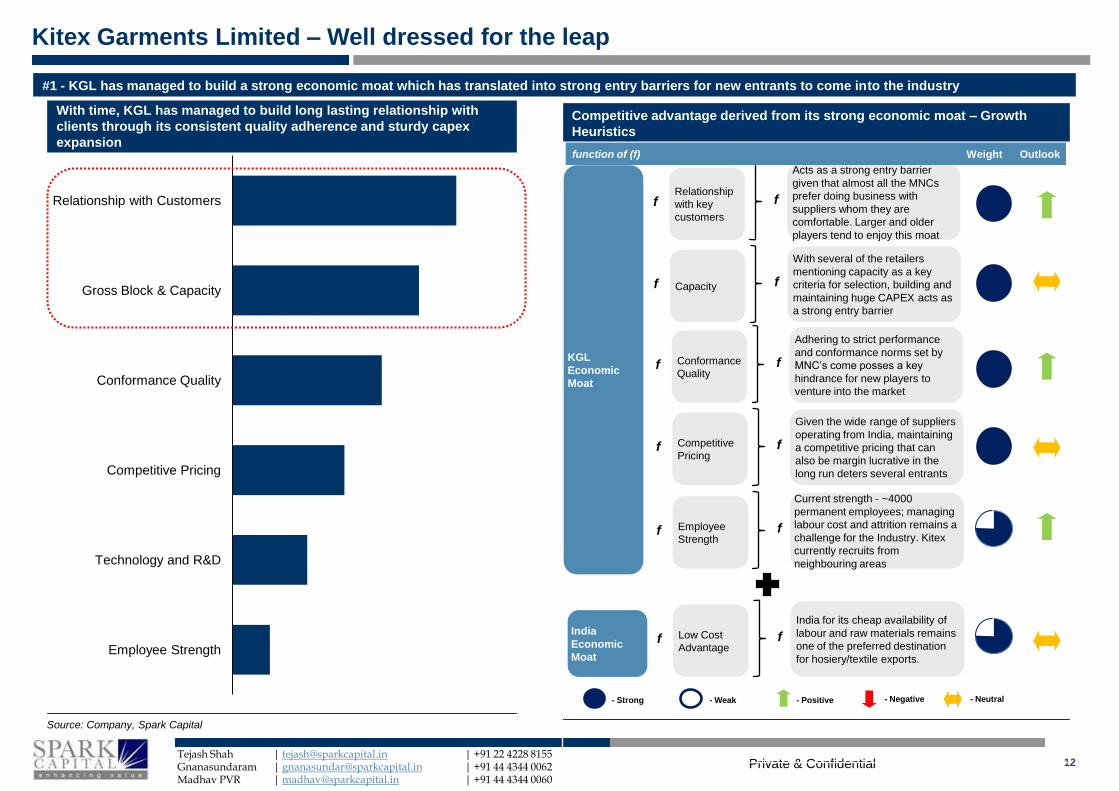
#1 - KGL has managed to build a strong economic moat which has translated into strong entry barriers for new entrants to come into the industry
Competitive advantage derived from its strong economic moat – Growth
Heuristics
KGL
Economic
Moat
Relationship
with key
customers
f
India
Economic
Moat
Acts as a strong entry barrier
given that almost all the MNCs
prefer doing business with
suppliers whom they are
comfortable. Larger and older
players tend to enjoy this moat
f
function of (f) Weight Outlook
Capacity f
With several of the retailers
mentioning capacity as a key
criteria for selection, building and
maintaining huge CAPEX acts as
a strong entry barrier
f
Conformance
Quality f
Adhering to strict performance
and conformance norms set by
MNC’s come posses a key
hindrance for new players to
venture into the market
f
Competitive
Pricing f
Given the wide range of suppliers
operating from India, maintaining
a competitive pricing that can
also be margin lucrative in the
long run deters several entrants
f
Employee
Strength f
Current strength - ~4000
permanent employees; managing
labour cost and attrition remains a
challenge for the Industry. Kitex
currently recruits from
neighbouring areas
f
Low Cost
Advantage f
India for its cheap availability of
labour and raw materials remains
one of the preferred destination
for hosiery/textile exports.
f
- Negative - Strong - Weak - Positive - Neutral
Relationship with Customers
Gross Block & Capacity
Conformance Quality
Competitive Pricing
Technology and R&D
Employee Strength
Private & Confidential
Kitex Garments Limited – Well dressed for the leap
Tejash Shah | [email protected] | +91 22 4228 8155 Gnanasundaram | [email protected] | +91 44 4344 0062 Madhav PVR | [email protected] | +91 44 4344 0060
13
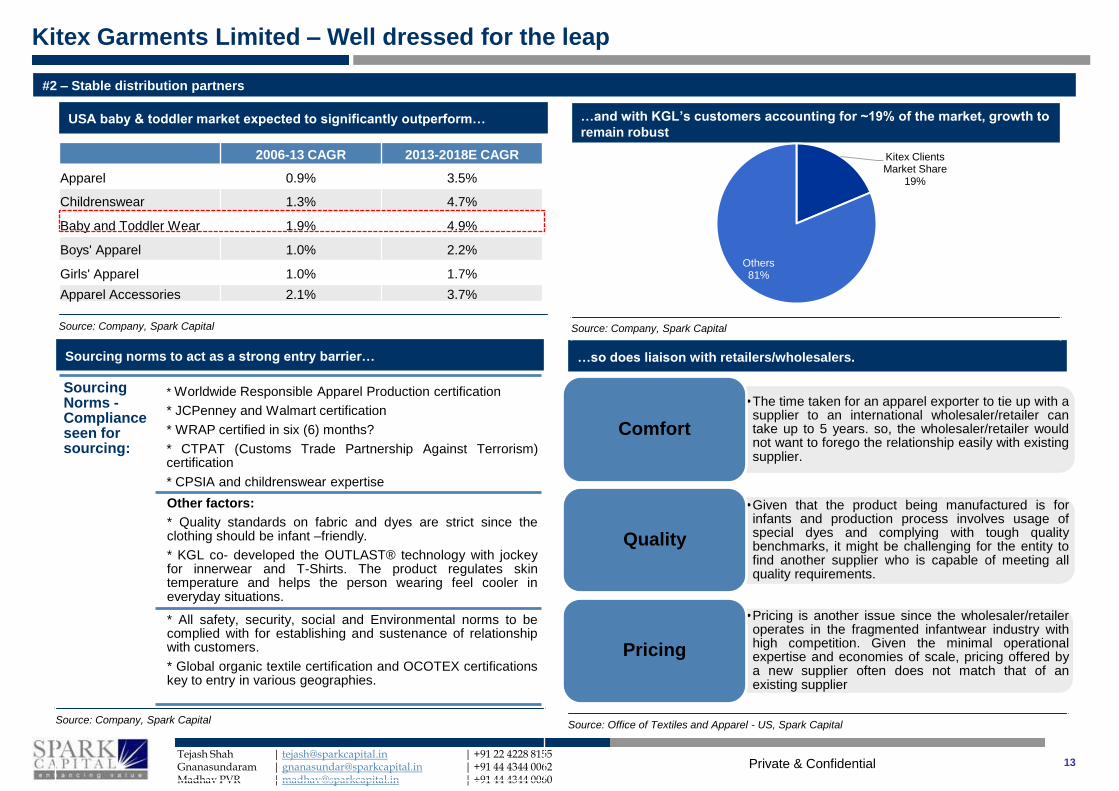
USA baby & toddler market expected to significantly outperform…
Source: Company, Spark Capital
#2 – Stable distribution partners
…so does liaison with retailers/wholesalers.
Source: Office of Textiles and Apparel - US, Spark Capital
…and with KGL’s customers accounting for ~19% of the market, growth to
remain robust
Source: Company, Spark Capital
Sourcing norms to act as a strong entry barrier…
Source: Company, Spark Capital
2006-13 CAGR 2013-2018E CAGR
Apparel 0.9% 3.5%
Childrenswear 1.3% 4.7%
Baby and Toddler Wear 1.9% 4.9%
Boys' Apparel 1.0% 2.2%
Girls' Apparel 1.0% 1.7%
Apparel Accessories 2.1% 3.7%
Kitex Clients Market Share
19%
Others 81%
Sourcing Norms - Compliance seen for sourcing:
* Worldwide Responsible Apparel Production certification
* JCPenney and Walmart certification
* WRAP certified in six (6) months?
* CTPAT (Customs Trade Partnership Against Terrorism) certification
* CPSIA and childrenswear expertise
Other factors:
* Quality standards on fabric and dyes are strict since the clothing should be infant –friendly.
* KGL co- developed the OUTLAST® technology with jockey for innerwear and T-Shirts. The product regulates skin temperature and helps the person wearing feel cooler in everyday situations.
* All safety, security, social and Environmental norms to be complied with for establishing and sustenance of relationship with customers.
* Global organic textile certification and OCOTEX certifications key to entry in various geographies.
•The time taken for an apparel exporter to tie up with a supplier to an international wholesaler/retailer can take up to 5 years. so, the wholesaler/retailer would not want to forego the relationship easily with existing supplier.
Comfort
•Given that the product being manufactured is for infants and production process involves usage of special dyes and complying with tough quality benchmarks, it might be challenging for the entity to find another supplier who is capable of meeting all quality requirements.
Quality
•Pricing is another issue since the wholesaler/retailer operates in the fragmented infantwear industry with high competition. Given the minimal operational expertise and economies of scale, pricing offered by a new supplier often does not match that of an existing supplier
Pricing
Private & Confidential
Kitex Garments Limited – Well dressed for the leap
Tejash Shah | [email protected] | +91 22 4228 8155 Gnanasundaram | [email protected] | +91 44 4344 0062 Madhav PVR | [email protected] | +91 44 4344 0060
14
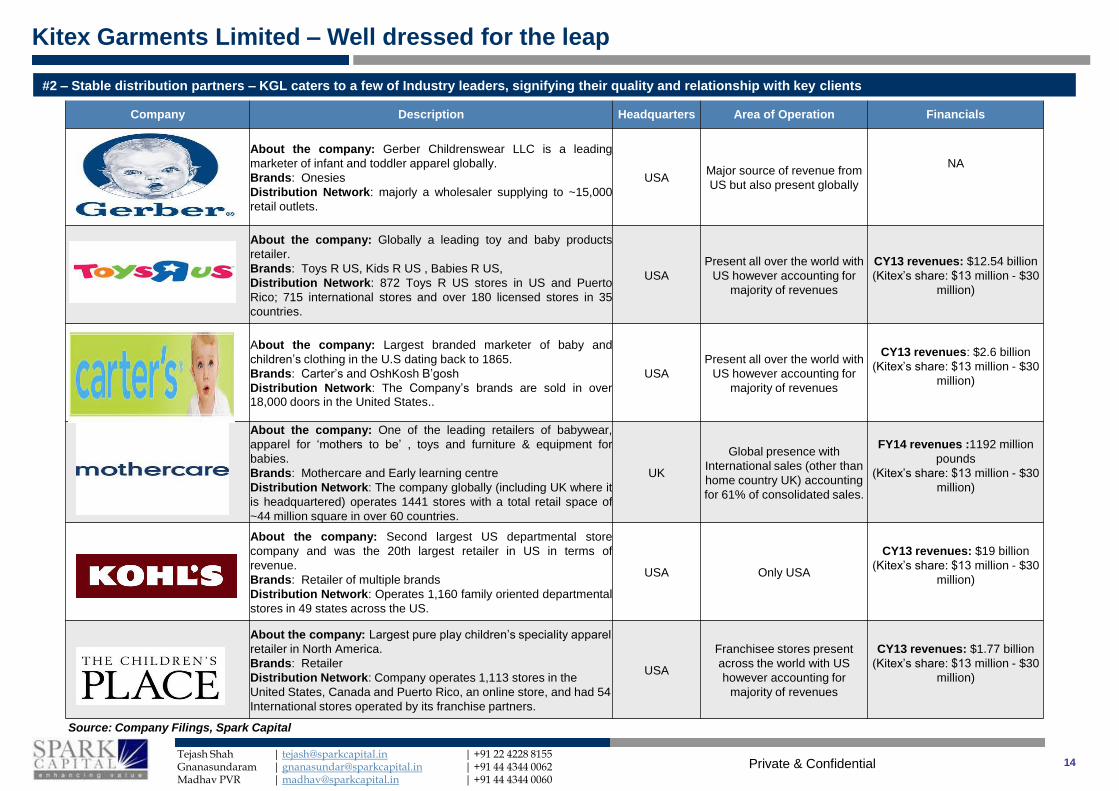
Company Description Headquarters Area of Operation Financials
About the company: Gerber Childrenswear LLC is a leading
marketer of infant and toddler apparel globally.
Brands: Onesies
Distribution Network: majorly a wholesaler supplying to ~15,000
retail outlets.
USA Major source of revenue from
US but also present globally
NA
About the company: Globally a leading toy and baby products
retailer.
Brands: Toys R US, Kids R US , Babies R US,
Distribution Network: 872 Toys R US stores in US and Puerto
Rico; 715 international stores and over 180 licensed stores in 35
countries.
USA
Present all over the world with
US however accounting for
majority of revenues
CY13 revenues: $12.54 billion
(Kitex’s share: $13 million - $30
million)
About the company: Largest branded marketer of baby and
children’s clothing in the U.S dating back to 1865.
Brands: Carter’s and OshKosh B’gosh
Distribution Network: The Company’s brands are sold in over 18,000 doors in the United States..
USA
Present all over the world with
US however accounting for
majority of revenues
CY13 revenues: $2.6 billion
(Kitex’s share: $13 million - $30
million)
About the company: One of the leading retailers of babywear,
apparel for ‘mothers to be’ , toys and furniture & equipment for
babies.
Brands: Mothercare and Early learning centre
Distribution Network: The company globally (including UK where it
is headquartered) operates 1441 stores with a total retail space of
~44 million square in over 60 countries.
UK
Global presence with
International sales (other than
home country UK) accounting
for 61% of consolidated sales.
FY14 revenues :1192 million
pounds
(Kitex’s share: $13 million - $30
million)
About the company: Second largest US departmental store
company and was the 20th largest retailer in US in terms of
revenue.
Brands: Retailer of multiple brands
Distribution Network: Operates 1,160 family oriented departmental
stores in 49 states across the US.
USA Only USA
CY13 revenues: $19 billion
(Kitex’s share: $13 million - $30
million)
About the company: Largest pure play children’s speciality apparel
retailer in North America.
Brands: Retailer
Distribution Network: Company operates 1,113 stores in the
United States, Canada and Puerto Rico, an online store, and had 54
International stores operated by its franchise partners.
USA
Franchisee stores present
across the world with US
however accounting for
majority of revenues
CY13 revenues: $1.77 billion
(Kitex’s share: $13 million - $30
million)
Source: Company Filings, Spark Capital
#2 – Stable distribution partners – KGL caters to a few of Industry leaders, signifying their quality and relationship with key clients
Private & Confidential
Kitex Garments Limited – Well dressed for the leap
Tejash Shah | [email protected] | +91 22 4228 8155 Gnanasundaram | [email protected] | +91 44 4344 0062 Madhav PVR | [email protected] | +91 44 4344 0060
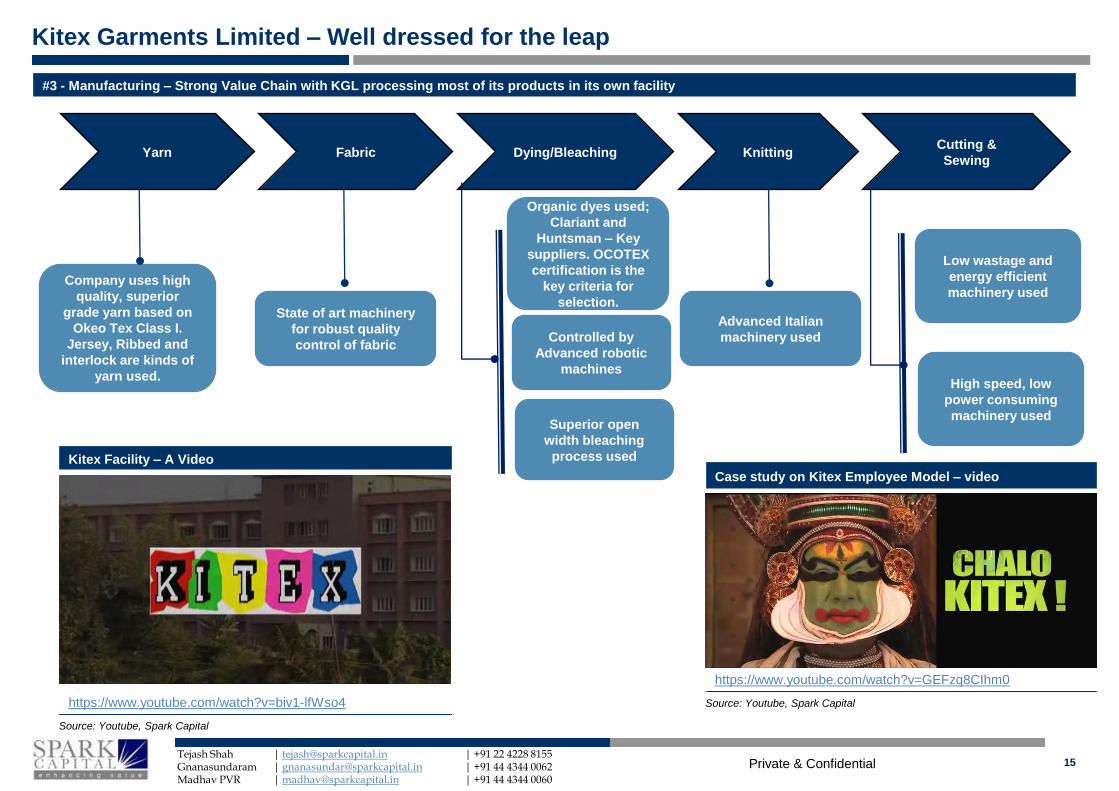
Yarn Fabric Dying/Bleaching Knitting Cutting &
Sewing
Low wastage and
energy efficient
machinery used
15
Company uses high
quality, superior
grade yarn based on
Okeo Tex Class I.
Jersey, Ribbed and
interlock are kinds of
yarn used.
Organic dyes used;
Clariant and
Huntsman – Key
suppliers. OCOTEX
certification is the
key criteria for
selection. State of art machinery
for robust quality
control of fabric Controlled by
Advanced robotic
machines
Superior open
width bleaching
process used
High speed, low
power consuming
machinery used
Advanced Italian
machinery used
Kitex Facility – A Video
https://www.youtube.com/watch?v=biv1-lfWso4
Source: Youtube, Spark Capital
Case study on Kitex Employee Model – video
https://www.youtube.com/watch?v=GEFzq8CIhm0
Source: Youtube, Spark Capital
#3 - Manufacturing – Strong Value Chain with KGL processing most of its products in its own facility
Private & Confidential
Kitex Garments Limited – Well dressed for the leap
Tejash Shah | [email protected] | +91 22 4228 8155 Gnanasundaram | [email protected] | +91 44 4344 0062 Madhav PVR | [email protected] | +91 44 4344 0060
16
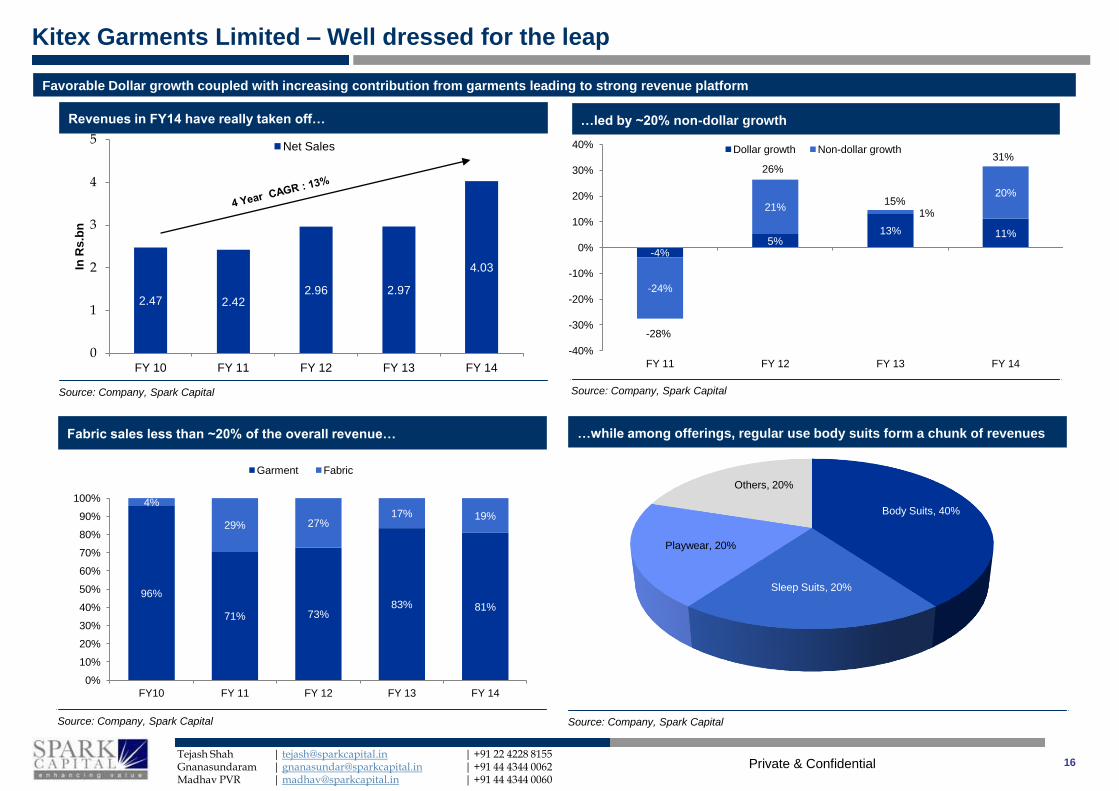
Revenues in FY14 have really taken off…
Source: Company, Spark Capital
Favorable Dollar growth coupled with increasing contribution from garments leading to strong revenue platform
…while among offerings, regular use body suits form a chunk of revenues
Source: Company, Spark Capital
…led by ~20% non-dollar growth
Source: Company, Spark Capital
Fabric sales less than ~20% of the overall revenue…
Source: Company, Spark Capital
-4% 5%
13% 11%
-24%
21% 1%
20%
-28%
26%
15%
31%
-40%
-30%
-20%
-10%
0%
10%
20%
30%
40%
FY 11 FY 12 FY 13 FY 14
Dollar growth Non-dollar growth
96%
71% 73% 83% 81%
4%
29% 27% 17% 19%
0%
10%
20%
30%
40%
50%
60%
70%
80%
90%
100%
FY10 FY 11 FY 12 FY 13 FY 14
Garment Fabric
Body Suits, 40%
Sleep Suits, 20%
Playwear, 20%
Others, 20%
2.47 2.42 2.96 2.97
4.03
0
1
2
3
4
5
FY 10 FY 11 FY 12 FY 13 FY 14
In R
s.b
n
Net Sales
Private & Confidential
Kitex Garments Limited – Well dressed for the leap
Tejash Shah | [email protected] | +91 22 4228 8155 Gnanasundaram | [email protected] | +91 44 4344 0062 Madhav PVR | [email protected] | +91 44 4344 0060
17
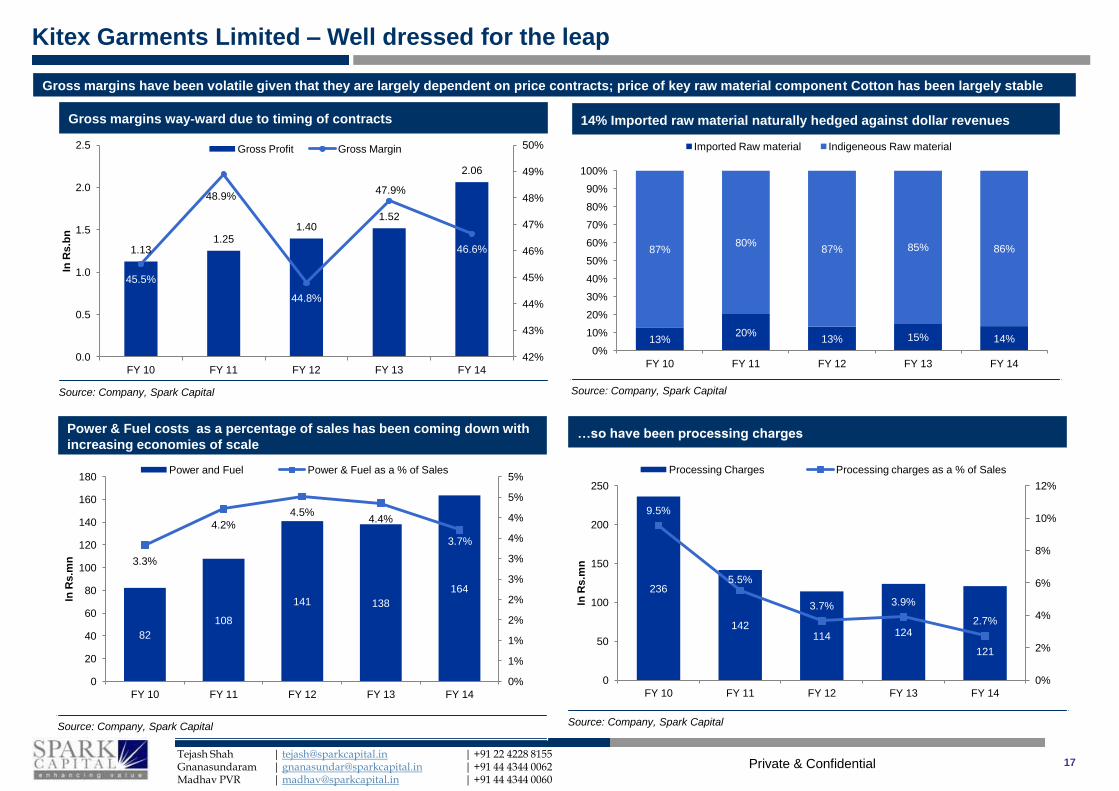
Gross margins way-ward due to timing of contracts
Source: Company, Spark Capital
Gross margins have been volatile given that they are largely dependent on price contracts; price of key raw material component Cotton has been largely stable
…so have been processing charges
Source: Company, Spark Capital
14% Imported raw material naturally hedged against dollar revenues
Source: Company, Spark Capital
Power & Fuel costs as a percentage of sales has been coming down with
increasing economies of scale
Source: Company, Spark Capital
13% 20%
13% 15% 14%
87% 80%
87% 85% 86%
0%
10%
20%
30%
40%
50%
60%
70%
80%
90%
100%
FY 10 FY 11 FY 12 FY 13 FY 14
Imported Raw material Indigeneous Raw material
82
108
141 138
164
3.3%
4.2%
4.5% 4.4%
3.7%
0%
1%
1%
2%
2%
3%
3%
4%
4%
5%
5%
0
20
40
60
80
100
120
140
160
180
FY 10 FY 11 FY 12 FY 13 FY 14
In R
s.m
n
Power and Fuel Power & Fuel as a % of Sales
236
142 114 124
121
9.5%
5.5%
3.7% 3.9%
2.7%
0%
2%
4%
6%
8%
10%
12%
0
50
100
150
200
250
FY 10 FY 11 FY 12 FY 13 FY 14
In R
s.m
n
Processing Charges Processing charges as a % of Sales
1.13 1.25
1.40 1.52
2.06
45.5%
48.9%
44.8%
47.9%
46.6%
42%
43%
44%
45%
46%
47%
48%
49%
50%
0.0
0.5
1.0
1.5
2.0
2.5
FY 10 FY 11 FY 12 FY 13 FY 14
In R
s.b
n
Gross Profit Gross Margin
Private & Confidential
Kitex Garments Limited – Well dressed for the leap
Tejash Shah | [email protected] | +91 22 4228 8155 Gnanasundaram | [email protected] | +91 44 4344 0062 Madhav PVR | [email protected] | +91 44 4344 0060
18
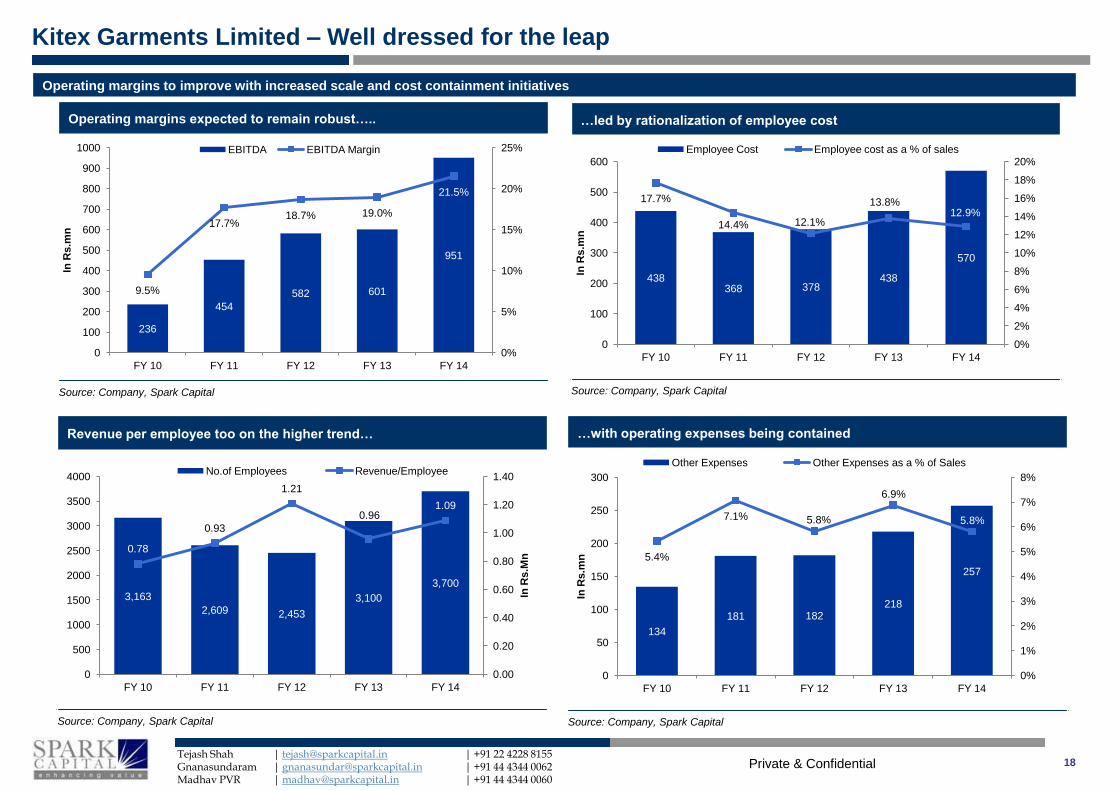
Operating margins expected to remain robust…..
Source: Company, Spark Capital
Operating margins to improve with increased scale and cost containment initiatives
…with operating expenses being contained
Source: Company, Spark Capital
…led by rationalization of employee cost
Source: Company, Spark Capital
Revenue per employee too on the higher trend…
Source: Company, Spark Capital
438 368 378
438
570
17.7%
14.4% 12.1%
13.8% 12.9%
0%
2%
4%
6%
8%
10%
12%
14%
16%
18%
20%
0
100
200
300
400
500
600
FY 10 FY 11 FY 12 FY 13 FY 14
In R
s.m
n
Employee Cost Employee cost as a % of sales
3,163
2,609 2,453
3,100
3,700
0.78
0.93
1.21
0.96 1.09
0.00
0.20
0.40
0.60
0.80
1.00
1.20
1.40
0
500
1000
1500
2000
2500
3000
3500
4000
FY 10 FY 11 FY 12 FY 13 FY 14
In R
s.M
n
No.of Employees Revenue/Employee
134
181 182 218
257
5.4%
7.1% 5.8%
6.9%
5.8%
0%
1%
2%
3%
4%
5%
6%
7%
8%
0
50
100
150
200
250
300
FY 10 FY 11 FY 12 FY 13 FY 14
In R
s.m
n
Other Expenses Other Expenses as a % of Sales
236
454
582 601
951
9.5%
17.7% 18.7% 19.0%
21.5%
0%
5%
10%
15%
20%
25%
0
100
200
300
400
500
600
700
800
900
1000
FY 10 FY 11 FY 12 FY 13 FY 14
In R
s.m
n
EBITDA EBITDA Margin
Private & Confidential
Kitex Garments Limited – Well dressed for the leap
Tejash Shah | [email protected] | +91 22 4228 8155 Gnanasundaram | [email protected] | +91 44 4344 0062 Madhav PVR | [email protected] | +91 44 4344 0060
19
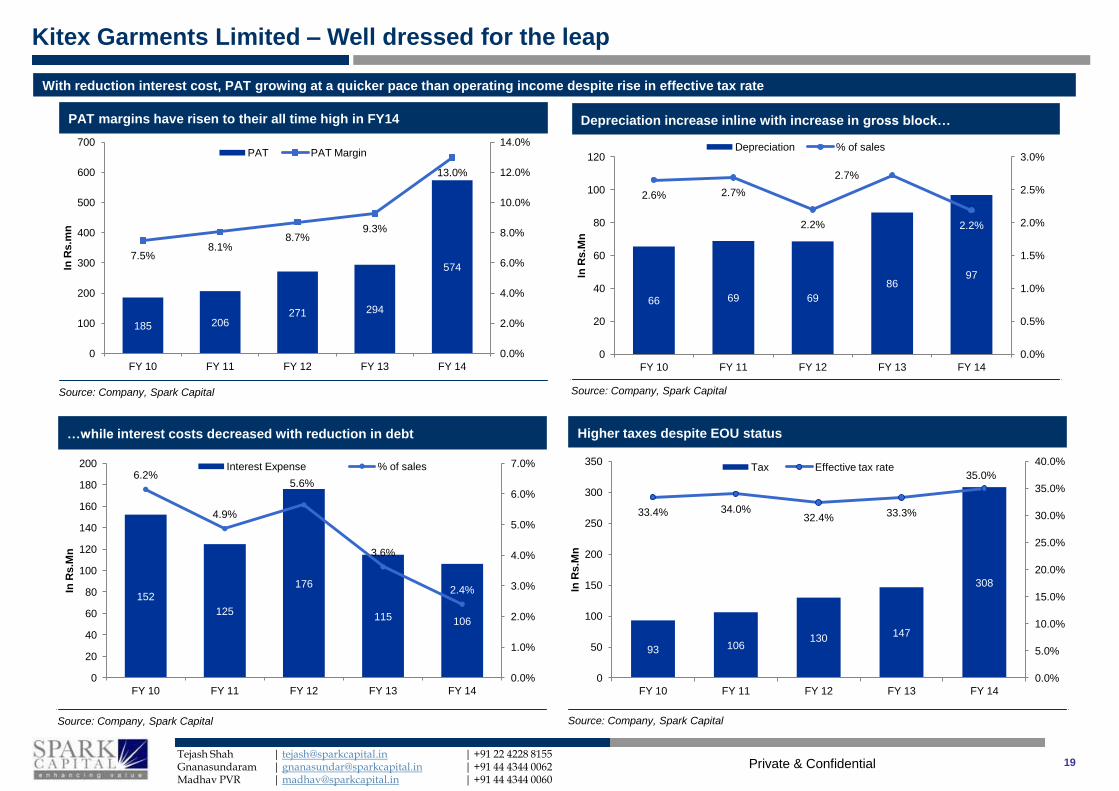
PAT margins have risen to their all time high in FY14
Source: Company, Spark Capital
With reduction interest cost, PAT growing at a quicker pace than operating income despite rise in effective tax rate
Higher taxes despite EOU status
Source: Company, Spark Capital
Depreciation increase inline with increase in gross block…
Source: Company, Spark Capital
…while interest costs decreased with reduction in debt
Source: Company, Spark Capital
152
125
176
115 106
6.2%
4.9%
5.6%
3.6%
2.4%
0.0%
1.0%
2.0%
3.0%
4.0%
5.0%
6.0%
7.0%
0
20
40
60
80
100
120
140
160
180
200
FY 10 FY 11 FY 12 FY 13 FY 14
In R
s.M
n
Interest Expense % of sales
185 206 271 294
574 7.5%
8.1% 8.7%
9.3%
13.0%
0.0%
2.0%
4.0%
6.0%
8.0%
10.0%
12.0%
14.0%
0
100
200
300
400
500
600
700
FY 10 FY 11 FY 12 FY 13 FY 14
In R
s.m
n
PAT PAT Margin
66 69 69
86 97
2.6% 2.7%
2.2%
2.7%
2.2%
0.0%
0.5%
1.0%
1.5%
2.0%
2.5%
3.0%
0
20
40
60
80
100
120
FY 10 FY 11 FY 12 FY 13 FY 14
In R
s.M
n
Depreciation % of sales
93 106 130
147
308
33.4% 34.0% 32.4% 33.3%
35.0%
0.0%
5.0%
10.0%
15.0%
20.0%
25.0%
30.0%
35.0%
40.0%
0
50
100
150
200
250
300
350
FY 10 FY 11 FY 12 FY 13 FY 14
In R
s.M
n
Tax Effective tax rate

Private & Confidential
Kitex Garments Limited – Well dressed for the leap
Tejash Shah | [email protected] | +91 22 4228 8155 Gnanasundaram | [email protected] | +91 44 4344 0062 Madhav PVR | [email protected] | +91 44 4344 0060
20
5X revenue growth in ten years without any equity dilution….
Source: Company, Spark Capital
Internal accruals have largely been used over the past few years for CAPEX and repayment of loans
…leading to consistent high return ratios
Source: Company, Spark Capital
…so have been debt repayment controlled leverage inspite of growth
Source: Company, Spark Capital
Sales rising in tandem with gross block addition…
Source: Company, Spark Capital
47.5
47.5 47.5 47.5 47.5 47.5 47.5 47.5 47.5 47.5
47
86 173 251 336 505 689 927 1,176 1,694
0%
10%
20%
30%
40%
50%
60%
70%
80%
90%
100%
2005 2006 2007 2008 2009 2010 2011 2012 2013 2014
Equity Share Capital Reserves and Surplus
697
880 884 918
1,194
1.26 1.19
0.91
0.75 0.69
0.00
0.20
0.40
0.60
0.80
1.00
1.20
1.40
0
200
400
600
800
1000
1200
1400
FY 10 FY 11 FY 12 FY 13 FY 14
In R
s.m
n
Total Debt Debt-Equity ratio
1.44 1.51 1.59 1.61
2.34
2.47 2.42
2.96 2.97
4.03
0.0
0.5
1.0
1.5
2.0
2.5
3.0
3.5
4.0
4.5
FY 10 FY 11 FY 12 FY 13 FY 14
In R
s.b
n
Gross Block Net Sales
40%
32% 32%
27%
39%
17% 18% 20%
17%
23%
0%
5%
10%
15%
20%
25%
30%
35%
40%
45%
FY 10 FY 11 FY 12 FY 13 FY 14
ROE ROCE
Private & Confidential
Kitex Garments Limited – Well dressed for the leap
Tejash Shah | [email protected] | +91 22 4228 8155 Gnanasundaram | [email protected] | +91 44 4344 0062 Madhav PVR | [email protected] | +91 44 4344 0060
21
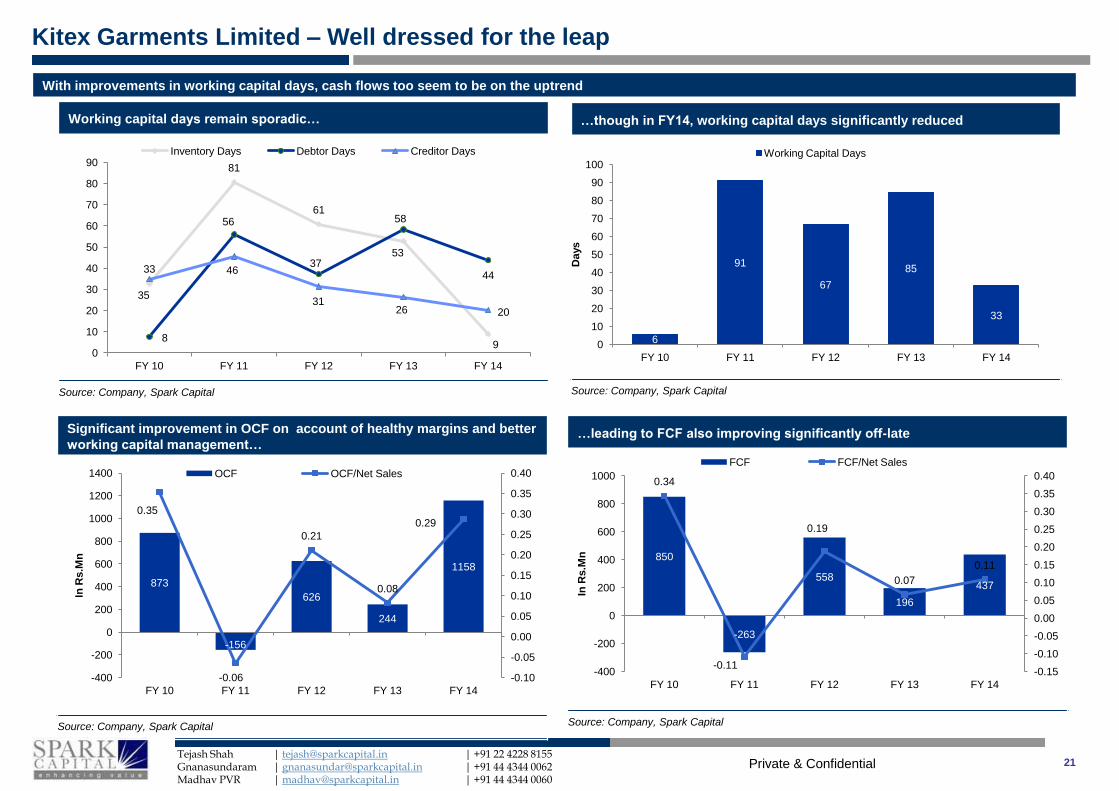
Working capital days remain sporadic…
Source: Company, Spark Capital
With improvements in working capital days, cash flows too seem to be on the uptrend
…leading to FCF also improving significantly off-late
Source: Company, Spark Capital
…though in FY14, working capital days significantly reduced
Source: Company, Spark Capital
Significant improvement in OCF on account of healthy margins and better
working capital management…
Source: Company, Spark Capital
33
81
61
53
9 8
56
37
58
44
35
46
31 26 20
0
10
20
30
40
50
60
70
80
90
FY 10 FY 11 FY 12 FY 13 FY 14
Inventory Days Debtor Days Creditor Days
6
91
67
85
33
0
10
20
30
40
50
60
70
80
90
100
FY 10 FY 11 FY 12 FY 13 FY 14
Days
Working Capital Days
873
-156
626
244
1158
0.35
-0.06
0.21
0.08
0.29
-0.10
-0.05
0.00
0.05
0.10
0.15
0.20
0.25
0.30
0.35
0.40
-400
-200
0
200
400
600
800
1000
1200
1400
FY 10 FY 11 FY 12 FY 13 FY 14
In R
s.M
n
OCF OCF/Net Sales
850
-263
558
196
437
0.34
-0.11
0.19
0.07
0.11
-0.15
-0.10
-0.05
0.00
0.05
0.10
0.15
0.20
0.25
0.30
0.35
0.40
-400
-200
0
200
400
600
800
1000
FY 10 FY 11 FY 12 FY 13 FY 14
In R
s.M
n
FCF FCF/Net Sales
Private & Confidential
Kitex Garments Limited – Well dressed for the leap
Tejash Shah | [email protected] | +91 22 4228 8155 Gnanasundaram | [email protected] | +91 44 4344 0062 Madhav PVR | [email protected] | +91 44 4344 0060
22
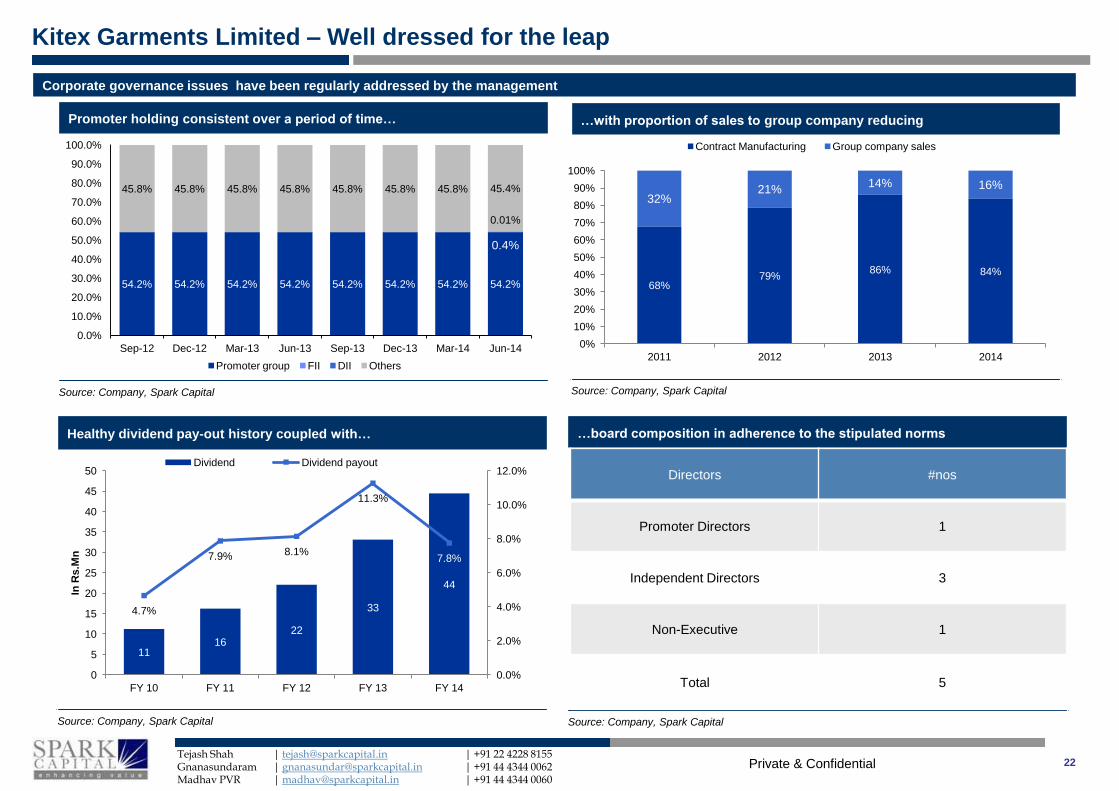
Promoter holding consistent over a period of time…
Source: Company, Spark Capital
Corporate governance issues have been regularly addressed by the management
…board composition in adherence to the stipulated norms
Source: Company, Spark Capital
…with proportion of sales to group company reducing
Source: Company, Spark Capital
Healthy dividend pay-out history coupled with…
Source: Company, Spark Capital
54.2% 54.2% 54.2% 54.2% 54.2% 54.2% 54.2% 54.2%
0.4%
0.01%
45.8% 45.8% 45.8% 45.8% 45.8% 45.8% 45.8% 45.4%
0.0%
10.0%
20.0%
30.0%
40.0%
50.0%
60.0%
70.0%
80.0%
90.0%
100.0%
Sep-12 Dec-12 Mar-13 Jun-13 Sep-13 Dec-13 Mar-14 Jun-14
Promoter group FII DII Others
68% 79%
86% 84%
32% 21%
14% 16%
0%
10%
20%
30%
40%
50%
60%
70%
80%
90%
100%
2011 2012 2013 2014
Contract Manufacturing Group company sales
11 16
22
33
44
4.7%
7.9% 8.1%
11.3%
7.8%
0.0%
2.0%
4.0%
6.0%
8.0%
10.0%
12.0%
0
5
10
15
20
25
30
35
40
45
50
FY 10 FY 11 FY 12 FY 13 FY 14
In R
s.M
n
Dividend Dividend payout
Directors #nos
Promoter Directors 1
Independent Directors 3
Non-Executive 1
Total 5
Private & Confidential
Kitex Garments Limited – Well dressed for the leap
Tejash Shah | [email protected] | +91 22 4228 8155 Gnanasundaram | [email protected] | +91 44 4344 0062 Madhav PVR | [email protected] | +91 44 4344 0060
23
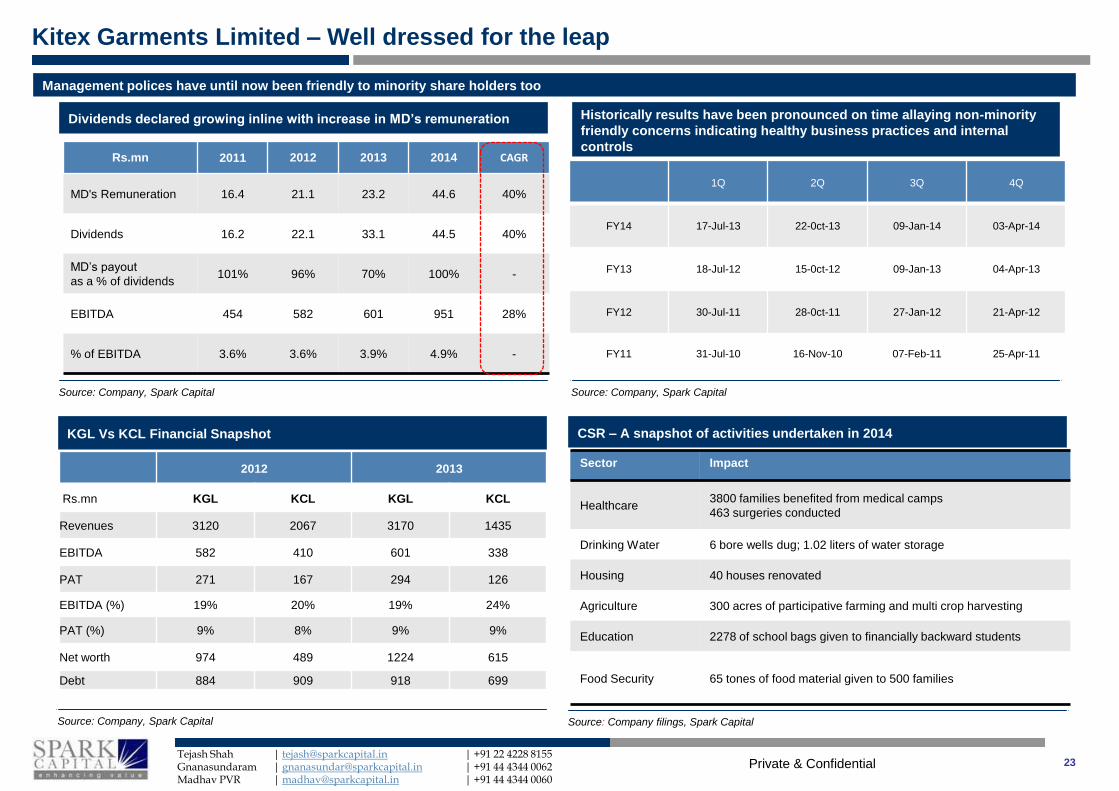
Dividends declared growing inline with increase in MD’s remuneration
Source: Company, Spark Capital
Management polices have until now been friendly to minority share holders too
CSR – A snapshot of activities undertaken in 2014
Source: Company filings, Spark Capital
Historically results have been pronounced on time allaying non-minority
friendly concerns indicating healthy business practices and internal
controls
Source: Company, Spark Capital
KGL Vs KCL Financial Snapshot
Source: Company, Spark Capital
Rs.mn 2011 2012 2013 2014 CAGR
MD's Remuneration 16.4 21.1 23.2 44.6 40%
Dividends 16.2 22.1 33.1 44.5 40%
MD’s payout
as a % of dividends 101% 96% 70% 100% -
EBITDA 454 582 601 951 28%
% of EBITDA 3.6% 3.6% 3.9% 4.9% -
1Q 2Q 3Q 4Q
FY14 17-Jul-13 22-0ct-13 09-Jan-14 03-Apr-14
FY13 18-Jul-12 15-0ct-12 09-Jan-13 04-Apr-13
FY12 30-Jul-11 28-0ct-11 27-Jan-12 21-Apr-12
FY11 31-Jul-10 16-Nov-10 07-Feb-11 25-Apr-11
Sector Impact
Healthcare 3800 families benefited from medical camps
463 surgeries conducted
Drinking Water 6 bore wells dug; 1.02 liters of water storage
Housing 40 houses renovated
Agriculture 300 acres of participative farming and multi crop harvesting
Education 2278 of school bags given to financially backward students
Food Security 65 tones of food material given to 500 families
2012 2013
Rs.mn KGL KCL KGL KCL
Revenues 3120 2067 3170 1435
EBITDA 582 410 601 338
PAT 271 167 294 126
EBITDA (%) 19% 20% 19% 24%
PAT (%) 9% 8% 9% 9%
Net worth 974 489 1224 615
Debt 884 909 918 699
Private & Confidential
Kitex Garments Limited – Well dressed for the leap
Tejash Shah | [email protected] | +91 22 4228 8155 Gnanasundaram | [email protected] | +91 44 4344 0062 Madhav PVR | [email protected] | +91 44 4344 0060
24
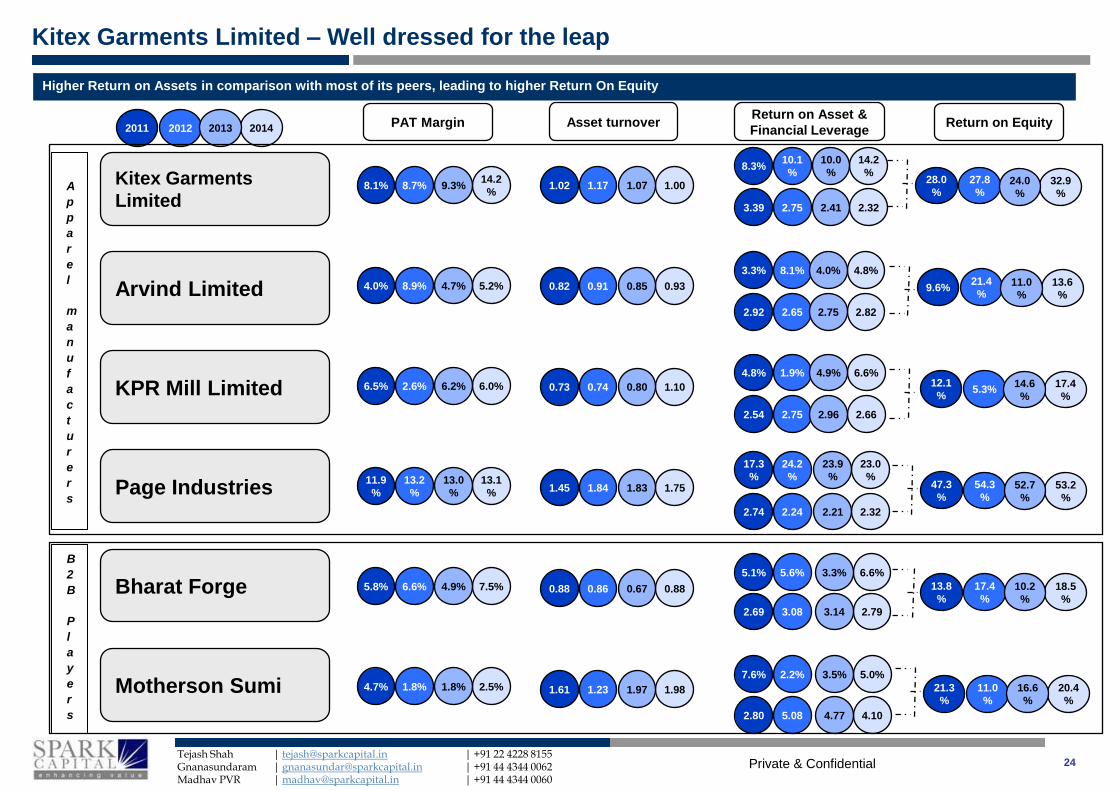
Higher Return on Assets in comparison with most of its peers, leading to higher Return On Equity
2011 2014 2012 2013
8.1% 14.2
% 8.7% 9.3% 1.02 1.00 1.17 1.07
8.3% 14.2
%
10.1
%
10.0
%
3.39 2.32 2.75 2.41
PAT Margin Asset turnover Return on Asset &
Financial Leverage Return on Equity
28.0
% 32.9
%
27.8
% 24.0
%
4.0% 5.2% 8.9% 4.7% 0.82 0.93 0.91 0.85 9.6% 13.6
%
21.4
% 11.0
%
6.5% 6.0% 2.6% 6.2% 0.73 1.10 0.74 0.80 12.1
% 17.4
% 5.3%
14.6
%
11.9
%
13.1
%
13.2
%
13.0
% 1.45 1.75 1.84 1.83 47.3
% 53.2
%
54.3
% 52.7
%
5.8% 7.5% 6.6% 4.9% 0.88 0.88 0.86 0.67 13.8
%
18.5
%
17.4
%
10.2
%
4.7% 2.5% 1.8% 1.8% 1.61 1.98 1.23 1.97 21.3
%
20.4
%
11.0
%
16.6
%
3.3% 4.8% 8.1% 4.0%
2.92 2.82 2.65 2.75
4.8% 6.6% 1.9% 4.9%
2.54 2.66 2.75 2.96
17.3
%
23.0
%
24.2
%
23.9
%
2.74 2.32 2.24 2.21
5.1% 6.6% 5.6% 3.3%
2.69 2.79 3.08 3.14
7.6% 5.0% 2.2% 3.5%
2.80 4.10 5.08 4.77
Kitex Garments
Limited
Arvind Limited
KPR Mill Limited
Page Industries
Bharat Forge
Motherson Sumi
A
p
p
a
r
e
l
m
a
n
u
f
a
c
t
u
r
e
r
s
B
2
B
P
l
a
y
e
r
s
Private & Confidential
Kitex Garments Limited – Well dressed for the leap
Tejash Shah | [email protected] | +91 22 4228 8155 Gnanasundaram | [email protected] | +91 44 4344 0062 Madhav PVR | [email protected] | +91 44 4344 0060
25
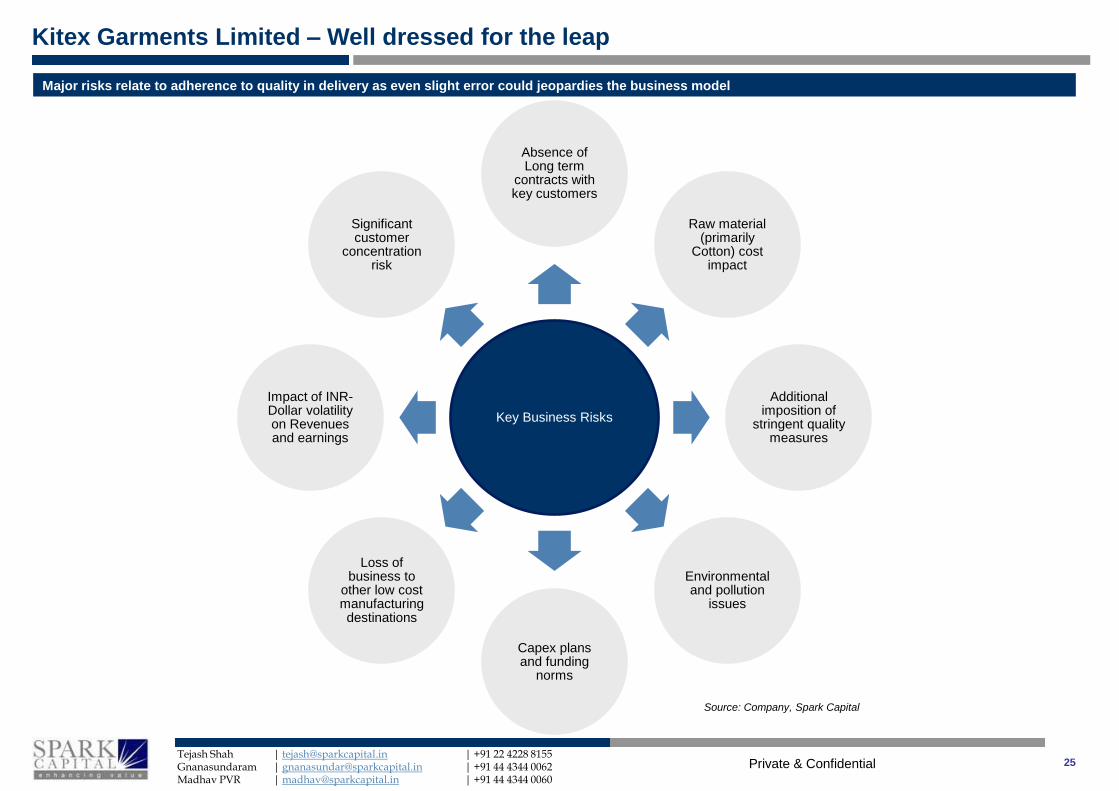
Major risks relate to adherence to quality in delivery as even slight error could jeopardies the business model
Source: Company, Spark Capital
Key Business Risks
Absence of Long term
contracts with key customers
Raw material (primarily
Cotton) cost impact
Additional imposition of
stringent quality measures
Environmental and pollution
issues
Capex plans and funding
norms
Loss of business to
other low cost manufacturing destinations
Impact of INR-Dollar volatility on Revenues and earnings
Significant customer
concentration risk
Private & Confidential
Kitex Garments Limited – Well dressed for the leap
Tejash Shah | [email protected] | +91 22 4228 8155 Gnanasundaram | [email protected] | +91 44 4344 0062 Madhav PVR | [email protected] | +91 44 4344 0060
26
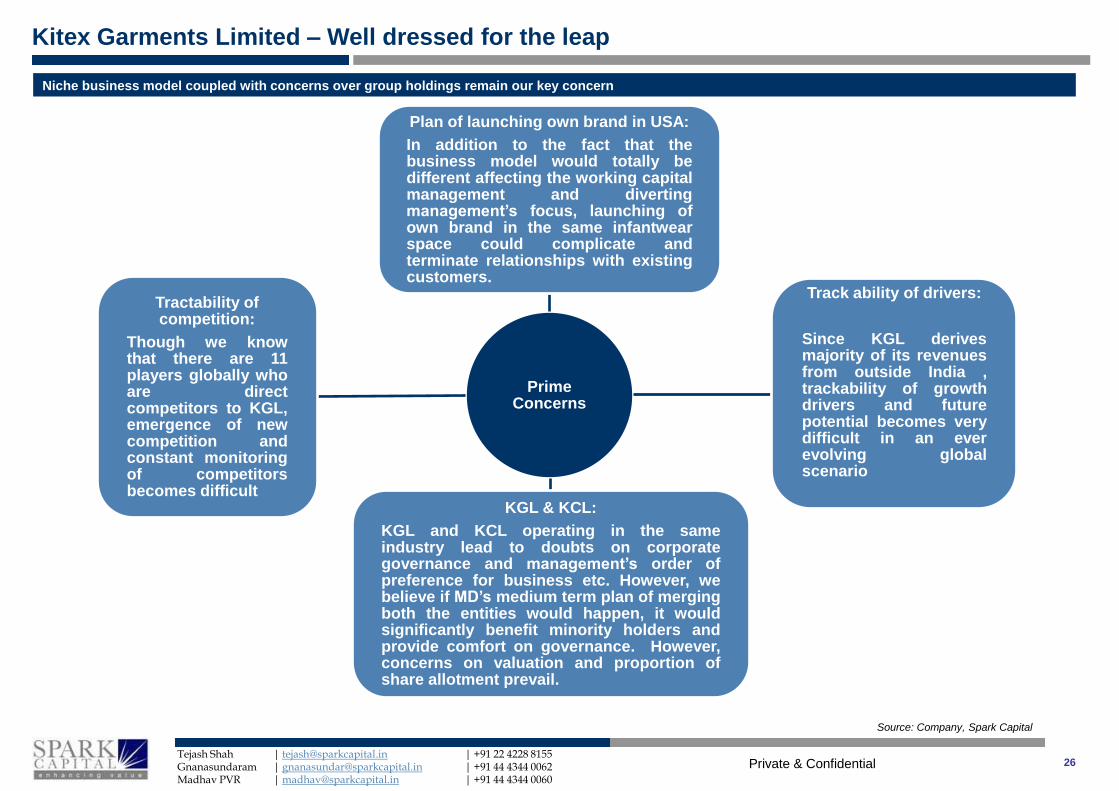
Niche business model coupled with concerns over group holdings remain our key concern
Source: Company, Spark Capital
Prime Concerns
Plan of launching own brand in USA:
In addition to the fact that the business model would totally be different affecting the working capital management and diverting management’s focus, launching of own brand in the same infantwear space could complicate and terminate relationships with existing customers.
Track ability of drivers:
Since KGL derives majority of its revenues from outside India , trackability of growth drivers and future potential becomes very difficult in an ever evolving global scenario
KGL & KCL:
KGL and KCL operating in the same industry lead to doubts on corporate governance and management’s order of preference for business etc. However, we believe if MD’s medium term plan of merging both the entities would happen, it would significantly benefit minority holders and provide comfort on governance. However, concerns on valuation and proportion of share allotment prevail.
Tractability of competition:
Though we know that there are 11 players globally who are direct competitors to KGL, emergence of new competition and constant monitoring of competitors becomes difficult
Private & Confidential
Kitex – Well dressed for the leap
Abridged Financial Statements
Rs. mn FY11 FY12 FY13 FY14 FY11 FY12 FY13 FY14
Profit & Loss Growth Ratios (%)
Revenue 2,561 3,120 3,170 4,422 Revenues 4% 22% 2% 40%
EBIDTA 454 582 601 951 EBIDTA 101% 28% 3% 58%
Other Income 52 63 40 133 Normalised PAT -14% 31% 8% 95%
Depreciation 69 69 86 97 Margins (%)
EBIT 437 577 555 988 Gross 48.9% 44.8% 47.9% 46.6%
Interest 125 176 115 106 EBIDTA 17.7% 18.7% 19.0% 21.5%
PBT 312 401 440 882 Normalised PAT 8.1% 8.7% 9.3% 13.0%
Normalised PAT 206 271 294 574 Leverage Ratios (x)
Balance Sheet Debt to Equity 1.2 0.9 0.8 0.7
Net Worth 736 974 1,224 1,742 Current Ratio 1.7 2.2 2.7 2.5
Loan Funds 880 884 918 1,194 Return Ratios (%)
Deffered Tax Liabilities 157 163 161 216 RoCE 18.2% 20.4% 17.0% 23.4%
Sources of Funds 1,786 2,037 2,328 3,175 RoE 32.0% 31.7% 26.7% 38.7%
Net Block 1,212 1,220 1,168 1,809 Total Asset Turnover (x) 1.5 1.6 1.4 1.5
Capital WIP 9 4 23 7 Per Share
Goodwill - - - - EPS (Rs.) 4.3 5.7 6.2 12.1
Investments 38 38 106 45 Dividend (Rs.) 0.3 0.5 0.7 1.5
Total Current Assets 1,229 1,405 1,648 2,173 Valuation Metrics
Total Current Liabilities 714 637 621 862 Current Market Price 338
Net Current Assets 515 768 1,027 1,311 Shares Outstanding (mn) 48 48 48 48
Application of Funds 1,786 2,037 2,328 3,175 Market Cap. (Rs. mn) 16,055
Cash Flow Enterprise Value (Rs. mn) 16,835 16,546 16,459 16,172
Cash Flow from Operation (156) 626 244 1,158 EV /Sales (x) 6.6 5.3 5.2 3.7
Cash Flow from Investments (107) (68) (48) (720) Price/Earnings (x) 77.8 59.2 54.7 28.0
Free Cash Flow (263) 558 196 437 Price/Book (x) 21.8 16.5 13.1 9.2
Cash Flow from Financing 244 (267) (153) 183 EV/EBIDTA (x) 37.1 28.4 27.4 17.0
Closing Cash Balance 62 355 408 1,032 FCF Yield -1.6% 3.5% 1.2% 2.7%
27
Private & Confidential
Kitex Garments Limited – Well dressed for the leap
Tejash Shah | [email protected] | +91 22 4228 8155 Gnanasundaram | [email protected] | +91 44 4344 0062 Madhav PVR | [email protected] | +91 44 4344 0060
Spark Disclaimer
Spark Capital Advisors (India) Private Limited (Spark Capital) and its affiliates are engaged in investment banking, investment advisory and institutional equities. Spark Capital is registered with SEBI as a Stock Broker and Category 1 Merchant Banker.
This document does not constitute or form part of any offer or solicitation for the purchase or sale of any financial instrument or as an official confirmation of any transaction. This document is provided for assistance only and is not intended to be and must not alone be taken as the basis for an investment decision. Nothing in this document should be construed as investment or financial advice, and nothing in this document should be construed as an advice to buy or sell or solicitation to buy or sell the securities of companies referred to in this document.
Each recipient of this document should make such investigations as it deems necessary to arrive at an independent evaluation of an investment in the securities of companies referred to in this document (including the merits and risks involved), and should consult its own advisors to determine the merits and risks of such an investment. This document is being supplied to you solely for your information and may not be reproduced, redistributed or passed on, directly or indirectly, to any other person or published, copied, in whole or in part, for any purpose. This report is not directed or intended for distribution to or use by any person or entity who is a citizen or resident of or located in any locality, state, country or other jurisdiction, where such distribution, publication, availability or use would be contrary to law, regulation or which would subject Spark Capital and/or its affiliates to any registration or licensing requirement within such jurisdiction. The securities described herein may or may not be eligible for sale in all jurisdictions or to a certain category of investors. Persons in whose possession this document may come are required to inform themselves of and to observe such applicable restrictions. This material should not be construed as an offer to sell or the solicitation of an offer to buy any security in any jurisdiction where such an offer or solicitation would be illegal.
Spark Capital makes no representation or warranty, express or implied, as to the accuracy, completeness or fairness of the information and opinions contained in this document. Spark Capital , its affiliates, and the employees of Spark Capital and its affiliates may, from time to time, effect or have effected an own account transaction in, or deal as principal or agent in or for the securities mentioned in this document. They may perform or seek to perform investment banking or other services for, or solicit investment banking or other business from, any company referred to in this report.
This report has been prepared on the basis of information, which is already available in publicly accessible media or developed through an independent analysis by Spark Capital. While we would endeavour to update the information herein on a reasonable basis, Spark Capital and its affiliates are under no obligation to update the information. Also, there may be regulatory, compliance or other reasons that prevent Spark Capital and its affiliates from doing so. Neither Spark Capital nor its affiliates or their respective directors, employees, agents or representatives shall be responsible or liable in any manner, directly or indirectly, for views or opinions expressed in this report or the contents or any errors or discrepancies herein or for any decisions or actions taken in reliance on the report or the inability to use or access our service in this report or for any loss or damages whether direct or indirect, incidental, special or consequential including without limitation loss of revenue or profits that may arise from or in connection with the use of or reliance on this report.
Spark Capital and/or its affiliates and/or employees may have interests/positions, financial or otherwise in the securities mentioned in this report. To enhance transparency, Spark Capital has incorporated a disclosure of interest statement in this document. This should however not be treated as endorsement of views expressed in this report:
Absolute Rating Interpretation
Buy Stock expected to provide positive returns of >15% over a 1-year horizon
Add Stock expected to provide positive returns of >5% – <15% over a 1-year
horizon
Reduce Stock expected to provide returns of <5% – -10% over a 1-year horizon
Sell Stock expected to fall >10% over a 1-year horizon
Recommendation History
Date CMP Target price Rating
28
Private & Confidential
Kitex Garments Limited – Well dressed for the leap
Tejash Shah | [email protected] | +91 22 4228 8155 Gnanasundaram | [email protected] | +91 44 4344 0062 Madhav PVR | [email protected] | +91 44 4344 0060
Analyst Certification of Independence
The views expressed in this research report accurately reflect the analyst’s personal views about any and all of the subject securities or issuers; and no part of the research analyst’s compensations was, is or will be, directly or indirectly, related to the specific recommendation or views expressed in the report.
Additional Disclaimer for US Institutional Investors
This research report prepared by Spark Capital Advisors (India) Private Limited is distributed in the United States to US Institutional Investors (as defined in Rule 15a-6 under the Securities Exchange Act of 1934, as amended) only by Decker & Co, LLC, a broker-dealer registered in the US (registered under Section 15 of Securities Exchange Act of 1934, as amended). Decker & Co accepts responsibility on the research reports and US Institutional Investors wishing to effect transaction in the securities discussed in the research material may do so through Decker & Co. All responsibility for the distribution of this report by Decker & Co, LLC in the US shall be borne by Decker & Co, LLC. All resulting transactions by a US person or entity should be effected through a registered broker-dealer in the US. This report is not directed at you if Spark Capital Advisors (India) Private Limited or Decker & Co, LLC is prohibited or restricted by any legislation or regulation in any jurisdiction from making it available to you. You should satisfy yourself before reading it that Decker & Co, LLC and Spark Capital Advisors (India) Private Limited are permitted to provide research material concerning investment to you under relevant legislation and regulations;
Disclosure of interest statement Yes/No
Analyst ownership of the stock No
Group/directors ownership of the stock No
Broking relationship with the company covered No
Investment banking relationship with the company covered No
29
Related Documents