Environment and Conservation Division, with assistance of Climate Change Study Team Ministry of Environment, Lands and Agricultural Development KIRIBATI GOVERNMENT Second Communication under the United Nations Framework Convention on Climate Change June 2013

Welcome message from author
This document is posted to help you gain knowledge. Please leave a comment to let me know what you think about it! Share it to your friends and learn new things together.
Transcript
Environment and Conservation Division, with assistance of Climate Change Study Team
Ministry of Environment, Lands and Agricultural Development
KIRIBATI GOVERNMENT
Second Communication under theUnited Nations Framework Convention on
Climate Change
June 2013
2
Preface
In 1999 through the initial communication report, Kiribati underscored the grave concerns
faced by climate change. The Government of Kiribati is thankful for some initial reactions
from the international community responding to these concerns with few adaptation projects.
These efforts are not adequate in so far!
In this second report the same premises upon which Kiribati underlined the concerns in the
initial communication report have not been changed but rather intensified and complex over
time as observed in the last 10 years. The status of national circumstances, measures
undertaken, including constraints toward meeting our obligation under the UNFCCC are all
explicitly detailed in this report. This is also in recognition of the fact that Kiribati, as a Least
Developed Country, can do very little to prevent the damages and impacts it is now facing.
This also demonstrates our trust in the UNFCCC which is the only multilateral fora
responsible for avoiding dangerous climate change impacts and enhances environmental
integrity.
The Government and people of Kiribati have been and will continue to be mentally,
physically worried and apprehensive by risks brought in by climate change, extreme events,
slow onset events and sea level rise in the near and longer term future.
On that note, I would like to express my sincere appreciation to those who have contributed
to this significant Second communication report by Kiribati to the UNFCCC, and to invite
development partners particularly Developed Country Parties to consider the real issues
highlighted in this report with optimism for their immediate support in the less distant future.
”... we must listen, take heed of whatis happening in the most vulnerablestates in the frontline, like Kiribati
and act accordingly, act withurgency... ”
3
Tekeraoi!
Hon. Tiarite Kwong
Minister of Environment, Lands and Agricultural Development.
Date: 27th June 2013
4
Acknowledgement
The successful completion of this report has been made possible through consistent
participation and contributions of members of the National Climate Change Study Team from
the early inception of this Second National Communication project in 2008 toward the end.
The details of the team members can be viewed in the Annex of this report.
The content of the report owed credits to outcomes of several nationally and internationally
driven projects and programs that have occurred from 2000. The undertakings produced
some of the most up to date data and information that were employed to inform this report as
well as practical measures to responding to climate change.
It would be a remiss not to mention consultancy based firms and organisations that have been
contracted to fill in the information and capacity gaps relevant to specific components of the
SNC report. This includes Pitt&Sherry from Australia for substantive work on Greenhouse
Gas Inventory Calculation and Clim-systems from New Zealand for the substantial provision
of, and training on, the vulnerability assessment tool.
The technical comments were received from National Communication Support Programme
(NCSP) – UNDP, Climate Change Division of the Secretariat for Pacific Regional
Environment Program (SPREP), Secretariat for Pacific Community (SPC), Pacific Australia
Climate Change Science & Adaptation Planning Program (PACCSAP) and National Institute
for Water and Atmospheric Research (NIWA). These comments have been extremely useful
toward shaping the final structure of the report.
Last but not least, is to acknowledge other local consultants like Ben Namakin, local
stakeholders, functional government’s committees such as National Adaptation Steering
Committee, Secretaries’ level meeting; and finally Cabinet for appreciation and approval of
this Kiribati’s national communication report to the United National Convention of Climate
Change herein.
5
Acronyms
ADB Asian Development Bank
BNPL Basic Need Poverty Line
COP Conference of the Parties
CCU Climate Change Unit
CCST Climate Change Study Team
CRP Climate Risk Profile
CSIRO Australian Commonwealth Scientific and Industrial Research Organisation
CGCCM Canada Global Climate Change Model
CCDMS Climate Change Database Management System
CDM Clean Development Mechanism
DSI Drought Severity Index
DCC Development Coordinating Committee
EbA Ecosystem-Based Adaptation
ECD Environment and Conservation Division
EDB Equatorial Doldrums’ BeltENSO El Nino and Southern Oscillation Oscillation
EPU Energy Planning Unit
FPL Food Poverty Line
FAR Fourth Assessment Report of the IPCC
FAO Food and Agricultural Organisation
EIA Environment Impact Assessment
GHG Green House Gas
GDP Global Domestic Product
GCM Global Circulation Models
GEF Global Environment Facility
GFOL Goddard Fluid Dynamics Laboratory
HFC Hydro-fluoro Carbons
IPCC Inter-governmental Panel on Climate Change
IMR Infant Mortality Rate
INC Initial National Communication
ISME International Society for Mangrove Ecosystems
ICZM Integrated Coastal Zone Management
ITCZ Inter Tropical Convergence Zone
JICA Japan International Cooperation Agency
LE Life Expectancy
LDC Least Developed Country
KMS Kiribati Meteorology Service
KPA Key Policy Area
6
KAP Kiribati Adaptation Program
KOIL Kiribati Oil Company Limited
KBA Key Biodiversity Area
KVAAM Kiribati Vulnerability & Adaptation Assessment Methodology
KP Kyoto Protocol
KirCAN Kiribati Climate Action Network
KDP Kiribati Development Plan
LDC Least Developed Country
MELAD Ministry of Environment, Lands and Agricultural Development
MCTTD Ministry of Communication, Transport and Tourism Development
MPWU Ministry of Public Works and Utilities
MLOS Mean Level of the Sea
NGO Non-Governmental Organisations
NIWA National Institute for Water and Atmospheric research
NAPA National Adaptation Program of Action
NZ New Zealand
NIES National Institute for Environmental Services
NDS National Development Strategy
NCCHAP National Climate Change and Health Action Plan
NASC National Adaptation Steering Committee
NSO National Statistics Office
OB Office of Beretitenti (President)
PICCAP Pacific Island Climate Change Adaptation Program
PCCSP Pacific Climate Change Science Program
PAD Project Appraisal Document
PIPA Phoenix Islands Protected Area
PV Photovoltaic
RERF Kiribati Revenue and Equalisation Reserve Fund
SNC Second National Communication
SRMU Strategic Risk Management Unit
SOPAC Applied Geo-science and Technology Division
SPREP Secretariat for Pacific Environment Program
SPCZ South Pacific Convergence Zone
SAPHE Sanitation and Public Health and Environment Project
SPC Secretariat for Pacific Community
SRES Scientific Report for Emission Scenarios
TAR Third Assessment Report
TFR Total Fertility Rate
US United States
UNFCCC United Nations Framework Convention on Climate Change
7
UNDP United Nations Development Bank
UNCBD United Nations for Convention on Biological Diversity
UNESCO United Nation Education and Scientific Commission Organisation
UNICEF United Nation Children’s FundUSP University of the South Pacific
V&A Vulnerability and Adaptation Assessment
WB World Bank
WEU Water Engineering Unit
WMO World Meteorological Organisation
8
Table of Contents
Preface ....................................................................................................................................................2
Acknowledgement ..................................................................................................................................4
Acronyms................................................................................................................................................5
EXECUTIVE SUMMARY ..................................................................................................................14
1.0 INTRODUCTION ....................................................................................................................26
1.1 PURPOSE.............................................................................................................................26
1.2 PROCESS AND METHODOLOGY....................................................................................26
1.3 LINKAGES OF SNC TO ENVIRONMENT ACT AND NATIONAL DEVELOPMENTPLAN ..............................................................................................................................................29
2.0 NATIONAL CIRCUMSTANCES ...........................................................................................32
2.1 INTRODUCTION ................................................................................................................32
2.2 INSTITUTIONS FOR IMPLEMENTING THE UNFCCC .................................................33
2.3 GEOGRAPHY......................................................................................................................36
2.4 CLIMATE.............................................................................................................................49
2.5 SOCIO-ECONOMIC CIRCUMSTANCES..........................................................................67
3.0 ISLAND BIODIVERSITY.......................................................................................................83
4.0 GREENHOUSE GAS INVENTORY AND MITIGATION ....................................................90
4.1 DATA, METHODOLOGY AND MANUAL ......................................................................90
4.2 GHG INVENTORY, EMISSIONS AND TRENDS ............................................................92
4.3 MITIGATION.......................................................................................................................95
5.0 VULNERABILITY AND ADAPTATION ..............................................................................99
5.1 NATIONAL FRAMEWORKS FOR VULNERABILITY AND ADAPTATIONASSESSMENT.................................................................................................................................99
5.2 V&A STUDIES IN KIRIBATI SINCE THE INITIAL NATIONAL COMMUNICATIONS102
5.3 EXISTING CLIMATE CHANGE AND SEA LEVEL RISE SCENARIOS .....................106
5.4 EXISTING SOCIO-ECONOMIC SCENARIOS ...............................................................114
9
5.5 CONSOLIDATING CLIMATE CHANGE AND SEA LEVEL RISE SCENARIOS BASEDON EXISTING CLIMATE MODELLING WORK.......................................................................118
5.6 VULNERABILITIES AND IMPACTS OF CLIMATE CHANGE ON KEY ISLANDCOMPONENTS IN KIRIBATI......................................................................................................144
5.7 ADAPTATION OPTIONS AND MAINSTREAMING CLIMATE CHANGEADAPTATION INTO NATIONAL DEVELOPMENT ................................................................164
6.0 CAPACITY BUILDING AND TRAINING ..........................................................................175
7.0 RESEARCH, DATA AND SYSTEMATIC OBERVATION................................................177
8.0 CONSTRAINTS AND GAPS ................................................................................................179
8.1 STATUS OF CONTRAINTS AND GAPS ........................................................................179
8.2 CONSTRAINTS AND GAPS RELEVENAT TO IMPLEMENTING UNFCCC .............181
8.3 CONSTRAINTS AND GAPS RELEVANT TO ARTICLE 6 OF UNFCCC....................185
9.0 PROPOSED PROJECT CONCEPTS.....................................................................................187
REFERENCES ...................................................................................................................................190
ANNEX 1. List of the Kiribati Climate Change Study Team and other local stakeholders who havecontributed to the SNC Document ......................................................................................................194
10
List of Tables and Figures
Tables
Table 1: Roles of key institutions in the National Communication process .........................................33
Table 2. Description of island geographical features............................................................................39
Table 3: Record of sea level from different gauges showing datum shifts ...........................................43
Table 4: Sea level rise of different time series......................................................................................45
Table 5 : Temperature averages ............................................................................................................52
Table 6: Average, maxima, minima of annual rainfall in mm for period 1947-2004...........................55
Table 7: Trends of rainfall on different stations for period 1947-2004 ................................................56
Table 8: Extreme rainfall values with reference to day durations for 50% exceedance probability.....57
Table 9: Annual Return Interval for rainfall .........................................................................................59
Table 10: Drought severity ...................................................................................................................60
Table 11: Monthly frequently of wind directions .................................................................................62
Table 12: Wind Speed frequency..........................................................................................................63
Table 13: Annual maximum gusts, 1992-2009.....................................................................................64
Table 14: Cloud cover for islands .........................................................................................................66
Table 15: Age structure at the census 2000 and 2005...........................................................................67
Table 16: Population distribution by main regions and census.............................................................68
Figure 17: Population trends of urban and rural areas of Kiribati ........................................................70
Table 18: Number of adults who never attended formal schools..........................................................71
Table 19: Education levels of the workforce at two recent censuses 2000 and 2005 ...........................72
Table 20. Pattern of three statistics on health .......................................................................................74
Table 21: Kiribati GDP by Industry for 2011 ($A'000) – revised June 2012.......................................76
Table 22: Socio-economic indicators for 2001-2009............................................................................78
Table 23: Poverty..................................................................................................................................80
Table 24: Carbon Dioxide emissions by regions, sectors and by years ................................................92
Table 25: Emission from livestock .......................................................................................................94
11
Table 26: GDP and EMISSIONS correlation analysis .........................................................................95
Table 27. Matrix of V&A studies and their details undertaken in Kiribati.........................................102
Table 28. Kiribati Approved Climate Change Scenarios in 2005.......................................................106
Table 29. Local definition on climate change time frame planning....................................................108
Table 30. Climate Change projections................................................................................................110
Table 31. Projections of Population of Kiribati ..................................................................................114
Table 32 . Projection outputs from various climate tools ...................................................................119
Table 33. Results of interpolating projection outputs from various climate tools ..............................121
Table 34. Summary of Temperature Scenarios...................................................................................122
Table 35. Results of interpolating rainfall projection outputs from various tools ..............................124
Table 36. Rainfall scenarios for Kiribati Second National Communication report ............................127
Table 37. Sea level rise and temperature scenarios recommended by this SNC report ......................129
Table 38. Sea Level rise projections from different tools recommended by SNC report ...................130
Table 39. Tarawa rainfall depth-duration-frequency based on 1971-1994 records (NIWA)..............133
Table 40. DSI from data and modelled drought events ......................................................................136
Table 41. Droughts at each of the Kiribati islands..............................................................................137
Table 42. Temperature change scenarios............................................................................................139
Table 43. Percentage changes of rainfall depths per temperature increase.........................................140
Table 44. Tarawa historical data scenario for 2090 on rainfall intensity............................................140
Table 45. Tarawa expected drought durations for various years (NIWA)..........................................141
Table 46. Impact of different climate change variables and their degree of their projections on thechildren and communities - Kiribati ...................................................................................................158
Table 47. Climate change policies relevant to implementation of UNFCCC and addressing climatechange impacts in Kiribati ..................................................................................................................166
Table 48. Compendium of adaptation efforts implemented in Kiribati. .............................................171
Table 49. National challenges on respective Article 6 obligations .....................................................185
12
Figures
Figure 1: Map of Kiribati ......................................................................................................................36
Figure 2. Cross-section of typical coral atoll island..............................................................................38
Figure 3. Aerial view of low-lying coral atoll - South Tarawa .............................................................39
Figure 4: Sea level time series from different tidal gauges...................................................................43
Figure 5: Adjusted sea level using Sea-frame as reference datum........................................................44
Figure 6: Sea level with analysis of trends of different time series ......................................................44
Figure 7: Gourlay definition of coast used for modelling waves impacts on atolls..............................46
Figure 8: Spatial tides changes of few islands in Kiribati during spring season...................................47
Figure 9: Cross-section of an atoll showing freshwater lens ................................................................48
Figure 10. Contributions to the national economy of some key sectors in 2005 ..................................77
Figure 12 : Phoenix Island Protected Area ...........................................................................................88
Figure 13. Kiribati total emission trends (in Giga gram - Gg) for periods 2004 – 2008 ......................93
Figure 14: Kiribati Vulnerability & Adaptation Assessment Methodology flow chart ......................100
Figure 15. Drought record in Kiribati from 1998 – 2001 ...................................................................108
Figure 16. Trends for a 100 year return period events for Drought ....................................................109
Figure 17. Sea level rise projections ...................................................................................................109
Figure 18. Air temperature scenarios ..................................................................................................121
Figure 19. Rainfall projection outputs for different SRES – Sim-Clim tool.......................................126
Figure 20. Rainfall projections for different SRES - PCCSP .............................................................126
Figure 21. Rainfall intensity on 10mins duration ...............................................................................141
Figure 22. Drought months' scenarios for Tarawa ..............................................................................142
Figure 23. Coral atoll showing freshwater lens ..................................................................................145
Figure 24. Scenarios for inundation of lands of Bikenibeu village - Tarawa Island due to sea level rise............................................................................................................................................................146
Figure 25. Houses in a low lying coastal zone in Kiribati ..................................................................147
13
Figure 26. Inundation land maps, showing land situated below sea level, 2070 A1FI + 1 in 10 yr stormevents ..................................................................................................................................................148
Figure 27. Risk levels per Village of Tarawa Island...........................................................................148
Figure 28. Agricultural activities in the islands of Kiribati ................................................................150
Figure 29. Fisheries activities and tuna resources in Kiribati .............................................................151
Figure 30. Island crops polluted by sea water intrusion......................................................................155
Figure 31. Coral reefs bleaching in Phoenix Islands - Kiribati...........................................................156
Figure 32. Baseline survey results on social perception on climate change .......................................157
Figure 33. Population distribution on sources of portal water sources in Tarawa – Kiribati..............163
Figure 34. Toilet facilities in Tarawa Island, Kiribati and population distribution over them ...........163
Figure 35. Climate change institutional settings in Kiribati ...............................................................164
Figure 36. Mainstreaming process in Kiribati ....................................................................................174
14
EXECUTIVE SUMMARY
The compilation of Kiribati’s Second National Communication (SNC) to the United Nations
Framework Convention on Climate Change (UNFCCC) adopts a participatory approach
through contributions of members of the National Climate Change Study team (CCST). The
process begins with designing the overall content of the report (building on the Initial
Communication report), followed by allocation of responsibilities for data gathering
pertaining to each information as relevant to chapters, and sub-sections contained in the
structure of the report. The thematic working groups (on National Circumstances, Adaptation
and Mitigation) were then formed in an effort to cluster the work of Climate Change Study
Team on specific topics of the report. Each thematic working group proceeded with
identification of available data and also those that are not available or somewhat difficult to
collate. Data collected were gathered and weaved in consistency with the content of the
report. Fragmented or absent data were augmented through engagement of
international/regional and national consultants where applicable and produce input to such
gaps. The overall coordination and steering of the process involving compiling SNC was the
responsibility of the Project Management Unit and the Environment & Conservation
Division, MELAD.
The SNC project’s approach uplifts important elements of building capacity of members of
CCST on climate change, increase knowledge on how climate change was directly linked to
other institutions’ roles and hence the need for more integration of climate change into
relevant planning processes. Despite the success aspect of this approach, this does not mean
that there are no constraints faced during the entire implementation of the project. The
greatest challenge faced with involving national stakeholders was the sporadic availability of
members, limited level of capacity and knowledge on climate change, unpredictable
consistency in pursuing tasks as agreed tasks by thematic groups. These challenges were
compounded by the members’ own routine tasks and over-burden commitments within their
own institutions.
Nevertheless, the report was completed according to what it was initially planned in terms of
contents and structure. The draft went through several institutions including regional and
international bodies, Secretaries and Cabinet for review and endorsement.
15
There are still missing data that require further assessments and research but due to
inadequacy of resources and time with current project, these information were planned to
form part of the subsequent Third National Communication.
The report has 5 mains chapters on National Circumstances, Island Biodiversity, Greenhouse
Gas Inventory and Emission, Vulnerability and Adaptation and Other Matters. The executive
summary presents key information from each chapter only.
The Republic of Kiribati as a sovereign state is committed to be mentally and physically
prepared to the risks that climate change may bring. From 2000 to date, slow onset adverse
impacts and extreme events were the driving forces for Kiribati to forge ahead with planning
her response to climate change. The Kiribati Climate Change Adaptation Strategy includes
institutionalising a nationally coordinated and participatory based adaptation approach and
programs, in addition to securing bilateral and multilateral donor support to help meet the
costs of the national climate change strategies.
Key technical, steering institutions and committee structures (Climate Change Study Team
and the National Adaptation Steering Committee) were established and whose work have
been integrated into the current national development planning process and make appropriate
reporting and advice in a coherent manner. This is done so in the same spirit of building
island resilience from the adverse impacts and extreme events of climate change and in
parallel with achieving the common development goals of Kiribati.
Kiribati is a country that comprise of no more than coral atoll (lagoonal and non-lagoonal)
and raised limestone islands but with a large ocean space (Economic Exclusive Zone).
Except for Ocean island or Banaba (with more than 10m elevation), all islands of Kiribati are
raised not more than 5m above mean sea level. The shorelines of the islands range from as
short as 11.3km to 221km (refer to table 2). The width of liveable lands on each islands only
range from 5.2km2 to 321km2. These geo-morphological features are not expected to
increase substantially either in size or elevations in the future. This is an important aspect in
addition to layers of demographic elements, environmental and climate change pressures.
The soil was made up of largely calcareous materials in the form of coarse coral sand, gravels
16
and typically quite variable organic matter contents. This presents a very poor fertility soil
for agricultural productivity, and therefore confined to a limited variety of food crops. Such
characteristics of small atoll islands, determine that freshwater resources are almost non-
existent. The freshwater resource is known to exist as a thin layer of freshwater over
seawater underground due to the high hydraulic conductivity soil of coral atolls. The
existence of the freshwater lens is dependent on the discharge from rainfall only, and is the
main source of portal water of rural communities in Kiribati.
The rate of sea level, waves and other oceanographic features of islands and how these
function in the dynamic coastal system of each islands, are also equally fundamental in
determining the national circumstances of Kiribati. However the following were noted, sea
level rise has been increasing with a rate of between +2.1mm to +5.7mm per year. The range
represents different pools where data were collected and are also results of differences in
mean level of sea (MLOS) as datum or reference points. It was also noted that modelling
waves in the context of enhanced understanding on the different types and definition of reefs
will assist inform baseline knowledge in this area, and its significant relationship with the
climate change and sea level rise.
Nevertheless, according to the current body of information on this particular geo-
morphological subject, reef islands or atolls are still regarded as some of the most vulnerable
and threatened coastal systems among reviewed systems, particularly in the face of climate
change and sea level rise.
The climate of Kiribati has been described as a hot and humid tropical climate. However,
there are marked differences in rainfall across the 3 main groups of islands of Kiribati
(Gilbert, Line and Phoenix groups), and also within the groups. Temperature and winds were
also uniquely differing with their own trends.
It is important to consider the traditional knowledge regarding the characterisation and
prediction of weather and climate. This is the knowledge that appears to stress astronomical
factors as principal drivers of the climate of Kiribati. With this knowledge, I-Kiribati
identified two known seasons in Kiribati – “Te Aumeang” and “Te Aumaiaki”. Te Aumeang
is characterized by stormy and rainy climate and weather for six months, from November to
17
April. For the rest of the months, from May to October, the climate and weather is normally
calm and dry – Te Aumaiaki.
The climate of Kiribati is governed mainly by the movement of Inter-tropical Convergence
Zone (ICTZ) and the equatorial doldrums’ belt (EDB) which is present through-out the year
in the western pacific. The South Pacific Convergence Zone (SPCZ) has an effect on the
climate of the southernmost islands but to a lesser extent.
The Walker Circulation and associated El Nino Southern Oscillation (El Niño and La Niña)
with their marked opposite conditions of flooding (excessive rainfall and severe weather
events) and drought for different parts of the South Pacific and the wider tropical region of
the globe are the predominating phenomena that determine or have direct relationship with
the Kiribati’s climate.
The temperature averages are best described as increasing for the past decades (last 30 to 40
years). Annual monthly mean temperature range from 27.8oC – 28.4oC, Annual monthly
average of max temperature range from 31.1oC – 31.2oC and the Annual monthly average
minimum temperature are 25.25oC – 25.41oC. The mean monthly sea temperatures for each
of the years (1940 to date) are finally averaged to give what considered as the mean annual
sea temperature which is 29.60C.
For observations and characterisation of rainfall in Kiribati, only 4 rainfall stations were able
to retain more than 30 years datasets, and these are stations in Butaritari Island, Betio Island,
Kanton Island and Kiritimati Island.
The trends vary a lot but they can be best summed up in annual averages and ranges for each
island representing the entire Kiribati as follows; Annual average rainfall from 940 – 3160
(mm), Maximum ranges fluctuate from as high as 3473 to 4823 mm, and minimum ranges
from as low as 177 to 1447mm. The analysis of drought duration for a 1% Annual
Exceedance of Probabilities or Annual Return Interval of 100 years indicates that many
islands in Kiribati can experience long and damaging drought events (more than 12months).
18
The most frequent wind speed is between 5-10knots and an increasing trend of 0.5knots per
year was also observed for Kiribati. The mean cloud cover for stations in Kiribati is 5.56 to
5.86.
The population of Kiribati over the period spanned by censuses intervals indicates an
increasing trend i.e. from 72,335 in 1990 to 92, 533 in 2005. The distribution of this increase
over the 3 main groups of islands of Kiribati indicates that the Gilbert and Line & Phoenix
group shares have increased.
The Total Fertility Rate “declined quite dramatically from about 4.5 during the 1990s to
about 3.5 in 2005” (Kiribati Government. 2007. Kiribati 2005 Census, Volume 2: Analytical
Report). Likewise, Infant Mortality Rate has declined to 52 at the 2005 Census compared to
estimated value of 61 in the 1995 Census. And life expectancy at birth is 63.1 years in 2005
Census compared to 62.8 yrs in the 2000 Census.
Preliminary population data on the 2010 Census indicate urbanization at 48.4% of all
population and rural population of 51.6%. If Kiritimati is taken as an urban area because the
livelihoods and services there are quite similar to those on South Tarawa, then urbanization
proportion of the population in the 2010 Census is 53.3%, exceeding the rural population
proportion.
From the three census years intervals, the levels of education achieved by people of working
age group and above may indicate that there is general increase in the number of people aged
15 years and over, who never attended formal schools during the period 1986-1990. This is
because during 1995 Census, there were 2788 persons aged 15 years and over, who never
attended school compared to 4781 of the same category in the 2005 Census. This increase
would mostly be from persons born between 1986 and 1990 and who at the 2005 Census are
aged between 15 and 20 and never attended school. This implies that there are increasingly
more children not attending any schools and more adults not having opportunities to attend
formal schools.
19
The records in the two census (1990 and 1995), show increases in the number of employees
with the level of education above the secondary level in the rest of employment categories.
Since 1995 there has been significant increase in the number of persons with post graduate
degrees up to doctorate qualification.
Improvements in the Infant Mortality Rate (IMR), Life Expectancy (LE) at Birth and even
the TFR (Total Fertility Rate) suggest that the general health of the population is improving if
longevity of life means healthy life. This implies that state of health of the people shows
improvement over the decade 1995-2005. The IMR (Infant Mortality Rate) has declined
from 67 in 1990 to 52 in 2005.
Kiribati is still recognized as a Least Developed Country (LDC) in the United Nations
categorization of countries on the basis of their wealth and stages of socio economic
development. The need for external assistance will continue into the foreseeable future. It is
also the precarious economic situation of Kiribati that makes the need of external assistance
unavoidable. Government’s recurrent revenue sources include from income tax and
corporate tax, license fees paid by foreign fishing vessels, import duties, and drawdown from
Revenue Equalization Reserve Fund.
The GDP per capita for Kiribati ranged from $969 in 2001 to $1,085 in 2009. Government’s
sector contribution to GDP shows an increasing trend, indicating more government’s services
have been established and are addressing areas that have received less attention in the past.
Over the period 2001-2009, government’s contributions to GDP have varied between 32%
and 42% but with a positive trend. This suggests that Government’s budgets will remain a
significant contributor to Kiribati’s GDP and its growth.
Unemployment rate is very high. The Kiribati Millennium Goals Report 2007 gives the rates
of unemployment of 78.1% in 2000 and 66.5% in 2005 but notes that the rates are obscured
in Census Reports since people who do not work for wages always regard themselves as self
employed fishermen or farmers. The group that is highly dependent on natural resources and
climate conditions.
20
This is where it brings into relevance the need for more government’s services on areas such
as environment protection and conservation as it also feeds into pillars of sustainable
economic social and livelihood development.
The natural state of biodiversity of Kiribati continues to face threats from several human and
natural induced factors including climate change and sea level rise. Their abundance and
services they harbour will be relied upon in the future for social livelihood and economic
development activities, in addition to the resilience of Kiribati to the adverse effects of
climate change.
The Government of Kiribati has and will continue to implement a number of conservation
projects and initiatives which have linkages to climate change in terms of adaptation and
mitigation measures. These projects are implemented by Ministry of Environment, Lands
and Agricultural Development and also through its Environment and Conservation Division.
Currently these ongoing projects and initiatives include: i) the Phoenix Islands Protected Area
(PIPA), ii) Mangrove Rehabilitation Project which is implemented continuously in
collaboration with an organization in Japan known as the International Society for Mangrove
Ecosystems (ISME), iii) KAP II Mangrove Project, iv) the Ramsar Small Grant Project
funded by the Ramsar Convention on Wetlands and vi) the Programme of Work on Protected
Areas Project.
Given the socio-economic situation of Kiribati’s where the dominant driving sector to
economic growth is government’s service(s) with very few small-scale industries; Kiribati
emissions of greenhouse gases (GHGs) are insignificant when compared to emissions in the
great majority of diversified economy countries.
The primary sector of emission for Kiribati includes Energy, Agriculture and Forestry. The
Inventory compiled for this national communication which uses the IPCC 2006 Guidelines
are for years from 2004 to 2008. The total emission trends for all sectors (for carbon dioxide
and other GHGs) can be viewed in the graph below.
21
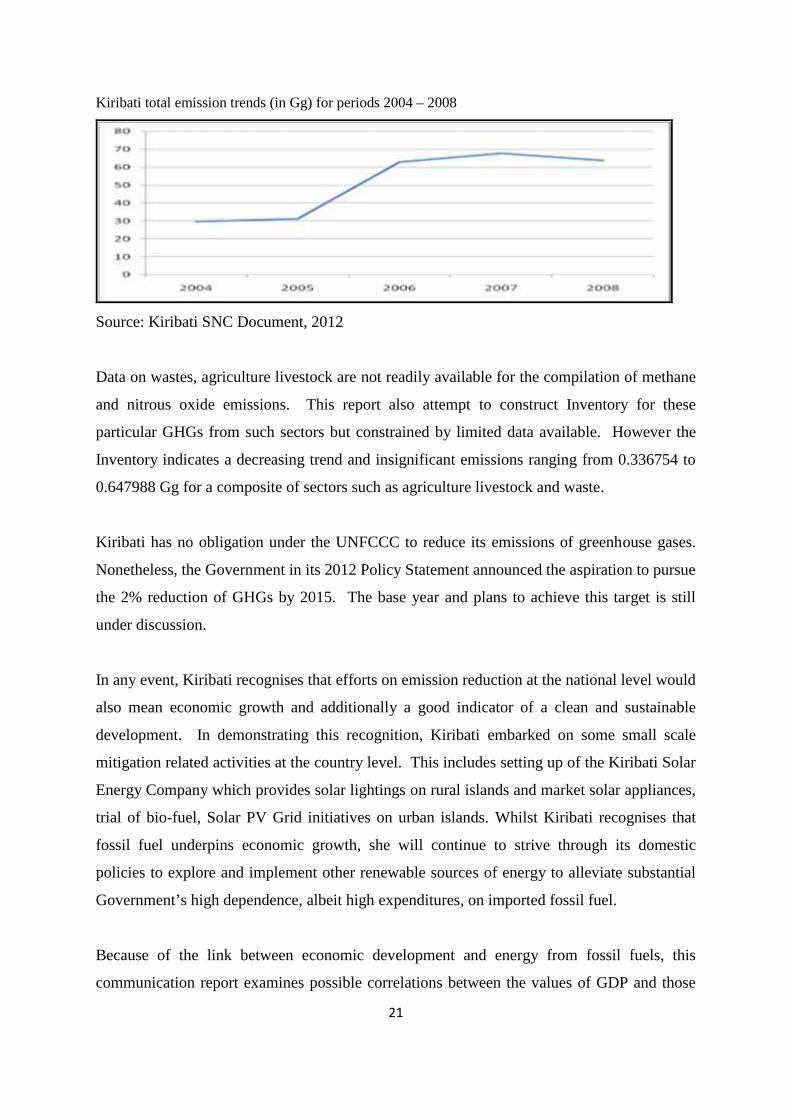
Kiribati total emission trends (in Gg) for periods 2004 – 2008
Source: Kiribati SNC Document, 2012
Data on wastes, agriculture livestock are not readily available for the compilation of methane
and nitrous oxide emissions. This report also attempt to construct Inventory for these
particular GHGs from such sectors but constrained by limited data available. However the
Inventory indicates a decreasing trend and insignificant emissions ranging from 0.336754 to
0.647988 Gg for a composite of sectors such as agriculture livestock and waste.
Kiribati has no obligation under the UNFCCC to reduce its emissions of greenhouse gases.
Nonetheless, the Government in its 2012 Policy Statement announced the aspiration to pursue
the 2% reduction of GHGs by 2015. The base year and plans to achieve this target is still
under discussion.
In any event, Kiribati recognises that efforts on emission reduction at the national level would
also mean economic growth and additionally a good indicator of a clean and sustainable
development. In demonstrating this recognition, Kiribati embarked on some small scale
mitigation related activities at the country level. This includes setting up of the Kiribati Solar
Energy Company which provides solar lightings on rural islands and market solar appliances,
trial of bio-fuel, Solar PV Grid initiatives on urban islands. Whilst Kiribati recognises that
fossil fuel underpins economic growth, she will continue to strive through its domestic
policies to explore and implement other renewable sources of energy to alleviate substantial
Government’s high dependence, albeit high expenditures, on imported fossil fuel.
Because of the link between economic development and energy from fossil fuels, this
communication report examines possible correlations between the values of GDP and those
22
of the carbon dioxide emissions from fossil fuels. The correlations of carbon dioxide
emissions from fossil fuels used separately under some of the categories in the inventory of
emission, and the values of GDP contributions from the comparable categories of the
economy was also examined.
From the analysis, it is noted that GDP at current prices or at constant prices are highly
correlated with emissions of carbon dioxide from fossil fuels. However the correlations
between the contributions to GDP of the different sectors and the corresponding emissions of
carbon dioxide from the same labelled sectors vary because there is no consistency in the
sectors as defined under the two separate considerations – national accounts and greenhouse
gases inventory.
This denotes and further emphasizes the essential role of mitigation, not only, on domestic
development but also spin-off effects to protect the environment and global benefits as well.
This leads to the real need of directing future focus on in-depth mitigation analysis and how
to better facilitate voluntary appropriate mitigation of climate change in the near future.
In the context of climate change, defining “Vulnerability” has been very pivotal to
understanding measures and strategies to respond to the adverse impacts of climate change.
The IPCC defined vulnerability as “the extent to which climate change may damage or harm
a system”. It adds that vulnerability “depends not only on a system’s sensitivity, but also on
its ability to adapt to new climatic conditions”. Kiribati agreed with that definition and
continues to disclose elements of our vulnerability along the spectrum of that definition.
Since the last Initial communication report, there have been several climate modelling &
downscaling efforts aimed at understanding the extent of possible future climates, including
projected sea level rise for Kiribati. The details of these works including different scenarios
from different credible work of several international institutions can be found in the
Vulnerability and Adaptation section of this report.
Based on these scientific undertakings, there is consensus that i) both ambient and sea surface
temperatures will increase in the coming future i.e. from 2025 up to 2100 with a range of
28oC to 32oC; ii) precipitation will also increase on average but this is highly variable
23
spatially and there should be caution on possibility of prolonged devastating drought events;
iii) Sea level is also expected to rise in the future by several centimetres (range from 15cm to
70cm at different time scales). This confirms the notion that climate change in the future
could dangerously damage or harm Kiribati’s various systems.
As mentioned earlier, Kiribati is comprised mostly of coral atolls and therefore the
environment systems that provide sustenance to living population are sensitive to any drastic
or slow onset climatic conditions. Urban centres/settlements are among the many vulnerable
sectors due to socio-economic activities and that climate change could further exacerbate the
impacts.
Several sectors and systems have also been examined in past vulnerability assessments and
consensually concluded that Kiribati has already been exposed to risks and impacts of climate
change coupled with additional layers of stress already existed over these systems.
With the low adaptive capacity of island systems compounded by limited resources (spatially
and financially) to deal with the adverse effects of climate change, this report finds
consistency with His Excellency President Tong in his arguments stating that Kiribati and
other low-lying island countries should be perceived within this phenomena as “Vulnerable
countries in the frontline”.
The projections of climate change and existing national fragile circumstances will only add
up to compounded and probably unthinkable level of impacts which may be extremely
difficult to neither cope with, nor reverse it in the longer term future.
The other advantage of V&A studies is that they will continue to assist to inform forward
planning, allowing the identification of suitable adaptation options and develop adaptation
planning strategies` – at any particular level of sector and scope which will be seen to have
results on adaptive capacity, resilience and overall security of Kiribati in the longer term
future.
Adaptation and Risk reduction was recognised by Kiribati as the only solution (with external
support) to safeguarding critical systems and Kiribati’s communities from what could
24
emanate from the scale of our vulnerability, and risks by climate change. This notion was
slowly happening and mainstreamed into sectoral and national planning priorities.
Institutional arrangements, mainstreaming processes e.g. mainstreaming of our CCA and
DRR efforts as being implemented by KAPIII, relevant policy instruments e.g. Climate
Change Policy Framework, etc from various sectors are beginning to emerge and come into
play. As this becomes to set its scene, coordination mechanism including climate change
policy formulation, coordination, capacity mechanism framework and adequate capacity of
sectors are essential elements that need to be in place and function properly as pre-requisites
of this process of effective adaptation.
The process of compiling national communications efficiently requires capacity at sectoral
levels for appropriate data generation and inputting to various components of the report. A
robust and systematically updated data framework, including a working institutional setting
that facilitate this reporting process and also translates the national communication into
policy relevant information tailored to specific needs of national communications as well as
sectoral operatives and priorities, will add value and inform the overall national approach to
respond to climate change in the future.
Kiribati as one of the least developed countries does not have the resources to focus
attention/actions on institutional strengthening needs. Evidently, there were already real
issues that certainly need more attention/assistance and this is one of the core reasons why
most of these institutional and capacity gaps were often sidelined or marginalized. These
characterised the main areas of constraints and gaps in this whole process of preparing
national communication.
Informed decision making requires accurate, consistent and timely provision of advices
which should be based on factual, science-based and rigorous planning. Research capacities
and capabilities in Kiribati that could alleviate this gap were chronically lacking at national
level. Most of the research needs have been supplemented by international and regional
organisations. Though these researches from these institutions are extremely critical to
inform decision making at the national level, they could be very prolonged and untimely.
25
These gaps and constraints will continue to impede the process of preparing subsequent
national communications, implementation of obligations under UNFCCC and overall national
response to climate change, unless addressed.
The Kiribati SNC report ends with proposed project concepts that emerged and were
identified during the preparation of this national communication report. These concepts could
be translated into programmatic proposals with the view of seeking assistance to address
some of the gaps and constraints identified in this report. This is an attempt to complement
on-going national efforts and priorities that have been planned and thought out to also resolve
the multifaceted challenges of responding to climate change.
26
1.0 INTRODUCTION
1.1 PURPOSE
Under Art 12.1 of the United Nations Framework Convention on Climate Change, each
Party is required to communicate to the Conference of the Parties information on its
implementation of the Convention. As a least developed low lying small island country,
Kiribati would not have been able to meet this obligation without financial support from
Annex 1 Parties. This support was received by Kiribati in April 2008, and has enabled
the submission of this Second National Communication to the UNFCCC.
The scope of information and how they are structured in the SNC are based on the
UNFCCC COP Decision 17/CP.8 “Guidelines for the preparation of the national
communications from Parties not included in Annex I to the Convention”, and Kiribati
Initial National Communication 1999.
1.2 PROCESS AND METHODOLOGY
The MELAD, through its Environment and Conservation Division (ECD), is the
implementing Ministry for the SNC Project. The Climate Change Unit within the ECD,
collaborating with other Ministries and stakeholders through Climate Change Study Team
and networking, has been responsible for technical information contained in this SNC
Report.
The Climate Change Unit started off with an initial strength of two employees but it
receives the support it requires from the whole staff of the ECD as and when necessary.
Two more individuals responsible for mitigation and adaptation were later recruited to
the Unit. With that mode of operation, the CCU produced initial elements of information
relevant for inclusion in the SNC while regularly referencing these to the CCST. The
information were then collated to produce an initial draft text of the SNC that finally
developed into the approved SNC.
27
The process and tasks undertaken for the SNC have engaged many individuals from other
Government’s line ministries, NGOs and the private sector. It is the Cabinet who approve
on 31st May 2013 this final version of the SNC. However representatives from wider
sections of the nation were involved from the formulation stage of the project document
to its completion stage.
At the inception workshop for the preparation of the SNC project held in 2006,
participants discussed broad areas of climate change issues that stakeholders consider to
be included in the SNC report. These include i) energy and greenhouse gas inventories to
understand Kiribati dependency on fossil fuels; ii) contribution to climate change and
opportunities to mitigate climate change from the sector; iii) key climatic systems and
their impacts on the economy to understand economic impacts of climate change; and iv)
vulnerability and adaptation to be emphasized in order to heighten the need for global
action to mitigate climate change and for Kiribati to be assisted in its adaptation. These
issues are reflected in the approved SNC project document.
Based on the Initial National Communication, a draft outline of the SNC was adopted by
the CCST. Major topics in the draft outline are greenhouse inventories and mitigation,
vulnerability and adaptation, national circumstances. For each of these topics, a working
group with core members from the CCST was established. The plan was for each of the
thematic working groups to work through its topics from data collection, analysis, and
finally to documenting information for inputting into the SNC Report. This plan was not
as successful as originally anticipated.
The working groups were only able to provide to the CCU copies of some reports related
to coastal vulnerability and adaptation, data on fuel consumptions, livestock, and on
population. Climate data were readily made available to CCU by the Kiribati
Meteorological Services (KMS). Thus leaving analytical work and the documenting of
information to the CCU to work through, which it was doing whilst at the same time
regularly referencing substantial outputs to CCST. This work also used information
available since 2000 as part of national climate change related programs.
28
It was obvious that CCST involvement in the work on the SNC was less than what was
expected. The reasons were that members of the CCST working groups have their own
areas of work and priorities which left them no time to undertake analytical work and
documenting of the information for the SNC. Moreover, high turnover of members who
represent different ministries contributed significantly to the lack of continuity in pursuing
the originally planned work of the Working Groups.
At the very start of the SNC project, CCU realized that some tasks would be very
technical for working groups and CCU to be able to undertake adequately. A framework
on vulnerability and adaptation that can set out what Kiribati wish to understand from any
vulnerability and adaptation assessments is one of these tasks. The CCU and the CCST
over several meetings have been able, however, to develop this type of framework as
highlighted in the Vulnerability and Adaptation Chapter.
There are technical tasks that present technical teams cannot carry on such as GHG
Inventory, so on. For these tasks, international experts were mobilized to conduct an in-
country training workshop of week duration. Members of the CCST and other
government’s employees were able to participate. A training manual was produced, and
moreover, a similar workshop training conducted by one of the trainees was organized for
members of the CCST who did not attend the one conducted by the international expert.
Nevertheless, the SNC Project faced difficulties in getting data on some of the remote
islands of Kiribati such as Kiritimati. Based on information and knowledge gained in
these trainings, the CCU has produced the greenhouse inventories that are included in this
SNC. An alternative approach is to train members of the CCST and ECD so that
whenever they travel to Kiritimati islands, they could conduct data collection for the
GHG Inventory.
But the pace of work had not been up to speed that it was necessary for UNDP to arrange
measures to fast track the project activities. Included was the acquisition of SIMCLIM
tool and demonstrations of how it can be used.
29
1.3 LINKAGES OF SNC TO ENVIRONMENT ACT AND NATIONALDEVELOPMENT PLAN
The SNC Project’s key objective is to strengthen the technical and institutional capacity
of Kiribati to prepare and submit its SNC Document to the UNFCCC. This project also
serves at the same time as a capacity building project for Kiribati to understand how
climate change and its impacts on national circumstances could evolve over time. It also
heightens the logical connection of key climate change issues with the whole components
of the environment.
This logical connection perhaps underpins Presidential allocations of climate change
portfolio with other environmental issues to the Ministry of Environment, Land and
Agriculture Development. “Environment”, according to the Environment Amendment
Act 2007 (which retains the definition in the original Environment Act 2000) defines
“environment” as “natural and social and cultural systems and their constituent parts and
the interaction of their constituent parts, including people, communities and economic,
aesthetic, culture and social factors”. This covers very broad areas of national issues.
All areas of national issues that got into the political agenda of government are reflected in
ministerial portfolios; government (including colonial administration) has been instituted
over a century; and until recently, it was thought that there was nothing left unattended to
form new agenda on “environment”. This has changed recently during the period from
late 1980s to early 1990s, when the concept of sustainable development was developing at
international level which made Kiribati to recognize the need for creating, a ministerial
responsibility for environment for the first time. The three Rio Conventions were
significant in bringing home the message that degradation in the global environment is real
and require actions by all countries at the national and local levels.
The first legislation on the Environment was unanimously adopted in 1999 by Parliament,
and came into force as the Environment Act 1999. Unanimous support for the conservation
and protection of the environment came from the visibility of the deterioration of the urban
environment. Parliamentarians welcomed the Environment Act and thought it was
something that was long overdue.
30
The object of the Act at Section 3 (b) (iv) reflects international agenda on the protection of
the global environment. Issues in the object include “to reduce risks to human health and to
protect prevent the degradation of the environment by all practical means, including the
following - (iv) to comply with and give effect to international and regional conventions
and obligations relating to the environment”. The importance of this section in the object
has been raised in the Environment Amendment Act 2007 to become Section 3 (e); it is no
longer a sub paragraph in the section. Also in this amendment Act, climate change was
integrated into the Environment Impact Assessment checklists and enacted in its
regulations.
The activities of the ECD in pursuing Kiribati obligations under the three Rio Conventions –
UNCBD, UNCCD, and UNFCCC – and other International Environment Agreements to
which Kiribati is a party are consistent with the object of the Environment Act 1999.
Nevertheless there is still more to be done in order for Kiribati to fully comply with its
obligations under the Rio Conventions, not that this means ECD has been able to fully
implement its Environment Act and Regulations. This is due to limited in-country capacity
and resources available to ECD.
With the limited resources, Kiribati has been able to increase established positions within
the ECD from one officer to about ten, within a period of about two decades for which
environment issues have been recognized to form part of the national agenda. The number
of project officers has also increased with the increasing number of activities related to
implementing at the country level commitments under those Multi-lateral Environmental
Agreements.
Although much of the obligations that are pursued are on preparation of plans and
reporting, these reinforce the need to undertake focused actions on implementing the
Environment Act and Regulations that have immediate benefits to the local environment.
These include activities such as pollution control and waste management, development
licensing system utilizing EIA procedures, inspection and monitoring of the enhancement
of key ecosystems such as corals, mangroves and seagrasses.
31
As for the fact that climate change is an economic issue, the SNC needs to be consistent
with national development objectives and strategies. During the period of between the
Initial National Communication and this SNC, there have been three serial National
Development Strategies, each of four year timeframe which is also the life time of the
Government. Economic growth, vibrant economy, sustainable development, distribution of
wealth, improved state of the environment, and people’s needs are recurring themes with
varying importance accorded to each relative to the others in the goals of National
Development Strategies.
Normally, the preparation of National Development Strategies involves consultations
among different line Ministries with the Ministry of finance and economic development as
the leading institution. The NDS is fundamentally the planning document of the
Government. It needs therefore to be consistent with “policy statements” of the present
Government that has been presented to Parliament at its first sitting after the Government
comes into power. Global and international issues bearing on economic development and
environment protection, such as those of the “Millennium Development Goals” and
“Agenda 21”, have drawn the government’s attention to some of the emerging issues e.g.
environment, climate change. These documents play an important role in informing the
formulation of the NDS.
Emerging issues include inadequate and substandard infrastructure in the urban area, high
unemployment rate among young people, and increasing overuse and consequential
degradation of the environment and natural resources. In addition, climate change is
recognized in the NDS2004-2007 as potentially causing costly risks to economic growth as
well as social adverse impacts. Understandably the climate change impacts on natural
systems are first to be experienced by local communities, and because of these impacts on
their natural systems, their livelihood and social organization would be affected in ways
that will produce outcomes that are less than optimal.
NDS 2008-2011 goal is “Enhancing economic growth for sustainable development” that
captures the thrust of Government’s policy statement which is ‘A vibrant economy for the
people of Kiribati’. Climate change is being integrated into the “Environment” Key Policy
Area.
32
2.0 NATIONAL CIRCUMSTANCES
2.1 INTRODUCTION
The purpose of this chapter is to provide bio-physical and socio-economic information and
characteristics that are vital for wider understanding on Kiribati’s vulnerability to the adverse
effects of climate change, its capacity and its options for adaptation, as well as its options for
addressing its GHG emissions within the broader context of sustainable development.
It is acknowledged that the UNFCCC has been the driver for past and existing programmes
related to climate change at the national, regional and international level. The chapter
proceeded with explaining institutional arrangements at the national level that are involved in
the preparation of the Second National Communication, including institutional settings for
planning and managing climate change adaptation and mitigation. The underlying
geographical and important morphology constructs of Kiribati that make it particularly
vulnerable to climate change. The current and future climate outlook with important trends
and elements are also explained. In the last section of this chapter, socio-economic
circumstances is detailed with important association with Kiribati’s vulnerabilities, capacity
and capability; necessary to address adaptation and mitigation at the national level.
The chapter aims to provide updated information on each sub-section of the national
circumstances since the submission of the Initial National Communication in 1999.
Therefore based on the efforts vested in this project, new scientific information or outcomes
of research that have recently produced since 1999 and are related to the sub-sections of
national circumstances was captured and presented in this second national communication.
33
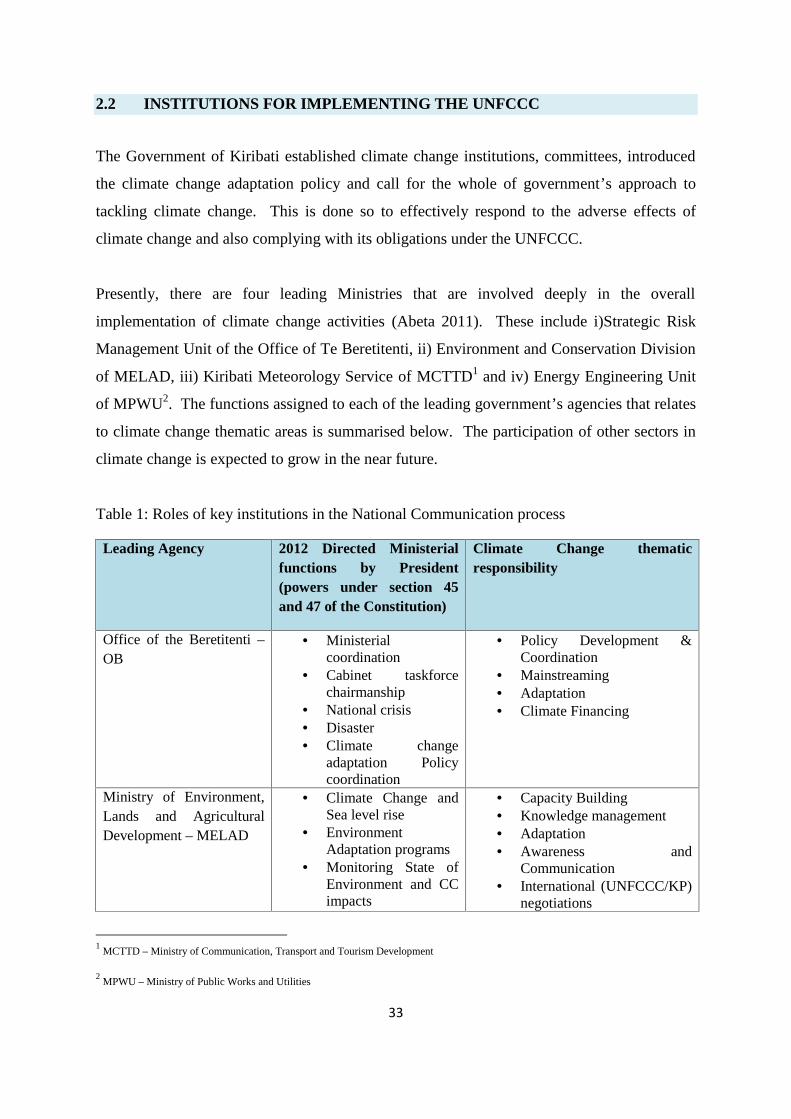
2.2 INSTITUTIONS FOR IMPLEMENTING THE UNFCCC
The Government of Kiribati established climate change institutions, committees, introduced
the climate change adaptation policy and call for the whole of government’s approach to
tackling climate change. This is done so to effectively respond to the adverse effects of
climate change and also complying with its obligations under the UNFCCC.
Presently, there are four leading Ministries that are involved deeply in the overall
implementation of climate change activities (Abeta 2011). These include i)Strategic Risk
Management Unit of the Office of Te Beretitenti, ii) Environment and Conservation Division
of MELAD, iii) Kiribati Meteorology Service of MCTTD1 and iv) Energy Engineering Unit
of MPWU2. The functions assigned to each of the leading government’s agencies that relates
to climate change thematic areas is summarised below. The participation of other sectors in
climate change is expected to grow in the near future.
Table 1: Roles of key institutions in the National Communication process
Leading Agency 2012 Directed Ministerialfunctions by President(powers under section 45and 47 of the Constitution)
Climate Change thematicresponsibility
Office of the Beretitenti –OB
Ministerialcoordination
Cabinet taskforcechairmanship
National crisis Disaster Climate change
adaptation Policycoordination
Policy Development &Coordination
Mainstreaming Adaptation Climate Financing
Ministry of Environment,Lands and AgriculturalDevelopment – MELAD
Climate Change andSea level rise
EnvironmentAdaptation programs
Monitoring State ofEnvironment and CCimpacts
Capacity Building Knowledge management Adaptation Awareness and
Communication International (UNFCCC/KP)
negotiations
1MCTTD – Ministry of Communication, Transport and Tourism Development
2MPWU – Ministry of Public Works and Utilities
34
Focal point for internationaland regional climate changeagencies (SPREP, AOSIS.etc)
Climate Financing Overview of climate change
issues, maintaining climatechange information data andinformation
Ministry ofCommunication, Transportand Tourism Development– MCTTD
Meteorologicalservices
Capacity Building Knowledge management Research & Systematic
observation
Ministry of Public Worksand Utilities - MPWU
Energy Management(and other alternativesources of energyincluding SolarEnergy Company)
Mitigation Technology Needs
Assessment
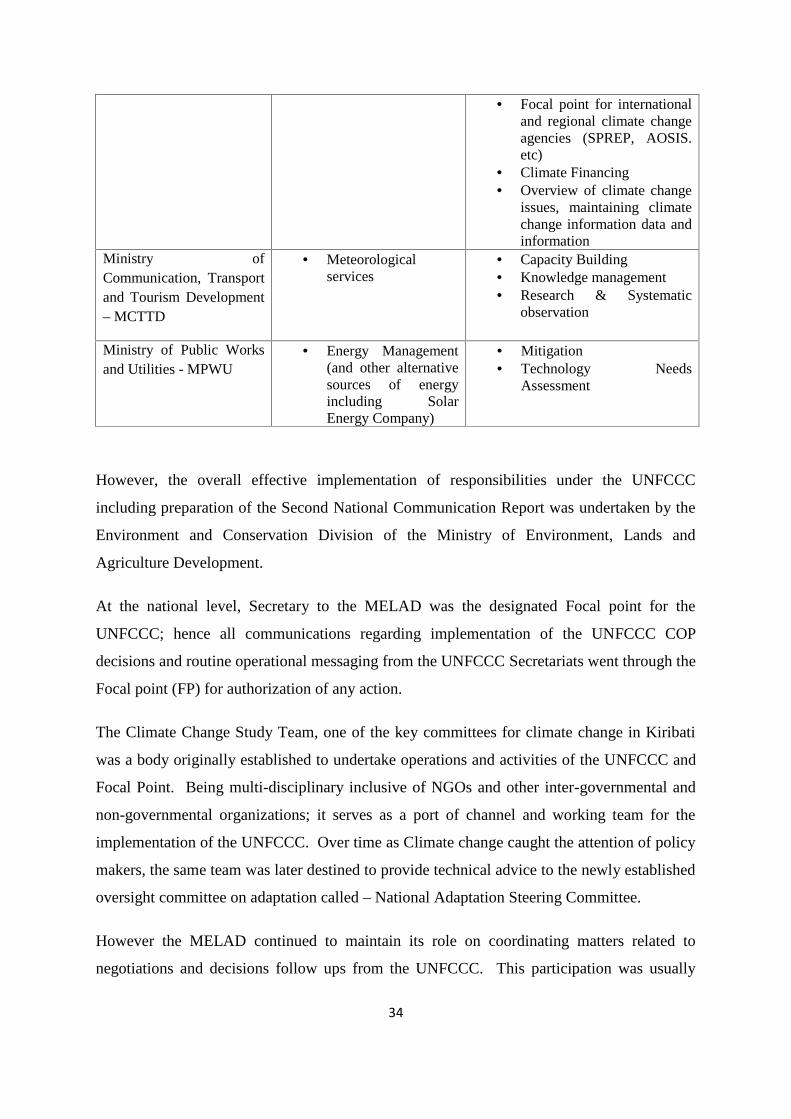
However, the overall effective implementation of responsibilities under the UNFCCC
including preparation of the Second National Communication Report was undertaken by the
Environment and Conservation Division of the Ministry of Environment, Lands and
Agriculture Development.
At the national level, Secretary to the MELAD was the designated Focal point for the
UNFCCC; hence all communications regarding implementation of the UNFCCC COP
decisions and routine operational messaging from the UNFCCC Secretariats went through the
Focal point (FP) for authorization of any action.
The Climate Change Study Team, one of the key committees for climate change in Kiribati
was a body originally established to undertake operations and activities of the UNFCCC and
Focal Point. Being multi-disciplinary inclusive of NGOs and other inter-governmental and
non-governmental organizations; it serves as a port of channel and working team for the
implementation of the UNFCCC. Over time as Climate change caught the attention of policy
makers, the same team was later destined to provide technical advice to the newly established
oversight committee on adaptation called – National Adaptation Steering Committee.
However the MELAD continued to maintain its role on coordinating matters related to
negotiations and decisions follow ups from the UNFCCC. This participation was usually
35
constrained by lack of sufficient capacity and knowledge on the background and substance of
the negotiation’s hot issues and how those relates to the local context, inconsistency in
participation and lack of interest to participate. In the post negotiation sessions, being a
relatively small work force, appetites for follow-up actions were often absent due to
numerous official tasks that burden negotiators to commit to such actions. This could be
addressed by creating either permanent or project-based positions to shoulder these
commitments.
In terms of the SNC preparation, the CCST with its thematic working groups focusing on
specific components was still used to deliver the tasks. Although, recognising that some
undertakings were implemented by international experts due to inadequacy of knowledge
and/or lack of time. The financial resources provided to support the process assisted Kiribati
to undertake focussed assignments and capacity building activities relevant to climate change
to be successfully completed.
36
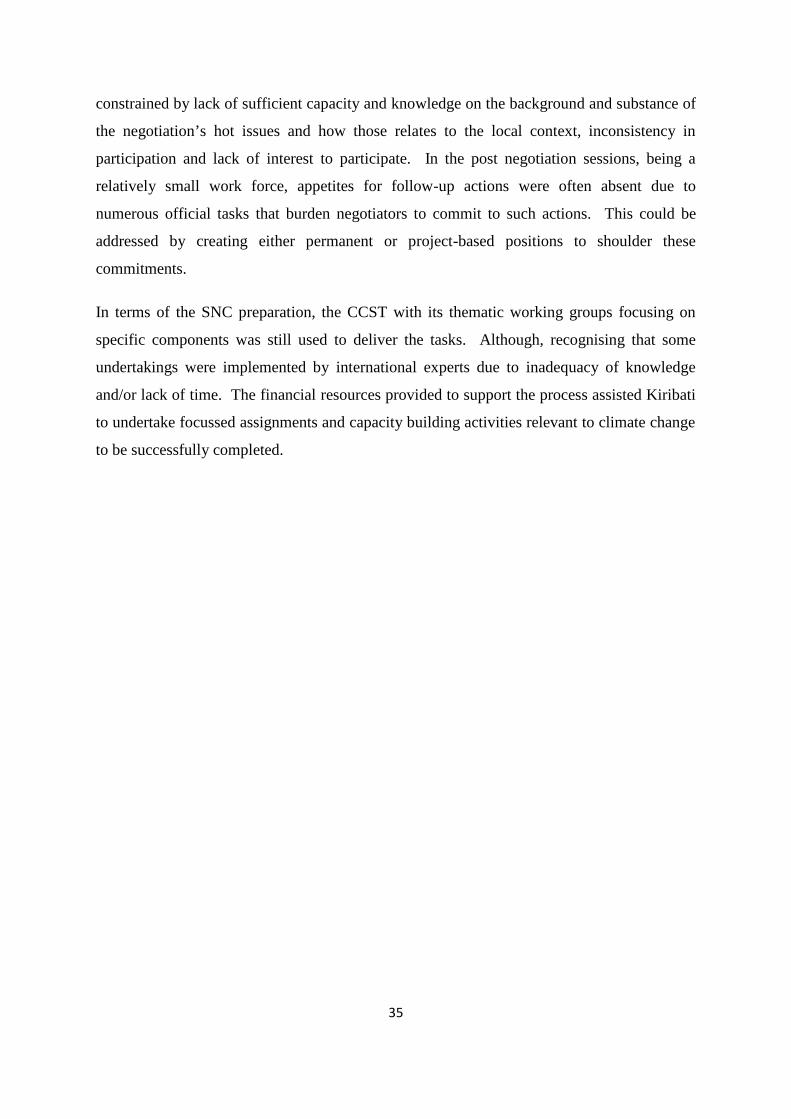
2.3 GEOGRAPHY
Kiribati is a small island country in the central Pacific, comprised of 33main islands span in
three main groups of islands, Gilbert, Line and Phoenix Islands. From the 33 islands, only
one island, (Gilbert Group) is a raised limestone and the other 32 are low-lying coral atoll
islands. There are a total of 12 uninhabited islands; most of them are from the Phoenix and
Line group. The whole area of the Phoenix Group (of just more than 400,000 km2 and
comprised of 8 atoll islands) was declared by Government of Kiribati as the Phoenix Island
Protected Area and named as a UNESCO World Heritage site in 2010.
Figure 1: Map of Kiribati
Source: Google Maps and Photos
Atolls termed from the Maldivian word “atolu” represent a generally ring-shaped structure.
These are characterised by an annular reef around a central lagoon, while there are also
isolated table reefs in geological settings where only one island is found on the smaller reef or
37
lagoon is residual feature (Nicholls 2007). The extents of atoll islands vary in size and shape
either along the entire rim or may be restricted to one or more breaks of the rim margins.
There were several theories and studies performed in the past over the formation of coral atoll
islands. This was best understood by Charles Darwin’s (Darwin, 1842 as quoted in
Woodroofe, 2007) initial and revised opinion on coral atoll formation. Darwin’s first viewed
atoll formation as a result of gradual subsidence of volcanic land eruptions underwater, but
dependent on the time horizon (which may be prolonged in some cases) of the subsistence of
the foundations on which the atolls were formed, together with the possible upward growth of
the reef constructing corals. The detail of these studies were also captured and detailed in
the Initial National Communication.
These geological studies have been instrumental in explicating the geo-morphological origins
and features of atoll islands relative to issues referred like sea level rise and their
vulnerability to potential environmental stressors e.g. climate change. This specific aspect of
information on geology of atoll islands is fundamentally important to understand, as Kiribati
closely monitor the trends of changing climate and the risks they poses on these atoll systems
in the future.
According to the current body of information on this topic, reef islands or atolls are still
regarded as some of the most threatened coastal systems among many reviewed systems, in
the face of sea level rise. The extent of their capacity and their vulnerability in the face of
climate change will be revealed in subsequent national communications.
The atolls are generally elongated in a north-south orientation, with the eastern side facing
the predominant easterly winds. Several passages separate islands in most of the atolls, and
these have allowed exchange of seawater on the two opposite sides of the atoll to take place.
Intertidal reef platforms with varying widths (150 –200 m.) exist around table reefs and at
atolls with lagoons on the side facing the prevailing winds. Intertidal mud platform extends
seaward from the lagoonal beach to the lowest low water mark beyond which the platform
slopes to the seabed.
38
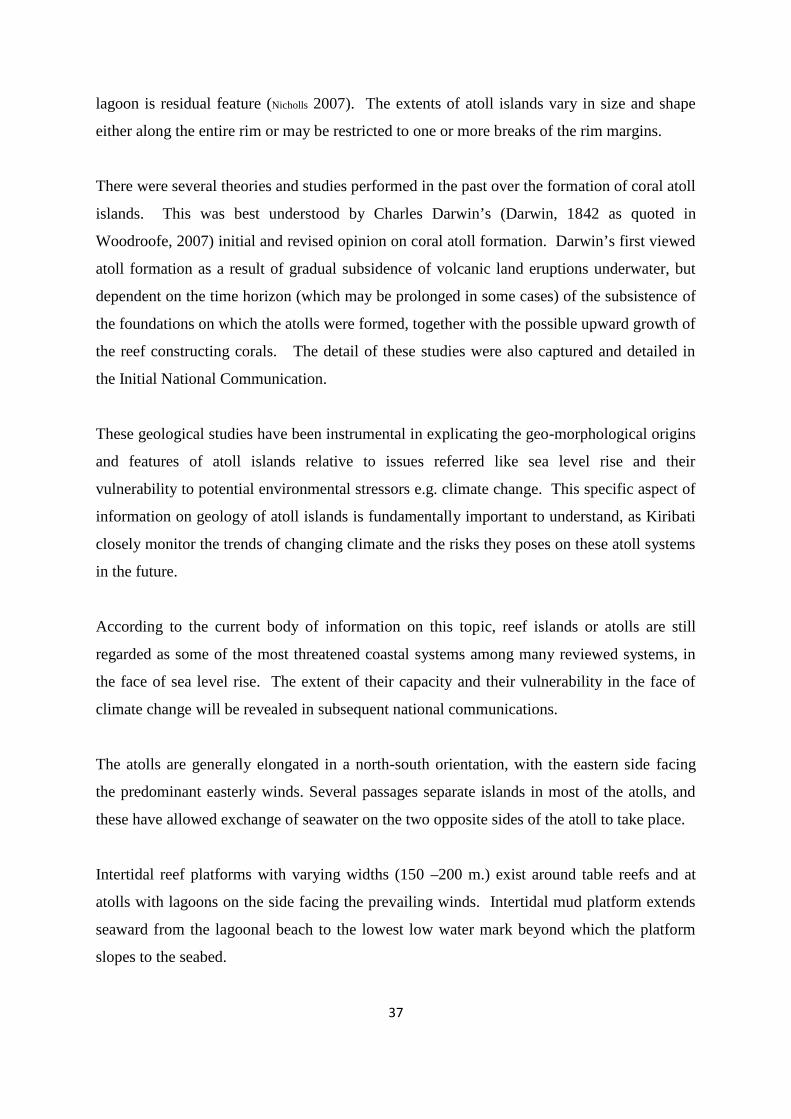
The ocean side of the atolls are slightly higher than the lagoon sides. Variation in heights of
the land surface across the atoll is quite small, but stretches of berms at the edge of the atoll
on the ocean sides are quite visible in parts of the atoll (Webb 2005). The land surface is
probably within 1 meter and 4 meters above the reef platforms and the lagoonal mud
platforms.
Figure 2. Cross-section of typical coral atoll island
Source: Falkland, 2004
39
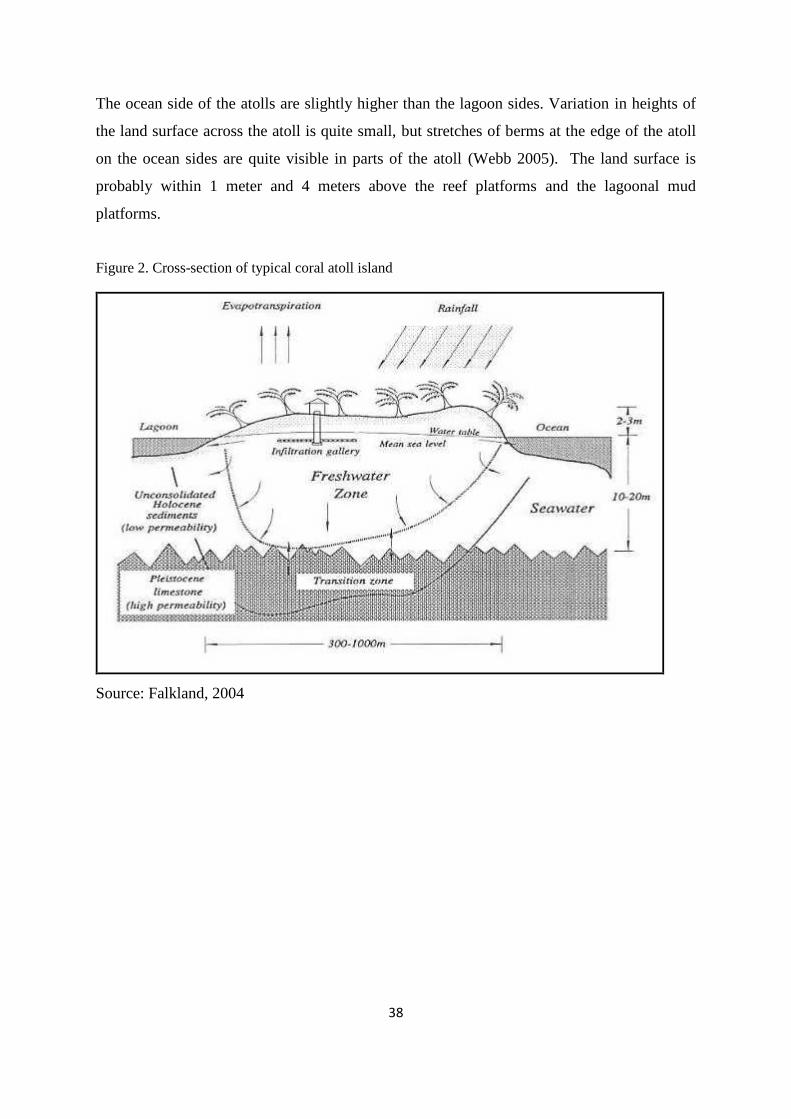
Figure 3. Aerial view of low-lying coral atoll - South Tarawa
Source: Google maps and photos
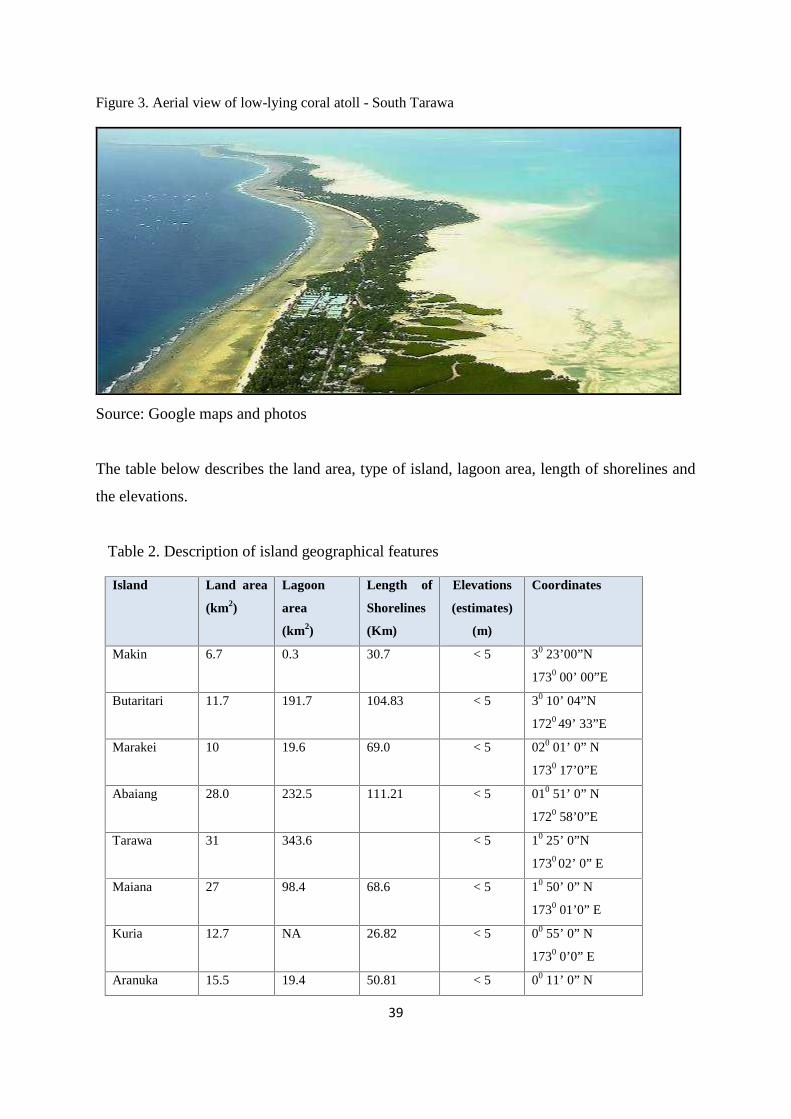
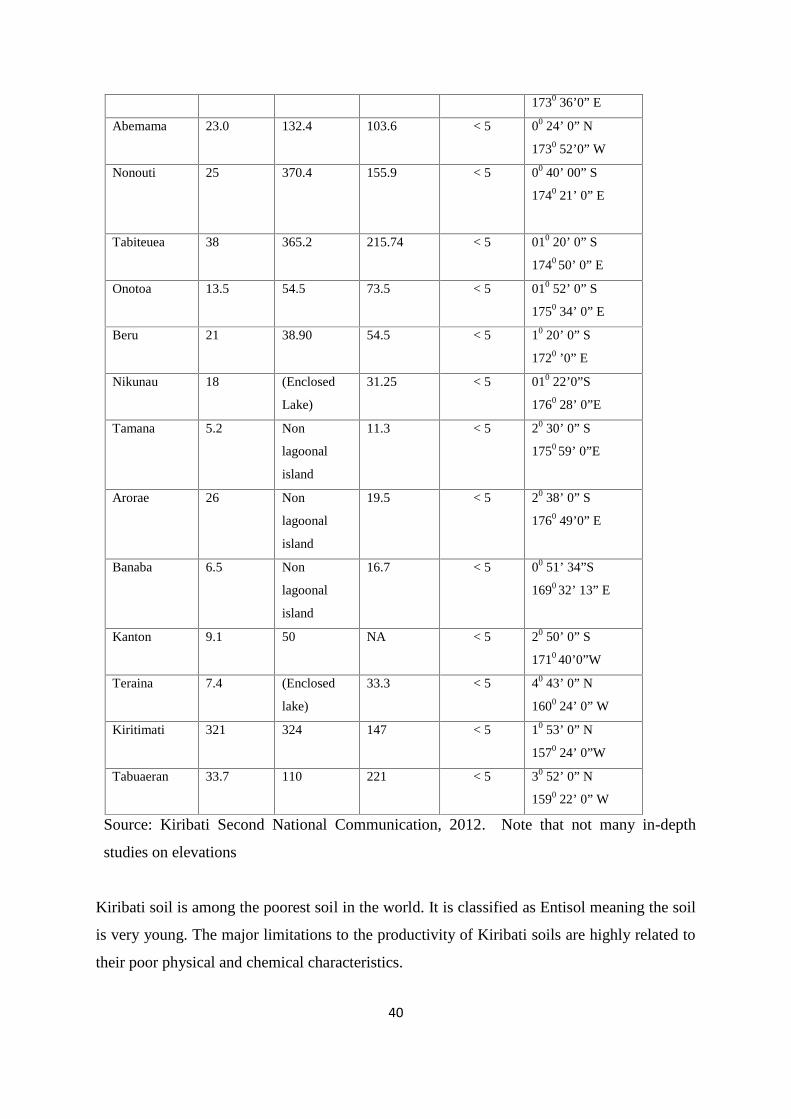
The table below describes the land area, type of island, lagoon area, length of shorelines and
the elevations.
Table 2. Description of island geographical features
Island Land area
(km2)
Lagoon
area
(km2)
Length of
Shorelines
(Km)
Elevations
(estimates)
(m)
Coordinates
Makin 6.7 0.3 30.7 < 5 30 23’00”N
1730 00’ 00”E
Butaritari 11.7 191.7 104.83 < 5 30 10’ 04”N
1720 49’ 33”E
Marakei 10 19.6 69.0 < 5 020 01’ 0” N
1730 17’0”E
Abaiang 28.0 232.5 111.21 < 5 010 51’ 0” N
1720 58’0”E
Tarawa 31 343.6 < 5 10 25’ 0”N
1730 02’ 0” E
Maiana 27 98.4 68.6 < 5 10 50’ 0” N
1730 01’0” E
Kuria 12.7 NA 26.82 < 5 00 55’ 0” N
1730 0’0” E
Aranuka 15.5 19.4 50.81 < 5 00 11’ 0” N
40
1730 36’0” E
Abemama 23.0 132.4 103.6 < 5 00 24’ 0” N
1730 52’0” W
Nonouti 25 370.4 155.9 < 5 00 40’ 00” S
1740 21’ 0” E
Tabiteuea 38 365.2 215.74 < 5 010 20’ 0” S
1740 50’ 0” E
Onotoa 13.5 54.5 73.5 < 5 010 52’ 0” S
1750 34’ 0” E
Beru 21 38.90 54.5 < 5 10 20’ 0” S
1720 ’0” E
Nikunau 18 (Enclosed
Lake)
31.25 < 5 010 22’0”S
1760 28’ 0”E
Tamana 5.2 Non
lagoonal
island
11.3 < 5 20 30’ 0” S
1750 59’ 0”E
Arorae 26 Non
lagoonal
island
19.5 < 5 20 38’ 0” S
1760 49’0” E
Banaba 6.5 Non
lagoonal
island
16.7 < 5 00 51’ 34”S
1690 32’ 13” E
Kanton 9.1 50 NA < 5 20 50’ 0” S
1710 40’0”W
Teraina 7.4 (Enclosed
lake)
33.3 < 5 40 43’ 0” N
1600 24’ 0” W
Kiritimati 321 324 147 < 5 10 53’ 0” N
1570 24’ 0”W
Tabuaeran 33.7 110 221 < 5 30 52’ 0” N
1590 22’ 0” W
Source: Kiribati Second National Communication, 2012. Note that not many in-depth
studies on elevations
Kiribati soil is among the poorest soil in the world. It is classified as Entisol meaning the soil
is very young. The major limitations to the productivity of Kiribati soils are highly related to
their poor physical and chemical characteristics.
41
The soils are made up largely of calcareous materials in the form of coarse coral sand and
gravels and typically with quite variable organic matter content (Trewren, 1984). The
general profile of the atoll soil is thin layers of organic accumulation overlying a calcareous
substratum of the parent materials which are themselves having a geologically young
formation. Because of this, the particles constituting the soil remain coarse, and their holding
capacity for water is poor, compounding the problem associated with increased temperature
and vapour-transpiration.
Shallow depth of soil, sandiness of the soil texture, low organic matter content and very high
soil pH are the major factors contributing to low or poor soil productivity. The high calcium
content of the soil caused some important trace elements such as iron (Fe), Manganese (Mn),
Copper (Cu), and Zinc (Zn) to be lock and not made available to plant.
Consequently, the availability of some major nutrient elements like Nitrogen (N), potassium
(K), phosphorus (P) and Magnesium are also influenced by the soil pH and organic matter
content (Bar, 1992, Morrison, 1986, Finlay, 1987, and Beenna, 1994).
Ground water quality and quantity and as well as the activity of the micro-organisms are
critically important factors to agricultural activities including crop and livestock production.
The nature of Kiribati soil restricted the type of food crops and other flora that can thrive and
adapt. Some of the traditional food crops include coconut (Cocosnucifera), pandanus
(Pandanustectorius), breadfruit (Artocarpusaltilis), babai (Cyrtospermachamissonis) and te
bero (Ficus) are well adapted to the conditions of atoll environments (Thaman, 1992). There
are also other specialized flora adapted well to the alkaline soil and are also part of the natural
vegetation (Morrison, 1990).
Noting that the composition of Kiribati soil is predominantly carbonate sediments, it is
significant also to reveal important sediment producers as it underpins the future existence of
islands. Parent materials from which the soil is derived are corals, coralline algae and
foraminifera which produce tonnes of million carbonate annually since first formation of
these islands (Milliman, 1974 – in (Biribo 2008)). These continue to provide sediments to
the land at the edges. However of most important is the sustainability of the supply of these
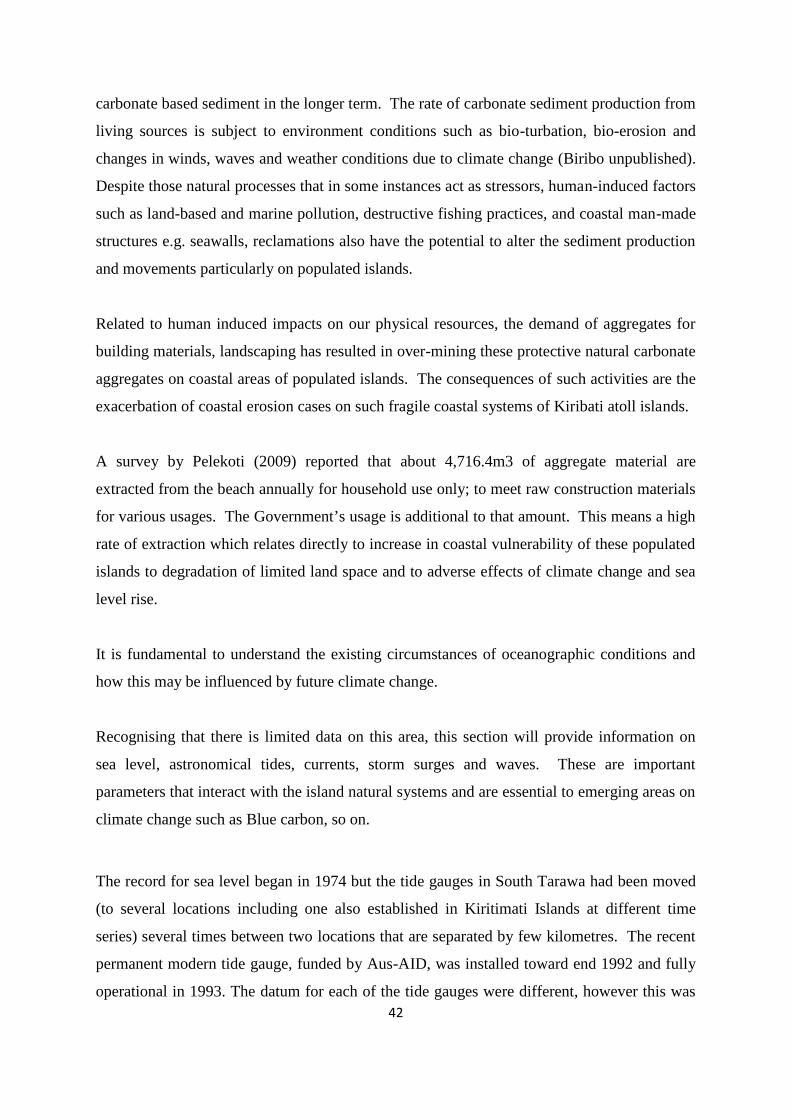
42
carbonate based sediment in the longer term. The rate of carbonate sediment production from
living sources is subject to environment conditions such as bio-turbation, bio-erosion and
changes in winds, waves and weather conditions due to climate change (Biribo unpublished).
Despite those natural processes that in some instances act as stressors, human-induced factors
such as land-based and marine pollution, destructive fishing practices, and coastal man-made
structures e.g. seawalls, reclamations also have the potential to alter the sediment production
and movements particularly on populated islands.
Related to human induced impacts on our physical resources, the demand of aggregates for
building materials, landscaping has resulted in over-mining these protective natural carbonate
aggregates on coastal areas of populated islands. The consequences of such activities are the
exacerbation of coastal erosion cases on such fragile coastal systems of Kiribati atoll islands.
A survey by Pelekoti (2009) reported that about 4,716.4m3 of aggregate material are
extracted from the beach annually for household use only; to meet raw construction materials
for various usages. The Government’s usage is additional to that amount. This means a high
rate of extraction which relates directly to increase in coastal vulnerability of these populated
islands to degradation of limited land space and to adverse effects of climate change and sea
level rise.
It is fundamental to understand the existing circumstances of oceanographic conditions and
how this may be influenced by future climate change.
Recognising that there is limited data on this area, this section will provide information on
sea level, astronomical tides, currents, storm surges and waves. These are important
parameters that interact with the island natural systems and are essential to emerging areas on
climate change such as Blue carbon, so on.
The record for sea level began in 1974 but the tide gauges in South Tarawa had been moved
(to several locations including one also established in Kiritimati Islands at different time
series) several times between two locations that are separated by few kilometres. The recent
permanent modern tide gauge, funded by Aus-AID, was installed toward end 1992 and fully
operational in 1993. The datum for each of the tide gauges were different, however this was
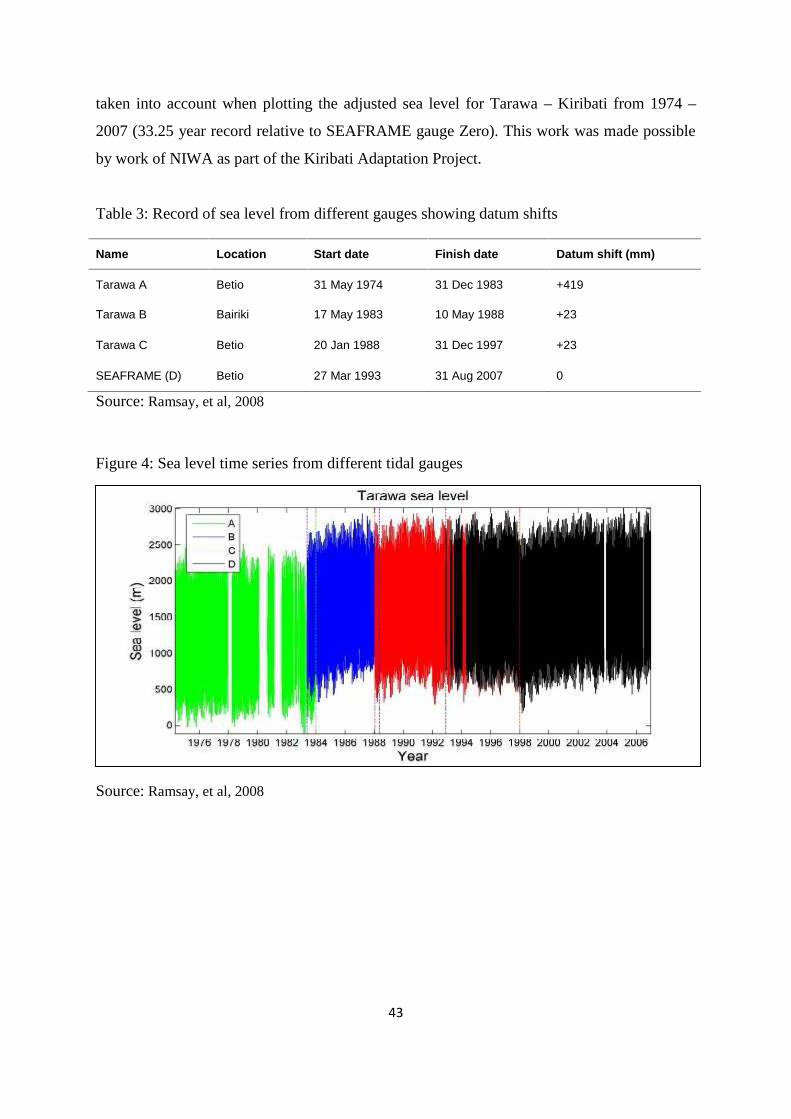
43
taken into account when plotting the adjusted sea level for Tarawa – Kiribati from 1974 –
2007 (33.25 year record relative to SEAFRAME gauge Zero). This work was made possible
by work of NIWA as part of the Kiribati Adaptation Project.
Table 3: Record of sea level from different gauges showing datum shifts
Name Location Start date Finish date Datum shift (mm)
Tarawa A Betio 31 May 1974 31 Dec 1983 +419
Tarawa B Bairiki 17 May 1983 10 May 1988 +23
Tarawa C Betio 20 Jan 1988 31 Dec 1997 +23
SEAFRAME (D) Betio 27 Mar 1993 31 Aug 2007 0
Source: Ramsay, et al, 2008
Figure 4: Sea level time series from different tidal gauges
Source: Ramsay, et al, 2008
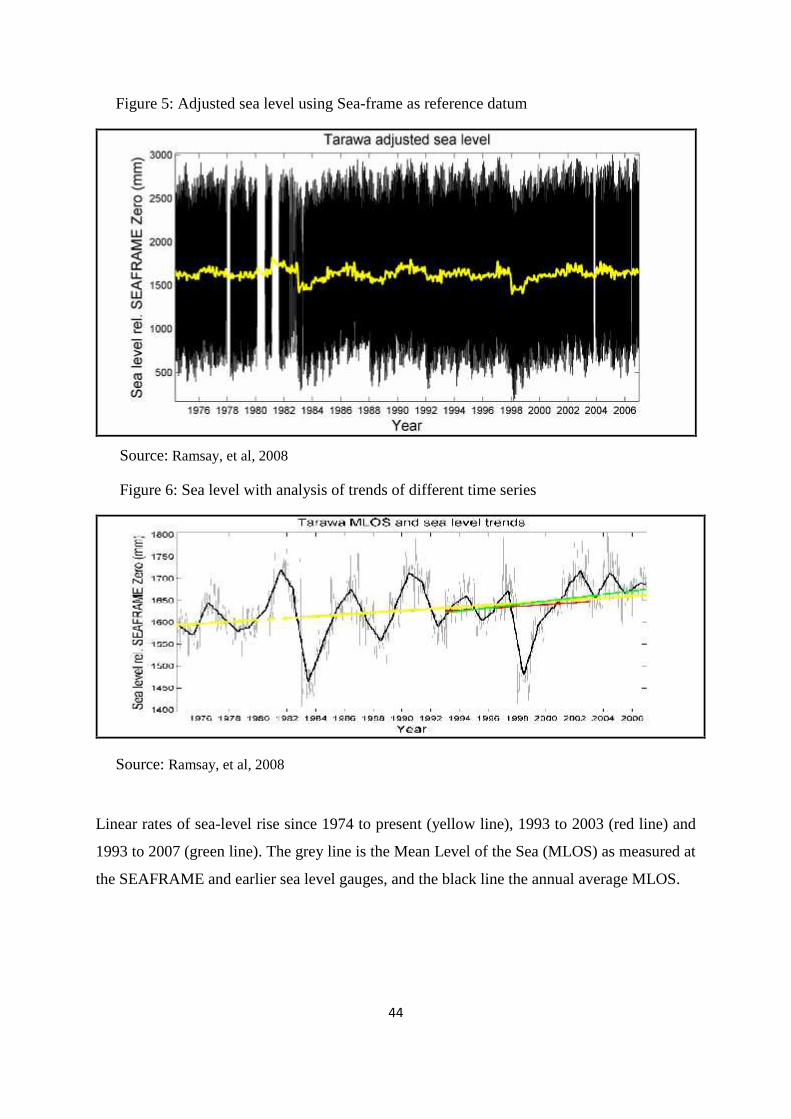
44
Figure 5: Adjusted sea level using Sea-frame as reference datum
Source: Ramsay, et al, 2008
Figure 6: Sea level with analysis of trends of different time series
Source: Ramsay, et al, 2008
Linear rates of sea-level rise since 1974 to present (yellow line), 1993 to 2003 (red line) and
1993 to 2007 (green line). The grey line is the Mean Level of the Sea (MLOS) as measured at
the SEAFRAME and earlier sea level gauges, and the black line the annual average MLOS.
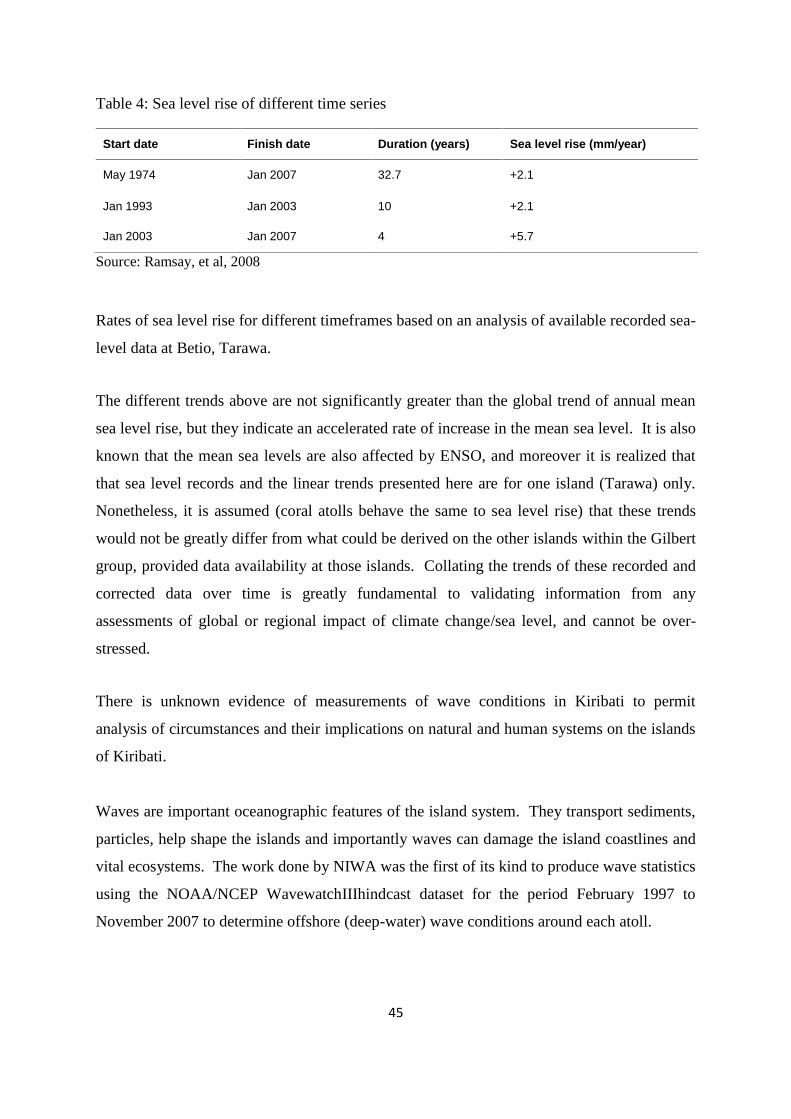
45
Table 4: Sea level rise of different time series
Start date Finish date Duration (years) Sea level rise (mm/year)
May 1974 Jan 2007 32.7 +2.1
Jan 1993 Jan 2003 10 +2.1
Jan 2003 Jan 2007 4 +5.7
Source: Ramsay, et al, 2008
Rates of sea level rise for different timeframes based on an analysis of available recorded sea-
level data at Betio, Tarawa.
The different trends above are not significantly greater than the global trend of annual mean
sea level rise, but they indicate an accelerated rate of increase in the mean sea level. It is also
known that the mean sea levels are also affected by ENSO, and moreover it is realized that
that sea level records and the linear trends presented here are for one island (Tarawa) only.
Nonetheless, it is assumed (coral atolls behave the same to sea level rise) that these trends
would not be greatly differ from what could be derived on the other islands within the Gilbert
group, provided data availability at those islands. Collating the trends of these recorded and
corrected data over time is greatly fundamental to validating information from any
assessments of global or regional impact of climate change/sea level, and cannot be over-
stressed.
There is unknown evidence of measurements of wave conditions in Kiribati to permit
analysis of circumstances and their implications on natural and human systems on the islands
of Kiribati.
Waves are important oceanographic features of the island system. They transport sediments,
particles, help shape the islands and importantly waves can damage the island coastlines and
vital ecosystems. The work done by NIWA was the first of its kind to produce wave statistics
using the NOAA/NCEP WavewatchIIIhindcast dataset for the period February 1997 to
November 2007 to determine offshore (deep-water) wave conditions around each atoll.
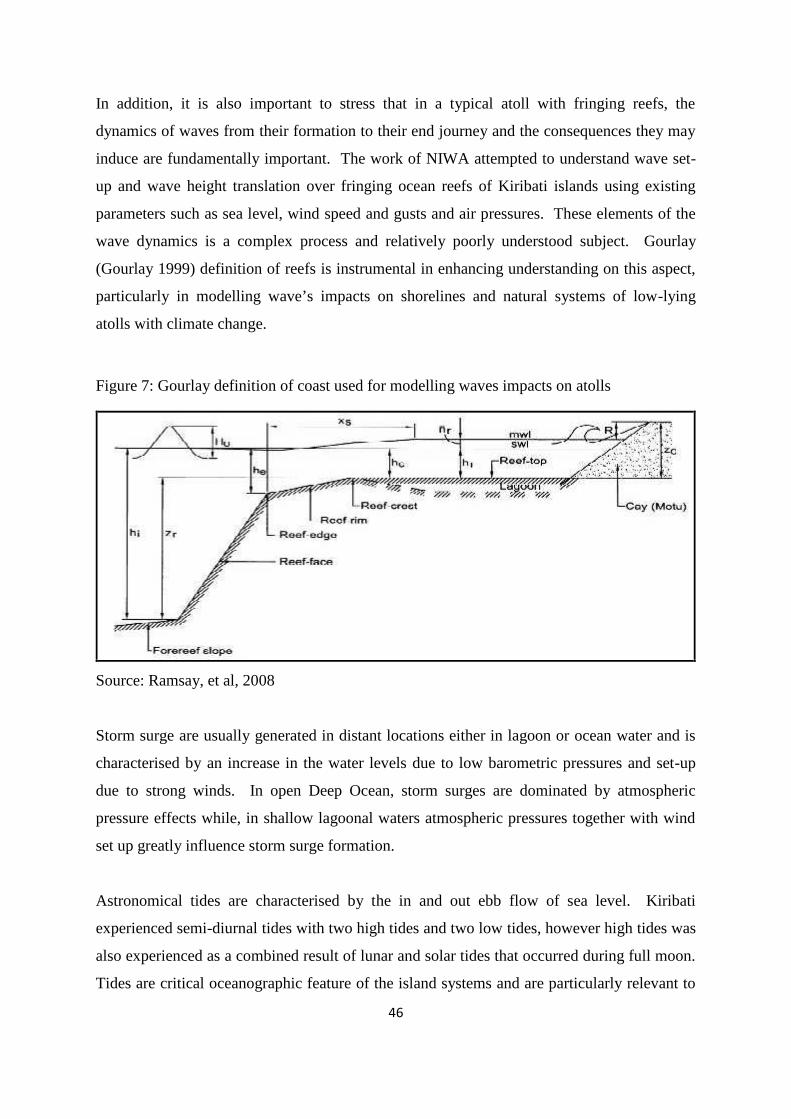
46
In addition, it is also important to stress that in a typical atoll with fringing reefs, the
dynamics of waves from their formation to their end journey and the consequences they may
induce are fundamentally important. The work of NIWA attempted to understand wave set-
up and wave height translation over fringing ocean reefs of Kiribati islands using existing
parameters such as sea level, wind speed and gusts and air pressures. These elements of the
wave dynamics is a complex process and relatively poorly understood subject. Gourlay
(Gourlay 1999) definition of reefs is instrumental in enhancing understanding on this aspect,
particularly in modelling wave’s impacts on shorelines and natural systems of low-lying
atolls with climate change.
Figure 7: Gourlay definition of coast used for modelling waves impacts on atolls
Source: Ramsay, et al, 2008
Storm surge are usually generated in distant locations either in lagoon or ocean water and is
characterised by an increase in the water levels due to low barometric pressures and set-up
due to strong winds. In open Deep Ocean, storm surges are dominated by atmospheric
pressure effects while, in shallow lagoonal waters atmospheric pressures together with wind
set up greatly influence storm surge formation.
Astronomical tides are characterised by the in and out ebb flow of sea level. Kiribati
experienced semi-diurnal tides with two high tides and two low tides, however high tides was
also experienced as a combined result of lunar and solar tides that occurred during full moon.
Tides are critical oceanographic feature of the island systems and are particularly relevant to
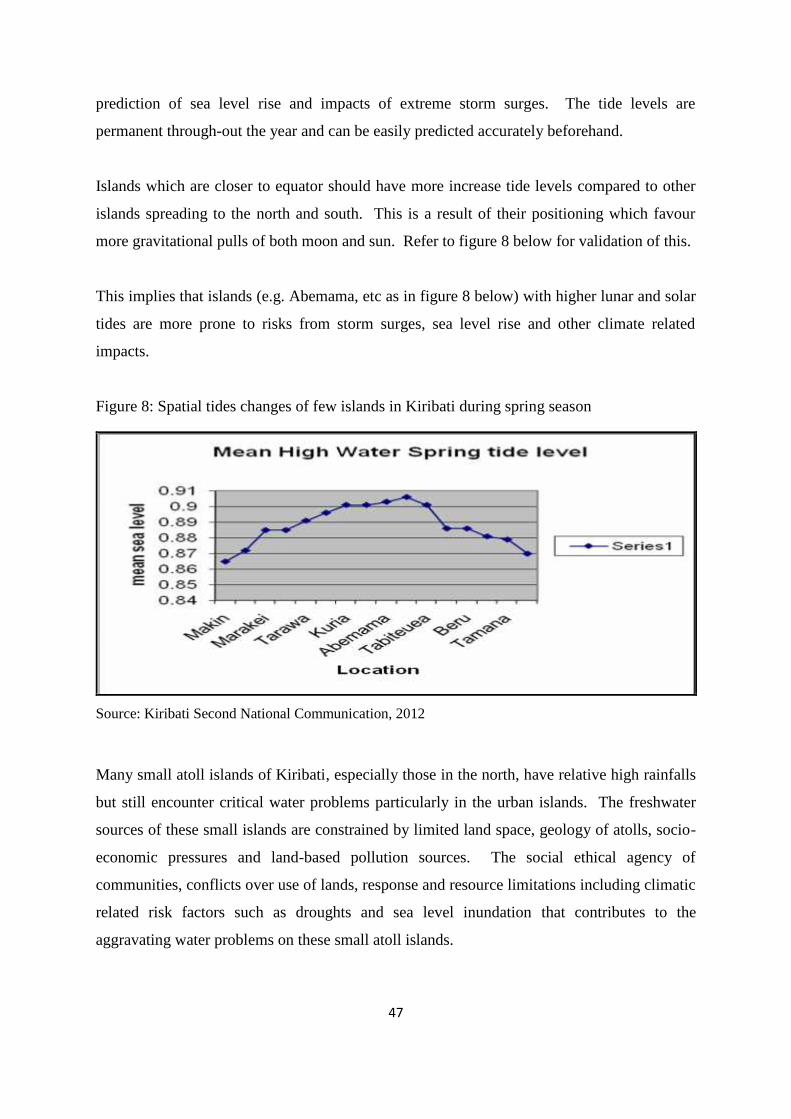
47
prediction of sea level rise and impacts of extreme storm surges. The tide levels are
permanent through-out the year and can be easily predicted accurately beforehand.
Islands which are closer to equator should have more increase tide levels compared to other
islands spreading to the north and south. This is a result of their positioning which favour
more gravitational pulls of both moon and sun. Refer to figure 8 below for validation of this.
This implies that islands (e.g. Abemama, etc as in figure 8 below) with higher lunar and solar
tides are more prone to risks from storm surges, sea level rise and other climate related
impacts.
Figure 8: Spatial tides changes of few islands in Kiribati during spring season
Source: Kiribati Second National Communication, 2012
Many small atoll islands of Kiribati, especially those in the north, have relative high rainfalls
but still encounter critical water problems particularly in the urban islands. The freshwater
sources of these small islands are constrained by limited land space, geology of atolls, socio-
economic pressures and land-based pollution sources. The social ethical agency of
communities, conflicts over use of lands, response and resource limitations including climatic
related risk factors such as droughts and sea level inundation that contributes to the
aggravating water problems on these small atoll islands.
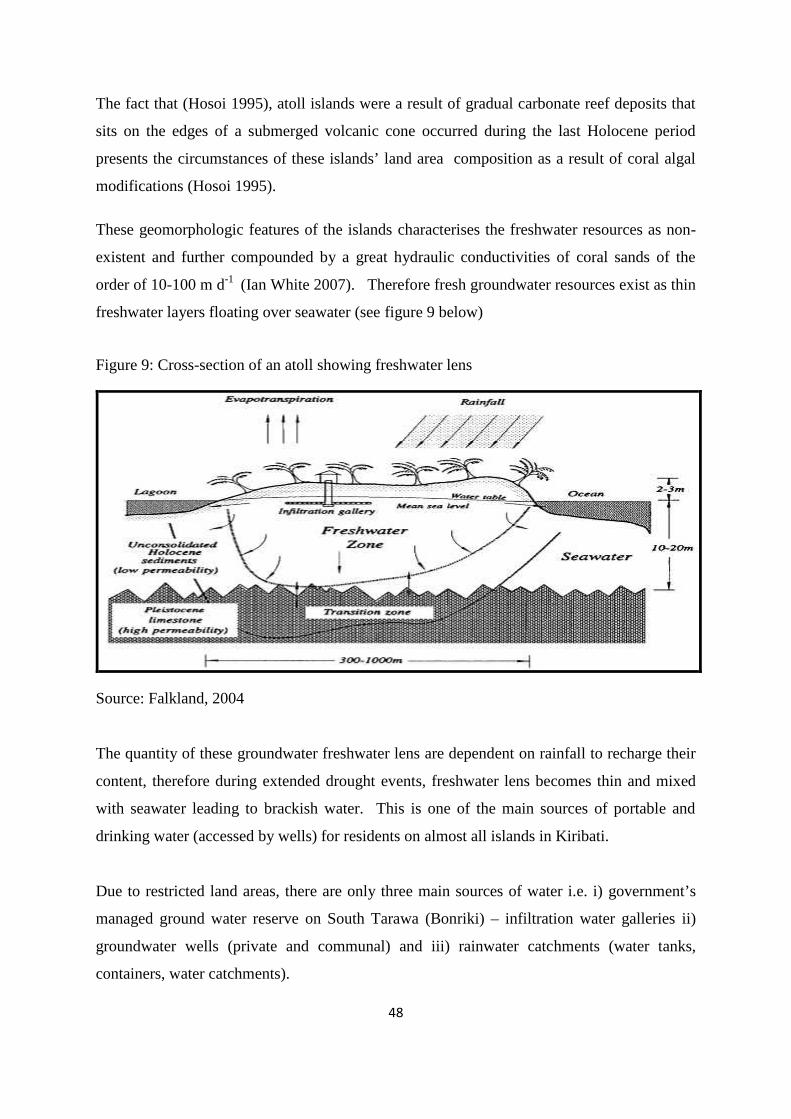
48
The fact that (Hosoi 1995), atoll islands were a result of gradual carbonate reef deposits that
sits on the edges of a submerged volcanic cone occurred during the last Holocene period
presents the circumstances of these islands’ land area composition as a result of coral algal
modifications (Hosoi 1995).
These geomorphologic features of the islands characterises the freshwater resources as non-
existent and further compounded by a great hydraulic conductivities of coral sands of the
order of 10-100 m d-1 (Ian White 2007). Therefore fresh groundwater resources exist as thin
freshwater layers floating over seawater (see figure 9 below)
Figure 9: Cross-section of an atoll showing freshwater lens
Source: Falkland, 2004
The quantity of these groundwater freshwater lens are dependent on rainfall to recharge their
content, therefore during extended drought events, freshwater lens becomes thin and mixed
with seawater leading to brackish water. This is one of the main sources of portable and
drinking water (accessed by wells) for residents on almost all islands in Kiribati.
Due to restricted land areas, there are only three main sources of water i.e. i) government’s
managed ground water reserve on South Tarawa (Bonriki) – infiltration water galleries ii)
groundwater wells (private and communal) and iii) rainwater catchments (water tanks,
containers, water catchments).
49
2.4 CLIMATE
As noted from the section above on the geography of Kiribati, the three groups of islands are
in the Central Pacific, widely spread out within few degrees North and South of the Equator
and longitudes East and West of the International Dateline. The climate of this particular
region of the Earth surface has been described as dry maritime type.
However, there are marked differences in rainfall across the groups, and within the groups.
Temperature and winds are also slightly different. Long term records on consistent basis are
available for Betio Weather Station in South Tarawa, and it is largely from these records that
describe the climate of Kiribati.
Firstly controlling factors of the Kiribati climate was discussed. Traditional knowledge and
information appear to stress astronomical factors as principal drivers of the climate of
Kiribati. However, it was not the stars that maintain their positions, but that the Earth with
Kiribati remains fixed in its position in space while the stars revolve. The Sun travels
northward and southward, along an upper arc and along a lower arc relative to Kiribati, that is
as observed from Kiribati. And this apparent movement of the Sun is associated with the
movements of more distant stars, two of which are identified with two known seasons in
Kiribati – “Te Aumeang” and “Te Aumaiaki”. Te Aumeang is characterized by stormy and
rainy climate and weather and last for six months, from around November to April. For the
rest of the months, that is May to October, the climate and weather is characterized as calm
and dry. Variations or changes from these seasonal weather patterns, which may be of days
or weeks durations are claimed to be predictable from observations of heavenly bodies
including the moon.
Implicit in the traditional knowledge of weather and climate is the sense of the relative
position of Kiribati in the globe against the background of stars. And Kiribati is spread
within the equatorial belt. Wind directions are from the easterly quadrants. Our traditional
weather seasons “Te Aumeang” and “Te Aumaiaki” convey the sense of the directions of
the winds, from the north and from the south respectively (Teuatabo 2011). But Hadley cells
are more accurate in describing drivers of wind directions.
50
Kiribati climate is indeed part of the global climate systems. The Walker Circulation and
associated El Niño and La Niña with their marked opposite conditions of flooding and
drought for different parts of the South Pacific and the wider tropical region of the globe are
predominating phenomena that determine Kiribati climate. These phenomena have also
marked conditions on the temperature and movement (east to west) of the waters of the
Central Pacific Ocean, and on wind direction. The patterns of the Walker Circulation are so
synchronized with those of the El Niño/La Niña phases, that they are being referred to as one
phenomenon – the ENSO (El Niño Southern Oscillation) for which the SOI has been
developed to indicate the level of their distinctive states. Negative values of the SOI are pro-
El Niño with a corresponding mode of the Walker Circulation. Positive values are pro-La
Niña with opposite mode of the Walker Circulation. El Niño is known to occur every 5 to 7
years.
ENSO is known to affect known weather systems in the Pacific and monsoons in the Indian
Ocean. It is also through ENSO effects on these systems (or correlation in the shifts of the
positions) that determine the climate variability of Kiribati. A little to the north of Kiribati
stretches the Inter Tropical Convergent Zone which is a region of lower pressure and cloud
cover. Farther to the south is the South Pacific Convergent Zone which is orientated in a
NW-SE alignment. During El Niño, these systems tend to move towards the Equator and
therefore get closer to Kiribati which then experience heavy rainfall.
Monsoon winds in the Indian Ocean may also have influence on variability of winds
directions and speed in Kiribati. Perhaps on low magnitude but longer period frequency,
Pacific Decadal Oscillation may influence as well the climate of Kiribati, moderating or
exacerbating the immediate influence of the ENSO.
Upper winds regimes are not known but at stratosphere strong westerly are known to prevail
with occasional short waves generated. Kiribati is cyclone-free, but when and where
cyclones or hurricanes happen to pass close from the north or south, Kiribati gets strong
winds reaching gale forces and even storm forces.
The primary cause of the global climate (and Kiribati climate part of this) is from solar
energy that has been absorbed in the climate systems. IPCC Reports (M.L. Parry 2007) have
51
warned world leaders that enhanced greenhouse effect is leading the world to catastrophic
climate change. However, how enhanced greenhouse effects interact with the climate
systems and phenomena to signal and cause a climate change regime of Kiribati remain
unknown.
However, there are records of climate variables that are discussed in the latter sections of the
report. The records were made available by the Kiribati Meteorological Services Department
to ECD and both authorities worked collaboratively to produce information on these sections.
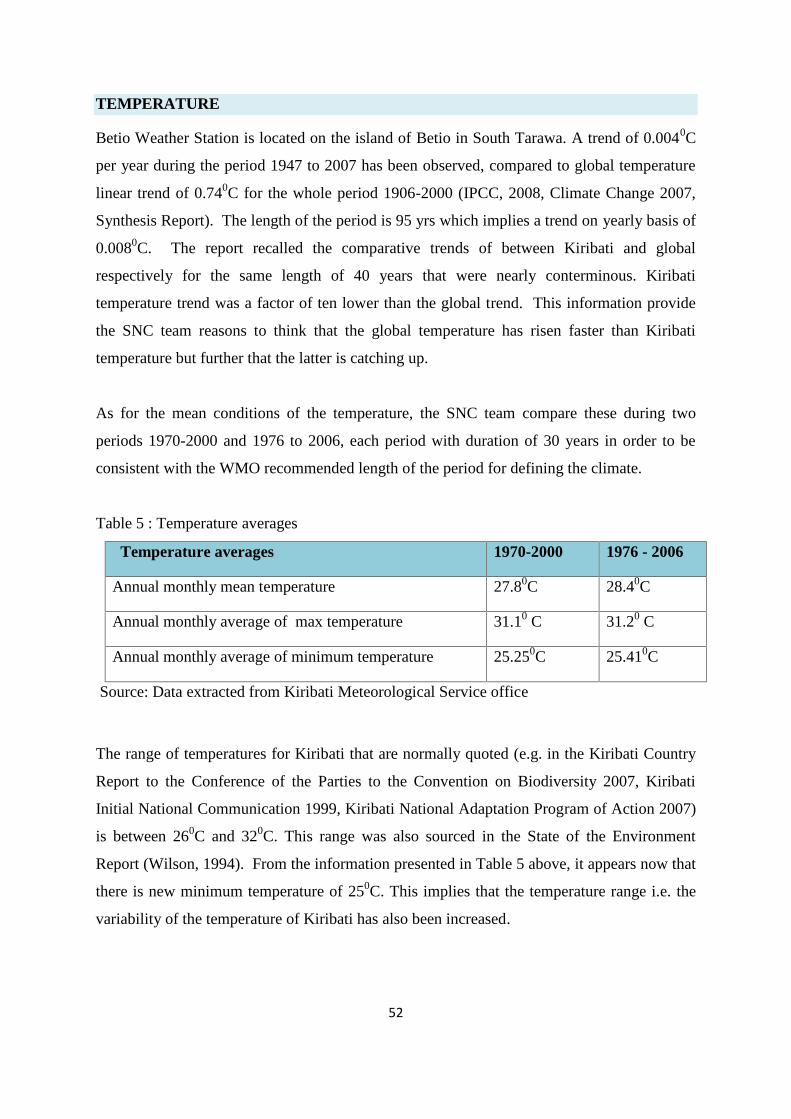
52
TEMPERATURE
Betio Weather Station is located on the island of Betio in South Tarawa. A trend of 0.0040C
per year during the period 1947 to 2007 has been observed, compared to global temperature
linear trend of 0.740C for the whole period 1906-2000 (IPCC, 2008, Climate Change 2007,
Synthesis Report). The length of the period is 95 yrs which implies a trend on yearly basis of
0.0080C. The report recalled the comparative trends of between Kiribati and global
respectively for the same length of 40 years that were nearly conterminous. Kiribati
temperature trend was a factor of ten lower than the global trend. This information provide
the SNC team reasons to think that the global temperature has risen faster than Kiribati
temperature but further that the latter is catching up.
As for the mean conditions of the temperature, the SNC team compare these during two
periods 1970-2000 and 1976 to 2006, each period with duration of 30 years in order to be
consistent with the WMO recommended length of the period for defining the climate.
Table 5 : Temperature averages
Temperature averages 1970-2000 1976 - 2006
Annual monthly mean temperature 27.80C 28.40C
Annual monthly average of max temperature 31.10 C 31.20 C
Annual monthly average of minimum temperature 25.250C 25.410C
Source: Data extracted from Kiribati Meteorological Service office
The range of temperatures for Kiribati that are normally quoted (e.g. in the Kiribati Country
Report to the Conference of the Parties to the Convention on Biodiversity 2007, Kiribati
Initial National Communication 1999, Kiribati National Adaptation Program of Action 2007)
is between 260C and 320C. This range was also sourced in the State of the Environment
Report (Wilson, 1994). From the information presented in Table 5 above, it appears now that
there is new minimum temperature of 250C. This implies that the temperature range i.e. the
variability of the temperature of Kiribati has also been increased.
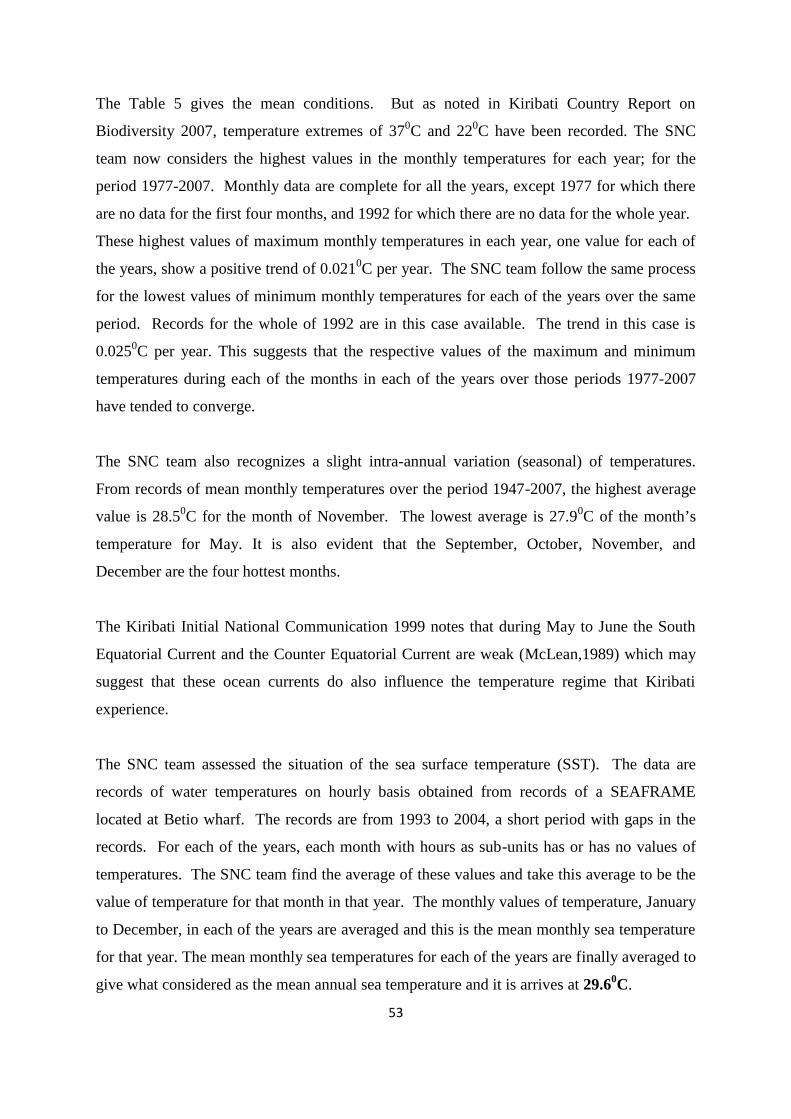
53
The Table 5 gives the mean conditions. But as noted in Kiribati Country Report on
Biodiversity 2007, temperature extremes of 370C and 220C have been recorded. The SNC
team now considers the highest values in the monthly temperatures for each year; for the
period 1977-2007. Monthly data are complete for all the years, except 1977 for which there
are no data for the first four months, and 1992 for which there are no data for the whole year.
These highest values of maximum monthly temperatures in each year, one value for each of
the years, show a positive trend of 0.0210C per year. The SNC team follow the same process
for the lowest values of minimum monthly temperatures for each of the years over the same
period. Records for the whole of 1992 are in this case available. The trend in this case is
0.0250C per year. This suggests that the respective values of the maximum and minimum
temperatures during each of the months in each of the years over those periods 1977-2007
have tended to converge.
The SNC team also recognizes a slight intra-annual variation (seasonal) of temperatures.
From records of mean monthly temperatures over the period 1947-2007, the highest average
value is 28.50C for the month of November. The lowest average is 27.90C of the month’s
temperature for May. It is also evident that the September, October, November, and
December are the four hottest months.
The Kiribati Initial National Communication 1999 notes that during May to June the South
Equatorial Current and the Counter Equatorial Current are weak (McLean,1989) which may
suggest that these ocean currents do also influence the temperature regime that Kiribati
experience.
The SNC team assessed the situation of the sea surface temperature (SST). The data are
records of water temperatures on hourly basis obtained from records of a SEAFRAME
located at Betio wharf. The records are from 1993 to 2004, a short period with gaps in the
records. For each of the years, each month with hours as sub-units has or has no values of
temperatures. The SNC team find the average of these values and take this average to be the
value of temperature for that month in that year. The monthly values of temperature, January
to December, in each of the years are averaged and this is the mean monthly sea temperature
for that year. The mean monthly sea temperatures for each of the years are finally averaged to
give what considered as the mean annual sea temperature and it is arrives at 29.60C.
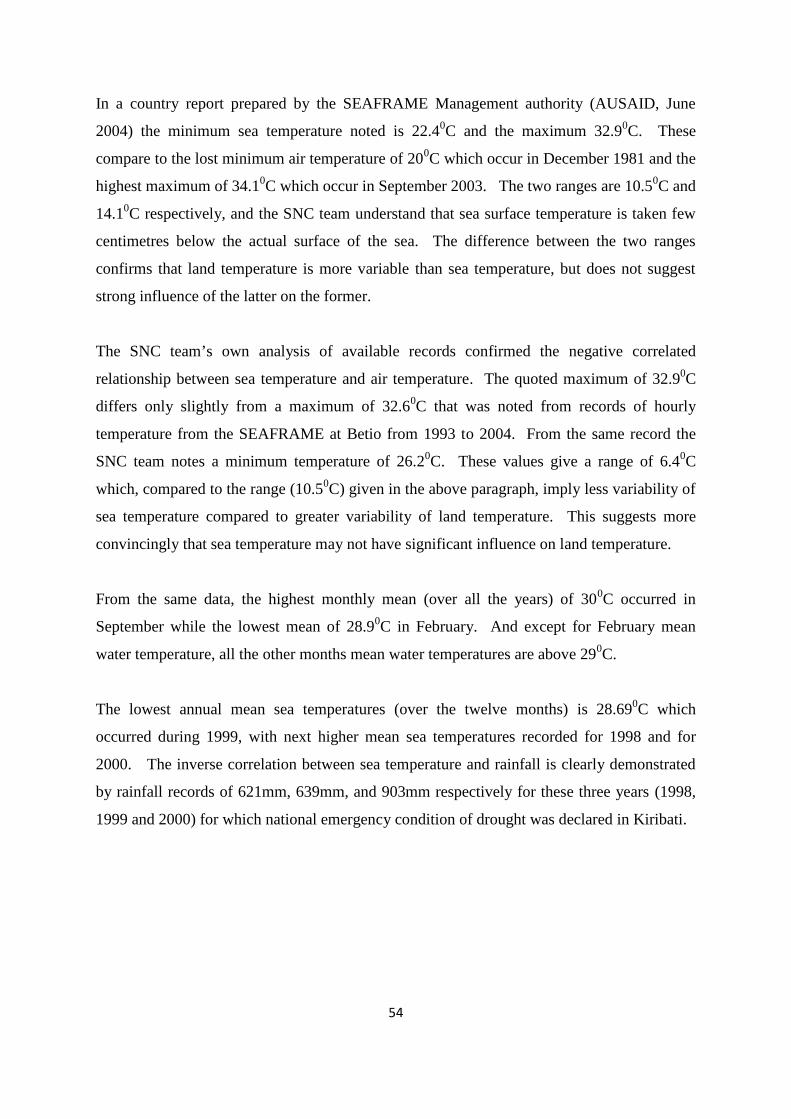
54
In a country report prepared by the SEAFRAME Management authority (AUSAID, June
2004) the minimum sea temperature noted is 22.40C and the maximum 32.90C. These
compare to the lost minimum air temperature of 200C which occur in December 1981 and the
highest maximum of 34.10C which occur in September 2003. The two ranges are 10.50C and
14.10C respectively, and the SNC team understand that sea surface temperature is taken few
centimetres below the actual surface of the sea. The difference between the two ranges
confirms that land temperature is more variable than sea temperature, but does not suggest
strong influence of the latter on the former.
The SNC team’s own analysis of available records confirmed the negative correlated
relationship between sea temperature and air temperature. The quoted maximum of 32.90C
differs only slightly from a maximum of 32.60C that was noted from records of hourly
temperature from the SEAFRAME at Betio from 1993 to 2004. From the same record the
SNC team notes a minimum temperature of 26.20C. These values give a range of 6.40C
which, compared to the range (10.50C) given in the above paragraph, imply less variability of
sea temperature compared to greater variability of land temperature. This suggests more
convincingly that sea temperature may not have significant influence on land temperature.
From the same data, the highest monthly mean (over all the years) of 300C occurred in
September while the lowest mean of 28.90C in February. And except for February mean
water temperature, all the other months mean water temperatures are above 290C.
The lowest annual mean sea temperatures (over the twelve months) is 28.690C which
occurred during 1999, with next higher mean sea temperatures recorded for 1998 and for
2000. The inverse correlation between sea temperature and rainfall is clearly demonstrated
by rainfall records of 621mm, 639mm, and 903mm respectively for these three years (1998,
1999 and 2000) for which national emergency condition of drought was declared in Kiribati.
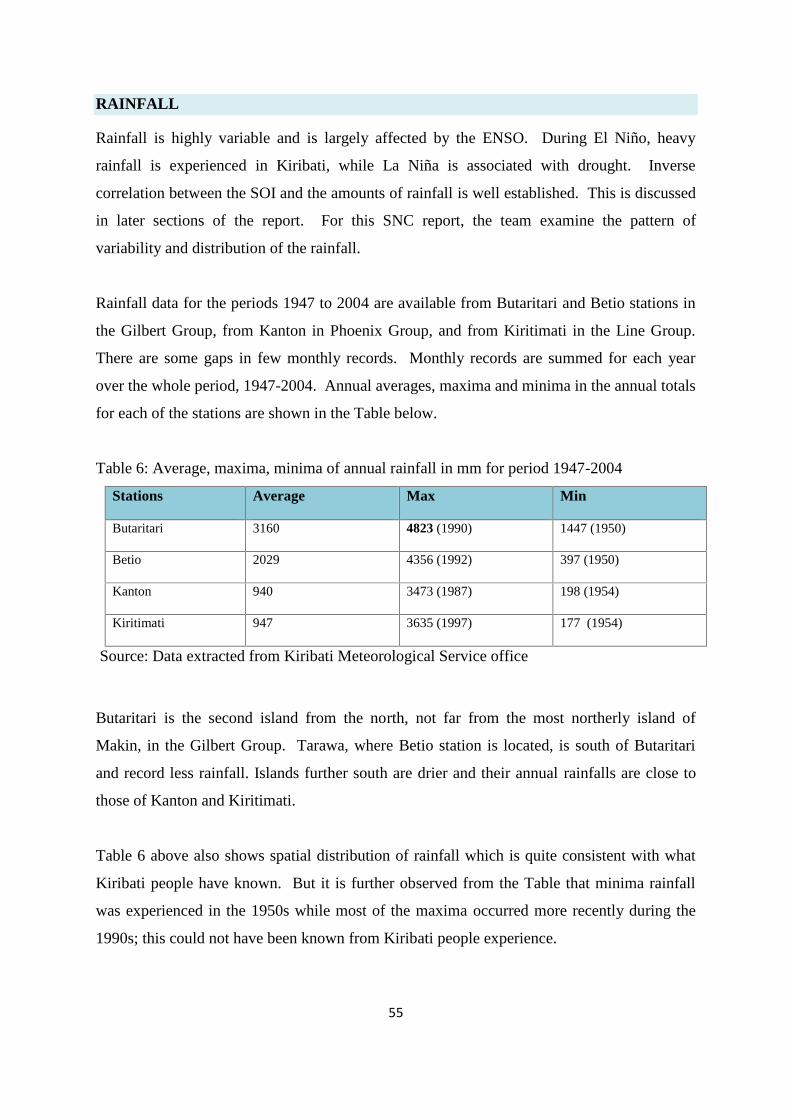
55
RAINFALL
Rainfall is highly variable and is largely affected by the ENSO. During El Niño, heavy
rainfall is experienced in Kiribati, while La Niña is associated with drought. Inverse
correlation between the SOI and the amounts of rainfall is well established. This is discussed
in later sections of the report. For this SNC report, the team examine the pattern of
variability and distribution of the rainfall.
Rainfall data for the periods 1947 to 2004 are available from Butaritari and Betio stations in
the Gilbert Group, from Kanton in Phoenix Group, and from Kiritimati in the Line Group.
There are some gaps in few monthly records. Monthly records are summed for each year
over the whole period, 1947-2004. Annual averages, maxima and minima in the annual totals
for each of the stations are shown in the Table below.
Table 6: Average, maxima, minima of annual rainfall in mm for period 1947-2004
Stations Average Max Min
Butaritari 3160 4823 (1990) 1447 (1950)
Betio 2029 4356 (1992) 397 (1950)
Kanton 940 3473 (1987) 198 (1954)
Kiritimati 947 3635 (1997) 177 (1954)
Source: Data extracted from Kiribati Meteorological Service office
Butaritari is the second island from the north, not far from the most northerly island of
Makin, in the Gilbert Group. Tarawa, where Betio station is located, is south of Butaritari
and record less rainfall. Islands further south are drier and their annual rainfalls are close to
those of Kanton and Kiritimati.
Table 6 above also shows spatial distribution of rainfall which is quite consistent with what
Kiribati people have known. But it is further observed from the Table that minima rainfall
was experienced in the 1950s while most of the maxima occurred more recently during the
1990s; this could not have been known from Kiribati people experience.
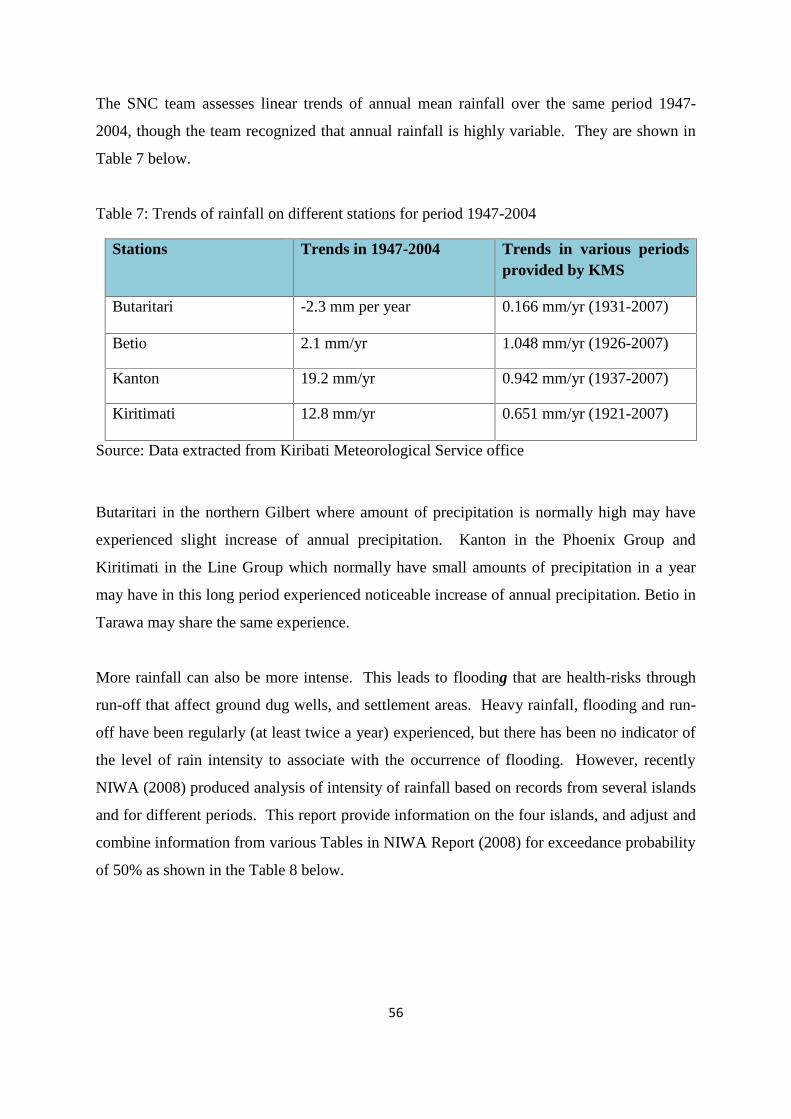
56
The SNC team assesses linear trends of annual mean rainfall over the same period 1947-
2004, though the team recognized that annual rainfall is highly variable. They are shown in
Table 7 below.
Table 7: Trends of rainfall on different stations for period 1947-2004
Stations Trends in 1947-2004 Trends in various periodsprovided by KMS
Butaritari -2.3 mm per year 0.166 mm/yr (1931-2007)
Betio 2.1 mm/yr 1.048 mm/yr (1926-2007)
Kanton 19.2 mm/yr 0.942 mm/yr (1937-2007)
Kiritimati 12.8 mm/yr 0.651 mm/yr (1921-2007)
Source: Data extracted from Kiribati Meteorological Service office
Butaritari in the northern Gilbert where amount of precipitation is normally high may have
experienced slight increase of annual precipitation. Kanton in the Phoenix Group and
Kiritimati in the Line Group which normally have small amounts of precipitation in a year
may have in this long period experienced noticeable increase of annual precipitation. Betio in
Tarawa may share the same experience.
More rainfall can also be more intense. This leads to flooding that are health-risks through
run-off that affect ground dug wells, and settlement areas. Heavy rainfall, flooding and run-
off have been regularly (at least twice a year) experienced, but there has been no indicator of
the level of rain intensity to associate with the occurrence of flooding. However, recently
NIWA (2008) produced analysis of intensity of rainfall based on records from several islands
and for different periods. This report provide information on the four islands, and adjust and
combine information from various Tables in NIWA Report (2008) for exceedance probability
of 50% as shown in the Table 8 below.
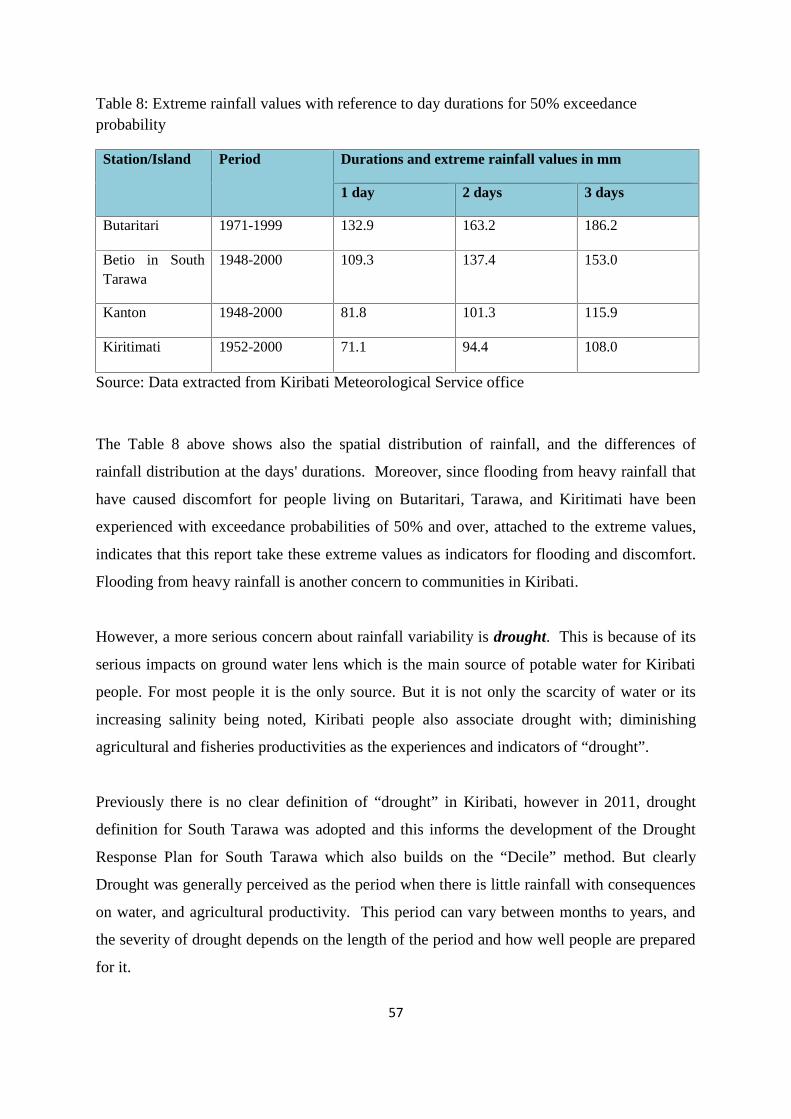
57
Table 8: Extreme rainfall values with reference to day durations for 50% exceedanceprobability
Station/Island Period Durations and extreme rainfall values in mm
1 day 2 days 3 days
Butaritari 1971-1999 132.9 163.2 186.2
Betio in SouthTarawa
1948-2000 109.3 137.4 153.0
Kanton 1948-2000 81.8 101.3 115.9
Kiritimati 1952-2000 71.1 94.4 108.0
Source: Data extracted from Kiribati Meteorological Service office
The Table 8 above shows also the spatial distribution of rainfall, and the differences of
rainfall distribution at the days' durations. Moreover, since flooding from heavy rainfall that
have caused discomfort for people living on Butaritari, Tarawa, and Kiritimati have been
experienced with exceedance probabilities of 50% and over, attached to the extreme values,
indicates that this report take these extreme values as indicators for flooding and discomfort.
Flooding from heavy rainfall is another concern to communities in Kiribati.
However, a more serious concern about rainfall variability is drought. This is because of its
serious impacts on ground water lens which is the main source of potable water for Kiribati
people. For most people it is the only source. But it is not only the scarcity of water or its
increasing salinity being noted, Kiribati people also associate drought with; diminishing
agricultural and fisheries productivities as the experiences and indicators of “drought”.
Previously there is no clear definition of “drought” in Kiribati, however in 2011, drought
definition for South Tarawa was adopted and this informs the development of the Drought
Response Plan for South Tarawa which also builds on the “Decile” method. But clearly
Drought was generally perceived as the period when there is little rainfall with consequences
on water, and agricultural productivity. This period can vary between months to years, and
the severity of drought depends on the length of the period and how well people are prepared
for it.
58
In the past and recent period, drought conditions have been experienced. Anecdotal sources
talked of droughts after the World War II (1940s) when some island governments issued
ration of rice for the people’s food, but for water they just had to live with underground saline
water. More recently in 1999, the Government of Kiribati declared state of emergency for
the whole of Kiribati on account of drought felt throughout, but in particular for water
supplies for urban Tarawa. Indeed “drought” conditions of varying durations have been
experienced from time to time.
While drought is real to people who experience it, findings of past scientific objective
investigations on drought have been inadequate to account the sufferings of people who have
experienced the drought impacts. This is also to mention that there is few scientifically
impact assessments that have been undertaken in Kiribati to understand the level of drought
impacts on the society.
There was the case of the drought experienced during 1998-2000, when it was scientifically
assessed that the ground water lens from which water was pumped to supply the urban
population of South Tarawa still had huge amount of water with tolerable salinity level.
Nonetheless, fresh water lenses were halved as reported in Falkland, 2003, “Kiribati SAPHE
Project: Mid-Term Review. Review of groundwater resources management for Tarawa”.
Based on rainfall records, and several tools of analysis, the amounts of rainfall in 1998-2000
would be considered as drought conditions. These analysis tools include Decile Method
(DM), Critical Risk Profile (CRP), and Drought Severity Index (DSI). But there is
inadequate local capacity to fully understand them and use them to analyse data. It is known
that drought depend on rainfall temporal distribution at a particular island; the appropriate
time interval that can be set within which to define drought conditions depends on the
purpose for which rainfall has been useful for the needs of people. The Decile Method was
the first to be introduced, it is also the simplest of the three and there is better understanding
of it.
The CRP and the DSI were more recently brought to our notice and still take time to enable
these to be used as tools. CRP uses maximum and minimum of rainfall for each year during
the period and establishes ranking to work out the return period and exceedance probability.
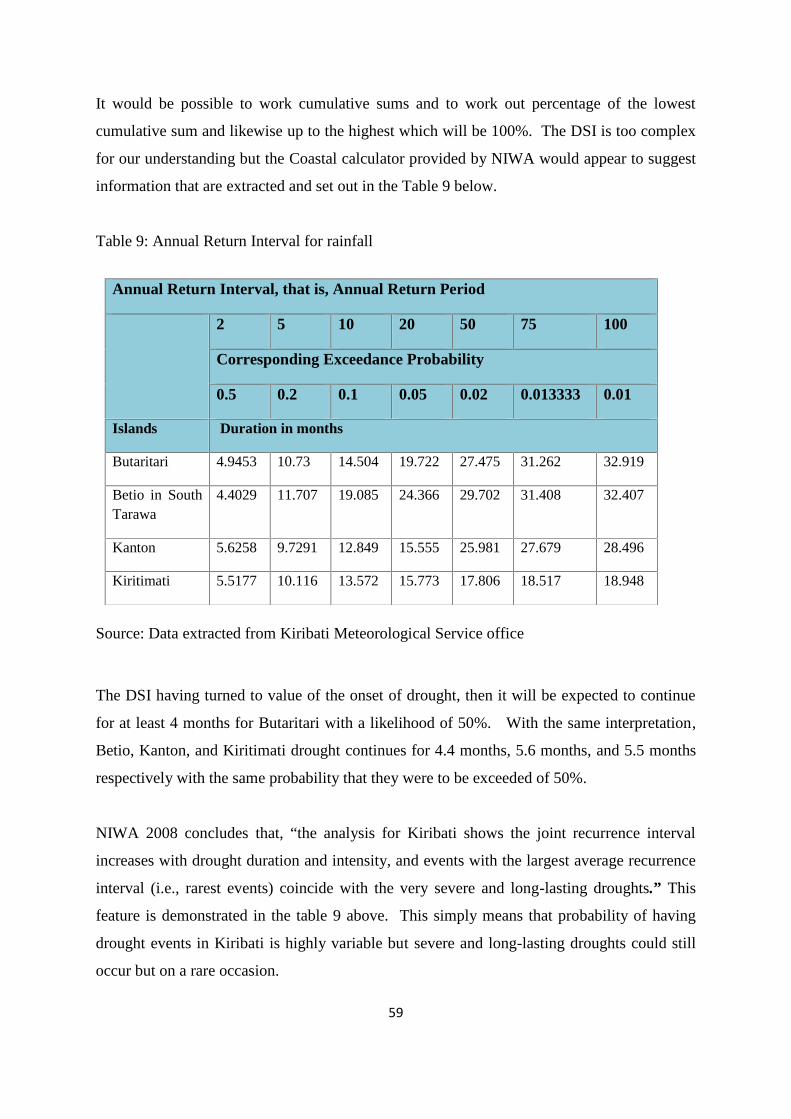
59
It would be possible to work cumulative sums and to work out percentage of the lowest
cumulative sum and likewise up to the highest which will be 100%. The DSI is too complex
for our understanding but the Coastal calculator provided by NIWA would appear to suggest
information that are extracted and set out in the Table 9 below.
Table 9: Annual Return Interval for rainfall
Source: Data extracted from Kiribati Meteorological Service office
The DSI having turned to value of the onset of drought, then it will be expected to continue
for at least 4 months for Butaritari with a likelihood of 50%. With the same interpretation,
Betio, Kanton, and Kiritimati drought continues for 4.4 months, 5.6 months, and 5.5 months
respectively with the same probability that they were to be exceeded of 50%.
NIWA 2008 concludes that, “the analysis for Kiribati shows the joint recurrence interval
increases with drought duration and intensity, and events with the largest average recurrence
interval (i.e., rarest events) coincide with the very severe and long-lasting droughts.” This
feature is demonstrated in the table 9 above. This simply means that probability of having
drought events in Kiribati is highly variable but severe and long-lasting droughts could still
occur but on a rare occasion.
Annual Return Interval, that is, Annual Return Period
2 5 10 20 50 75 100
Corresponding Exceedance Probability
0.5 0.2 0.1 0.05 0.02 0.013333 0.01
Islands Duration in months
Butaritari 4.9453 10.73 14.504 19.722 27.475 31.262 32.919
Betio in SouthTarawa
4.4029 11.707 19.085 24.366 29.702 31.408 32.407
Kanton 5.6258 9.7291 12.849 15.555 25.981 27.679 28.496
Kiritimati 5.5177 10.116 13.572 15.773 17.806 18.517 18.948
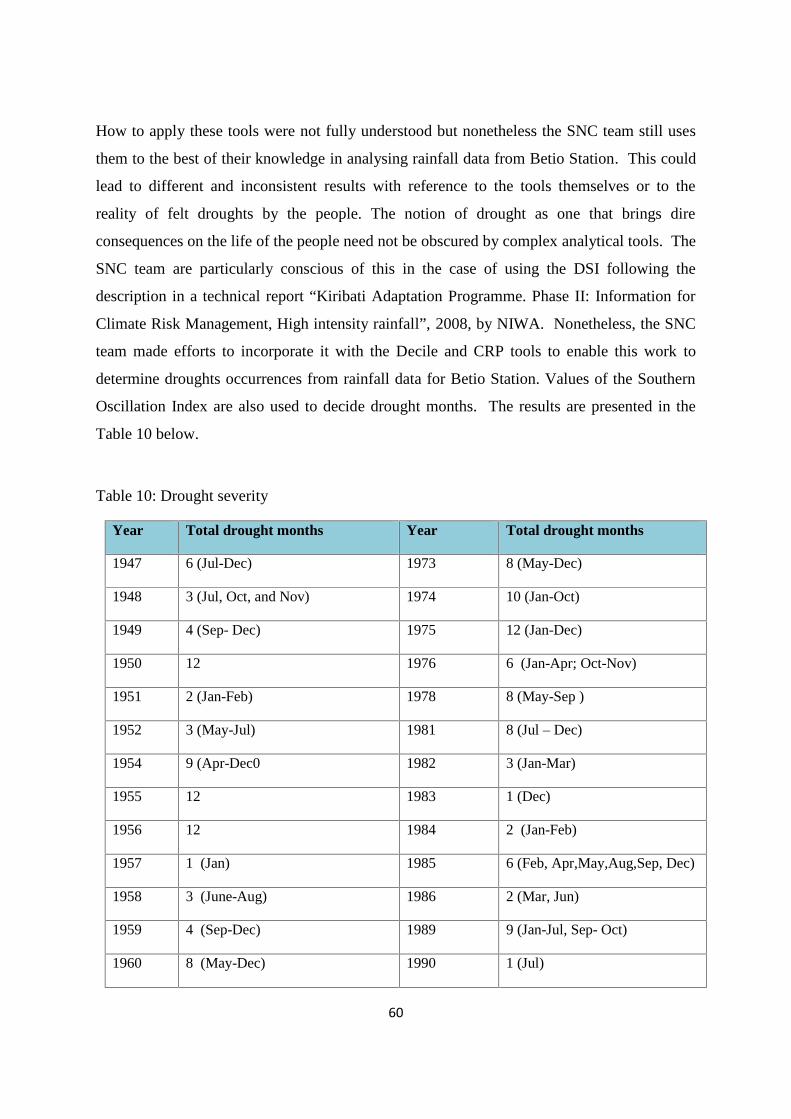
60
How to apply these tools were not fully understood but nonetheless the SNC team still uses
them to the best of their knowledge in analysing rainfall data from Betio Station. This could
lead to different and inconsistent results with reference to the tools themselves or to the
reality of felt droughts by the people. The notion of drought as one that brings dire
consequences on the life of the people need not be obscured by complex analytical tools. The
SNC team are particularly conscious of this in the case of using the DSI following the
description in a technical report “Kiribati Adaptation Programme. Phase II: Information for
Climate Risk Management, High intensity rainfall”, 2008, by NIWA. Nonetheless, the SNC
team made efforts to incorporate it with the Decile and CRP tools to enable this work to
determine droughts occurrences from rainfall data for Betio Station. Values of the Southern
Oscillation Index are also used to decide drought months. The results are presented in the
Table 10 below.
Table 10: Drought severity
Year Total drought months Year Total drought months
1947 6 (Jul-Dec) 1973 8 (May-Dec)
1948 3 (Jul, Oct, and Nov) 1974 10 (Jan-Oct)
1949 4 (Sep- Dec) 1975 12 (Jan-Dec)
1950 12 1976 6 (Jan-Apr; Oct-Nov)
1951 2 (Jan-Feb) 1978 8 (May-Sep )
1952 3 (May-Jul) 1981 8 (Jul – Dec)
1954 9 (Apr-Dec0 1982 3 (Jan-Mar)
1955 12 1983 1 (Dec)
1956 12 1984 2 (Jan-Feb)
1957 1 (Jan) 1985 6 (Feb, Apr,May,Aug,Sep, Dec)
1958 3 (June-Aug) 1986 2 (Mar, Jun)
1959 4 (Sep-Dec) 1989 9 (Jan-Jul, Sep- Oct)
1960 8 (May-Dec) 1990 1 (Jul)
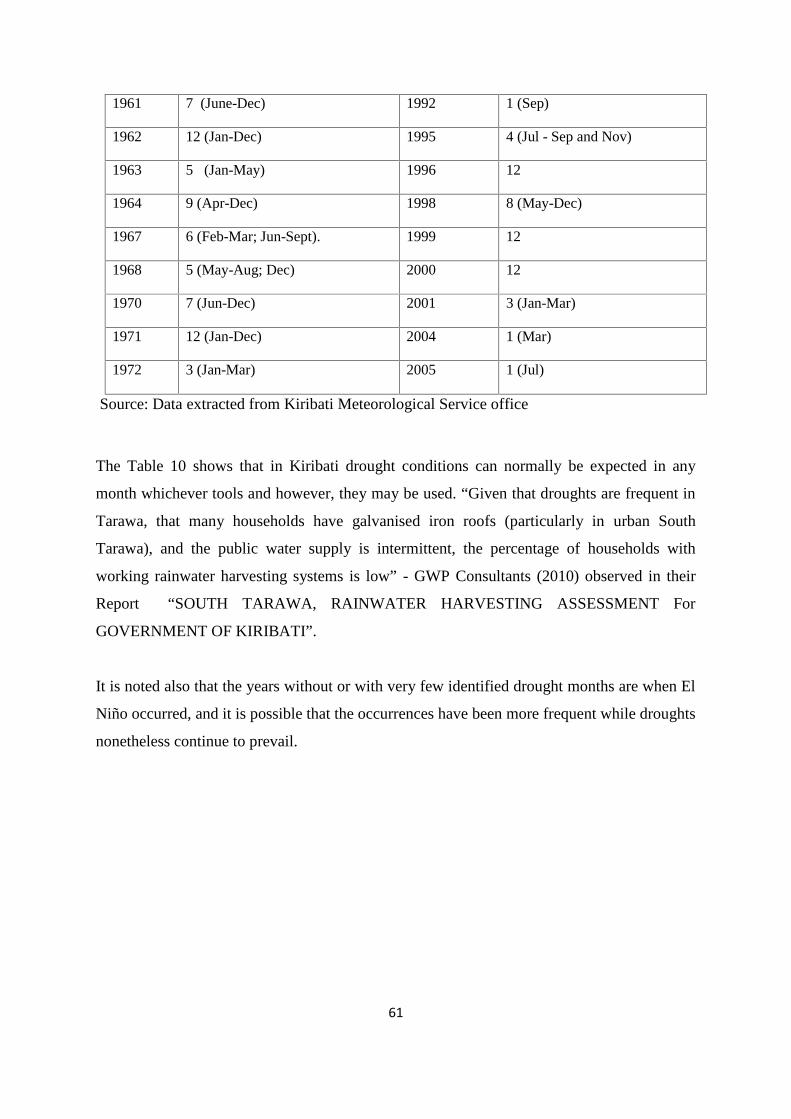
61
1961 7 (June-Dec) 1992 1 (Sep)
1962 12 (Jan-Dec) 1995 4 (Jul - Sep and Nov)
1963 5 (Jan-May) 1996 12
1964 9 (Apr-Dec) 1998 8 (May-Dec)
1967 6 (Feb-Mar; Jun-Sept). 1999 12
1968 5 (May-Aug; Dec) 2000 12
1970 7 (Jun-Dec) 2001 3 (Jan-Mar)
1971 12 (Jan-Dec) 2004 1 (Mar)
1972 3 (Jan-Mar) 2005 1 (Jul)
Source: Data extracted from Kiribati Meteorological Service office
The Table 10 shows that in Kiribati drought conditions can normally be expected in any
month whichever tools and however, they may be used. “Given that droughts are frequent in
Tarawa, that many households have galvanised iron roofs (particularly in urban South
Tarawa), and the public water supply is intermittent, the percentage of households with
working rainwater harvesting systems is low” - GWP Consultants (2010) observed in their
Report “SOUTH TARAWA, RAINWATER HARVESTING ASSESSMENT For
GOVERNMENT OF KIRIBATI”.
It is noted also that the years without or with very few identified drought months are when El
Niño occurred, and it is possible that the occurrences have been more frequent while droughts
nonetheless continue to prevail.
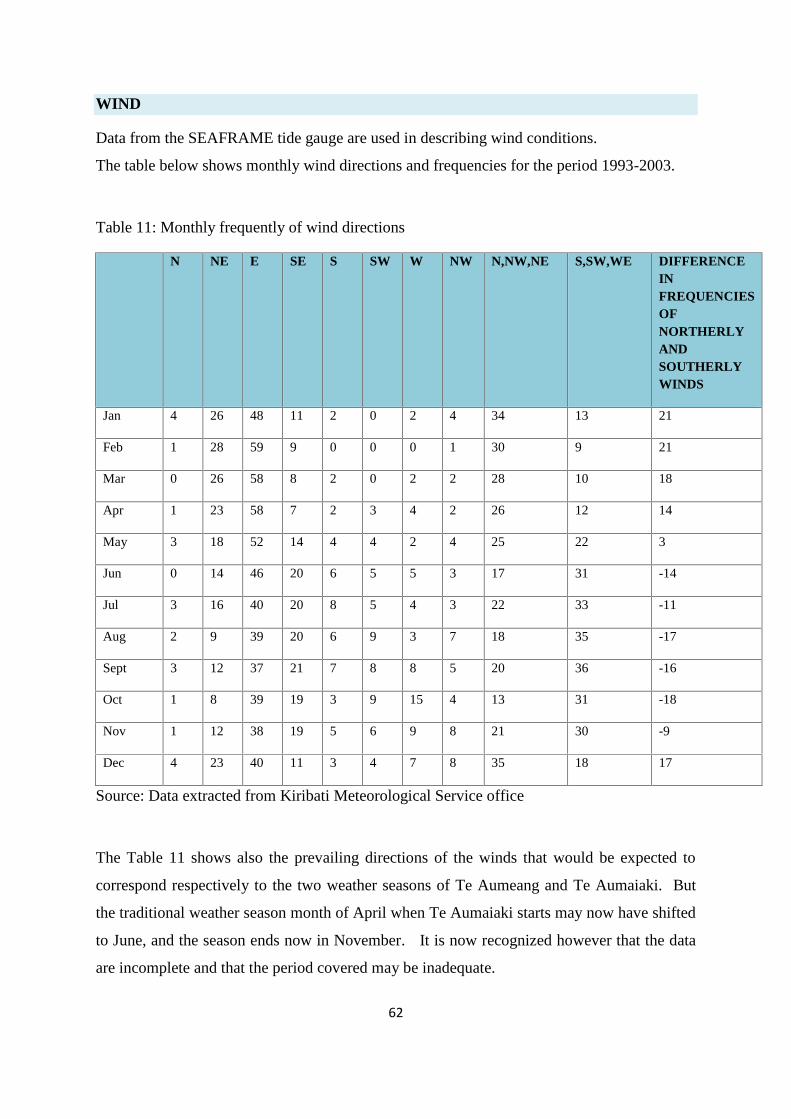
62
WIND
Data from the SEAFRAME tide gauge are used in describing wind conditions.
The table below shows monthly wind directions and frequencies for the period 1993-2003.
Table 11: Monthly frequently of wind directions
N NE E SE S SW W NW N,NW,NE S,SW,WE DIFFERENCEINFREQUENCIESOFNORTHERLYANDSOUTHERLYWINDS
Jan 4 26 48 11 2 0 2 4 34 13 21
Feb 1 28 59 9 0 0 0 1 30 9 21
Mar 0 26 58 8 2 0 2 2 28 10 18
Apr 1 23 58 7 2 3 4 2 26 12 14
May 3 18 52 14 4 4 2 4 25 22 3
Jun 0 14 46 20 6 5 5 3 17 31 -14
Jul 3 16 40 20 8 5 4 3 22 33 -11
Aug 2 9 39 20 6 9 3 7 18 35 -17
Sept 3 12 37 21 7 8 8 5 20 36 -16
Oct 1 8 39 19 3 9 15 4 13 31 -18
Nov 1 12 38 19 5 6 9 8 21 30 -9
Dec 4 23 40 11 3 4 7 8 35 18 17
Source: Data extracted from Kiribati Meteorological Service office
The Table 11 shows also the prevailing directions of the winds that would be expected to
correspond respectively to the two weather seasons of Te Aumeang and Te Aumaiaki. But
the traditional weather season month of April when Te Aumaiaki starts may now have shifted
to June, and the season ends now in November. It is now recognized however that the data
are incomplete and that the period covered may be inadequate.
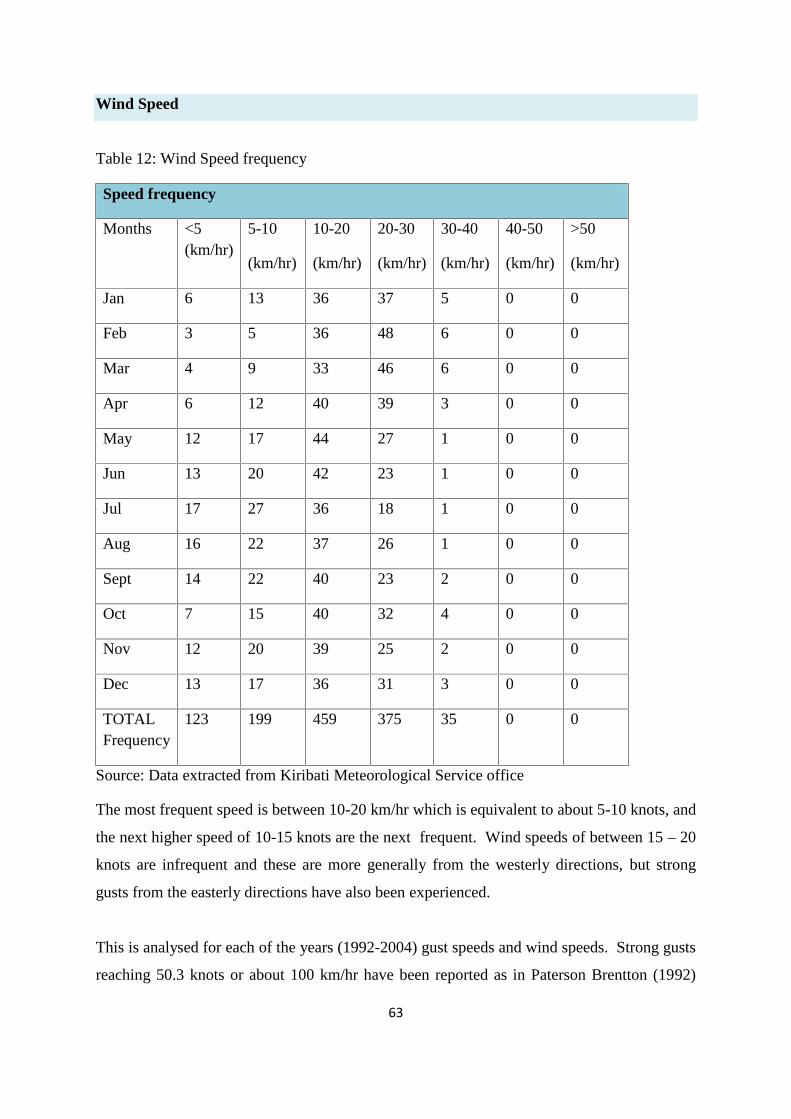
63
Wind Speed
Table 12: Wind Speed frequency
Speed frequency
Months <5(km/hr)
5-10
(km/hr)
10-20
(km/hr)
20-30
(km/hr)
30-40
(km/hr)
40-50
(km/hr)
>50
(km/hr)
Jan 6 13 36 37 5 0 0
Feb 3 5 36 48 6 0 0
Mar 4 9 33 46 6 0 0
Apr 6 12 40 39 3 0 0
May 12 17 44 27 1 0 0
Jun 13 20 42 23 1 0 0
Jul 17 27 36 18 1 0 0
Aug 16 22 37 26 1 0 0
Sept 14 22 40 23 2 0 0
Oct 7 15 40 32 4 0 0
Nov 12 20 39 25 2 0 0
Dec 13 17 36 31 3 0 0
TOTALFrequency
123 199 459 375 35 0 0
Source: Data extracted from Kiribati Meteorological Service office
The most frequent speed is between 10-20 km/hr which is equivalent to about 5-10 knots, and
the next higher speed of 10-15 knots are the next frequent. Wind speeds of between 15 – 20
knots are infrequent and these are more generally from the westerly directions, but strong
gusts from the easterly directions have also been experienced.
This is analysed for each of the years (1992-2004) gust speeds and wind speeds. Strong gusts
reaching 50.3 knots or about 100 km/hr have been reported as in Paterson Brentton (1992)
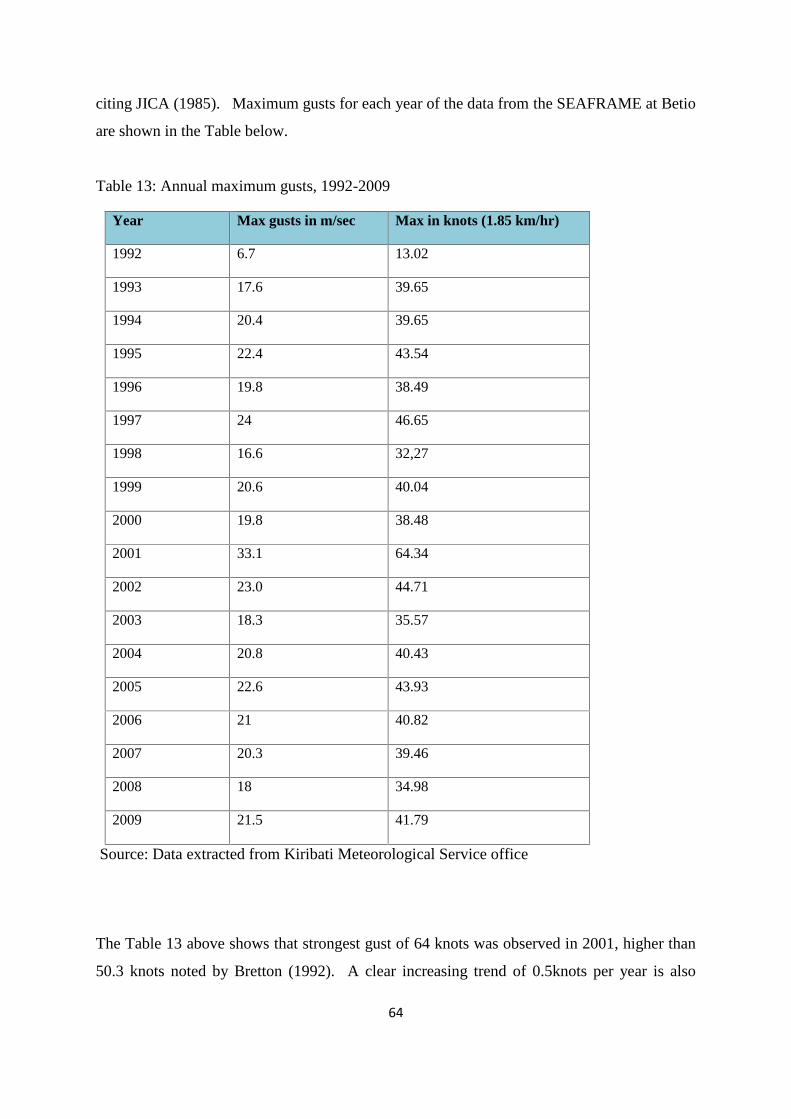
64
citing JICA (1985). Maximum gusts for each year of the data from the SEAFRAME at Betio
are shown in the Table below.
Table 13: Annual maximum gusts, 1992-2009
Year Max gusts in m/sec Max in knots (1.85 km/hr)
1992 6.7 13.02
1993 17.6 39.65
1994 20.4 39.65
1995 22.4 43.54
1996 19.8 38.49
1997 24 46.65
1998 16.6 32,27
1999 20.6 40.04
2000 19.8 38.48
2001 33.1 64.34
2002 23.0 44.71
2003 18.3 35.57
2004 20.8 40.43
2005 22.6 43.93
2006 21 40.82
2007 20.3 39.46
2008 18 34.98
2009 21.5 41.79
Source: Data extracted from Kiribati Meteorological Service office
The Table 13 above shows that strongest gust of 64 knots was observed in 2001, higher than
50.3 knots noted by Bretton (1992). A clear increasing trend of 0.5knots per year is also
65
observed in the table above, but again the data may not be of adequate length and quality to
establish a more persistent value.
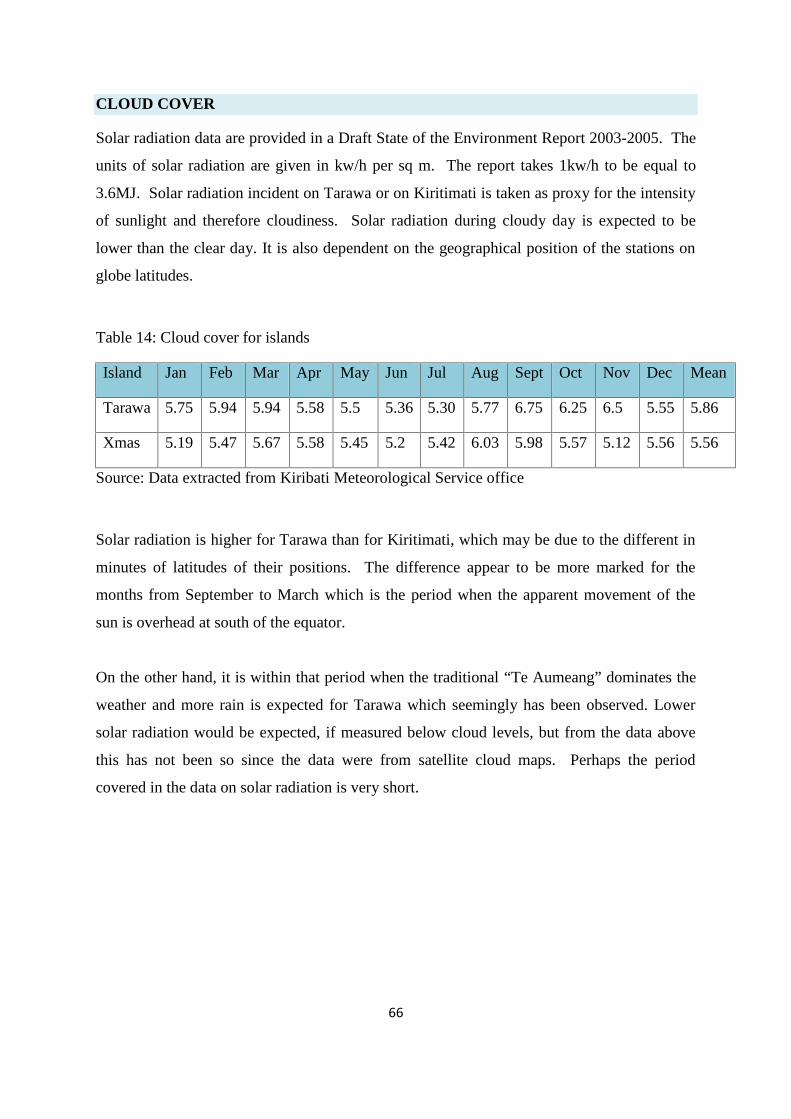
66
CLOUD COVER
Solar radiation data are provided in a Draft State of the Environment Report 2003-2005. The
units of solar radiation are given in kw/h per sq m. The report takes 1kw/h to be equal to
3.6MJ. Solar radiation incident on Tarawa or on Kiritimati is taken as proxy for the intensity
of sunlight and therefore cloudiness. Solar radiation during cloudy day is expected to be
lower than the clear day. It is also dependent on the geographical position of the stations on
globe latitudes.
Table 14: Cloud cover for islands
Island Jan Feb Mar Apr May Jun Jul Aug Sept Oct Nov Dec Mean
Tarawa 5.75 5.94 5.94 5.58 5.5 5.36 5.30 5.77 6.75 6.25 6.5 5.55 5.86
Xmas 5.19 5.47 5.67 5.58 5.45 5.2 5.42 6.03 5.98 5.57 5.12 5.56 5.56
Source: Data extracted from Kiribati Meteorological Service office
Solar radiation is higher for Tarawa than for Kiritimati, which may be due to the different in
minutes of latitudes of their positions. The difference appear to be more marked for the
months from September to March which is the period when the apparent movement of the
sun is overhead at south of the equator.
On the other hand, it is within that period when the traditional “Te Aumeang” dominates the
weather and more rain is expected for Tarawa which seemingly has been observed. Lower
solar radiation would be expected, if measured below cloud levels, but from the data above
this has not been so since the data were from satellite cloud maps. Perhaps the period
covered in the data on solar radiation is very short.
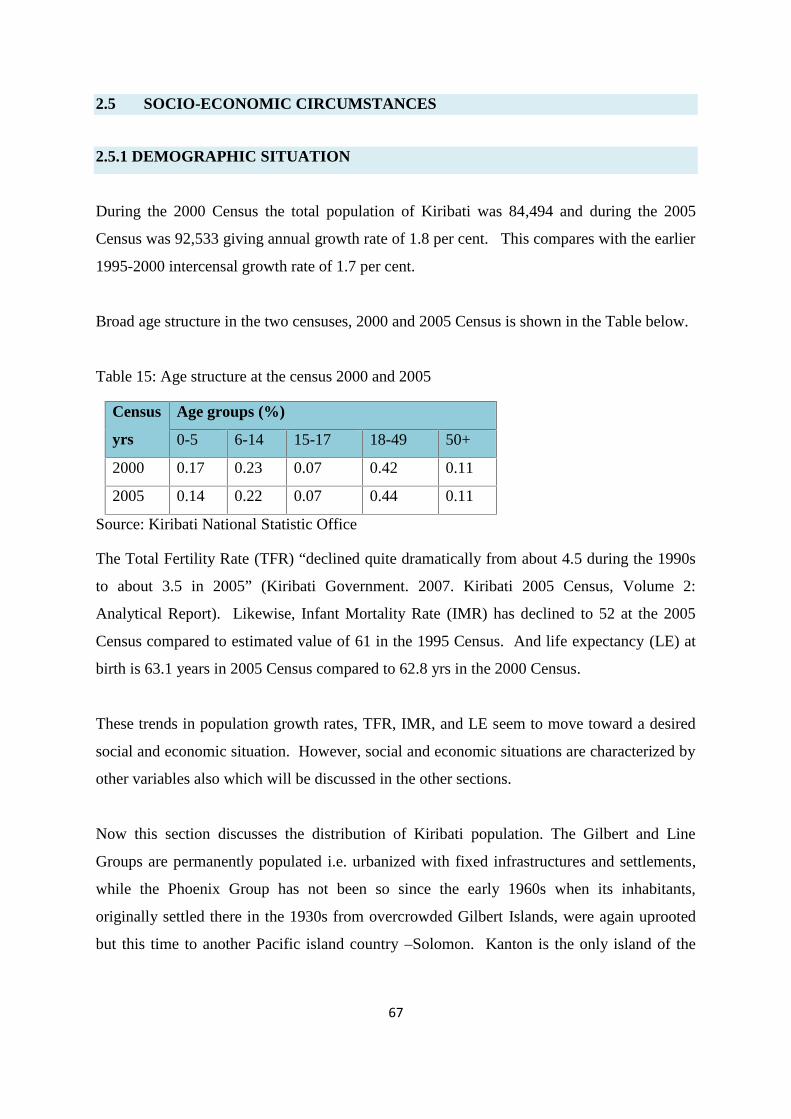
67
2.5 SOCIO-ECONOMIC CIRCUMSTANCES
2.5.1 DEMOGRAPHIC SITUATION
During the 2000 Census the total population of Kiribati was 84,494 and during the 2005
Census was 92,533 giving annual growth rate of 1.8 per cent. This compares with the earlier
1995-2000 intercensal growth rate of 1.7 per cent.
Broad age structure in the two censuses, 2000 and 2005 Census is shown in the Table below.
Table 15: Age structure at the census 2000 and 2005
Census
yrs
Age groups (%)
0-5 6-14 15-17 18-49 50+
2000 0.17 0.23 0.07 0.42 0.11
2005 0.14 0.22 0.07 0.44 0.11
Source: Kiribati National Statistic Office
The Total Fertility Rate (TFR) “declined quite dramatically from about 4.5 during the 1990s
to about 3.5 in 2005” (Kiribati Government. 2007. Kiribati 2005 Census, Volume 2:
Analytical Report). Likewise, Infant Mortality Rate (IMR) has declined to 52 at the 2005
Census compared to estimated value of 61 in the 1995 Census. And life expectancy (LE) at
birth is 63.1 years in 2005 Census compared to 62.8 yrs in the 2000 Census.
These trends in population growth rates, TFR, IMR, and LE seem to move toward a desired
social and economic situation. However, social and economic situations are characterized by
other variables also which will be discussed in the other sections.
Now this section discusses the distribution of Kiribati population. The Gilbert and Line
Groups are permanently populated i.e. urbanized with fixed infrastructures and settlements,
while the Phoenix Group has not been so since the early 1960s when its inhabitants,
originally settled there in the 1930s from overcrowded Gilbert Islands, were again uprooted
but this time to another Pacific island country –Solomon. Kanton is the only island of the
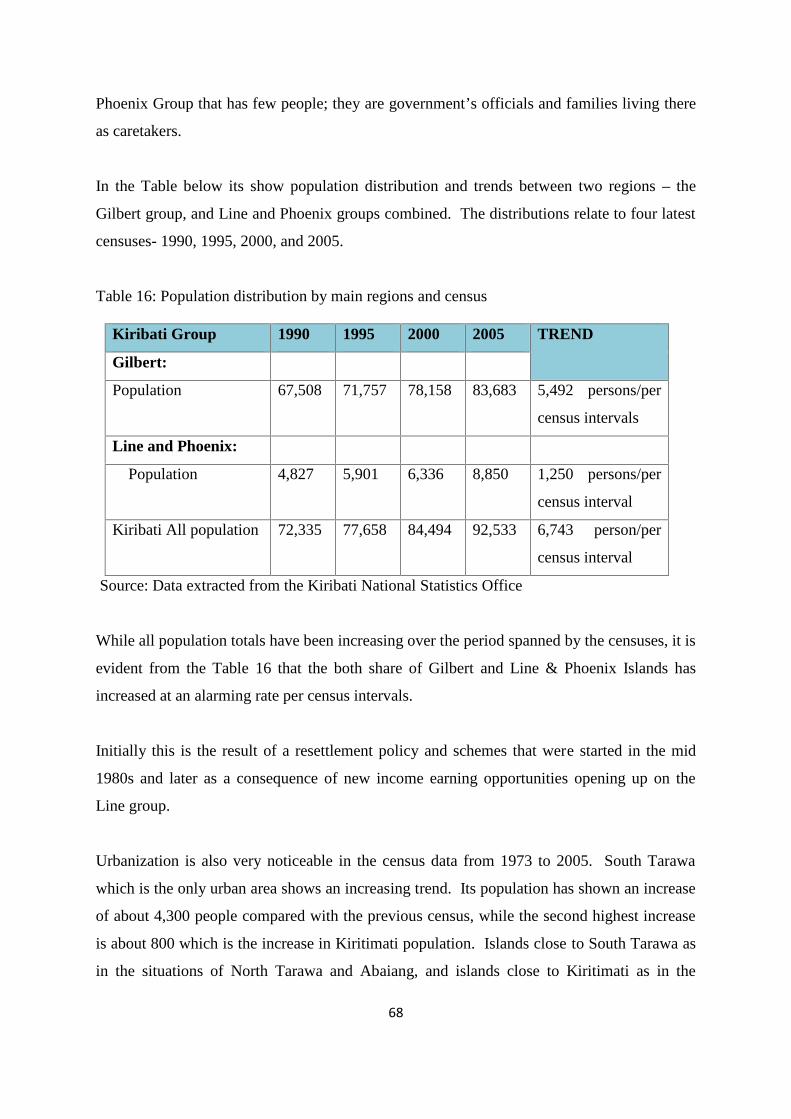
68
Phoenix Group that has few people; they are government’s officials and families living there
as caretakers.
In the Table below its show population distribution and trends between two regions – the
Gilbert group, and Line and Phoenix groups combined. The distributions relate to four latest
censuses- 1990, 1995, 2000, and 2005.
Table 16: Population distribution by main regions and census
Source: Data extracted from the Kiribati National Statistics Office
While all population totals have been increasing over the period spanned by the censuses, it is
evident from the Table 16 that the both share of Gilbert and Line & Phoenix Islands has
increased at an alarming rate per census intervals.
Initially this is the result of a resettlement policy and schemes that were started in the mid
1980s and later as a consequence of new income earning opportunities opening up on the
Line group.
Urbanization is also very noticeable in the census data from 1973 to 2005. South Tarawa
which is the only urban area shows an increasing trend. Its population has shown an increase
of about 4,300 people compared with the previous census, while the second highest increase
is about 800 which is the increase in Kiritimati population. Islands close to South Tarawa as
in the situations of North Tarawa and Abaiang, and islands close to Kiritimati as in the
Kiribati Group 1990 1995 2000 2005 TREND
Gilbert:
Population 67,508 71,757 78,158 83,683 5,492 persons/per
census intervals
Line and Phoenix:
Population 4,827 5,901 6,336 8,850 1,250 persons/per
census interval
Kiribati All population 72,335 77,658 84,494 92,533 6,743 person/per
census interval
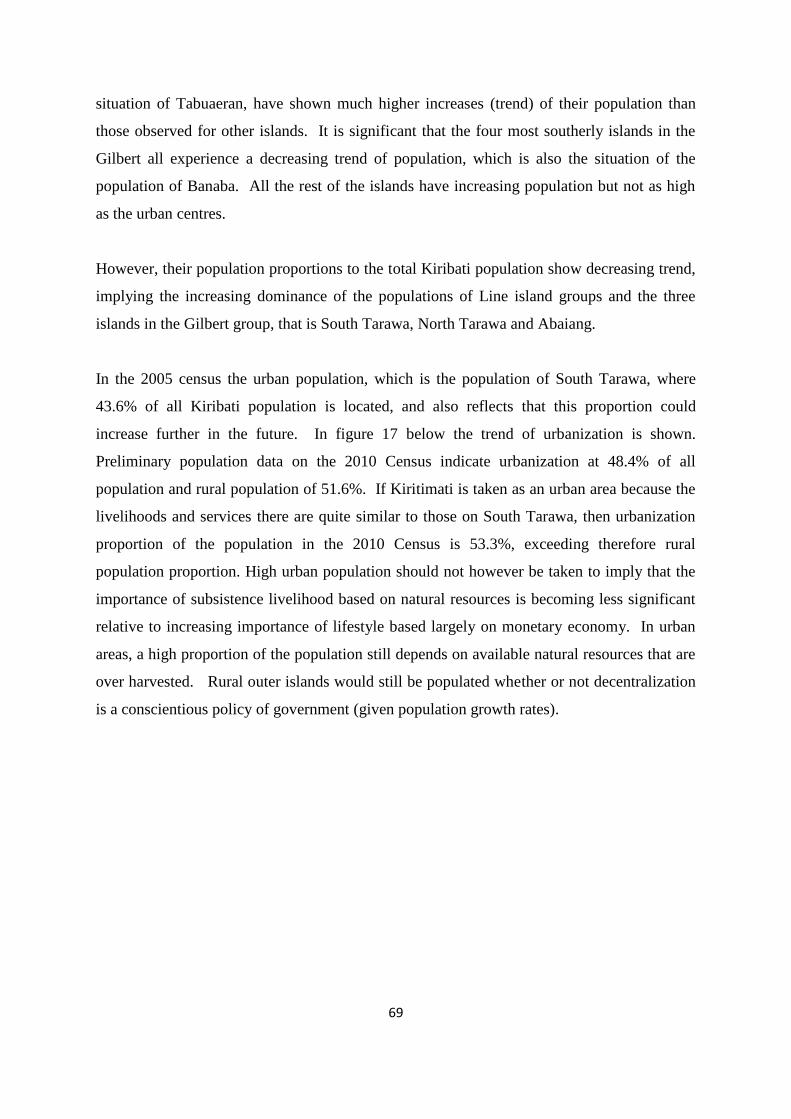
69
situation of Tabuaeran, have shown much higher increases (trend) of their population than
those observed for other islands. It is significant that the four most southerly islands in the
Gilbert all experience a decreasing trend of population, which is also the situation of the
population of Banaba. All the rest of the islands have increasing population but not as high
as the urban centres.
However, their population proportions to the total Kiribati population show decreasing trend,
implying the increasing dominance of the populations of Line island groups and the three
islands in the Gilbert group, that is South Tarawa, North Tarawa and Abaiang.
In the 2005 census the urban population, which is the population of South Tarawa, where
43.6% of all Kiribati population is located, and also reflects that this proportion could
increase further in the future. In figure 17 below the trend of urbanization is shown.
Preliminary population data on the 2010 Census indicate urbanization at 48.4% of all
population and rural population of 51.6%. If Kiritimati is taken as an urban area because the
livelihoods and services there are quite similar to those on South Tarawa, then urbanization
proportion of the population in the 2010 Census is 53.3%, exceeding therefore rural
population proportion. High urban population should not however be taken to imply that the
importance of subsistence livelihood based on natural resources is becoming less significant
relative to increasing importance of lifestyle based largely on monetary economy. In urban
areas, a high proportion of the population still depends on available natural resources that are
over harvested. Rural outer islands would still be populated whether or not decentralization
is a conscientious policy of government (given population growth rates).
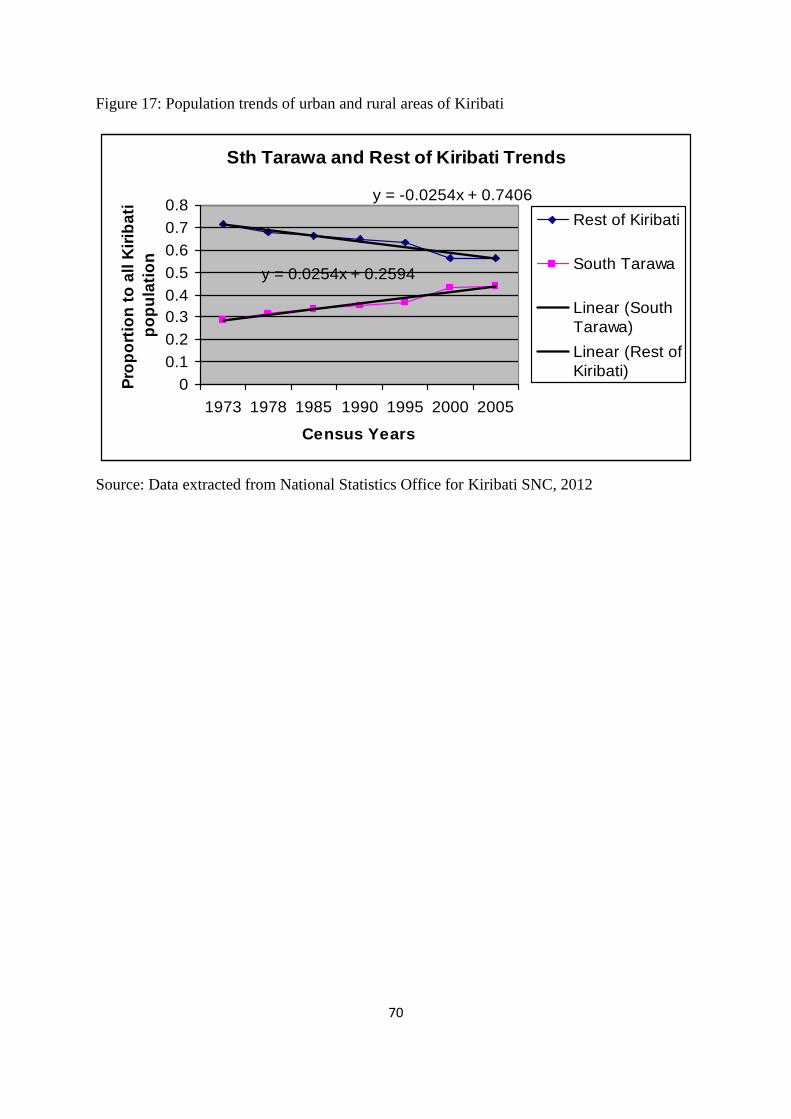
70
Figure 17: Population trends of urban and rural areas of Kiribati
Sth Tarawa and Rest of Kiribati Trends
y = 0.0254x + 0.2594
y = -0.0254x + 0.7406
00.10.20.30.40.50.60.70.8
1973 1978 1985 1990 1995 2000 2005
Census Years
Prop
ortio
n to
all
Kirib
ati
popu
latio
n
Rest of Kiribati
South Tarawa
Linear (SouthTarawa)Linear (Rest ofKiribati)
Source: Data extracted from National Statistics Office for Kiribati SNC, 2012
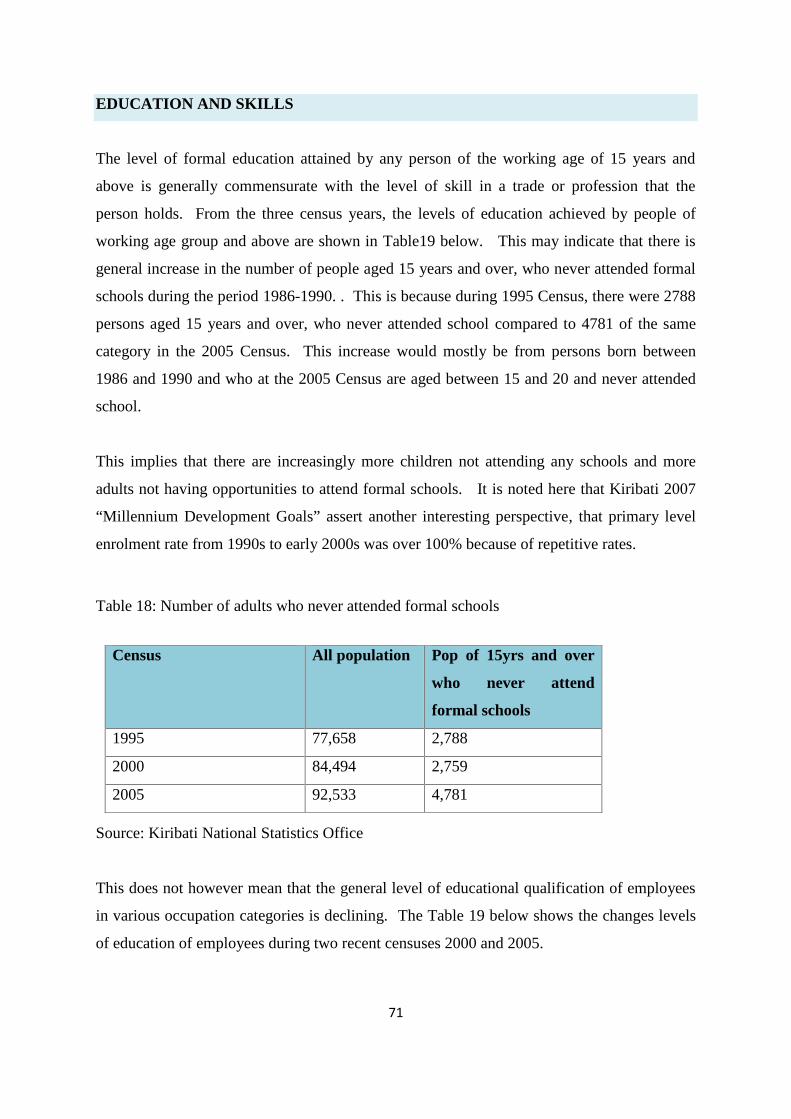
71
EDUCATION AND SKILLS
The level of formal education attained by any person of the working age of 15 years and
above is generally commensurate with the level of skill in a trade or profession that the
person holds. From the three census years, the levels of education achieved by people of
working age group and above are shown in Table19 below. This may indicate that there is
general increase in the number of people aged 15 years and over, who never attended formal
schools during the period 1986-1990. . This is because during 1995 Census, there were 2788
persons aged 15 years and over, who never attended school compared to 4781 of the same
category in the 2005 Census. This increase would mostly be from persons born between
1986 and 1990 and who at the 2005 Census are aged between 15 and 20 and never attended
school.
This implies that there are increasingly more children not attending any schools and more
adults not having opportunities to attend formal schools. It is noted here that Kiribati 2007
“Millennium Development Goals” assert another interesting perspective, that primary level
enrolment rate from 1990s to early 2000s was over 100% because of repetitive rates.
Table 18: Number of adults who never attended formal schools
Source: Kiribati National Statistics Office
This does not however mean that the general level of educational qualification of employees
in various occupation categories is declining. The Table 19 below shows the changes levels
of education of employees during two recent censuses 2000 and 2005.
Census All population Pop of 15yrs and over
who never attend
formal schools
1995 77,658 2,788
2000 84,494 2,759
2005 92,533 4,781
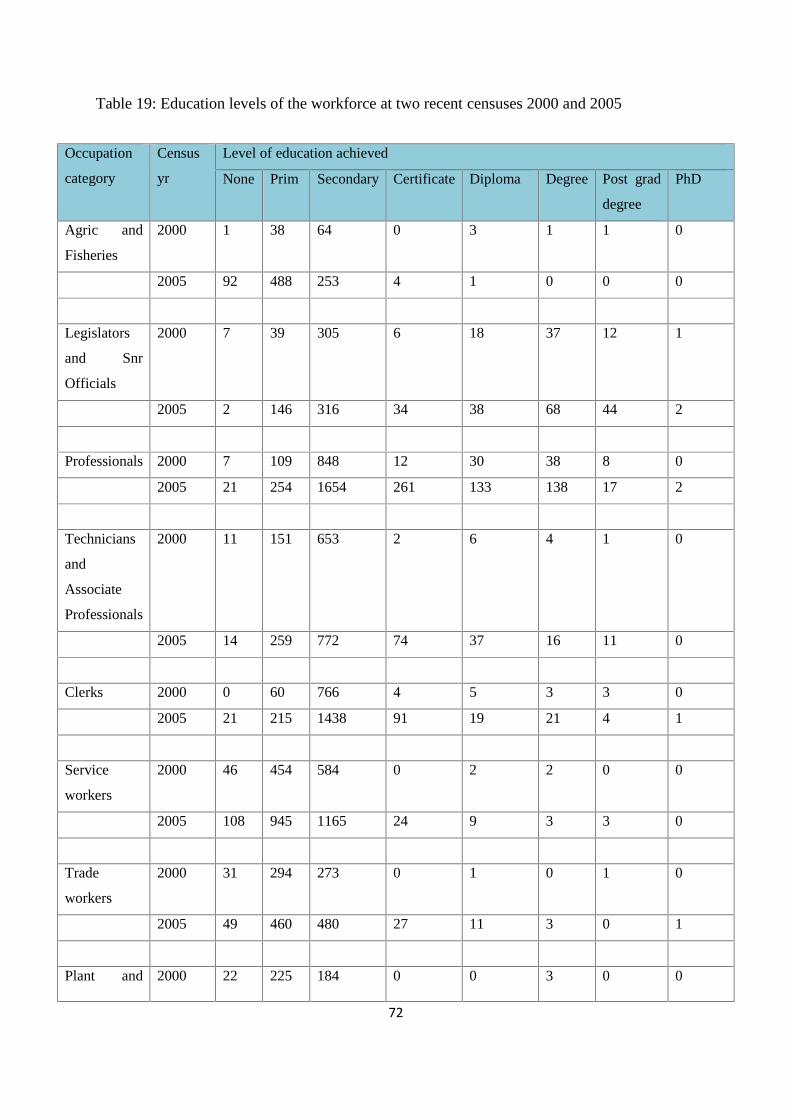
72
Table 19: Education levels of the workforce at two recent censuses 2000 and 2005
Occupation
category
Census
yr
Level of education achieved
None Prim Secondary Certificate Diploma Degree Post grad
degree
PhD
Agric and
Fisheries
2000 1 38 64 0 3 1 1 0
2005 92 488 253 4 1 0 0 0
Legislators
and Snr
Officials
2000 7 39 305 6 18 37 12 1
2005 2 146 316 34 38 68 44 2
Professionals 2000 7 109 848 12 30 38 8 0
2005 21 254 1654 261 133 138 17 2
Technicians
and
Associate
Professionals
2000 11 151 653 2 6 4 1 0
2005 14 259 772 74 37 16 11 0
Clerks 2000 0 60 766 4 5 3 3 0
2005 21 215 1438 91 19 21 4 1
Service
workers
2000 46 454 584 0 2 2 0 0
2005 108 945 1165 24 9 3 3 0
Trade
workers
2000 31 294 273 0 1 0 1 0
2005 49 460 480 27 11 3 0 1
Plant and 2000 22 225 184 0 0 3 0 0
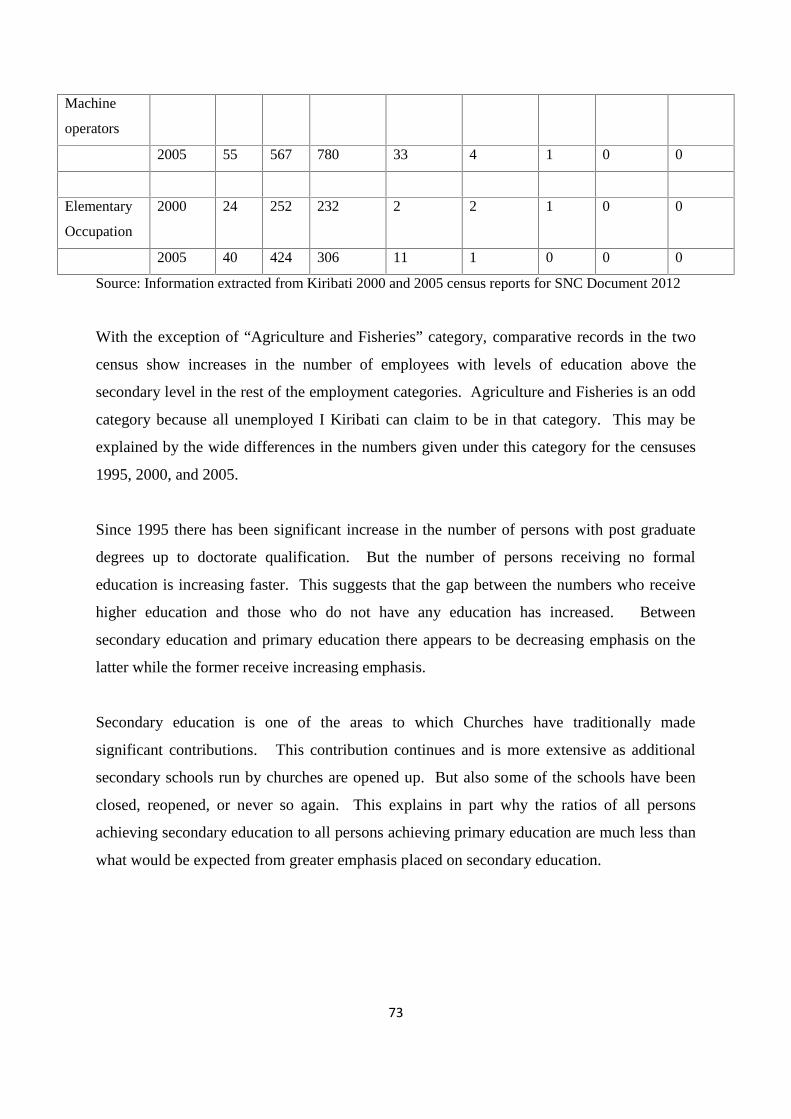
73
Source: Information extracted from Kiribati 2000 and 2005 census reports for SNC Document 2012
With the exception of “Agriculture and Fisheries” category, comparative records in the two
census show increases in the number of employees with levels of education above the
secondary level in the rest of the employment categories. Agriculture and Fisheries is an odd
category because all unemployed I Kiribati can claim to be in that category. This may be
explained by the wide differences in the numbers given under this category for the censuses
1995, 2000, and 2005.
Since 1995 there has been significant increase in the number of persons with post graduate
degrees up to doctorate qualification. But the number of persons receiving no formal
education is increasing faster. This suggests that the gap between the numbers who receive
higher education and those who do not have any education has increased. Between
secondary education and primary education there appears to be decreasing emphasis on the
latter while the former receive increasing emphasis.
Secondary education is one of the areas to which Churches have traditionally made
significant contributions. This contribution continues and is more extensive as additional
secondary schools run by churches are opened up. But also some of the schools have been
closed, reopened, or never so again. This explains in part why the ratios of all persons
achieving secondary education to all persons achieving primary education are much less than
what would be expected from greater emphasis placed on secondary education.
Machine
operators
2005 55 567 780 33 4 1 0 0
Elementary
Occupation
2000 24 252 232 2 2 1 0 0
2005 40 424 306 11 1 0 0 0
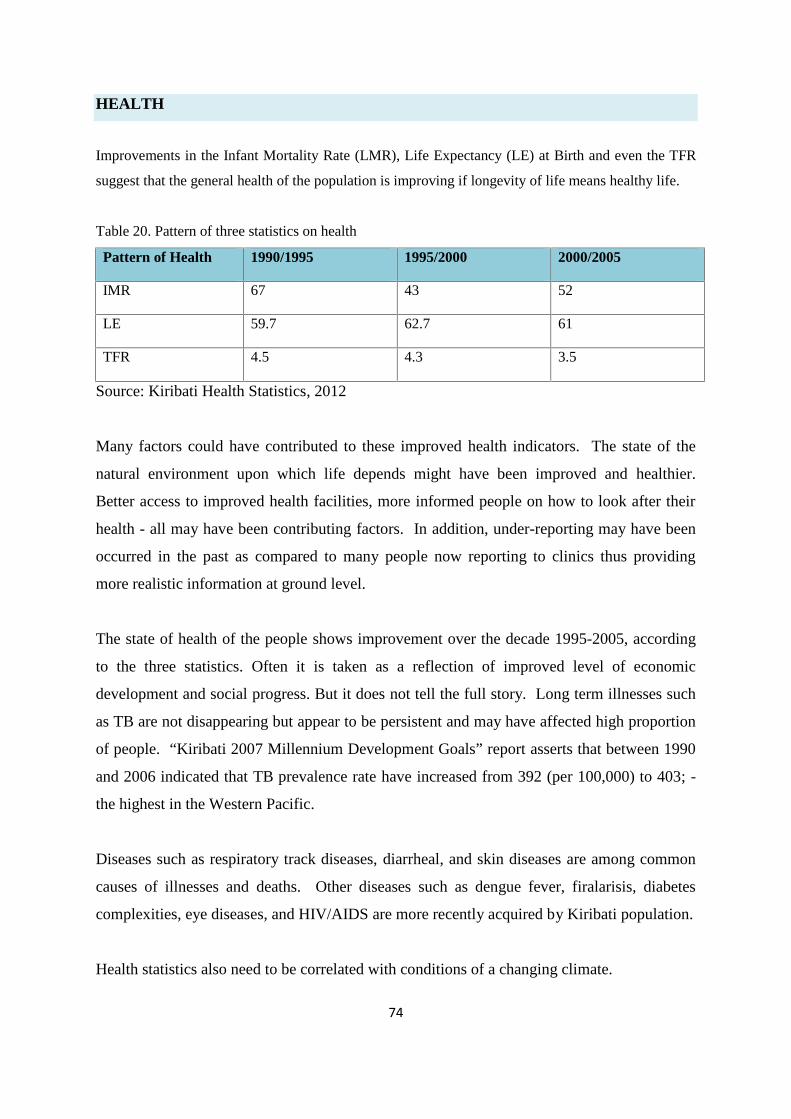
74
HEALTH
Improvements in the Infant Mortality Rate (LMR), Life Expectancy (LE) at Birth and even the TFR
suggest that the general health of the population is improving if longevity of life means healthy life.
Table 20. Pattern of three statistics on health
Pattern of Health 1990/1995 1995/2000 2000/2005
IMR 67 43 52
LE 59.7 62.7 61
TFR 4.5 4.3 3.5
Source: Kiribati Health Statistics, 2012
Many factors could have contributed to these improved health indicators. The state of the
natural environment upon which life depends might have been improved and healthier.
Better access to improved health facilities, more informed people on how to look after their
health - all may have been contributing factors. In addition, under-reporting may have been
occurred in the past as compared to many people now reporting to clinics thus providing
more realistic information at ground level.
The state of health of the people shows improvement over the decade 1995-2005, according
to the three statistics. Often it is taken as a reflection of improved level of economic
development and social progress. But it does not tell the full story. Long term illnesses such
as TB are not disappearing but appear to be persistent and may have affected high proportion
of people. “Kiribati 2007 Millennium Development Goals” report asserts that between 1990
and 2006 indicated that TB prevalence rate have increased from 392 (per 100,000) to 403; -
the highest in the Western Pacific.
Diseases such as respiratory track diseases, diarrheal, and skin diseases are among common
causes of illnesses and deaths. Other diseases such as dengue fever, firalarisis, diabetes
complexities, eye diseases, and HIV/AIDS are more recently acquired by Kiribati population.
Health statistics also need to be correlated with conditions of a changing climate.
75
2.5.2 ECONOMIC SITUATION
Kiribati is recognized as a Least Developed Country (LDC) in the United Nations
categorization of countries on the basis of their wealth and stages of socio economic
development. The UNFCCC acknowledge that special considerations for funding and
transfer of technologies should be given to LDC needs.
Accordingly, Kiribati deserves assistance from UNFCCC processes and international funds
that are established, so as for Kiribati to be able to meet the challenges of climate change.
These challenges include the impacts of sea level rise, increasing frequency and severity of
storms and storm surges on crucial islands ecological resources such as coastal areas, ground
water lens, traditional agricultural plantations and systems. Assistance to Kiribati has been
forthcoming since 1990, with significant increases during the recent decade.
There is a need to investigate the level of assistance that Kiribati had received either directly
from the UNFCCC process or indirect through bilateral arrangements. This external
assistance must also be fully understood in terms of which sectors and categories they have
been vested into e.g. technical assistance, capacity building, and investments. These are
important baseline climate finance information that is fundamental to inform Kiribati on
notion of climate finance as should “new and additional” to aid funding. These are current
issues that need to be ascertained in the subsequent Third National Communication.
There is no doubt that the need for external assistance will continue into the foreseeable
future (Kiribati had preliminary assessed it financial needs with respect to climate change and
was quite substantial). This is supported by anticipated increase in the severity of the impacts
of sea level rise and storms on the coastal zone where development and settlement
infrastructures concentrate. Ground water lenses are most vulnerable as well. And
ecosystems and biodiversity need protecting from slow onsets, and creeping or unexpected
impacts of climate change.
Due to its poor economic situation the need for external assistance seems to be unavoidable
in Kiribati. Main sources of Government’s recurrent revenue come from income tax and
corporate tax, license fees paid by foreign fishing vessels, import duties, and drawdown from
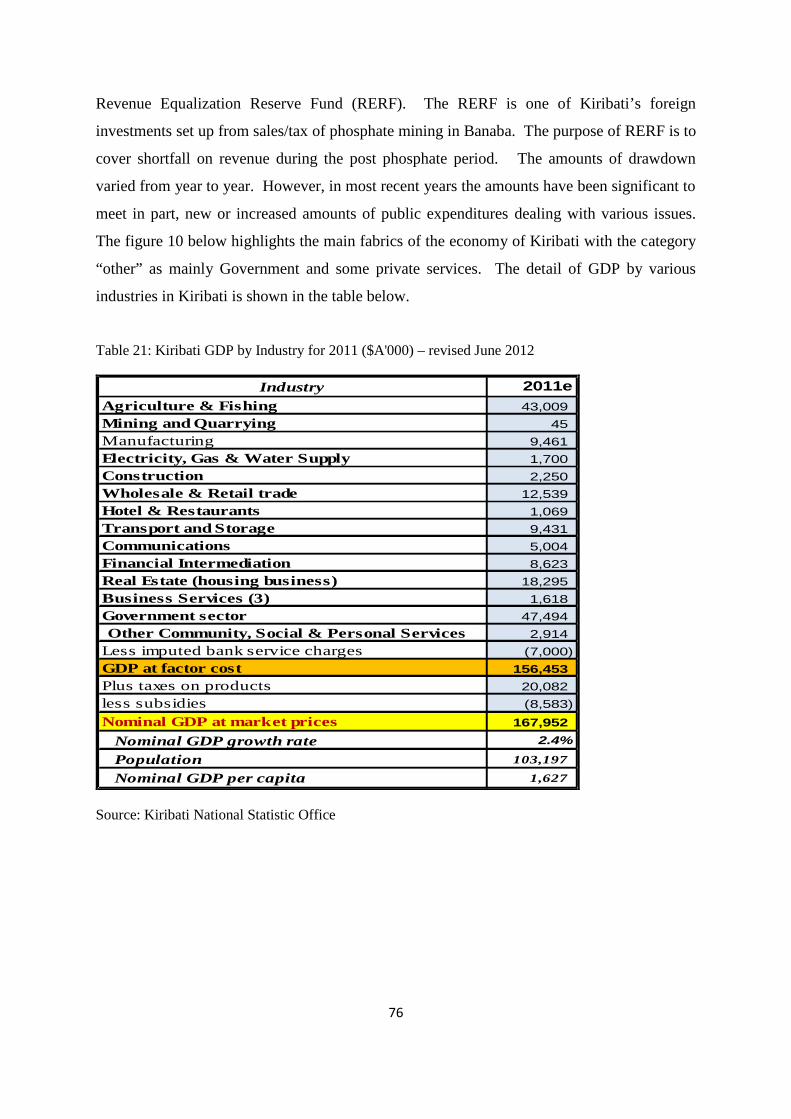
76
Revenue Equalization Reserve Fund (RERF). The RERF is one of Kiribati’s foreign
investments set up from sales/tax of phosphate mining in Banaba. The purpose of RERF is to
cover shortfall on revenue during the post phosphate period. The amounts of drawdown
varied from year to year. However, in most recent years the amounts have been significant to
meet in part, new or increased amounts of public expenditures dealing with various issues.
The figure 10 below highlights the main fabrics of the economy of Kiribati with the category
“other” as mainly Government and some private services. The detail of GDP by various
industries in Kiribati is shown in the table below.
Table 21: Kiribati GDP by Industry for 2011 ($A'000) – revised June 2012
Industry 2011eAgriculture & Fishing 43,009Mining and Quarrying 45Manufacturing 9,461Electricity, Gas & Water Supply 1,700Construction 2,250Wholesale & Retail trade 12,539Hotel & Restaurants 1,069Transport and Storage 9,431Communications 5,004Financial Intermediation 8,623Real Estate (housing business) 18,295Business Services (3) 1,618Government sector 47,494Other Community, Social & Personal Services 2,914
Less imputed bank service charges (7,000)GDP at factor cost 156,453Plus taxes on products 20,082less subsidies (8,583)Nominal GDP at market prices 167,952 Nominal GDP growth rate 2.4%
Population 103,197
Nominal GDP per capita 1,627
Source: Kiribati National Statistic Office
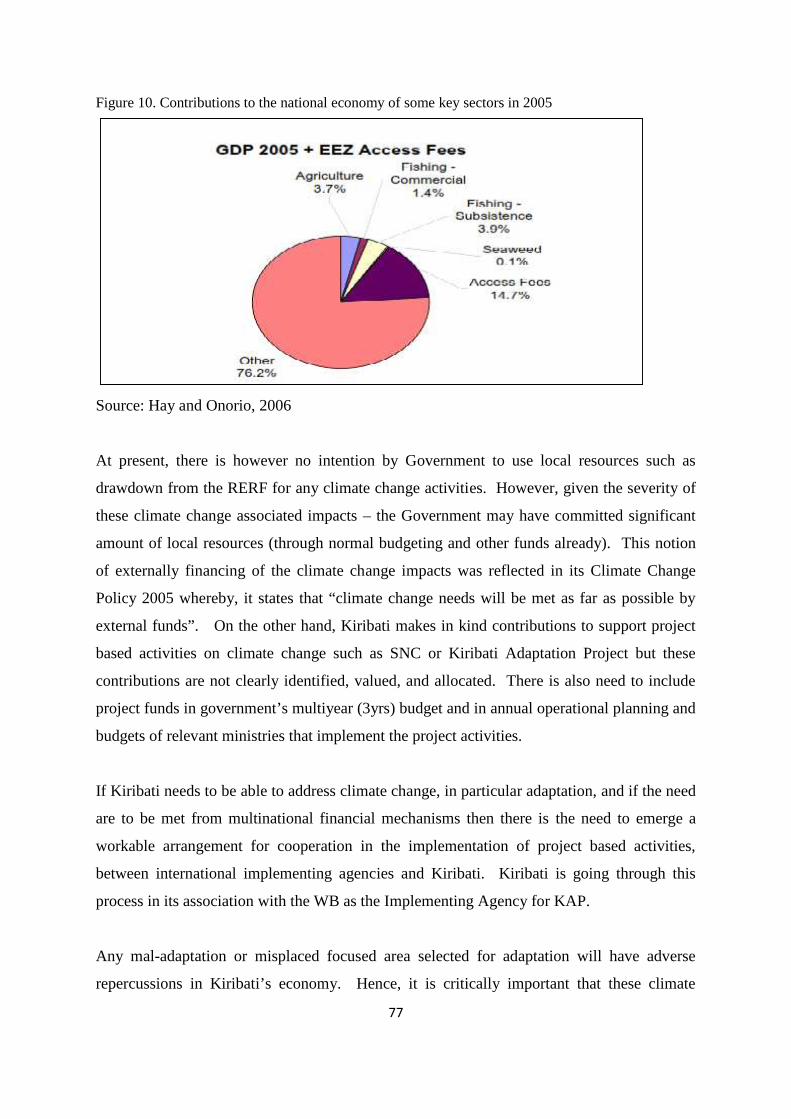
77
Figure 10. Contributions to the national economy of some key sectors in 2005
Source: Hay and Onorio, 2006
At present, there is however no intention by Government to use local resources such as
drawdown from the RERF for any climate change activities. However, given the severity of
these climate change associated impacts – the Government may have committed significant
amount of local resources (through normal budgeting and other funds already). This notion
of externally financing of the climate change impacts was reflected in its Climate Change
Policy 2005 whereby, it states that “climate change needs will be met as far as possible by
external funds”. On the other hand, Kiribati makes in kind contributions to support project
based activities on climate change such as SNC or Kiribati Adaptation Project but these
contributions are not clearly identified, valued, and allocated. There is also need to include
project funds in government’s multiyear (3yrs) budget and in annual operational planning and
budgets of relevant ministries that implement the project activities.
If Kiribati needs to be able to address climate change, in particular adaptation, and if the need
are to be met from multinational financial mechanisms then there is the need to emerge a
workable arrangement for cooperation in the implementation of project based activities,
between international implementing agencies and Kiribati. Kiribati is going through this
process in its association with the WB as the Implementing Agency for KAP.
Any mal-adaptation or misplaced focused area selected for adaptation will have adverse
repercussions in Kiribati’s economy. Hence, it is critically important that these climate
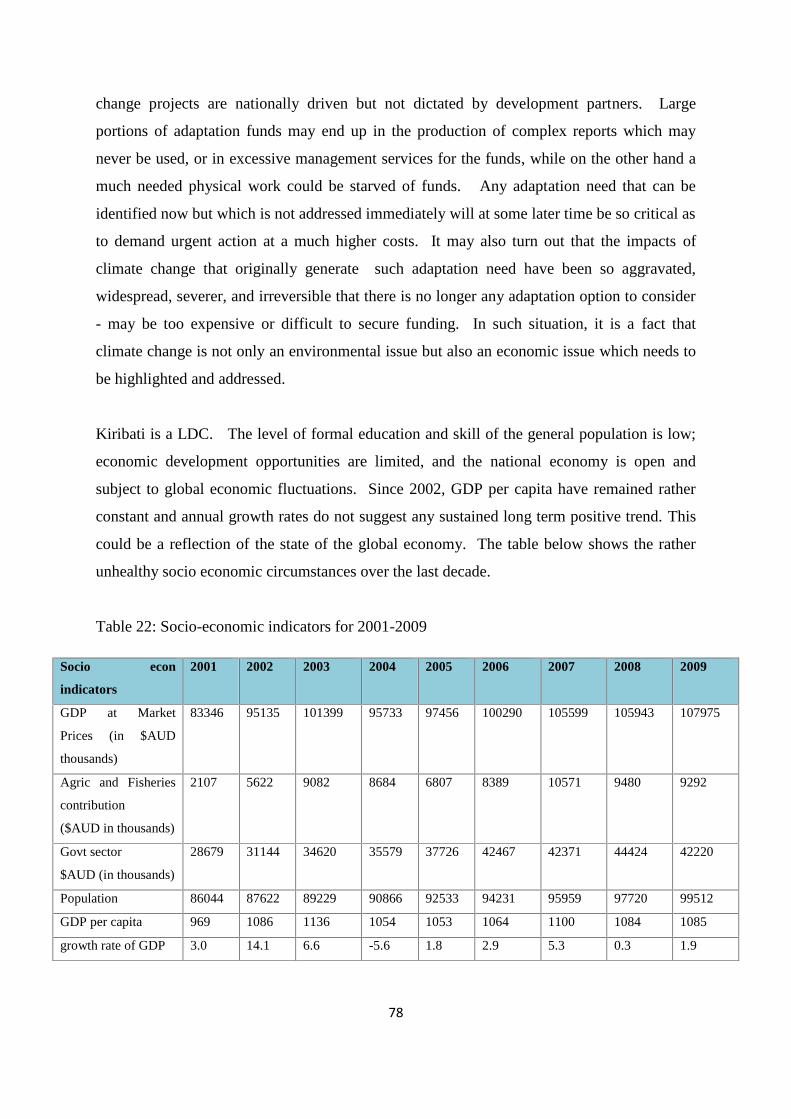
78
change projects are nationally driven but not dictated by development partners. Large
portions of adaptation funds may end up in the production of complex reports which may
never be used, or in excessive management services for the funds, while on the other hand a
much needed physical work could be starved of funds. Any adaptation need that can be
identified now but which is not addressed immediately will at some later time be so critical as
to demand urgent action at a much higher costs. It may also turn out that the impacts of
climate change that originally generate such adaptation need have been so aggravated,
widespread, severer, and irreversible that there is no longer any adaptation option to consider
- may be too expensive or difficult to secure funding. In such situation, it is a fact that
climate change is not only an environmental issue but also an economic issue which needs to
be highlighted and addressed.
Kiribati is a LDC. The level of formal education and skill of the general population is low;
economic development opportunities are limited, and the national economy is open and
subject to global economic fluctuations. Since 2002, GDP per capita have remained rather
constant and annual growth rates do not suggest any sustained long term positive trend. This
could be a reflection of the state of the global economy. The table below shows the rather
unhealthy socio economic circumstances over the last decade.
Table 22: Socio-economic indicators for 2001-2009
Socio econ
indicators
2001 2002 2003 2004 2005 2006 2007 2008 2009
GDP at Market
Prices (in $AUD
thousands)
83346 95135 101399 95733 97456 100290 105599 105943 107975
Agric and Fisheries
contribution
($AUD in thousands)
2107 5622 9082 8684 6807 8389 10571 9480 9292
Govt sector
$AUD (in thousands)
28679 31144 34620 35579 37726 42467 42371 44424 42220
Population 86044 87622 89229 90866 92533 94231 95959 97720 99512
GDP per capita 969 1086 1136 1054 1053 1064 1100 1084 1085
growth rate of GDP 3.0 14.1 6.6 -5.6 1.8 2.9 5.3 0.3 1.9
79
Source: National Statistics Office, 2010. Kiribati National Accounts. The Production
Account and GDP.
Government’s sector contribution to GDP also shows an increasing trend, indicating more
government’s services addressing areas that in the past have received less attention. Among
such areas are environment protection and conservation. Another significant feature
observed in the Table is the drop in GDP from the level in 2003 to what it is in 2004. It has
been suggested in “Kiribati 2007 Millennium Development Goals” that this is due to increase
in oil prices from US$20 a barrel in 2001 to US$70 a barrel in 2005, and to high fluctuation
in the price of copra and seaweed. These costs tend to increase the costs of intermediate
inputs to final domestic products, and moreover increase the imbalance of trade.
Government’s recurrent budget is based generally on five years budget of two years
backward, and two years forward, of the current year. There is also a requirement that
Ministries prepare their current year Operational Plans which they regularly monitored and
upon which performances are assessed. Government’s expenditures, in particular wages and
salaries, are factors in GDP. Over the period 2001-2009, government’s contributions to GDP
have varied between 32% and 42% but with positive trend. This suggests that Government’s
budgets will remain significant contributor to GDP and its growth.
But how well has GDP filtered down and distributed throughout the regions and households,
NSO and UNDP analysis of data from the “2006 Household Income and Expenditure
Survey” report shows that expenditure of the household in the Line and Phoenix Group is
higher than that of the household in South Tarawa. As expected, households on the rest of
Gilbert, that is, in the rural areas, have the lowest expenditure. These imply that household
incomes are different for the three main regions.
The analysis is specifically on poverty levels and characterization. The SNC team extracted
some important information and show them in the Table below. They are based on
expenditure patterns of the lowest thirty percentile of ranked levels of expenditure. If there
are households whose incomes per week are below the FPL for the area in which they live,
then these households would be categorized as absolutely poor. From the second column it
can be clearly noted that it is more expensive in South Tarawa than in the Line and Phoenix
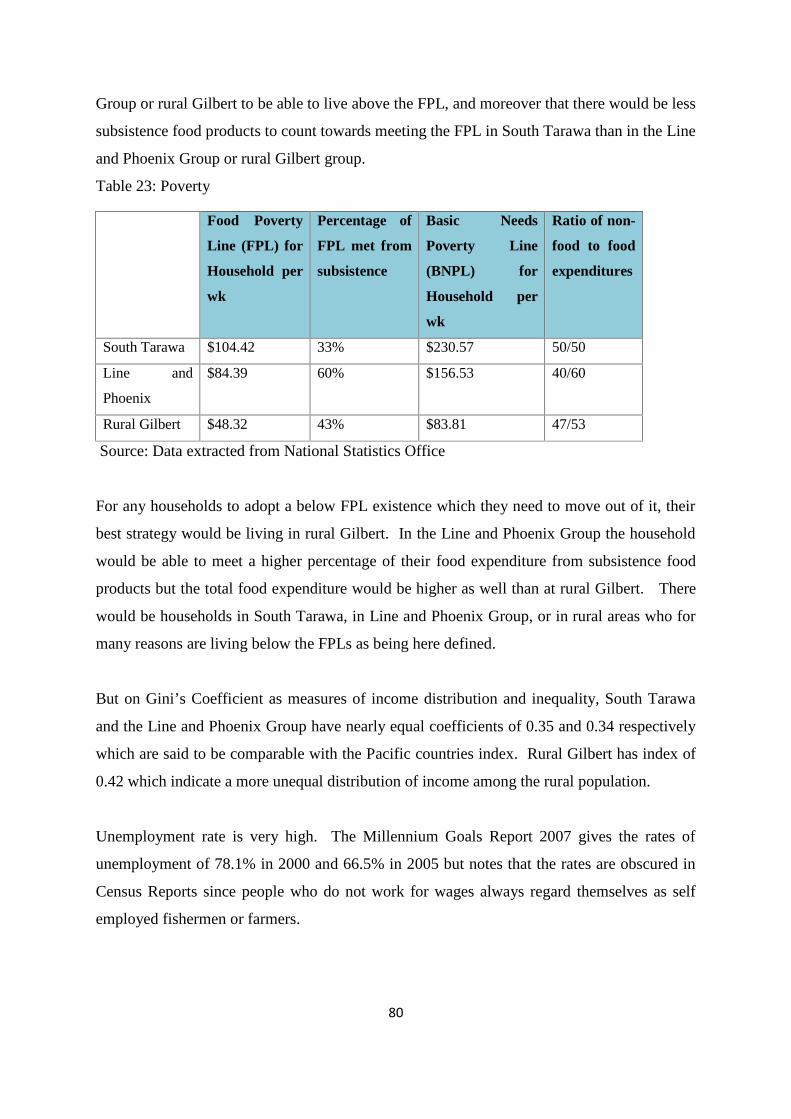
80
Group or rural Gilbert to be able to live above the FPL, and moreover that there would be less
subsistence food products to count towards meeting the FPL in South Tarawa than in the Line
and Phoenix Group or rural Gilbert group.
Table 23: Poverty
Food Poverty
Line (FPL) for
Household per
wk
Percentage of
FPL met from
subsistence
Basic Needs
Poverty Line
(BNPL) for
Household per
wk
Ratio of non-
food to food
expenditures
South Tarawa $104.42 33% $230.57 50/50
Line and
Phoenix
$84.39 60% $156.53 40/60
Rural Gilbert $48.32 43% $83.81 47/53
Source: Data extracted from National Statistics Office
For any households to adopt a below FPL existence which they need to move out of it, their
best strategy would be living in rural Gilbert. In the Line and Phoenix Group the household
would be able to meet a higher percentage of their food expenditure from subsistence food
products but the total food expenditure would be higher as well than at rural Gilbert. There
would be households in South Tarawa, in Line and Phoenix Group, or in rural areas who for
many reasons are living below the FPLs as being here defined.
But on Gini’s Coefficient as measures of income distribution and inequality, South Tarawa
and the Line and Phoenix Group have nearly equal coefficients of 0.35 and 0.34 respectively
which are said to be comparable with the Pacific countries index. Rural Gilbert has index of
0.42 which indicate a more unequal distribution of income among the rural population.
Unemployment rate is very high. The Millennium Goals Report 2007 gives the rates of
unemployment of 78.1% in 2000 and 66.5% in 2005 but notes that the rates are obscured in
Census Reports since people who do not work for wages always regard themselves as self
employed fishermen or farmers.
81
However, agricultural and fisheries resources are limited and variable. Unemployed persons
who claimed self employment in those activities could not be taken seriously.
Copra has been the only income source from agricultural farming. Copra production of the
Gilbert Group during the period 1990 to 2003 shows a declining trend, while the Line Group
for the same period shows an increasing trend. It is also interesting to observe that four years
cumulative annual totals of rainfall and of copra production are highly correlated. This may
show that coconut productivity has a cycle of four years, or alternatively the cycle of peoples'
efforts to harvest copra is four years.
82
2.5.3 INTERNATIONAL ASSISTANCE TO KIRIBATI’s EFFORTS ON CC
Kiribati Initial National Communication submitted to the COP in 2000 was one of the outputs
of the Pacific Islands Climate Change Assistance Programme to which Kiribati participated.
The PICCAP was executed through SPREP and funds were from GEF.
Before the PICCAP was the US Country Study Programme which was the first climate
change project, starting in 1995. The project activities were on enabling activities involving
vulnerability studies which gradually extended to cover identification of adaptation measures.
After PICCAP, funding for LDCs was set up in a decision of the COP under the name of
National Adaptation Plan of Action. Kiribati participated in the NAPA and working with
UNDP completed its NAPA document and submitted it to the COP. Concurrently with the
preparation of the NAPA, Kiribati welcomed also WB initiative to start a Kiribati Adaptation
Project with co-finance from Government of Japan. The initial phase of KAP under the WB
was the preparation of Adaptation Project Implementation Plan for the second phase, and
studies that were considered necessary for this preparation.
The second phase of KAP, that is KAP II, is completed in 2011 with many technical reports
that were produced on the coastal vulnerability relative to sea level scenarios, droughts
information, and water planning documents, designs of coastal protection, construction of
some coastal protection structures, rainwater harvesting and construction of a community
infiltration gallery in North Tarawa, and other improvement works on South Tarawa water
supply. Phase III of the KAP is being designed. The intention is to concentrate on
addressing coastal risks, and water supply that are associated with climate change.
Funds for these projects are from bilateral sources as was the case of the US Country Study
Program, or from Multi-lateral source, including donor agencies like Aus-AID and NZAID
that contributes to financing KAPII, and through GEF as in the case of the NAPA and KAP.
Kiribati experience with implementing agencies suggest that this need to evolve to better
understanding and responsiveness to the real need to protect natural systems from
degradation impacts of climate change, and to ensure the long term sustainability of human
systems.
83
3.0 ISLAND BIODIVERSITY
The natural state of biodiversity in Kiribati is affected by climate change as when the various
living organisms constituting an ecosystem are stressed by the increasing levels in physical
aspects of their ambient environment. For examples the health, diversity, and abundance of
species of corals, and fish stocks could decrease when the temperature and acidity of the
ocean increase. Mangrove ecosystems now being monitored would enable assessment in due
course of how they are thriving under current conditions associated with progressing climate
change. The climatic conditions include, increasing temperature, rising sea level rise, more
frequent storm surges, and possibly increase in annual precipitation are more frequent and
experienced in Kiribati.
Other coastal ecosystems that are found along the beach and close to the shoreline would be
subjected to climate change conditions particularly from sea level rise and storm surges
which generally lead to observed eroding of beach and shoreline. Coastal vegetation
including coconut trees and pandanus trees are uprooted through coastal erosion, or damaged
by sea water over wash.
There are also existing threats that are induced as direct results of socio-economic activities
e.g. marine export demands, channels and causeways, among others.
Biodiversity as represented by different species of organisms provide materials required for
the livelihood of the people. Different species supplying particular needs of the people would
have different tolerant levels to climate change physical factors such as temperature and sea
level increases for example. This characteristic of biodiversity will provide opportunities to
develop ways to enhance the tolerance of ecosystems to climate change impacts.
Coconut and pandanus trees are basic perennial crops for food and cash. They grow well
throughout Kiribati, and are sources of materials for traditionally housing constructions, and
for many amenities in the traditional livelihood of the people. However, in the case of
pandanus trees, some important species have eroded or lost due to the change in consumption
pattern and preference of I-Kiribati.
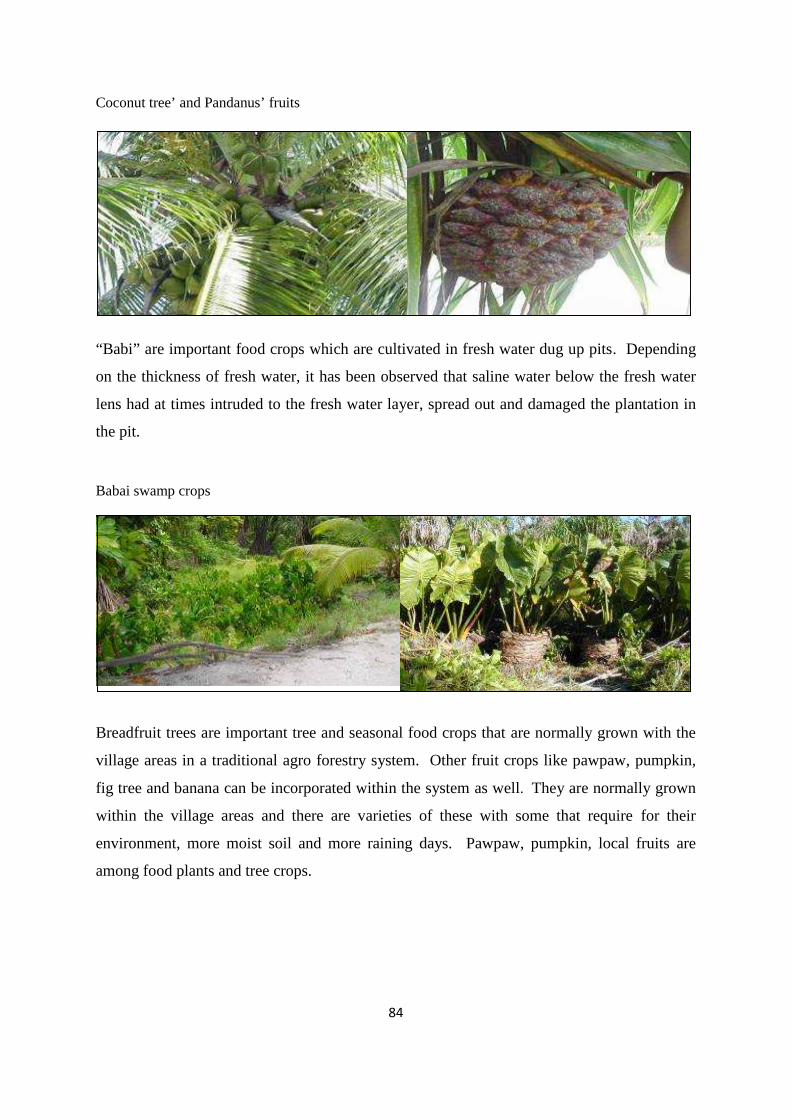
84
Coconut tree’ and Pandanus’ fruits
“Babi” are important food crops which are cultivated in fresh water dug up pits. Depending
on the thickness of fresh water, it has been observed that saline water below the fresh water
lens had at times intruded to the fresh water layer, spread out and damaged the plantation in
the pit.
Babai swamp crops
Breadfruit trees are important tree and seasonal food crops that are normally grown with the
village areas in a traditional agro forestry system. Other fruit crops like pawpaw, pumpkin,
fig tree and banana can be incorporated within the system as well. They are normally grown
within the village areas and there are varieties of these with some that require for their
environment, more moist soil and more raining days. Pawpaw, pumpkin, local fruits are
among food plants and tree crops.
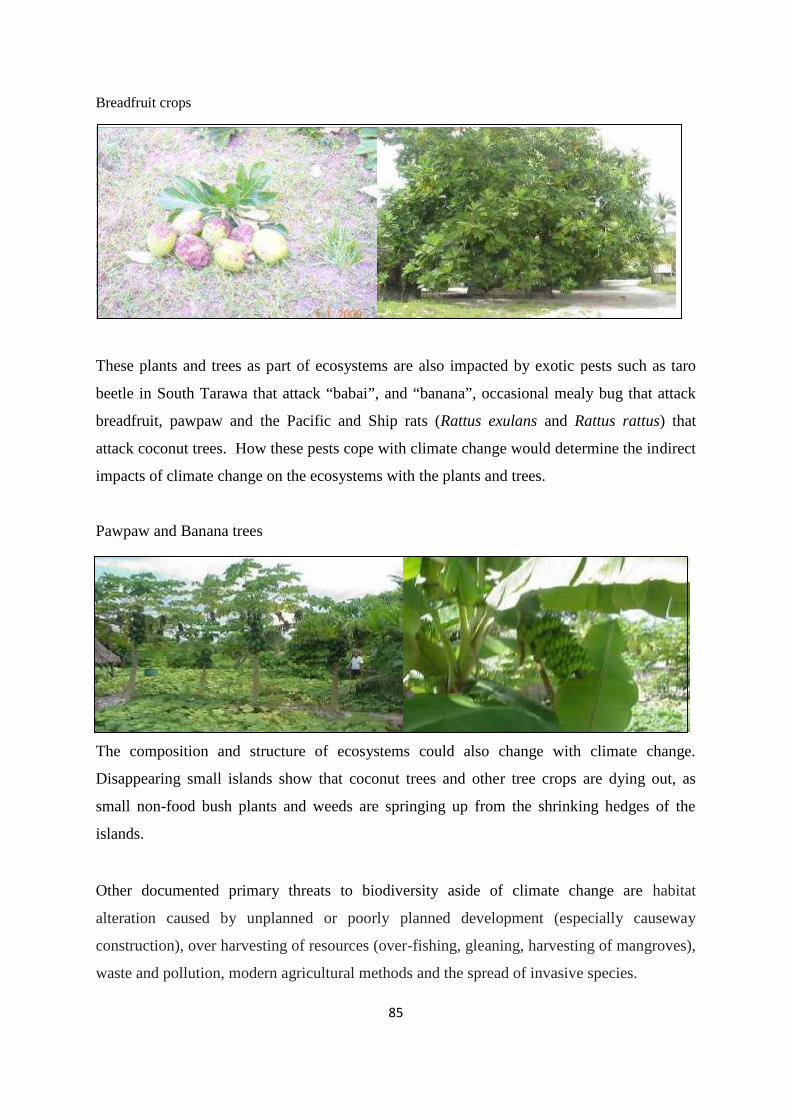
85
Breadfruit crops
These plants and trees as part of ecosystems are also impacted by exotic pests such as taro
beetle in South Tarawa that attack “babai”, and “banana”, occasional mealy bug that attack
breadfruit, pawpaw and the Pacific and Ship rats (Rattus exulans and Rattus rattus) that
attack coconut trees. How these pests cope with climate change would determine the indirect
impacts of climate change on the ecosystems with the plants and trees.
Pawpaw and Banana trees
The composition and structure of ecosystems could also change with climate change.
Disappearing small islands show that coconut trees and other tree crops are dying out, as
small non-food bush plants and weeds are springing up from the shrinking hedges of the
islands.
Other documented primary threats to biodiversity aside of climate change are habitat
alteration caused by unplanned or poorly planned development (especially causeway
construction), over harvesting of resources (over-fishing, gleaning, harvesting of mangroves),
waste and pollution, modern agricultural methods and the spread of invasive species.
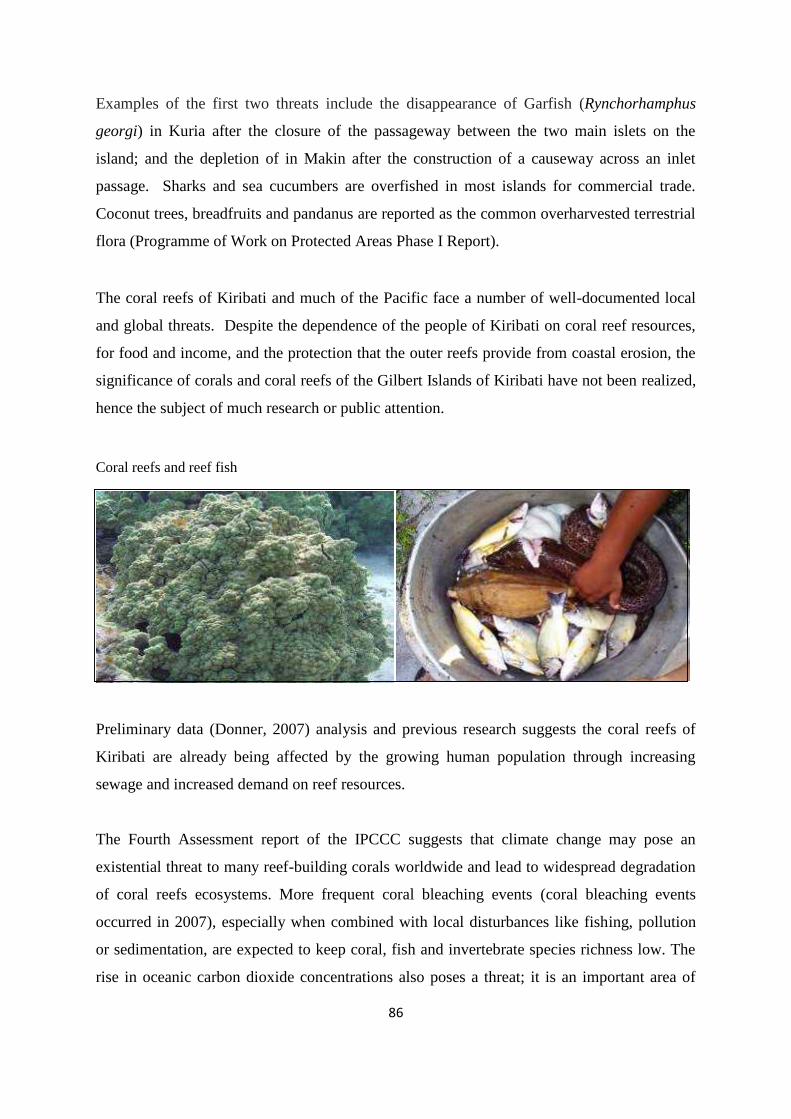
86
Examples of the first two threats include the disappearance of Garfish (Rynchorhamphus
georgi) in Kuria after the closure of the passageway between the two main islets on the
island; and the depletion of in Makin after the construction of a causeway across an inlet
passage. Sharks and sea cucumbers are overfished in most islands for commercial trade.
Coconut trees, breadfruits and pandanus are reported as the common overharvested terrestrial
flora (Programme of Work on Protected Areas Phase I Report).
The coral reefs of Kiribati and much of the Pacific face a number of well-documented local
and global threats. Despite the dependence of the people of Kiribati on coral reef resources,
for food and income, and the protection that the outer reefs provide from coastal erosion, the
significance of corals and coral reefs of the Gilbert Islands of Kiribati have not been realized,
hence the subject of much research or public attention.
Coral reefs and reef fish
Preliminary data (Donner, 2007) analysis and previous research suggests the coral reefs of
Kiribati are already being affected by the growing human population through increasing
sewage and increased demand on reef resources.
The Fourth Assessment report of the IPCCC suggests that climate change may pose an
existential threat to many reef-building corals worldwide and lead to widespread degradation
of coral reefs ecosystems. More frequent coral bleaching events (coral bleaching events
occurred in 2007), especially when combined with local disturbances like fishing, pollution
or sedimentation, are expected to keep coral, fish and invertebrate species richness low. The
rise in oceanic carbon dioxide concentrations also poses a threat; it is an important area of
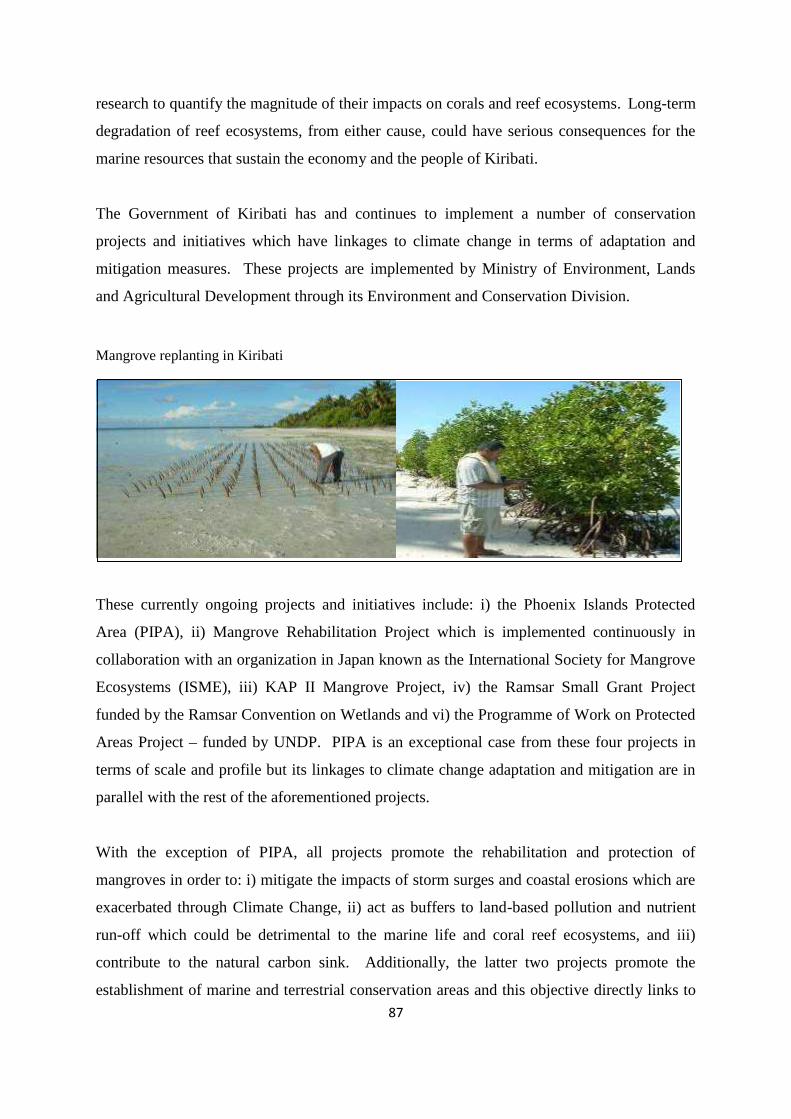
87
research to quantify the magnitude of their impacts on corals and reef ecosystems. Long-term
degradation of reef ecosystems, from either cause, could have serious consequences for the
marine resources that sustain the economy and the people of Kiribati.
The Government of Kiribati has and continues to implement a number of conservation
projects and initiatives which have linkages to climate change in terms of adaptation and
mitigation measures. These projects are implemented by Ministry of Environment, Lands
and Agricultural Development through its Environment and Conservation Division.
Mangrove replanting in Kiribati
These currently ongoing projects and initiatives include: i) the Phoenix Islands Protected
Area (PIPA), ii) Mangrove Rehabilitation Project which is implemented continuously in
collaboration with an organization in Japan known as the International Society for Mangrove
Ecosystems (ISME), iii) KAP II Mangrove Project, iv) the Ramsar Small Grant Project
funded by the Ramsar Convention on Wetlands and vi) the Programme of Work on Protected
Areas Project – funded by UNDP. PIPA is an exceptional case from these four projects in
terms of scale and profile but its linkages to climate change adaptation and mitigation are in
parallel with the rest of the aforementioned projects.
With the exception of PIPA, all projects promote the rehabilitation and protection of
mangroves in order to: i) mitigate the impacts of storm surges and coastal erosions which are
exacerbated through Climate Change, ii) act as buffers to land-based pollution and nutrient
run-off which could be detrimental to the marine life and coral reef ecosystems, and iii)
contribute to the natural carbon sink. Additionally, the latter two projects promote the
establishment of marine and terrestrial conservation areas and this objective directly links to
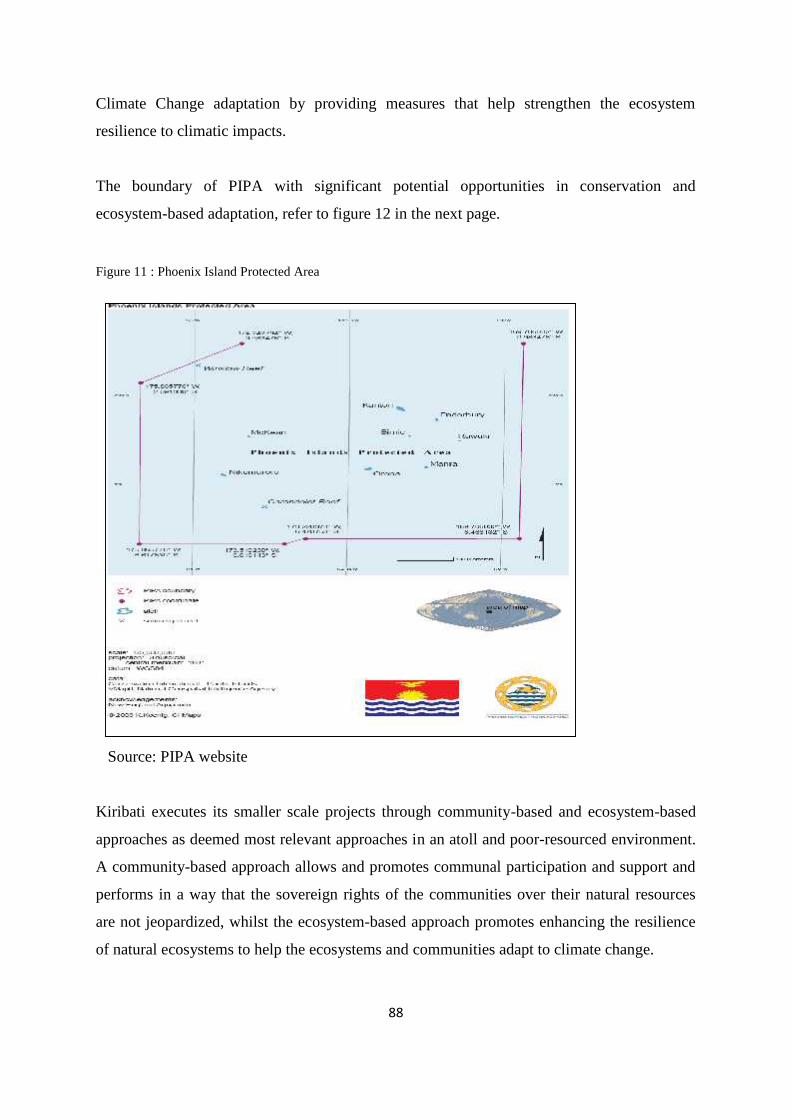
88
Climate Change adaptation by providing measures that help strengthen the ecosystem
resilience to climatic impacts.
The boundary of PIPA with significant potential opportunities in conservation and
ecosystem-based adaptation, refer to figure 12 in the next page.
Figure 11 : Phoenix Island Protected Area
Source: PIPA website
Kiribati executes its smaller scale projects through community-based and ecosystem-based
approaches as deemed most relevant approaches in an atoll and poor-resourced environment.
A community-based approach allows and promotes communal participation and support and
performs in a way that the sovereign rights of the communities over their natural resources
are not jeopardized, whilst the ecosystem-based approach promotes enhancing the resilience
of natural ecosystems to help the ecosystems and communities adapt to climate change.
89
Besides the KAP II Mangrove Projects, the rest are currently ongoing and there is plan to
continue and expand and build work on the PIPA, the Programme of Work on Protected
Areas, Ramsar Small Grant Project and the KAP II Mangrove Planting and Re-planting
Project which will continue to receive support from KAP III due to successful
implementation during KAP II.
90
4.0 GREENHOUSE GAS INVENTORY AND MITIGATION
4.1 DATA, METHODOLOGY AND MANUAL
Kiribati emissions of greenhouse gases are insignificant relative to global country-based
average emissions. However, in the local context they are important as they measure Kiribati
economy dependency on fossil fuels which has been increasing. Given the insignificant
level, this project indicated a slight increase in the emission compared to the 1st National
Communication. Information on local emissions would also be part of the data to determine
opportunities in technology acquisition and development for mitigating climate change and
promoting sustainable development in Kiribati. This importance needs to be understood in
Kiribati.
Any methodology for assessing emissions requires activity data. Fossil fuels used in energy
dependent purposes of sectors of the economy are all imported. Kiribati Oil Company
Limited (KOIL) is the main importer of major oil types and the distributor to various retailers
and major users such as public suppliers of electricity, shipping services, and civil aviation.
Some businesses import bottled Liquefied Petroleum Gas (LPG) but data on these are not
available.
Other categories of greenhouse gas emissions are agriculture livestock. Data for these are
obtained from the reports of national population censuses. Data on wastes are not readily
available to use in the compilation of greenhouse gas emissions.
Data for the purpose of compiling national inventory of greenhouse gases need to be
improved. With this recognition, nonetheless inventory of greenhouse gases is compiled with
in mind a commitment to improve on data collection and management.
The methodology used is based on IPCC 2006 Guidelines and an international consultant was
mobilized to offer hands- on training on the methodology. The outputs of the training include
the compilation of the inventory for the years 2004, and 2005. Based on the knowledge
gained in the training, it has been possible to work through the IPCC 2006 Guidelines to
91
compile the inventory of greenhouse gases from the use of fossil fuels, and livestock for the
years 2004, 2005, 2006, 2007 and 2008.
Conversion factors and emission factors that are required to turn raw activity data into
emissions are de facto values given in the IPCC 2006 Guidelines and those that are provided
in the training. The units may have been different but they are of equivalent values.
The SNC team have been able to describe steps adopted to compile the inventory and these
descriptions constitute the manuals for this purpose.
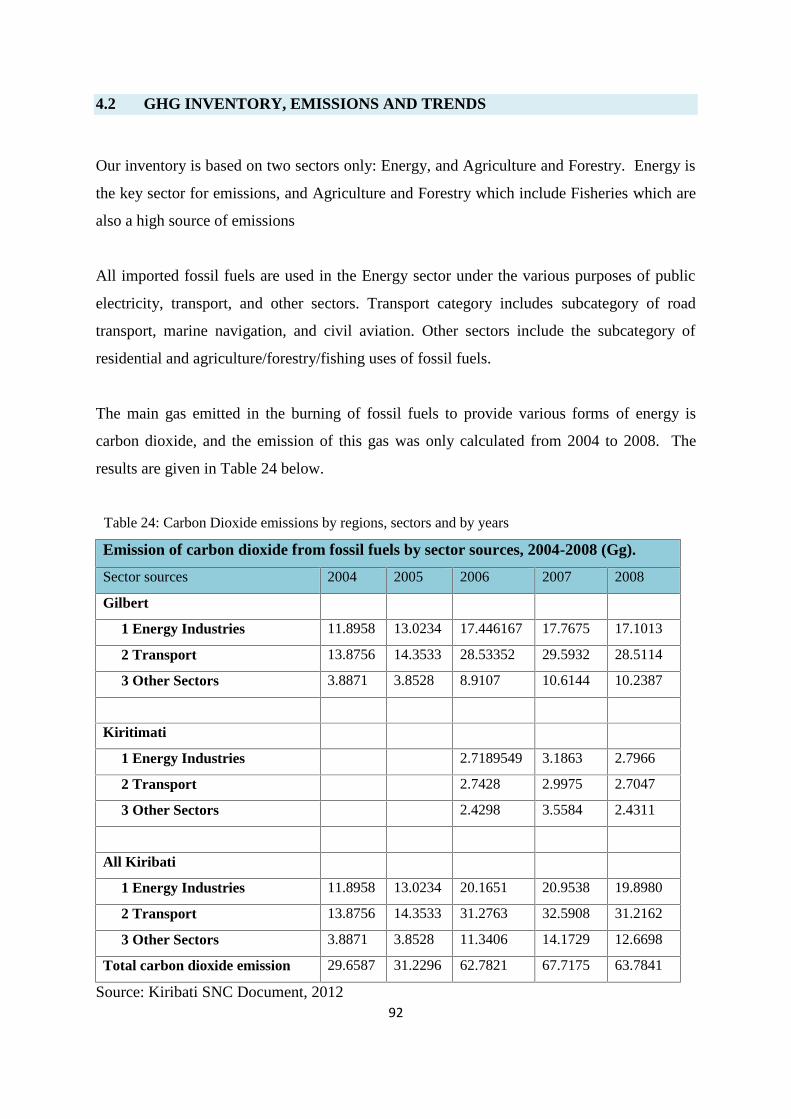
92
4.2 GHG INVENTORY, EMISSIONS AND TRENDS
Our inventory is based on two sectors only: Energy, and Agriculture and Forestry. Energy is
the key sector for emissions, and Agriculture and Forestry which include Fisheries which are
also a high source of emissions
All imported fossil fuels are used in the Energy sector under the various purposes of public
electricity, transport, and other sectors. Transport category includes subcategory of road
transport, marine navigation, and civil aviation. Other sectors include the subcategory of
residential and agriculture/forestry/fishing uses of fossil fuels.
The main gas emitted in the burning of fossil fuels to provide various forms of energy is
carbon dioxide, and the emission of this gas was only calculated from 2004 to 2008. The
results are given in Table 24 below.
Table 24: Carbon Dioxide emissions by regions, sectors and by years
Emission of carbon dioxide from fossil fuels by sector sources, 2004-2008 (Gg).
Sector sources 2004 2005 2006 2007 2008
Gilbert
1 Energy Industries 11.8958 13.0234 17.446167 17.7675 17.1013
2 Transport 13.8756 14.3533 28.53352 29.5932 28.5114
3 Other Sectors 3.8871 3.8528 8.9107 10.6144 10.2387
Kiritimati
1 Energy Industries 2.7189549 3.1863 2.7966
2 Transport 2.7428 2.9975 2.7047
3 Other Sectors 2.4298 3.5584 2.4311
All Kiribati
1 Energy Industries 11.8958 13.0234 20.1651 20.9538 19.8980
2 Transport 13.8756 14.3533 31.2763 32.5908 31.2162
3 Other Sectors 3.8871 3.8528 11.3406 14.1729 12.6698
Total carbon dioxide emission 29.6587 31.2296 62.7821 67.7175 63.7841
Source: Kiribati SNC Document, 2012
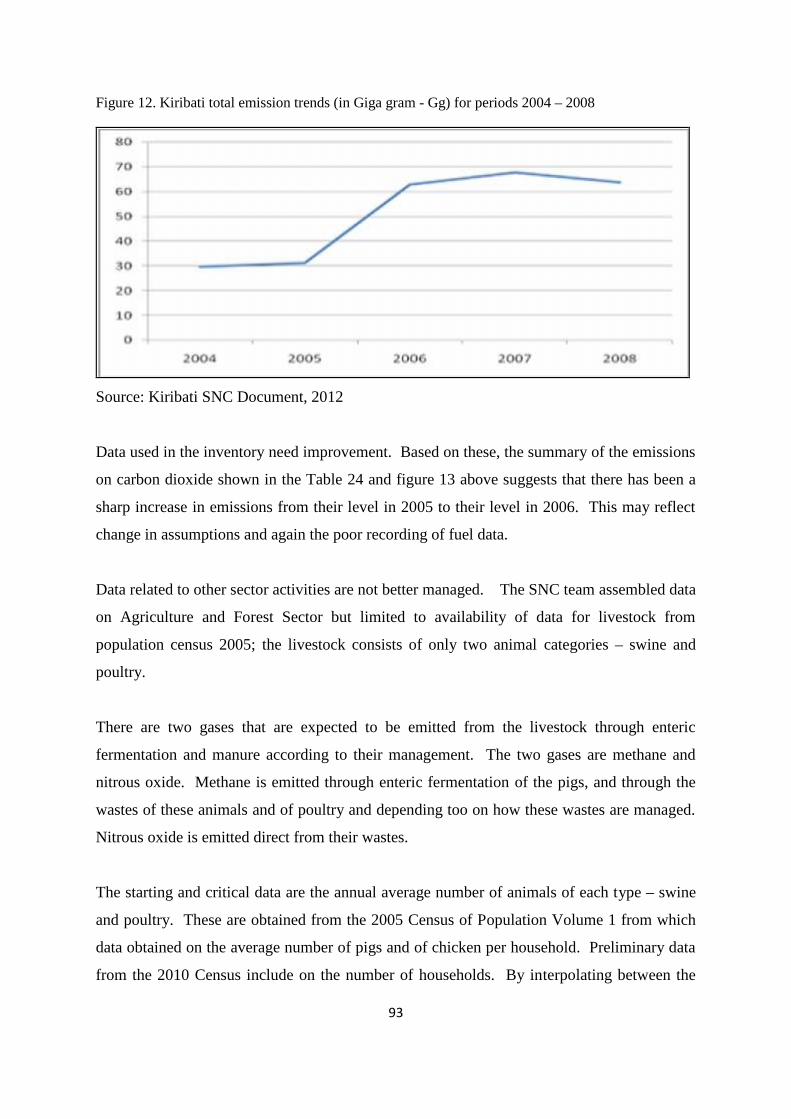
93
Figure 12. Kiribati total emission trends (in Giga gram - Gg) for periods 2004 – 2008
Source: Kiribati SNC Document, 2012
Data used in the inventory need improvement. Based on these, the summary of the emissions
on carbon dioxide shown in the Table 24 and figure 13 above suggests that there has been a
sharp increase in emissions from their level in 2005 to their level in 2006. This may reflect
change in assumptions and again the poor recording of fuel data.
Data related to other sector activities are not better managed. The SNC team assembled data
on Agriculture and Forest Sector but limited to availability of data for livestock from
population census 2005; the livestock consists of only two animal categories – swine and
poultry.
There are two gases that are expected to be emitted from the livestock through enteric
fermentation and manure according to their management. The two gases are methane and
nitrous oxide. Methane is emitted through enteric fermentation of the pigs, and through the
wastes of these animals and of poultry and depending too on how these wastes are managed.
Nitrous oxide is emitted direct from their wastes.
The starting and critical data are the annual average number of animals of each type – swine
and poultry. These are obtained from the 2005 Census of Population Volume 1 from which
data obtained on the average number of pigs and of chicken per household. Preliminary data
from the 2010 Census include on the number of households. By interpolating between the
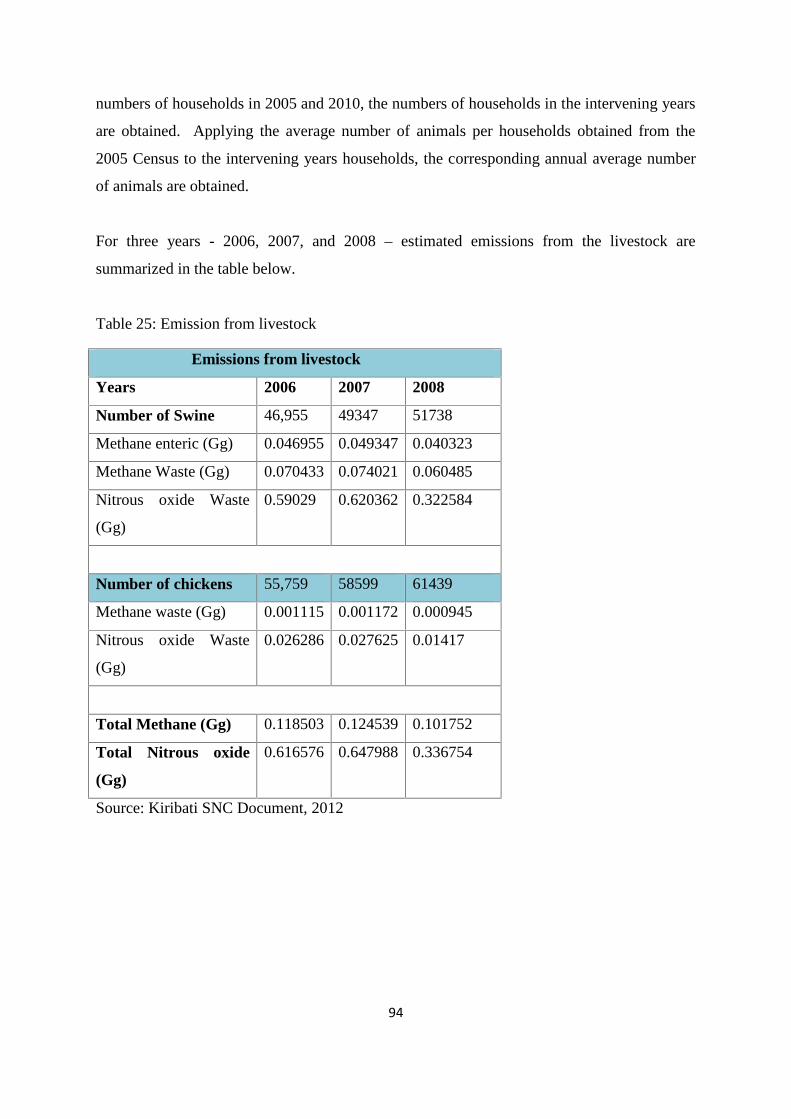
94
numbers of households in 2005 and 2010, the numbers of households in the intervening years
are obtained. Applying the average number of animals per households obtained from the
2005 Census to the intervening years households, the corresponding annual average number
of animals are obtained.
For three years - 2006, 2007, and 2008 – estimated emissions from the livestock are
summarized in the table below.
Table 25: Emission from livestock
Emissions from livestock
Years 2006 2007 2008
Number of Swine 46,955 49347 51738
Methane enteric (Gg) 0.046955 0.049347 0.040323
Methane Waste (Gg) 0.070433 0.074021 0.060485
Nitrous oxide Waste
(Gg)
0.59029 0.620362 0.322584
Number of chickens 55,759 58599 61439
Methane waste (Gg) 0.001115 0.001172 0.000945
Nitrous oxide Waste
(Gg)
0.026286 0.027625 0.01417
Total Methane (Gg) 0.118503 0.124539 0.101752
Total Nitrous oxide
(Gg)
0.616576 0.647988 0.336754
Source: Kiribati SNC Document, 2012
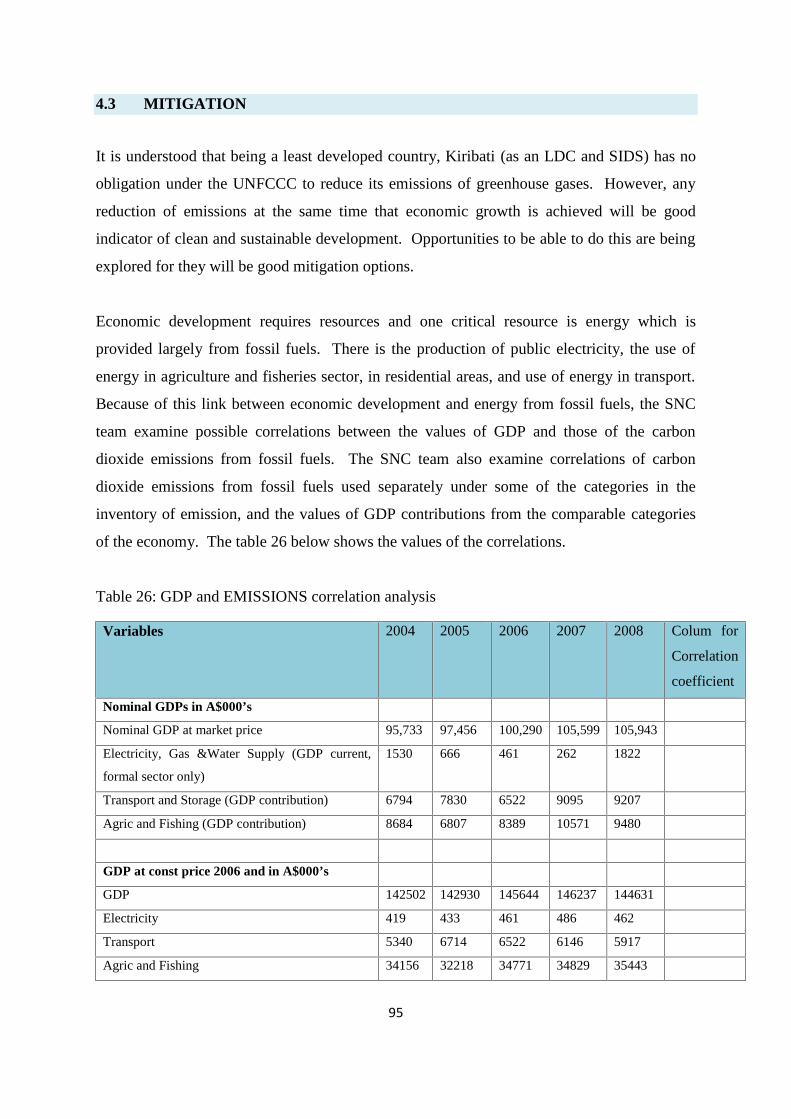
95
4.3 MITIGATION
It is understood that being a least developed country, Kiribati (as an LDC and SIDS) has no
obligation under the UNFCCC to reduce its emissions of greenhouse gases. However, any
reduction of emissions at the same time that economic growth is achieved will be good
indicator of clean and sustainable development. Opportunities to be able to do this are being
explored for they will be good mitigation options.
Economic development requires resources and one critical resource is energy which is
provided largely from fossil fuels. There is the production of public electricity, the use of
energy in agriculture and fisheries sector, in residential areas, and use of energy in transport.
Because of this link between economic development and energy from fossil fuels, the SNC
team examine possible correlations between the values of GDP and those of the carbon
dioxide emissions from fossil fuels. The SNC team also examine correlations of carbon
dioxide emissions from fossil fuels used separately under some of the categories in the
inventory of emission, and the values of GDP contributions from the comparable categories
of the economy. The table 26 below shows the values of the correlations.
Table 26: GDP and EMISSIONS correlation analysis
Variables 2004 2005 2006 2007 2008 Colum for
Correlation
coefficient
Nominal GDPs in A$000’s
Nominal GDP at market price 95,733 97,456 100,290 105,599 105,943
Electricity, Gas &Water Supply (GDP current,
formal sector only)
1530 666 461 262 1822
Transport and Storage (GDP contribution) 6794 7830 6522 9095 9207
Agric and Fishing (GDP contribution) 8684 6807 8389 10571 9480
GDP at const price 2006 and in A$000’s
GDP 142502 142930 145644 146237 144631
Electricity 419 433 461 486 462
Transport 5340 6714 6522 6146 5917
Agric and Fishing 34156 32218 34771 34829 35443
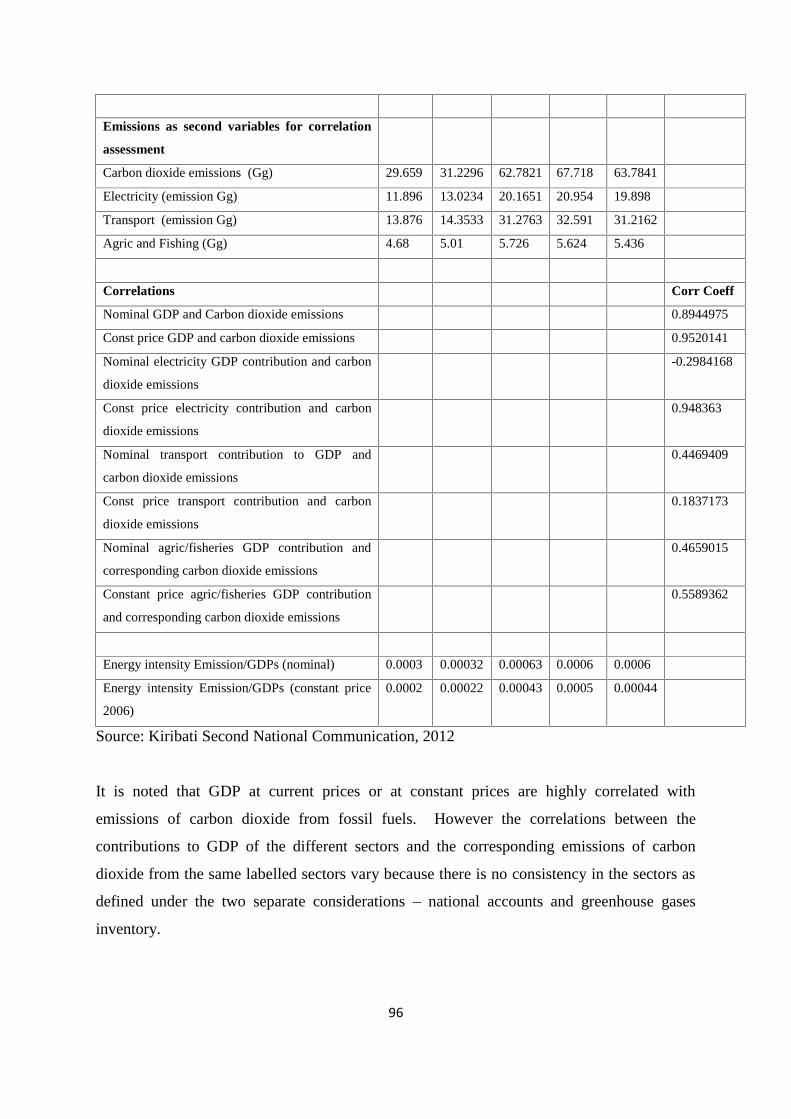
96
Emissions as second variables for correlation
assessment
Carbon dioxide emissions (Gg) 29.659 31.2296 62.7821 67.718 63.7841
Electricity (emission Gg) 11.896 13.0234 20.1651 20.954 19.898
Transport (emission Gg) 13.876 14.3533 31.2763 32.591 31.2162
Agric and Fishing (Gg) 4.68 5.01 5.726 5.624 5.436
Correlations Corr Coeff
Nominal GDP and Carbon dioxide emissions 0.8944975
Const price GDP and carbon dioxide emissions 0.9520141
Nominal electricity GDP contribution and carbon
dioxide emissions
-0.2984168
Const price electricity contribution and carbon
dioxide emissions
0.948363
Nominal transport contribution to GDP and
carbon dioxide emissions
0.4469409
Const price transport contribution and carbon
dioxide emissions
0.1837173
Nominal agric/fisheries GDP contribution and
corresponding carbon dioxide emissions
0.4659015
Constant price agric/fisheries GDP contribution
and corresponding carbon dioxide emissions
0.5589362
Energy intensity Emission/GDPs (nominal) 0.0003 0.00032 0.00063 0.0006 0.0006
Energy intensity Emission/GDPs (constant price
2006)
0.0002 0.00022 0.00043 0.0005 0.00044
Source: Kiribati Second National Communication, 2012
It is noted that GDP at current prices or at constant prices are highly correlated with
emissions of carbon dioxide from fossil fuels. However the correlations between the
contributions to GDP of the different sectors and the corresponding emissions of carbon
dioxide from the same labelled sectors vary because there is no consistency in the sectors as
defined under the two separate considerations – national accounts and greenhouse gases
inventory.
97
The SNC Project also evaluated energy intensity which was defined as the carbon dioxide
emissions associated with a dollar of GDP. The last rows show these values. There appears
to be two lots of years with equitable values of energy intensity; the first lot corresponds to
2004 and 2005, the second lot includes 2006, 2007, and 2008. This jump from the values in
the first two years to the values in the later three years may be due to the different qualities of
the data in the two periods rather than the jump in the actual energy intensity.
It is also most likely that there was an increase in the energy intensity. This increase implies
that a dollar increase in the GDP would require higher amount of emissions of carbon
dioxide. This in turn implies inefficiency in the economy.
The extent of mitigation analysis on how different sectors would improve their overall
mitigation in terms of the existing policies, taxes frameworks, and other social economic
incentives and enabling instruments; to allow nationally appropriate mitigation options to
flow and progress more effectively was not covered in this project. This will be the new area
of focus in the subsequent third national communication.
However, in general there is much room to explore opportunities to be able to reduce
emissions of carbon dioxide from the various technologies. Presently, Kiribati does not have
any plan or policy in place to reduce emissions in accordance with decisions or provisions of
the UNFCCC. Nonetheless, the Government in its 2012 Policy Statement announced the
aspiration to pursue the 2% reduction of GHGs by 2015. The base year and plans to achieve
this target is still under discussion. Therefore the Government is indeed interested to explore
renewable energy measures and support measures towards this aspiration. The Government
has formulated the Kiribati Energy Policy (KIEP) and it Implementation Plan to pursue this
aspiration on fuel energy sources only, with the aim of reducing emissions through alternative
energy sources highlighted in the policy.
According to Wade, etc (2004); given that almost all of the GHG emissions occur on the
urban islands of Kiribati, any reduction in GHG emissions will largely be through energy
efficiency improvements or the use of grid connected renewable energy systems. The largest
potential renewable energy source that could be viable for Kiribati includes conversion from
diesel fuel to bio-fuels on coconut oil. Other sources are biogas generation from community
98
pig pens and wind power for power generation. These options have the potential to save fuel
and reduce emissions but require high social and financial investments to make it viable.
Other renewable energy sources such as Ocean Thermal Energy Conversion (OTEC), Wave
and Tidal energy are considered impractical according to the Wade’s 2004 assessment.
99
5.0 VULNERABILITY AND ADAPTATION
5.1 NATIONAL FRAMEWORKS FOR VULNERABILITY AND ADAPTATIONASSESSMENT
The Fourth Assessment Report of the Intergovernmental Panel on Climate Change affirmed
that climate change is unequivocal as it was and still is the result of anthropogenic
interventions. Although the cause of Climate change is largely blamed on developed
countries, Kiribati will and must bear the consequences particularly as the adverse effects
gradually increase in frequency and intensity in the near future.
Since the Initial National Communication report in 1999, several studies and assessments
have been undertaken by various international institutions on various vulnerable sectors
relevant to climate change in Kiribati. These studies are important undertakings to highlight
key vulnerabilities in Kiribati which require adaptive actions. However, due to a cross-
cutting nature of climate change and increase interest of international academic and research
institutions’ interest on Kiribati vulnerability to climate change, local stakeholders and
recipients sectors have experienced proliferation of climate change information from these
professional Vulnerability and Adaptation (V&A) assessments. With limited understanding
and capacity to complement and influence these assessment, local sectors dealt with these
international academic/research institutions independently. The information and outcomes of
these studies in most cases were complex and difficult to absorb and understand.
As part of the Second National Communication project, and trying to better use the V&A
assessments, the Kiribati V&A Assessment Methodology (KVAAM) was prepared as a tool
to assess studies and assessment reports that have already been prepared. This tool will also
assist in determining whether, from much of the information already available in reports on
the vulnerability of Kiribati to climate change, additional information is needed to undertake
more studies. The KVAAM will guide any commissioned studies as to types of information
that are to be researched and produced, and would be also instrumental in understanding
synergies from different reports which may be used for informed decision-making and
adaptation.
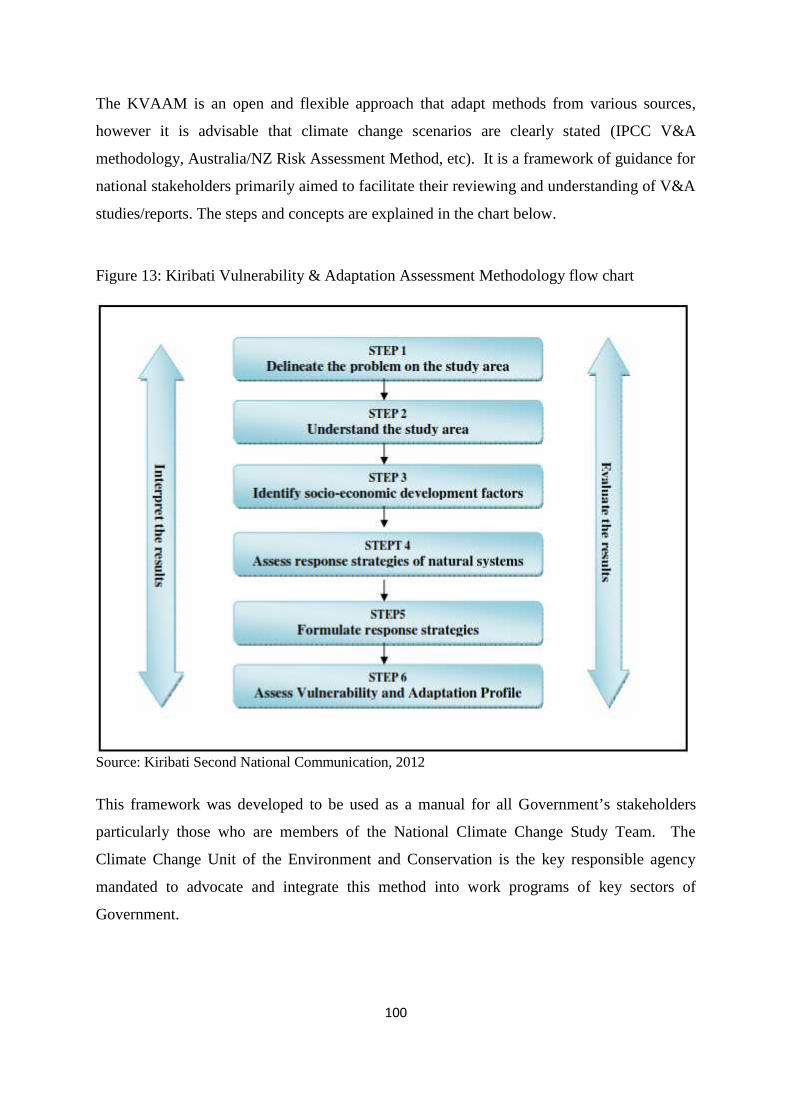
100
The KVAAM is an open and flexible approach that adapt methods from various sources,
however it is advisable that climate change scenarios are clearly stated (IPCC V&A
methodology, Australia/NZ Risk Assessment Method, etc). It is a framework of guidance for
national stakeholders primarily aimed to facilitate their reviewing and understanding of V&A
studies/reports. The steps and concepts are explained in the chart below.
Figure 13: Kiribati Vulnerability & Adaptation Assessment Methodology flow chart
Source: Kiribati Second National Communication, 2012
This framework was developed to be used as a manual for all Government’s stakeholders
particularly those who are members of the National Climate Change Study Team. The
Climate Change Unit of the Environment and Conservation is the key responsible agency
mandated to advocate and integrate this method into work programs of key sectors of
Government.
101
Although, the framework was placed to build national capacity on V&A, it is recognized that
technical capacity building on climate change science, modelling, in-depth understanding on
models used in studies and others are necessary to increase competencies of local sectors to
understand and contribute in any V&A assessments. This is considered one of the technical
capacity building needs for members of CCST on this particular subject.
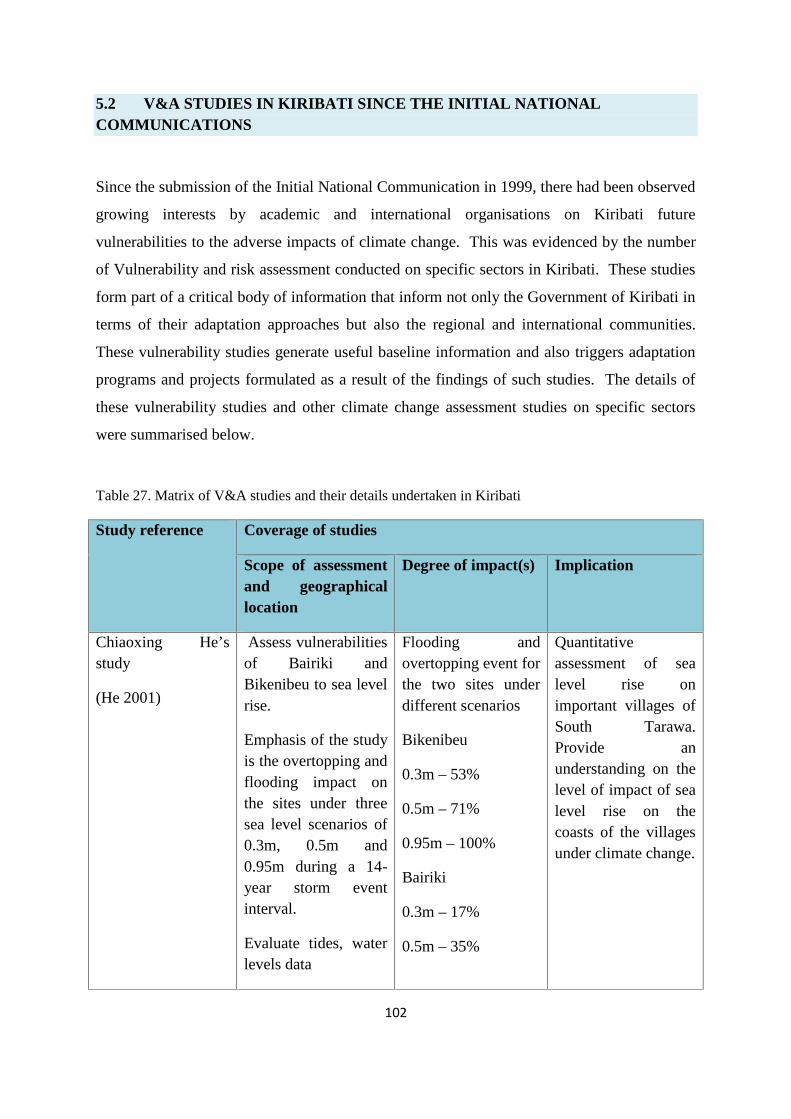
102
5.2 V&A STUDIES IN KIRIBATI SINCE THE INITIAL NATIONALCOMMUNICATIONS
Since the submission of the Initial National Communication in 1999, there had been observed
growing interests by academic and international organisations on Kiribati future
vulnerabilities to the adverse impacts of climate change. This was evidenced by the number
of Vulnerability and risk assessment conducted on specific sectors in Kiribati. These studies
form part of a critical body of information that inform not only the Government of Kiribati in
terms of their adaptation approaches but also the regional and international communities.
These vulnerability studies generate useful baseline information and also triggers adaptation
programs and projects formulated as a result of the findings of such studies. The details of
these vulnerability studies and other climate change assessment studies on specific sectors
were summarised below.
Table 27. Matrix of V&A studies and their details undertaken in Kiribati
Study reference Coverage of studies
Scope of assessmentand geographicallocation
Degree of impact(s) Implication
Chiaoxing He’sstudy
(He 2001)
Assess vulnerabilitiesof Bairiki andBikenibeu to sea levelrise.
Emphasis of the studyis the overtopping andflooding impact onthe sites under threesea level scenarios of0.3m, 0.5m and0.95m during a 14-year storm eventinterval.
Evaluate tides, waterlevels data
Flooding andovertopping event forthe two sites underdifferent scenarios
Bikenibeu
0.3m – 53%
0.5m – 71%
0.95m – 100%
Bairiki
0.3m – 17%
0.5m – 35%
Quantitativeassessment of sealevel rise onimportant villages ofSouth Tarawa.Provide anunderstanding on thelevel of impact of sealevel rise on thecoasts of the villagesunder climate change.
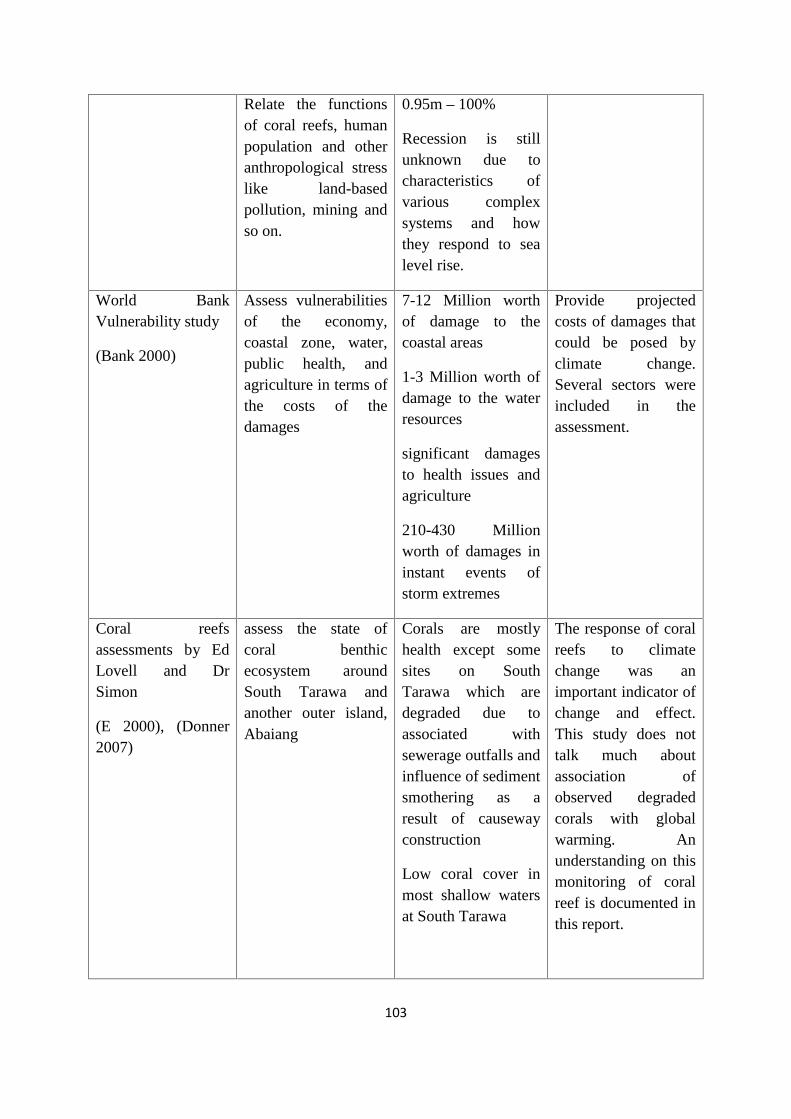
103
Relate the functionsof coral reefs, humanpopulation and otheranthropological stresslike land-basedpollution, mining andso on.
0.95m – 100%
Recession is stillunknown due tocharacteristics ofvarious complexsystems and howthey respond to sealevel rise.
World BankVulnerability study
(Bank 2000)
Assess vulnerabilitiesof the economy,coastal zone, water,public health, andagriculture in terms ofthe costs of thedamages
7-12 Million worthof damage to thecoastal areas
1-3 Million worth ofdamage to the waterresources
significant damagesto health issues andagriculture
210-430 Millionworth of damages ininstant events ofstorm extremes
Provide projectedcosts of damages thatcould be posed byclimate change.Several sectors wereincluded in theassessment.
Coral reefsassessments by EdLovell and DrSimon
(E 2000), (Donner2007)
assess the state ofcoral benthicecosystem aroundSouth Tarawa andanother outer island,Abaiang
Corals are mostlyhealth except somesites on SouthTarawa which aredegraded due toassociated withsewerage outfalls andinfluence of sedimentsmothering as aresult of causewayconstruction
Low coral cover inmost shallow watersat South Tarawa
The response of coralreefs to climatechange was animportant indicator ofchange and effect.This study does nottalk much aboutassociation ofobserved degradedcorals with globalwarming. Anunderstanding on thismonitoring of coralreef is documented inthis report.
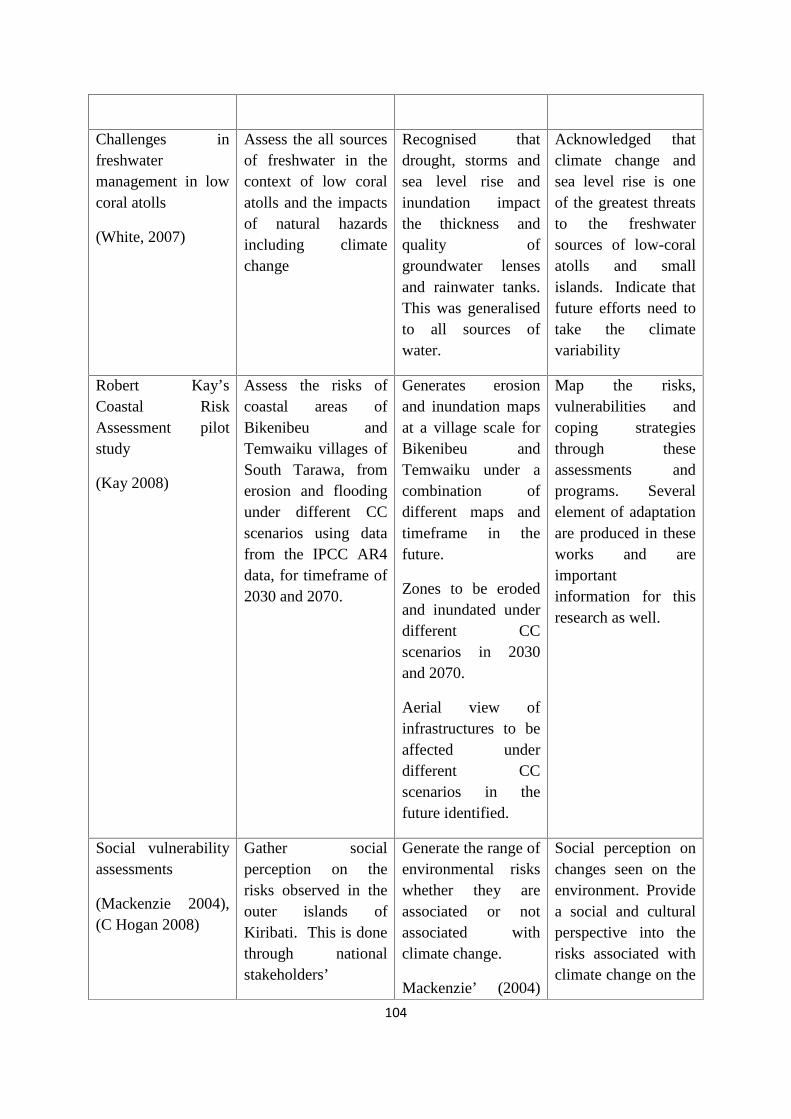
104
Challenges infreshwatermanagement in lowcoral atolls
(White, 2007)
Assess the all sourcesof freshwater in thecontext of low coralatolls and the impactsof natural hazardsincluding climatechange
Recognised thatdrought, storms andsea level rise andinundation impactthe thickness andquality ofgroundwater lensesand rainwater tanks.This was generalisedto all sources ofwater.
Acknowledged thatclimate change andsea level rise is oneof the greatest threatsto the freshwatersources of low-coralatolls and smallislands. Indicate thatfuture efforts need totake the climatevariability
Robert Kay’sCoastal RiskAssessment pilotstudy
(Kay 2008)
Assess the risks ofcoastal areas ofBikenibeu andTemwaiku villages ofSouth Tarawa, fromerosion and floodingunder different CCscenarios using datafrom the IPCC AR4data, for timeframe of2030 and 2070.
Generates erosionand inundation mapsat a village scale forBikenibeu andTemwaiku under acombination ofdifferent maps andtimeframe in thefuture.
Zones to be erodedand inundated underdifferent CCscenarios in 2030and 2070.
Aerial view ofinfrastructures to beaffected underdifferent CCscenarios in thefuture identified.
Map the risks,vulnerabilities andcoping strategiesthrough theseassessments andprograms. Severalelement of adaptationare produced in theseworks and areimportantinformation for thisresearch as well.
Social vulnerabilityassessments
(Mackenzie 2004),(C Hogan 2008)
Gather socialperception on therisks observed in theouter islands ofKiribati. This is donethrough nationalstakeholders’
Generate the range ofenvironmental riskswhether they areassociated or notassociated withclimate change.
Mackenzie’ (2004)
Social perception onchanges seen on theenvironment. Providea social and culturalperspective into therisks associated withclimate change on the
105
consultation andfacilitated throughparticipatorydiscussion.
indicated that mostpeople observed therisks as bad, whichimplies that theimpacts are alreadyhappening.
coastal zone.
Based on the above table, it is evident that a number of V&A studies with distinct scopes and
objectives in Kiribati had been undertaken and consensually demonstrate that Kiribati has
already been exposed to risks and impacts of climate change. The projections of climate and
sea level rise together with existing undesirable national socio-economic circumstances will
only add up to compounded and probably unthinkable level of impacts which may be
extremely difficult to cope and reverse them. The other positives of V&A studies was that
they will continue to assist and inform forward and constructive adaptation actions and
adaptation planning – at any particular level of sector. The results are expected to enhance
adaptive capacity, resilience and overall security of Kiribati in the near and longer term
future.
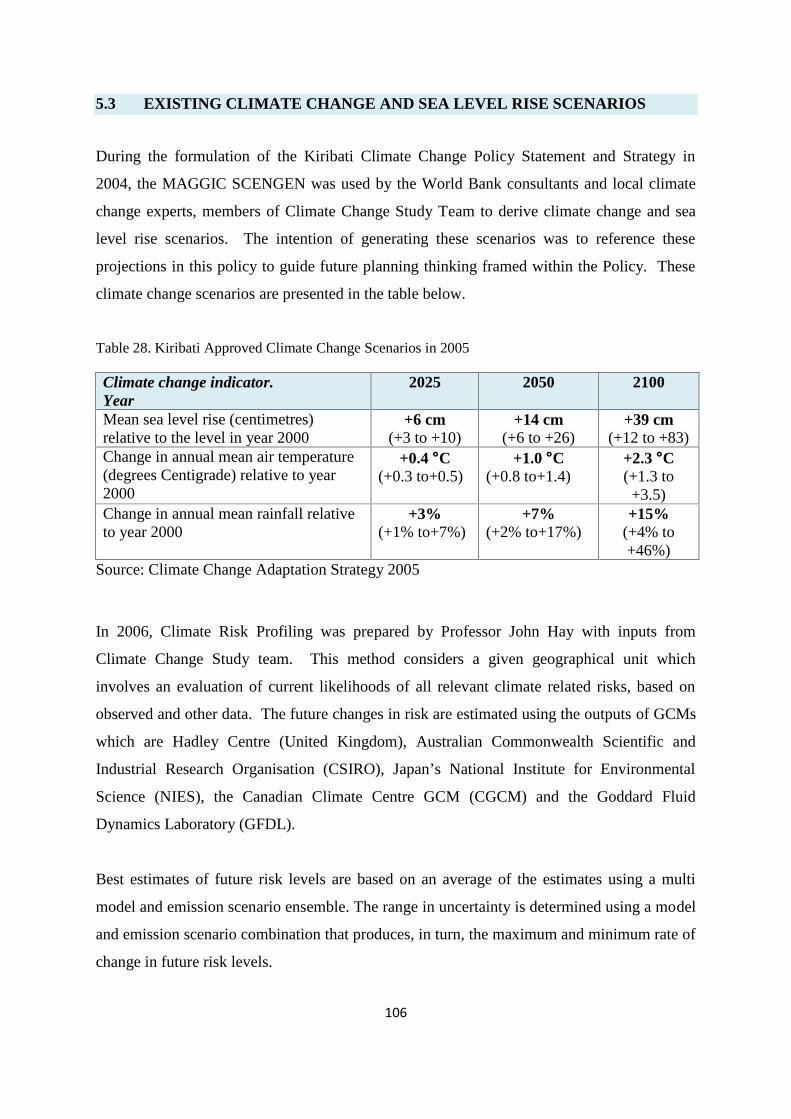
106
5.3 EXISTING CLIMATE CHANGE AND SEA LEVEL RISE SCENARIOS
During the formulation of the Kiribati Climate Change Policy Statement and Strategy in
2004, the MAGGIC SCENGEN was used by the World Bank consultants and local climate
change experts, members of Climate Change Study Team to derive climate change and sea
level rise scenarios. The intention of generating these scenarios was to reference these
projections in this policy to guide future planning thinking framed within the Policy. These
climate change scenarios are presented in the table below.
Table 28. Kiribati Approved Climate Change Scenarios in 2005
Climate change indicator.Year
2025 2050 2100
Mean sea level rise (centimetres)relative to the level in year 2000
+6 cm(+3 to +10)
+14 cm(+6 to +26)
+39 cm(+12 to +83)
Change in annual mean air temperature(degrees Centigrade) relative to year2000
+0.4 C(+0.3 to+0.5)
+1.0 C(+0.8 to+1.4)
+2.3 C(+1.3 to
+3.5)Change in annual mean rainfall relativeto year 2000
+3%(+1% to+7%)
+7%(+2% to+17%)
+15%(+4% to+46%)
Source: Climate Change Adaptation Strategy 2005
In 2006, Climate Risk Profiling was prepared by Professor John Hay with inputs from
Climate Change Study team. This method considers a given geographical unit which
involves an evaluation of current likelihoods of all relevant climate related risks, based on
observed and other data. The future changes in risk are estimated using the outputs of GCMs
which are Hadley Centre (United Kingdom), Australian Commonwealth Scientific and
Industrial Research Organisation (CSIRO), Japan’s National Institute for Environmental
Science (NIES), the Canadian Climate Centre GCM (CGCM) and the Goddard Fluid
Dynamics Laboratory (GFDL).
Best estimates of future risk levels are based on an average of the estimates using a multi
model and emission scenario ensemble. The range in uncertainty is determined using a model
and emission scenario combination that produces, in turn, the maximum and minimum rate of
change in future risk levels.
107
According to this report, (Hay 2006), best estimates of long term, systematic changes in the
average climate for Kiribati indicate that by 2050 sea level is likely to have increased by 37
cm, rainfall by over 20%, extreme wind gusts by 7% and maximum temperatures by almost
1.0 C. No significant long term trends are evident in the observed daily, monthly, annual or
maximum daily rainfall.
The foregoing analyses convey two key messages: (i) increased occurrences of extreme high
sea levels, air temperatures and winds are highly likely in the coming decades; and (ii) there
is less certainty regarding changes in the frequency of intense precipitation events (daily or
hourly), but there are indications that the frequency of these events will also increase in the
future.
In 2008 the Kiribati Adaptation Program Phase II contracted New Zealand’s National
Institute for Water and Atmospheric (NIWA) to develop climate risk information for Kiribati.
This work produced the Coastal and Drought Calculator tools. These are the tools that used
local data, global data, and outputs of GCMs to estimate projections, calculate return periods
of any climate factor on various sites on islands of Kiribati. These tools are imperative
towards generating specific on-site climate risk information for drought and impacts of
climate change on coastal areas. It also confirms that Kiribati is vulnerable to the extreme
events including droughts.
In addition, a drought response action plan was prepared by the Government of Kiribati
through its Ministry of Public Works & Utilities in 2011 and submitted for Cabinet
consideration in early 2012. The document outlines the methodology for determining the
level or severity of drought condition for South Tarawa, Kiribati. The methodology provides
a definition of drought, in the context of South Tarawa water resources and identifies a
procedure for alerting the required government and non-government stakeholders and
community of the drought status. The diagram below summarises the drought methodology
adopted for South Tarawa.
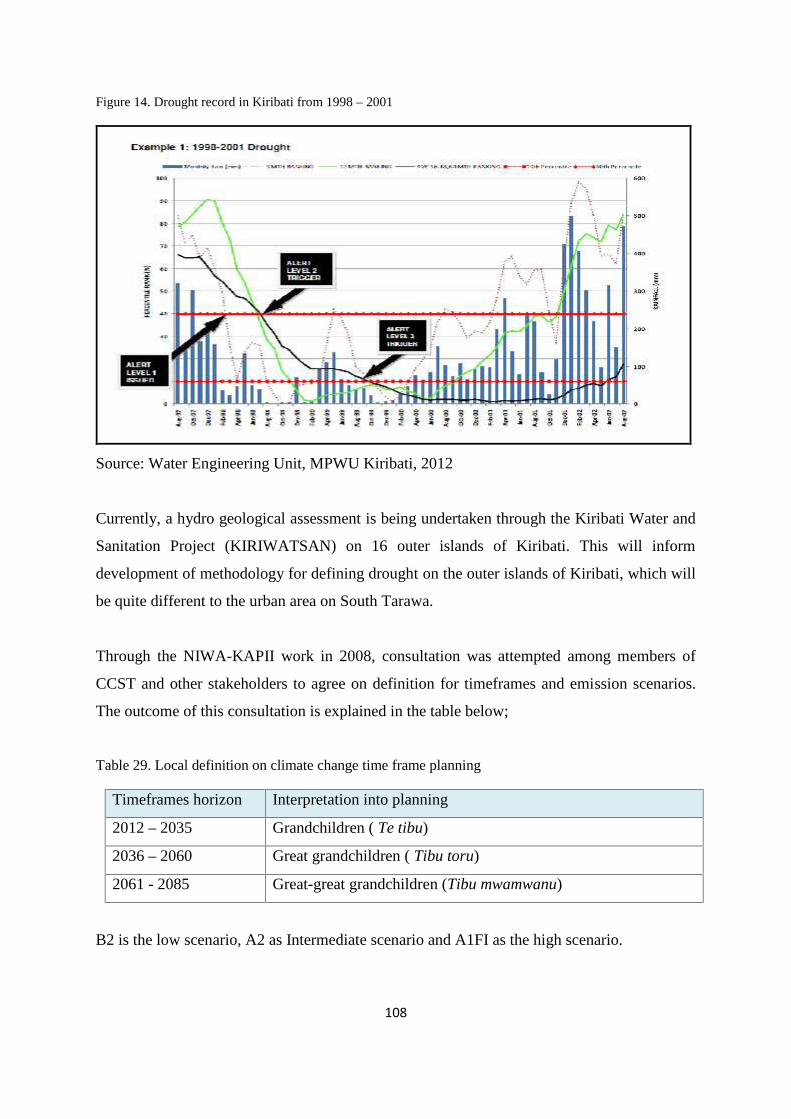
108
Figure 14. Drought record in Kiribati from 1998 – 2001
Source: Water Engineering Unit, MPWU Kiribati, 2012
Currently, a hydro geological assessment is being undertaken through the Kiribati Water and
Sanitation Project (KIRIWATSAN) on 16 outer islands of Kiribati. This will inform
development of methodology for defining drought on the outer islands of Kiribati, which will
be quite different to the urban area on South Tarawa.
Through the NIWA-KAPII work in 2008, consultation was attempted among members of
CCST and other stakeholders to agree on definition for timeframes and emission scenarios.
The outcome of this consultation is explained in the table below;
Table 29. Local definition on climate change time frame planning
Timeframes horizon Interpretation into planning
2012 – 2035 Grandchildren ( Te tibu)
2036 – 2060 Great grandchildren ( Tibu toru)
2061 - 2085 Great-great grandchildren (Tibu mwamwanu)
B2 is the low scenario, A2 as Intermediate scenario and A1FI as the high scenario.
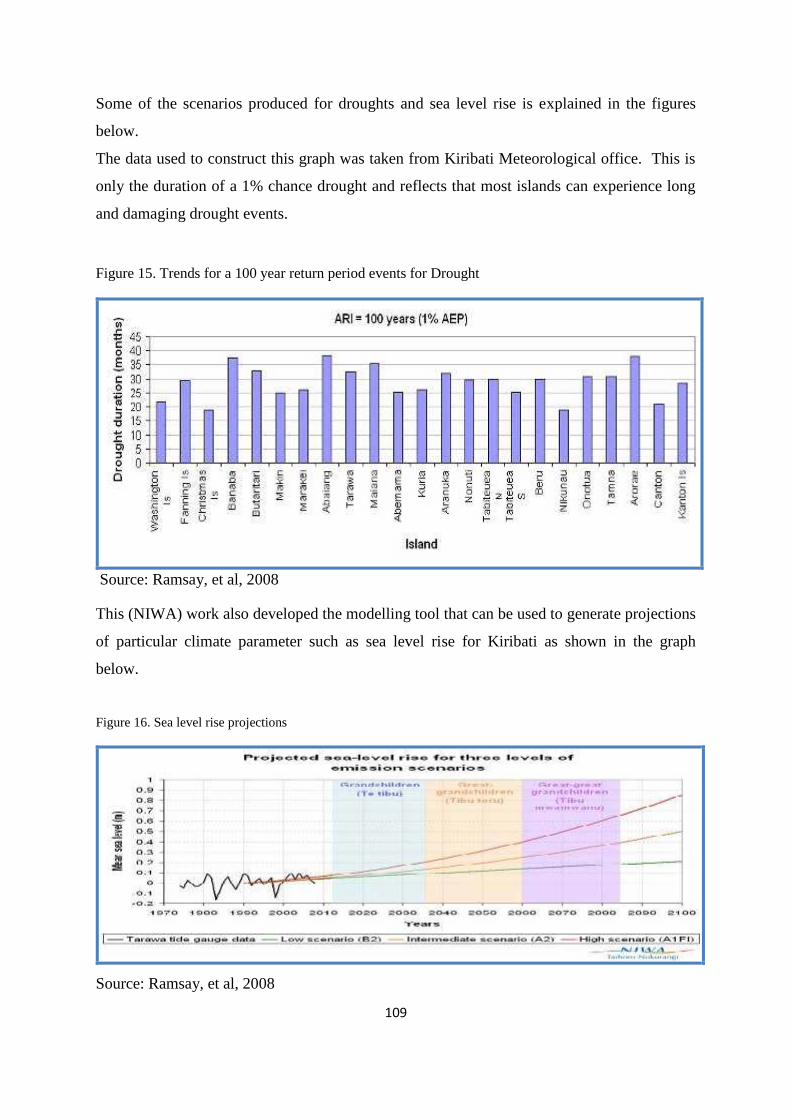
109
Some of the scenarios produced for droughts and sea level rise is explained in the figures
below.
The data used to construct this graph was taken from Kiribati Meteorological office. This is
only the duration of a 1% chance drought and reflects that most islands can experience long
and damaging drought events.
Figure 15. Trends for a 100 year return period events for Drought
Source: Ramsay, et al, 2008
This (NIWA) work also developed the modelling tool that can be used to generate projections
of particular climate parameter such as sea level rise for Kiribati as shown in the graph
below.
Figure 16. Sea level rise projections
Source: Ramsay, et al, 2008
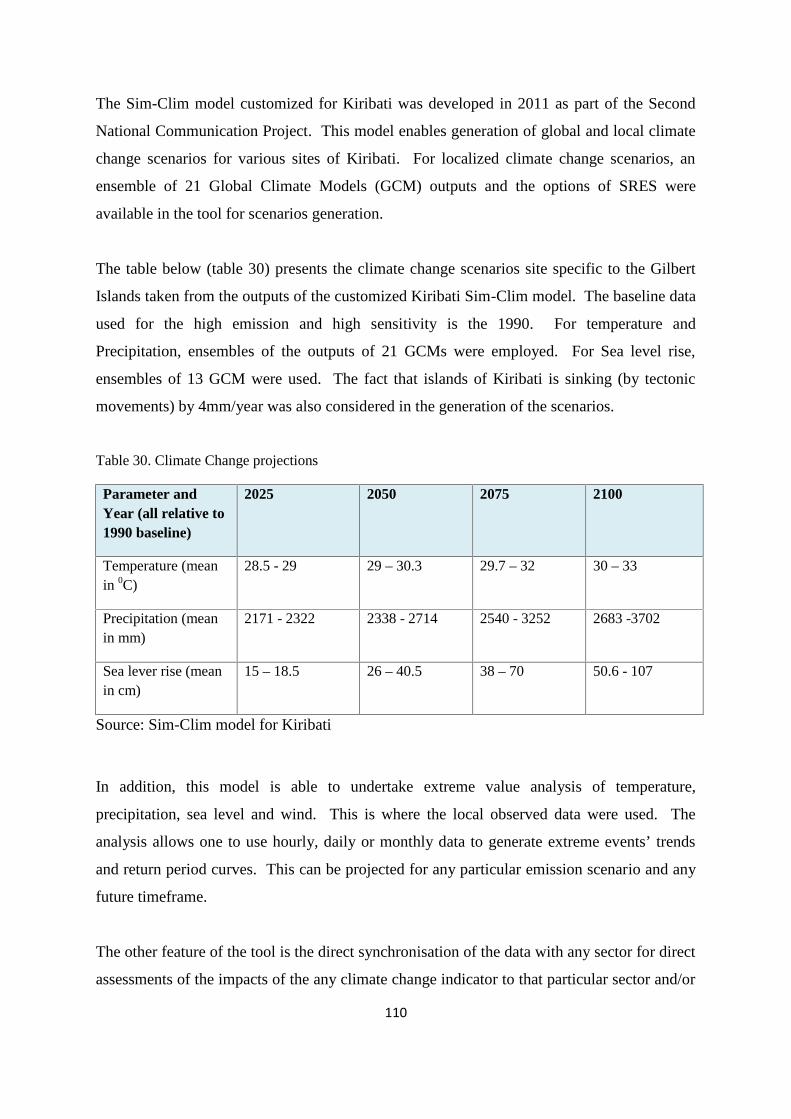
110
The Sim-Clim model customized for Kiribati was developed in 2011 as part of the Second
National Communication Project. This model enables generation of global and local climate
change scenarios for various sites of Kiribati. For localized climate change scenarios, an
ensemble of 21 Global Climate Models (GCM) outputs and the options of SRES were
available in the tool for scenarios generation.
The table below (table 30) presents the climate change scenarios site specific to the Gilbert
Islands taken from the outputs of the customized Kiribati Sim-Clim model. The baseline data
used for the high emission and high sensitivity is the 1990. For temperature and
Precipitation, ensembles of the outputs of 21 GCMs were employed. For Sea level rise,
ensembles of 13 GCM were used. The fact that islands of Kiribati is sinking (by tectonic
movements) by 4mm/year was also considered in the generation of the scenarios.
Table 30. Climate Change projections
Parameter andYear (all relative to1990 baseline)
2025 2050 2075 2100
Temperature (meanin 0C)
28.5 - 29 29 – 30.3 29.7 – 32 30 – 33
Precipitation (meanin mm)
2171 - 2322 2338 - 2714 2540 - 3252 2683 -3702
Sea lever rise (meanin cm)
15 – 18.5 26 – 40.5 38 – 70 50.6 - 107
Source: Sim-Clim model for Kiribati
In addition, this model is able to undertake extreme value analysis of temperature,
precipitation, sea level and wind. This is where the local observed data were used. The
analysis allows one to use hourly, daily or monthly data to generate extreme events’ trends
and return period curves. This can be projected for any particular emission scenario and any
future timeframe.
The other feature of the tool is the direct synchronisation of the data with any sector for direct
assessments of the impacts of the any climate change indicator to that particular sector and/or
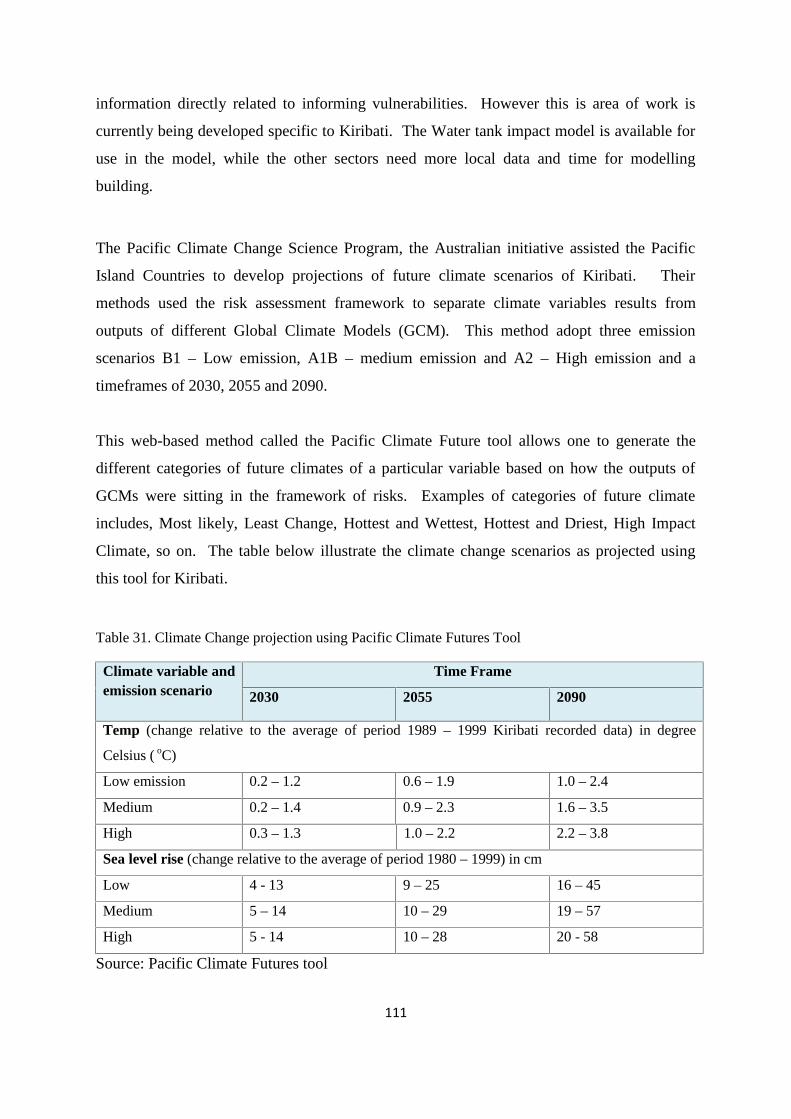
111
information directly related to informing vulnerabilities. However this is area of work is
currently being developed specific to Kiribati. The Water tank impact model is available for
use in the model, while the other sectors need more local data and time for modelling
building.
The Pacific Climate Change Science Program, the Australian initiative assisted the Pacific
Island Countries to develop projections of future climate scenarios of Kiribati. Their
methods used the risk assessment framework to separate climate variables results from
outputs of different Global Climate Models (GCM). This method adopt three emission
scenarios B1 – Low emission, A1B – medium emission and A2 – High emission and a
timeframes of 2030, 2055 and 2090.
This web-based method called the Pacific Climate Future tool allows one to generate the
different categories of future climates of a particular variable based on how the outputs of
GCMs were sitting in the framework of risks. Examples of categories of future climate
includes, Most likely, Least Change, Hottest and Wettest, Hottest and Driest, High Impact
Climate, so on. The table below illustrate the climate change scenarios as projected using
this tool for Kiribati.
Table 31. Climate Change projection using Pacific Climate Futures Tool
Climate variable andemission scenario
Time Frame
2030 2055 2090
Temp (change relative to the average of period 1989 – 1999 Kiribati recorded data) in degree
Celsius ( oC)
Low emission 0.2 – 1.2 0.6 – 1.9 1.0 – 2.4
Medium 0.2 – 1.4 0.9 – 2.3 1.6 – 3.5
High 0.3 – 1.3 1.0 – 2.2 2.2 – 3.8
Sea level rise (change relative to the average of period 1980 – 1999) in cm
Low 4 - 13 9 – 25 16 – 45
Medium 5 – 14 10 – 29 19 – 57
High 5 - 14 10 – 28 20 - 58
Source: Pacific Climate Futures tool
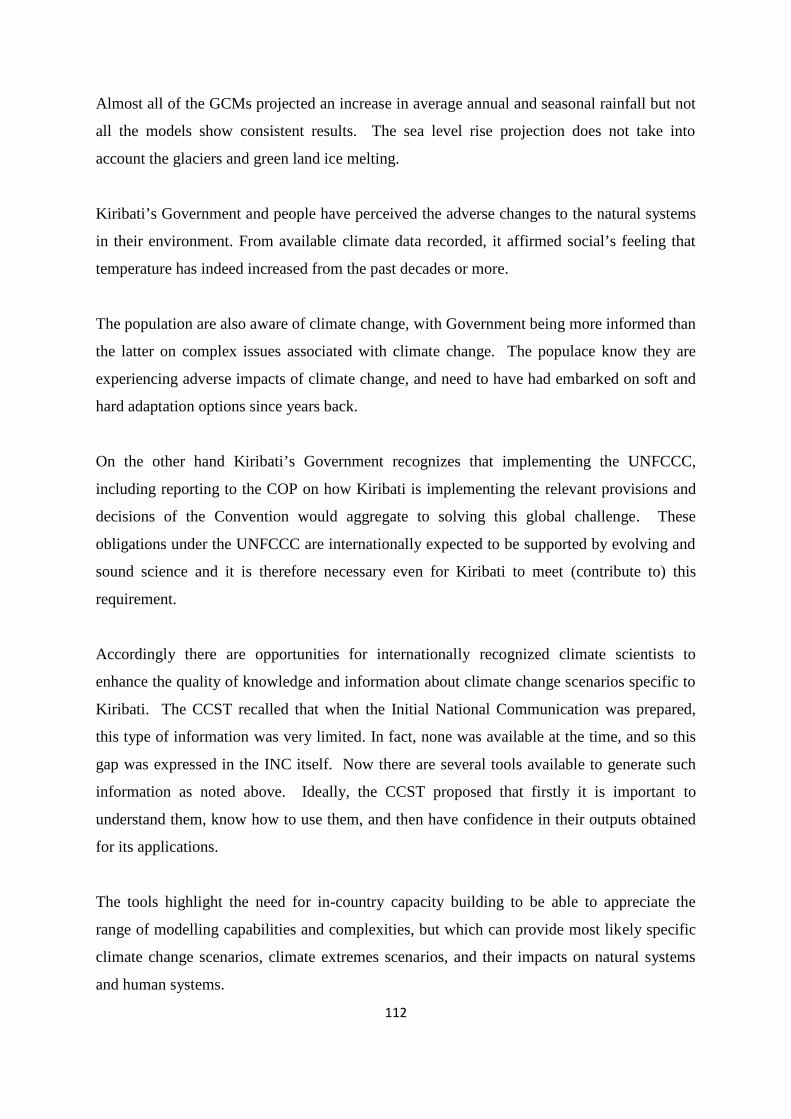
112
Almost all of the GCMs projected an increase in average annual and seasonal rainfall but not
all the models show consistent results. The sea level rise projection does not take into
account the glaciers and green land ice melting.
Kiribati’s Government and people have perceived the adverse changes to the natural systems
in their environment. From available climate data recorded, it affirmed social’s feeling that
temperature has indeed increased from the past decades or more.
The population are also aware of climate change, with Government being more informed than
the latter on complex issues associated with climate change. The populace know they are
experiencing adverse impacts of climate change, and need to have had embarked on soft and
hard adaptation options since years back.
On the other hand Kiribati’s Government recognizes that implementing the UNFCCC,
including reporting to the COP on how Kiribati is implementing the relevant provisions and
decisions of the Convention would aggregate to solving this global challenge. These
obligations under the UNFCCC are internationally expected to be supported by evolving and
sound science and it is therefore necessary even for Kiribati to meet (contribute to) this
requirement.
Accordingly there are opportunities for internationally recognized climate scientists to
enhance the quality of knowledge and information about climate change scenarios specific to
Kiribati. The CCST recalled that when the Initial National Communication was prepared,
this type of information was very limited. In fact, none was available at the time, and so this
gap was expressed in the INC itself. Now there are several tools available to generate such
information as noted above. Ideally, the CCST proposed that firstly it is important to
understand them, know how to use them, and then have confidence in their outputs obtained
for its applications.
The tools highlight the need for in-country capacity building to be able to appreciate the
range of modelling capabilities and complexities, but which can provide most likely specific
climate change scenarios, climate extremes scenarios, and their impacts on natural systems
and human systems.
113
All of the tools provide scientific basis for the convincing knowledge together with the
experiences from the Kiribati people that their islands are already critically vulnerable and
will continue to be threatened due to the adverse climate change and sea level rise impacts.
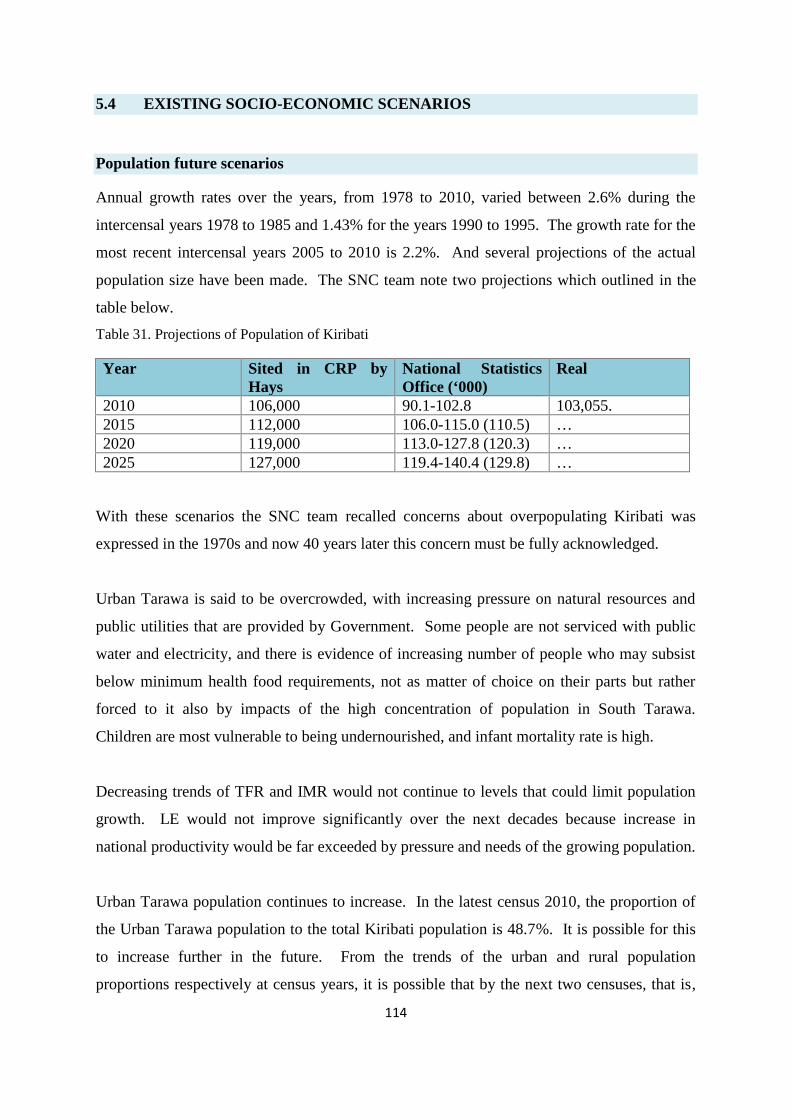
114
5.4 EXISTING SOCIO-ECONOMIC SCENARIOS
Population future scenarios
Annual growth rates over the years, from 1978 to 2010, varied between 2.6% during the
intercensal years 1978 to 1985 and 1.43% for the years 1990 to 1995. The growth rate for the
most recent intercensal years 2005 to 2010 is 2.2%. And several projections of the actual
population size have been made. The SNC team note two projections which outlined in the
table below.
Table 31. Projections of Population of Kiribati
Year Sited in CRP byHays
National StatisticsOffice (‘000)
Real
2010 106,000 90.1-102.8 103,055.2015 112,000 106.0-115.0 (110.5) …2020 119,000 113.0-127.8 (120.3) …2025 127,000 119.4-140.4 (129.8) …
With these scenarios the SNC team recalled concerns about overpopulating Kiribati was
expressed in the 1970s and now 40 years later this concern must be fully acknowledged.
Urban Tarawa is said to be overcrowded, with increasing pressure on natural resources and
public utilities that are provided by Government. Some people are not serviced with public
water and electricity, and there is evidence of increasing number of people who may subsist
below minimum health food requirements, not as matter of choice on their parts but rather
forced to it also by impacts of the high concentration of population in South Tarawa.
Children are most vulnerable to being undernourished, and infant mortality rate is high.
Decreasing trends of TFR and IMR would not continue to levels that could limit population
growth. LE would not improve significantly over the next decades because increase in
national productivity would be far exceeded by pressure and needs of the growing population.
Urban Tarawa population continues to increase. In the latest census 2010, the proportion of
the Urban Tarawa population to the total Kiribati population is 48.7%. It is possible for this
to increase further in the future. From the trends of the urban and rural population
proportions respectively at census years, it is possible that by the next two censuses, that is,
115
by 2020, half of the Kiribati population today could be in Urban Tarawa. The other half
would be in rural Gilbert and in the Line Group; this implies that there will be higher
population density in Urban Kiribati compared to rural Kiribati.
Between Urban Tarawa and Kiritimati, the latter known as secondary growth centre, the rates
of population increase in the former has been four times faster than that of the latter. This
fact and that of population proportions in the Line Islands group being more increasing in rate
than that of rural Gilbert group may suggest that more people will move to the Line Islands
and that more development can be accommodated at Kiritimati in particular. Over 90% of
the population during previous censuses lives in the Gilbert group but a decreasing trend is
now observed. It is expected that this high percentage will decrease below 90% at some
future dates.
Between censuses, there are no consistent patterns of the populations of rural islands as
proportions to all Kiribati population. Population proportions of any island during two
successive censuses may show an increase but during other successive censuses can show a
decrease. This may indicate that at census years people can easily relocate themselves
between urban Tarawa and outer islands.
Education and skills scenarios
Availability of formal education at various levels must have increased from baseline of high
literacy rate among adults, and of more lately the claim to have been able to provide primary
education for all children. Nevertheless, Table 19 indicated an increased number of adults
who never attended formal schools” which translate that this number has increased in the
2005 census from what they were at during census years 2000 and 1995. It is unrealistic to be
optimistic that all children would be able to receive formal education at primary level; there
were those who would not. There will always be costs to parents to enable their children to
attend primary education.
The Government has given priority to primary education, and extended this to cover junior
secondary education levels. But there will always be limit to Kiribati capability to provide
116
those levels of education for all, whilst population continues to increase. The number of
children who would never have attended formal education would increase in future years.
The importance of tertiary and post tertiary levels of education is not overlooked by
Government. Increasing number of privileged nationals has achieved qualifications from
colleges and universities outside of the country. They are taking up professional and
administrative jobs in the country, but more recently they are now competing for available
jobs.
More people and of greater proportion of the total population would never have formal
primary education than those attaining tertiary and above tertiary levels of education. The
gap is the difference in the proportions between that which relate to number of people who
never have had formal education and that which relate to the number of people with tertiary
and post tertiary levels of education. The trend of this gap is expected to expand.
However, the increase in this gap allows Kiribati to set and achieve economic development
goals, benefit from technological advancement, from good practices of government, and from
aspects of globalization. Generally these nationals become agents of change from the simple
subsistence to a globalised way of life. And all processes of globalization such as trade,
communication, and overseas employments, facilitate the socio-economic changes that are
taking place in Kiribati.
Traditional social values and norms are now being challenged by new alternatives.
Egalitarian values that underpin social relations and traditional activities are being challenged
by the differences in economic wealth as the new basis for social relations and for activities
that go beyond traditional scope.
Reciprocity and communal solidarity begin to lose their traditional values as guidelines for
relationships including through reciprocated and cooperative activities. Monetary gains and
profits prevail as alternative guidelines.
In the future, Kiribati traditional social structure and values will change to “modern” form.
The emphasis is on a more harmonious structure and values with those of the region and the
globe. Education and national wealth; and how these are distributed across the population
117
will set the course of development, welfare, social structure and governance for Kiribati
people. Traditions would erode as people aspire for modern life.
Economic development scenarios
The process of development will always continue. This developmental process will equate
with the existence of Kiribati as a nation and state. Kiribati will remain a LDC for many
years, and dependent on bilateral and multinational assistance for development.
As noted above, population will continue to increase. Kiribati natural resources are expected
to be overexploited and decreased in abundance and quality, due also to adverse impacts of
climate change and socio-economic demands.
“Rich” and “poor” will be well recognized as characterization of people within the whole
Kiribati population. There is high tendency that poverty and associated poor health indicators
will be more acute and characteristic of the majority of the population. Living standards for
the majority will fall, exploitation of resources including human labour would be stretched to
extremes and more prominent in urban areas, and private ownership of properties will be less
respected.
With reduced abundance and quality of natural resources, labour productivity would
accordingly be reduced. This meant for subsistence livelihood that extra efforts were to be
exerted for the same level of productivity presently obtained with lesser labour input.
Subsistence livelihood would be more impoverished.
Unless substantial adaptation and sustainable development are implemented seriously in the
near future, these economic development scenarios will be less acute.
118
5.5 CONSOLIDATING CLIMATE CHANGE AND SEA LEVEL RISESCENARIOS BASED ON EXISTING CLIMATE MODELLING WORK
Mean Temperature
An elderly woman on Butaritari according to a report by Dr. McKenzie has observed that the
“Sun has come down on her island”. The island is less direct under the sun as it is located in
the most northerly part of the Gilbert group; most of the other islands are more directly facing
the sun. This sense of increasing temperature is no doubt shared by many Kiribati people.
In the Initial National Communication, it is reported that temperature is slightly increasing.
In the SNC it notes that there is clear indication that temperature has increased. However,
our concern is what impacts the future scenarios of temperature may bring to Kiribati.
The CCAS produced in 2005 has temperature scenarios. Subsequently there have been
several studies and tools which contain information relevant for determining temperature
baseline and future scenarios.
After synthesizing information on temperature scenarios, all relevant information are shown
together in the table below.
Beside temperature scenarios of the CCAS, those of the SIMCLIM, PCCSP, and NIWA
respectively are shown in different ways in the table 32 below. SIMCLIM scenarios copied
straight from this report are actual values (not changes from baseline values), PCCSP
scenarios copied from the PCCSP Country Report are changes from baseline, and NIWA
scenarios are also changes. They are similar in that the scenarios are in ranges of
temperatures with upper and lower bounds. All these scenarios show increases.
The baseline year for SIMCLIM is 1990, and for the PCCSP and NIWA it is 1980-1999
which is represented by 1990 temperature. The SNC team therefore use 1990 temperature in
the SIMCLIM tool as the baseline. Over the Gilberts, 1990 temperature varies between
28.130C and 28.3oC. The table below shows all relevant information in determining
temperature scenarios.
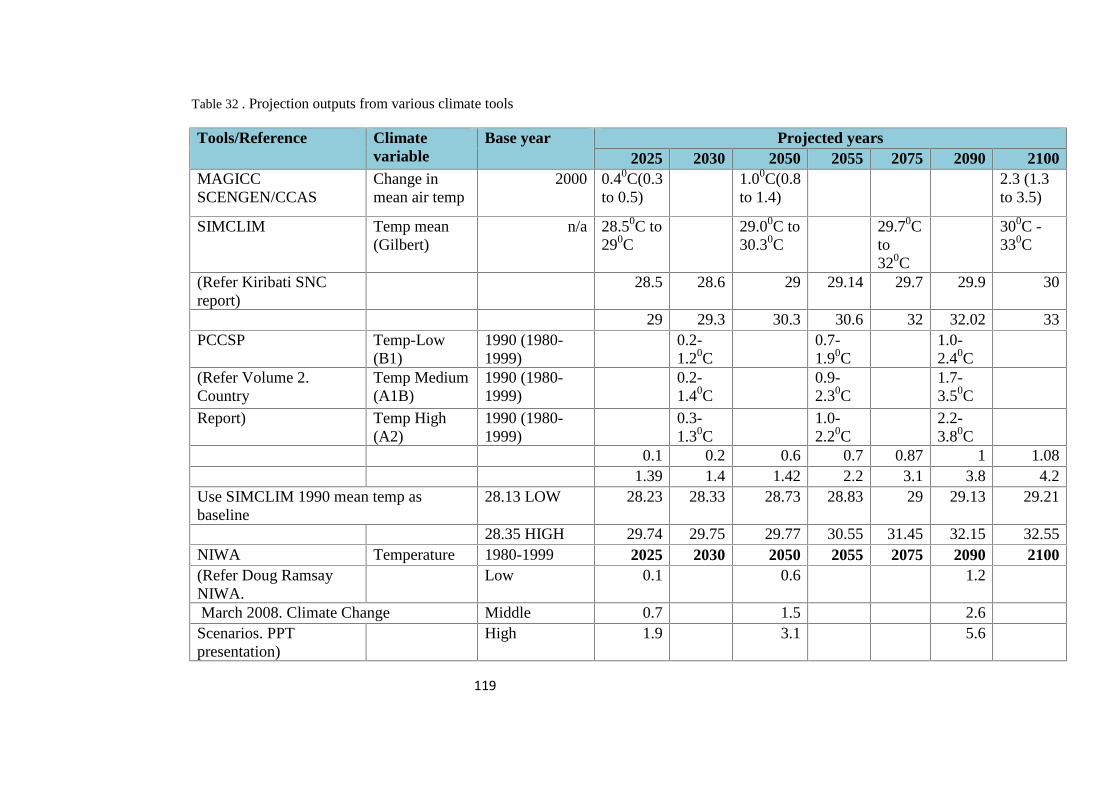
119
Table 32 . Projection outputs from various climate tools
Tools/Reference Climatevariable
Base year Projected years2025 2030 2050 2055 2075 2090 2100
MAGICCSCENGEN/CCAS
Change inmean air temp
2000 0.40C(0.3to 0.5)
1.00C(0.8to 1.4)
2.3 (1.3to 3.5)
SIMCLIM Temp mean(Gilbert)
n/a 28.50C to290C
29.00C to30.30C
29.70Cto320C
300C -330C
(Refer Kiribati SNCreport)
28.5 28.6 29 29.14 29.7 29.9 30
29 29.3 30.3 30.6 32 32.02 33PCCSP Temp-Low
(B1)1990 (1980-1999)
0.2-1.20C
0.7-1.90C
1.0-2.40C
(Refer Volume 2.Country
Temp Medium(A1B)
1990 (1980-1999)
0.2-1.40C
0.9-2.30C
1.7-3.50C
Report) Temp High(A2)
1990 (1980-1999)
0.3-1.30C
1.0-2.20C
2.2-3.80C
0.1 0.2 0.6 0.7 0.87 1 1.081.39 1.4 1.42 2.2 3.1 3.8 4.2
Use SIMCLIM 1990 mean temp asbaseline
28.13 LOW 28.23 28.33 28.73 28.83 29 29.13 29.21
28.35 HIGH 29.74 29.75 29.77 30.55 31.45 32.15 32.55NIWA Temperature 1980-1999 2025 2030 2050 2055 2075 2090 2100(Refer Doug RamsayNIWA.
Low 0.1 0.6 1.2
March 2008. Climate Change Middle 0.7 1.5 2.6Scenarios. PPTpresentation)
High 1.9 3.1 5.6
120
This SNC report gives SIMCLIM- based mean temperature for Gilbert for the scenario years
of 2025, 2050, 2075, and 2100. The other scenarios years in the same table are 2030, 2055,
and 2090. For these years the SNC team obtain mean temperature values by interpolation.
Volume 2 Country Report of the Climate Change in the Pacific: Scientific Assessment and
New Research by the PCCSP show temperature scenarios for the years 2030, 2055, and 2090.
For the other scenarios years namely 2025, 2050, 2075, and 2100 the SNC team obtain their
corresponding temperature change values by interpolation or by extrapolation whichever is
more appropriate. These are added to the baseline temperatures of 1990 (these baseline
values are obtained from the SIMCLIM) to obtain mean temperature scenarios.
Presentations by Ramsay on NIWA scenarios of temperature, changes in temperature from
the base year period 1980 to 1999 are shown in the table above. Again the 1990 temperature
range in the Gilbert group as per adopted by SIMCLIM was representative of the baseline
1980-1999. In the same way as worked out for temperature values under the PCCSP tool,
temperature values for the scenarios years under the NIWA information was done.
Upper bounds of the PCCSP and SIMCLIM are more comparable with each other, than both
against the upper bounds of NIWA which are clearly higher. Comparing lower bounds, it is
NIWA and PCCSP that are more comparable with both clearly lower than SIMCLIM lower
bounds. The ranges for upper and lower bounds within each tool, shows that they are more
comparable for PCCSP and SIMCLIM, whilst NIWA has the widest range.
Scenarios for mean temperature
Although people have felt increasing temperature as noted above, our analysis of mean
temperature indicate that warming is much lower than global average. This information was
reported in the INC and re-asserts it in the SNC report but that it is catching up to the global
increase of temperature. For this reason Kiribati would not use upper bounds of temperature
that are shown in the NIWA scenarios. Those of the PCCSP and SIMCLIM are used to
determine upper bounds in the temperature scenarios.
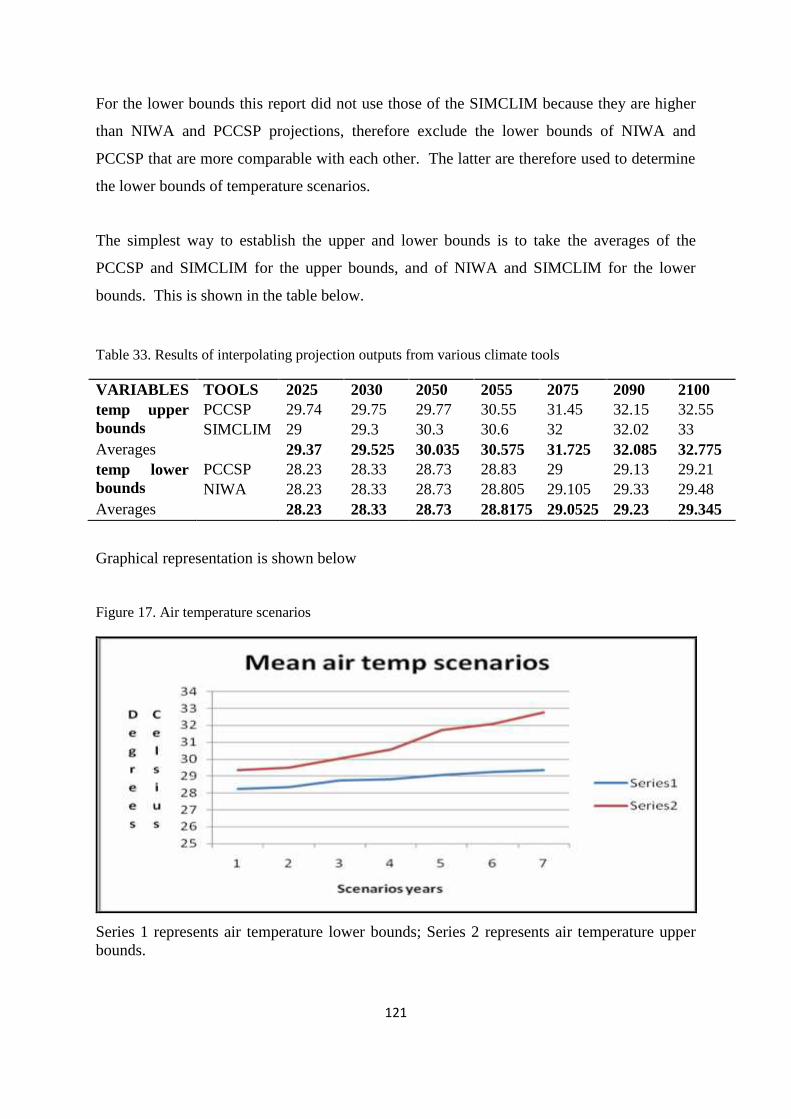
121
For the lower bounds this report did not use those of the SIMCLIM because they are higher
than NIWA and PCCSP projections, therefore exclude the lower bounds of NIWA and
PCCSP that are more comparable with each other. The latter are therefore used to determine
the lower bounds of temperature scenarios.
The simplest way to establish the upper and lower bounds is to take the averages of the
PCCSP and SIMCLIM for the upper bounds, and of NIWA and SIMCLIM for the lower
bounds. This is shown in the table below.
Table 33. Results of interpolating projection outputs from various climate tools
VARIABLES TOOLS 2025 2030 2050 2055 2075 2090 2100temp upperbounds
PCCSP 29.74 29.75 29.77 30.55 31.45 32.15 32.55SIMCLIM 29 29.3 30.3 30.6 32 32.02 33
Averages 29.37 29.525 30.035 30.575 31.725 32.085 32.775temp lowerbounds
PCCSP 28.23 28.33 28.73 28.83 29 29.13 29.21NIWA 28.23 28.33 28.73 28.805 29.105 29.33 29.48
Averages 28.23 28.33 28.73 28.8175 29.0525 29.23 29.345
Graphical representation is shown below
Figure 17. Air temperature scenarios
Series 1 represents air temperature lower bounds; Series 2 represents air temperature upperbounds.
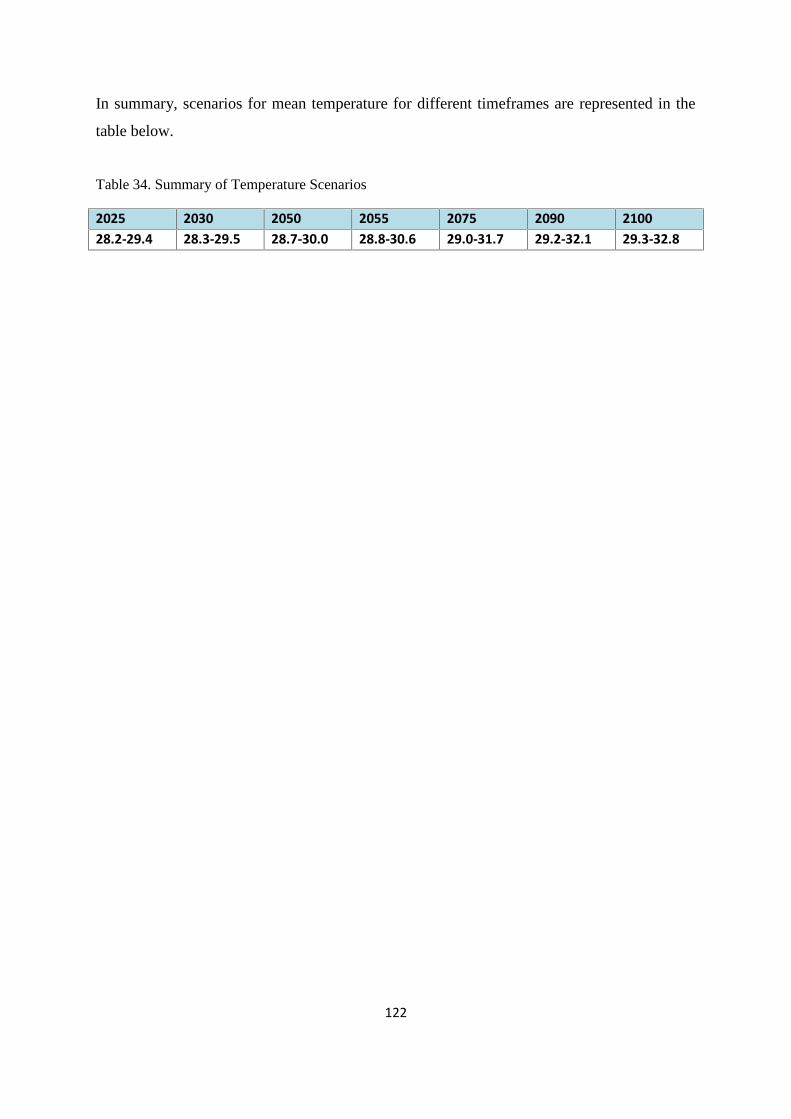
122
In summary, scenarios for mean temperature for different timeframes are represented in the
table below.
Table 34. Summary of Temperature Scenarios
2025 2030 2050 2055 2075 2090 210028.2-29.4 28.3-29.5 28.7-30.0 28.8-30.6 29.0-31.7 29.2-32.1 29.3-32.8
123
Rainfall
Rainfall is highly variable and unlike air temperature there is no clear pattern globally as to
whether it has been increasing. While the long term trend may indicate slight increase,
within the more recent period since 1980 the trend is decreasing (PCCSP Fact sheet). But
most studies, in particular those related to water resources, would suggest that Kiribati
rainfall has been increasing. Scenarios of rainfall that are adopted in the CCAS are from
global climate models in the MAGICC that show increases; few models in the MAGICC that
show decreases of rainfall for Kiribati were left out.
While rainfall is projected to increase, at the same time drought is expected to be as regular as
it has been. Seasonal rainfall pattern may not change significantly. Work under KAP II
provides information on the risks of drought events that could still occur. PCCSP with
various global models project decreases and increases of rainfall from base year. On the
other hand, SIMCLIM, using various global climate models, projects only increases of
rainfall for Kiribati. Synthesizing information on rainfall scenarios from various efforts is of
paramount important for the complete understanding of Kiribati.
The SNC report collated scenarios of rainfall for Gilbert from various sources and is shown
in the Table 35 below.
For PCCSP Future Climate the SNC project team have simply adopted the scenarios that are
given for Gilbert in the PCCSP 2011 report, “Climate Change in the Pacific: Scientific
Assessment and New Research. Volume 2: Country Reports”. The given rainfall scenarios
are for the years 2030, 2055, and 2090. For the other years, the given rainfall values are
interpolated or extrapolated as appropriate the years in question. Sim-Clim scenarios are
extracted from the tools with KI Gilbert selected as the site. The SNC team also extracted
scenarios of global changes in rainfall.
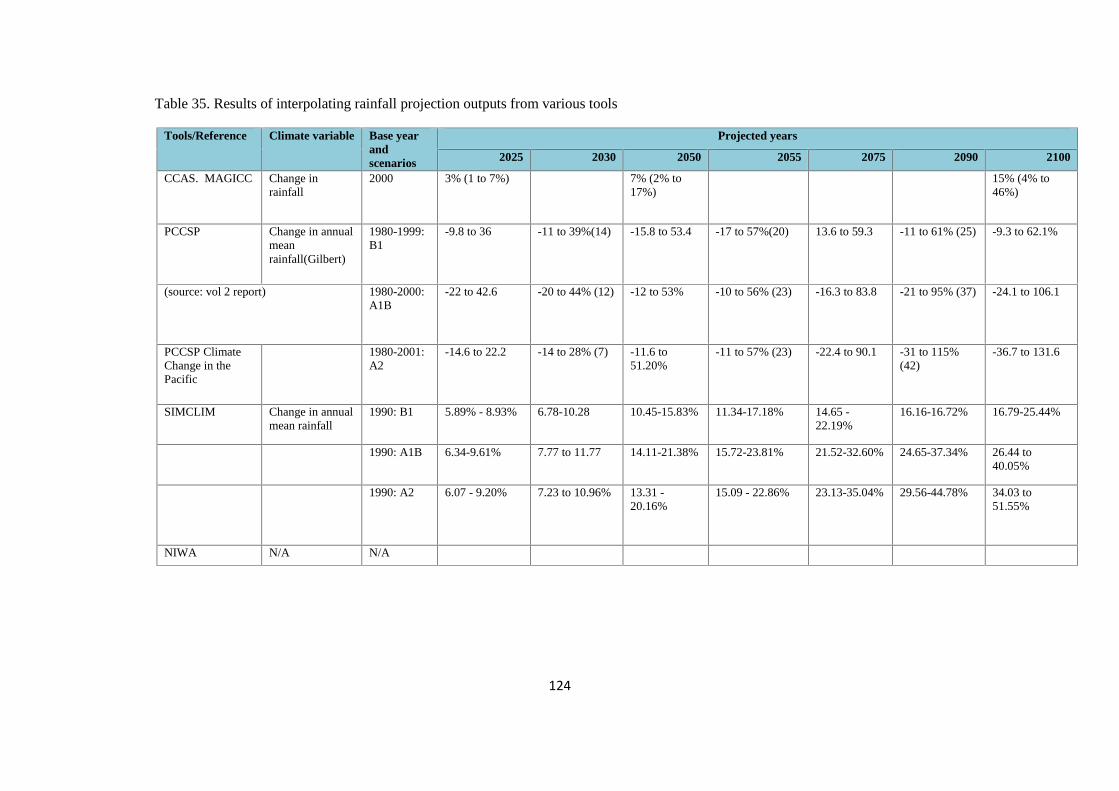
124
Table 35. Results of interpolating rainfall projection outputs from various tools
Tools/Reference Climate variable Base yearandscenarios
Projected years
2025 2030 2050 2055 2075 2090 2100
CCAS. MAGICC Change inrainfall
2000 3% (1 to 7%) 7% (2% to17%)
15% (4% to46%)
PCCSP Change in annualmeanrainfall(Gilbert)
1980-1999:B1
-9.8 to 36 -11 to 39%(14) -15.8 to 53.4 -17 to 57%(20) 13.6 to 59.3 -11 to 61% (25) -9.3 to 62.1%
(source: vol 2 report) 1980-2000:A1B
-22 to 42.6 -20 to 44% (12) -12 to 53% -10 to 56% (23) -16.3 to 83.8 -21 to 95% (37) -24.1 to 106.1
PCCSP ClimateChange in thePacific
1980-2001:A2
-14.6 to 22.2 -14 to 28% (7) -11.6 to51.20%
-11 to 57% (23) -22.4 to 90.1 -31 to 115%(42)
-36.7 to 131.6
SIMCLIM Change in annualmean rainfall
1990: B1 5.89% - 8.93% 6.78-10.28 10.45-15.83% 11.34-17.18% 14.65 -22.19%
16.16-16.72% 16.79-25.44%
1990: A1B 6.34-9.61% 7.77 to 11.77 14.11-21.38% 15.72-23.81% 21.52-32.60% 24.65-37.34% 26.44 to40.05%
1990: A2 6.07 - 9.20% 7.23 to 10.96% 13.31 -20.16%
15.09 - 22.86% 23.13-35.04% 29.56-44.78% 34.03 to51.55%
NIWA N/A N/A
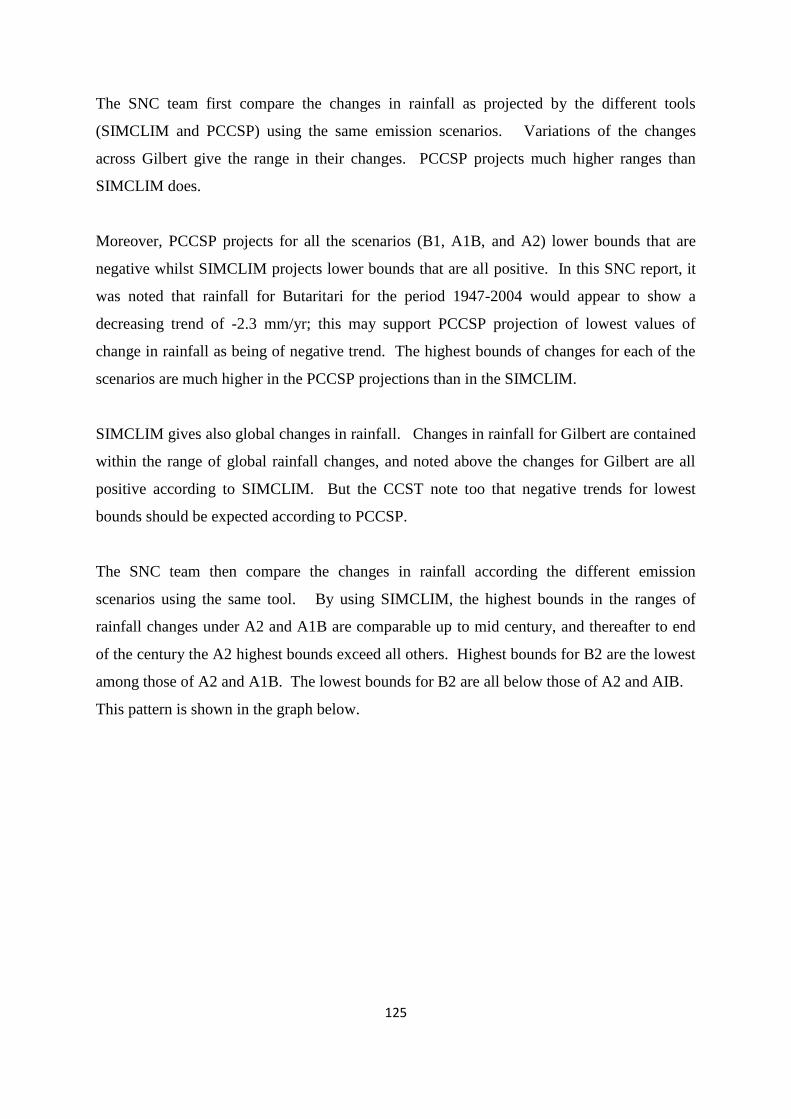
125
The SNC team first compare the changes in rainfall as projected by the different tools
(SIMCLIM and PCCSP) using the same emission scenarios. Variations of the changes
across Gilbert give the range in their changes. PCCSP projects much higher ranges than
SIMCLIM does.
Moreover, PCCSP projects for all the scenarios (B1, A1B, and A2) lower bounds that are
negative whilst SIMCLIM projects lower bounds that are all positive. In this SNC report, it
was noted that rainfall for Butaritari for the period 1947-2004 would appear to show a
decreasing trend of -2.3 mm/yr; this may support PCCSP projection of lowest values of
change in rainfall as being of negative trend. The highest bounds of changes for each of the
scenarios are much higher in the PCCSP projections than in the SIMCLIM.
SIMCLIM gives also global changes in rainfall. Changes in rainfall for Gilbert are contained
within the range of global rainfall changes, and noted above the changes for Gilbert are all
positive according to SIMCLIM. But the CCST note too that negative trends for lowest
bounds should be expected according to PCCSP.
The SNC team then compare the changes in rainfall according the different emission
scenarios using the same tool. By using SIMCLIM, the highest bounds in the ranges of
rainfall changes under A2 and A1B are comparable up to mid century, and thereafter to end
of the century the A2 highest bounds exceed all others. Highest bounds for B2 are the lowest
among those of A2 and A1B. The lowest bounds for B2 are all below those of A2 and AIB.
This pattern is shown in the graph below.
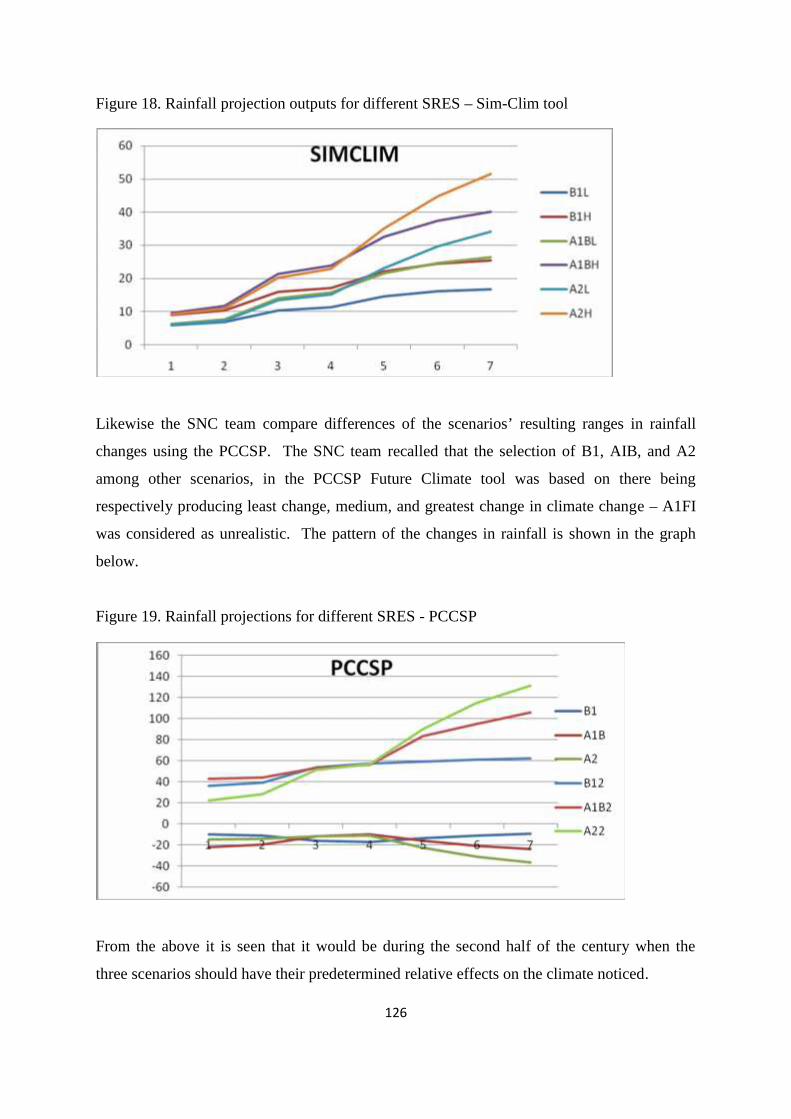
126
Figure 18. Rainfall projection outputs for different SRES – Sim-Clim tool
Likewise the SNC team compare differences of the scenarios’ resulting ranges in rainfall
changes using the PCCSP. The SNC team recalled that the selection of B1, AIB, and A2
among other scenarios, in the PCCSP Future Climate tool was based on there being
respectively producing least change, medium, and greatest change in climate change – A1FI
was considered as unrealistic. The pattern of the changes in rainfall is shown in the graph
below.
Figure 19. Rainfall projections for different SRES - PCCSP
From the above it is seen that it would be during the second half of the century when the
three scenarios should have their predetermined relative effects on the climate noticed.
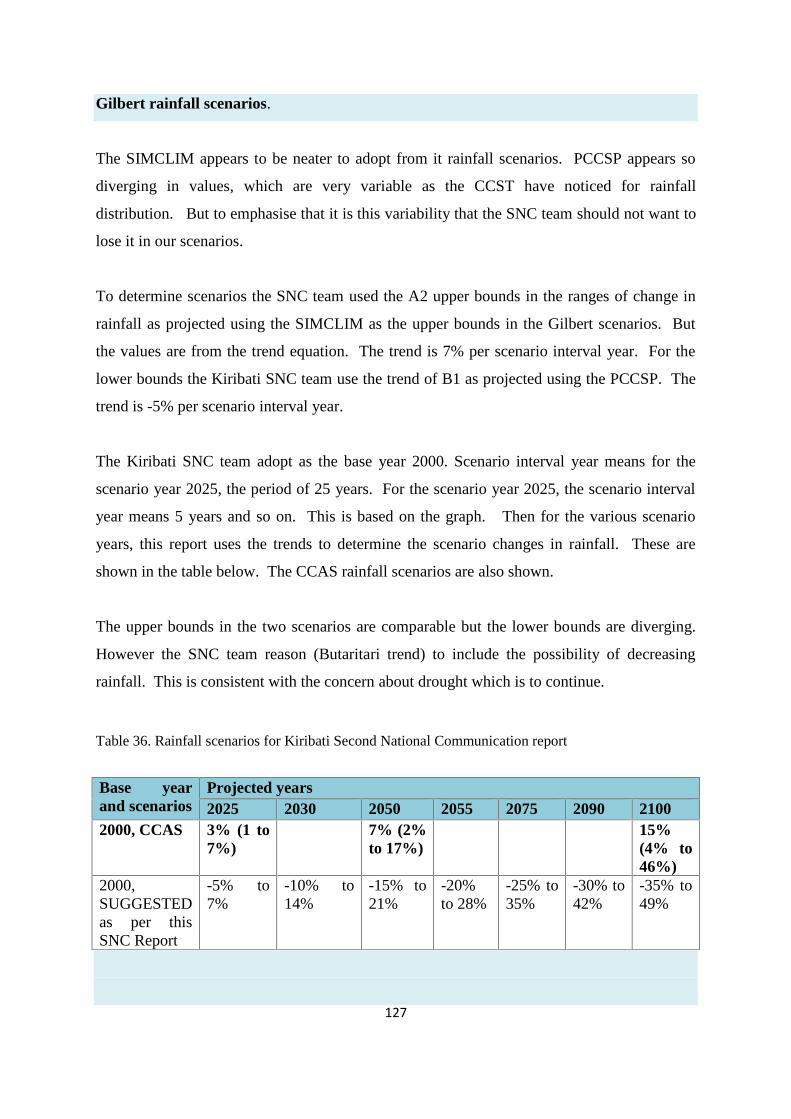
127
Gilbert rainfall scenarios.
The SIMCLIM appears to be neater to adopt from it rainfall scenarios. PCCSP appears so
diverging in values, which are very variable as the CCST have noticed for rainfall
distribution. But to emphasise that it is this variability that the SNC team should not want to
lose it in our scenarios.
To determine scenarios the SNC team used the A2 upper bounds in the ranges of change in
rainfall as projected using the SIMCLIM as the upper bounds in the Gilbert scenarios. But
the values are from the trend equation. The trend is 7% per scenario interval year. For the
lower bounds the Kiribati SNC team use the trend of B1 as projected using the PCCSP. The
trend is -5% per scenario interval year.
The Kiribati SNC team adopt as the base year 2000. Scenario interval year means for the
scenario year 2025, the period of 25 years. For the scenario year 2025, the scenario interval
year means 5 years and so on. This is based on the graph. Then for the various scenario
years, this report uses the trends to determine the scenario changes in rainfall. These are
shown in the table below. The CCAS rainfall scenarios are also shown.
The upper bounds in the two scenarios are comparable but the lower bounds are diverging.
However the SNC team reason (Butaritari trend) to include the possibility of decreasing
rainfall. This is consistent with the concern about drought which is to continue.
Table 36. Rainfall scenarios for Kiribati Second National Communication report
Base yearand scenarios
Projected years2025 2030 2050 2055 2075 2090 2100
2000, CCAS 3% (1 to7%)
7% (2%to 17%)
15%(4% to46%)
2000,SUGGESTEDas per thisSNC Report
-5% to7%
-10% to14%
-15% to21%
-20%to 28%
-25% to35%
-30% to42%
-35% to49%
128
Sea level rise
Of different but connected impacts of climate change, sea level rise attracts significant level
of response from Kiribati people. Within a relatively brief period, it was considered to be a
threat not in the near future but in distant future. And monitoring of the sea level was needed
and so was established through Australian Assistance program in the Pacific islands.
Now it is felt that it is time to raise issues that the Kiribati SNC team highly suggest should
start preparing for the extreme threat that sea level rise (extreme sea levels projections) is
causing. People will be displaced, and opportunities for external migration should be
quietly explored. In the meantime, let it be granted that people are already incurring losses
and damages to their properties. For the country, the meagre natural resources are more
frequently facing severe damaging impacts of extreme weather conditions.
The future of Kiribati in the world with climate change was described, few decades back, to
be bleak with possible submergence some decades later. After four decades hence, Kiribati
has not disappeared but certainly sea level has risen over the decades.
What are plausible levels of rising sea that can be expected in the future years? Kiribati
needs sea level scenarios.
At the time of KAP 1 and NAPA, scenarios were established and these become part of the
Climate Change Adaptation Strategy adopted in 2005. The scenarios were compiled from
information elicited from the MAGICC tool.
During the years of KAP11 and SNC (2007 to date) more sources of information on scenarios
are available. They are from scientific institutes and programmes, namely Clim-system
which develop “SIMCLIM”, Pacific Climate Change Science Programme (PCCSP) which
develop “Climate future” tool, and New Zealand Institute of Water and Atmosphere which
develop “Coastal Calculator”.
The SNC team attempted to synthesize information from those various tools. The synthesis
is the scenario the Kiribati SNC team wish to recommend.
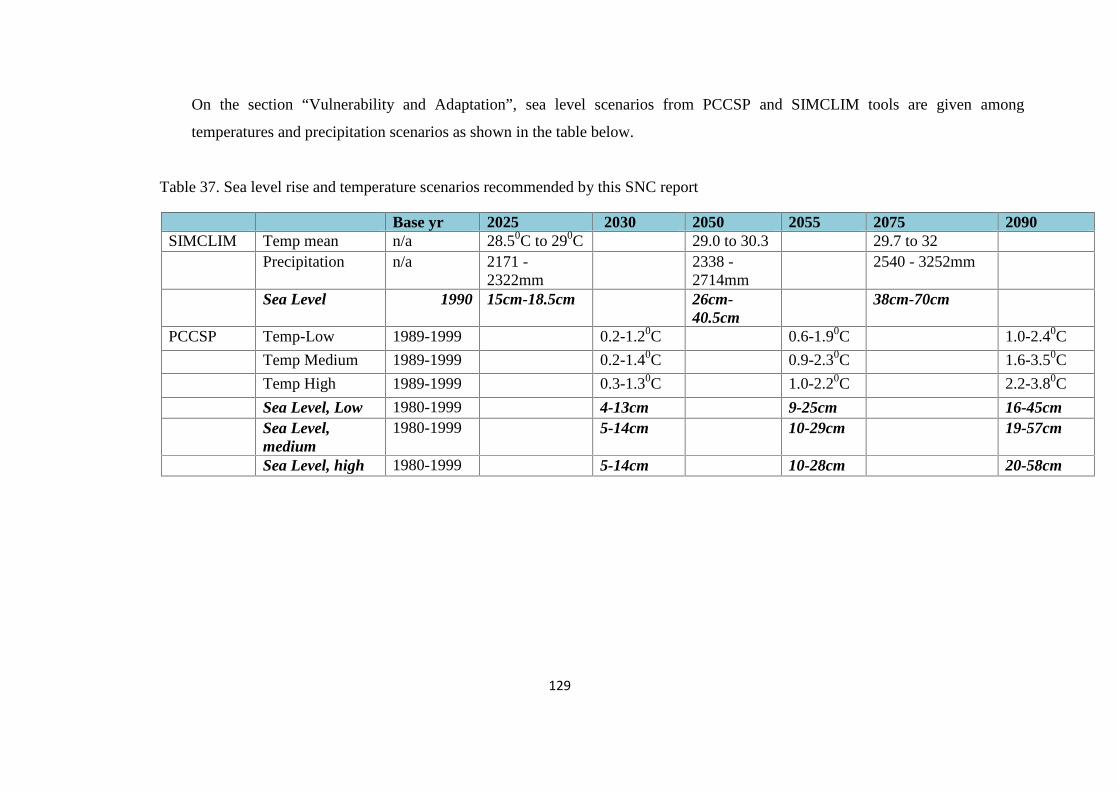
129
On the section “Vulnerability and Adaptation”, sea level scenarios from PCCSP and SIMCLIM tools are given among
temperatures and precipitation scenarios as shown in the table below.
Table 37. Sea level rise and temperature scenarios recommended by this SNC report
Base yr 2025 2030 2050 2055 2075 2090SIMCLIM Temp mean n/a 28.50C to 290C 29.0 to 30.3 29.7 to 32
Precipitation n/a 2171 -2322mm
2338 -2714mm
2540 - 3252mm
Sea Level 1990 15cm-18.5cm 26cm-40.5cm
38cm-70cm
PCCSP Temp-Low 1989-1999 0.2-1.20C 0.6-1.90C 1.0-2.40C
Temp Medium 1989-1999 0.2-1.40C 0.9-2.30C 1.6-3.50C
Temp High 1989-1999 0.3-1.30C 1.0-2.20C 2.2-3.80C
Sea Level, Low 1980-1999 4-13cm 9-25cm 16-45cmSea Level,medium
1980-1999 5-14cm 10-29cm 19-57cm
Sea Level, high 1980-1999 5-14cm 10-28cm 20-58cm
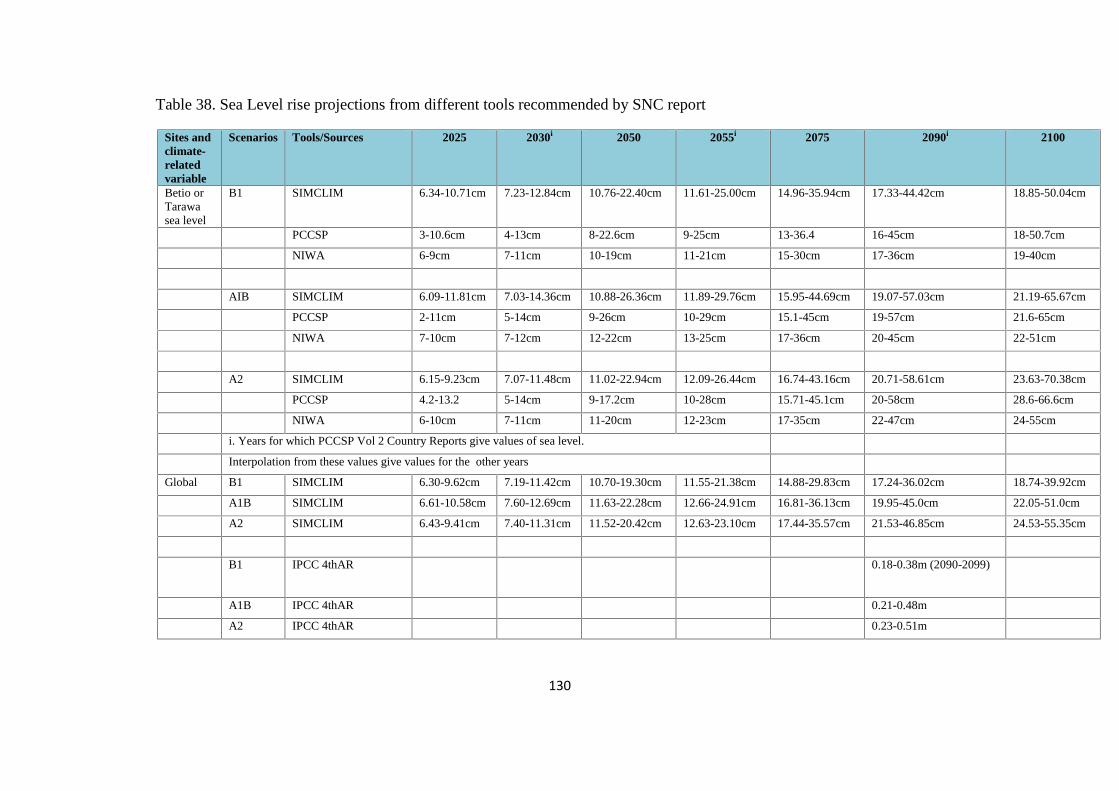
130
Table 38. Sea Level rise projections from different tools recommended by SNC report
Sites andclimate-relatedvariable
Scenarios Tools/Sources 2025 2030i 2050 2055i 2075 2090i 2100
Betio orTarawasea level
B1 SIMCLIM 6.34-10.71cm 7.23-12.84cm 10.76-22.40cm 11.61-25.00cm 14.96-35.94cm 17.33-44.42cm 18.85-50.04cm
PCCSP 3-10.6cm 4-13cm 8-22.6cm 9-25cm 13-36.4 16-45cm 18-50.7cm
NIWA 6-9cm 7-11cm 10-19cm 11-21cm 15-30cm 17-36cm 19-40cm
AIB SIMCLIM 6.09-11.81cm 7.03-14.36cm 10.88-26.36cm 11.89-29.76cm 15.95-44.69cm 19.07-57.03cm 21.19-65.67cm
PCCSP 2-11cm 5-14cm 9-26cm 10-29cm 15.1-45cm 19-57cm 21.6-65cm
NIWA 7-10cm 7-12cm 12-22cm 13-25cm 17-36cm 20-45cm 22-51cm
A2 SIMCLIM 6.15-9.23cm 7.07-11.48cm 11.02-22.94cm 12.09-26.44cm 16.74-43.16cm 20.71-58.61cm 23.63-70.38cm
PCCSP 4.2-13.2 5-14cm 9-17.2cm 10-28cm 15.71-45.1cm 20-58cm 28.6-66.6cm
NIWA 6-10cm 7-11cm 11-20cm 12-23cm 17-35cm 22-47cm 24-55cm
i. Years for which PCCSP Vol 2 Country Reports give values of sea level.
Interpolation from these values give values for the other years
Global B1 SIMCLIM 6.30-9.62cm 7.19-11.42cm 10.70-19.30cm 11.55-21.38cm 14.88-29.83cm 17.24-36.02cm 18.74-39.92cm
A1B SIMCLIM 6.61-10.58cm 7.60-12.69cm 11.63-22.28cm 12.66-24.91cm 16.81-36.13cm 19.95-45.0cm 22.05-51.0cm
A2 SIMCLIM 6.43-9.41cm 7.40-11.31cm 11.52-20.42cm 12.63-23.10cm 17.44-35.57cm 21.53-46.85cm 24.53-55.35cm
B1 IPCC 4thAR 0.18-0.38m (2090-2099)
A1B IPCC 4thAR 0.21-0.48m
A2 IPCC 4thAR 0.23-0.51m
131
Conclusion
The scenarios in more distant future have wider range than in nearer future years. This
implies increasing level of uncertainties with increasing length of the future time frame.
Nonetheless for the SNC team and Kiribati, this is the best available scientific information,
and futher that in planning the SNC team thought that Kiribati should be prepared for the
worse case scenario.
132
Scenarios for Extreme Events
This section define extreme environmental events as occurrences of environmental variables
far exceeding or far below their normal magnitudes over comparable time intervals, and
moreover impact adversely on the livelihood and health of the community and people.
Selection of the length of time intervals is important for it should be reasonable for the type
of impacts considered. For example, in impacts of droughts time intervals of few months is
reasonable whereas for flooding few hour time intervals may be more reasonable.
The type of variables to be used need also to be reasonable for the impacts considered.
Running totals of rainfall for each of three months duration (3 months interval) may be more
reasonable from which to assess drought than totals of consecutive three months rainfall.
Related to climate change, the environmental variables that can be relevant include sea level,
height of storm surges, wave heights, wind speed and direction, amounts of rainfall in a
period, and temperature. Values far exceeding or far below their normal magnitudes in any
of these variables are usually associated with their adverse impacts on the livelihood and
health of the people. For this reason, it is important to collect and understand information
about extreme events.
Various technical studies and tools have been produced on extremes. These include Climate
Risk Profiles produced by Prof J. Hay, NIWA 2008 works, PCCSP and SIMCLIM. The SNC
team made attempts to bring out useful information from these sources and to suggest, based
on what the SNC team can comprehend from those works, the risks to Kiribati from extreme
events. Underlying assumptions in the studies of extreme events
The concern is climate and weather extreme events. The desire is to understand the
likelihood of their occurrences, the return periods, their severity and the consequences for the
people affected.
The likelihood of the occurrence of any extreme value, say of the variable –rainfall, should be
based on its relative frequency in the time series of all values of the variable over some length
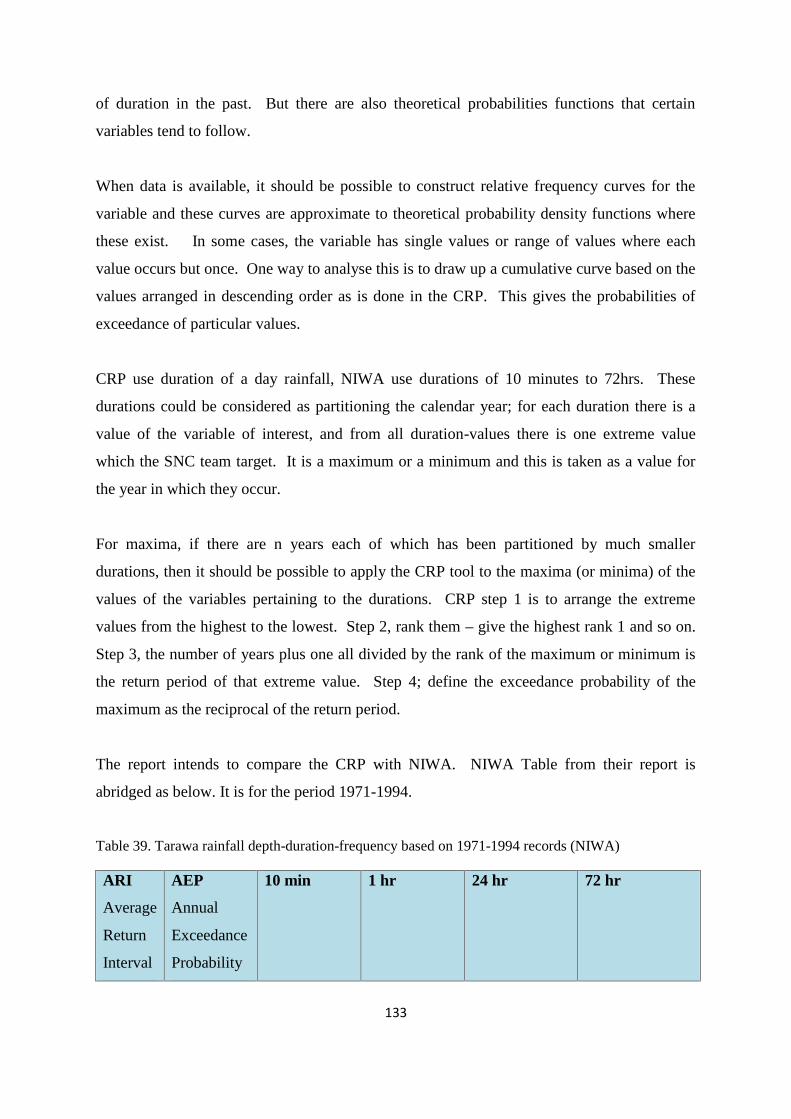
133
of duration in the past. But there are also theoretical probabilities functions that certain
variables tend to follow.
When data is available, it should be possible to construct relative frequency curves for the
variable and these curves are approximate to theoretical probability density functions where
these exist. In some cases, the variable has single values or range of values where each
value occurs but once. One way to analyse this is to draw up a cumulative curve based on the
values arranged in descending order as is done in the CRP. This gives the probabilities of
exceedance of particular values.
CRP use duration of a day rainfall, NIWA use durations of 10 minutes to 72hrs. These
durations could be considered as partitioning the calendar year; for each duration there is a
value of the variable of interest, and from all duration-values there is one extreme value
which the SNC team target. It is a maximum or a minimum and this is taken as a value for
the year in which they occur.
For maxima, if there are n years each of which has been partitioned by much smaller
durations, then it should be possible to apply the CRP tool to the maxima (or minima) of the
values of the variables pertaining to the durations. CRP step 1 is to arrange the extreme
values from the highest to the lowest. Step 2, rank them – give the highest rank 1 and so on.
Step 3, the number of years plus one all divided by the rank of the maximum or minimum is
the return period of that extreme value. Step 4; define the exceedance probability of the
maximum as the reciprocal of the return period.
The report intends to compare the CRP with NIWA. NIWA Table from their report is
abridged as below. It is for the period 1971-1994.
Table 39. Tarawa rainfall depth-duration-frequency based on 1971-1994 records (NIWA)
ARI
Average
Return
Interval
AEP
Annual
Exceedance
Probability
10 min 1 hr 24 hr 72 hr
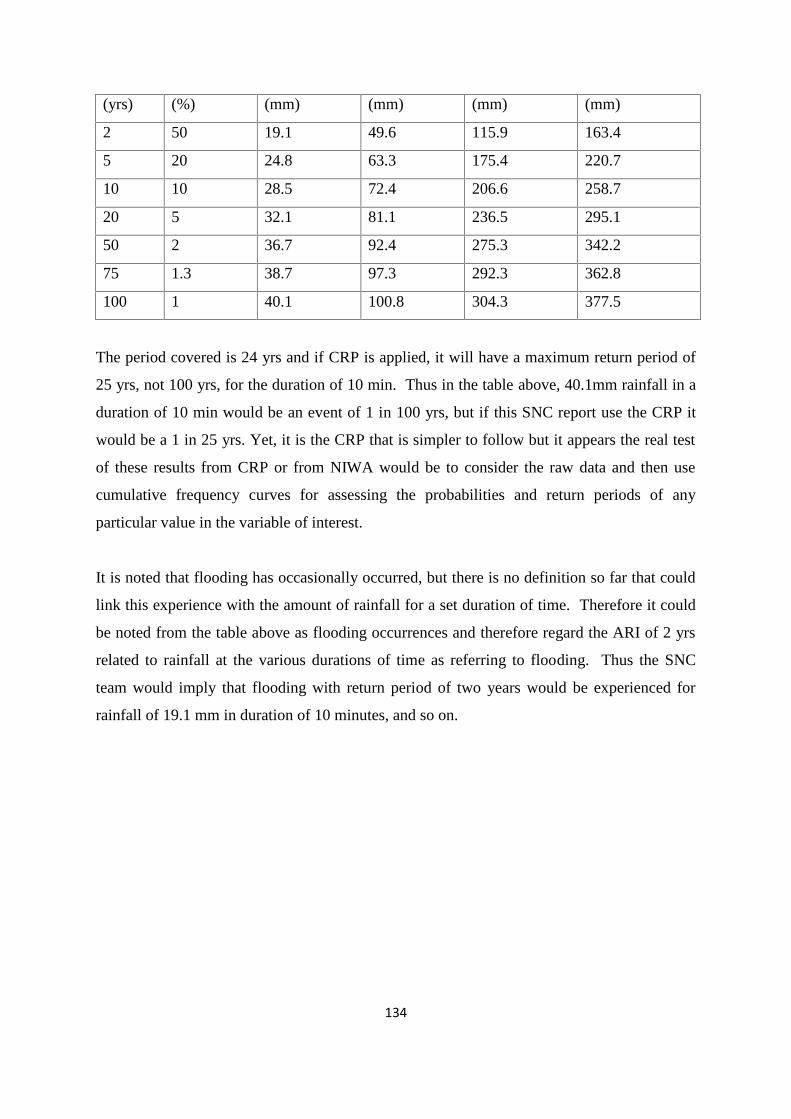
134
(yrs) (%) (mm) (mm) (mm) (mm)
2 50 19.1 49.6 115.9 163.4
5 20 24.8 63.3 175.4 220.7
10 10 28.5 72.4 206.6 258.7
20 5 32.1 81.1 236.5 295.1
50 2 36.7 92.4 275.3 342.2
75 1.3 38.7 97.3 292.3 362.8
100 1 40.1 100.8 304.3 377.5
The period covered is 24 yrs and if CRP is applied, it will have a maximum return period of
25 yrs, not 100 yrs, for the duration of 10 min. Thus in the table above, 40.1mm rainfall in a
duration of 10 min would be an event of 1 in 100 yrs, but if this SNC report use the CRP it
would be a 1 in 25 yrs. Yet, it is the CRP that is simpler to follow but it appears the real test
of these results from CRP or from NIWA would be to consider the raw data and then use
cumulative frequency curves for assessing the probabilities and return periods of any
particular value in the variable of interest.
It is noted that flooding has occasionally occurred, but there is no definition so far that could
link this experience with the amount of rainfall for a set duration of time. Therefore it could
be noted from the table above as flooding occurrences and therefore regard the ARI of 2 yrs
related to rainfall at the various durations of time as referring to flooding. Thus the SNC
team would imply that flooding with return period of two years would be experienced for
rainfall of 19.1 mm in duration of 10 minutes, and so on.
135
Droughts
More understanding about flooding is undoubtedly desired. Drought remains a subjective
phenomenon. It is a shortage of potable water due to shortage of rainfall experienced by the
people throughout the island due to below normal rainfall.
Low rainfall over long enough periods will also set in drought conditions. Drought of some
durations have always occurred in Kiribati, and along any atolls in Kiribati there are areas at
which ground water lens is very thin and very vulnerable to drought.
For analysis of rainfall to understand drought, various definitions and tools were noted.
White and Falkland in one of their reports on Kiribati water resources mentioned and
explained “decile method”. This method is noted in the Kiribati Climate Change National
Implementing Strategy.
NIWA in their highly technical report on drought which they prepare for KAP II explain
“drought severity index” which is based on comparing the median of previous three months
with the median of current month. For each month, median value should be known; medians
of three months should also be known. The anomaly of rainfall for the current month is the
current rainfall less the median which if it is negative, then it is compared with the median of
the previous three months (taken together) and if it is also negative then the drought is
considered to set in. The DSI (drought susceptibility index) is just the anomaly value, taken
as positive (i.e. modulus). The lower the value of the DSI, the lesser is the drought severity;
conversely, the higher the DSI, the more is the drought severity.
DSI applied to record of rainfall at any island gives ranges of DSI, durations that the
particular range of values has persisted, and their frequencies within the period covered in the
record. The table 40 below is extracted from NIWA report (2008) and gives the analysis for
Tarawa.
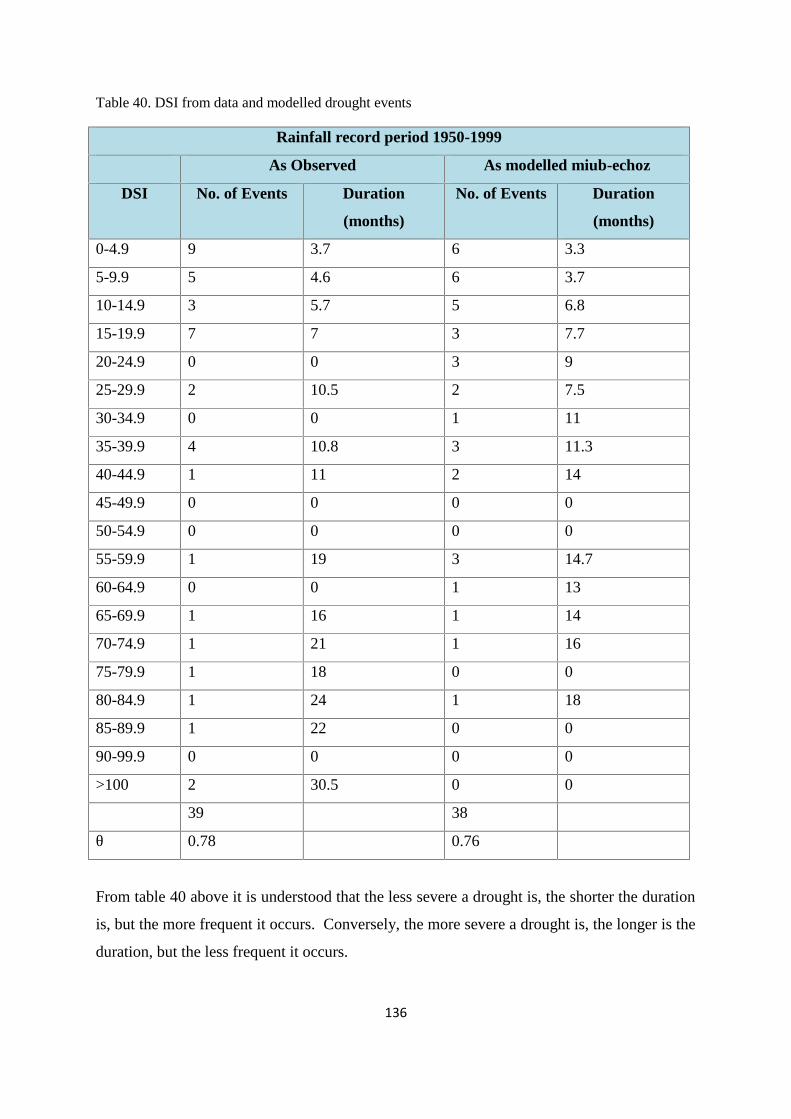
136
Table 40. DSI from data and modelled drought events
Rainfall record period 1950-1999
As Observed As modelled miub-echoz
DSI No. of Events Duration
(months)
No. of Events Duration
(months)
0-4.9 9 3.7 6 3.3
5-9.9 5 4.6 6 3.7
10-14.9 3 5.7 5 6.8
15-19.9 7 7 3 7.7
20-24.9 0 0 3 9
25-29.9 2 10.5 2 7.5
30-34.9 0 0 1 11
35-39.9 4 10.8 3 11.3
40-44.9 1 11 2 14
45-49.9 0 0 0 0
50-54.9 0 0 0 0
55-59.9 1 19 3 14.7
60-64.9 0 0 1 13
65-69.9 1 16 1 14
70-74.9 1 21 1 16
75-79.9 1 18 0 0
80-84.9 1 24 1 18
85-89.9 1 22 0 0
90-99.9 0 0 0 0
>100 2 30.5 0 0
39 38
θ 0.78 0.76
From table 40 above it is understood that the less severe a drought is, the shorter the duration
is, but the more frequent it occurs. Conversely, the more severe a drought is, the longer is the
duration, but the less frequent it occurs.
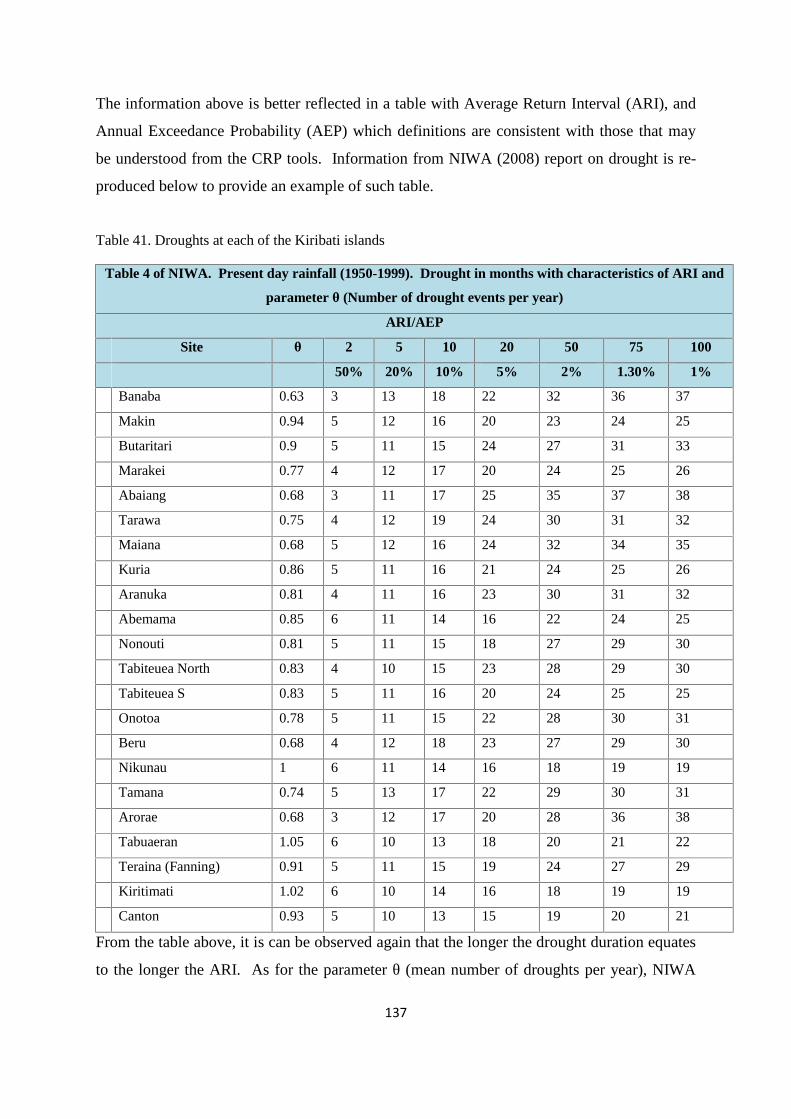
137
The information above is better reflected in a table with Average Return Interval (ARI), and
Annual Exceedance Probability (AEP) which definitions are consistent with those that may
be understood from the CRP tools. Information from NIWA (2008) report on drought is re-
produced below to provide an example of such table.
Table 41. Droughts at each of the Kiribati islands
Table 4 of NIWA. Present day rainfall (1950-1999). Drought in months with characteristics of ARI and
parameter θ (Number of drought events per year)
ARI/AEP
Site θ 2 5 10 20 50 75 100
50% 20% 10% 5% 2% 1.30% 1%
Banaba 0.63 3 13 18 22 32 36 37
Makin 0.94 5 12 16 20 23 24 25
Butaritari 0.9 5 11 15 24 27 31 33
Marakei 0.77 4 12 17 20 24 25 26
Abaiang 0.68 3 11 17 25 35 37 38
Tarawa 0.75 4 12 19 24 30 31 32
Maiana 0.68 5 12 16 24 32 34 35
Kuria 0.86 5 11 16 21 24 25 26
Aranuka 0.81 4 11 16 23 30 31 32
Abemama 0.85 6 11 14 16 22 24 25
Nonouti 0.81 5 11 15 18 27 29 30
Tabiteuea North 0.83 4 10 15 23 28 29 30
Tabiteuea S 0.83 5 11 16 20 24 25 25
Onotoa 0.78 5 11 15 22 28 30 31
Beru 0.68 4 12 18 23 27 29 30
Nikunau 1 6 11 14 16 18 19 19
Tamana 0.74 5 13 17 22 29 30 31
Arorae 0.68 3 12 17 20 28 36 38
Tabuaeran 1.05 6 10 13 18 20 21 22
Teraina (Fanning) 0.91 5 11 15 19 24 27 29
Kiritimati 1.02 6 10 14 16 18 19 19
Canton 0.93 5 10 13 15 19 20 21
From the table above, it is can be observed again that the longer the drought duration equates
to the longer the ARI. As for the parameter θ (mean number of droughts per year), NIWA
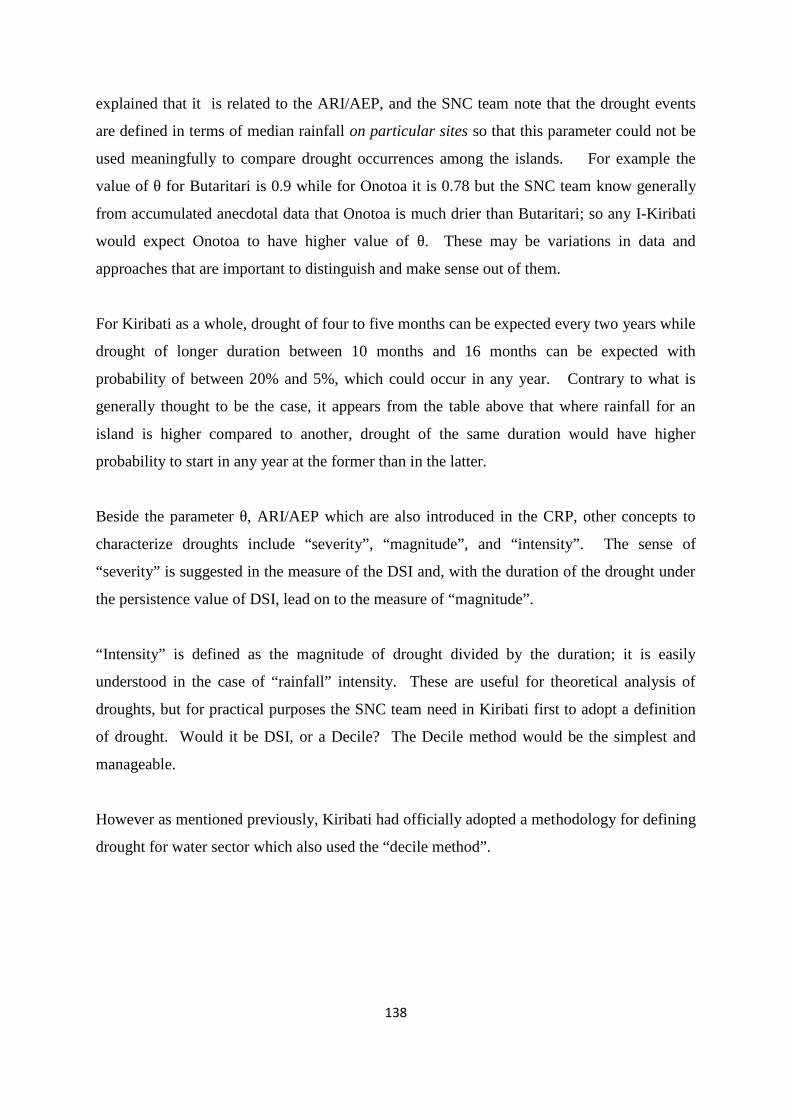
138
explained that it is related to the ARI/AEP, and the SNC team note that the drought events
are defined in terms of median rainfall on particular sites so that this parameter could not be
used meaningfully to compare drought occurrences among the islands. For example the
value of θ for Butaritari is 0.9 while for Onotoa it is 0.78 but the SNC team know generally
from accumulated anecdotal data that Onotoa is much drier than Butaritari; so any I-Kiribati
would expect Onotoa to have higher value of θ. These may be variations in data and
approaches that are important to distinguish and make sense out of them.
For Kiribati as a whole, drought of four to five months can be expected every two years while
drought of longer duration between 10 months and 16 months can be expected with
probability of between 20% and 5%, which could occur in any year. Contrary to what is
generally thought to be the case, it appears from the table above that where rainfall for an
island is higher compared to another, drought of the same duration would have higher
probability to start in any year at the former than in the latter.
Beside the parameter θ, ARI/AEP which are also introduced in the CRP, other concepts to
characterize droughts include “severity”, “magnitude”, and “intensity”. The sense of
“severity” is suggested in the measure of the DSI and, with the duration of the drought under
the persistence value of DSI, lead on to the measure of “magnitude”.
“Intensity” is defined as the magnitude of drought divided by the duration; it is easily
understood in the case of “rainfall” intensity. These are useful for theoretical analysis of
droughts, but for practical purposes the SNC team need in Kiribati first to adopt a definition
of drought. Would it be DSI, or a Decile? The Decile method would be the simplest and
manageable.
However as mentioned previously, Kiribati had officially adopted a methodology for defining
drought for water sector which also used the “decile method”.
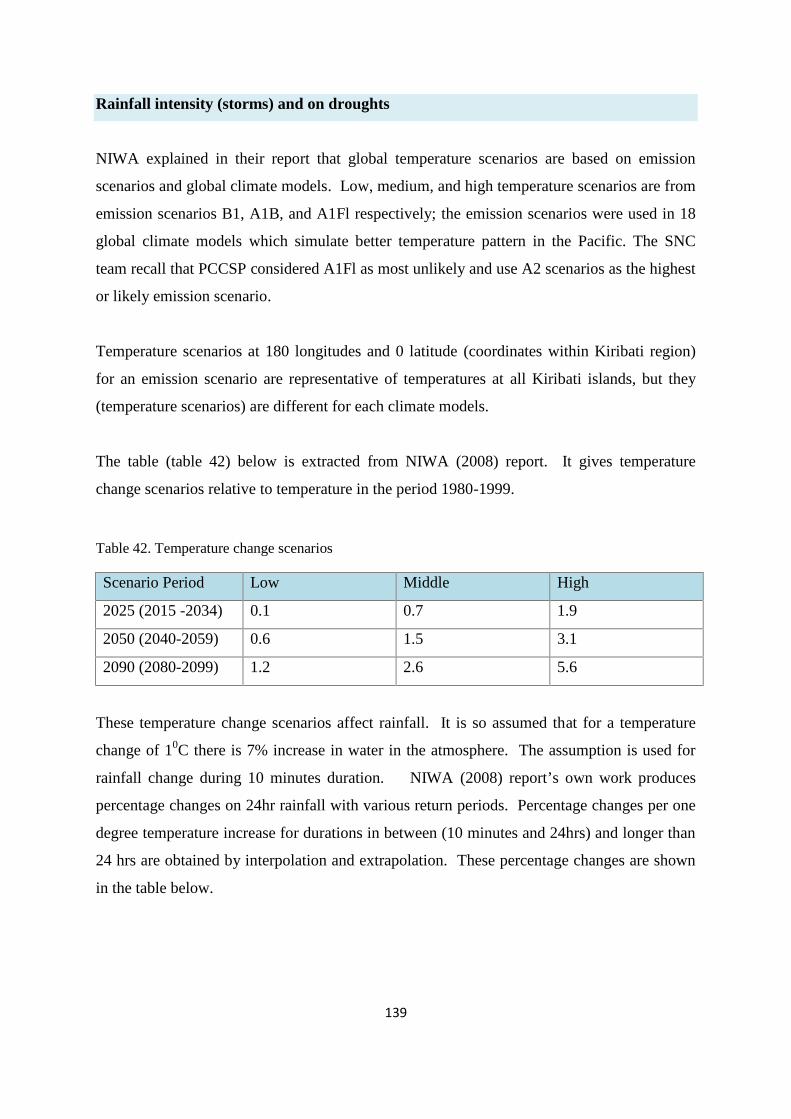
139
Rainfall intensity (storms) and on droughts
NIWA explained in their report that global temperature scenarios are based on emission
scenarios and global climate models. Low, medium, and high temperature scenarios are from
emission scenarios B1, A1B, and A1Fl respectively; the emission scenarios were used in 18
global climate models which simulate better temperature pattern in the Pacific. The SNC
team recall that PCCSP considered A1Fl as most unlikely and use A2 scenarios as the highest
or likely emission scenario.
Temperature scenarios at 180 longitudes and 0 latitude (coordinates within Kiribati region)
for an emission scenario are representative of temperatures at all Kiribati islands, but they
(temperature scenarios) are different for each climate models.
The table (table 42) below is extracted from NIWA (2008) report. It gives temperature
change scenarios relative to temperature in the period 1980-1999.
Table 42. Temperature change scenarios
Scenario Period Low Middle High
2025 (2015 -2034) 0.1 0.7 1.9
2050 (2040-2059) 0.6 1.5 3.1
2090 (2080-2099) 1.2 2.6 5.6
These temperature change scenarios affect rainfall. It is so assumed that for a temperature
change of 10C there is 7% increase in water in the atmosphere. The assumption is used for
rainfall change during 10 minutes duration. NIWA (2008) report’s own work produces
percentage changes on 24hr rainfall with various return periods. Percentage changes per one
degree temperature increase for durations in between (10 minutes and 24hrs) and longer than
24 hrs are obtained by interpolation and extrapolation. These percentage changes are shown
in the table below.
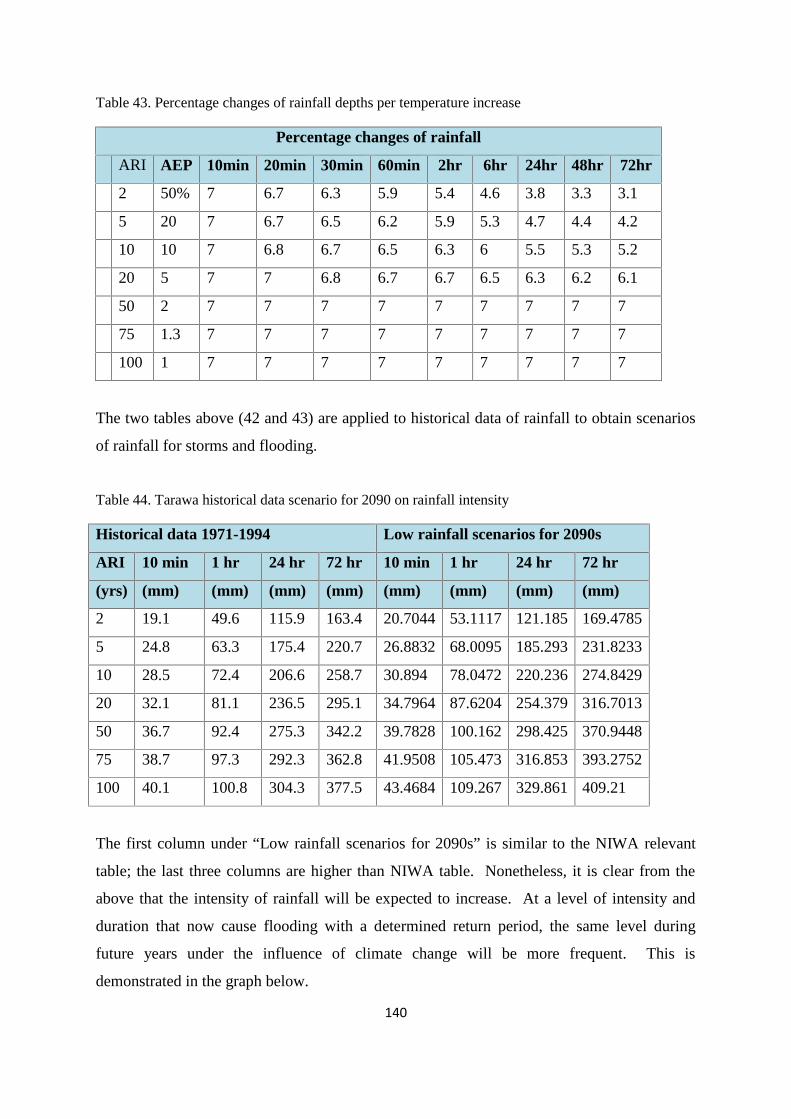
140
Table 43. Percentage changes of rainfall depths per temperature increase
Percentage changes of rainfall
ARI AEP 10min 20min 30min 60min 2hr 6hr 24hr 48hr 72hr
2 50% 7 6.7 6.3 5.9 5.4 4.6 3.8 3.3 3.1
5 20 7 6.7 6.5 6.2 5.9 5.3 4.7 4.4 4.2
10 10 7 6.8 6.7 6.5 6.3 6 5.5 5.3 5.2
20 5 7 7 6.8 6.7 6.7 6.5 6.3 6.2 6.1
50 2 7 7 7 7 7 7 7 7 7
75 1.3 7 7 7 7 7 7 7 7 7
100 1 7 7 7 7 7 7 7 7 7
The two tables above (42 and 43) are applied to historical data of rainfall to obtain scenarios
of rainfall for storms and flooding.
Table 44. Tarawa historical data scenario for 2090 on rainfall intensity
Historical data 1971-1994 Low rainfall scenarios for 2090s
ARI 10 min 1 hr 24 hr 72 hr 10 min 1 hr 24 hr 72 hr
(yrs) (mm) (mm) (mm) (mm) (mm) (mm) (mm) (mm)
2 19.1 49.6 115.9 163.4 20.7044 53.1117 121.185 169.4785
5 24.8 63.3 175.4 220.7 26.8832 68.0095 185.293 231.8233
10 28.5 72.4 206.6 258.7 30.894 78.0472 220.236 274.8429
20 32.1 81.1 236.5 295.1 34.7964 87.6204 254.379 316.7013
50 36.7 92.4 275.3 342.2 39.7828 100.162 298.425 370.9448
75 38.7 97.3 292.3 362.8 41.9508 105.473 316.853 393.2752
100 40.1 100.8 304.3 377.5 43.4684 109.267 329.861 409.21
The first column under “Low rainfall scenarios for 2090s” is similar to the NIWA relevant
table; the last three columns are higher than NIWA table. Nonetheless, it is clear from the
above that the intensity of rainfall will be expected to increase. At a level of intensity and
duration that now cause flooding with a determined return period, the same level during
future years under the influence of climate change will be more frequent. This is
demonstrated in the graph below.
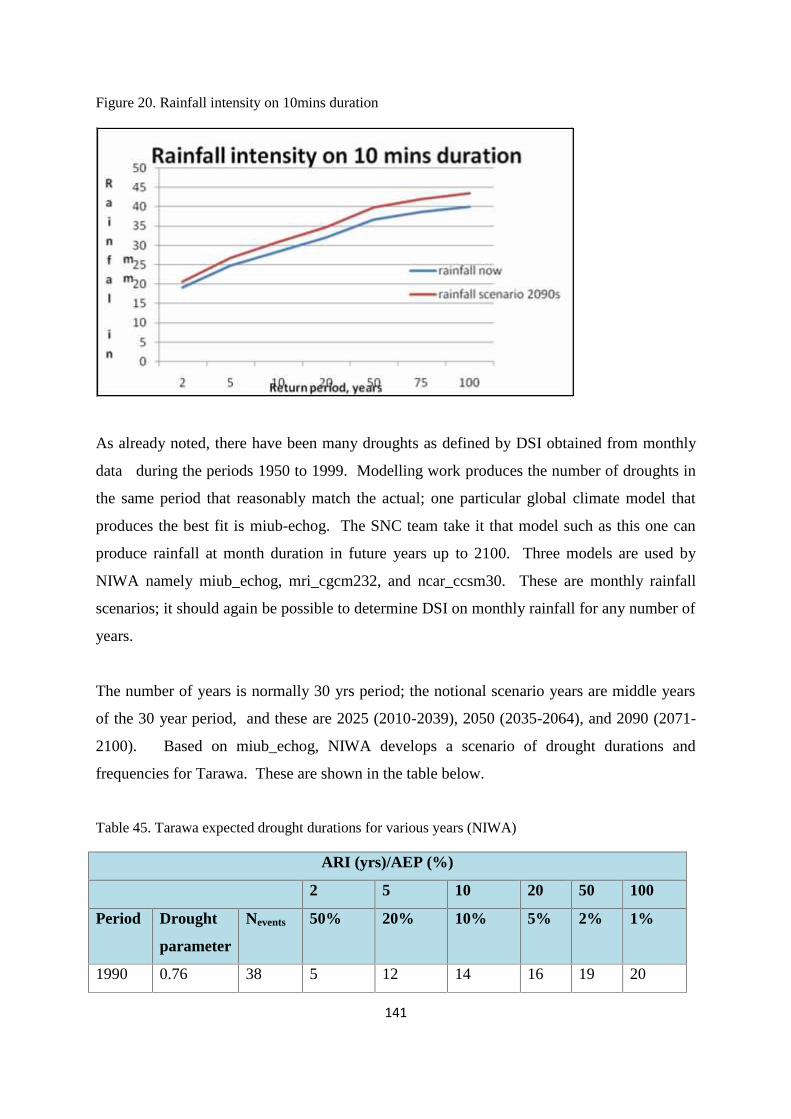
141
Figure 20. Rainfall intensity on 10mins duration
As already noted, there have been many droughts as defined by DSI obtained from monthly
data during the periods 1950 to 1999. Modelling work produces the number of droughts in
the same period that reasonably match the actual; one particular global climate model that
produces the best fit is miub-echog. The SNC team take it that model such as this one can
produce rainfall at month duration in future years up to 2100. Three models are used by
NIWA namely miub_echog, mri_cgcm232, and ncar_ccsm30. These are monthly rainfall
scenarios; it should again be possible to determine DSI on monthly rainfall for any number of
years.
The number of years is normally 30 yrs period; the notional scenario years are middle years
of the 30 year period, and these are 2025 (2010-2039), 2050 (2035-2064), and 2090 (2071-
2100). Based on miub_echog, NIWA develops a scenario of drought durations and
frequencies for Tarawa. These are shown in the table below.
Table 45. Tarawa expected drought durations for various years (NIWA)
ARI (yrs)/AEP (%)
2 5 10 20 50 100
Period Drought
parameter
Nevents 50% 20% 10% 5% 2% 1%
1990 0.76 38 5 12 14 16 19 20
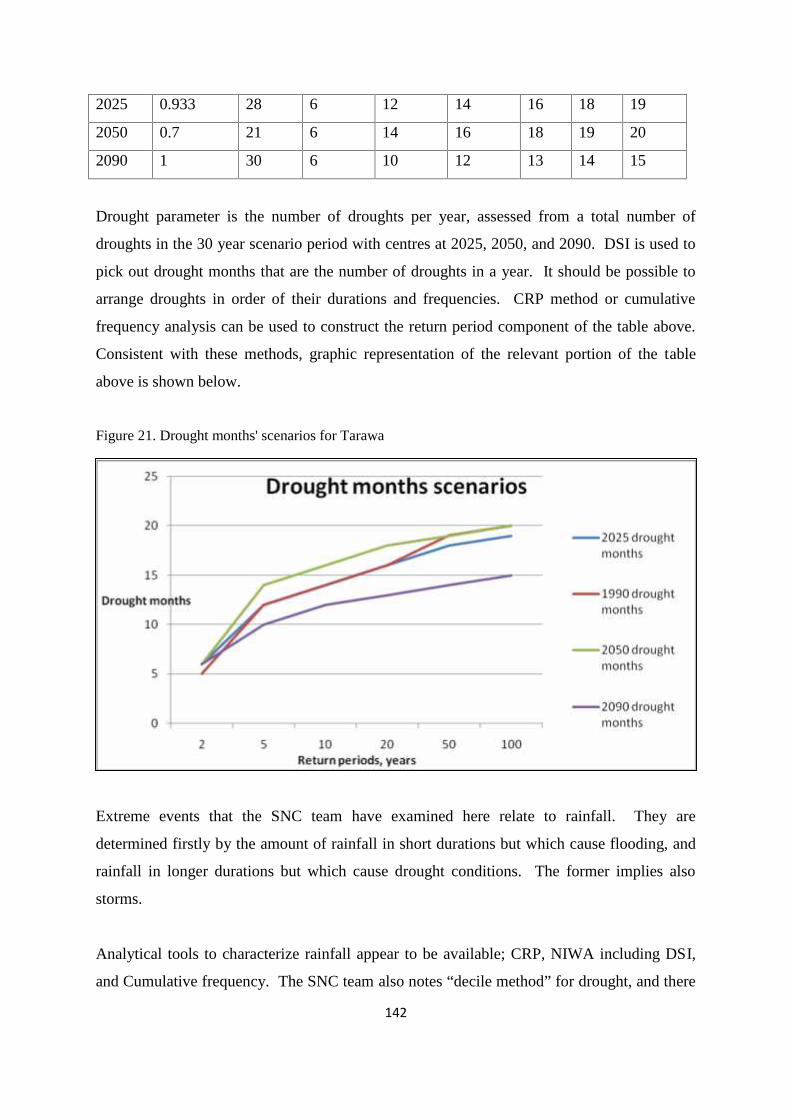
142
2025 0.933 28 6 12 14 16 18 19
2050 0.7 21 6 14 16 18 19 20
2090 1 30 6 10 12 13 14 15
Drought parameter is the number of droughts per year, assessed from a total number of
droughts in the 30 year scenario period with centres at 2025, 2050, and 2090. DSI is used to
pick out drought months that are the number of droughts in a year. It should be possible to
arrange droughts in order of their durations and frequencies. CRP method or cumulative
frequency analysis can be used to construct the return period component of the table above.
Consistent with these methods, graphic representation of the relevant portion of the table
above is shown below.
Figure 21. Drought months' scenarios for Tarawa
Extreme events that the SNC team have examined here relate to rainfall. They are
determined firstly by the amount of rainfall in short durations but which cause flooding, and
rainfall in longer durations but which cause drought conditions. The former implies also
storms.
Analytical tools to characterize rainfall appear to be available; CRP, NIWA including DSI,
and Cumulative frequency. The SNC team also notes “decile method” for drought, and there
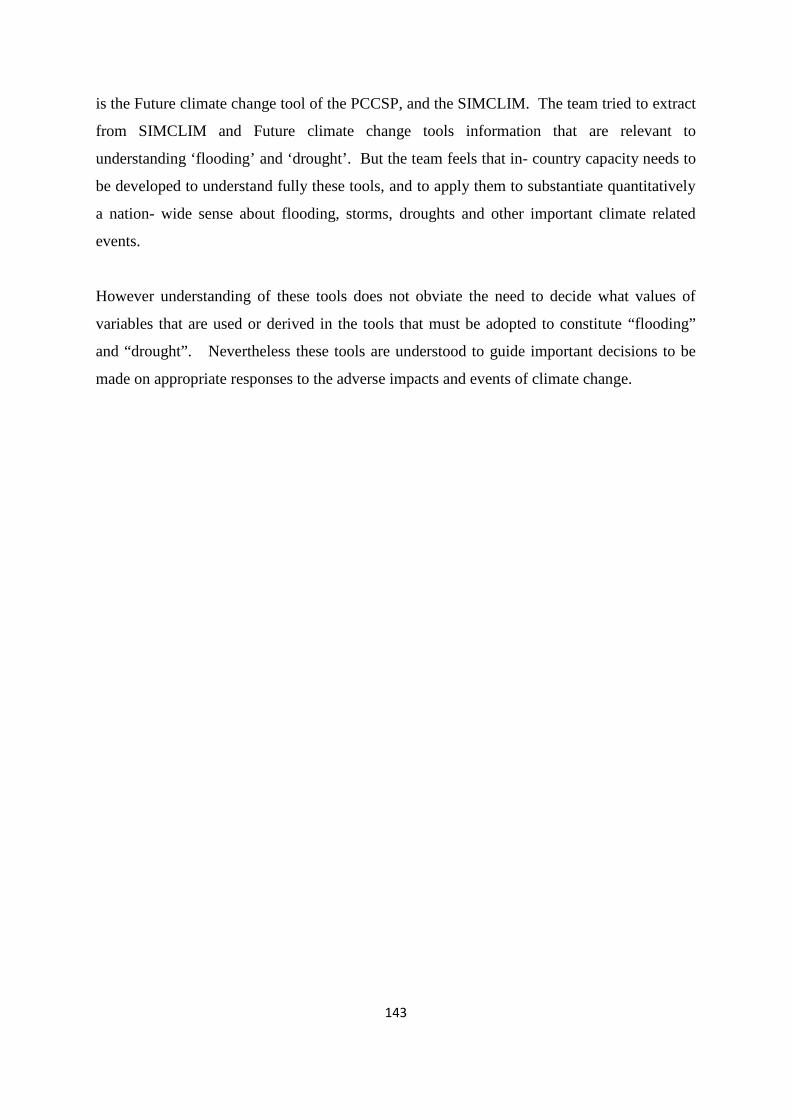
143
is the Future climate change tool of the PCCSP, and the SIMCLIM. The team tried to extract
from SIMCLIM and Future climate change tools information that are relevant to
understanding ‘flooding’ and ‘drought’. But the team feels that in- country capacity needs to
be developed to understand fully these tools, and to apply them to substantiate quantitatively
a nation- wide sense about flooding, storms, droughts and other important climate related
events.
However understanding of these tools does not obviate the need to decide what values of
variables that are used or derived in the tools that must be adopted to constitute “flooding”
and “drought”. Nevertheless these tools are understood to guide important decisions to be
made on appropriate responses to the adverse impacts and events of climate change.
144
5.6 VULNERABILITIES AND IMPACTS OF CLIMATE CHANGE ON KEYISLAND COMPONENTS IN KIRIBATI
Kiribati comprised of mostly coral atolls with the exception of only 1 raised limestone island,
Banaba. According to the 2005 census the majority of I-Kiribati resided on coral atolls and
therefore they have depended on the existing complex ecosystems of these coral atolls. The
socio-economic demands of Kiribati such as coastal aggregates mining on fragile coastal
environment, population growth with issue over limited land space and natural resources for
livelihood and infrastructure developments will exacerbate the vulnerability of Kiribati.
These existing socio-economic forces on the environments of these coral atolls combined
with climate variability and climate change effects are additional burdens that does not only
continue to threaten these sources of livelihoods but will eventually despair the people’s
cognition of being safe and able to survive in these islands.
This section covers the current state of important components of atoll islands and their
vulnerability to the projected adverse effects of climate change. These critical components
include Water lens, Coastal Zone, Agricultural systems, Marine ecosystems, Biodiversity and
Livelihood and Health.
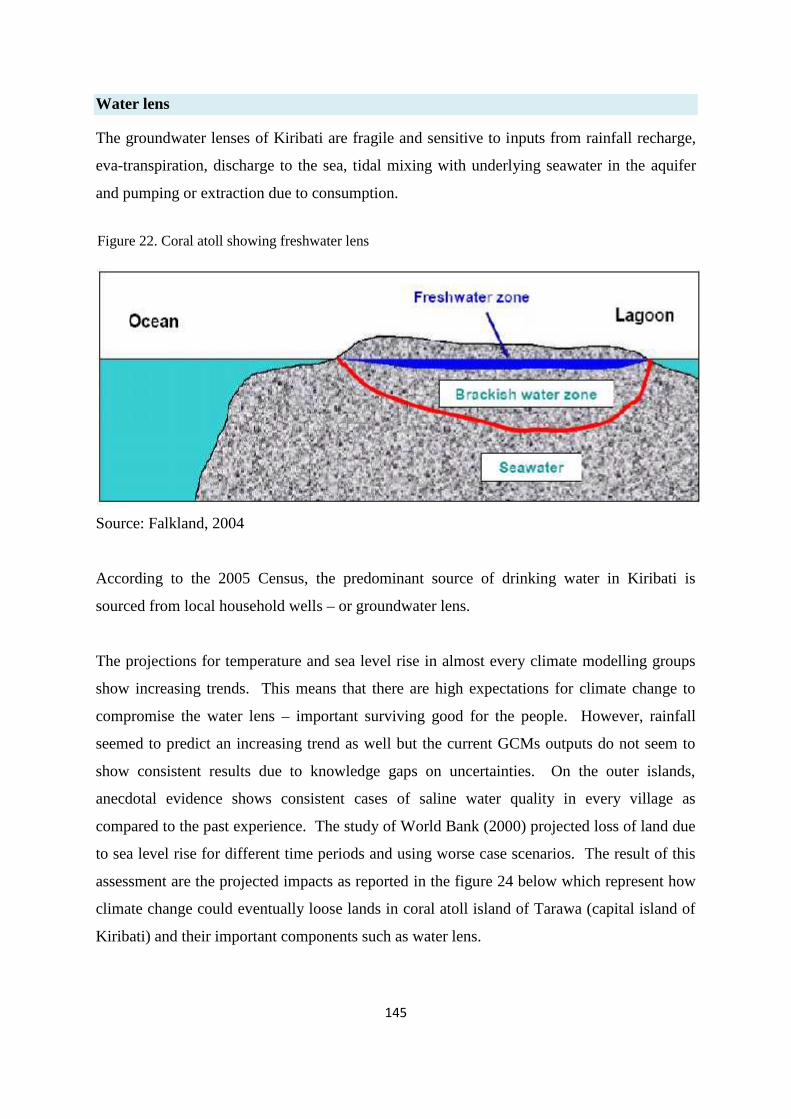
145
Water lens
The groundwater lenses of Kiribati are fragile and sensitive to inputs from rainfall recharge,
eva-transpiration, discharge to the sea, tidal mixing with underlying seawater in the aquifer
and pumping or extraction due to consumption.
Source: Falkland, 2004
According to the 2005 Census, the predominant source of drinking water in Kiribati is
sourced from local household wells – or groundwater lens.
The projections for temperature and sea level rise in almost every climate modelling groups
show increasing trends. This means that there are high expectations for climate change to
compromise the water lens – important surviving good for the people. However, rainfall
seemed to predict an increasing trend as well but the current GCMs outputs do not seem to
show consistent results due to knowledge gaps on uncertainties. On the outer islands,
anecdotal evidence shows consistent cases of saline water quality in every village as
compared to the past experience. The study of World Bank (2000) projected loss of land due
to sea level rise for different time periods and using worse case scenarios. The result of this
assessment are the projected impacts as reported in the figure 24 below which represent how
climate change could eventually loose lands in coral atoll island of Tarawa (capital island of
Kiribati) and their important components such as water lens.
Figure 22. Coral atoll showing freshwater lens
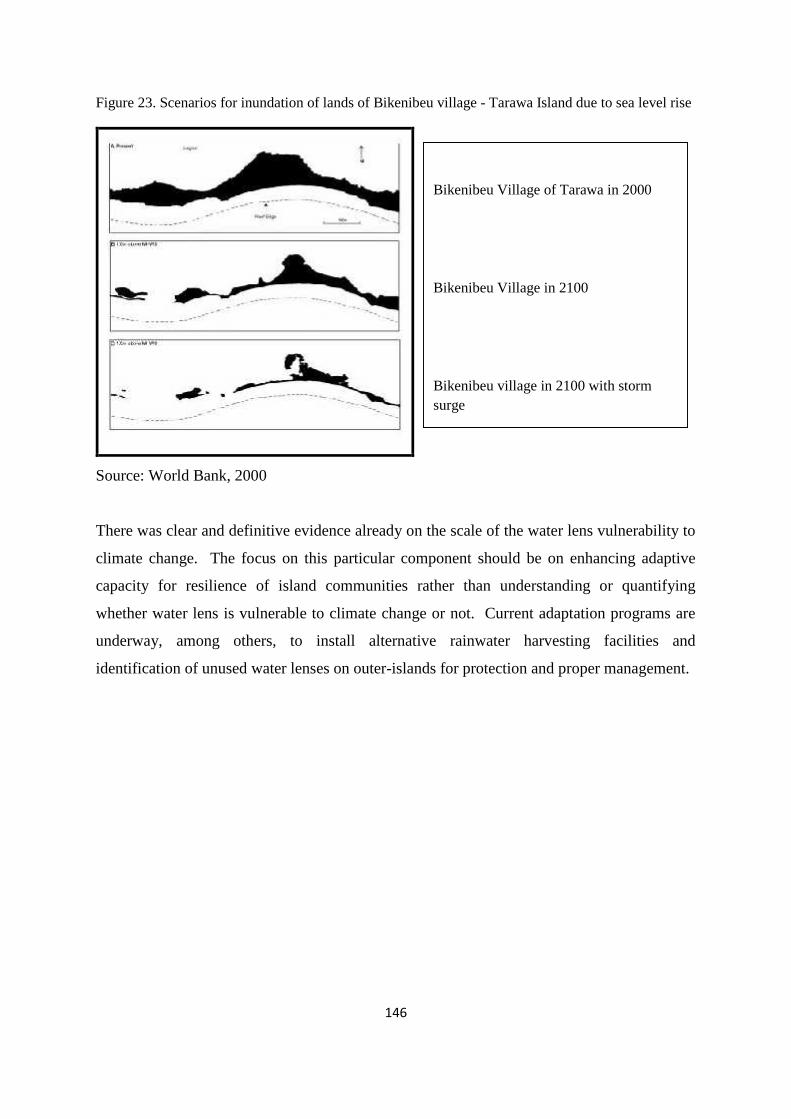
146
Figure 23. Scenarios for inundation of lands of Bikenibeu village - Tarawa Island due to sea level rise
Source: World Bank, 2000
There was clear and definitive evidence already on the scale of the water lens vulnerability to
climate change. The focus on this particular component should be on enhancing adaptive
capacity for resilience of island communities rather than understanding or quantifying
whether water lens is vulnerable to climate change or not. Current adaptation programs are
underway, among others, to install alternative rainwater harvesting facilities and
identification of unused water lenses on outer-islands for protection and proper management.
Bikenibeu Village of Tarawa in 2000
Bikenibeu Village in 2100
Bikenibeu village in 2100 with stormsurge
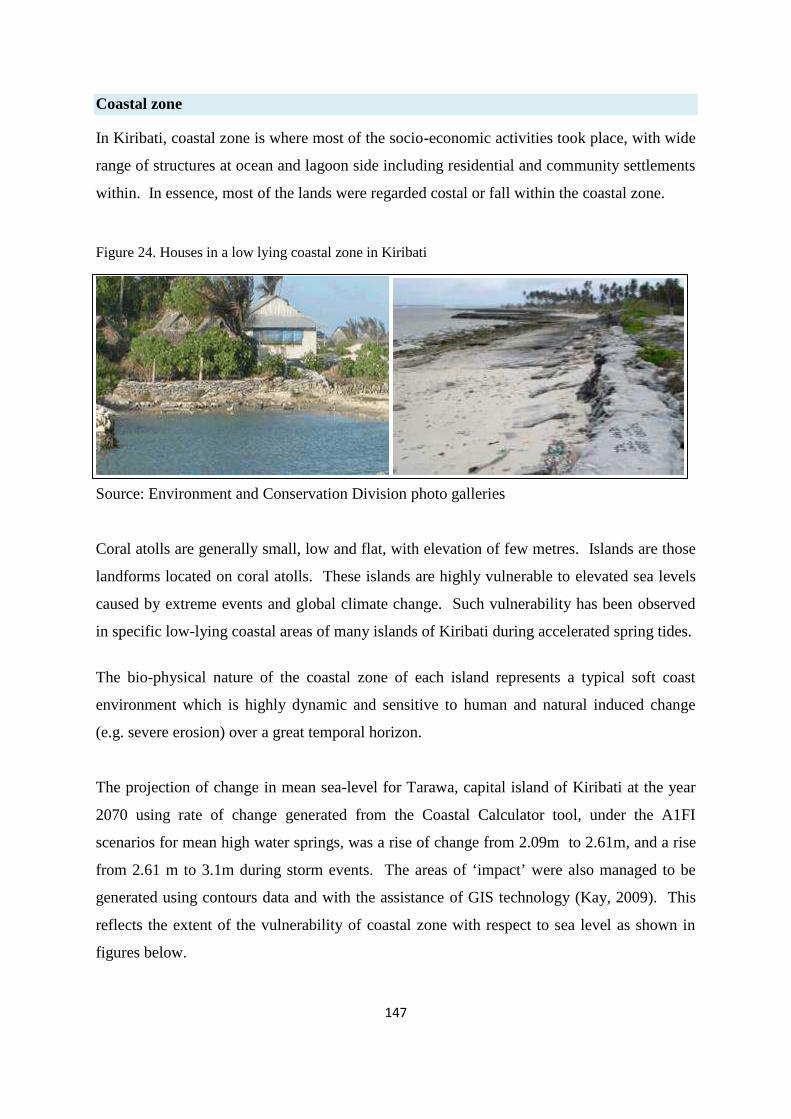
147
Coastal zone
In Kiribati, coastal zone is where most of the socio-economic activities took place, with wide
range of structures at ocean and lagoon side including residential and community settlements
within. In essence, most of the lands were regarded costal or fall within the coastal zone.
Figure 24. Houses in a low lying coastal zone in Kiribati
Source: Environment and Conservation Division photo galleries
Coral atolls are generally small, low and flat, with elevation of few metres. Islands are those
landforms located on coral atolls. These islands are highly vulnerable to elevated sea levels
caused by extreme events and global climate change. Such vulnerability has been observed
in specific low-lying coastal areas of many islands of Kiribati during accelerated spring tides.
The bio-physical nature of the coastal zone of each island represents a typical soft coast
environment which is highly dynamic and sensitive to human and natural induced change
(e.g. severe erosion) over a great temporal horizon.
The projection of change in mean sea-level for Tarawa, capital island of Kiribati at the year
2070 using rate of change generated from the Coastal Calculator tool, under the A1FI
scenarios for mean high water springs, was a rise of change from 2.09m to 2.61m, and a rise
from 2.61 m to 3.1m during storm events. The areas of ‘impact’ were also managed to be
generated using contours data and with the assistance of GIS technology (Kay, 2009). This
reflects the extent of the vulnerability of coastal zone with respect to sea level as shown in
figures below.
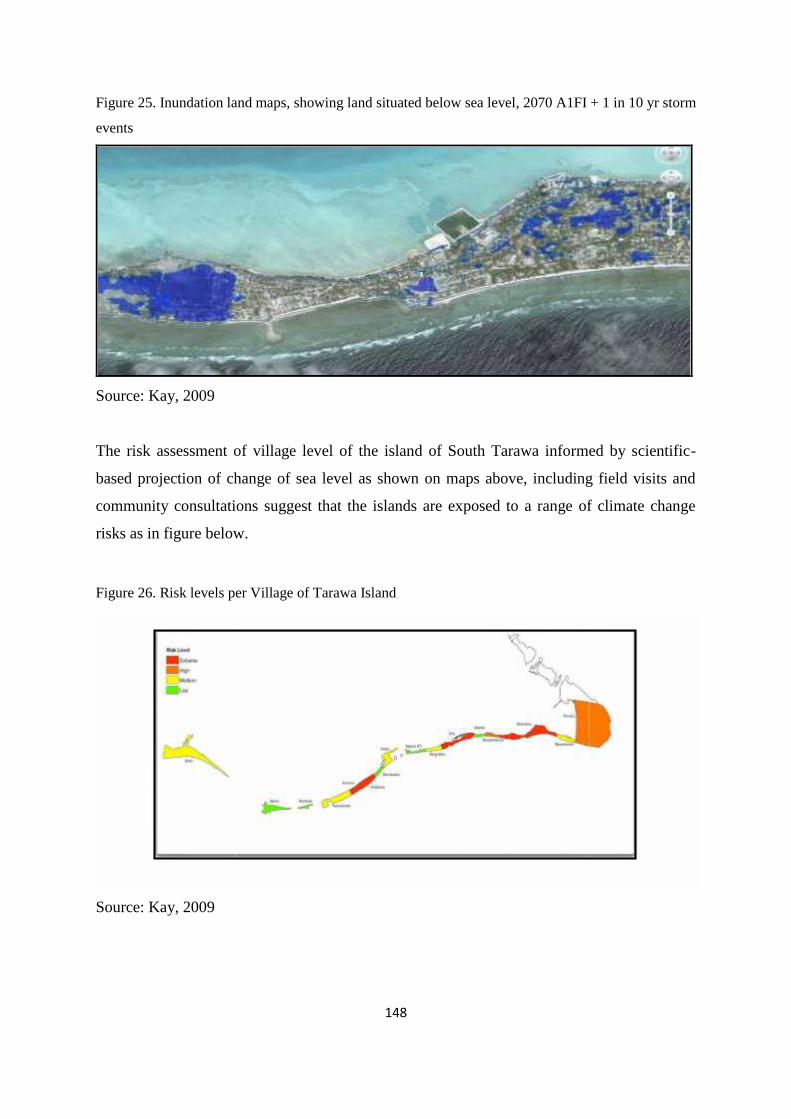
148
Figure 25. Inundation land maps, showing land situated below sea level, 2070 A1FI + 1 in 10 yr storm
events
Source: Kay, 2009
The risk assessment of village level of the island of South Tarawa informed by scientific-
based projection of change of sea level as shown on maps above, including field visits and
community consultations suggest that the islands are exposed to a range of climate change
risks as in figure below.
Figure 26. Risk levels per Village of Tarawa Island
Source: Kay, 2009
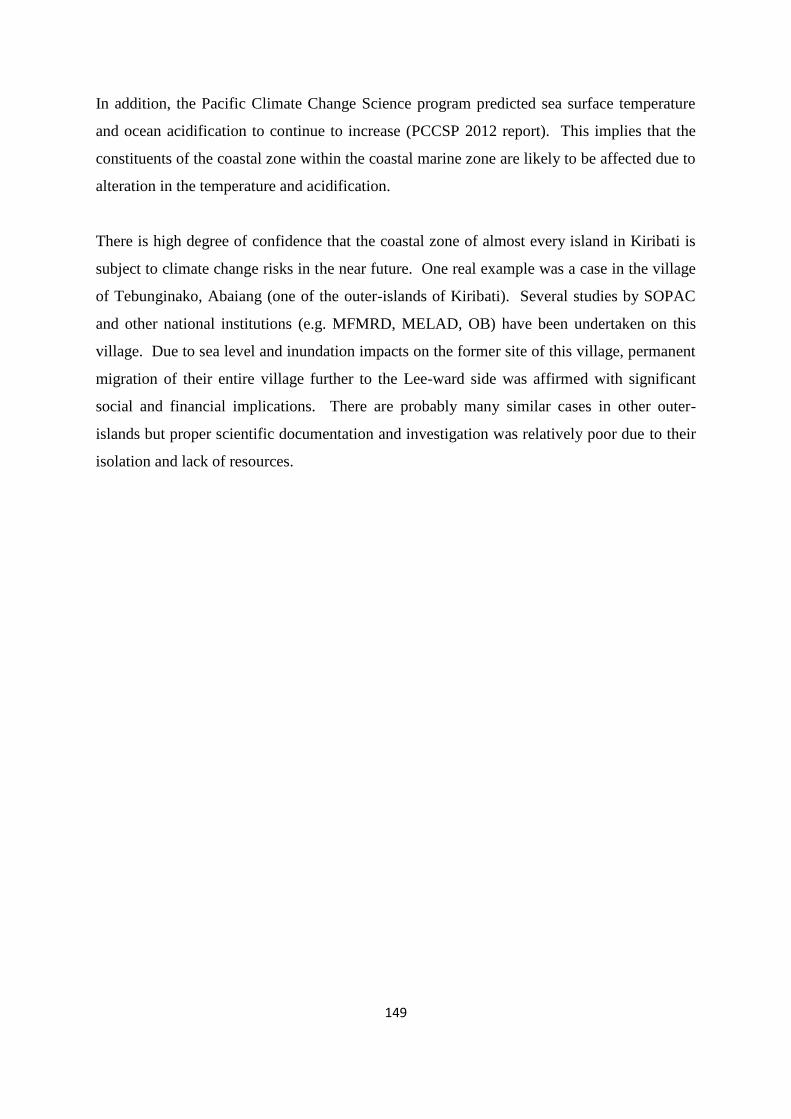
149
In addition, the Pacific Climate Change Science program predicted sea surface temperature
and ocean acidification to continue to increase (PCCSP 2012 report). This implies that the
constituents of the coastal zone within the coastal marine zone are likely to be affected due to
alteration in the temperature and acidification.
There is high degree of confidence that the coastal zone of almost every island in Kiribati is
subject to climate change risks in the near future. One real example was a case in the village
of Tebunginako, Abaiang (one of the outer-islands of Kiribati). Several studies by SOPAC
and other national institutions (e.g. MFMRD, MELAD, OB) have been undertaken on this
village. Due to sea level and inundation impacts on the former site of this village, permanent
migration of their entire village further to the Lee-ward side was affirmed with significant
social and financial implications. There are probably many similar cases in other outer-
islands but proper scientific documentation and investigation was relatively poor due to their
isolation and lack of resources.
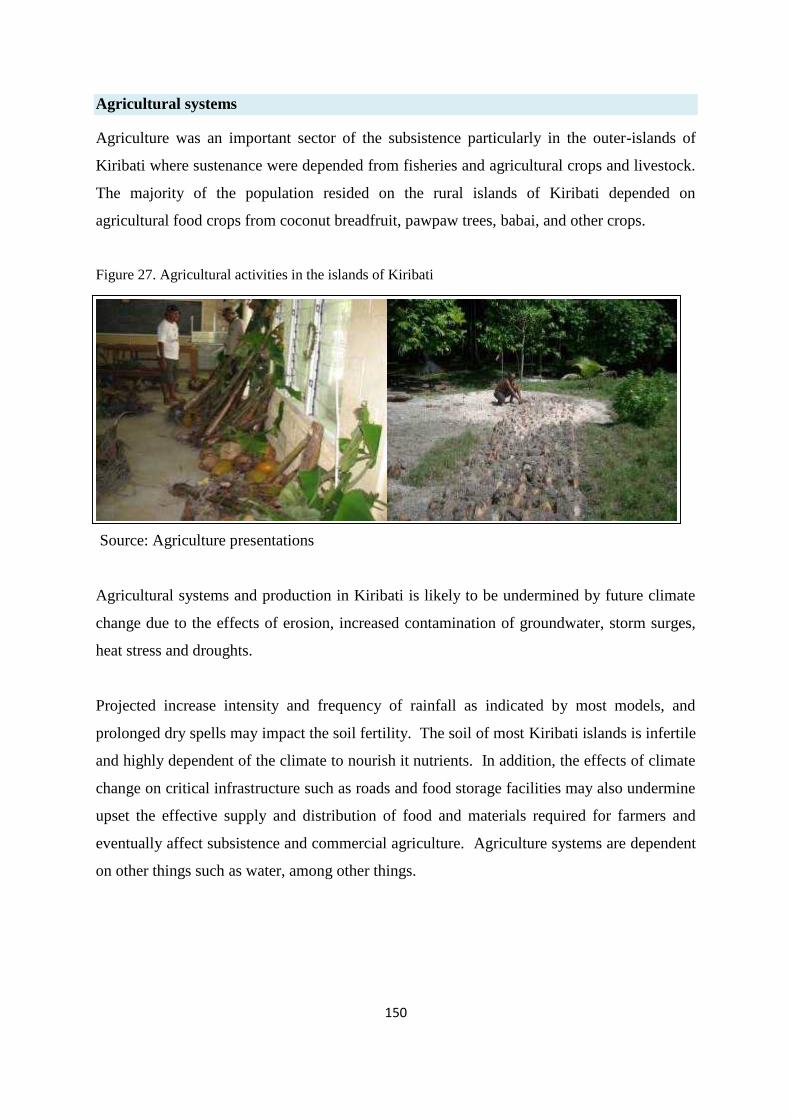
150
Agricultural systems
Agriculture was an important sector of the subsistence particularly in the outer-islands of
Kiribati where sustenance were depended from fisheries and agricultural crops and livestock.
The majority of the population resided on the rural islands of Kiribati depended on
agricultural food crops from coconut breadfruit, pawpaw trees, babai, and other crops.
Figure 27. Agricultural activities in the islands of Kiribati
Source: Agriculture presentations
Agricultural systems and production in Kiribati is likely to be undermined by future climate
change due to the effects of erosion, increased contamination of groundwater, storm surges,
heat stress and droughts.
Projected increase intensity and frequency of rainfall as indicated by most models, and
prolonged dry spells may impact the soil fertility. The soil of most Kiribati islands is infertile
and highly dependent of the climate to nourish it nutrients. In addition, the effects of climate
change on critical infrastructure such as roads and food storage facilities may also undermine
upset the effective supply and distribution of food and materials required for farmers and
eventually affect subsistence and commercial agriculture. Agriculture systems are dependent
on other things such as water, among other things.
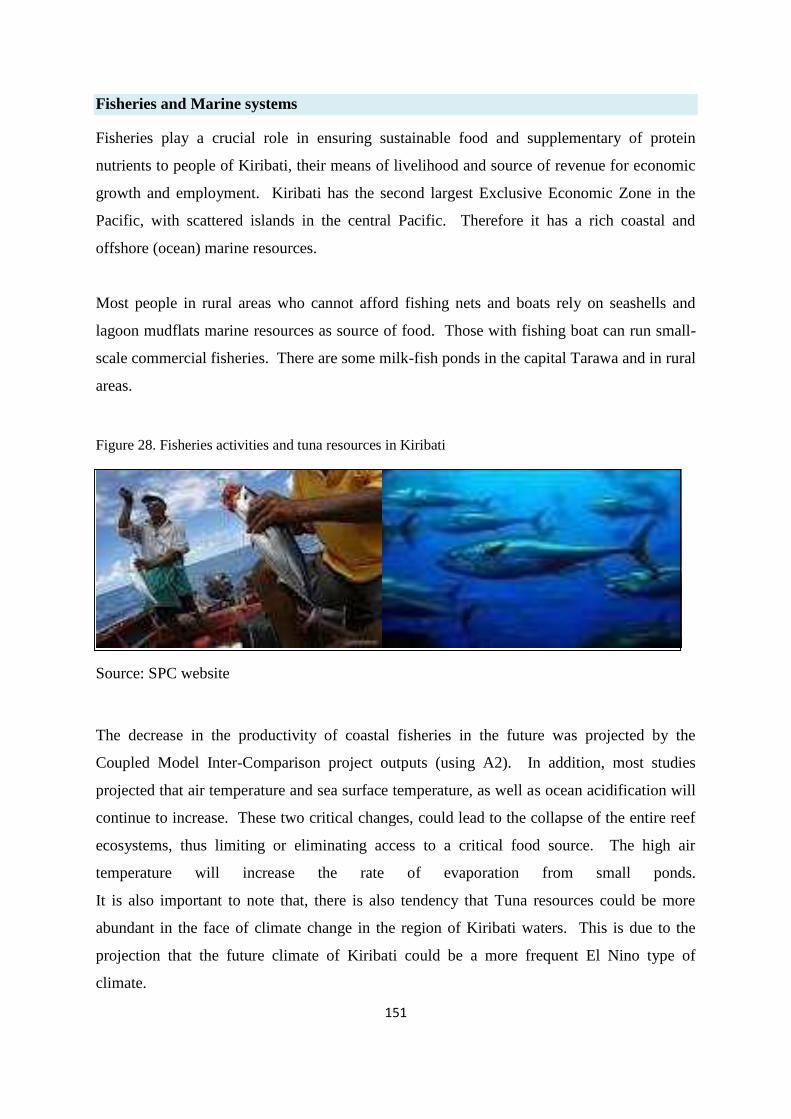
151
Fisheries and Marine systems
Fisheries play a crucial role in ensuring sustainable food and supplementary of protein
nutrients to people of Kiribati, their means of livelihood and source of revenue for economic
growth and employment. Kiribati has the second largest Exclusive Economic Zone in the
Pacific, with scattered islands in the central Pacific. Therefore it has a rich coastal and
offshore (ocean) marine resources.
Most people in rural areas who cannot afford fishing nets and boats rely on seashells and
lagoon mudflats marine resources as source of food. Those with fishing boat can run small-
scale commercial fisheries. There are some milk-fish ponds in the capital Tarawa and in rural
areas.
Figure 28. Fisheries activities and tuna resources in Kiribati
Source: SPC website
The decrease in the productivity of coastal fisheries in the future was projected by the
Coupled Model Inter-Comparison project outputs (using A2). In addition, most studies
projected that air temperature and sea surface temperature, as well as ocean acidification will
continue to increase. These two critical changes, could lead to the collapse of the entire reef
ecosystems, thus limiting or eliminating access to a critical food source. The high air
temperature will increase the rate of evaporation from small ponds.
It is also important to note that, there is also tendency that Tuna resources could be more
abundant in the face of climate change in the region of Kiribati waters. This is due to the
projection that the future climate of Kiribati could be a more frequent El Nino type of
climate.
152
An El Nino climate means more warm pool waters in the central pacific which brings with it
fortunes of Tuna (especially Skipjack tuna). This becomes a positive impact of climate
change on the fisheries sector. The coastal fisheries will be impacted much.
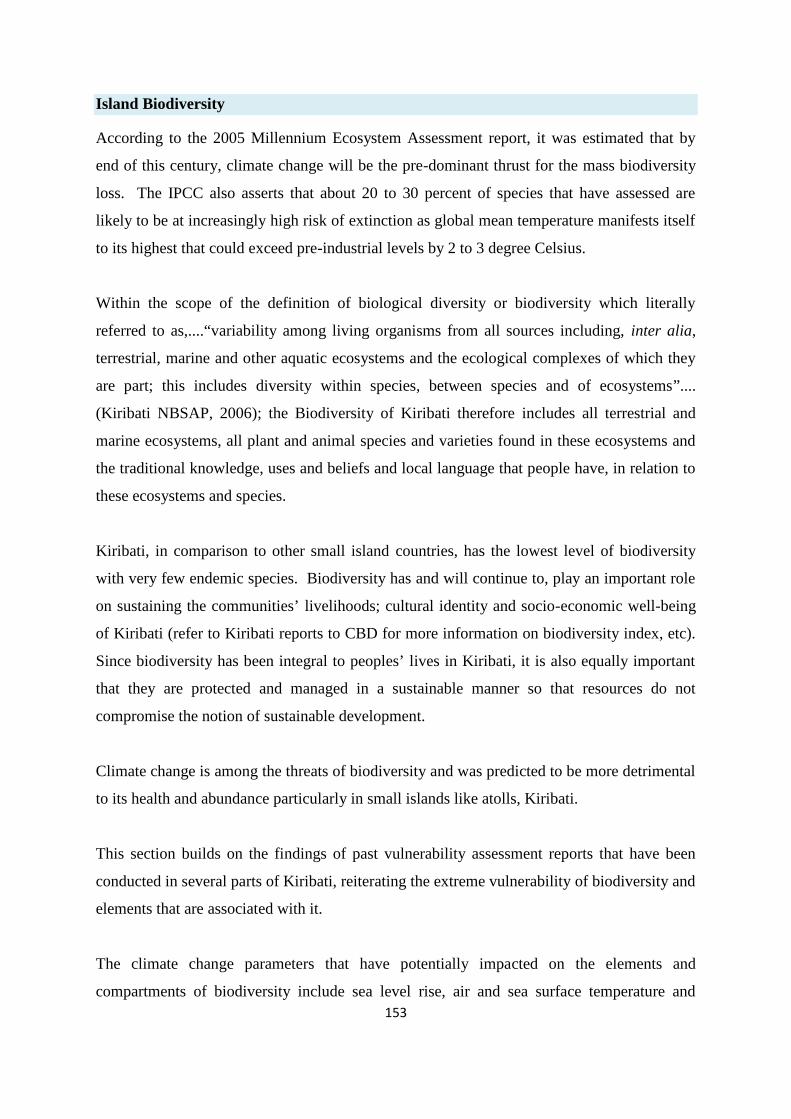
153
Island Biodiversity
According to the 2005 Millennium Ecosystem Assessment report, it was estimated that by
end of this century, climate change will be the pre-dominant thrust for the mass biodiversity
loss. The IPCC also asserts that about 20 to 30 percent of species that have assessed are
likely to be at increasingly high risk of extinction as global mean temperature manifests itself
to its highest that could exceed pre-industrial levels by 2 to 3 degree Celsius.
Within the scope of the definition of biological diversity or biodiversity which literally
referred to as,....“variability among living organisms from all sources including, inter alia,
terrestrial, marine and other aquatic ecosystems and the ecological complexes of which they
are part; this includes diversity within species, between species and of ecosystems”....
(Kiribati NBSAP, 2006); the Biodiversity of Kiribati therefore includes all terrestrial and
marine ecosystems, all plant and animal species and varieties found in these ecosystems and
the traditional knowledge, uses and beliefs and local language that people have, in relation to
these ecosystems and species.
Kiribati, in comparison to other small island countries, has the lowest level of biodiversity
with very few endemic species. Biodiversity has and will continue to, play an important role
on sustaining the communities’ livelihoods; cultural identity and socio-economic well-being
of Kiribati (refer to Kiribati reports to CBD for more information on biodiversity index, etc).
Since biodiversity has been integral to peoples’ lives in Kiribati, it is also equally important
that they are protected and managed in a sustainable manner so that resources do not
compromise the notion of sustainable development.
Climate change is among the threats of biodiversity and was predicted to be more detrimental
to its health and abundance particularly in small islands like atolls, Kiribati.
This section builds on the findings of past vulnerability assessment reports that have been
conducted in several parts of Kiribati, reiterating the extreme vulnerability of biodiversity and
elements that are associated with it.
The climate change parameters that have potentially impacted on the elements and
compartments of biodiversity include sea level rise, air and sea surface temperature and

154
drought severity. Rain downpour is to some extent plays an important role to enhancing
biodiversity abundance. However, in urban islands it is also believed that rain downpour was
an ingrained factor to land-based pollution which in turn pollutes coastal marine biodiversity.
It is clear from the past trends and projections that these climate parameters have increased
variability. These patterns have contributed to the downgrade of Kiribati’s limited
biodiversity.
Alternatively, rain downpour has impacts on the avi-fauna population. During the El Nino
season towards the end of 2009 to early March 2010, five nesting colonies in the Southeast
end of Kiritimati Island Peninsula along with number of nesting grounds at the Central area
lagoon area of the same island – a popular habitat occupied by shearwater, noddies and terns
were badly affected by flooding from the prolonged period of heavy rainfall.
Vulnerability studies specific on biodiversity was limited simply because biodiversity was
too broad. Further research is required on this to establish some of reliable data and
mechanisms to use health of biodiversity as an indicator of the level of climate change
impacts. However many sector vulnerability studies have confirmed biodiversity will be
severally affected in the face of climate change. According to the World Bank report, it is
clearly stated that a large proportion of land in South Tarawa will be lost due to inundation as
a result of climate change (refer to fig 24). This could be imitated to be similar situation to
the rest of islands in Kiribati or even worse depending on many geo-related features.
However, on many islands saltwater salinity have been reported to have been increased
resulting in contamination of their “giant taro” plantations and other crops. Increase force of
storm surges coupled with sea level increase has accelerated risks of inundation in many of
the outer-islands. This was repeatedly reported by several outer-islanders in national
consultations.
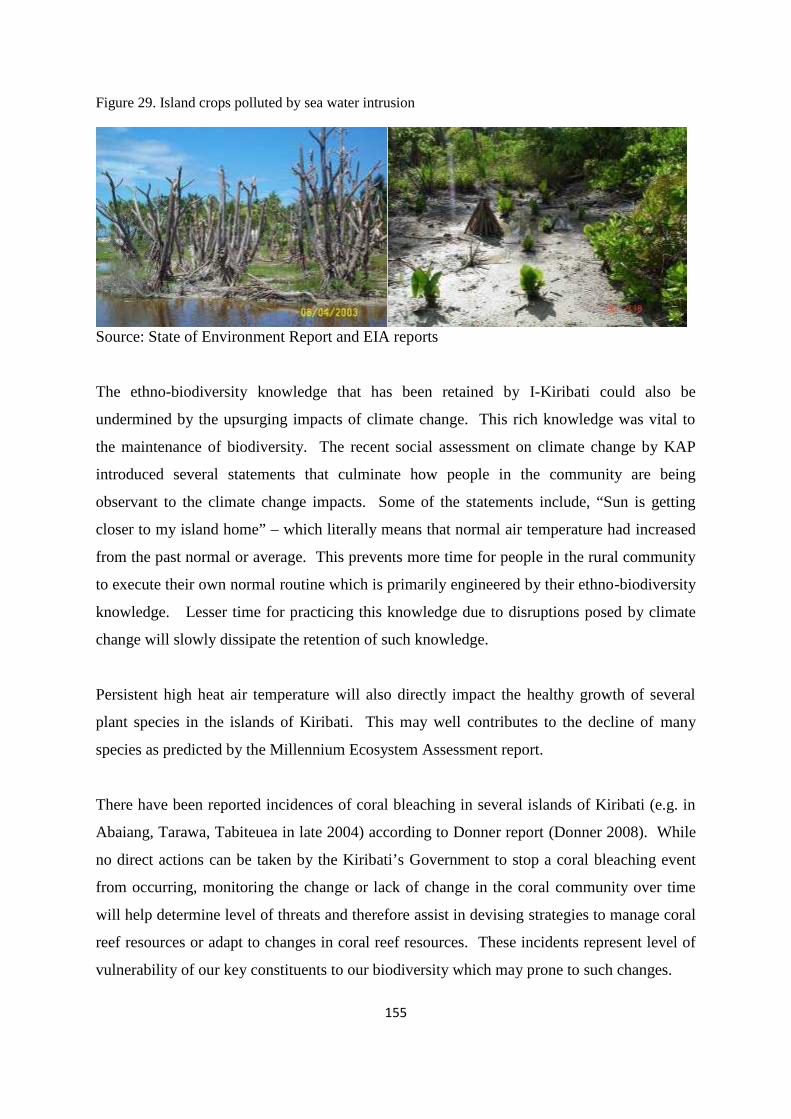
155
Figure 29. Island crops polluted by sea water intrusion
Source: State of Environment Report and EIA reports
The ethno-biodiversity knowledge that has been retained by I-Kiribati could also be
undermined by the upsurging impacts of climate change. This rich knowledge was vital to
the maintenance of biodiversity. The recent social assessment on climate change by KAP
introduced several statements that culminate how people in the community are being
observant to the climate change impacts. Some of the statements include, “Sun is getting
closer to my island home” – which literally means that normal air temperature had increased
from the past normal or average. This prevents more time for people in the rural community
to execute their own normal routine which is primarily engineered by their ethno-biodiversity
knowledge. Lesser time for practicing this knowledge due to disruptions posed by climate
change will slowly dissipate the retention of such knowledge.
Persistent high heat air temperature will also directly impact the healthy growth of several
plant species in the islands of Kiribati. This may well contributes to the decline of many
species as predicted by the Millennium Ecosystem Assessment report.
There have been reported incidences of coral bleaching in several islands of Kiribati (e.g. in
Abaiang, Tarawa, Tabiteuea in late 2004) according to Donner report (Donner 2008). While
no direct actions can be taken by the Kiribati’s Government to stop a coral bleaching event
from occurring, monitoring the change or lack of change in the coral community over time
will help determine level of threats and therefore assist in devising strategies to manage coral
reef resources or adapt to changes in coral reef resources. These incidents represent level of
vulnerability of our key constituents to our biodiversity which may prone to such changes.
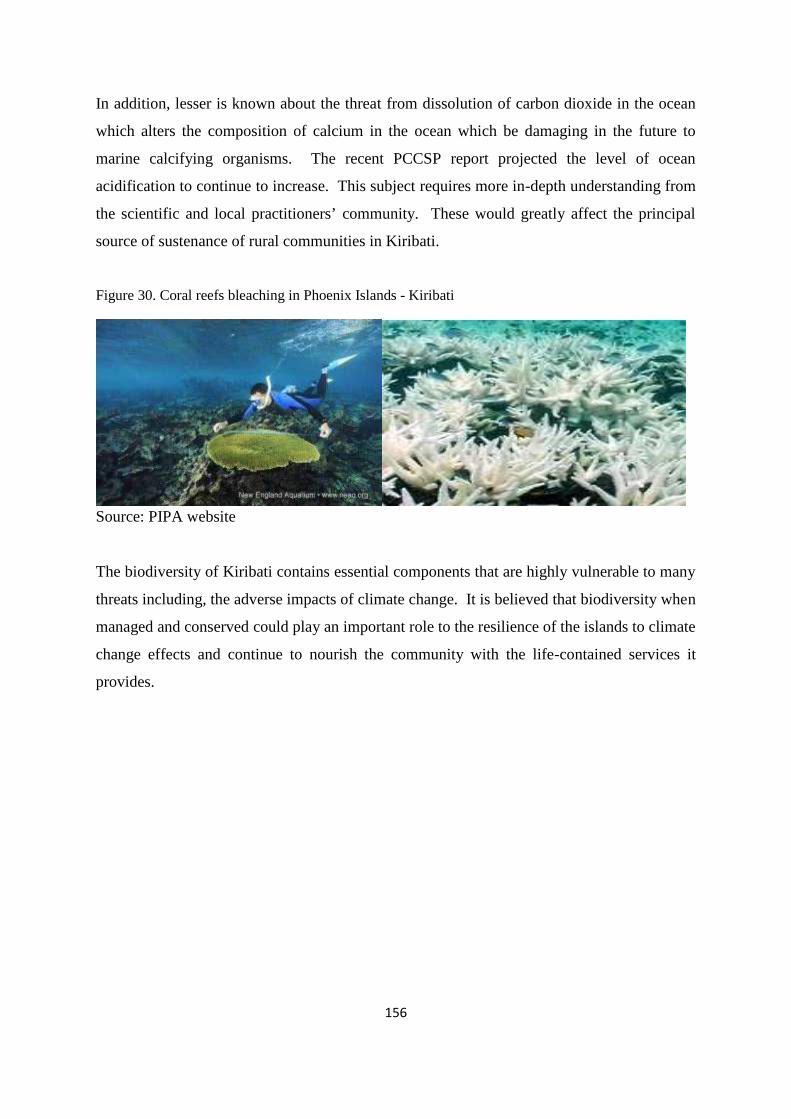
156
In addition, lesser is known about the threat from dissolution of carbon dioxide in the ocean
which alters the composition of calcium in the ocean which be damaging in the future to
marine calcifying organisms. The recent PCCSP report projected the level of ocean
acidification to continue to increase. This subject requires more in-depth understanding from
the scientific and local practitioners’ community. These would greatly affect the principal
source of sustenance of rural communities in Kiribati.
Figure 30. Coral reefs bleaching in Phoenix Islands - Kiribati
Source: PIPA website
The biodiversity of Kiribati contains essential components that are highly vulnerable to many
threats including, the adverse impacts of climate change. It is believed that biodiversity when
managed and conserved could play an important role to the resilience of the islands to climate
change effects and continue to nourish the community with the life-contained services it
provides.
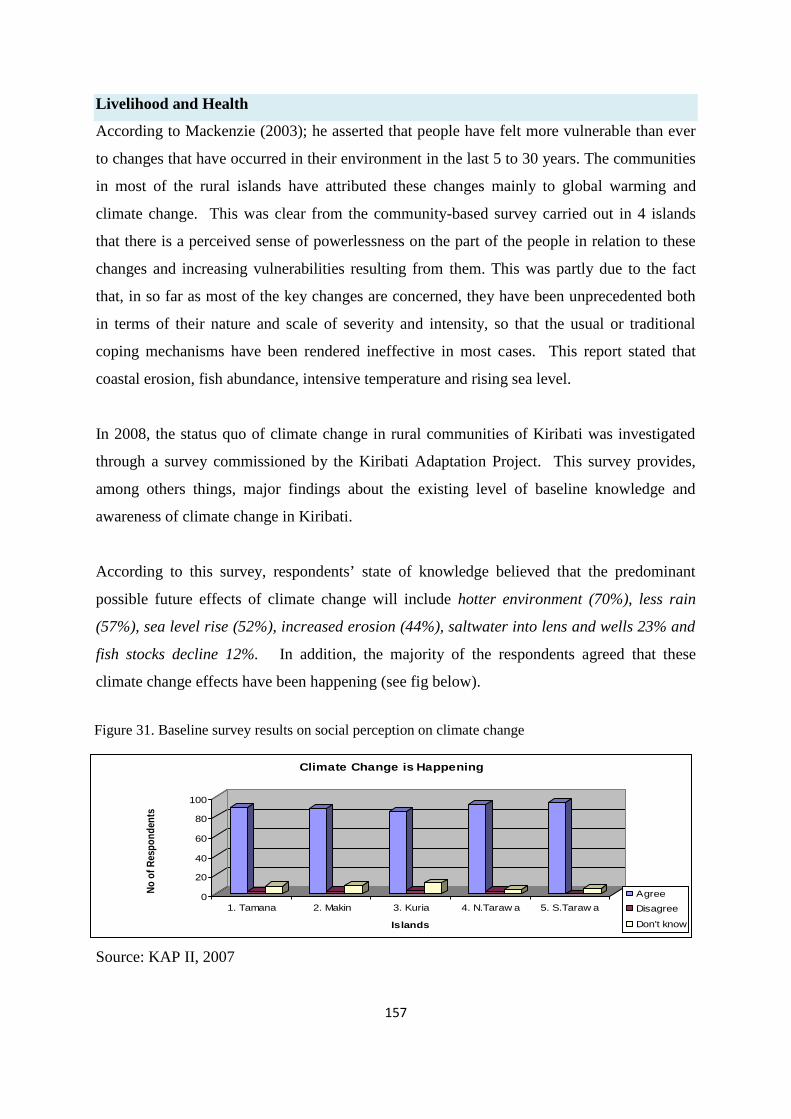
157
Livelihood and Health
According to Mackenzie (2003); he asserted that people have felt more vulnerable than ever
to changes that have occurred in their environment in the last 5 to 30 years. The communities
in most of the rural islands have attributed these changes mainly to global warming and
climate change. This was clear from the community-based survey carried out in 4 islands
that there is a perceived sense of powerlessness on the part of the people in relation to these
changes and increasing vulnerabilities resulting from them. This was partly due to the fact
that, in so far as most of the key changes are concerned, they have been unprecedented both
in terms of their nature and scale of severity and intensity, so that the usual or traditional
coping mechanisms have been rendered ineffective in most cases. This report stated that
coastal erosion, fish abundance, intensive temperature and rising sea level.
In 2008, the status quo of climate change in rural communities of Kiribati was investigated
through a survey commissioned by the Kiribati Adaptation Project. This survey provides,
among others things, major findings about the existing level of baseline knowledge and
awareness of climate change in Kiribati.
According to this survey, respondents’ state of knowledge believed that the predominant
possible future effects of climate change will include hotter environment (70%), less rain
(57%), sea level rise (52%), increased erosion (44%), saltwater into lens and wells 23% and
fish stocks decline 12%. In addition, the majority of the respondents agreed that these
climate change effects have been happening (see fig below).
Source: KAP II, 2007
0
20
40
60
80
100
No o
f Res
pond
ents
1. Tamana 2. Makin 3. Kuria 4. N.Taraw a 5. S.Taraw a
Islands
Climate Change is Happening
AgreeDisagree
Don't know
Figure 31. Baseline survey results on social perception on climate change
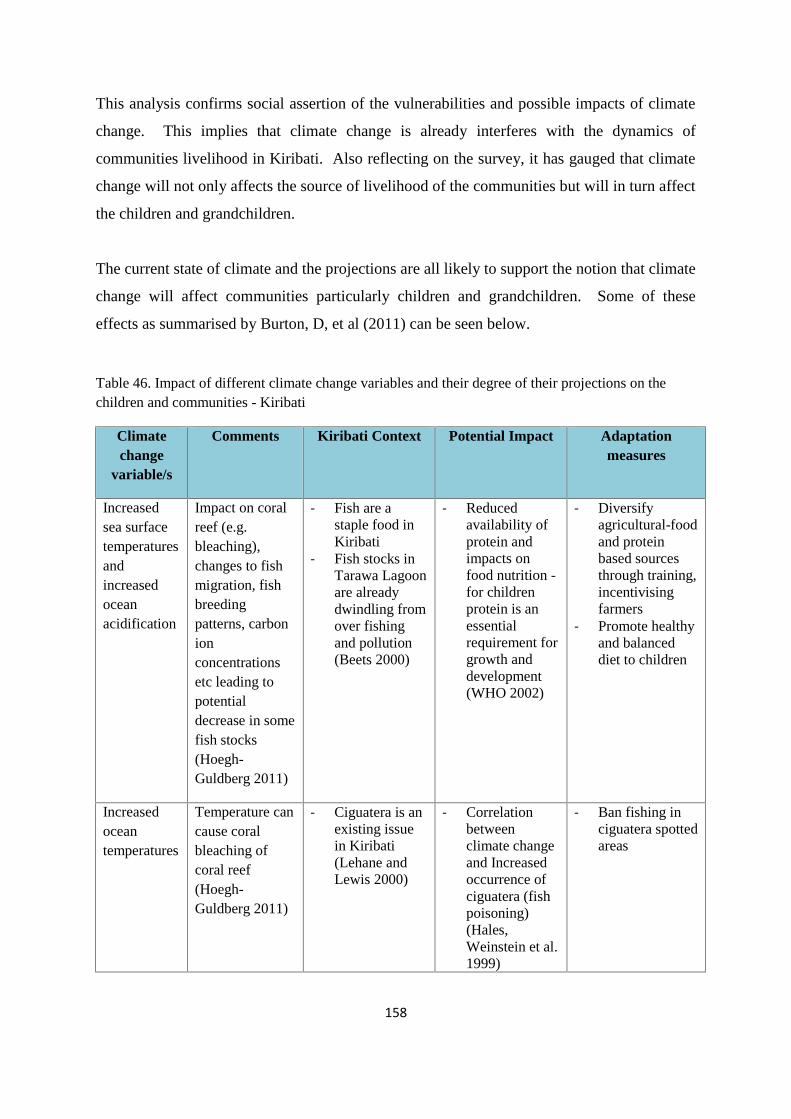
158
This analysis confirms social assertion of the vulnerabilities and possible impacts of climate
change. This implies that climate change is already interferes with the dynamics of
communities livelihood in Kiribati. Also reflecting on the survey, it has gauged that climate
change will not only affects the source of livelihood of the communities but will in turn affect
the children and grandchildren.
The current state of climate and the projections are all likely to support the notion that climate
change will affect communities particularly children and grandchildren. Some of these
effects as summarised by Burton, D, et al (2011) can be seen below.
Table 46. Impact of different climate change variables and their degree of their projections on thechildren and communities - Kiribati
Climatechange
variable/s
Comments Kiribati Context Potential Impact Adaptationmeasures
Increasedsea surfacetemperaturesandincreasedoceanacidification
Impact on coralreef (e.g.bleaching),changes to fishmigration, fishbreedingpatterns, carbonionconcentrationsetc leading topotentialdecrease in somefish stocks(Hoegh-Guldberg 2011)
- Fish are astaple food inKiribati
- Fish stocks inTarawa Lagoonare alreadydwindling fromover fishingand pollution(Beets 2000)
- Reducedavailability ofprotein andimpacts onfood nutrition -for childrenprotein is anessentialrequirement forgrowth anddevelopment(WHO 2002)
- Diversifyagricultural-foodand proteinbased sourcesthrough training,incentivisingfarmers
- Promote healthyand balanceddiet to children
Increasedoceantemperatures
Temperature cancause coralbleaching ofcoral reef(Hoegh-Guldberg 2011)
- Ciguatera is anexisting issuein Kiribati(Lehane andLewis 2000)
- Correlationbetweenclimate changeand Increasedoccurrence ofciguatera (fishpoisoning)(Hales,Weinstein et al.1999)
- Ban fishing inciguatera spottedareas
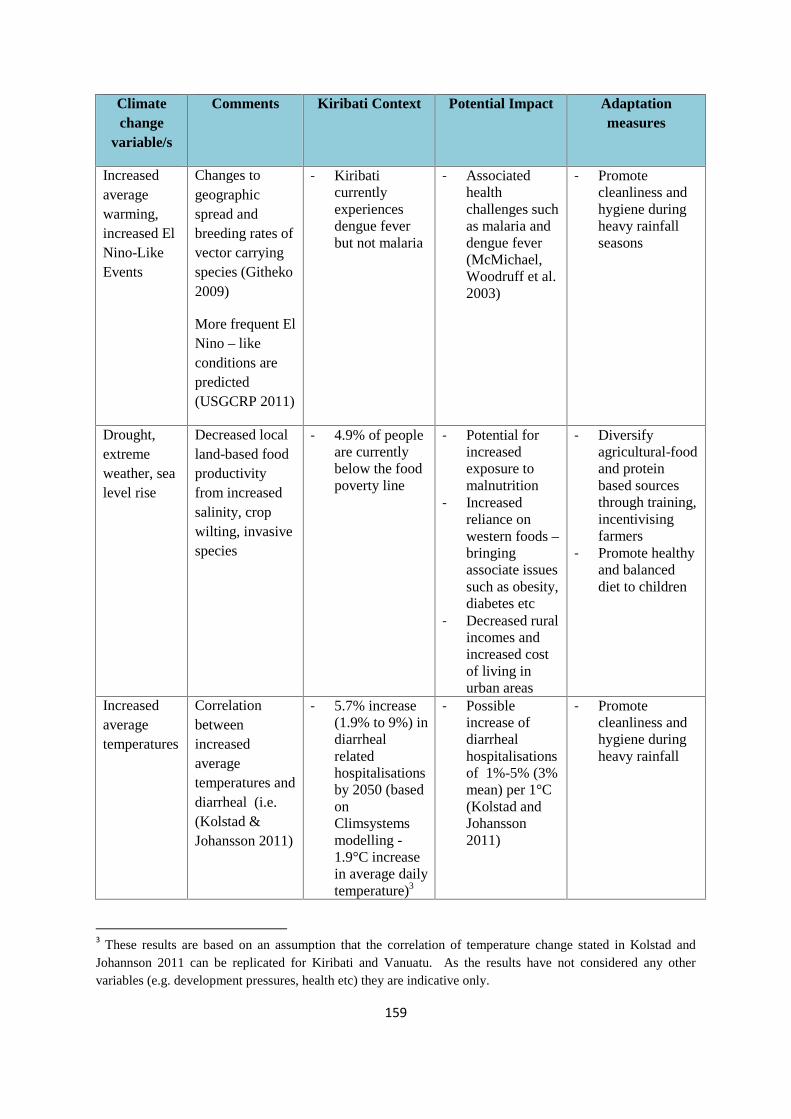
159
Climatechange
variable/s
Comments Kiribati Context Potential Impact Adaptationmeasures
Increasedaveragewarming,increased ElNino-LikeEvents
Changes togeographicspread andbreeding rates ofvector carryingspecies (Githeko2009)
More frequent ElNino – likeconditions arepredicted(USGCRP 2011)
- Kiribaticurrentlyexperiencesdengue feverbut not malaria
- Associatedhealthchallenges suchas malaria anddengue fever(McMichael,Woodruff et al.2003)
- Promotecleanliness andhygiene duringheavy rainfallseasons
Drought,extremeweather, sealevel rise
Decreased localland-based foodproductivityfrom increasedsalinity, cropwilting, invasivespecies
- 4.9% of peopleare currentlybelow the foodpoverty line
- Potential forincreasedexposure tomalnutrition
- Increasedreliance onwestern foods –bringingassociate issuessuch as obesity,diabetes etc
- Decreased ruralincomes andincreased costof living inurban areas
- Diversifyagricultural-foodand proteinbased sourcesthrough training,incentivisingfarmers
- Promote healthyand balanceddiet to children
Increasedaveragetemperatures
Correlationbetweenincreasedaveragetemperatures anddiarrheal (i.e.(Kolstad &Johansson 2011)
- 5.7% increase(1.9% to 9%) indiarrhealrelatedhospitalisationsby 2050 (basedonClimsystemsmodelling -1.9°C increasein average dailytemperature)3
- Possibleincrease ofdiarrhealhospitalisationsof 1%-5% (3%mean) per 1°C(Kolstad andJohansson2011)
- Promotecleanliness andhygiene duringheavy rainfall
3 These results are based on an assumption that the correlation of temperature change stated in Kolstad andJohannson 2011 can be replicated for Kiribati and Vanuatu. As the results have not considered any othervariables (e.g. development pressures, health etc) they are indicative only.
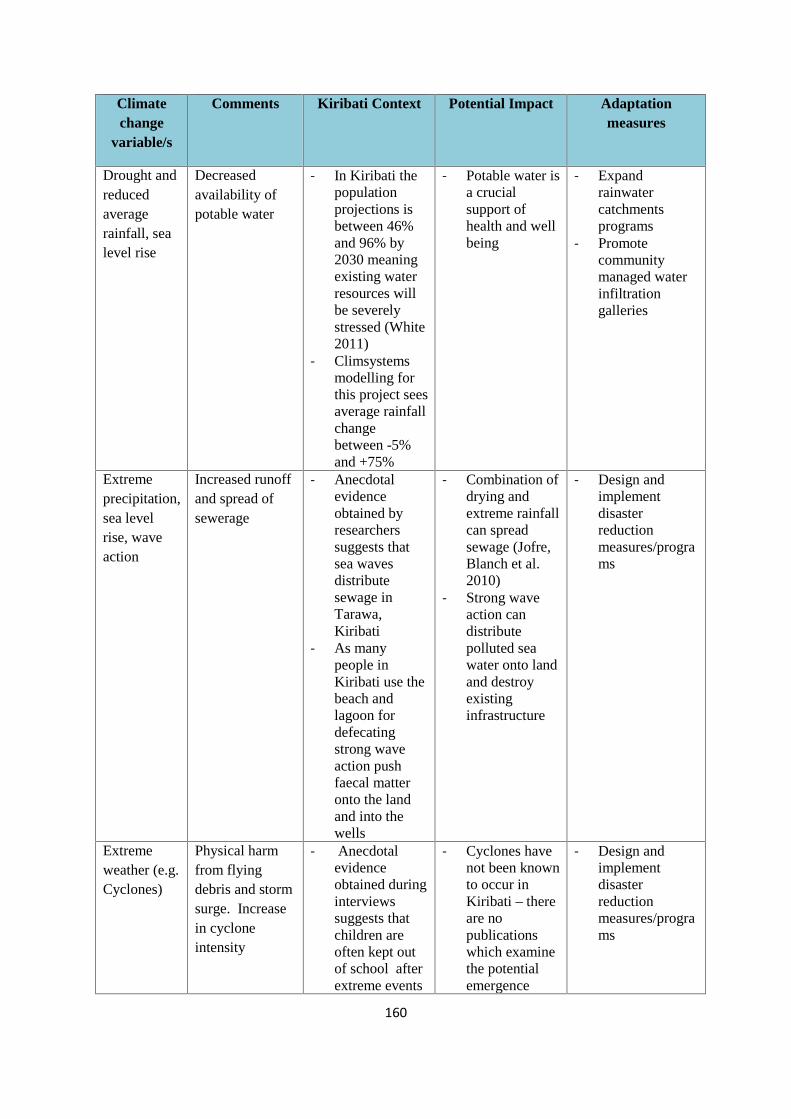
160
Climatechange
variable/s
Comments Kiribati Context Potential Impact Adaptationmeasures
Drought andreducedaveragerainfall, sealevel rise
Decreasedavailability ofpotable water
- In Kiribati thepopulationprojections isbetween 46%and 96% by2030 meaningexisting waterresources willbe severelystressed (White2011)
- Climsystemsmodelling forthis project seesaverage rainfallchangebetween -5%and +75%
- Potable water isa crucialsupport ofhealth and wellbeing
- Expandrainwatercatchmentsprograms
- Promotecommunitymanaged waterinfiltrationgalleries
Extremeprecipitation,sea levelrise, waveaction
Increased runoffand spread ofsewerage
- Anecdotalevidenceobtained byresearcherssuggests thatsea wavesdistributesewage inTarawa,Kiribati
- As manypeople inKiribati use thebeach andlagoon fordefecatingstrong waveaction pushfaecal matteronto the landand into thewells
- Combination ofdrying andextreme rainfallcan spreadsewage (Jofre,Blanch et al.2010)
- Strong waveaction candistributepolluted seawater onto landand destroyexistinginfrastructure
- Design andimplementdisasterreductionmeasures/programs
Extremeweather (e.g.Cyclones)
Physical harmfrom flyingdebris and stormsurge. Increasein cycloneintensity
- Anecdotalevidenceobtained duringinterviewssuggests thatchildren areoften kept outof school afterextreme events
- Cyclones havenot been knownto occur inKiribati – thereare nopublicationswhich examinethe potentialemergence
- Design andimplementdisasterreductionmeasures/programs
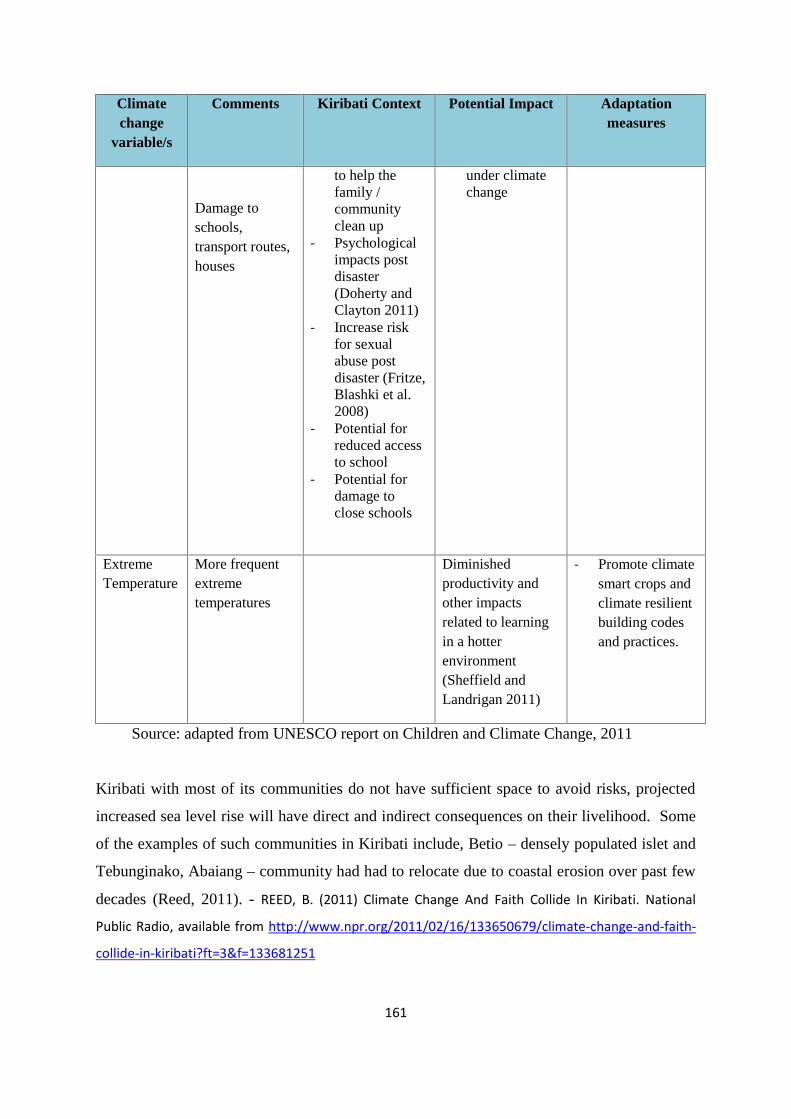
161
Climatechange
variable/s
Comments Kiribati Context Potential Impact Adaptationmeasures
Damage toschools,transport routes,houses
to help thefamily /communityclean up
- Psychologicalimpacts postdisaster(Doherty andClayton 2011)
- Increase riskfor sexualabuse postdisaster (Fritze,Blashki et al.2008)
- Potential forreduced accessto school
- Potential fordamage toclose schools
under climatechange
ExtremeTemperature
More frequentextremetemperatures
Diminishedproductivity andother impactsrelated to learningin a hotterenvironment(Sheffield andLandrigan 2011)
- Promote climatesmart crops andclimate resilientbuilding codesand practices.
Source: adapted from UNESCO report on Children and Climate Change, 2011
Kiribati with most of its communities do not have sufficient space to avoid risks, projected
increased sea level rise will have direct and indirect consequences on their livelihood. Some
of the examples of such communities in Kiribati include, Betio – densely populated islet and
Tebunginako, Abaiang – community had had to relocate due to coastal erosion over past few
decades (Reed, 2011). - REED, B. (2011) Climate Change And Faith Collide In Kiribati. National
Public Radio, available from http://www.npr.org/2011/02/16/133650679/climate-change-and-faith-
collide-in-kiribati?ft=3&f=133681251
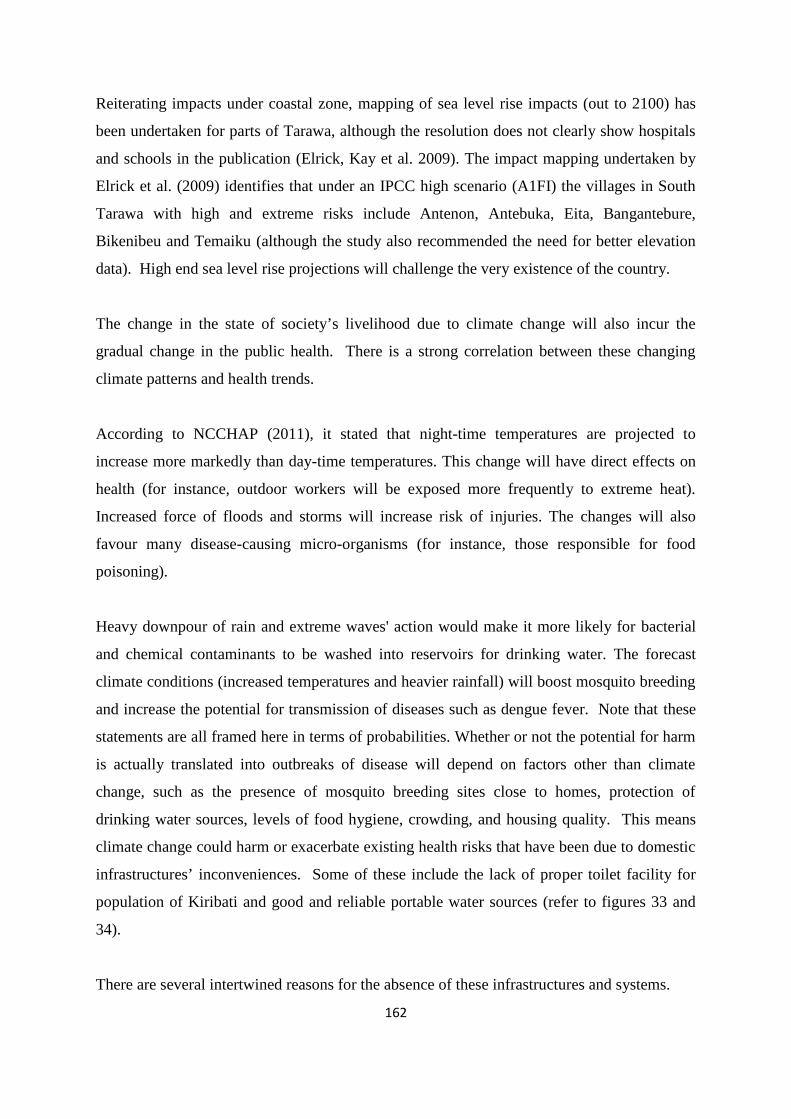
162
Reiterating impacts under coastal zone, mapping of sea level rise impacts (out to 2100) has
been undertaken for parts of Tarawa, although the resolution does not clearly show hospitals
and schools in the publication (Elrick, Kay et al. 2009). The impact mapping undertaken by
Elrick et al. (2009) identifies that under an IPCC high scenario (A1FI) the villages in South
Tarawa with high and extreme risks include Antenon, Antebuka, Eita, Bangantebure,
Bikenibeu and Temaiku (although the study also recommended the need for better elevation
data). High end sea level rise projections will challenge the very existence of the country.
The change in the state of society’s livelihood due to climate change will also incur the
gradual change in the public health. There is a strong correlation between these changing
climate patterns and health trends.
According to NCCHAP (2011), it stated that night-time temperatures are projected to
increase more markedly than day-time temperatures. This change will have direct effects on
health (for instance, outdoor workers will be exposed more frequently to extreme heat).
Increased force of floods and storms will increase risk of injuries. The changes will also
favour many disease-causing micro-organisms (for instance, those responsible for food
poisoning).
Heavy downpour of rain and extreme waves' action would make it more likely for bacterial
and chemical contaminants to be washed into reservoirs for drinking water. The forecast
climate conditions (increased temperatures and heavier rainfall) will boost mosquito breeding
and increase the potential for transmission of diseases such as dengue fever. Note that these
statements are all framed here in terms of probabilities. Whether or not the potential for harm
is actually translated into outbreaks of disease will depend on factors other than climate
change, such as the presence of mosquito breeding sites close to homes, protection of
drinking water sources, levels of food hygiene, crowding, and housing quality. This means
climate change could harm or exacerbate existing health risks that have been due to domestic
infrastructures’ inconveniences. Some of these include the lack of proper toilet facility for
population of Kiribati and good and reliable portable water sources (refer to figures 33 and
34).
There are several intertwined reasons for the absence of these infrastructures and systems.
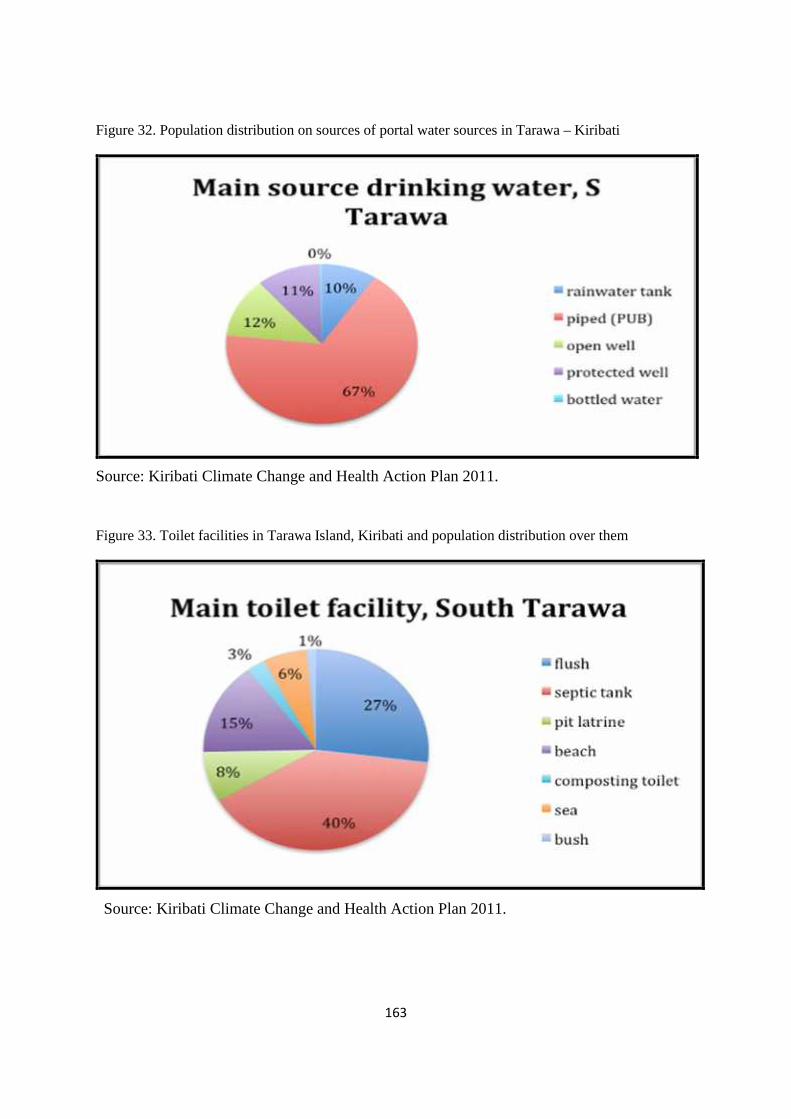
163
Figure 32. Population distribution on sources of portal water sources in Tarawa – Kiribati
Source: Kiribati Climate Change and Health Action Plan 2011.
Figure 33. Toilet facilities in Tarawa Island, Kiribati and population distribution over them
Source: Kiribati Climate Change and Health Action Plan 2011.
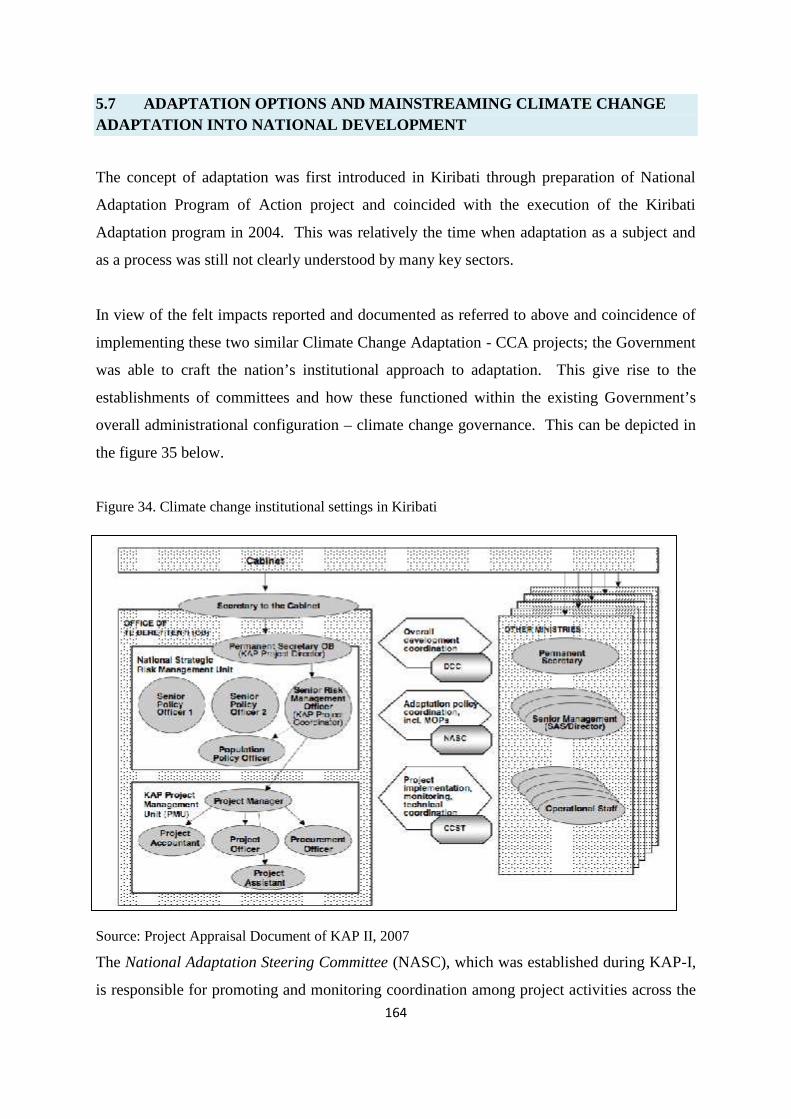
164
5.7 ADAPTATION OPTIONS AND MAINSTREAMING CLIMATE CHANGEADAPTATION INTO NATIONAL DEVELOPMENT
The concept of adaptation was first introduced in Kiribati through preparation of National
Adaptation Program of Action project and coincided with the execution of the Kiribati
Adaptation program in 2004. This was relatively the time when adaptation as a subject and
as a process was still not clearly understood by many key sectors.
In view of the felt impacts reported and documented as referred to above and coincidence of
implementing these two similar Climate Change Adaptation - CCA projects; the Government
was able to craft the nation’s institutional approach to adaptation. This give rise to the
establishments of committees and how these functioned within the existing Government’s
overall administrational configuration – climate change governance. This can be depicted in
the figure 35 below.
Figure 34. Climate change institutional settings in Kiribati
Source: Project Appraisal Document of KAP II, 2007
The National Adaptation Steering Committee (NASC), which was established during KAP-I,
is responsible for promoting and monitoring coordination among project activities across the
165
implementing agencies, including the utilization and sharing of technical expertise. The
NASC is chaired by the Secretary of the OB, and includes higher level officials from all key
Ministries, as well as representatives of the Kiribati Council of Churches, the Kiribati
Association of NGOs (KANGO), the national women’s organization, All Women of Kiribati
(AMAK), and the Kiribati Chamber of Commerce. The NASC will continue to provide
overall policy analysis, quality control and advice to the Government of Kiribati on matters
related to climate risk management, covering both NAPA and KAP-II issues and activities.
The Climate Change Study Team (CCST), established as a committee for Kiribati Initial
Communication Project, which was later implemented NAPA preparation along with KAP I,
contains technical officers from all key departments affected by climate risks. The CCST
will continue to provide expert analysis and technical advice to the Government of Kiribati
on climate-related matters, as well as coordinate scientific activities relevant to the planning
and execution of the NAPA preparation Project and KAP-III Project implementation.
These two committee engineered by two different institutions, Strategic Policy and Risk
Management Unit, Office of Te Beretitenti and the Climate Change Unit – Environment and
Conservation under the Ministry of Environment, Lands and Agricultural Development will
be guided by the overall Policy framework of the Government on climate change, and with
support of line Ministries and sectors.
The existing committees of more specific responsibilities are expected to provide
complementary role to the overarching committee reference above. However, coordination
and direction of overall Policies should not be compromised given any situation, which are
equally extremely important. This is where the role of the NASC and the Office of Te
Beretitenti would eventually come into play.
The roles of different committees and how they are being supported by each administration is
fundamental to achieving overall adaptation or increasing resilience of the country. There is
also further thinking to link the role of these committees with disaster committee. However
this is still in discussion.
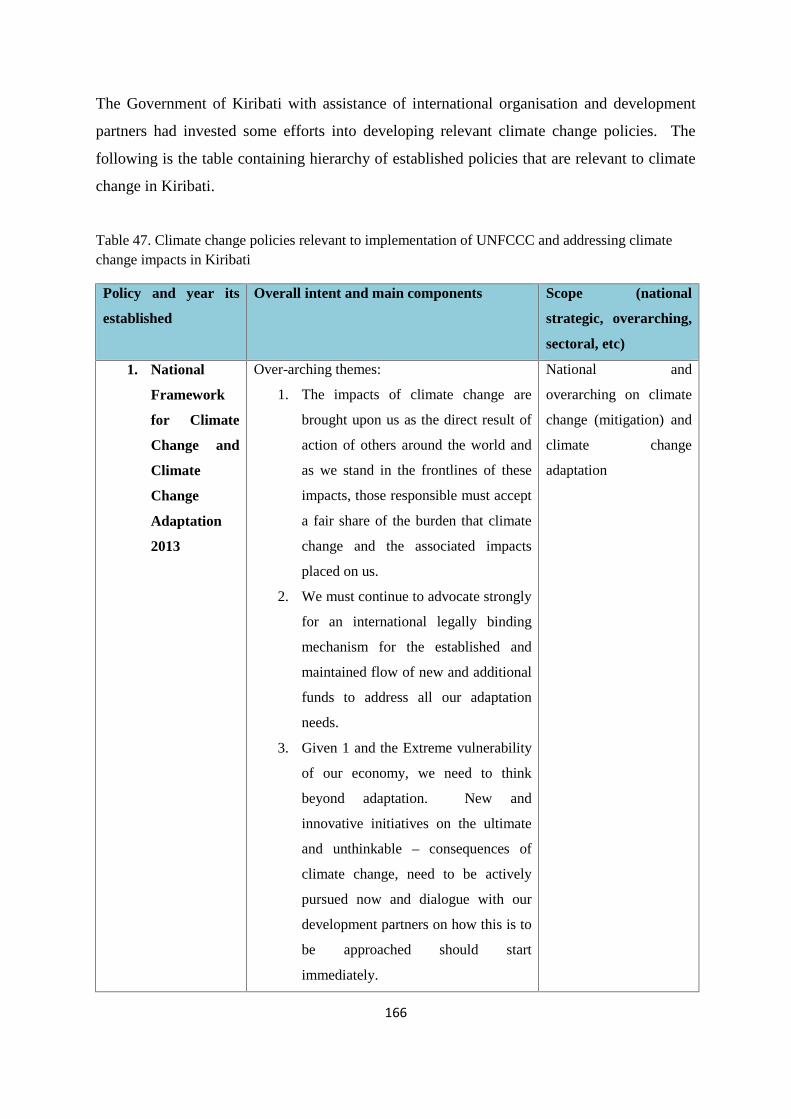
166
The Government of Kiribati with assistance of international organisation and development
partners had invested some efforts into developing relevant climate change policies. The
following is the table containing hierarchy of established policies that are relevant to climate
change in Kiribati.
Table 47. Climate change policies relevant to implementation of UNFCCC and addressing climatechange impacts in Kiribati
Policy and year its
established
Overall intent and main components Scope (national
strategic, overarching,
sectoral, etc)
1. National
Framework
for Climate
Change and
Climate
Change
Adaptation
2013
Over-arching themes:
1. The impacts of climate change are
brought upon us as the direct result of
action of others around the world and
as we stand in the frontlines of these
impacts, those responsible must accept
a fair share of the burden that climate
change and the associated impacts
placed on us.
2. We must continue to advocate strongly
for an international legally binding
mechanism for the established and
maintained flow of new and additional
funds to address all our adaptation
needs.
3. Given 1 and the Extreme vulnerability
of our economy, we need to think
beyond adaptation. New and
innovative initiatives on the ultimate
and unthinkable – consequences of
climate change, need to be actively
pursued now and dialogue with our
development partners on how this is to
be approached should start
immediately.
National and
overarching on climate
change (mitigation) and
climate change
adaptation
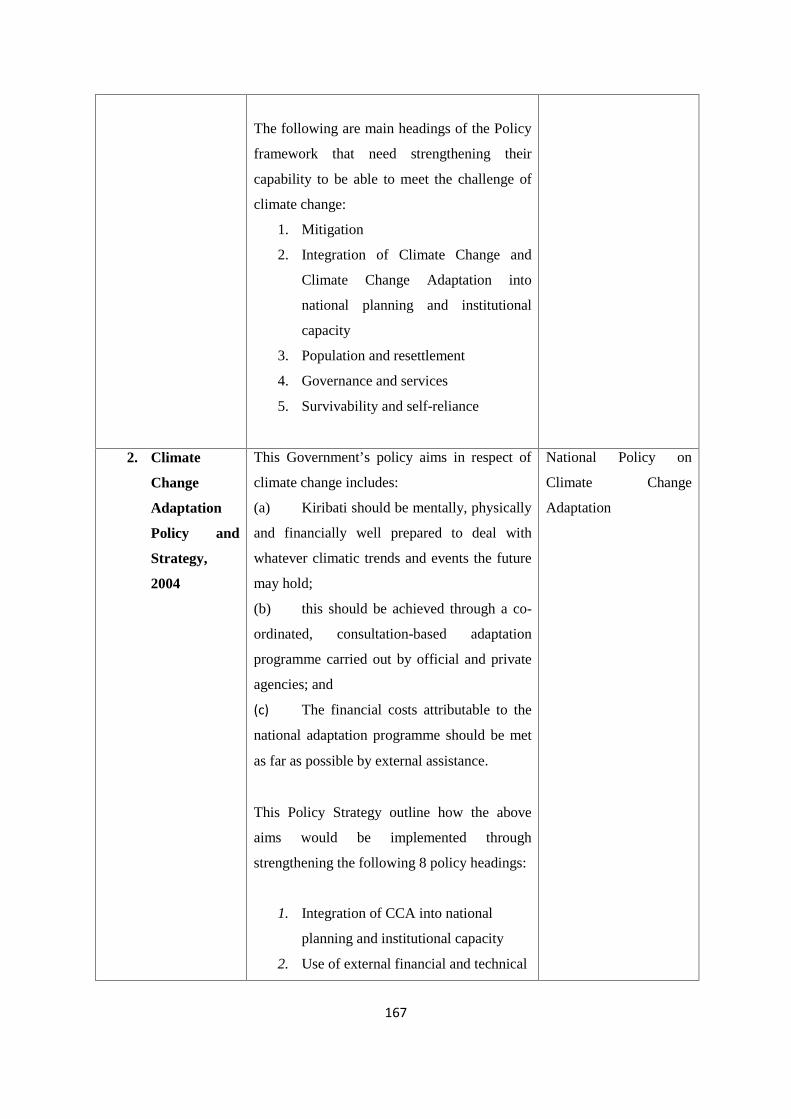
167
The following are main headings of the Policy
framework that need strengthening their
capability to be able to meet the challenge of
climate change:
1. Mitigation
2. Integration of Climate Change and
Climate Change Adaptation into
national planning and institutional
capacity
3. Population and resettlement
4. Governance and services
5. Survivability and self-reliance
2. Climate
Change
Adaptation
Policy and
Strategy,
2004
This Government’s policy aims in respect of
climate change includes:
(a) Kiribati should be mentally, physically
and financially well prepared to deal with
whatever climatic trends and events the future
may hold;
(b) this should be achieved through a co-
ordinated, consultation-based adaptation
programme carried out by official and private
agencies; and
(c) The financial costs attributable to the
national adaptation programme should be met
as far as possible by external assistance.
This Policy Strategy outline how the above
aims would be implemented through
strengthening the following 8 policy headings:
1. Integration of CCA into national
planning and institutional capacity
2. Use of external financial and technical
National Policy on
Climate Change
Adaptation
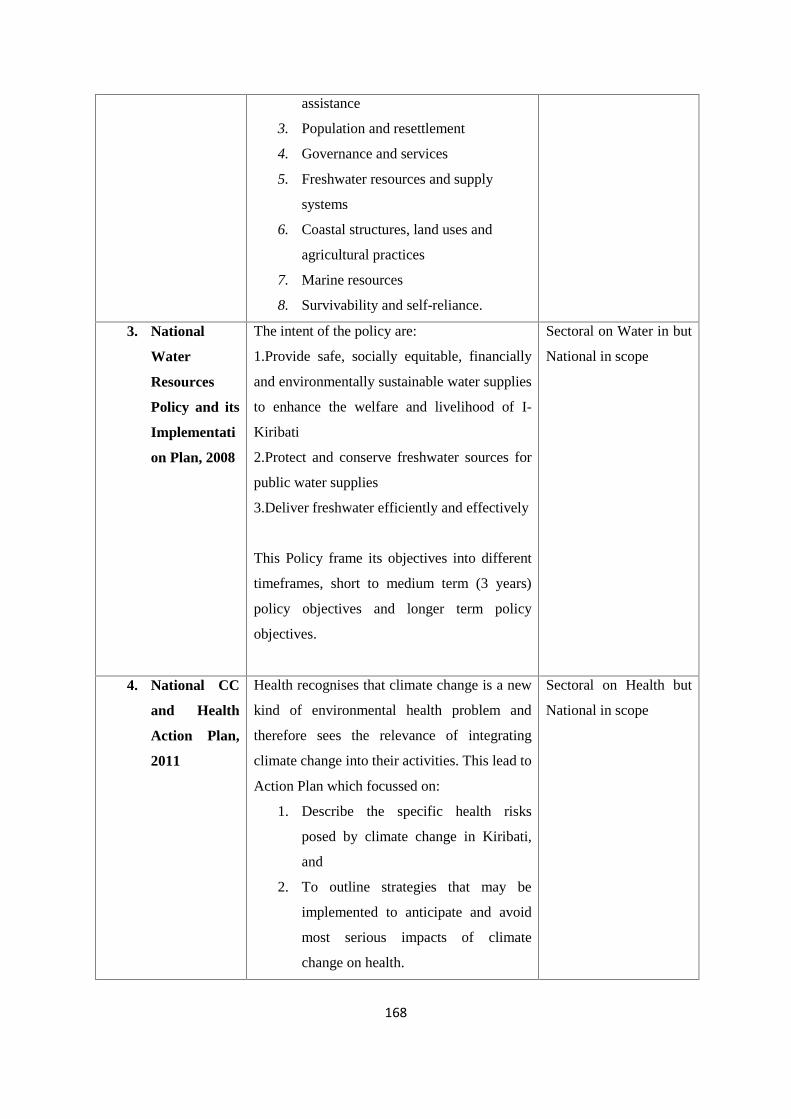
168
assistance
3. Population and resettlement
4. Governance and services
5. Freshwater resources and supply
systems
6. Coastal structures, land uses and
agricultural practices
7. Marine resources
8. Survivability and self-reliance.
3. National
Water
Resources
Policy and its
Implementati
on Plan, 2008
The intent of the policy are:
1.Provide safe, socially equitable, financially
and environmentally sustainable water supplies
to enhance the welfare and livelihood of I-
Kiribati
2.Protect and conserve freshwater sources for
public water supplies
3.Deliver freshwater efficiently and effectively
This Policy frame its objectives into different
timeframes, short to medium term (3 years)
policy objectives and longer term policy
objectives.
Sectoral on Water in but
National in scope
4. National CC
and Health
Action Plan,
2011
Health recognises that climate change is a new
kind of environmental health problem and
therefore sees the relevance of integrating
climate change into their activities. This lead to
Action Plan which focussed on:
1. Describe the specific health risks
posed by climate change in Kiribati,
and
2. To outline strategies that may be
implemented to anticipate and avoid
most serious impacts of climate
change on health.
Sectoral on Health but
National in scope
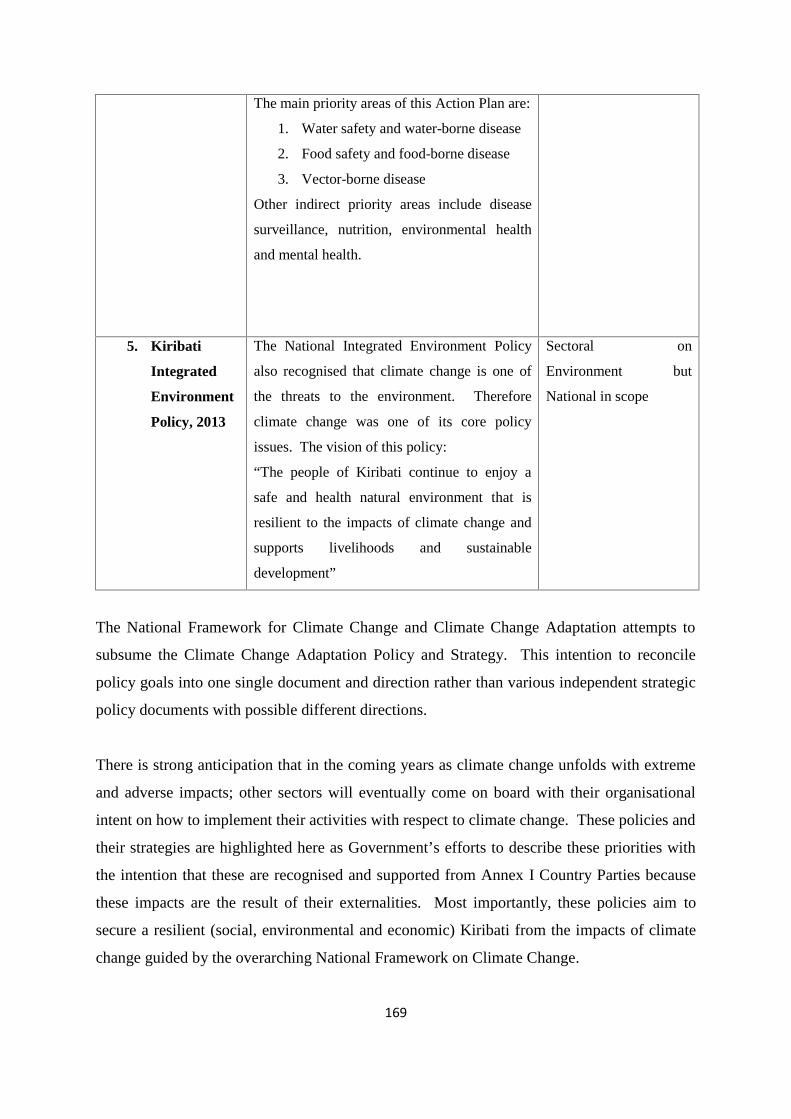
169
The main priority areas of this Action Plan are:
1. Water safety and water-borne disease
2. Food safety and food-borne disease
3. Vector-borne disease
Other indirect priority areas include disease
surveillance, nutrition, environmental health
and mental health.
5. Kiribati
Integrated
Environment
Policy, 2013
The National Integrated Environment Policy
also recognised that climate change is one of
the threats to the environment. Therefore
climate change was one of its core policy
issues. The vision of this policy:
“The people of Kiribati continue to enjoy a
safe and health natural environment that is
resilient to the impacts of climate change and
supports livelihoods and sustainable
development”
Sectoral on
Environment but
National in scope
The National Framework for Climate Change and Climate Change Adaptation attempts to
subsume the Climate Change Adaptation Policy and Strategy. This intention to reconcile
policy goals into one single document and direction rather than various independent strategic
policy documents with possible different directions.
There is strong anticipation that in the coming years as climate change unfolds with extreme
and adverse impacts; other sectors will eventually come on board with their organisational
intent on how to implement their activities with respect to climate change. These policies and
their strategies are highlighted here as Government’s efforts to describe these priorities with
the intention that these are recognised and supported from Annex I Country Parties because
these impacts are the result of their externalities. Most importantly, these policies aim to
secure a resilient (social, environmental and economic) Kiribati from the impacts of climate
change guided by the overarching National Framework on Climate Change.
170
Kiribati considers climate change adaptation seriously and most of its adaptation activities
were project-based activities. However, the Government of Kiribati understood it very well
that despite the fact that while Kiribati strive hard to attract external assistance to support our
adaptation needs, significant amount of annual budgeted resources have already been
assimilated and projected to increase in the future to protect our shorelines, install water
catchments and to name a few.
The domestic pressures was already burdening the existing environment, social and economic
trajectories of future Kiribati, while noting that climate change had already add slow and
immediate onsets of climate change adverse impacts.
This implies that significant amount of efforts and interventions are required now to build
resilience of atoll systems, social and economic stability in the coming years.
Kiribati had implemented a number of adaptation measures and also assessed their
effectiveness with a view to recommend better approaches, measures and areas for adaptation
in the future. The table (table 48) below summarises the list of adaptation measures (both
soft and hard) that have been implemented through different initiatives. This table 48 does
not include other interventions by line Ministries of the Government which were also graded
as adaptation measures but were not supported as incremental costs occurred due to climate
change.
Kiribati believed that next phase of adaptation will involve implementation of the National
Adaptation Program of Action and other relevant climate policies and action plans that have
been or will be developed in the future by various departments. Some of the emerging and
immediate adaptation options that are likely to dominate future adaptation agendas in Kiribati
may range from food security, ecosystem approach to adaptation, sustainable local
governments’ involvement in climate change adaptation, integrated coastal and water
management adaptation, to name a few. However, these areas need to be re-prioritised and
implemented in a coordinated manner so as to avoid duplication, best use of limited resources
and improve synergies and lessons learned for a resilient socio-economic and physical
environment of Kiribati.
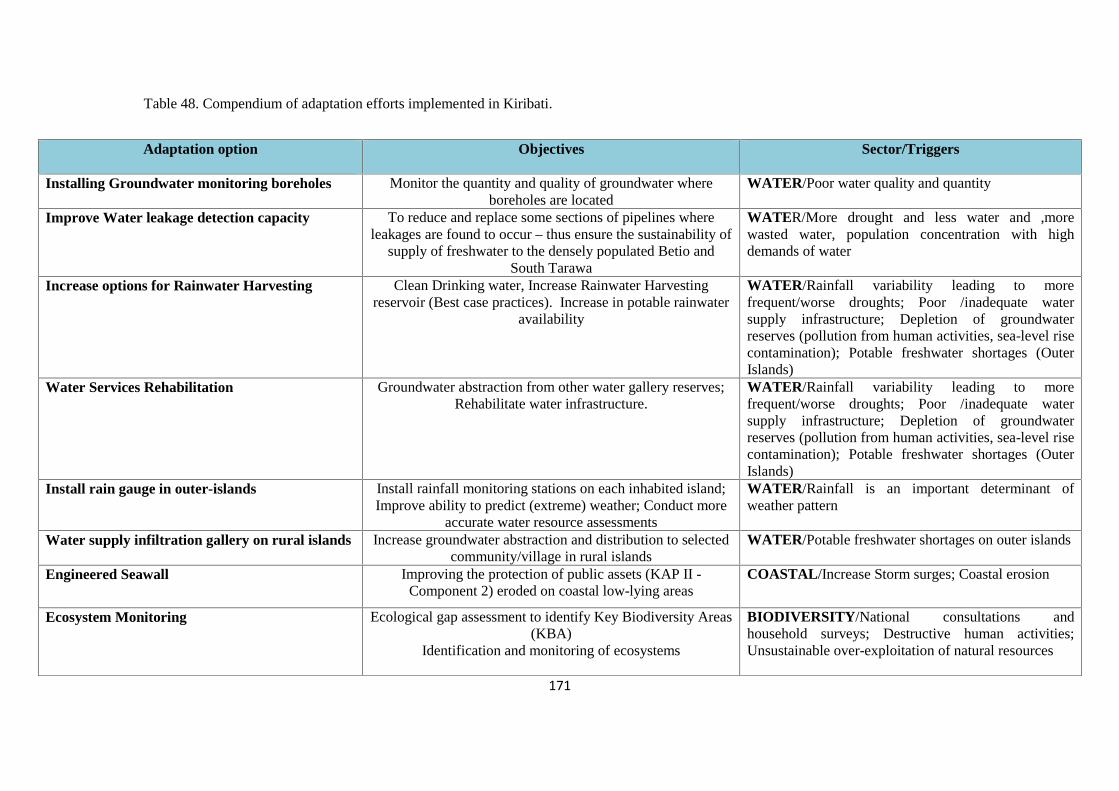
171
Table 48. Compendium of adaptation efforts implemented in Kiribati.
Adaptation option Objectives Sector/Triggers
Installing Groundwater monitoring boreholes Monitor the quantity and quality of groundwater whereboreholes are located
WATER/Poor water quality and quantity
Improve Water leakage detection capacity To reduce and replace some sections of pipelines whereleakages are found to occur – thus ensure the sustainability of
supply of freshwater to the densely populated Betio andSouth Tarawa
WATER/More drought and less water and ,morewasted water, population concentration with highdemands of water
Increase options for Rainwater Harvesting Clean Drinking water, Increase Rainwater Harvestingreservoir (Best case practices). Increase in potable rainwater
availability
WATER/Rainfall variability leading to morefrequent/worse droughts; Poor /inadequate watersupply infrastructure; Depletion of groundwaterreserves (pollution from human activities, sea-level risecontamination); Potable freshwater shortages (OuterIslands)
Water Services Rehabilitation Groundwater abstraction from other water gallery reserves;Rehabilitate water infrastructure.
WATER/Rainfall variability leading to morefrequent/worse droughts; Poor /inadequate watersupply infrastructure; Depletion of groundwaterreserves (pollution from human activities, sea-level risecontamination); Potable freshwater shortages (OuterIslands)
Install rain gauge in outer-islands Install rainfall monitoring stations on each inhabited island;Improve ability to predict (extreme) weather; Conduct more
accurate water resource assessments
WATER/Rainfall is an important determinant ofweather pattern
Water supply infiltration gallery on rural islands Increase groundwater abstraction and distribution to selectedcommunity/village in rural islands
WATER/Potable freshwater shortages on outer islands
Engineered Seawall Improving the protection of public assets (KAP II -Component 2) eroded on coastal low-lying areas
COASTAL/Increase Storm surges; Coastal erosion
Ecosystem Monitoring Ecological gap assessment to identify Key Biodiversity Areas(KBA)
Identification and monitoring of ecosystems
BIODIVERSITY/National consultations andhousehold surveys; Destructive human activities;Unsustainable over-exploitation of natural resources
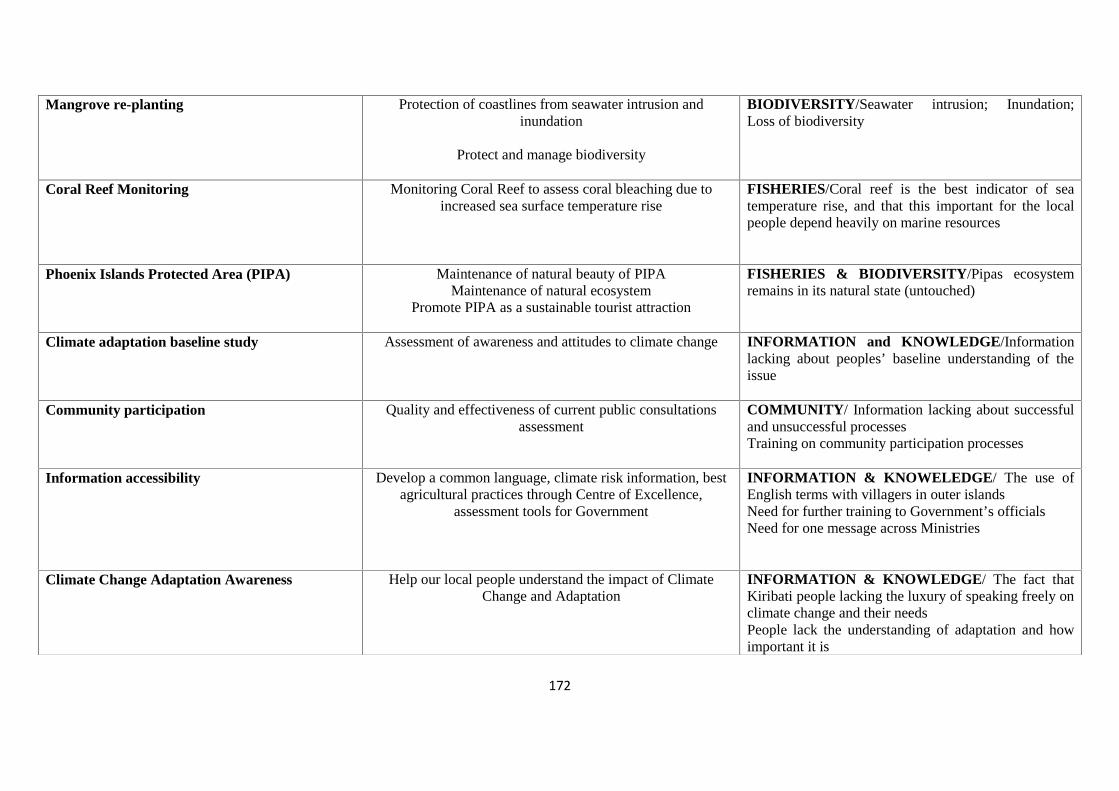
172
Mangrove re-planting Protection of coastlines from seawater intrusion andinundation
Protect and manage biodiversity
BIODIVERSITY/Seawater intrusion; Inundation;Loss of biodiversity
Coral Reef Monitoring Monitoring Coral Reef to assess coral bleaching due toincreased sea surface temperature rise
FISHERIES/Coral reef is the best indicator of seatemperature rise, and that this important for the localpeople depend heavily on marine resources
Phoenix Islands Protected Area (PIPA) Maintenance of natural beauty of PIPAMaintenance of natural ecosystem
Promote PIPA as a sustainable tourist attraction
FISHERIES & BIODIVERSITY/Pipas ecosystemremains in its natural state (untouched)
Climate adaptation baseline study Assessment of awareness and attitudes to climate change INFORMATION and KNOWLEDGE/Informationlacking about peoples’ baseline understanding of theissue
Community participation Quality and effectiveness of current public consultationsassessment
COMMUNITY/ Information lacking about successfuland unsuccessful processesTraining on community participation processes
Information accessibility Develop a common language, climate risk information, bestagricultural practices through Centre of Excellence,
assessment tools for Government
INFORMATION & KNOWELEDGE/ The use ofEnglish terms with villagers in outer islandsNeed for further training to Government’s officialsNeed for one message across Ministries
Climate Change Adaptation Awareness Help our local people understand the impact of ClimateChange and Adaptation
INFORMATION & KNOWLEDGE/ The fact thatKiribati people lacking the luxury of speaking freely onclimate change and their needsPeople lack the understanding of adaptation and howimportant it is
173
The table 48 above suggests that some effective adaptation options have been implemented in
an effort to build resilience of some of the critical systems/sectors and invigorate other areas
particularly information and knowledge. It is obvious that adaptation is a huge burden,
expensive exercise and will continue to be part of everyday or normal routines of the country.
It is expected to see emergence of new sectors and areas for adaptation (which were not also
sufficiently covered in the list thus far) as the need arises in the future. These will include
health, local governments (sub-national) and cities, food security, human resource
development including up-skilling programs, tourism, gender based adaptation, ecosystem
based adaptation.
To make adaptation become part of everyday life, mainstreaming comes into play as been
advocated and progressed also in Kiribati through adaptation programs recently in 2004 until
these days.
Therefore, Mainstreaming climate change adaptation into national development processes
becomes an important element of effective adaptation as it ensures that climate change
adaptation was given more prominence at the national level. It is also significant that climate
change as an urgent issue is mainstreaming into the national planning frameworks to gain
“whole of nation” participation in its various implementation phases. This mainstreaming
process requires a clear and elaborate system of communication and reporting information
and other outputs. In Kiribati, the system was set up to act in parallel with the reporting
mechanisms of the National Sustainable Development Strategy or what commonly known as
the Kiribati Development Plan. In Kiribati, the mainstreaming process was understood and
conceptualized to be working in the logical steps as described in the flow chart (figure 36)
below.
Although the mainstreaming process is a new concept, it has been practiced at it early stage
in Kiribati and is expected to be a continuous and reiterative process that will involve
eventually all sectors/institutions/communities in Kiribati.
There is much to do and understand further how this process is actually working. This
implies that proper data and reporting mechanisms need to be in place to support the
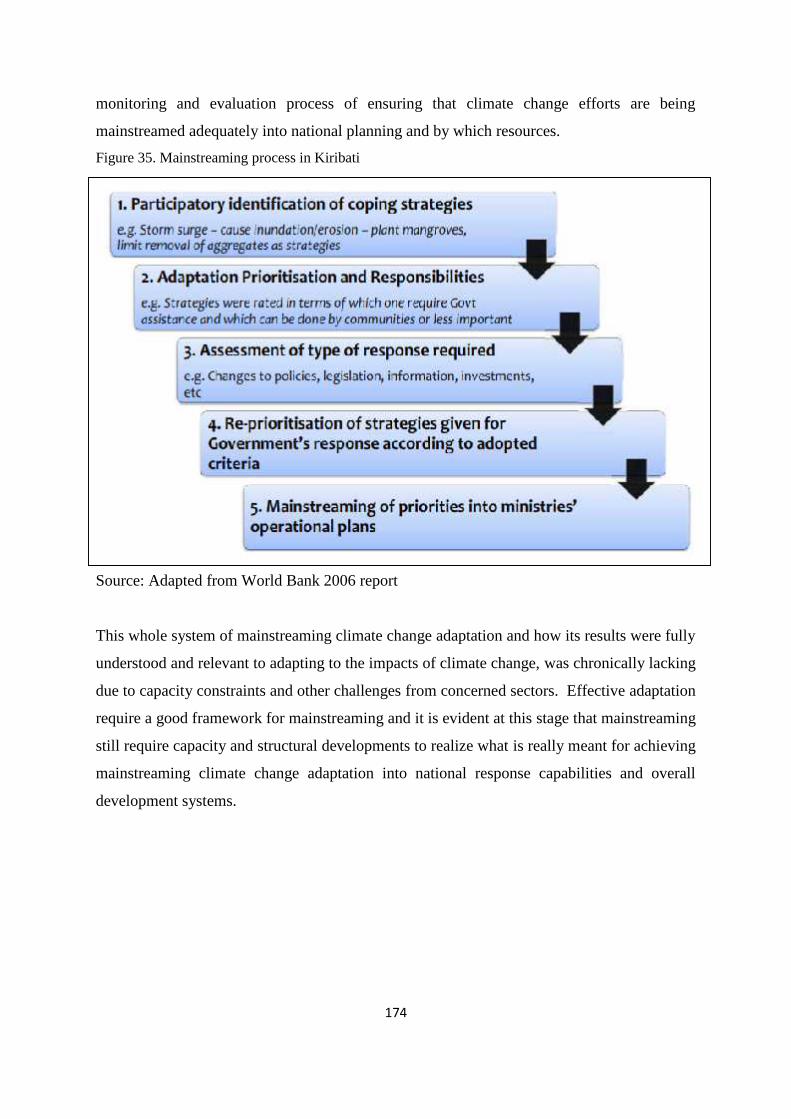
174
monitoring and evaluation process of ensuring that climate change efforts are being
mainstreamed adequately into national planning and by which resources.
Figure 35. Mainstreaming process in Kiribati
Source: Adapted from World Bank 2006 report
This whole system of mainstreaming climate change adaptation and how its results were fully
understood and relevant to adapting to the impacts of climate change, was chronically lacking
due to capacity constraints and other challenges from concerned sectors. Effective adaptation
require a good framework for mainstreaming and it is evident at this stage that mainstreaming
still require capacity and structural developments to realize what is really meant for achieving
mainstreaming climate change adaptation into national response capabilities and overall
development systems.
175
6.0 CAPACITY BUILDING AND TRAINING
The status quo of institutional capacity, training and research in Kiribati was chronically
lacking. The biggest challenge towards achieving an improved cognitive, research and
training sector is funding, and the source to generate funding is economy – which was
relatively weak as indicated in Kiribati being categorised among the Least Developed
Countries. Like other developing countries, the Government of Kiribati priority aspiration is
to build economic wealth which could then later assist other pillars of development e.g. social
and environment pillars. Therefore, training, capacity building and research were commonly
viewed among other sectors or services that do not generate revenue but rather funnel out the
resources.
Capacity building, training and research needs of the Government were often supported by
development partners and internationally recognised organisation, e.g. UN based
organisation, international and regional banks, regional agencies and to name a few.
Since the Initial National Communication report, there is increased acceptance of the
relevance of having capacity building, training and research to be amalgamated in the
workings and activities of the Government. This was seen as an opportunity to improve
decision making and overall state of innovation and creativity which can have positive
benefits to the developmental agenda and the community as a whole. Though this was more
effectively managed at the personnel level; the systemic, institutional and research areas were
still independently vested within each individual organisation to handle.
Nevertheless, through an enabling environment project on national capacity self assessment
for the three Rio Conventions; the component of this project for one of the Conventions –
UNFCCC becomes very relevant to addressing the needs to understanding capacity needs on
climate change at the national level. As identified by this report, some of the overall capacity
development outputs anticipated to address capacity constraints in Kiribati with respect to
implementing obligations under the UNFCCC or relatively benefiting the national capacity
needs for undertaking climate change activities on the ground, includes;
176
1. Improved understanding of climate change across sectors of the population (such as
work force, communities, etc)
2. Enhanced capacity at all levels to undertake V&A assessments, prioritize and
implement adaptation actions
3. Enhance capacity to undertake research, conduct systematic observations in areas of
meteorology, ecosystem and hydrology.
The details on the capacity development actions on each of the three outputs above can be
extracted from the Kiribati NCSA 2011 Report. Again the NCSA report is not an exhaustive
means to report on the capacity needs of Kiribati with respect to climate change. There are
other aspects of climate change which deals with infrastructures, economic planning and
social well-being which are not necessarily reflected in this enabling environment capacity
assessment project.
Opportunities for training were observed to have been increased since the last decade on
climate change. These opportunities need to be extended to other sectors and policy makers.
The Government’s entity for training public civil servants need to work closely with other
government’s organisations in designing and coordinating training needs and opportunities
geared for an anticipated climate change response required in the future.
The research is critical to inform the process of decision making and more over to accurately
monitor and advice on state of climate change and the responses that community need to be
aware of, from time to time. In the past, this need have been largely facilitated or supported
by academia, regional organisations and other well-resourced international organisations.
With this normalcy, Government‘s decisions at national level may have been strongly
associated with international advice in many cases. This could be seen positive or negative, as
in certain incidences the urgency of needing those required technical advice instantly
(whether it is climate change or any other issue) may not always readily available. This leads
to the proposition to consider establishing a national institution with research capability on
pressing and emerging issues. Other more in-depth and sophisticated issues which require
similar weight of research’s attention could be dealt with by international organisations with
proper research expertise on such matter.
177
7.0 RESEARCH, DATA AND SYSTEMATIC OBERVATION
As previously stressed in section 6.0, research capacities and capabilities in Kiribati are
chronically limited at the national level. Nevertheless, these needs have been greatly
substantiated and supported with programs, project-based activities and initiatives of regional
and international institutions with more research/analytical capabilities and resources. With
the urgency and prominence of climate change issues in the context of future developments
and survivability of Kiribati, immediate and responsive informed planning and decision
making is required. Therefore considering the strengthening of national research capacities
and frameworks may address this issue. To what extent this may be feasible, require future
assessment and deployment of investments to this cause.
Data/information are necessary to not only complementing efficient technical assistance from
regional and international entities but would also aid in addressing some of the critical issues
which require on-the-ground focussed undertakings that require timely response for decision
making and more importantly implementation of Kiribati’s obligations under the UNFCCC.
Informed decision making requires accurate and consistent-based advices which should be
based on factual, science-based and rigorous planning. One of the main ingredients to
achieving this is data and information. Two national websites (www.climate.gov.ki and
www.environment.gov.ki) were developed during since 2009 and contains both data and
information on climate change. Unfortunately, limited quantitative scientifically proven data
has been one of the many challenges of Kiribati. This problem applies to almost every key
institutions with relatively poor institutional frameworks and capacity to gather data, archive
data systematically, tailor data to performance indicators and more over analyse data to
generate relevant information. Most of the institutions have data structures but often ad-hoc,
poorly managed and fragmented. This leads to the proposition of reiterating a request to
developed country Parties with advanced data knowledge and resources to support Kiribati as
clearly highlighted in the provisions of Article 5 of the UNFCCC.
The Kiribati National Meteorological Service had developed the 2009 National Strategic
Policy with the intent to set it strategic policy goals and directions through improvements and
strengthening of various specific areas. The Policy recognised it very well that these strategic
178
policy objectives will still be impossible with the provision of financial support from
international donor communities. Some of the areas proposed under this strategic policy
include institutional capacity building, maintenance and upgrading of stations and data
infrastructure of the KMS, to name a few. These specific needs on data and systematic
observation can be found in the Strategic Policy document of the Kiribati Meteorological
Service.
179
8.0 CONSTRAINTS AND GAPS
8.1 STATUS OF CONTRAINTS AND GAPS
Kiribati national circumstances focusing on the states of its environment, social and cultural,
and economic development aspects are pooled and considered together against the backdrop
of global climate change. The challenge of climate change that Kiribati is facing, suggestive
of gaps between what it is assured of and what is considered to be timely, adequate, and
appropriate action will be appreciated. Sector policies and institutional issues to marshal
efforts to meet the challenge are also factors that contribute to the gaps.
From those considerations, Kiribati continues increasingly to be vulnerable to climate change
and its impacts. The national sense of Kiribati’s current and future vulnerability to climate
change has weakened (among key Government’s officials) confidence in the UNFCCC
processes to be able to timely mitigate climate change. This is apparently due to the slow
pace and lack of ambition in reaching decisions (at the UNFCCC level) which are expected to
curb emission of greenhouse gas emissions (GHGs) and the required financial support to
address impacts felt now by Parties to the UNFCCC. The important gap was therefore
embedded on the question of not knowing whether or not; the UNFCCC processes will be
able to prevent dangerous anthropogenic interference to the climate system.
Key environment aspects such as low lying, narrow coral islands, calcareous and poor
agriculture soil, and precarious ground water lens as the main source of water, droughts, and
storm surges inundating villages are well recognized. However, this knowledge and
experience is considered in the UNFCCC process as insufficient to define vulnerability, to
design adaptation measures, and to proceed to seek external assistance.
Vulnerability and adaptation assessments and studies are still demanded as pre-requirements
to physical structural adaptation. The demand of rigorous science on the vulnerability and
adaptation options assessment is unfair to the realities about Kiribati; on the other hand it
provides opportunities for international consultants to contribute to the planning of adaptation
options. In turn this implies there is gap in the available national human resource to provide
180
the required scientific information or to sufficiently understand such information as may be
provided by international consultants.
The gaps exist between information provided by international consultants and the national
capability to understand them, between any justifications for conducting vulnerability studies
and the experienced incidences of vulnerability of the national circumstances, and between
national capability and the need that this too should be able to provide scientific information
on the vulnerability of Kiribati to climate change.
Moreover the requirement of rigorous science which usually only confirms experienced
aspects of Kiribati vulnerability to climate change will only lead to delayed planning and
implementation of appropriate adaptation actions. There is therefore a gap between the time
that the rigorous science has or can be provided, and when appropriate adaptation actions
based on the rigorous science may start. Furthermore, the scattered nature of the islands of
Kiribati means the range for which to understand the nature of vulnerability in a rigorous
scientific framework would be very large that there would never be an end to be able to
justify more and more scientific assessment of Kiribati vulnerability to climate change.
Associated with the need of rigorous scientific information are data and approved tools and
models. Data usually lack good geographical and temporal coverage. The quality of the data
is also questionable except data that are systematically collected as part of well established
monitoring procedures such as for the weather and sea levels by the Kiribati Meteorological
Services. Computer based tools to understand future climate change and impacts on various
sectors could be expensive, highly complex, but must be used. Other useful tools for
integrated vulnerability and adaptation assessments would also be useful. Kiribati national
capability to make use any of these tools has not been assessed, but it is most certain that
these are areas where serious gaps are expected.
National capacity to plan adaptation activities and to access available international assistance
or climate change finance is limited. This is further complicated by the difficult requirements
or conditions of external assistance usually require “middle men” type arrangements (e.g.
Implementing Agencies) for the execution of the activities. At times, these create more
181
layers of processes and gaps between priorities or how to implement activities that middle
organisations decide and those that national authorities would prefer.
Institutional arrangements to enhance holistic national approach to address climate change
through effective leadership, consultation among key officials, and coordination have much
need of improvement. In addition, it is also noted that externally funded projects on climate
change tend to also have influence over the national priorities and how things should be
improved within the existing processes of Government. This is an opportunity to take
advantage of.
8.2 CONSTRAINTS AND GAPS RELEVENAT TO IMPLEMENTING UNFCCC
Themes are taken from the UNFCCC Articles. And key themes are the objective, principles,
adaptation, preparation of GHG inventories, mitigation, reporting, research and systematic
observation, education, training and public awareness, international negotiations under the
UNFCCC processes, and financial mechanism.
Parties to the UNFCCC are concerned that human activities have been substantially
increasing the atmospheric concentrations of greenhouse gases, leading to enhanced warming
of the Earth’s surface and atmosphere, and affecting natural ecosystems and humankind.
Most recently, IPCC FAR (2007) affirms that the warming of the climate system is
unequivocal, and this is most likely due to emissions of anthropogenic greenhouse gases. The
ultimate objective of stabilizing atmospheric concentration of greenhouse gases at a safe level
for ecosystems to be able to adapt naturally and economic development to proceed in a
sustainable manner (Art.2 of the UNFCCC) presents therefore a big challenge.
Various parties have proposed different concentration levels: one group proposed 350 ppm
(Parts Per Million) while another group proposed 450 ppm, and then there were proposed
levels of temperature increases of 1.50C, and 2.00C. These are gaps when compared together,
concluded the fact that these have implications for Kiribati survival. Thus the gaps between
the different concentration levels and between temperature levels, and between these and
what may turn out to be realistic for the objectives, considered on global scale and for
182
Kiribati geographical scale are important considerations to Kiribati. Current assessments are
that these gaps are ominous for the future survival of Kiribati because any value within the
gaps would make climate change and sea level impacts far in excess of the adaptive capacity
of Kiribati. Moreover, scientific guidance on concentration or emission levels that will cause
dangerous interference with the climate system will never be provided explicitly and so the
gap in any agreed concentration level and 350 ppm would be determined solely by prevailing
political and economic forces in the negotiations.
Among the principles that were adapted to guide actions to address climate change are
sustainable development principles and common but differentiated responsibilities. The fact
that the latter has been too often referred to may suggest that many parties hold that this
principle override concern about the sustainability of the global environment for future
generations. In other words, there cannot be progress on agreed global mitigation unless the
Parties consider that their individual set mitigation targets conform to their individual
understanding of their share in, and how is to be shared the “differentiated responsibilities”.
Individual countries place their interest above the global interest even if part of the global
would be destroyed.
The precautionary principle has been acknowledged, but also that economic development is
necessary to be able to address climate change. If climate change is occurring because of
past and current economic development, then it is also acknowledged that the latter contains
opportunities to be able to address climate change. The facts on the gap between the intent
in the precautionary principle and any actions that are accordingly stopped or reduced, after
having recognized the problem of global warming, is from the profiles of global emissions
which is nonetheless increasing. Therefore, global actions are departing greatly from the
precautionary principle.
Adaptation is visibly required in natural systems in Kiribati as already noted. Coastal
ecosystems and water resources are affected by rising sea levels, increasing storm surges, and
extremes of rainfall – flooding and droughts. The UNFCCC accord favourable
considerations for international assistance to various characteristics of countries such as for
being small islands, low lying coastal, least developed among the developing countries – and
these properly describe Kiribati circumstances. Perhaps encouraged by these considerations
183
and the attractiveness of justice, Kiribati has considered that external assistance should be
sought for all its adaptation needs, and at the same time that it is recognized that local
resources are very limited for the national needs were there being no climate change.
External assistance that have been secured for adaptation has been inadequate to address
adequate adaptation throughout the atolls, and Kiribati has no option but to use its local
resources to meet part of the costs of damage experienced by communities from extreme
weather conditions including storm surges.
An important element of information that Parties should communicate to the COP is their
national inventories of greenhouse gas emissions. These gases include carbon dioxide (CO2),
methane (CH4), and nitrous oxide (N2O) and it is emission of these gases only that this report
is now reporting. Other gases are hydro-fluorocarbons (HFCs), perfluorocarbons (PFCs), and
sulphur hexafluoride (SF6). In this exercise, Kiribati activities data are from the energy sector,
and agriculture. In the energy sector, these data consists of imports and consumptions of
three major fossil fuel types – diesel, petrol (benzene), and kerosene. Activity data of
different purposes in the use of energy such as for public electricity, transport, navigation,
and residential are estimated rather than being based on available disaggregated data for these
different purposes. In the agriculture sector, activities data are the number of livestock, that
is, pigs and chicken, and include estimated data on fuels used for fishing outboard motors.
The inventory presented is compiled with the knowledge that there were significant gaps in
the processes and procedural steps that were circumvented through estimations. These
highlight the inadequate data collection and management systems in the entities that are
involved. Improvement for the sake of the compilation of the inventories of emissions of
greenhouse gases would not be critical since national emissions are insignificant compared to
global emissions but very important for informing policy options that promote cleaner and
sustainable development.
National system for compilation of inventory of greenhouse gases need therefore to be
improved and widely appreciated among relevant sectors. Currently mitigation option
through more use of renewable energy such as the use of photovoltaic cells for lighting,
cooling medical supplies in rural areas is being pursued. Kiribati Copra Mill is producing
bio-fuel and promoting its use. However there are no programmes devoted to specific
options for mitigation involving technology acquisition and diffusion. But technology is
184
present in all sectors and human activities and as already noted, the economy may be
increasingly less efficient; emissions per dollar GDPs appear to have been increasing.
There is limited research capacity that nationals could undertake on topics relevant to climate
change. It may be helpful to work closely with the University of the South Pacific (USP) and
suggest topics that require in-depth research for them to incorporate in their future academic
research programs. Their involvements in any such research undertaken by international
scientists were often minimal that the research programs the Government approved could be
enlisted in their programs and their results could be useful information to feed the current
research deficient status at the national level. However, ministries and divisions may have
data that they collect on the aspects of national affairs and circumstances for which they are
responsible and may have carried out analysis for their use and some for public information.
But until most recently, there have been very little opportunities for sharing information and
research among ministries.
More qualified nationals now recognize the relevance of climate change to their particular
areas of interest. Kiribati Meteorological Service personnel are very aware about global
warming as they continue monitoring the weather and occasionally analyse climate data.
Officials of the Fisheries and the Environment Divisions in undertaking coral monitoring do
so with awareness of climate change and potential effects on coral health. But there is still a
big gap between the desired level of integrating climate change into sector policy and
planning and actions.
In the education sector, it is felt desirable for schools to teach topics that are specific on
climate change. However, it is not easy to come up with such topics because climate change
being multidisciplinary would have been implicit in normal subjects covered in schools.
Nonetheless, effort is being made to construct a course that aims to focus on science and
issues about climate change. This seems to be a huge challenge due to resources. The GIZ,
UNICEF and SPC are currently assisting this area in the Curriculum Development and
Resource Division in Kiribati. Public awareness raising on climate change is conducted in
the form of workshops, visits to communities and schools, displays and disseminations of
prepared posters and pamphlets. Current radio programs are also contributing from NGOs
and other sectors so it is important to capitalize also on those efforts.
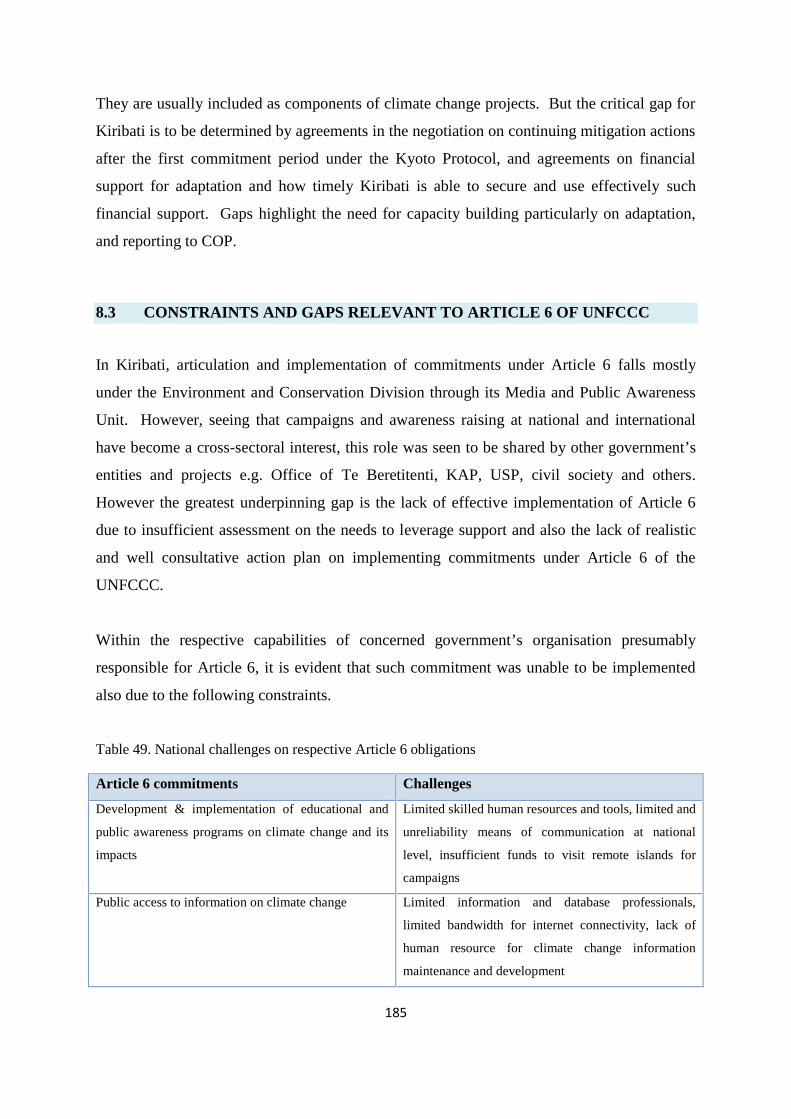
185
They are usually included as components of climate change projects. But the critical gap for
Kiribati is to be determined by agreements in the negotiation on continuing mitigation actions
after the first commitment period under the Kyoto Protocol, and agreements on financial
support for adaptation and how timely Kiribati is able to secure and use effectively such
financial support. Gaps highlight the need for capacity building particularly on adaptation,
and reporting to COP.
8.3 CONSTRAINTS AND GAPS RELEVANT TO ARTICLE 6 OF UNFCCC
In Kiribati, articulation and implementation of commitments under Article 6 falls mostly
under the Environment and Conservation Division through its Media and Public Awareness
Unit. However, seeing that campaigns and awareness raising at national and international
have become a cross-sectoral interest, this role was seen to be shared by other government’s
entities and projects e.g. Office of Te Beretitenti, KAP, USP, civil society and others.
However the greatest underpinning gap is the lack of effective implementation of Article 6
due to insufficient assessment on the needs to leverage support and also the lack of realistic
and well consultative action plan on implementing commitments under Article 6 of the
UNFCCC.
Within the respective capabilities of concerned government’s organisation presumably
responsible for Article 6, it is evident that such commitment was unable to be implemented
also due to the following constraints.
Table 49. National challenges on respective Article 6 obligations
Article 6 commitments Challenges
Development & implementation of educational and
public awareness programs on climate change and its
impacts
Limited skilled human resources and tools, limited and
unreliability means of communication at national
level, insufficient funds to visit remote islands for
campaigns
Public access to information on climate change Limited information and database professionals,
limited bandwidth for internet connectivity, lack of
human resource for climate change information
maintenance and development
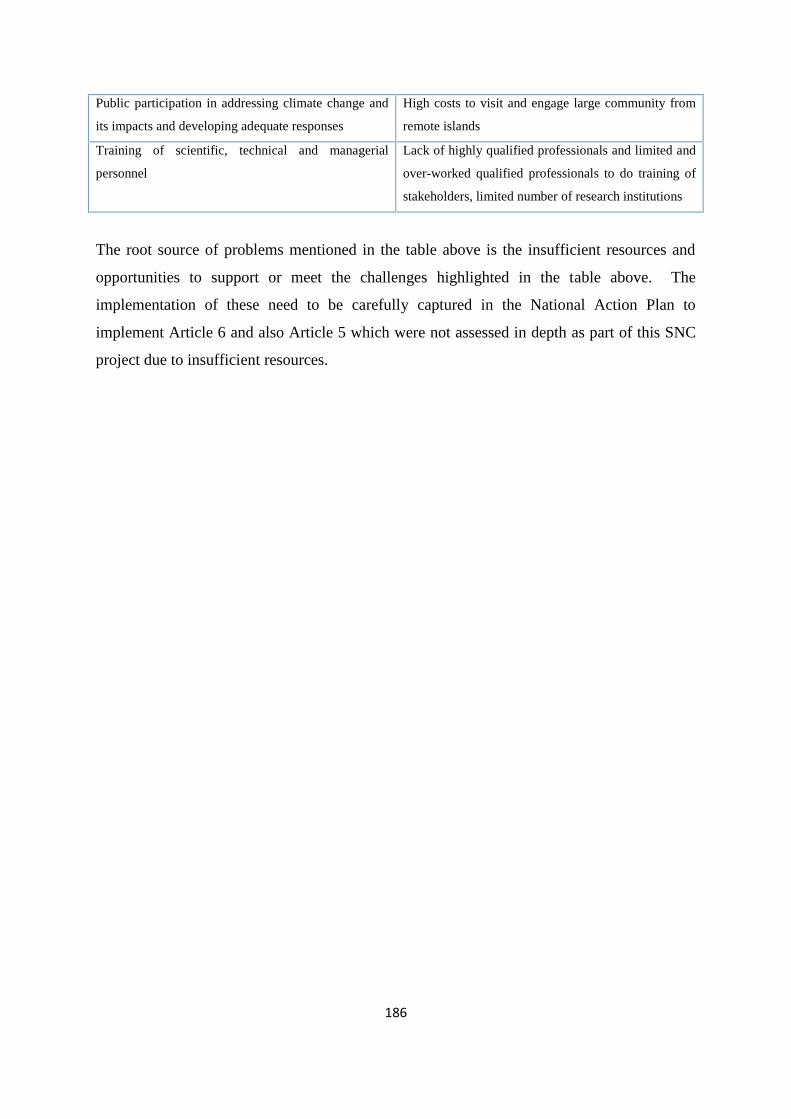
186
Public participation in addressing climate change and
its impacts and developing adequate responses
High costs to visit and engage large community from
remote islands
Training of scientific, technical and managerial
personnel
Lack of highly qualified professionals and limited and
over-worked qualified professionals to do training of
stakeholders, limited number of research institutions
The root source of problems mentioned in the table above is the insufficient resources and
opportunities to support or meet the challenges highlighted in the table above. The
implementation of these need to be carefully captured in the National Action Plan to
implement Article 6 and also Article 5 which were not assessed in depth as part of this SNC
project due to insufficient resources.
187
9.0 PROPOSED PROJECT CONCEPTS
1. Kiribati Climate Change Database Management System and Sectoral data
strengthening
National reporting as a UNFCCC obligation covers a compilation of greenhouse gas
inventories, description of the national circumstances, vulnerability and adaptation
assessments, and national mitigation measures. For these different purposes and
applications, specific data are required. Types of data have to be identified, located
throughout governments and private sectors, collected and organized systematically at
one central location within the Climate Change section of the ECD, and regularly
updated. These institutions therefore need support to construct data relevant to
climate change responses (e.g. asset inventory for loss and damages, so on) and NC
reporting accordingly. The CCDMS would also provide data for SOE required under
the Environment (Amendment) Act 2007.
2. National Adaptation Programme of Action and Support to other National
Climate change Priorities
Food security is becoming a serious concern including ecosystem-based services.
Health adaptation, Traditional agricultural systems, ecosystem-based adaptation
measures, also exploring blue carbon concept, building social adaptive capacity based
adaptation programs including educational reforms, up-skilling initiatives are some of
the new areas for adaptation.
There is already some thinking at the national level to advance adaptation efforts
beyond Kiribati shores. These are outlined in the related climate change policies of
Kiribati such as National Framework for CC and CCA, Kiribati Integrated
Environment Policy, and the upcoming Kiribati Joint Implementation Plan for CC and
DRM.
Environmental sustainability is the foundation of resilience building and therefore
requires support in order to play their vital role. Existing environment protection and
188
management systems must be fully supported to envision their goals which are
aligned to emission reductions and adaptation.
3. Morphological development of reef islands over different time scales to support
appropriate coastal management plans
Low-lying reef islands formed on the rim of atolls in Kiribati appear threatened by the
impacts of anticipated sea-level rise. There is general agreement that the responses of
reef islands to sea-level rise are largely negative. To have a better understanding of
how these reef island will cope with future sea-level rise requires an understanding of
their past behaviour at different time scales. In turn, the development of appropriate
coastal management plans will depend largely on the assessment of the past
morphological changes of reef islands. In order to capture the past behaviour of reef
islands at different time scales will involve the following three studies a) examination
of the morphological evolution of reef islands morphological evolution of reef islands,
b) investigation of the topography of reef islands to water levels using detailed
topographic information and, c) historical shoreline changes
4. Kiribati Adaptation Project focussing on protecting key infrastructures
Low lying reef islands of the atolls, extending seaward from the top of the beach to
the sloping beach to the intertidal reef platform are subject to erosion and inundation
from high sea level and storm surges. Roads, water pipes, electrical cables, buildings
in South Tarawa are being exposed to high risks from coastal erosion and inundation
that can be attributed to sea level rise and storm surges associated with climate
change.
Ground water lens in South Tarawa is highly vulnerable from erosion, saltwater
intrusion, and inundation. With increasing urbanization in terms of the increase in
population and economic development activities, the shortage of ground water
resources would be highlighted when so many people would be affected.
KAP should continue to provide assistance to Kiribati to be able to protect its public
assets from the risks of climate change impacts, maintain urban services in particular
water supplies to the increasing population of South Tarawa, and to improve water
189
supplies and chronic coastal erosion issues at outer islands for local communities that
are most in need.
5. Raising public understanding of technical information about the environment
Efforts need is required to identify near parallel ideas that exist within the Kiribati
language to those key ideas and concepts that are found in relevant technical reports
and information.
Support programs focussing on behavioural change is required more in the future to
inform and educate the public on this important issue.
Support is also needed for the establishment of core working group, with local
professionals to work separately and as a group, to review and expand any available
“bilingual vocabulary” about the environment, in particular where words and ideas are
about climate change.
6. Analyzing scientific information that has been produced on the vulnerability of,
and adaptation options for Kiribati.
Various tools and methodologies have been used to characterize the vulnerability of
and to come up with adaptation options for Kiribati. These include the several reports
since 2000, and tools and methodologies that are acquired or produced through KAP
or SNC or other initiatives. These include the works of NIWA, SIMCLIM, and
PCCSP. There is a need for a capacity building program for local stakeholders to
understand the relevance, and application of these tools within their respective
sectors. There is also a need to build local capacity to be able to optimise the use of
these vulnerability tools with establishing baseline information and data for
quantification of the impacts, losses and damages associated with climate change.
7. Support to CDM and overall Nationally appropriate mitigation framework and
actions
Financing opportunities that could lead to better promotion, deployment and
implementation of applicable clean and renewable energy technologies in Kiribati.
The establishment of a formal institution to manage CDM and NAMAs require
support.
190
REFERENCES
Abeta, R. (2011). Institutional analysis of the organisation and allocation of
responsibilities across Government for an improved level of collaboration on Climate
Change E. a. C. D. Climate Change Unit. Tarawa, Government of Kiribati: 10.
Bank, W. (2000). Cities, Seas and Storms. Managing change in the pacific island economies.
November 30, 2000, World Bank. IV: 135.
Beets, J. (2000). Declines in fin fish resources in Tarawa Lagoon, Kiribati emphasize the
need for increased conservation effort. National Museum of Natural History, Smithsonian
Institution, available from http://www.botany.hawaii.edu/faculty/duffy/arb/481-493/490.pdf.
Biribo, N. (2008). Analyses of spatial and multi-temporal coastal changes of selected sites
in Tarawa, Kiribati. Department of Marine Science. Suva, University of the South Pacific.
Master of Science: 239.
Biribo, N. (unpublished). Composition of carbonate sediment for Betio and Marenanuka
islets. Suva, University of the South Pacific: 39.
C Hogan, T. K. (2008). Baseline Report: Survey of Public Awareness and Altitudes towards
climate change issues and challenges. Tarawa, Kiribati Adaptation Project: 22.
Doherty, T. J. and S. D. Clayton (2011). "The psychological impacts of global climate
change." American Psychologist 66: 265-276.
Donner, D. S. (2007). Coral Reef Benthic Monitoring - Final Report. G. o. K. Kiribati
Adaptation Project. Tarawa, unpublished: 29.
E, L. (2000). Coral Reef benthic surveys of Tarawa and Abaiang Atolls, Republic of Kiribati.
SOPAC Technical Report 310. Suva, SOPAC: 88.
191
Elrick, C., R. Kay, et al. (2009). Planning Manual: Supporting land use decision making in
the Republic of Kiribati. Prepared for Kiribati Adaptation Project Phase II (KAP II).
Government of Kiribati
http://www.climate.gov.ki/pdf/Adaptation/KAP%20Planning%20Manual.pdf.
Fritze, J. G., G. A. Blashki, et al. (2008). "Hope, despair and transformation: Climate change
and the promotion of mental health and wellbeing." International Journal of Mental Health
Systems 2(13).
Gourlay, M. R. S. a. M. R. (1999). "On the modelling of wave breaking and set-up on coral
reefs." Coastal Engineering: 27.
Hales, S., P. Weinstein, et al. (1999). "Ciguatera (Fish Poisoning), El Niño, and Pacific Sea
Surface Temperatures." Ecosystem Health 5: 1(20-25).
He, C. (2001). Assessment of the vulnerabilities of Bairiki and Bikenibeu, South Tarawa,
Kiribati to accelerated sea level rise, SOPAC: 36.
Hoegh-Guldberg, O. (2011). The Impact of Climate Change on Coral Reef Ecosystems, pp.
391-403. Coral Reefs: An Ecosystem in Transition. Z. Dubinsky and N. Stambler, Springer
Netherlands.
Hosoi, F. D. a. (1995). Coastal erosioin in South Tarawa, Kiribati. SOPAC Technical Report
no 225. Suva, SOPAC.
Ian White, T. F., Pascal Perez, Anne Dray, Taboia Metutera, Eita Metai and Marc Overmars
(2007). "Climatic and Human Influences on Groundwater in Low Atolls." Vadose Zone
Journal: 10.
Jofre, J., A. Blanch, et al. (2010). "Water-Borne Infectious Disease Outbreaks Associated
with Water Scarcity and Rainfall Events." The Handbook of Environmental Chemistry 8:
147-159.
192
Kay, R. (2008). Development of an Integrated Climate Change Adaptation Risk Diagnosis
and Planning Process: Final Report. Report prepared for the Kiribati Adaptation Project:
Phase II, Coastal Zone Management Pty Ltd: 82.
Kolstad, E. and K. Johansson (2011). "Uncertainties Associated with Quantifying Climate
Change Impacts on Human Health: A Case Study for Diarrhea." Environmental Health
Perspectives 119 (3): 299-305.
Lehane, L. and R. Lewis (2000). "Ciguatera: recent advances but the risk remains."
International Journal of Food Microbiology 61: 91-125.
M.L. Parry, O. F. C., J.P. Palutikof, P.J. van der Linden and C.E. Hanson, Eds., Ed. (2007).
Impacts, Adaptation and Vulnerability: Contribution of WG II to the Fourth Assessment of
the IPCC. UK, Cambridge University Press.
Mackenzie, D. U. (2004). Social Assessment of Adaptation in Kiribati. G. o. K. Kiribati
Adaptation Project. Tarawa, Kiribati, unpublished: 99.
McMichael, A., R. Woodruff, et al. (2003). Human Health and Climate Change in Oceania:
A Risk Assessment 2002. Commonwealth of Australia, Canberra, available from
http://www.health.gov.au/internet/main/publishing.nsf/content/2D4037B384BC05F6CA256F
1900042840/$File/env_climate.pdf.
Nicholls, R. J., P.P. Wong, V.R. Burkett, J.O. Codignotto, J.E. Hay, R.F. McLean, S.
Ragoonaden and C.D. Woodroffe (2007). Coastal systems and low-lying areas. Climate
Change 2007: Impacts, Adaptation and Vulnerability. Contribution of Working Group II to
the Fourth Assessment Report of the Intergovernmental Panel on Climate Change. O. F. C.
M.L. Parry, J.P. Palutikof, P.J. van der Linden and C.E. Hanson, Eds. UK, University
Cambridge Press, Cambridge: 43.
Sheffield, P. E. and P. J. Landrigan (2011). "Global climate change and children's health:
Threats and strategies for prevention " Environmental Health Perspectives 119: 3, pp. 291-
193
298: accessed 4.5.2011, http://www.ncbi.nlm.nih.gov/pmc/articles/PMC3059989/pdf/ehp-
119-291.pdf.
Teuatabo, N. (2011). Traditional knowledge and climate change: 10.
Webb, A. (2005). Assessment of coastal processes, impacts, erosion mitigation options and
beach mining - South Tarawa. Suva, SOPAC: 47.
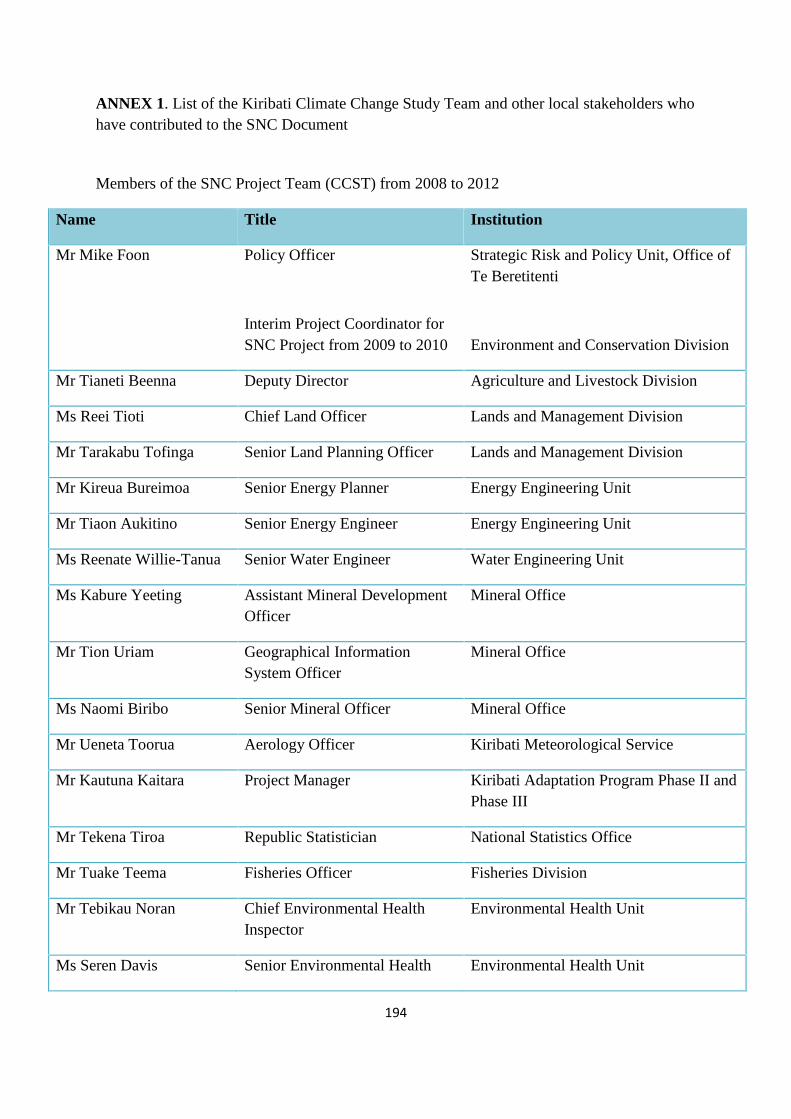
194
ANNEX 1. List of the Kiribati Climate Change Study Team and other local stakeholders whohave contributed to the SNC Document
Members of the SNC Project Team (CCST) from 2008 to 2012
Name Title Institution
Mr Mike Foon Policy Officer
Interim Project Coordinator forSNC Project from 2009 to 2010
Strategic Risk and Policy Unit, Office ofTe Beretitenti
Environment and Conservation Division
Mr Tianeti Beenna Deputy Director Agriculture and Livestock Division
Ms Reei Tioti Chief Land Officer Lands and Management Division
Mr Tarakabu Tofinga Senior Land Planning Officer Lands and Management Division
Mr Kireua Bureimoa Senior Energy Planner Energy Engineering Unit
Mr Tiaon Aukitino Senior Energy Engineer Energy Engineering Unit
Ms Reenate Willie-Tanua Senior Water Engineer Water Engineering Unit
Ms Kabure Yeeting Assistant Mineral DevelopmentOfficer
Mineral Office
Mr Tion Uriam Geographical InformationSystem Officer
Mineral Office
Ms Naomi Biribo Senior Mineral Officer Mineral Office
Mr Ueneta Toorua Aerology Officer Kiribati Meteorological Service
Mr Kautuna Kaitara Project Manager Kiribati Adaptation Program Phase II andPhase III
Mr Tekena Tiroa Republic Statistician National Statistics Office
Mr Tuake Teema Fisheries Officer Fisheries Division
Mr Tebikau Noran Chief Environmental HealthInspector
Environmental Health Unit
Ms Seren Davis Senior Environmental Health Environmental Health Unit
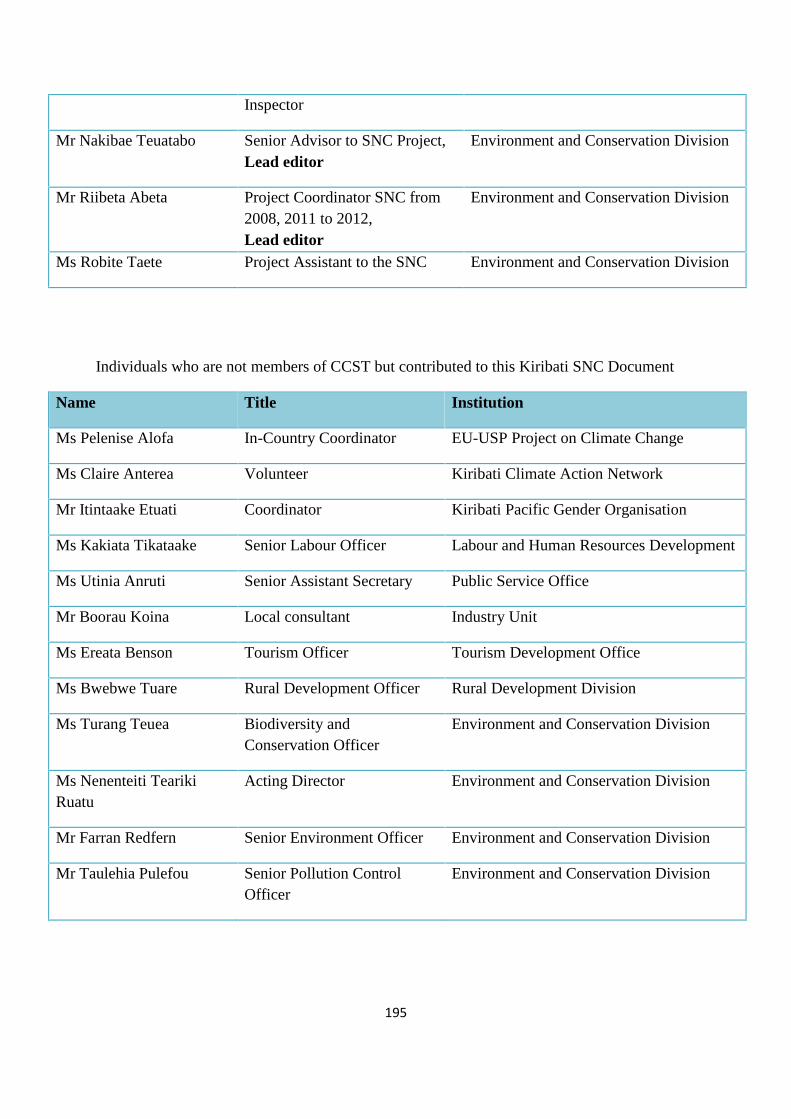
195
Inspector
Mr Nakibae Teuatabo Senior Advisor to SNC Project,Lead editor
Environment and Conservation Division
Mr Riibeta Abeta Project Coordinator SNC from2008, 2011 to 2012,Lead editor
Environment and Conservation Division
Ms Robite Taete Project Assistant to the SNC Environment and Conservation Division
Individuals who are not members of CCST but contributed to this Kiribati SNC Document
Name Title Institution
Ms Pelenise Alofa In-Country Coordinator EU-USP Project on Climate Change
Ms Claire Anterea Volunteer Kiribati Climate Action Network
Mr Itintaake Etuati Coordinator Kiribati Pacific Gender Organisation
Ms Kakiata Tikataake Senior Labour Officer Labour and Human Resources Development
Ms Utinia Anruti Senior Assistant Secretary Public Service Office
Mr Boorau Koina Local consultant Industry Unit
Ms Ereata Benson Tourism Officer Tourism Development Office
Ms Bwebwe Tuare Rural Development Officer Rural Development Division
Ms Turang Teuea Biodiversity andConservation Officer
Environment and Conservation Division
Ms Nenenteiti TearikiRuatu
Acting Director Environment and Conservation Division
Mr Farran Redfern Senior Environment Officer Environment and Conservation Division
Mr Taulehia Pulefou Senior Pollution ControlOfficer
Environment and Conservation Division
Filename: Kiribati SNC Master copy_FINAL1_46A7371Directory: C:\Users\Environment\AppData\Local\TempTemplate:
C:\Users\Environment\AppData\Roaming\Microsoft\Templates\Normal.dotm
Title: Kiribati Second National Communication ReportSubject:Author: Riibeta AbetaKeywords:Comments:Creation Date: 27/06/2013 5:31:00 PMChange Number: 7Last Saved On: 27/06/2013 5:33:00 PMLast Saved By: EnvironmentTotal Editing Time: 4 MinutesLast Printed On: 27/06/2013 5:34:00 PMAs of Last Complete Printing
Number of Pages: 195Number of Words: 53,185 (approx.)Number of Characters: 288,269 (approx.)
Related Documents


