Kingston Community Roundtable on Poverty Reduction c/o Social Planning Council of Kingston & Area 260 Brock St, Kingston, ON K7L 1S4 Tel 613-546-2843 [email protected] www.kingstonpovertyreduction.ca Submission to the Social Assistance Review from the Kingston Roundtable on Poverty Reduction The Kingston Community Roundtable on Poverty Reduction appreciated the opportunity to organize and participate in the Social Assistance Review session with the Commissioners held in Kingston on July 12, 2011. As well, we are submitting this written response to the Commissioners. We hope this will be of help in formulating the recommendations they will make in the months ahead. We have structured our submission by providing the principles we believe should be guiding every aspect of Social Assistance in Ontario followed by two examples of programs in Kingston that successfully employ these principles. We have also included a copy of our 2010 Deprivation Index with an explanation of why we think it is a valuable tool for tracking and monitoring the success of income security policy and should be institutionalized in communities across the province. Part l: The principles we believe should direct all elements of the Social Assistance program in the Province of Ontario: a) The program should ensure that all clients are treated with dignity. b) The primary focus of case workers should be supporting clients rather than enforcing compliance with regulations. c) Rules governing the program should be clearly written, reasonable in number and equitably applied in all locations. That is so say, there should be fairness in the delivery of the program, while providing for flexibility that enables staff to assist clients to meet their individual needs in the community in which they live. d) The goal of the program should be the end of deep poverty. Part 2: Two models of service delivery that succeed in Kingston We have included two models of service delivery to demonstrate the effectiveness of applying the above stated principles and priorities. It is our hope that you will apply these models to improve the impact of Ontario’s social service system. Direct Funding‐Self Managed Attendant Services

Welcome message from author
This document is posted to help you gain knowledge. Please leave a comment to let me know what you think about it! Share it to your friends and learn new things together.
Transcript

Kingston CommunityRoundtable on Poverty Reduction
c/o Social Planning Council of Kingston & Area 260 Brock St, Kingston, ON K7L 1S4
Tel 613-546-2843 [email protected]
www.kingstonpovertyreduction.ca
Submission to the Social Assistance Review from the Kingston Roundtable on Poverty Reduction
The Kingston Community Roundtable on Poverty Reduction appreciated the opportunity
to organize and participate in the Social Assistance Review session with the Commissioners held in Kingston on July 12, 2011. As well, we are submitting this written response to the Commissioners. We hope this will be of help in formulating the recommendations they will make in the months ahead.
We have structured our submission by providing the principles we believe should be guiding every aspect of Social Assistance in Ontario followed by two examples of programs in Kingston that successfully employ these principles. We have also included a copy of our 2010 Deprivation Index with an explanation of why we think it is a valuable tool for tracking and monitoring the success of income security policy and should be institutionalized in communities across the province.
Part l: The principles we believe should direct all elements of the Social Assistance
program in the Province of Ontario:
a) The program should ensure that all clients are treated with dignity.
b) The primary focus of case workers should be supporting clients rather than enforcing
compliance with regulations.
c) Rules governing the program should be clearly written, reasonable in number and
equitably applied in all locations. That is so say, there should be fairness in the delivery
of the program, while providing for flexibility that enables staff to assist clients to meet
their individual needs in the community in which they live.
d) The goal of the program should be the end of deep poverty.
Part 2: Two models of service delivery that succeed in Kingston We have included two models of service delivery to demonstrate the effectiveness of
applying the above stated principles and priorities. It is our hope that you will apply these models to improve the impact of Ontario’s social service system.
Direct Funding‐Self Managed Attendant Services

2
This program is for adults with physical disabilities who require assistance carrying out activities of daily living and want to take full responsibility for managing a budget, hiring and supervising their own attendants. This program is available province‐wide. An individual uses this program at home, at work, or in the community leading to more choices, greater flexibility and control in managing personal and community resources.
A self‐manager is a person in control of his or her own situation and not easily manipulated. A self‐manager is a person who knows what services he or she wants and needs, someone with plans – perhaps to move, work or study – or simply a clear desire to take responsibility for improving his or her own services.
The Direct Funding Program is administered by the Centre for Independent Living Toronto in partnership with the Ontario Network of Independent Living Centres. The Independent Living Centres in Ontario act as entrepenuership centres responding to self‐managers requests for assistance in administration, hiring and training.
Access To Employment The Access to Employment program supports people with disabilities or people with
significant barriers to finding and maintaining employment using the Independent Living (IL) model. The program assists people who are referred by Ontario Works.
The IL model is one of consumer empowerment where persons with disabilities are provided with the information, support and training to make choices and decisions in taking responsibility in their own employment process.
The Access to Employment program provides individual consultation and support throughout the entire process of planning, obtaining and maintaining employment. More specifically the program focuses on assistance with identifying, clarifying and minimizing or managing barriers to employment. The program provides training in disability and life management strategies. At the same time the program offers the range of typical employment services such as career planning, resume and interview preparation, as well as, networking with employers.
Summary These models both utilize a peer approach to supporting individuals. They also view the
participant as the expert in their process who need to be responsible for and in control of or at least managing their community services.
Part 3: The Deprivation Index developed by the Roundtable The Social Assistance Review being undertaken in the province of Ontario is an eagerly
awaited opportunity for recipients, advocates and caseworkers to give valuable input on overhauling the social assistance system. In Ontario, the rule‐intensive, punitive, and often degrading nature of Ontario Works (OW) and Ontario Disability Support Program (ODSP) acts

3
as a barrier to client success rather than a support. We need to improve the outcomes for people on assistance by creating a more efficient and equitable system of delivery. However, we currently lack the understanding necessary to create a better system. We do not understand that needs of people on assistance and further, we do not understand the barriers that prevent those needs from being met.
We are proposing that the government of Ontario use the framework developed by the Kingston Community Roundtable on Poverty Reduction in our 2010 Deprivation Index to analyze and track policy outcomes in communities across Ontario. We use the term deprivation rather than poverty to convey that we are talking about more than income. The Deprivation Index is a tool that provides an analysis of our community, extending into multiple domains and giving us a more holistic way to understand issues. The data collection process and subsequent mapping we did allowed us to present a contextual and locationally driven analysis of Kingston. Analyzing multiple domains that seek to expand our conception of deprivation and mapping the data to understand the geographical context provides the opportunity to identify systemic barriers that exist in our neighbourhoods. Identifying systemic barriers in neighbourhoods allows us to advocate for targeted policy that address the needs in those communities.
Current tools measuring poverty in Canada often limit their analysis to income, which in turn limits our understanding of poverty. The Deprivation Index reframes the issue to understand the intersections of multiple indicators. In Kingston we chose to look at education, food, geography, health, housing and income. OW and ODSP need to be understood in the context of our entire income security system. Social services such as education, healthcare, housing and childcare must also be understood as a part of that system. Therefore, we need a tool that will allow us to see the broader impacts policy has on our neighbourhoods.
The deprivation index provides context and place based analysis of deprivation. By mapping indicators, we are able to see the role neighbourhoods play in shaping poverty. Mapping the data we collected geographically made it clear the there are significant inequalities between neighbourhoods in Kingston. We were also able to track trends of multiple deprivations existing in specific neighbourhoods to demonstrate the intersectionality of income, health, education, housing, food and geography to give a more comprehensive picture of deprivation. The mapping we did reinforced the need for targeted policy interventions to ensure that children growing up in the North end of Kingston are not prohibited from reaching their potential because of where they live.
Analysis beyond income, integrated with a contextualizing data collection and mapping process moves the conversation about poverty away from individual blame towards an understanding of systemic barriers. For instance, our mapping demonstrated that the barriers facing residents of Kingston’s North end are different from the barriers facing residents of Kingston’s West end. Further, the barriers that exist in Kingston are different than those in other communities. It is imprudent to apply the same answers to every problem therefore we

4
need to tailor services and funding to meet the needs evident in specific neighbourhoods and communities.
Kingston’s 2010 Deprivation Index should be used as a framework for understanding the varying needs in communities across Ontario. Our index is based on the UK Deprivation Index, rather than the Ontario Deprivation Index because it gave us the ability to structure the domains around what we saw as important in our own community. In the UK, each region: England, Scotland, Northern Ireland and Wales, used different indicators and domains to acknowledge the differences that exist between those regions. Using the currently developed Ontario Deprivation Index is both impractical and less useful. While valuable, most organizations have neither the staff capacity nor the funds to replicate the data collected in Toronto by undertaking a large‐scale research project. Instead, the 2010 Deprivation Index provided a framework for analyzing data already available in our community through various agencies. The data was presented using clear language, mapping and graphs to make it easily accessible and usable.
Vulnerable populations tend to be highly studied groups in our community and we implore any organization that intends to do further research to be mindful and considerate of this when developing their approach.
Policy directing spending has to be better focused and targeted to improve the outcomes for people on assistance. However, we currently lack the tools necessary to identify the different barriers facing communities. In this climate of poor bashing and blaming, we need a tool that clearly identifies systemic barriers and refutes arguments individualizing the problems. The contextual and place based analysis of the 2010 Deprivation Index broadens our understanding of deprivation in our community. If we are really serious about reducing poverty in Ontario, we need to understand that each community is different and deserves to be treated as such. We believe that individual contexts need to be at the forefront of any program to assist people out of poverty. As each individual has different needs and circumstances, each community has different needs and circumstances. Therefore, the Ministry of Community and Social Services needs to empower communities to develop their own domains and foci to create their own Deprivation Indexes making it easier to identify the barriers people face in their own communities.

Asthma Mental Illness ObesityPhysical Activity Excellent Health
Highest Lowest
Income Groups
TOO SMALL
TOO BIG-$222
-$15
-$15
-$185
-$185
-$136
-$338
-$289
-$289
-$515
-$515
$571
$571
$620
$620
$364
$586 $756 $909 $1135Bachelor 1-Bedroom 2-Bedroom 3-Bedroom
TOO SMALL
TOO BIG-$122
-$27
-$27 -$180
-$118
-$118
-$344
-$344
$729
$729
$791
$791
$464On
tario
Work
sOD
SP
$0
$0
$0
Average Rents
Maximum Shelter Rates
Typical Pregnancy
Elementary SchoolYear
University Degree
190 days
280 da
Shelf life of Canned Tuna
For a Family
For Seniors
For Single Bedroom
Typic
al W
ait Ti
mes
for So
cial H
ousin
gCo
mpare
-
LegendAffordable Housing Locations
Meals Available in the Community
Emer ceng y Food Assisstance
Kingston Dissemination AreasAverage Income ($)
Data Not Available$0 - $30,000.00$30,000.01 - $60,000.00$60,000.01 $90,000.00
ood Assistance Locations with Average Income ($) Levels per Dissemination Area*
ing to their population (usually in the range of 400 - 700 people).
2009
King St. W.
John Counter Blvd.
Mon
treal
St.
Div
isio
n St
.
01
Princess St.
HIGHWAY 2
Average Income with Affordable Housing and Food Assistance
Kindergarten students not ready for school
18.6%21.5%
15.5%
22.9%
22.9%
37.1%
Typical Kindergarten Classof 20 students.
KFL&A Average
$
$
$
$
$
Toronto
$590
$1293
-$101
$
$
$
Ottawa
$607
$1227
-$52
$
$
$
$
$
$
$
$
Kingston
$614
$1327
-$159
$
$
$
$
$
$
$
$
$
$
Kingston
$216
$558
-$194
$
$
$
$
$
$
$
$
$
$
$
$
$
$
$
Family of Four Single Adult
$
$
$
* Worst family shortfall in Ontario.
$$
$$
$$
$$
$$
$$
$$
$$
$$
$$
$$
$$
$$
$$
$$
$$
$$* Worst family shortfall
in Ontario
Peterborough
$221
$568
-$209
Perth
$205
$474
-$99
Region
Nutritious Food Basket
Average Rent
Income less NFB & Rent
$580 Income $1782 Income
*
= -$20
$
$
$
$
$
$
$
Hamilton
$212
$501
-$133
No deficit
Algoma
$622
$726
$434
$$
$$
$$
$$
$$
$$
$$
$$
$$
$$
$$
$$
$$
$$
$$
$$
$$
$$
$$
$$
$$
$$
$$
$$
$$
$$
$$
$$
$$
$$
$$
$$
$$
$$
2010 Deprivation IndexEducationFoodGeographyHealthHousing Income
AcknowledgementsWhen we, the Kingston Community Roundtable
on Poverty Reduction, accepted our mandate to foster sustainable community leadership capacity through the pursuit of poverty reduction, we knew that to demonstrate any measure of change, we would have to develop a measurement tool to monitor reduction in the number of people living in poverty in Kingston. We are proud and excited to be part of a provincial, national, and even international place-based effort to eradicate poverty one community at a time.
To develop this monitoring tool, the Roundtable collaborated with a number of City of Kingston staff. Our research quickly showed us the complexity of properly selecting domains and indicators, the inadequacies inherent in quantitative measuring, and the newness, even globally, of this field of study. Perhaps the greatest constraint on the selection of indicators is the availability of data. However, it is equally important to select a manageable number of indicators that adequately capture the wide range of issues associated with poverty, such that they collectively provide a reasonably comprehensive picture of the extent and nature of poverty. The resulting Deprivation Index document identifies six domains and several indicators within each domain that reflect the present situation in Kingston. This baseline document offers a central core of measurements that can be compared annually, but
which also can be expanded upon as we progress in our mandate.
We acknowledge the contributions of the following people:
• Those who began the process of developing a monitoring tool: Judy Reichstein, Cheryl Hitchen, and Lance Thurston from city staff and Zaineb Zimmerman, Jim Stevens, Joel LaMorre, Tara Kainer, Mike Serson, Marijana Matovic, Martha Rudden, Kathy Horton, John Osborne, and Alice Gazeley from the Roundtable.
• Those who continued to carry the process further: Naomi Mori, Linda Cassidy, Bonita McCourt, Stephen Doig, Dallis Smith, Judy Postma, and Alice Gazeley from the Targets & Timelines Group of the Roundtable.
• Those who collected data: Chloe Shniffer, Tristan Johnson, Asma Fatehi, and student interns from Queen’s University.
• Those who contributed to the text.And a special thank you to our co-ordinator Julia
Bryan and our designer Aric McBay, who grappled with finding an effective way to bring this information to the public.
Alice Gazeley, ChairTargets & Timelines GroupKingston Community Roundtable on Poverty Reduction
Poverty Reduction Domains are distinct aspects of deprivation which can be recognized and measured separately. This is an index of six domains: food, education, geography, housing, health, and income.
Poverty Reduction Indicators are numbers or sets of numbers to obtain a comprehensive picture. They have a twofold purpose: to monitor changes over time and to monitor differences between different groups in the population.
Poverty Reduction is a multi-faceted challenge which demands multi-faceted strategies to realize sustainable solutions.
Definitions:

2010 Deprivation Index – 1
In 2009, the Kingston Community Roundtable on Poverty Reduction began work with the City of Kingston on the development of this Deprivation Index, a tool to measure poverty in our community. Poverty has traditionally been measured by income. Income alone, however, is an imperfect measure for poverty, because it draws a stark line between who is counted as poor and who is not. Often, these measures are not put in context with other important information, such as the cost of living in a particular community or the availability of affordable housing options. Poverty is not only about income, but also about deprivation. This Deprivation Index is part of a broader trend to view poverty, not simply as a singular set of circumstances, but as the inability to participate fully in Canadian life due to structural inequalities in access to social, economic, political, and cultural resources. This report is divided into six domains: education, food, geography, housing, health, and income.
Our intention is to create a picture of the household circumstances of a person or family living in poverty in Kingston. Where possible, the measures used are put in context with specific neighbourhood information, locally developed data, or comparisons with other communities.
As this index evolves, the information it provides, particularly through maps, will allow for more targeted, informed policies that we will direct at underprivileged neighbourhoods. Poor neighbourhoods are not just made up of poor people; they often lack access to the services, resources, and community facilities that are taken for granted in neighbourhoods that are more privileged. Understanding the geographical distribution of deprivation gives us better tools to address disadvantaged areas in our community, not simply disadvantaged people.
The effectiveness of this index relies on building partnerships with other community organisations to work together developing reliable and accurate local level information. In the 2011 Deprivation Index, we hope that our food section will contain data from the Food Providers’ Networking Group, a voluntary committee made up of local food service providers who meet regularly to share information and resources. The group is currently developing standardised measures to track program usage across all their member organisations. In fact, we hope to work with many partner organisations over the next year to achieve a more accurate picture of deprivation in Kingston and work with them to address that deprivation.
IntroductionPoverty is the condition of a human being who is deprived of the resources, means, choices and power necessary to acquire and maintain economic self-sufficiency or to facilitate integration and participation in society.Province of Quebec, Bill 112, An Act to Combat Poverty and Social Exclusion

2 – 2010 Deprivation Index
Education
EQAO Test Scores
The Education Quality and Accountability Office conducts provincially mandated annual standardized tests of school children at grades 3 and 6 to assess skills in reading, writing, and mathematics.
Test scores on the provincial level have mostly shown improvement over the past five years. In
Kingston, however, Grade 3 reading and Grade 6 mathematics scores have stagnated. Kingston has generally scored below the provincial average on EQAO test scores.
EQAO scores and school readiness vary widely by neighbourhood (see opposite page).
70%
60%
50%
70%
60%
50%Grad
e 6Gr
ade 3
Ontario Average Kingston (LDSB)
2009
2008
2007
2006
2005
2009
2008
2007
2006
2005
2009
2008
2007
2006
2005Reading Writing Mathematics
Ontario’s Poverty Reduction Strategy argues that education plays an important role in ensuring a longer, healthier life. Education alone, however, does not protect a person from poverty. According to the Ontario Association of Food Bank’s 2009 Hunger Report, over 30% of food bank users in Ontario had a post-secondary degree or diploma.
In the recently released Social Determinants of Health: The Canadian Facts, the authors argue that level of education is highly correlated with other social determinants of health, such as level of income, employment security, and working conditions. As the report further argues, strong support programs can address the effects of education on poverty and ill health; for instance, if adequate income and necessary services such as childcare could be available to all, the effects of having less education would be reduced. A long-term American study cited in the Ontario Association of Food Bank’s The Cost of Living report found that every dollar spent on early education will return between seven and ten dollars later because
of the reduced need for special education, welfare, unemployment, and prison expenditures.
Education is especially important because it is often a prerequisite for gaining employment. In Canada, people with university degrees have the highest income. However, statistics from 2006 indicate that the 1000 Islands Region had a lower proportion of residents with university degrees, compared to the average in Ontario. Ontario’s Poverty Reduction Strategy states that the best poverty reduction strategy is a strong, publicly funded education system. Education, however, also takes place outside of traditional academic settings. Those with better educations have more opportunities to benefit from new training if they face changes in their employment situations. Education also facilitates wider possibilities for civic activities and engagement in the political process, which allow citizens to understand and influence the factors that affect their lives.
In 2007, according to Statistics Canada’s Labour Force Survey, 35.8% of residents in Kingston were not participating in the labour force.

2010 Deprivation Index – 3
Alwington vs Rideau Heights Highest Level of Schooling
In Ontario’s Poverty Reduction Strategy, the readiness of kindergarten students for school is a key indicator for measuring progress. The Early Development Instrument, used to measure readiness, maps vulnerabilities in five domains: communication skills and general knowledge; language cognitive development; emotional health and maturity; social knowledge and competence; and physical health and well being. The graphic below shows the percentage of students in senior kindergarten who are rated low in one or more of these domains. When mapped, this indicator suggests that classes in north Kingston neighbourhoods can expect to have a large percentage
of vulnerable students. This distribution of students can put a significant burden on teaching staff, affecting the education of all students in the class and the school.
Ontario’s Poverty Reduction Strategy states that, according to research, a child’s readiness to learn at age five is a predictor of future ability in school. School readiness can be improved with targeted support programs for mothers and children, such as stable and affordable housing. In Canada, children with educated parents perform better than children whose parents do not have post-secondary education; ensuring both adults and children have access to education is important for breaking the cycle of poverty.
In Alwington, 4 out of 5 people have university education. In Rideau Heights, fewer than 1 out of 10 do. A third of the people in Rideau Heights lack any
diploma or certificate; in Alwington, only 1 in 25 do. College schooling is more common in Kingston in general than either comparison neighbourhood.
8%
33%
82%
18%
24%
8%
10%
8%
4%
32%
24%
6%
11%
32%Rideau Heights
Kingston
Alwington
No Diploma or CertificateHigh SchoolApprentice or TradesCollegeUniversity
School Readiness
Kindergarten students not ready for school
18.6%21.5%
15.5%
22.9%
22.9%
37.1%
Typical Kindergarten Classof 20 students.
KFL&A Average
18.6%
4 – 2010 Deprivation Index
$
$
$
$
$
Toronto
$590
$1293
-$101
$
$
$
Ottawa
$607
$1227
-$52
$
$
$
$
$
$
$
$
Kingston
$614
$1327
-$159
$
$
$
$
$
$
$
$
$
$
Kingston
$216
$558
-$194
$
$
$
$
$
$
$
$
$
$
$
$
$
$
$
Family of Four Single Adult
$
$
$
* Worst family shortfall in Ontario.
$$
$$
$$
$$
$$
$$
$$
$$
$$
$$
$$
$$
$$
$$
$$
$$
$$* Worst family shortfall
in Ontario
Peterborough
$221
$568
-$209
Perth
$205
$474
-$99
Region
Nutritious Food Basket
Average Rent
Income less NFB & Rent
$580 Income $1782 Income
*
= -$20
$
$
$
$
$
$
$
Hamilton
$212
$501
-$133
No deficit
Algoma
$622
$726
$434
$$
$$
$$
$$
$$
$$
$$
$$
$$
$$
$$
$$
$$
$$
$$
$$
$$
$$
$$
$$
$$
$$
$$
$$
$$
$$
$$
$$
$$
$$
$$
$$
$$
$$
Food
Nutritious Food Basket Shortfall
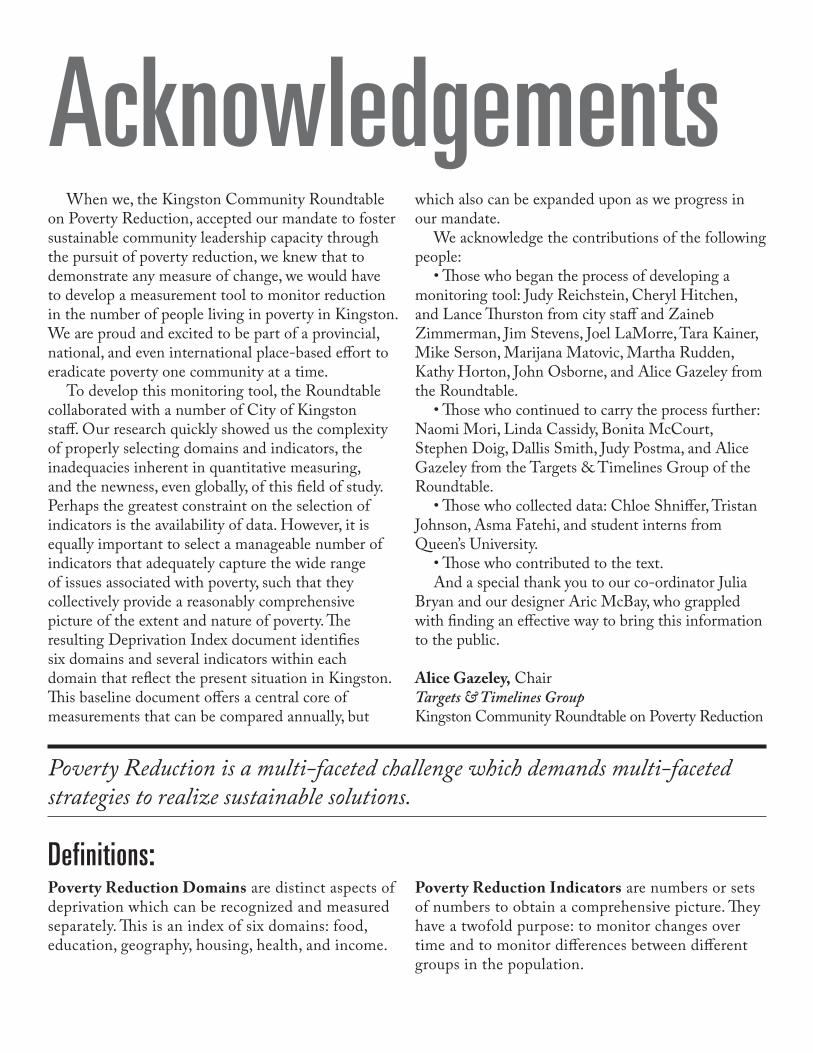
Food is a basic necessity and a human right, yet many Kingstonians must regularly choose between food and shelter.
Food insecurity is directly related to income; according to the recently released The Canadian Facts, low-income people consume fewer servings of fruits and vegetables, milk products, and vitamins than those in food-secure households. Dietary deficiencies are associated with higher rates of chronic diseases such as diabetes, high blood pressure, and heart disease.
The Canadian Community Health Survey found that food insecurity is more common in households with children (10.4%) than in those without children (8.6%). It also found that food insecurity is especially
common in households led by single mothers (25%).Obesity, which was once traditionally associated
with overindulgence, is now correlated to poverty and a lack of available, affordable, and appropriate food choices. When communities or individuals are deprived of access to nutritious food, it is often not simply a function of individual choice but a result of how social environments shape the decisions we make and the behaviours we engage in.
According to the Ontario Association of Food Banks report, one in four households are turning to food banks (25.1%), and many children do not eat breakfast one or more times per week. In a larger number of households (33.4%), at least one member regularly misses three or
Based on the 2009 NFB Survey, Income from Ontario Works Nov/Dec 2009.

2010 Deprivation Index – 5
Fruit and vegetable consumption by public health unit. The percentage of people 12 and older who reported consuming fruits and vegetables five or more times per day. At 43%, Kingston is close to the provincial average for fruit and vegetable consumpion.
The Partners in Mission Food Bank has distributed food hampers in Kingston since 1986. Their busiest year of all time was 1994 (10,572 hampers). The second-place year was 2009, with 10,247 hampers. The year-on-year increase for 2009 was the biggest single year increase since the food bank’s first year.
Food bank usage is largely about paying rent, which is a non-negotiable cost each month. In Kingston, very high rental costs and low vacancy rates cause greater food insecurity, because renters are unable to find relief by moving. As the recent Where’s Home report states, “There are no charities that will pay the rent, but there are food banks.” For low-income people, their
only budget mobility is in their food expenditures. According to an Ontario Association of Food Banks report, almost all of those who use food banks live in rental housing, with 65% in market rental housing and 34% in assisted housing. A third of those who use the food banks are new Canadians and over half have a post-secondary degree.
The Sick and Tired report suggests that social assistance recipients have a household food insecurity rate 15 times higher than the non-poor do. According to our Public Health Unit, in Kingston 11.4% of residents have experienced or worried about food insecurity in the past 12 months.
more meals per week, or one day worth of food, due to lack of money. Unfortunately, much of the food that is consumed does not meet basic nutritional needs. In many of the households turning to food banks (63%), members do not consume the recommended daily servings of milk and milk alternatives. An even higher proportion of members of households turning to food banks (72.4%) do not consume the required servings of fruits and vegetables.
The Nutritious Food Basket Shortfall table indicates that, when put into context, the power to make healthy food choices is constrained by the cost of living in Kingston. The table shows the family and individual incomes for people living on social assistance. The Mayor’s Taskforce on Poverty report suggests that there were approximately 11,000 people in Kingston who relied on some kind of assistance in 2008. The report further argues that there are approximately 7,500 more ‘working poor’ people living below the poverty line, who do not receive any kind of assistance.
Wellington-Dufferin-GuelphKFL&A
York RenfrewChatham-Kent
50%43%
37% 36%29%
Fruit and Vegetable Consumption
FOOD BANK USE: Partners in Mission
0
2000
4000
6000
8000
10,000
12,000
86 87 88 89 90 91 92 93 94 95 96 97 98 99 00 01 02 03 04 05 06 07 08 09

6 – 2010 Deprivation Index
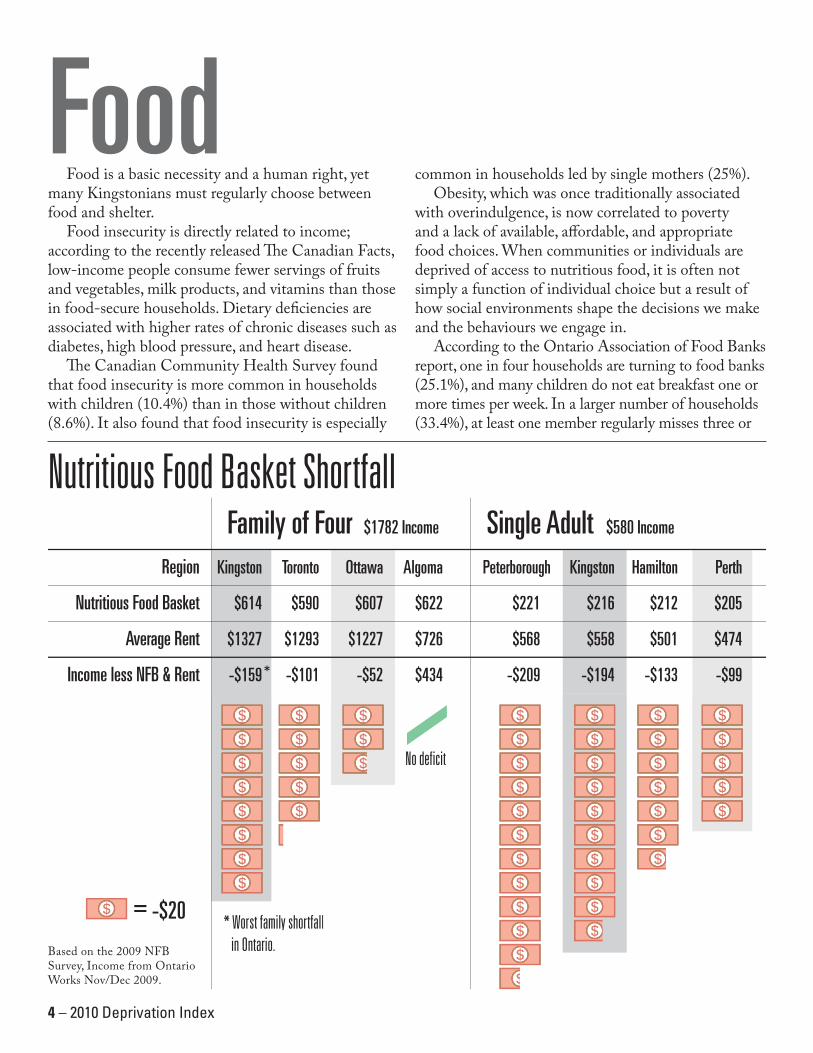
Geography
Bath Rd.
Princess St.
Front Rd.King St. W.
John Counter Blvd.Taylor-Kidd Blvd.
Mid
land
Ave
.G
ardi
ners
Rd.
Syde
nham
Rd.
Pert
h R
d.
Mon
trea
l St.
Div
isio
n St
.
HIGHWAY 401
Day
s R
d. Brock St.
Princess St.
Lake Ontario
St. Lawrence River
Legend0 (or No Data)30000 - 4599946000 - 61999
62000 - 7799978000 - 9399994000 - 110000
Source: 2006 Statistics Canada Census Data
City of Kingston - Median Family Income ($) (2005) Per Census Tract - 2006 Census
¯ 0 1 2 3 40.5Kilometers
* Census tracts are geographic divisions of a metropolitan area. Census data is collected individually from these areas.
Bath Rd.
Princess St.
Front Rd.King St. W.
John Counter Blvd.Taylor-Kidd Blvd.
Mid
land
Ave
.G
ardi
ners
Rd.
Syde
nham
Rd.
Pert
h R
d.
Mon
trea
l St.
Div
isio
n St
.
HIGHWAY 401
Day
s R
d. Brock St.
Princess St.
Lake Ontario
St. Lawrence RiverLegend
0% (or No Data)0.1 - 7.0%7.1 - 14.0%14.1 - 21.0%21.1 - 28.0%28.1 - 35.0%
Source: 2006 Statistics Canada Census Data
City of Kingston - Unemployment Rate By Census Dissemination Area (Persons Aged 15 and Over)
¯ 0 1 2 3 40.5Kilometers
** Note: Areas with a high student population tend to have a relatively higher unemployment rate due to educational commitments.* Census dissemination areas are composed of one or more neighbouring blocks with a population of 400 to 700 persons.
Bath Rd.
Princess St.
Front Rd.King St. W.
John Counter Blvd.Taylor-Kidd Blvd.
Mid
land
Ave
.G
ardi
ners
Rd.
Syde
nham
Rd.
Pert
h R
d.
Mon
trea
l St.
Div
isio
n St
.
HIGHWAY 401
Day
s R
d. Brock St.
Princess St.
Kingston Mills Rd.
St. Lawrence River / Fleuve Saint-LaurentNorth Channel
LegendKingston Dissemination AreasNo Certificate, Diploma, or Degree
01 - 2525.1 - 5050.1 - 7575.1 - 100100.1 - 125125.1 - 150** Dissemination Areas are small areas in a city varying in size according to their population (usually in the range of 400 - 700 people).
0 1 2 3 40.5Kilometers
City of Kingston - Population with No Education Certificate, Diploma, or Degree* (Per Dissemination Area**)
* Including no high school diploma -
LegendAffordable Housing Locations
Meals Available in the Community
Emer ceng y Food Assisstance
Kingston Dissemination AreasAverage Income ($)
Data Not Available$0 - $30,000.00$30,000.01 - $60,000.00$60,000.01 $90,000.00
0 1 2 3 40.5Kilometers
City of Kingston - Community Meals/Emergency Food Assistance Locations with Average Income ($) Levels per Dissemination Area*
* Dissemination Areas are small areas in a city varying in size according to their population (usually in the range of 400 - 700 people).Source of Income Data: Statistics Canada 2006 CensusKingston Community Meal / Food Assistance Data as of September, 2009
Bath Rd.
Princess St.
Front Rd.King St. W.
John Counter Blvd.
Taylor-Kidd Blvd.
Mid
land
Ave
.
Gar
dine
rs R
d.
Mon
treal
St.
Div
isio
n St
.
HIGHWAY 401
Day
s R
d.
Princess St.
HIGHWAY 2
Average Income with Affordable Housing and Food Assistance % Population without education
Median family incomeUnemployment Rate
2010 Deprivation Index – 7
Maps prepared by Ben Niven, Roundtable GIS Summer Student, 2010. Information sourced from 2006 Statistics Canada Census Data, except for food assistance and affordable housing data which was compiled by the Roundtable.
Bath Rd.
Princess St.
Front Rd.King St. W.
John Counter Blvd.Taylor-Kidd Blvd.
Mid
land
Ave
.G
ardi
ners
Rd.
Syde
nham
Rd.
Pert
h R
d.
Mon
trea
l St.
Div
isio
n St
.
HIGHWAY 401
Day
s R
d. Brock St.
Princess St.
Lake Ontario
St. Lawrence River
Legend0 (or No Data)30000 - 4599946000 - 61999
62000 - 7799978000 - 9399994000 - 110000
Source: 2006 Statistics Canada Census Data
City of Kingston - Median Family Income ($) (2005) Per Census Tract - 2006 Census
¯ 0 1 2 3 40.5Kilometers
* Census tracts are geographic divisions of a metropolitan area. Census data is collected individually from these areas.
Bath Rd.
Princess St.
Front Rd.King St. W.
John Counter Blvd.Taylor-Kidd Blvd.
Mid
land
Ave
.G
ardi
ners
Rd.
Syde
nham
Rd.
Pert
h R
d.
Mon
trea
l St.
Div
isio
n St
.
HIGHWAY 401
Day
s R
d. Brock St.
Princess St.
Lake Ontario
St. Lawrence RiverLegend
0% (or No Data)0.1 - 7.0%7.1 - 14.0%14.1 - 21.0%21.1 - 28.0%28.1 - 35.0%
Source: 2006 Statistics Canada Census Data
City of Kingston - Unemployment Rate By Census Dissemination Area (Persons Aged 15 and Over)
¯ 0 1 2 3 40.5Kilometers
** Note: Areas with a high student population tend to have a relatively higher unemployment rate due to educational commitments.* Census dissemination areas are composed of one or more neighbouring blocks with a population of 400 to 700 persons.
Bath Rd.
Princess St.
Front Rd.King St. W.
John Counter Blvd.Taylor-Kidd Blvd.
Mid
land
Ave
.G
ardi
ners
Rd.
Syde
nham
Rd.
Pert
h R
d.
Mon
trea
l St.
Div
isio
n St
.
HIGHWAY 401
Day
s R
d. Brock St.
Princess St.
Kingston Mills Rd.
St. Lawrence River / Fleuve Saint-LaurentNorth Channel
LegendKingston Dissemination AreasNo Certificate, Diploma, or Degree
01 - 2525.1 - 5050.1 - 7575.1 - 100100.1 - 125125.1 - 150** Dissemination Areas are small areas in a city varying in size according to their population (usually in the range of 400 - 700 people).
0 1 2 3 40.5Kilometers
City of Kingston - Population with No Education Certificate, Diploma, or Degree* (Per Dissemination Area**)
* Including no high school diploma -
LegendAffordable Housing Locations
Meals Available in the Community
Emer ceng y Food Assisstance
Kingston Dissemination AreasAverage Income ($)
Data Not Available$0 - $30,000.00$30,000.01 - $60,000.00$60,000.01 $90,000.00
0 1 2 3 40.5Kilometers
City of Kingston - Community Meals/Emergency Food Assistance Locations with Average Income ($) Levels per Dissemination Area*
* Dissemination Areas are small areas in a city varying in size according to their population (usually in the range of 400 - 700 people).Source of Income Data: Statistics Canada 2006 CensusKingston Community Meal / Food Assistance Data as of September, 2009
Bath Rd.
Princess St.
Front Rd.King St. W.
John Counter Blvd.
Taylor-Kidd Blvd.
Mid
land
Ave
.
Gar
dine
rs R
d.
Mon
treal
St.
Div
isio
n St
.
HIGHWAY 401
Day
s R
d.
Princess St.
HIGHWAY 2
Average Income with Affordable Housing and Food Assistance % Population without education
Median family incomeUnemployment Rate

8 – 2010 Deprivation Index
HealthMany studies have shown that people living in low-
income neighbourhoods are more likely to experience more stressful working conditions, a higher rate of job insecurity, and higher rates of life dissatisfaction. The 2009 Sick and Tired report found that social assistance recipients have significantly higher rates of poor health, including higher rates of diabetes, heart disease, chronic bronchitis, arthritis and rheumatism, mood
disorders, and anxiety disorders. In the year before the study, one in ten assistance recipients had considered suicide. Suicide attempts are ten times higher for those on social assistance compared to the non-poor. According to the CIHI 2010 Canadian Health Indicators report, the rate of heart attacks in the least affluent neighbourhoods was 37% higher than the rate in the most affluent ones.
Health Adjusted Life Expectancy11.4 years lost to poverty
2.8 years lost to cancer
9.7 years lost to povery
2.5 years lost to cancer
Men
Wom
en
The poorest men have 11.4 fewer years of good health than the most affluent. Women lose 9.7 years. This is much greater than loss of life from cancer.
Self-Reported Health by Income
Analysis of self-reported health by income for the Kingston CMA, according to the Canadian Community Health Survey. Self-reported health
shows that higher income groups tend to have better overall health, and are less likely to suffer from asthma or obesity.
Asthma Mental Illness ObesityPhysical Activity Excellent Health0
5
10
15
20
25
30
35
Highest Lowest
Income Groups
%

2010 Deprivation Index – 9
Low birth weight per 1000 live births. The incidence of low birth weight in Kingston has been on the decline. Kingston’s incidence of low birth weight has improved significantly since 1991, but is still slightly worse than the Canadian average.
Peterborough
KFL&ALeeds, Grenville and LanarkToronto
Ottawa
41.8
33.027.4 25.3 22.2
Teen pregnancy rate in by public health unit. The teen pregnancy rate in Kingston, Frontenac, Lennox & Addington Public Health is 33 per 1000 teenaged females. This is significantly higher than the provincial average of 27.4 per 1000.
50
60
70
80KingstonCanada
2006200119961991
BIRTH AND PREGNANCYLow birth weight Teen pregnancy
The Health Adjusted Life Expectancy measures the number of years lived in good health, and according to Statistics Canada, income-related disparities in health-adjusted life expectancy were found to be considerably larger than those for the conventional life expectancy indicator. Income plays a role in overall life expectancy
in Canada, wealthy men and women live longer than their poorer neighbours. When the Health Adjusted Life Expectancy Measure is applied, only 51.2 per cent of Canadian men in the lowest income group (the bottom 10 per cent) can expect to live to age 75 compared with almost 75 per cent of high-income earners (the top 10 %).
The primary factors that shape the health of Canadians are not medical treatments or lifestyle choices, but rather the living conditions we experience. These conditions are referred to as the social determinants of health. Dennis Raphael, a leading Canadian researcher on the social determinants of health, defines them as the economic and social conditions that shape the health of individuals and communities. He identifies 14 key determinants, including income and income distribution, gender, employment and working conditions, and the social safety net. These factors are the primary determinants of whether individuals stay healthy or become ill, and the extent to which a person possesses the physical, social, and personal resources to identify and achieve personal aspirations, satisfy needs, and cope with the environment.
According to The Canadian Facts, the bottom third of Canadian income earners are 50% less likely
to see a specialist when needed, 50% more likely to find it difficult to get care on weekends or evenings, and 40% more likely to wait five days or more for an appointment with a physician. The report also states that Canadians with below-average incomes are three times less likely to fill a prescription due to cost and 60% less able to get a needed test or treatment due to cost than above-average income earners.
Birth weight and teen pregnancy are two indicators for measuring poverty reduction. Ontario’s Poverty Reduction Plan argues that measuring birth weights is important as babies born to low-income families more often have below-normal birth weights, which can put them at a higher risk for poor future health outcomes. According to the Ontario Women’s Health Council, youth living in poverty have a teen pregnancy rate that is five times the average. Children of teenage parents are more likely to become teenage parents themselves, perpetuating the cycle of poverty.
Social Determinants of Health
10 – 2010 Deprivation Index
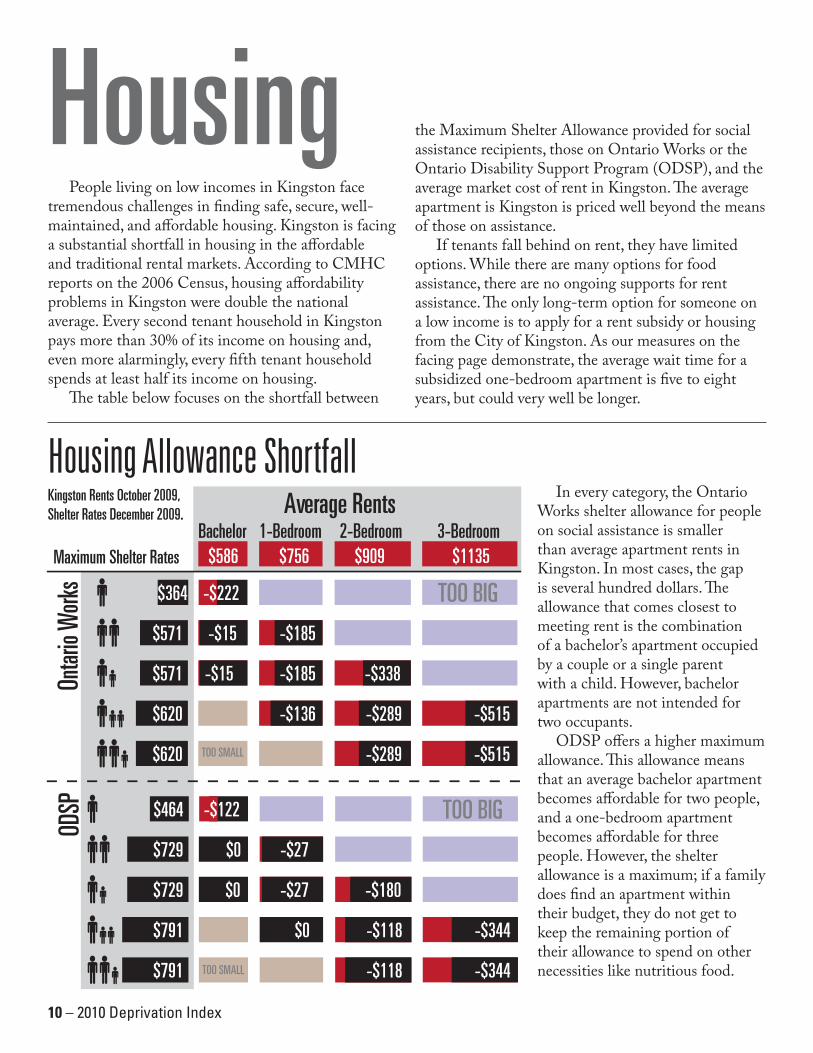
Housing
In every category, the Ontario Works shelter allowance for people on social assistance is smaller than average apartment rents in Kingston. In most cases, the gap is several hundred dollars. The allowance that comes closest to meeting rent is the combination of a bachelor’s apartment occupied by a couple or a single parent with a child. However, bachelor apartments are not intended for two occupants.
ODSP offers a higher maximum allowance. This allowance means that an average bachelor apartment becomes affordable for two people, and a one-bedroom apartment becomes affordable for three people. However, the shelter allowance is a maximum; if a family does find an apartment within their budget, they do not get to keep the remaining portion of their allowance to spend on other necessities like nutritious food.
Housing Allowance Shortfall
TOO SMALL
TOO BIG-$222
-$15
-$15
-$185
-$185
-$136
-$338
-$289
-$289
-$515
-$515
$571
$571
$620
$620
$364
$586 $756 $909 $1135Bachelor 1-Bedroom 2-Bedroom 3-Bedroom
TOO SMALL
TOO BIG-$122
-$27
-$27 -$180
-$118
-$118
-$344
-$344
$729
$729
$791
$791
$464
Ontar
io W
orks
ODSP
$0
$0
$0
Average Rents
Maximum Shelter Rates
Kingston Rents October 2009, Shelter Rates December 2009.
People living on low incomes in Kingston face tremendous challenges in finding safe, secure, well-maintained, and affordable housing. Kingston is facing a substantial shortfall in housing in the affordable and traditional rental markets. According to CMHC reports on the 2006 Census, housing affordability problems in Kingston were double the national average. Every second tenant household in Kingston pays more than 30% of its income on housing and, even more alarmingly, every fifth tenant household spends at least half its income on housing.
The table below focuses on the shortfall between
the Maximum Shelter Allowance provided for social assistance recipients, those on Ontario Works or the Ontario Disability Support Program (ODSP), and the average market cost of rent in Kingston. The average apartment is Kingston is priced well beyond the means of those on assistance.
If tenants fall behind on rent, they have limited options. While there are many options for food assistance, there are no ongoing supports for rent assistance. The only long-term option for someone on a low income is to apply for a rent subsidy or housing from the City of Kingston. As our measures on the facing page demonstrate, the average wait time for a subsidized one-bedroom apartment is five to eight years, but could very well be longer.
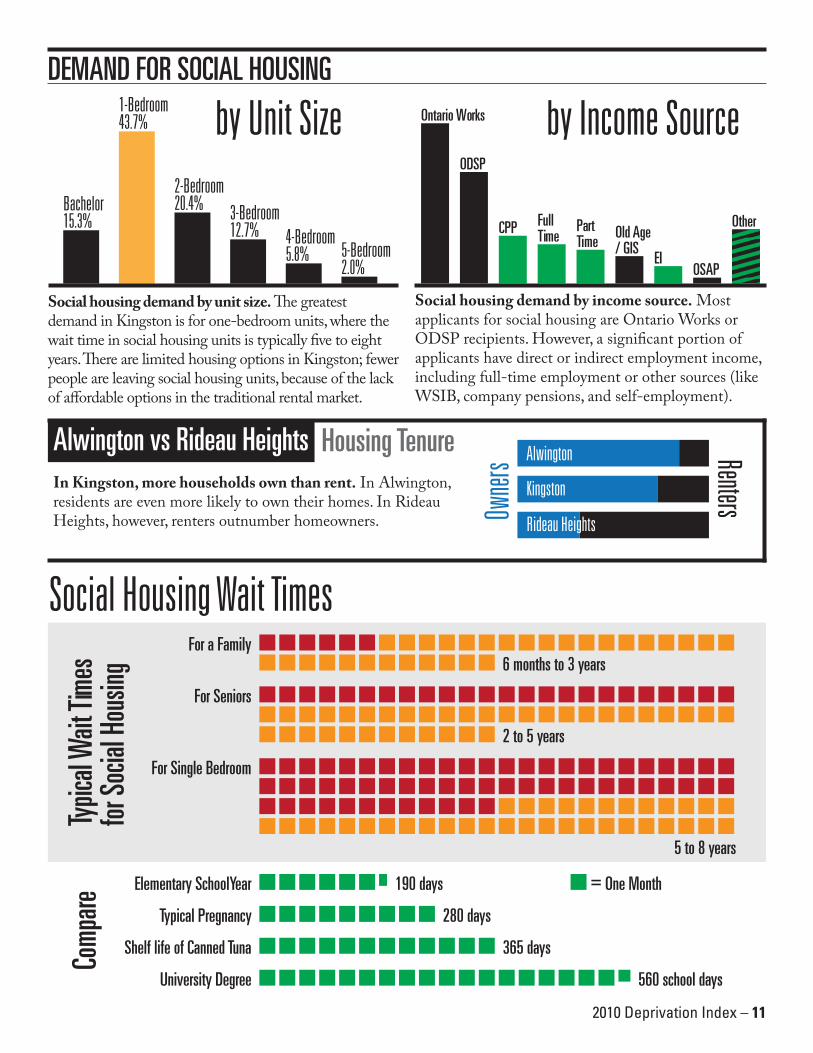
2010 Deprivation Index – 11
by Unit Size
Social housing demand by unit size. The greatest demand in Kingston is for one-bedroom units, where the wait time in social housing units is typically five to eight years. There are limited housing options in Kingston; fewer people are leaving social housing units, because of the lack of affordable options in the traditional rental market.
Bachelor15.3%
1-Bedroom43.7%
2-Bedroom20.4% 3-Bedroom
12.7% 4-Bedroom5.8% 5-Bedroom
2.0%
Social housing demand by income source. Most applicants for social housing are Ontario Works or ODSP recipients. However, a significant portion of applicants have direct or indirect employment income, including full-time employment or other sources (like WSIB, company pensions, and self-employment).
by Income SourceDEMAND FOR SOCIAL HOUSING
Other
OSAPEI
Old Age / GIS
Part Time
Full TimeCPP
ODSP
Ontario Works
Social Housing Wait Times
Alwington vs Rideau Heights Housing TenureIn Kingston, more households own than rent. In Alwington, residents are even more likely to own their homes. In Rideau Heights, however, renters outnumber homeowners. Ow
ners
Renters
Alwington
Kingston
Rideau Heights
Typical Pregnancy
Elementary SchoolYear
University Degree
190 days
280 days
560 school days
Shelf life of Canned Tuna 365 days
For a Family
For Seniors
For Single Bedroom
6 months to 3 years
2 to 5 years
5 to 8 years
Typic
al W
ait Ti
mes
for So
cial H
ousin
g
= One Month
Comp
are

12 – 2010 Deprivation Index
IncomeThis deprivation index is meant to demonstrate
that poverty is not a function of income alone; however, poverty is always impacted by income. Wages have failed to keep pace with inflation and those on social assistance have a spending power that is 55% below what it was in the early 1990s. Rates of poverty and income inequality in Canada increased dramatically during the past decade and are now reaching levels above that of the average for countries in the Organization for Economic Cooperation and
Development. In Rideau Heights, more than three times as many live on less than $10,000 a year than in the average Kingston neighbourhood. One in four households in Rideau Heights has an income under $20,000 a year. Welfare rates and minimum wage are the same across Ontario even though the cost of living is different in different communities. This imbalance means that in Kingston, given high rental costs, poor families have to get by on even less.
The Market Basket Measure is an estimate of a family of four’s basic spending on a “basket” of goods and services (including food, shelter, clothing, and transportation). The measure is calculated anew each year. A family can be considered poor if its disposable income is less than this amount. In 2000, the bottom 20% of tax-filers in Kingston made 52% (or less) of this amount, meaning they would face a large
shortfall to support a family’s basic expenses. The median income in 2000 only offered a 15% margin above the cost of the market basket. In 2005, the situation improved slightly for the median income, but worsened slightly for the poorest 20%. This change implies that disposable incomes are improving for wealthier people, but stagnating or declining for those in poverty.
52%
51%
2000
2005
20% of tax-filers make less income.Second Decile
115%
119%
Half of tax-filers make more, half make less.Median Income
$28,400
$32,500$14,000
Market BasketAnnual “basket” for a family of four.
Market Basket$24,648
Market Basket$27,215
$12,900

2010 Deprivation Index – 13
5%
10%
15%
20%
Kingston
Canada
2005200019951990
FAMILIES IN POVERTY
Working Poor
Rideau Heights: $39,022 Alwington: $161,322
Welfare Allowances
Percentage of families that are working poor.* Since 1995, more and more families can be classified as working poor. Kingston has a higher proportion of working poor than the Canadian average.
Percentage of families receiving social assistance. Fewer families have been receiving social assistance since 1995, which is partly a reflection of heavier access restrictions. Kingston continues to rate worse on this measure than the national average.
Alwington has four times the family income of Rideau Heights. Although Rideau Heights is a low-income neighbourhood, family income there is closer to the average Kingston household than Alwington is.
In Kingston, over 10 % of the population receives social assistance. In Rideau Heights, most residents rely on government benefits to make ends meet–about twice as many as the rest of the city. Unemployment in Rideau Heights is also high at 15.9%, while adults over 25 face almost three times the rate of unemployment as the rest of the city. The basic amount for a single person living on social assistance is $585/month ($364 for shelter and $221 for basic needs), and for a single parent with one child it is $1005/month ($572 for shelter, $341 for basic needs and $92 for the Ontario Child Benefit).
While there is certainly some abuse of the welfare system (an estimated $10 million in 2008), it is important to put these numbers in a broader context. A 2005 study from Simon Fraser University found that roughly 30 to 40% of households underreported income by, on average, roughly $8,000 in 1999. In real terms, this underreporting added up to approximately $4 to $5 billion dollars in lost revenue each year. The authors of that study noted that these amounts are sufficient to provide a number of national public programs–for instance, the cost of a national childcare program was estimated at $5 billion dollars over five years in 2005.
4%
6%
8%
10%
KingstonCanada
2005200019951990
% on Social Assistance
Alwington vs Rideau Heights Average Family Income
* These are families with some employment which make less than the Low Income Cut-Off.
Alwington$161,322
Median$69,530 Rideau Heights
$39,022
Welfare & Tax Fraud

Designed by Aric McBay.
Related Documents