Kingsport: Demographic and Economic Context Presented to the Kingsport Economic Summit November 4, 1999 Patrick L. Phillips Senior Vice President Economics Research Associates Washington DC

Kingsport: Demographic and Economic Context Presented to the Kingsport Economic Summit November 4, 1999 Patrick L. Phillips Senior Vice President Economics.
Jan 01, 2016
Welcome message from author
This document is posted to help you gain knowledge. Please leave a comment to let me know what you think about it! Share it to your friends and learn new things together.
Transcript

Kingsport: Demographic and Economic Context
Presented to the Kingsport Economic Summit
November 4, 1999
Patrick L. Phillips
Senior Vice President
Economics Research Associates
Washington DC

The Tri-Cities and Peer Group Communities Key Demographic and Economic Factors
• Population
• Age
• Education
• Job Distribution and Growth
• Retail Sales
• “Lifestyles”
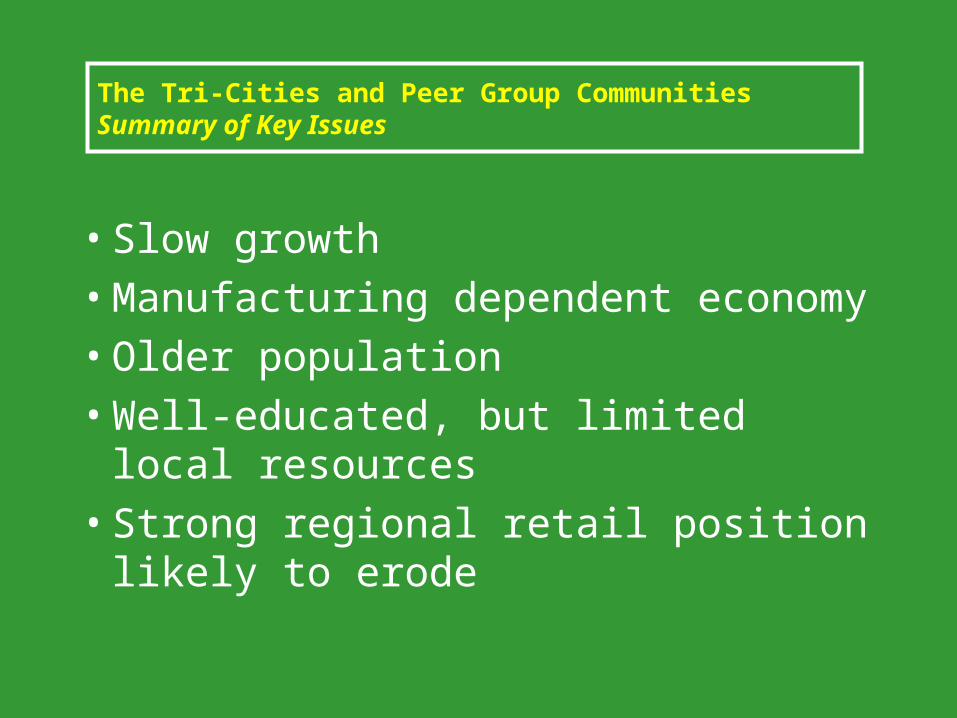
The Tri-Cities and Peer Group Communities Summary of Key Issues
• Slow growth• Manufacturing dependent economy• Older population• Well-educated, but limited local
resources• Strong regional retail position likely to
erode
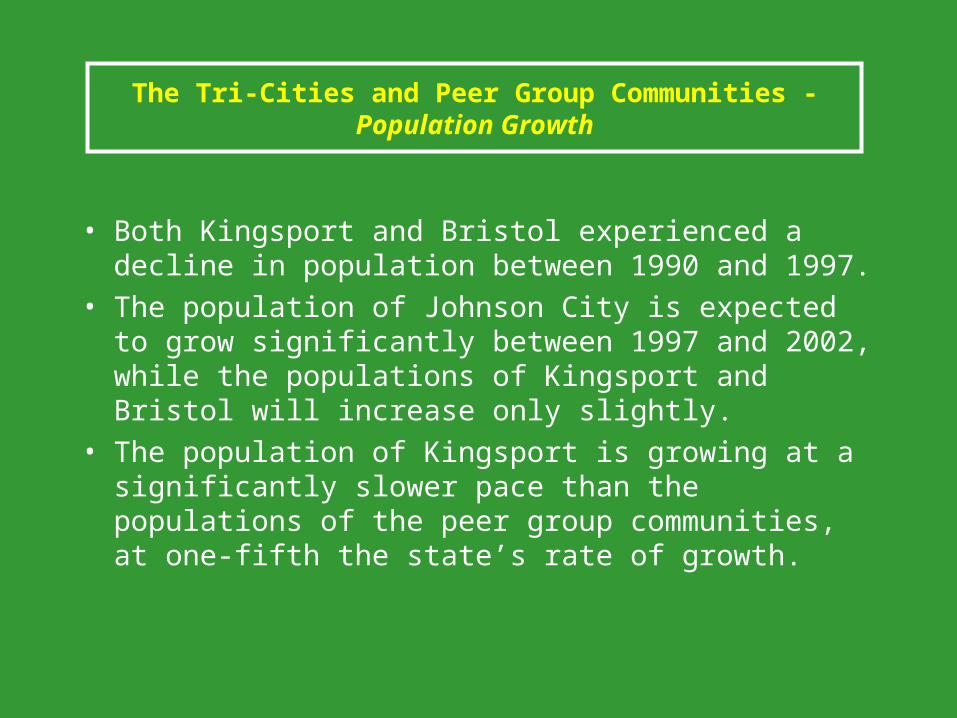
The Tri-Cities and Peer Group Communities -Population Growth
• Both Kingsport and Bristol experienced a decline in population between 1990 and 1997.
• The population of Johnson City is expected to grow significantly between 1997 and 2002, while the populations of Kingsport and Bristol will increase only slightly.
• The population of Kingsport is growing at a significantly slower pace than the populations of the peer group communities, at one-fifth the state’s rate of growth.

The Tri-Cities and Peer Group Communities -Population Growth
POPULATION CHANGE, 1990-1997/1997-2002
-2.0%
-1.0%
0.0%
1.0%
2.0%
3.0%
4.0%
5.0%
6.0%
7.0%
8.0%
Kingsport Johnson City Bristol, TN/VA
1990-1997
1997-2002
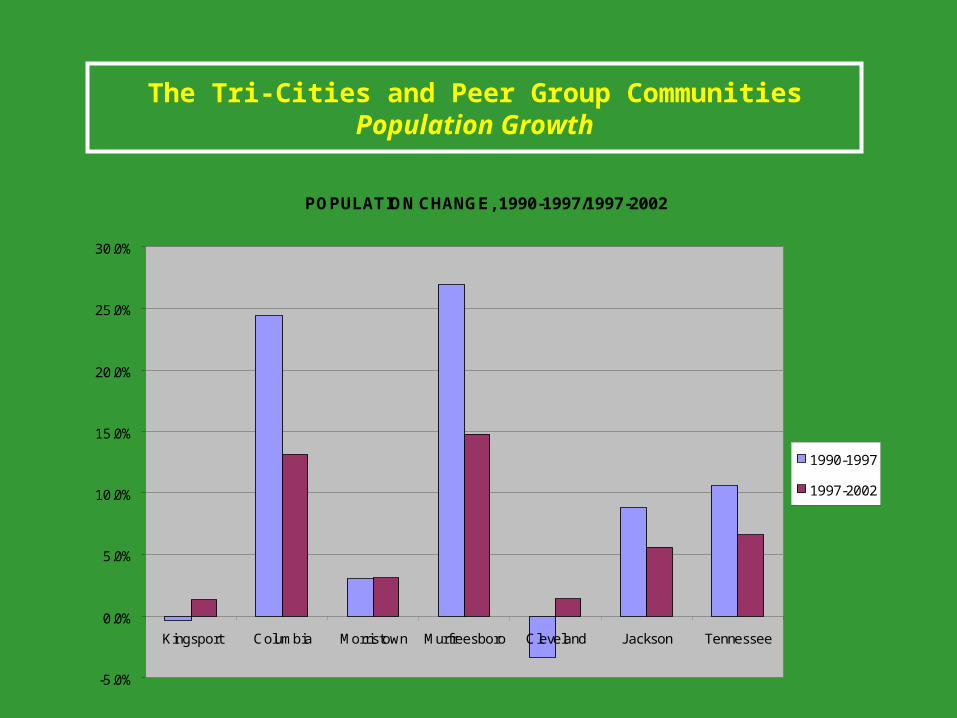
The Tri-Cities and Peer Group CommunitiesPopulation Growth
POPULATION CHANGE, 1990-1997/1997-2002
-5.0%
0.0%
5.0%
10.0%
15.0%
20.0%
25.0%
30.0%
Kingsport Columbia Morristown Murfreesboro Cleveland Jackson Tennessee
1990-1997
1997-2002

The Tri-Cities and Peer Group CommunitiesAge
• The population of Kingsport is older, with a median age of 42.3 years.
• Over 21 percent of the population is over the age of 65, compared to 13 percent for the state as a whole.
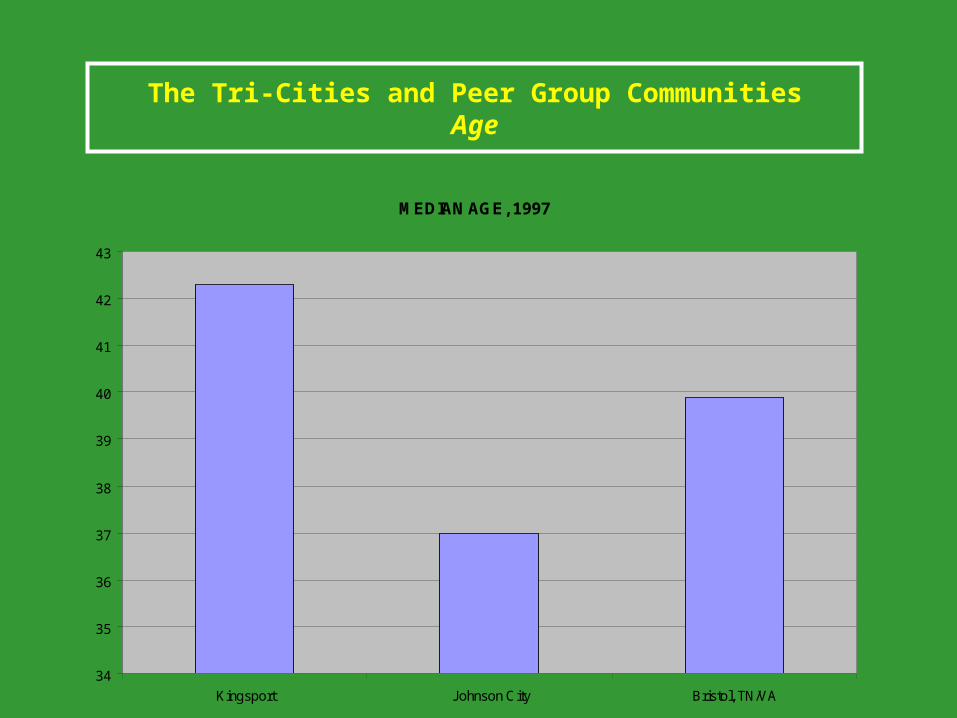
The Tri-Cities and Peer Group CommunitiesAge
MEDIAN AGE, 1997
34
35
36
37
38
39
40
41
42
43
Kingsport Johnson City Bristol, TN/VA

The Tri-Cities and Peer Group CommunitiesAge
MEDIAN AGE, 1997
0
5
10
15
20
25
30
35
40
45
Kingsport Columbia Morristown Murfreesboro Cleveland Jackson Tennessee
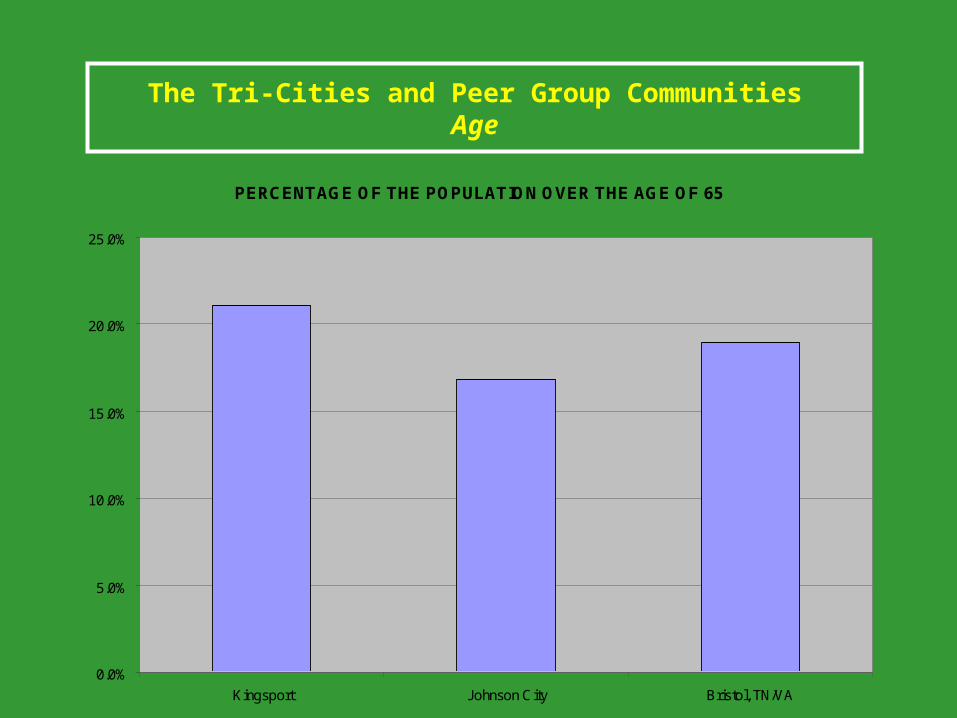
The Tri-Cities and Peer Group CommunitiesAge
PERCENTAGE OF THE POPULATION OVER THE AGE OF 65
0.0%
5.0%
10.0%
15.0%
20.0%
25.0%
Kingsport Johnson City Bristol, TN/VA
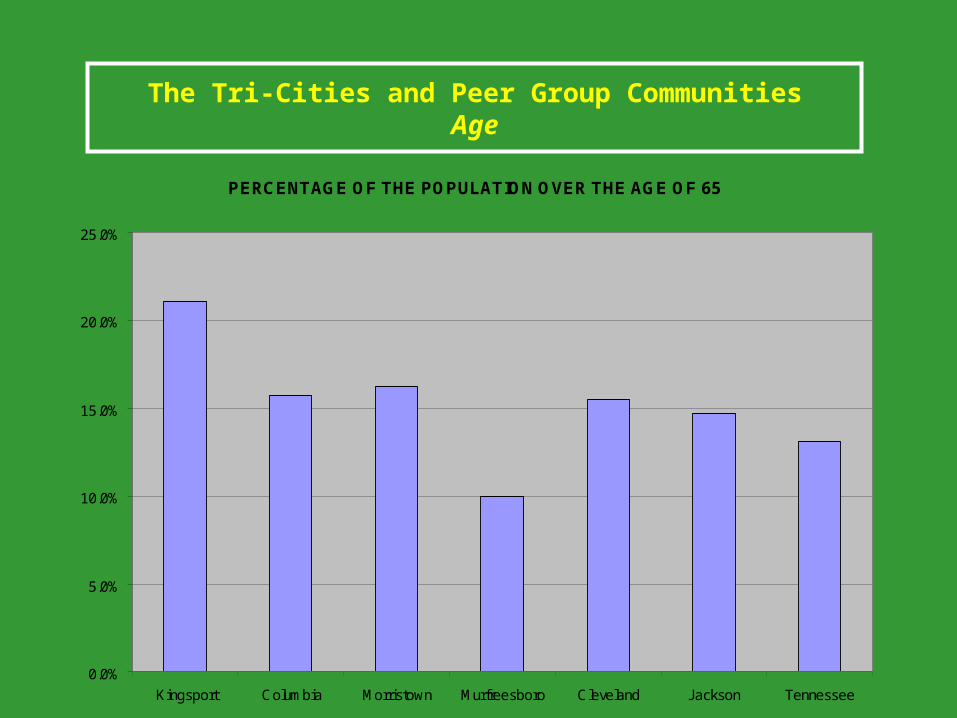
The Tri-Cities and Peer Group CommunitiesAge
PERCENTAGE OF THE POPULATION OVER THE AGE OF 65
0.0%
5.0%
10.0%
15.0%
20.0%
25.0%
Kingsport Columbia Morristown Murfreesboro Cleveland Jackson Tennessee

The Tri-Cities and Peer Group CommunitiesEducation
• The population of Kingsport is relatively well educated.
• Nearly 19 percent of the population has earned a college degree or above, compared to less than 14 percent for the state as a whole.
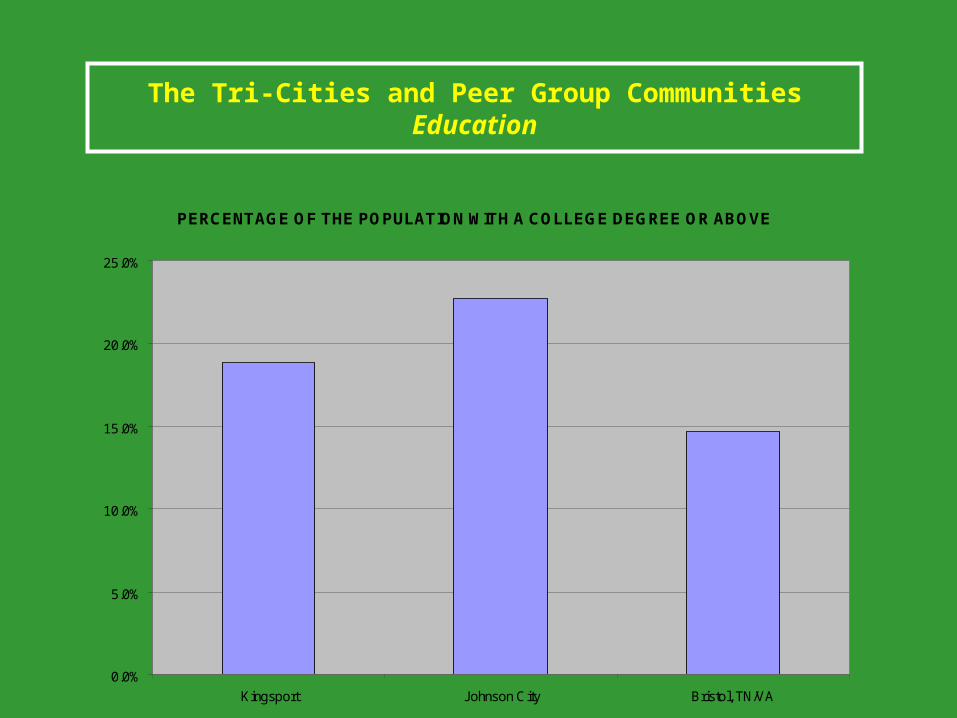
The Tri-Cities and Peer Group CommunitiesEducation
PERCENTAGE OF THE POPULATION WITH A COLLEGE DEGREE OR ABOVE
0.0%
5.0%
10.0%
15.0%
20.0%
25.0%
Kingsport Johnson City Bristol, TN/VA

The Tri-Cities and Peer Group CommunitiesEducation
PERCENTAGE OF THE POPULATION WITH COLLEGE DEGREE OR ABOVE
0.0%
5.0%
10.0%
15.0%
20.0%
25.0%
Kingsport Columbia Morristown Murfreesboro Cleveland Jackson Tennessee

The Tri-Cities and Peer Group CommunitiesEmployment
• Nearly 40 percent of Kingsport’s workforce is employed in manufacturing.

The Tri-Cities and Peer Group CommunitiesEmployment
EMPLOYMENT DISTRIBUTION BY SIC CATEGORY, PERCENT OF TOTAL, 1997
0.0%
5.0%
10.0%
15.0%
20.0%
25.0%
30.0%
35.0%
40.0%
45.0%
Mini
ng/C
onstr
uctio
n
Man
ufactu
ring
TCU
Who
lesale
Retai
lFIR
E
Servic
es
Public
Sec
tor
Kingsport
Johnson City
Bristol, TN/VA

The Tri-Cities and Peer Group CommunitiesEmployment
EMPLOYMENT DISTRIBUTION BY SIC CATEGORY, PERCENT OF TOTAL, 1997
0.0%
5.0%
10.0%
15.0%
20.0%
25.0%
30.0%
35.0%
40.0%
45.0%
Mini
ng/C
onstr
uctio
n
Man
ufactu
ring
TCU
Who
lesale
Retai
lFIR
E
Servic
es
Public
Sec
tor
Kingsport
Columbia
Morristown
Murfreesboro
Cleveland
Jackson
Tennessee

The Tri-Cities and Peer Group CommunitiesRetail Sales
• Kingsport enjoys relatively high retail sales per capita.
• In 1997, retail sales per capita in Kingsport was nearly $22,000, or twice the retail sales per capita for the state as a whole.
• General merchandise represents nearly 25 percent of retail sales in Kingsport.
• “Median location” has shifted--will Kingsport’s position fade?
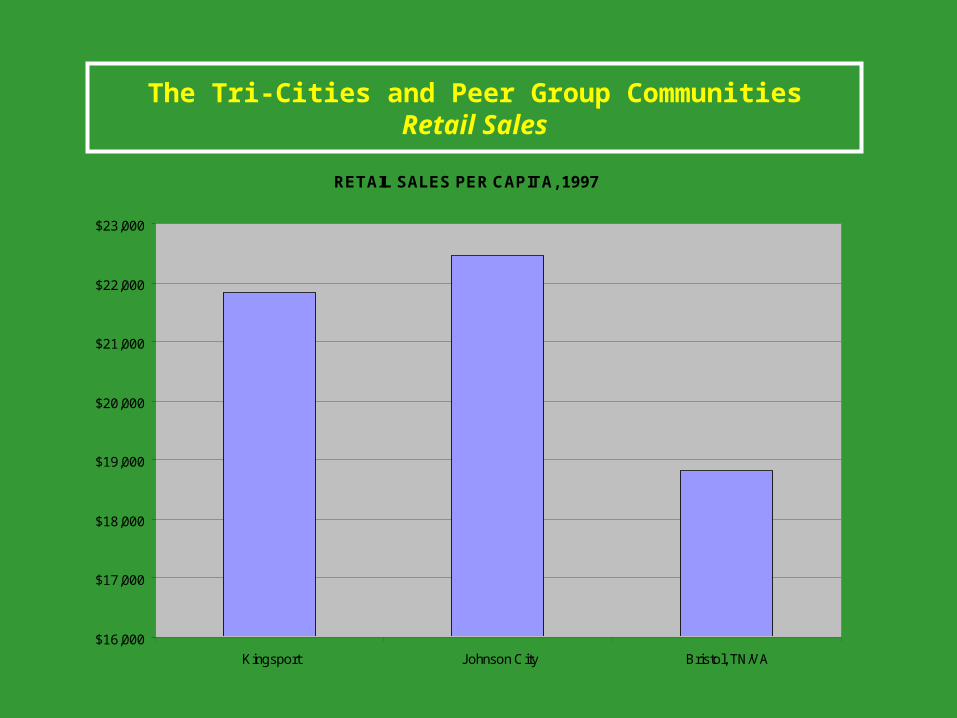
The Tri-Cities and Peer Group CommunitiesRetail Sales
RETAIL SALES PER CAPITA, 1997
$16,000
$17,000
$18,000
$19,000
$20,000
$21,000
$22,000
$23,000
Kingsport Johnson City Bristol, TN/VA

The Tri-Cities and Peer Group CommunitiesRetail Sales
RETAIL SALES PER CAPITA, 1997
$0
$5,000
$10,000
$15,000
$20,000
$25,000
Kingsport Columbia Morristown Murfreesboro Cleveland Jackson Tennessee

The Tri-Cities and Peer Group CommunitiesRetail Sales
RETAIL SALES DISTRIBUTION, PERCENT OF TOTAL SALES, 1997
0.0%
5.0%
10.0%
15.0%
20.0%
25.0%
30.0%
35.0%
40.0%
Bldg M
at'rl/
Garde
n Sup
.
Gener
al M
erch
.
Food
Store
s
Auto/G
as
Appar
el/Acc
esso
ry
Furnit
ure/
Furnis
hings
Eating
/Drin
king
Misc
.
Kingsport
Johnson City
Bristol, TN/VA

The Tri-Cities and Peer Group CommunitiesRetail Sales
RETAIL SALES DISTRIBUTION, PERCENT OF TOTAL SALES, 1997
0.0%
5.0%
10.0%
15.0%
20.0%
25.0%
30.0%
35.0%
40.0%
Bldg M
at'rl/
Garde
n Sup
.
Gener
al M
erch
.
Food
Store
s
Auto/G
as
Appar
el/Acc
esso
ry
Furnit
ure/
Furnis
hings
Eating
/Drin
king
Misc
.
Kingsport
Columbia
Morristown
Murfreesboro
Cleveland
Jackson
Tennessee

The Tri-Cities and Peer Group CommunitiesLifestyles
• How does Kingsport appear on the “radar screen” of national companies?
• Fairly or not, “Factory and Farm Communities” represent over half of the households in Kingsport. The majority of these households are designated as “Rustbelt Neighborhoods.”

The Tri-Cities and Peer Group CommunitiesLifestyles
DISTRIBUTION OF HOUSEHOLDS BY LIFESTYLE CATEGORY
0.0
10.0
20.0
30.0
40.0
50.0
60.0
Affluen
t Fam
ilies
Upsca
le Hou
seho
lds
Up & C
oming
Sing
les
Retire
men
t Styl
es
Youn
g M
obile
Adu
lts
City D
weller
s
Facto
ry & F
arm
Com
mun
ities
Downto
wn Res
iden
ts
Pe
rce
nt
Ho
use
ho
lds
Kingsport
Johnson City
Bristol, TN/VA
U.S.A.

The Tri-Cities and Peer Group CommunitiesLifestyles
DISTRIBUTION OF HOUSEHOLDS BY LIFESTYLE CATEGORY
0
10
20
30
40
50
60
70
Affluent Families Retirement Styles Factory & FarmCommunities
Downtown Residents
Pe
rce
nt
Ho
use
ho
lds Kingsport
Columbia
Morristown
Murfreesboro
Cleveland
Jackson
U.S.A.
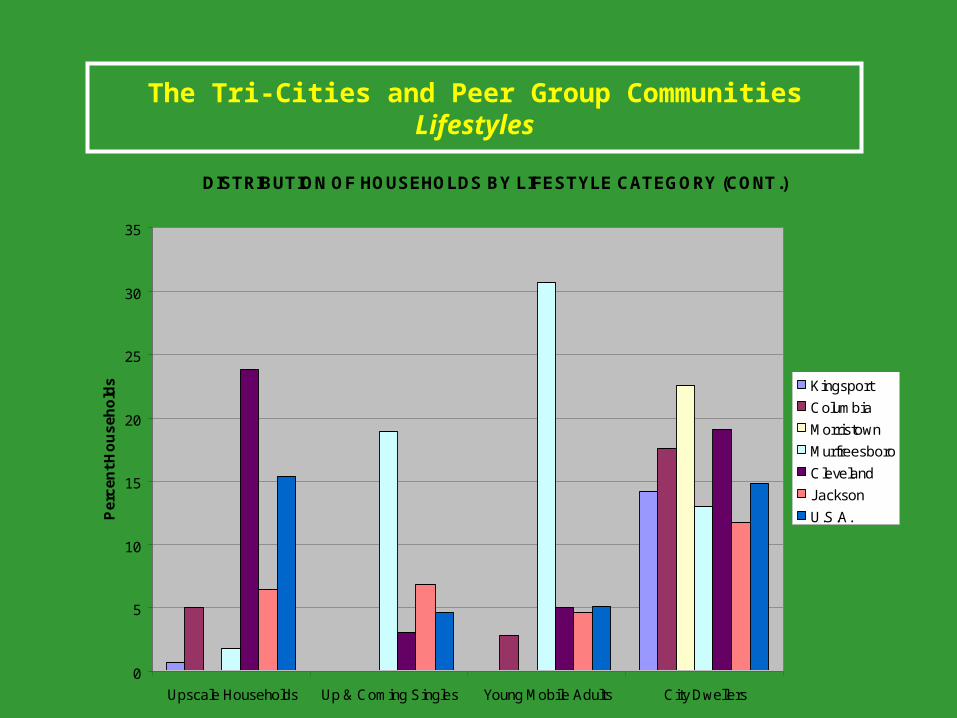
The Tri-Cities and Peer Group CommunitiesLifestyles
DISTRIBUTION OF HOUSEHOLDS BY LIFESTYLE CATEGORY (CONT.)
0
5
10
15
20
25
30
35
Upscale Households Up & Coming Singles Young Mobile Adults City Dwellers
Pe
rce
nt
Ho
use
ho
lds Kingsport
Columbia
Morristown
Murfreesboro
Cleveland
Jackson
U.S.A.
The Tri-Cities and Peer Group CommunitiesExamples of Economic “Repositioning”
• Chattanooga • Charleston• Augusta• Jacksonville• Binghamton, NY • Cleveland• Salt Lake City
Related Documents