King’s Research Portal Document Version Peer reviewed version Link to publication record in King's Research Portal Citation for published version (APA): Papavasileiou, E., Zygoura, V., Richardson, T., Cortis, D., Eleftheriadis, H., & Jackson, T. L. (2015). Intravitreal aflibercept (A-IVI) for the treatment of neovascular age-related macular degeneration (nv-AMD): one year experience. Hell J Nucl Med, 18(1), 29-32. http://www.nuclmed.web.auth.gr/magazine/eng/sept15/suppl.pdf Citing this paper Please note that where the full-text provided on King's Research Portal is the Author Accepted Manuscript or Post-Print version this may differ from the final Published version. If citing, it is advised that you check and use the publisher's definitive version for pagination, volume/issue, and date of publication details. And where the final published version is provided on the Research Portal, if citing you are again advised to check the publisher's website for any subsequent corrections. General rights Copyright and moral rights for the publications made accessible in the Research Portal are retained by the authors and/or other copyright owners and it is a condition of accessing publications that users recognize and abide by the legal requirements associated with these rights. •Users may download and print one copy of any publication from the Research Portal for the purpose of private study or research. •You may not further distribute the material or use it for any profit-making activity or commercial gain •You may freely distribute the URL identifying the publication in the Research Portal Take down policy If you believe that this document breaches copyright please contact [email protected] providing details, and we will remove access to the work immediately and investigate your claim. Download date: 04. Jul. 2022

Welcome message from author
This document is posted to help you gain knowledge. Please leave a comment to let me know what you think about it! Share it to your friends and learn new things together.
Transcript
King’s Research Portal
Document VersionPeer reviewed version
Link to publication record in King's Research Portal
Citation for published version (APA):Papavasileiou, E., Zygoura, V., Richardson, T., Cortis, D., Eleftheriadis, H., & Jackson, T. L. (2015). Intravitrealaflibercept (A-IVI) for the treatment of neovascular age-related macular degeneration (nv-AMD): one yearexperience. Hell J Nucl Med, 18(1), 29-32. http://www.nuclmed.web.auth.gr/magazine/eng/sept15/suppl.pdf
Citing this paperPlease note that where the full-text provided on King's Research Portal is the Author Accepted Manuscript or Post-Print version this maydiffer from the final Published version. If citing, it is advised that you check and use the publisher's definitive version for pagination,volume/issue, and date of publication details. And where the final published version is provided on the Research Portal, if citing you areagain advised to check the publisher's website for any subsequent corrections.
General rightsCopyright and moral rights for the publications made accessible in the Research Portal are retained by the authors and/or other copyrightowners and it is a condition of accessing publications that users recognize and abide by the legal requirements associated with these rights.
•Users may download and print one copy of any publication from the Research Portal for the purpose of private study or research.•You may not further distribute the material or use it for any profit-making activity or commercial gain•You may freely distribute the URL identifying the publication in the Research Portal
Take down policyIf you believe that this document breaches copyright please contact [email protected] providing details, and we will remove access tothe work immediately and investigate your claim.
Download date: 04. Jul. 2022
www.nuclmed.gr Hell J Nucl Med Suppl, September-December 2015 1
Notes from Colleagues who participated in the
3rd
International Medical Olympiad
“… Thank you for the great honor you addressed to me to come and present our work… and for the excellent
hospitality… hope to meet again and discuss… I would promote my work always in the frame of the excellence
and philanthropy in which the Olympiads participate...”
Dr Sterghios A. Moschos, Reader-Director University of Westminster, London
“The 3rd
Olympiad was an excellent event. Congratulations for its flawless organization. I have been satisfied by
the very interesting papers which were presented and I will surely participate in the next Olympiad…”
Dr Ioannis Vamvakas, Athens
“… it was a pleasure to participate in the 3rd Olympiad… the event was very interesting and of high scientific
level…”
Professor Giuseppe Rubini, Bari
“The 3rd
Olympiad was excellent. Combined a high scientific level, the enthusiasm of new colleagues, the
achievement of their efforts, professionalism and politeness. I congratulate you and wish that the Organizing
Committee shall organize similar Olympiads for many more decades…”
Professor Stavros Baloyiannis, Thessaloniki
“I thank you cordially for the chance you gave me to participate in the 3rd
Medical Olympiad. I declare from now
my participation in the next…”
Professor Andreas Petropoulos, Geneva
“… I would like to thank you for giving me the opportunity to participate in the 3rd
Medical Olympiad…”
Alexis Kokolakis, Director of CERN-HERMES
“Once again I'd like to thank you for giving me the opportunity to be a part of the 3rd
Medical Olympiad. At the
same time I want to congratulate you for the successful organization of the meeting… Wishing you and co-
workers all the best... Thank you for your… increasing the level of medical sciences..”
Professor Boris Ajdinovic, Belgrade
“… Congratulations for holding another wonderful and successful meeting… The quality of papers presented in
this meeting was very high…”
Dr Rakesh Kumar, Professor and Head of Department, New Delhi
“… I wanted to thank you and the Organizing Committee for arranging the 3rd International Medical Olympiad
which was a great scientific experience for me… I highly appreciate your kindness, the precise and wonderful time
schedule and the excursion as well.”
Dr Amir Nikouei, Tehran
www.nuclmed.gr Hell J Nucl Med Suppl, September-December 2015 2
Index (The name of the first author is only mentioned)
Full text Papers Pages
1 Application of Kanban system on a hospital pharmacy. E. Mitka 4
2 The role of dopaminergic neurotransmission in pathophysiology of action tremor in
Parkinson’s disease. A. N. Asabella 11
3 Role of 18
F-FDG PET/CT in the evaluation of response to antibiotic therapy in patients
affected by infectious spondylodiscitis. A. Di Palo 17
4 The diagnostic performance of 99m
Tc-HMPAO radiolabeled leucocytes scintigraphy in the
investigations of infection. A single center experience. A. Notopoulos 23
5 Intravitreal aflibercept (A-IVI) for the treatment of neovascular age-related macular
degeneration (nv-AMD): one year experience. E. Papavasileiou 29
6 Real-world treatment of diabetic macular oedema: a comparison of combined ranibizumab
plus macular LASER with macular LASER monotherapy. V. Zygoura 33
7 Imaging of cardiac amyloidosis by 99m
Tc-PYP scintigraphy. V. Papantoniou 42
8 Exploration of mechanisms in nutriepigenomics: Identification of chromatin-modifying
compounds from Olea Europaea. N. Bonvino 51
9 Psychological aspects in brain tumor patients: A prospective study. A. Nikouei 63
10 Radioguided surgery using gamma detection probe technology for resection of cerebral glioma.
A. Nikouei 68
11 Voxel based internal dosimetry during radionuclide therapy. I. Vamvakas 76
12 The diagnostic performance and added value of 18
F-FDG PET/CT in the detection of liver
metastases in recurrent colorectal carcinoma patients. S. Odalovic 81
13 Diagnostic medicine: A comprehensive ABCDE algorithm for accurate interpretation of radiology
and pathology images and data. C. Zioga 88
14 Radionuclide imaging: Past, present and future outlook in the diagnosis of infected prosthetic
joints. L. Brammen 95
15 Can tumor necrosis factor a (TNF-a) and interleukin 6 (IL-6) be used as prognostic markers of
infection following ureteroscopic lithrotripsy and extracorporeal shock wave lithotripsy for
ureteral stones? A. Bantis 103
16 Social cognition in adults: the role of cognitive control. D. Moraitou 109
17 Comparing the latent structure of raven’s educational coloured progressive matrices among young
children and older adults: A preliminary study. G. Papantoniou 122
18 Our experience with Informative and Communication Technologies (ICT) in Dementia. M. Tsolaki 131
www.nuclmed.gr Hell J Nucl Med Suppl, September-December 2015 3
Abstracts Pages
19 Assessing an avoidable and dispensable reoperative entity: Self-referred flawed cleft lip and
palate repair. P. Foroglou 140
20 Role of 18
F-DOPA PET/CT and 131
I-MIBG planar scintigraphy in evaluating patients with
Pheochromocytoma. G. Bandopadhyaya 141
21 In-111 polyclonal HIG identifies patients but not atherosclerotic lesions at risk - a 5 years
follow-up. H. Sinzinger 142
22 Validation of numerical outputs of IAEA software by the analysis of diuretic nephrogram
in children with antenatally detected hydronephrosis. S. Beatovic 143
23 Ebola Check: Delivering molecular diagnostics at the point of need. S. Moschos 144
24 Evidence-based innovative therapeutic medicine of Cretan plants: some encouraging specific
functions and claims. C. Lionis 145
25 Quantification of parafoveal capillary network using a semi-automated algorithm. Z. Kapsala 146
26 Serum levels of Fetuin-A in patients with coronary artery disease. Corellation with
SPET myocardium scintigraphy. A. Zisimopoulos 147
27 Preventing cardiac diseases in childhood. A. Petropoulos 148
28 18F-FBPA as a tumor specific tracer of L-type amino acid transporter 1 (LAT1):
PET evaluation in tumor and inflammation compared to 18
F-FDG and 11
C-methionine.
T. Watabe 149
29 The role of copeptin in patients with subarachnoid haemorrage. A. Zisimopoulos 150
30 Three reasons for on-line remote telemonitoring of patients treated with high doses of
radionuclide therapy. Our experience. M. Matovic 151
31 Brain capillaries in Alzheimer’s disease. S. J. Baloyannis 152
32 The importance of angiotensin II type 1 receptor gene polymorphism to losartan
treatment in improving glomerulopathy in type 1 diabetic patients. B. Ajdinovic 153
33 Sitagliptin reduces urinary microalbumin in experimental model of diabetic
nephropathy. I. Tsavdaridis 154
34 IgG4-related disease: The utility of 18
F-FDG PET/CT in diagnosis and treatment. J. Lauwyck 155
35 Can tumor necrosis factor a (TNF-a) and interleukin 6 (IL-6) be used as prognostic markers
of infection following ureteroscopic lithrotripsy and extracorporeal shock wave lithotripsy
for ureteral stones? A.Bantis 160
www.nuclmed.gr Hell J Nucl Med Suppl, September-December 2015 4
Application of Kanban System on a hospital pharmacy Eleftheria Mitka MSc, MBA, PhD Candidate Electrical and Computer Engineering, Democritus University, Xanthi, 67100, Thrace, Greece Keywords: Lean management - Hospital pharmacy - Kanban System - Continuous improvement - Value – Waste - ABC-XYZ analysis Correspondence adress: Eleftheria Mitka MSc, MBA, PhD candidate, Email: [email protected] Abstract This is a brief overview of principles, views and methods, of the Kanban System for the pharmacy of a general hospital. The
main goal is the reduction of stores managed by the pharmacy, as well as improvement of the mode of operation. Solutions to
problems, such as inadequate storage space, the delay in serving patients or clinics and the expiration of various
pharmaceutical formulations, stored for so long time, are provided. The philosophy behind the Kanban procurement System and
specifically its applicability to a pharmacy underperforming in terms of efficiency, in Greece, are described. Based on the
analysis of stock requirement, item stock prices and demand, it is concluded that a significant percentage of the stocked drugs
can be procured using the Kanban System. Significant cost savings and operational advantages following the Kanban System
will take place. The challenging endeavor is the analysis, design and application of a system that supports the proposed
procurement method. Hospital pharmacies in Greece and in other countries that face an economic crisis may largely benefit
after using the Kanban System.
HJNM 2015; 18(Suppl1); 4-10 Published on line: 12 December 2015
Introduction
ospital is a complex intricate organization comprises providers, therapies, physical location, technology and innovation that require continuous improvement towards providing what patient wants quickly, efficiently, and with little waste. The complex procedures of a Greek General Hospital is the objective of this paper focusing on the
application of lean management systematically in the hospital pharmacy, as Lean Hospital is considered a common practice in health care organizations in USA and other countries [11]. Observing the activities that take place on the value stream of processes, identifying the root causes of the non-value adding activities such as tremendous allocation of resources (people, technology, shared information), overworked staff, inefficient processes and bad service, the health care organization lead to a lean topos health provider [9].
The hospital that was studied is accountable for over budgeted costs for medications during 2013 since Greece is facing economic crisis and it is characterized as red hospital of Greek health care system that need help from Hellenic republic, government and Ministry of Health. The director of hospital pharmacy has to report and explain to the Greek authorities for the over budgeting spent for medications in year 2013. The goal of this study was the application of Kanban System estimating Kanban quantities and reallocating the budget cost for medications and consumable health material efficiently enough to overcome the deficit. This system helps in achieving a stable working environment in the battlefield of competitiveness at the lower overall cost while the Lean Hospital has the best chances to win the battle of surviving, making strategic inventory management a reality.
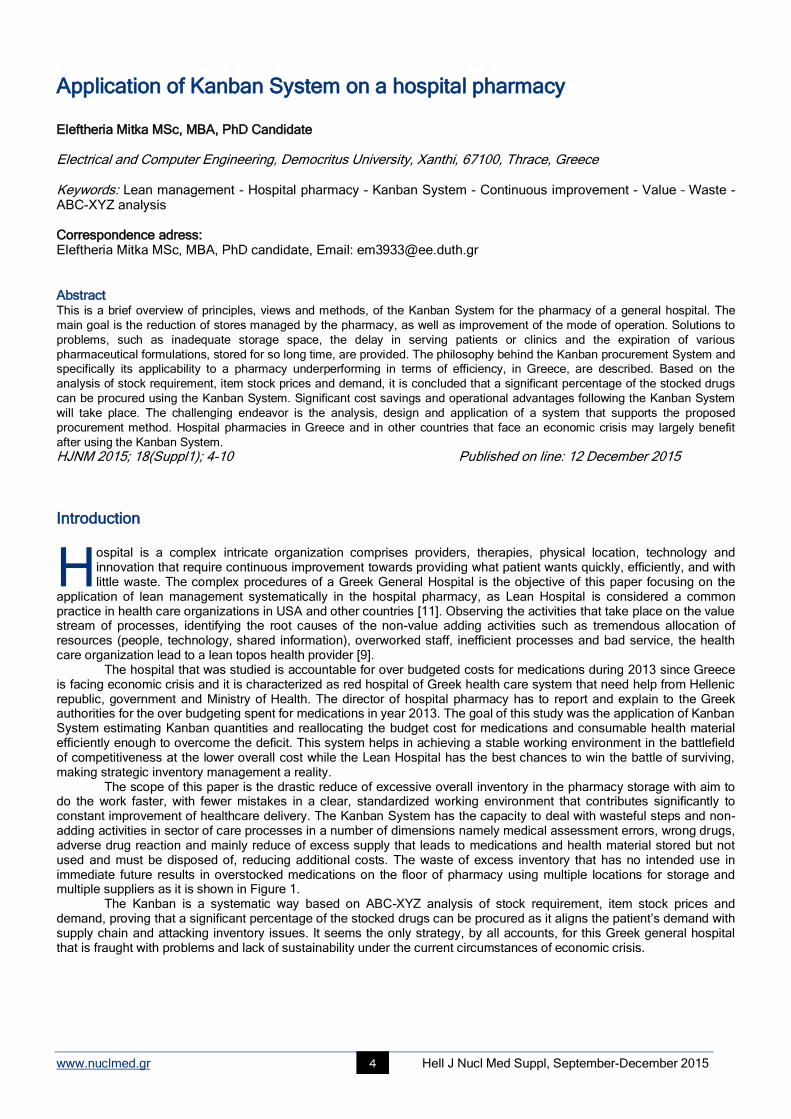
The scope of this paper is the drastic reduce of excessive overall inventory in the pharmacy storage with aim to do the work faster, with fewer mistakes in a clear, standardized working environment that contributes significantly to constant improvement of healthcare delivery. The Kanban System has the capacity to deal with wasteful steps and non-adding activities in sector of care processes in a number of dimensions namely medical assessment errors, wrong drugs, adverse drug reaction and mainly reduce of excess supply that leads to medications and health material stored but not used and must be disposed of, reducing additional costs. The waste of excess inventory that has no intended use in immediate future results in overstocked medications on the floor of pharmacy using multiple locations for storage and multiple suppliers as it is shown in Figure 1.
The Kanban is a systematic way based on ABC-XYZ analysis of stock requirement, item stock prices and demand, proving that a significant percentage of the stocked drugs can be procured as it aligns the patient’s demand with supply chain and attacking inventory issues. It seems the only strategy, by all accounts, for this Greek general hospital that is fraught with problems and lack of sustainability under the current circumstances of economic crisis.
H
www.nuclmed.gr Hell J Nucl Med Suppl, September-December 2015 5
Figure 1. Overstocked medications in the pharmacy, multiple locations and multiple suppliers
Review of lean management The paper highlights the adapting of Toyota Production System (TPS) idea to healthcare delivery services. The principles of this system contribute with concept, technology solutions and processes that lead to produce cars with low cost, best quality, short lead time and elimination of waste [10]. The lean management is synonymous to TPS since it uses less of everything (effort, parts, space, time, equipment) compared to other manufacturing production systems adding value from the customer’s point of view. Value is considered any specifications and procedures of production system that the end consumer is ready to pay for. Waste or muda is the non-adding value activities or services that do not add value to customer’s experience, is anything other than using minimum resources for achieving higher efficiency and accelerating momentum [7, 8] and do not contribute directly to the society.
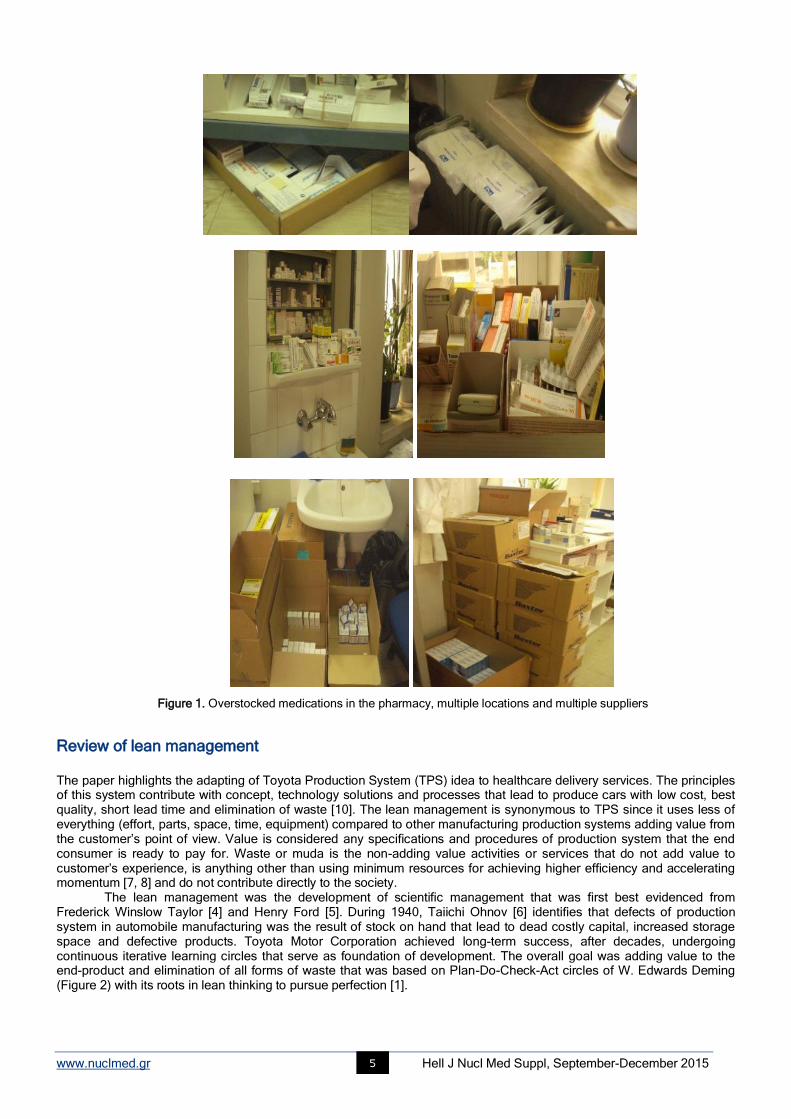
The lean management was the development of scientific management that was first best evidenced from Frederick Winslow Taylor [4] and Henry Ford [5]. During 1940, Taiichi Ohnov [6] identifies that defects of production system in automobile manufacturing was the result of stock on hand that lead to dead costly capital, increased storage space and defective products. Toyota Motor Corporation achieved long-term success, after decades, undergoing continuous iterative learning circles that serve as foundation of development. The overall goal was adding value to the end-product and elimination of all forms of waste that was based on Plan-Do-Check-Act circles of W. Edwards Deming (Figure 2) with its roots in lean thinking to pursue perfection [1].
www.nuclmed.gr Hell J Nucl Med Suppl, September-December 2015 6
Figure 2. The Deming cycle
Kanban Systems
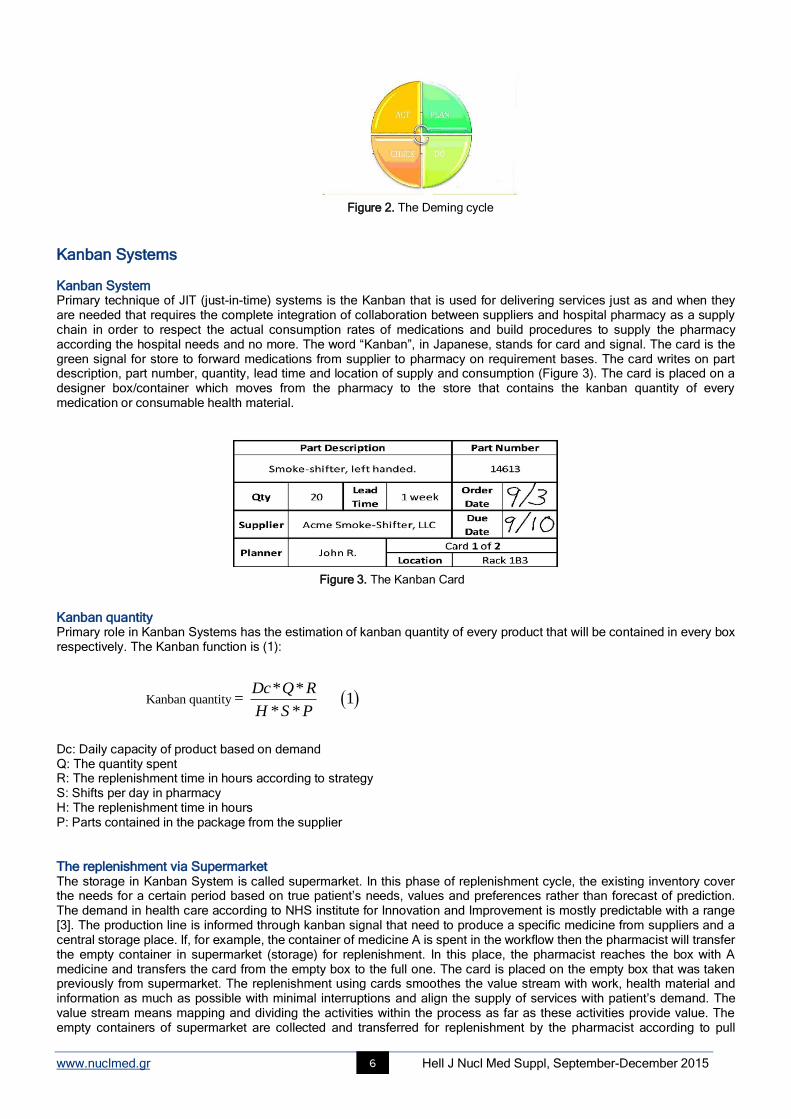
Kanban System Primary technique of JIT (just-in-time) systems is the Kanban that is used for delivering services just as and when they are needed that requires the complete integration of collaboration between suppliers and hospital pharmacy as a supply chain in order to respect the actual consumption rates of medications and build procedures to supply the pharmacy according the hospital needs and no more. The word “Kanban”, in Japanese, stands for card and signal. The card is the green signal for store to forward medications from supplier to pharmacy on requirement bases. The card writes on part description, part number, quantity, lead time and location of supply and consumption (Figure 3). The card is placed on a designer box/container which moves from the pharmacy to the store that contains the kanban quantity of every medication or consumable health material.
Figure 3. The Kanban Card
Kanban quantity Primary role in Kanban Systems has the estimation of kanban quantity of every product that will be contained in every box respectively. The Kanban function is (1): Dc: Daily capacity of product based on demand Q: The quantity spent R: The replenishment time in hours according to strategy S: Shifts per day in pharmacy H: The replenishment time in hours P: Parts contained in the package from the supplier
The replenishment via Supermarket The storage in Kanban System is called supermarket. In this phase of replenishment cycle, the existing inventory cover the needs for a certain period based on true patient’s needs, values and preferences rather than forecast of prediction. The demand in health care according to NHS institute for Innovation and Improvement is mostly predictable with a range [3]. The production line is informed through kanban signal that need to produce a specific medicine from suppliers and a central storage place. If, for example, the container of medicine A is spent in the workflow then the pharmacist will transfer the empty container in supermarket (storage) for replenishment. In this place, the pharmacist reaches the box with A medicine and transfers the card from the empty box to the full one. The card is placed on the empty box that was taken previously from supermarket. The replenishment using cards smoothes the value stream with work, health material and information as much as possible with minimal interruptions and align the supply of services with patient’s demand. The value stream means mapping and dividing the activities within the process as far as these activities provide value. The empty containers of supermarket are collected and transferred for replenishment by the pharmacist according to pull
Kanban quantity * *
= 1* *
Dc Q R
H S P
www.nuclmed.gr Hell J Nucl Med Suppl, September-December 2015 7
system that was aforementioned. The full containers are stored by the pharmacist in supermarket while the production lines follow the FIFO (First In-First Out).
Forms of Kanban Usually, two types of Kanban applied in corporations. The application is not restricted since the organization can establish its own signal for replenishment. The most widespread is single card - double container and fetch - batch card.
System of single card The card sets the beginning of workflow according to current conditions (for example card or optical signal alerts for stockout). Medicines are only provided upstream when the patient downstream requests for health care [2]. The order of doctor’s prescription sets the beginning of medicine delivery. One card is placed in every container box. The box contains the quantity of a specific medicine that covers a specific time frame according to strategic inventory management (Table I). When the box is empty, the card is moved to the place of replenishment while the box is moved to the supermarket. When the supplier full the box again, the card is placed on it until it will empty again and the cycle is repeated when the pharmacist receive the full box with the card on it.
System of two cards The system consists of two containers in the place of pharmacy. If the work station is available then the pharmacist begins the activity described in the production card described in a special box. The card informs the pharmacist about the medicines that are needed. The pharmacist searches the medicines in the supermarket. Every code has a traffic card. If the medicines are available, removes the traffic cards and place them on a special box. If not, then he goes back to the box of production cards and takes the next one. When he finds the production card and the available medicines he completes the production activity and the production card is placed on the place that transfers the medicines to the clinics. The two cards is the one fetch card that alerts for bringing medicines from supermarket while the batch or production card alerts for collection of medicines for box that are needed in the clinic.
The general hospital-case study
Structure of General Hospital The General Hospital that was studied has 3 sectors: Medical, Nursing and Administration. Taking account the staff data, it is calculated that planned permanent posts are 542, the covered posts are 343 while the empty are 199 (Diagram 1). So the hospital in order to complete its staff should employ 542 overall employers in the 3 sectors while now has 343. In medical sector, the planned permanent posts are 93 while the covered are 73. In nursing, there exist 241 planned permanent posts while the covered are 165. In administration, the planned permanent posts are 34 while the covered are 27.
37%
63%
Empty
Covered
Diagram 1. Empty and covered posts according staff data.
Design of Kanban System for a hospital pharmacy
ABC-XYZ analysis According to ABC-XYZ analysis, inventory levels will be accurately calculated based on Kanban codes of medicine and health material while afterwards Kanban quantity is calculated based on the analysis of stock requirement, item stock prices and demand. The medicines’ codes used by the pharmacy were segmented and prioritized in different segments were 835 and consumable health materials were 401. The analysis was applied separately for medicines and consumable health material. The medicines were divided in 3 categories. The codes classified “A” are expensive (represent 5%-10% of the codes that correspond to 60%-80% of the overall inventory), B includes less expensive (represent 10%-30% of codes that correspond to 10%-30% of the overall inventory) and on C are the cheapest ones (represent 60%-85% of codes that correspond to remaining 5%-15% of the overall inventory). X classifies medicines with high/stable demand, Y mediocre while on Z the low demand. The codes included in X with big X are suitable for Kanban while as X getting smaller, the kanban ability decreases (Figure 4). The medicines in AZ are not suitable for Kanban.
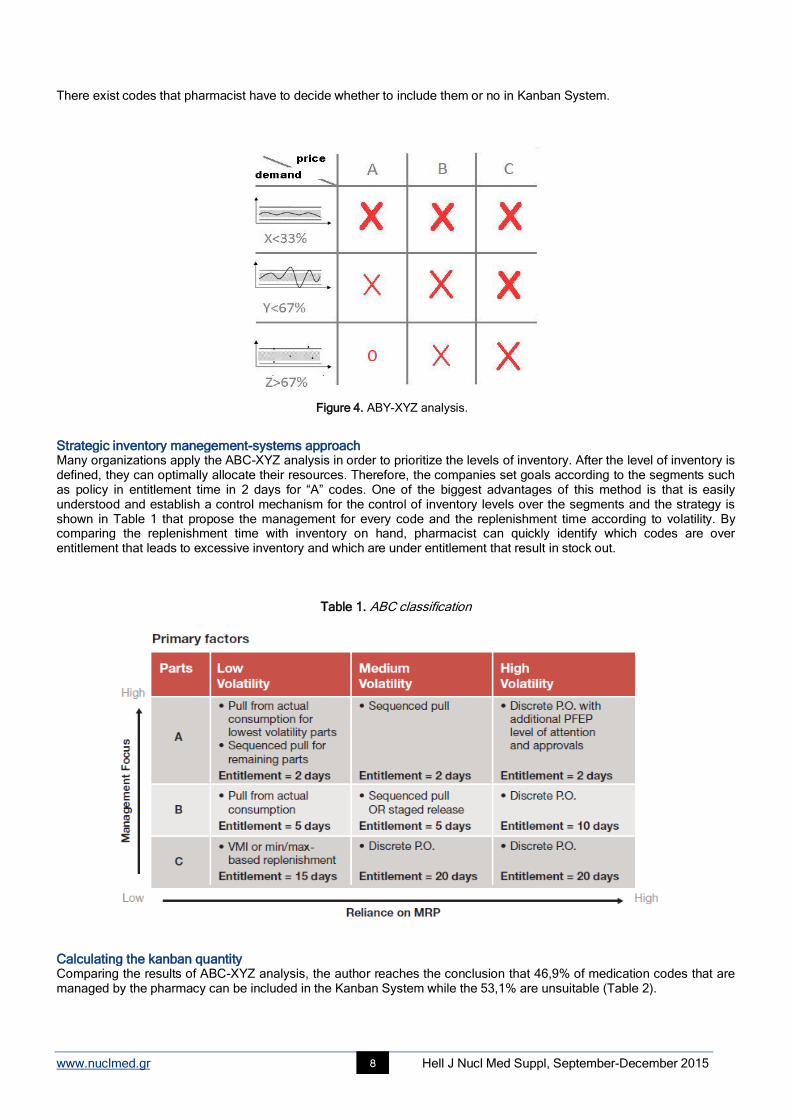
www.nuclmed.gr Hell J Nucl Med Suppl, September-December 2015 8
There exist codes that pharmacist have to decide whether to include them or no in Kanban System.
Figure 4. ABY-XYZ analysis.
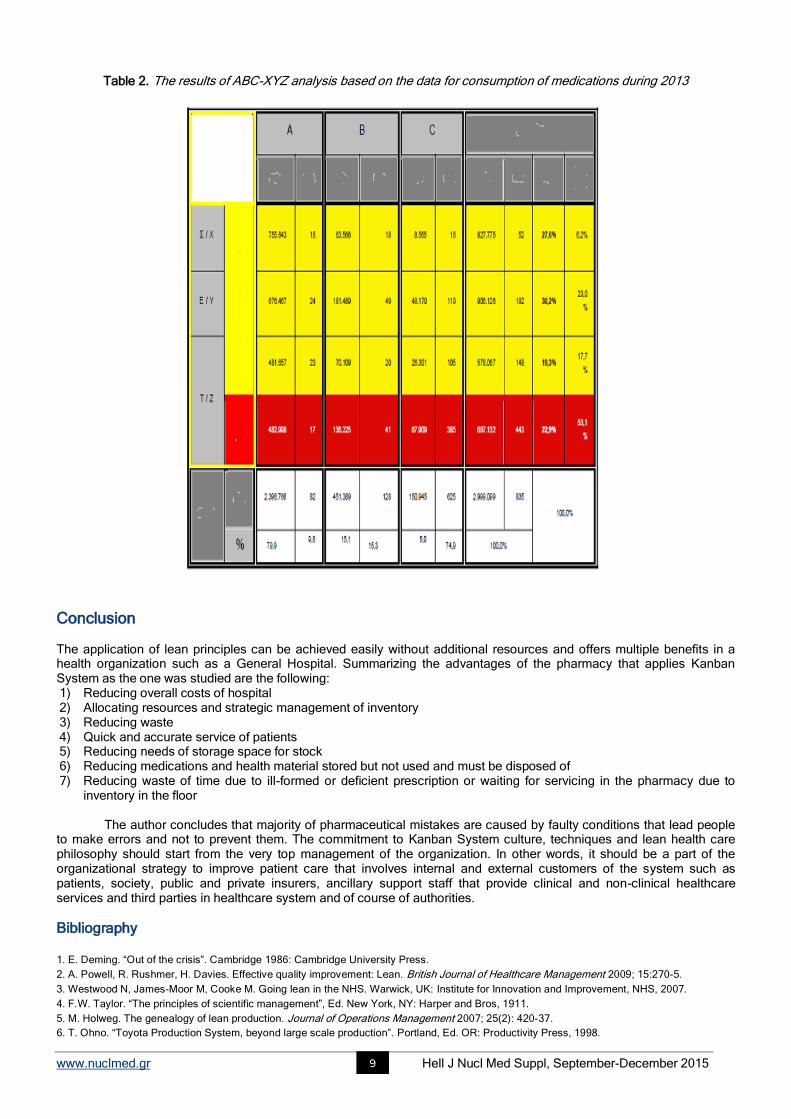
Strategic inventory manegement-systems approach Many organizations apply the ABC-XYZ analysis in order to prioritize the levels of inventory. After the level of inventory is defined, they can optimally allocate their resources. Therefore, the companies set goals according to the segments such as policy in entitlement time in 2 days for “A” codes. One of the biggest advantages of this method is that is easily understood and establish a control mechanism for the control of inventory levels over the segments and the strategy is shown in Table 1 that propose the management for every code and the replenishment time according to volatility. By comparing the replenishment time with inventory on hand, pharmacist can quickly identify which codes are over entitlement that leads to excessive inventory and which are under entitlement that result in stock out.
Table 1. ABC classification
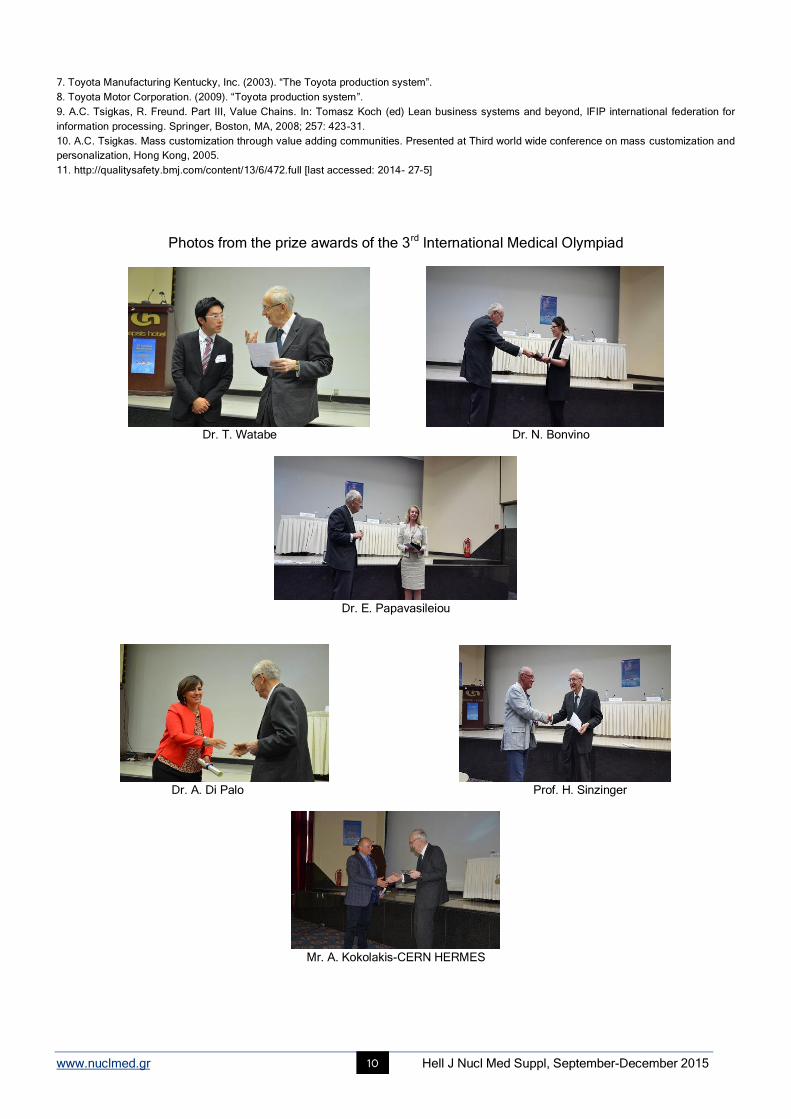
Calculating the kanban quantity Comparing the results of ABC-XYZ analysis, the author reaches the conclusion that 46,9% of medication codes that are managed by the pharmacy can be included in the Kanban System while the 53,1% are unsuitable (Table 2).
www.nuclmed.gr Hell J Nucl Med Suppl, September-December 2015 9
Table 2. The results of ABC-XYZ analysis based on the data for consumption of medications during 2013
Conclusion The application of lean principles can be achieved easily without additional resources and offers multiple benefits in a health organization such as a General Hospital. Summarizing the advantages of the pharmacy that applies Kanban System as the one was studied are the following: 1) Reducing overall costs of hospital 2) Allocating resources and strategic management of inventory 3) Reducing waste 4) Quick and accurate service of patients 5) Reducing needs of storage space for stock 6) Reducing medications and health material stored but not used and must be disposed of 7) Reducing waste of time due to ill-formed or deficient prescription or waiting for servicing in the pharmacy due to
inventory in the floor The author concludes that majority of pharmaceutical mistakes are caused by faulty conditions that lead people
to make errors and not to prevent them. The commitment to Kanban System culture, techniques and lean health care philosophy should start from the very top management of the organization. In other words, it should be a part of the organizational strategy to improve patient care that involves internal and external customers of the system such as patients, society, public and private insurers, ancillary support staff that provide clinical and non-clinical healthcare services and third parties in healthcare system and of course of authorities.
Bibliography
1. E. Deming. “Out of the crisis”. Cambridge 1986: Cambridge University Press.
2. A. Powell, R. Rushmer, H. Davies. Effective quality improvement: Lean. British Journal of Healthcare Management 2009; 15:270-5.
3. Westwood N, James-Moor M, Cooke M. Going lean in the NHS. Warwick, UK: Institute for Innovation and Improvement, NHS, 2007.
4. F.W. Taylor. “The principles of scientific management”, Ed. New York, NY: Harper and Bros, 1911.
5. M. Holweg. The genealogy of lean production. Journal of Operations Management 2007; 25(2): 420-37.
6. T. Ohno. “Toyota Production System, beyond large scale production”. Portland, Ed. OR: Productivity Press, 1998.
www.nuclmed.gr Hell J Nucl Med Suppl, September-December 2015 10
7. Toyota Manufacturing Kentucky, Inc. (2003). “The Toyota production system”.
8. Toyota Motor Corporation. (2009). “Toyota production system”.
9. A.C. Tsigkas, R. Freund. Part III, Value Chains. In: Tomasz Koch (ed) Lean business systems and beyond, IFIP international federation for
information processing. Springer, Boston, MA, 2008; 257: 423-31.
10. A.C. Tsigkas. Mass customization through value adding communities. Presented at Third world wide conference on mass customization and
personalization, Hong Kong, 2005.
11. http://qualitysafety.bmj.com/content/13/6/472.full [last accessed: 2014- 27-5]
Photos from the prize awards of the 3rd International Medical Olympiad
Dr. T. Watabe Dr. N. Bonvino
Dr. E. Papavasileiou
Dr. A. Di Palo Prof. H. Sinzinger
Mr. A. Kokolakis-CERN HERMES
www.nuclmed.gr Hell J Nucl Med Suppl, September-December 2015 11
Role of dopaminergic neurotransmission in pathophysiology of action tremor in Parkinson’s disease
Artor Niccoli Asabella
1, MD, PhD, Angelo Fabio Gigante
2, MD,
Cristina Ferrari
1, MD, Alessandra Di Palo
1, MD,
Domenico Rubini1, MD, Emilio Paolo Mossa
1, MD, Sabino Dagostino
2, MD, Roberta Pellicciari
2, MD,
Giovanni
Defazio2, MD, PhD, Giuseppe Rubini
1, MD, PhD
1.
Nuclear Medicine Unit, D.I.M., University of Bari “Aldo Moro”, Bari, Italy, 2. Department of Basic Medical
Sciences, Neuroscience and Sense Organs, University of Bari “Aldo Moro”, Bari, Italy
Keywords: Parkinson’s disease - Dopamine transporter - Putamen - Action tremor – SPET Correspondence address: Artor Niccoli Asabella, PhD, Piazza G. Cesare 11, 70124 Bari, Italy, Phone number: +39 080 5592913, Fax number: +39 080 5593250, Email: [email protected]
Abstract Background: Rest tremor (RT), a tremor that occurs in a body part that is completely supported against gravity, is together with
rigidity and bradykinesia among the core features of Parkinson’s disease (PD). In addition to classical RT, many PD patients
also have action tremor (AT) occurring during sustained postures or voluntary movement. Earlier studies showed a good
correlation between striatal dopamine transporter (DAT) binding, measured with [123
I] FP-CIT SPET and bradykinesia. By
contrast, neither rigidity nor rest tremor seems to be closely related to the degree of dopaminergic denervation as measured by
DAT imaging. Little is known about the relationship, if any, between the severity of action tremor and striatal DAT binding.
Subjects and Methods: A cross-sectional study was conducted in 94 patients (57 men and 37 women) with Parkinson’s disease
staging 1-2 on the Hoehn-Yahr scale. Data on the severity of action tremor and other motor signs were collected using the
Unified Parkinson’s Disease Rating Scale part III. DAT imaging was performed after injection of 111-185MBq of 123
I-FP-CIT.
Images were visualized on Workstation Xeleris 3.0 (GE Healthcare) and reconstructed with dedicated software by a nuclear
physician blinded about the clinical information of patients. Spearman correlation coefficient was performed to evaluate the
relationship between putamen DAT binding and severity of bradykinesia, severity of rigidity, RT and AT respectively.
Multivariable logistic regression analysis was used to assess the association between age, sex, disease duration, and levodopa
equivalent daily dose and investigated variables after adjusting for possible confounders. Results: In this group of patients with
early PD, DAT binding in the putamen significantly correlated with the severity of bradykinesia (Spearman r=-0.35, P<0.001) but
not with the severity of rigidity (Spearman r=0.02, P=0.8), RT (Spearman r=0.05, P=0.6), or AT (Spearman r=-0.03, P=0.7). The
findings were confirmed by multivariable regression analysis adjusted by age, sex, disease duration, and levodopa equivalent
daily dose. Conclusion: Our study confirms the good correlation between putamen DAT binding and bradykinesia and the lack of
correlation between putamen DAT binding and rigidity/RT. In addition, we failed to found any significant correlation between
putamen DAT binding and severity of action tremor, which suggests a contribution of non-dopaminergic mechanisms to its
pathophysiology.
HJNM 2015; 18(Suppl1); 11-16 Published on line: 12 December 2015
Introduction
arkinson’s disease (PD) is a progressive neurodegenerative disease that is mainly characterized by bradykinesia, rigidity, rest tremor (RT), and postural instability. In addition to classical RT, many PD patients also have action tremor (AT) occurring during sustained postures or voluntary movement. These motor abnormalities reflect at least
in part neurodegeneration in the substantia nigra pars compacta with secondary dopamine decrease in the striatum. In the early stages of PD, dopamine decrease is more evident in the putamen nucleus.
Dopamine transporter (DAT) single photon emission computed tomography (SPET) imaging has been extensively used as objective in vivo marker of nigrostriatal neuron loss in PD showing a widespread reduced striatal uptake which is greater in putamen than in caudate. Severity of bradykinesia is correlated with DAT uptake both in the caudate and putamen whereas rigidity and RT have sometimes been found to be related to putamen uptake alone [1-7]. It is worth noting that most studies assessing the relationship between DAT uptake and tremor in PD did not distinguish between RT and AT [3, 4, 7, 8, 9]. In this study, therefore, we assessed in a large sample of PD patients the relationship between striatal DAT uptake and severity of RT and AT, separately.
Materials and Methods
Patients and Clinical Assessment
P
www.nuclmed.gr Hell J Nucl Med Suppl, September-December 2015 12
During a 4-years period (2009-2012) DAT SPET with [123
I]FP-CIT (123
I-ioflupane, DaTSCAN; GE Healthcare) was performed in 114 patients suffering from Parkinsonian Syndromes referred to our Movement Disorder Centre. Among these patients, 94 had a final diagnosis of (Idiopathic) Parkinson disease according with the United Kingdom Parkinson's Disease Society Brain Bank criteria [10]. Patients with imaging findings indicative of basal ganglia lesions, or with other causes of parkinsonism were excluded. Information on relevant demographic and clinical data as well as on DAT uptake was collected. At the time of the DAT SPET study, a clinical examination during off conditions (at least 12 hours after stopping medication) was conducted by one experienced neurologist using the Unified Parkinson’s Disease Rating Scale (UPDRS part III) to assess motor clinical signs (RT and AT included) [11], and the Hoehn and Yahr (HY) scale to assess the disease stage [12]. For the purpose of the study, only patients with early PD staging (1-2 on the Hoehn-Yahr scale) entered into the study; UPDRS motor subscores for rest tremor (items 20), action tremor (item 21), rigidity (item 22), and bradykinesia (items 23-26) were analyzed. The study was approved by our ethics committee and informed consent was provided by all subjects.
DAT SPET procedure and data processing DAT SPET imaging was performed in all subjects 3 hours after injection of 111-185MBq of [
123I]FP-CIT using a dual-head
gamma camera (Infinia, GE Healthcare, Waukesha, Wisconsin, USA) equipped with parallel-hole, low-energy high-resolution collimators. SPET studies were acquired using the following parameters: 128x128 matrix, rotation of 360°, 60 views, 6° view angle, 45s for projection. Slice thickness was 3.68mm. Acquisition time was 22min; total brain counts >1 million were achieved in all examinations. Reconstruction was performed by filtered back-projection with a Butterworth filter (cut-off frequency: 0.3cycles/cm, 10
th order) to produce transaxial slices that were attenuation corrected. Attenuation
correction was performed according to Chang method (attenuation coefficient: 0.12cm), after manually drawing an ellipse around the head contour [13].
System spatial resolution (full width at half-maximum) at a radius of rotation of 15.9cm was
11mm as reported elsewhere [14, 15]. For analysis of DAT striatal uptake, slices were reoriented to be parallel to the canthomeatal line and two transverse slices representing the most intense striatal binding were summed. A standard region of interest (ROI) template, constructed according to a stereotactic atlas and including fixed regions for caudate nucleus, putamen, whole striatum, and occipital cortex, was placed bilaterally on the combined image, as described previously [16]. Estimates of specific striatal binding were made by subtracting occipital counts (nonspecific binding) from total striatal counts. The ratio of specific to non-specific striatal [
123I]FP-CIT binding was then calculated dividing the
specific striatal uptake by the occipital uptake. These binding ratios were also used to calculate comparable ones for caudate nucleus and putamen. An example of DAT SPET imaging is showed in Figure 1.
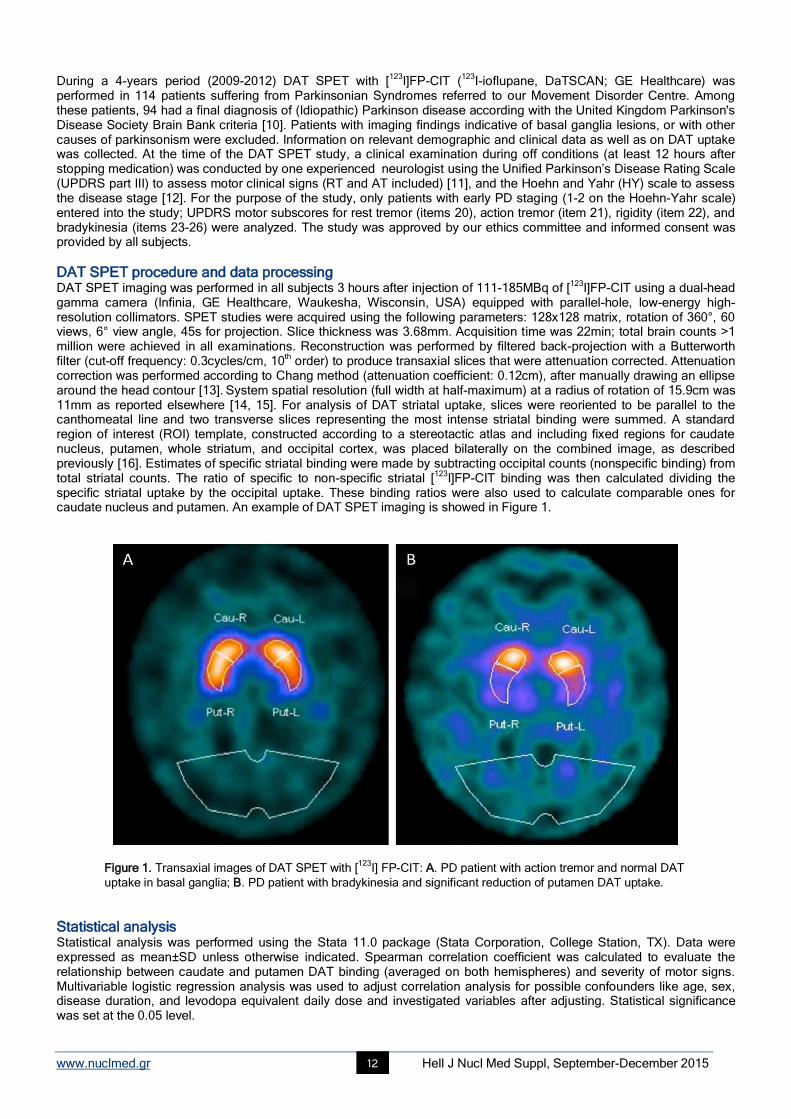
Figure 1. Transaxial images of DAT SPET with [123
I] FP-CIT: A. PD patient with action tremor and normal DAT
uptake in basal ganglia; B. PD patient with bradykinesia and significant reduction of putamen DAT uptake.
Statistical analysis Statistical analysis was performed using the Stata 11.0 package (Stata Corporation, College Station, TX). Data were expressed as mean±SD unless otherwise indicated. Spearman correlation coefficient was calculated to evaluate the relationship between caudate and putamen DAT binding (averaged on both hemispheres) and severity of motor signs. Multivariable logistic regression analysis was used to adjust correlation analysis for possible confounders like age, sex, disease duration, and levodopa equivalent daily dose and investigated variables after adjusting. Statistical significance was set at the 0.05 level.
www.nuclmed.gr Hell J Nucl Med Suppl, September-December 2015 13
Results Demographic and clinical information on PD patients and control subjects are reported in Table 1. There was a significant relationship between caudate and putamen DAT uptake and age at study time (caudate: rho=-0.4, P<0.001; putamen: rho=-0.2, P=0.04), whereas no relationship was observed between both caudate or putamen DAT uptake and PD duration (caudate: rho=0.07, P=0.5; putamen: rho=-0.14, P=0.17).
Table 1. Demographic and clinical features of the study population
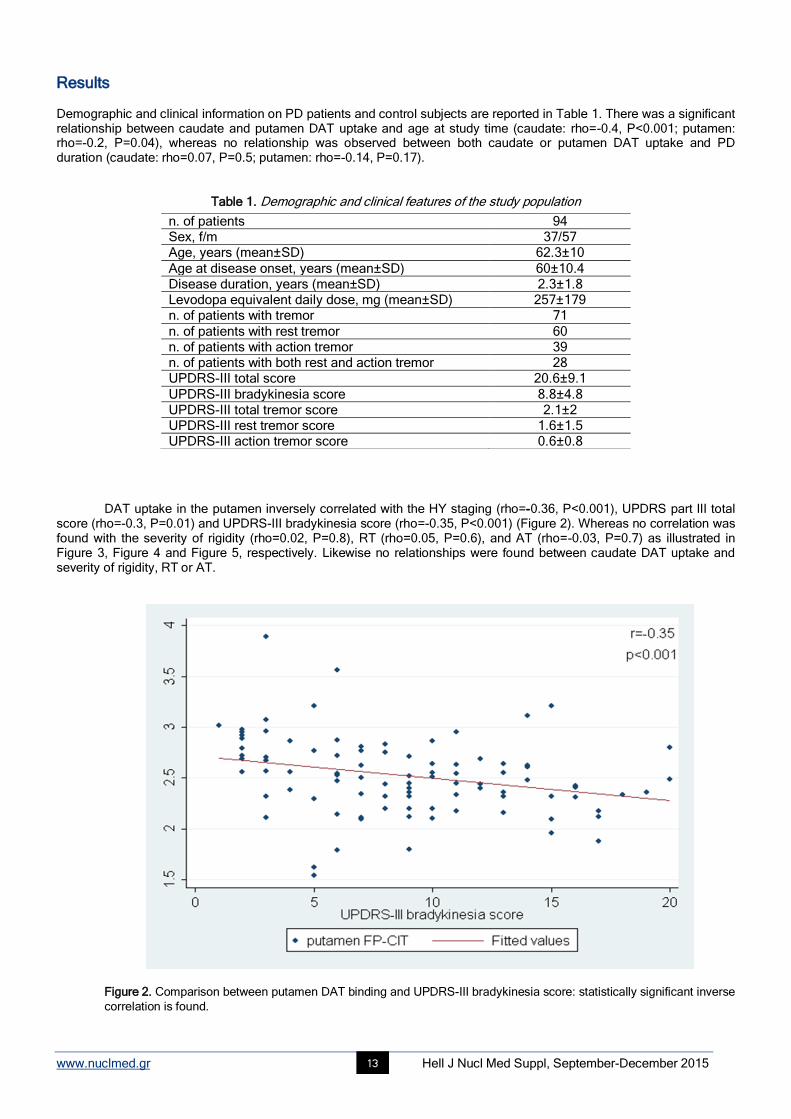
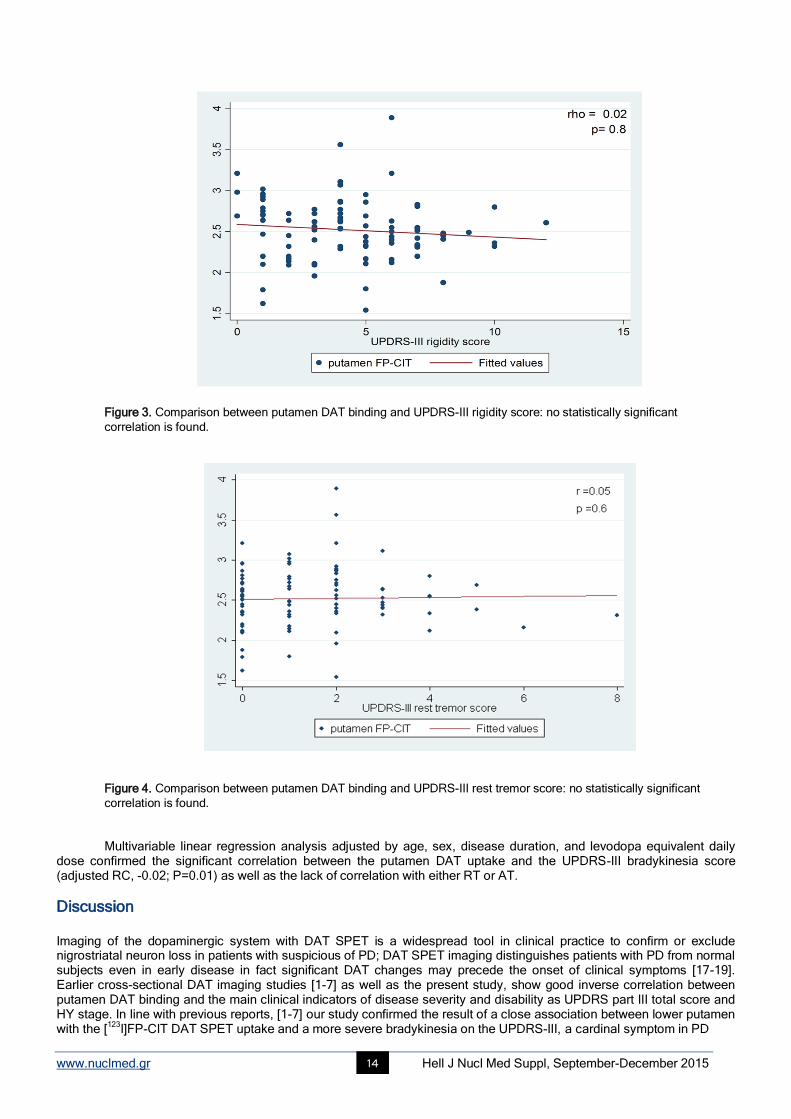
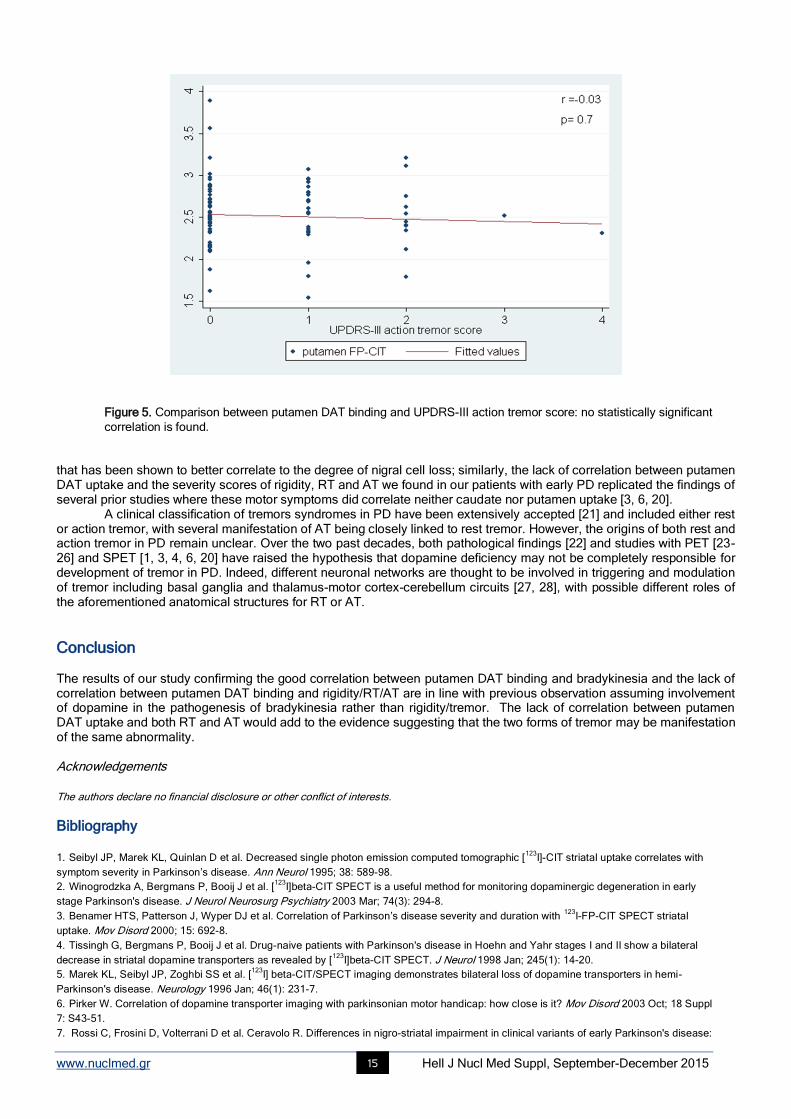
DAT uptake in the putamen inversely correlated with the HY staging (rho=-0.36, P<0.001), UPDRS part III total score (rho=-0.3, P=0.01) and UPDRS-III bradykinesia score (rho=-0.35, P<0.001) (Figure 2). Whereas no correlation was found with the severity of rigidity (rho=0.02, P=0.8), RT (rho=0.05, P=0.6), and AT (rho=-0.03, P=0.7) as illustrated in Figure 3, Figure 4 and Figure 5, respectively. Likewise no relationships were found between caudate DAT uptake and severity of rigidity, RT or AT.
Figure 2. Comparison between putamen DAT binding and UPDRS-III bradykinesia score: statistically significant inverse
correlation is found.
n. of patients 94 Sex, f/m 37/57 Age, years (mean±SD) 62.3±10
Age at disease onset, years (mean±SD) 60±10.4 Disease duration, years (mean±SD) 2.3±1.8 Levodopa equivalent daily dose, mg (mean±SD) 257±179 n. of patients with tremor 71
n. of patients with rest tremor 60 n. of patients with action tremor 39 n. of patients with both rest and action tremor 28 UPDRS-III total score 20.6±9.1
UPDRS-III bradykinesia score 8.8±4.8 UPDRS-III total tremor score 2.1±2 UPDRS-III rest tremor score 1.6±1.5 UPDRS-III action tremor score 0.6±0.8
www.nuclmed.gr Hell J Nucl Med Suppl, September-December 2015 14
Figure 3. Comparison between putamen DAT binding and UPDRS-III rigidity score: no statistically significant
correlation is found.
Figure 4. Comparison between putamen DAT binding and UPDRS-III rest tremor score: no statistically significant
correlation is found. Multivariable linear regression analysis adjusted by age, sex, disease duration, and levodopa equivalent daily
dose confirmed the significant correlation between the putamen DAT uptake and the UPDRS-III bradykinesia score (adjusted RC, -0.02; P=0.01) as well as the lack of correlation with either RT or AT.
Discussion Imaging of the dopaminergic system with DAT SPET is a widespread tool in clinical practice to confirm or exclude nigrostriatal neuron loss in patients with suspicious of PD; DAT SPET imaging distinguishes patients with PD from normal subjects even in early disease in fact significant DAT changes may precede the onset of clinical symptoms [17-19]. Earlier cross-sectional DAT imaging studies [1-7] as well as the present study, show good inverse correlation between putamen DAT binding and the main clinical indicators of disease severity and disability as UPDRS part III total score and HY stage. In line with previous reports, [1-7] our study confirmed the result of a close association between lower putamen with the [
123I]FP-CIT DAT SPET uptake and a more severe bradykinesia on the UPDRS-III, a cardinal symptom in PD
www.nuclmed.gr Hell J Nucl Med Suppl, September-December 2015 15
Figure 5. Comparison between putamen DAT binding and UPDRS-III action tremor score: no statistically significant
correlation is found. that has been shown to better correlate to the degree of nigral cell loss; similarly, the lack of correlation between putamen DAT uptake and the severity scores of rigidity, RT and AT we found in our patients with early PD replicated the findings of several prior studies where these motor symptoms did correlate neither caudate nor putamen uptake [3, 6, 20].
A clinical classification of tremors syndromes in PD have been extensively accepted [21] and included either rest or action tremor, with several manifestation of AT being closely linked to rest tremor. However, the origins of both rest and action tremor in PD remain unclear. Over the two past decades, both pathological findings [22] and studies with PET [23-26] and SPET [1, 3, 4, 6, 20] have raised the hypothesis that dopamine deficiency may not be completely responsible for development of tremor in PD. Indeed, different neuronal networks are thought to be involved in triggering and modulation of tremor including basal ganglia and thalamus-motor cortex-cerebellum circuits [27, 28], with possible different roles of the aforementioned anatomical structures for RT or AT.
Conclusion The results of our study confirming the good correlation between putamen DAT binding and bradykinesia and the lack of correlation between putamen DAT binding and rigidity/RT/AT are in line with previous observation assuming involvement of dopamine in the pathogenesis of bradykinesia rather than rigidity/tremor. The lack of correlation between putamen DAT uptake and both RT and AT would add to the evidence suggesting that the two forms of tremor may be manifestation of the same abnormality. Acknowledgements The authors declare no financial disclosure or other conflict of interests.
Bibliography
1. Seibyl JP, Marek KL, Quinlan D et al. Decreased single photon emission computed tomographic [123
I]-CIT striatal uptake correlates with
symptom severity in Parkinson’s disease. Ann Neurol 1995; 38: 589-98.
2. Winogrodzka A, Bergmans P, Booij J et al. [123
I]beta-CIT SPECT is a useful method for monitoring dopaminergic degeneration in early
stage Parkinson's disease. J Neurol Neurosurg Psychiatry 2003 Mar; 74(3): 294-8.
3. Benamer HTS, Patterson J, Wyper DJ et al. Correlation of Parkinson’s disease severity and duration with 123
I-FP-CIT SPECT striatal
uptake. Mov Disord 2000; 15: 692-8.
4. Tissingh G, Bergmans P, Booij J et al. Drug-naive patients with Parkinson's disease in Hoehn and Yahr stages I and II show a bilateral
decrease in striatal dopamine transporters as revealed by [123
I]beta-CIT SPECT. J Neurol 1998 Jan; 245(1): 14-20.
5. Marek KL, Seibyl JP, Zoghbi SS et al. [123
I] beta-CIT/SPECT imaging demonstrates bilateral loss of dopamine transporters in hemi-
Parkinson's disease. Neurology 1996 Jan; 46(1): 231-7.
6. Pirker W. Correlation of dopamine transporter imaging with parkinsonian motor handicap: how close is it? Mov Disord 2003 Oct; 18 Suppl
7: S43-51.
7. Rossi C, Frosini D, Volterrani D et al. Ceravolo R. Differences in nigro-striatal impairment in clinical variants of early Parkinson's disease:
www.nuclmed.gr Hell J Nucl Med Suppl, September-December 2015 16
evidence from a FP-CIT SPECT study. Eur J Neurol 2010 Apr; 17(4): 626-30. Epub 2009 Dec 29.
8. Isaias IU, Benti R, Cilia R et al. [123
I]FP-CIT striatal binding in early Parkinson's disease patients with tremor vs. akinetic-rigid onset.
Neuroreport 2007 Sep 17; 18(14): 1499-502
9. Schillaci O, Chiaravalloti A, Pierantozzi M et al. Different patterns of nigrostriatal degeneration in tremor type versus the akinetic-rigid and
mixed types of Parkinson's disease at the early stages: molecular imaging with 123I-FP-CIT SPECT. Int J Mol Med 2011 Nov; 28(5): 881-6.
10. Hughes A, Daniel SE, Kilford L et al. Accuracy of clinical diagnosis of idiopathic Parkinson's disease: a clinico-pathological study of 100
cases. J Neurol Neurosurg Psychiatry 1992; 55: 181-4.
11. Fahn S, Elton RL and Members of the UPDRS Development Committee: Unified Parkinson's Disease rating scale. In: Recent Development
in Parkinson's Disease. Vol. 2. Fahn S, Marsden CD, Calne DB and Goldstein M (eds). Macmillan Healthcare Information, Florhan Park 1987;
153-64.
12. Hoehn MM, Yahr MD. Parkinsonism: onset, progression and mortality. Neurology 1967; May; 17(5): 427-42.
13. Scherfler C, Seppi K, Donnemiller E et al. Voxel-wise analysis of [123
I]beta-CIT SPECT differentiates the Parkinson variant of multiple
system atrophy from idiopathic Parkinson's disease. Brain 2005; 128: 1605-12.
14. Roselli F, Pisciotta NM, Pennelli M et al. Midbrain SERT in degenerative parkinsonisms: a 123
I-FP-CIT SPECT study. Mov Disord 2010; 25:
1853-9.
15. Soret M, Koulibaly PM, Darcourt J, Buvat I. Partial volume effect correction in SPECT for striatal uptake measurements in patients with
neurodegenerative diseases: impact upon patient classification. Eur J Nucl Med Mol Imaging 2006; 33: 1062-72.
16. Booij J, Tissingh G, Boer GJ et al. [123
I]FP-CIT SPECT shows a pronounced decline of striatal dopamine transporter labelling in early and
advanced Parkinson’s disease. J Neurol Neurosurg Psychiatry 1997; 62: 133-40.
17. Eshuis SA, Jager PL, Maguire RP et al. Direct comparison of FP-CIT SPECT and F-DOPA PET in patients with Parkinson's disease and
healthy controls. Eur J Nucl Med Mol Imaging 2009; 36: 454e62.
18. Nikolaus S, Antke C, Kley K et al. Investigating the dopaminergic synapse in vivo. I. Molecular imaging studies in humans. Rev Neurosci
2007; 18: 439e72.
19. Marek KL, Seibyl JP, Zoghbi SS et al. [123
I] beta-CIT/SPECT imaging demonstrates bilateral loss of dopamine transporters in hemi-
Parkinson's disease. Neurology 1996; 46: 231e7.
20. Brücke T, Asenbaum S, Pirker W et al. Measurement of the dopaminergic degeneration in Parkinson's disease with [123
I] beta-CIT and
SPECT. Correlation with clinical findings and comparison with multiple system atrophy and progressive supranuclear palsy. J Neural Transm
Suppl 1997; 50: 9-24.
21. Deuschl G, Bain P, Brin M. Consensus statement of the Movement Disorder Society on Tremor. Ad Hoc Scientific Committee. Mov Disord
1998; 13 Suppl 3: 2-23. Review.
22. Jellinger KA. Post mortem studies in Parkinson’s disease-is it possible to detect brain areas for specific symptoms? J Neural Transm Suppl
1999; 56: 1-29.
23. Morrish PK, Sawle GV, Brooks DJ. Clinical and [18
F]dopa PET findings in early Parkinson's disease. J Neurol Neurosurg Psychiatry 1995;
59: 597-600.
24. Leenders KL, Samlmon EP, Tyrrell P et al. The nigrostriatal dopaminergic system assessed in vivo by positron emission tomography in
healthy volunteer subjects and patients with Parkinson’s disease. Arch Neurol 1990; 47: 1290-8.
25. Otsuka M, Ichiya Y, Kuwabara Y et al. Differences in the reduced 18
F-dopa uptakes of the caudate and the putamen in Parkinson’s disease:
correlations with the three main symptoms. J Neurol Sci 1996; 136: 169-73.
26. Antonini A, Moeller JR, Nakamura T et al. The metabolic anatomy of tremor in Parkinson’s disease. Neurology 1998; 51: 803-10.
27. Hallett M, Deuschl G. Are we making progress in the understanding of tremor in Parkinson's disease? Ann Neurol 2010 Dec; 68(6): 780-1.
28. Helmich RC, Hallett M, Deuschl G et al. Cerebral causes and consequences of parkinsonian resting tremor: a tale of two circui ts? Brain
2012 Nov; 135 (Pt 11): 3206-26.
From the 3rd International Medical Olympiad
Professors G. Bandopadhyaya, E. Giannoulis and S. Dungu
www.nuclmed.gr Hell J Nucl Med Suppl, September-December 2015 17
Role of 18F-FDG PET/CT in the evaluation of response to antibiotic therapy in patients affected by infectious spondylodiscitis Artor Niccoli Asabella, MD, PhD, Francesca Iuele, MD,
Francesco Simone, MD, Margherita Fanelli, MD, PhD,
Valentina Lavelli, MD, Cristina Ferrari, MD, Alessandra Di Palo, MD, Antonio Notaristefano, MD, Nunzio Clemente Merenda, MD, Giuseppe Rubini, MD, PhD Nuclear Medicine Unit, D.I.M., University of Bari “Aldo Moro”, Bari, Italy
Keywords: Spondylodiscitis -
18F-FDG PET/CT - MRI - Semiquantitative parameters
Correspondence address: Artor Niccoli Asabella, PhD, Piazza G. Cesare 11, 70124 Bari, Italy, Phone number: +39 080 5592913, Fax number: +39 080 5593250, Email: [email protected]
Abstract Objective: Spondylodiscitis is characterized by infection involving the intervertebral disc and adjacent vertebrae. It can occur
anywhere in the vertebral column but more commonly involves lumbar spine. Our aim was to evaluate the usefulness of 18
F-
FDG PET/CT to detect the early response to antibiotic therapy in patients affected by infectious spondylodiscitis and to compare
the role of 18
F-FDG PET/CT and MRI in post-treatment evaluation. Materials and Methods: 15 patients (12M, 3F), with mean age
65±13 years old, with typical clinical symptoms of Infectious Spondylodiscitis (pain, fever and increase of inflammatory indexes)
and confirmed by blood culture or vertebral biopsy underwent within three day-interval a 18
F-FDG PET/CT and Magnetic
Resonance (MR) at “baseline” and after antibiotic therapy. Semiquantitative parameters at 18
F-FDG PET/CT “baseline” SUV
max1, MTV1 and TLG1 and after therapy SUV max2, MTV2 and TLG2 of involved vertebrae were calculated. Follow-up period
of at least three months was available for all patients. T-student test for paired groups was performed to compare baseline and
after therapy 18
F-FDG PET/CT semiquantitative parameters. Results: According to 18
F-FDG PET/CT parameters all patients
showed a response to antibiotic therapy. All patients were positive at “baseline” MRI of the spine, while at follow-up, 7/15
patients showed MR signs of infection and were considered “positive” and 8/15 showed resolution of infectious condition and,
therefore they were considered “negative”. A statistical significant difference between 18
F-FDG PET/CT “baseline” and after
antibiotic therapy was found for all semiquantitative parameters: SUV max (t=5.8, P=0.01); MTV (t=5.17, P=0.001); TLG (t=5,26,
P=0,001). The comparison between the “baseline” and “after treatment” 18
F-FDG semiquantitative parameters showed a
significant reduction of all parameters. This reduction was relevant also in patients with positive post-treatment MRI. This can be
probably related to the tissue remodeling in the very immediate phase post-treatment, resulted positive at MRI and negative at 18
F-FDG PET/CT. Clinical follow-up of at least three months confirmed these results. Conclusions: 18
F-FDG PET/CT is useful to
detect the early response to antibiotic therapy in patients affected by infectious spondylodiscitis. 18
F-FDG PET/CT
semiquantitative parameters provide critical diagnostic information of the infectious process. 18
F-FDG PET/CT should be
considered as first-line exam in the early post-treatment evaluation of spondylodiscitis while MR should be preferred for delayed
assessment.
HJNM 2015; 18(Suppl1); 17-22 Published on line: 12 December 2015
Introduction
he spondylodiscitis are rare but serious diseases, difficult to diagnose and manage. The spine infections may involve disc, bone and paravertebral tissues. The peak incidence is in patients under 20 years of age and between 50 and 70 years of age [1]. The increased incidence of spondylodiscitis in the last years [2] may also be due to an
improvement in diagnostic sensitivity [3]. An increase in the prevalence of vertebral osteomyelitis with Staphylococcus aureus septicemia is reported in
literature [3, 4]. In other reports the increase of spondylodiscitis cases is attributed to intravenous drug use, diabetes mellitus, long term steroid use, to the rise in health-care-associated infections [5], chronic renal or liver diseases, increase of the immunosuppressed subjects, ageing population [2] and, especially, spinal surgery [6].
The most commonly found pathogen responsible for spondylodiscitis is Staphylococcus Aureus. The range described in different studies varies from 20% to 84% [1]. Coagulase-negative staphylococci, Streptococcus species, Pseudomonas aeruginosa, Escherichia coli, and fungi such as Candida albicans are also regularly found [7]. Tuberculous spondylodiscitis is rare, but is a serious clinical for the neurological complication and severe vertebral deformity [8].
Lumbar vertebrae are most frequently affected in spondylodiscitis, followed by the thoracic and the cervical area. In a significant number of cases a multifocal involvement may be observed.
The diagnosis is usually late due to nonspecific nature of symptoms (back pain, fever, nausea, and weight loss). It is based on clinical, laboratory and radiological features (blood cultures, MRI scans and vertebral biopsies) [1]. MRI is considered the modality of choice for the radiological diagnosis of spondylodiscitis. It has a reported sensitivity of 96%, specificity of 93% and accuracy of 94% [9].
Fluorine-18 fluorodeoxyglucose positron emission tomography (FDG-PET) is showing promise as sensitive
T

www.nuclmed.gr Hell J Nucl Med Suppl, September-December 2015 18
modality in detecting not only malignant tumors, but also inflammatory diseases [10, 11]. Evidence in the scientific literature shows a expanding role of
18F-FDG PET/CT as clinical utility beyond the remit of cancer imaging, with
applications in a diverse group of non-oncological conditions that include suspected infection and inflammation central nervous system disorders (e.g., dementia), and cardiovascular disease (e.g., cardiac sarcoidosis) [12, 13].
It can effectively distinguish infection from degenerative changes even when magnetic resonance imaging (MRI) is inconclusive [14].
The aim of this retrospective study was to evaluate the role of 18
F-FDG semiquantitative parameters at diagnosis and after antibiotic therapy and to compare these semiquantitative parameters with MRI scan results in post-treatment assessment in early prediction of response to therapy in patients affected by infective haematogenous spondylodiscitis.
Materials and Methods
Patients Thirty two consecutive patients with suspected haematogenous infective spondylodiscitis were selected from our database.
Patient inclusion criteria were: clinical symptoms suggestive of active infection of the spine (fever, back pain); increase of inflammatory indexes (ESR and/or CRP); infection diagnosed by microbiological documentation in cultures of image-guided spinal puncture fluid or blood; contrast-enhanced MRI and
18F-FDG PET/CT before the start of therapy and
after antibiotic therapy (after 6 weeks); the interval between MRI and 18
F-FDG PET/CT was within 3 days. Ten patients were excluded because they did not perform a microbiological culture, seven patients were
excluded because they did not undergo the second MRI scan. So, 15 patients were included. Of these patients 12 were male and 3 female. Mean age of this study population
was 65±13 years. We considered as gold standard the clinical-laboratory follow-up of at least 3 months after the end of treatment.
18
F-FDG PET/CT Whole-body
18F-FDG PET/CT was carried out using standard procedures. Scans were performed using a hybrid PET/CT
scanner (Discovery STE, General Electric Healthcare Milwaukee, WI, USA) with a full-ring PET scanner with bismuth germinate crystals and a low-dosehelical CT scanner (16 slice). Patients fasted for 6h before PET acquisition. Blood glucose levels were required to be less than 140mg/dl before intravenous injection of 3.7MBq/kg of
18F-FDG.
After intravenous injection using a venous line patients remained in a quiet room for approximately 60min. During acquisitions, patients were positioned supine with their arms raised above the head. Whole-body PET data were acquired in 3D mode and for 3min per bed position. The total duration of the examination from the hip to the head was approximately 20min.
The PET/CT exam was considered positive for infection when 18
F-FDG uptake was higher than bone marrow uptake in adjacent vertebras and/or soft tissue uptake.
Contrast-enhanced MRI MRI examinations of the spine were acquired with a 1.5T scanner (ACHIEVA, Philips Healthcare) with a dedicated array spine coil. The scanning of cervical, thoracic, and/or lumbar spine was performed. The MRI scan protocol consisted of T1-weighted, TSE, T2 and STIR. The T1-weighted sagittal, axial and coronal scans were performed after contrast agent administration in all patientsin free breathing except for the chest and abdomen, obtained with breath-hold.
The total duration of the examination was 20-25 minutes without considering post-processing. The reconstructed images in the coronal plane for each station were merged to obtain coronal whole-body images. The same acquisition and processing procedure was performed at baseline MRI (MRI1) and after therapy MRI (MRI2).
MRI findings were considered indicative of spondylodiscitis decreased signal intensity from disc and adjacent vertebral bodies on T1-weighted images, increased signal intensity on T2-weighted images (due to oedema) and loss of endplate definition on T1 weighting. The Gadolinium enhancement of discs, vertebrae and surrounding soft tissues helps to differentiate infective lesions from degenerative changes (Modic type 1 abnormalities) or neoplasms [9].
Image Analysis An experienced nuclear medicine physicians reviewed all
18F-FDG PET/CT images on a dedicated workstation (GE
Advantage 4.3). Metabolic and volumetric parameters were measured using MultiVol CONF PETCT software (GE Healthcare, Milwaukee, WI, USA). Semi-quantitative parameters, maximum standardized uptake value (SUV max), metabolic tumor volume (MTV) and Total Lesion Glycolysis (TLG), were calculated at
18F-FDG PET/CT “baseline” (SUV
max1, MTV1 and TLG1) and after therapy (SUV max2, MTV2 and TLG2). The software provides a delineated VOI using an isocontour threshold method based on the SUV. To collect the metabolic tumor volume (MTV) and total lesion glycolysis (TLG) a fixed threshold value of 40% of
the SUVmax uptake was used to determine lesion margins automatically, according to the previously published method of Larson et al and Lee [15, 16]. TLG was obtained by multiplying the SUVmean by the number of voxels.
Statistical analysis To compare baseline and after therapy
18F-FDG PET/CT semi-quantitative parameters was used at-Student test for
www.nuclmed.gr Hell J Nucl Med Suppl, September-December 2015 19
paired groups. A P value of less than 0.05 was considered statistically significant.
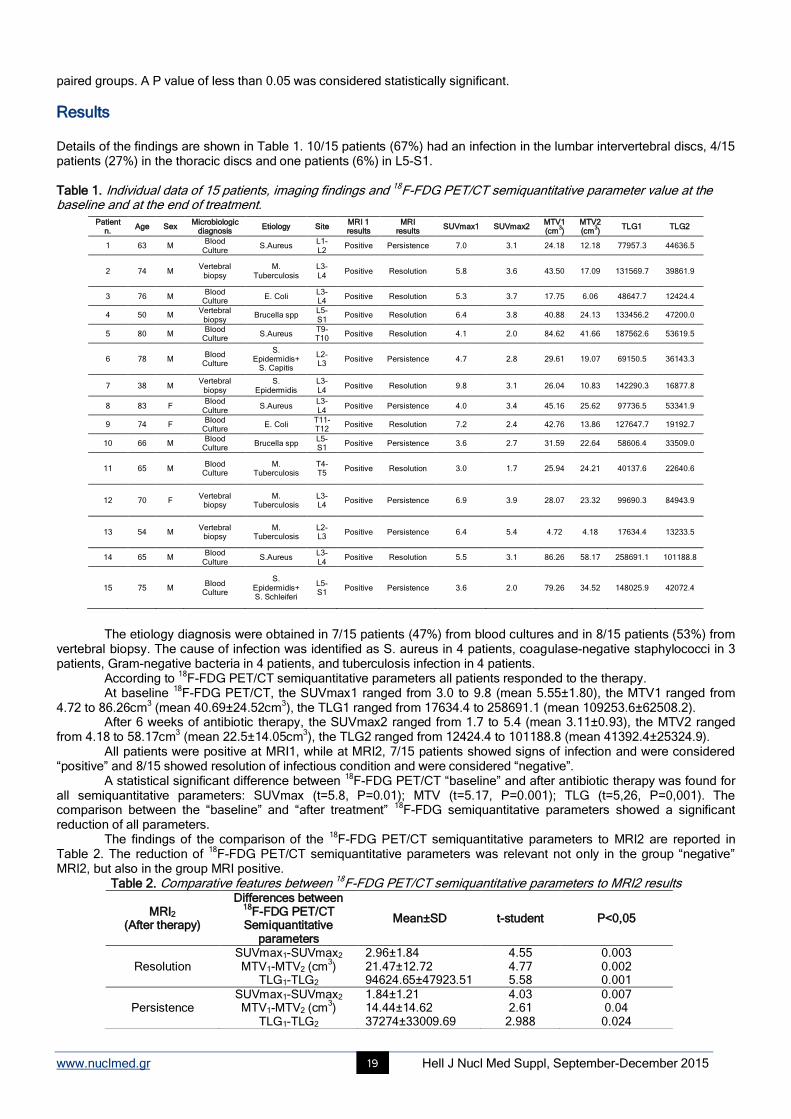
Results Details of the findings are shown in Table 1. 10/15 patients (67%) had an infection in the lumbar intervertebral discs, 4/15 patients (27%) in the thoracic discs and one patients (6%) in L5-S1. Table 1. Individual data of 15 patients, imaging findings and 18F-FDG PET/CT semiquantitative parameter value at the baseline and at the end of treatment.
The etiology diagnosis were obtained in 7/15 patients (47%) from blood cultures and in 8/15 patients (53%) from
vertebral biopsy. The cause of infection was identified as S. aureus in 4 patients, coagulase-negative staphylococci in 3 patients, Gram-negative bacteria in 4 patients, and tuberculosis infection in 4 patients.
According to 18
F-FDG PET/CT semiquantitative parameters all patients responded to the therapy. At baseline
18F-FDG PET/CT, the SUVmax1 ranged from 3.0 to 9.8 (mean 5.55±1.80), the MTV1 ranged from
4.72 to 86.26cm3 (mean 40.69±24.52cm
3), the TLG1 ranged from 17634.4 to 258691.1 (mean 109253.6±62508.2).
After 6 weeks of antibiotic therapy, the SUVmax2 ranged from 1.7 to 5.4 (mean 3.11±0.93), the MTV2 ranged from 4.18 to 58.17cm
3 (mean 22.5±14.05cm
3), the TLG2 ranged from 12424.4 to 101188.8 (mean 41392.4±25324.9).
All patients were positive at MRI1, while at MRI2, 7/15 patients showed signs of infection and were considered “positive” and 8/15 showed resolution of infectious condition and were considered “negative”.
A statistical significant difference between 18
F-FDG PET/CT “baseline” and after antibiotic therapy was found for all semiquantitative parameters: SUVmax (t=5.8, P=0.01); MTV (t=5.17, P=0.001); TLG (t=5,26, P=0,001). The comparison between the “baseline” and “after treatment”
18F-FDG semiquantitative parameters showed a significant
reduction of all parameters. The findings of the comparison of the
18F-FDG PET/CT semiquantitative parameters to MRI2 are reported in
Table 2. The reduction of 18
F-FDG PET/CT semiquantitative parameters was relevant not only in the group “negative” MRI2, but also in the group MRI positive.
Table 2. Comparative features between 18F-FDG PET/CT semiquantitative parameters to MRI2 results
MRI2 (After therapy)
Differences between 18
F-FDG PET/CT Semiquantitative
parameters
Mean±SD t-student P<0,05
Resolution SUVmax1-SUVmax2 MTV1-MTV2 (cm
3)
TLG1-TLG2
2.96±1.84 21.47±12.72 94624.65±47923.51
4.55 4.77 5.58
0.003 0.002 0.001
Persistence SUVmax1-SUVmax2 MTV1-MTV2 (cm
3)
TLG1-TLG2
1.84±1.21 14.44±14.62 37274±33009.69
4.03 2.61
2.988
0.007 0.04 0.024
Patient n.
Age Sex Microbiologic
diagnosis Etiology Site
MRI 1 results
MRI results
SUVmax1 SUVmax2 MTV1 (cm
3)
MTV2 (cm
3)
TLG1 TLG2
1 63 M Blood
Culture S.Aureus
L1-L2
Positive Persistence 7.0 3.1 24.18 12.18 77957.3 44636.5
2 74 M Vertebral
biopsy M.
Tuberculosis L3-L4
Positive Resolution 5.8 3.6 43.50 17.09 131569.7 39861.9
3 76 M Blood
Culture E. Coli
L3-L4
Positive Resolution 5.3 3.7 17.75 6.06 48647.7 12424.4
4 50 M Vertebral
biopsy Brucella spp
L5-S1
Positive Resolution 6.4 3.8 40.88 24.13 133456.2 47200.0
5 80 M Blood
Culture S.Aureus
T9-T10
Positive Resolution 4.1 2.0 84.62 41.66 187562.6 53619.5
6 78 M Blood
Culture
S. Epidermidis+
S. Capitis
L2-L3
Positive Persistence 4.7 2.8 29.61 19.07 69150.5 36143.3
7 38 M Vertebral
biopsy S.
Epidermidis L3-L4
Positive Resolution 9.8 3.1 26.04 10.83 142290.3 16877.8
8 83 F Blood
Culture S.Aureus
L3-L4
Positive Persistence 4.0 3.4 45.16 25.62 97736.5 53341.9
9 74 F Blood
Culture E. Coli
T11-T12
Positive Resolution 7.2 2.4 42.76 13.86 127647.7 19192.7
10 66 M Blood
Culture Brucella spp
L5-S1
Positive Persistence 3.6 2.7 31.59 22.64 58606.4 33509.0
11 65 M Blood
Culture M.
Tuberculosis T4-T5
Positive Resolution 3.0 1.7 25.94 24.21 40137.6 22640.6
12 70 F Vertebral
biopsy M.
Tuberculosis L3-L4
Positive Persistence 6.9 3.9 28.07 23.32 99690.3 84943.9
13 54 M Vertebral
biopsy M.
Tuberculosis L2-L3
Positive Persistence 6.4 5.4 4.72 4.18 17634.4 13233.5
14 65 M Blood
Culture S.Aureus
L3-L4
Positive Resolution 5.5 3.1 86.26 58.17 258691.1 101188.8
15 75 M Blood
Culture
S. Epidermidis+ S. Schleiferi
L5-S1
Positive Persistence 3.6 2.0 79.26 34.52 148025.9 42072.4
www.nuclmed.gr Hell J Nucl Med Suppl, September-December 2015 20
Clinical symptoms resolved within 2 to 6 weeks. CRP and ESR returned to normal values in all patients within 3
months of follow-up. According the clinical-laboratory resolution, all patients were considered responders to therapy.
Discussion In recent years the role of
18F-FDG-PET/CT in inflammatory and infectious diseases, besides cancer is growing since it
has been useful in cases of fever of unknown origin, vasculitis, infected prostheses, osteomyelitis, sarcoidosis, fungal infections and rheumatoid arthritis [10, 12, 17].
The accumulation of 18
F-FDG in these diseases is based on glucose uptake in activated leukocytes, because the higher present of glucose transporter (GLUT) proteins on cell membrane [18].
In the evaluation of suspected spondylodiscitis, MRI imaging is currently the gold standard imaging technique, for its high sensitivity, for the excellent anatomical information without the use of ionizing radiations [19]. There are situations where MRI can be less helpful for diagnosing infection because of its lower specificity [20], such as in the presence of fractures and spinal implants [21] or when the suspected spondylodiscitis is associated to Modic type or arthro-degenerative changes [22].
The role of 18
F-FDG PET/CT for the diagnosis of spondylodiscitis was described in several studies [14, 23, 24]. Albert et al [24] reported in a study of 11 patients with Modic type 1 changes (above and below herniated
disc/discs) in lumbar spine, no increased in 18
F-FDG metabolism in any vertebra or disc. Ohtori et al [25] evaluated the utility of
18F-FDG-PET for the diagnosis of pyogenic spondylitis in 18 patients. They reported a high sensitivity and
specificity in detecting infection, and recommended 18
F-FDG-PET for distinguishing between common Modic change and spinal infection.
Two reviews [23, 26] evaluated the role 18
F-FDG PET/CT in diagnosis of spinal infections, in comparison with conventional radionuclide imaging test (bone scan, radiolabeled leukocyte scan and gallium scan), morphological imaging (CT, MRI) and clinical-laboratory evidence of disease. Thy concluded
18F-FDG PET/CT is very promising
alternative to other procedures, especially in presence of implants. Recently Fuster et al. [27] compared
18F-FDG PET/CT and MRI in diagnosis of haematogenous spondylodiscitis in 26
patients, calculating SUV max in an area surrounding the lesion suspected of infection. They concluded that 18
F-FDG PET/CT and the quantification with SUVmax are useful in the evaluation of suspected spondylodiscitis and especially in patients in whom MRI is suggestive of infection but no soft-tissue involvement is present.
In our study, in accordance with literature, positive findings on 18
F-FDG PET/CT scans and the semiquantitative parameters correlated to positive MRI scans at baseline evaluation in all patients.
Up to date, the literature data about the role of 18
F-FDG PET/CT in the therapy follow-up in spine infections and inflammatory diseases are few [10]. Nanni et al. [28] evaluated the role of
18F-FDG PET/CT in the early prediction of
response to therapy in comparison to CRP serum levels in patients affected by haematogenous spondylodiscitis. They concluded the delta-SUVmax had higher sensitivity for the early identification of responders.
Our data demonstrate that 18
F-FDG PET/CT semiquantitative parameters (SUVmax, but also MTV and TLG) are useful to demonstrate the response to the antibiotic treatment (Figure 1). The difference between baseline and post-treatment values of all these semiquantitative parameters resulted statistically significant.
Another important finding of our study regards the positive MRI2 group. In these 7/15 patients a statistically significant reduction of all semiquantitative parameters (SUVmax, MTV and TLG) was observed despite an unchanged MRI2 results. In these patients, MRI results were inconclusive, due to tissue remodeling or edema of paravertebral tissue or degenerative spine diseases in the early post-treatment period (Figure 2).
To the best of our knowledge, our study is the first one that evaluated the role of 18
F-FDG PET/CT semiquantitative parameters to detect and to prove the antibiotic therapy efficacy in infectious spondylodiscitis, demonstrating a significant reduction of SUVmax, MTV e TLG. It’s the first time that the efficacy of therapy was correlated to the decrease of MTV and TLG.
www.nuclmed.gr Hell J Nucl Med Suppl, September-December 2015 21
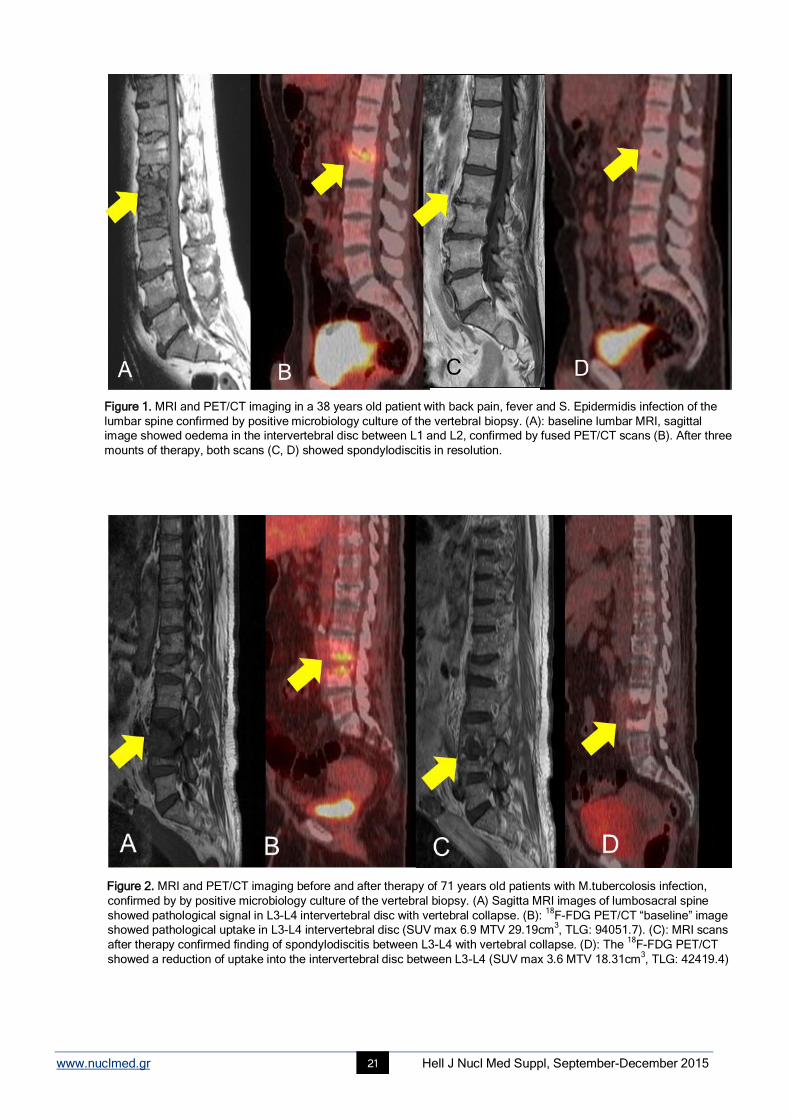
Figure 1. MRI and PET/CT imaging in a 38 years old patient with back pain, fever and S. Epidermidis infection of the
lumbar spine confirmed by positive microbiology culture of the vertebral biopsy. (A): baseline lumbar MRI, sagittal
image showed oedema in the intervertebral disc between L1 and L2, confirmed by fused PET/CT scans (B). After three
mounts of therapy, both scans (C, D) showed spondylodiscitis in resolution.
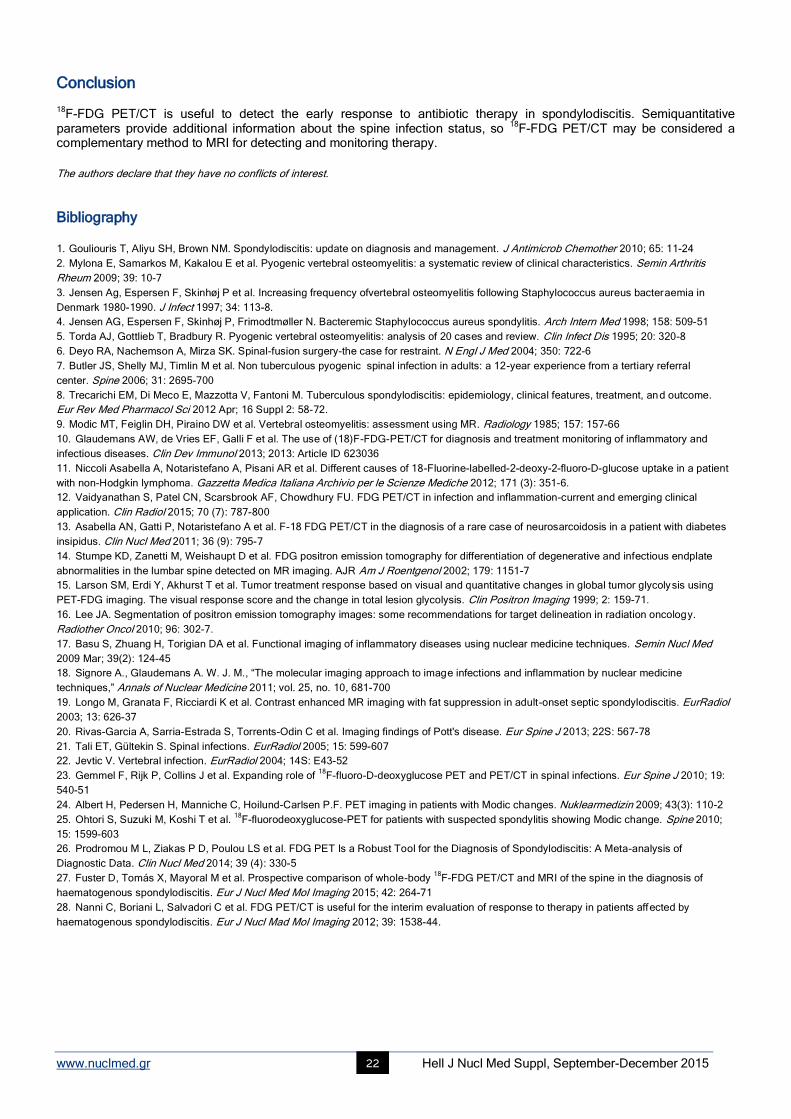
Figure 2. MRI and PET/CT imaging before and after therapy of 71 years old patients with M.tubercolosis infection,
confirmed by by positive microbiology culture of the vertebral biopsy. (A) Sagitta MRI images of lumbosacral spine
showed pathological signal in L3-L4 intervertebral disc with vertebral collapse. (B): 18
F-FDG PET/CT “baseline” image
showed pathological uptake in L3-L4 intervertebral disc (SUV max 6.9 MTV 29.19cm3, TLG: 94051.7). (C): MRI scans
after therapy confirmed finding of spondylodiscitis between L3-L4 with vertebral collapse. (D): The 18
F-FDG PET/CT
showed a reduction of uptake into the intervertebral disc between L3-L4 (SUV max 3.6 MTV 18.31cm3, TLG: 42419.4)
www.nuclmed.gr Hell J Nucl Med Suppl, September-December 2015 22
Conclusion 18
F-FDG PET/CT is useful to detect the early response to antibiotic therapy in spondylodiscitis. Semiquantitative parameters provide additional information about the spine infection status, so
18F-FDG PET/CT may be considered a
complementary method to MRI for detecting and monitoring therapy.
The authors declare that they have no conflicts of interest.
Bibliography
1. Gouliouris T, Aliyu SH, Brown NM. Spondylodiscitis: update on diagnosis and management. J Antimicrob Chemother 2010; 65: 11-24
2. Mylona E, Samarkos M, Kakalou E et al. Pyogenic vertebral osteomyelitis: a systematic review of clinical characteristics. Semin Arthritis
Rheum 2009; 39: 10-7
3. Jensen Ag, Espersen F, Skinhøj P et al. Increasing frequency ofvertebral osteomyelitis following Staphylococcus aureus bacteraemia in
Denmark 1980-1990. J Infect 1997; 34: 113-8.
4. Jensen AG, Espersen F, Skinhøj P, Frimodtmøller N. Bacteremic Staphylococcus aureus spondylitis. Arch Intern Med 1998; 158: 509-51
5. Torda AJ, Gottlieb T, Bradbury R. Pyogenic vertebral osteomyelitis: analysis of 20 cases and review. Clin Infect Dis 1995; 20: 320-8
6. Deyo RA, Nachemson A, Mirza SK. Spinal-fusion surgery-the case for restraint. N Engl J Med 2004; 350: 722-6
7. Butler JS, Shelly MJ, Timlin M et al. Non tuberculous pyogenic spinal infection in adults: a 12-year experience from a tertiary referral
center. Spine 2006; 31: 2695-700
8. Trecarichi EM, Di Meco E, Mazzotta V, Fantoni M. Tuberculous spondylodiscitis: epidemiology, clinical features, treatment, and outcome.
Eur Rev Med Pharmacol Sci 2012 Apr; 16 Suppl 2: 58-72.
9. Modic MT, Feiglin DH, Piraino DW et al. Vertebral osteomyelitis: assessment using MR. Radiology 1985; 157: 157-66
10. Glaudemans AW, de Vries EF, Galli F et al. The use of (18)F-FDG-PET/CT for diagnosis and treatment monitoring of inflammatory and
infectious diseases. Clin Dev Immunol 2013; 2013: Article ID 623036
11. Niccoli Asabella A, Notaristefano A, Pisani AR et al. Different causes of 18-Fluorine-labelled-2-deoxy-2-fluoro-D-glucose uptake in a patient
with non-Hodgkin lymphoma. Gazzetta Medica Italiana Archivio per le Scienze Mediche 2012; 171 (3): 351-6.
12. Vaidyanathan S, Patel CN, Scarsbrook AF, Chowdhury FU. FDG PET/CT in infection and inflammation-current and emerging clinical
application. Clin Radiol 2015; 70 (7): 787-800
13. Asabella AN, Gatti P, Notaristefano A et al. F-18 FDG PET/CT in the diagnosis of a rare case of neurosarcoidosis in a patient with diabetes
insipidus. Clin Nucl Med 2011; 36 (9): 795-7
14. Stumpe KD, Zanetti M, Weishaupt D et al. FDG positron emission tomography for differentiation of degenerative and infectious endplate
abnormalities in the lumbar spine detected on MR imaging. AJR Am J Roentgenol 2002; 179: 1151-7
15. Larson SM, Erdi Y, Akhurst T et al. Tumor treatment response based on visual and quantitative changes in global tumor glycolysis using
PET-FDG imaging. The visual response score and the change in total lesion glycolysis. Clin Positron Imaging 1999; 2: 159-71.
16. Lee JA. Segmentation of positron emission tomography images: some recommendations for target delineation in radiation oncology.
Radiother Oncol 2010; 96: 302-7.
17. Basu S, Zhuang H, Torigian DA et al. Functional imaging of inflammatory diseases using nuclear medicine techniques. Semin Nucl Med
2009 Mar; 39(2): 124-45
18. Signore A., Glaudemans A. W. J. M., “The molecular imaging approach to image infections and inflammation by nuclear medicine
techniques,” Annals of Nuclear Medicine 2011; vol. 25, no. 10, 681-700
19. Longo M, Granata F, Ricciardi K et al. Contrast enhanced MR imaging with fat suppression in adult-onset septic spondylodiscitis. EurRadiol
2003; 13: 626-37
20. Rivas-Garcia A, Sarria-Estrada S, Torrents-Odin C et al. Imaging findings of Pott's disease. Eur Spine J 2013; 22S: 567-78
21. Tali ET, Gültekin S. Spinal infections. EurRadiol 2005; 15: 599-607
22. Jevtic V. Vertebral infection. EurRadiol 2004; 14S: E43-52
23. Gemmel F, Rijk P, Collins J et al. Expanding role of 18
F-fluoro-D-deoxyglucose PET and PET/CT in spinal infections. Eur Spine J 2010; 19:
540-51
24. Albert H, Pedersen H, Manniche C, Hoilund-Carlsen P.F. PET imaging in patients with Modic changes. Nuklearmedizin 2009; 43(3): 110-2
25. Ohtori S, Suzuki M, Koshi T et al. 18
F-fluorodeoxyglucose-PET for patients with suspected spondylitis showing Modic change. Spine 2010;
15: 1599-603
26. Prodromou M L, Ziakas P D, Poulou LS et al. FDG PET Is a Robust Tool for the Diagnosis of Spondylodiscitis: A Meta-analysis of
Diagnostic Data. Clin Nucl Med 2014; 39 (4): 330-5
27. Fuster D, Tomás X, Mayoral M et al. Prospective comparison of whole-body 18
F-FDG PET/CT and MRI of the spine in the diagnosis of
haematogenous spondylodiscitis. Eur J Nucl Med Mol Imaging 2015; 42: 264-71
28. Nanni C, Boriani L, Salvadori C et al. FDG PET/CT is useful for the interim evaluation of response to therapy in patients affected by
haematogenous spondylodiscitis. Eur J Nucl Mad Mol Imaging 2012; 39: 1538-44.
www.nuclmed.gr Hell J Nucl Med Suppl, September-December 2015 23
The diagnostic performance of 99mTc-HMPAO radiolabeled leucocytes scintigraphy in the investigations of infection. A single center experience Athanasios Notopoulos
1 MD, PhD, Christodoulos Likartsis
1, MD, Evangelia Zaromytidou
1 MD, Ioannis Petrou
1 MD,
Georgios Meristoudis1 MD, Emmanouil Alevroudis
1 MD, Zoi Oikonomou
1 MD, Tryfon Stavros
2 MD, PhD, Kyriakos
Psarras3 MD, PhD, Konstantinos Papazoglou
4 MD, PhD
1. Nuclear Medicine Department, Hippokration General Hospital, Thessaloniki, 2.NHS Department of Chest Medicine, Papanikolaou General Hospital, Thessaloniki, 3. Second Propedeutic Surgery Department, Aristotle University of Thessaloniki, 4. Fifth Department of Surgery, Aristotle University of Thessaloniki, Hellas
Keywords:
99mTc-HMPAO RL-WBC scan - Perigraft tissue infection - Osteomyelitis - FUO
Correspondence address: Zaromytidou Evangelia MD, Nuclear Medicine Department, Hippokration General Hospital, Thessaloniki, Email: [email protected]
Abstract Objective: This study aims to evaluate the diagnostic efficacy of
99mTc-HMPAO-labeled white blood cells scintigraphy (RL-WBC
scan) in a variety of infectious processes. Despite the technical difficulties of labeling WBCs without altering their
viability/pathophysiologic integrity and the lengthy imaging procedure, the RL-WBC scan has gained an evolving role in the
detection of occult infection. Methods: Retrospective review of 66 patient files (34 males and 32 females) that underwent this
functional imaging test from September 2013 until September 2015. Their mean age was 58.39±18.63 (range: 11-84) years.
Twenty seven of them were investigated for fever of unknown origin, 6 with suspicion of inflammatory bowel disease, 9 with
aneurysm of celiac artery before or after abdominal endovascular aortic repair, 6 with joint prostheses, 5 with diabetic
angiopathy, and 13 had rather undefined symptoms. Results: The mean labeling yield of the leukocytes with the lipophilic
complex 99m
Tc-HMPAO was 57.4±8.6. The RL-WBC scan was positive in 39/66 patients, including 16/27 patients with fever of
unknown origin and 8/9 patients with aortic aneurysm/graft infection. It showed expected/suspected localization of radioactivity
in 23 patients, whereas 11 of them had equivocal signs of infection. In 16 patients, a significant change in patients’ management
was conferred, as non-suspected locations of inflammatory process were detected, based on early functional alterations derived
from leukocyte recruitment. Conclusion: The RL-WBC scan (i) is extremely useful in the diagnosis of perigraft tissue infection
and osteomyelitis (except for spine) with high rate of sensitivity and specificity (≈90%) when timely used, and (ii) may provide
valuable information in patients with fever of unknown origin, inflammatory bowel disease or vague symptoms. False positive
results have been noticed mainly due to artifacts, co-existent skeletal lesions or in the early postoperative course because of the
nonspecific radionuclide uptake in the healing tissue. On the other hand, false negative results may appear in delayed aortic
graft infection, etc. Difficulties arise in the discrimination between infection and sterile inflammatory lesions accompanying
atheromatosis or grafts/prostheses. Our experience shows that there should take place a closer co-operation between nuclear
medicine physicians and clinicians to ensure the rational selection of the patients that would benefit from this complex diagnostic
procedure, in order to get the optimal results concerning in vivo inflammation/abscess visualization.
HJNM 2015; 18(Suppl1); 23-28 Published on line: 12 December 2015
Introduction
n clinical setting, the distinction between inflammation and infection is an important step towards their optimal management, as they arise from different pathophysiologic pathways. Inflammation is the response of the organism to a pathogen or tissue injury that may be caused by physical, chemical or immunological agents or even by radiation. It is characterized by local hyperemia, pain, and edema or swelling. An infection is caused by an exogenous pathogen (such as bacteria, viruses or fungi and etc.), has signs and symptoms such as fever, pain, loss of appetite, general
malaise and abnormal laboratory results. It is often accompanied by an acute inflammation that may last for hours or days and is usually resolved without residual lesions [1].
The acute inflammation lasts for a short duration (8-10 days) and neutrophils are the predominant cells mediating cellular immunity, whereas chronic inflammation may last from few weeks to many years, is usually accompanied by late complications and it is characterized by reduction in the number of neutrophils and an increased infiltration of macrophages, lymphocytes, plasma cells and fibroblasts [1, 2].
The potential imaging targets in infection and acute inflammation are (i) the pathogens (bacteria, fungi), (ii) the activated endothelial cells and the involved cytokines and mediators in these processes, (iii) the macromolecules that accumulate in inflamed tissues due to the increased vascular permeability and, (iv) the polymorphonuclear cells (leukocytes, granulocytes) that migrate to the injured tissue.
The need for detection and assessment of the different pathobiochemical conditions involved in infectious and
I
www.nuclmed.gr Hell J Nucl Med Suppl, September-December 2015 24
inflammatory processes has led into the application of radiopharmaceuticals which may selectively localize in inflamed or infected tissues [3, 4]. Their physical characteristics, recommended administered activity, time of imaging, and common clinical uses will described later.
The available radiopharmaceuticals for imaging infections and acute inflammation are:
Acute inflammation 67
Ga-68
Ga-citrate, 99m
Tc/99m
Tc-SnF2/111
In/18
F-FDG/64
Cu-labeled WBC, 99m
Tc-labeled MoAb (LeuTech, leukoscan,
scintimun), 99m
Tc/111
In-HIG, 99m
Tc-nanocolloids, 18
F-FDG, 123
I-IL-1ra, 99m
Tc-IL-8, 99m
Tc-P483H, 99m
Tc-EP1-HNE2, 99m
Tc-a-
E-selectin, 99m
Tc-DMP444, 99m
Tc-chemotactic peptides, 99m
Tc-PEG-liposomes
For Bacterial infection 99m
Tc/18
F-ubiquitidin 29-41, 99m
Tc-human neutrophils peptide 1-3, 99m
Tc-bacteriophage, 99m
Tc/111
In-biotin, 99m
Tc-PAMA4, 99m
Tc/18
F-ciprofloxacin (Infecton), 99m
Tc-alafosfalin, 99m
Tc-cefoperazone, 99m
Tc-ceftixozime, 99m
Tc-ceftriaxone, 99m
Tc-
cefuroxime, 99m
Tc-kanamycin, 99m
Tc-isoniazid, 99m
Tc-lomefloxacin, 99m
Tc-ofloxacin, 99m
Tc-moxifloxacin, 99m
Tc-
nitrofurantoin, 99m
Tc-norfloxacin, 99m
Tc-pefloxacin, 99m
Tc-rifampicin, 99m
Tc-sitafloxacin, 99m
Tc-sparafloxacin, 99m
Tc-
gatifloxacin, 99m
Tc-cefepime, 18
F-fluoroacetamidoglucopyranose
For Fungal infection 99m
Tc-fluconazole, 123
I-chitinase, 99m
Tc-CBP21, 99m
Tc-hLF 1-11
Radiological imaging procedures such as ultrasonography, X-ray, computed tomography (CT) and magnetic
resonance imaging (MRI) have shown variable sensitivity, but they exhibit suboptimal specificity for infections especially during the early phase whereas there are no changes in the relevant anatomic structures. As they are all morphologic imaging tests, they cannot detect the preceding functional disturbances and pathobiologic alterations [5-7]. Nuclear medicine techniques are very important in the evaluation of patients with suspected infection. By adding substantial physiological information to these patients, the source of infection can often be localized and treated effectively.
The most primitive radioisotope for detection of infection is 67
Ga-citrate. It is transported either in ionic form or bound to transferrin, binds to the transferrin receptor (CD71), and may leak through the vascular epithelium at the site of infection, where it is then bound to lactoferrin. Another mechanism of uptake may be based on the production of siderophores by microorganisms grown in a low-iron environment. Siderophores have a binding affinity for both iron and gallium; because of a lack of freely available iron,
67Ga citrate may be transported directly into the cell in its place. Is
mainly used for the study of chronic osteomyelitis, in which gallium imaging has shown better results than leukocyte scanning. In immunocompromised patients, it is the exam of choice for detecting opportunistic respiratory tract infections. It could also be helpful for scintigraphic imaging of FUO patients, due to its diagnostic potential for both acute and chronic inflammatory conditions and neoplasms. Unfortunately it has several disadvantages, like the long physical half-life (78 hours), low specificity due to physiological bowel excretion and accumulation in malignant tissues, high and multiple energy gamma radiation causing high radiation absorbed doses to the patients and staff. These disadvantages and the development of newer radiopharmaceuticals have resulted in the replacement of
67Ga-scintigraphy with radiolabeled
leukocytes in the majority of infectious diseases. The role of
99mTc-methylenediphosphonate (MDP) bone scintigraphy in infection imaging is limited to diagnosing
osteomyelitis. Tracer uptake depends on blood flow (increased vascularity and permeability) and the rate of new bone formation. Three phase bone scanning with
99mTc-MDP is commonly used for diagnosing osteomyelitis. The test is highly
sensitive and can be positive as early as 2 days after the onset of symptoms. Its role in the evaluation of painful joint replacement has been extensively investigated. The overall accuracy of
99mTc-MDP scan in assessing the painful
prosthetic joint is about 50%-70%, rather suboptimal to be clinically useful, except perhaps as a screening test, or in conjunction with other radionuclide studies like gallium or labeled leukocyte imaging.
18F-FDG is a positron emitter with a half-life of 110min. FDG is transported through the cellular membrane by
glucose transporter proteins and is subsequently phosphorylated to [18
F]2΄-FDG-6 phosphate by the hexokinase enzyme. FDG may accumulate not only in malignant tissues but also in inflammatory processes. The use of
18F-FDG-PET in
infections is limited to spondylodiscitis, FUO, vascular graft infections and vasculitis, but has also important value in various inflammatory diseases, such as sarcoidosis. The imaging of bacteria still needs some clarification.
The aforementioned mechanisms are obviously complementary steps in the inflammatory processes, thus putting forward the research for more specific and delineating approaches. The white blood cells (WBC) labeled with 99m
Tc-HMPAO or 111
In-oxine can be considered as the gold standard nuclear imaging technique for the diagnosis of infections in the bone and soft tissue, except for spondylodiscitis [8, 9]. These autologous leukocytes are characterized by high specificity, because they only accumulate as a result of active migration into the inflamed tissues. After injection, they show rapid clearance from the lungs and blood pool, with progressive migration into the spleen, liver, bone marrow and the sites of infection where a neutrophilic infiltrate predominates. Radiolabeled WBCs first adhere to the vascular endothelium and then migrate toward the infected area through the endothelium and basal membrane, thus representing a specific indicator for leukocytic infiltration.
The primary clinical indications for radiolabeled leukocytes include inflammatory bowel diseases, osteomyelitis, and the follow-up of patients with infections of vascular and orthopedic prostheses and soft tissue infections. In fever of unknown origin (FUO), its application has been associated with high sensitivity and specificity values. The reported
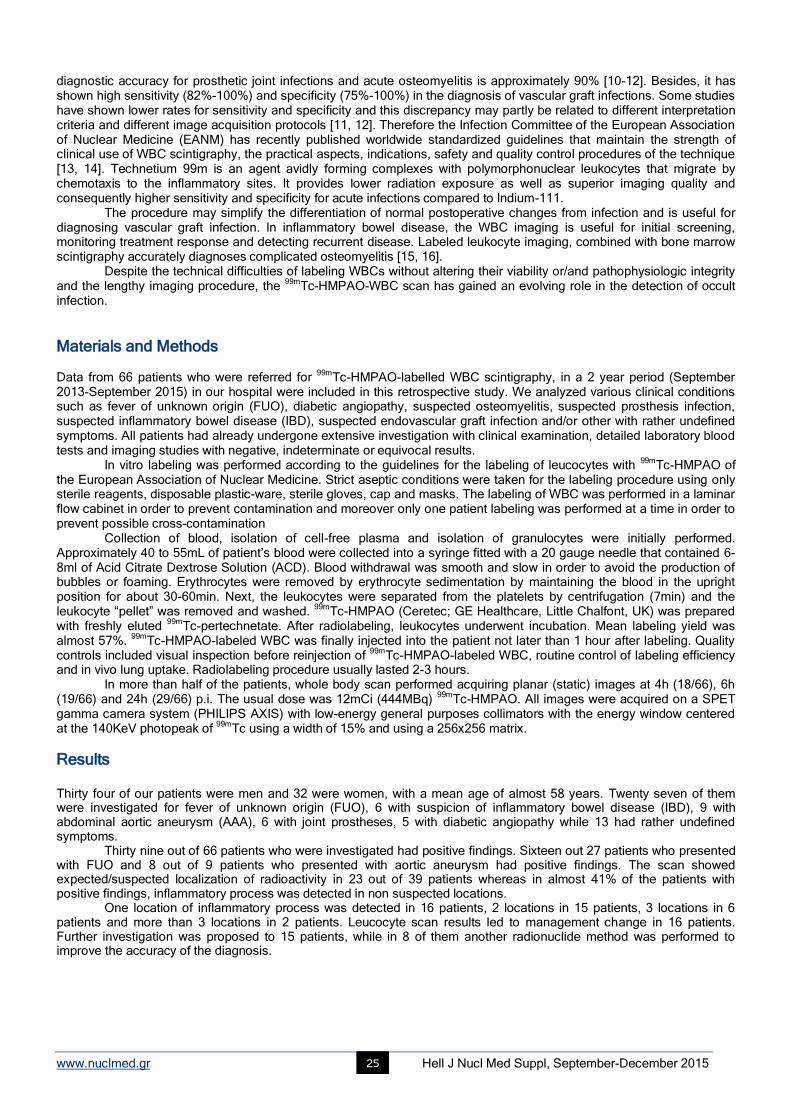
www.nuclmed.gr Hell J Nucl Med Suppl, September-December 2015 25
diagnostic accuracy for prosthetic joint infections and acute osteomyelitis is approximately 90% [10-12]. Besides, it has shown high sensitivity (82%-100%) and specificity (75%-100%) in the diagnosis of vascular graft infections. Some studies have shown lower rates for sensitivity and specificity and this discrepancy may partly be related to different interpretation criteria and different image acquisition protocols [11, 12]. Therefore the Infection Committee of the European Association of Nuclear Medicine (EANM) has recently published worldwide standardized guidelines that maintain the strength of clinical use of WBC scintigraphy, the practical aspects, indications, safety and quality control procedures of the technique [13, 14]. Technetium 99m is an agent avidly forming complexes with polymorphonuclear leukocytes that migrate by chemotaxis to the inflammatory sites. It provides lower radiation exposure as well as superior imaging quality and consequently higher sensitivity and specificity for acute infections compared to Indium-111.
The procedure may simplify the differentiation of normal postoperative changes from infection and is useful for diagnosing vascular graft infection. In inflammatory bowel disease, the WBC imaging is useful for initial screening, monitoring treatment response and detecting recurrent disease. Labeled leukocyte imaging, combined with bone marrow scintigraphy accurately diagnoses complicated osteomyelitis [15, 16].
Despite the technical difficulties of labeling WBCs without altering their viability or/and pathophysiologic integrity and the lengthy imaging procedure, the
99mTc-HMPAO-WBC scan has gained an evolving role in the detection of occult
infection.
Materials and Methods Data from 66 patients who were referred for
99mTc-HMPAO-labelled WBC scintigraphy, in a 2 year period (September
2013-September 2015) in our hospital were included in this retrospective study. We analyzed various clinical conditions such as fever of unknown origin (FUO), diabetic angiopathy, suspected osteomyelitis, suspected prosthesis infection, suspected inflammatory bowel disease (IBD), suspected endovascular graft infection and/or other with rather undefined symptoms. All patients had already undergone extensive investigation with clinical examination, detailed laboratory blood tests and imaging studies with negative, indeterminate or equivocal results.
In vitro labeling was performed according to the guidelines for the labeling of leucocytes with 99m
Tc-HMPAO of the European Association of Nuclear Medicine. Strict aseptic conditions were taken for the labeling procedure using only sterile reagents, disposable plastic-ware, sterile gloves, cap and masks. The labeling of WBC was performed in a laminar flow cabinet in order to prevent contamination and moreover only one patient labeling was performed at a time in order to prevent possible cross-contamination
Collection of blood, isolation of cell-free plasma and isolation of granulocytes were initially performed. Approximately 40 to 55mL of patient’s blood were collected into a syringe fitted with a 20 gauge needle that contained 6-8ml of Acid Citrate Dextrose Solution (ACD). Blood withdrawal was smooth and slow in order to avoid the production of bubbles or foaming. Erythrocytes were removed by erythrocyte sedimentation by maintaining the blood in the upright position for about 30-60min. Next, the leukocytes were separated from the platelets by centrifugation (7min) and the leukocyte “pellet” was removed and washed.
99mTc-HMPAO (Ceretec; GE Healthcare, Little Chalfont, UK) was prepared
with freshly eluted 99m
Tc-pertechnetate. After radiolabeling, leukocytes underwent incubation. Mean labeling yield was almost 57%.
99mTc-HMPAO-labeled WBC was finally injected into the patient not later than 1 hour after labeling. Quality
controls included visual inspection before reinjection of 99m
Tc-HMPAO-labeled WBC, routine control of labeling efficiency and in vivo lung uptake. Radiolabeling procedure usually lasted 2-3 hours.
In more than half of the patients, whole body scan performed acquiring planar (static) images at 4h (18/66), 6h (19/66) and 24h (29/66) p.i. The usual dose was 12mCi (444MBq)
99mTc-HMPAO. All images were acquired on a SPET
gamma camera system (PHILIPS AXIS) with low-energy general purposes collimators with the energy window centered at the 140KeV photopeak of
99mTc using a width of 15% and using a 256x256 matrix.
Results Thirty four of our patients were men and 32 were women, with a mean age of almost 58 years. Twenty seven of them were investigated for fever of unknown origin (FUO), 6 with suspicion of inflammatory bowel disease (IBD), 9 with abdominal aortic aneurysm (AAA), 6 with joint prostheses, 5 with diabetic angiopathy while 13 had rather undefined symptoms.
Thirty nine out of 66 patients who were investigated had positive findings. Sixteen out 27 patients who presented with FUO and 8 out of 9 patients who presented with aortic aneurysm had positive findings. The scan showed expected/suspected localization of radioactivity in 23 out of 39 patients whereas in almost 41% of the patients with positive findings, inflammatory process was detected in non suspected locations.
One location of inflammatory process was detected in 16 patients, 2 locations in 15 patients, 3 locations in 6 patients and more than 3 locations in 2 patients. Leucocyte scan results led to management change in 16 patients. Further investigation was proposed to 15 patients, while in 8 of them another radionuclide method was performed to improve the accuracy of the diagnosis.
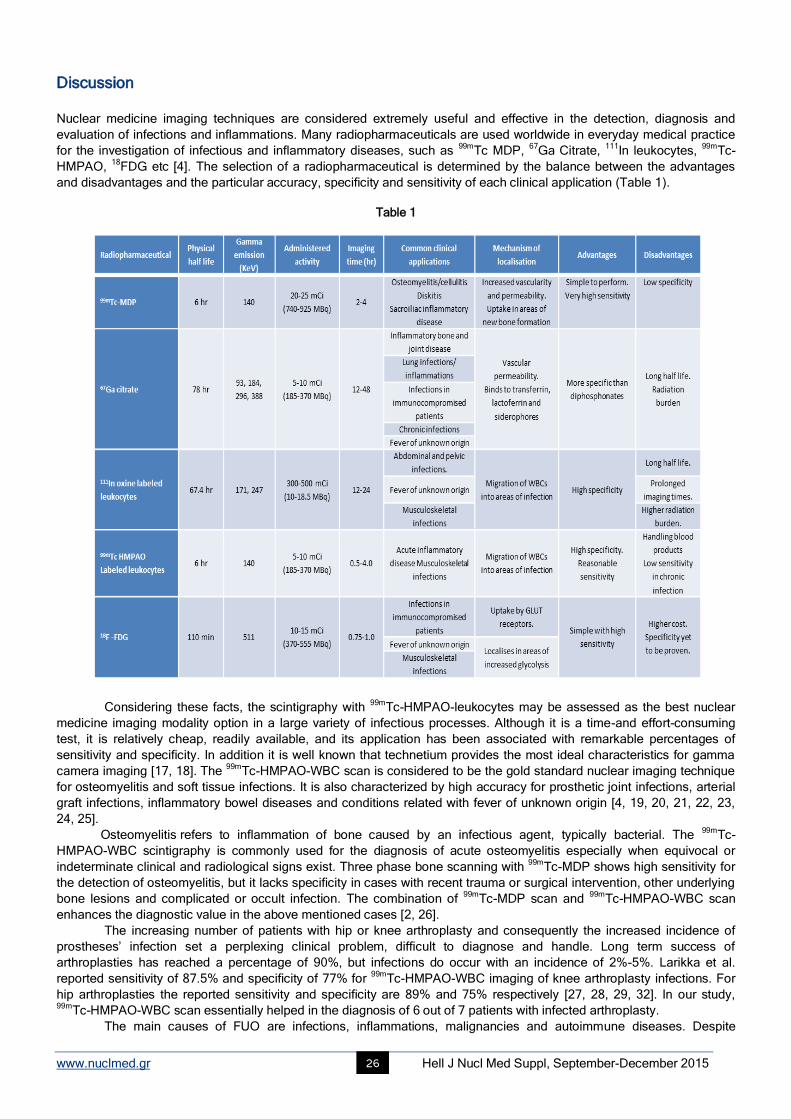
www.nuclmed.gr Hell J Nucl Med Suppl, September-December 2015 26
Discussion Nuclear medicine imaging techniques are considered extremely useful and effective in the detection, diagnosis and
evaluation of infections and inflammations. Many radiopharmaceuticals are used worldwide in everyday medical practice
for the investigation of infectious and inflammatory diseases, such as 99m
Tc MDP, 67
Ga Citrate, 111
In leukocytes, 99m
Tc-
HMPAO, 18
FDG etc [4]. The selection of a radiopharmaceutical is determined by the balance between the advantages
and disadvantages and the particular accuracy, specificity and sensitivity of each clinical application (Table 1).
Table 1
Considering these facts, the scintigraphy with 99m
Tc-HMPAO-leukocytes may be assessed as the best nuclear
medicine imaging modality option in a large variety of infectious processes. Although it is a time-and effort-consuming
test, it is relatively cheap, readily available, and its application has been associated with remarkable percentages of
sensitivity and specificity. In addition it is well known that technetium provides the most ideal characteristics for gamma
camera imaging [17, 18]. The 99m
Tc-HMPAO-WBC scan is considered to be the gold standard nuclear imaging technique
for osteomyelitis and soft tissue infections. It is also characterized by high accuracy for prosthetic joint infections, arterial
graft infections, inflammatory bowel diseases and conditions related with fever of unknown origin [4, 19, 20, 21, 22, 23,
24, 25].
Osteomyelitis refers to inflammation of bone caused by an infectious agent, typically bacterial. The 99m
Tc-
HMPAO-WBC scintigraphy is commonly used for the diagnosis of acute osteomyelitis especially when equivocal or
indeterminate clinical and radiological signs exist. Three phase bone scanning with 99m
Tc-MDP shows high sensitivity for
the detection of osteomyelitis, but it lacks specificity in cases with recent trauma or surgical intervention, other underlying
bone lesions and complicated or occult infection. The combination of 99m
Tc-MDP scan and 99m
Tc-HMPAO-WBC scan
enhances the diagnostic value in the above mentioned cases [2, 26].
The increasing number of patients with hip or knee arthroplasty and consequently the increased incidence of
prostheses’ infection set a perplexing clinical problem, difficult to diagnose and handle. Long term success of
arthroplasties has reached a percentage of 90%, but infections do occur with an incidence of 2%-5%. Larikka et al.
reported sensitivity of 87.5% and specificity of 77% for 99m
Tc-HMPAO-WBC imaging of knee arthroplasty infections. For
hip arthroplasties the reported sensitivity and specificity are 89% and 75% respectively [27, 28, 29, 32]. In our study, 99m
Tc-HMPAO-WBC scan essentially helped in the diagnosis of 6 out of 7 patients with infected arthroplasty.
The main causes of FUO are infections, inflammations, malignancies and autoimmune diseases. Despite
www.nuclmed.gr Hell J Nucl Med Suppl, September-December 2015 27
thorough clinical, laboratory and imaging investigation, the underlying cause may be difficult to determine. 99m
Tc-HMPAO-
WBC scan may provide essential information regarding the detection of infection focus leading to appropriate
management of the patient. We have demonstrated the presence of scintigraphic findings highly indicative of the cause of
FUO in 16 out of 27 patients (59.25%). As several causes of FUO are not usually associated with neutrophil infiltration,
the test proves helpful in 25%-50% of the cases (Figures 1, 2) [30].
Inflammatory bowel disease (IBD) involves chronic inflammation of all or part of the digestive tract. 99m
Tc-
HMPAO-WBC scan has been successfully applied to elucidate the location of the lesions, to evaluate their response to
treatment and to detect early reoccurrence; however its role remains to be established [17, 21, 31].
Prosthetic vascular grafts may be complicated by infections in 1-5% of patients. The early management of grafts
infections represents a crucial matter due to the associated very high morbidity and mortality rates. 99m
Tc-HMPAO-WBC
scan offers significant diagnostic value for the diagnosis of prosthetic vascular graft infection with high accuracy (~95%)
[20, 24].
Conclusion Conclusively, the RL-WBC scan (i) is extremely useful in the diagnosis of perigraft tissue infection and osteomyelitis (except for spine) with high rate of sensitivity and specificity (≈90%) when timely used, and (ii) may provide valuable information in patients with fever of unknown origin, inflammatory bowel disease or vague symptoms. False positive results have been noticed mainly due to artifacts, co-existent skeletal lesions or in the early postoperative course because of the nonspecific radionuclide uptake in the healing tissue. On the other hand, false negative results may appear in delayed aortic graft infection, etc. Difficulties arise in the discrimination between infection and sterile inflammatory lesions accompanying atheromatosis or grafts/prostheses. The triggering of several signaling pathways may lead to sterile inflammation. Its pathophysiology has recently started being elucidated and its diagnosis is still largely up to clinical suspicion. As neutrophils are one of the first cellular mediators of sterile inflammation forming clusters at the site of injury and propagate the sequential inflammatory process,
99mTc-HMPAO radiolabeled leucocytes scintigraphy cannot provide a
definite discrimination between sterile and infectious inflammation. In addition to this, no other imaging studies provide clear differential diagnosis for such clinical setting. Molecular methods (such as the expression of certain genes or PCR determination of the relative amounts of plasma mitochondrial and bacterial DNA), have shown promising results indicating the presence of sterile inflammation. This crucial distinction may lead to novel therapeutic approaches that will dampen inflammation at the injury site without disabling systemic innate immune pathways affording protection against
Figure 1. An 11 years old boy with FUO. Ophthalmological evaluation revealed iridocyclitis. Findings from colonoscopy and bone scan were normal. Abdomen CT showed thickening of ileum wall which was an indicator of local inflammation. The presence of enlarged lymph nodes in the area of the proximal ascending colon set the suspicion for lymphoma. From the first hour until the completion of the study a diffuse mildly and inhomogeneously increased concentration of the radiolabeled autologous WBC at the area of ileum and proximal ascending colon can be observed.
Figure 2. A 79 years old female with FUO, pemphigus with a recent onset, Parkinson disease, diabetes mellitus and by-pass history. Four blood cultures showed infection from S. aureus. Whole body scan performed in 1h, 4h and 20h p.i. The increased concentration of the radiolabeled WBC in the pelvis bilaterally just above the bladder and also at the 6th thoracic vertebrae, set the suspicion of infection. The concentration at the left hip was attributed to radioinfection.
ved.

www.nuclmed.gr Hell J Nucl Med Suppl, September-December 2015 28
infection Our experience shows that there should take place a closer co-operation between nuclear medicine physicians and clinicians to ensure the rational selection of the patients that would benefit from this complex diagnostic procedure, in order to get the optimal results concerning in vivo inflammation/abscess visualization.
Bibliography
1. Rankling JA: Biologic mediators of aute inflammation. Clin Issues 2004; 15: 3-7
2. Stumpe KD, Strobel K. Osteomyelitis and arthritis. Semin Nucl Med 2009; 39: 27-35
3. Christina A. Truluck, PhD. Nuclear Medicine Technology: Inflammation and Infection Imaging. J Radiol Nur 2007; 26: 77-85.
4. W Becker and J Meller. The role of nuclear medicine in infection and inflammation. Review article Lancet Infectious Diseases 2001; 1: 326-
33
5. Alireza Doroudi at al. Clinical Evaluation of 99m
Tc-MDP Three Phase Bone Scan and 99m
Tc-UBI 29-41 Scintigraphy Imaging in Preferentially
Detection Infection from Sterile Inflammation among Diabetic Patients with Suspected Foot Infection. IOSR J Pharm Volume 5, Issue 2,
February 2015; 20-6
6. C.J. Palestro. The current rule of gallium imaging in infection. Sem Nucl Med 1994; 14: 128-41
7. P. Laverman at al. Development of infection and inflammation targeting compounds. Curr Radiopharm 2008; 1: 42-8
8. Van der Bruggen W et al. PET and SPECT in osteomyelitis and prosthetic bone and joint infections: a systematic review. Semin Nucl Med
2010; 40: 3-15.
9. Signore A, Glaudemans AW. The molecular imaging approach to image infections and inflammation by nuclear medicine techniques. Ann
Nucl Med 2011; 25: 681-700.
10. Palestro CJ, Love C, Bhargava KK. Labeled leukocyte imaging: current status and future directions. Q J Nucl Med Mol Imag 2009; 53: 105-
23.
11. Love C, Marwin SE, Palestro CJ. Nuclear medicine and the infected joint replacement. Semin Nucl Med 2009; 39: 66-78.
12. Gemmel F, Van den Wyngaert H, Love C, Welling MM. Prosthetic joint infections: radionuclide state-of-the-art- imaging. Eur J Nucl Med
Mol Imag 2012; 39: 892-909.
13. Tondeur MC, Sand A, Ham HH. Interobserver reproducibility in the interpretation of 99m
Tc-labelled white blood cell scintigraphic images.
Nucl Med Commun 2008; 29: 1093-9.
14. Glaudemans AW, Galli F, Pacilio M, Signore A. Leukocyte and bacteria imaging in prosthetic joint infections. Eur Cell Mater 2013; 25: 61-
77.
15. De Vries EF, Roca M, Jamar F et al. Guidelines for the labelling of leucocytes with 99m
Tc-HMPAO. Inflammation/infection Taskgroup of
the European Association of Nuclear Medicine. Eur J Nucl Med Mol Imag 2010; 37: 842-8.
16. Roca M, De Vries EF, Jamar F et al. Guidelines for the labelling of leucocytes with (111)In-oxine. Inflammation/ infection Taskgroup of the
European Association of Nuclear Medicine. Eur J Nucl Med Mol Imag 2010; 37: 835-41.
17. Hughes DK. Nuclear medicine and infection detection: the relative effectiveness of imaging with 111
In-oxine-, 99m
Tc-HMPAO-, and 99m
Tc-
stannous fluoride colloid-labeledleukocytes and with 67
Ga-citrate. J Nucl Med Technol 2003 Dec; 31(4): 196-201; quiz 203-4. Review
18. Chai-Hung Kao and Shyn-Jen Wang. Spread of Infectious Complications of Odogentic Abscess Detected by Technetium-99m-HMPAO-
Labeled WBC Scan of Occult Sepsis in the Intensive Care Unit. J Nucl Med 1992 Feb; 33(2): 254-5.
19. Lantto E. Investigation of suspected intra-abdominal sepsis: the contribution of nuclear medicine. Scand J Gastroenterol Suppl. 1994;
203:11-4.
20. Prats E. et al. Diagnosis of prosthetic vascular graft infection by technetium-99m-HMPAO-labeled leukocytes. J Nucl Med. 1994 Aug; 35(8):
1303-7.
21. Mota LG et al. Leukocyte-technetium-99m uptake in Crohn's disease: does it show subclinical disease? World J Gastroenterol. 2010 Jan
21; 16(3): 365-71.
22. Charron M, Orenstein SR, Bhargava S. Detection of inflammatory bowel disease in pediatric patients with technetium-99m-HMPAO-labeled
leukocytes. J Nucl Med 1994 Mar; 35(3): 451-5.
23. Abdullah Al-Zahrani, Khaled El-Saban, Hijji Al-Sakhri. Diagnosis of bone infection by complementary role of technetium-99m MDP and
technetium-99m hexamethylpropylene-amineoxime-leukocytes. Indian J Nucl Med 2012 Jul-Sep; 27(3): 164-71.
24. Emmanuel Gardeta et al. Comparison of detection of F-18 fluorodeoxyglucose positron emission tomography and 99m
Tc-
hexamethylpropylene amine oxime labelled leukocyte scintigraphy for an aortic graft infection. Oxford Journals Medicine & Health
Interactive CardioVasc Thoracic Surgery Volume 10, Issue 1 Pp. 142-3.
25. Paola A. Erba et al. Image acquisition and interpretation criteria for 99m
Tc-HMPAO-labelled white blood cell scintigraphy: results of a
multicentre study. Eur J Nucl Med Mol Imaging 2014; 41: 615-23.
26. Ballani NS et al. The value of quantitative uptake of 99m
Tc-MDP and 99m
Tc-HMPAO white blood cells in detecting osteomyelitis in
violated peripheral bones. J Nucl Med Technol 2007 Jun; 35(2): 91-5.
27. Fuster D. et al. Potential use of bone marrow scintigraphy in suspected prosthetic hip infectionevaluated with 99m
Tc-HMPAO-leukocytes.
Rev Esp Med Nucl 2008 Nov-Dec; 27(6): 430-5.
28. Pelosi E. et al. 99m
Tc-HMPAO-leukocyte scintigraphy in patients with symptomatic total hip or knee arthroplasty: improved
diagnostic accuracy by means of semiquantitative evaluation. J Nucl Med 2004 Mar; 45(3): 438-44.
29. Mountford P.J, Hall F.M, Wells C.P. 99m
Tc-MDP, 67
Ga-citrate, 111
In leukocytes for detecting prosthetic hip infection. Nucl Med Commun 1986;
7: 113-20.
30. Chantal P. Bleeker-Rovers et al. Fever of Unknown Origin. Semin Nucl Med 39: 81-7.
31. Carrera D. et al. Prognostic utility of scintigraphy with 99m
Tc-HMPAO labelled leukocytes in inflammatory bowel disease. Rev Esp Med Nucl
2006 Nov-Dec; 25(6): 380-6.
32. Palestro J. Christopher. Nuclear medicine and the failed joint replacement: Past, present and future. World J Radiol 2014 Jul 28; 6(7): 446-
58.
www.nuclmed.gr Hell J Nucl Med Suppl, September-December 2015 29
Intravitreal aflibercept (A-IVI) for the treatment of neovascular age-related macular degeneration (nv-AMD): one year experience Evangelia Papavasileiou
1,2*, MD, PhD, FEBOphth, Vasiliki Zygoura
3*, MD, DiSSO, MSc, FEBOphth, Theresa
Richardson4, MBBS (Hons), FRCS (Ophth), BSc, Dominic Cortis
5, MSc, AIA, Haralabos Eleftheriadis
2, MD, Timothy
L. Jackson2,6
, PhD, FRCOphth *Joint first authors
1. Massachusetts Eye and Ear Infirmary, Harvard Medical School, Boston, USA, 2. King’s College Hospital, London, UK, 3. Moorfields Eye Hospital, London, UK, 4. Western Eye Hospital, Imperial College Healthcare NHS Trust, London, UK, 5. Department of Mathematics, University of Leicester, UK, 6. King’s College London, London, UK
Keywords: Aflibercept - Intravitreal - Neovascular age - Related macular degeneration Correspondence adress: Evangelia Papavasileiou, MD, PhD, FEBOphth, Department of Ophthalmology, King’s College Hospital, London SE5 9RS, United Kingdom, Email: [email protected]
Abstract Objective: To report the anatomical and functional results of intravitreal injections of aflibercept (Eylea) (A-IVI) for the treatment
of naïve eyes with neovascular age-related macular degeneration (nv-AMD). Subjects and Methods: This retrospective, one-
center, non-comparative chart review included 26 treatment naïve eyes with nv-AMD of 26 patients (14 male) with a mean age of
80.5 (range 63-91) who had a complete follow-up of 14 months. The morphological analysis included spectral domain optical
coherence tomography and fundus fluorescein angiography, while the functional assessment included logarithm of the minimum
angle of resolution (LogMAR) best correct visual acuity (BCVA). The timing of the follow-up was: baseline, 3, 6, and 14 months.
All patients received 8 A-IVI according to the protocol (first 3 consecutive monthly A-IVI, followed by bi-monthly retreatment for
the first year, regardless of disease activity as per local guidelines). Statistical analysis was performed using
ANOVA. Improvement of visual acuity more than 15 letters was considered as ‘improvement’, less than 5 letters as ‘stable’ and
any letter loss as ‘worsening’. Results: Mean±standard deviation LogMAR visual acuity improved from 0.26±0.15 at presentation
to 0.14±0.20 at the final follow-up of 14 months (P=0.02). BCVA was stable in 23.1%, improved in 61.5% (16 eyes) worsened in
15.4%. A mean pretreatment central macular thickness of 409μm reduced significantly to 229μm at month 14 (P<0.02). The
OCT of eyes with worsened BCVA showed resolution of retinal fluid but presence of subretinal fibrosis. No adverse events were
attributed to aflibercept. Conclusions: Patients who had a worsening in visual acuity were found to have longer duration of
symptoms prior to treatment and presence of geographic atrophy, and/or subretinal haemorrhage and/or subretinal fibrosis at
baseline. From our experience, with 14 months follow-up, A-IVI is an effective treatment for treatment naïve patients with nv-
AMD. Our real world results were similar to pivotal trials. HJNM 2015; 18(Suppl1); 29-32 Published on line: 12 December 2015
Introduction
ge-related macular degeneration (AMD) is a chronic progressive condition associated with ageing, characterised by central vision loss that may lead to irreversible vision loss if left untreated or sub optimally managed [1-3]. It is characteristically a disease of individuals >50 years of age and is the leading cause of visual loss in developed
countries. In the United States, it is estimated that approximately 6% of individuals 65-74 years of age, and 20% of those older than 75 years of age are affected with AMD [4]. The annual UK incidence of wet neovascular AMD (nv-AMD) is estimated to be 39,700 with 103.1 new cases per 100,000 adult population per year [5]. Non-modifiable risk factors for AMD are include age and genetic Modifiable risk factors include cigarette smoking, high body mass index and low-level dietary antioxidants [6].
With an ageing population, vision loss from AMD is expected to increase [7]. AMD can be classified into one of two general subgroups: early AMD which is mainly characterised by drusen and retinal pigment epithelium (RPE) changes; and late AMD, which is characterised by geographic atrophy of the RPE (dry AMD) and nv-AMD [1]. The dry form of AMD is more prevalent, accounting for approximately 90% of all AMD cases, and is often characterized by a slow degeneration of the macula resulting in atrophy of the central retina with gradual vision loss over a period of years. By contrast, nv-AMD, although less prevalent, commonly causes sudden, often substantial, loss of central vision and is responsible for most cases of severe loss of visual acuity in this disease [3]. Dry AMD is characterised by soft drusen, RPE atrophy, geographic outer retinal atrophy and loss of choriocapillaris, [6] while nv-AMD is characterised by fluid, haemorrhage, RPE detachment and exudates. For dry AMD there is lack of effective therapy, whereas v-AMD can be effectively treated with anti-angiogenic therapies [6]. Without treatment the natural history of nv-AMD is macular scarring and visual loss [3]. Patterns of choroidal neovascularization in common forms of wet AMD include occult CNV in >85% of cases and classic CNV in around 12%. Rarer forms include idiopathic polypoidal choroidal vasculopathy (IPCV) and
A
www.nuclmed.gr Hell J Nucl Med Suppl, September-December 2015 30
retinal angiomatous proliferation (RAP) [6, 8-9]. Nv-AMD results when abnormal blood vessels (neovascularization) proliferate under and/or within the retina.
These blood vessels leak blood and fluid into the retina, which results in rapid vision loss. The end stage of the disease is scarring with irreversible destruction of the central retina. The current FDA approved pharmacologic therapies for nv-AMD target and inhibit vascular endothelial growth factor (VEGF). VEGF is an endothelial cell survival factor and a mitogen. Endothelial cells are a key component of neovascular tissue. All approved anti-VEGF agents for wet AMD are administered by intravitreal injection. These include ranibizumab (Lucentis), aflibercept (Eylea), and pegaptanib sodium (Macugen) [10-13].
In addition, although not licenced by the FDA for the treatment of n-v AMD, the anti-VEGF agent Avastin (bevacizumab) is currently used to treat the ~50% of eyes with nv-AMD in the United States. A multicenter, prospective, randomized trial, funded by the US National Eye Institute, “The Comparison of Age-Related Macular Degeneration Treatments Trials” (CATT) demonstrated that monthly dosing with Avastin 1.25mg (0.05mL) was non-inferior to monthly dosing of Lucentis for eyes with nv AMD [14].
Avastin, Lucentis, and Eylea, on average, all improve the visual outcomes in eyes with nv AMD. The primary mechanism of action of these anti-VEGF agents is to decrease the intraretinal and subretinal fluid associated with abnormal blood vessels.
Aflibercept, also known as VEGF Trap-Eye is the first fully human intravitreal fusion protein. Key binding domains of VEGF-R1 and VEGF-R2 are fused for tight binding affinity for both VEGF-A isomers and placental growth factor (PIGF) [15-16]. Two dual-domain arms are used for one aflibercept molecule to mimic the natural receptor pairing necessary for growth factor signalling. The Fc portion of IgG1 is fused to the dual-domain arms resulting in the engineered molecule of aflibercept. Aflibercept binds both VEGF-A and PIGF with an affinity higher than their natural receptors [15-16]. View 1 and 2 were phase III trials comparing aflibercept to ranibizumab and showed that aflibercept 2mg every 8 weeks produced non-inferior efficacy results to monthly ranibizumab, that persistent to 96 weeks. The proportion of fluid-free eyes was similar in all groups at both 52 weeks and this benefit remained at 96 weeks. Aflibercept was well-tolerated and had a similar profile to ranibizumab for ocular treatment-emergent and injection-related adverse events, and for systemic non-ocular adverse events [12].
In the first 12 months, aflibercept 2mg in 50 microlitres can be given every two months with no requirement for monitoring between injections, following three monthly induction injections [12]. The aim of the present study was to report the morpho-functional results of intravitreal injection of aflibercept (Eylea) for nv-AMD, and compare these to those published in the pivotal trials.
Method We retrospectively reviewed the charts of 26 consecutive patients who underwent treatment with A-IVI for nv-AMD. All eyes included were treatment naïve.
The morphological analyses included spectral-domain optical coherence tomography (SD-OCT) and fluorescein angiography (FA), while the functional assessment included logarithm of the minimum angle of resolution (LogMAR) best corrected visual acuity (BCVA). For each individual case, permission to treat was also obtained from the Chair of the Hospital's Drug and Therapeutics Committee. Ethical approval was not required to retrospectively report this interventional case series.
Patients were treated under topical anaesthesia. Eyes were prepared using povidone iodine, surgical draping, and placement of an eyelid speculum. Each eye received a single, pars plana intravitreal injection of 2mg of aflibercept. All patients received 8 A-IVI according to the protocol (first 3 consecutive monthly A-IVI, followed by bimonthly retreatment for the first year, regardless of disease activity as per local guidelines).
Baseline FA and serial SD-OCT scans (Spectralis, Heidelberg Engineering, Heidelberg, Germany) were read in a masked fashion to quantify the central retinal thickness (CRT). Follow up was at baseline, months 1, 2, 3 and then every 2 months for the first 14 months.
Statistical analysis was performed using ANOVA. P-values<0.05 were considered significant. We examined 26 eyes of 26 patients, including 14 males and 12 females with mean age of 80.5 (range 63 to 91). Endpoint was the proportion of patients maintaining vision (defining as losing <15 letters on an ETDRS chart at 14 months.
Results At the end of the follow-up, 61.5% (16 eyes) had improved the BCVA, 23.1% remained stable and 15.4% had a worsening of BCVA (P-value <0.02%). Mean±standard deviation LogMAR BCVA improved from 0.26±0.15 at presen-tation to 0.14±0.20 at the final follow-up of 14 months (P=0.02).
All the patients had a reduction of the central macular thickness at month 12 (P-value<0.02%). Mean central macular thickness (decreased from 409±154 microns to 229±122μm (P-value<0.02%).
In the eyes with a worsening of the VA at the end of the follow-up (15.4%) there were retinal scars evident on the OCT, but the macula was dry.
Visual acuity worsening in 15.4% of eyes was found to be related to either the acute appearance of sub-retinal or sub-RPE haemorrhage or to late stage of disease at the time of observation due to structural damage of the fovea from
www.nuclmed.gr Hell J Nucl Med Suppl, September-December 2015 31
the development of subfoveal scarring formation, geographic atrophy and/or fovea-involving exudation.
Discussion A broad range of trials have investigated the efficacy and safety of ranibizumab, aflibercept and bevacizumab in n-v AMD and similar outcomes were reported [10-12, 14].
The one-year results of intravitreal injection of aflibercept showed that the majority of patients had improvement or stabilisation of BCVA from baseline. Visual acuity worsening in 15.4% of eyes was found to be related to either the acute appearance of sub-retinal or sub-RPE haemorrhage or to late stage of disease at the time of observation due to structural damage of the fovea from the development of subfoveal scarring formation, geographic atrophy and / or fovea-involving exudation.
The eyes with the most favourable visual outcome had early diagnosis and treatment of their disease. In our study mean (±standard deviation) LogMAR visual acuity improved from 0.26±0.15 at presentation to
0.14±0.20 at the final follow-up of 14 months (P=0.02). One of the limitations of our study is that our sample is small and we cannot generate our results, which however
seem to be consistent with pivotal VIEW 1 and VIEW 2 trials. In VIEW 1 and VIEW 2, all 4 methods of treatment led to excellent and statistically equivalent visual outcomes,
with each of the 4 arms achieving a mean of 8.3 to 9.3 letters of visual gain at the 1-year primary endpoint [12]. From an anatomical perspective, a slightly different result was observed. Specifically, analysis of central macular
thickness (CMT) by OCT in the aflibercept 2mg arm in which patients were treated every 2 months revealed a “saw-tooth pattern” after the initial 3 monthly doses: CMT transiently increased at the end of the 2-month interval and then decreased upon retreatment, a phenomenon also observed in CLEAR-IT 2, the phase 2 study of aflibercept [17].
These observations suggest that aflibercept’s maximal anti-VEGF biological activity may not last a full 8 weeks in all patients. Nonetheless, secondary analyses of the data indicate that eyes receiving aflibercept monthly and every other month after 3 loading doses were 52% and 38% more likely, respectively, to demonstrate no macular edema at any point during the first 52 weeks compared with monthly ranibizumab (P<0.01).
Conclusions In conclusion, patients with n-v AMD treated with intravitreal aflibercept resulted in stabilised vision and improved anatomic outcomes, while allowing injection intervals to be extended. From our experience, with 12 months follow-up, intravitreal injection of aflibercept showed to have promising outcomes for treatment naive patients with n-v AMD. A long term follow-up would be useful to evaluate the stability of this treatment. Comparison of
18F-FDG PET/CT and MDCT
Aflibercept is an extremely effective anti-VEGF medication in the management of neovascular AMD. Many patients treated with aflibercept will require more than every-other-month dosing to achieve and maintain maximal retinal deturgescence. Still other antiangiogenic agents, including inhibitors of platelet derived growth factor (PDGF), are being actively investigated, and future advances will likely continue to improve patients’ vision and reduce their treatment burden.
The authors have no conflicts of interest to declare.
Bibliography 1. Bird AC, Bressler NM, Bressler SB et al. An international classification and grading system for age-related maculopathy and age-related
macular degeneration. The International ARM Epidemiological Study Group. Surv Ophthalmol 1995; 39: 367-74.
2. Facts about age-related macular degeneration. National Eye Institute. 2012.
3. De Jong PT. Age-related macular degeneration. N Engl J Med 2006; 355: 1474-85.
4. Leibowitz HM, Krueger DE, Maunder LR et al. The Framingham Eye Study monograph: An ophthalmological and epidemiological study of
cataract, glaucoma, diabetic retinopathy, macular degeneration, and visual acuity in a general population of 2631 adults, 1973-1975. Surv
Ophthalmol 1980; 24: 335-610.
5. Owen CG, Jarrar Z, Wormald R et al. The estimated prevalence and incidence of late stage age related macular degeneration in the UK. Br
J Ophthalmol 2012; 96: 752-6.
6. Jager RD, Mieler WF, and Miller JW. Age-related macular degeneration. N Engl J Med 2008; 358: 2606-17.
7. American Foundation for the blind (AFB). Special Report on Aging and Vision Loss. American Foundation for the blind (AFB); 2013.
8. Freund KB, Zweifel SA, and Engelbert M. Do we need a new classification for choroidal neovascularization in age-related macular
degeneration? Retina. United States; 2010, p. 1333-49.
9. Vingerling JR, Dielemans I, Hofman A et al. The prevalence of age-related maculopathy in the Rotterdam Study. Ophthalmology 1995; 102:
205-10.
10. Brown DM, Kaiser PK, Michels M et al. Ranibizumab versus verteporfin for neovascular age-related macular degeneration. N Engl J Med
2006; 355: 1432-44.
11. Rosenfeld PJ, Brown DM, Heier JS et al. Ranibizumab for neovascular age-related macular degeneration. N Engl J Med 2006; 355: 1419-
31.
12. Heier JS, Brown DM, Chong V et al. Intravitreal aflibercept (VEGF trap-eye) in wet age-related macular degeneration. Ophthalmology 2012;
www.nuclmed.gr Hell J Nucl Med Suppl, September-December 2015 32
119: 2537-48. 13. Gragoudas ES, Adamis AP, Cunningham ET Jr. et al. Pegaptanib for neovascular age-related macular degeneration. N Engl J Med 2004;
351: 2805-16.
14. Martin DF, Maguire MG, Fine SL, et al. Ranibizumab and bevacizumab for treatment of neovascular age-related macular degeneration:
two-year results. Ophthalmology 2012; 119: 1388-98.
15. VEGF TRAP-EYE (aflibercept ophthalmic solution). Regeneron Pharmaceuticals Inc. 2011.
16. Heier J. VEGF Trap-Eye for Exudative AMD. Retinal Physician; 2009.
17. Heier JS, Boyer D, Nguyen QD et al. The 1-year results of CLEAR-IT 2, a phase 2 study of vascular endothelial growth factor trap-eye
dosed as-needed after 12-week fixed dosing. Ophthalmology 2011; 118: 1098-106.Olson IR. Plotzker A. Ezzyat Y. The enigmatic temporal
pole: a review of findings on social and emotional processing. Brain 2007: 130: 1718–31.
From the 3rd International Medical Olympiad
Dr. S. Moschos, Dr. P. Grammaticos, Dr. A. Nikouei and Dr. S. Dash Profs. G. Rubini, P. Grammaticos and G. Bandopadhyaya
Dr. N. Bonvino, Dr. P. Grammaticos and Dr. P. Thakral
www.nuclmed.gr Hell J Nucl Med Suppl, September-December 2015 33
Real-world treatment of diabetic macular oedema: a comparison of combined ranibizumab plus macular LASER with macular LASER monotherapy Vasiliki Zygoura
1*, MD, DiSSO, MSc, FEBOphth, Evangelia Papavasileiou
2,3*, MD, PhD, FEBOphth, Demetrios G.
Vavvas2, MD, PhD, Dominic Cortis
4,5, MSc, AIA, Ηaralabos Eleftheriadis
3, MD, Timothy L Jackson
3,6, PhD,
FRCOphth
1. Moorfields Eye Hospital, London, UK, 2.
Massachusetts Eye and Ear Infirmary, Harvard Medical School, Boston,
USA, 3. King’s College Hospital, London, UK, 4. Department of Mathematics, University of Leicester, UK, 5. Department of Insurance, University of Malta, 6. King’s College London, London, UK. *Joint first authors Keywords: Anti-VEGF factors - Diabetic macular oedema - LASER photocoagulation - Optical coherence tomography Correspondence address: Vasiliki Zygoura, MD, DiSSO, MSc, FEBOphth, Moorfields Eye Hospital, London EC1V 2PD, United Kingdom, Email: [email protected]
Abstract Objective: To study real world outcomes of ranibizumab (Lucentis) intravitreal injection in diabetic macular oedema (DMO).
Subjects and Methods: We included 100 patients with DMO. Those who had optical coherence tomography central retinal
thickness (CRT) of 400μm or more (Group 1) underwent combination treatment with ranibizumab and macular LASER, while
those with CRT less than 400μm (Group 2) had LASER monotherapy. The primary outcome measure was change in best
corrected visual acuity (BCVA) from baseline. Secondary outcomes were change of CRT from baseline, the number of
intravitreal injections in group one during the first and second year of follow-up and the proportion of LASER sessions in both
groups at 2 years follow-up. Patients’ lipid profile was compared to the presence and extent of macular hard exudates, quantified
using masked readers and image analysis software. Results: Group 1 showed better outcomes in terms of BCVA and CRT
compared to Group 2 during the two-year follow-up period. The mean number of ranibizumab intravitreal injections in Group 1
was reduced from 3.86 (standard deviation±1.37) in the first year to 2.02 in the second year. At 2 years, Group 1 had a higher
proportion of individuals that had undergone 3 macular LASER treatments (4% Group 1, 28% Group 2). The presence of hard
exudates was associated with higher total cholesterol (P=0.004 and P=0.041 group 1 and 2 respectively) and with higher low
density lipoprotein (LDL) cholesterol (P=0.01 and P=0.045 respectively). The size of hard exudates was associated with higher
total cholesterol (P=0.02 and P=0.03 respectively) and with higher LDL cholesterol (P=0.003 and P=0.01 respectively). Neither
high density lipoprotein (HDL) cholesterol, nor triglycerides were related to the presence or size of hard exudates. No serious
adverse events were attributed to either LASER or ranibizumab. Conclusions: Combination treatment of intravitreal ranibizumab
injections and macular LASER appears safe and effective over two years. The need for injection declines over time. There is an
association between higher levels of serum total and LDL cholesterol and the presence and the extent of hard exudates.
HJNM 2015; 18(Suppl1); 33-41 Published on line: 12 December 2015
Introduction
he prevalence of diabetes in the United Kingdom is projected to increase from nearly three million adults in 2013 [1] to around 5 million people by 2025 [2]. Together, diabetic retinopathy (DR) and maculopathy represent the second most common cause of certifiable blindness among working-age adults in England and Wales [3].
The visual acuity in diabetic patients is most commonly compromised because of the complications of retinal neovascularization and/or the occurrence of diabetic maculopathy, either in the form of ischaemic maculopathy, DMO or a combination of both [4].
The classification of DMO varies. The Early Treatment Diabetic Retinopathy Study (ETDRS) defined Clinically Significant Macular Oedema (CSMO) as DMO that threatens the centre of the macula (fovea) and was assessed by slit-lamp biomicroscopy [5]. Diabetic maculopathy can be described as focal oedema, diffuse oedema, ischaemic maculopathy or mixed maculopathy depending on the blood–retinal barrier integrity and the macular perfusion in fundus fluorescein angiography (FFA) [5]. OCT is also commonly used to define DMO as centre-involving, if the central 1mm subfield is involved [6]. OCT may also provide a number of quantitative measures of severity, such as the retinal thickness, the extent of retinal thickening, and the macular volume, as well as qualitative measures such as the retinal morphology and co-existing disease of the vitreo-retinal interface [4, 7].
DR and maculopathy, primarily driven by chronic hyperglycaemia, is the result of a complex pathway with a variety of sequential and related processes [8]. The pathophysiological pathways of DR and DMO implicate the upregulation of inflammatory mediators and vascular endothelial growth factor (VEGF). VEGF expression is induced
T

www.nuclmed.gr Hell J Nucl Med Suppl, September-December 2015 34
directly by hypoxia or through inflammatory mediators [9]. Consequently, both VEGF and inflammatory factors including ICAM-1, interleukin-6 (IL-6) and MCP-1 affect the integrity of the blood–retinal barrier [10] [11-12]. Additionally, placental growth factor (PlGF), [13] tight junction proteins, and other vasoactive factors, including protein kinase C (PKC), histamine, angiotensin II (AII), matrix metalloproteinases (MMPs), pigment epithelium derived factor (PEDF), platelet-derived growth factor (PDGF), and basic fibroblast growth factor (b-FGF) appear to play significant role in the development of DMO [10]. VEGF promotes retinal neovascularization acting as an endothelial cell mitogen, whilst inducing DMO due to its vasopermeability properties [14].
There have been a variety of clinical trials investigating the efficacy and safety of intravitreal anti-VEGF, steroid intravitreal injections and macular laser as monotherapy or combination treatment for DMO [5, 11-12, 15-25]. Given that the anti-VEGF intravitreal agents have shown impressive results in the management of DMO and that the LASER has been shown to be effective, the combination treatment could augment the advantages of both.
The main purpose of this study was to study real world outcomes of ranibizumab intravitreal injection in DMO, given alone and in combination with LASER, and to assess if patients’ lipid profile influences the clinical manifestations of DMO.
Subjects, Material, Methods Study Design This was a prospective, one-center, interventional, parallel, two group study recruiting diabetic patients with CSMO in at least one eye. The patients were fully informed of the purpose of the study and all provided written informed consent. Institutional Review Board approval was obtained and the study adhered to the tenets of the Declaration of Helsinki. Outcome measures The primary outcome measure was change in BCVA from baseline to year 2. Secondary outcomes were change in CRT from baseline, the number of intravitreal injections in the combination treatment group during the first and the second year of monitoring and the proportion of LASER sessions in both groups at 2 years follow-up. The patients’ lipidemic profile was investigated in terms of total, low-density lipoprotein (LDL), high-density lipoprotein (HDL), cholesterol and triglycerides (TGL). Population The eye with the worst BCVA of one hundred patients with DMO from the Outpatient Medical Retina Clinic was included in the study. Inclusion criteria were men or women aged ≥18 years, diabetes mellitus (DM) type I or II, glycosylated hemoglobin (HbA1C) between 6% and 9%, and the presence of CSMO in the study eye regardless of DR stage.
Exclusion criteria were an unstable systemic condition (lack of glycemic control, systolic blood pressure [BP]>155mmHg or diastolic >95mmHg), history of local administration or systemic administration of corticosteroids in the last three months, pan retinal photocoagulation (PRP) or macular photocoagulation to the study eye in the last three months, intravitreal or sub-Tenon administration of triamcinolone in the last three months in the study eye, previous participation in a clinical study with anti-VEGF agents, history of macular surgery or other ophthalmic surgery for DMO in the eye study, previous retinal vein occlusion (RVO), any intraocular surgery in the last twelve months, active intraocular or periocular inflammation, and clinically significant peripheral vascular disease in the last twelve months.
Interventions Patients were allocated to one of two treatment groups based on their baseline CRT, in accordance with the UK’s National Institute of Health and Care Excellence (NICE) guidance, which reserves ranibizumab for patients with a CRT of at least 400μm.
Group 1: Fifty consecutive diabetic patients with CRT greater than or equal to 400μm underwent combination therapy with intravitreal ranibizumab and macular LASER. Group 1 received three monthly intravitreal injections (loading dose) of 0.5mg ranibizumab via pars plana injection and underwent macular LASER photocoagulation (focal or grid) on the third month. Further intravitreal injections were received on a pro re nata (PRN) basis if there was at least one of the following criteria: 1) CRT increase of more than 50μm on OCT, 2) BCVA loss of at least 5 EDTRS letters compared to last measurement, 3) presence of intraretinal or subretinal fluid on OCT, 4) as per investigator judgment, such as BCVA worsening in 2 consecutive visits even if the numeric criteria did not meet the 5 letter criteria.
Macular LASER photocoagulation could be repeated every three months up to three times in total if required. Modified focal or grid LASER was performed as follows: Focal LASER was performed in all leaking micro
aneurysms within 500 to 3000μm from the fovea with 50μm spot size and duration 0.05-0.1 seconds. Grid LASER was conducted between 500 to 3000μm from the center of the fovea and no LASER was applied to papilo-macular area.
Group 2: Fifty consecutive diabetic patients with CRT less than 400μm underwent LASER monotherapy (Group 2). Group 2 received a baseline macular LASER and then two more sessions (at least 3 months in apart), if there was residual leakage in FFA, increase in CRT as above or as per the investigator’s judgement.
Study assessments All patients were evaluated for changes in BCVA (EDTRS letters) and changes in CRT were measured by OCT (Stratus, Model 3000, Carl Zeiss Meditec) at monthly intervals during the two year study period. Further assessment with FFA in order to estimate the fluorescein leakage and with colour fundus photography in order to estimate the size of hard
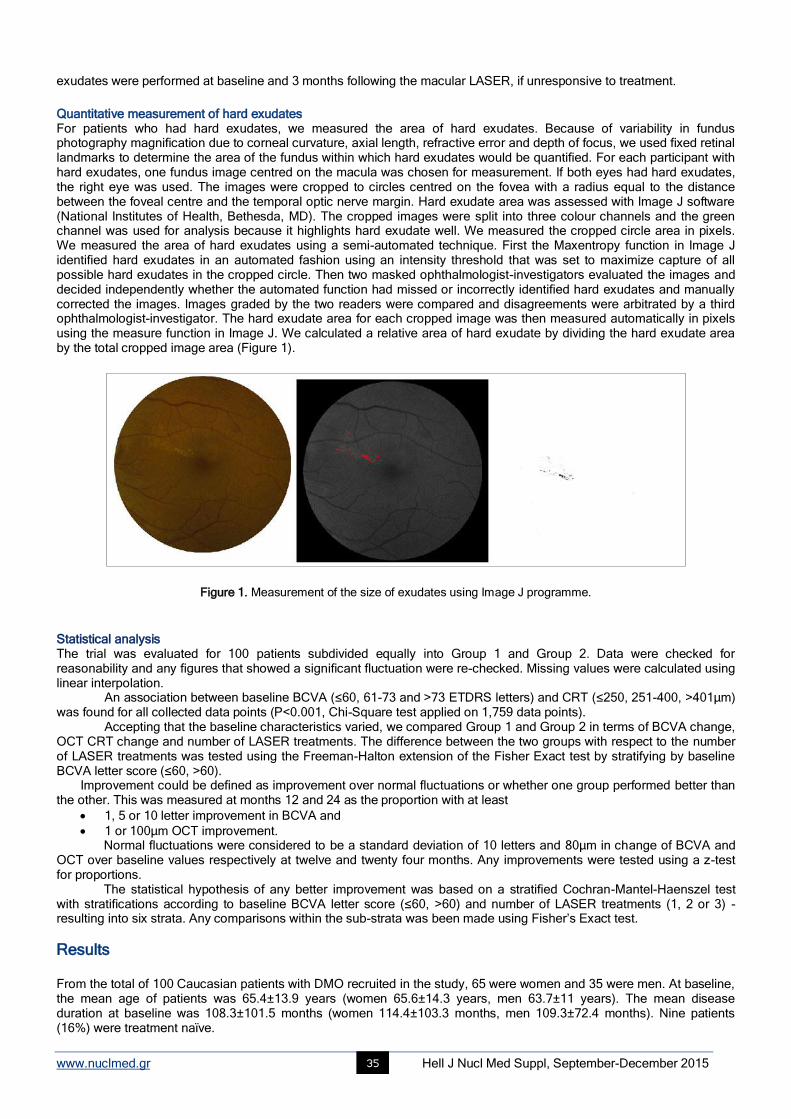
www.nuclmed.gr Hell J Nucl Med Suppl, September-December 2015 35
exudates were performed at baseline and 3 months following the macular LASER, if unresponsive to treatment.
Quantitative measurement of hard exudates For patients who had hard exudates, we measured the area of hard exudates. Because of variability in fundus photography magnification due to corneal curvature, axial length, refractive error and depth of focus, we used fixed retinal landmarks to determine the area of the fundus within which hard exudates would be quantified. For each participant with hard exudates, one fundus image centred on the macula was chosen for measurement. If both eyes had hard exudates, the right eye was used. The images were cropped to circles centred on the fovea with a radius equal to the distance between the foveal centre and the temporal optic nerve margin. Hard exudate area was assessed with Image J software (National Institutes of Health, Bethesda, MD). The cropped images were split into three colour channels and the green channel was used for analysis because it highlights hard exudate well. We measured the cropped circle area in pixels. We measured the area of hard exudates using a semi-automated technique. First the Maxentropy function in Image J identified hard exudates in an automated fashion using an intensity threshold that was set to maximize capture of all possible hard exudates in the cropped circle. Then two masked ophthalmologist-investigators evaluated the images and decided independently whether the automated function had missed or incorrectly identified hard exudates and manually corrected the images. Images graded by the two readers were compared and disagreements were arbitrated by a third ophthalmologist-investigator. The hard exudate area for each cropped image was then measured automatically in pixels using the measure function in Image J. We calculated a relative area of hard exudate by dividing the hard exudate area by the total cropped image area (Figure 1).
Figure 1. Measurement of the size of exudates using Image J programme. Statistical analysis The trial was evaluated for 100 patients subdivided equally into Group 1 and Group 2. Data were checked for reasonability and any figures that showed a significant fluctuation were re-checked. Missing values were calculated using linear interpolation.
An association between baseline BCVA (≤60, 61-73 and >73 ETDRS letters) and CRT (≤250, 251-400, >401μm) was found for all collected data points (P<0.001, Chi-Square test applied on 1,759 data points).
Accepting that the baseline characteristics varied, we compared Group 1 and Group 2 in terms of BCVA change, OCT CRT change and number of LASER treatments. The difference between the two groups with respect to the number of LASER treatments was tested using the Freeman-Halton extension of the Fisher Exact test by stratifying by baseline BCVA letter score (≤60, >60).
Improvement could be defined as improvement over normal fluctuations or whether one group performed better than the other. This was measured at months 12 and 24 as the proportion with at least
1, 5 or 10 letter improvement in BCVA and
1 or 100µm OCT improvement. Normal fluctuations were considered to be a standard deviation of 10 letters and 80µm in change of BCVA and
OCT over baseline values respectively at twelve and twenty four months. Any improvements were tested using a z-test for proportions.
The statistical hypothesis of any better improvement was based on a stratified Cochran-Mantel-Haenszel test with stratifications according to baseline BCVA letter score (≤60, >60) and number of LASER treatments (1, 2 or 3) - resulting into six strata. Any comparisons within the sub-strata was been made using Fisher’s Exact test.
Results From the total of 100 Caucasian patients with DMO recruited in the study, 65 were women and 35 were men. At baseline, the mean age of patients was 65.4±13.9 years (women 65.6±14.3 years, men 63.7±11 years). The mean disease duration at baseline was 108.3±101.5 months (women 114.4±103.3 months, men 109.3±72.4 months). Nine patients (16%) were treatment naïve.
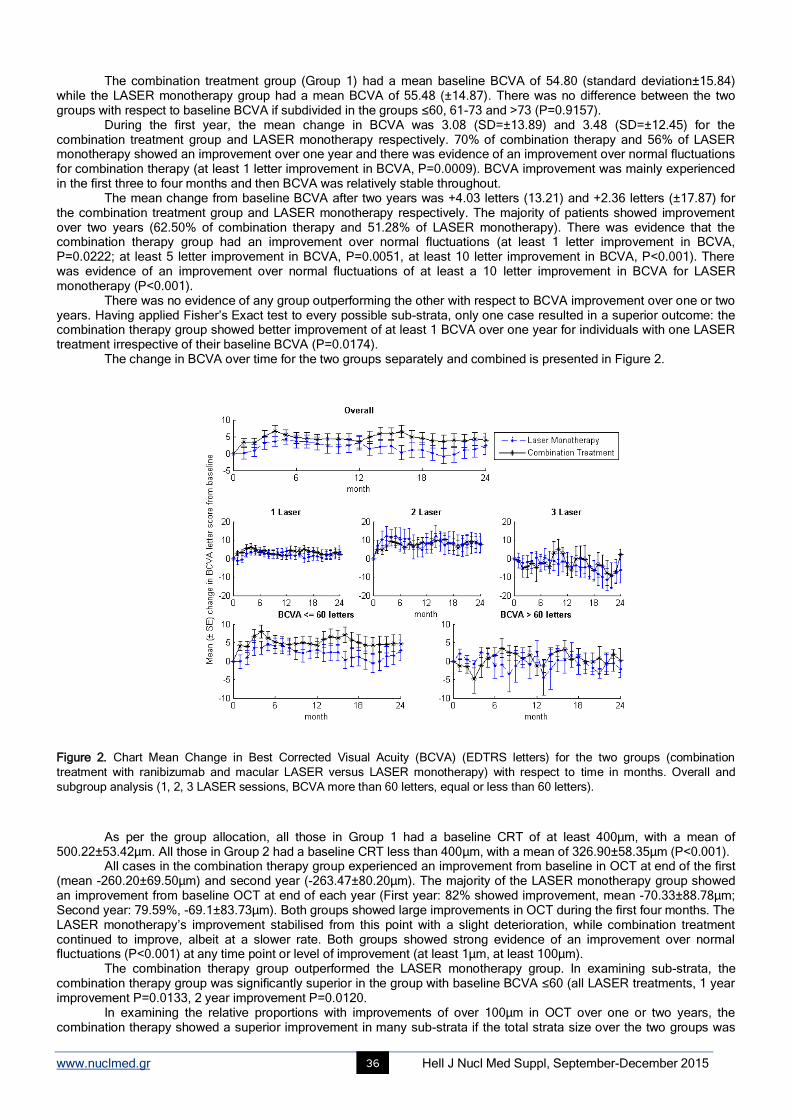
www.nuclmed.gr Hell J Nucl Med Suppl, September-December 2015 36
The combination treatment group (Group 1) had a mean baseline BCVA of 54.80 (standard deviation±15.84) while the LASER monotherapy group had a mean BCVA of 55.48 (±14.87). There was no difference between the two groups with respect to baseline BCVA if subdivided in the groups ≤60, 61-73 and >73 (P=0.9157).
During the first year, the mean change in BCVA was 3.08 (SD=±13.89) and 3.48 (SD=±12.45) for the combination treatment group and LASER monotherapy respectively. 70% of combination therapy and 56% of LASER monotherapy showed an improvement over one year and there was evidence of an improvement over normal fluctuations for combination therapy (at least 1 letter improvement in BCVA, P=0.0009). BCVA improvement was mainly experienced in the first three to four months and then BCVA was relatively stable throughout.
The mean change from baseline BCVA after two years was +4.03 letters (13.21) and +2.36 letters (±17.87) for the combination treatment group and LASER monotherapy respectively. The majority of patients showed improvement over two years (62.50% of combination therapy and 51.28% of LASER monotherapy). There was evidence that the combination therapy group had an improvement over normal fluctuations (at least 1 letter improvement in BCVA, P=0.0222; at least 5 letter improvement in BCVA, P=0.0051, at least 10 letter improvement in BCVA, P<0.001). There was evidence of an improvement over normal fluctuations of at least a 10 letter improvement in BCVA for LASER monotherapy (P<0.001).
There was no evidence of any group outperforming the other with respect to BCVA improvement over one or two years. Having applied Fisher’s Exact test to every possible sub-strata, only one case resulted in a superior outcome: the combination therapy group showed better improvement of at least 1 BCVA over one year for individuals with one LASER treatment irrespective of their baseline BCVA (P=0.0174).
The change in BCVA over time for the two groups separately and combined is presented in Figure 2.
Figure 2. Chart Mean Change in Best Corrected Visual Acuity (BCVA) (EDTRS letters) for the two groups (combination
treatment with ranibizumab and macular LASER versus LASER monotherapy) with respect to time in months. Overall and
subgroup analysis (1, 2, 3 LASER sessions, BCVA more than 60 letters, equal or less than 60 letters).
As per the group allocation, all those in Group 1 had a baseline CRT of at least 400μm, with a mean of 500.22±53.42μm. All those in Group 2 had a baseline CRT less than 400μm, with a mean of 326.90±58.35μm (P<0.001).
All cases in the combination therapy group experienced an improvement from baseline in OCT at end of the first (mean -260.20±69.50μm) and second year (-263.47±80.20μm). The majority of the LASER monotherapy group showed an improvement from baseline OCT at end of each year (First year: 82% showed improvement, mean -70.33±88.78μm; Second year: 79.59%, -69.1±83.73μm). Both groups showed large improvements in OCT during the first four months. The LASER monotherapy’s improvement stabilised from this point with a slight deterioration, while combination treatment continued to improve, albeit at a slower rate. Both groups showed strong evidence of an improvement over normal fluctuations (P<0.001) at any time point or level of improvement (at least 1µm, at least 100µm).
The combination therapy group outperformed the LASER monotherapy group. In examining sub-strata, the combination therapy group was significantly superior in the group with baseline BCVA ≤60 (all LASER treatments, 1 year improvement P=0.0133, 2 year improvement P=0.0120.
In examining the relative proportions with improvements of over 100µm in OCT over one or two years, the combination therapy showed a superior improvement in many sub-strata if the total strata size over the two groups was
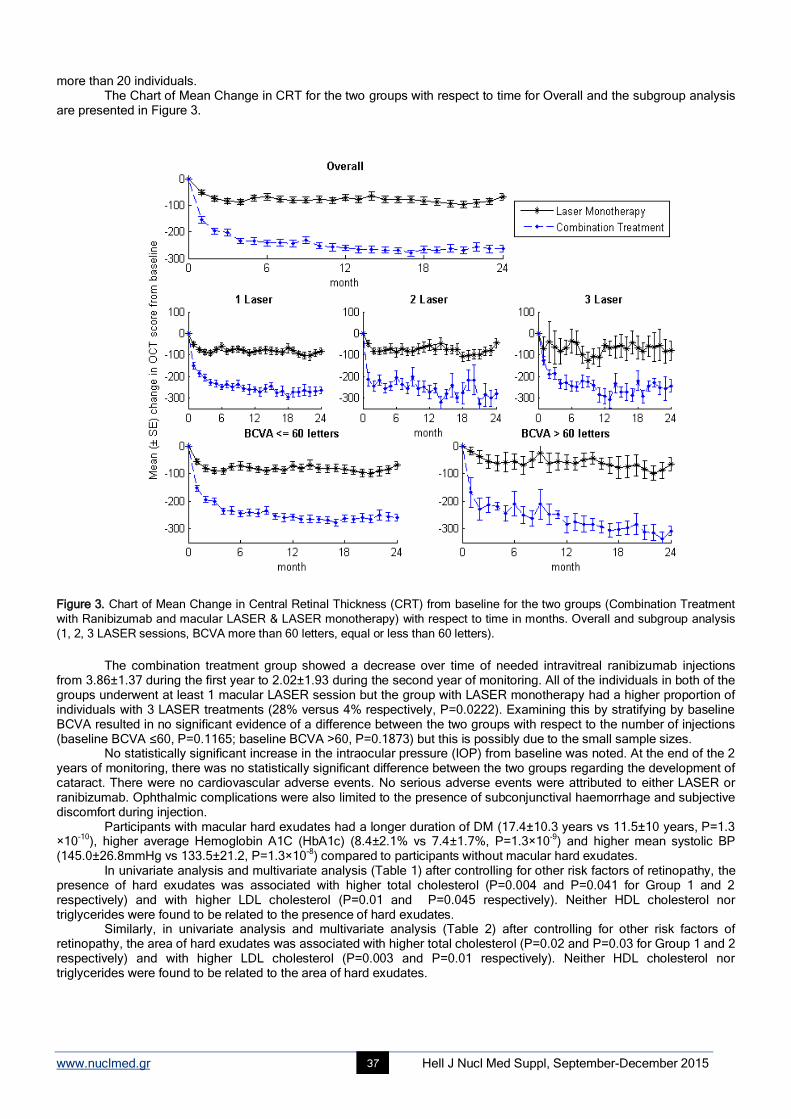
www.nuclmed.gr Hell J Nucl Med Suppl, September-December 2015 37
more than 20 individuals. The Chart of Mean Change in CRT for the two groups with respect to time for Overall and the subgroup analysis
are presented in Figure 3.
Figure 3. Chart of Mean Change in Central Retinal Thickness (CRT) from baseline for the two groups (Combination Treatment
with Ranibizumab and macular LASER & LASER monotherapy) with respect to time in months. Overall and subgroup analysis
(1, 2, 3 LASER sessions, BCVA more than 60 letters, equal or less than 60 letters).
The combination treatment group showed a decrease over time of needed intravitreal ranibizumab injections
from 3.86±1.37 during the first year to 2.02±1.93 during the second year of monitoring. All of the individuals in both of the groups underwent at least 1 macular LASER session but the group with LASER monotherapy had a higher proportion of individuals with 3 LASER treatments (28% versus 4% respectively, P=0.0222). Examining this by stratifying by baseline BCVA resulted in no significant evidence of a difference between the two groups with respect to the number of injections (baseline BCVA ≤60, P=0.1165; baseline BCVA >60, P=0.1873) but this is possibly due to the small sample sizes.
No statistically significant increase in the intraocular pressure (IOP) from baseline was noted. At the end of the 2 years of monitoring, there was no statistically significant difference between the two groups regarding the development of cataract. There were no cardiovascular adverse events. No serious adverse events were attributed to either LASER or ranibizumab. Ophthalmic complications were also limited to the presence of subconjunctival haemorrhage and subjective discomfort during injection.
Participants with macular hard exudates had a longer duration of DM (17.4±10.3 years vs 11.5±10 years, P=1.3 ×10
-10), higher average Hemoglobin A1C (HbA1c) (8.4±2.1% vs 7.4±1.7%, P=1.3×10
-9) and higher mean systolic BP
(145.0±26.8mmHg vs 133.5±21.2, P=1.3×10⁻⁸
) compared to participants without macular hard exudates. In univariate analysis and multivariate analysis (Table 1) after controlling for other risk factors of retinopathy, the
presence of hard exudates was associated with higher total cholesterol (P=0.004 and P=0.041 for Group 1 and 2 respectively) and with higher LDL cholesterol (P=0.01 and P=0.045 respectively). Neither HDL cholesterol nor triglycerides were found to be related to the presence of hard exudates.
Similarly, in univariate analysis and multivariate analysis (Table 2) after controlling for other risk factors of retinopathy, the area of hard exudates was associated with higher total cholesterol (P=0.02 and P=0.03 for Group 1 and 2 respectively) and with higher LDL cholesterol (P=0.003 and P=0.01 respectively). Neither HDL cholesterol nor triglycerides were found to be related to the area of hard exudates.
www.nuclmed.gr Hell J Nucl Med Suppl, September-December 2015 38
Table 1. Association between serum lipid levels and presence of macular hard exudates Univariate Multivariate*
OR (95% CI) P value OR (95% CI) P value
Total Cholesterol
(per 10mg/dL) 1.05 (1.01-1.08) 0.004 1.04 (1.001-1.08) 0.041
LDL Cholesterol
(per 10mg/dL) 1.05 (1.01-1.09) 0.01 1.04 (1.001-1.09) 0.045
HDL Cholesterol
(per 10mg/dL) 1.03 (.92-1.14) 0.58 1.07 (0.96-1.2) 0.19
Triglycerides
(per 10mg/dL) 1.01 (0.99-1.03) 0.13 0.99 (0.97-1.02) 0.56
* Controlling for age, sex, duration of DM, HbA1C, and systolic BP. Abbreviations: OR=Odds Ratio, CI=Confidence Interval,
LDL=Low Density Lipoprotein, HDL=High Density Lipoprotein, DM=Diabetes Mellitus, HbA1C=Haemoglobin A1C, BP=Blood
Pressure
Table 2. Association between serum lipid levels and the size of macular hard exudates Univariate Multivariate*
Coef (95% CI) P value Coef (95% CI) P value
Total Cholesterol
(per mg/dL)
0.001
(0.0002-0.0019) 0.02
0.001
(0.0001-0.002) 0.03
LDL Cholesterol
(per mg/dL)
0.001
(0.0004-0.002) 0.003
0.001
(0.0002-0.002) 0.01
HDL Cholesterol
(per mg/dL)
0.001
(-0.0009-0.004) 0.20
0.0025
(-0.0002-0.005)
0.07
Triglycerides
(per mg/dL)
0.0002
(-0.0003-0.0008) 0.5
-0.0001
(-0.0007-0.0004) 0.66
* Controlling for age, sex, duration of DM, HbA1C, and systolic BP. Abbreviations: OR=Odds Ratio, CI=Confidence Interval,
LDL=Low Density Lipoprotein, HDL=High Density Lipoprotein, DM=Diabetes Mellitus, HbA1C=Haemoglobin A1C, BP=Blood
Pressure
Discussion Ranibizumab has been found to significantly reduce CRT in DMO, [20, 24] as does macular LASER. Therefore, theoretically, the combination may be synergistic or have additive benefit. Our analysis found that the combined ranibizumab and macular LASER treatment had positive results in terms of both BCVA and CRT. Whilst these results compared favorably to the LASER monotherapy group, differences in baseline characteristics make it difficult to directly compare the interventions in terms of discriminating the effect of each treatment regimen. Nonetheless, in pragmatic terms the data suggest that combined treatment is acceptable in terms of both safety and efficacy. These results are in line with the results from the major studies of DMO. The differences that exist may arise from our relatively small sample size and differences in our eligibility criteria and in particular lower baseline BCVA. The main studies [16, 18, 21] included patients with mean baseline BCVA between 57.6 and 62.4 ETDRS letters in the LASER monotherapy group and only one study [19] had patients with a substantially lower baseline BCVA of 28.4 letters. In the combination treatment arm of these studies, mean baseline BCVA was between 63.4 and 66.0 ETDRS letters, [18, 21] while only one study had patients with poor baseline BCVA, of 28.9 letters [19]. Our study combination treatment group
www.nuclmed.gr Hell J Nucl Med Suppl, September-December 2015 39
measured 54.8 letters at baseline and the LASER monotherapy group measured 55.5 letters. Baseline CRT in the above studies was lower than our study (between 371.0 to 474μm for the combination therapy groups), but it was higher in the LASER monotherapy group (from 407 to 540μm). Our mean values were 500.22μm for the combination group and 326.90μm for the LASER monotherapy group. The Ranibizumab Monotherapy or Combined with LASER versus LASER Monotherapy for Diabetic Macular Edema (RESTORE) study, [21] the sub-group with CRT greater than 400μm showed the greatest benefit following intravitreal ranibizumab compared to LASER monotherapy, which agrees with our data. Conversely, in two other studies [26-27] where intravitreal bevacizumab (Avastin) was injected in eyes with CRT greater than 400μm, the results were not as good as ranibizumab. DRCR.net protocol I [18] and the expanded DRCR.net protocol I study, [28] concluded that ranibizumab treatment with prompt versus deferred macular LASER were similarly effective. Deferred LASER referred to macular LASER applied at 6 months following the initiation of the intravitreal injections. In our study the first LASER session was applied in the third month after three induction injections of ranibizumab. The three-year results from Protocol I [29] found that - following 2 years of treatment - only 1 and 2 injections of ranibizumab are required in conjunction with prompt or deferred LASER. In the extended 3 year results, there was a slight difference between the prompt and deferred LASER groups, with better BCVA in the group with ranibizumab and deferred LASER treatment. We also found that the combination of anti-VEGF and deferred LASER (at 3 months) resulted in a decrease in the average number of injections required over time, with 3.86 injections during the first year and 2.02 injections in the second year. None of our patients in either group showed worsening of DR, whereas, some patients displayed improvement. This observation is in accordance with several clinical studies in which treatment with anti-VEGF resulted in a transient improvement of PDR [30] and treatment with intravitreal ranibizumab resulted in reduction of the cumulative risk of worsening of DR [18], [31] in patients with or without PDR [32]. Regarding eyes with macular hard exudates, we found that both the presence of hard exudates and their size were both associated with higher total and LDL cholesterol, after adjusting for other risk factors for DR. Other epidemiological studies, including the Wisconsin Epidemiologic Study of Diabetic Retinopathy (WESDR) study [33], found similar associations between higher total and /or LDL cholesterol and the presence of hard exudate size [33-40]. Other studies found no association with lipids [41-42]. Our study investigated not only the relationship between lipid profile and the presence of macular exudates, but also the relationship between lipids and the size of hard exudates. As far as we are aware, there has been only one study to assess both of these parameters [41]. The study included 97 participants with DM type 1 and 2. Similar to our study, the researchers found that higher levels of total and LDL cholesterol were associated with increased total area of hard exudates in the univariate analysis. However, in multivariate analysis, total cholesterol was no longer associated with the increased total area of hard exudates. Furthermore, LDL cholesterol levels and triglyceride levels did not share the association. Other clinical trials correlated dyslipidaemia to macular hard exudates in DMO [43-43]. Oral treatment with atorvastatin in patients with type 2 DM and dyslipidemia reduces the severity of hard exudates [43]. DMO is a major cause of visual loss in diabetic patients [45-46]. Hard exudates are often seen in the posterior pole in patients with DMO and should they become center-involving, they can cause structural damage to the fovea and permanent loss of vision, even after resolution of DMO [47]. This risk of permanent vision loss highlights the importance of identifying the modifiable risk factors for the development of hard exudates [47]. An important limitation of this study is that the patient groups were not comparable at baseline so, in addition to the small sample size, comparisons between groups must be interpreted with considerable caution, both in terms of observed differences and apparent similarities.
Conclusions The combination of macular LASER and ranibizumab has acceptable safety and efficacy for the treatment of DMO greater than 400 microns. There appears to be an association between higher levels of total and LDL cholesterol and the presence and the extent of hard exudates. Acknowledgments We would like to thank Eleni K. Konstantinou, MD, Research Fellow at Massachusetts Eye and Ear Infirmary, Boston, USA for doing part of the literature search. Authors declare that they have no conflicts of interes
Bibliography 1. IDF DIABETES ATLAS. International Diabetes Federation. 2013.
2. Diabetes in the UK 2011/2012: Key statistics on diabetes. Diabetes UK. 2011.
3. Liew G, Michaelides M, and Bunce C. A comparison of the causes of blindness certifications in England and Wales in working age adults (16-
64 years), 1999-2000 with 2009-2010. BMJ Open 2014; 4: e004015.
4. Diabetic retinopathy guideline. The Royal College of Ophthalmologists. 2012.
5. Photocoagulation for diabetic macular edema. Early Treatment Diabetic Retinopathy Study report number 1. Early Treatment D iabetic
Retinopathy Study research group. Archives of ophthalmology 1985; 103: 1796-806.

www.nuclmed.gr Hell J Nucl Med Suppl, September-December 2015 40
6. Browning DJ, Glassman AR, Aiello LP et al. Optical coherence tomography measurements and analysis methods in optical coherence
tomography studies of diabetic macular edema. Ophthalmology 2008; 115: 1366-71, 71.e1.
7. Panozzo G, Parolini B, Gusson E et al. Diabetic macular edema: an OCT-based classification. Semin Ophthalmol 2004; 19: 13-20.
8. Stitt AW, Lois N, Medina RJ et al. Advances in our understanding of diabetic retinopathy. Clin Sci (Lond) 2013; 125: 1-17.
9. Cohen T, Nahari D, Cerem LW et al. Interleukin 6 induces the expression of vascular endothelial growth factor. J Biol Chem 1996; 271: 736-
41.
10. Bhagat N, Grigorian RA, Tutela A, and Zarbin MA. Diabetic macular edema: pathogenesis and treatment. Surv Ophthalmol 2009; 54: 1-32.
11. Boyer DS, Yoon YH, Belfort R, Jr. et al. Three-year, randomized, sham-controlled trial of dexamethasone intravitreal implant in patients with
diabetic macular edema. Ophthalmology 2014; 121: 1904-14.
12. Campochiaro PA, Brown DM, Pearson A et al. Long-term benefit of sustained-delivery fluocinolone acetonide vitreous inserts for diabetic
macular edema. Ophthalmology 2011; 118: 626-35 e2.
13. Miyamoto N, de Kozak Y, Jeanny JC et al. Placental growth factor-1 and epithelial haemato-retinal barrier breakdown: potential implication in
the pathogenesis of diabetic retinopathy. Diabetologia 2007; 50: 461-70.
14. Leung DW, Cachianes G, Kuang WJ et al. Vascular endothelial growth factor is a secreted angiogenic mitogen. Science 1989; 246: 1306-9.
15. Rajendram R, Fraser-Bell S, Kaines A et al. A 2-year prospective randomized controlled trial of intravitreal bevacizumab or LASER therapy
(BOLT) in the management of diabetic macular edema: 24-month data: report 3. Arch Ophthalmol 2012; 130: 972-9.
16. Do DV, Schmidt-Erfurth U, Gonzalez VH et al. The DA VINCI Study: phase 2 primary results of VEGF Trap-Eye in patients with diabetic
macular edema. Ophthalmology 2011; 118: 1819-26.
17. A randomized trial comparing intravitreal triamcinolone acetonide and focal/grid photocoagulation for diabetic macular edema.
Ophthalmology 2008; 115: 1447-9, 9.e1-10.
18. Elman MJ, Aiello LP, Beck RW et al. Randomized trial evaluating ranibizumab plus prompt or deferred LASER or triamcinolone plus prompt
LASER for diabetic macular edema. Ophthalmology 2010; 117: 1064-77.e35.
19. Nguyen QD, Shah SM, Heier JS et al. Primary End Point (Six Months) Results of the Ranibizumab for Edema of the mAcula in diabetes
(READ-2) study. Ophthalmology 2009; 116: 2175-81.e1.
20. Massin P, Bandello F, Garweg JG et al. Safety and efficacy of ranibizumab in diabetic macular edema (RESOLVE Study): a 12-month,
randomized, controlled, double-masked, multicenter phase II study. Diabetes care 2010; 33: 2399-405.
21. Mitchell P, Bandello F, Schmidt-Erfurth U et al. The RESTORE study: ranibizumab monotherapy or combined with LASER versus LASER
monotherapy for diabetic macular edema. Ophthalmology 2011; 118: 615-25.
22. Prunte C, Fajnkuchen F, Mahmood S et al. Ranibizumab 0.5mg treat-and-extend regimen for diabetic macular oedema: the RETAIN study.
Br J Ophthalmol 2015.
23. Ishibashi T, Li X, Koh A et al. The REVEAL Study: Ranibizumab Monotherapy or Combined with LASER versus LASER Monotherapy in
Asian Patients with Diabetic Macular Edema. Ophthalmology 2015; 122: 1402-15.
24. Brown DM, Nguyen QD, Marcus DM et al. Long-term outcomes of ranibizumab therapy for diabetic macular edema: the 36-month results
from two phase III trials: RISE and RIDE. Ophthalmology 2013; 120: 2013-22.
25. Brown DM, Schmidt-Erfurth U, Do DV et al. Intravitreal Aflibercept for Diabetic Macular Edema: 100-Week Results From the VISTA and
VIVID Studies. Ophthalmology 2015; 122: 2044-52.
26. Sivaprasad S, Crosby-Nwaobi R, Esposti SD et al. Structural and functional measures of efficacy in response to bevac izumab monotherapy
in diabetic macular oedema: exploratory analyses of the BOLT study (report 4). PLoS One 2013; 8: e72755.
27. Nepomuceno AB, Takaki E, Paes de Almeida FP, Peroni R, Cardillo JA, Siqueira RC, et al. A prospective randomized trial of intravitreal
bevacizumab versus ranibizumab for the management of diabetic macular edema. Am J Ophthalmol 2013; 156: 502-10.e2.
28. Elman MJ, Bressler NM, Qin H et al. Expanded 2-year follow-up of ranibizumab plus prompt or deferred LASER or triamcinolone plus prompt
LASER for diabetic macular edema. Ophthalmology 2011; 118: 609-14.
29. Elman MJ, Qin H, Aiello LP et al. Intravitreal ranibizumab for diabetic macular edema with prompt versus deferred LASER treatment: three-
year randomized trial results. Ophthalmology 2012; 119: 2312-8.
30. Avery RL, Pearlman J, Pieramici DJ et al. Intravitreal bevacizumab (Avastin) in the treatment of proliferative diabetic retinopathy.
Ophthalmology 2006; 113: 1695.e1-15.
31. Ip MS, Domalpally A, Hopkins JJ, Wong P, and Ehrlich JS. Long-term effects of ranibizumab on diabetic retinopathy severity and
progression. Arch Ophthalmol 2012; 130: 1145-52.
32. Bressler SB, Qin H, Melia M et al. Exploratory analysis of the effect of intravitreal ranibizumab or triamcinolone on worsening of diabetic
retinopathy in a randomized clinical trial. JAMA Ophthalmol 2013; 131: 1033-40.
33. Klein BE, Moss SE, Klein R, and Surawicz TS. The Wisconsin Epidemiologic Study of Diabetic Retinopathy. XIII. Relationship of serum
cholesterol to retinopathy and hard exudate. Ophthalmology 1991; 98: 1261-5.
34. Roy MS and Klein R. Macular edema and retinal hard exudates in African Americans with type 1 diabetes: the New Jersey 725 . Arch
Ophthalmol 2001; 119: 251-9.
35. Klein R, Marino EK, Kuller LH et al. The relation of atherosclerotic cardiovascular disease to retinopathy in people with diabetes in the
Cardiovascular Health Study. Br J Ophthalmol 2002; 86: 84-90.
36. Klein R, Sharrett AR, Klein BE et al. The association of atherosclerosis, vascular risk factors, and retinopathy in adults with diabetes: the
atherosclerosis risk in communities study. Ophthalmology 2002; 109: 1225-34.
37. Chew EY, Klein ML, Ferris FL, 3rd et al. Association of elevated serum lipid levels with retinal hard exudate in diabetic retinopathy. Early
Treatment Diabetic Retinopathy Study (ETDRS) Report 22. Arch Ophthalmol 1996; 114: 1079-84.
38. van Leiden HA, Dekker JM, Moll AC et al. Blood pressure, lipids, and obesity are associated with retinopathy: the hoorn s tudy. Diabetes
Care 2002; 25: 1320-5.
39. Miljanovic B, Glynn RJ, Nathan DM, Manson JE, and Schaumberg DA. A prospective study of serum lipids and risk of diabetic macular
edema in type 1 diabetes. Diabetes 2004; 53: 2883-92.
40. Idiculla J, Nithyanandam S, Joseph M et al. Serum lipids and diabetic retinopathy: A cross-sectional study. Indian J Endocrinol Metab 2012;
16: S492-4.
41. Sasaki M, Kawasaki R, Noonan JE et al. Quantitative measurement of hard exudates in patients with diabetes and their associations with
serum lipid levels. Invest Ophthalmol Vis Sci 2013; 54: 5544-50.
42. Sachdev N and Sahni A. Association of systemic risk factors with the severity of retinal hard exudates in a north Indian population with type 2
diabetes. J Postgrad Med 2010; 56: 3-6.
www.nuclmed.gr Hell J Nucl Med Suppl, September-December 2015 41
43. Gupta A, Gupta V, Thapar S, and Bhansali A. Lipid-lowering drug atorvastatin as an adjunct in the management of diabetic macular edema.
Am J Ophthalmol 2004; 137: 675-82.
44. Panagiotoglou TD, Ganotakis ES, Kymionis GD et al. Atorvastatin for diabetic macular edema in patients with diabetes mellitus and elevated
serum cholesterol. Ophthalmic Surg LASERs Imaging 2010; 41: 316-22.
45. Frank RN. Diabetic retinopathy. N Engl J Med 2004; 350: 48-58.
46. Fong DS, Ferris FL, 3rd, Davis MD, and Chew EY. Causes of severe visual loss in the early treatment diabetic retinopathy study: ETDRS
report no. 24. Early Treatment Diabetic Retinopathy Study Research Group. Am J Ophthalmol 1999; 127: 137-41.
47. King RC, Dobree JH, Kok D et al. Exudative diabetic retinopaty. Spontaneous changes and effects of a corn oil diet. Br J Ophthalmol
1963;47:666-72.
From the 3rd International Medical Olympiad – Professors’ lunch
Profs. T. Yamamoto and P. Grammaticos
Group of Colleagues
www.nuclmed.gr Hell J Nucl Med Suppl, September-December 2015 42
Imaging of cardiac amyloidosis by 99mTc-PYP scintigraphy Vasileios Papantoniou
1, MD, PhD, Pipitsa Valsamaki
1, MD, PhD, Stathis Kastritis
2, MD, Spyridon Tsiouris
3, MD,
Zisis Delichas1, MD, Yiannis Papantoniou
1, MD, Maria Tsiouma
1, MD, Theodoros Athanasoulis
1, MD, Andreas
Fotopoulos3, MD, PhD, Meletios Athanasios Dimopoulos
2, MD, PhD
1. Nuclear Medicine Department, 2. Department of Clinical Therapeutics, School of Medicine, National and Kapodistrian University of Athens, Alexandra General Hospital, Athens, Greece, 3. Nuclear Medicine Department, University Hospital of Ioannina, Ioannina, Greece Keywords: Cardiac amyloidosis –
99mTc-PYP scintigraphy
Correspondence adress: Dr. Vassilios Papantoniou, Nuclear Medicine Department, University General Hospital Alexandra 80, Vas. Sofias Ave., 11528 Athens, Greece. Phone: +30 210 3381736, Mobile: +30 6937100588, Email: [email protected] Abstract Objective: Cardiac amyloidosis (CA) is an underestimated and underdiagnosed cause of cardiac insufficiency. Despite being
often considered as a solitary entity attributable to extracellular deposition of fibrillary proteins, there exist at least two different
pathophysiologic backgrounds, with different clinical course and treatment. a) In light-chain cardiac amyloidosis (immunoglobulin
light-chain amyloidosis-AL) the fibrils consist of light-chain immunoglobulins produced by a clonal plasma cell population in bone
marrow. b) In CA related to transthyretin (transthyretin-related amyloidosis – ATTR), whether familial amyloid cardiomyopathy or
senile systemic amyloidosis, monomers or dimers of the normally tetrameric protein of transthyretin are deposited in the
myocardium. Today, definitive diagnosis of cardiac amyloid disease is based on endomyocardial biopsy in conjunction with
immunohistochemical parameters or, in ambiguous cases, with mass spectroscopy. Several radiotracers have been hitherto
tried in the detection of CA. Subjects and Methods: In this pilot study technetium-99m pyrophosphate (99m
Tc-PYP) was
administered to patients suffering from CA, aiming to differentiate scintigraphically between AL and ATTR. Twelve patients (8
males, aged [mean±SD] 70,6±13,2y; 4 females, aged 65,7±9,9y) were enrolled for the discrimination between AL and ATTR.
Diagnosis was confirmed by biopsy combined with the clinical and laboratory evaluation of the patients. Myocardial scintigraphy
(planar and tomographic imaging) was conducted at 1, 2 and/or 3h after intravenous administration of 555-925MBq 99m
Tc-PYP.
Myocardial radiotracer uptake was evaluated optically and also by a semiquantitative method. Two regions of interest (ROI)
were drawn: one over the heart and another over the contralateral hemithorax, to calculate the corresponding heart-to-
contralateral (H/CL) count ratio. According to established reference standards, a cut-off H/CL value of 1.5 best discriminates
between the two conditions. 99m
Tc-PYP scintigraphy revealed diffuse intense myocardial uptake upon visual evaluation that was
also verified semi-quantitatively in 6 patients, all of which had ATTR. Faint or no myocardial tracer uptake was found in 4
patients who were diagnosed with AL. Two AL patients had a borderline positive scan on visual evaluation but their H/CL ratios
did not exceed the value of 1.5. In three patients, we also attempted scintigraphy with the tracer pentavalent 99m
Tc-
dimercaptosuccinic acid. Results and possible mechanisms of uptake are discussed. The sensitivity and specificity of
scintigraphy with 99m
Tc-PYP was high, albeit the small number of patients. In conclusion: These preliminary results are
compatible with current international literature, and demonstrate that scintigraphy with 99m
Tc-PYP may prove a simple, non-
invasive and widely available method in the identification of patients with the ATTR subtype, thus optimizing therapeutic
decisions.
HJNM 2015; 18(Suppl1); 42-50 Published on line: 12 December 2015
Introduction
ardiac amyloidosis (CA) or "stiff heart syndrome" constitutes an underestimated and underdiagnosed cause of cardiac insufficiency. It is a progressive disorder caused by the deposition of an abnormal extracellular fibrillary protein, namely amyloid, in the heart tissue, leading to early death due to congestive heart failure and arrhythmias.
Amyloidotic cardiac involvement can occur either as part of a systemic disease, or as a localized phenomenon. Amyloid deposition can occur in multiple organs (e.g. heart, liver, kidneys, skin, eyes, lungs, nervous system) resulting in a variety of clinical manifestations. The type of the primary pro-amyloidogenic protein is the major determinant of the pattern and the severity of organ involvement. Furthermore, treatment decisions are based on the type of the amyloid fibril composition. Thus, in primary light chain (AL) cardiac amyloidosis the fibrils consist of light chain immunoglobulins produced by a clonal plasma cell population in the bone marrow and treatment involves chemotherapy or autologous peripheral blood stem cell transplantation. In AL, the spectrum and pattern of organ involvement is very wide, including proteinuria with or without renal dysfunction, hepatomegaly, congestive heart failure, and autonomic or sensory neuropathy, but cardiac involvement occurs in more than half of the cases and is sometimes the only presenting feature
C
www.nuclmed.gr Hell J Nucl Med Suppl, September-December 2015 43
[1]. In transthyretin-related cardiac amyloidosis (ATTR), further classified in familial amyloid cardiomyopathy
(ATTRmutant or AATRm) and acquired senile systemic amyloidosis (ATTRwild-type or AATRwt), misfolded monomers or dimers of the normally tetrameric protein of transthyretin form amyloid fibrils that are deposited in the myocardium. Transthyretin-related cardiac amyloidosis constitutes by far the most common cause of non-AL cardiac amyloidosis; it is more common in men than in women [2], and rarely develops in people under the age of 40. In familial ATTR syndromes, an inherited mutation causes the production of a mutated protein which tends to produce amyloid fibrils; several mutations have been associated with cardiac ATTR. ATTRm has an autosomal dominant pattern of inheritance; however, a negative family history is not rare. Wild-type ATTR is an acquired amyloidosis, which is increasingly recognized in the past decade. Wild-type TTR amyloid deposits are found at autopsy in about 25% of individuals above 80 years of age. Wild-type ATTR is a predominantly cardiac disease and the only other significant extracardiac feature is a history of carpal tunnel syndrome, often preceding heart failure by 3 to 5 years. Extracardiac involvement is most unusual [1]. Transthyretin is produced in the liver and treatment may involve drugs that stabilize transthyretin and prevent disease progression or organ transplantation in ATTRm. Mutations in other genes, such apolipoprotein A1 may rarely result in amyloid formation affecting the heart.
The diagnostic algorithm of CA encompasses hitherto biomarkers, electrocardiography (ECG), echocardiography (ECHO), cardiac magnetic resonance (CMR) and biopsy, which remains the reference standard. In current clinical practice, biopsy is required for older patients in order to accurately identify the cardiac amyloid fibril type as well as for patients with an echocardiographically thickened left ventricle who have no history of hypertension, valvular disease, and have a family history of hypertrophic cardiomyopathy, particularly if the patient is young. However, the identification of amyloid fibrils by Congo-red staining alone is not sufficient for the correct diagnosis of amyloidosis and the identification of the specific amyloid fibril type is required. The correct typing is demanding and requires additional immunohistochemical studies, genetic tests and may also require advanced technology such as mass spectroscopy, which is the reference standard for the identification of the amino acid sequence of the amyloid-forming protein.
An important aspect of the diagnostic algorithm for the identification of amyloidosis and amyloid type is the requirement for an invasive procedure such as endomyocardial biopsy. Although relatively safe, tissue sampling is not always feasible and a small but real risk of complications exists. Thus, non-invasive methods that could aid in the diagnosis of cardiac amyloidosis and the differentiation between the AL and ATTR types of amyloid deposits can improve substantially our diagnostic algorithms. In this pilot study we applied myocardial scintigraphy with technetium-99m-labelled pyrophosphate (
99mTc-PYP) aiming to discriminate AL from ATTR and optimize therapeutic decisions. We also
attempted a preliminary comparison with another radiotracer, specifically pentavalent technetium-99m labelled dimercaptosuccinic acid [
99mTc(V)-DMSA], whenever feasible.
Subjects and Methods Twelve patients (8 males, aged [mean±SD] 70.6±13.2 years; 4 females, aged 65.7±9.9 years) were enrolled in the context of discriminating AL from ATTR cardiac amyloidosis, in the nuclear medicine departments of two tertiary referral hospitals. The present study protocol was in agreement with the ethical guidelines of the 1975 Declaration of Helsinki as reflected in a priori approval by our Institutional Review Committees. Written informed consent was obtained from each patient.
Myocardial scintigraphy (planar and tomographic imaging) was conducted with a single-head γ-camera in the first department (Sophycamera DS7, Sopha Medical Vision International, Buc Cedex, France) and a dual-head camera in the second (General Electric Optima NM/CT 640, GE Healthcare, Wauwatosa, WI, USA), equipped with high-resolution, parallel-hole collimators. Imaging was performed at 1, 2 and/or 3h after intravenous administration of 555-925MBq
99mTc-
PYP. The photopeak was centered at 140keV, with a symmetric 10% window. Planar images were acquired for a total of 500,000 counts, on a 128×128 or 256×256 matrix. Tomographic imaging (single-photon emission tomography, SPET) in a 64×64 matrix, 32 frames at 20sec/frame, followed in cases of
99mTc-PYP myocardial uptake on planar images.
Myocardial radiotracer uptake was evaluated optically and also by the use of a semiquantitative method. Two rectangular or circular regions of interest (ROIs) were drawn: one over the heart and another (mirror) over the contralateral hemithorax, to calculate the corresponding heart-to-contralateral (H/CL) count ratio. According to published reference standards, a cut-off H/CL value of 1.5 is considered as best discriminating between AL and ATTR [3]. Three patients were additionally submitted to planar myocardial scintigraphy with 555-925MBq
99mTc(V)-DMSA at 2h and 24h pi
acquiring 250,000 counts, on a 256×256 matrix. The results of both scintigraphic modalities were compared with clinical, laboratory, other imaging and biopsy findings.
Results 99m
Tc-PYP scintigraphy revealed intense diffuse myocardial uptake on optical evaluation that was also verified quantitatively in 6 patients (5 males, 1 female), all of whom were diagnosed with ATTR (Figure 1). None or faint myocardial tracer uptake was found in 4 patients (1 male, 3 females), who were ultimately diagnosed with AL (Figures 2 and 3). Two AL patients (males) showed a borderline positive scan with mild uptake on visual evaluation, but their H/CL ratios did not exceed 1.5 (Figure 4). Despite the small patient population, we estimated the sensitivity and specificity of myocardial
99mTc-PYP scintigraphy at 100%, when applying the semiquantitative method of the H/CL ratio. Notably, the
specificity decreased to 75% when relying solely on visual assessment. All three patients studied with 99m
Tc(V)-DMSA
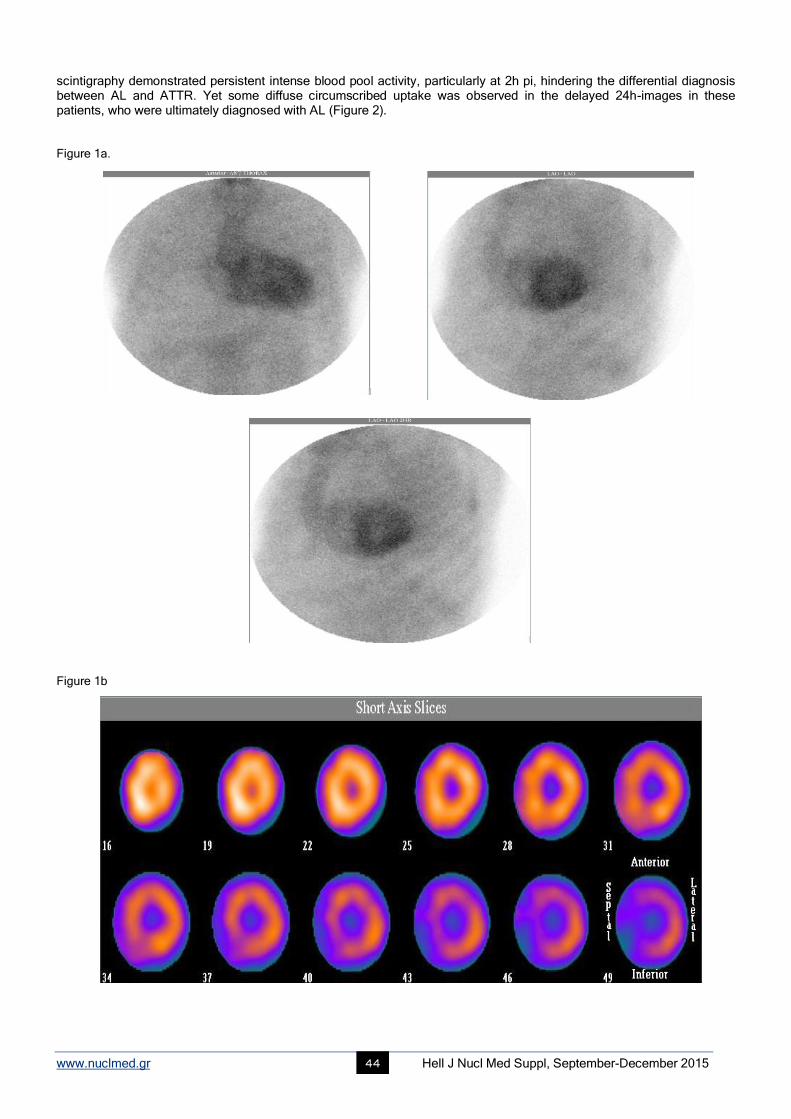
www.nuclmed.gr Hell J Nucl Med Suppl, September-December 2015 44
scintigraphy demonstrated persistent intense blood pool activity, particularly at 2h pi, hindering the differential diagnosis between AL and ATTR. Yet some diffuse circumscribed uptake was observed in the delayed 24h-images in these patients, who were ultimately diagnosed with AL (Figure 2). Figure 1a.
Figure 1b
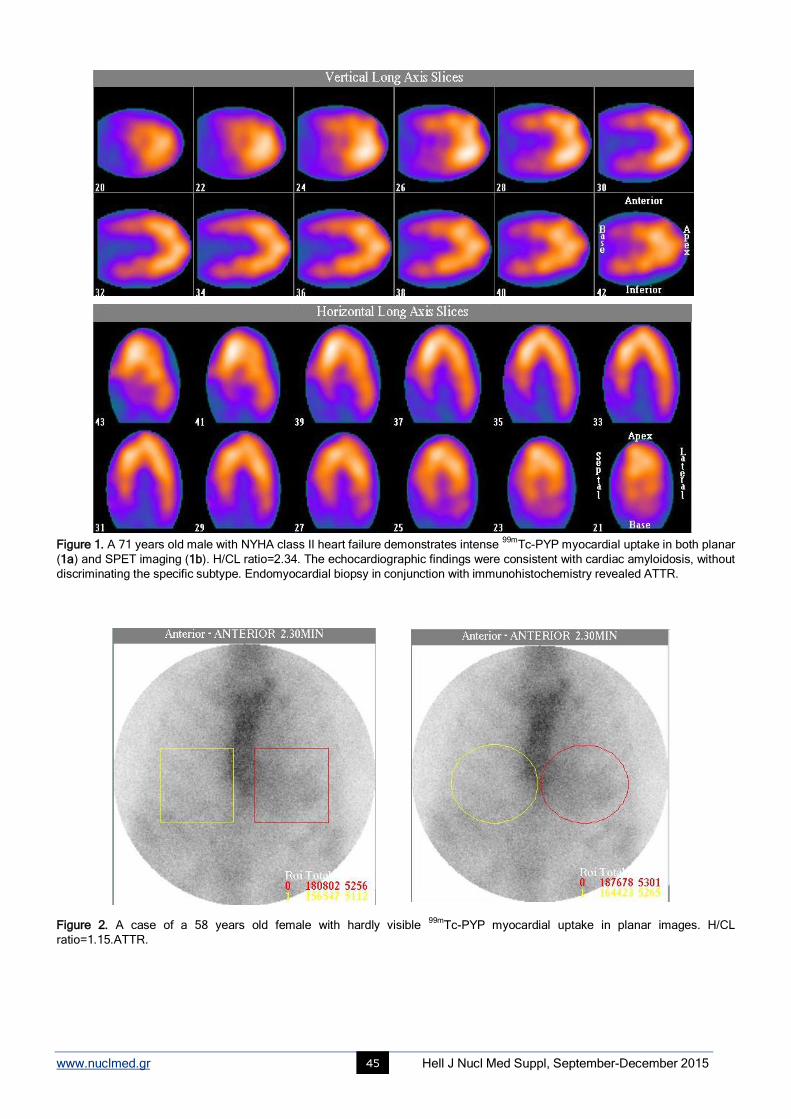
www.nuclmed.gr Hell J Nucl Med Suppl, September-December 2015 45
Figure 1. A 71 years old male with NYHA class II heart failure demonstrates intense 99m
Tc-PYP myocardial uptake in both planar
(1a) and SPET imaging (1b). H/CL ratio=2.34. The echocardiographic findings were consistent with cardiac amyloidosis, without
discriminating the specific subtype. Endomyocardial biopsy in conjunction with immunohistochemistry revealed ATTR.
Figure 2. A case of a 58 years old female with hardly visible 99m
Tc-PYP myocardial uptake in planar images. H/CL
ratio=1.15.ATTR.
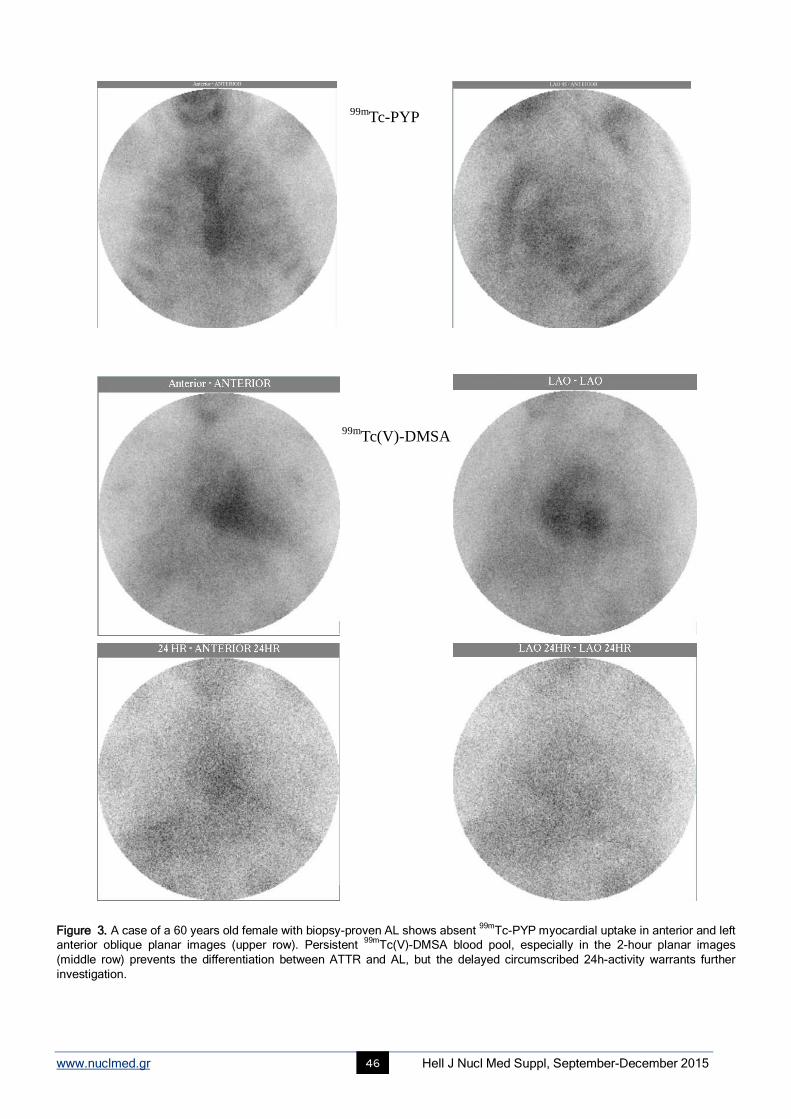
www.nuclmed.gr Hell J Nucl Med Suppl, September-December 2015 46
Figure 3. A case of a 60 years old female with biopsy-proven AL shows absent 99m
Tc-PYP myocardial uptake in anterior and left
anterior oblique planar images (upper row). Persistent 99m
Tc(V)-DMSA blood pool, especially in the 2-hour planar images
(middle row) prevents the differentiation between ATTR and AL, but the delayed circumscribed 24h-activity warrants further
investigation.
99mTc-PYP
99mTc(V)-DMSA
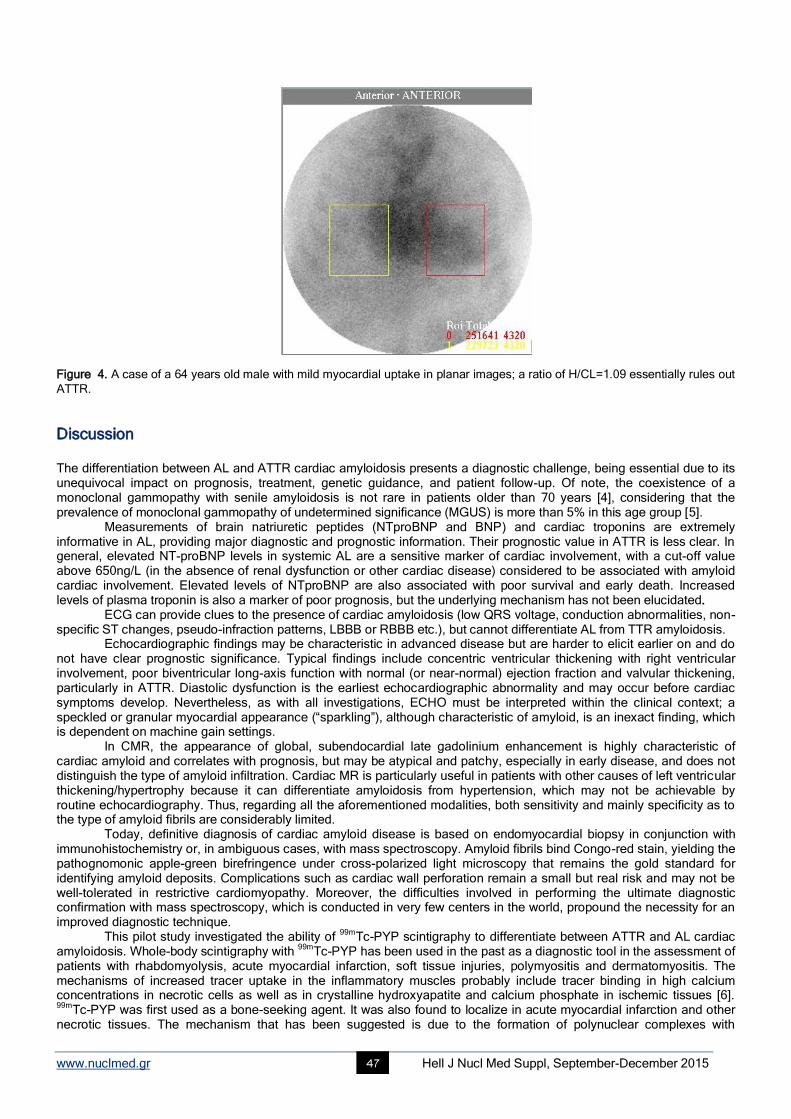
www.nuclmed.gr Hell J Nucl Med Suppl, September-December 2015 47
Figure 4. A case of a 64 years old male with mild myocardial uptake in planar images; a ratio of H/CL=1.09 essentially rules out
ATTR.
Discussion
The differentiation between AL and ATTR cardiac amyloidosis presents a diagnostic challenge, being essential due to its unequivocal impact on prognosis, treatment, genetic guidance, and patient follow-up. Of note, the coexistence of a monoclonal gammopathy with senile amyloidosis is not rare in patients older than 70 years [4], considering that the prevalence of monoclonal gammopathy of undetermined significance (MGUS) is more than 5% in this age group [5].
Measurements of brain natriuretic peptides (NTproBNP and BNP) and cardiac troponins are extremely informative in AL, providing major diagnostic and prognostic information. Their prognostic value in ATTR is less clear. In general, elevated NT-proBNP levels in systemic AL are a sensitive marker of cardiac involvement, with a cut-off value above 650ng/L (in the absence of renal dysfunction or other cardiac disease) considered to be associated with amyloid cardiac involvement. Elevated levels of NTproBNP are also associated with poor survival and early death. Increased levels of plasma troponin is also a marker of poor prognosis, but the underlying mechanism has not been elucidated.
ECG can provide clues to the presence of cardiac amyloidosis (low QRS voltage, conduction abnormalities, non-specific ST changes, pseudo-infraction patterns, LBBB or RBBB etc.), but cannot differentiate AL from TTR amyloidosis.
Echocardiographic findings may be characteristic in advanced disease but are harder to elicit earlier on and do not have clear prognostic significance. Typical findings include concentric ventricular thickening with right ventricular involvement, poor biventricular long-axis function with normal (or near-normal) ejection fraction and valvular thickening, particularly in ATTR. Diastolic dysfunction is the earliest echocardiographic abnormality and may occur before cardiac symptoms develop. Nevertheless, as with all investigations, ECHO must be interpreted within the clinical context; a speckled or granular myocardial appearance (“sparkling”), although characteristic of amyloid, is an inexact finding, which is dependent on machine gain settings.
In CMR, the appearance of global, subendocardial late gadolinium enhancement is highly characteristic of cardiac amyloid and correlates with prognosis, but may be atypical and patchy, especially in early disease, and does not distinguish the type of amyloid infiltration. Cardiac MR is particularly useful in patients with other causes of left ventricular thickening/hypertrophy because it can differentiate amyloidosis from hypertension, which may not be achievable by routine echocardiography. Thus, regarding all the aforementioned modalities, both sensitivity and mainly specificity as to the type of amyloid fibrils are considerably limited.
Today, definitive diagnosis of cardiac amyloid disease is based on endomyocardial biopsy in conjunction with immunohistochemistry or, in ambiguous cases, with mass spectroscopy. Amyloid fibrils bind Congo-red stain, yielding the pathognomonic apple-green birefringence under cross-polarized light microscopy that remains the gold standard for identifying amyloid deposits. Complications such as cardiac wall perforation remain a small but real risk and may not be well-tolerated in restrictive cardiomyopathy. Moreover, the difficulties involved in performing the ultimate diagnostic confirmation with mass spectroscopy, which is conducted in very few centers in the world, propound the necessity for an improved diagnostic technique.
This pilot study investigated the ability of 99m
Tc-PYP scintigraphy to differentiate between ATTR and AL cardiac amyloidosis. Whole-body scintigraphy with
99mTc-PYP has been used in the past as a diagnostic tool in the assessment of
patients with rhabdomyolysis, acute myocardial infarction, soft tissue injuries, polymyositis and dermatomyositis. The mechanisms of increased tracer uptake in the inflammatory muscles probably include tracer binding in high calcium concentrations in necrotic cells as well as in crystalline hydroxyapatite and calcium phosphate in ischemic tissues [6]. 99m
Tc-PYP was first used as a bone-seeking agent. It was also found to localize in acute myocardial infarction and other necrotic tissues. The mechanism that has been suggested is due to the formation of polynuclear complexes with
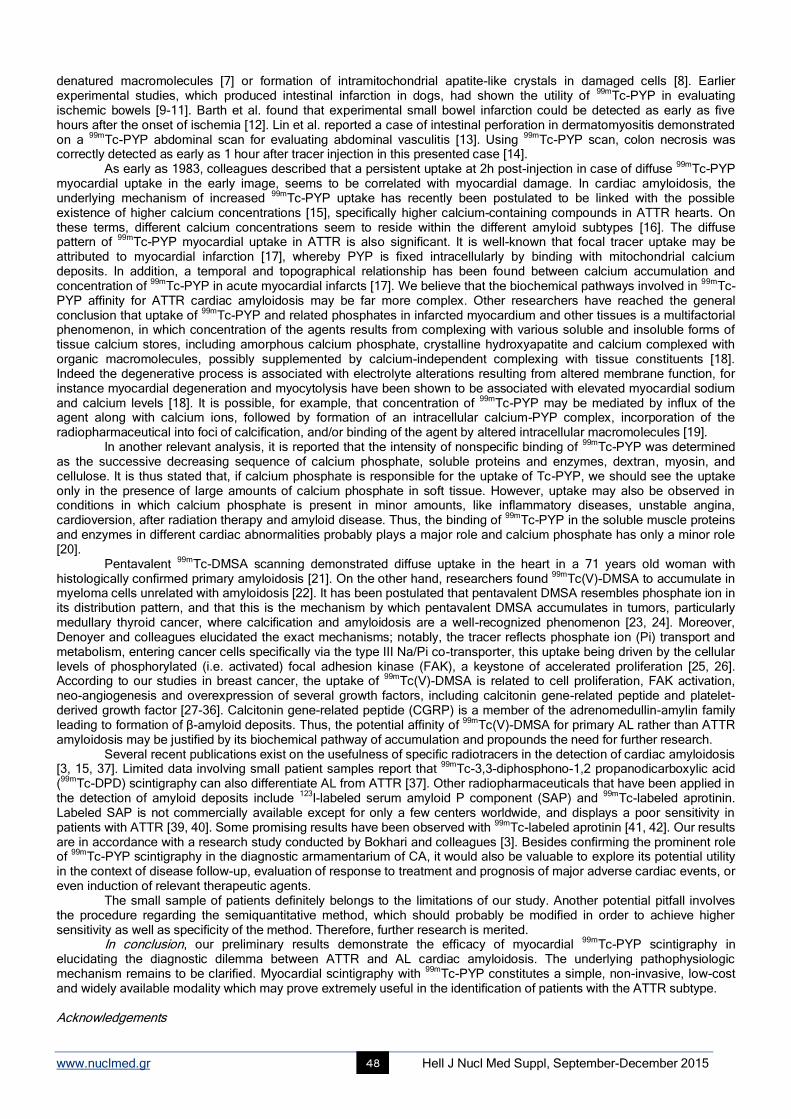
www.nuclmed.gr Hell J Nucl Med Suppl, September-December 2015 48
denatured macromolecules [7] or formation of intramitochondrial apatite-like crystals in damaged cells [8]. Earlier experimental studies, which produced intestinal infarction in dogs, had shown the utility of
99mTc-PYP in evaluating
ischemic bowels [9-11]. Barth et al. found that experimental small bowel infarction could be detected as early as five hours after the onset of ischemia [12]. Lin et al. reported a case of intestinal perforation in dermatomyositis demonstrated on a
99mTc-PYP abdominal scan for evaluating abdominal vasculitis [13]. Using
99mTc-PYP scan, colon necrosis was
correctly detected as early as 1 hour after tracer injection in this presented case [14]. As early as 1983, colleagues described that a persistent uptake at 2h post-injection in case of diffuse
99mTc-PYP
myocardial uptake in the early image, seems to be correlated with myocardial damage. In cardiac amyloidosis, the underlying mechanism of increased
99mTc-PYP uptake has recently been postulated to be linked with the possible
existence of higher calcium concentrations [15], specifically higher calcium-containing compounds in ATTR hearts. On these terms, different calcium concentrations seem to reside within the different amyloid subtypes [16]. The diffuse pattern of
99mTc-PYP myocardial uptake in ATTR is also significant. It is well-known that focal tracer uptake may be
attributed to myocardial infarction [17], whereby PYP is fixed intracellularly by binding with mitochondrial calcium deposits. In addition, a temporal and topographical relationship has been found between calcium accumulation and concentration of
99mTc-PYP in acute myocardial infarcts [17]. We believe that the biochemical pathways involved in
99mTc-
PYP affinity for ATTR cardiac amyloidosis may be far more complex. Other researchers have reached the general conclusion that uptake of
99mTc-PYP and related phosphates in infarcted myocardium and other tissues is a multifactorial
phenomenon, in which concentration of the agents results from complexing with various soluble and insoluble forms of tissue calcium stores, including amorphous calcium phosphate, crystalline hydroxyapatite and calcium complexed with organic macromolecules, possibly supplemented by calcium-independent complexing with tissue constituents [18]. Indeed the degenerative process is associated with electrolyte alterations resulting from altered membrane function, for instance myocardial degeneration and myocytolysis have been shown to be associated with elevated myocardial sodium and calcium levels [18]. It is possible, for example, that concentration of
99mTc-PYP may be mediated by influx of the
agent along with calcium ions, followed by formation of an intracellular calcium-PYP complex, incorporation of the radiopharmaceutical into foci of calcification, and/or binding of the agent by altered intracellular macromolecules [19].
In another relevant analysis, it is reported that the intensity of nonspecific binding of 99m
Tc-PYP was determined as the successive decreasing sequence of calcium phosphate, soluble proteins and enzymes, dextran, myosin, and cellulose. It is thus stated that, if calcium phosphate is responsible for the uptake of Tc-PYP, we should see the uptake only in the presence of large amounts of calcium phosphate in soft tissue. However, uptake may also be observed in conditions in which calcium phosphate is present in minor amounts, like inflammatory diseases, unstable angina, cardioversion, after radiation therapy and amyloid disease. Thus, the binding of
99mTc-PYP in the soluble muscle proteins
and enzymes in different cardiac abnormalities probably plays a major role and calcium phosphate has only a minor role [20].
Pentavalent 99m
Tc-DMSA scanning demonstrated diffuse uptake in the heart in a 71 years old woman with histologically confirmed primary amyloidosis [21]. On the other hand, researchers found
99mTc(V)-DMSA to accumulate in
myeloma cells unrelated with amyloidosis [22]. It has been postulated that pentavalent DMSA resembles phosphate ion in its distribution pattern, and that this is the mechanism by which pentavalent DMSA accumulates in tumors, particularly medullary thyroid cancer, where calcification and amyloidosis are a well-recognized phenomenon [23, 24]. Moreover, Denoyer and colleagues elucidated the exact mechanisms; notably, the tracer reflects phosphate ion (Pi) transport and metabolism, entering cancer cells specifically via the type III Na/Pi co-transporter, this uptake being driven by the cellular levels of phosphorylated (i.e. activated) focal adhesion kinase (FAK), a keystone of accelerated proliferation [25, 26]. According to our studies in breast cancer, the uptake of
99mTc(V)-DMSA is related to cell proliferation, FAK activation,
neo-angiogenesis and overexpression of several growth factors, including calcitonin gene-related peptide and platelet-derived growth factor [27-36]. Calcitonin gene-related peptide (CGRP) is a member of the adrenomedullin-amylin family leading to formation of β-amyloid deposits. Thus, the potential affinity of
99mTc(V)-DMSA for primary AL rather than ATTR
amyloidosis may be justified by its biochemical pathway of accumulation and propounds the need for further research. Several recent publications exist on the usefulness of specific radiotracers in the detection of cardiac amyloidosis
[3, 15, 37]. Limited data involving small patient samples report that 99m
Tc-3,3-diphosphono-1,2 propanodicarboxylic acid (99m
Tc-DPD) scintigraphy can also differentiate AL from ATTR [37]. Other radiopharmaceuticals that have been applied in the detection of amyloid deposits include
123I-labeled serum amyloid P component (SAP) and
99mTc-labeled aprotinin.
Labeled SAP is not commercially available except for only a few centers worldwide, and displays a poor sensitivity in patients with ATTR [39, 40]. Some promising results have been observed with
99mTc-labeled aprotinin [41, 42]. Our results
are in accordance with a research study conducted by Bokhari and colleagues [3]. Besides confirming the prominent role of
99mTc-PYP scintigraphy in the diagnostic armamentarium of CA, it would also be valuable to explore its potential utility
in the context of disease follow-up, evaluation of response to treatment and prognosis of major adverse cardiac events, or even induction of relevant therapeutic agents.
The small sample of patients definitely belongs to the limitations of our study. Another potential pitfall involves the procedure regarding the semiquantitative method, which should probably be modified in order to achieve higher sensitivity as well as specificity of the method. Therefore, further research is merited.
In conclusion, our preliminary results demonstrate the efficacy of myocardial 99m
Tc-PYP scintigraphy in elucidating the diagnostic dilemma between ATTR and AL cardiac amyloidosis. The underlying pathophysiologic mechanism remains to be clarified. Myocardial scintigraphy with
99mTc-PYP constitutes a simple, non-invasive, low-cost
and widely available modality which may prove extremely useful in the identification of patients with the ATTR subtype.
Acknowledgements
www.nuclmed.gr Hell J Nucl Med Suppl, September-December 2015 49
We would like to express our gratitude to Mr. Dimitrios Kotsias and Mrs. Evdokia Koletsi for their valuable technical support.
Bibliography
1. Banypersad SM, Moon JC, Whelan C et al. Updates in cardiac amyloidosis: a review. J Amer Hear Assoc 2012; 1: e000364.
2. Chee CE, Lacy MQ, Dogan A et al. Pitfalls in the diagnosis of primary amyloidosis. Clin Lymphoma Myeloma Leuk 2010; 177-80.
3. Bokhari S, Castaño A, Pozniakoff T et al. 99m
Tc-pyrophosphate scintigraphy for differentiating light-chain cardiac amyloidosis from the
transthyretin-related familial and senile cardiac amyloidoses. Circ Cardiovasc Imag 2013; 2: 195-201.
4. Chaulagain CP, Comenzo RL. How we treat systemic light-chain amyloidosis. Clinical Advances in Hematology & Oncology 2015; 5: 1-12.
5. Monoclonal Gammopathy of Undetermined Significance, Waldenström Macroglobulinemia, AL Amyloidosis, and Related Plasma Cell
Disorders: Diagnosis and Treatment. Improving patient care through esoteric laboratory testing 2006; (31)
11:www.mayoreferenceservices.org/communique.
6. Wiltshire JP, Custer T. Lumbar muscle rhabdomyolysis as a cause of acute renal failure after Roux-en-Y gastric bypass. Obes Surg 2003; 13:
306-13.
7. Dewanjee MK, Kahn PC. Mechanism of localization of 99m
Tc-labeled pyrophosphate and tetracycline in infarcted myocardium. J Nucl Med
1976; 17: 639-46.
8. Buja LM, Parkey RW, Dees JH et al. Morphologic correlates of technetium-99m stannous pyrophosphate imaging of acute myocardial infarcts
in dogs. Circulation 1975; 52: 596-607.
9. Schimmel DH, Moss AA, Hoffer PB. Radionuclide imaging of intestinal infarction in dogs. Invest Radiol 1976; 11: 277-81.
10. Barth KH, Alderson PO, Strandberg JD et al. 99m
Tc-pyrophosphate imaging in experimental mesenteric infarction: relationship of tracer
uptake to the degree of ischemic injury. Radiology 1978; 129: 491-95.
11. Kressel HY, Moss AA, Montgomery CK et al. Radionuclide imaging of bowel infarction complicating small bowel intussusception in dogs.
Invest Radiol 1978; 13: 127-31.
12. Barth KH, Alderson PO, Strandberg JD, Fara JW. Early imaging of experimental intestinal infarction with 99m
Tcpyrophosphate. Radiology
1979; 133: 459-62.
13. Lin WY, Wang SJ, Hwang DW et al. Technetium-99m-pyrophosphate scintigraphic findings of intestinal perforation in dermatomyositis. J
Nucl Med 1995; 36: 1615-7.
14. Gang-Uei Hung, Te-Hsin Chao, Chia-Hua Chang et al. Colon necrosis demonstrated on 99m
Tc-Pyrophosphate scintigraphy. Ann Nucl Med
Sci 2001; 14: 257-60.
15. Chen W, Dilsizian V. Molecular imaging of amyloidosis: will the heart be the next target after the brain?.Curr Cardiol Rep. 2012; 14: 226-33.
16. Matsumori A, Kadota K, Kawai C. Technetium-99m pyrophosphate uptake in experimental viral perimyocarditis: sequential study of
myocardial uptake and pathologic correlates. Circulation 1980; 61: 802-7.
17. Buja LM, Parkey RW, Dees JH et al. Morphologic correlates of technetium-99m stannous pyrophosphate imaging of acute myocardial
infarcts in dogs. Circulation 1975; 52: 596-607.
18. Buja LM, Poliner LR, Parkey RW et al. Clinicopathologic study of persistently positive technetium-99m stannous pyrophosphate myocardial
scintigrams and myocytolytic degeneration after myocardial infarction. Circulation 1977; 56: 1016.
19. Dewanjee MK, Prince EW. Cellular necrosis model in tissue culture: uptake of 99m
Tc-tetracycline and the pertechnetate ion. J Nucl Med
1974; 15: 577-81.
20. Dewanjee MK. Technetium-99m pyrophosphate uptake. Circulation 1978; 58: 186-187.
21. Yukihiro M, Pentavalent technetium-99m dimercaptosuccinic acid uptake in primary amyloidosis: comparison with autopsy findings. Radiat
Med 1997; 5(5): 317-20.
22. Ohnishi T. Pentavalent technetium-99m-DMSA uptake in a patient having multiple myeloma without amyloidosis. J Nucl Med 1991; 32(9):
1785-7.
23. Ohta H. A new tumor-seeking agent. Clin Nucl Med 1985; l0: 855-60.
24. Ohta H. Technetium-99m(V)DMSA uptake in amyloidosis. J Nucl Med 1989: 30: 2049-52.
25. Denoyer D, Perek N, Le Jeune N et al. Evidence that 99m
Tc-(V)-DMSA uptake is mediated by NaPi cotransporter type III in tumour cell lines.
Eur J Nucl Med Mol Imaging 2004; (31)1: 77-84.
26. Denoyer D, Perek N, Le Jeune N et al. Correlation between 99m
Tc-(V)-DMSA uptake and constitutive level of phosphorylated focal adhesion
kinase in an in vitro model of cancer cell lines. Eur J Nucl Med Mol Imaging 2005; (32)7: 820-7.
27. Papantoniou V, Valsamaki P, Tsiouris S. Scintimammography-Molecular Imaging: Value and New Perspectives with 99m
Tc(V)-DMSA. In:
Imaging of the Breast-Technical Aspects and Clinical Implication, Dr. Laszlo Tabar (Ed.), 2012; ISBN: 978-953-51-0284-7, InTech.
28. Papantoniou V, Tsiouris S. In vitro verification of the correlation of in vivo 99m
Tc(V)-DMSA uptake with cellular proliferation rate. Εur J Nucl
Med Mol Imaging 2005; 10: 1240-1.
29. Papantoniou V, Ptohis N, Tsiouris S. Diffuse tracer uptake in scintimammography: not as nonspecific or benign as original ly believed? J Nucl
Med 3: 554-5.
30. Papantoniou V, Tsiouris S, Koutsikos J et al. Scintimammographic detection of usual ductal breast hyperplasia with increased proliferation
rate at risk for malignancy. Nucl Med Commun 2006; 11: 911-7.
31. Papantoniou V, Tsiouris S, Sotiropoulou M et al. The Potential role of calcitonin gene-related peptide (CGRP) in breast carcinogenesis and
its correlation with 99m
Tc(V)-DMSA scintimammography. Am J Clin Oncol 4: 420-7.
32. Papantoniou V, Sotiropoulou E, Valsamaki P et al. Reduced uptake of the proliferation-seeking radiotracer technetium-99m-labelled
pentavalent dimercaptosuccinic acid in a 47-year-old woman with severe breast epithelial hyperplasia taking ibuprofen: a case report. J Med
Cas Rep 2010; 4: 89.
33. Papantoniou V, Tsaroucha A, Valsamaki P et al. Mixed invasive ductal associated with in situ, but not pure invasive breast carcinoma,
correlates with neoangiogenesis, increased breast density, calcitonin gene related peptide positivity and cell proliferation seeking radiotracer

www.nuclmed.gr Hell J Nucl Med Suppl, September-December 2015 50
99mTc(V)DMSA uptake. Εur J Nucl Med Mol Imaging 2010; 2: 417.
34. Papantoniou V, Tsaroucha A, Valsamaki P et al. Ibuprofen induces reduction of the proliferation-seeking radiotracer 99m
Tc(V)-DMSA uptake
in severe epithelial breast hyperplasia without atypia. Mol Imaging 2010; 5: 233-6.
35. Papantoniou V, Sotiropoulou E, Valsamaki P et al. Breast density, scintimammographic 99m
Tc(V)DMSA uptake and calcitonin gene related
peptide (CGRP) expression in mixed invasive ductal associated with extensive in situ ductal carcinoma (IDC+DC IS) and pure invasive ductal
carcinoma (IDC): correlation with estrogen receptor (ER) status, proliferation index Ki-67 and histological grade. Breast Cancer 2011; 4:286-91.
36. Papantoniou V, Valsamaki P, Sotiropoulou E et al. Increased breast density correlates with the proliferation–seeking radiotracer 99m
Tc(V)-
DMSA uptake in florid epithelial hyperplasia and in mixed ductal carcinoma in situ with invasive ductal carcinoma but not in pure invasive ductal
carcinoma and in mild epithelial hyperplasia. Mol Imaging 2011; 10: 370-6.
37. de Harodel Moral FJ, Sanchez-Lajusticia A, Gomez-Bueno M et al. Role of cardiac scintigraphy with 99m
Tc-DPD in the differentiation of
cardiac amyloidosis subtype. Rev Esp Cardiol 2012; 65(5): 440-6.
38. Hawkins PN, Lavender JP, Pepys MB. Evaluation of systemic amyloidosis by scintigraphy with 123
I-labeled serum amyloid P component. N
Engl J Med 1990; 323: 508-13.
39. Hawkins P. Serum amyloid P component scintigraphy for diagnosis and monitoring amyloidosis. Curr Opin Nephrol Hypertens 2002; 11:
649-55.
40. Hazenberg BPC, Van Rijswijk MH, Lub-de Hooge MN et al. Diagnostic performance and prognostic value of extravascular retention of 123
I-
labeled serum amyloid P component in systemic amyloidosis. J Nucl Med 2007; 48: 865-72.
41. Glaudemans AW, Slart RH, Zeebregts CJ et al. Nuclear imaging in cardiac amyloidosis. Eur J Nucl Med Mol Imaging 2009; 36: 702-14.
42. Han S, Chong V, Murray T et al. Preliminary experience of 99m
Tc-aprotinin scintigraphy in amyloidosis. Eur J Haematol 2007; 79: 494-500.
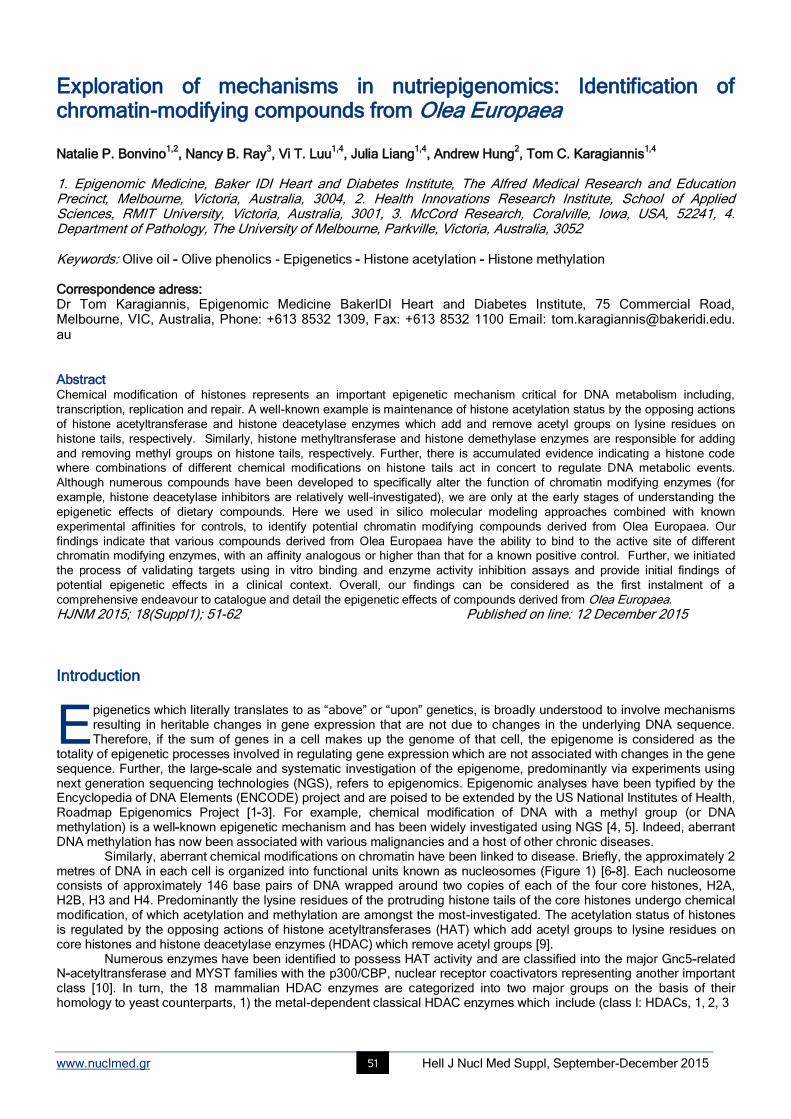
www.nuclmed.gr Hell J Nucl Med Suppl, September-December 2015 51
Exploration of mechanisms in nutriepigenomics: Identification of chromatin-modifying compounds from Olea Europaea Natalie P. Bonvino
1,2, Nancy B. Ray
3, Vi T. Luu
1,4, Julia Liang
1,4, Andrew Hung
2, Tom C. Karagiannis
1,4
1. Epigenomic Medicine, Baker IDI Heart and Diabetes Institute, The Alfred Medical Research and Education Precinct, Melbourne, Victoria, Australia, 3004, 2. Health Innovations Research Institute, School of Applied Sciences, RMIT University, Victoria, Australia, 3001, 3. McCord Research, Coralville, Iowa, USA, 52241, 4. Department of Pathology, The University of Melbourne, Parkville, Victoria, Australia, 3052 Keywords: Olive oil - Olive phenolics - Epigenetics - Histone acetylation - Histone methylation Correspondence adress: Dr Tom Karagiannis, Epigenomic Medicine BakerIDI Heart and Diabetes Institute, 75 Commercial Road, Melbourne, VIC, Australia, Phone: +613 8532 1309, Fax: +613 8532 1100 Email: [email protected]. au Abstract Chemical modification of histones represents an important epigenetic mechanism critical for DNA metabolism including,
transcription, replication and repair. A well-known example is maintenance of histone acetylation status by the opposing actions
of histone acetyltransferase and histone deacetylase enzymes which add and remove acetyl groups on lysine residues on
histone tails, respectively. Similarly, histone methyltransferase and histone demethylase enzymes are responsible for adding
and removing methyl groups on histone tails, respectively. Further, there is accumulated evidence indicating a histone code
where combinations of different chemical modifications on histone tails act in concert to regulate DNA metabolic events.
Although numerous compounds have been developed to specifically alter the function of chromatin modifying enzymes (for
example, histone deacetylase inhibitors are relatively well-investigated), we are only at the early stages of understanding the
epigenetic effects of dietary compounds. Here we used in silico molecular modeling approaches combined with known
experimental affinities for controls, to identify potential chromatin modifying compounds derived from Olea Europaea. Our
findings indicate that various compounds derived from Olea Europaea have the ability to bind to the active site of different
chromatin modifying enzymes, with an affinity analogous or higher than that for a known positive control. Further, we initiated
the process of validating targets using in vitro binding and enzyme activity inhibition assays and provide initial findings of
potential epigenetic effects in a clinical context. Overall, our findings can be considered as the first instalment of a
comprehensive endeavour to catalogue and detail the epigenetic effects of compounds derived from Olea Europaea.
HJNM 2015; 18(Suppl1); 51-62 Published on line: 12 December 2015
Introduction
pigenetics which literally translates to as “above” or “upon” genetics, is broadly understood to involve mechanisms resulting in heritable changes in gene expression that are not due to changes in the underlying DNA sequence. Therefore, if the sum of genes in a cell makes up the genome of that cell, the epigenome is considered as the
totality of epigenetic processes involved in regulating gene expression which are not associated with changes in the gene sequence. Further, the large-scale and systematic investigation of the epigenome, predominantly via experiments using next generation sequencing technologies (NGS), refers to epigenomics. Epigenomic analyses have been typified by the Encyclopedia of DNA Elements (ENCODE) project and are poised to be extended by the US National Institutes of Health, Roadmap Epigenomics Project [1-3]. For example, chemical modification of DNA with a methyl group (or DNA methylation) is a well-known epigenetic mechanism and has been widely investigated using NGS [4, 5]. Indeed, aberrant DNA methylation has now been associated with various malignancies and a host of other chronic diseases.
Similarly, aberrant chemical modifications on chromatin have been linked to disease. Briefly, the approximately 2 metres of DNA in each cell is organized into functional units known as nucleosomes (Figure 1) [6-8]. Each nucleosome consists of approximately 146 base pairs of DNA wrapped around two copies of each of the four core histones, H2A, H2B, H3 and H4. Predominantly the lysine residues of the protruding histone tails of the core histones undergo chemical modification, of which acetylation and methylation are amongst the most-investigated. The acetylation status of histones is regulated by the opposing actions of histone acetyltransferases (HAT) which add acetyl groups to lysine residues on core histones and histone deacetylase enzymes (HDAC) which remove acetyl groups [9].
Numerous enzymes have been identified to possess HAT activity and are classified into the major Gnc5-related N-acetyltransferase and MYST families with the p300/CBP, nuclear receptor coactivators representing another important class [10]. In turn, the 18 mammalian HDAC enzymes are categorized into two major groups on the basis of their homology to yeast counterparts, 1) the metal-dependent classical HDAC enzymes which include (class I: HDACs, 1, 2, 3
E
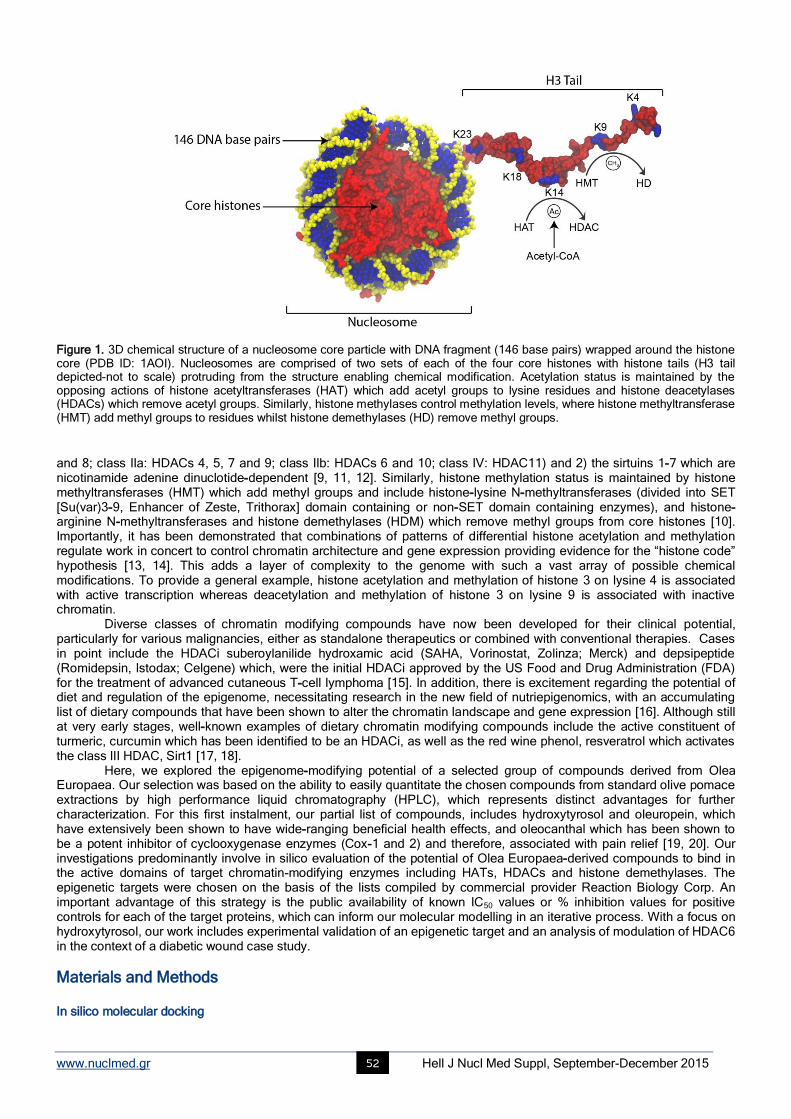
www.nuclmed.gr Hell J Nucl Med Suppl, September-December 2015 52
Figure 1. 3D chemical structure of a nucleosome core particle with DNA fragment (146 base pairs) wrapped around the histone core (PDB ID: 1AOI). Nucleosomes are comprised of two sets of each of the four core histones with histone tails (H3 tail depicted-not to scale) protruding from the structure enabling chemical modification. Acetylation status is maintained by the opposing actions of histone acetyltransferases (HAT) which add acetyl groups to lysine residues and histone deacetylases (HDACs) which remove acetyl groups. Similarly, histone methylases control methylation levels, where histone methyltransferase (HMT) add methyl groups to residues whilst histone demethylases (HD) remove methyl groups.
and 8; class IIa: HDACs 4, 5, 7 and 9; class IIb: HDACs 6 and 10; class IV: HDAC11) and 2) the sirtuins 1-7 which are nicotinamide adenine dinuclotide-dependent [9, 11, 12]. Similarly, histone methylation status is maintained by histone methyltransferases (HMT) which add methyl groups and include histone-lysine N-methyltransferases (divided into SET [Su(var)3-9, Enhancer of Zeste, Trithorax] domain containing or non-SET domain containing enzymes), and histone-arginine N-methyltransferases and histone demethylases (HDM) which remove methyl groups from core histones [10]. Importantly, it has been demonstrated that combinations of patterns of differential histone acetylation and methylation regulate work in concert to control chromatin architecture and gene expression providing evidence for the “histone code” hypothesis [13, 14]. This adds a layer of complexity to the genome with such a vast array of possible chemical modifications. To provide a general example, histone acetylation and methylation of histone 3 on lysine 4 is associated with active transcription whereas deacetylation and methylation of histone 3 on lysine 9 is associated with inactive chromatin. Diverse classes of chromatin modifying compounds have now been developed for their clinical potential, particularly for various malignancies, either as standalone therapeutics or combined with conventional therapies. Cases in point include the HDACi suberoylanilide hydroxamic acid (SAHA, Vorinostat, Zolinza; Merck) and depsipeptide (Romidepsin, Istodax; Celgene) which, were the initial HDACi approved by the US Food and Drug Administration (FDA) for the treatment of advanced cutaneous T-cell lymphoma [15]. In addition, there is excitement regarding the potential of diet and regulation of the epigenome, necessitating research in the new field of nutriepigenomics, with an accumulating list of dietary compounds that have been shown to alter the chromatin landscape and gene expression [16]. Although still at very early stages, well-known examples of dietary chromatin modifying compounds include the active constituent of turmeric, curcumin which has been identified to be an HDACi, as well as the red wine phenol, resveratrol which activates the class III HDAC, Sirt1 [17, 18]. Here, we explored the epigenome-modifying potential of a selected group of compounds derived from Olea Europaea. Our selection was based on the ability to easily quantitate the chosen compounds from standard olive pomace extractions by high performance liquid chromatography (HPLC), which represents distinct advantages for further characterization. For this first instalment, our partial list of compounds, includes hydroxytyrosol and oleuropein, which have extensively been shown to have wide-ranging beneficial health effects, and oleocanthal which has been shown to be a potent inhibitor of cyclooxygenase enzymes (Cox-1 and 2) and therefore, associated with pain relief [19, 20]. Our investigations predominantly involve in silico evaluation of the potential of Olea Europaea-derived compounds to bind in the active domains of target chromatin-modifying enzymes including HATs, HDACs and histone demethylases. The epigenetic targets were chosen on the basis of the lists compiled by commercial provider Reaction Biology Corp. An important advantage of this strategy is the public availability of known IC50 values or % inhibition values for positive controls for each of the target proteins, which can inform our molecular modelling in an iterative process. With a focus on hydroxytyrosol, our work includes experimental validation of an epigenetic target and an analysis of modulation of HDAC6 in the context of a diabetic wound case study.
Materials and Methods In silico molecular docking
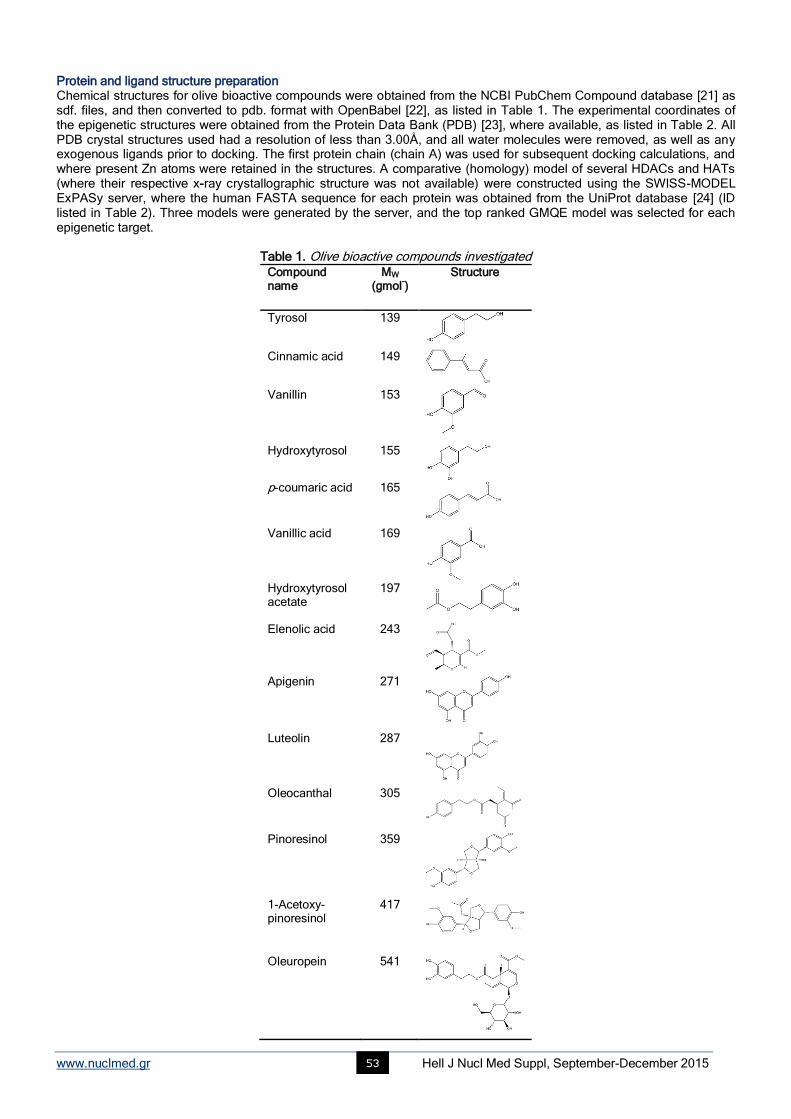
www.nuclmed.gr Hell J Nucl Med Suppl, September-December 2015 53
Protein and ligand structure preparation Chemical structures for olive bioactive compounds were obtained from the NCBI PubChem Compound database [21] as sdf. files, and then converted to pdb. format with OpenBabel [22], as listed in Table 1. The experimental coordinates of the epigenetic structures were obtained from the Protein Data Bank (PDB) [23], where available, as listed in Table 2. All PDB crystal structures used had a resolution of less than 3.00Å, and all water molecules were removed, as well as any exogenous ligands prior to docking. The first protein chain (chain A) was used for subsequent docking calculations, and where present Zn atoms were retained in the structures. A comparative (homology) model of several HDACs and HATs (where their respective x-ray crystallographic structure was not available) were constructed using the SWISS-MODEL ExPASy server, where the human FASTA sequence for each protein was obtained from the UniProt database [24] (ID listed in Table 2). Three models were generated by the server, and the top ranked GMQE model was selected for each epigenetic target.
Table 1. Olive bioactive compounds investigated Compound name
MW (gmol
-)
Structure
Tyrosol
139
Cinnamic acid
149
Vanillin 153
Hydroxytyrosol
155
p-coumaric acid
165
Vanillic acid
169
Hydroxytyrosol acetate
197
Elenolic acid
243
Apigenin
271
Luteolin
287
Oleocanthal
305
Pinoresinol
359
1-Acetoxy-pinoresinol
417
Oleuropein
541
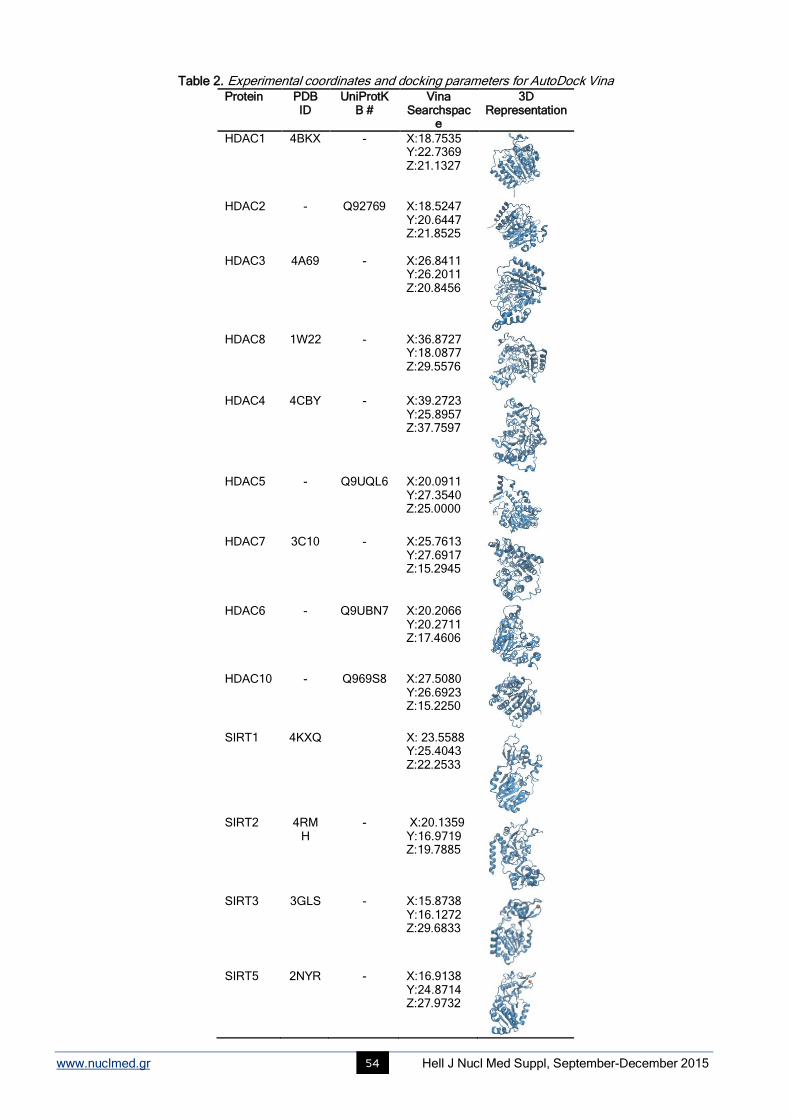
www.nuclmed.gr Hell J Nucl Med Suppl, September-December 2015 54
Table 2. Experimental coordinates and docking parameters for AutoDock Vina Protein PDB
ID UniProtK
B # Vina
Searchspace
3D Representation
HDAC1 4BKX - X:18.7535 Y:22.7369 Z:21.1327
HDAC2 - Q92769 X:18.5247
Y:20.6447 Z:21.8525
HDAC3 4A69 - X:26.8411 Y:26.2011 Z:20.8456
HDAC8 1W22 - X:36.8727
Y:18.0877 Z:29.5576
HDAC4 4CBY - X:39.2723
Y:25.8957 Z:37.7597
HDAC5 - Q9UQL6 X:20.0911
Y:27.3540 Z:25.0000
HDAC7 3C10 - X:25.7613
Y:27.6917 Z:15.2945
HDAC6 - Q9UBN7 X:20.2066
Y:20.2711 Z:17.4606
HDAC10 - Q969S8 X:27.5080
Y:26.6923 Z:15.2250
SIRT1 4KXQ X: 23.5588
Y:25.4043 Z:22.2533
SIRT2 4RM
H - X:20.1359
Y:16.9719 Z:19.7885
SIRT3 3GLS - X:15.8738
Y:16.1272 Z:29.6833
SIRT5 2NYR - X:16.9138
Y:24.8714 Z:27.9732
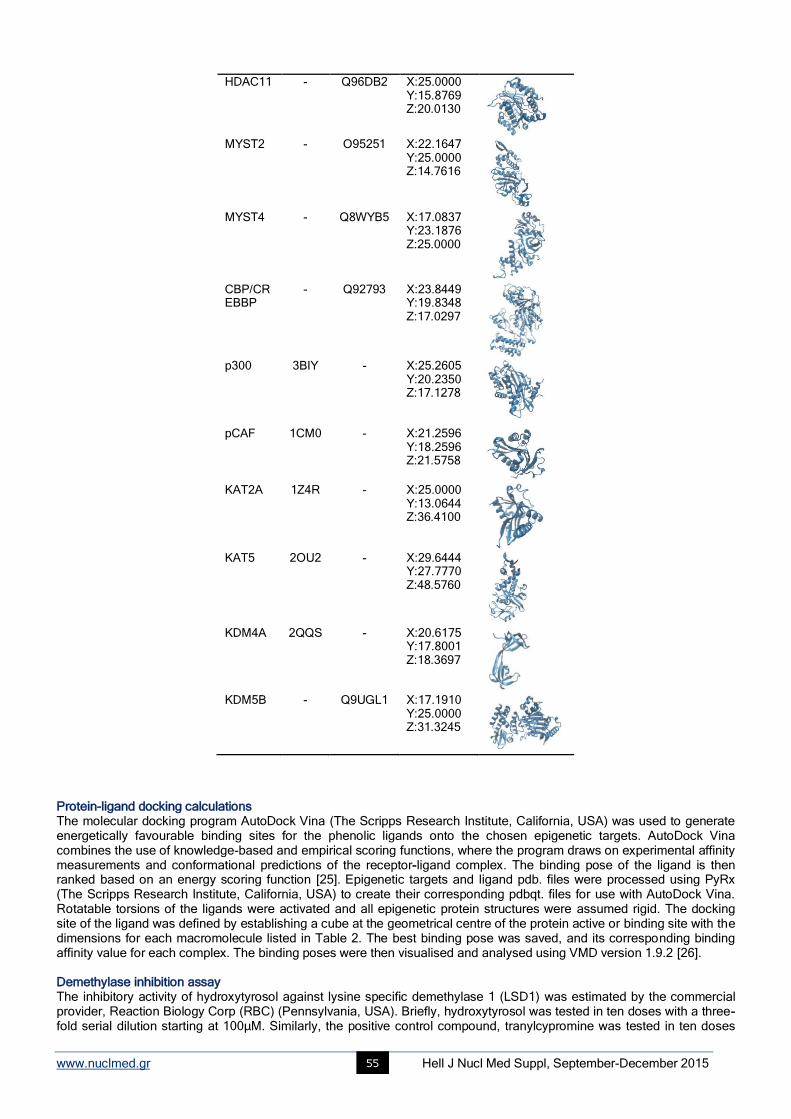
www.nuclmed.gr Hell J Nucl Med Suppl, September-December 2015 55
HDAC11 - Q96DB2 X:25.0000 Y:15.8769 Z:20.0130
MYST2 - O95251 X:22.1647
Y:25.0000 Z:14.7616
MYST4 - Q8WYB5 X:17.0837
Y:23.1876 Z:25.0000
CBP/CREBBP
- Q92793 X:23.8449 Y:19.8348 Z:17.0297
p300 3BIY - X:25.2605
Y:20.2350 Z:17.1278
pCAF 1CM0 - X:21.2596 Y:18.2596 Z:21.5758
KAT2A 1Z4R - X:25.0000 Y:13.0644 Z:36.4100
KAT5 2OU2 - X:29.6444
Y:27.7770 Z:48.5760
KDM4A 2QQS - X:20.6175
Y:17.8001 Z:18.3697
KDM5B - Q9UGL1 X:17.1910
Y:25.0000 Z:31.3245
Protein-ligand docking calculations The molecular docking program AutoDock Vina (The Scripps Research Institute, California, USA) was used to generate energetically favourable binding sites for the phenolic ligands onto the chosen epigenetic targets. AutoDock Vina combines the use of knowledge-based and empirical scoring functions, where the program draws on experimental affinity measurements and conformational predictions of the receptor-ligand complex. The binding pose of the ligand is then ranked based on an energy scoring function [25]. Epigenetic targets and ligand pdb. files were processed using PyRx (The Scripps Research Institute, California, USA) to create their corresponding pdbqt. files for use with AutoDock Vina. Rotatable torsions of the ligands were activated and all epigenetic protein structures were assumed rigid. The docking site of the ligand was defined by establishing a cube at the geometrical centre of the protein active or binding site with the dimensions for each macromolecule listed in Table 2. The best binding pose was saved, and its corresponding binding affinity value for each complex. The binding poses were then visualised and analysed using VMD version 1.9.2 [26]. Demethylase inhibition assay The inhibitory activity of hydroxytyrosol against lysine specific demethylase 1 (LSD1) was estimated by the commercial provider, Reaction Biology Corp (RBC) (Pennsylvania, USA). Briefly, hydroxytyrosol was tested in ten doses with a three-fold serial dilution starting at 100μM. Similarly, the positive control compound, tranylcypromine was tested in ten doses
www.nuclmed.gr Hell J Nucl Med Suppl, September-December 2015 56
with a three-fold serial dilution starting at 100μM. A fluorescence coupling enzyme assay based on the production of FAD-dependent H2O2 as a result of demethylase activity of LSD1, using 10µM histone H3(1-21) K4me2 peptide as a substrate, was measured by coupling with horse radish peroxidase and Amplex Red. The IC50 values for each compound were then calculated. Immunofluorescence staining of epidermal tissue sections Tissue collection and processing Six tissue samples were obtained through therapeutic debridement procedures over several weeks, at Ashwood Medical Group, Melbourne, Australia with informed consent. The samples were collected from a 79 year old male patient whom suffered from a chronic diabetic venous ulcer of approximately 10cm
2, located on the right inferolateral lower leg. The
patient was treated with a commercial topical antimicrobial spray, containing the Olivamine 10® formulation, which
includes a hydroxytyrosol containing olive extract. Sections were paraffin embedded by Gribbles Pathology Veterinary, and subsequently, sections of 4μm were prepared at a clearance angle of 5° using the Leica Microsystems microtome. Immunofluorescence Expression of HDAC6 and acetylated α-tubulin were examined in the skin samples using anti-HDAC6 (1:500) (Epitomics, California, U.S.A) and anti-acetylated α-tubulin (1:250) antibodies. Samples were deparaffinised in xylene and hydrated in three washes of graded ethanol. Slides were subsequently microwaved on high power for 1 minute and low power for 10 minutes before left to cool at room temperature for 20 minutes. Slides were then equilibrated with two washes in 0.1% Tween 20 with phosphate buffered saline (PBS) for 15 minutes on an orbital mixer at room temperature. Tissues on the slide were circled with a mini pap pen (Invitrogen, California, U.S.A) and were blocked with 100μL of 1% bovine serum albumin (BSA (v/v)) for 1 hour and blotted. Subsequently, 100μL of primary antibody in 1% BSA was added and slides were incubated overnight in a 4°C humidified chamber. Slides were then washed 3 times in 0.1% Tween 20 PBS for 10 minutes at room temperature on an orbital mixer. Secondary antibody (100-300µL) anti-mouse 488 (1:500) and anti-rabbit 546 (1:500) in 1% BSA was added for a 1 hour incubation in a dark humidied chamber on an orbital mixer at room temperature. TOPRO-3 (100-300µL; 1:1000) in PBS was the added for a further 10 minutes. Slides were then washed twice for 10 minutes in PBS on an orbital mixer. Excess PBS was blotted off the slides and samples were cover slipped with Permount before left to dry in a dark humid chamber for three days. Skin sections were examined and images were obtained using the A1r Nikon confocal microscope from Monash Micro Imaging set at x60 objective with oil. A Z-stacked imaged was acquired with a step size of 0.25μm.
Results In silico docking studies and in vitro inhibition of LSD1 by hydroxytyrosol Molecular docking studies were performed on the 14 bioactive compounds to obtain insight into their binding pose onto the epigenetic target enyzmes. In turn, the calculated free energy of binding (ΔG) for each complex was also predicted. The binding affinities obtained for the bioactive compounds to each epigenetic target is presented in Figure 2. The values indicate the binding energy upon docking of the ligand to the known active site or binding site of the protein, as stipulated in the literature. The results demonstrate clear trends within the protein groups, and among the global dataset. Firstly, there appears to be an increase in binding affinity following docking with the higher weighted compounds, especially from apigenin through to oleuropein which all possess more than one phenyl ring. Secondly, there appears to be similarity between homologous epigenetic targets, whereby the first three HDAC classes produce comparable results within their respective cohort, while KAT2A and KAT5 share low binding affinities to the tested ligands. Thirdly, among the Class II, III and IV HDACs, HDAC4, 6, 7 & 11 as well as SIRT1 showcase a more homogenous spread of binding affinities, with some interesting higher docking affinities seen with the lower weight compounds hydroxytyrosol and cinnamic acid. Upon close inspection of the docked ligands to the above epigenetic targets, it was noticed that histidine residues were directly involved in ligand interactions among HDAC 4, 6, 7 and 11 as well as within LSD1 (Figure 3).
The findings from the LSD1 demethylase profiling indicated inhibition of the enzyme by hydroxytyrosol with an IC50 of 3.57µM demonstrating more potent activity than the positive control and well-known LSD1 inhibitor, tranylcypromine (IC50 =17.7µM).
Immunofluorescence expression of HDAC6 in a chronic diabetic ulcer The level of HDAC6 and acetylated α-tubulin expression was characterised in tissue sections obtained from the peri wound of a diabetic ulcer treated with a commercial topical product, containing the Olivamine 10
® formulation, which
includes a hydroxytyrosol containing olive extract. The findings illustrate the time-dependent increase in expression of HDAC6 within the tissue sections examined, without a concomitant change in expression of acetylated α-tubulin from week 1 to week 3, Figure 5.
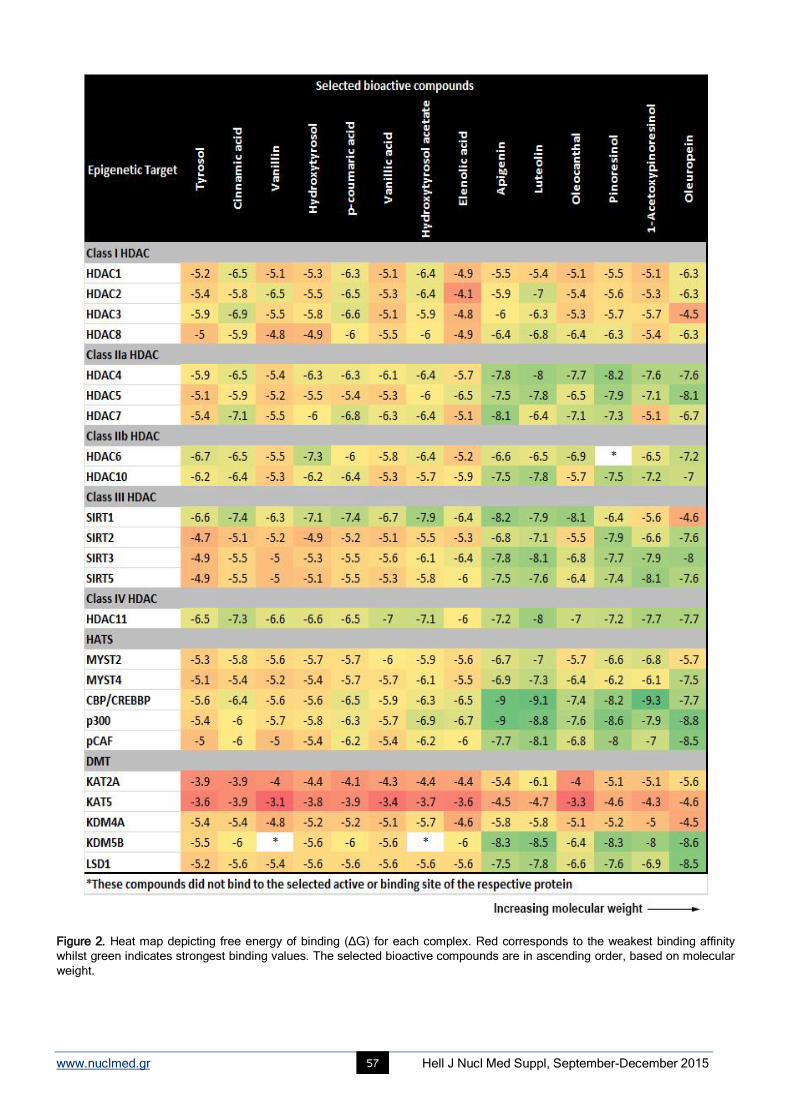
www.nuclmed.gr Hell J Nucl Med Suppl, September-December 2015 57
Figure 2. Heat map depicting free energy of binding (ΔG) for each complex. Red corresponds to the weakest binding affinity
whilst green indicates strongest binding values. The selected bioactive compounds are in ascending order, based on molecular
weight.
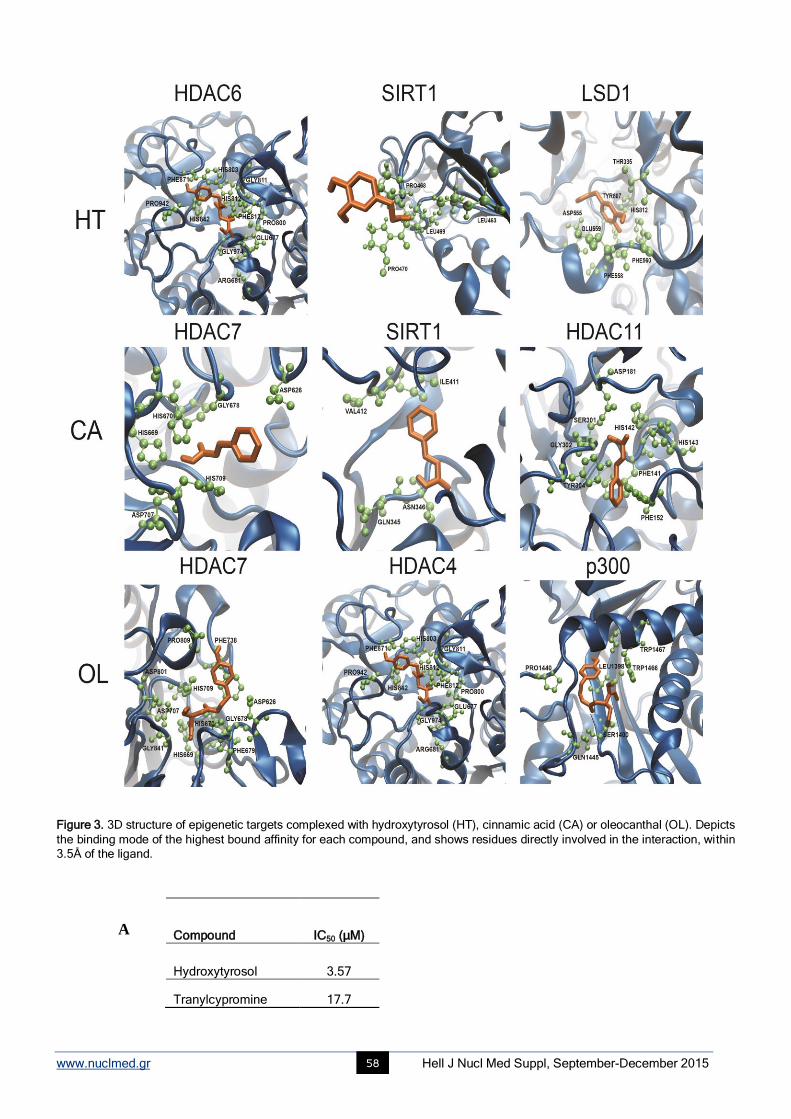
www.nuclmed.gr Hell J Nucl Med Suppl, September-December 2015 58
Figure 3. 3D structure of epigenetic targets complexed with hydroxytyrosol (HT), cinnamic acid (CA) or oleocanthal (OL). Depicts
the binding mode of the highest bound affinity for each compound, and shows residues directly involved in the interaction, within
3.5Å of the ligand.
Compound IC50 (μM)
Hydroxytyrosol 3.57
Tranylcypromine 17.7
A
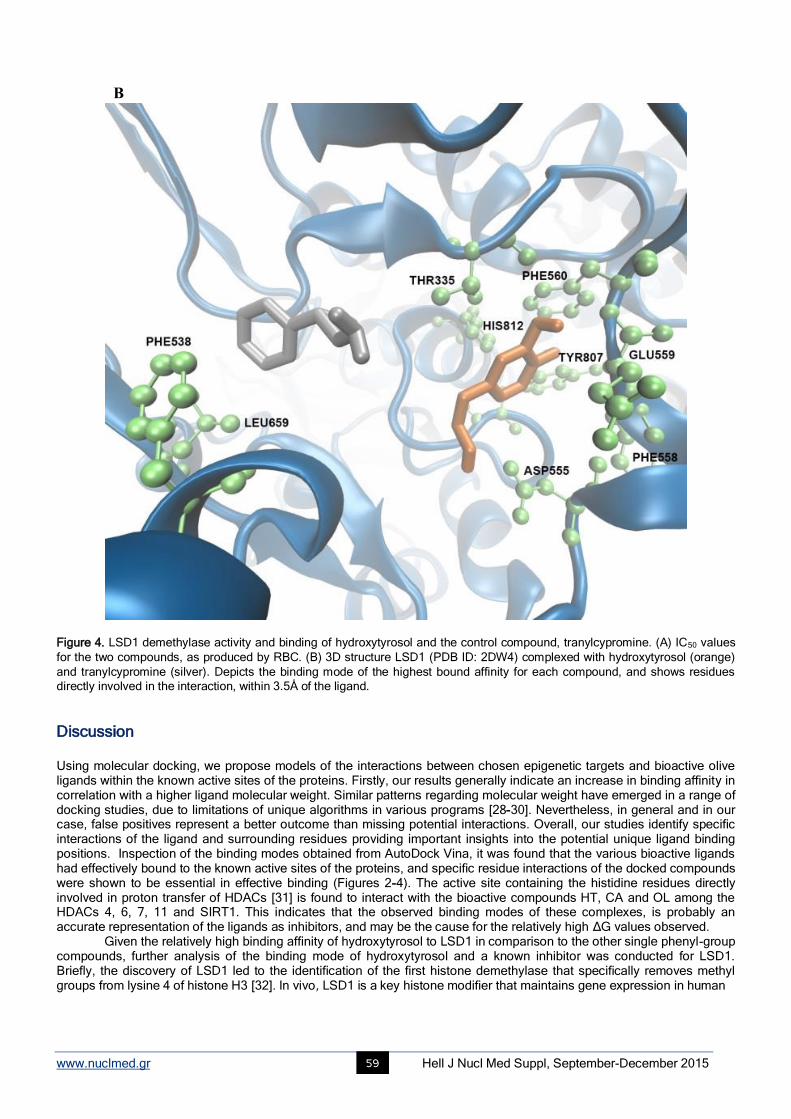
www.nuclmed.gr Hell J Nucl Med Suppl, September-December 2015 59
Figure 4. LSD1 demethylase activity and binding of hydroxytyrosol and the control compound, tranylcypromine. (A) IC50 values
for the two compounds, as produced by RBC. (B) 3D structure LSD1 (PDB ID: 2DW4) complexed with hydroxytyrosol (orange)
and tranylcypromine (silver). Depicts the binding mode of the highest bound affinity for each compound, and shows residues
directly involved in the interaction, within 3.5Å of the ligand.
Discussion Using molecular docking, we propose models of the interactions between chosen epigenetic targets and bioactive olive ligands within the known active sites of the proteins. Firstly, our results generally indicate an increase in binding affinity in correlation with a higher ligand molecular weight. Similar patterns regarding molecular weight have emerged in a range of docking studies, due to limitations of unique algorithms in various programs [28-30]. Nevertheless, in general and in our case, false positives represent a better outcome than missing potential interactions. Overall, our studies identify specific interactions of the ligand and surrounding residues providing important insights into the potential unique ligand binding positions. Inspection of the binding modes obtained from AutoDock Vina, it was found that the various bioactive ligands had effectively bound to the known active sites of the proteins, and specific residue interactions of the docked compounds were shown to be essential in effective binding (Figures 2-4). The active site containing the histidine residues directly involved in proton transfer of HDACs [31] is found to interact with the bioactive compounds HT, CA and OL among the HDACs 4, 6, 7, 11 and SIRT1. This indicates that the observed binding modes of these complexes, is probably an accurate representation of the ligands as inhibitors, and may be the cause for the relatively high ΔG values observed.
Given the relatively high binding affinity of hydroxytyrosol to LSD1 in comparison to the other single phenyl-group compounds, further analysis of the binding mode of hydroxytyrosol and a known inhibitor was conducted for LSD1. Briefly, the discovery of LSD1 led to the identification of the first histone demethylase that specifically removes methyl groups from lysine 4 of histone H3 [32]. In vivo, LSD1 is a key histone modifier that maintains gene expression in human
Β
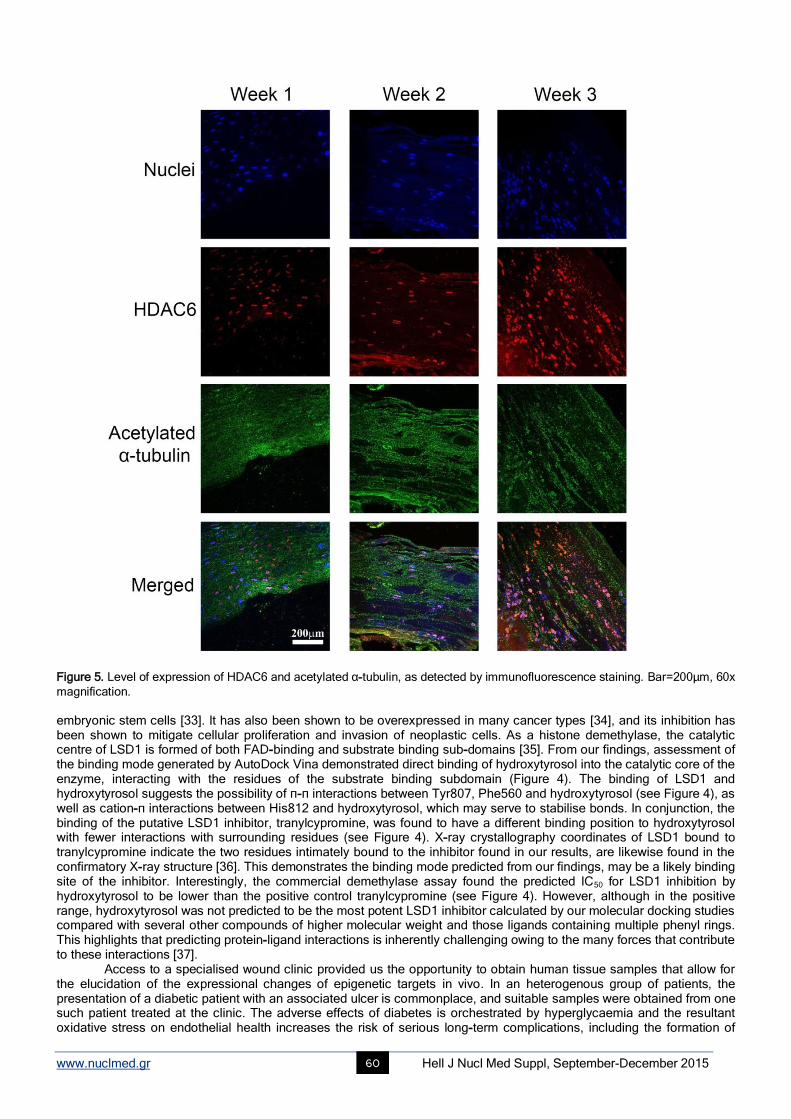
www.nuclmed.gr Hell J Nucl Med Suppl, September-December 2015 60
Figure 5. Level of expression of HDAC6 and acetylated α-tubulin, as detected by immunofluorescence staining. Bar=200µm, 60x
magnification. embryonic stem cells [33]. It has also been shown to be overexpressed in many cancer types [34], and its inhibition has been shown to mitigate cellular proliferation and invasion of neoplastic cells. As a histone demethylase, the catalytic centre of LSD1 is formed of both FAD-binding and substrate binding sub-domains [35]. From our findings, assessment of the binding mode generated by AutoDock Vina demonstrated direct binding of hydroxytyrosol into the catalytic core of the enzyme, interacting with the residues of the substrate binding subdomain (Figure 4). The binding of LSD1 and hydroxytyrosol suggests the possibility of π-π interactions between Tyr807, Phe560 and hydroxytyrosol (see Figure 4), as well as cation-π interactions between His812 and hydroxytyrosol, which may serve to stabilise bonds. In conjunction, the binding of the putative LSD1 inhibitor, tranylcypromine, was found to have a different binding position to hydroxytyrosol with fewer interactions with surrounding residues (see Figure 4). X-ray crystallography coordinates of LSD1 bound to tranylcypromine indicate the two residues intimately bound to the inhibitor found in our results, are likewise found in the confirmatory X-ray structure [36]. This demonstrates the binding mode predicted from our findings, may be a likely binding site of the inhibitor. Interestingly, the commercial demethylase assay found the predicted IC50 for LSD1 inhibition by hydroxytyrosol to be lower than the positive control tranylcypromine (see Figure 4). However, although in the positive range, hydroxytyrosol was not predicted to be the most potent LSD1 inhibitor calculated by our molecular docking studies compared with several other compounds of higher molecular weight and those ligands containing multiple phenyl rings. This highlights that predicting protein-ligand interactions is inherently challenging owing to the many forces that contribute to these interactions [37].
Access to a specialised wound clinic provided us the opportunity to obtain human tissue samples that allow for the elucidation of the expressional changes of epigenetic targets in vivo. In an heterogenous group of patients, the presentation of a diabetic patient with an associated ulcer is commonplace, and suitable samples were obtained from one such patient treated at the clinic. The adverse effects of diabetes is orchestrated by hyperglycaemia and the resultant oxidative stress on endothelial health increases the risk of serious long-term complications, including the formation of
www.nuclmed.gr Hell J Nucl Med Suppl, September-December 2015 61
diabetic leg and foot ulcers [38]. Several studies have shown that epigenetic changes play a role in diabetic complications [39-41]. Specifically, underlying differences in the cellular phenotype of fibroblasts obtained from diabetic ulcers has been shown to be influenced by significantly lower global DNA methylation patterns as compared to fibroblasts from non-diabetic wounds [42]. Activation and persistence of the proinflammatory M1 macrophage in diabetic wound tissue has also been indicated to be a result of altered H3K27 demethylase (KDM6B) activity [43].
Following the relatively high binding affinity obtained from hydroxytyrosol bound to HDAC6, we further examined the change in HDAC6 and acetylated α-tubulin expression from tissue obtained from a diabetic wound, treated with a commercial topical antimicrobial, containing the Olivamine 10
® formulation, which includes a hydroxytyrosol-containing
olive extract (Figure 5). The results showed an increase in expression of HDAC6 without any quantitative change in the acetylated α-tubulin levels. HDAC6 is an α-tubulin deacetylase and its over-expression has been demonstrated to promote chemotactic cell movement [44]. This indicates that although the expressional increase in HDAC6 is apparent over the time course, the analogous α-tubulin deacetylase activity of HDAC6 is not pronounced. Little work has been conducted on the effect of HDAC6 expression on wound healing, however a study on corneal epithelial cells, has shown the enhancement of HDAC6 activity results in the deacetylation of α-tubulin, effectively increasing cell migration [45, 46]. Indeed, given the dynamic and transient nature of protein acetylation, our findings require further clarifications with much greater n numbers and time points. Further, whether the expressional increase in HDAC6 within the tissue was due to hydroxytyrosol specifically or the synergistic effect of the Olivamine 10
® formulation must be further explored.
Our in silico findings indicate that the predicted IC50 for LSD1 inhibition by hydroxytyrosol is lower than the positive control tranylcypromine. However, it should be noted that although in the positive range, hydroxytyrosol was not predicted to be the most potent LSD1 inhibitor on the basis of molecular docking compared with various compounds of higher molecular weight. This highlights the need to refine our in silico methodologies and to utilise algorithms designed to factor for differences in molecular weight. Given the above observations however, on the basis of the molecular docking prediction, we may assume a high inhibition activity of hydroxytyrosol against HDAC6, which, nevertheless must be validated both in vitro and in vivo. These observations are interesting in the context of our case study results which indicated a significant increase in the expression of HDAC6 with time without a concomitant change in the expression of acetylated α-tubulin. Taken together, reasonable hypotheses may be that 1) the increased expression of the enzyme in the wounded skin could be a compensatory response to inhibition by the olive-derived, hydroxytyrosol containing components of the formulation and 2) the potent inhibition of HDAC6 by components of the formulation supersedes the increased expression of the HDAC6 enzyme and hence the lack of significant changes in the acetylation of α-tubulin.
Conclusion Overall, we provide the first instalment for the identification of potential chromatin modifying compounds derived from Olea Europaea. Our combined in silico and in vitro observations highlight various compounds that may regulate the function of enzymes that write (HATs) and erase (HDACs and HDM) chemical modifications on chromatin. A pertinent example arising from the current work is the finding that the extensively investigated phenolic compound, hydroxytyrosol, may have activity as an inhibitor of HDAC6 and LSD1. When considering our in silico findings, we observe a trend indicating that molecular weight is an important determinant of a positive result in terms of binding the target domain of the enzymes. This is a known caveat in the field and future work will aim at eliminating this bias. Our approach will involve both using alternative docking software with varying algorithms and if required developing our own algorithms to further consolidate the in silico and in vitro findings in an iterative process. Furthermore, we aim to extend our work to incorporate further chromatin modifying enzymes (for example, histone methyltransferases) and enzymes involved in DNA methylation. Finally, we plan to extend our database of compounds derived from Olea Europaea for exploration using our methodologies.
Acknowledgements T.C.K is supported by an Australian Research Council Future Fellowship and the Epigenomic Medicine Laboratory at the Baker IDI Heart and Diabetes Institute is supported by McCord Research. N.P.B is the recipient of an Australian Post-Graduate Award and RMIT University top-up stipend. Supported in part by the Victorian Government’s Operational Infrastructure Support Program. Conflicts of interest Epigenomic Medicine at Baker IDI Heart and Diabetes Institute and N.B.R are funded by McCord Research.
Bibliography
1. Chadwick L.H. The NIH Roadmap Epigenomics Program data resource. Epigenomics 2012; 4(3): 317-24.
2. Consortium E.P. An integrated encyclopedia of DNA elements in the human genome. Nature 2012; 489(7414): 57-74.
3. Roadmap Epigenomics C. et al. Integrative analysis of 111 reference human epigenomes. Nature 2015; 518(7539): 317-30.
4. Bird A. Perceptions of epigenetics. Nature 2007; 447(7143): 396-8.
5. Suzuki M.M. and A. Bird. DNA methylation landscapes: provocative insights from epigenomics. Nat Rev Genet 2008; 9(6): 465-76.
6. Dawson M.A., T. Kouzarides and B.J. Huntly. Targeting epigenetic readers in cancer. N Engl J Med 2012; 367(7): 647-57.
7. Tessarz P. and T. Kouzarides. Histone core modifications regulating nucleosome structure and dynamics. Nat Rev Mol Cell Biol 2014;

www.nuclmed.gr Hell J Nucl Med Suppl, September-December 2015 62
15(11): 703-8.
8. Kouzarides T. Chromatin modifications and their function. Cell 2007; 128(4): 693-705.
9. Dokmanovic M., C. Clarke and P.A. Marks. Histone deacetylase inhibitors: overview and perspectives. Mol Cancer Res 2007; 5(10): 981-9.
10. Roth S.Y., J.M. Denu and C.D. Allis. Histone acetyltransferases. Annu Rev Biochem 2001; 70: 81-120.
11. Licciardi P.V. et al. Influence of natural and synthetic histone deacetylase inhibitors on chromatin. Antioxid Redox Signal 2012; 17(2): 340-
54.
12. Dokmanovic M. and P.A. Marks. Prospects: histone deacetylase inhibitors. J Cell Biochem 2005; 96(2): 293-304.
13. Strahl B.D. and C.D. Allis. The language of covalent histone modifications. Nature 2000; 403(6765): 41-5.
14. Sun Z.W. and C.D. Allis. Ubiquitination of histone H2B regulates H3 methylation and gene silencing in yeast. Nature 2002; 418(6893): 104-8.
15. Falkenberg K.J. and R.W. Johnstone. Histone deacetylases and their inhibitors in cancer, neurological diseases and immune disorders. Nat
Rev Drug Discov 2014; 13(9): 673-91.
16. Choi S.W. and S. Friso. Epigenetics: A New Bridge between Nutrition and Health. Adv Nutr 2010; 1(1): 8-16.
17. Borra M.T., B.C. Smith and J.M. Denu. Mechanism of human SIRT1 activation by resveratrol. J Biol Chem 2005; 280(17): 17187-95.
18. Reuter S. et al. Epigenetic changes induced by curcumin and other natural compounds. Genes Nutr 2011; 6(2): 93-108.
19. Beauchamp G.K. et al. Phytochemistry: ibuprofen-like activity in extra-virgin olive oil. Nature 2005; 437(7055): 45-6.
20. Vissers M.N., P.L. Zock and M.B. Katan. Bioavailability and antioxidant effects of olive oil phenols in humans: a review. Eur J Clin
Nutr 2004; 58(6): 955-65.
21. Sauer H., M. Wartenberg and J. Hescheler. Reactive oxygen species as intracellular messengers during cell growth and
differentiation 2001; 11(4): 173-86.
22. O'Boyle N.M. et al. Open Babel: An open chemical toolbox. J Cheminformatics 2011.
23. Skiöld S. et al. Radiation-induced stress response in peripheral blood of breast cancer patients differs between patients with severe
acute skin reactions and patients with no side effects to radiotherapy. Mutation Research/Genetic Toxicology and Environmenta l
Mutagenesis 2013; 756(1-2): 152-7.
24. Haghdoost S. et al. The nucleotide pool is a significant target for oxidative stress. Free Radic Biol Med 2006; 41(4): 620-6.
25. Trott O. and A.J. Olson. AutoDock Vina: improving the speed and accuracy of docking with a new scoring function, efficient optimization
and multithreading. J Comput Chem 2010; 31(2): 455-61.
26. Humphrey W., Dalke A. and Schulten, K. VMD - Visual Molecular Dynamics. J Mol Graph 1996; 14: 33-8.
27. Xu W.S., R.B. Parmigiani and P.A. Marks. Histone deacetylase inhibitors: molecular mechanisms of action. Oncogene 2007; 26(37): 5541-
52.
28. Kim R. and J. Skolnick. Assessment of Programs for Ligand Binding Affinity Prediction. J Comput Chem 2008; 29(8): 1316-31.
29. Velec H.F.G., H. Gohlke and G. Klebe. DrugScore(CSD)-knowledge-based scoring function derived from small molecule crystal data
with superior recognition rate of near-native ligand poses and better affinity prediction. Journal Of Medicinal Chemistry 2005; 48(20): 6296-303.
30. Ferrara P. et al. Assessing scoring functions for protein-ligand interactions. J Med Chem 2004; 47(12): 3032-47.
31. Kai C. et al. Inhibition and Mechanism of HDAC8 Revisited. J Amer Chem Soc 2014; 136(33): 11636-43.
32. Shi Y. et al. Article: Histone Demethylation Mediated by the Nuclear Amine Oxidase Homolog LSD1. Cell 2004; 119: 941-53.
33. Adamo A. et al. LSD1 regulates the balance between self-renewal and differentiation in human embryonic stem cells. Nat Cell Biol # 2011;
13(6): 652-9.
34. Tangfeng L. et al. Over-Expression of LSD1 Promotes Proliferation, Migration and Invasion in Non-Small Cell Lung Cancer. PLoS ONE
2012; 7(4): 1-8.
35. Stavropoulos P., G. Blobel and A. Hoelz. Crystal structure and mechanism of human lysine-specific demethylase-1. Nature Structural &
Molecular Biology 2006; 13(7): 626-32.
36. Mimasu S. et al. Crystal structure of histone demethylase LSD1 and tranylcypromine at 2.25 A. Biochem Biophys Res Commun 2008;
366(1): 15-22.
37. Mathambo Kumalo, H., S. Bhakat and M.E.S. Soliman. Theory and Applications of Covalent Docking in Drug Discovery: Merits and Pitfalls .
Molecules 2015; 20(2): 1984-2000.
38. Paneni, F. et al. Diabetes and vascular disease: pathophysiology, clinical consequences, and medical therapy: part I. Eur Heart J
2013; 34(31): 2436-43.
39. Gray S.G. and P. De Meyts. Role of histone and transcription factor acetylation in diabetes pathogenesis. Diabetes/Metabolism Research
And Reviews 2005; 21(5): 416-33.
40. Sidaway P. Diabetes: Epigenetic changes lead to impaired wound healing in patients with T2DM. Nat Rev Endocrinol 2015; 11(2): 65-5.
41. Ling C. and L. Groop. Epigenetics: A Molecular Link Between Environmental Factors and Type 2 Diabetes. Diabetes 2009; 58(12): 2718-25.
42. Park L.K. et al. Genome-wide DNA methylation analysis identifies a metabolic memory profile in patient-derived diabetic foot ulcer
fibroblasts. Epigenetics 2014; 9(10): 1339-49.
43. Gallagher K.A. et al. Epigenetic changes in bone marrow progenitor cells influence the inflammatory phenotype and alter wound healing in
type 2 diabetes. Diabetes 2015; 64(4): 1420-30.
44. LeDizet M. and G. Piperno. Identification of an acetylation site of Chlamydomonas alpha-tubulin. Proceedings Of The National Academy Of
Sciences Of The United States Of America 1987; 84(16): 5720-4.
45. Wang J., A. Lin and L. Lu. Effect of EGF-induced HDAC6 activation on corneal epithelial wound healing. Investigative Ophthalmology
& Visual Science 2010; 51(6): 2943-8.
46. Hubbert C. et al. HDAC6 is a microtubule-associated deacetylase. Nature 2002; 417(6887): 455-8.
www.nuclmed.gr Hell J Nucl Med Suppl, September-December 2015 63
Psychological aspects in brain tumor patients: A prospective study
Afsoun Seddighi MD, Amir Saied Seddighi MD, Amir Nikouei MD, Farzad Ashrafi MD, Shabnam Nohesara MD
Shohada Tajrish Neurosurgical Center of Excellence, Functional Neurosurgery Research Center of Shohada Tajrish Hospital, Shahid Beheshti University of Medical Sciences, Tehran, Iran
Keywords: Brain Tumor - Depression - Obsessive compulsive disorder - Anxiousness - Brain surgery Correspondence address: Amir Saied Seddighi, Department of Neurosurgery, Shohada Tajrish Hospital, Tajrish Sq, Tehran, Iran. Email: [email protected]
Abstract Objective: Very few studies have utilized specific criteria to assess mental disorders in brain tumor patients, and from them, they
are mainly descriptive. The purpose of this study is to examine mental disorders in relation to tumor characteristics and patients’
psychosocial factors using DSM-IV (depression, sleep and mood) criteria, among brain tumor patients. Materials and Methods:
From March 2009 to July 2011, 98 patients who surgically treated with intracranial neoplasm were included in this prospective
study. The mean age of the patient group was 42.2 years with a range of 18-60 years with a male to female ratio of 1.2. The
most common tumor type was glioblastoma multiform (30.3%), followed by meningioma (16.8%) and anaplastic glioma (12.3%).
Results: In our study, the prevalence of mild depression was about 30% for males and 38% for females before surgery; however
at 3 months after surgery, this amount decreased to the amount of 25.6% and 26% for male and female patients respectively.
Before tumor operation, the prevalence of major depression was 10.4% for males and 19.7% for females. At 3 months after
operation the prevalence of major depression was 12.8% for males, and 6.7% for females. Aggression or suicide attempts were
not seen related to depression. Before operative intervention, severe anxiousness as well as severe Obsessive Compulsive
Disorder (OCD) symptoms was present in 14.7% of males while at 3 months after operation, prevalence of severe anxiousness
and severe OCD symptoms decreased to 4% and 9.3% respectively. In females, 28.7% of the subjects had reported to have
severe anxiousness and 25.6% severe OCD symptoms. Three months after surgery, these amounts were 17.6% and 38.7%
respectively. Conclusion: Depressive symptoms as well as anxious and OCD psychopathology were shown to be prevalent
signs among patients with brain tumor. Diagnosis of the previous mentioned symptoms were totally based on DSM-IV criteria
and these disorders and the percentiles don’t seem to be related to each other. Due to high variability of tumor stages, statistical
analysis of whether the mentioned psychiatric symptoms get worsen at the later stages of the tumor genesis was not feasible.
Although not measured directly, mentioned psychiatric symptoms seem to get worsen at the later stages of the brain tumor. The
associated factors are tumor location, patient’s premorbid psychiatric status, cognitive symptoms and adaptive or maladaptive
response to stress.
HJNM 2015; 18(Suppl1); 63-67 Published on line: 12 December 2015
Introduction
rimary brain tumor has a great, often dramatic impact on the life of patients and their families [1, 2]. Brain tumor, being both a malignancy and a progressive neurodegenerative disease, has a direct effect on the patient’s cognitive, neurological and psychic functions, causing focal cerebral dysfunction at the site of the tumor lesion [3].
In addition, treatment of the tumor, i.e. surgery, radiotherapy, chemotherapy and immunotherapy, may be neurotoxic and cause dysfunction of the sub cortical white matter [4]. The main literature in the field of neuropsychiatry symptoms for brain tumor patients has been based on individual case reports and retrospective case series [3]. In addition, studies focusing on psychiatric symptoms in brain tumor patients are mainly descriptive, and the number of cases in the study populations is small [5, 6]. Quality of life (QOL) in brain tumor patients has not yet been extensively studied; the first studies were initiated as recently as in the 1990’s [7, 8]. Since many studies of QOL in brain tumor patients are either retrospective or cross-sectional in nature, the effects of tumor characteristics and treatment as well as patients’ emotional and cognitive impairments are difficult to estimate over time [6]. This study is a prospective project in which mental disorders among brain tumor patients are evaluated. The purpose of this study is to examine mental disorders in relation to tumor characteristics and patients’ psychosocial factors among brain tumor patients.
Materials and Methods In this study, 98 patients with intracranial brain tumor were referred to the clinic of neurosurgery from March 2009 to July 2011 and were surgically treated. The mean age of the patient group was 42.2 years with a range of 18-60 years. Fifty five percent (55%) of the patients were male. Male to female ratio was 1.2. In terms of educational level, 51.8% had high school diploma or less, 38.5% had a college degree, and 9.7% held a post graduate degree. Most of the patients were not
P

www.nuclmed.gr Hell J Nucl Med Suppl, September-December 2015 64
employed (67.9%) at the time of the interview and testing, while the remainders were employed full time (17.6%), or part time (24.5%). The majority of the patients (61.8%) were married, while the remainders were never married, separated/divorced, or widowed. Range of Karnofsky Performance Scale (KPS) ratings was from 60% to 100%. In our cases, 28% had KPS=100; 26% had KPS=90; 15% had KPS=80; and 31% had KPS=70. The majority of the patients in our study had frontal lobe tumors (42.6%) of the glioblastoma multiform (GBM) type (43.8%). The location and side of the tumors are summarized in table 1.
Table 1. Olive bioactive compounds investigated Location No (%)
Right No (%)
Left No (%)
Total No (%)
Frontal 18 (20.7) 20 (23.0) 38 (42.6)
Temporal 10 (11.5) 7 (8.0) 17 (19.1)
Parietal 5 (5.7) 10 (11.5) 15 (16.9)
Brain Stem - - 9 (10.2)
Others 2 (2.3) 8 (8.9) 10 (11.2)
The most common pathologic type was glioblastoma multiform (30.3%), followed by meningioma (16.8%). Table 2 demonstrates the relative frequency of the pathologic tumor types of the patients.
Table 2. The frequency of the pathologic type of brain tumors in the patients
Pathologic Type No (%)
Glioblastoma multiforme 27 (30.3)
Anaplastic glioma 11 (12.3)
Low grade glioma 9 (10.1)
Meningioma 15 (16.8)
Ependymoma 4 (4.5)
Germinoma 2 (2.2)
Hemangioma 2 (2.2)
Lymphoma 3 (3.4)
Medulloblastoma 3 (3.4)
Pituitary Adenoma 8 (8.9)
Metastasis 5 (5.6)
Total 89 (100)
In this study, the patients had received multiple and varied treatments. The treatments included: neurosurgical debulking (85%); regional radiotherapy (68%); chemotherapy (32.2%); whole brain irradiation (17.3%); and gamma knife radiotherapy (4.6%). In addition, 82.5% of the patients' group was on steroids at the time of their interviews. The prevalence of depressive symptoms was assessed with Beck Depression Inventory (BDI). The level of anxiety according to CCEI, and the level of obsessive-compulsive symptoms (OBS) in the CCEI were assessed separately for male and female patients. In the male patients, the prevalence of at least mild depression (BDI) prior to operation was 30%, while it was 25.6% (Figure 1) months after the operation. In the female patients, 37.8% were shown to be at least mildly depressed before tumor operation. However, at three months after operation, 26% of the females were found to have at least mild depression (Figure 2). Before tumor operation, the prevalence of major depression (BDI scores 14 or over) was 10.4% for males and 19.7% for females. At three months after operation the prevalence of major depression was 12.8% for males, and 6.7% for females. Before tumor operation, 14.7% of the male patients were severely anxious, while the corresponding proportion was 4% at three months after the operation. In the female patients, 28.7% of the subjects had reported to be severely anxious before tumor operation. However, the rate of severe anxiety was 17.6 % in the female group three months after the operation. The level of anxiety differed significantly between the genders at three months (P=0.015) after tumor operation, but not before.
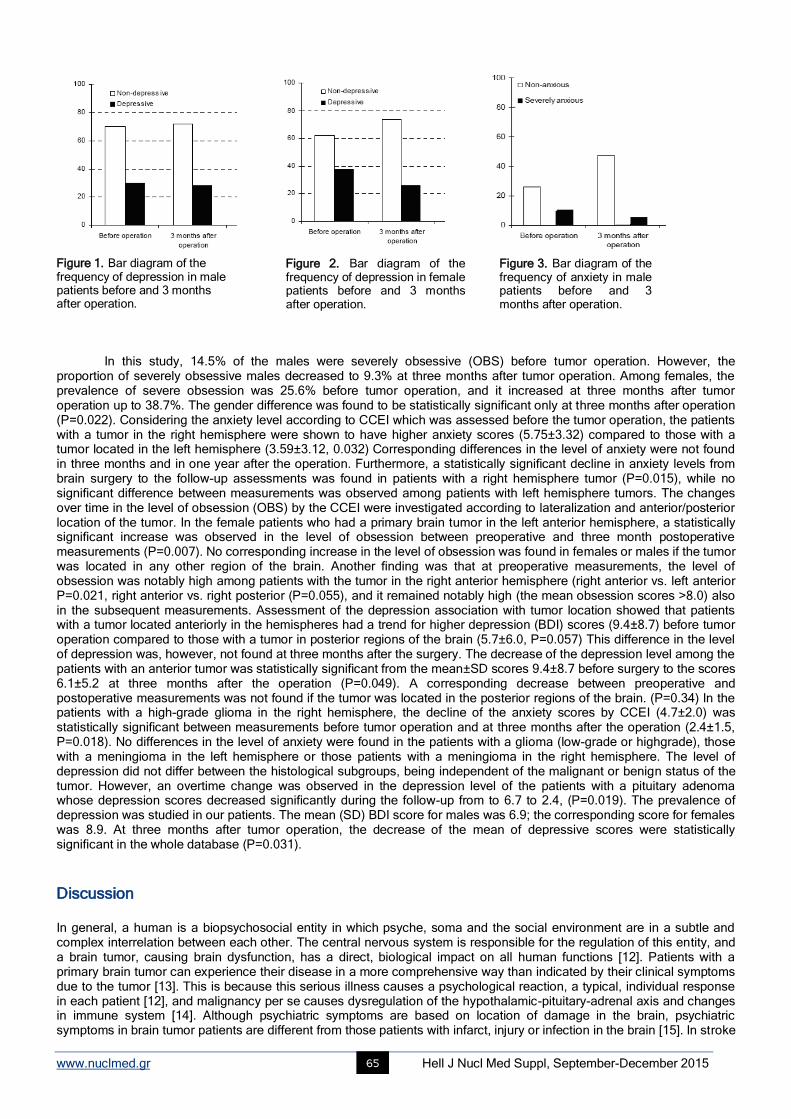
www.nuclmed.gr Hell J Nucl Med Suppl, September-December 2015 65
Figure 1. Bar diagram of the frequency of depression in male patients before and 3 months after operation.
In this study, 14.5% of the males were severely obsessive (OBS) before tumor operation. However, the proportion of severely obsessive males decreased to 9.3% at three months after tumor operation. Among females, the prevalence of severe obsession was 25.6% before tumor operation, and it increased at three months after tumor operation up to 38.7%. The gender difference was found to be statistically significant only at three months after operation (P=0.022). Considering the anxiety level according to CCEI which was assessed before the tumor operation, the patients with a tumor in the right hemisphere were shown to have higher anxiety scores (5.75±3.32) compared to those with a tumor located in the left hemisphere (3.59±3.12, 0.032) Corresponding differences in the level of anxiety were not found in three months and in one year after the operation. Furthermore, a statistically significant decline in anxiety levels from brain surgery to the follow-up assessments was found in patients with a right hemisphere tumor (P=0.015), while no significant difference between measurements was observed among patients with left hemisphere tumors. The changes over time in the level of obsession (OBS) by the CCEI were investigated according to lateralization and anterior/posterior location of the tumor. In the female patients who had a primary brain tumor in the left anterior hemisphere, a statistically significant increase was observed in the level of obsession between preoperative and three month postoperative measurements (P=0.007). No corresponding increase in the level of obsession was found in females or males if the tumor was located in any other region of the brain. Another finding was that at preoperative measurements, the level of obsession was notably high among patients with the tumor in the right anterior hemisphere (right anterior vs. left anterior P=0.021, right anterior vs. right posterior (P=0.055), and it remained notably high (the mean obsession scores >8.0) also in the subsequent measurements. Assessment of the depression association with tumor location showed that patients with a tumor located anteriorly in the hemispheres had a trend for higher depression (BDI) scores (9.4±8.7) before tumor operation compared to those with a tumor in posterior regions of the brain (5.7±6.0, P=0.057) This difference in the level of depression was, however, not found at three months after the surgery. The decrease of the depression level among the patients with an anterior tumor was statistically significant from the mean±SD scores 9.4±8.7 before surgery to the scores 6.1±5.2 at three months after the operation (P=0.049). A corresponding decrease between preoperative and postoperative measurements was not found if the tumor was located in the posterior regions of the brain. (P=0.34) In the patients with a high-grade glioma in the right hemisphere, the decline of the anxiety scores by CCEI (4.7±2.0) was statistically significant between measurements before tumor operation and at three months after the operation (2.4±1.5, P=0.018). No differences in the level of anxiety were found in the patients with a glioma (low-grade or highgrade), those with a meningioma in the left hemisphere or those patients with a meningioma in the right hemisphere. The level of depression did not differ between the histological subgroups, being independent of the malignant or benign status of the tumor. However, an overtime change was observed in the depression level of the patients with a pituitary adenoma whose depression scores decreased significantly during the follow-up from to 6.7 to 2.4, (P=0.019). The prevalence of depression was studied in our patients. The mean (SD) BDI score for males was 6.9; the corresponding score for females was 8.9. At three months after tumor operation, the decrease of the mean of depressive scores were statistically significant in the whole database (P=0.031).
Discussion In general, a human is a biopsychosocial entity in which psyche, soma and the social environment are in a subtle and complex interrelation between each other. The central nervous system is responsible for the regulation of this entity, and a brain tumor, causing brain dysfunction, has a direct, biological impact on all human functions [12]. Patients with a primary brain tumor can experience their disease in a more comprehensive way than indicated by their clinical symptoms due to the tumor [13]. This is because this serious illness causes a psychological reaction, a typical, individual response in each patient [12], and malignancy per se causes dysregulation of the hypothalamic-pituitary-adrenal axis and changes in immune system [14]. Although psychiatric symptoms are based on location of damage in the brain, psychiatric symptoms in brain tumor patients are different from those patients with infarct, injury or infection in the brain [15]. In stroke
Figure 2. Bar diagram of the frequency of depression in female patients before and 3 months after operation.
Figure 3. Bar diagram of the frequency of anxiety in male patients before and 3 months after operation.
www.nuclmed.gr Hell J Nucl Med Suppl, September-December 2015 66
patients, psychiatric symptoms are more studied and destruction of neurons is seen, while in brain tumor patients deficits are mainly based on the more gradual displacement and plasticity of neuronal structures [16]. Psychiatric symptoms can be the first and only signs of primary brain tumor and between 1% and 2% of patients with a psychiatric disorder may have unrecognized brain neoplasm [17, 18]. Depressive symptoms as well as anxiousness and obsessive psychopathology were shown to be prevalent signs among neurosurgical patients with a primary brain tumor in our patients. In our study, the prevalence of at least mild depression before tumor operation was as high as 30% for males and 38% for females. Although the proportion of depressed patients decreased significantly after tumor operation, the prevalence of at least mild depression was still notably high. Before tumor operation, severe anxiousness symptoms as well as severe obsessive compulsive symptoms were present in 14% of the male patients. In females, 29% had reported to have severe anxiousness and 25% severe obsessive symptoms. However, the prevalence of severe anxiousness decreased both in females and in males to 14% and 4% respectively during the follow-up. Contrary to anxiety symptoms, the prevalence of severe obsession increased significantly up to the three-month measurement point in female patients, while it decreased during the follow-ups in male patients. Assessment of the tumor lateralization association with the anxiety of patients before tumor operation showed that the level of anxiety was substantially higher in the patients with a tumor in the right hemisphere compared to those with a left hemispheric tumor. Furthermore, the level of anxiety decreased significantly three months after tumor operation in the patients with a right hemispheric tumor. While investigating the level of obsession in relation to tumor location, it was found that in the female patients with a tumor in the left anterior region of the brain the obsession scores were significantly increased three months after operation. However, in the patients with a tumor in the right anterior location, severe obsession was already present before tumor operation as well as at the follow-ups. The association of depression with tumor location and with the patients’ functional outcome was also investigated. The anterior location of the tumor of the patients was associated with higher preoperative depressive scores compared to the scores of the patients suffering from a posterior location of the tumor. In addition, depression was found to be significantly correlated with the patients’ decreased functional outcome before tumor operation and at follow-ups. Among patients with a primary brain tumor, depression was shown to be a major psychiatric symptom, and in all likelihood it complicated the course of the disease before and after operation. In addition, obsessive and compulsive symptoms in females appeared to increase as early as at three months after operation among those with a tumor in left anterior location of the brain. Severe obsession was found especially in female patients with a tumor in the right anterior location of the brain at all the measurement points. In earlier literature, depression among cancer patients was considered to be a normal psychological reaction to a serious illness [19]. Nowadays, there is growing evidence that depression in cancer patients is not merely an appropriate psychological reaction, but that it has biological and biochemical bases [14]. The pathophysiology behind the depression in cancer patients is most probably multifactorial in its origin. As suggested by several researchers, deregulations of the hypothalamic-pituitary-adrenal axis and changes in cytokine levels in the brain may lie behind the association between depression and cancer [14, 19]. Further, depression in cancer patients complicates coping with the disease, causes worsening the quality of life and interferes with adherence to medical treatment [20]. The prognosis of cancer patients may worsen particularly due to depression as depression often prevents patients from complying with treatment regimens and other health-promoting behaviors [21]. Both obsessive-compulsive symptoms and depression are known to decrease the quality of life in the patients [22, 23]. Patients in psychiatric settings may present with such medical conditions as brain tumors, which may or may not be associated with neurological symptoms. In some cases, patients may only have psychiatric symptoms such as mood changes, psychotic symptoms, panic attacks, changes in personality, or memory difficulties. Brain tumors may be detected in patients at their first presentation to mental health services or sometimes in patients with well-established psychiatric diagnoses. In this study, we showed that in some cases brain tumors can be neurologically silent and only present atypical psychiatric symptoms. We emphasize the need for neuroimaging studies in patients with atypical changes in mental status, even without neurological signs or symptoms. Our findings remain exploratory due to small sample size, but they suggest that psychological problems develop over time and are due to a combination of neurological and psychosocial problems that ensure initial treatments. The factors suggested being associated with psychiatric symptoms among brain tumor patients are tumor location, patient’s premorbid psychiatric status, tumor-associated cognitive symptoms and adaptive or maladaptive response to stress, usually all in combination [3]. Treating these problems may reduce the complications in patients with brain tumors.
The authors declare that they have no conflicts of interest.
Bibliography 1. Passik SD, Malkin MG, Breitbart WS, Horowitz S. Psychiatric and Psychosocial aspects of neurooncology. J Psychosoc Oncol 1994; 12: 101-
22.
2. Salander P, Bergenheim T, Henriksson R. The creation of protection and hope in patients with malignant brain tumours. Soc Sci Med 1996;
42: 985-96.
3. Weitzner MA. Psychosocial and neuropsychiatric aspects of patients with primary brain tumors. Cancer Invest 1999; 17(4): 285-91, Review.
4. Scheibel RS, Meyers CA, Levin VA. Cognitive dysfunction following surgery for intraceregral glioma: influence of histopathology, lesion
location, and treatment. J Neurooncol 1996; 30: 61-9.
5. Irle E, Peper M, Wowra B, Kunze S. Mood changes after surgery for tumors of the cerebral cortex. Arch Neurol 1994; 51: 164-74.
6. Weitzner MA, Meyers CA. Cognitive functioning and quality of life in malignant glioma patients: a review of the literature. Psycho-Oncology
1997; 6: 169-77.

www.nuclmed.gr Hell J Nucl Med Suppl, September-December 2015 67
7. Aiken RD. Quality-of-life issues in patients with malignant gliomas. Semin Oncol 1994; 21: 273-5.
8. Lovely MP. Quality of life of brain tumor patients. Semin Oncol Nurs 1988; 14: 73-80.
9. Schag CC, Heinrich RL, Ganz PA. Karnofsky performance status revisited: reliability, validity and guidelines. J Clin Oncol 1984; 2: 180-93.
10. Haines A, Cooper J, Meade TW. Psychological characteristics and fatal ischaemic heart disease. Heart 2001; 85: 385-9.
11. Beck AT, Steer RA, Garbin MG. Psychometric properties of the Beck depression Inventory: twenty-five years of evaluation. Clin Psychol
Rev 1988; 8: 77-100.
12. Weitzner MA. Psychosocial and neuropsychiatric aspects of patients with primary brain tumors. Cancer Invest 1999; 17: 285-91.
13. Fox S. Use of Quality of life instrument to improve assessment of brain tumor patients in outpatient setting. J Neurosci Nurs 1998; 30: 322-5.
14. Horrobin DF, Bennet CN. Depression and bipolar disorder: relationships to impaired fatty acid and phospholipid metabolism and to diabetes,
cardiovascular disease, immunological abnormalities, cancer, ageing and osteoporosis. Prostaglandins Leukotri Essent Fatty Acids 1999;
60: 217-34.
15. Carson AJ, MacHale S, Allen K et al. Depression after stroke and lesion location: a systematic review. Lancet 2000; 356: 122-6.
16. Anderson SW, Damasio H, Tranel D. Neuropsychological impairments associated with lesions caused by tumor or stroke. Arch Neurol
1990; 47: 397-405.
17. Davis FG, Kupelian V, Freels S et al. Prevalence estimates for primary brain tumors in the United States by behavior and major histology
groups. Neurooncol 2001; 3: 152-8.
18. Price TRP, Goetz KL, Lowell MR. Neuropsychaitric aspects of brain tumors, American Psychiatric Textbook of Neuropsychiatry, 2nd Edition.
Edited by Yudofsky SC, Hales RE. Washington DC, American Psychiatric Press 1992; 473-97.
19. Spiegel D. Cancer and depression. Br J Psych 1996; 168: 109-16.
20. Spiegel D, Giese-Davis J. Depression and cancer: Mechanisms and disease progression. Biol Psychiatry 2003; 54: 269-82.
21. Evans DL, Charney DS. Mood disorders and medical illness: A major public health problem. Biol Psychiatry 2003; 54: 177-80.
22. Hollander E, Kwon JH, Stein DJ et al. Obsessive compulsive and spectrum disorders: overview and quality of life issues. J Clin Psychiatry
1996; 57 (suppl 8): 3-6.
23. Pelletier G, Verhoef MJ, Khatri N, Hagen N. Quality of life in brain tumor patients: the relative contributions of depression, fatigue, emotional
distress, and existential issues. J Neuro Oncol 2002; 57: 41- 9.
The excursion to mount Olympus. First stop at St. Athanasios monastery
www.nuclmed.gr Hell J Nucl Med Suppl, September-December 2015 68
Radioguided surgery using gamma detection probe technology for resection of cerebral glioma
Afsoun Seddighi MD, Mohammad Esmail Akbari MD, Amir Saied Seddighi MD, Elaheh Pirayesh MD, Mohammad Mehdi Soleymani MD, Hesam Rahimi Baqdashti MD, Amir Nikouei MD, Alireza Zali MD, Seyed Mahmod Tabatabaei MD, Shoeib Naimian MD, Omid Mellati MD, Alireza Sheikhi MD
Shohada Tajrish Neurosurgical Center of Excellence, Functional Neurosurgery Research Center of Shohada Tajrish Hospital, Shahid Beheshti University of Medical Sciences, Tehran, Iran
Keywords: Gross total resection - Glioma - Gamma detection probe - Radioguided surgery Correspondence address: Amir Saied Seddighi, Department of Neurosurgery, Shohada Tajrish Hospital, Tajrish Sq, Tehran, Iran. Email: [email protected]
Abstract Objective: Using microsurgical procedures without intraoperative imaging, Gross Total Resection (GTR) has so far only been
achieved in less than 30% of all cases. Radio-guided surgery was introduced in the clinical setting in 1985 in an attempt to
facilitate intraoperative tumor detection. Because of few studies in literature about this subject, we decided to use gamma probe
with the hypothesis that we could increase extent of tumor resection. Materials and Methods: From January 2013 till February
2014, 22 patients with cerebral glioma were randomized equally into two groups and evaluated. In the first group, 370MBq of
Technetiumc-99m was injected. The microsurgical resection of the tumor was performed as much as possible, and then the
tumoral bed was examined, if the signal was more than 2 times of the background signal, more tissue resection performed if
feasible until the signal was diminished. In the control group, conventional resection of the tumor was performed. The extent of
tumor resection was assessed by contrast magnetic resonance imaging (MRI) study. Results: Before surgery the patients in the
first group had average tumor volume of 81.68±9.78. In the second group the average tumor volume before surgery was
82.63±10.06cc. There is no significant difference between preoperative tumor volumes in two groups. In the first group, in the
post-operative MRI, the tumor volume was 5.04±2.69cc and in the second group it was 9.5±4.8cc. Eight patients (72.7%) in the
radioguided group experienced radical resection (more than 95%), but in the control group radical resection was achieved in just
3 patients (27.2%), radical resection was significantly higher in radioguided group (P<0.001). Due to the usage of the gamma
detection probe, time of finding the tumor in the radioguided group was significantly less than control group (P=0.02). However
total operation time in the radioguided group, was not significantly more than the control group (P=0.88). Conclusions:
Neuronavigation system increases the percentage of gross total resection, but it is expensive, increases duration of surgery is
not considered a real-time assessment, and is not accurate in determining the borders of glioma due to brain shift. In contrast,
radio-guided surgery is easy to use, real time, not expensive, and increases the extent of tumor resection.
HJNM 2015; 18(Suppl1); 68-75 Published on line: 12 December 2015
Introduction
he surgery of brain tumors is one of the major concerns in the field of neurosurgery. These tumors constitute approximately 2% of all adult tumors. Unfortunately, more than half of these tumors are high-grade gliomas that are highly aggressive with a great probability of recurrence that makes median survival time 1-3 years after diagnosis.
Finally, 50% to 75% of patients suffering from low-grade glioma pass away because of the disease [1]. In the literature it is shown that extent of radical resection of malignant tumors is a predictor of survival; however,
there is no randomized trial that compares simple debulking cytoreductive surgery with radical resection on survival [2-9]. Efficacy of radiotherapy and chemotherapy on these tumors are inversely related to the remaining of tumor after resection [10].
So, patients with extensive tumor resection, even with the same chemotherapy regimen, had significantly longer survival time than patients in whom just a biopsy was carried out [11]. On the other hand, aggressive resection also may increase the risk of neurological deficits which definitely affect on patient’s quality of life [12]. Obviously, the aim of surgery is to achieve maximum tumor resection with minimal neurosurgical complications.
The most important and basically therapeutic management of malignant gliomas is microsurgical resection, [8, 9] however complete resection of these tumors has been achieved in less than 30% of all the patients [2, 5]. Preoperative imaging like CT and MRI can help define the location of brain tumors, but estimation of the exact spatial location of an intracranial lesion during surgery is usually difficult [13].
One of the important challenges in complete resection of gliomas is the obscure plane between the tumor and normal brain tissue. Also, surgery near the eloquent areas is hazardous and prevents aggressive resection [14]. Several preoperative and intraoperative techniques have been developed to make resection of these tumors more accurate and feasible. These techniques can determine the tumors position anatomically and differ it with functional nearby brain
T
www.nuclmed.gr Hell J Nucl Med Suppl, September-December 2015 69
tissue. One of the innovative techniques in modern surgery is neuronavigation using image guided systems. This technique was used firstly by Robert et al. in 1986 [15].
In the late 20th century, neuronavigation system has been developed [16]. This technique is a frameless, image-guaided system that is based on preoperative CT or MRI. It can increase the accuracy of the size and location of craniotomy and makes tailored tumor resection more feasible. Although neuronavigation shows the exact boundary of the tumor and other structure at the beginning of surgery, images were taken before the operation and don’t show changes in brain shape and location of its structure that would happen during surgery and so it is not considered as a real-time imaging procedure [16, 17].
Functional brain MRI is another modality that helps the surgeon to visualize eloquent areas of the brain. In this technique, active part of brain will be shown due to higher blood flow through them when the patients move their limbs or talk. MRI shows these parts in a different color.
However, it is not very accurate in assigning tumor position but surgeon can avoid functional regions during surgery. This imaging technique is not available in operation room, so it’s not a real-time imaging technique [18]. Fiber tracking using diffusion tensor imaging (DTI) shows exact location of the eloquent white matter structures. Merged with neuronavigation data, the accuracy of surgery especially near the functional brain tissue is increased. This technique is not real-time too and it’s not available in most centers [18].
The functional brain tissues also can be determined intraoperatively with direct cortical stimulation. First time, Foerster reported “Direct Cortical Stimulation” and “Brain Mapping” technique in 1930, [19] and then Penfield et al. described it in details [20-22]. In this technique, after craniotomy with use of a bipolar or unipolar electrode touching the brain surface, motor responses will be recorded as MEP (motor evoked potentials) on limbs while the patient is just sedated without general anesthesia. The areas that caused MEP response will be marked with sterile papers to make a Brain Mapping in order to avoid during resection of tumor [8, 18].
Paramount benefit of this method is real-time detection of functional brain tissues, but it has some difficulties and complications. Anesthesia process is difficult and the operation time will increase [18]. On the other hand, operation on awake patient will cause some complications like respiratory dysfunction, hemodynamic instability (rising blood pressure and heart rate), seizure during surgery, neurological deficit, brain edema and hemorrhage, local anesthetizing drug toxicity, nausea and vomiting, aspiration, pulmonary emboli and even death [23].
Intraoperative imaging using ultrasonography is another technique for improving detection of tumors, especially in subcortical cystic glioma and adjacent ventricles and peritumoral vasculature with neuronavigation [24]. Koivukangas and Kelly introduced use of ultrasonography as an intraoperative imaging technique in 1986 [25]. The most important advantage of ultrasonography is the ability of real-time imaging during surgery. But it does not have adequate efficiency in non cystic tumors. Combination of ultrasonography with neuronavigation can increase the accuracy of glioma surgery [24, 26].
Another technique for improving resection of glioma is fluorescence-guided surgery that uses fluorescent tumor markers in order to distinguish tumor from natural brain tissues. In this technique, after administration of oral 5-aminolevulinic acid (5-ALA) that is nonfluorscent prodrug, this substance will be metabolized to protoporphyrin IX (PpIX) in tumor tissue through heme biosynthesis pathway [27]. So PpIX accumulate in malignant glioma and it has fluorescent nature. In normal brain tissue, PpIX level is very low. In the view provided by the special microscope that omits blue light (400nm wavelength), the tumor tissue is shown as a reddish material and the normal brain as a bluish tissue [27-29]. It has been shown that fluorescence-guided surgery increases tumor resection with less morbidity. The reported side effects of oral administration of 5-ALA has been skin photo sensitivity [30, 31].
However, 5-ALA is not FDA approved yet. This method needs a special microscope that is limited to a few centers. 5-ALA is now commercially available but it is extremely expensive [29]. The other real-time intraoperative imaging procedure is intraoperative MRI that allows surgeons to take MRI during surgery in the operation room. The first 0.5 Tesla intraoperative MRI system was manufactured in Brigham’s Hospital in Boston in 1990 [32]. Sutherland et al. in 1999 used intraoperative MRI in neurosurgery field. They used this system to operate brain tumors and vascular lesions [33]. This technique is almost real-time and the surgeon can use it for maximum resection of glioma with minimum neurological deficit; [34] however, it needs specially equipped operation theatre without any magnetic material device in either surgery tools or anesthetic equipments that is so expensive and right now, it exists in just 100 centers all over the world [18]. It does not exist in Iran too. Moreover, this technique will lengthen the operation time and is technically demanding [35].
Radio-guided surgery has been developed about 60 years ago [36]. Using gamma detection probe technology, radio-guided surgery has revolutionized the surgical management of many malignancies such as breast cancer, colorectal cancer, melanoma and parathyroid disease [37, 38]. This technique provides critical and real-time information about size, location and invasion of the tumor into the adjacent tissues, so as to help find surgical resection margins accurately.
Moreover, this technique has enabled the surgeons to be able to perform maximal cytoreduction with fewer complications [38].
Morley and Jefferson used phosphorus-32 and a modified Geiger-Muller probe that detect beta radiation to map the tumor extent and locate the tumor to guide biopsy for the first time [39].
Desiatnikov et al. used this technique with similar purposes in 1968 [40]. The first radioguided brain tumor surgery with using a gamma probe was reported by Vilelha and Carneiro in 2002. They resect a metastatic renal cell carcinoma in the right parietal lobe of a 62 year old man with use of gamma probe after injection of Tc-99m [41]. Thereafter, just a few studies performed, using radioguided surgery. In 2004, Kojima et al reported resection of primary or secondary brain tumors in 13 patients, using gamma probe. They used Tc-99m as a radionuclide agent [42]. Then Gay et al used In-111(DTPA)-D-Phe 1 pentereotide (an analoge of somatostatin) as radionuclide to resect meningiomas in 10
www.nuclmed.gr Hell J Nucl Med Suppl, September-December 2015 70
patients [45]. In 2006, Serrano et al used Thallium-201 to resect an astrocytoma of right temporoparietal lobe with radioguided surgery [46]. They also reported resection of 6 patients’ malignant astrocytomas in 2008, using same technique [47]. Finally, Bhanot et al in 2007 reported radioguided surgery, using Tc-99m for resection of 13 patient’s glioma [48]. The efficacy of this approach in brain tumor surgery has not been properly investigated and there is no general comparison of this technique with conventional methods in the literature. The aim of this study is to determine the effect of radio guided surgery in cerebral gliomas in our series.
Materials and Methods In this study all the patients who were diagnosed as cerebral glioma in our institute from January 2013 till February 2014 referred to our neurosurgical clinic were evaluated. They did not receive any brain surgery, chemo or radio therapy before. The inclusion criteria were patients aged between 18-60 years that their neuroimaging were consistent with cerebral glioma. After performing MRI (in postgadolinium T1-weighted images), only cases with the potential for complete tumor resection (non eloquent lesions and not deep seated) were selected. Our exclusion criteria were as follows: deep lesions, involvement of the eloquent areas, gliomatosis cerebri, pregnant or lactating women. All the selected cases were randomized into two groups.
Before the study, informed consent was obtained from all the patients and complete procedure of the study was explained to their family and themselves and our study was reviewed and accepted by Shahid Beheshti university ethical committee.
Functional metabolic imaging modalities can provide information about metabolic status of brain tumors. However it seems that positron emission tomography (PET) has more sensitivity than SPET (single-photon emission computed tomography), but SPET is considered as a valuable alternative because of lower cost and wider availability [49].
In the first group, before the procedures, Tc-99m MIBI SPET was performed. A brain SPET was performed 40 minutes after the injection of 111MBq of Tc-99m MIBI. Images were reported quantitatively and qualitatively. The patients who didn’t have enough uptakes in SPET were excluded from study. The others had acceptable uptake in SPET.
With using of the open-source image processing software “ImageJ” developed by the National Institutes of Health (http://rsb.info.nih.gov/ij/index.html) in slice with maximum lesion uptake, relative tracer concentration was calculated in ROI (region of interest) and a second mirror region on the contra lateral normal side of the brain in the same slice (as normal background uptake). By dividing average signal in the lesion ROI by those in the mirror regions, T/N (tumor/normal) ratios were achieved [49]. These T/N ratios are shown in Table 2.
A surgical gamma probe was used (SCINTIPROBE MR100) with the energy window manually ranged between 60 and 180keV, including the 2 main photo peaks of Tc-99m MIBI. Tip of our probe diameter was 15mm.
After all requisites had been fulfilled, an additional dose of 37MBq of Tc-99m MIBI chloride was injected at the same time as the craniotomy in the operating room. In the course of the surgery, the signal from skull, dura, cortex overlying the tumor and the tumoral bed after tumor resection was recorded with the use of hand held gamma probe and its related digital detector. The signal of the suspected tumoral area more than the index ratio of the background signal was considered significant. The time between the end of the bone flap resection and tumor identification were also determined in each case. Then surgical resection of the tumor was performed as much as possible considering the color and consistency and differentiation with surrounding tissue. Then the tumoral bed was examined, if the signal was more than T/N ratio of the background signal, more tissue resection performed (if feasible) until the signal was diminished. In the control group, conventional resection of the tumor was performed. After surgery, in all the cases, MRI with and without contrast were performed at first post-operative day and the tumor remnant was determined and compared with the preoperative MRI. The tumor volume was estimated using Cavalieri principle [50, 51]. The recorded variable were as follows: Age, sex, tumor location, pre op and post op tumor volume, the time between bone flap removal and tumor identification, and the signal recorded from skull, dura, cortex and tumoral bed. All the data were gathered in a data base using Excel software. For comparison of the data between the two groups we used Student T test and for the assessment of the intervening factors, Chi square test was performed.
Results In this study all the patients who were diagnosed as cerebral glioma from January 2013 till February 2014 referred to our neurosurgical clinic were evaluated. According to our inclusion and exclusion criteria 22 patients were selected and randomized into two groups. The first group consisted of 11 patients who were considered for radio guided surgery. In this group 7 cases were male (63.7%) and 4 cases were female (36.3%). The average age of this group was 37.1y with the standard deviation of 10.9y. Maximum age was 54y and the minimum age was 32y with the median of 32y. The second group consisted of 11 patients who were considered as the control group. In this group 6 cases were male (54.5%) and 5 cases were female (45.5%). The average age of this group was 41.3y with the standard deviation of 5.2y. Maximum age was 52y and the minimum age was 36y with the median of 40y. There is no significant difference between ages of these groups. (P=0.099) In 8 cases of the first group, the site of the tumor was in the right hemisphere (72.7%) and in 3 cases (27.3%) the tumor was located in the left hemisphere. The location of the tumor was in frontal lobe in 2 patients (18.2%), occipital lobe in 1 case (9%), temporal lobe in 7 cases (63.8%) and insula in 1 case (9%). The most common chief complaint of the
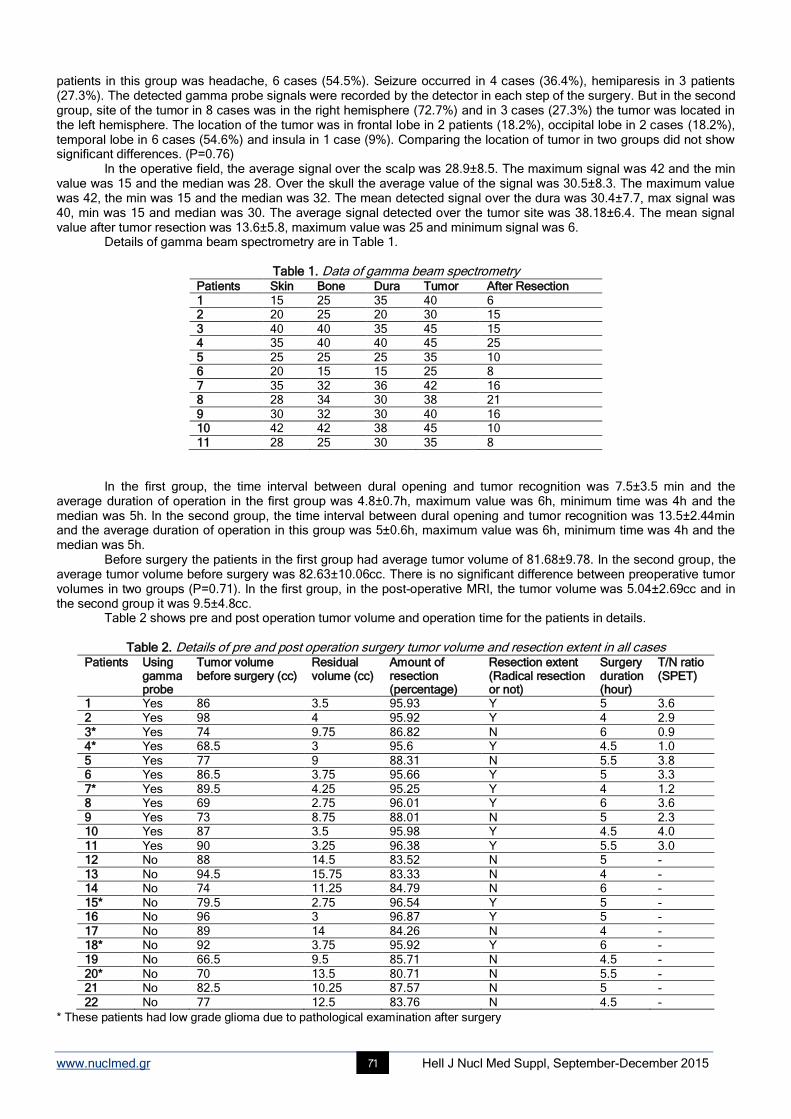
www.nuclmed.gr Hell J Nucl Med Suppl, September-December 2015 71
patients in this group was headache, 6 cases (54.5%). Seizure occurred in 4 cases (36.4%), hemiparesis in 3 patients (27.3%). The detected gamma probe signals were recorded by the detector in each step of the surgery. But in the second group, site of the tumor in 8 cases was in the right hemisphere (72.7%) and in 3 cases (27.3%) the tumor was located in the left hemisphere. The location of the tumor was in frontal lobe in 2 patients (18.2%), occipital lobe in 2 cases (18.2%), temporal lobe in 6 cases (54.6%) and insula in 1 case (9%). Comparing the location of tumor in two groups did not show significant differences. (P=0.76) In the operative field, the average signal over the scalp was 28.9±8.5. The maximum signal was 42 and the min value was 15 and the median was 28. Over the skull the average value of the signal was 30.5±8.3. The maximum value was 42, the min was 15 and the median was 32. The mean detected signal over the dura was 30.4±7.7, max signal was 40, min was 15 and median was 30. The average signal detected over the tumor site was 38.18±6.4. The mean signal value after tumor resection was 13.6±5.8, maximum value was 25 and minimum signal was 6. Details of gamma beam spectrometry are in Table 1.
Table 1. Data of gamma beam spectrometry Patients Skin Bone Dura Tumor After Resection
1 15 25 35 40 6 2 20 25 20 30 15
3 40 40 35 45 15 4 35 40 40 45 25
5 25 25 25 35 10 6 20 15 15 25 8
7 35 32 36 42 16 8 28 34 30 38 21
9 30 32 30 40 16 10 42 42 38 45 10
11 28 25 30 35 8
In the first group, the time interval between dural opening and tumor recognition was 7.5±3.5 min and the average duration of operation in the first group was 4.8±0.7h, maximum value was 6h, minimum time was 4h and the median was 5h. In the second group, the time interval between dural opening and tumor recognition was 13.5±2.44min and the average duration of operation in this group was 5±0.6h, maximum value was 6h, minimum time was 4h and the median was 5h.
Before surgery the patients in the first group had average tumor volume of 81.68±9.78. In the second group, the average tumor volume before surgery was 82.63±10.06cc. There is no significant difference between preoperative tumor volumes in two groups (P=0.71). In the first group, in the post-operative MRI, the tumor volume was 5.04±2.69cc and in the second group it was 9.5±4.8cc.
Table 2 shows pre and post operation tumor volume and operation time for the patients in details.
Table 2. Details of pre and post operation surgery tumor volume and resection extent in all cases Patients Using
gamma probe
Tumor volume before surgery (cc)
Residual volume (cc)
Amount of resection (percentage)
Resection extent (Radical resection or not)
Surgery duration (hour)
T/N ratio (SPET)
1 Yes 86 3.5 95.93 Y 5 3.6
2 Yes 98 4 95.92 Y 4 2.9
3* Yes 74 9.75 86.82 N 6 0.9 4* Yes 68.5 3 95.6 Y 4.5 1.0
5 Yes 77 9 88.31 N 5.5 3.8 6 Yes 86.5 3.75 95.66 Y 5 3.3
7* Yes 89.5 4.25 95.25 Y 4 1.2 8 Yes 69 2.75 96.01 Y 6 3.6
9 Yes 73 8.75 88.01 N 5 2.3 10 Yes 87 3.5 95.98 Y 4.5 4.0
11 Yes 90 3.25 96.38 Y 5.5 3.0 12 No 88 14.5 83.52 N 5 -
13 No 94.5 15.75 83.33 N 4 - 14 No 74 11.25 84.79 N 6 -
15* No 79.5 2.75 96.54 Y 5 - 16 No 96 3 96.87 Y 5 -
17 No 89 14 84.26 N 4 - 18* No 92 3.75 95.92 Y 6 -
19 No 66.5 9.5 85.71 N 4.5 -
20* No 70 13.5 80.71 N 5.5 - 21 No 82.5 10.25 87.57 N 5 -
22 No 77 12.5 83.76 N 4.5 -
* These patients had low grade glioma due to pathological examination after surgery
www.nuclmed.gr Hell J Nucl Med Suppl, September-December 2015 72
After surgery the pathological report of the tumor were as follows: astrocyroma grade 2 in 1 case (9.1%), oligodendroglioma grade 2 in 2 patients, astrocytoma grade 3 in 2 cases and gliobalstoma multiform 6 cases. In the second group, pathological report of the tumor were astrocyroma grade 2 in 1 case (9%), oligodendroglioma grade 2 in 2 patients (18.2%), astrocytoma grade 3 in 3 cases (27.3%) and gliobalstoma multiform in 5 cases (45.4%). The difference between these two groups was not significant (P=0.88).
Discussion In most centers from all over the world, common imaging techniques like neuronavigation system, MRI or CT-scan with contrast is not available in the operating room [32]. So lack of realtime imaging technique in the operating room is noticeable. MRI but these imaging techniques are not usually available in the operating room and if they were, they would be so expensive. Differentiation between brain tumors and natural brain tissue during an operation is so important, because we need to remove as much as possible of tumor with less damage to the normal and especially functional brain tissues. Maximum removal of the brain tumor and cytoreduction increases the efficacy of adjuvant therapies (i.e. radiotherapy or chemotherapy) [42].
In this study, the mean residual tumor volume was 5.04cc in radioguided group and 9.5cc in control group. There
was a significant difference between residual volumes in the 2 groups (P=0.01).
In our study, 8 patients (72.7%) in the radioguided group experienced radical resection (more than 95%), but in the control group radical resection was achieved in just 3 patients (27.2%) that our control group is similar to other studies using microsurgery. Radical resection was significantly higher in radioguided group (P<0.001). In our study, extending the amount of tumor resection in the cases demonstrating significant signal did not increase the rate of postoperative neurological deficit (18% in both groups). This may be due to the fact that we only included patients with total resectability potential. Time of finding the tumor in the radioguided group was significantly less than control group (P=0.02). This reduction in finding tumor time is because of using gamma probe. However, total operation time in the radioguided group, was not significantly more than the control group (P=0.88). The annual exposure limit of radionuclide was set by The International Commission on Radiological Protection (ICRP) as a total dose equivalent of 100000μSv per year in five years that it has to not exceed 50000μSv in a year [52, 53]. Radiation exposure from Tc-99m MIBI used for radioguided surgery of brain has been evaluated. The mean exposure time was 6.1 hours for all operation room personnel. The mean whole body exposure was 27.9μSv for surgeons, 25.8μSv for nurses and 14.9μSv for anesthetists [42]. According to existing data microsurgery without any intraoperative imaging, resulted in gross total resection (GTR) in 27% to 38.2% of patients [54-57]. Neuronavigation system increases the percentage of gross total resection, but it is expensive, increases duration of surgery and is not considered a real-time assessment, and is not accurate in determining the borders of glioma duo to brain shift [2]. Kurimoto et al. reported that GTR can be achieved in 64.3% of cases using using neuronavigation system [57]. Our complication rate was 18%. In Kurimoto study the rate of complication after resection of cerebral glioma was 17.6% in microsurgery group (similar to our results) and just 9.5% in neuronavigation group [57]. Nimsky reported 10.2% complications after surgery using neuronavigation and just 2.9% in their patients operated with iMRI [56]. In a study performed by Enchev et al., they evaluated efficacy of intra-operative ultrasound combined with neuronavigation on operation of recurrent cystic glioma. Postoperation evaluation revealed 60% GTR, 20% near total resection and 20% subtotal resection of tumor. Intraoperative ultrasonography is so useful in subcortical cystic tumors, it is real-time and economical; however it has not enough accuracy in operating of solid tumors and interpretation of these tumors images need more experience [24]. In 2006, Muragaki reported that iMRI use in 96 cases with cerebral glioma, resulted in 0.025mL tumor residue whereas in the control group the average tumor remnant was 1.7mL. (P<0.001) [58]. They also reported that in patients with iMRI application, GTR achieved in 95% of their patients [58]. In Nimsky series, GTR was achieved in only 27% of their patients according to the results obtained by iMRI. After the iMRI evaluation, the overall GTR was achieved in 40% of the cases [54-56]. Currently, just about 100 centers in all over the world have special operation room and surgery device, adapted for intraoperative MRI and these facilities are very expensive [18]. It is not worldwide and there is no such an operation room in Iran. The overall cost of polestar N20 iMRI was over 3 million dollars that mentioned in Makary study and it has about 120,000$ running cost each year [59]. As claimed by American Hospital Association Health Data Management Group guidelines in 2008, this system’s economic life is only 5 years without any end-of-life salvages value [60]. As it was shown in the literature, iMRI elongates the operating time about 0.5 to 2 hours more than usual [61-63]. Stummer et al., in their series compared fluorescence-guided surgery using 5-ALA with microsurgery. In fluorescence-guided group 65% of patients showed GTR, but in microsurgery group just 36% of their patients showed GTR in post-operative MRI.31 Also in 2014, Piquer et al. reported 79.3% GTR in their series using fluorescence-guided [64]. This microscope is expensive and using 5-ALA is costly for each patient, however it is commercially available
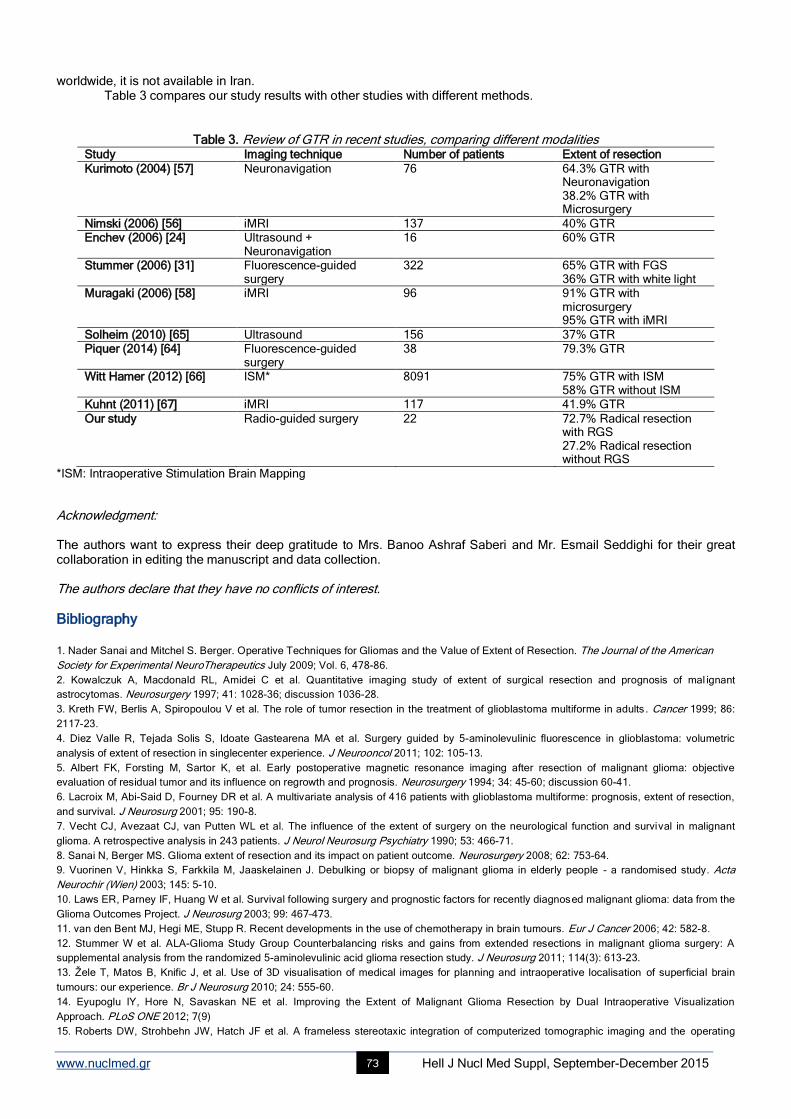
www.nuclmed.gr Hell J Nucl Med Suppl, September-December 2015 73
worldwide, it is not available in Iran. Table 3 compares our study results with other studies with different methods.
Table 3. Review of GTR in recent studies, comparing different modalities Study Imaging technique Number of patients Extent of resection
Kurimoto (2004) [57] Neuronavigation 76 64.3% GTR with Neuronavigation 38.2% GTR with Microsurgery
Nimski (2006) [56] iMRI 137 40% GTR Enchev (2006) [24] Ultrasound +
Neuronavigation 16 60% GTR
Stummer (2006) [31] Fluorescence-guided surgery
322 65% GTR with FGS 36% GTR with white light
Muragaki (2006) [58] iMRI 96 91% GTR with microsurgery 95% GTR with iMRI
Solheim (2010) [65] Ultrasound 156 37% GTR Piquer (2014) [64] Fluorescence-guided
surgery 38 79.3% GTR
Witt Hamer (2012) [66] ISM* 8091 75% GTR with ISM 58% GTR without ISM
Kuhnt (2011) [67] iMRI 117 41.9% GTR
Our study Radio-guided surgery 22 72.7% Radical resection with RGS 27.2% Radical resection without RGS
*ISM: Intraoperative Stimulation Brain Mapping
Acknowledgment: The authors want to express their deep gratitude to Mrs. Banoo Ashraf Saberi and Mr. Esmail Seddighi for their great collaboration in editing the manuscript and data collection. The authors declare that they have no conflicts of interest.
Bibliography
1. Nader Sanai and Mitchel S. Berger. Operative Techniques for Gliomas and the Value of Extent of Resection. The Journal of the American
Society for Experimental NeuroTherapeutics July 2009; Vol. 6, 478-86.
2. Kowalczuk A, Macdonald RL, Amidei C et al. Quantitative imaging study of extent of surgical resection and prognosis of mal ignant
astrocytomas. Neurosurgery 1997; 41: 1028-36; discussion 1036-28.
3. Kreth FW, Berlis A, Spiropoulou V et al. The role of tumor resection in the treatment of glioblastoma multiforme in adults . Cancer 1999; 86:
2117-23.
4. Diez Valle R, Tejada Solis S, Idoate Gastearena MA et al. Surgery guided by 5-aminolevulinic fluorescence in glioblastoma: volumetric
analysis of extent of resection in singlecenter experience. J Neurooncol 2011; 102: 105-13.
5. Albert FK, Forsting M, Sartor K, et al. Early postoperative magnetic resonance imaging after resection of malignant glioma: objective
evaluation of residual tumor and its influence on regrowth and prognosis. Neurosurgery 1994; 34: 45-60; discussion 60-41.
6. Lacroix M, Abi-Said D, Fourney DR et al. A multivariate analysis of 416 patients with glioblastoma multiforme: prognosis, extent of resection,
and survival. J Neurosurg 2001; 95: 190-8.
7. Vecht CJ, Avezaat CJ, van Putten WL et al. The influence of the extent of surgery on the neurological function and survival in malignant
glioma. A retrospective analysis in 243 patients. J Neurol Neurosurg Psychiatry 1990; 53: 466-71.
8. Sanai N, Berger MS. Glioma extent of resection and its impact on patient outcome. Neurosurgery 2008; 62: 753-64.
9. Vuorinen V, Hinkka S, Farkkila M, Jaaskelainen J. Debulking or biopsy of malignant glioma in elderly people - a randomised study. Acta
Neurochir (Wien) 2003; 145: 5-10.
10. Laws ER, Parney IF, Huang W et al. Survival following surgery and prognostic factors for recently diagnosed malignant glioma: data from the
Glioma Outcomes Project. J Neurosurg 2003; 99: 467–473.
11. van den Bent MJ, Hegi ME, Stupp R. Recent developments in the use of chemotherapy in brain tumours. Eur J Cancer 2006; 42: 582-8.
12. Stummer W et al. ALA-Glioma Study Group Counterbalancing risks and gains from extended resections in malignant glioma surgery: A
supplemental analysis from the randomized 5-aminolevulinic acid glioma resection study. J Neurosurg 2011; 114(3): 613-23.
13. Žele T, Matos B, Knific J, et al. Use of 3D visualisation of medical images for planning and intraoperative localisation of superficial brain
tumours: our experience. Br J Neurosurg 2010; 24: 555-60.
14. Eyupoglu IY, Hore N, Savaskan NE et al. Improving the Extent of Malignant Glioma Resection by Dual Intraoperative Visualization
Approach. PLoS ONE 2012; 7(9)
15. Roberts DW, Strohbehn JW, Hatch JF et al. A frameless stereotaxic integration of computerized tomographic imaging and the operating
www.nuclmed.gr Hell J Nucl Med Suppl, September-December 2015 74
microscope. J Nenirosnrg 1986; 65: 545-9.
16. Wadley J, Dorward N, Kitchen N, Thomas D. Pre-operative planning and intra-operative guidance in modern neurosurgery: a review of 300
cases. Ann R Coll Surg Engl 1999; 81: 217-25.
17. Bermann JI, Berger MS, Chung SW. Accuracy of diffusion tensor magnetic resonance imaging tractography assessed using intraoperative
subcortical stimulation mapping and magnetic source imaging. J Neurosurg 2007; 107: 488-94.
18. Andrej Vranic: New developments in surgery of malignant gliomas, Radiol Oncol 2011 September; 45(3): 159-165
19. Foerster O. The cerebral cortex of man. Lancet 1931; 2: 309-12.
20. Penfield W, Bolchey E. Somatic motor and sensory representation in the cerebral cortex of man as studied by electrical st imulation. Brain
1937; 60: 389-443.
21. Penfield W, Erickson TC. Epilepsy and cerebral localization. A study of the mechanism, treatment, and prevention of epileptic seizures.
1941.
22. Penfield W, Rasmussen T. Secondary sensory and motor representation. 1950.
23. Andrius P. Skucas, Alan A. Artru: Anesthetic Complications of Awake Craniotomies for Epilepsy Surgery. Anesth Analg 2006; 102: 882-7
24. Enchev Y, Bozinov O, Miller D et al. Imageguided ultrasonography for recurrent cystic gliomas. Acta Neurochir (Wien) 2006; 148: 1053-63.
25. Koivukangas J, Kelly PJ. Application of ultrasound imaging to stereotactic brain tumor surgery. Ann Clin Res 1986; 18: 25-32
26. Jodicke A, Springer T, Boker D-K. Real-time integration of ultrasound into neuronavigation: technical accuracy using a lightemitting- diode-
based navigation system. Acta Neurochir (Wien) 2004; 146: 1211-20
27. Stummer W, Stocker S, Novotny A et al: In vitro and in vivo porphyrin accumulation by C6 glioma cells after exposure to 5- aminolevulinic
acid. J Photochem Photobiol 1998; B 45: 160-9.
28. Stummer W, Novotny A, Stepp H et al.: Fluorescence-guided resection of glioblastoma multiforme utilizing 5-ALA-induced porphyrins. A
prospective study in 52 consecutive patients. J Neurosurg 2000; 93: 1003-13.
29. Van Meir EG, Hadjipanayis CG, Norden AD et al. Exciting new advances in neuro-oncology: The avenue to a cure for malignant glioma. CA
Cancer J Clin 2010; 60: 166-93.
30. Stummer W, Stepp H, Moller G et al.: Technical principles for protoporphyrin-IX-fluorescence guided microsurgical resection of malignant
glioma tissue. Acta Neurochir 1998; 140: 995-1000.
31. Stummer W, Pichlmeier U, Meinel T et al.: ALA-Glioma Study Group. Fluorescence-guided surgery with 5-aminolevulinic acid for resection of
malignant glioma: A randomized controlled multicentre phase III trial. Lancet Oncol 2006; 7: 392-401.
32. Black PM, Moriarty T, Alexander E 3rd et al. Development and implementation of intraoperative magnetic resonance imaging and its
neurosurgical applications. Neurosurgery 1997; 41: 831-42 (discussion 842-5).
33. Sutherland GR, Kaibara T, Louw D et al. A mobile high-field magnetic resonance system for neurosurgery. J Neurosurg 1999; 91: 804-13.
34. Lipson AC, Gargollo PC, Black PM. Intraoperative magnetic resonance imaging: considerations for the operating room of the future. J Clin
Neurosci 2001 Jul; 8(4): 305-10
35. Hefti M, Mehdorn H.M., Albert I, Dorner L. Fluorescence-Guided Surgery for Malignant Glioma: A Review on AminolevulinicAcid Induced
Protoporphyrin IX Photodynamic Diagnostic in Brain Tumors: Current Medical Imaging Reviews, 2010; 6(4) : 254-8
36. Selverstone B, Sweet WH, Robinson CV: The clinical use of radioactive phosphorus in the surgery of brain tumors. Ann Surg 1949, 130:
643-51
37. Nieroda CA, Milenic DE, Colcher D, Schlom J: Monoclonal Antibodies for Use in Radioimmunoguided Surgery (RIGS). In
Radioimmunoguided Surgery (RIGS) in the Detection and Treatment of Colorectal Cancer 1st edition. Edited by: Martin EW. Austin: R.G.
Landes Company 1994: 7-27
38. Stephen P Povoski, Ryan L Neff, Cathy M Mojzisik et al. A comprehensive overview of radioguided surgery using gamma detection probe
technology. World Journal of Surgical Oncology 2009; 7: 11
39. Morley TP, Jefferson G. Use if radioactive phosphorus brain tumours at operation. Br J Med 1952; 2: 4784-7.
40. Desiatnikov VM, Kotliarov EV, Liass FM. Apparat dlia lokalizatsii novoobrazovanii golovnogo mozgo vo bremia operatsii s pomostch’ih P32
(An instrument for localization of brain neoplasms during surgery with the use of P32). Med Radiol (Mosk) 1968; 13: 41-4.
41. Vilelha Filo O, Carneiro Filho O. Gamma Probe-assisted brain tumor microsurgical resection: a new technique. Arq Neuropsiquiatr 2002; 60:
1042-7.
42. Kojima T, Kumita S, Yamaguchi F et al.: Radioguided brain tumorectomy using a gamma detecting probe and a mobile solid-state gamma
camera. Surg Neurol 2004, 61: 229-38. discussion 238
45. Gay E, Vuillez JP, Palombi O et al.: Intraoperative and postoperative gamma detection of somatostatin receptors in bone-invasive en plaque
meningiomas. Neurosurgery 2005, 57 (1 Suppl): 107-12. discussion 112-3
46. Serrano J, Rayo JI, Infante JR et al. Radioguided neurosurgery: a novel application of nuclear medicine. Rev Esp Med Nucl 2006, 25: 184-7.
[Spanish]
47. Serrano J, Rayo JI, Infante JR et al. Radioguided surgery in brain tumors with Thallium-201. Clin Nucl Med 2008; 33: 838-40
48. Bhanot Y, Rao S, Parmeshwaran RV: Radio-guided neurosurgery (RGNS): early experience with its use in brain tumour surgery. Br J
Neurosurg 2007; 21: 382-8.
49. Spyridon Tsiouris, George Alexiou, Athanasios Papadopoulos and Andreas Fotopoulos (2011). Metabolic imaging of brain tumor by 99m
Tc-
tetrofosmin scintitomography, diagnostic techniques and surgical management of brain tumors, Dr. Ana Lucia Abujamra (Ed.), ISBN: 978-953-
307-589-1
50. Mackay CE, Pakkenberg B, Roberts N. Comparison of compartment volumes estimated from MR images and physical sections of f ormalin
fixed cerebral hemispheres. Acta Stereol 1999; 18: 149-59.
51. Bunyamin Sahin, Mehmet Emirzeoglu, Ahmet Uzun et al Unbiased estimation of the liver volume by the Cavalieri principle using magnetic
resonance images. European Journal of Radiology 2003; 47: 164-70
52. ICRP, Publication 60: The 1990 Recommendations of the International Commission on Radiological Protection. Ann ICRP 1991; 21(1-3): 1-
201.
53. ICRP, Publication 103: The 2007 Recommendations of the International Commission on Radiological Protection (Chapters 5 and 6). Ann
ICRP 2007; 37(2-4): 81-123.
www.nuclmed.gr Hell J Nucl Med Suppl, September-December 2015 75
54. Nimsky C, Ganslandt O and Fahlbusch R. “Implementation of fiber tract navigation,” Neurosurgery 2006; vol. 58, no. 4, supplement 2, pp. S-
292–S-303.
55. Nimsky C, Ganslandt O, Merhof D et al. “Intraoperative visualization of the pyramidal tract by diffusion-tensor-imaging-based fiber tracking,”
NeuroImage 2006; vol. 30, no. 4, pp. 1219-29.
56. Nimsky C, Ganslandt O, Buchfelder M, Fahlbusch R. “Intraoperative visualization for resection of gliomas: the role of functional
neuronavigation and intraoperative 1.5 T MRI,” Neurological Research 2006; vol. 28, no. 5, pp. 482-7.
57. Kurimoto M, Hayashi N, Kamiyama H et al. “Impact of neuronavigation and image-guided extensive resection for adult patients with
supratentorial malignant astrocytomas: a singleinstitution retrospective study,” Minimally Invasive Neurosurgery 2004; vol. 47, no. 5, pp. 278-83.
58. Muragaki Y, Iseki H, Maruyama T et al, “Usefulness of intraoperative magnetic resonance imaging for glioma surgery,” Acta Neurochirurgica
2006; vol. 98, supplement, pp. 67-75.
59. Makary M, Chiocca EA, Erminy N et al. Clinical and Economic Outcomes of Low-Field Intraoperative MRI-Guided Tumor Resection
Neurosurgery. Journal of magnetic resonance imaging 2011; 34: 1022-30
60. Health Data Management Group. Estimated useful lives of depreciable hospital assets. Chicago: American Hospital Association; 2008.
61. Barua E, Johnston J, Fujii J et al. Anesthesia for brain tumor resection using intraoperative magnetic resonance imaging (iMRI) with the
Polestar N-20 system: experience and challenges. J Clin Anesth 2009; 21: 371-6.
62. Gerlach R, du Mesnil de Rochemont R, Gasser T et al. Feasibility of PoleStar N20, an ultra-low-field intraoperative magnetic resonance
imaging system in resection control of pituitary macroadenomas: lessons learned from the first 40 cases. Neurosurgery 2008; 63: 272-85
63. Archer DP, McTaggart Cowan RA et al. Intraoperative mobile magnetic resonance imaging for craniotomy lengthens the procedure but does
not increase morbidity. Can J Anaesth 2002; 49: 420-6.
64. Piquer J, Llacer JL, Rovira V et al. Fluorescence-Guided Surgery and Biopsy in Gliomas with an Exoscope System. Hindawi Publishing
Corporation 2014; Volume 2014, Article ID 207974, 6 pages.
65. Solheim O, Selbekk T, Jakola AS, Unsgard G. Ultrasound-guided operations in unselected high-grade gliomas--overall results, impact of
image quality and patient selection. Acta Neurochir (Wien) 2010 Nov; 152(11): 1873-86.
66. De Witt Hamer PC, Robles SG, Zwinderman AH et al. Impact of intraoperative stimulation brain mapping on glioma surgery outcome: a
meta-analysis. J Clin Oncol 2012 Jul 10; 30(20): 2559-65.
67. Kuhnt D, Becker A, Ganslandt O et al. Correlation of the extent of tumor volume resection and patient survival in surgery of glioblastoma
multiforme with high-field intraoperative MRI guidance. Neuro Oncol 2011 Dec; 13(12): 1339-48.
From the excursion - A view of mount Olympus at Prionia, at 1.200 meters
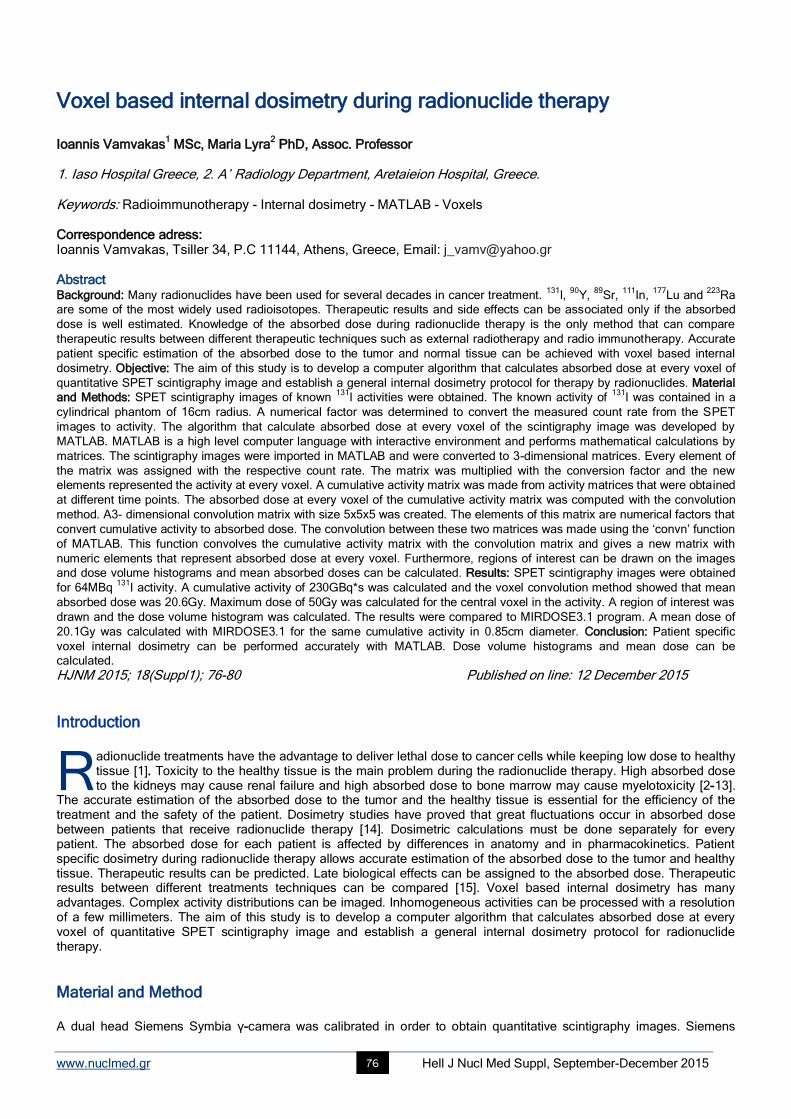
www.nuclmed.gr Hell J Nucl Med Suppl, September-December 2015 76
Voxel based internal dosimetry during radionuclide therapy Ioannis Vamvakas
1 MSc, Maria Lyra
2 PhD, Assoc. Professor
1. Iaso Hospital Greece, 2. A΄ Radiology Department, Aretaieion Hospital, Greece. Keywords: Radioimmunotherapy - Internal dosimetry - MATLAB - Voxels Correspondence adress: Ioannis Vamvakas, Tsiller 34, P.C 11144, Athens, Greece, Email: [email protected] Abstract Background: Many radionuclides have been used for several decades in cancer treatment.
131I,
90Y,
89Sr,
111In,
177Lu and
223Ra
are some of the most widely used radioisotopes. Therapeutic results and side effects can be associated only if the absorbed
dose is well estimated. Knowledge of the absorbed dose during radionuclide therapy is the only method that can compare
therapeutic results between different therapeutic techniques such as external radiotherapy and radio immunotherapy. Accurate
patient specific estimation of the absorbed dose to the tumor and normal tissue can be achieved with voxel based internal
dosimetry. Objective: The aim of this study is to develop a computer algorithm that calculates absorbed dose at every voxel of
quantitative SPET scintigraphy image and establish a general internal dosimetry protocol for therapy by radionuclides. Material
and Methods: SPET scintigraphy images of known 131
I activities were obtained. The known activity of 131
I was contained in a
cylindrical phantom of 16cm radius. A numerical factor was determined to convert the measured count rate from the SPET
images to activity. The algorithm that calculate absorbed dose at every voxel of the scintigraphy image was developed by
MATLAB. MATLAB is a high level computer language with interactive environment and performs mathematical calculations by
matrices. The scintigraphy images were imported in MATLAB and were converted to 3-dimensional matrices. Every element of
the matrix was assigned with the respective count rate. The matrix was multiplied with the conversion factor and the new
elements represented the activity at every voxel. A cumulative activity matrix was made from activity matrices that were obtained
at different time points. The absorbed dose at every voxel of the cumulative activity matrix was computed with the convolution
method. A3- dimensional convolution matrix with size 5x5x5 was created. The elements of this matrix are numerical factors that
convert cumulative activity to absorbed dose. The convolution between these two matrices was made using the ‘convn’ function
of MATLAB. This function convolves the cumulative activity matrix with the convolution matrix and gives a new matrix with
numeric elements that represent absorbed dose at every voxel. Furthermore, regions of interest can be drawn on the images
and dose volume histograms and mean absorbed doses can be calculated. Results: SPET scintigraphy images were obtained
for 64MBq 131
I activity. A cumulative activity of 230GBq*s was calculated and the voxel convolution method showed that mean
absorbed dose was 20.6Gy. Maximum dose of 50Gy was calculated for the central voxel in the activity. A region of interest was
drawn and the dose volume histogram was calculated. The results were compared to MIRDOSE3.1 program. A mean dose of
20.1Gy was calculated with MIRDOSE3.1 for the same cumulative activity in 0.85cm diameter. Conclusion: Patient specific
voxel internal dosimetry can be performed accurately with MATLAB. Dose volume histograms and mean dose can be
calculated.
HJNM 2015; 18(Suppl1); 76-80 Published on line: 12 December 2015
Introduction
adionuclide treatments have the advantage to deliver lethal dose to cancer cells while keeping low dose to healthy tissue [1]. Toxicity to the healthy tissue is the main problem during the radionuclide therapy. High absorbed dose to the kidneys may cause renal failure and high absorbed dose to bone marrow may cause myelotoxicity [2-13].
The accurate estimation of the absorbed dose to the tumor and the healthy tissue is essential for the efficiency of the treatment and the safety of the patient. Dosimetry studies have proved that great fluctuations occur in absorbed dose between patients that receive radionuclide therapy [14]. Dosimetric calculations must be done separately for every patient. The absorbed dose for each patient is affected by differences in anatomy and in pharmacokinetics. Patient specific dosimetry during radionuclide therapy allows accurate estimation of the absorbed dose to the tumor and healthy tissue. Therapeutic results can be predicted. Late biological effects can be assigned to the absorbed dose. Therapeutic results between different treatments techniques can be compared [15]. Voxel based internal dosimetry has many advantages. Complex activity distributions can be imaged. Inhomogeneous activities can be processed with a resolution of a few millimeters. The aim of this study is to develop a computer algorithm that calculates absorbed dose at every voxel of quantitative SPET scintigraphy image and establish a general internal dosimetry protocol for radionuclide therapy.
Material and Method A dual head Siemens Symbia γ-camera was calibrated in order to obtain quantitative scintigraphy images. Siemens
R
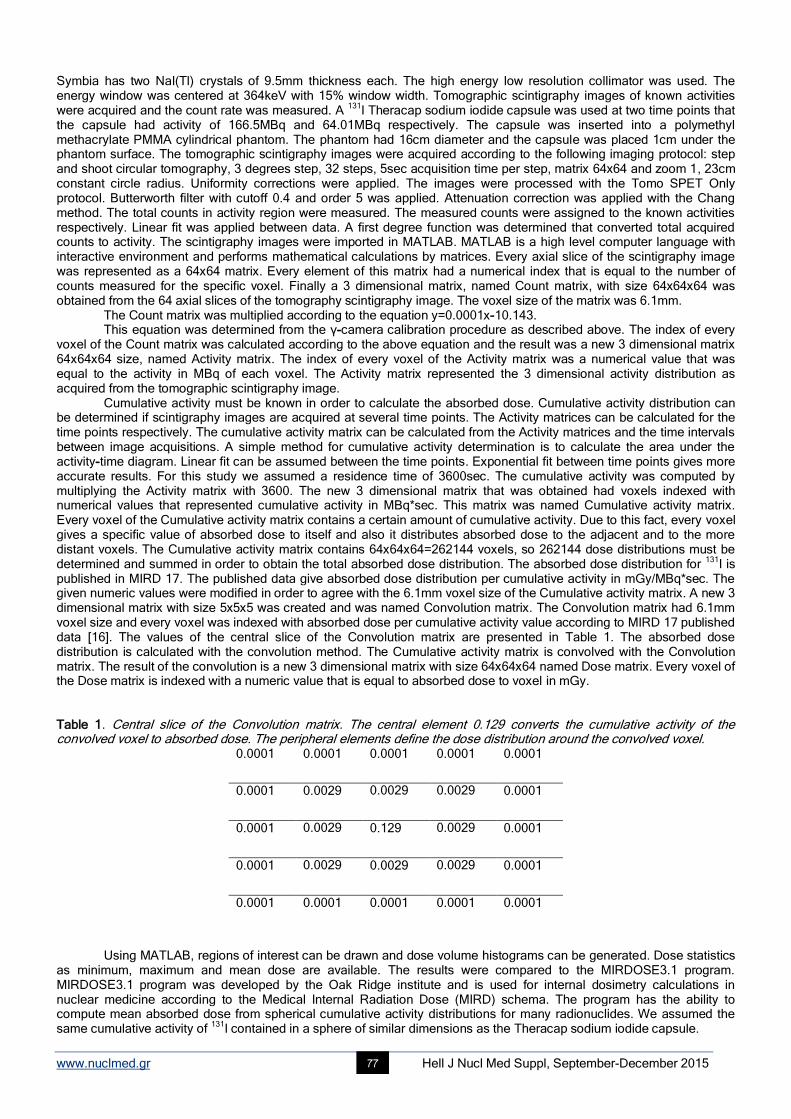
www.nuclmed.gr Hell J Nucl Med Suppl, September-December 2015 77
Symbia has two NaI(Tl) crystals of 9.5mm thickness each. The high energy low resolution collimator was used. The energy window was centered at 364keV with 15% window width. Tomographic scintigraphy images of known activities were acquired and the count rate was measured. A
131Ι Theracap sodium iodide capsule was used at two time points that
the capsule had activity of 166.5MBq and 64.01MBq respectively. The capsule was inserted into a polymethyl methacrylate PMMA cylindrical phantom. The phantom had 16cm diameter and the capsule was placed 1cm under the phantom surface. The tomographic scintigraphy images were acquired according to the following imaging protocol: step and shoot circular tomography, 3 degrees step, 32 steps, 5sec acquisition time per step, matrix 64x64 and zoom 1, 23cm constant circle radius. Uniformity corrections were applied. The images were processed with the Tomo SPET Only protocol. Butterworth filter with cutoff 0.4 and order 5 was applied. Attenuation correction was applied with the Chang method. The total counts in activity region were measured. The measured counts were assigned to the known activities respectively. Linear fit was applied between data. A first degree function was determined that converted total acquired counts to activity. The scintigraphy images were imported in MATLAB. MATLAB is a high level computer language with interactive environment and performs mathematical calculations by matrices. Every axial slice of the scintigraphy image was represented as a 64x64 matrix. Every element of this matrix had a numerical index that is equal to the number of counts measured for the specific voxel. Finally a 3 dimensional matrix, named Count matrix, with size 64x64x64 was obtained from the 64 axial slices of the tomography scintigraphy image. The voxel size of the matrix was 6.1mm.
The Count matrix was multiplied according to the equation y=0.0001x-10.143. This equation was determined from the γ-camera calibration procedure as described above. The index of every
voxel of the Count matrix was calculated according to the above equation and the result was a new 3 dimensional matrix 64x64x64 size, named Activity matrix. The index of every voxel of the Activity matrix was a numerical value that was equal to the activity in MBq of each voxel. The Activity matrix represented the 3 dimensional activity distribution as acquired from the tomographic scintigraphy image.
Cumulative activity must be known in order to calculate the absorbed dose. Cumulative activity distribution can be determined if scintigraphy images are acquired at several time points. The Activity matrices can be calculated for the time points respectively. The cumulative activity matrix can be calculated from the Activity matrices and the time intervals between image acquisitions. A simple method for cumulative activity determination is to calculate the area under the activity-time diagram. Linear fit can be assumed between the time points. Exponential fit between time points gives more accurate results. For this study we assumed a residence time of 3600sec. The cumulative activity was computed by multiplying the Activity matrix with 3600. The new 3 dimensional matrix that was obtained had voxels indexed with numerical values that represented cumulative activity in MBq*sec. This matrix was named Cumulative activity matrix. Every voxel of the Cumulative activity matrix contains a certain amount of cumulative activity. Due to this fact, every voxel gives a specific value of absorbed dose to itself and also it distributes absorbed dose to the adjacent and to the more distant voxels. The Cumulative activity matrix contains 64x64x64=262144 voxels, so 262144 dose distributions must be determined and summed in order to obtain the total absorbed dose distribution. The absorbed dose distribution for
131I is
published in MIRD 17. The published data give absorbed dose distribution per cumulative activity in mGy/MBq*sec. The given numeric values were modified in order to agree with the 6.1mm voxel size of the Cumulative activity matrix. A new 3 dimensional matrix with size 5x5x5 was created and was named Convolution matrix. The Convolution matrix had 6.1mm voxel size and every voxel was indexed with absorbed dose per cumulative activity value according to MIRD 17 published data [16]. The values of the central slice of the Convolution matrix are presented in Table 1. The absorbed dose distribution is calculated with the convolution method. The Cumulative activity matrix is convolved with the Convolution matrix. The result of the convolution is a new 3 dimensional matrix with size 64x64x64 named Dose matrix. Every voxel of the Dose matrix is indexed with a numeric value that is equal to absorbed dose to voxel in mGy. Table 1. Central slice of the Convolution matrix. The central element 0.129 converts the cumulative activity of the convolved voxel to absorbed dose. The peripheral elements define the dose distribution around the convolved voxel.
0.0001 0.0001 0.0001 0.0001 0.0001
0.0001 0.0029 0.0029 0.0029 0.0001
0.0001 0.0029 0.129 0.0029 0.0001
0.0001 0.0029 0.0029 0.0029 0.0001
0.0001 0.0001 0.0001 0.0001 0.0001
Using MATLAB, regions of interest can be drawn and dose volume histograms can be generated. Dose statistics
as minimum, maximum and mean dose are available. The results were compared to the MIRDOSE3.1 program. MIRDOSE3.1 program was developed by the Oak Ridge institute and is used for internal dosimetry calculations in nuclear medicine according to the Medical Internal Radiation Dose (MIRD) schema. The program has the ability to compute mean absorbed dose from spherical cumulative activity distributions for many radionuclides. We assumed the same cumulative activity of
131I contained in a sphere of similar dimensions as the Theracap sodium iodide capsule.
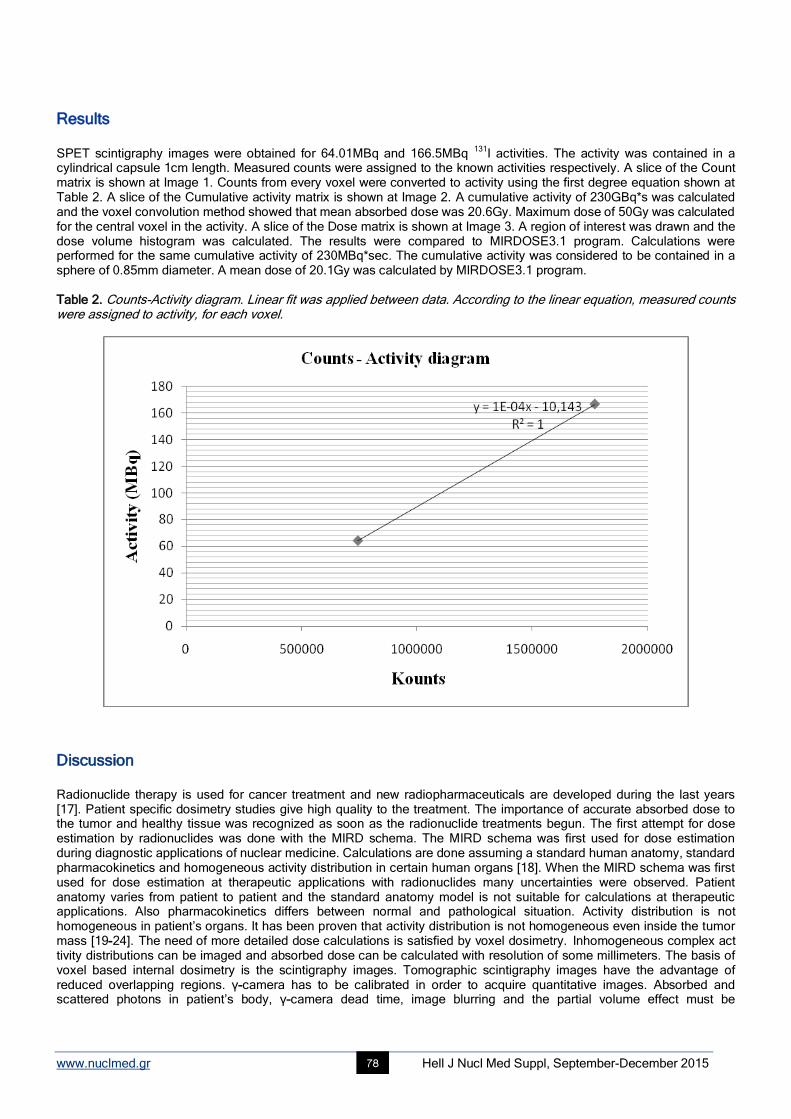
www.nuclmed.gr Hell J Nucl Med Suppl, September-December 2015 78
Results SPET scintigraphy images were obtained for 64.01MBq and 166.5MBq
131I activities. The activity was contained in a
cylindrical capsule 1cm length. Measured counts were assigned to the known activities respectively. A slice of the Count matrix is shown at Image 1. Counts from every voxel were converted to activity using the first degree equation shown at Table 2. A slice of the Cumulative activity matrix is shown at Image 2. A cumulative activity of 230GBq*s was calculated and the voxel convolution method showed that mean absorbed dose was 20.6Gy. Maximum dose of 50Gy was calculated for the central voxel in the activity. A slice of the Dose matrix is shown at Image 3. A region of interest was drawn and the dose volume histogram was calculated. The results were compared to MIRDOSE3.1 program. Calculations were performed for the same cumulative activity of 230MBq*sec. The cumulative activity was considered to be contained in a sphere of 0.85mm diameter. A mean dose of 20.1Gy was calculated by MIRDOSE3.1 program. Table 2. Counts-Activity diagram. Linear fit was applied between data. According to the linear equation, measured counts were assigned to activity, for each voxel.
Discussion Radionuclide therapy is used for cancer treatment and new radiopharmaceuticals are developed during the last years [17]. Patient specific dosimetry studies give high quality to the treatment. The importance of accurate absorbed dose to the tumor and healthy tissue was recognized as soon as the radionuclide treatments begun. The first attempt for dose estimation by radionuclides was done with the MIRD schema. The MIRD schema was first used for dose estimation during diagnostic applications of nuclear medicine. Calculations are done assuming a standard human anatomy, standard pharmacokinetics and homogeneous activity distribution in certain human organs [18]. When the MIRD schema was first used for dose estimation at therapeutic applications with radionuclides many uncertainties were observed. Patient anatomy varies from patient to patient and the standard anatomy model is not suitable for calculations at therapeutic applications. Also pharmacokinetics differs between normal and pathological situation. Activity distribution is not homogeneous in patient’s organs. It has been proven that activity distribution is not homogeneous even inside the tumor mass [19-24]. The need of more detailed dose calculations is satisfied by voxel dosimetry. Inhomogeneous complex act tivity distributions can be imaged and absorbed dose can be calculated with resolution of some millimeters. The basis of voxel based internal dosimetry is the scintigraphy images. Tomographic scintigraphy images have the advantage of reduced overlapping regions. γ-camera has to be calibrated in order to acquire quantitative images. Absorbed and scattered photons in patient’s body, γ-camera dead time, image blurring and the partial volume effect must be
www.nuclmed.gr Hell J Nucl Med Suppl, September-December 2015 79
Image 1. Axial slice of the Count matrix. Image 2. Axial slice of the Cumulative activity The index of every voxel is equal to the matrix. The index of every voxel is equal to the measured counts for each voxel. The total cumulative activity in MBq*sec for each voxel. measured counts for every voxel are indexed.
Image 3. Axial slice of the Dose matrix. The index of every voxel is equal to the absorbed dose in mGy for each voxel. taken into account [25-31]. A standard imaging protocol must be followed for imaging a suitable phantom which contains known activities in order to determine a factor that converts measured counts to activity. The same imaging protocol must be followed later when imaging the patients. The imaging protocol is preferred to be fast and must have enough resolution for dosimetry calculations. The protocol introduced in this study needs about 3 minutes to be executed and gives 6.1mm resolution which we consider as a good settlement between imaging time and detailed activity definition. The constant radius circular orbit has the advantage of good reproducibility and also less scatter radiation reach the collimator. Typical administered activity for
131I therapy is 3700MBq. Patients that receive thyroid surgery have 24 hour uptake 1%-3%. 37-
117MBq 131
I are expected to be localized at thyroid remaining tissue [32-34]. 64.01MBq and 166.5MBq were used for γ-camera calibration and these values are close to the expected activities for the clinical practice. The whole image processing and dose calculations are executed with the MATLAB software. The total processing time is a few seconds and can be performed by common computers. The result for the mean absorbed dose is in excellent agreement with the MIRDOSE3.1 program. In conclusion voxel based internal dosimetry can be performed accurately with MATLAB software. Dose volume histograms and mean dose can be calculated. The method can be developed in the future for other therapeutic isotopes.
www.nuclmed.gr Hell J Nucl Med Suppl, September-December 2015 80
Bibliography
1. Lyra M, Andreou M, Georgantzoglou A et al. Radionuclides Used in Nuclear Medicine Therapy-From Production to Dosimetry. Current
Medical Imaging Reviews. 2013; 9(1): 51-87.
2. Sgouros G. Dosimetry of Internal Emitters. J Nucl Med 2005; 46: 18S-27S
3. Wessels BW, Bolch WE, Bouchet LG et al. Bone marrow dosimetry for radionuclide therapy: A multi-institutional comparison. J Nucl Med.
2004; 45: 1725-33.
4. Zanzonico P, Sgouros G. Predicting myelotoxicity in radioimmunotherapy: what does dosimetry contribute? J Nucl Med. 1997; 38: 1753-4.
5. Goddu SM, Howell RW, Giuliani DC, Rao DV. Biological dosimetry of bone marrow for incorporated yttrium-90. J Nucl Med. 1998; 39:
547-52.
6. Breitz HB, Fisher DR, Wessels BW. Marrow toxicity and radiation absorbed dose estimates from rhenium-186-labeled monoclonal
antibody. J Nucl Med.1998; 39: 1746-51.
7. Wong JY, Wang J, Liu A et al. Evaluating changes in stable chromosomal translocation frequency in patients receiving
radioimmunotherapy. Int J Radiat Oncol Biol Phys. 2000; 46: 599-607.
8. Lenarczyk M, Goddu SM, Rao DV, Howell RW. Biologic dosimetry of bone marrow: induction of micronuclei in reticulocytes after
exposure to 32P and 90Y. J Nucl Med. 2001; 42: 162-9.
9. O’Donoghue JA, Baidoo N, Deland D et al. Hematologic toxicity in radioimmunotherapy: dose-response relationships for I-131 labeled
antibody therapy. Cancer Biother Radiopharm. 2002; 17: 435-43.
10. Emami B, Lyman J, Brown A et al. Tolerance of normal tissue to therapeutic irradiation. Int J Radiat Oncol Biol Phys. 1991; 21: 109-22.
11. Behr TM, Behe M, Angerstein C et al. Cholecystokinin-B/gastrin receptor binding peptides: preclinical development and evaluation of
their diagnostic and therapeutic potential. Clin Cancer Res. 1999; 5: 3124s-3138s.
12. Breitz H, Wendt R, Stabin M et al. Dosimetry of High Dose Skeletal Targeted Radiotherapy (STR) with (166)Ho-DOTMP. Cancer Biother
Radiopharm. 2003; 18:225-30.
13. Wessels B. Summary and perspectives on kidney dose-response to radionuclide therapy. Cancer Biother Radiopharm. 2004; 19: 388-90.
14. Vamvakas I, Logopati N, Andreou M et al. Patient specific computer automated dosimetry calculations during therapy
with 111
In Octreotide. Eur J Radiography. 2009; 4(1): 180-3.
15. Lassmann M, Chiesa C, Flux G, M. Bardiès. EANM Dosimetry Committee guidance document:good practice of clinical dosimetry
reporting. Eur J Nucl Med Mol Imaging. 2010; 259(10): 1549-53.
16. Bolch WE, Bouchet LG, Robertson JS et al. MIRD Pamphlet No. 17: The Dosimetry of Nonuniform Activity Distributions Radionuclide S
Values at the Voxel Level. J Nuc Med 1999; 40: 118-368.
17. Goyal J, Antonarakis ES. Bone-targeting radiopharmaceuticals for the treatment of prostate cancer with bone metastases. Cancer Letters.
2012; 323: 135-46.
18. Bolch WE, Eckerman KF, Sgouros G, Thomas SR. MIRD Pamphlet No. 21: A Generalized Schema for Radiopharmaceutical Dosimetry-
Standardization of Nomenclature. J Nucl Med. 2009; 50(3): 477-84.
19. Busemann Sokole E, Plachcinska A, Britten A et al. Routine quality control recommendations for nuclear medicine instrumentation. Eur J
Nucl Med Mol Imaging. 2010; 37: 662-71.
20. Lassmann M, Luster M, Hanscheid H, Reiners C. Impact of 131
I diagnostic activities on the biokinetics of thyroid remnants. J Nucl Med.
2004; 45: 619-25.
21. Jonsson L, Ljungberg M, Strand SE. Evaluation of accuracy in activity calculations for the conjugate view method from Monte Carlo
simulated scintillation camera images using experimental data in an anthropomorphic phantom. J Nucl Med. 2005; 46: 1679-86.
22. He B, Du Y, Segars WP et al. Evaluation of quantitative imaging methods for organ activity and residence time estimation using a
population of phantoms having realistic variations in anatomy and uptake. Med Phys. 2009; 36: 612-9.
23. Assié K, Dieudonne A, Gardin I et al. Comparison between 2D and 3D dosimetry protocols in 90
Yibritumomabtiuxetan
radioimmunotherapy of patients with non-Hodgkin's lymphoma. Cancer Biother Radiopharm. 2008; 23: 53-64.
24. Vriens D, Visser EP, de Geus-Oei LF, Oyen WJ. Methodological considerations in quantification of oncological FDG PET studies. Eur J
Nucl Med Mol Imaging. 2010; 37: 1408-25.
25. Jaszczak RJ, Floyd CE, Coleman RE. Scatter compensation techniques for SPECT. IEEE Trans Nucl Sci. 1985; 32: 786-93.
26. Ichihara T, Ogawa K, Motomura N et al. Compton scatter compensation using the triple-energy window method for single-and dual-
isotope SPECT. J Nucl Med. 1993; 34: 2216-21.
27. Jentzen W. Experimental investigation of factors affecting the absolute recovery coefficients in iodine-124 PET lesion imaging. Phys Med
Biol. 2010; 55: 2365-98.
28. Jentzen W, Weise R, Kupferschlager J et al. Iodine-124 PET dosimetry in differentiated thyroid cancer: recovery coefficient in 2D and 3D
modes for PET (/CT) systems. Eur J Nucl Med Mol Imaging. 2008; 35: 611-23.
29. Hobbs RF, Baechler S, van Senthamizhchel S et al. A gamma camera count rate saturation correction method for whole-body planar
imaging. Phys Med Biol. 2010; 55: 817-31.
30. Chiesa C, Negri A, Albertini C et al. A practical dead time correction method in planar activity quantification for dosimetry during
radionuclide therapy. Q J Nucl Med Mol Imaging. 2009; 53: 658-70.
31. Gregory RA, Hooker CA, Partridge M, Flux GD. Optimization and assessment of quantitative 124
I imaging on a Philips Gemini dual GS
PET/CT system. Eur J Nucl Med Mol Imaging. 2009; 36: 1037-48.
32. Nota S, Molyvda-Athanassopoulou E, Siountas A et al. Oprimizing the protocol for the calculation of the doses of 131
I administered for the
treatment of benign thyroid disease. Hell J Nucl Med. 2004; (7) 1:14-7.
33. Chatzopoulos D, Markou P. Whole-body 131
I washout in a patient with metastatic well-differentiated papillary thyroid carcinoma treated with
repeated 131
I administration. Hell J Nucl Med. 2004; (7) 1: 18-21.
34. Esfahani AF, Dabbagh Kakhki VR, Fallahi B. Comparative evaluation of two fixed doses of 185 and 370MBq 131
I, for the treatment of
Graves’ disease resistant to antithyroid drugs. Hell J Nucl Med. 2005; 8 (3): 158-61.
www.nuclmed.gr Hell J Nucl Med Suppl, September-December 2015 81
The diagnostic performance and added value of 18F-FDG PET/CT in the detection of liver metastases in recurrent colorectal carcinoma patients Strahinja Odalovic
1,2 MD, Vera Artiko
1,2 MD, PhD, Dragana Sobic-Saranovic
1,2 MD, PhD,
Milica Stojiljkovic1 MD, Milorad Petrovic
2,3 MD, PhD, Nebojsa Petrovic
1,2 MD, PhD, Nebojsa Kozarevic
1 MD, Isidora
Grozdic-Milojevic1 MD, PhD, Vladimir Obradovic
1 MD, PhD
1. Center of Nuclear Medicine, Clinical Center of Serbia, Belgrade, Serbia, 2. Faculty of Medicine, University of Belgrade, Belgrade, Serbia, 3. Clinic for Abdominal Surgery, Clinical Center of Serbia, Belgrade, Serbia Keywords:
18F-FDG PET/CT scan - Recurrent colorectal carcinoma - Liver metastases - MDCT
Correspondence adress: Strahinja Odalovic, Center of Nuclear Medicine, Clinical Center of Serbia, Visegradska 26, 11000 Belgrade, Republic of Serbia, Tel: +381113663448, Fax: +381113615641, Mobile: +381641953368, E-mail: [email protected] Abstract Objective: The aim of this study was to assess the value of
18F-fluorodeoxyglucose (
18F-FDG) PET/CT in detection of liver
metastases in patients with suspected recurrent colorectal carcinoma, as well as to compare diagnostic performance of 18
F-FDG
PET/CT with conventional imaging methods (MDCT). Subjects and Methods: This study included 73 patients with resected
primary colorectal adenocarcinoma referred for 18
F-FDG PET/CT to the National PET Center, at the Clinical Center of Serbia,
Belgrade, from January 2010 to May 2013, with suspicion of recurrence. The patients underwent 18
F-FDG PET/CT examination
on a 64-slice hybrid PET/CT scanner (Biograph, TruePoint64, Siemens Medical Solutions, Inc. USA). Prior to 18
F-FDG PET/CT
all patients underwent contrast-enhanced MDCT. Findings of 18
F-FDG PET/CT and MDCT were compared to findings of
subsequent histopathological examinations or with results of clinical and imaging follow-up over at least six months. Final
diagnosis of liver metastases of colorectal cancer was made either by histopathological examination of specimen after biopsy or
surgery, or based on clinical, laboratory and imaging evaluation during first six months after PET/CT scan. Results: In detection
of liver metastases 18
F-FDG PET/CT showed sensitivity, specificity, positive predictive value, negative predictive value and
accuracy of 83.3%, 95.3%, 92.6%, 89.1% and 90.4%, respectively. In addition, MDCT showed sensitivity, specificity, positive
predictive value, negative predictive value and accuracy in detection of liver metastases of 60%, 88.4%, 78.3%, 76% and 76.7%,
respectively. There was significant difference in sensitivity (83.3% vs 60%; P=0.045) between these two methods. In addition,
significant difference was observed in accuracy between PET/CT and MDCT (90.4% vs 76.7%; P=0.016). The higher specificity
in visualization of liver metastases was also achieved by 18
F-FDG PET/CT compared to MDCT (95.3% vs 88.4%), but this
difference was not significant (P=0.37). Conclusion: 18
F-FDG PET/CT was highly sensitive, specific and accurate method in
detection of liver metastases in patients with suspected recurrent colorectal carcinoma in our study. This hybrid imaging showed
superior diagnostic performance in evaluation of suspected colorectal cancer liver metastases compared to conventional
imaging.
HJNM 2015; 18(Suppl1); 81-87 Published on line: 12 December 2015
Introduction
olorectal cancer (CRC) is the third most commonly diagnosed cancer in males and the second in females in the world, and it represents the fourth cause of cancer-related deaths among men and third among women [1]. Most CRC survivors are enrolled in post-treatment surveillance programs, aiming to detect recurrent disease in an early
stage, as this has been shown to improve overall survival [2]. Between 55% and 80% of patients will develop recurrence, which involves the liver in 35%-50% of patients. Isolated hepatic recurrence initially occurs in approximately 30% of patients, with authors reporting between 17% and 55% [3]. Overall, liver metastases represent leading cause of cancer-related morbidity and mortality in colorectal cancer [4].
At present, whole-body fluorine-18-fluoro-deoxyglucose positron emission tomography/computed tomography (18
F-FDG PET/CT) is an advanced diagnostic imaging technique in detecting loco-regional recurrence and metastases in postoperative patients with colorectal carcinoma for its higher sensitivity and specificity [5]. However, other authors reported on lower sensitivity and specificity of
18F-FDG PET/CT compared to multi-detector computerized tomography
(MDCT) and magnetic resonance imaging (MRI) in detection of liver metastases [6, 7]. In addition, combined positron emission tomography/ magnetic resonance (PET/MR) imaging is proven to be more sensitive in the detection of colorectal cancer liver metastases compared to PET/CT [8].
According to previous, the aim of this study was to assess the diagnostic performance and added value of 18
F-fluorodeoxyglucose (
18F-FDG) PET/CT in detection of liver metastases in patients with suspected metastatic recurrent
colorectal carcinoma, compared to conventional imaging methods (MDCT).
C
www.nuclmed.gr Hell J Nucl Med Suppl, September-December 2015 82
Subjects and Method Study population This study included 73 patients with resected primary colorectal adenocarcinoma referred for
18F-FDG PET/CT to the
National PET Center, at the Clinical Center of Serbia, Belgrade, from February 2010 to May 2013, with suspicion of metastatic recurrent colorectal cancer. The patients underwent
18F-FDG PET/CT examination on a 64-slice hybrid
PET/CT scanner (Biograph, TruePoint64, Siemens Medical Solutions, Inc. USA). Prior to 18
F-FDG PET/CT all patients underwent contrast-enhanced MDCT, as well as serial measurements of serum levels of CEA. The inclusion criteria were: histopathologically confirmed colorectal adenocarcinoma, curative resection of the primary tumor, at least 3 months before PET/CT and availability for follow-up after
18F-FDG PET/CT for at least 6 months. After exclusion of patients with
previous history of another type of malignancy and patients with insufficient follow-up data, 73 patients were finally eligible for the study. Procedures The indications for
18F-FDG PET/CT examination were: symptoms and signs suggesting recurrence; abnormal or
equivocal contrast-enhanced MDCT findings; or elevated tumor marker levels. Findings of 18
F-FDG PET/CT in the liver were retrospectively compared to results of MDCT. During follow-up clinical data, results of subsequent imaging tests and laboratory data were collected and evaluated every three months. Findings of imaging tests were compared with findings of histopathological examination or with results of at least 6 months of clinical and imaging follow-up. The study was approved by the Ethics Committee of the Faculty of Medicine of the University of Belgrade.
Data acquisition and interpretation The patients underwent
18F-FDG PET/CT examination on a 64-slice hybrid PET/CT scanner (Biograph, TruePoint64,
Siemens Medical Solutions, Inc. USA) at National PET Center, Clinical Center of Serbia, Belgrade. After fasting for 6h patients received an intravenous injection of 5.5MBq/kg of
18F-FDG. Blood glucose level over 11mmol/l was considered
as exclusion criteria for PET/CT examination. Following injection of 18
F-FDG, patients rested in quiet and darkened room for 60min, after which images of PET/CT were obtained. Low-dose non-enhanced CT scans (120kV with automatic, real-time dose-modulation amperage, slice thickness of 5mm, pitch of 1,5 and a rotation time of 0.5s) and 3-dimensional PET scans (6-7 fields of view, 3min/field) were acquired from the base of the skull to the mid thigh. Non-corrected and attenuation-corrected CT, PET and fused PET/CT images were displayed for analysis on a Syngo Multimodality workplace (Siemens AG).
18F-FDG PET/CT findings were defined as positive for liver metastases if any abnormal
18F-FDG uptake was
observed in the liver after exclusion of benign and physiological causes, with or without clearly visible corresponding CT malformation. Semi-quantitative analysis of
18F-FDG uptake was based on maximum standardized uptake value
(SUVmax), which was corrected for individual body weight and dose injected, and calculated as follows: tissue activity (counts/pixel/s) multiplied by calibration factor divided by injected
18F-FDG dose (MBq/kg of body weight). Findings were
interpreted separately by two nuclear medicine physicians. Consensus was reached in cases of discrepancy. Final diagnosis of liver metastases of CRC was made either by histopathological examination of specimen after
surgery or biopsy, or based on clinical and imaging evaluation during first six months after PET/CT scan. Overall, liver metastases were definitely diagnosed in 29 patients, with histopathological confirmation of the metastases in the liver in 18 cases. PET/CT study was defined as true-positive when
18F-FDG avid lesions were histopathologically confirmed to be
malignant or lesions responded to therapy. The 18
F-FDG PET/CT study without abnormal 18
F-FDG uptake or with 18
F-FDG uptake regarded as physiological or benign, and no evidence of malignancy during follow-up was considered to be true-negative. A false-positive PET/CT study showed at least one lesion characterized as malignant, but without evidence of disease on follow-up. And, finally, false-negative studies had evidence of recurrence on further examination during the first six months after PET/CT, despite negative PET/CT findings.
Statistical analysis The diagnostic performance of
18F-FDG PET/CT and MDCT was assessed by calculation of specificity, sensitivity,
positive predictive value (PPV), negative predictive value (NPV) and diagnostic accuracy. The difference in sensitivity, specificity and accuracy between FDG PET/CT and MDCT in detection of liver metastases of colorectal cancer was assessed using McNemar’s test. A P value of less than 0.05 was considered significant.
Results The demographic and clinical characteristics of patients included in this study, with reference to MDCT and
18F-FDG
PET/CT findings regarding liver metastases of colorectal cancer are given in Table 1.
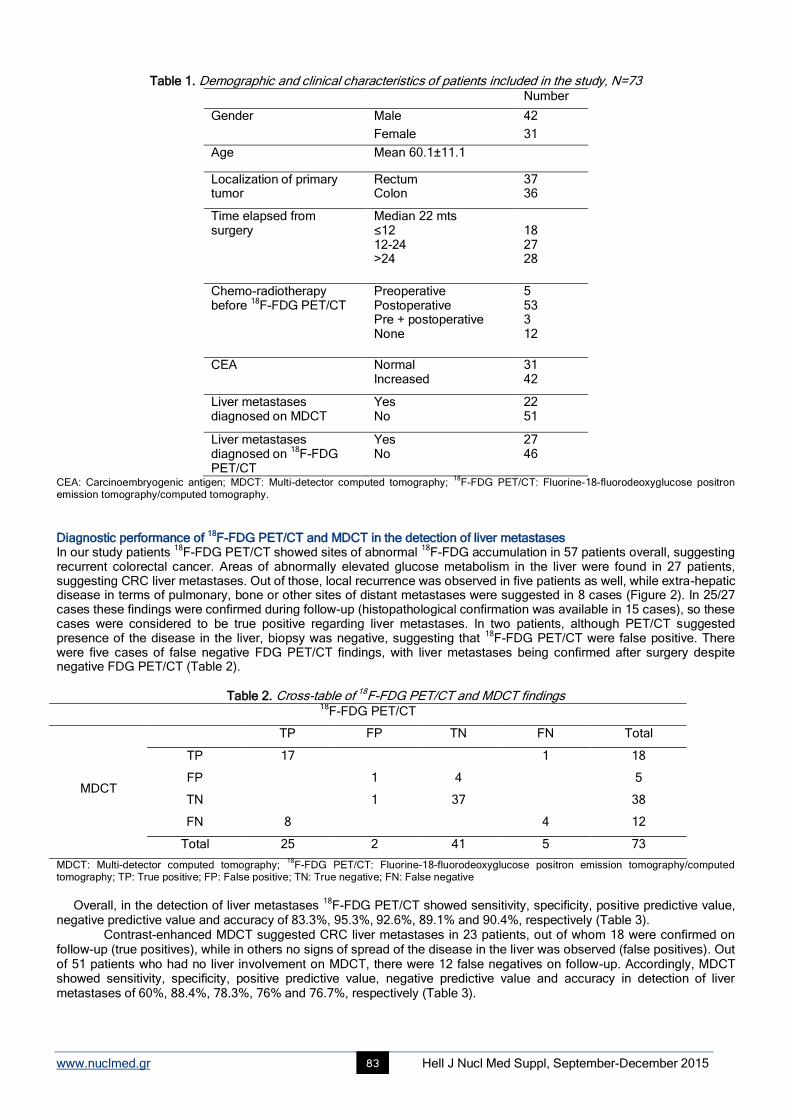
www.nuclmed.gr Hell J Nucl Med Suppl, September-December 2015 83
Table 1. Demographic and clinical characteristics of patients included in the study, N=73
Number
Gender Male 42
Female 31
Age Mean 60.1±11.1
Localization of primary tumor
Rectum Colon
37 36
Time elapsed from surgery
Median 22 mts ≤12 12-24 >24
18 27 28
Chemo-radiotherapy before
18F-FDG PET/CT
Preoperative Postoperative Pre + postoperative None
5 53 3 12
CEA Normal Increased
31 42
Liver metastases diagnosed on MDCT
Yes No
22 51
Liver metastases diagnosed on
18F-FDG
PET/CT
Yes No
27 46
CEA: Carcinoembryogenic antigen; MDCT: Multi-detector computed tomography; 18
F-FDG PET/CT: Fluorine-18-fluorodeoxyglucose positron emission tomography/computed tomography.
Diagnostic performance of
18F-FDG PET/CT and MDCT in the detection of liver metastases
In our study patients 18
F-FDG PET/CT showed sites of abnormal 18
F-FDG accumulation in 57 patients overall, suggesting recurrent colorectal cancer. Areas of abnormally elevated glucose metabolism in the liver were found in 27 patients, suggesting CRC liver metastases. Out of those, local recurrence was observed in five patients as well, while extra-hepatic disease in terms of pulmonary, bone or other sites of distant metastases were suggested in 8 cases (Figure 2). In 25/27 cases these findings were confirmed during follow-up (histopathological confirmation was available in 15 cases), so these cases were considered to be true positive regarding liver metastases. In two patients, although PET/CT suggested presence of the disease in the liver, biopsy was negative, suggesting that
18F-FDG PET/CT were false positive. There
were five cases of false negative FDG PET/CT findings, with liver metastases being confirmed after surgery despite negative FDG PET/CT (Table 2).
Table 2. Cross-table of 18F-FDG PET/CT and MDCT findings 18
F-FDG PET/CT
MDCT
TP FP TN FN Total
TP 17 1 18
FP 1 4 5
TN 1 37 38
FN 8 4 12
Total 25 2 41 5 73
MDCT: Multi-detector computed tomography; 18
F-FDG PET/CT: Fluorine-18-fluorodeoxyglucose positron emission tomography/computed tomography; TP: True positive; FP: False positive; TN: True negative; FN: False negative
Overall, in the detection of liver metastases
18F-FDG PET/CT showed sensitivity, specificity, positive predictive value,
negative predictive value and accuracy of 83.3%, 95.3%, 92.6%, 89.1% and 90.4%, respectively (Table 3). Contrast-enhanced MDCT suggested CRC liver metastases in 23 patients, out of whom 18 were confirmed on
follow-up (true positives), while in others no signs of spread of the disease in the liver was observed (false positives). Out of 51 patients who had no liver involvement on MDCT, there were 12 false negatives on follow-up. Accordingly, MDCT showed sensitivity, specificity, positive predictive value, negative predictive value and accuracy in detection of liver metastases of 60%, 88.4%, 78.3%, 76% and 76.7%, respectively (Table 3).
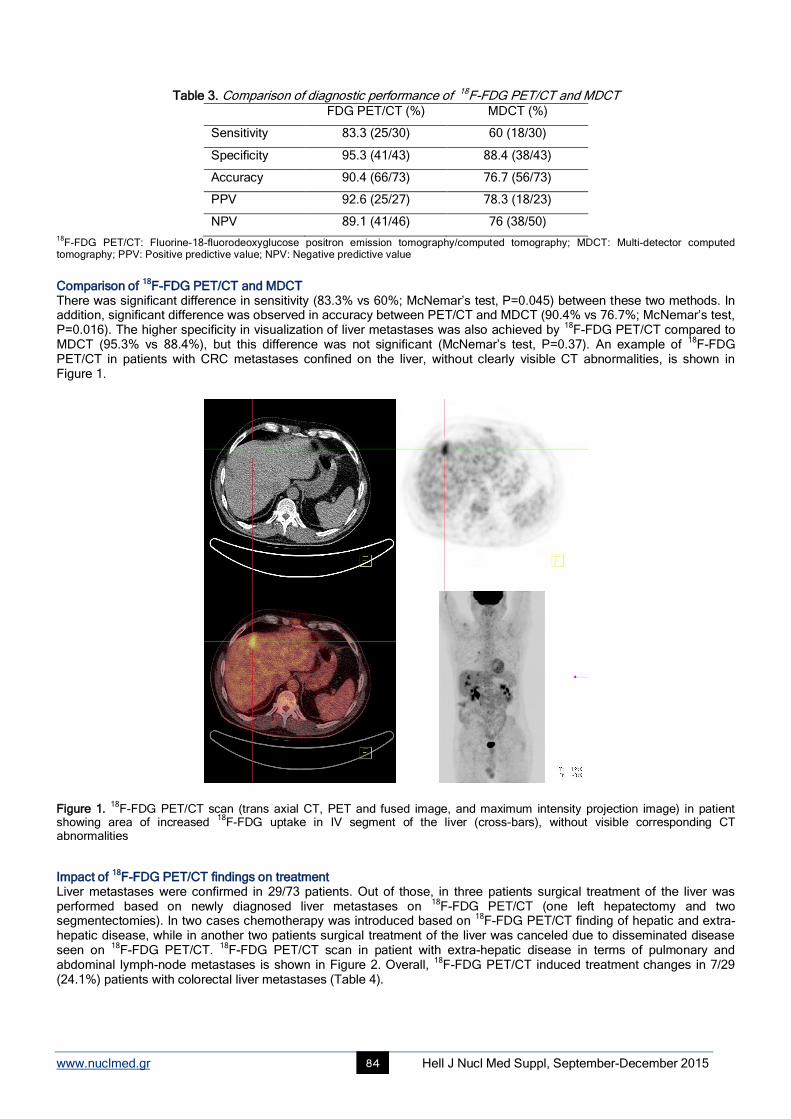
www.nuclmed.gr Hell J Nucl Med Suppl, September-December 2015 84
Table 3. Comparison of diagnostic performance of 18F-FDG PET/CT and MDCT
FDG PET/CT (%) MDCT (%)
Sensitivity 83.3 (25/30) 60 (18/30)
Specificity 95.3 (41/43) 88.4 (38/43)
Accuracy 90.4 (66/73) 76.7 (56/73)
PPV 92.6 (25/27) 78.3 (18/23)
NPV 89.1 (41/46) 76 (38/50)
18F-FDG PET/CT: Fluorine-18-fluorodeoxyglucose positron emission tomography/computed tomography; MDCT: Multi-detector computed
tomography; PPV: Positive predictive value; NPV: Negative predictive value
Comparison of
18F-FDG PET/CT and MDCT
There was significant difference in sensitivity (83.3% vs 60%; McNemar’s test, P=0.045) between these two methods. In addition, significant difference was observed in accuracy between PET/CT and MDCT (90.4% vs 76.7%; McNemar’s test, P=0.016). The higher specificity in visualization of liver metastases was also achieved by
18F-FDG PET/CT compared to
MDCT (95.3% vs 88.4%), but this difference was not significant (McNemar’s test, P=0.37). An example of 18
F-FDG PET/CT in patients with CRC metastases confined on the liver, without clearly visible CT abnormalities, is shown in Figure 1.
Figure 1.
18F-FDG PET/CT scan (trans axial CT, PET and fused image, and maximum intensity projection image) in patient
showing area of increased 18
F-FDG uptake in IV segment of the liver (cross-bars), without visible corresponding CT abnormalities
Impact of 18
F-FDG PET/CT findings on treatment Liver metastases were confirmed in 29/73 patients. Out of those, in three patients surgical treatment of the liver was performed based on newly diagnosed liver metastases on
18F-FDG PET/CT (one left hepatectomy and two
segmentectomies). In two cases chemotherapy was introduced based on 18
F-FDG PET/CT finding of hepatic and extra-hepatic disease, while in another two patients surgical treatment of the liver was canceled due to disseminated disease seen on
18F-FDG PET/CT.
18F-FDG PET/CT scan in patient with extra-hepatic disease in terms of pulmonary and
abdominal lymph-node metastases is shown in Figure 2. Overall, 18
F-FDG PET/CT induced treatment changes in 7/29 (24.1%) patients with colorectal liver metastases (Table 4).
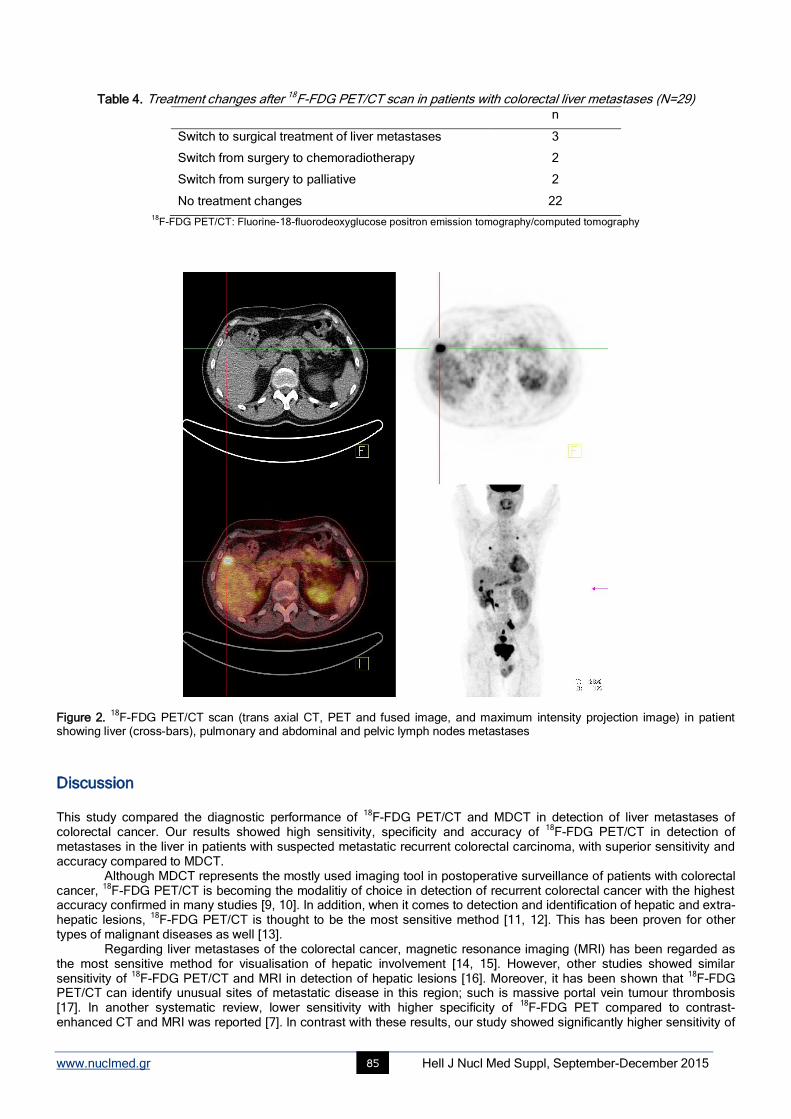
www.nuclmed.gr Hell J Nucl Med Suppl, September-December 2015 85
Table 4. Treatment changes after 18F-FDG PET/CT scan in patients with colorectal liver metastases (N=29)
n
Switch to surgical treatment of liver metastases 3
Switch from surgery to chemoradiotherapy 2
Switch from surgery to palliative 2
No treatment changes 22 18
F-FDG PET/CT: Fluorine-18-fluorodeoxyglucose positron emission tomography/computed tomography
Figure 2.
18F-FDG PET/CT scan (trans axial CT, PET and fused image, and maximum intensity projection image) in patient
showing liver (cross-bars), pulmonary and abdominal and pelvic lymph nodes metastases
Discussion This study compared the diagnostic performance of
18F-FDG PET/CT and MDCT in detection of liver metastases of
colorectal cancer. Our results showed high sensitivity, specificity and accuracy of 18
F-FDG PET/CT in detection of metastases in the liver in patients with suspected metastatic recurrent colorectal carcinoma, with superior sensitivity and accuracy compared to MDCT.
Although MDCT represents the mostly used imaging tool in postoperative surveillance of patients with colorectal cancer,
18F-FDG PET/CT is becoming the modalitiy of choice in detection of recurrent colorectal cancer with the highest
accuracy confirmed in many studies [9, 10]. In addition, when it comes to detection and identification of hepatic and extra-hepatic lesions,
18F-FDG PET/CT is thought to be the most sensitive method [11, 12]. This has been proven for other
types of malignant diseases as well [13]. Regarding liver metastases of the colorectal cancer, magnetic resonance imaging (MRI) has been regarded as
the most sensitive method for visualisation of hepatic involvement [14, 15]. However, other studies showed similar sensitivity of
18F-FDG PET/CT and MRI in detection of hepatic lesions [16]. Moreover, it has been shown that
18F-FDG
PET/CT can identify unusual sites of metastatic disease in this region; such is massive portal vein tumour thrombosis [17]. In another systematic review, lower sensitivity with higher specificity of
18F-FDG PET compared to contrast-
enhanced CT and MRI was reported [7]. In contrast with these results, our study showed significantly higher sensitivity of
www.nuclmed.gr Hell J Nucl Med Suppl, September-December 2015 86
18F-FDG PET/CT over MDCT in detection of hepatic metastases.
In a systematic review and economic evaluation, which included six studies and 362 patients, the estimates of sensitivity and specificity of
18F-FDG PET/CT for liver metastases in patient-based analyses ranged from 87%-100% and
from 75%-100%, respectively, with pooled sensitivity of 91% and specificity of 76%. In the same study, the sensitivity and specificity of contrast-enhanced CT ranged from 75%-98% and 25%-100%, respectively [18]. Although our study confirmed superiority of
18F-FDG PET/CT over MDCT, we reported lower sensitivity of
18F-FDG PET/CT compared to
above study, because of number of cases with false negative results. This can be explained with the cystic presentation of the lesions in two patients, which were subjected to surgery due to accelerated growth and confirmed to be metastatic disease.
In our study, the specificity of 18
F-FDG PET/CT, although it was higher, did not differ significantly from MDCT. This complies with the results of other researchers [11]. The reason can be found in very few false positive findings due to inflammatory and/or postoperative changes, because
18F-FDG PET/CT was performed at least three months after any
kind of surgical treatment. The agreement of various preoperative and intra-operative imaging modalities, including
18F-FDG PET/CT, with
operative findings in patients with colorectal liver metastases, assessed in the study of Bonanni et al., showed good correlation of
18F-FDG PET/CT with histopathological results and very good correlation with AJCC/UICC stage of
metastatic liver disease. The only modality showing better correlation was intra-operative ultrasound [19]. In our study, among 18 patients with CRC liver metastases subjected to histopathological examination during follow-up,
18F-FDG
PET/CT finding was confirmed in 15 cases. 18
F-FDG PET/CT affected treatment in 24.1% of our patients with liver metastases. This completely complies with the results of meta-analysis [7]. The treatment changes included cancellation of intended surgical treatment of liver metastases, when extra-hepatic disease was observed and switch to surgical treatment in cases when
18F-FDG PET/CT
identified metastases confined to liver, which were not observed with MDCT. The limitations of the study were retrospective comparison of
18F-FDG PET/CT findings with MDCT results,
relatively small sample and the presence of the liver metastases in a little less than half of our patients, but enough to determine the benefit of
18F-FDG PET/CT in evaluation and management of these patients. Although histopathological
confirmation of colorectal cancer metastases to the liver was made not in all patients, this was overcome with long and detailed follow-up.
In conclusion, 18
F-FDG PET/CT was highly sensitive, specific and accurate method in detection of liver metastases in patients with suspected recurrent colorectal carcinoma in our study. This hybrid imaging showed superior diagnostic performance in evaluation of suspected colorectal cancer liver metastases compared to conventional imaging and induced treatment changes in approximately one-quarter of our patients with proven colorectal liver metastases.
Acknowledgements This work was supported by the Serbian Ministry of Education and Science, grant No 175018.
The authors have no conflicts of interest to declare.
Bibliography
1. Torre LA, Bray F, Siegel RL et al. Global cancer statistics, 2012. CA Cancer J Clin 2015; 65: 87-108.
2. Jeffery M, Hickey BE, Hider PN. Follow-up strategies for patients treated for non-metastatic colorectal cancer. Cochrane Database Syst
Rev 2007; 1: CD002200.
3. Pinson CW, Wright JK, Chapman WC et al. Repeat hepatic surgery for colorectal cancer metastasis to the
liver. Ann Surg 1996; 223: 765-76.
4. McLoughlin JM, Jensen EH, Malafa M. Resection of colorectal liver metastases: current perspectives. Cancer Control 2006; 13: 32-41.
5. Han A, Xue J, Zhu D et al. Clinical value of 18
F-FDG PET/CT in postoperative monitoring for patients with colorectal
carcinoma. Cancer Epidemiol. 2011; 35: 497-500.
6. Hee JY, Kyung SH, Nara M et al. Reliability of 18
F-Fluorodeoxyglucose positron emission tomography/computed tomography in the nodal
staging of colorectal cancer patients. Ann Coloproctol 2014; 30: 259-65.
7. Maffione AM, Lopci E, Bluemel C et al. Diagnostic accuracy and impact on management of 18
F-FDG PET and PET/CT in colorectal liver
metastasis: a meta-analysis and systenatic review. Eur J Nucl Med Mol Imaging 2015; 42: 152-63.
8. Wen-Yong T, Zhi-Yuan Z, Jun Z et al. Sensitivity of PET/MR images in liver metastases with advanced colorectal carcinoma. Hell J Nucl
Med 2011; 14(3): 264-8.
9. Maas M, Rutten IJG, Nelemans PJ et al. What is the most accurate whole-body imaging modality for assessment of local and distant
recurrent disease in colorectal cancer? A meta-analysis. Eur J Nucl Med Mol Imaging 2011; 38: 1560-71.
10. Caglar M, Yener C, Karabulut E. Value of CT, FDG PET-CT and serum tumor markers in staging recurrent colorectal cancer. Int J Comput
Assist Radiol Surg 2015; 10: 993-1002.
11. Zhang Y, Feng B, Zhang GL et al. Value of 18
F-FDG PET-CT in surveillance of postoperative colorectal cancer patients with various
carcinoembryonic antigen concentrations. World J Gastroenterol 2014; 20: 6608-14.
12. Kruse V, Cocquyt V, Borms M et al. Serum tumor markers and PET/CT imaging for tumor recurrence detection. Ann Nucl Med 2013; 27:
97-104.
13. Bagni O, Filippi L, Pelle G, Scopinaro F. 18
F-FDG PET/CT imaging of massive portal vein thrombosis from ileal adenocarcinoma. Hell J
Nucl Med 2014; 17: 52-3.

www.nuclmed.gr Hell J Nucl Med Suppl, September-December 2015 87
14. Floriani I, Torr V, Rulli E et al. Performance of imaging modalities in diagnosis of liver metastases from colorectal cancer: a systematic
review and meta-analysis. J Magn Reson Imaging 2010; 31: 19-31.
15. Morton KA, Clark PB. Diagnostic imaging nuclear medicine. 8th
ed. Utah: Amirsys; 2007.
16. Patel S, McCall M, Ohinmaa A et al. Positron emission tomography/computed tomographic scan compared to
computed tomographic scans for detecting colorectal liver metastases: a systematic review. Ann Surg 2011; 253: 666-71.
17. Mittal BR, Manohar K, Kashyap R et al. The role of 18
F-FDG PET/CT in initial staging of patients with
locally advanced breast carcinoma with an emphasis on M staging. Hell J Nucl Med 2011; 14: 135-9.
18. Brush J, Boyd K, Chappell F et al. The value of FDG positron emission tomography/computerised tomography (PET/CT) in pre-operative
staging of colorectal cancer: a systematic review and economic evaluation. Health Technol Assess 2011; 15: 1-175.
19. Bonanni L, de’Liguori Carino N, Deshpande R et al. A comparison of diagnostic imaging modalities for colorectal liver metastases. Eur J
Surg Oncol 2014; 101: 613-21.
www.nuclmed.gr Hell J Nucl Med Suppl, September-December 2015 88
Diagnostic medicine: A comprehensive ABCDE algorithm for accurate interpretation of radiology and pathology images and data Christina A. Zioga MSc, MD, Chariklia T. Destouni PhD, MD Department of Cytopathology, Theagenio Cancer Hospital of Thessaloniki, Greece Keywords:
18F-FDG PET/CT scan - Recurrent colorectal carcinoma - Liver metastases - MDCT
Correspondence adress: Christina Zioga, Resident of Cytopathology, Department of Cytopathology, Theagenio Cancer Hospital, 2 Alexander Symeonidi Street, Thessaloniki 54639, Greece. Tel.: 0030 6944784026; Fax: 0030 2310845514; Email: [email protected] Abstract A pathway to the procedure of interpreting radiology images or pathology slides is presented. This simplified mnemonic can be
used as a memory aid determining the order in which diagnosis should be approached. First, before we place the radiology
image in front of the lightbox or the slide under the microscope we have to be sure that it is adequately labelled and prepared
(Correct). It is also necessary to have or gather all available information concerning the patient and if possible his full medical
history (A, Available Information). Once we come across the image, two fundamental questions should be answered: which part
of the body does the image concern and-where applicable-if the image is adequate (B, Body). Next, we proceed to answer if we
have a neoplastic tissue or not (C, Cancer). We then either form a differential diagnosis list or we reach to a final diagnosis (D, Diagnosis), which is followed by the writing of the report (E, Exhibit). These series of steps followed as an ad hoc procedure by
most specialists, are important in order to achieve a complete and clear diagnosis and report, which is intended to support
optimal clinical practice. This ABCDE concept is a generic standard approach which is not limited to specific specimens and can
lead to faster diagnosis with less mistakes.
HJNM 2015; 18(Suppl1); 88-94 Published on line: 12 December 2015
Introduction
atient management is conducted by a multidisciplinary team, including radiologists, pathologists, surgeons, radiation oncologists, and medical oncologists, all of whom should communicate effectively. The correct diagnosis and complete report of radiologists and pathologists are cornerstones to disease diagnosis, treatment and follow-
up of patients. The diagnostic pathway begins when a test is indicated and a request is generated; it progresses via the
diagnostic process and ends when a report is acted upon by the requester. 1Minimum standards for the identification of
patient and his radiology image or tissue sample must be produced by the corresponding laboratory. All relevant clinical information should accompany the sample on the appropriate request form. Trained laboratory staff should follow a process of generating a radiology image or a pathology slide (rad-path image) according to local protocols. The generated images are interpreted by professionals-radiologists, pathologists. The final report should include radiology or pathology findings and ideally a final conclusion. Where ancillary studies are performed, the findings should be included in the body of the report.
Even though protocols and proforms can orientate radiologists and pathologists when creating a report, there is a need for a clear and standardized diagnosis pathway that identifies the order in which a rad-path image should be evaluated. This article proposes a systematic framework for bridging the above gap. The proposed algorithm provides a step by step approach to rad-path image diagnosis primarily to medical students as well as to biomedical scientists, residents, radiologists and pathologists. In particular, the present article describes a practical and systematic ABCDE approach that can be used as a guide to rad-path image diagnosis pathway. The proposed procedure is a generic standard approach which is not limited to specific specimens and can help improve both diagnoses and the quality of the final report being issued to clinicians.
The procedure consists of six sequential steps. The underlying idea is that every step should be cleared before proceeding to the following one. If a step has not been cleared, additional clarifications that need to be taken into consideration are provided. The first three steps (Correct, A, B) are considered as prerequisite checkpoints before reaching the diagnosis phase (C, D). Cited data are meant to provide a uniform framework of thinking and reporting (E) across all health care professionals that use the relevant information. A detailed discussion of the general principles of image quality, collection, submission, preparation and staining of samples is outside the scope of this document. The proposed ABCDE algorithm has been inspired from the Cytology ABCDE algorithm.
2To the best of our knowledge such a
generic ABCDE approach has not emerged in the open literature.
P

www.nuclmed.gr Hell J Nucl Med Suppl, September-December 2015 89
A comprehensive ABCDE procedure for accurate interpretation of radiology and patholoy images and data The proposed ABCDE pathway for the radiology image or pathology slide (rad-path image) diagnosis is summarized in Table 1.
Table 1. The ABCDE of radiology image or pathology slide diagnosis Correct Correctly labelled and prepared rad-path image
(same name - number of patient on rad-path image and request form, correct
preparation)
A Available information
(gender, age, medical history of the patient)
B Body
Rad: (is the image compatible with the expected radiological findings according to
topography of the lesion?
& do we have an adequate image?)
Path: (are the microscopic elements compatible with the expected histopathological
findings according to topography of the lesion?
& do we have an adequate sample?)
C Cancer
(is it a neoplasm or a non-neoplastic lesion?)
D Diagnosis
(we assess what we saw)
E Exhibit findings
(we write a report)
Note: rad-path image = Radiology or Pathology generated images
A flowchart of the suggested algorithm is depicted in Figure 1
The procedure follows six-step process, which commences with the “Correct” step.
Correct: At this stage, we ensure that the rad-path image corresponds to patient and we look for optimal image preparation technique. When receiving a rad-path image for diagnosis and prior to having it examined in front of the lightbox or under the microscope, we need to confirm that the name on the image or the number slide matches the one on the request form (correctly labelled). Correct stage is a safeguard. Regarding quality, radiology images and pathology slides should be prepared as documented in laboratory standard operating procedures (correctly prepared). Available Information (A): At this stage, we establish the basis for our diagnosis. Note that all relevant available information is a prerequisite for an accurate diagnosis. The first thing we need to register is the personal data and clinical information of the patient and in particular, the name, gender, age, medical history, previous rad-path images if any, previous tumors if any, relevant treatment given (such as radiotherapy or chemotherapy), as well as all accompanying radiologic information (when examining a pathology slide) and laboratory results. Patient history is the key in many cases. Do we already have this data (best case scenario is that clinicians provided us all relevant information)? If the answer is Yes, then we directly move on to step B. If the answer is No, then we must gather all necessary information. We can communicate with the managing clinician for clarification; or, if we are in a clinical setting, we can search the medical records. Some may skip this step rushing forward with the radiologic image interpretation or the microscopic examination of the slide. However, it is of paramount importance to acquire the missing data in order to correctly and rapidly form a complete and accurate differential diagnosis or a definitive diagnosis.
Note that current guidelines recommend that the clinician, radiologist, and pathologist work together towards establishing a diagnosis. Clinical and imaging information play a critical role to a pathology diagnosis.
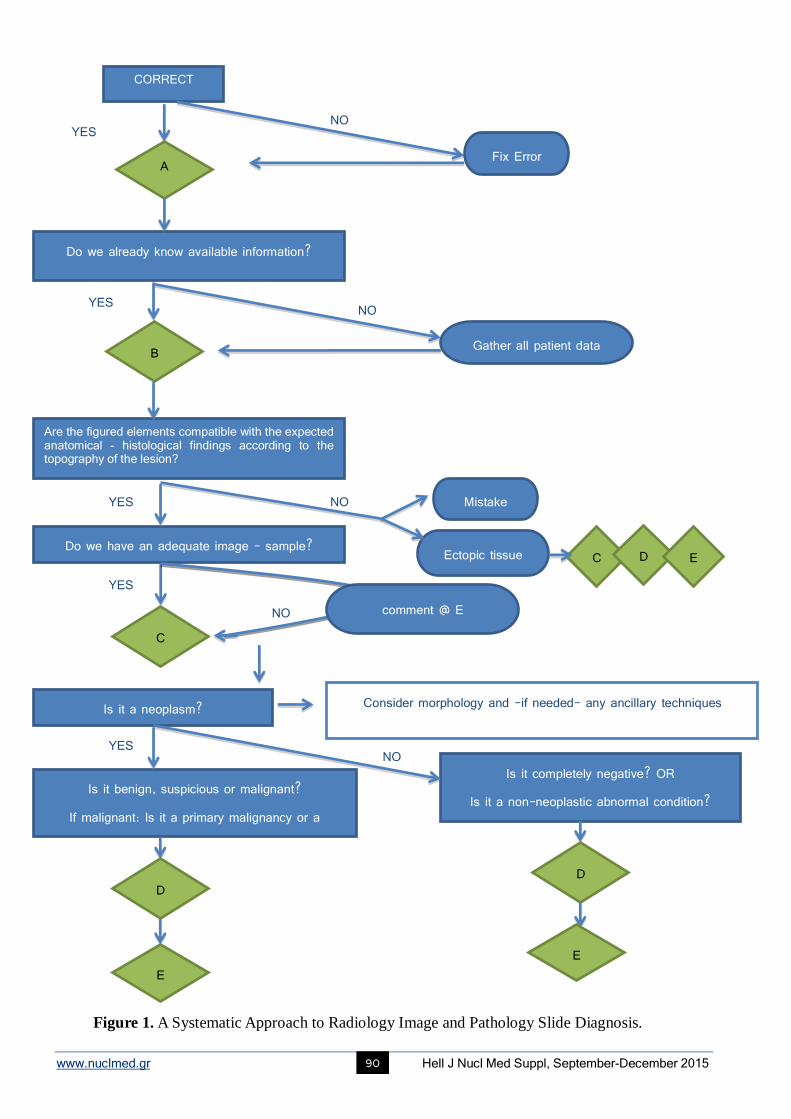
www.nuclmed.gr Hell J Nucl Med Suppl, September-December 2015 90
YES
NO YES
CORRECT
Fix Error A
Do we already know available information?
YES
YES
YES NO
NO
NO
Gather all patient data
C
B
Are the figured elements compatible with the expected anatomical - histological findings according to the topography of the lesion?
Ectopic tissue
Mistake
Do we have an adequate image - sample?
Is it a neoplasm?
NO
Is it benign, suspicious or malignant? If malignant: Is it a primary malignancy or a
secondary one?
Is it completely negative? OR Is it a non-neoplastic abnormal condition?
Consider morphology and -if needed- any ancillary techniques
comment @ E
D
Figure 1. A Systematic Approach to Radiology Image and Pathology Slide Diagnosis.
C D E
D
E E
www.nuclmed.gr Hell J Nucl Med Suppl, September-December 2015 91
Body (B): At this stage, we check if the rad-path image is in accordance with the information provided in the lesion field on the request form. We also question the adequacy of the rad-path image-where it applies. It is essential to know what to expect, from an anatomy point of view for Radiology and from histological point of view for Pathology. We need to know the topography of lesion, the part of the body that the sample comes from. For example, in a mammogram we expect to see a pair of breasts depicted symmetrically, in a Pap smear we expect to see squamous and endocervical cells. Are the figured elements compatible with the expected anatomical or histological findings according to the topography of the lesion? If the answer is Yes, then we proceed to the next question, which is “Do we have an adequate image-sample?” If the answer is No, then we either consider it as a mistake that needs to be clarified before proceeding to C or consider the possibility of ectopic tissue and proceed to step C. Awareness of possible ectopic tissue in erratic locations can help radiologists and pathologists make the correct interpretation of rad-path images. Assessment of adequacy of the sample is a prerequisite for reducing the incidence of false results and in particular, false negatives. In case of a mammogram for example, pectoral muscle should be properly depicted.
3In case
of sputum, if we do not see any pulmonary macrophages it is a superficial expectoration and we cannot have a representative image of the possible underling lesion.
4
Do we have an adequate image-sample? If the answer is Yes, then we move on to step C. If the answer is No, then we move to C, keeping in mind that at stage E a comment needs to be added, pointing out the inadequacy of the rad-path image. The reason of inadequacy should be clearly stated in the report.
5
Cancer (C): At this stage, we decide about the neoplastic or not character of the lesion. The radiological and histopathological examination of a lesion is the basis of cancer diagnostics. Morphology can confirm malignancy, as opposed to a reactive or infectious process. For most cases a morphologic examination is sufficient for conclusive determination of a lesion. However, sometimes, we need further diagnostic work-up in order to reach a definitive decision. Reaching stage C, we examine morphology and the following question is posed: Is it a neoplasm? If the answer is Yes, then we have to differentiate between benign, suspicious and malignant conditions by looking for hallmark features that will enforce our decision. In case of malignancy, we must deduce if the morphology defines a primary malignant tumor or a metastasis. Note that if morphology isn’t straight-forward, we need to consider the use of additional imaging modalities or the use of ancillary techniques e.g. immunohistochemistry. Subsequently, we move on to step D. If the answer is No, we need to examine the following complementary questions. Is it completely negative or do the features imply a non-neoplastic abnormal condition (e.g. infection, atrophy, dysplasia)? After answering the above question, we move on to step D. Diagnosis (D): At this stage, we make our decision. We have collected all clinical information (stage A), macroscopic description of specimen-if any-and radiologic or microscopic findings (stages B and C). It is the right time to formulate a diagnosis in our mind. Sometimes, we may arrive at this stage only to form a differential diagnosis list, while we wait for ancillary studies to take place and lead us to a definitive diagnosis. An accurate, specific and sufficiently comprehensive diagnosis will enable the clinician to develop an optimal plan of therapeutic intervention. If we are not able to completely identify the lesion, we provide a differential diagnosis list. Then, we move to the final step E. Exhibit (E): At this stage, we exhibit our findings by writing a report. Good formatting of the report is essential in order to optimise our communication with the clinician. Standardization, uniformity and consistency in the presentation of results between laboratories greatly facilitate the clinicians to read and understand reports coming from different laboratories. It is therefore of considerable importance the adoption of a systematic reporting procedure regarding diagnosis of cancer.
5For this reason, there are standard protocols
that can be followed to present the required data elements in many of the eligible cancer radiology or pathology reports. 6The final report should include patient, doctor and specimen identification, a gross description of the specimen-if any-,
radiologic or microscopic findings and ideally a final conclusion7,8
. Note that in case of an inadequate specimen, an adequacy statement needs to be added in stage E of the report. Any notes and suggestions are also included here.
5
In Tables 2 and 3, we present two examples on the application of the proposed ABCDE algorithm to radiology and pathology diagnosis procedure accordingly.
www.nuclmed.gr Hell J Nucl Med Suppl, September-December 2015 92
Table 2. The ABCDE diagnosis pathway for radiology-case of a mammogram
Table 3. The ABCDE diagnosis pathway for pathology-case of a fine needle aspiration of breast
Correct Correctly labelled mammogram (confirm patient)
Correctly prepared mammogram (exposure dose and time, the entire breast parenchyma is
included on the image)
A Available
information
Gender: woman
Age: 42-year-old
Medical history: clear
Physical examination findings: palpable lump in the right breast
Previous films for comparison: none
B Body
Breast
Being adequate: Pectoral muscle is properly depicted
C Cancer Suspicious abnormality, hyperdense mass with irregular shape and
spiculated margins, that significantly disturbs the surrounding parenchymal
architecture of the breast
D Diagnosis Suspicious for invasive breast carcinoma
E Exhibit Identifications, exposure, views
Imaging findings: narrative description of what we saw
Conclusion: BIRADS 4
Correct Correctly labelled slides (confirm patient)
Correctly prepared slides (stain, slides covered without air)
A Available
information
Gender: woman
Age: 42-year-old
Medical history: clear
Physical examination findings: palpable lump in the right breast
Radiological findings: BIRADS 4
B Body Breast
Being adequate: Solid lesions: No specific requirement for a minimum
number of epithelial cells. 11
Cystic lesions: There are no criteria for a minimal cell count. 11
C Cancer YES
Smears are hypercellular, with sheets and cords of malignant cells.
Cells are crowded and enlarged. Nuclei are hyperchromatic with occasional
prominent nucleoli. Myoepithelial cells are lacking. Abundant large cellular
fragments with slender, well-formed papillary structures with narrow
avascular stalks and wide bulbous ends = micropapillary form.
ICC: ER+(2+) , PR+(2+) , c-erb-B2+(3+), Ki-67>20%
D Diagnosis Ductal carcinoma
E Exhibit Identifications
Macroscopic: FNA of palpable mass ±2cm, close to areola of right breast; 3
slides: 1 prepared with liquid-based cytology method and 2 prepared with
conventional method; Pap stain.
Microscopic: narrative description of what we saw, plus ICC findings
Conclusion: Ductal carcinoma
www.nuclmed.gr Hell J Nucl Med Suppl, September-December 2015 93
Discussion To the best of our knowledge and after a careful search of all relevant literature, there are two ABCDEF and an ABCDEFGHI guide in Radiology, all three for chest radiograph assessment. In Pathology the only worldwide “ABCDE criteria” currently available is a heuristic procedure for detecting melanoma. There is also the “ABCD scheme”, the so-called Whitmore-Jewett prostate staging that has been replaced by the TNM staging system. The Diagnostic Medicine ABCDE has been inspired from the Cytology ABCDE algorithm(2).
The described Diagnostic Medicine ABCDE procedure is a well-structured and systematic way of thinking when examining a radiology image or a pathology slide. The originality of this work is that all these steps have been structured to comply to an ABCDE algorithm that provides a consistent set of steps for reliable diagnosis. It should be noted that it is a generic concept, not limited to specific specimens or imaging modalities. The proposed pathway is in its first edition and has not been through a full cycle of use, review and further refinement.
These sequential steps are followed as an ad-hoc procedure by most specialists, but as a new standardized and systematic method they can be a useful, practical and educational tool for all medical professionals. For students, it should add an element of fun and guidance to the learning process. In addition, if all medical students are acquainted with this generic ABCDE algorithm, in their follow-up professional years they will be more inclined to provide all relevant information to radiologists and pathologists, which can potentially lead to faster diagnosis, and they can better understand and appreciate Diagnostic’s Medicine role. It can also set the basis of a common language among doctors of different specialties.
Medical instructors can use this practical ABCDE guide to facilitate teaching. They can use it to present a case, to write a case report or to embed it to their lectures.
Professionals who teach residents could also make use of the generic ABCDE philosophy when they simultaneously view an image in front of the lightbox or the slides under the teaching microscope. They can communicate their observations in a more coded way. For example, “what’s the A?”, “what did you find in C?”, “what’s your opinion about D?”
Everyone who processes radiology images or pathology specimens can probably find it useful, practical and educational as well. It could also help improve outcomes in reports by ensuring that all important elements for a complete diagnosis will be included.
We believe that by using this ABCDE step-by-step approach a medical professional cannot deviate from the right course of action when interpreting a medical image. Furthermore, the use of the Diagnostic Medicine ABCDE procedure can potentially lead to faster diagnosis with less mistakes. Thus, we conclude that the generic ABCDE algorithm for radiology image and pathology slide interpretation is of great value to diagnosis field and it can give birth to other ABCDE algorithms on medical diagnosis in the future.
Acknowledgements The authors wish to thank Professor Costas Kiparissides for his expert advice and comments. Author Contributions ZC conceived the original idea for this article and prepared the first draft of the manuscript. Both authors contributed to the critical revision of the paper, they ensure that questions related to the accuracy and integrity of any part of the work are appropriately investigated and resolved and they both approved the final manuscript for submission. Author Information Authors declare: no support from any organisation for the submitted work; no financial relationships with any organisations that might have an interest in the submitted work; no other relationships or activities that could appear to have influenced the submitted work. Advances in knowledge Diagnostic Medicine ABCDE algorithm:
is a new structured way to orientate radiology image or pathology slide assessment
describes a generic systematic procedure in radiology and pathology diagnosis, not limited to specific specimens or imaging modalities
is a useful practical and educational tool for all medical professionals i.e. students, residents, specialists, professors and researchers
is an approach towards integrating Radiology and Pathology.
Implication for patient care Diagnostic Medicine ABCDE algorithm can potentially lead to faster diagnosis with less mistakes.

www.nuclmed.gr Hell J Nucl Med Suppl, September-December 2015 94
Bibliography
1. Diagnostic Test Reporting & Acknowledgement Procedures - Pathology & Clinical Imaging. R. Cornwall Hosp. NHS Trust 2014.
www.rcht.uk/DocumentsLibrary/RoyalComwallHospitalsTrust/Clinical/Pathology/DiagnosticTestingProcedur-es.pdf
2. Zioga C. & Destouni C. Cytology ABCDE: A Practical ABCDE Algorithm for Cytology Diagnosis. Diagn. Pathol 2015; 1.
3. Popli M. B., Teotia R., Narang M. & Krishna H. Breast Positioning during Mammography: Mistakes to be Avoided. Breast Cancer (Auckl)
2014; 8: 119-24.
4. Erozan Y. S. & Ramzy I. Pulmonary Cytopathology (Essentials in Cytopathology). (Springer Science + Business Media, LLC, 2014).
5. Thyroid cytology structured reporting protocols. R. Coll. Pathol. Australas. (The Royal College of Pathologists of Australasia, 2014). At
http://www.rcpa.edu.au/getattachment/b0545d63-2198-4d39-b190-9624ed686404/Protocol-thyroid-FNA-cytology.aspx
6. Cancer Program Standards 2012: Ensuring Patient-Centered Care. Commision Cancer, Am. Coll. Surg 2012; 65-66.
https://www.facs.org/~/media/files/qualityprograms/cancer/coc/programstandards2012.ashx
7. Kocjan G. et al. BSCC Code of Practice--fine needle aspiration cytology. Cytopathology 2009; 20: 283-96.
8. Denton K., Giles T., Smith P., Chandra, A. & Desai M. Tissue pathways for exfoliative cytology and fine needle aspiration. R. Coll. Pathol,
2010. http://www.rcpath.org/Resources/RCPath/MigratedResources/Documents/G/g08 6tpexfolia-tivecytologyfnacytology.pdf
9. Ali S, Parwani A. Breast Cytopathology. Rosenthal D, editor. Springer Science + Business Media, LLC; 2007. 14, 85-138.
10. Sorace J, Aberle DR, Elimam D, Lawvere S, Tawfik O, Wallace WD. Integrating pathology and radiology disciplines: an emerging
opportunity? BMC Med [Internet]. 2012 Jan [cited 2015 Jul 2];10(1):100. Available from: http://www.biomedcentral.com/1741-7015/10/100
11. Murphey MD, Madewell JE, Olmsted WW, Ros PR, Neiman HL. A history of radiologic pathology correlation at the Armed Forces Institute of
Pathology and its evolution into the American Institute for Radiologic Pathology. Radiology [Internet]. Radiological Society of North America,
Inc.; 2012 Feb 1 [cited 2015 Aug 23];262(2):623–34. Available from: http://pubs.rsna.org/doi/abs/10.1148/radiol.11111357
Monuments from the city of Thessaloniki
The White Tower
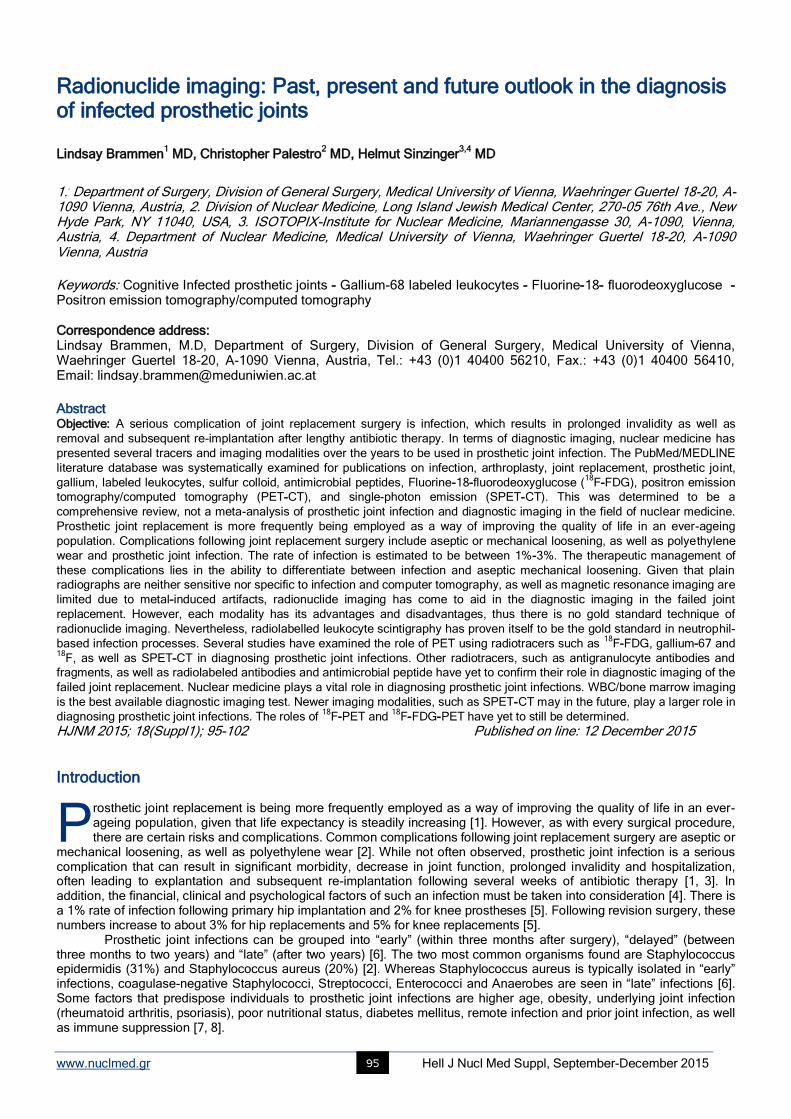
www.nuclmed.gr Hell J Nucl Med Suppl, September-December 2015 95
Radionuclide imaging: Past, present and future outlook in the diagnosis of infected prosthetic joints Lindsay Brammen
1 MD, Christopher Palestro
2 MD, Helmut Sinzinger
3,4 MD
1.
. Department of Surgery, Division of General Surgery, Medical University of Vienna, Waehringer Guertel 18-20, A-
1090 Vienna, Austria, 2. Division of Nuclear Medicine, Long Island Jewish Medical Center, 270-05 76th Ave., New Hyde Park, NY 11040, USA, 3. ISOTOPIX-Institute for Nuclear Medicine, Mariannengasse 30, A-1090, Vienna, Austria, 4.
Department of Nuclear Medicine, Medical University of Vienna, Waehringer Guertel 18-20, A-1090
Vienna, Austria Keywords: Cognitive Infected prosthetic joints - Gallium-68 labeled leukocytes - Fluorine-18- fluorodeoxyglucose - Positron emission tomography/computed tomography Correspondence address: Lindsay Brammen, M.D, Department of Surgery, Division of General Surgery, Medical University of Vienna, Waehringer Guertel 18-20, A-1090 Vienna, Austria, Tel.: +43 (0)1 40400 56210, Fax.: +43 (0)1 40400 56410, Email: [email protected]
Abstract Objective: A serious complication of joint replacement surgery is infection, which results in prolonged invalidity as well as
removal and subsequent re-implantation after lengthy antibiotic therapy. In terms of diagnostic imaging, nuclear medicine has
presented several tracers and imaging modalities over the years to be used in prosthetic joint infection. The PubMed/MEDLINE
literature database was systematically examined for publications on infection, arthroplasty, joint replacement, prosthetic joint,
gallium, labeled leukocytes, sulfur colloid, antimicrobial peptides, Fluorine-18-fluorodeoxyglucose (18
F-FDG), positron emission
tomography/computed tomography (PET-CT), and single-photon emission (SPET-CT). This was determined to be a
comprehensive review, not a meta-analysis of prosthetic joint infection and diagnostic imaging in the field of nuclear medicine.
Prosthetic joint replacement is more frequently being employed as a way of improving the quality of life in an ever-ageing
population. Complications following joint replacement surgery include aseptic or mechanical loosening, as well as polyethylene
wear and prosthetic joint infection. The rate of infection is estimated to be between 1%-3%. The therapeutic management of
these complications lies in the ability to differentiate between infection and aseptic mechanical loosening. Given that plain
radiographs are neither sensitive nor specific to infection and computer tomography, as well as magnetic resonance imaging are
limited due to metal-induced artifacts, radionuclide imaging has come to aid in the diagnostic imaging in the failed joint
replacement. However, each modality has its advantages and disadvantages, thus there is no gold standard technique of
radionuclide imaging. Nevertheless, radiolabelled leukocyte scintigraphy has proven itself to be the gold standard in neutrophil-
based infection processes. Several studies have examined the role of PET using radiotracers such as 18
F-FDG, gallium-67 and 18
F, as well as SPET-CT in diagnosing prosthetic joint infections. Other radiotracers, such as antigranulocyte antibodies and
fragments, as well as radiolabeled antibodies and antimicrobial peptide have yet to confirm their role in diagnostic imaging of the
failed joint replacement. Nuclear medicine plays a vital role in diagnosing prosthetic joint infections. WBC/bone marrow imaging
is the best available diagnostic imaging test. Newer imaging modalities, such as SPET-CT may in the future, play a larger role in
diagnosing prosthetic joint infections. The roles of 18
F-PET and 18
F-FDG-PET have yet to still be determined.
HJNM 2015; 18(Suppl1); 95-102 Published on line: 12 December 2015
Introduction
rosthetic joint replacement is being more frequently employed as a way of improving the quality of life in an ever-ageing population, given that life expectancy is steadily increasing [1]. However, as with every surgical procedure, there are certain risks and complications. Common complications following joint replacement surgery are aseptic or
mechanical loosening, as well as polyethylene wear [2]. While not often observed, prosthetic joint infection is a serious complication that can result in significant morbidity, decrease in joint function, prolonged invalidity and hospitalization, often leading to explantation and subsequent re-implantation following several weeks of antibiotic therapy [1, 3]. In addition, the financial, clinical and psychological factors of such an infection must be taken into consideration [4]. There is a 1% rate of infection following primary hip implantation and 2% for knee prostheses [5]. Following revision surgery, these numbers increase to about 3% for hip replacements and 5% for knee replacements [5].
Prosthetic joint infections can be grouped into “early” (within three months after surgery), “delayed” (between three months to two years) and “late” (after two years) [6]. The two most common organisms found are Staphylococcus epidermidis (31%) and Staphylococcus aureus (20%) [2]. Whereas Staphylococcus aureus is typically isolated in “early” infections, coagulase-negative Staphylococci, Streptococci, Enterococci and Anaerobes are seen in “late” infections [6]. Some factors that predispose individuals to prosthetic joint infections are higher age, obesity, underlying joint infection (rheumatoid arthritis, psoriasis), poor nutritional status, diabetes mellitus, remote infection and prior joint infection, as well as immune suppression [7, 8].
P
www.nuclmed.gr Hell J Nucl Med Suppl, September-December 2015 96
Between the patient’s bone and the prosthesis material is a thin layer of reactive fibrous tissue, also known as a membrane [1]. In prosthetic joint infection, either as a result of microbial colonization that occurs at time of implantation or haematogenous seeding leads to inflammatory cells, collagen and blood vessels thicken this membrane [1]. Furthermore, the pathogens attach to the membrane by means of capsular polysaccharide-associated adhesins and a proteinaceous cell wall, subsequently secreting a biofilm that protects them from the host immune response and antibiotics [1]. Therefore, diagnosis and subsequent treatment of joint infections are quite difficult.
It is a known fact that bacteria secrete chemotactic factors, such as histamine and prostaglandins that recruit leukocytes, induce endothelial activation and cause edema. Therefore, the incessant recruitment of leukocytes from the blood to the periprosthetic tissue is typical of acute or sub-acute bacterial infection. Due to active migration into an infected tissue by means of adherence to vascular endothelium followed by migration, autologous radiolabelled white blood cells have a high specificity [9]. A subtype of white blood cells (WBC), neutrophils, are present in the infected joint and are the predominantly labeled circulating cell in labeled leukocyte scintigraphy (LS) with tracers, such as
111In-oxine
and 99m
Tc-hexamethyl propyleneamine oxime (HMPAO) [1]. Leukocyte labeling in infection imaging was first introduced in 1976 by McAfee and Thakur [10]. Labeled leukocytes do not accumulate at sites absent of infection or where there is increased bone turnover [1]. Therefore, LS is considered to be a valuable tool in diagnosing prosthetic joint infections [1]. In addition, given that neutrophils are typically absent in aseptic loosened prosthesis, LS should be able to distinguish between an infected prosthesis and an inflamed aseptic prosthesis [5, 11, 12]. However, bone marrow displacement or activation by surgery can result in a secondary uptake of leukocytes around prostheses [1]. Therefore, a combination of LS and bone marrow scintigraphy (BMS) with
99mTc-sulphur-/nanocolloid has been introduced [1]. Within 48 hours of
bacterial seeding, an acidic pH, low oxygen tension, increased intraosseous pressure and vascular insufficiency suppress the uptake of sulfur-/nano colloid [13]. Given that infection stimulates the uptake of leukocytes, but suppresses the uptake of sulfur-/nanocolloid, LS and BMS in infections are spatially incongruent [5]. If however, the uptake of the two radiopharmaceuticals is similar or spatially congruent, the labeled leukocyte activity is attributable to bone marrow uptake [5]. In terms of diagnostic imaging, nuclear medicine has offered various tracers and imaging modalities over the years to be used in diagnosing infected joint replacements. This review will discuss those most widely used.
Preoperative work-up in suspected prosthetic infections Prosthetic joint infection is defined by major and minor criteria. Major criteria include: a) presence of a sinus tract communicating with the prosthesis or b) two positive periprosthetic cultures with phenotypically identical organisms [14]. Minor criteria include: 1) raised serum erythrocyte sedimentation rate (ESR) and serum C-reactive protein concentration (CRP), 2) raised synovial WBC count change on leucocyte esterase test strip, 3) raised synovial polymorphonuclear neutrophil percentage, 4) positive histological analysis of periprosthetic tissue or 5) a single positive culture [14]. One of the most perplexing diagnostic situations involves a persistent marginally elevated CRP or tenacious pain after surgery [1]. Therefore, diagnosis involves a variety of different factors. Firstly, thorough clinical histories, including medical, surgical and physical examinations deliver excellent initial diagnostic and aid in subsequent diagnostic evaluation [1]. Further diagnostic evaluation of prosthetic joint infection includes hematological tests with inflammation markers (C-reactive protein (CRP), WBC count, ESR and interleukin-6). A study by Glithero et al. (1993) [15] examining CRP values in patients with suspected prosthetic infections reported a sensitivity, specificity and accuracy of 83%, 74%, and 77%, respectively. In a study currently under review, the sensitivity of CRP was 57%, specificity 28%, with an overall accuracy of 33% [16]. A review by Yuan et al. (2014) [17] demonstrated that CRP had good diagnostic accuracy for periprosthetic infections with a sensitivity of 82% and specificity of 77%. Overall, it appears that CRP alone is not very accurate in prosthetic joint infections. In terms of WBC count, a study by Berbari et al. (2010) [18] that demonstrated that WBC count has the lowest diagnostic accuracy for prosthetic joint infections. While this analysis only investigated serum CRP and WBC count, a study by Claassen et al. (2014) [19] that assessed 46 patients with knee arthroplasty and aspiration in 77 cases, demonstrated an increase in WBC count in only 7 cases and normal levels in the remaining patients. In addition, CRP was increased in 33 cases and normal in 44 cases [19]. In a study currently under review, they demonstrated a sensitivity of 0%, specificity of 92% and overall accuracy of 82% [16]. Similar to this study, Claassen et al. (2014) [19] also concluded that CRP and WBC are not accurate in diagnosing ongoing infection. A normal CRP or ESR cannot completely rule out a low-grade infection, given that false negative results can occur following long-term antibiotic treatment or in patients with delayed-onset infection [18]. Therefore, additional diagnostic examinations, such as joint aspiration with a WBC count and differential, gram stain and culture, as well as numerous imaging modalities may be required [1, 18].
Well-established tracers in infection 67
Gallium-citrate Gallium-67 (
67Ga) is an analog of iron that can bind to circulating transferrin in its ionic form and thus uses transferrin
receptors to enter cells and become highly stable [20, 21]. Roughly 90% of 67
Ga-citrate is transferrin-bound and found in the plasma [22]. It is believed that
67Ga-citrate can seep through the vascular endothelium and attach to lactoferrin, which
is released by leukocytes or siderophores expelled by the infectious microorganisms at infection foci [23]. Given that the siderophores have a high affinity for
67Ga, they readily bind and are transported into the microorganism, to later be
www.nuclmed.gr Hell J Nucl Med Suppl, September-December 2015 97
phagocytized by macrophages [24]. 67
Ga is normally distributed within the liver, bone marrow, bone, soft tissues, gastrointestinal- and genitourinary tracts [21, 24]. In the past,
67Ga has been used for accessing prosthetic joint infection.
The reported accuracy lies between 50% [25] and 95% [26]. Gomez-Luzuriaga et al. (1988) [27] demonstrated a sensitivity, specificity and accuracy of 70%, 90% and 80%, respectively. Mountford et al. (1986) [28] and McKillop et al. (1984) [29] also reported the accuracy of gallium scintigraphy in prosthetic joint infection to be 80%. Conversely, Kraemer et al. (1993) [30] exhibited a low sensitivity of 38% but a high specificity of 100% and overall accuracy of 81%. In addition, Aliabadi et al. (1989) [31] demonstrated a sensitivity of 37% and specificity of 100%. Merkel et al. (1986) [32] presented a study showing 66% sensitivity, 81% specificity and 77% accuracy in
67Ga diagnostic testing of infection in the painful
prostheses. Similar results have been seen in 67
Ga testing in animals. Merkel et al. (1984) [33] reported a sensitivity, specificity and accuracy of 61%, 71% and 67%, respectively in loose and infected canine arthroplasty. While diagnostic testing with
67Ga in prosthetic joint infections has been carried out at one time, its accuracy was not acceptable when
trying to determine an infected prosthetic joint from an inflamed one. It is now typically limited to diagnosing chronic osteomyelitis, fever of unknown origin (FUO) and lung infections. 111
In-oxine 111
In-oxine is characterized by its ability to diffuse through the cell membrane and detach itself from the lipophilic complex, thus leading to an irreversible binding to the nuclear and other intracellular components [21, 34]. Some advantages of using
111In-oxine include a 67h half-life with a constant distribution limited to the bone marrow, liver and spleen, which is a
great benefit, especially in infections of the prosthetic joint and musculoskeletal system [22]. Disadvantages include not being able to use this radiotracer in inflammatory bowel diseases, as well as a 24h-interval requirement between injection and imaging [22]. The sensitivity of indium-111 LS lies within 38%-100%, specificity between 15%-100% and accuracy 60%-96% [15, 35-37]. However, in combination with technetium-99m sulfur colloid, it is possible to increase sensitivity, specificity and accuracy. Mulamba et al. (1983) [38] demonstrated a sensitivity, specificity and accuracy of 92%, 100% and 96%, respectively. Furthermore, Palestro et al. (1991) [39] exhibited a sensitivity of 86%, specificity of 97% and accuracy of 95% in 41 patients with knee prostheses suspected of being infected. In addition, Palestro et al. (1990) [40] reported a sensitivity, specificity and accuracy of 100%, 97% and 98%, respectively in 92 cemented total-hip arthroplasties. Finally, a study by Joseph et al. (2001) [41] in 58 patients before reoperation of total knee or hip arthroplasty demonstrated a sensitivity of 46%, specificity of 100% and overall accuracy of 88%. Typical indications of using
111In-oxine include diagnostic imaging for prosthetic joint infections, chronic osteomyelitis and in certain cases of
fever of unknown origin/occult fever [23]. 99m
Tc-hexamethylpropyleneamine oxine (HMPAO) Labeling of leukocytes with
99mTc-HMPAO was first introduced in 1986 by Peters et al (1999) [42]. The
99mTc-HMPAO
complex is able to enter the cell, transform to a hydrophilic state and then becomes trapped in the cell [23]. Some advantages of using this tracer include low radiation burden, continuous availability, cheapness and ideal γ-ray energy [43]. It also has a higher proton flux, which permits the imagining of body parts such as feet [23]. Given its low radiation, this tracer can easily be used in children. However, this tracer is less stable than
111In-oxine, eluting from cells up to 7%/h,
which requires imaging to occur within 2-4h after injection of the tracer [23, 43, 44]. 99m
Tc-HMPAO accumulated in the gastrointestinal tract, bone marrow, spleen, liver and kidneys [23]. It is commonly used in the imaging of bone/joint infection, irritable bowel disease and soft tissue infection. Leukocyte labeling with
111In-oxine or
99mTc-HMPAO
The reported accuracy of WBC-labeling combined with bone marrow imaging ranges from 86-98% of patients [39-41, 45-54]. One of the earliest studies with 30 patients examining labeled leukocytes with bone marrow imaging and hip arthroplasty by Mulamba et al. (1983) [38] observed a 92% sensitivity and 100% specificity for diagnosing hip infections. Another study of labeled leukocytes and bone marrow scans in 72 patients with hip arthroplasty by Palestro et al. (1990) [40] demonstrated 100% sensitivity and 97% specificity in diagnosing infection. A review examining 59 patients with failed hip- and knee arthroplasties by Love at al. (2004) [53] reported the sensitivity, specificity and accuracy of combined leukocyte/bone marrow scanning to be 100%, 91%, and 95%, respectively. In addition, a study by El Espera et al. (2004) [52] determined 80% sensitivity, 94% specificity and 91% accuracy in 60 patients with knee or hip arthroplasty that received combined leukocyte/bone marrow scanning. While most studies show that combined leukocyte-and bone marrow scanning is highly specific, the sensitivity of this method can vary. A study by Pill et al. (2006) [55] reported only 50% sensitivity in combined leukocyte/bone marrow scan. Furthermore, while Joseph et al. (2001) [41] reported 100% specificity in their patient population of 58 patients with total knee or hip arthroplasty, they observed only 46% sensitivity for combined leukocyte/bone marrow imaging.
It has been argued that poor sensitivity can be attributed to chronicity of an infection, as well as non-specific inflammation [29, 56-58]. While chronic infections are typically characterized by less distinct neutrophil recruitment and edema [59], a study by Datz et al. (1986) [11] that examined the labeled leukocytes in acute and chronic infections found no significant statistical difference in sensitivity. In non-specific inflammation, neutrophils are generally absent [60]. Given that LS is most sensitive in imaging neutrophil-dominate responses [60], aseptic inflammation may lead to false negative results and a decrease in sensitivity [61]. While it was once discussed that false negative results could be due to prior antibiotic treatment, several studies have shown this not to be the case [62, 63]. However, one must keep in consideration that both the activity and uptake can vary, as well as the normal distribution of WBC in the bone marrow [64]. For example, one would expect to see fewer WBC migrating to the joints of chronic infection. Furthermore, uptake depends on the number of WBC that migrate to the site of infection [64].
Despite the high accuracy of this technique, LS does have its disadvantages, which have to be considered
www.nuclmed.gr Hell J Nucl Med Suppl, September-December 2015 98
before performing this test. Firstly, the procedure is labor intensive. Given that two to three technologists are involved in the labeling and imaging processes, it can be estimated that a total of 8-10 hours is required from them for this technique, over two days. Furthermore, this technique is routinely available in only a few hospitals worldwide. In addition, it involves contact with blood products, which requires strict protocols, such as the use of a laminar flow hood [51, 53, 60, 65]. The indications for the combination imaging LS/BMS include prosthetic joint infection, musculoskeletal infections, and neuropathic joint [64]. Leukocyte scintigraphy has also been implemented in patients with fever of unknown origin, postoperative infections, as well as systemic infections [64]. 18
F-deoxyglucose (FDG) The first studies investigating the role of
18F-FDG in infection imaging were first introduced in 2006 [66-68]. Cells with
increased glucose requirements, such as inflammatory cells and tumor cells readily take up 18
F-FDG [43]. Given that deoxyglucose cannot leave the cell after it has been taken up, it can be used in the imaging of the above-mentioned cells [69, 70]. Some of the advantages of this tracer include easy preparation and imaging [43]. On the other hand, disadvantages include a short half-time of 110 minutes, as well as a low labeling efficiency when compared to
111In-oxine
and 99m
Tc-HMPAO [59]. Given the negative aspects of the tracer, two to three times more activity must be used in the labeling process, which ultimately results in a higher activity being injected into the patient [71]. In addition, given its short half-life, late images required in prosthetic joint infection imaging are not possible [59]. Physiological uptake of
18F-FDG is
seen in the brain, heart, kidneys and bladder [59]. Infection imaging with 18
F-FDG has shown high sensitivity, but low specificity, mainly due to the fact that imaging is based on increased metabolic activity [72, 73]. Thus, its role in diagnosing osteomyelitis and infected prosthetic joints is limited. One major drawback with
18F-FDG in infection imaging
are the artifacts adjacent to prostheses [74]. In addition, healing tissues up to 6 months following surgery, bone fractures, varicose veins and atherosclerotic lesions can all demonstrate non-specific
18F-FDG uptake [75, 76]. As shown in a recent
study by Aydin et al. (2015) [77] 18
F-FDG uptake was confined to the proximal segment of the prosthesis in 62 asymptomatic patients who underwent total hip replacement, whereby the femoral segment showed no uptake. Thus, a positive
18F-FDG-scan in infection must be interpreted with caution given the various reasons that can produce false
positive results [78]. Several studies have investigated 18
F-FDG in infection imaging. Zhuang et al. (2001) [79] demonstrated 89.5% increase in
18F-FDG uptake along hip arthroplasties and 77.8% in knee arthroplasties. Chacko et al.
(2002) [80] exhibited 92% sensitivity and 97% specificity in infection of hip arthroplasty. In both of these studies, intensity was not able to differentiate between aseptic inflammation versus infection. As seen in a study by Delank et al. (2006) [81] they were able to demonstrate that
18F-FDG-PET was able to positively diagnose evidence of loosening in 76.4% of
patients and detect periprosthetic inflammation in 100% of septic cases. However, only 45.5% of cases were positive for increased abrasion and aseptic inflammation, thus,
18F-FDG-PET was not able to deduce the difference between
abrasion-induced versus inflammation due to bacteria [81]. Similar results were seen in a study by Garcia-Barrecheguren et al. (2007) [82] who reported a low sensitivity (64%) and specificity (67%) of
18F-FDG-PET in hip replacement infections.
In regards to accuracy, Cremerius et al. (2003) [83] and Gravius et al. (2010) [84] reported roughly 89% accurate in infection of hip arthroplasties, while Manthey et al. (2002) reported 96% accuracy [85]. On the other hand, Stumpe et al. (2004) [86] demonstrated an accuracy of only 69%, with bone scintigraphy being more accurate (80%) than
18F-FDG-PET
in their study. Pill et al. (2006) [55] exhibited 95% sensitivity and 93% specificity in infected hip replacements, versus 50% sensitivity and 95.1% specificity of WBC/marrow imaging in a subgroup of these patients. Regardless of the different criteria on how to interpret
18F-FDG uptake in infection, it has been exhibited in several studies that
18F-FDG-PET is less
accurate when compared to labeled WBC/bone marrow imaging in diagnosing prosthetic joint infection [53, 87, 88]. In a meta-analysis, the overall sensitivity and specificity of
18F-FDG-PET in prosthetic joint infection was 82% and 87%,
respectively [89]. Thus, its role in diagnosing prosthetic joint infection still needs to be determined. However, it has been shown to be important in diagnosing spondylodiscitis [79, 90, 91].
Future outlook Recently published papers assessing future directions in leukocyte labeling include using monoclonal antibodies, SPET-CT as an adjunct to scintigraphy, as well as
18F-FDG PET. The use of monoclonal antibodies such as Sulesomab for
infection diagnostics has also been recently discussed and reported sensitivity and specificity lie between 75% to 93% and 65% to 86%, respectively [92-94]. Its role in infection diagnostics has, however, yet to be determined. On the other hand, the additional role of SPET-CT is a promising direction in infection diagnostics. In a study by Graute et al. (2010) [95] they were able to increase sensitivity from 66% to 89% and specificity from 60% to 73% by combining planar images with SPET-CT. Furthermore, a recently published study by Kim et al. (2014) [96], which assessed adding SPET-CT to 99m
Tc-HMPAO-labeled leukocytes, demonstrated an increase in sensitivity from 82% to 93.3%, specificity 88% to 93.3%, PPV from 89% to 94.3% and NPV 80.5% to 92.1% and diagnostic accuracy from 84.8% to 93.3%. Additionally, a study by Bar-Shalom et al. (2006) [97] demonstrated the additional role of SPET/CT in patients with
111In-WBC, as it is able to
provide exact localization, as well as the extent of the infection, thus improving diagnosis. In addition, Filippi et al. (2006) [98] demonstrated 100% accuracy when using SPET/CT with
99mTc-exametazime labeled leukocytes in patients with
suspected musculoskeletal infection, compared to 64% when using solely scintigraphy. Horger et al. (2003) [99] exhibited 97% accuracy when using
99mTc-labeled anti-granulocyte antibody and SPET/CT in the diagnosis of bone infection versus
59% accuracy of scintigraphy alone. It is believed, in accordance with other studies that the CT component increases the sensitivity by precisely localizing the anatomical site of infection [98]. Lastly, the role of
18F-FDG PET has showed great
potential for infection diagnostics and for studying bone metabolism. A study by Sterner et al. (2007) [100] was able to
www.nuclmed.gr Hell J Nucl Med Suppl, September-December 2015 99
demonstrate that the sensitivity, specificity and accuracy of 18
F-FDG PET, 100%, 56%, and 71%, respectively, were higher when compared to radiographs with 43%, 86%, and 64%, respectively, when assessing for aseptic loosening in 14 patients with painful knee arthroplasties. Kobayashi et al. (2011) [101] exhibited sensitivity 95%, specificity 88% and overall accuracy 91% of
18F-PET in 49 patients following total hip arthroplasty with significant differences shown between
the maximum standardized uptake value (SUVmax) values for aseptic and septic loosening. Several studies by Ullmark et al. (2012, 2013) [102, 103] demonstrated the promising role of
18F-FDG PET in analyzing bone formation. While SPET-CT
increases sensitivity through the CT component, an increase in sensitivity leads to a decrease in specificity. In conclusion, until the roles of SPET-CT and
18F-FDG PET in diagnostic infection imaging can be determined, the combination of LS
with bone marrow imaging is an accurate technique in diagnosing prosthetic infections.
Conclusion Nuclear medicine plays a vital role in diagnosing prosthetic joint infections. This review has shown that currently, WBC/bone marrow imaging is the best available diagnostic imaging test. Newer imaging modalities, such as SPET-CT may in the future, play a bigger role in diagnosing prosthetic joint infections, especially given that it can provide us with important additional information, such as exact anatomical location. The roles of
18F-FDG PET and
18F-FDG PET/CT have
yet to be determined. The authors declare that they have no conflicts of interest.
Bibliography
1. Gemmel F, Van den Wyngaert H, Love C et al. Prosthetic joint infections: radionuclide state-of-the-art imaging. Europ J Nucl Med Mol Imag
2012; 39(5): 892-909.
2. Love C, Marwin SE, Palestro CJ. Nuclear medicine and the infected joint replacement. Semin Nucl Med 2009; 39(1): 66-78.
3. Lazzeri E, Manca M, Molea N et al. Clinical validation of the avidin/indium-111 biotin approach for imaging infection/inflammation in
orthopaedic patients. Europ J Nucl Med Mol Imag 1999; 26(6): 606-14.
4. Bauer TW, Parvizi J, Kobayashi N et al. Diagnosis of periprosthetic infection. J Bone Joint Surg Amer vol. 2006; 88(4): 869-82.
5. Love C, Tomas MB, Marwin SE et al. Role of nuclear medicine in diagnosis of the infected joint replacement. Radiographics 2001; 21(5):
1229-38.
6. Zimmerli W, Trampuz A, Ochsner PE. Prosthetic-joint infections. N Engl J Med 2004; 351(16): 1645-54.
7. Zimmerli W. Infection and musculoskeletal conditions: Prosthetic-joint-associated infections. Best Practice Res Clin Rheumatol 2006; 20(6):
1045-63.
8. Cataldo MA, Petrosillo N, Cipriani M et al. Prosthetic joint infection: recent developments in diagnosis and management. J Infection 2010;
61(6): 443-8.
9. Datz FL. Indium-111-labeled leukocytes for the detection of infection: current status. Semin Nucl Med 1994; 24(2): 92-109.
10. McAfee JG, Thakur ML. Survey of radioactive agents for in vitro labeling of phagocytic leukocytes. II. Particles. J Nucl Med 1976; 17(6):
488-92.
11. Datz FL, Thorne DA. Effect of chronicity of infection on the sensitivity of the In-111-labeled leukocyte scan. Am J Roentgenol 1986; 147(4):
809-12.
12. Krznaric E, Roo MD, Verbruggen A et al. Chronic osteomyelitis: diagnosis with technetium-99m-d, l-hexamethylpropylene amine oxime
labelled leucocytes. Europ J Nucl Med 1996; 23(7): 792-7.
13. Mader JT, Brown GL, Guckian JC, et al. A mechanism for the amelioration by hyperbaric oxygen of experimental staphylococcal
osteomyelitis in rabbits. J Infectious Dis 1980; 142(6): 915-22.
14. Parvizi J, Gehrke T, Chen AF. Proceedings of the International Consensus on Periprosthetic Joint Infection. Bone Joint J 2013; 95-B(11):
1450-2.
15. Glithero PR, Grigoris P, Harding LK et al. White cell scans and infected joint replacements. Failure to detect chronic infection. J Bone Joint
Surg Br 1993; 75(3): 371-4.
16. Brammen L, Holinka J, Windhager R et al. A retrospective analysis of the accuracy of radioactively labeled autologous leukocy tes in
patients with infected prosthetic joints. 2015 (inpreperation-reviewed).
17. Yuan K, Chen HL, Cui ZM. Diagnostic accuracy of C-reactive protein for periprosthetic joint infection: a meta-analysis. Surg Infect
(Larchmt) 2014; 15(5): 548-59.
18. Berbari E, Mabry T, Tsaras G et al. Inflammatory blood laboratory levels as markers of prosthetic joint infection: a systematic review and
meta-analysis. J Bone Joint Surg Am 2010; 92(11): 2102-9.
19. Claassen L, Radtke K, Ettinger M et al. Preoperative diagnostic for periprosthetic joint infection prior to total knee revision arthroplasty.
Orthop Rev (Pavia) 2014; 6(3): 5437.
20. Peters AM. The utility of [99m
Tc]HMPAO-leukocytes for imaging infection. Semin Nucl Med 1994; 24(2): 110-27.
21. Chianelli M, Mather SJ, Martin-Comin J et al. Radiopharmaceuticals for the study of inflammatory processes: a review. Nuclear medicine
communications 1997; 18(5): 437-55.
22. Love C, Palestro CJ. Radionuclide imaging of infection. J Nucl Med Technol 2004; 32(2): 47-57; quiz 8-9.
23. Hughes DK. Nuclear medicine and infection detection: the relative effectiveness of imaging with 111In-oxine-, 99m
Tc-HMPAO-, and 99m
Tc-stannous fluoride colloid-labeled leukocytes and with 67
Ga-citrate. J Nucl Med Technol 2003; 31(4):196-201; quiz 3-4.
24. Palestro CJ. The current role of gallium imaging in infection. Semin Nucl Med 1994; 24(2): 128-41.
www.nuclmed.gr Hell J Nucl Med Suppl, September-December 2015 100
25. Williams F, McCall IW, Park WM et al. Gallium-67 scanning in the painful total hip replacement. Clin Radiol 1981; 32(4): 431-9.
26. Tehranzadeh J, Gubernick I, Blaha D. Prospective study of sequential technetium-99m phosphate and gallium imaging in painful hip
prostheses (comparison of diagnostic modalities). Clin Nucl Med 1988; 13(4): 229-36.
27. Gomez-Luzuriaga MA, Galan V, Villar JM. Scintigraphy with Tc, Ga and In in painful total hip prostheses. Int Orthop 1988; 12(2): 163-7.
28. Mountford PJ, Hall FM, Wells CP et al. 99m
Tc-MDP, 67
Ga-citrate and 111
In-leucocytes for detecting prosthetic hip infection. Nucl Med
Commun 1986; 7(2): 113-20.
29. McKillop JH, McKay I, Cuthbert GF et al. Scintigraphic evaluation of the painful prosthetic joint: a comparison of gallium-67 citrate and
indium-111 labelled leucocyte imaging. Clin Radiol 1984; 35(3): 239-41.
30. Kraemer WJ, Saplys R, Waddell JP et al. Bone scan, gallium scan, and hip aspiration in the diagnosis of infected total hip arthroplasty. J
Arthroplasty 1993; 8(6): 611-6.
31. Aliabadi P, Tumeh SS, Weissman BN et al. Cemented total hip prosthesis: radiographic and scintigraphic evaluation. Radiology 1989;
173(1): 203-6.
32. Merkel KD, Brown ML, Fitzgerald RH, Jr. Sequential technetium-99m HMDP-gallium-67 citrate imaging for the evaluation of infection in the
painful prosthesis. J Nucl Med 1986; 27(9): 1413-7.
33. Merkel KD, Fitzgerald RH, Jr., Brown ML. Scintigraphic examination of total hip arthroplasty: comparison of indium with technetium-gallium
in the loose and infected canine arthroplasty. Hip 1984: 163-92.
34. Thakur ML, Lavender JP, Arnot RN, et al. Indium-111-labeled autologous leukocytes in man. J Nucl Med 1977; 18(10): 1014-21.
35. Pring DJ, Henderson RG, Keshavarzian A et al. Indium-granulocyte scanning in the painful prosthetic joint. Am J Roentgenol 1986; 147(1):
167-72.
36. Pring DJ, Henderson RG, Rivett AG et al. Autologous granulocyte scanning of painful prosthetic joints. J Bone Joint Surg Br 1986; 68(4):
647-52.
37. Wukich DK, Abreu SH, Callaghan JJ et al. Diagnosis of infection by preoperative scintigraphy with indium-labeled white blood cells. J Bone
Joint Surg Am 1987; 69(9): 1353-60.
38. Mulamba L, Ferrant A, Leners N et al. Indium-111 leucocyte scanning in the evaluation of painful hip arthroplasty. Acta Orthop Scand 1983;
54(5): 695-7.
39. Palestro CJ, Swyer AJ, Kim CK et al. Infected knee prosthesis: diagnosis with In-111 leukocyte, Tc-99m sulfur colloid, and Tc-99m MDP
imaging. Radiology 1991; 179(3): 645-8.
40. Palestro CJ, Kim CK, Swyer AJ et al. Total-hip arthroplasty: periprosthetic indium-111-labeled leukocyte activity and complementary
technetium-99m-sulfur colloid imaging in suspected infection. J Nucl Med 1990; 31(12): 1950-5.
41. Joseph TN, Mujtaba M, Chen AL et al. Efficacy of combined technetium-99m sulfur colloid/indium-111 leukocyte scans to detect infected
total hip and knee arthroplasties. J Arthroplasty 2001; 16(6): 753-8.
42. Peters AM, Danpure HJ, Osman S et al. Clinical experience with 99m
Tc-hexamethylpropylene-amineoxime for labelling leucocytes and
imaging inflammation. Lancet 1986; 2(8513): 946-9.
43. Corstens FH, van der Meer JW. Nuclear medicine's role in infection and inflammation. Lancet 1999; 354(9180): 765-70.
44. Larikka MJ, Ahonen AK, Junila JA et al. Improved method for detecting knee replacement infections based on extended combined 99m
Tc-
white blood cell/bone imaging. Nucl Med Commun 2001; 22(10): 1145-50.
45. King AD, Peters AM, Stuttle AW et al. Imaging of bone infection with labelled white blood cells: role of contemporaneous bone marrow
imaging. Europ J Nucl Med 1990; 17(3-4): 148-51.
46. Seabold JE, Nepola JV, Marsh JL et al. Postoperative bone marrow alterations: potential pitfalls in the diagnosis of osteomye litis with In-
111-labeled leukocyte scintigraphy. Radiology 1991; 180(3): 741-7.
47. Palestro CJ, Roumanas P, Swyer AJ et al. Diagnosis of musculoskeletal infection using combined In-111 labeled leukocyte and Tc-99m SC
marrow imaging. Clin Nucl Med 1992; 17(4): 269-73.
48. Achong DM, Oates E. The computer-generated bone marrow subtraction image: a valuable adjunct to combined In-111 WBC/Tc-99m in
sulfur colloid scintigraphy for musculoskeletal infection. Clin Nucl Med 1994; 19(3): 188-93.
49. Devillers A, Moisan A, Jean S et al. Technetium-99m hexamethylpropylene amine oxime leucocyte scintigraphy for the diagnosis of bone
and joint infections: a retrospective study in 116 patients. Europ J Nucl Med 1995; 22(4): 302-7.
50. Palestro CJ, Mehta HH, Patel M et al. Marrow versus infection in the Charcot joint: indium-111 leukocyte and technetium-99m sulfur colloid
scintigraphy. J Nucl Med 1998; 39(2): 346-50.
51. Palestro CJ. Nuclear medicine, the painful prosthetic joint, and orthopedic infection. J Nucl Med 2003; 44(6): 927-9.
52. El Espera I, Blondet C, Moullart V et al. The usefulness of 99m
Tc sulfur colloid bone marrow scintigraphy combined with 111
In leucocyte
scintigraphy in prosthetic joint infection. Nucl Med Commun 2004; 25(2): 171-5.
53. Love C, Marwin SE, Tomas MB et al. Diagnosing infection in the failed joint replacement: a comparison of coincidence detection 18
F-FDG
and 111
In-labeled leukocyte/99m
Tc-sulfur colloid marrow imaging. J Nucl Med 2004; 45(11): 1864-71.
54. Fuster D, Duch J, Soriano A et al. [Potential use of bone marrow scintigraphy in suspected prosthetic hip infection evaluated with 99m
Tc-
HMPAO-leukocytes]. Revista Espanola de Medicina Nuclear 2008; 27(6): 430-5.
55. Pill SG, Parvizi J, Tang PH et al. Comparison of fluorodeoxyglucose positron emission tomography and (111)indium-white blood cell
imaging in the diagnosis of periprosthetic infection of the hip. J Arthroplasty 2006; 21(6 Suppl 2): 91-7.
56. Propst-Proctor SL, Dillingham MF, McDougall IR et al. The white blood cell scan in orthopedics. Clin Orthop Related Res 1982; (168): 157-
65.
57. Johnson JA, Christie MJ, Sandler MP et al. Detection of occult infection following total joint arthroplasty using sequential technetium-99m
HDP bone scintigraphy and indium-111 WBC imaging. J Nucl Med 1988; 29(8): 1347-53.
58. Al-Sheikh W, Sfakianakis GN, Mnaymneh W et al. Subacute and chronic bone infections: diagnosis using In-111, Ga-67 and Tc-99m MDP
bone scintigraphy, and radiography. Radiology 1985; 155(2): 501-6.
59. Glaudemans AW, Galli F, Pacilio M et al. Leukocyte and bacteria imaging in prosthetic joint infection. Eur Cell Mater 2013; 25: 61-77.
60. Palestro CJ. Nuclear medicine and the failed joint replacement: Past, present, and future. World J Radiol 2014; 6(7): 446-58.
61. Palestro CJ, Love C, Bhargava KK. Labeled leukocyte imaging: current status and future directions. Quart J Nucl Med Mol Imag 2009;
www.nuclmed.gr Hell J Nucl Med Suppl, September-December 2015 101
53(1): 105-23.
62. Sinzinger H, Granegger S. The effect of various antibiotics on the labelling efficiency of human white blood cells with 111
In-oxine. Nucl Med
Commun 1988; 9(8): 597-601.
63. Datz FL, Thorne DA. Effect of antibiotic therapy on the sensitivity of indium-111-labeled leukocyte scans. J Nucl Med 1986; 27(12): 1849-53.
64. Palestro CJ, Love C, Tronco GG et al. Combined labeled leukocyte and technetium 99m sulfur colloid bone marrow imaging for diagnosing
musculoskeletal infection. Radiographics 2006; 26(3): 859-70.
65. Roca M, Martin-Comin J, Becker W et al. A consensus protocol for white blood cells labelling with technet ium-99m hexamethylpropylene
amine oxime. International Society of Radiolabeled Blood Elements (ISORBE). Europ J Nucl Med 1998; 25(7): 797-9.
66. Dumarey N, Egrise D, Blocklet D et al. Imaging infection with 18
F-FDG-labeled leukocyte PET/CT: initial experience in 21 patients. J J Nucl
Med 2006; 47(4): 625-32.
67. Rini JN, Palestro CJ. Imaging of infection and inflammation with 18
F-FDG-labeled leukocytes. Quart J Nucl Med Mol Imaging 2006; 50(2):
143-6.
68. Rini JN, Bhargava KK, Tronco GG et al. PET with FDG-labeled leukocytes versus scintigraphy with 111
In-oxine-labeled leukocytes for
detection of infection. Radiology 2006; 238(3): 978-87.
69. Guhlmann A, Brecht-Krauss D, Suger G et al. Fluorine-18-FDG PET and technetium-99m antigranulocyte antibody scintigraphy in chronic
osteomyelitis. J Nucl Med 1998; 39(12): 2145-52.
70. Sugawara Y, Braun DK, Kison PV et al. Rapid detection of human infections with fluorine-18 fluorodeoxyglucose and positron emission
tomography: preliminary results. Europ J Nucl Med 1998; 25(9): 1238-43.
71. Palestro CJ, Love C, Miller TT. Diagnostic imaging tests and microbial infections. Cell Microbiol 2007; 9(10): 2323-33.
72. Kumar V. Radiolabeled white blood cells and direct targeting of micro-organisms for infection imaging. Quart J Nucl Med Mol Imaging 2005;
49(4): 325-38.
73. Aksoy SY, Asa S, Ozhan M et al. FDG and FDG-labelled leucocyte PET/CT in the imaging of prosthetic joint infection. EuropJ Nucl Med Mol
Imaging 2014; 41(3): 556-64.
74. Goerres GW, Ziegler SI, Burger C et al. Artifacts at PET and PET/CT caused by metallic hip prosthetic material. Radiology 2003; 226(2):
577-84.
75. Zhuang H, Sam JW, Chacko TK et al. Rapid normalization of osseous FDG uptake following traumatic or surgical fractures. Europ J Nucl
Med Mol Imaging 2003; 30(8): 1096-103.
76. Jones-Jackson L, Walker R, Purnell G et al. Early detection of bone infection and differentiation from post-surgical inflammation using 2-
deoxy-2-[18
F]-fluoro-D-glucose positron emission tomography (FDG-PET) in an animal model. J Orthop Res 2005; 23(6): 1484-9.
77. Aydin A, Yu JQ, Zhuang H et al. Patterns of 18
F-FDG PET images in patients with uncomplicated total hip arthroplasty. Hell J Nucl Med
2015; 18(2): 93-6.
78. Israel O, Keidar Z. PET/CT imaging in infectious conditions. Ann N Y Acad Sci 2011; 1228: 150-66.
79. Zhuang H, Duarte PS, Pourdehnad M et al. The promising role of 18
F-FDG PET in detecting infected lower limb prosthesis implants. J Nucl
Med 2001; 42(1): 44-8.
80. Chacko TK, Zhuang H, Stevenson K et al. The importance of the location of fluorodeoxyglucose uptake in periprosthetic infection in painful
hip prostheses. Nucl Med Commun 2002; 23(9): 851-5.
81. Delank KS, Schmidt M, Michael JW et al. The implications of 18
F-FDG PET for the diagnosis of endoprosthetic loosening and infection in
hip and knee arthroplasty: results from a prospective, blinded study. BMC Musculoskelet Disord 2006; 7: 20.
82. Garcia-Barrecheguren E, Rodriguez Fraile M, Toledo Santana G et al. [FDG-PET: a new diagnostic approach in hip prosthetic replacement].
Rev Esp Med Nucl 2007; 26(4): 208-20.
83. Cremerius U, Mumme T, Reinartz P et al. [Analysis of 18
F-FDG uptake patterns in PET for diagnosis of septic and aseptic loosening after
total hip arthroplasty]. Nuklearmedizin 2003; 42(6): 234-9.
84. Gravius S, Gebhard M, Ackermann D et al. [Analysis of 18
F-FDG uptake pattern in PET for diagnosis of aseptic loosening versus prosthesis
infection after total knee arthroplasty. A prospective pilot study]. Nuklearmedizin 2010; 49(3): 115-23.
85. Manthey N, Reinhard P, Moog F et al. The use of [18
F]fluorodeoxyglucose positron emission tomography to differentiate between synovitis,
loosening and infection of hip and knee prostheses. Nucl Med Commun 2002; 23(7): 645-53.
86. Stumpe KD, Notzli HP, Zanetti M et al. FDG PET for differentiation of infection and aseptic loosening in total hip replacements: comparison
with conventional radiography and three-phase bone scintigraphy. Radiology 2004; 231(2): 333-41.
87. Van Acker F, Nuyts J, Maes A et al. FDG-PET, 99m
Tc-HMPAO white blood cell SPET and bone scintigraphy in the evaluation of painful
total knee arthroplasties. Europ J Nucl Med 2001; 28(10): 1496-504.
88. Vanquickenborne B, Maes A, Nuyts J et al. The value of (18
F)FDG-PET for the detection of infected hip prosthesis. Europ J Nucl Med Mol
Imaging 2003; 30(5): 705-15.
89. Kwee TC, Kwee RM, Alavi A. FDG-PET for diagnosing prosthetic joint infection: systematic review and metaanalysis. Europ J Nucl Med Mol
Imaging 2008; 35(11): 2122-32.
90. Zhuang H, Alavi A. 18-fluorodeoxyglucose positron emission tomographic imaging in the detection and monitoring of infection and
inflammation. Semin Nucl Med 2002; 32(1):4 7-59.
91. Bleeker-Rovers CP, de Kleijn EM, Corstens FH et al. Clinical value of FDG PET in patients with fever of unknown origin and patients
suspected of focal infection or inflammation. Europ J Nucl Med Mol Imaging 2004; 31(1): 29-37.
92. Iyengar KP, Vinjamuri S. Role of 99m
Tc Sulesomab in the diagnosis of prosthetic joint infections. Nucl Med Commun 2005; 26(6): 489-96.
93. Pakos EE, Fotopoulos AD, Stafilas KS et al. Use of 99m
Tc-sulesomab for the diagnosis of prosthesis infection after total joint arthroplasty. J
Internat Med Res 2007; 35(4): 474-81.
94. von Rothenburg T SM, Schaffstein J, Koester O, Schmid G. Imaging of infected total arthroplasty with Tc-99m-labeled antigranulocyte
antibody Fab'fragments. Clin Nucl Med 2004; 29: 548-51.
95. Graute V, Feist M, Lehner S et al. Detection of low-grade prosthetic joint infections using 99m
Tc-antigranulocyte SPECT/CT: initial clinical
results. Europ J Nucl Med Mol Imaging 2010; 37(9): 1751-9.
96. Kim HO, Na SJ, Oh SJ et al. Usefulness of adding SPECT/CT to 99m
Tc-hexamethylpropylene amine oxime (HMPAO)-labeled leukocyte
www.nuclmed.gr Hell J Nucl Med Suppl, September-December 2015 102
imaging for diagnosing prosthetic joint infections. J Comput Assist Tomogr 2014; 38(2): 313-9.
97. Bar-Shalom R, Yefremov N, Guralnik L et al. SPECT/CT using 67
Ga and 111
In-labeled leukocyte scintigraphy for diagnosis of infection. J
Nucl Med 2006; 47(4): 587-94.
98. Filippi L, Schillaci O. Usefulness of hybrid SPECT/CT in 99m
Tc-HMPAO-labeled leukocyte scintigraphy for bone and joint infections. J Nucl
Med 2006; 47(12): 1908-13.
99. Horger M, Eschmann SM, Pfannenberg C et al. The value of SPET/CT in chronic osteomyelitis. Europ J Nucl Med Mol Imaging 2003;
30(12):1665-73.
100. Sterner T, Pink R, Freudenberg L et al. The role of [18
F]fluoride positron emission tomography in the early detection of aseptic loosening of
total knee arthroplasty. Int J Surg 2007; 5(2): 99-104.
101. Kobayashi N, Inaba Y, Choe H et al. Use of F-18 fluoride PET to differentiate septic from aseptic loosening in total hip arthroplasty
patients. Clin Nucl Med 2011; 36(11): e156-61.
102. Ullmark G, Nilsson O, Maripuu E et al. Analysis of bone mineralization on uncemented femoral stems by [18
F]-fluoride-PET: a randomized
clinical study of 16 hips in 8 patients. Acta Orthop 2013; 84(2): 138-44.
103. Ullmark G, Sorensen J, Nilsson O. Analysis of bone formation on porous and calcium phosphate-coated acetabular cups: a randomised
clinical [18F]fluoride PET study. Hip Int 2012; 22(2): 172-8.
Thessaloniki – Sunset
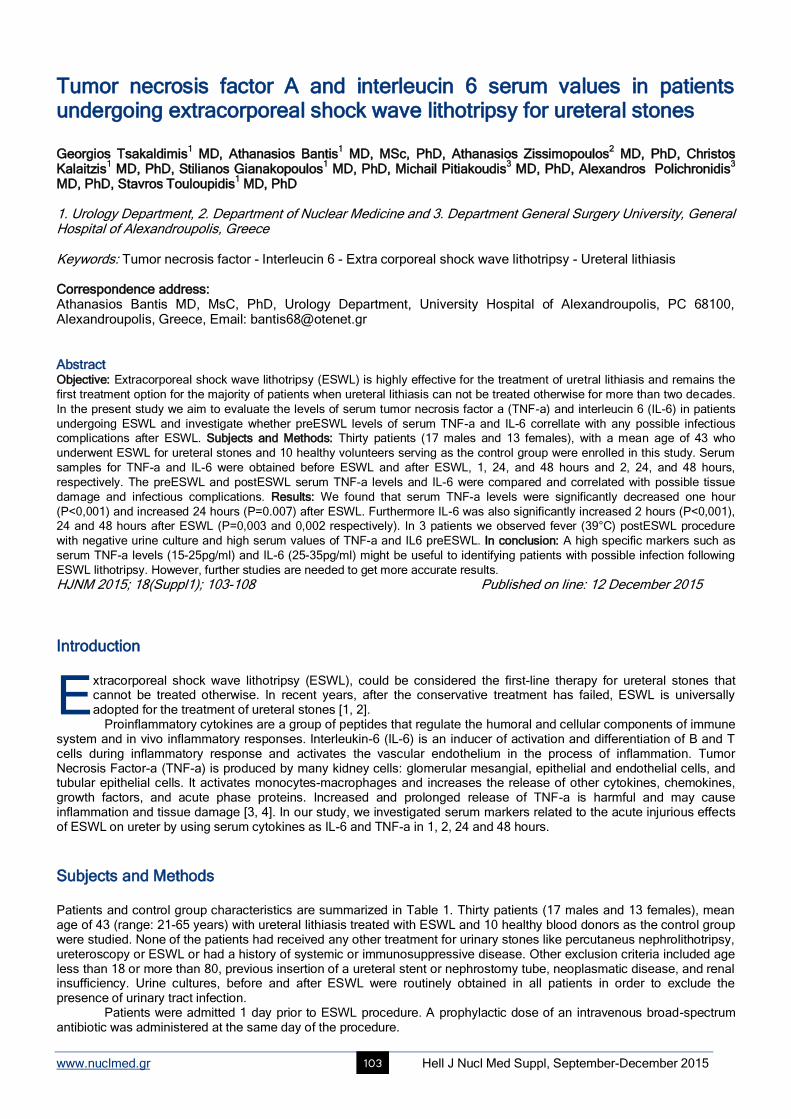
www.nuclmed.gr Hell J Nucl Med Suppl, September-December 2015 103
Tumor necrosis factor A and interleucin 6 serum values in patients undergoing extracorporeal shock wave lithotripsy for ureteral stones Georgios Tsakaldimis
1 MD, Athanasios Bantis
1 MD, MSc, PhD, Athanasios Zissimopoulos
2 MD, PhD, Christos
Kalaitzis1 MD, PhD, Stilianos Gianakopoulos
1 MD, PhD, Michail Pitiakoudis
3 MD, PhD, Alexandros Polichronidis
3
MD, PhD, Stavros Touloupidis1 MD, PhD
1. Urology Department, 2. Department of Nuclear Medicine and 3. Department General Surgery University, General Hospital of Alexandroupolis, Greece Keywords: Tumor necrosis factor - Interleucin 6 - Extra corporeal shock wave lithotripsy - Ureteral lithiasis Correspondence address: Athanasios Bantis MD, MsC, PhD, Urology Department, University Hospital of Alexandroupolis, PC 68100, Alexandroupolis, Greece, Email: [email protected] Abstract Objective: Extracorporeal shock wave lithotripsy (ESWL) is highly effective for the treatment of uretral lithiasis and remains the
first treatment option for the majority of patients when ureteral lithiasis can not be treated otherwise for more than two decades.
In the present study we aim to evaluate the levels of serum tumor necrosis factor a (TNF-a) and interleucin 6 (IL-6) in patients
undergoing ESWL and investigate whether preESWL levels of serum TNF-a and IL-6 correllate with any possible infectious
complications after ESWL. Subjects and Methods: Thirty patients (17 males and 13 females), with a mean age of 43 who
underwent ESWL for ureteral stones and 10 healthy volunteers serving as the control group were enrolled in this study. Serum
samples for TNF-a and IL-6 were obtained before ESWL and after ESWL, 1, 24, and 48 hours and 2, 24, and 48 hours,
respectively. The preESWL and postESWL serum TNF-a levels and IL-6 were compared and correlated with possible tissue
damage and infectious complications. Results: We found that serum TNF-a levels were significantly decreased one hour
(P<0,001) and increased 24 hours (P=0.007) after ESWL. Furthermore IL-6 was also significantly increased 2 hours (P<0,001),
24 and 48 hours after ESWL (P=0,003 and 0,002 respectively). In 3 patients we observed fever (39°C) postESWL procedure
with negative urine culture and high serum values of TNF-a and IL6 preESWL. In conclusion: A high specific markers such as
serum TNF-a levels (15-25pg/ml) and IL-6 (25-35pg/ml) might be useful to identifying patients with possible infection following
ESWL lithotripsy. However, further studies are needed to get more accurate results.
HJNM 2015; 18(Suppl1); 103-108 Published on line: 12 December 2015
Introduction
xtracorporeal shock wave lithotripsy (ESWL), could be considered the first-line therapy for ureteral stones that cannot be treated otherwise. In recent years, after the conservative treatment has failed, ESWL is universally adopted for the treatment of ureteral stones [1, 2].
Proinflammatory cytokines are a group of peptides that regulate the humoral and cellular components of immune system and in vivo inflammatory responses. Interleukin-6 (IL-6) is an inducer of activation and differentiation of B and T cells during inflammatory response and activates the vascular endothelium in the process of inflammation. Tumor Necrosis Factor-a (TNF-a) is produced by many kidney cells: glomerular mesangial, epithelial and endothelial cells, and tubular epithelial cells. It activates monocytes-macrophages and increases the release of other cytokines, chemokines, growth factors, and acute phase proteins. Increased and prolonged release of TNF-a is harmful and may cause inflammation and tissue damage [3, 4]. In our study, we investigated serum markers related to the acute injurious effects of ESWL on ureter by using serum cytokines as IL-6 and TNF-a in 1, 2, 24 and 48 hours.
Subjects and Methods Patients and control group characteristics are summarized in Table 1. Thirty patients (17 males and 13 females), mean age of 43 (range: 21-65 years) with ureteral lithiasis treated with ESWL and 10 healthy blood donors as the control group were studied. None of the patients had received any other treatment for urinary stones like percutaneus nephrolithotripsy, ureteroscopy or ESWL or had a history of systemic or immunosuppressive disease. Other exclusion criteria included age less than 18 or more than 80, previous insertion of a ureteral stent or nephrostomy tube, neoplasmatic disease, and renal insufficiency. Urine cultures, before and after ESWL were routinely obtained in all patients in order to exclude the presence of urinary tract infection.
Patients were admitted 1 day prior to ESWL procedure. A prophylactic dose of an intravenous broad-spectrum antibiotic was administered at the same day of the procedure.
E
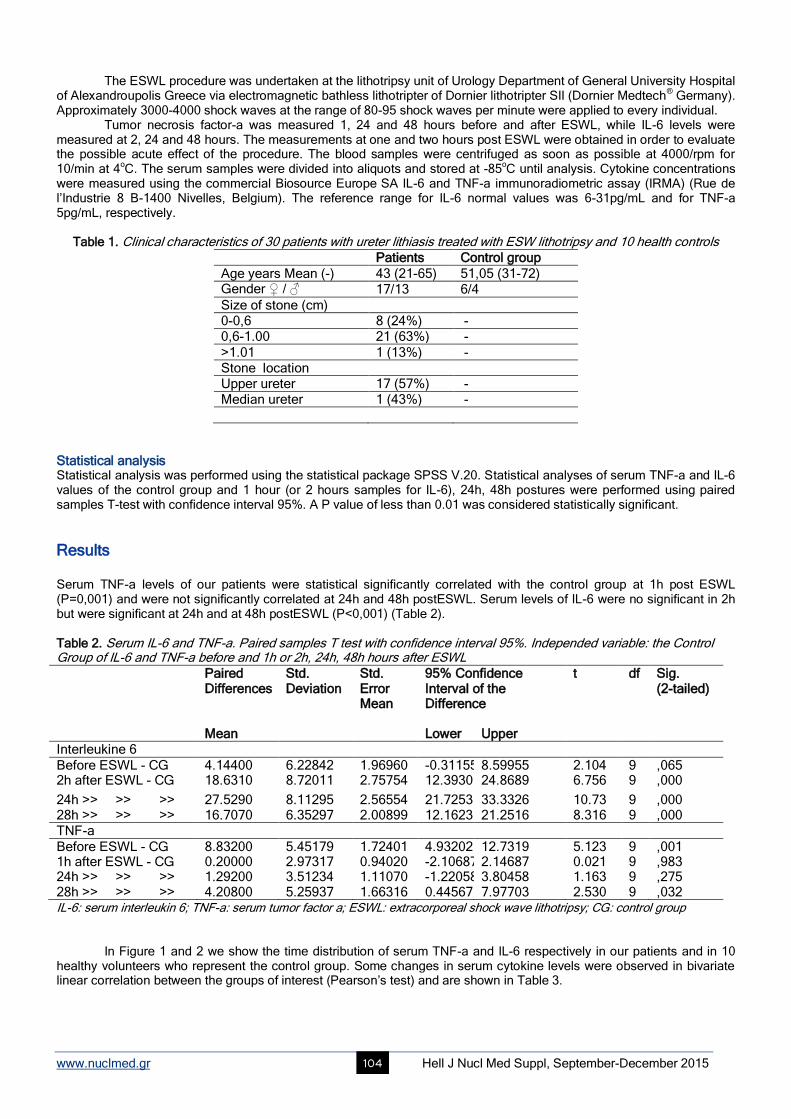
www.nuclmed.gr Hell J Nucl Med Suppl, September-December 2015 104
The ESWL procedure was undertaken at the lithotripsy unit of Urology Department of General University Hospital of Alexandroupolis Greece via electromagnetic bathless lithotripter of Dornier lithotripter SII (Dornier Medtech
® Germany).
Approximately 3000-4000 shock waves at the range of 80-95 shock waves per minute were applied to every individual. Tumor necrosis factor-a was measured 1, 24 and 48 hours before and after ESWL, while IL-6 levels were
measured at 2, 24 and 48 hours. The measurements at one and two hours post ESWL were obtained in order to evaluate the possible acute effect of the procedure. The blood samples were centrifuged as soon as possible at 4000/rpm for 10/min at 4
oC. The serum samples were divided into aliquots and stored at -85
oC until analysis. Cytokine concentrations
were measured using the commercial Biosource Europe SA IL-6 and TNF-a immunoradiometric assay (IRMA) (Rue de l’Industrie 8 B-1400 Nivelles, Belgium). The reference range for IL-6 normal values was 6-31pg/mL and for TNF-a 5pg/mL, respectively.
Table 1. Clinical characteristics of 30 patients with ureter lithiasis treated with ESW lithotripsy and 10 health controls
Patients Control group
Age years Mean (-) 43 (21-65) 51,05 (31-72) Gender ♀ / ♂ 17/13 6/4
Size of stone (cm) 0-0,6 8 (24%) - 0,6-1.00 21 (63%) -
>1.01 1 (13%) - Stone location Upper ureter 17 (57%) - Median ureter 1 (43%) -
Statistical analysis Statistical analysis was performed using the statistical package SPSS V.20. Statistical analyses of serum TNF-a and IL-6 values of the control group and 1 hour (or 2 hours samples for IL-6), 24h, 48h postures were performed using paired samples T-test with confidence interval 95%. A P value of less than 0.01 was considered statistically significant.
Results Serum TNF-a levels of our patients were statistical significantly correlated with the control group at 1h post ESWL (P=0,001) and were not significantly correlated at 24h and 48h postESWL. Serum levels of IL-6 were no significant in 2h but were significant at 24h and at 48h postESWL (P<0,001) (Table 2). Table 2. Serum IL-6 and TNF-a. Paired samples T test with confidence interval 95%. Independed variable: the Control Group of IL-6 and TNF-a before and 1h or 2h, 24h, 48h hours after ESWL
Paired Differences
Std. Deviation
Std. Error Mean
95% Confidence Interval of the Difference
t df Sig. (2-tailed)
Mean Lower Upper Interleukine 6
Before ESWL - CG 4.14400 6.22842 1.96960 -0.31155 8.59955 2.104 9 ,065 2h after ESWL - CG 18.6310 8.72011 2.75754 12.3930 24.8689 6.756 9 ,000
24h >> >> >> 27.5290 8.11295 2.56554 21.7253 33.3326 10.73 9 ,000 28h >> >> >> 16.7070 6.35297 2.00899 12.1623 21.2516 8.316 9 ,000 TNF-a
Before ESWL - CG 8.83200 5.45179 1.72401 4.93202 12.7319 5.123 9 ,001 1h after ESWL - CG 0.20000 2.97317 0.94020 -2.10687 2.14687 0.021 9 ,983 24h >> >> >> 1.29200 3.51234 1.11070 -1.22058 3.80458 1.163 9 ,275 28h >> >> >> 4.20800 5.25937 1.66316 0.44567 7.97703 2.530 9 ,032 IL-6: serum interleukin 6; TNF-a: serum tumor factor a; ESWL: extracorporeal shock wave lithotripsy; CG: control group
In Figure 1 and 2 we show the time distribution of serum TNF-a and IL-6 respectively in our patients and in 10 healthy volunteers who represent the control group. Some changes in serum cytokine levels were observed in bivariate linear correlation between the groups of interest (Pearson’s test) and are shown in Table 3.
www.nuclmed.gr Hell J Nucl Med Suppl, September-December 2015 105
Figure 1. The distribution of serum TNF-a before and after ESWL and the control group of the study
Figure 2. The distribution of serum IL-6 before and after ESWL and the 10 healthy volunteers which represents the control group
Serum TNF-a levels were significantly decreased 1h after (P<0,001) and increased 24h (P=0.007) after ESWL. Furthermore, IL-6 was also significantly increased 2h (P<0,001), 24h and 48h after ESWL (P=0,003 and 0,002 respectively). All patients developed postESWL microscopic haematuria and were successfully treated conservatively with drinking lots of fluids and antibiotics. Post ESWL fever (>39°C) was developed in 3 patients (10%) and was managed with i.v antibiotic (ciprofloxacin 1gr/day for 7 days). All those patients had negative urine culture pre ESWL and serum values for TNF-a were 22 to 24.51pg/mL, and 24-25.42pg/mL for IL6. PostESWL at 1 hour for TNF-a the serum values decreased to 14-15.84pg/mL (from 22 to 24.51pg/mL) and at two hours for IL increased to 69-73.56pg/mL (from 24-25.42). Other complications such as stone or stone fractions migration, ureteral or renal injury and haematomas were absent. .
Discussion The method of ESWL was introduced in 1980 as a minimally invasive treatment for patients with upper urinary tract stones. Prior to the introduction of this new method, the only treatment available for calculi that could not pass through the urinary tract was open surgery. Since then, ESWL has become the preferred tool in the urologist’s armamentarium for treatment according to the size and localization of renal and ureter stones [5, 6]. The comminution of the calculus by ESWL is due to mechanical forces generated by the shock waves. These mechanical forces are not innocuous and may result in damage of the kidney, ureter and vascular injury [7].
www.nuclmed.gr Hell J Nucl Med Suppl, September-December 2015 106
Table 3. Bivariate linear correlation between the groups of interest (Pearson’s test). Serum TNF-a and IL-6 values before and 1h or 2h,24h,48h after ESWL
Tumor necrosis factor a
Before URS 1h after URS 2h for IL6
24h after URS 48h after URS
Before URS
PC P value N
,
1h after URS
PC P value N
261 ,164 30
24h >> >>
PC P value N
,132 .487 30
,863 ,000 30
48h >> >>
PC P value
-.018 ,924
,376* ,041
,482** ,.007
N 30 30 30
Interleukine 6 Before URS
PC P value N
2h after URS
PC P value N
,738** ,000 30
24h >> >>
PC P value N
,528** ,003 30
,665** ,000 30
48h >> >>
PC P value
,540* ,002
,598 ,000
,723** ,000
N 30 30 30 ** Correlation is significant at the 0.01 level (2-tailed),* Correlation is significant at the 0.05 level (2-tailed), PC: Pearson Correlation, P value: Sig. (2-tailed)
Emergency treatment for stone removal should be considered for stones with a diameter of ≥7mm, when
adequate pain relief cannot be achieved and in cases that stone causes obstruction associated with infection, especially in cases of a single stone [8].
The whole ESWL procedure requires a well equipped department and some follow-up time in order to reach a satisfactory stone-free situation. It also requires more patient’s visits to the clinic. Retreatment may be necessary in ESWL more than in other ureter lithiasis treatments. The advantages of ESWL are noninvasiveness and no need of local or general anesthesia [9].
Absolute contraindications for ESWL include urosepsis, uncontrolled hypertension, distal obstruction of stone passage and pregnancy. Other relative contraindications are morbid obesity [10] and cystine stone is well known for its resistance for ESWL [11].
Shock waves destroying stones in soft tissues are through to have harmful effects on the surrounding tissues or may induce inflammation [12]. The most common complication for renal and uper ureter ESWL is perirenal, intrarenal, or subcapsular hemorrhage caused by direct tissue damage. Acute pancreatitis is an additional, although rare, complication [13].
Secretion of IL-6 and TNF-a activates several other reactions exacerbating the host inflammatory response. In vitro human blood monocytes produce IL-6 and TNF-a when exposed to 25-50pg/mL of endotoxin. Such endotoxin levels have been reported in the bloodstream of patients during septic shock [14].
Reports in the literature suggest that the intensity of tissue damage can be measured by cytokines and acute-phase proteins [4, 15-17]. After tissue damage, local neutrophils granulocytes and macrophages activate the cytokine cascade and lead to subsequent production of IL-6 with following local or systemic acute phase reaction. Other investigators have shown that 30 to 60/min after injury, IL-6 can be detected and peak serum levels are reached within 6h [18].
For urine IL-6 and IL-1 levels Goktas C et al. (2012) found that before ESWL, there was no significant elevation. In early phase, 24h after ESWL, there was a strong inflammatory response that could be detected by measuring urine IL-6. For IL-1 the inflammatory response continued at a slower rate, up to 14 days after and finally they conclude that urine IL-6 and IL-1 may be used to measure the severity of inflammation [18].
Perez-Fentes (2015) demonstrate that tissue damage caused by the percutaneous nephrolithotomy (PCNL) on 40 patients is low. This damage increases significantly in those cases showing postoperative complications. IL-6 at 24hours has been shown to be a good predictive tool for the development of complications after PCNL. On the other hand the group treated with ESWL (50 patients) didn’t show significant changes in any of the studied serum cytokines such IL-1β TNF-α and IL-6 [19].
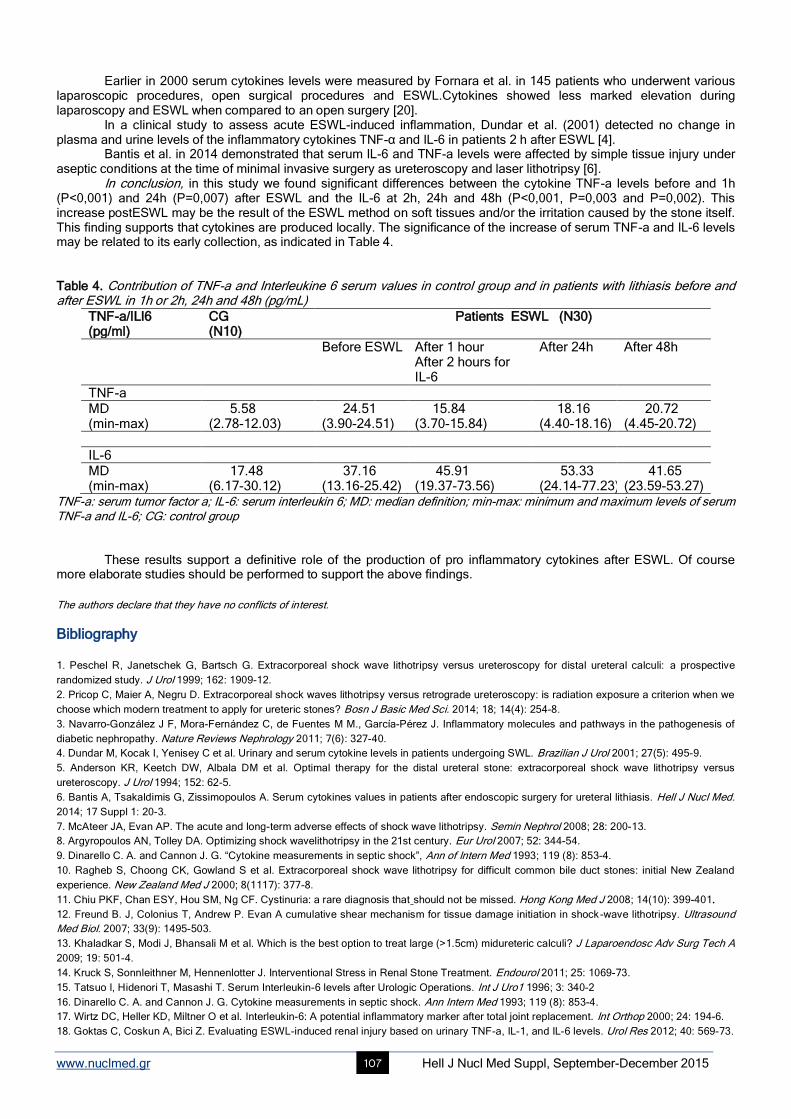
www.nuclmed.gr Hell J Nucl Med Suppl, September-December 2015 107
Earlier in 2000 serum cytokines levels were measured by Fornara et al. in 145 patients who underwent various laparoscopic procedures, open surgical procedures and ESWL.Cytokines showed less marked elevation during laparoscopy and ESWL when compared to an open surgery [20].
In a clinical study to assess acute ESWL-induced inflammation, Dundar et al. (2001) detected no change in plasma and urine levels of the inflammatory cytokines TNF-α and IL-6 in patients 2 h after ESWL [4].
Bantis et al. in 2014 demonstrated that serum IL-6 and TNF-a levels were affected by simple tissue injury under aseptic conditions at the time of minimal invasive surgery as ureteroscopy and laser lithotripsy [6].
In conclusion, in this study we found significant differences between the cytokine TNF-a levels before and 1h (P<0,001) and 24h (P=0,007) after ESWL and the IL-6 at 2h, 24h and 48h (P<0,001, P=0,003 and P=0,002). This increase postESWL may be the result of the ESWL method on soft tissues and/or the irritation caused by the stone itself. This finding supports that cytokines are produced locally. The significance of the increase of serum TNF-a and IL-6 levels may be related to its early collection, as indicated in Table 4. Table 4. Contribution of TNF-a and Interleukine 6 serum values in control group and in patients with lithiasis before and after ESWL in 1h or 2h, 24h and 48h (pg/mL)
TNF-a/ILl6 (pg/ml)
CG (N10)
Patients ESWL (N30)
Before ESWL After 1 hour After 2 hours for IL-6
After 24h After 48h
TNF-a MD (min-max)
5.58 (2.78-12.03)
24.51 (3.90-24.51)
15.84 (3.70-15.84)
18.16 (4.40-18.16)
20.72 (4.45-20.72)
IL-6 MD (min-max)
17.48 (6.17-30.12)
37.16 (13.16-25.42)
45.91 (19.37-73.56)
53.33 (24.14-77.23)
41.65 (23.59-53.27)
TNF-a: serum tumor factor a; IL-6: serum interleukin 6; MD: median definition; min-max: minimum and maximum levels of serum TNF-a and IL-6; CG: control group
These results support a definitive role of the production of pro inflammatory cytokines after ESWL. Of course more elaborate studies should be performed to support the above findings. The authors declare that they have no conflicts of interest.
Bibliography
1. Peschel R, Janetschek G, Bartsch G. Extracorporeal shock wave lithotripsy versus ureteroscopy for distal ureteral calculi: a prospective
randomized study. J Urol 1999; 162: 1909-12.
2. Pricop C, Maier A, Negru D. Extracorporeal shock waves lithotripsy versus retrograde ureteroscopy: is radiation exposure a criterion when we
choose which modern treatment to apply for ureteric stones? Bosn J Basic Med Sci. 2014; 18; 14(4): 254-8.
3. Navarro-González J F, Mora-Fernández C, de Fuentes M M., García-Pérez J. Inflammatory molecules and pathways in the pathogenesis of
diabetic nephropathy. Nature Reviews Nephrology 2011; 7(6): 327-40.
4. Dundar M, Kocak I, Yenisey C et al. Urinary and serum cytokine levels in patients undergoing SWL. Brazilian J Urol 2001; 27(5): 495-9.
5. Anderson KR, Keetch DW, Albala DM et al. Optimal therapy for the distal ureteral stone: extracorporeal shock wave lithotripsy versus
ureteroscopy. J Urol 1994; 152: 62-5.
6. Bantis A, Tsakaldimis G, Zissimopoulos A. Serum cytokines values in patients after endoscopic surgery for ureteral lithiasis. Hell J Nucl Med.
2014; 17 Suppl 1: 20-3.
7. McAteer JA, Evan AP. The acute and long-term adverse effects of shock wave lithotripsy. Semin Nephrol 2008; 28: 200-13.
8. Argyropoulos AN, Tolley DA. Optimizing shock wavelithotripsy in the 21st century. Eur Urol 2007; 52: 344-54.
9. Dinarello C. A. and Cannon J. G. “Cytokine measurements in septic shock”, Ann of Intern Med 1993; 119 (8): 853-4.
10. Ragheb S, Choong CK, Gowland S et al. Extracorporeal shock wave lithotripsy for difficult common bile duct stones: initial New Zealand
experience. New Zealand Med J 2000; 8(1117): 377-8.
11. Chiu PKF, Chan ESY, Hou SM, Ng CF. Cystinuria: a rare diagnosis that should not be missed. Hong Kong Med J 2008; 14(10): 399-401.
12. Freund B. J, Colonius T, Andrew P. Evan A cumulative shear mechanism for tissue damage initiation in shock-wave lithotripsy. Ultrasound
Med Biol. 2007; 33(9): 1495-503.
13. Khaladkar S, Modi J, Bhansali M et al. Which is the best option to treat large (>1.5cm) midureteric calculi? J Laparoendosc Adv Surg Tech A
2009; 19: 501-4.
14. Kruck S, Sonnleithner M, Hennenlotter J. Interventional Stress in Renal Stone Treatment. Endourol 2011; 25: 1069-73.
15. Tatsuo I, Hidenori T, Masashi T. Serum Interleukin-6 levels after Urologic Operations. Int J Uro1 1996; 3: 340-2
16. Dinarello C. A. and Cannon J. G. Cytokine measurements in septic shock. Ann Intern Med 1993; 119 (8): 853-4.
17. Wirtz DC, Heller KD, Miltner O et al. Interleukin-6: A potential inflammatory marker after total joint replacement. Int Orthop 2000; 24: 194-6.
18. Goktas C, Coskun A, Bici Z. Evaluating ESWL-induced renal injury based on urinary TNF-a, IL-1, and IL-6 levels. Urol Res 2012; 40: 569-73.

www.nuclmed.gr Hell J Nucl Med Suppl, September-December 2015 108
19. Pérez-Fentes D, Gude F, Blanco-Parra M et al. Assessment of tissue damage due to percutaneous nephrolithotomy using serum
concentrations of inflammatory mediators. Actas Urol Esp.2015; 39(5): 283-90
20. Fornara P, Doehn C, Seyfarth M, Jocham D. Why is urological laparoscopy minimally invasive? Eur Urol. 2000; 37(3): 241-50.
Thessaloniki St. Demetrius
Chalkeon church
www.nuclmed.gr Hell J Nucl Med Suppl, September-December 2015 109
Social cognition in adults: the role of cognitive control Elena-Ioanna
Nazlidou
1 Msc. Despina Moraitou
1 Phd. Demetrios Natsopoulos
2 Phd. Georgia Papantoniou
3 Phd
1. School of Psychology, Aristotle University of Thessaloniki, Greece 2. School of Psychology, University of Cyprus, Cyprus 3. Department of Early Childhood Education, University of Ioannina, Greece
Keywords: Executive functions - Faux Pas – Frontal aging - Indirect speech – Social mental verbs Correspondence address: Elena-Ioanna Nazlidou, School of Psychology, Aristotle University of Thessaloniki, Greece, Email: elenaaithiopia@ hotmail.com
Abstract Aim: This study aimed at examining the direct and indirect, via cognitive control and emotion recognition, effects of advancing
age on adults’ social cognition, and especially, on complex forms of it such as indirect speech, faux pas, and social mental verb
understanding. Method: The sample comprised a total of 70 adults, aged from 18 to 83 years. Participants were almost equally
distributed in each one of three age-groups (young, middle-aged, and older adults), according to their gender and educational
level. Three tasks measuring the ability to interpret indirect speech, the ability to understand faux pas, and social mental verb
understanding, respectively, were administered as measures of social cognition. Cognitive control, as inhibitory control, task
switching, updating-monitoring, and planning, as well as basic emotion decoding from visual cues, were measured by four and
one task respectively. Results: After the confirmation of the factor structure of each one of the dimensions of social cognition,
and the examination of the direct effects of age on them, the all-inclusive path model finally confirmed showed that age has a
significant negative indirect effect, via cognitive control, on social cognition as ability to interpret indirect speech and faux pas.
Conclusion: The decreased performance that cognitively healthy older adults exhibit, as regards specific complex dimensions of
social cognition, could be attributed to negative effects of age on cognitive control. However, it is likely that some other complex
dimensions of social cognition are not affected by frontal aging. HJNM 2015; 18(Suppl1); 109-121 Published on line: 12 December 2015
Introduction
ocial cognition includes automatic and voluntary cognitive processes applied for decoding and encoding the social world [1]. It is defined as the ability to represent mentally the relations between ourselves and other people, as well as the use of these representations to guide social behavior [2]. In fact, social cognition is a higher-order cognitive
process that serves interactions [3] and leads to coherent interpersonal relationships [4]. As such a complex process, it comprises a set of abilities. Theory of Mind (ToM), namely the ability to attribute the full range of mental states, is the most representative and most studied dimension of social cognition [5]. At the theoretical level, a distinction is made between two broad dimensions of ToM: a. the cognitive dimension that refers to the ability to make inferences about cognitive states, such as beliefs, thoughts, and intentions [6]; b. the affective dimension that represents the ability to infer the feelings, affective states and emotions of others [7]. Recent studies in the field of social and cognitive neuroscience have identified a number of specific components of ToM.
A core component is called ‘first-order’ ToM and concerns the ability to draw conclusions about a person's mental states, like beliefs and thoughts (e.g., I think that Mr. X thinks that...) [8]. ‘Second-order’ ToM, a more complex form of ToM [9], corresponds to more internal representations about ourselves, and involves the ability of simultaneously adopting two perspectives (e.g., Mr. X thinks that Miss Y thinks that…) [10]. Higher metarepresentations are involved in more advanced ToM components, such as the comprehension of ‘indirect speech’ and ‘faux pas’.
Indirect speech is ubiquitous in ‘everyday’ social interactions, when people make jokes or speak ironically or sarcastically [11]. The indirect meaning arises from the fact that there is a discrepancy between the literal meaning of the words and the social context [12]. In order to understand indirect speech, someone should comprehend speaker’s intentions and other mental states, such as beliefs and feelings [13]. Specifically, understanding indirect speech requires first-order ToM as regards the speaker’s belief, to avoid interpreting it as a mistake, as well as second-order ToM as regards the speaker’s belief about the listener’s belief, to avoid interpreting it as a lie [14].
Faux pas is a particular case of a non-intentional action. A faux pas occurs when a speaker says something without considering if it is something that the listener might not want to hear or know, and which typically has a negative outcome on the listener that the speaker never intended. It implies both the ability to refer to other’s state of mind and the appreciation of the emotional impact of their statement on their listener [15]. Faux pas involves both cognitive and affective ToM, as faux pas understanding requires the ability to infer epistemological mental states, intentions and emotions. Specifically, in order for a faux pas to be identified, one should understand that the speaker did not realize that the statement should not have been said and that the listener may feel sad or upset [16]. The understanding that the speaker’s intention was not malicious is also required [13].
Mental verbs are claimed to contribute to ToM [17]. From the semantic point of view, mental verbs relate to the
S
www.nuclmed.gr Hell J Nucl Med Suppl, September-December 2015 110
‘language of mind’ [18] and assist the understanding of our own and other’s mental states. Philosophers of language distinguish some subclasses within the general class of mental verbs, like cognitive mental verbs (know, remember, understand etc.) and social mental verbs (promise, agree, suggest, etc.), with cognitive mental verbs denoting a true event (factive) described in the complement clause, and social mental verbs denoting an obligation or intention, stating reasons, arguments and communications [19]. Hence, by definition, it is obvious that social mental verbs are very strongly interconnected with social cognition and ToM. In any case, in order to judge a mental verb about the factivity or nonfactivity, it is necessary one to be able to separate mind content (mental representation) from reality [20].
Moreover, emotion recognition, which is an important but somehow instinctive and primitive social skill, is suggested to be interlinked with social cognition and empathy [21]. In particular, the ability to decode emotions from facial expressions seems to be related with the affective ToM, as it was found that the brain areas which are activated during these functions are overlapped [5]. In addition, in a recent study where older participants performed lower that younger ones, in faux pas discrimination, it was found that emotion recognition fully mediated age effects, [22]. These results provide evidence for the role of emotion recognition in a range of important social deficits.
As regards the pattern of social cognition’s changes with age, there is still no clear research conclusion. This is true in particular for ToM, as the number of empirical studies is limited, and although most of them have concluded that there is a decline, there are contradictory findings in the literature. The first study aiming to investigate ToM in aging [23] found that older adults were more efficient than younger ones, in terms of their performance on the ‘Strange Stories test’. This is a ToM task in which participants have to make inferences about what one character thinks about the mental state of another character, by decoding sarcasm, irony or social rule violation. Conversely, in a recent study, it is reported that young–old and old–old adults performed more poorly than young participants on a similar task, except when cognitive load was reduced. These findings show that older adults are impaired only on ToM tasks with high cognitive processing demands [24]. In the same vein, age-related declines in ToM were found, when second-order ToM tasks requiring participants to consider the thoughts of two different characters, were used, while less complex first-order ToM was not impaired with age. This could indicate that, rather than showing a specific deficit in the ability to represent mental states, older adults show a decline in the domain-general resources required for complex ToM judgments [25]. However, such a conclusion is also debatable, as preservation of more complex forms of ToM, like faux pas, has been supported by other studies [26].These discrepancies may have arisen from methodological limitations, such as ceiling effects, small samples or the use of tasks with different demands for assessing the same ToM component. In particular, the older studies tended to examine a single ToM component or use only one type of task to measure it [10]. Nevertheless, recent research suggests that different dimensions of social cognition and ToM follow different developmental trajectories [27].
Regardless of the uncertainty about the identification of social cognition’s dimensions that appear to be impaired in normal aging, another important issue concerns the relation between these impairments and deterioration of other cognitive functions. Aging is known to be accompanied by irreversible changes at a cellular level that evolve progressively with age [28]. As regards central nervous system during normal aging, many changes occur in brain’s structure and function [29]. As a result, cognitive functions seem to be affected to a greater or lesser extent [30]. Neuropsychological research demonstrates a cognitive profile of contrasts in aging, as some main functions display deficits, while others remain intact [31]. Impairments in functions that are supported by frontal lobe, such as cognitive control or as it is usually called, ‘executive functions’, are well documented [32]. It has been suggested that executive functions are strongly required during the production of a social inference, and therefore, are involved in ToM, throughout lifespan development [33]. Thus, it is interesting to examine their contribution in ToM performance in aging. Previous studies showed conflicting results. Some of them concluded that the deterioration in cognitive ToM components observed in healthy older adults is a result of an age-related decline in executive functions, like inhibitory control, rather than an impairment of the actual system for representing mental states {34-35}. However, at least one recent study clearly shows that age-related decline in ToM is not attributable to age-related impairment in executive functions [24].
Based on the theoretical framework, it seems that despite the fact that, recently, research interest has shifted to the investigation of social cognition in aging, clear conclusions about which are the dimensions of social cognition that are affected by age, as well as about the role of other cognitive functions in the developmental trajectory of ToM have not been formulated. In this light, the present study was designed to examine adults’ ability to understand higher-order dimensions of social cognition and ToM, which are less studied formerly, and explore the effects of age, gender and education on these abilities. The study aimed also at examining the relations among social cognition, emotion recognition, cognitive control, and individual - demographic factors.
Τhe hypotheses of the study were formulated as follows: 1. Although deficits in less complex dimensions of social cognition in older adults than the abilities selected to be examined in this study have been confirmed by previous research, the effects of executive functions on social cognition decrements seem to be decisive. Therefore, it was assumed that age would not have any direct effect on any one of the dimensions of social cognition that the present study aimed to examine. 2a. According to several studies, impairments in social cognition with age are mediated by executive functions, which are also impaired. Thus, it was suggested that there would be an indirect negative effect of age on social cognition, through cognitive control. 2b. Apart from the hypothesized indirect effect of age on social cognition via cognitive control, this study aimed also at examining potential effects exerted by age on social cognition, via the ability of emotion recognition. Data in this field are limited. Only one study found that age affect indirectly and negatively, via emotion recognition, the ability to understand faux pas [22]. Hence, it was assumed that there would be indirect negative effects of age on the dimensions of social cognition involving affective elements, like understanding of faux pas where empathy is required, and understanding of indirect speech, which requires, among others, inferring the feelings of the speaker. 3. The effects of individual - demographic factors, like gender and educational level, on adults’ social cognition have
www.nuclmed.gr Hell J Nucl Med Suppl, September-December 2015 111
attracted little research interest. For this reason, a specific aim of the present study was to examine their direct effects on social cognition’s dimensions. According to one study [36], older adults’ impaired performance on social cognition was not affected by educational level. Hence, it was assumed that there would not be direct effects of this factor on social cognition's dimension.
Method Participants The sample comprised a total of 70 adults (34 women) from Greece, who participated voluntarily in the study. As regards the age of the participants, the sample consisted of three age-groups: young, middle-aged, and older adults. Participants belonged to three different educational levels (EL): middle EL (n=25, 10-12 years of education), upper EL (n=19, ≥13 years of education–vocational/technical school), and high EL (n=26, ≥13 years of education-university and technological educational institute). Participants in each one of the three age-groups were almost equally distributed in terms of their gender, F (2, 67)=0.046, P>0.05, and educational level, F (2, 67)=0.076, P>0.05, with no statistically significant differences between the age-groups (Table 1). The sample of the 70 participants was the final one, after the exclusion of persons who met the exclusionary criteria used in the study. Exclusionary criteria for all possible participants were the presence of uncorrected hearing or visual loss, and a history of mental illness (depression symptoms and/or a history of psychosis) or substance abuse. The presence of depressive symptoms in the older adult group was examined with the Geriatric Depression Scale-15 (GDS-15). Taking into account the financial crisis in Greece, a relatively flexible criterion for exclusion (a score more than 8) of the older adult participants on the basis of their GDS–15 score was adopted, considering that the GDS-15 score ‘6-7’ was confirmed as a valid cutoff level for the diagnosis of older adult depression in Greece [37]. To investigate the existence of depressive symptomatology in young and middle-aged adults, the Beck Depression Inventory (BDI) was administered. Potential participants who scored over ‘30’ were excluded, as this rating is an indication of serious clinical depression [38]. Additional exclusionary criterion for the older adult participants was the existence of cognitive decline. A score lower than ‘23-24’ in the Mini Mental State Examination (MMSE) is considered indicative of cognitive impairment [39]. However, in this study, to ensure that older participants were cognitively healthy, a more stringent criterion was used, as a score lower than 27 excluded the potential participant.
Table 1. Participants’ distribution according to age, gender, and educational level
*GDS = Geriatric Depression Scale; **MMSE = Mini Mental State Examination; ***BDI= Beck Depression Inventory
Measures Social cognition Indirect Speech Understanding Task: Irony, Humor, Sarcasm (ISUT). Based on ‘’Strange Stories test” [23], the ISUT was developed by Natsopoulos, for the purposes of the present study, as a part of a battery of tasks aiming at examining different complex dimensions of social cognition. The ISUT contains nine stories (three of each form of indirect speech, namely of irony, humor, and sarcasm), in which the protagonists say something that are not meant literally. Every story is read by the examiner. Initially, the participant is asked to answer a series of control questions, in order to examine whether they cognitively understand the story. This is a prerequisite to proceed with the following step. Then, the participant’s task is to answer the main two questions developed to examine ToM. In the first, the participant has to answer if the protagonist’s statement is true. Only if the answer to this question is ‘’no’’, suggesting that the non-literal meaning of the story is understood, the second question, that is ‘’Why did he/she say that?’’, is given. In order for the interpretation of the indirect speech to be considered “correct”, it is necessary the participant to understand the motivations and various mental states of the person who expresses something not literally. As regards scoring for the ISUT, every correct answer, for the main two questions, is credited with ‘1’ and every incorrect answer is taking ‘0’. An example item of the task is the following: Philip is reliable worker. His employer cuts a significant amount of his fixed fee. Philip disappointed says: “I did not expect
Adult participants
Age-group
Age
Range
(years)
Mean
SD
Gender
Male
Female
Middle
Education
Upper
(years)
High
GDS*
Mean
(SD)
MMSE** BDI***
Mean Mean
(SD) (SD)
Young (n=26)
18-30
23.4
4.0
14
10
10
5
11
4.8 (5.9) 4.0 (4.2) Middle-aged (n=20) 35-58 45.8 6.7 10 10 7 7 6
Older (n=24) 65-83 71.6 5.8 12 12 8 7 9 1.4
(1.4)
28.8
(1.6)
Total sample (N=70) 18-83 47.1 21.2 36 34 25 19 26
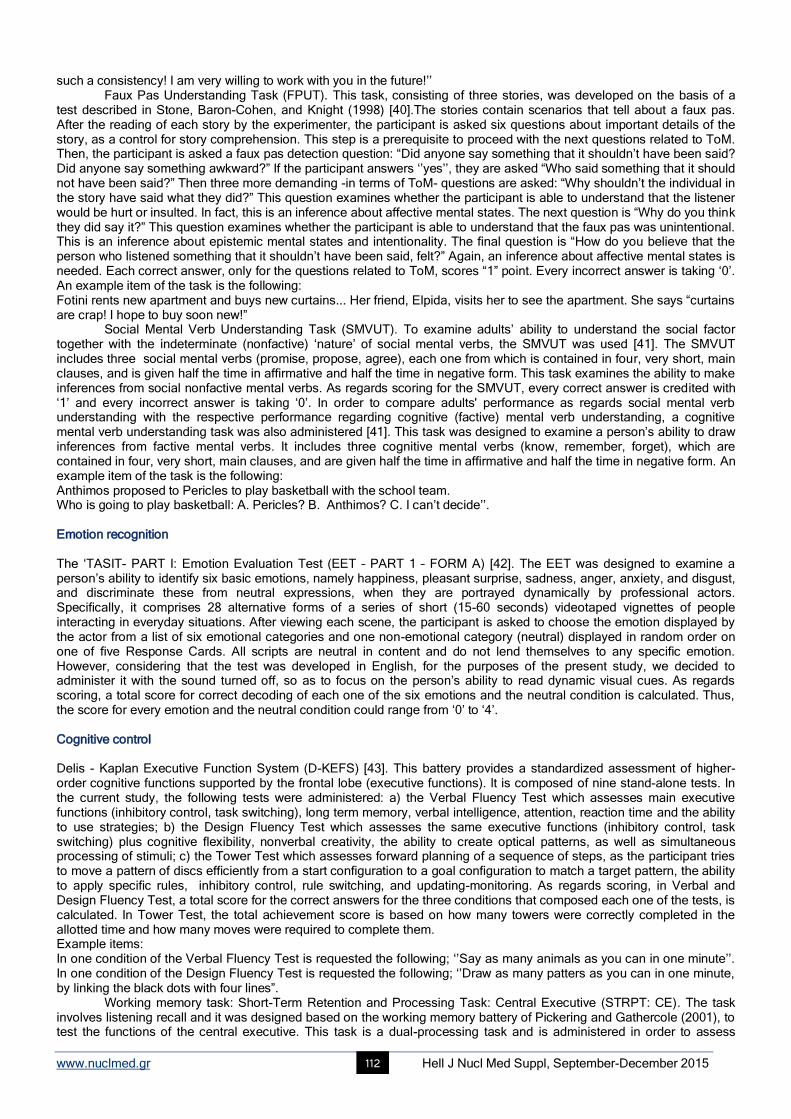
www.nuclmed.gr Hell J Nucl Med Suppl, September-December 2015 112
such a consistency! I am very willing to work with you in the future!’’ Faux Pas Understanding Task (FPUT). This task, consisting of three stories, was developed on the basis of a
test described in Stone, Baron-Cohen, and Knight (1998) [40].The stories contain scenarios that tell about a faux pas. After the reading of each story by the experimenter, the participant is asked six questions about important details of the story, as a control for story comprehension. This step is a prerequisite to proceed with the next questions related to ToM. Then, the participant is asked a faux pas detection question: “Did anyone say something that it shouldn’t have been said? Did anyone say something awkward?” If the participant answers ‘’yes’’, they are asked “Who said something that it should not have been said?” Then three more demanding -in terms of ToM- questions are asked: “Why shouldn’t the individual in the story have said what they did?” This question examines whether the participant is able to understand that the listener would be hurt or insulted. In fact, this is an inference about affective mental states. The next question is “Why do you think they did say it?” This question examines whether the participant is able to understand that the faux pas was unintentional. This is an inference about epistemic mental states and intentionality. The final question is “How do you believe that the person who listened something that it shouldn’t have been said, felt?” Again, an inference about affective mental states is needed. Each correct answer, only for the questions related to ToM, scores “1” point. Every incorrect answer is taking ‘0’. An example item of the task is the following: Fotini rents new apartment and buys new curtains... Her friend, Elpida, visits her to see the apartment. She says “curtains are crap! I hope to buy soon new!”
Social Mental Verb Understanding Task (SMVUT). To examine adults’ ability to understand the social factor together with the indeterminate (nonfactive) ‘nature’ of social mental verbs, the SMVUT was used [41]. The SMVUT includes three social mental verbs (promise, propose, agree), each one from which is contained in four, very short, main clauses, and is given half the time in affirmative and half the time in negative form. This task examines the ability to make inferences from social nonfactive mental verbs. As regards scoring for the SMVUT, every correct answer is credited with ‘1’ and every incorrect answer is taking ‘0’. In order to compare adults' performance as regards social mental verb understanding with the respective performance regarding cognitive (factive) mental verb understanding, a cognitive mental verb understanding task was also administered [41]. This task was designed to examine a person’s ability to draw inferences from factive mental verbs. It includes three cognitive mental verbs (know, remember, forget), which are contained in four, very short, main clauses, and are given half the time in affirmative and half the time in negative form. An example item of the task is the following: Anthimos proposed to Pericles to play basketball with the school team. Who is going to play basketball: A. Pericles? B. Anthimos? C. I can’t decide’’. Emotion recognition The ‘TASIT- PART I: Emotion Evaluation Test (EET – PART 1 – FORM A) [42]. The EET was designed to examine a person’s ability to identify six basic emotions, namely happiness, pleasant surprise, sadness, anger, anxiety, and disgust, and discriminate these from neutral expressions, when they are portrayed dynamically by professional actors. Specifically, it comprises 28 alternative forms of a series of short (15-60 seconds) videotaped vignettes of people interacting in everyday situations. After viewing each scene, the participant is asked to choose the emotion displayed by the actor from a list of six emotional categories and one non-emotional category (neutral) displayed in random order on one of five Response Cards. All scripts are neutral in content and do not lend themselves to any specific emotion. However, considering that the test was developed in English, for the purposes of the present study, we decided to administer it with the sound turned off, so as to focus on the person’s ability to read dynamic visual cues. As regards scoring, a total score for correct decoding of each one of the six emotions and the neutral condition is calculated. Thus, the score for every emotion and the neutral condition could range from ‘0’ to ‘4’. Cognitive control Delis - Kaplan Executive Function System (D-KEFS) [43]. This battery provides a standardized assessment of higher-order cognitive functions supported by the frontal lobe (executive functions). It is composed of nine stand-alone tests. In the current study, the following tests were administered: a) the Verbal Fluency Test which assesses main executive functions (inhibitory control, task switching), long term memory, verbal intelligence, attention, reaction time and the ability to use strategies; b) the Design Fluency Test which assesses the same executive functions (inhibitory control, task switching) plus cognitive flexibility, nonverbal creativity, the ability to create optical patterns, as well as simultaneous processing of stimuli; c) the Tower Test which assesses forward planning of a sequence of steps, as the participant tries to move a pattern of discs efficiently from a start configuration to a goal configuration to match a target pattern, the ability to apply specific rules, inhibitory control, rule switching, and updating-monitoring. As regards scoring, in Verbal and Design Fluency Test, a total score for the correct answers for the three conditions that composed each one of the tests, is calculated. In Tower Test, the total achievement score is based on how many towers were correctly completed in the allotted time and how many moves were required to complete them. Example items: In one condition of the Verbal Fluency Test is requested the following; ‘’Say as many animals as you can in one minute’’. In one condition of the Design Fluency Test is requested the following; ‘’Draw as many patters as you can in one minute, by linking the black dots with four lines”.
Working memory task: Short-Term Retention and Processing Task: Central Executive (STRPT: CE). The task involves listening recall and it was designed based on the working memory battery of Pickering and Gathercole (2001), to test the functions of the central executive. This task is a dual-processing task and is administered in order to assess
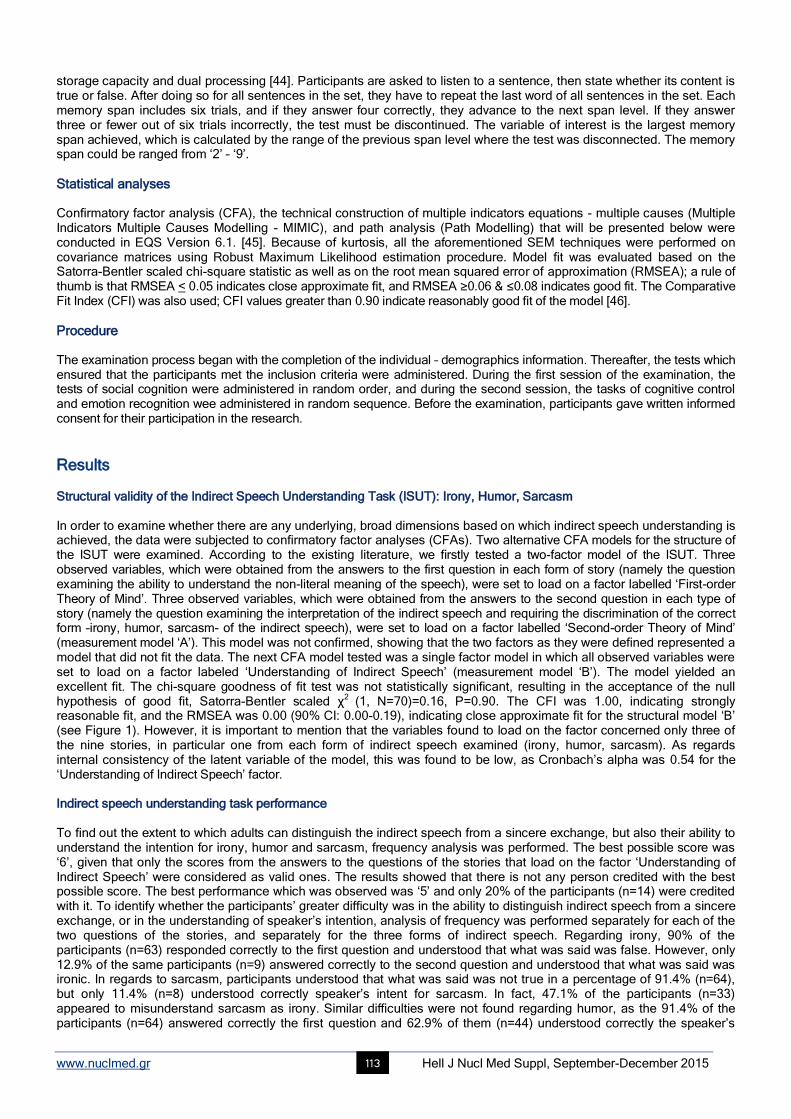
www.nuclmed.gr Hell J Nucl Med Suppl, September-December 2015 113
storage capacity and dual processing [44]. Participants are asked to listen to a sentence, then state whether its content is true or false. After doing so for all sentences in the set, they have to repeat the last word of all sentences in the set. Each memory span includes six trials, and if they answer four correctly, they advance to the next span level. If they answer three or fewer out of six trials incorrectly, the test must be discontinued. The variable of interest is the largest memory span achieved, which is calculated by the range of the previous span level where the test was disconnected. The memory span could be ranged from ‘2’ – ‘9’.
Statistical analyses Confirmatory factor analysis (CFA), the technical construction of multiple indicators equations - multiple causes (Multiple Indicators Multiple Causes Modelling - MIMIC), and path analysis (Path Modelling) that will be presented below were conducted in EQS Version 6.1. [45]. Because of kurtosis, all the aforementioned SEM techniques were performed on covariance matrices using Robust Maximum Likelihood estimation procedure. Model fit was evaluated based on the Satorra-Bentler scaled chi-square statistic as well as on the root mean squared error of approximation (RMSEA); a rule of thumb is that RMSEA < 0.05 indicates close approximate fit, and RMSEA ≥0.06 & ≤0.08 indicates good fit. The Comparative Fit Index (CFI) was also used; CFI values greater than 0.90 indicate reasonably good fit of the model [46].
Procedure The examination process began with the completion of the individual – demographics information. Thereafter, the tests which ensured that the participants met the inclusion criteria were administered. During the first session of the examination, the tests of social cognition were administered in random order, and during the second session, the tasks of cognitive control and emotion recognition wee administered in random sequence. Before the examination, participants gave written informed consent for their participation in the research.
Results Structural validity of the Indirect Speech Understanding Task (ISUT): Irony, Humor, Sarcasm In order to examine whether there are any underlying, broad dimensions based on which indirect speech understanding is achieved, the data were subjected to confirmatory factor analyses (CFAs). Two alternative CFA models for the structure of the ISUT were examined. According to the existing literature, we firstly tested a two-factor model of the ISUT. Three observed variables, which were obtained from the answers to the first question in each form of story (namely the question examining the ability to understand the non-literal meaning of the speech), were set to load on a factor labelled ‘First-order Theory of Mind’. Three observed variables, which were obtained from the answers to the second question in each type of story (namely the question examining the interpretation of the indirect speech and requiring the discrimination of the correct form –irony, humor, sarcasm- of the indirect speech), were set to load on a factor labelled ‘Second-order Theory of Mind’ (measurement model ‘A’). This model was not confirmed, showing that the two factors as they were defined represented a model that did not fit the data. The next CFA model tested was a single factor model in which all observed variables were set to load on a factor labeled ‘Understanding of Indirect Speech’ (measurement model ‘B’). The model yielded an excellent fit. The chi-square goodness of fit test was not statistically significant, resulting in the acceptance of the null hypothesis of good fit, Satorra-Bentler scaled χ
2 (1, Ν=70)=0.16, P=0.90. The CFI was 1.00, indicating strongly
reasonable fit, and the RMSEA was 0.00 (90% CI: 0.00-0.19), indicating close approximate fit for the structural model ‘B’ (see Figure 1). However, it is important to mention that the variables found to load on the factor concerned only three of the nine stories, in particular one from each form of indirect speech examined (irony, humor, sarcasm). As regards internal consistency of the latent variable of the model, this was found to be low, as Cronbach’s alpha was 0.54 for the ‘Understanding of Indirect Speech’ factor. Indirect speech understanding task performance To find out the extent to which adults can distinguish the indirect speech from a sincere exchange, but also their ability to understand the intention for irony, humor and sarcasm, frequency analysis was performed. The best possible score was ‘6’, given that only the scores from the answers to the questions of the stories that load on the factor ‘Understanding of Indirect Speech’ were considered as valid ones. The results showed that there is not any person credited with the best possible score. The best performance which was observed was ‘5’ and only 20% of the participants (n=14) were credited with it. To identify whether the participants’ greater difficulty was in the ability to distinguish indirect speech from a sincere exchange, or in the understanding of speaker’s intention, analysis of frequency was performed separately for each of the two questions of the stories, and separately for the three forms of indirect speech. Regarding irony, 90% of the participants (n=63) responded correctly to the first question and understood that what was said was false. However, only 12.9% of the same participants (n=9) answered correctly to the second question and understood that what was said was ironic. In regards to sarcasm, participants understood that what was said was not true in a percentage of 91.4% (n=64), but only 11.4% (n=8) understood correctly speaker’s intent for sarcasm. In fact, 47.1% of the participants (n=33) appeared to misunderstand sarcasm as irony. Similar difficulties were not found regarding humor, as the 91.4% of the participants (n=64) answered correctly the first question and 62.9% of them (n=44) understood correctly the speaker’s
www.nuclmed.gr Hell J Nucl Med Suppl, September-December 2015 114
Indirect Speech Understanding
intention.
Figure 1. The underlying structure of the Understanding of Indirect Speech latent factor (standardized solution).
*All loadings drawn indicate significant associations (P0.05). **e = measurement error Structural validity of the faux pas understanding task (FPUT) Although similar tests have been used in several studies previously, there is no evidence for the factorial structure of such a test. Based on what is theoretically examined via the questions that constitute the FPUT, we firstly tested a single factor model of the FPUT. Six variables, which were resulted from the summative scores of the answers to the ToM-related questions of the three stories of the FPUT, were set to load on a factor labeled ‘Faux Pas Understanding’ (measurement model A). This model was not confirmed, showing that the latent factor as it was defined was responsible for the misspecification of the model. Inspection of the standardized solution revealed that the variable-indicator ‘Did anyone say something that it shouldn’t have been said?’ (Faux pas identification question) had a non-significant loading on the factor. Therefore, we tested a single factor model, where five of the ToM-related questions of the FPUT set to load on a latent factor labeled ‘Understanding the commit conditions of Faux Pas’, while the observed variable ‘Identification of Faux Pas’ was set to be free (measurement model B). The Wald and the Lagrange tests, which represent frequently used statistics to identify focal areas of misfit in a CFA solution, showed that three of the five variables had to be kept to load on the latent factor. Moreover, the latent factor and the free observed variable in the model should be allowed to correlate with each other. The modified model yielded an excellent fit. The chi-square goodness of fit test was not statistically significant, resulting in the acceptance of the null hypothesis of good fit, Satorra-Bentler scaled χ
2 (2, Ν=70)=1.13, P=0.57.
The CFI was 1.00, indicating strongly reasonable fit, and the RMSEA was 0.00 (90% CI: 0.00-0.20), indicating close approximate fit for the modified model (see Figure 2). At this point, it is important to mention that the three variables kept corresponded to the answers to the questions: ‘Why shouldn’t the individual in the story have said what he/she did?’, ‘Why do you think he/she did say it?’, ‘How do you believe the person that listened something shouldn’t have been said, felt?’ (see Figure 2). The internal consistency of the latent variable was found to be good, as Cronbach’s alpha was 0.78 for the ‘Understanding the commit conditions of Faux Pas’ construct. Faux pas understanding task performance In order to examine adults’ performance in this task, analysis of frequency was performed. The results showed that participants had a well-formulated ability both to identify the Faux Pas and to understand the commit conditions of Faux Pas. The best possible score as regards the ability to identify Faux Pas was ‘three points’ and 81.4% of the participants (n=57) were credited with this. Regarding the ability to understand the commit conditions of Faux Pas, 21.4% of the total sample (n=15) responded correctly in the three questions for each one of the three stories (score = ‘9’), while the same proportion answered correctly in eight and seven questions (score = ‘8’ or ‘7’). Looking in more detail the performance, participants appeared to have in a greater extent the ability to identify correctly the feelings of the person that listened something shouldn’t have been said, as 71.4% of the participants (n=50 ) responded correctly in the respective questions.
Irony
Is this true?
Why it was said?
0.47 0.88e
0.98 Humor
Is this true?
Why it was said? 0.22e
0.25
Sarcasm
Is this true?
Why it was said?
0.97e
www.nuclmed.gr Hell J Nucl Med Suppl, September-December 2015 115
Understanding the
commit conditions of
Faux Pas
Figure 2. The structural model of the Faux Pas Understanding Task (standardized solution).
*All loadings and correlations drawn indicate significant associations (P0.05). **e = measurement error Structural validity of the Social Mental Verb Understanding Task (SMVUT) According to the extant literature, it is supported that the processing of affirmative and negative sentences differs, as each of them is mediated by distinct brain regions [47]. For this reason, we tested a two-factor model of the SMVUT. Three observed variables referring to social verb understanding, when the verbs are given in affirmative form, were set to load on a factor labelled ‘Understanding of Social Verbs in Affirmative Form’. The remaining three variables referring respectively to understanding of each one of the same social verbs, when the verbs are given in negative form, were set to load on a second factor labeled ‘Understanding of Social Verbs in Negative Form’ (measurement model ‘A’). The Lagrange test showed that the two factors in the model should be allowed to correlate with each other (structural model ‘A’). This structural model yielded an excellent fit. The chi-square goodness of fit test was not statistically significant, resulting in the acceptance of the null hypothesis of good fit, Satorra-Bentler scaled χ
2 (7, Ν=70)=5.64, P=0.58. The CFI was 1.00,
indicating strongly reasonable fit, and the RMSEA was 0.00 (90% CI: 0.00-0.13), indicating close approximate fit for the structural model ‘A’ (see Figure 3). As regards internal consistency of the two latent variables, Cronbach’s alpha was 0.70 and 0.78 for the ‘Understanding of Social Verbs in Affirmative Form’ and the ‘Understanding of Social Verbs in Negative Form’ factor respectively. Social Mental Verb Understanding Task performance The results from the analysis of frequency showed that adults did not possess a well-formulated level of social mental verb understanding. There was not any person credited with the best possible score as regards the ability to draw inferences from social - nonfactive verbs given in affirmative form, while only 7.1% of the participants (n=5) were credited with the best score for their ability to draw inferences from social - nonfactive verbs given in negative form. In fact, 51.4% (n=36) and 37.1% (n=26) of the participants were found to mistakenly attribute the meaning of all three verbs in affirmative and negative sentences, respectively. In sharp contrast, adults were found to posses the ability to draw inferences from cognitive - factive mental verbs, as 77.1% (n=54) and 42.9% (n=30) of the participants were credited with the best score, when the cognitive mental verbs were given in affirmative sentences and in the negative form respectively. Direct effects of age, gender and educational level on understanding of indirect speech, faux pas, and social mental verbs To examine the effects of age, education, and gender on the ISUT, FPUT and SMVUT, the Multiple Indicators Multiple Causes (MIMIC) modelling technique was used. In MIMIC models, both the latent factor and its indicators are regressed onto exogenous variables added to a CFA model established previously. MIMIC models were not confirmed, a finding that indicates that there was not any effect of age and the other two individual-demographic factors on the ability to understand indirect speech, on faux pas understanding, as well as on the ability to understand the indeterminate ‘nature’ of social mental verbs.
0.72e 0.69 Why “X” shouldn’t have
said that?
Identification of Faux Pas
0.61e 0.51
Why do you think he/she did say it?
0.91
0.79 ‘How do you believe
the person that listened something shouldn’t have been said, felt?
0.86e
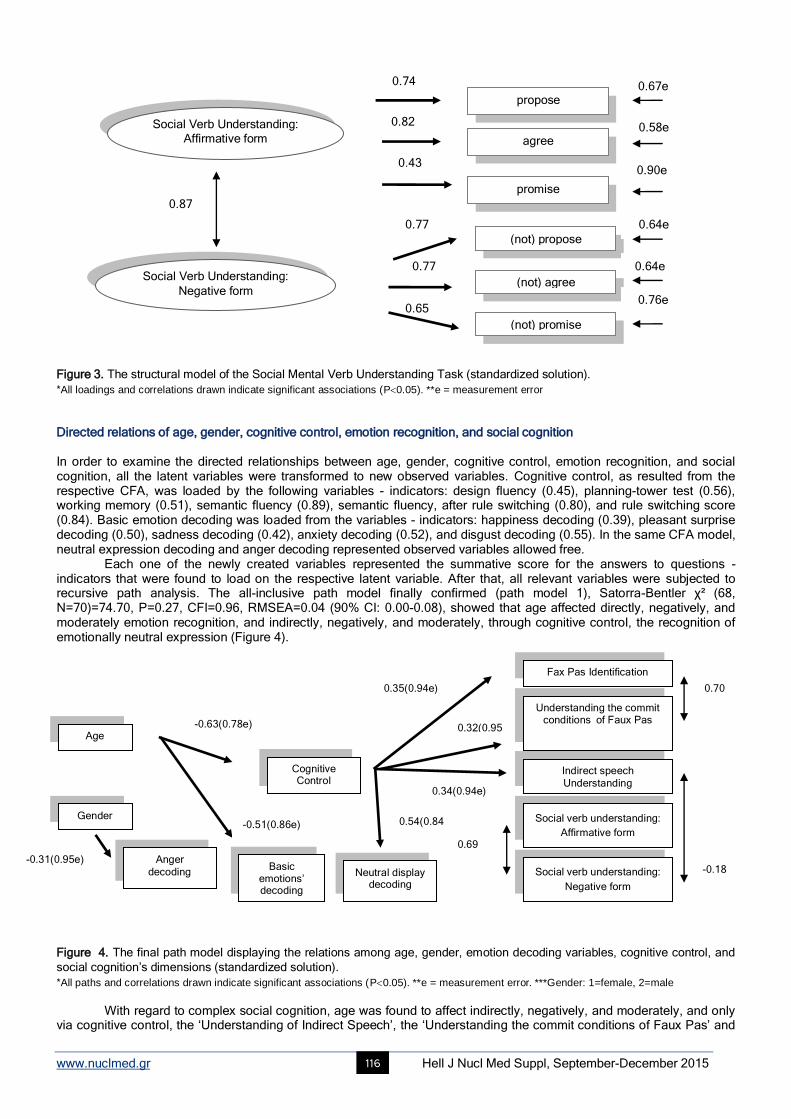
www.nuclmed.gr Hell J Nucl Med Suppl, September-December 2015 116
Social Verb Understanding:
Negative form
Social Verb Understanding:
Affirmative form
Figure 3. The structural model of the Social Mental Verb Understanding Task (standardized solution).
*All loadings and correlations drawn indicate significant associations (P0.05). **e = measurement error Directed relations of age, gender, cognitive control, emotion recognition, and social cognition In order to examine the directed relationships between age, gender, cognitive control, emotion recognition, and social cognition, all the latent variables were transformed to new observed variables. Cognitive control, as resulted from the respective CFA, was loaded by the following variables - indicators: design fluency (0.45), planning-tower test (0.56), working memory (0.51), semantic fluency (0.89), semantic fluency, after rule switching (0.80), and rule switching score (0.84). Basic emotion decoding was loaded from the variables - indicators: happiness decoding (0.39), pleasant surprise decoding (0.50), sadness decoding (0.42), anxiety decoding (0.52), and disgust decoding (0.55). In the same CFA model, neutral expression decoding and anger decoding represented observed variables allowed free.
Each one of the newly created variables represented the summative score for the answers to questions - indicators that were found to load on the respective latent variable. After that, all relevant variables were subjected to recursive path analysis. The all-inclusive path model finally confirmed (path model 1), Satorra-Bentler χ² (68, N=70)=74.70, P=0.27, CFI=0.96, RMSEA=0.04 (90% CI: 0.00-0.08), showed that age affected directly, negatively, and moderately emotion recognition, and indirectly, negatively, and moderately, through cognitive control, the recognition of emotionally neutral expression (Figure 4).
Figure 4. The final path model displaying the relations among age, gender, emotion decoding variables, cognitive control, and
social cognition’s dimensions (standardized solution).
*All paths and correlations drawn indicate significant associations (P0.05). **e = measurement error. ***Gender: 1=female, 2=male
With regard to complex social cognition, age was found to affect indirectly, negatively, and moderately, and only via cognitive control, the ‘Understanding of Indirect Speech’, the ‘Understanding the commit conditions of Faux Pas’ and
propose
0.67e
0.82 0.58e
agree
0.43
0.87
0.90e
promise
0.77
(not) propose
0.64e
0.74
0.64e
0.65
(not) agree
(not) promise
0.76e
Fax Pas Identification
0.70 0.35(0.94e)
Understanding the commit conditions of Faux Pas
0.32(0.95e)
-0.63(0.78e) Age
Indirect speech
Understanding
Cognitive Control
0.34(0.94e)
-0.31(0.95e)
-0.51(0.86e) 0.54(0.84e)
Social verb understanding:
Affirmative form
Gender
0.69
Anger
decoding Basic
emotions’ decoding
Neutral display decoding
Social verb understanding:
Negative form
-0.18
0.77
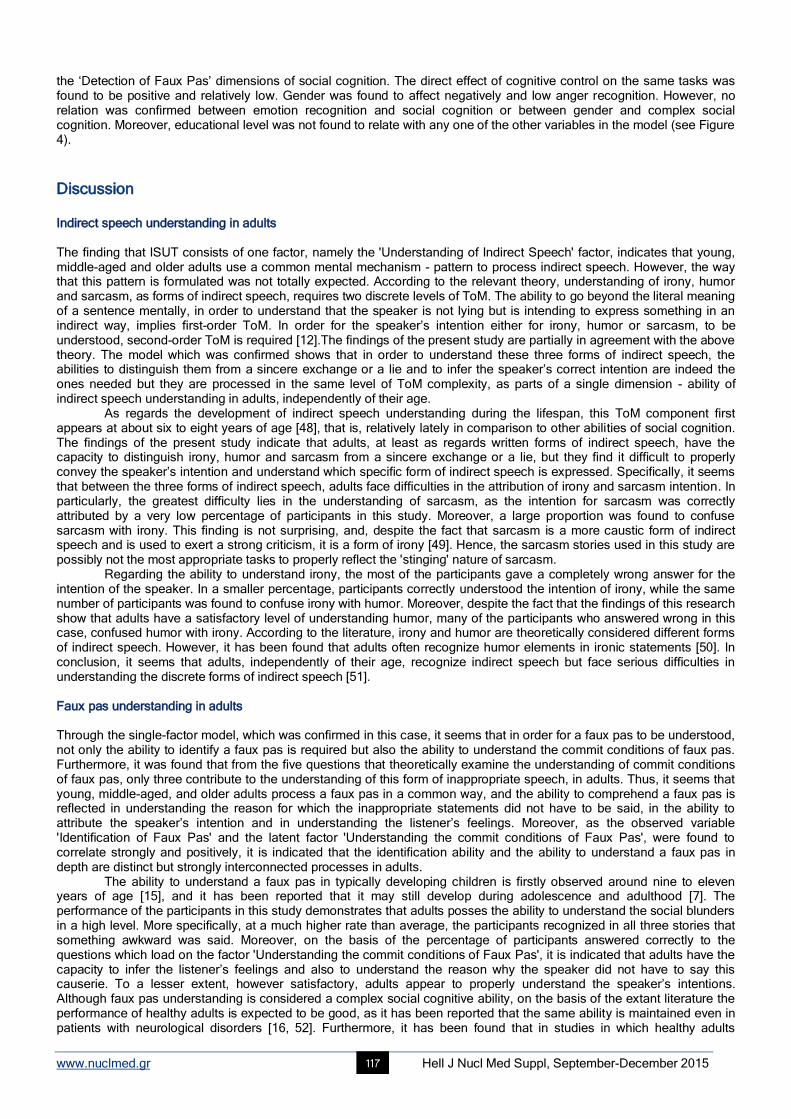
www.nuclmed.gr Hell J Nucl Med Suppl, September-December 2015 117
the ‘Detection of Faux Pas’ dimensions of social cognition. The direct effect of cognitive control on the same tasks was found to be positive and relatively low. Gender was found to affect negatively and low anger recognition. However, no relation was confirmed between emotion recognition and social cognition or between gender and complex social cognition. Moreover, educational level was not found to relate with any one of the other variables in the model (see Figure 4).
Discussion Indirect speech understanding in adults The finding that ISUT consists of one factor, namely the 'Understanding of Indirect Speech' factor, indicates that young, middle-aged and older adults use a common mental mechanism - pattern to process indirect speech. However, the way that this pattern is formulated was not totally expected. According to the relevant theory, understanding of irony, humor and sarcasm, as forms of indirect speech, requires two discrete levels of ToM. The ability to go beyond the literal meaning of a sentence mentally, in order to understand that the speaker is not lying but is intending to express something in an indirect way, implies first-order ToM. In order for the speaker’s intention either for irony, humor or sarcasm, to be understood, second-order ToM is required [12].The findings of the present study are partially in agreement with the above theory. The model which was confirmed shows that in order to understand these three forms of indirect speech, the abilities to distinguish them from a sincere exchange or a lie and to infer the speaker’s correct intention are indeed the ones needed but they are processed in the same level of ToM complexity, as parts of a single dimension - ability of indirect speech understanding in adults, independently of their age.
As regards the development of indirect speech understanding during the lifespan, this ToM component first appears at about six to eight years of age [48], that is, relatively lately in comparison to other abilities of social cognition. The findings of the present study indicate that adults, at least as regards written forms of indirect speech, have the capacity to distinguish irony, humor and sarcasm from a sincere exchange or a lie, but they find it difficult to properly convey the speaker’s intention and understand which specific form of indirect speech is expressed. Specifically, it seems that between the three forms of indirect speech, adults face difficulties in the attribution of irony and sarcasm intention. In particularly, the greatest difficulty lies in the understanding of sarcasm, as the intention for sarcasm was correctly attributed by a very low percentage of participants in this study. Moreover, a large proportion was found to confuse sarcasm with irony. This finding is not surprising, and, despite the fact that sarcasm is a more caustic form of indirect speech and is used to exert a strong criticism, it is a form of irony [49]. Hence, the sarcasm stories used in this study are possibly not the most appropriate tasks to properly reflect the 'stinging' nature of sarcasm.
Regarding the ability to understand irony, the most of the participants gave a completely wrong answer for the intention of the speaker. In a smaller percentage, participants correctly understood the intention of irony, while the same number of participants was found to confuse irony with humor. Moreover, despite the fact that the findings of this research show that adults have a satisfactory level of understanding humor, many of the participants who answered wrong in this case, confused humor with irony. According to the literature, irony and humor are theoretically considered different forms of indirect speech. However, it has been found that adults often recognize humor elements in ironic statements [50]. In conclusion, it seems that adults, independently of their age, recognize indirect speech but face serious difficulties in understanding the discrete forms of indirect speech [51]. Faux pas understanding in adults Through the single-factor model, which was confirmed in this case, it seems that in order for a faux pas to be understood, not only the ability to identify a faux pas is required but also the ability to understand the commit conditions of faux pas. Furthermore, it was found that from the five questions that theoretically examine the understanding of commit conditions of faux pas, only three contribute to the understanding of this form of inappropriate speech, in adults. Thus, it seems that young, middle-aged, and older adults process a faux pas in a common way, and the ability to comprehend a faux pas is reflected in understanding the reason for which the inappropriate statements did not have to be said, in the ability to attribute the speaker’s intention and in understanding the listener’s feelings. Moreover, as the observed variable 'Identification of Faux Pas' and the latent factor 'Understanding the commit conditions of Faux Pas', were found to correlate strongly and positively, it is indicated that the identification ability and the ability to understand a faux pas in depth are distinct but strongly interconnected processes in adults.
The ability to understand a faux pas in typically developing children is firstly observed around nine to eleven years of age [15], and it has been reported that it may still develop during adolescence and adulthood [7]. The performance of the participants in this study demonstrates that adults posses the ability to understand the social blunders in a high level. More specifically, at a much higher rate than average, the participants recognized in all three stories that something awkward was said. Moreover, on the basis of the percentage of participants answered correctly to the questions which load on the factor 'Understanding the commit conditions of Faux Pas', it is indicated that adults have the capacity to infer the listener’s feelings and also to understand the reason why the speaker did not have to say this causerie. To a lesser extent, however satisfactory, adults appear to properly understand the speaker’s intentions. Although faux pas understanding is considered a complex social cognitive ability, on the basis of the extant literature the performance of healthy adults is expected to be good, as it has been reported that the same ability is maintained even in patients with neurological disorders [16, 52]. Furthermore, it has been found that in studies in which healthy adults
www.nuclmed.gr Hell J Nucl Med Suppl, September-December 2015 118
participated as a control group, their performance was very high [53-54]. Social mental verb understanding in adults Considering the model which was confirmed for the SMVUT, it seems that this complex ToM ability consists of two interconnected dimensions, namely the abilities to understand social verbs in affirmative form and in negative form. The findings show that young, middle-aged, and older adults process social mental verbs in a common way, which, however, varies depending on the form in which the verb is given. Such a conclusion corroborates the suggestion that the processing of affirmative and negative sentences differs, as it has been observed that during their processing different brain areas are activated. Christensen (2009) [47], on the basis of the findings of an fMRI study, has claimed that, through a negation, left premotor cortex exhibits an increased activation, whereas affirmation causes an increased activation in the right supramarginal gyrus. In this vein, it is likely that since these two types of clauses are mediated by different brain areas, they could also be processed in a different way, at the cognitive – behavioral level [47]. Although language significantly affects the quality of social interactions and the performance on tasks that measure various dimensions of social cognition [17], the empirical studies examining the ability to understand social mental verbs in adulthood are considerably limited. In this context, the present study tried to fill the gap that exists as concerns adults’ ability to understand the social factor and the ‘indeterminate’ nature of social verbs. The results indicated that adults do not possess a well-formulated level of social mental verb understanding during the lifespan. This does not mean that they do not understand the semantics or the meaning of social mental verbs. However, it seems that, when they have to make inferences about these verbs, they are based on heuristics or/and pragmatological schemes. Generally, discourse comprehension could occur through top-down processing and also by using the ‘real world’ knowledge [55]. Furthermore, in order to understand a text, complex representations are used, which are formed by text information and also by the accumulated knowledge [56]. Moreover, in order to comprehend a text, people tend to use situation models, which are multi-dimensional representations of the topic of the text that include information such as space, time, and causal relationships [57]. According to the findings of this study, it seems that adults, due to their need to eliminate uncertainty involved in the information processing system about a social mental verb [58], tend to ‘treat’ social, nonfactive verbs as factive ones. On the other hand, the high-level performance of the participants, as regards cognitive mental verb understanding, indicates that adults have the ability to understand the factivity and the true event that these verbs denote. Knowing the way in which adults organize their mental lexicon, this finding is not surprising. As mentioned, they seem to be more able to process mental verbs of low uncertainty such as the factive ones, because of their lower-level demands in terms of inference and information processing resources [59]. Age and social cognition: Is there any direct relationship? One of the main aims of the current study was to examine the direct effects of age on higher-order abilities of social cognition. Although the findings of the existing studies are controversial, the majority argue that older adults exhibit deficits even in simpler forms of social cognition, such as the ability to understand false beliefs [27, 60]. However, in most of the studies it was found that the factor of age does not explain these deficits, as they seem to be mediated fully or partially by other factors, such as executive functions or fluid intelligence [10, 61]. In this line, in the present study it was hypothesized that age would not affect any complex ability of social cognition. This hypothesis (1
st) was confirmed,
supporting previous findings according to which age is considered simply a time axis, along which various developmental phenomena emerge, and not an interpretive factor for the impairments that older adults face in various cognitive domains [62]. According to the first study examining social cognition in relation to age, it was found that older adults, due to their greater experience, exhibit an improvement in their ability to infer mental states [23]. However, in this study the possible effect of other factors on social cognition performance was not examined. This is a methodological limitation that controverts the validity of the results, as it seems that some factors, such as vocabulary, provide information for the interpretation of older adults' performance. Indeed, in a subsequent research, where older adults did not show deficits in ToM, it was found that the maintenance of this function was attributed to their superior vocabulary abilities. Thus, it has been argued that any deficits that could demonstrate older adults in ToM, are not specific ToM deficits but could emerge due to a general cognitive decline [25]. Gender, educational level, and social cognition In the present study, the examination of the direct effects of educational level and gender on social cognition confirmed the relevant hypothesis (3
rd), as neither educational level nor gender directly affected social cognition. As regards
educational level, this result is in line with previous research findings, which showed that this factor does not contribute to the observed older adults' deficits in their ability to infer mental states [36]. However, according to another study, the differences in the performance on social cognition’s tasks, which were observed between older adults with high and low educational level, indirectly indicated that high educational level implies higher crystallized intelligence. Hence, this probably constitutes a protective factor for the difficulties that may occur in social cognition across lifespan development [63]. The participants of the current study, as in a recent research of Cavallini et al. (2013) [36], had middle, upper and high educational level. Perhaps, this is a main reason why there was not observed any effect from educational level on complex social cognition examined in this study.
As regards gender, it has been reported that in participants with autism spectrum disorder, it was observed that women performed better on ToM. This superiority of women was claimed that it possibly exists, because women’s empathy is in a superior level than men’s [64]. In a recent study, where high-school students participated, it was found
www.nuclmed.gr Hell J Nucl Med Suppl, September-December 2015 119
that gender affects directly and indirectly, through empathy, the performance in a ToM task, with women to display higher performance [65]. As far as we know, the factor of gender has not been examined in relation to its' possible direct effect on social cognition in adults. The results of the current study confirm the respective hypothesis (3
rd), demonstrating that
gender does not affect directly the complex abilities of social cognition. It is therefore likely that, regardless the differences observed between the two genders in social behavior in “everyday” life [64], men and women in experimental conditions process the respective tasks in a common way. Age, gender, educational level, cognitive control, emotion recognition, and social cognition: are there any indirect relations between individual-demographic factors and social cognition? The path model confirmed, shows that age affects directly and negatively the ability to recognize basic emotions, and indirectly and negatively, via cognitive control processes, the ability to recognize the emotionally neutral expressions. These findings are in line with previous research, as in several studies it was found that older adults are less able to recognize emotions from visual stimuli [66-67]. These difficulties are attributed to the general cognitive function, as it is suggested that the advance of age, accompanied by cognitive decline, causes deficits in recognizing emotions, regardless of their valence [68]. Moreover, this model shows that gender affects directly the ability to recognize anger, as women’s performance was significantly better. Differences between the two genders in favor of women are observed since childhood and continued in the period of adulthood [69]. It has been supported that these differences are probably interlinked with gender differences observed in the functional organization and architecture of the brain structures, which are involved in the control of emotions [70, 71].
Interestingly, as regards social cognition, age appears to affect indirectly and negatively the abilities to identify and understand indirect speech and faux pas, through its' effect on cognitive control. Hence, it could be suggested that cognitive control mediates the relation between age and social cognition, and, specifically, between age and the dimensions associated with affective ToM (2
nd hypothesis). This finding contradicts those of another study, according to
which age was found to affect only those abilities that are related to cognitive ToM [60]. However, at least one study had similar results. In this case, age was found to negatively affect only the dimensions of social cognition in which processing of affective elements was needed. It has been suggested that possibly such a finding was observed due to the association of these abilities with higher memory load [65]. Moreover, it could be argued that as affective dimensions of ToM overlap with cognitive empathy [35], it is likely that the negative effects of age on those abilities could be attributed to deficits in cognitive empathy observed in normal aging [72].
In conclusion, the present study contributes to the literature in terms of providing findings about the difficulties which adults have in sarcasm, irony and social mental verb understanding. Moreover, the findings confirm the conclusions of the existing research, in terms of revealing the important role of cognitive control in social cognition: it was found that the higher-level abilities of social cognition that combine cognitive and affective ToM components, are negatively affected by age, but this effect is fully mediated by the difficulties that older adults face in cognitive control tasks.
However, there are some limitations in the study. The restricted nature of the sample should be noted with regard to the number of participants in each age-group. The limited number of dimensions of social cognition examined, the non-dynamic tasks used, the inability to associate behavioral performance with more objective indices of cognitive performance and neuroimaging data should be also mentioned. Moreover, a main limitation is the cross-sectional design of the study. It is unknown if the same pattern of results would be obtained if the same persons had repeatedly been measured at different age. Generally speaking, more rigorous methods and longitudinal design are needed to examine in depth the effects of age on social cognition.
The authors have no conflicts of interest to declare.
Bibliography 1. Beer JS, Ochsner KN. Social cognition: a multi level analysis. Brain Res 2000: 1079: 98–105.
2. Adolphs R. The neurobiology of social cognition. Curr Opin Neurobiol 2001: 11: 231–9.
3. Adolphs R. Social cognition and the human brain. Trends Cogn Sci 1999: 3: 469–79.
4. Moran JM. Lifespan development: the effects of typical aging on theory of mind. Behav Brain Res 2003: 237: 32–40.
5. Kemp J, Després O, Sellal F, & Dufour A. Theory of Mind in normal ageing and neurodegenerative pathologies. Ageing Res Rev 2012:11:
199–219.
6. Coricelli G. Two-levels of mental states attribution: from automaticity to voluntariness. Neuropsychologia 2005: 43: 294–300.
7. Sebastian CL. Fontaine NMG. Bird G. Blakemore SJ. Brito S. McCrory EJP. Viding E. Neural processing associated with cognitive and
affective Theory of Mind in adolescents and adults. Soc Cogn Affect Neur 2011: 7: 53–63.
8. Baron‐Cohen S. Autism: The Empathizing–Systemizing (E‐S) Theory. Ann NY Acad Sci 2009:1156: 68-80.
9. Morin A. Levels of consciousness and self-awareness: A comparison and integration of various neurocognitive views. Conscious Cogn
2006: 15: 358–71.
10. Duval C, Piolino P, Bejanin A, Eustache F, Desgranges B. Age effects on different components of theory of mind. Conscious Cogn 2011: 20:
627–42.
11. Harada T, Itakura S, Xu F, Lee K, Nakashita S, Saito DN, Sadato N. Neural correlates of the judgment of lying: A functional magnetic
resonance imaging study. Neurosci Res 2009: 63: 24-34.
12. Channon S, Pellijeff A, Rule A. Social cognition after head injury: sarcasm and theory of mind. Brain Lang 2005: 93: 123–34.
13. Martín-Rodríguez JF, León-Carrión J. Theory of mind deficits in patients with acquired brain injury: a quantitative review. Neuropsychologia
2010: 48: 1181–91.
14. Shamay-Tsoory SG, Tomer R, Aharon-Peretz J. Deficit in understanding sarcasm in patients with prefrontal lesion is related to impaired
www.nuclmed.gr Hell J Nucl Med Suppl, September-December 2015 120
empathic ability. Brain Cognition 2002: 8: 558-63.
15. Baron-Cohen S, O’Riordan M, Stone VE et al. Recognition of faux pas by normally developing children with Asperger’s syndrome or high-
functioning autism. J Autism Dev Disord 1999: 29: 407–18.
16. Gregory C. Lough S, Stone V, Erzinclioglu S et al. Theory of mind in patients with frontal variant frontotemporal dementia and Alzheimer’s
disease: theoretical and practical implications. Brain 2002:125: 752-64.
17. De Villiers J.G, Pyers JE. Complements to cognition: a longitudinal study of the relationship between complex syntax and false-belief-
understanding. Cognitive Dev 2002:17:1037–60.
18. Beer JS. Ochsner KN. Social cognition: a multi level analysis. Brain Res 2000: 1079: 98–105.
19. Adolphs R. The neurobiology of social cognition. Curr Opin Neurobiol 2001: 11: 231–9.
20. Adolphs R. Social cognition and the human brain. Trends Cogn Sci 1999: 3: 469–79.
21. Moran JM. Lifespan development: the effects of typical aging on theory of mind. Behav Brain Res 2003: 237: 32–40.
22. Kemp J.,Després O. Sellal F. & Dufour A. Theory of Mind in normal ageing and neurodegenerative pathologies. Ageing Res Rev 2012:11:
199–219.
23. Coricelli G. Two-levels of mental states attribution: from automaticity to voluntariness. Neuropsychologia 2005: 43: 294–300.
24. Sebastian CL. Fontaine NMG. Bird G. Blakemore SJ. Brito S. McCrory EJP. Viding E. Neural processing associated with cognitive and
affective Theory of Mind in adolescents and adults. Soc Cogn Affect Neur 2011: 7: 53–63.
25. Baron‐Cohen S. Autism: The Empathizing–Systemizing (E‐S) Theory. Ann NY Acad Sci 2009:1156: 68-80.
26. Morin A. Levels of consciousness and self-awareness: A comparison and integration of various neurocognitive views. Conscious Cogn
2006: 15: 358–71.
27. Duval C. Piolino P. Bejanin A., Eustache F. Desgranges B. Age effects on different components of theory of mind. Conscious Cogn 2011:
20: 627–42.
28. Harada T. Itakura S. Xu F. Lee K. Nakashita S. Saito DN. Sadato N. Neural correlates of the judgment of lying: A functional magnetic
resonance imaging study. Neurosci Res 2009: 63: 24-34.
29. Channon S. Pellijeff A. Rule A. Social cognition after head injury: sarcasm and theory of mind. Brain Lang 2005: 93: 123–34.
30. Martín-Rodríguez JF. León-Carrión J. Theory of mind deficits in patients with acquired brain injury: a quantitative review . Neuropsychologia
2010: 48: 1181–91.
31. Shamay-Tsoory SG. Tomer R. Aharon-Peretz J. Deficit in understanding sarcasm in patients with prefrontal lesion is related to impaired
empathic ability. Brain Cognition 2002: 8: 558-63.
32. Baron-Cohen S. O’Riordan M, Stone VE. Jones R. Plaisted K. Recognition of faux pas by normally developing children with Asperger’s
syndrome or high-functioning autism. J Autism Dev Disord 1999: 29: 407–18.
33. Gregory C. Lough S. Stone V. Erzinclioglu S. Martin L., Baron‐Cohen S. Hodges JR. Theory of mind in patients with frontal variant
frontotemporal dementia and Alzheimer’s disease: theoretical and practical implications. Brain 2002:125: 752-64.
34. De Villiers J.G. Pyers JE. Complements to cognition: a longitudinal study of the relationship between complex syntax and false-belief-
understanding. Cognitive Dev 2002:17:1037–60.
35. Olson IR. Plotzker A. Ezzyat Y. The enigmatic temporal pole: a review of findings on social and emotional processing. Brain 2007: 130:
1718–31.
36. Austin JL. How to do things with words. Mass: Harvard University Press. Cambridge, 1962/1975.
37. Cheung H, Chen HC, Yeung W. Relations between mental verb and false belief understanding in Cantonese-speaking children. J Exp Child
Psychol 2009: 104: 141–155.
38. Rakoczy H. Harder-Kasten A. Sturm L. The decline of theory of mind in old age is (partly) mediated by developmental changes in domain-
general abilities. Brit J Psychol 2012: 103(1): 58–72.
39. Halberstadt J. Ruffman T. Murray J. Taumoepeau M. Ryan M. Emotion perception explains age-related differences in the perception of
social gaffes. Psychol Aging 2011: 26: 133–6.
40. Happé FG. Winner E. Brownell H. The getting of wisdom: theory of mind in old age. Dev Psychol 1998: 34: 358.
41. Maylor E. Moulson JM. Muncer AM. Taylor L. Does performance on theory of mind tasks decline in old age? Brit J Psychol 2003: 93: 465–
85.
42. Slessor G. Phillips LH. Bull R. Exploring the specificity of age-related differences in theory of mind tasks. Psychol Aging 2007: 22: 639–43.
43. MacPherson SE. Phillips LH. Della Sala S. Age, executive function and social decision making: A dorsolateral prefrontal theory of cognitive
aging. Psychol Aging 2002: 17: 598–609.
44. Bernstein DM. Thornton WL. Sommerville JA. Theory of mind through the ages: Older and middle-aged adults exhibit more errors than do
younger adults on a continuous false belief task. Exp Aging Res 2011: 37: 481-502.
45. Cauley JA. Dorman JS. Ganguli M. Genetic and aging epidemiology: The merging of two disciplines. Neurol Clin 1996: 14: 467-75.
46. West RL. An application of prefrontal cortex function theory to cognitive aging. Psychol Bull 1996: 120: 272.
47. Salthouse TA. Atkinson TM. Berish DE. Executive functioning as a potential mediator of age-related cognitive decline in normal adults. J
Exp Psychol Gen 2003: 132: 566.
48. Hedden T. Gabrieli JDE. Insights into the ageing mind: a view from cognitive neuroscience. Nat Rev Neurosci 2004:5: 87–96.
49. Elderkin-Thompson V. Ballmaier M. Hellemann G. Pham D. Kumar A. Executive function and MRI prefrontal volumes among healthy older
adults. Neuropsychology 2008: 22: 626–37.
50. Leslie A. M. Friedman O. German T. P. Core mechanisms in ‘theory of mind’. Trends Cogn Sci, 2004: 8: 528–33.
51. German TP. Hehman J. Representational and executive selection resources in “theory of mind”: evidence from compromised belief-desire
reasoning in old age. Cognition 2006: 101: 129–52.
52. Bailey PE. Henry JD. Growing less empathic with age: Disinhibition of the self-perspective. J Gerontol B Psychol Sci Soc Sci 2008: 63:
219-26.
53. Cavallini E. Lecce S. Bottiroli S. Palladino P. Pagnin A. Beyond false belief: theory of mind in young, young-old, and old-old adults. Int J
Aging Hum Dev 2013: 76: 181–98.
54. Fountoulakis KN. Tsolaki M. Iacovides A. Yesavage J. O’Hara R., Kazis A. Ierodiakonou C. The validation of the short form of the Geriatric

www.nuclmed.gr Hell J Nucl Med Suppl, September-December 2015 121
Depression Scale (GDS) in Greece. Aging Clin Exp Res 1999: 1: 367-72.
55. Mystakidou K. Tsilika E. Parpa E. Smyrniotis V. Galanos A. Vlahos L. Beck Depression Inventory: exploring its psychometric properties in a
palliative care population of advanced cancer patients. Eur J Cancer Care 2007: 16: 244-50.
56. Fountoulakis KN. Tsolaki M. Chantzi H. Kazis A. Mini mental state examination (MMSE): a validation study in Greece. Am J Alzheimers Dis
Other Demen 2000: 15: 342-5.
57. Stone VE Baron-Cohen S. Knight RT. Frontal lobe contributions to theory of mind. J Cogn Neurosci 1998: 10: 640–56.
58. Spanoudis GC. Natsopoulos D. Memory functioning and mental verbs acquisition in children with specific language impairment. Res Dev
Disabil 2011: 32: 2916-26.
59. McDonald S. Bornhofen C. Shum D. Long E. Saunders C., Neulinger K. Reliability and validity of The Awareness of Social Inference Test
(TASIT): a clinical test of social perception. Disabil Rehabil 2006: 28: 1529-42.
60. Delis DC. Kaplan E. Kramer JH. Delis-Kaplan executive function system (D-KEFS). Psychological Corporation: 2001.
61. Stavrakaki S. Megari K. Kosmidis MH. Apostolidou M. Takou E. Working memory and verbal fluency in simultaneous interpreters . J Clin
Exp Neuropsyc 2012: 34: 624-33.
62. Bentler PM. EQS for Windows (version 6.1). Encino, CA: Multivariate Software: 2005.
63. Brown TA. Confirmatory factor analysis for applied research. Guilford Press: 2012
64. Christensen KR. Negative and affirmative sentences increase activation in different areas in the brain. J Neurolinguist 2009: 22: 1-17.
65. Winner E. Leekam S. Distinguishing irony from deception: Understanding the speaker’s second order intention. Brit J Dev Psychol, 1991: 9:
257–70.
66. Uchiyama HΤ. Saito DN. Tanabe HC. Harada T. Seki A. Ohno K. Sadato N. Distinction between the literal and intended meanings of
sentences: a functional magnetic resonance imaging study of metaphor and sarcasm. Cortex 2012: 48: 563–83.
67. Dews S. Kaplan J. Winner E. Why not say it directly? The social functions of irony. Discourse Processes 1995: 19: 347–67.
68. Gibbs RW. O’Brien J. Psychological aspects of irony understanding. J Pragmatics 1996: 16: 523–530.
69. Péron J. Vicente S. Leray E. Drapier S. Drapier D. Cohen R. Vérin M. Are dopaminergic pathways involved in theory of mind? A study in
Parkinson’s disease. Neuropsychologia 2009: 47: 406–14.
70. Stone VE. Baron-Cohen S. Calder A. Keane J. Young A. Acquired theory of mind impairments in individuals with bilateral amygdala
lesions. Neuropsychologia 2003: 41: 209–20.
71. Zalla T. Sav AM. Stopin A. Ahade S. Leboyer M. Faux pas detection and intentional action in Asperger Syndrome. A replication on a
French sample. J Autism Dev Disord 2009: 39: 373–82.
72. Burke DM. Shafto MA. Language and Aging. In Craik FI. Salthouse TA. Eds. The handbook of aging and cognition 3rd
ed. Psychology
Press 2008: 3: 373-443.
73. Stine-Morrow EA. Gagne DD. Morrow DG. De Wall BH. Age differences in rereading. Mem Cognition 2004: 32: 696-710.
74. Zwaan RA. Radvansky GA. Situation models in language comprehension and memory. Psychol Bull 1998: 123:162.
75. Moraitou D. Papantoniou G. Gkinopoulos T. Nigritinou M. Older adults' decoding of emotions: age‐related differences in interpreting
dynamic emotional displays and the well‐preserved ability to recognize happiness. Psychogeriatrics 2013: 13: 139-47.
76. Schwanenflugel PJ, Fabricius WV, Alexander J. Developing theories of mind: Understanding concepts and relations between menta l
activities. Child Dev 1996: 65: 1546-63.
77. Wang Z. Su Y. Age-related differences in the performance of theory of mind in older adults: A dissociation of cognitive and affective
components. Psychol Aging 2013: 28: 284.
78. Sullivan S. Ruffman T. Social understanding: How does it fare with advancing years? Brit J Psychol 2004: 95: 1–18.
79. Spiro A. Brady C. Integrating health into cognitive aging research and theory. In S. Hofer and D. Alwin (Eds.), Handbook of cognitive aging
Thousand Oaks, California: Sage. 2008: 260-83.
80. Li X. Wang K. Wang F. Tao Q. Xie Y. Cheng Q. Aging of theory of mind: The influence of educational level and cognitive processing. Int J
Psychol 2013: 48: 715-27.
81. Iibañez A. Manes F. Contextual social cognition and the behavioral variant of frontotemporal dementia. Neurology 2012: 78: 1354–62
82. Wang Y. Su Y. Theory of mind in old adults: The performance on Happe's stories and faux pas stories. Psychologia 2006: 49: 228-37.
83. Ko SG. Lee TH. Yoon HY. Kwon JH. Mather M. How does context affect assessments of facial emotion? The role of culture and age.
Psycholo Aging 2011: 26: 48.
84. Suzuki A, Hoshino T, Shigemasu K, Kawamura M. Decline or improvement? Age-related differences in facial expression recognition. Biol
Psychol 2007: 74: 75-84.
85. Ruffman T. Henry JD. Livingstone V. Phillips LH. A meta-analytic review of emotion recognition and aging: implications for
neuropsychological models of aging. Neurosci Biobehav Rev 2008: 32: 863–81.
86. Biele C, Grabowska A. Sex differences in perception of emotion intensity in dynamic and static facial expressions. Exp Brain Res 2006:
171: 1-6.
87. Cahill L. Why sex matters for neuroscience. Nat Rev Neurosci 2006: 7: 477-84.
88. Rotter NG. Rotter GS. Sex differences in the encoding and decoding of negative facial emotions. J Nonverbal Behav, 1988:12: 139-48.
89. Bailey PE. Henry JD. Von Hippel W. Empathy and social functioning in late adulthood. Aging Ment Health 2008: 12: 499-503.

www.nuclmed.gr Hell J Nucl Med Suppl, September-December 2015 122
Comparing the latent structure of Raven’s educational coloured progressive matrices among young children and older adults: A preliminary study Georgia Papantoniou
1 PhD, Despina Moraitou
2 PhD, Magda Dinou
1 MD, Effie Katsadima
1 MSc, Eugenia Savvidou
3
MSt., Evangelia Foutsitzi1 PhD student, Elvira Masoura
2 PhD
1. Department of Early Childhood Education, University of Ioannina, Greece 2. School of Psychology, Aristotle University of Thessaloniki, Greece, 3. Department of Primary Education, University of Ioannina, Greece Keywords: Cognitive aging - Cognitive development - Inductive reasoning - Executive functions - Retrogenesis Correspondence address: Georgia Papantoniou, Department of Early Childhood Education, University of Ioannina, Greece, Email:
[email protected] Abstract Objective: The aim of the present study was the comparison of the general cognitive ability (g) between young children and older
adults through the investigation of the latent structure qualitative changes in [R] Educational Coloured Progressive Matrices
(CPM) from age to age, using Confirmatory Factor Analyses (CFA) and testing a conventional unidimensional model. Method:
The sample consisted of 42 kindergarten and 56 elementary school students (age range: 5-8 years) and 118 new-old adults and
27 old-old adults (age range: 61-88 years). The participants’ cognitive abilities were examined in: (a) the Raven’s Educational
CPM test, and (b) the Mini-Mental State Examination (MMSE). Results: CFA applied to data of the total sample, elementary
school students subsample and new-old adults subsample, indicating that individual variability across [R] CPM measured
variables (total scores for each of the three sets) can be modeled by one latent variable (a single underlying factor). The same
pattern of [R] CPM latent structure was not verified for the subsamples of kindergarten students and old-old adults, since the
variance of a single underlying factor was not found to be statistically significant. Conclusion: The results support the existence
of a different factor structure in [R] Educational CPM between first- to second- grade elementary school students and new-old
adults, on the one hand, and kindergarten students and old-old adults, on the other. This difference could possibly reflect the
underdevelopment of inductive reasoning and executive functioning in the group of kindergarten students and the
disorganization of them in the group of old-old adults.
HJNM 2015; 18(Suppl1); 122-130 Published on line: 12 December 2015
Introduction
esearchers in the field of cognitive aging seem to agree that, on average, cognitive functioning declines with aging. Among the cognitive abilities that seem to be more affected by age is fluid intelligence, the capacity to solve problems in novel situations, independent of acquired knowledge [1, 2]. On the contrary, crystallized intelligence,
i.e. the ability to use skills, knowledge, and experience, seems to remain intact [2]. Moreover, researchers have observed the general relationship between aging and development as findings in
gerontological research have indicated that the collapse of intelligence in dementia patients causes retrogression to childhood and/or appears to reverse Piaget’s developmental stages [3-5]. As stated by the retrogenic models, there is an inverse and progressive pattern of functional and cognitive decline observed in Alzheimer’s Disease (AD) patients compared to the developmental acquisition of these capacities in children. Retrogenesis has been defined as the process by which degenerative mechanisms reverse the order of acquisition in normal development [6-8]. The findings regarding the retrogenic models suggest that comparisons should be made between the cognitive ability of these two groups of population, namely the developing children and the retrograding elderly people. This suggestion has been taken into account in the limited use, in assessing cognition in moderate and severe AD patients, of several screening instruments available for cognitive examination in infancy and childhood. For example, the application of the adapted and modified Ordinal Scales of Psychological Developmental (OSPD), developed by Uzgiris and Hunt for cognitive testing in infants, has been found to be superior to the use of traditional tests, such as the Mini-Mental State Examination (MMSE), in evaluating the cognitive capacity of patients with moderately severe and severe AD [9]. It was also reported that the use of test measures previously applied to infants and young children, based on Piagetian tradition, demonstrated residual cognitive capacity in subjects with severe AD previously considered untestable [6, 10]. Furthermore, childhood intelligence test measures, such as the Japanese version of the Binet scale, namely the Tanaka-Binet intelligence scale, has been found to be useful in evaluating cognition in moderate to severe AD patients [9].
Since there is a loss of cognitive abilities acquired during childhood before the appearance of clinically detectable dementia [5], comparisons of cognitive ability should also be made between the aforementioned groups of population,
R
www.nuclmed.gr Hell J Nucl Med Suppl, September-December 2015 123
namely the developing children and the normal older adults or preclinical Alzheimer Disease (AD) patients. As regards the preclinical AD patients with neurological changes it was reported that they do not demonstrate
measurable cognitive decline on standard tests [11, 12]. More sensitive tests to detect early or preclinical stages of AD are desired, such as the Mini-Mental State Examination (MMSE), Wechler Adult Intelligence Scale-Revised (WAIS-R) and Wechler Memory Scale-Revised (WMS-R) which are evidence-based test batteries for memory decline and intelligence. However, these scales can be administered (have been developed and standardized) only to persons between 16 and 74 years of age [5].
In order for an approximate comparison between children’s and older adults’ cognitive ability to be correctly conducted, the administration of the same screening instruments to the two groups should be available [5, 13]. In addition, throughout the many attempts that have been made to develop test batteries for the early detection of dementia, it is also possible that the detection of preclinical AD could be more accurate through neuropsychological tests focused on the detection of developmental disturbances both in young children and older adults. Therefore, simple screening instruments, available for cognitive examination in infancy and childhood, are needed to allow the assessment of the cognitive ability in older adults, in a short period of time, which would assist in early detection of cognitive impairment.
Raven’s progressive matrices
Raven’s Progressive Matrices–Standard Progressive Matrices (SPM) and Coloured Progressive Matrices (CPM)–have commonly been employed in such investigations of group comparisons as they are considered to be among the best measures of general intelligence. Moreover, they have, both, been widely used in research, educational and clinical settings [14-18].
Raven’s Progressive Matrices have been used for more than 70 years. In specific, J. C. Raven published the first version of his progressive matrices test in 1938 with a subtitle Perceptual Intelligence Test. The revised version, which was published in 1956, is known today as Standard Progressive Matrices (SPM). The test is non-verbal and was originally constructed as a test of eductive ability (from the Latin root “educere”, meaning “to draw out’), which can be described as the ability to make “meaning out of confusion” or the ability to go “beyond the given to perceive that which is not immediately obvious” [19]. Most of us today would call it inductive reasoning or general reasoning.
Later, the original Standard Progressive Matrices (SPM) were supplemented by two more main versions -namely the easier Coloured Progressive Matrices (CPM) and the more difficult Advanced Progressive Matrices (APM)-, which followed the concept of standard matrices in all respects. Since then the three versions of the test (Standard, Coloured and Advanced Progressive Matrices) have been among the best-known and the most widely-used instruments for studying intelligence [20, 21].
Coloured Progressive Matrices (CPM) first appeared in 1947 as an alternative form of the Raven’s Standard Progressive Matrices (SPM) and was revised in 1956. The CPM test was intended for children aged 5 to 11, special populations, and those who do not speak English. It comprises 36 items divided into three sets of 12 (Set A, AB and B). In each item subjects are presented with an incomplete design and six alternatives among which one must be chosen that best completes the design. The items increase in difficulty, and so do the three sets, with set B containing the most challenging items. Knowledge acquired by answering previous items is necessary in order to answer a subsequent item, which implies that the respondent is expected to learn from items. The items of the CPM test are arranged to assess mental development up to the stage when a person is sufficiently able to reason by analogy and to adopt this way of thinking as a consistent method of inference [19].
The first standardization of CPM occurred in 1949 in the UK town of Dumfries. The sample consisted of 627 children between the ages of 5–11 years, representing 25% of the total school population. The test was sensitive to fluctuations in intellectual function, demonstrating good test–retest reliability (r=0.80) [22]. In 1982, a follow-up normative study was conducted in Dumfries with a sample of 598 children. In 1998, the parallel version of CPM (CPM-P) was developed in conjunction with the SPM+ and included the creation of a parallel version of Set AB. The newest edition of [R] CPM is the Raven’s Educational CPM [19]. It has not incorporated any change in the items of the test but provided new normative data based on its U.K. standardization. The [R] Educational CPM standardization was conducted with a nation-wide stratified sample based on census data for geographical region, gender, race/ethnicity and parental educational level, a total of 608 children [19].
Apart from the UK normative studies, standardization of the CPM test has occurred in many countries around the world, such as the United States, France Argentina, Canada, Hong Kong, Germany, Romania, Slovenia, Lithuania, Turkey, Kuwait, South Africa, Pakistan, India (in nine Indian tribal groups) etc. Furthermore, a study aiming at providing normative data in older populations was conducted in the Netherlands with a representative age and gender stratified sample of 2.815 individuals aged from 55 to 85 years [23].
According to the [R] Educational CPM Manual [19], criterion-related validity report, there have been conducted a lot of studies that investigated the test’s ability to predict performance in educational, cross-cultural and clinical settings. As regards the clinical settings, some studies have looked at the use of CPM with healthy adults and AD patients. It was reported that among normal subjects CPM loaded .66 on a factor described as the ability to achieve perceptual organization and among pre-operative dementia patients CPM loaded 0.88 on a factor including low verbal Wechsler scores, poor EEG patterns, emotional instability and lack of social interest [19]. Furthermore, a strong association was found between the drawing impairment of AD patients and their CPM score (r=-0.59). Diagnostic differentiation between AD-type patients and those with vascular dementia, based on the use of their primitive responses to CPM, has also been reported. A correlation of 0.59 of the CPM scores with verbal WAIS scores and an internal consistency of the CPM test of 0.68, were also reported in studies with older adults [19]. Reliability measurements were also calculated from the [R]
www.nuclmed.gr Hell J Nucl Med Suppl, September-December 2015 124
Educational CPM standardization sample. The constructors of Raven’s Educational CPM [19] report a split–half reliability of 0.97 (N=608) They also found a parallel forms reliability of 0.87 between the CPM and the CPM-P, the former edition of the test, in an equating study on a sample of 83 children [19].
With regard to their factorial validity, although Raven’s Progressive Matrices were initially developed as measures of the eduction of relations, they have been regarded by many researchers as appropriate measures of general intelligence (g-factor) according to the classic Spearman terminology [24-26]. However, this contention of a unidimensional nature of the ability measured by Raven’s Progressive Matrices has been debated, with no signs of an end in sight.
Some researchers [27] found that APM measure two different processes, namely verbal-analytical and visual-spatial. Other researchers [28] found some sets in SPM to be unidimensional and some not. They applied a Rasch analysis on sets A to E of [R] PM and they found that Set A and the first half of Set B measured the perceptual process, while the second half of Set B and Sets C to E measured the analytic process. Furthermore, they concluded that other processes were probably involved in the solution of half the items in Set E [28].
A lot of researchers [16, 29] identified in the factor structure of SPM three first-order factors that have been organized on the second-order g-factor. In specific, they confirmed the aforementioned [28] identification of a perceptual factor measured by Set A and the first items of Set B, and they also observed that the aforementioned [28] analytical factor could be separated in two distinct factors. These findings were also supported by researchers who argued that, although it is sometimes claimed that [R] Matrices provide an almost pure measure of g, there is evidence that the easier items in SPM and APM measure a perceptual or Gestalt factor distinct from the more analytic items in the rest of the tests [22].
Principal component analyses and nonlinear factor analyses both provided qualified support for both the multidimensional and the unidimensional models. Some researchers found that Rasch analyses more strongly suggest that APM are best described as being multidimensional [30], while other researchers concluded that, although the test yielded several specific first-order factors, it seems to be unifactorial as regards the second order [31].
As regards the factor structure of the CPM test in specific, from its inception, it has been acknowledged that the CPM test has a high g loading, with a visuo-spatial ‘k’-factor involved to some degree [19]. Carlson noted a development in the reasoning process required for CPM solutions from perceptual to conceptual. This notification led him to relate CPM to Piagetian conservation concepts and found high loadings for both perceptual and conceptual items on the factor defined as simultaneous processing [32]. Further development of this work has led to the identification of three factors within the CPM items, namely, closure and abstract reasoning by analogy, pattern completion through identity and closure, and simple pattern completion [33, 34]. In a sample 180 first-to third-grade children, these factors were found to account for 36% of the total variance [34]. The aforementioned German findings were also confirmed in American studies [15, 35]. Principal component factor analyses were applied on data from 783 primary-grade children in California and the same three factors were found to account for 28% to 41% of the total variance [15].
However, other researchers analysed the findings of a sample of 166 gifted children on a little different way: They concluded that the CPM measures one factor, which has three related facets [36]. This position seems to support that probably the “most distinctive feature” of Raven’s test “is its very low loading on any factor other than g” [26]. Furthermore, the authors of the Raven’s Educational CPM manual [19] also claimed that the Item-Response-Theory-based item analysis demonstrates the scientific value of “general cognitive ability”.
More recently, some researchers [31] suggest that it is crucial the possible constructive elements that form g (the cognitive processes, such as memory, learning, perception, metacognition etc., that the participants use during solving intelligence tests) to be taken into account in the discussion about the factor structure of intelligence tests, such as [R] PM. For them, the solutions with three or four factors identified in the items of CPM are also optimal. In their confirmatory factor analyses of the test, in the models with the explicitly introduced higher-order general factor the correlations of the primary factors with the general factor were between 0.50 to 0.90. However, both the models with and without the higher order factor were found to fit data equally well. As regards the findings provided from the application of factor analysis by age, they found that factor solutions are practically stabilized after the age of five when a factor pattern that is later repeated at all ages is already form. This factor pattern reflects the difficulty of the CPM’s items. On the contrary, at the age of four, the factors do not resemble the factors obtained at older ages [31].
Aim of the study Based, firstly, on findings in the field of cognitive aging, supporting that fluid intelligence (inductive reasoning) increases rapidly in the early years of life and declines with aging [1, 2], and, secondly, on the hypothesis of “retrogenesis”, the aim of the present study was the comparison of the, highly correlated with fluid intelligence [37], general cognitive ability (g) between the developing children and the healthy older adults. The comparison has been conducted through the investigation of the latent structure qualitative changes in [R] Educational CPM from age to age, using Confirmatory Factor Analyses (CFA). Comparing pair-wise the four groups of our sample (first-to second-grade elementary school students with new-old adults) and (kindergarten students with old- old adults), the latent structure in [R] Educational CPM is expected to differentiate between first-to second-grade elementary school students and new-old adults, on the one hand and kindergarten students and old-old adults, on the other (Hypothesis 1). In specific, we expected to find similar latent structure in [R] Educational CPM for first-to second-grade elementary school students and new-old adults (Hypothesis 2a), and similar latent structure in [R] Educational CPM for
www.nuclmed.gr Hell J Nucl Med Suppl, September-December 2015 125
kindergarten students and old-old adults (Hypothesis 2b).
Method Participants and procedure The total sample consisted of four groups of individuals: a group of kindergarten students, a group of first- to second- grade elementary school students, a group of new-old adults, and a group of old-old adults.
The first group comprised 42 kindergarten students 5 to 6 years old (mean age=68.1 months, age range: 61-75 months). Of the 42 participants, 16 were boys (38.1%) and 26 were girls (61.9%). The second group included 56 first- to second- grade elementary school students 6 to 8 years old (mean age=85.45 months, age range: 74-98 months). Of the 56 participants, 22 were boys (39.3%) and 34 were girls (60.7%). All the children attending regular classrooms, without a history of learning difficulties (based on the school records and student reports) in two preschool institutions (one public and one private) and three primary schools (two public and one private) of medium and high socioeconomic status, in the city of Ioannina in Epirus (a province in the West of Greece). All the young participants, additionally to the [R] Educational CPM, completed the Greek version of the Mini Mental State Examination [MMSE; 38, 39] in order for a brief estimate of their overall cognitive functioning to be provided [for the kindergarten students: M=22.67 (SD=3.66), and for first-to second-grade elementary school students: M=26.95 (SD=2.28)]. These means are consistent with previous findings [5, 13]. In collaboration with the school committees, parents gave their written statement of consent prior to the participation of their children in this study and then they completed an individual–demographics form. Children’s testing in [R] Educational CPM and MMSE was performed in their school environment, by trained interviewers under the surveillance of a psychologist. No time limit was assigned for the completion of the tests and all young participants were informed that they were free to withdraw from testing at any time.
Given that the [R] Educational CPM test was also intended for use with older adults, two groups of older adults were tested. In specific, one group comprised 118 new-old adults (mean age=71.33 years, age range: 61-79 years). Of the 118 participants, 45 were men (38.1%) and 73 were women (61.9%). The second group of older adults included 27 old-old adults (mean age=83.04 years, age range: 80-88 years). Of the 27 participants, 10 were men (37.0%) and 17 were women (63.0%).
Exclusion criteria for both groups were history of neurological conditions or psychiatric diseases, alcohol or drug abuse, severe head trauma, profound visual impairments, and verbal incomprehension. Moreover, all the participants additionally completed the Greek version of the Mini Mental State Examination [MMSE; 38-39]. In specific, the subsample of older adults consisted of 122 normal participants (103 new adults & 19 older adults), who had MMSE scores between 25 and 30 points, and 23 participants (15 new adults & 8 older adults), who had MMSE scores between 20 and 24 points falling in the Mild Cognitive Impairment (MCI) to mild dementia range [38-39], although they had not been diagnosed by consultant neurologists and psychiatrists as meeting diagnostic criteria for possible dementia. All the participants were community dwelling adults–volunteers recruited by the researchers through seniors’ centers. They were residents of Thessaloniki and Kozani (a town in the province of West Macedonia in Greece). Participants were examined at an individual basis, either at the center recruited, or in their own home. No time limit was assigned for the completion of the examination and the participants were informed that they were free to withdraw from testing at any time. For all the participants informed consent was obtained and then they completed an individual–demographics form. It should be noted that the subsample of older adults included an overrepresantation (57.2%) of persons with 9 years of formal education or fewer. Instrument Raven’s educational coloured progressive matrices (R-CPM). Raven’s Educational Coloured Progressive Matrices are designed to assess the intellectual processes of young children ranging in age from 4 to 11 years [19]. The book form of the [R] Educational CPM contains three sets (A, AB, and B) of 12 items of coloured large-print drawings each. In each item subjects are presented with an incomplete design and six alternatives among which one must be chosen that best completes the design. Every correctly solved item results in 1 point. Sum scores may be used for every set (score range 0-12) or for the total [R] CPM test (score range 0-36). Statistical analysis As has already been mentioned the aim of the present study was the investigation of the latent structure qualitative changes in [R] Educational CPM from age to age, using Confirmatory Factor Analyses (CFA). According to the aforementioned findings in the introduction section, it is obvious that previous empirical works have implied several a priori competing models for CPM dimensionality. It should be also noted here that the present study did not aim to test extensively the constructive validity and the rest psychometric properties of [R] Educational CPM in Greek population, since the Greek standardization of [R] Educational CPM is in progress [40]. Furthermore, the sample size of the present study was inadequate for the conduction of CFA models testing the dimensionality of the [R] Educational CPM (including the 36 items of the test) in every one of the four groups of the sample. It is recommended that the sample size requirements, for SEM techniques, would be at least five observations per estimated parameter [41]. Hence, in order for the sample size to be adequate, at least 180 persons should participate in every group.
Because of the relatively small sample size of each group, analyses were not run at the item level. Instead, the covariance matrix was based on three total scores (measured variables), namely, total raw score for Set A, total raw
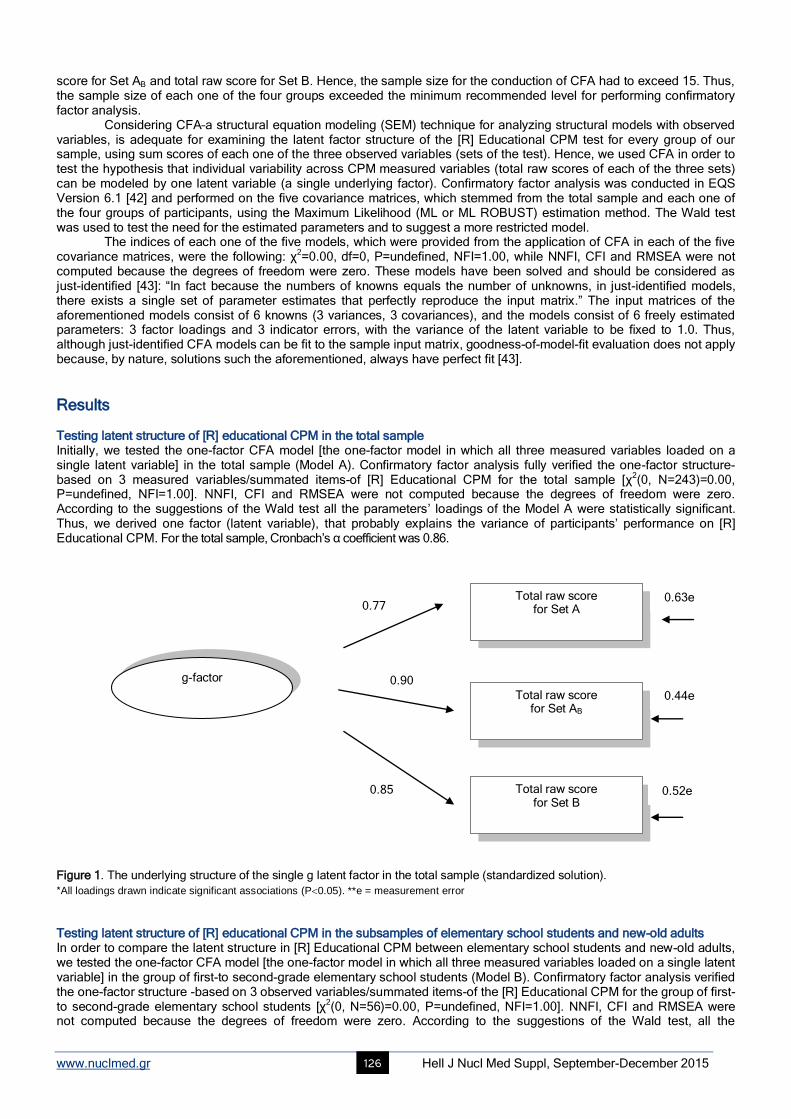
www.nuclmed.gr Hell J Nucl Med Suppl, September-December 2015 126
score for Set AB and total raw score for Set B. Hence, the sample size for the conduction of CFA had to exceed 15. Thus, the sample size of each one of the four groups exceeded the minimum recommended level for performing confirmatory factor analysis. Considering CFA–a structural equation modeling (SEM) technique for analyzing structural models with observed variables, is adequate for examining the latent factor structure of the [R] Educational CPM test for every group of our sample, using sum scores of each one of the three observed variables (sets of the test). Hence, we used CFA in order to test the hypothesis that individual variability across CPM measured variables (total raw scores of each of the three sets) can be modeled by one latent variable (a single underlying factor). Confirmatory factor analysis was conducted in EQS Version 6.1 [42] and performed on the five covariance matrices, which stemmed from the total sample and each one of the four groups of participants, using the Maximum Likelihood (ML or ML ROBUST) estimation method. The Wald test was used to test the need for the estimated parameters and to suggest a more restricted model. The indices of each one of the five models, which were provided from the application of CFA in each of the five covariance matrices, were the following: χ
2=0.00, df=0, P=undefined, NFI=1.00, while NNFI, CFI and RMSEA were not
computed because the degrees of freedom were zero. These models have been solved and should be considered as just-identified [43]: “In fact because the numbers of knowns equals the number of unknowns, in just-identified models, there exists a single set of parameter estimates that perfectly reproduce the input matrix.” The input matrices of the aforementioned models consist of 6 knowns (3 variances, 3 covariances), and the models consist of 6 freely estimated parameters: 3 factor loadings and 3 indicator errors, with the variance of the latent variable to be fixed to 1.0. Thus, although just-identified CFA models can be fit to the sample input matrix, goodness-of-model-fit evaluation does not apply because, by nature, solutions such the aforementioned, always have perfect fit [43].
Results Testing latent structure of [R] educational CPM in the total sample Initially, we tested the one-factor CFA model [the one-factor model in which all three measured variables loaded on a single latent variable] in the total sample (Model A). Confirmatory factor analysis fully verified the one-factor structure-based on 3 measured variables/summated items-of [R] Educational CPM for the total sample [χ
2(0, Ν=243)=0.00,
P=undefined, NFI=1.00]. NNFI, CFI and RMSEA were not computed because the degrees of freedom were zero. According to the suggestions of the Wald test all the parameters’ loadings of the Model A were statistically significant. Thus, we derived one factor (latent variable), that probably explains the variance of participants’ performance on [R] Educational CPM. For the total sample, Cronbach’s α coefficient was 0.86.
Figure 1. The underlying structure of the single g latent factor in the total sample (standardized solution).
*All loadings drawn indicate significant associations (P0.05). **e = measurement error Testing latent structure of [R] educational CPM in the subsamples of elementary school students and new-old adults In order to compare the latent structure in [R] Educational CPM between elementary school students and new-old adults, we tested the one-factor CFA model [the one-factor model in which all three measured variables loaded on a single latent variable] in the group of first-to second-grade elementary school students (Model B). Confirmatory factor analysis verified the one-factor structure -based on 3 observed variables/summated items-of the [R] Educational CPM for the group of first- to second-grade elementary school students [χ
2(0, Ν=56)=0.00, P=undefined, NFI=1.00]. NNFI, CFI and RMSEA were
not computed because the degrees of freedom were zero. According to the suggestions of the Wald test, all the
Total raw score for Set A
Total raw score for Set AB
Total raw score for Set B
0.77
0.90
0.85
0.63e
0.44e
0.52e
g-factor
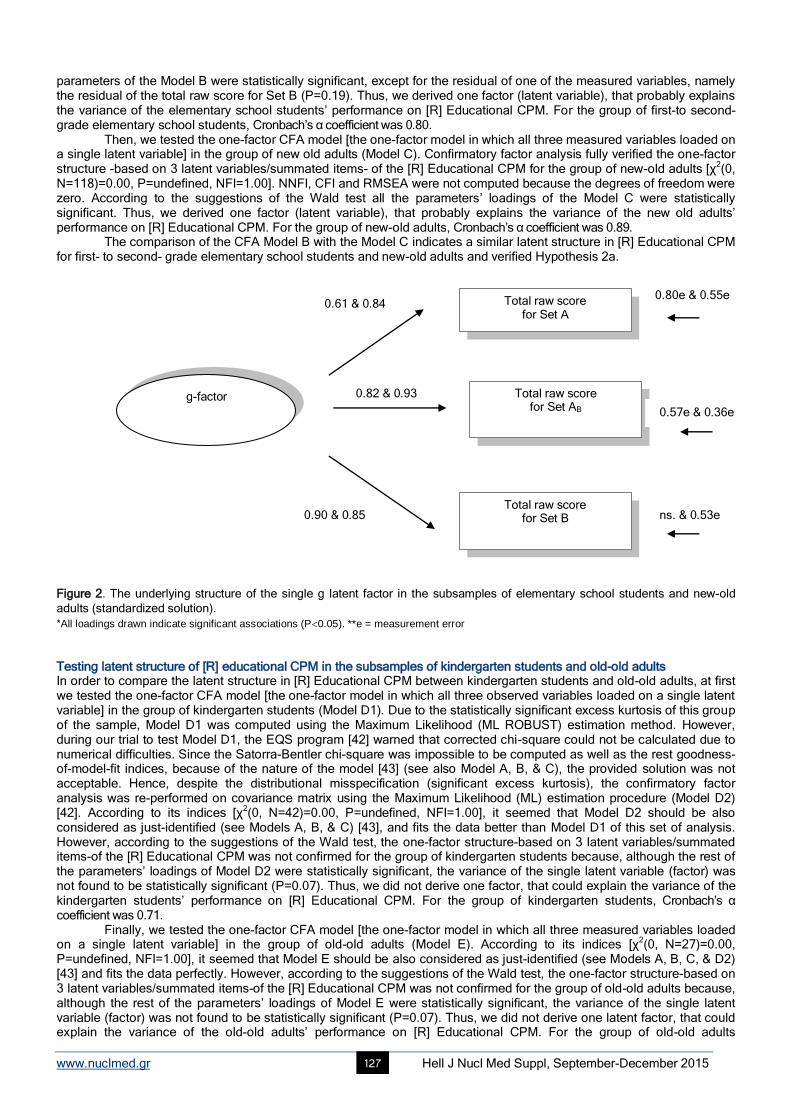
www.nuclmed.gr Hell J Nucl Med Suppl, September-December 2015 127
parameters of the Model B were statistically significant, except for the residual of one of the measured variables, namely the residual of the total raw score for Set B (P=0.19). Thus, we derived one factor (latent variable), that probably explains the variance of the elementary school students’ performance on [R] Educational CPM. For the group of first-to second-grade elementary school students, Cronbach’s α coefficient was 0.80. Then, we tested the one-factor CFA model [the one-factor model in which all three measured variables loaded on a single latent variable] in the group of new old adults (Model C). Confirmatory factor analysis fully verified the one-factor structure -based on 3 latent variables/summated items- of the [R] Educational CPM for the group of new-old adults [χ
2(0,
Ν=118)=0.00, P=undefined, NFI=1.00]. NNFI, CFI and RMSEA were not computed because the degrees of freedom were zero. According to the suggestions of the Wald test all the parameters’ loadings of the Model C were statistically significant. Thus, we derived one factor (latent variable), that probably explains the variance of the new old adults’ performance on [R] Educational CPM. For the group of new-old adults, Cronbach’s α coefficient was 0.89. The comparison of the CFA Model B with the Model C indicates a similar latent structure in [R] Educational CPM for first- to second- grade elementary school students and new-old adults and verified Hypothesis 2a.
Figure 2. The underlying structure of the single g latent factor in the subsamples of elementary school students and new-old
adults (standardized solution).
*All loadings drawn indicate significant associations (P0.05). **e = measurement error Testing latent structure of [R] educational CPM in the subsamples of kindergarten students and old-old adults In order to compare the latent structure in [R] Educational CPM between kindergarten students and old-old adults, at first we tested the one-factor CFA model [the one-factor model in which all three observed variables loaded on a single latent variable] in the group of kindergarten students (Model D1). Due to the statistically significant excess kurtosis of this group of the sample, Model D1 was computed using the Maximum Likelihood (ML ROBUST) estimation method. However, during our trial to test Model D1, the EQS program [42] warned that corrected chi-square could not be calculated due to numerical difficulties. Since the Satorra-Bentler chi-square was impossible to be computed as well as the rest goodness-of-model-fit indices, because of the nature of the model [43] (see also Model A, B, & C), the provided solution was not acceptable. Hence, despite the distributional misspecification (significant excess kurtosis), the confirmatory factor analysis was re-performed on covariance matrix using the Maximum Likelihood (ML) estimation procedure (Model D2) [42]. According to its indices [χ
2(0, Ν=42)=0.00, P=undefined, NFI=1.00], it seemed that Model D2 should be also
considered as just-identified (see Models A, B, & C) [43], and fits the data better than Model D1 of this set of analysis. However, according to the suggestions of the Wald test, the one-factor structure-based on 3 latent variables/summated items-of the [R] Educational CPM was not confirmed for the group of kindergarten students because, although the rest of the parameters’ loadings of Model D2 were statistically significant, the variance of the single latent variable (factor) was not found to be statistically significant (P=0.07). Thus, we did not derive one factor, that could explain the variance of the kindergarten students’ performance on [R] Educational CPM. For the group of kindergarten students, Cronbach’s α coefficient was 0.71. Finally, we tested the one-factor CFA model [the one-factor model in which all three measured variables loaded on a single latent variable] in the group of old-old adults (Model E). According to its indices [χ
2(0, Ν=27)=0.00,
P=undefined, NFI=1.00], it seemed that Model E should be also considered as just-identified (see Models A, B, C, & D2) [43] and fits the data perfectly. However, according to the suggestions of the Wald test, the one-factor structure-based on 3 latent variables/summated items-of the [R] Educational CPM was not confirmed for the group of old-old adults because, although the rest of the parameters’ loadings of Model E were statistically significant, the variance of the single latent variable (factor) was not found to be statistically significant (P=0.07). Thus, we did not derive one latent factor, that could explain the variance of the old-old adults’ performance on [R] Educational CPM. For the group of old-old adults
Total raw score for Set A
Total raw score for Set AB
Total raw score for Set B
0.61 & 0.84
0.82 & 0.93
0.90 & 0.85
0.80e & 0.55e
0.57e & 0.36e
ns. & 0.53e
g-factor
www.nuclmed.gr Hell J Nucl Med Suppl, September-December 2015 128
Cronbach’s α coefficient was 0.72. The comparison of the CFA Model D2 with Model E indicates a similar pattern of structure in [R] Educational CPM for kindergarten students and old-old adults and verified Hypothesis 2b. To summarize, the aforementioned findings confirm Hypothesis 1 and support the existence of a different factor structure in [R] Educational CPM between first-to second-grade elementary school students and new-old adults, on the one hand, and kindergarten students and old-old adults, on the other.
Discussion Although we stuck to the standard methodology of confirmatory research, the present study should not be understood as testing the hypothesis of unidimensionality in [R] Educational CPM. The aim of the present study was the comparison of the general cognitive ability between the developing children and the retrograding older adults through the investigation of the latent structure qualitative changes in [R] Educational CPM from age to age, using Confirmatory Factor Analyses (FCA) and testing a conventional unidimensional model. With regard to dimensionality, for the groups of elementary school students and new-old adults, the results of CFA seem to support the existence of a single latent g-factor measured by [R] Educational CPM. For the groups of kindergarten students and old-old adults the existence of a single latent g-factor measured by [R] Educational CPM was not confirmed, since its variance was not found to be statistically significant. The aforementioned findings are consistent with previous findings [31] indicating that the factor solutions are stabilized after the age of 5-6. Until then, the factor structure of [R] CPM does not resemble much the factor structure obtained in older ages. Since inductive reasoning or general reasoning (the current name of eductive ability) is one of the main possible constructive elements that form g, a possible explanation for these findings could be that inductive generalization is not a unitary cognitive operation, but it is possible to start with perception and only in the end to develop pure induction [44,45]. Some researchers [31] provided another explanation, taking also into account a possible component of g, namely the executive functioning. According to them, the delay of stabilization of the CPM factor structure at earlier ages (before the age of 5-6) could reflect lack of metacognitive and self-regulative processes–two of the main components of executive functioning–and could be attributed to the inflexible solving strategy, the poor management of goal activity and the weak mechanisms of control [31,4 6-51]. The similar, not unidimensional structure of the [R] Educational CPM test that was observed, in the present study, between the group of kindergarten students and the group of old-old adults, is possible to indicate a qualitative change, perhaps a start of disorganization, either in the inductive reasoning, and/or in the executive functioning of the old-old adults comparing to that of the new-old adults [46-51]. This finding is consistent with the general admission in the field of cognitive aging, stating that cognitive functioning declines with aging and fluid intelligence –which is highly related to inductive reasoning– is among the cognitive abilities that seem to be more affected by age [1, 2]. In general terms, the different pattern in the latent factor structure of the [R] Educational CPM test, that was found in the present study, between the groups of kindergarten students and old-old adults, on the one hand, and the groups of first- to second- grade elementary school students and new-old adults, on the other, is a supporting finding with regard to the hypothesis of “retrogenesis”. It should be also noted that the disorganization of general cognitive ability as regards two of its components, namely inductive reasoning and executive functioning [46-51], was found to be present before the appearance of clinically detectable dementia in the majority of the participants in the subsample of old-old adults. This finding seems to be in line with recent findings indicating that a large proportion of healthy old-old adults show memory decline which may represent the early stages of a potentially more severe cognitive impairment [5, 11-12]. Furthermore, the concept that normal old-old adults, as well as MCI patients, retrograde to the levels of early childhood, regarding their general cognitive ability, simplifies the understanding of them and contributes to their appropriate care from their family and caregivers. In conclusion, this is a pilot study of [R] Educational CPM conducted in a Greek population of young children and older adults. More research is also needed to further validate and refine, in other cultural contexts, the different pattern in the structure of g, -as it is measured by [R] Educational CPM-, that was found in the present study, between the groups of kindergarten students and old-old adults, on the one hand, and the groups of first- to second- grade elementary school students and new-old adults, on the other. The results of our findings, with the size of the sample used, support the usefulness of [R] Educational CPM as a sensitive neuropsychological test for the detection, in the old-old adults, of the differentiation and/or the decline of the general cognitive ability acquired during childhood. In order for the applicability of [R] Educational CPM to be assessed in Greek older adults, normative data have to be provided for this population. This would permit us to test further the quality of the [R] Educational CPM test as an appropriate neuropsychological instrument for screening general cognitive ability in normal older adults and/or preclinical dementia patients as well. The authors declare that they have no conflicts of interest.
Bibliography
1. Salthouse TA, Pink JE, Tucher-Drob EM. Contextual analysis of fluid intelligence. Intelligence 2008; 36: 464-86.
doi:10.1016/j.intell.2007.10.003
2. Moraitou D, Efklides A. The wise thinking and acting questionnaire; The cognitive facet of wisdom and its relation with memory, affect, and
hope. Journal of Happiness Studies 2012; 13: 849-73.
www.nuclmed.gr Hell J Nucl Med Suppl, September-December 2015 129
3. deAjuriaguerra J, Tissot R. Some aspects of psychoneurologic disintegration in senile dementia. In: Mueller CH & Ciompi L. Eds. Senile
dementia. Huber, Switzerland.1968; 69-79.
4. Rudial-Alvarez S, Sola S, Machado MC et al. The comparison of cognitive and functional performance in children and Alzheimer’s disease
supports the retrogenesis model. J Alzheimers Dis 2013; 33: 191-203.
5. Shoji M, Fukushima K, Wakayana M et al.Intellectual faculties in patients with Alzheimer's disease regress to the level of a 4–5-year-old child.
Geriatr Gerontol Int 2002; 2: 143-7.
6. Reinsberg B, Franssen EH, Hasan SM et al. Retrogenesis: clinical, physiologic, and pathologic mechanisms in brain aging, Alzheimer’s and
other dementing processes. Eur Arch Psy Clin N 1999a; 249: 28-36.
7. Reinsberg B, Kenowsky S, Franssen EH et al. Towards a science of Alzheimer’s disease management: A model based upon current
knowledge of retrogenesis. Int Psychogeriatr 1999b; 11: 7-23.
8. Reinsberg B, Franssen EH, Souren LEM et al. Evidence and mechanisms of retrogenesis in Alzheimer’s and other dementias: Management
and treatment import. Am J Alzheimers Dis 2002; 17: 202-12.
9. Borza LR.΄The concept of retrogenesis: New ways of understanding Alzheimer’s disease΄. Unpublished Dissertation, New York University,
USA. 2012.
10. Da Silva R, Bueno O, Bertolucci P. The retrogenesis theory to classify stages of Alzheimer’s disease in a sample of the Braz ilian population.
Alzheimers Dement :The Journal of the Alzheimer’s Association, 2011; 7: 241-2.
11. Goldman WP, Price JL, Storandt M et al. Absence of cognitive impairment or decline in preclinical Alzheimer’s disease. Neurology 2001; 56:
361-7.
12. Schmitt FA, Davis DG, Wekstein DR et al. ‘Preclinical’ AD revisited: neuropathology of cognitive normal older adults. Neurology 2000; 55:
370-6.
13. Rubial-Alvarez S, Machado MC, Sintas E et al. A preliminary study of the Mini-Mental State Examination in a Spanish child population. J
Child Neurol 2007; 22: 1269-73.
14. Bartak L, Rutter M , Cox A. A comparative study of infantile autism and specific developmental receptive language disorder: I The Children.
Brit J Psychiat 1975; 126: 127-45.
15. Carlson JS, Jensen CM. The factorial structure of the Raven Coloured Progressive Matrices Test: A Re-analysis. Educ Psychol Meas 1980;
40: 1111-6.
16. Lynn R, Irwing P. Sex differences on the Progressive Matrices: A meta-analysis. Intelligence 2004; 32: 481-98.
17. Shah A, Frith U. An islet of ability in autistic children: a research note. J Child Psychol Psyc 1983: 24: 613-20.
18. Wright S, Taylor DM, Ruggiero KM. Examining the potential for academic achievement among Inuit children. Comparisons on the Raven
CPM. J Cross Cult Psychol 1996; 27: 733-53.
19. Raven J, Rust J, Squire A. Manual: Coloured Progressive Matrices and Crichton Vocabulary Scale. NCS Pearson, London. 2008.
20. Brouwers SA, Van de Vijver, Van Hemert DA. Variation in Raven’s Progressive Matrices scores across time and place. Learn Individ DIffer
2009; 19: 330-8.
21. Machintosh NJ, Benett ES. What do Raven’s Matrices measure? An analysis in terms of sex differences. Intelligence 2005; 33: 663-74.
22. Cotton SM, Kiely PM, Crewther DP et al. A normative and reliability study for the Raven’s Coloured Progressive Matrices for primary school
aged children from Victoria, Australia. Pers Indiv Differ 2005; 39: 647-59.
23. Smits CHM, Smit JH, Van den Heuvel N, Jonker C. Norms for an Abbreviated Raven’s Coloured Progressive Matrices in an Older Sample.
J Clin Psychol 1997; 53: 687–97.
24. Spearman CE. The abilities of man. Macmillan, London.1927.
25. Burke HR. Raven’s progressive matrices: a review and critical evaluation. J Genet Psychol 1958; 93:199-228.
26. Jensen AR. The g factor: the science of mental ability. Praeger, Westport, CT. 1998.
27. DeSchon RP, Chan D, Weissbein DA. Verbal overshadowing effects on Raven’s advanced progressive matrices: Evidence for
multidimensional performance determinants. Intelligence 1995; 21: 135-55.
28. Van der Ven AHGS, Ellis JL. A Rasch analysis of Raven’s standard progressive matrices. Pers Indiv Differ 2000; 29: 45-64.
29. Lynn R. Allik J. Irwing P. Sex differences on three factors identified in Raven’s Standard Progressive Matrices. Intelligence 2004; 32: 411-
24.
30. Vigneau F, Bors DA. Items in context: assessing the dimensionality of Raven’s Advanced Progressive Matrices. Educ Psychol Meas 2005;
65: 109-23.
31. Fajgelj S, Bala G, Katic R. Latent structure of Raven’s Colored Progressive Matrices. Coll. Antropol. 2010; 34: 1015-26.
32. Carlson JS, Wiedl KH. Modes of information integration and Piagetian measures of concrete operational thought. Intelligence 1977; 1: 335-
43.
33. Schmidtke A, Schaller S. Comparative study of factor structure of Raven’s Coloured Progressive Matrices. Percept Motor Skill 1980; 51:
1244-6.
34. Wiedl KH, Carlson JS. The factorial structure of the Raven Coloured Progressive Matrices Test. Educ Psychol Meas 1976; 36: 409-13.
35. Carlson J, Jensen CM. Reliability of the Raven Coloured Progressive Matrices Test: Age and Ethnic Group Comparisons. J Consult Clin
Psych 1981; 49: 320-2.
36. Green KE, Kluever RC. Structural properties of Raven’s Coloured Progressive Matrices for a sample of gifted children. Percept Motor Skill
1991; 72: 59-64.
37. Gustafsson JE. A unifying model for the structure of intellectual abilities. Intelligence 1984; 8: 179-203.
38. Folstein MF, Folstein SE, McHugh PR. Mini-mental state: A practical method for grading the cognitive state of patients for the clinicians. J
Psychiat Res 1975; 12: 189-98.
39. Fountoulakis KN. Tsolaki M. Chantzi H. Kazis A. Mini mental state examination (MMSE): a validation study in Greece. Am J Alzheimers Dis
Other Demen 2000; 15: 342-5.
40. Sideridis G, Antoniou F, Simos P, Mouzaki A. Raven’s Colour Progressive Matrices, Greek Standardizat ion. Topos Publishers, Athens. Ιn
press.
41. Hair J, Anderson R, Tatham R, Black W. Multivariate data analysis. Prentice Hall, New Jersey.1998.

www.nuclmed.gr Hell J Nucl Med Suppl, September-December 2015 130
42. Bentler PM. EQS 6.1.Structural Equations Program Manual . Multivariate Software, Inc., Encino, CA. 2005.
43. Brown TA. Confirmatory factor analysis for applied research. Guilford, New York. 2006.
44. Sloutsky VM, Fisher AV. Induction and categorization in young children: A similarity-based model. J Exp Psychol Gen 2004; 133: 166-88.
45. Hayes BK, Thompson SP. Causal relations and feature similarity in children's inductive reasoning. J Exp Psychol Gen 2007; 136: 470- 84.
46. Leeds L, Meara RJ, Woods R, Hobson JP. A comparison of the new executive functioning domains of the CAMCOG-R with existing tests of
executive function in elderly stroke survivors. Age Ageing 2001; 30: 251-4.
47. Aderson PJ, Reidy N. Assessing executive function in preschoolers. Neuropsychol Rev 2012; 22: 345-60.
48. Carlson SM, Davis AC, Leach JG. Less is more: Executive function and symbolic representation in preschool children. Psychol Sci 2005;
16: 609–16.
49. Miyake A, Friedman NP, Emerson MJ et al. The unity and diversity of executive functions and their contributions to complex “f rontal lobe”
tasks: Α latent variable analysis. Cognitive Psychol 2000; 41: 49–100.
50. Salthouse TA. Relations between cognitive abilities and measures of executive functioning. Neuropsychology 2005; 19: 532-45.
51. Zelazo PD, Carlson, SM. Hot and cool executive function in childhood and adolescence: Development and plasticity. Child Development
Perspectives 2012; 6: 354-60.
www.nuclmed.gr Hell J Nucl Med Suppl, September-December 2015 131
Our experience with informative and communication technologies (ICT) in dementia Magda Tsolaki
1,7 MD, PhD, Stelios Zygouris
1,7 BSc, Ioulietta Lazarou
3,7 BSc, Ioannis Kompatsiaris
3 PhD, Leontios
Chatzileontiadis2 PhD, Constantinos Votis
3 MSc, PhD, Dimitrios Tzovaras
3 PhD, Anastasios Karakostas
3 PhD,
Constantina Karagkiozi7 BSc, Tatianna Dimitriou
1 BSc, Thasyvoulos Tsiatsios
4 MSc, PhD, Stavros Dimitriadis
4
MSc, PhD, Ioannis Tarnanas1 PhD, Dimitris Dranidis
5 PhD, Panagiotis Bamidis
6 PhD
1. 3rd
Department of Neurology, Faculty of Health Sciences, Medical School, Aristotle University of Thessaloniki, 2.
School of Electrical & Computer Engineering, Aristotle University of Thessaloniki, 3. Information Technologies
Institute, Centre for Research and Technology Hellas, Thessaloniki, Greece, 4. Department of Informatics, Aristotle
University of Thessaloniki, 5. International Faculty of the University of Sheffield, CITY College, 6. Laboratory of
Medical Physics, Faculty of Health Sciences, Medical School, Aristotle University of Thessaloniki, Thessaloniki,
Greece, 7. Alzheimer Hellas
Keywords: Dementia - Mild Cognitive Impairment - Diagnosis – Interventions- Support systems – Caregivers-Health
Professionals
Correspondence address: Magda Tsolaki MD, PhD, 3rd Department of Neurology, Aristotle University of Thessaloniki, School of Medicine, Email: [email protected]
Abstract Our research is implementing high quality next generation services for the Prediction, Early Diagnosis, Monitoring, and Support
of patients with Cognitive Impairment (Subjective Cognitive Impairment –SCI-, Mild Cognitive Impairment –MCI-, Mild Dementia)
and Education and Training for all stakeholders. Prediction, Early Diagnosis and Monitoring: The first idea was to Research and
Develop a novel System using motion detection devices, depth cameras, and intelligent objects of everyday use (ranging from
cooking implements such as kitchen to furniture (e.g. sofa, bed, etc.) which are appropriately adapted in order to capture
changes of subject’s Activities of Daily Living –ADL- and behavioural patterns (including mobility, nutrition, exercising and
medication schedule). We also demonstrated the potential of a virtual supermarket (VSM) cognitive training game as a
screening tool for patients with MCI in a sample of older adults. We have indicated that this VSM application displayed a correct
classification rate (CCR) of 87.30%, achieving a level of diagnostic accuracy similar to standardized neuropsychological tests,
which are the gold standard for MCI screening http://www.en-noisis.gr/ Support of patients: Cognitive tasks and cognitive
exercises for patients suffering from Alzheimer’s Disease (AD) through web-based applications. These exercises have been
developed in such a way in order to exploit rich interactive multimedia interfaces (including music) based on human computer
interaction principles. To this direction we are implementing a web based portal with supportive services such as (a) on-line
monitoring of patient’s progress by health care professionals, (b) statistical representation of patients’ progress. Multimedia
enriched cognitive exercises in virtual reality form (i.e. 3D Serious Games) use suitable modalities for such activities through the
creation probable of new brain cells and by assisting the brain to find out alternative methods to execute functions, which are
controlled by damaged brain regions. Another program the “robot-programming-as-cognitive-training” approach aims to explore
the impact that the activity of programming a friendly robot might have on AD and MCI patients’ condition.
http://aspad.csd.auth.gr. Another study aimed at investigating the benefits of combined physical and cognitive training on global
cognition while assessing the effect of training dosage and exploring the role of several potential effect modifiers. The results
indicate that combined physical and cognitive training improves global cognition in a dose-responsive manner but these benefits
may be less pronounced in older adults with mild dementia. The long-lasting impact of combined training on the incidence and
trajectory of cognitive disorders in relation to its severity should be assessed in future long-term trials.
www.longlastingmemories.eu. Finally, Symbiosis is a revolutionary system aiming at providing integrated solutions to a series of
problems related with MCI and AD. It is the first integrated AD support system that takes into account patient’s response in an
adaptive way that fulfills each patient’s special needs and provides to caregivers and doctors considerable facilitations,
unlocking the potential of innovative supporting role. www.youtube.com/watch?v=BDkLz-T-jYE. Education and training for all
stakeholders (i.e. health professionals and informal and formal caregivers) through distance education platforms and e-
collaboration services. To augment this effort, the research team integrates biofeedback modules for stress measurement in
teleconferences in order to support the emotional awareness of the participants. The depression, anxiety and burden of
caregivers were reduced significantly in the same way as in a face to face intervention. http://aspad.csd.auth.gr. In conclusion
www.nuclmed.gr Hell J Nucl Med Suppl, September-December 2015 132
ICT can help health professionals and caregivers to support in a better wy the patients with cognitive, functional and behavioral
problems.
HJNM 2015; 18(Suppl1); 131-139 Published on line: 12 December 2015
Introduction
mong the 10 more important medical topics on AGEING the first is dementia. The prevalence of dementia is rising
all over the world, with considerable socio-economic impacts that are creating an imperative need for finding
effective means of treatment. According to WHO report in 2015 47,47 million people suffer from dementia, while
this number will increase in 2030 and 2050 to 75,63 and 135,46 million respectively [1]. In Europe, it is estimated that
between six to ten million people suffer from dementia [2]. In Greece, according ADI-2015 report [3], the number of
patients is about 197.000. According to our epidemiological studies in North Greece the prevalence rate is between 7,2%-
9,6% in elderly more than 70 years old, that means between 144.000 to 192.000 [4, 5]. The prevalence of dementia
increases with age, from approximately 1.5% in persons aged 60–69 years to 40% in persons 90 years and older [6] and it
is found to be higher in nursing home residents in the Western countries [7].
Neurodegenerative dementias are chronic, progressive, devastating disorders which in early stages are usually
characterized only by cognitive problems. In addition dementia influences activities of daily living and patients have
behavioral and psychological problems, also known as Behavioral and Psychological Symptoms in Dementia (BPSD) [8].
Caregivers of patients with dementia have great levels of anxiety, burden and depression. The most frequent dementia is
Alzheimer’s disease (AD). There are different stages of AD: Asymptomatic, Mild Cognitive Impairment, early AD,
moderate AD and severe AD. The diagnosis of asymptomatic and mild cognitive impairment based on medical history,
neuropsychological and medical examinations is difficult even today and even in best memory clinics in the world. In
current clinical practice, management of dementia begins with its diagnosis, which is based on criteria and assessments
with tests that highlight quantitative and qualitative changes in cognitive functions, behavior and ADL. There are only
symptomatic medications for AD until today.
Therefore there are needs which are unmet in Dementia and we need contribution from other sciences in order to
succeed better and earlier diagnosis and also to find methods for management the disease in order both the patients and
caregivers have better quality of life.
Prediction, Early Diagnosis and Monitoring: Computerized tests Prediction and early diagnosis
With the rise of the aging population the risk for cognitive impairment leading to dementia increases drastically. The
international scientific community seeks to find early disease markers and assessment tools for these markers that allow
to identify earlier people at risk to develop dementia so that they can receive intervention earlier. All these require early
monitoring and evaluating precisely and accurately the patient’s behaviour and symptoms remotely and on a continuous
base.
Until now, the assessment of patients with cognitive impairment was mainly based on clinical interviews for which
clinicians use scales or questionnaires to evaluate cognitive functions, behavior, and daily life activities. However, with
these methods certain problems can arise such as 1. Patients and caregivers can have a confusing awareness of the own
condition and 2. Assessor can be Subjective of Biased. The question is how can we measure behavior more objectively?
Currently, there are several diagnostic tools for assessing dementia, but the sensitivity for the early detection of
dementia is very low [9]. Furthermore, the majority of these tests are complex and need highly trained personnel and
specialized equipment, which is not usually available at primary care level. Because of this, MCI and mild AD are often
unrecognized in primary care centers [10]. Therefore, there is a need to develop screening tests oriented to the general
practitioners that allows them to differentiate with high accuracy MCI and mild AD patients, and that is easily applicable in
daily practice in primary care centers.
The relationship between neuropsychology and technology dates back to the introduction of the first personal
computers. Neuropsychologists and test designers have always monitored technological progress and were quick to
implement new technologies in neuropsychological testing and evaluation [11]. One could argue that test designers
adopted new technology with a high degree of enthusiasm and saw technology as a means that would lead to improved
testing and evaluation.
The first computers provided the opportunity for automatic scoring and record keeping which led to the
development of lengthy batteries. Test designers, freed from the need for manual scoring, designed batteries that could
cover every possible diagnostic situation from performance testing to dementia diagnosis and evaluating the effects of
chemical agents on the brain. Ongoing technological progress opened up many new possibilities. Since test batteries
were already quite comprehensive the use of new technology focused more on the test interface. Technologies such as
multimedia, voice instructions and touch screens led to tests that were easier to administer while being more pleasant for
A
www.nuclmed.gr Hell J Nucl Med Suppl, September-December 2015 133
the examinee. Ongoing technological developments led to further development and diversification of computerized tests.
Tablet PCs allow for the administration of tests without using office space in a hospital or health center. These small
devices enable administration in the waiting room and even in the patients’ home for patients who cannot visit a hospital.
At the same time web-based administration and scoring lowers costs and overcomes issues of hardware and software
compatibility.
Currently, computerized tests are being used in various aspects of neuropsychological evaluation. There is a
diverse range of tests designed either for in-depth evaluation or screening. At the same time a number of tests are often
specific to certain conditions such as MCI while others cover a large spectrum of cognitive dysfunction. Recently test
designers have shifted their focus to the design of short screening tests aiming to detect cognitive impairment at its
earliest stages and there is a general tendency towards reducing administration time and making the tests more user-
friendly. There is a wealth of research activity on the subject ranging from the evaluation of existing tests and batteries to
the design of new ones. Our recent review has identified 18 tests currently used in the neuropsychological evaluation of
older adults and another 3 tests that are still in the development phase [9].
The wealth of computerized instruments could lead one to believe that computerized testing is well established,
perhaps to the same extend as traditional pencil and paper instruments. Unfortunately the current situation is a lot more
complicated.
Computerized tests are not as well established as traditional instruments. There is currently no “gold-standard”
as far as computerized testing is concerned. Lack of normative data and psychometric standards is often cited [12] and
the volume of relevant research literature remains lower than that available for pencil and paper tests. Data on concurrent
validity with pencil and paper instruments are often inconclusive even when these tests measure the same cognitive
domains. It is worth noting thought that some researchers argue that concurrent validity should not be used to judge the
quality of a computerized test since traditional tests often exhibit poor construct validity themselves. The use of
discriminant validity as an indicator of the test’s quality is proposed since their unique format can render comparison with
pencil and paper instruments redundant [13].
Our work on computerized tests
1. We demonstrated the potential of a virtual supermarket cognitive training game as a screening tool for patients with
MCI in a sample of older adults. So far virtual reality game–based applications and especially virtual supermarkets have
been used as cognitive training applications and as measures of cognitive functions, although it has been shown that they
can detect MCI only when used in combination with standardized neuropsychological tests. We succeeded in making the
shift to MCI screening via robust virtual reality game applications that can be used on their own for accurate MCI
detection. We have indicated that the virtual supermarket (VSM) application displayed a correct classification rate (CCR)
of 87.30%, achieving a level of diagnostic accuracy similar to standardized neuropsychological tests, which are the gold
standard for MCI screening [14]. Under the same project (http://www.en-noisis.gr/ennoisis/) we have prepared a virtual
garden and a virtual laundry.
2. Custom Serious Games with dual-task walking (DTW) "motor signatures" performance data provided an ecological and
reliable approach for cognitive assessment across multiple sessions and thus can be used as a useful tool for tracking
longitudinal change in observational and interventional studies on amnestic MCI (aMCI) [15].
3. Diadohokinetic (DDK) SPEECH tests were also used by speech-language pathologists for assessment of motor
speech impairment. Quick and accurate production of rapid, alternating sound tokens involving different parts of mouse,
e.g. “puh-tuk-kuh-puh-tuh-kuh-”. The DDK test may challenge both motor and cognitive control over speech production. Is
the DDK regularity useful in distinguishing between Control/MCI/AD groups [16]? We have to go on our research with
more patients.
4. To provide a solution to this problem the European FP7 project Dem@care was created, which stands for Dementia
Ambient Care: Multi-parametric monitoring for timeless assessment and self-independence of PwD which had the goal
was to develop a system consisting of different sensors allowing continuous, more complete and remotely monitoring of
PwD, their condition, lifestyle, their symptoms and illness progression. One potential solution for this problem may be the
use of new Technologies such as sensors which can measure certain parameters. One potential solution for this problem
may be the use of new Technologies such as sensors which can measure certain parameters such as movement
intensity or walking speed which in turn can be related to certain changes in behavior. For example GPS tracking
technologies for assessing loss of orientation. The advantage of such devices is that they enable the patients’
performances and actions to be captured in real time and real life situations. Some exmaples are actigraphy, automatic
speech analyses and automatic video analyses.
Monitoring
Typical questionnaire-based assessment approaches tend to introduce a high level of subjectivity, while lacking the
comprehensive view of the person’s life and status that only continuous monitoring can provide. Using ICT is a framework
that provides objective observations regarding the completion of daily tasks of the person with dementia, focusing on the
differences between MCI and AD patients. More specifically, a sensor-based framework is proposed as a remedy to
www.nuclmed.gr Hell J Nucl Med Suppl, September-December 2015 134
support clinicians’ assessments and eventually patients by semantically integrating and analyzing multi-sensory data.
However, approaches with more than one sensor had three main problems until now: (i) how we can analyze the raw data
from the sensors, (ii) how clinicians can use all the sensors efficiently during interventions and (iii) how results could be
visualized in order to be valuable for the clinicians’ assessments. Our project dem@care (http://www.demcare.eu). The
proposed system in this project tries to address the above problems by employing knowledge-driven interpretation
techniques based on Semantic Web technologies to analyze the sensors’ recorded data, visualizing it through a simple
clinician interface. In order to evaluate the system, a pilot study was conducted with patients with cognitive problems. The
main goal of this pilot study was to identify whether the system is able to identify differences between MCI and AD
patients and eventually verify the results of the clinical assessment.
Sensors
The sensors currently included in the framework support a variety of data formats and are non-intrusive, whether ambient
or wearable. In this scenario, an ambient depth camera1 is placed to survey the whole room, collecting both image and
depth data. The Plug sensors2 are attached to electronic devices, i.e. to the tea kettle and radio in this intervention, to
collect power consumption data. Tags3 are attached to objects of interest, i.e. tea cup, kettle, drug-box, watering can,
folder of bills and phone, capturing motion events and consequently, providing information about the objects used during
the protocol. Regarding wearable sensors, the intervention employs the wristwatch4 that measures moving intensity
during directed and semi-directed activities, and a wearable wireless microphone to record the participant’s voice during
directed activities and vocal tasks.
Data retrieval and storage
One of the main technical obstacles in concurrent AAL systems, is to unify and timely coordinate sensor data retrieval,
synchronicity and homogeneity. Indeed, the sensors used in our intervention present various data forms and especially
both real-time and asynchronous data transfer. A dedicated module interfaces with each sensor, complying with its own
API and platform dependencies. The ambient camera module continuously stores image and depth frames from the
device’s live feed. In addition, the module developed for Tags is push-based, sending certain sensor events to the system
for storage, such as motion detection. The plugs on the other hand, are pull-based. Therefore, the module for plugs
constantly polls them for power consumption data. The module for the microphone is also able to start and retrieve a
recording on-demand. While, the aforementioned sensors are always online to the system, the wristwatch has to be
connected to start the data transfer. However, this process is also aided by the system, as the wristwatch module is able
to automatically retrieve and process wristwatch data upon connection.
The clinician interface
One of the main limitations of the systems presented in the related work section is that they require the presence of a
technician during a protocol. Considering this issue, we designed and developed the clinician interface based on the
following main principles and goals: (i) The system should be easily operated by a novice computer user, (ii) The
clinicians should be always informed about the current status of the protocol and the relevant instructions, (iii) The
clinicians should easily operate the sensors and they should be informed about potential problems with the sensors, (iv)
The clinicians should be informed about the results of each patient in a comprehensive way after the completion of the
protocol, (v) They could easily conduct a diagnosis based on the system and correlate data from the system with
neuropsychological assessment. In order for the human computer interaction to be efficient, the tasks, procedures and
methods that the clinician may perform with the system need to be structured in a logical and consistent manner. This
means that the interface should be intuitive and the system should address the clinician’s goal and objectives. Moreover,
the number of actions that a user has to perform in accomplishing a task (even for technologically demanding tasks, like
the operations of the sensors) should be minimized.
Our intervention
The intervention was conducted in a lab environment in the above day care center. Each participant started with a regular
consultation with a general practitioner, and then undergoes the ecological assessment, which is followed by a
neuropsychological assessment. During the consultations, demographical and medical characteristics are gathered by
means of widely used and generally recognized assessment tools. Using an instruction sheet, participants had to
complete 8 daily-living-like activities in 15 minutes: Make a phone call, Water a plant, Boil water to prepare tea, Turn on
the radio, Read a magazine and write some answers, Establish account balance, Check the pill box, and Exit the room.
The intervention consists of monitoring persons with cognitive impairment using the system’s technology in order to
1 Xtion Pro: http://www.asus.com/Multimedia/Xtion_PRO/
2 Plugwise sensors: https://www.plugwise.nl/
3 Wireless Sensor Tag System: https://www.plugwise.nl/
4 DTI-2, provided by Philips, www.philips.com
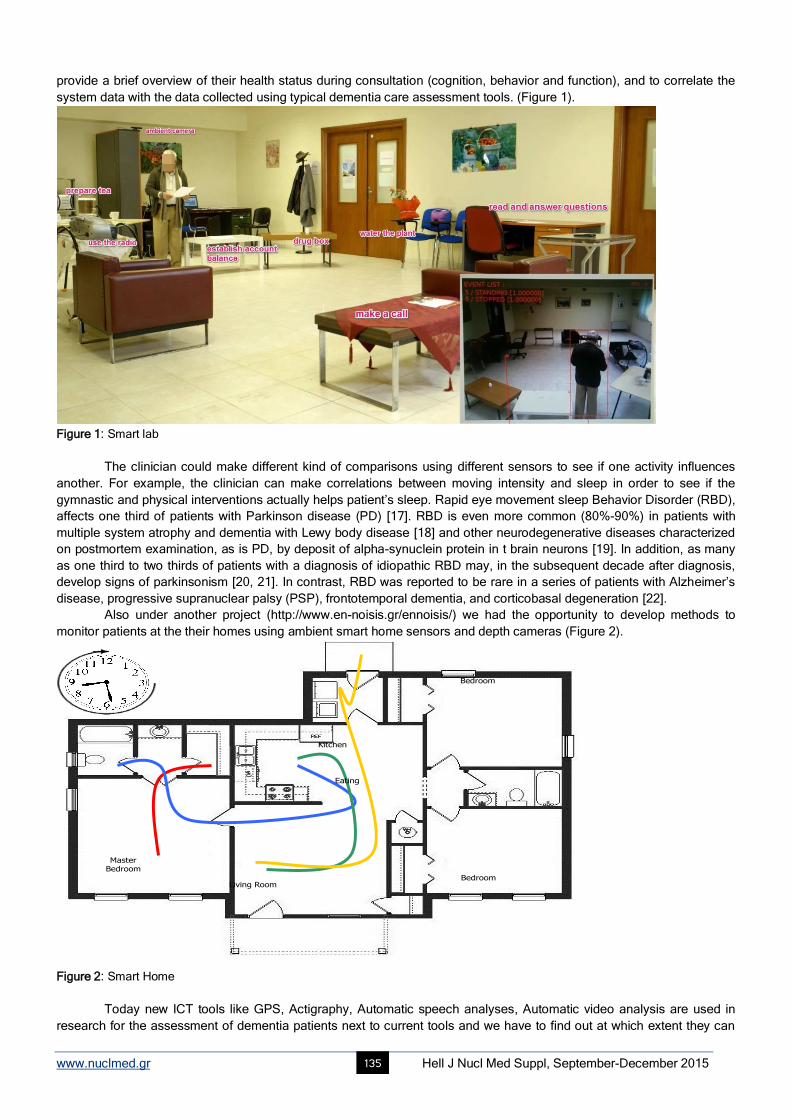
www.nuclmed.gr Hell J Nucl Med Suppl, September-December 2015 135
provide a brief overview of their health status during consultation (cognition, behavior and function), and to correlate the
system data with the data collected using typical dementia care assessment tools. (Figure 1).
Figure 1: Smart lab
The clinician could make different kind of comparisons using different sensors to see if one activity influences
another. For example, the clinician can make correlations between moving intensity and sleep in order to see if the
gymnastic and physical interventions actually helps patient’s sleep. Rapid eye movement sleep Behavior Disorder (RBD),
affects one third of patients with Parkinson disease (PD) [17]. RBD is even more common (80%-90%) in patients with
multiple system atrophy and dementia with Lewy body disease [18] and other neurodegenerative diseases characterized
on postmortem examination, as is PD, by deposit of alpha-synuclein protein in t brain neurons [19]. In addition, as many
as one third to two thirds of patients with a diagnosis of idiopathic RBD may, in the subsequent decade after diagnosis,
develop signs of parkinsonism [20, 21]. In contrast, RBD was reported to be rare in a series of patients with Alzheimer’s
disease, progressive supranuclear palsy (PSP), frontotemporal dementia, and corticobasal degeneration [22].
Also under another project (http://www.en-noisis.gr/ennoisis/) we had the opportunity to develop methods to
monitor patients at the their homes using ambient smart home sensors and depth cameras (Figure 2).
FOLLOWING THE MOVEMENTS
Bedroom
Living Room
MasterBedroom
Bedroom
Kitchen
Eating
Figure 2: Smart Home
Today new ICT tools like GPS, Actigraphy, Automatic speech analyses, Automatic video analysis are used in
research for the assessment of dementia patients next to current tools and we have to find out at which extent they can
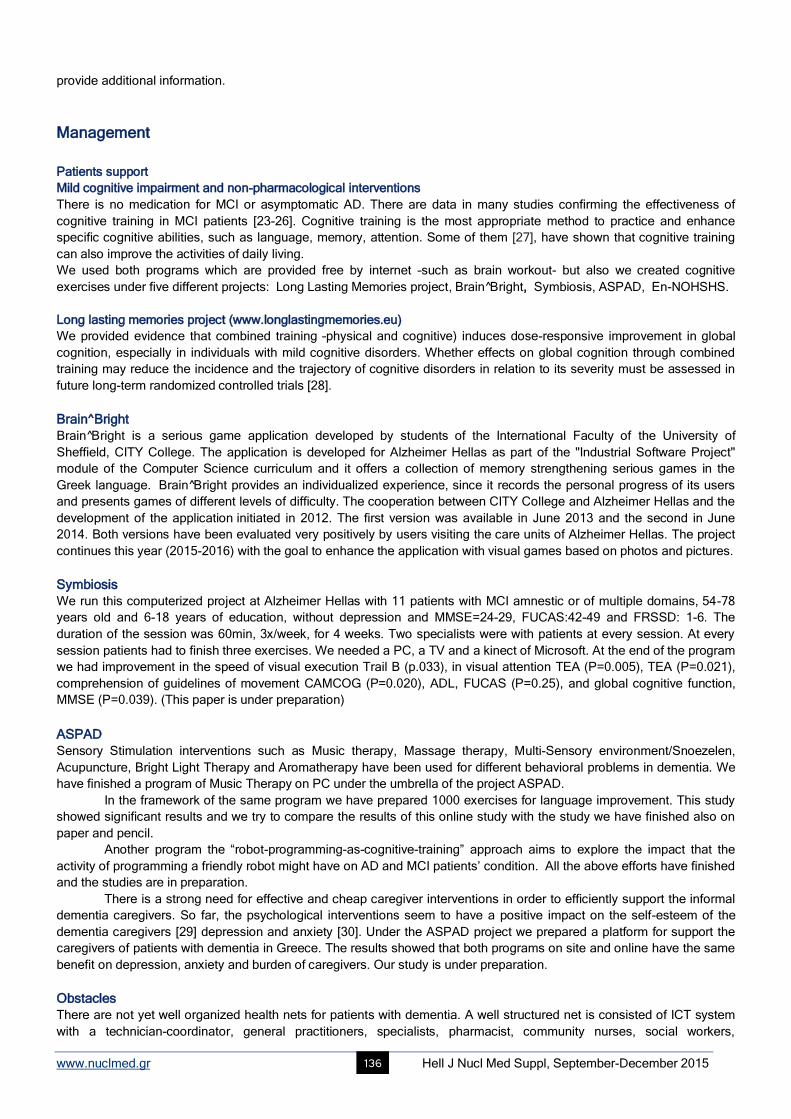
www.nuclmed.gr Hell J Nucl Med Suppl, September-December 2015 136
provide additional information.
Management
Patients support
Mild cognitive impairment and non-pharmacological interventions
There is no medication for MCI or asymptomatic AD. There are data in many studies confirming the effectiveness of
cognitive training in MCI patients [23-26]. Cognitive training is the most appropriate method to practice and enhance
specific cognitive abilities, such as language, memory, attention. Some of them [27], have shown that cognitive training
can also improve the activities of daily living.
We used both programs which are provided free by internet –such as brain workout- but also we created cognitive
exercises under five different projects: Long Lasting Memories project, Brain B̂right, Symbiosis, ASPAD, En-NOHSHS.
Long lasting memories project (www.longlastingmemories.eu)
We provided evidence that combined training –physical and cognitive) induces dose-responsive improvement in global
cognition, especially in individuals with mild cognitive disorders. Whether effects on global cognition through combined
training may reduce the incidence and the trajectory of cognitive disorders in relation to its severity must be assessed in
future long-term randomized controlled trials [28].
Brain^Bright
Brain B̂right is a serious game application developed by students of the International Faculty of the University of
Sheffield, CITY College. The application is developed for Alzheimer Hellas as part of the "Industrial Software Project"
module of the Computer Science curriculum and it offers a collection of memory strengthening serious games in the
Greek language. Brain B̂right provides an individualized experience, since it records the personal progress of its users
and presents games of different levels of difficulty. The cooperation between CITY College and Alzheimer Hellas and the
development of the application initiated in 2012. The first version was available in June 2013 and the second in June
2014. Both versions have been evaluated very positively by users visiting the care units of Alzheimer Hellas. The project
continues this year (2015-2016) with the goal to enhance the application with visual games based on photos and pictures.
Symbiosis
We run this computerized project at Alzheimer Hellas with 11 patients with MCI amnestic or of multiple domains, 54-78
years old and 6-18 years of education, without depression and MMSE=24-29, FUCAS:42-49 and FRSSD: 1-6. The
duration of the session was 60min, 3x/week, for 4 weeks. Two specialists were with patients at every session. At every
session patients had to finish three exercises. We needed a PC, a TV and a kinect of Microsoft. At the end of the program
we had improvement in the speed of visual execution Trail B (p.033), in visual attention ΤΕΑ (P=0.005), ΤΕΑ (P=0.021),
comprehension of guidelines of movement CAMCOG (P=0.020), ADL, FUCAS (P=0.25), and global cognitive function,
MMSE (P=0.039). (This paper is under preparation)
ASPAD
Sensory Stimulation interventions such as Music therapy, Massage therapy, Multi-Sensory environment/Snoezelen,
Acupuncture, Bright Light Therapy and Aromatherapy have been used for different behavioral problems in dementia. We
have finished a program of Music Therapy on PC under the umbrella of the project ASPAD.
In the framework of the same program we have prepared 1000 exercises for language improvement. This study
showed significant results and we try to compare the results of this online study with the study we have finished also on
paper and pencil.
Another program the “robot-programming-as-cognitive-training” approach aims to explore the impact that the
activity of programming a friendly robot might have on AD and MCI patients’ condition. All the above efforts have finished
and the studies are in preparation.
There is a strong need for effective and cheap caregiver interventions in order to efficiently support the informal
dementia caregivers. So far, the psychological interventions seem to have a positive impact on the self-esteem of the
dementia caregivers [29] depression and anxiety [30]. Under the ASPAD project we prepared a platform for support the
caregivers of patients with dementia in Greece. The results showed that both programs on site and online have the same
benefit on depression, anxiety and burden of caregivers. Our study is under preparation.
Obstacles
There are not yet well organized health nets for patients with dementia. A well structured net is consisted of ICT system
with a technician-coordinator, general practitioners, specialists, pharmacist, community nurses, social workers,
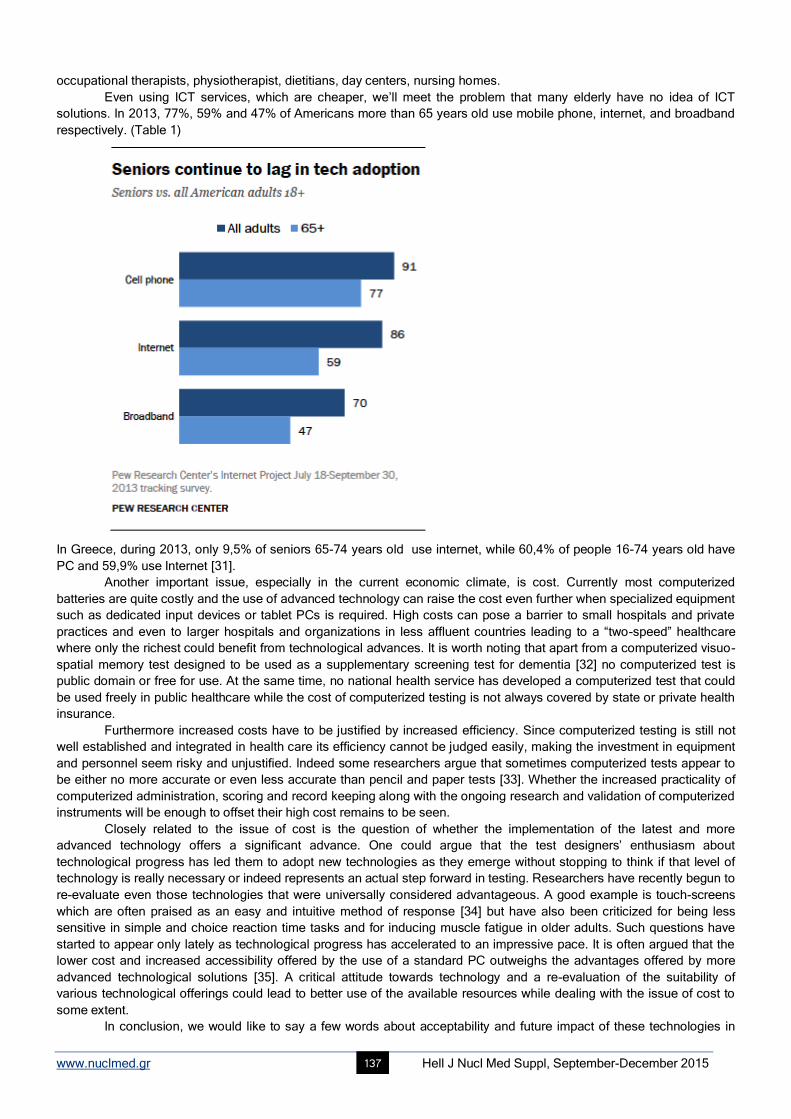
www.nuclmed.gr Hell J Nucl Med Suppl, September-December 2015 137
occupational therapists, physiotherapist, dietitians, day centers, nursing homes.
Even using ICT services, which are cheaper, we’ll meet the problem that many elderly have no idea of ICT
solutions. In 2013, 77%, 59% and 47% of Americans more than 65 years old use mobile phone, internet, and broadband
respectively. (Table 1)
In Greece, during 2013, only 9,5% of seniors 65-74 years old use internet, while 60,4% of people 16-74 years old have
PC and 59,9% use Internet [31].
Another important issue, especially in the current economic climate, is cost. Currently most computerized
batteries are quite costly and the use of advanced technology can raise the cost even further when specialized equipment
such as dedicated input devices or tablet PCs is required. High costs can pose a barrier to small hospitals and private
practices and even to larger hospitals and organizations in less affluent countries leading to a “two-speed” healthcare
where only the richest could benefit from technological advances. It is worth noting that apart from a computerized visuo-
spatial memory test designed to be used as a supplementary screening test for dementia [32] no computerized test is
public domain or free for use. At the same time, no national health service has developed a computerized test that could
be used freely in public healthcare while the cost of computerized testing is not always covered by state or private health
insurance.
Furthermore increased costs have to be justified by increased efficiency. Since computerized testing is still not
well established and integrated in health care its efficiency cannot be judged easily, making the investment in equipment
and personnel seem risky and unjustified. Indeed some researchers argue that sometimes computerized tests appear to
be either no more accurate or even less accurate than pencil and paper tests [33]. Whether the increased practicality of
computerized administration, scoring and record keeping along with the ongoing research and validation of computerized
instruments will be enough to offset their high cost remains to be seen.
Closely related to the issue of cost is the question of whether the implementation of the latest and more
advanced technology offers a significant advance. One could argue that the test designers’ enthusiasm about
technological progress has led them to adopt new technologies as they emerge without stopping to think if that level of
technology is really necessary or indeed represents an actual step forward in testing. Researchers have recently begun to
re-evaluate even those technologies that were universally considered advantageous. A good example is touch-screens
which are often praised as an easy and intuitive method of response [34] but have also been criticized for being less
sensitive in simple and choice reaction time tasks and for inducing muscle fatigue in older adults. Such questions have
started to appear only lately as technological progress has accelerated to an impressive pace. It is often argued that the
lower cost and increased accessibility offered by the use of a standard PC outweighs the advantages offered by more
advanced technological solutions [35]. A critical attitude towards technology and a re-evaluation of the suitability of
various technological offerings could lead to better use of the available resources while dealing with the issue of cost to
some extent.
In conclusion, we would like to say a few words about acceptability and future impact of these technologies in
www.nuclmed.gr Hell J Nucl Med Suppl, September-December 2015 138
clinical practice: If we want them to be successfully integrated and used in clinical routine, the perceived benefits for the
end-user, must be stronger present than perceived efforts to use the technology, this increases motivation which is an
important factor and the key to acceptability. The technology has to be easy to use and should not interfere too much with
daily life activities, should be not too intrusive. Clinician who uses the technology needs to take the time and the effort to
explain to the patients the possible benefits of using a device, explain why are using it and what is it measuring. So the
device alone is useless, and it is useful to underline the Importance of personal social interaction between the patient, the
clinican and the technology (mixed approach). We have not to forget that there is a need for immediate
feedback/visualization of the recorded data and measurements – enhance feeling of safety. In order to develop a
technology that is successfully used afterwards, we need a maximum of end-user involvement, which means the clinican
and the patients should be Involved in the design from the beginning on. Finally, monitoring by sensors is only beneficial
if it is followed by an intervention/prompting/support to the user.
Bibliography
1. World Health Organization. The epidemiology and impact of dementia. Current state and future trends.
http://www.who.int/mental_health/neurology/dementia/dementia_thematicbrief_epidemiology.pdf
2. Wimo A, Jonsson L, Gustavsson A, McDai et al. The economic impact of dementia in Europe in 2008-cost estimates from the Eurocode
project. Int J Geriat Psychiatry 2011, 26: 825–32.
3. Alzheimer’s Disease International. World Alzheimer Report 2015. The Global impact of dementia. An analysis of revalence, incidence, cost
and trends. http://www.alz.co.uk/research/WorldAlzheimerReport2015.pdf
4. Μ.Tsolaki, C.Fountoulakis, I.Pavlopoulos et al. Prevalence of Alzheimer's Disease and other dementing disorders in Pilea, Greece. American
Journal of Alzheimer΄s Disease 1999; 14:138-48.
5. Tsolaki M, Kakoudaki T, Tsolaki A, et al. Prevalence of Mild Cognitive Impairment in Individuals Aged over 65 in a Rural Area in North
Greece. Advances in Alzheimer’s Disease, 2014; 3: 11-19.
6. Qiu C, De R, Fratiglioni L: The epidemiology of the dementias: an update. Curr Opin Psychiatry 2007, 20: 380–5.
7. Schaufele M, Kohler L, Hendlmeier I et al. Prevalence of dementia and medical care in German nursing homes: a nationally representative
survey. Psychiatr Prax 2013, 40: 200–6.
8. Soril LJJ, Leggett LE, Lorenzetti DL et al. Effective Use of the Built Environment to Manage Behavioural and Psychological Symptoms of
Dementia: A Systematic Review. PLoS One 2014; 9(12): e115425.
9. Tierney MC, Szalai JP, Dunn E et al. Prediction of probable Alzheimer disease in patients with symptoms suggestive of memory
impairment. Value of the Mini-Mental State Examination. Arch Fam Med 2000; 9: 527–32.
10. Gifford DR, Cummings JL. Evaluating dementia screening tests: methodologic standards to rate their performance. Neurology 1999; 52: 224–
7.
11. Zygouris S, Tsolaki M. Computerized cognitive testing for older adults: a review. Am J Alzheimers Dis Other Demen 2015 Feb;30(1): 13-28.
doi: 10.1177/1533317514522852. Epub 2014 Feb 13. Review.
12. Wild K, Howieson D, Webbe F et al. The status of computerized cognitive testing in aging: A systematic review. Alzheimer's & Dementia
2008: 4(6): 428–37.
13. Elwood, R. W. MicroCog: Assessment of Cognitive Functioning. Neuropsychology Review 2001; 11: 89-100.
14. Zygouris S, Giakoumis D, Votis K et al. Can a virtual reality cognitive training application fulfill a dual role? Using the virtual supermarket
cognitive training application as a screening tool for mild cognitive impairment. J Alzheimers Dis 2015; 44(4):1333-47.
15. Tarnanas I, Papagiannopoulos S, Kazis D et al. Reliability of a novel serious game using dual-task gait profiles to early characterize aMCI.
Front Aging Neurosci 2015 Apr 22; 7: 50.
16. Satt A, Sorin A, Toledo-Ronen O et al. Evaluation of Speech-Based Protocol for Detection of Early-Stage Dementia. 14th
Annual Conference
of the International Speech Communication Association. Special Focus: Speech in Life Sciences and Human
Societies.(http://www.interspeech2013.org/)
17. Schenck CH, Bundlie SR, Patterson AL, Mahowald MW. Chronic behavioral disorders of human REM sleep. A new category of parasomnia.
Sleep 1986; 9: 293-308.
18. Plazzi G, Corsini R, Provini F et al. REM sleep behavior disorders in multiple system atrophy. Neurology 1997; 48:1094-7.
19. Hardy J, Gwinn-Hardy K. Genetic classification of primary neurodegenerative disease. Science 1998; 282:1075-9.
20. Schenck CH, Bundlie SR, Mahowald MW. Delayed emergence of a parkinsonian disorder in 38% of 29 older men initially diagnosed with
idiopathic rapid eye movement sleep behavior disorder. Neurology 1996; 46: 388-93.
21. Schenck CH, Bundlie S, Mahowald MW. REM behavior disorder: delayed emergence of parkinsonism and/or dementia in 65% of older men
initially diagnosed with idiopathic RBD, and an analysis of the minimum and maximum tonic and/or phasic electromyographic abnormalities
found during REM sleep. Sleep 2003; 26(Suppl): A316.
22. Boeve BF, Silber MH, Ferman TJ et al. REM sleep behavior disorder and degenerative dementia: an association likely reflecting Lewy body
disease. Neurology 1998; 51: 363-70.
23. Suzuki H, Kuraoka M, Yasunaga M et al. Cognitive intervention through a training program for picture book reading in community-dwelling
older adults: a randomized controlled trial. BMC Geriatrics 2014; 14: 122
24. Lim M.H.X., Liu K.P.Y, Cheung G.S.F et al. Effectiveness of a Multifaceted Cognitive Training Program for People with Mild Cognitive
Impairment: A One-Group Pre- and Posttest Design. Hong Kong Journal of Occupational Therapy 2012; 22(1): 3–8.
25. Zinke K, Zeintl M, Rose N.S et al. Working memory training and transfer in older adults: Effects of age, baseline performance, and training
gains. Developmental Psychology 2014, 50(1): 304-535
26. Heinzel S, Schulte S, Onken J et al. Working memory training improvements and gains in non-trained cognitive tasks in young and older
adults. Aging, Neuropsychology and Cognition: A Journal on Normal and Dysfunctional Development 2014; 21(2): 146-73
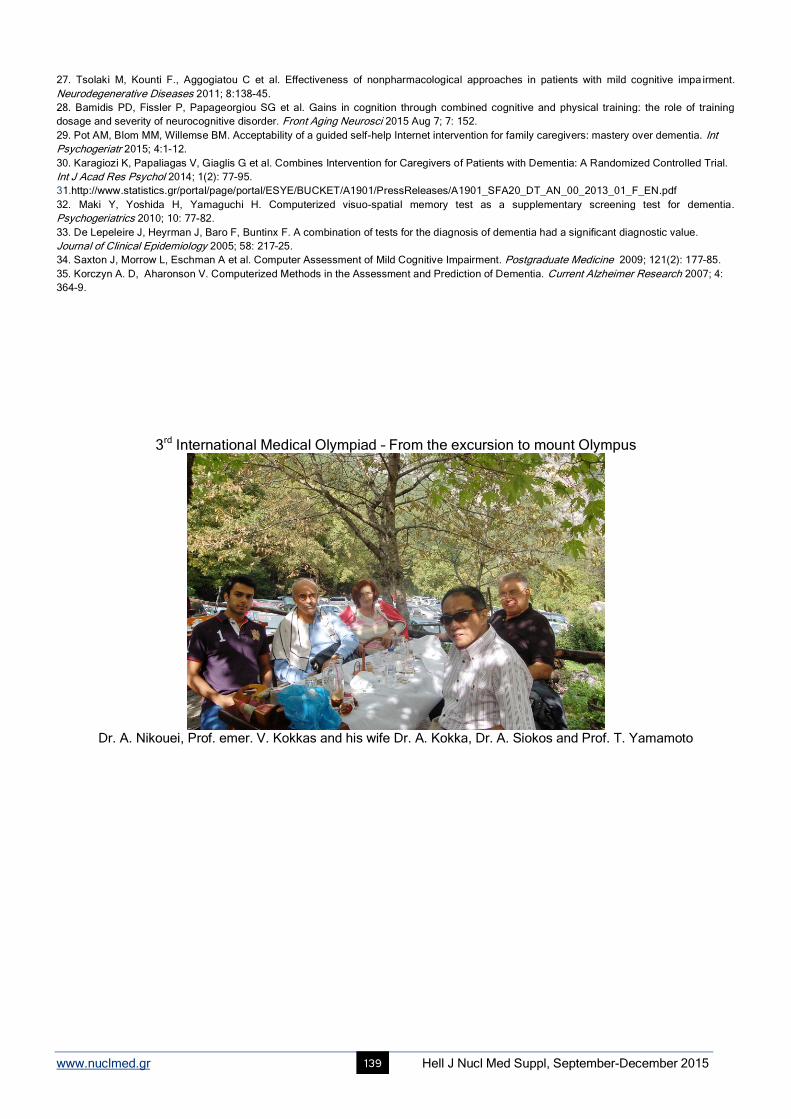
www.nuclmed.gr Hell J Nucl Med Suppl, September-December 2015 139
27. Tsolaki M, Kounti F., Aggogiatou C et al. Effectiveness of nonpharmacological approaches in patients with mild cognitive impa irment.
Neurodegenerative Diseases 2011; 8:138-45.
28. Bamidis PD, Fissler P, Papageorgiou SG et al. Gains in cognition through combined cognitive and physical training: the role of training
dosage and severity of neurocognitive disorder. Front Aging Neurosci 2015 Aug 7; 7: 152.
29. Pot AM, Blom MM, Willemse BM. Acceptability of a guided self-help Internet intervention for family caregivers: mastery over dementia. Int
Psychogeriatr 2015; 4:1-12.
30. Karagiozi K, Papaliagas V, Giaglis G et al. Combines Intervention for Caregivers of Patients with Dementia: A Randomized Controlled Trial.
Int J Acad Res Psychol 2014; 1(2): 77-95.
31.http://www.statistics.gr/portal/page/portal/ESYE/BUCKET/A1901/PressReleases/A1901_SFA20_DT_AN_00_2013_01_F_EN.pdf
32. Maki Y, Yoshida H, Yamaguchi H. Computerized visuo-spatial memory test as a supplementary screening test for dementia.
Psychogeriatrics 2010; 10: 77-82.
33. De Lepeleire J, Heyrman J, Baro F, Buntinx F. A combination of tests for the diagnosis of dementia had a significant diagnostic value.
Journal of Clinical Epidemiology 2005; 58: 217–25.
34. Saxton J, Morrow L, Eschman A et al. Computer Assessment of Mild Cognitive Impairment. Postgraduate Medicine 2009; 121(2): 177–85.
35. Korczyn A. D, Aharonson V. Computerized Methods in the Assessment and Prediction of Dementia. Current Alzheimer Research 2007; 4:
364-9.
3rd International Medical Olympiad – From the excursion to mount Olympus
Dr. A. Nikouei, Prof. emer. V. Kokkas and his wife Dr. A. Kokka, Dr. A. Siokos and Prof. T. Yamamoto
www.nuclmed.gr Hell J Nucl Med Suppl, September-December 2015 140
Abstracts Assessing an avoidable and dispensable reoperative entity: Self-referred flawed cleft lip and palate repair Pericles Foroglou MD, PhD, FEBOPRAS, Antonis Tsimponis MD, Olga-Christina Goula MD, PhD, Efterpi Demiri MD, PhD, FEBOPRAS Department of Plastic Surgery, Medical Section-Faculty of Health Sciences-Aristotle University of Thessaloniki, Papageorgiou General Hospital Correspondence adress: Pericles Foroglou, M.D, PhD, FEBOPRAS, Asst. Professor of Plastic & Reconstructive Surgery, Aristotle University of Thessaloniki, Papageorgiou General Hospital, Ring Road - Nea Efkarpia, Thessaloniki 56403 – Greece, Tel: +30 2310991568, Fax: +30 2310991566, Email: [email protected] Abstract
Objective: Cleft lip and palate (CLP) is comprised within the wide range of congenital deformities of the maxillofacial region with
an overall incidence on the increase from 1:1000 to 1:700 live births thus being the most common congenital birth error. Failure
of the lateral and medial nasal processes to fuse with the anterior extension of maxillary processes and of the palatal shelves
between the 4th
and 8th
gestational week results in cleft lip and palate. Clefts include different types with variable severity,
confirming the complexity and unpredictable expression of cleft modality and have a multifactorial aetiology. Functional
impairment, aesthetic disturbances and psychosocial effects are common sequalae in patients with cleft lip and palate. The main
long-term morbidity of this condition may include dysfunctional speech, impaired hearing and communication, as well as dental
problems. These complications are followed by unfavourable surgical outcome and aesthetic appearance, which all seem to
affect this group of patients significantly and have an impact significantly both quality of life and healthcare. Treatment
requirements of cleft patients are multifactorial and a multi-disciplinary approach and intervention at multiple levels is necessary.
Yet, in this country, resources available to parents and consistent publicity given to this issue and its treatment are still
inadequate in spite of the introduction of “Centres of Excellence” and Unified Hospitalization Coding or DRG equivalents to
optimize health management. The multi-disciplinary approach to cleft management has been a reality for over a century while
cleft treatment protocols are still being evaluated in order to optimise standards of cleft care. According to relevant guidelines
primary surgical management of lip and palate defects is performed during the first 3 to 9 months of life. Secondary operations in
the form of revisional lip and nose procedures are performed at later stages aiming with an aesthetically improved outcome.
Indications for surgery include widened scars, lip contour deformities, shortened lips, poorly defined and flattened nasal tip, short
columella and irregularities of the nostrils (narrow or high-riding) and cartilages. Wound dehiscence, contractures, vermilion
notching, white roll malalignment and orovestibular fistulas are possible unfavourable results after cleft lip repair. The
psychological status of children and adults with repaired cleft lip and palate has been the subject of extensive research
especially regarding the way of their evaluation facial appearance, satisfaction and need for secondary corrective surgical
procedures in the hope of increasing their self-esteem and self-confidence. Conclusion: The aim of this study was to assess
secondary CLP deformity management in an accredited present-day tertiary hospital facility with an existing infrastructure of a
specialist teams however not formed in a multidisciplinary group. Equally, to answer questions of specific operation indications
and choice as related to prior surgeries, hospitalization time and cost, provision of adequate preoperative information,
correlation between paediatric and plastic surgeons and effect of post-plastic surgical care on patients’ health and well-being. It
also aims at presenting, beyond our current primary cleft lip and palate repair approach, appropriate indications and timing of
secondary repair and achieved results.
HJNM 2015; 18(Suppl1); 140 Published on line: 12 December 2015
www.nuclmed.gr Hell J Nucl Med Suppl, September-December 2015 141
Role of 18F-DOPA PET/CT and 131I-MIBG planar scintigraphy in evaluating patients with pheochromocytoma
G.P.Bandopadhyaya*, Abhishek Kumar, Jyotsana Kumari Department of Nuclear Medicine & PET, All India Institute of Medical Sciences, New Delhi, India Correspondence adress: Dr. G.P.Bandopadhyaya F-1206 (IInd Floor) Chittaranjan Park New Delhi-110019 INDIA E-mail: [email protected] Abstract
Objective: The aim of this retrospective study was to evaluate role of 18
F-DOPA PET/CT and 131
I-MIBG planar scintigraphy in
patients with pheochromocytoma. Methods: The patients with diagnosis of pheochromocytoma based on radiological and
biochemical markers were retrospectively selected for the study. These patients had undergone both 131
I-MIBG scintigraphy and
18F-DOPA PET/CT. The imaging findings were compared to patient histopathology reports, biochemical markers and clinical
follow up whenever available to establish the diagnosis. Results: 131
I-MIBG showed a sensitivity of 68% and specificity of 100%. 18
F-DOPA PET/CT showed a sensitivity of 82% and specificity of 100%. 18
F-DOPA was better at localizing and finding more no
of lesions as compared to 131
I-MIBG scintigraphy. 18
F–DOPA also is a better study in evaluation of paragangliomas. Conclusions:
18F-DOPA PET/CT seems to be a better modality in comparison to
131I-MIBG scintigraphy in the evaluation of
pheochromocytoma/paraganglioma. At this point both these tracers seem to have mutually additive role in these patients and
essential investigations with diagnosis and follow-up of this disease.
HJNM 2015; 18(Suppl1); 141 Published on line: 12 December 2015
www.nuclmed.gr Hell J Nucl Med Suppl, September-December 2015 142
In-111 polyclonal HIG identifies patients but not atherosclerotic lesions at risk - a 5 years follow-up Robert Berent
1 MD, Johann Auer
2 MD, Susanne Granegger
3, Helmut Sinzinger
3 MD, PhD
1. HerzReha Bad Ischl, Center for Cardiovascular Rehabilitation, Bad Ischl, Austria, 2. Department of Internal Medicine, Hospital Braunau/Inn, Austria, 3. Isotopix, Institute for Nuclear Medicine, Vienna, Austria Correspondence adress: Professor Helmut Sinzinger, Isotopix, Institute for Nuclear Medicine, Vienna, Austria, Email: [email protected] Abstract There is a strong need for non-invasive detection of human atherosclerotic lesions. One of the radioisotopic approaches using
Indium-111-HIG has been shown to accumulate in oxidized LDL-rich foam cells and inflammatory vascular lesions. Earlier
human studies in 200 patients, 100 with peripheral vascular disease and 100 with carotid artery disease comparing In-111-HIG
scintigraphy with sonographic data revealed a high sensitivity (70%-77%) but a very low specificity (33%-41%). At this time we
concluded the approach “not promising” for human studies. However, clinical follow-up over 5 years now shows that those
patients with positive In-111-HIG scintigraphy exhibited a significantly higher vascular morbidity (P<0,01) and mortality (P<0,01),
especially in the immediate follow-up period. Retrospective analysis discovered higher CRP and isoprostane (8-epi-
prostaglandin (PG) F2) levels in HIG-positive patients at the time of scintigraphy. These findings indicate that In-111-HIG
reflecting vascular lesions with a high inflammatory component, probably more prone to rupture, may identify a population at
high vascular risk rather than a lesion at risk. The clinical impact of this finding should be assessed in prospective studies.
HJNM 2015; 18(Suppl1); 142 Published on line: 12 December 2015
www.nuclmed.gr Hell J Nucl Med Suppl, September-December 2015 143
Validation of numerical outputs of IAEA software by the analysis of diuretic nephrogram in children with antenatally detected hydronephrosis Slobodanka Lj. Beatovic
1, MD, PhD, Dragana P. Sobic-Saranovic
1 MD, PhD, Emilija D. Jaksic
1 MD, PhD, Vera M.
Artiko1 MD, PhD, Boris Ajdinovic
2 MD, PhD
1. University of Belgrade, Faculty of Medicine, Center for Nuclear Medicine, Clinical Center of Serbia, 2. Military Medical Academy, Belgrade, Serbia Correspondence adress: Slobodanka Lj. Beatovic University of Belgrade, Faculty of Medicine, Center for Nuclear Medicine, Clinical Center of Serbia, Visegradska 26 St. 11000 Belgrade, Serbia Tel: +381 11 2423221, Fax: +381 11 3640071, E-mail: [email protected] Abstract Diuretic nephrogram is important diagnostic tool in the postnatal follow-up of asymptomatic antenatally detected hydronephrosis
(HN). In the last decades, two quantitative indices of renal excretion, output efficiency and the residual kidney counts normalized
to the 1-2min counts (normalized residual activity, NORA) have been proposed, that enhance the accuracy of technique to
detect kidneys with obstruction. Unfortunately, in many nuclear medicine departments in developing countries the obsolete
computer systems do not give the opportunity of sophisticated analysis of nephrogram. Almost a decade ago, the Nuclear
Medicine Section of the International Atomic Energy Agency (IAEA) has developed non-commercial software for nephrogram
processing on a simple p-computer, which allows access to the developments in this field. However, till now, the software has
not been widely implemented in the nuclear medicine institutions in developing countries. Furthermore, the accuracy of
numerical outputs of the software has not been assessed in comparison with commercial software. The aims of this study in
children were: a) to calculate, by means of the International Atomic Energy Agency (IAEA) software, the values of the
technetium-99m mercapto-acetyl-triglycine (99m
Tc MAG3) parameters in three categories of kidneys: normal kidneys, obstructed
kidneys and hypotonic unobstructed kidneys and b) to assess the accuracy of the obtained numerical parameters by comparing
with the values published by other authors. Investigation was carried out on a sample of 62 children: 43 boys and 19 girls
(median age: 16 months) with antenatally detected HN attributed to pelviureteric junction (PUJ) stenosis. Neither of kidneys had
undergone pyeloplasty prior to our investigation. 130 nephrogram curves were analyzed. 22-minutes acquisition with 132 10sec
images was applied. Furosemide was administered after 2min (F+2). Post-void static image was acquired at 60min. Two
observers analyzed each study and classified kidneys into three categories. Group 1: 84 kidneys contralateral to hydronephrotic
kidney, without structural abnormality on previous diagnostics; Group 2: 30 hypotonic non-obstructed kidneys; Group 3: 16
obstructed kidneys. Parameters analyzed were: output efficiency (OE), residual kidney counts at 20min normalized to the 1-2min
counts (NORA20) and residual kidney counts on post-micturition acquisition normalized to the 1-2min counts (NORAPM). Results
were presented as mean±SD. For group 1 they were: OE: 95±1.5%; NORA20: 0.25±0.06; NORAPM: 0.02±0.007. Results for
group 2 were: OE: 87±7.8%; NORA20: 0.57±0.19; NORAPM: 0.03±0.02. For group 3: OE: 56±9.6%; NORA20: 2.16±0.33;
NORAPM: 0.27±0.13. Linear regression analysis showed significant inverse linear correlation between NORA20 and ROE20 (R=-
0.982; y=99.6–21.1x) at 0.01 level. ROC analysis revealed cutoff values of predicting obstruction at 71%, 1.62 and 0.11 for OE,
NORA20 and NORAPM, respectively. Conclusion: We have calculated in children by means of the IAEA software the values of
three advanced parameters of the 99m
Tc MAG3 F+2 diuresis nephrogram for normal kidneys, hypotonic non-obstructed and
obstructed kidneys. The overall results provided evidence of excellent agreement of obtained results with previously reported
values of the quantitative parameters of renal washout. The parameters of IAEA software has been shown to be reliable in
assessing kidney drainage. The nuclear medicine section of the IAEA should be encouraged to produce final version of the
software and to release it through IAEA Web site.
HJNM 2015; 18(Suppl1); 143 Published also on line: 12 December 2015
www.nuclmed.gr Hell J Nucl Med Suppl, September-December 2015 144
Ebola Check: Delivering molecular diagnostics at the point of need Sterghios A. Moschos FIBMS FRSC MRSB Correspondence adress: Westminster Genomic Services, Department of Biomedical Sciences, Faculty of Science and Technology, University of Westminster, 115 New Cavendish Str., London, W1W 6UW, UK. Abstract The 2013-5 global outbreak of Ebolavirus disease brought to sharp focus the need for diagnostic capacity to be equitably
available on a global scale: from the most under-developed areas of resource-limited countries in West Africa to high volume
international travel hubs in Europe and the USA. Quick detection of the causal agent of disease is pivotal to containment,
contact tracing and clinical action to protect healthcare workers, communities and patients.
Nucleic acid testing (NAT) by real time reverse transcription quantitative polymerase chain reaction (RT-PCR) has
emerged as the preferred method for reliable patient status confirmation. Presently, this is served through advanced clinical
molecular laboratory testing in a <8hr manual process that requires 3.5ml venous blood samples. To meet the demand in West
Africa, this has necessitated large-scale mobile laboratory and volunteer biomedical scientist deployment: a solution that has
proven eventually adequate, albeit temporary against future re-emergence of this and other haemorrhagic fever disease agents
prevalent in the region.
The EbolaCheck consortium was formed in August 2014 to address the need for delivering NAT at the point of care.
We have developed a novel platform technology that can QUantitatively, RAPidly IDentify (QuRapID) known RNA or DNA
targets in viruses, bacteria, or eukaryotic cells directly in crude biofluids, including whole blood, in under 40min using a 5
microliter sample. The portable, battery-operated system lacks microfluidics, pumps or other sensitive/high cost parts making it
suitable for the environmental and economic challenges of resource-limited countries. The simple, safe, 5-step sample-to-
answer process requires minimal training and informs frontline healthcare workers of diagnostic status, whilst reporting remotely
epidemiologically relevant results. Data on biosafety level 2 surrogate Ebolavirus templates presented in encapsulated or
enveloped viruses indicate performance comparable to clinical laboratory testing and utility beyond filoviruses. Emerging
performance data on live Ebolavirus, non-human primate disease model and patient samples, as well as future development
plans will be discussed.
HJNM 2015; 18(Suppl1); 144 Published on line: 12 December 2015
www.nuclmed.gr Hell J Nucl Med Suppl, September-December 2015 145
Evidence-based innovative therapeutic medicine of Cretan plants: some encouraging specific functions and claims Christos Lionis MD, PhD, FRCGP (Hon) School of Medicine, University of Crete, Greece Correspondence adress: Christos Lionis MD, PhD School of Medicine, University of Crete, Greece Email: [email protected] Abstract The Island of Crete was the place where the use of herbal medicine has its roots since the Bronze Age period. Although, the
consumption of aromatic plants as component in curing common diseases is still on population’s practices, a new interest was
appeared on the basis of studies with a focus on illness behavior as a mutual collaboration between the University of Crete and
the University of Leiden, The Netherlands. The antioxidant activity of certain Cretan plants has been documented and it has
been shown and reported that herbal extracts are possible to decrease lipid per oxidation in cultured lung cells exposed to iron
or ozon. The biological effects and bioactivity of essential oils as well as their antibacterial properties have been previously
discussed in the literature. However, it was the first attempt in Europe when a double blind randomized controlled trial examined
the effectiveness of an essential-oil extract of three Cretan aromatic plants (Origanum Dictamnus, Coridothymus Capitatus,
Salvia Friticosa) designed and implemented in rural Crete on patients with upper respiratory tract infection. Descriptive
differences were recently reported in favorable direction especially in the virus-positive population, while these results guide at
the moment a series of actions for further research and discussion on the potentialities in the therapeutic medicine. An over-the-
counter drug under the name of “Cretan Iama” and as soft-gel capsules has recently circulated in Greece by the Olvos Science
SA. A recent joint attempt (Clinic of Social and Family Medicine and Department of Experimental Endocrinology at the School of
Medicine, University of Crete) under the support of the National Strategic Reference Framework Program focused on the
effectiveness of functional extract of Mentha Spicata encapsulated in yogurt with honey on lipids profile of health patients in rural
Crete. The first reported results of a cross-over study which was designed and implemented recently were in a favorite direction
and it was in agreement with the animal based study that was carried out in the frame of this project. In conclusion, the two first
studies on the Cretan medicinal and aromatic plants support the potentialities of the use of Ethno botanical methodology to
move the needle of innovation on viral infections and lipids metabolism.
HJNM 2015; 18(Suppl1); 145 Published on line: 12 December 2015
www.nuclmed.gr Hell J Nucl Med Suppl, September-December 2015 146
Quantification of parafoveal capillary network using a semi-automated algorithm Zoi Kapsala
1 MD, Msc, Aristofanis Pallikaris
1 Msc, Emmanouil Ganotakis
2, MD, PhD, Joana Moschandreas
2 PhD,
Miltiadis Tsilimbaris1 MD, PhD
1. Ophthalmology Department, Medical School, University of Crete, Heraklion, 2. Department of Social Medicine, Medical School, University of Crete, Heraklion Correspondence adress: Zoi Kapsala, MD, Msc, Ophthalmology Department, Medical School, University of Crete, P.O. Box 2208, P.C. 71003, Heraklion, Greece. Abstract Objective: The quantification of the morphology of the parafoveal capillary network (PCN) in fluorescein angiography (FA)
images using a novel semi-automated computerized method. Material and Methods: Using the MatLab R2011 a software we
developed an algorithm that detects automatically the parafoveal capillary bed and its branch points as depicted in FA images
creating simultaneously an one-pixel-wide skeleton of it. The detection process starts after delineating manually the foveal
avascular zone in a cropped 1500μm*1500μm subimage resulting from the original FA image. Thereafter the algorithm
calculates the capillary density and the branch points in a circle area with 1000μm radius. The method was also applied on FA
images from subjects without diabetes mellitus, diabetics without diabetic retinopathy (DR) signs, patients with non-proliferative
DR and patients with proliferative DR in order to assess the PCN morphology metrics for the studied groups. Results: The PCN
density and the parafoveal capillary branch points were estimated for the mentioned subject groups and any significant
differences among them were assessed as well. Conclusions: The described method could serve as a potential tool for the
diagnosis and monitoring of PCN diseases and subclinical abnormalities. The assessed metrics reflect the capillary
abnormalities in the central 1000μm area across different DR stages.
HJNM 2015; 18(Suppl1); 146 Published on line: 12 December 2015
www.nuclmed.gr Hell J Nucl Med Suppl, September-December 2015 147
Serum levels of fetuin-A in patients with coronary artery disease. Corellation with SPET myocardium scintigraphy Athanassios Zissimopoulos
1 MD, PhD, Lukia Baloka
3 Ms, Eleni Nagorni
1 MD, Evangelos Karathanos
1 MD,
Antonios Tsartsarakis1 MD, Vasiliki Apostolidou
1 MD,
Andina Thomaidou
2 MD, Gregory Tripsianis
4 MD, PhD
1. Nuclear Medicine Department, 2. Cardiology Clinic, Univ. Hospital of Alexandroupolis Democritus University of Thrace, 3. School of Molecular Biology and Genetics, 4. Department of Medical Statistics, Democritus University of Thrace, Alexandroupolis Greece Correspondence adress: Athanasios Zissimopoulos MD, PhD, Professor-Director Nuclear Medicine Department, University of Thrace, University Hospital of Alexandroupolis, Greece, Email: [email protected]
Abstract Objective: Fetuin-A is an acidic glycoprotein produced in the liver, as an inhibitor for cysteine protease. Its gene is founded in
chromosome 3 (3q27). It is involved in various physiological and pathological conditions. These include vascular decalcification,
bone metabolism, insulin resistance, protease function control, neurological illnesses and multiplication of breast cancer cells.
Vascular calcifications predict cardiovascular disease which can be a major cause of death. So, fetuin-A is a potent circulating
calcification inhibitor. Studies on individuals with clinical cardiovascular disease supported that lower levels of fetuine-A are
released with coronary artery circulation (CAC) and the function of the heart valve. Our aim was to evaluate fetuin-A values of
the patients with coronary artery disease, as a prognostic factor of the disease, in correlation with SPET myocardium
scintigraphy. Patients and Methods: We studied 40 patients, 25 male and 15 female, with a mean age 48±8 years (range 36 to
69), with coronary heart disease. All were subjected to myocardium scintigraphy, in the Nuclear Medicine Department of
University Hospital of Alexandroupolis. Simultaneously, blood samples were drawn for the determination of fetuin-A. Serum
fetuin-A levels were measured by a commercially available sandwich ELISA (Epitope Diagnostics, Inc., San Diego, CA).
Results: The average values of fetuin-A range between 140-297mg/L, as it is derived from the current bibliography and our
laboratory tests. In normal individuals, pathological values were considered to be under 140mg/L. Twenty five patients with
positive SPET imaging for myocardium necrosis (scars) had low fetuin values (45-148mg/ L), 10 of them passing away within 6
months, while the rest of them were showing an encumbered clinical condition (P<0.005). Ten patients with reversible ischemia
showed relatively low values (125-302mg/L) (P<0.005). Five patients with a normal myocardiac scintigraphic imaging showed
normal values of fetuin-A (165-508mg/L) (P<0.005). Conclusions: Patients with myocardium necrosis demonstrated very low
values of fetuin. Patients with ischemia show low amounts while patients with negative Scintigraphy for ischemia showed normal
results of fetuin. The 10 patients that passed away in 6 months showed very low amounts of fetuin. Fetuin-A is supported to be a
reliable prognostic factor in monitoring patients with coronary heart disease.
HJNM 2015; 18(Suppl1); 147 Published on line: 12 December 2015
www.nuclmed.gr Hell J Nucl Med Suppl, September-December 2015 148
Preventing cardiac diseases in childhood Andreas Petropoulos
1 MD, MSc, Doris Ehringer-Schetitska
2 MD, Peter Fritsch
3 MD, PhD, Eero Jokinen
4 MD, PhD,
Robert Dalla Pozza5 MD, PhD, Renate Oberhoffer
6 MD, PhD on behalf of the Association for European Paediatric
Cardiology Working Group Cardiovascular Prevention Pediatric Cardiology Working Group Cardiovascular Prevention 1. Dept. Pediatric Cardiology Merkezi Klinika, Azerbaijan Medical University, Baku, Azerbaijan, 2. Dept. of Paediatrics, Landesklinikum Wiener Neustadt, Austria, 3. Dept. of Paediatric Cardiology, University Children’s Hospital, Graz, Austria, 4. Dept. of Paediatric Cardiology, Children’s Hospital, University of Helsinki, Stenbackinkatu Finland, 5. Dept of Pediatric Cardiology, Ludwig Maximilians-University of Munich, Germany, 6. Institute of Preventive Paediatrics, Technical University of Munich, Uptown Munich, Germany Correspondence adress: Dr Andreas Petropoulos, Merkezi Post (MPS) Baku, Az. 1000 P.O box 2, Azerbaijan Abstract Objective: The burden of cardiac disease in childhood is unknown. It will be a sum of 1% of living births in the general
population, suffering from Congenital Heart Disease (CHD) + approximately 2.5% of the general population suffering from
bicuspid aortic valve diseases + an unknown higher prevalence of acquired diseases. Cardiomyopathies, arrhythmias - sudden
cardiac death (SCD), rheumatic heard disease, hypertension and accelerating atherosclerosis are among the most frequent.
Adding on, genetic syndromes including cardiac defects, endocarditis and myocarditis we can address a large pediatric
population worldwide, suffering from heart disease. Diagnosis and treatment of these diseases are not afforded in many
countries worldwide due to luck of human and material resources. The aim of this paper is to describe how some of the above
mentioned diseases can be either early detected or prevented. The working Group “Cardiovascular Prevention” of the
Association of European Pediatric and Congenital Cardiology (AEPC) focused on some forms of them since its formation in
2011. These areas are: 1) some forms of critical CHD, 2) sudden cardiac death linked to sport activities and 3) detecting-
preventing cardio vascular diseases CVD in the young. Methods-Populations: Measurements of pre and post ductal saturation of
oxygen using pulse oximeters, after the first day from birth, can early and cheaply detect critical Ductal Arteriosus dependent
pulmonary or systemic and cyanotic CHD, saving lives and decreasing significantly the cost of medical care. This screening test
can be applied to all neonates as late as possible after their birth and before released to their homes. A combination of detailed
medical history, physical examination and 12 lead ECG, during a pre-participation in sport activities medical screening test can
prevent SCD, related to a variety of nosology. This combined screening test can be applied to all children before they are
exposed to school or leisure sport activities. Screening to early detect and treating existent risk factors (RF) for CVD as well as
preventing obesity and hypertension, contributes in lowering the burden of CVD. Specific screening tests as laboratory
measurements of lipids, fasting glucose or regular measurements of Blood Pressure and waist to hip ratio in children with a
family history of CVD or other co-morbidity that provokes accelerating atherosclerosis must be done on a regular basis. Results:
Since 2010, four European studies reporting the test accuracy of routine pulse oximetry screening, in over 150.000 babies, have
delivered new data. A systematic review and meta-analysis of 230.000 screened babies, reported high specificity, moderate
sensitivity and a low false-positive rate. Routine screening for critical CHD using pulse oximetry is being increasingly supported
and was added to the recommended uniform screening panel in the USA in 2011. Evaluating children with CHD before their
involvement in sport activities, so a clear view in what they can and what they can’t to is vital for their safety. For children
involved in competitive or leisure sport activities, an initial evaluation and a yearly F/U is vital. In cases of near SCD events an
additional thorough investigation and appropriate management is required. Investigating the severity of the existing RF and
cooperating with Pediatricians in their treatment (e.g. heredity forms of hyperlipidemias, existing hypertension) of them is
essential. Furthermore preventing acceleration of atherosclerosis in patients with: Diabetes Mellitus I, II, chronic renal disease,
post Kawasaki disease, post heart transplantation patients, Cardio-Metabolic Syndrome patients, by eradicating RF primordially
or by alternating them by opposing a healthy life style or by medicine treatment, has sown in many studies to post pone clinical
events in adulthood. Discussion: As many studies have proved the role of preventive measures that can alternate the outcome
of cardiac diseases in childhood. AEPC/Preventive Cardiology working group is in the process to publish in the near future
guidelines on this topic.
HJNM 2015; 18(Suppl1); 148 Published on line: 12 December 2015
www.nuclmed.gr Hell J Nucl Med Suppl, September-December 2015 149
18F-FBPA as a tumor specific tracer of L-type amino acid transporter 1 (LAT1): PET evaluation in tumor and inflammation compared to 18F-FDG and 11C-methionine Tadashi Watabe
1,2 MD, PhD, Jun Hatazawa
1,2 MD, PhD
1. Department of Nuclear Medicine and Tracer Kinetics, 2. PET Molecular Imaging Center, Osaka University Graduate School of Medicine, Japan Correspondence adress: Tadashi Watabe MD, PhD, 2-2 Yamadaoka, Suita, Osaka 565-0871, JAPAN. Email: [email protected] Abstract Objective:
18F-FDG-PET is used worldwide for oncology patients. However, we sometimes encounter false positive cases of
18F-
FDG PET, such as moderate uptake in the inflammatory lesion, because 18
F-FDG accumulates not only in the cancer cells but
also in the inflammatory cells (macrophage, granulation tissue, etc). To overcome this limitation of 18
F-FDG, we started to use
(4-borono-2-[18
F]fluoro-L-phenylalanine) 18
F-FBPA, an artificial amino acid tracer which is focusing attention as a tumor specific
PET tracer. Physiological accumulation of 18
F-FBPA is limited in the kidney and urinary tract in humans, which enable preferable
evaluation of uptake in the abdominal organs compared to 11
C-methionine (11
C-MET). The purpose of this study was to evaluate
18F-FBPA as a tumor specific tracer by in vitro cellular uptake analysis focusing on the selectivity of L-type amino acid
transporter 1 (LAT1), which is specifically expressed in tumor cells, and in vivo PET analysis in rat xenograft and inflammation
models compared to 18
F-FDG and 11
C-methionine. Subjects and Methods: Uptake inhibition and efflux experiments were
performed in HEK293-LAT1 and LAT2 cells using cold BPA, cold 18
F-FBPA, and hot 18
F-FBPA to evaluate LAT affinity and
transport capacity. Position emission tomography studies were performed in rat xenograft model of C6 glioma 2 weeks after the
implantation (n=9, body weight=197±10.5g) and subcutaneous inflammation model 4 days after the injection of turpentine oil
(n=9, body weight=197±14.4g). Uptake on static PET images were compared among 18
F-FBPA at 60-70min post injection, 18
F-
FDG at 60-70min, and 11
C-MET at 20-30min in the tumors and the inflammatory lesions by maximum standardized uptake value
(SUVmax). Results: Cellular uptake analysis showed no significant difference in inhibitory effect and efflux of LAT1 between cold
18F-FBPA and cold BPA, suggesting the same affinity and transport capacity via LAT1. Uptake of
18F-FBPA via LAT1 was
superior to LAT2 by the concentration dependent uptake analysis. Position emission tomography analysis using SUVmax
showed significantly higher accumulation of 18
F-FDG in the tumor and the inflammatory lesions (7.19±2.11 and 4.66±0.63,
respectively) compared to 18
F-FBPA (3.23±0.40 and 1.86±0.19, respectively) and 11
C-MET (3.39±0.43 and 1.63±0.11,
respectively) (P<0.01 by Tukey test). No significant difference was observed between 18
F-FBPA and 11
C-MET. Conclusions: 18
F-
FBPA showed high selectivity of LAT1 by in vitro cellular uptake analysis, suggesting the potential as a tumor-specific substrate.
In vivo PET analysis showed significantly lower uptake of 18
F-FBPA and 11
C-MET in the inflammatory lesions compared to 18
F-
FDG, suggesting comparable utility of 18
F-FBPA PET to 11
C-MET PET in differentiating between the tumor and the inflammation.
HJNM 2015; 18(Suppl1); 149 Published on line: 12 December 2015
www.nuclmed.gr Hell J Nucl Med Suppl, September-December 2015 150
The role of copeptin in patients with subarachnoid haemorrage Athanassios Zissimopoulos
1 MD, PhD, Theodosia Vogiatzaki
2 MD, PhD, Fotini Babatsikou
4, Marion Velissaratou
3
Ms, Lukia Baloka3 Ms, Evangelos Karathanos
1 MD, Anastasia Pistola
1 Ms, Xristos Christofis
2 MD, Xristos Iatrou
2
MD, PhD 1. Nuclear Medicine Department, 2. Clinic of Anaesthesiology, Univ. Hospital of Alexandroupolis, Democritus University of Thrace, 3. School of Molecular Biology and Genetics, Democritus University of Thrace, Alexandroupolis, 4. Nursing School TEI Athens, Greece Correspondence adress: Athanasios Zissimopoulos MD, PhD, Professor-Director Nuclear Medicine Department, University of Thrace, University Hospital of Alexandroupolis, Greece, Email: [email protected]
Abstract Objective: Subarachnoid haemorrhage is responsible to a great extend for the death rate of patients who are hospitalised in
intensive care units (ICU) with haemorrhage. The early detection of its severity plays an important role for the resulting health of
the patients. Neurohormone Copeptin is the C-end of pro-arginine vasopressin in plasma has been used as a prognostic marker
in a number of various illnesses (acute myocardial infarction, heart and renal failure, acute dyspnoea, intracerebral and
subarachnoid haemorrhage, ischaemic stroke, liver cirrhosis, acute pancreatitis). However, its prognostic value in subarachnoid
haemorrhage has yet to be valued. The aim of our study was to evaluate copeptin plasma values of patients with subarachnoid
haemorrhage hospitalised in the ICU, as a prognostic factor for the severity of this disease. Patients and Methods: We studied
32 patients, 21 male, 11 female, (average age 59±7 years), who were hospitalised in the ICU of Univ. Hospital of
Alexandroupolis. Plasma Copeptin values were measured in the Nuclear Medicine Laboratory, with the Radioimmunoassay
(RIA) method. The appropriate kit, from Phoenix Pharmaceuticals Inc. (USA), was used. Statistical Analysis: The x2 student test
was used for statistical analysis. Results: The cut-off value of copeptin ranged between 0.4-4.4 pmol/L. 19 patients showed
gradual increase of copeptin values, (125-578 pmol/L), with a bad prognosis of the illness (P<0.005). Four of them with
extremely high copeptin values died. Decrease of copeptin values for the rest 15 patients were correlated with the improvement
of their clinical condition (P<0.005). Eleven patients appeared to have high values, followed by the gradual decrease by a range
of 85-12pmol/L, and had a good prognosis of the condition. Two patients with normal values demonstrated to have a good
clinical condition. Conclusion: Patients with a gradual increase of copeptin values showed to have bad prognosis of the disease.
Four with extremely high copeptin values passed away, while patients with a gradual decrease or a normal amount of copeptin
values had good prognosis. It is supported that copeptin values are a reliable prognostic factor in monitoring patients with
intracranial haemorrhage.
HJNM 2015; 18(Suppl1); 150 Published on line: 12 December 2015
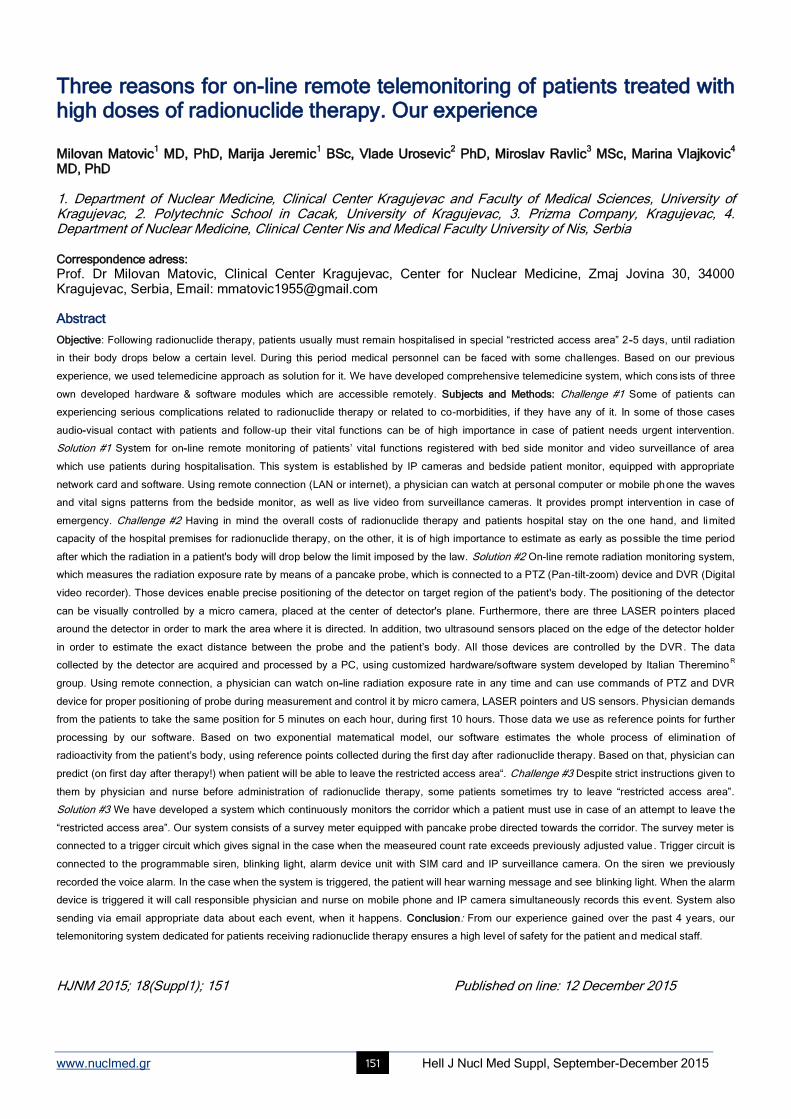
www.nuclmed.gr Hell J Nucl Med Suppl, September-December 2015 151
Three reasons for on-line remote telemonitoring of patients treated with high doses of radionuclide therapy. Our experience Milovan Matovic
1 MD, PhD, Marija Jeremic
1 BSc, Vlade Urosevic
2 PhD, Miroslav Ravlic
3 MSc, Marina Vlajkovic
4
MD, PhD 1. Department of Nuclear Medicine, Clinical Center Kragujevac and Faculty of Medical Sciences, University of Kragujevac, 2. Polytechnic School in Cacak, University of Kragujevac, 3. Prizma Company, Kragujevac, 4. Department of Nuclear Medicine, Clinical Center Nis and Medical Faculty University of Nis, Serbia Correspondence adress:
Prof. Dr Milovan Matovic, Clinical Center Kragujevac, Center for Nuclear Medicine, Zmaj Jovina 30, 34000 Kragujevac, Serbia, Email: [email protected] Abstract
Objective: Following radionuclide therapy, patients usually must remain hospitalised in special “restricted access area” 2-5 days, until radiation
in their body drops below a certain level. During this period medical personnel can be faced with some challenges. Based on our previous
experience, we used telemedicine approach as solution for it. We have developed comprehensive telemedicine system, which cons ists of three
own developed hardware & software modules which are accessible remotely. Subjects and Methods: Challenge #1 Some of patients can
experiencing serious complications related to radionuclide therapy or related to co-morbidities, if they have any of it. In some of those cases
audio-visual contact with patients and follow-up their vital functions can be of high importance in case of patient needs urgent intervention.
Solution #1 System for on-line remote monitoring of patients’ vital functions registered with bed side monitor and video surveillance of area
which use patients during hospitalisation. This system is established by IP cameras and bedside patient monitor, equipped with appropriate
network card and software. Using remote connection (LAN or internet), a physician can watch at personal computer or mobile phone the waves
and vital signs patterns from the bedside monitor, as well as live video from surveillance cameras. It provides prompt intervention in case of
emergency. Challenge #2 Having in mind the overall costs of radionuclide therapy and patients hospital stay on the one hand, and limited
capacity of the hospital premises for radionuclide therapy, on the other, it is of high importance to estimate as early as possible the time period
after which the radiation in a patient's body will drop below the limit imposed by the law. Solution #2 On-line remote radiation monitoring system,
which measures the radiation exposure rate by means of a pancake probe, which is connected to a PTZ (Pan-tilt-zoom) device and DVR (Digital
video recorder). Those devices enable precise positioning of the detector on target region of the patient's body. The positioning of the detector
can be visually controlled by a micro camera, placed at the center of detector's plane. Furthermore, there are three LASER po inters placed
around the detector in order to mark the area where it is directed. In addition, two ultrasound sensors placed on the edge of the detector holder
in order to estimate the exact distance between the probe and the patient’s body. All those devices are controlled by the DVR . The data
collected by the detector are acquired and processed by a PC, using customized hardware/software system developed by Italian ThereminoR
group. Using remote connection, a physician can watch on-line radiation exposure rate in any time and can use commands of PTZ and DVR
device for proper positioning of probe during measurement and control it by micro camera, LASER pointers and US sensors. Physician demands
from the patients to take the same position for 5 minutes on each hour, during first 10 hours. Those data we use as reference points for further
processing by our software. Based on two exponential matematical model, our software estimates the whole process of elimination of
radioactivity from the patient’s body, using reference points collected during the first day after radionuclide therapy. Based on that, physician can
predict (on first day after therapy!) when patient will be able to leave the restricted access area“. Challenge #3 Despite strict instructions given to
them by physician and nurse before administration of radionuclide therapy, some patients sometimes try to leave “restricted access area”.
Solution #3 We have developed a system which continuously monitors the corridor which a patient must use in case of an attempt to leave the
“restricted access area”. Our system consists of a survey meter equipped with pancake probe directed towards the corridor. The survey meter is
connected to a trigger circuit which gives signal in the case when the measeured count rate exceeds previously adjusted value . Trigger circuit is
connected to the programmable siren, blinking light, alarm device unit with SIM card and IP surveillance camera. On the siren we previously
recorded the voice alarm. In the case when the system is triggered, the patient will hear warning message and see blinking light. When the alarm
device is triggered it will call responsible physician and nurse on mobile phone and IP camera simultaneously records this event. System also
sending via email appropriate data about each event, when it happens. Conclusion: From our experience gained over the past 4 years, our
telemonitoring system dedicated for patients receiving radionuclide therapy ensures a high level of safety for the patient and medical staff.
HJNM 2015; 18(Suppl1); 151 Published on line: 12 December 2015
www.nuclmed.gr Hell J Nucl Med Suppl, September-December 2015 152
Brain capillaries in Alzheimer’s disease
Stavros J. Baloyannis MD, PhD, Professor Emeritus Aristotelian University of Thessaloniki, Greece, Research Institute for Alzheimer’s disease, Aristotelian University, Greece Correspondence adress: Stavros J. Baloyannis MD, PhD. Email: [email protected] Abstract
Alzheimer’s disease is the most common cause of irreversible dementia, affecting mostly the presenile and senile age, shaping
a tragic profile in the epilogue of the life of the suffering people. Due to the severity and the social impact of the disease an
ongoing research activity is in climax nowadays, associated with many legal, social, ethical, humanitarian, philosophical and
economic considerations. From the neuropathological point of view the disease is characterized by dendritic pathology, loss of
synapses and dendritic spines, affecting mostly selective neuronal networks of critical importance for memory and cognition,
such as the basal forebrain cholinergic system, the medial temporal regions, the hippocampus and many neocortical association
areas. Tau pathology consisted of intracellular accumulation of neurofibrillary tangles of hyperphosphorilated tau protein and
accumulation of Aβ-peptide’s deposits, defined as neuritic plaques, are the principal neuropathological diagnostic criteria of the
disease. The neurotoxic properties of the oligomerics of the Aβ-peptide and tau mediated neurodegeneration are among the
main causative factors of impaired synaptic plasticity, neuronal loss, dendritic alterations and tremendous synaptic loss. The
gradual degeneration of the organelles, particularly mitochondria, smooth endoplasmic reticulum and Golgi apparatus,
visualized clearly by electron microscopy (EM), emphasize the importance of the oxidative stress and amyloid toxicity in the
pathogenetic cascade of the disease. The vascular factor may be an important component of the whole spectrum of the
pathogenesis of AD. It is of substantial importance the concept that the structural alterations of the brain capillaries, may
contribute in the pathology of AD, given that the disruption of the BBB may induce exacerbation of AD pathology, by promoting
inflammation around the blood capillaries and in the neuropile space diffusely. From the morphological point of view, silver
impregnation techniques revealed a marked tortuosity of the capillaries in early cases of AD. In addition, the distance between
two branch points is longer in capillaries of AD brains, whereas the branch point density as well as the ratio of the branch point
density to astrocytic density is substantially decreased in AD in comparison with age matched normal controls. EM revealed, that
the most frequent morphological alterations of the brain capillaries in AD consist of thickness, splitting and duplication of the
basement membrane, reduction of the length of tight junctions, decrease of the number of tight junctions per vessel length,
associated as a rule, with morphological alterations of the mitochondria of the endothelial cells, the pericytes and the
perivascular astrocytic processes. The number of the pinocytotic vesicles is substantially increase in the endothelium of the
brain capillaries in AD in comparison with age matched normal controls. Endothelial cells play a very important role in the
transport systems in the brain. Subsequently, the dysfunction of the endothelial cells and the disruption of the BBB may induce
serious impairment in the transport system. The dysfunction of the brain capillaries may result in releasing neurotoxic factors,
such as thrombin, pro-inflammatory cytokines, nitric oxide and leukocyte adhesion molecules, and in abnormal regulation of Aβ-
peptide homeostasis in the brain. The impairment of the brain capillaries in structures of the brain, which are crucial for the
homeostatic equilibrium, such as the hypothalamic nuclei, may induce autonomic dysfunction, which usually occur in the
advanced stages of AD, affecting dramatically the viability of the patients. Degeneration of the pericytes is also observed
emphasizing even more the importance of the vascular factor in AD. Pericytes may serve as integrators, coordinators and
effectors of blood-brain barrier structure and maintenance, and play a key role in microvascular stability, capillary density and
angiogenesis. The correlation between AD pathology and vascular pathology, at the level of brain capillaries and BBB, raises
the rational question, whether the efficient treatment of the vascular factor might be beneficial for the patients who suffer from
AD. It is reasonable that any protection of the brain capillaries at the initial stages of the disease might contribute in the
abbreviation of the long chain of pathological alteration, which occur following the disruption of the BBB, which serves as the
essential interface between the vascular system and the brain.
HJNM 2015; 18(Suppl1); 152 Published on line: 12 December 2015
www.nuclmed.gr Hell J Nucl Med Suppl, September-December 2015 153
The importance of angiotensin II type 1 receptor gene polymorphism to losartan treatment in improving glomerulopathy in type 1 diabetic patients Boris Ajdinovic
1 MD, PhD, Tamara Dragovic
2 MD, PhD, Zvonko Magic
3 MD, PhD, Nikola Kocev
4 MD
1. Military Medical Academy, Institute of Nuclear Medicine, 2. Clinic of Endocrinology, 3. Institute for Medical Research, Belgrade, Serbia; School of Medicine, Belgrade University, 4. Institute for Informatics and Statistics, Belgrade, Serbia Correspondence adress: Boris Ajdinović, MD, PhD, Institute of Nuclear Medicine, Military Medical Academy, Belgrade, Serbia, Phone: +381 112661 647, Email: [email protected] Abstract Objective: Diabetic nephropathy (DN) is a clinical syndrome characterized by persistent albuminuria, increasing arterial blood
pressure and progressive decline in glomerular filtration rate (GFR). When persistent albuminuria is established,
antihypertensive treatment becomes most important factor in slowing the progression of diabetic glomerulopathy. Aim of this
study was to examine if renoprotective response to losartan therapy, in patients with diabetic nephropathy, depends on 1166
A/C gene polymorphism for its target receptor, angiotensin II type 1 receptor (AT1R). Subjects and Methods: The study included
35 patients with diabetes mellitus type 1 and high urinary albumin excretion rate (>30mg/24h) genotyped for the 1166 A/C gene
polymorphism for the AT1R. The participants were segregated into three genotype groups according to combinations of A or C
allele: AA-16, AC-15 and CC-4 patients. The patients received losartan 50mg daily for 4 weeks, following 100mg daily for 8
weeks. At baseline and after losartan therapy period, blood pressure, GFR (Gates method) and filtration fraction (FF) were
calculated. FF was calculated by dividing GFR by ERPF (Schlegels method). Results: GFR remained unchanged in all genotype
groups. FF was significantly reduced from baseline by 0.018±0.024 (P=0.012) only in the AC group. In the AA genotype FF was
reduced from baseline by 0.017±0.03 (P=0.052) and in the CC group by 0.01±0.008 (P=0.092). In the AA group, systolic blood
pressure declined from 136±24mmHg at baseline, to an average of 121±18mmHg at the end of the study (P=0.001). The AC
group achieved reduction from 131±10mmHg at baseline to 115±7mmHg (P=0.001) during the investigation period. In the AA
genotype group losartan reduced diastolic blood pressure from 86±13mmHg at baseline to 78±8mmHg (P=0.004), and in the AC
genotype from 88±5mmHg at baseline to 11.7±5.6mmHg during the investigation period (P=0.001). In the CC genotype diastolic
blood pressure reduction remained nonsignificant (P=0.066). Conclusion: The results of our small sample size study provide the
evidence that 1166 A/C AT1R polymorphism could be associated with the renoprotective response to losartan therapy.
HJNM 2015; 18(Suppl1); 153 Published on line: 12 December 2015
www.nuclmed.gr Hell J Nucl Med Suppl, September-December 2015 154
Sitagliptin reduces urinary microalbumin in experimental model of diabetic nephropathy Ioannis Tsavdaridis MD, Dimochristos Papadimitriou
Mst, Dora Karanikola DMD, PhD, Kostas Kalousis MD, MSc,
Areti Katsouda Mst, Maria Mironidou-Tzouveleki MD, PhD A' Laboratory of Pharmacology, Faculty of Medicine, School of Health Sciences, Aristotle University of Thessaloniki, Greece Correspondence adress: Dimochristos Papadimitriou Mst, A' Laboratory of Pharmacology, Faculty of Medicine, School of Health Sciences, Aristotle University of Thessaloniki, Greece. Email: [email protected] Abstract Objective: The term Diabetic kidney disease (DKD) refers to any disease of the kidney that is a result of long-term
hyperglycemia caused either by diabetes mellitus type 1 (DT1) or type 2 (DT2). When DKD coexists with macro albuminuria or
proteinuria the condition is called diabetic nephropathy. DKD is the primary cause of renal failure since it is responsible for the
44% of new cases presented in the U.S.A. in 2008. Sitagliptin is an inhibitor of the enzyme dipeptidyl peptidase and is used as a
treatment for diabetes since 2006. Through the inhibition of the enzyme’s action sitagliptin prevents the degradation of GLP-1
which is an endogenous peptide with significant hypoglycemic actions, particularly postprandial. The proven hypoglycemic
actions of sitagliptin led the researchers to further study the possible effects sitagliptin may have on the complications of
diabetes mellitus such as diabetic nephropathy. The purpose of the study is to examine the effect of sitagliptin on diabetic
nephropathy using biochemical parameters for assessment. Methods: 27db/db mice were used in total. They were about 4
weeks old. The mice were randomly divided into 3 groups each one consisting of 9 mice, the first 2 groups received sitagliptin
treatment over a period of 32 weeks while the third did not receive any treatment. In the first group the mice received 200mg
sitagliptin per Kg of body weight and in the second 10mg per Kg. At the end of the 32 weeks period the serum glucose, urea,
creatinine, cholesterol, LDL, HDL, hsCRP and triglycerides as well as the urinary creatinine and microalbumin were measured in
all 3 groups. Results: The first group (received 200mg/kg) in comparison to the third group (control group) exhibited a reduction
in the biochemical parameters measured: glucose -12.35% (P=0.16), urea -17.18% (P=0.61), creatinine -0.81% (P=0.95 ),
cholesterol -19.28% (P=0,09), HDL -12,25% (P=0.26), LDL -31.2% (P=0.25), triglycerides -13,9% (P=0.37), hsCRP -49.8%
(P=0.06), microalbumin -37.8% (P<0.0001). Conclusion: The administration of sitagliptin reduces in a statistically significant
manner the urinary microalbumin. In addition, hsCRP was greatly reduced but the reduction did not reach the required
significance level. The other biochemical data presented a reduction which could not be considered as statistically significant.
However, it should be mentioned that the exact mechanisms by which sitagliptin achieves this reduction in the biochemical
parameters measured, except for the glucose reduction, remain unclear. Although it is suggested that the reduction of
glucotoxicity due to sitagliptin treatment is the main reason for those results, the effects of sitagliptin on inflammation, protection
of the endothelium and reduction of arterial blood pressure might play a facilitating role.
HJNM 2015; 18(Suppl1); 154 Published on line: 12 December 2015
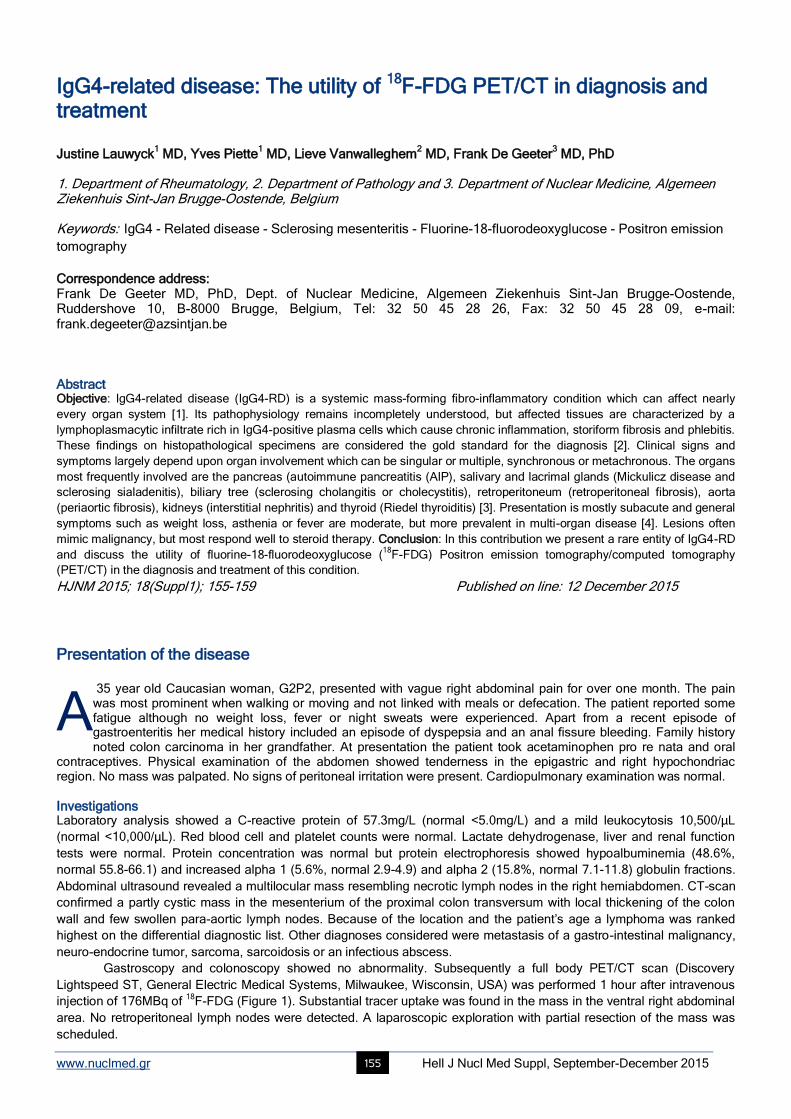
www.nuclmed.gr Hell J Nucl Med Suppl, September-December 2015 155
IgG4-related disease: The utility of 18F-FDG PET/CT in diagnosis and treatment Justine Lauwyck
1 MD, Yves Piette
1 MD, Lieve Vanwalleghem
2 MD, Frank De Geeter
3 MD, PhD
1. Department of Rheumatology, 2. Department of Pathology and 3. Department of Nuclear Medicine, Algemeen Ziekenhuis Sint-Jan Brugge-Oostende, Belgium Keywords: IgG4 - Related disease - Sclerosing mesenteritis - Fluorine-18-fluorodeoxyglucose - Positron emission
tomography Correspondence address: Frank De Geeter MD, PhD, Dept. of Nuclear Medicine, Algemeen Ziekenhuis Sint-Jan Brugge-Oostende, Ruddershove 10, B-8000 Brugge, Belgium, Tel: 32 50 45 28 26, Fax: 32 50 45 28 09, e-mail: [email protected]
Abstract Objective: IgG4-related disease (IgG4-RD) is a systemic mass-forming fibro-inflammatory condition which can affect nearly
every organ system [1]. Its pathophysiology remains incompletely understood, but affected tissues are characterized by a
lymphoplasmacytic infiltrate rich in IgG4-positive plasma cells which cause chronic inflammation, storiform fibrosis and phlebitis.
These findings on histopathological specimens are considered the gold standard for the diagnosis [2]. Clinical signs and
symptoms largely depend upon organ involvement which can be singular or multiple, synchronous or metachronous. The organs
most frequently involved are the pancreas (autoimmune pancreatitis (AIP), salivary and lacrimal glands (Mickulicz disease and
sclerosing sialadenitis), biliary tree (sclerosing cholangitis or cholecystitis), retroperitoneum (retroperitoneal fibrosis), aorta
(periaortic fibrosis), kidneys (interstitial nephritis) and thyroid (Riedel thyroiditis) [3]. Presentation is mostly subacute and general
symptoms such as weight loss, asthenia or fever are moderate, but more prevalent in multi-organ disease [4]. Lesions often
mimic malignancy, but most respond well to steroid therapy. Conclusion: In this contribution we present a rare entity of IgG4-RD
and discuss the utility of fluorine-18-fluorodeoxyglucose (18
F-FDG) Positron emission tomography/computed tomography
(PET/CT) in the diagnosis and treatment of this condition.
HJNM 2015; 18(Suppl1); 155-159 Published on line: 12 December 2015
Presentation of the disease
35 year old Caucasian woman, G2P2, presented with vague right abdominal pain for over one month. The pain was most prominent when walking or moving and not linked with meals or defecation. The patient reported some fatigue although no weight loss, fever or night sweats were experienced. Apart from a recent episode of gastroenteritis her medical history included an episode of dyspepsia and an anal fissure bleeding. Family history noted colon carcinoma in her grandfather. At presentation the patient took acetaminophen pro re nata and oral
contraceptives. Physical examination of the abdomen showed tenderness in the epigastric and right hypochondriac region. No mass was palpated. No signs of peritoneal irritation were present. Cardiopulmonary examination was normal.
Investigations Laboratory analysis showed a C-reactive protein of 57.3mg/L (normal <5.0mg/L) and a mild leukocytosis 10,500/µL
(normal <10,000/µL). Red blood cell and platelet counts were normal. Lactate dehydrogenase, liver and renal function
tests were normal. Protein concentration was normal but protein electrophoresis showed hypoalbuminemia (48.6%,
normal 55.8-66.1) and increased alpha 1 (5.6%, normal 2.9-4.9) and alpha 2 (15.8%, normal 7.1-11.8) globulin fractions.
Abdominal ultrasound revealed a multilocular mass resembling necrotic lymph nodes in the right hemiabdomen. CT-scan
confirmed a partly cystic mass in the mesenterium of the proximal colon transversum with local thickening of the colon
wall and few swollen para-aortic lymph nodes. Because of the location and the patient’s age a lymphoma was ranked
highest on the differential diagnostic list. Other diagnoses considered were metastasis of a gastro-intestinal malignancy,
neuro-endocrine tumor, sarcoma, sarcoidosis or an infectious abscess.
Gastroscopy and colonoscopy showed no abnormality. Subsequently a full body PET/CT scan (Discovery
Lightspeed ST, General Electric Medical Systems, Milwaukee, Wisconsin, USA) was performed 1 hour after intravenous
injection of 176MBq of 18
F-FDG (Figure 1). Substantial tracer uptake was found in the mass in the ventral right abdominal
area. No retroperitoneal lymph nodes were detected. A laparoscopic exploration with partial resection of the mass was
scheduled.
A
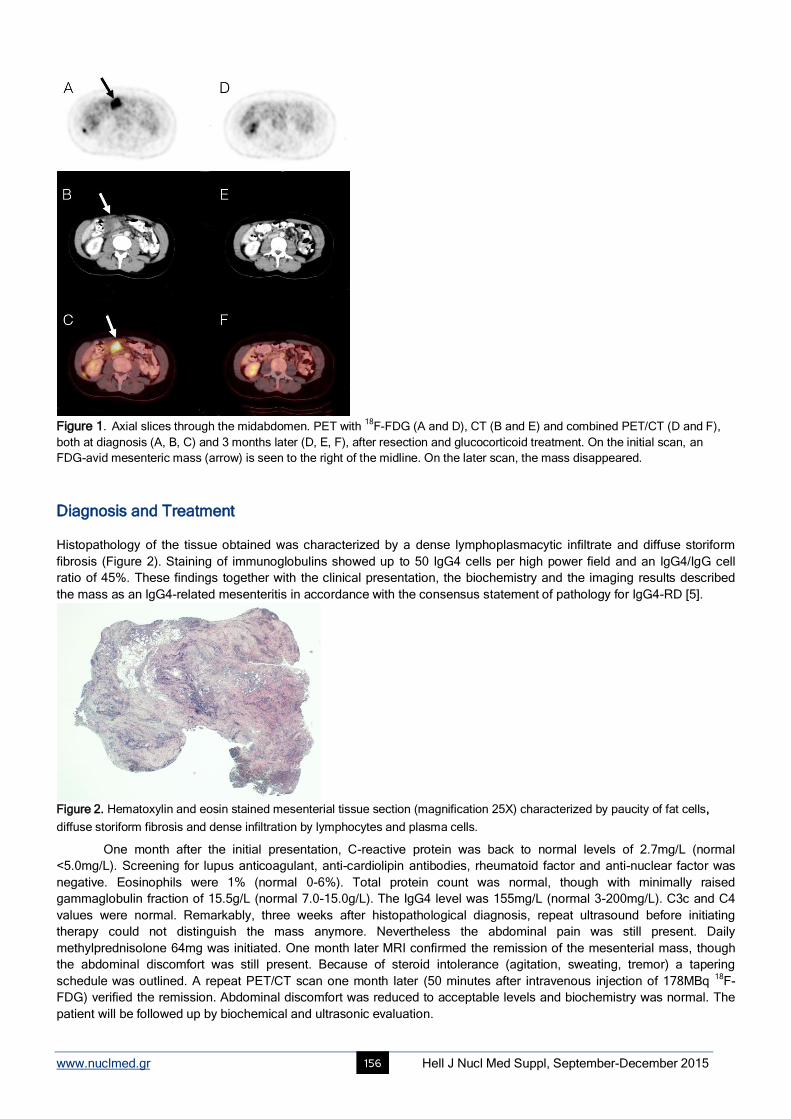
www.nuclmed.gr Hell J Nucl Med Suppl, September-December 2015 156
Figure 1. Axial slices through the midabdomen. PET with
18F-FDG (A and D), CT (B and E) and combined PET/CT (D and F),
both at diagnosis (A, B, C) and 3 months later (D, E, F), after resection and glucocorticoid treatment. On the initial scan, an
FDG-avid mesenteric mass (arrow) is seen to the right of the midline. On the later scan, the mass disappeared.
Diagnosis and Treatment Histopathology of the tissue obtained was characterized by a dense lymphoplasmacytic infiltrate and diffuse storiform
fibrosis (Figure 2). Staining of immunoglobulins showed up to 50 IgG4 cells per high power field and an IgG4/IgG cell
ratio of 45%. These findings together with the clinical presentation, the biochemistry and the imaging results described
the mass as an IgG4-related mesenteritis in accordance with the consensus statement of pathology for IgG4-RD [5].
Figure 2. Hematoxylin and eosin stained mesenterial tissue section (magnification 25X) characterized by paucity of fat cells, diffuse storiform fibrosis and dense infiltration by lymphocytes and plasma cells.
One month after the initial presentation, C-reactive protein was back to normal levels of 2.7mg/L (normal
<5.0mg/L). Screening for lupus anticoagulant, anti-cardiolipin antibodies, rheumatoid factor and anti-nuclear factor was
negative. Eosinophils were 1% (normal 0-6%). Total protein count was normal, though with minimally raised
gammaglobulin fraction of 15.5g/L (normal 7.0-15.0g/L). The IgG4 level was 155mg/L (normal 3-200mg/L). C3c and C4
values were normal. Remarkably, three weeks after histopathological diagnosis, repeat ultrasound before initiating
therapy could not distinguish the mass anymore. Nevertheless the abdominal pain was still present. Daily
methylprednisolone 64mg was initiated. One month later MRI confirmed the remission of the mesenterial mass, though
the abdominal discomfort was still present. Because of steroid intolerance (agitation, sweating, tremor) a tapering
schedule was outlined. A repeat PET/CT scan one month later (50 minutes after intravenous injection of 178MBq 18
F-
FDG) verified the remission. Abdominal discomfort was reduced to acceptable levels and biochemistry was normal. The
patient will be followed up by biochemical and ultrasonic evaluation.
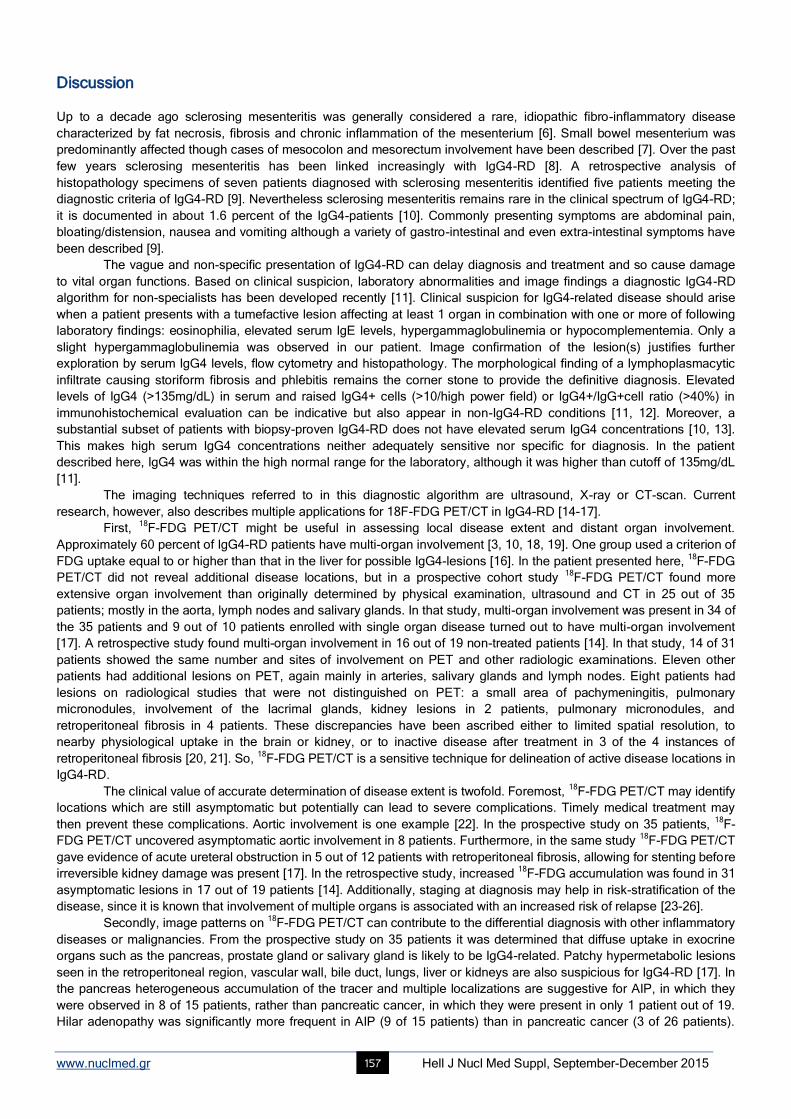
www.nuclmed.gr Hell J Nucl Med Suppl, September-December 2015 157
Discussion Up to a decade ago sclerosing mesenteritis was generally considered a rare, idiopathic fibro-inflammatory disease
characterized by fat necrosis, fibrosis and chronic inflammation of the mesenterium [6]. Small bowel mesenterium was
predominantly affected though cases of mesocolon and mesorectum involvement have been described [7]. Over the past
few years sclerosing mesenteritis has been linked increasingly with IgG4-RD [8]. A retrospective analysis of
histopathology specimens of seven patients diagnosed with sclerosing mesenteritis identified five patients meeting the
diagnostic criteria of IgG4-RD [9]. Nevertheless sclerosing mesenteritis remains rare in the clinical spectrum of IgG4-RD;
it is documented in about 1.6 percent of the IgG4-patients [10]. Commonly presenting symptoms are abdominal pain,
bloating/distension, nausea and vomiting although a variety of gastro-intestinal and even extra-intestinal symptoms have
been described [9].
The vague and non-specific presentation of IgG4-RD can delay diagnosis and treatment and so cause damage
to vital organ functions. Based on clinical suspicion, laboratory abnormalities and image findings a diagnostic IgG4-RD
algorithm for non-specialists has been developed recently [11]. Clinical suspicion for IgG4-related disease should arise
when a patient presents with a tumefactive lesion affecting at least 1 organ in combination with one or more of following
laboratory findings: eosinophilia, elevated serum IgE levels, hypergammaglobulinemia or hypocomplementemia. Only a
slight hypergammaglobulinemia was observed in our patient. Image confirmation of the lesion(s) justifies further
exploration by serum IgG4 levels, flow cytometry and histopathology. The morphological finding of a lymphoplasmacytic
infiltrate causing storiform fibrosis and phlebitis remains the corner stone to provide the definitive diagnosis. Elevated
levels of IgG4 (>135mg/dL) in serum and raised IgG4+ cells (>10/high power field) or IgG4+/IgG+cell ratio (>40%) in
immunohistochemical evaluation can be indicative but also appear in non-IgG4-RD conditions [11, 12]. Moreover, a
substantial subset of patients with biopsy-proven IgG4-RD does not have elevated serum IgG4 concentrations [10, 13].
This makes high serum IgG4 concentrations neither adequately sensitive nor specific for diagnosis. In the patient
described here, IgG4 was within the high normal range for the laboratory, although it was higher than cutoff of 135mg/dL
[11].
The imaging techniques referred to in this diagnostic algorithm are ultrasound, X-ray or CT-scan. Current
research, however, also describes multiple applications for 18F-FDG PET/CT in IgG4-RD [14-17].
First, 18
F-FDG PET/CT might be useful in assessing local disease extent and distant organ involvement.
Approximately 60 percent of IgG4-RD patients have multi-organ involvement [3, 10, 18, 19]. One group used a criterion of
FDG uptake equal to or higher than that in the liver for possible IgG4-lesions [16]. In the patient presented here, 18
F-FDG
PET/CT did not reveal additional disease locations, but in a prospective cohort study 18
F-FDG PET/CT found more
extensive organ involvement than originally determined by physical examination, ultrasound and CT in 25 out of 35
patients; mostly in the aorta, lymph nodes and salivary glands. In that study, multi-organ involvement was present in 34 of
the 35 patients and 9 out of 10 patients enrolled with single organ disease turned out to have multi-organ involvement
[17]. A retrospective study found multi-organ involvement in 16 out of 19 non-treated patients [14]. In that study, 14 of 31
patients showed the same number and sites of involvement on PET and other radiologic examinations. Eleven other
patients had additional lesions on PET, again mainly in arteries, salivary glands and lymph nodes. Eight patients had
lesions on radiological studies that were not distinguished on PET: a small area of pachymeningitis, pulmonary
micronodules, involvement of the lacrimal glands, kidney lesions in 2 patients, pulmonary micronodules, and
retroperitoneal fibrosis in 4 patients. These discrepancies have been ascribed either to limited spatial resolution, to
nearby physiological uptake in the brain or kidney, or to inactive disease after treatment in 3 of the 4 instances of
retroperitoneal fibrosis [20, 21]. So, 18
F-FDG PET/CT is a sensitive technique for delineation of active disease locations in
IgG4-RD.
The clinical value of accurate determination of disease extent is twofold. Foremost, 18
F-FDG PET/CT may identify
locations which are still asymptomatic but potentially can lead to severe complications. Timely medical treatment may
then prevent these complications. Aortic involvement is one example [22]. In the prospective study on 35 patients, 18
F-
FDG PET/CT uncovered asymptomatic aortic involvement in 8 patients. Furthermore, in the same study 18
F-FDG PET/CT
gave evidence of acute ureteral obstruction in 5 out of 12 patients with retroperitoneal fibrosis, allowing for stenting before
irreversible kidney damage was present [17]. In the retrospective study, increased 18
F-FDG accumulation was found in 31
asymptomatic lesions in 17 out of 19 patients [14]. Additionally, staging at diagnosis may help in risk-stratification of the
disease, since it is known that involvement of multiple organs is associated with an increased risk of relapse [23-26].
Secondly, image patterns on 18
F-FDG PET/CT can contribute to the differential diagnosis with other inflammatory
diseases or malignancies. From the prospective study on 35 patients it was determined that diffuse uptake in exocrine
organs such as the pancreas, prostate gland or salivary gland is likely to be IgG4-related. Patchy hypermetabolic lesions
seen in the retroperitoneal region, vascular wall, bile duct, lungs, liver or kidneys are also suspicious for IgG4-RD [17]. In
the pancreas heterogeneous accumulation of the tracer and multiple localizations are suggestive for AIP, in which they
were observed in 8 of 15 patients, rather than pancreatic cancer, in which they were present in only 1 patient out of 19.
Hilar adenopathy was significantly more frequent in AIP (9 of 15 patients) than in pancreatic cancer (3 of 26 patients).
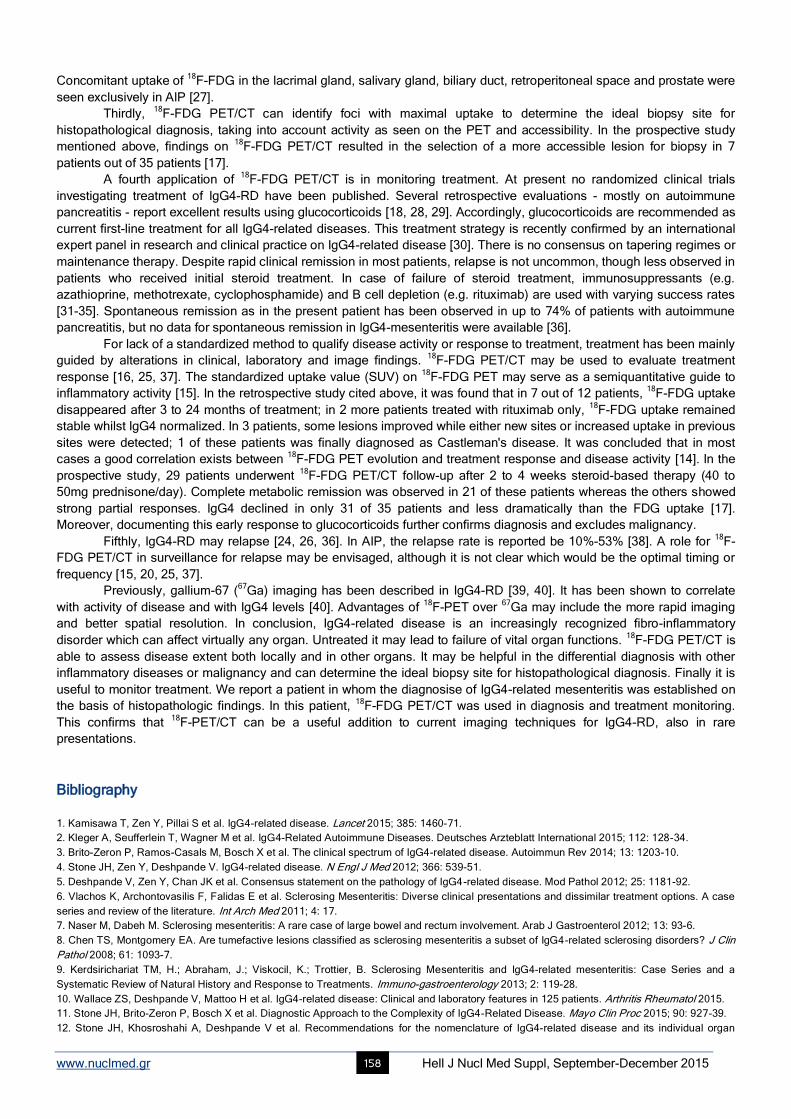
www.nuclmed.gr Hell J Nucl Med Suppl, September-December 2015 158
Concomitant uptake of 18
F-FDG in the lacrimal gland, salivary gland, biliary duct, retroperitoneal space and prostate were
seen exclusively in AIP [27].
Thirdly, 18
F-FDG PET/CT can identify foci with maximal uptake to determine the ideal biopsy site for
histopathological diagnosis, taking into account activity as seen on the PET and accessibility. In the prospective study
mentioned above, findings on 18
F-FDG PET/CT resulted in the selection of a more accessible lesion for biopsy in 7
patients out of 35 patients [17].
A fourth application of 18
F-FDG PET/CT is in monitoring treatment. At present no randomized clinical trials
investigating treatment of IgG4-RD have been published. Several retrospective evaluations - mostly on autoimmune
pancreatitis - report excellent results using glucocorticoids [18, 28, 29]. Accordingly, glucocorticoids are recommended as
current first-line treatment for all IgG4-related diseases. This treatment strategy is recently confirmed by an international
expert panel in research and clinical practice on IgG4-related disease [30]. There is no consensus on tapering regimes or
maintenance therapy. Despite rapid clinical remission in most patients, relapse is not uncommon, though less observed in
patients who received initial steroid treatment. In case of failure of steroid treatment, immunosuppressants (e.g.
azathioprine, methotrexate, cyclophosphamide) and B cell depletion (e.g. rituximab) are used with varying success rates
[31-35]. Spontaneous remission as in the present patient has been observed in up to 74% of patients with autoimmune
pancreatitis, but no data for spontaneous remission in IgG4-mesenteritis were available [36].
For lack of a standardized method to qualify disease activity or response to treatment, treatment has been mainly
guided by alterations in clinical, laboratory and image findings. 18
F-FDG PET/CT may be used to evaluate treatment
response [16, 25, 37]. The standardized uptake value (SUV) on 18
F-FDG PET may serve as a semiquantitative guide to
inflammatory activity [15]. In the retrospective study cited above, it was found that in 7 out of 12 patients, 18
F-FDG uptake
disappeared after 3 to 24 months of treatment; in 2 more patients treated with rituximab only, 18
F-FDG uptake remained
stable whilst IgG4 normalized. In 3 patients, some lesions improved while either new sites or increased uptake in previous
sites were detected; 1 of these patients was finally diagnosed as Castleman's disease. It was concluded that in most
cases a good correlation exists between 18
F-FDG PET evolution and treatment response and disease activity [14]. In the
prospective study, 29 patients underwent 18
F-FDG PET/CT follow-up after 2 to 4 weeks steroid-based therapy (40 to
50mg prednisone/day). Complete metabolic remission was observed in 21 of these patients whereas the others showed
strong partial responses. IgG4 declined in only 31 of 35 patients and less dramatically than the FDG uptake [17].
Moreover, documenting this early response to glucocorticoids further confirms diagnosis and excludes malignancy.
Fifthly, IgG4-RD may relapse [24, 26, 36]. In AIP, the relapse rate is reported be 10%-53% [38]. A role for 18
F-
FDG PET/CT in surveillance for relapse may be envisaged, although it is not clear which would be the optimal timing or
frequency [15, 20, 25, 37].
Previously, gallium-67 (67
Ga) imaging has been described in IgG4-RD [39, 40]. It has been shown to correlate
with activity of disease and with IgG4 levels [40]. Advantages of 18
F-PET over 67
Ga may include the more rapid imaging
and better spatial resolution. In conclusion, IgG4-related disease is an increasingly recognized fibro-inflammatory
disorder which can affect virtually any organ. Untreated it may lead to failure of vital organ functions. 18
F-FDG PET/CT is
able to assess disease extent both locally and in other organs. It may be helpful in the differential diagnosis with other
inflammatory diseases or malignancy and can determine the ideal biopsy site for histopathological diagnosis. Finally it is
useful to monitor treatment. We report a patient in whom the diagnosise of IgG4-related mesenteritis was established on
the basis of histopathologic findings. In this patient, 18
F-FDG PET/CT was used in diagnosis and treatment monitoring.
This confirms that 18
F-PET/CT can be a useful addition to current imaging techniques for IgG4-RD, also in rare
presentations.
Bibliography 1. Kamisawa T, Zen Y, Pillai S et al. IgG4-related disease. Lancet 2015; 385: 1460-71.
2. Kleger A, Seufferlein T, Wagner M et al. IgG4-Related Autoimmune Diseases. Deutsches Arzteblatt International 2015; 112: 128-34.
3. Brito-Zeron P, Ramos-Casals M, Bosch X et al. The clinical spectrum of IgG4-related disease. Autoimmun Rev 2014; 13: 1203-10.
4. Stone JH, Zen Y, Deshpande V. IgG4-related disease. N Engl J Med 2012; 366: 539-51.
5. Deshpande V, Zen Y, Chan JK et al. Consensus statement on the pathology of IgG4-related disease. Mod Pathol 2012; 25: 1181-92.
6. Vlachos K, Archontovasilis F, Falidas E et al. Sclerosing Mesenteritis: Diverse clinical presentations and dissimilar treatment options. A case
series and review of the literature. Int Arch Med 2011; 4: 17.
7. Naser M, Dabeh M. Sclerosing mesenteritis: A rare case of large bowel and rectum involvement. Arab J Gastroenterol 2012; 13: 93-6.
8. Chen TS, Montgomery EA. Are tumefactive lesions classified as sclerosing mesenteritis a subset of IgG4-related sclerosing disorders? J Clin
Pathol 2008; 61: 1093-7.
9. Kerdsirichariat TM, H.; Abraham, J.; Viskocil, K.; Trottier, B. Sclerosing Mesenteritis and IgG4-related mesenteritis: Case Series and a
Systematic Review of Natural History and Response to Treatments. Immuno-gastroenterology 2013; 2: 119-28.
10. Wallace ZS, Deshpande V, Mattoo H et al. IgG4-related disease: Clinical and laboratory features in 125 patients. Arthritis Rheumatol 2015.
11. Stone JH, Brito-Zeron P, Bosch X et al. Diagnostic Approach to the Complexity of IgG4-Related Disease. Mayo Clin Proc 2015; 90: 927-39.
12. Stone JH, Khosroshahi A, Deshpande V et al. Recommendations for the nomenclature of IgG4-related disease and its individual organ

www.nuclmed.gr Hell J Nucl Med Suppl, September-December 2015 159
system manifestations. Arthritis Rheum 2012; 64: 3061-7.
13. Carruthers MN, Khosroshahi A, Augustin T et al. The diagnostic utility of serum IgG4 concentrations in IgG4-related disease. Ann Rheum
Dis 2015; 74: 14-8.
14. Ebbo M, Grados A, Guedj E et al. Usefulness of 2-[18F]-fluoro-2-deoxy-D-glucose-positron emission tomography/computed tomography for
staging and evaluation of treatment response in IgG4-related disease: a retrospective multicenter study. Arthritis Care Res (Hoboken) 2014; 66:
86-96.
15. Nakatani K, Nakamoto Y, Togashi K. Utility of FDG PET/CT in IgG4-related systemic disease. Clin Radiol 2012; 67: 297-305.
16. Takahashi H, Yamashita H, Morooka M et al. The utility of FDG-PET/CT and other imaging techniques in the evaluation of IgG4-related
disease. Joint Bone Spine 2014; 81: 331-6.
17. Zhang J, Chen H, Ma Y et al. Characterizing IgG4-related disease with (1)(8)F-FDG PET/CT: a prospective cohort study. Eur J Nucl Med
Mol Imaging 2014; 41: 1624-34.
18. Ebbo M, Daniel L, Pavic M et al. IgG4-related systemic disease: features and treatment response in a French cohort: results of a multicenter
registry. Medicine (Baltimore) 2012; 91: 49-56.
19. Zen Y, Nakanuma Y. IgG4-related disease: a cross-sectional study of 114 cases. Am J Surg Pathol 2010; 34: 1812-9.
20. Vaglio A, Greco P, Versari A et al. Post-treatment residual tissue in idiopathic retroperitoneal fibrosis: active residual disease or silent "scar"
? A study using 18F-fluorodeoxyglucose positron emission tomography. Clin Exp Rheumatol 2005; 23: 231-4.
21. Vaglio A, Versari A, Fraternali A et al. (18)F-fluorodeoxyglucose positron emission tomography in the diagnosis and followup of idiopathic
retroperitoneal fibrosis. Arthritis Rheum 2005; 53: 122-5.
22. Agaimy A, Weyand M, Strecker T. Inflammatory thoracic aortic aneurysm (lymphoplasmacytic thoracic aortitis): a 13-year-experience at a
German Heart Center with emphasis on possible role of IgG4. Int J Clin Exp Pathol 2013; 6: 1713-22.
23. Detlefsen S, Zamboni G, Frulloni L et al. Clinical features and relapse rates after surgery in type 1 autoimmune pancreat itis differ from type
2: a study of 114 surgically treated European patients. Pancreatology 2012; 12: 276-83.
24. Hart PA, Kamisawa T, Brugge WR et al. Long-term outcomes of autoimmune pancreatitis: a multicentre, international analysis. Gut 2013; 62:
1771-6.
25. Matsubayashi H, Furukawa H, Maeda A et al. Usefulness of positron emission tomography in the evaluation of distribution and activity of
systemic lesions associated with autoimmune pancreatitis. Pancreatology 2009; 9: 694-9.
26. Yamamoto M, Takahashi H, Ishigami K et al. Relapse patterns in IgG4-related disease. Ann Rheum Dis 2012; 71: 1755.
27. Ozaki Y, Oguchi K, Hamano H et al. Differentiation of autoimmune pancreatitis from suspected pancreatic cancer by fluorine-18
fluorodeoxyglucose positron emission tomography. J Gastroenterol 2008; 43: 144-51.
28. Kamisawa T, Okazaki K, Kawa S et al. Amendment of the Japanese Consensus Guidelines for Autoimmune Pancreatitis, 2013 III. Treatment
and prognosis of autoimmune pancreatitis. J Gastroenterol 2014; 49: 961-70.
29. Tomiyama T, Uchida K, Matsushita M et al. Comparison of steroid pulse therapy and conventional oral steroid therapy as initial treatment for
autoimmune pancreatitis. J Gastroenterol 2011; 46: 696-704.
30. Khosroshahi A, Wallace ZS, Crowe JL et al. International Consensus Guidance Statement on the Management and Treatment of IgG4-
Related Disease. Arthritis Rheumatol 2015; 67: 1688-99.
31. Yamamoto M, Awakawa T, Takahashi H. Is rituximab effective for IgG4-related disease in the long term? Experience of cases treated with
rituximab for 4 years. Ann Rheum Dis 2015; 74: e46.
32. Della-Torre E, Campochiaro C, Bozzolo EP et al. Methotrexate for maintenance of remission in IgG4-related disease. Rheumatology
(Oxford) 2015.
33. Carruthers MN, Topazian MD, Khosroshahi A et al. Rituximab for IgG4-related disease: a prospective, open-label trial. Ann Rheum Dis 2015;
74: 1171-7.
34. Hart PA, Topazian MD, Witzig TE et al. Treatment of relapsing autoimmune pancreatitis with immunomodulators and rituximab: the Mayo
Clinic experience. Gut 2013; 62: 1607-15.
35. Khosroshahi A, Carruthers MN, Deshpande V et al. Rituximab for the treatment of IgG4-related disease: lessons from 10 consecutive
patients. Medicine (Baltimore) 2012; 91: 57-66.
36. Kamisawa T, Shimosegawa T, Okazaki K et al. Standard steroid treatment for autoimmune pancreatitis. Gut 2009; 58: 1504-7.
37. Nakajo M, Jinnouchi S, Noguchi M et al. FDG PET and PET/CT monitoring of autoimmune pancreatitis associated with extrapancreatic
autoimmune disease. Clin Nucl Med 2007; 32: 282-5.
38 Kamisawa T, Okazaki K, Kawa S et al. Japanese consensus guidelines for management of autoimmune pancreatitis: III. Treatment and
prognosis of AIP. J Gastroenterol 2010; 45: 471-7.
39. Momose M, Kadoya M, Yano K et al. Semiquantitative measurement of pulmonary hilar gallium-67 uptake using single photon emission
computed tomography/computed tomography for the diagnosis of autoimmune pancreatitis. Jpn J Radiol 2010; 28: 733-9.
40. Saegusa H, Momose M, Kawa S et al. Hilar and pancreatic gallium-67 accumulation is characteristic feature of autoimmune pancreatitis.
Pancreas 2003; 27: 20-5.
www.nuclmed.gr Hell J Nucl Med Suppl, September-December 2015 160
Can tumor necrosis factor a (TNF-a) and interleukin 6 (IL-6) be used as prognostic markers of infection following ureteroscopic lithrotripsy and extracorporeal shock wave lithotripsy for ureteral stones? Athanasios Bantis
1 MD, MsC, PhD, Georgios Tsakaldimis
1 MD, Athanasios Zissimopoulos
2 MD, PhD, Christos
Kalaitzis1 MD, PhD, Stilianos Gianakopoulos
1 MD, PhD, Michail Pitiakoudis
3 MD, PhD, Alexandros Polichronidis
3
MD, PhD, Stavros Touloupidis1 MD, PhD
1. Urology Department, 2. Department of Nuclear Medicine, 3. Department General Surgery University General Hospital of Alexandroupolis
Correspondence address: Athanasios Bantis MD, MsC, PhD, Urology Department, University Hospital of Alexandroupolis, PC 68100,
Alexandroupolis, Greece
Abstract Objective: Ureteroscopic lithotripsy (URS) and Extracorporeal shock wave lithotripsy (ESWL) are highly effective for the
treatment of uretral lithiasis and remain the treatment option for the majority of patients for more than two decades. In the
present study we aimed to evaluate the levels of serum tumor necrosis factor A (TNFa) and interleucin 6 (IL6) in patients
undergoing ESWL and URS. Subjects and Methods: A total number of seventy patients were involved in our study. Thirty
patients (17 males, 13 females), with a mean age of 43 had underwent ESWL and thirty patients (19 males, 11 females), with a
mean age of 47 (range: 26-68) underwent URS lithotripsy. Ten healthy volunteers serving as the control group were enrolled in
this study. Serum samples for TNF-a and IL-6 were obtained before URS and ESWL and after the procedure at 1, 24, and 48
hours and at 2, 24, and 48 hours, respectively. The pre ESWL/URS and post ESWL/URS levels were compared and correlated
with possible tissue damage. According to ESWL procedure we found that serumTNF-a levels were significantly increased after
one hour (P<0,001) and after 24 hours (P=0.007). Furthermore, IL-6was significantly increased at 2 (P< 0,001), 24 and 48 hours
post ESWL (P=0,003 and 0,002) respectively. For URS serum TNF-a levels were statistical significantly correlated
preoperatively with one hour (P=0,0083) and 48 hours (P<0,001) after URS and IL-6 with 2 and 24 hours (P<0,001). In 3
patients for URS and 1 for ESWL we observed post procedure fever (>38.5C0). All those patients had preoperatively high values
of TNF-a and Il-6 that increased at 1 and 2-hours respectively. In conclusion, high pre ESWL/URS levels of serum TNF-a and IL-
6 may indicate a predisposition for post ESWL/URS inflammation and infection following URS lithotripsy or ESWL procedure.
HJNM 2015; 18(Suppl1); 160 Published on line: 12 December 2015
Related Documents