Kinetics of selenium release in mine waste from the Meade Peak Phosphatic Shale, Phosphoria Formation, Wooley Valley, Idaho, USA Lisa L. Stillings a, ⁎, Michael C. Amacher b a U.S. Geological Survey, MS-176, University of Nevada, Reno, Reno, NV 89557, United States b U.S. Forest Service, Rocky Mountain Research Station, Forestry Sciences Lab, 860 N 1200 E, Logan, UT 84321, United States abstract article info Article history: Received 23 February 2009 Received in revised form 23 October 2009 Accepted 26 October 2009 Keywords: Selenium Oxidation kinetics Leaching Black shale Marine shale Phosphoria Formation Phosphorite from the Meade Peak Phosphatic Shale member of the Permian Phosphoria Formation has been mined in southeastern Idaho since 1906. Dumps of waste rock from mining operations contain high concentrations of Se which readily leach into nearby streams and wetlands. While the most common mineralogical residence of Se in the phosphatic shale is elemental Se, Se(0), Se is also an integral component of sulfide phases (pyrite, sphalerite and vaesite–pyrite ss ) in the waste rock. It may also be present as adsorbed selenate and/or selenite, and FeSe 2 and organo-selenides. Se release from the waste rock has been observed in field and laboratory experiments. Release rates calculated from waste rock dump and column leachate solutions describe the net, overall Se release from all of the possible sources of Se listed above. In field studies, Se concentration in seepage water (pH 7.4–7.8) from the Wooley Valley Unit 4 dump ranges from 3600 μg/L in May to 10 μg/L by Sept. Surface water flow, Q, from the seep also declines over the summer, from 2 L/s in May to 0.03 L/s in Sept. Se flux ([Se] ⁎ Q) reaches a steady-state of b 150 mg/day in 1–4 months, depending upon the volume of Q. Se release (mg/L) follows a first order reaction with a rate constant, k, = 1.35 – 6.35e−3h −1 (11.8–55.6 yr −1 ). Laboratory experiments were performed with the waste shale in packed bed reactors; residence time varied from 0.09 to 400 h and outlet pH ∼ 7.5. Here, Se concentration increased with increasing residence time and release was modeled with a first order reaction with k = 2.19e−3h −1 (19.2 yr −1 ). Rate constants reported here fall within an order of magnitude of reported rate constants for oxidation of Se (0) formed by bacterial precipitation. This similarity among rate constants from both field and laboratory studies combined with the direct observation of Se(0) in waste shales of the Phosphoria Formation suggests that oxidation of Se(0) may control steady-state Se concentration in water draining the Wooley Valley waste dump. Published by Elsevier B.V. 1. Introduction An elevated concentration of selenium, Se, in the environment is a critical concern due to its link with deaths, deformities, and birth defects in waterfowl, wildlife, and domestic stock. Much of the attention has been focused on drainage water from agricultural lands, because Se-rich irrigation drainage in the Kesterson Reservoir, CA, caused significant waterfowl mortality and deformity in the early-mid 1980s (Presser, 1994). Indeed, many agricultural lands in the western U.S. are underlain by Se-rich, Cretaceous marine shales and exhibit elevated Se concentra- tions in associated surface water, bottom sediments, and biota samples (Engberg and Sylvester, 1993; Seiler et al., 2003). Weathering of exposed Cretaceous shales has been cited as the major source of Se to the environment (McNeal and Balistrieri, 1989). Irrigation of agricultural land is not the only pathway for mobili- zation and transport of Se, however. Other activities that release Se to the environment include coal mining and combustion; gold, silver, and phosphate mining; metal smelting; municipal landfills; and oil transport, refining, and utilization (Lemly, 2002). This present paper focuses on the magnitude and rate of release of Se from phosphate mining activities in the Permian-aged Phosphoria Formation. The Phosphoria Formation is a marine black shale that occurs in a 350,000 km 2 region in Idaho, Wyoming, Montana, Utah, and Nevada, and forms one of the largest occurrences of phosphate rock in the world (Hein et al., 2004). Phosphate mining began in the region in 1906 and continues to the present day. However, in addition to the abundant phosphate component in the shale (up to 20% in the Meade Peak Member of the unit), the Phosphoria also contains trace elements associated with the marine components. These elements, including Ag, Cd, Cr, Cu, Mo, Ni, Se, V, and Zn, were associated with the marine plankton that comprised much of the organic fraction of the sediment when it was originally deposited in a shallow marginal sea (Piper, 1999; Hein et al., 2004). Elevated concentrations of these trace elements, and Chemical Geology 269 (2010) 113–123 ⁎ Corresponding author. Tel.: +1 775 784 5803. E-mail address: [email protected] (L.L. Stillings). 0009-2541/$ – see front matter. Published by Elsevier B.V. doi:10.1016/j.chemgeo.2009.10.011 Contents lists available at ScienceDirect Chemical Geology journal homepage: www.elsevier.com/locate/chemgeo

Welcome message from author
This document is posted to help you gain knowledge. Please leave a comment to let me know what you think about it! Share it to your friends and learn new things together.
Transcript

Chemical Geology 269 (2010) 113–123
Contents lists available at ScienceDirect
Chemical Geology
j ourna l homepage: www.e lsev ie r.com/ locate /chemgeo
Kinetics of selenium release in mine waste from the Meade Peak Phosphatic Shale,Phosphoria Formation, Wooley Valley, Idaho, USA
Lisa L. Stillings a,⁎, Michael C. Amacher b
a U.S. Geological Survey, MS-176, University of Nevada, Reno, Reno, NV 89557, United Statesb U.S. Forest Service, Rocky Mountain Research Station, Forestry Sciences Lab, 860 N 1200 E, Logan, UT 84321, United States
⁎ Corresponding author. Tel.: +1 775 784 5803.E-mail address: [email protected] (L.L. Stillings).
0009-2541/$ – see front matter. Published by Elsevierdoi:10.1016/j.chemgeo.2009.10.011
a b s t r a c t
a r t i c l e i n f oArticle history:Received 23 February 2009Received in revised form 23 October 2009Accepted 26 October 2009
Keywords:SeleniumOxidation kineticsLeachingBlack shaleMarine shalePhosphoria Formation
Phosphorite from the Meade Peak Phosphatic Shale member of the Permian Phosphoria Formation has beenmined in southeastern Idaho since 1906. Dumps of waste rock from mining operations contain highconcentrations of Se which readily leach into nearby streams and wetlands. While the most commonmineralogical residence of Se in the phosphatic shale is elemental Se, Se(0), Se is also an integral componentof sulfide phases (pyrite, sphalerite and vaesite–pyritess) in the waste rock. It may also be present asadsorbed selenate and/or selenite, and FeSe2 and organo-selenides.Se release from the waste rock has been observed in field and laboratory experiments. Release ratescalculated from waste rock dump and column leachate solutions describe the net, overall Se release from allof the possible sources of Se listed above. In field studies, Se concentration in seepage water (pH 7.4–7.8)from the Wooley Valley Unit 4 dump ranges from 3600 µg/L in May to 10 µg/L by Sept. Surface water flow, Q,from the seep also declines over the summer, from 2 L/s in May to 0.03 L/s in Sept. Se flux ([Se]⁎Q) reaches asteady-state of b150 mg/day in 1–4 months, depending upon the volume of Q. Se release (mg/L) follows afirst order reaction with a rate constant, k,=1.35–6.35e−3 h−1 (11.8–55.6 yr−1).Laboratory experiments were performed with the waste shale in packed bed reactors; residence time variedfrom 0.09 to 400 h and outlet pH∼7.5. Here, Se concentration increased with increasing residence time andrelease was modeled with a first order reaction with k=2.19e−3 h−1 (19.2 yr−1).Rate constants reported here fall within an order of magnitude of reported rate constants for oxidation of Se(0) formed by bacterial precipitation. This similarity among rate constants from both field and laboratorystudies combined with the direct observation of Se(0) in waste shales of the Phosphoria Formation suggeststhat oxidation of Se(0) may control steady-state Se concentration in water draining the Wooley Valley wastedump.
B.V.
Published by Elsevier B.V.
1. Introduction
An elevated concentration of selenium, Se, in the environment is acritical concern due to its linkwith deaths, deformities, and birth defectsin waterfowl, wildlife, and domestic stock. Much of the attention hasbeen focused ondrainagewater from agricultural lands, because Se-richirrigation drainage in the Kesterson Reservoir, CA, caused significantwaterfowl mortality and deformity in the early-mid 1980s (Presser,1994). Indeed,many agricultural lands in thewestern U.S. are underlainby Se-rich, Cretaceousmarine shales and exhibit elevated Se concentra-tions in associated surface water, bottom sediments, and biota samples(Engberg and Sylvester, 1993; Seiler et al., 2003). Weathering ofexposed Cretaceous shales has been cited as the major source of Se tothe environment (McNeal and Balistrieri, 1989).
Irrigation of agricultural land is not the only pathway for mobili-zation and transport of Se, however. Other activities that release Se tothe environment include coal mining and combustion; gold, silver, andphosphate mining; metal smelting; municipal landfills; and oiltransport, refining, and utilization (Lemly, 2002). This present paperfocuses on the magnitude and rate of release of Se from phosphatemining activities in the Permian-aged Phosphoria Formation.
The Phosphoria Formation is a marine black shale that occurs in a350,000 km2 region in Idaho, Wyoming, Montana, Utah, and Nevada,and forms one of the largest occurrences of phosphate rock in theworld(Hein et al., 2004). Phosphate mining began in the region in 1906 andcontinues to the present day. However, in addition to the abundantphosphate component in the shale (up to 20% in the Meade PeakMember of the unit), the Phosphoria also contains trace elementsassociated with the marine components. These elements, including Ag,Cd, Cr, Cu, Mo, Ni, Se, V, and Zn, were associated with the marineplankton that comprised much of the organic fraction of the sedimentwhen it was originally deposited in a shallowmarginal sea (Piper, 1999;Hein et al., 2004). Elevated concentrations of these trace elements, and

Fig. 1. Schematic of the plug flow reactors used in this study. The mass balance (Eq. (1))is written for a differentially thin package of fluid, ΔV, and then integrated along thelength of the column. Cin and Cout are concentrations in fluid flowing into and out of thevolume element, ΔV, respectively.
114 L.L. Stillings, M.C. Amacher / Chemical Geology 269 (2010) 113–123
phosphate, were produced due to the loss of ∼90% of the host organicmatter during diagenesis, from retention of nutrients (phosphate) bythe sediment, and because of low influx of other, diluting, terrigenoussediments (Piper, 2001).
Phosphorite rock within the Phosphoria Fm. contains an averageSe concentration of 30 mg/kg, with a maximum concentration of800 mg/kg. Associated mudstones have an average concentration of14 mg/kg and a maximum concentration of 1500 mg/kg Se (Buck andJones, 2002). Mining activities over the past century have amplifiedthe natural release of potentially toxic trace elements, including Se, tothe environment.
Release of Se has been a major concern in southeast Idaho. In 1996,several horses pastured near a phosphatewaste dumpwere euthanizeddue to severe selenium toxicosis. Since then many more horses and afew hundred sheep have died from eating Se contaminated forage.Aquatic invertebrates, salamanders, and birds have been found withhigh concentrations of Se, and advisories for human consumption offishand elk livers have been issued (Tetra Tech EM Inc., 2002; GreaterYellowstone Coalition, 2006).
Several management strategies to limit Se release have beensuggested and adopted by mining companies and land managers insoutheastern Idaho. These include new designs of waste dumps to limitwater flow to seleniferous materials, changes in seed mixtures forrevegetating slopes, and soil amendments for limiting Se uptake byplants (Agriumet al., 2005;Mackowiak and Amacher, 2008). In order todesign treatment methods for Se in drainage from the waste dump it isfirst necessary to estimate the magnitude of Se release over time. Ourexperiments were designed to measure the rate constant of Se releasefrom the waste rock produced as a byproduct of phosphate mining insoutheastern Idaho.
2. Methods
2.1. Laboratory experiments
2.1.1. MaterialsThe black shale used in these experiments was a bulk composite
sample collected from an exposed outcrop of theMeade PeakMemberof the Phosphoria Formation at Maybe Canyon in southeastern ID.Previous chemical analyses of this sample determined a total Seconcentration of 111 mg/kg, oxalate extractable Se of 27.8 mg/kg, andsaturated paste water extractable Se of 0.72 mg/kg (Mackowiak andAmacher, 2008).
Shale samples were prepared by sieving to b0.25 in. (0.635 cm) inthefield and air-drying at ambient temperature in trays on greenhousebenches. The sample was not sieved to a range of grain sizes; this wasunnecessary because the sample disaggregated upon wetting.
2.1.2. Experimental set-upPlug flow reactors (also called packed bed reactors; flow cells from
Soil Measurement Systems, Tucson, AZ) were used for the experiments(Fig. 1). Several reactor sizes (Table 1) were employed in order toprovide a range of residence times, necessary for data analysis. Theinflow solution (Fig. 1) was deionized water, equilibrated withatmosphere (pH ∼5.7). Flow rates, ranging from 1.8 to 36 cm3 h−1
(Table 1), were controlled by a Soil Measurement Systems syringepump. No evidence of back pressure was observed. Reaction progresswas monitored with real-time specific conductivity measurements ofthe outlet solutions, using a Thermo Orion model 135A conductivitymeterwith temperature-compensated electrode calibratedwith 0.01 MKCl (1413 µS at 25 °C). Solutions were then filtered (b1 µmwith glass-fiber syringe filters) acidified, and refrigerated for later analysis of Seconcentrationwith hydride generation atomic adsorption spectrometry(HGAAS). The detection limit for the HGAAS is approximately 0.5 µg/LSe. Quality control samples included internal standards, reagent andmethod blanks, and sample duplicates.
2.1.3. Data analysisA plug flow reactor (PFR) can be visualized with a schematic
(Fig. 1) whereby the reaction between a fluid and the solid occurswithin a differentially thin package of fluid (volume=ΔV) that movesas a unit, longitudinally through the reactor (Hill, 1977). Themovement of the element of interest, Se, through the system isdescribed with a mass balance equation:
Influx − Outflux + Rate of changeby reaction
= Rate ofaccumulation
Fin − Fout + R = ΔC ð1Þ
Flux is the product of volumetric flow rate times concentration(Q⁎C), and R is positive for products and negative for reactants. If weassume a first order reaction, then R=k⁎C, where k is the rateconstant (h−1). Therefore, the mass balance on the thin package offluid (ΔV; Fig. 1) can be written as:
QC jV−QC jV + ΔV + ΔVkðC⁎−CÞ = ΔV∂Cðv; tÞ
dtð2Þ
QC|V flux of Se into the volume element, mg h−1
QC|V+ΔV flux of Se out of the volume element, mg h−1
ΔVk(C⁎−C) the rate of addition of Se to the fluid, due to reaction,mg h−1, where
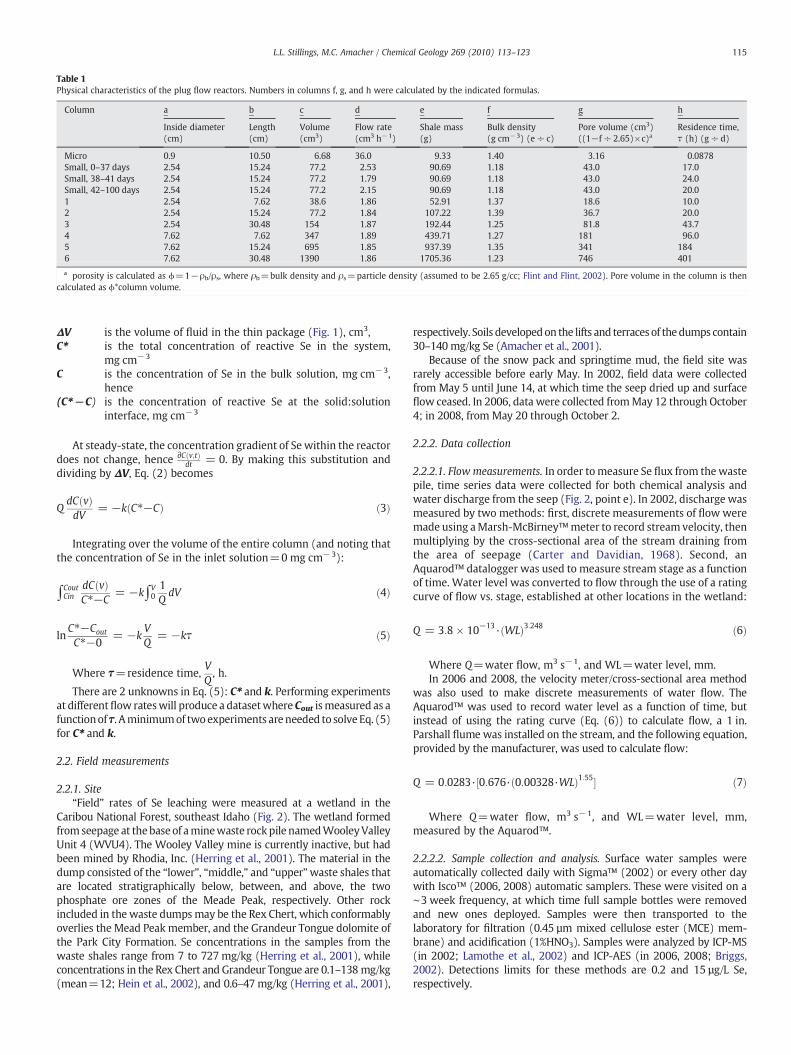
Table 1Physical characteristics of the plug flow reactors. Numbers in columns f, g, and h were calculated by the indicated formulas.
Column a b c d e f g h
Inside diameter(cm)
Length(cm)
Volume(cm3)
Flow rate(cm3 h−1)
Shale mass(g)
Bulk density(g cm−3) (e ÷ c)
Pore volume (cm3)((1−f ÷ 2.65)×c)a
Residence time,τ (h) (g ÷ d)
Micro 0.9 10.50 6.68 36.0 9.33 1.40 3.16 0.0878Small, 0–37 days 2.54 15.24 77.2 2.53 90.69 1.18 43.0 17.0Small, 38–41 days 2.54 15.24 77.2 1.79 90.69 1.18 43.0 24.0Small, 42–100 days 2.54 15.24 77.2 2.15 90.69 1.18 43.0 20.01 2.54 7.62 38.6 1.86 52.91 1.37 18.6 10.02 2.54 15.24 77.2 1.84 107.22 1.39 36.7 20.03 2.54 30.48 154 1.87 192.44 1.25 81.8 43.74 7.62 7.62 347 1.89 439.71 1.27 181 96.05 7.62 15.24 695 1.85 937.39 1.35 341 1846 7.62 30.48 1390 1.86 1705.36 1.23 746 401
a porosity is calculated as ϕ=1−ρb/ρs, where ρb=bulk density and ρs=particle density (assumed to be 2.65 g/cc; Flint and Flint, 2002). Pore volume in the column is thencalculated as ϕ*column volume.
115L.L. Stillings, M.C. Amacher / Chemical Geology 269 (2010) 113–123
ΔV is the volume of fluid in the thin package (Fig. 1), cm3,C⁎ is the total concentration of reactive Se in the system,
mg cm−3
C is the concentration of Se in the bulk solution, mg cm−3,hence
(C⁎−C) is the concentration of reactive Se at the solid:solutioninterface, mg cm−3
At steady-state, the concentration gradient of Se within the reactordoes not change, hence ∂Cðv;tÞ
dt = 0. By making this substitution anddividing by ΔV, Eq. (2) becomes
QdCðvÞdV
= −kðC⁎−CÞ ð3Þ
Integrating over the volume of the entire column (and noting thatthe concentration of Se in the inlet solution=0 mg cm−3):
∫CoutCin
dCðvÞC⁎−C
= −k∫V01QdV ð4Þ
lnC⁎−Cout
C⁎−0= −k
VQ
= −kτ ð5Þ
Where τ=residence time,VQ, h.
There are 2 unknowns in Eq. (5): C⁎ and k. Performing experimentsat differentflow rateswill produce a datasetwhereCout ismeasured as afunctionofτ. Aminimumof twoexperiments areneeded to solve Eq. (5)for C⁎ and k.
2.2. Field measurements
2.2.1. Site“Field” rates of Se leaching were measured at a wetland in the
Caribou National Forest, southeast Idaho (Fig. 2). The wetland formedfrom seepage at thebase of aminewaste rockpile namedWooleyValleyUnit 4 (WVU4). The Wooley Valley mine is currently inactive, but hadbeen mined by Rhodia, Inc. (Herring et al., 2001). The material in thedump consisted of the “lower”, “middle,” and “upper”waste shales thatare located stratigraphically below, between, and above, the twophosphate ore zones of the Meade Peak, respectively. Other rockincluded in the waste dumpsmay be the Rex Chert, which conformablyoverlies the Mead Peak member, and the Grandeur Tongue dolomite ofthe Park City Formation. Se concentrations in the samples from thewaste shales range from 7 to 727 mg/kg (Herring et al., 2001), whileconcentrations in the Rex Chert and Grandeur Tongue are 0.1–138 mg/kg(mean=12; Hein et al., 2002), and 0.6–47 mg/kg (Herring et al., 2001),
respectively. Soils developedon the lifts and terracesof thedumps contain30–140 mg/kg Se (Amacher et al., 2001).
Because of the snow pack and springtime mud, the field site wasrarely accessible before early May. In 2002, field data were collectedfrom May 5 until June 14, at which time the seep dried up and surfaceflow ceased. In 2006, data were collected fromMay 12 through October4; in 2008, from May 20 through October 2.
2.2.2. Data collection
2.2.2.1. Flow measurements. In order tomeasure Se flux from thewastepile, time series data were collected for both chemical analysis andwater discharge from the seep (Fig. 2, point e). In 2002, discharge wasmeasured by two methods: first, discrete measurements of flow weremade using aMarsh-McBirney™meter to record stream velocity, thenmultiplying by the cross-sectional area of the stream draining fromthe area of seepage (Carter and Davidian, 1968). Second, anAquarod™ datalogger was used to measure stream stage as a functionof time. Water level was converted to flow through the use of a ratingcurve of flow vs. stage, established at other locations in the wetland:
Q = 3:8 × 10⁻¹³·ðWLÞ3:248 ð6Þ
Where Q=water flow, m3 s−1, and WL=water level, mm.In 2006 and 2008, the velocity meter/cross-sectional area method
was also used to make discrete measurements of water flow. TheAquarod™ was used to record water level as a function of time, butinstead of using the rating curve (Eq. (6)) to calculate flow, a 1 in.Parshall flume was installed on the stream, and the following equation,provided by the manufacturer, was used to calculate flow:
Q = 0:0283·½0:676·ð0:00328·WLÞ1:55� ð7Þ
Where Q=water flow, m3 s−1, and WL=water level, mm,measured by the Aquarod™.
2.2.2.2. Sample collection and analysis. Surface water samples wereautomatically collected daily with Sigma™ (2002) or every other daywith Isco™ (2006, 2008) automatic samplers. These were visited on a∼3 week frequency, at which time full sample bottles were removedand new ones deployed. Samples were then transported to thelaboratory for filtration (0.45 µm mixed cellulose ester (MCE) mem-brane) and acidification (1%HNO3). Samples were analyzed by ICP-MS(in 2002; Lamothe et al., 2002) and ICP-AES (in 2006, 2008; Briggs,2002). Detections limits for these methods are 0.2 and 15 µg/L Se,respectively.

Fig. 2. Location map and schematic for the Wooley Valley Unit 4 waste dump and wetland, after Stillings and Amacher, 2004. Stream flow and Se concentrations were measuredimmediately downstream of the main seep, point e. Stream water flowed northward from the main seep to the settling pond, then into Angus Creek.
116 L.L. Stillings, M.C. Amacher / Chemical Geology 269 (2010) 113–123
Because water samples remained in the plastic autosampler bottlesfor 3 weeks before collection, filtration, and acidification, there is apossibility of sample degradation and/or Se adsorption to containerwalls. This possibility was evaluated by comparing Se concentration insamples collected immediately before and after the date of samplebottle retrieval and redeployment. The last sample in the tray of fullbottles was collected the morning of the site visit, and filtered/acidifiedupon return to the lab; hence there was a short time between samplecollection and processing. The first sample collected in the bottle trayafter a site visit and bottle redeployment experienced the longest timebetween collection and processing; hence it had the greatest possibilityfor sample degradation and Se loss. The variation in Se concentrationsbetween these samples ranged from ∼5–40% and did not appear to bemuch greater than concentration variation observed among sampleswithin a sample tray. We conclude that while sample degradation isalways a possibility when automatic samplers are used, Se concentra-tions in samples collected before and after site visits are within samplemethod/analytical error.
Seep chemistry and discharge measurements are to be publishedas a U.S. Geological Survey Open-File Report (Stillings and Amacher,submitted for publication).
3. Results
3.1. Laboratory experiments
In all experiments and reactors, selenium concentration was high inthe initial outlet samples and decreased, over time, to a constant value(Fig. 3). In themicro column experiment, thefluid pumpwas stopped at
168 h, when Se reached a steady-state concentration of 5.2±0.83 µg/L.The shale remainedwet, in the column, until 2856 hwhen thefluidflowwas resumed. Upon resumption, Se concentration quickly reached apeak of 124 µg/L, before it slowly decreased to another steady-stateconcentration of 1.7±1.3 µg/L.
A strong relation was noticed between specific conductivity valuesof the outlet solutions and Se concentration in the micro and smallcolumn experiments (Figs. 3, 4). Therefore, for the column 1–6experiments, specific conductivity was used to estimate Se concen-tration, with the following expression:
log½Se� = ðSC0:48−600:48Þ0:35 ð8Þ
Where log[Se]=the logarithm of Se concentration (µg/L), andSC=specific conductivity (µS/cm). In fitting the specific conductivitydata (Fig. 4), a model was chosen that most accurately fit the data forlow specific conductivity, because it is the low conductivity data whichdefine steady-state concentrations (Table 2).
3.2. Field experiments
In the early 2000s, southeastern ID experienced several dry yearswith little snowfall. Hence, data for flow and Se concentration at theWooleyValley seepwereonly available for 2002, 2006 and2008(Fig. 5a,b). In 2002 data collection began onMay 8 and continued through June12, when the flow at the seep ceased. Subsequent winters with lowsnow pack caused minimal flows at the seep. However the winters of2006 and 2008 were wet enough for the seep to begin flowing again,

Fig. 3. Concentration of Se versus time, for all experiments. Closed symbols represent Se concentrations determined from HGAAS. Open symbols denote Se concentrations calculatedfrom specific conductivity measurements. Vertical lines on the micro and small column plots indicate a change in flow rate or an interruption of the experiment.
117L.L. Stillings, M.C. Amacher / Chemical Geology 269 (2010) 113–123
hence data collection continued fromMay throughOctober, in 2006 and2008.
In all years, Se concentration dropped exponentially over time(Fig. 5b). In 2002, Se concentration, [Se], in outflow from the seepdropped from 3600 µg/L on May 9 to ∼50 µg/L on June 9. The range inconcentrationwasnot as great in2006 and it decreasedmore slowly overtime. The high was ∼1200 µg/L on May 14; this dropped to ∼10 µg/L onOct. 3. In 2008 [Se]was2700 µg/LonMay20, and this dropped to16.5 µg/L by Oct. 2. Despite differences in the initial Se concentration and flowdischarge among 2002, 2006, and 2008, the totalmass of Se leached fromthewaste rock during these periods did not vary greatly, being 570, 810,
Fig. 4. Relationship between log Se concentration and specific conductivity. Data pointswere measured from the small column experiment.
and 640 g, respectively (Fig. 5c). In 2002, the initial daily flux wasmeasured at 60 g Se/day, in 2006 and 2008 it was 70 and 100 g Se/day,respectively.
4. Discussion
4.1. Laboratory experiments
Data from the column leaching experiments were analyzedwith theprocedure described in the Methods section, above. First a “steady-state” concentration was determined from each experiment, where“steady-state” was defined as a constant concentration over time. Inpractice, Se concentrations in the outlet solutions were nevercompletely invariant, so the steady state concentration is expressed asamean and standard deviation for several data points at the end of eachexperiment (Table 2).
In a plug flow reactor, the steady-state outlet concentrationwill be afunction of the reaction rate and the residence time of the fluid in thereactor. A plot of steady-state concentration vs residence time (Fig. 6a)shows that outlet, steady-state concentration increases with increasingresidence time. A linear model fits the data with an r2 of 0.979. Byselecting τ and C ([Se]s− s] from any two points on the line, Eq. (5) canbe solved for the rate constant k (2.19e−3 h−1), and the amount ofreactive Se in the system, C⁎ (170 μg/L). While Fig. 6a describes thephysical relationship between residence time and steady-state concen-tration, the kinetic expression of Eq. (5) can be illustrated in Fig. 6b,where the negative slope of the line is the rate constant.
It must be noted that this rate constant describes an overall, steady-state reaction. Examination of [Se]outlet as a function of time (Fig. 3)

Table 2Steady-state time period, Se concentration ([Ses− s]), and specific conductivity (SCs− s) in the outflow of each reactor. The value ‘n’ is the number of samples used to calculate mean[Se]s− s; the time period is the interval over which steady-state was observed.
Column Times− s h pHoutlet [Se]s− s μg/L mean [Se]s− s μg/L stand dev SCs−s μS/cm mean SCs− s μS/cm stand dev n
Micro 144–168 7.5 5.2 0.8 7Micro 2940–3024 7.5 1.7 1.3 17Small, 0–37 days 712–872 7.6 5.1 1.4 73.6 1.2 8Small, 38–41 days 895–864 7.4 7.7 1.4 75.8 2.2 4Small, 42–100 days 2120–2304 7.4 3.8 0.5 55.2 3.9 91 1990–2159 7.5 2.7⁎ 0.8 53.9 1.1 82 1990–2159 7.4 8.9⁎ 0.5 76.0 1.3 83 1990–2159 7.5 13.7⁎ 0.4 88.4 1.2 84 1990–2231 7.7 30.4⁎ 0.8 132 1.9 115 2183–2303 7.8 63.3⁎ 0.2 212 0.5 66 2351–2543 7.9 98.3⁎ 0.9 290 2.0 7
⁎[Ses− s] calculated from SCs− s, Eq. (8).
118 L.L. Stillings, M.C. Amacher / Chemical Geology 269 (2010) 113–123
shows that in every experiment [Se]outlet is initially high, and then dropsto a much lower, steady-state concentration. Moreover, when flow isresumed after a period of drying, [Se]outlet will peak before beginninganother exponential decline.
This observation, of an initially high [Se] followed by a low, steady-state [Se] suggests that it is the highly soluble form of Se that is firstreleased from the shale, followed by a slower release of Se from a lesssoluble, refractory source. Selenium can be found in a variety of formswithin the shalewaste rock: itmay be found in various redox species, Se(−II), Se(0), Se(IV), and Se(VI), it may be adsorbed to mineral surfaces,found in salts, associatedwith organics, substituted for S in sulfides, andperhaps found as elemental Se(0), a product of bacterial oxidation(Dowdle and Oremland, 1998; Losi and Frankenberger, 1998). Ryseret al., 2005, 2006, observed multiple oxidation states for Se (Se(−II,0),Se(IV), and Se(VI)) inwaste rock from thephosphatemines in southeastIdaho. Perkins and Foster, 2004, observed Se to be associated withoxyhydroxides in weathered sections of the Phosphoria Fm., andassociated with sulfides and as elemental Se in unweathered sections.
Highly soluble Semight be found in easily hydrolyzed salts, and/or asspecies adsorbed to mineral surfaces. Numerous studies have shownthat adsorption/desporption reactions have fairly rapid kinetics, andthat rate constants for these reactions are on the same order as those forthe release of water from hydration shell of metals in solution (Hachiyaet al., 1984, Zhang and Sparks, 1989; van Leeuwen, 2008). While thesereactions may contribute Se to the initial outlet solution of thelaboratory soil columns, the adsorption reactions should be atequilibrium once steady-state is obtained (i.e. constant pH and Seconcentration). Studies of Se speciation in the Kesterson soils show thatthemost soluble Se species are Se(VI) and Se(IV),with Se(VI) having thegreatest solubility because it does not adsorb to mineral surfaces asstrongly as Se(IV). Several studies demonstrate that it is the oxidized,highly soluble Se which is rapidly released from soils, and that longer-term release is governed byoxidation ofmore refractory species, such asSe(0), and Se associated with sulfides (Masscheleyn et al., 1990;Tokunaga, et al., 1994, 1996; Zawilslanski and Zavarin, 1996; Martensand Suarez, 1997; Losi and Frankenberger, 1998; Zawislanski et al.,2003). In the experiments presented here, Se concentrations from thelong term, steady-state release were used to calculate the rate constant.It is reasonable to assume that this rate constant reflects oxidation of arefractory Se species, such as Se(0) or Se-bearing sulfides.
Grauch et al., 2004, examined shales of the Meade Peak memberwith a combination of optical microscopy, SEM, and electronmicroprobe techniques. They concluded that although Se is foundassociated with sulfides (pyrite, sphalerite, and vaesite–pyritess), thepredominate Se-bearing solid phase is native Se, Se(0), found in grainsof b2 µm. Textural relationships suggest that the grains of Se(0) grewby filling in pore spaces after catagenesis. Ryser et al., 2005, identifieddzharkenite, FeSe2, a di-selenide carbon compound, Se-substitutedpyrite, and elemental Se in soils and waste rock from mining in thePhosphoria Frm. With this data in mind, it is likely that the long term
release of Se from the laboratory column experiments is governed byoxidation of Se(− II,0).
4.2. Field experiments
At Wooley Valley, the waste rock dump might be viewed as achemical reactor where rainwater/snowmelt enters the dump,percolates through and reacts with the waste shale, and exits at theseep. The plot of Se concentration versus time at the seepage outlet ofthe dump (Fig. 5b) is very similar to the plot of Se concentration at theoutlet of the plug flow reactors (Fig. 3). Because of the similarity inoutput data trends and processes between the laboratory and fieldexperiments, it is tempting to use the same procedure (Fig. 6 and Eqs.(2)–(5)) to analyze both datasets. However there are differences in‘reactor design’ between the laboratory and field experiments thatkeep the data from being comparable. The differences between the 2systems include the following:
• Solution flow path: in the laboratory plug flow reactor the solutionenters the reactor at one point and, ideally, travels as a plugthroughout the length of the column, with each plug arriving at theoutletwith the samepath length and reaction time. This is not the casefor the waste rock dump, where fluid can enter the dump anywherealong its surface, and travel to various depths within the dump.Therefore water that exits the dump at the seepage point is acomposite of solutions that travelled along different flow paths.
• Solution flow discharge: in the laboratory plug flow reactor, each plugof solution travels through the column with the same velocity,determined by the pump rate. Discharge is constant, and determinedbyflow rate and the cross-sectional area of the reactor. In thefield, thedischarge varies throughout the experiment (Fig. 5a) because it isproportional to the hydraulic head which decreases throughout theseason, and the permeability which is variable throughout theheterogeneous dump.
The net result of both factors is that in the field experiment, unlikethe plug flow laboratory experiment, all fluid elements will NOT havethe same residence timewithin the reactor, meaning the results cannotbe directly comparable.
Instead of using the method of Fig. 6 to calculate the ‘field’ rateconstant for Se release, it is possible to calculate an estimatedapparent k directly from the data (Fig. 7). In our conceptual model, Seis leached from the waste rock, Se(s), and transferred to the solutionphase, Se(aq):
nSeðsÞ→SeðaqÞ ð9Þ
where the coefficient n indicates that the stoichiometry of this reactionis unknown.While Se might be oxidized and released from a refractoryphase such as elemental Se or a Se-bearing sulfide, it might be adsorbedor re-precipitated into another phase, hence not immediately soluble.

Fig. 5. a. Discharge from the seep at the base of the waste rock dump at Wooley Valley, for 2002, 2006, and 2008. Discharge was measured by measuring stream velocity and thecross-sectional area. The calculated discharge was obtained from a rating curve of discharge vs water level (2002) and the Parshall flume rating equation (2006, 2008). b. Seconcentration in the seep from the waste rock dump at Wooley Valley. c. Flux of Se from the waste rock dump at Wooley Valley. Flux is calculated as discharge×concentration.
119L.L. Stillings, M.C. Amacher / Chemical Geology 269 (2010) 113–123
Laidler, 1987, shows that for any reaction, 2A→Z, the rate ofconsumption of reactant A, υA, is equal to the rate of production ofproduct Z, υZ, divided by stoichiometry:
12υA = υZ ð10Þ
Rate constants follow the same rule:
12kA = kZ ð11Þ
Therefore, for the reaction in Eq. (9), the rate constant can becalculated from the production of the product, Se(aq). When the Seconcentration in seep discharge (Fig. 5b) is plotted as lnSe(aq) as afunction of time (Fig. 7), it fits the linearized, integrated form of a firstorder rate equation
lnðSeðaqÞÞ = ln SeðaqÞ0−kSeðaqÞt ð12Þ

Fig. 6. a. Steady-state Se concentrations [Se]s− s, as a function of fluid residence time inthe reactor. b. An illustration of the plug flow reactor equation (Eq. (5)), showing therelationship between the extent of reaction at steady-state, Cout/C⁎, residence time τ,and the rate constant, k.
Fig. 7. [Se] vs time, from the outlet seep at the waste rock dump, Wooley Valley, ID.
120 L.L. Stillings, M.C. Amacher / Chemical Geology 269 (2010) 113–123
where the slope of the line is −kSe(aq). Rate constants obtained fromthis method are 6.35e−3 h−1 (2002 data), 1.35e−3 h−1 (2006 data),and 2.71e−3 h−1 (2008 data).
Although the two calculationmethods (Fig. 6 vs Fig. 7) produce ratesof the same order of magnitude, it must be noted that the lab and thefield rate constants may describe different reactions. In the laboratoryexperiments, steady-state outlet concentrations were used to calculatethe first order rate constant, whereas in the field experiments all of thedata were used to calculate the rate constant. The field rate constantlikely describes a net reaction that includes leaching of both readilysoluble and refractory Se, whereas the lab constant describes onlyleaching of refractory Se. The break in slope in Fig. 7, 2008 data(∼2000 h, August 13), may be an artifact because Se concentrations inthe samples were at the analytical detection limit of ∼15 µg/L.
4.3. Comparison to kinetic rate constants determined from other studies
A number of experiments have been conducted to measure rates ofSe oxidation in both laboratory and field settings (Table 3). Most of thestudies cited in Table 3 used soils thatwere collected near the KestersonReservoir and its associated agricultural drains. The exceptions wereSarathchandra and Watkinson, 1981, who isolated a bacterium fromtopsoil alluvium collected from the Whangaehu River on the NorthIsland of New Zealand, and this study.
Many of the studies, especially those of Tokunaga et al., 1994, 1996,and Zawislanski et al., 2003, Zawilslanski and Zavarin, 1996, observedthe speciation of Se in their experimental soil materials. They calculaterate constants based upon the appearance of Se(IV+VI) in solution,and/or the extraction of Se(IV+VI) from soil adsorption sites. Thus, rateconstants are calculated from concentrations of the oxidized reactionproducts in solution or soil extracts.
There are differences in the experimental approach from thesestudies and the laboratory and field experiments presented here. First,perhaps most importantly, the experiments in this study were flowthrough experiments, where all of the experiments in Table 3 wereeither laboratory batch and static soil column incubations, or soil fieldplot studies. In this study, resultswere obtainedbymeasuring soluble Sein leachate at the outlet of the soil columns, or at the seepage outlet ofthe waste dump. Oxygen was not a limiting factor as it might be inpondedwater over an underlying soil column, or in a batch experiment.Next, because many of the studies in Table 3 measured Se speciation intheir experimental soil materials, they could quote oxidation rates ofspecific reactants such as Serefractory, Se(0), or Seorganic startingmaterials.The rates cited in this present study were for a net reaction, encom-passing the oxidation of Se many possible sources (sulfides, Se(0),Seorganic, and Seadsorbed) and did not correct for Se adsorption orreprecipitation.
With this understanding, it is still interesting to compare the rateconstants for Se oxidation in Table 3. Rate constants range from a lowof 0.004 yr−1 (Sarathchandra and Watkinson, 1981) to a high of108.6 yr−1 (Tokunaga et al., 1996). The rate of 0.004 yr−1was observedin a batch reactor for bacterial oxidation of a gray allotrope of Se(0); ared colloidal allotropeof Se(0),wasused in the samestudy andprovided

Table 3Comparison of lab and field rate constants for Se oxidation. Rates are quoted in units provided by the authors, and converted to yr−1 for ease of comparison. “n.r.”=not reported.
Study Experimentalconditions
Temperature pH Eh Lab rateconstant
Field rateconstant
Modeled reactionorder
This study Field, waste rock mine dumpPhosphoria Frm, SE Idaho
41.1°Fa (meanannual temp)
7.4–7.8 atm. 0.001–0.006 h−1
(11.8–55.6 yr−1)First order
This study Lab, packed bed reactor columnsFlow rate=1.8–36 cm3 hr−1
Ambient(22–26 deg C)
7.4–7.6 atm. 0.00219 h−1
(19.2 yr−1)First order
Bulk density=1.2–1.4 g cm−3
Zawislanski et al., 2003 Field plot studies of Se oxidationfrom applied, seleniferoussediments. Rate constant estimatedfrom XANES analysis of Se speciationin sediments. Authors emphasizethat rates strongly influenced byearly rapid oxidation of organicSe species.
n.r. 7.4–7.7 n.r. 0.82 yr–1 First order
Dowdle and Oremland,1998
Laboratory experiments with soilslurries spiked with Se(0), andbacterial enrichment cultures
Soilslurries=n.r.enrichmentculture=25 °C
Soilslurries=7.5
atm. 0.006–0.011/day(2.2–4.0 yr–1; soilslurry, bacterialSe(0)) 0.001/day(0.36 yr–1; soil slurry,chemical Se(0))0.002–0.007/day(0.73–2.6 yr–1;bacterial enrichmentexperiments)
[Seproducts]/[Seinitial]/time
Losi and Frankenberger,1998
Laboratory microcosm experiments,oxidation of soils spiked with Se(0);soils were collected from the SanJoaquin Valley, CA, and representeda range of Se levels (0–80 mg/kg).Rates calculated as in Zawilslanskiand Zavarin, 1996
n.r. 3 of 4 soils hadpH=7.8–7.9.One soil hadpH=2.6.
n.r. 0.04–0.39 yr–1 First order
Tokunaga et al., 1996 Laboratory columns whereSe-enriched solutions ponded overSe-free sediments. 25% Se (60 ppm)transferred from solution to sedimentsin ∼50 days(reduction). 60% (36 ppm)of this transferred Se re-oxidized in 2days after the end of the reductionexperiment.
n.r. n.r. −400–0mV, beforeoxid. began
0.3/dayb (108.6 yr–1) [Seproducts]/[Seinitial]/time
Zawislanski and Zavarin,1996
Laboratory soil incubations, noenrichment with additional Se.
15–35 °C 6.9–8.0 n.r. 0.058–0.29 yr−1
Seorganic0.11–2.4 yr–1
Serefractory
First order
Tokunaga et al., 1994 Field plots, soil profiles n.r. n.r. n.r. 0.052–0.062 yr−1
b[Seproducts]/[Seinitial]/time
Masscheleyn et al., 1990 Laboratory incubations, noenrichmentwith additional Se
28 °C 6.5–9 −200, 0,200, 400
0.0014 day−1b
at 0 mV (0.511 yr–1)[Seproducts]/[Seinitial]/time
Sarathchandra andWatkinson, 1981
Lab, bacterial enrichment culturesusing a gray Se(0) and a red Se(0).The red Se(0) was thought to havea greater surface area, leading to thehigher rate constant. Rates calculatedas in Dowdle & Oremland, 1998.
28 °C 7 atm. 0.00001/day(0.004 yr–1;gray Se)–0.001/day(0.4 yr–1; red Se)
[Seproducts]/[Seinitial]/time
a Mean annual temperature at the Soda Springs airport, ID. Western Regional Climate Center, http://www.wrcc.dri.edu/CLIMATEDATA.html.b Rate constant values not provided in study, but calculated from data as indicated in the right-hand column.
121L.L. Stillings, M.C. Amacher / Chemical Geology 269 (2010) 113–123
a rate constant of 0.4 yr−1. The authors suggested the low rate wasbecause of the low surface area of the gray Se(0), compared to the red.Dowdle and Oremland, 1998, also experimented with both a red and agray allotrope of Se(0) but in their work the allotropes were formed bybacterial and chemical reduction, respectively, of Se(IV). Here, the grayform of Se(0) had a rate constant for oxidation ∼1 order of magnitudelower than the constant for the red Se(0) (Table 3). The highest rateconstant for Se oxidation, 108.6 yr−1, was measured in laboratoryexperiments where 3 mM solutions of Se(VI) were ponded overuncontaminated soils for ∼50 days. During this time reduction of Se(VI) to Se(0) was observed. The rate constant for Se oxidation wascalculated for the short-term reoxidation that occurred within the2 days following the end of the reduction experiment, when the wet
sediments were collected and stored in air (Tokunaga et al., 1996). Inthese experiments the high concentration of Se in the experiment,together with the short (50 day) reduction time, may have led to a highconcentration of easily re-oxidized Se and hence a high rate constant.
The rate constants derived from this study, from both field andlaboratory experiments, are ∼1 order of magnitude higher than thehighest constants reported from Dowdle and Oremland, 1998, andZawilslanski and Zavarin, 1996, but lower than the highest constantreported, 108.6 yr−1. Dowdle and Oremland, 1998, reported aconstant of 2.2–4.0 yr−1 for oxidation of a red, bacterially precipitatedform of Se(0); Zawislanski and Zavarin reported a constant of 2.4 yr−1
for oxidation of a refractory Se phase in laboratory incubations of Secontaminated soils. Both of these experiments were batch

122 L.L. Stillings, M.C. Amacher / Chemical Geology 269 (2010) 113–123
experiments where the authors made the effort to keep the sampleaerated, but they were not flow through experiments. While the‘refractory Se’ phasewas not identified, it is likely to contain Se(0) andSe-sulfide phases.
The comparison between rate constants of this study (11.8–55.6 yr−1) and those of Table 3 for Se(0) oxidation (2.4–108.6 yr−1)suggest that it may be Se(0) that is oxidizing to a soluble Se. This isconsistent with the previously noted observations of Grauch et al.,2004, and Ryser et al., 2006, who reported that the most commonhost of Se in the Meade Peak shale is elemental Se, Se(0).
5. Conclusions
Se leaching from shales of the Meade Peak member of thePhosphoria Formation was observed in both field and laboratoryexperiments. In both sets of experiments, Se concentration in outletsolutions was high, initially, and decreased over time to a steady-stateconcentration. Twomethodswere used to estimate the rate constant: Inthe laboratory experiments, a linear plot of outlet Se concentrationversus residence timewas used to estimate a first order rate constant of2.19e−3 h−1. In the field, a plot of ln[Se] versus time was fit with firstorder rate model, where k=6.35e−3 h−1 (2002), 1.35e−3 h−1
(2006), and 2.71e−3 h−1 (2008).The rate constants estimated by this study are within an order of
magnitude of other rate constants, cited in the literature, for oxidationof bacterially precipitated Se(0). While the methods described in thisstudy produce a constant for a net, overall rate, it has been shown thatthe predominate Se-bearing phase in the Meade Peak shale iselemental Se, Se(0). Therefore, the similarity between the new rateconstants presented here to known rate constants for Se(0) oxidationsuggests that oxidation of Se(0) in the Meade Peak shale controls theconcentration of Se in waters draining dumps of waste rock that haveresulted from mining activities in the Phosphoria Fm. in southeasternIdaho.
Acknowledgements
Funding for this work was provided by the U.S. Geological SurveyMinerals Research Program (LLS) and the U.S. Forest Service ECAP/AMLprogram (MCA). Both authors wish to thank Kay Laird (USFS-RMRS,Logan UT) for analyzing samples for Se by HGAAS; as well as ChuckCoronella, Dept. Chemical Engineering, University of Nevada, Reno, forassistance with analysis of data from a plug flow reactor. Ralph Seilerand Dave Naftz, of the U.S.Geological Survey, and 2 anonymousreviewers provided very helpful reviews. Any use of trade, product, orfirm names is for descriptive purposes only and does not implyendorsement by the U.S. Government.
References
Agrium Conda Phosphate Operations, Astaris LLC, Bureau of Land Management, IdahoDepartment of Lands, J.R. Simplot Company, Monsanto Company, and United StatesForest Service, 2005. Selenium Management Practices, A Cooperative Document,http://giscenter-ims.isu.edu/SISP/reports/Se%20Management%20Practices%202006-2005.pdf, accessed June, 2009.
Amacher, M.C., Herring, J.R., Stillings, L.L., 2001. Total recoverable selenium and otherelements by HNO3 and HClO4 digestion and other soil characterization data fromWooley Valley Units 3 and 4 waste rock dumps and Dairy Syncline lease area soils,southeast Idaho. Open-File Report 01-69. U.S. Geological Survey. 65 pp.
Briggs, Paul H., 2002. The determination of forty elements in geological and botanicalsamples by inductively coupled plasma-atomic emission spectrometry. AnalyticalMethods for Chemical Analysis of Geologic and Other Materials. In: Taggat Jr.,Joseph E. (Ed.), Open-File Report 02-223, Chapter G. U.S. Geological Survey.
Buck, Brian W., Jones, Jeffery L., 2002. Interagency/industry coordination to respond toSelenium contamination at phosphate mines in southeastern Idaho. http://www.fs.fed.us/geology/buck-jones.pdf, accessed January, 2009.
Carter, R.W., Davidian, J., 1968. General procedure for gaging streams. Techniques ofWater-Resources Investigations. U.S. Geological Survey. book 3, chap A6, 13 pp.
Dowdle, P.R., Oremland, R.S., 1998. Microbial oxidation of elemental Selenium in soilslurries and bacterial cultures. Environ. Sci. Technol. 32, 3749–3755.
Engberg, R.A., Sylvester, M.A., 1993. Concentrations, distribution, and sources of Seleniumfrom irrigated lands in western United States. J. Irrig. Drain. Eng. 119, 522–536.
Flint, Alan L., Flint, Lorraine E., 2002. Chapter 2.2: Particle Density. In: Dane, Jacob H.,Topp, G. Clarke (Eds.), SSSA Book Series, vol. 5. Soil Science Society of America, Inc.,pp. 229–240.
Grauch II, R., Desborough, G.A., Meeker, G.P., Foster, A.L., Tysdal, R.G., Herring, F.R., Lowers,H.A., Ball, B.A., Zielinski, R.A., Hohnson, E.A., 2004. Petrogenesis and mineralogicresidence of selected elements in the Meade Peak Phosphatic Shale member of thePermian Phosphoria formation, southeast Idaho. In: Hein, James R. (Ed.), Life Cycle ofthe Phosphoria Formation. Handbook of Exploration and Environmental Geochem-istry, vol. 8. Elsevier, pp. 189–226.
Greater Yellowstone Coalition, 2006. Animal Deaths, Local Extinctions, andHumanHealthConcerns in the Phosphate Mining Area of Southeast Idaho. Fact sheet available athttp://www.greateryellowstone.org/media/pdf/SmokyMine-Animal_Extinct.pdf,accessed January, 2009.
Hachiya, K., Sasaki, M., Ikeda, T., Mikami, N., Yasunaga, 1984. Static and kinetic studies ofadsorption–desorption ofmetal ions on a y-Al, O, surface 2. Kinetic study bymeans ofpressure-jump technique T. J. Phys. Chem. 88, 27–31.
Hein, James R., McIntyre, Brandie, Perkins, Robert B., Piper, David Z., Evans, James, 2002.Composition of the Rex Chert and associated rocks of the Permian PhosphoriaFormation: Soda Springs Area, SE Idaho. Open-File Report 02-345. U.S. GeologicalSurvey. 30 pp.
Hein, J.R., Perkins, R.B., McIntyre, B.R., 2004. Evolution of thought concerning the origin ofthe Phosphoria Formation, western US Phosphate Field. In: Hein, James R. (Ed.), LifeCycle of the Phosphoria Formation: From Deposition to Post-Mining Environment:Handbook of Exploration and Environmental Geochemistry, vol. 8, pp. 19–42.
Herring, J.R., Grauch, R.I., Siems, D.F., Tysdal, R.G., Johnson, E.A., Zielinski, R.A., Desborough,G.A., Knudsen, A., Gunter, M.E., 2001. Chemical composition of strata of the MeadePeak phosphatic shale member of the Permian Phosphoria Formation. Open-FileReport 01-195. U.S. Geological Survey. 72 pp.
Hill Jr., Charles G., 1977. An Introduction to Chemical Engineering Kinetics and ReactorDesign. John Wiley and Sons, NY. 594 pp.
Laidler, Keith J., 1987. Chemical Kinetics, 3rd ed., Harper & Row, Publishers, Inc. 531 pp.Lamothe, Paul J., Meier, Allen L., Wilson, Stephen A., 2002. The determination of forty-four
elements in aqueous samples by inductively coupled plasma-mass spectrometry.Analytical Methods for Chemical Analysis of Geologic and Other Materials. In: TaggatJr., Joseph E. (Ed.), Open-File Report 02-223. U.S. Geological Survey. Chapter H.
Lemly, A.D., 2002. Selenium Assessment in Aquatic Ecosystems. Springer. 160 pp.Losi, M.E., Frankenberger Jr., W.T., 1998. Microbial oxidation and solubilization of
precipitated elemental Selenium in soil. J. Environ. Qual. 27, 836–843.Mackowiak, C.L., Amacher, M.C., 2008. Soil sulfur amendments suppress selenium uptake
by alfalfa and western wheatgrass. J. Environ. Qual. 37, 772–779.Martens, D.A., Suarez, D.L., 1997. Selenium speciation of marine shales, alluvial soils, and
evaporation basin soils of California. J. Environ. Qual. 26, 424–432.Masscheleyn, P.H., Delaune, R.D., Patrick, W.H., 1990. Transformations of Selenium as
affected by sediment oxidation–reduction potential and pH. Environ. Sci. Technol.24, 91–96.
McNeal, JamesM., Balistrieri, Laurie S., 1989.Geochemistry andoccurrenceof selenium; anoverview. In: Jacobs, L.W. (Ed.), Selenium in Agriculture and the Environment, vol. 23.SSSA Special Publication, pp. 1–13.
Perkins, R.B., Foster, A.L., 2004. Mineral affinities and distribution of selenium and othertrace elements in black shale and phosphorite of the Phosphoria Formation. LifeCycle of the Phosphoria Formation: From Deposition to Post-Mining Environment.In: Hein, James R. (Ed.), Handbook of Exploration and Environmental Geochem-istry, vol. 8. Elsevier B.V., pp. 251–295.
Piper, D.Z., 2001. Marine chemistry of the Permian Phosphoria Formation and Basin,southeast Idaho. Econ. Geol. 96, 599–620.
Piper, D.Z., 1999. Trace elements and major-element oxides in the PhosphoriaFormation at Enoch Valley, Idaho—Permian sources and current reactivities.Open File Report 99-163. U.S. Geological Survey. 66 pp.
Presser, T., 1994. The Kesterson effect. Environ. Manage. 18, 437–454.Ryser, Amy L., Strawn, Daniel G., Marcus, Matthew A., Johnson-Maynard, Jodi L., Gunter,
MickeyE.,Möller, Gregory, 2005.Micro-spectroscopic investigate of selenium-bearingminerals from the Western US Phosphate Resource Area. Geochem. Trans. 6, 1–11.
Ryser, Amy L., Strawn, Daniel G., Marcus, Matthew A., Johnson-Maynard, Jodi L., Möller,Gregory, 2006. Microscopically focused synchrotron X-ray investigation fo seleniumspeciation in soils developing on reclaimed mine lands. Environ. Sci. Technol. 40,462–467.
Sarathchandra, S.U., Watkinson, J.H., 1981. Oxidation of elemental Selenium to seleniteby Bacillus megaterium. Science 211, 600–601.
Seiler, Ralph L., Skorupa, Joseph P., Naftz, David L., Nolan, Thomas B., 2003. Irrigation-induced contamination of water, sediment, and biota in the western United States—synthesis of data from the National Irrigation Water Quality Program. ProfessionalPaper, vol. 1655. U.S. Geological Survey. 123 pp.
Stillings, L., Amacher, M., 2004. Selenium attenuation in a wetland formed from minedrainage in the Phosphoria Formation, southeast Idaho. Life Cycle of the PhosphoriaFormation: FromDeposition to the Post-Mining Environment. In: Hein, James R. (Ed.),Handbook of Exploration and Environmental Geochemistry, vol. 8. Elsevier B.V.,Amsterdam, pp. 467–482.
Stillings, Lisa L., Amacher, Michael C., submitted for publication. Chemistry anddischarge of seeps and surface waters draining mined waste rock from the MeadePeak Phosphatic Shale, Phosphoria Formation, Wooley Valley Unit 4, southeasternIdaho, USA. U.S. Geological Survey Open-File Report.

123L.L. Stillings, M.C. Amacher / Chemical Geology 269 (2010) 113–123
Tetra Tech EM, Inc., 2002. Final Area Wide Human Health and Ecological RiskAssessment, Selenium Project Southeast Idaho Phosphate Mining Resource Area.Contract Number C023, Task Order AWI-00-01. available at http://giscenter-ims.isu.edu/SISP/Area_Wide_Reports.html, accessed June, 2009.
Tokunaga, Tetsu K., Pickering, Ingrid J., Brown Jr., Gordon E., 1996. Seleniumtransformations in ponded sediments. Soil Sci. Soc. Am. J. 60, 781–790.
Tokunaga, T.K., Zawislanksi, P.T., Johannis, P.W., Benson, S., 1994. Field investigations ofselenium speciation, transformation, and transport in soils from KestersonReservoir and Lahontan Valley. In: Benson, S. (Ed.), Selenium in the Environment.Marcel Dekker, Inc., pp. 119–138.
van Leeuwen, Herman P., 2008. Eigen kinetics in surface complexation of aqueousmetal ions. Langmuir 24, 11718–11721.
Zawilslanski, P.T., Zavarin, M., 1996. Nature and rates of selenium transformations: alaboratory study of Kesterson Reservoir soils. Soil Sci. Soc. Am. J. 60, 791–800.
Zawislanski, Peter T., Benson, Sally M., Terbert, Robert, Borglin, Sharon E., 2003.Selenium speciation, solubility, and mobility in land-disposed dredged sediments.Environ. Sci. Technol. 37, 2415–2420.
Zhang, P.C., Sparks, D.L., 1989. Kinetics and mechanisms of molybdate absorption/desorption at the goethite/water interface using pressure-jump relaxation. Soil Sci.Soc. Am. J. 53, 1028–1034.
Related Documents