Subscriber access provided by Universiteitsbibliotheek | Vrije Universiteit Brussel Crystal Growth and Design is published by the American Chemical Society. 1155 Sixteenth Street N.W., Washington, DC 20036 Article Kinetics and Thermodynamics of Glucose Isomerase Crystallization Mike Sleutel, Ronnie Willaert, Christopher Gillespie, Christine Evrard, Lode Wyns, and Dominique Maes Cryst. Growth Des., 2009, 9 (1), 497-504 • DOI: 10.1021/cg800756h • Publication Date (Web): 10 December 2008 Downloaded from http://pubs.acs.org on January 13, 2009 More About This Article Additional resources and features associated with this article are available within the HTML version: • Supporting Information • Access to high resolution figures • Links to articles and content related to this article • Copyright permission to reproduce figures and/or text from this article

Welcome message from author
This document is posted to help you gain knowledge. Please leave a comment to let me know what you think about it! Share it to your friends and learn new things together.
Transcript
Subscriber access provided by Universiteitsbibliotheek | Vrije Universiteit Brussel
Crystal Growth and Design is published by the American Chemical Society. 1155Sixteenth Street N.W., Washington, DC 20036
Article
Kinetics and Thermodynamics of Glucose Isomerase CrystallizationMike Sleutel, Ronnie Willaert, Christopher Gillespie, Christine Evrard, Lode Wyns, and Dominique Maes
Cryst. Growth Des., 2009, 9 (1), 497-504 • DOI: 10.1021/cg800756h • Publication Date (Web): 10 December 2008
Downloaded from http://pubs.acs.org on January 13, 2009
More About This Article
Additional resources and features associated with this article are available within the HTML version:
• Supporting Information• Access to high resolution figures• Links to articles and content related to this article• Copyright permission to reproduce figures and/or text from this article
Kinetics and Thermodynamics of Glucose Isomerase Crystallization
Mike Sleutel,*,† Ronnie Willaert,† Christopher Gillespie,§ Christine Evrard,‡ Lode Wyns,†
and Dominique Maes†
Structural Biology Brussels, Flanders InteruniVersity Institute for Biotechnology (VIB), VrijeUniVersiteit Brussel, Belgium, Laboratoire de Biologie Moleculaire et de Genie Genetique, UniVersitede Liege, Belgium, and Department of Chemical Engineering, Center for Molecular and EngineeringThermodynamics, UniVersity of Delaware, 150 Academy Street, Newark, Delaware 19176
ReceiVed July 14, 2008; ReVised Manuscript ReceiVed October 6, 2008
ABSTRACT: A quantitative study using laser confocal microscopy combined with differential interference microscopy on thekinetics and thermodynamics of the crystallization of glucose isomerase is presented. Fundamental crystallization parameters aredetermined from the kinetics of step advancement and rates of two-dimensional (2D) nucleation. The ruling mass transfer pathwayand accompanying activation barriers are discussed. In brief, the solubility exhibits normal temperature dependence and thecrystallization enthalpy is the thermodynamic driving force. The diminishing entropic cost for higher PEG concentrations is attributedto water structuring and a decrease in water activity. The prominent step generation mechanism is homogeneous 2D nucleation forhigh supersaturations. At low driving forces 2D nucleation occurs on anomalously hyperactive sites and the step edge free energiesfor homogeneous and heterogeneous nucleation are determined. The number of nucleation centers for both mechanisms are estimatedand from the density of nucleation centers we obtain for the activation barrier of adsorption ∼3.8 kJ mol-1. No step-step interactionis observed for interstep distances >70 nm. Theoretical fits of step velocity data suggest surface diffusion makes a non-negligiblecontribution to surface kinetics. From the temperature dependence of the step kinetic coefficient the activation barrier for crystallizationwas determined to be <22.4 kJ mol-1.
Introduction
The crystal habit is (initially) composed of three types ofcrystal faces, that is, facetted (F), stepped (S), and kinked (K)faces.1 The latter two grow much faster due to their abundanceof growth sites, that is, kinks, and as such disappear during thecourse of the growth process, leading to a crystal habit outlinedby singular F faces. Under conditions of a nonvanishingactivation barrier for nucleation and kink formation (i.e., belowthe kinetic roughening transition2 and with moderate molecularthermal energy,3 that is, below the thermal roughening temper-ature) these interfaces are smooth surfaces where the relativelyrare incorporation sites are situated along the molecular rowsthat define the edges of the unfinished advancing crystallinelayers traversing the surface. For F faces where kinks aretypically widely spaced, an interesting competition betweenmass transfer through bulk and surface diffusion arises. Withthe presence of kink-free terraces in between the (linear) sinks,that is, steps, the growth units can now also adhere to the surface,diffuse two-dimensionally and incorporate into kinks, a pathwaypreviously not possible on the S and K faces in the early stagesof crystal growth. Systems where the intersink distance becomesfar greater than the molecule size may benefit from a reductionin dimensionality in terms of trapping efficiency of growth units.For instance, Adam and Delbruck showed4,5 that the efficiencyof biological diffusion processes such as membrane-associatedreactions can be increased by confining the search space ofdiffusing species from the surrounding bulk liquid phase to atwo-dimensional surface. They considered the specific case ofbacterial chemotaxis where, not very much unlike crystallization,substrates can reach specific sinks (receptor molecules) througheither bulk diffusion or sequential adsorption followed by surface
diffusion. Elaborating on this notion, Berg and Purcell5 foundthat the mass transfer efficiency of 2D diffusion depends onthe average distance between sinks on the surface, with sinksbeing kinks in our case, or more generally, steps. It is notinconceivable that a similar mechanism may operate for thecrystallization case.6 Of course, the ruling mass transfer pathwaywill not be defined solely by the relative pathway efficiencies,but to a great extent by the heights of the activation barriersthe molecules encounter.
Initially, the surface diffusion mechanism for solution growthwas considered to be improbable given the small energy ofdissolution and the large diffusivity of proteins in the bulk. Theabsence of experimental data on step diffusion field overlapstrengthened this notion. This is not surprising considering thattypical diffusion length scales (commensurate with the meanfree path of the admolecules) have been estimated to be as lowas 50-500 nm, or 10-100 molecule diameters, which is smallerthan typical interstep distances for the conditions utilized in moststudies. A shift in the direct incorporation paradigm came aboutby both Michaelson interferometry and atomic force microscopyexperiments from which the existence of step-step interactionas a consequence of surface diffusion field overlap and stepdecoupling through the Schwoebel effect was demonstrated forthe crystallization from solution of both small molecules (ADP7)and proteins (lysozyme,8 canavalin,9 insulin10). Additionalevidence supporting the surface diffusion mechanism was foundin the molecular-scale incorporation statistics at the kink level((apo)ferritin,11 triose phosphate isomerase12) and more re-cently13 through single-molecule visualization of fluorescentlabeled molecules at the solution-crystal interface (F-HEWL).In contrast, the role of surface diffusion on step kinetics on the(010) face of lysozyme was deemed negligible14 given the lowterrace coverage of adsorbed molecules. Given that (in)directevidence for the surface diffusion mechanism has been presentedfor five proteins only, it can hardly be considered a universaltrait of macromolecular crystallization. Also, the scarcity of
* To whom correspondence should be addressed. E-mail: [email protected]. Telephone: +32-2-6291923. Fax: +32-2-6291963.
† Vrije Universiteit Brussel.§ University of Delaware.‡ Universite de Liege.
CRYSTALGROWTH& DESIGN
2009VOL. 9, NO. 1
497–504
10.1021/cg800756h CCC: $40.75 2009 American Chemical SocietyPublished on Web 12/10/2008
quantitative data on the various activation barriers determiningthe rates of step advancement exemplifies the need for moreresearch on this topic. Hence, we present in this work additionalevidence in support of the surface diffusion hypothesis for thecrystallization of macromolecules. We study the specific caseof glucose isomerase. In the first section we address the ther-modynamics of crystallization, followed by two quantitativesections on the anisotropy of surface kinetics and the mechanismof 2D nucleation. In the fourth and fifth parts of this work, wediscuss the ruling mass transfer pathway (i.e., surface diffusion)and the accompanying activation barriers for the elementarysurface processes.
Materials and Methods
Crystallization of Glucose Isomerase. Glucose isomerase fromStreptomyces rubiginosus was purchased from Hampton Research(California, USA). The protein solution was dialyzed against 10 mMHepes buffer pH 7.0 and 1 mM MgCl2. Protein concentrations weredetermined by UV absorbance at 280 nm. For the atomic forcemicroscopy (AFM) experiments, crystals were grown at 20 °C onnonsiliconized 10 mm diameter glass discs using the sitting drop vapordiffusion technique with the aid of microbridges (Hampton Research).The protein solution used in the crystallization set-ups contained 30mg/mL protein in 100 mM Hepes pH 7.0 and 200 mM MgCl2. Dropswere prepared by mixing 2 µL of glucose isomerase solution with 2µL reservoir solution of 100 mM Hepes pH 7.0, 200 mM MgCl2, and5% PEG 1000. For the laser confocal microscopy experiments, crystalswere grown in situ using the batch method at 30 mg/mL glucoseisomerase, 100 mM Hepes pH 7.0, 200 mM MgCl2, and 5% PEG1000.At these conditions, the protein crystallizes in the orthorhombic form(I222, a ) 94.01 Å, b ) 99.37 Å, c ) 103.01 Å).15
Solubility Curve Determination. Crystals were grown using thebatch method in eppendorf tubes and stored for one month at varioustemperatures, that is, 277, 283, 288, 293, 301, and 310 K. Rigorousmixing of samples was performed at weekly intervals to avoid prematurecessation of growth as a consequence of impurity surface poisoning.After one month, samples were centrifuged for 30 min at 8000 rpm attheir respective incubation temperatures. Protein concentration of theobtained supernatant was taken to be the equilibrium concentration forthe respective condition.
Ideality Assumption. To verify the validity of the ideality assump-tion (γe ) 1) we calculate the activity coefficient γe using16 ln γe )2B2MCe where M is the molecular mass of glucose isomerase, B2 isthe second virial coefficient and Ce the equilibrium protein concentra-tion. Since the value of B2 for glucose isomerase is not available, weemploy a lower limit B2, that is, the lowest value present in the literature-8 × 10⁻⁴ cm3 mol g-2 for protein crystallization. Using this lowerlimit we then obtain a non-negligible maximum error of 19% for thedetermination of the standard entropy ∆S° and enthalpy ∆H° ofcrystallization. Since nonideality (γe * 1) is more pronounced for higherprotein concentrations,17 we omit the highest Ce (310 K) in thedetermination of ∆H° and ∆S° to lower the introduced error. The linear
fit of the truncated data set (277-301 K) then yields an admissibleerror of ( 6% for the determination of the thermodynamic parametersand γe ) 1 becomes justified.
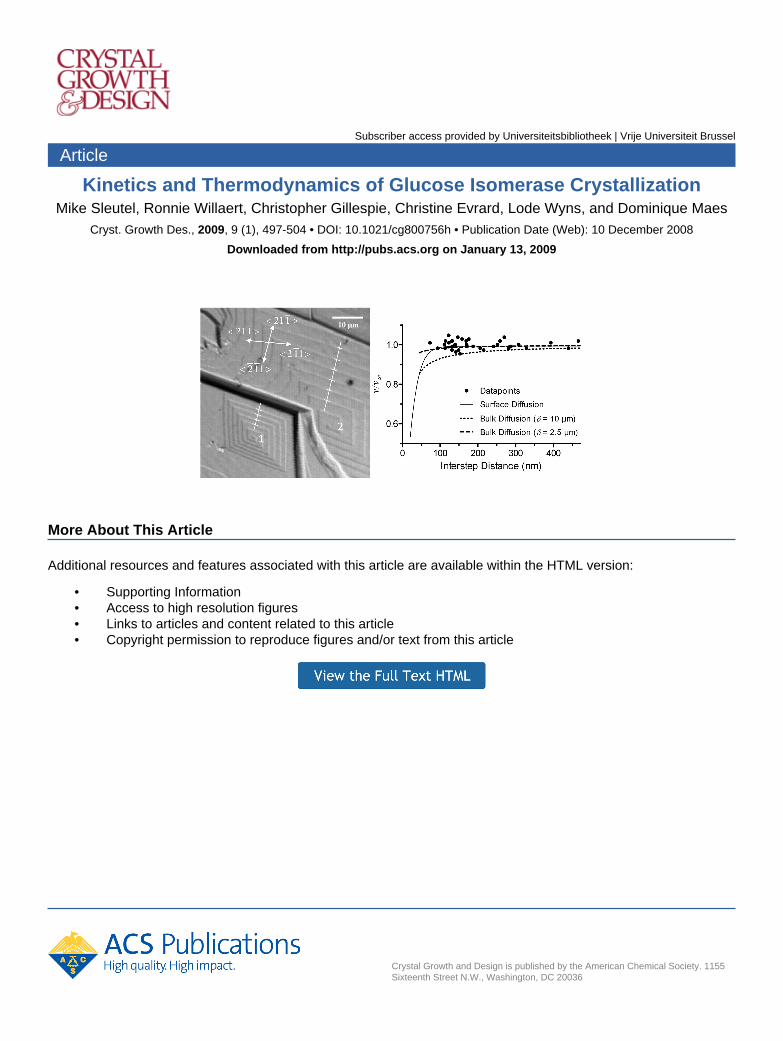
Surface Imaging Using Laser Confocal Microscopy (LCM)Combined with Differential Interference Contrast Microscopy(DIM). Growing (011) faces of orthorhombic glucose isomerase crystalswere observed in situ by LCM-DIM. For this, a D-Eclipse C1 confocalsystem was attached to an inverted Eclipse TE-2000 U opticalmicroscope (Nikon, Brussels, Belgium). An air objective lens PlanFluor20× with a numerical aperture of 0.45 and a working distance of 7.6mm was used (theoretical lateral resolution 660 nm). The diameter ofthe confocal aperture used for the observation was 103 µm. A Nomarskiprism was inserted into the optical path to utilize differential interferencecontrast. The experimental cell was a 45 mm × 12.5 mm quartz cuvettewith two detachable windows (Hellma, Mullheim, Germany). Crystalswere illuminated with an argon-ion laser with a wavelength of 488nm. Photomicrographs of 512 × 512 pixels were acquired over a 4 sscan time with a pixel-dwell of 11 µs. For the conditions used in thisstudy, glucose isomerase crystallizes exclusively in the orthorhombicform (I222) (Figure 1a). For this polymorph, the crystal habit is definedby planes with indexes 011, 101, and 110. After nucleation insidethe experimental cell, the four crystallographically equivalent (011),(01j1), (011j), and (01j1j) prism faces (011) were most frequentlyparallel to the plane of observation of the LCM-DIM experiment andhence were studied in this work.
Atomic Force Microscopy (AFM). AFM imaging of the crystal-lization processes was conducted in tapping mode using NanoscopeIIIa multimode AFM (Veeco, Santa Barbara, USA). Standard siliconnitride and oxide sharpened SPM tips (Veeco, Santa Barbara, USA)were used. Cantilevers with nominal force constants of 0.01 N/m weretypically utilized. In order to minimize the force applied to thecrystalline surface during scanning, the set point voltage was continuallyadjusted to the lowest level for which tip-crystal contact was maintained.Step growth velocities were determined by scanning perpendicular tothe step and disabling the slow scan (vertical) axis. The slopes of thesteps were taken as the tangential growth velocities.
Results and Discussion
Crystallization Thermodynamics Are Characterized bya Negative Enthalpy Contribution. The protein solubility Ce
dependence on temperature was measured between 277 and 310K for the condition 100 mM Hepes pH 7.0, 200 mM MgCl2,2% and 5% PEG 1000. Ce was determined macroscopically bymeasuring the protein concentration C of the bulk solution inequilibrium with the solid crystalline phase (Figure 1b blackcircles and gray squares, macroscopic) and microscopically bydetermining the protein concentration for which the step velocityis zero (Figure 1b light gray triangles, microscopic). As can beseen from Figure 1b, glucose isomerase exhibits a normalsolubility dependence of temperature for PEG1000, that is,protein solubility increases with temperature. This solubility data
Figure 1. (a) Orthorombic (I222) glucose isomerase crystal (nine faces), habit is defined by planes with indexes 011, 101, and 110. (b) van’tHoff plot of the solubility data based on batch method (gray squares 2% PEG 1000 and black circles 5% PEG 1000) and zero step velocity method(light gray triangles 5% PEG); lines indicate fits based on eq 3.
498 Crystal Growth & Design, Vol. 9, No. 1, 2009 Sleutel et al.
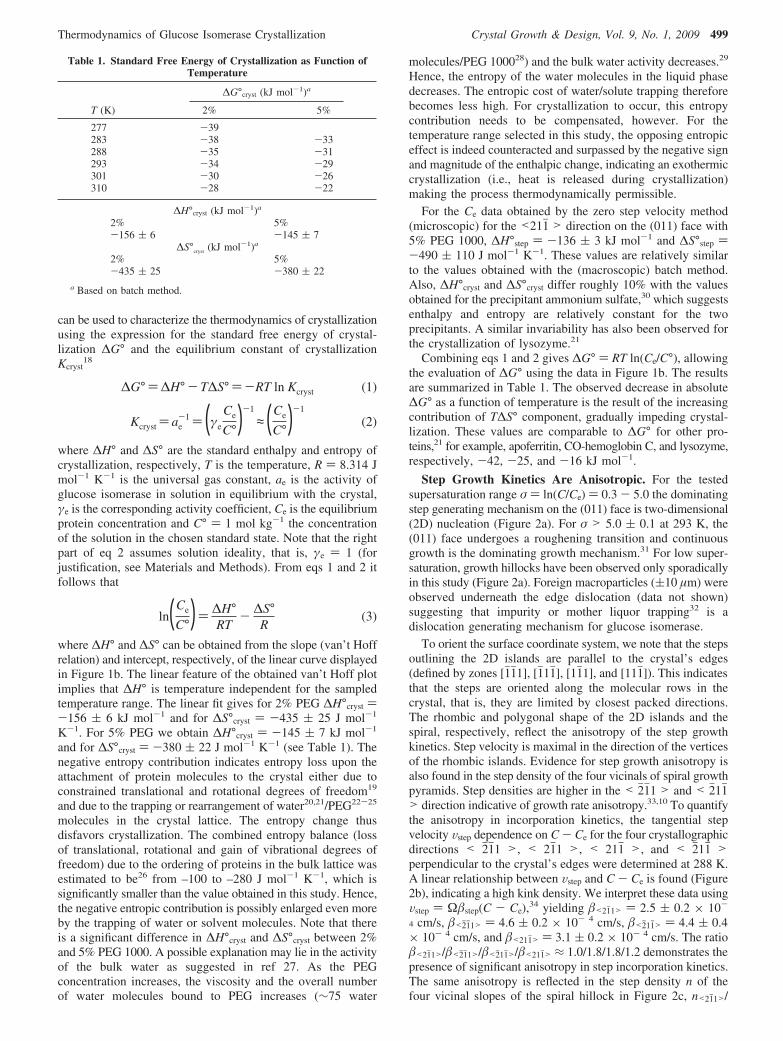
can be used to characterize the thermodynamics of crystallizationusing the expression for the standard free energy of crystal-lization ∆G° and the equilibrium constant of crystallizationKcryst
18
∆G°)∆H°- T∆S°)-RT ln Kcryst (1)
Kcryst ) ae-1 ) (γe
Ce
C°)-1
≈ (Ce
C°)-1
(2)
where ∆H° and ∆S° are the standard enthalpy and entropy ofcrystallization, respectively, T is the temperature, R ) 8.314 Jmol-1 K-1 is the universal gas constant, ae is the activity ofglucose isomerase in solution in equilibrium with the crystal,γe is the corresponding activity coefficient, Ce is the equilibriumprotein concentration and C° ) 1 mol kg-1 the concentrationof the solution in the chosen standard state. Note that the rightpart of eq 2 assumes solution ideality, that is, γe ) 1 (forjustification, see Materials and Methods). From eqs 1 and 2 itfollows that
ln(Ce
C°)) ∆H°RT
- ∆S°R
(3)
where ∆H° and ∆S° can be obtained from the slope (van’t Hoffrelation) and intercept, respectively, of the linear curve displayedin Figure 1b. The linear feature of the obtained van’t Hoff plotimplies that ∆H° is temperature independent for the sampledtemperature range. The linear fit gives for 2% PEG ∆H°cryst )-156 ( 6 kJ mol-1 and for ∆S°cryst ) -435 ( 25 J mol-1
K-1. For 5% PEG we obtain ∆H°cryst ) -145 ( 7 kJ mol-1
and for ∆S°cryst ) -380 ( 22 J mol-1 K-1 (see Table 1). Thenegative entropy contribution indicates entropy loss upon theattachment of protein molecules to the crystal either due toconstrained translational and rotational degrees of freedom19
and due to the trapping or rearrangement of water20,21/PEG22-25
molecules in the crystal lattice. The entropy change thusdisfavors crystallization. The combined entropy balance (lossof translational, rotational and gain of vibrational degrees offreedom) due to the ordering of proteins in the bulk lattice wasestimated to be26 from –100 to –280 J mol-1 K-1, which issignificantly smaller than the value obtained in this study. Hence,the negative entropic contribution is possibly enlarged even moreby the trapping of water or solvent molecules. Note that thereis a significant difference in ∆H°cryst and ∆S°cryst between 2%and 5% PEG 1000. A possible explanation may lie in the activityof the bulk water as suggested in ref 27. As the PEGconcentration increases, the viscosity and the overall numberof water molecules bound to PEG increases (∼75 water
molecules/PEG 100028) and the bulk water activity decreases.29
Hence, the entropy of the water molecules in the liquid phasedecreases. The entropic cost of water/solute trapping thereforebecomes less high. For crystallization to occur, this entropycontribution needs to be compensated, however. For thetemperature range selected in this study, the opposing entropiceffect is indeed counteracted and surpassed by the negative signand magnitude of the enthalpic change, indicating an exothermiccrystallization (i.e., heat is released during crystallization)making the process thermodynamically permissible.
For the Ce data obtained by the zero step velocity method(microscopic) for the <211j > direction on the (011) face with5% PEG 1000, ∆H°step ) -136 ( 3 kJ mol-1 and ∆S°step )-490 ( 110 J mol-1 K-1. These values are relatively similarto the values obtained with the (macroscopic) batch method.Also, ∆H°cryst and ∆S°cryst differ roughly 10% with the valuesobtained for the precipitant ammonium sulfate,30 which suggestsenthalpy and entropy are relatively constant for the twoprecipitants. A similar invariability has also been observed forthe crystallization of lysozyme.21
Combining eqs 1 and 2 gives ∆G° ) RT ln(Ce/C°), allowingthe evaluation of ∆G° using the data in Figure 1b. The resultsare summarized in Table 1. The observed decrease in absolute∆G° as a function of temperature is the result of the increasingcontribution of T∆S° component, gradually impeding crystal-lization. These values are comparable to ∆G° for other pro-teins,21 for example, apoferritin, CO-hemoglobin C, and lysozyme,respectively, -42, -25, and -16 kJ mol-1.
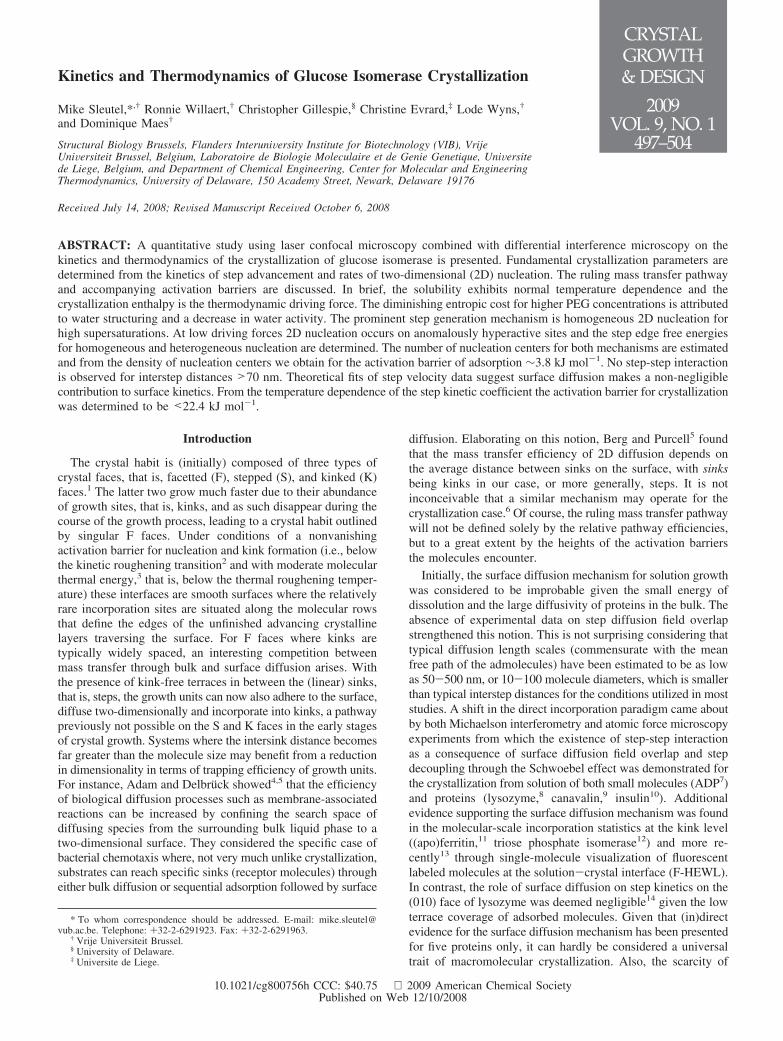
Step Growth Kinetics Are Anisotropic. For the testedsupersaturation range σ ) ln(C/Ce) ) 0.3 - 5.0 the dominatingstep generating mechanism on the (011) face is two-dimensional(2D) nucleation (Figure 2a). For σ > 5.0 ( 0.1 at 293 K, the(011) face undergoes a roughening transition and continuousgrowth is the dominating growth mechanism.31 For low super-saturation, growth hillocks have been observed only sporadicallyin this study (Figure 2a). Foreign macroparticles ((10 µm) wereobserved underneath the edge dislocation (data not shown)suggesting that impurity or mother liquor trapping32 is adislocation generating mechanism for glucose isomerase.
To orient the surface coordinate system, we note that the stepsoutlining the 2D islands are parallel to the crystal’s edges(defined by zones [1j1j1], [1j11j], [11j1], and [111j]). This indicatesthat the steps are oriented along the molecular rows in thecrystal, that is, they are limited by closest packed directions.The rhombic and polygonal shape of the 2D islands and thespiral, respectively, reflect the anisotropy of the step growthkinetics. Step velocity is maximal in the direction of the verticesof the rhombic islands. Evidence for step growth anisotropy isalso found in the step density of the four vicinals of spiral growthpyramids. Step densities are higher in the < 2j1j1 > and < 2j11j> direction indicative of growth rate anisotropy.33,10 To quantifythe anisotropy in incorporation kinetics, the tangential stepvelocity Vstep dependence on C - Ce for the four crystallographicdirections < 2j1j1 >, < 21j1 >, < 211j >, and < 2j11j >perpendicular to the crystal’s edges were determined at 288 K.A linear relationship between Vstep and C - Ce is found (Figure2b), indicating a high kink density. We interpret these data usingVstep ) Ωstep(C - Ce),34 yielding <21j1> ) 2.5 ( 0.2 × 10-
4 cm/s, <2j1j1> ) 4.6 ( 0.2 × 10- 4 cm/s, <2j11j> ) 4.4 ( 0.4× 10- 4 cm/s, and <211j> ) 3.1 ( 0.2 × 10- 4 cm/s. The ratio<21j1>/<2j1j1>/<2j11j>/<211j> ≈ 1.0/1.8/1.8/1.2 demonstrates thepresence of significant anisotropy in step incorporation kinetics.The same anisotropy is reflected in the step density n of thefour vicinal slopes of the spiral hillock in Figure 2c, n<21j1>/
Table 1. Standard Free Energy of Crystallization as Function ofTemperature
∆G°cryst (kJ mol-1)a
T (K) 2% 5%
277 -39283 -38 -33288 -35 -31293 -34 -29301 -30 -26310 -28 -22
∆H°cryst (kJ mol-1)a
2% 5%-156 ( 6 -145 ( 7
∆S°cryst (kJ mol-1)a
2% 5%-435 ( 25 -380 ( 22
a Based on batch method.
Thermodynamics of Glucose Isomerase Crystallization Crystal Growth & Design, Vol. 9, No. 1, 2009 499

n<2j1j1>/n<2j11j>/n<211j> ≈ 1.0/1.7/1.8/1.2. Note that spiral aniso-tropy (degree of polygonization) is determined by both theanisotropy of the step line energy and of the step kineticcoefficient. While the former dominates in the center of thespiral, anisotropy in becomes pronounced at the spiral’speriphery.33 Hence, we conclude from the polygonal step shapenear the spiral’s center and at the spiral’s periphery (Figure 2c)that the step line energy contains the same anisotropy as .
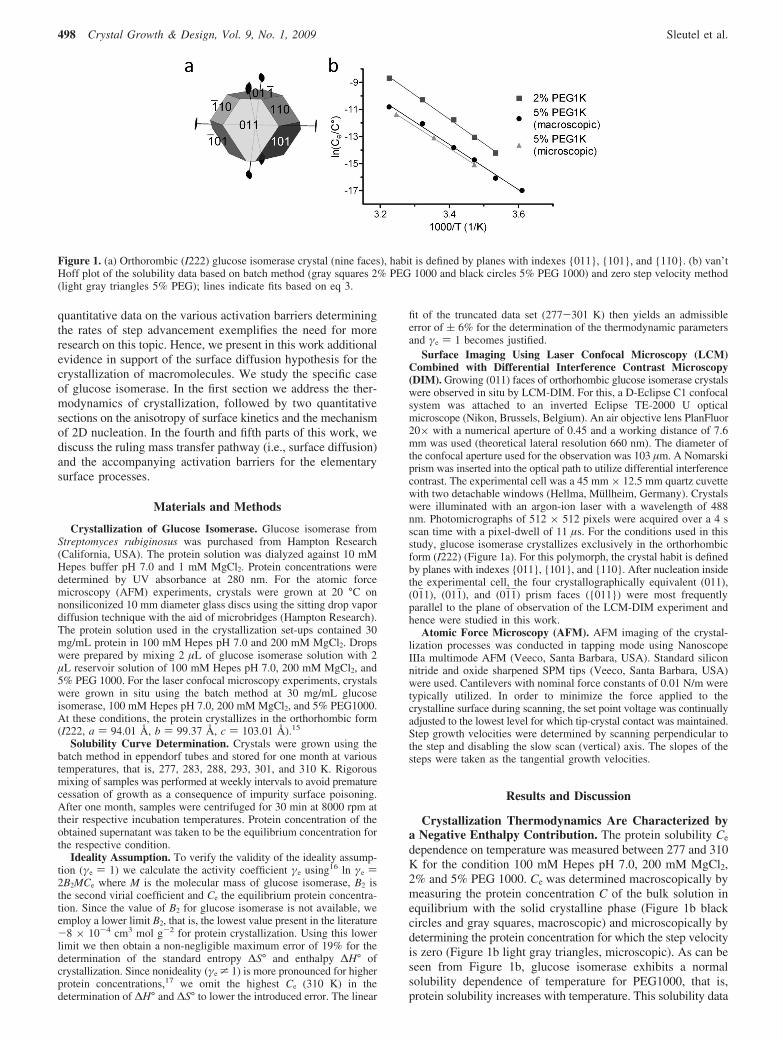
Heterogeneous 2D Nucleation Is the Prominent StepGeneration Mechanism at σ ) ln(C/Ce) e 0.7. While 2Dnucleation is the dominating step generation mechanism at 0.3< σ < 5.0 for the (011) crystal face of undisturbed crystals(i.e., no incorporation of microcrystals, no mechanical stress),we observed spiral dislocations only sporadically. However, theoccurrence of growth hillocks was significantly higher fordisturbed crystals. A similar observation has also been madefor lysozyme35 where multiple nucleation on dislocation-freecrystals was observed. To study the kinetics of step generationmore quantitatively, we measured the 2D nucleation rates as afunction of protein concentration (Figure 3a). The steady-state2D nucleation rates J were evaluated using a model derivedfrom classical nucleation theory.1
ln J) ln(ω*ΓZ)- πκ2s
k2T2 ln(C/Ce)(4)
where ω* is the frequency of attachment of molecules to thecritical 2D nucleus, Γ is the Zeldovich factor, Z is the steady-state admolecule surface concentration, κ is the specific edgefree energy and s is the surface area of a single molecule in thecritical 2D nucleus (determined using AFM: (9.7 × 10- 17 m2).From Figure 4a we see that ln J follows a clear linear
relationship as a function of 1/T 2 ln(C/Ce) with a kink around1.66 × 10- 7 K-2, being ln(C/Ce) ) 0.7 at 293 K. Such a kinkhas been observed for thaumatin,36 lysozyme,35 and inorganiccrystals of ADP37 and can interpreted as homogeneous andheterogeneous nucleation at high (regime 1) and low (regime2) supersaturations, respectively. The slower decrease in ln J(larger slope) for σ > 0.7 indicates a smaller specific edge freeenergy that stems from 2D nucleation on hyperactive sites suchas defects and impurity particles. Fits based on eq 4 of the twolinear regimes in Figure 3a yield κ1 ) 6.0 ( 0.3 × 10- 13 J/mand κ2 ) 2.0 ( 0.2 × 10- 13 J/m. The two-dimensional analogof κ, that is, the effective surface free energy of the step end R,can be estimated using R ) κ/h35 (the step height h ≈ 7 nmdetermined using AFM), giving for R1 ) 0.086 ( 0.004 mJ/m2
and R2 ) 0.029 ( 0.003 mJ/m2, respectively. These values are1 order of magnitude smaller than for lysozyme35 and 3-4 timessmaller than for catalase38 and thaumatin36 and are com-mensurate with the measured high 2D nucleation rates for thiscase.
From the steady-state 2D nucleation rates combined with theknowledge of the step kinetic coefficient, we calculate thesupersaturation dependence of the normal growth rate R usingthe birth and spread model33
R= h(πVstep2 J)1 ⁄ 3 ) h[π(Ωstep(C-Ce))
2J]1 ⁄ 3
if S1 ⁄ 2 > (Vstep ⁄ J)1 ⁄ 3 (5)
where S is the surface area of the crystal face. Typical crystallength scales were 50 µm, which is significantly larger than themaximal value of (Vstep/J)1/3 achieved in this study, that is, (10µm. Hence, the use of eq 5 is justified. Expressing the normalgrowth rate in the coordinates ln(R/σ5/6) versus 1/σ allows for
Figure 2. (a) 2D nucleation on the (011) face of an orthorhombic glucose isomerase crystal: miller indices within square brackets denote crystaledge orientation, miller indices within angular brackets denote directions perpendicular to crystal’s edges. (b) Vstep as function of driving force:slopes of the linear fits yield the step kinetic coefficient step for the four directions, (c) growth hillock spiraling around an edge dislocation protrudingthe (011) face, foreign particles present in the crystal bulk or on the surface can be seen.
Figure 3. (a) 2D nucleation rates as a function of 1/T 2 ln(C/Ce). Solid lines represent fits based on eq 4. Two domains are clearly discernible:homogeneous nucleation at σ > 0.7 (black dots), heterogeneous nucleation at σ < 0.7 (gray dots). (b) Supersaturation dependence of the normalgrowth rate R produced by 2D nucleation. Solid lines represent fits based on eq 6.
500 Crystal Growth & Design, Vol. 9, No. 1, 2009 Sleutel et al.
the determination of the number of 2D nucleation centers ns
using37
ln(R ⁄ σ5⁄6)) ln[hCestep(Ω2hans)
1⁄3]- πΩR2h
3(kT)2σ(6)
with a being the distance between adjacent molecules (deter-mined using AFM: 9-10 nm). From the slope of the linear fitin Figure 3b one can determine the effective surface free energyR. For the regions of homogeneous and heterogeneous nucle-ation we obtain, respectively, R1 ) 0.110 ( 0.005 mJ/m2 andR2 ) 0.034 ( 0.005 mJ/m2. Note that these values are quitecomparable to the values obtained from the fits based on eq 4,hereby validating the applicability of the birth and spread model.
Extrapolation of the linear fits presented in Figure 3b givesthe intercept with the ordinate axis, which in its turn yields ns1
) 3 ( 2 × 108 cm- 2 for the regime of homogeneous nucleation.For lower supersaturations where nucleation is assumed not tooccur around natiVe admolecules but at anomalously active sites(e.g., impurity particles), we get for the surface concentrationof active sites ns2 ) ns* ) 1.2 ( 0.6 × 104 cm- 2. These valuesare quite similar as obtained for thaumatin36 and ADP.37
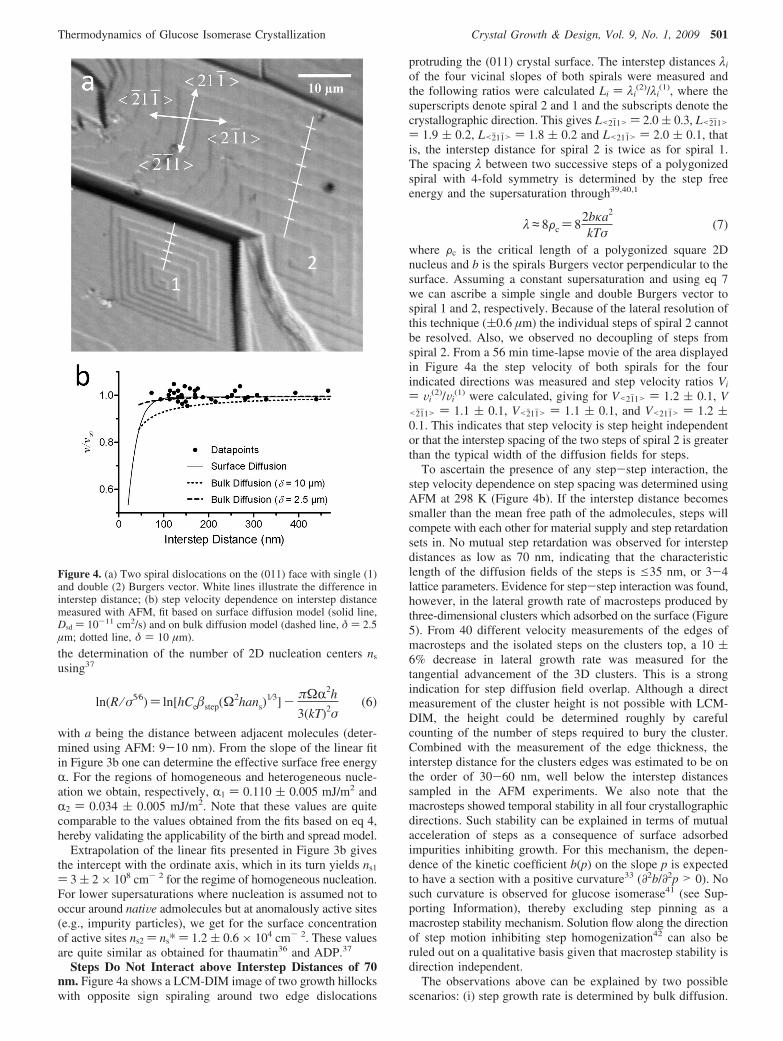
Steps Do Not Interact above Interstep Distances of 70nm. Figure 4a shows a LCM-DIM image of two growth hillockswith opposite sign spiraling around two edge dislocations
protruding the (011) crystal surface. The interstep distances λi
of the four vicinal slopes of both spirals were measured andthe following ratios were calculated Li ) λi
(2)/λi(1), where the
superscripts denote spiral 2 and 1 and the subscripts denote thecrystallographic direction. This gives L<21j1> ) 2.0 ( 0.3, L<2j1j1>) 1.9 ( 0.2, L<2j11j> ) 1.8 ( 0.2 and L<211j> ) 2.0 ( 0.1, thatis, the interstep distance for spiral 2 is twice as for spiral 1.The spacing λ between two successive steps of a polygonizedspiral with 4-fold symmetry is determined by the step freeenergy and the supersaturation through39,40,1
λ ≈ 8Fc ) 82bκa2
kTσ(7)
where Fc is the critical length of a polygonized square 2Dnucleus and b is the spirals Burgers vector perpendicular to thesurface. Assuming a constant supersaturation and using eq 7we can ascribe a simple single and double Burgers vector tospiral 1 and 2, respectively. Because of the lateral resolution ofthis technique ((0.6 µm) the individual steps of spiral 2 cannotbe resolved. Also, we observed no decoupling of steps fromspiral 2. From a 56 min time-lapse movie of the area displayedin Figure 4a the step velocity of both spirals for the fourindicated directions was measured and step velocity ratios Vi
) Vi(2)/Vi
(1) were calculated, giving for V<21j1> ) 1.2 ( 0.1, V<2j1j1> ) 1.1 ( 0.1, V<2j11j> ) 1.1 ( 0.1, and V<211j> ) 1.2 (0.1. This indicates that step velocity is step height independentor that the interstep spacing of the two steps of spiral 2 is greaterthan the typical width of the diffusion fields for steps.
To ascertain the presence of any step-step interaction, thestep velocity dependence on step spacing was determined usingAFM at 298 K (Figure 4b). If the interstep distance becomessmaller than the mean free path of the admolecules, steps willcompete with each other for material supply and step retardationsets in. No mutual step retardation was observed for interstepdistances as low as 70 nm, indicating that the characteristiclength of the diffusion fields of the steps is e35 nm, or 3-4lattice parameters. Evidence for step-step interaction was found,however, in the lateral growth rate of macrosteps produced bythree-dimensional clusters which adsorbed on the surface (Figure5). From 40 different velocity measurements of the edges ofmacrosteps and the isolated steps on the clusters top, a 10 (6% decrease in lateral growth rate was measured for thetangential advancement of the 3D clusters. This is a strongindication for step diffusion field overlap. Although a directmeasurement of the cluster height is not possible with LCM-DIM, the height could be determined roughly by carefulcounting of the number of steps required to bury the cluster.Combined with the measurement of the edge thickness, theinterstep distance for the clusters edges was estimated to be onthe order of 30-60 nm, well below the interstep distancessampled in the AFM experiments. We also note that themacrosteps showed temporal stability in all four crystallographicdirections. Such stability can be explained in terms of mutualacceleration of steps as a consequence of surface adsorbedimpurities inhibiting growth. For this mechanism, the depen-dence of the kinetic coefficient b(p) on the slope p is expectedto have a section with a positive curvature33 (∂2b/∂2p > 0). Nosuch curvature is observed for glucose isomerase41 (see Sup-porting Information), thereby excluding step pinning as amacrostep stability mechanism. Solution flow along the directionof step motion inhibiting step homogenization42 can also beruled out on a qualitative basis given that macrostep stability isdirection independent.
The observations above can be explained by two possiblescenarios: (i) step growth rate is determined by bulk diffusion.
Figure 4. (a) Two spiral dislocations on the (011) face with single (1)and double (2) Burgers vector. White lines illustrate the difference ininterstep distance; (b) step velocity dependence on interstep distancemeasured with AFM, fit based on surface diffusion model (solid line,Dsd ) 10-11 cm2/s) and on bulk diffusion model (dashed line, δ ) 2.5µm; dotted line, δ ) 10 µm).
Thermodynamics of Glucose Isomerase Crystallization Crystal Growth & Design, Vol. 9, No. 1, 2009 501

In this case the step velocity of a double height step (for whichh = D/) would reduce by a factor (1 + step2h/D)-1 ) (1 +0.0016)-1, that is, negligible, whereas retardation of steps ofmacroscopic height would occur; or (ii) steps are fed throughsurface diffusion with an appreciable Ehrlich-Schwoebel barrierfor incorporation from the lower terrace. Let us evaluate bothpossible scenarios using the expression for the relative velocityV/V∞ of parallel equidistant steps controlled by either bulk orsurface diffusion:43
VV∞
) (1+ hπD
ln[λh
sinh(πδλ )])-1
(bulk diffusion)
(8a)
VV∞
)tanh(λ/λs)
1+Dsd
λstanh(λ/λs)
(surface diffusion) (8b)
where V∞ is the velocity of an isolated step, λ is the interstepdistance, δ is the distance normal to the surface for which C )Cbulk, λs is the surface distance normal to the step for which theadmolecule concentration has reached the equilibrium value andDsd is the surface diffusivity. As fitting parameters we used λs
) 35 nm, D ) 3.5 × 10- 7 cm2/s, and ) 3.8 × 10- 4 cm/s.
Both models predict experimental observations in a satisfactoryway (Figure 4b). However, the fit based on the bulk diffusionmodel does require δ to be ∼2.5 µm. A strong deviation fromthe experimental data is already observed for a slightly largervalue, that is, 10 µm. Given that δ is in the range of 150 µmfor lysozyme44 (with comparable values45 for ) (2-3) ×10
- 4
cm/s and D ) 7.3 × 10- 7cm2/s) a value of δ ) 2.5 µmwould seem improbable, thereby negating the bulk diffusionmodel for the case presented in this work, that is, glucoseisomerase. Adequate correspondence between the step velocitydata and the surface diffusion model is obtained for surfacediffusivities Dsd < 10-11 cm2/s. Recent single-molecule visu-alization experiments have estimated the surface diffusivity offluorescence labeled lysozyme to be 4-5 orders of magnitudesmaller than the bulk diffusivity.13 This makes the obtainedvalue of the surface diffusivity for glucose isomerase probable.Hence we conclude that for the conditions sampled in this study,surface diffusion is the dominating mass transfer pathway fromthe bulk toward the kink.
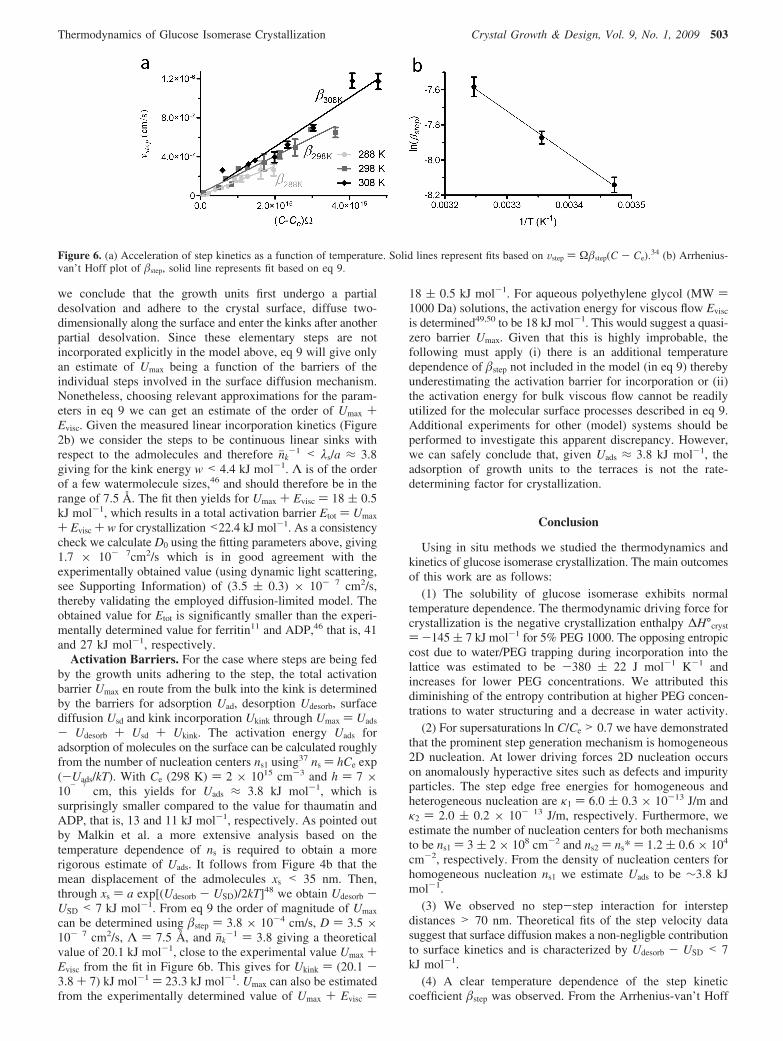
The Total Activation Energy for a Growth Unit EnRoute from the Bulk to a Kink is <22.4 kJ mol-1. Toinvestigate the temperature dependence of step incorporationkinetics, step velocities for the < 211j > direction as a functionof C - Ce were measured for three different temperatures 288,298, and 308 K (Figure 6a). Care was taken to select crystalssmaller than 100 µm to minimize the presence of surfaceconcentration gradients. Additionally, step velocities weremeasured of steps closest to the edges or vertices of the crystalface to obtain the closest approximation of the surface concen-tration to the bulk concentration. Typical interstep distances werefar greater than 70 nm. Using coolant flows, the temperature ofthe experimental cell was maintained at 1 K accuracy. Thecorresponding step kinetic coefficients based on the slopes ofthe linear fits are <211j>
288K ) 2.9 ( 0.1 × 10- 4 cm/s,<211j>
298K ) 3.8 ( 0.1 × 10- 4 cm/s, and <211j>308K ) 5.1 (
0.3 × 10- 4 cm/s. A clear acceleration of kinetics is observed.The height of the net energy barrier that molecules encounterfrom bulk to the step and/or kink can be ascertained by usingthe expression for the step kinetic coefficient for crystallizationin solution. For this we use a diffusion-limited kinetics modelwith a mass-independent step derived by Petsev et al.46
step )1njk
DΛ
exp(-Umax
kT )) 1
1+ 0.5 exp( wkT)
D0
Λexp (-Umax +Evisc
kT ) (9)
where njk-1 is the kink density, D is the diffusivity, k is the
Boltzmann constant, Λ is the radius of curvature of thesurface-molecule interaction potential around its maximum atUmax. As pointed out by Chen et al.11 both njk
-1 and D have anexponential temperature dependence, yielding the right-hand partof eq 9. The validity of an Arrhenius-type of temperaturedependence of the diffusivity has already been verified for thecase of bovine serum albumin.47 Although a slight deviationfrom Arrhenius behavior is observed, this departure from anexponential temperature dependence occurs at far lower tem-peratures than sampled in this study, suggesting that the use ofthe expression D ) D0 exp(-Evisc/kT) is justified here.
The activation barrier derived from the fit in Figure 6b thusrepresents a total activation barrier Etot that includes theactivation barriers for viscous flow Evisc, the energy needed forkink formation w and the barrier for incorporation into the kinkUmax (see right-hand part of eq 9). From the previous section
Figure 5. The lateral expansion of three-dimensional clusters adsorbedon the (011) face, between 0 min (a) and 45 min (b). The macrostepsare stable as a function of time for all four edge directions and advanceslower than the steps of the newly formed 2D islands on the clusterssurface.
502 Crystal Growth & Design, Vol. 9, No. 1, 2009 Sleutel et al.
we conclude that the growth units first undergo a partialdesolvation and adhere to the crystal surface, diffuse two-dimensionally along the surface and enter the kinks after anotherpartial desolvation. Since these elementary steps are notincorporated explicitly in the model above, eq 9 will give onlyan estimate of Umax being a function of the barriers of theindividual steps involved in the surface diffusion mechanism.Nonetheless, choosing relevant approximations for the param-eters in eq 9 we can get an estimate of the order of Umax +Evisc. Given the measured linear incorporation kinetics (Figure2b) we consider the steps to be continuous linear sinks withrespect to the admolecules and therefore njk
-1 < λs/a ≈ 3.8giving for the kink energy w < 4.4 kJ mol-1. Λ is of the orderof a few watermolecule sizes,46 and should therefore be in therange of 7.5 Å. The fit then yields for Umax + Evisc ) 18 ( 0.5kJ mol-1, which results in a total activation barrier Etot ) Umax
+ Evisc + w for crystallization <22.4 kJ mol-1. As a consistencycheck we calculate D0 using the fitting parameters above, giving1.7 × 10- 7cm2/s which is in good agreement with theexperimentally obtained value (using dynamic light scattering,see Supporting Information) of (3.5 ( 0.3) × 10- 7 cm2/s,thereby validating the employed diffusion-limited model. Theobtained value for Etot is significantly smaller than the experi-mentally determined value for ferritin11 and ADP,46 that is, 41and 27 kJ mol-1, respectively.
Activation Barriers. For the case where steps are being fedby the growth units adhering to the step, the total activationbarrier Umax en route from the bulk into the kink is determinedby the barriers for adsorption Uad, desorption Udesorb, surfacediffusion Usd and kink incorporation Ukink through Umax ) Uads
- Udesorb + Usd + Ukink. The activation energy Uads foradsorption of molecules on the surface can be calculated roughlyfrom the number of nucleation centers ns1 using37 ns ) hCe exp(-Uads/kT). With Ce (298 K) ) 2 × 1015 cm-3 and h ) 7 ×10
- 7
cm, this yields for Uads ≈ 3.8 kJ mol-1, which issurprisingly smaller compared to the value for thaumatin andADP, that is, 13 and 11 kJ mol-1, respectively. As pointed outby Malkin et al. a more extensive analysis based on thetemperature dependence of ns is required to obtain a morerigorous estimate of Uads. It follows from Figure 4b that themean displacement of the admolecules xs < 35 nm. Then,through xs ) a exp[(Udesorb - USD)/2kT]48 we obtain Udesorb -USD < 7 kJ mol-1. From eq 9 the order of magnitude of Umax
can be determined using step ) 3.8 × 10⁻⁴ cm/s, D ) 3.5 ×10- 7 cm2/s, Λ ) 7.5 Å, and njk
-1 ) 3.8 giving a theoreticalvalue of 20.1 kJ mol-1, close to the experimental value Umax +Evisc from the fit in Figure 6b. This gives for Ukink ) (20.1 -3.8 + 7) kJ mol-1 ) 23.3 kJ mol-1. Umax can also be estimatedfrom the experimentally determined value of Umax + Evisc )
18 ( 0.5 kJ mol-1. For aqueous polyethylene glycol (MW )1000 Da) solutions, the activation energy for viscous flow Evisc
is determined49,50 to be 18 kJ mol-1. This would suggest a quasi-zero barrier Umax. Given that this is highly improbable, thefollowing must apply (i) there is an additional temperaturedependence of step not included in the model (in eq 9) therebyunderestimating the activation barrier for incorporation or (ii)the activation energy for bulk viscous flow cannot be readilyutilized for the molecular surface processes described in eq 9.Additional experiments for other (model) systems should beperformed to investigate this apparent discrepancy. However,we can safely conclude that, given Uads ≈ 3.8 kJ mol-1, theadsorption of growth units to the terraces is not the rate-determining factor for crystallization.
Conclusion
Using in situ methods we studied the thermodynamics andkinetics of glucose isomerase crystallization. The main outcomesof this work are as follows:
(1) The solubility of glucose isomerase exhibits normaltemperature dependence. The thermodynamic driving force forcrystallization is the negative crystallization enthalpy ∆H°cryst
)-145 ( 7 kJ mol-1 for 5% PEG 1000. The opposing entropiccost due to water/PEG trapping during incorporation into thelattice was estimated to be -380 ( 22 J mol-1 K-1 andincreases for lower PEG concentrations. We attributed thisdiminishing of the entropy contribution at higher PEG concen-trations to water structuring and a decrease in water activity.
(2) For supersaturations ln C/Ce > 0.7 we have demonstratedthat the prominent step generation mechanism is homogeneous2D nucleation. At lower driving forces 2D nucleation occurson anomalously hyperactive sites such as defects and impurityparticles. The step edge free energies for homogeneous andheterogeneous nucleation are κ1 ) 6.0 ( 0.3 × 10⁻¹³ J/m andκ2 ) 2.0 ( 0.2 × 10- 13 J/m, respectively. Furthermore, weestimate the number of nucleation centers for both mechanismsto be ns1 ) 3 ( 2 × 108 cm-2 and ns2 ) ns* ) 1.2 ( 0.6 × 10⁴
cm-2, respectively. From the density of nucleation centers forhomogeneous nucleation ns1 we estimate Uads to be ∼3.8 kJmol-1.
(3) We observed no step-step interaction for interstepdistances > 70 nm. Theoretical fits of the step velocity datasuggest that surface diffusion makes a non-negligble contributionto surface kinetics and is characterized by Udesorb - USD < 7kJ mol-1.
(4) A clear temperature dependence of the step kineticcoefficient step was observed. From the Arrhenius-van’t Hoff
Figure 6. (a) Acceleration of step kinetics as a function of temperature. Solid lines represent fits based on Vstep ) Ωstep(C - Ce).34 (b) Arrhenius-van’t Hoff plot of step, solid line represents fit based on eq 9.
Thermodynamics of Glucose Isomerase Crystallization Crystal Growth & Design, Vol. 9, No. 1, 2009 503
plot of step a total activation barrier for crystallization wasdetermined to be <22.4 kJ mol-1.
Acknowledgment. We are indebted to G. Nicolis and P.Vekilov for vital critical discussions. This work was supportedby the Flanders Interuniversity Institute for Biotechnology(VIB), the Research Council of the VUB and the BelgianFederal Science Policy Office (DWTC). We thank the EuropeanSpace Agency for financing in the context of Prodex projectAO2004.
Supporting Information Available: Glucose isomerase bulk dif-fusivity as a function of PEG 1000 concentration, at 100 mM HepespH 7.0, 200 mM MgCl2, and 298 K. Anisotropy of the kineticcoefficient b as a function of local slope p (•) and 4th order polynomialfit (dashed line). ∂2b/∂2p dependence on p (black line) obtained by takingthe first derivative of the 4th order polynomial fit. This material isavailable free of charge via the Internet at http://pubs.acs.org.
References
(1) Markov, I. V. In Crystal Growth for Beginners: Fundamentals ofNucleation, Crystal Growth and Epitaxy; Markov, I. V., Eds.; WorldScientific Publishing: Singapore, 2003.
(2) Buckley, H. E. In Crystal Growth; John Wiley and Sons: New York,1951.
(3) Burton, W. K.; Cabrera, N.; Frank, F. C. Philos. Trans. R. Soc. Lond.1951, 243, 299–358.
(4) Adam, G.; Delbruck, M. In Structural Chemistry and MolecularBiology; Rich, A.,Davidson, N., Eds.; Freeman: San Francisco, 1968;p 198.
(5) Berg, H. C.; Purcell, E. M. Biophys. J. 1977, 20, 193–219.(6) Garza-Lopez, R. A.; Bouchard, P.; Nicolis, G.; Sleutel, M.; Brzezinski,
J.; Kozak, J. J. Chem. Phys. 2008, 114701–114714.(7) Vekilov, P. G.; Kuznetsov, Y.; Chernov, A. A. J. Cryst. Growth 1992,
121, 643–655.(8) Vekilov, P. G.; Monaco, L. A.; Rosenberger, F. J. Cryst. Growth 1995,
156, 267–278.(9) Land, T. A.; De Yoreo, J. J.; Lee, J. D. Surf. Sci. 1997, 384, 136–
155.(10) Reviakine, I. J. Am. Chem. Soc. 2003, 125, 11684–11693.(11) Chen, K.; Vekilov, P. G. Phys. ReV. E 2002, 66, 21606-121606-5.(12) Sleutel, M.; Vanhee, C.; Van de Weerdt, C.; Decanniere, K.; Maes,
D.; Wyns, L.; Willaert, R. Cryst. Growth Des. 2008, 8, 1173–1180.(13) Sazaki, G.; Okada, M.; Matsui, T.; Watanabe, T.; Higuchi, H.;
Tsukamoto, K.; Nakajima, K. Cryst. Growth Des. 2008, 8, 2024–2031.(14) Chernov, A. A.; Rashkovich, L. N.; Yaminski, I. V.; Gvozdev, N. V.
J. Phys.: Condens. Matter. 1999, 11, 9969–9984.(15) Carrell, H. L.; Glusker, J. P.; Burger, V.; Manfre, F.; Tritsch, D.;
Biellmann, J.-F. Proc. Natl. Acad. Sci. U. S. A. 1989, 86, 4440–4444.(16) Hill, T. L. In An Introduction to Statistical Thermodynamics; Bonner,
F. T., Pimentel, G. C., Eds.; Dover: New York, 1986.(17) Ross, P. D.; Minton, A. P. J. Mol. Biol. 1977, 112, 437–452.(18) Atkins, P. In Physical Chemistry, 6th ed.; Freeman: New York, 1998.(19) Tidor, B.; Karplus, M. J. Mol. Biol. 1994, 238, 405–414.(20) Yau, S. T.; Petsev, D. N.; Thomas, B. R.; Vekilov, P. G. J. Mol. Biol.
2000, 303, 667–678.
(21) Vekilov, P. G.; Feeling-Taylor, A. R.; Yau, S. T.; Petsev, D. N. ActaCrystallogr. D 2002, D58, 1611–1616.
(22) Koepke, J.; Scharff, E. I.; Lucke, C.; Ruterjans, H.; Fritzsch, G. ActaCrystallogr. D 2002, 58, 1757–1759.
(23) Zhang, M.; Wei, Z.; Chang, S.; Teng, M.; Gong, W. J. Mol. Biol.2006, 358, 97–105.
(24) Hasek, J. Z. Kristallogr. Suppl. 2006, 23, 613–618.(25) Barbosa, J. A. R. G.; Silva, L. P.; Teles, R. C. L.; Esteves, G. F.;
Azevedo, R. B.; Ventura, M. M.; de Freitas, S. M. Biophys. J. 2007,92, 1638–1650.
(26) Vekilov, P. G. Cryst. Growth Des. 2007, 7, 2796–2810.(27) Vekilov, P. G. Cryst. Growth Des. 2007, 7, 2239–2246.(28) Branca, C.; Magazu, S.; Maisano, G.; Migliardo, P.; Migliardo, F.;
Romeo, G. Phys. Scr. 2002, 66, 175–179.(29) Ninni, L.; Camargo, M. S.; Meirelles, A. J. A. Thermochim. Acta 1999,
328, 167–176.(30) Suzuki, Y.; Sazaki, G.; Visuri, K.; Tamura, K.; Nakajima, K.;
Yanagiya, S. Cryst. Growth Des. 2002, 2, 321–324.(31) Sleutel, M.; Maes, D.; Wyns, L.; Willaert, R. Cryst. Growth Des. 2008,
accepted for publication.(32) Sazaki, G.; Tsukamoto, K.; Yai, S.; Okada, M.; Nakajima, K. Cryst.
Growth Des. 2005, 5, 1729–1735.(33) Chernov, A. A. In Modern Crystallography III. Crystal Growth;
Queisser, H.-J., Eds.; Springer-Verlag: Berlin, 1984.(34) Vekilov, P. G.; Alexander, J. I. D. Chem. ReV. 2000, 100, 2061–2089.(35) Van Driessche, A. E. S.; Sazaki, G.; Otalora, F.; Gonzalez-Rico, F. M.;
Dold, P.; Tsukamoto, K.; Nakajima, K. Cryst. Growth Des. 2007, 7,1980–1987.
(36) Malkin, A. J.; Kuznetsov, Y. G.; Glantz, W.; McPherson, A. J. Phys.Chem. 1996, 100, 11736–11743.
(37) Malkin, A. J.; Chernov, A. A.; Alexeev, I. V. J. Cryst. Growth 1989,97, 765–769.
(38) Malkin, A. J.; Kuznetsov, Y. G.; McPherson, A. Surf. Sci. 1997, 393,95–107.
(39) Cabrera, N.; Levine, M. M. Philos. Mag. 1956, 1, 450–458.(40) Muller-Krumbhaar, H.; Burkhardt, T. W.; Kroll, D. M. J. Cryst. Growth
1977, 38, 13.(41) Sleutel, M.; Willaert, R.; Wyns, L.; Maes, D. Submitted to Crystal
Growth and Design, 2008 .(42) Chernov, A. A.; Coriell, S. R.; Murray, B. T. J. Cryst. Growth 1993,
132, 405–413.(43) Chernov, A. A. In Modern Crystallography III; Cardona, M., Fulde,
P., Queisser, H.-J., Eds.; Springer-Verlag: Berlin, 1984; Chapter 5, p209.
(44) Lin, H.; Rosenberger, F.; Alexander, J. I.; Nadarajah, A. J. Cryst.Growth 1995, 151, 153–162.
(45) Vekilov, P. G.; Rosenberger, F. J. Cryst. Growth 1996, 158, 540–551.
(46) Petsev, D. N.; Chen, K.; Gliko, O.; Vekilov, P. G. Proc. Natl. Acad.Sci. U. S. A. 2003, 100, 792–796.
(47) Placidi, M.; Cannistraro, S. Chem. Phys. Lett. 1999, 310, 130–136.(48) Bennema, P. J. Cryst. Growth 1969, 5, 29–43.(49) Chan, J.; Popov, J. J.; Kolisnek-Kehl, S.; Leaist, D. G. J. Solution
Chem. 2003, 32, 197–214.(50) Bai, T.-C.; Huang, C.-G.; Li, Q. Fluid Phase Equilib. 2003, 207,
209–223.
CG800756H
504 Crystal Growth & Design, Vol. 9, No. 1, 2009 Sleutel et al.
Related Documents