Kinetic and Catalytic Studies of Polyethylene Terephthalate Synthesis Vorgelegt von Fatemeh Ahmadnian Von der Fakultät II - Mathematik und Naturwissenschaften Der Technischen Universität Berlin zur Erlangung des akademischen Grades Doktor der Ingenieurwissenschaften - Dr. Ing. - vorgelegte Dissertation Promotionsausschuss: Vorsitzende: Prof. Dr. rer. nat. R. von Klitzing Berichter: Prof. Dr. rer. nat. K-H. Reichert Prof. Dr. rer. nat. R. Schomäcker Prof. Dr. Ing. M. Bartke Tag der wissenschaftlichen Aussprache: 23.07.08 Berlin, 2008 D 83

Welcome message from author
This document is posted to help you gain knowledge. Please leave a comment to let me know what you think about it! Share it to your friends and learn new things together.
Transcript

Kinetic and Catalytic Studies of Polyethylene
Terephthalate Synthesis
Vorgelegt von
Fatemeh Ahmadnian
Von der Fakultät II - Mathematik und Naturwissenschaften Der Technischen Universität Berlin
zur Erlangung des akademischen Grades
Doktor der Ingenieurwissenschaften
- Dr. Ing. -
vorgelegte Dissertation
Promotionsausschuss:
Vorsitzende: Prof. Dr. rer. nat. R. von Klitzing
Berichter: Prof. Dr. rer. nat. K-H. Reichert
Prof. Dr. rer. nat. R. Schomäcker
Prof. Dr. Ing. M. Bartke
Tag der wissenschaftlichen Aussprache: 23.07.08
Berlin, 2008
D 83

‘Imagination is more important than knowledge. Knowledge is limited. Imagination encircles the world.’
Albert Einstein

Acknowledgment
I would like to express my deep and sincere gratitude to my supervisor, Professor Karl-Heinz Reichert. His wide knowledge and his logical way of thinking have been of great value for me. His understanding, encouraging and personal guidance have provided a good basis for the present thesis. I am deeply grateful to his detailed and constructive comments and his important support throughout this work.
I wish to express my warm and sincere thanks to Professor Reinhard Schomäcker for his scientific and administrative guidance during my thesis. I greatly appreciate having the chance to teach and supervise lab courses.
My sincere thanks go to the examination committee, Professor Michael Bartke and Professor Regine von Klitzing.
I owe my most sincere gratitude to Dr. Gunter Feix, Dr. Reiner Hagen and Dr. Christofer Hess, for scientific discussions and analytical measurements.
I wish to thank Dr. Geiseler for all his organizatorial helps and supports. He was always ready to help and found always solution for any problem that we faced.
I wish to extend my warmest thanks to all those who have helped me with my work at Technical University Berlin. I would like to thank Astrid for Infrared measurements and also her friendship and support during difficult moments especially for assisting in the organization of scientific symposium on February 2008. Special thanks go to Annette and Annie for all their assistance during my work and teaching duties, to Mrs Wenzel and Mrs Löhr for their sympathetic helps in secretarial works.
I warmly thank all members of research groups of Prof. Schomäcker and Prof. Strasser for warm working atmosphere and funny times in any celebration.
My special appreciation goes to my colleagues, Mohamed, Fernanda and Luis for their scientific assistance in my work and also their friendships and concerns. I am thankful for all beautiful moments that we had together and that nice environment in the group. I would like to thank my former colleagues Marian and Ali.
I wish to thank my friends, Farnoosh, Sara, Pantea, Raha, Zoya, Sohrab, Samira, Arsalan, Juchan, Meena, Rosy and Debby, for good times we spent together in these two years.
I would like deeply to gratitude Milan and Ana Bosnjak for their kindness and support in my residence in Germany. They let me own happy family also in Germany.
I am deeply indebted to my family especially to my parents for their love, continuous support, inspiration and dedication from the first day of my birth. Without them I could not reach to this point now. They share in my entire successes. My special gratitude goes to my lovely sister, my brothers, Mehdi, Nazanin and Safoura for their support and encouragement.

My last but not least gratitude goes to Marijo, for his love, patience, support, concern and dedication during the long process toward this goal. I can not thank him enough.
Thank you all.
Berlin 2008

i
Abstract of Dissertation
Polyethylene terephthalate synthesis by polycondensation of bis (hydroxyethylene)
terephthalate and its low molecular weight oligomers catalyzed by different titanium (IV)
based catalysts was investigated. An industrial catalyst, antimony triacetate, was used as a
reference catalyst. Polycondensation was carried out in a stirred tank reactor made of
aluminium in the temperature range of 250°C to 280°C under 1 mbar vacuum. The products
were characterized with respect to conversion of reaction, molecular weight and concentration
of side products. For further investigation, differential scanning calorimetry and
thermogravimetric analysis techniques were used in nonisothermal mode under nitrogen
purging. Differential scanning calorimetry is an appropriate technique for catalyst fast
screening of polycondensation reaction. However, some critical points like catalytic activity
of sample holder and mass transfer of by-products should be carefully optimized.
Seven different commercially available titanium (IV) compounds were applied which can be
mainly classified as chelated and non-chelated titanium derivatives. It was found that non-
chelated titanium catalysts were highly active in the synthesis of polyethylene terephthalate
nevertheless accelerates the formation of undesired side products. Chelated titanium catalysts
showed less activity and more selectivity in the polycondesation reaction. It was also found
that the original used titanium compounds were precursors. The catalysts active sites is
formed in the beginning of reaction. The exact structure of active species is not known.
Probably, the active species is formed by exchange reaction between hydroxyl end groups of
monomer and ligands of titanium.
The kinetics of polycondensation reaction catalyzed by titanium tetrabutoxide in melt phase,
obeys a second order rate law with respect to the concentration of functional end groups. The
overall activation energy of polycodenation reaction is 63 kJ mol-1 and that is about 28% less
than of antimony triacetate catalyzed polycondensation reaction. A mathematical model was
developed to describe kinetic of polycondensation reaction, progress of molecular weight and
concentration of side products. The model employed different chemical reactions like
reversible polycondensation, degradation reaction and also physical processes like mass
transport of ethylene glycol and water. The experimental data were fitted very well by model
with respect to conversion, molecular weight and concentration of side products by using of
software package PREDICI®. Modeling of molecular weight distribution required
modification of the reaction scheme to consider formation of short and long chains of
polymers. Good fitting was achieved at lower reaction temperature.

ii
Zusammenfassung der Dissertationsschrift
In dieser Arbeit wurde die durch verschiedene Titan(IV)verbindungen katalysierte
Polykondensation von Bis-hydroxyethylenterephtalat und deren niedermolekularen
Oligomeren zu Polyethylenterephtalat untersucht. Der industriell verwendete Katalysator
Antimontriazetat wurde als Referenzkatalysator verwendet. Untersucht wurde die
Polykondensation in einem Rührkesselreaktor aus Aluminium in einem Temperaturbereich
von 250 bis 280 °C unter Vakuum von etwa 1 mbar. Während der Reaktion wurden Proben
entnommen und der Umsatz, die Molmasse der Polymere und die Konzentration der Neben-
produkte untersucht. Ferner wurde die Polykondensation von Bis-hydroxyethylenterephtalat
auch in einem Differentialkalorimeter sowie einer Thermowage bei Atmosphärendruck unter
Stickstoff und nicht–isothermen Bedingungen durchgeführt und analysiert. Besonders
geeignet für das schnelle Testen von verschiedenen Katalysatoren ist die Methode der
Differentialkalorimetrie. Allerdings müssen für zuverlässige Ergebnisse besondere
Voraussetzungen hierbei berücksichtigt werden. Dies betrifft insbesondere die Beachtung von
Stofftransportprozessen sowie mögliche katalytische Einflüsse des Materials des
Probenbehälters.
Als Katalysator für die Synthese von Polyethylenterephtalat wurden sieben verschiedene
kommerziell erhältliche Titan(IV)verbindungen verwendet. Hierbei handelt es sich um
chelatisierte und nicht-chelatisierte Titankomplexe. Es wurde festgestellt, dass alle nicht–
chelatisierten Titankomplexe hoch aktive Katalysatoren für die
Polyethylenterephtalatsynthese sind, jedoch katalysieren sie gleichzeitig die Bildung
störender Nebenprodukte. Chelatisierte Titanverbindungen hingegen sind katalytisch weniger
aktiv und weisen aber eine hohe Selektivität auf. Es wurde festgestellt, dass die untersuchten
Titanverbindungen sehr wahrscheinlich nur Vorstufen von katalytisch aktiven Zentren sind,
die sich zu Beginn der Reaktion bilden. Die genaue Struktur der aktiven Spezies ist nicht
bekannt. Wahrscheinlich werden die aktiven Zentren durch Austauschreaktion zwischen
Hydroxylgruppen von Monomeren und den Liganden der Titanverbindungen gebildet.
Die Kinetik der mit Titantetrabutoxid katalysierten Polykondensation von Bis-
hydroxyethylenterephthalat in der Schmelze kann durch eine Reaktion zweiter Ordnung
bezüglich der Konzentration der funktionellen Gruppen beschrieben werden. Die
Bruttoaktivierungsenergie der Polykondensation liegt bei etwa 63 kJ mol-1 und ist damit um
etwa 28 % niedriger als die der Antimontriazetat katalysierten Polykondensation. Für die
mathematische Beschreibung der Kinetik der Polykondensation, der Molmasse der gebildeten
Polymeren, sowie der Konzentration der wichtigsten Nebenprodukte wurde ein

iii
Reaktionsmodell entwickelt und durch Parameteranpassung getestet. Das Modell beinhaltet
verschiedene chemische Teilschritte wie Polykondensation, Austauschreaktionen,
Zersetzungsreaktionen, sowie Stofftransportprozesse von Ethylenglykol und Wasser. Mit
Hilfe des Rechenprogramms PREDICI® konnten die experimentellen Ergebnisse sehr gut
beschrieben werden. In Bezug auf die Simulation der Molmassenverteilung der Polymeren
müssen jedoch Erweiterungen des Reaktionsschemas vorgenommen werden.

iv
Contents Abstract of Dissertation……………………………………………………………….. i
Zusammenfassung der Dissertationsschrift …………………………………………. ii
Chapter 1: Introduction to Condensate Polymers…………………………………...
1
1.1 General introduction ………………………………………………………………
1.2 Polyesters……………………………………………………………………………
1.2.1 Historical and economical aspects…………………………………………….
1.2.2 Synthetic methods of polyethylene terephthalate……………………………..
1.2.3 Catalysis……………………………………………………………………….
1.2.4 Industrial processes of polyethylene terephthalate synthesis in melt phase…...
1.2.5 Polyethylene terephthalate synthesis in solid state……………………………
1.3 Polyamides………………………………………………………………………….
1.3.1 Historical and economical aspects…………………………………………….
1.3.2 Synthetic methods of polyamides……………………………………………..
1.3.2.1 Polycondensation ……………………………..…….………………...
1.3.2.2 Ring-opening polymerization………………………………………….
1.3.3 Kinetics………………………………………………………………………..
1.3.4 Industrial processes of polyamides production………………………………..
1.3.4.1 Polyamide 6……………………………………………………………
1.3.4.2 Polyamide 66…………………………………………………………..
1.4 Polycarbonates……………………………………………………………………...
1.4.1 Historical aspects……………………………………………………………....
1.4.2 Polycarbonate synthesis and process……………….………………………….
1.4.2.1 Melt transesterification…………………………………………………
1.4.2.1.1 Synthesis and catalysis……………………………………….
1.4.2.1.2 Kinetic and mass transfer phenomena …………………..…...
1.4.2.1.3 Transesterification process…………………………….…….
1.4.2.2 Polycarbonate synthesis in solution ….………………………………..
1.4.2.2.1 Solution process……………………………………………...
1.4.2.3 Interfacial polycondensation…………………………………………...
1
1
1
2
6
7
12
12
12
13
13
14
15
17
17
20
22
22
22
23
23
24
25
25
26
26

v
1.4.2.3.1 Synthetic aspects……………………………………………..
1.4.2.3.2 Kinetic and mass transfer phenomena………………………..
1.4.2.3.3 Interfacial polycondensation processes………………………
1.5 Objectives of project…………………………………………………...…………..
1.6 References…………………………………………………………………………..
26
27
28
30
31
Chapter 2: Screening of Different Titanium (IV) Catalysts in Polyethylene
Terephthalate Synthesis
Abstract…………………………………………………………………………………
2.1 Introduction………………………………………………………………………...
2.2 Experimental part………………………………………………………………….
2.2.1 Chemicals……………………………………………………………………...
2.2.2 Preparation of sample for catalyst screening………………………………….
2.2.3 Catalyst fast screening………….……………………………………………..
2.2.4 Reuse of catalyst after pre-polycondensation…………………………………
2.2.5 Polycondensation in lab scale stirred tank reactor……………..……………...
2.2.6 Solid state polycondensation…………………………………………………..
2.2.7 Thermogravimetric analysis…………………………………………………...
2.2.8 Infrared spectroscopy………………………………………………………….
2.3 Differential scanning calorimetry……………………………….………………...
2.3.1 Principle of data acquisition…………………………………………………...
2.3.2 Principle of screening …………………………………………………………
2.4 Results and discussion……………………………………………………………..
2.4.1 Effect of sample preparation method on activity of titanium (IV) catalyst…...
2.4.2 Effect of titanium (IV) ligands on its catalytic activity……………………….
2.4.3 Effect of titanium (IV) ligand nature on polymer degradation in the course of
polycondensation……………………………………………………………...
2.4.4 Thermal stability of titanium (IV) compounds with different ligands………...
2.4.5 Catalyst screening in lab scale stirred tank reactor………………..…………..
2.4.6 Thermal stability of polymer…………………………………………………..
2.4.7 Effect of reuse of catalyst after pre-polycondensation on its catalytic activity
2.4.8 Solid state polycondensation…………………………………………………..
2.4.8.1 Optimization of reaction operational condition……………………….
33
34
35
35
36
36
36
37
37
38
38
38
38
40
42
42
43
44
45
46
48
49
49
50
vi
2.4.8.2 Catalyst screening in solid state polycondensation……………………
2.4.8.3 Effect of polymer particle size on polycondensation process…..……..
2.4.9 Infrared spectroscopic studies…………………………………………………
2.5 Conclusion…………………………………………………………………………..
2.6 References…………………………………………………………………………
50
51
52
55
56
Chapter 3: Kinetic Studies of Polyethylene Terephthalate Synthesis with Titanium
tetrabutoxide and Application of Thermogravimetric Analysis
Abstract…………………………………………………………………………………
3.1 Introduction………………………………………………………………………...
3.2 Experimental part………………………………………………………………….
3.2.1 Sample preparation……………………………………………………………
3.2.2 Polycondensation in lab scale stirred tank reactor…………………………….
3.2.3 Polymer decomposition………………………………………………………..
3.3 Thermogravimetric analysis………………………………………………………
3.3.1 Apparatus……………………………………………………………………..
3.3.2 Principle of screening…………………………………………………………
3.4 Results and discussion……………………………………………………………..
3.4.1 Optimization of thermogravimetric analysis for quantitative study……..…....
3.4.2 Mass transfer limitations………………………………………………………
3.4.3 Kinetic of polycondensation…………………………………………………..
3.4.4 Kinetic of polymer decomposition……………………………..……………...
3.5 Conclusion…………………………………………………………………………..
3.6 References…………………………………………………………………………..
57
58
58
58
58
58
59
59
60
60
60
63
64
70
72
74
Chapter 4: Modeling of Kinetic, Molecular Weight and Molecular Weight Distribution
of Polyethylene Terephthalate Synthesis Catalyzed by Titanium tetrabutoxide in Melt
Phase
Abstract…………………………………………………………………………………
4.1 Introduction………………………………………………………………………...
4.2 Experimental part………………………………………………………………….
4.2.1 Chemicals……………………………………………………………………...
4.2.2 Polycondensation in lab scale stirred tank reactor…………………………….
75
76
77
77
77
vii
4.2.3 Polymer characterization………………………………………………………
4.2.3.1 Determination of intrinsic viscosity of polymer.……………………...
4.2.3.2 Determination of carboxyl end groups concentration of polymer…….
4.2.3.3 Determination of diethylene glycol content of polymer.……………...
4.2.3.4 Determination of acetaldehyde content of polymer…….……………..
4.2.4 Reproducibility of torque measurement and viscosity of polymer…………...
4.3 Reaction model……………………………………………………………………..
4.4 Experimental results……………………………………………………………….
4.5 Modeling results and discussion…………………..………………………………
4.6 Modeling of molecular weight distribution………………………………………
4.7 Conclusion………………………………………………………………………….
4.8 References………………………………………………………………………….
Abbreviation....................................................................................................................
Symbols............................................................................................................................
Appendix..........................................................................................................................
Appendix I.................................................................................................................
Appendix II................................................................................................................
Appendix III..............................................................................................................
79
79
80
80
80
81
81
89
91
97
99
100
101
103
107
107
108
112

Chapter 1: Introduction to Condensate Polymers
1.1 General Introduction
The class of macromolecular products defined as condensate polymers includes most of
synthetic materials manufactured world-wide and used as high-strength and/or high
toughness plastics and fibers as well as almost all the hard resins covering very wide range
of applications. The definition of such a family of polymer is intended to the condensation
methods of polymerization by which they are usually synthesis. This synthetic method
from stand point of the polymer chain growth mechanism follows step growth
polymerization which proceeds via step-by-step succession of elementary reactions
between reactive sites. Each independent step causes the disappearance of two coreacting
centres and creates a new linking unit between a pair of molecules. In order to obtain long
polymer chain, the reactants must be at least bifunctional, monofunctional reactants act as
stopper.
Polyesters (PEs), polyamides (PAs) and polycarbonates (PCs) are commercially important
condensate polymers as commodity and engineering polymers with a wide variety of
usage which are playing very important role in daily life.
1.2 Polyesters
1.2.1 Historical and economical aspects.
The first studies on synthesis of polyesters go back to the last century [1-3]. It was only in
the late 1920s that Carothers undertook an extensive study of this subject but the product
could not find great commercial interest [4]. But it was only 15 years after, when Whinfield
prepared polyethylene terephthalate (PET) and became widely used [5]. Nowadays, PET is
the third largest produced commodity polymer after polyolefins (Figure 1.2.1) [6].
Blends 7%
PS6% PVC
12%
PP 14%
PE 24%
Others 1%
PET 14%
Composites 14%PUR
4%Syn.Elas
4%
Figure 1.2.1 Diagram of polymer production in 2006 (in weight percentage).

Chapter 1: Introduction to Condensate Polymers
2
Figure 1.2.2 Regional PET production capacity [6].
Figure 1.2.2 shows the regional PET production capacity in all over the world from 1992
to predicted time of 2012. The total global production of PET in 2007 was about 20
million metric ton. In general, about 63% of PET is used as fibers in staple, filament and
woven forms, while the remaining 37% is used as a packaging resin for bottles, containers,
sheet and film. Figure 1.2.3, represents consumption pattern of PET in packaging
application [6].
Water26%
Sheet6% Beer
2%
CSD37%
Others29%
Figure 1.2.3 Consumption pattern of PET in packaging application (wt %) in 2006.
1.2.2 Synthetic methods of polyethylene terephthalate
PET is a polymer formed mainly by polycondensation of purified terephthalic acid (PTA)
and ethylene glycol (EG). The synthesis of PET requires two reaction steps. The first step
is esterification of PTA with EG, forming a so-called pre-polymer which contains the
Regional PET Capacities 1992 - 2012
-
5
10
15
20
25
30
1992
1993
1994
1995
1996
1997
1998
1999
2000
2001
2002
2003
2004
2005
2006
2007
2008
2009
2010
2011
2012
Mill
ion
Met
ric
To
ns
NORTH AMERICA SOUTH AMERICA EUROPEAN UNION CENTRAL EUROPE MID EAST-AFRICA ASIA
M
illio
n M
etri
c T
on
s
Chapter 1: Introduction to Condensate Polymers
3
O O
O O
OH OH
O O
OHOH
O O
O O
OH OH
O O
O O
OH OHn OH
OH
+
n-1+
[Antimony]
- CH3OH - H2O
PET
Transesterification Esterification
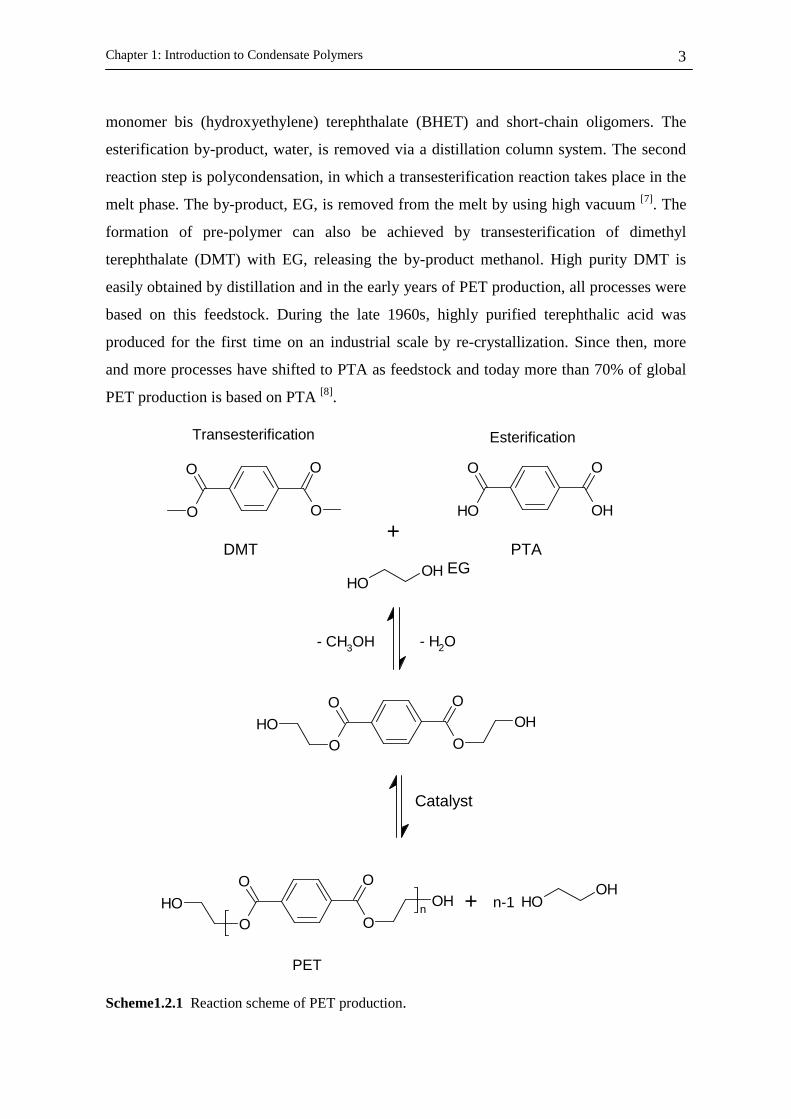
monomer bis (hydroxyethylene) terephthalate (BHET) and short-chain oligomers. The
esterification by-product, water, is removed via a distillation column system. The second
reaction step is polycondensation, in which a transesterification reaction takes place in the
melt phase. The by-product, EG, is removed from the melt by using high vacuum [7]. The
formation of pre-polymer can also be achieved by transesterification of dimethyl
terephthalate (DMT) with EG, releasing the by-product methanol. High purity DMT is
easily obtained by distillation and in the early years of PET production, all processes were
based on this feedstock. During the late 1960s, highly purified terephthalic acid was
produced for the first time on an industrial scale by re-crystallization. Since then, more
and more processes have shifted to PTA as feedstock and today more than 70% of global
PET production is based on PTA [8].
Scheme1.2.1 Reaction scheme of PET production.
EG
Catalyst
DMT PTA
Chapter 1: Introduction to Condensate Polymers
4
Because of the high number of molecules with different chain lengths and compositions
present in the polymer, reactions are commonly described as reactions between functional
groups. Equal reactivity is assumed for functional groups with the same chemical vicinity,
meaning that their reactivity is independent of the chain length of the parent molecules.
This concept was initially introduced by Flory [9, 10] and applies without any serious errors
if the functional groups are separated by more than three atoms in the chain. If the
functional groups in the monomer are separated by only one or two atoms, the reactivity of
the monomer and dimer may differ greatly.
PET synthesis is complicated by presence of different side reactions beside the main
polycondensation reaction which could be summarized as follows:
1. Thermal degradation of polymer chain and acetaldehyde formation
Thermal degradation of PET is a major problem at temperature above its melting point
(260°C) and inevitably occurs in polymer melts during synthesis and processing. The
primary degradation reactions have higher activation energies than the polycondensation
reactions, and thus become more and more important with increasing reaction
temperature. Major consequences for the PET quality are an intrinsic viscosity (IV) drop,
formation of carboxyl end groups and acetaldehyde (AA), and yellowing of the polymer.
Carboxyl end groups reduce the hydrolytic and thermal stability, and in standard PET
grades their concentration should not exceed 25 mmol kg-1. AA migrates into the contents
of food packaging, so causing flavour problems of the products. For bottle-grade PET,
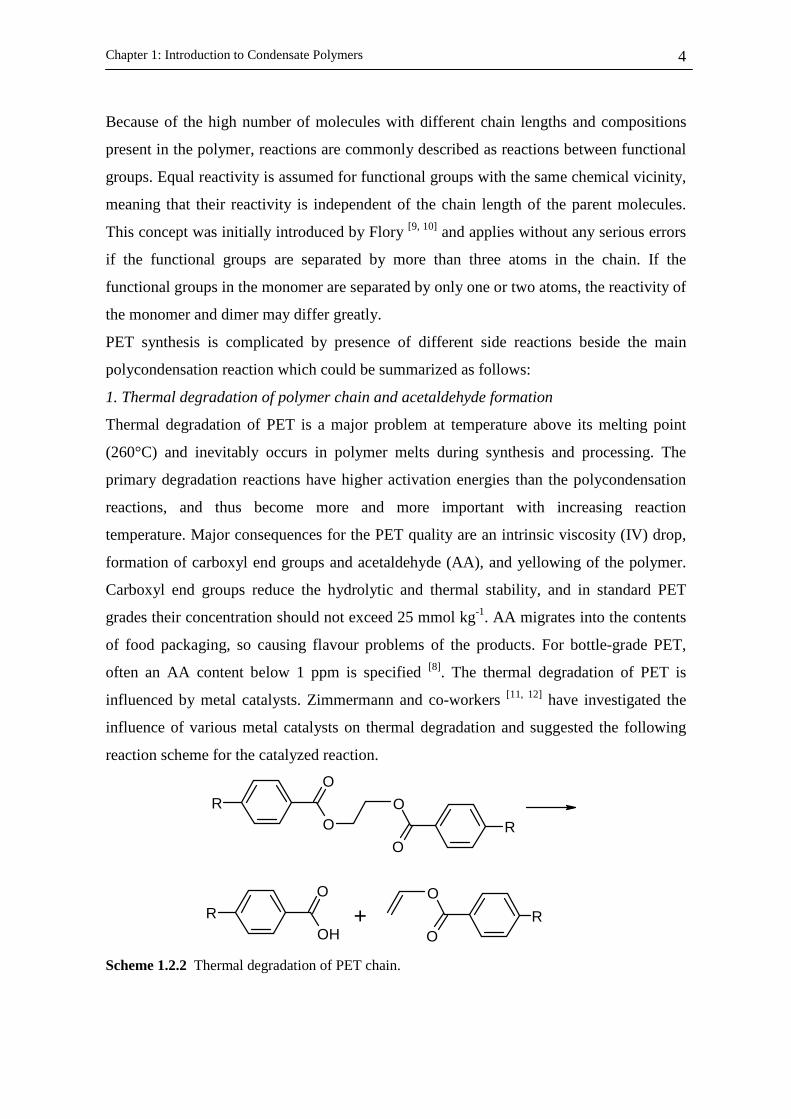
often an AA content below 1 ppm is specified [8]. The thermal degradation of PET is
influenced by metal catalysts. Zimmermann and co-workers [11, 12] have investigated the
influence of various metal catalysts on thermal degradation and suggested the following
reaction scheme for the catalyzed reaction.
RO
O
O
O
R
ROH
O
+O
O
R
Scheme 1.2.2 Thermal degradation of PET chain.
Chapter 1: Introduction to Condensate Polymers
5
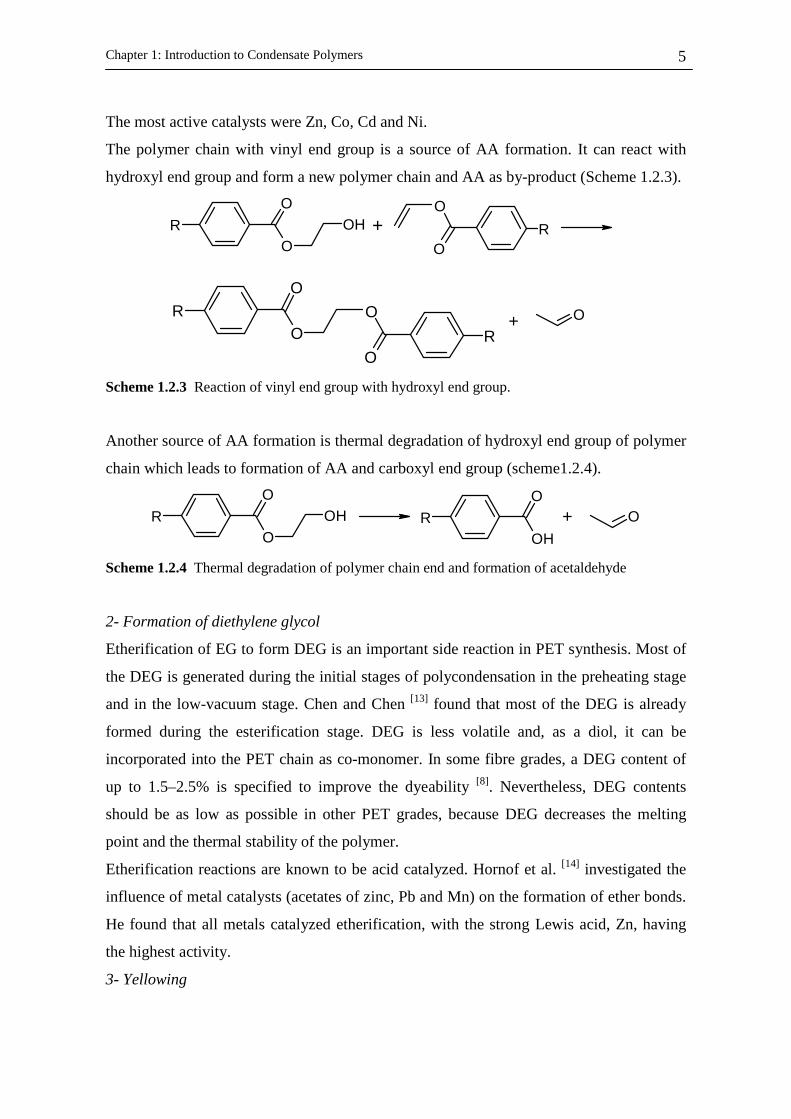
The most active catalysts were Zn, Co, Cd and Ni.
The polymer chain with vinyl end group is a source of AA formation. It can react with
hydroxyl end group and form a new polymer chain and AA as by-product (Scheme 1.2.3).
RO
OOH
O
O
R
RO
O
O
O
RO
+
+
Scheme 1.2.3 Reaction of vinyl end group with hydroxyl end group.
Another source of AA formation is thermal degradation of hydroxyl end group of polymer
chain which leads to formation of AA and carboxyl end group (scheme1.2.4).
RO
OOH R
OH
O+ O
Scheme 1.2.4 Thermal degradation of polymer chain end and formation of acetaldehyde
2- Formation of diethylene glycol
Etherification of EG to form DEG is an important side reaction in PET synthesis. Most of
the DEG is generated during the initial stages of polycondensation in the preheating stage
and in the low-vacuum stage. Chen and Chen [13] found that most of the DEG is already
formed during the esterification stage. DEG is less volatile and, as a diol, it can be
incorporated into the PET chain as co-monomer. In some fibre grades, a DEG content of
up to 1.5–2.5% is specified to improve the dyeability [8]. Nevertheless, DEG contents
should be as low as possible in other PET grades, because DEG decreases the melting
point and the thermal stability of the polymer.
Etherification reactions are known to be acid catalyzed. Hornof et al. [14] investigated the
influence of metal catalysts (acetates of zinc, Pb and Mn) on the formation of ether bonds.
He found that all metals catalyzed etherification, with the strong Lewis acid, Zn, having
the highest activity.
3- Yellowing

Chapter 1: Introduction to Condensate Polymers
6
The polymer colour is regarded as a quality parameter, and low-quality PET grades show
yellow colouring. Yellowing of the polymer can be caused by thermal as well as by
oxidative degradation and is a severe problem in PET synthesis, especially in the
production of bottle grades. The formation mechanisms and the nature of chromophores in
PET are still a matter of discussion. Postulated chromophores are polyenaldehydes from
the aldol condensation of acetaldehyde [15] and polyenes from polyvinyl esters, as well as
quinones [16]. Goodings [15] has proposed aldol condensation as forming polyconjugated
species by subsequent reactions of acetaldehyde molecules.
1.2.3 Catalysis
The metal catalysts based on antimony and germanium dominate the industrial production
process of PET. Meanwhile a large number of metals and non-metals show a significant
catalytic effect but the replacement of antimony and germanium as polycondensation
catalysts in an industrial scale has not succeeded until now.
Today, three different antimony compounds are used as polycondensation catalysts;
antimony triacetate, antimony trioxide and antimony glycolate. The majority of the
polyester is catalysed by antimony trioxide originating from a wide variety of sources. The
main drawback of antimony compounds is having negative environmental impact as heavy
metal although there is no scientific evidence regarding any negative health impact of
antimony used as polycondensation catalyst, but there are variable limitation of antimony
content of final product specially in food packaging application which have limitation in
the range of 5-20 ppb with respect to the consumer countries (maximum 5 ppb in bottle
application for drinking water based on TVO Germany) [17].
Germanium catalyzed polyester were mainly used during the early years in film
applications because of its high clarity. Today the main portion of germanium catalyst is
still consumed by Japanese polyester producers who like the high brilliancy of the
polymer for bottle applications. Assuming an average germanium metal content of 80
ppm, this presents a polyester production of about 0.72 % of the world production. The
price of about 500 US$ per kg pure germanium dioxide is the main driving force to
gradually replace this catalyst [17].
Titanium based catalysts are very active in the PET synthesis but the main draw back of
this catalysts is their poor selectivity causing an increase in concentration of side products
and dropping the quality of polymer. The optimal design of titanium compound for

Chapter 1: Introduction to Condensate Polymers
7
catalysis of PET synthesis is a big challenge in related industries. More information will
be presented in chapter 2. Summary of all published data indicate that antimony – free
PET based on germanium covers 350000 t/y and antimony – free PET based on titanium,
aluminium, magnesium covers about the same amount. This confirmed the former
statement: PET based on antimony-free catalysts is still a niche product [18].
1.2.4 Industrial processes of polyethylene terephthalate synthesis in melt phase
The first polyester fiber production was started in 1955 at ICI (GB) with a capacity of
10000 t/y batch wise. Currently, batch plants are mainly used for specialities and niche
products. Batch plant capacities span the range from 20 to 60 t/d. The increasing demand
for PET gave rise to the development of continuously operated large-scale plants. The
capacity of continuous PET plants has grown since the late 1960s from 20 t/d to presently
600 t/d in a single line, with the tendency to still higher capacities. Figure 1.2.4, shows the
four specific units that a continuous polycondensation plant is consisted including: Slurry
preparation unit, reaction unit, vacuum unit and distillation unit. Reaction unit which is the
heart of the production plant consist of one to three esterification reactors two to five pre-
polycondensation reactors and one finisher [19].
Figure1.2.4 Continuous PET production plant based on Zimmer technology [19].

Chapter 1: Introduction to Condensate Polymers
8
The monomers PTA and EG are mixed upstream to the esterification reactor in a jacketed
slurry preparation unit equipped with a stirrer for highly viscous fluids (e.g. ‘Intermig’).
The typical molar ratio of EG to PTA lies between 1.1 and 1.3. The esterification
temperature and the molar ratio of monomers are the main controlling factors for the
average degree of polycondensation of the esterification product (pre-polymer), as well as
for its content of carboxyl end groups and DEG. The esterification by-product, water, is
removed via a process column in a continuous steady-state mode of operation. The bottom
product of the column, being mainly EG, flows back into the esterification reactor. The
esterification of PTA is catalyzed by protons and in standard industrial operations neither
an additional esterification catalyst nor a polycondensation catalyst is added to the
esterification reactor. Some new ‘antimony-free’ polycondensation catalysts [20] also affect
the speed of esterification significantly and it could be advantageous to add them directly
into the slurry preparation vessel. The esterification temperature ranges between 235 and
265°C, while the absolute pressure is controlled between ambient pressure and a slight
overpressure (0.1–0.4 MPa). At the end of the esterification, the temperature is raised to
values between 260 and 285°C and the pressure is often reduced to a moderate vacuum,
thus increasing the evaporation of excess EG.
The product of the esterification reactor is fed by gravity into the pre-polycondensation
reactor. In the polycondensation reactor, the pre-polymer reacts, forming longer polymer
chains and EG is liberated. To shift the chemical equilibrium to the product side, the by-
product EG is removed via vacuum (ca. 1 mbar (100 Pa)). EG vapour jet pumps or
mechanical rotary piston pumps are used for vacuum generation. In the first quarter of the
polycondensation process, the reaction temperature is increased to values between 270 and
295°C and the pressure is slowly reduced with time to avoid high carry over of pre-
polymer into the vacuum system. Blade or anchor stirrers are commonly used to renew the
surface of the melt and to provide heat which is transferred into the melt by dissipation of
the stirrer energy. The stirrer speed is reduced gradually to avoid overheating and reduce
power consumption. From the pre-polycondensation stage, the product is pumped by gear
pumps through a filter into the finisher. Finisher provides a high specific surface area and
short diffusion lengths, thus maintaining high polycondensation rates at reduced
temperatures. For a high performance at this step, disc- or cage-type reactors are common.
The optimum stirrer design provides a plug flow characteristic with little back mixing. In
this case, the residence time distribution is narrow and the average rate of

Chapter 1: Introduction to Condensate Polymers
9
polycondensation is high. The desired degree of polycondensation, and respectively the
final melt viscosity, is set by adjusting the vacuum, the reaction temperature and the
average residence time by level control. Figure 1.2.5 shows a view of inside of cage
reactor. Figure 1.2.6 represents formation of thin layer of PET which accelerates mass
transport phenomena.
Figure 1.2.5 DISCAGE® reactor [21].
Figure1.2.6 Thin film formation in DISCAGE® reactor [21].
Since 1990, as the production was growing fast and market demand was increasing large
and larger plant should be built which was not economically profitable. Furthermore, the
price of raw material was increasing to 85% of production costs, therefore the engineering
companies start to design and build up new plants in order to minimize production cost by
reduction in equipment and installation, building and construction, personal, energy
consumption and maintenance costs. In 1996, Uhde Inventa-Fischer introduced the first 4-
Reactor single-stream PET technology to the market (Figure 1.2.7) [21].

Chapter 1: Introduction to Condensate Polymers
10
Figure 1.2.7 Flow diagram of 4R-Technology of Uhde Inventa-Fisher [21].
Figure 1.2.8 Flow diagram of 2R-technology of PET production [21].

Chapter 1: Introduction to Condensate Polymers
11
This company [21] could improve the plant design by introducing 2-reactor single stream
PET technology ESPREE ® in 2002 which could reduced the production costs up to 20%
(Figure 1.2.8). The reduction of number of reactors was also target by other PET plant
designer. Zimmer AG [19] and Aquafil [22] have claimed PET production plant with 3 and 1
reactor respectively.
Figure 1.2.9 Scheme of Melt-To-Resin ® Technology of Uhde Inventa-Fisher [21].
The production of bottle-grads resins requires high molecular weight PET which is
achieved by polycondensation in solid state under inter atmosphere or vacuum to reach IV
of 0.85 dl g-1. This is a long-term energy and investment-intense operation that also
impairs quality. In 2004, Uhde Inventa-Fisher[21] announced their new Melt-to-Resin
(MTR)® technology which was based on their 2R-process consisting of the brand new
ESPREE® tower reactor and the DISCAGE® MV (for medium viscosity) finisher reactor.
The technology besides other advantages such as improved product quality and less

Chapter 1: Introduction to Condensate Polymers
12
maintenance cost, also can increase the profit by 30 to 40 EUR/ton PET on conversion
costs compared to the old technology (Figure 1.2.8).
1.2.5 Polyethylene terephthalate synthesis in solid state
Polycondensation of highly viscous PET in the melt phase is limited. The removal of the
volatile by-products becomes more difficult due to diffusion inhibited by increasing
viscosity of polymer. In addition, undesirable side reactions due to thermal degradation
impede the growth of the molecular chains. As a consequence, the reaction rate decreases
and decomposition reactions dominate, thus resulting in a decrease in the melt viscosity.
As it is able to address these limitations, solid state polycondensation (SSP) has become
the method of choice and is therefore so popular. This is the kind of process that can be
defined as the polycondensation of semi-crystalline, low molecular weight polymers to
high molecular weight polymers occurring below the melting temperature of polymer, but
well above the glass transition temperature.
In order to interpret reaction progress in SSP, several key assumptions should be
considered; the reactive end groups and the catalyst are located in the amorphous regions,
no reaction occurs in crystalline region, polycondensation reaction is reversible reaction
but is complicated by the two-phase character of the semi-crystalline polymer [8]. The PET
synthesis in SSP is diffusion controlled; therefore it is needed to provide enough
interfacial area to allow the efficient removal of by-products from solid phase, by reduce
the particle size of polymer. A practically difficulty in this case is the possible tendency of
particles to stick which make the process unfeasible. It can be overcome by starting with
polymer with sufficiently high crystallinity [26].
SSP can be carried out batch wise or continuously, either under vacuum or an inert gas
flow. The continuous process is appropriate for the large-scale production of polyesters
used in bottle manufacture. Currently, reactors with capacities of more than 600 t/d have
been employed [8].
1.3 Polyamides
1.3.1 Historical and economical aspects
Polyamides or nylons were first synthesized by Gabriel and Maas in 1889 [23]. Carothers
continued their work and prepared a large number of nylons in the late 1920’s.

Chapter 1: Introduction to Condensate Polymers
13
Independent of his efforts, successful attempts to make nylons from ε-caprolactam were
undertaken in Germany, and the first commercially produced nylon monofilaments
appeared on the German market in 1939. In the U.S. nylon stockings were successfully
introduced to the public in May 1940. Britain and Italy followed during World War II, and
since the beginning of the 1950’s, the production of polyamide fibers has greatly expanded
throughout the world, as many new producers entered the field, and the original
manufacturers expanded their capacities[24]. The annual demands of PAs increase
drastically in application of fiber and automotive. The total PAs consumption in 2006 was
about 7.1 million tons in which polyamide 6 (PA 6) has the highest consumption [25]
(Figure 1.3.1).
PA 657%
PA 6638%
HPPA5%
Figure 1.3.1 Global consumption of different polyamides(wt %).
1.3.2 Synthetic methods of polyamides
1.3.2.1. Polycondensation
Amination is occurring by direct reaction of an amine with a carboxyl acid accompanied
by elimination of water. The reactive groups may be on a single molecule like an amino
acid (AB type) or they can be different molecule, i.e., diamins and dicarboxylic acids. The
reaction schemes can be described as follows.
H2NRCOOH NHRC
O
[ ]n
OHH + H2On n-1
Scheme 1.3.1 AB type of polycondensation reaction in polyamide synthesis.
RNH2+ R'COOH RNHCOR' + H2OH2N HOOCn n [ ]H2N COOHn
n-1
Scheme 1.3.2 AA and BB type of polycondensation reaction in polyamide synthesis.
Polyamide 66

Chapter 1: Introduction to Condensate Polymers
14
Polyamide 66 (PA 66) is made by condensation of adipic acid with hexamethylene
diamine (Scheme 1.3.3). AH salt is formed as an intermediate and subsequent
polymerization involving the elimination of water leads to the polymer.
H
O
O
H + NH2
NH2
N
O
O H
N
H
[ ] + H2O
n
n n
2n
Scheme 1.3.3 Reaction of PA 66 synthesis.
1.3.2.2 Ring-opening polymerization
Ring-opening polymerization is an effective and important method for preparing high
molecular weight polymers from cyclic lactate such as ε-caprolactam. Ring-opening
Polymerization catalyzed by alkali metals follows a chain growth polymerization
mechanism without elimination of a by-product molecule. The reaction shows an
induction period which depends on temperature. It is followed by an extremely rapid
reaction which is completed in a few minutes. Although salts of phosphorous acid and
other phosphorous can catalyzed the polymerization, they are not commonly added to
commercial polymerizations. However, ring-opening by hydrolysis follows a step growth
mechanism with 3 steps of reactions as hydrolysis reaction, addition reaction and
condensation reaction.
Polyamide 6
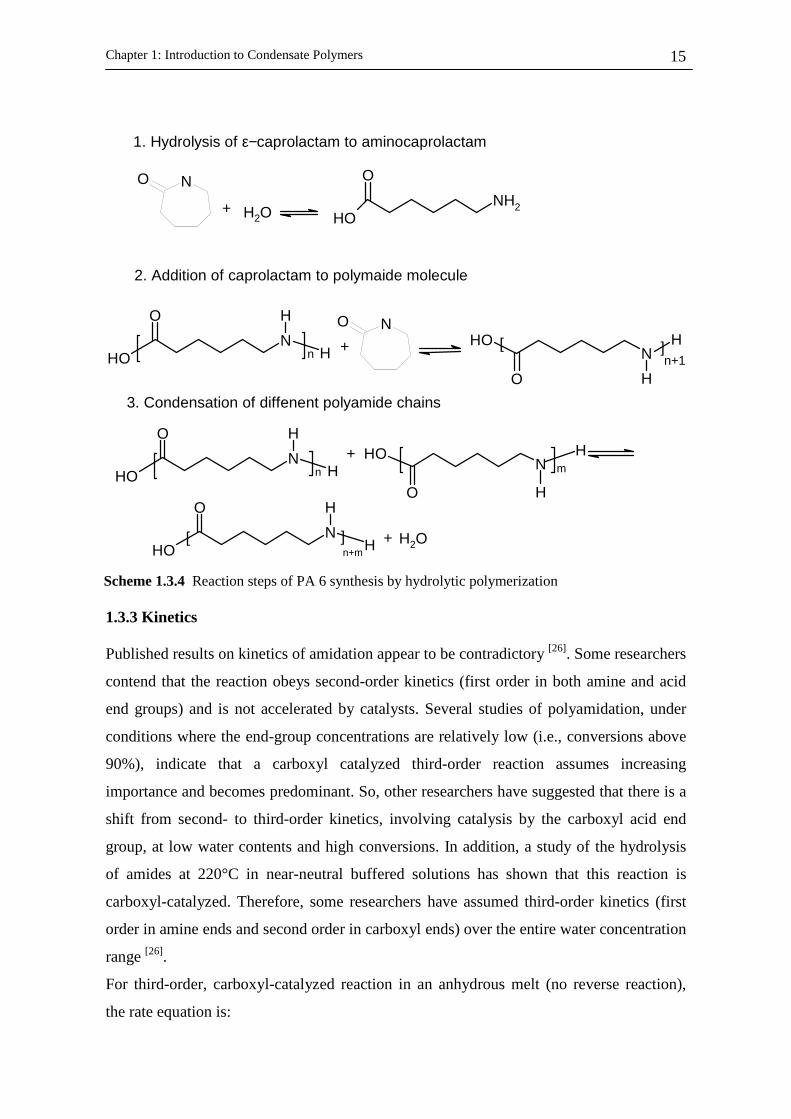
Polyamide 6 (PA 6) is predominately made by a hydrolytic polymerization mechanism
(Scheme1.3.4). The reaction is initiated by hydrolysis of ε-caprolactam with water, and
aminocaprolactam is formed in catalytic quantities. ε-caprolactam successfully adds to this
chain until a molecular weight of 8000-14000 g mol-1 is reached. Subsequently, a
condensation polymerization occurs, and the initially formed short chains are linked
together to chains of molecular weights between 18000 and 33000 g mol-1. In the final
equilibrium step, a molecular weight of 20000- 36000 g mol-1 is achieved. Chain stopping
elements, either acids or amines, are used to achieve the desired molecular weight.
Chapter 1: Introduction to Condensate Polymers
15
+ H2ONH2
O
OH
]
1. Hydrolysis of ε−caprolactam to aminocaprolactam
2. Addition of caprolactam to polymaide molecule
O
OHN
H
H
n
NOH
O H
H[ n+1
3. Condensation of diffenent polyamide chains
NOH
O H
Hm +
O
OHN
H
H
n
O
OHN
H
H
+
[ ]n+m
+ H2O
NO
NO
1.3.3 Kinetics
Published results on kinetics of amidation appear to be contradictory [26]. Some researchers
contend that the reaction obeys second-order kinetics (first order in both amine and acid
end groups) and is not accelerated by catalysts. Several studies of polyamidation, under
conditions where the end-group concentrations are relatively low (i.e., conversions above
90%), indicate that a carboxyl catalyzed third-order reaction assumes increasing
importance and becomes predominant. So, other researchers have suggested that there is a
shift from second- to third-order kinetics, involving catalysis by the carboxyl acid end
group, at low water contents and high conversions. In addition, a study of the hydrolysis
of amides at 220°C in near-neutral buffered solutions has shown that this reaction is
carboxyl-catalyzed. Therefore, some researchers have assumed third-order kinetics (first
order in amine ends and second order in carboxyl ends) over the entire water concentration
range [26].
For third-order, carboxyl-catalyzed reaction in an anhydrous melt (no reverse reaction),
the rate equation is:
Scheme 1.3.4 Reaction steps of PA 6 synthesis by hydrolytic polymerization

Chapter 1: Introduction to Condensate Polymers
16
[ ] [ ]22][
NHCOOHkdt
COOHd =− (1.3.1)
If [COOH]=[NH2], the integrated rate equation is given by:
[ ] [ ] ktCOOHCOOH 220
2 =− −− (1.3.2)
For [COOH] - [NH2]=D, the integrated rate equation becomes
[ ][ ] [ ] CkDtCOOHNH
COOHD +=−
−− 1
2
1 ln (1.3.3)
where C is a constant of integration determined by initial conditions.
In the presence of water a carboxyl-catalyzed hydrolysis reaction must be introduced. The
rate equation is then given by
[ ] [ ] [ ] [ ]CONHOHCOOHkCOOHkdt
COOHdh 2
2][ −=− (1.3.4)
For kinetic studies at high conversions, where [CONH], concentration of polymer, is
essentially constant, and at fixed water vapour pressure and concentration of water in the
melt:
[ ] [ ] [ ] [ ] eqeqeqh kPNHCOOHkCONHOHk == 22 (1.3.5)
where the symbol P stands for end product and the rate equation becomes
[ ] [ ]eqPPCOOHkdt
COOHd −=− ][ (1.3.6)
which can be written as following integrated form
[ ][ ] [ ] [ ] CtCOOHk
COOHCOOH
COOHeq
eq
+=
−2
22
2
ln (1.3.7)
The catalysts applied for the polyamides synthesis are bromic acid, hypophosphorus acids
and hypophosphite salts and phosphonic acids and according to the type of catalyst used, a
psudo-second-order kinetic contribution were reported [26].
Various values have been reported for activation energy of polyamidation in the range of
47-100 kJ mol-1. The activation energy of chain end diffusion of polyamide is less than
other type of polycondensation reaction. Therefore, the reaction rate is not affected by
viscosity of medium, except that water removal may become more limiting in nonagitated
high viscose melt. Another well-established principle is that similar to polyester, reactivity
of a functional end group is not affected by the length of parent molecule.
Chapter 1: Introduction to Condensate Polymers
17
During formation of PA 66, equilibrium constant is not constant as in other cases. Here the
thermodynamic of liquid phase plays very important role. The equilibrium constant is not
a function of concentration but a function of activity [27]. Therefore, the equilibrium
constant can be defined as:
appcA
wL
ccAA
wwLL
cA
wL KKxx
xxK
xx
xx
aa
aa
k
kK γγγγ
γγ=====
' (1.3.8)
where k, k' are rate constant of forward and backward reactions respectively. ai, γi, xi are
activity, activity coefficient and molar fraction of each species. The activity coefficient of
water can be determined by the following equation:
)2258
390.6exp(Tw −=γ (1.3.9)
The apparent equilibrium constant is written as:
))11
(exp(0
0 TTR
HKK app −∆−= (1.3.10)
It was found [27] that the frequency factor of the Arrhenius expression has the following
dependency to molar fraction of volatile water:
)2.445.8))(2.0
exp(47.01exp((0 ww x
xK −−−= (1.3.11)
Therefore, the rate of reversible polycondensation reaction to form PA 66 is expressed:
)]][[
]][]([[ 22
appK
CONHOHCOOHNHCOOHkR −= (1.3.12)
A value of 95 kJ mol-1 for activation energy was reported in literature [28].
1.3.4 Industrial processes of polyamide production
1.3.4.1 Polyamide 6
PA 6 can be produced in batch and continuous operation. The batch operation is nowadays
applied for very small production. Continuous processes are used by the major
manufacturers of PA 6. Continuous production could be done in a single stage or two
stage processes. The so-called VK-tube (Vereinfacht Kontinuierlich = simplified
continuous) was developed in Germany. It is a vertical tube operated at atmospheric
pressure wherein heating and pre-polymerization take place in the upper part and polymer
is formed in the lower section [29]. The middle and the lower part of the VK-tube are built
as a tubular reactor. Very even cooling is realized from the middle to the lower part of the
Chapter 1: Introduction to Condensate Polymers
18
VK-tube to achieve a high degree of conversion which ensures that the density of the melt
increases constantly downwards to the outlet. Thus back-mixing is prevented and plug
flow is guaranteed. The polymer melt, which is kept very close to the chemical
equilibrium, is discharged continuously by a gear pump and sent to the pelletizer. A
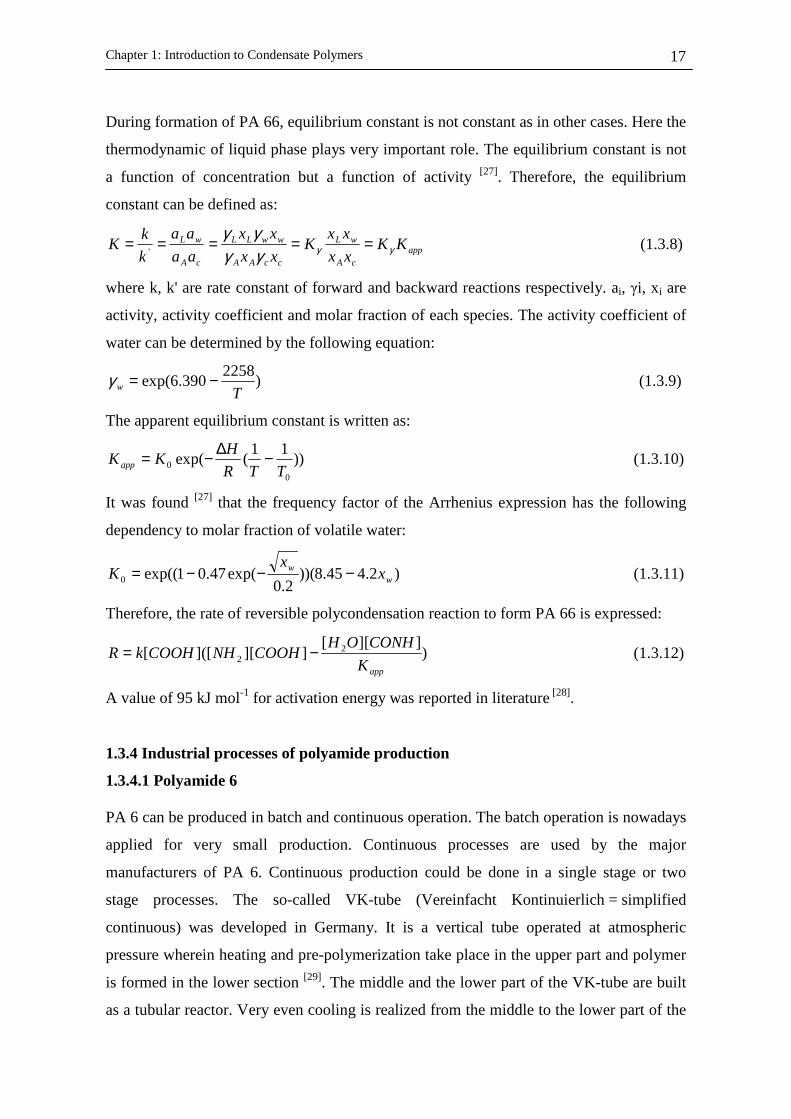
scheme of the BASF process [30] shows a VK tube feeding a pelletizer followed by a water
extraction unit (Figure 1.3.2).
Figure 1.3.2 Flow diagram of PA 6 process of BASF [30]. a) Feed tank; b) VK tube; c) Pourer; d) Pelletizer; e) Water bath; f) Extractor; g)Dryer
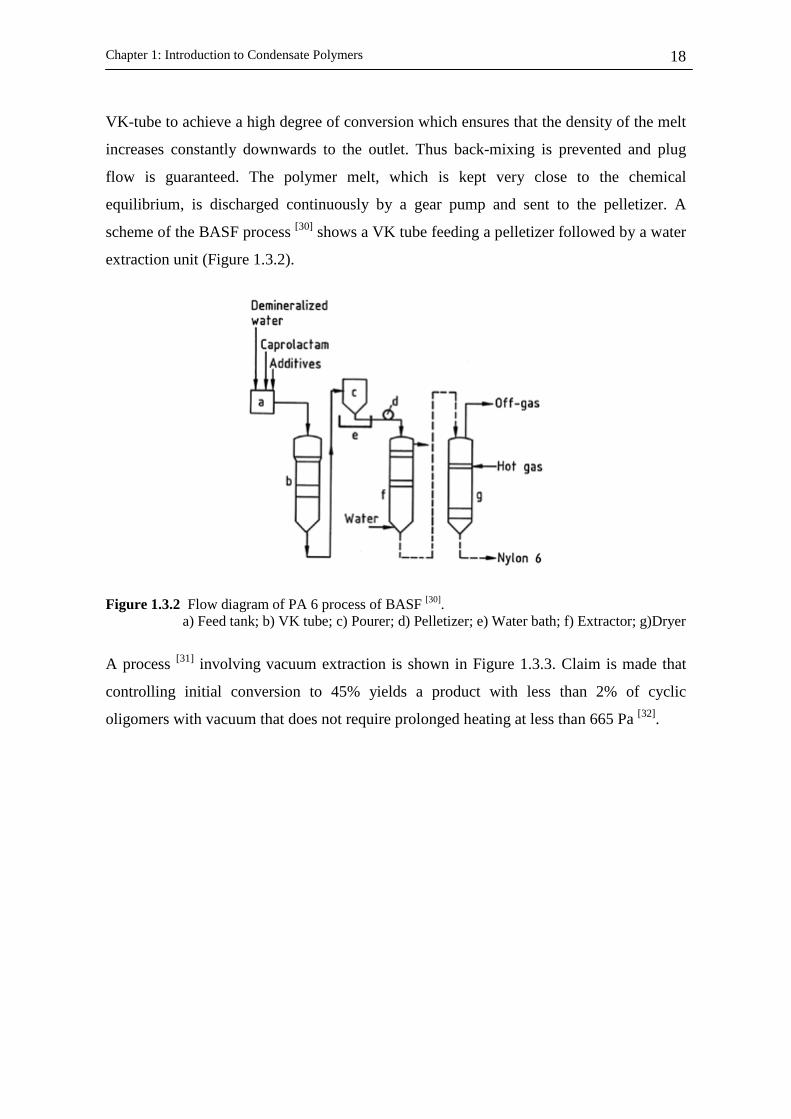
A process [31] involving vacuum extraction is shown in Figure 1.3.3. Claim is made that
controlling initial conversion to 45% yields a product with less than 2% of cyclic
oligomers with vacuum that does not require prolonged heating at less than 665 Pa [32].
Chapter 1: Introduction to Condensate Polymers
19
Figure 1.3.3 Flow diagram of PA 6 process of Allied Chemical [31].
a) Pump; b) Stirrer; c) Holding tank; d) Filter; e) Flow meter; f) Pre-heater; g) Hydrolyzer; h) Metering pump; i) Polyaddition reactor; j) Vent; k) Vacuum flasher; l) Finisher; m) Spinning heads.
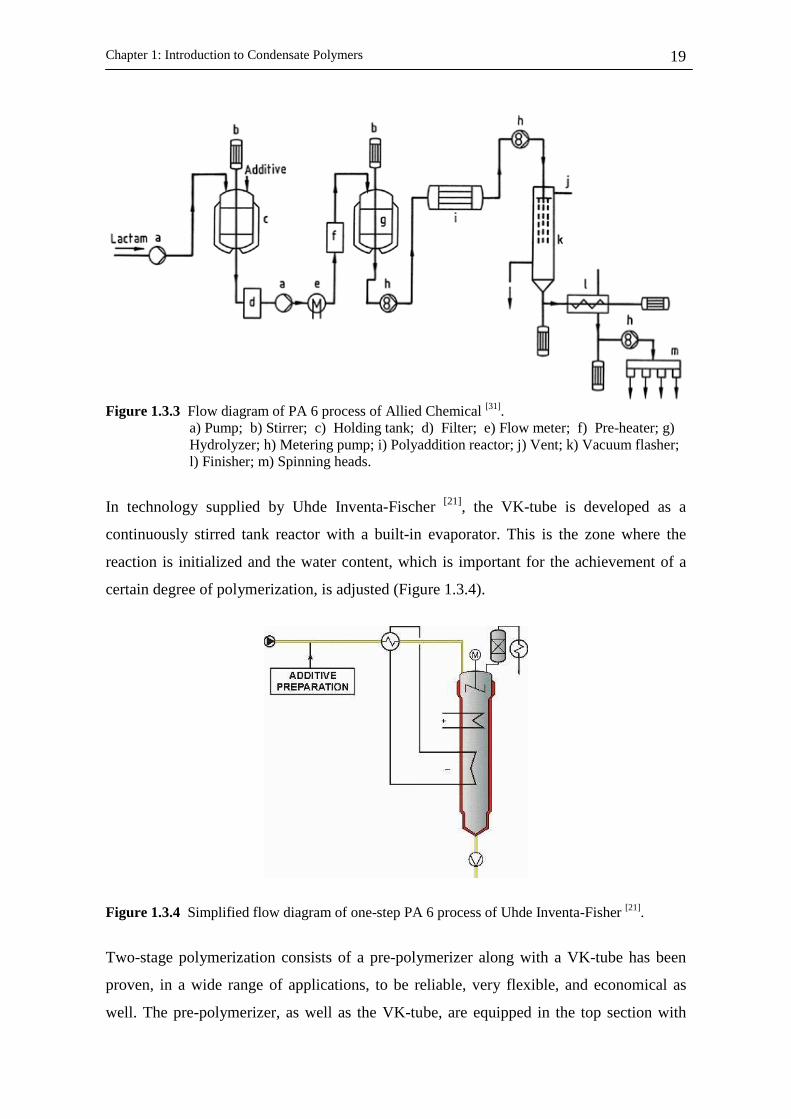
In technology supplied by Uhde Inventa-Fischer [21], the VK-tube is developed as a
continuously stirred tank reactor with a built-in evaporator. This is the zone where the
reaction is initialized and the water content, which is important for the achievement of a
certain degree of polymerization, is adjusted (Figure 1.3.4).
Figure 1.3.4 Simplified flow diagram of one-step PA 6 process of Uhde Inventa-Fisher [21].
Two-stage polymerization consists of a pre-polymerizer along with a VK-tube has been
proven, in a wide range of applications, to be reliable, very flexible, and economical as
well. The pre-polymerizer, as well as the VK-tube, are equipped in the top section with
Chapter 1: Introduction to Condensate Polymers
20
tie-heat exchangers providing a large heat transfer area. Prior to the pre-polymerizer, the
inlet product is pre-heated in a vessel and excess water is evaporated using the reaction
enthalpy which is given off in the VK-tube. The pre-polymerizer is operated under
controlled pressure which leads to a high conversion of the caprolactam and to a low
residence time in the polymerization process ahead. In order to produce a polymer with a
high viscosity, the pressure in the VK-tube can be reduced from atmospheric pressure
down to a precisely controlled vacuum. The water content in the polymer is adjusted by
the formation of a thin polymer film at the top of the VK-tube. The lower part of the VK-
tube is provided with a melt cooling system to achieve a high degree of polymerization.
The polymer melt is discharged at a constant rate by an adjustable gear pump. The special
design of the pre-polymerizer and the VK-polymerizer internals ensure a high
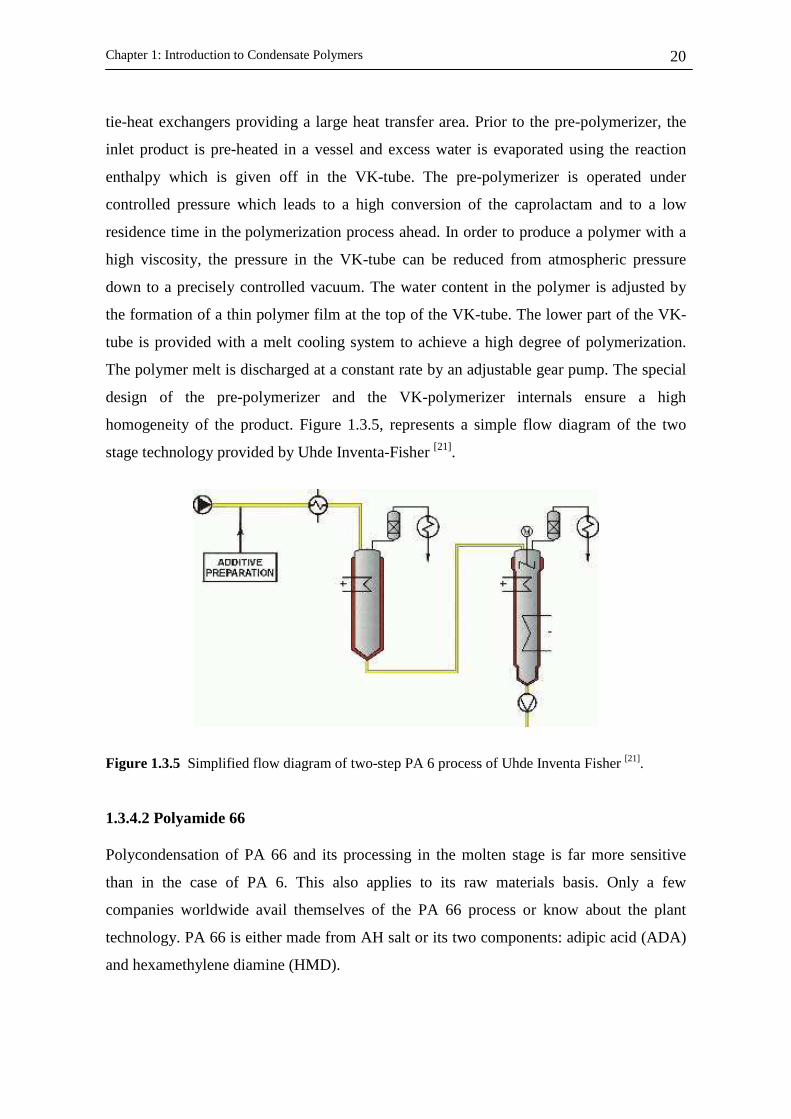
homogeneity of the product. Figure 1.3.5, represents a simple flow diagram of the two
stage technology provided by Uhde Inventa-Fisher [21].
Figure 1.3.5 Simplified flow diagram of two-step PA 6 process of Uhde Inventa Fisher [21].
1.3.4.2 Polyamide 66
Polycondensation of PA 66 and its processing in the molten stage is far more sensitive
than in the case of PA 6. This also applies to its raw materials basis. Only a few
companies worldwide avail themselves of the PA 66 process or know about the plant
technology. PA 66 is either made from AH salt or its two components: adipic acid (ADA)
and hexamethylene diamine (HMD).

Chapter 1: Introduction to Condensate Polymers
21
Preparation of AH salt solution
Mixing of the two components ADA and HMD requires exact dosing, temperature and
process control. Even during storage, liquid HMD must be kept within a low temperature
range. HMD is a vivid reagent, which is especially sensitive to O2 and CO2. The process
for preparing an AH salt solution from ADA and HMD is continuous. After mixing the
two components together with water, the pH-value is precisely corrected, in order to
achieve the end-group equivalence necessary for PA 66 polycondensation. The final
concentration of the AH salt solution is about 50% by weight. If the starting material is
solid AH salt, it is first dissolved in water and afterwards concentrated continuously by
evaporation of a part of the water. From this point, the process is the same as using liquid
salt solutions from the beginning, comprising the two components ADA and HMD [21].
Batch polycondensation
The stored salt solution is concentrated under pressure to 65 – 80 % before charging to an
autoclave. The essential features are heating to 210°C under autogeneous pressure to reach
a pressure of 1.75 MPa, gradually increasing the temperature to about 275°C while
releasing steam at a rate which maintains the pressure, reducing the pressure at a rate that
avoids cooling and finally holding the batch at atmospheric or reduced pressure to obtain
the target molecular mass before extruding the polymer under inert gas pressure. This
procedure is designed to assure that there is enough water present to avoid freezing of the
batch before the melting point has been reached. Water also minimizes excessive loss of
diamine. Stirred autoclaves are used but are normally unnecessary. The extrudate is in a
wide ribbon that is quenched with water which is subsequently removed by jet blowers.
The ribbon is cut into chips which are blended and packaged [33, 34]. The polycondensation
autoclaves ensure a gentle polycondensation due to the size and favourable arrangement of
the internal heat exchange surfaces. The capacity of batch polycondensation plants is up to
25 t/d in one line [21].
Continuous polycondensation
The same concerns for control of the rate of removal of water and loss of diamine exist as
in batch polymerization, but the situation is complicated by the needs of a continuous

Chapter 1: Introduction to Condensate Polymers
22
process. Typically, a first stage involves evaporation/reaction with controlled loss of water
to form a pre-polymer and minimize loss of diamine (Figure 1.3.6).
Figure 1.3.6 Continuous polymerizer for PA 66 [7]. a) Evaporator/reactor; b) Vent; c) Pump; d) Finisher; e) Flash tubes
Further reaction occurs in subsequent stages with controlled evaporation in devices known
as “separators” and “flashers”. The desired molecular weight and water content are
obtained in a “finisher”. However large patent literature exist that claims improvement in
each of these devices or combinations thereof for process simplification [7].
1.4 Polycarbonates
1.4.1 Historical aspects
The existence of polycarbonate (PC) resins has been known for nearly a century. However
the real beginnings of commercial polycarbonate resin technology occurred on 1950s
when two major international chemicals companies, General Electric and Bayer
announced their inventions almost simultaneously which based on the reaction of
phosgene and salt of bisphenol A (BPA) to produce the bisphenol A polycarbonate [35, 36].
Many alternative formulations were published and patented but none of them could take
the place of original PBA.
1.4.2 Polycarbonate synthesis and processes

Chapter 1: Introduction to Condensate Polymers
23
The chemistry employed to make polycarbonate resins depending on process applied
include interfacial, trasesterification and solution-based methods. The methods differ in
reaction medium, reaction condition, catalysts and monomeric raw material, but they have
one raw material common to all methods: phosgene which provides the source of
carbonate carbonyl moiety at some stage of monomer or polymer synthesis. The
commercially most important monomer is BPA however many other type of bisphenol
have been converted to polycarbonate but very few of them have been used in industry for
PC production. Examples include 1,1-bis(4-hydroxyphenyl)cyclohexane (bisphenol C,
BPC), 2,2-bis(3,5-dibromo-4-hydroxyphenyl)propane, (tetrabromobisphenol A, TBBPA),
and 2,2-bis(3,5-dimethyl-4-hydroxyphenyl)propane, (tetramethylbisphenol A, TMBPA)[7].
1.4.2.1 Melt transesterification
1.4.2.1.1 Synthesis and catalysis
Transesterification is carried out in melt phase. The carbonyl is provided by carbonyl
ester. The other monomers are aromatic diols which have the thermal stability at melt
condition to survive the polymerization reaction. The transesterifcation leads to the
exchange of hydroxylic reagents with diol releasing the monohydroxylic agent from the
reactant as a reaction by-product (Scheme1.4.1).
OH R' OH + RO OR
OCatalyst
OH R' O OR
O
+ ROH
Scheme 1.4.1 Transesterification reaction.
Typical catalysts for melt transesterification are basic catalysts like lithium, sodium or
potassium hydroxide. The reaction is also catalyzed by titanium teterabutoxide much like
polyesterification reaction [37]. The catalysts can adjust the reaction rate. They react with
aromatic diols to form diolates prior to reaction with the carbonate ester.
The resin molecular weight is controlled by manipulating the residence time of the
reactant system at high temperature and high vacuum in the melt phase. The chain
prolongation can be continued and polymer remains as living polymer but it can be
controlled by adding high boiling reactive monofunctional phenols chain as terminator in
the initial formulation.
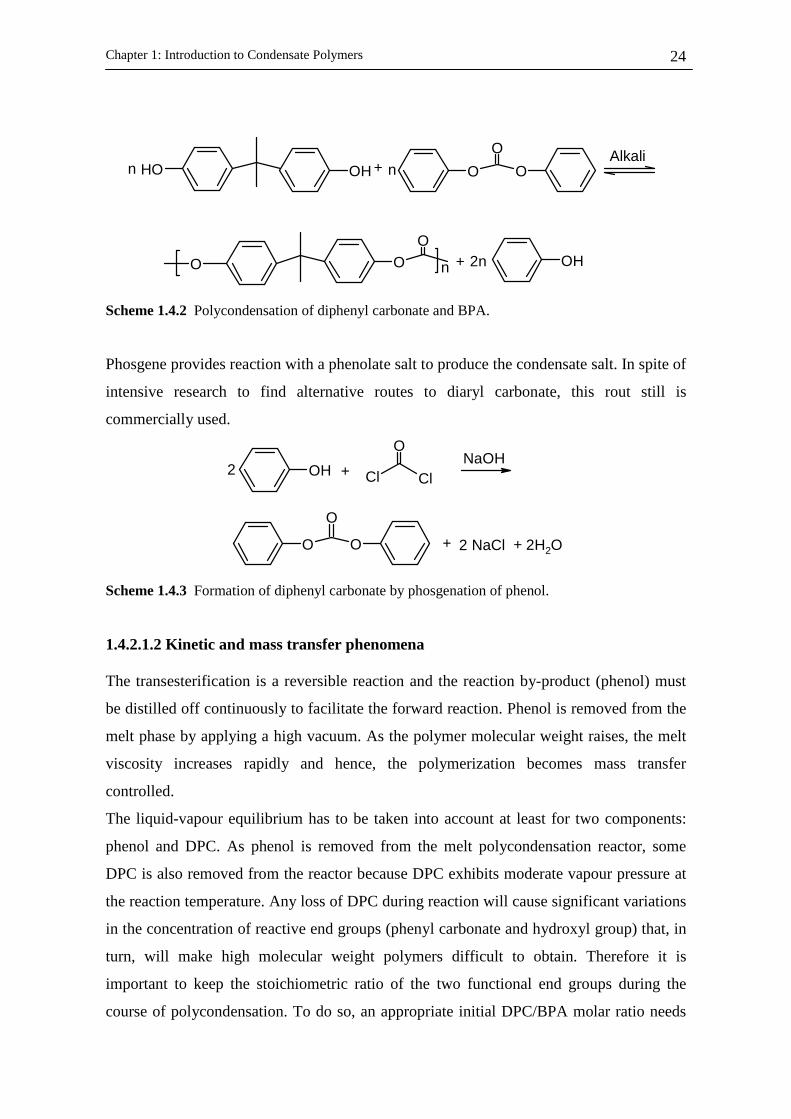
The following reaction is the polycondensation of diphenyl carbonate (DPC) and BPA:
Chapter 1: Introduction to Condensate Polymers
24
OH OH + O O
O Alkali
O OO
n OH+
n n
2n
Scheme 1.4.2 Polycondensation of diphenyl carbonate and BPA.
Phosgene provides reaction with a phenolate salt to produce the condensate salt. In spite of
intensive research to find alternative routes to diaryl carbonate, this rout still is
commercially used.
OH +2 Cl Cl
ONaOH
O O
O
+ 2 NaCl + 2H2O
Scheme 1.4.3 Formation of diphenyl carbonate by phosgenation of phenol.
1.4.2.1.2 Kinetic and mass transfer phenomena
The transesterification is a reversible reaction and the reaction by-product (phenol) must
be distilled off continuously to facilitate the forward reaction. Phenol is removed from the
melt phase by applying a high vacuum. As the polymer molecular weight raises, the melt
viscosity increases rapidly and hence, the polymerization becomes mass transfer
controlled.
The liquid-vapour equilibrium has to be taken into account at least for two components:
phenol and DPC. As phenol is removed from the melt polycondensation reactor, some
DPC is also removed from the reactor because DPC exhibits moderate vapour pressure at
the reaction temperature. Any loss of DPC during reaction will cause significant variations
in the concentration of reactive end groups (phenyl carbonate and hydroxyl group) that, in
turn, will make high molecular weight polymers difficult to obtain. Therefore it is
important to keep the stoichiometric ratio of the two functional end groups during the
course of polycondensation. To do so, an appropriate initial DPC/BPA molar ratio needs

Chapter 1: Introduction to Condensate Polymers
25
to be employed to compensate for the loss of DPC in a reflux column. The concentrations
of phenol and DPC in both the vapour phase and the liquid phase need to be calculated.
The following vapour pressure equations are reported in literature [38] for phenol and DPC:
58.98
1052.113.7ln
30
−×−=
TPp (1.4.1)
55.191
)987.1
1048.1(ln
40 +×−=
TPDPC (1.4.2)
Since the transesterifcation reaction occurs to some extent even without any catalyst, the
rate constant of polycondensation could be express in the following form:
][Catkkk cu += (1.4.3)
where [Cat ] is the catalyst concentration ku represents the rate constant for uncatalyzed
transesterification and kc represents the rate constant for the catalyzed transesterification.
The forward and reverse reaction rates for the uncatalyzed transesterification are reported [38] to be:
)105712
exp()10108.3( 7
RTku −×= [l mol-1 min-1] (1.4.4)
)188225
exp()10028.2( 7´
RTku −×= [l mol-1 min-1] (1.4.5)
and for the catalyzed reactions:
)58102
exp()1062.9( 8
RTkc −×= [l2 mol-2 min-1] (1.4.6)
)50536
exp()1004.8( 7´
RTk c −×= [l2 mol-2 min-1] (1.4.7)
1.4.2.1.3 Transesterification process
Transesterifiction process usually involves preliminary melting of precursor diaryl
carbonates and BPA. The molten reagent, along with carefully metered catalysts and chain
terminators, are fed to a mixer under reduced pressure. The reaction is usually catalyzed
with very small amounts of alkali at 190 – 320°C and reduced pressure (down to ca. 0.1
kPa). The temperature is initially low and the pressure is slightly reduced (e.g., 200°C at
20 kPa). During the course of reaction the temperature is raised and the pressure reduced.
Mass transfer and hence the speed with which phenol can be removed are reduced with
increasing viscosity. Reactors are needed that provide a high rate of surface renewal.

Chapter 1: Introduction to Condensate Polymers
26
These may be wiped-film evaporators, single or twins extruders, reactor of rotating disk
type [39, 40].
1.4.2.2 Polycarbonate synthesis in solution
Solution PC synthesis was the first process pursued commercially. In this synthetic
method, all the reactants are soluble in the reaction matrix. The differences with
transesterification is application of organic solvents like methylene chloride and organic
base such as pyridine which is sufficiently basic to succeed in dissolving the aromatic diol
to produce reactive pyridinium salts as reaction by-product [41, 42].
1.4.2.2.1 Solution polycondensation process
Commercial solution processes in PC production are batch processes [41, 42]. The reactants
are placed in a stirred tank reactor. Typically, methylene chloride, pyridine, BPA and
chain terminator are added to the reaction vessel. Phosgen is bubbled into the stirred
mixture. At the conclusion of the reaction, the pyridinium hydrochloride must be removed
from the reaction solution prior to polymer isolation. The removal of the pyridinium
hydrochloride is usually accomplished by multiple aqueous acid and water washes. The
major disadvantages of the solution process are in the difficulty in removing all traces of
pyridine and pyridinium hydrochloride from the polymer solution and in the cost of
recovery/purification of the pyridine.
1.4.2.3 Interfacial polycondensation
1.4.2.3.1 Synthetic aspects
The interfacial synthesis involves reaction at the boundary between two immiscible
solvents which are protic and aprotic respectively. Some reactant dissolved in the aprotic
organic solvent layer and some in protic aqueous layer. During the reaction, the monomers
react in the interface with the polymerizing resin growing into and remaining dissolved in
aprotic phase. The typical solvents used in industry are methylene chloride and aqueous
caustic. The caustic dissolves aromatic diol and the phenolic chain terminators. The
methylene chloride layer dissolves the carbonate source which invariably is phosgene [43,
44]. The overall reaction scheme is shown in scheme 1.4.4.

Chapter 1: Introduction to Condensate Polymers
27
NaO ONan Cl Cl
O
2n NaCl
+
O OO
n
n
+
Scheme 1.4.4 Synthesis of PC via interfacial rout of reaction
The synthesis proceeds in three steps: Phosgenation of BPA, formation of oligomeric
carbonates with phenolic and chloroformate end groups; which will follow by
polycondensation of oligomers. The phosgenation is started by dispersion of two phases.
In phosgenation step, the concentration of BPA is very important. Since at high
concentration a fourth solid phase might be present.
In all interfacial procedures vigorous agitation is necessary to promote practical reaction
rate. The reaction is exothermic and provisions must be made to control reflux of the
volatile methylene chloride. The concentration above 26 % of resins in methylene chloride
can results in metastable solutions whose coagulation or high viscosities can cause
problems in production facilities.
In polycondensation step, a monofunctional phenol is added as chain terminator to control
the molecular weight of the final polycarbonate. At this step reaction rate decreases. The
final polycondensation stages are catalyzed by tertiary amines.
1.4.2.3.2 Kinetic and mass transfer phenomena
Phosgenation is generally mass transfer limited and its rate depends on mixing as well as
on pH and the volume ratio of the organic and aqueous phases. Although the
polycondensation reaction of end groups is slower, both rates still show the same
dependencies due to the interfacial nature of the reaction. The reaction rate could be
influenced by following phenomena:
• Dispersion of two phases. Rates always depend on mixing. Effective kinetic rate
constant can be formulated as a function of energy dissipation or interfacial area.
• Type of emulsion (oil in water (o/w) as well as water in oil (w/o)).
• The partition of phenols between the phases and its pH dependence. Kosky et al. [45] studied the reaction hydrolysis taking into account the different phases and the

Chapter 1: Introduction to Condensate Polymers
28
partitioning of BPA between them. Monofunctional phenols with better solubility
in the organic phase show a better efficiency as chain terminators.
• Mass transfer to and across the boundaries.
1.4.2.3.3 Interfacial polycondensation processes
Interfacial polymerization developed first at Farbenfabriken Bayer AG [46], is employed by
most polycarbonate manufactures by three techniques: batch, semi batch and continuous
process.
Batch interfacial process
The reactants and reaction media are charged into a single vessel where the
polymerization takes place. Phosgene is bubbled into rapidly stirred vessel at a rate which
is tailored to the parameters of the system insuring maximum phosgene uptake. pH value
decreases during reaction therefore additional caustic is added as reaction progress. At the
end of reaction the aqueous solution is separated from PC/methylene chloride solution.
The polymer solution is purified and isolated.
The batch process has some drawbacks. Since chain terminators are added in the initial
charge diaryl carbonates, low molecular weight oligomers are produced which leads to
broadening of molecular weight distribution. Furthermore, the batch processes are also
plagued with the problems of batch to batch variability which requires very excellent
process controls.
Semi batch interfacial process
Semi batch operations use a sequence of stirred tank reactors to promote the polycarbonate
synthesis. Commercial systems can include two to four reactors[47, 48]. Three series reactors
are common process configuration. These three reactors configurations allow sequential
programming of pH, addition of chain terminators and phase transfer agents. The first
reactor is charged similarly to the single batch interfacial reactor. Methylene chloride,
caustic and BPA chloroformates are added and subsequently treated by phosgene gas. In
general the whole reaction mixture is transferred to second reactor when pH of around 10
is reached. There, a phase transfer agent, ([R4N+]Cl-) is added and polymer molecular
weight increases.

Chapter 1: Introduction to Condensate Polymers
29
The polydispersity index of semi batch process is similar to that for batch process. If chain
terminating agent is added in the second reactor after production of BPA oligomers, the
level of low molecular weight oligomers are reduced relative to batch process. However,
control system must be precise in order to avoid product variability.
Continuous interfacial synthesis
Continuous polycarbonate processes are only variants of the semi batch process [49]. Here
the functions of the first reactor are preformed by continuous mixer where phosgenation
takes place. The reactants are fed into the system with all reactants concentrations
carefully set and rate of addition in precisely maintained. The mixture is sent to another
stirred tank reactor in which the oligomerization takes place. The produced heat is
removed by cooling jacket. After reaching a certain degree of polymerization, the product
which is mixed with fresh phenol is conveyed to the tubular reactors where the main
polycondensation will occur. Figure 1.4.1 shows a simplified flow diagram of this process.
The polydispersity index is in the same range as in batch process. The products have
consistent properties.
Figure 1.4.1 Simplified flow diagram of continuously operated PC synthesis.

Chapter 1: Introduction to Condensate Polymers
30
1.5 Objectives of project
Antimony compounds are still the main catalyst of choice in PET synthesis in production
plants. This is due to the high selectivity of this compound in the course of
polycondensation reaction. However, because of the main disadvantage of this catalyst as
a heavy metal, intensive attempts have been invested to replace it by a more
environmentally friendly catalyst.
Despite of releasing huge number of patents claiming titanium compounds being the best
choice of replacement of antimony, but the fundamental aspects and mechanism of
catalysis in PET synthesis is poorly understood. The reason lies in the nature of reaction
(reversible and parallel side reactions) and in the reaction condition (high temperature
causing side reaction, variation of pressure from 3 bar to 0.1 mbar, high viscosity).
The aim of this project was to understand fundamental aspect of titanium-based catalyst
PET synthesis by screening of different commercially available titanium-based
compounds. Furthermore, optimization of differential scanning calorimetry and
thermogravimetric analysis as fast screening technique was in major interest. Another
objective was developing a comprehensive mathematical model to be able to simulate
kinetic, molecular weight, concentration of side products and molecular weight
distribution. A set of reliable experimental data should be achieved by developing a lab
scale stirred tank reactor equipped with a very precise online data acquisition.

Chapter 1: Introduction to Condensate Polymers
31
1.6 References
[1] J. Berzelius, Ann., 26, (1847)
[2] A. V. Laurenco, Ann. Chem. Phys., 67, 293 (1863)
[3] K. Kraut, Justus Liebigs Ann. Chem., 150, 1(1869)
[4] W.H. Carothers, J. Am. Chem. Soc., 51, 2548 (1929)
[5] J. R. Whinfield, J. T. Dickson, Br. Pat. 578 079 (1941)
[6] U. K. Thiele, POLYESTER BOTTLE RESINS, Production, Processing, Properties and
Recycling, Heidelberg Business Media GmbH, 2007, ISBN 978-3-9807497-4-9
[7] Ullmann Encyclopedia of Industrial Chemistry, 4th Edition, John Wiley & Sons (2000)
[8] J. Scheirs, T. E. Long, Modern Polyesters: Chemistry and Technology of Polyesters
and Copolyesters, John Wiley & Sons (2003)
[9] P. J. Flory, J. Am. Chem. Soc., 58, 1877 (1936)
[10] P. J. Flory, Principles of Polymer Chemistry, Cornell University Press, Ithaca, New
York (1953)
[11] H. Zimmermann, D. D. Chu, Faserforschung Textiltechnik, 24, 445 (1973)
[12] H. Zimmermann, Faserforschung Textiltechnik, 13, 481 (1962)
[13] J.-W. Chen, L.-W. Chen, J. Polym. Sci., Polym.Chem. Ed., 36, 3073 (1998)
[14] V. Hornof, J. Macromol. Sci. Chem., A15, 503 (1981)
[15] E. P. Goodings, Soc. Chem. Ind. (London), Monograph No. 13, 211 (1961)
[16] M. Edge, R. Wiles, N. S. Allen, W. A. McDonald, S. V. Mortlock, Polymer., 36,
227 (1995)
[17] U. K. Thiele, Inter. J. Polym. Mat., 50, 387 (2001)
[18] U. K. Thiele, The European PET Conference, Barcelona, October 2006
[19] WWW.Zimmer-AG.de
[20] K. C. Cannon, S.R. Seshadri, R. R. Dirks, EP Pat. 0 970 983 A2 (2000)
[21] www.Uhde-Inventa-fischer.com
[22] www.Aquafileng.com
[23] S. Gabriel, T. Maass. R., 32, 1266 (1889)
[24] H. E. Stepniczka, Ind. Eng. Chem. Prod. Res. Develop., 12, 1 (1973)
[25] F. Charaf, Polyamide 2007 World Congress, Zurich, June 2007
[26] H. F. Mark, N. M. Bikales, C. G. Overberger, G. Menges, Encyclopaedia of Polymer
Science and Engineering, 2nd Edition, volume 11, John Wiley & Sons (1988)
[27] M. Steppan, J. Appl. Polym. Sci., 33, 2333 (1987)
Chapter 1: Introduction to Condensate Polymers
32
[28] M. A. Schaffer, K. B. Mcauley, M. F Cunningham, E. K. Marchildon, Ind. Eng.
Chem. Res., 42, 2948 (2003)
[29] H. Jacobs, C. Schweigman, Fifth European/Second International Symposium on
Chemical Reaction Engineering, Amsterdam, 1972
[30] G. S. Kirshenbaum, High Performance Polymers: Their Origin and Development,
Elsevier (1986)
[31] I. C. Twilley, G. J. Coll, Jr., D. W. H. Roth, (Allied Chemical), US Pat. 3 578 640
(1968)
[32] I. C. Twilley, D. W. H. Roth, R. A. Lofquis, (Allied Chemical), CA Pat. 823 290
(1967 )
[33] G. De, W. Graves, (Du Pont), US Pat. 2 289 774 (1939)
[34] W. G. Johnson, (Du Pont), US Pat. 3 491 177, (1967)
[35] H. Schnell, L. Bottenbruch, H. Krimm, (Bayer AG), Belg. Pat. 532 543 (1954)
[36] D.W. Fox, (General Electric Company), Australian Pat. 221 192 (1955)
[37] G. W. Parshall, S. D. Ittel, Homogeneous Catalysis, 2nd Edition, John Wiley & Sons,
(1992)
[38] B. G. Woo, K. Y. Choi, W. H. Song, S. H. Lee, J. Appl. Polym. Sci., 80, 1253 (2001)
[39] U. Curtius, L. Bottenbruch, H. Schnell, ( Bayer AG), US Pat. 3442 854 (1969)
[40] H. Yamana, T. Kuni, H. Nakai, (Mitsubbishi Gas Chemical Co.), US Pat. 3 888 826
(1975)
[41] K. Dik, G. Ham, J. Gross, (Dow Chemical Co.), US Pat. 4378 454 (1983)
[42] J. H. Vestergaard, (General Electric Co.), US Pat. 3 989 672 (1976)
[43] M. Rabinovitz, Y. Cohen, M. Halpern, Angew. Chem. Int. Ed. Engl., 25, 690 (1986)
[44] D. Landini, A. Maia, A. Rampoldi, J. Org. Chem., 51, 5474 (1986)
[45] P. K. Kosky, J. M. Silva, Ind. Eng. Chem. Res., 30, 468 (1991)
[46] W. Alewelt, G. Jacobs, D. Margotte, E. Lax (Bayer AG), US Pat. 4 127 561 (1978)
[47] T. Megumi, S. Kondo, (Mitsubishi Gas Chemical Co.), US Pat. 4 097 457 (1978)
[48] H. Koda, T. Megumi, H. Yoshizahi, (Mitsubishi Gas Chemical Co.), US Pat. 4 413
103 (1983)
[49] H. Vernaleken, O. Court, K. Weirauch, (Bayer AG), US Pat. 3 674740 (1972)
[50] P. Horn, H. Kuerten, (BASF SE), US Pat. 3 945969 (1978)
Chapter 2: Screening of Different Titanium (IV) Catalysts in
Polyethylene Terephthalate Synthesis
Abstract
Polycondensation of bis (hydroxyethylene) terephthalate and its oligomers to polyethylene
terephthalate catalyzed by different chelated and non-chelated titanium (IV) catalysts in
lab scale stirred tank reactor and micro scale crucible of differential scanning calorimetry
was investigated. Different titanium compounds showed different activity and selectivity
in polyethylene terephthalate synthesis. The nature of ligand of catalyst has a significant
effect on catalyst activity and selectivity. In general, non-chelated organic titanium (IV)
derivatives were more active and less selective than corresponding chelated compounds.
In chelated titanium compounds, the activity was affected by nature of multidentate and
monodentate ligands simultaneously. In solid state polycondensation reaction, the same
results were achieved with respect to effect of catalyst type on catalytic activity.
Polycondensation progress is characterized by an initial induction period which depends
on the type of catalyst. The original used titanium compounds seem to be catalyst
precursors and are probably activated by ligand exchange reaction.
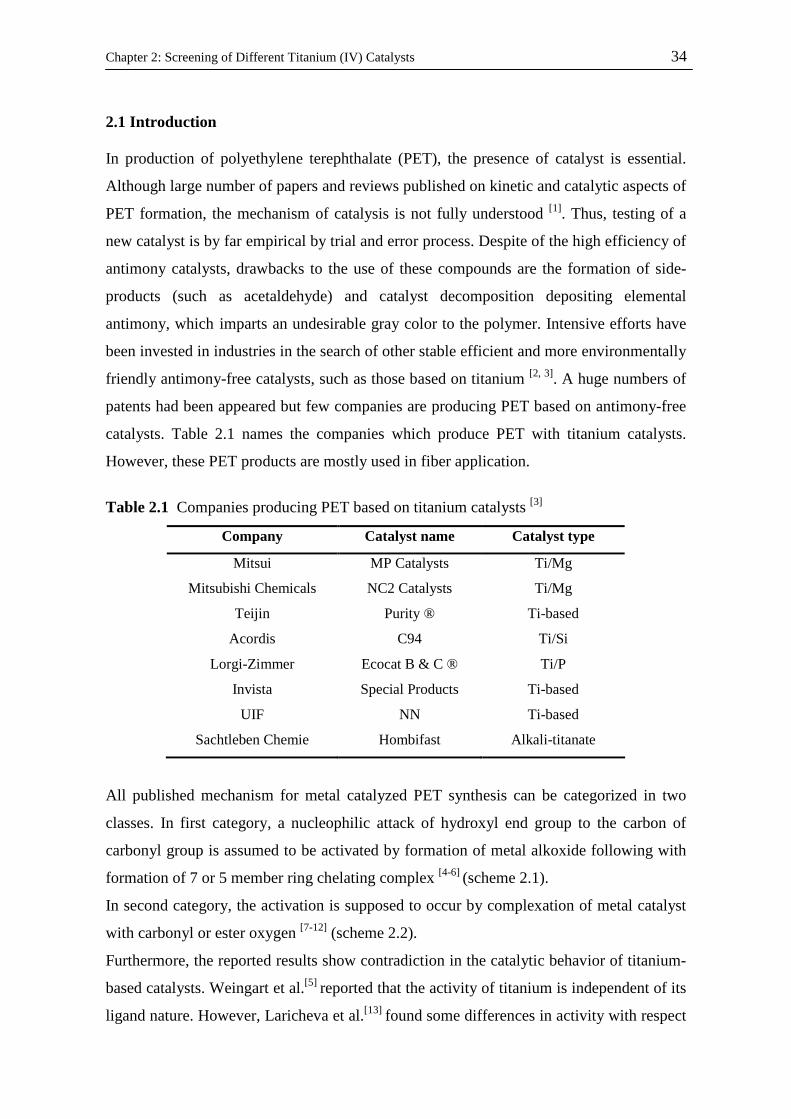
Chapter 2: Screening of Different Titanium (IV) Catalysts 34
2.1 Introduction
In production of polyethylene terephthalate (PET), the presence of catalyst is essential.
Although large number of papers and reviews published on kinetic and catalytic aspects of
PET formation, the mechanism of catalysis is not fully understood [1]. Thus, testing of a
new catalyst is by far empirical by trial and error process. Despite of the high efficiency of
antimony catalysts, drawbacks to the use of these compounds are the formation of side-
products (such as acetaldehyde) and catalyst decomposition depositing elemental
antimony, which imparts an undesirable gray color to the polymer. Intensive efforts have
been invested in industries in the search of other stable efficient and more environmentally
friendly antimony-free catalysts, such as those based on titanium [2, 3]. A huge numbers of
patents had been appeared but few companies are producing PET based on antimony-free
catalysts. Table 2.1 names the companies which produce PET with titanium catalysts.
However, these PET products are mostly used in fiber application.
Table 2.1 Companies producing PET based on titanium catalysts [3]
Company Catalyst name Catalyst type
Mitsui MP Catalysts Ti/Mg
Mitsubishi Chemicals NC2 Catalysts Ti/Mg
Teijin Purity ® Ti-based
Acordis C94 Ti/Si
Lorgi-Zimmer Ecocat B & C ® Ti/P
Invista Special Products Ti-based
UIF NN Ti-based
Sachtleben Chemie Hombifast Alkali-titanate
All published mechanism for metal catalyzed PET synthesis can be categorized in two
classes. In first category, a nucleophilic attack of hydroxyl end group to the carbon of
carbonyl group is assumed to be activated by formation of metal alkoxide following with
formation of 7 or 5 member ring chelating complex [4-6] (scheme 2.1).
In second category, the activation is supposed to occur by complexation of metal catalyst
with carbonyl or ester oxygen [7-12] (scheme 2.2).
Furthermore, the reported results show contradiction in the catalytic behavior of titanium-
based catalysts. Weingart et al.[5] reported that the activity of titanium is independent of its
ligand nature. However, Laricheva et al.[13] found some differences in activity with respect

Chapter 2: Screening of Different Titanium (IV) Catalysts 35
to the nature of attached ligands. Otton et al. [14, 15] showed that the activity of titanium
catalysts is affected by the type of reaction medium and the kinetic of catalyzed reaction
depends on the reaction medium. Furthermore, possible deactivation of titanium catalyst
during polycondensation is an open question which is not fully understood, since it was
reported that the polymeric form of titanium compounds as product of hydrolysis is still
catalytically active [13].
O O
O RM O
RO
O
O
M
(1) (2) Scheme 2.1 Formation of 7 member ring (1) and 5 member ring (2) in activation step of metal
catalyzed polycondensation.
OOH
O
O
OH
O
M
Scheme 2.2 Complexation of metal to the carbonyl oxygen to activate nucleophilic attack for
chain prolongation. The aim of this chapter is to study catalysis aspects of different titanium-based catalyzed
polycondensation reaction and express a reaction progress rout that can explain best the
experimental results by screening of different patented catalysts.
2.2 Experimental part
2.2.1 Chemicals
Bis (hydroxyethylene) terephthalate (BHET) (> 99%) was from Aldrich, ethylene glycol
(EG) (>99%) was from Merck, titanium (IV) tetrabutoxid (Cat 1) (>98%) and
chlorotriisopropoxy titanium (IV) (Cat 3) (> 98%) were from Fulka, tetrakis
Chapter 2: Screening of Different Titanium (IV) Catalysts 36
(diethylamido) titanium (IV) (Cat 2) (>99.999%), titanium (IV) tert-butoxide (Cat 4)
(purum), titanium (IV) bis (ammonium lactate) dihydroxide (Cat 5) (50 wt% in water),
diisopropoxytitanium bis (acetylacetonate) (Cat 6) (75 wt% in isopropanol) and titanium
(IV) (triethanolaminato) isopropoxide (Cat 7) ( 80 wt% in isopropanol) were from
Aldrich. PET oligomer with chain length of 4-5 units was from Equipolymers GmbH.
Antimony triacetate (> 98%) was from Uhde Inventa-Fischer and was mixed with EG.
Model molecule ethylene glycol monobenzoat (EGMB) was synthesised by method of
Santacesaria et al. [4]. All the applied chemicals were used without further purification.
2.2.2 Preparation of sample for catalyst screening
The preliminary studies of different sample preparation methods showed that the most
reliable and reproducible method of sample preparation is the following: 1 µl of Cat 1 was
added to the appropriate amount of molten BHET (5-25 g) at 110°C and stirred at this
temperature for 15 min. The product was cooled down and ground to fine powder and
used for catalysts screening. The expressed catalysts concentration in mol ppm is based on
mol of titanium atom to mol of BHET.
2.2.3 Catalyst fast screening
Differential scanning calorimetry instrument, DSC 6, from Perkin Elmer was used as
catalysts fast screening method. Aluminium crucible was filled with about 10 mg of
sample and inserted in the DSC oven. Nitrogen gas (50 ml min-1) was purging over the
sample to carry away the by-product as it formed.
2.2.4 Reuse of catalyst after pre-polycondensation
The desired amount of catalyst was added to molten BHET in a glass vessel and mixed for
10 min before starting reaction by applying vacuum at 260°C. The pre-polycondensation
was running for 1 and 4 h and was stopped by breaking vacuum with nitrogen flow. The
polymeric product was depolymerised by cooking in EG under reflux. After complete
depolymerization, the product was cooled down to room temperature and EG was
removed by vacuum at 50°C. Then fresh BHET was added to the obtained powder to
adjust catalyst concentration, mixed and introduced to DSC crucible for screening.
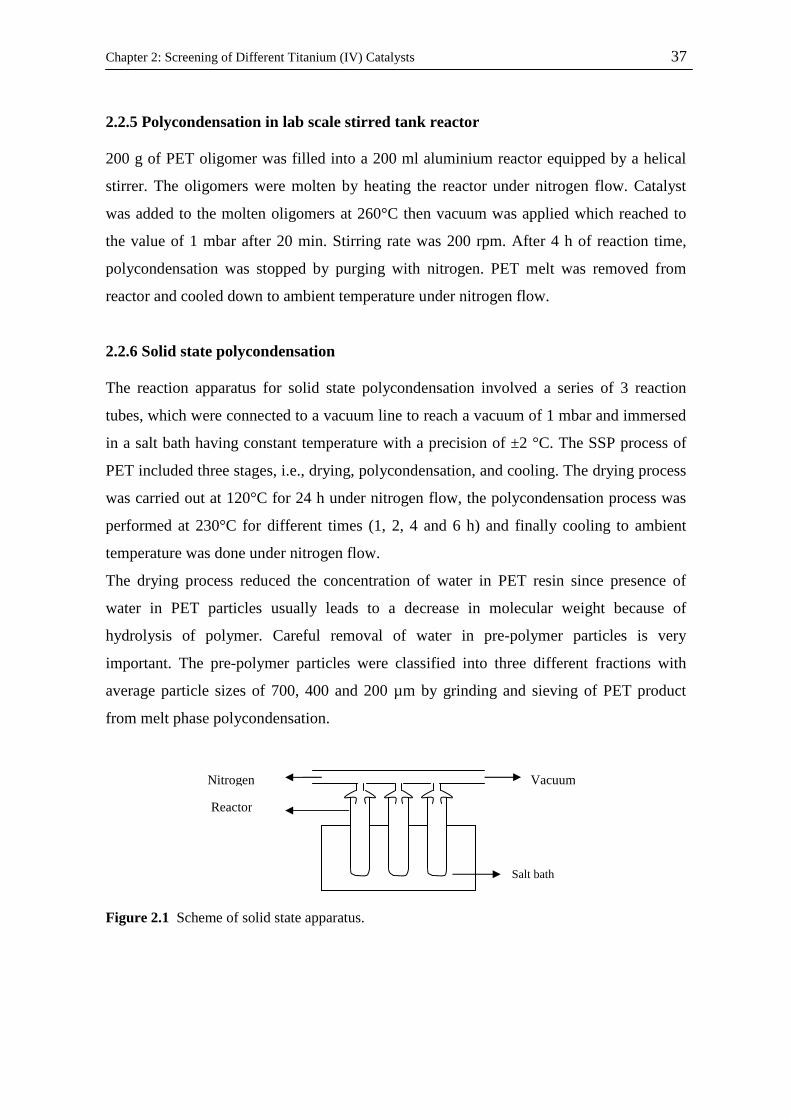
Chapter 2: Screening of Different Titanium (IV) Catalysts 37
2.2.5 Polycondensation in lab scale stirred tank reactor
200 g of PET oligomer was filled into a 200 ml aluminium reactor equipped by a helical
stirrer. The oligomers were molten by heating the reactor under nitrogen flow. Catalyst
was added to the molten oligomers at 260°C then vacuum was applied which reached to
the value of 1 mbar after 20 min. Stirring rate was 200 rpm. After 4 h of reaction time,
polycondensation was stopped by purging with nitrogen. PET melt was removed from
reactor and cooled down to ambient temperature under nitrogen flow.
2.2.6 Solid state polycondensation
The reaction apparatus for solid state polycondensation involved a series of 3 reaction
tubes, which were connected to a vacuum line to reach a vacuum of 1 mbar and immersed
in a salt bath having constant temperature with a precision of ±2 °C. The SSP process of
PET included three stages, i.e., drying, polycondensation, and cooling. The drying process
was carried out at 120°C for 24 h under nitrogen flow, the polycondensation process was
performed at 230°C for different times (1, 2, 4 and 6 h) and finally cooling to ambient
temperature was done under nitrogen flow.
The drying process reduced the concentration of water in PET resin since presence of
water in PET particles usually leads to a decrease in molecular weight because of
hydrolysis of polymer. Careful removal of water in pre-polymer particles is very
important. The pre-polymer particles were classified into three different fractions with
average particle sizes of 700, 400 and 200 µm by grinding and sieving of PET product
from melt phase polycondensation.
Figure 2.1 Scheme of solid state apparatus.
Vacuum Nitrogen
Salt bath
Reactor
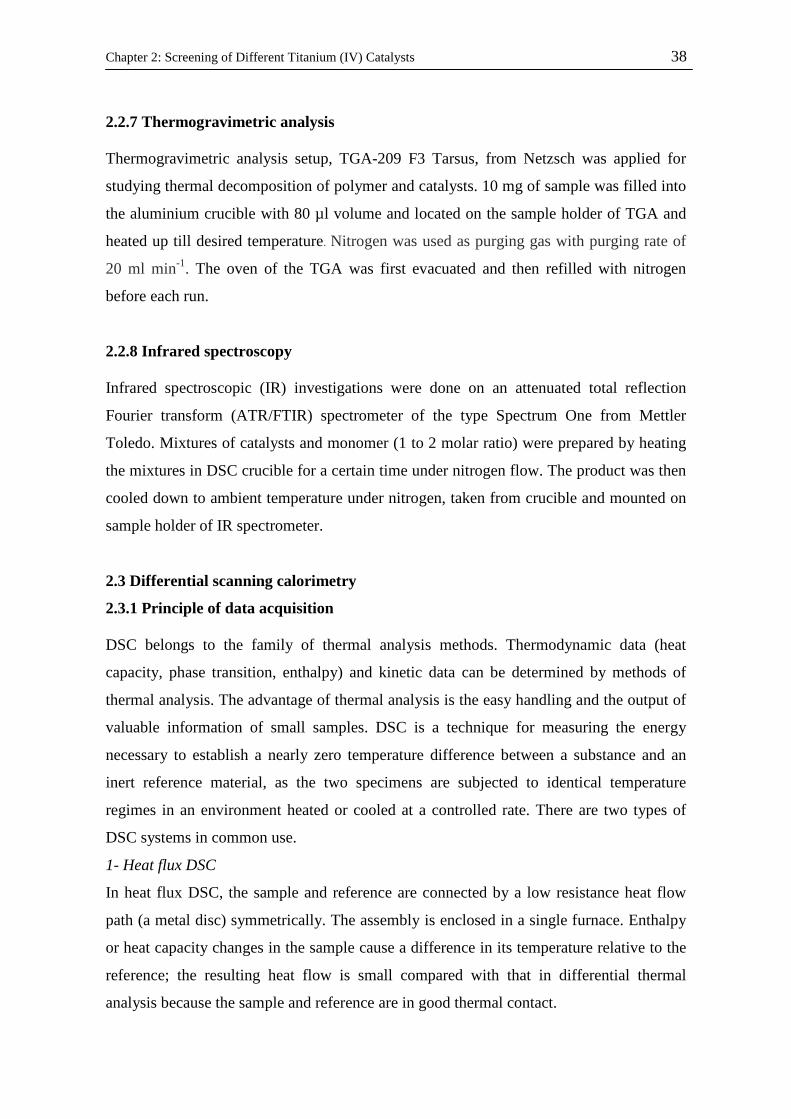
Chapter 2: Screening of Different Titanium (IV) Catalysts 38
2.2.7 Thermogravimetric analysis
Thermogravimetric analysis setup, TGA-209 F3 Tarsus, from Netzsch was applied for
studying thermal decomposition of polymer and catalysts. 10 mg of sample was filled into
the aluminium crucible with 80 µl volume and located on the sample holder of TGA and
heated up till desired temperature. Nitrogen was used as purging gas with purging rate of
20 ml min-1. The oven of the TGA was first evacuated and then refilled with nitrogen
before each run.
2.2.8 Infrared spectroscopy
Infrared spectroscopic (IR) investigations were done on an attenuated total reflection
Fourier transform (ATR/FTIR) spectrometer of the type Spectrum One from Mettler
Toledo. Mixtures of catalysts and monomer (1 to 2 molar ratio) were prepared by heating
the mixtures in DSC crucible for a certain time under nitrogen flow. The product was then
cooled down to ambient temperature under nitrogen, taken from crucible and mounted on
sample holder of IR spectrometer.
2.3 Differential scanning calorimetry
2.3.1 Principle of data acquisition
DSC belongs to the family of thermal analysis methods. Thermodynamic data (heat
capacity, phase transition, enthalpy) and kinetic data can be determined by methods of
thermal analysis. The advantage of thermal analysis is the easy handling and the output of
valuable information of small samples. DSC is a technique for measuring the energy
necessary to establish a nearly zero temperature difference between a substance and an
inert reference material, as the two specimens are subjected to identical temperature
regimes in an environment heated or cooled at a controlled rate. There are two types of
DSC systems in common use.
1- Heat flux DSC
In heat flux DSC, the sample and reference are connected by a low resistance heat flow
path (a metal disc) symmetrically. The assembly is enclosed in a single furnace. Enthalpy
or heat capacity changes in the sample cause a difference in its temperature relative to the
reference; the resulting heat flow is small compared with that in differential thermal
analysis because the sample and reference are in good thermal contact.

Chapter 2: Screening of Different Titanium (IV) Catalysts 39
2- Power compensation DSC
In this system the temperatures of the sample and reference are controlled independently
using separate, identical furnaces. The temperatures of the sample and reference are made
identical by varying the power input to the two furnaces; the energy required to do this is a
measure of the enthalpy or heat capacity change in the sample relative to the reference.
In DSC, when a change of heat capacity, phase transition or reaction occurs, the
equilibrium between sample and reference is disturbed. The sample temperature is higher
(exothermic event) or lower (endothermic event) than the reference. This temperature
difference is detected and heat flow is calculated.
TKQ ∆−=∆•
(2.1)
•∆Q is the heat flow and the constant K has to be determined by calibration. The
difference of heat flowing to the sample and reference is given by
•∆ Q = ( SQ
•– RQ
•) + β)( ,, MRpMSp CC − (2.2)
SQ•
is the heat flow to the sample, RQ•
is the heat flow to the reference, Cp,MS is heat
capacity of the sample measuring system, Cp,MR is heat capacity of the reference
measuring system andβ = dTs/dt is heating rate. The heat flow in the sample with a
chemical reaction is given by,
SQ•
=dt
dTC s
sp, + chemQ•
(2.3)
where spC , is heat capacity of the sample and chemQ•
is heat flow by chemical reaction
which is given by following equation,
)( Rchem HVRQ ∆−=•
(2.4)
R is reaction rate; V is reaction volume and RH∆ is molar reaction enthalpy. For the inert
reference,
RQ•
= RpC , dt
dTR = RpC , β (2.5)
where RpC , is heat capacity of the reference.
Since the measuring systems of sample and reference were made of same material with the
same heat capacity, therefore the second part of equation (2.2) is negligible.

Chapter 2: Screening of Different Titanium (IV) Catalysts 40
•∆Q =( SQ
•– RQ
•)= spC , dt
dTs + chemQ•
- RpC , β (2.6)
During reaction dTs/dt is not identical withβ . This unknown parameter must be
eliminated. It is considered that there is a heat flow resistance MSR between the sample
measuring system at temperature MST and the sample at temperatureST ,
•∆Q =
MS
SMS
R
TT − (2.7)
The term dTs /dt can be eliminated by differentiation the previous equation with time. With
approximation of dTMS/dt = β ,
•∆Q = chemQ
•+( spC , - RpC , ) β - spC , MSR
dt
Qd•
∆ (2.8)
•∆Q = chemQ
•+ pC∆ β -τ
dt
Qd•
∆ (2.9)
The detected signal contains three contributions. First, there is the heat flow from
reaction chemQ•
. Second, there is a term which is dependent on the difference of the heat
capacities of the sample and the reference. The third contribution is influenced by the so
called time constant τ = spC , MSR of the measuring system and the slope of the measured
signal. The third term reflects the time lag between the chemical heat flow and the reaction
of the compensation heater.
2.3.2 Principle of catalysts screening
The DSC thermogram of polycondensation reaction is shown in figure 2.2. The first
endothermic peak is due to the melting of monomer, the second peak represents
evaporation of by-product EG. Since evaporation of EG is assumed to be fast compare to
polycondensation, this peak represents polycondensation reaction of BHET. The absence
of mass transfer limitation at present condition was drawn by running polycondensation
reactions at different gas purging rate and different amounts of reaction mass. The bell
shape of the reaction peak is due to the fact that rate of polycondensation is a function of
temperature and concentration of functional end groups and it increases with increasing
temperature and decreases with decreasing of concentration of functional groups. At lower
temperatures the effect of temperature is dominant while at higher temperatures the effect
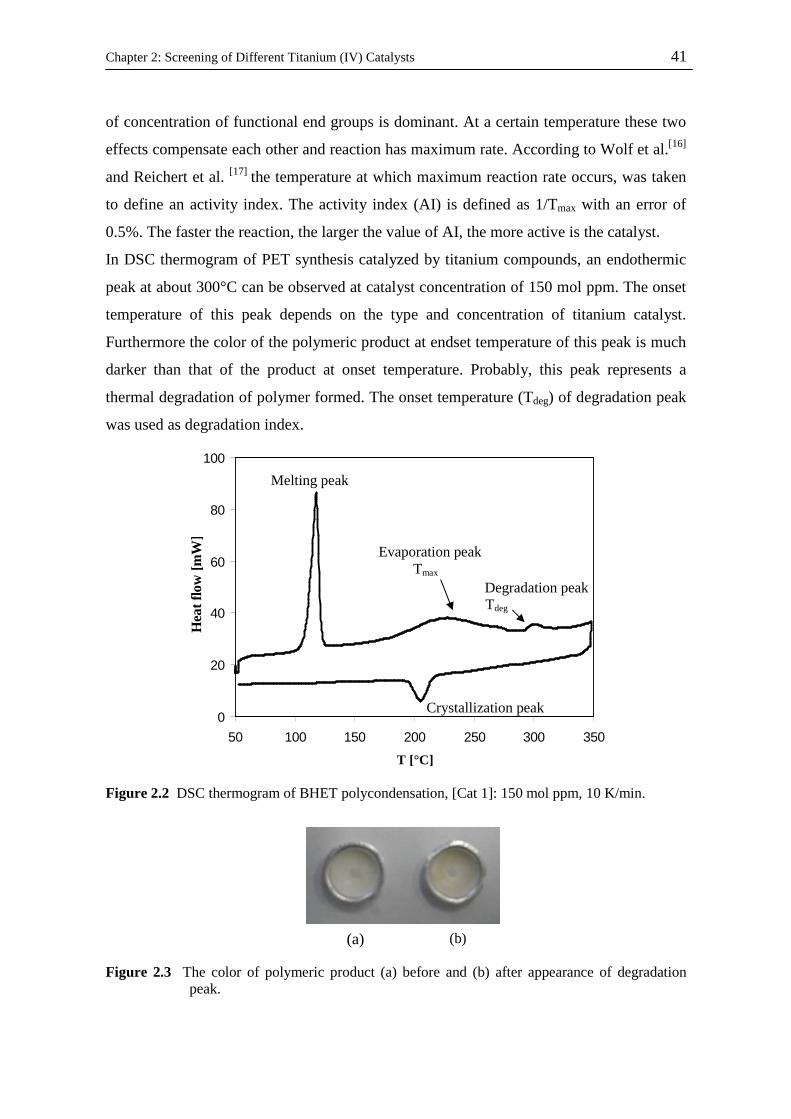
Chapter 2: Screening of Different Titanium (IV) Catalysts 41
of concentration of functional end groups is dominant. At a certain temperature these two
effects compensate each other and reaction has maximum rate. According to Wolf et al.[16]
and Reichert et al. [17] the temperature at which maximum reaction rate occurs, was taken
to define an activity index. The activity index (AI) is defined as 1/Tmax with an error of
0.5%. The faster the reaction, the larger the value of AI, the more active is the catalyst.
In DSC thermogram of PET synthesis catalyzed by titanium compounds, an endothermic
peak at about 300°C can be observed at catalyst concentration of 150 mol ppm. The onset
temperature of this peak depends on the type and concentration of titanium catalyst.
Furthermore the color of the polymeric product at endset temperature of this peak is much
darker than that of the product at onset temperature. Probably, this peak represents a
thermal degradation of polymer formed. The onset temperature (Tdeg) of degradation peak
was used as degradation index.
0
20
40
60
80
100
50 100 150 200 250 300 350
T [°C]
Hea
t flo
w [m
W]
Figure 2.2 DSC thermogram of BHET polycondensation, [Cat 1]: 150 mol ppm, 10 K/min.
(b) Figure 2.3 The color of polymeric product (a) before and (b) after appearance of degradation
peak.
Crystallization peak
Melting peak
Evaporation peak Tmax
Degradation peak Tdeg
(a)
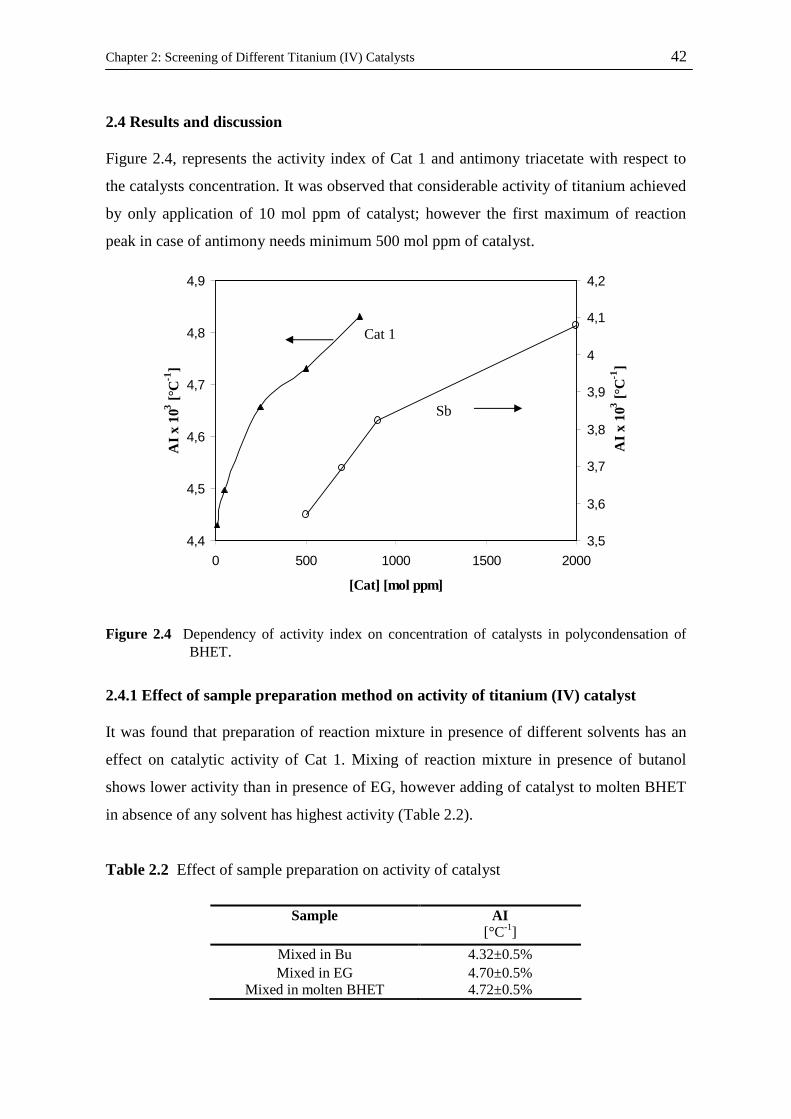
Chapter 2: Screening of Different Titanium (IV) Catalysts 42
2.4 Results and discussion
Figure 2.4, represents the activity index of Cat 1 and antimony triacetate with respect to
the catalysts concentration. It was observed that considerable activity of titanium achieved
by only application of 10 mol ppm of catalyst; however the first maximum of reaction
peak in case of antimony needs minimum 500 mol ppm of catalyst.
4,4
4,5
4,6
4,7
4,8
4,9
0 500 1000 1500 2000
[Cat] [mol ppm]
AI x
103 [°
C-1
]
3,5
3,6
3,7
3,8
3,9
4
4,1
4,2
AI x
103 [°
C-1
]
Figure 2.4 Dependency of activity index on concentration of catalysts in polycondensation of BHET.
2.4.1 Effect of sample preparation method on activity of titanium (IV) catalyst
It was found that preparation of reaction mixture in presence of different solvents has an
effect on catalytic activity of Cat 1. Mixing of reaction mixture in presence of butanol
shows lower activity than in presence of EG, however adding of catalyst to molten BHET
in absence of any solvent has highest activity (Table 2.2).
Table 2.2 Effect of sample preparation on activity of catalyst
Sample AI [°C-1]
Mixed in Bu 4.32±0.5% Mixed in EG 4.70±0.5%
Mixed in molten BHET 4.72±0.5%
Cat 1
Sb

Chapter 2: Screening of Different Titanium (IV) Catalysts 43
2.4.2 Effect of titanium (IV) ligands on catalytic activity
The influence of ligands attached to titanium on catalytic activity was studied for two
categories of the titanium compounds. First category (scheme 2.3) involves non-chelated
titanium (IV) derivatives with general name of tetraalkyl titanate, consist of monodentate
ligands of alkyl chains with differences in structure of ligand and electronegativity of
atoms bonded to titanium.
Ti
O
O
O
O
Titanium(IV) tetrabutoxide
N
NN Ti
N
Tetrakis (diethylamido)titanium(IV) ( Cat 4)
Ti
O
O
O
O
Titanium(IV) tertbutoxide (Cat 2)
Ti
O
Cl
O
O
Chloroisopropoxy titanium (IV) (Cat 3)
( Cat 1)
Scheme 2.3 Non-chelated titanium (IV) catalysts.
O
O
Ti
O
O
O
O
4+
titanium (IV) bis (ammonium lactato) dihydroxide (Cat 5)
Diisopropoxytitanium bis (acetylacetonate) (Cat 6)
OO
O
Ti
O
O
OOH
HO
NH4+
NH4+
Ti
O
OO
NO
Titanium (IV) (triethanlaminato) isopropoxide (Cat 7)
Scheme 2.4 Chelated titanium (IV) catalysts.
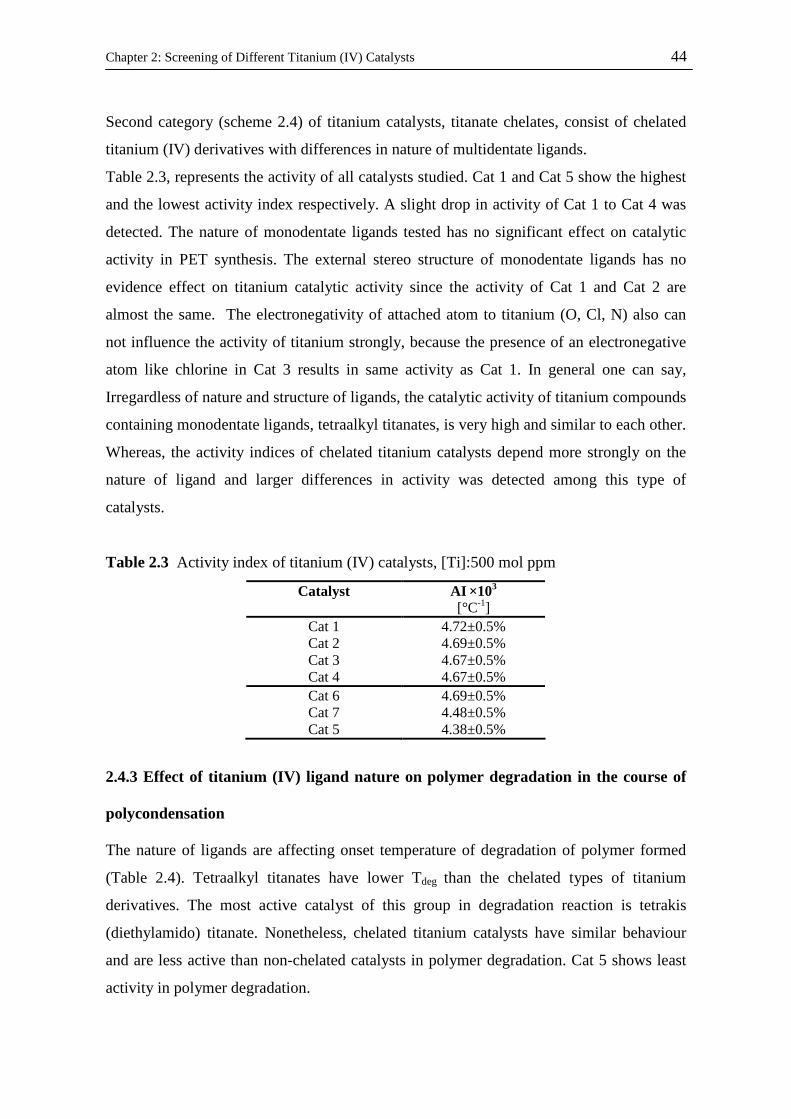
Chapter 2: Screening of Different Titanium (IV) Catalysts 44
Second category (scheme 2.4) of titanium catalysts, titanate chelates, consist of chelated
titanium (IV) derivatives with differences in nature of multidentate ligands.
Table 2.3, represents the activity of all catalysts studied. Cat 1 and Cat 5 show the highest
and the lowest activity index respectively. A slight drop in activity of Cat 1 to Cat 4 was
detected. The nature of monodentate ligands tested has no significant effect on catalytic
activity in PET synthesis. The external stereo structure of monodentate ligands has no
evidence effect on titanium catalytic activity since the activity of Cat 1 and Cat 2 are
almost the same. The electronegativity of attached atom to titanium (O, Cl, N) also can
not influence the activity of titanium strongly, because the presence of an electronegative
atom like chlorine in Cat 3 results in same activity as Cat 1. In general one can say,
Irregardless of nature and structure of ligands, the catalytic activity of titanium compounds
containing monodentate ligands, tetraalkyl titanates, is very high and similar to each other.
Whereas, the activity indices of chelated titanium catalysts depend more strongly on the
nature of ligand and larger differences in activity was detected among this type of
catalysts.
Table 2.3 Activity index of titanium (IV) catalysts, [Ti]:500 mol ppm
Catalyst AI ×103
[°C-1] Cat 1 4.72±0.5% Cat 2 4.69±0.5% Cat 3 4.67±0.5% Cat 4 4.67±0.5% Cat 6 4.69±0.5% Cat 7 4.48±0.5% Cat 5 4.38±0.5%
2.4.3 Effect of titanium (IV) ligand nature on polymer degradation in the course of
polycondensation
The nature of ligands are affecting onset temperature of degradation of polymer formed
(Table 2.4). Tetraalkyl titanates have lower Tdeg than the chelated types of titanium
derivatives. The most active catalyst of this group in degradation reaction is tetrakis
(diethylamido) titanate. Nonetheless, chelated titanium catalysts have similar behaviour
and are less active than non-chelated catalysts in polymer degradation. Cat 5 shows least
activity in polymer degradation.
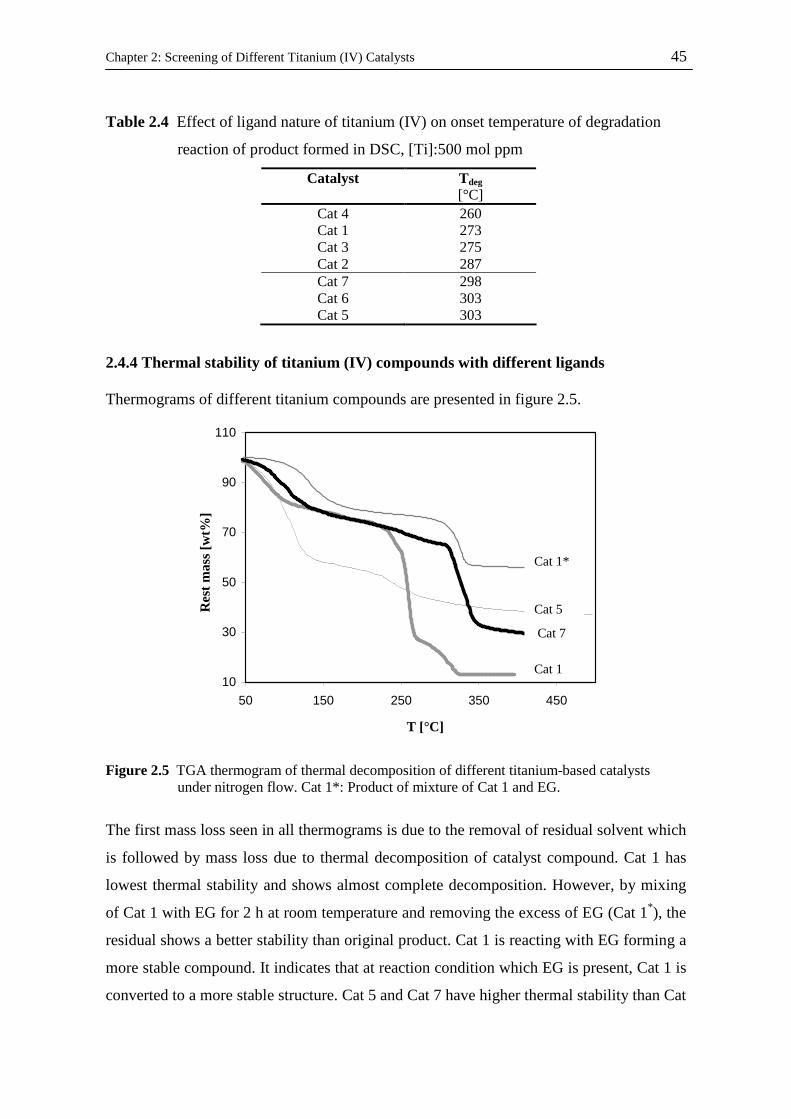
Chapter 2: Screening of Different Titanium (IV) Catalysts 45
Table 2.4 Effect of ligand nature of titanium (IV) on onset temperature of degradation
reaction of product formed in DSC, [Ti]:500 mol ppm
Catalyst Tdeg [°C]
Cat 4 260 Cat 1 273 Cat 3 275 Cat 2 287 Cat 7 298 Cat 6 303 Cat 5 303
2.4.4 Thermal stability of titanium (IV) compounds with different ligands
Thermograms of different titanium compounds are presented in figure 2.5.
10
30
50
70
90
110
50 150 250 350 450
T [°C]
Res
t mas
s [w
t%]
Figure 2.5 TGA thermogram of thermal decomposition of different titanium-based catalysts under nitrogen flow. Cat 1*: Product of mixture of Cat 1 and EG.
The first mass loss seen in all thermograms is due to the removal of residual solvent which
is followed by mass loss due to thermal decomposition of catalyst compound. Cat 1 has
lowest thermal stability and shows almost complete decomposition. However, by mixing
of Cat 1 with EG for 2 h at room temperature and removing the excess of EG (Cat 1*), the
residual shows a better stability than original product. Cat 1 is reacting with EG forming a
more stable compound. It indicates that at reaction condition which EG is present, Cat 1 is
converted to a more stable structure. Cat 5 and Cat 7 have higher thermal stability than Cat
Cat 7
Cat 5
Cat 1
Cat 1*

Chapter 2: Screening of Different Titanium (IV) Catalysts 46
1, but decomposition is also taking place at polycondensation temperature. The catalysts
which are more thermally stable were found to be less active in polycondensation reaction.
2.3.5 Catalyst screening in lab scale stirred tank reactor
The activity of catalysts was screened in stirred tank reactor by measuring torque of stirrer
online during polycondensation. Since torque of stirrer depends on viscosity of reaction
mixture and viscosity is correlated to progress of polycondensation, one can follow
conversion of reaction and thereby activity of catalyst. Figure 2.6, presents the change of
torque in the course of polycondensation catalyzed by different catalysts. The
measurements show an induction time for titanium catalysts. Since different titanium
catalysts show different induction periods in PET synthesis, the induction period is not
caused by physical effects like sensitivity of torque measuring system. In case of antimony
catalyst, it was found that this period is an inhibition period and is relatively long and can
be due to an interaction of antimony with hydroxyl end groups of monomer preventing
formation of active sites [18]. With consumption of hydroxyl end groups in the course of
polycondensation, the catalytic activity of antimony is increasing. The induction period of
titanium based catalysts might be of different nature and varies with catalyst type.
However, variation of catalyst concentration did not change the duration of induction, it
only change slightly the slope of torque measured during induction period and strong
change in slope was detected in the polycondensation period.
It is believed that induction period of titanium catalysts is due to formation of active sites
which is depending on the nature of ligands of catalyst. That might be reflected in
different capability of titanium compounds to form titanium alkoxide by ligand exchange
reaction with hydroxyl end groups of monomer and oligomers. The ligand exchange
capability of Cat 1 is very high since it is known that butoxide groups attached to titanium
can be exchanged easily. However, in Cat 5, the hydroxide groups are rather stable and
ligand exchange reactions should happen by breakage of the chelating ring. In this sense
the original titanium catalysts are precursors and are activated in the first stage of reaction.
This fact can also be observed in preparation of sample for catalyst screening in DSC.
Activation of Cat 1 in molten BHET is a time dependent procedure and optimal activity is
achieved after 15 min of mixing (Table 2.5). This illustrates that total concentration of
active species is formed only after a certain time of mixing.

Chapter 2: Screening of Different Titanium (IV) Catalysts 47
0
0,1
0,2
0,3
0,4
0,5
0,6
0,7
0,8
0,9
1
0 50 100 150 200 250 300Reaction time [min]
Tor
que
of s
tirre
r [N
cm
]
Figure 2.6 Torque of stirrer during polycondensation of BHET and its oligomers in stirred tank reactor at 260°C under vacuum in presence of different catalysts. [Ti]: 20 wt ppm and [Sb]:250 wt ppm.
0
0,1
0,2
0,3
0,4
0,5
0,6
0,7
0,8
0,9
1
0 50 100 150 200 250 300
Reaction time [min]
Tor
que
of s
tirre
r [N
cm
]
Figure 2.7 Variation of torque of stirrer with change of concentration of Cat 1 at 260°C.
Cat 1
Cat 7
Cat 5
Sb
10 wt ppm
20 wt ppm 30 wt ppm
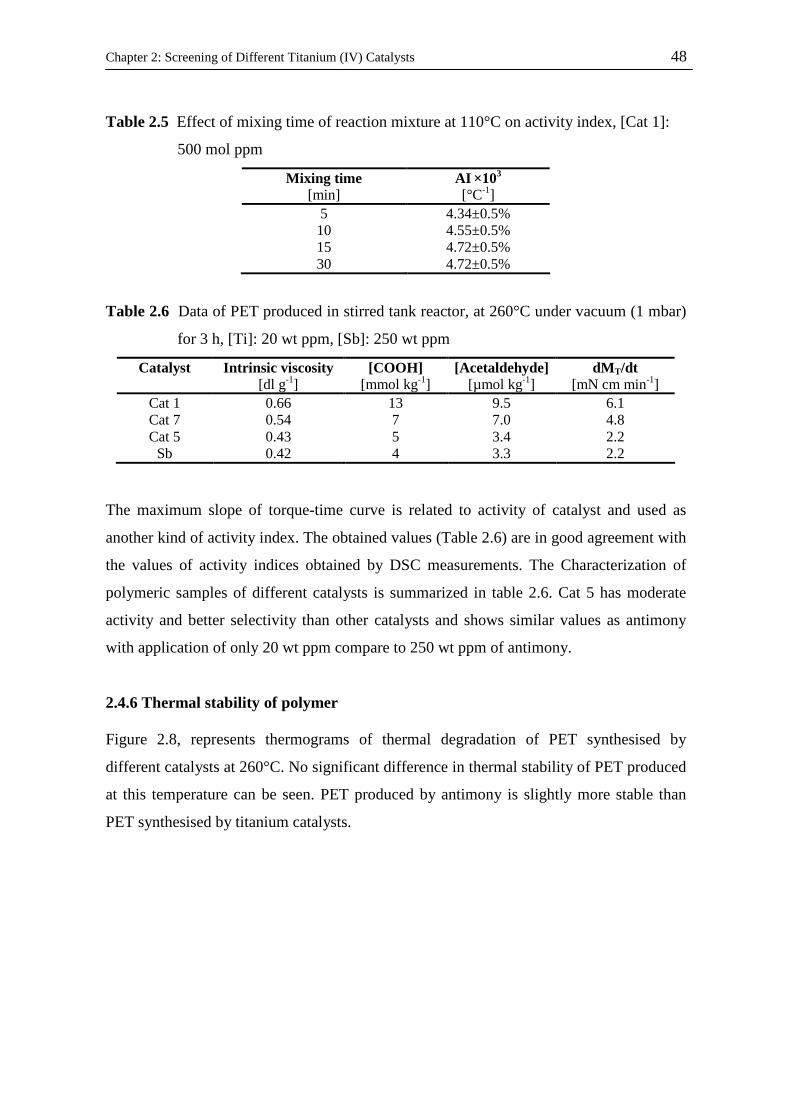
Chapter 2: Screening of Different Titanium (IV) Catalysts 48
Table 2.5 Effect of mixing time of reaction mixture at 110°C on activity index, [Cat 1]:
500 mol ppm
Mixing time [min]
AI ×103
[°C-1] 5 4.34±0.5% 10 4.55±0.5% 15 4.72±0.5% 30 4.72±0.5%
Table 2.6 Data of PET produced in stirred tank reactor, at 260°C under vacuum (1 mbar)
for 3 h, [Ti]: 20 wt ppm, [Sb]: 250 wt ppm
Catalyst Intrinsic viscosity [dl g-1]
[COOH] [mmol kg-1]
[Acetaldehyde] [µmol kg-1]
dMT/dt [mN cm min-1]
Cat 1 0.66 13 9.5 6.1 Cat 7 0.54 7 7.0 4.8 Cat 5 0.43 5 3.4 2.2 Sb 0.42 4 3.3 2.2
The maximum slope of torque-time curve is related to activity of catalyst and used as
another kind of activity index. The obtained values (Table 2.6) are in good agreement with
the values of activity indices obtained by DSC measurements. The Characterization of
polymeric samples of different catalysts is summarized in table 2.6. Cat 5 has moderate
activity and better selectivity than other catalysts and shows similar values as antimony
with application of only 20 wt ppm compare to 250 wt ppm of antimony.
2.4.6 Thermal stability of polymer
Figure 2.8, represents thermograms of thermal degradation of PET synthesised by
different catalysts at 260°C. No significant difference in thermal stability of PET produced
at this temperature can be seen. PET produced by antimony is slightly more stable than
PET synthesised by titanium catalysts.
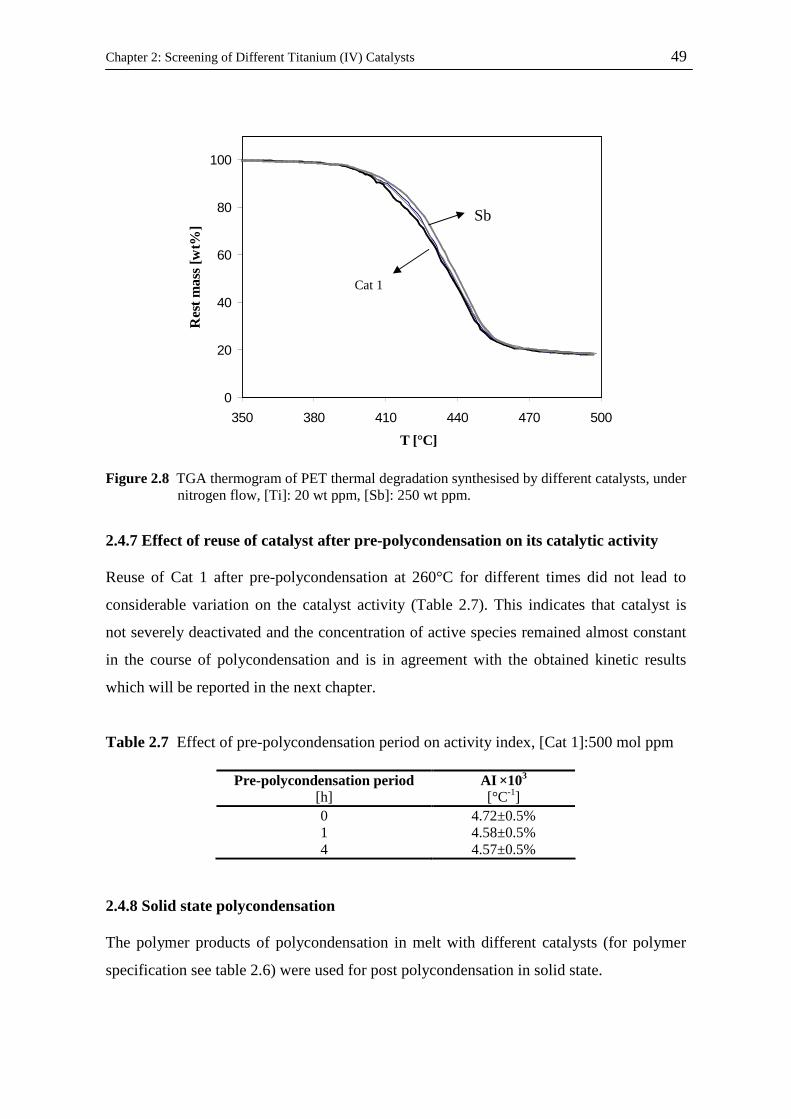
Chapter 2: Screening of Different Titanium (IV) Catalysts 49
0
20
40
60
80
100
350 380 410 440 470 500
T [°C]
Res
t mas
s [w
t%]
Figure 2.8 TGA thermogram of PET thermal degradation synthesised by different catalysts, under nitrogen flow, [Ti]: 20 wt ppm, [Sb]: 250 wt ppm.
2.4.7 Effect of reuse of catalyst after pre-polycondensation on its catalytic activity
Reuse of Cat 1 after pre-polycondensation at 260°C for different times did not lead to
considerable variation on the catalyst activity (Table 2.7). This indicates that catalyst is
not severely deactivated and the concentration of active species remained almost constant
in the course of polycondensation and is in agreement with the obtained kinetic results
which will be reported in the next chapter.
Table 2.7 Effect of pre-polycondensation period on activity index, [Cat 1]:500 mol ppm
Pre-polycondensation period [h]
AI ×103
[°C-1] 0 4.72±0.5% 1 4.58±0.5% 4 4.57±0.5%
2.4.8 Solid state polycondensation
The polymer products of polycondensation in melt with different catalysts (for polymer
specification see table 2.6) were used for post polycondensation in solid state.
Cat 1
Sb

Chapter 2: Screening of Different Titanium (IV) Catalysts 50
2.4.8.1 Optimization of reaction operational condition
The reaction condition was optimized with respect to the removal of by-product in such
ways; nitrogen purging through a fixed non-stirred bed, nitrogen purging through a stirred
bed and vacuum. It was found that working under vacuum is the most effective way to
carry away the produced by-product.
Table 2.8 Comparison of efficiency of by-product removal method [Cat 1]: 20 wt ppm
Removal method Molecular weight [g/mol]
Nitrogen- non-stirred bed 63827 Nitrogen- stirred bed 71751
Vacuum 79508
2.4.8.2 Catalyst screening in solid state polycondensation
The increase of number average molecular weight with time is shown in figure 2.8. Taking
the initial slope of curves of different catalysts and normalize them with respect to the
catalyst concentration, the activity indices shown in table 2.9 are obtained. This shows that
titanium catalysts are more active than antimony catalyst. Also, in solid state
polycondensation, different types of titanium catalysts have different activity and their
activity order is in agreement with activity order in the melt phase polycondensation. The
lower activity of titanium catalysts in SSP might be caused by the lower mobility of the
chain end to reach catalyst active species with low concentration compare to higher
concentration of antimony which is more accessible for chain end.
Table 2.9 Normalized activity index of different catalysts in solid state polycondensation
at 230°C
Catalyst AI×106 [g2 mol-2h-1]
Cat 1 393 Cat 2 388 Cat 5 384 Sb 47
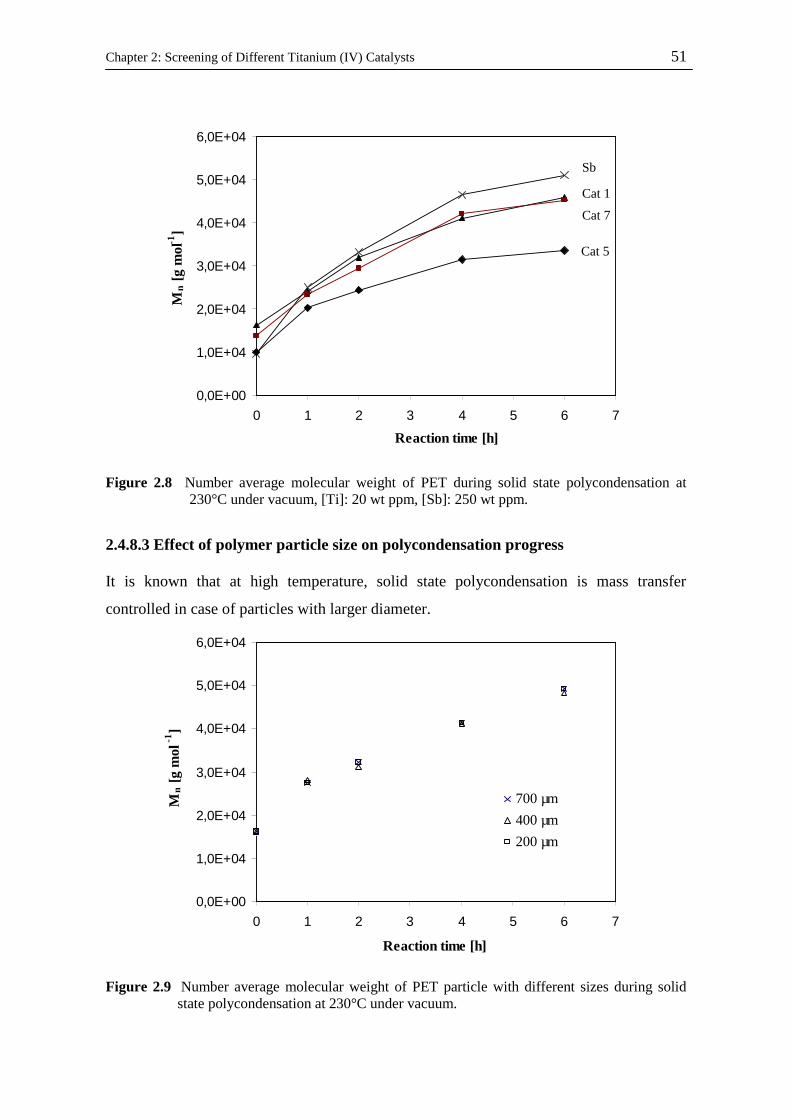
Chapter 2: Screening of Different Titanium (IV) Catalysts 51
0,0E+00
1,0E+04
2,0E+04
3,0E+04
4,0E+04
5,0E+04
6,0E+04
0 1 2 3 4 5 6 7
Reaction time [h]
Mn [g
mol
-1]
Figure 2.8 Number average molecular weight of PET during solid state polycondensation at 230°C under vacuum, [Ti]: 20 wt ppm, [Sb]: 250 wt ppm.
2.4.8.3 Effect of polymer particle size on polycondensation progress
It is known that at high temperature, solid state polycondensation is mass transfer
controlled in case of particles with larger diameter.
0,0E+00
1,0E+04
2,0E+04
3,0E+04
4,0E+04
5,0E+04
6,0E+04
0 1 2 3 4 5 6 7
Reaction time [h]
Mn [g
mol
-1]
700 µm
400 µm
200 µm
Figure 2.9 Number average molecular weight of PET particle with different sizes during solid state polycondensation at 230°C under vacuum.
Cat 5
Cat 1
Cat 7
Sb

Chapter 2: Screening of Different Titanium (IV) Catalysts 52
The effect of particles size in titanium catalyzed solid state polycondensation was studied
(Figure 2.9). It was found that for particles with diameters less than 1 mm, the reaction is
completely chemistry controlled and mass transfer limitations are absent.
2.4.9 Infrared spectroscopic studies
Pure EGMB has several absorption bands in the range of 1067-1262 cm-1 due to C-O
vibration, a doublet at 1710-1717 cm-1 due to carbonyl stretching and various bands
between 1365-1497 cm-1 that corresponds to benzene. Hydroxyl end group vibration
appeared by a broad peak at about 3091-3657 cm-1. The change of spectrum of EGMB
mixed with Cat 1 with molar ratio of 1 to 1 was investigated (Figure 2.10 and 2.11). The
spectrum did not show significant changes at 100°C while increasing temperature to
140°C led to disappearing of the peaks corresponding to hydroxyl end groups. This
indicates that ligand exchange reaction was happened between butyl groups of catalyst and
hydroxyl end groups of EGMG and titanium alkoxide was formed. Furthermore, a new
peak at about 1550 cm-1 was appeared, which might be due to complexation to the titanium
centre.
0
20
40
60
80
100
120
140
1000 1200 1400 1600 1800 2000 2200 2400
Wave number [cm -1]
Nr.
Abs
[%]
Figure 2.10 IR spectra of EGMB, mixture of EGMB and Cat 1 at 100°C and 140°C in the range of 1000-2000 cm-1.
Figure 2.12 and 2.13 represent the IR spectra of BHET, Cat 1 and Cat 5 and mixture of
each catalyst with BHET (molar ratio of 1 to 2) at 120°C and 260°C. In spectra of Cat 1-
EGMB+Cat 1 at 140°C
EGMB+Cat 1 at 100°C
EGMB
C=O
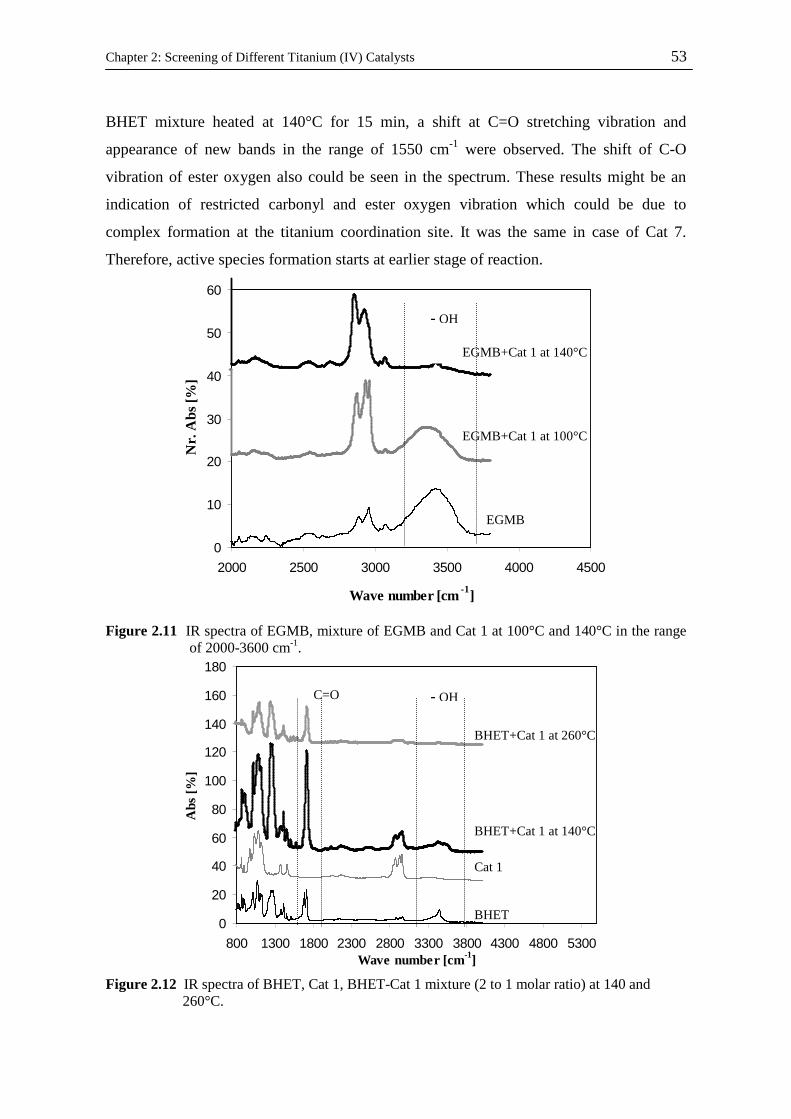
Chapter 2: Screening of Different Titanium (IV) Catalysts 53
BHET mixture heated at 140°C for 15 min, a shift at C=O stretching vibration and
appearance of new bands in the range of 1550 cm-1 were observed. The shift of C-O
vibration of ester oxygen also could be seen in the spectrum. These results might be an
indication of restricted carbonyl and ester oxygen vibration which could be due to
complex formation at the titanium coordination site. It was the same in case of Cat 7.
Therefore, active species formation starts at earlier stage of reaction.
0
10
20
30
40
50
60
2000 2500 3000 3500 4000 4500
Wave number [cm -1]
Nr.
Abs
[%]
Figure 2.11 IR spectra of EGMB, mixture of EGMB and Cat 1 at 100°C and 140°C in the range of 2000-3600 cm-1.
0
20
40
60
80
100
120
140
160
180
800 1300 1800 2300 2800 3300 3800 4300 4800 5300Wave number [cm-1]
Abs
[%]
Figure 2.12 IR spectra of BHET, Cat 1, BHET-Cat 1 mixture (2 to 1 molar ratio) at 140 and 260°C.
EGMB+Cat 1 at 100°C
EGMB
EGMB+Cat 1 at 140°C
BHET+Cat 1 at 260°C
BHET+Cat 1 at 140°C
Cat 1
BHET
- OH C=O
- OH
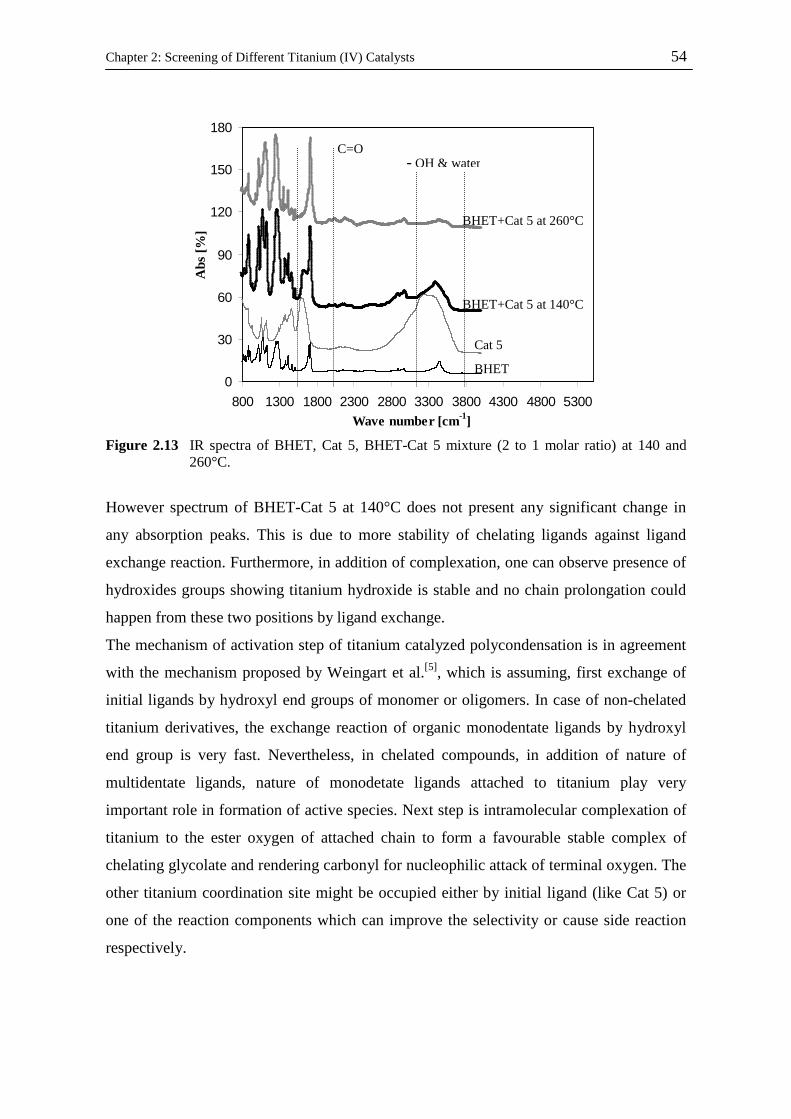
Chapter 2: Screening of Different Titanium (IV) Catalysts 54
0
30
60
90
120
150
180
800 1300 1800 2300 2800 3300 3800 4300 4800 5300Wave number [cm-1]
Abs
[%]
Figure 2.13 IR spectra of BHET, Cat 5, BHET-Cat 5 mixture (2 to 1 molar ratio) at 140 and
260°C.
However spectrum of BHET-Cat 5 at 140°C does not present any significant change in
any absorption peaks. This is due to more stability of chelating ligands against ligand
exchange reaction. Furthermore, in addition of complexation, one can observe presence of
hydroxides groups showing titanium hydroxide is stable and no chain prolongation could
happen from these two positions by ligand exchange.
The mechanism of activation step of titanium catalyzed polycondensation is in agreement
with the mechanism proposed by Weingart et al.[5], which is assuming, first exchange of
initial ligands by hydroxyl end groups of monomer or oligomers. In case of non-chelated
titanium derivatives, the exchange reaction of organic monodentate ligands by hydroxyl
end group is very fast. Nevertheless, in chelated compounds, in addition of nature of
multidentate ligands, nature of monodetate ligands attached to titanium play very
important role in formation of active species. Next step is intramolecular complexation of
titanium to the ester oxygen of attached chain to form a favourable stable complex of
chelating glycolate and rendering carbonyl for nucleophilic attack of terminal oxygen. The
other titanium coordination site might be occupied either by initial ligand (like Cat 5) or
one of the reaction components which can improve the selectivity or cause side reaction
respectively.
BHET+Cat 5 at 260°C
BHET+Cat 5 at 140°C
Cat 5
BHET
- OH & water C=O
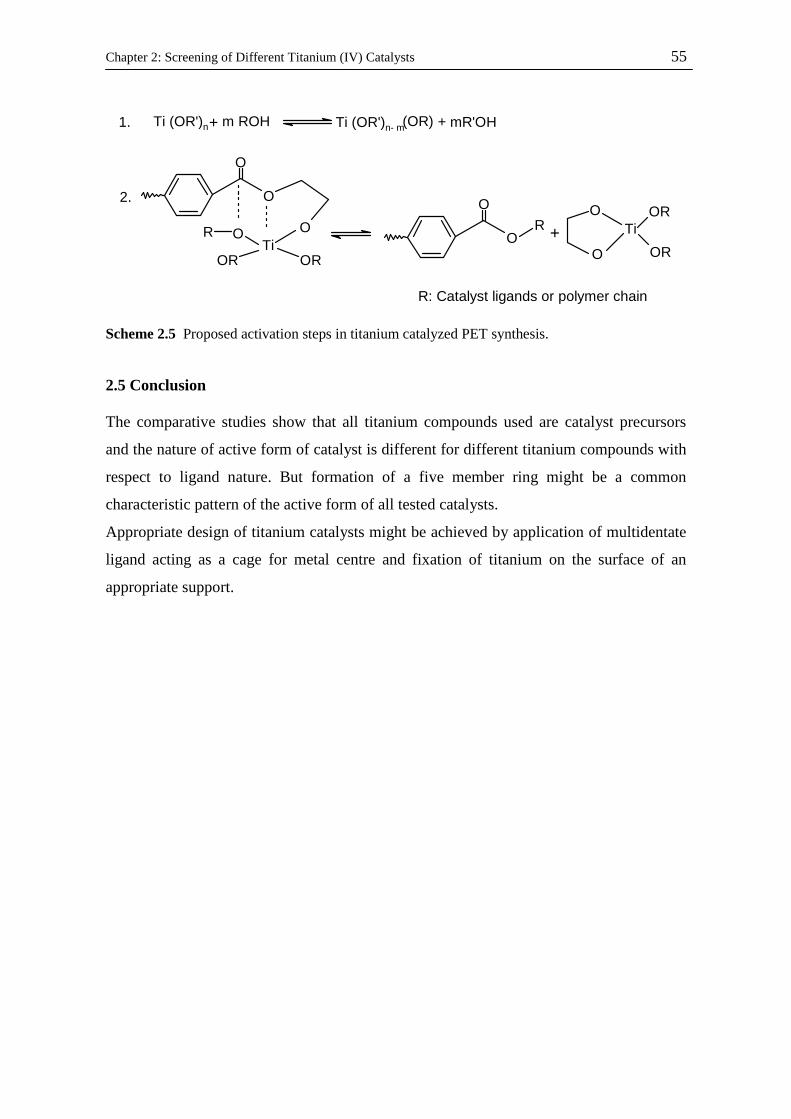
Chapter 2: Screening of Different Titanium (IV) Catalysts 55
Ti (OR')n+ m ROH Ti (OR')n- m(OR) + mR'OH
TiOR
O
OR
O
O
O
R O
O
R + TiO OR
ORO
1.
2.
R: Catalyst ligands or polymer chain
Scheme 2.5 Proposed activation steps in titanium catalyzed PET synthesis.
2.5 Conclusion
The comparative studies show that all titanium compounds used are catalyst precursors
and the nature of active form of catalyst is different for different titanium compounds with
respect to ligand nature. But formation of a five member ring might be a common
characteristic pattern of the active form of all tested catalysts.
Appropriate design of titanium catalysts might be achieved by application of multidentate
ligand acting as a cage for metal centre and fixation of titanium on the surface of an
appropriate support.
Chapter 2: Screening of Different Titanium (IV) Catalysts 56
2.6 References
[1] J. Scheirs, T. E. Long, Modern Polyesters: Chemistry and Technology of Polyesters
and Copolyesters, John Wiley & Sons (2003)
[2] U. K. Thiele, Inter. J. Polym. Mater., 5, 387 (2001)
[3] U. K. Thiele, Chem. Fiber. Inter., 54, 162 (2004)
[4] B. Apicella, M. Di Serio, L. Fiocca, R. Po, E. Santacesaria, J. Appl. Polym. Sci., 69,
2423 (1998)
[5] F. Weingart, PhD Thesis, University of Stuttgart (1994 )
[6] S. B. Maerov, J. Polym. Chem., 17, 4033 (1979)
[7] K. Tomita, Polymer, 14, 50 (1973)
[8] K. Tomita, H. Ida, Polymer., 16, 185 (1975)
[9] K. Tomita, Nippon Kagaku Kaishi, 514, (1975)
[10] K. H. Wolf, PhD Thesis, University of Stuttgart (1976 )
[11] K. H. Wolf, H. Herlinger, Angew. Makromol. Chemie, 65, 13, (1977)
[12] J. S. Chung, J. Macromol. Sci.-Chem., 27(4), 479 (1990)
[13] T. N. Laricheva, M. I. Siling, Russian. Chem. Rev., 65 (3) 279 (1996)
[14] J. Otton, S. Ratton, J. Polym. Sci.: Part A: Poylm. Chem., 26, 2183 (1988)
[15] J. Otton, S. Ratton, J. Polym. Sci.: Part A: Poylm. Chem., 26, 2199 (1988)
[16] K. H. Wolf, B. Kuester, H. Herlinger, C. J. Tschang, E. Schollmeyer, Angew.
Makromol. Chem., 68, 23 (1978)
[17] F.-A. El-Toufaili, G. Feix, K.-H. Reichert, Thermochim. Acta., 432, 101 (2005)
[18] R. W. Stevenson, J. Polym. Sci., Part A-1, 7,395 (1969)

Chapter 3: Kinetic Studies of Polyethylene Terephthalate
Synthesis with Titanium Tetrabutoxide and Application of
Thermogravimetric Analysis
Abstract
Thermogravimetric analysis was used to study the kinetic of polycondensation of bis
(hydroxyethylene) terephthalate catalyzed by titanium tetrabutoxide. Polycondensation
reaction can be modelled best with a second order reaction with respect to hydroxyl end
groups concentration. Kinetic data depends on the mode of operation in thermogravimetric
analysis. In nonisothermal mode, the overall activation energy was determined by model-
free method and the frequency factor was found to be affected by catalyst concentration.
The kinetic study of isothermal reaction in thermogravimetric analysis is complex due to
the fact that isothermal condition are reached only at relative high conversion of reaction
and also high activity of the catalyst studied. Kinetic investigation of polyethylene
terephthalate degradation indicates high degradation activity of titanium catalysts in
comparison to antimony catalysts.

Chapter 3: Kinetic Studies of Polyethylene Terephthalate Synthesis 58
3.1 Introduction
Thermogravimetric analysis (TGA) was used as a technique for catalyst screening for the
first time by Bhatty et al. [1], in 1986. They used the onset temperature of thermogram at
which initial mass loss occurs as activity index. In 1997, Zimmerer et al. [2] applied TGA
to examine the kinetics of polycondensation reaction in order to estimate the mass transfer
influence and optimize reaction condition. They considered also monomer evaporation in
their mathematical model. Moreover, they studied diffusion of EG within the melt by
changing the thickness of the polymer layer. Rieckmann et al. [3] also applied TGA to
study the kinetic of PET synthesis and tried to consider mass transfer effects. Reichert et
al. [4] studied the kinetics of hydrotalcite catalyzed BHET polycondensation by TGA and
applying nonisothermal mode of operation.
The aim of this chapter is to optimize TGA for quantitative study of titanium catalyzed
PET synthesis and obtain kinetic data of polycondensation and degradation reaction by
application of this method.
3.2 Experimental part
3.2.1 Sample preparation
Sample preparation technique is the same as described method in chapter 2.
3.2.2 Polycondensation in lab scale stirred tank reactor
Polycondensation was also run in a lab scale stirred tank reactor made of glass with a
volume of 200 ml equipped with a special helical type of stirrer. Polycondensation was
performed with 120 g monomer and 10 wt ppm of Cat 1 at different temperatures 250,
255, 260°C and 0.1 mbar with stirring speed of 200 rpm for different reaction times 2, 3
and 4 h.
3.2.3 Polymer decomposition
The polymer decomposition was studied in TGA as described in chapter 2. The polymer
particles used were synthesized in lab scale stirred tank reactor at 280°C for 4 h.
Concentration of Cat 1 in PET synthesis was 50 wt ppm. 250 wt ppm of antimony
triacetate was used to synthesize PET as reference material.

Chapter 3: Kinetic Studies of Polyethylene Terephthalate Synthesis 59
3.3 Thermogravimetric analysis
3.3.1 Apparatus
Thermogravimetry, TGA-209 F3 Tarsus, from Netzsch company was applied in this
investigation. This instrument offers a resolution of 0.1 µg and operates between room
temperature and 1000°C with freely selectable heating rates from 0.001 K min-1 up to 100
K min-1. The accurate sample temperature is detected by a thermocouple in direct contact
with the sample crucible. Through the reliable vertical construction with sample carrier
lift, the thermo-balance as a top-loader is easy and safe to use, with no hang-down wires or
exposed fragile parts. The inner room of oven can be flashed with purge gas (nitrogen) and
it is supported by protective gas to provide an inert atmosphere with in the oven and
microbalance chamber. 10 mg of prepared sample was filled into the aluminium crucible
with 80 µl volume which was located on the sample holder of TGA. Nitrogen was used as
purging gas with purging rate of 20 ml min-1. The vertical construction of sample holder
provided efficient purging. The oven of the TGA was first evacuated and then purged with
nitrogen before each run. Isothermal polycondensation of BHET was investigated at 220,
230, 240 and 250°C for 40 min reaction time. Nonisothermal runs were performed at
heating rates of 1, 5 and 20 K min-1 starting at 30°C and ending at 300°C.
Figure 3.1 Scheme of TGA-209 F3 Tarsus.

Chapter 3: Kinetic Studies of Polyethylene Terephthalate Synthesis 60
3.3.2 Principle of screening
A thermogram obtained from dynamic heating of a BHET-catalyst mixture is shown in
figure 3.2. Mass loss starts at a certain temperature indicating onset of polycondensation
with onset temperature of To. On the other hand, a temperature (Tm) can be obtained at
which rate of mass loss has a maximum. In addition, the total mass loss which is due to
EG evaporation can be correlated to the total conversion of polycondensation. These
parameters can be applied as activity ordering indices in catalyst screening. TGA
measurements are reproducible with standard deviation less than 1% for each of these
parameters.
75
80
85
90
95
100
105
0 5 10 15 20 25 30
Reaction time [min]
Res
t mas
s [w
t%]
50
100
150
200
250
300
T [°
C]
Figure 3.2 TGA thermogram of BHET polycondensation with 10 mol ppm of Cat 1.
3.4 Results and discussion
3.4.1 Optimization of thermogravimetric analysis for quantitative study
The micro-scale of the TGA crucibles provides micro-scale diffusion path length and
thereby mass transfer limitations might be avoided. The main draw back of this system is
the absence of effective mixing of reaction mass. However it can be seen that reaction
mixture within the TGA crucible is moving very strongly and stimulates self-mixing
thereby. Another problem can be the catalytic activity of the crucible itself. It was found
that aluminium crucibles have least catalytic activity [5]. Moreover, monomer evaporation
T0
Total mass loss
Tm

Chapter 3: Kinetic Studies of Polyethylene Terephthalate Synthesis 61
is present during polycondensation of BHET [2,4], since polycondensation of BHET in an
open crucible has a mass loss much higher than expected for complete conversion equal to
24.4 wt% (Figure 3.3).
244.0254
62 ===BHETofmassMolar
EGofmassMolar
massMonomer
lossmassTotal (3.1)
Increasing mass loss with decreasing monomer amount is due to increase of specific
surface exposed to purging gas and increase of mobility of the melt leading to
enhancement in evaporation rate. To reduce monomer evaporation, a lid with a hole in the
centre covered the aluminium crucible in all polycondensation runs.
0
10
20
30
40
50
60
0 5 10 15 20 25 30 35 40
Reaction time [min]
Mas
s lo
ss [w
t%]
0
50
100
150
200
250
300
T [°
C]
Figure 3.3 Thermograms of polycondensation of BHET with different weight of monomer in an open crucible at 250°C.
Another important point in application of TGA is the mode of operation. Running the
reaction merely isothermal was not possible. Since the heating rate and heating time from
ambient to reaction temperature have effect on mass loss and consequently concentration
of hydroxyl end groups. These effects however were considered in the kinetic studies.
Figure 3.4, represents the thermogram of BHET polycondensation in quasi-isothermal
mode of operation with different initial heating rates. At high heating rate the thermal lag
between sample and oven is highest and at lower heating rate, higher conversion is
10 mg
5 mg
3 mg 1 mg
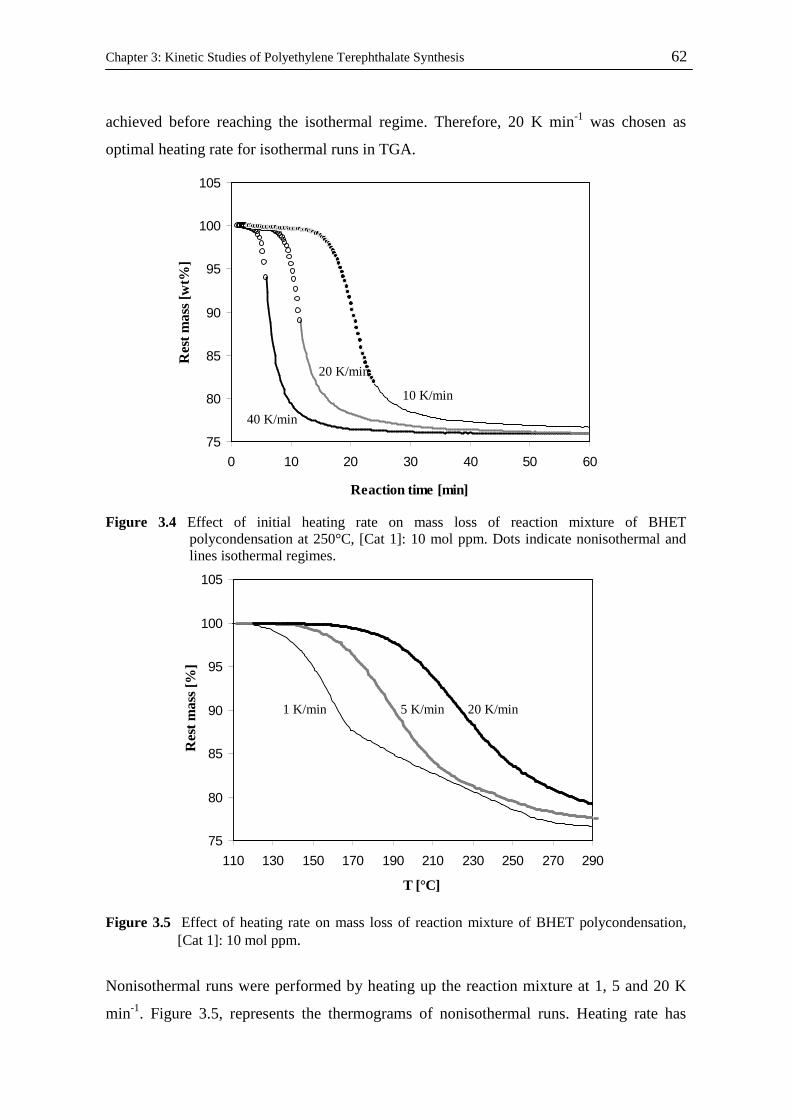
Chapter 3: Kinetic Studies of Polyethylene Terephthalate Synthesis 62
achieved before reaching the isothermal regime. Therefore, 20 K min-1 was chosen as
optimal heating rate for isothermal runs in TGA.
75
80
85
90
95
100
105
0 10 20 30 40 50 60
Reaction time [min]
Res
t mas
s [w
t%]
Figure 3.4 Effect of initial heating rate on mass loss of reaction mixture of BHET
polycondensation at 250°C, [Cat 1]: 10 mol ppm. Dots indicate nonisothermal and lines isothermal regimes.
75
80
85
90
95
100
105
110 130 150 170 190 210 230 250 270 290
T [°C]
Res
t mas
s [%
]
Figure 3.5 Effect of heating rate on mass loss of reaction mixture of BHET polycondensation, [Cat 1]: 10 mol ppm.
Nonisothermal runs were performed by heating up the reaction mixture at 1, 5 and 20 K
min-1. Figure 3.5, represents the thermograms of nonisothermal runs. Heating rate has
1 K/min 5 K/min 20 K/min
40 K/min
20 K/min
10 K/min
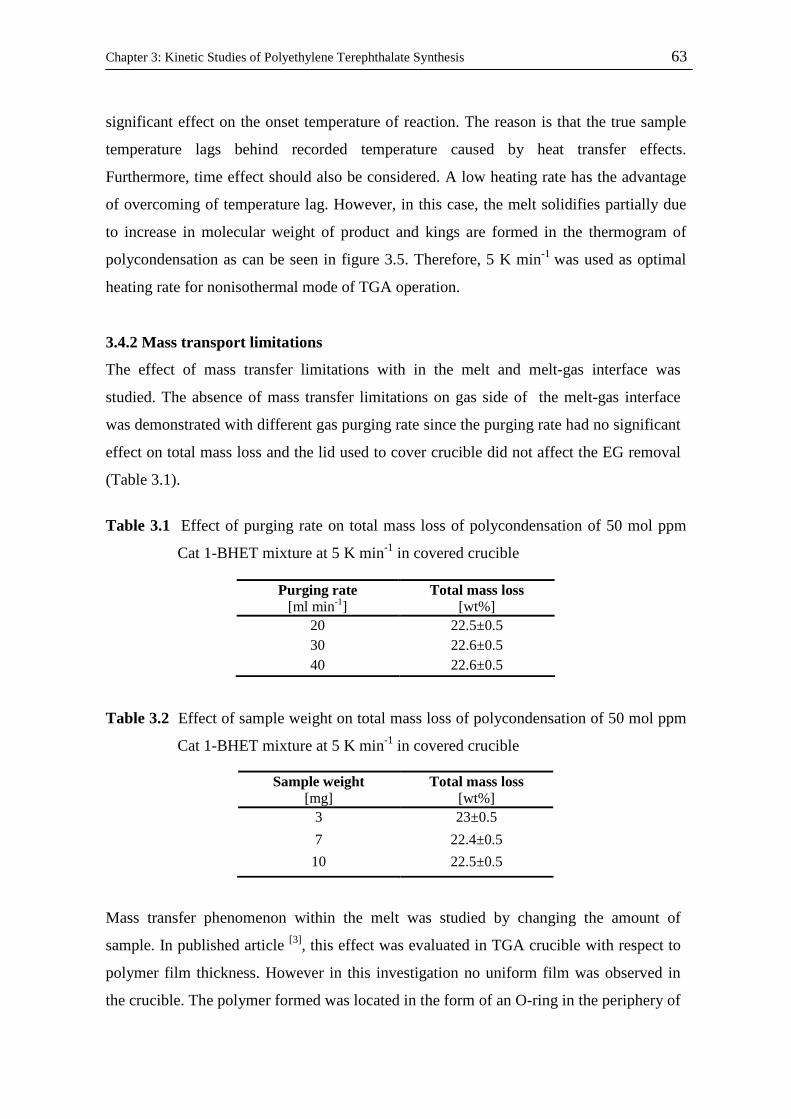
Chapter 3: Kinetic Studies of Polyethylene Terephthalate Synthesis 63
significant effect on the onset temperature of reaction. The reason is that the true sample
temperature lags behind recorded temperature caused by heat transfer effects.
Furthermore, time effect should also be considered. A low heating rate has the advantage
of overcoming of temperature lag. However, in this case, the melt solidifies partially due
to increase in molecular weight of product and kings are formed in the thermogram of
polycondensation as can be seen in figure 3.5. Therefore, 5 K min-1 was used as optimal
heating rate for nonisothermal mode of TGA operation.
3.4.2 Mass transport limitations
The effect of mass transfer limitations with in the melt and melt-gas interface was
studied. The absence of mass transfer limitations on gas side of the melt-gas interface
was demonstrated with different gas purging rate since the purging rate had no significant
effect on total mass loss and the lid used to cover crucible did not affect the EG removal
(Table 3.1).
Table 3.1 Effect of purging rate on total mass loss of polycondensation of 50 mol ppm
Cat 1-BHET mixture at 5 K min-1 in covered crucible
Table 3.2 Effect of sample weight on total mass loss of polycondensation of 50 mol ppm
Cat 1-BHET mixture at 5 K min-1 in covered crucible
Mass transfer phenomenon within the melt was studied by changing the amount of
sample. In published article [3], this effect was evaluated in TGA crucible with respect to
polymer film thickness. However in this investigation no uniform film was observed in
the crucible. The polymer formed was located in the form of an O-ring in the periphery of
Purging rate [ml min-1]
Total mass loss [wt%]
20 22.5±0.5 30 22.6±0.5 40 22.6±0.5
Sample weight [mg]
Total mass loss [wt%]
3 23±0.5
7 22.4±0.5
10 22.5±0.5
Chapter 3: Kinetic Studies of Polyethylene Terephthalate Synthesis 64
the crucible. Therefore, it is unreliable to use film thickness as parameter for mass
transfer studies. The obtained total mass loss of polycondensation of BHET catalysed by
50 mol ppm Cat 1 in covered crucible was presented in the table 3.2. The results show no
influence of amount of reaction mixture on total mass loss. Mass transfer limitations
within the melt are negligible.
3.4.3 Kinetic of polycondensation
Quantitative evaluation of thermograms which is corresponding to calculation of hydroxyl
end groups concentration with respect to mass loss in TGA was done according to the
method of Reichert et al.[9] by considering volume change during reaction.
The number of moles of produced EG as a function of time, nt,EG, is calculated by the
following equation:
EGEGt M
lossmassn =, (3.2)
where EGM is the molar mass of EG.
The initial number of hydroxyl end groups,OH,on , is given by:
BHET
BHEToBHEToOHo M
mnn ,
,,
22 == (3.3)
where BHET,on is the initial number of moles of BHET, BHET,om is the initial mass of BHET
and BHETM is the molar mass of BHET. In each condensation step two hydroxyl end
groups are consumed and one EG is produced. The number of moles of hydroxyl end
groups remaining after a reaction time t, nt,OH , can be calculated from the amount of
produced EG by the following equation:
EGBHET
BHEToEGtOHoOHt M
lossmass
M
mnnn
222 ,
,,, −=−= (3.4)
For kinetic studies it is required to convert the number of moles of hydroxyl end groups
into concentration via dividing it by the melt volume:
t
OHtt V
nOH ,][ = (3.5)
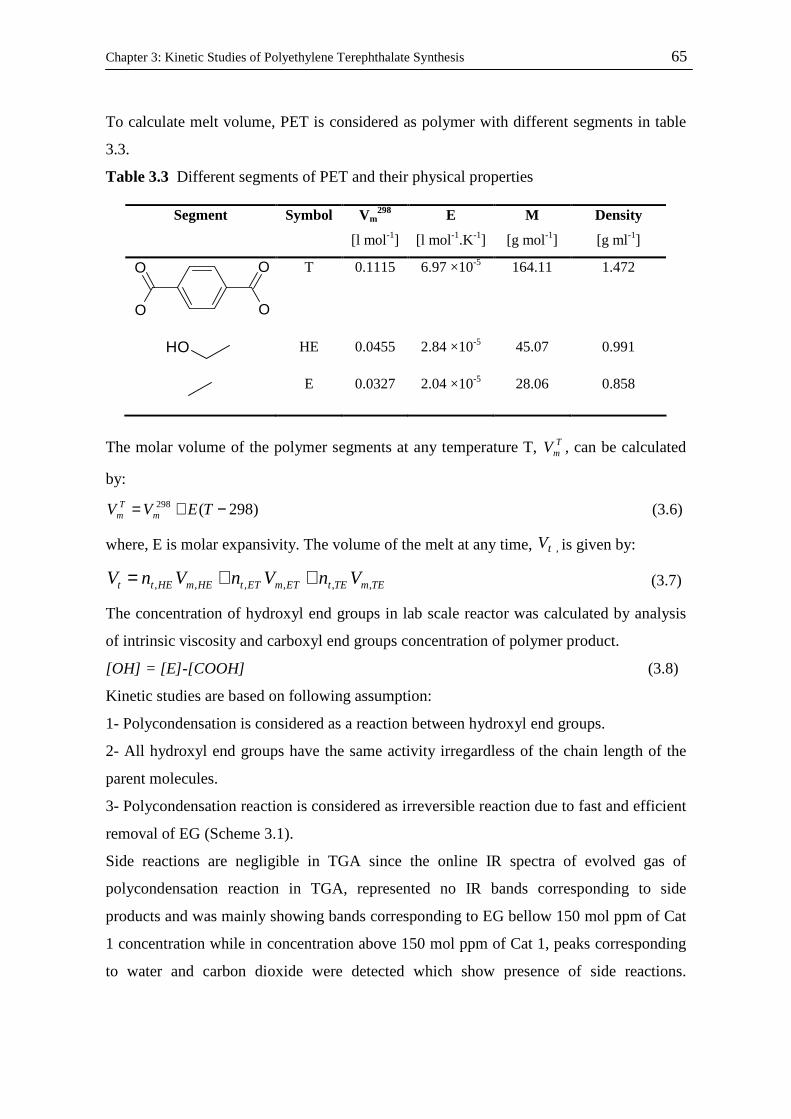
Chapter 3: Kinetic Studies of Polyethylene Terephthalate Synthesis 65
To calculate melt volume, PET is considered as polymer with different segments in table
3.3.
Table 3.3 Different segments of PET and their physical properties
Segment Symbol Vm298
[l mol-1]
E
[l mol-1.K-1]
M
[g mol-1]
Density
[g ml-1]
O O
O O
T 0.1115 6.97 ×10⁻⁵ 164.11 1.472
OH
HE 0.0455 2.84 ×10⁻⁵ 45.07 0.991
E 0.0327 2.04 ×10⁻⁵ 28.06 0.858
The molar volume of the polymer segments at any temperature T, T
mV , can be calculated
by:
)298(298 −+= TEVV mT
m (3.6)
where, E is molar expansivity. The volume of the melt at any time, tV , is given by:
TEmTEtETmETtHEmHEtt VnVnVnV ,,,,,, ++= (3.7)
The concentration of hydroxyl end groups in lab scale reactor was calculated by analysis
of intrinsic viscosity and carboxyl end groups concentration of polymer product.
[OH] = [E]-[COOH] (3.8)
Kinetic studies are based on following assumption:
1- Polycondensation is considered as a reaction between hydroxyl end groups.
2- All hydroxyl end groups have the same activity irregardless of the chain length of the
parent molecules.
3- Polycondensation reaction is considered as irreversible reaction due to fast and efficient
removal of EG (Scheme 3.1).
Side reactions are negligible in TGA since the online IR spectra of evolved gas of
polycondensation reaction in TGA, represented no IR bands corresponding to side
products and was mainly showing bands corresponding to EG bellow 150 mol ppm of Cat
1 concentration while in concentration above 150 mol ppm of Cat 1, peaks corresponding
to water and carbon dioxide were detected which show presence of side reactions.

Chapter 3: Kinetic Studies of Polyethylene Terephthalate Synthesis 66
Furthermore, the results were approved by application of DSC and appearance of
degradation peaks discussed in chapter 2 (Table 3.4).
OO
O OOH OHn
OO
O OOH OH
n
+ OHOH
Τi (OBu)4
(n -1)
Scheme 3.1 Polycondensation of BHET. Table 3.3 Wave number of detected IR band and corresponding chemical group
4- Mass transfer limitations in polycondensation reaction are neglected.
Fitting of nonisothermal data to different reaction models results in widely varying
Arrhenius parameters. This problem had been addressed by different authors [6-9]. The way
of obtaining trustworthy kinetic parameter is to extract them in a way that is independent
of reaction model. A viable alternative method is based on the model–free isoconversional
method and allows obtaining unambiguous values of activation energy by considering of
its dependency on reaction conversion. Friedman isoconversional method [6] applied in
these studies (equation 3.10), is derived by taking the logarithm of reaction rate equation
of nonisothermal experiment (equation 3.9) with constant heating rate, β=dT/dt:
)()exp(0 xfRT
Ek
dT
dx a−=β
(3.9)
x
xa
xx RT
Exfk
dT
dx ,,0 )](ln[)ln( −= (3.10)
where x is conversion and f(x) represents the reaction progress as function of conversion.
The linear plots between ln(dx/dT)x and 1/Tx determine the value of Ea (activation energy)
at different conversion. The software package, Thermokinetic from Netzsch company was
Wave number [cm-1]
Chemical group [-]
2941 CH2
3650 O-H
1052 C-O

Chapter 3: Kinetic Studies of Polyethylene Terephthalate Synthesis 67
used for determination of activation energy of nonisothermal experiments. Figure 3.6,
represents dependency of overall activation energy of nonisothermal reaction on
conversion. It is observed that in the conversion range of 0 to 80%, activation energy
remains constant with a value of 92±4 kJ mol-1. Increasing of activation energy at higher
conversion might be due to the presence of side reactions which affect overall activation
energy. This value of activation energy (92 kJ mol-1) was used for the determination of
frequency factor by application of simulation software.
60
70
80
90
100
110
120
0 0,2 0,4 0,6 0,8 1x
Ea
[kJ
mol
-1 ]
Figure 3.6 Dependency of activation energy on conversion of nonisothermal reaction evaluated by Friedman method [6].
The reaction order with respect to hydroxyl end groups concentration, was determined
with integration method. Best fitting was achieved by plotting of experimental data with a
second order reaction kinetic (Figure 3.7). Therefore the reaction rate, R [mol l-1 min-1],
can be written as following:
20 ][]exp[
][
2
1OH
RT
Ek
dt
OHdR a−
=−= (3.11)
k0 is overall frequency factor [l mol-1 min-1] and Ea is overall activation energy.
The PREDICI [10] software package was used for detailed kinetic modeling. It was applied
to fit experimental conversion-time curves. The fitting parameter was frequency factor for
initial overall activation energy of 92 kJ mol-1. Figure 3.8 shows experimental and
simulated data with second order kinetic for nonisothermal run. The fitting quality
indicates second order kinetic is able to predict polycondensation progress.
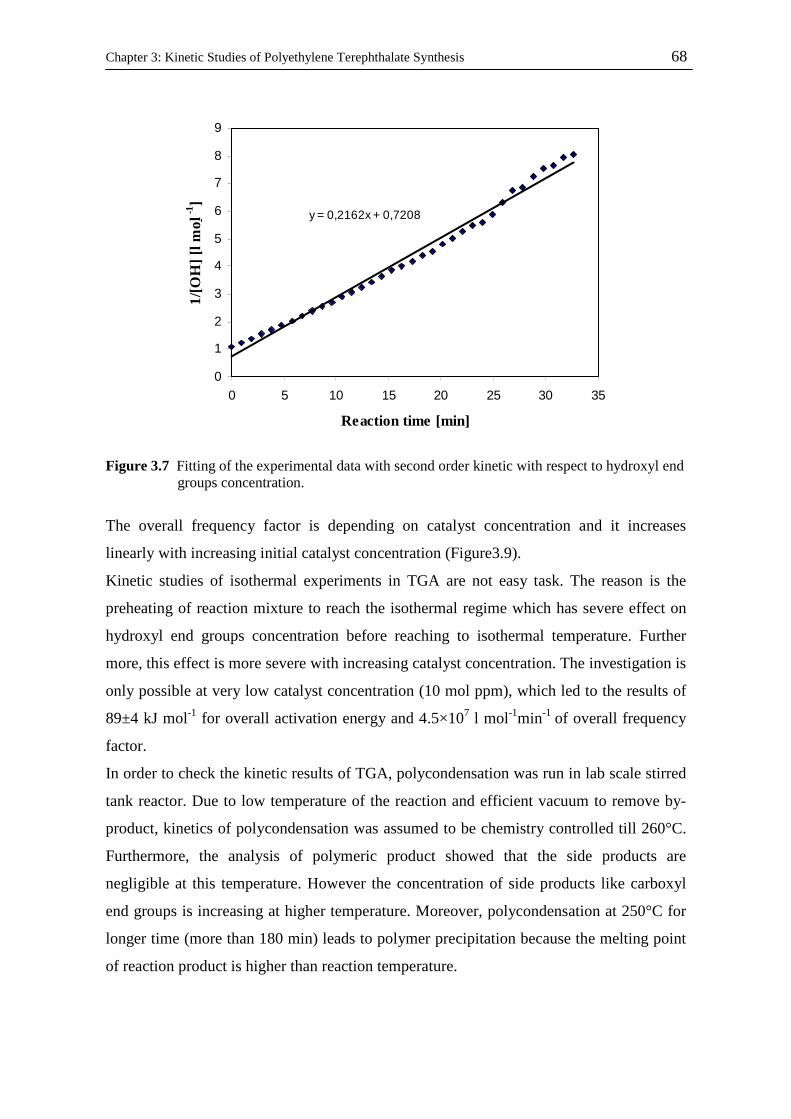
Chapter 3: Kinetic Studies of Polyethylene Terephthalate Synthesis 68
y = 0,2162x + 0,7208
0
1
2
3
4
5
6
7
8
9
0 5 10 15 20 25 30 35
Reaction time [min]
1/[O
H] [
l mo
l -1]
Figure 3.7 Fitting of the experimental data with second order kinetic with respect to hydroxyl end groups concentration.
The overall frequency factor is depending on catalyst concentration and it increases
linearly with increasing initial catalyst concentration (Figure3.9).
Kinetic studies of isothermal experiments in TGA are not easy task. The reason is the
preheating of reaction mixture to reach the isothermal regime which has severe effect on
hydroxyl end groups concentration before reaching to isothermal temperature. Further
more, this effect is more severe with increasing catalyst concentration. The investigation is
only possible at very low catalyst concentration (10 mol ppm), which led to the results of
89±4 kJ mol-1 for overall activation energy and 4.5×10⁷ l mol-1min-1 of overall frequency
factor.
In order to check the kinetic results of TGA, polycondensation was run in lab scale stirred
tank reactor. Due to low temperature of the reaction and efficient vacuum to remove by-
product, kinetics of polycondensation was assumed to be chemistry controlled till 260°C.
Furthermore, the analysis of polymeric product showed that the side products are
negligible at this temperature. However the concentration of side products like carboxyl
end groups is increasing at higher temperature. Moreover, polycondensation at 250°C for
longer time (more than 180 min) leads to polymer precipitation because the melting point
of reaction product is higher than reaction temperature.
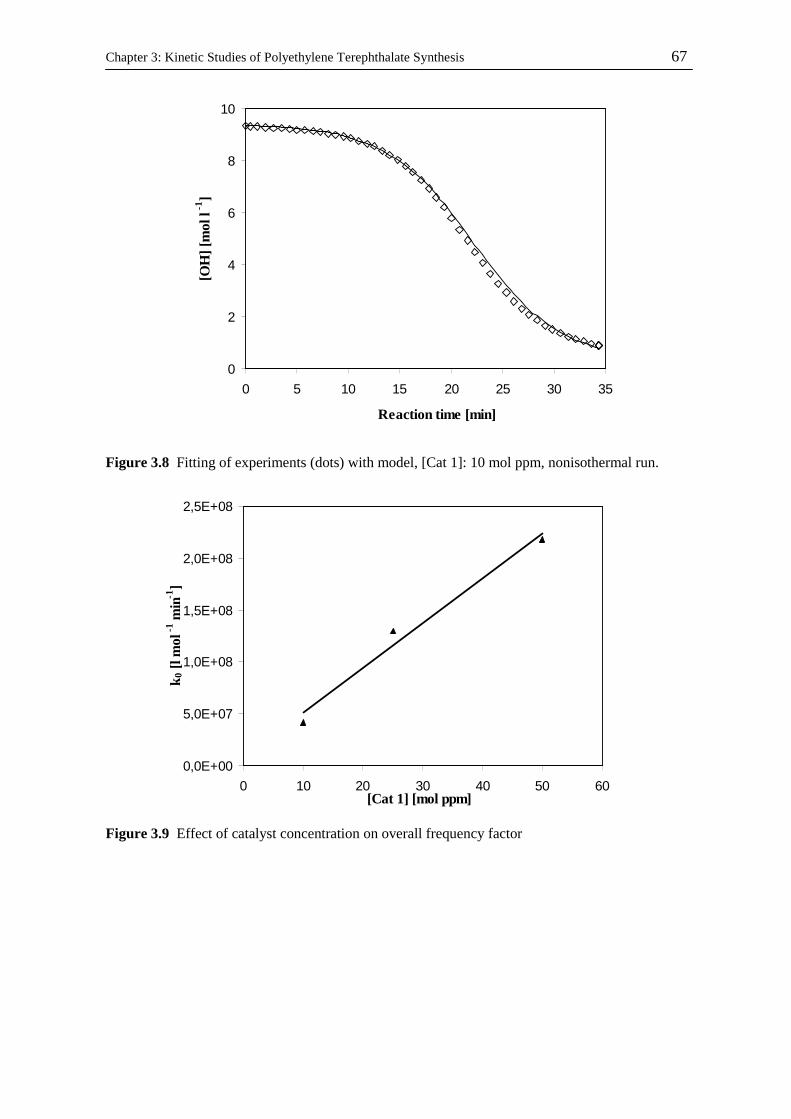
Chapter 3: Kinetic Studies of Polyethylene Terephthalate Synthesis 67
0
2
4
6
8
10
0 5 10 15 20 25 30 35
Reaction time [min]
[OH
] [m
ol l
-1]
Figure 3.8 Fitting of experiments (dots) with model, [Cat 1]: 10 mol ppm, nonisothermal run.
0,0E+00
5,0E+07
1,0E+08
1,5E+08
2,0E+08
2,5E+08
0 10 20 30 40 50 60[Cat 1] [mol ppm]
k 0 [l
mol
-1 m
in-1
]
Figure 3.9 Effect of catalyst concentration on overall frequency factor
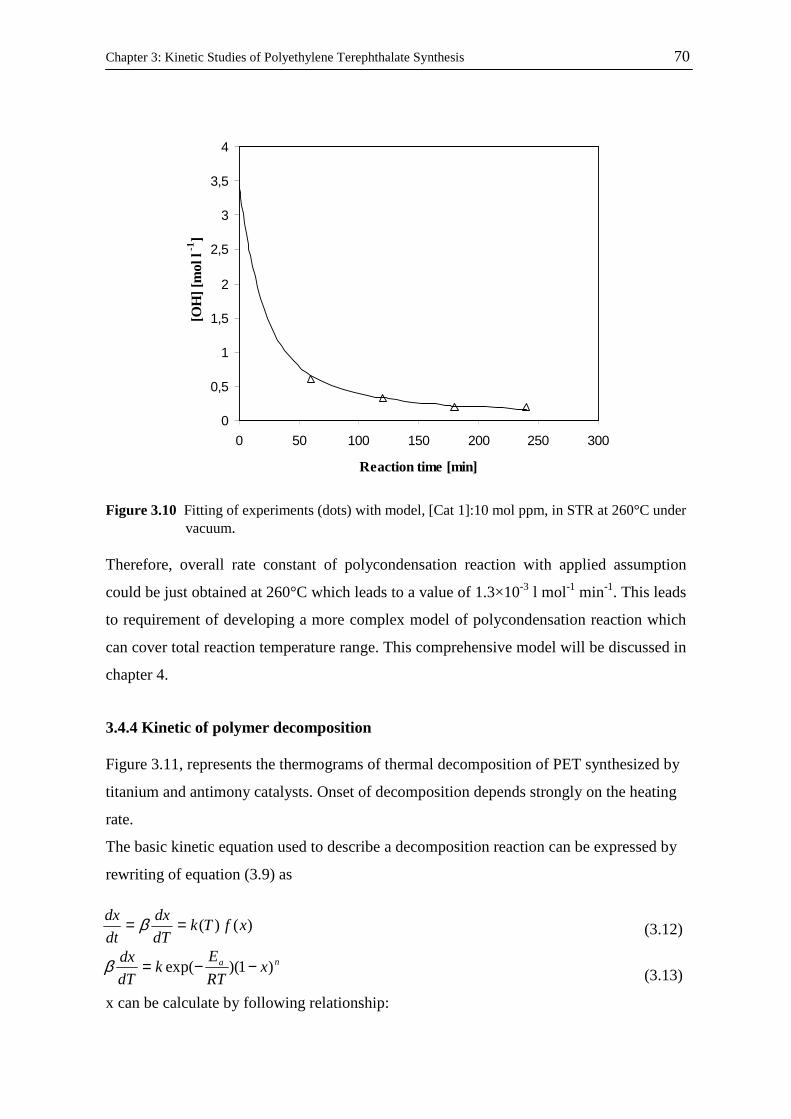
Chapter 3: Kinetic Studies of Polyethylene Terephthalate Synthesis 70
0
0,5
1
1,5
2
2,5
3
3,5
4
0 50 100 150 200 250 300
Reaction time [min]
[OH
] [m
ol l
-1]
Figure 3.10 Fitting of experiments (dots) with model, [Cat 1]:10 mol ppm, in STR at 260°C under vacuum. Therefore, overall rate constant of polycondensation reaction with applied assumption
could be just obtained at 260°C which leads to a value of 1.3×10⁻³ l mol-1 min-1. This leads
to requirement of developing a more complex model of polycondensation reaction which
can cover total reaction temperature range. This comprehensive model will be discussed in
chapter 4.
3.4.4 Kinetic of polymer decomposition
Figure 3.11, represents the thermograms of thermal decomposition of PET synthesized by
titanium and antimony catalysts. Onset of decomposition depends strongly on the heating
rate.
The basic kinetic equation used to describe a decomposition reaction can be expressed by
rewriting of equation (3.9) as
(3.12)
(3.13)
x can be calculate by following relationship:
)()( xfTkdT
dx
dt
dx == β
na xRT
Ek
dT
dx)1)(exp( −−=β

Chapter 3: Kinetic Studies of Polyethylene Terephthalate Synthesis 71
f
t
mm
mmx
−−
=0
0 (3.14)
where m0 is initial sample mass, mt is sample mass at time t and mf is mass of residual
sample.
At maximum rate, , therefore, following equation can be used to calculate
activation energy:
(3.15)
where Tm, is temperature at maximum reaction rate. By plotting ln (β/RTm2) versus 1/Tm,
the slope will be corresponding to Ea (Figure 3.12 and 3.13).
Activation energy of 176 kJ mol-1 and 200 kJ mol-1 was obtained for decomposition of
PET synthesised by titanium and antimony catalysts respectively. That is an indication
that titanium catalyst also activates degradation reaction of polymer chain. The reasons of
stronger effect of catalysts on decomposition reaction in comparison to results in chapter
2, might be the higher titanium concentration (50 wt ppm compare to 20 wt ppm), higher
molecular weight of polymer and higher temperature of synthesis of polymer (temperature
of 280°C and 260°C).
0
20
40
60
80
100
120
350 370 390 410 430 450 470 490T [°C]
Res
t mas
s [w
t %]
Sb-5 K/minSb-10 K/minSb-20 K/minTi-5 K/minTi-10 K/minTi-20 K/min
Figure 3.11 Thermograms of PET decomposition with different catalysts at different heating rates.
02
2
=dT
xd
)exp()1( 12
m
an
amRT
Ex
E
nk
RT−−= −β

Chapter 3: Kinetic Studies of Polyethylene Terephthalate Synthesis 72
-21
-20,8
-20,6
-20,4
-20,2
-20
-19,8
-19,6
-19,4
0,00137 0,00138 0,00139 0,00140 0,00141 0,00142 0,00143 0,00144 0,00145
1/Tm [K -1]
ln(β
/RT m
2 ) [J
mol
-1m
in-1
]
Figure 3.12 Plot of ln (β/RTm2) versus 1/Tm for Cat 1.
-13,8
-13,6
-13,4
-13,2
-13
-12,8
-12,6
-12,4
-12,2
-12
0,00137 0,00138 0,00139 0,0014 0,00141 0,00142 0,00143 0,00144
1/Tm [K -1]
ln(β
/RT m
2 ) [J
mol
-1 m
in-1
]
Figure 3.13 Plot of ln (β/RTm2) versus 1/Tm for antimony.
3.5 Conclusion
Thermogravimetric analysis is a suitable method for fast screening of catalyst of
polycondensation reaction, since reaction is characterized by mass loss. However, the
method of thermogravimetry for quantitative kinetic studies of polycondensation reactions

Chapter 3: Kinetic Studies of Polyethylene Terephthalate Synthesis 73
should be used only if another independent method is confirming the thermogravimetry
results. Furthermore, this technique is a suitable technique for evaluation of polymer
degradation.

Chapter 3: Kinetic Studies of Polyethylene Terephthalate Synthesis 74
3.6 References
[1] G. A. Gamlen, T.H. Shah, J.I. Bhatty, D. Dollimore, Acta. Thermochim., 106, 105
(1986)
[2] W. Zimmerer, PhD Thesis, Swiss Federal Institute of Technology, Lausanne (1997)
[3] Th. Rieckmann, S. Völker, Chem. Eng. Sci., 56, 945 (2001)
[4] F.-A. El-Toufaili, G. Feix, K.-H. Reichert, Macromol. Mater. Eng., 291, 114 (2006)
[5] F.-A. El-Toufaili, G. Feix, K.-H. Reichert, Thermochim. Acta, 432, 101 (2005)
[6] H. Friedman, J. Polymer. Sci. C, 6, 183 (1963)
[7] S. Vyazovkin, N. Sbirrauoli, Macromol. Chem. Phys., 200, 2294 (1999)
[8] R. B. Prime, Polym. Eng. Sci., 13, 365 (1973)
[9] F.-X. Perrin, T. M. H. Nguyen, J.-L. Vernet, Macromol. Chem. Phys., 208, 718 (2007)
[10] M. Wulkow, Macromol. Theory. Simul., 5, 393 (1996)

Chapter 4: Modeling of Kinetic, Molecular Weight and Molecular
Weight Distribution of Polyethylene Terephthalate Synthesis Catalyzed
by Titanium Tetrabutoxide in Melt Phase
Abstract
Low molecular weight oligomers of polyethylene terephthalate were used to conduct the
polycondensation reaction in lab scale stirred tank reactor at isothermal conditions (260 to
280°C) under vacuum (1 mbar) with titanium tetrabutoxide as catalyst (10 wt ppm). The
reaction was run for different times and the product produced was analyzed with respect to
molecular weight and molecular weight distribution and concentration of side products.
A mathematical model was developed including the polycondensation reaction, all major
side reactions and mass transfer processes. With this model conversion of reaction,
molecular weight and, concentration of side products can be modeled very well. In case of
molecular weight distribution deviation between simulation and experiments are observed.
Kinetic data of polycondensation process was extracted from simulation work and
indicates that titanium tetrabutoxide is a more active but less selective catalyst than
antimony triacetate. This is due to the fact that activation energies of all chemical
reactions involved are much lower in case of titanium catalyst at conditions studied.

Chapter 4: Modeling of kinetic and molecular weight 76
4.1 Introduction
Modeling in general has a high potential value to industry in terms of reactor design, scale
up, process optimization, product structure control and reactor stability and safety.
Consequently, great effort has gone into model development for PET process. However,
due to many uncertainty surrounding to mechanism of catalyzed polycondensation; a wide
range of models and kinetic results exist which often differ significantly. Moreover, the
reaction kinetics of the polycondensation process is complicated by presence of side
reactions and is still under investigation and is not unambiguously determined. The
published data depend on the specific experimental procedures and applied catalysts and
the resulting kinetic parameters vary with the assumed kinetic model and the applied data
fitting procedure [1-13]. Table 4.1 represents published kinetic data of polycondensation
reaction in synthesis of PET. The presented results were achieved by different
determination methods. Effect of catalyst concentration is mostly included in the rate
constant.
Table 4.1 Published kinetic data of polycondensation reaction of PET synthesis[1-13]
Year Auther Catalyst K [-]
T [°C]
Ea [kJ mol-1]
k [l n mol-m min-
1] 1960 Challa No K=K(Pn) 195-282 96 -
1968 Fontana Pb, Zn, Ca,
Sb
0.5 152-228 - -
1969 Stevenson Sb2O3 0.36 275 59 (Sb2O3), 167 (no cat)
0.6
1971 Hovenkamp Sb2O3, Zn, Mn, Pb, Ca
0.8 197 - -
1973 Tomita Zn - 270-300 99 -
1978 Yokoyama Sb2O3 1 275,280,285 77 (Sb2O3), 167 (nocat)
0.3-1.62×10⁻¹
1979 Chegolya H+, TPA 0.5 214,234,244 102 7.3
1980 Rafler SbAc3 - 270 1.55×10⁻¹
1980 Reimschuessel H+,Sb2O3 ∆S=-80.3, ∆H=-38.1
202,215,226 115(Sb2O3), 91.4 (H+),
205 (no cat)
-
1986 Ravindranath Sb2O3 0.5 290 77.3 6.8×10⁵ 1989 Yamada Sb2O3 - 240-265 11.7 -
2000 Collins No - 270,280,290 168 -
2001 Rieckmann No - 287 92 8.9
2006 El-Toufaili HT - dynamic 92 4.3×10⁸

Chapter 4: Modeling of kinetic and molecular weight 77
In general three types of methods were applied for kinetic investigation of
polycondensation reaction: semi batch stirred tank reactor, thin film and thermal analysis
method in which the micro scale of reactor is causing high specific surface area of reaction
mass. The melt viscosity of reaction mixture increases rapidly with progressing
polycondensation. As the polycondensation reaction is a reversible equilibrium reaction,
the macro kinetics of the polycondensation process becomes more and more limited by the
mass transfer of the volatising EG at higher conversion and temperature. A good reactor
design should employ this knowledge concerning rate limitations. It should also provide a
maximum specific surface area, ensuring minimum mass transfer distances, respectively
an utmost thin polymer film.
The aim of this chapter is to evaluate kinetic parameters of titanium tetrabutoxide
catalyzed PET synthesis and develop a mathematical model to predict conversion,
molecular weight and concentration of side products.
4.2 Experimental part
4.2.1Chemicals
Oligomer with properties shown in table 4.2 was supplied by Equipolymers GmbH. A 2:1
weight ratio mixture of o-dichlorobenzol and phenol was from Organo Spezial Chemie
GmbH. The chemicals used for analysis were bromophenol blue (>99%), chloroform
(>98%), o-cresol (>99%) and potassium hydroxide solution in ethanol 0.1 N, which were
supplied by Merck. All the reactants were used in the experiments without further
purification and without especial treatments, except in the case of Cat 1, which was mixed
with EG and kept under an inert atmosphere.
Table 4.2 Properties of oligomers used for polycondensation
M n [mol/g]
Pn [COOH] [mmol kg-1]
889 4-5 30
4.2.2 Polycondensation in lab scale stirred tank reactor
In previous studies, polycondensation was run in a glass reactor heated by salt bath to
desired temperature, but due to better heat transfer from heating medium to reaction
mixture, better temperature control and more safety during reaction run, glass reactor was
replaced by metal reactor made of aluminium (Figure 4.1-b).
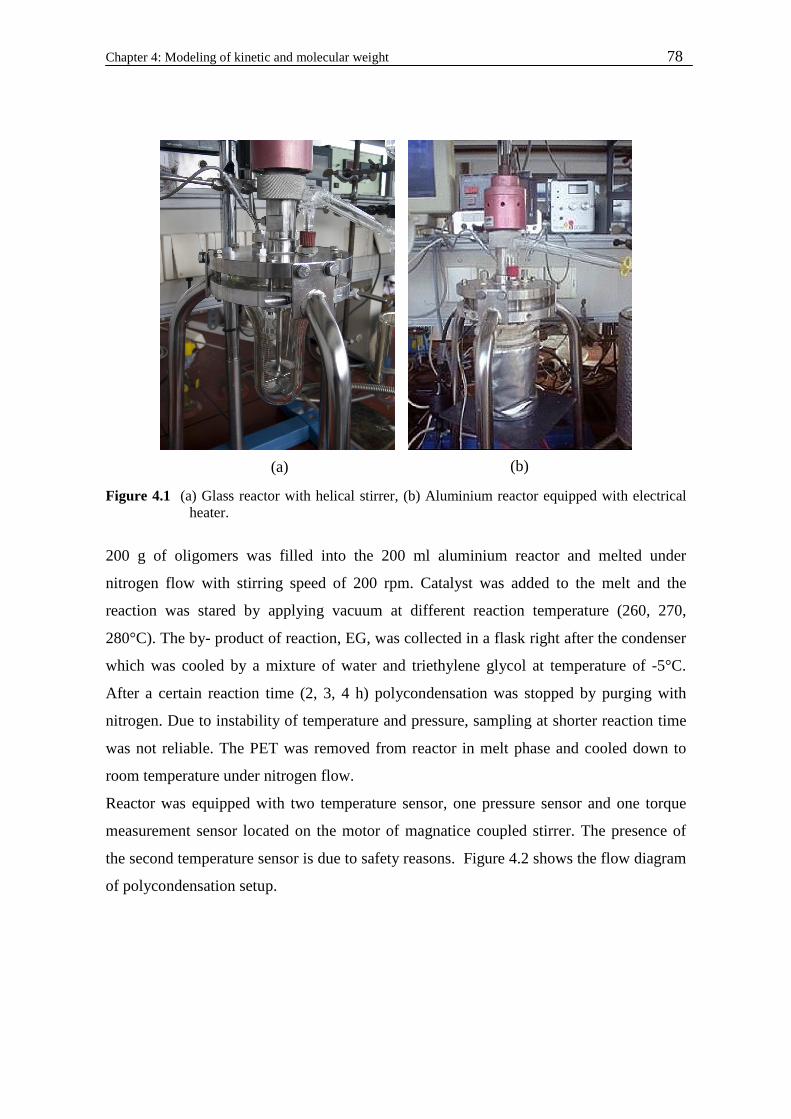
Chapter 4: Modeling of kinetic and molecular weight 78
Figure 4.1 (a) Glass reactor with helical stirrer, (b) Aluminium reactor equipped with electrical heater.
200 g of oligomers was filled into the 200 ml aluminium reactor and melted under
nitrogen flow with stirring speed of 200 rpm. Catalyst was added to the melt and the
reaction was stared by applying vacuum at different reaction temperature (260, 270,
280°C). The by- product of reaction, EG, was collected in a flask right after the condenser
which was cooled by a mixture of water and triethylene glycol at temperature of -5°C.
After a certain reaction time (2, 3, 4 h) polycondensation was stopped by purging with
nitrogen. Due to instability of temperature and pressure, sampling at shorter reaction time
was not reliable. The PET was removed from reactor in melt phase and cooled down to
room temperature under nitrogen flow.
Reactor was equipped with two temperature sensor, one pressure sensor and one torque
measurement sensor located on the motor of magnatice coupled stirrer. The presence of
the second temperature sensor is due to safety reasons. Figure 4.2 shows the flow diagram
of polycondensation setup.
(a) (b)

Chapter 4: Modeling of kinetic and molecular weight 79
Figure 4.2 Flow diagram of polycondensation setup.
4.2.3 Polymer characterization
4.2.3.1 Determination of intrinsic viscosity of polymer
10 g of polymer was placed in a strainer and cooled by liquid nitrogen. The polymer was
immediately ground to powder in a centrifugal mill (RETZSCH MZ 100) with 0.5 mm
mesh bottom. The ground polymer was dried at constant temperature of 100°C in a
halogen moisture analyzer of METTLER HG53. The dried sample was then dissolved in
solvent mixture of phenol and 1,2-dichlorobenzene with a phenol concentration of 50
wt%. Homogeneous sample was filled in sample bottles and place in auto sampler of IV
measurement instrument (SCHOTT AVSPro). The inner temperature of capillary was
maintained at 25°C. The time that sample solution needs to pass the capillary is detected
and the viscosity of the solution was calculated with the analytical equation supplied by
Equipolymers GmbH. The measuring system is very precise and reproducible (error of ±
0.8).
By using of polymer samples with known molecular weight and measuring of intrinsic
viscosity (IV), the following equation was defined to describe relation between number
average molecular weight (Mn) and IV.
3458.2)ln( 4706.1 += IVM n (4.1)
T T
P
T
0-100deg
mV10-50
Nitrogen
Computer
Reactants
Stirred Tank Reactor Condenser Vacuum System
Chapter 4: Modeling of kinetic and molecular weight 80
4.2.3.2 Determination of carboxyl end groups concentration of polymer
1 g of polymer was added as powder in a titration flask along with 35 ml solvent (o-
cresol/chloroform). The sample was dissolved for 15 min at 170°C in a heating block
system and then cooled down to room temperature. The carboxyl end groups of polymer
were titrated against 0.05 N potassium hydroxide using tetrabromophenol blue in ethanol
as an indicator. The concentration of carboxyl end groups was calculated by application of
following equation.
m
BQCOOH
)(103][
−= (4.2)
where Q [mmol] = consumed KOH [ml] × 0.05 [mol l-1] × t
B [mmol] = solvent without sample= consumed KOH [ml] × 0.05 [mol l-1] × t
m = mass of substance in g
t = titer for 0.05 N KOH by using bromobenzoic acid
The error of analysis was calculated to be ± 1%.
4.2.3.3 Determination of diethylene glycol content of polymer
About 1 g of the ground PET together with 30 ml methanol and zinc acetate as catalyst
and tetraethylene glycol dimethyl ether as internal standard were introduced into a
pressure container. The container was heated for 2 h at 220°C in an oven. The PET
material was decomposed to diethylene glycol and methyl isophthalate.
The reaction solutions are analyzed by gas chromatography (PERKIN ELMER GC –
Autosystem XL) after cooling to ambient temperature. The DEG and IPA amounts are
calculated from the areas of the DEG and IPA ester peaks in relation to the internal
standard peak. The GC was calibrated with defined amounts of DEG and IPA ester before.
4.2.3.4 Determination of acetaldehyde content of polymer
0.1 to 0.3 g of the ground PET sample is introduced into a 22 ml head space vial and
closed with a PTFE-coated seal. Vials are tempered in a head space oven (headspace auto
sampler - HS-40XL (PERKIN ELMER)) at 150°C for 90 minutes and then analyzed by
GC (GC - AutoSystem XL (PERKIN ELMER)). The calibration is done by total
evaporation of different acetaldehyde water mixtures.

Chapter 4: Modeling of kinetic and molecular weight 81
4.2.4 Reproducibility of torque measurement and polymer viscosity
Figure 4.3 shows the diagram of torque of stirrer during polycondensation reaction at
260°C and 200 rpm for three runs. The obtained curves for all three measurements are in
good agreement.
0
0,1
0,2
0,3
0,4
0,5
0,6
0,7
0,8
0,9
0 1 2 3 4 5Reaction time [h]
Tor
que
of s
tirre
r [N
cm
]
first run at 270°C
second run at 270°C
third run at 270°C
Figure 4.3 Reproducibility of torque of stirrer at three different runs
The reproducibility was also tested for intrinsic viscosity of PET, at different temperature
and time. Table 4-2 shows the results. Each reported value is the average value of 3
different polycondensation runs for the certain temperature.
Table 4.3 Reproducibility of intrinsic viscosity of PET at different temperature and time.
[Cat 1]: 10 wt ppm
Reaction temperature [°C]
Reaction time [h]
IV [dl g-1]
260 3 0.465±0.004 260 4 0.518±0.005 270 3 0.522±0.005 270 4 0.602±0.006
4.3 Reaction model
The kinetic modeling of polycondensation was done based on following assumption:
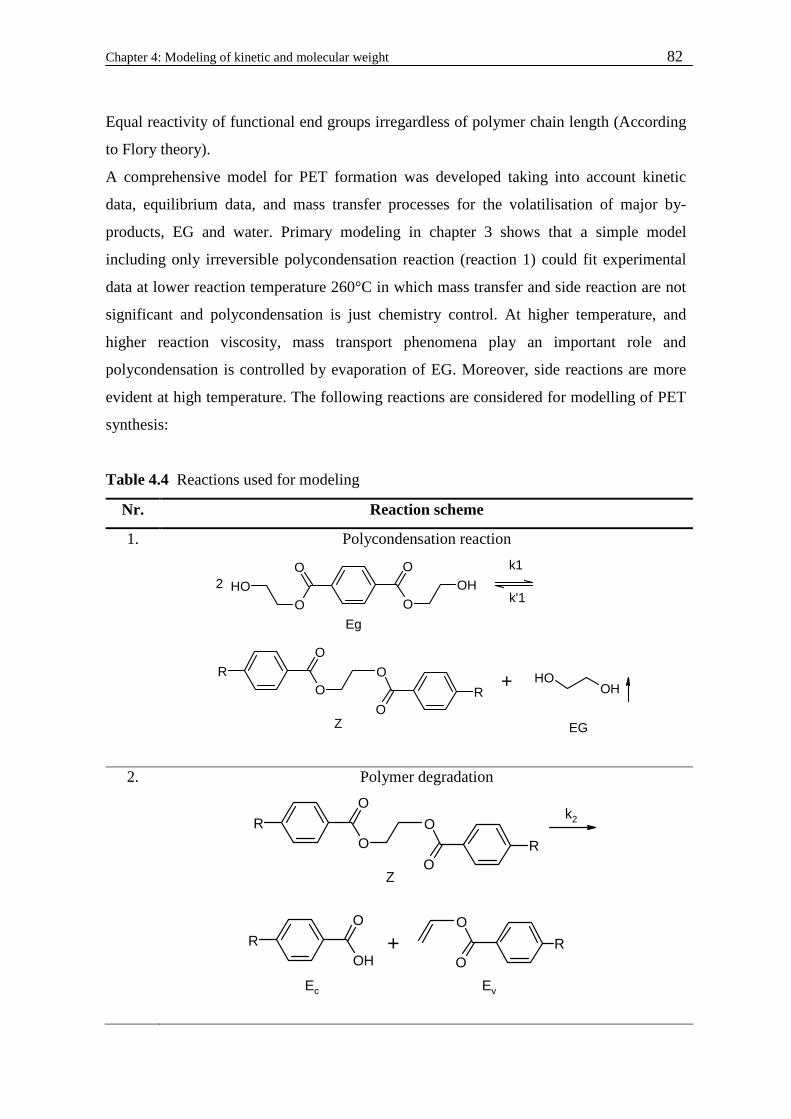
Chapter 4: Modeling of kinetic and molecular weight 82
Equal reactivity of functional end groups irregardless of polymer chain length (According
to Flory theory).
A comprehensive model for PET formation was developed taking into account kinetic
data, equilibrium data, and mass transfer processes for the volatilisation of major by-
products, EG and water. Primary modeling in chapter 3 shows that a simple model
including only irreversible polycondensation reaction (reaction 1) could fit experimental
data at lower reaction temperature 260°C in which mass transfer and side reaction are not
significant and polycondensation is just chemistry control. At higher temperature, and
higher reaction viscosity, mass transport phenomena play an important role and
polycondensation is controlled by evaporation of EG. Moreover, side reactions are more
evident at high temperature. The following reactions are considered for modelling of PET
synthesis:
Table 4.4 Reactions used for modeling
Nr. Reaction scheme
1. Polycondensation reaction
O O
OHOH
O O2
+ OHOH
k1
k'1
Eg
EG
RO
O
O
O
R
Z
2. Polymer degradation
k2RO
O
O
O
R
ROH
O
+O
O
R
Ec Ev
Z

Chapter 4: Modeling of kinetic and molecular weight 83
3. Formation of AA
RO
OOH
ROH
O+ O
k3
Eg
Ec AA
4. Formation of AA
RO
OOH
O
O
R
RO
O
O
O
RO
+
+
k4
Eg Ev
AAZ
5. Esterification reaction
ROH
O
OHOH
+
RO
OOH + H2O
k5
k'5Ec EG
Eg W
6. Esterification reaction
ROH
O+ R
O
OOH
+ H2OR
O
O
O
O
R
k6
k'6
Ec Eg
Z W

Chapter 4: Modeling of kinetic and molecular weight 84
7. Formation of DEG
RO
OOH + OH
OH
k7
ROH
O
+ OHO
OH
DEGEc
Eg EG
8. Formation of DEG
RO
OOH2
ROH
O+ R
O
O
OOH
k8
Eg
Ec PETDEG
9. Formation of DEG
RO
OOH R
O
O
OOH k9
+
RO
O
O
O
ROH
OOH+
Eg PETDEG
Z DEG
The rate expression of reactions 1-9 have following forms:
[ ] [ ][ ] [ ] [ ] [ ][ ]
−=
−=
1
20,1
1
211 K
EGZEgcatk
K
EGZEgkR (4.3)
[ ]ZkR 22 = (4.4)
[ ]EgkR 33 = (4.5)
[ ][ ]EvEgkR 44 = (4.6)
[ ][ ] [ ][ ]
−=
555 K
WEgEGEckR (4.7)
Chapter 4: Modeling of kinetic and molecular weight 85
[ ][ ] [ ][ ]
−=
666 K
WZEgEckR (4.8)
[ ][ ]EGEgkR 77 = (4.9)
[ ] 288 EgkR = (4.10)
[ ][ ] [ ][ ]
−=
999 K
DEGZEgPETkR DEG (4.11)
where, k1, and k4-9 are second order rate constants, and k2, k3 are first order rate constants.
K1 is equilibrium constant of polycondensation reaction, K5 and K6 are equilibrium
constants of esterification reactions. In equation 4.3, catalyst concentration is excluded
from rate constant (k1,0). In all other rate equations, concentration of catalyst is
incorporated into the rate constant. It is assumed that catalyst concentration remains
constant in the course of polycondensation.
In order to simplify the process of fitting parameters to experimental data and simplify the
mathematical model, three main assumptions were done, following the general trend
published for antimony catalyzed PET synthesis.
1- Irregardless of the end groups, the polycondensation reactions have the same rate
constant. The assumption eliminates the need of considering three separated rate
constants for the glycolate, DEG and vinyl end groups (k1 = k4 = k9), and simplify
the process of parameter fitting.
2- Two esterification reactions have the same rate constant, irregardless of the
reactants involved (k5=k6).
3- All the side reactions of the chain ends have same probability of reacting and
therefore, have same rate constant (k3 = k7 = k8).
Mass transfer limitations It was discussed that the melt viscosity increases with progressing polycondensation. As
the transesterification reaction is a reversible equilibrium reaction, polycondensation
process becomes more and more limited by the mass transfer of EG evaporation.
Modeling of PET synthesis catalyzed by titanium catalysts without application of mass
transfer effect could not give the reliable fitting to the experimental results. Especially at
elevated temperature where the viscosity of the reaction mixture increases strongly and
transfer of by-product from reaction mixture is more problematic. Therefore it is needed to

Chapter 4: Modeling of kinetic and molecular weight 86
consider a variable mass transfer coefficient of EG with respect to the degree of
polymerization and temperature. The equation was introduced first by Reickmann et al.[3]:
))267(1.01)(043.0exp(0, CTPkk nmm °−+−= (4.12)
Where km is the mass transfer coefficient, Pn is the degree of polycondensation, T is the
temperature of the reaction mixture and km,0 is the initial value of the mass transfer
coefficient, which in the case of the different conditions in the system can be obtained by
fitting to the experimental data.
Therefore the rate of mass transfer of EG express as follows:
[ ] [ ]( )00 )][]([ EGEGkEGEGakR LmLlm −=−= (4.13)
[EG]l is concentration of EG in melt phase and [EG]0 is interfacial concentration.
Furthermore, similar equation can describe the rate of mass transfer of water
[ ] [ ]( )0WWkR Lww −= (4.14)
[W] l is concentration of water in melt phase and [W]0 is interfacial concentration. For
calculation of mass transfer coefficient of water, the following initial assumption was
considered and the final value was obtained by fitting.
mwEGw kmmk 2/1)/(= (4.15)
The interfacial concentration of EG and water can be obtained by considering vapour-
liquid phase equilibrium concept. In the present work only the total content of DEG (free
DEG and DEG incorporated in the polymer chain) could be measured. Furthermore, since
the vapour pressure of AA is very high at polycondensation temperature, it is assumed that
AA is removed instantly at it formed. The low molecular weight oligomers have very low
vapour pressure and are assumed to be non volatile. Therefore, initially the phase
equilibrium in the interface is considered just only for EG and water. The interfacial
concentration [i]0 or the corresponding mole fraction, xi, (i: EG, Water) of each volatile in
the interface can be calculated from the vapour pressure Pi0 and the activity coefficient γi
taken from the Flory–Huggins model. In this work, the values reported by Laubriet et al. [7]
are used:
iwEG
xxx
PETi
+−=
)(1
][][ 0 (4.16)
The vapour phase is assumed to follow the ideal gas low.
(4.17)
itiii yPPx =0γ

Chapter 4: Modeling of kinetic and molecular weight 87
Vapour pressure for EG and water is calculated by
(4.18)
3.33
66.4047568.18ln 0
−−=
TPW (4.19)
At polycondensation reaction temperature, vapour pressure of water was calculated to be
much higher and the partial pressure of water at reaction pressure is smaller than EG.
Therefore, the phase equilibrium is considered for EG which means vapour phase contain
only EG and interfacial concentration of water is zero.
For calculation of activity coefficient:
+−= PET
iiEG mm
χγ 11exp
1 (4.20)
In which mi is the ratio of molar volume of polymer to molar volume of EG, PETχ is
Flory-Huggins interaction parameter and is taken approximately as 1.3 for EG.
The volume of the melt phase occupied by EG per volume of reaction mixture is given by:
EG
LEG EGM
ρυ ][
= (4.21)
and the molar volume of polymer is calculated by
][
1
PET
υυ −= (4.22)
The material balance at vapour-liquid phase equilibrium are expressed by
1=EGy (4.23)
1=+ PETEG xx (4.24) Hence, equation 4.16 is rewritten as
EGEG
xx
PETEG
−=
1
][][ 0 (4.25)
The material balance equations of reaction components are:
[ ]98765431 22 RRRRRRRR
dt
Egd −−−−+−−−= (4.26)
[ ]751 RRRR
dt
EGdm
L −−−= (4.27)
)ln(042.47.8576
703.49ln 0 TT
PEG −−=

Chapter 4: Modeling of kinetic and molecular weight 88
[ ]43 RR
dt
AAd += (4.28)
[ ]97 RR
dt
DEGd += (4.29)
[ ]42 RR
dt
Evd −= (4.30)
[ ]wRRR
dt
Wd −+= 65 (4.31)
[ ]658732 RRRRRR
dt
Ecd −−+++= (4.32)
[ ]98 RR
dt
PETd DEG −= (4.33)
[ ]96421 RRRRR
dt
Zd +++−= (4.34)
The kinetic parameters which were used for a first fitting test are taken from literature [1, 3]
and are listed in table 4.5. The activation energy of PET degradation was the value
obtained by degradation study in TGA in chapter 3.
Table 4.5 Data used for parameter estimation
Reaction Rate constant k0,i
[l n mol-m min] Ea
[kJ mol-1] K [-]
Poylcondensation k1=k6=k9 6.80×10⁵ 77.4 0.5
Degradation of PET k2 3.09×10⁹ 176.0 -
Acetaldehyde formation k3=k6 4.16×10⁷ 95.0 -
Esterification of Ec k4=k5 1.04×10⁶ 73.6 1.25
DEG formation k7=k8 4.16×10⁷ 95.0 -
The software packages, PREDICI® from company CiT GmbH and Berkley Madonna were
applied to develop the model. The simulation was performed with following steps:
• Sensitivity studies which was applied to find out how dramatic the effect of
varying one constant might be for a certain property or variable and also for whole
simulation. The following priorities were found: 1) rate constant of
polycondensation, 2) rate constant of degradation, 3) rate constant of side reactions
involved at chain end, 4) rate constant of esterification and 5) mass transfer
coefficient.
• Parameter estimation which was based on fitting of reaction rate constants to the
reliable set of experimental data

Chapter 4: Modeling of kinetic and molecular weight 89
4.4 Experimental results
Effect of temperature on the reaction progress was studied by running polycondensation at
different reaction temperatures for different times.
0,00
0,10
0,20
0,30
0,40
0,50
0,60
0,70
0 1 2 3 4 5Reaction time [h]
IV [d
l g-1
]
260°C
270°C
280°C
255°C
Figure 4.4 Intrinsic viscosity of PET at different temperatures ([Cat 1]: 10 wt ppm).
0,0E+00
2,0E+03
4,0E+03
6,0E+03
8,0E+03
1,0E+04
1,2E+04
1,4E+04
1,6E+04
1,8E+04
2,0E+04
0 1 2 3 4 5Reaction time [h]
Mn
[g m
ol -1
]
Figure 4.5 Number average molecular weight of PET at different temperatures ([Cat 1]:10 wt ppm).
280°C
270°C
260°C
255°C
280°C
270°C
260°C
255°C
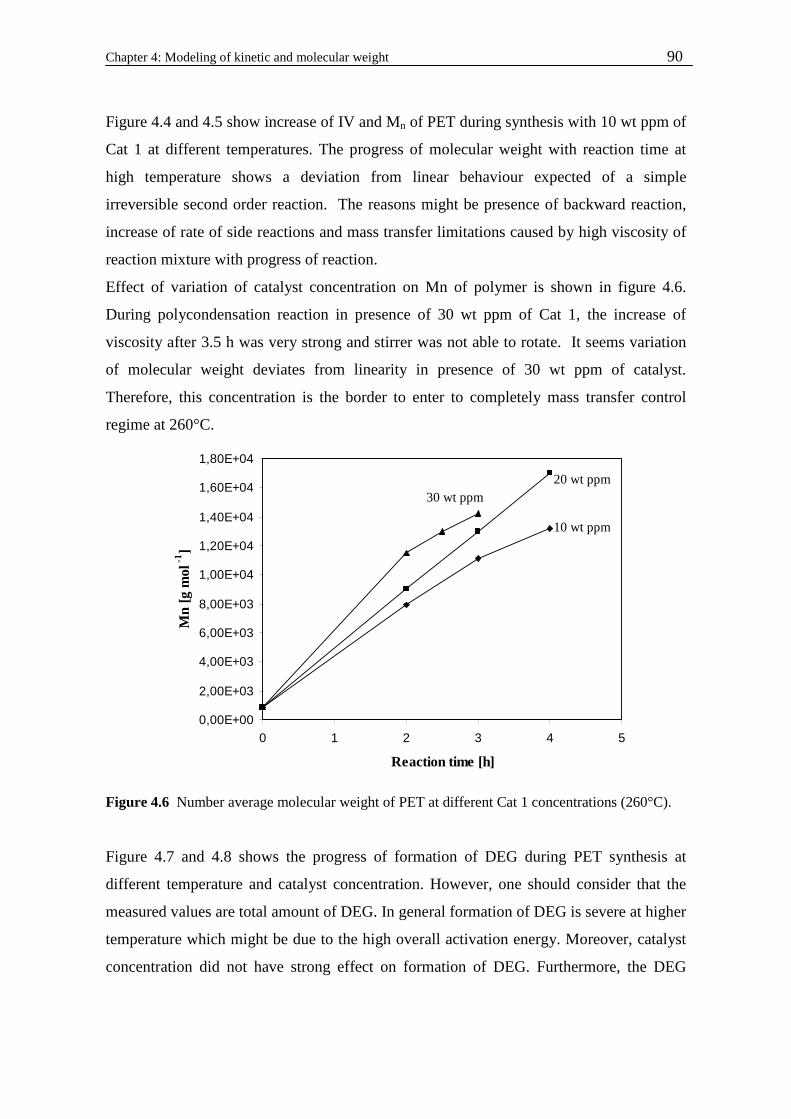
Chapter 4: Modeling of kinetic and molecular weight 90
Figure 4.4 and 4.5 show increase of IV and Mn of PET during synthesis with 10 wt ppm of
Cat 1 at different temperatures. The progress of molecular weight with reaction time at
high temperature shows a deviation from linear behaviour expected of a simple
irreversible second order reaction. The reasons might be presence of backward reaction,
increase of rate of side reactions and mass transfer limitations caused by high viscosity of
reaction mixture with progress of reaction.
Effect of variation of catalyst concentration on Mn of polymer is shown in figure 4.6.
During polycondensation reaction in presence of 30 wt ppm of Cat 1, the increase of
viscosity after 3.5 h was very strong and stirrer was not able to rotate. It seems variation
of molecular weight deviates from linearity in presence of 30 wt ppm of catalyst.
Therefore, this concentration is the border to enter to completely mass transfer control
regime at 260°C.
0,00E+00
2,00E+03
4,00E+03
6,00E+03
8,00E+03
1,00E+04
1,20E+04
1,40E+04
1,60E+04
1,80E+04
0 1 2 3 4 5
Reaction time [h]
Mn
[g m
ol -1
]
Figure 4.6 Number average molecular weight of PET at different Cat 1 concentrations (260°C).
Figure 4.7 and 4.8 shows the progress of formation of DEG during PET synthesis at
different temperature and catalyst concentration. However, one should consider that the
measured values are total amount of DEG. In general formation of DEG is severe at higher
temperature which might be due to the high overall activation energy. Moreover, catalyst
concentration did not have strong effect on formation of DEG. Furthermore, the DEG
10 wt ppm
20 wt ppm 30 wt ppm

Chapter 4: Modeling of kinetic and molecular weight 91
content of all synthesised PET was much less than limited values for industrial production
of PET.
0,215
0,22
0,225
0,23
0,235
0,24
0,245
0,25
0 1 2 3 4 5Reaction time [h]
[DE
G] [
mm
ol l -
1 ]
255°C260°C270°C280°C
Figure 4.7 DEG formation at different temperatures ([Cat 1]: 10 wt ppm).
0,218
0,22
0,222
0,224
0,226
0,228
0,23
0,232
0,234
0,236
0 1 2 3 4 5
Reaction time [h]
[DE
G][m
mol
l -1
]
Figure 4.8 DEG formation at different Cat 1 concentrations (260°C).
4.5 Modeling results and discussion
Figure 4.9 presents fitting of reaction conversion with the reaction model presented in
table 4.4 and the kinetic data in table 4.6.
255°C
260°C
270°C
280°C
10ppm
20ppm
30ppm
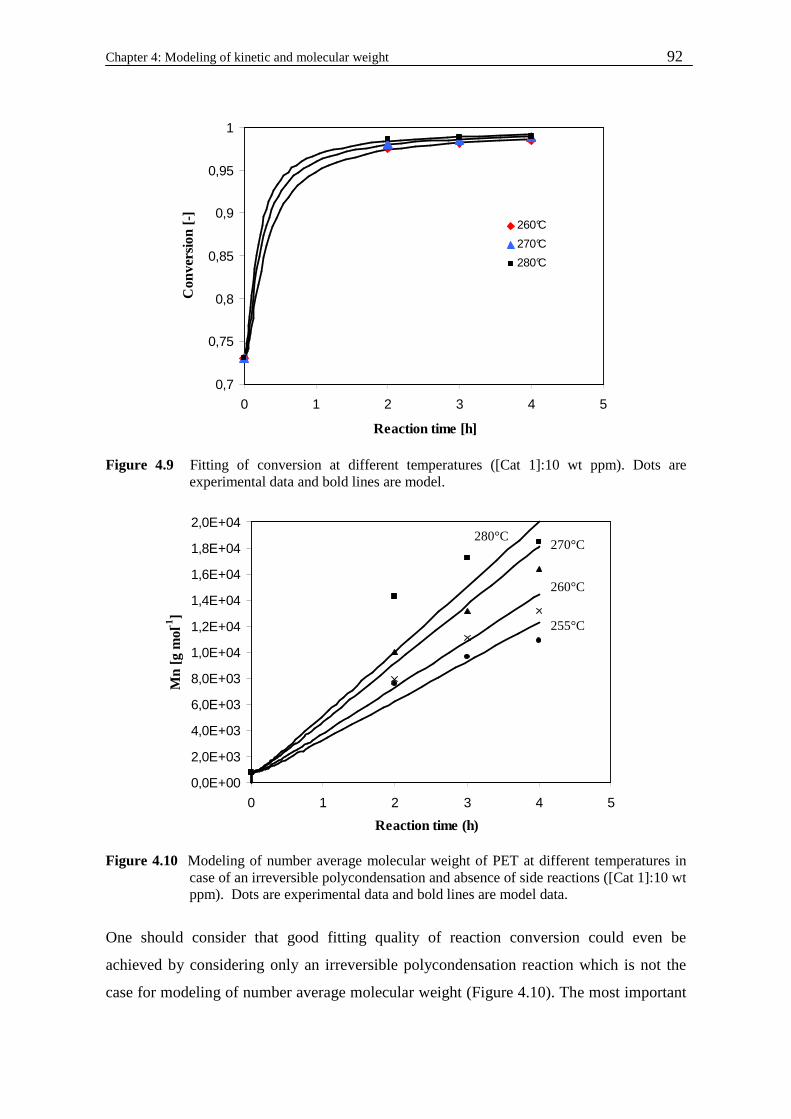
Chapter 4: Modeling of kinetic and molecular weight 92
0,7
0,75
0,8
0,85
0,9
0,95
1
0 1 2 3 4 5
Reaction time [h]
Con
vers
ion
[-] 260°C
270°C
280°C
Figure 4.9 Fitting of conversion at different temperatures ([Cat 1]:10 wt ppm). Dots are experimental data and bold lines are model.
0,0E+00
2,0E+03
4,0E+03
6,0E+03
8,0E+03
1,0E+04
1,2E+04
1,4E+04
1,6E+04
1,8E+04
2,0E+04
0 1 2 3 4 5
Reaction time (h)
Mn
[g m
ol-1
]
255°C, 10ppm260°C, 10ppm270°C, 10ppm280°C, 10ppm
Figure 4.10 Modeling of number average molecular weight of PET at different temperatures in case of an irreversible polycondensation and absence of side reactions ([Cat 1]:10 wt ppm). Dots are experimental data and bold lines are model data.
One should consider that good fitting quality of reaction conversion could even be
achieved by considering only an irreversible polycondensation reaction which is not the
case for modeling of number average molecular weight (Figure 4.10). The most important
280°C 270°C
260°C
255°C

Chapter 4: Modeling of kinetic and molecular weight 93
part of modeling is fitting of average molecular weight of PET which is influenced by side
reaction and reaction temperature. The quality of fitting molecular weight of PET with the
set of data in table 4.6 can be seen in figure 4.11.
0,0E+00
2,0E+03
4,0E+03
6,0E+03
8,0E+03
1,0E+04
1,2E+04
1,4E+04
1,6E+04
1,8E+04
2,0E+04
0 1 2 3 4 5
Reaction time [h]
Mn
[g m
ol -
1 ]
Figure 4.11 Fitting of number average molecular weight of PET at different temperature with the
model introduced in session 4.3. The points are experimental data and the lines are simulations ([Cat 1]: 10 wt ppm).
The progress of Mn with reaction time at different temperatures is quite different from
progress of conversion because it is more affected by increase of rate of side reactions and
backward reaction. The following equations express the relation between number average
molecular weight and degree of polycondensation and the reaction conversion. The α
value is the ratio of concentration of carboxylic end group to the total end groups
concentration. This value depends strongly to the rate of side reactions like esterification
and polymer chain degradation and increases at high temperature.
xPn −
=1
1 (4.35)
)44(262192 α−+= nn PM (4.36)
][][
][
COOHOH
COOH
+=α (4.37)
280°C
270°C
260°C
255°C

Chapter 4: Modeling of kinetic and molecular weight 94
0
2
4
6
8
10
12
14
16
18
20
0 0,5 1 1,5 2 2,5 3 3,5 4 4,5
Reaction time [h]
[CO
OH
] [m
mol
kg-1
]
Figure 4.12 Fitting of carboxyl end groups concentration at different temperatures ([Cat 1]: 10 wt ppm). The points are experimental data and the lines are simulations.
0,2
0,4
0,6
0,8
1
1,2
1,4
0,0018 0,00182 0,00184 0,00186 0,00188
1/T [K -1]
ln[k
] [m
ol l
-1 m
in-1
]
Figure 4.13 Arrhenius plot of overall rate constant of formation of carboxyl end groups during polycondensation of BHET oligomers.
The model can also predict variation of carboxyl end groups concentration in the
polymeric product (Figure 4.12). The sharp decay of concentration of carboxyl end groups
in the beginning of reaction is due to the initial strong increase in the esterification rate
280°C
270°C
260°C
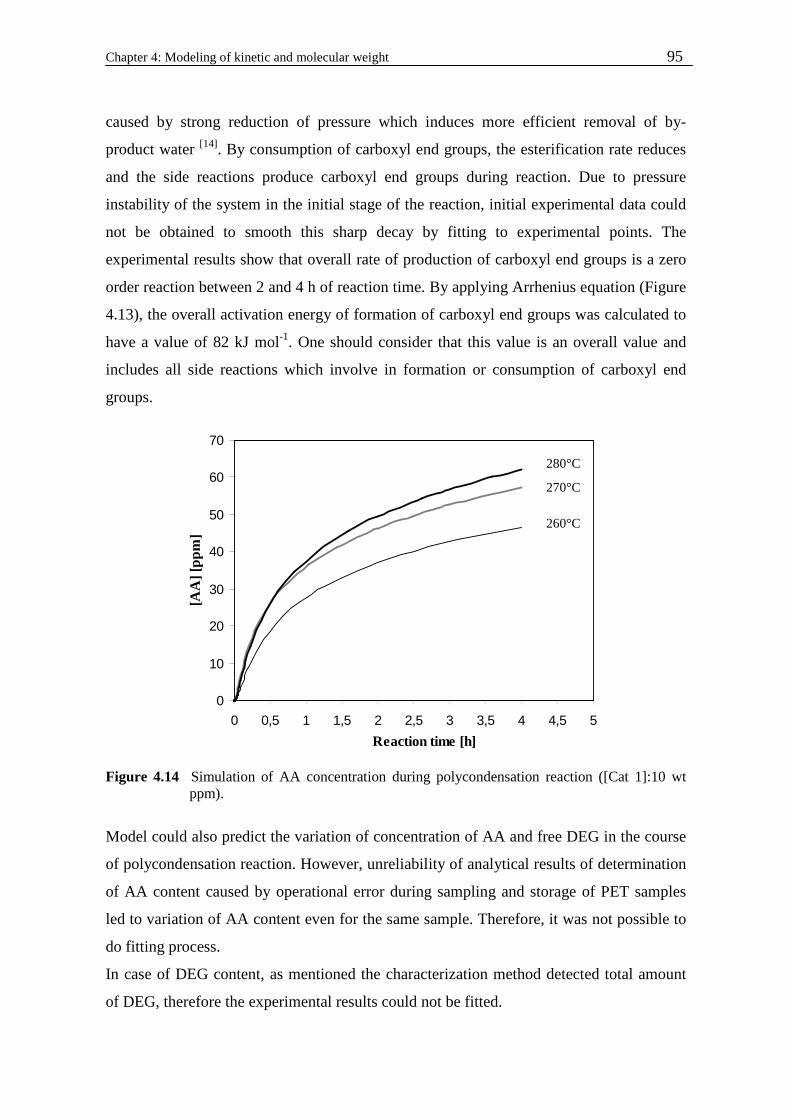
Chapter 4: Modeling of kinetic and molecular weight 95
caused by strong reduction of pressure which induces more efficient removal of by-
product water [14]. By consumption of carboxyl end groups, the esterification rate reduces
and the side reactions produce carboxyl end groups during reaction. Due to pressure
instability of the system in the initial stage of the reaction, initial experimental data could
not be obtained to smooth this sharp decay by fitting to experimental points. The
experimental results show that overall rate of production of carboxyl end groups is a zero
order reaction between 2 and 4 h of reaction time. By applying Arrhenius equation (Figure
4.13), the overall activation energy of formation of carboxyl end groups was calculated to
have a value of 82 kJ mol-1. One should consider that this value is an overall value and
includes all side reactions which involve in formation or consumption of carboxyl end
groups.
0
10
20
30
40
50
60
70
0 0,5 1 1,5 2 2,5 3 3,5 4 4,5 5
Reaction time [h]
[AA
] [pp
m ]
Figure 4.14 Simulation of AA concentration during polycondensation reaction ([Cat 1]:10 wt ppm).
Model could also predict the variation of concentration of AA and free DEG in the course
of polycondensation reaction. However, unreliability of analytical results of determination
of AA content caused by operational error during sampling and storage of PET samples
led to variation of AA content even for the same sample. Therefore, it was not possible to
do fitting process.
In case of DEG content, as mentioned the characterization method detected total amount
of DEG, therefore the experimental results could not be fitted.
280°C
270°C
260°C

Chapter 4: Modeling of kinetic and molecular weight 96
0,00
0,05
0,10
0,15
0,20
0,25
0,30
0 1 2 3 4 5
Reaction time[h]
[DE
G][m
mol
l -1
]
Figure 4.15 Simulation of increasing of free DEG concentration during polycondensation reaction ([Cat 1]: 10 wt ppm).
Table 4.6, presents kinetic data of optimal modeling of PET synthesis including side
reactions and mass transfer process. The activation energy of 63 kJ mol-1 of
polycondensation reaction with titanium catalyst is lower than the one of antimony
catalyst (77 kJ mol-1).
Table 4.6 Kinetic data obtained by simulation of PET synthesis in melt phase with Cat 1
Paratemer Polycondensation* PET degradation
AA formation
DEG formation
Esterification
Ea [kJ mol-1]
63 165 71 71 48
k0,i [l n mol-m min]
4.8×10⁷ 7.85×10⁹ 2.91×10⁴ 2.91×10⁴ 5.73×10³
* Effect of catalyst concentration on frequency factor is excluded.
Table 4.7 Initial overall mass transfer coefficient (km,0) for different temperatures
Reaction Temperature [°C]
km,0
[min -1] 255 1.62 260 2.05 270 2.76 280 2.92
Table 4.7, shows the initial value of overall mass transfer coefficient (km,0) achieved by
data fitting which increases with increasing temperature.
280°C
260°C
270°C

Chapter 4: Modeling of kinetic and molecular weight 97
4.6 Modeling of molecular weight distribution
Modeling of molecular weight distribution (MWD) was executed using the same
simulation program. The MWD of the polymer samples produced at 260°C and 280°C
with 10 wt ppm of Cat 1 was simulated first by using the reaction scheme listed in table
4.4. The result of simulation was a very narrow MWD (PDI less than 2) for reaction at 260
and 280°C (Figure 4.16).
0
0,2
0,4
0,6
0,8
1
1,2
1,4
0 0,5 1 1,5 2 2,5 3
log(Mn) [kg mol -1]
dW/d
log(
Mn)
Figure 4.16 Molecular weight distribution of PET synthesised at 260 and 280°C [Cat 1]:10 wt ppm.
Table 4.8 Polydispersity index of PET after 4 h of reaction at different temperatures
Reaction Temperature [°C]
Source PDI [-]
GPC 2.45 260 Model 1.92 GPC 3.78
280 Model 1.90
The PDI values obtained by GPC measurements (GPC 1100 of Agilent) and modeling are
reported in table 4.7. The large differences between these values indicate the necessity to
improve the model by introduction of side reactions leading to formation of short and long
chain polymers which are missing in simulated MWD curve.
Model, 260°C
Model, 280°C
Experiment, 280°C Experiment,
260°C
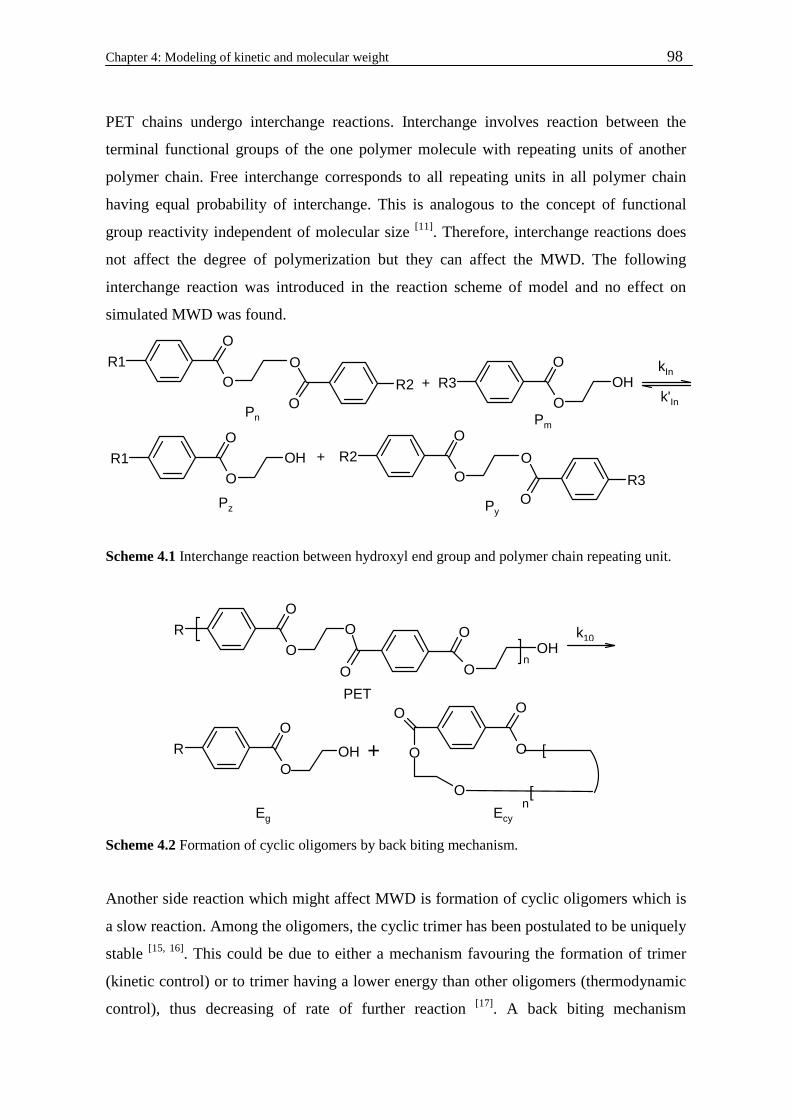
Chapter 4: Modeling of kinetic and molecular weight 98
PET chains undergo interchange reactions. Interchange involves reaction between the
terminal functional groups of the one polymer molecule with repeating units of another
polymer chain. Free interchange corresponds to all repeating units in all polymer chain
having equal probability of interchange. This is analogous to the concept of functional
group reactivity independent of molecular size [11]. Therefore, interchange reactions does
not affect the degree of polymerization but they can affect the MWD. The following
interchange reaction was introduced in the reaction scheme of model and no effect on
simulated MWD was found.
R1O
O
O
O
R2 + R3O
OOH
kIn
k'In
R1O
OOH R2
O
O
O
O
R3
+
Pn Pm
Pz Py
Scheme 4.1 Interchange reaction between hydroxyl end group and polymer chain repeating unit.
RO
O
O
O O
O
OHn
RO
O
+OH O
O
O
O
O
[
[n
k10
PET
Eg Ecy
Scheme 4.2 Formation of cyclic oligomers by back biting mechanism.
Another side reaction which might affect MWD is formation of cyclic oligomers which is
a slow reaction. Among the oligomers, the cyclic trimer has been postulated to be uniquely
stable [15, 16]. This could be due to either a mechanism favouring the formation of trimer
(kinetic control) or to trimer having a lower energy than other oligomers (thermodynamic
control), thus decreasing of rate of further reaction [17]. A back biting mechanism
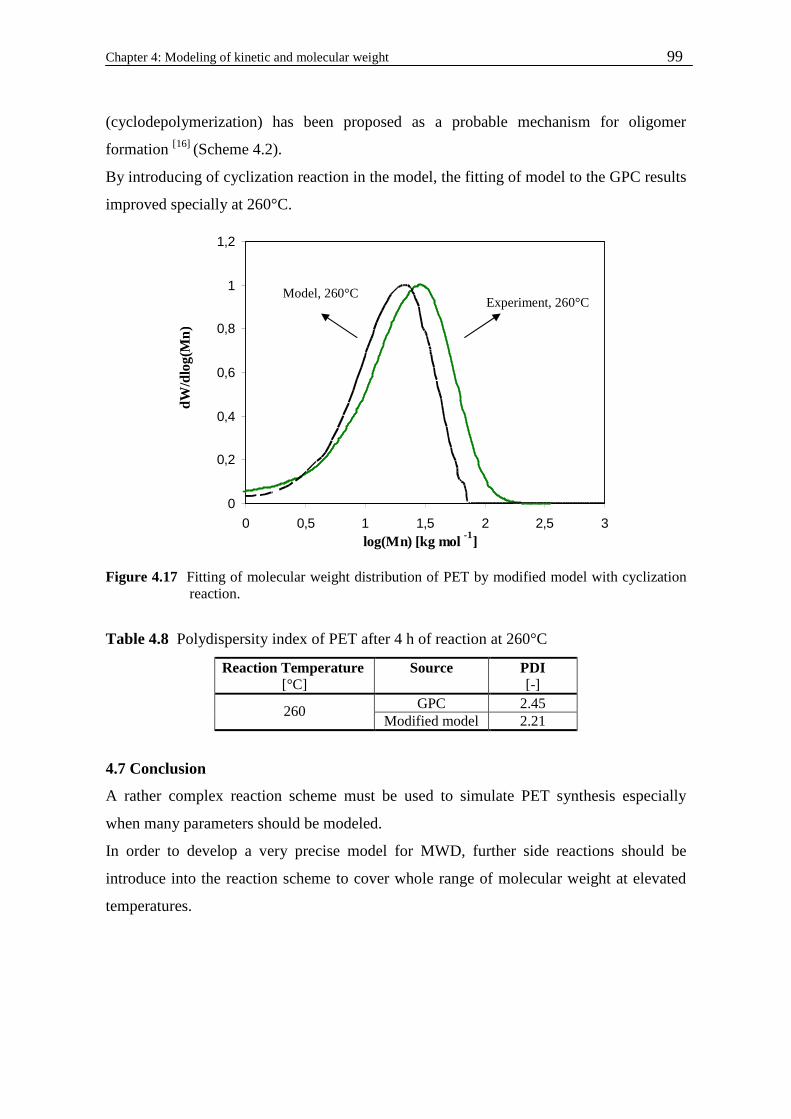
Chapter 4: Modeling of kinetic and molecular weight 99
(cyclodepolymerization) has been proposed as a probable mechanism for oligomer
formation [16] (Scheme 4.2).
By introducing of cyclization reaction in the model, the fitting of model to the GPC results
improved specially at 260°C.
0
0,2
0,4
0,6
0,8
1
1,2
0 0,5 1 1,5 2 2,5 3log(Mn) [kg mol -1]
dW/d
log(
Mn)
Figure 4.17 Fitting of molecular weight distribution of PET by modified model with cyclization reaction.
Table 4.8 Polydispersity index of PET after 4 h of reaction at 260°C
Reaction Temperature [°C]
Source PDI [-]
GPC 2.45 260 Modified model 2.21
4.7 Conclusion
A rather complex reaction scheme must be used to simulate PET synthesis especially
when many parameters should be modeled.
In order to develop a very precise model for MWD, further side reactions should be
introduce into the reaction scheme to cover whole range of molecular weight at elevated
temperatures.
Experiment, 260°C Model, 260°C
Chapter 4: Modeling of kinetic and molecular weight 100
4.8 References
[1] K. Ravindranath, R. A. Mashelkar, J. Appl. Polym. Sci., 26, 3179 (1981)
[2] K. Ravindranath, R. A.Mashelkar, J. Appl. Polym. Sci., 27, 2625 (1982)
[3] J. Scheirs, T. E. Long, Modern Polyesters: Chemistry and Technology of Polyesters
and Copolyesters, John Wiley & Sons (2003)
[4] F. -A. El-Toufaili, G. Feix, K.-H. Reichert, Macromol. Mat. Eng., 291, 114 (2006)
[5] W. Zimmerer, PhD Thesis, Swiss Federal Institute of Technology, Lausanne (1997)
[6] C.-K. Kang, J. Applied Polym. Sci. 63, 163 (1997)
[7] C. Laubriet, B.LeCorre, K. Y.Choi, Ind. Eng. Chem. Res., 30, 2 (1991)
[8] C. M. Fontana, J. Polym. Sci., Part A-1, 6, 2343 (1968)
[9] K. Ravindranath, R. A. Mashelkar, Polym. Eng. Sci., 22, 610 (1982)
[10] K. Ravindranath, R. A. Mashelkar, Polym. Eng. Sci., 22, 619 (1982)
[11] K. Ravindranath, R. A. Mashelkar, Polym. Eng. Sci., 22, 628 (1982)
[12] T. Yamada, Y. Imamura, Polym. Plast. Technol. Eng., 28, 811 (1989)
[13] L. Finelli , J. Appl. Polym. Sci., 92, 1887 (2004)
[14] G. W. Parshall, S. D. Ittel, Homogeneous Catalysis, 2nd Edition, John Wiley & Sons,
INC (1992)
[15] I. Goodman, B. F. Nesbitt, Polymer., 1, 384 (1960)
[16] A. L. Cimecioglu, S. H. Zeronian, K. W. Alger, M. J. Collins, G. C. East, Appl. J.
Polym. Sci., 32, 4719 (1986)
[17] L. H. Peebles, M. W. Huffmann, C. T. Ablett, J. Polym. Sci., Part A-1, 7, 479 (1969)

Abbreviation 101
Abbreviation
AA Acetaldehyde
Abs Absorbance
ADA Adipic acid
AI Activity index
BHET Bis (hydroxyethylene) terephthalate
BPA Bisphenol A
BPC Bisphenol C
Bu Butanol
Cat Catalyst
CSD Carbonated soft drink
DEG Diethylene glycol
DMT Dimethyl terephthalate
DPC Diphenyl carbonate
DSC Differential scanning calorimetry
Ec Carboxyl terminal
Ecy Cyclic terminal
EG Ethylene glycol
Eg Glycolate terminal
EGMB Ethylene glycol monobenzoate
ET Ethylene segment
Ev Vinyl terminal
GC Gas chromatography
GPC Gel permission chromatography
HE Hydroxy ethylene segment
HMD Hexamethylene diamine
HPPA High performance polyamide
HT Hydrotalcite
IPA Isophthalate
IR Infrared spectroscopy
IV Intrinsic viscosity
MTR Melt to resin
Abbreviation 102
MWD Molecular weight distribution
PA Polyamide
PA 6 Polyamide 6
PA 66 Polyamide 66
PDI Polydispersity index
PBT Polybuthylene terephthalate
PC Polycarbonate
PE Polyethylene
PE Polyester
PET Polyethylene terephthalate
PP Polypropylene
PS Polystyrene
PTA Purified terephthalic acid
PUR Polyurethane
PVC Polyvinyl chloride
Sb Antimony
SSP Solid state polycondensation
STR Stirred tank reactor
Syn.Elas Synthetic elastomer
T Terephthalic segment
TA Thermal analysis
TBBPA Tetrabromobisphenol A
TE Terephthalate segment
TMBPA Tetramethylbisphenol A
TGA Thermogravimetric analysis
TVO Trinkwasserverordnung
VK Vereinfacht Kontinuierlich tube
W Water
Z Diester

Symbols 103
Symbols
aA Activity of amine terminal [-]
ac Activity of carboxyl terminal [-]
aL Activity of polymeric amide [-]
α Ratio of concentration of carboxylic end groups to
concentration of total end groups
[-]
AI Activity index based on DSC measurment [°C-1]
AI Activity index based on torque measurement [mN cm min-1]
B Amount of solvent without sample for titration [mmol]
β Heating rate [K min-1]
C Integration constant [-]
CP, MR Heat capacity of the reference measuring system [J K-1]
CP, MS Heat capacity of the sample measuring system [J K-1]
CP, R Heat capacity of the reference [J K-1]
CP,S Heat capacity of the sample [J K-1]
[COOH] Concentration of carboxyl end groups [mol l-1]
D Difference in concentration of acid and amine end groups [mol l-1]
RH∆ � Enthalpy of reaction [J mol -1]
E Molar expansivity of polymeric segment [l mol-1K-1]
[E] Concentration of total end group of PET [mol l-1]
Ea Activation energy [J mol-1]
Ea,x Activation energy at x conversion [J mol-1]
[EG]0 Interfacial concentration of ethylene glycol [mol l-1]
[EG]L Concentration of ethylene glycol in melt phase [mol l -1]
f(x) Reaction progress as function of conversion [-]
IV Intrinsic viscosity [dl g -1]
K Calibration constant of DSC [J s-1 K-1]
Kapp Apparent equilibrium constant [-]
k Rate constant of forward reaction [lnmol-m min-1]
k´ Rate constant of backward reaction [lnmol-m min-1]
kc Rate constant of forward catalyzed transesterification [l2 mol-2min-1]
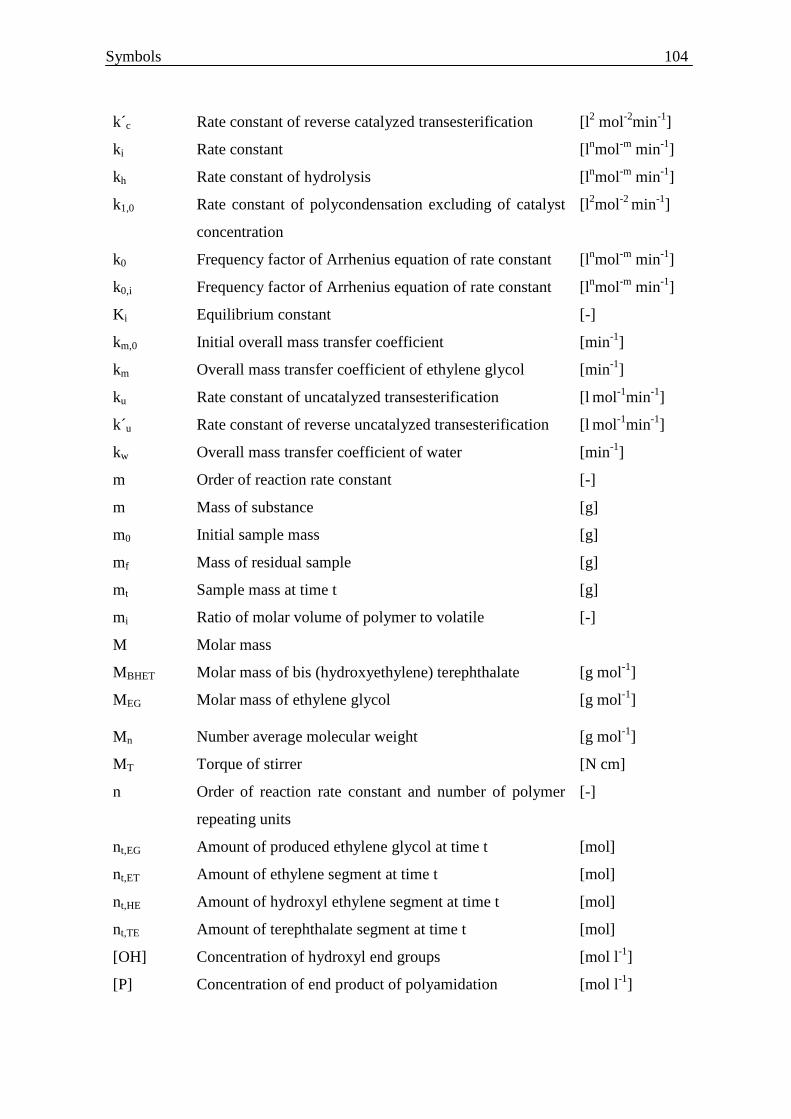
Symbols 104
k´c Rate constant of reverse catalyzed transesterification [l2 mol-2min-1]
ki Rate constant [lnmol-m min-1]
kh Rate constant of hydrolysis [lnmol-m min-1]
k1,0 Rate constant of polycondensation excluding of catalyst
concentration
[l2mol-2 min-1]
k0 Frequency factor of Arrhenius equation of rate constant [lnmol-m min-1]
k0,i Frequency factor of Arrhenius equation of rate constant [lnmol-m min-1]
K i Equilibrium constant [-]
km,0 Initial overall mass transfer coefficient [min-1]
km Overall mass transfer coefficient of ethylene glycol [min-1]
ku Rate constant of uncatalyzed transesterification [l mol-1min-1]
k´u Rate constant of reverse uncatalyzed transesterification [l mol-1min-1]
kw Overall mass transfer coefficient of water [min-1]
m Order of reaction rate constant [-]
m Mass of substance [g]
m0 Initial sample mass [g]
mf Mass of residual sample [g]
mt Sample mass at time t [g]
mi Ratio of molar volume of polymer to volatile [-]
M Molar mass
MBHET Molar mass of bis (hydroxyethylene) terephthalate [g mol-1]
MEG Molar mass of ethylene glycol
[g mol-1]
Mn Number average molecular weight [g mol-1]
MT Torque of stirrer [N cm]
n Order of reaction rate constant and number of polymer
repeating units
[-]
nt,EG Amount of produced ethylene glycol at time t [mol]
nt,ET Amount of ethylene segment at time t [mol]
nt,HE Amount of hydroxyl ethylene segment at time t [mol]
nt,TE Amount of terephthalate segment at time t [mol]
[OH] Concentration of hydroxyl end groups [mol l-1]
[P] Concentration of end product of polyamidation [mol l-1]
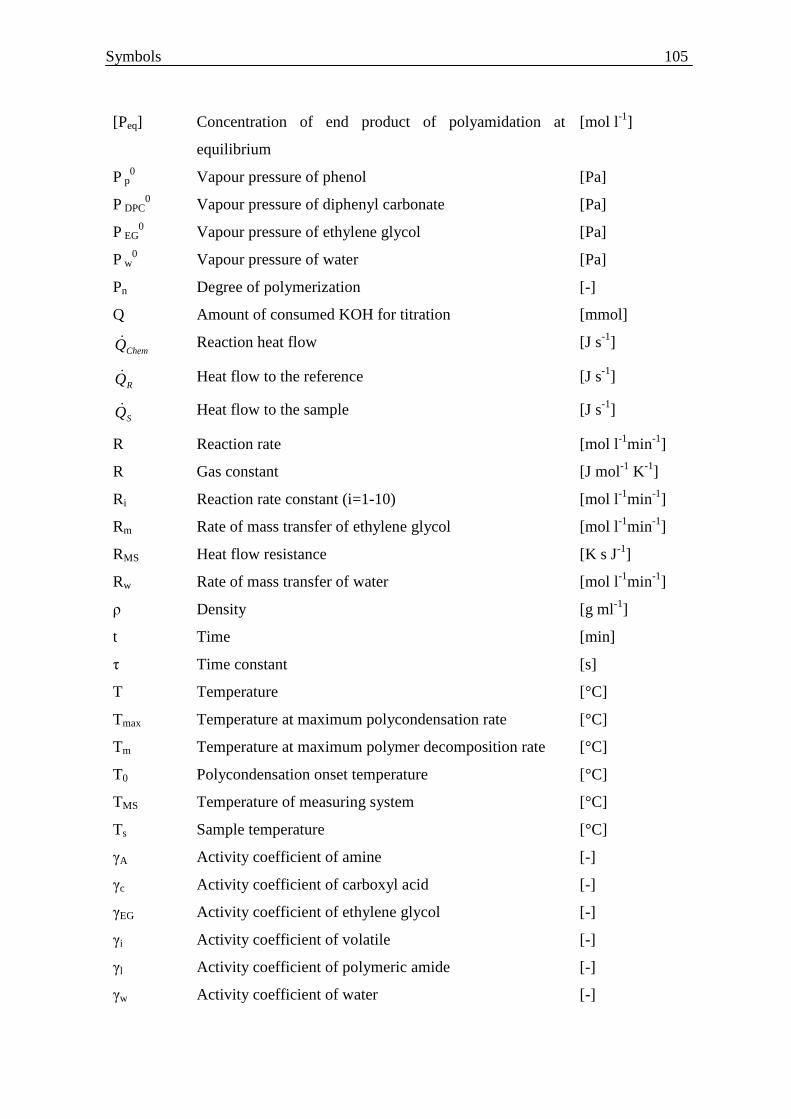
Symbols 105
[Peq] Concentration of end product of polyamidation at
equilibrium
[mol l-1]
P p0 Vapour pressure of phenol [Pa]
P DPC0 Vapour pressure of diphenyl carbonate [Pa]
P EG0 Vapour pressure of ethylene glycol [Pa]
P w0 Vapour pressure of water [Pa]
Pn Degree of polymerization [-]
Q Amount of consumed KOH for titration [mmol]
ChemQ& Reaction heat flow [J s-1]
RQ& Heat flow to the reference [J s-1]
SQ& Heat flow to the sample [J s-1]
R Reaction rate [mol l-1min-1]
R Gas constant [J mol-1 K-1]
Ri Reaction rate constant (i=1-10) [mol l-1min-1]
Rm Rate of mass transfer of ethylene glycol [mol l-1min-1]
RMS Heat flow resistance [K s J-1]
Rw Rate of mass transfer of water [mol l-1min-1]
ρ Density [g ml-1]
t Time [min]
τ Time constant [s]
T Temperature [°C]
Tmax Temperature at maximum polycondensation rate [°C]
Tm Temperature at maximum polymer decomposition rate [°C]
T0 Polycondensation onset temperature [°C]
TMS Temperature of measuring system [°C]
Ts Sample temperature [°C]
γA Activity coefficient of amine [-]
γc Activity coefficient of carboxyl acid [-]
γEG Activity coefficient of ethylene glycol [-]
γi Activity coefficient of volatile [-]
γl Activity coefficient of polymeric amide [-]
γw Activity coefficient of water [-]

Symbols 106
V Reaction volume [l]
Vm Molar volume of polymeric segment [l mol-1]
298mV Molar volume of polymeric segment at 298 K [l mol-1]
TmV Molar volume of polymeric segment at T temperature [l mol-1]
Vt Volume of the melt at time t [l]
V Vdw Molar Van der Waals volume of polymeric segment [l mol-1]
υ Volume of melt occupied by volatile species per volume
of mixture
[-]
υ Molar volume of polymer in melt phase [l mol-1]
[W]0 Concentration of water in gas phase [mol l-1]
[W] l Concentration of water in melt phase [mol l-1]
xA Mole fraction of amine terminal in liquid phase at phase
equilibrium
[-]
xc
Mole fraction of carboxyl terminal in liquid phase at
phase equilibrium
[-]
x Conversion [-]
xi Mole fraction of volatile in liquid phase at phase
equilibrium
[-]
xl Mole fraction of amine terminal in liquid phase at phase
equilibrium
[-]
xEG Mole fraction of ethylene glycol in liquid phase at phase
equilibrium
[-]
xw Mole fraction of water in liquid phase at phase
equilibrium
[-]
χPET Flory-Huggins coefficient [-]
yi Mole fraction of volatile in vapour phase [-]
yEG Mole fraction of ethylene glycol in vapour phase [-]
yw Mole fraction of water in vapour phase [-]
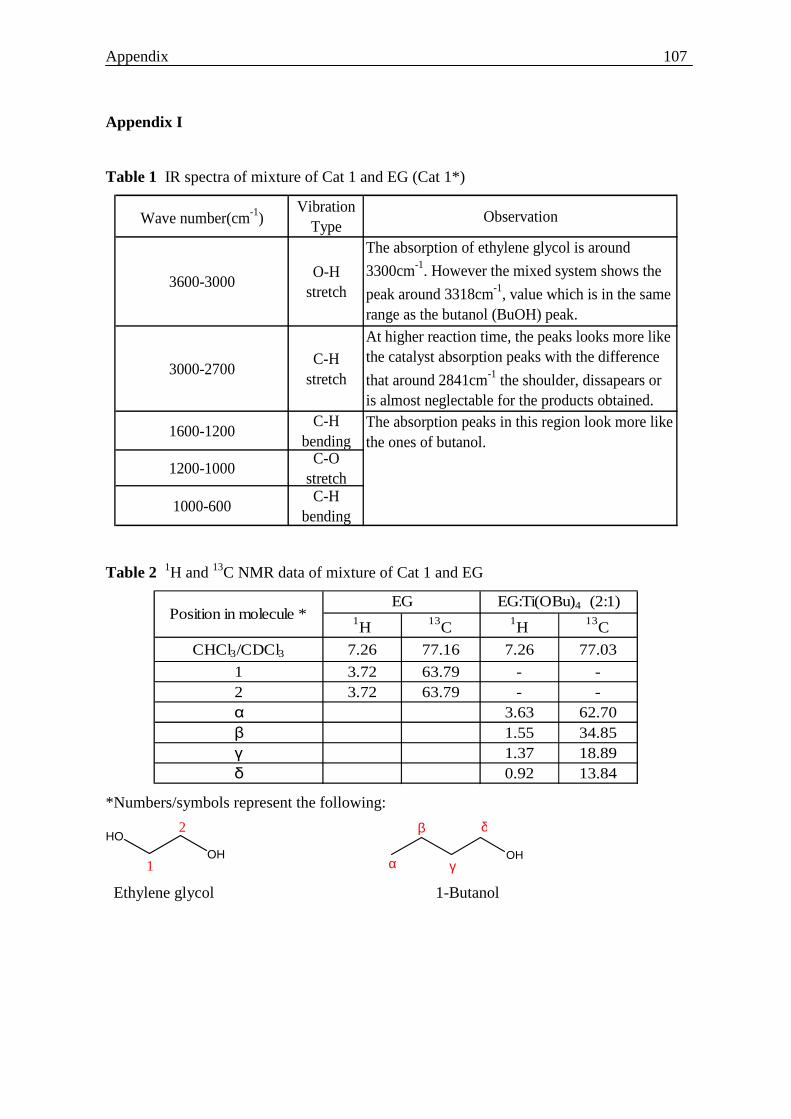
Appendix 107
Appendix I
Table 1 IR spectra of mixture of Cat 1 and EG (Cat 1*)
Wave number(cm-1)Vibration
TypeObservation
3600-3000O-H
stretch
The absorption of ethylene glycol is around
3300cm-1. However the mixed system shows the
peak around 3318cm-1, value which is in the same range as the butanol (BuOH) peak.
3000-2700C-H
stretch
At higher reaction time, the peaks looks more like the catalyst absorption peaks with the difference
that around 2841cm-1 the shoulder, dissapears or is almost neglectable for the products obtained.
1600-1200C-H
bending
1200-1000C-O
stretch
1000-600C-H
bending
The absorption peaks in this region look more like the ones of butanol.
Table 2 1H and 13C NMR data of mixture of Cat 1 and EG
1H 13C 1H 13C
CHCl3/CDCl3 7.26 77.16 7.26 77.03
1 3.72 63.79 - -2 3.72 63.79 - -α 3.63 62.70β 1.55 34.85γ 1.37 18.89δ 0.92 13.84
EG Position in molecule *
EG:Ti(OBu)4 (2:1)
*Numbers/symbols represent the following:
HO
OH1
2
OH
α
β
γ
δ
Ethylene glycol 1-Butanol

Appendix 108
Appemdix II
Table 1 TGA data of nonisothermal run for calculation of activation energy based on
model free method for [Cat 1]:10 mol ppm
5 K min-1 10 K min-1 20 K min-1
T [°C]
Mass loss [%]
T [°C]
Mass lass [%]
T [°C]
Mass loss [%]
110.43 100 110.40 100 110.40 100 114.2035 99.98019 113.5705 99.99124 113.84872 99.99501 117.977 99.97235 117.341 99.97317 117.58744 99.98694 121.7505 99.96623 121.1115 99.94554 121.32616 99.96946 125.524 99.96623 124.882 99.93347 125.06488 99.94832 129.2975 99.96826 128.6525 99.91552 128.8036 99.92889 133.071 99.96259 132.423 99.90101 132.54232 99.90676 136.8445 99.94486 136.1935 99.89013 136.28104 99.88515 140.618 99.9124 139.964 99.871 140.01976 99.86346 144.3915 99.87604 143.7345 99.84504 143.75848 99.83909 148.165 99.81226 147.505 99.81432 147.4972 99.81941 151.9385 99.72787 151.2755 99.78263 151.23592 99.7998 155.712 99.61522 155.046 99.73861 154.97464 99.77378 159.4855 99.46275 158.8165 99.68624 158.71336 99.74494 163.259 99.24068 162.587 99.63436 162.45208 99.70913 167.0325 98.99254 166.3575 99.54687 166.1908 99.67117 170.806 98.67285 170.128 99.41242 169.92952 99.61421 174.5795 98.30445 173.8985 99.25539 173.66824 99.55143 178.353 97.83801 177.669 99.07714 177.40696 99.47614 182.1265 97.28768 181.4395 98.85535 181.14568 99.39221
185.9 96.66406 185.21 98.58913 184.8844 99.2868 189.6735 95.91849 188.98051 98.27414 188.62312 99.16078 193.447 95.1003 192.75101 97.89808 192.36184 99.02275
197.22051 94.17388 196.52151 97.46119 196.10056 98.83742 200.99401 93.17481 200.29201 96.94165 199.83928 98.63029 204.76751 92.0986 204.06251 96.36539 203.57799 98.38802 208.54101 90.94942 207.83301 95.69213 207.31671 98.10369 212.31451 89.7627 211.60351 94.96134 211.05543 97.77996
214 89.15 215.37401 94.15778 214.79415 97.39876 216.08801 88.54771 219.14451 93.15527 218.53287 96.9632 219.86151 87.34372 222.91501 92.2904 222.27159 96.40712 223.63501 86.17081 226.68551 91.25648 226.01031 95.78713 227.40851 85.05072 230.45601 90.18559 229.74903 95.08849 231.18201 84.01266 234.22651 89.05003 233.48775 94.3814 234.95551 83.06447 237.99701 87.99672 237.22647 93.62994 238.72901 82.21086 241.76751 86.90162 240.96519 92.84081 242.50251 81.43924 245.53801 85.76727 244.70391 91.99272 246.27601 80.78927 249.30851 84.83721 248.44263 91.09208 250.04951 80.24793 253.07901 83.89647 252.18135 90.16601 253.82301 79.76796 256.84951 83.00939 255.92007 89.2022 257.59651 79.3404 260.62001 82.21317 259.65879 88.30435 261.37001 78.99084 264.39051 81.52365 263.39751 87.39067

Appendix 109
5 K min-1 10 K min-1 20 K min-1
T [°C]
Mass loss [%]
T [°C]
Mass lass [%]
T [°C]
Mass loss [%]
265.14351 78.68923 268.16101 80.92659 267.13623 86.48977 268.91701 78.4304 271.93151 80.39738 270.87495 85.49447 272.69051 78.20953 275.70201 79.92472 274.61367 84.47694
Table 2 TGA data of nonisothermal run for calculation of activation energy based on
model free method for [Cat 1]: 50 mol ppm
5 K min-1 10 K min-1 20 K min-1
T [°C]
Mass loss [%]
T [°C]
Mass lass [%]
T [°C]
Mass loss [%]
130.05 100 129.73 100 130.05 100 132.889 99.7631246 133.10086 99.7618936 133.38824 99.98223 135.728 99.5161113 136.47172 99.4860068 136.72648 99.96214 138.567 99.2230661 139.84258 99.2363385 140.06472 99.93871 141.406 98.9278035 143.21344 98.9683144 143.40296 99.91483 144.245 98.5570626 146.5843 98.6584119 146.7412 99.88658 147.084 98.1082765 149.95516 98.2911606 150.07944 99.85212 149.923 97.6151065 153.32602 97.9215875 153.41768 99.80373 152.762 97.0723661 156.69688 97.4472734 156.75592 99.74749 155.601 96.3730013 160.06774 96.9870289 160.09416 99.67637 158.44 95.5503711 163.4386 96.3551767 163.4324 99.58956 161.279 94.6574924 166.80946 95.6417831 166.77064 99.4875 164.118 93.5592108 170.18032 94.8248844 170.10888 99.37663 166.957 92.3224743 173.55118 93.8482803 173.44712 99.23369 169.796 90.9343223 176.92204 92.7805156 176.78536 99.063 172.635 89.2646262 180.2929 91.4485989 180.1236 98.84311 175.474 87.4302392 183.66376 89.8841409 183.46184 98.60734 178.313 85.3683794 187.03462 88.1508008 186.80008 98.31466 181.152 83.0847257 190.40548 86.0217639 190.13832 97.96574 183.991 80.6132844 193.77634 83.8138212 193.47656 97.41665 186.83 77.8290466 197.1472 81.2695361 196.8148 97.07948 189.669 74.9506573 200.51806 78.0782032 200.15304 96.48549 192.508 71.8106867 203.88892 75.4123188 203.49128 95.90261 195.347 68.5409989 207.25978 72.015305 206.82952 95.25019 198.186 65.1895497 210.63064 68.8105484 210.16776 94.53856 201.025 61.7409945 214.00151 65.2487072 213.506 93.80124 203.864 58.3339308 215 63.4349633 216.84424 93.02863 206.703 54.979977 217.37237 61.3225638 220.18248 92.21294 209.542 51.634039 220.74323 58.224003 223.52072 91.36515 212.381 48.4634837 224.11409 54.5396592 226.85896 90.51608 215.22 45.3132261 227.48495 51.2007728 230.1972 89.67205 218.059 42.4581058 230.85581 47.924002 231.1 89.37 220.898 39.8400343 234.22667 44.6482153 233.53544 88.81399 223.737 37.2590768 237.59753 41.6787843 236.87368 87.98459 226.576 34.8733064 240.96839 38.9407833 240.21192 87.1671

Appendix 110
5 K min-1 10 K min-1 20 K min-1
T [°C]
Mass loss [%]
T [°C]
Mass lass [%]
T [°C]
Mass loss [%]
229.415 32.6619264 244.33925 36.3384488 243.55016 86.35736 232.254 30.6119442 247.71011 33.775343 246.8884 85.5429 235.093 28.5825845 251.08097 31.2690637 250.22664 84.78882 240.771 25.1415573 257.82269 27.0260556 256.90312 83.57388 243.61 23.464364 261.19355 24.9723707 260.24136 83.033 246.449 21.8282266 264.56441 23.285011 263.5796 82.40065 246.449 21.8282266 264.56441 23.285011 263.5796 82.40065 249.288 20.1903165 267.93527 21.8027364 266.91784 81.95701 252.127 18.8889828 271.30613 20.3680417 270.25608 81.5381 254.966 17.6922352 274.67699 19.2484953 273.59432 81.22696 257.805 16.4970314 278.04785 18.1619087 276.93256 80.88435 260.644 15.3063425 281.41871 17.1395767 280.27081 80.55982 277.678 11.0892686 280.517 10.6636524
Table 3 TGA data of nonisothermal run for calculation of activation energy based on
model free method for [Cat 1]: 100 mol ppm
5 K min-1 10 K min-1 20 K min-1
T [°C]
Mass loss [%]
T [°C]
Mass loss [%]
T [°C]
Mass loss [%]
118.91 100 130.05 100 136.23 100 121.9718 99.99371 133.0488 99.9807 139.0988 99.9819366 125.0336 99.98465 136.0476 99.96169 141.9676 99.9637725 128.0954 99.96498 139.0464 99.9344 144.8364 99.943169 131.1572 99.95469 142.0452 99.9053 147.7052 99.9172734 134.219 99.91813 145.044 99.86653 150.574 99.8859045 137.2808 99.88254 148.0428 99.81506 153.4428 99.8454938 140.3426 99.82178 151.0416 99.75233 156.3116 99.795124 143.4044 99.75017 154.0404 99.68878 159.1804 99.7341198 146.4662 99.65307 157.0392 99.55023 162.0492 99.6781053 149.528 99.53297 160.038 99.42475 164.918 99.601215 152.5898 99.36443 163.0368 99.26517 167.7868 99.5117651 155.6516 99.16439 166.0356 99.08111 170.6556 99.4015706 158.7134 98.89016 169.0344 98.84948 173.5244 99.270712 161.7752 98.59254 172.0332 98.5709 176.3932 99.1210946 164.837 98.22437 175.032 98.24107 179.262 98.9548854 167.8988 97.77659 178.0308 97.85845 182.1308 98.7545757 170.9606 97.25096 181.0296 97.41857 184.9996 98.5180182 174.0224 96.64805 184.0284 96.9097 187.8684 98.2562608 177.0842 95.9708 187.0272 96.32925 190.7372 97.9398496 180.146 95.2122 190.026 95.6931 193.606 97.5887027 183.2078 94.38958 193.0248 94.99644 196.4748 97.134881 186.2696 93.48793 196.0236 94.11383 199.3436 96.6377152 189.3314 92.54938 199.0224 93.35729 202.2124 96.1295522

Appendix 111
5 K min-1 10 K min-1 20 K min-1
T [°C]
Mass loss [%]
T [°C]
Mass lass [%]
T [°C]
Mass loss [%]
226.073 83.03895 232.0092 84.28173 236.638 88.0704611 229.1348 82.54755 235.008 83.66534 239.5068 87.3647603 232.1966 82.08587 238.0068 83.09766 242.3756 86.6663574 235.2584 81.65295 241.0056 82.62293 245.2444 86.0171046 238.3202 81.2097 244.0044 82.18174 248.1132 85.3851592 241.382 80.82065 247.0032 81.75309 250.982 84.78172 244.4438 80.46942 250.002 81.35986 253.8508 84.2306867 247.5056 80.15696 253.0008 80.9863 256.7196 83.8019037 250.5674 79.85173 255.9996 80.6136 259.5884 83.3899946 253.6292 79.56634 258.9984 80.26788 262.4572 82.9305582 256.691 79.32764 261.9972 79.95391 265.326 82.4432406 259.7528 79.11411 264.996 79.69449 268.1948 82.1034035 262.8146 78.95002 267.9948 79.42451 271.0636 81.6928854 265.8764 78.81195 270.9936 79.18957 273.9324 81.3804558 268.9382 78.68226 273.9924 78.98564 276.8012 81.018221
272 78.58595 276.9912 78.81251 275.0618 78.49239 278.1236 78.40162

Appendix 112
Appendix III
Table 1 Experimental data of lab scale stirred tank reactor
[Cat 1] [wt ppm]
Temperature [°C]
Time [h]
IV [dl g-1]
M n [g mol-1] Conversion
[COOH] [mmol kg-1]
[AA] [ppm]
[DEG] [%]
10 260 2 0.37 7.93E+03 0.976 5.4 5.2 1.73 10 260 3 0.47 1.11E+04 0.983 8.7 6.4 1.76 10 260 4 0.52 1.32E+04 0.985 9.1 4.6 1.77 10 255 2 0.36 7.56E+03 0.974 4.9 4.1 1.72 10 255 3 0.42 9.65E+03 0.980 7.0 4.0 1.73 10 255 4 0.46 1.09E+04 0.982 7.6 6.9 1.74 20 260 2 0.40 9.05E+03 0.979 10.2 5.6 1.76 20 260 3 0.52 1.30E+04 0.985 11.6 8.4 1.76 20 260 4 0.66 1.86E+04 0.990 13.7 12.7 1.81 30 260 2 0.42 9.48E+03 0.980 12.1 9.7 1.75 30 260 2.5 0.49 1.20E+04 0.984 13.7 9.2 1.75 30 260 3 0.55 1.42E+04 0.986 14.2 11.0 1.78 0 260 4 0.19 3.04E+03 0.935 2.9 10.8 1.76 10 270 2 0.43 1.00E+04 0.981 7.4 8.1 1.73 10 270 3 0.52 1.32E+04 0.985 10.0 15.4 1.81 10 270 4 0.61 1.64E+04 0.988 11.9 8.7 1.88 10 280 2 0.55 1.43E+04 0.987 9.0 8.0 1.75 10 280 3 0.63 1.72E+04 0.989 12.4 16.1 1.86 10 280 4 0.66 1.85E+04 0.990 16.2 12.7 1.90
250 - Sb 260 4 0.42 9.53E+03 0.980 4.6 3.4 1.78 250 - Sb 260 3 0.37 8.00E+03 0.976 4.1 3.9 1.80 250 - Sb 260 2 0.33 6.62E+03 0.971 2.3 2.7 1.75
Table 2 Analytical data of intrinsic viscosity for PET synthesised at 270°C, [Cat 1]: 10 wt
ppm
No. Times measured for the solvent [s]
Times measured for the sample [s]
Viscosity Number [ml g-1]
1 266.31 361.28 61.701 2 266.34 361.48 3 266.19 361.06 4 265.99 361.05 5 266.00 361.41 6 265.96 361.14 7 266.18 361.83 8 265.99 361.8 9 265.87 361.72 10 265.93 361.84
Average 266.07 361.46 St. Deviation 0.16 0.32
Porcentual error 0.18% 0.27%
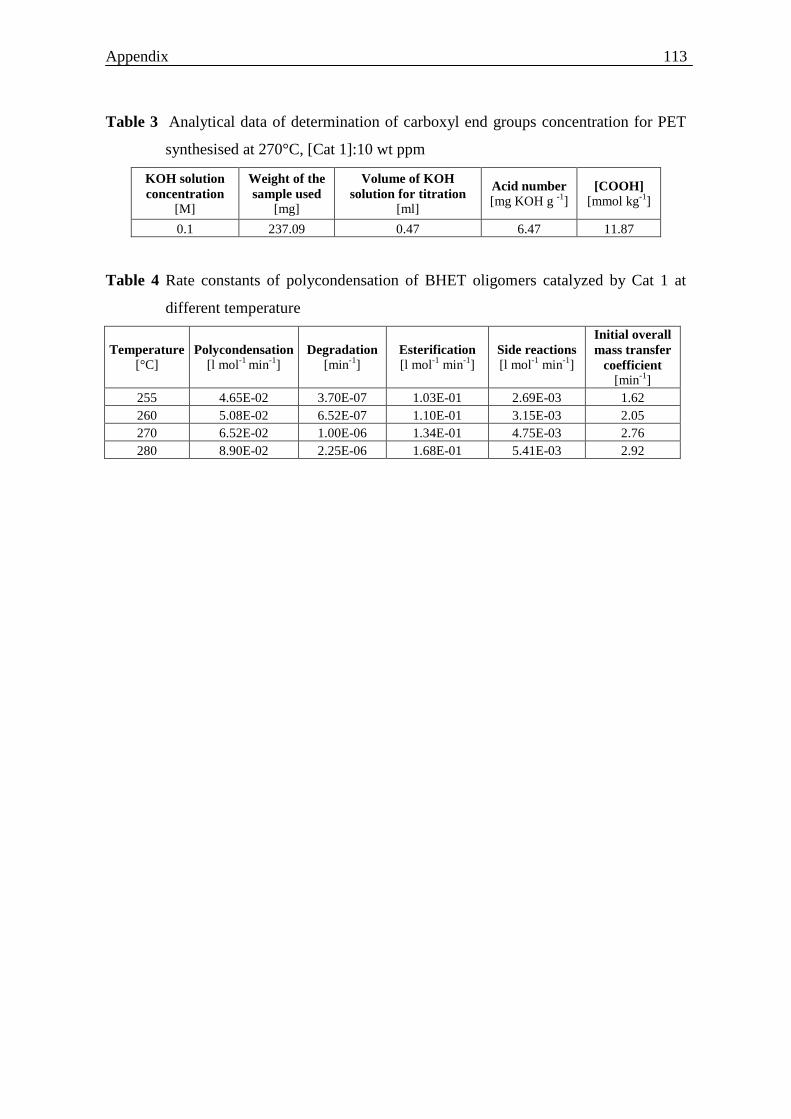
Appendix 113
Table 3 Analytical data of determination of carboxyl end groups concentration for PET
synthesised at 270°C, [Cat 1]:10 wt ppm
KOH solution concentration
[M]
Weight of the sample used
[mg]
Volume of KOH solution for titration
[ml]
Acid number [mg KOH g -1]
[COOH] [mmol kg-1]
0.1 237.09 0.47 6.47 11.87
Table 4 Rate constants of polycondensation of BHET oligomers catalyzed by Cat 1 at
different temperature
Temperature [°C]
Polycondensation [l mol-1 min-1]
Degradation [min-1]
Esterification [l mol-1 min-1]
Side reactions [l mol-1 min-1]
Initial overall mass transfer
coefficient [min-1]
255 4.65E-02 3.70E-07 1.03E-01 2.69E-03 1.62 260 5.08E-02 6.52E-07 1.10E-01 3.15E-03 2.05 270 6.52E-02 1.00E-06 1.34E-01 4.75E-03 2.76 280 8.90E-02 2.25E-06 1.68E-01 5.41E-03 2.92
Related Documents