Astron. Astrophys. 323, 749–761 (1997) ASTRONOMY AND ASTROPHYSICS Kinematics and stellar populations in active galaxies: the LINER NGC 4579 (M58) J. Palacios 1 , M.L. Garc´ ıa-Vargas 2 , Angeles D´ ıaz 1 , Roberto Terlevich 3 , and Elena Terlevich 4 1 Dpto. de F´ ısica Te´ orica, Facultad de Ciencias, C-XI. Cantoblanco. Universidad Aut´ onoma de Madrid, E-28049 Madrid, Spain 2 INSA; ESA IUE Observatory, Villafranca del Castillo Satellite Tracking Station, PO Box 50727, E-28080 Madrid, Spain 3 Royal Greenwich Observatory, Madingley Road, Cambridge CB30EZ, UK 4 Institute of Astronomy, Madingley Road, Cambridge CB30HA, UK Received 10 May 1996 / Accepted 13 January 1997 Abstract. We present long slit spectroscopy from the blue to the near-IR of the LINER galaxy NGC 4579 (M58). Stellar in- dices are used as tools to investigate if any differences in the kinematics and/or stellar content exist between the nucleus and the circumnuclear regions of the galaxy. Blue indices are found to be affected by contamination due to emission lines in the cen- tral region and the method to measure these indices is discussed. No peculiarities are found in the stellar kinematics with respect to the bulges of normal spirals, whose old population can fit the observations of the bulge of NGC 4579. Alternatively, the low central values of Mg 2 and the high values of Mg 1 in the blue and MgI in the near-IR lead us to propose the dominant bulge stellar population in NGC 4579 to be substantially younger than the one present in ordinary ellipticals and S0 galaxies, and therefore a population with an age of about (2.5 ± 1) Gyr. and a metallic- ity of (1.5 ± 0.5) Z is also able to reproduce simultaneously the studied spectral indices as well as the optical spectral energy distribution of the nucleus of NGC 4579. Key words: galaxies: NGC 4579(M58) – active – kinematics and dynamics – stellar content 1. Introduction Although the interest in the properties of galaxies which host active galactic nuclei (AGN) has increased in the last years, still there are few studies which refer to the stellar populations and kinematical properties of these objects. Contamination by the emission line spectrum arising from the ionized gas and lack of spatial resolution constitute the main technical difficulties involved in the project. Prominent stellar lines in the optical and near-IR spectral regions can be used to characterize the stellar populations dom- inating the light at those wavelengths as well as to study their Send offprint requests to: M.L. Garc´ ıa-Vargas corresponding rotation and velocity dispersions. If long slit ob- servations are used the spatial behaviour of these properties can be explored. This is the first one of two papers in which the magnesium spectral indices (atomic Mgb, molecular Mg 1 and Mg 2 ) and Fe 52 in the blue and the Ca II triplet, CaT, and MgI in the near-IR are used to study the kinematics and stellar populations in the central 10 arcsec of nearby active galaxies. Since LINERs are the least active of AGN, they are probably the best candidates to undertake such a study since the continuum is dominated by stellar light in the optical and near infrared. This is the reason to devote this first paper to discuss in detail the results for the LINER NGC 4579 (M58). In a following paper, we will analyze the results for three Seyfert galaxies: NGC 5953, NGC 6814 and NGC 7469. The galaxy NGC 4579, M58, is located at about 20 Mpc (cz = 1502 Km/s, V´ eron-Cetty & V´ eron 1993) and is a member of the Virgo cluster. It has a morphological type SBb (de Vau- coleurs et al. 1991), and was classified as LINER by Filippenko & Sargent (1985) who reported the evidence of weak broad H α emission, already detected by Stauffer (1982). Keel (1983) pub- lished an H α + [NII] narrow band image noting a weak spiral pattern northeast of the nucleus. This feature was observed later as a loop of emission by Pogge (1989) and interpreted as the rem- iniscent of the emission bubbles associated with radio-structures in low luminosity AGN. The extended emission observed in H α + [NII] amounts to 62% of the total. Long slit spectroscopy along the loop and in the circumnuclear region is reported by Gonz´ alez-Delgado & P´ erez (1996). According to them, [OIII] imaging shows a stellar-source nuclear appearance, implying a relatively low ionization state. A nuclear flat spectrum radio core was reported by Hummel et al. (1984; 1987, 1990), as well as X-ray emission (Halpern & Steiner 1983). IUE data by Kinney et al. (1993) show an UV continuum similar to that observed in normal galaxies, and emission lines similar to those observed in Seyfert 2 galaxies although with enhanced low ionization lines (Reichert et al. 1993). Recently, Barth et al. (1996) have presented a FOS/HST UV spectrum of

Welcome message from author
This document is posted to help you gain knowledge. Please leave a comment to let me know what you think about it! Share it to your friends and learn new things together.
Transcript

Astron. Astrophys. 323, 749–761 (1997) ASTRONOMYAND
ASTROPHYSICS
Kinematics and stellar populations in active galaxies:the LINER NGC 4579 (M58)J. Palacios1, M.L. Garcıa-Vargas2, Angeles Dıaz1, Roberto Terlevich3, and Elena Terlevich4
1 Dpto. de Fısica Teorica, Facultad de Ciencias, C-XI. Cantoblanco. Universidad Autonoma de Madrid, E-28049 Madrid, Spain2 INSA; ESA IUE Observatory, Villafranca del Castillo Satellite Tracking Station, PO Box 50727, E-28080 Madrid, Spain3 Royal Greenwich Observatory, Madingley Road, Cambridge CB30EZ, UK4 Institute of Astronomy, Madingley Road, Cambridge CB30HA, UK
Received 10 May 1996 / Accepted 13 January 1997
Abstract. We present long slit spectroscopy from the blue tothe near-IR of the LINER galaxy NGC 4579 (M58). Stellar in-dices are used as tools to investigate if any differences in thekinematics and/or stellar content exist between the nucleus andthe circumnuclear regions of the galaxy. Blue indices are foundto be affected by contamination due to emission lines in the cen-tral region and the method to measure these indices is discussed.No peculiarities are found in the stellar kinematics with respectto the bulges of normal spirals, whose old population can fit theobservations of the bulge of NGC 4579. Alternatively, the lowcentral values of Mg2 and the high values of Mg1 in the blue andMgI in the near-IR lead us to propose the dominant bulge stellarpopulation in NGC 4579 to be substantially younger than theone present in ordinary ellipticals and S0 galaxies, and thereforea population with an age of about (2.5± 1) Gyr. and a metallic-ity of (1.5 ± 0.5) Z� is also able to reproduce simultaneouslythe studied spectral indices as well as the optical spectral energydistribution of the nucleus of NGC 4579.
Key words: galaxies: NGC 4579(M58) – active – kinematicsand dynamics – stellar content
1. Introduction
Although the interest in the properties of galaxies which hostactive galactic nuclei (AGN) has increased in the last years, stillthere are few studies which refer to the stellar populations andkinematical properties of these objects. Contamination by theemission line spectrum arising from the ionized gas and lackof spatial resolution constitute the main technical difficultiesinvolved in the project.
Prominent stellar lines in the optical and near-IR spectralregions can be used to characterize the stellar populations dom-inating the light at those wavelengths as well as to study their
Send offprint requests to: M.L. Garcıa-Vargas
corresponding rotation and velocity dispersions. If long slit ob-servations are used the spatial behaviour of these properties canbe explored.
This is the first one of two papers in which the magnesiumspectral indices (atomic Mgb, molecular Mg1 and Mg2) and Fe52
in the blue and the Ca II triplet, CaT, and MgI in the near-IRare used to study the kinematics and stellar populations in thecentral 10 arcsec of nearby active galaxies. Since LINERs arethe least active of AGN, they are probably the best candidatesto undertake such a study since the continuum is dominated bystellar light in the optical and near infrared. This is the reasonto devote this first paper to discuss in detail the results for theLINER NGC 4579 (M58). In a following paper, we will analyzethe results for three Seyfert galaxies: NGC 5953, NGC 6814and NGC 7469.
The galaxy NGC 4579, M58, is located at about 20 Mpc(cz = 1502 Km/s, Veron-Cetty & Veron 1993) and is a memberof the Virgo cluster. It has a morphological type SBb (de Vau-coleurs et al. 1991), and was classified as LINER by Filippenko& Sargent (1985) who reported the evidence of weak broad Hα
emission, already detected by Stauffer (1982). Keel (1983) pub-lished an Hα + [NII] narrow band image noting a weak spiralpattern northeast of the nucleus. This feature was observed lateras a loop of emission by Pogge (1989) and interpreted as the rem-iniscent of the emission bubbles associated with radio-structuresin low luminosity AGN. The extended emission observed in Hα
+ [NII] amounts to 62% of the total. Long slit spectroscopyalong the loop and in the circumnuclear region is reported byGonzalez-Delgado & Perez (1996). According to them, [OIII]imaging shows a stellar-source nuclear appearance, implyinga relatively low ionization state. A nuclear flat spectrum radiocore was reported by Hummel et al. (1984; 1987, 1990), as wellas X-ray emission (Halpern & Steiner 1983).
IUE data by Kinney et al. (1993) show an UV continuumsimilar to that observed in normal galaxies, and emission linessimilar to those observed in Seyfert 2 galaxies although withenhanced low ionization lines (Reichert et al. 1993). Recently,Barth et al. (1996) have presented a FOS/HST UV spectrum of
750 J. Palacios et al.: Kinematics and stellar populations in active galaxies: the LINER NGC 4579 (M58)
Table 1. Spectral configurations
Spectral range Disp FWHM Exp time(A) (A / pixel) (A) (s)
Blue 4330 - 5618 2.28 4.0 1200
Red 5850 - 7109 2.29 3.3 600
Near-IR 7840 - 9139 2.30 3.7 1200
NGC4579. Maoz et al. (1995) report the detection in the nucleusof NGC 4579 of a bright unresolved source (< 0.11”) in anUV (2300 A) FOC image by HST. They also report a slightlyextended source (PA=72o) with flux about 15% of the brighternuclear source and located at 0.58” from it. This detection iscoincident with the detection of the optical loop. The authorssuggest a star cluster as the possible ionizing source.
This paper is divided as follows: Sect. 2 summarizes theobservations and data-reduction procedures. The measurementmethods are described in Sect. 3, spectral indices in 3.1 andkinematics in 3.2. Sect. 4 presents the results. In particular, sub-section 4.1 contains those referring to the nuclear gas kinemat-ics, 4.2 the stellar kinematics, like the rotation curve and thevelocity dispersion curve, and 4.3 the spatial gradients of theblue and near-IR spectral indices. Sect. 5 discusses the resultson the basis of evolutionary synthesis models. Finally, Sect. 6summarizes the conclusions.
2. Observations and data reduction
The observations were carried out on 1989 July 10 and 11, at theObservatorio del Roque de los Muchachos on the Spanish islandof La Palma, at the Cassegrain focus of the INT 2.5 m telescope.We used the Intermediate Dispersion Spectrograph (IDS), the235 mm camera and a CCD detector with a GEC chip. The pixelsize for this setup configuration was 0.7”. The slit width was210 µm, equivalent to 1.4”. Two different gratings were used tocover the wavelength range: R400V for the blue (λc = 4976 A)and around Hα (λc = 6469 A) and R400R for the near-IR (λc= 8488 A). Two colour filters: WG360 and GC495 were usedto avoid second order contamination in the Hα and IR spectrarespectively. Three different wavelength ranges were chosenfor observation: (a) the blue spectrum, including the Mgb, Fe52,Mg1, Mg2 stellar features, as well as nebular emission lines:Hγ , Hβ , [OIII]4363, 4959, 5007 A, [FeII]5284, 5317, 5363A, (b) the red range centered at Hα for observations of the redemission line spectrum (Hα , [OI]6300, 6363; [NII]6548, 6584,[SII]6717, 6731 A), and (c) the near-IR spectrum to observeCaT, 8498, 8542, 8662 A and MgI 8807 A stellar features, andthe [SIII]9069 A emission line.
The spectral ranges, grating resolutions and exposure timesare given in Table 1. The object was observed with the slit atP.A. 298o.
Fig. 1. Nuclear spectrum of the galaxy NGC 4579 in the blue (top),red (middle) and near-IR (bottom). The vertical scale corresponds tothe spectrum in which the strongest lines are fully plotted.
Several bias, preflash images and flat-field frames in thethree wavelength ranges were taken at the beginning and theend of the night. One calibration lamp exposure per spectralregion and telescope position was performed. The calibrationlamps used were CuAr in blue-red spectroscopy and CuAr +CuNe for near-IR spectroscopy. Two standard stars, HD140283

J. Palacios et al.: Kinematics and stellar populations in active galaxies: the LINER NGC 4579 (M58) 751
Table 2. Stellar reference frame
Star Spectral type Blue near-IR
BD+17 4708 F6 sd X XBD+26 2606 F5 X XHD140283 F3 sd X XHR7407 K0 III X XHR7813 K0 III X XHR7914 G5 V X –HR7942 G9 III X –HR8532 F7 V X XHR8784 F8 IV X X
and BD+17 4708, were observed in the three wavelength rangesfor flux calibration.
Observations of 9 template stars in the blue and 7 in thenear-IR ranges were made. These stars were selected to pro-vide a good stellar reference frame in the same system as thegalaxies for the analysis of the velocity dispersions. Table 2 liststhe stars as well as their spectral types. The seeing during theobservations was 1.5”.
The data reduction was carried out at the UniversidadAutonoma de Madrid, using Starlink FIGARO and ESO MI-DAS standard software packages. The procedure includes theremoval of cosmic rays, the subtraction of a dark current, bias,and the subtraction of a dark-corrected pre-flash frame, neces-sary due to the non-linearity of the detector for low-count level.The non-linearity is only noticeable at the CCD edges, but hasto be taken into account since the CCD borders sometimes mustbe used for sky subtraction, a critical phase in the analysis.
After these preliminar corrections, the bi-dimensional im-ages were divided by a normalized flat-field. Several flat-fieldframes were taken along the night. Their spatial profiles werecontrolled, comparing them with the ones from calibration arcs(one arc per observation), allowing a careful flat-field correc-tion, specially in the CCD edges, whose importance has alreadybeen remarked.
The spectra were corrected for atmospheric extinction usinga mean extinction curve appropriate for La Palma Observatory(King 1985). The assigned air-mass was the averaged value overthe exposure time. Flux calibration was then achieved usingtwo standard stars, taking the calibrated data from Oke & Gunn(1983). The errors in flux calibration are lower than 5%.
Fig. 1 shows the nuclear spectrum of NGC 4579 at the threeobserved wavelength ranges.
3. Measurement methods
In this work we present spatial gradients of stellar features in-dices and kinematical parameters (rotation and velocity disper-sion curves). From the bi-dimensional frames we have extractedspectra at different values of the galactocentric distance. Thenumber of pixels was chosen with the criterion of having enoughsignal to noise to measure the Mgb line in the blue and the CaT
Fig. 2. Spatial profiles of the blue (top) and near-IR (bottom)two-dimensional spectra. The horizontal lines mark the extractions forthe 1D individual spectra used to perform the gradients.
in the near IR spectra. The minimum number of pixels was 3(according to the seeing). We oversampled the bi-dimensionalprofiles to improve the spatial resolution. The assigned effectiveradius (galactocentric distance) for each extraction was foundby weighting the radius of each scan with the luminosity profile,using a emission-free continuum window. The spatial profileswith the extractions are shown in Fig. 2.
3.1. Spectral indices
The indices we have measured correspond to different stellarfeatures: various magnesium indices (Mgb, Mg1, Mg2) and Fe52
in the blue range, and CaT and MgI, in the near-IR. The valueof a given index depends strongly on the system in which themeasurements are made, being necessary to specify a spectralwindow to measure the stellar feature and at least two continuumbandpasses. The pseudo-continuum used to measure the indexis then defined by a linear fit to the averaged fluxes in eachchosen side-spectral windows.
The definitions for the measured indices are given in Gorgaset al. (1993) for the blue features and Dıaz et al. (1989) for thenear-IR ones (CaT and MgI). Accordingly, the CaT index hasbeen taken as the sum of the two strongest lines (λλ 8542, 8662A) pseudo equivalent widths. The windows for the features and
752 J. Palacios et al.: Kinematics and stellar populations in active galaxies: the LINER NGC 4579 (M58)
Table 3. Spectral features and continuum windows
Feature Central band-pass (A) Continuum band-pass (A)
5144.50 - 5162.00Mgb 5162.00 - 5193.25
5193.25 - 5207.004897.00 - 4958.25
Mg1 5071.00 - 5134.755303.00 - 5366.754897.00 - 4958.25
Mg2 5156.00 - 5197.255303.00 - 5366.755235.50 - 5249.25
Fe52 5248.00 - 5286.755288.00 - 5319.25
8527.00 - 8557.00 8447.50 - 8462.50CaT +
8647.00 - 8677.00 8842.50 - 8857.508775.00 - 8787.00
MgI 8799.50 - 8814.508845.00 - 8855.00
the continuum band-passes for each index are summarized inTable 3.
Some emission lines, often present in AGN spectra can con-taminate the continuum band-passes. Such is the case for [OI] λ8440 A at the blue side of the CaT and the emission-line doublet[NI]λλ 5197.9, 5200.4 A(we will refer to is as [NI]λ 5200 A)at the red side of the Mgb line, and in the central window ofMg2 index. Therefore, in the cases in which the presence of gasis known, optional windows, or alternatively a different methodto decontaminate the value of the index have to be used.
For the CaT case, Terlevich et al. (1990) proposed an op-tional window for the blue continuum, centered at 8582 A and15 A wide. However, in the case of NGC 4579, no emission at[OI] 8440 A is detected (see Fig. 1, bottom), and therefore theoriginally defined windows for CaT have been used.
In this case, [NI]5200 A emission is seen, confined to thenucleus of the galaxy. In the following, we discuss the methodused to measure the blue indices in the spectra affected by [NI]contamination (from -1.3” to +1.2”). Out of these regions, wehave used the standard method and windows.
The Mgb is the index more clearly affected by [NI]λ 5200 Acontamination. Goudfrooij & Emsellem (1996, hereafter GE96)have discussed how the emission [NI]λ 5200 A affects theMgb line strength measurements in elliptical galaxies and spiralbulges which in some cases, after the subtraction of an old stellarpopulation template, show emission features from ionized gas.These authors conclude that the compiled values of the Mgbindex could be overestimated by up to 2 A due to this effect.
According to GE96, it is possible to calculate the equivalentwidth of the [NI]5200 A line width which is contaminating theoriginal red continuum band-pass of the Mgb index. Therefore,we have fitted a gaussian profile to the [NI]5200 A line, and wehave integrated this profile between the wavelengths of the red
Table 4. Measured and decontaminated values of Mgb index
Radius Mgb0 Mgb1 Mgb2 Mgb Error(arcsec) A A A A A
–0.1 5.42 3.37 3.09 3.23 0.18+0.2 5.52 3.44 3.04 3.24 0.26–0.4 5.55 3.55 3.04 3.29 0.26+1.2 4.07 2.86 3.12 2.99 0.30–1.3 4.35 2.93 3.06 3.00 0.20+1.9 3.28 2.93 3.53 3.23 0.38–2.0 3.52 2.16 2.86 2.51 0.35
window (5193.25 - 5207.00). Using formula (5) of GE96, wehave calculated the EW which has to be substracted from thevalues of the Mgb index measured with the original band-passes,and we have corrected the values.
We also use an optional window to measure the Mgb in-dex. We define the window between 5220 and 5234 A. We havenot found significant differences in the values of the Mgb indexmeasured with the optional window with respect to the ones us-ing the original band-passes in the sample of stars observed withthe same instrumental configuration as NGC 4579 the same ap-plied to the outer regions of the galaxy. However, our alternativewindow would have to be tested in a sample of normal galaxies.As it can be seen in Table 4, we obtain values very similar byusing either our alternative window, or the technique proposedby GE96.
Table 4 shows the blue radial gradients of some indices inthe central region where spectra show [NI] contamination. Thedifferent measured and corrected values are also displayed asfollows: column 2 displays Mgb0, the value of Mgb index mea-sured with the original contaminated continuum band-pass, col-umn 3, Mgb1 the corrected value according to the measuredMgb0 minus the contribution given by [NI] as in GE96 (for-mula 5), column 4 shows Mgb2 the values of the Mgb indexmeasured with our new spectral window. Column 5 gives theadopted value for the Mgb index, taken as the average betweencolumns 3 and 4. Finally, column 6 gives the error associatedtaken as the maximum between the measurement errors andthe differences between columns 3, 4 and the adopted value.Therefore this is the maximum error.
For the Mg molecular indices, Mg1 and Mg2, the strongestcontaminating emission line is [OIII]4959 A. Three optionalwindows were defined in Gorgas (1987) for elliptical galaxiesin which [OIII] emission was present: one at the blue side ofMg1 (5045 - 5071 A); a second one at the red side of Mg2 (5303- 5367 A), and a third one between both (5135 - 5157 A). Theaverage value of the first and second windows was used as theblue continuum for Mg1 and Mg2 indices. In our case (and maybe in other similar spectra) the alternative continuum for Mg1 iseven more absorbed than the feature itself, and the informationcould be simply lost if these alternative windows were used.Therefore, to measure the magnesium molecular indices, wehave removed the [OIII]λ 4959 A line from the spectrum, and
J. Palacios et al.: Kinematics and stellar populations in active galaxies: the LINER NGC 4579 (M58) 753
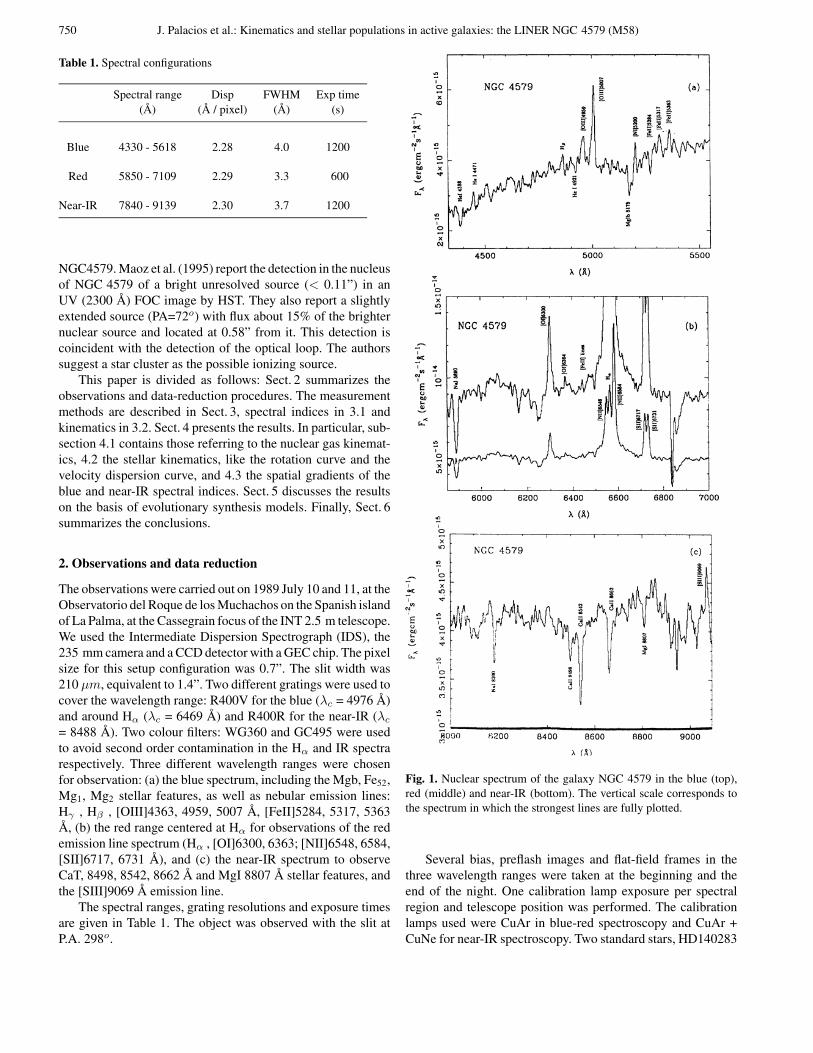
Fig. 3. Spatial gradients of Mg1 (top) and Mg2 (bottom) are displayedas a function of the galactocentric distance. Circles correspond to thevalues measured directly on the original spectra and open squares arethose measured after removing the [OIII] λ 4959 A
then we have measured the indices with the standard continuumband-passes. To illustrate this effect, Fig. 3 shows the valuesof the molecular indices measured before (circles) and after(squares) removing the [OIII] 4959 A line. The corrections areof the order of +0.02 mag. in Mg2 and between +0.01 and +0.03mag in the Mg1 index.
Finally, in the case of the Mg2 index, the contribution of the[NI] emission line has to be taken into account since it couldcontribute to the central window when the feature is measured,diluting the index. We have performed this correction after theprevious one ([OIII] effect). Following Eq. (6) of GE96 we havecalculated the corrective equivalent width of [NI]5200 A insidethe central value of the Mg2 window in the way described abovefor the red window of the Mgb index. For the same galactocen-tric distances given in Table 4, the values of the corrections wehave to add to the Mg2 index are 0.010, 0.010, 0.010, 0.006,0.007, 0.002 and 0.006 respectively.
When line indices are measured in galaxies, an extra-broadening of spectral absorption features appears due to thevelocity dispersion of stars in the galaxy (see Terlevich et al.1990). This afects the continuum producing smaller equivalentwidths. To correct for this effect, a given spectral index is artifi-cially broadened in the template stars by convolving their spectrawith gaussians of different σ, and a broadening correction curve
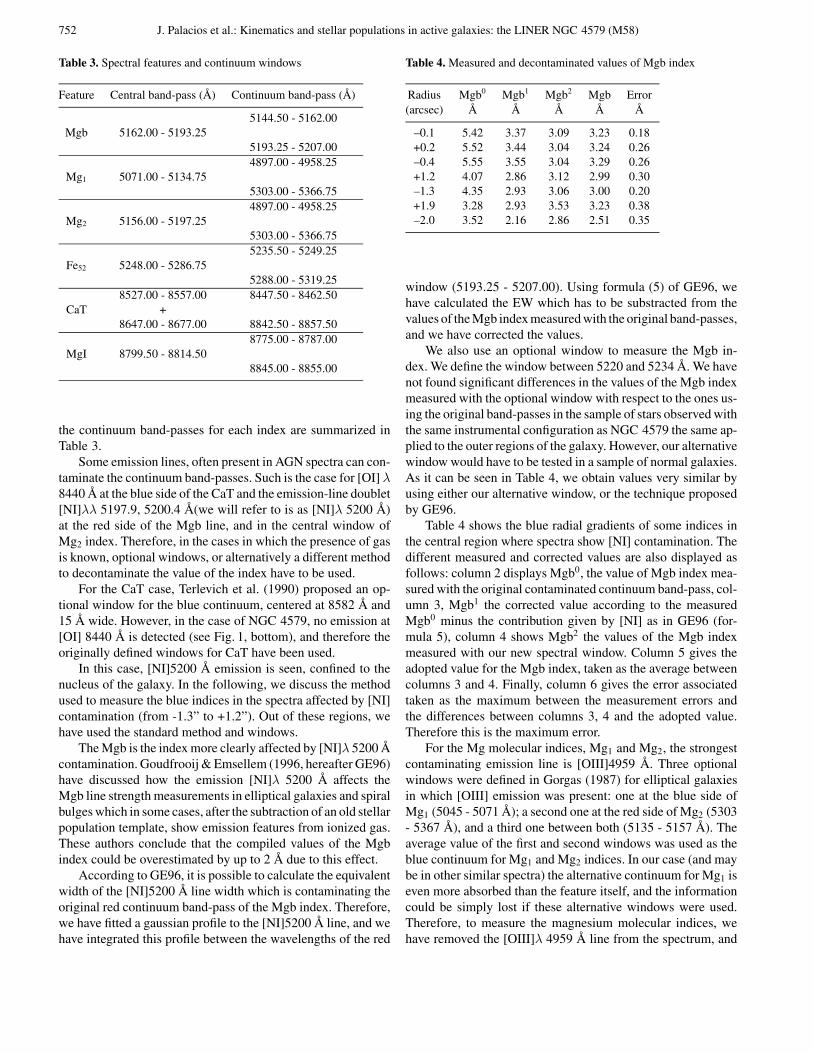
Fig. 4. Broadening correction curves for the Mgb and CaT indices.Y axis represents the ratio between the equivalent width measuredin a stellar spectrum (at rest) and the same index measured in thebroadened stellar spectrum. Different points correspond to differentcalibration stars observed during the night. A gaussian function wasused to broaden the stellar spectrum.
is built. Fig. 4 shows the broadening correction curves for Mgbin the blue and CaT in the near-IR. The best least-square fittingsto the broadening correction curves (one per index) are givenby the following equations:
Mgbr = Mgbσ(1− 10−4 × (4.4σ − 0.03σ2)) A (1)
Mgr1 = Mgσ1 (1− 10−4 × (1.79σ − 0.019σ2)) mag (2)
Mgr2 = Mgσ2 (1 + 10−5 × (7.52σ − 0.0015σ2)) mag (3)
Fer52 = Feσ52(1− 10−5 × (5.2σ − 0.4σ2)) A (4)
CaT r = CaTσ(1 + 10−5 × (7.7σ + 0.2σ2)) A (5)
MgIr = MgIσ(1− 10−5 × (7.7σ − 0.9σ2)) A (6)
where r means the value at rest. For values of the Mgb index,measured with optional windows, the σ broadening correctionexpression is:
Mgbrop = Mgbσop(1 + 10−4 × (1.52σ − 0.003σ2)) A (7)
It is important to apply the corrections in this order: first theσbroadening correction, and then the optional window correction,if this was necessary (not in our case).

754 J. Palacios et al.: Kinematics and stellar populations in active galaxies: the LINER NGC 4579 (M58)
3.2. Kinematics
Stellar velocity dispersion measurements are needed to quantifythe kinematics of the stellar population, and to obtain informa-tion about the central potential, responsible for the dynamics.The first method used to measure velocity dispersion was theFourier Quotient Method (Sargent et al. 1977). Perhaps themethod most commonly used nowadays is the cross-correlationtechnique (Tonry & Davies 1979) which requires the compar-ison with a stellar template. The velocity dispersion is derivedfrom the width of the cross-correlation function after decon-volution from the instrumental profile. This procedure usuallyincludes a filtering of high frequencies of the Fourier transformspectrum to avoid noise contamination and a low frequency fil-tering to eliminate the residual continuum.
At any rate, as pointed out by Dressler (1984) and Davieset al. (1987) the measured systemic velocity and σ are indepen-dent of the method used. Bottema (1988; 1989) used the wholeprofile of the cross- correlation function instead of the mainpeak only. The use of this method is possible only with highsignal to noise spectra, obtained with long exposure times.
In this work, we use the cross-correlation method with slightdifferences with respect to the original one proposed by Tonryand Davies (1979). We consider a stellar spectrum as templatewhich, after subtracting the continuum, is convolved with dif-ferent gaussian functions (of different σ), simulating a largerange in velocity dispersion. The gaussian-convolved spectraare cross-correlated with the unconvolved original stellar spec-trum, and the width of the main peak of the cross-correlationfunction is measured. No frequency filtering is applied in thisprocedure. This method allows us to get a relation between thisvalue (main peak’s width) and σ of the input gaussian. Usingthen a polynomial fitting for values of σ higher than 70 Km/swe build the correction curve for each stellar template. We re-peat this procedure for each of the stellar templates considered.To measure the velocity dispersion, σ, in a galactic spectrum,we convolve it (after continuum subtraction) with each stellartemplate, correcting the width of the main peak in the cross-correlation function according to the corresponding correctioncurve, obtaining σ. We considered σ as the average of the σvalues found for each stellar spectrum used as template. Thisprocedure allows a more precise measurement of σ. A very sim-ilar procedure has been used by Nelson & Whittle (1995). Themain differences are: (a) they use an average stellar templateinstead of individual ones and (b) they filter high and low fre-quencies after the cross-correlation to avoid noise contaminationand residual contributions to the continuum respectively.
The radial velocity, Vr, was measured using two meth-ods:(a) through the shift between the spectrum and each ofthe templates (at rest), and (b) through the cross-correlationbetween the observed spectrum and an artificial template in-cluding δ functions at the positions of the 3 Mg lines (in theblue), and the 3 Ca lines (in the near-IR) The adopted Vr wasthe average of the two derived values.
The gas velocity dispersion has been measured by fitting agaussian to the emission lines. Table 5 summarizes the resultsin row 1.
Table 5. Gas and stellar nuclear velocity dispersions forNGC 4579. Our data are compared with the ones in the literature(Gonzalez-Delgado & Perez 1996, GD96, Whitmore et al. 1985, W85;and Nelson & Whittle 1995, NW95). Note that σg (no [OIII]) refer tothe value got by using all the emission lines except those correspondingto [OIII].
σ(Km/s) Our work W85 NW95 GD96
σg (no [OIII]) 150 ± 20 — — —σg ([OIII]) 250 ± 17 — 278 238 ± 6σs (CaT) 130 ± 13 — — 185 ± 14σs (MgI) 167 ± 17 185 ± 14 160 ± 11 —
The values for the stellar σ and Vr as function of the galac-tocentric radius are listed in columns 2 and 3 respectively inTables 6 and 7.
4. Results: kinematics and index gradients in NGC 4579
4.1. Nuclear gas kinematics
The relation between the gas and stellar kinematics in the nu-cleus is interesting and the results are summarized in Table 5.
If the [OIII] lines are excluded, the mean velocity dispersionof the gas is 150 ± 20 Km/s, similar to that measured from theCaT (130 ± 13 Km/s) and Mg blue lines (167 ± 17 Km/s).The velocity dispersion from the [OIII] lines, 250 ± 17 Km/s,is however substantially larger than the stellar one, implyinga different kinematics for the highly ionized gas and the starsin the nucleus of the galaxy. We have found indications of theexistence of an extra component in [OIII], slightly broader andbarely noticeable in Fig. 1, which might be associated with theremnants of emission bubbles (see Pogge 1989).
This behaviour of [OIII] has been observed also in anotherwell studied LINER, NGC 1052 (Terlevich et al. 1990).
4.2. Stellar kinematical profiles
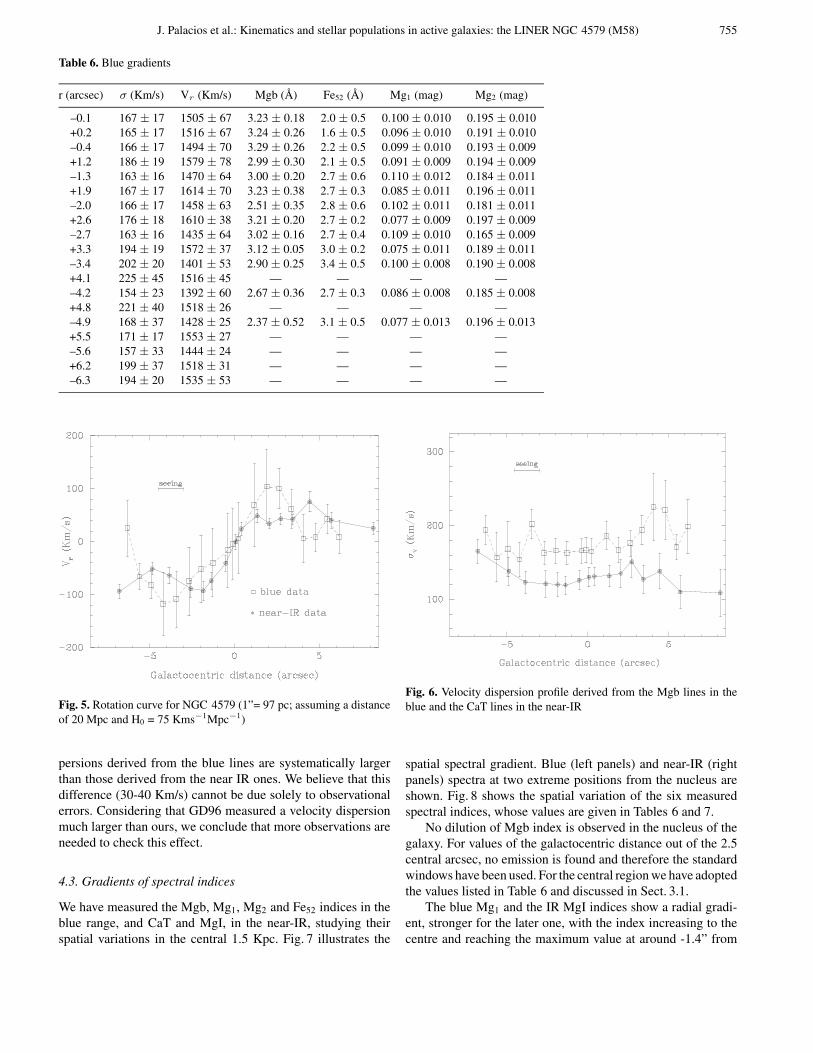
Figs. 5 and 6 show the rotation and the velocity dispersion curvesfor NGC 4579 as derived from the analysis of blue absorptionlines (open squares) and near infrared ones (filled circles).
The rotation curve seems to be symmetric with respect tothe nucleus. No significant differences are found between blueand near IR data although the radial velocity gradient seems tobe slightly larger in the near IR (50 Km/s/arcsec) than in theblue (30 Km/s/arcsec). This can be explained as an obscurationeffect. The near-IR observations reach deeper into the centralregion of the galaxy allowing the measurement of velocitiescloser to the nucleus. This effect has been observed in othergalaxies, in particular in the starburst galaxies M82 (McKeithet al. 1993), NGC 2146 (Prada et al. 1994), and NGC 253(Prada et al. 1996). In all of them, steeper velocity gradientswere found for the lines in the near-IR than in the optical.
The stellar velocity dispersion distribution is rather flat bothin the blue and near IR spectral regions. However, velocity dis-
J. Palacios et al.: Kinematics and stellar populations in active galaxies: the LINER NGC 4579 (M58) 755
Table 6. Blue gradients
r (arcsec) σ (Km/s) Vr (Km/s) Mgb (A) Fe52 (A) Mg1 (mag) Mg2 (mag)
–0.1 167 ± 17 1505 ± 67 3.23 ± 0.18 2.0 ± 0.5 0.100 ± 0.010 0.195 ± 0.010+0.2 165 ± 17 1516 ± 67 3.24 ± 0.26 1.6 ± 0.5 0.096 ± 0.010 0.191 ± 0.010–0.4 166 ± 17 1494 ± 70 3.29 ± 0.26 2.2 ± 0.5 0.099 ± 0.010 0.193 ± 0.009+1.2 186 ± 19 1579 ± 78 2.99 ± 0.30 2.1 ± 0.5 0.091 ± 0.009 0.194 ± 0.009–1.3 163 ± 16 1470 ± 64 3.00 ± 0.20 2.7 ± 0.6 0.110 ± 0.012 0.184 ± 0.011+1.9 167 ± 17 1614 ± 70 3.23 ± 0.38 2.7 ± 0.3 0.085 ± 0.011 0.196 ± 0.011–2.0 166 ± 17 1458 ± 63 2.51 ± 0.35 2.8 ± 0.6 0.102 ± 0.011 0.181 ± 0.011+2.6 176 ± 18 1610 ± 38 3.21 ± 0.20 2.7 ± 0.2 0.077 ± 0.009 0.197 ± 0.009–2.7 163 ± 16 1435 ± 64 3.02 ± 0.16 2.7 ± 0.4 0.109 ± 0.010 0.165 ± 0.009+3.3 194 ± 19 1572 ± 37 3.12 ± 0.05 3.0 ± 0.2 0.075 ± 0.011 0.189 ± 0.011–3.4 202 ± 20 1401 ± 53 2.90 ± 0.25 3.4 ± 0.5 0.100 ± 0.008 0.190 ± 0.008+4.1 225 ± 45 1516 ± 45 — — — —–4.2 154 ± 23 1392 ± 60 2.67 ± 0.36 2.7 ± 0.3 0.086 ± 0.008 0.185 ± 0.008+4.8 221 ± 40 1518 ± 26 — — — —–4.9 168 ± 37 1428 ± 25 2.37 ± 0.52 3.1 ± 0.5 0.077 ± 0.013 0.196 ± 0.013+5.5 171 ± 17 1553 ± 27 — — — —–5.6 157 ± 33 1444 ± 24 — — — —+6.2 199 ± 37 1518 ± 31 — — — —–6.3 194 ± 20 1535 ± 53 — — — —
Fig. 5. Rotation curve for NGC 4579 (1”= 97 pc; assuming a distanceof 20 Mpc and H0 = 75 Kms−1Mpc−1)
persions derived from the blue lines are systematically largerthan those derived from the near IR ones. We believe that thisdifference (30-40 Km/s) cannot be due solely to observationalerrors. Considering that GD96 measured a velocity dispersionmuch larger than ours, we conclude that more observations areneeded to check this effect.
4.3. Gradients of spectral indices
We have measured the Mgb, Mg1, Mg2 and Fe52 indices in theblue range, and CaT and MgI, in the near-IR, studying theirspatial variations in the central 1.5 Kpc. Fig. 7 illustrates the
Fig. 6. Velocity dispersion profile derived from the Mgb lines in theblue and the CaT lines in the near-IR
spatial spectral gradient. Blue (left panels) and near-IR (rightpanels) spectra at two extreme positions from the nucleus areshown. Fig. 8 shows the spatial variation of the six measuredspectral indices, whose values are given in Tables 6 and 7.
No dilution of Mgb index is observed in the nucleus of thegalaxy. For values of the galactocentric distance out of the 2.5central arcsec, no emission is found and therefore the standardwindows have been used. For the central region we have adoptedthe values listed in Table 6 and discussed in Sect. 3.1.
The blue Mg1 and the IR MgI indices show a radial gradi-ent, stronger for the later one, with the index increasing to thecentre and reaching the maximum value at around -1.4” from

756 J. Palacios et al.: Kinematics and stellar populations in active galaxies: the LINER NGC 4579 (M58)
Fig. 7. Representative spectra at two dif-ferent galactocentric distances (r in arcsec).Left panels correspond to blue spectra andspectra at the right are the correspondingones in the near-IR. The spectra have beennormalized, dividing them by the continuum
Table 7. Near-IR gradients
r (arcsec) σ (Km/s) Vr (Km/s) CaT (A) MgI (A)
+0.1 130 ± 13 1586 ± 14 6.5 ± 0.3 0.97 ± 0.04+0.4 131 ± 12 1610 ± 13 6.5 ± 0.5 0.71 ± 0.06–0.5 126 ± 13 1545 ± 15 6.9 ± 0.2 1.16 ± 0.05+1.3 132 ± 14 1635 ± 12 5.9 ± 0.5 0.58 ± 0.09–1.4 119 ± 12 1512 ± 16 6.5 ± 0.2 1.10 ± 0.04+2.1 135 ± 19 1620 ± 9 6.3 ± 0.5 —–1.8 120 ± 16 1493 ± 18 6.7 ± 0.1 0.79 ± 0.05+2.7 151 ± 22 1629 ± 11 6.9 ± 0.5 —–2.6 121 ± 18 1497 ± 16 6.5 ± 0.3 0.45 ± 0.05+3.4 127 ± 19 1628 ± 10 6.5 ± 0.6 —–3.9 123 ± 15 1522 ± 15 6.8 ± 0.3 —+4.4 138 ± 24 1661 ± 19 6.0 ± 0.4 —–4.9 138 ± 19 1535 ± 12 6.9 ± 0.5 —+5.7 110 ± 22 1626 ± 15 6.9 ± 0.7 —–6.8 165 ± 16 1492 ± 13 7.0 ± 0.5 —+8.2 109 ± 32 1611 ± 11 7.4 ± 0.5 —
the nucleus. This could be the result of an increasing metallicitytowards the centre of the galaxy.
This behaviour is not shared by the Mg2 index for whicha constant value of 0.195 ± 0.010 mag is found in the central10 arcsec of the galaxy. [NI] emission at 5200 A contaminatesthe measured index in the nuclear spectrum since the band-passfor the Mg2 feature extends to 5197.25 A (see also Sect. 3.1).
However, no significant gradient is found either when the centraltwo increments (the two showing emission lines) are excluded.
The measured CaT is also rather constant through the cen-tral 10 arcsec of the galaxy with a mean value of 6.5 ± 0.5 A(consistent with the result of an almost flat gradient found byGonzalez-Delgado & Perez 1996, with an average value of 6.4A). The fact that neither dilution nor enhacement of the CaTlines is observed indicates that they probably correspond to thebulge underlying population.
Finally, the Fe52 index is found to be substantially dilutedin the centre with respect to that measured in normal bulges.Such a dilution cannot be attributed to the ionizing continuumresponsible for the activity of the AGN since in that case theMgb index should also appear diluted. Weak [FeII] emissionconcentrated in the galaxy nucleus might be responsible for theobserved weakening of the absorption lines. In fact, UV spectraof NGC 4579 obtained with IUE (Reichert et al. 1992) alsoshow blended [FeII] emission. This has been confirmed in theFOS/HST spectrum of the nucleus of this galaxy by Barth et al.(1996). Apart from this dilution, the average value of the indexout of the nucleus is 2.9 ± 0.5 A and no spatial gradient isfound. For the stellar population analysis in the central region,we have averaged the values of the indices between +0.5” and-1.5” except in the case of Fe52. The value we have adoptedfor this index is 2.7 A since this is the only non-contaminatedobservation which is still in this region (at r = -1.3”) accordingto the rotation curve (see Fig. 5), but it has to be considered onlyas an estimation.

J. Palacios et al.: Kinematics and stellar populations in active galaxies: the LINER NGC 4579 (M58) 757
Fig. 8a–f. Spectral index gradients: Mgb,Fe52, Mg1 and Mg2 blue indices and CaTand MgI 8807 in the near-IR are shown asa function of the galactocentric distance inpanels a, b, c, d, e and f respectively
5. Discussion: constraints for the age and metallicity of theparent galaxy
To interpret our results we have used the most recent modelsavailable to compute the stellar indices as a function of the ageand the metallicity for Single Stellar Populations (SSP).
Worthey (1994) presented evolutionary synthesis models forSSP as a function of the metallicity, based on the revised Yaleisochrones (Green et al. 1987), the atmosphere models by Ku-rucz (1992) and the stellar atlases of Bessell et al. (1989, 1991)and Gunn & Stryker (1983). He synthesized 21 absorption stel-lar indices using the fitting functions calculated by Worthey et al.(1994) in which each index is a function of the stellar effectivetemperature, surface gravity and metallicity.
According to Worthey’s (1994) work, the model which bestreproduces our results for the nuclear stellar population corre-
sponds to a SSP with an age around 3 Gyr and solar metallicity.Alternatively, if a higher metallicity model (1.7 Z�) is chosen,the population should be even younger, 1.5-2 Gyr. A model of0.5 Z� and around 12 Gyr would also fit the observed valueswithin the errors. Models for ages older than 12 Gyr would givetoo large values of both, Mg2 and Mgb indices. Table 8 sum-marizes Worthey’s predictions for these models, and our resultsfor NGC 4579.
Casuso et al. (1996) have computed the Mg2 index as a func-tion of age and metallicity. They also use the fitting functions byWorthey et al. (1994) to calculate the index for each particularstar in the HR diagram. The improvement with respect to pre-vious models (Peletier 1989; Worthey 1994) resides in the useof the Padova isochrones (Bertelli et al. 1994), which include
758 J. Palacios et al.: Kinematics and stellar populations in active galaxies: the LINER NGC 4579 (M58)
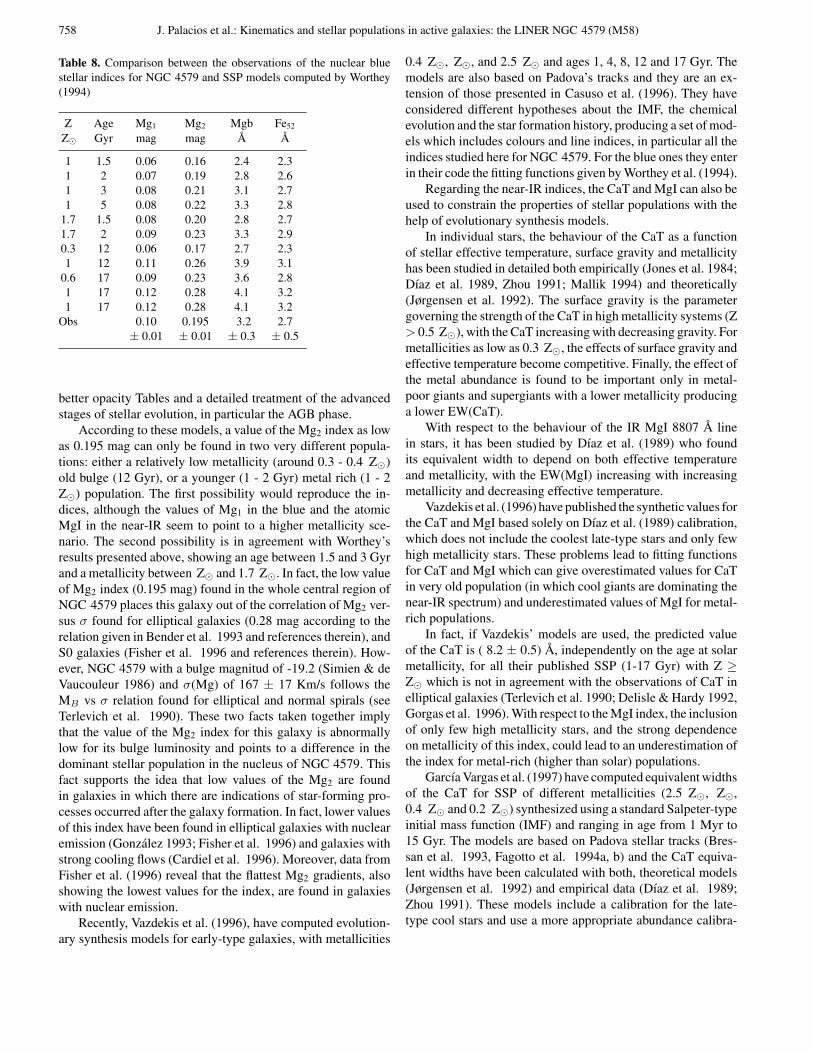
Table 8. Comparison between the observations of the nuclear bluestellar indices for NGC 4579 and SSP models computed by Worthey(1994)
Z Age Mg1 Mg2 Mgb Fe52
Z� Gyr mag mag A A
1 1.5 0.06 0.16 2.4 2.31 2 0.07 0.19 2.8 2.61 3 0.08 0.21 3.1 2.71 5 0.08 0.22 3.3 2.8
1.7 1.5 0.08 0.20 2.8 2.71.7 2 0.09 0.23 3.3 2.90.3 12 0.06 0.17 2.7 2.31 12 0.11 0.26 3.9 3.1
0.6 17 0.09 0.23 3.6 2.81 17 0.12 0.28 4.1 3.21 17 0.12 0.28 4.1 3.2
Obs 0.10 0.195 3.2 2.7± 0.01 ± 0.01 ± 0.3 ± 0.5
better opacity Tables and a detailed treatment of the advancedstages of stellar evolution, in particular the AGB phase.
According to these models, a value of the Mg2 index as lowas 0.195 mag can only be found in two very different popula-tions: either a relatively low metallicity (around 0.3 - 0.4 Z�)old bulge (12 Gyr), or a younger (1 - 2 Gyr) metal rich (1 - 2Z�) population. The first possibility would reproduce the in-dices, although the values of Mg1 in the blue and the atomicMgI in the near-IR seem to point to a higher metallicity sce-nario. The second possibility is in agreement with Worthey’sresults presented above, showing an age between 1.5 and 3 Gyrand a metallicity between Z� and 1.7 Z�. In fact, the low valueof Mg2 index (0.195 mag) found in the whole central region ofNGC 4579 places this galaxy out of the correlation of Mg2 ver-sus σ found for elliptical galaxies (0.28 mag according to therelation given in Bender et al. 1993 and references therein), andS0 galaxies (Fisher et al. 1996 and references therein). How-ever, NGC 4579 with a bulge magnitud of -19.2 (Simien & deVaucouleur 1986) and σ(Mg) of 167 ± 17 Km/s follows theMB vs σ relation found for elliptical and normal spirals (seeTerlevich et al. 1990). These two facts taken together implythat the value of the Mg2 index for this galaxy is abnormallylow for its bulge luminosity and points to a difference in thedominant stellar population in the nucleus of NGC 4579. Thisfact supports the idea that low values of the Mg2 are foundin galaxies in which there are indications of star-forming pro-cesses occurred after the galaxy formation. In fact, lower valuesof this index have been found in elliptical galaxies with nuclearemission (Gonzalez 1993; Fisher et al. 1996) and galaxies withstrong cooling flows (Cardiel et al. 1996). Moreover, data fromFisher et al. (1996) reveal that the flattest Mg2 gradients, alsoshowing the lowest values for the index, are found in galaxieswith nuclear emission.
Recently, Vazdekis et al. (1996), have computed evolution-ary synthesis models for early-type galaxies, with metallicities
0.4 Z�, Z�, and 2.5 Z� and ages 1, 4, 8, 12 and 17 Gyr. Themodels are also based on Padova’s tracks and they are an ex-tension of those presented in Casuso et al. (1996). They haveconsidered different hypotheses about the IMF, the chemicalevolution and the star formation history, producing a set of mod-els which includes colours and line indices, in particular all theindices studied here for NGC 4579. For the blue ones they enterin their code the fitting functions given by Worthey et al. (1994).
Regarding the near-IR indices, the CaT and MgI can also beused to constrain the properties of stellar populations with thehelp of evolutionary synthesis models.
In individual stars, the behaviour of the CaT as a functionof stellar effective temperature, surface gravity and metallicityhas been studied in detailed both empirically (Jones et al. 1984;Dıaz et al. 1989, Zhou 1991; Mallik 1994) and theoretically(Jørgensen et al. 1992). The surface gravity is the parametergoverning the strength of the CaT in high metallicity systems (Z> 0.5 Z�), with the CaT increasing with decreasing gravity. Formetallicities as low as 0.3 Z�, the effects of surface gravity andeffective temperature become competitive. Finally, the effect ofthe metal abundance is found to be important only in metal-poor giants and supergiants with a lower metallicity producinga lower EW(CaT).
With respect to the behaviour of the IR MgI 8807 A linein stars, it has been studied by Dıaz et al. (1989) who foundits equivalent width to depend on both effective temperatureand metallicity, with the EW(MgI) increasing with increasingmetallicity and decreasing effective temperature.
Vazdekis et al. (1996) have published the synthetic values forthe CaT and MgI based solely on Dıaz et al. (1989) calibration,which does not include the coolest late-type stars and only fewhigh metallicity stars. These problems lead to fitting functionsfor CaT and MgI which can give overestimated values for CaTin very old population (in which cool giants are dominating thenear-IR spectrum) and underestimated values of MgI for metal-rich populations.
In fact, if Vazdekis’ models are used, the predicted valueof the CaT is ( 8.2 ± 0.5) A, independently on the age at solarmetallicity, for all their published SSP (1-17 Gyr) with Z ≥Z� which is not in agreement with the observations of CaT inelliptical galaxies (Terlevich et al. 1990; Delisle & Hardy 1992,Gorgas et al. 1996). With respect to the MgI index, the inclusionof only few high metallicity stars, and the strong dependenceon metallicity of this index, could lead to an underestimation ofthe index for metal-rich (higher than solar) populations.
Garcıa Vargas et al. (1997) have computed equivalent widthsof the CaT for SSP of different metallicities (2.5 Z�, Z�,0.4 Z� and 0.2 Z�) synthesized using a standard Salpeter-typeinitial mass function (IMF) and ranging in age from 1 Myr to15 Gyr. The models are based on Padova stellar tracks (Bres-san et al. 1993, Fagotto et al. 1994a, b) and the CaT equiva-lent widths have been calculated with both, theoretical models(Jørgensen et al. 1992) and empirical data (Dıaz et al. 1989;Zhou 1991). These models include a calibration for the late-type cool stars and use a more appropriate abundance calibra-

J. Palacios et al.: Kinematics and stellar populations in active galaxies: the LINER NGC 4579 (M58) 759
Table 9. Comparison between the nuclear observations and models ofstellar indices for NGC 4579. All the indices are taken from Vazdekiset al. (1996) except the CaT which has been taken from Garcıa-Vargaset al. (1997).
Z Age Mg1 Mg2 Mgb Fe52 CaT MgIZ� Gyr mag mag A A A A
1 1 0.034 0.123 2.1 2.0 5.8 0.641 3 0.070 0.186 2.9 2.5 7.1 0.741 4 0.089 0.218 3.4 2.8 7.2 0.792 2 0.080 0.191 3.0 2.7 6.9 0.80
2.5 1 0.064 0.172 2.6 2.6 7.2 0.841 10 0.114 0.263 3.9 3.1 7.3 0.84
0.4 12 0.081 0.202 3.2 2.6 5.9 0.730.4 17 0.092 0.216 3.3 2.7 5.9 0.77Obs 0.10 0.195 3.2 2.7 6.5 0.98
± 0.01 ± 0.01 ± 0.3 ± 0.5 ± 0.5 ± 0.1
tion based on the theoretical models by Jørgensen et al. (1992),but see the discussion in Garcıa-Vargas et al. (1997).
We have used the models described above to constrain theage of the dominant stellar population. For the predictions ofCaT we have taken the models by Garcıa-Vargas et al. (1997).For MgI, since the only available models are those of Vazdekiset al. (1996) we have used them but we have to keep in mindthat they could be only lower limits to the real value (especiallyin their models at Z ≥ Z�).
Table 9 presents a comparison between the observations andmodels of the studied stellar indices in NGC 4579. All the com-puted indices have been taken from Vazdekis et al. (1996) ex-cept the CaT which has been taken from Garcıa-Vargas et al.(1997). Both set of models are computed with the same evolu-tionary scheme (Padova’s isochones of SSP) and for a unimodalstandard (Salpeter) IMF. Some models interpolated between theoriginal ones (3 Gyr and 10 Gyr at Z� and 2 Gyr at 2 Z�) arealso given for comparison.
The blue indices, specially the strong constraint given bythe low Mg2 index, again point to the same conclusion reachedfrom Worthey’s models. The solution is not single-valued andthe observations are consistent with an old bulge (see model at0.4 Z� and 12 Gyr) or alternatively with a younger population(see model at 2 Z� and 2 Gyr).
From the near-IR indices, the models indicate that the ob-served EW(CaT) in NGC 4579 can be originated in a populationwith a metallicity about solar and an age between 1 and 2 Gyr.Such a population produces an EW(CaT) of 6.5± 0.5 A whichis also the observed value. However, the value of CaT is alsoquite consistent with an old 0.4 Z� population (5.9 ± 0.5 A).
The IR MgI line gradient found in the central region ofNGC 4579 could therefore be interpreted as a gradient in metal-licity since more metal rich stars would in general also be cooler,both effects combining to produce IR MgI line.
All the evidence seem to indicate that the physical parame-ters of the dominant central population in NGC 4579 could cor-
respond to a high metallicity system (around Z�) substantiallyyounger than a typical old bulge population. Current populationsynthesis models of SSP place its age between 1 and 3 Gyr.
Previous works have pointed to an old population, suggestedon the basis of the optical spectral energy distribution. Stauf-fer (1982) showed a low dispersion spectrum of the nucleus ofNGC 4579, finding that a template population like that of theE galaxy NGC 3379 would be suitable. In fact, NGC 4579 wasclassified by Bica (1988) in the spectral group S3, which is redstrong lined like those of E3 and E2 (like NGC3379 and othertypical E and S0), although inspection of Fig. 12 (S3) and 13(S4) from Bica (1988) and the observed spectra by Gonzalez-Delgado & Perez (1996, see Fig. 8a), indicates that this galaxycan be classified as S4, for which an intermediate population(1-5 Gyr) is expected contributing less than 20% to the light inthe blue.
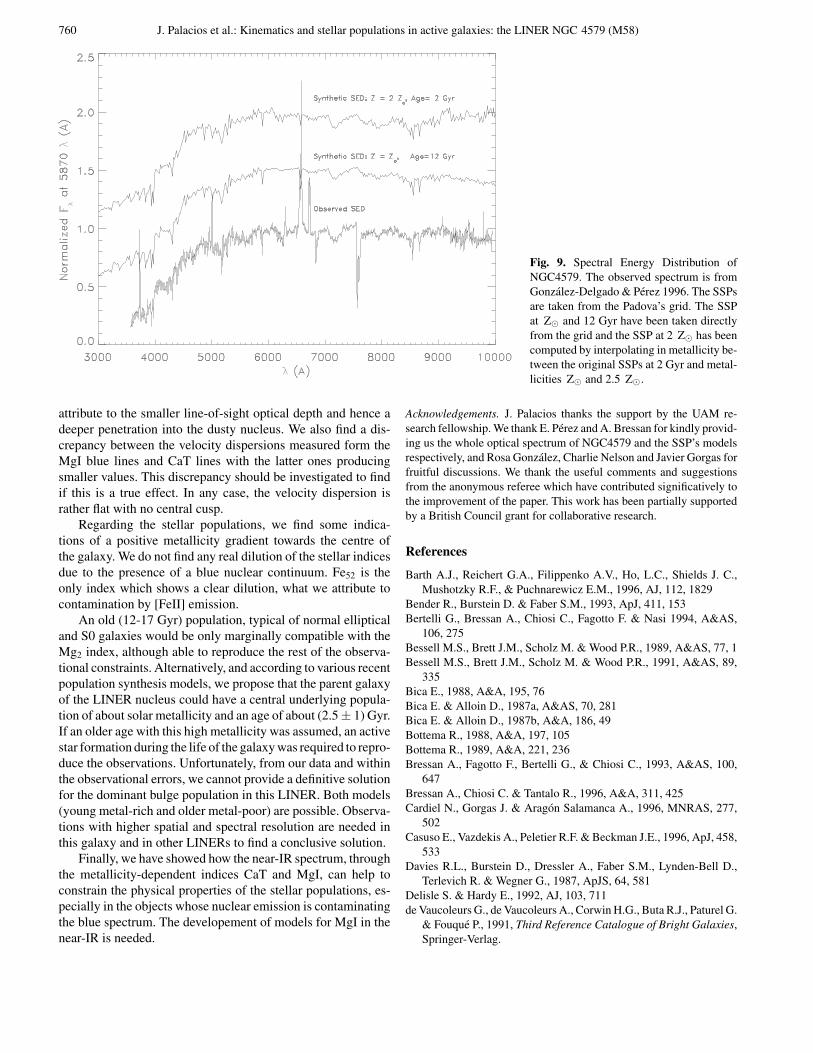
To test again both possibilities, we have compared modelsof SSP with the observed spectrum of NGC4579. Bica & Alloin(1987a) present data for NGC4579 up to 7520 A, but the galaxyis not included in their near-IR sample (Bica & Alloin 1987b).To have a wider wavelength range we have used the opticalspectrum of M58 kindly provided by E. Perez (see Gonzalez-Delgado & Perez 1996). For the models, we have taken thoseSSP published by Padova’s group and kindly provided by A.Bressan. The specifications of their models are described inTantalo et al. (1996) and Bressan et al. (1996). We have red-dened the SSPs with a value of E(B-V)=0.15 mag (Barth et al.gives a value between a minimum of 0.10 and a maximum of0.19 mag for the nucleus of NGC4579). The spectrum providedby Gonzalez-Delgado & Perez and the two SSPs which best fitthe SED, provided by A. Bressan are displayed in Fig. 9.
The observed values for the continuum flux ratios at thespecified wavelengths in A 4020/5870, 4570/5870, 5340/5870,6630/5870, 6990/5870, 7790/5870, 8310/5870, 8890/5870,9430/5870, 9610/5870 and 9790/5870 are: 0.51, 0.79, 0.92,1.02, 0.99, 0.95, 0.91, 0.99, 0.96, 1.01 and 1.1 respectively.The synthetic values for a SSP of 2 Z� and 2 Gyr are 0.51,0.84, 0.90, 0.97, 0.96, 0.92, 0.89, 0.94, 0.95, 0.97 and 0.93. Thecomparison shows that the model and the observations are inagreement. If we take a SSP of 12 Gyr and Z=0.008, the pre-dicted values for the same ratios are: 0.46, 0.79, 0.90, 1.00, 0.99,0.96, 0.93, 0.95, 0.92, 0.91 and 0.87, also consistent. Both pop-ulations, a youngest metal-rich or an old metal-poor can fit theSED.
Finally, if models with a SFR and chemical evolution aretaken (Vazdekis et al. 1996) the observations are consistent witha stellar population of (7 ± 3) Gyr, a SFR of (10 ± 5) × 10−4
M�yr−1, and an average solar metallicity.
6. Conclusions
We have studied the kinematics and stellar population in thecentral regions of the LINER galaxy NGC 4579 by using longslit spectroscopic observations in the blue and near-IR.
From the kinematical study, we find a marginally steeperradial gradient in the near-IR (CaT) velocity curve which we
760 J. Palacios et al.: Kinematics and stellar populations in active galaxies: the LINER NGC 4579 (M58)
Fig. 9. Spectral Energy Distribution ofNGC4579. The observed spectrum is fromGonzalez-Delgado & Perez 1996. The SSPsare taken from the Padova’s grid. The SSPat Z� and 12 Gyr have been taken directlyfrom the grid and the SSP at 2 Z� has beencomputed by interpolating in metallicity be-tween the original SSPs at 2 Gyr and metal-licities Z� and 2.5 Z�.
attribute to the smaller line-of-sight optical depth and hence adeeper penetration into the dusty nucleus. We also find a dis-crepancy between the velocity dispersions measured form theMgI blue lines and CaT lines with the latter ones producingsmaller values. This discrepancy should be investigated to findif this is a true effect. In any case, the velocity dispersion israther flat with no central cusp.
Regarding the stellar populations, we find some indica-tions of a positive metallicity gradient towards the centre ofthe galaxy. We do not find any real dilution of the stellar indicesdue to the presence of a blue nuclear continuum. Fe52 is theonly index which shows a clear dilution, what we attribute tocontamination by [FeII] emission.
An old (12-17 Gyr) population, typical of normal ellipticaland S0 galaxies would be only marginally compatible with theMg2 index, although able to reproduce the rest of the observa-tional constraints. Alternatively, and according to various recentpopulation synthesis models, we propose that the parent galaxyof the LINER nucleus could have a central underlying popula-tion of about solar metallicity and an age of about (2.5± 1) Gyr.If an older age with this high metallicity was assumed, an activestar formation during the life of the galaxy was required to repro-duce the observations. Unfortunately, from our data and withinthe observational errors, we cannot provide a definitive solutionfor the dominant bulge population in this LINER. Both models(young metal-rich and older metal-poor) are possible. Observa-tions with higher spatial and spectral resolution are needed inthis galaxy and in other LINERs to find a conclusive solution.
Finally, we have showed how the near-IR spectrum, throughthe metallicity-dependent indices CaT and MgI, can help toconstrain the physical properties of the stellar populations, es-pecially in the objects whose nuclear emission is contaminatingthe blue spectrum. The developement of models for MgI in thenear-IR is needed.
Acknowledgements. J. Palacios thanks the support by the UAM re-search fellowship. We thank E. Perez and A. Bressan for kindly provid-ing us the whole optical spectrum of NGC4579 and the SSP’s modelsrespectively, and Rosa Gonzalez, Charlie Nelson and Javier Gorgas forfruitful discussions. We thank the useful comments and suggestionsfrom the anonymous referee which have contributed significatively tothe improvement of the paper. This work has been partially supportedby a British Council grant for collaborative research.
References
Barth A.J., Reichert G.A., Filippenko A.V., Ho, L.C., Shields J. C.,Mushotzky R.F., & Puchnarewicz E.M., 1996, AJ, 112, 1829
Bender R., Burstein D. & Faber S.M., 1993, ApJ, 411, 153Bertelli G., Bressan A., Chiosi C., Fagotto F. & Nasi 1994, A&AS,
106, 275Bessell M.S., Brett J.M., Scholz M. & Wood P.R., 1989, A&AS, 77, 1Bessell M.S., Brett J.M., Scholz M. & Wood P.R., 1991, A&AS, 89,
335Bica E., 1988, A&A, 195, 76Bica E. & Alloin D., 1987a, A&AS, 70, 281Bica E. & Alloin D., 1987b, A&A, 186, 49Bottema R., 1988, A&A, 197, 105Bottema R., 1989, A&A, 221, 236Bressan A., Fagotto F., Bertelli G., & Chiosi C., 1993, A&AS, 100,
647Bressan A., Chiosi C. & Tantalo R., 1996, A&A, 311, 425Cardiel N., Gorgas J. & Aragon Salamanca A., 1996, MNRAS, 277,
502Casuso E., Vazdekis A., Peletier R.F. & Beckman J.E., 1996, ApJ, 458,
533Davies R.L., Burstein D., Dressler A., Faber S.M., Lynden-Bell D.,
Terlevich R. & Wegner G., 1987, ApJS, 64, 581Delisle S. & Hardy E., 1992, AJ, 103, 711de Vaucoleurs G., de Vaucoleurs A., Corwin H.G., Buta R.J., Paturel G.
& Fouque P., 1991, Third Reference Catalogue of Bright Galaxies,Springer-Verlag.
J. Palacios et al.: Kinematics and stellar populations in active galaxies: the LINER NGC 4579 (M58) 761
Dıaz A.I., Terlevich E. & Terlevich R., 1989, MNRAS, 239, 325Dressler A., 1984, ApJ, 281, 512Fagotto F., Bressan A., Bertelli G., Chiosi C., 1994a, A&AS, 104, 365Fagotto F., Bressan A., Bertelli G., Chiosi C., 1994b, A&AS, 105, 29Filippenko A.V. & Sargent W.L.W., 1985, ApJS, 57, 503Fisher D., Franx M. & Illingworth G., 1996, ApJ, 459, 110Garcıa-Vargas M.L., Molla M. & Bressan A., 1997, submittedGonzalez J.J., 1993, PhD Thesis. Univ. California.Gonzalez-Delgado R.M. & Perez E., 1996, MNRAS, 281, 1105Gorgas J., 1987, PhD Thesis. Univ. Complutense, MadridGorgas J., Faber S.M., Burstein D., Gonzalez J., Courteau S. & Prosser
C., 1993, ApJS, 86, 153Gorgas J., Garcıa-Vargas M.L. & Cardiel, 1996, in preparationGoudfrooij P. & Emsellem E., 1996, A&A, 306, L45Green E.M., Demarque P. & King C.R., 1987, The Revised Yale
Isochrones and Luminosity Functions (New Haven: Yale UniversityObservatory)
Gunn J.E. & Stryker L.L., 1983, ApJS, 52, 121Halpern J.P. & Steiner J.E., 1983, ApJ, 269, 37Hummel E., Van der Hulst J.M. & Dickey J.M., 1984, A&A, 134, 207Hummel E., Van der Hulst J.M., Keel W.C. & Kennicutt R.C.Jr, 1987,
A&AS, 70, 517Hummel E., Van der Hulst J.M., Kennicutt R.C.Jr & Keel W.C., 1990,
A&A, 236, 333Jones J.E., Alloin D.M. & Jones B.J.T., 1984, ApJ, 283, 457Jørgensen U.G., Carlsson M. & Johnson H.R., 1992, A&A, 254, 258Keel W.C., 1983, ApJ, 269, 466King D.L., 1985, La Palma Technical Note No. 15Kinney A.L., Bohlin R.C., Calzetti D., Panagia N. & Wyse R.F.G, 1993,
ApJS, 86, 5Kurucz R., 1992, Precision Photometry: Astrophysics of the Galaxy,
ed. P.G. Davis Phillip, A.R. Upgren & K.A. Janes, L. Davis press,Schenectady
Mallik S.V., 1994, A&AS, 103, 279Maoz D., Filippenko A.V., Ho L.C., Rix H.W., Bohcall J.N., Schneider
D.P. & Macchetto F.D., 1995, ApJ, 440, 91Mc Keith C.D., Castles J., Greve A., Downes D., 1993, A&A, 272, 98Nelson C.H. & Whittle M., 1995, ApJS, 99, 67Oke J.B. & Gunn J.E., 1983, ApJ, 266, 713Peletier R.F., 1989, PhD Thesis, Univ. GroningenPogge R.W., 1989, ApJS, 71, 433Prada F., Beckman J.E., Castles J., McKeith C.D. & Greve A., 1994,
ApJ, 423, L35.Prada F., Manchado A., Canzian B., Peletier R.F., McKeith C.D. &
Beckman J.E., 1996, ApJ, 458, 537.Reichert G., Branduardi-Raymont G., Filippenko A.V., Mason K.O.,
Puchnarewicz E.M. & Wu C., 1992, ApJ, 387, 536Reichert G., Puchnarewicz E.M., Filippenko A.V., Mason K.O. &
Branduardi-Raymont G., 1993, in The Nearest Active Galaxies,eds. J. Beckman, L. Colina & H. Netzer, CSIC, p. 85
Sargent W.L.W, Schester P.L., Bocksenberg A. & Shortridge K, 1977,ApJ, 212, 326
Simien F. & de Vaucouleurs G., 1986, ApJ, 302, 564Stauffer J.R., 1982, ApJ, 262, 66Tantalo R., Chiosi C., Bressan A. & Fagotto F., 1996, A&A, 311, 361Terlevich E., Dıaz A.I. & Terlevich R., 1990, MNRAS, 242, 271Tonry J.L. & Davies M., 1979, AJ, 84, 1511Vazdekis A., Casuso E., Peletier R.F. & Beckman J.E., 1996, ApJS,
106, 307Veron-Cetty M.P. & Veron P., 1993, A Catalogue of Quasars and Active
NucleiWhitmore B.C., McElroy D.B. & Tonry J.L., 1985, ApJS, 59, 1Whorthey G., 1994, ApJS, 95, 107Whorthey G., Faber S.M., Gonzalez J.J. & Burstein D., 1994, ApJS,
94, 687Zhou X., 1991, A&A, 248, 367
This article was processed by the author using Springer-Verlag LaTEXA&A style file L-AA version 3.
Related Documents