A strategy for growth The integrated offer Kier Group plc Annual Report and Accounts 2016

Welcome message from author
This document is posted to help you gain knowledge. Please leave a comment to let me know what you think about it! Share it to your friends and learn new things together.
Transcript

Kier G
roup plc Annual Report and Accounts 2016
A strategy for growthThe integrated offerKier Group plcAnnual Report and Accounts 2016
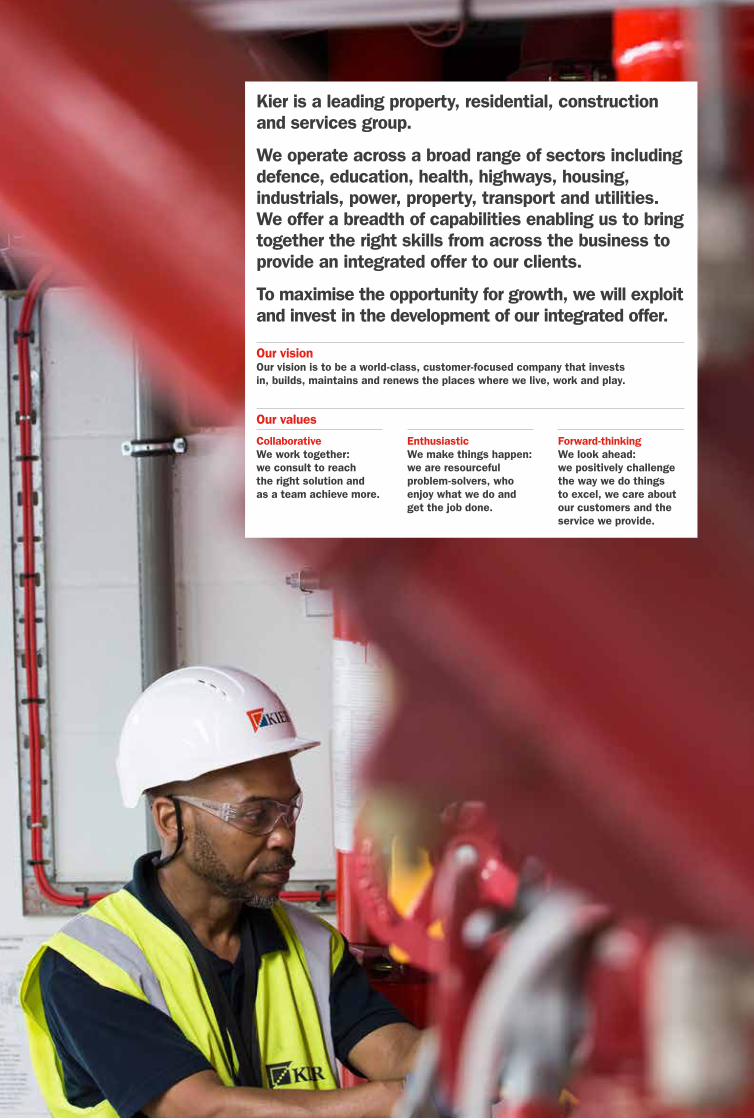
Kier is a leading property, residential, construction and services group.
We operate across a broad range of sectors including defence, education, health, highways, housing, industrials, power, property, transport and utilities. We offer a breadth of capabilities enabling us to bring together the right skills from across the business to provide an integrated offer to our clients.
To maximise the opportunity for growth, we will exploit and invest in the development of our integrated offer.
Our visionOur vision is to be a world-class, customer-focused company that invests in, builds, maintains and renews the places where we live, work and play.
Our values
CollaborativeWe work together: we consult to reach the right solution and as a team achieve more.
EnthusiasticWe make things happen: we are resourceful problem-solvers, who enjoy what we do and get the job done.
Forward-thinkingWe look ahead: we positively challenge the way we do things to excel, we care about our customers and the service we provide.

Kier at a glanceStrength and breadth of capabilities
We can help clients to finance, plan, design, construct and maintain their assets. The Group’s business model enables us to address complex opportunities through our strong and strategic client relationships.
Property Pages 32 and 33 Residential Pages 34 and 35 Construction Pages 36 and 37 Services Pages 38 and 39
The Property division encompasses property development and structured finance. The division operates across a number of sectors but particularly the industrial, commercial, retail and leisure sectors as well as the public sector.
• Activity focused on UK regions• Principally non-speculative focus or in joint venture
Kier Living, our residential business, includes affordable mixed tenure housing partnerships and private house building. Its clients include local authorities, housing associations and the private rented sector.
• 100% regional• Private, affordable and mixed tenure housing• Average sales price <£250k• Mixed tenure pipeline >£600m
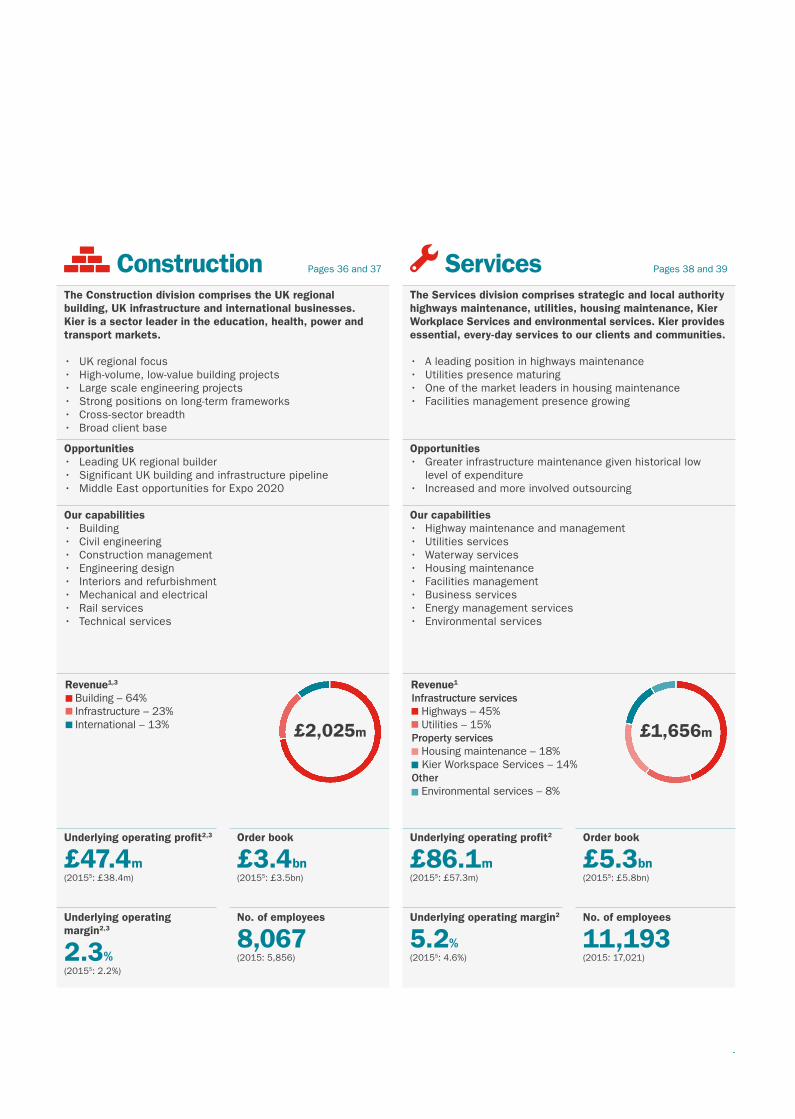
The Construction division comprises the UK regional building, UK infrastructure and international businesses. Kier is a sector leader in the education, health, power and transport markets.
• UK regional focus • High-volume, low-value building projects• Large scale engineering projects• Strong positions on long-term frameworks• Cross-sector breadth• Broad client base
The Services division comprises strategic and local authority highways maintenance, utilities, housing maintenance, Kier Workplace Services and environmental services. Kier provides essential, every-day services to our clients and communities.
• A leading position in highways maintenance• Utilities presence maturing • One of the market leaders in housing maintenance• Facilities management presence growing
Opportunities• >£1bn pipeline• Greater local authority interactions
Opportunities• Shortage of UK housing• Increasing demand for affordable housing
Opportunities• Leading UK regional builder• Significant UK building and infrastructure pipeline• Middle East opportunities for Expo 2020
Opportunities• Greater infrastructure maintenance given historical low
level of expenditure• Increased and more involved outsourcing
Our capabilities• Asset management• Bespoke occupier solutions• Joint ventures• Owner occupiers• Partnerships• Project investment• Regeneration• Structured finance
Our capabilities• Affordable housing• Living space• Mixed-use communities• Private residential housing• Regeneration
Our capabilities• Building• Civil engineering• Construction management• Engineering design• Interiors and refurbishment• Mechanical and electrical• Rail services• Technical services
Our capabilities• Highway maintenance and management• Utilities services• Waterway services• Housing maintenance• Facilities management• Business services• Energy management services• Environmental services
Revenue1
Property development – 77%Structured �nance – 23%
£176m
RevenueMixed tenure housing – 53%Private house building – 47%
£353m
Revenue1,3
Building – 64%Infrastructure – 23%International – 13% £2,025m
Revenue1
Infrastructure services Highways – 45% Utilities – 15%Property services Housing maintenance – 18% Kier Workspace Services – 14%Other Environmental services – 8%
£1,656m
Underlying operating profit2
£21.4m(2015: £22.7m)
Average capital4
£(94)m(2015: £(83)m)
Underlying operating profit2
£20.3m(2015: £11.2m)
Average capital4
£(231)m(2015: £(263)m)
Underlying operating profit2,3
£47.4m(20155: £38.4m)
Order book
£3.4bn(20155: £3.5bn)
Underlying operating profit2
£86.1m(20155: £57.3m)
Order book
£5.3bn(20155: £5.8bn)
No. of employees
81(2015: 81)
No. of employees
608(2015: 613)
Underlying operating margin2,3
2.3%(20155: 2.2%)
No. of employees
8,067(2015: 5,856)
Underlying operating margin2
5.2%(20155: 4.6%)
No. of employees
11,193(2015: 17,021)
1 Group and share of joint ventures.2 Stated before non-underlying items. See note 4 to the consolidated financial statements.3 Continuing operations.4 Equates to net debt.5 Restated to reflect the re-allocation of Mouchel Consulting from the Services division to the Construction division.
-
We can help clients to finance, plan, design, construct and maintain their assets. The Group’s business model enables us to address complex opportunities through our strong and strategic client relationships.
Property Pages 32 and 33 Residential Pages 34 and 35 Construction Pages 36 and 37 Services Pages 38 and 39
The Property division encompasses property development and structured finance. The division operates across a number of sectors but particularly the industrial, commercial, retail and leisure sectors as well as the public sector.
• Activity focused on UK regions• Principally non-speculative focus or in joint venture
Kier Living, our residential business, includes affordable mixed tenure housing partnerships and private house building. Its clients include local authorities, housing associations and the private rented sector.
• 100% regional• Private, affordable and mixed tenure housing• Average sales price <£250k• Mixed tenure pipeline >£600m
The Construction division comprises the UK regional building, UK infrastructure and international businesses. Kier is a sector leader in the education, health, power and transport markets.
• UK regional focus • High-volume, low-value building projects• Large scale engineering projects• Strong positions on long-term frameworks• Cross-sector breadth• Broad client base
The Services division comprises strategic and local authority highways maintenance, utilities, housing maintenance, Kier Workplace Services and environmental services. Kier provides essential, every-day services to our clients and communities.
• A leading position in highways maintenance• Utilities presence maturing • One of the market leaders in housing maintenance• Facilities management presence growing
Opportunities• >£1bn pipeline• Greater local authority interactions
Opportunities• Shortage of UK housing• Increasing demand for affordable housing
Opportunities• Leading UK regional builder• Significant UK building and infrastructure pipeline• Middle East opportunities for Expo 2020
Opportunities• Greater infrastructure maintenance given historical low
level of expenditure• Increased and more involved outsourcing
Our capabilities• Asset management• Bespoke occupier solutions• Joint ventures• Owner occupiers• Partnerships• Project investment• Regeneration• Structured finance
Our capabilities• Affordable housing• Living space• Mixed-use communities• Private residential housing• Regeneration
Our capabilities• Building• Civil engineering• Construction management• Engineering design• Interiors and refurbishment• Mechanical and electrical• Rail services• Technical services
Our capabilities• Highway maintenance and management• Utilities services• Waterway services• Housing maintenance• Facilities management• Business services• Energy management services• Environmental services
Revenue1
Property development – 77%Structured �nance – 23%
£176m
RevenueMixed tenure housing – 53%Private house building – 47%
£353m
Revenue1,3
Building – 64%Infrastructure – 23%International – 13% £2,025m
Revenue1
Infrastructure services Highways – 45% Utilities – 15%Property services Housing maintenance – 18% Kier Workspace Services – 14%Other Environmental services – 8%
£1,656m
Underlying operating profit2
£21.4m(2015: £22.7m)
Average capital4
£(94)m(2015: £(83)m)
Underlying operating profit2
£20.3m(2015: £11.2m)
Average capital4
£(231)m(2015: £(263)m)
Underlying operating profit2,3
£47.4m(20155: £38.4m)
Order book
£3.4bn(20155: £3.5bn)
Underlying operating profit2
£86.1m(20155: £57.3m)
Order book
£5.3bn(20155: £5.8bn)
No. of employees
81(2015: 81)
No. of employees
608(2015: 613)
Underlying operating margin2,3
2.3%(20155: 2.2%)
No. of employees
8,067(2015: 5,856)
Underlying operating margin2
5.2%(20155: 4.6%)
No. of employees
11,193(2015: 17,021)
1 Group and share of joint ventures.2 Stated before non-underlying items. See note 4 to the consolidated financial statements.3 Continuing operations.4 Equates to net debt.5 Restated to reflect the re-allocation of Mouchel Consulting from the Services division to the Construction division.
-

Financial highlightsA robust underlying performance
Group revenue1 (£m)
£4.1bn
Underlying profit before tax1,2 (£m)
£124.9m
Reported (loss)/profit before tax (£m)
£(15.4)m
12
13
14
15
16
£2.0bn
£1.9bn
£2.9bn
£3.3bn
£4.1bn
£58.3m
£45.9m
£73.7m
£85.9m
£124.9m
12
13
14
15
16
£49.0m
£24.2m
£15.4m
£39.5m
£(15.4)m
12
13
14
15
16
Underlying earnings per share1,2 (p)
106.7p
Total dividend (£m)
£61m
Dividend per share (p)
64.5p
107.4p
78.9p
87.5p
96.0p
106.7p
12
13
14
15
16
£26m
£34m
£39m
£47m
£61m
12
13
14
15
16
52.7p
54.3p
57.6p
55.2p
64.5p
12
13
14
15
16
Order book (£bn)
£8.7bn
Net (debt)/cash balances (£m)
£(99)m
Additional highlights
• Results in line with expectations• Integration of Mouchel completed and
portfolio simplification well advanced• Significantly improved net debt position• Reduction in net pension scheme (post
tax) deficit to £72m (2015: £123m)
£4.3bn
£4.3bn
£6.2bn
£9.3bn
£8.7bn
12
13
14
15
16
12
13
14
15
16
£129m
£60m
£(123)m
£(141)m
£(99)m
1 Continuing operations. 2 Stated before non-underlying items, see note 4 to the consolidated financial statements.
Contents
Strategic Report1 Financial highlights2 The Kier investment case4 Chairman’s statement6 Chief Executive’s strategic review10 Our markets12 Our business model13 Our strategy14 Our strategic performance16 Strategy in action20 Key performance indicators22 Resources and relationships26 Risk management27 Principal risks and uncertainties32 Divisional review: Property34 Divisional review: Residential36 Divisional review: Construction38 Divisional review: Services40 Financial review
Governance Report46 Corporate Governance Statement46 Chairman’s introduction48 Board statements (including
the viability statement)50 Leadership52 Board of Directors54 Effectiveness56 Nomination Committee report 58 Accountability 59 Risk Management and
Audit Committee report63 Safety, Health and Environment
Committee report 65 Relations with shareholders66 Remuneration Report66 Annual statement of the Chair
of the Remuneration Committee68 Annual report on remuneration78 Directors’ remuneration policy (summary)86 Directors’ Report88 Statement of Directors’ Responsibilities
Financial Statements89 Independent auditor’s report96 Consolidated income statement97 Consolidated statement
of comprehensive income98 Consolidated statement
of changes in equity99 Consolidated balance sheet100 Consolidated cash flow statement101 Notes to the consolidated financial
statements139 Principal operating subsidiaries and
business units143 Company balance sheet144 Company statement of changes in equity145 Notes to the Company financial statements
Other Information149 Financial record150 Corporate information
Strategic R
eport1–4
5G
overnance Report
46
–88
Financial Statem
ents8
9–1
48
Kier Group plc Annual Report and Accounts 2016 1
Strategic Report
The Kier investment case
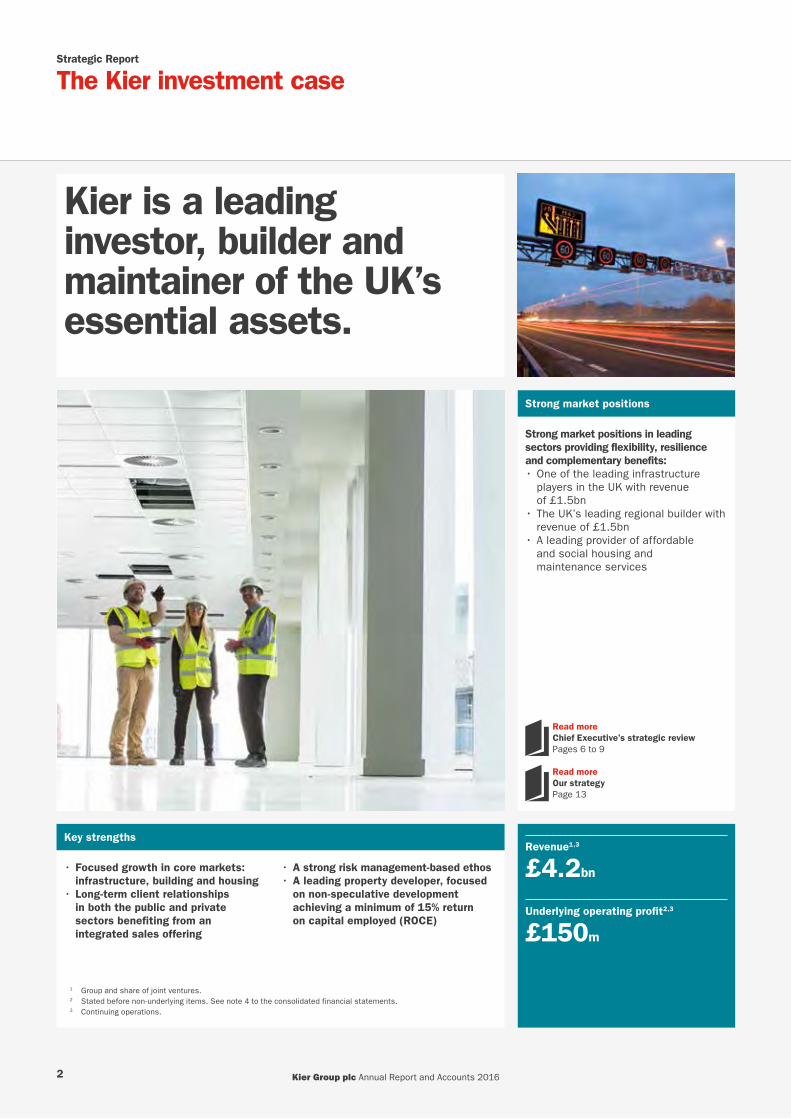
Kier is a leading investor, builder and maintainer of the UK’s essential assets.
Strong market positions
Strong market positions in leading sectors providing flexibility, resilience and complementary benefits:• One of the leading infrastructure
players in the UK with revenue of £1.5bn
• The UK’s leading regional builder with revenue of £1.5bn
• A leading provider of affordable and social housing and maintenance services
Read more Chief Executive’s strategic reviewPages 6 to 9
Read more Our strategyPage 13
Key strengthsRevenue1,3
£4.2bn
Underlying operating profit2,3
£150m
• Focused growth in core markets: infrastructure, building and housing
• Long-term client relationships in both the public and private sectors benefiting from an integrated sales offering
• A strong risk management-based ethos• A leading property developer, focused
on non-speculative development achieving a minimum of 15% return on capital employed (ROCE)
1 Group and share of joint ventures.2 Stated before non-underlying items. See note 4 to the consolidated financial statements.3 Continuing operations.
Kier Group plc Annual Report and Accounts 20162

Kier’s financial track record shows:
• Historical stable and reliable earnings with good visibility provided by a strong order book
• A sustainable and progressive dividend• A disciplined approach to risk management and capital allocation• 15% ROCE required from all capital investments• Strong organic drivers complemented by successful integration of acquisitions
provide a platform for growth• Double-digit profit growth year-on-year on average to 2020
Underlying operating profit by division2
Property
£21m
Residential
£20m
Construction3
£47m
Services
£86m
Read more Financial reviewPages 40 to 45
Read more Key performance indicatorsPages 20 and 21
An efficient capital model
• Reinvesting capital from our cash generative businesses into asset-intensive parts of the Group to enhance shareholder returns
• A balanced capital model with approximately £350m of capital deployed in property and residential activities targeting a minimum 15% ROCE annually
Strategic R
eport1–4
5G
overnance Report
46
–88
Financial Statem
ents8
9–1
48
Kier Group plc Annual Report and Accounts 2016 3
Strategic Report
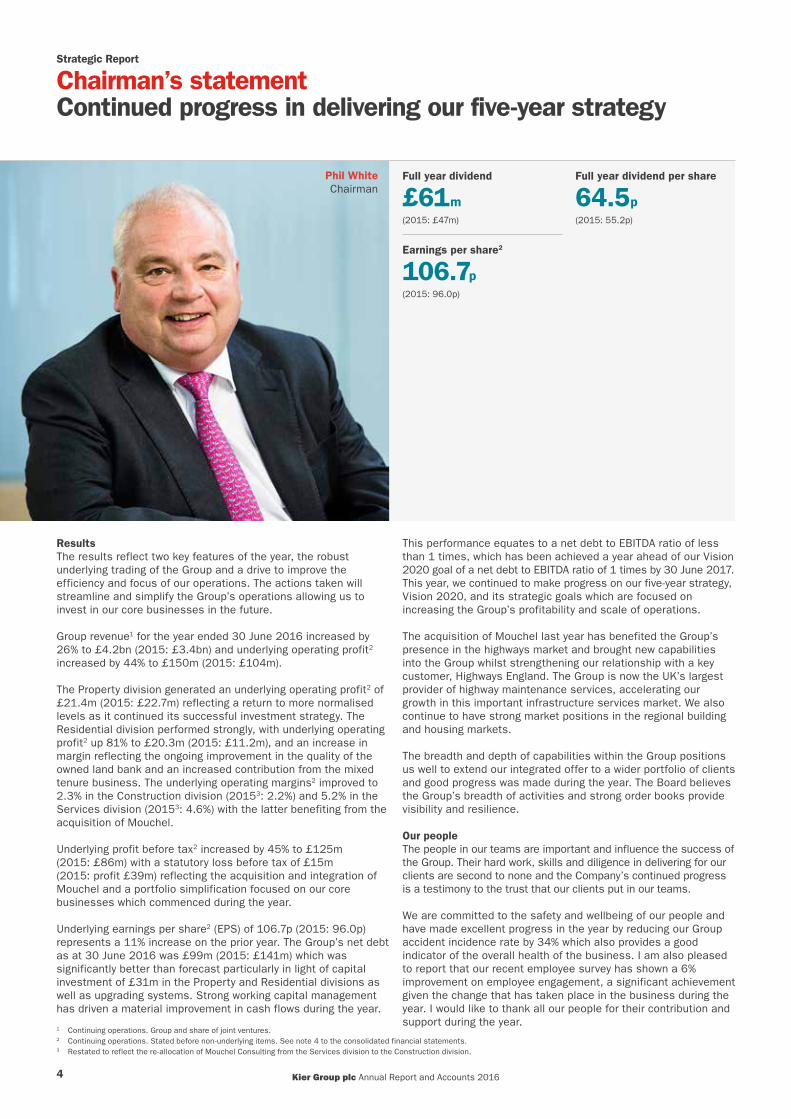
Chairman’s statementContinued progress in delivering our five-year strategy
Full year dividend
£61m(2015: £47m)
Full year dividend per share
64.5p(2015: 55.2p)
Earnings per share2
106.7p(2015: 96.0p)
ResultsThe results reflect two key features of the year, the robust underlying trading of the Group and a drive to improve the efficiency and focus of our operations. The actions taken will streamline and simplify the Group’s operations allowing us to invest in our core businesses in the future.
Group revenue1 for the year ended 30 June 2016 increased by 26% to £4.2bn (2015: £3.4bn) and underlying operating profit2 increased by 44% to £150m (2015: £104m).
The Property division generated an underlying operating profit2 of £21.4m (2015: £22.7m) reflecting a return to more normalised levels as it continued its successful investment strategy. The Residential division performed strongly, with underlying operating profit2 up 81% to £20.3m (2015: £11.2m), and an increase in margin reflecting the ongoing improvement in the quality of the owned land bank and an increased contribution from the mixed tenure business. The underlying operating margins2 improved to 2.3% in the Construction division (20153: 2.2%) and 5.2% in the Services division (20153: 4.6%) with the latter benefiting from the acquisition of Mouchel.
Underlying profit before tax2 increased by 45% to £125m (2015: £86m) with a statutory loss before tax of £15m (2015: profit £39m) reflecting the acquisition and integration of Mouchel and a portfolio simplification focused on our core businesses which commenced during the year.
Underlying earnings per share2 (EPS) of 106.7p (2015: 96.0p) represents a 11% increase on the prior year. The Group’s net debt as at 30 June 2016 was £99m (2015: £141m) which was significantly better than forecast particularly in light of capital investment of £31m in the Property and Residential divisions as well as upgrading systems. Strong working capital management has driven a material improvement in cash flows during the year.
This performance equates to a net debt to EBITDA ratio of less than 1 times, which has been achieved a year ahead of our Vision 2020 goal of a net debt to EBITDA ratio of 1 times by 30 June 2017. This year, we continued to make progress on our five-year strategy, Vision 2020, and its strategic goals which are focused on increasing the Group’s profitability and scale of operations.
The acquisition of Mouchel last year has benefited the Group’s presence in the highways market and brought new capabilities into the Group whilst strengthening our relationship with a key customer, Highways England. The Group is now the UK’s largest provider of highway maintenance services, accelerating our growth in this important infrastructure services market. We also continue to have strong market positions in the regional building and housing markets.
The breadth and depth of capabilities within the Group positions us well to extend our integrated offer to a wider portfolio of clients and good progress was made during the year. The Board believes the Group’s breadth of activities and strong order books provide visibility and resilience.
Our peopleThe people in our teams are important and influence the success of the Group. Their hard work, skills and diligence in delivering for our clients are second to none and the Company’s continued progress is a testimony to the trust that our clients put in our teams.
We are committed to the safety and wellbeing of our people and have made excellent progress in the year by reducing our Group accident incidence rate by 34% which also provides a good indicator of the overall health of the business. I am also pleased to report that our recent employee survey has shown a 6% improvement on employee engagement, a significant achievement given the change that has taken place in the business during the year. I would like to thank all our people for their contribution and support during the year.
Phil White Chairman
1 Continuing operations. Group and share of joint ventures. 2 Continuing operations. Stated before non-underlying items. See note 4 to the consolidated financial statements.3 Restated to reflect the re-allocation of Mouchel Consulting from the Services division to the Construction division.
Kier Group plc Annual Report and Accounts 20164
DividendIn line with the Group’s progressive dividend policy, the Board is recommending a full year dividend for the year ended 30 June 2016 of 64.5 pence per share (2015: 55.2 pence), amounting to approximately £61m (2015: £47m). An interim dividend of 21.5 pence per share (2015: 19.2 pence) amounting to approximately £20m (2015: £13m), was paid on 20 May 2016. Underlying earnings per share provides 1.7 times (2015: 1.7 times) full year dividend cover. Subject to shareholder approval, the final dividend will be paid on 2 December 2016 to shareholders on the register at the close of business on 30 September 2016. A scrip dividend alternative will also be available.
The Board and corporate governanceThe Board is committed to good governance, which we believe will support the delivery of the Group’s strategy. In light of the Group’s plans for future growth, and following recent significant acquisitions, we reviewed the Board’s composition to ensure that it has the correct balance of skills, experience and knowledge. During the year, we were pleased to appoint Justin Atkinson, Adam Walker and Constance Baroudel as Non-Executive Directors. Richard Bailey stood down as the Senior Independent Director. I would like to thank Richard for his contribution to the Board. Justin has subsequently been appointed to the role of the Senior Independent Director and Adam as Chair of the Risk Management and Audit Committee.
Amanda Mellor has decided not to stand for re-election at the 2016 Annual General Meeting (AGM) and will, therefore, be leaving the Board with effect from the conclusion of the meeting. Amanda has made a significant contribution to the Board and its committees, latterly as the Chair of the Remuneration Committee, since her appointment in 2011. We would like to thank Amanda for her hard work during her time on the Board. Constance will assume the role of the Chair of the Remuneration Committee with effect from the conclusion of the AGM.
BrexitThe EU Referendum vote result has created some uncertainty albeit with no material impact on Kier to date.
OutlookThe Group’s order book of £8.7bn provides a resilient backdrop for the year ahead. The Group continues to perform well in growing market sectors including infrastructure, housing and regional building, providing a breadth of capabilities to our clients. For the first time, 50% of Group profit now comes from our Services division where essential day-to-day services are provided to clients and we have long-term visibility of our future pipeline of work.
We remain focused on growing the business through improving operational efficiencies and investing in new technology to support our operations. We believe that our range of complementary businesses underpins the resilience of our operating model and the strength of our order book. Having completed the integration of Mouchel, we are well progressed with the simplification of our portfolio of businesses and focused on capitalising on the growth opportunities available to the Group. We remain confident of achieving our goal of double-digit profit growth on average each year to 2020.
Phil White Chairman
21 September 2016
Governance highlights
The Governance Report on pages 46 to 88 (inclusive) provides details of the Group’s approach to governance and how it supports the delivery of our Vision 2020 strategy. The highlights of the year included:
Nomination Committee• Appointed three new Non-Executive Directors;• Monitored the inductions of those Directors; and• Reviewed the pipeline of potential future Board members.
Read more in the Nomination Committee report on pages 56 and 57.
Safety, Health and Environment Committee• Implemented the results of the Group’s behavioural safety
self-assessment;• Oversaw the integration of Mouchel’s safety, health and
environment (SHE) policies and procedures; and• Monitored the Group’s current SHE performance.
Read more in the Safety, Health and Environment Committee report on pages 63 and 64.
Risk Management and Audit Committee• Monitored the Group’s systems of risk management and
internal control;• Supported the Board in providing the viability statement
for the first time; and• Reviewed significant judgements made by management
in preparing the 2016 financial statements.
Read more in the Risk Management and Audit Committee report on pages 59 to 62 (inclusive).
Remuneration Committee• Reviewed the framework of executive remuneration at Kier;• Consulted with shareholders with respect to the Executive
Directors’ remuneration for 2017; and• Approved the Executive Directors’ 2015 bonus payments,
assessed the Executive Directors’ performance against their 2016 bonus targets and set their 2017 bonus targets.
Read more in the Remuneration Report on pages 66 to 85 (inclusive).
Strategic R
eport1–4
5G
overnance Report
46
–88
Financial Statem
ents8
9–1
48
Kier Group plc Annual Report and Accounts 2016 5

Strategic Report
Chief Executive’s strategic reviewA clear vision for our business
Q&A with Haydn Mursell
Q. How would you summarise the past year?A. The year has been one of consolidation and evolution for the Group.
We have made good progress on the goals I set out in last year’s report. We are focusing on the businesses within the Group that will drive growth while improving the quality of our earnings by streamlining and simplifying the portfolio. We are also investing in technology and systems to provide the platform that will allow the Group to grow through better management information.
Our core businesses provide an integrated offer for our clients, and in each of these businesses we aim to be top three in our markets.
Q. Can you explain the results and the divisional performance? A. We saw underlying profits from operations2 of £150m with exceptional charges being incurred in the year relating to the acquisition and integration of Mouchel and the portfolio simplification.
Property had a good year. We achieved a return on capital employed (ROCE) ahead of an increased target we set ourselves. The division received strong support from joint venture funding partners, and its regional coverage and sector breadth provided considerable opportunity. Property has more than £1bn worth of projects already in the pipeline.
In Residential, we completed over 2,100 units, in line with our estimates. We continue to trade through our historical land bank, and reinvest capital in mixed tenure affordable housing. Having launched the New Communities Partnership, which aims to create approximately 10,000 new affordable homes across the UK over the next five years, we are seeing a significant level of interest, with meetings taking place with our local authority clients.
Revenue1
£4.2bn(2015: £3.4bn)
Combined Construction and Services order book
£8.7bn(2015: £9.3bn)
Underlying operating profit2
£150m(2015: £104m)
We have a £600m mixed tenure pipeline, which we see as a growing market for us to service and an important market to address the UK housing shortage.
The Construction division has enjoyed significant growth year- on-year, and has traded well, underpinned by our presence in the regional UK building market. In our Infrastructure business, we have a high-quality medium-term pipeline and it is a very important sector for us in both capital works and maintenance work. The UK needs better infrastructure – road, rail and utilities networks – as well as a balanced energy generation strategy as coal fired stations gradually go offline. We welcome the UK Government approval of Hinkley Point C where we are undertaking enabling works. We are one of six contractors appointed to the major works Lot of the new highways framework in the East of England. We are also in a pre-qualification position on High Speed 2 (HS2).
Internationally, we have a strong business in the Middle East, principally in Dubai which is preparing for Expo 2020 and is consequently investing in its infrastructure. The total Construction division order book is £3.4bn and covers more than 90% of our targeted revenue for the 2017 financial year.
The Services division has grown markedly year-on-year, more recently reflecting the integration of Mouchel. We are now the UK’s leading provider of highways management and maintenance. We have a maturing utilities business; the facilities management business has shown double-digit growth; and the housing maintenance business has remained stable in the face of the 2015 Budget rent reductions. More than 90% of the Services division targeted revenue for the 2017 financial year is covered by the current order book. We have good visibility of earnings as far off as 2020 due to the long-term nature of our contracts.
Haydn Mursell Chief Executive
Kier Group plc Annual Report and Accounts 20166
The Group has a strong long-term order book of £8.7bn. This has reduced slightly reflecting the unwinding of the longer term contracts as is typical of the Services sector.
However, we are pleased that in the Construction division, the current order book of £3.4bn for secured and probable work, excluding framework wins, provides for more than 90% of forecast revenue for the 2017 financial year, on increasing volumes. In our Services division more than 90% of the targeted revenue for 2017 is secured, excluding potential extensions to the value of £2.7bn.
Following the integration of two sizeable acquisitions over the last two years, on 4 July 2016 we announced a simplification of the Group’s portfolio. This, combined with challenging trading conditions in the Caribbean and the effect of the collapse of the oil price on the recyclates market, has resulted in a number of exceptionals which affect the statutory reported numbers. As the Group evolves, this focus on our core businesses and simplification of our portfolio will position us well for future growth.
Q. Moving on to the financial results, what do the figures say about where the business is? A. Our revenue and underlying profit indicate that Kier has performed well in many of its market sectors during the year. The order books show that our core businesses are in good shape, and we can see the workload ahead of us for a number of years.
The balance sheet, which will be the ‘engine’ of our growth, has been strengthened by our excellent cash performance, and the additional support we have received from our funding partners. For example, we completed the raising of £81m of additional finance through the German Schuldschein market post the EU Referendum vote which confirms support for the Group. In summary, the figures show growth, resilience and a focus on our core businesses. We remain committed to maintaining a progressive dividend, which will broadly follow the Group earnings profile.
Q. What about the Group’s net debt position?A. Our goal was to achieve a net debt to EBITDA ratio of 1 times by 30 June 2017. We are pleased to have achieved this on an underlying profit basis a year ahead of schedule. Following an improved cash performance, our net debt position of £99m at 30 June 2016 is well ahead of the forecast range of £150m–£170m. Debt will always form part of our balanced capital structure as we choose to invest the Group’s free cash flow in our asset-based businesses such as property development.
Q. You mentioned improving the quality of earnings. Can you elaborate?A. We are focused on improving our margins. In the Construction division, margins will improve as infrastructure and international projects increase as a proportion of our total construction work. In Services, the acquisition of Mouchel has lifted the average margin and, as the Group generates cash, we will reinvest it into the Property division, which generates higher margins.
In the Residential division, we are trading through our historical land bank and new, cheaper land is an increasing proportion of our trading activities together with our growing mixed tenure activities, all of which will improve the Group’s overall margin.
Q. What makes Kier’s business model so strong?A. With our breadth of capabilities, we are able to help our clients look at the whole-life cost of their assets. We can invest our own capital or take an equity share in a project, then construct the asset and look after it for the client. We call this proposition; Invest, Build and Maintain.
Having such a balanced set of businesses offers the Group two advantages: complementary opportunities providing corresponding capital flows, and a natural resilience through diversification across different business cycles. For example, our Construction and Services divisions generate cash that we can invest into the Property division. In addition, while some of our infrastructure clients have capital projects requiring our civil engineering skills, others want maintenance services. However, it is to those that require both that we can provide an end-to-end service. Many of our clients, such as local authorities, continue to be under financial pressure and need greater control over budgets, or to derive income from their assets, all of which we can help them with. I do not believe any of our competitors have such a broad range of services which they can cross-sell.
Q. So the integrated offer approach is a competitive advantage?A. Definitely. The challenge is communicating this USP, internally to our teams and from there on to our client base. We know from experience that where we provide a breadth of capabilities to existing clients, we find our service delivery is often much more efficient for them and us based on a clear, well-understood relationship. Cross-selling requires the versatility and agility to establish deeper client relationships. This is the single biggest opportunity for Kier. We already have examples of where we are doing just this for our clients: Highways England, Kent County Council, North Tyneside Council and Northamptonshire County Council to name just a few.
Q. What does the recently announced streamlining of the portfolio entail?A. We have strict financial criteria that all our businesses must meet. We also want to ensure that each business provides a long-term strategic fit in the Group.
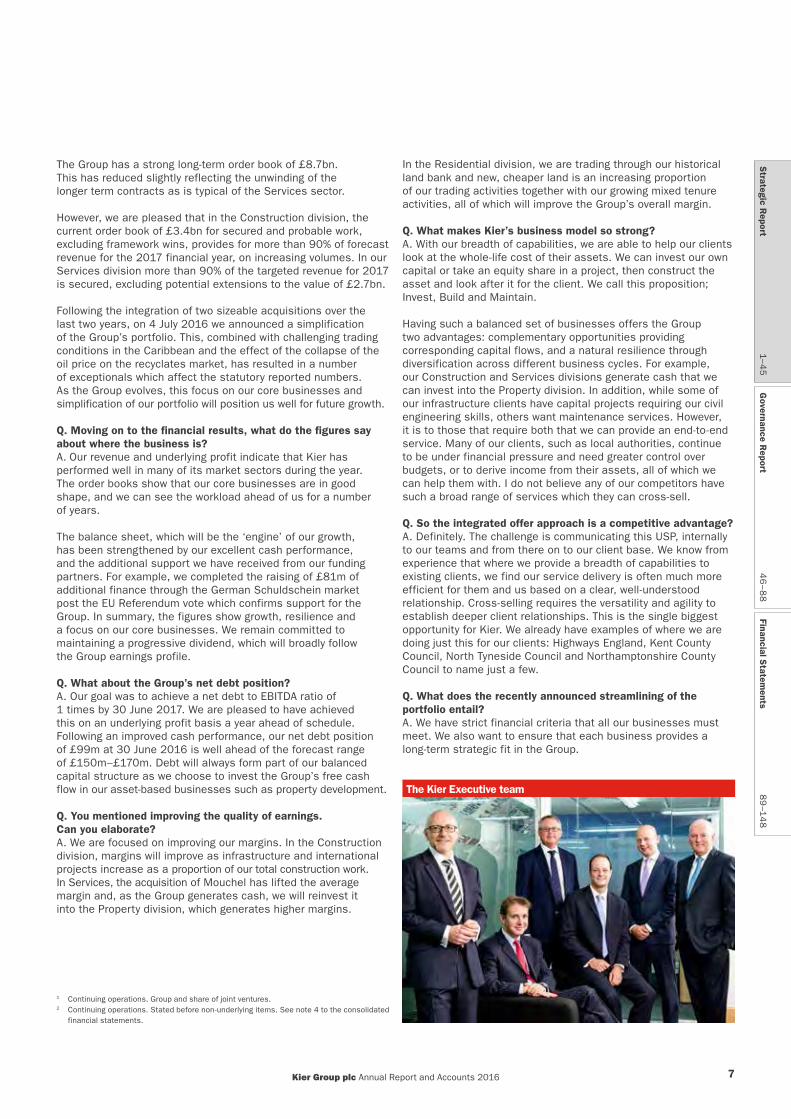
The Kier Executive team
1 Continuing operations. Group and share of joint ventures.2 Continuing operations. Stated before non-underlying items. See note 4 to the consolidated
financial statements.
Strategic R
eport1–4
5G
overnance Report
46
–88
Financial Statem
ents8
9–1
48
Kier Group plc Annual Report and Accounts 2016 7
Strategic Report
Chief Executive’s strategic review continued
Our vision in action
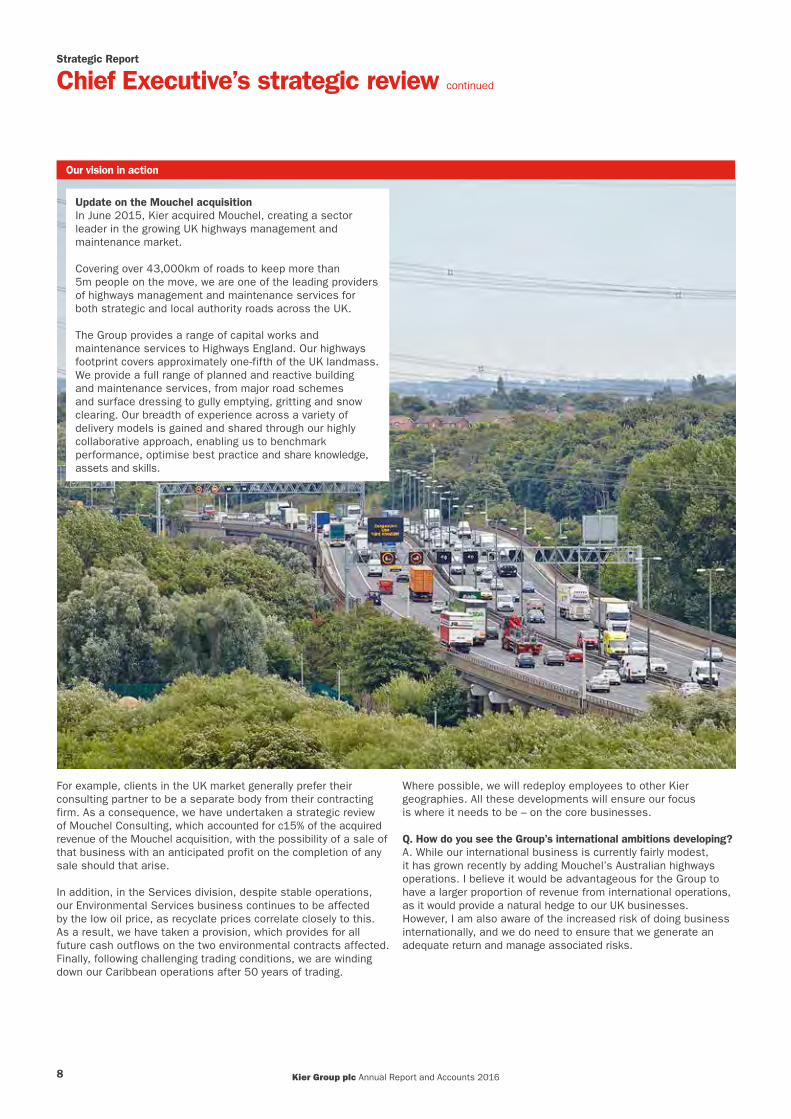
Update on the Mouchel acquisition In June 2015, Kier acquired Mouchel, creating a sector leader in the growing UK highways management and maintenance market.
Covering over 43,000km of roads to keep more than 5m people on the move, we are one of the leading providers of highways management and maintenance services for both strategic and local authority roads across the UK.
The Group provides a range of capital works and maintenance services to Highways England. Our highways footprint covers approximately one-fifth of the UK landmass. We provide a full range of planned and reactive building and maintenance services, from major road schemes and surface dressing to gully emptying, gritting and snow clearing. Our breadth of experience across a variety of delivery models is gained and shared through our highly collaborative approach, enabling us to benchmark performance, optimise best practice and share knowledge, assets and skills.
For example, clients in the UK market generally prefer their consulting partner to be a separate body from their contracting firm. As a consequence, we have undertaken a strategic review of Mouchel Consulting, which accounted for c15% of the acquired revenue of the Mouchel acquisition, with the possibility of a sale of that business with an anticipated profit on the completion of any sale should that arise.
In addition, in the Services division, despite stable operations, our Environmental Services business continues to be affected by the low oil price, as recyclate prices correlate closely to this. As a result, we have taken a provision, which provides for all future cash outflows on the two environmental contracts affected. Finally, following challenging trading conditions, we are winding down our Caribbean operations after 50 years of trading.
Where possible, we will redeploy employees to other Kier geographies. All these developments will ensure our focus is where it needs to be – on the core businesses.
Q. How do you see the Group’s international ambitions developing?A. While our international business is currently fairly modest, it has grown recently by adding Mouchel’s Australian highways operations. I believe it would be advantageous for the Group to have a larger proportion of revenue from international operations, as it would provide a natural hedge to our UK businesses. However, I am also aware of the increased risk of doing business internationally, and we do need to ensure that we generate an adequate return and manage associated risks.
Kier Group plc Annual Report and Accounts 20168
Therefore, if we grow our overseas operations, we will do so in a select number of developed locations where there is a well understood contractual environment, with clients we know well and where we understand the nature of the marketplace.
It is also important to plan resourcing of overseas projects, and to have a pipeline of work in any particular region, rather than one-off projects. British construction and engineering are well respected abroad and there are further opportunities available with greater political impetus and support.
Q. How has the integration of Mouchel gone?A. It has gone well and is now complete. We used the same in-house integration team we had for the May Gurney acquisition which enabled us to share our learnings from that process.
The 5–10 year nature of highways contracts provides good long-term visibility of earnings. We are now the largest highways maintenance provider in the UK. We have integrated Mouchel’s business processing operations with Kier’s facilities management operations, creating Kier Workplace Services. The total integration has saved £4m in the 2016 financial year and we expect it to save £15m in the 2017 financial year, in excess of our original expectations. As a result, the integration costs increased in light of the increased scope undertaken.
The acquisition remains on track to deliver ROCE in excess of our target of 15% so although we spent more money on integrating Mouchel, we have also created more savings, so the return has justified the increased expenditure.
Q. How does a major acquisition such as this affect company culture?A. Kier has a strong culture emanating from its management buy-out back in the 1990s and many of our employees are shareholders. This creates great interest in the success of the Company and a sense of belonging, which has stayed with Kier over the years and is one of our strengths. However, cultural integration takes time to truly embed. At Kier, we have a can-do culture supported by our values of being collaborative, enthusiastic and forward-thinking. We also need to ensure we retain the best from those companies that we have acquired. This is something that is important to me personally.
Q. What about safety, which is also ingrained in a company culture and is one of your non-financial KPIs?A. We have new, strong leadership within our Safety, Health, Environment & Assurance team. We continue to see improvements in how people think about safety – as well as health and environment. However, it is important to keep the focus not just on processes but very importantly, on people’s behaviour as well. In the UK, our accident incidence rate (AIR) is below 200 for the first time ever, showing a marked decline in reported accidents, and we are working hard to maintain that downward trend. A number of our businesses are achieving a zero AIR, a great accomplishment. We have focused on visible leadership programmes, run a number of well-received internal campaigns about health, safety and wellbeing, and have been evolving our behavioural change programme, ensuring people do the right thing for the right reasons. Internationally, the incident rate has also dropped markedly, reflecting the focused work we are undertaking in those regions.
Q. So people are generally responding well to the change within Kier?A. Yes. There has been considerable change across the Group with an overall 4% headcount reduction during the year. The latest employee engagement survey scores are encouraging, showing improved engagement and enablement scores. In general terms, I believe these scores show we are investing in our people, giving them the right tools and that they feel good about working for Kier. I am proud of their contribution and thank them for their support.
One challenge is to improve the diversity of our employee base, particularly increasing the ratio of female to male employees. The industries in which we operate are making moves in the right direction, and we are a big advocate of this. We have to accept this will be a long-term challenge, but we are playing our part. We are also focused on promoting Kier to those starting out in their careers, making sure that we help students understand the opportunities that exist in our sectors.
Q. What feedback do you get from customers?A. All the clients I speak to – and I try speak to as many as possible – are very positive about Kier, and are willing to give their views and also to listen to what we have to say. I find our clients are happy to have candid and informal conversations, which is a testament to our teams of people who have established these relationships. Our customer satisfaction scores continue to be very good.
Q. The major news at the end of your financial year was the EU Referendum result. How will this affect the growth you anticipate?A. Given our healthy order books, we are in a strong position and have seen no material impact to the Group’s trading to date. We have solid pipelines and our largely non-speculative approach to property development positions us well. The Services division, representing 50% of the Group’s profits and providing essential every-day services, is relatively unaffected by Brexit. Overall, the Group is continuing to pursue growth in 2017.
Q. What is the outlook for the Group? A. Our focus remains on improving our operational efficiency and consequently improving our margins. We believe the strength of our business model gives us the versatility and agility to deliver on our integrated offer which provides Kier with a competitive advantage in the marketplace. We remain confident of achieving our goal of double-digit profit growth on average each year to 2020. I look forward to the future with confidence.
Haydn Mursell Chief Executive
21 September 2016
Strategic R
eport1–4
5G
overnance Report
46
–88
Financial Statem
ents8
9–1
48
Kier Group plc Annual Report and Accounts 2016 9
Strategic Report
Our marketsA positive market environment
Kier’s markets are largely underpinned by fundamental drivers that will endure regardless of short or medium-term economic adjustments. These drivers include demographic change, changes in the way we live and pressure on the UK Government’s finances. The result will be increasing demand on essential infrastructure that Kier is uniquely placed to benefit from.
Solid long-term fundamentalsThe UK population continues to grow The UK population is expanding. Recent projections show the population reaching 74m by 2039 (2015: 65m), with net migration accounting for around half of this growth.
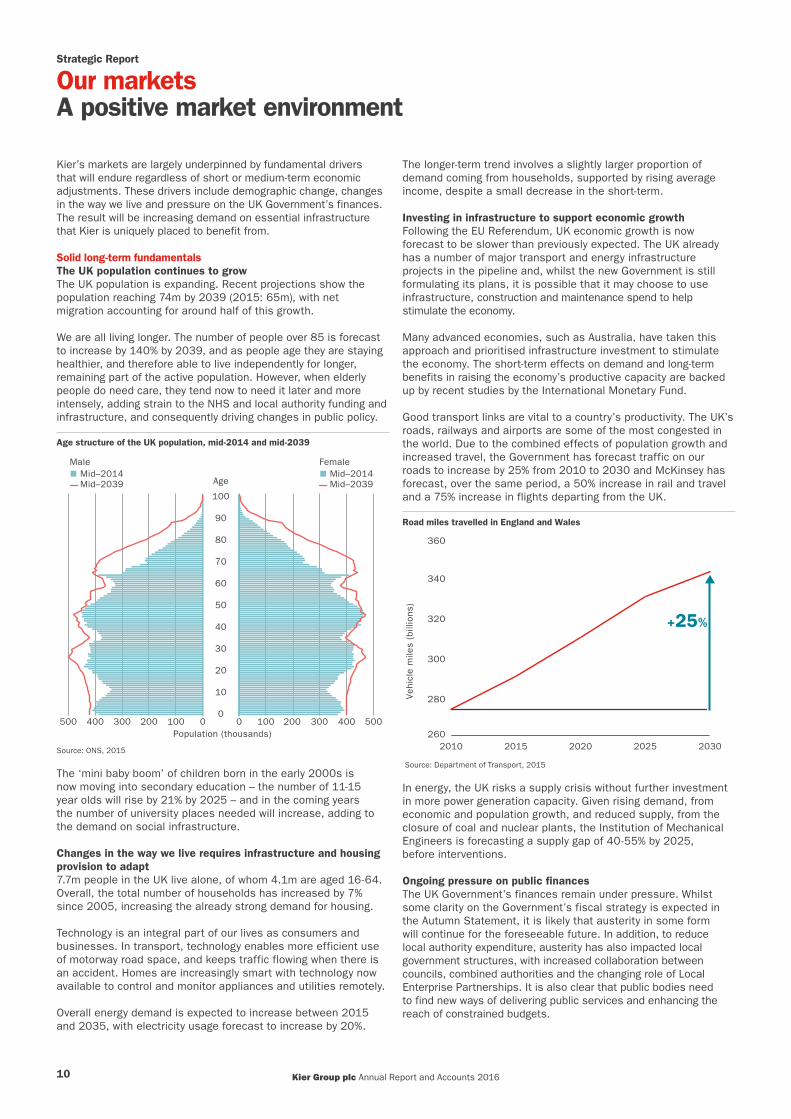
We are all living longer. The number of people over 85 is forecast to increase by 140% by 2039, and as people age they are staying healthier, and therefore able to live independently for longer, remaining part of the active population. However, when elderly people do need care, they tend now to need it later and more intensely, adding strain to the NHS and local authority funding and infrastructure, and consequently driving changes in public policy.
Age structure of the UK population, mid-2014 and mid-2039
100100 00 200200 300300 400 500400500Population (thousands)
100
0
Age
10
20
30
40
50
60
70
80
90
MaleMid–2014Mid–2039
FemaleMid–2014Mid–2039
Source: ONS, 2015
The ‘mini baby boom’ of children born in the early 2000s is now moving into secondary education – the number of 11-15 year olds will rise by 21% by 2025 – and in the coming years the number of university places needed will increase, adding to the demand on social infrastructure.
Changes in the way we live requires infrastructure and housing provision to adapt 7.7m people in the UK live alone, of whom 4.1m are aged 16-64. Overall, the total number of households has increased by 7% since 2005, increasing the already strong demand for housing.
Technology is an integral part of our lives as consumers and businesses. In transport, technology enables more efficient use of motorway road space, and keeps traffic flowing when there is an accident. Homes are increasingly smart with technology now available to control and monitor appliances and utilities remotely.
Overall energy demand is expected to increase between 2015 and 2035, with electricity usage forecast to increase by 20%.
The longer-term trend involves a slightly larger proportion of demand coming from households, supported by rising average income, despite a small decrease in the short-term.
Investing in infrastructure to support economic growthFollowing the EU Referendum, UK economic growth is now forecast to be slower than previously expected. The UK already has a number of major transport and energy infrastructure projects in the pipeline and, whilst the new Government is still formulating its plans, it is possible that it may choose to use infrastructure, construction and maintenance spend to help stimulate the economy.
Many advanced economies, such as Australia, have taken this approach and prioritised infrastructure investment to stimulate the economy. The short-term effects on demand and long-term benefits in raising the economy’s productive capacity are backed up by recent studies by the International Monetary Fund.
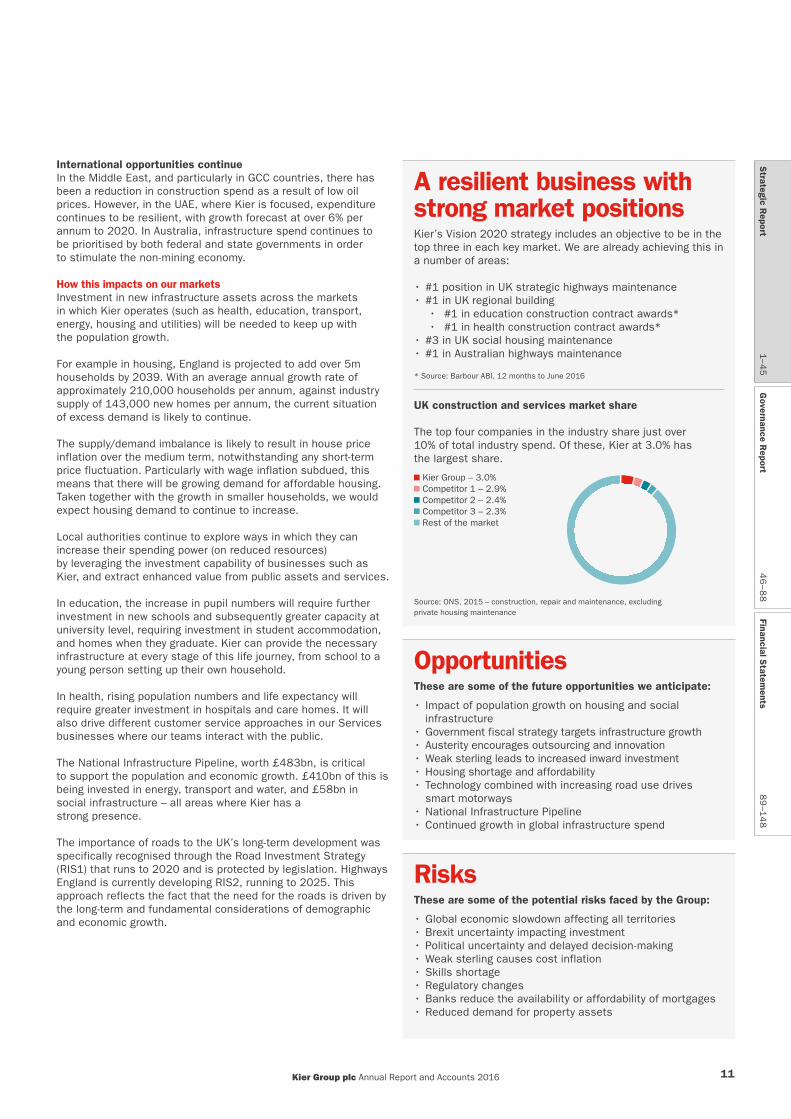
Good transport links are vital to a country’s productivity. The UK’s roads, railways and airports are some of the most congested in the world. Due to the combined effects of population growth and increased travel, the Government has forecast traffic on our roads to increase by 25% from 2010 to 2030 and McKinsey has forecast, over the same period, a 50% increase in rail and travel and a 75% increase in flights departing from the UK.
Road miles travelled in England and Wales
2010 2015 2020 2025 2030
Vehi
cle
mile
s (b
illio
ns)
+25%
260
280
300
320
340
360
Source: Department of Transport, 2015
In energy, the UK risks a supply crisis without further investment in more power generation capacity. Given rising demand, from economic and population growth, and reduced supply, from the closure of coal and nuclear plants, the Institution of Mechanical Engineers is forecasting a supply gap of 40-55% by 2025, before interventions.
Ongoing pressure on public finances The UK Government’s finances remain under pressure. Whilst some clarity on the Government’s fiscal strategy is expected in the Autumn Statement, it is likely that austerity in some form will continue for the foreseeable future. In addition, to reduce local authority expenditure, austerity has also impacted local government structures, with increased collaboration between councils, combined authorities and the changing role of Local Enterprise Partnerships. It is also clear that public bodies need to find new ways of delivering public services and enhancing the reach of constrained budgets.
Kier Group plc Annual Report and Accounts 201610
International opportunities continueIn the Middle East, and particularly in GCC countries, there has been a reduction in construction spend as a result of low oil prices. However, in the UAE, where Kier is focused, expenditure continues to be resilient, with growth forecast at over 6% per annum to 2020. In Australia, infrastructure spend continues to be prioritised by both federal and state governments in order to stimulate the non-mining economy.
How this impacts on our marketsInvestment in new infrastructure assets across the markets in which Kier operates (such as health, education, transport, energy, housing and utilities) will be needed to keep up with the population growth.
For example in housing, England is projected to add over 5m households by 2039. With an average annual growth rate of approximately 210,000 households per annum, against industry supply of 143,000 new homes per annum, the current situation of excess demand is likely to continue.
The supply/demand imbalance is likely to result in house price inflation over the medium term, notwithstanding any short-term price fluctuation. Particularly with wage inflation subdued, this means that there will be growing demand for affordable housing. Taken together with the growth in smaller households, we would expect housing demand to continue to increase.
Local authorities continue to explore ways in which they can increase their spending power (on reduced resources) by leveraging the investment capability of businesses such as Kier, and extract enhanced value from public assets and services.
In education, the increase in pupil numbers will require further investment in new schools and subsequently greater capacity at university level, requiring investment in student accommodation, and homes when they graduate. Kier can provide the necessary infrastructure at every stage of this life journey, from school to a young person setting up their own household.
In health, rising population numbers and life expectancy will require greater investment in hospitals and care homes. It will also drive different customer service approaches in our Services businesses where our teams interact with the public.
The National Infrastructure Pipeline, worth £483bn, is critical to support the population and economic growth. £410bn of this is being invested in energy, transport and water, and £58bn in social infrastructure – all areas where Kier has a strong presence.
The importance of roads to the UK’s long-term development was specifically recognised through the Road Investment Strategy (RIS1) that runs to 2020 and is protected by legislation. Highways England is currently developing RIS2, running to 2025. This approach reflects the fact that the need for the roads is driven by the long-term and fundamental considerations of demographic and economic growth.
A resilient business with strong market positionsKier’s Vision 2020 strategy includes an objective to be in the top three in each key market. We are already achieving this in a number of areas:
• #1 position in UK strategic highways maintenance• #1 in UK regional building
• #1 in education construction contract awards*• #1 in health construction contract awards*
• #3 in UK social housing maintenance• #1 in Australian highways maintenance
* Source: Barbour ABI, 12 months to June 2016
UK construction and services market share
The top four companies in the industry share just over 10% of total industry spend. Of these, Kier at 3.0% has the largest share.
Kier Group – 3.0%Competitor 1 – 2.9%Competitor 2 – 2.4%Competitor 3 – 2.3%Rest of the market
Source: ONS, 2015 – construction, repair and maintenance, excludingprivate housing maintenance
OpportunitiesThese are some of the future opportunities we anticipate:
• Impact of population growth on housing and social infrastructure
• Government fiscal strategy targets infrastructure growth• Austerity encourages outsourcing and innovation • Weak sterling leads to increased inward investment• Housing shortage and affordability • Technology combined with increasing road use drives
smart motorways• National Infrastructure Pipeline• Continued growth in global infrastructure spend
RisksThese are some of the potential risks faced by the Group:
• Global economic slowdown affecting all territories• Brexit uncertainty impacting investment• Political uncertainty and delayed decision-making• Weak sterling causes cost inflation• Skills shortage• Regulatory changes• Banks reduce the availability or affordability of mortgages • Reduced demand for property assets
Strategic R
eport1–4
5G
overnance Report
46
–88
Financial Statem
ents8
9–1
48
Kier Group plc Annual Report and Accounts 2016 11

Strategic Report
Our business modelHow we create value for our stakeholders
A resilient and agile business model
Our GroupOur vision is to be a world-class, customer-focused company that invests in, builds, maintains and renews the places where we live, work and play. We operate across a range of sectors including defence, education, health, housing, industrials, power, property, transport and utilities.
A compatible set of businessesThis broad, complementary set of activities is the foundation of our business model. It means we have the basis to maximise returns by using capital from our cash generative businesses to invest in asset-intensive activities. To achieve this requires versatility and agility.
Investing to enable our growthThe investment we continuously make in our capabilities – safety, people, systems – gives us that versatility and agility, and is key to optimising the return from our integrated offer. This allows us to adapt to changing client needs and to offer more to each customer, using the full scope of our Group in the process. It underpins our future growth and ensures that we can take a safe and risk-managed approach to that growth.
Visible income streamsOur well-matched spread of businesses ensures that we can develop income streams that are visible inasmuch as they are reliable and dependable looking forward. The income streams are reliable because construction projects are tightly managed, and real estate and residential housing investments are predominately non-speculative. They are dependable because Kier’s Services businesses, which make up 50% of Kier’s profits, provide day-to-day essential public services. Asset maintenance in areas where spend is mandated by regulation or statute (eg water, strategic highways) have contracts with long durations.
These factors enable us to be more certain about returns to our shareholders over the medium-term while creating and delivering exceptional value for our customers.
People
Systems
Safe
ty
Capital employed
Construction Property
ResidentialServices
Capital created Capital employed
Creatingcustomer
value
Capitaldistribution
Capitalinvested
Capital reinvested
Capital reinvested
Shareholderreturns
Capital created
Kier Group plc Annual Report and Accounts 201612
Our strategyHow we maximise value
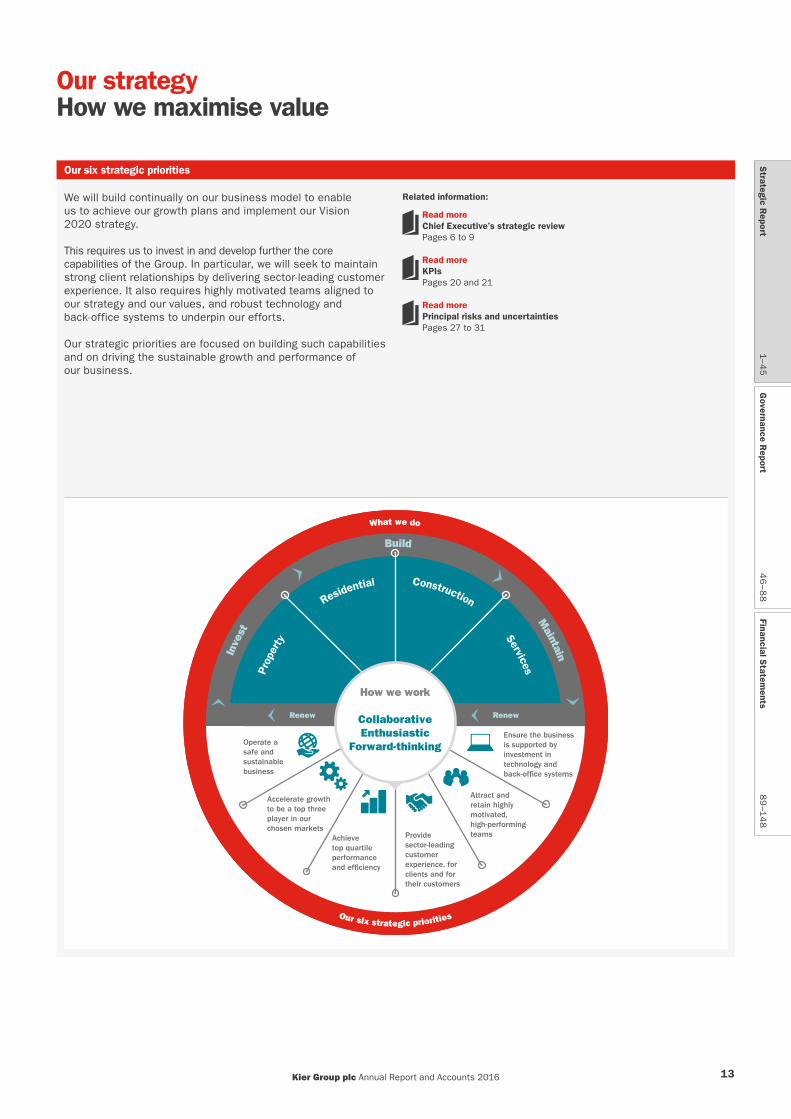
Our six strategic priorities
We will build continually on our business model to enable us to achieve our growth plans and implement our Vision 2020 strategy.
This requires us to invest in and develop further the core capabilities of the Group. In particular, we will seek to maintain strong client relationships by delivering sector-leading customer experience. It also requires highly motivated teams aligned to our strategy and our values, and robust technology and back-office systems to underpin our efforts.
Our strategic priorities are focused on building such capabilities and on driving the sustainable growth and performance of our business.
Related information:
Read moreChief Executive’s strategic review Pages 6 to 9
Read moreKPIs Pages 20 and 21
Read morePrincipal risks and uncertainties Pages 27 to 31
Prop
erty
Residential Construction
Services
Achievetop quartileperformanceand ef�ciency
Ensure the business is supported byinvestment intechnology andback-of�ce systems
Provide sector-leading customerexperience, for clients and for their customers
Attract and retain highly motivated, high-performingteams
Operate a safe and sustainable business
Accelerate growthto be a top three player in our chosen markets
Renew Renew
How we work
CollaborativeEnthusiastic
Forward-thinking
What we do
Our six strategic priorities
Inve
st
Build
Maintain
Strategic R
eport1–4
5G
overnance Report
46
–88
Financial Statem
ents8
9–1
48
Kier Group plc Annual Report and Accounts 2016 13
Strategic Report
Our strategic performanceProgress against our vision and strategic priorities
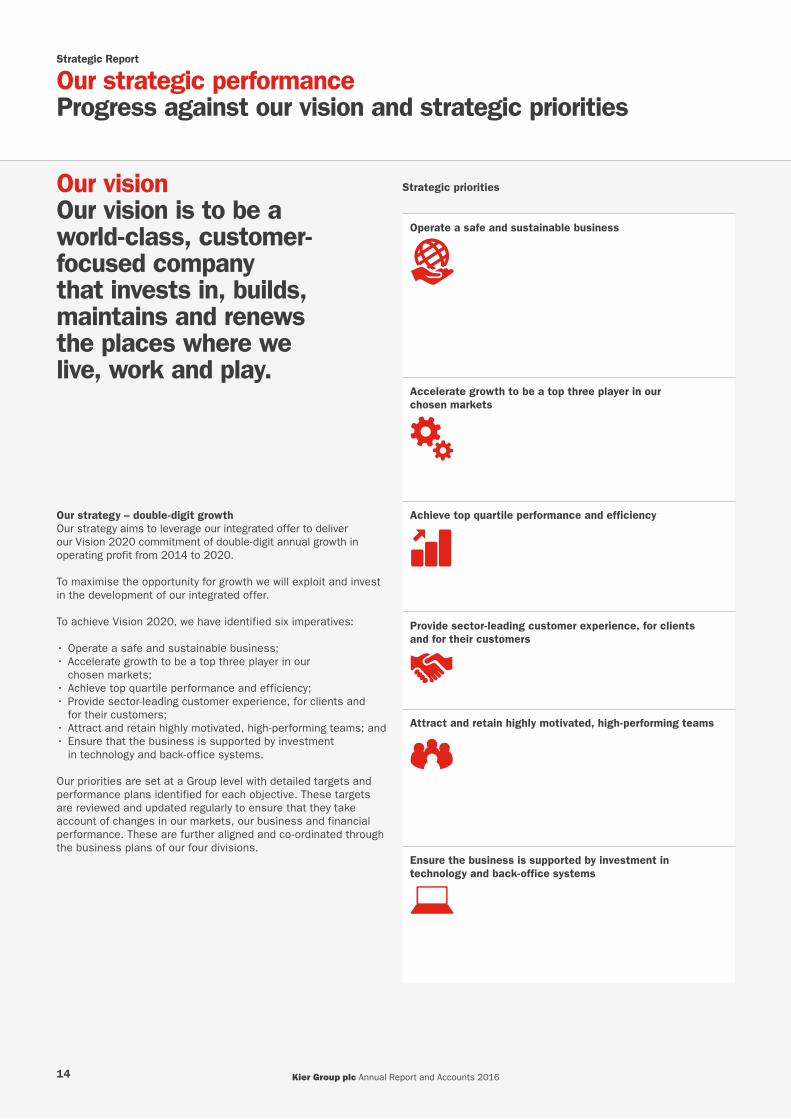
Our visionOur vision is to be a world-class, customer-focused company that invests in, builds, maintains and renews the places where we live, work and play.
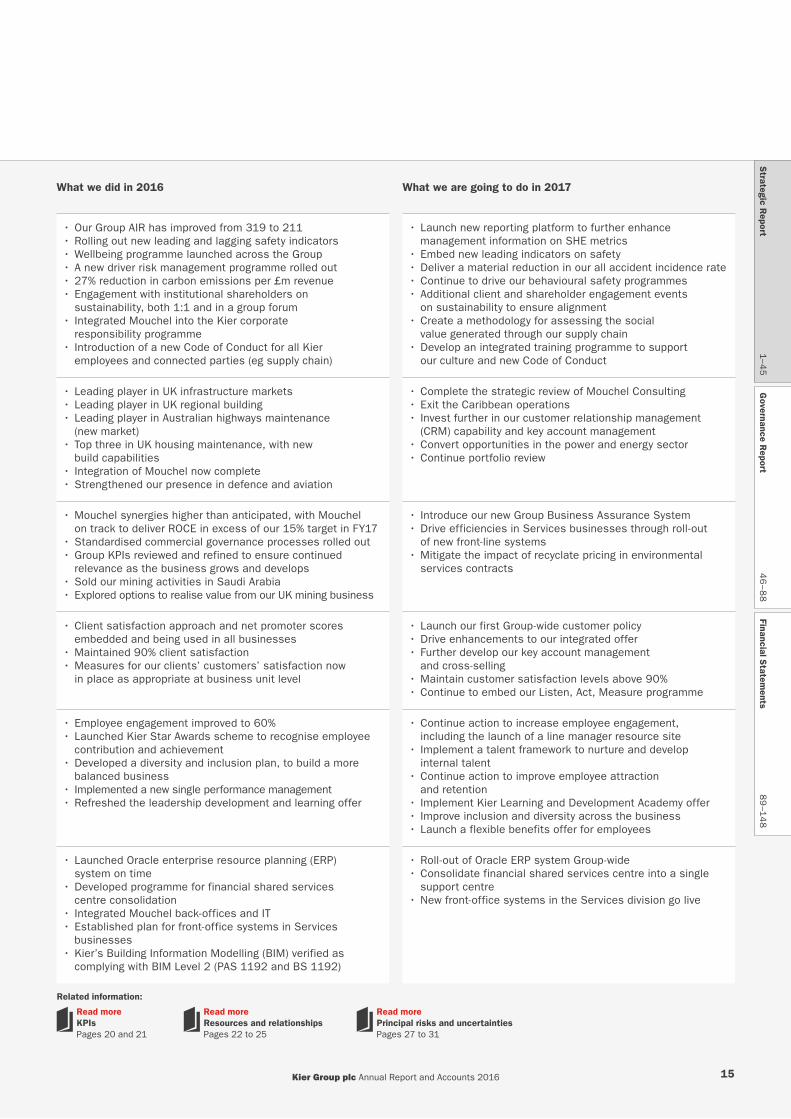
Strategic priorities What we did in 2016 What we are going to do in 2017
Operate a safe and sustainable business
OLD ICONS NEW ICONS
• Our Group AIR has improved from 319 to 211• Rolling out new leading and lagging safety indicators• Wellbeing programme launched across the Group• A new driver risk management programme rolled out• 27% reduction in carbon emissions per £m revenue• Engagement with institutional shareholders on
sustainability, both 1:1 and in a group forum• Integrated Mouchel into the Kier corporate
responsibility programme• Introduction of a new Code of Conduct for all Kier
employees and connected parties (eg supply chain)
• Launch new reporting platform to further enhance management information on SHE metrics
• Embed new leading indicators on safety• Deliver a material reduction in our all accident incidence rate• Continue to drive our behavioural safety programmes• Additional client and shareholder engagement events
on sustainability to ensure alignment • Create a methodology for assessing the social
value generated through our supply chain• Develop an integrated training programme to support
our culture and new Code of Conduct
Accelerate growth to be a top three player in our chosen markets
OLD ICONS NEW ICONS
• Leading player in UK infrastructure markets• Leading player in UK regional building• Leading player in Australian highways maintenance
(new market)• Top three in UK housing maintenance, with new
build capabilities • Integration of Mouchel now complete• Strengthened our presence in defence and aviation
• Complete the strategic review of Mouchel Consulting• Exit the Caribbean operations • Invest further in our customer relationship management
(CRM) capability and key account management• Convert opportunities in the power and energy sector• Continue portfolio review
Our strategy – double-digit growthOur strategy aims to leverage our integrated offer to deliver our Vision 2020 commitment of double-digit annual growth in operating profit from 2014 to 2020.
To maximise the opportunity for growth we will exploit and invest in the development of our integrated offer.
To achieve Vision 2020, we have identified six imperatives:
• Operate a safe and sustainable business;• Accelerate growth to be a top three player in our
chosen markets;• Achieve top quartile performance and efficiency; • Provide sector-leading customer experience, for clients and
for their customers;• Attract and retain highly motivated, high-performing teams; and • Ensure that the business is supported by investment
in technology and back-office systems.
Our priorities are set at a Group level with detailed targets and performance plans identified for each objective. These targets are reviewed and updated regularly to ensure that they take account of changes in our markets, our business and financial performance. These are further aligned and co-ordinated through the business plans of our four divisions.
Achieve top quartile performance and efficiency
OLD ICONS NEW ICONS
• Mouchel synergies higher than anticipated, with Mouchel on track to deliver ROCE in excess of our 15% target in FY17
• Standardised commercial governance processes rolled out• Group KPIs reviewed and refined to ensure continued
relevance as the business grows and develops• Sold our mining activities in Saudi Arabia• Explored options to realise value from our UK mining business
• Introduce our new Group Business Assurance System • Drive efficiencies in Services businesses through roll-out
of new front-line systems• Mitigate the impact of recyclate pricing in environmental
services contracts
Provide sector-leading customer experience, for clients and for their customers
OLD ICONS NEW ICONS
• Client satisfaction approach and net promoter scores embedded and being used in all businesses
• Maintained 90% client satisfaction• Measures for our clients’ customers’ satisfaction now
in place as appropriate at business unit level
• Launch our first Group-wide customer policy• Drive enhancements to our integrated offer• Further develop our key account management
and cross-selling• Maintain customer satisfaction levels above 90%• Continue to embed our Listen, Act, Measure programme
Attract and retain highly motivated, high-performing teams
OLD ICONS NEW ICONS
• Employee engagement improved to 60%• Launched Kier Star Awards scheme to recognise employee
contribution and achievement• Developed a diversity and inclusion plan, to build a more
balanced business• Implemented a new single performance management• Refreshed the leadership development and learning offer
• Continue action to increase employee engagement, including the launch of a line manager resource site
• Implement a talent framework to nurture and develop internal talent
• Continue action to improve employee attraction and retention
• Implement Kier Learning and Development Academy offer • Improve inclusion and diversity across the business• Launch a flexible benefits offer for employees
Ensure the business is supported by investment in technology and back-office systems
OLD ICONS NEW ICONS
• Launched Oracle enterprise resource planning (ERP) system on time
• Developed programme for financial shared services centre consolidation
• Integrated Mouchel back-offices and IT• Established plan for front-office systems in Services
businesses• Kier’s Building Information Modelling (BIM) verified as
complying with BIM Level 2 (PAS 1192 and BS 1192)
• Roll-out of Oracle ERP system Group-wide• Consolidate financial shared services centre into a single
support centre• New front-office systems in the Services division go live
Kier Group plc Annual Report and Accounts 201614
Our visionOur vision is to be a world-class, customer-focused company that invests in, builds, maintains and renews the places where we live, work and play.
Strategic priorities What we did in 2016 What we are going to do in 2017
Operate a safe and sustainable business
OLD ICONS NEW ICONS
• Our Group AIR has improved from 319 to 211• Rolling out new leading and lagging safety indicators• Wellbeing programme launched across the Group• A new driver risk management programme rolled out• 27% reduction in carbon emissions per £m revenue• Engagement with institutional shareholders on
sustainability, both 1:1 and in a group forum• Integrated Mouchel into the Kier corporate
responsibility programme• Introduction of a new Code of Conduct for all Kier
employees and connected parties (eg supply chain)
• Launch new reporting platform to further enhance management information on SHE metrics
• Embed new leading indicators on safety• Deliver a material reduction in our all accident incidence rate• Continue to drive our behavioural safety programmes• Additional client and shareholder engagement events
on sustainability to ensure alignment • Create a methodology for assessing the social
value generated through our supply chain• Develop an integrated training programme to support
our culture and new Code of Conduct
Accelerate growth to be a top three player in our chosen markets
OLD ICONS NEW ICONS
• Leading player in UK infrastructure markets• Leading player in UK regional building• Leading player in Australian highways maintenance
(new market)• Top three in UK housing maintenance, with new
build capabilities • Integration of Mouchel now complete• Strengthened our presence in defence and aviation
• Complete the strategic review of Mouchel Consulting• Exit the Caribbean operations • Invest further in our customer relationship management
(CRM) capability and key account management• Convert opportunities in the power and energy sector• Continue portfolio review
Our strategy – double-digit growthOur strategy aims to leverage our integrated offer to deliver our Vision 2020 commitment of double-digit annual growth in operating profit from 2014 to 2020.
To maximise the opportunity for growth we will exploit and invest in the development of our integrated offer.
To achieve Vision 2020, we have identified six imperatives:
• Operate a safe and sustainable business;• Accelerate growth to be a top three player in our
chosen markets;• Achieve top quartile performance and efficiency; • Provide sector-leading customer experience, for clients and
for their customers;• Attract and retain highly motivated, high-performing teams; and • Ensure that the business is supported by investment
in technology and back-office systems.
Our priorities are set at a Group level with detailed targets and performance plans identified for each objective. These targets are reviewed and updated regularly to ensure that they take account of changes in our markets, our business and financial performance. These are further aligned and co-ordinated through the business plans of our four divisions.
Achieve top quartile performance and efficiency
OLD ICONS NEW ICONS
• Mouchel synergies higher than anticipated, with Mouchel on track to deliver ROCE in excess of our 15% target in FY17
• Standardised commercial governance processes rolled out• Group KPIs reviewed and refined to ensure continued
relevance as the business grows and develops• Sold our mining activities in Saudi Arabia• Explored options to realise value from our UK mining business
• Introduce our new Group Business Assurance System • Drive efficiencies in Services businesses through roll-out
of new front-line systems• Mitigate the impact of recyclate pricing in environmental
services contracts
Provide sector-leading customer experience, for clients and for their customers
OLD ICONS NEW ICONS
• Client satisfaction approach and net promoter scores embedded and being used in all businesses
• Maintained 90% client satisfaction• Measures for our clients’ customers’ satisfaction now
in place as appropriate at business unit level
• Launch our first Group-wide customer policy• Drive enhancements to our integrated offer• Further develop our key account management
and cross-selling• Maintain customer satisfaction levels above 90%• Continue to embed our Listen, Act, Measure programme
Attract and retain highly motivated, high-performing teams
OLD ICONS NEW ICONS
• Employee engagement improved to 60%• Launched Kier Star Awards scheme to recognise employee
contribution and achievement• Developed a diversity and inclusion plan, to build a more
balanced business• Implemented a new single performance management• Refreshed the leadership development and learning offer
• Continue action to increase employee engagement, including the launch of a line manager resource site
• Implement a talent framework to nurture and develop internal talent
• Continue action to improve employee attraction and retention
• Implement Kier Learning and Development Academy offer • Improve inclusion and diversity across the business• Launch a flexible benefits offer for employees
Ensure the business is supported by investment in technology and back-office systems
OLD ICONS NEW ICONS
• Launched Oracle enterprise resource planning (ERP) system on time
• Developed programme for financial shared services centre consolidation
• Integrated Mouchel back-offices and IT• Established plan for front-office systems in Services
businesses• Kier’s Building Information Modelling (BIM) verified as
complying with BIM Level 2 (PAS 1192 and BS 1192)
• Roll-out of Oracle ERP system Group-wide• Consolidate financial shared services centre into a single
support centre• New front-office systems in the Services division go live
Related information:
Read moreKPIs Pages 20 and 21
Read moreResources and relationships Pages 22 to 25
Read morePrincipal risks and uncertainties Pages 27 to 31
Strategic R
eport1–4
5G
overnance Report
46
–88
Financial Statem
ents8
9–1
48
Kier Group plc Annual Report and Accounts 2016 15

Wallsend, North Tyneside – Kier Living and Services providing affordable housing
Working together to get the job done
A joint venture between Kier Services and North Tyneside Council was formed to oversee the building of affordable homes in the North-East. But when the opportunity arose for a technically challenging 41-unit scheme at Wallsend, Kier Living took on the project in light of the project size and specialist skill required.
With Kier Services looking after the pre-construction process, including surveys, designs and early procurement, Kier Living took on the role of developer for 31 houses and 10 rental apartments. The project involved demolishing a former police station – and recovering a previously buried ‘time capsule’ for the local constabulary – as well as obsolete housing and offices. The timber frame houses, clad in brickwork, provide excellent insulation levels to keep residents’ fuel bills down.
Strategic Report
Strategy in action
Kier Group plc Annual Report and Accounts 201616
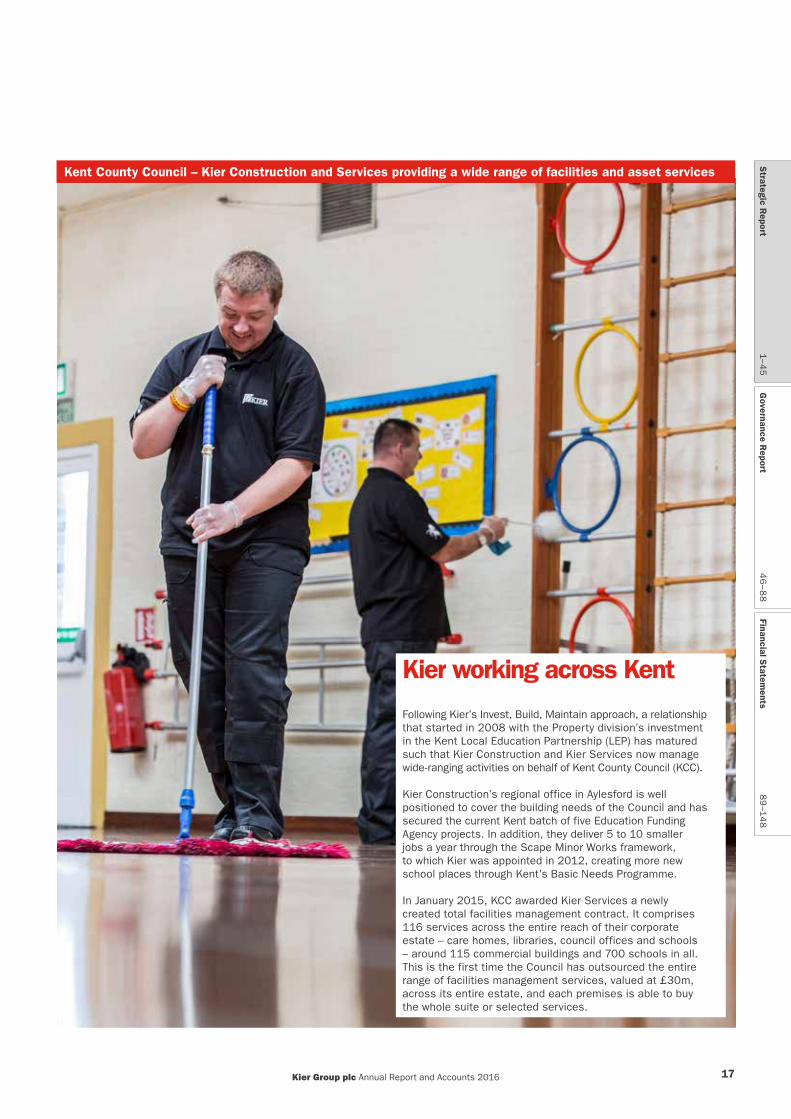
Kent County Council – Kier Construction and Services providing a wide range of facilities and asset services
Kier working across Kent
Following Kier’s Invest, Build, Maintain approach, a relationship that started in 2008 with the Property division’s investment in the Kent Local Education Partnership (LEP) has matured such that Kier Construction and Kier Services now manage wide-ranging activities on behalf of Kent County Council (KCC).
Kier Construction’s regional office in Aylesford is well positioned to cover the building needs of the Council and has secured the current Kent batch of five Education Funding Agency projects. In addition, they deliver 5 to 10 smaller jobs a year through the Scape Minor Works framework, to which Kier was appointed in 2012, creating more new school places through Kent’s Basic Needs Programme.
In January 2015, KCC awarded Kier Services a newly created total facilities management contract. It comprises 116 services across the entire reach of their corporate estate – care homes, libraries, council offices and schools – around 115 commercial buildings and 700 schools in all. This is the first time the Council has outsourced the entire range of facilities management services, valued at £30m, across its entire estate, and each premises is able to buy the whole suite or selected services.
Strategic R
eport1–4
5G
overnance Report
46
–88
Financial Statem
ents8
9–1
48
Kier Group plc Annual Report and Accounts 2016 17

Strategic Report
Strategy in action continued
Five Pancras Square, London – Kier Construction and Services creating a community facility
Creating an award-winning facility for Camden Council
Kier Construction built Five Pancras Square to house the new headquarters for London-based Camden Council, including a state-of-the-art leisure centre with two pools, a fitness centre, library and café. Following the successful completion of the project, the Council also appointed Kier Services to provide on-site facilities management services.
Built over 13 floors, this £68m project won 18 awards, including Sustainable Project of the Year at the 2015 Construction News Awards, and The Prime Minister’s Better Public Building Award 2015, which recognises publicly funded projects completed on time and on budget that bring real change to a community. The building was also one of the first inner-city buildings in the UK to achieve a BREEAM (the Building Research Establishment Environmental Assessment Method) ‘Outstanding’ sustainability rating. Knowledge of the building’s construction helped Kier ensure a seamless occupation and operation of this important public building with the appropriate asset management strategies.
Kier Group plc Annual Report and Accounts 201618

3 Sovereign Square, Leeds City Centre – Kier Property and Construction building for the future
A new office development regenerating the city of Leeds
Kier Property, working with Kier Construction, has created a regeneration project, 3 Sovereign Square – a first-class retail, leisure and office development in the heart of the city. This BREEAM ‘Excellent’ building offers 93,240 sq ft of cutting-edge office space over five floors, flexibly designed and substantially pre-let to a UK law firm with international reach. All-round glazing provides an abundance of natural light, while the ground floor includes 10,400 sq ft of retail space.
The building will be completed on budget, on time and to the highest quality. This new development is part of a trio of buildings built around a new green public space that provides a link between the city centre and the newly regenerated South Bank and is seen as key to the city’s future economic growth. The investment was sold on completion to Leeds City Council.
Strategic R
eport1–4
5G
overnance Report
46
–88
Financial Statem
ents8
9–1
48
Kier Group plc Annual Report and Accounts 2016 19
Strategic Report
Key performance indicatorsMeasuring the successful delivery of our strategy
Financial1
Key performance indicator Progress in 2016 Comment
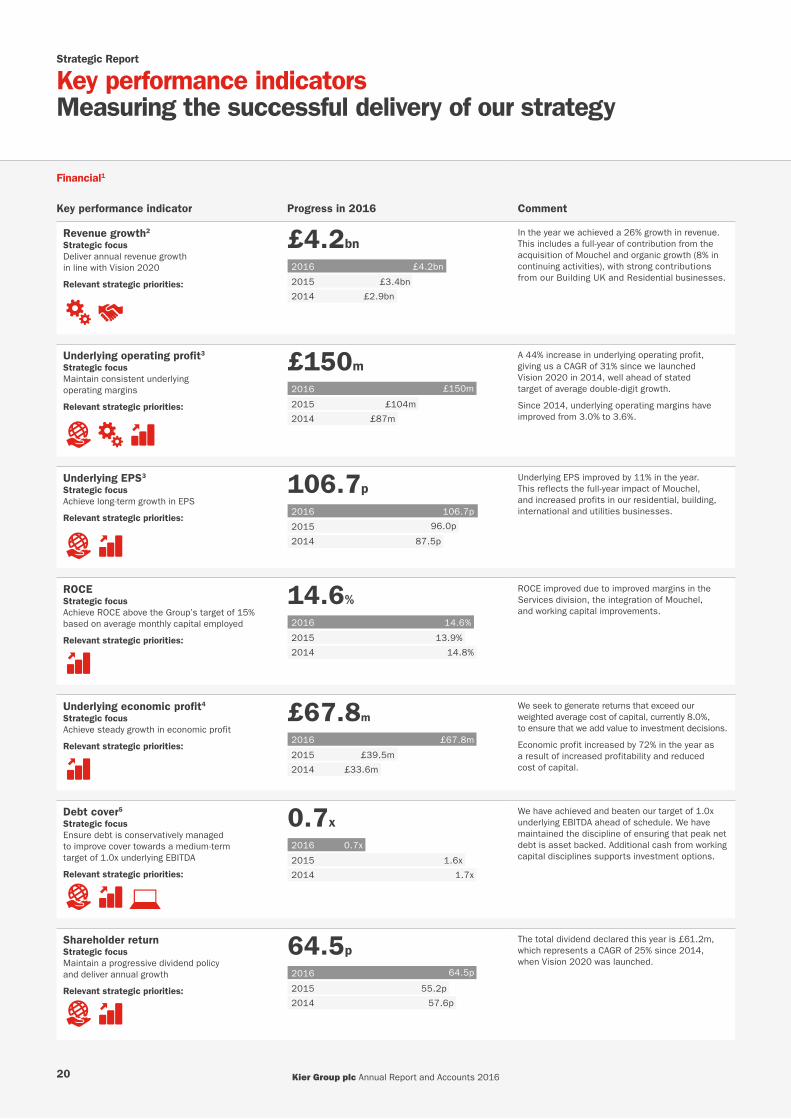
Revenue growth2
Strategic focus Deliver annual revenue growth in line with Vision 2020
Relevant strategic priorities:
OLD ICONS NEW ICONS
OLD ICONS NEW ICONS
£4.2bn
2014
2015
2016 £4.2bn
£2.9bn
£3.4bn
In the year we achieved a 26% growth in revenue. This includes a full-year of contribution from the acquisition of Mouchel and organic growth (8% in continuing activities), with strong contributions from our Building UK and Residential businesses.
Underlying operating profit3
Strategic focus Maintain consistent underlying operating margins
Relevant strategic priorities:
OLD ICONS NEW ICONS
OLD ICONS NEW ICONS
OLD ICONS NEW ICONS
£150m
2014
2015
2016 £150m
£87m
£104m
A 44% increase in underlying operating profit, giving us a CAGR of 31% since we launched Vision 2020 in 2014, well ahead of stated target of average double-digit growth.
Since 2014, underlying operating margins have improved from 3.0% to 3.6%.
Underlying EPS3
Strategic focus Achieve long-term growth in EPS
Relevant strategic priorities:
OLD ICONS NEW ICONS
OLD ICONS NEW ICONS
106.7p
2014
2015
2016 106.7p
87.5p
96.0p
Underlying EPS improved by 11% in the year. This reflects the full-year impact of Mouchel, and increased profits in our residential, building, international and utilities businesses.
ROCEStrategic focus Achieve ROCE above the Group’s target of 15% based on average monthly capital employed
Relevant strategic priorities:
OLD ICONS NEW ICONS
14.6%
2014
2015
2016 14.6%
14.8%
13.9%
ROCE improved due to improved margins in the Services division, the integration of Mouchel, and working capital improvements.
Underlying economic profit4
Strategic focus Achieve steady growth in economic profit
Relevant strategic priorities:
OLD ICONS NEW ICONS
£67.8m
2014
2015
2016 £67.8m
£33.6m
£39.5m
We seek to generate returns that exceed our weighted average cost of capital, currently 8.0%, to ensure that we add value to investment decisions.
Economic profit increased by 72% in the year as a result of increased profitability and reduced cost of capital.
Debt cover5
Strategic focus Ensure debt is conservatively managed to improve cover towards a medium-term target of 1.0x underlying EBITDA
Relevant strategic priorities:
OLD ICONS NEW ICONS
OLD ICONS NEW ICONS
OLD ICONS NEW ICONS
0.7x
2014
2015
2016 0.7x
1.7x
1.6x
We have achieved and beaten our target of 1.0x underlying EBITDA ahead of schedule. We have maintained the discipline of ensuring that peak net debt is asset backed. Additional cash from working capital disciplines supports investment options.
Shareholder returnStrategic focus Maintain a progressive dividend policy and deliver annual growth
Relevant strategic priorities:
OLD ICONS NEW ICONS
OLD ICONS NEW ICONS
64.5p
2014
2015
2016 64.5p
57.6p
55.2p
The total dividend declared this year is £61.2m, which represents a CAGR of 25% since 2014, when Vision 2020 was launched.
Non-financial
Key performance indicator Progress in 2016 Comment
Safety – Group accident incidence rate (AIR)Strategic focus Achieve year-on-year improvement in the Group AIR, and remain below the Health and Safety Executive benchmark for the UK
Relevant strategic priorities:
OLD ICONS NEW ICONS
OLD ICONS NEW ICONS
OLD ICONS NEW ICONS
211
2014
2015
2016 211
342
319
We have achieved a 34% reduction in reportable accidents across the Group due to our concerted efforts on training and behavioural change.
As part of Kier’s commitment to safety, every Director undertakes site safety visits on a monthly basis, as a minimum. 4,729 visits were completed last year (target 3,600 visits).
Customer experienceStrategic focus Deliver a high level of customer satisfaction which is key to supporting sustainable long-term growth across our markets and client base
Relevant strategic priorities:
OLD ICONS NEW ICONS
OLD ICONS NEW ICONS
OLD ICONS NEW ICONS
90%
2014
2015
2016 90%
n/a
90%
Our customer satisfaction measure is now embedded across our businesses. 763 customer interviews took place this year, covering 87% of our revenues, compared with 394 interviews in 2015. Our net promoter score of +49 reflects a strong focus on customers.
Employee engagementStrategic focus Achieve a continuous improvement in employee engagement survey score
Relevant strategic priorities:
OLD ICONS NEW ICONS
OLD ICONS NEW ICONS
60%
2014
2015
2016 60%
54%
n/a
Employee engagement has improved to 60% with an increase in employee participation in the survey of 15% to 71%. Leaders across the business are focused on the action needed to continue the improvement.
Employee retentionStrategic focus Retain employees at or above industry average
Relevant strategic priorities:
OLD ICONS NEW ICONS
OLD ICONS NEW ICONS
OLD ICONS NEW ICONS
87%
2014
2015
2016 87%
88%
85%
Employee retention has improved to 87%. Actions to improve retention further will continue, including a focus on induction for new joiners, clearer career pathways and access to development opportunities for all employees.
SustainabilityStrategic focus Maintain a high ranking in Business in the Community’s Corporate Responsibility Index
Relevant strategic priorities:
OLD ICONS NEW ICONS
OLD ICONS NEW ICONS
OLD ICONS NEW ICONS
OLD ICONS NEW ICONS
87%
2014
2015
2016 87%
85%
87%
We have maintained our score of 87% against a higher bar. This was due to improvement in areas such as corporate strategy, integration, environmental management, marketplace management and disclosure.
1 Financial information in this table relates to continuing operations.2 Group and share of joint ventures.3 Stated before non-underlying items. See note 4 to the consolidated financial statements.4 We calculate economic profit by taking underlying operating profit and subtracting average capital employed, multiplied by the weighted average cost of capital.5 Including finance leases.
20 Kier Group plc Annual Report and Accounts 2016
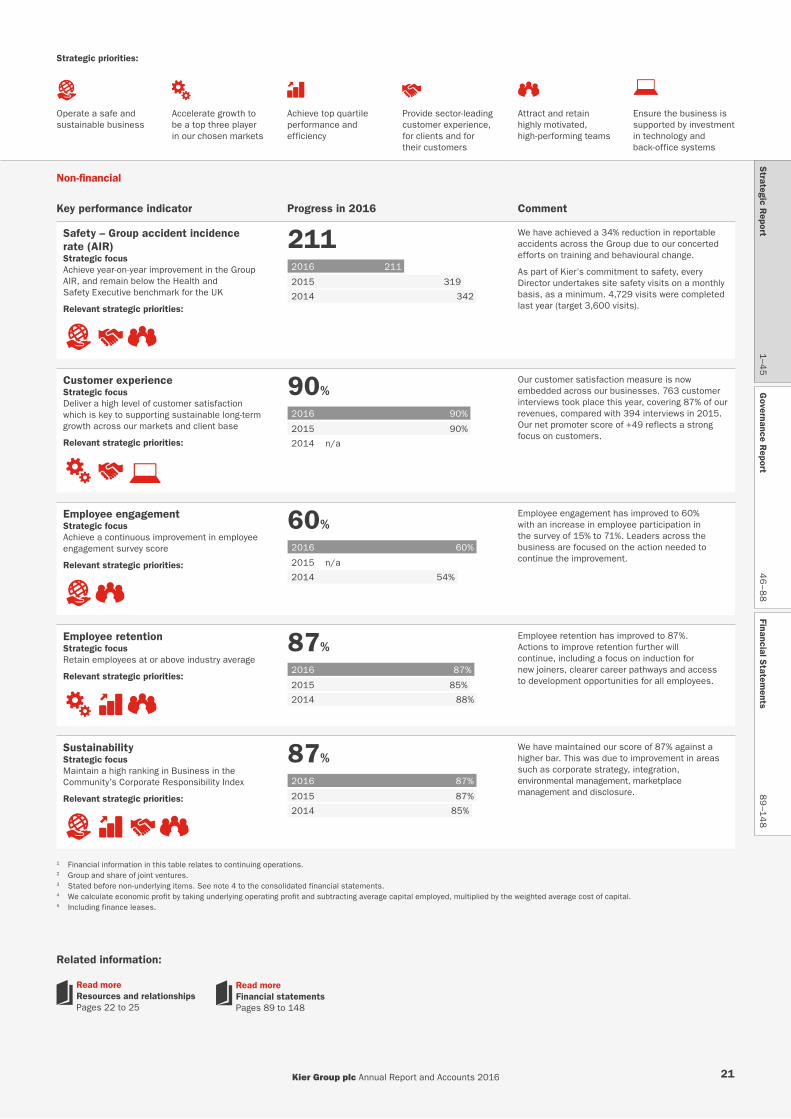
Strategic priorities:
OLD ICONS NEW ICONS
OLD ICONS NEW ICONS
OLD ICONS NEW ICONS
OLD ICONS NEW ICONS
OLD ICONS NEW ICONS
OLD ICONS NEW ICONS
Operate a safe and sustainable business
Accelerate growth to be a top three player in our chosen markets
Achieve top quartile performance and efficiency
Provide sector-leading customer experience, for clients and for their customers
Attract and retain highly motivated, high-performing teams
Ensure the business is supported by investment in technology and back-office systems
Financial1
Key performance indicator Progress in 2016 Comment
Revenue growth2
Strategic focus Deliver annual revenue growth in line with Vision 2020
Relevant strategic priorities:
OLD ICONS NEW ICONS
OLD ICONS NEW ICONS
£4.2bn
2014
2015
2016 £4.2bn
£2.9bn
£3.4bn
In the year we achieved a 26% growth in revenue. This includes a full-year of contribution from the acquisition of Mouchel and organic growth (8% in continuing activities), with strong contributions from our Building UK and Residential businesses.
Underlying operating profit3
Strategic focus Maintain consistent underlying operating margins
Relevant strategic priorities:
OLD ICONS NEW ICONS
OLD ICONS NEW ICONS
OLD ICONS NEW ICONS
£150m
2014
2015
2016 £150m
£87m
£104m
A 44% increase in underlying operating profit, giving us a CAGR of 31% since we launched Vision 2020 in 2014, well ahead of stated target of average double-digit growth.
Since 2014, underlying operating margins have improved from 3.0% to 3.6%.
Underlying EPS3
Strategic focus Achieve long-term growth in EPS
Relevant strategic priorities:
OLD ICONS NEW ICONS
OLD ICONS NEW ICONS
106.7p
2014
2015
2016 106.7p
87.5p
96.0p
Underlying EPS improved by 11% in the year. This reflects the full-year impact of Mouchel, and increased profits in our residential, building, international and utilities businesses.
ROCEStrategic focus Achieve ROCE above the Group’s target of 15% based on average monthly capital employed
Relevant strategic priorities:
OLD ICONS NEW ICONS
14.6%
2014
2015
2016 14.6%
14.8%
13.9%
ROCE improved due to improved margins in the Services division, the integration of Mouchel, and working capital improvements.
Underlying economic profit4
Strategic focus Achieve steady growth in economic profit
Relevant strategic priorities:
OLD ICONS NEW ICONS
£67.8m
2014
2015
2016 £67.8m
£33.6m
£39.5m
We seek to generate returns that exceed our weighted average cost of capital, currently 8.0%, to ensure that we add value to investment decisions.
Economic profit increased by 72% in the year as a result of increased profitability and reduced cost of capital.
Debt cover5
Strategic focus Ensure debt is conservatively managed to improve cover towards a medium-term target of 1.0x underlying EBITDA
Relevant strategic priorities:
OLD ICONS NEW ICONS
OLD ICONS NEW ICONS
OLD ICONS NEW ICONS
0.7x
2014
2015
2016 0.7x
1.7x
1.6x
We have achieved and beaten our target of 1.0x underlying EBITDA ahead of schedule. We have maintained the discipline of ensuring that peak net debt is asset backed. Additional cash from working capital disciplines supports investment options.
Shareholder returnStrategic focus Maintain a progressive dividend policy and deliver annual growth
Relevant strategic priorities:
OLD ICONS NEW ICONS
OLD ICONS NEW ICONS
64.5p
2014
2015
2016 64.5p
57.6p
55.2p
The total dividend declared this year is £61.2m, which represents a CAGR of 25% since 2014, when Vision 2020 was launched.
Non-financial
Key performance indicator Progress in 2016 Comment
Safety – Group accident incidence rate (AIR)Strategic focus Achieve year-on-year improvement in the Group AIR, and remain below the Health and Safety Executive benchmark for the UK
Relevant strategic priorities:
OLD ICONS NEW ICONS
OLD ICONS NEW ICONS
OLD ICONS NEW ICONS
211
2014
2015
2016 211
342
319
We have achieved a 34% reduction in reportable accidents across the Group due to our concerted efforts on training and behavioural change.
As part of Kier’s commitment to safety, every Director undertakes site safety visits on a monthly basis, as a minimum. 4,729 visits were completed last year (target 3,600 visits).
Customer experienceStrategic focus Deliver a high level of customer satisfaction which is key to supporting sustainable long-term growth across our markets and client base
Relevant strategic priorities:
OLD ICONS NEW ICONS
OLD ICONS NEW ICONS
OLD ICONS NEW ICONS
90%
2014
2015
2016 90%
n/a
90%
Our customer satisfaction measure is now embedded across our businesses. 763 customer interviews took place this year, covering 87% of our revenues, compared with 394 interviews in 2015. Our net promoter score of +49 reflects a strong focus on customers.
Employee engagementStrategic focus Achieve a continuous improvement in employee engagement survey score
Relevant strategic priorities:
OLD ICONS NEW ICONS
OLD ICONS NEW ICONS
60%
2014
2015
2016 60%
54%
n/a
Employee engagement has improved to 60% with an increase in employee participation in the survey of 15% to 71%. Leaders across the business are focused on the action needed to continue the improvement.
Employee retentionStrategic focus Retain employees at or above industry average
Relevant strategic priorities:
OLD ICONS NEW ICONS
OLD ICONS NEW ICONS
OLD ICONS NEW ICONS
87%
2014
2015
2016 87%
88%
85%
Employee retention has improved to 87%. Actions to improve retention further will continue, including a focus on induction for new joiners, clearer career pathways and access to development opportunities for all employees.
SustainabilityStrategic focus Maintain a high ranking in Business in the Community’s Corporate Responsibility Index
Relevant strategic priorities:
OLD ICONS NEW ICONS
OLD ICONS NEW ICONS
OLD ICONS NEW ICONS
OLD ICONS NEW ICONS
87%
2014
2015
2016 87%
85%
87%
We have maintained our score of 87% against a higher bar. This was due to improvement in areas such as corporate strategy, integration, environmental management, marketplace management and disclosure.
1 Financial information in this table relates to continuing operations.2 Group and share of joint ventures.3 Stated before non-underlying items. See note 4 to the consolidated financial statements.4 We calculate economic profit by taking underlying operating profit and subtracting average capital employed, multiplied by the weighted average cost of capital.5 Including finance leases.
Related information:
Read moreResources and relationships Pages 22 to 25
Read moreFinancial statements Pages 89 to 148
Strategic R
eport1–4
5G
overnance Report
46
–88
Financial Statem
ents8
9–1
48
Kier Group plc Annual Report and Accounts 2016 21
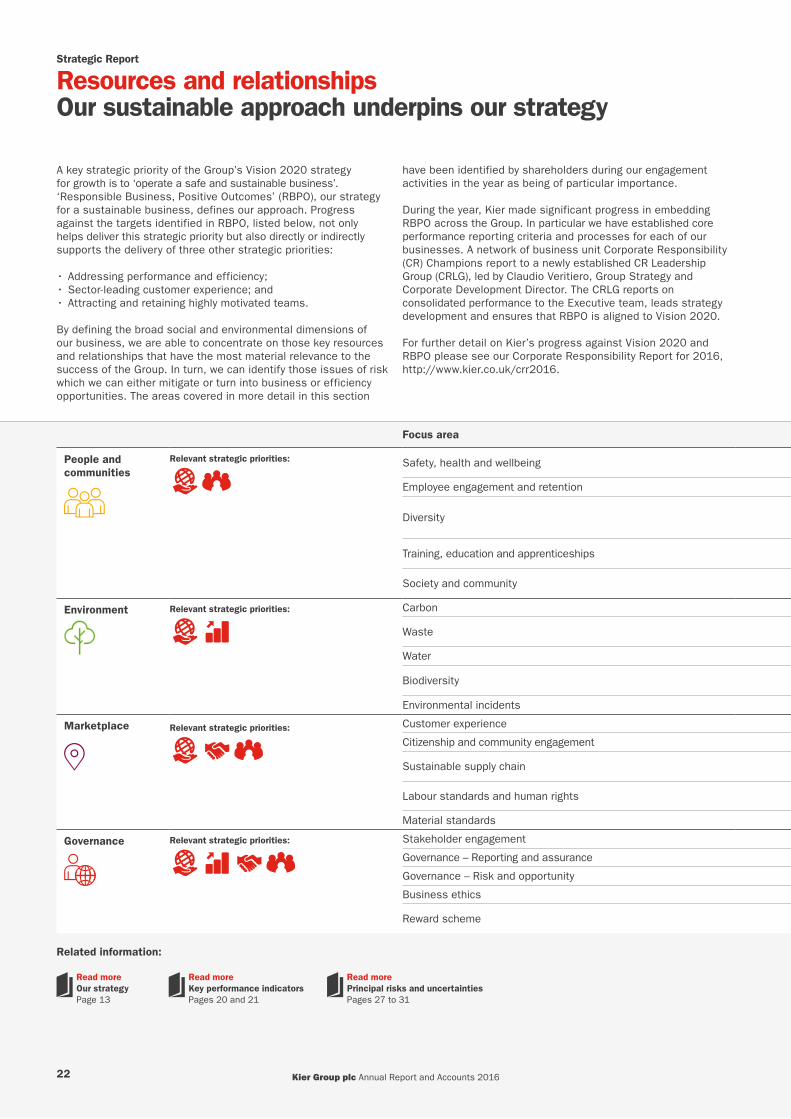
Strategic Report
Resources and relationshipsOur sustainable approach underpins our strategy
A key strategic priority of the Group’s Vision 2020 strategy for growth is to ‘operate a safe and sustainable business’. ‘Responsible Business, Positive Outcomes’ (RBPO), our strategy for a sustainable business, defines our approach. Progress against the targets identified in RBPO, listed below, not only helps deliver this strategic priority but also directly or indirectly supports the delivery of three other strategic priorities:
• Addressing performance and efficiency; • Sector-leading customer experience; and• Attracting and retaining highly motivated teams.
By defining the broad social and environmental dimensions of our business, we are able to concentrate on those key resources and relationships that have the most material relevance to the success of the Group. In turn, we can identify those issues of risk which we can either mitigate or turn into business or efficiency opportunities. The areas covered in more detail in this section
have been identified by shareholders during our engagement activities in the year as being of particular importance.
During the year, Kier made significant progress in embedding RBPO across the Group. In particular we have established core performance reporting criteria and processes for each of our businesses. A network of business unit Corporate Responsibility (CR) Champions report to a newly established CR Leadership Group (CRLG), led by Claudio Veritiero, Group Strategy and Corporate Development Director. The CRLG reports on consolidated performance to the Executive team, leads strategy development and ensures that RBPO is aligned to Vision 2020.
For further detail on Kier’s progress against Vision 2020 and RBPO please see our Corporate Responsibility Report for 2016, http://www.kier.co.uk/crr2016.
Focus area Progress 2020 target
People and communities
Relevant strategic priorities:
OLD ICONS NEW ICONS
OLD ICONS NEW ICONS
Safety, health and wellbeing 34% reduction in the accident incidence rate (AIR) achieved from last year Zero AIR
Employee engagement and retention Engagement increased from 54% in 2014 to 60% in 2016 75% employee engagement
Diversity Graduate diversity ratio has improved to 76:24 male:female. Overall Group ratio is 77:23. Further work is required to measure trainee and apprentice diversity
70:30 male:female ratio for graduate, trainee and apprentice recruits
Training, education and apprenticeships Further investment in back-office systems to allow for accurate recording and reporting 5 training days per employee
Society and community Phase one of the development of Kier’s social value calculator has been completed leading to a significant increase in value recorded 10% additional social value created
Environment
Relevant strategic priorities:
OLD ICONS NEW ICONS
OLD ICONS NEW ICONS
Carbon 27.4% relative reduction achieved 10% relative reduction from 2014 baseline
Waste Construction waste increased to 9.4m3 per £100k revenue. Re-use and recycling improved to 86% 30% relative reduction from 2014 baseline
Water Water usage benchmark established 10% reduction from 2015 benchmark
Biodiversity 35 Biodiversity Interest Group (BIG) challenges completed, or one per £120m of revenue 1 BIG challenge/£50m of revenue
Environmental incidents All Environmental Incidence Rate (AEIR) benchmark established 25% reduction from 2015 benchmark
Marketplace
Relevant strategic priorities:
OLD ICONS NEW ICONS
OLD ICONS NEW ICONS
OLD ICONS NEW ICONS
Customer experience A satisfaction rate of 90% was achieved 90% customer satisfaction
Citizenship and community engagement 76% (38.2/50) in the Considerate Constructors Scheme (CCS) 80% (40/50) average score in CCS
Sustainable supply chain 2,029 individuals from our supplier and sub-contractor base are registered with the Supply Chain Sustainability School (SCSS) Partners engaged in the SCSS
Labour standards and human rights Responsible Procurement and Anti-slavery and Human Trafficking policies published Meet core principles of UN Declaration of Human Rights
Material standards First tranche of material standards agreed 100% compliance with Kier material standards
Governance
Relevant strategic priorities:
OLD ICONS NEW ICONS
OLD ICONS NEW ICONS
OLD ICONS NEW ICONS
OLD ICONS NEW ICONS
Stakeholder engagement 87% in the Business in the Community (BITC) CR Index Annual independent review by BITC
Governance – Reporting and assurance Global Reporting Initiative (GRI) G4 reporting guidelines adopted Integrated reporting to GRI G4 reporting guidelines
Governance – Risk and opportunity Ongoing Quantify risk across non-financial measures
Business ethics Achieved – new target agreed on Kier’s Code of Conduct Train all employees on the Code of Conduct
Reward scheme Kier remains on track to review its remuneration policy – see remuneration report on pages 66 to 77 Reward scheme for non-financial performance
Related information:
Read moreOur strategy Page 13
Read moreKey performance indicators Pages 20 and 21
Read morePrincipal risks and uncertainties Pages 27 to 31
Kier Group plc Annual Report and Accounts 201622
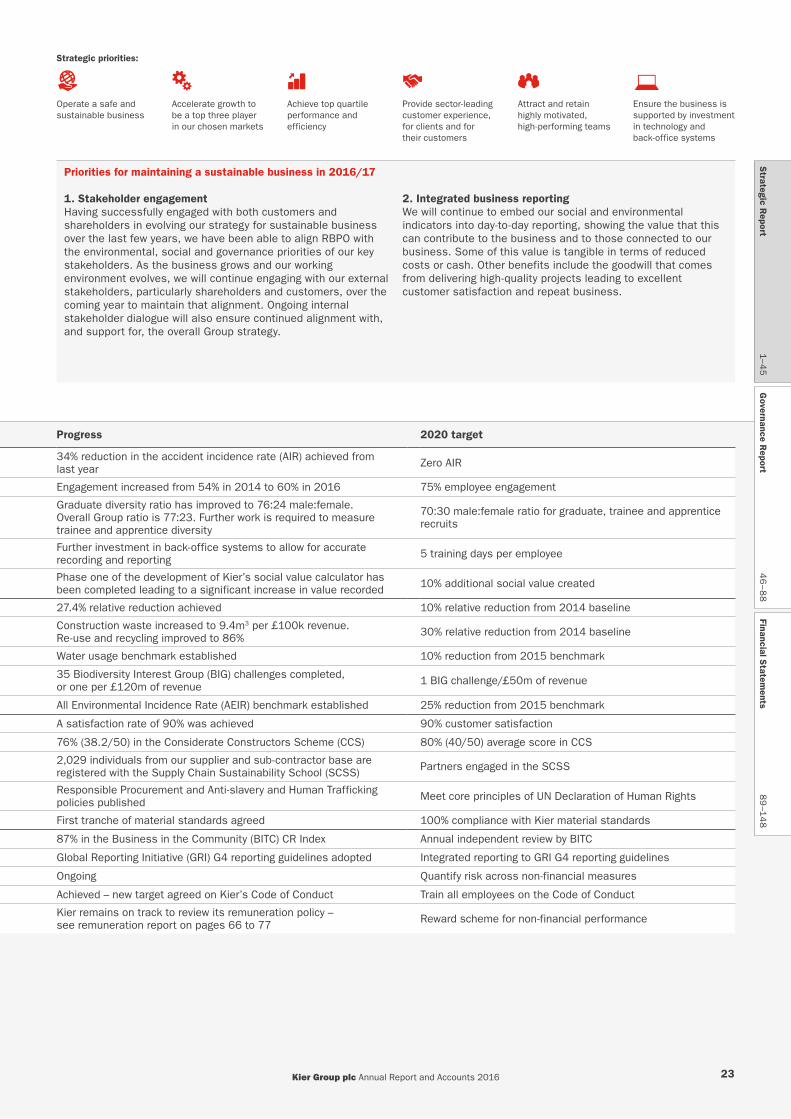
Focus area Progress 2020 target
People and communities
Relevant strategic priorities:
OLD ICONS NEW ICONS
OLD ICONS NEW ICONS
Safety, health and wellbeing 34% reduction in the accident incidence rate (AIR) achieved from last year Zero AIR
Employee engagement and retention Engagement increased from 54% in 2014 to 60% in 2016 75% employee engagement
Diversity Graduate diversity ratio has improved to 76:24 male:female. Overall Group ratio is 77:23. Further work is required to measure trainee and apprentice diversity
70:30 male:female ratio for graduate, trainee and apprentice recruits
Training, education and apprenticeships Further investment in back-office systems to allow for accurate recording and reporting 5 training days per employee
Society and community Phase one of the development of Kier’s social value calculator has been completed leading to a significant increase in value recorded 10% additional social value created
Environment
Relevant strategic priorities:
OLD ICONS NEW ICONS
OLD ICONS NEW ICONS
Carbon 27.4% relative reduction achieved 10% relative reduction from 2014 baseline
Waste Construction waste increased to 9.4m3 per £100k revenue. Re-use and recycling improved to 86% 30% relative reduction from 2014 baseline
Water Water usage benchmark established 10% reduction from 2015 benchmark
Biodiversity 35 Biodiversity Interest Group (BIG) challenges completed, or one per £120m of revenue 1 BIG challenge/£50m of revenue
Environmental incidents All Environmental Incidence Rate (AEIR) benchmark established 25% reduction from 2015 benchmark
Marketplace
Relevant strategic priorities:
OLD ICONS NEW ICONS
OLD ICONS NEW ICONS
OLD ICONS NEW ICONS
Customer experience A satisfaction rate of 90% was achieved 90% customer satisfaction
Citizenship and community engagement 76% (38.2/50) in the Considerate Constructors Scheme (CCS) 80% (40/50) average score in CCS
Sustainable supply chain 2,029 individuals from our supplier and sub-contractor base are registered with the Supply Chain Sustainability School (SCSS) Partners engaged in the SCSS
Labour standards and human rights Responsible Procurement and Anti-slavery and Human Trafficking policies published Meet core principles of UN Declaration of Human Rights
Material standards First tranche of material standards agreed 100% compliance with Kier material standards
Governance
Relevant strategic priorities:
OLD ICONS NEW ICONS
OLD ICONS NEW ICONS
OLD ICONS NEW ICONS
OLD ICONS NEW ICONS
Stakeholder engagement 87% in the Business in the Community (BITC) CR Index Annual independent review by BITC
Governance – Reporting and assurance Global Reporting Initiative (GRI) G4 reporting guidelines adopted Integrated reporting to GRI G4 reporting guidelines
Governance – Risk and opportunity Ongoing Quantify risk across non-financial measures
Business ethics Achieved – new target agreed on Kier’s Code of Conduct Train all employees on the Code of Conduct
Reward scheme Kier remains on track to review its remuneration policy – see remuneration report on pages 66 to 77 Reward scheme for non-financial performance
Related information:
Read moreOur strategy Page 13
Read moreKey performance indicators Pages 20 and 21
Read morePrincipal risks and uncertainties Pages 27 to 31
Priorities for maintaining a sustainable business in 2016/17
1. Stakeholder engagementHaving successfully engaged with both customers and shareholders in evolving our strategy for sustainable business over the last few years, we have been able to align RBPO with the environmental, social and governance priorities of our key stakeholders. As the business grows and our working environment evolves, we will continue engaging with our external stakeholders, particularly shareholders and customers, over the coming year to maintain that alignment. Ongoing internal stakeholder dialogue will also ensure continued alignment with, and support for, the overall Group strategy.
2. Integrated business reportingWe will continue to embed our social and environmental indicators into day-to-day reporting, showing the value that this can contribute to the business and to those connected to our business. Some of this value is tangible in terms of reduced costs or cash. Other benefits include the goodwill that comes from delivering high-quality projects leading to excellent customer satisfaction and repeat business.
Strategic priorities:
OLD ICONS NEW ICONS
OLD ICONS NEW ICONS
OLD ICONS NEW ICONS
OLD ICONS NEW ICONS
OLD ICONS NEW ICONS
OLD ICONS NEW ICONS
Operate a safe and sustainable business
Accelerate growth to be a top three player in our chosen markets
Achieve top quartile performance and efficiency
Provide sector-leading customer experience, for clients and for their customers
Attract and retain highly motivated, high-performing teams
Ensure the business is supported by investment in technology and back-office systems
Strategic R
eport1–4
5G
overnance Report
46
–88
Financial Statem
ents8
9–1
48
Kier Group plc Annual Report and Accounts 2016 23

Strategic Report
Resources and relationships continued
People and communitiesSociety and communityOur long-term target is to generate 10% additional social value, measured as a proportion of Group turnover. We launched the Kier social value calculator in 2015 to help us track progress and understand the economic benefit to communities and individuals created by Kier, for example through employment opportunities with us or our supply chain partners, by providing training or supporting good causes. In the year ended June 2016 through such activities, we positively impacted on nearly 80,000 lives, gave over 270,000 hours of employee time and created £9.6m of social and community value.
Community and social value (£m)
Cash donated and spent Value of community hoursValue of employment & skills hours Social value generated
1615
0
4
2£2,884,376
£9,589,674
6
8
10
DiversityThe sustainable growth of Kier will be reliant on attracting and retaining the best talent. We operate in sectors where skills are scarce, the market is highly competitive and new disruptive technologies could fundamentally change the nature of the work that we do. A balanced business, which makes the most of the diversity of talent and experience available to us, will ensure that we have the agility and resilience to deliver sustainable growth. We provide further commentary on diversity, growth and risk within the Chief Executive’s strategic review on page 9, risk management on page 28 and Governance in action on page 47.
Diversity1 Male Female
All employees14,564 4,328
77% 23%
Senior management
309 38
89% 11%
Directors10 2
83% 17%
Male – 77%Female – 23%
Ethnicity of employees1
White – 58%Not stated – 37%Black and minority ethnic – 5%
1 Data excludes casual and overseas operative workforce data
EnvironmentCarbonOur total or absolute emissions reduced by 15,551 tCO2e or 10.7% year-on-year driven by reduced output at our surface coal mine, and the sale of the Fleet & Passenger Services business, and offset in part by increased emissions in the Residential division.
In relative terms emissions declined by 27.4% to 36.6 tCO2e per £m revenue. The two main contributors were the acquisition of Mouchel with its low emissions to revenue ratio having a diluting effect; and the reduction in output from our surface coal mine which has had a high emissions to revenue ratio historically. A focus on energy efficiency also made a contribution.
Kier has achieved its 2020 target of a 10% reduction in emissions per £m revenue ahead of plan. A revised target will be set and we will continue to focus on improving energy efficiency and reducing fuel consumption.
Emission type:2014
CO2e tonnes2015
CO2e tonnes
Scope 1: operation of facilities 0 0
Scope 1 combustion 129,756 112,651-13.2%
Total Scope 1 emissions 129,756 112,651
Scope 2: purchased energy 15,634 17,189+9.9%
Scope 2 total emissions 15,634 17,189
Total emissions 145,390 129,839
Greenhouse gas emissions intensity ratio 50.4t/£m(-2% v 2013)
36.6t/£m-27.4%
Turnover (£m) 2,885 3,552
Supporting contextThe period of greenhouse gas emissions reporting is the calendar year 2015 to mirror our reporting to the Carbon Disclosure Project. We report on emissions as required by the Companies Act 2006 (Strategic Report and Directors’ Report) Regulations 2013. Scope 1 fugitive emissions are excluded. We do not account for any share of principal joint ventures or operations unless in majority financial control. Our dataset, on which our emissions/£ are based, represents 92% of Kier’s operations by turnover. Our methodology has been based on the principles of the Greenhouse Gas Protocol. Conversion factors are those published by the Department for Environment, Food and Rural Affairs in 2015. The emissions associated with our principal joint operations in the period where Kier procured energy/fuel was 12,850 tonnes CO2e.
WasteThe amount of materials that Kier purchases is a direct cost to our business. A focus on reducing the amount of waste we generate will make our business more efficient as well as achieving economic and environmental benefits. This focus has helped us consistently reduce waste to landfill and increase re-use and recycling.
Construction material waste – diversion from landfill
100%
0
86
20 14
This data is collated from a sample representing 37% of Kier Group by revenue.
Re-used/recycled
14 15 16
Land�lled
22
78 80
Kier Group plc Annual Report and Accounts 201624
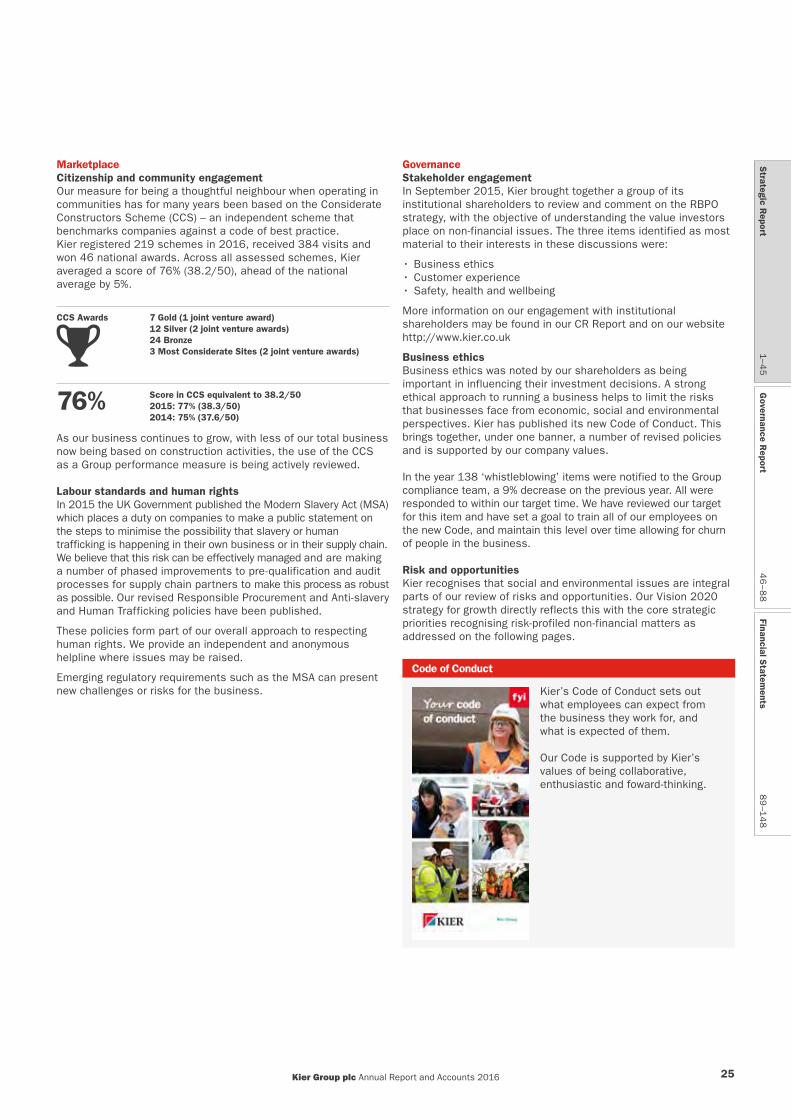
MarketplaceCitizenship and community engagementOur measure for being a thoughtful neighbour when operating in communities has for many years been based on the Considerate Constructors Scheme (CCS) – an independent scheme that benchmarks companies against a code of best practice. Kier registered 219 schemes in 2016, received 384 visits and won 46 national awards. Across all assessed schemes, Kier averaged a score of 76% (38.2/50), ahead of the national average by 5%.
CCS Awards 7 Gold (1 joint venture award)12 Silver (2 joint venture awards)24 Bronze3 Most Considerate Sites (2 joint venture awards)
76% Score in CCS equivalent to 38.2/502015: 77% (38.3/50)2014: 75% (37.6/50)
As our business continues to grow, with less of our total business now being based on construction activities, the use of the CCS as a Group performance measure is being actively reviewed.
Labour standards and human rightsIn 2015 the UK Government published the Modern Slavery Act (MSA) which places a duty on companies to make a public statement on the steps to minimise the possibility that slavery or human trafficking is happening in their own business or in their supply chain. We believe that this risk can be effectively managed and are making a number of phased improvements to pre-qualification and audit processes for supply chain partners to make this process as robust as possible. Our revised Responsible Procurement and Anti-slavery and Human Trafficking policies have been published.
These policies form part of our overall approach to respecting human rights. We provide an independent and anonymous helpline where issues may be raised.
Emerging regulatory requirements such as the MSA can present new challenges or risks for the business.
GovernanceStakeholder engagementIn September 2015, Kier brought together a group of its institutional shareholders to review and comment on the RBPO strategy, with the objective of understanding the value investors place on non-financial issues. The three items identified as most material to their interests in these discussions were:
• Business ethics• Customer experience• Safety, health and wellbeing
More information on our engagement with institutional shareholders may be found in our CR Report and on our website http://www.kier.co.uk
Business ethicsBusiness ethics was noted by our shareholders as being important in influencing their investment decisions. A strong ethical approach to running a business helps to limit the risks that businesses face from economic, social and environmental perspectives. Kier has published its new Code of Conduct. This brings together, under one banner, a number of revised policies and is supported by our company values.
In the year 138 ‘whistleblowing’ items were notified to the Group compliance team, a 9% decrease on the previous year. All were responded to within our target time. We have reviewed our target for this item and have set a goal to train all of our employees on the new Code, and maintain this level over time allowing for churn of people in the business.
Risk and opportunitiesKier recognises that social and environmental issues are integral parts of our review of risks and opportunities. Our Vision 2020 strategy for growth directly reflects this with the core strategic priorities recognising risk-profiled non-financial matters as addressed on the following pages.
Code of Conduct
Kier’s Code of Conduct sets out what employees can expect from the business they work for, and what is expected of them.
Our Code is supported by Kier’s values of being collaborative, enthusiastic and foward-thinking.
Strategic R
eport1–4
5G
overnance Report
46
–88
Financial Statem
ents8
9–1
48
Kier Group plc Annual Report and Accounts 2016 25

Strategic Report
Risk managementStrong risk management supports the delivery of our strategy
IntroductionThe Board is responsible for the Group’s systems of risk management and internal control and for ensuring that significant risks are identified and appropriately managed.
The Group recognises that consistent and effective risk management is vital to the delivery of its strategic priorities and has aligned its risk assessment and Vision 2020 progress tracking processes.
The Group has a well-established process and methodology for the identification, quantification, monitoring and management of the principal risks faced by the business.
The Group also has a clear focus on continually improving its risk management processes and internal control environment.
The Board has delegated the review of the effectiveness of the Group’s risk management processes to the Risk Management and Audit Committee (the RMAC).
How the Group identifies and manages riskA summary of how the Group identifies and manages risk is as follows:
Risk Management and Audit Committee• Responsible for overseeing the Group’s systems of
risk management and internal control• Reviews the effectiveness of risk management
processes, ensuring that appropriate action is taken to manage the principal risks
Group risk summaryA periodic consolidated analysis of the principal risks and the effectiveness of their mitigation is reviewed by the RMAC
Performance indicatorsPerformance against a number of measures is monitored. This provides an indication of how well risks are managed and is aligned to the Group’s strategic priorities
Divisional management• Responsible for systems of risk management and
internal control within their division• Provides support and challenge on their businesses’
assessment of risk and the adequacy of mitigations
Group functions• Act as subject matter experts on the principal risks
and provide independent support and challenge on the assessment and management of risks
Divisional risk summaryA periodic consolidated analysis of the business risk registers is reviewed by divisional management
Principal risk summaryA periodic consolidated analysis of each principal risk as assessed within the business risk registers is reviewed by Group functions
Business unit management• Responsible for systems of risk management and
internal control within their business unit• Maintain risk registers that include all principal risks
identified by the Board and any further risks deemed significant by each business
Business risk register
Remedial actionWhere mitigation is not effective or the net risk level is still deemed to be too high, further action is agreed and implemented
Gross risk level The pre- mitigation risk size considering the potential financial impact and the likelihood of occurring
Key mitigationsKey mitigations are documented and their effectiveness assessed
Net risk levelThe post- mitigation risk size, taking into account the effectiveness of key mitigations
Assurance activity Activity by various parties (including Internal Audit) that provides assurance as to the effectiveness of the risk management and internal control systems
Strategic priorities The Board determines its strategic priorities
Principal risks On an annual basis, the Board, in conjunction with the business, assesses the principal risks faced by the Group
Risk management and internal control The Board is responsible for the Group’s systems of risk management and internal control
Board
Risk Management and Audit CommitteeThe Board delegates responsibility for reviewing the effectiveness of the Group’s systems
of risk management and internal control to the Risk Management and Audit Committee
Kier Group plc Annual Report and Accounts 201626
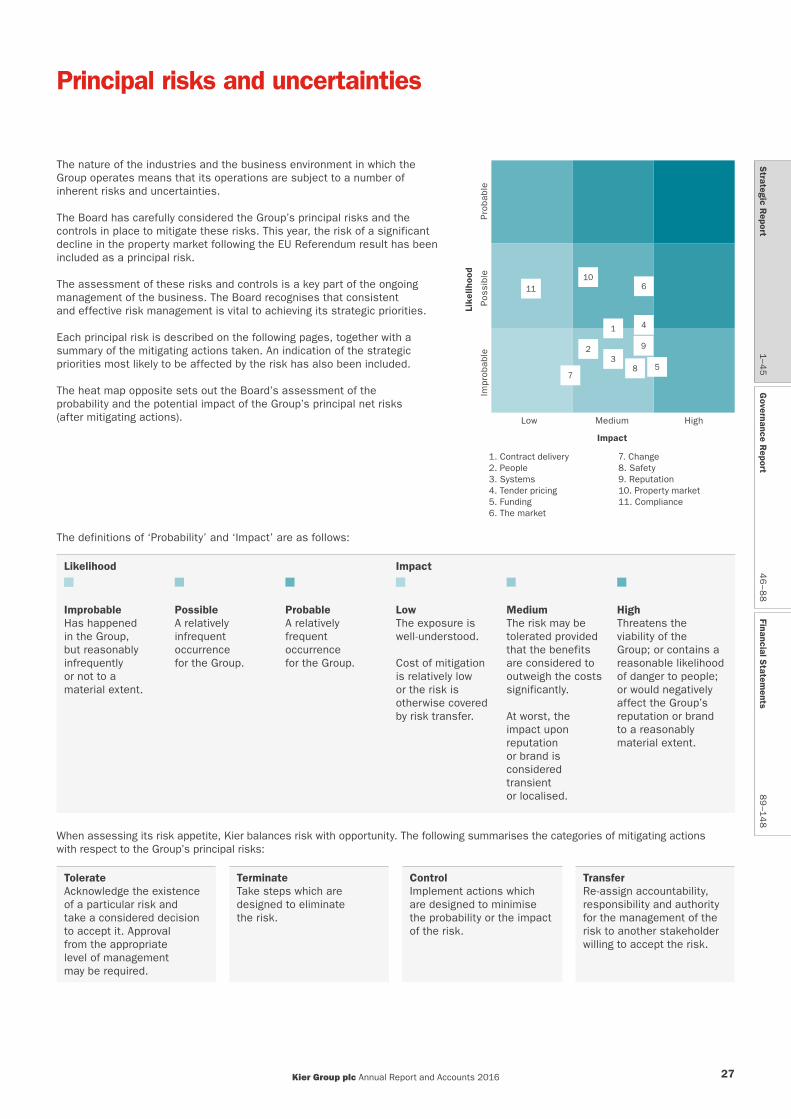
The definitions of ‘Probability’ and ‘Impact’ are as follows:
Likelihood Impact
ImprobableHas happened in the Group, but reasonably infrequently or not to a material extent.
PossibleA relatively infrequent occurrence for the Group.
ProbableA relatively frequent occurrence for the Group.
LowThe exposure is well-understood.
Cost of mitigation is relatively low or the risk is otherwise covered by risk transfer.
MediumThe risk may be tolerated provided that the benefits are considered to outweigh the costs significantly.
At worst, the impact upon reputation or brand is considered transient or localised.
HighThreatens the viability of the Group; or contains a reasonable likelihood of danger to people; or would negatively affect the Group’s reputation or brand to a reasonably material extent.
When assessing its risk appetite, Kier balances risk with opportunity. The following summarises the categories of mitigating actions with respect to the Group’s principal risks:
TolerateAcknowledge the existence of a particular risk and take a considered decision to accept it. Approval from the appropriate level of management may be required.
TerminateTake steps which are designed to eliminate the risk.
ControlImplement actions which are designed to minimise the probability or the impact of the risk.
TransferRe-assign accountability, responsibility and authority for the management of the risk to another stakeholder willing to accept the risk.
Principal risks and uncertainties
Like
lihoo
d
Impact
Impr
obab
lePo
ssib
lePr
obab
le
Low Medium High
11
87
3
4
2
1
5
6
9
10
The nature of the industries and the business environment in which the Group operates means that its operations are subject to a number of inherent risks and uncertainties.
The Board has carefully considered the Group’s principal risks and the controls in place to mitigate these risks. This year, the risk of a significant decline in the property market following the EU Referendum result has been included as a principal risk.
The assessment of these risks and controls is a key part of the ongoing management of the business. The Board recognises that consistent and effective risk management is vital to achieving its strategic priorities.
Each principal risk is described on the following pages, together with a summary of the mitigating actions taken. An indication of the strategic priorities most likely to be affected by the risk has also been included.
The heat map opposite sets out the Board’s assessment of the probability and the potential impact of the Group’s principal net risks (after mitigating actions).
1. Contract delivery2. People3. Systems4. Tender pricing5. Funding6. The market
7. Change8. Safety9. Reputation10. Property market11. Compliance
Strategic R
eport1–4
5G
overnance Report
46
–88
Financial Statem
ents8
9–1
48
Kier Group plc Annual Report and Accounts 2016 27
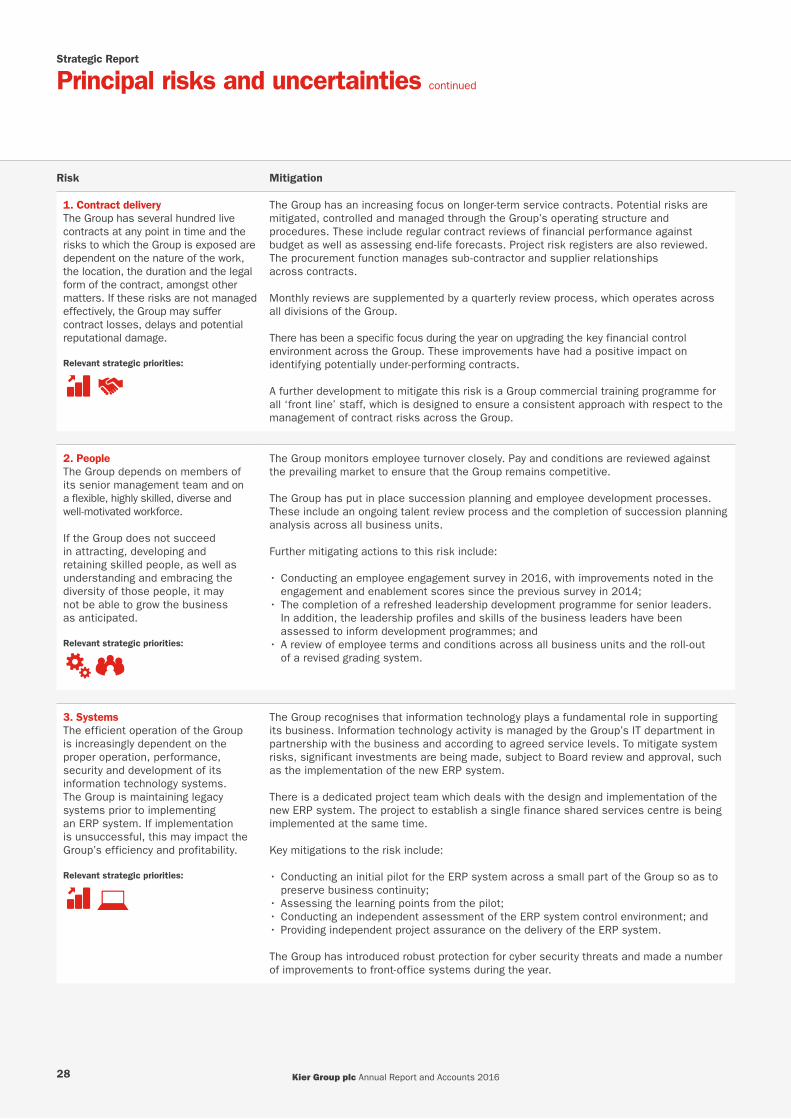
Strategic Report
Principal risks and uncertainties continued
Risk Mitigation
1. Contract deliveryThe Group has several hundred live contracts at any point in time and the risks to which the Group is exposed are dependent on the nature of the work, the location, the duration and the legal form of the contract, amongst other matters. If these risks are not managed effectively, the Group may suffer contract losses, delays and potential reputational damage.
Relevant strategic priorities:
OLD ICONS NEW ICONS
OLD ICONS NEW ICONS
The Group has an increasing focus on longer-term service contracts. Potential risks are mitigated, controlled and managed through the Group’s operating structure and procedures. These include regular contract reviews of financial performance against budget as well as assessing end-life forecasts. Project risk registers are also reviewed. The procurement function manages sub-contractor and supplier relationships across contracts.
Monthly reviews are supplemented by a quarterly review process, which operates across all divisions of the Group.
There has been a specific focus during the year on upgrading the key financial control environment across the Group. These improvements have had a positive impact on identifying potentially under-performing contracts.
A further development to mitigate this risk is a Group commercial training programme for all ‘front line’ staff, which is designed to ensure a consistent approach with respect to the management of contract risks across the Group.
2. PeopleThe Group depends on members of its senior management team and on a flexible, highly skilled, diverse and well-motivated workforce.
If the Group does not succeed in attracting, developing and retaining skilled people, as well as understanding and embracing the diversity of those people, it may not be able to grow the business as anticipated.
Relevant strategic priorities:
OLD ICONS NEW ICONS
OLD ICONS NEW ICONS
The Group monitors employee turnover closely. Pay and conditions are reviewed against the prevailing market to ensure that the Group remains competitive.
The Group has put in place succession planning and employee development processes. These include an ongoing talent review process and the completion of succession planning analysis across all business units.
Further mitigating actions to this risk include:
• Conducting an employee engagement survey in 2016, with improvements noted in the engagement and enablement scores since the previous survey in 2014;
• The completion of a refreshed leadership development programme for senior leaders. In addition, the leadership profiles and skills of the business leaders have been assessed to inform development programmes; and
• A review of employee terms and conditions across all business units and the roll-out of a revised grading system.
3. SystemsThe efficient operation of the Group is increasingly dependent on the proper operation, performance, security and development of its information technology systems. The Group is maintaining legacy systems prior to implementing an ERP system. If implementation is unsuccessful, this may impact the Group’s efficiency and profitability.
Relevant strategic priorities:
OLD ICONS NEW ICONS
OLD ICONS NEW ICONS
The Group recognises that information technology plays a fundamental role in supporting its business. Information technology activity is managed by the Group’s IT department in partnership with the business and according to agreed service levels. To mitigate system risks, significant investments are being made, subject to Board review and approval, such as the implementation of the new ERP system.
There is a dedicated project team which deals with the design and implementation of the new ERP system. The project to establish a single finance shared services centre is being implemented at the same time.
Key mitigations to the risk include:
• Conducting an initial pilot for the ERP system across a small part of the Group so as to preserve business continuity;
• Assessing the learning points from the pilot;• Conducting an independent assessment of the ERP system control environment; and • Providing independent project assurance on the delivery of the ERP system.
The Group has introduced robust protection for cyber security threats and made a number of improvements to front-office systems during the year.
Kier Group plc Annual Report and Accounts 201628
Risk Mitigation
4. Tender pricingThe work for which Kier tenders is often complex and long-term with significant associated risks. Tender assumptions may be inaccurate or the risks associated with the tender may not be fully understood. If tenders are under-priced, contract losses and potential reputational damage will result. If tenders are over-priced, order books may suffer.
Relevant strategic priorities:
OLD ICONS NEW ICONS
OLD ICONS NEW ICONS
The Group’s appetite for long-term, large, competitively-tendered construction contracts is limited. This is influenced by the desire to maintain quality of workload and to manage risk. Tenders for contracts are subject to a governance structure which includes Group-wide standing orders, with approval by the Chief Executive/Finance Director, other Executive Directors or divisional directors, depending upon the value and nature of the contract. Tenders with defined specific risks are reviewed by the Group’s Risk Review Committee.
Current mitigations include the Group-wide commercial training programme for all ‘front line’ staff, which is designed to ensure a consistent approach with respect to the management of contract risks across the Group.
5. FundingThe Property and Residential divisions require finance to be provided by the Group and external sources. The Construction and Services divisions rely on Group bonding facilities. Without these, revenue and profit would reduce.
Relevant strategic priorities:
OLD ICONS NEW ICONS A Group-wide initiative has increased the focus on cash forecasting and working capital management, with regular reviews with managing directors and finance directors, identification of cash generating opportunities and improved reporting on cash performance.
Borrowing facilities have recently been renegotiated and extended. The Group has strong, long-term relationships with the providers of its bonding lines and has an in-house team which monitors headroom and advises on bond terms and conditions.
The Group’s Investment Committee is responsible for approving capital investment and optimising the allocation of capital.
The Property division utilises a number of joint ventures to manage risk and enhance returns. Joint venture partners are carefully selected to mitigate operational risk within projects. By entering joint ventures, the Group can ensure that the Property division is not over-exposed to any one sector, geographical location or individual property.
The Residential division works with housing associations and is seeking to develop joint venture relationships, in each case to mitigate its funding risks.
6. The marketThe Group’s strategy depends on the level of expenditure within both the public and private sectors. Smaller markets will likely result in lower revenue for the Group.
Relevant strategic priorities:
OLD ICONS NEW ICONSThe Group has:
• A wide regional network of offices across the UK, which is well integrated into local communities, the client base and the supply chain;
• A high number of framework agreements and partnerships with Government, local authorities and the private sector; and
• An integrated offer, with Property typically peaking earlier in an economic cycle and Services later, which provides a natural mitigation against the effects of a recession.
The Group also carries out monthly and quarterly reviews of its workload and forecasts its overhead levels as a percentage of future work in order to maintain an appropriate ratio of overhead costs to revenue.
There have been a number of market assessments of trading sensitivities during the year (particularly before and after the EU Referendum vote). The Group has undertaken contingency planning to consider and assess the associated market risk of the result of the EU Referendum vote.
Strategic priorities:
OLD ICONS NEW ICONS
OLD ICONS NEW ICONS
OLD ICONS NEW ICONS
OLD ICONS NEW ICONS
OLD ICONS NEW ICONS
OLD ICONS NEW ICONS
Operate a safe and sustainable business
Accelerate growth to be a top three player in our chosen markets
Achieve top quartile performance and efficiency
Provide sector-leading customer experience, for clients and for their customers
Attract and retain highly motivated, high-performing teams
Ensure the business is supported by investment in technology and back-office systems
Strategic R
eport1–4
5G
overnance Report
46
–88
Financial Statem
ents8
9–1
48
Kier Group plc Annual Report and Accounts 2016 29
Risk Mitigation
7. ChangeThe Group has recently grown significantly, principally through the acquisitions of May Gurney and Mouchel. This growth has resulted in a number of areas of change within the Group. Each of these areas needs careful management.
Two of the most significant change programmes are the implementation of the ERP system and the establishment of the single finance shared services centre. Unless carefully managed, these programmes risk diverting management’s attention away from core operations, causing a loss of focus on key market opportunities, a loss of control of the existing business and an adverse effect on the Group’s operational and financial performance.
Relevant strategic priorities:
OLD ICONS NEW ICONS
OLD ICONS NEW ICONS The Group’s change programmes are tightly controlled by appropriate project governance.
Significant progress has been made during the year with respect to the integration of the legacy Mouchel businesses. In particular, the operating models of the Kier and Mouchel businesses have, where appropriate, been integrated.
There is a steering committee for both the ERP system and single finance shared services centre projects, together with independent project assurance. There have also been regular updates to the Board on progress throughout the year.
During the year, the Board approved a new Code of Conduct, one of the aims of which is to promote a consistent set of behaviours to support the management of change throughout the Group as it continues to grow.
8. SafetyThe Group’s activities are inherently complex and potentially hazardous and require the continuous monitoring and management of health, safety and environmental risks.
Failure to manage these risks could result in injury to employees, sub-contractors or members of the public or damage to the environment. This could also expose the Group to significant potential liability, particularly in the light of new sentencing guidelines, and to reputational damage.
Relevant strategic priorities:
OLD ICONS NEW ICONS
OLD ICONS NEW ICONS
Detailed policies and procedures exist to mitigate such risks and are subject to review and monitoring by the operating businesses and SHE specialists. Each business has a director who is responsible for co-ordinating health and safety activities. The SHE audit programme identifies common areas of non-compliance across the Group, helping to drive improvements. Compliance is monitored in a number of ways including audit, leadership tours and inspections.
The Group’s behavioural change programme is designed to develop behaviours at supervisor and workforce level, while the Visible Leadership Programme is encouraging engagement by management with employees working on the Group’s site.
Strategic Report
Principal risks and uncertainties continued
Kier Group plc Annual Report and Accounts 201630

Risk Mitigation
9. ReputationThe Group’s ability to tender for new business and its relationship with customers, supply chain partners, employees and other stakeholders depends in large part on the good reputation that it has established and how it is perceived by others. The Group’s growth targets may not be achieved if its reputation is adversely affected.
Relevant strategic priorities:
OLD ICONS NEW ICONS
OLD ICONS NEW ICONS
OLD ICONS NEW ICONS
OLD ICONS NEW ICONS
With the increasing profile of the Group, the ability to monitor and measure the Group’s reputation through client and customer feedback is key.
The steps taken by the Group to maintain, protect and enhance its reputation include Group-wide customer satisfaction monitoring, maintaining relations with Government, effective leadership, community engagement and striving to operate a safe and sustainable business.
In addition, the management of the Group’s principal risks, as described in this section of the Annual Report, assists to maintain and protect its reputation.
10. Property marketFollowing the EU Referendum vote, the Group has identified the potential for a significant decline in the UK property market as a potential risk to the Property and Residential divisions. If this decline occurred, then the financial performance of the Property and Residential divisions would likely be adversely affected.
Relevant strategic priorities:
OLD ICONS NEW ICONS
OLD ICONS NEW ICONS
The risk mitigation strategies include work-in-progress monitoring, carrying a robust forward order book in the Residential division and minimising exposure to the cyclical market by purchasing schemes with an appropriate lifecycle. In addition, the Government has put in place further controls since the last market downturn, such as the Mortgage Credit Directive and the Help to Buy scheme, which have assisted to mitigate the risks associated with the residential market.
On new developments, the business is careful to control speculative risk. The Kier Property division operates a largely non-speculative approach to investments.
The Group has undertaken contingency planning to consider and assess the associated market risk of the result of the EU Referendum vote.
11. ComplianceThe Group is subject to a number of complex, demanding and evolving legal and regulatory requirements. A breach of laws or regulations could lead to disputes, investigations or legal proceedings, resulting in a disruption of business ranging from additional costs incurred on a project or in the overall management of the breach, to civil and/or criminal penalties as well as reputational damage.
Relevant strategic priorities:
OLD ICONS NEW ICONS
OLD ICONS NEW ICONS
The Group monitors and responds to legal and regulatory developments and conducts risk assessments to assess material changes to applicable law and regulation.
The Group mitigates the compliance risk in a number of ways, including requiring that all of its subsidiaries, employees, suppliers and sub-contractors comply with applicable laws and regulations, updating its policies to ensure that it complies with changes in legislation and regulation and providing training on relevant issues.
The Group operates and encourages the use of a whistleblowing helpline, enabling employees to raise concerns.
Examples of current or future changes in law and regulation which are considered as likely to be relevant to the Group include:
• The Modern Slavery Act 2015: a working group was established during the year to address the requirements of the legislation (please see further details on page 25);
• COP21: our CR Leadership Group is taking steps to ensure compliance; and• General Data Protection Regulation: steps are being considered to ensure compliance
with the regulations, which come into force in 2018.
Related information:
Read moreViability statement Page 48
Strategic priorities:
OLD ICONS NEW ICONS
OLD ICONS NEW ICONS
OLD ICONS NEW ICONS
OLD ICONS NEW ICONS
OLD ICONS NEW ICONS
OLD ICONS NEW ICONS
Operate a safe and sustainable business
Accelerate growth to be a top three player in our chosen markets
Achieve top quartile performance and efficiency
Provide sector-leading customer experience, for clients and for their customers
Attract and retain highly motivated, high-performing teams
Ensure the business is supported by investment in technology and back-office systems
Strategic R
eport1–4
5G
overnance Report
46
–88
Financial Statem
ents8
9–1
48
Kier Group plc Annual Report and Accounts 2016 31
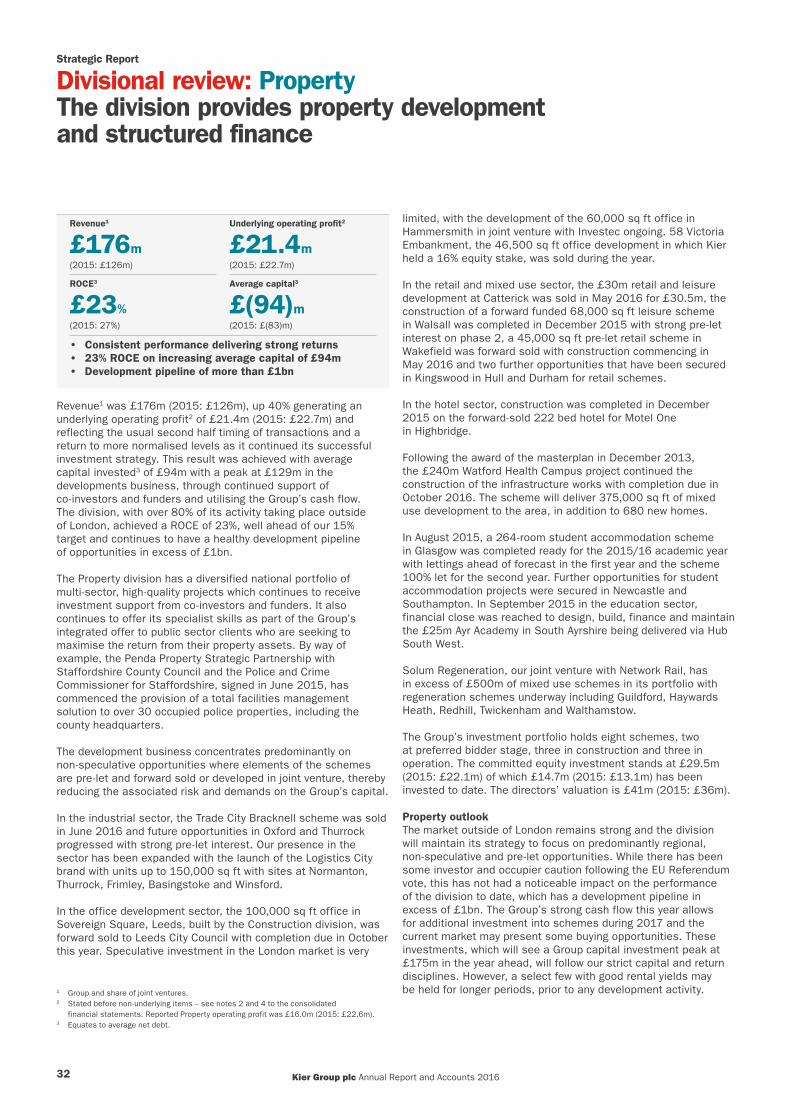
Strategic Report
Divisional review: PropertyThe division provides property development and structured finance
Revenue1
£176m(2015: £126m)
Underlying operating profit2
£21.4m(2015: £22.7m)
ROCE3
£23%(2015: 27%)
Average capital3
£(94)m(2015: £(83)m)
• Consistent performance delivering strong returns• 23% ROCE on increasing average capital of £94m• Development pipeline of more than £1bn
Revenue1 was £176m (2015: £126m), up 40% generating an underlying operating profit2 of £21.4m (2015: £22.7m) and reflecting the usual second half timing of transactions and a return to more normalised levels as it continued its successful investment strategy. This result was achieved with average capital invested3 of £94m with a peak at £129m in the developments business, through continued support of co-investors and funders and utilising the Group’s cash flow. The division, with over 80% of its activity taking place outside of London, achieved a ROCE of 23%, well ahead of our 15% target and continues to have a healthy development pipeline of opportunities in excess of £1bn.
The Property division has a diversified national portfolio of multi-sector, high-quality projects which continues to receive investment support from co-investors and funders. It also continues to offer its specialist skills as part of the Group’s integrated offer to public sector clients who are seeking to maximise the return from their property assets. By way of example, the Penda Property Strategic Partnership with Staffordshire County Council and the Police and Crime Commissioner for Staffordshire, signed in June 2015, has commenced the provision of a total facilities management solution to over 30 occupied police properties, including the county headquarters.
The development business concentrates predominantly on non-speculative opportunities where elements of the schemes are pre-let and forward sold or developed in joint venture, thereby reducing the associated risk and demands on the Group’s capital.
In the industrial sector, the Trade City Bracknell scheme was sold in June 2016 and future opportunities in Oxford and Thurrock progressed with strong pre-let interest. Our presence in the sector has been expanded with the launch of the Logistics City brand with units up to 150,000 sq ft with sites at Normanton, Thurrock, Frimley, Basingstoke and Winsford.
In the office development sector, the 100,000 sq ft office in Sovereign Square, Leeds, built by the Construction division, was forward sold to Leeds City Council with completion due in October this year. Speculative investment in the London market is very
limited, with the development of the 60,000 sq ft office in Hammersmith in joint venture with Investec ongoing. 58 Victoria Embankment, the 46,500 sq ft office development in which Kier held a 16% equity stake, was sold during the year.
In the retail and mixed use sector, the £30m retail and leisure development at Catterick was sold in May 2016 for £30.5m, the construction of a forward funded 68,000 sq ft leisure scheme in Walsall was completed in December 2015 with strong pre-let interest on phase 2, a 45,000 sq ft pre-let retail scheme in Wakefield was forward sold with construction commencing in May 2016 and two further opportunities that have been secured in Kingswood in Hull and Durham for retail schemes.
In the hotel sector, construction was completed in December 2015 on the forward-sold 222 bed hotel for Motel One in Highbridge.
Following the award of the masterplan in December 2013, the £240m Watford Health Campus project continued the construction of the infrastructure works with completion due in October 2016. The scheme will deliver 375,000 sq ft of mixed use development to the area, in addition to 680 new homes.
In August 2015, a 264-room student accommodation scheme in Glasgow was completed ready for the 2015/16 academic year with lettings ahead of forecast in the first year and the scheme 100% let for the second year. Further opportunities for student accommodation projects were secured in Newcastle and Southampton. In September 2015 in the education sector, financial close was reached to design, build, finance and maintain the £25m Ayr Academy in South Ayrshire being delivered via Hub South West.
Solum Regeneration, our joint venture with Network Rail, has in excess of £500m of mixed use schemes in its portfolio with regeneration schemes underway including Guildford, Haywards Heath, Redhill, Twickenham and Walthamstow.
The Group’s investment portfolio holds eight schemes, two at preferred bidder stage, three in construction and three in operation. The committed equity investment stands at £29.5m (2015: £22.1m) of which £14.7m (2015: £13.1m) has been invested to date. The directors’ valuation is £41m (2015: £36m).
Property outlookThe market outside of London remains strong and the division will maintain its strategy to focus on predominantly regional, non-speculative and pre-let opportunities. While there has been some investor and occupier caution following the EU Referendum vote, this has not had a noticeable impact on the performance of the division to date, which has a development pipeline in excess of £1bn. The Group’s strong cash flow this year allows for additional investment into schemes during 2017 and the current market may present some buying opportunities. These investments, which will see a Group capital investment peak at £175m in the year ahead, will follow our strict capital and return disciplines. However, a select few with good rental yields may be held for longer periods, prior to any development activity.1 Group and share of joint ventures.
2 Stated before non-underlying items – see notes 2 and 4 to the consolidated financial statements. Reported Property operating profit was £16.0m (2015: £22.6m).
3 Equates to average net debt.
Kier Group plc Annual Report and Accounts 201632

Focused principally on non-speculative developments
We are committed to helping improve the overall quality of the built environment by reinvesting in available land and buildings, turning them into national assets with a future
We have delivered over 1.2m sq ft of commercial space during the last financial year
Kier Property has developed 5m sq ft of industrial space in the past four years
Kier Property undertakes investment, development and asset management across a broad spectrum of property assets for the private and public sectors.
Strategic R
eport1–4
5G
overnance Report
46
–88
Financial Statem
ents8
9–1
48
Kier Group plc Annual Report and Accounts 2016 33

Strategic Report
Divisional review: ResidentialKier Residential, branded Kier Living, includes mixed tenure affordable housing and private house building
Revenue
£353m(2015: £257m)
Underlying operating profit1
£20.3m(2015: £11.2m)
Average capital2
£(231)m(2015: £(263)m)
• Revenue was up 37% to £353m• Healthy mixed tenure pipeline of >£600m, >70%
secured for FY17• Launch of the New Communities Partnership (NCP)
joint venture• Completions increased to 2,139 units including c750
units from private sale completions
The Residential division’s activities are focused on both private house sales and working with local authorities, registered providers and other clients to build mixed tenure affordable housing. This blended approach to house building provides resilience to market fluctuations and all of the division’s activity is outside of London. The regional profile of the business provides a stable environment for mixed tenure affordable house building with demand continuing to exceed supply.
Revenues increased to £353m (2015: £257m) with the total number of unit completions increasing to 2,139 units, generating an increase in underlying operating margin1 to 5.8%. Underlying operating profit1 of £20.3m (2015: £11.2m), up 81%, was achieved as our focus increased on mixed tenure housing. The rebalancing of the legacy Kier land bank continues. The cash performance of the business was excellent.
Since the EU Referendum vote, sales and visitor levels have remained consistent with historical seasonal trends and the sales rate per active site pre and post the vote has remained consistent. Notwithstanding, new investment in land is being tightly managed and monitored to align to the pace of sales.
Mixed tenureTurnover in the mixed tenure business of £187m was up 63% on the previous year with a marginal reduction in average invested capital to £39m. This reflected the low working capital requirements of the mixed tenure model and the shift in the year to a higher contracting output which is also reflected in the reduced operating margin. The mixed tenure business achieved approximately 1,400 completions (2015: 1,424) in the year and the business has a pipeline of more than £600m, and is more than 70% secured for FY17.
In May, the NCP joint venture, in conjunction with Cheyne Capital and The Housing Growth Partnership, a joint venture between Lloyds Bank and the Homes and Communities Agency, was launched.
The NCP joint venture will invest £1bn and build up to 10,000 new homes throughout the UK. Interest from local authorities in the NCP has been high with over 35 sites currently being evaluated with 11 local authorities across the country.
Following the successful integration of the Southdale business, the business now has coverage across the north of England and the Midlands. During the year, the business secured places on all available significant frameworks covering the north of England including Torus, Innovation Chain North West, Thirteen Housing Group, Cutting Edge, Scape, YORbuild and Places for People.
The rent cuts announced in the Comprehensive Spending Review in Autumn 2015 saw a number of clients delay affordable housing development schemes as organisations reshaped their development plans to adapt to new income forecasts. To align to this new landscape, the division has refocused its capability to deliver new, innovative mixed tenure joint ventures. The first of these, Northern Ventures, in collaboration with Together Housing and Thirteen Housing Group, aims to deliver 500 units per annum in schemes across the north of England.
PrivateThe year saw an uplift in private sale completions on Kier owned land with c750 completions (2015: 706). The land bank mix continues to improve with approximately 50% of completions on land bought before 2008 and the remainder on newer land. The business continues to rationalise its land bank and re-invest in mixed tenure opportunities to return capital to the Group. The land bank has reduced to 3,279 speculative units (2015: 3,413) and sales were completed at a rate of 0.6 units per trading site per week. Help to Buy has underpinned new home sales and accounted for approximately half of private sales. Average sales prices were at £230k and the business is currently more than 50% forward sold for FY2017.
Residential outlookThe division continues to address the UK shortage of housing with particular focus on mixed tenure housing. The stimulus provided by Government initiatives such as Help to Buy, coupled with the availability of mortgages and the recent reduction in interest rates, should see the business continue to grow and improve its ROCE year-on-year. With a mixed tenure pipeline of more than £600m, we have good revenue visibility in the business for the next four years and, when combined with our experience of housing maintenance, we are well positioned to assist our clients to develop their portfolios for both private and affordable housing purposes and to deliver the maintenance requirements thereafter. In the mixed tenure business, the significant imbalance between supply and demand for affordable housing in the UK requires a long-term solution. We are working with local authorities, registered providers and central government to address the issue through a variety of financing options.
1 Stated before non-underlying items – see note 2 and 4 to the consolidated financial statements. Reported Residential operating profit was £19.5m (2015: £11.2m).
2 Equates to average net debt.
Kier Group plc Annual Report and Accounts 201634

Kier Living delivers over 2m sq ft of residential space every year, 50% of which is either affordable or starter homes
By 2020 our Residential division, Kier Living, will build more than 4,000 homes every year
Kier is addressing the housing shortage with a focus on mixed tenure housing
Two Kier Living apprentices, Daniel Northgroves and David Foston who recently received a scholarship from the Construction Industry Training Board.
Strategic R
eport1–4
5G
overnance Report
46
–88
Financial Statem
ents8
9–1
48
Kier Group plc Annual Report and Accounts 2016 35

Strategic Report
Divisional review: ConstructionThe Construction division comprises the UK regional building, UK infrastructure and international businesses
Revenue1
£2,025m(20153: £1,732m)
Underlying operating profit2
£47.4m(20153: £38.4m)
Underlying operating margin2
2.3%(20153: 2.2%)
Order book
£3.4bn(20153: £3.5bn)
• Record revenue of £2bn• Increased underlying operating margin of 2.3%• Order book solid at £3.4bn
The Construction division experienced a record year of growth, with revenue1 up 17% to £2.0bn (20153: £1.7bn). The division benefited from the incorporation of Mouchel Consulting as well as strong growth in the regional building business delivering a 10% increase in like-for-like volumes. This resulted in an underlying operating profit2 increase of 23% to £47.4m (20153: £38.4m). Underlying operating margins2 increased to 2.3% (20153: 2.2%) and the working capital position has improved. The current order book of £3.4bn for secured and probable work, excluding framework wins, includes more than 90% of forecast revenue for the 2017 financial year, on increasing volumes.
UK regional buildingDuring the year, the split of work across the business was broadly 50/50 private and public sector, reflecting a balanced portfolio and consistent with prior years. Buoyant sectors included education, student accommodation, aviation, transport, defence and bio-tech, the latter particularly within the Cambridge region.
Collaborative working on strategic frameworks continues to underpin the day-to-day activity of the business. Frameworks provide a steady stream of opportunities and long-term relationships with clients with an addressable spend of over £20bn over the next five years.
In September 2015, Kier won the four-year Scape Minor Works framework for the second time, giving Kier businesses, including our regional building, housing maintenance and facilities management activities, the unique opportunity to deliver up to £1.5bn of public sector projects throughout the UK, each valued at up to £4m over a four-year period. At the end of the financial year, nine months into the framework, Scape Minor Works awards totalled at £60m, with a pipeline of a further £160m of projects in pre-construction. Through this framework, the Group is working for a broad range of public sector clients.
Education awards continue to be secured under the Education Funding Agency framework and in the year, we achieved selected panel member status on a further five schemes worth £156m.
In August 2016, Kier was named as one of the six principal supply chain partners on the four-year, £4bn Department of Health ProCure22 framework, the new framework replacing ProCure21+, building further on the Group’s leading position in the health sector.
New framework successes during the year included the South West Wales Regional Contractors framework, valued at £850m which is used by 27 local authorities and public bodies in Wales. Kier was successful on all four Lots tendered, covering contracts from £3.5m to over £15m. In addition, a position on the YORbuild2 Construction framework was awarded in February 2016, with a value of £2bn. This framework can be accessed by local authorities, public sector bodies and third sector organisations across the Yorkshire and Humber region, Sheffield Local Enterprise Partnership (LEP) area, North East England and Lincolnshire. After the year end, Kier was selected as one of five framework partners appointed to deliver construction works worth up to £750m at Gatwick Airport on each of the Lots tendered covering low and medium complexity building works and medium complexity civil works over the next five years. In addition, Kier has been selected for the £500m University of Cambridge framework and secured a place on the £240m Essex Construction framework for projects over £2m.
We have continued to build on our existing expertise in the education, health, commercial and defence sectors and we have also penetrated a number of new sectors covering aviation, logistics and distribution, bio-tech and science.
The Construction division has continued to work with the Property division on delivering developments including 58 Victoria Embankment, London, Sovereign Street, Leeds, a student accommodation development in Glasgow and Motel One in Newcastle.
InfrastructureThe infrastructure business operates across a number of sectors and across a broad range of project values from frameworks to larger-scale projects, such as Crossrail. Key sectors for the business are transportation, water and the nuclear and energy sectors.
In the transportation sector, Crossrail, the Mersey Gateway project and the Smart Motorways programme continue to make good progress. Kier’s presence in capital programmes in the UK highways sector continues to grow, complementing Kier’s highways maintenance operations. Key successes in the period include the award of a new £600m highways framework in the East of England, with Kier being one of six contractors appointed to the major works Lot.
1 Group and share of joint ventures. Continuing operations.2 Continuing operations. Stated before non-underlying items – see notes 2 and 4 to the
consolidated financial statements. Reported Construction operating profit from continuing operations was £15.9m (20153: £37.5m).
3 Restated to reflect the re-allocation of Mouchel Consulting from the Services division to the Construction division.
Kier Group plc Annual Report and Accounts 201636
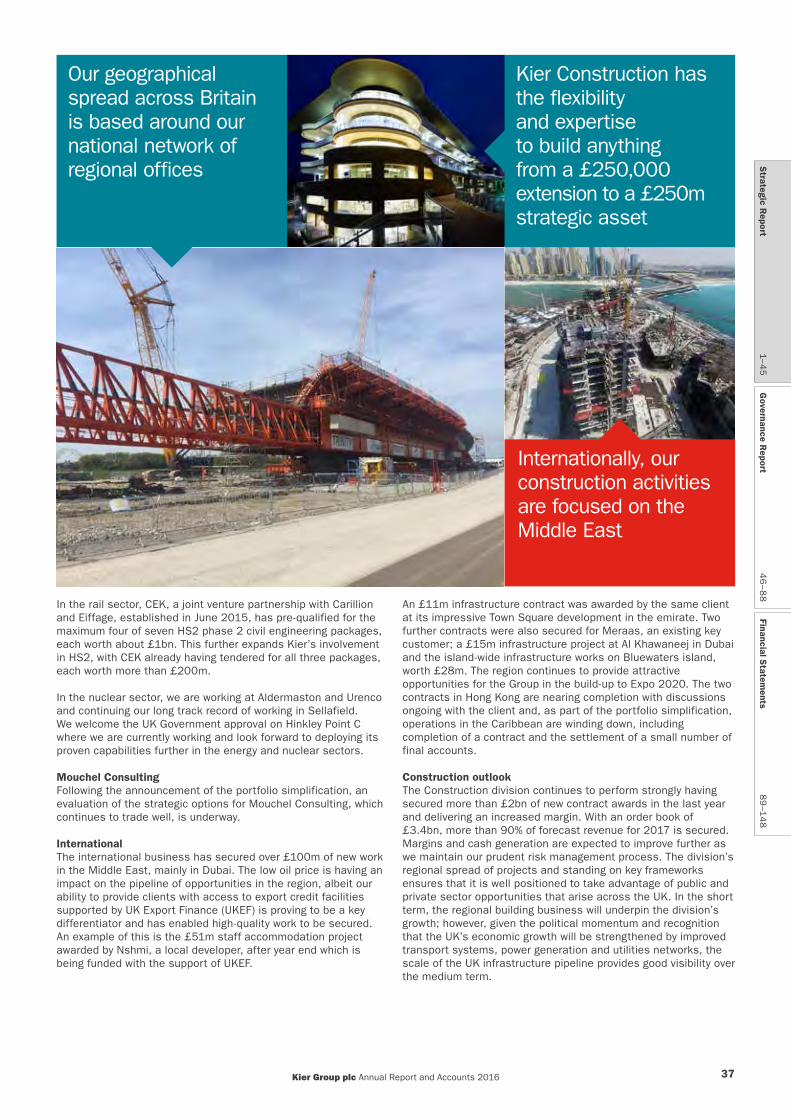
In the rail sector, CEK, a joint venture partnership with Carillion and Eiffage, established in June 2015, has pre-qualified for the maximum four of seven HS2 phase 2 civil engineering packages, each worth about £1bn. This further expands Kier’s involvement in HS2, with CEK already having tendered for all three packages, each worth more than £200m.
In the nuclear sector, we are working at Aldermaston and Urenco and continuing our long track record of working in Sellafield. We welcome the UK Government approval on Hinkley Point C where we are currently working and look forward to deploying its proven capabilities further in the energy and nuclear sectors.
Mouchel ConsultingFollowing the announcement of the portfolio simplification, an evaluation of the strategic options for Mouchel Consulting, which continues to trade well, is underway.
InternationalThe international business has secured over £100m of new work in the Middle East, mainly in Dubai. The low oil price is having an impact on the pipeline of opportunities in the region, albeit our ability to provide clients with access to export credit facilities supported by UK Export Finance (UKEF) is proving to be a key differentiator and has enabled high-quality work to be secured. An example of this is the £51m staff accommodation project awarded by Nshmi, a local developer, after year end which is being funded with the support of UKEF.
An £11m infrastructure contract was awarded by the same client at its impressive Town Square development in the emirate. Two further contracts were also secured for Meraas, an existing key customer; a £15m infrastructure project at Al Khawaneej in Dubai and the island-wide infrastructure works on Bluewaters island, worth £28m. The region continues to provide attractive opportunities for the Group in the build-up to Expo 2020. The two contracts in Hong Kong are nearing completion with discussions ongoing with the client and, as part of the portfolio simplification, operations in the Caribbean are winding down, including completion of a contract and the settlement of a small number of final accounts.
Construction outlookThe Construction division continues to perform strongly having secured more than £2bn of new contract awards in the last year and delivering an increased margin. With an order book of £3.4bn, more than 90% of forecast revenue for 2017 is secured. Margins and cash generation are expected to improve further as we maintain our prudent risk management process. The division’s regional spread of projects and standing on key frameworks ensures that it is well positioned to take advantage of public and private sector opportunities that arise across the UK. In the short term, the regional building business will underpin the division’s growth; however, given the political momentum and recognition that the UK’s economic growth will be strengthened by improved transport systems, power generation and utilities networks, the scale of the UK infrastructure pipeline provides good visibility over the medium term.
Kier Construction has the flexibility and expertise to build anything from a £250,000 extension to a £250m strategic asset
Internationally, our construction activities are focused on the Middle East
Our geographical spread across Britain is based around our national network of regional offices S
trategic Report
1–45
Governance R
eport4
6–8
8Financial S
tatements
89
–14
8
Kier Group plc Annual Report and Accounts 2016 37
Strategic Report
Divisional review: ServicesThe Services division comprises strategic and local authority highways maintenance, utilities, housing maintenance, Kier Workplace Services and Environmental Services
Revenue1
£1,656m(20153: £1,236m)
Underlying operating profit2
£86.1m(20153: £57.3m)
Underlying operating margin2
5.2%(20153: 4.6%)
Order book
£5.3bn(20153: £5.8bn)
• Significant revenue growth to £1.7bn• Strong and increased underlying operating margin
of 5.2%• Expanded highways capability following the integration
of Mouchel• Long-term order book of c£5.3bn with additional
potential extensions of more than £2.7bn
Services revenue1 was up 34% to £1.7bn (20153: £1.2bn), reflecting a robust organic performance by the business and a full year’s contribution from the Mouchel businesses. Underlying operating profit2 was £86.1m (20153: £57.3m), up 50%. Underlying operating margins improved to 5.2%, reflecting the organic performance of the division and the newly acquired businesses.
The integration of Mouchel has delivered the anticipated cost savings of £4m in FY16. Furthermore, additional savings of £5m are anticipated in FY17, increasing the forecast annual cost synergies from the Mouchel acquisition to a total of £15m in FY17. To achieve the higher level of savings, integration costs have increased by £36m to £50m, with these additional costs having been incurred during FY16. This has included a 4% reduction in overall Group headcount with in excess of 850 roles being removed, mainly through the amalgamation of business units and the consolidation of the managerial and support roles. The Mouchel acquisition remains on track to deliver a return on capital in excess of our target of 15% in FY17.
The order book at 30 June 2016 of £5.3bn (20153: £5.8bn) has reduced by £0.5bn, as expected, reflecting the unwinding of the longer-term contracts typical of the utilities and highways sectors which result in a reduction in the order book each year of c.£600m. More than 90% of targeted revenue for 2017 is secured, moreover, the order book does not include potential contract extensions, which, if included, would add more than £2.7bn.
Infrastructure Services – Highways maintenance Following the acquisition of Mouchel, the integration of the highways management teams has been completed, creating one team that oversees the combined highways maintenance activity for the Group. The highways businesses performed well in the year. In Strategic Highways, the five-year Road Investment Strategy funding remains unchanged. The formal tender process for Highways England Areas 1 and 13 and a number of other Areas, where Kier is not currently the maintenance provider, is underway and these provide further opportunity for the Group specifically where Highways England has lifted the cap on the number of Areas that can be awarded to one company from four to five. In March a £50m design services contract was awarded by Highways England for Area 7, covering the East Midlands.
Demonstrating a leading commitment to collaborative working, Kier Highways has pioneered an alliance approach with the British Standards Institution for its supply chain partners. In May 2016, the Area 3 team and its suppliers were the first to become certified to BS 11000 Collaborative Business Relationships as part of a new alliance approach. It is anticipated that this innovative model will be adopted by other contractors. In the local authorities market where the Group has five contracts plus its operations in London, budget challenges continue for our clients and we are working with clients on new approaches to service provision. This has been well received by clients, including Surrey County Council which earlier this year extended the Group’s relationship with the provision of a four-year £160m extension to the existing Surrey Highways contract. The current local authority highways bidding pipeline has a value of over £2bn despite the recent quieter bidding cycle.
In Australia, where we operate seven contracts as part of the DownerMouchel joint venture, expenditure on infrastructure capital spend continues. Bid opportunities have been developed in Western Australia and New South Wales and opportunities in the New Zealand market continue to be evaluated.
Infrastructure Services – UtilitiesFollowing the completion of the AMP6 bidding process and the successful mobilisation of the Thames Water and Anglian Water contracts, work is focusing on the cultural transformation of the alliances to deliver more efficiently. During the year, a £105m five-year extension has been awarded on the Scottish Water contract for the provision of repair and maintenance services for the waste water network across Scotland. In addition, two extensions for existing contracts with South West Water and Bournemouth Water are in advanced discussion. After the year end, two new contracts were won; a three-year £50m National Grid Infrastructure Protection Works framework security contract, in joint venture with Siemens, and a £40m trunk mains utility contract for Affinity Water, a new client win.
1 Group and share of joint ventures.2 Stated before non-underlying items – see notes 2 and 4 to the consolidated financial
statements. Reported Services operating profit from £5.6m (20153: £38.6m).3 Restated to reflect the re-allocation of Mouchel Consulting from the Services division
to the Construction division.
Kier Group plc Annual Report and Accounts 201638

Property Services – Housing maintenance The business continues to be impacted by the social rent reduction announced in last year’s Budget. This has impacted on our clients’ finances and their long-term planning and, consequently, resulted in a reduced level of new awards.
Our strong partnership with Genesis continues and discussions are ongoing about extending the scope of services to include compliance works. With the anticipated merger of registered providers and the increasing need for social housing, we are starting to see new opportunities for the provision of end-to-end services which our Residential and Services divisions can provide with a combined new build and maintenance offering.
Changes of approach and greater efficiencies with our clients are necessary to address reducing client budgets. In addition to our breadth of services, we have developed and are implementing an improved front-end IT system to better and more efficiently interact with our clients’ own systems and enable us to drive operational efficiencies and flexibility.
Property Services – Kier Workplace ServicesThe new division, incorporating facilities management, property management and business processing, was launched on 1 July 2016. The business provides end-to-end workplace solutions for both public and private sector clients, designed to address a growing market seeking the full range of hard and soft facilities management, asset management and wider business services.
During the year, facilities management contracts were awarded by a number of organisations in the heritage and arts sector, in local government and other areas of the public sector such as health
and blue light. Key contract awards totalling c£100m include a £32m contract to deliver repairs and estate management to Southwark Council, a mechanical and electrical services contract with the Royal Shakespeare Company, a £12m contract to provide mechanical and electrical services to the six Imperial War Museums (IWM) as well as a £30m repeat award by Wiltshire County Council.
OtherThe operational performance of the Environmental Services business remains on track, albeit the decline in the commodity prices has resulted, as announced on 4 July, in a provision of £35m on losses incurred by the Environmental Services business which will be taken in FY16, providing for all future cash outflows on two environmental contracts of eight and ten years’ remaining duration. Additionally, in light of the recyclate pricing, the carrying value of our investment in Biogen, our renewable energy joint venture in which the Group holds a 50% share, has been reviewed and resulted in an impairment cost to Kier of £5m in FY16.
Services outlookThe Services division, which accounts for 50% of the Group’s profit, provides essential, day-to-day, routine services to clients and communities. Many of these budgets are ring-fenced which provides resilience to the Group. The integration of the Mouchel business has been completed and the Services division is benefiting from the complementary capabilities now within the Group, something that our clients are increasingly interested in. The Services order book of £5.3bn provides good long-term visibility of our workload with potential extensions adding a further £2.7bn, and is more than 90% secured for 2017.
By collaborating with the Group’s development and construction teams, we can collectively manage every aspect of our clients’ requirements
Kier Highways is the UK’s largest maintainer of road tunnels in the UK, including the Blackwall Tunnel
Kier preserves over 2,200 miles of canals and waterways in England and Wales, undertakes works in 350,000 homes every year, and carries out 750,000 repairs – one every 45 seconds.
Strategic R
eport1–4
5G
overnance Report
46
–88
Financial Statem
ents8
9–1
48
Kier Group plc Annual Report and Accounts 2016 39

Bev Dew Finance Director
The results reflect a robust operating result for the Group in a year of significant change and refocusing. The costs arising from the activities associated with our portfolio simplification and the acquisition of the Mouchel Group have resulted in a statutory loss before tax of £15m (2015: Profit of £39m) being reported.
Accounting policies and segmental reportingThe Group’s annual consolidated financial statements are prepared in accordance with International Financial Reporting Standards as adopted by the EU (IFRSs). There have been no significant changes to the accounting policies adopted by the Group during the year ended 30 June 2016.
Subsidiary statutory accounts are to be prepared under revised UK GAAP and the Kier Group plc entity only financial statements have been prepared in accordance with the changes outlined in FRS101.
Within the Group segmental reporting disclosure, the activities of Mouchel Consulting have been reclassified from the Services division to the Construction division and the comparatives have been restated as a result.
12
13
14
15
16
£2.0bn
£1.9bn
£2.9bn
£3.4bn
£4.2bn
Revenue1
£4.2bn
Underlying financial performanceThe Group has recorded a robust underlying performance with record turnover, underlying operating profit and underlying EPS. The acquisition of Mouchel in June 2015 has been the catalyst for these results supplemented by organic revenue growth of 8% (2015: 12%) across the Group.
Revenue, including share of joint ventures, has increased 26% in the period with all divisions reporting material volume increases.
Revenue from the Group’s Property division of £176m (2015: £126m) represented a 40% increase on the prior year and average capital invested was £94m (2015: £83m). The Group continues to drive investment in a capital efficient manner using joint venture structures and asset finance where appropriate. The average investment in joint ventures during the year was £106.1m (2015: £66.6m). As in prior years, the Group remains a predominantly non-speculative investor in development assets concentrated in the commercial, retail and business park sectors. 89% (2015: 59%) of the Property division results were generated outside of London reflecting the increasingly diverse asset base.
The Residential division, which includes income from the provision of private and social housing units and contracting turnover from residential projects, again saw material growth in the year with revenues increasing 37% to £353m (2015: £257m). As in prior periods, this volume was second half weighted with 55% of units (2015: 67%) being completed in the second half.
Strategic Report
Financial reviewThe Group has recorded a robust underlying performance
1 Group and share of joint ventures. Continuing operations.2 Stated before non-underlying items; see note 4 to the consolidated
financial statements.3 Restated to reflect the re-allocation of Mouchel Consulting from the
Services division to the Construction division.
Earnings per share2
106.7p(2015: 96.0p)
Reduction in net pension deficit
£72m(2015: £123m)
Net debt significantly reduced
£99m(2015: £141m)
Kier Group plc Annual Report and Accounts 201640
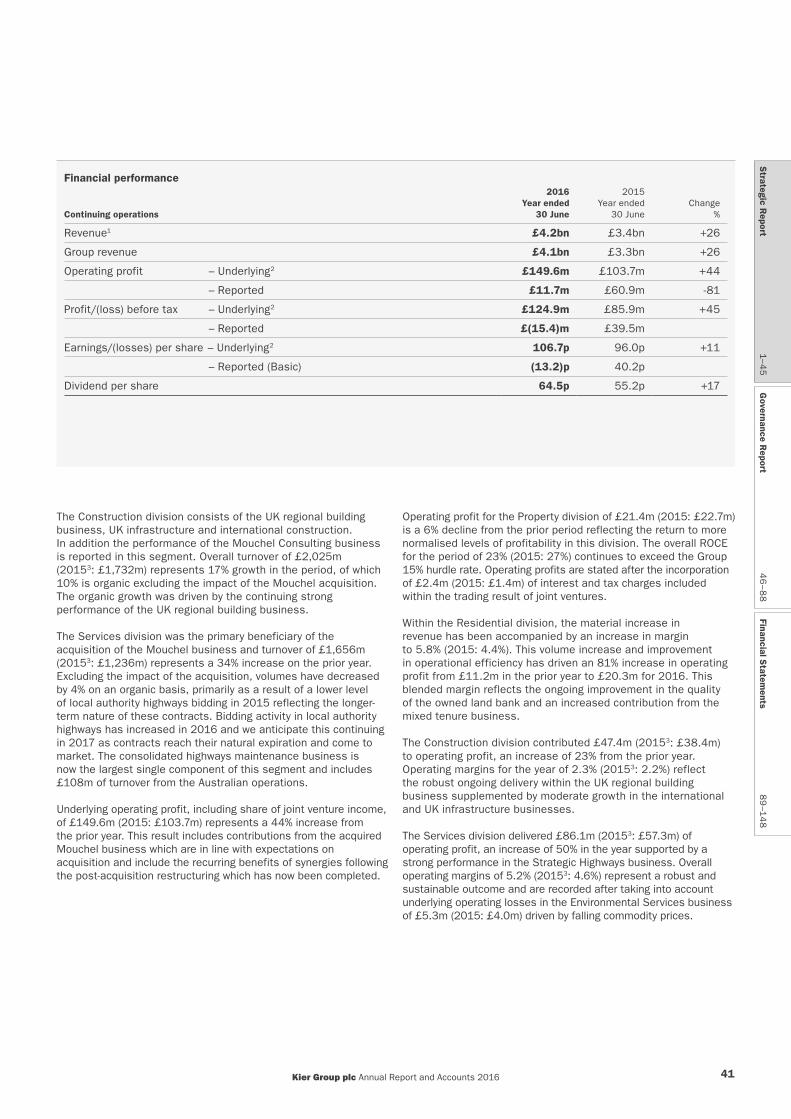
The Construction division consists of the UK regional building business, UK infrastructure and international construction. In addition the performance of the Mouchel Consulting business is reported in this segment. Overall turnover of £2,025m (20153: £1,732m) represents 17% growth in the period, of which 10% is organic excluding the impact of the Mouchel acquisition. The organic growth was driven by the continuing strong performance of the UK regional building business.
The Services division was the primary beneficiary of the acquisition of the Mouchel business and turnover of £1,656m (20153: £1,236m) represents a 34% increase on the prior year. Excluding the impact of the acquisition, volumes have decreased by 4% on an organic basis, primarily as a result of a lower level of local authority highways bidding in 2015 reflecting the longer-term nature of these contracts. Bidding activity in local authority highways has increased in 2016 and we anticipate this continuing in 2017 as contracts reach their natural expiration and come to market. The consolidated highways maintenance business is now the largest single component of this segment and includes £108m of turnover from the Australian operations.
Underlying operating profit, including share of joint venture income, of £149.6m (2015: £103.7m) represents a 44% increase from the prior year. This result includes contributions from the acquired Mouchel business which are in line with expectations on acquisition and include the recurring benefits of synergies following the post-acquisition restructuring which has now been completed.
Operating profit for the Property division of £21.4m (2015: £22.7m) is a 6% decline from the prior period reflecting the return to more normalised levels of profitability in this division. The overall ROCE for the period of 23% (2015: 27%) continues to exceed the Group 15% hurdle rate. Operating profits are stated after the incorporation of £2.4m (2015: £1.4m) of interest and tax charges included within the trading result of joint ventures.
Within the Residential division, the material increase in revenue has been accompanied by an increase in margin to 5.8% (2015: 4.4%). This volume increase and improvement in operational efficiency has driven an 81% increase in operating profit from £11.2m in the prior year to £20.3m for 2016. This blended margin reflects the ongoing improvement in the quality of the owned land bank and an increased contribution from the mixed tenure business.
The Construction division contributed £47.4m (20153: £38.4m) to operating profit, an increase of 23% from the prior year. Operating margins for the year of 2.3% (20153: 2.2%) reflect the robust ongoing delivery within the UK regional building business supplemented by moderate growth in the international and UK infrastructure businesses.
The Services division delivered £86.1m (20153: £57.3m) of operating profit, an increase of 50% in the year supported by a strong performance in the Strategic Highways business. Overall operating margins of 5.2% (20153: 4.6%) represent a robust and sustainable outcome and are recorded after taking into account underlying operating losses in the Environmental Services business of £5.3m (2015: £4.0m) driven by falling commodity prices.
Financial performance
Continuing operations
2016 Year ended
30 June
2015 Year ended
30 June Change
%
Revenue1 £4.2bn £3.4bn +26
Group revenue £4.1bn £3.3bn +26
Operating profit – Underlying2 £149.6m £103.7m +44
– Reported £11.7m £60.9m -81
Profit/(loss) before tax – Underlying2 £124.9m £85.9m +45
– Reported £(15.4)m £39.5m
Earnings/(losses) per share – Underlying2 106.7p 96.0p +11
– Reported (Basic) (13.2)p 40.2p
Dividend per share 64.5p 55.2p +17
Strategic R
eport1–4
5G
overnance Report
46
–88
Financial Statem
ents8
9–1
48
Kier Group plc Annual Report and Accounts 2016 41

Strategic Report
Financial review continued
Total corporate costs of £25.6m (2015: £25.9m) reflect the continuing investment in the Group support structure. The IAS19 pension administration charge has reduced in the year to £3.3m (2015: £6.8m) following the closure of the Group’s pension schemes to future accrual in the prior financial year. With the ongoing implementation of its Enterprise Resource Planning (ERP) system in 2016, the Group will be consolidating its financial shared services function in Manchester in 2017.
The net underlying finance costs of £24.7m (2015: £17.8m) incorporate the additional working capital requirements and associated banking facilities acquired with the Mouchel transaction in June 2015. In addition, a full year’s interest charge has been incurred on the US Private Placement debt facilities taken out in November 2014. Interest on finance leases of £1.4m (2015: £2.6m) reduced in the year following the disposal of the Fleet & Passenger Services business (F&PS) in July 2015. Financing charges associated with the Group’s pension schemes have increased to £5.6m (2015: £2.2m) following the incorporation of the Mouchel Group’s pension schemes into the Group’s balance sheet.
The tax charge for the period of £22.5m (2015: £16.9m) represents an effective corporation tax rate of 18.0% (2015: 19.7%). This is a discount of 2.0% (2015: 1.1%) on the basic rate of UK corporation tax. This discount is driven by the reappraisal of prior period balances and accounting for joint venture disposals in the Property division where tax is accounted for within operating profit of the Group.
Underlying EPS of 106.7 pence represents an 11% increase on the prior period (2015: 96.0 pence). Overall shares in issue of 96.1m have increased from 95.2m in 2015 following the additional shares issued under scrip dividends (0.4m) and share ownership schemes (0.5m).
Non-underlying items The Group has recognised a net charge (pre-taxation) of £151.3m in respect of non-underlying items in the year. These are summarised below:
• Transaction, integration and restructuring costs following the acquisition of Mouchel. In the 2016 financial year, the Group has materially restructured both the acquired Mouchel business and the legacy Kier operations, primarily within the Services division. This has included the redundancy costs of in excess of 850 people across the business, mainly through the amalgamation of individual business units and the consolidation of managerial and support roles. Total costs associated were £49.9m which included £35m severance costs.
• Impact of commodity prices on waste collection contracts. The Group operates two waste contracts with recyclate income clauses. These contracts conclude in 2023 and 2025. Recyclate income is highly correlated to oil prices which have fallen 40% since the second half of 2014. The Group has recognised provisions associated with these contracts of £35.6m which assumes an ongoing income equivalent average oil price of $60 per barrel for the remainder of the contract life.
• Asset impairment. A £5m non-cash impairment has been recorded in respect of the Group’s Biogen joint venture investment where forecast commodity and energy prices have impacted anticipated future revenues.
• Closure of Caribbean operations. Following a strategic review of the international operations in 2016 including, but not limited to, future pipeline opportunities, operational risks and selective bidding, the Board concluded that it was appropriate to close the Group’s Caribbean operations. A £23.1m provision has been recorded in relation to this and associated contract final account positions.
• Construction Workers Compensation Scheme. Under the provisions of an industry settlement agreement, the Group has recognised an additional £4.5m provision for legal fees and compensation.
Corporate costs
2016 £m
2015 £m
Unrecovered overhead (22.3) (19.1)
IAS19 pension charge (3.3) (6.8)
(25.6) (25.9)
Underlying net finance costs1 – continuing operations2016
£m 2015
£m
Net interest receivable on operating cash balances – 0.7
Interest payable and fees on committed borrowings (17.7) (13.7)
Interest payable on finance leases (1.4) (2.6)
Net interest on new defined benefit obligations (5.6) (2.2)
(24.7) (17.8)
1 Stated before non-underlying items; see note 4 to the consolidated financial statements.
Kier Group plc Annual Report and Accounts 201642

• Impairment of mining operations. The Group recognised an additional £5m provision after tax in respect of the Scottish coal mining operations in the year, reflecting the revised disposal timetable and consequential additional remediation costs incurred.
• Sale of F&PS business. The Group has reported an exceptional gain of £1.7m (2015: charge of £3.4m) following the disposal of the F&PS business which concluded in July 2015.
• Amortisation of intangible contract rights and discount unwind. During the year the Group has recognised an amortisation charge of £21.5m (2015: £11.2m) and an interest charge in respect of discount unwind of £2.4m (2015: £3.6m).
Other non-underlying items2016
£m 2015
£m
Transaction, integration and restructuring costs following the acquisition of Mouchel (49.9) (21.9)
Provision for commodity prices relating to Environmental Services recyclate costs (35.6) –
Provision relating to Biogen investment (5.0) –
Provision for closure of Caribbean operations (23.1) –
Construction Workers Compensation Scheme costs (4.5) –
Gains/(costs) relating to the disposal of Fleet & Passenger Services 1.7 (3.4)
Costs associated with cessation of the Kier Group final salary pension scheme – (6.3)
Total non-underlying items relating to continuing operations (116.4) (31.6)
Discontinued – UK mining (net of £6m tax) (5.0) (21.8)
Total non-underlying items (121.4) (53.4)
The Group announced a strategic review of the Mouchel Consulting business in July 2016. This review could encompass the sale of the operations. The business contributed operating profit of £8m in the current financial year.
Cash performanceThe overall year-end net debt position of the Group improved materially in the year to £99m (2015: £141m) at 30 June, a net cash inflow of £42m (2015: £18m outflow).
Comparing the Group’s underlying operating profit to operating cash flows (including joint ventures) before movements in working capital, this represents a 121% (2015: 106%) operating cash conversion.
Strong working capital management during the year has driven a material improvement in cash flows and resulted in a cash inflow of £55m (2015: £58m inflow). The business has seen robust working capital performance across all segments and the increasing ability of the business to improve the billing cycle supported by sustainable process and system enhancements in the Services division in particular, has driven substantial outperformance in the year.
The Group’s investment in fixed, intangible and joint venture assets resulted in a net outflow of £31m (2015: £82m). The ability of the Group to purchase land on deferred terms was the primary driver for a net inflow of £6m in residential investment in the period. The Property division continues to maximise the efficiency with which it used the Group’s capital through the use of externally funded joint ventures. The Group’s investment in fixed assets included the purchase of £14m of property, plant and equipment and an investment of £25m in intangibles in respect of the Group’s ERP system. The balance of investing cash flows include the net movement on assets and liabilities held for resale.
Net interest payments of £18m reflected the revised capital structure of the Group following the acquisition of Mouchel and the full-year cost of the 2014 US Private Placement. Dividend cash flows of £50m have increased from £41m primarily reflecting the 39.6m shares issued in May 2015 as part of the Mouchel acquisition rights issue. Amounts paid to the pension schemes in respect of agreed deficit recovery plans have increased to £25m driven by the additional contribution to the acquired Mouchel Group scheme.
The net cash outflow from non-underlying items totalled £83m. The major components included £36m of cash that was expended on activities resulting from the acquisition of Mouchel and the associated restructuring, and the incorporation of £33m of debt from discontinued mining activities into the Group’s net debt balance. The completion of the sale of the F&PS business resulted in a £16m net inflow on 1 July 2015.
Strategic R
eport1–4
5G
overnance Report
46
–88
Financial Statem
ents8
9–1
48
Kier Group plc Annual Report and Accounts 2016 43
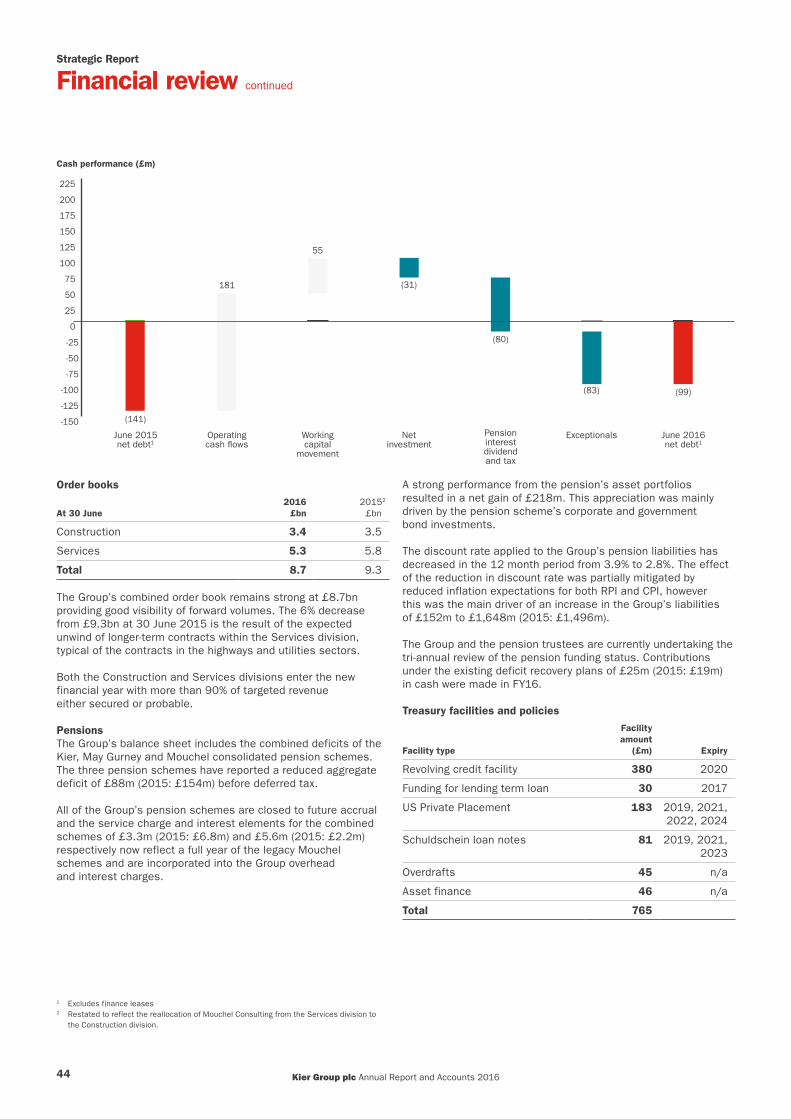
Strategic Report
Financial review continued
Order books
At 30 June2016
£bn 20152
£bn
Construction 3.4 3.5
Services 5.3 5.8
Total 8.7 9.3
The Group’s combined order book remains strong at £8.7bn providing good visibility of forward volumes. The 6% decrease from £9.3bn at 30 June 2015 is the result of the expected unwind of longer-term contracts within the Services division, typical of the contracts in the highways and utilities sectors.
Both the Construction and Services divisions enter the new financial year with more than 90% of targeted revenue either secured or probable.
Pensions The Group’s balance sheet includes the combined deficits of the Kier, May Gurney and Mouchel consolidated pension schemes. The three pension schemes have reported a reduced aggregate deficit of £88m (2015: £154m) before deferred tax.
All of the Group’s pension schemes are closed to future accrual and the service charge and interest elements for the combined schemes of £3.3m (2015: £6.8m) and £5.6m (2015: £2.2m) respectively now reflect a full year of the legacy Mouchel schemes and are incorporated into the Group overhead and interest charges.
A strong performance from the pension’s asset portfolios resulted in a net gain of £218m. This appreciation was mainly driven by the pension scheme’s corporate and government bond investments.
The discount rate applied to the Group’s pension liabilities has decreased in the 12 month period from 3.9% to 2.8%. The effect of the reduction in discount rate was partially mitigated by reduced inflation expectations for both RPI and CPI, however this was the main driver of an increase in the Group’s liabilities of £152m to £1,648m (2015: £1,496m).
The Group and the pension trustees are currently undertaking the tri-annual review of the pension funding status. Contributions under the existing deficit recovery plans of £25m (2015: £19m) in cash were made in FY16.
Treasury facilities and policies
Facility type
Facility amount
(£m) Expiry
Revolving credit facility 380 2020
Funding for lending term loan 30 2017
US Private Placement 183 2019, 2021,2022, 2024
Schuldschein loan notes 81 2019, 2021,2023
Overdrafts 45 n/a
Asset finance 46 n/a
Total 765
Cash performance (£m)
-150
-125
-100
-75
-50
-25
0
25
50
75
100
125
150
175
200
225
181
(141)
55
(31)
(99)
(80)
(83)
June 2015net debt1
Operating cash �ows
Working capital
movement
Net investment
Pension interest dividendand tax
Exceptionals June 2016net debt1
1 Excludes finance leases2 Restated to reflect the reallocation of Mouchel Consulting from the Services division to
the Construction division.
Kier Group plc Annual Report and Accounts 201644
The Group continues to actively review its treasury and banking facilities and increased its overall borrowing facilities excluding asset finance to £719m during the year (2015: £638m).
The Group’s pre-existing facilities as noted above, were all maintained in the year. The Group recently concluded the raising of an additional £81m of debt under a Schuldschein placement into the Euro debt market. This additional facility was secured on variable terms across 3, 5 and 7 years with an average tenor of 4.9 years and is fully hedged with cross-currency and interest rate swaps.
The Group has £26.3m (2015: £71.7m) of finance lease obligations on the balance sheet at 30 June 2016. The overall reduction includes £31.1m of assets disposed of as part of the sale of the F&PS business and £10m in respect of Environmental Services, including contracts exited in the year. The level of finance leases retained within the remaining business are broadly unchanged.
Financial instruments The Group’s financial instruments comprise cash and liquid investments. The Group, largely through its PFI and property joint ventures, enters into derivative transactions (principally interest rate swaps) to manage interest rate risks arising from its operations and its sources of finance. The US dollar and Euro denominated loan notes have been hedged with fixed cross-currency swaps at inception to mitigate the foreign exchange risk. The Group does not enter into speculative transactions.
There are minor foreign currency risks arising from our operations. The Group has a limited number of international operations in different currencies. Currency exposure to international assets is hedged through inter-company balances and borrowings, so that assets denominated in foreign currencies are matched, as far as possible, by liabilities. Where there may be further exposure to currency fluctuations, forward exchange contracts are completed to buy and sell foreign currency.
Dividend policyThe Board is proposing a final dividend of 43.0 pence per share on the 96.1m shares in issue at 30 June 2016. Combined with the interim dividend of 21.5 pence for shares in issue at February 2016, the total dividend declared this year of 64.5 pence (2015: 55.2 pence) represents a 17% increase on prior year, reaffirming our progressive dividend policy.
Going concernThe Chief Executive’s strategic review highlights the activities of the Group and those factors likely to affect its future development, performance and financial position. These have been carefully considered by the Board in relation to the Group’s ability to operate within its current and foreseeable resources.
The Group has significant financial resources, committed banking facilities, long-term contracts and long order books. For these reasons, the directors continue to adopt the going concern basis in preparing the Group’s 2016 financial statements. The full going concern statement is set out on page 48. A summary of the work undertaken by management and the Risk Management and Audit Committee (the RMAC) to support this statement is set out on page 60.
Viability statementThe Board has assessed the viability of the Group over a three-year period ending 30 June 2019, as it is required to do under the UK Corporate Governance Code. The Board’s statement is set out on page 48. A summary of the work undertaken by management and the RMAC to support this statement is set out on pages 60 and 61.
Bev Dew Finance Director
21 September 2016
The Strategic Report is approved by the Board and was signed on its behalf by:
Haydn Mursell Bev DewChief Executive Finance Director
21 September 2016
Strategic R
eport1–4
5G
overnance Report
46
–88
Financial Statem
ents8
9–1
48
Kier Group plc Annual Report and Accounts 2016 45

Phil White Chairman
Corporate Governance Statement
Chairman’s introduction
Dear shareholder,As a board, we believe that good governance will support the delivery of the Group’s strategy and is essential to the way in which the business operates on a day-to-day basis. Some examples of the Board’s governance role are set out on page 47.
In this part of the Annual Report, we describe governance at Kier, the principal activities of the Board and its committees throughout the year and how we have complied with the UK Corporate Governance Code (September 2014 edition) (the Code). A full version of the Code can be found on the Financial Reporting Council’s website: http://www.frc.org.uk.
People and cultureAs members of the Board, we play an important role in setting the Group’s culture, which is in turn supported by the Group’s core values. In doing so, it is important to lead by example: during the year, as a board, we have continued to manage the Group’s growth closely, in light of some challenging market conditions.
It is also important that the Board has appropriate visibility of the business and, during the year, members of the Board have visited a number of the Group’s sites, which has been useful in continuing to develop our understanding of the business.
LeadershipOur Board is collectively responsible for the long-term success of the Group, for developing and delivering its strategy and for establishing a framework of controls to assess and manage risk effectively. A summary of the Board’s governance framework is set out on page 50.
It is, therefore, very important that the Board has a range of skills and experience which challenges, motivates and supports the business. The skills and experience of the Executive Directors are balanced by those of the Non-Executive Directors, who bring significant experience from other organisations and sectors. Please see pages 52 and 53 for the Directors’ biographies.
During the year, we appointed Justin Atkinson and Adam Walker as Non-Executive Directors and, with effect from 1 July 2016, Constance Baroudel also joined as a Non-Executive Director. Each of these individuals has settled in well to their role. In our preliminary results statement, we announced that the Chair of the Remuneration Committee, Amanda Mellor, has decided not to stand for re-election at the Annual General Meeting (AGM) on 18 November. Subject to her election as a Director at the AGM, Constance will take over the role of Chair of the Remuneration Committee from the conclusion of the meeting. During the year, Richard Bailey also stood down from the Board. I would like to thank both Richard and Amanda for their contributions during their time on the Board.
EffectivenessKier has grown significantly in recent years, principally as a result of the acquisitions of May Gurney and Mouchel. It is important that we continue to manage this growth effectively.
We made reasonable progress in most areas of the action plan which we agreed following the 2015 Board evaluation process, as described on page 54. One of the key areas of focus has been succession planning at Board level and immediately below. In addition to the appointments of Justin, Adam and Constance, the Board and the Nomination Committee reviewed the pipeline of potential future Executive Directors. This will continue to be an area of focus during the 2017 financial year. Improvements to the search, selection and succession planning process for Non-Executive Directors and the process for reviewing executive remuneration, and setting and measuring performance targets, were also identified as areas of focus for the year ahead.
AccountabilityThe Board understands our responsibility to present a fair, balanced and understandable assessment of the Group’s position and prospects in this Annual Report, to assess the principal risks facing the Group, to ensure that effective systems of risk management and internal control are in place and to provide a statement as to the Group’s long-term viability. The steps that we have taken during the year to comply with these requirements can be found in this section of the Annual Report.
RemunerationWe were pleased to have received 98.50% of votes in favour of our Remuneration Report at the 2015 AGM, following 88.52% of votes in favour in 2014.
During the summer of 2016, we consulted with shareholders with respect to the Executive Directors’ remuneration for the 2017 financial year. We were grateful to shareholders for the level of engagement and their positive feedback.
Our current remuneration policy remains unaltered. We will engage with shareholders next year with respect to a revised policy for approval at the 2017 AGM.
Relations with shareholdersAs Chairman, I welcome the opportunity to meet shareholders and my discussions with them during the year on a variety of matters have helped me to keep the Board informed about their issues and concerns.
During the year, our Senior Independent Director, Justin Atkinson, met major shareholders to understand their views and our Remuneration Committee Chair, Amanda Mellor, also met a number of shareholders to discuss the proposals for the Executive Directors’ remuneration.
Phil WhiteChairman of the Board
21 September 2016
“ As a board, we believe that good governance will support the delivery of the Group’s strategy.”
Kier Group plc Annual Report and Accounts 201646
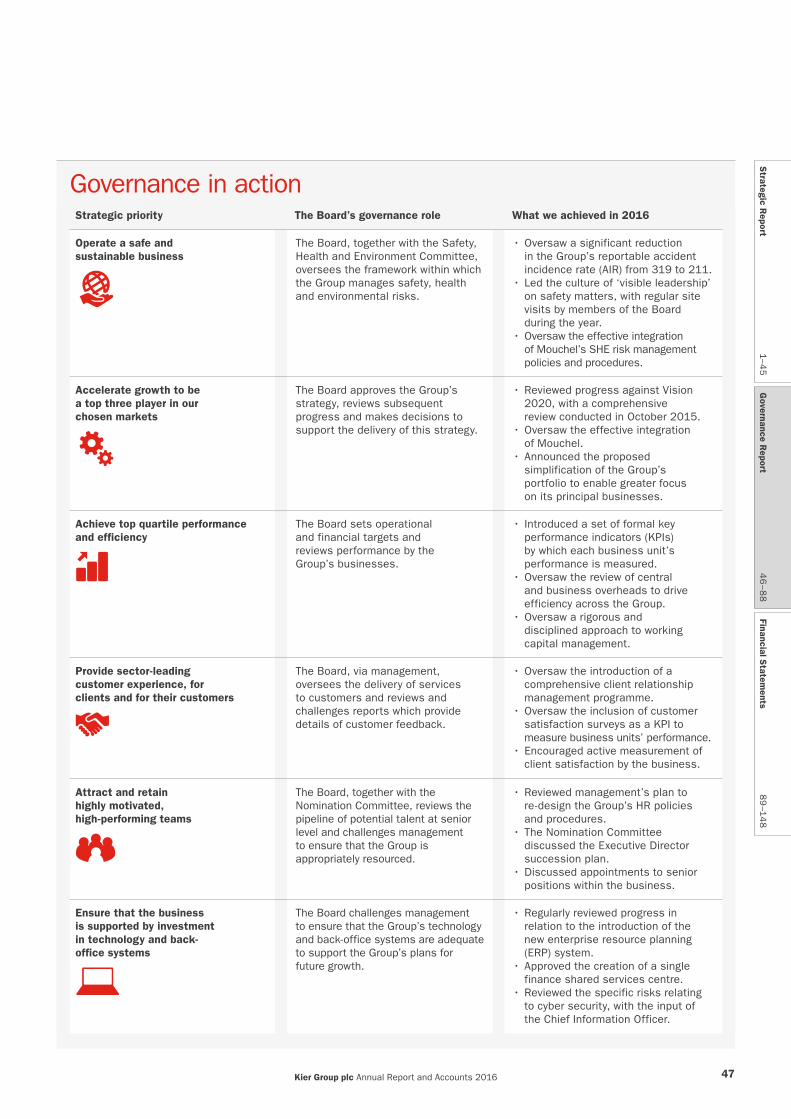
Governance in actionStrategic priority The Board’s governance role What we achieved in 2016
Operate a safe and sustainable business
OLD ICONS NEW ICONS
The Board, together with the Safety, Health and Environment Committee, oversees the framework within which the Group manages safety, health and environmental risks.
• Oversaw a significant reduction in the Group’s reportable accident incidence rate (AIR) from 319 to 211.
• Led the culture of ‘visible leadership’ on safety matters, with regular site visits by members of the Board during the year.
• Oversaw the effective integration of Mouchel’s SHE risk management policies and procedures.
Accelerate growth to be a top three player in our chosen markets
OLD ICONS NEW ICONS
The Board approves the Group’s strategy, reviews subsequent progress and makes decisions to support the delivery of this strategy.
• Reviewed progress against Vision 2020, with a comprehensive review conducted in October 2015.
• Oversaw the effective integration of Mouchel.
• Announced the proposed simplification of the Group’s portfolio to enable greater focus on its principal businesses.
Achieve top quartile performance and efficiency
OLD ICONS NEW ICONS
The Board sets operational and financial targets and reviews performance by the Group’s businesses.
• Introduced a set of formal key performance indicators (KPIs) by which each business unit’s performance is measured.
• Oversaw the review of central and business overheads to drive efficiency across the Group.
• Oversaw a rigorous and disciplined approach to working capital management.
Provide sector-leading customer experience, for clients and for their customers
OLD ICONS NEW ICONS
The Board, via management, oversees the delivery of services to customers and reviews and challenges reports which provide details of customer feedback.
• Oversaw the introduction of a comprehensive client relationship management programme.
• Oversaw the inclusion of customer satisfaction surveys as a KPI to measure business units’ performance.
• Encouraged active measurement of client satisfaction by the business.
Attract and retain highly motivated, high-performing teams
OLD ICONS NEW ICONS
The Board, together with the Nomination Committee, reviews the pipeline of potential talent at senior level and challenges management to ensure that the Group is appropriately resourced.
• Reviewed management’s plan to re-design the Group’s HR policies and procedures.
• The Nomination Committee discussed the Executive Director succession plan.
• Discussed appointments to senior positions within the business.
Ensure that the business is supported by investment in technology and back-office systems
OLD ICONS NEW ICONS
The Board challenges management to ensure that the Group’s technology and back-office systems are adequate to support the Group’s plans for future growth.
• Regularly reviewed progress in relation to the introduction of the new enterprise resource planning (ERP) system.
• Approved the creation of a single finance shared services centre.
• Reviewed the specific risks relating to cyber security, with the input of the Chief Information Officer.
Kier Group plc Annual Report and Accounts 2016 47
Strategic R
eport1–4
5G
overnance Report
46
–88
Financial Statem
ents8
9–1
48
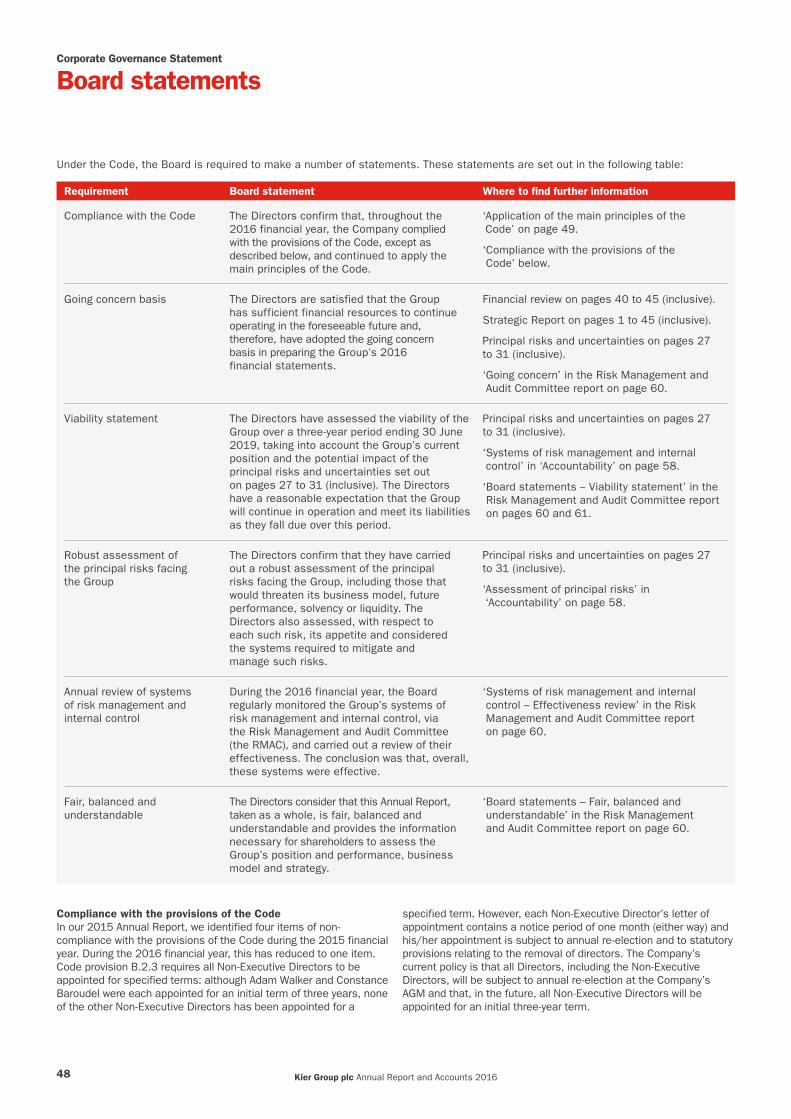
Under the Code, the Board is required to make a number of statements. These statements are set out in the following table:
Requirement Board statement Where to find further information
Compliance with the Code The Directors confirm that, throughout the 2016 financial year, the Company complied with the provisions of the Code, except as described below, and continued to apply the main principles of the Code.
‘ Application of the main principles of the Code’ on page 49.
‘ Compliance with the provisions of the Code’ below.
Going concern basis The Directors are satisfied that the Group has sufficient financial resources to continue operating in the foreseeable future and, therefore, have adopted the going concern basis in preparing the Group’s 2016 financial statements.
Financial review on pages 40 to 45 (inclusive).
Strategic Report on pages 1 to 45 (inclusive).
Principal risks and uncertainties on pages 27 to 31 (inclusive).
‘ Going concern’ in the Risk Management and Audit Committee report on page 60.
Viability statement The Directors have assessed the viability of the Group over a three-year period ending 30 June 2019, taking into account the Group’s current position and the potential impact of the principal risks and uncertainties set out on pages 27 to 31 (inclusive). The Directors have a reasonable expectation that the Group will continue in operation and meet its liabilities as they fall due over this period.
Principal risks and uncertainties on pages 27 to 31 (inclusive).
‘ Systems of risk management and internal control’ in ‘Accountability’ on page 58.
‘ Board statements – Viability statement’ in the Risk Management and Audit Committee report on pages 60 and 61.
Robust assessment of the principal risks facing the Group
The Directors confirm that they have carried out a robust assessment of the principal risks facing the Group, including those that would threaten its business model, future performance, solvency or liquidity. The Directors also assessed, with respect to each such risk, its appetite and considered the systems required to mitigate and manage such risks.
Principal risks and uncertainties on pages 27 to 31 (inclusive).
‘ Assessment of principal risks’ in ‘Accountability’ on page 58.
Annual review of systems of risk management and internal control
During the 2016 financial year, the Board regularly monitored the Group’s systems of risk management and internal control, via the Risk Management and Audit Committee (the RMAC), and carried out a review of their effectiveness. The conclusion was that, overall, these systems were effective.
‘ Systems of risk management and internal control – Effectiveness review’ in the Risk Management and Audit Committee report on page 60.
Fair, balanced and understandable
The Directors consider that this Annual Report, taken as a whole, is fair, balanced and understandable and provides the information necessary for shareholders to assess the Group’s position and performance, business model and strategy.
‘ Board statements – Fair, balanced and understandable’ in the Risk Management and Audit Committee report on page 60.
Compliance with the provisions of the Code In our 2015 Annual Report, we identified four items of non-compliance with the provisions of the Code during the 2015 financial year. During the 2016 financial year, this has reduced to one item. Code provision B.2.3 requires all Non-Executive Directors to be appointed for specified terms: although Adam Walker and Constance Baroudel were each appointed for an initial term of three years, none of the other Non-Executive Directors has been appointed for a
specified term. However, each Non-Executive Director’s letter of appointment contains a notice period of one month (either way) and his/her appointment is subject to annual re-election and to statutory provisions relating to the removal of directors. The Company’s current policy is that all Directors, including the Non-Executive Directors, will be subject to annual re-election at the Company’s AGM and that, in the future, all Non-Executive Directors will be appointed for an initial three-year term.
Corporate Governance Statement
Board statements
Kier Group plc Annual Report and Accounts 201648
Application of the main principles of the Code During the 2016 financial year, the Company continued to apply the main principles of the Code, as follows:
A. LeadershipA1 The Board’s role The Board met formally 10 times during the year. There is a clear schedule of matters reserved for the Board, together with delegated authorities which are used throughout the Group.
A2 A clear division of responsibilities The roles of the Chairman and Chief Executive are clearly defined. Phil White, the Chairman, is responsible for the leadership and effectiveness of the Board. Haydn Mursell, the Chief Executive, is responsible for leading the day-to-day management of the Group within the strategy set by the Board.
A3 Role of the Chairman The Chairman sets the agendas for Board meetings, manages the meetings (in conjunction with the Company Secretary) and facilitates open and constructive dialogue during them.
A4 Role of the Non-Executive Directors The Chairman promotes an open and constructive environment in the boardroom and actively invites the Non-Executive Directors’ views. The Non-Executive Directors provide objective, rigorous and constructive challenge to management and meet regularly in the absence of the Executive Directors.
B. EffectivenessB1 The Board’s composition The Nomination Committee is responsible for regularly reviewing the composition of the Board. In making appointments to the Board, the Nomination Committee considers the range of skills, knowledge and experience required in order to maintain an effective board.
B2 Board appointments The appointment of new Directors is led by the Nomination Committee. Further details of the activities of the Nomination Committee can be found on pages 56 and 57.
B3 Time commitments On appointment, Directors are notified of the time commitment expected from them which, in practice, goes beyond that set out in their letter of appointment. External directorships, which may affect existing time commitments, must be agreed with the Chairman.
B4 Induction, training and development All Directors receive an induction on joining the Board. Training is made available to members of the Board in accordance with their requirements.
B5 Provision of information and support The Chairman, in conjunction with the Company Secretary, ensures that all Board members receive accurate and timely information.
B6 Board and committee performance evaluation During the 2016 financial year, the Board undertook an evaluation of its own performance. Details of the evaluation can be found on page 55.
B7 Re-election of Directors All Directors were subject to shareholder election or re-election at the 2015 AGM, as will be the case at the 2016 AGM (other than Amanda Mellor).
C. AccountabilityC1 Financial and business reporting The Board has established arrangements to ensure that reports and other information published by the Group are fair, balanced and understandable. The Strategic Report is set out on pages 1 to 45 (inclusive) and this provides information about the performance of the Group, the business model, the Group’s strategy and the risks and uncertainties relating to the Group’s future prospects.
C2 Risk management and internal control systems The Board sets the Group’s risk appetite and annually reviews the effectiveness of the
Group’s risk management and internal control systems. The activities of the RMAC, which assists the Board with its responsibilities in relation to the management of risk, are summarised on pages 59 to 62 (inclusive).
C3 Role and responsibilities of the Risk Management and Audit Committee The Board has delegated a number of responsibilities to the RMAC, which is responsible for overseeing the Group’s financial reporting processes, internal control and risk management framework and the work undertaken by the external auditor.
D. RemunerationD1 Levels and elements of remuneration The Remuneration Committee sets levels of remuneration which are designed to promote the long-term success of the Group and structures remuneration so as to link it to both corporate and individual performance, thereby aligning management’s interests with those of shareholders.
D2 Development of remuneration policy and packages Details of the activities of the Remuneration Committee can be found in the Remuneration Report on pages 66 to 85 (inclusive).
E. Relations with shareholdersE1 Shareholder engagement and dialogue The Board takes an active role in engaging with shareholders. The Board particularly values opportunities to meet with shareholders and the Chairman ensures that the Board is kept informed about shareholders’ views.
E2 Constructive use of the AGM The AGM provides the Board with an important opportunity to meet with shareholders, who are invited to meet the Board following the formal business of the meeting.
Kier Group plc Annual Report and Accounts 2016 49
Strategic R
eport1–4
5G
overnance Report
46
–88
Financial Statem
ents8
9–1
48
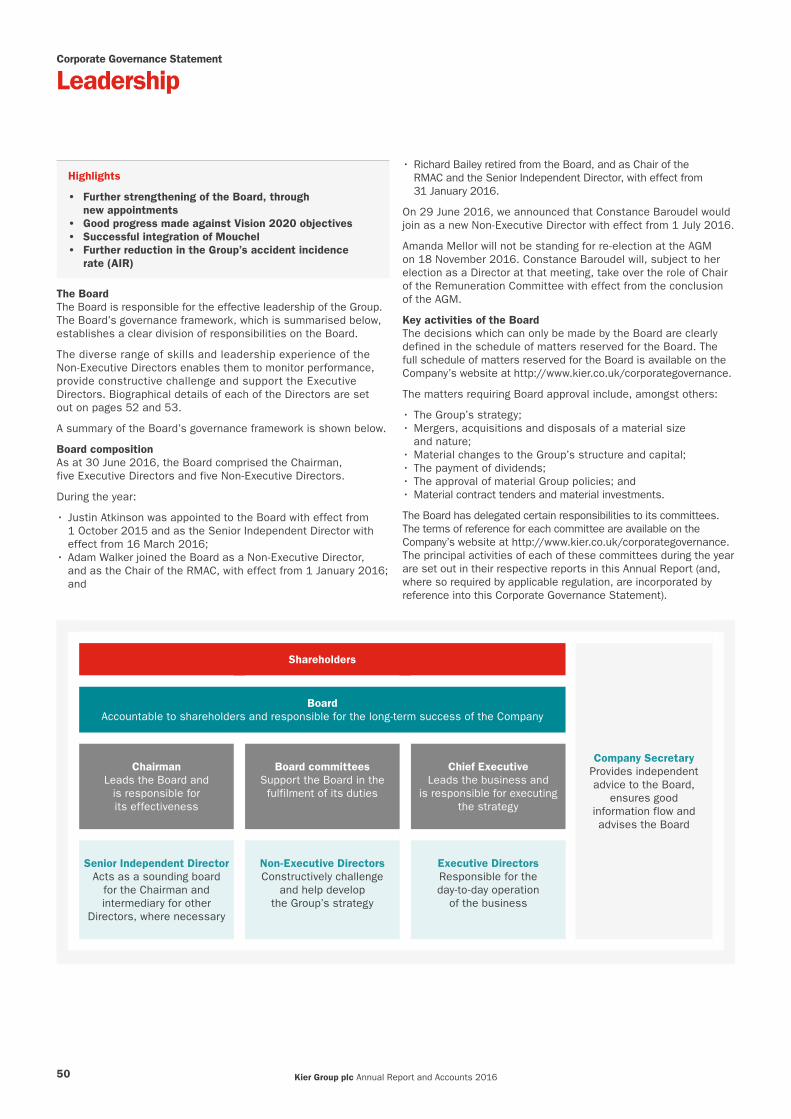
Corporate Governance Statement
Leadership
The BoardThe Board is responsible for the effective leadership of the Group. The Board’s governance framework, which is summarised below, establishes a clear division of responsibilities on the Board.
The diverse range of skills and leadership experience of the Non-Executive Directors enables them to monitor performance, provide constructive challenge and support the Executive Directors. Biographical details of each of the Directors are set out on pages 52 and 53.
A summary of the Board’s governance framework is shown below.
Board compositionAs at 30 June 2016, the Board comprised the Chairman, five Executive Directors and five Non-Executive Directors.
During the year:
• Justin Atkinson was appointed to the Board with effect from 1 October 2015 and as the Senior Independent Director with effect from 16 March 2016;
• Adam Walker joined the Board as a Non-Executive Director, and as the Chair of the RMAC, with effect from 1 January 2016; and
Shareholders
Company SecretaryProvides independent advice to the Board,
ensures good information flow and advises the Board
BoardAccountable to shareholders and responsible for the long-term success of the Company
ChairmanLeads the Board and
is responsible for its effectiveness
Board committeesSupport the Board in the fulfilment of its duties
Chief ExecutiveLeads the business and
is responsible for executing the strategy
Senior Independent DirectorActs as a sounding board
for the Chairman and intermediary for other
Directors, where necessary
Non-Executive DirectorsConstructively challenge
and help develop the Group’s strategy
Executive DirectorsResponsible for the day-to-day operation
of the business
Highlights
• Further strengthening of the Board, through new appointments
• Good progress made against Vision 2020 objectives• Successful integration of Mouchel• Further reduction in the Group’s accident incidence
rate (AIR)
• Richard Bailey retired from the Board, and as Chair of the RMAC and the Senior Independent Director, with effect from 31 January 2016.
On 29 June 2016, we announced that Constance Baroudel would join as a new Non-Executive Director with effect from 1 July 2016.
Amanda Mellor will not be standing for re-election at the AGM on 18 November 2016. Constance Baroudel will, subject to her election as a Director at that meeting, take over the role of Chair of the Remuneration Committee with effect from the conclusion of the AGM.
Key activities of the BoardThe decisions which can only be made by the Board are clearly defined in the schedule of matters reserved for the Board. The full schedule of matters reserved for the Board is available on the Company’s website at http://www.kier.co.uk/corporategovernance.
The matters requiring Board approval include, amongst others:
• The Group’s strategy;• Mergers, acquisitions and disposals of a material size
and nature;• Material changes to the Group’s structure and capital;• The payment of dividends;• The approval of material Group policies; and• Material contract tenders and material investments.
The Board has delegated certain responsibilities to its committees. The terms of reference for each committee are available on the Company’s website at http://www.kier.co.uk/corporategovernance. The principal activities of each of these committees during the year are set out in their respective reports in this Annual Report (and, where so required by applicable regulation, are incorporated by reference into this Corporate Governance Statement).
Kier Group plc Annual Report and Accounts 201650

Key Board discussions and activitiesA summary of the Board’s key discussions and activities during the year is set out in the following table:
Topic Discussions/activity
• Safety, financial and operational performance
• Reviewed reports on safety, financial and operational performance
• Reviewed reports on financial performance, working capital management and forecasts
• Approved forecasts and budgets
• Strategy, leadership and governance
• Reviewed progress against Vision 2020
• Reviewed the integration of Mouchel
• Appointed new Directors and discussed succession planning
• Discussed feedback from meetings of the Board’s committees
• Considered the evaluation of the Board and its committees
• Financial statements, systems of risk management and internal control
• Approved the 2015 Annual Report and 2016 interim results
• Approved the 2015 final dividend and 2016 interim dividend
• Considered reports from the Chair of the RMAC on systems of risk management and internal control
• Considered risk management procedures and key risks and uncertainties facing the Group
• Relations with shareholders
• Considered matters relating to the 2015 AGM
• Reviewed feedback from investors following results presentations or meetings with Board members
Board and committee meeting attendanceBoard and committee meetings are typically held at Tempsford Hall, in London or at one of the Group’s regional offices or sites. For example, the August 2015 meeting was held at the Speke office and, following the April 2016 meeting, the Board visited two of the Group’s London projects.
The number of Board and committee meetings attended by each Director during the 2016 financial year is as follows:
Director Board1
Nomination Committee1
Remuneration Committee
RiskManagement
and Audit Committee
Safety,Health and
EnvironmentCommittee
Overallattendance
Justin Atkinson2 8/8 2/2 4/4 3/3 3/3 100%
Richard Bailey3 5/5 1/1 2/3 2/2 – 91%
Kirsty Bashforth 10/10 2/2 6/6 5/5 4/4 100%
Nigel Brook 10/10 – – – – 100%
Bev Dew 10/10 – – – – 100%
Amanda Mellor4 10/10 2/2 6/6 4/5 3/4 93%
Haydn Mursell 10/10 – – – – 100%
Nigel Turner 10/10 – – – – 100%
Claudio Veritiero 10/10 – – – – 100%
Adam Walker5 5/5 1/1 3/3 3/3 – 100%
Phil White6 9/10 2/2 5/6 – – 89%
Nick Winser 10/10 2/2 6/6 5/5 4/4 100%
1 Additional Board and Nomination Committee meetings were held during the year specifically to appoint Non-Executive Directors.2 Justin Atkinson was appointed to the Board with effect from 1 October 2015. 3 Richard Bailey retired from the Board with effect from 31 January 2016. 4 Amanda Mellor was unable to attend the Safety, Health and Environment Committee and RMAC meetings in June 2016, due to prior business commitments.5 Adam Walker was appointed to the Board with effect from 1 January 2016. 6 Phil White was unable to attend the Board and Remuneration Committee meetings in August 2015 due to ill-health.
Kier Group plc Annual Report and Accounts 2016 51
Strategic R
eport1–4
5G
overnance Report
46
–88
Financial Statem
ents8
9–1
48

Corporate Governance Statement
Board of DirectorsThe right mix of skills and experience
Bev Dew (45)Finance DirectorDate appointed to Board: January 2015Tenure on Board: 1 year, 8 monthsIndependent: No Committee memberships:NoneRelevant skills and experience:• A chartered accountant, having trained and
qualified at Coopers & Lybrand• Twenty years’ experience in the construction
industry, with previous senior finance roles at Balfour Beatty, Lendlease, Redrow and Invensys Rail
• Significant experience in finance and capital structures
• Strong track record in cost control, cash flow management and pension scheme risk management
• Recent experience of ERP and other systems implementation programmes
Principal current external appointments:None
Phil White CBE (66)ChairmanDate appointed to Board/as Chairman: July 2006/January 2008Tenure on Board: 10 years, 2 monthsIndependent: YesCommittee memberships:
1 2
Relevant skills and experience:• A chartered accountant with substantial
operational and commercial experience, particularly within the transport and contracting sectors
• Significant listed company board experience gained in executive and non-executive roles
• Formerly Chief Executive of National Express Group from 1997 to 2006 and a non-executive director of Stagecoach Group from 2010 to 2016
• Experienced in mergers and acquisitions and strategy development
Principal current external appointments:• Chairman, Lookers• Chairman, The Unite Group• Non-Executive Director, Vp
Nigel Turner (51)Executive Director – Developments, Property and Business ServicesDate appointed to Board: March 2015Tenure on Board: 1 year, 6 monthsIndependent: No Committee memberships:NoneRelevant skills and experience: • A chartered surveyor and a member of the
Royal Institution of Chartered Surveyors• Detailed knowledge of the property
development sector, in particular• Significant commercial and transactional
experience, having negotiated a large number of investments and other projects in his career
• Detailed knowledge of the Group’s business units, in particular through their interaction with the Property division
• Experienced in dealing with lenders, joint venture partners and other key stakeholders
Principal current external appointments:None
Haydn Mursell (45)Chief ExecutiveDate appointed to Board/as Chief Executive: November 2010/July 2014Tenure on Board: 5 years, 10 monthsIndependent: NoCommittee memberships:NoneRelevant skills and experience:• A chartered accountant, having trained and
qualified at KPMG• Significant sector experience through previous
senior finance roles at Balfour Beatty and Bovis Lend Lease
• Operational leadership experience gained through previous responsibility for the Property division
• Detailed knowledge of the Group gained through previous role as Finance Director, in particular
• Strong track record in mergers and acquisitions, both at Kier and in previous organisations
Principal current external appointments:None
Nigel Brook (58)Executive Director – Construction and Infrastructure Services Date appointed to Board: March 2015Tenure on Board: 1 year, 6 monthsIndependent: No Committee memberships:NoneRelevant skills and experience: • A chartered quantity surveyor and a member
of the Royal Institution of Chartered Surveyors• Over 35 years’ experience in the construction
sector, having previously held roles at AMEC, Ballast and Miller Construction
• Significant experience in management and delivery of large and complex projects throughout the UK
• Strong track record of customer service and operational performance improvement
• Strong track record on health and safety matters
Principal current external appointments:None
Claudio Veritiero (43)Group Strategy and Corporate Development DirectorDate appointed to Board: March 2015Tenure on Board: 1 year, 6 monthsIndependent: No Committee memberships:NoneRelevant skills and experience: • Significant experience of a wide variety
of corporate transactions during early part of career in investment banking at Rothschild
• Previous listed company board experience as an executive director of Speedy Hire
• Operational leadership experience within Kier through previous role as managing director of the Services division
• Strong record in mergers and acquisitions, both at Kier and in previous roles
Principal current external appointments:None
Kier Group plc Annual Report and Accounts 201652
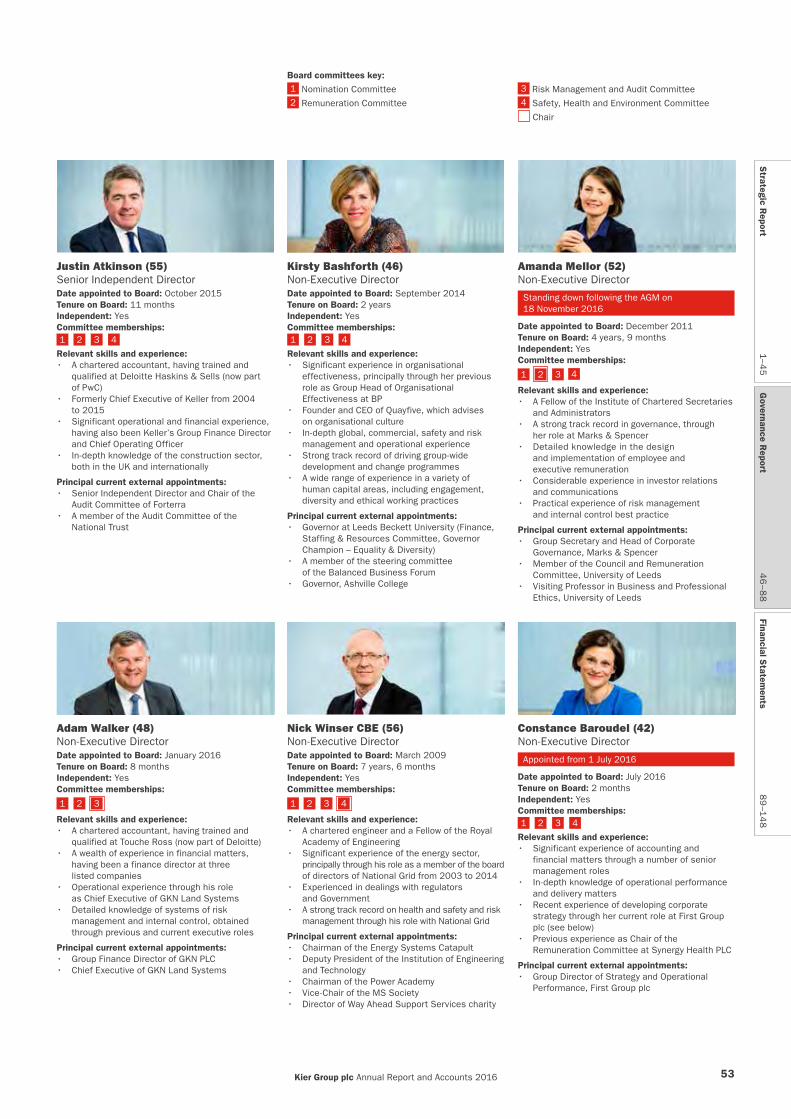
Justin Atkinson (55)Senior Independent Director Date appointed to Board: October 2015Tenure on Board: 11 monthsIndependent: YesCommittee memberships:1 2 3 4
Relevant skills and experience:• A chartered accountant, having trained and
qualified at Deloitte Haskins & Sells (now part of PwC)
• Formerly Chief Executive of Keller from 2004 to 2015
• Significant operational and financial experience, having also been Keller’s Group Finance Director and Chief Operating Officer
• In-depth knowledge of the construction sector, both in the UK and internationally
Principal current external appointments:• Senior Independent Director and Chair of the
Audit Committee of Forterra• A member of the Audit Committee of the
National Trust
Amanda Mellor (52)Non-Executive Director
Standing down following the AGM on 18 November 2016
Date appointed to Board: December 2011Tenure on Board: 4 years, 9 monthsIndependent: Yes Committee memberships:
1 2 3 4
Relevant skills and experience:• A Fellow of the Institute of Chartered Secretaries
and Administrators• A strong track record in governance, through
her role at Marks & Spencer• Detailed knowledge in the design
and implementation of employee and executive remuneration
• Considerable experience in investor relations and communications
• Practical experience of risk management and internal control best practice
Principal current external appointments:• Group Secretary and Head of Corporate
Governance, Marks & Spencer• Member of the Council and Remuneration
Committee, University of Leeds• Visiting Professor in Business and Professional
Ethics, University of Leeds
Nick Winser CBE (56)Non-Executive Director Date appointed to Board: March 2009Tenure on Board: 7 years, 6 monthsIndependent: YesCommittee memberships:
2 3 41
Relevant skills and experience:• A chartered engineer and a Fellow of the Royal
Academy of Engineering• Significant experience of the energy sector,
principally through his role as a member of the board of directors of National Grid from 2003 to 2014
• Experienced in dealings with regulators and Government
• A strong track record on health and safety and risk management through his role with National Grid
Principal current external appointments:• Chairman of the Energy Systems Catapult• Deputy President of the Institution of Engineering
and Technology• Chairman of the Power Academy• Vice-Chair of the MS Society• Director of Way Ahead Support Services charity
Kirsty Bashforth (46)Non-Executive DirectorDate appointed to Board: September 2014Tenure on Board: 2 yearsIndependent: Yes Committee memberships:1 2 3 4
Relevant skills and experience:• Significant experience in organisational
effectiveness, principally through her previous role as Group Head of Organisational Effectiveness at BP
• Founder and CEO of Quayfive, which advises on organisational culture
• In-depth global, commercial, safety and risk management and operational experience
• Strong track record of driving group-wide development and change programmes
• A wide range of experience in a variety of human capital areas, including engagement, diversity and ethical working practices
Principal current external appointments:• Governor at Leeds Beckett University (Finance,
Staffing & Resources Committee, Governor Champion – Equality & Diversity)
• A member of the steering committee of the Balanced Business Forum
• Governor, Ashville College
Adam Walker (48)Non-Executive Director Date appointed to Board: January 2016Tenure on Board: 8 monthsIndependent: YesCommittee memberships:
1 2 3
Relevant skills and experience:• A chartered accountant, having trained and
qualified at Touche Ross (now part of Deloitte)• A wealth of experience in financial matters,
having been a finance director at three listed companies
• Operational experience through his role as Chief Executive of GKN Land Systems
• Detailed knowledge of systems of risk management and internal control, obtained through previous and current executive roles
Principal current external appointments:• Group Finance Director of GKN PLC• Chief Executive of GKN Land Systems
Constance Baroudel (42)Non-Executive Director
Appointed from 1 July 2016
Date appointed to Board: July 2016Tenure on Board: 2 monthsIndependent: YesCommittee memberships:1 2 3 4
Relevant skills and experience:• Significant experience of accounting and
financial matters through a number of senior management roles
• In-depth knowledge of operational performance and delivery matters
• Recent experience of developing corporate strategy through her current role at First Group plc (see below)
• Previous experience as Chair of the Remuneration Committee at Synergy Health PLC
Principal current external appointments:• Group Director of Strategy and Operational
Performance, First Group plc
3 Risk Management and Audit Committee4 Safety, Health and Environment Committee5 Chair
Board committees key:1 Nomination Committee2 Remuneration Committee
Kier Group plc Annual Report and Accounts 2016 53
Strategic R
eport1–4
5G
overnance Report
46
–88
Financial Statem
ents8
9–1
48

Corporate Governance Statement
Effectiveness
A programme of courses is made available to the Directors, who are encouraged to attend courses which they consider to be of relevance to their roles.
Information and supportThe Board is provided with regular and timely information on the Group’s operational and financial performance, together with reports on trading, the markets, health and safety and other matters.
The Company Secretary is the secretary to the Board and each of its committees. Prior to each Board or committee meeting, the Company Secretary ensures that the relevant papers are made available, via a secure electronic portal, five working days in advance of the meeting. All Directors have access to the services of the Company Secretary and may take independent professional advice at the expense of the Company.
Re-election of DirectorsAs it is the first AGM since their appointments, resolutions will be proposed to elect Adam Walker and Constance Baroudel as Directors at the AGM on 18 November 2016. All other Directors, other than Amanda Mellor who will retire from the Board with effect from the conclusion of the meeting, will offer themselves for re-election at the AGM.
Following the 2016 evaluation of the Board’s performance, the performance of each of the Non-Executive Directors is considered to be effective and they are each considered to demonstrate appropriate commitment to the role. Nick Winser has served as a Director for over seven years. Since there have been a number of recent appointments to the Board, and taking into account Nick’s experience in SHE matters (as a former executive director of National Grid), the Board considers it appropriate to propose Nick for re-election.
Highlights
• Successful induction of new Non-Executive Directors• Launch of training programme for Board members• Completion of all actions from 2015 Board evaluation• Greater focus on executive and senior management
succession planning
Time commitmentThe Executive Directors may serve on other boards of directors, provided that they can demonstrate that any such appointment will not interfere with their time commitment to the Company. The major commitments of the Directors are outlined on pages 52 and 53.
The Nomination Committee remains satisfied that all Non-Executive Directors have sufficient time to meet their commitments to the Company and that the Chairman’s other commitments do not interfere with the performance of his day-to-day duties to the Company.
Induction and developmentDetails of inductions of recently appointed Directors are set out in the Nomination Committee report on page 67.
During the year, the Board also received briefings from the Company’s external advisers on changes to legislation, regulation or market practice. For example, during the year, the Board received briefings on the latest developments in SHE regulation and on cyber security from the Chief Information Officer.
Directors are also encouraged to continue to update their skills and knowledge and to ensure that they are aware of developments in market practice.
Board tenure Board balance Board composition
0–2 years 2–4 years 4–6 years 6+ years
Male Female
Executive Directors Non-Executive Directors Chairman
2015 Board performance evaluationWe have made reasonable progress against the areas of focus identified in the 2015 evaluation, as demonstrated by the following table:
Area of focus Progress made
• Set aside sufficient time for formal discussions about strategy at Board meetings
• Quarterly updates provided to the Board
• Comprehensive review of strategy at the October 2015 Board meeting
• Ensuring that the Group’s systems of risk management and internal control support its continued growth
• Significant progress made on the implementation of the ERP system
• Implementation of all material recommendations from a review of the Group’s key financial controls
• Increasing the focus on formal succession planning
• Appointment of a new Group HR Director and Head of Talent and Organisational Development
• Nomination Committee meeting in May 2015 to review the executive management talent pipeline
• Continued focus on Board and committee administration
• Continuous review of Board papers to ensure that high-quality information is provided
• Debriefs held after Board meetings to ensure continuous improvement in administration
Kier Group plc Annual Report and Accounts 201654

2016 Board performance evaluation
The 2016 evaluation was led by the Chairman, with the assistance of the Company Secretary. The evaluation focused on a number of key areas:
The skills and experience
of the Board
Meetings and Board
administration
The effectiveness of the Board’s
decision-making
The Board’s role with respect to the Group’s strategy
The Board’s management
of risk
The Board’s engagement with key stakeholders, including shareholders and employees
The operation of the Board’s committees
The process was divided into four stages:
Stage 1 Stage 2 Stage 3 Stage 4
Completion of questionnaire
Evaluation of responses/reporting
Initial discussions with the Chairman and then the Board
Feedback to individual Directors
A comprehensive questionnaire was sent to each Board member. Board members completed and returned the questionnaire to the Company Secretary.
The Company Secretary compiled a report based on the feedback provided by Board members, addressing the performance of the Board and each of its committees.
The Company Secretary and the Chairman discussed the draft conclusions. Subsequently, these conclusions and a draft action plan were discussed by the Board at its meeting in August 2016. The Board approved the action plan.
The Senior Independent Director met the other Non-Executive Directors to discuss the Chairman’s performance and then met the Chairman to provide collective feedback. The Chairman provided feedback to individual Directors.
The 2016 evaluation confirmed that, overall, the Board and its committees are making reasonable progress. However, certain improvements to the operation of the Nomination and Remuneration Committees were highlighted, as referred to on page 46. A summary of the Board’s key strengths and its principal areas of focus for 2017, as identified by the evaluation, is as follows:
Key strengths Principal areas of focus for 2017
• The new Executive Directors appointed in 2015 have settled in well
• Improving the search, selection and succession planning process for Non-Executive Directors. Continuing the good progress made with respect to executive and senior management succession planning
• A healthy and robust debate is held at Board meetings • Ensuring that the Group’s management of risk remains appropriate in light of its growth
• The Board sets aside time for in-depth discussions about strategy
• Reviewing/refreshing Vision 2020
• The Board has increased its focus on formal executive and senior management succession planning
• Continuous review of the information provided to the Board, so as to ensure that decisions can continue to be made effectively
Kier Group plc Annual Report and Accounts 2016 55
Strategic R
eport1–4
5G
overnance Report
46
–88
Financial Statem
ents8
9–1
48
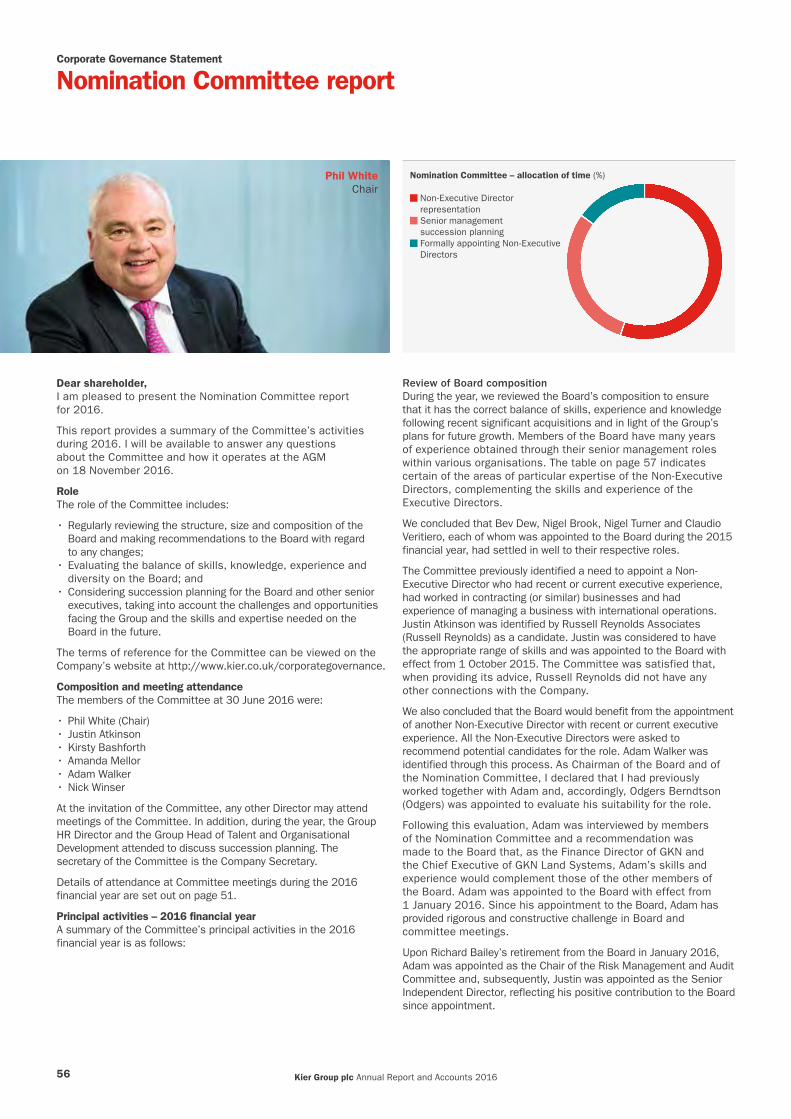
Corporate Governance Statement
Nomination Committee report
Dear shareholder,I am pleased to present the Nomination Committee report for 2016.
This report provides a summary of the Committee’s activities during 2016. I will be available to answer any questions about the Committee and how it operates at the AGM on 18 November 2016.
RoleThe role of the Committee includes:
• Regularly reviewing the structure, size and composition of the Board and making recommendations to the Board with regard to any changes;
• Evaluating the balance of skills, knowledge, experience and diversity on the Board; and
• Considering succession planning for the Board and other senior executives, taking into account the challenges and opportunities facing the Group and the skills and expertise needed on the Board in the future.
The terms of reference for the Committee can be viewed on the Company’s website at http://www.kier.co.uk/corporategovernance.
Composition and meeting attendanceThe members of the Committee at 30 June 2016 were:
• Phil White (Chair)• Justin Atkinson• Kirsty Bashforth• Amanda Mellor• Adam Walker• Nick Winser
At the invitation of the Committee, any other Director may attend meetings of the Committee. In addition, during the year, the Group HR Director and the Group Head of Talent and Organisational Development attended to discuss succession planning. The secretary of the Committee is the Company Secretary.
Details of attendance at Committee meetings during the 2016 financial year are set out on page 51.
Principal activities – 2016 financial yearA summary of the Committee’s principal activities in the 2016 financial year is as follows:
Review of Board compositionDuring the year, we reviewed the Board’s composition to ensure that it has the correct balance of skills, experience and knowledge following recent significant acquisitions and in light of the Group’s plans for future growth. Members of the Board have many years of experience obtained through their senior management roles within various organisations. The table on page 57 indicates certain of the areas of particular expertise of the Non-Executive Directors, complementing the skills and experience of the Executive Directors.
We concluded that Bev Dew, Nigel Brook, Nigel Turner and Claudio Veritiero, each of whom was appointed to the Board during the 2015 financial year, had settled in well to their respective roles.
The Committee previously identified a need to appoint a Non-Executive Director who had recent or current executive experience, had worked in contracting (or similar) businesses and had experience of managing a business with international operations. Justin Atkinson was identified by Russell Reynolds Associates (Russell Reynolds) as a candidate. Justin was considered to have the appropriate range of skills and was appointed to the Board with effect from 1 October 2015. The Committee was satisfied that, when providing its advice, Russell Reynolds did not have any other connections with the Company.
We also concluded that the Board would benefit from the appointment of another Non-Executive Director with recent or current executive experience. All the Non-Executive Directors were asked to recommend potential candidates for the role. Adam Walker was identified through this process. As Chairman of the Board and of the Nomination Committee, I declared that I had previously worked together with Adam and, accordingly, Odgers Berndtson (Odgers) was appointed to evaluate his suitability for the role.
Following this evaluation, Adam was interviewed by members of the Nomination Committee and a recommendation was made to the Board that, as the Finance Director of GKN and the Chief Executive of GKN Land Systems, Adam’s skills and experience would complement those of the other members of the Board. Adam was appointed to the Board with effect from 1 January 2016. Since his appointment to the Board, Adam has provided rigorous and constructive challenge in Board and committee meetings.
Upon Richard Bailey’s retirement from the Board in January 2016, Adam was appointed as the Chair of the Risk Management and Audit Committee and, subsequently, Justin was appointed as the Senior Independent Director, reflecting his positive contribution to the Board since appointment.
Nomination Committee – allocation of time (%)
Non-Executive Director representation Senior management succession planning Formally appointing Non-Executive Directors
Phil White Chair
Kier Group plc Annual Report and Accounts 201656
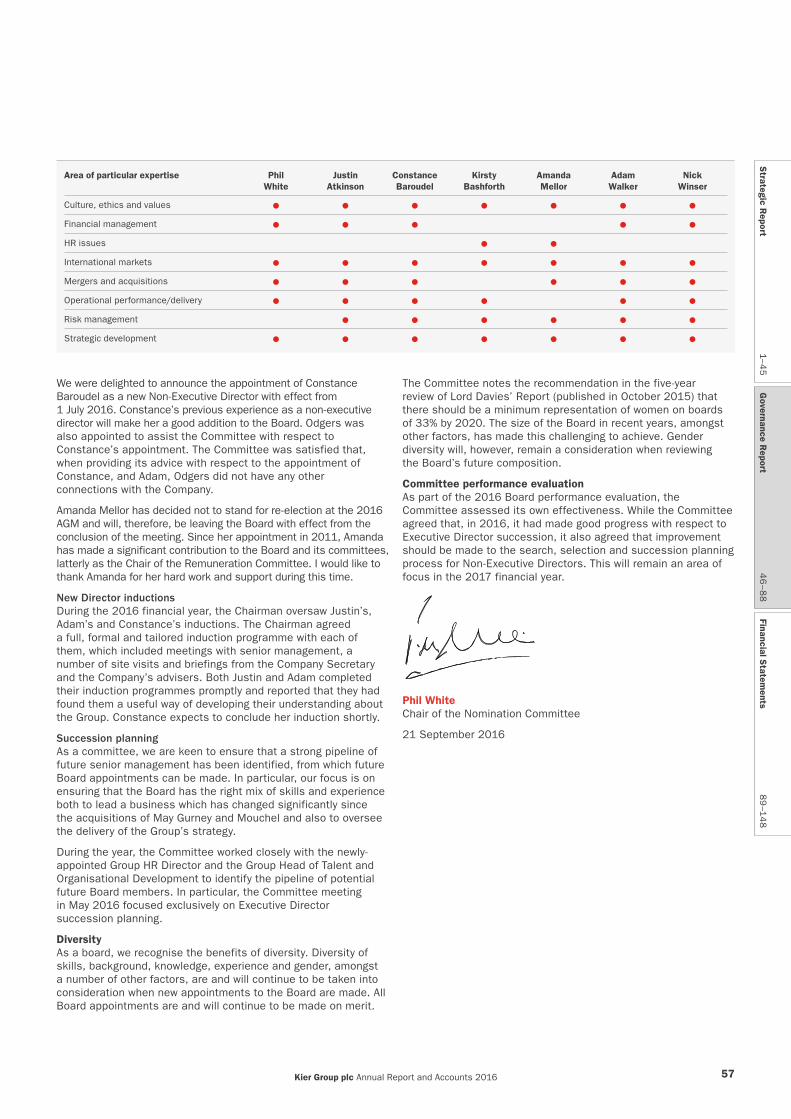
We were delighted to announce the appointment of Constance Baroudel as a new Non-Executive Director with effect from 1 July 2016. Constance’s previous experience as a non-executive director will make her a good addition to the Board. Odgers was also appointed to assist the Committee with respect to Constance’s appointment. The Committee was satisfied that, when providing its advice with respect to the appointment of Constance, and Adam, Odgers did not have any other connections with the Company.
Amanda Mellor has decided not to stand for re-election at the 2016 AGM and will, therefore, be leaving the Board with effect from the conclusion of the meeting. Since her appointment in 2011, Amanda has made a significant contribution to the Board and its committees, latterly as the Chair of the Remuneration Committee. I would like to thank Amanda for her hard work and support during this time.
New Director inductionsDuring the 2016 financial year, the Chairman oversaw Justin’s, Adam’s and Constance’s inductions. The Chairman agreed a full, formal and tailored induction programme with each of them, which included meetings with senior management, a number of site visits and briefings from the Company Secretary and the Company’s advisers. Both Justin and Adam completed their induction programmes promptly and reported that they had found them a useful way of developing their understanding about the Group. Constance expects to conclude her induction shortly.
Succession planningAs a committee, we are keen to ensure that a strong pipeline of future senior management has been identified, from which future Board appointments can be made. In particular, our focus is on ensuring that the Board has the right mix of skills and experience both to lead a business which has changed significantly since the acquisitions of May Gurney and Mouchel and also to oversee the delivery of the Group’s strategy.
During the year, the Committee worked closely with the newly-appointed Group HR Director and the Group Head of Talent and Organisational Development to identify the pipeline of potential future Board members. In particular, the Committee meeting in May 2016 focused exclusively on Executive Director succession planning.
DiversityAs a board, we recognise the benefits of diversity. Diversity of skills, background, knowledge, experience and gender, amongst a number of other factors, are and will continue to be taken into consideration when new appointments to the Board are made. All Board appointments are and will continue to be made on merit.
Area of particular expertise PhilWhite
JustinAtkinson
ConstanceBaroudel
KirstyBashforth
AmandaMellor
AdamWalker
NickWinser
Culture, ethics and values
Financial management
HR issues
International markets
Mergers and acquisitions
Operational performance/delivery
Risk management
Strategic development
The Committee notes the recommendation in the five-year review of Lord Davies’ Report (published in October 2015) that there should be a minimum representation of women on boards of 33% by 2020. The size of the Board in recent years, amongst other factors, has made this challenging to achieve. Gender diversity will, however, remain a consideration when reviewing the Board’s future composition.
Committee performance evaluationAs part of the 2016 Board performance evaluation, the Committee assessed its own effectiveness. While the Committee agreed that, in 2016, it had made good progress with respect to Executive Director succession, it also agreed that improvement should be made to the search, selection and succession planning process for Non-Executive Directors. This will remain an area of focus in the 2017 financial year.
Phil WhiteChair of the Nomination Committee
21 September 2016
Kier Group plc Annual Report and Accounts 2016 57
Strategic R
eport1–4
5G
overnance Report
46
–88
Financial Statem
ents8
9–1
48
Corporate Governance Statement
Accountability
Systems of risk management and internal controlGeneralThe Board is responsible for the Group’s systems of risk management and internal control, including those established to identify, assess, manage and monitor risk. These systems are designed to mitigate, but cannot completely eliminate, the risks faced by the Group. The Board has delegated responsibility for overseeing the implementation of these systems to the RMAC.
The Head of Internal Audit reports to the RMAC on strategic risk issues and has oversight of the Group’s risk management framework. Working with the Head of Internal Audit, management is responsible for the identification and evaluation of the risks that apply to the Group’s business and operations, together with the design and implementation of controls which are designed to manage those risks.
Risk registers are prepared at business unit, divisional and Group level. Those registers identify internal and external factors and risks, including those relating to contract delivery, tender pricing, the Group’s IT systems and its funding requirements. These risks, and the controls designed to mitigate them, are continuously monitored.
The principal aspects of the Group’s systems of risk management and internal control also include:
• The Risk Review Committee, which reviews risks arising during tenders for new contracts;
• The Investment Committee, which reviews risks relating to investment decisions taken by the Group;
• The Group’s standing orders that set out delegated authorities within which the Group operates. These are supplemented by standing orders which apply at divisional and business unit levels; and
• A number of Group-wide committees which ensure that key risks are managed appropriately. These include the Safety, Health and Environment Committee and committees which focus on the management of IT risks relating to the Group.
To support this structure, the Group has a ‘whistleblowing’ arrangement which enables employees to raise concerns in confidence. Further information about this arrangement is set out under ‘Systems of risk management and internal control – Whistleblowing arrangements’ in the Risk Management and Audit Committee report on page 60.
A summary of how the Group identifies and manages risk is set out on page 26.
Highlights
• Effective systems of risk management and internal control• Robust assessment of principal risks and uncertainties• Assessment of the Board’s risk appetite conducted• Viability statement produced for the first time
Financial reporting processThe Group has clear policies and procedures to ensure the conformity, reliability and accuracy of financial reporting, including the process for preparing the Group’s interim and annual financial statements.
The Group recruits suitably qualified and experienced finance professionals who have responsibility for the financial reporting process. Duties are segregated, with clear lines of accountability and delegations of authority. The Group’s financial reporting policies and procedures cover financial planning and reporting, preparation of financial information and the monitoring and control of capital expenditure. The Group’s financial statements preparation process includes reviews at business unit, divisional and Group levels.
Effectiveness reviewThe Code requires the Board, at least annually, to conduct a review of the Group’s systems of risk management and internal control. The steps taken by the RMAC, on behalf of the Board, in reviewing these systems are described under ‘Systems of risk management and internal control – Effectiveness review’ in the Risk Management and Audit Committee report on page 60.
Assessment of principal risksThe Group’s principal risks and uncertainties are set out on pages 27 to 31 (inclusive). The Board’s statement relating to its assessment of the principal risks is set out on page 48.
Following the appointment of a new Head of Internal Audit, the Board has taken the opportunity to conduct a fresh review of its principal risks and uncertainties, together with its appetite with respect to each such risk. At its meeting in June 2016, the Board reviewed a report produced by management which identified management’s views of the Group’s principal risks. The Board broadly supported management’s assessment and then indicated its desired position with respect to each such risk, using gradings of ‘risk averse’, ‘risk neutral’ or ‘risk tolerant’. This feedback is being taken into account by the Internal Audit function when reviewing the Group’s systems of risk management and internal control.
Board statementsThe Board delegated the responsibility for conducting the work required for it to provide the ‘fair, balanced and understandable’, ‘going concern’ and ‘viability’ statements to the RMAC. Further details of the work carried out by the RMAC in support of these statements is set out in the Risk Management and Audit Committee report on pages 60 and 61. In conducting this work, the RMAC acts on behalf of the Board and its activities remain the responsibility of the Board.
Kier Group plc Annual Report and Accounts 201658
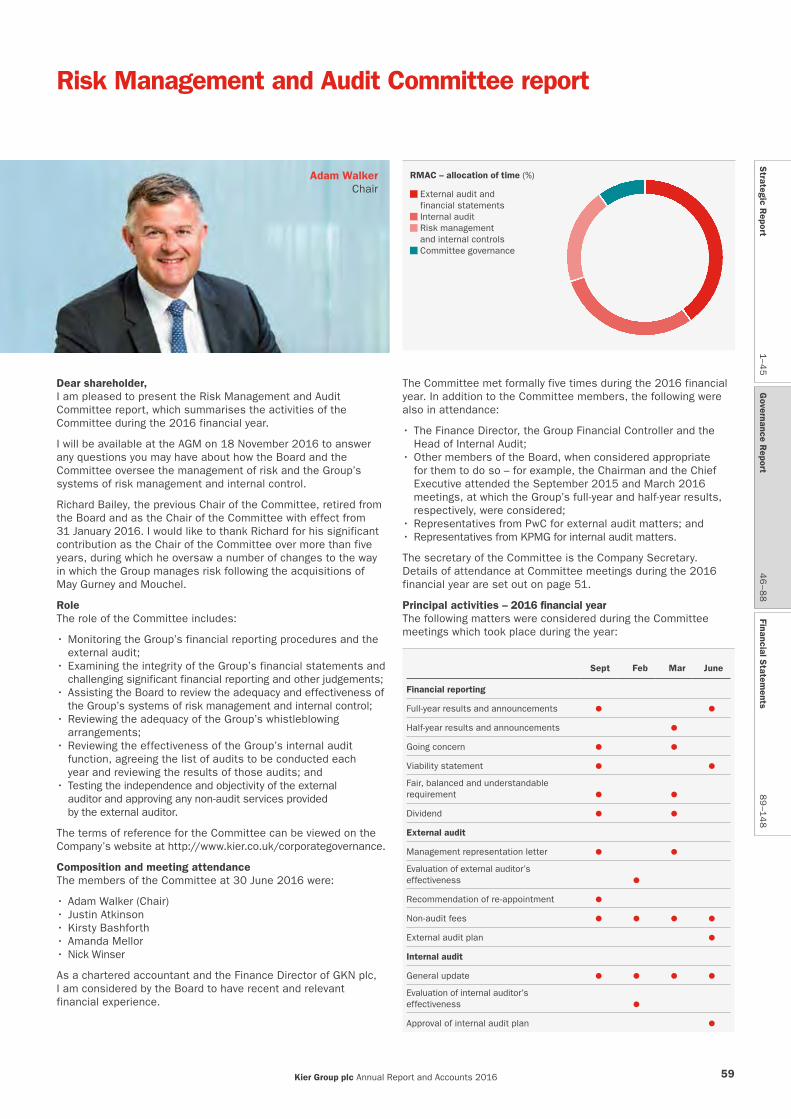
Risk Management and Audit Committee report
The Committee met formally five times during the 2016 financial year. In addition to the Committee members, the following were also in attendance:
• The Finance Director, the Group Financial Controller and the Head of Internal Audit;
• Other members of the Board, when considered appropriate for them to do so – for example, the Chairman and the Chief Executive attended the September 2015 and March 2016 meetings, at which the Group’s full-year and half-year results, respectively, were considered;
• Representatives from PwC for external audit matters; and• Representatives from KPMG for internal audit matters.
The secretary of the Committee is the Company Secretary. Details of attendance at Committee meetings during the 2016 financial year are set out on page 51.
Principal activities – 2016 financial yearThe following matters were considered during the Committee meetings which took place during the year:
Sept Feb Mar June
Financial reporting
Full-year results and announcements
Half-year results and announcements
Going concern
Viability statement
Fair, balanced and understandable requirement
Dividend
External audit
Management representation letter
Evaluation of external auditor’s effectiveness
Recommendation of re-appointment
Non-audit fees
External audit plan
Internal audit
General update
Evaluation of internal auditor’s effectiveness
Approval of internal audit plan
Dear shareholder,I am pleased to present the Risk Management and Audit Committee report, which summarises the activities of the Committee during the 2016 financial year.
I will be available at the AGM on 18 November 2016 to answer any questions you may have about how the Board and the Committee oversee the management of risk and the Group’s systems of risk management and internal control.
Richard Bailey, the previous Chair of the Committee, retired from the Board and as the Chair of the Committee with effect from 31 January 2016. I would like to thank Richard for his significant contribution as the Chair of the Committee over more than five years, during which he oversaw a number of changes to the way in which the Group manages risk following the acquisitions of May Gurney and Mouchel.
RoleThe role of the Committee includes:
• Monitoring the Group’s financial reporting procedures and the external audit;
• Examining the integrity of the Group’s financial statements and challenging significant financial reporting and other judgements;
• Assisting the Board to review the adequacy and effectiveness of the Group’s systems of risk management and internal control;
• Reviewing the adequacy of the Group’s whistleblowing arrangements;
• Reviewing the effectiveness of the Group’s internal audit function, agreeing the list of audits to be conducted each year and reviewing the results of those audits; and
• Testing the independence and objectivity of the external auditor and approving any non-audit services provided by the external auditor.
The terms of reference for the Committee can be viewed on the Company’s website at http://www.kier.co.uk/corporategovernance.
Composition and meeting attendanceThe members of the Committee at 30 June 2016 were:
• Adam Walker (Chair)• Justin Atkinson• Kirsty Bashforth• Amanda Mellor• Nick Winser
As a chartered accountant and the Finance Director of GKN plc, I am considered by the Board to have recent and relevant financial experience.
Adam Walker Chair
RMAC – allocation of time (%)
External audit and financial statements Internal audit Risk management and internal controls Committee governance
Kier Group plc Annual Report and Accounts 2016 59
Strategic R
eport1–4
5G
overnance Report
46
–88
Financial Statem
ents8
9–1
48
Principal activities – 2016 financial year continued
Sept Feb Mar June
Risk management
Systems of risk management and internal control
Assessment of principal risks
Other
Whistleblowing
Review of terms of reference
Systems of risk management and internal controlGeneralInformation on how the Group identifies and manages risk is set out on page 26. A description of the principal aspects of the Group’s systems of risk management and internal control is set out on page 58.
During the year, the Committee reviewed reports providing a consolidated analysis of the divisional and business unit risk registers. Having done so, it challenged management to ensure that the risks identified were being appropriately managed and mitigated. In addition, the Committee challenged management to consider potential future risks which may affect the Group, in the light of its plans for future growth.
Effectiveness reviewThe Code requires the Board, at least annually, to conduct a review of the effectiveness of the Group’s risk management and internal control systems. The Board’s statement about this review is set out on page 48.
At its meeting in September 2016, the Committee reviewed management’s assessment of the key elements of the Group’s systems of risk management and internal control. The Committee noted, in particular, that:
• During the year, management had made significant progress with respect to implementing a number of actions following the review of the Group’s key financial controls;
• Good progress had been made in relation to the Group’s ERP system;
• Management had agreed to set up a single finance shared services centre, which would facilitate the introduction of common systems and procedures across the Group; and
• During the year, KPMG had conducted a number of internal audit reviews across the Group’s operations and had worked with management to ensure that actions were closed-out appropriately.
Whistleblowing arrangementsThe Company makes available an externally-hosted helpline, which employees can call, in confidence, if they have any concerns about improprieties in financial reporting or other matters. Any such concerns raised are then investigated. During the year, the Committee reviewed reports which provided details of any material issues referred to the helpline and how management had investigated them. Access to the Kier helpline was made available to the Mouchel businesses during the year.
Board statementsUnder the Code, the Board is required to provide a number of statements, as set out on page 48. The Committee’s work to support the Board’s statement with respect to the Group’s systems of risk management and internal control is described above under ‘Systems of risk management and internal control
– Effectiveness review’. The Committee’s work with respect to the ‘fair, balanced and understandable’, ‘going concern’ and ‘viability’ statements is described below.
Fair, balanced and understandableThe principal aspects of the review process conducted by the Committee and management to support the Board’s statement were:
• Setting up a committee of senior individuals within the Group to draft the Annual Report;
• Holding regular meetings of this committee to discuss and agree significant disclosure items;
• The committee members retaining copies of supporting materials and confirming that, in their opinion, the sections drafted by them were ‘fair, balanced and understandable’;
• Requesting that certain key contributors to sections of this Annual Report (for example, Managing Directors and Finance Directors of business units) sign a declaration confirming the accuracy of the information provided;
• Arranging for PwC and FutureValue (a corporate reporting consultancy) to review the Annual Report and for Mercer, the Company’s remuneration consultants, to review the Remuneration Report;
• Circulating drafts of the Annual Report to the Committee and the Board for review; and
• Discussing material disclosure items at a meeting of the Committee held in September 2016.
Going concernThe principal aspects of the review process conducted by the Committee and management to support the Board’s statement were:
• Reviewing the Group’s available sources of funding and, in particular, testing the covenants and assessing the available headroom using a range of assumptions;
• Reviewing the short, medium and long-term cash flow forecasts, noting the significant progress made during the year in relation to short-term cash management;
• Taking into account the current and forecast activities of the Group, including its long-term contracts and order books, and those factors considered likely to affect its future performance and financial position; and
• Taking into account the Group’s principal risks and uncertainties.
The Committee discussed the going concern statement at its meeting in September 2016 and, having done so, recommended that the Board provided it in the form set out on page 48.
Viability statementThe Directors have chosen to consider the prospects of the Group over a three-year period ending 30 June 2019, as they consider it to be a period over which they are able to forecast the Group’s performance with reasonable certainty. In particular:
• As part of its work to support this statement, the Committee took into account the potential likelihood and impact of the Group’s principal risks and uncertainties. These risks and uncertainties are assessed on a rolling three-year basis;
• A number of the programmes relating to the Group’s key construction projects, which are important factors in an assessment of the Group’s performance, support a review over a three-year period; and
• The KPIs contained in Vision 2020 cover a three-year period ending 30 June 2019.
Corporate Governance Statement
Risk Management and Audit Committee report continued
Kier Group plc Annual Report and Accounts 201660
The Committee has supported the Board in the delivery of this statement by:
• Considering the current position and prospects of the Group, as described above under ‘Going concern’;
• Reviewing progress against Vision 2020, which was also formally discussed at Board meetings during the year;
• Assessing the Group’s principal risks and uncertainties; and• Reviewing a scenario stress test conducted by management that
involved an assessment of the Group’s ability to absorb varying degrees of plausible downside scenarios, including significant reductions in revenue, profitability and cash, the removal of finance facilities and a material adverse affect on the business caused by Brexit.
The Committee discussed and approved the viability statement at its meeting in September 2016 and, having done so, recommended that the Board provided it in the form set out on page 48.
Internal auditInternal audits – 2016 financial yearDuring the 2016 financial year, the Committee monitored the implementation and progress of the 2016 internal audit plan, which was approved by the Committee at its June 2015 meeting. Results from each completed audit were discussed by the Committee, together with the actions taken by management with respect to those audits.
Internal auditor effectivenessThe Code and the Committee’s terms of reference require the Committee to monitor and review the effectiveness of the Group’s internal audit function.
During the 2016 financial year, the Head of Internal Audit issued a detailed questionnaire addressing various aspects of both the Internal Audit function and KPMG’s performance as the co-sourced internal auditor to a number of stakeholders, including members of the Committee and senior management. The feedback from the completed questionnaires was then discussed by the Committee at its meeting in February 2016.
The Committee concluded that, overall, the Group’s Internal Audit function was operating effectively, with positive feedback being provided in relation to the quality of KPMG’s reports to the Committee, the focused nature of KPMG’s review methodology and the ability for material risk issues to be escalated effectively to senior management. Areas of focus identified by the review included a need to ensure that topics for audit were carefully selected, that issues identified during audits were appropriately closed-out and that reports were produced in a timely manner. Feedback was subsequently provided to KPMG.
KPMG has indicated its willingness to continue in office and the Committee has decided to appoint KPMG as the co-sourced internal auditor for the 2017 financial year.
External auditIntroductionThe Committee is responsible for:
• Approving the annual audit plan;• Monitoring the effectiveness of the external audit process;• Making recommendations to the Board in relation to
the appointment, re-appointment and removal of the external auditor;
• Approving the remuneration and terms of engagement of the external auditor;
• Reviewing and monitoring the external auditor’s independence and objectivity; and
• Developing and implementing a policy on the engagement of the external auditor to supply non-audit services.
External auditor effectivenessA similar process to that used for the purposes of assessing the internal audit function’s effectiveness was applied with respect to PwC’s performance as the external auditor.
A questionnaire was issued to a number of key stakeholders, including members of the Committee and those involved in the 2015 audit, and the feedback received was discussed by the Committee at its meeting in February 2016.
The Committee concluded that, overall, it was satisfied with PwC’s performance during its first year as the external auditor. Positive feedback was received in respect of PwC’s collaborative, but challenging, approach, its technical expertise and the quality of its reporting to the Committee. The review also identified the need to ensure that the audit team has an appropriate range of skills and experience, that the audit process is adequately communicated and that there is effective project management of the audit process.
The Committee will formally assess PwC’s performance in relation to the 2016 audit process during the 2017 financial year. However, the Committee discussed its preliminary views at its meeting in September 2016 and concluded that, overall, it was satisfied with PwC’s performance.
PwC has indicated its willingness to continue in office and the Committee has recommended PwC’s re-appointment to the Board. A resolution to this effect will therefore be proposed at the 2016 AGM.
External auditor independence and non-audit servicesDuring the 2016 financial year, PwC provided non-audit services to the Group. The Committee monitors the level and scope of non-audit work awarded to PwC to ensure that any services provided are within relevant ethical guidance and that the associated fees are not of a level that would affect PwC’s independence and objectivity. All fees relating to the provision of non-audit fees by PwC must be referred to and agreed by the Committee.
The fees paid to PwC during the 2016 financial year in respect of non-audit services were:
Type of services Specific servicesAmount
(£000)
Non-audit assurance
Project assurance in relation to ERP project 62
Sustainability reporting assurance 45
Interims review – 2016 financial year 35
Tax advice and compliance
Mouchel tax compliance services – UK 46
Mouchel tax advice and compliance – Middle East 31
Total 219
The total audit fees payable by the Group with respect to the 2016 financial year are £1,419,000. The total non-audit fees during the 2016 financial year therefore represented approximately 15% of the audit fees payable in respect of the year. During the 2015 financial year, £496,000 was paid to PwC in relation to non-audit fees, representing approximately 39% of the audit fees for that year. All figures exclude VAT.
Kier Group plc Annual Report and Accounts 2016 61
Strategic R
eport1–4
5G
overnance Report
46
–88
Financial Statem
ents8
9–1
48
PwC was first appointed to conduct the interims review and audit for the 2015 financial year. PwC has strict requirements on lead partner rotation and the lead audit partner is required to change after five years. As part of the 2016 audit, PwC confirmed that it was independent within the meaning of applicable regulatory and professional requirements. Taking this into account, and having considered the steps taken by PwC to preserve its independence, the Committee concluded that PwC’s independence had not been compromised notwithstanding the level of non-audit fees incurred during the year.
Financial statements – 2016The audit processThe scope of the 2016 audit was approved by the Committee at its meeting in June 2016. The Committee reviewed and challenged the proposed plan and considered the levels of materiality and resources proposed by PwC to ensure that they met the Group’s requirements. The audit fee was also discussed with the Committee prior to its approval.
I met the lead audit partner from PwC to discuss the 2016 audit process. At its September 2016 meeting, the Committee reviewed PwC’s findings and discussed the significant issues that arose during the audit. In particular, the Committee and PwC discussed the key accounting and audit judgements and reviewed any unadjusted audit differences which had been identified.
Significant issues and other accounting judgementsThe Committee is responsible for reviewing the appropriateness of management’s judgements, assumptions and estimates in preparing the financial statements. After discussions with management and PwC, the Committee determined that the significant issues and other accounting judgements relating to the 2016 financial statements are as shown in the table below.
Committee performance evaluationAs part of the 2016 Board performance evaluation, the Committee assessed its own effectiveness. Committee members agreed that, overall, the Committee’s performance had been effective during the year. The Committee agreed that areas of focus for the 2017 financial year included continuing to review the Group’s approach to the evaluation of risk, ensuring appropriate interaction between the Board and the Committee on risk and maximising the benefits of the Internal Audit programme.
Adam WalkerChair of the Risk Management and Audit Committee
21 September 2016
Significant issue and other accounting judgements
How the Board/RMAC addressed these issues/judgements
Accounting for long-term contracts – including profit recognition, work-in-progress and provisioning
The Group has significant long-term contracts in the Construction and Services divisions, in particular. Profit is recognised according to the stage of completion of the contract. The assessment of profit requires the exercise of judgement when preparing estimates of the forecast costs and revenues of a contract. A number of factors are relevant to this assessment, including, in particular, the expected recovery of costs.
During the year, the Board regularly reviewed and considered management’s latest assessment of the forecast costs and revenues on certain significant long-term contracts – for example, the Group’s projects for MTR in Hong Kong and its Environmental Services contracts. In addition, the Committee identified accounting for long-term contracts as one of the principal matters for review by PwC in the 2016 audit. The Committee also discussed management’s assessment of the profit on such contracts with PwC and management when considering the interim and year-end financial statements at its meetings in March 2016 and September 2016, respectively. PwC’s conclusion is set out in the independent auditor’s report: please see page 90.
Accounting for adjustments to underlying profit
Management has separately disclosed certain non-underlying items, in addition to presenting the underlying results of the Group. Details of those items are set out in note 4 to the consolidated financial statements.
The non-underlying items and their disclosure have been regularly discussed at Board meetings during the 2016 financial year. The Board obtained advice from the Company’s corporate brokers and PwC in relation to such items. The Committee identified the accounting treatment of non-underlying items as one of the principal matters for review by PwC in the 2016 audit. At its meeting in September 2016, the Committee reviewed and considered these items with both PwC and management in the context of its review of the 2016 financial statements. PwC’s conclusion is set out in the independent auditor’s report: please see page 91.
Valuation of land and properties
The Group holds inventory within the Residential division, primarily comprising land held for residential development, for which construction has not started, and work-in-progress. The carrying value of the inventory is based on the Group’s current estimates of the sales prices and building costs.
One of the key elements of the systems of risk management and internal control within the Residential division is the development appraisals prepared by management, using a number of internal and external reference points. At its meeting in June 2016, the Committee identified the valuation of land and properties as a key area of judgement and, therefore, instructed PwC to challenge the principal assumptions underlying management’s appraisals during the 2016 audit, in particular those relating to building costs and sales rates. PwC’s conclusion is set out in the independent auditor’s report: please see page 90.
Assessment of carrying value of goodwill
The majority of the Group’s goodwill relates to the acquisitions of Mouchel and May Gurney. Both the Board and the Committee have continued to oversee and monitor the performance of the Group during the 2016 financial year. This performance and, in particular, the Group’s ability to generate cash is of particular relevance to the audit procedures conducted by PwC with respect to the carrying value of goodwill. Throughout the year, the Board and the Committee have challenged management to ensure effective cash management by the Group’s businesses. PwC’s conclusion is set out in the independent auditor’s report: please see page 92.
Corporate Governance Statement
Risk Management and Audit Committee report continued
Kier Group plc Annual Report and Accounts 201662
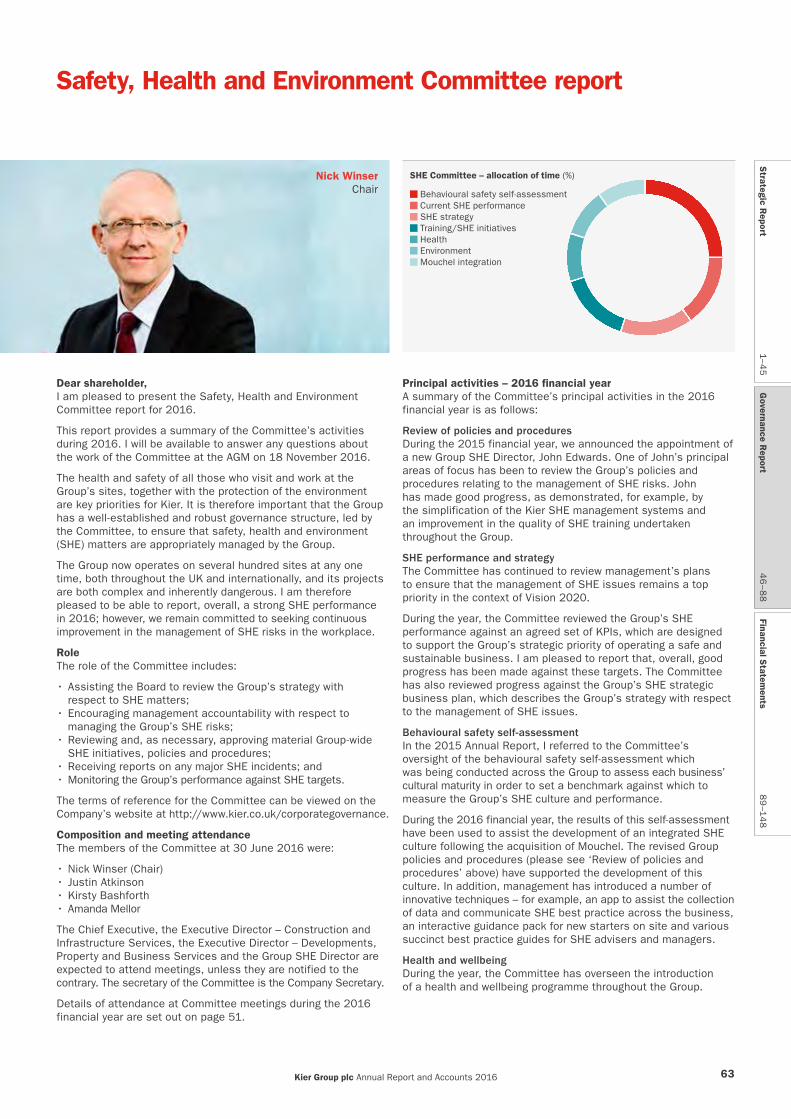
Safety, Health and Environment Committee report
Nick Winser Chair
Dear shareholder,I am pleased to present the Safety, Health and Environment Committee report for 2016.
This report provides a summary of the Committee’s activities during 2016. I will be available to answer any questions about the work of the Committee at the AGM on 18 November 2016.
The health and safety of all those who visit and work at the Group’s sites, together with the protection of the environment are key priorities for Kier. It is therefore important that the Group has a well-established and robust governance structure, led by the Committee, to ensure that safety, health and environment (SHE) matters are appropriately managed by the Group.
The Group now operates on several hundred sites at any one time, both throughout the UK and internationally, and its projects are both complex and inherently dangerous. I am therefore pleased to be able to report, overall, a strong SHE performance in 2016; however, we remain committed to seeking continuous improvement in the management of SHE risks in the workplace.
RoleThe role of the Committee includes:
• Assisting the Board to review the Group’s strategy with respect to SHE matters;
• Encouraging management accountability with respect to managing the Group’s SHE risks;
• Reviewing and, as necessary, approving material Group-wide SHE initiatives, policies and procedures;
• Receiving reports on any major SHE incidents; and• Monitoring the Group’s performance against SHE targets.
The terms of reference for the Committee can be viewed on the Company’s website at http://www.kier.co.uk/corporategovernance.
Composition and meeting attendanceThe members of the Committee at 30 June 2016 were:
• Nick Winser (Chair)• Justin Atkinson• Kirsty Bashforth• Amanda Mellor
The Chief Executive, the Executive Director – Construction and Infrastructure Services, the Executive Director – Developments, Property and Business Services and the Group SHE Director are expected to attend meetings, unless they are notified to the contrary. The secretary of the Committee is the Company Secretary.
Details of attendance at Committee meetings during the 2016 financial year are set out on page 51.
SHE Committee – allocation of time (%)
Behavioural safety self-assessment Current SHE performance SHE strategy Training/SHE initiatives Health Environment Mouchel integration
Principal activities – 2016 financial yearA summary of the Committee’s principal activities in the 2016 financial year is as follows:
Review of policies and proceduresDuring the 2015 financial year, we announced the appointment of a new Group SHE Director, John Edwards. One of John’s principal areas of focus has been to review the Group’s policies and procedures relating to the management of SHE risks. John has made good progress, as demonstrated, for example, by the simplification of the Kier SHE management systems and an improvement in the quality of SHE training undertaken throughout the Group.
SHE performance and strategyThe Committee has continued to review management’s plans to ensure that the management of SHE issues remains a top priority in the context of Vision 2020.
During the year, the Committee reviewed the Group’s SHE performance against an agreed set of KPIs, which are designed to support the Group’s strategic priority of operating a safe and sustainable business. I am pleased to report that, overall, good progress has been made against these targets. The Committee has also reviewed progress against the Group’s SHE strategic business plan, which describes the Group’s strategy with respect to the management of SHE issues.
Behavioural safety self-assessment In the 2015 Annual Report, I referred to the Committee’s oversight of the behavioural safety self-assessment which was being conducted across the Group to assess each business’ cultural maturity in order to set a benchmark against which to measure the Group’s SHE culture and performance.
During the 2016 financial year, the results of this self-assessment have been used to assist the development of an integrated SHE culture following the acquisition of Mouchel. The revised Group policies and procedures (please see ‘Review of policies and procedures’ above) have supported the development of this culture. In addition, management has introduced a number of innovative techniques – for example, an app to assist the collection of data and communicate SHE best practice across the business, an interactive guidance pack for new starters on site and various succinct best practice guides for SHE advisers and managers.
Health and wellbeingDuring the year, the Committee has overseen the introduction of a health and wellbeing programme throughout the Group.
Kier Group plc Annual Report and Accounts 2016 63
Strategic R
eport1–4
5G
overnance Report
46
–88
Financial Statem
ents8
9–1
48

The principal aim of the programme has been to raise awareness of common health issues. The programme included initiatives ranging from a ‘health kiosk’ (which tested staff on core health issues), which visited various offices and sites around the country, to raising awareness of more significant occupational health issues.
Environmental mattersManagement has established a set of KPIs against which it measures the Group’s environmental performance, including with respect to carbon emissions, water usage and waste management. During the year, the Committee reviewed the Group’s performance against these KPIs and was pleased to note that good progress was being made. In addition, the Committee reviewed the statistics relating to the reporting of environmental incidents (for example, effluence leakages or spillages and noise or dust pollution) and challenged management to take appropriate action following such incidents. The Committee also oversaw Kier’s Environment Week in June 2016, the principal objective of which was to increase awareness of environmental issues across the Group.
Mouchel integrationOne of the key projects overseen by management during the year was the integration of Mouchel’s and Kier’s respective SHE policies and procedures, creating a uniform set of policies and procedures across the enlarged Group. Management, the business and the SHE teams have worked hard to ensure that this integration was conducted in an efficient manner, with as little disruption to the combined business as possible. Further details are set out opposite.
Current performanceAt each of its meetings during the year, the Committee reviewed the Group’s current SHE performance. A range of statistics, supported by an appropriate commentary, was tabled for discussion. The Committee has continued to challenge management to ensure that the remedial actions which are taken following ‘high-potential’ incidents are closed-out in a timely manner, that such incidents continue to be reported and that the learning points are communicated across the Group.
Regulatory investigationsFrom time to time, the Health and Safety Executive (the HSE) and the Environment Authority (the EA) will conduct investigations into incidents which occur on the Group’s sites. Some of these investigations result in court proceedings being taken against the Group and, as a committee, we work with management to ensure that its approach to the conduct of these proceedings is appropriate, in particular in light of the new sentencing guidelines for health and safety offences which came into force in February 2016.
During the year, the Committee monitored the status of the HSE’s investigation into a fatality which took place in March 2014 on the BFK joint venture’s site at Farringdon station (part of the Crossrail project), together with two other incidents which occurred in January 2015 on the joint venture’s site at Bond Street. In addition, the Committee oversaw management’s response to the EA’s prosecution of the KMI joint venture following an environmental incident on a site in the North West in December 2013.
Mouchel integration
During our due diligence on Mouchel, we were able to obtain an early understanding of how it managed SHE risks and identified a common approach in a number of areas. Subsequently, we have aligned the structure of the legacy Mouchel SHE function with Kier’s equivalent, integrated the reporting of SHE statistics and, where appropriate, migrated data and processes from external systems used by Mouchel to Kier’s systems.
Committee performance evaluationAs part of the 2016 Board performance evaluation, the Committee assessed its own effectiveness. Committee members agreed that, overall, the Committee’s performance had been effective during the year. The Committee identified providing oversight of the steps taken by management to promote health and wellbeing issues throughout the Group and to support the Group’s commitment to operating a safe and sustainable business as being two principal areas of focus during the 2017 financial year.
Nick WinserChair of the Safety, Health and Environment Committee
21 September 2016
Corporate Governance Statement
Safety, Health and Environment Committee report continued
Kier Group plc Annual Report and Accounts 201664

Relations with shareholders
Relations with shareholdersMembers of the Board welcome the opportunity to engage with shareholders and to understand their views on matters of importance to them – for example, strategy, governance, remuneration and sustainability.
Strategy The Chief Executive and the Finance Director met major shareholders following the preliminary announcement of the Group’s 2015 results and the announcement of the Group’s 2016 interim results to discuss a number of matters, including progress against the Group’s strategy.
During the year, the Chairman also met major shareholders on an informal basis to discuss a variety of matters, including the Group’s strategy and governance and remuneration matters.
GovernanceJustin Atkinson, in his capacity as the Senior Independent Director, met a number of shareholders following his appointment to the role. These meetings have assisted Justin to develop a balanced understanding of their issues and concerns.
RemunerationThe Chair of the Remuneration Committee, Amanda Mellor, led the engagement with shareholders with respect to the Executive Directors’ remuneration for the 2017 financial year. The Remuneration Committee is grateful to shareholders for the level of their engagement and reflected their feedback in its deliberations.
SustainabilityIn September 2015, a number of major shareholders met to review our strategy for a sustainable business, at which we demonstrated how this strategy has been integrated into Vision 2020. We also gained an understanding of the key non-financial considerations taken into account by shareholders – for example, business ethics, customer experience and health and safety. Other meetings with individual shareholders on sustainability matters were held during the year.
Constructive use of the AGMThe Board uses the AGM as an opportunity to communicate directly with shareholders.
All members of the Board attend the Company’s AGMs and shareholders are invited to attend, ask questions and meet directors prior to, and after, the formal proceedings. The Chairs of the Board committees are present at the meeting to answer questions on the work of their committees.
The results of the voting at the 2015 AGM were:
For Against
Resolution
Percentage of votes
cast1,2
Percentage of votes
cast2
1 Receive Annual Report and Accounts 99.92 0.08
2 Remuneration Report 98.50 1.50
3 Declare final dividend 99.96 0.04
4–14 Appointment of Directors 96.81–99.98 3.19–0.02
15 Appointment of auditor 99.94 0.06
16 Auditor’s remuneration 99.97 0.03
17 Authority to allot shares 99.77 0.23
18 Disapplication of pre-emption rights 94.92 5.08
19 Approve the new Sharesave Scheme 99.98 0.02
20 Meetings on 14 days’ notice 95.59 4.411 Includes those votes for which discretion was given to the Chairman.2 Does not include votes withheld.
Highlights
• Roadshows following financial results• Meetings between the Senior Independent Director
and shareholders • Meetings with shareholders on remuneration and
sustainability issues• Capital Markets Day, with a focus on the
highways business
Capital Markets Day – 6 July 2016
On 6 July 2016, we held a Capital Markets Day at the Area 3 depot near Basingstoke to provide investors and analysts with an insight into the Group’s highways maintenance and management operations. Representatives from one of our key clients, Highways England, also attended.
Kier Group plc Annual Report and Accounts 2016 65
Strategic R
eport1–4
5G
overnance Report
46
–88
Financial Statem
ents8
9–1
48

Amanda Mellor Chair
Remuneration Report
Annual statement of the Chair of the Remuneration Committee
Dear shareholder,On behalf of the Board, I am pleased to present the Remuneration Report for 2016, which provides details of the remuneration earned by the Directors in the 2016 financial year.
Our remuneration policy was approved by shareholders at the 2014 AGM and no changes have been made to it since then. However, in order to ensure transparency and to provide context for the decisions taken by the Committee during the year, a summary of the policy has been included in this report. Information relating to the implementation of our remuneration policy in the 2016 and 2017 financial years is included in the annual report on remuneration.
As in previous years, this report is divided into three sections: this annual statement, the annual report on remuneration on pages 68 to 77 (inclusive) and a summary of the remuneration policy on pages 78 to 85 (inclusive).
Remuneration frameworkDuring the 2016 financial year, the Committee reviewed the framework for executive remuneration at Kier in detail to ensure that it remained appropriate to promote the long-term success of the Company. The Committee is also aware of the need for executive remuneration at Kier to remain competitive and to reflect trends in the market.
Working together with its remuneration advisers, Mercer, the Committee considered a number of potential options for the simplification of Kier’s executive remuneration framework.
However, the Committee concluded that, although a number of these options would incentivise the delivery of Vision 2020 and align management’s interests with those of shareholders, the scope of the proposals would require material changes to the current remuneration policy. The Committee therefore intends to reconsider these proposals during the 2017 financial year, when it will engage with shareholders in relation to a revised remuneration policy for shareholder approval at the 2017 AGM.
Shareholder engagementAs part of its broader review of the executive remuneration framework (please see above), the Committee also took the opportunity to review the principal component elements of the Executive Directors’ remuneration, including base salary, annual bonus and long-term incentives. The Committee then engaged with shareholders with respect to:
• The Executive Directors’ base salaries for the 2017 financial year;
• The removal of the ‘personal objectives’ element of the annual bonus scheme, with the 20% awarded in the 2016 financial year being re-allocated across the profit and cash targets; and
• The inclusion of a third performance condition in the annual Long Term Incentive Plan (the LTIP) award – namely, a net debt:EBITDA performance condition.
The review identified, in particular, that the Chief Executive’s base salary, maximum annual bonus opportunity and LTIP award were all low relative to those at peer group companies. Taking this into account, and noting the positive feedback received from shareholders about the Chief Executive’s performance since being appointed to the role in 2014, the Committee proposed an 11.3% increase in his base salary to £590,000 for the 2017 financial year. The Committee also proposed a 4% increase in base salary for the other Executive Directors, reflecting their continued strong performance and the approximate salary increases across the Group’s professionally-qualified employees. Further details of the Executive Directors’ base salaries for the 2017 financial year are set out on page 76.
To ensure a strong link between pay and the value delivered to shareholders, the Committee proposed that the 20% ‘personal objectives’ element of the 2016 bonus would be re-distributed across the net debt/cash and profit elements of the 2017 bonus, as to 15% and 5%, respectively.
Having reviewed the performance conditions for the LTIP, the Committee concluded that earnings per share (EPS) and total shareholder return (TSR) remained relevant measures of performance. However, the Committee also concluded that it would now be appropriate to introduce a performance condition linked to long-term cash generation and conversion, since both are key objectives in the context of the delivery of Vision 2020 and are complementary to the existing EPS and TSR measures. Although the Committee considered return on capital employed (ROCE) as a potential performance condition, it concluded that it would not be an appropriate measure because significant parts of the Group (for example, Construction and Services) do not utilise capital to a material extent.
Remuneration – 2017 financial yearThe Committee is grateful for the level of engagement from shareholders to the proposals summarised above. During the consultation process, I met with and spoke to a number of shareholders to understand their views, before reporting back to the Committee. Overall, shareholders were supportive of the proposals. The Committee discussed this feedback when deciding the Executive Directors’ remuneration for 2017, as follows:
• Base salaries: these are set out on page 76 and reflect the considerations summarised above;
Remuneration Committee allocation of time (%)
Remuneration framework review Approval of Executive Directors’ remuneration in 2017 Bonuses – approval, assessment of performance and target setting LTIP review 2015 Remuneration Report and governance
Kier Group plc Annual Report and Accounts 201666

• Annual bonus: the maximum opportunity remains at 100% of base salary. Of this, a maximum of 50% will relate to profit, a maximum of 40% to year-end cash/net debt and a maximum of 10% to health and safety targets. Performance against the specific targets will be disclosed in next year’s Annual Report; and
• LTIP: each of the Executive Directors will continue to receive an award of 150% of their base salaries. The performance conditions for this award will relate to EPS (50%), TSR (25%) and net debt: EBITDA (25%) measured over the three-year period ending 30 June 2016, as described in further detail on page 76.
There are no other changes to any other elements of the Executive Directors’ remuneration.
The Committee’s principal activities – 2016 financial yearIn addition to its review of the remuneration framework, its engagement with shareholders and setting the Executive Directors’ remuneration for 2017, the Committee’s other principal activities and key decisions during the year included:• Approving the 2015 Remuneration Report and considering the
2015 AGM vote on the report;• Reviewing and approving the bonuses paid to the Executive
Directors in respect of the 2015 financial year;• Setting the performance measures relating to, and the
quantum of, LTIP awards made to the Executive Directors during the 2016 financial year;
• Making a preliminary assessment of performance against the Executive Directors’ bonus targets for the 2016 financial year;
• Considering institutional investors’ current guidelines on executive remuneration;
• Considering the remuneration arrangements for the Group’s wider workforce;
• Considering external market developments and best practice;• Reviewing the Committee’s terms of reference; and• Reviewing the Committee’s performance.
A summary of the Committee’s allocation of time during the year is set out on page 66.
Since 1 July 2016, the Committee has approved the Executive Directors’ bonus payments relating to the 2016 financial year and considered the level of vesting of the 2013 LTIP award following the end of the performance period on 30 June 2016.
The Committee believes that the 2016 bonus payments reflect the overall performance of the Group in the year, during which management oversaw the successful integration of Mouchel, began the simplification of the Group’s portfolio of businesses and has focused on driving operational efficiencies throughout the Group. The maximum payment of the cash element of the 2016 bonus (25%) reflects the Group’s good working capital performance, which has been a priority for management during the year. Each of the Executive Directors performed well against their personal objectives and each received 15% (out of a maximum opportunity of 20%) for this element of the 2016 bonus.
The three-year performance period for the LTIP award granted in 2013 concluded on 30 June 2016. The Executive Directors will receive 34% of the award when it vests in October 2016. The Committee believes that the level of vesting of the award demonstrates the Group’s robust performance over the past three years in challenging market conditions.
Further details relating to the bonus payments and the vesting of the 2013 LTIP award are set out on pages 69 and 70, respectively.
Committee performance evaluationAs part of the 2016 Board performance evaluation, the Committee assessed its own effectiveness. The Committee acknowledged that executive remuneration is increasingly an area of focus for shareholders and other interested parties. Accordingly, it identified the need to continue to improve the process for reviewing executive remuneration and setting and measuring targets as key priorities for the 2017 financial year.
Remuneration policyNo changes to the remuneration policy will be proposed at the 2016 AGM. However, one of the Committee’s principal areas of focus for the 2017 financial year will be to review the existing policy and to consider whether changes are required to ensure that our remuneration framework continues to support and drive the delivery of Vision 2020 and to motivate and challenge our leaders to continue to grow the business and deliver value to shareholders. We will work with our remuneration advisers to ensure that the revised policy aligns with the Vision 2020 goals to deliver strong performance and sustainable shareholder returns. The Committee will engage with shareholders to ensure that their views are reflected in the revised policy, which will be put to shareholders for approval at the 2017 AGM.
Compliance statementThis report complies with the Companies Act 2006, Schedule 8 of the Large and Medium-sized Companies and Groups (Accounts and Reports) (Amendment) Regulations 2013 and the Listing Rules of the Financial Conduct Authority and applies the main principles relating to remuneration which are set out in the UK Corporate Governance Code (September 2014 edition).
ConclusionI hope that you find our report helpful. The Committee has sought to ensure full and transparent levels of disclosure with respect to executive remuneration at Kier and to share with shareholders how it seeks to balance various considerations and interests in a fair way for the long-term success of the Group. Linking pay to the Group’s performance and the delivery of the Group’s strategy are important parts of the Committee’s remit.
As Chair of the Committee, I have welcomed the opportunity to meet a number of major shareholders during the year to understand their views on executive remuneration, both at Kier and more broadly, and also to share with them the Committee’s approach. The Committee has found this engagement with shareholders beneficial and will continue to seek to incorporate their views when considering executive remuneration at Kier.
I will be available to answer any questions at the AGM on 18 November 2016.
Amanda MellorChair of the Remuneration Committee
21 September 2016
Kier Group plc Annual Report and Accounts 2016 67
Strategic R
eport1–4
5G
overnance Report
46
–88
Financial Statem
ents8
9–1
48
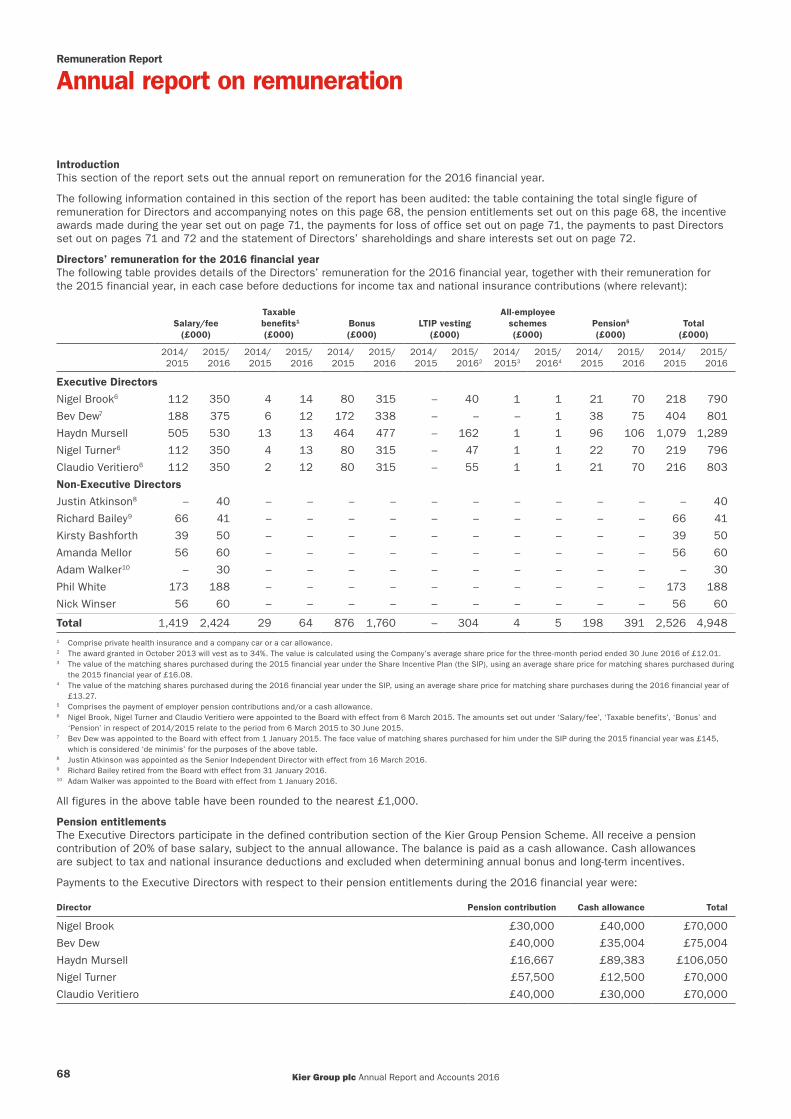
IntroductionThis section of the report sets out the annual report on remuneration for the 2016 financial year.
The following information contained in this section of the report has been audited: the table containing the total single figure of remuneration for Directors and accompanying notes on this page 68, the pension entitlements set out on this page 68, the incentive awards made during the year set out on page 71, the payments for loss of office set out on page 71, the payments to past Directors set out on pages 71 and 72 and the statement of Directors’ shareholdings and share interests set out on page 72.
Directors’ remuneration for the 2016 financial yearThe following table provides details of the Directors’ remuneration for the 2016 financial year, together with their remuneration for the 2015 financial year, in each case before deductions for income tax and national insurance contributions (where relevant):
Salary/fee(£000)
Taxable benefits1
(£000)Bonus (£000)
LTIP vesting(£000)
All-employee schemes (£000)
Pension5 (£000)
Total (£000)
2014/2015
2015/2016
2014/2015
2015/2016
2014/2015
2015/2016
2014/2015
2015/20162
2014/20153
2015/20164
2014/2015
2015/2016
2014/2015
2015/2016
Executive Directors
Nigel Brook6 112 350 4 14 80 315 – 40 1 1 21 70 218 790
Bev Dew7 188 375 6 12 172 338 – – – 1 38 75 404 801
Haydn Mursell 505 530 13 13 464 477 – 162 1 1 96 106 1,079 1,289
Nigel Turner6 112 350 4 13 80 315 – 47 1 1 22 70 219 796
Claudio Veritiero6 112 350 2 12 80 315 – 55 1 1 21 70 216 803
Non-Executive Directors
Justin Atkinson8 – 40 – – – – – – – – – – – 40
Richard Bailey9 66 41 – – – – – – – – – – 66 41
Kirsty Bashforth 39 50 – – – – – – – – – – 39 50
Amanda Mellor 56 60 – – – – – – – – – – 56 60
Adam Walker10 – 30 – – – – – – – – – – – 30
Phil White 173 188 – – – – – – – – – – 173 188
Nick Winser 56 60 – – – – – – – – – – 56 60
Total 1,419 2,424 29 64 876 1,760 – 304 4 5 198 391 2,526 4,9481 Comprise private health insurance and a company car or a car allowance.2 The award granted in October 2013 will vest as to 34%. The value is calculated using the Company’s average share price for the three-month period ended 30 June 2016 of £12.01.3 The value of the matching shares purchased during the 2015 financial year under the Share Incentive Plan (the SIP), using an average share price for matching shares purchased during
the 2015 financial year of £16.08. 4 The value of the matching shares purchased during the 2016 financial year under the SIP, using an average share price for matching share purchases during the 2016 financial year of
£13.27.5 Comprises the payment of employer pension contributions and/or a cash allowance.6 Nigel Brook, Nigel Turner and Claudio Veritiero were appointed to the Board with effect from 6 March 2015. The amounts set out under ‘Salary/fee’, ‘Taxable benefits’, ‘Bonus’ and
‘Pension’ in respect of 2014/2015 relate to the period from 6 March 2015 to 30 June 2015.7 Bev Dew was appointed to the Board with effect from 1 January 2015. The face value of matching shares purchased for him under the SIP during the 2015 financial year was £145,
which is considered ‘de minimis’ for the purposes of the above table.8 Justin Atkinson was appointed as the Senior Independent Director with effect from 16 March 2016.9 Richard Bailey retired from the Board with effect from 31 January 2016.10 Adam Walker was appointed to the Board with effect from 1 January 2016.
All figures in the above table have been rounded to the nearest £1,000.
Pension entitlementsThe Executive Directors participate in the defined contribution section of the Kier Group Pension Scheme. All receive a pension contribution of 20% of base salary, subject to the annual allowance. The balance is paid as a cash allowance. Cash allowances are subject to tax and national insurance deductions and excluded when determining annual bonus and long-term incentives.
Payments to the Executive Directors with respect to their pension entitlements during the 2016 financial year were:
Director Pension contribution Cash allowance Total
Nigel Brook £30,000 £40,000 £70,000
Bev Dew £40,000 £35,004 £75,004
Haydn Mursell £16,667 £89,383 £106,050
Nigel Turner £57,500 £12,500 £70,000
Claudio Veritiero £40,000 £30,000 £70,000
Remuneration Report
Annual report on remuneration
Kier Group plc Annual Report and Accounts 201668
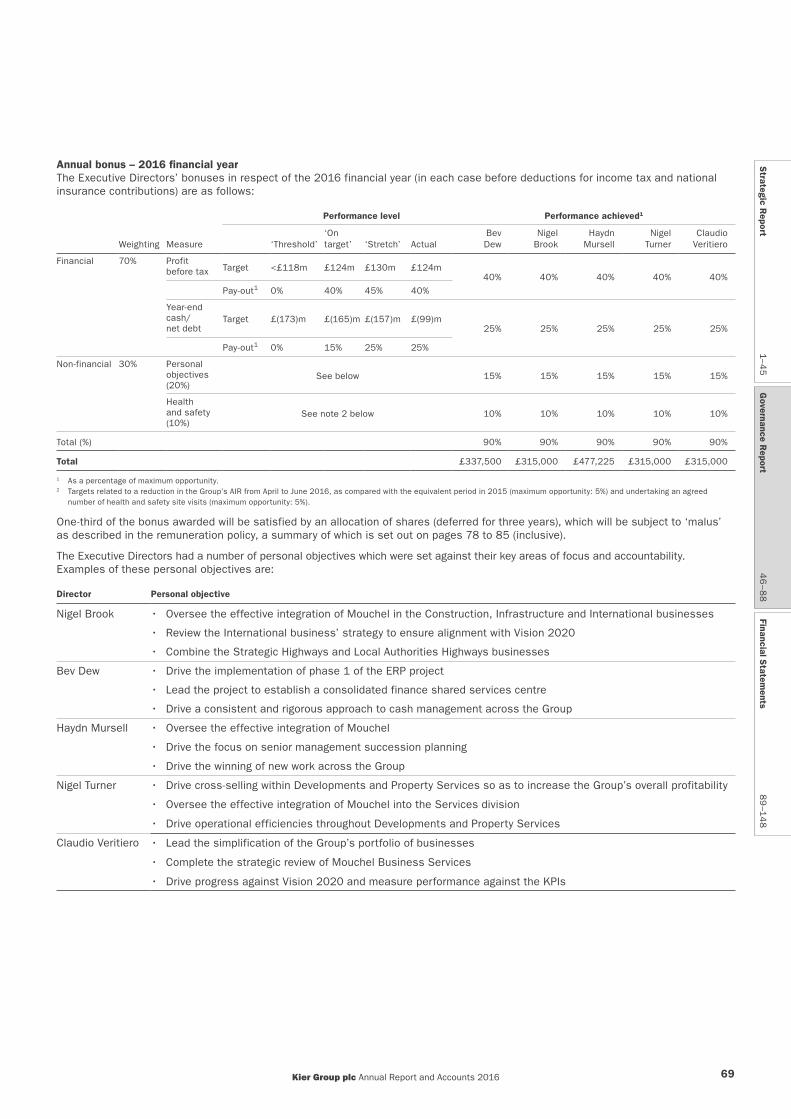
Annual bonus – 2016 financial yearThe Executive Directors’ bonuses in respect of the 2016 financial year (in each case before deductions for income tax and national insurance contributions) are as follows:
Performance level Performance achieved1
Weighting Measure ‘Threshold’ ‘On target’ ‘Stretch’ Actual
Bev Dew
Nigel Brook
Haydn Mursell
Nigel Turner
Claudio Veritiero
Financial 70% Profit before tax Target <£118m £124m £130m £124m
40% 40% 40% 40% 40%
Pay-out1 0% 40% 45% 40%
Year-end cash/ net debt
Target £(173)m £(165)m £(157)m £(99)m25% 25% 25% 25% 25%
Pay-out1 0% 15% 25% 25%
Non-financial 30% Personal objectives (20%)
See below 15% 15% 15% 15% 15%
Health and safety (10%)
See note 2 below 10% 10% 10% 10% 10%
Total (%) 90% 90% 90% 90% 90%
Total £337,500 £315,000 £477,225 £315,000 £315,000
1 As a percentage of maximum opportunity.2 Targets related to a reduction in the Group’s AIR from April to June 2016, as compared with the equivalent period in 2015 (maximum opportunity: 5%) and undertaking an agreed
number of health and safety site visits (maximum opportunity: 5%).
One-third of the bonus awarded will be satisfied by an allocation of shares (deferred for three years), which will be subject to ‘malus’ as described in the remuneration policy, a summary of which is set out on pages 78 to 85 (inclusive).
The Executive Directors had a number of personal objectives which were set against their key areas of focus and accountability. Examples of these personal objectives are:
Director Personal objective
Nigel Brook • Oversee the effective integration of Mouchel in the Construction, Infrastructure and International businesses
• Review the International business’ strategy to ensure alignment with Vision 2020
• Combine the Strategic Highways and Local Authorities Highways businesses
Bev Dew • Drive the implementation of phase 1 of the ERP project
• Lead the project to establish a consolidated finance shared services centre
• Drive a consistent and rigorous approach to cash management across the Group
Haydn Mursell • Oversee the effective integration of Mouchel
• Drive the focus on senior management succession planning
• Drive the winning of new work across the Group
Nigel Turner • Drive cross-selling within Developments and Property Services so as to increase the Group’s overall profitability
• Oversee the effective integration of Mouchel into the Services division
• Drive operational efficiencies throughout Developments and Property Services
Claudio Veritiero • Lead the simplification of the Group’s portfolio of businesses
• Complete the strategic review of Mouchel Business Services
• Drive progress against Vision 2020 and measure performance against the KPIs
Kier Group plc Annual Report and Accounts 2016 69
Strategic R
eport1–4
5G
overnance Report
46
–88
Financial Statem
ents8
9–1
48
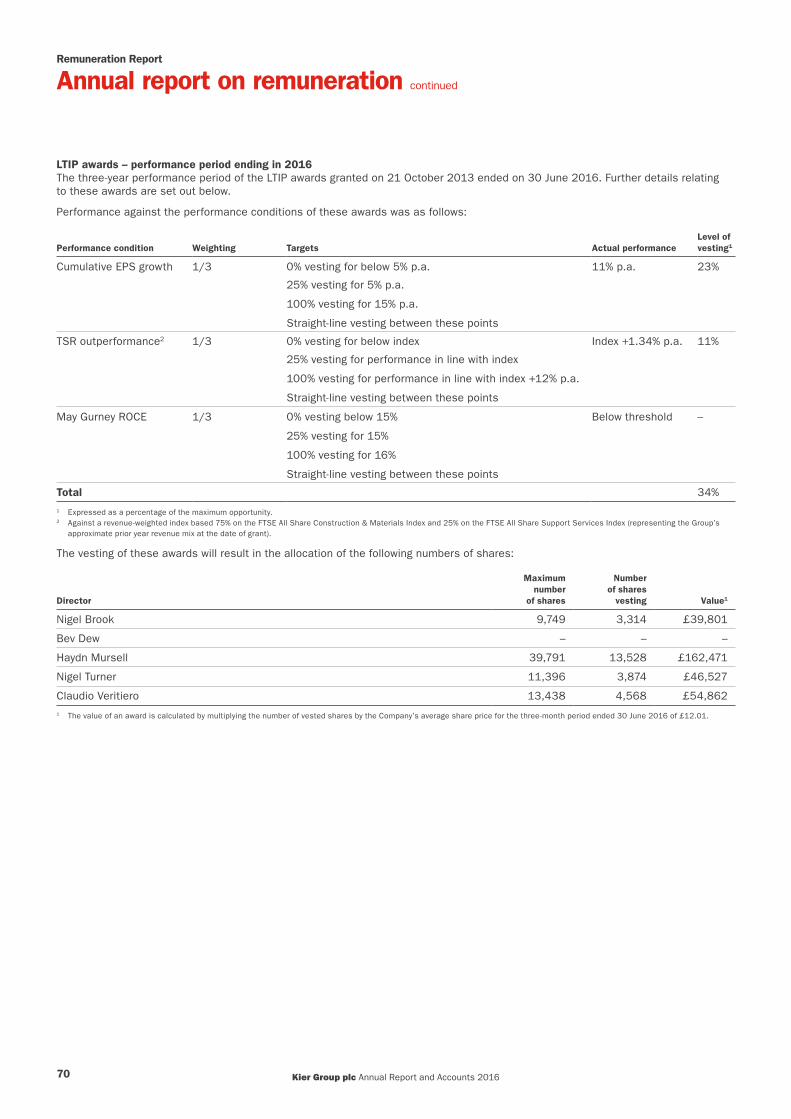
LTIP awards – performance period ending in 2016The three-year performance period of the LTIP awards granted on 21 October 2013 ended on 30 June 2016. Further details relating to these awards are set out below.
Performance against the performance conditions of these awards was as follows:
Performance condition Weighting Targets Actual performanceLevel of vesting1
Cumulative EPS growth 1/3 0% vesting for below 5% p.a. 11% p.a. 23%
25% vesting for 5% p.a.
100% vesting for 15% p.a.
Straight-line vesting between these points
TSR outperformance2 1/3 0% vesting for below index Index +1.34% p.a. 11%
25% vesting for performance in line with index
100% vesting for performance in line with index +12% p.a.
Straight-line vesting between these points
May Gurney ROCE 1/3 0% vesting below 15% Below threshold –
25% vesting for 15%
100% vesting for 16%
Straight-line vesting between these points
Total 34%1 Expressed as a percentage of the maximum opportunity.2 Against a revenue-weighted index based 75% on the FTSE All Share Construction & Materials Index and 25% on the FTSE All Share Support Services Index (representing the Group’s
approximate prior year revenue mix at the date of grant).
The vesting of these awards will result in the allocation of the following numbers of shares:
Director
Maximumnumber
of shares
Numberof shares
vesting Value1
Nigel Brook 9,749 3,314 £39,801
Bev Dew – – –
Haydn Mursell 39,791 13,528 £162,471
Nigel Turner 11,396 3,874 £46,527
Claudio Veritiero 13,438 4,568 £54,8621 The value of an award is calculated by multiplying the number of vested shares by the Company’s average share price for the three-month period ended 30 June 2016 of £12.01.
Remuneration Report
Annual report on remuneration continued
Kier Group plc Annual Report and Accounts 201670

Incentive awards made during the 2016 financial yearThe following incentive awards were made to each of the Executive Directors during the 2016 financial year:
Award Basis of award DirectorFace value1
Potential award for threshold performance
End of performance period Vesting date
Difference between exercise price and face value
Performance measures
LTIP
150% of base salary for the year ended 30 June 2016
Nigel Brook £525,175
25% of face value
30 June 2018
22 October 2018
n/a
Awards are based 50% on three-year cumulative EPS and 50% on relative TSR performance
Bev Dew £562,700
Haydn Mursell £795,650
Nigel Turner £525,175
Claudio Veritiero £525,175
Deferred shares
1/3 of the net bonus for the year ended 30 June 2015
Nigel Brook £31,877
n/a n/a29 September 2018
n/aContinued service condition (subject to ‘malus’)
Bev Dew £30,431
Haydn Mursell £81,990
Nigel Turner £42,843
Claudio Veritiero £38,056
SIP
Matching shares purchased in accordance with the SIP rules
Nigel Brook £902
n/a n/a n/a n/aContinued service condition
Bev Dew £916
Haydn Mursell £756
Nigel Turner £916
Claudio Veritiero £9021 For the LTIP awards, ‘face value’ is calculated using the market price of a share in the capital of the Company on 21 October 2015 of £13.96. For the deferred share awards, ‘face
value’ is calculated using the market price of a share in the capital of the Company on 28 September 2015 of £13.64. For the SIP, ‘face value’ is calculated using the total number of shares bought on behalf of the relevant individuals during the 2016 financial year and an average share price for matching share purchases during the year of £13.27.
The performance conditions (and respective weightings) and targets for the LTIP awards which were granted during the 2016 financial year are set out in the table below. The awards will, subject to the satisfaction of the performance conditions, vest on the third anniversary of the grant date (22 October 2018).
Performance condition Weighting Targets
Cumulative EPS growth 50% 0% vesting for below 5% p.a.
25% vesting for 5% p.a.
100% vesting for 15% p.a.
Straight-line vesting between all points
TSR outperformance¹ 50% 0% vesting for performance below index
25% vesting for performance in line with index
100% vesting for performance in line with index +12% p.a.
Straight-line vesting between all points
¹ Against a revenue-weighted index based 50% on the FTSE All Share Construction & Materials Index and 50% on the FTSE All Share Support Services Index (representing the Group’s approximate prior year revenue mix at the date of grant).
Payments for loss of officeNo payments were made for loss of office during the 2016 financial year.
Payments to past DirectorsSteve Bowcott’s employment with the Group ceased on 30 April 2015. The details of the payments agreed to be made to Steve are set out on page 90 of last year’s Annual Report.
On 6 July 2015, it was announced that Steve had obtained alternative employment with John Sisk & Son, which commenced on 1 September 2015. As a result, the monthly payments to Steve ceased from such date. During the 2016 financial year, the Company paid £406,166 to Steve pursuant to the terms of his settlement agreement. No further payments will be made to Steve.
Kier Group plc Annual Report and Accounts 2016 71
Strategic R
eport1–4
5G
overnance Report
46
–88
Financial Statem
ents8
9–1
48
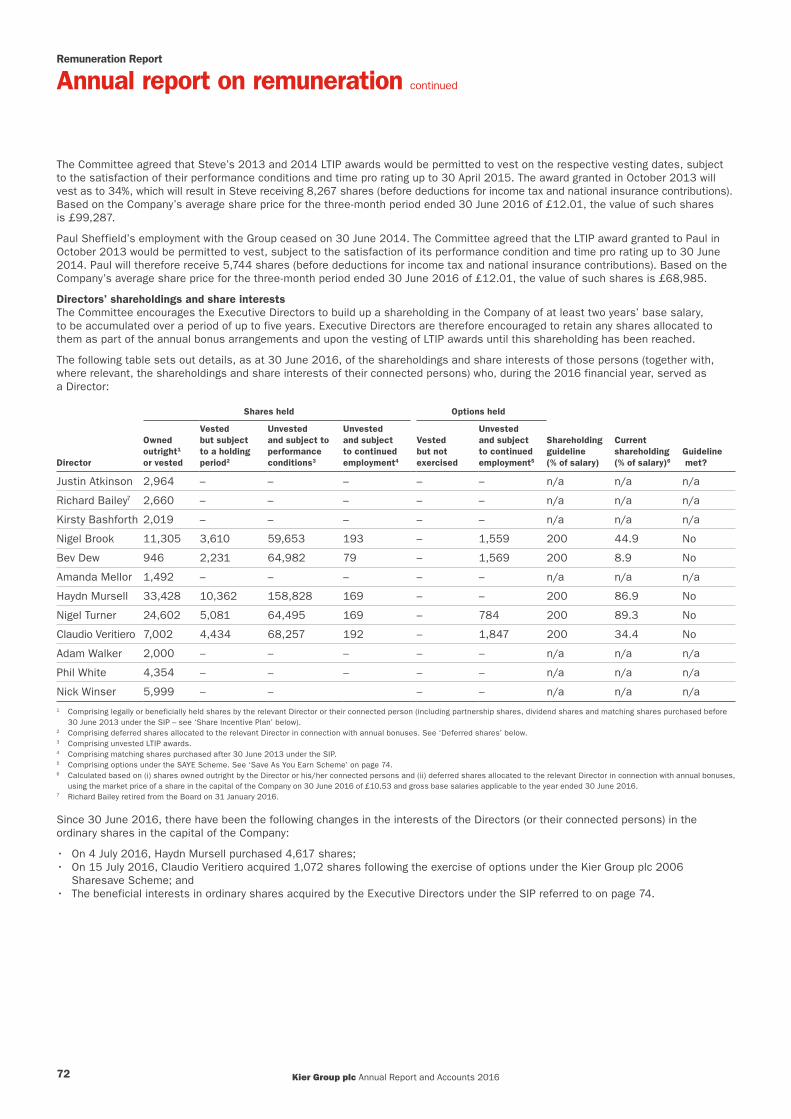
The Committee agreed that Steve’s 2013 and 2014 LTIP awards would be permitted to vest on the respective vesting dates, subject to the satisfaction of their performance conditions and time pro rating up to 30 April 2015. The award granted in October 2013 will vest as to 34%, which will result in Steve receiving 8,267 shares (before deductions for income tax and national insurance contributions). Based on the Company’s average share price for the three-month period ended 30 June 2016 of £12.01, the value of such shares is £99,287.
Paul Sheffield’s employment with the Group ceased on 30 June 2014. The Committee agreed that the LTIP award granted to Paul in October 2013 would be permitted to vest, subject to the satisfaction of its performance condition and time pro rating up to 30 June 2014. Paul will therefore receive 5,744 shares (before deductions for income tax and national insurance contributions). Based on the Company’s average share price for the three-month period ended 30 June 2016 of £12.01, the value of such shares is £68,985.
Directors’ shareholdings and share interestsThe Committee encourages the Executive Directors to build up a shareholding in the Company of at least two years’ base salary, to be accumulated over a period of up to five years. Executive Directors are therefore encouraged to retain any shares allocated to them as part of the annual bonus arrangements and upon the vesting of LTIP awards until this shareholding has been reached.
The following table sets out details, as at 30 June 2016, of the shareholdings and share interests of those persons (together with, where relevant, the shareholdings and share interests of their connected persons) who, during the 2016 financial year, served as a Director:
Shares held Options held
Director
Ownedoutright1
or vested
Vested but subject to a holdingperiod2
Unvested and subject toperformanceconditions3
Unvested and subject to continuedemployment4
Vested but notexercised
Unvested and subject to continued employment5
Shareholding guideline(% of salary)
Currentshareholding(% of salary)6
Guideline met?
Justin Atkinson 2,964 – – – – – n/a n/a n/a
Richard Bailey7 2,660 – – – – – n/a n/a n/a
Kirsty Bashforth 2,019 – – – – – n/a n/a n/a
Nigel Brook 11,305 3,610 59,653 193 – 1,559 200 44.9 No
Bev Dew 946 2,231 64,982 79 – 1,569 200 8.9 No
Amanda Mellor 1,492 – – – – – n/a n/a n/a
Haydn Mursell 33,428 10,362 158,828 169 – – 200 86.9 No
Nigel Turner 24,602 5,081 64,495 169 – 784 200 89.3 No
Claudio Veritiero 7,002 4,434 68,257 192 – 1,847 200 34.4 No
Adam Walker 2,000 – – – – – n/a n/a n/a
Phil White 4,354 – – – – – n/a n/a n/a
Nick Winser 5,999 – – – – n/a n/a n/a1 Comprising legally or beneficially held shares by the relevant Director or their connected person (including partnership shares, dividend shares and matching shares purchased before
30 June 2013 under the SIP – see ‘Share Incentive Plan’ below).2 Comprising deferred shares allocated to the relevant Director in connection with annual bonuses. See ‘Deferred shares’ below.3 Comprising unvested LTIP awards.4 Comprising matching shares purchased after 30 June 2013 under the SIP.5 Comprising options under the SAYE Scheme. See ‘Save As You Earn Scheme’ on page 74.6 Calculated based on (i) shares owned outright by the Director or his/her connected persons and (ii) deferred shares allocated to the relevant Director in connection with annual bonuses,
using the market price of a share in the capital of the Company on 30 June 2016 of £10.53 and gross base salaries applicable to the year ended 30 June 2016.7 Richard Bailey retired from the Board on 31 January 2016.
Since 30 June 2016, there have been the following changes in the interests of the Directors (or their connected persons) in the ordinary shares in the capital of the Company:
• On 4 July 2016, Haydn Mursell purchased 4,617 shares; • On 15 July 2016, Claudio Veritiero acquired 1,072 shares following the exercise of options under the Kier Group plc 2006
Sharesave Scheme; and• The beneficial interests in ordinary shares acquired by the Executive Directors under the SIP referred to on page 74.
Remuneration Report
Annual report on remuneration continued
Kier Group plc Annual Report and Accounts 201672
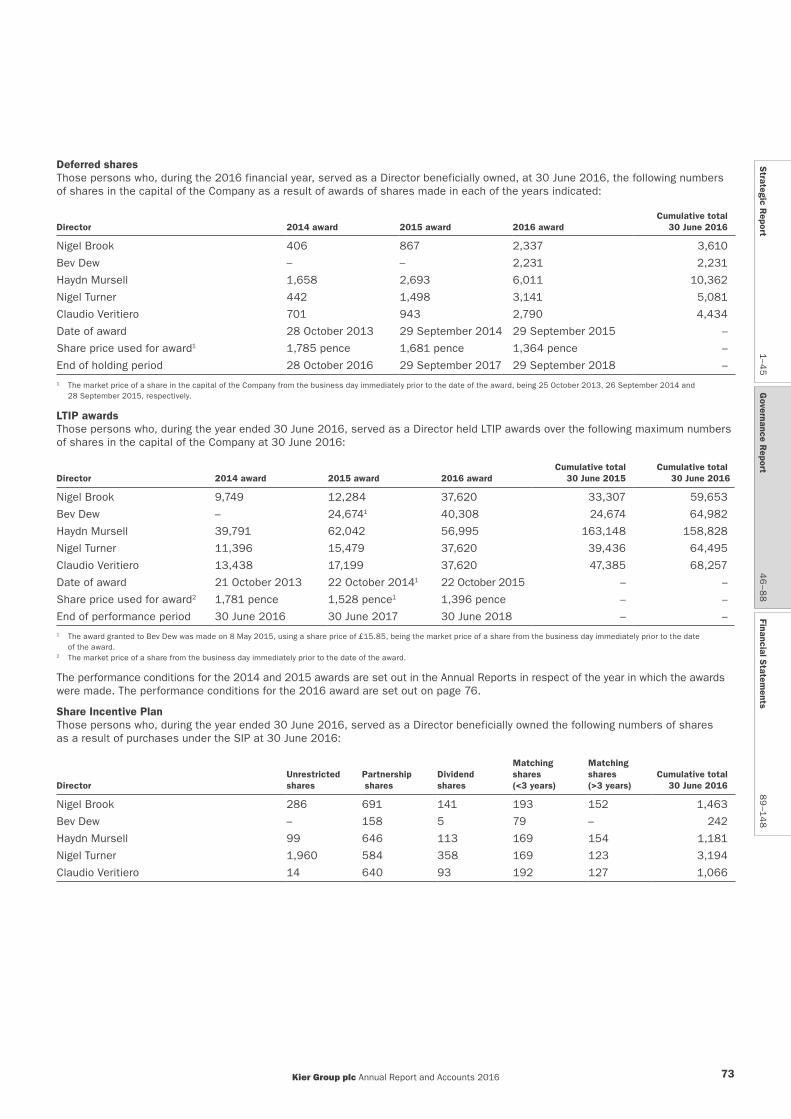
Deferred sharesThose persons who, during the 2016 financial year, served as a Director beneficially owned, at 30 June 2016, the following numbers of shares in the capital of the Company as a result of awards of shares made in each of the years indicated:
Director 2014 award 2015 award 2016 awardCumulative total
30 June 2016
Nigel Brook 406 867 2,337 3,610
Bev Dew – – 2,231 2,231
Haydn Mursell 1,658 2,693 6,011 10,362
Nigel Turner 442 1,498 3,141 5,081
Claudio Veritiero 701 943 2,790 4,434
Date of award 28 October 2013 29 September 2014 29 September 2015 –
Share price used for award1 1,785 pence 1,681 pence 1,364 pence –
End of holding period 28 October 2016 29 September 2017 29 September 2018 –1 The market price of a share in the capital of the Company from the business day immediately prior to the date of the award, being 25 October 2013, 26 September 2014 and
28 September 2015, respectively.
LTIP awardsThose persons who, during the year ended 30 June 2016, served as a Director held LTIP awards over the following maximum numbers of shares in the capital of the Company at 30 June 2016:
Director 2014 award 2015 award 2016 awardCumulative total
30 June 2015Cumulative total
30 June 2016
Nigel Brook 9,749 12,284 37,620 33,307 59,653
Bev Dew – 24,6741 40,308 24,674 64,982
Haydn Mursell 39,791 62,042 56,995 163,148 158,828
Nigel Turner 11,396 15,479 37,620 39,436 64,495
Claudio Veritiero 13,438 17,199 37,620 47,385 68,257
Date of award 21 October 2013 22 October 20141 22 October 2015 – –
Share price used for award2 1,781 pence 1,528 pence1 1,396 pence – –
End of performance period 30 June 2016 30 June 2017 30 June 2018 – –1 The award granted to Bev Dew was made on 8 May 2015, using a share price of £15.85, being the market price of a share from the business day immediately prior to the date
of the award. 2 The market price of a share from the business day immediately prior to the date of the award.
The performance conditions for the 2014 and 2015 awards are set out in the Annual Reports in respect of the year in which the awards were made. The performance conditions for the 2016 award are set out on page 76.
Share Incentive PlanThose persons who, during the year ended 30 June 2016, served as a Director beneficially owned the following numbers of shares as a result of purchases under the SIP at 30 June 2016:
DirectorUnrestricted shares
Partnership shares
Dividend shares
Matching shares (<3 years)
Matching shares (>3 years)
Cumulative total 30 June 2016
Nigel Brook 286 691 141 193 152 1,463
Bev Dew – 158 5 79 – 242
Haydn Mursell 99 646 113 169 154 1,181
Nigel Turner 1,960 584 358 169 123 3,194
Claudio Veritiero 14 640 93 192 127 1,066
Kier Group plc Annual Report and Accounts 2016 73
Strategic R
eport1–4
5G
overnance Report
46
–88
Financial Statem
ents8
9–1
48
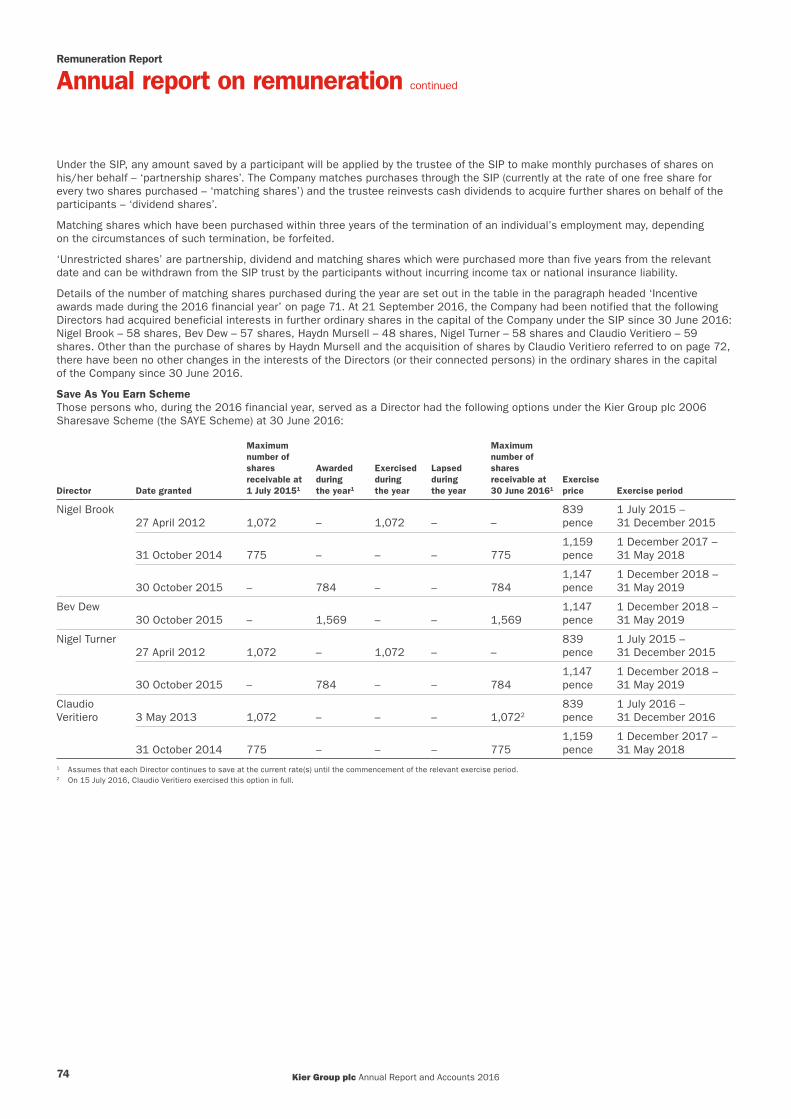
Under the SIP, any amount saved by a participant will be applied by the trustee of the SIP to make monthly purchases of shares on his/her behalf – ‘partnership shares’. The Company matches purchases through the SIP (currently at the rate of one free share for every two shares purchased – ‘matching shares’) and the trustee reinvests cash dividends to acquire further shares on behalf of the participants – ‘dividend shares’.
Matching shares which have been purchased within three years of the termination of an individual’s employment may, depending on the circumstances of such termination, be forfeited.
‘Unrestricted shares’ are partnership, dividend and matching shares which were purchased more than five years from the relevant date and can be withdrawn from the SIP trust by the participants without incurring income tax or national insurance liability.
Details of the number of matching shares purchased during the year are set out in the table in the paragraph headed ‘Incentive awards made during the 2016 financial year’ on page 71. At 21 September 2016, the Company had been notified that the following Directors had acquired beneficial interests in further ordinary shares in the capital of the Company under the SIP since 30 June 2016: Nigel Brook – 58 shares, Bev Dew – 57 shares, Haydn Mursell – 48 shares, Nigel Turner – 58 shares and Claudio Veritiero – 59 shares. Other than the purchase of shares by Haydn Mursell and the acquisition of shares by Claudio Veritiero referred to on page 72, there have been no other changes in the interests of the Directors (or their connected persons) in the ordinary shares in the capital of the Company since 30 June 2016.
Save As You Earn SchemeThose persons who, during the 2016 financial year, served as a Director had the following options under the Kier Group plc 2006 Sharesave Scheme (the SAYE Scheme) at 30 June 2016:
Director Date granted
Maximumnumber ofsharesreceivable at1 July 20151
Awardedduringthe year1
Exercisedduringthe year
Lapsed during the year
Maximumnumber ofsharesreceivable at30 June 20161
Exercise price Exercise period
Nigel Brook27 April 2012 1,072 – 1,072 – –
839pence
1 July 2015 –31 December 2015
31 October 2014 775 – – – 7751,159pence
1 December 2017 –31 May 2018
30 October 2015 – 784 – – 7841,147pence
1 December 2018 –31 May 2019
Bev Dew30 October 2015 – 1,569 – – 1,569
1,147pence
1 December 2018 –31 May 2019
Nigel Turner27 April 2012 1,072 – 1,072 – –
839pence
1 July 2015 –31 December 2015
30 October 2015 – 784 – – 7841,147pence
1 December 2018 –31 May 2019
Claudio Veritiero 3 May 2013 1,072 – – – 1,0722
839pence
1 July 2016 –31 December 2016
31 October 2014 775 – – – 7751,159pence
1 December 2017 –31 May 2018
1 Assumes that each Director continues to save at the current rate(s) until the commencement of the relevant exercise period.2 On 15 July 2016, Claudio Veritiero exercised this option in full.
Remuneration Report
Annual report on remuneration continued
Kier Group plc Annual Report and Accounts 201674
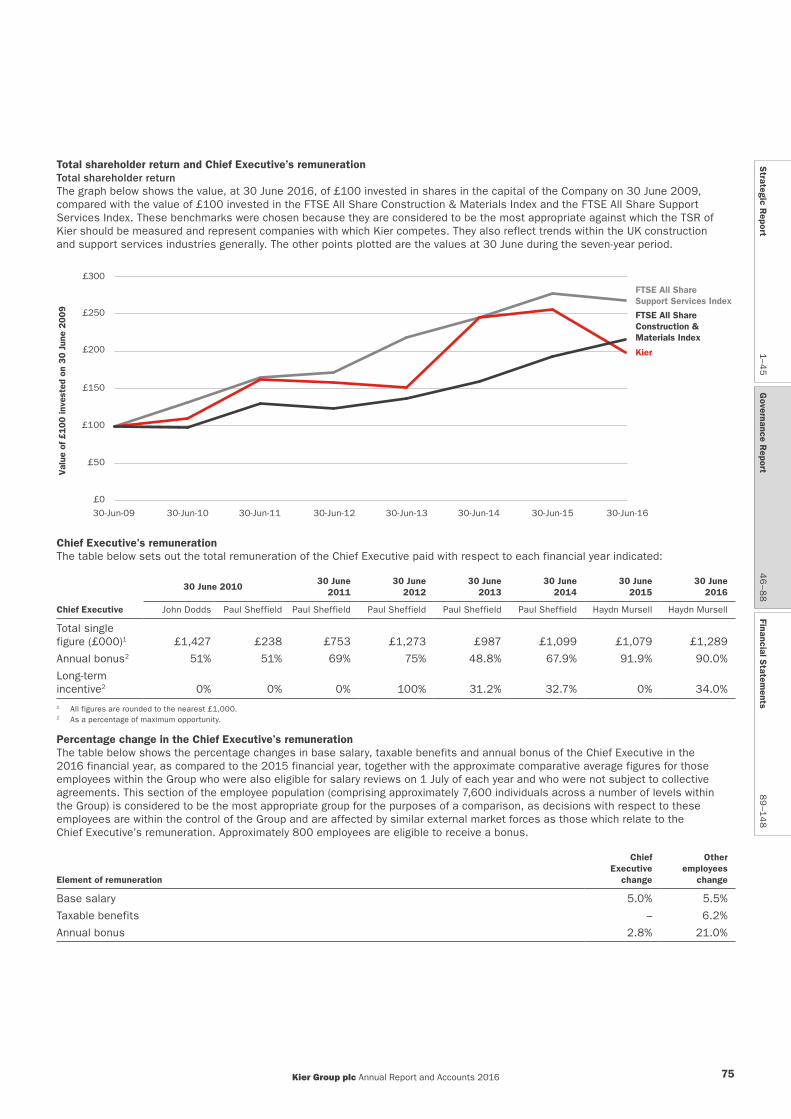
Total shareholder return and Chief Executive’s remunerationTotal shareholder returnThe graph below shows the value, at 30 June 2016, of £100 invested in shares in the capital of the Company on 30 June 2009, compared with the value of £100 invested in the FTSE All Share Construction & Materials Index and the FTSE All Share Support Services Index. These benchmarks were chosen because they are considered to be the most appropriate against which the TSR of Kier should be measured and represent companies with which Kier competes. They also reflect trends within the UK construction and support services industries generally. The other points plotted are the values at 30 June during the seven-year period.
£50
£0
30-Jun-1630-Jun-1530-Jun-1430-Jun-1330-Jun-1230-Jun-1130-Jun-1030-Jun-09
£100
£150
£200 Kier
£250
£300
Val
ue o
f £100 in
vest
ed o
n 30 J
une
2009
FTSE All ShareSupport Services Index
FTSE All Share Construction & Materials Index
Chief Executive’s remunerationThe table below sets out the total remuneration of the Chief Executive paid with respect to each financial year indicated:
30 June 201030 June
201130 June
201230 June
201330 June
201430 June
201530 June
2016
Chief Executive John Dodds Paul Sheffield Paul Sheffield Paul Sheffield Paul Sheffield Paul Sheffield Haydn Mursell Haydn Mursell
Total single figure (£000)1 £1,427 £238 £753 £1,273 £987 £1,099 £1,079 £1,289
Annual bonus2 51% 51% 69% 75% 48.8% 67.9% 91.9% 90.0%
Long-term incentive2 0% 0% 0% 100% 31.2% 32.7% 0% 34.0%1 All figures are rounded to the nearest £1,000.2 As a percentage of maximum opportunity.
Percentage change in the Chief Executive’s remunerationThe table below shows the percentage changes in base salary, taxable benefits and annual bonus of the Chief Executive in the 2016 financial year, as compared to the 2015 financial year, together with the approximate comparative average figures for those employees within the Group who were also eligible for salary reviews on 1 July of each year and who were not subject to collective agreements. This section of the employee population (comprising approximately 7,600 individuals across a number of levels within the Group) is considered to be the most appropriate group for the purposes of a comparison, as decisions with respect to these employees are within the control of the Group and are affected by similar external market forces as those which relate to the Chief Executive’s remuneration. Approximately 800 employees are eligible to receive a bonus.
Element of remuneration
Chief Executive
change
Other employees
change
Base salary 5.0% 5.5%
Taxable benefits – 6.2%
Annual bonus 2.8% 21.0%
Kier Group plc Annual Report and Accounts 2016 75
Strategic R
eport1–4
5G
overnance Report
46
–88
Financial Statem
ents8
9–1
48
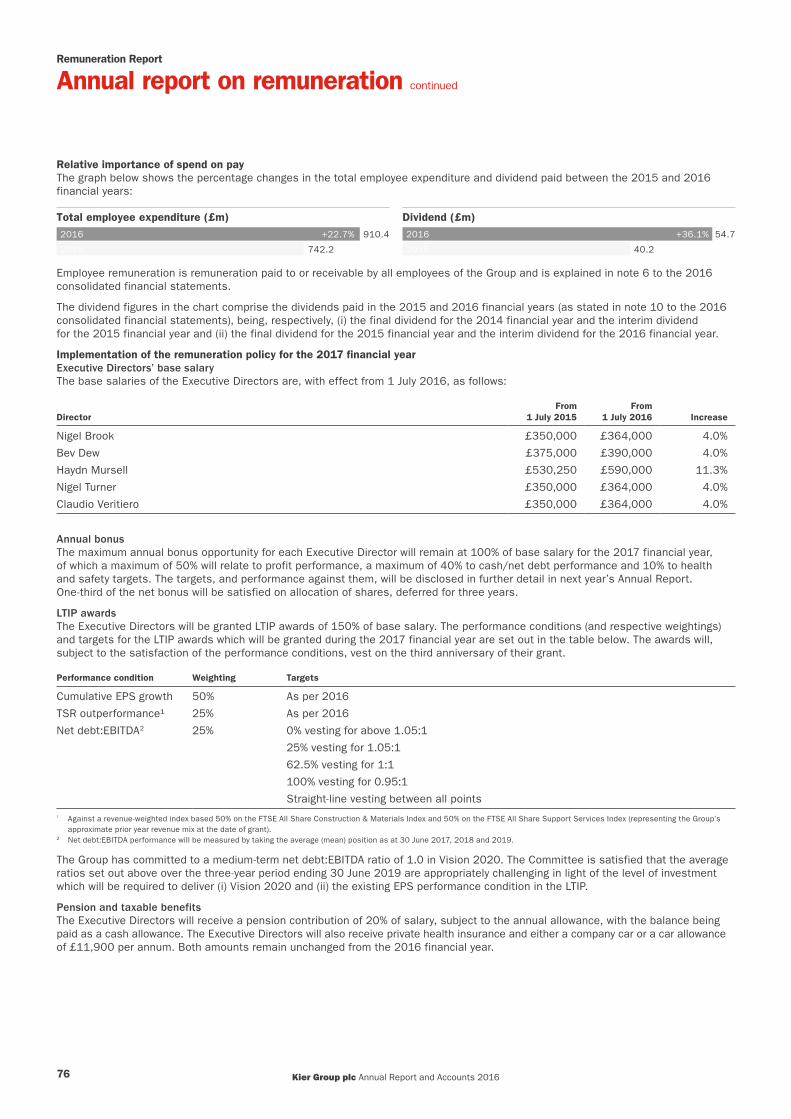
Relative importance of spend on payThe graph below shows the percentage changes in the total employee expenditure and dividend paid between the 2015 and 2016 financial years:
Total employee expenditure (£m)
2015
2016
742.2
+22.7% 910.4
Dividend (£m)
2015
2016
40.2
+36.1% 54.7
Employee remuneration is remuneration paid to or receivable by all employees of the Group and is explained in note 6 to the 2016 consolidated financial statements.
The dividend figures in the chart comprise the dividends paid in the 2015 and 2016 financial years (as stated in note 10 to the 2016 consolidated financial statements), being, respectively, (i) the final dividend for the 2014 financial year and the interim dividend for the 2015 financial year and (ii) the final dividend for the 2015 financial year and the interim dividend for the 2016 financial year.
Implementation of the remuneration policy for the 2017 financial yearExecutive Directors’ base salaryThe base salaries of the Executive Directors are, with effect from 1 July 2016, as follows:
DirectorFrom
1 July 2015From
1 July 2016 Increase
Nigel Brook £350,000 £364,000 4.0%
Bev Dew £375,000 £390,000 4.0%
Haydn Mursell £530,250 £590,000 11.3%
Nigel Turner £350,000 £364,000 4.0%
Claudio Veritiero £350,000 £364,000 4.0%
Annual bonusThe maximum annual bonus opportunity for each Executive Director will remain at 100% of base salary for the 2017 financial year, of which a maximum of 50% will relate to profit performance, a maximum of 40% to cash/net debt performance and 10% to health and safety targets. The targets, and performance against them, will be disclosed in further detail in next year’s Annual Report. One-third of the net bonus will be satisfied on allocation of shares, deferred for three years.
LTIP awardsThe Executive Directors will be granted LTIP awards of 150% of base salary. The performance conditions (and respective weightings) and targets for the LTIP awards which will be granted during the 2017 financial year are set out in the table below. The awards will, subject to the satisfaction of the performance conditions, vest on the third anniversary of their grant.
Performance condition Weighting Targets
Cumulative EPS growth 50% As per 2016
TSR outperformance¹ 25% As per 2016
Net debt:EBITDA2 25% 0% vesting for above 1.05:1
25% vesting for 1.05:1
62.5% vesting for 1:1
100% vesting for 0.95:1
Straight-line vesting between all points¹ Against a revenue-weighted index based 50% on the FTSE All Share Construction & Materials Index and 50% on the FTSE All Share Support Services Index (representing the Group’s
approximate prior year revenue mix at the date of grant).2 Net debt:EBITDA performance will be measured by taking the average (mean) position as at 30 June 2017, 2018 and 2019.
The Group has committed to a medium-term net debt:EBITDA ratio of 1.0 in Vision 2020. The Committee is satisfied that the average ratios set out above over the three-year period ending 30 June 2019 are appropriately challenging in light of the level of investment which will be required to deliver (i) Vision 2020 and (ii) the existing EPS performance condition in the LTIP.
Pension and taxable benefitsThe Executive Directors will receive a pension contribution of 20% of salary, subject to the annual allowance, with the balance being paid as a cash allowance. The Executive Directors will also receive private health insurance and either a company car or a car allowance of £11,900 per annum. Both amounts remain unchanged from the 2016 financial year.
Remuneration Report
Annual report on remuneration continued
Kier Group plc Annual Report and Accounts 201676

Non-Executive Directors’ feesThe Board previously agreed that the fee structure which would apply to the Non-Executive Directors (excluding the Chairman) for the two years from 1 July 2015 would be as follows:
DirectorFrom
1 July 2015
Non-Executive Director £50,000
Chair of Board committee £10,000
Senior Independent Director £10,000
The Committee also agreed that, following an increase in the Chairman’s fee of 8.7% to £188,000 with effect from 1 July 2015, there would be no increase from 1 July 2016. The Chairman does not receive a fee for his work as the Chair of the Nomination Committee. Accordingly, there were no increases in the fees payable to the Non-Executive Directors (including the Chairman) from 1 July 2016.
The total fees payable to the Non-Executive Directors with effect from 1 July 2016 are as follows:
DirectorBase fee from
1 July 2016
Chair of Boardcommittee
fee from 1 July 2016
Senior Independent
Director fee from
1 July 2016Total from
1 July 2016Increase from
1 July 2016
Justin Atkinson £50,000 – £10,000 £60,000 –
Constance Baroudel1 £50,000 – – £50,000 –
Kirsty Bashforth £50,000 – – £50,000 –
Amanda Mellor2 £50,000 £10,000 – £60,000 –
Adam Walker £50,000 £10,000 – £60,000 –
Phil White £188,000 – – £188,000 –
Nick Winser £50,000 £10,000 – £60,000 –1 Subject to her election as a Director at the 2016 AGM, Constance Baroudel will also be appointed as the Chair of the Remuneration Committee and will receive an annual fee of
£10,000 for the role.2 Amanda Mellor will not stand for re-election at the 2016 AGM.
Remuneration Committee Membership and meeting attendance The members of the Committee at 30 June 2016 were:
• Amanda Mellor (Chair) • Justin Atkinson • Kirsty Bashforth• Adam Walker • Phil White • Nick Winser
The Chief Executive is invited, from time to time, to attend Committee meetings. No individuals are involved in decisions relating to their own remuneration. The Committee met formally six times during the year. The secretary of the Committee is the Company Secretary. The Committee’s terms of reference can be viewed on the Company’s website at https://www.kier.co.uk/corporategovernance.
AdvisersDuring the 2016 financial year, Mercer was engaged by the Committee as its remuneration advisers.
Mercer provides advice in respect of the Mouchel Superannuation Fund. However, the Committee is satisfied that Mercer, in providing remuneration advice to the Committee, did not have any connection with the Company that impaired its independence. Total fees of £73,895 (excluding VAT) were payable in respect of Mercer’s services during the 2016 financial year. Mercer is a signatory to the Code of Conduct for Remuneration Consultants which has been developed by the Remuneration Consultants Group.
The Committee also receives support and advice from the Company Secretary (Hugh Raven) and the Group HR Director (Chris Last).
Shareholder votingAt the 2015 AGM, the results of the vote on the resolution relating to the Remuneration Report were:
Votes for1 Percentage votes for Votes against2 Percentage votes against Votes withheld
59,015,627 98.50 895,892 1.50 412,8681 Includes those votes for which discretion was given to the Chairman. 2 Does not include votes withheld.
At the 2014 AGM, the results of the vote on the resolution relating to the remuneration policy were:
Votes for1 Percentage votes for Votes against2 Percentage votes against Votes withheld
31,687,997 98.87 361,173 1.13 115,4151 Includes those votes for which discretion was given to the Chairman. 2 Does not include votes withheld.
Kier Group plc Annual Report and Accounts 2016 77
Strategic R
eport1–4
5G
overnance Report
46
–88
Financial Statem
ents8
9–1
48
Remuneration Report
Directors’ remuneration policy (summary)
IntroductionKier’s remuneration policy, which was approved at the 2014 AGM, will continue to apply in the 2017 financial year. Accordingly, we will not be seeking shareholder approval for a revised policy at the 2016 AGM.
As it did last year, the Committee has decided to include the policy table and certain other extracts from the policy in this year’s report for ease of reference and so as to provide context for the decisions taken by the Committee during the year. Where relevant, references to targets in the policy have been updated to refer to 2017 targets, together with certain other non-material changes. The full policy is set out on pages 69 to 76 (inclusive) of the 2014 Annual Report, which can be found on Kier’s website at http://www.kier.co.uk/annualreport2014.
A summary of the Group’s policy for each element of an Executive Director’s remuneration is set out in the table below:
Policy table
Element and link to strategy Operation Opportunity Performance measures
Base salaryTo attract and retain Executive Directors of the calibre required to deliver the Group’s strategy.
Salaries are reviewed annually by reference to an individual’s experience, performance and role within the Group, the external market (including FTSE companies of a similar size and sector peers) and any increase awarded to the wider employee population.
Any increase is typically effective from 1 July.
Any increase will typically be in line with those awarded to the wider employee population. The Committee has discretion to award higher increases in circumstances that it considers appropriate, such as a material change in the complexity of the business or an individual’s responsibility. Details of salary changes will be disclosed in the Annual Report.
Continued strong performance.
BenefitsTo provide benefits which are competitive with the market.
Benefits are reviewed from time to time and typically include, but are not limited to, a company car or car allowance, private health insurance and life assurance.
In certain circumstances, the Committee may also approve the provision of additional benefits or allowances – for example, the relocation of an Executive Director to perform his or her role.
Benefits are set at a level which the Committee considers appropriate in light of the market and an individual’s circumstances.
None.
SAYE SchemeTo encourage ownership of the Company’s shares.
An HMRC-approved scheme allowing all employees, including Executive Directors, to save up to the maximum limit specified by HMRC rules. Options are granted at up to a 20% discount.
The maximum amount that may be saved is the limit prescribed by HMRC (or such other lower limit as determined by the Committee) at the time employees are invited to participate in the scheme. Typically, employees are invited to participate on an annual basis.
None.
SIPTo encourage ownership of the Company’s shares.
An HMRC-approved scheme which is open to all UK tax resident employees of participating Group companies. Executive Directors are eligible to participate.
The plan allows employees to purchase shares out of pre-tax income.
The Company may match shares purchased with an award of free shares. Matching shares may be forfeited if employees leave within three years of their award, in accordance with the SIP rules.
The plan trustee can reinvest cash dividends to acquire further shares on behalf of participants.
Participants can purchase shares up to the prevailing limit approved by HMRC (or such other lower limit as determined by the Committee) at the time they are invited to participate.
The Company currently offers to match purchases made through the plan at the rate of one free share for every two shares purchased.
None.
PensionTo provide a retirement benefit which is competitive with the market.
Executive Directors participate in a defined contribution scheme. For current Executive Directors, the maximum employer contribution is 20% of pensionable salary.
Executive Directors may elect to receive all or part of the employer contribution as a taxable cash supplement.
None.
Annual bonusTo reward the delivery of near-term performance targets and business strategy.
The Company operates a discretionary bonus scheme.
Performance measures and targets are set by the Committee at the start of the year. Payments are based on an assessment of performance at the end of the year.
One-third of any award is deferred for three years (subject to early release for ‘good leavers’) and satisfied in Kier Group plc shares.
Past awards of deferred shares are subject to forfeiture if an individual’s employment is terminated in circumstances of gross misconduct and/or justifying summary dismissal and/or the Group’s profit before tax or cash position for the relevant year is found to have been misstated.
Awards of deferred shares made from 2014 will include a revised ‘malus’ provision. See ‘Malus’ on page 82. Dividend payments accrue on deferred bonus shares over the deferral period.
The current maximum potential bonus is 100% of base salary.
‘Threshold’ performance, for which an element of bonus may become payable under each component of the annual bonus, is set by the Committee at the start of each financial year.
The level of bonus for achieving threshold performance varies by performance measure, and may vary for a measure from year to year, to ensure that it is aligned with the Committee’s assessment of the degree of difficulty (or ‘stretch’) in achieving it.
The performance measures and targets for the 2017 financial year are profit (50%), cash (40%) and health and safety (10%).
The Committee has discretion to determine the measures and their relative weightings each year. The weighting towards non-financial measures will be no higher than 25% of the maximum potential bonus.
The Committee has discretion to adjust bonus payments to ensure that they accurately reflect business performance over the performance period and are fair to shareholders as well as recipients.
Actual targets for each performance measure (and performance against each of these targets), and any use by the Committee of its discretion with respect to bonus payments, will be disclosed in the Annual Report immediately following the end of the performance period.
Kier Group plc Annual Report and Accounts 201678

IntroductionKier’s remuneration policy, which was approved at the 2014 AGM, will continue to apply in the 2017 financial year. Accordingly, we will not be seeking shareholder approval for a revised policy at the 2016 AGM.
As it did last year, the Committee has decided to include the policy table and certain other extracts from the policy in this year’s report for ease of reference and so as to provide context for the decisions taken by the Committee during the year. Where relevant, references to targets in the policy have been updated to refer to 2017 targets, together with certain other non-material changes. The full policy is set out on pages 69 to 76 (inclusive) of the 2014 Annual Report, which can be found on Kier’s website at http://www.kier.co.uk/annualreport2014.
A summary of the Group’s policy for each element of an Executive Director’s remuneration is set out in the table below:
Policy table
Element and link to strategy Operation Opportunity Performance measures
Base salaryTo attract and retain Executive Directors of the calibre required to deliver the Group’s strategy.
Salaries are reviewed annually by reference to an individual’s experience, performance and role within the Group, the external market (including FTSE companies of a similar size and sector peers) and any increase awarded to the wider employee population.
Any increase is typically effective from 1 July.
Any increase will typically be in line with those awarded to the wider employee population. The Committee has discretion to award higher increases in circumstances that it considers appropriate, such as a material change in the complexity of the business or an individual’s responsibility. Details of salary changes will be disclosed in the Annual Report.
Continued strong performance.
BenefitsTo provide benefits which are competitive with the market.
Benefits are reviewed from time to time and typically include, but are not limited to, a company car or car allowance, private health insurance and life assurance.
In certain circumstances, the Committee may also approve the provision of additional benefits or allowances – for example, the relocation of an Executive Director to perform his or her role.
Benefits are set at a level which the Committee considers appropriate in light of the market and an individual’s circumstances.
None.
SAYE SchemeTo encourage ownership of the Company’s shares.
An HMRC-approved scheme allowing all employees, including Executive Directors, to save up to the maximum limit specified by HMRC rules. Options are granted at up to a 20% discount.
The maximum amount that may be saved is the limit prescribed by HMRC (or such other lower limit as determined by the Committee) at the time employees are invited to participate in the scheme. Typically, employees are invited to participate on an annual basis.
None.
SIPTo encourage ownership of the Company’s shares.
An HMRC-approved scheme which is open to all UK tax resident employees of participating Group companies. Executive Directors are eligible to participate.
The plan allows employees to purchase shares out of pre-tax income.
The Company may match shares purchased with an award of free shares. Matching shares may be forfeited if employees leave within three years of their award, in accordance with the SIP rules.
The plan trustee can reinvest cash dividends to acquire further shares on behalf of participants.
Participants can purchase shares up to the prevailing limit approved by HMRC (or such other lower limit as determined by the Committee) at the time they are invited to participate.
The Company currently offers to match purchases made through the plan at the rate of one free share for every two shares purchased.
None.
PensionTo provide a retirement benefit which is competitive with the market.
Executive Directors participate in a defined contribution scheme. For current Executive Directors, the maximum employer contribution is 20% of pensionable salary.
Executive Directors may elect to receive all or part of the employer contribution as a taxable cash supplement.
None.
Annual bonusTo reward the delivery of near-term performance targets and business strategy.
The Company operates a discretionary bonus scheme.
Performance measures and targets are set by the Committee at the start of the year. Payments are based on an assessment of performance at the end of the year.
One-third of any award is deferred for three years (subject to early release for ‘good leavers’) and satisfied in Kier Group plc shares.
Past awards of deferred shares are subject to forfeiture if an individual’s employment is terminated in circumstances of gross misconduct and/or justifying summary dismissal and/or the Group’s profit before tax or cash position for the relevant year is found to have been misstated.
Awards of deferred shares made from 2014 will include a revised ‘malus’ provision. See ‘Malus’ on page 82. Dividend payments accrue on deferred bonus shares over the deferral period.
The current maximum potential bonus is 100% of base salary.
‘Threshold’ performance, for which an element of bonus may become payable under each component of the annual bonus, is set by the Committee at the start of each financial year.
The level of bonus for achieving threshold performance varies by performance measure, and may vary for a measure from year to year, to ensure that it is aligned with the Committee’s assessment of the degree of difficulty (or ‘stretch’) in achieving it.
The performance measures and targets for the 2017 financial year are profit (50%), cash (40%) and health and safety (10%).
The Committee has discretion to determine the measures and their relative weightings each year. The weighting towards non-financial measures will be no higher than 25% of the maximum potential bonus.
The Committee has discretion to adjust bonus payments to ensure that they accurately reflect business performance over the performance period and are fair to shareholders as well as recipients.
Actual targets for each performance measure (and performance against each of these targets), and any use by the Committee of its discretion with respect to bonus payments, will be disclosed in the Annual Report immediately following the end of the performance period.
Kier Group plc Annual Report and Accounts 2016 79
Strategic R
eport1–4
5G
overnance Report
46
–88
Financial Statem
ents8
9–1
48

Remuneration Report
Directors’ remuneration policy (summary) continued
Policy table continued
Element and link to strategy Operation Opportunity Performance measures
LTIP To reward the sustained strong performance by the Group over three years.
Awards are made annually and vest, subject to the achievement of performance conditions, at the end of a three-year performance period.
At the start of each performance period, the Committee sets performance targets which it considers to be appropriately stretching.
Awards are satisfied in the form of a deferred, contingent right to acquire shares in the Company, at no cost to the individual.
LTIP awards granted from 2014 will include a ‘malus’ provision. See ‘Malus’ on page 82.
If an event or series of events occurs as a result of which the Committee deems it fair that the performance conditions should be waived or modified, the Committee has discretion during the vesting period to waive or modify them. Any modified performance conditions must be no more difficult to satisfy than the original performance conditions were when first set.
Any use of Committee discretion with respect to waiving or modifying performance conditions will be disclosed in the relevant Annual Report.
The maximum award under the rules of the plan is 200% of base salary.
The Committee may grant awards of up to the maximum permitted under the LTIP rules when it considers it appropriate to do so. The reasons for an award in excess of 150% of salary will be disclosed in the relevant Annual Report.
On achieving the threshold performance level for each element of the award, 25% of the relevant element of the award will vest. Vesting is on a straight-line basis between threshold and maximum levels of performance.
The performance conditions for the LTIP awards to be awarded in the 2017 financial year will relate to EPS (50%), TSR (25%) and net debt:EBITDA (25%).
EPS performance is measured by compound cumulative growth over the performance period.
TSR outperformance is measured on a multiplicative basis relative to a revenue-weighted index based on the FTSE All Share Construction & Materials Index and the FTSE All Share Support Services Index. If TSR outperformance is used in future award cycles, the revenue weightings will be fixed based on the Group’s approximate revenue mix in the year prior to grant.
The Committee retains discretion to supplement EPS and TSR with additional performance measures to ensure that the awards are always linked to sustained business performance. No measure will carry a weighting of less than 25%.
Actual performance measures and weightings will be disclosed in the Annual Report immediately following the granting of an award.
Kier Group plc Annual Report and Accounts 201680
Policy table continued
Element and link to strategy Operation Opportunity Performance measures
LTIP To reward the sustained strong performance by the Group over three years.
Awards are made annually and vest, subject to the achievement of performance conditions, at the end of a three-year performance period.
At the start of each performance period, the Committee sets performance targets which it considers to be appropriately stretching.
Awards are satisfied in the form of a deferred, contingent right to acquire shares in the Company, at no cost to the individual.
LTIP awards granted from 2014 will include a ‘malus’ provision. See ‘Malus’ on page 82.
If an event or series of events occurs as a result of which the Committee deems it fair that the performance conditions should be waived or modified, the Committee has discretion during the vesting period to waive or modify them. Any modified performance conditions must be no more difficult to satisfy than the original performance conditions were when first set.
Any use of Committee discretion with respect to waiving or modifying performance conditions will be disclosed in the relevant Annual Report.
The maximum award under the rules of the plan is 200% of base salary.
The Committee may grant awards of up to the maximum permitted under the LTIP rules when it considers it appropriate to do so. The reasons for an award in excess of 150% of salary will be disclosed in the relevant Annual Report.
On achieving the threshold performance level for each element of the award, 25% of the relevant element of the award will vest. Vesting is on a straight-line basis between threshold and maximum levels of performance.
The performance conditions for the LTIP awards to be awarded in the 2017 financial year will relate to EPS (50%), TSR (25%) and net debt:EBITDA (25%).
EPS performance is measured by compound cumulative growth over the performance period.
TSR outperformance is measured on a multiplicative basis relative to a revenue-weighted index based on the FTSE All Share Construction & Materials Index and the FTSE All Share Support Services Index. If TSR outperformance is used in future award cycles, the revenue weightings will be fixed based on the Group’s approximate revenue mix in the year prior to grant.
The Committee retains discretion to supplement EPS and TSR with additional performance measures to ensure that the awards are always linked to sustained business performance. No measure will carry a weighting of less than 25%.
Actual performance measures and weightings will be disclosed in the Annual Report immediately following the granting of an award.
Kier Group plc Annual Report and Accounts 2016 81
Strategic R
eport1–4
5G
overnance Report
46
–88
Financial Statem
ents8
9–1
48
Remuneration Report
Directors’ remuneration policy (summary) continued
Payments from outstanding awardsThe Company will honour any commitment entered into, and Executive Directors will be eligible to receive payment from any award made, prior to the approval and introduction of the remuneration policy with effect from the AGM on 13 November 2014.
Notes to the policy table‘Malus’Deferred annual bonus awards made before 2014 include the ‘malus’ provision described in the table above, whereas deferred annual bonus and LTIP awards granted from 2014 onwards are and will be subject to revised ‘malus’ provisions.
These allow the Committee to determine, in its absolute discretion, that (i) an unvested LTIP award (or part of an award) may not vest or that the level of vesting is reduced and/or (ii) the number of deferred shares (allocated in part satisfaction of the annual bonus) is reduced (including to nil) in certain circumstances. Examples of such circumstances include, but are not limited to:
• A material misstatement of the Group’s financial statements;• A material error in determining the level of satisfaction of
a performance condition or target;• A participant deliberately misleading the Company, the market
and/or shareholders in relation to the financial performance of the Group; and
• A participant’s employment being terminated in circumstances of gross misconduct and/or circumstances justifying summary dismissal.
The Committee has the right to apply the ‘malus’ provision to an individual or on a collective basis.
Executive Director shareholding guidelinesThe Committee encourages Executive Directors to accumulate a shareholding in the Company of at least two years’ base salary over a period of up to five years. Executive Directors are encouraged to retain any shares allocated to them as part of the annual bonus arrangements and 50% of the shares allocated to them upon the vesting of LTIP awards (net of tax) until they reach this level of shareholding.
Selection of performance measures and approach to setting targetsThe measures used for the annual bonus are determined annually to reflect KPIs which are considered important and relevant to the Group. The Committee believes that using a number of measures provides a balanced incentive. The measures themselves are aligned to, and are designed to support the delivery of, the Group’s strategy.
In relation to the LTIP awards, the Committee believes that the combination of EPS, TSR and net debt:EBITDA clearly aligns performance to shareholders’ interests and the Group’s long-term strategy. EPS is a key measure of long-term underlying performance of the Group. TSR is intended to measure management’s contribution to the creation of value for shareholders. A revenue-weighted index based on the FTSE All Share Construction & Materials Index and FTSE All Share Support Services Index reflects the Group’s mix of business. Cash (and, therefore, net debt) is an important financial measure in the contracting sector. In future years, the Committee may decide to select other performance measures.
Targets for the annual bonus and the LTIP awards are reviewed before the awards are made, based on a number of internal and external reference points. The Committee intends that targets will be stretching but achievable and will align management’s interests with those of shareholders.
Differences from remuneration policy for other employeesKier’s approach to setting annual remuneration is broadly consistent across the Group. Consideration is given to the experience, performance and responsibilities of individuals as well as publicly available external benchmarking data, to the extent considered necessary or appropriate. Certain grades of senior employees are eligible to participate in an annual bonus scheme with similar performance measures to those used for the Executive Directors. Maximum opportunities and specific performance measures vary by seniority, with business-specific measures applied where appropriate. Senior managers (currently, approximately 250 individuals) are also eligible to participate in the LTIP. The performance measures for each LTIP award cycle are typically the same for all participants (although the rules of the LTIP permit the Committee to grant LTIP awards using different performance measures). Award sizes vary according to seniority and responsibility.
Kier Group plc Annual Report and Accounts 201682
Approach to remuneration on recruitmentExternal appointmentWhen recruiting a new Executive Director from outside the Group, the Committee may make use of all the existing components of remuneration. In addition, the Committee may consider it appropriate to grant an award under an alternative scheme or arrangement in order to facilitate recruitment of an individual, subject to the policy set out below:
Component Approach
Base salary The base salaries of new appointees will be determined by reference to relevant market data, experience and skills of the individual, internal relativities and the appointee’s current base salary. Where a new appointee has an initial base salary set below the market median, any subsequent adjustment will be managed by the Committee, using (where appropriate) phased increases and subject to the individual’s development in the role.
Benefits New appointees will be eligible to receive benefits in line with the remuneration policy, which may also include (but are not limited to) any necessary expenses relating to expatriation or relocation on recruitment.
SAYE Scheme New appointees will be eligible to participate on the same terms as all other employees.
SIP New appointees will be eligible to participate on the same terms as all other employees.
Pension New appointees will receive pension contributions of up to 20% of pensionable salary into a defined contribution pension arrangement or an equivalent taxable cash supplement or a combination of both.
Annual bonus The annual bonus structure described in the remuneration policy will apply to new appointees (including the maximum opportunity), pro rated in the year of joining to reflect the proportion of that year employed. One-third of any bonus earned will be deferred into shares.
LTIP New appointees may be granted awards under the LTIP of up to 200% of salary, as contemplated by the remuneration policy.
‘Buy-out’ awards The Committee may consider it appropriate to grant a ‘buy-out’ award (with respect to either a bonus or a share- based incentive scheme) under an alternative scheme or arrangement in order to facilitate the recruitment of an individual. When doing so, the Committee may, to the extent required, exercise the discretion available under Listing Rule 9.4.2. Any such ‘buy-out’ award would have a fair value of no higher than that of the award forfeited. In granting any such award, the Committee will consider relevant factors, including any performance conditions attached to the forfeited awards, the likelihood of those conditions being met and the proportion of the vesting period remaining.
When considering any performance conditions, the Committee will, where appropriate, take into account those used in the Company’s own incentive arrangements. Where appropriate, the Committee will also consider whether it is necessary to introduce further retention measures for an individual – for example, extended deferral periods.
In determining an appropriate remuneration package, the Committee will take into consideration all relevant factors to ensure that the arrangements are in the best interests of the Company’s shareholders.
Internal promotionWhen recruiting a new Executive Director through internal promotion, the Committee will set remuneration in a manner consistent with the policy for external appointments set out above (other than with respect to ‘buy-out’ awards). Where an individual has contractual commitments made prior to their promotion to Executive Director level, the Company will continue to honour these commitments.
The remuneration of individuals below the Board is typically not greater than for Executive Directors.
Kier Group plc Annual Report and Accounts 2016 83
Strategic R
eport1–4
5G
overnance Report
46
–88
Financial Statem
ents8
9–1
48
Remuneration Report
Directors’ remuneration policy (summary) continued
Service contractsA summary of the key elements of the Executive Directors’ service agreements (insofar as they relate to remuneration) is as follows:
Term of contract Summary of provisions
Notice period 12 months’ notice (both to and from the Executive Director).
Payment in lieu of notice (PILON)
Employment can be terminated with immediate effect by undertaking to make a PILON comprising base salary, accrued (but untaken) holiday entitlement, pension contributions or allowance, car allowance and private medical insurance.
The Company is entitled to make the PILON on a phased basis, so that any outstanding payment(s) would be reduced or stopped if alternative employment is obtained.
Change of control There are no payments due upon a change of control, although deferred bonus will be released.
Entitlements on termination
There is no contractual entitlement to notice or any other payments in respect of the period after cessation of employment in circumstances in which the individual is summarily dismissed. In such circumstances, deferred bonus shares will be forfeited and LTIP awards will lapse.
If the individual is not a ‘bad leaver’ (and any ‘malus’ provision is not applied), deferred bonus shares will be released upon cessation of employment and the position with respect to LTIP awards is as set out under ‘Payments for loss of office’ below.
If not required to take any remaining holiday entitlement during his/her notice period, the Executive Director will receive a payment for any accrued (but untaken) holiday entitlement.
It is expected that these terms will apply to any service agreements entered into with Executive Directors during the period in which this remuneration policy will apply.
Payments for loss of officeThe Company’s policy on payments for loss of office is as follows:
Component Approach
Annual bonus Individuals who are considered to be ‘good leavers’ may be considered for a bonus in relation to the year in which their active employment ceases. Any payment will normally be pro rated for length of service and performance during the year. However, the Committee retains the discretion to review the performance of the individual and the Group in general and, having done so, determine that a different level of bonus payment would be appropriate.
Deferred shares allocated in part satisfaction of annual bonuses may be released to an individual upon cessation of employment if (s)he is considered to be a ‘good leaver’. Otherwise, they will be released at the end of the three-year holding period.
LTIP If an Executive Director’s employment ceases for reasons of death, ill-health, injury, disability, retirement with the agreement of the Company or his/her employing company ceasing to be a member of the Group or such other circumstances approved by the Committee, outstanding awards are retained. The Committee may also (at its discretion) permit unvested LTIP awards to vest on an accelerated basis or alternatively be retained until the vesting date. Unvested LTIP awards will, subject to Committee discretion, normally be pro rated for length of service during the performance period and will, subject to performance, normally vest at the same time as all other awards in the LTIP award cycle. A ‘malus’ provision also applies to all LTIP awards granted from 2014.
For all other leavers, outstanding LTIP awards automatically lapse, unless the Committee exercises its discretion otherwise (taking into account the factors detailed immediately following this table).
SIP and SAYE Scheme
The Executive Directors are subject to the same ‘leaver’ provisions as all other participants, as prescribed by the rules of the relevant scheme or plan.
Other If the Company terminates an Executive Director’s employment by reason of redundancy, the Company will make a redundancy payment to the Executive Director in line with his service agreement, any applicable collective bargaining agreement and applicable law and regulation.
The Company may make a contribution towards an Executive Director’s legal fees for advice relating to a compromise or settlement agreement and may also make other payments connected to the departure – for example, for outplacement services. With respect to any such payments, the Committee will authorise what it considers to be reasonable in the circumstances.
Change of control Deferred bonus shares will be released, any outstanding LTIP awards may vest early (subject to the Committee’s discretion, having taken into account current and forecast progress against the performance condition(s), the proportion of the vesting period which has elapsed and any other factors considered by the Committee to be relevant) and the rules of the SIP and the SAYE Scheme will apply. No payments are due under the Executive Directors’ service agreements upon a change of control.
Kier Group plc Annual Report and Accounts 201684
Where appropriate, the Committee will oblige the individual to mitigate his/her losses and either offset any alternative remuneration received by the individual against any payments made by the Company for loss of office or reduce any payments to be made by the Company for loss of office to take account of any failure to mitigate when, in the reasonable opinion of the Committee, the individual has failed actively to do so.
In exercising discretion in respect of any of the elements referred to above, the Committee will take into account all factors which it considers to be appropriate at the relevant time. These include, but are not limited to: the duration of the Executive Director’s service; the Committee’s assessment of the Executive Director’s contribution to the success of the Group; whether the Executive Director has worked any notice period or whether a payment in lieu of notice is being made; the need to ensure an orderly handover of duties; and the need to compromise any claims which the Executive Director may have. Any use of Committee discretion will be disclosed in the relevant annual report on remuneration.
Consideration of employment conditions elsewhere in the GroupEmployees are not formally consulted on the Executive Directors’ remuneration and were not consulted during the preparation of the remuneration policy set out above. However, the Group’s employee engagement survey provides an opportunity for employees to provide their opinion on their own remuneration arrangements (and also on other matters across the Group).
The Committee takes into account the overall pay and employment conditions of employees within the Group when making decisions on the Executive Directors’ remuneration. Accordingly, the Committee (i) is provided with information about the proposed annual Group-wide pay review when setting the Executive Directors’ salaries, (ii) is made aware of the approximate outcomes of annual bonuses and (iii) sets the LTIP performance targets which typically apply to all participants in the annual LTIP award cycle.
Consideration of shareholder viewsThe views of shareholders, and guidance from shareholder representative bodies, are important to the Committee and provide the context for setting the remuneration of the Executive Directors.
The Committee intends to review the remuneration policy during the 2017 financial year and will consult with shareholders if it decides that material changes need to be made to it.
Non-Executive Director remuneration policyGeneralThe Non-Executive Directors’ remuneration (including that of the Chairman) reflects the anticipated time commitment to fulfil their duties. Non-Executive Directors do not receive bonuses, long-term incentive awards, a pension or compensation on termination of their appointments. The policy on Non-Executive Directors’ fees is as follows:
Element and link to strategy Operation Opportunity Performance measures
FeesTo attract and retain Non-Executive Directors of the calibre required and with appropriate skills and experience.
Fee levels are reviewed annually with reference to individual experience, the external market and the expected time commitment required of the Director.
Additional fees are payable to the Chairs of the Board’s committees and to the Senior Independent Director.
Fees may be increased in line with the outcome of the annual review and will not normally exceed the increase awarded to the wider employee population. Higher increases may be awarded should there be a material change to the requirements of the role, such as additional time commitment.
Any changes to fees will be disclosed in the annual report on remuneration for the relevant year.
Continued strong performance.
Recruiting Non-Executive DirectorsWhen recruiting a new Non-Executive Director, the Committee will follow the policy set out in the table above.
Kier Group plc Annual Report and Accounts 2016 85
Strategic R
eport1–4
5G
overnance Report
46
–88
Financial Statem
ents8
9–1
48
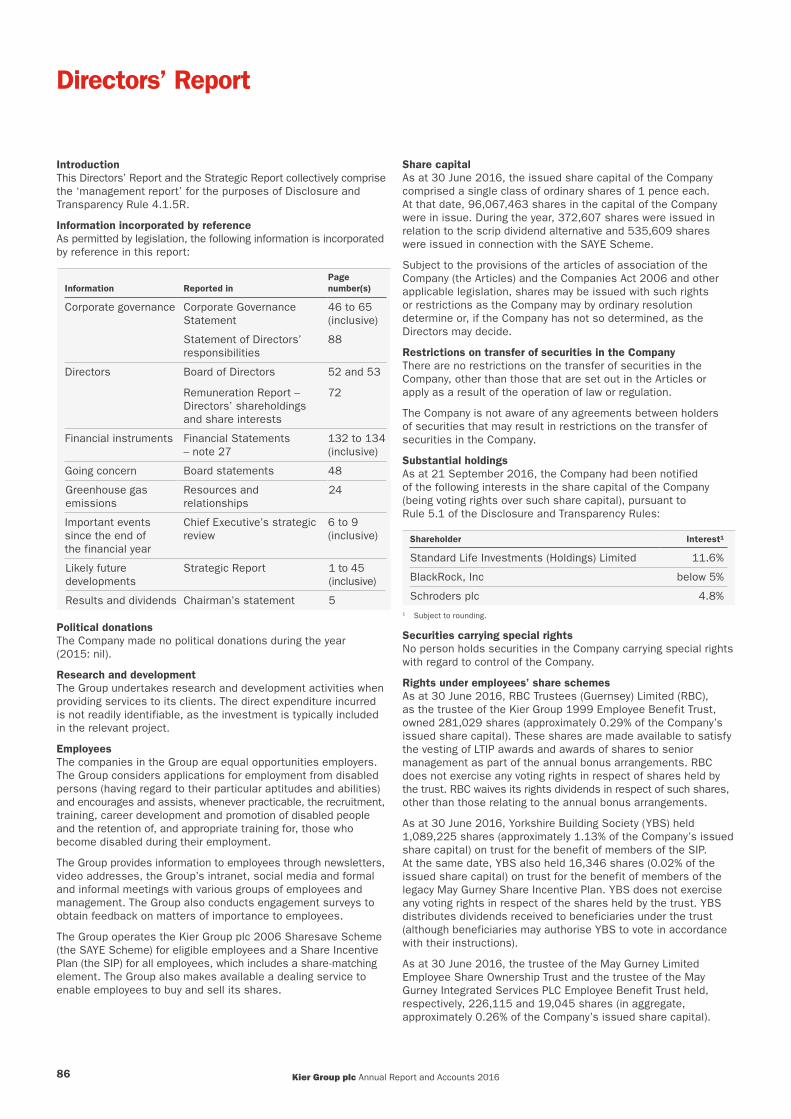
Directors’ Report
IntroductionThis Directors’ Report and the Strategic Report collectively comprise the ‘management report’ for the purposes of Disclosure and Transparency Rule 4.1.5R.
Information incorporated by referenceAs permitted by legislation, the following information is incorporated by reference in this report:
Information Reported inPage number(s)
Corporate governance Corporate Governance Statement
46 to 65 (inclusive)
Statement of Directors’ responsibilities
88
Directors Board of Directors 52 and 53
Remuneration Report – Directors’ shareholdings and share interests
72
Financial instruments Financial Statements – note 27
132 to 134 (inclusive)
Going concern Board statements 48
Greenhouse gas emissions
Resources and relationships
24
Important events since the end of the financial year
Chief Executive’s strategic review
6 to 9 (inclusive)
Likely future developments
Strategic Report 1 to 45 (inclusive)
Results and dividends Chairman’s statement 5
Political donationsThe Company made no political donations during the year (2015: nil).
Research and developmentThe Group undertakes research and development activities when providing services to its clients. The direct expenditure incurred is not readily identifiable, as the investment is typically included in the relevant project.
EmployeesThe companies in the Group are equal opportunities employers. The Group considers applications for employment from disabled persons (having regard to their particular aptitudes and abilities) and encourages and assists, whenever practicable, the recruitment, training, career development and promotion of disabled people and the retention of, and appropriate training for, those who become disabled during their employment.
The Group provides information to employees through newsletters, video addresses, the Group’s intranet, social media and formal and informal meetings with various groups of employees and management. The Group also conducts engagement surveys to obtain feedback on matters of importance to employees.
The Group operates the Kier Group plc 2006 Sharesave Scheme (the SAYE Scheme) for eligible employees and a Share Incentive Plan (the SIP) for all employees, which includes a share-matching element. The Group also makes available a dealing service to enable employees to buy and sell its shares.
Share capitalAs at 30 June 2016, the issued share capital of the Company comprised a single class of ordinary shares of 1 pence each. At that date, 96,067,463 shares in the capital of the Company were in issue. During the year, 372,607 shares were issued in relation to the scrip dividend alternative and 535,609 shares were issued in connection with the SAYE Scheme.
Subject to the provisions of the articles of association of the Company (the Articles) and the Companies Act 2006 and other applicable legislation, shares may be issued with such rights or restrictions as the Company may by ordinary resolution determine or, if the Company has not so determined, as the Directors may decide.
Restrictions on transfer of securities in the CompanyThere are no restrictions on the transfer of securities in the Company, other than those that are set out in the Articles or apply as a result of the operation of law or regulation.
The Company is not aware of any agreements between holders of securities that may result in restrictions on the transfer of securities in the Company.
Substantial holdingsAs at 21 September 2016, the Company had been notified of the following interests in the share capital of the Company (being voting rights over such share capital), pursuant to Rule 5.1 of the Disclosure and Transparency Rules:
Shareholder Interest¹
Standard Life Investments (Holdings) Limited 11.6%
BlackRock, Inc below 5%
Schroders plc 4.8%1 Subject to rounding.
Securities carrying special rightsNo person holds securities in the Company carrying special rights with regard to control of the Company.
Rights under employees’ share schemesAs at 30 June 2016, RBC Trustees (Guernsey) Limited (RBC), as the trustee of the Kier Group 1999 Employee Benefit Trust, owned 281,029 shares (approximately 0.29% of the Company’s issued share capital). These shares are made available to satisfy the vesting of LTIP awards and awards of shares to senior management as part of the annual bonus arrangements. RBC does not exercise any voting rights in respect of shares held by the trust. RBC waives its rights dividends in respect of such shares, other than those relating to the annual bonus arrangements.
As at 30 June 2016, Yorkshire Building Society (YBS) held 1,089,225 shares (approximately 1.13% of the Company’s issued share capital) on trust for the benefit of members of the SIP. At the same date, YBS also held 16,346 shares (0.02% of the issued share capital) on trust for the benefit of members of the legacy May Gurney Share Incentive Plan. YBS does not exercise any voting rights in respect of the shares held by the trust. YBS distributes dividends received to beneficiaries under the trust (although beneficiaries may authorise YBS to vote in accordance with their instructions).
As at 30 June 2016, the trustee of the May Gurney Limited Employee Share Ownership Trust and the trustee of the May Gurney Integrated Services PLC Employee Benefit Trust held, respectively, 226,115 and 19,045 shares (in aggregate, approximately 0.26% of the Company’s issued share capital).
Kier Group plc Annual Report and Accounts 201686

These shares are made available to satisfy awards of shares under the Group’s remuneration arrangements. Neither trustee exercises any voting rights in respect of shares held by their respective trust and each waivers dividends payable with respect to such shares.
Restrictions on voting rightsNo shareholder will, unless the Board otherwise determines, be entitled to vote at any general meeting unless all calls or other sums then payable by it in respect of that share have been paid or if that shareholder has been served with a disenfranchisement notice.
The Company is not aware of any agreements between holders of securities that may result in restrictions on voting rights.
Appointment and replacement of Directors Directors may be appointed by the Company by ordinary resolution or by the Board. A Director appointed by the Board holds office only until the next AGM of the Company after his/her appointment and is then eligible to stand for election.
At each AGM of the Company, one-third of the Directors are required to retire by rotation and may offer themselves for re-election by the members. However, at the forthcoming AGM of the Company all the Directors will offer themselves for re-election in accordance with the UK Corporate Governance Code and the Company’s current policy. Please see pages 52 and 53 for further information about the Directors’ skills and experience and pages 54 and 55 headed ‘Effectiveness’.
The Company may by ordinary resolution, of which special notice has been given, remove any Director before the expiry of the Director’s period of office.
Amendment of ArticlesThe Articles may be amended by a special resolution of the Company’s shareholders.
Powers of the DirectorsSubject to the Articles, the Companies Acts and any directions given by shareholders, the Company’s business is managed by the Board, which may exercise all the powers of the Company.
Powers in relation to the Company issuing its sharesThe Directors were granted authority at the AGM on 12 November 2015 to allot shares in the Company (i) up to an aggregate nominal amount of £318,773 and (ii) up to an aggregate nominal amount of £637,467 in connection with a rights issue. The Directors were also granted authority to allot shares non-pre-emptively and wholly for cash up to an aggregate nominal amount of £95,620.
In addition, at the 2013 AGM, an ordinary resolution was approved which grants the Directors the authority to continue to offer the scrip dividend alternative.
Powers in relation to the Company buying back its sharesThe Company may only buy back shares if the Articles do not prohibit it from doing so and it has received the requisite authority from shareholders in general meeting. Although the Articles do not contain any such prohibition, the Company did not request any such authority at its last AGM and does not propose to do so at the forthcoming AGM.
Change of controlThe Group’s loan facility agreements with its UK lending banks, the note purchase agreements entered into in 2012 and 2014 in connection with the Group’s US private placements of notes and the Schuldschein loan agreements entered into in May and June
2016 each contain provisions under which, in the event of a change of control of the Company, the Company may be required to repay all outstanding amounts borrowed.
Certain of the Group’s commercial arrangements, including certain of its joint venture agreements, contract bond agreements and other commercial agreements entered into in the ordinary course of business, include change of control provisions.
Certain of the Group’s employee share schemes contain provisions relating to a change of control of the Company. Outstanding options and awards may become exercisable or vest upon a change of control.
There are no agreements between the Company and the Directors providing for compensation for loss of office that occurs as a result of a takeover bid (other than those referred to above).
BranchesBecause the Group is a global business, it has activities which operate through branches in certain jurisdictions.
AuditorThe Board has decided that PricewaterhouseCoopers LLP will be proposed as the Group’s auditor for the financial year ending 30 June 2017 and a resolution relating to this re-appointment will be tabled at the forthcoming AGM.
AGMThe Company’s 2016 AGM will be held at 12 noon on 18 November 2016 at the Andaz Hotel, 40 Liverpool Street, London, EC2M 7QN.
This Directors’ Report was approved by the Board and signed on its behalf by:
Hugh Raven Company Secretary
21 September 2016
Tempsford Hall Sandy Bedfordshire SG19 2BD
Kier Group plc Annual Report and Accounts 2016
Strategic R
eport1–4
5G
overnance Report
46
–88
Financial Statem
ents8
9–1
48
87
Statement of Directors’ responsibilities
IntroductionThe Directors are responsible for preparing the Annual Report and the Group and parent company financial statements in accordance with applicable law and regulations.
Company law requires the Directors to prepare the Group and parent company financial statements for each financial year. Under that law, they are required to prepare the Group financial statements in accordance with International Financial Reporting Standards as adopted by the European Union (‘IFRS’) and applicable law and have elected to prepare the parent company financial statements in accordance with UK Accounting Standards and applicable law (‘UK Generally Accepted Accounting Practice’).
Under company law, the Directors must not approve the financial statements unless they are satisfied that they give a true and fair view of the state of affairs of the Group and parent company and of their profit or loss for that period.
In preparing each of the Group and parent company financial statements, the Directors are required to:
• Select suitable accounting policies and then apply them consistently;
• Make judgements and estimates that are reasonable and prudent;
• For the Group financial statements, state whether they have been prepared in accordance with IFRS;
• For the parent company financial statements, state whether applicable UK Accounting Standards have been followed, subject to any material departures disclosed and explained in the parent company financial statements; and
• Prepare the financial statements on the going concern basis unless it is inappropriate to presume that the Group and the parent company will continue in business.
The Directors are responsible for keeping adequate accounting records that are sufficient to show and explain the parent company’s transactions and disclose with reasonable accuracy at any time the financial position of the parent company and enable them to ensure that its financial statements comply with the Companies Act 2006 and, with respect to the Group financial statements, Article 4 of the IAS Regulation.
The Directors have general responsibility for taking such steps as are reasonably open to them to safeguard the assets of the Group and to prevent and detect fraud and other irregularities.
Under applicable law and regulations, the Directors are also responsible for preparing the Strategic Report, the Directors’ Report, the Remuneration Report and the Corporate Governance Statement and for ensuring that these comply with applicable laws and regulations.
The Directors are responsible for the maintenance and integrity of the corporate and financial information included on the Company’s website. Legislation in the UK governing the preparation and dissemination of financial statements may differ from legislation in other jurisdictions.
Directors’ responsibility statementEach of the Directors, whose names and functions are set out on pages 52 and 53, confirms that to the best of his or her knowledge:
• The financial statements contained in this Annual Report, prepared in accordance with the applicable set of accounting standards, give a true and fair view of the assets, liabilities, financial position and profit or loss of the Company and the undertakings included in the consolidation as a whole; and
• The management report contained in this Annual Report includes a fair review of the development and performance of the business and the position of the Company and the undertakings included in the consolidation taken as a whole, together with a description of the principal risks and uncertainties that they face.
Disclosure to auditorsEach Director who holds office at the date of approval of this Directors’ Report confirms that, so far as each such Director is aware, there is no relevant audit information of which the auditor is unaware; and the Directors have taken all the steps that they ought to have taken as directors to make themselves aware of any relevant audit information and to establish that the auditor is aware of that information.
Signed on behalf of the Board by:
Haydn Mursell Bev DewChief Executive Finance Director
21 September 2016
Kier Group plc Annual Report and Accounts 201688
Financial Statements
Independent auditor’s report to the members of Kier Group plc
Report on the financial statementsOur opinionIn our opinion:
• Kier Group plc’s Group financial statements and Company financial statements (the “financial statements”) give a true and fair view of the state of the Group’s and of the Company’s affairs as at 30 June 2016 and of the Group’s loss and cash flows for the year then ended;
• the Group financial statements have been properly prepared in accordance with International Financial Reporting Standards (“IFRSs”) as adopted by the European Union;
• the Company financial statements have been properly prepared in accordance with United Kingdom Generally Accepted Accounting Practice; and
• the financial statements have been prepared in accordance with the requirements of the Companies Act 2006 and, as regards the Group financial statements, Article 4 of the IAS Regulation.
What we have auditedKier Group plc’s financial statements comprise:
• the Consolidated balance sheet as at 30 June 2016;
• the Company balance sheet as at 30 June 2016;
• the Consolidated income statement and Consolidated statement of comprehensive income for the year then ended;
• the Consolidated cash flow statement for the year then ended;
• the Consolidated statement of changes in equity for the year then ended;
• the Company statement of changes in equity for the year then ended; and
• the notes to the financial statements, which include a summary of significant accounting policies and other explanatory information.
Certain required disclosures have been presented elsewhere in the Annual Report, rather than in the notes to the financial statements. These are cross-referenced from the financial statements and are identified as audited.
The financial reporting framework that has been applied in the preparation of the Group financial statements is applicable law and IFRSs as adopted by the European Union. The financial reporting framework that has been applied in the preparation of the parent company financial statements is applicable law and United Kingdom Accounting Standards, comprising FRS101 “Reduced Disclosure Framework”, and applicable law (United Kingdom Generally Accepted Accounting Practice).
Our audit approachOverview
Audit scope
Areas offocus
Materiality
• Overall Group materiality: £6.2m (2015: £4.3m) which represents 5% of consolidated profit before tax excluding non-underlying items.
• We conducted audit work across all four of the Group’s divisions, which accounted for 95% of Group revenues.
• Accounting for long-term contracts – including profit recognition, work in progress and provisioning.• Accounting for and presentation of adjustments to underlying profit.• Assessment of carrying value of goodwill.• Valuation of land and properties.
The scope of our audit and our areas of focusWe conducted our audit in accordance with International Standards on Auditing (UK and Ireland) (“ISAs (UK & Ireland)”).
We designed our audit by determining materiality and assessing the risks of material misstatement in the financial statements. In particular, we looked at where the Directors made subjective judgements, for example in respect of significant accounting estimates that involved making assumptions and considering future events that are inherently uncertain. As in all of our audits we also addressed the risk of management override of internal controls, including evaluating whether there was evidence of bias by the Directors that represented a risk of material misstatement due to fraud.
The risks of material misstatement that had the greatest effect on our audit, including the allocation of our resources and effort, are identified as “areas of focus” in the table below. We have also set out how we tailored our audit to address these specific areas in order to provide an opinion on the financial statements as a whole, and any comments we make on the results of our procedures should be read in this context. This is not a complete list of all risks identified by our audit.
Kier Group plc Annual Report and Accounts 2016 89
Strategic R
eport1–4
5G
overnance Report
46
–88
Financial Statem
ents8
9–1
48
Financial Statements
Independent auditor’s report to the members of Kier Group plc continued
Area of focus How our audit addressed the area of focus
Valuation of land and propertiesRefer to page 62 (Risk Management and Audit Committee Report), page 105 (accounting policy) and page 125 (notes).
Inventory in the Property and Residential divisions is stated at the lower of cost and net realisable value (i.e. the forecast selling price less the remaining costs to build and sell). An assessment of the net realisable value of inventory is carried out at each balance sheet date and is dependent upon management’s estimate of forecast selling prices and build costs (by reference to current prices), which may require significant judgement.
The Group holds inventory of £251.9m (2015: £284m) within the Residential division, which comprises the Group’s land held for residential development £137.3m (2015: £117m) and residential work in progress £114.6m (2015: £167m) where building work has commenced.
We focused our work on those sites with a value of £47.1m (2015: £46.8m) where there is no immediate intention of development as there is a heightened risk that they are valued above their recoverable amount. Therefore a change in the Group’s forecast estimate of sales price and build cost could have a material impact on the carrying value of inventories in the Group’s financial statements.
We reviewed the property-specific development appraisals supporting the carrying values and challenged the key assumptions underlying these appraisals as follows:
• We reviewed management’s expected build cost per square foot by comparing to the build costs for similar units on other sites and where there were differences, validating explanations against third-party confirmations including quantity surveyor cost estimates, correspondence with suppliers or comparable properties on other sites;
• We challenged management on their intention to develop these sites; and
• We challenged management’s forecast sales prices to supporting third-party evidence from management’s external sales agents and by comparing the forecast sales price of a sample of sales prices achieved and the list prices of comparable assets as published by estate agents.
We did not encounter any issues through our audit procedures that indicated the land or properties tested were impaired.
Accounting for long-term contracts – including profit recognition, work in progress and provisioningRefer to page 62 (Risk Management and Audit Committee Report) and pages 102 and 103 (accounting policy).
The Group has significant long-term contracts in both the Construction and Services divisions. The recognition of profit on construction and long-term services contracts in accordance with IAS 11 is based on the stage of completion of contract activity. This is assessed by reference to the proportion of contract costs incurred for the work performed at the balance sheet date relative to the estimated total costs of the contract at completion.
Profit on contracts is a significant risk for our audit because of the judgement involved in preparing suitable estimates of the forecast costs and revenue on contracts. An error in the contract forecast could result in a material variance in the amount of profit or loss recognised to date and therefore also in the current period.
These judgements include the expected recovery of costs arising from the following: variations to the contract requested by the customer, compensation events, and claims made against the contractor for delays or other additional costs for which the customer is liable. The inclusion of these amounts in the contract forecast where they are not recoverable could result in a material error in the level of profit or loss recognised by the Group.
We focused our work on those contracts with the greatest estimation uncertainty over the final contract values and therefore profit outcome. These in particular included the forecast position on a major infrastructure project for MTR in Hong Kong where significant judgement regarding final values remains; and long-term environmental contracts in the services division where profitability is impacted by estimated future recyclate recovery prices.
We challenged the judgements applied in management’s forecasts, in particular the key assumptions, which included the expected recovery of variations, claims and compensation events included in the forecast, and the historical financial performance and forecast out-turn against budget of other contracts of a similar nature and size and industry knowledge.
We inspected correspondence and meeting minutes with customers concerning variations, claims and compensation events, and obtained third-party assessments of these from legal or technical experts contracted by the Group, if applicable, to assess whether this information was consistent with the estimates made.
We inspected selected signed contracts for key clauses to identify relevant contractual mechanisms such as the sharing of cost overruns or efficiencies with the customer, contractual damages and success fees and assess whether these key clauses have been appropriately reflected in the amounts included in the forecasts.
We inspected correspondence with insurers relating to recognised insurance claims as well as assessments of these undertaken by the insurers and Group’s legal experts where applicable to assess whether this information supported the position taken on the contract.
In respect of long-term Environmental Services contracts we challenged the assumptions in the cash flow models surrounding efficiency improvements in the cost base and projected revenues from the sale of recyclate.
We did not identify any issues where the judgements made were materially inappropriate.
Kier Group plc Annual Report and Accounts 201690

Area of focus How our audit addressed the area of focus
Accounting for adjustments to underlying profitRefer to page 62 (Risk Management and Audit Committee Report), page 102 (accounting policy) and page 109 (notes).
In order to give a better understanding of the underlying performance of the business, management has presented a view of the underlying results of the Group, with separate disclosure of ‘non-underlying items’ consisting of the following:
• £49.9m of restructuring charges relating to reorganisation and integration costs following the June 2015 acquisition of Mouchel;
• £35.6m of charges in relation to under-performing contracts in Environmental Services;
• £23.1m of costs and charges associated with the closure of the Caribbean business and associated contract losses;
• A £1.7m gain relating to the disposal of Kier FPS Limited (“F&PS”) in July 2015;
• £5.0m impairment charges relating to Biogen investment;
• £4.5m of costs associated with the settlement of the Construction Workers Compensation Scheme;
• £23.9m of intangible amortisation and discount unwind on acquired businesses; and
• £5.0m in respect of the write-down of the UK mining business held for sale, presented in discontinued operations.
The determination of which items are classified as ‘non-underlying’ is subject to judgement and therefore users of the accounts could be misled if amounts are not classified appropriately or presented consistently.
We also considered the risk of one-off gains during the year not being properly identified and therefore presented inappropriately within underlying profit.
We considered the appropriateness of the adjustments made to the statutory result before tax to derive underlying performance. In order to do this we considered:
• The Group’s accounting policy on exceptional and non-underlying items;
• The application of IFRS, in particular IAS 1; and
• European Securities and Markets Authority (“ESMA”) guidelines on alternative performance measures issued on 3 July 2016.
We challenged management on the appropriateness of the classification of each item, being mindful that classification should be balanced between gains and losses, the basis for the classification clearly disclosed and applied consistently from one year to the next.
Our work identified certain items that management had classified as non-underlying which we considered to be more judgemental in nature than others. These included the restructuring charges of £49.9m, Caribbean closure costs of £23.1m and £35.6m charges relating to Environmental Services. Having assessed in detail the nature of the individual components of the restructuring charges, we were satisfied with their presentation as non-underlying and the explanations provided in the financial statements as to their nature.
We assessed the nature of material non-recurring gains during the year impacting the underlying result before tax and challenged management as to whether these should be identified within non-underlying items.
Having considered the nature and quantum of these items, overall we were satisfied that the presentation of non-underlying and exceptional items in the financial statements for the year ended 30 June 2016 is materially appropriate.
Kier Group plc Annual Report and Accounts 2016 91
Strategic R
eport1–4
5G
overnance Report
46
–88
Financial Statem
ents8
9–1
48

Financial Statements
Independent auditor’s report to the members of Kier Group plc continued
Area of focus How our audit addressed the area of focus
Assessment of carrying value of goodwillRefer to page 62 (Risk Management and Audit Committee Report), page 102 (accounting policy) and pages 120 and 121 (notes).
As detailed in note 12 of the financial statements, the Group’s key cash generating units (CGUs) are Construction, Services, Residential and Property. The majority of the Group’s goodwill relates to the acquisitions of Mouchel (£314.6m) in June 2015 and May Gurney (£194.7m) in July 2013. The majority (97%) of goodwill recognised from both of these acquisitions is allocated to the Services CGU with the remainder (3%) allocated to the Construction CGU.
Management tests goodwill for impairment annually, with reference to value in use which is measured by the present value of the cash flow forecasts expected to be derived by the respective CGUs.
The services industry continues to experience challenging margins due to increased costs and more competitive pricing in the market. Furthermore there is increased uncertainty over UK market conditions following the result of the EU Referendum. Therefore there is a risk that sufficient cash flows will not be generated within the Services CGU to support the carrying amount of goodwill. Due to their respective sizes, we did not consider the Construction, Property or Residential CGUs to be areas of significant focus.
As part of our audit procedures, we corroborated the justification of the CGUs defined by management, particularly Services, by reviewing the financial information that management uses to measure the performance of that business. We also tested the principles and integrity of the Group’s discounted cash flow model that supports the value in use of the CGUs in order to satisfy ourselves that the methodology applied in the annual impairment assessments was in line with the requirements of IAS36, and that the assumptions underpinning the model were appropriate.
As part of our work:
• we specifically challenged and agreed key inputs such as contract margin and profitability to underlying agreements, our knowledge of the Group and industry and historical outcomes;
• we assessed the other key assumptions management applied in these models (discount rate, growth rate and inflation), remaining sceptical of explanations and obtaining supporting evidence for key assertions, including comparing to available external data where available; and
• we also reviewed management’s sensitivity analysis and considered further realistic sensitivity to all key assumptions and underlying cash flows.
We did not identify any issues with management’s key assumptions based on our review of supporting evidence, management’s and our own sensitivity analysis performed. There was significant headroom calculated by management over the carrying amount of the Services CGU, and therefore we were satisfied that the goodwill is not impaired.
We also tested whether the disclosures were in line with applicable accounting standards and no issues were identified.
Kier Group plc Annual Report and Accounts 201692
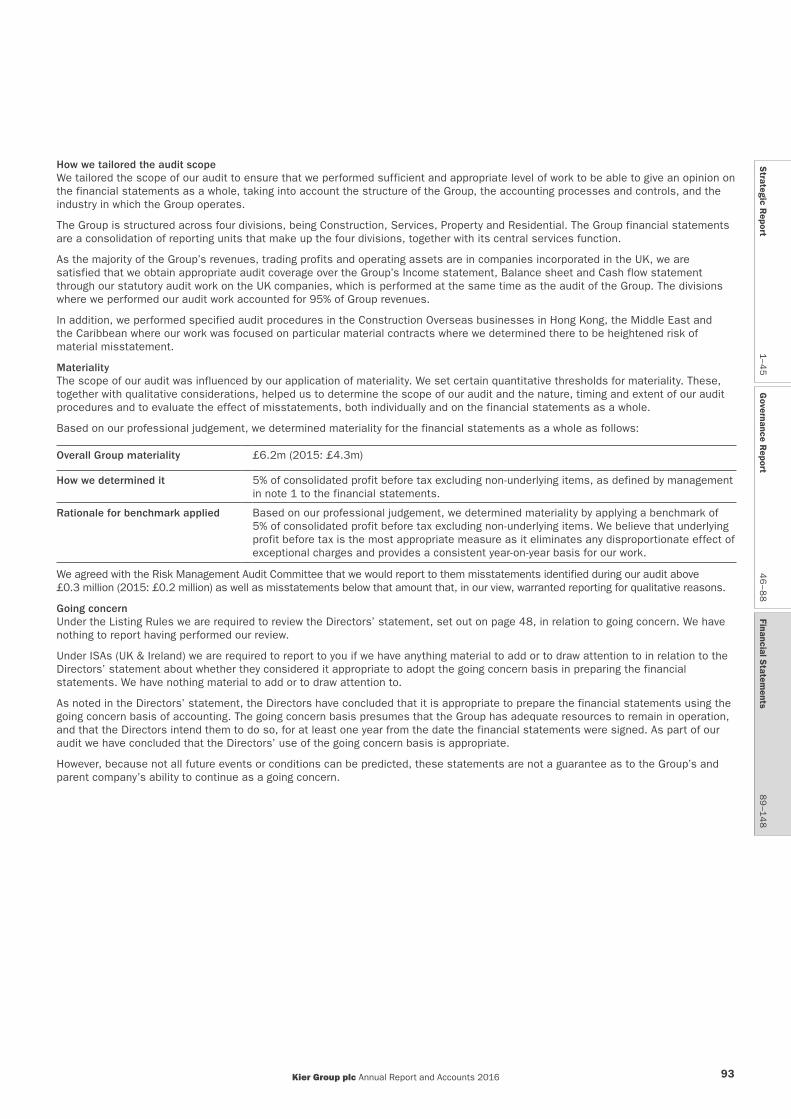
How we tailored the audit scopeWe tailored the scope of our audit to ensure that we performed sufficient and appropriate level of work to be able to give an opinion on the financial statements as a whole, taking into account the structure of the Group, the accounting processes and controls, and the industry in which the Group operates.
The Group is structured across four divisions, being Construction, Services, Property and Residential. The Group financial statements are a consolidation of reporting units that make up the four divisions, together with its central services function.
As the majority of the Group’s revenues, trading profits and operating assets are in companies incorporated in the UK, we are satisfied that we obtain appropriate audit coverage over the Group’s Income statement, Balance sheet and Cash flow statement through our statutory audit work on the UK companies, which is performed at the same time as the audit of the Group. The divisions where we performed our audit work accounted for 95% of Group revenues.
In addition, we performed specified audit procedures in the Construction Overseas businesses in Hong Kong, the Middle East and the Caribbean where our work was focused on particular material contracts where we determined there to be heightened risk of material misstatement.
MaterialityThe scope of our audit was influenced by our application of materiality. We set certain quantitative thresholds for materiality. These, together with qualitative considerations, helped us to determine the scope of our audit and the nature, timing and extent of our audit procedures and to evaluate the effect of misstatements, both individually and on the financial statements as a whole.
Based on our professional judgement, we determined materiality for the financial statements as a whole as follows:
Overall Group materiality £6.2m (2015: £4.3m)
How we determined it 5% of consolidated profit before tax excluding non-underlying items, as defined by management in note 1 to the financial statements.
Rationale for benchmark applied Based on our professional judgement, we determined materiality by applying a benchmark of 5% of consolidated profit before tax excluding non-underlying items. We believe that underlying profit before tax is the most appropriate measure as it eliminates any disproportionate effect of exceptional charges and provides a consistent year-on-year basis for our work.
We agreed with the Risk Management Audit Committee that we would report to them misstatements identified during our audit above £0.3 million (2015: £0.2 million) as well as misstatements below that amount that, in our view, warranted reporting for qualitative reasons.
Going concernUnder the Listing Rules we are required to review the Directors’ statement, set out on page 48, in relation to going concern. We have nothing to report having performed our review.
Under ISAs (UK & Ireland) we are required to report to you if we have anything material to add or to draw attention to in relation to the Directors’ statement about whether they considered it appropriate to adopt the going concern basis in preparing the financial statements. We have nothing material to add or to draw attention to.
As noted in the Directors’ statement, the Directors have concluded that it is appropriate to prepare the financial statements using the going concern basis of accounting. The going concern basis presumes that the Group has adequate resources to remain in operation, and that the Directors intend them to do so, for at least one year from the date the financial statements were signed. As part of our audit we have concluded that the Directors’ use of the going concern basis is appropriate.
However, because not all future events or conditions can be predicted, these statements are not a guarantee as to the Group’s and parent company’s ability to continue as a going concern.
Kier Group plc Annual Report and Accounts 2016 93
Strategic R
eport1–4
5G
overnance Report
46
–88
Financial Statem
ents8
9–1
48

Other reporting requirementsConsistency of other informationCompanies Act 2006 opinionsIn our opinion:
• the information given in the Strategic Report and the Directors’ Report for the financial year for which the financial statements are prepared is consistent with the financial statements; and
• the information given in the Corporate Governance Statement as set out on page 49 with respect to internal control and risk management systems and about share capital structures is consistent with the financial statements.
ISAs (UK & Ireland) reporting
Under ISAs (UK & Ireland) we are required to report to you if we have anything material to add or to draw attention to in relation to:
• Information in the Annual Report is: – materially inconsistent with the information in the audited financial statements; or – apparently materially incorrect based on, or materially inconsistent with, our knowledge
of the Group and parent company acquired in the course of performing our audit; or – otherwise misleading.
We have no exceptions to report arising from this responsibility.
• the statement given by the Directors on page 48, in accordance with provision C.1.1 of the UK Corporate Governance Code (“the Code”), that they consider the Annual Report taken as a whole to be fair, balanced and understandable and provides the information necessary for members to assess the Group’s position and performance, business model and strategy is materially inconsistent with our knowledge of the Group and parent company acquired in the course of performing our audit.
We have no exceptions to report arising from this responsibility.
• the section of the Annual Report on page 59, as required by provision C.3.8 of the Code, describing the work of the Audit Committee does not appropriately address matters communicated by us to the Audit Committee.
We have no exceptions to report arising from this responsibility.
Under ISAs (UK & Ireland) we are required to report to you if we have anything material to add or to draw attention to in relation to:
• the Directors’ confirmation on page 48 of the Annual Report, in accordance with provision C.2.1 of the Code, that they have carried out a robust assessment of the principal risks facing the Group, including those that would threaten its business model, future performance, solvency or liquidity.
We have nothing material to add or to draw attention to.
• the disclosures in the Annual Report that describe those risks and explain how they are being managed or mitigated.
We have nothing material to add or to draw attention to.
• the Directors’ explanation on page 48 of the Annual Report, in accordance with provision C.2.2 of the Code, as to how they have assessed the prospects of the Group, over what period they have done so and why they consider that period to be appropriate, and their statement as to whether they have a reasonable expectation that the Group will be able to continue in operation and meet its liabilities as they fall due over the period of their assessment, including any related disclosures drawing attention to any necessary qualifications or assumptions.
We have nothing material to add or to draw attention to.
Under the Listing Rules we are required to review the Directors’ statement that they have carried out a robust assessment of the principal risks facing the Group and the Directors’ statement in relation to the longer-term viability of the Group. Our review was substantially less in scope than an audit and only consisted of making inquiries and considering the Directors’ process supporting their statements; checking that the statements are in alignment with the relevant provisions of the Code; and considering whether the statements are consistent with the knowledge acquired by us in the course of performing our audit. We have nothing to report having performed our review.
Adequacy of accounting records and information and explanations receivedUnder the Companies Act 2006 we are required to report to you if, in our opinion:
• we have not received all the information and explanations we require for our audit; or
• adequate accounting records have not been kept by the company, or returns adequate for our audit have not been received from branches not visited by us; or
• the company financial statements and the part of the Directors’ Remuneration Report to be audited are not in agreement with the accounting records and returns.
We have no exceptions to report arising from this responsibility.
Financial Statements
Independent auditor’s report to the members of Kier Group plc continued
Kier Group plc Annual Report and Accounts 201694
Directors’ remunerationDirectors’ remuneration report – Companies Act 2006 opinionIn our opinion, the part of the Directors’ Remuneration Report to be audited has been properly prepared in accordance with the Companies Act 2006.
Other Companies Act 2006 reportingUnder the Companies Act 2006 we are required to report to you if, in our opinion, certain disclosures of Directors’ remuneration specified by law are not made. We have no exceptions to report arising from these responsibilities.
Corporate governance statementUnder the Companies Act 2006 we are required to report to you if, in our opinion, a corporate governance statement has not been prepared by the parent company. We have no exceptions to report arising from this responsibility.
Under the Listing Rules we are required to review the part of the Corporate Governance Statement relating to ten provisions of the UK Corporate Governance Code. We have nothing to report having performed our review.
Responsibilities for the financial statements and the auditOur responsibilities and those of the DirectorsAs explained more fully in the Directors’ Responsibilities Statement set out on page 88, the Directors are responsible for the preparation of the financial statements and for being satisfied that they give a true and fair view.
Our responsibility is to audit and express an opinion on the financial statements in accordance with applicable law and ISAs (UK & Ireland). Those standards require us to comply with the Auditing Practices Board’s Ethical Standards for Auditors.
This report, including the opinions, has been prepared for and only for the company’s members as a body in accordance with Chapter 3 of Part 16 of the Companies Act 2006 and for no other purpose. We do not, in giving these opinions, accept or assume responsibility for any other purpose or to any other person to whom this report is shown or into whose hands it may come save where expressly agreed by our prior consent in writing.
What an audit of financial statements involvesAn audit involves obtaining evidence about the amounts and disclosures in the financial statements sufficient to give reasonable assurance that the financial statements are free from material misstatement, whether caused by fraud or error. This includes an assessment of:
• whether the accounting policies are appropriate to the Group’s and the parent company’s circumstances and have been consistently applied and adequately disclosed;
• the reasonableness of significant accounting estimates made by the Directors; and
• the overall presentation of the financial statements.
We primarily focus our work in these areas by assessing the Directors’ judgements against available evidence, forming our own judgements, and evaluating the disclosures in the financial statements.
We test and examine information, using sampling and other auditing techniques, to the extent we consider necessary to provide a reasonable basis for us to draw conclusions. We obtain audit evidence through testing the effectiveness of controls, substantive procedures or a combination of both.
In addition, we read all the financial and non-financial information in the Annual Report to identify material inconsistencies with the audited financial statements and to identify any information that is apparently materially incorrect based on, or materially inconsistent with, the knowledge acquired by us in the course of performing the audit. If we become aware of any apparent material misstatements or inconsistencies we consider the implications for our report.
Jonathan Hook (Senior Statutory Auditor)for and on behalf of PricewaterhouseCoopers LLPChartered Accountants and Statutory Auditors
London
21 September 2016
Kier Group plc Annual Report and Accounts 2016 95
Strategic R
eport1–4
5G
overnance Report
46
–88
Financial Statem
ents8
9–1
48
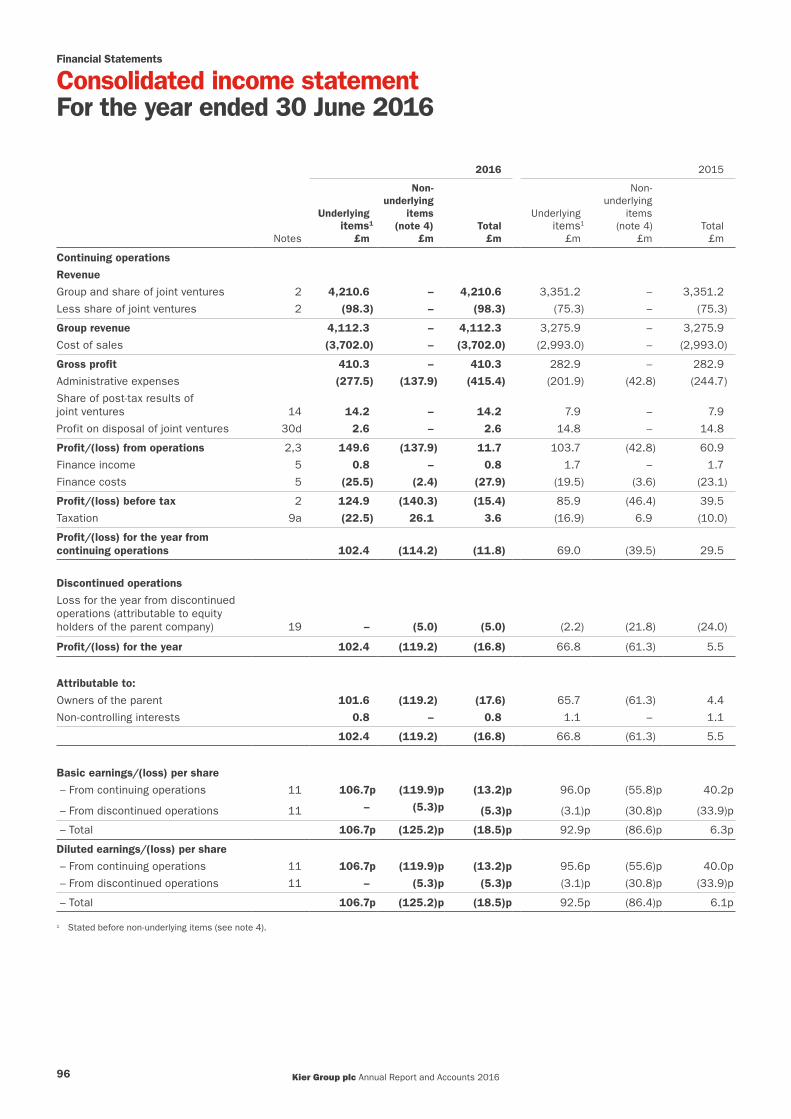
Financial Statements
Consolidated income statementFor the year ended 30 June 2016
2016 2015
Notes
Underlyingitems1
£m
Non-underlying
items(note 4)
£mTotal
£m
Underlying items1
£m
Non-underlying
items (note 4)
£mTotal £m
Continuing operations
Revenue
Group and share of joint ventures 2 4,210.6 – 4,210.6 3,351.2 – 3,351.2
Less share of joint ventures 2 (98.3) – (98.3) (75.3) – (75.3)
Group revenue 4,112.3 – 4,112.3 3,275.9 – 3,275.9
Cost of sales (3,702.0) – (3,702.0) (2,993.0) – (2,993.0)
Gross profit 410.3 – 410.3 282.9 – 282.9
Administrative expenses (277.5) (137.9) (415.4) (201.9) (42.8) (244.7)
Share of post-tax results of joint ventures 14 14.2 – 14.2 7.9 – 7.9
Profit on disposal of joint ventures 30d 2.6 – 2.6 14.8 – 14.8
Profit/(loss) from operations 2,3 149.6 (137.9) 11.7 103.7 (42.8) 60.9
Finance income 5 0.8 – 0.8 1.7 – 1.7
Finance costs 5 (25.5) (2.4) (27.9) (19.5) (3.6) (23.1)
Profit/(loss) before tax 2 124.9 (140.3) (15.4) 85.9 (46.4) 39.5
Taxation 9a (22.5) 26.1 3.6 (16.9) 6.9 (10.0)
Profit/(loss) for the year from continuing operations 102.4 (114.2) (11.8) 69.0 (39.5) 29.5
Discontinued operations
Loss for the year from discontinued operations (attributable to equity holders of the parent company) 19 – (5.0) (5.0) (2.2) (21.8) (24.0)
Profit/(loss) for the year 102.4 (119.2) (16.8) 66.8 (61.3) 5.5
Attributable to:
Owners of the parent 101.6 (119.2) (17.6) 65.7 (61.3) 4.4
Non-controlling interests 0.8 – 0.8 1.1 – 1.1
102.4 (119.2) (16.8) 66.8 (61.3) 5.5
Basic earnings/(loss) per share
– From continuing operations 11 106.7p (119.9)p (13.2)p 96.0p (55.8)p 40.2p
– From discontinued operations 11 – (5.3)p (5.3)p (3.1)p (30.8)p (33.9)p
– Total 106.7p (125.2)p (18.5)p 92.9p (86.6)p 6.3p
Diluted earnings/(loss) per share
– From continuing operations 11 106.7p (119.9)p (13.2)p 95.6p (55.6)p 40.0p
– From discontinued operations 11 – (5.3)p (5.3)p (3.1)p (30.8)p (33.9)p
– Total 106.7p (125.2)p (18.5)p 92.5p (86.4)p 6.1p
1 Stated before non-underlying items (see note 4).
Kier Group plc Annual Report and Accounts 201696

Consolidated statement of comprehensive incomeFor the year ended 30 June 2016
Notes2016
£m2015
£m
(Loss)/profit for the year (16.8) 5.5
Items that may be reclassified subsequently to the income statement
Share of joint venture fair value movements on cash flow hedging instruments 14 (0.1) 0.7
Deferred tax on share of joint venture fair value movements on cash flow hedging instruments 9c – (0.2)
Fair value gain on cash flow hedging instruments 27 18.5 0.2
Fair value movements on cash flow hedging instruments recycled to the Income Statement 5 (17.7) –
Deferred tax on fair value movements on cash flow hedging instruments 9c (0.2) –
Foreign exchange gains on long-term funding of foreign operations 9.6 0.9
Foreign exchange translation differences (1.1) (0.2)
Total items that may be reclassified subsequently to the income statement 9.0 1.4
Items that will not be reclassified to the income statement
Re-measurement of defined benefit liabilities 8 47.6 (34.0)
Deferred tax (charge)/credit on actuarial gain/losses on defined benefit liabilities 9c (9.1) 6.8
Total items that will not be reclassified to the income statement 38.5 (27.2)
Other comprehensive income/(loss) for the year 47.5 (25.8)
Total comprehensive income/(loss) for the year 30.7 (20.3)
Attributable to:
Equity holders of parent 29.9 (21.4)
Non-controlling interests – continuing operations 0.8 1.1
30.7 (20.3)
Total comprehensive income/(loss) attributable to equity shareholders arises from:
Continuing operations 34.9 2.6
Discontinued operations (5.0) (24.0)
29.9 (21.4)
Strategic R
eport1–4
5G
overnance Report
46
–88
Financial Statem
ents8
9–1
48
Kier Group plc Annual Report and Accounts 2016 97

Financial Statements
Consolidated statement of changes in equityFor the year ended 30 June 2016
Share capital
£m
Sharepremium
£m
Capital redemption
reserve £m
Retained earnings
£m
Cash flow
hedge reserve
£m
Translationreserve
£m
Merger reserve
£m
Equity attributable to owners of
the parent £m
Non-controlling
interests £m
Total equity
£m
At 1 July 2014 0.6 73.7 2.7 51.4 (2.9) (3.6) 184.8 306.7 3.0 309.7
Profit for the year – – – 4.4 – – – 4.4 1.1 5.5
Other comprehensive (loss)/income – – – (27.2) 0.7 0.7 – (25.8) – (25.8)
Dividends paid – – – (40.2) – – – (40.2) (2.3) (42.5)
Issue of own shares 0.4 334.8 – – – – – 335.2 – 335.2
Share-based payments – – – 3.4 – – – 3.4 – 3.4
Tax on share-based payments – – – (0.1) – – – (0.1) – (0.1)
Transfers1 – – – 50.0 – – (50.0) – – –
At 30 June 2015 1.0 408.5 2.7 41.7 (2.2) (2.9) 134.8 583.6 1.8 585.4
(Loss)/profit for the year – – – (17.6) – – – (17.6) 0.8 (16.8)
Other comprehensive income – – – 38.5 0.5 8.5 – 47.5 – 47.5
Dividends paid – – – (54.7) – – – (54.7) (0.4) (55.1)
Issue of own shares – 9.5 – – – – – 9.5 – 9.5
Share-based payments – – – 5.6 – – – 5.6 – 5.6
At 30 June 2016 1.0 418.0 2.7 13.5 (1.7) 5.6 134.8 573.9 2.2 576.1
1 See the Company only accounts on page 143.
Kier Group plc Annual Report and Accounts 201698
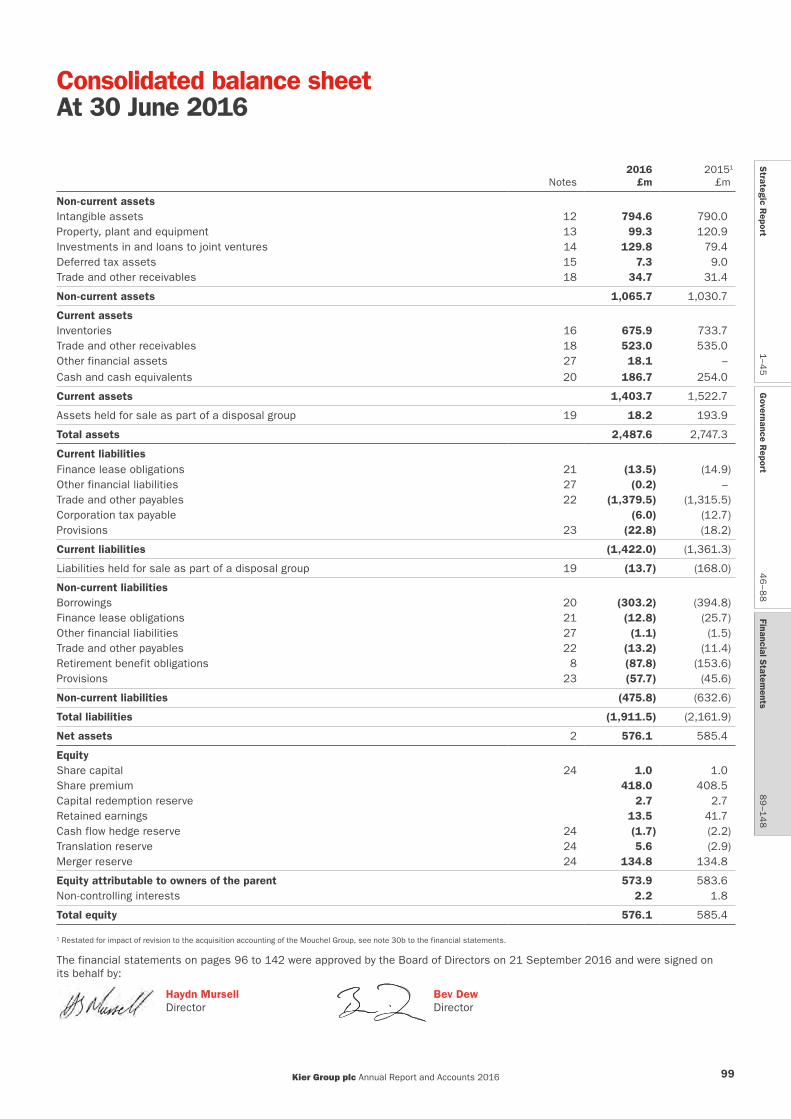
Consolidated balance sheet At 30 June 2016
Notes2016
£m20151
£m
Non-current assetsIntangible assets 12 794.6 790.0Property, plant and equipment 13 99.3 120.9Investments in and loans to joint ventures 14 129.8 79.4Deferred tax assets 15 7.3 9.0Trade and other receivables 18 34.7 31.4
Non-current assets 1,065.7 1,030.7
Current assetsInventories 16 675.9 733.7Trade and other receivables 18 523.0 535.0Other financial assets 27 18.1 –Cash and cash equivalents 20 186.7 254.0
Current assets 1,403.7 1,522.7
Assets held for sale as part of a disposal group 19 18.2 193.9
Total assets 2,487.6 2,747.3
Current liabilitiesFinance lease obligations 21 (13.5) (14.9)Other financial liabilities 27 (0.2) – Trade and other payables 22 (1,379.5) (1,315.5)Corporation tax payable (6.0) (12.7)Provisions 23 (22.8) (18.2)
Current liabilities (1,422.0) (1,361.3)
Liabilities held for sale as part of a disposal group 19 (13.7) (168.0)
Non-current liabilitiesBorrowings 20 (303.2) (394.8)Finance lease obligations 21 (12.8) (25.7)Other financial liabilities 27 (1.1) (1.5)Trade and other payables 22 (13.2) (11.4)Retirement benefit obligations 8 (87.8) (153.6)Provisions 23 (57.7) (45.6)
Non-current liabilities (475.8) (632.6)
Total liabilities (1,911.5) (2,161.9)
Net assets 2 576.1 585.4
EquityShare capital 24 1.0 1.0Share premium 418.0 408.5Capital redemption reserve 2.7 2.7Retained earnings 13.5 41.7Cash flow hedge reserve 24 (1.7) (2.2)Translation reserve 24 5.6 (2.9)Merger reserve 24 134.8 134.8
Equity attributable to owners of the parent 573.9 583.6Non-controlling interests 2.2 1.8
Total equity 576.1 585.4
1 Restated for impact of revision to the acquisition accounting of the Mouchel Group, see note 30b to the financial statements.
The financial statements on pages 96 to 142 were approved by the Board of Directors on 21 September 2016 and were signed on its behalf by:
Haydn Mursell Bev Dew Director Director
Strategic R
eport1–4
5G
overnance Report
46
–88
Financial Statem
ents8
9–1
48
Kier Group plc Annual Report and Accounts 2016 99
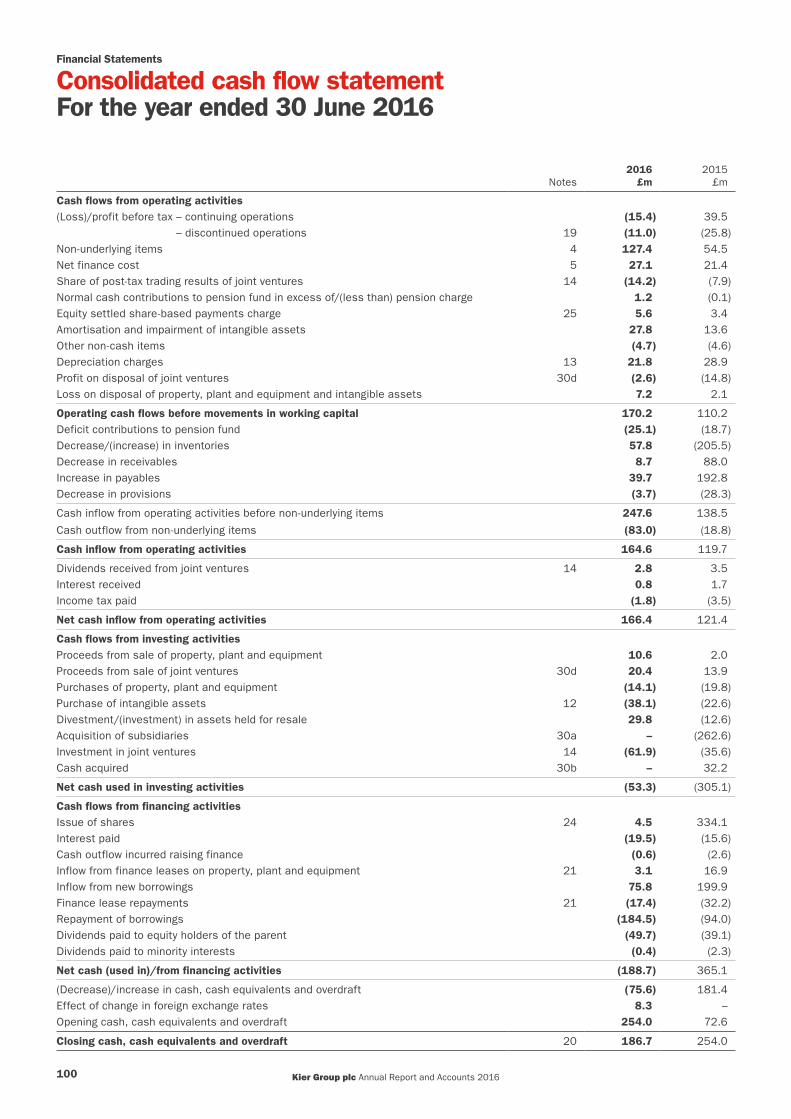
Notes2016
£m2015
£m
Cash flows from operating activities (Loss)/profit before tax – continuing operations (15.4) 39.5 – discontinued operations 19 (11.0) (25.8)Non-underlying items 4 127.4 54.5Net finance cost 5 27.1 21.4Share of post-tax trading results of joint ventures 14 (14.2) (7.9)Normal cash contributions to pension fund in excess of/(less than) pension charge 1.2 (0.1)Equity settled share-based payments charge 25 5.6 3.4Amortisation and impairment of intangible assets 27.8 13.6Other non-cash items (4.7) (4.6)Depreciation charges 13 21.8 28.9Profit on disposal of joint ventures 30d (2.6) (14.8)Loss on disposal of property, plant and equipment and intangible assets 7.2 2.1
Operating cash flows before movements in working capital 170.2 110.2Deficit contributions to pension fund (25.1) (18.7)Decrease/(increase) in inventories 57.8 (205.5)Decrease in receivables 8.7 88.0Increase in payables 39.7 192.8Decrease in provisions (3.7) (28.3)
Cash inflow from operating activities before non-underlying items 247.6 138.5
Cash outflow from non-underlying items (83.0) (18.8)
Cash inflow from operating activities 164.6 119.7
Dividends received from joint ventures 14 2.8 3.5Interest received 0.8 1.7Income tax paid (1.8) (3.5)
Net cash inflow from operating activities 166.4 121.4
Cash flows from investing activities Proceeds from sale of property, plant and equipment 10.6 2.0Proceeds from sale of joint ventures 30d 20.4 13.9Purchases of property, plant and equipment (14.1) (19.8)Purchase of intangible assets 12 (38.1) (22.6)Divestment/(investment) in assets held for resale 29.8 (12.6)Acquisition of subsidiaries 30a – (262.6)Investment in joint ventures 14 (61.9) (35.6)Cash acquired 30b – 32.2
Net cash used in investing activities (53.3) (305.1)
Cash flows from financing activities Issue of shares 24 4.5 334.1Interest paid (19.5) (15.6)Cash outflow incurred raising finance (0.6) (2.6)Inflow from finance leases on property, plant and equipment 21 3.1 16.9Inflow from new borrowings 75.8 199.9Finance lease repayments 21 (17.4) (32.2)Repayment of borrowings (184.5) (94.0)Dividends paid to equity holders of the parent (49.7) (39.1)Dividends paid to minority interests (0.4) (2.3)
Net cash (used in)/from financing activities (188.7) 365.1
(Decrease)/increase in cash, cash equivalents and overdraft (75.6) 181.4Effect of change in foreign exchange rates 8.3 –Opening cash, cash equivalents and overdraft 254.0 72.6
Closing cash, cash equivalents and overdraft 20 186.7 254.0
Financial Statements
Consolidated cash flow statementFor the year ended 30 June 2016
Kier Group plc Annual Report and Accounts 2016100

Notes to the consolidated financial statementsFor the year ended 30 June 2016
1 Significant accounting policiesKier Group plc (the Company) is a public limited company domiciled in the United Kingdom (UK), incorporated in England and Wales and listed on the London Stock Exchange. The Company’s registered number is 2708030. The consolidated financial statements of the Company for the year ended 30 June 2016 comprise the Company and its subsidiaries (together referred to as the Group) and the Group’s interest in joint arrangements.
The consolidated financial statements were approved by the directors on 21 September 2016.
Statement of complianceThe Group’s consolidated financial statements have been prepared and approved by the directors in accordance with International Financial Reporting Standards as adopted by the European Union (IFRS) and therefore comply with Article 4 of the EU IAS Regulation and with those parts of the Companies Act 2006 that are applicable to companies reporting under IFRS. The Group has applied all accounting standards issued by the International Accounting Standards Board (‘IASB’) and interpretations issued by the IFRS Interpretations Committee as adopted by the European Union and effective for accounting periods beginning on 1 July 2015.
The Company has elected to prepare its parent company financial statements in accordance with the FRS101 ‘Reduced Disclosure Framework’. These are presented on pages 143 to 148.
Basis of preparationThe Group has considerable financial resources, long-term contracts and a diverse range of customers and suppliers across its business activities.
After making enquiries, the directors have a reasonable expectation that the Company and the Group have adequate resources to continue in operational existence for the foreseeable future. Accordingly, the directors continue to adopt the going concern basis in preparing the Group’s financial statements.
The financial statements are presented in pounds sterling. They have been prepared on the historical cost basis except for derivative financial instruments which are stated at their fair value.
The following new standards and amendments to standards are effective for the financial year ended 30 June 2016 onwards:
• Amendments to IAS19 Defined Benefit Plans: Employee Contributions
• Annual improvements to IFRS 2010-2012 Cycle• Annual improvements to IFRS 2011-2013 Cycle
The following new standards and amendments to standards have been issued, and will take effect for periods beginning on or after 1 January 2016 other than IFRS9 and IFRS15 which will take effect for periods starting after 1 January 2018 and IFRS16 which will take effect for periods starting after 1 January 2019:
IFRS2 (amendments) Share Based Payment
IFRS5 (amendments) Non-current Assets Held for Sale and Discontinued Operations
IFRS7 (amendments) Financial Instruments: Disclosures
IFRS9 Financial Instruments
IFRS11 (amendments) Joint arrangements
IFRS12 (amendments) Disclosure of Interest in Other Entities
IFRS15 Revenue from Contracts with Customers
IFRS16 Leases
IAS1 (amendments) Presentation of Financial Statements
IAS7 (amendments) Statement of Cash Flows
IAS12 (amendments) Income Taxes
IAS16 (amendments) Property, Plant and Equipment
IAS19 (amendments) Employee Benefits
IAS38 (amendments) Intangible Assets
The directors are considering the impact of these new standards and interpretations in future periods.
IFRS15 will replace IAS18 ‘Revenue’ and IAS11 ‘Construction Contracts’. It will become effective for accounting periods beginning on or after 1 January 2018 and will therefore be applied for the first time to the Group accounts for the year ended 30 June 2019; the IASB has indicated that early adoption will be permitted. The Group has begun a systematic review of all existing major contracts to ensure that the impact and effects of the IFRS15 and IFRS16 are fully understood and changes to the current accounting procedures are highlighted and acted upon in advance of the effective date.
Other than the impact of IFRS15 and IFRS16 as noted above, no significant net impact from the adoption of these new standards is expected. The Group has chosen not to adopt any of the above standards and interpretations earlier than required.
The following accounting policies have been applied consistently in dealing with items which are considered material in relation to the Group’s financial statements.
Basis of consolidation(a) SubsidiariesThe consolidated financial statements comprise the financial statements of the Company and subsidiaries controlled by the Company drawn up to 30 June 2016. Control exists when the Group has direct or indirect power to govern the financial and operating policies of an entity so as to obtain economic benefits from its activities. Subsidiaries are included in the consolidated financial statements from the date that control transfers to the Group until the date that control ceases.
Business combinations are accounted for using the acquisition method as at the acquisition date, which is the date on which control is transferred to the Group. Control is the power to govern the financial and operating policies of an entity so as to obtain benefits from its activities. In assessing control, the Group takes into consideration potential voting rights that currently are exercisable.
If a business combination is achieved in stages, the acquisition date carrying value of the acquirer’s previously held equity interest in the acquiree is re-measured to fair value at the acquisition date; any gains or losses arising from such re-measurements are recognised in profit or loss.
For acquisitions on or after 1 January 2010, the Group measures goodwill at the acquisition date as:
• The fair value of the consideration transferred; plus • The recognised amount of any non-controlling interests in
the acquiree; plus• If the business combination is achieved in stages, the fair
value of the existing equity interest in the acquiree; less• The net recognised amount (generally fair value) of the
identifiable assets acquired and liabilities assumed.
Kier Group plc Annual Report and Accounts 2016 101
Strategic R
eport1–4
5G
overnance Report
46
–88
Financial Statem
ents8
9–1
48
Financial Statements
Notes to the consolidated financial statementsFor the year ended 30 June 2016 continued
1 Significant accounting policies continuedWhen the result is negative, a ‘bargain purchase’ gain is recognised immediately in the income statement.
Provisional fair values allocated at a reporting date are finalised within 12 months of the acquisition date.
The consideration transferred does not include amounts related to the settlement of pre-existing relationships. Such amounts are generally recognised in the income statement. Costs related to the acquisition, other than those associated with the issue of debt or equity securities, that the Group incurs in connection with a business combination are expensed as incurred. Any contingent consideration payable is recognised at fair value at the acquisition date. Subsequent changes to the fair value of the contingent consideration are recognised in the income statement unless the contingent consideration is classified as equity, in which case settlement is accounted for within reserves.
Accounting policies of subsidiaries are adjusted where necessary to ensure consistency with those used by the Group. All intra-Group transactions, balances, income and expenses are eliminated on consolidation.
(b) Joint arrangementsA joint arrangement is a contractual arrangement whereby the Group undertakes an economic activity that is subject to joint control with third parties.
The Group’s interests in joint ventures are accounted for using the equity method. Under this method the Group’s share of the profits less losses of joint ventures is included in the consolidated income statement and its interest in their net assets is included in investments in the consolidated balance sheet. Where the share of losses exceeds the Group’s interest in the entity and there is no obligation to fund these losses the carrying amount is reduced to nil, following which no further losses are recognised. Interest in the entity is the carrying amount of the investment together with any long-term interests that, in substance, form part of the net investment in the entity.
From time to time the Group undertakes contracts jointly with other parties. These fall under the category of joint operations as defined by IFRS11. In accordance with IFRS11, the Group accounts for its own share of sales, profits, assets, liabilities and cash flows measured according to the terms of the agreements.
Goodwill and other intangible assetsGoodwill arising on consolidation represents the excess of the consideration over the Group’s interest in the fair value of the identifiable assets and liabilities of a subsidiary.
Goodwill is recognised as an asset and reviewed for impairment at least annually. Any impairment is recognised immediately in the income statement and is not subsequently reversed. Negative goodwill is recognised in the income statement immediately. On disposal of a subsidiary or jointly controlled entity, the attributable carrying amount of goodwill is included in the determination of the profit or loss on disposal.
Other intangible assets which comprise contract rights and computer software are stated at cost less accumulated amortisation and impairment losses. Amortisation is charged to administrative expenses in the income statement on a straight-line basis over the expected useful lives of the assets, which are principally as follows:
Contract rights Over the remaining contract life
Computer software 3–7 years
Internally generated intangible assets developed by the Group are recognised only if all of the following conditions are met:
• An asset is created that can be identified;• It is probable that the asset created will generate future
economic benefits; and• The development cost of the asset can be measured reliably.
Other research expenditure is written off in the period in which it is incurred.
Non-underlying items1
Certain items are presented separately in the consolidated income statement as non-underlying items where, in the judgement of the directors, they need to be disclosed separately by virtue of their nature, size or incidence in order to obtain a clear and consistent presentation of the Group’s underlying business performance.
Examples of material items which may give rise to disclosure as non-underlying items include gains or losses on the disposal of businesses, costs of restructuring and reorganisation of existing businesses, integration of newly acquired businesses, asset impairments and acquisition transaction costs and unwind of discounts. They also include reclassification of provisions in respect of such items.
Amortisation of acquired intangible assets is also treated as a non-underlying item so that the underlying profit of the Group can be measured on a comparable basis from period to period.
These are examples, and from time to time it may be appropriate to disclose further items as non-underlying in order to highlight the underlying performance of the Group.
Underlying operating profit is one of the key measures used by the Board to monitor the Group’s performance.1 Exceptional items.
Revenue and profit recognitionRevenue comprises the fair value of the consideration received or receivable, net of value added tax, rebates and discounts and after eliminating sales within the Group. It also includes the Group’s proportion of work carried out under jointly controlled operations.
Revenue and profit are recognised as follows:
(a) Construction contractsRevenue arises from increases in valuations on contracts and is normally determined by external valuations. It is the gross value of work carried out for the period to the balance sheet date (including retentions) but excludes claims until they are actually certified.
Profit on contracts is calculated in accordance with accounting standards and industry practice. Industry practice is to assess the estimated final outcome of each contract and recognise the profit based upon the percentage of completion of the contract at the relevant date. The assessment of the final outcome of each contract is determined by regular review of the revenues and costs to complete that contract. Consistent contract review procedures are in place in respect of contract forecasting.
Kier Group plc Annual Report and Accounts 2016102
The general principles for profit recognition are as follows:
• Profits on short duration contracts are taken when the contract is complete;
• Profits on other contracts are recognised on a percentage of completion basis when the contract’s outcome can be estimated reliably;
• Provision is made for losses incurred or foreseen in bringing the contract to completion as soon as they become apparent;
• Claims receivable are recognised as income when received or certified for payment, except that in preparing contract forecasts to completion, a prudent and reasonable evaluation of claims receivable may be included to mitigate foreseeable losses and only to the extent that there is reasonable certainty of recovery; and
• Variations and compensation events are included in forecasts to completion when it is considered highly probable that they will be recovered.
Percentage completion is normally calculated by taking certified value to date as a percentage of estimated final value, unless the internal value is materially different to the certified value, in which case the internal value is used.
(b) ServicesRevenue and profit from services rendered, which include facilities management, highways maintenance, street cleaning and recycling, is recognised as and when the service is provided.
Where revenue that has been recognised is subsequently determined not to be recoverable due to a dispute with the client, these amounts are charged against the revenue recognised. Where non-recovery is as a result of inability of a client to meet its obligations, these amounts are charged to administrative expenses.
Unbilled revenue is the difference between the revenue recognised and the amounts actually invoiced to customers. Where invoicing exceeds the amount of revenue recognised these amounts are included in deferred income.
(c) Private housing and land salesRevenue from housing sales is recognised at the fair value of the consideration received or receivable on legal completion, net of incentives. Revenue from land sales and land exchanges is recognised on the unconditional exchange of contracts. Profit is recognised on a site-by-site basis by reference to the expected out-turn result from each site. The principal estimation technique used by the Group in attributing profit on sites to a particular period is the preparation of forecasts on a site-by-site basis. These focus on revenues and costs to complete and enable an assessment to be made of the final out-turn on each site. Consistent review procedures are in place in respect of site forecasting. Provision is made for any losses foreseen in completing a site as soon as they become apparent.
(d) Property developmentRevenue in respect of property developments is taken on unconditional exchange of contracts on disposal of finished developments. Profit taken is subject to any amounts necessary to cover residual commitments relating to development performance. Provision is made for any losses foreseen in completing a development as soon as they become apparent.
Where developments are sold in advance of construction being completed, revenue and profit are recognised from the point of sale and as the significant outstanding acts of construction and development are completed. If a development is sold in advance
of the commencement of construction, no revenue or profit is recognised at the point of sale. Revenue and profit are recognised in line with the progress on construction, based on the percentage completion of the construction and development work. If a development is sold during construction but prior to completion, revenue and profit are recognised at the time of sale in line with the percentage completion of the construction and development works at the time of sale and thereafter in line with the percentage of completion of the construction and development works.
(e) Private Finance Initiative (PFI) service concession agreementsRevenue relating to construction or upgrade services under a service concession agreement is recognised based on the stage of completion of the work performed, consistent with the Group’s accounting policy on recognising revenue on construction contracts (see above). Operation or service revenue is recognised in the period in which the services were provided by the Group. When the Group provides more than one service in a service concession agreement, the consideration received is allocated by reference to the relative fair values of the services delivered.
Pre-contract costsCosts associated with bidding for contracts are written off as incurred (pre-contract costs). When it is probable that a contract will be awarded, usually when the Group has secured preferred bidder status, costs incurred from that date to the date of financial close are carried forward in the balance sheet as other receivables.
When financial close is achieved on PFI or Public Private Partnership (PPP) contracts, costs are recovered from the special purpose vehicle and pre-contract costs within this recovery that were not previously capitalised are credited to the income statement, except to the extent that the Group retains a share in the special purpose vehicle. The amount not credited is deferred and recognised over the life of the construction contract to which the costs relate.
Property, plant and equipment and depreciationDepreciation is based on historical or deemed cost, including expenditure that is directly attributable to the acquisition of the items, less the estimated residual value, and the estimated economic lives of the assets concerned. Freehold land is not depreciated. Other tangible assets are depreciated to residual values in equal annual instalments over the period of their estimated economic lives, which are principally as follows:
Freehold land and buildings 25–50 years
Leasehold buildings and improvements Period of lease
Plant and equipment (including vehicles) 3–12 years
Assets held under finance leases are depreciated over the shorter of the term of the lease or the expected useful life of the asset.
LeasesLeases in terms of which the Group assumes substantially all of the risks and rewards of ownership are classified as finance leases. On initial recognition the leased asset is measured at an amount equal to the lower of its fair value and the present value of the minimum lease payments. Subsequent to initial recognition, the asset is accounted for in accordance with the accounting policy applicable to that asset.
Other leases are operating leases and the rental charges are charged to the income statement on a straight-line basis over the life of each lease.
Kier Group plc Annual Report and Accounts 2016 103
Strategic R
eport1–4
5G
overnance Report
46
–88
Financial Statem
ents8
9–1
48

Financial Statements
Notes to the consolidated financial statementsFor the year ended 30 June 2016 continued
1 Significant accounting policies continuedEmployee benefits(a) Retirement benefit obligationsFor defined contribution pension schemes operated by the Group, amounts payable are charged to the income statement as they fall due.
The Group accounts for defined benefit obligations in accordance with IAS19. Obligations are measured at discounted present value while plan assets are measured at fair value. The operating and financing costs of such plans are recognised separately in the income statement; current service costs are spread systematically over the lives of employees and financing costs are recognised in full in the period in which they arise. Re-measurements of the net defined pension liability, including actuarial gains and losses, are recognised immediately in other comprehensive income.
The net finance cost is calculated by applying the discount rate to the net balance of the defined benefit obligation and the fair value of plan assets. This cost is included in finance costs in the income statement.
Where the calculations result in a surplus to the Group, the recognised asset is limited to the present value of any available future refunds from the plan or reductions in future contributions to the plan.
(b) Share-based paymentsShare-based payments granted but not vested are valued at the fair value of the shares at the date of grant. This affects the Sharesave and Long Term Incentive Plan (LTIP) schemes. The fair value of these schemes at the date of award is calculated using the Black-Scholes model apart from the total shareholder return element of the LTIP which is based on a stochastic model.
The cost to the Group of awards to employees under the LTIP scheme is spread on a straight-line basis over the relevant performance period. The scheme awards to senior employees a number of shares which will vest after three years if particular criteria are met. The cost of the scheme is based on the fair value of the shares at the date the options are granted.
Shares purchased and held in trust in connection with the Group’s share schemes are deducted from retained earnings. No gain or loss is recognised within the income statement on the market value of these shares compared with the original cost.
Finance income and costsInterest receivable and payable on bank balances is credited or charged to the income statement as incurred using the effective interest rate method.
Borrowing costs are capitalised where the Group constructs qualifying assets. All other borrowing costs are written off to the income statement as incurred.
Borrowing costs incurred within the Group’s jointly controlled entities relating to the construction of assets in PFI and PPP projects are capitalised until the relevant assets are brought into operational use.
Notional interest payable, representing the unwinding of the discount on long-term liabilities, is charged to finance costs.
TaxationIncome tax comprises current and deferred tax. Income tax is recognised in the income statement except to the extent that it relates to items recognised directly in equity, in which case it is recognised in equity.
Current tax is the expected tax payable on taxable income for the year, using tax rates enacted or substantively enacted at the balance sheet date, and any adjustment to tax payable in respect of previous years.
Deferred tax is provided using the balance sheet method, providing for temporary differences between the carrying amounts of assets and liabilities for financial reporting purposes and the amounts used for taxation purposes. The deferred tax provision is based on the expected manner of realisation or settlement of the carrying amount of the assets and liabilities, using tax rates enacted or substantively enacted at the balance sheet date.
A deferred tax asset is recognised only to the extent that it is probable that future taxable profits will be available against which the asset can be utilised. Deferred tax assets are reduced to the extent that it is no longer probable that the related tax benefit will be realised.
Foreign currenciesTransactions denominated in foreign currencies are recorded at the exchange rates in effect when they take place. Resulting foreign currency denominated assets and liabilities are translated at the exchange rates ruling at the balance sheet date. Exchange differences arising from foreign currency transactions are reflected in the income statement.
Items included in the financial statements of each of the Group’s subsidiaries are measured using the currency of the primary economic environment in which each entity operates (‘the functional currency’). The consolidated financial statements are presented in GBP, which is the Group’s presentation currency.
The assets and liabilities of overseas subsidiary undertakings are translated at the rate of exchange ruling at the balance sheet date. Trading profits or losses are translated at average rates prevailing during the accounting period. Differences on exchange arising from the retranslation of net investments in overseas subsidiary undertakings at the year-end rates are recognised in other comprehensive income. All other translation differences are reflected in the income statement.
Mining assetsOpencast expenditure incurred prior to the commencement of operating an opencast site is capitalised and the cost less the residual value is depreciated over the ‘coaling life’ of the site on a coal extraction basis.
The cost of restoration is recognised as a provision as soon as the restoration liability arises. The amount provided represents the present value of the anticipated costs. Costs are charged against the provision as incurred and the unwinding of the discount is included within finance costs. A tangible asset is created for an amount equivalent to the initial provision and depreciated on a coal extraction basis over the life of the asset. Where there is a subsequent change to the estimated restoration costs or discount rate, the present value of the change is recognised as a change in the restoration provision with a corresponding change in the cost of the tangible asset until the asset is fully depreciated when the remaining adjustment is taken to the income statement.
Kier Group plc Annual Report and Accounts 2016104

InventoriesInventories, including land held for and in the course of development, are valued at the lower of cost and net realisable value. Cost comprises direct materials and, where appropriate, labour and production overheads which have been incurred in bringing the inventories and work in progress to their present location and condition. Cost in certain circumstances also includes notional interest as explained in the accounting policy for finance income and costs. Net realisable value represents the estimated selling price less all estimated costs of completion and costs to be incurred in marketing, selling and distribution.
Construction work in progress is included within inventories in the balance sheet. It is measured at cost plus profit less losses recognised to date less progress billings. If payments received from customers exceed the income recognised, the difference is included within trade and other payables in the balance sheet.
Land inventory is recognised at the time a liability is recognised; generally after exchange of unconditional contracts.
Property inventory, which represents all development land and work in progress, is included at cost less any losses foreseen in completing and disposing of the development less any amounts received or receivable as progress payments or part disposals. Where a property is being developed, cost includes cost of acquisition and development to date, including directly attributable fees, expenses and finance charges net of rental or other income attributable to the development. Where development property is not being actively developed, net rental income and finance costs are taken to the income statement.
Assets held for saleAssets classified as held for sale are measured at the lower of their carrying amount and fair value less costs to sell.
Assets are classified as held for sale if their carrying amount will be recovered through a sale transaction rather than through continuing use. This condition is regarded as met only when the sale is highly probable and the assets are available for sale in their present condition.
Share capitalThe ordinary share capital of the Company is recorded as the proceeds received, net of directly attributable incremental issue costs.
ProvisionsProvisions are recognised when the Group has a present legal or constructive obligation as a result of a past event, and where it is probable that an outflow will be required to settle the obligation and the amount can be reliably estimated.
Financial instrumentsFinancial assets and financial liabilities are recognised in the Group’s balance sheet when the Group becomes a party to the contractual provisions of the instrument. The principal financial assets and liabilities of the Group are as follows:
(a) Trade receivables and trade payablesGiven the varied activities of the Group it is not practicable to identify a common operating cycle. The Group has therefore allocated receivables and payables due within 12 months of the balance sheet date to current with the remainder included in non-current.
Trade receivables do not carry interest and are stated at their initial cost reduced by appropriate allowances for estimated irrecoverable amounts.
Trade payables on normal terms are not interest bearing and are stated at their nominal value. Trade payables on extended terms, particularly in respect of land purchases, are discounted and recorded at their present value.
(b) Cash and cash equivalentsCash and cash equivalents in the cash flow statement comprise cash at bank and in hand, including bank deposits with original maturities of three months or less, net of bank overdrafts where legal right of set off exists. Bank overdrafts are included within financial liabilities in current liabilities in the balance sheet.
(c) Bank and other borrowingsInterest-bearing bank and other borrowings are recorded at the fair value of the proceeds received, net of direct issue costs. Finance charges, including premiums payable on settlement or redemption and direct issue costs, are accounted for on an accruals basis in the income statement using the effective interest method and are added to the carrying value of the instrument to the extent that they are not settled in the period in which they arise.
(d) PFI assetsUnder the terms of a PFI or similar project, where the risks and rewards of ownership remain largely with the purchaser of the associated services, the Group’s interest in the asset is classified as a financial asset and included at its amortised cost within investment in joint ventures.
(e) Derivative financial instrumentsDerivatives are initially recognised at fair value on the date that the contract is entered into and subsequently re-measured in future periods at their fair value. The method of recognising the resulting change in fair value depends on whether the derivative is designated as a hedging instrument and whether the hedging relationship is effective.
For cash flow hedges the effective part of the change in fair value of these derivatives is recognised directly in other comprehensive income. Any ineffective portion is recognised immediately in the income statement. Amounts accumulated in equity are recycled to the income statement in the periods when the hedged items will affect profit or loss. The fair value of interest rate derivatives is the estimated amount that the Group would receive or pay to terminate the derivatives at the balance sheet date.
If the hedging instrument no longer meets the criteria for hedge accounting, expires or is sold, terminated or exercised, the hedge accounting is discontinued prospectively. The cumulative gain or loss previously recognised in equity remains there until the forecast transaction occurs.
The Group enters into forward contracts in order to hedge against transactional foreign currency exposures. In cases where these derivative instruments are significant, hedge accounting is applied as described above. Where hedge accounting is not applied, changes in fair value of derivatives are recognised in the income statement. Fair values are based on observable market prices at the balance sheet date.
(f) Government grantsGovernment grant income is recognised at the point that there is reasonable assurance that the Group will comply with the conditions attached to it, and that the grant will be received.
Kier Group plc Annual Report and Accounts 2016 105
Strategic R
eport1–4
5G
overnance Report
46
–88
Financial Statem
ents8
9–1
48

Financial Statements
Notes to the consolidated financial statementsFor the year ended 30 June 2016 continued
1 Significant accounting policies continued Accounting estimates and judgementsThe key assumptions concerning the future and other key sources of estimation uncertainty at the balance sheet date that have a significant risk of causing a material adjustment to the carrying amounts of assets and liabilities within the next financial year are as follows:
(a) Revenue and profit recognitionThe estimation techniques used for revenue and profit recognition in respect of property development, private housing sales, construction contracts and services contracts require forecasts to be made of the outcome of long-term contracts which require assessments and judgements to be made on the recovery of pre-contract costs, changes in the scope of work, contract programmes, maintenance and defects liabilities and changes in costs.
(b) Valuation of land and work in progressThe key judgements and estimates in determining the net realisable value of land and work in progress are:
• An estimation of costs to complete;• An estimation of the remaining revenues; and• An estimation of selling costs.
These assessments include a degree of uncertainty and therefore if the key judgements and estimates change unfavourably, write downs of land and work in progress may be necessary.
(c) Determination of fair values of identifiable net assets on acquisitions On the acquisition of a business, fair values are attributed to the identifiable assets and liabilities and contingent liabilities unless the fair value cannot be measured reliably, in which case the value is subsumed into goodwill.
(d) Defined benefit pension scheme valuationsIn determining the valuation of defined benefit pension scheme assets and liabilities, a number of key assumptions have been made. The key assumptions, which are given below, are largely dependent on factors outside the control of the Group:
• Expected return on plan assets;• Inflation rate;• Mortality;• Discount rate; and• Salary and pension increases.
Details of the assumptions used are included in note 8.
(e) ProvisionsProvisions are liabilities of uncertain timing or amount and therefore in making a reliable estimate of the amount and timing of liabilities judgement is applied and re-evaluated at each reporting date.
(f) Recoverable value of recognised receivablesThe recoverability of trade and other receivables is regularly reviewed in the light of available economic information specific to each receivable and provisions are recognised for balances considered to be irrecoverable.
(g) GoodwillDetermining whether goodwill is impaired requires an estimation of the value in use of CGUs to which the goodwill has been allocated. The value in use calculation requires an estimate to be made of the timing and amount of future cash flows expected to arise from the CGU and the application of a suitable discount rate
in order to calculate the net present value. Cash flow forecasts for the next three years are based on the Group’s budgets and forecasts. Other key inputs in assessing each CGU are revenue growth, operating margin and discount rate. The assumptions are set out in note 12 together with an assessment of the impact of reasonably possible sensitivities.
(h) Non-underlying itemsNon-underlying items are items of financial performance which the Group believes should be separately identified on the face of the income statement to assist in understanding the underlying financial performance achieved by the Group. Determining whether an item is part of underlying or non-underlying items requires judgement.
A total non-underlying cost of £119.2m after tax was charged to the income statement for the year ended 30 June 2016.
(i) Held for sale and discontinued operationsWhen it is probable that businesses will be sold within one year and they are being actively marketed they meet the criteria to be classified as held for sale. Discontinued operations are businesses or a group of businesses which meet the criteria to be held for sale, have been sold or abandoned, and form a separate major line of business of the Group. Management judgement is applied in assessing the timing of sale to meet the classification criteria.
Details of assets held for sale and discontinued operations are set out in note 19.
(j) TaxationThe Group is subject to tax in a number of jurisdictions and judgement is required in determining the overall provision for income taxes. The Group provides for future liabilities in respect of uncertain tax positions where additional tax may become payable in future periods and such provisions are based on management’s assessment of exposures.
Deferred tax liabilities are generally provided for in full and deferred tax assets are recognised to the extent that it is judged probable that future taxable profit will arise against which the temporary differences will be utilised.
2 Segmental reportingThe Group operates four divisions: Property, Residential, Construction and Services, which is the basis on which the Group manages and reports its primary segmental information. Corporate includes unrecovered overheads and the charge for defined benefit pension schemes.
Segmental information is based on the information provided to the Chief Executive, together with the Board, who is the chief operating decision maker. The segments are strategic business units which have different core customers and offer different services. The segments are discussed in the Chief Executive’s strategic review on pages 6 to 9 and the divisional reviews on pages 32 to 39.
The accounting policies of the operating segments are the same as those described in the summary of significant accounting policies on pages 101 to 106. The Group evaluates segmental information on the basis of profit or loss from operations before non-underlying items, interest and income tax expense. The segmental results that are reported to the Chief Executive include items directly attributable to a segment as well as those that can be allocated on a reasonable basis.
Kier Group plc Annual Report and Accounts 2016106
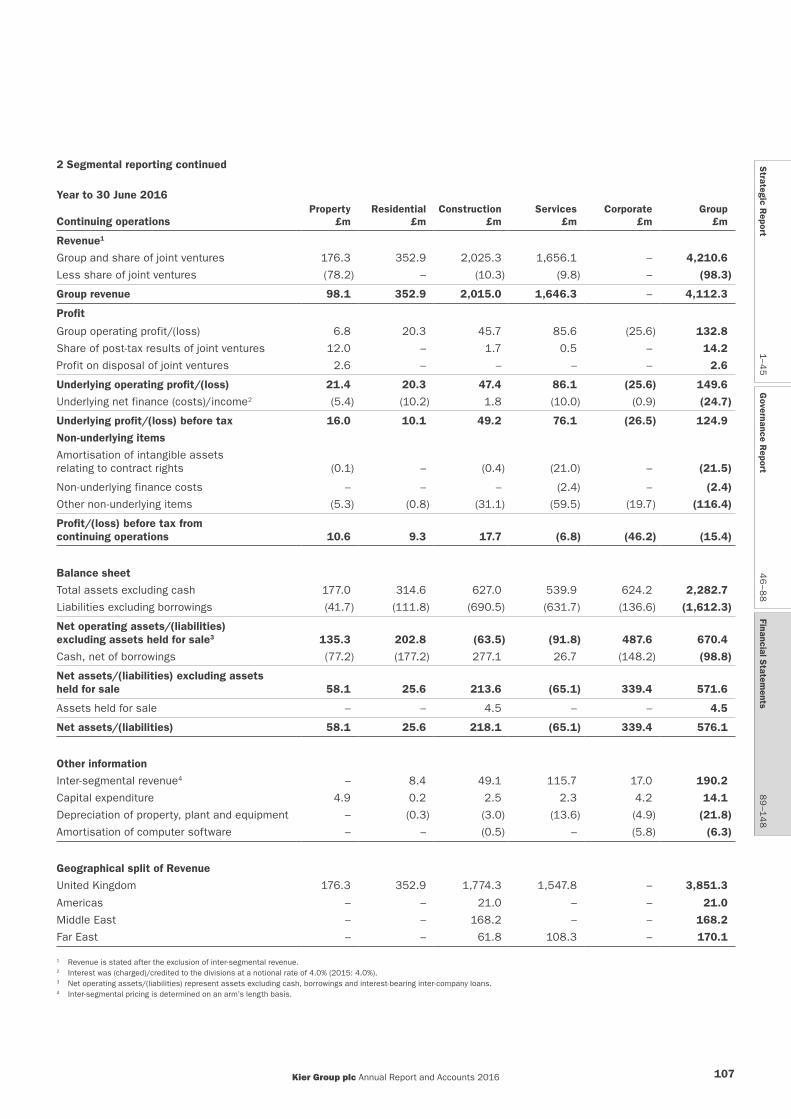
2 Segmental reporting continued
Year to 30 June 2016
Continuing operationsProperty
£mResidential
£mConstruction
£mServices
£mCorporate
£mGroup
£m
Revenue1
Group and share of joint ventures 176.3 352.9 2,025.3 1,656.1 – 4,210.6
Less share of joint ventures (78.2) – (10.3) (9.8) – (98.3)
Group revenue 98.1 352.9 2,015.0 1,646.3 – 4,112.3
Profit
Group operating profit/(loss) 6.8 20.3 45.7 85.6 (25.6) 132.8
Share of post-tax results of joint ventures 12.0 – 1.7 0.5 – 14.2
Profit on disposal of joint ventures 2.6 – – – – 2.6
Underlying operating profit/(loss) 21.4 20.3 47.4 86.1 (25.6) 149.6
Underlying net finance (costs)/income2 (5.4) (10.2) 1.8 (10.0) (0.9) (24.7)
Underlying profit/(loss) before tax 16.0 10.1 49.2 76.1 (26.5) 124.9
Non-underlying items
Amortisation of intangible assets relating to contract rights (0.1) – (0.4) (21.0) – (21.5)
Non-underlying finance costs – – – (2.4) – (2.4)
Other non-underlying items (5.3) (0.8) (31.1) (59.5) (19.7) (116.4)
Profit/(loss) before tax from continuing operations 10.6 9.3 17.7 (6.8) (46.2) (15.4)
Balance sheet
Total assets excluding cash 177.0 314.6 627.0 539.9 624.2 2,282.7
Liabilities excluding borrowings (41.7) (111.8) (690.5) (631.7) (136.6) (1,612.3)
Net operating assets/(liabilities) excluding assets held for sale3 135.3 202.8 (63.5) (91.8) 487.6 670.4
Cash, net of borrowings (77.2) (177.2) 277.1 26.7 (148.2) (98.8)
Net assets/(liabilities) excluding assets held for sale 58.1 25.6 213.6 (65.1) 339.4 571.6
Assets held for sale – – 4.5 – – 4.5
Net assets/(liabilities) 58.1 25.6 218.1 (65.1) 339.4 576.1
Other information
Inter-segmental revenue4 – 8.4 49.1 115.7 17.0 190.2
Capital expenditure 4.9 0.2 2.5 2.3 4.2 14.1
Depreciation of property, plant and equipment – (0.3) (3.0) (13.6) (4.9) (21.8)
Amortisation of computer software – – (0.5) – (5.8) (6.3)
Geographical split of Revenue
United Kingdom 176.3 352.9 1,774.3 1,547.8 – 3,851.3
Americas – – 21.0 – – 21.0
Middle East – – 168.2 – – 168.2
Far East – – 61.8 108.3 – 170.1
1 Revenue is stated after the exclusion of inter-segmental revenue.2 Interest was (charged)/credited to the divisions at a notional rate of 4.0% (2015: 4.0%).3 Net operating assets/(liabilities) represent assets excluding cash, borrowings and interest-bearing inter-company loans.4 Inter-segmental pricing is determined on an arm’s length basis.
Kier Group plc Annual Report and Accounts 2016 107
Strategic R
eport1–4
5G
overnance Report
46
–88
Financial Statem
ents8
9–1
48

Financial Statements
Notes to the consolidated financial statementsFor the year ended 30 June 2016 continued
2 Segmental reporting continued
Year to 30 June 2015
Continuing operationsProperty
£mResidential
£mConstruction6
£mServices6
£mCorporate
£mGroup
£m
Revenue1
Group and share of joint ventures 126.2 257.2 1,732.2 1,235.6 – 3,351.2
Less share of joint ventures (66.8) – (7.8) (0.7) – (75.3)
Group revenue 59.4 257.2 1,724.4 1,234.9 – 3,275.9
Profit
Group operating profit/(loss) 2.1 11.2 36.6 57.0 (25.9) 81.0
Share of post-tax results of joint ventures 5.8 – 1.8 0.3 – 7.9
Profit on disposal of joint ventures 14.8 – – – – 14.8
Underlying operating profit/(loss) 22.7 11.2 38.4 57.3 (25.9) 103.7
Underlying net finance (costs)/income2 (2.5) (11.0) 8.2 (6.6) (5.9) (17.8)
Underlying profit/(loss) before tax 20.2 0.2 46.6 50.7 (31.8) 85.9
Non-underlying items
Amortisation of intangible assets relating to contract rights (0.1) – (0.4) (10.7) – (11.2)
Non-underlying finance costs – – – (3.6) – (3.6)
Other non-underlying items – – (0.5) (8.0) (23.1) (31.6)
Profit/(loss) before tax from continuing operations 20.1 0.2 45.7 28.4 (54.9) 39.5
Balance sheet3
Total assets excluding cash 128.2 320.5 674.7 547.0 629.0 2,299.4
Liabilities excluding borrowings (24.7) (59.6) (741.1) (587.0) (186.7) (1,599.1)
Net operating assets/(liabilities) excluding assets held for sale4 103.5 260.9 (66.4) (40.0) 442.3 700.3
Cash, net of borrowings (73.9) (243.9) 289.8 (43.9) (68.9) (140.8)
Net assets/(liabilities) excluding assets held for sale 29.6 17.0 223.4 (83.9) 373.4 559.5
Assets/(liabilities) held for sale 20.3 – (7.4) 13.1 (0.1) 25.9
Net assets/(liabilities) 49.9 17.0 216.0 (70.8) 373.3 585.4
Other information
Inter-segmental revenue5 1.9 – 19.3 123.6 14.0 158.8
Capital expenditure 0.1 0.3 2.2 5.9 11.3 19.8
Depreciation of property, plant and equipment – (0.1) (7.7) (15.0) (6.1) (28.9)
Amortisation of computer software – – 0.3 (2.6) (2.5) (4.8)
Geographical split of Revenue
United Kingdom 126.2 257.2 1,592.4 1,212.2 – 3,188.0
Americas – – 30.5 – – 30.5
Middle East – – 70.2 – – 70.2
Far East – – 39.1 23.4 – 62.5
1 Revenue is stated after the exclusion of inter-segmental revenue.2 Interest was (charged)/credited to the divisions at a notional rate of 4.0%.3 Restated for the impact of revision to the acquisition accounting for the Mouchel Group, see note 30b to the financial statements. 4 Net operating assets/(liabilities) represent assets excluding cash, borrowings and interest-bearing inter-company loans.5 Inter-segmental pricing is determined on an arm’s length basis.6 Restated to reflect the reallocation of Mouchel Consulting from the Services division to the Construction division.
Kier Group plc Annual Report and Accounts 2016108
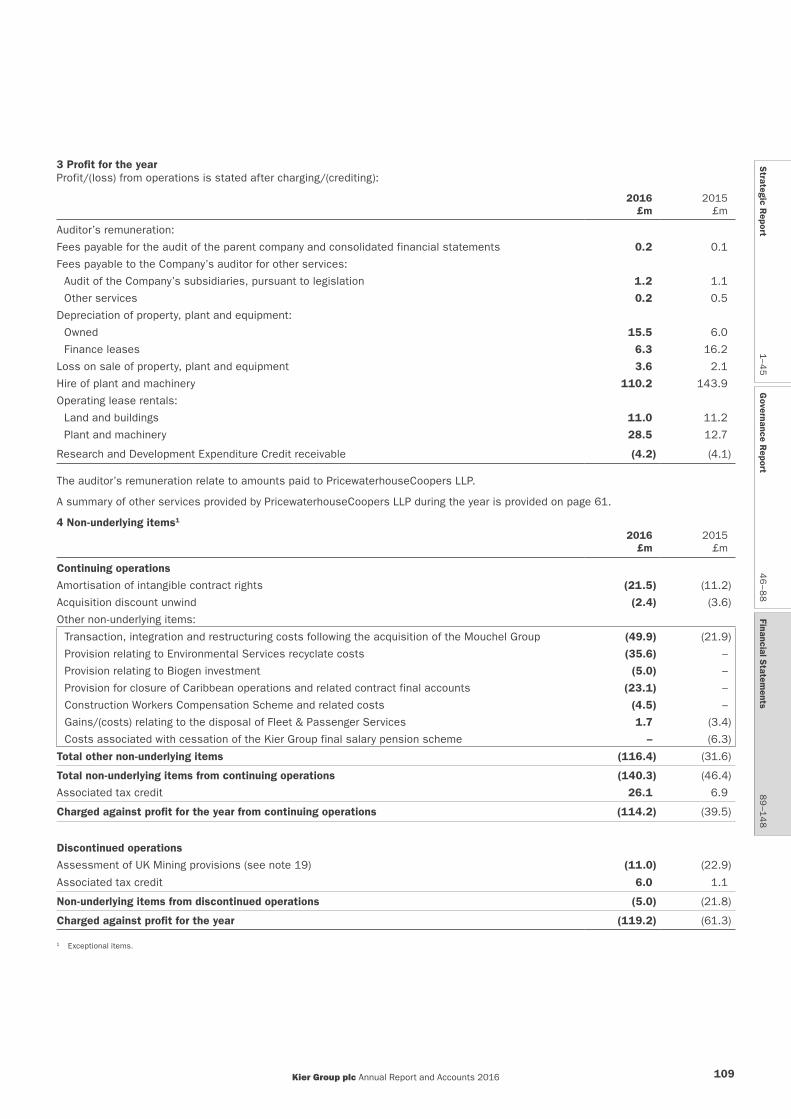
3 Profit for the yearProfit/(loss) from operations is stated after charging/(crediting):
2016 £m
2015 £m
Auditor’s remuneration:
Fees payable for the audit of the parent company and consolidated financial statements 0.2 0.1
Fees payable to the Company’s auditor for other services:
Audit of the Company’s subsidiaries, pursuant to legislation 1.2 1.1
Other services 0.2 0.5
Depreciation of property, plant and equipment:
Owned 15.5 6.0
Finance leases 6.3 16.2
Loss on sale of property, plant and equipment 3.6 2.1
Hire of plant and machinery 110.2 143.9
Operating lease rentals:
Land and buildings 11.0 11.2
Plant and machinery 28.5 12.7
Research and Development Expenditure Credit receivable (4.2) (4.1)
The auditor’s remuneration relate to amounts paid to PricewaterhouseCoopers LLP.
A summary of other services provided by PricewaterhouseCoopers LLP during the year is provided on page 61.
4 Non-underlying items1
2016 £m
2015 £m
Continuing operations
Amortisation of intangible contract rights (21.5) (11.2)
Acquisition discount unwind (2.4) (3.6)
Other non-underlying items:
Transaction, integration and restructuring costs following the acquisition of the Mouchel Group (49.9) (21.9)
Provision relating to Environmental Services recyclate costs (35.6) –
Provision relating to Biogen investment (5.0) –
Provision for closure of Caribbean operations and related contract final accounts (23.1) –
Construction Workers Compensation Scheme and related costs (4.5) –
Gains/(costs) relating to the disposal of Fleet & Passenger Services 1.7 (3.4)
Costs associated with cessation of the Kier Group final salary pension scheme – (6.3)
Total other non-underlying items (116.4) (31.6)
Total non-underlying items from continuing operations (140.3) (46.4)
Associated tax credit 26.1 6.9
Charged against profit for the year from continuing operations (114.2) (39.5)
Discontinued operations
Assessment of UK Mining provisions (see note 19) (11.0) (22.9)
Associated tax credit 6.0 1.1
Non-underlying items from discontinued operations (5.0) (21.8)
Charged against profit for the year (119.2) (61.3)
1 Exceptional items.
Kier Group plc Annual Report and Accounts 2016 109
Strategic R
eport1–4
5G
overnance Report
46
–88
Financial Statem
ents8
9–1
48
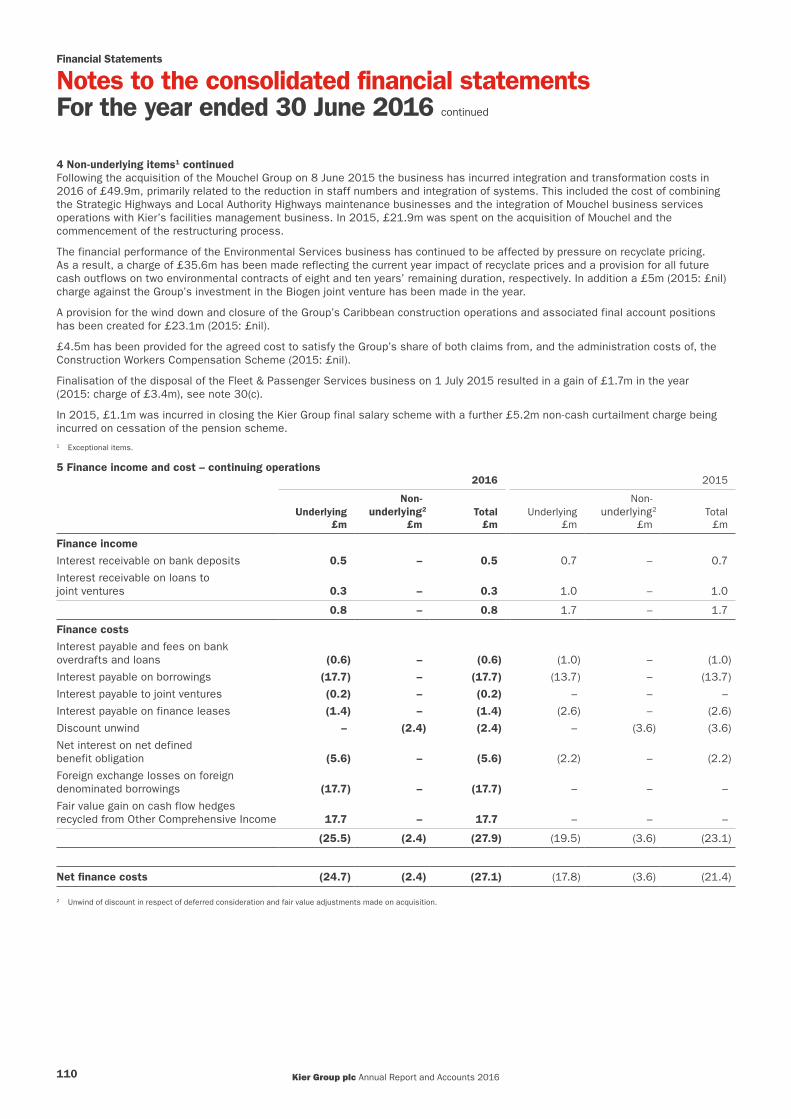
Financial Statements
Notes to the consolidated financial statementsFor the year ended 30 June 2016 continued
4 Non-underlying items1 continuedFollowing the acquisition of the Mouchel Group on 8 June 2015 the business has incurred integration and transformation costs in 2016 of £49.9m, primarily related to the reduction in staff numbers and integration of systems. This included the cost of combining the Strategic Highways and Local Authority Highways maintenance businesses and the integration of Mouchel business services operations with Kier’s facilities management business. In 2015, £21.9m was spent on the acquisition of Mouchel and the commencement of the restructuring process.
The financial performance of the Environmental Services business has continued to be affected by pressure on recyclate pricing. As a result, a charge of £35.6m has been made reflecting the current year impact of recyclate prices and a provision for all future cash outflows on two environmental contracts of eight and ten years’ remaining duration, respectively. In addition a £5m (2015: £nil) charge against the Group’s investment in the Biogen joint venture has been made in the year.
A provision for the wind down and closure of the Group’s Caribbean construction operations and associated final account positions has been created for £23.1m (2015: £nil).
£4.5m has been provided for the agreed cost to satisfy the Group’s share of both claims from, and the administration costs of, the Construction Workers Compensation Scheme (2015: £nil).
Finalisation of the disposal of the Fleet & Passenger Services business on 1 July 2015 resulted in a gain of £1.7m in the year (2015: charge of £3.4m), see note 30(c).
In 2015, £1.1m was incurred in closing the Kier Group final salary scheme with a further £5.2m non-cash curtailment charge being incurred on cessation of the pension scheme. 1 Exceptional items.
5 Finance income and cost – continuing operations2016 2015
Underlying £m
Non-underlying2
£mTotal £m
Underlying £m
Non-underlying2
£mTotal
£m
Finance income
Interest receivable on bank deposits 0.5 – 0.5 0.7 – 0.7
Interest receivable on loans to joint ventures 0.3 – 0.3 1.0 – 1.0
0.8 – 0.8 1.7 – 1.7
Finance costs
Interest payable and fees on bank overdrafts and loans (0.6) – (0.6) (1.0) – (1.0)
Interest payable on borrowings (17.7) – (17.7) (13.7) – (13.7)
Interest payable to joint ventures (0.2) – (0.2) – – –
Interest payable on finance leases (1.4) – (1.4) (2.6) – (2.6)
Discount unwind – (2.4) (2.4) – (3.6) (3.6)
Net interest on net defined benefit obligation (5.6) – (5.6) (2.2) – (2.2)
Foreign exchange losses on foreign denominated borrowings (17.7) – (17.7) – – –
Fair value gain on cash flow hedges recycled from Other Comprehensive Income 17.7 – 17.7 – – –
(25.5) (2.4) (27.9) (19.5) (3.6) (23.1)
Net finance costs (24.7) (2.4) (27.1) (17.8) (3.6) (21.4)
2 Unwind of discount in respect of deferred consideration and fair value adjustments made on acquisition.
Kier Group plc Annual Report and Accounts 2016110
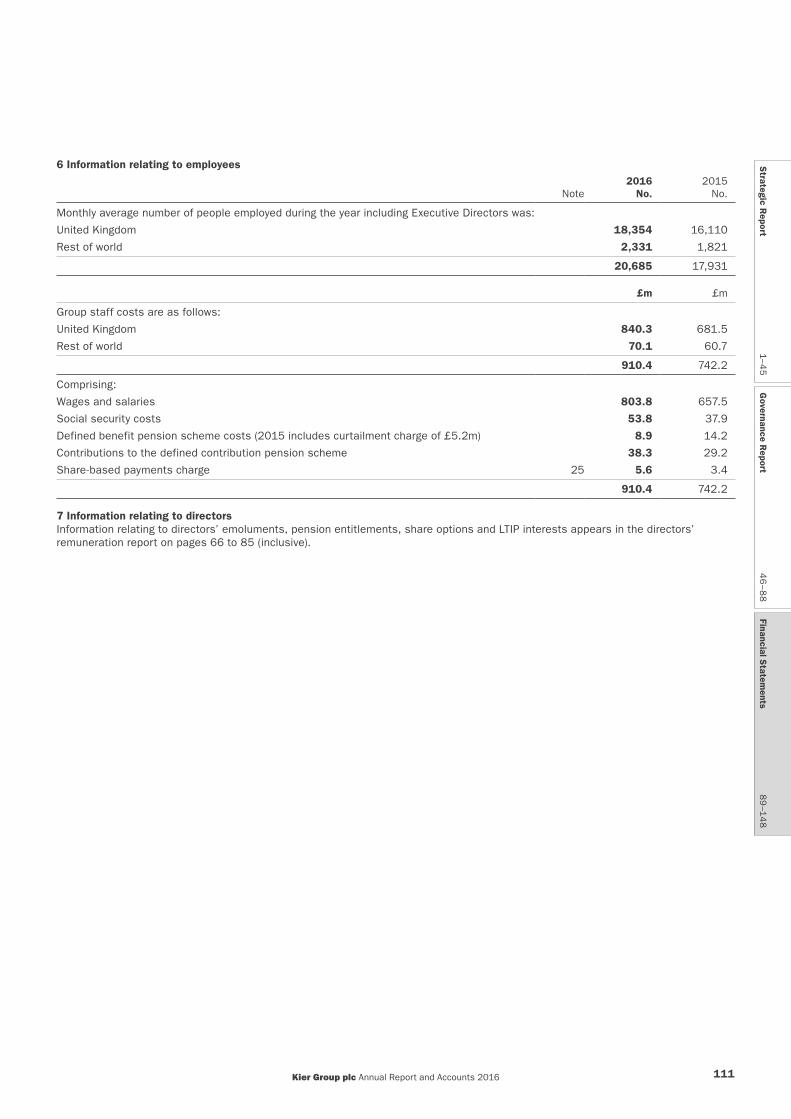
6 Information relating to employees
Note2016
No.2015 No.
Monthly average number of people employed during the year including Executive Directors was:
United Kingdom 18,354 16,110
Rest of world 2,331 1,821
20,685 17,931
£m £m
Group staff costs are as follows:
United Kingdom 840.3 681.5
Rest of world 70.1 60.7
910.4 742.2
Comprising:
Wages and salaries 803.8 657.5
Social security costs 53.8 37.9
Defined benefit pension scheme costs (2015 includes curtailment charge of £5.2m) 8.9 14.2
Contributions to the defined contribution pension scheme 38.3 29.2
Share-based payments charge 25 5.6 3.4
910.4 742.2
7 Information relating to directorsInformation relating to directors’ emoluments, pension entitlements, share options and LTIP interests appears in the directors’ remuneration report on pages 66 to 85 (inclusive).
Kier Group plc Annual Report and Accounts 2016 111
Strategic R
eport1–4
5G
overnance Report
46
–88
Financial Statem
ents8
9–1
48
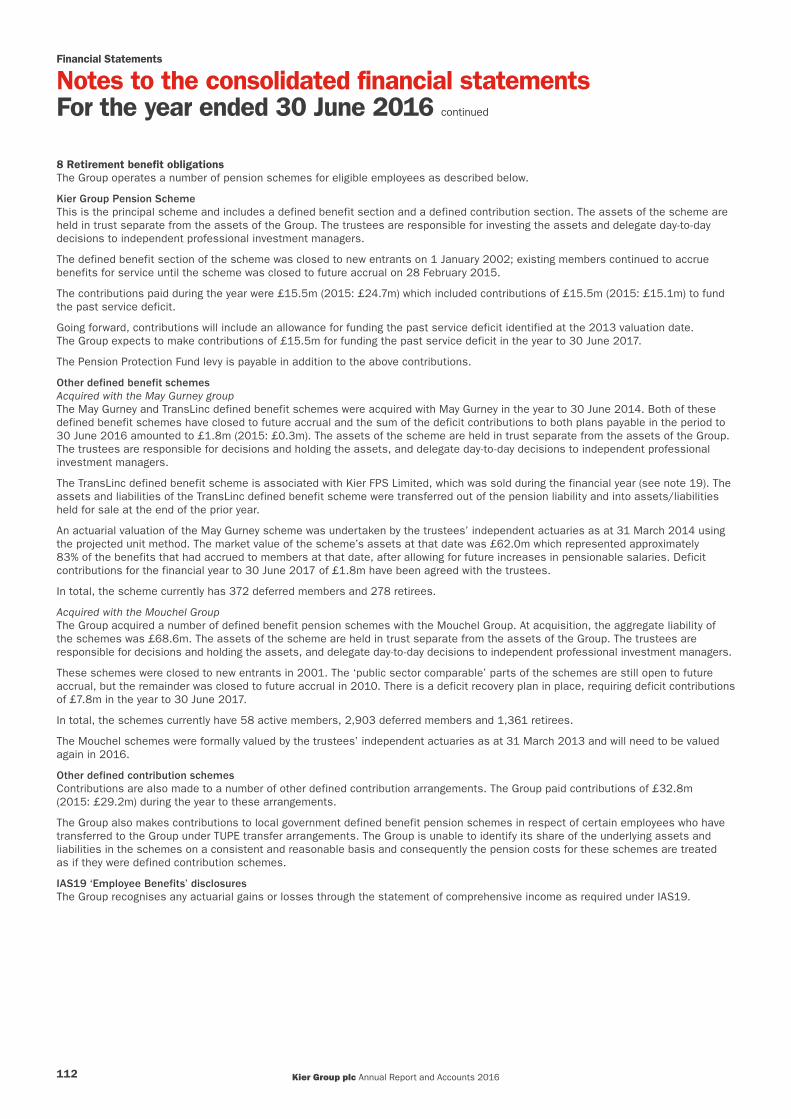
Financial Statements
Notes to the consolidated financial statementsFor the year ended 30 June 2016 continued
8 Retirement benefit obligationsThe Group operates a number of pension schemes for eligible employees as described below.
Kier Group Pension SchemeThis is the principal scheme and includes a defined benefit section and a defined contribution section. The assets of the scheme are held in trust separate from the assets of the Group. The trustees are responsible for investing the assets and delegate day-to-day decisions to independent professional investment managers.
The defined benefit section of the scheme was closed to new entrants on 1 January 2002; existing members continued to accrue benefits for service until the scheme was closed to future accrual on 28 February 2015.
The contributions paid during the year were £15.5m (2015: £24.7m) which included contributions of £15.5m (2015: £15.1m) to fund the past service deficit.
Going forward, contributions will include an allowance for funding the past service deficit identified at the 2013 valuation date. The Group expects to make contributions of £15.5m for funding the past service deficit in the year to 30 June 2017.
The Pension Protection Fund levy is payable in addition to the above contributions.
Other defined benefit schemesAcquired with the May Gurney groupThe May Gurney and TransLinc defined benefit schemes were acquired with May Gurney in the year to 30 June 2014. Both of these defined benefit schemes have closed to future accrual and the sum of the deficit contributions to both plans payable in the period to 30 June 2016 amounted to £1.8m (2015: £0.3m). The assets of the scheme are held in trust separate from the assets of the Group. The trustees are responsible for decisions and holding the assets, and delegate day-to-day decisions to independent professional investment managers.
The TransLinc defined benefit scheme is associated with Kier FPS Limited, which was sold during the financial year (see note 19). The assets and liabilities of the TransLinc defined benefit scheme were transferred out of the pension liability and into assets/liabilities held for sale at the end of the prior year.
An actuarial valuation of the May Gurney scheme was undertaken by the trustees’ independent actuaries as at 31 March 2014 using the projected unit method. The market value of the scheme’s assets at that date was £62.0m which represented approximately 83% of the benefits that had accrued to members at that date, after allowing for future increases in pensionable salaries. Deficit contributions for the financial year to 30 June 2017 of £1.8m have been agreed with the trustees.
In total, the scheme currently has 372 deferred members and 278 retirees.
Acquired with the Mouchel GroupThe Group acquired a number of defined benefit pension schemes with the Mouchel Group. At acquisition, the aggregate liability of the schemes was £68.6m. The assets of the scheme are held in trust separate from the assets of the Group. The trustees are responsible for decisions and holding the assets, and delegate day-to-day decisions to independent professional investment managers.
These schemes were closed to new entrants in 2001. The ‘public sector comparable’ parts of the schemes are still open to future accrual, but the remainder was closed to future accrual in 2010. There is a deficit recovery plan in place, requiring deficit contributions of £7.8m in the year to 30 June 2017.
In total, the schemes currently have 58 active members, 2,903 deferred members and 1,361 retirees.
The Mouchel schemes were formally valued by the trustees’ independent actuaries as at 31 March 2013 and will need to be valued again in 2016.
Other defined contribution schemesContributions are also made to a number of other defined contribution arrangements. The Group paid contributions of £32.8m (2015: £29.2m) during the year to these arrangements.
The Group also makes contributions to local government defined benefit pension schemes in respect of certain employees who have transferred to the Group under TUPE transfer arrangements. The Group is unable to identify its share of the underlying assets and liabilities in the schemes on a consistent and reasonable basis and consequently the pension costs for these schemes are treated as if they were defined contribution schemes.
IAS19 ‘Employee Benefits’ disclosuresThe Group recognises any actuarial gains or losses through the statement of comprehensive income as required under IAS19.
Kier Group plc Annual Report and Accounts 2016112

The principal assumptions used by the independent qualified actuaries were:
Kier Group Pension Scheme2016
%2015
%2014
%
Rate of general increases in pensionable salaries 2.8 3.4 3.3
Rate of increase to pensions in payment liable for Limited Price Indexation 2.8 3.3 3.2
Discount rate 2.8 3.9 4.4
Inflation rate (Retail Price Index (RPI)) 2.8 3.4 3.4
Inflation rate (Consumer Price Index (CPI)) 1.7 2.3 2.4
The mortality assumptions are that life expectancy from age 60 is currently 27.8 years for a man and 29.7 years for a woman but is expected to increase to 28.9 years for future male and 31.0 years for future female pensioners who retire in 2036.
Value
2016
£m2015
£m2014
£m
Land – – 13.3
Equities, property and other return-seeking assets 684.0 672.5 644.9
PFI assets – 8.5 7.3
Government bonds, cash, swaps and collateral 381.4 238.4 171.6
Total market value of assets 1,065.4 919.4 837.1
Present value of liabilities (1,088.9) (994.6) (900.2)
Deficit (23.5) (75.2) (63.1)
Related deferred tax asset 4.2 15.0 12.6
Net pension liability (19.3) (60.2) (50.5)
May Gurney defined benefit schemes2016
%2015
%2014
%
Rate of increase to pensions in payment liable for Limited Price Indexation 2.8 3.3 3.2
Discount rate 2.8 3.9 4.4
Inflation rate (RPI) 2.8 3.4 3.4
Inflation rate (CPI) 1.7 2.3 2.4
Kier Group plc Annual Report and Accounts 2016 113
Strategic R
eport1–4
5G
overnance Report
46
–88
Financial Statem
ents8
9–1
48

Financial Statements
Notes to the consolidated financial statementsFor the year ended 30 June 2016 continued
8 Retirement benefit obligations continuedThe mortality assumptions are that life expectancy from age 60 is currently 26.5 years for a man and 28.8 years for a woman but is expected to increase to 28.1 years for future male and 30.5 years for future female pensioners who retire in 2036.
Value
2016£m
2015£m
Equities, property and other return-seeking assets 28.7 29.3
Government bonds and cash 43.7 37.1
Total market value of assets 72.4 66.4
Present value of liabilities (78.4) (69.9)
Deficit (6.0) (3.5)
Related deferred tax asset 1.1 0.7
Net pension liability (4.9) (2.8)
Mouchel defined benefit schemes
2016%
2015%
Rate of general increases in pensionable salaries 2.8 3.4
Discount rate 2.8 3.9
Inflation rate (‘RPI’) 2.8 3.4
Inflation rate (‘CPI’) 1.7 2.3
The mortality assumptions are that life expectancy from age 60 is currently 27.3 years for a man and 29.8 years for a woman but is expected to increase to 29.1 years for future male and 31.7 years for future female pensioners who retire in 2036.
Value
2016£m
2015£m
Land 16.2 16.1
Equities, property and other return-seeking assets 364.3 277.6
Government bonds, cash, swaps and collateral 42.3 62.6
Total market value of assets 422.8 356.3
Present value of liabilities (481.1) (431.2)
Deficit (58.3) (74.9)
Related deferred tax asset 10.5 15.0
Net pension liability (47.8) (59.9)
Kier Group plc Annual Report and Accounts 2016114
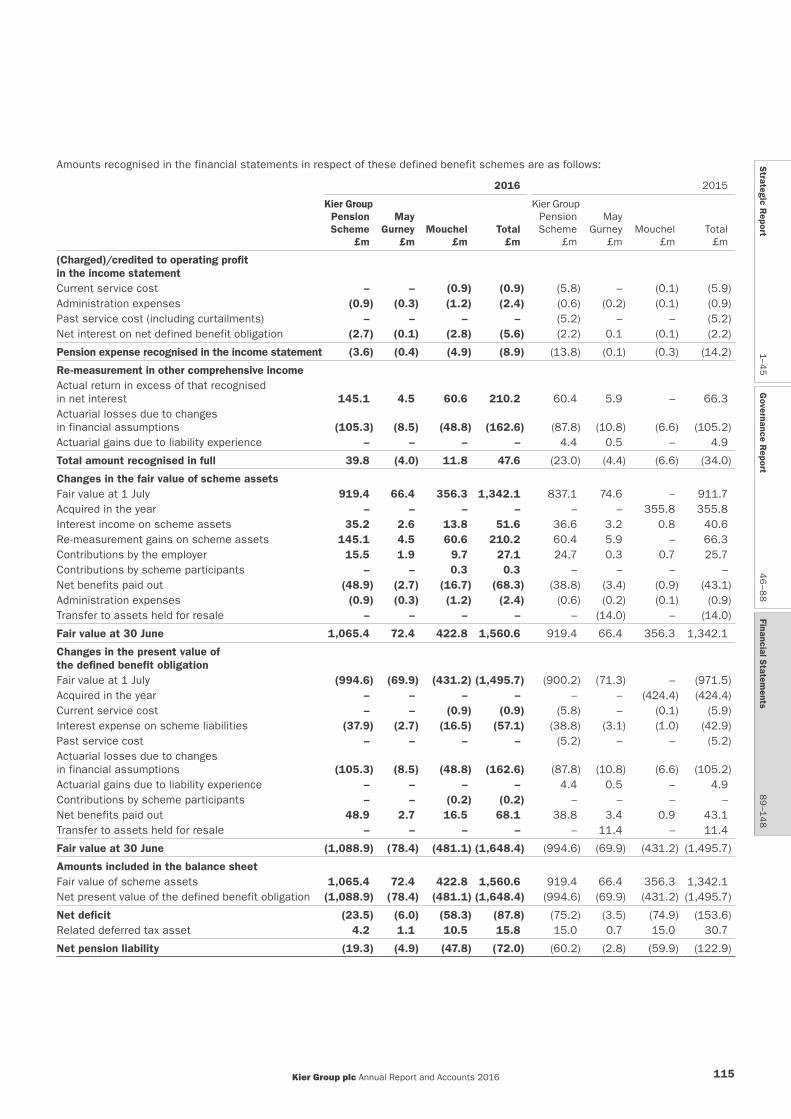
Amounts recognised in the financial statements in respect of these defined benefit schemes are as follows:
2016 2015
Kier GroupPensionScheme
£m
May Gurney
£mMouchel
£mTotal
£m
Kier GroupPensionScheme
£m
MayGurney
£mMouchel
£mTotal
£m
(Charged)/credited to operating profit in the income statementCurrent service cost – – (0.9) (0.9) (5.8) – (0.1) (5.9)Administration expenses (0.9) (0.3) (1.2) (2.4) (0.6) (0.2) (0.1) (0.9)Past service cost (including curtailments) – – – – (5.2) – – (5.2) Net interest on net defined benefit obligation (2.7) (0.1) (2.8) (5.6) (2.2) 0.1 (0.1) (2.2)
Pension expense recognised in the income statement (3.6) (0.4) (4.9) (8.9) (13.8) (0.1) (0.3) (14.2)
Re-measurement in other comprehensive incomeActual return in excess of that recognised in net interest 145.1 4.5 60.6 210.2 60.4 5.9 – 66.3Actuarial losses due to changes in financial assumptions (105.3) (8.5) (48.8) (162.6) (87.8) (10.8) (6.6) (105.2)Actuarial gains due to liability experience – – – – 4.4 0.5 – 4.9
Total amount recognised in full 39.8 (4.0) 11.8 47.6 (23.0) (4.4) (6.6) (34.0)
Changes in the fair value of scheme assetsFair value at 1 July 919.4 66.4 356.3 1,342.1 837.1 74.6 – 911.7Acquired in the year – – – – – – 355.8 355.8Interest income on scheme assets 35.2 2.6 13.8 51.6 36.6 3.2 0.8 40.6Re-measurement gains on scheme assets 145.1 4.5 60.6 210.2 60.4 5.9 – 66.3Contributions by the employer 15.5 1.9 9.7 27.1 24.7 0.3 0.7 25.7Contributions by scheme participants – – 0.3 0.3 – – – – Net benefits paid out (48.9) (2.7) (16.7) (68.3) (38.8) (3.4) (0.9) (43.1)Administration expenses (0.9) (0.3) (1.2) (2.4) (0.6) (0.2) (0.1) (0.9)Transfer to assets held for resale – – – – – (14.0) – (14.0)
Fair value at 30 June 1,065.4 72.4 422.8 1,560.6 919.4 66.4 356.3 1,342.1
Changes in the present value of the defined benefit obligationFair value at 1 July (994.6) (69.9) (431.2) (1,495.7) (900.2) (71.3) – (971.5)Acquired in the year – – – – – – (424.4) (424.4)Current service cost – – (0.9) (0.9) (5.8) – (0.1) (5.9)Interest expense on scheme liabilities (37.9) (2.7) (16.5) (57.1) (38.8) (3.1) (1.0) (42.9)Past service cost – – – – (5.2) – – (5.2)Actuarial losses due to changes in financial assumptions (105.3) (8.5) (48.8) (162.6) (87.8) (10.8) (6.6) (105.2)Actuarial gains due to liability experience – – – – 4.4 0.5 – 4.9Contributions by scheme participants – – (0.2) (0.2) – – – – Net benefits paid out 48.9 2.7 16.5 68.1 38.8 3.4 0.9 43.1Transfer to assets held for resale – – – – – 11.4 – 11.4
Fair value at 30 June (1,088.9) (78.4) (481.1) (1,648.4) (994.6) (69.9) (431.2) (1,495.7)
Amounts included in the balance sheetFair value of scheme assets 1,065.4 72.4 422.8 1,560.6 919.4 66.4 356.3 1,342.1Net present value of the defined benefit obligation (1,088.9) (78.4) (481.1) (1,648.4) (994.6) (69.9) (431.2) (1,495.7)
Net deficit (23.5) (6.0) (58.3) (87.8) (75.2) (3.5) (74.9) (153.6)Related deferred tax asset 4.2 1.1 10.5 15.8 15.0 0.7 15.0 30.7
Net pension liability (19.3) (4.9) (47.8) (72.0) (60.2) (2.8) (59.9) (122.9)
Kier Group plc Annual Report and Accounts 2016 115
Strategic R
eport1–4
5G
overnance Report
46
–88
Financial Statem
ents8
9–1
48

Financial Statements
Notes to the consolidated financial statementsFor the year ended 30 June 2016 continued
8 Retirement benefit obligations continuedHistory of experience gains and losses for defined benefit schemes in aggregate:
2016£m
2015£m
2014 £m
2013£m
2012 £m
Fair value of scheme assets 1,560.6 1,342.1 911.7 966.6 883.1
Net present value of the defined benefit obligation (1,648.4) (1,495.7) (971.5) (1,016.3) (940.9)
Net deficit (87.8) (153.6) (59.8) (49.7) (57.8)
Related deferred tax asset 15.8 30.7 11.9 11.4 13.9
Net pension liability (72.0) (122.9) (47.9) (38.3) (43.9)
Difference between expected and actual return on scheme assets 210.2 66.3 44.0 45.7 (6.1)
Experience gains/(losses) on scheme liabilities – 4.9 8.7 0.7 (42.9)
The Group made no contributions in excess of the scheduled deficit payments to the Kier Group Pension Scheme in the period (2015: £3.3m).
Pension sensitivityThe following tables shows the change in surplus/(deficit) arising from a change in the significant actuarial assumptions used to determine the retirement benefits obligations:
Kier Group Pension Scheme: 2016 2015
+0.25%/+1 year£m
-0.25%/-1 year£m
+0.25%/+1 year£m
-0.25%/-1 year£m
Discount rate (+/-0.25%) 43.7 (46.4) 45.7 (45.7)
Inflation rate (+/-0.25%) (41.6) 40.7 (31.0) 31.0
Increase in life expectancy (+/-1 year) (32.9) 32.9 (33.2) 33.2
Mouchel Group pension schemes: 2016 2015
+0.25%/+1 year£m
-0.25%/-1 year£m
+0.25%/+1 year£m
-0.25%/-1 year£m
Discount rate (+/-0.25%) 20.8 (22.2) 19.4 (19.4)
Inflation rate (+/-0.25%) (22.1) 20.8 (17.0) 17.0
Increase in life expectancy (+/-1 year) (13.1) 13.1 (10.8) 10.8
The sensitivity analyses above have been determined based on reasonably possible changes of the respective assumptions occurring at the end of the reporting period and may not be representative of the actual change, which is based on a change in a key assumption while holding all other assumptions constant. When calculating the sensitivity to the assumption, the same method used to calculate the liability recognised in the balance sheet has been applied. The methods and types of assumptions used in preparing the sensitivity analyses did not change compared with the previous period.
Kier Group plc Annual Report and Accounts 2016116
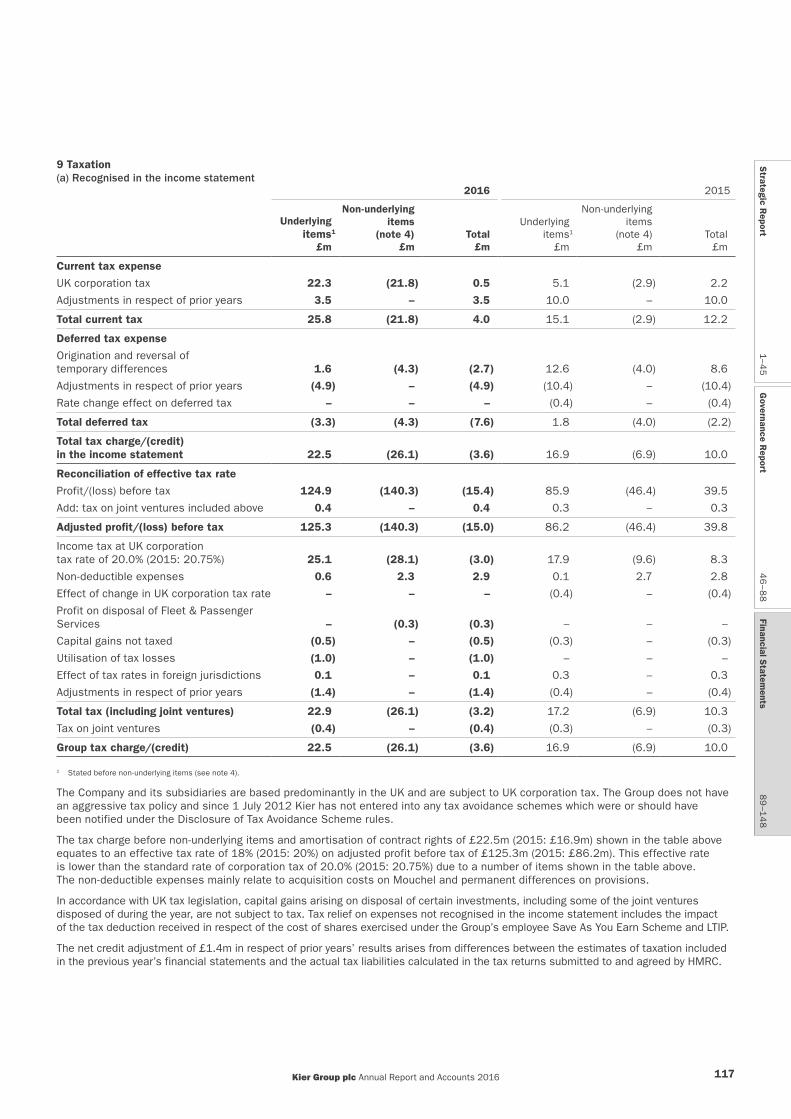
9 Taxation (a) Recognised in the income statement
2016 2015
Underlying items1
£m
Non-underlyingitems
(note 4) £m
Total £m
Underlyingitems1
£m
Non-underlyingitems
(note 4) £m
Total£m
Current tax expense
UK corporation tax 22.3 (21.8) 0.5 5.1 (2.9) 2.2
Adjustments in respect of prior years 3.5 – 3.5 10.0 – 10.0
Total current tax 25.8 (21.8) 4.0 15.1 (2.9) 12.2
Deferred tax expense
Origination and reversal of temporary differences 1.6 (4.3) (2.7) 12.6 (4.0) 8.6
Adjustments in respect of prior years (4.9) – (4.9) (10.4) – (10.4)
Rate change effect on deferred tax – – – (0.4) – (0.4)
Total deferred tax (3.3) (4.3) (7.6) 1.8 (4.0) (2.2)
Total tax charge/(credit) in the income statement 22.5 (26.1) (3.6) 16.9 (6.9) 10.0
Reconciliation of effective tax rate
Profit/(loss) before tax 124.9 (140.3) (15.4) 85.9 (46.4) 39.5
Add: tax on joint ventures included above 0.4 – 0.4 0.3 – 0.3
Adjusted profit/(loss) before tax 125.3 (140.3) (15.0) 86.2 (46.4) 39.8
Income tax at UK corporation tax rate of 20.0% (2015: 20.75%) 25.1 (28.1) (3.0) 17.9 (9.6) 8.3
Non-deductible expenses 0.6 2.3 2.9 0.1 2.7 2.8
Effect of change in UK corporation tax rate – – – (0.4) – (0.4)
Profit on disposal of Fleet & Passenger Services – (0.3) (0.3) – – –
Capital gains not taxed (0.5) – (0.5) (0.3) – (0.3)
Utilisation of tax losses (1.0) – (1.0) – – –
Effect of tax rates in foreign jurisdictions 0.1 – 0.1 0.3 – 0.3
Adjustments in respect of prior years (1.4) – (1.4) (0.4) – (0.4)
Total tax (including joint ventures) 22.9 (26.1) (3.2) 17.2 (6.9) 10.3
Tax on joint ventures (0.4) – (0.4) (0.3) – (0.3)
Group tax charge/(credit) 22.5 (26.1) (3.6) 16.9 (6.9) 10.0
1 Stated before non-underlying items (see note 4).
The Company and its subsidiaries are based predominantly in the UK and are subject to UK corporation tax. The Group does not have an aggressive tax policy and since 1 July 2012 Kier has not entered into any tax avoidance schemes which were or should have been notified under the Disclosure of Tax Avoidance Scheme rules.
The tax charge before non-underlying items and amortisation of contract rights of £22.5m (2015: £16.9m) shown in the table above equates to an effective tax rate of 18% (2015: 20%) on adjusted profit before tax of £125.3m (2015: £86.2m). This effective rate is lower than the standard rate of corporation tax of 20.0% (2015: 20.75%) due to a number of items shown in the table above. The non-deductible expenses mainly relate to acquisition costs on Mouchel and permanent differences on provisions.
In accordance with UK tax legislation, capital gains arising on disposal of certain investments, including some of the joint ventures disposed of during the year, are not subject to tax. Tax relief on expenses not recognised in the income statement includes the impact of the tax deduction received in respect of the cost of shares exercised under the Group’s employee Save As You Earn Scheme and LTIP.
The net credit adjustment of £1.4m in respect of prior years’ results arises from differences between the estimates of taxation included in the previous year’s financial statements and the actual tax liabilities calculated in the tax returns submitted to and agreed by HMRC.
Kier Group plc Annual Report and Accounts 2016 117
Strategic R
eport1–4
5G
overnance Report
46
–88
Financial Statem
ents8
9–1
48

Financial Statements
Notes to the consolidated financial statementsFor the year ended 30 June 2016 continued
9 Taxation continued(b) Recognised in the cash flow statementThe cash flow statement shows payments of £1.8m during the year (2015: £3.5m).
(c) Recognised in the statement of comprehensive income2016
£m2015
£m
Deferred tax expense (including effect of change in tax rate)
Share of fair value movements on joint venture cash flow hedging instruments – 0.2
Fair value movements on cash flow hedging instruments 0.2 –
Actuarial gains/(losses) on defined benefit pension schemes 9.1 (6.8)
Total tax charge/(credit) in the statement of comprehensive income 9.3 (6.6)
(d) Factors that may affect future tax chargesChanges to the UK corporation tax rates were announced in the Chancellor’s Budget on 16 March 2016. The change announced is to reduce the main rate to 17% from 1 April 2020.
Changes to reduce the UK corporation tax rate to 19% from 1 April 2017 and to 18% from 1 April 2020 had already been substantially enacted on 26 October 2015.
As the change to 17% had not been substantively enacted at the balance sheet date their effects are not included in these financial statements. The overall effect of that change, if it had applied to the deferred tax balance at the balance sheet date, would be to reduce the deferred tax asset by an additional £0.2m with £0.7m being credited to the income statement and £0.9m being charged directly to the statement of comprehensive income.
The deferred tax balance as at the year end has been recognised at 18%.
(e) Tax lossesAt the balance sheet date the Group has unused tax losses of £172.5m (2015: £177.3m) available for offset against future profits. A deferred tax asset has been recognised in respect of £23.3m (2015: £43.2m) of income tax losses.
No deferred tax asset has been recognised in respect of the remaining losses due to the unpredictability of future profit streams against which these losses could be offset. Under present tax legislation, these losses may be carried forward indefinitely.
10 Dividends Amounts recognised as distributions to owners of the parent in the year:
2016 £m
2015£m
Final dividend for the year ended 30 June 2015 of 36.0 pence (2014: 39.6 pence) 34.2 27.0
Interim dividend for the year ended 30 June 2016 of 21.5 pence (2015: 19.2 pence) 20.5 13.2
54.7 40.2
The proposed final dividend of 43.0 pence (2015: 36.0 pence) bringing the total dividend for the year to 64.5 pence (2015: 55.2 pence) had not been approved at the balance sheet date and so has not been included as a liability in these financial statements. The dividend totalling circa £40.7m will be paid on 2 December 2016 to shareholders on the register at the close of business on 30 September 2016. A scrip dividend alternative will be offered.
Kier Group plc Annual Report and Accounts 2016118
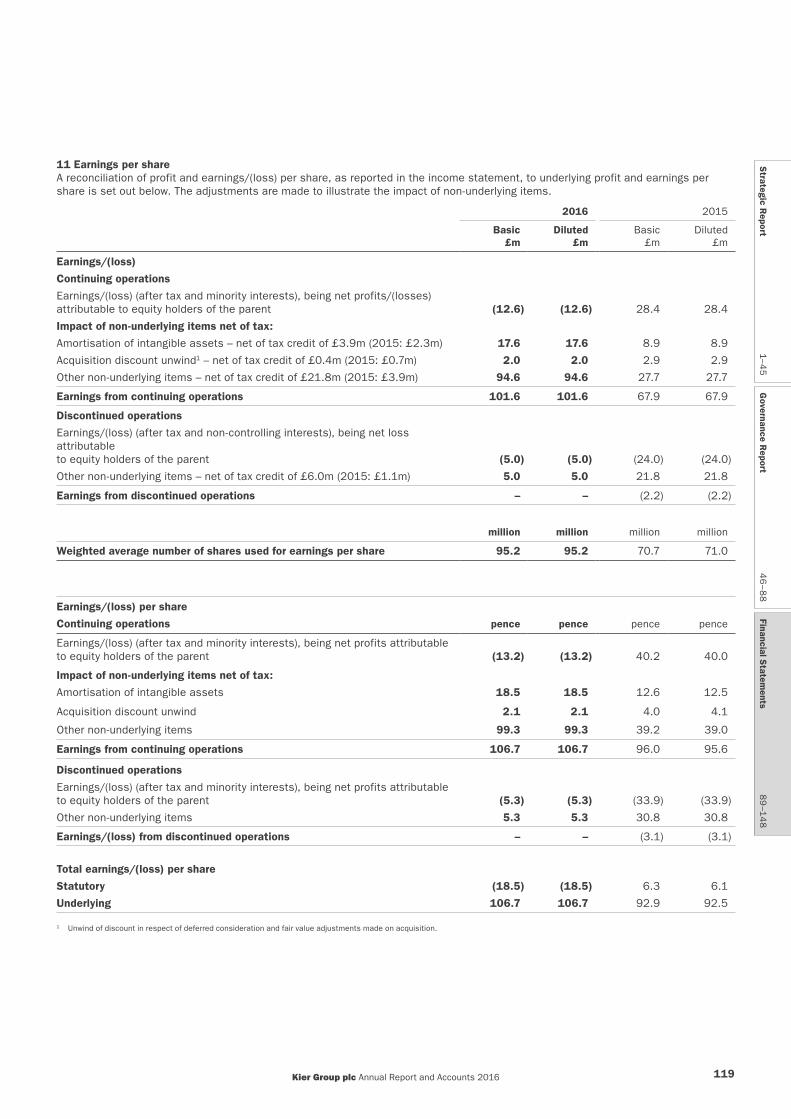
11 Earnings per shareA reconciliation of profit and earnings/(loss) per share, as reported in the income statement, to underlying profit and earnings per share is set out below. The adjustments are made to illustrate the impact of non-underlying items.
2016 2015
Basic £m
Diluted £m
Basic £m
Diluted £m
Earnings/(loss)
Continuing operations
Earnings/(loss) (after tax and minority interests), being net profits/(losses) attributable to equity holders of the parent (12.6) (12.6) 28.4 28.4
Impact of non-underlying items net of tax:
Amortisation of intangible assets – net of tax credit of £3.9m (2015: £2.3m) 17.6 17.6 8.9 8.9
Acquisition discount unwind1 – net of tax credit of £0.4m (2015: £0.7m) 2.0 2.0 2.9 2.9
Other non-underlying items – net of tax credit of £21.8m (2015: £3.9m) 94.6 94.6 27.7 27.7
Earnings from continuing operations 101.6 101.6 67.9 67.9
Discontinued operations
Earnings/(loss) (after tax and non-controlling interests), being net loss attributable to equity holders of the parent (5.0) (5.0) (24.0) (24.0)
Other non-underlying items – net of tax credit of £6.0m (2015: £1.1m) 5.0 5.0 21.8 21.8
Earnings from discontinued operations – – (2.2) (2.2)
million million million million
Weighted average number of shares used for earnings per share 95.2 95.2 70.7 71.0
Earnings/(loss) per share
Continuing operations pence pence pence pence
Earnings/(loss) (after tax and minority interests), being net profits attributable to equity holders of the parent (13.2) (13.2) 40.2 40.0
Impact of non-underlying items net of tax:
Amortisation of intangible assets 18.5 18.5 12.6 12.5
Acquisition discount unwind 2.1 2.1 4.0 4.1
Other non-underlying items 99.3 99.3 39.2 39.0
Earnings from continuing operations 106.7 106.7 96.0 95.6
Discontinued operations
Earnings/(loss) (after tax and minority interests), being net profits attributable to equity holders of the parent (5.3) (5.3) (33.9) (33.9)
Other non-underlying items 5.3 5.3 30.8 30.8
Earnings/(loss) from discontinued operations – – (3.1) (3.1)
Total earnings/(loss) per share
Statutory (18.5) (18.5) 6.3 6.1
Underlying 106.7 106.7 92.9 92.5
1 Unwind of discount in respect of deferred consideration and fair value adjustments made on acquisition.
Kier Group plc Annual Report and Accounts 2016 119
Strategic R
eport1–4
5G
overnance Report
46
–88
Financial Statem
ents8
9–1
48
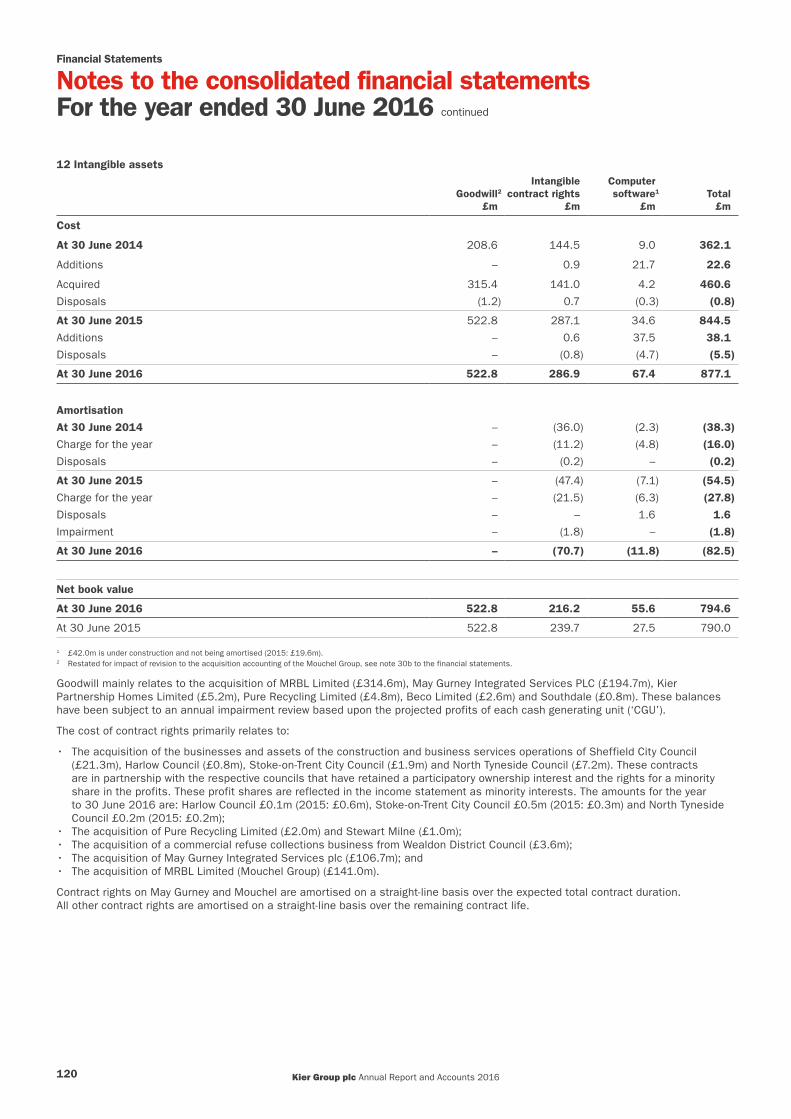
Financial Statements
Notes to the consolidated financial statementsFor the year ended 30 June 2016 continued
12 Intangible assets
Goodwill2
£m
Intangible contract rights
£m
Computer software1
£mTotal
£m
Cost
At 30 June 2014 208.6 144.5 9.0 362.1
Additions – 0.9 21.7 22.6
Acquired 315.4 141.0 4.2 460.6
Disposals (1.2) 0.7 (0.3) (0.8)
At 30 June 2015 522.8 287.1 34.6 844.5
Additions – 0.6 37.5 38.1
Disposals – (0.8) (4.7) (5.5)
At 30 June 2016 522.8 286.9 67.4 877.1
Amortisation
At 30 June 2014 – (36.0) (2.3) (38.3)
Charge for the year – (11.2) (4.8) (16.0)
Disposals – (0.2) – (0.2)
At 30 June 2015 – (47.4) (7.1) (54.5)
Charge for the year – (21.5) (6.3) (27.8)
Disposals – – 1.6 1.6
Impairment – (1.8) – (1.8)
At 30 June 2016 – (70.7) (11.8) (82.5)
Net book value
At 30 June 2016 522.8 216.2 55.6 794.6
At 30 June 2015 522.8 239.7 27.5 790.0
1 £42.0m is under construction and not being amortised (2015: £19.6m).2 Restated for impact of revision to the acquisition accounting of the Mouchel Group, see note 30b to the financial statements.
Goodwill mainly relates to the acquisition of MRBL Limited (£314.6m), May Gurney Integrated Services PLC (£194.7m), Kier Partnership Homes Limited (£5.2m), Pure Recycling Limited (£4.8m), Beco Limited (£2.6m) and Southdale (£0.8m). These balances have been subject to an annual impairment review based upon the projected profits of each cash generating unit (‘CGU’).
The cost of contract rights primarily relates to:
• The acquisition of the businesses and assets of the construction and business services operations of Sheffield City Council (£21.3m), Harlow Council (£0.8m), Stoke-on-Trent City Council (£1.9m) and North Tyneside Council (£7.2m). These contracts are in partnership with the respective councils that have retained a participatory ownership interest and the rights for a minority share in the profits. These profit shares are reflected in the income statement as minority interests. The amounts for the year to 30 June 2016 are: Harlow Council £0.1m (2015: £0.6m), Stoke-on-Trent City Council £0.5m (2015: £0.3m) and North Tyneside Council £0.2m (2015: £0.2m);
• The acquisition of Pure Recycling Limited (£2.0m) and Stewart Milne (£1.0m);• The acquisition of a commercial refuse collections business from Wealdon District Council (£3.6m); • The acquisition of May Gurney Integrated Services plc (£106.7m); and• The acquisition of MRBL Limited (Mouchel Group) (£141.0m).
Contract rights on May Gurney and Mouchel are amortised on a straight-line basis over the expected total contract duration. All other contract rights are amortised on a straight-line basis over the remaining contract life.
Kier Group plc Annual Report and Accounts 2016120
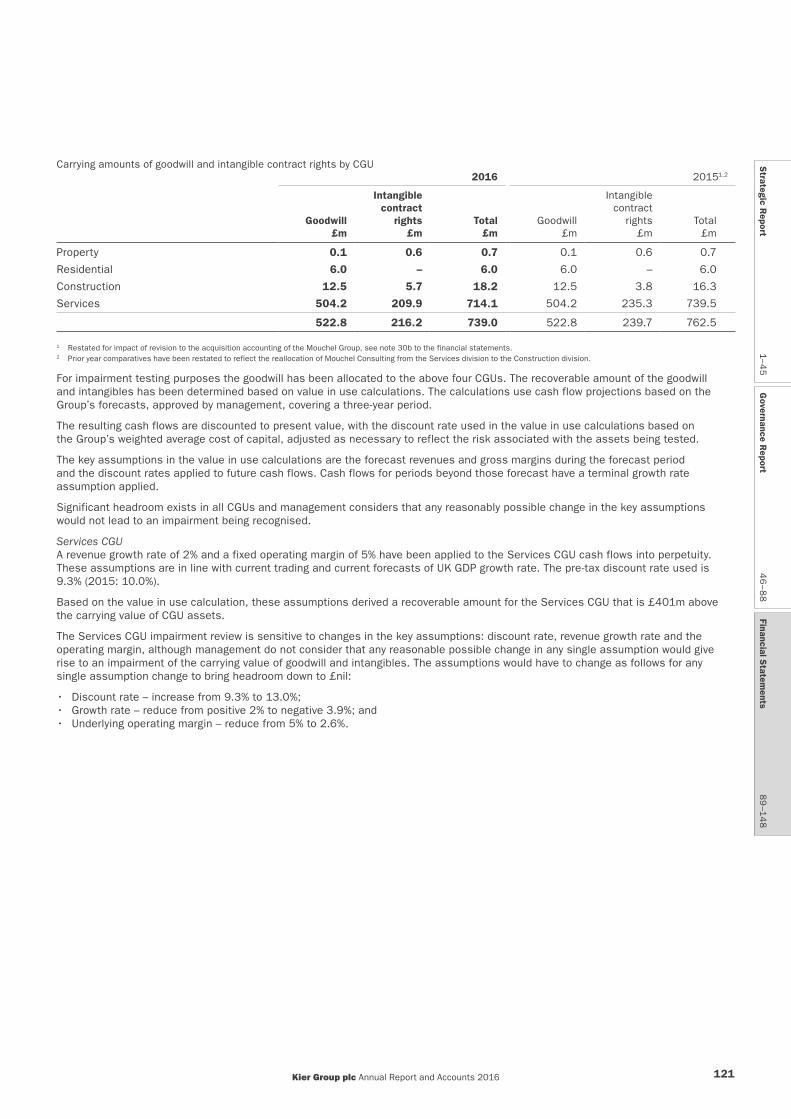
Carrying amounts of goodwill and intangible contract rights by CGU2016 20151,2
Goodwill£m
Intangible contract
rights£m
Total£m
Goodwill£m
Intangible contract
rights£m
Total£m
Property 0.1 0.6 0.7 0.1 0.6 0.7
Residential 6.0 – 6.0 6.0 – 6.0
Construction 12.5 5.7 18.2 12.5 3.8 16.3
Services 504.2 209.9 714.1 504.2 235.3 739.5
522.8 216.2 739.0 522.8 239.7 762.5
1 Restated for impact of revision to the acquisition accounting of the Mouchel Group, see note 30b to the financial statements.2 Prior year comparatives have been restated to reflect the reallocation of Mouchel Consulting from the Services division to the Construction division.
For impairment testing purposes the goodwill has been allocated to the above four CGUs. The recoverable amount of the goodwill and intangibles has been determined based on value in use calculations. The calculations use cash flow projections based on the Group’s forecasts, approved by management, covering a three-year period.
The resulting cash flows are discounted to present value, with the discount rate used in the value in use calculations based on the Group’s weighted average cost of capital, adjusted as necessary to reflect the risk associated with the assets being tested.
The key assumptions in the value in use calculations are the forecast revenues and gross margins during the forecast period and the discount rates applied to future cash flows. Cash flows for periods beyond those forecast have a terminal growth rate assumption applied.
Significant headroom exists in all CGUs and management considers that any reasonably possible change in the key assumptions would not lead to an impairment being recognised.
Services CGUA revenue growth rate of 2% and a fixed operating margin of 5% have been applied to the Services CGU cash flows into perpetuity. These assumptions are in line with current trading and current forecasts of UK GDP growth rate. The pre-tax discount rate used is 9.3% (2015: 10.0%).
Based on the value in use calculation, these assumptions derived a recoverable amount for the Services CGU that is £401m above the carrying value of CGU assets.
The Services CGU impairment review is sensitive to changes in the key assumptions: discount rate, revenue growth rate and the operating margin, although management do not consider that any reasonable possible change in any single assumption would give rise to an impairment of the carrying value of goodwill and intangibles. The assumptions would have to change as follows for any single assumption change to bring headroom down to £nil:
• Discount rate – increase from 9.3% to 13.0%;• Growth rate – reduce from positive 2% to negative 3.9%; and• Underlying operating margin – reduce from 5% to 2.6%.
Kier Group plc Annual Report and Accounts 2016 121
Strategic R
eport1–4
5G
overnance Report
46
–88
Financial Statem
ents8
9–1
48
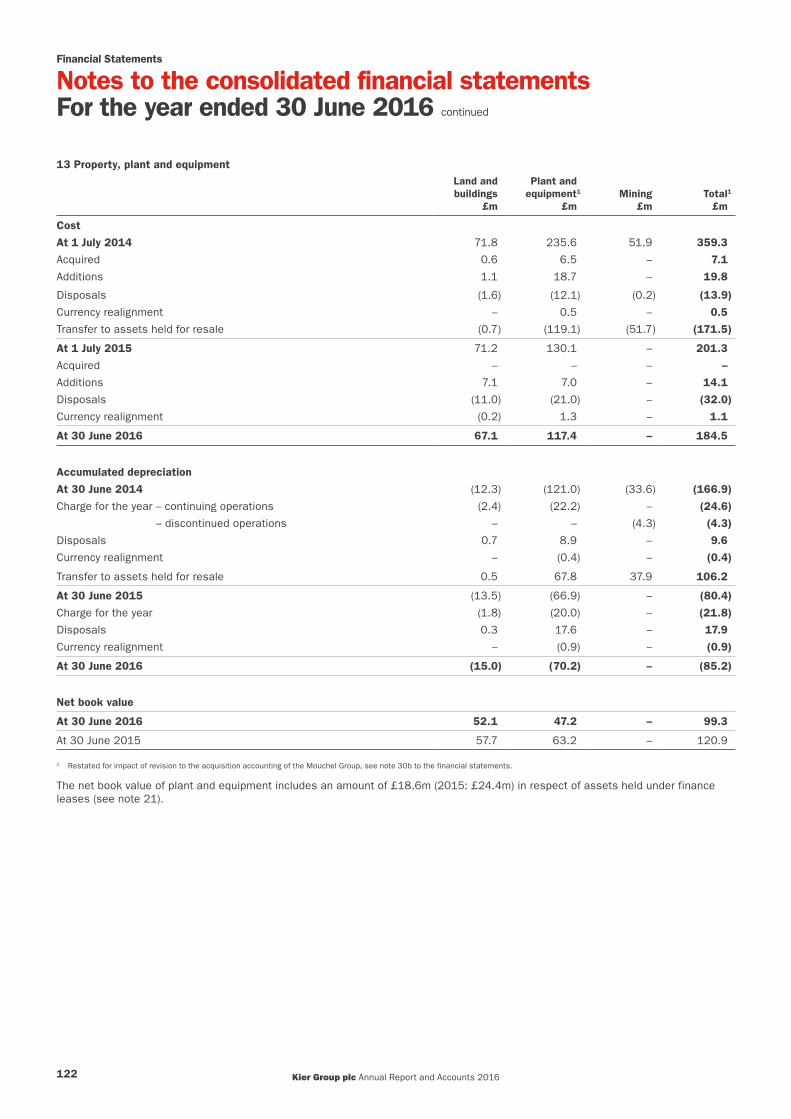
Financial Statements
Notes to the consolidated financial statementsFor the year ended 30 June 2016 continued
13 Property, plant and equipment Land and buildings
£m
Plant and equipment1
£mMining
£mTotal1
£m
Cost
At 1 July 2014 71.8 235.6 51.9 359.3
Acquired 0.6 6.5 – 7.1
Additions 1.1 18.7 – 19.8
Disposals (1.6) (12.1) (0.2) (13.9)
Currency realignment – 0.5 – 0.5
Transfer to assets held for resale (0.7) (119.1) (51.7) (171.5)
At 1 July 2015 71.2 130.1 – 201.3
Acquired – – – –
Additions 7.1 7.0 – 14.1
Disposals (11.0) (21.0) – (32.0)
Currency realignment (0.2) 1.3 – 1.1
At 30 June 2016 67.1 117.4 – 184.5
Accumulated depreciation
At 30 June 2014 (12.3) (121.0) (33.6) (166.9)
Charge for the year – continuing operations (2.4) (22.2) – (24.6)
– discontinued operations – – (4.3) (4.3)
Disposals 0.7 8.9 – 9.6
Currency realignment – (0.4) – (0.4)
Transfer to assets held for resale 0.5 67.8 37.9 106.2
At 30 June 2015 (13.5) (66.9) – (80.4)
Charge for the year (1.8) (20.0) – (21.8)
Disposals 0.3 17.6 – 17.9
Currency realignment – (0.9) – (0.9)
At 30 June 2016 (15.0) (70.2) – (85.2)
Net book value
At 30 June 2016 52.1 47.2 – 99.3
At 30 June 2015 57.7 63.2 – 120.9
1 Restated for impact of revision to the acquisition accounting of the Mouchel Group, see note 30b to the financial statements.
The net book value of plant and equipment includes an amount of £18.6m (2015: £24.4m) in respect of assets held under finance leases (see note 21).
Kier Group plc Annual Report and Accounts 2016122
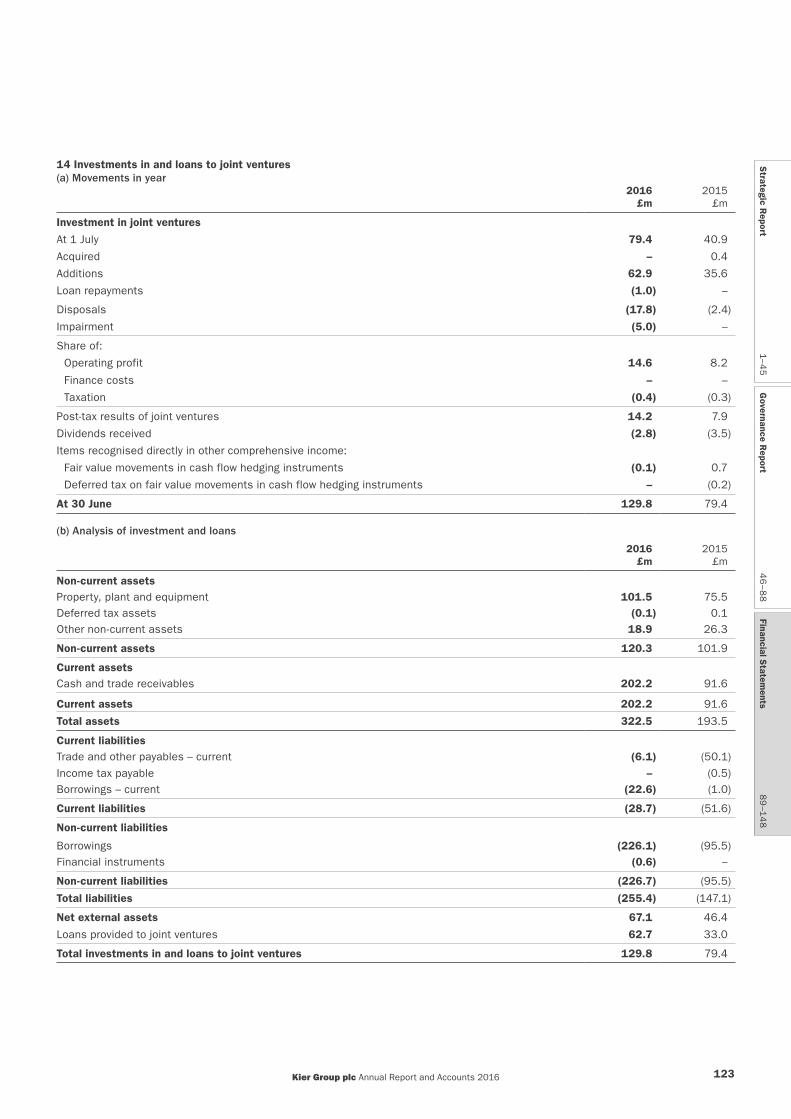
14 Investments in and loans to joint ventures(a) Movements in year
2016 £m
2015 £m
Investment in joint ventures
At 1 July 79.4 40.9
Acquired – 0.4
Additions 62.9 35.6
Loan repayments (1.0) –
Disposals (17.8) (2.4)
Impairment (5.0) –
Share of:
Operating profit 14.6 8.2
Finance costs – –
Taxation (0.4) (0.3)
Post-tax results of joint ventures 14.2 7.9
Dividends received (2.8) (3.5)
Items recognised directly in other comprehensive income:
Fair value movements in cash flow hedging instruments (0.1) 0.7
Deferred tax on fair value movements in cash flow hedging instruments – (0.2)
At 30 June 129.8 79.4
(b) Analysis of investment and loans
2016
£m2015
£m
Non-current assetsProperty, plant and equipment 101.5 75.5Deferred tax assets (0.1) 0.1Other non-current assets 18.9 26.3
Non-current assets 120.3 101.9
Current assetsCash and trade receivables 202.2 91.6
Current assets 202.2 91.6
Total assets 322.5 193.5
Current liabilitiesTrade and other payables – current (6.1) (50.1)
Income tax payable – (0.5)Borrowings – current (22.6) (1.0)
Current liabilities (28.7) (51.6)
Non-current liabilities
Borrowings (226.1) (95.5)Financial instruments (0.6) –
Non-current liabilities (226.7) (95.5)
Total liabilities (255.4) (147.1)
Net external assets 67.1 46.4
Loans provided to joint ventures 62.7 33.0
Total investments in and loans to joint ventures 129.8 79.4
Kier Group plc Annual Report and Accounts 2016 123
Strategic R
eport1–4
5G
overnance Report
46
–88
Financial Statem
ents8
9–1
48

Financial Statements
Notes to the consolidated financial statementsFor the year ended 30 June 2016 continued
14 Investments in and loans to joint ventures continuedThe Group has provided guarantees to support borrowing facilities of joint ventures as follows:
2016 2015
Borrowing facility
£mGuarantees
£m
Drawn at 30 June
£m
Borrowing facility
£mGuarantee
£m
Drawn at 30 June
£m
Kier Sydenham LP 45.0 7.5 45.0 45.8 7.5 45.8
Biogen (UK) Limited 11.0 11.0 11.0 22.0 17.0 15.0
Kier Reading LLP 18.3 8.0 17.2 16.0 8.0 16.0
Kier Hammersmith Limited 24.1 24.1 12.8 21.5 21.5 3.5
Kier Trade City LLP 23.8 11.1 11.7 19.0 2.9 0.6
Fore UK 1B LP 19.3 19.3 19.3 19.3 19.3 5.2
Tri-link 140 LLP 5.5 5.5 5.5 – – –
Kier Foley Street LLP 54.3 5.0 38.9 – – –
201.3 91.5 161.4 143.6 76.2 86.1
Other than as disclosed above the liabilities of the joint ventures are without recourse to the Group. Details of the Group’s interests in joint ventures are given on page 141.
15 Deferred tax The following are the major deferred tax assets and liabilities recognised by the Group and movements thereon during the current and prior reporting year:
Intangible1 assets
£m
Property, plant and
equipment £m
Short-term temporary
differences £m
Retirement benefit
obligations £m
Tax losses1
£mTotal
£m
At 1 July 2014 (20.3) 4.7 2.6 11.9 2.9 1.8
Acquired (28.2) 9.7 0.2 13.7 – (4.6)
Credited/(charged) to income statement 1.4 2.7 (3.4) (1.7) 2.2 1.2
Transfers – – 1.4 – – 1.4
Research and Development Expenditure Credit – – 2.5 – – 2.5
Credited directly to comprehensive income – – – 6.8 – 6.8
Share-based payments charged to equity – – (0.1) – – (0.1)
At 30 June 2015 (47.1) 17.1 3.2 30.7 5.1 9.0
Acquired
Credited/(charged) to income statement 8.7 8.3 (0.1) (5.8) (0.9) 10.2
Transfers – – (2.6) – – (2.6)
Credited directly to comprehensive income – – (0.2) (9.1) – (9.3)
At 30 June 2016 (38.4) 25.4 0.3 15.8 4.2 7.3
1 Restated for impact of revision to the acquisition accounting of the Mouchel Group, see note 30b to the financial statements.
Kier Group plc Annual Report and Accounts 2016124
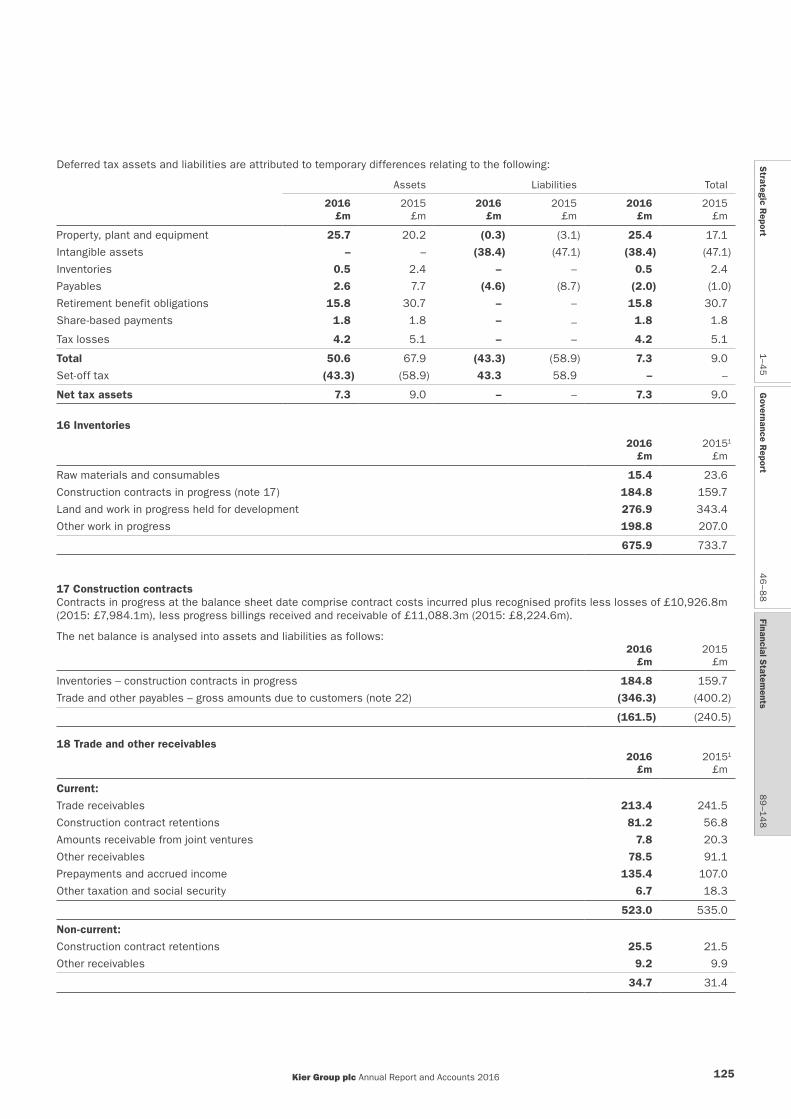
Deferred tax assets and liabilities are attributed to temporary differences relating to the following:
Assets Liabilities Total
2016 £m
2015£m
2016 £m
2015 £m
2016 £m
2015 £m
Property, plant and equipment 25.7 20.2 (0.3) (3.1) 25.4 17.1
Intangible assets – – (38.4) (47.1) (38.4) (47.1)
Inventories 0.5 2.4 – – 0.5 2.4
Payables 2.6 7.7 (4.6) (8.7) (2.0) (1.0)
Retirement benefit obligations 15.8 30.7 – – 15.8 30.7
Share-based payments 1.8 1.8 – – 1.8 1.8
Tax losses 4.2 5.1 – – 4.2 5.1
Total 50.6 67.9 (43.3) (58.9) 7.3 9.0
Set-off tax (43.3) (58.9) 43.3 58.9 – –
Net tax assets 7.3 9.0 – – 7.3 9.0
16 Inventories
2016 £m
20151
£m
Raw materials and consumables 15.4 23.6
Construction contracts in progress (note 17) 184.8 159.7
Land and work in progress held for development 276.9 343.4
Other work in progress 198.8 207.0
675.9 733.7
17 Construction contractsContracts in progress at the balance sheet date comprise contract costs incurred plus recognised profits less losses of £10,926.8m (2015: £7,984.1m), less progress billings received and receivable of £11,088.3m (2015: £8,224.6m).
The net balance is analysed into assets and liabilities as follows:2016
£m2015
£m
Inventories – construction contracts in progress 184.8 159.7
Trade and other payables – gross amounts due to customers (note 22) (346.3) (400.2)
(161.5) (240.5)
18 Trade and other receivables 2016
£m20151
£m
Current:
Trade receivables 213.4 241.5
Construction contract retentions 81.2 56.8
Amounts receivable from joint ventures 7.8 20.3
Other receivables 78.5 91.1
Prepayments and accrued income 135.4 107.0
Other taxation and social security 6.7 18.3
523.0 535.0
Non-current:
Construction contract retentions 25.5 21.5
Other receivables 9.2 9.9
34.7 31.4
Kier Group plc Annual Report and Accounts 2016 125
Strategic R
eport1–4
5G
overnance Report
46
–88
Financial Statem
ents8
9–1
48

Financial Statements
Notes to the consolidated financial statementsFor the year ended 30 June 2016 continued
19 Non-current assets held for sale and discontinued operationsAt the prior year end, the assets and liabilities of Kier FPS Limited (F&PS), Kier Minerals Limited (KML) and the Group’s interests in two of its property ventures, Kier Catterick Limited (KCL) and Justice Support Services (Norfolk and Suffolk) Holdings Limited (JSS) were held for sale. During the year, F&PS and JSS were sold – see Note 30. The sale of the assets held by KCL was also completed during the year.
The assets and liabilities of KML remain classified as held for sale and discontinued. Discussions to sell were well advanced at the year end and the Group has made a strategic decision to exit from its UK mining operations, which constitute a separate major line of business for the Group. KML is expected to be sold during the year ended 30 June 2017.
(a) Assets of disposal group classified as held for sale2016 2015
KML£m
Total£m
Total£m
Property, plant and equipment 5.0 5.0 75.9
Other intangibles – – 9.0
Inventory 3.6 3.6 0.3
Other current assets 9.6 9.6 108.7
Total 18.2 18.2 193.9
(b) Liabilities of disposal group classified as held for sale2016 2015
KML£m
Total£m
Total£m
Trade and other payables (5.0) (5.0) (24.7)
Other current liabilities – – (132.4)
Provisions (8.7) (8.7) (10.9)
Total (13.7) (13.7) (168.0)
Net assets held for sale 4.5 4.5 25.9
(c) Result of discontinued operationsAnalysis of the result of the UK Mining operations and the result recognised on the re-measurement of the associated assets is as follows:
2016 £m
2015 £m
Revenue – 20.6
Operating costs – (22.5)
Operating loss – (1.9)
Finance costs – (1.0)
Underlying loss before tax – (2.9)
Tax – 0.7
Underlying loss after tax of discontinued operations – (2.2)
Creation of provisions in respect of re-measurement of net assets of discontinued activities to realisable value (11.0) (22.9)
Tax 6.0 1.1
Loss after tax recognised on the re-measurement of net assets of discontinued activities to realisable value (5.0) (21.8)
Loss for the year from discontinued operations (5.0) (24.0)
The Group’s UK Mining operations were classified as discontinued in the year ended 30 June 2015, those results included a non-underlying provision of £22.9m reflecting the Group’s assessment of the realisable value of the UK Mining operations. During the year ended 30 June 2016, the operations generated revenues of £3.6m. A further assessment of realisable value has resulted in an additional non-underlying charge of £11m, before the impact of a tax credit of £6m.
Kier Group plc Annual Report and Accounts 2016126

(d) Cash flows from discontinued operations2016
£m2015
£m
Operating cash flows (33.0) 1.3
Investing cash flows – (1.2)
Financing cash flows (0.4) (0.2)
Total cash flows (33.4) (0.1)
20 Cash, cash equivalents and borrowings2016
£m2015
£m
Cash and cash equivalents – bank balances and cash in hand 186.7 254.0
Borrowings due within one year – –
Borrowings due after one year (303.2) (394.8)
Impact of cross-currency hedging 17.7 –
Net borrowings (98.8) (140.8)
Cash and cash equivalents include £85.9m (2015: £78.6m) being the Group’s share of cash and cash equivalents held by joint operations, £52.1m (2015: £67.3m) of cash that cannot be offset against other Group bank balances and £nil of restricted cash (2015: £0.2m).
Cash and cash equivalents are subject to Group-wide cash pooling arrangements. On a gross basis, cash and cash equivalents were £1,263.2m (2015: £1,595.6m) and overdrafts were £1,076.5m (2015: £1,341.6m).
Information on borrowings is detailed in note 27.
21 Finance lease obligations2016 2015
Future minimum
lease payments
£mInterest
£m
Present value of
minimum lease
payments £m
Future minimum
lease payments
£mInterest
£m
Present value of
minimum lease
payments £m
At 1 July 42.6 (2.0) 40.6 92.4 (5.4) 87.0
New obligations 3.6 (0.5) 3.1 17.7 (0.8) 16.9
Repayments (18.5) 1.1 (17.4) (34.8) 2.6 (32.2)
Transferred to assets held for sale – – – (32.7) 1.6 (31.1)
At 30 June 27.7 (1.4) 26.3 42.6 (2.0) 40.6
Finance lease liabilities are payable as follows:
2016 2015
Future minimum
lease payments
£mInterest
£m
Present value of minimum
lease payments
£m
Future minimum
lease payments
£mInterest
£m
Present value of
minimum lease
payments £m
Less than one year 14.4 (0.9) 13.5 15.9 (1.0) 14.9
Between two and five years 13.3 (0.5) 12.8 26.7 (1.0) 25.7
At 30 June 27.7 (1.4) 26.3 42.6 (2.0) 40.6
Kier Group plc Annual Report and Accounts 2016 127
Strategic R
eport1–4
5G
overnance Report
46
–88
Financial Statem
ents8
9–1
48
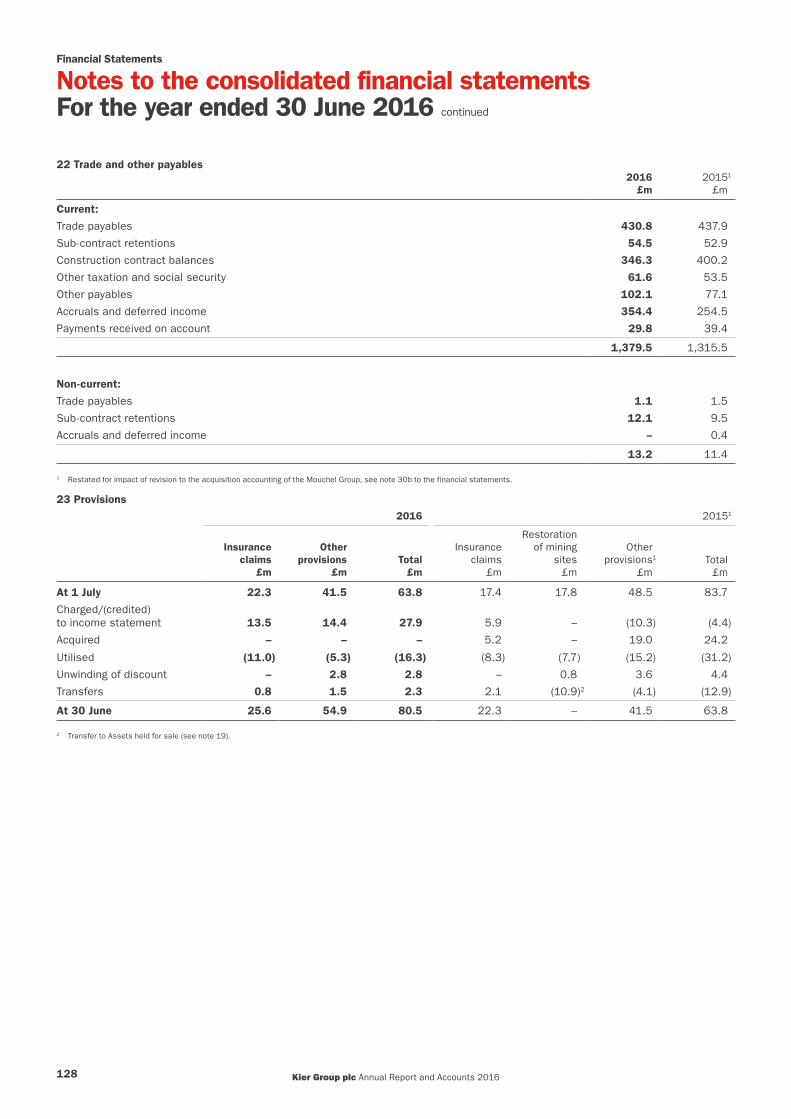
Financial Statements
Notes to the consolidated financial statementsFor the year ended 30 June 2016 continued
22 Trade and other payables2016
£m20151
£m
Current:
Trade payables 430.8 437.9
Sub-contract retentions 54.5 52.9
Construction contract balances 346.3 400.2
Other taxation and social security 61.6 53.5
Other payables 102.1 77.1
Accruals and deferred income 354.4 254.5
Payments received on account 29.8 39.4
1,379.5 1,315.5
Non-current:
Trade payables 1.1 1.5
Sub-contract retentions 12.1 9.5
Accruals and deferred income – 0.4
13.2 11.4
1 Restated for impact of revision to the acquisition accounting of the Mouchel Group, see note 30b to the financial statements.
23 Provisions2016 20151
Insurance claims
£m
Other provisions
£mTotal £m
Insurance claims
£m
Restoration of mining
sites £m
Other provisions1
£mTotal £m
At 1 July 22.3 41.5 63.8 17.4 17.8 48.5 83.7
Charged/(credited) to income statement 13.5 14.4 27.9 5.9 – (10.3) (4.4)
Acquired – – – 5.2 – 19.0 24.2
Utilised (11.0) (5.3) (16.3) (8.3) (7.7) (15.2) (31.2)
Unwinding of discount – 2.8 2.8 – 0.8 3.6 4.4
Transfers 0.8 1.5 2.3 2.1 (10.9)2 (4.1) (12.9)
At 30 June 25.6 54.9 80.5 22.3 – 41.5 63.8
2 Transfer to Assets held for sale (see note 19).
Kier Group plc Annual Report and Accounts 2016128
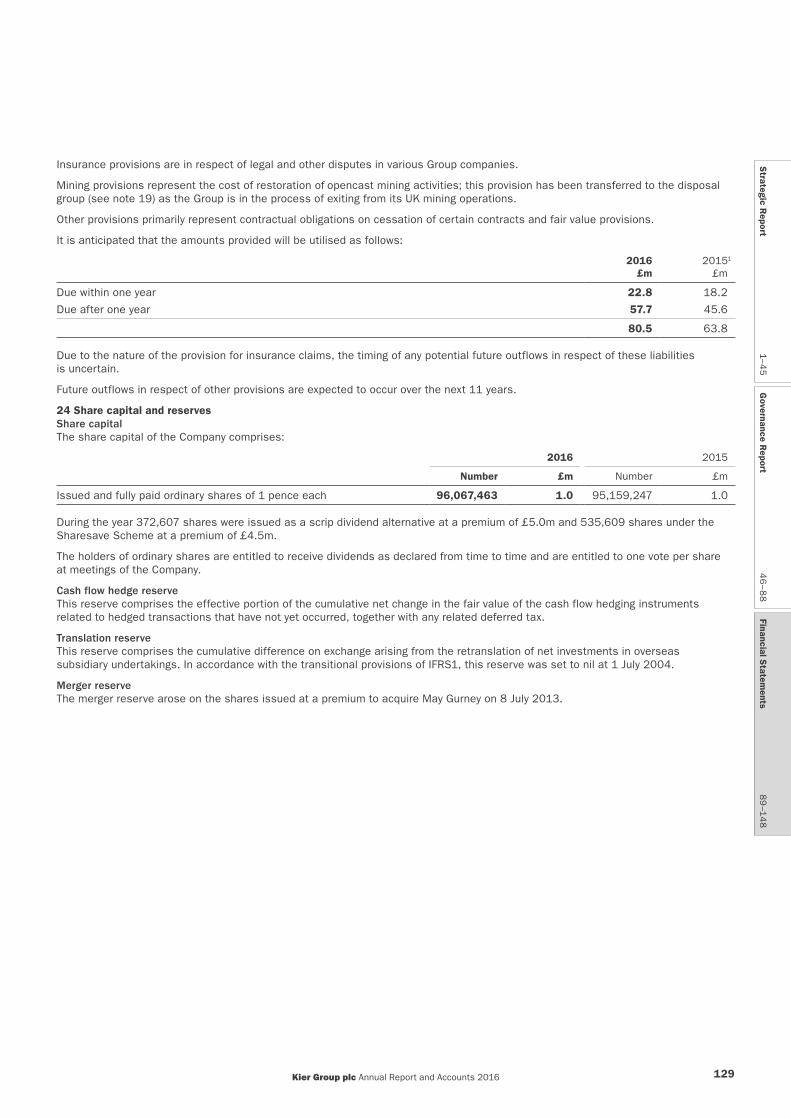
Insurance provisions are in respect of legal and other disputes in various Group companies.
Mining provisions represent the cost of restoration of opencast mining activities; this provision has been transferred to the disposal group (see note 19) as the Group is in the process of exiting from its UK mining operations.
Other provisions primarily represent contractual obligations on cessation of certain contracts and fair value provisions.
It is anticipated that the amounts provided will be utilised as follows:
2016 £m
20151
£m
Due within one year 22.8 18.2
Due after one year 57.7 45.6
80.5 63.8
Due to the nature of the provision for insurance claims, the timing of any potential future outflows in respect of these liabilities is uncertain.
Future outflows in respect of other provisions are expected to occur over the next 11 years.
24 Share capital and reservesShare capitalThe share capital of the Company comprises:
2016 2015
Number £m Number £m
Issued and fully paid ordinary shares of 1 pence each 96,067,463 1.0 95,159,247 1.0
During the year 372,607 shares were issued as a scrip dividend alternative at a premium of £5.0m and 535,609 shares under the Sharesave Scheme at a premium of £4.5m.
The holders of ordinary shares are entitled to receive dividends as declared from time to time and are entitled to one vote per share at meetings of the Company.
Cash flow hedge reserveThis reserve comprises the effective portion of the cumulative net change in the fair value of the cash flow hedging instruments related to hedged transactions that have not yet occurred, together with any related deferred tax.
Translation reserveThis reserve comprises the cumulative difference on exchange arising from the retranslation of net investments in overseas subsidiary undertakings. In accordance with the transitional provisions of IFRS1, this reserve was set to nil at 1 July 2004.
Merger reserveThe merger reserve arose on the shares issued at a premium to acquire May Gurney on 8 July 2013.
Kier Group plc Annual Report and Accounts 2016 129
Strategic R
eport1–4
5G
overnance Report
46
–88
Financial Statem
ents8
9–1
48

Financial Statements
Notes to the consolidated financial statementsFor the year ended 30 June 2016 continued
25 Share-based paymentsOptions and awards over the Company’s ordinary shares at 30 June 2016 were as follows:
Date of grant
Sharesave Scheme
3 May 2013
Sharesave Scheme
31 Oct 2014
Sharesave Scheme
31 Oct 2015
LTIP 2014 award
21 Oct 2013
LTIP 2015 award 22 Oct
2014
LTIP 2016 award22 Oct 2015 Total
Awards outstanding at 30 June 2016
– directors 1,072 1,550 3,137 74,374 131,678 210,163 421,974
– employees 175,289 621,341 1,206,854 515,367 734,921 1,059,973 4,313,745
176,361 622,891 1,209,991 589,741 866,599 1,270,136 4,735,719
Exercise price (pence) 839 1,159 1,147 nil nil nil
Sharesave Scheme1,338,394 options were granted in the year (2015: 762,213). Options under the Sharesave Scheme are all equity settled. The weighted average market price of Kier Group plc shares at the date of exercise of options was 1,124 pence (2015: 1,377 pence).
Long Term Incentive PlanAwards made under the scheme are normally able to vest following the third anniversary of the date of the grant. Vesting may be in full or in part (with the balance of the award lapsing) and is subject to the Group achieving specific performance targets. Awards under the LTIP are all equity settled.
The awards which are taken as shares are intended to be satisfied from the following shares held by the Kier Group 1999 Employee Benefit Trust and May Gurney Group Trustees Ltd Employee Share Ownership Plan Trust rather than from the issue of new shares. These shares are accounted for as a deduction from retained earnings.
2016 2015
Number of shares
Value £m
Number of shares
Value£m
At 1 July 681,503 7.4 736,792 9.3
Acquired as a consequence of the rights issue – – 122,575 –
Issued in satisfaction of awards and other schemes (129,262) (1.2) – –
Issued in satisfaction of deferred bonus schemes (26,072) (0.3) (177,864) (1.9)
At 30 June 526,169 5.9 681,503 7.4
The market value of these shares at 30 June 2016 was £5.5m (2015: £9.7m). The dividends on these shares have been waived.
A description of these schemes and the terms and conditions of each scheme are included in the directors’ remuneration report on pages 66 to 85.
Kier Group plc Annual Report and Accounts 2016130

Value of share schemesThe fair value per option granted has been calculated using the following assumptions. These calculations are based on the Black-Scholes model for all options apart from the total shareholder return (TSR) element of the LTIP which is based on a stochastic model.
Sharesave Scheme
Date of grant3 May 2013
31 October 2014
31 October2015
Share price at grant (pence) 1,187 1,490 1,377
Exercise price (pence) 839 1,159 1,147
Option life (years) 3.0 3.0 3.0
Expected volatility 27.2% 27.1% 22.9%
Dividend yield 5.6% 4.8% 4.7%
Risk-free interest rate 0.4% 1.1% 0.9%
Value per option (pence) 139.5 160.1 222.6
Long Term Incentive Plan
Date of grant
21 October2013
(EPS element)
21 October2013
(TSR element)
22 October2014
(EPS element)
22 October2014
(TSR element)
22 October2015
(EPS element)
22 October2015
(TSR element)
Share price at grant (pence) 1,797 1,797 1,519 1,519 1,388 1,388
Exercise price nil nil nil nil nil nil
Option life (years) 3.0 3.0 3.0 3.0 3.0 3.0
Expected volatility n/a 28.6% n/a 24.6% n/a 23.3%
Dividend yield 3.8% 3.8% 4.7% 4.7% 4.8% 4.8%
Risk-free interest rate n/a 0.8% n/a 1.0% n/a 0.7%
Value per option (pence) 1,281.9 1,092.1 1,053.0 604.8 1,203.7 801.0
The value per option represents the fair value of the option less the consideration payable.
The fair value of the TSR element incorporates an assessment of the number of shares that will be awarded, as the performance conditions are market conditions under IFRS2 ‘Share-based Payment’.
The performance conditions of the EPS element are non-market conditions under IFRS2. The fair value therefore does not include an assessment of the number of shares that will be awarded. Instead the amount charged for this element is based on the fair value factored by a ‘true-up’ for the number of awards that are expected to vest.
The expected volatility is based on historical volatility over the last three years. The risk-free rate of return is the yield on zero-coupon UK Government bonds of a term consistent with the assumed option life.
£5.6m relating to share-based payments has been recognised in the income statement as employee costs (2015: £3.4m). Included in other payables is an amount of £0.8m (2015: £0.3m) relating to provisions for employer’s national insurance.
A reconciliation of option movements is shown below:
2016 2015
Number of options
Weighted average exercise
priceNumber
of options
Weighted average exercise
price
Outstanding at 1 July 3,897,744 405.8p 2,743,955 404.3p
Forfeited (1,190,953) 569.5p (662,477) 632.5p
Exercised (666,626) 795.4p (291,651) 591.9p
Granted 2,695,554 278.3p 1,326,442 575.9p
Impact of rights issue – – 781,475 –
Outstanding at 30 June 4,735,719 476.8p 3,897,744 405.8p
Exercisable at 30 June 176,361 839.0p – –
The options outstanding at 30 June 2016 have a weighted average remaining contractual life of 1.84 years (2015: 1.32 years).
Kier Group plc Annual Report and Accounts 2016 131
Strategic R
eport1–4
5G
overnance Report
46
–88
Financial Statem
ents8
9–1
48
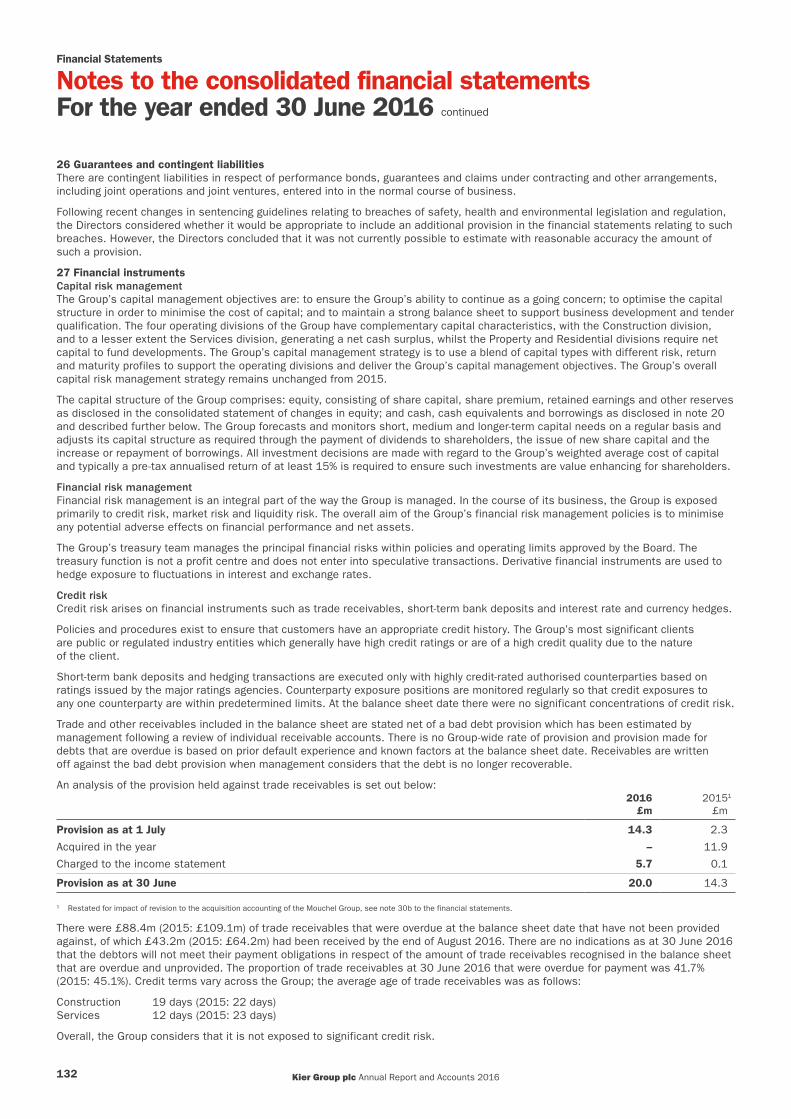
Financial Statements
Notes to the consolidated financial statementsFor the year ended 30 June 2016 continued
26 Guarantees and contingent liabilitiesThere are contingent liabilities in respect of performance bonds, guarantees and claims under contracting and other arrangements, including joint operations and joint ventures, entered into in the normal course of business.
Following recent changes in sentencing guidelines relating to breaches of safety, health and environmental legislation and regulation, the Directors considered whether it would be appropriate to include an additional provision in the financial statements relating to such breaches. However, the Directors concluded that it was not currently possible to estimate with reasonable accuracy the amount of such a provision.
27 Financial instrumentsCapital risk managementThe Group’s capital management objectives are: to ensure the Group’s ability to continue as a going concern; to optimise the capital structure in order to minimise the cost of capital; and to maintain a strong balance sheet to support business development and tender qualification. The four operating divisions of the Group have complementary capital characteristics, with the Construction division, and to a lesser extent the Services division, generating a net cash surplus, whilst the Property and Residential divisions require net capital to fund developments. The Group’s capital management strategy is to use a blend of capital types with different risk, return and maturity profiles to support the operating divisions and deliver the Group’s capital management objectives. The Group’s overall capital risk management strategy remains unchanged from 2015.
The capital structure of the Group comprises: equity, consisting of share capital, share premium, retained earnings and other reserves as disclosed in the consolidated statement of changes in equity; and cash, cash equivalents and borrowings as disclosed in note 20 and described further below. The Group forecasts and monitors short, medium and longer-term capital needs on a regular basis and adjusts its capital structure as required through the payment of dividends to shareholders, the issue of new share capital and the increase or repayment of borrowings. All investment decisions are made with regard to the Group’s weighted average cost of capital and typically a pre-tax annualised return of at least 15% is required to ensure such investments are value enhancing for shareholders.
Financial risk managementFinancial risk management is an integral part of the way the Group is managed. In the course of its business, the Group is exposed primarily to credit risk, market risk and liquidity risk. The overall aim of the Group’s financial risk management policies is to minimise any potential adverse effects on financial performance and net assets.
The Group’s treasury team manages the principal financial risks within policies and operating limits approved by the Board. The treasury function is not a profit centre and does not enter into speculative transactions. Derivative financial instruments are used to hedge exposure to fluctuations in interest and exchange rates.
Credit riskCredit risk arises on financial instruments such as trade receivables, short-term bank deposits and interest rate and currency hedges.
Policies and procedures exist to ensure that customers have an appropriate credit history. The Group’s most significant clients are public or regulated industry entities which generally have high credit ratings or are of a high credit quality due to the nature of the client.
Short-term bank deposits and hedging transactions are executed only with highly credit-rated authorised counterparties based on ratings issued by the major ratings agencies. Counterparty exposure positions are monitored regularly so that credit exposures to any one counterparty are within predetermined limits. At the balance sheet date there were no significant concentrations of credit risk.
Trade and other receivables included in the balance sheet are stated net of a bad debt provision which has been estimated by management following a review of individual receivable accounts. There is no Group-wide rate of provision and provision made for debts that are overdue is based on prior default experience and known factors at the balance sheet date. Receivables are written off against the bad debt provision when management considers that the debt is no longer recoverable.
An analysis of the provision held against trade receivables is set out below:2016
£m20151
£m
Provision as at 1 July 14.3 2.3
Acquired in the year – 11.9
Charged to the income statement 5.7 0.1
Provision as at 30 June 20.0 14.3
1 Restated for impact of revision to the acquisition accounting of the Mouchel Group, see note 30b to the financial statements.
There were £88.4m (2015: £109.1m) of trade receivables that were overdue at the balance sheet date that have not been provided against, of which £43.2m (2015: £64.2m) had been received by the end of August 2016. There are no indications as at 30 June 2016 that the debtors will not meet their payment obligations in respect of the amount of trade receivables recognised in the balance sheet that are overdue and unprovided. The proportion of trade receivables at 30 June 2016 that were overdue for payment was 41.7% (2015: 45.1%). Credit terms vary across the Group; the average age of trade receivables was as follows:
Construction 19 days (2015: 22 days)Services 12 days (2015: 23 days)
Overall, the Group considers that it is not exposed to significant credit risk.
Kier Group plc Annual Report and Accounts 2016132
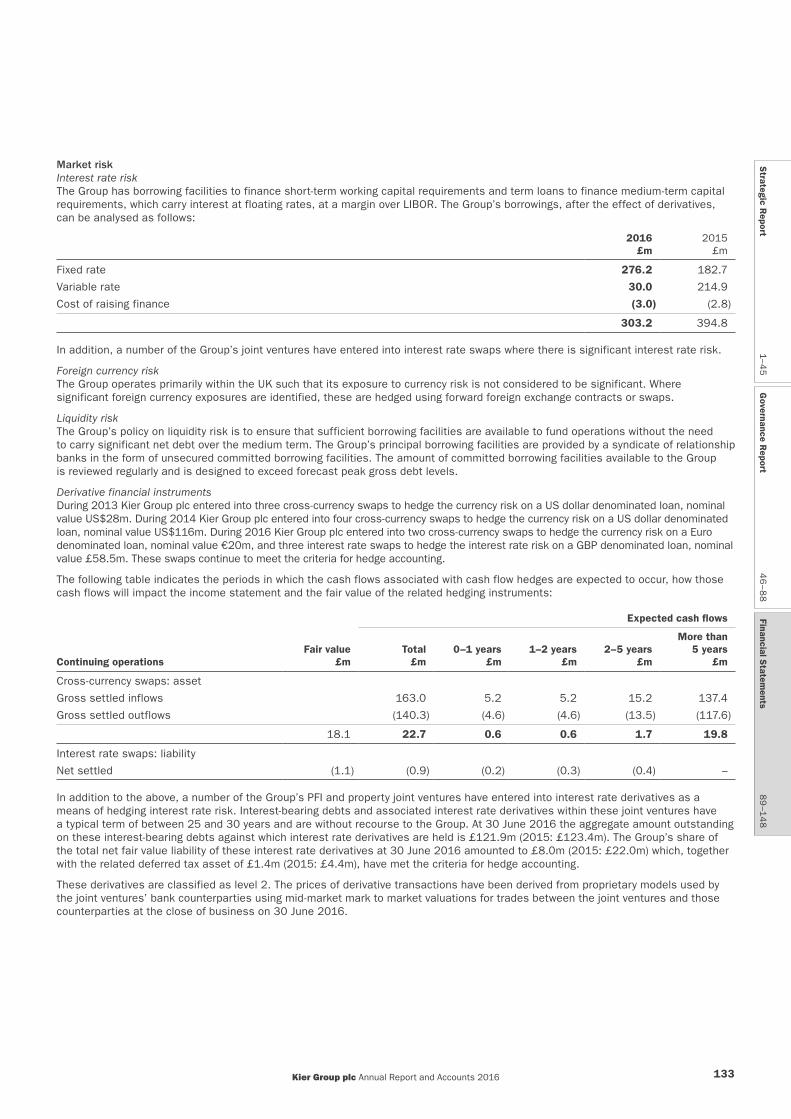
Market riskInterest rate riskThe Group has borrowing facilities to finance short-term working capital requirements and term loans to finance medium-term capital requirements, which carry interest at floating rates, at a margin over LIBOR. The Group’s borrowings, after the effect of derivatives, can be analysed as follows:
2016 £m
2015 £m
Fixed rate 276.2 182.7
Variable rate 30.0 214.9
Cost of raising finance (3.0) (2.8)
303.2 394.8
In addition, a number of the Group’s joint ventures have entered into interest rate swaps where there is significant interest rate risk.
Foreign currency riskThe Group operates primarily within the UK such that its exposure to currency risk is not considered to be significant. Where significant foreign currency exposures are identified, these are hedged using forward foreign exchange contracts or swaps.
Liquidity riskThe Group’s policy on liquidity risk is to ensure that sufficient borrowing facilities are available to fund operations without the need to carry significant net debt over the medium term. The Group’s principal borrowing facilities are provided by a syndicate of relationship banks in the form of unsecured committed borrowing facilities. The amount of committed borrowing facilities available to the Group is reviewed regularly and is designed to exceed forecast peak gross debt levels.
Derivative financial instrumentsDuring 2013 Kier Group plc entered into three cross-currency swaps to hedge the currency risk on a US dollar denominated loan, nominal value US$28m. During 2014 Kier Group plc entered into four cross-currency swaps to hedge the currency risk on a US dollar denominated loan, nominal value US$116m. During 2016 Kier Group plc entered into two cross-currency swaps to hedge the currency risk on a Euro denominated loan, nominal value €20m, and three interest rate swaps to hedge the interest rate risk on a GBP denominated loan, nominal value £58.5m. These swaps continue to meet the criteria for hedge accounting.
The following table indicates the periods in which the cash flows associated with cash flow hedges are expected to occur, how those cash flows will impact the income statement and the fair value of the related hedging instruments:
Continuing operations
Expected cash flows
Fair value £m
Total £m
0–1 years £m
1–2 years £m
2–5 years £m
More than5 years
£m
Cross-currency swaps: asset
Gross settled inflows 163.0 5.2 5.2 15.2 137.4
Gross settled outflows (140.3) (4.6) (4.6) (13.5) (117.6)
18.1 22.7 0.6 0.6 1.7 19.8
Interest rate swaps: liability
Net settled (1.1) (0.9) (0.2) (0.3) (0.4) –
In addition to the above, a number of the Group’s PFI and property joint ventures have entered into interest rate derivatives as a means of hedging interest rate risk. Interest-bearing debts and associated interest rate derivatives within these joint ventures have a typical term of between 25 and 30 years and are without recourse to the Group. At 30 June 2016 the aggregate amount outstanding on these interest-bearing debts against which interest rate derivatives are held is £121.9m (2015: £123.4m). The Group’s share of the total net fair value liability of these interest rate derivatives at 30 June 2016 amounted to £8.0m (2015: £22.0m) which, together with the related deferred tax asset of £1.4m (2015: £4.4m), have met the criteria for hedge accounting.
These derivatives are classified as level 2. The prices of derivative transactions have been derived from proprietary models used by the joint ventures’ bank counterparties using mid-market mark to market valuations for trades between the joint ventures and those counterparties at the close of business on 30 June 2016.
Kier Group plc Annual Report and Accounts 2016 133
Strategic R
eport1–4
5G
overnance Report
46
–88
Financial Statem
ents8
9–1
48

Financial Statements
Notes to the consolidated financial statementsFor the year ended 30 June 2016 continued
27 Financial instruments continuedFinancial assetsLoans and receivables at amortised cost, cash and cash equivalents: 2016
£m20151
£m
Cash and cash equivalents 186.7 254.0
Trade and other receivables (including £34.7m due after more than one year) – excluding prepayments 422.3 459.4
Loans to joint ventures 62.7 33.0
671.7 746.4
1 Restated for impact of revision to the acquisition accounting of the Mouchel Group, see note 30b to the financial statements.
Financial liabilities – analysis of maturity datesAt 30 June 2016 the Group had the following financial liabilities together with the maturity profile of their contractual cash flows:
Continuing operations
Discontinuedoperations
30 June 2016
Trade andother
payables1,2
£mBorrowings
£m
Finance lease
obligations £m
Total £m
Derivative financial
instruments £m
Carrying value 1,301.3 303.2 26.3 1,630.8 –
Contractual cash flows
Less than one year 1,288.1 40.8 14.4 1,343.3 –
One to two years 13.2 10.3 10.0 33.5 –
Two to three years – 10.3 3.0 13.3 –
Three to four years – 34.8 0.3 35.1 –
Four to five years – 67.7 – 67.7 –
Over five years – 194.9 – 194.9 –
1,301.3 358.8 27.7 1,687.8 –
30 June 2015
Carrying value 1,234.1 394.8 40.6 1,669.5 0.4
Contractual cash flows
Less than one year 1,222.7 13.0 15.9 1,251.6 0.4
One to two years 11.4 42.8 17.0 71.2 –
Two to three years – 12.4 7.0 19.4 –
Three to four years – 12.5 2.1 14.6 –
Four to five years – 221.6 0.6 222.2 –
Over five years – 167.1 – 167.1 –
1,234.1 469.4 42.6 1,746.1 0.4
2 Trade and other payables excludes deferred consideration, deferred income, taxes and social security and payments on account.
There is no material difference between the carrying value and fair value of the Group’s financial assets and liabilities, other than for derivative financial instruments.
The Group’s derivatives are classified as level 2. The prices of derivative transactions have been derived from propriatory models used by the company’s bank counterparties using mid-market mark to market valuations for trades between the company and those counterparties at the close of business on 30 June 2016.
Kier Group plc Annual Report and Accounts 2016134

Borrowings and borrowing facilitiesThe Group has the following unsecured committed facilities after the effect of derivatives:
• Revolving credit facility of £380.0m, at a margin over LIBOR, due for renewal in June 2020, £nil drawn at 30 June 2016 (2015: £185.0m);
• One term loan at a margin over LIBOR, £30.0m repayable January 2017, fully drawn at 30 June 2016, £30.0m (2015: £30.0m);• Four loan notes, principal amounts of £45.0m, US$28.0m, £47.0m and US$116.0m, with fixed coupons of between 4.1% and
4.9%, repayable in four repayments, December 2019, December 2022, November 2021 and November 2024, fully drawn at 30 June 2016, £182.7m at hedged rates (2015: £182.7m);
• Two loan notes, principal amounts of €10.0m and €10.0m, with fixed coupons of between 1.5% and 2.1%, repayable in May 2021 and May 2023, fully drawn at 30 June 2016 £15.7m at hedged rates (2015: £nil); and
• One loan note, principal amount of £58.5m at a margin over LIBOR with maturity date May 2021, fully drawn at 30 June 2016 (2015: £nil).
In addition the Group has an unsecured overdraft of £45.0m (2015: £45.0m), at a margin over LIBOR, repayable on demand, £nil drawn at 30 June 2016 (2015: £nil) and a bank loan of £1.6m (2015: £nil).
The committed facilities are subject to certain covenants linked to the Group’s financing structure, specifically regarding the ratios of debt to EBITDA, interest cover, and consolidated net worth. The Group has complied with these covenants throughout the period.
Included within borrowings are capitalised loan fees of £3.0m (2015: £2.8m).
The derivative financial instrument (fuel price forward contracts) for discontinued operations matured during the year and was £nil at 30 June 2016 (2015: current liabilities of £0.4m).
28 Financial and capital commitments 2016
£m2015
£m
Commitments for capital expenditure 7.9 6.3
Commitments for equity and subordinate debt in joint ventures 9.8 16.3
17.7 22.6
The total of future minimum lease payments under non-cancellable operating lease rentals are payable as follows:
2016 2015
Property £m
Plant and machinery
£mProperty
£m
Plant and machinery
£m
Within one year 8.8 10.1 10.1 22.1
Between one and five years 21.7 70.1 25.2 32.1
Over five years 22.9 2.0 20.0 7.0
53.4 82.2 55.3 61.2
The Group leases properties and vehicles for operational purposes. Property leases vary considerably in length up to a maximum period beyond 30 June 2016 of 13 years. Vehicle leases typically run for a period of four years. No leases include contingent rentals.
Kier Group plc Annual Report and Accounts 2016 135
Strategic R
eport1–4
5G
overnance Report
46
–88
Financial Statem
ents8
9–1
48
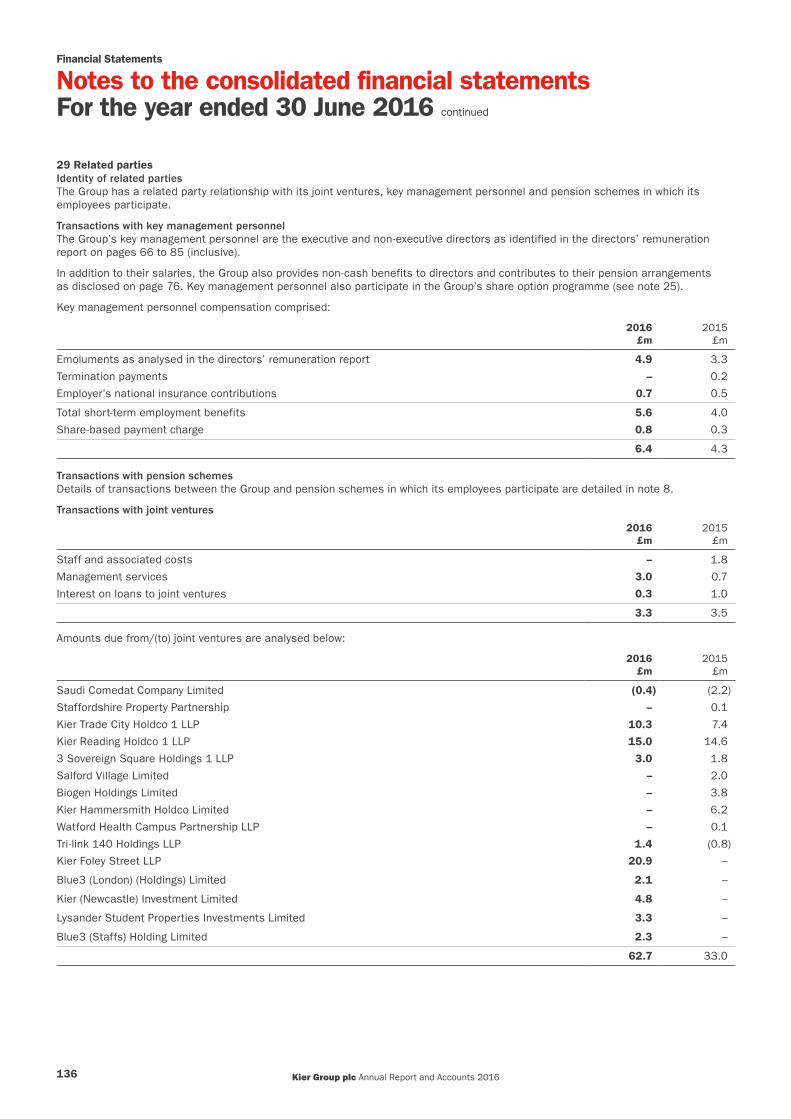
Financial Statements
Notes to the consolidated financial statementsFor the year ended 30 June 2016 continued
29 Related partiesIdentity of related partiesThe Group has a related party relationship with its joint ventures, key management personnel and pension schemes in which its employees participate.
Transactions with key management personnelThe Group’s key management personnel are the executive and non-executive directors as identified in the directors’ remuneration report on pages 66 to 85 (inclusive).
In addition to their salaries, the Group also provides non-cash benefits to directors and contributes to their pension arrangements as disclosed on page 76. Key management personnel also participate in the Group’s share option programme (see note 25).
Key management personnel compensation comprised:
2016 £m
2015 £m
Emoluments as analysed in the directors’ remuneration report 4.9 3.3
Termination payments – 0.2
Employer’s national insurance contributions 0.7 0.5
Total short-term employment benefits 5.6 4.0
Share-based payment charge 0.8 0.3
6.4 4.3
Transactions with pension schemesDetails of transactions between the Group and pension schemes in which its employees participate are detailed in note 8.
Transactions with joint ventures
2016 £m
2015 £m
Staff and associated costs – 1.8
Management services 3.0 0.7
Interest on loans to joint ventures 0.3 1.0
3.3 3.5
Amounts due from/(to) joint ventures are analysed below:
2016 £m
2015 £m
Saudi Comedat Company Limited (0.4) (2.2)
Staffordshire Property Partnership – 0.1
Kier Trade City Holdco 1 LLP 10.3 7.4
Kier Reading Holdco 1 LLP 15.0 14.6
3 Sovereign Square Holdings 1 LLP 3.0 1.8
Salford Village Limited – 2.0
Biogen Holdings Limited – 3.8
Kier Hammersmith Holdco Limited – 6.2
Watford Health Campus Partnership LLP – 0.1
Tri-link 140 Holdings LLP 1.4 (0.8)
Kier Foley Street LLP 20.9 –
Blue3 (London) (Holdings) Limited 2.1 –
Kier (Newcastle) Investment Limited 4.8 –
Lysander Student Properties Investments Limited 3.3 –
Blue3 (Staffs) Holding Limited 2.3 –
62.7 33.0
Kier Group plc Annual Report and Accounts 2016136
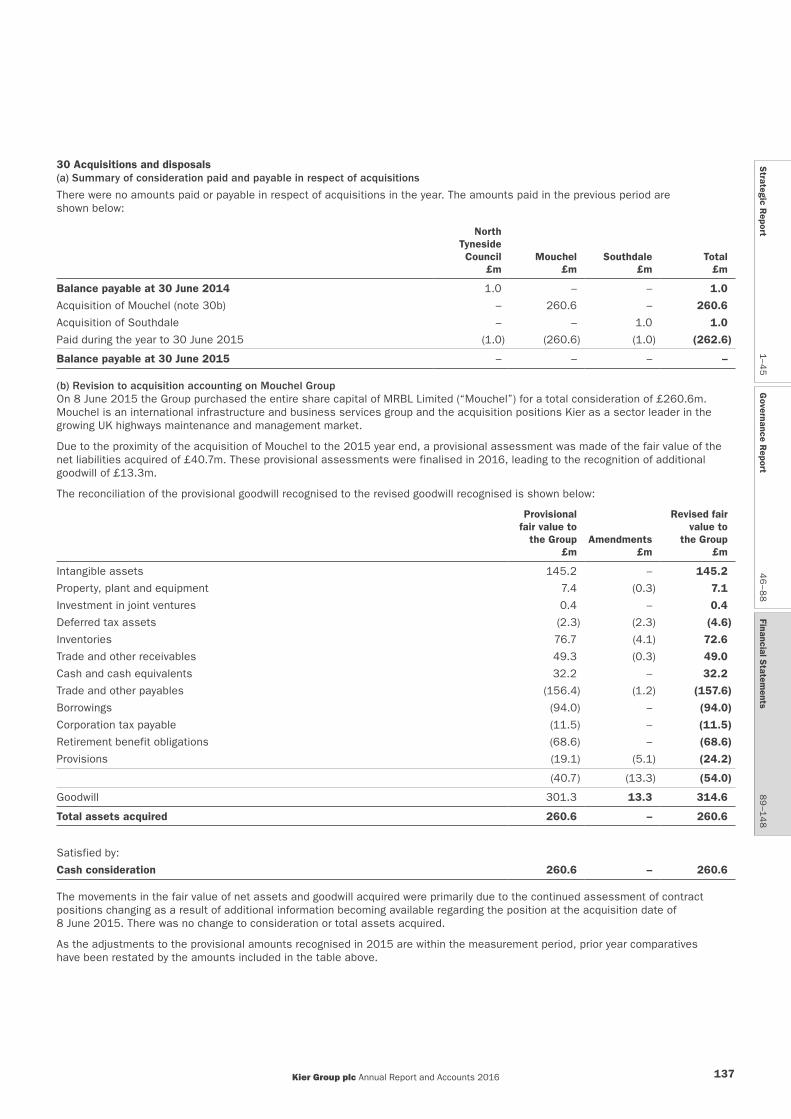
30 Acquisitions and disposals(a) Summary of consideration paid and payable in respect of acquisitions
There were no amounts paid or payable in respect of acquisitions in the year. The amounts paid in the previous period are shown below:
North Tyneside Council
£mMouchel
£mSouthdale
£mTotal £m
Balance payable at 30 June 2014 1.0 – – 1.0
Acquisition of Mouchel (note 30b) – 260.6 – 260.6
Acquisition of Southdale – – 1.0 1.0
Paid during the year to 30 June 2015 (1.0) (260.6) (1.0) (262.6)
Balance payable at 30 June 2015 – – – –
(b) Revision to acquisition accounting on Mouchel Group On 8 June 2015 the Group purchased the entire share capital of MRBL Limited (“Mouchel”) for a total consideration of £260.6m. Mouchel is an international infrastructure and business services group and the acquisition positions Kier as a sector leader in the growing UK highways maintenance and management market.
Due to the proximity of the acquisition of Mouchel to the 2015 year end, a provisional assessment was made of the fair value of the net liabilities acquired of £40.7m. These provisional assessments were finalised in 2016, leading to the recognition of additional goodwill of £13.3m.
The reconciliation of the provisional goodwill recognised to the revised goodwill recognised is shown below:
Provisional fair value to
the Group£m
Amendments£m
Revised fair value to
the Group£m
Intangible assets 145.2 – 145.2
Property, plant and equipment 7.4 (0.3) 7.1
Investment in joint ventures 0.4 – 0.4
Deferred tax assets (2.3) (2.3) (4.6)
Inventories 76.7 (4.1) 72.6
Trade and other receivables 49.3 (0.3) 49.0
Cash and cash equivalents 32.2 – 32.2
Trade and other payables (156.4) (1.2) (157.6)
Borrowings (94.0) – (94.0)
Corporation tax payable (11.5) – (11.5)
Retirement benefit obligations (68.6) – (68.6)
Provisions (19.1) (5.1) (24.2)
(40.7) (13.3) (54.0)
Goodwill 301.3 13.3 314.6
Total assets acquired 260.6 – 260.6
Satisfied by:
Cash consideration 260.6 – 260.6
The movements in the fair value of net assets and goodwill acquired were primarily due to the continued assessment of contract positions changing as a result of additional information becoming available regarding the position at the acquisition date of 8 June 2015. There was no change to consideration or total assets acquired.
As the adjustments to the provisional amounts recognised in 2015 are within the measurement period, prior year comparatives have been restated by the amounts included in the table above.
Kier Group plc Annual Report and Accounts 2016 137
Strategic R
eport1–4
5G
overnance Report
46
–88
Financial Statem
ents8
9–1
48
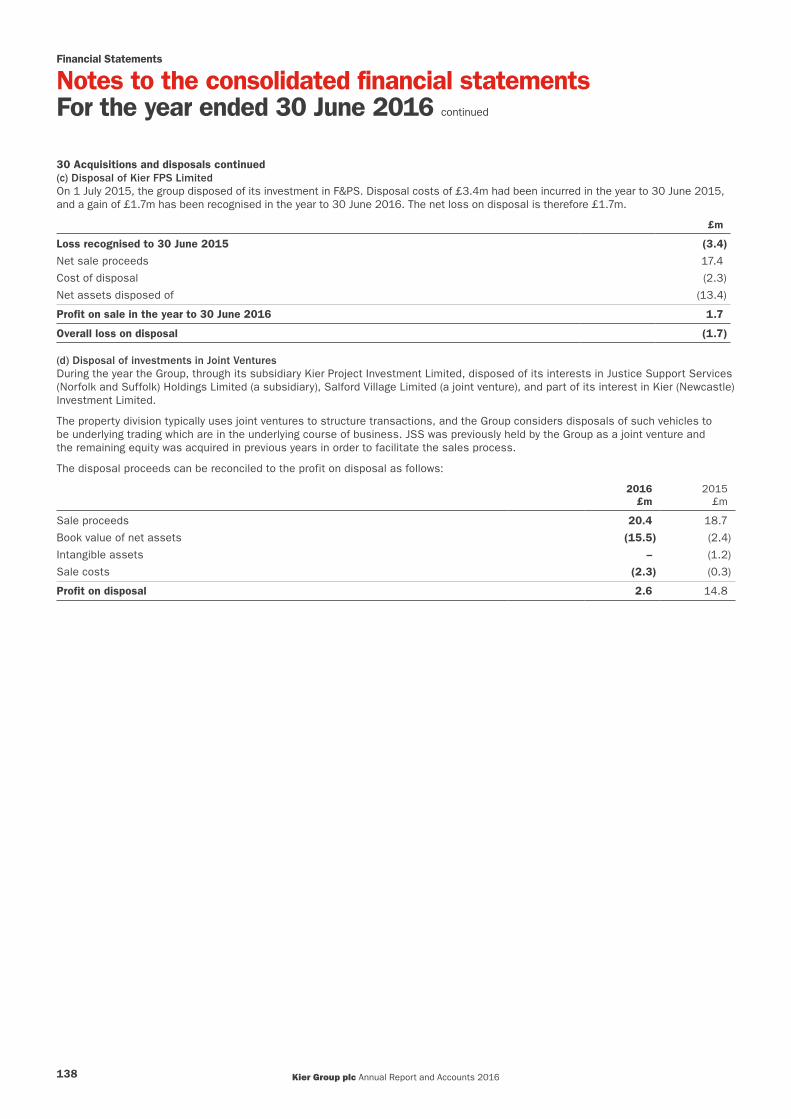
Financial Statements
Notes to the consolidated financial statementsFor the year ended 30 June 2016 continued
30 Acquisitions and disposals continued(c) Disposal of Kier FPS LimitedOn 1 July 2015, the group disposed of its investment in F&PS. Disposal costs of £3.4m had been incurred in the year to 30 June 2015, and a gain of £1.7m has been recognised in the year to 30 June 2016. The net loss on disposal is therefore £1.7m.
£m
Loss recognised to 30 June 2015 (3.4)
Net sale proceeds 17.4
Cost of disposal (2.3)
Net assets disposed of (13.4)
Profit on sale in the year to 30 June 2016 1.7
Overall loss on disposal (1.7)
(d) Disposal of investments in Joint VenturesDuring the year the Group, through its subsidiary Kier Project Investment Limited, disposed of its interests in Justice Support Services (Norfolk and Suffolk) Holdings Limited (a subsidiary), Salford Village Limited (a joint venture), and part of its interest in Kier (Newcastle) Investment Limited.
The property division typically uses joint ventures to structure transactions, and the Group considers disposals of such vehicles to be underlying trading which are in the underlying course of business. JSS was previously held by the Group as a joint venture and the remaining equity was acquired in previous years in order to facilitate the sales process.
The disposal proceeds can be reconciled to the profit on disposal as follows:
2016£m
2015£m
Sale proceeds 20.4 18.7
Book value of net assets (15.5) (2.4)
Intangible assets – (1.2)
Sale costs (2.3) (0.3)
Profit on disposal 2.6 14.8
Kier Group plc Annual Report and Accounts 2016138
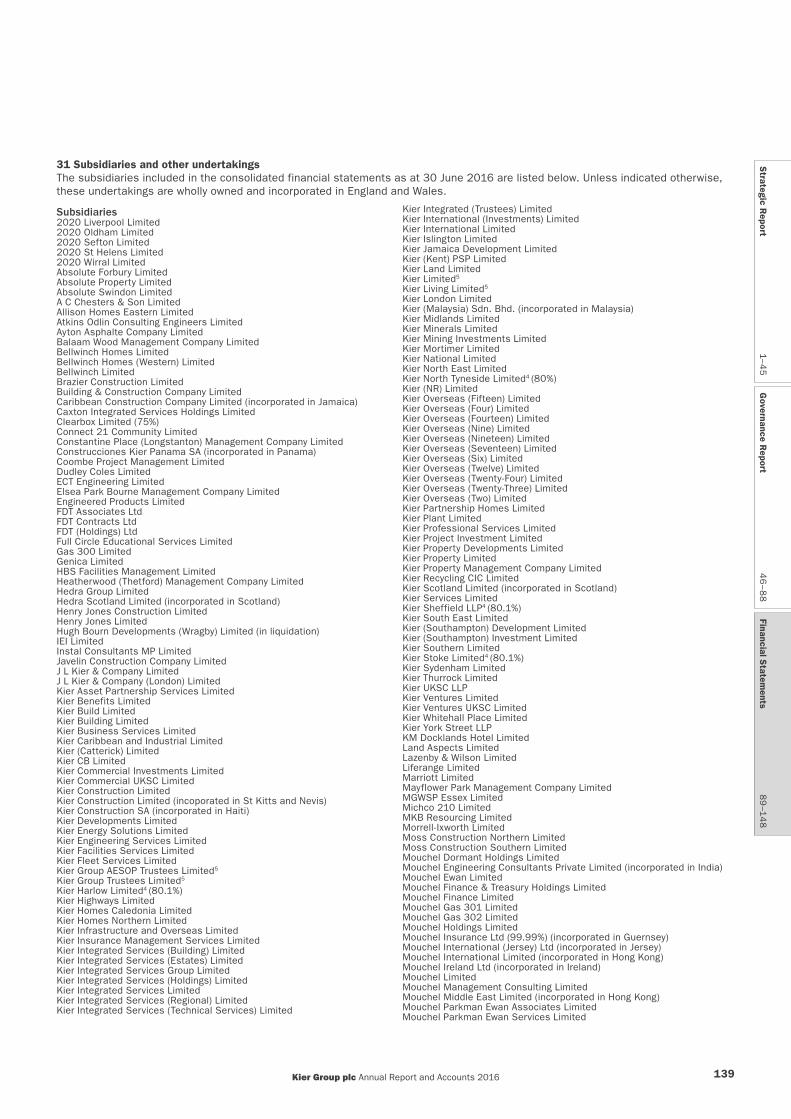
31 Subsidiaries and other undertakingsThe subsidiaries included in the consolidated financial statements as at 30 June 2016 are listed below. Unless indicated otherwise, these undertakings are wholly owned and incorporated in England and Wales.
Subsidiaries2020 Liverpool Limited 2020 Oldham Limited 2020 Sefton Limited 2020 St Helens Limited 2020 Wirral Limited Absolute Forbury LimitedAbsolute Property LimitedAbsolute Swindon LimitedA C Chesters & Son LimitedAllison Homes Eastern LimitedAtkins Odlin Consulting Engineers LimitedAyton Asphalte Company LimitedBalaam Wood Management Company LimitedBellwinch Homes LimitedBellwinch Homes (Western) LimitedBellwinch LimitedBrazier Construction LimitedBuilding & Construction Company LimitedCaribbean Construction Company Limited (incorporated in Jamaica)Caxton Integrated Services Holdings LimitedClearbox Limited (75%)Connect 21 Community LimitedConstantine Place (Longstanton) Management Company LimitedConstrucciones Kier Panama SA (incorporated in Panama)Coombe Project Management LimitedDudley Coles LimitedECT Engineering LimitedElsea Park Bourne Management Company LimitedEngineered Products LimitedFDT Associates LtdFDT Contracts LtdFDT (Holdings) LtdFull Circle Educational Services LimitedGas 300 LimitedGenica LimitedHBS Facilities Management LimitedHeatherwood (Thetford) Management Company LimitedHedra Group LimitedHedra Scotland Limited (incorporated in Scotland)Henry Jones Construction LimitedHenry Jones LimitedHugh Bourn Developments (Wragby) Limited (in liquidation)IEI LimitedInstal Consultants MP LimitedJavelin Construction Company LimitedJ L Kier & Company LimitedJ L Kier & Company (London) LimitedKier Asset Partnership Services LimitedKier Benefits LimitedKier Build LimitedKier Building LimitedKier Business Services LimitedKier Caribbean and Industrial LimitedKier (Catterick) Limited Kier CB LimitedKier Commercial Investments LimitedKier Commercial UKSC LimitedKier Construction LimitedKier Construction Limited (incoporated in St Kitts and Nevis)Kier Construction SA (incorporated in Haiti)Kier Developments LimitedKier Energy Solutions LimitedKier Engineering Services LimitedKier Facilities Services LimitedKier Fleet Services LimitedKier Group AESOP Trustees Limited5
Kier Group Trustees Limited5
Kier Harlow Limited4 (80.1%)
Kier Highways LimitedKier Homes Caledonia LimitedKier Homes Northern LimitedKier Infrastructure and Overseas LimitedKier Insurance Management Services LimitedKier Integrated Services (Building) LimitedKier Integrated Services (Estates) LimitedKier Integrated Services Group LimitedKier Integrated Services (Holdings) LimitedKier Integrated Services LimitedKier Integrated Services (Regional) LimitedKier Integrated Services (Technical Services) Limited
Kier Integrated (Trustees) LimitedKier International (Investments) LimitedKier International LimitedKier Islington LimitedKier Jamaica Development LimitedKier (Kent) PSP LimitedKier Land LimitedKier Limited5
Kier Living Limited5
Kier London LimitedKier (Malaysia) Sdn. Bhd. (incorporated in Malaysia)Kier Midlands LimitedKier Minerals LimitedKier Mining Investments LimitedKier Mortimer LimitedKier National LimitedKier North East LimitedKier North Tyneside Limited4 (80%)
Kier (NR) LimitedKier Overseas (Fifteen) LimitedKier Overseas (Four) LimitedKier Overseas (Fourteen) LimitedKier Overseas (Nine) LimitedKier Overseas (Nineteen) LimitedKier Overseas (Seventeen) LimitedKier Overseas (Six) LimitedKier Overseas (Twelve) LimitedKier Overseas (Twenty-Four) LimitedKier Overseas (Twenty-Three) LimitedKier Overseas (Two) LimitedKier Partnership Homes LimitedKier Plant LimitedKier Professional Services LimitedKier Project Investment LimitedKier Property Developments Limited Kier Property LimitedKier Property Management Company LimitedKier Recycling CIC LimitedKier Scotland Limited (incorporated in Scotland)Kier Services LimitedKier Sheffield LLP4 (80.1%)
Kier South East LimitedKier (Southampton) Development LimitedKier (Southampton) Investment LimitedKier Southern LimitedKier Stoke Limited4 (80.1%)
Kier Sydenham LimitedKier Thurrock LimitedKier UKSC LLPKier Ventures LimitedKier Ventures UKSC LimitedKier Whitehall Place LimitedKier York Street LLPKM Docklands Hotel LimitedLand Aspects LimitedLazenby & Wilson LimitedLiferange LimitedMarriott LimitedMayflower Park Management Company LimitedMGWSP Essex LimitedMichco 210 LimitedMKB Resourcing LimitedMorrell-Ixworth LimitedMoss Construction Northern LimitedMoss Construction Southern LimitedMouchel Dormant Holdings LimitedMouchel Engineering Consultants Private Limited (incorporated in India)Mouchel Ewan LimitedMouchel Finance & Treasury Holdings LimitedMouchel Finance LimitedMouchel Gas 301 LimitedMouchel Gas 302 LimitedMouchel Holdings LimitedMouchel Insurance Ltd (99.99%) (incorporated in Guernsey)Mouchel International (Jersey) Ltd (incorporated in Jersey)Mouchel International Limited (incorporated in Hong Kong)Mouchel Ireland Ltd (incorporated in Ireland)Mouchel LimitedMouchel Management Consulting LimitedMouchel Middle East Limited (incorporated in Hong Kong)Mouchel Parkman Ewan Associates LimitedMouchel Parkman Ewan Services Limited
Kier Group plc Annual Report and Accounts 2016 139
Strategic R
eport1–4
5G
overnance Report
46
–88
Financial Statem
ents8
9–1
48

Financial Statements
Notes to the consolidated financial statementsFor the year ended 30 June 2016 continued
Subsidiaries continuedMouchel Parkman GB LimitedMouchel Parkman LDA LimitedMouchel Parkman Metro LimitedMouchel Parkman (NI) Limited (incorporated in Northern Ireland)Mouchel Parkman Property Management LimitedMouchel Parkman ServiGroup LimitedMouchel Parkman ServiRail Construction Projects LimitedMouchel Parkman ServiServices LimitedMouchel Parkman ServiWays LimitedMouchel Pty Ltd (incorporated in Australia)Mouchel Rail LimitedMouchel Rail No. 2 LimitedMouchel South Africa Pty Limited (49%) (incorporated in South Africa)Mouchel Traffic Support LimitedMouchel Trustee LimitedMPHBS LimitedMRBL LimitedNewbury King & Co LimitedNew Learning Limited Norfolk Community Recycling Services LimitedParkman Botswana (Pty) Limited (99%) (incorporated in Botswana)Parkman Consultants LimitedParkman Consulting Engineers Parkman Group Professional Services Limited Parkman Holdings LimitedParkman Kenya Limited (incorporated in Kenya)Parkman Nigeria Limited (incorporated in Nigeria)Parkman Scotland Limited (incorporated in Scotland)Parkman South East LimitedPCE Holdings Limited PFI Street Lighting LimitedPure Buildings LimitedPure Recycling Warwick Limited Riley Builders LimitedRobert Marriott Group LimitedSaudi Kier Construction Limited (incorporated in Saudi Arabia)Sea Place Management LimitedSenturion (BidCo) LimitedSenturion Group LimitedSenturion (MidCo) LimitedSenturion Trustees LimitedSocial Power (Harlow) Holdings LimitedSocial Power (Harlow) LimitedT Cartledge LimitedTempsford Cedars LimitedTempsford Holdings Limited5
Tempsford Insurance Company Limited5 (incorporated in Guernsey)Tempsford Oaks Limited5
T H Construction LimitedT J Brent LimitedTraffic Support EBT LimitedTudor Homes (East Anglia) LimitedTurriff Contractors Limited (incorporated in Scotland)Turriff Group Limited (incorporated in Scotland)Turriff Smart Services Limited (incorporated in Scotland)Twigden Homes LimitedTwigden Homes Southern LimitedUnderground Moling Services Limited (incorporated in Scotland)Usherlink LimitedWallis Builders LimitedWallis LimitedWallis Western LimitedW & C French (Construction) LimitedWilliam Moss Civil Engineering LimitedThe William Moss Group LimitedWygate Management Company Limited
Kier Group plc Annual Report and Accounts 2016140

Joint venturesInterest held
Interest held
Property2020 Knowsley Limited3 Sovereign Square Holdings 1 LLP3 Sovereign Square Holdings 2 LLP3 Sovereign Square LLPAK Student Living Limited9
Alliance Community Partnership Limited (incorporated in Scotland)Biogen Bryn Pica LimitedBiogen Gwyriad LimitedBiogen Holdings Limited3 (Ordinary, Preferred Ordinary and Preference)Biogen LimitedBiogen (UK) LimitedBiogen Waen LimitedBlack Rock Devco LLPBlack Rock Holdco 1 LLPBlack Rock Holdco 2 LLPDownerMouchel Services Pty Limited (incorporated in Australia) Dragon Lane Holdings 1 LLPDragon Lane Holdings 2 LLPDragon Lane LLPEngage Lambeth Limited Fore UK 1B LPGreenfinch LimitedKent LEP 1 LimitedKier Foley Street Holdco 1 LLPKier Foley Street Holdco 2 LLPKier Foley Street LLPKier Hammersmith Holdco LimitedKier Hammersmith LimitedKier (Newcastle) Investment LimitedKier Reading Holdco 1 LLPKier Reading Holdco 2 LLPKier Reading LLPKier Sydenham GP Holdco LimitedKier Sydenham GP LimitedKier Sydenham LPKier Sydenham Nominee LimitedKier Trade City Holdco 1 LLPKier Trade City Holdco 2 LLPKier Trade City LLPKier Warth LimitedKingswood Devco Holdings 1 LLPKingswood Devco Holdings 2 LLPKingswood Devco LLPLambeth Learning Partnership (PSP) Limited Lysander Student Properties Investments Limited9
80.1%50%50%50%50%10%50%26%50%50%50%27.5%50%50%50%50%50%50%50%52%29%50%80%90%90%90%50%50%75%90%90%90%50%50%50%50%90%90%90%50%50%50%50%65%50%
Lysander Student Properties Limited9
Lysander Student Properties Operations Limited9
Magnetic LimitedPenda LimitedPremier Inn Kier LimitedRosewood Energy LimitedSolum Regeneration (Bishops) LLPSolum Regeneration Epsom (GP Subsidiary) LimitedSolum Regeneration Epsom (GP) LimitedSolum Regeneration (Epsom) Limited PartnershipSolum Regeneration Epsom (Residential) LLPSolum Regeneration (Guildford) LLPSolum Regeneration (Haywards) LLPSolum Regeneration (Kingswood) LLPSolum Regeneration (Maidstone) LLPSolum Regeneration (Redhill) LLPSolum Regeneration (Surbiton) LLPSolum Regeneration (Tanner) LLPSolum Regeneration (Tonbridge) LLPSolum Regeneration (Twickenham) LLP Solum Regeneration (Wembley) LLPTranscend Property LimitedTri-Link 140 Holdings 1 LLPTri-Link 140 Holdings 2 LLPTri-Link 140 LLPWatford Health Campus Partnership LLPWinsford Devco LLPWinsford Holdings 1 LLPWinsford Holdings 2 LLP
Long-term concession holdings under the Private FinanceInitiativeBlue 3 (London) (Holdings) LimitedBlue 3 (London) LimitedBlue 3 (Staffs) (Holdings) LimitedBlue 3 (Staffs) LimitedEvolution (Woking) Holdings LimitedEvolution (Woking) Limited
50%50%75%50%50%50%50%50%49.55%50%50%50%50%50%50%50%50%50%50%50%50%50%50%50%50%50%50%50%50%
50%50%80%80%50%50%
Services ConstructionHackney Schools for the Future LimitedMouchel Babcock Education Investments LimitedMouchel Babcock Education Services LimitedMouchel IRE Limited (incorporated in Ukraine)Network Information Services LimitedTeam Van Oord Limited The Impact Partnership (Rochdale Borough) LimitedThe Unity Partnership LimitedTor2 Limited (PSP Shares)3
VinciMouchel Limited
40%50%50%50%50%25%80.1%66.7%80.1%50%
Besix-Kier Dabhol Societe anonyme (incorporated in Belgium) (in liquidation)
Kier Construction LLC (incorporated in UAE)Kier Dubai LLC (incorporated in UAE)Kier Graham Defence LimitedRathenraw Limited (incorporated in Northern Ireland)Saudi Comedat Company Limited (incorporatedin Saudi Arabia) (sold 13 July 2016)
40%49%49%50%50%
25%
Kier Group plc Annual Report and Accounts 2016 141
Strategic R
eport1–4
5G
overnance Report
46
–88
Financial Statem
ents8
9–1
48

Financial Statements
Notes to the consolidated financial statementsFor the year ended 30 June 2016 continued
Joint operations
UK InternationalCrossrail Contracts300/410/435
Crossrail Contracts501/511
Deephams
Hercules
Hinkley Point C
KCD
KMI Plus
KMI Water
Mersey Gateway
Smart Motorways
a joint arrangement between KierInfrastructure and Overseas Limited, BAM Nuttall Limited and Ferrovial Agroman(UK) Limiteda joint arranagement between KierInfrastructure and Overseas Limited andBAM Nuttall Limiteda joint arrangement between KierInfrastructure and Overseas Limited, J Murphy & Sons Limited, and AecomLimiteda joint arrangement between KierConstruction Limited, Kier Living Limitedand Balfour Beattya joint arrangement between KierInfrastructure and Overseas Limited andBAM Nuttall Limiteda joint arrangement between Kier MGLimited and Clancy Docwra Limiteda joint arrangement between KierInfrastructure and Overseas Limited, J Murphy & Sons Limited, Inteserve ProjectServices Limited and Mouchel Limiteda joint arrangement between KierInfrastructure and Overseas Limited, J Murphy & Sons Limited and InterserveProject Services Limiteda joint arrangement between KierInfrastructure and Overseas Limited,Samsung C&T ECUK Limited and FCCConstruccion S.A.a joint arrangement between KierInfrastructure and Overseas Limited andCarillion Construction Limited
The following joint operations, in which the Group participation is between30% and 65%, operate overseas in the terrority indicated:
DPDP-6003 ResidentialProject (Bluewaters)
MTRC Contract 824
MTRC Contract 901
Saadiyat Rotana Hotel and Resort Complex
a joint arrangement between KierInfrastructure and Overseas Limited and AI Shafar General Contracting Co LLCa joint arrangement between KierInfrastructure and Overseas Limited and Kaden Construction Limiteda joint arrangement between KierInfrastructure and Overseas Limited, LaingO’Rourke Hong Kong Limited and KadenConstruction Limiteda joint arrangement between KierInfrastructure and Overseas Limited and Ali and Sons Contracting Co LLC
Notes:1 Each entity is incorporated in the United Kingdom, unless indicated otherwise.2 The share capital of all entities is wholly owned and held indirectly by Kier Group plc unless indicated otherwise.3 For entities that are not wholly owned, the shares held indirectly by Kier Group plc are ordinary shares unless indicated otherwise.4 The Group has entered into partnership agreements with Harlow Council, North Tyneside Council, Sheffield City Council and Stoke-on-Trent City Council whereby the respective councils
have a participating ownership interest and receive a minority share of the profits of Kier Harlow Limited, Kier North Tyneside Limited, Kier Sheffield LLP and Kier Stoke Limited.5 Shares held directly by Kier Group plc.6 Joint operations are contracted agreements to co-operate on a specific project which is an extension of the Group’s existing business. Joint ventures are ongoing businesses carrying
on their own trade. 7 Interests in the above joint ventures are held by subsidiary undertakings.8 The joint ventures where the Group has an interest in excess of 50% are still considered joint ventures as the Group still has joint control. 9 From 2 September 2016 the Group’s interest in the entity was 100%.
Kier Group plc Annual Report and Accounts 2016142
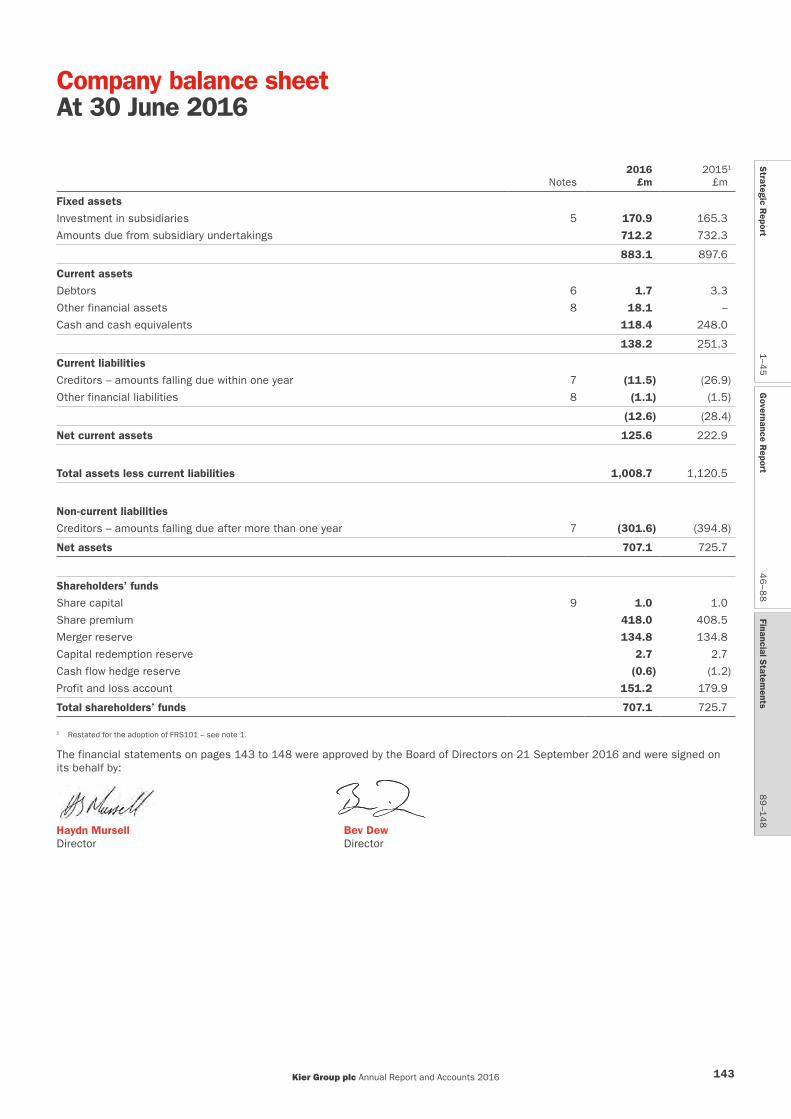
Notes2016
£m20151
£m
Fixed assets
Investment in subsidiaries 5 170.9 165.3
Amounts due from subsidiary undertakings 712.2 732.3
883.1 897.6
Current assets
Debtors 6 1.7 3.3
Other financial assets 8 18.1 –
Cash and cash equivalents 118.4 248.0
138.2 251.3
Current liabilities
Creditors – amounts falling due within one year 7 (11.5) (26.9)
Other financial liabilities 8 (1.1) (1.5)
(12.6) (28.4)
Net current assets 125.6 222.9
Total assets less current liabilities 1,008.7 1,120.5
Non-current liabilities
Creditors – amounts falling due after more than one year 7 (301.6) (394.8)
Net assets 707.1 725.7
Shareholders’ funds
Share capital 9 1.0 1.0
Share premium 418.0 408.5
Merger reserve 134.8 134.8
Capital redemption reserve 2.7 2.7
Cash flow hedge reserve (0.6) (1.2)
Profit and loss account 151.2 179.9
Total shareholders’ funds 707.1 725.7
1 Restated for the adoption of FRS101 – see note 1.
The financial statements on pages 143 to 148 were approved by the Board of Directors on 21 September 2016 and were signed on its behalf by:
Haydn Mursell Bev DewDirector Director
Company balance sheetAt 30 June 2016
Strategic R
eport1–4
5G
overnance Report
46
–88
Financial Statem
ents8
9–1
48
Kier Group plc Annual Report and Accounts 2016 143

Share capital
£m
Sharepremium
£m
Merger reserve
£m
Capital redemption
reserve£m
Profit and loss account
£m
Cash flow hedge
reserve£m
Total£m
At 1 July 20142 0.6 73.7 184.8 2.7 57.6 (1.3) 318.1
Profit for the year – – – – 109.8 – 109.8
Other comprehensive income – – – – – 0.1 0.1
Dividends paid – – – – (40.2) – (40.2)
Issue of own shares 0.4 334.8 – – – – 335.2
Transfers1 – – (50.0) – 50.0 – –
Share-based payments – – – – 3.4 – 3.4
Purchase of own shares – – – – (0.7) – (0.7)
At 30 June 20152 1.0 408.5 134.8 2.7 179.9 (1.2) 725.7
Profit for the year – – – – 20.0 – 20.0
Other comprehensive income – – – – – 0.6 0.6
Dividends paid – – – – (54.7) – (54.7)
Issue of own shares – 9.5 – – – – 9.5
Share-based payments – – – – 5.6 – 5.6
Purchase of own shares – – – – 0.4 – 0.4
At 30 June 2016 1.0 418.0 134.8 2.7 151.2 (0.6) 707.1
1 The Group restructured its ownership of Kier Integrated Services (Holdings) Limited to Kier Limited for a nil profit loss, for which it was paid £50.0m from free cash and entered into a long-term loan for the balance of consideration. As a consequence £50.0m of the merger reserve was transferred to retained earnings.
2 Restated for the adoption of FRS101 – see notes 1 and 10.
Included in the profit and loss account is the balance on the share scheme reserve which comprises the investment in own shares of £3.4m (2015: £3.7m) and a credit balance on the share scheme reserve of £10.2m (2015: £7.4m).
Details of the shares held by the Kier Group 1999 Employee Benefit Trust and of the share based payment scheme are included in note 25 to the consolidated financial statements.
Financial Statements
Company statement of changes in equityFor the year ended 30 June 2016
Kier Group plc Annual Report and Accounts 2016144

Notes to the Company financial statementsFor the year ended 30 June 2016
1 Accounting policiesThe principal accounting policies are summarised below. They have been applied consistently throughout the year and the preceding year.
Basis of preparationThe financial statements have been prepared in accordance with Financial Reporting Standard 101 ‘Reduced Disclosure Framework’ (‘FRS101’) and the Companies Act 2006. The financial statements have been prepared under the historical cost convention.
Kier Group plc is a company incorporated in the United Kingdom under the Companies Act. The address of the registered office is given on page 150.
The Company meets the definition of a qualifying entity under FRS100 ‘Application of Financial Reporting Requirements’. Accordingly in the year ended 30 June 2016, the Company has changed its accounting framework from UK Generally Accepted Accounting Practice (‘GAAP’) to FRS101. In doing so, the Company has applied the requirements of IFRS 1.6-33 and related appendices, but has taken advantage of the exemption in FRS101 (September 2015) not to present a third statement of financial position. These financial statements were prepared in accordance with FRS101 as issued by the Financial Reporting Council. The prior year financial statements were restated for material adjustments on adoption of FRS101 in the current year. For more information see note 10.
The Company’s financial statements are included in the Kier Group plc consolidated financial statements for the year ended 30 June 2016. As permitted by Section 408 of the Companies Act 2006, the Company has not presented its own profit and loss account.
The Company has taken advantage of the following disclosure exemptions in preparing these financial statements, as permitted by FRS101.
• The requirement of paragraphs 45(b) and 46 to 52 of IFRS ‘Share Based Payment’• The requirements of IFRS 7 ‘Financial Instruments: Disclosures’• The requirements of paragraphs 91 to 99 of IFRS13 ‘Fair Value Measurement’• The requirement in paragraph 38 of IAS1 ‘Presentation of Financial Statements’ to present comparative information in respect
of paragraph 79(a)(iv) of IAS1• The requirement of paragraphs 10(d), 10a(f), 16, 38A, 38B, 38C, 38D, 40A, 40B, 40C, 40D and 111 of IAS1 ‘Presentation of
Financial Statements’• The requirements of paragraphs 134 to 136 of IAS1 ‘Presentation of Financial Statements’• The requirements of IAS7 ‘Statement of Cash Flows’• The requirements of paragraphs 30 and 31 of IAS8 ‘Accounting Policies, Changes in Accounting Estimates and Errors’• The requirement of paragraphs 17 and 18A of IAS24 ‘Related Party Disclosures’• The requirements in IAS24 ‘Related party disclosures’ to disclose related party transaction entered into between two or more
members of a group• The requirements of paragraphs 134(d) to 134(f) and 135(c) to 135(e) of IAS36 ‘Impairment of Assets’
These financial statements are separate financial statements. The Company is exempt from the preparation of consolidated financial statements because it is included in the Annual Report and Financial Statements of the Group.
Where required, equivalent disclosures are given in the Annual Report and Financial Statements of the Group as shown in note 1 to 10.
Adoption of new and revised standardsAs explained above, the Company has adopted FRS101 for the first time in the current year. The impact of the adoption is shown in note 10.
Going concernThe directors have made enquiries and have a reasonable expectation that the Company has adequate resources to continue in existence for the foreseeable future. For this reason, they adopt the going concern basis in preparing the financial statements.
Fixed asset investmentsInvestments in subsidiary undertakings are included in the balance sheet at cost less any provision for impairment.
TaxationIncome tax comprises current and deferred tax. Income tax is recognised in the income statement except to the extent that it relates to items recognised directly in equity, in which case it is recognised in equity.
Current tax is the expected tax payable on taxable income for the year, using tax rates enacted or substantively enacted at the balance sheet date, and any adjustment to tax payable in respect of previous years.
Deferred tax is provided using the balance sheet method, providing for temporary differences between the carrying amounts of assets and liabilities for financial reporting purposes and the amounts used for taxation purposes. The deferred tax provision is based on the expected manner of realisation or settlement of the carrying amount of the assets and liabilities, using tax rates enacted or substantively enacted at the balance sheet date.
A deferred tax asset is recognised only to the extent that it is probable that future taxable profits will be available against which the asset can be utilised. Deferred tax assets are reduced to the extent that it is no longer probable that the related tax benefit will be realised.
Strategic R
eport1–4
5G
overnance Report
46
–88
Financial Statem
ents8
9–1
48
Kier Group plc Annual Report and Accounts 2016 145

1 Accounting policies continuedFinancial instruments Financial assets and financial liabilities are recognised in the Company’s balance sheet when the Company becomes a party to the contractual provisions of the instrument. The principal financial assets and liabilities of the Company are as follows:
(a) Cash and cash equivalentsCash and cash equivalents comprise cash at bank and in hand, including bank deposits with original maturities of three months or less, net of bank overdrafts where legal right of set off exists. Bank overdrafts are included within financial liabilities in current liabilities in the balance sheet.
(b) Bank and other borrowingsInterest-bearing bank and other borrowings are recorded at the fair value of the proceeds received, net of direct issue costs. Finance charges, including premiums payable on settlement or redemption and direct issue costs, are accounted for on an accruals basis in the income statement using the effective interest method and are added to the carrying value of the instrument to the extent that they are not settled in the period in which they arise.
(c) Derivative financial instrumentsDerivatives are initially recognised at fair value on the date that the contract is entered into and subsequently re-measured in future periods at their fair value. The method of recognising the resulting change in fair value depends on whether the derivative is designated as a hedging instrument and whether the hedging relationship is effective.
For cash flow hedges the effective part of the change in fair value of these derivatives is recognised directly in other comprehensive income. Any ineffective portion is recognised immediately in the income statement. Amounts accumulated in equity are recycled to the income statement in the periods when the hedged items will affect profit or loss. The fair value of interest rate derivatives is the estimated amount that the Company would receive or pay to terminate the derivatives at the balance sheet date.
If the hedging instrument no longer meets the criteria for hedge accounting, expires or is sold, terminated or exercised, the hedge accounting is discontinued prospectively. The cumulative gain or loss previously recognised in equity remains there until the forecast transaction occurs.
The Company enters into forward contracts in order to hedge against transactional foreign currency exposures. In cases where these derivative instruments are significant, hedge accounting is applied as described above. Where hedge accounting is not applied, changes in fair value of derivatives are recognised in the income statement. Fair values are based on quoted market prices at the balance sheet date.
Share-based paymentsShare-based payments granted but not vested are valued at the fair value of the shares at the date of grant. This affects the Sharesave and Long Term Incentive Plan (‘LTIP’) schemes. The fair value of these schemes at the date of award is calculated using the Black-Scholes model apart from the total shareholder return element of the LTIP which is based on a stochastic model.
The cost to the Company of awards to employees under the LTIP scheme is spread on a straight-line basis over the relevant performance period. The scheme awards to senior employees a number of shares which will vest after three years if particular criteria are met. The cost of the scheme is based on the fair value of the shares at the date the options are granted.
Shares purchased and held in trust in connection with the Company’s share schemes are deducted from retained earnings. No gain or loss is recognised within the income statement on the market value of these shares compared with the original cost.
Critical accounting judgements and key sources of estimation uncertaintyIn the application of the Company accounting policies which are described above, the directors are required to make judgements, estimates and assumptions about the carrying amounts of assets and liabilities that are not readily apparent from other sources. The estimates are based on historical experience and the factors that are considered to be relevant. Actual results may differ from those estimates.
The estimates are reviewed on an ongoing basis. Revisions to accounting estimates are recognised in the period in which the estimate is revised.
There are no critical judgements, apart from those involving estimates, that the directors have made in the process of applying the Company’s accounting policies and that have a significant effect on the amounts recognised in the financial statements.
They key assumptions and a key source of estimation uncertainty at the balance sheet date that has a significant risk of carrying a material adjustment to the carrying amount within the next financial year is:
Impairment of investment in subsidiaries Determining whether the Company’s investments in subsidiaries have been impaired requires estimations of the investments’ value in use. The value in use calculations require the entity to estimate the future cash flows expected to arise from investments. The carrying amount of the investment in subsidiaries at the balance sheet date was £170.9m (2015: £165.3m). No impairment losses have been recognised.
Financial Statements
Notes to the Company financial statementsFor the year ended 30 June 2016 continued
Kier Group plc Annual Report and Accounts 2016146
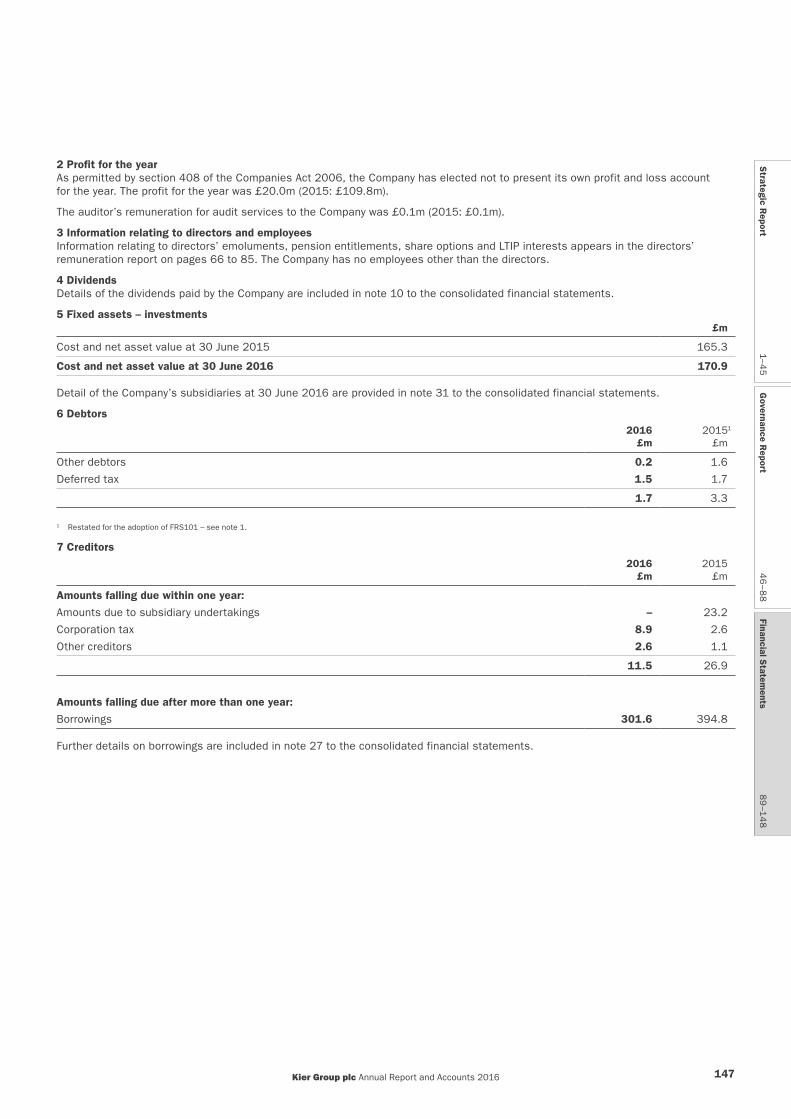
2 Profit for the yearAs permitted by section 408 of the Companies Act 2006, the Company has elected not to present its own profit and loss account for the year. The profit for the year was £20.0m (2015: £109.8m).
The auditor’s remuneration for audit services to the Company was £0.1m (2015: £0.1m).
3 Information relating to directors and employeesInformation relating to directors’ emoluments, pension entitlements, share options and LTIP interests appears in the directors’ remuneration report on pages 66 to 85. The Company has no employees other than the directors.
4 DividendsDetails of the dividends paid by the Company are included in note 10 to the consolidated financial statements.
5 Fixed assets – investments£m
Cost and net asset value at 30 June 2015 165.3
Cost and net asset value at 30 June 2016 170.9
Detail of the Company’s subsidiaries at 30 June 2016 are provided in note 31 to the consolidated financial statements.
6 Debtors2016
£m20151
£m
Other debtors 0.2 1.6
Deferred tax 1.5 1.7
1.7 3.3
1 Restated for the adoption of FRS101 – see note 1.
7 Creditors2016
£m2015
£m
Amounts falling due within one year:
Amounts due to subsidiary undertakings – 23.2
Corporation tax 8.9 2.6
Other creditors 2.6 1.1
11.5 26.9
Amounts falling due after more than one year:
Borrowings 301.6 394.8
Further details on borrowings are included in note 27 to the consolidated financial statements.
Strategic R
eport1–4
5G
overnance Report
46
–88
Financial Statem
ents8
9–1
48
Kier Group plc Annual Report and Accounts 2016 147
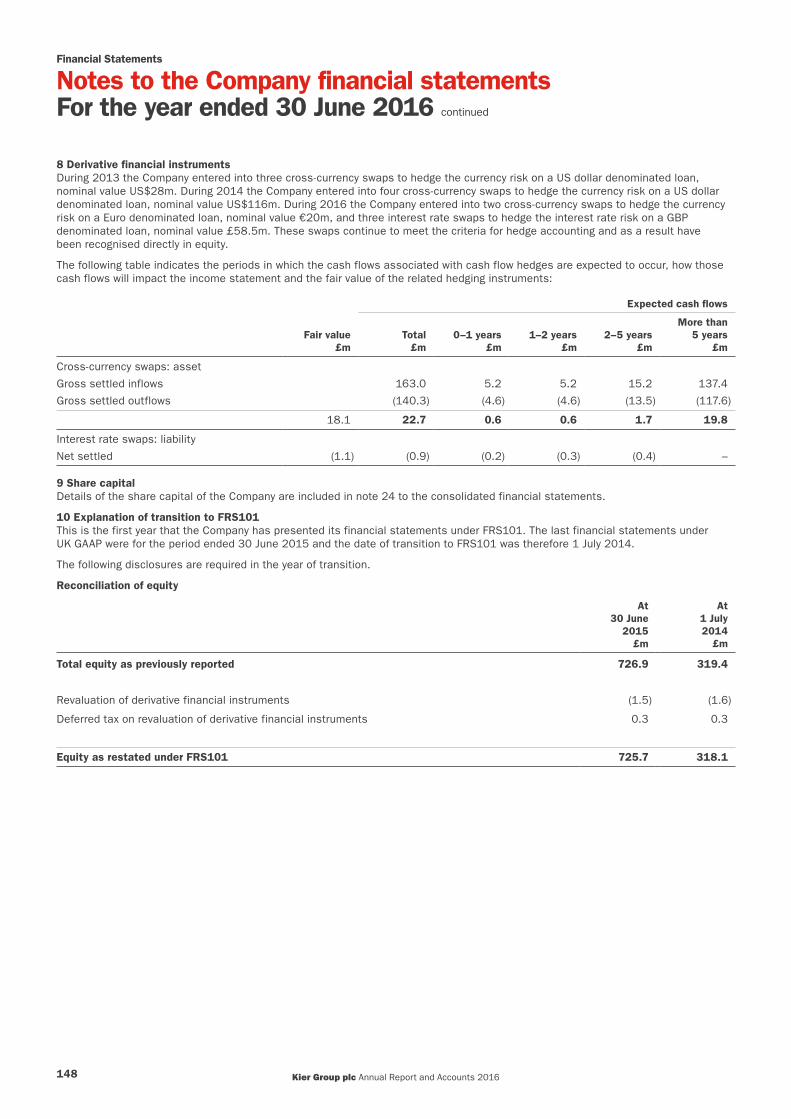
8 Derivative financial instrumentsDuring 2013 the Company entered into three cross-currency swaps to hedge the currency risk on a US dollar denominated loan, nominal value US$28m. During 2014 the Company entered into four cross-currency swaps to hedge the currency risk on a US dollar denominated loan, nominal value US$116m. During 2016 the Company entered into two cross-currency swaps to hedge the currency risk on a Euro denominated loan, nominal value €20m, and three interest rate swaps to hedge the interest rate risk on a GBP denominated loan, nominal value £58.5m. These swaps continue to meet the criteria for hedge accounting and as a result have been recognised directly in equity.
The following table indicates the periods in which the cash flows associated with cash flow hedges are expected to occur, how those cash flows will impact the income statement and the fair value of the related hedging instruments:
Expected cash flows
Fair value £m
Total £m
0–1 years £m
1–2 years £m
2–5 years £m
More than5 years
£m
Cross-currency swaps: asset
Gross settled inflows 163.0 5.2 5.2 15.2 137.4
Gross settled outflows (140.3) (4.6) (4.6) (13.5) (117.6)
18.1 22.7 0.6 0.6 1.7 19.8
Interest rate swaps: liability
Net settled (1.1) (0.9) (0.2) (0.3) (0.4) –
9 Share capitalDetails of the share capital of the Company are included in note 24 to the consolidated financial statements.
10 Explanation of transition to FRS101This is the first year that the Company has presented its financial statements under FRS101. The last financial statements under UK GAAP were for the period ended 30 June 2015 and the date of transition to FRS101 was therefore 1 July 2014.
The following disclosures are required in the year of transition.
Reconciliation of equity
At 30 June
2015£m
At 1 July2014
£m
Total equity as previously reported 726.9 319.4
Revaluation of derivative financial instruments (1.5) (1.6)
Deferred tax on revaluation of derivative financial instruments 0.3 0.3
Equity as restated under FRS101 725.7 318.1
Financial Statements
Notes to the Company financial statementsFor the year ended 30 June 2016 continued
Kier Group plc Annual Report and Accounts 2016148
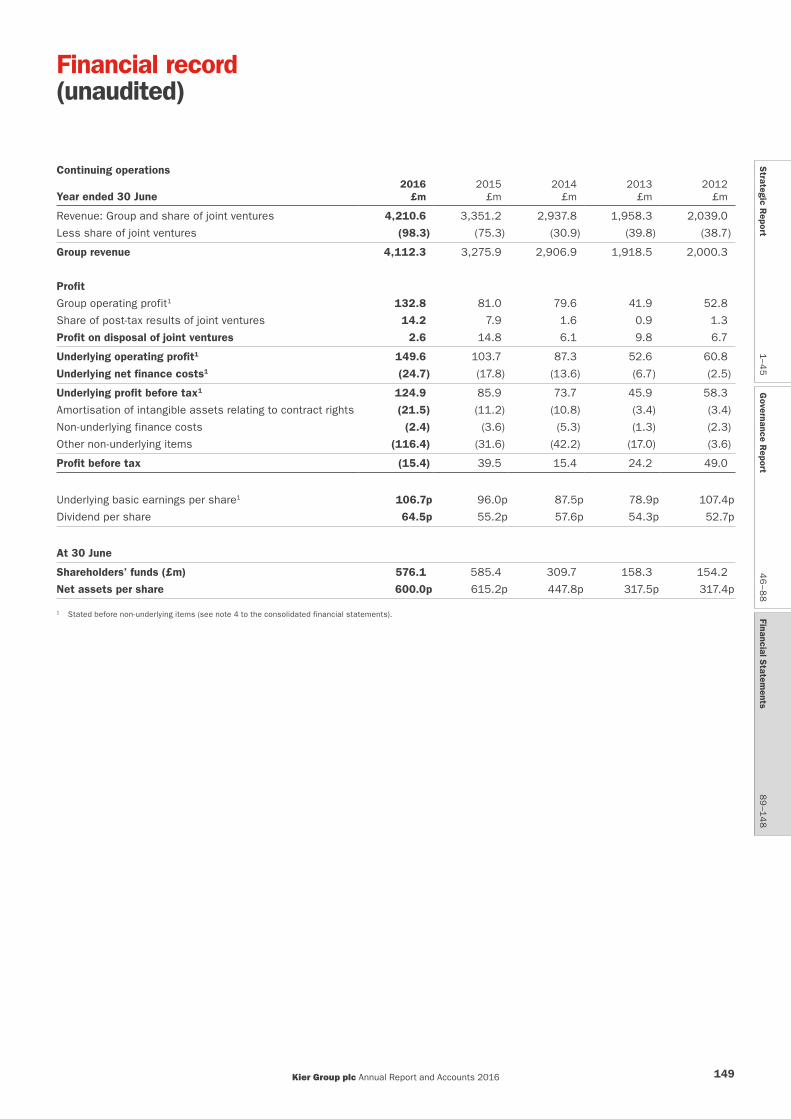
Financial record(unaudited)
Continuing operations
Year ended 30 June2016
£m2015
£m2014
£m2013
£m2012
£m
Revenue: Group and share of joint ventures 4,210.6 3,351.2 2,937.8 1,958.3 2,039.0
Less share of joint ventures (98.3) (75.3) (30.9) (39.8) (38.7)
Group revenue 4,112.3 3,275.9 2,906.9 1,918.5 2,000.3
Profit
Group operating profit1 132.8 81.0 79.6 41.9 52.8
Share of post-tax results of joint ventures 14.2 7.9 1.6 0.9 1.3
Profit on disposal of joint ventures 2.6 14.8 6.1 9.8 6.7
Underlying operating profit1 149.6 103.7 87.3 52.6 60.8
Underlying net finance costs1 (24.7) (17.8) (13.6) (6.7) (2.5)
Underlying profit before tax1 124.9 85.9 73.7 45.9 58.3
Amortisation of intangible assets relating to contract rights (21.5) (11.2) (10.8) (3.4) (3.4)
Non-underlying finance costs (2.4) (3.6) (5.3) (1.3) (2.3)
Other non-underlying items (116.4) (31.6) (42.2) (17.0) (3.6)
Profit before tax (15.4) 39.5 15.4 24.2 49.0
Underlying basic earnings per share1 106.7p 96.0p 87.5p 78.9p 107.4p
Dividend per share 64.5p 55.2p 57.6p 54.3p 52.7p
At 30 June
Shareholders’ funds (£m) 576.1 585.4 309.7 158.3 154.2
Net assets per share 600.0p 615.2p 447.8p 317.5p 317.4p
1 Stated before non-underlying items (see note 4 to the consolidated financial statements).
Kier Group plc Annual Report and Accounts 2016 149
Strategic R
eport1–4
5G
overnance Report
46
–88
Financial Statem
ents8
9–1
48
Board of DirectorsP M White CBEH J MursellB E J DewN P BrookN A TurnerC VeritieroJ R AtkinsonC F BaroudelA K BashforthA J MellorA C WalkerN P Winser CBE
SecretaryH E E Raven
Headquarters and registered officeKier Group plc Tempsford Hall Sandy Bedfordshire SG19 2BD
Registered numberEngland 2708030
Financial calendar18 November 2016 Annual general meeting
2 December 2016 Payment of final dividend for the year ended 30 June 2016
March 2017Announcement of half-year results and interim dividend for the six months ending 31 December 2016
May 2017Payment of interim dividend for the six months ending 31 December 2016
September 2017Announcement of preliminary full-year results and final dividend for the year ending 30 June 2017
AuditorPricewaterhouseCoopers LLP 1 Embankment Place London WC2N 6RH
Principal bankersBarclays Bank plc 1 Churchill Place London E14 5HP
Lloyds Banking Group plc 10 Gresham Street London EC2V 7AE
HSBC Bank plc Metropolitan House 321 Avebury Boulevard Milton Keynes MK9 2GA
Santander UK plc 2 Triton Square Regent’s Place London NW1 3AN
The Royal Bank of Scotland plc 280 Bishopsgate London EC2M 4RB
RegistrarsCapita Asset Services Northern House Woodsome Park Fenay Bridge Huddersfield West Yorkshire HD8 0LA
Financial advisersJ. P. Morgan Cazenove 20 Moorgate London EC2R 6DA
Numis Securities Limited 10 Paternoster Square London EC4M 7LT
Corporate information
Kier Group plc Annual Report and Accounts 2016150

Go online to find out moreOur corporate website has key information covering our capabilities, markets, corporate responsibility and investor relations.
www.kier.co.uk
Join the conversationEngage with us and keep up with the latest news and developments via social media.

Printed on Amadeus Primo Silk which is produced using wood fibre from fully responsible forests with FSC®certification. All pulps used are Elemental Chlorine Free (ECF). The manufacturing mill holds the ISO 14001 and EU Ecolabel certificates for environmental management.
Consultancy, design and production by Luminous www.luminous.co.uk


Kier Group plcTempsford Hall, SandyBedfordshire SG19 2BDTel: 01767 355000www.kier.co.uk
Kier G
roup plc Annual Report and Accounts 2016
Related Documents