11 ;2 kiE: qi1 CDO°UMITED DISTRIBUTION -- I * NationalDefence Defense nationale Research and Bureau de recherche Development Branch et developpement TECHNICAL MEMORANDUM 89/203 N January 1989 (03 N A STUDY OF FUEL DILUTION OF DIESEL LUBRICATING OIL BY GAS CHROMATOGRAPHY/MASS SPECTROMETRY J. A. Hiltz - D.E. Voint - R.D. Haggett DTIC S ELECTE K 4APR 1989 o&E 4- D Defence Centre de Research Recherches pour la Establishment Ddfense Atlantic , Atlantique Caniad 89 4 04 010

Welcome message from author
This document is posted to help you gain knowledge. Please leave a comment to let me know what you think about it! Share it to your friends and learn new things together.
Transcript

11 ;2 kiE: qi1 CDO°UMITED DISTRIBUTION --
I * NationalDefence Defense nationaleResearch and Bureau de rechercheDevelopment Branch et developpement
TECHNICAL MEMORANDUM 89/203N January 1989
(03
N
A STUDY OF FUEL DILUTION OFDIESEL LUBRICATING OIL BY GAS
CHROMATOGRAPHY/MASS SPECTROMETRY
J. A. Hiltz - D.E. Voint - R.D. Haggett
DTIC
S ELECTE K4APR 1989
o&E4- D
Defence Centre deResearch Recherches pour laEstablishment DdfenseAtlantic , Atlantique
Caniad
89 4 04 010

DEFENCE RESEARCH ESTABLISHMENT ATLANTIC CENTRE DE RECHERCHES POUR LA DtFENSE ATLANTIQUE9 GROVE STREET P 0 BOX 1012 9 GROVE STREET C P 1012
DARTMOUTH N.S TELEPHONE DARTMOUTH. N E
82Y 3Z7 (9r2) 426 3100 B2Y 3Z7

UNLIMITED DISTRIBUTION
mI 1* National Defence Defense nationaleResearch and Bureau de rechercheDevelopment Branch et diveloppement
A STUDY OF FUEL DILUTION OFDIESEL LUBRICATING OIL BY
GAS CHROMATOGRAPHY/MASS SPECTROMETRY
J.A. Hiltz - D.E. Veinot - R.D. Haggett
January 1989
Approved by L.J.Leggat Director/Tech logy Division
DISTRIBUTION APPROVED BY
D/TD
TECHNICAL MEMORANDUM 89/203
Defence A Centre de
Research Recherches pour laEstablishment D6fenseAtlantic Atlantique
Canad'

Abstract
V
A method for the detection and identification of fuelcomponents in diesel lubricating oil is described. The methoduses a capillary gas chromatograph coupled to a quadrupole massspectrometer to separate, detect and identify diluents in the oil.A typical analysis takes 40 minutes. Accurate determination ofthe level of fuel dilution of a diesel lubricating oil sampleusing GC/MS is shown to be dependent upon a number of factorsincluding the source of the fuel, the age of the fuel, thT thermalhistory of the fuel diluted diesel oil sample and the availabilityof a suitable sample of fuel to prepare standard response versusconcentration curves.- In contrast to the standard mehods ofdetermining fuel diluti'n in diesel lubricating oil such as ASTM
D445-82 (viscosity change), ASTM D92-78 (flash point reduction),and ASTM D3524-78 (packed column gas chromatography with flameionization detection), this method can identify diluents andcontaminants in the diesel lubricating oil. This is extremelyimportant in cases where the standard tests give false negativesor indicate the presence of a diluent but cannot identify thediluent.
ii
RESUME
L'article d6crit une m~thode de d~tection et d'identification des6l6ments de carburant presents dans de L'huile de graissage diesel. Lesinstruments utilis~s sont un chromatographe capillaire a' phase gazeuse et unspectrom~tre de masse quadripolaire; uls s~parent, d~c~lent et identifient lesdiluants de l'huile. L'analyse prend g~n~ralement 40 minutes. Ladetermination exacte de la quantit6 de carburant diluant present dans un6chantillon d'huile de graissage diesel, avec ces instruments, depend d'uncertain nombre de facteurs, notamment la source du carburant, son ige, lesant6c6dents thermiques de l'6chantillon et la disponibilit6 d'6chantillons decarburant suffisants pour 6tablir une courbe d'6talonnage en concentration.Grice a cette m~thode, on peut determiner quels diluants et contaminants sontpresents dans un 6chantillon d'huile, contrairement aux m6thodes pluscourantes de d6termination de la dilution de l'huile: ASTM D445-82(modifications de la viscosit6), ASTM D92-78 Cr6duction du point d'6clair),ASTM D3524-78 (chromatographie en phase gazeuse sur colonne garnie avecd6tection par ionisation de flanune). C'est un net avantage, car les essaisconventionnels donnent parfois de faux r~sultats n~gatifs ou des r6sultatspositifs incomplets parce qu'ils n'identifient pas le diluant.
Accession For
NTIS GRAMIDTIC TABUnannauycedJustificationK
ByD ist ribut ion/.
Availability Codes
Avaii and/orDist Special
TABLE OF CONTENTS
Page
1.0 Introduction 1
2.0 Experimental Approach 32.1 Equipment - Capillary Gas Chromatograph/Mass 3
Spectrometer/Data System (GC/MS/DS)
2.2 Standard Solutions 3
2.3 Naval Distillate Fuel Aging Study 4
3.0 Results and Discussion 4
3.1 Separation of Naval Distillate from Diesel 4
Lubricating Oil
3.2 Quantitative Analysis 5
3.2.1 Response Versus Concentration of 5Naval Distillate Fuel in DieselLubricating Oil
3.3 Relative Concentration of the Components of 6
Naval Distillate Fuel
3.4 Fuel Aging Studies 7
3.5 Examples of Fuel Dilution of Diesel 9Lubricating Oil by GC/MS
3.6 Identification of Diluents in Diesel 11Lubrucating Oil
3.7 Detection Limits of Naval Distillate Fuel 12
4.0 Conclusions 13
Figures 14
References 23
iv

1.0 INTRODUCTION
Accurate monitoring of the level of naval distillate fuel(CGSB 3-GP-IlMa1 ) dilution in diesel engine lubricating oil(MIL-L-9000G2 ) is an important concern in the daily operation ofCanadian Forces ships for two reasons. Fuel in the diesellubricating oil will lower the flash point of the lubricantmixture to below that for the unadulterated oil which presents asafety hazard due to the possibility of explosion in the enginecrankcase. Fuel can also act to alter the viscosity of the diesellubricating oil which may adversely affect its lubricatingproperties.
Conventionally, the level of fuel dilution of diesellubricating oil has been determined by two ASTM standard methods,namely, viscosity change3 and flash point 4 reduction, both ofwhich provide only indirect results for fuel dilution. Thesemethods involve the use of standards (prepared from stock samplesof diesel lubricating oil and naval distillate fuel) to preparecalibration curves relating the measured change to the level offuel dilution of the standards.
The determination of fuel dilution of diesel lubricatingoil by viscosity change involves the assumption that the reductionin viscosity of the sample is the result of fuel dilution.However, the reduction in viscosity may result from other factorsincluding dilution of the diesel lubricating oil by any otherless viscous solvent or by breakdown of the lubricant itself.Samples that have been in service for a period of time and arecontaminated with fuel will likely contain a lower percentage ofthe more volatile constituents of fuel as a result of in serviceevaporation of the lighter components. The use of a standardprepared in the laboratory from an unused sample of fuel wouldhave a different composition than the actual sample and this wouldeffect the calculated value of the fuel dilution, e.g., theapparent concentration of fuel determined from the calibrationplot may not necessarily reflect the actual level of fuel dilutionof the diesel lubricating oil. In other instances the viscosityof the diesel lubricating oil may be increased by a number offactors including polymerization and oxidation of the oil,excessive carbon buildup in the oil, or the addition of the wrongmakeup oil to the system. If the oil suffers fuel dilution at thesame time, the viscosity of the sample may not reflect the degreeof fuel dilution that has actually taken place. Viscosityanalysis, does however, provide some useful information regardingthe lubricating qualities of the fuel.
Similarly, a change in the flash point of a lubricating
1

fluid does not necessarily indicate that fuel dilution of thefluid has taken place. Although a decrease in flash point mayindicate the presence of a contaminant, it does not indicate thesource or nat.iue of the diluent. Flash point analysis does,however, provide an indication of the potential for explosivehazard while using the adulterated sample.
An ASTM method5 is in place that utilizes packed columngas chromatography (GC) with flame ionization detection (FID) toquantitatively determine fuel dilution of diesel lubricating oil.This ASTM method utilizes an internal standard (n-decane) in thequantitative step. A series of at least three solutions of fuelin diesel lubricating oil, containing known amounts of fuel and aconstant amount of n-decane, are prepared and utilized to plot acalibration curve of the ratio of the area of the fuel peaks tothe area of the internal standard peak against the concentrationof fuel in the solution. The peaks of the components of the navaldistillate fuel are assigned on the basis of their retentiontimes. The sample to be analyzed is then spiked with the internalstandard and the ratio of the areas under the fuel peaks and theinternal standard are determined. The concentration of the fuelin the sample, i.e., the fuel dilution, can then be obtained fromthe calibration curve.
As w~ih the methods using the measurement of viscosity andflash point changes, the packed column GC method with FID can notidentify the contaminant giving the observed response. If acontaminant is present that has a retention time in the range ofthe components of naval distillate fuel then it will also bemeasured as a component of the fuel. Further this packed columnmethod is not able to resolve the individual fuel constituents andthe response it provides is from the cumulative total of all ofthe compounds which elute from the column during a specified timeframe.
Capillary gas chromatography/mass spectrometry (GC/MS) hasthe ability to separate and identify the individual contaminantsin a diesel lubricating oil sample. The improved separationrealized with a capillary column facilitates quantitative analysisby allowing the quantitative measurement of the individualcomponents of the fuel. Identification of compounds eluting fromthe column can eliminate false positives caused by contaminants inthe sample with retention times similar to the components of thefuel and can also aid in determining the source of the contaminantin the fuel.
'This paper describes the development of a capillary GC/MSmethod for the detection and identification of contaminants in
2
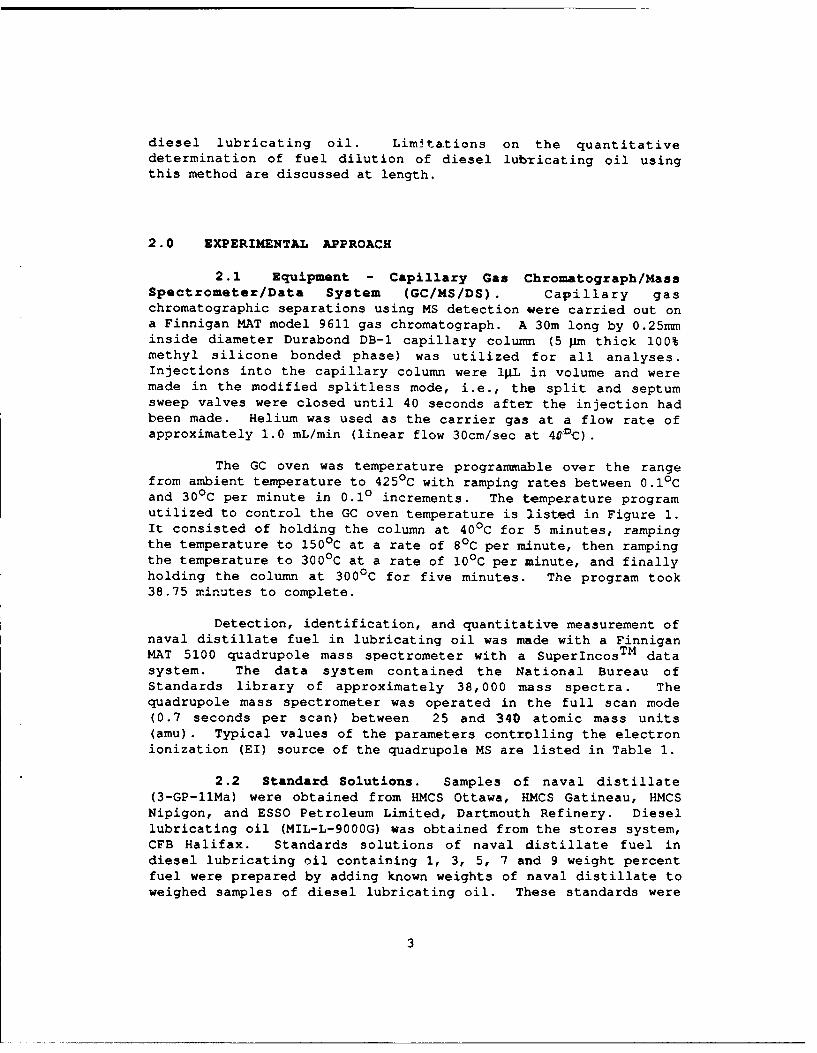
diesel lubricating oil. Limitations on the quantitativedetermination of fuel dilution of diesel lubricating oil usingthis method are discussed at length.
2.0 EXPERIMENTAL APPROACH
2.1 Equipment - Capillary Gas Chromatograph/MassSpectrometer/Data System (GC/MS/DS). Capillary gaschromatographic separations using MS detection were carried out ona Finnigan MAT model 9611 gas chromatograph. A 30m long by 0.25mminside diameter Durabond DB-1 capillary column (5 gm thick 100%methyl silicone bonded phase) was utilized for all analyses.Injections into the capillary column were lIL in volume and weremade in the modified splitless mode, i.e., the split and septumsweep valves were closed until 40 seconds afteT the injection hadbeen made. Helium was used as the carrier gas at a flow rate ofapproximately 1.0 mL/min (linear flow 30cm/sec at 490C).
The GC oven was temperature programmable over the rangefrom ambient temperature to 425 0C with ramping rates between 0.10Cand 300 C per minute in 0.10 increments. The temperature programutilized to control the GC oven temperature is listed in Figure 1.It consisted of holding the column at 400C for 5 minutes, rampingthe temperature to 150 0C at a rate of 80C per minute, then rampingthe temperature to 300 0 C at a rate of 100C per minute, and finallyholding the column at 300 0C for five minutes. The program took38.75 minutes to complete.
Detection, identification, and quantitative measurement ofnaval distillate fuel in lubricating oil was made with a FinniganMAT 5100 quadrupole mass spectrometer with a SuperIncosTM datasystem. The data system contained the National Bureau ofStandards library of approximately 38,000 mass spectra. Thequadrupole mass spectrometer was operated in the full scan mode(0.7 seconds per scan) between 25 and 340 atomic mass units(amu). Typical values of the parameters controlling the electronionization (EI) source of the quadrupole MS are listed in Table 1.
2.2 Standard Solutions. Samples of naval distillate(3-GP-llMa) were obtained from HMCS Ottawa, HMCS Gatineau, HMCSNipigon, and ESSO Petroleum Limited, Dartmouth Refinery. Diesellubricating oil (MIL-L-9000G) was obtained from the stores system,CFB Halifax. Standards solutions of naval distillate fuel indiesel lubricating oil containing 1, 3, 5, 7 and 9 weight percentfuel were prepared by adding known weights of naval distillate toweighed samples of diesel lubricating oil. These standards were
3

diluted 1 in 20 in hexane and 40pL of internal standard solutionwas added to each milliliter of the standard solution prior toanalysis.
Table 1
Typical values of the parameters used to control the massspectrometer and electron multiplier electronics.
Electron multiplier voltage 1400volts(-)Resolution low (RL) 132Resolution high (RH) 94Ion energy (IE) 2.51 voltsIon program (IP) 5.02 voltsExtractor (EX) 2.82 voltsLens (L) 134 volts(-)Electrometer range 7
The internal standards; decene, undecene, dodecene,tridecene, and tetradecene, were obtained from PolyscienceCorporation, Niles, Illinois. A stock solution of these alkenescontaining 6.67% 1-decene, 13.33% 1-undecene, 20.00% 1-dodecene,26.67% 1-tridecene, and 33.33% 1-tetradecene was diluted 1 part in100 with hexane to make the internal standard solution.
2.3 Naval Distillate Fuel Aging Study. A sampleof new naval distillate fuel was separated into three one litrealiquots. Two of the aliquots were placed in one litre polybottles, one for storage at 40C, the other for storage at roomtemperature and the third one litre portion was transfered to aloosely stoppered flask for placement in a water bath heated to85*C (1850F) to simulate the operating temperature of a dieselengine. One liter of a 5% (weight/weight) solution of navaldistillate fuel in diesel lubricating oil was also placed in theheated water bath. The samples were heated for one month duringwhich time one millilitre samples of the fuel and fuel-diluted oilwere taken daily for analysis by GC/MS. One hundred millilitresamples were taken weekly for flash point determination.
3.0 RESULTS AND DISCUSSION
3.1 Separation of Naval Distillate from DieselLubricating Oil. The reconstructed ion chromatogram (RIC) of asolution of naval distillate fuel in hexane, acquired using a fullscan (25 to 340 amu) and the temperature program listed in Figure
4

1, is shown in Figure 2a. The peaks corresponding to the variouscomponents of fuel eluted from the column between 5 and 35minutes. The RIC for a solution of diesel lubricating oil in
hexane acquired using the same conditions is shown in Figure 2b.The peaks corresponding to the diesel lubricating oil eluted from
the column between 25 and 40 minutes. Figure 2c shows the RIC fora 3% solution of naval distillate fuel in diesel lubricating oil.Comparison of the RIC of the mixture with those shown in Figures2a and 2b indicates that the temperature program and columnutilized gave a good separation of the components of the fuel thatelute prior to 25 minutes. Although this is not ideal it doesprovide separation of the majority of the fuel peaks from the
lubricating oil. That is, hydrocarbon molecules containing from
eight to twenty two carbon atoms, typical of the naval distillatefuel are separated from the diesel lubricating oil. Therefore any
of these fuel peaks can be used for quantitative analysis of fuelcomponents in the fuel diluted sample.
3.2 Quantitative Analysis. Internal standards were
used to minimize the effect of the variation of detector responseand facilitate comparison of results acquired over a period oftime. An internal standard should be similar to the component(s)being quantified in both structure and retention time so that thefactors affecting a change in response to an internal standardwill affect the response of the components of the fuel in a
similar way. The internal standards chosen; decene (C-10 or ten
carbon atoms), undecene (C-11), dodecene (C-12), tridecene (C-13),and tetradecene (C-14), are similar in structure to the fuel
components with the same number of carbon atoms and have retention
times that are close to but different from the correspondingalkanes; decane (C-10), undecane (C-11), dodecane (C-12),tridecane (C-13), and tetradecane (C-14), contained in the fuel.
As such, these alkenes are excellent internal standards forquantification of the corresponding alkanes in the fuel.
3.2.1 Response Versus Concentration of Naval
Distillate Fuel in Diesel Lubricating Oil. To determine if
the response of the various components of naval distillate fuel
increased linearly with an increase in the concentration of the
fuel in the diesel lubricating oil, a series of solutions
containing known amounts of fuel in diesel lubricating oil were
prepared and a constant amount (40pL/mL) of internal standard was
added to each solution. The RICs of solutions containing 1%, 3%,
5%, 7% and 9% fuel by weight in diesel lubricating oil, obtained
with MS detection, are shown in Figures 3a through 3e. The
internal standards; decene, undecene, dodecene, tridecene, and
tetradecene, and fuel peaks; decane, undecane, dodecane,
tridecane, and tetradecane, used to set up calibration curves are
5

designated in the chromatograms by S through S5 and P1 through P5respectively.
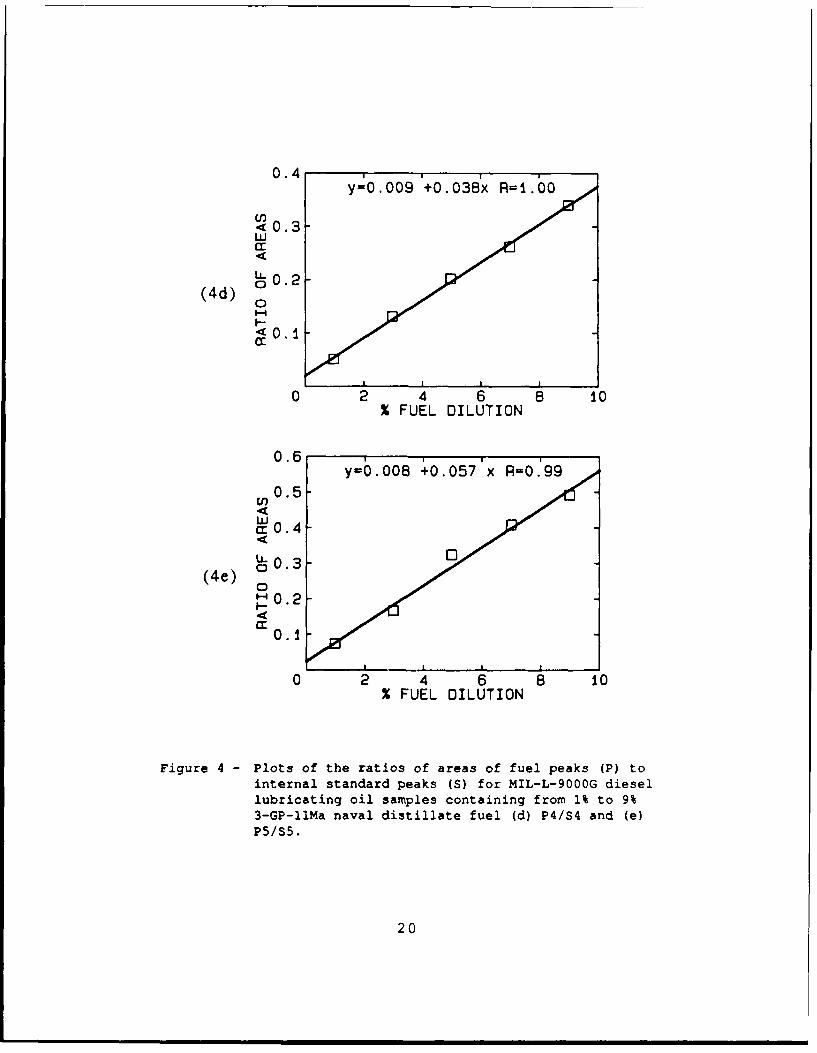
The ratios of the areas under each fuel peak and the
closest internal standard peak are listed in Table 2. Response(ratio of area under peak to that of internal standard) versusconcentration curves for each of the five peaks (decane throughtetradecane) are shown in Figures 4a through 4e.
Table 2
Data used to plot the calibration curves shown in Figures 4athrough 4e.
% Fuel Dilution
3 5 7 9
Peaks Ratio of Area (Fuel peak/Internal Standard)
PI*/S1* .119 .368 .599 .855 1.032P2/S2 .093 .222 .428 .602 .623P3/S3 .054 .153 .261 .414 .427P4/S4 .048 .130 .201 .271 .351P5/S5 .063 .162 .320 .419 .507
PI* - fuel peak 1 (decane)$1* - internal standard peak 1 (decene)
The correlation coefficients (r2 ) for these plots variedbetween 0.98 and 1.00 and indicate excellent correlation betweenthese ratios and the concentration of fuel in the diesellubricating oil.
3.3 Relative Concentration of the Components ofNaval Distillate Fuel. These results indicate that for a
particular sample of naval distillate fuel the response of anindividual component of the fuel relative to an internal standard
increases linearly with concentration. However, naval distillatefuel is a mixture of hydrocarbons, containing for the most part
molecules with from eight to twrnty-eight carbon atoms, whose
relative concentrations may vary depending on a number of factors
including the source of the crude oil used to obtain the fuel and
the age of the fuel sample.
6

To determine how the relative concentrations of variouscomponents of fuel vary from one sample to another, samples ofnaval distillate fuel from three ships; HMCS Ottawa, HMCSGatineau, and HMCS Nipigon, and a sample from ESSO PetroleumLimited, Dartmouth Refinery, were used to prepare 3% by weightstandards in diesel lubricating oil and the ratios of five of thefuel peaks to the internal standard peaks were determined. Theratios of the fuel peaks to the internal standard peaks for thefour fuel samples are shown in Table 3.
Table 3
Variations in the ratios of areas of fuel peaks to internalstandard peaks for 3% solutions of naval distillate fuel (fromsources listed) in MIL-L-9000G diesel lubricating oil.
Ratio of Areas (Fuel Peak/Internal Standard)
Peaks Imperial* Ottawa Gatineau Nipigon
P1/si 0.481 0.741 0.547 0.510P2/S2 0.176 0.584 0.411 0.314P3/$3 0.145 0.287 0.281 0.218P4/$4 0.102 0.231 0.176 0.187P5/S5 0.110 0.203 0.190 0.182
* - sample from ESSO Petroleum Limited, Dartmouth refinery.
The relative concentrations of the components in the fuelwere found to vary from one fuel sample to another. Thisindicates that it is not possible to quantitatively determine thelevel of fuel dilution of a sample of diesel lubricating oil usinga calibration plot prepared with fuel from any other source.
3.4 Fuel Aging Studies. The results of the thermal(850) aging of the naval distillate fuel and the diesellubricating oil containing 5% naval distillate fuel are shown inTables 4 and 5. Table 4 shows that the flash point of the navaldistillate fuel rose 12.5°C, from 66.5 0 C to 79.0°C, over the onemonth test period while the flash point of the 5% fuel dilutedsample increased by 10.0°C over the same period of time. Itshould be noted that the flash points of the fuel and fuel diluteddiesel oil were determined by different flash point methods.Coxrventionally flash point of fluids that flash below 100 0 C areg,*..erally determined by the closed cup method 6 while the flashpoints of fluids that flash above 100 0C are measured by the open
7

cup method4 .
Table 4
Variation in the flash points of naval distillate fuel and 5%naval distillate fuel in diesel lubricating oil with time ofexposure at 850 C.
Time at 850 C Flash Point (°C)(days) naval Distillate1 5% naval Distillate2
in Lubricating Oil
0 66.5 197.04 71.0 200.024 75.5 205.032 79.0 207.0
1- closed cup flash point2- open cup flash point
The increase in the flash points of the fuel and the 5%fuel diluted diesel oil with time indicates that the lightercomponents in the fuel mixture have volatilized in preference tothe heavier components. This is confirmed by the results of thedistillation curves shown in Table 5 where the initial boilingpoint of the sample aged for 4 weeks at 850C was 200 higher thanthe new sample or the sample aged at room temperature for 4 weekswhich indicates that the lower boiling components of the fuel havebeen reduced in concentration during the aging process.
Table 5
Distillation curves for samples of naval distillate fuel; 1)unaged sample, 2) sample aged 4 weeks at room temperature, and 3)sample aged 4 weeks at 850C.
Unaged Sample 4 Weeks 4 Weeksat RT 850 C
initial boiling point 168 0C 168 0C 188 0C10% recovery 208 210 22020% recovery 232 235 23850% recovery 279 280 27990% recovery 345 345 348end point 355 364 353
8

The aging of samples of fuel and diesel lubricating oil
containing 5% fuel dilution were also studied using GC/MS bymonitoring the variation in response of the decane, undecane,dodecane, tridecane, and tetradecane peaks of the fuel relative tothe internal standards; decene, undecene, dodecene, tridecene, andtetradecene respectively. Unlike the results from the flash pointand boiling range studies, the GC/MS results did not indicate adefinite trend, that is, a decrease in the relative response ofthese peaks with aging. This suggests that the change in the flashpoint and the boiling range of the aged samples is due primarilyto the loss of hydrocarbons lighter than decane.
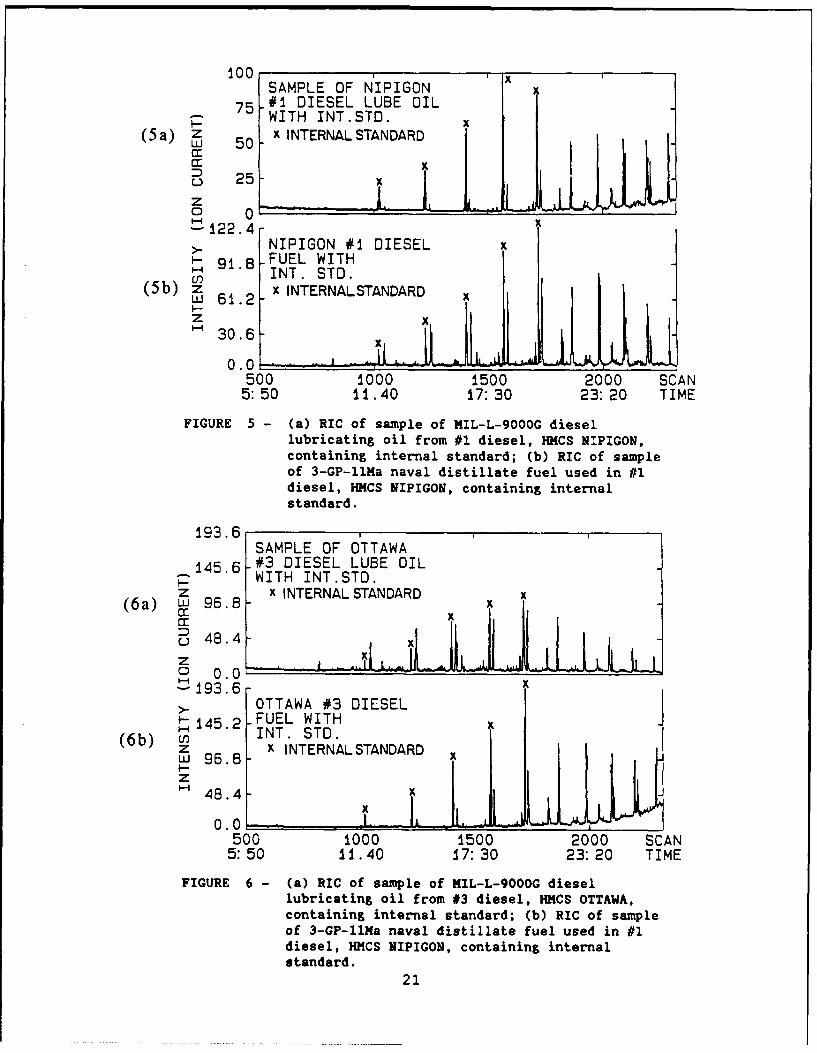
3.5 Examples of Fuel Dilution of DieselLubricating Oil by GC/MS. Two examples of determinations offuel dilution of MIL-L-9000G, the first from the number 1 dieselHMCS Nipigon and the other from HMCS Ottawa, using the GC/MStechnique follow. The percent fuel dilution of the samples ofMIL-L-9000G from these vessels was determined by viscosity changeat 100 0C to be 2% and 4% respectively. The RICs of a MIL-L-9000Gsample from the #1 diesel generator of HMCS Nipigon and a sampleof fuel from its tanks are shown in Figures 5a and 5b. Internalstandard was added to both samples. Comparison of the relativeresponse of the fuel peaks in the MIL-L-9000G sample received forfuel dilution analysis and the pure fuel sample to the internalstandards indicates that the fuel in the MIL-L-9000G sample haslost some of its lighter components.
A sample of fuel from the HMCS Nipigon was used toprepare a series of standard solutions of fuel in MIL-L-9000G andresponse versus concentration curves for the quantitation peakswere prepared. The ratios of the areas of the fuel peaks to theinternal standard peaks for the standard solutions containing 1%,
3%, 5%, and 7% by weight naval distillate fuel in MIL-L9000G areshown in Table 6. The best fit straight lines for the five fuelpeaks are also listed in Table 6. The apparent concentration offuel in the MIL-L-9000G (% fuel dilution) sample from Nipigon was
then calculated for each of the five peaks of the sample submitted
for fuel dilution. The apparent fuel dilution varied from less
than 1% for the decane peak (P1) to approximately 3.4% for the
tetradecane peak (P5).
9
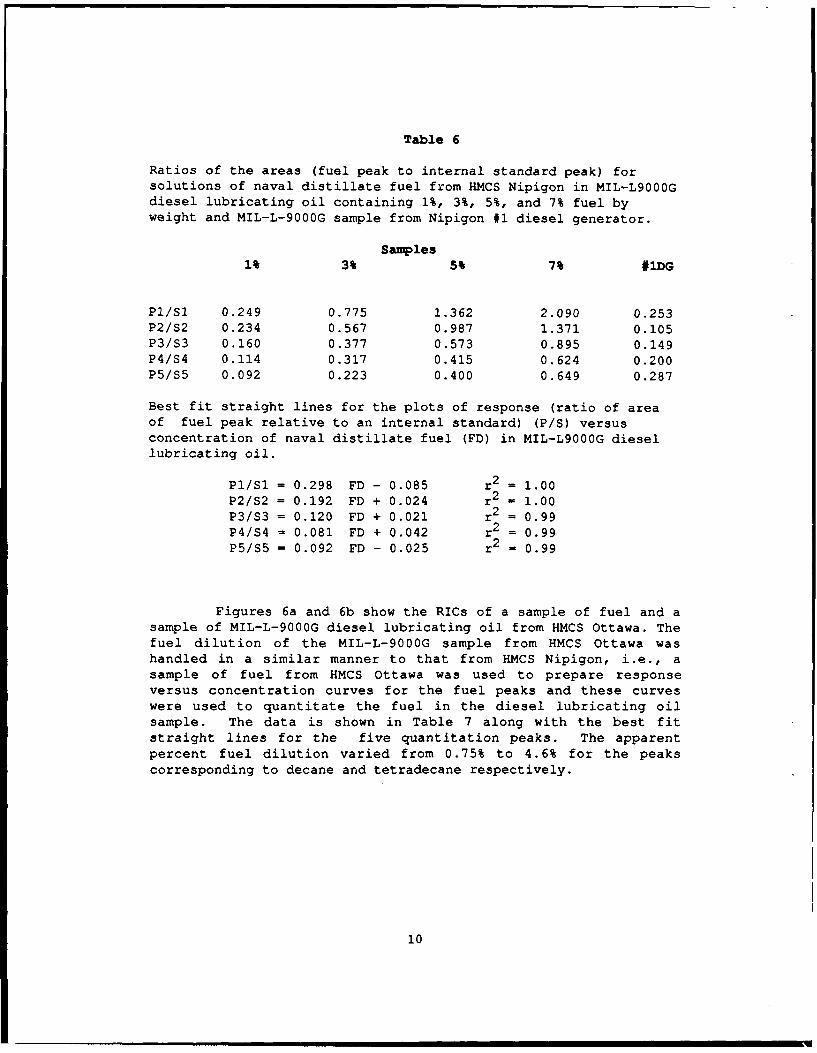
Table 6
Ratios of the areas (fuel peak to internal standard peak) forsolutions of naval distillate fuel from HMCS Nipigon in MIL-L9000Gdiesel lubricating oil containing 1%, 3%, 5%, and 7% fuel byweight and MIL-L-9000G sample from Nipigon #1 diesel generator.
Samples1% 3% 5% 7% #lDG
PI/Si 0.249 0.775 1.362 2.090 0.253P2/$2 0.234 0.567 0.987 1.371 0.105P3/$3 0.160 0.377 0.573 0.895 0.149P4/S4 0.114 0.317 0.415 0.624 0.200P5/S5 0.092 0.223 0.400 0.649 0.287
Best fit straight lines for the plots of response (ratio of areaof fuel peak relative to an internal standard) (P/S) versusconcentration of naval distillate fuel (FD) in MIL-L9000G diesellubricating oil.
P1/S1 = 0.298 FD - 0.085 r2 = 1.00P2/S2 = 0.192 FD + 0.024 r2 = 1.00P3/S3 = 0.120 FD + 0.021 r2 = 0.99P4/54 = 0.081 FD + 0.042 r2 = 0.99P5/55 = 0.092 FD - 0.025 r2 = 0.99
Figures 6a and 6b show the RICs of a sample of fuel and asample of MIL-L-9000G diesel lubricating oil from HMCS Ottawa. Thefuel dilution of the MIL-L-9000G sample from HMCS Ottawa washandled in a similar manner to that from HMCS Nipigon, i.e., asample of fuel from HMCS Ottawa was used to prepare responseversus concentration curves for the fuel peaks and these curveswere used to quantitate the fuel in the diesel lubricating oilsample. The data is shown in Table 7 along with the best fitstraight lines for the five quantitation peaks. The apparentpercent fuel dilution varied from 0.75% to 4.6% for the peakscorresponding to decane and tetradecane respectively.
10
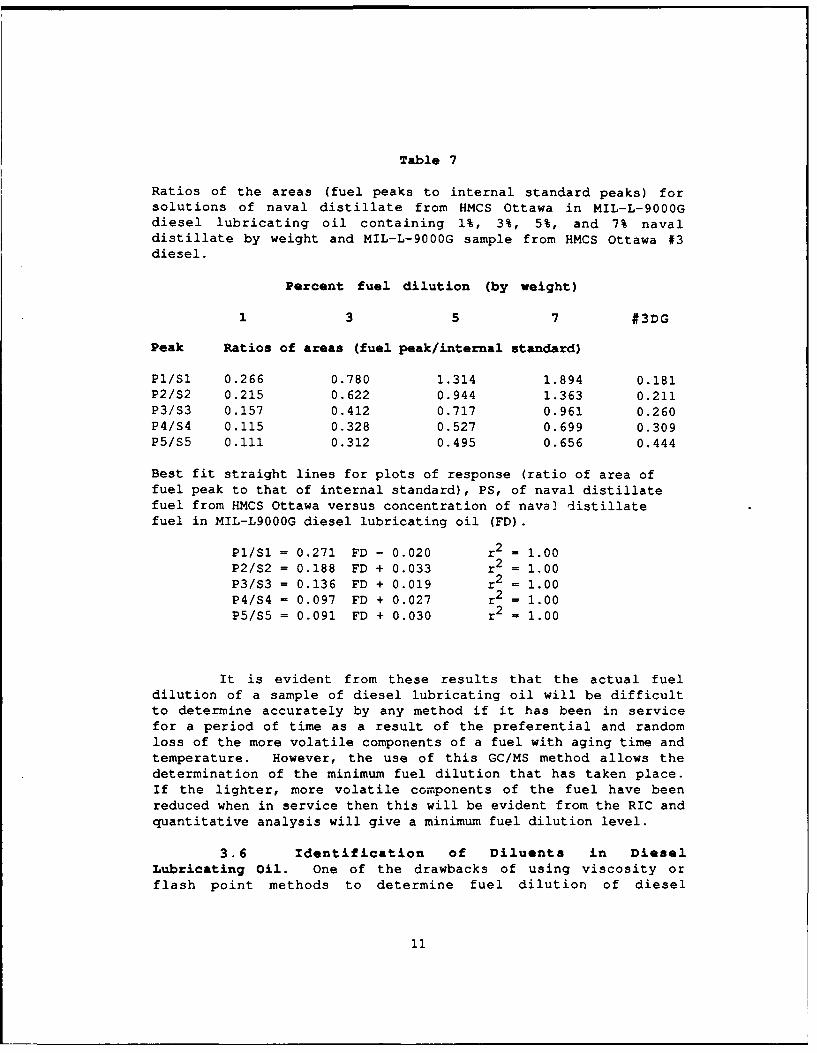
Table 7
Ratios of the areas (fuel peaks to internal standard peaks) forsolutions of naval distillate from HMCS Ottawa in MIL-L-9000Gdiesel lubricating oil containing 1%, 3%, 5%, and 7% navaldistillate by weight and MIL-L-9000G sample from HMCS Ottawa #3diesel.
Percent fuel dilution (by weight)
1 3 5 7 #3DG
Peak Ratios of areas (fuel peak/internal standard)
P1/Si 0.266 0.780 1.314 1.894 0.181P2/$2 0.215 0.622 0.944 1.363 0.211P3/$3 0.157 0.412 0.717 0.961 0.260P4/S4 0.115 0.328 0.527 0.699 0.309P5/S5 0.111 0.312 0.495 0.656 0.444
Best fit straight lines for plots of response (ratio of area offuel peak to that of internal standard), PS, of naval distillatefuel from HMCS Ottawa versus concentration of naval distillatefuel in MIL-L9000G diesel lubricating oil (FD).
P1/Si = 0.271 FD - 0.020 r2 = 1.00P2/S2 = 0.188 FD + 0.033 r2 = 1.00
P3/S3 = 0.136 FD + 0.019 r2 = 1.00P4/S4 = 0.097 FD + 0.027 r2 = 1.00P5/$5 = 0.091 FD + 0.030 r2 = 1.00
It is evident from these results that the actual fueldilution of a sample of diesel lubricating oil will be difficultto determine accurately by any method if it has been in servicefor a period of time as a result of the preferential and randomloss of the more volatile components of a fuel with aging time andtemperature. However, the use of this GC/MS method allows thedetermination of the minimum fuel dilution that has taken place.If the lighter, more volatile components of the fuel have beenreduced when in service then this will be evident from the RIC andquantitative analysis will give a minimum fuel dilution level.
3.6 Identification of Diluents in DieselLubricating Oil. One of the drawbacks of using viscosity orflash point methods to determine fuel dilution of diesel
11

lubricating oil is that the change in the measured property isassumed to be caused by fuel dilution. If a diluent other thanfuel has caused the change, the ability to identify the diluentwill aid in determining its source and allow steps to be taken tostop the ingress of the diluent.
The RIC of a sample of diesel lubricating oil suspected ofnaval distillate fuel dilution is shown in Figure 7. Analysis atNETE using a capillary GC with flame ionization detectionindicated that a diluent other than naval distillate fuel waspresent in the sample. Comparison of the traces shown in Figure 7and Figures 2a through 2e confirmed this analysis. The broad peak(retention time approximately 4.5 minutes) was determined to be,on the basis of its mass spectrum, 1,2-ethanediol, a commonly usedcoolant chemical. This analysis therefore suggested a potentialproblem related to coolant ingress into the diesel lubricating oiland not fuel dilution existed.
3.7 Detection Limit of Naval Distillate Fuel.The maximum allowable level of fuel dilution of diesel lubricatingoil has been set at 3%. However, the the maximum allowable limitfor fuel dilution of diesel lubricating oil is presently underreview. The GC/MS method described here has been found to beapplicable in the range from 1% to 9%. If it is required todetect naval distillate in diesel lubricating oil at lower levels,this method can be modified to allow detection of fuel dilution atlevels below 1%.
Two simple modifications of the method which result in alower detectable level of fuel are discussed below. The amount ofthe sample introduced for analysis can be increased. The 20 folddilution of the sample prior to analysis could be changed to a 10fold dilution, for instance, which would double the amount ofsample introduced onto the column. Alternatively, a 2pL injectioncould be used which would also double the amount of sampleintroduced onto the column. The sensitivity of the quadrupolemass spectrometrometer for particular compounds can be increaseddramatically through the use of specialized multiple ion detection(MID) sequences. An MID sequence can be designed which woulddetect only ions that are characteristic of the aliphatichydrocarbons of the fuel and internal standards. This is incontrast to the full scan used in this study which detects ionsbetween 25 and 340 atomic mass units. Much of the time in each 2second scan is spent looking for ions that are not characteristicof the compounds of interest. By determining the ionscharacteristic of the compounds of interest, the detector can beinstructed to detect only these ions during each scan. As moretime is spent detecting these ions, the sensitivity of the
12
detector increases proportionately.
4.0 CONCLUSIONS
A GC/MS technique for the detection and identification ofdiluents in diesel lubricating oil has been described. Theresponses of the various constituents of a typical navaldistillate fuel relative to internal standards have been shown tovary linearly with concentration. Accurate determination of thelevel of fuel dilution of a sample of diesel lubricating oil usinga capillary GC has been shown to be dependent upon factors such asthe source of the fuel, the age of the fuel and the thermalhistory of the fuel diluted lubricant sample. These resultsindicate that GC/MS analysis of diesel lubricating oils canconfirm the presence of fuel and separate, detect, and identifyother organic-based diluents and act as a useful adjunct tostandard tests for fuel dilution such as flash point lowering orviscosity change. However, it appears that the combined use offlash point and viscosity measurements are still the simplest andleast expensive means of obtaining the basic desired informationregarding potential explosion hazards and lubricity of fueldiluted diesel lubricating oils.
13

299
w 1 2 6-
0 8.7 17 26 34 TIME
GC VALVES: CLOSE OPEN
OV DIVERT 0.038.7t 1 1 1
SEQ.# FROM TEMP(C) TO TEMP (C) RATE(C/M) TIME(MIN) TOTAL TIME (MIN)
1 40 - 40 - 5.0 5.02 40 - 150 8.0 13.7 18.73 150 - 300 10.0 15.0 33.74 300 - 300 - 5.0 38.7
FIGURE 1 - Temperature program used to control the gaschromatograph oven.
100
jU75
U
z (2a)0
50-
z 25I-z
0 I I
500 1000 1500 2000 2500 3000 SCAN5:50 11: 40 17:30 23:20 29:10 35:00 TIME
Figure 2 - (a) RIC of a sample of 3-GP-11Ma naval distillate fuel.14

100
zLU 7 5r
z0
(2b)9-I--
zLU2 5I-z
0500 1000 1500 2000 2500 3000 SCAN5:50 11: 40 17:30 23:20 29:10 35:00 TIME
100 1 ,
x = FUEL PEAKS
zw 7 5
D XXU
zC"50
(2c)
L25 xx x
z - X
X X X X
500 1000 1500 2000 2500 3000 SCAN5:50 11:40 17:30 23:20 29:10 35:00 TIME
Figure 2 - (b) RIC of a sample of MIL-L-9000G diesel lubricatingoil; (c) RIC of a sample of MIL-L-9000G diesellubricating oil containing 3% 3-GP-llMa naval
distillate fuel.
15

100 I IT 1711 S
I--z
S75 S4r_- 1562
. S3
z 139850
(3a) S21219
z 25s,w 25- 1019
zP5
761 925 P1 P2 P3 P4 1813 19351172 1295
0 I I , I I
600 800 1000 1200 1400 1600 1800 SCAN7:00 9:20 11:40 14:00 16:20 18: 40 21:00 TIME
100 1' 1709 S5
1560
zLu75-
r1396
z0 2S50- 1219
(3b)
U)z 12I-25
1855I,- 3 P 110
z P2 P4
'-4 1933587 719 828 931 1095 1295 ,,
0 / I i I --- I-- L; , T-
600 800 1000 1200 1400 1600 1800 SCAN7:00 9:20 11:40 14:00 16:20 18:40 21:00 TIME
Figure 3 - RIC (scans 500 to 2000) of samples of MIL-L-9000Gdiesel lubricating oil containing (a) 1% and (b) 3%naval distillate fuel. Samples contain internalstandards (S).
16

100 , , , 1561 S4 1711 S5
zwrLL 75-SCr 1397
z0 50 SZ
S1218
(3c)--
P5 1856Ul)z SLU25- 10
P2 PI P4 1812I-
1934573 708 821 926 193 19
01600 800 1000 1200 1400 1600 1800 SCAN7:00 9:20 11:40 14:00 16:20 18:40 21:00 TIME
100 , ,S5S4
1560
I--
zL 7 5rr S3
1396
zC) 50(3d) S2
>- 1216 '512-618551-44
En P4z SI P2 P3LU 25 - 1016 1811I- 8Pz
0~~ ~ ,
II II565 702 816 922 1091164 IZ93 13
600 800 1000 1200 1400 1600 1800 SCAN7:00 9:20 11: 40 14:00 16:20 18:40 21: 00 TIME
Figure 3 - RIC (scans 500 to 2000) of samples of MIL-L-900OGdiesel lubricating oil containing (c) 5% and (d) 7%naval distillate fuel. Samples contain internalstandards (S).
17

100 ' 1712 S5
F- S4Z 1562U75 (858CC
U S31397
Z S20 1218S50-
(3e) P4
'-..
P2En S1 1812
z P1pi
Z , 1935
821 926 19 17 19S 573 708 167 91 ,.ro
0100 - III I 1
600 800 1000 1200 1400 1600 1800 SCAN7:00 9:20 11: 40 14:00 16:20 18:40 21: 00 TIME
Figure 3e - RIC (scans 500 to 2000) of sample of MIL-L-9000Gdiesel lubricating oil containing 9% navaldistillate fuel. Sample contains internalstandards (S).
18

Y=0.017 +0.115 x R=1.00
1.0W
E0.8
00.6(4a) 0 6
0.
0.2
0 2 4 6 8 0% FUEL DILUTION
0.7
m0 .6
(4) 0 .3
CcC
U)
~0.5
<o.4
<0.
(4b) 00.3
0.2
0.1-y=0.034 +0.072x R=0.98
0 2 4 6 8 10% FUEL DILUTION
0.5 y=6.00 +0.050x R=0. 9
0 .4 - 0 0
<0.3-
(4c) o(.2 $
~0.9
0 2 4 6 8 10% FUEL DILUTION
Figure 4 - Plots of the ratios of areas of fuel peaks (P) tointernal standard peaks (S) for MIL-L-9000G diesellubricating oil samples containing from 1% to 9%3-GP-llMa naval distillate fuel (a) Pl/Si, (b) P2/S2and (c) P3/S3.
19
0 . 4 y = . 0 +0 03 ' I I
<0.3w4:
L0.2(4d)
~0
0 2 4 6 8 10
% FUEL DILUTION
0.6y-0.008 +0.057 x R=0.99
0.5
cr0.4:
U-0.3-0(4e) 0
0.2
0 2 4 6 8 10% FUEL DILUTION
Figure 4 - Plots of the ratios of areas of fuel peaks (P) tointernal standard peaks (S) for MIL-L-9000G diesellubricating oil samples containing from 1% to 9%3-GP-llMa naval distillate fuel (d) P4/S4 and (e)P5/S5.
20
100 x
SAMPLE OF N'IPIGON
75 #I DIESEL LUBE OILWITH INT.STD.
(5a) z 50 NTERNALSTANDARD
25
z122.4 NIION#NIPIGON #1 DIESEL x
S91.8 -FUEL WITHINT. STD.
(5b) 61.2 X INTERNALSTANDARD
z30.6
0.0500 1000 1500 2000 SCAN5:50 11.40 17:30 23:20 TIME
FIGURE 5 - (a) RIC of sample of MIL-L-9000G diesellubricating oil from #1 diesel, HMCS NIPIGON,containing internal standard; (b) RIC of sampleof 3-GP-llMa naval distillate fuel used in #1diesel, HUCS NIPIGON, containing internalstandard.
193.6SAMPLE OF OTTAWA
145.6 #3 DIESEL LUBE OILWITH INT.STD.
z INTERNAL STANDARD(6a)D Uj 96.8-
U 48.4 x
0 0.0193.69 OTTAWA #3 DIESEL
145.2 FUEL WITH(6b) INT. STD.
z X INTERNAL STANDARD ,LU 96.8 xz
48.4- x
0.0 -- I- k .
500 1000 1500 2000 SCAN5:50 11.40 17:30 23:20 TIME
FIGURE 6 - (a) RIC of sample of MIL-L-900OG diesellubricating oil from #3 diesel, HKCS OTTAWA,containing internal standard; (b) RIC of sampleof 3-GP-llMa naval distillate fuel used in #1diesel, HNCS NIPIGON, containing internalstandard.
21

100
zL 7 5cc
0z0
~50
I-
zU 2 5
z
0 I I I I
500 1000 1500 2000 2500 3000 SCAN5:50 11:40 17:30 23:20 29:10 35:00 TIME
FIGURE 7 - RIC of a sample of MIL-L-9000G diesellubricating oil suspected of contamination witha diluent other than 3-GP-ll~a naval distillatefuel.
22

References
1. CGSB Specification 3-GP-llMa, Fuel, Naval Distillate (-60CPour), Canadian Government Specifications Board, Ottawa,Ontario, 1985.
2. Military Specification, Lubricating Oil, Shipboard InternalCombustion Engine, High Output Diesel, 23 March, 1979.
3. ASTM D-445-82, Kinematic Viscosity of Transparent and OpaqueLiquids, 1987 Annual Book of ASTM Standards, American Societyfor Testing and Materials, 1916 Race Street, Philadelphia,Pennsylvania, 1987.
4. ASTM D92-78, Flash and Fire Points by Cleveland Open Cup, 1987Annual Book of ASTM Standards, American Society for Testing andMaterials, 1916 Race Street, Philadelphia, Pennsylvania, 1987.
5. ASTM D3524-86, Test Method for Diesel Fuel Diluent in usedDiesel Engine Oils by Gas Chromatography, 1987 Annual Book ofASTM Standards, American Society for Testing and Materials,1916 Race Street, Philadelphia, Pennsylvania, 1987.
6. ASTM D93-85, Flash Point by Pensky-Martens Closed Tester, 1987Annual Book of ASTM Standards, American Society for Testing andMaterials, 1916 Race Street, Philadelphia, Pennsylvania, 1987.
23

UNCLASSIFIED
SECURITY CLASSIFICATION OF FORM(highest classification of Title, Abstract. Keywords)
DOCUMENT CONTROL DATA(Security classification of title, body of abstract and indexing annotation must be entered when the overall document is classified)
1. ORIGINATOR (the name and address of the organization preparing the document. 2. SECURITY CLASSIFICATION (overall securityOrganizations for whom the document was prepared. e.g. Establishment sponsoring a classification of the document, includingcontractors report, or tasking agency, are entered in section 8.) special warning terms if applicable)
Defence Research Establishment Atlantic,Dochyard Labboritory, Bldg. D-17, UNCLASSIFIED
FMO Halifax. NS R3K 2X0TITLE (the complete document title as indicated on the title page. Its classification should be indicated by the appropriate abbreviation(SC.R or U) in parentheses after the title.)
A STUDY OF FUEL DILUTION OF DIESEL LUBRICATING OIL BY GASCHROMATOGRAPHY/MASS SPECTROMETRY
4. AUTHORS (Last name. first name, middle initial. If military, show rank. e.g. Doe. Maj. John E.)
HILTZ, J.A., VEINOT, D.E., and HAGGETT, R.D.
5. DATE OF PUBLICATION (month and year of publication of document) 6a.NO. OF PAGES (total containing 6b. NO. OF REFS (total cited ininformation. Include Annexes, document)
January 1989 Appendices, etc.) 29 6
6. DESCRIPTIVE NOTES (the category of the document, e.g. technical report, technical note or memorandum. If appropriate, enter the type ofreport. e.g. interim, progress, summary, annual or final. Give the inclusive dates when a specific reporting period is covered.)
8. SPONSORING ACTIVITY (the name of the department project office or laboratory sponsoring the research and development. Include theaddress.)
9a. PROJECT OR GRANT NO. (if appropriate, the applicable research and 9b. CONTRACT NO. ( if appropriate, the applicable number underdevelopment project or grant number under which the document was which the document was written)written. Please specify whether project or grant)
1AI
1Oa. ORIGINATOR'S DOCUMENT NUMBER (the official document 1Ob. OTHER DOCUMENT NOS. (any other numbers which may benumber by which the document is identified by the originating assigned this document either by the originator or by the
activity. This number must be uniqu4 to this document.) sponsor)
DREA Technical Memorandum 89/203
11. DOCUMENT AVAILABILITY (any limitations on further dissemination of the document, other than those imposed by securityclassification)
X ) Unlimited distributionDistribution limited to defence departments and defence contractors; further distribution only as approvedDistribution limited to defence departments and Canadian defence contractors; further distribution only as approvedDistribution limited to government departments and agencies; further distribution only as approvedDistribution limited to defence departments; further distribution only as approved
Other (please specify):
12.. DOCUMENT ANNOUNCEMENT (any limitations to the bibliographic announcement of this document. This will normally correspond to the
Document Availability (11). However, where futher distribution (beyond the audience specified in 11) is possible, a wider announcementaudience may be selected.)
UNCASSIFIED
SECURIITY CLASSIFICATION OF FORMDCD03 2/06,87
25

UNCLASSI FIEDSECURITY CLASSIFICATION OF FORM
13. ABSTRACT ( U broef wd f1111100 sW y o1 the document It tay also appear elsewhere in the body of the document itself. It is highlydesirable that the abStract of classified documents be unclassified. Each paregroph of the abstract shalt begin with an indication of thesecurity classification o', the information in the pWgr41h (unless the document itself Is unclassified) represented as IS). (C). (A). or (U)h is not necessary to include here abstracts in both offical Iaguages unless the text is bilinul).
A method for the detection and identification of fuel componentsin diesel lubricating oil is described. The method uses a capillary gaschromatograph coupled to a quadrupole mass spectrometer to separate,detect and identify diluents in the oil. A typical analysis takes 40minutes. Accurate determination of the level of fuel dilution of adiesel lubricating oil sample using GC/MS is shown to be dependent upon anumber of factors including the source of the fuel, the age of the fuel,the thermal history of the fuel diluted diesel oil sample and theavailability of a suitable sample of fuel to prepare standard responseversus concentration curves. In contrast to the standard methods ofdetermining fuel diutiomn in diesel lubricating oil such as ASTM D445-82(viscosity change). ASTH D92-78 (flash point reduction), and ASTMD3524-78 (packed column gas chromatography with flame ionizationdetection), this method can identify diluents and contaminants in thediesel lubricating oil. This is extremely important in cases where thestandard tests give false negatives or indicate the presence of a diluentbut cannot identify the diluent.
14. KEYWORDS, DESCRPTORS on IDENTIFIERS (technically meaningful terms or short phrases that characterize a document and could behelpful in cataloguing Be douarwn They should be selected so that no security classification is required Identifiers, such as equipmentmodel designation, trade nme. militry project Code name. geographic location may also be included. If possible keywords should be selectedfrom a published thesaurus. e.g. 1'heseurus of Ingineering and Scientific Terms (TEST) and that thesaurus-identified If it is not possible toselect indexing terms which are Unclassified, the classification of each Should be indicated as with the title.)
FUEL DILUTION
DIESEL LUBRICATING OIL
GAS CHROIATOGRAPHY/1ASS SPECTROMETRY
QUANTATIVE ANALYSIS
IDENTIFICATION OF DILUENTS
ETHYLENE GLYCOL
FLASH POINT REDUCTION
VISCOSITY REDUCTION
UNCLASSIFIEDSECURITY CLASSIFICATION OF FORM
26
Related Documents