WANTS FINANCIAL AND INSURANCE SERVICES W H A T T A L E N T

KGWI: What Talent Wants - Finance
Jul 14, 2015
Welcome message from author
This document is posted to help you gain knowledge. Please leave a comment to let me know what you think about it! Share it to your friends and learn new things together.
Transcript
WANTSFINANCIAL AND INSURANCE SERVICES
WHAT TALENT
2
C O N T E N T S
03 18
271225
0605 20
281416
0922
Financial and Insurance Services: What workers want
Professional development: An important point of differentiation among employers
Did you know?A smooth application process: Regular, consistent communication is valued
In Financial and Insurance Services: It’s all about employer performance
The online talent community: Outside connections lead to inside relationships
Financial and Insurance Services talent: A snapshot
A cutting-edge work environment: The most current practices and technology attract top Financial and Insurance Services players
Kelly insight: There are six ways to give Financial and Insurance Services workers what they want
Structured on-boarding: The first 90 days make a difference
Career roadmaps: A green light in Financial and Insurance Services employee satisfaction
Multiple channels to access job information: Financial and Insurance Services workers use most channels actively
Competitive compensation: Still first in attraction but work–life balance and advancement can be dealmakers
candidates to connect with
the company, but develop
personalization features to
keep candidates engaged
and to differentiate your
company from others.
2. The channels for engaging
active and passive job seekers.
Workers peruse general online job
boards and company websites for
primary information about open
positions. More of them are using
social media and online talent
communities—not just automated
job listings—to monitor
companies and opportunities,
and to decide whether to
pursue employment. They want
comprehensive information
about compensation and
benefits, yet they also want
to understand the company’s
work environment—from
philosophy through to training.
Understanding the talent they
have and the talent they hope
to attract is the foundation for
creating effective strategies
in workforce planning, talent
analytics, and talent supply
chain management. It also keeps
human resources human.
Nearly 230,000 workers
participate in the Kelly Global
Workforce Index™. These surveys
shed light on their priorities
and desires for opportunity,
satisfaction, and growth in
the context of the current
business climate. The 2014
survey delves into six areas and
reveals actionable conclusions
that can inform and improve
corporate talent strategy.
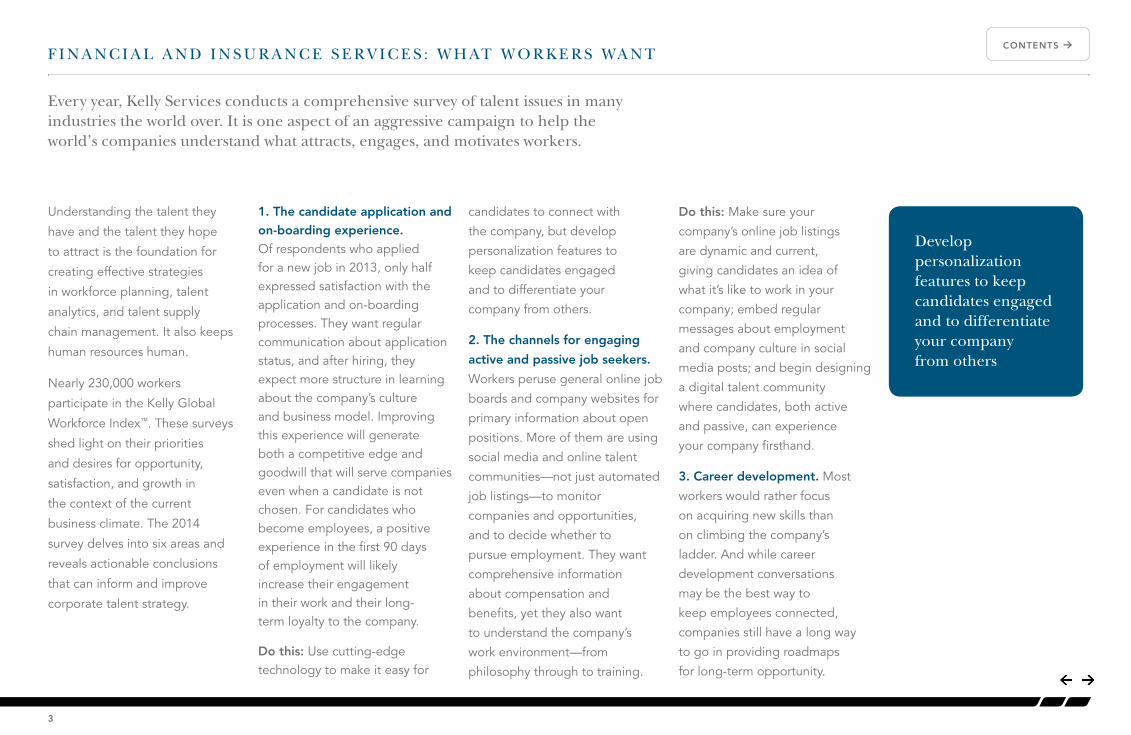
F I N A N C I A L A N D I N S U R A N C E S E R V I C E S : W H AT W O R K E R S WA N T
Every year, Kelly Services conducts a comprehensive survey of talent issues in many industries the world over. It is one aspect of an aggressive campaign to help the world’s companies understand what attracts, engages, and motivates workers.
CONTENTS Å
1. The candidate application and on-boarding experience. Of respondents who applied for a new job in 2013, only half expressed satisfaction with the application and on-boarding processes. They want regular communication about application status, and after hiring, they expect more structure in learning about the company’s culture and business model. Improving this experience will generate both a competitive edge and goodwill that will serve companies even when a candidate is not chosen. For candidates who become employees, a positive experience in the first 90 days of employment will likely increase their engagement in their work and their long-term loyalty to the company.
Do this: Use cutting-edge technology to make it easy for
Do this: Make sure your
company’s online job listings
are dynamic and current,
giving candidates an idea of
what it’s like to work in your
company; embed regular
messages about employment
and company culture in social
media posts; and begin designing
a digital talent community
where candidates, both active
and passive, can experience
your company firsthand.
3. Career development. Most
workers would rather focus
on acquiring new skills than
on climbing the company’s
ladder. And while career
development conversations
may be the best way to
keep employees connected,
companies still have a long way
to go in providing roadmaps
for long-term opportunity.
Develop personalization features to keep candidates engaged and to differentiate your company from others
3

Competitive compensation and benefits, work–life balance, and opportunities for career growth. Financial and Insurance Services workers give employers high marks for corporate culture, reputation, and global international work opportunities. Companies get lower marks for competitive compensation and internal opportunities to move into other positions.
Do this: Devote attention to flexible employment arrangements, your competitiveness in employment packages, and internal mobility, ensuring you connect them to your employment philosophy.
skills may be in high demand. Yet
even happily employed workers,
through unprecedented digital
access and mobility, stay on top
of new job opportunities. Workers
are confident in their worth
whatever their current situation.
Do this: Ensure your
compensation packages are
competitive; build a talent
community that compels
self-assured, skilled workers to
watch your company closely;
and use every digital means
available to give workers access
to new internal positions, industry
news, and career advice.
5. Worker preferences. Financial
and Insurance Services workers
like a company with a global
Do this: Provide training and professional development activities that increase workers’ marketplace value—this will foster loyalty and support whether or not a worker is a lifelong employee, improving public reputation, branding, and customer relationships. You should also tie worker-centric training to company values as a way to differentiate your company from competitors.
4. Worker engagement. Nearly two-thirds of Financial and Insurance Services workers intend to look for a new job in 2015. Contributing factors may include searching for better opportunities, evaluating the general job market, and learning that their
presence and longevity. They
seek environments that deliver
collaboration, flexibility, the latest
technology and equipment,
and matrix-based operating
models. And they will choose
skill development and work–life
balance over higher pay and
climbing the corporate ladder.
Do this: Invest in work
arrangements tailored to the
preferences of your target
workers. When communicating
with workers, emphasize your
stability, flexibility, and a specific
structure for offering them
development and balance.
6. Employer performance.
Three factors drive employee
attraction and retention:
In communicating with workers, emphasize your stability, flexibility, and a specific structure for offering them development and balance
4
CONTENTS Å
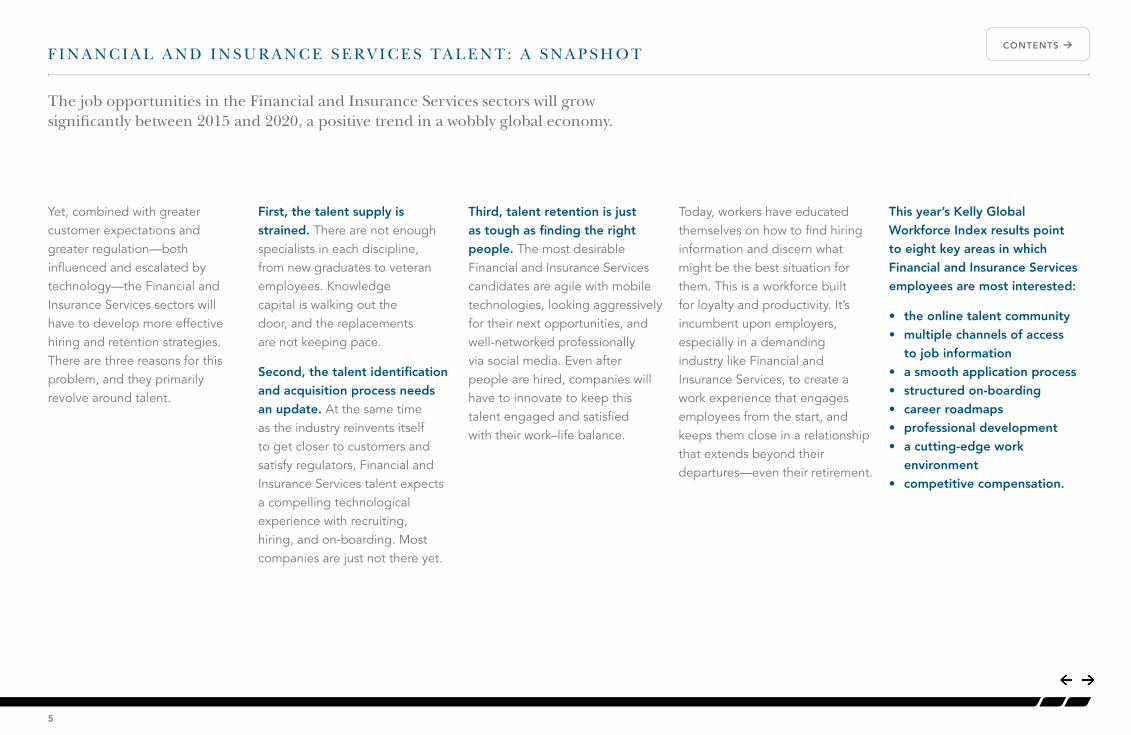
Yet, combined with greater customer expectations and greater regulation—both influenced and escalated by technology—the Financial and Insurance Services sectors will have to develop more effective hiring and retention strategies. There are three reasons for this problem, and they primarily revolve around talent.
The job opportunities in the Financial and Insurance Services sectors will grow significantly between 2015 and 2020, a positive trend in a wobbly global economy.
F I N A N C I A L A N D I N S U R A N C E S E R V I C E S TA L E N T : A S N A P S H O T
First, the talent supply is strained. There are not enough specialists in each discipline, from new graduates to veteran employees. Knowledge capital is walking out the door, and the replacements are not keeping pace.
Second, the talent identification and acquisition process needs an update. At the same time as the industry reinvents itself to get closer to customers and satisfy regulators, Financial and Insurance Services talent expects a compelling technological experience with recruiting, hiring, and on-boarding. Most companies are just not there yet.
Third, talent retention is just as tough as finding the right people. The most desirable Financial and Insurance Services candidates are agile with mobile technologies, looking aggressively for their next opportunities, and well-networked professionally via social media. Even after people are hired, companies will have to innovate to keep this talent engaged and satisfied with their work–life balance.
Today, workers have educated themselves on how to find hiring information and discern what might be the best situation for them. This is a workforce built for loyalty and productivity. It’s incumbent upon employers, especially in a demanding industry like Financial and Insurance Services, to create a work experience that engages employees from the start, and keeps them close in a relationship that extends beyond their departures—even their retirement.
This year’s Kelly Global Workforce Index results point to eight key areas in which Financial and Insurance Services employees are most interested:
• the online talent community• multiple channels of access
to job information• a smooth application process• structured on-boarding• career roadmaps• professional development• a cutting-edge work
environment• competitive compensation.
5
CONTENTS Å
CONTENTS Å
THE ONLINE TALENT COMMUNITY:
OUTSIDE CONNECTIONS LEAD TO INSIDE RELATIONSHIPS
6
T H E O N L I N E TA L E N T C O M M U N I T Y
ON PAR WITH THE GLOBAL AVERAGE
2% MORE THAN THE GLOBAL AVERAGE
ON PAR WITH THE GLOBAL
AVERAGE
ON PAR WITH THE GLOBAL AVERAGE
2% MORE THAN THE GLOBAL AVERAGE
58% 13% 11% 10% 7%LIKE TO PARTICIPATE IN SOCIAL EVENTS WITH
COMPANY EMPLOYEES
LIKE TO RECEIVE UPDATES ON A COMPANY’S FINANCIAL
PERFORMANCE
LIKE TO PARTICIPATE IN A COMPANY’S SOCIAL
MEDIA NETWORK
LIKE TO PARTICIPATE IN A COMPANY’S ONLINE TALENT COMMUNITY
LIKE PERIODIC CONTACT REGARDING WORK THAT
FITS THEIR SKILL SET
7
CONTENTS Å
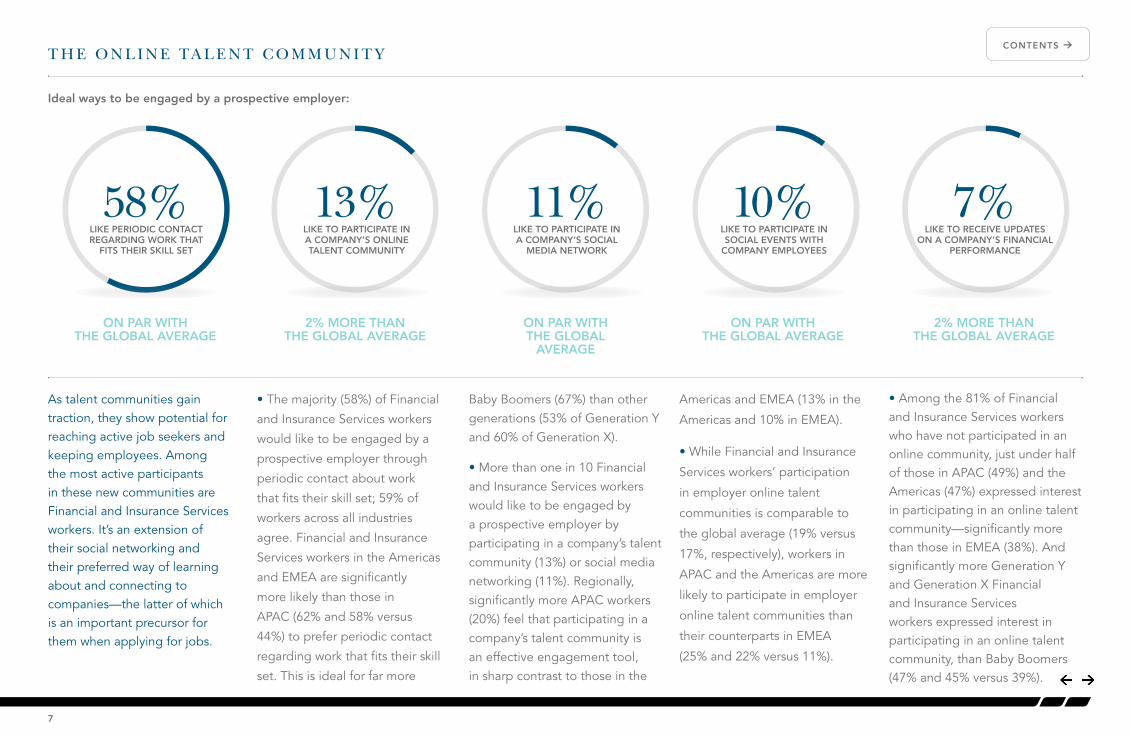
Ideal ways to be engaged by a prospective employer:
As talent communities gain traction, they show potential for reaching active job seekers and keeping employees. Among the most active participants in these new communities are Financial and Insurance Services workers. It’s an extension of their social networking and their preferred way of learning about and connecting to companies—the latter of which is an important precursor for them when applying for jobs.
• The majority (58%) of Financial
and Insurance Services workers
would like to be engaged by a
prospective employer through
periodic contact about work
that fits their skill set; 59% of
workers across all industries
agree. Financial and Insurance
Services workers in the Americas
and EMEA are significantly
more likely than those in
APAC (62% and 58% versus
44%) to prefer periodic contact
regarding work that fits their skill
set. This is ideal for far more
Baby Boomers (67%) than other generations (53% of Generation Y and 60% of Generation X).
• More than one in 10 Financial and Insurance Services workers would like to be engaged by a prospective employer by participating in a company’s talent community (13%) or social media networking (11%). Regionally, significantly more APAC workers (20%) feel that participating in a company’s talent community is an effective engagement tool, in sharp contrast to those in the
Americas and EMEA (13% in the
Americas and 10% in EMEA).
• While Financial and Insurance
Services workers’ participation
in employer online talent
communities is comparable to
the global average (19% versus
17%, respectively), workers in
APAC and the Americas are more
likely to participate in employer
online talent communities than
their counterparts in EMEA
(25% and 22% versus 11%).
• Among the 81% of Financial and Insurance Services workers who have not participated in an online community, just under half of those in APAC (49%) and the Americas (47%) expressed interest in participating in an online talent community—significantly more than those in EMEA (38%). And significantly more Generation Y and Generation X Financial and Insurance Services workers expressed interest in participating in an online talent community, than Baby Boomers (47% and 45% versus 39%).
T H E O N L I N E TA L E N T C O M M U N I T Y
8
CONTENTS Å
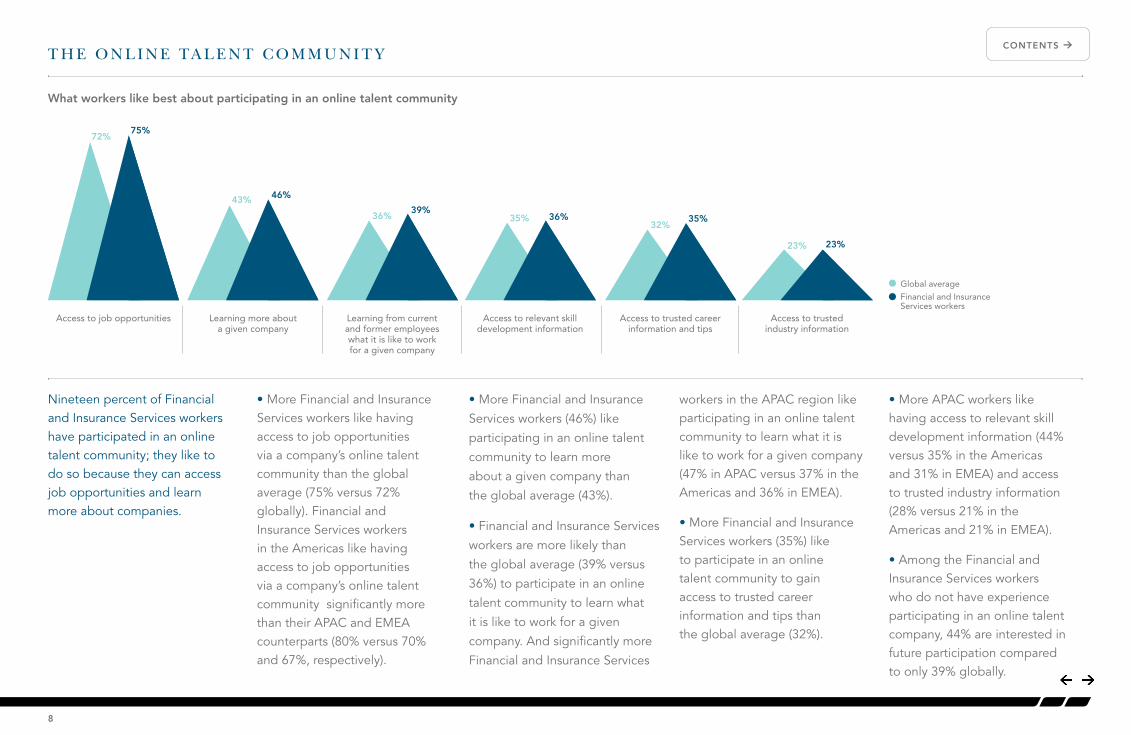
What workers like best about participating in an online talent community
Global average
Financial and Insurance Services workers
Access to job opportunities Learning more about a given company
Learning from current and former employees what it is like to work for a given company
Access to relevant skill development information
Access to trusted career information and tips
Access to trusted industry information
72%
43%
36% 35%32%
23%
75%
46%
39%36% 35%
23%
Nineteen percent of Financial and Insurance Services workers have participated in an online talent community; they like to do so because they can access job opportunities and learn more about companies.
• More Financial and Insurance Services workers like having access to job opportunities via a company’s online talent community than the global average (75% versus 72% globally). Financial and Insurance Services workers in the Americas like having access to job opportunities via a company’s online talent community significantly more than their APAC and EMEA counterparts (80% versus 70% and 67%, respectively).
• More Financial and Insurance
Services workers (46%) like
participating in an online talent
community to learn more
about a given company than
the global average (43%).
• Financial and Insurance Services
workers are more likely than
the global average (39% versus
36%) to participate in an online
talent community to learn what
it is like to work for a given
company. And significantly more
Financial and Insurance Services
workers in the APAC region like participating in an online talent community to learn what it is like to work for a given company (47% in APAC versus 37% in the Americas and 36% in EMEA).
• More Financial and Insurance Services workers (35%) like to participate in an online talent community to gain access to trusted career information and tips than the global average (32%).
• More APAC workers like having access to relevant skill development information (44% versus 35% in the Americas and 31% in EMEA) and access to trusted industry information (28% versus 21% in the Americas and 21% in EMEA).
• Among the Financial and Insurance Services workers who do not have experience participating in an online talent company, 44% are interested in future participation compared to only 39% globally.
9
CONTENTS Å
MULTIPLE CHANNELS TO ACCESS JOB INFORMATION:
FINANCIAL AND INSURANCE SERVICES WORKERSUSE MOST CHANNELS ACTIVELY
M U LT I P L E C H A N N E L S T O A C C E S S J O B I N F O R M AT I O N
ON PAR WITH THE GLOBAL AVERAGE
5% MORE THAN THE GLOBAL
AVERAGE
ON PAR WITH THE GLOBAL AVERAGE
4% LESS THAN THE GLOBAL
AVERAGE
ON PAR WITH THE GLOBAL
AVERAGE
26% 19% 15% 11% 10%USED RECRUITMENT
COMPANIES OR HEADHUNTERS
WERE APPROACHED DIRECTLY BY THE EMPLOYER
OR RECRUITER
HEARD ABOUT THE JOB THROUGH
WORD OF MOUTH
SECURED THEIR MOST RECENT JOB FROM
EMPLOYEE REFERRALS
USED ONLINE JOB BOARDS
10
CONTENTS Å
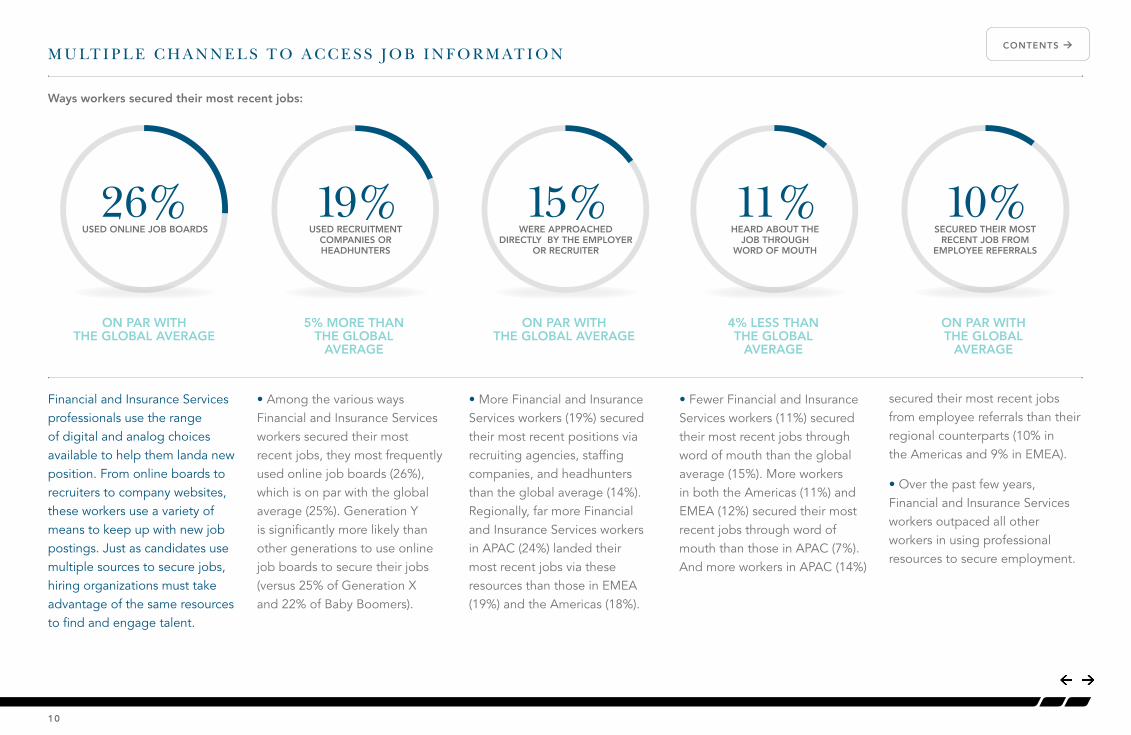
Ways workers secured their most recent jobs:
Financial and Insurance Services professionals use the range of digital and analog choices available to help them landa new position. From online boards to recruiters to company websites, these workers use a variety of means to keep up with new job postings. Just as candidates use multiple sources to secure jobs, hiring organizations must take advantage of the same resources to find and engage talent.
• Among the various ways Financial and Insurance Services workers secured their most recent jobs, they most frequently used online job boards (26%), which is on par with the global average (25%). Generation Y is significantly more likely than other generations to use online job boards to secure their jobs (versus 25% of Generation X and 22% of Baby Boomers).
• More Financial and Insurance Services workers (19%) secured their most recent positions via recruiting agencies, staffing companies, and headhunters than the global average (14%). Regionally, far more Financial and Insurance Services workers in APAC (24%) landed their most recent jobs via these resources than those in EMEA (19%) and the Americas (18%).
• Fewer Financial and Insurance Services workers (11%) secured their most recent jobs through word of mouth than the global average (15%). More workers in both the Americas (11%) and EMEA (12%) secured their most recent jobs through word of mouth than those in APAC (7%). And more workers in APAC (14%)
secured their most recent jobs from employee referrals than their regional counterparts (10% in the Americas and 9% in EMEA).
• Over the past few years, Financial and Insurance Services workers outpaced all other workers in using professional resources to secure employment.
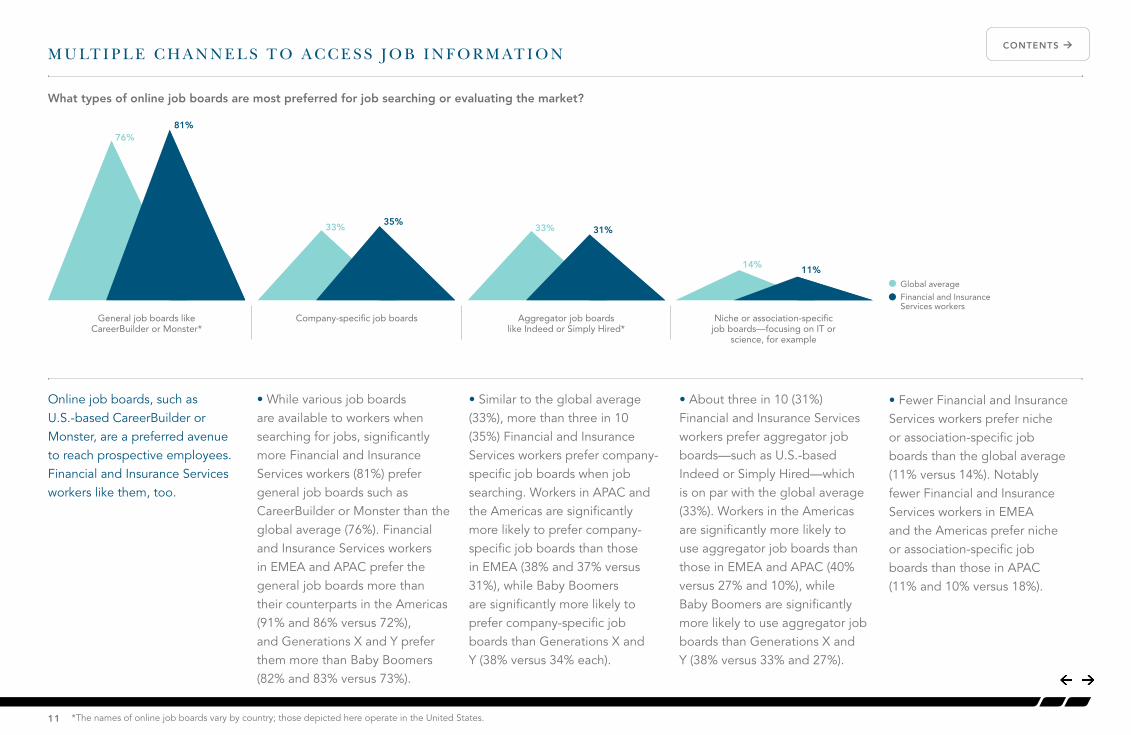
Online job boards, such as U.S.-based CareerBuilder or Monster, are a preferred avenue to reach prospective employees. Financial and Insurance Services workers like them, too.
• While various job boards are available to workers when searching for jobs, significantly more Financial and Insurance Services workers (81%) prefer general job boards such as CareerBuilder or Monster than the global average (76%). Financial and Insurance Services workers in EMEA and APAC prefer the general job boards more than their counterparts in the Americas (91% and 86% versus 72%), and Generations X and Y prefer them more than Baby Boomers (82% and 83% versus 73%).
• Similar to the global average (33%), more than three in 10 (35%) Financial and Insurance Services workers prefer company-specific job boards when job searching. Workers in APAC and the Americas are significantly more likely to prefer company-specific job boards than those in EMEA (38% and 37% versus 31%), while Baby Boomers are significantly more likely to prefer company-specific job boards than Generations X and Y (38% versus 34% each).
• About three in 10 (31%) Financial and Insurance Services workers prefer aggregator job boards—such as U.S.-based Indeed or Simply Hired—which is on par with the global average (33%). Workers in the Americas are significantly more likely to use aggregator job boards than those in EMEA and APAC (40% versus 27% and 10%), while Baby Boomers are significantly more likely to use aggregator job boards than Generations X and Y (38% versus 33% and 27%).
M U LT I P L E C H A N N E L S T O A C C E S S J O B I N F O R M AT I O N
11
CONTENTS Å
What types of online job boards are most preferred for job searching or evaluating the market?
Global average
Financial and Insurance Services workers
General job boards like CareerBuilder or Monster*
Company-specific job boards Aggregator job boards like Indeed or Simply Hired*
Niche or association-specific job boards—focusing on IT or
science, for example
76%
33% 33%
14%
81%
35%31%
11%
*The names of online job boards vary by country; those depicted here operate in the United States.
• Fewer Financial and Insurance Services workers prefer niche or association-specific job boards than the global average (11% versus 14%). Notably fewer Financial and Insurance Services workers in EMEA and the Americas prefer niche or association-specific job boards than those in APAC (11% and 10% versus 18%).
A SMOOTH APPLICATION
PROCESS:REGULAR, CONSISTENT COMMUNICATION IS VALUED
12
CONTENTS Å
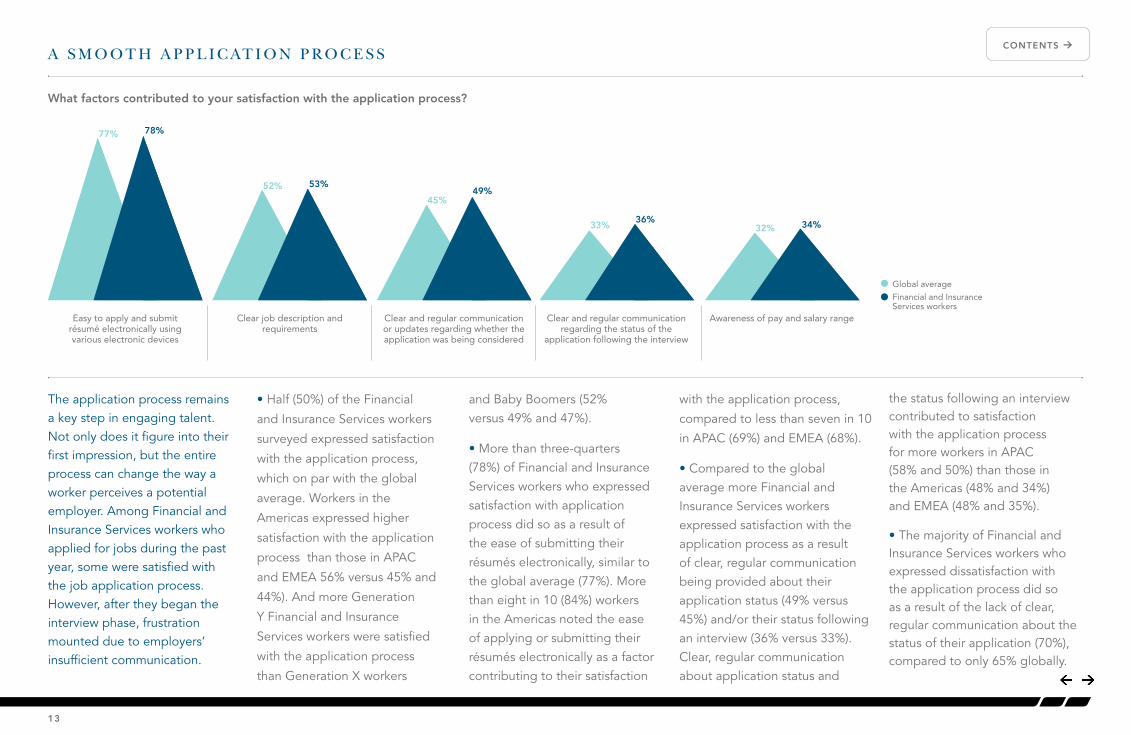
The application process remains a key step in engaging talent. Not only does it figure into their first impression, but the entire process can change the way a worker perceives a potential employer. Among Financial and Insurance Services workers who applied for jobs during the past year, some were satisfied with the job application process. However, after they began the interview phase, frustration mounted due to employers’ insufficient communication.
• Half (50%) of the Financial
and Insurance Services workers
surveyed expressed satisfaction
with the application process,
which on par with the global
average. Workers in the
Americas expressed higher
satisfaction with the application
process than those in APAC
and EMEA 56% versus 45% and
44%). And more Generation
Y Financial and Insurance
Services workers were satisfied
with the application process
than Generation X workers
and Baby Boomers (52% versus 49% and 47%).
• More than three-quarters (78%) of Financial and Insurance Services workers who expressed satisfaction with application process did so as a result of the ease of submitting their résumés electronically, similar to the global average (77%). More than eight in 10 (84%) workers in the Americas noted the ease of applying or submitting their résumés electronically as a factor contributing to their satisfaction
with the application process,
compared to less than seven in 10
in APAC (69%) and EMEA (68%).
• Compared to the global average more Financial and Insurance Services workers expressed satisfaction with the application process as a result of clear, regular communication being provided about their application status (49% versus 45%) and/or their status following an interview (36% versus 33%). Clear, regular communication about application status and
13
CONTENTS ÅA S M O O T H A P P L I C AT I O N P R O C E S S
the status following an interview contributed to satisfaction with the application process for more workers in APAC (58% and 50%) than those in the Americas (48% and 34%) and EMEA (48% and 35%).
• The majority of Financial and Insurance Services workers who expressed dissatisfaction with the application process did so as a result of the lack of clear, regular communication about the status of their application (70%), compared to only 65% globally.
Global average
Financial and Insurance Services workers
What factors contributed to your satisfaction with the application process?
Easy to apply and submit résumé electronically using various electronic devices
Clear job description and requirements
Clear and regular communication or updates regarding whether the application was being considered
Clear and regular communication regarding the status of the
application following the interview
Awareness of pay and salary range
77%
52%
45%
33% 32%
78%
53%49%
36% 34%

STRUCTURED ON-BOARDING:THE FIRST 90 DAYS MAKE A DIFFERENCE
14
CONTENTS Å
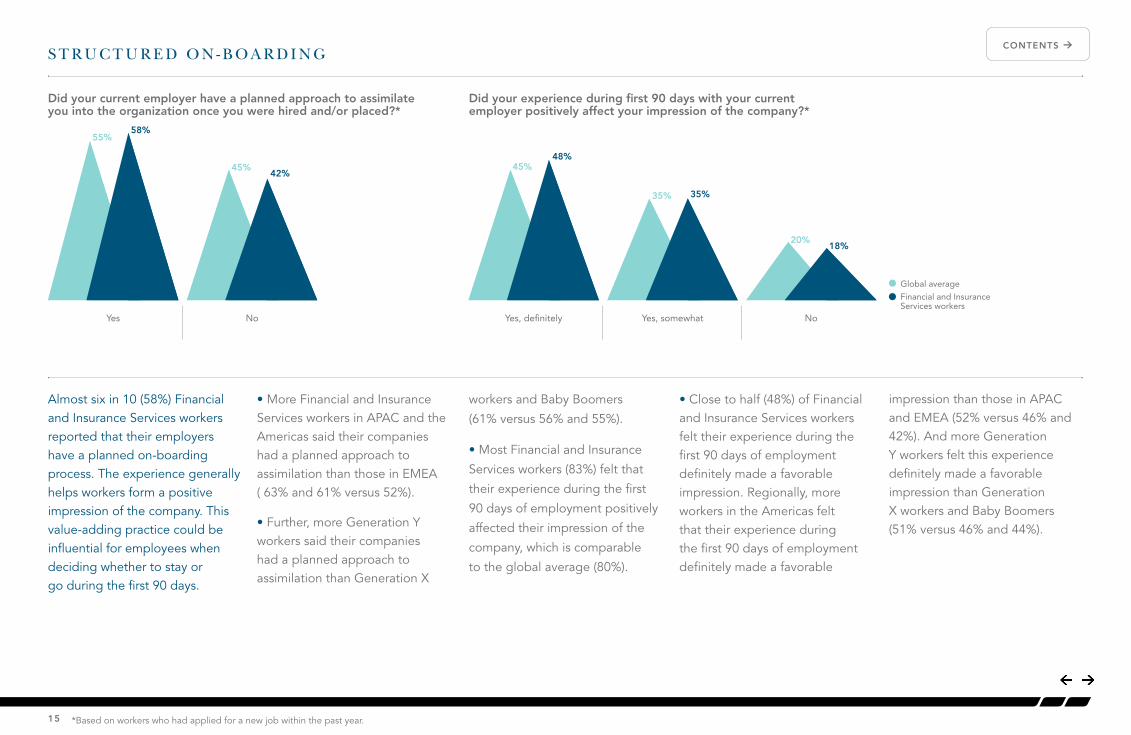
Almost six in 10 (58%) Financial and Insurance Services workers reported that their employers have a planned on-boarding process. The experience generally helps workers form a positive impression of the company. This value-adding practice could be influential for employees when deciding whether to stay or go during the first 90 days.
• More Financial and Insurance Services workers in APAC and the Americas said their companies had a planned approach to assimilation than those in EMEA ( 63% and 61% versus 52%).
• Further, more Generation Y workers said their companies had a planned approach to assimilation than Generation X
workers and Baby Boomers
(61% versus 56% and 55%).
• Most Financial and Insurance
Services workers (83%) felt that
their experience during the first
90 days of employment positively
affected their impression of the
company, which is comparable
to the global average (80%).
• Close to half (48%) of Financial and Insurance Services workers felt their experience during the first 90 days of employment definitely made a favorable impression. Regionally, more workers in the Americas felt that their experience during the first 90 days of employment definitely made a favorable
15
CONTENTS ÅS T R U C T U R E D O N - B O A R D I N G
Did your current employer have a planned approach to assimilate you into the organization once you were hired and/or placed?*
Did your experience during first 90 days with your current employer positively affect your impression of the company?*
Global average
Financial and Insurance Services workers
Yes, definitelyYes Yes, somewhatNo No
55%
45%
58%
42%45%
35%
20%
48%
35%
18%
*Based on workers who had applied for a new job within the past year.
impression than those in APAC and EMEA (52% versus 46% and 42%). And more Generation Y workers felt this experience definitely made a favorable impression than Generation X workers and Baby Boomers (51% versus 46% and 44%).
CAREER ROADMAPS:A GREEN LIGHT IN FINANCIAL AND INSURANCE
SERVICES EMPLOYEE SATISFACTION
16
CONTENTS Å
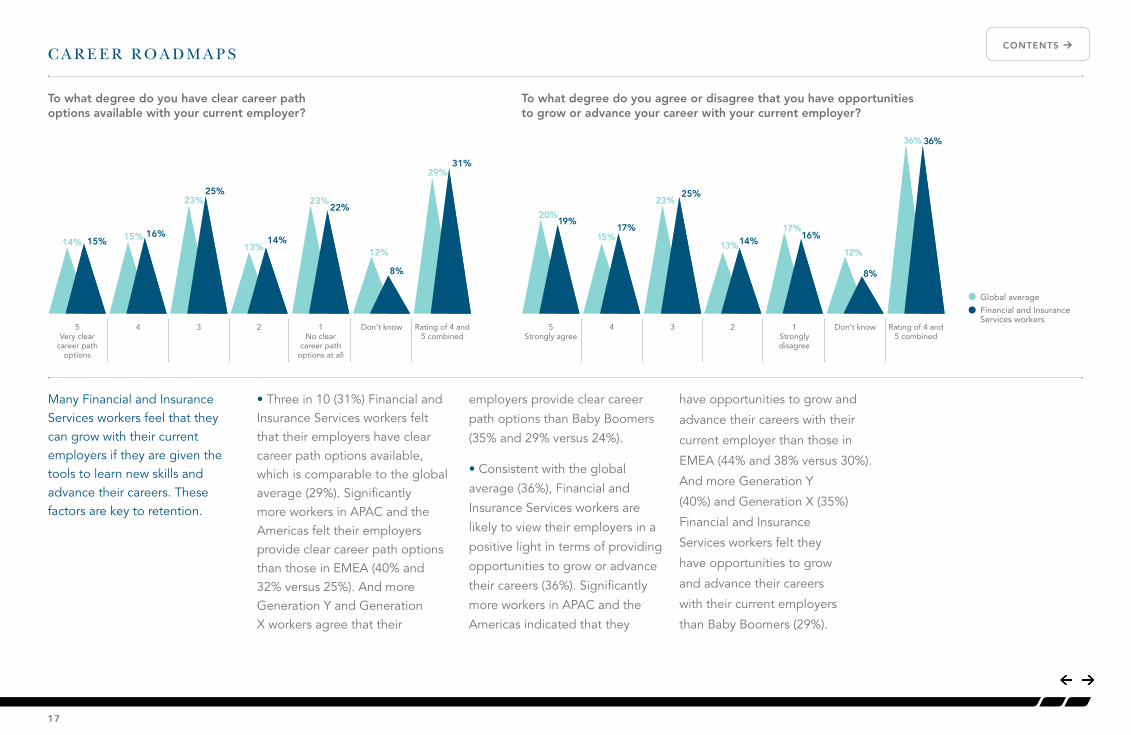
Many Financial and Insurance Services workers feel that they can grow with their current employers if they are given the tools to learn new skills and advance their careers. These factors are key to retention.
• Three in 10 (31%) Financial and Insurance Services workers felt that their employers have clear career path options available, which is comparable to the global average (29%). Significantly more workers in APAC and the Americas felt their employers provide clear career path options than those in EMEA (40% and 32% versus 25%). And more Generation Y and Generation X workers agree that their
employers provide clear career
path options than Baby Boomers
(35% and 29% versus 24%).
• Consistent with the global
average (36%), Financial and
Insurance Services workers are
likely to view their employers in a
positive light in terms of providing
opportunities to grow or advance
their careers (36%). Significantly
more workers in APAC and the
Americas indicated that they
have opportunities to grow and
advance their careers with their
current employer than those in
EMEA (44% and 38% versus 30%).
And more Generation Y
(40%) and Generation X (35%)
Financial and Insurance
Services workers felt they
have opportunities to grow
and advance their careers
with their current employers
than Baby Boomers (29%).
17
CONTENTS ÅC A R E E R R O A D M A P S
5Very clear
career path options
5Strongly agree
1No clear
career path options at all
1Strongly disagree
4 4Don’t know Don’t know3 3Rating of 4 and 5 combined
Rating of 4 and 5 combined
2 2
Global average
Financial and Insurance Services workers
15%
19%22%
16%16%17%
8% 8%
25% 25%
31%
36%
14% 14%
To what degree do you have clear career path options available with your current employer?
To what degree do you agree or disagree that you have opportunities to grow or advance your career with your current employer?
14%
20%
23%
17%15% 15%
12% 12%
23% 23%
29%
36%
13% 13%
PROFESSIONAL DEVELOPMENT:
AN IMPORTANT POINT OF DIFFERENTIATION AMONG EMPLOYERS
18
CONTENTS Å
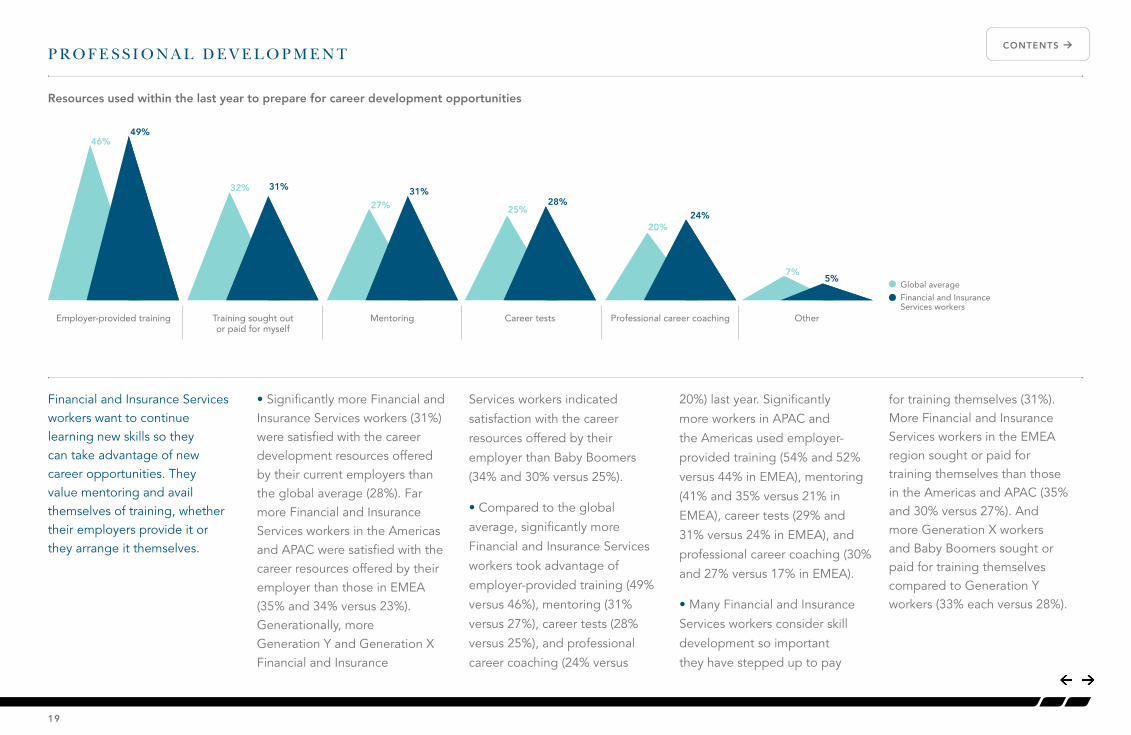
Financial and Insurance Services workers want to continue learning new skills so they can take advantage of new career opportunities. They value mentoring and avail themselves of training, whether their employers provide it or they arrange it themselves.
• Significantly more Financial and Insurance Services workers (31%) were satisfied with the career development resources offered by their current employers than the global average (28%). Far more Financial and Insurance Services workers in the Americas and APAC were satisfied with the career resources offered by their employer than those in EMEA (35% and 34% versus 23%). Generationally, more Generation Y and Generation X Financial and Insurance
Services workers indicated
satisfaction with the career
resources offered by their
employer than Baby Boomers
(34% and 30% versus 25%).
• Compared to the global
average, significantly more
Financial and Insurance Services
workers took advantage of
employer-provided training (49%
versus 46%), mentoring (31%
versus 27%), career tests (28%
versus 25%), and professional
career coaching (24% versus
20%) last year. Significantly
more workers in APAC and
the Americas used employer-
provided training (54% and 52%
versus 44% in EMEA), mentoring
(41% and 35% versus 21% in
EMEA), career tests (29% and
31% versus 24% in EMEA), and
professional career coaching (30%
and 27% versus 17% in EMEA).
• Many Financial and Insurance
Services workers consider skill
development so important
they have stepped up to pay
19
CONTENTS ÅP R O F E S S I O N A L D E V E L O P M E N T
for training themselves (31%). More Financial and Insurance Services workers in the EMEA region sought or paid for training themselves than those in the Americas and APAC (35% and 30% versus 27%). And more Generation X workers and Baby Boomers sought or paid for training themselves compared to Generation Y workers (33% each versus 28%).
Global average
Financial and Insurance Services workers
Resources used within the last year to prepare for career development opportunities
Employer-provided training Training sought out or paid for myself
Mentoring Career tests Professional career coaching Other
46%
32%
27% 25%
20%
7%
49%
31% 31%28%
24%
5%
A CUTTING-EDGE WORK ENVIRONMENT:
THE MOST CURRENT PRACTICES AND TECHNOLOGY ATTRACTTOP FINANCIAL AND INSURANCE SERVICES PLAYERS
20
CONTENTS Å
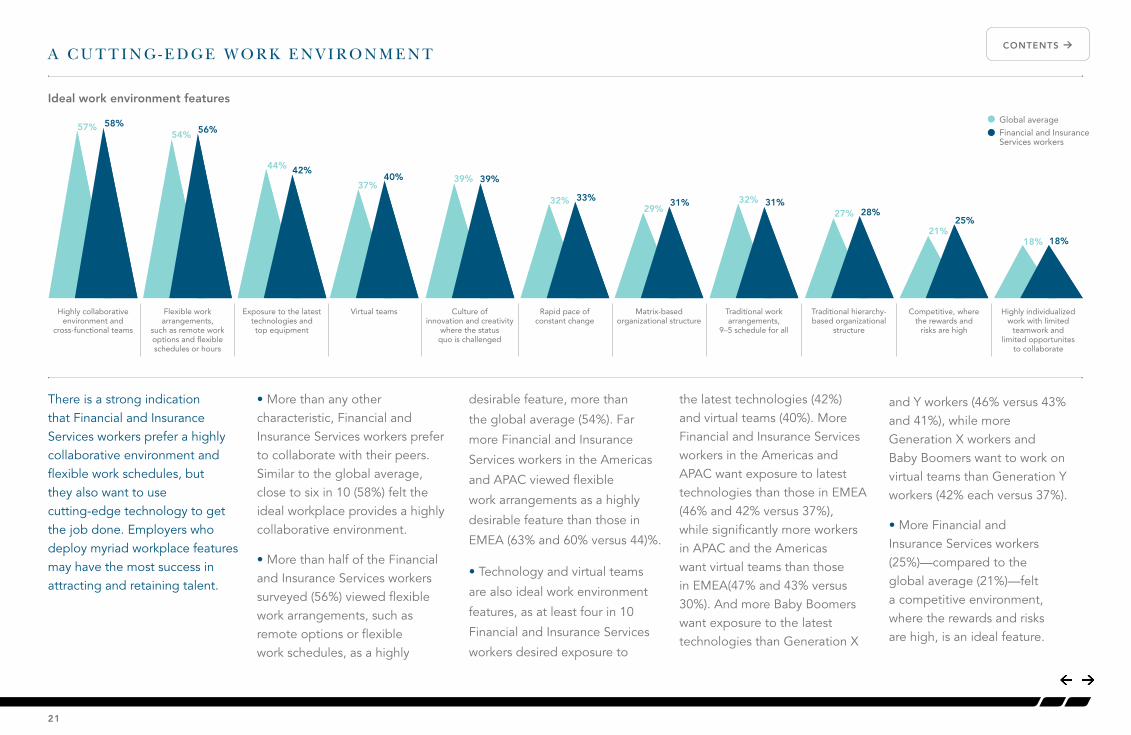
There is a strong indication that Financial and Insurance Services workers prefer a highly collaborative environment and flexible work schedules, but they also want to use cutting-edge technology to get the job done. Employers who deploy myriad workplace features may have the most success in attracting and retaining talent.
• More than any other characteristic, Financial and Insurance Services workers prefer to collaborate with their peers. Similar to the global average, close to six in 10 (58%) felt the ideal workplace provides a highly collaborative environment.
• More than half of the Financial and Insurance Services workers surveyed (56%) viewed flexible work arrangements, such as remote options or flexible work schedules, as a highly
desirable feature, more than
the global average (54%). Far
more Financial and Insurance
Services workers in the Americas
and APAC viewed flexible
work arrangements as a highly
desirable feature than those in
EMEA (63% and 60% versus 44)%.
• Technology and virtual teams
are also ideal work environment
features, as at least four in 10
Financial and Insurance Services
workers desired exposure to
the latest technologies (42%) and virtual teams (40%). More Financial and Insurance Services workers in the Americas and APAC want exposure to latest technologies than those in EMEA (46% and 42% versus 37%), while significantly more workers in APAC and the Americas want virtual teams than those in EMEA(47% and 43% versus 30%). And more Baby Boomers want exposure to the latest technologies than Generation X
21
CONTENTS ÅA C U T T I N G - E D G E W O R K E N V I R O N M E N T
and Y workers (46% versus 43% and 41%), while more Generation X workers and Baby Boomers want to work on virtual teams than Generation Y workers (42% each versus 37%).
• More Financial and Insurance Services workers (25%)—compared to the global average (21%)—felt a competitive environment, where the rewards and risks are high, is an ideal feature.
Highly collaborative environment and
cross-functional teams
Flexible work arrangements,
such as remote work options and flexible schedules or hours
Competitive, where the rewards and
risks are high
Exposure to the latest technologies and top equipment
Highly individualized work with limited
teamwork and limited opportunites
to collaborate
Global average
Financial and Insurance Services workers
57%54%
21%
44%
18%
58%
Virtual teams
37%40%
56%
25%
18%
Matrix-based organizational structure
29%31%
42%
Traditional work arrangements,
9–5 schedule for all
32% 31%
Rapid pace of constant change
32% 33%
Culture of innovation and creativity
where the status quo is challenged
39% 39%
Traditional hierarchy-based organizational
structure
27% 28%
Ideal work environment features
COMPETITIVE COMPENSATION:
STILL FIRST IN ATTRACTION BUT WORK–LIFE BALANCEAND ADVANCEMENT CAN BE DEALMAKERS
22
CONTENTS Å
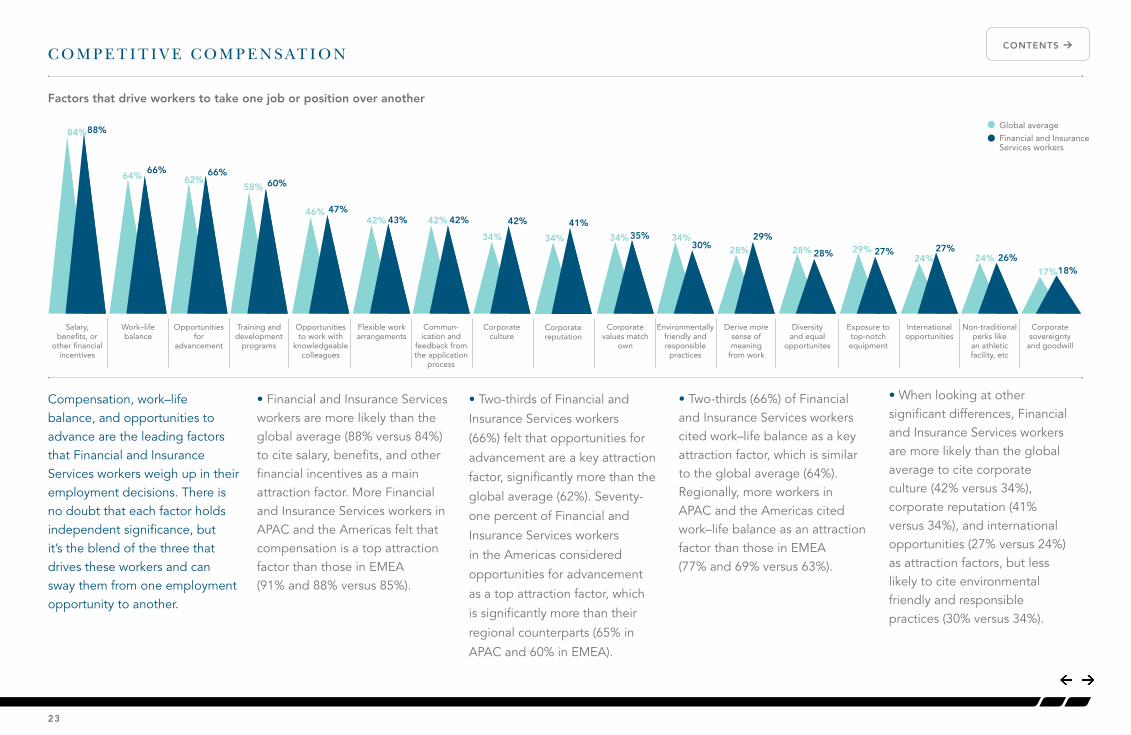
Compensation, work–life balance, and opportunities to advance are the leading factors that Financial and Insurance Services workers weigh up in their employment decisions. There is no doubt that each factor holds independent significance, but it’s the blend of the three that drives these workers and can sway them from one employment opportunity to another.
• Financial and Insurance Services workers are more likely than the global average (88% versus 84%) to cite salary, benefits, and other financial incentives as a main attraction factor. More Financial and Insurance Services workers in APAC and the Americas felt that compensation is a top attraction factor than those in EMEA (91% and 88% versus 85%).
• Two-thirds of Financial and
Insurance Services workers
(66%) felt that opportunities for
advancement are a key attraction
factor, significantly more than the
global average (62%). Seventy-
one percent of Financial and
Insurance Services workers
in the Americas considered
opportunities for advancement
as a top attraction factor, which
is significantly more than their
regional counterparts (65% in
APAC and 60% in EMEA).
23
CONTENTS ÅC O M P E T I T I V E C O M P E N S AT I O N
• Two-thirds (66%) of Financial and Insurance Services workers cited work–life balance as a key attraction factor, which is similar to the global average (64%). Regionally, more workers in APAC and the Americas cited work–life balance as an attraction factor than those in EMEA (77% and 69% versus 63%).
• When looking at other significant differences, Financial and Insurance Services workers are more likely than the global average to cite corporate culture (42% versus 34%), corporate reputation (41% versus 34%), and international opportunities (27% versus 24%) as attraction factors, but less likely to cite environmental friendly and responsible practices (30% versus 34%).
Salary, benefits, or
other financial incentives
Opportunities to work with
knowledgeable colleagues
Work–life balance
Corporate values match
own
Flexible work arrangements
Opportunities for
advancement
Training and development
programs
Global average
Financial and Insurance Services workers
Factors that drive workers to take one job or position over another
84%
46%
64%
34%
42%
62%58%
88%
Corporate reputation
34%
41%47%
International opportunities
24%27%
66%
35%
43%
Derive more sense of meaning
from work
28%29%
Corporate sovereignty
and goodwill
17%18%
66%
Environmentally friendly and responsible
practices
34%30%
Corporate culture
34%
42%
Diversity and equal
opportunites
28% 28%
60%
Exposure to top-notch equipment
29% 27%
Commun-ication and
feedback from the application
process
42% 42%
Non-traditional perks like an athletic facility, etc
24% 26%
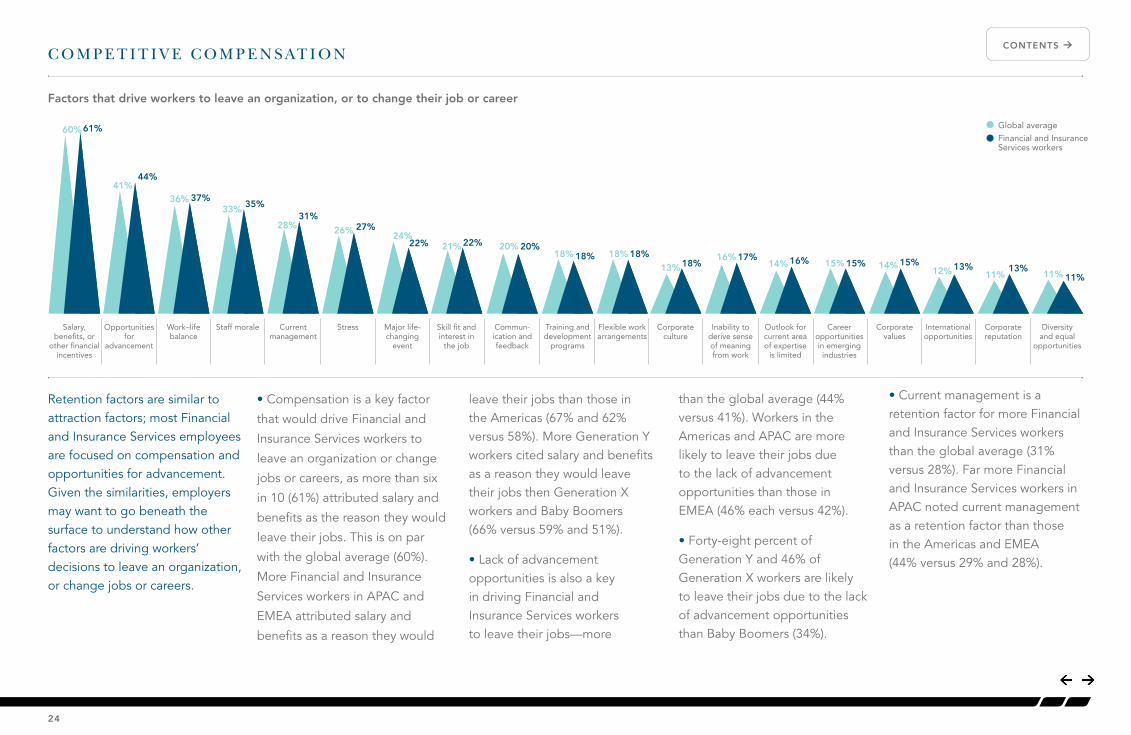
Retention factors are similar to attraction factors; most Financial and Insurance Services employees are focused on compensation and opportunities for advancement. Given the similarities, employers may want to go beneath the surface to understand how other factors are driving workers’ decisions to leave an organization, or change jobs or careers.
• Compensation is a key factor
that would drive Financial and
Insurance Services workers to
leave an organization or change
jobs or careers, as more than six
in 10 (61%) attributed salary and
benefits as the reason they would
leave their jobs. This is on par
with the global average (60%).
More Financial and Insurance
Services workers in APAC and
EMEA attributed salary and
benefits as a reason they would
leave their jobs than those in the Americas (67% and 62% versus 58%). More Generation Y workers cited salary and benefits as a reason they would leave their jobs then Generation X workers and Baby Boomers (66% versus 59% and 51%).
• Lack of advancement opportunities is also a key in driving Financial and Insurance Services workers to leave their jobs—more
24
CONTENTS ÅC O M P E T I T I V E C O M P E N S AT I O N
than the global average (44% versus 41%). Workers in the Americas and APAC are more likely to leave their jobs due to the lack of advancement opportunities than those in EMEA (46% each versus 42%).
• Forty-eight percent of Generation Y and 46% of Generation X workers are likely to leave their jobs due to the lack of advancement opportunities than Baby Boomers (34%).
• Current management is a retention factor for more Financial and Insurance Services workers than the global average (31% versus 28%). Far more Financial and Insurance Services workers in APAC noted current management as a retention factor than those in the Americas and EMEA (44% versus 29% and 28%).
Salary, benefits, or
other financial incentives
Current management
Opportunities for
advancement
StressWork–life balance
Major life-changing
event
Staff morale Skill fit and interest in
the job
Global average
Financial and Insurance Services workers
60%
28%
41%
26% 24%21% 20%
18%22% 20%
Flexible work arrangements
18% 18%18%
36%33%
61%
Training and development
programs
31%
44%
Commun-ication and feedback
27%
22%
14% 15%
Corporate values
14% 16%
Outlook for current area of expertise
is limited
37%
16% 17%
Inability to derive sense of meaning from work
12% 13%
International opportunities
11%13%
Corporate reputation
35%
15% 15%
Career opportunities in emerging industries
13% 18%
Corporate culture
11% 11%
Diversity and equal
opportunities
Factors that drive workers to leave an organization, or to change their job or career
IT’S ALL ABOUT EMPLOYER
PERFORMANCE
25
CONTENTS Å
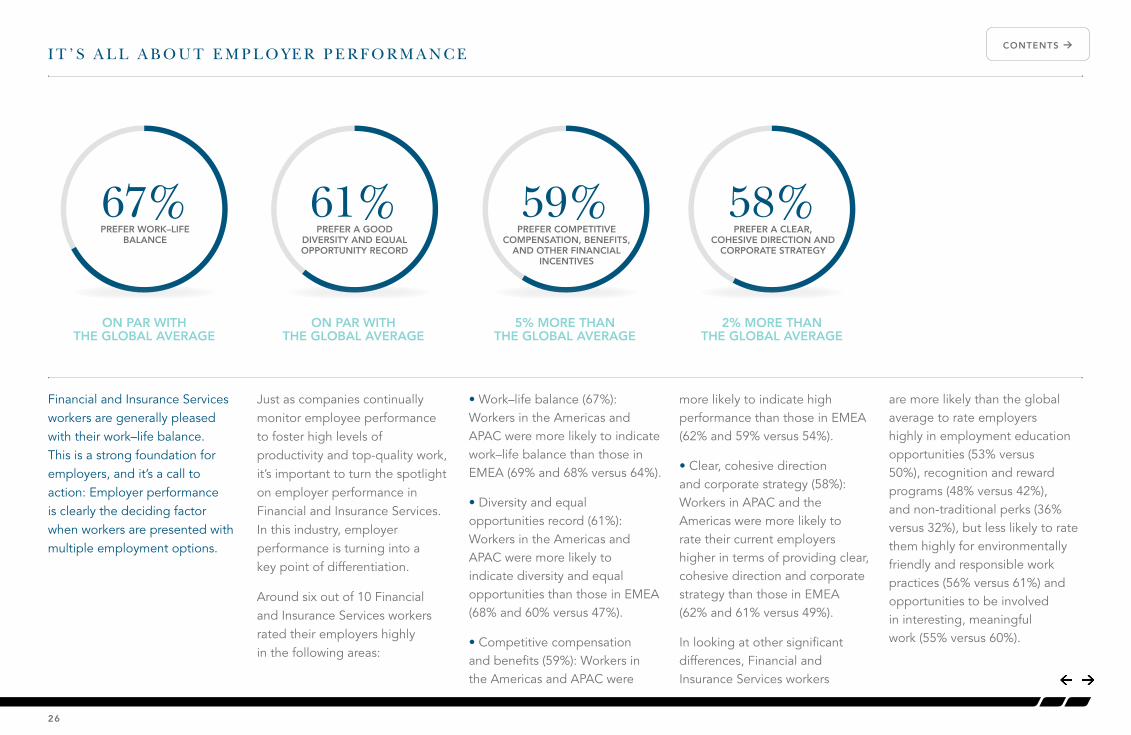
Financial and Insurance Services workers are generally pleased with their work–life balance. This is a strong foundation for employers, and it’s a call to action: Employer performance is clearly the deciding factor when workers are presented with multiple employment options.
Just as companies continually monitor employee performance to foster high levels of productivity and top-quality work, it’s important to turn the spotlight on employer performance in Financial and Insurance Services. In this industry, employer performance is turning into a key point of differentiation.
Around six out of 10 Financial and Insurance Services workers rated their employers highly in the following areas:
• Work–life balance (67%): Workers in the Americas and APAC were more likely to indicate work–life balance than those in EMEA (69% and 68% versus 64%).
• Diversity and equal opportunities record (61%): Workers in the Americas and APAC were more likely to indicate diversity and equal opportunities than those in EMEA (68% and 60% versus 47%).
• Competitive compensation and benefits (59%): Workers in the Americas and APAC were
more likely to indicate high performance than those in EMEA (62% and 59% versus 54%).
• Clear, cohesive direction and corporate strategy (58%): Workers in APAC and the Americas were more likely to rate their current employers higher in terms of providing clear, cohesive direction and corporate strategy than those in EMEA (62% and 61% versus 49%).
In looking at other significant differences, Financial and Insurance Services workers
I T ’ S A L L A B O U T E M P L O Y E R P E R F O R M A N C E
ON PAR WITH THE GLOBAL AVERAGE
ON PAR WITH THE GLOBAL AVERAGE
2% MORE THAN THE GLOBAL AVERAGE
67% 61% 58%PREFER A CLEAR,
COHESIVE DIRECTION AND CORPORATE STRATEGY
PREFER A GOOD DIVERSITY AND EQUAL OPPORTUNITY RECORD
5% MORE THAN THE GLOBAL AVERAGE
59%PREFER COMPETITIVE
COMPENSATION, BENEFITS, AND OTHER FINANCIAL
INCENTIVES
PREFER WORK–LIFE BALANCE
are more likely than the global average to rate employers highly in employment education opportunities (53% versus 50%), recognition and reward programs (48% versus 42%), and non-traditional perks (36% versus 32%), but less likely to rate them highly for environmentally friendly and responsible work practices (56% versus 61%) and opportunities to be involved in interesting, meaningful work (55% versus 60%).
26
CONTENTS Å
• More than half of the Financial
and Insurance Services workers
surveyed would give up higher
pay and/or career growth and
advancement for the opportunity
to learn new skills (57%) or for a
greater work–life balance (52%),
equal to the global averages.
More Financial and Insurance
Services workers in both APAC
and the Americas would give
up higher pay and/or career
growth and advancement for the
opportunity to learn new skills
(65% in APAC and 57% in the
Americas versus 54% in EMEA)
or for a greater work–life balance
(62% in APAC and 54% in the
Americas versus 45% in EMEA).
• Nearly two-thirds (65%) of
Financial and Insurance Services
workers will actively look for a
new position within the next year,
significantly more than the global
D I D Y O U K N O W ?
average (61%). More Financial and Insurance Services workers in EMEA will actively look for a new position within the next year than those in APAC and the Americas (69% and 64% versus 62%).
• Nearly half (46%) of the Financial and Insurance Services workers surveyed actively look for better job opportunities or evaluate the external job market, even when happy in their jobs. This is on par with the global average of 47%. Regionally, Financial and Insurance Services workers in EMEA and APAC are more likely than those in the Americas (53% and 50% versus 41%) to actively look for better job opportunities or evaluate the external job market.
• Significantly more Financial and Insurance Services workers felt that they are in a position of
high demand in the marketplace
than the global average (57%
versus 53%). Far more workers in
the Americas and APAC felt they
were in a position of high demand
in the marketplace than those in
EMEA (62% and 56% versus 48%).
• More Financial and Insurance
Services workers prefer to work
for a global company than the
global average (42% versus
35%). Further, and on par with
the global average, Financial
and Insurance Services workers
prefer to work for an established
company with longevity (43%
versus the 41% global average).
Financial and Insurance Services
workers in APAC and EMEA are
more likely than those in the
Americas to prefer to work for
a global company (65% and
50% versus 29%) and prefer
to work for an established
company with longevity (44%
and 48% versus 39%).
• A larger proportion of
Financial and Insurance Services
workers (21%) prefer to work for
Fortune 100 and 500 companies
than the global average (16%).
More workers in APAC prefer
to work for Fortune 100 and
500 companies than those
in the Americas and EMEA
(33% versus 21% and 17%).
• Nearly three-quarters (72%) of
Financial and Insurance Services
workers were willing to move
for the right job, which is on par
with the global average (70%).
More workers in APAC and EMEA
are willing to move for the right
job than those in the Americas
(82% and 73% versus 68%).
• Seven in 10 (70%) Financial
and Insurance Services workers
said they use social media
websites as their primary
method of networking (on par
with the 71% global average).
APAC Financial and Insurance
Services workers are more likely
than those in the Americas and
EMEA (77% versus 70% and
67%) to use social media as their
primary method of networking.
• Nearly four in 10 (38%)
Financial and Insurance Services
workers are inclined to search
for jobs via social media rather
than using traditional methods,
which is comparable to the global
average (36%). More APAC
workers are inclined to search
for jobs via social media than
those in EMEA and the Americas
(55% versus 36% and 34%).
27
CONTENTS Å
As complex as competing for high-quality performers has become, workers can be met on their terms without employers sacrificing their company’s core values and practices. Here are six things you can do as an employer to relate to the workforce dynamically and with satisfying results. At the same time, you will add definition and character to your workplace.
1. Deliver an exceptional
application and on-boarding
experience. Make your company irresistible by personalizing the hiring process through both technology and well-prepared staff members. Emphasize that you value engagement and highlight the factors that differentiate your company from others in your industry.
K E L LY I N S I G H T : T H E R E A R E S I X WAY S T O G I V E F I N A N C I A L A N D I N S U R A N C E S E R V I C E S W O R K E R S W H AT T H E Y WA N T
2. Participate in every possible
digital channel and be mobile-
friendly. The rise of social media and user-centric digital design has raised workers’ expectations for better and more up-to-date company information. Figure out where your employees and hiring targets spend their digital time, and make an effort to relate to them there. Most importantly, create a talent community that lives online yet is completely authentic to your workplace. Give workers a reason to pay attention to what you do and inspire them to join you.
3. Personalize the career path. Workers clearly see themselves as valuable in terms of the skills they
possess and new practices they can learn. Spend strategic time working out what your company can do to nurture every worker’s professional development. This cultivates loyalty and strengthens your company’s culture. It also ensures that your workforce is at the top of its game and ready to share the message that your company is a good place to work.
4. Fight to make your workplace
remarkable. Employees expect competitive pay packages and transparent employment policies. By emphasizing these two areas alone, your company will attract appropriate attention and build a positive image organically. Word gets around.
5. Determine how you can
please your workers. Learn the preferences, not just the needs, of your workforce. Think about how you can provide a stable yet flexible work environment that blends challenges and opportunities. Show your workers how this environment will help them grow and develop.
6. Develop your persona as
an employer. Articulate all the qualities that define your company’s approach to operating in and serving your market. Be ready to define how you are different from others in your industry and how you got to be that way. Give employees and candidates a reason to connect with your employment philosophy.
The 2014 Kelly Global Workforce Index™ revealed that workers expect to connect with employers—and potential employers—across a variety of channels and in real time.
28
CONTENTS Å
29Kelly Global Workforce Index™ EXIT
An Equal Opportunity Employer © 2014 Kelly Services
kellyservices.com
ABOUT KELLY SERVICES®
Kelly Services, Inc. (NASDAQ: KELYA, KELYB) is a leader in providing workforce solutions.
Kelly® offers a comprehensive array of outsourcing and consulting services, as well as
world-class staffing on a temporary, temporary-to-hire, and direct-hire basis. Serving clients
around the globe, Kelly provided employment to approximately 540,000 people in 2013.
Revenue in 2013 was $5.4 billion. Visit kellyservices.com and connect with us on Facebook,
LinkedIn, and Twitter. Download The Talent Project, a free iPad® app by Kelly Services.
ABOUT THE KELLY GLOBAL WORKFORCE INDEX™
The Kelly Global Workforce Index™ (KGWI) is an annual global survey revealing opinions
about work and the workplace. Approximately 230,000 people across the Americas,
EMEA and APAC regions responded to the survey. The survey was conducted online by
RDA Group on behalf of Kelly Services.
CONTENTS Å
Related Documents