Learning Analytics: The good, the bad, or perhaps ugly? @DrBartRienties Reader in Learning Analytics

Keynote address: Learning Analytics: The good, the bad, or perhaps ugly?
Aug 15, 2015
Welcome message from author
This document is posted to help you gain knowledge. Please leave a comment to let me know what you think about it! Share it to your friends and learn new things together.
Transcript
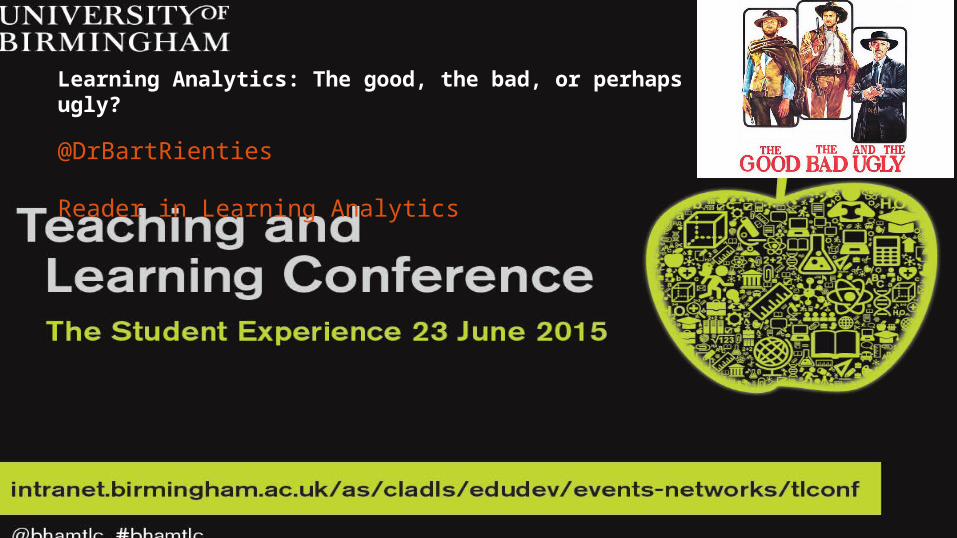
Learning Analytics: The good, the bad, or perhaps ugly?
@DrBartRienties
Reader in Learning Analytics

What is learning analytics?
http://bcomposes.wordpress.com/
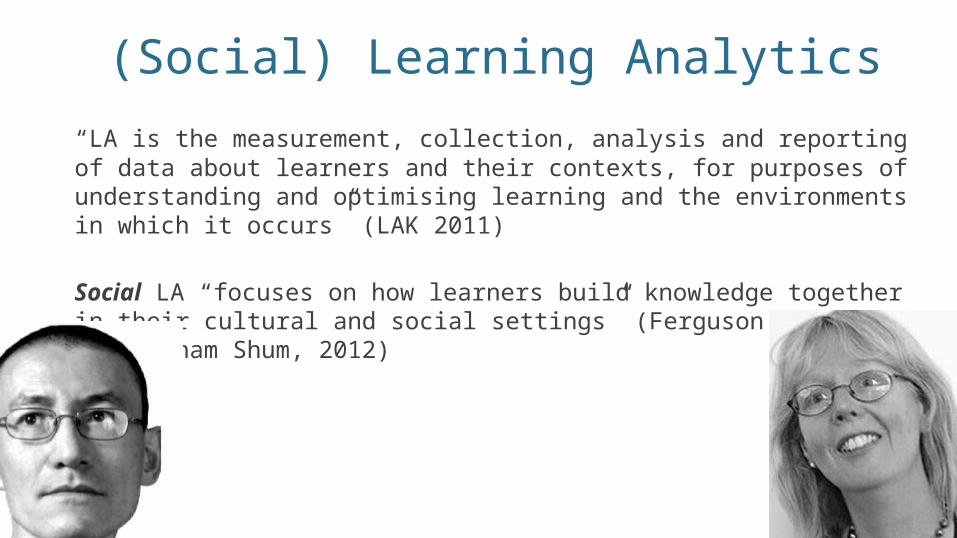
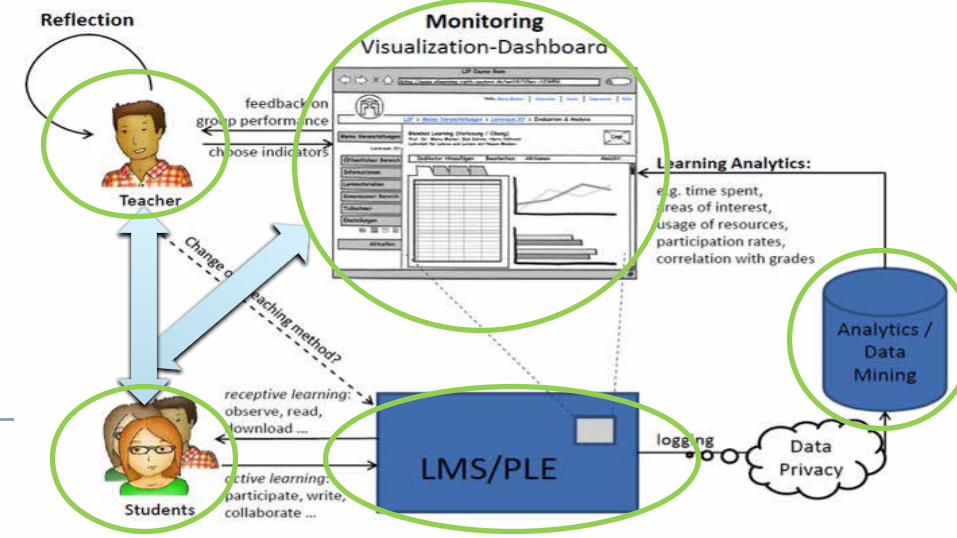
(Social) Learning Analytics
“LA is the measurement, collection, analysis and reporting of data about learners and their contexts, for purposes of understanding and optimising learning and the environments in which it occurs” (LAK 2011)
Social LA “focuses on how learners build knowledge together in their cultural and social settings” (Ferguson & Buckingham Shum, 2012)
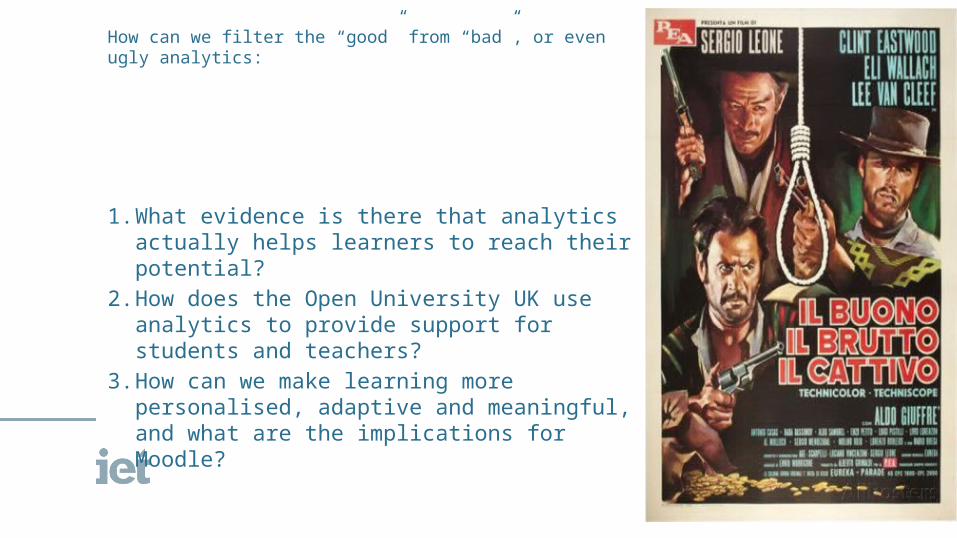
How can we filter the “good” from “bad”, or even ugly analytics:
1. What evidence is there that analytics actually helps learners to reach their potential?
2. How does the Open University UK use analytics to provide support for students and teachers?
3. How can we make learning more personalised, adaptive and meaningful, and what are the implications for Moodle?

Q1: http://evidence.laceproject.eu/

B) Linking learning design 150+ moduleswith learning analytics
A) How does the OU use LA? OU Analyse
C) How do students choose collaboration tools?
D Learning analytics with120+ variables
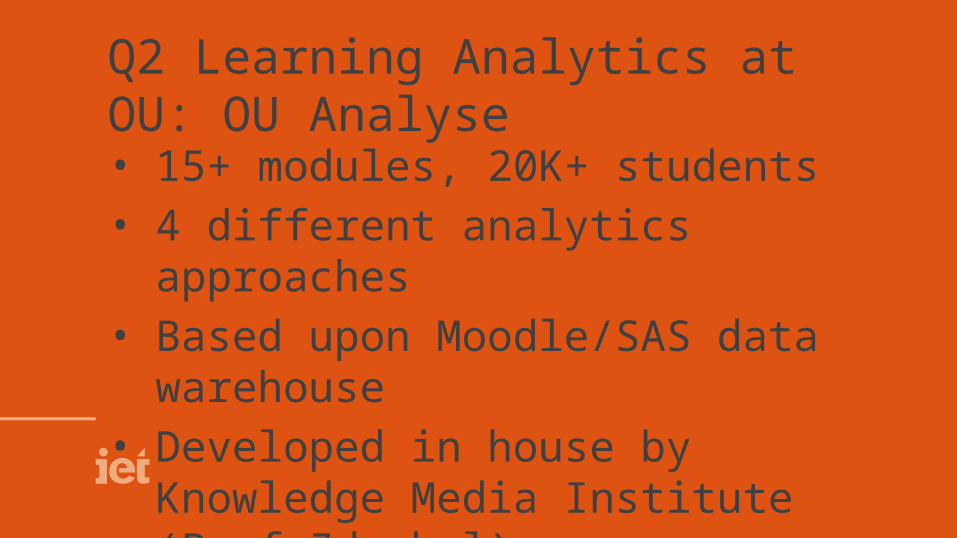
Q2 Learning Analytics at OU: OU Analyse• 15+ modules, 20K+ students• 4 different analytics approaches• Based upon Moodle/SAS data
warehouse• Developed in house by Knowledge
Media Institute (Prof Zdrahal)

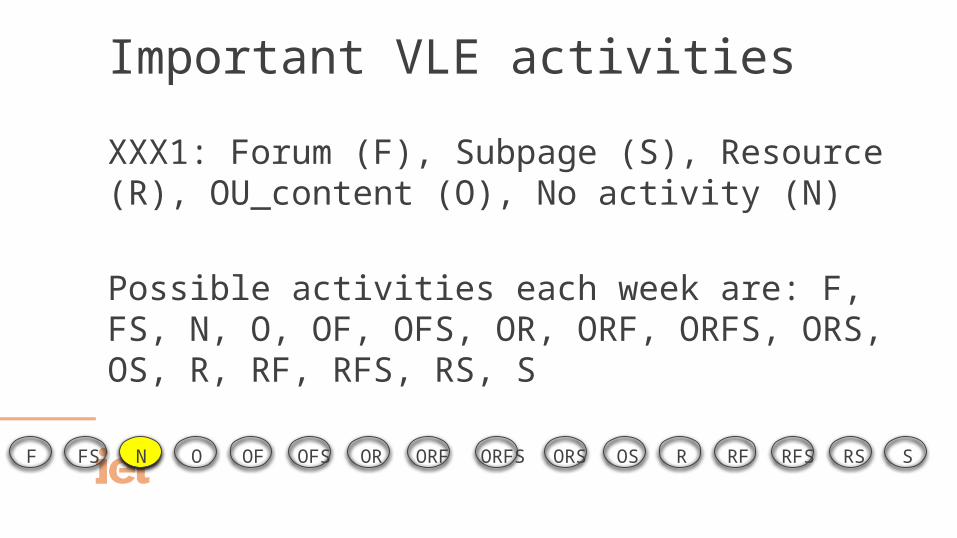
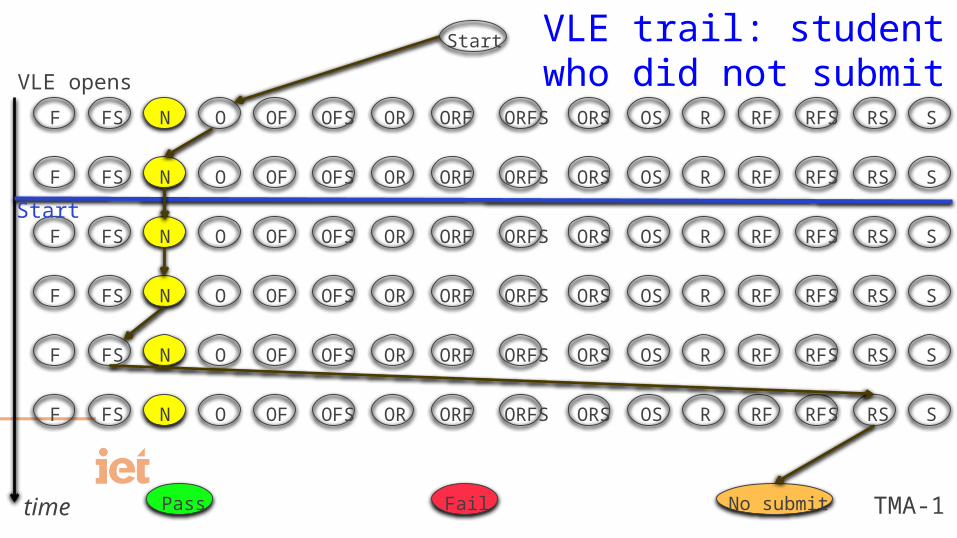
Important VLE activities
XXX1: Forum (F), Subpage (S), Resource (R), OU_content (O), No activity (N)
Possible activities each week are: F, FS, N, O, OF, OFS, OR, ORF, ORFS, ORS, OS, R, RF, RFS, RS, S
FSF RFSOFS ORFN O SRFROF OR ORSORFS OS RS

Start
FSF RFSOFS ORFN O SRFROF OR ORSORFS OS RS
FSF RFSOFS ORFN O SRFROF OR ORSORFS OS RS
FSF RFSOFS ORFN O SRFROF OR ORSORFS OS RS
FSF RFSOFS ORFN O SRFROF OR ORSORFS OS RS
FSF RFSOFS ORFN O SRFROF OR ORSORFS OS RS
Pass Fail No submit TMA-1time
VLE opens
Start
Activity space
FSF RFSOFS ORFN O SRFROF OR ORSORFS OS RS

FSF RFSOFS ORFN O SRFROF OR ORSORFS OS RS
Start
FSF RFSOFS ORFN O SRFROF OR ORSORFS OS RS
FSF RFSOFS ORFN O SRFROF OR ORSORFS OS RS
FSF RFSOFS ORFN O SRFROF OR ORSORFS OS RS
FSF RFSOFS ORFN O SRFROF OR ORSORFS OS RS
Pass Fail No submit TMA-1time
VLE opens
Start
VLE trail: successful student
FSF RFSOFS ORFN O SRFROF OR ORSORFS OS RS
FSF RFSOFS ORFN O SRFROF OR ORSORFS OS RS
Start
FSF RFSOFS ORFN O SRFROF OR ORSORFS OS RS
FSF RFSOFS ORFN O SRFROF OR ORSORFS OS RS
FSF RFSOFS ORFN O SRFROF OR ORSORFS OS RS
FSF RFSOFS ORFN O SRFROF OR ORSORFS OS RS
FSF RFSOFS ORFN O SRFROF OR ORSORFS OS RS
Pass Fail No submit TMA-1time
VLE opens
Start
VLE trail: student who did not submit
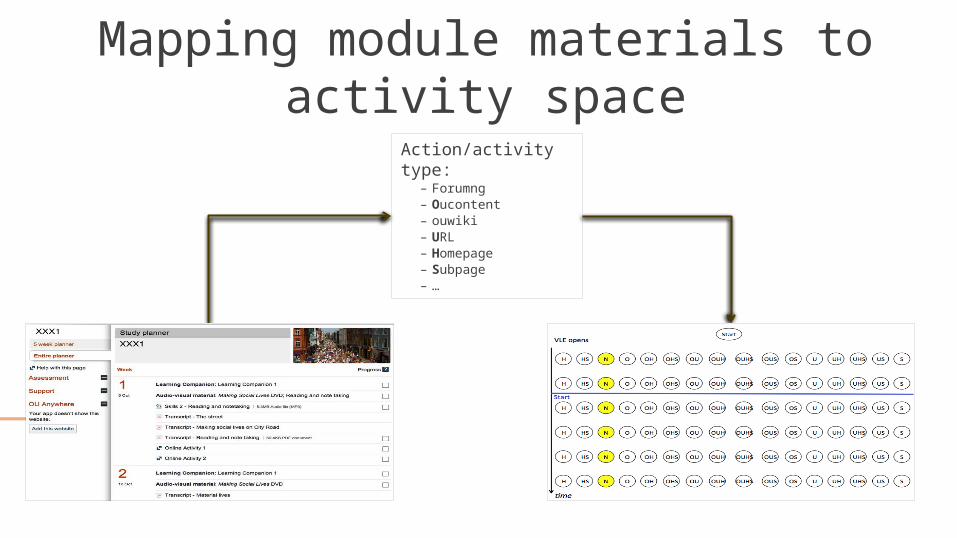
Action/activity type:– Forumng – Oucontent– ouwiki – URL – Homepage – Subpage – …
Mapping module materials to activity space
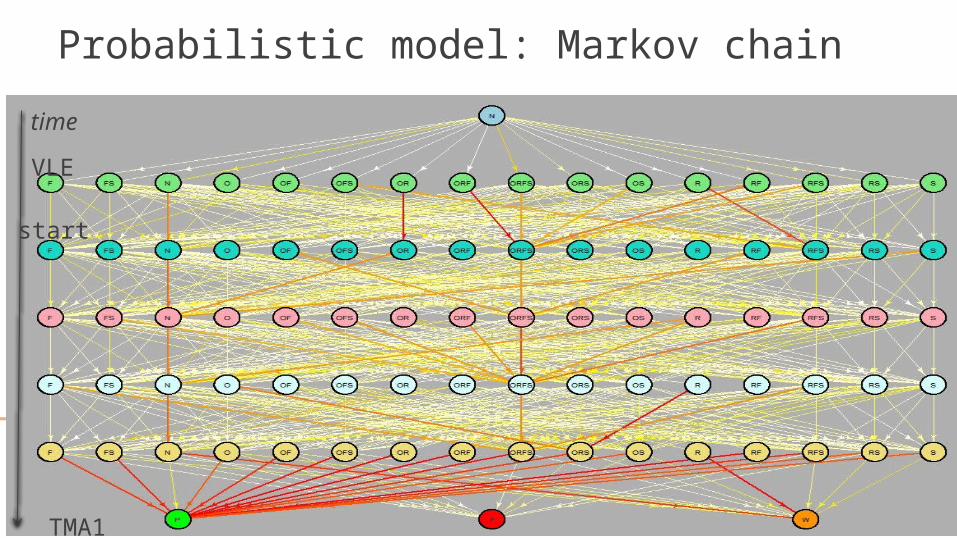
Probabilistic model: Markov chaintime
TMA1
VLE
start
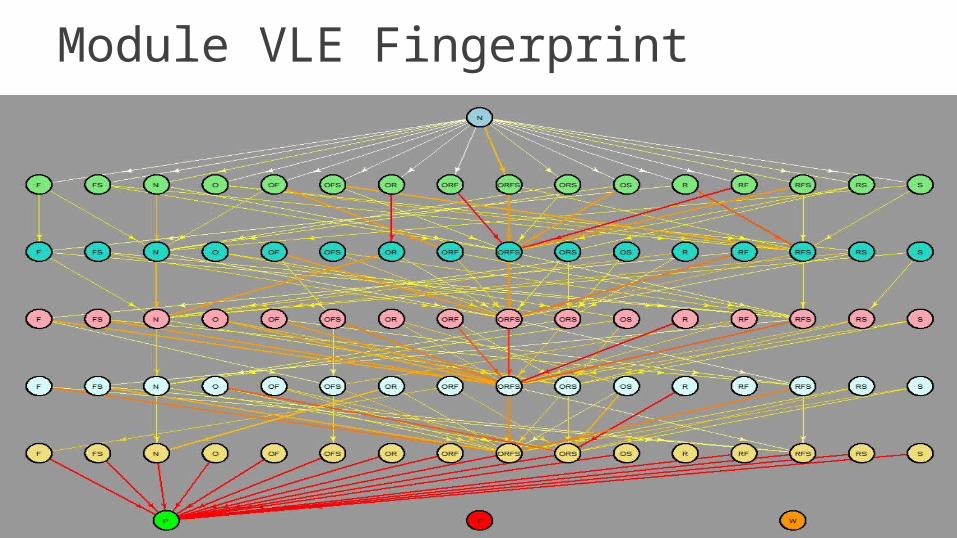
Module VLE Fingerprint
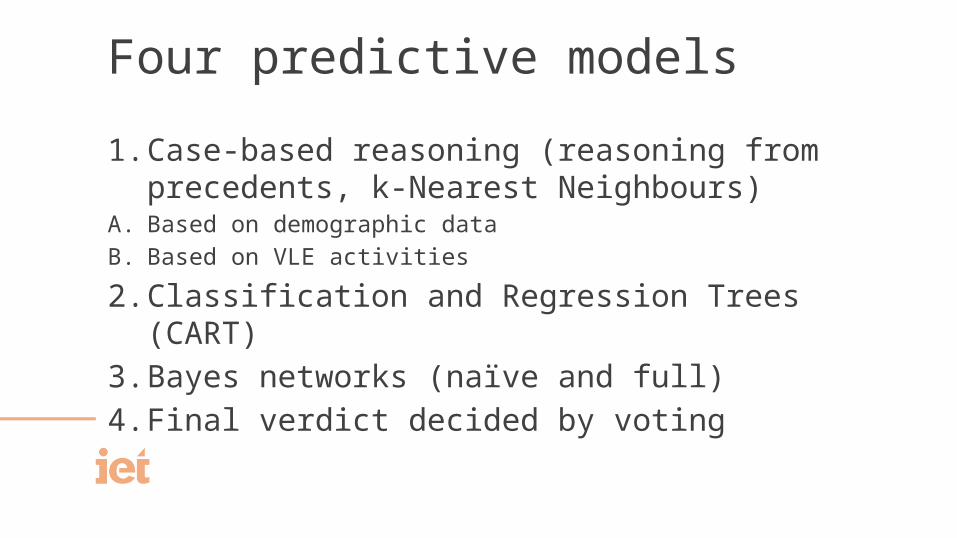
Four predictive models
1. Case-based reasoning (reasoning from precedents, k-Nearest Neighbours)
A. Based on demographic data
B. Based on VLE activities
2. Classification and Regression Trees (CART)
3. Bayes networks (naïve and full)
4. Final verdict decided by voting
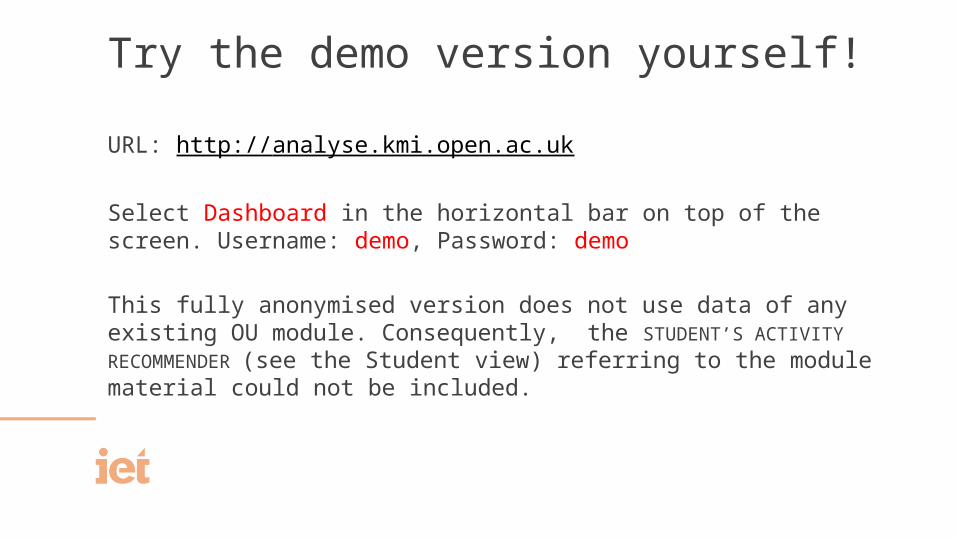
Try the demo version yourself!
URL: http://analyse.kmi.open.ac.uk
Select Dashboard in the horizontal bar on top of the screen. Username: demo, Password: demo
This fully anonymised version does not use data of any existing OU module. Consequently, the STUDENT’S ACTIVITY RECOMMENDER (see the Student view) referring to the module material could not be included.
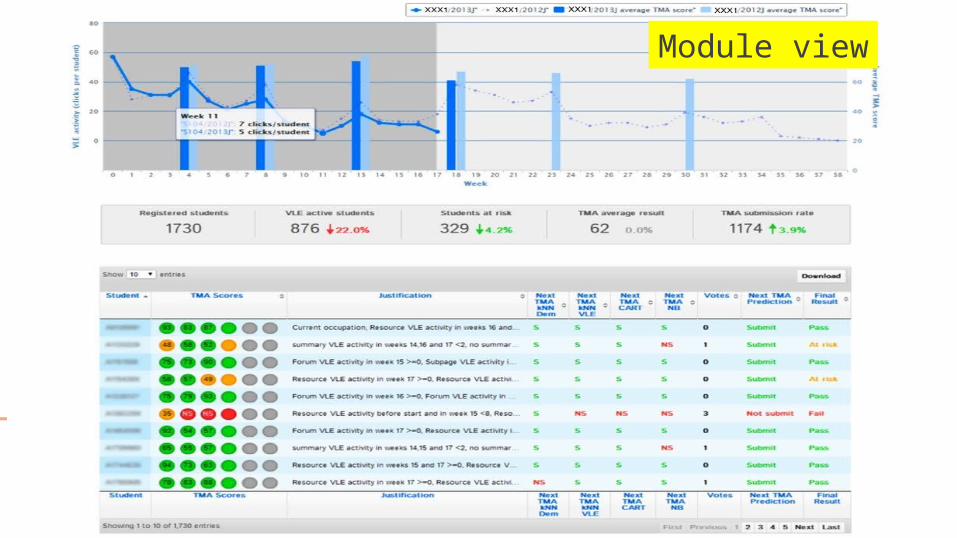
Module view
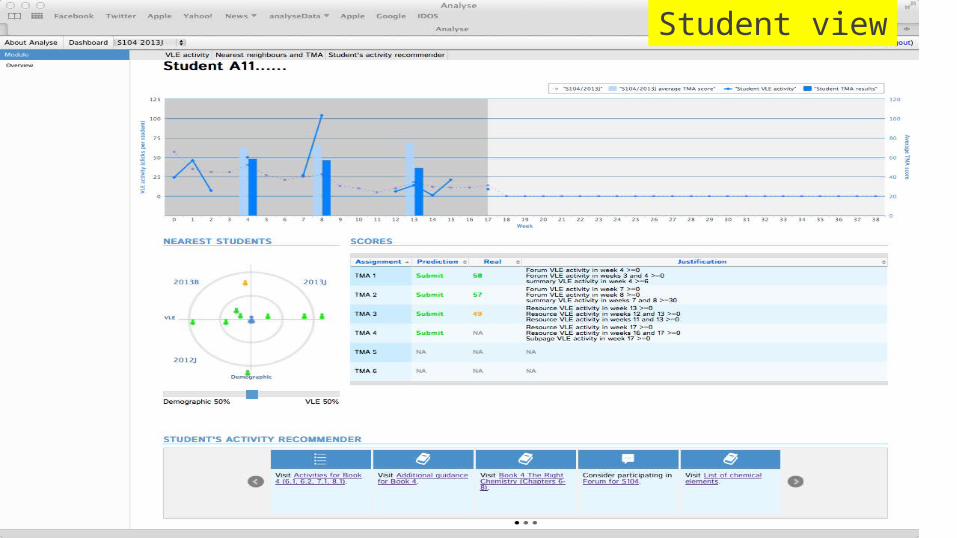
Student view

Study recommender
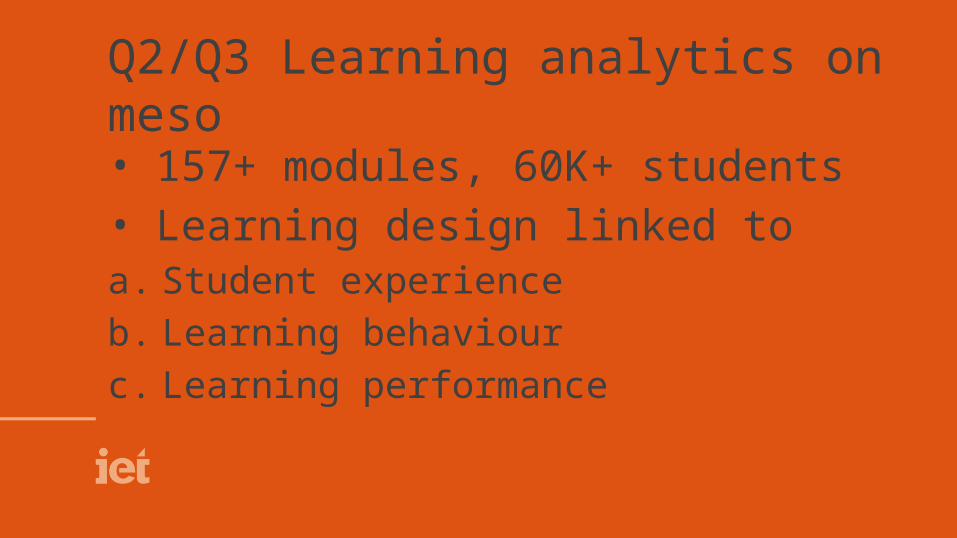
Q2/Q3 Learning analytics on meso
• 157+ modules, 60K+ students• Learning design linked toa. Student experience
b. Learning behaviour
c. Learning performance


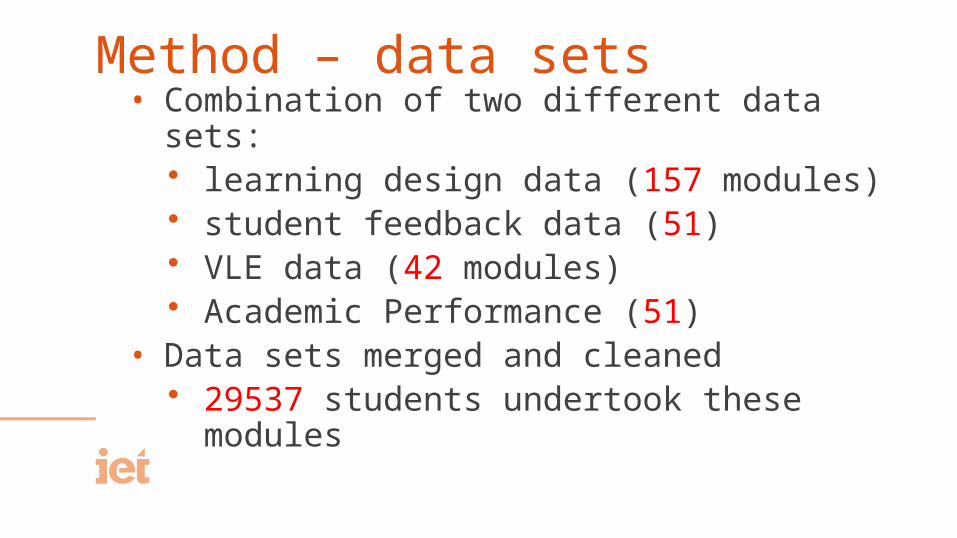
Method – data sets• Combination of two different data sets:
• learning design data (157 modules)• student feedback data (51)• VLE data (42 modules)• Academic Performance (51)
• Data sets merged and cleaned• 29537 students undertook these modules

Method – LD process• Mapping of modules to create learning
design data by OU’s LD specialists• Importance of consistency in mapping
process; validated in team and by Faculty• Use of seven activity categories, derived
from five year study across eight HE institutions


Assimilative Finding and handling information
Communication
Productive Experiential Interactive/
Adaptive
Assessment
Type of activity
Attending to information
Searching for and processing information
Discussing module related content with at least one other person (student or tutor)
Actively constructing an artefact
Applying learning in a real-world setting
Applying learning in a simulated setting
All forms of assessment, whether continuous, end of module, or formative (assessment for learning)
Examples of activity
Read, Watch, Listen, Think about, Access, Observe, Review, Study
List, Analyse, Collate, Plot, Find, Discover, Access, Use, Gather, Order, Classify, Select, Assess, Manipulate
Communicate, Debate, Discuss, Argue, Share, Report, Collaborate, Present, Describe, Question
Create, Build, Make, Design, Construct, Contribute, Complete, Produce, Write, Draw, Refine, Compose, Synthesise, Remix
Practice, Apply, Mimic, Experience, Explore, Investigate, Perform, Engage
Explore, Experiment, Trial, Improve, Model, Simulate
Write, Present, Report, Demonstrate, Critique

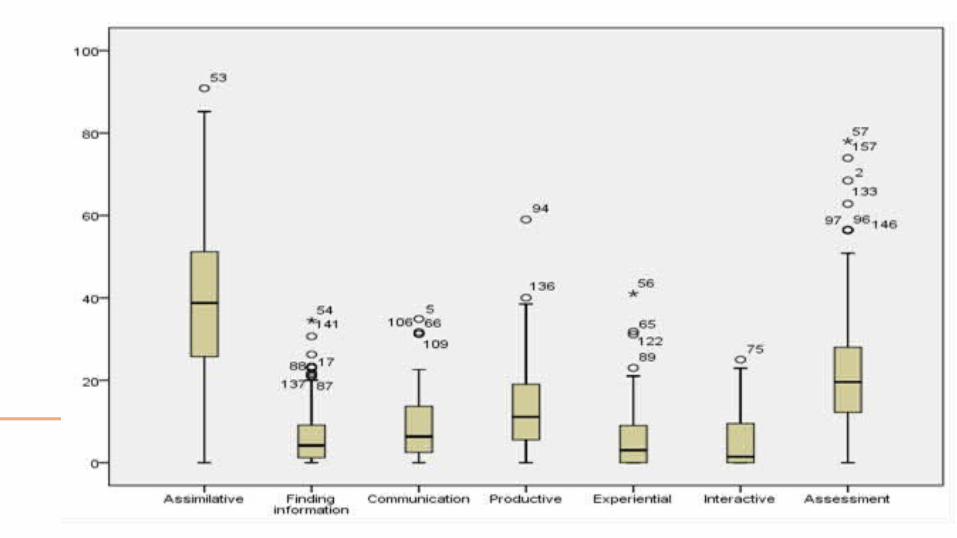


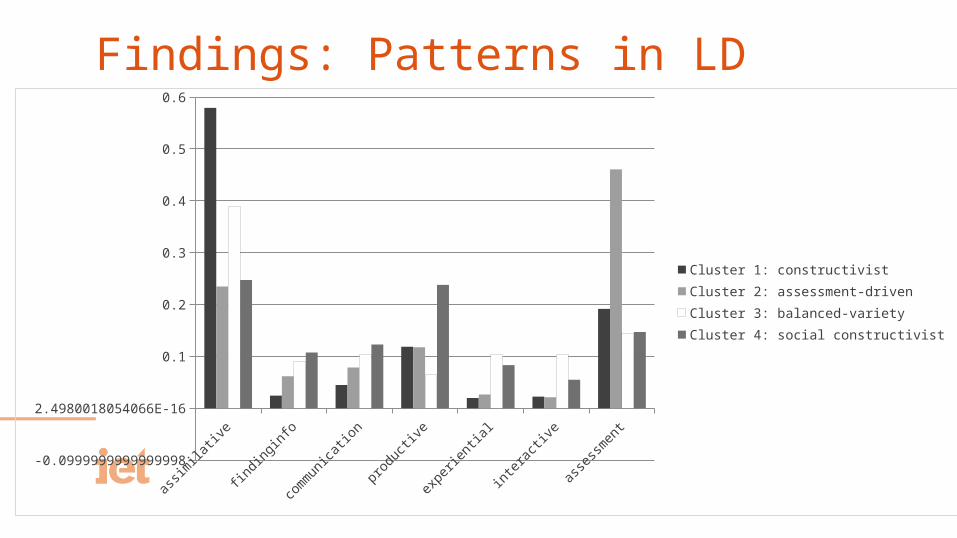
Findings: Patterns in LD
assimilative findinginfo communication productive experiential interactive assessment
-0.0999999999999998
2.4980018054066E-16
0.1
0.2
0.3
0.4
0.5
0.6
Cluster 1: constructivist
Cluster 2: assessment-driven
Cluster 3: balanced-variety
Cluster 4: social constructivist
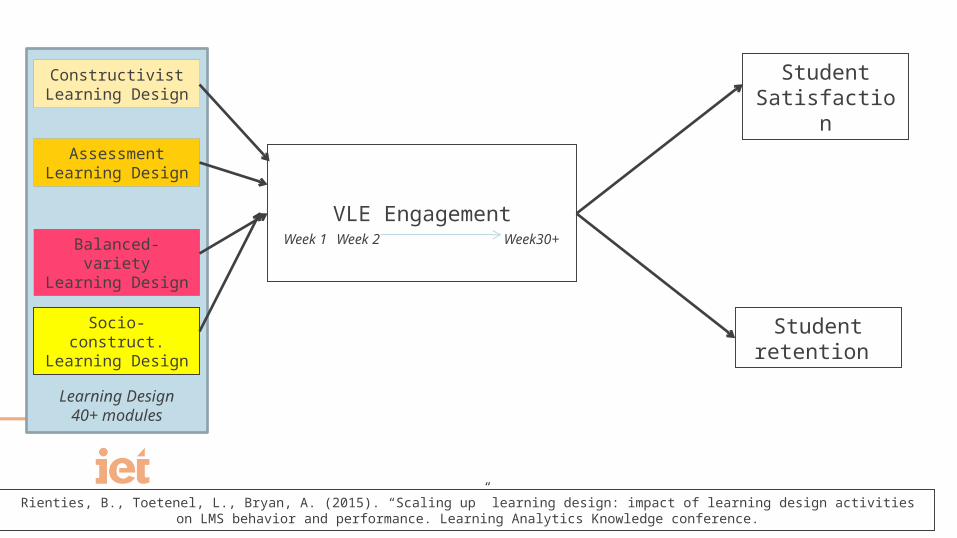
Constructivist Learning Design
Assessment Learning Design
Balanced-variety Learning Design
Socio-construct. Learning Design
VLE Engagement
Student Satisfaction
Student retention
Learning Design40+ modules
Week 1 Week 2 Week30+
Rienties, B., Toetenel, L., Bryan, A. (2015). “Scaling up” learning design: impact of learning design activities on LMS behavior and performance. Learning Analytics Knowledge conference.
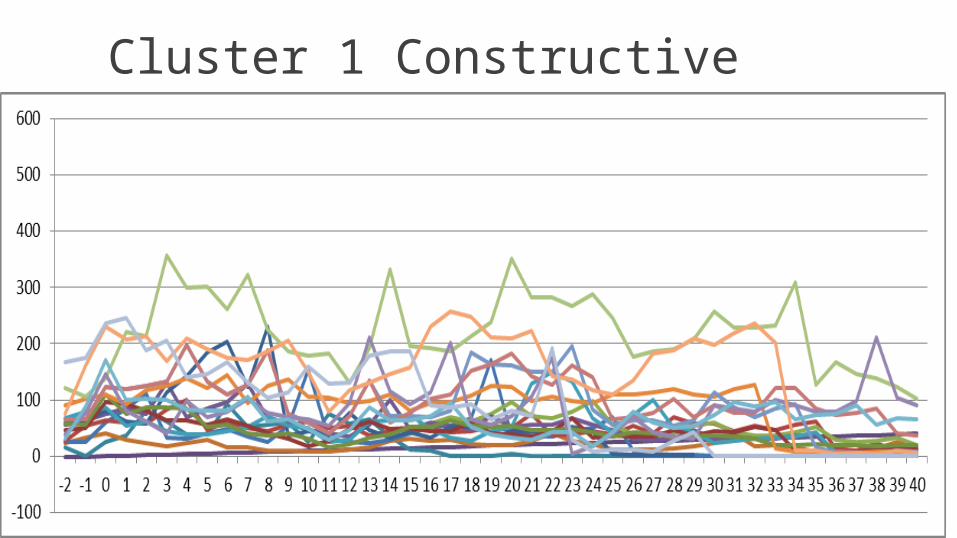
Cluster 1 Constructive
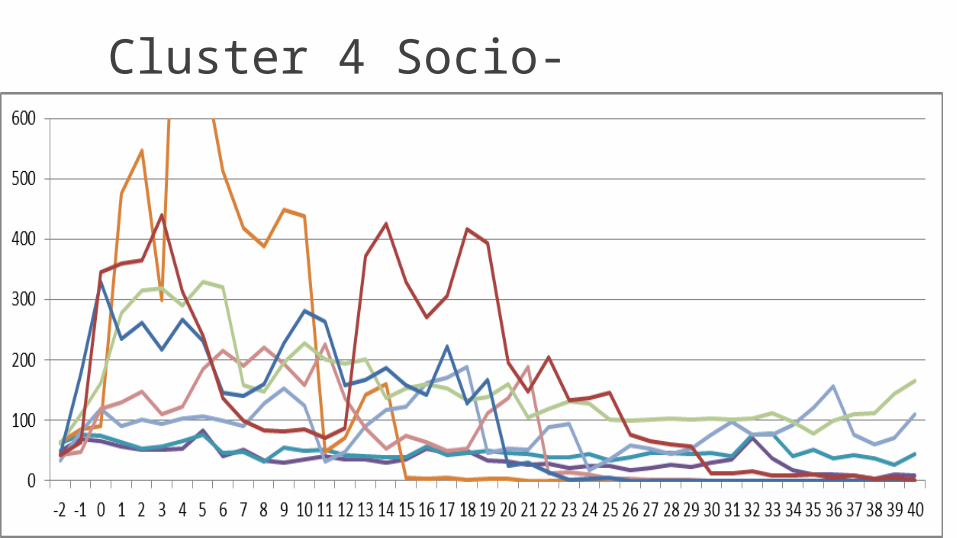
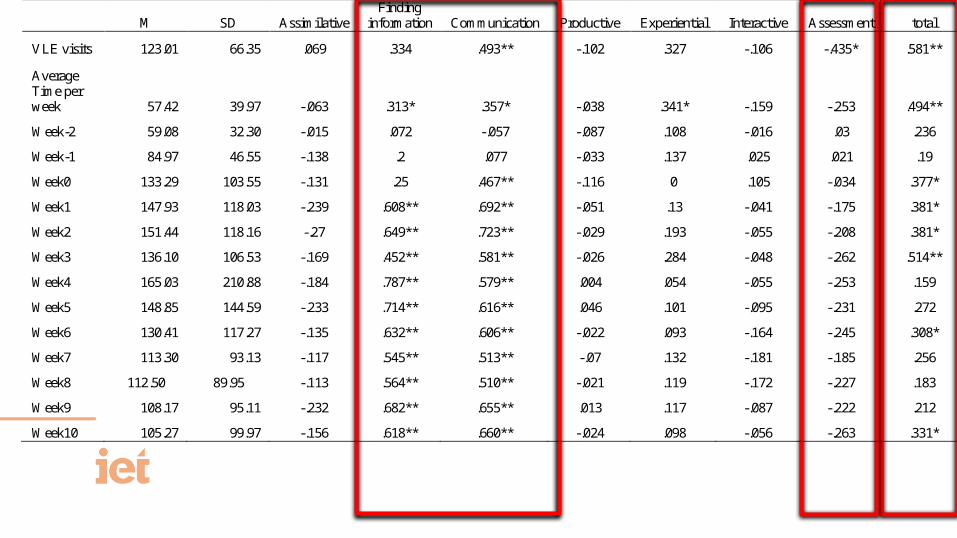
Cluster 4 Socio-constructive
M SD Assimilative Finding
information Communication Productive Experiential Interactive Assessment total
VLE visits 123.01 66.35 .069 .334 .493** -.102 .327 -.106 -.435* .581**
Average Time per week 57.42 39.97 -.063 .313* .357* -.038 .341* -.159 -.253 .494**
Week-2 59.08 32.30 -.015 .072 -.057 -.087 .108 -.016 .03 .236
Week-1 84.97 46.55 -.138 .2 .077 -.033 .137 .025 .021 .19
Week0 133.29 103.55 -.131 .25 .467** -.116 0 .105 -.034 .377*
Week1 147.93 118.03 -.239 .608** .692** -.051 .13 -.041 -.175 .381*
Week2 151.44 118.16 -.27 .649** .723** -.029 .193 -.055 -.208 .381*
Week3 136.10 106.53 -.169 .452** .581** -.026 .284 -.048 -.262 .514**
Week4 165.03 210.88 -.184 .787** .579** .004 .054 -.055 -.253 .159
Week5 148.85 144.59 -.233 .714** .616** .046 .101 -.095 -.231 .272
Week6 130.41 117.27 -.135 .632** .606** -.022 .093 -.164 -.245 .308*
Week7 113.30 93.13 -.117 .545** .513** -.07 .132 -.181 -.185 .256
Week8 112.50 89.95 -.113 .564** .510** -.021 .119 -.172 -.227 .183
Week9 108.17 95.11 -.232 .682** .655** .013 .117 -.087 -.222 .212
Week10 105.27 99.97 -.156 .618** .660** -.024 .098 -.056 -.263 .331*

M SD 1
Assimilative
2 Finding
info 3
Communication 4
Productive 5
Experiential 6
Interactive 7
Assessment total
9 Overall I am satisfied with the quality of the course 81.29 14.51 .253 -.259 -.315* -.11 .018 .135 -.034 .002
10 Overall I am satisfied with my study experience 80.52 13.20 .303* -.336* -.333* -.082 -.208 .137 .039 -.069
11 The module provided good value for money 66.86 16.28 .312* -.345* -.420** -.163 -.035 .197 .025 -.05
12 I was satisfied with the support provided by my tutor on this module 83.42 13.10 .230 -.231 -.263 -.049 -.051 .189 -.065 -.1
13 Overall I am satisfied with the teaching materials on this module 78.52 15.51 .291* -.257 -.323* -.091 -.134 .16 -.021 -.063
14 Overall I was able to keep up with the workload on this module 78.75 11.75 .182 -0.259 -.337* -.006 -.274 .012 .166 -.479**
15 The learning outcomes of this module were clearly stated 89.09 7.01 .287* -.350* -.292* -.211 -.156 .206 .104 -.037
16 I would recommend this module to other students 74.30 16.15 .204 -.285* -.310* -.086 -.065 .163 .052 -.036
17 The module met my expectations 74.26 14.44 .267 -.311* -.381** -.049 -.148 .152 .032 -.041
18 I enjoyed studying this module 75.40 15.49 .212 -.233 -.239 -.068 -.1 .207 -.017 .016
19 Average learning experience 77.53 13.34 .277* -.308* -.346* -.106 -.103 .177 .017 -.036
20 Average Support and workload 81.09 9.22 .277* -.327* -.399** -.038 -.211 .139 .061 -.377**

M SD 1
Assimilative 2 Finding
info 3
Communication 4
Productive 5
Experiential 6
Interactive 7
Assessment Total
21 Registrations 559.05 720.83 .391** -.07 -.27 .00 -.15 -.03 -.25 -.07
22 Completed of Registered Starts 77.36 11.18 -.327* .12 .18 .12 -.03 -.06 .22 -.10
23 Passed of Completed 93.60 6.48 -.25 .04 .01 .11 .04 .02 .18 -.25
24 Passed of Registered Starts 72.80 13.31 -.332* .10 .14 .13 -.01 -.05 .22 -.15
24 Level 2.30 1.20 -.382** .398** .166* .00 .222** -.13 .11 .394**
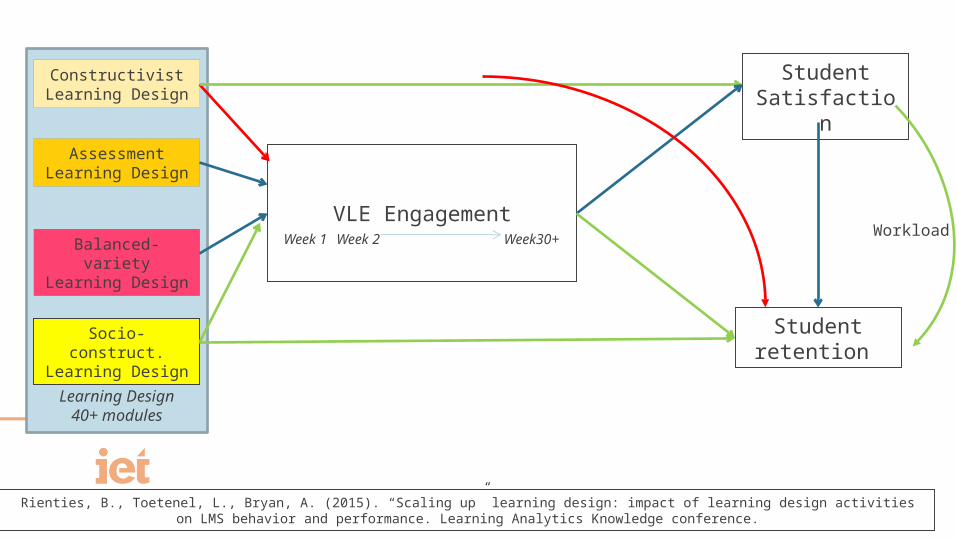
Constructivist Learning Design
Assessment Learning Design
Balanced-variety Learning Design
Socio-construct. Learning Design
VLE Engagement
Student Satisfaction
Student retention
Learning Design40+ modules
Week 1 Week 2 Week30+
Rienties, B., Toetenel, L., Bryan, A. (2015). “Scaling up” learning design: impact of learning design activities on LMS behavior and performance. Learning Analytics Knowledge conference.
Workload

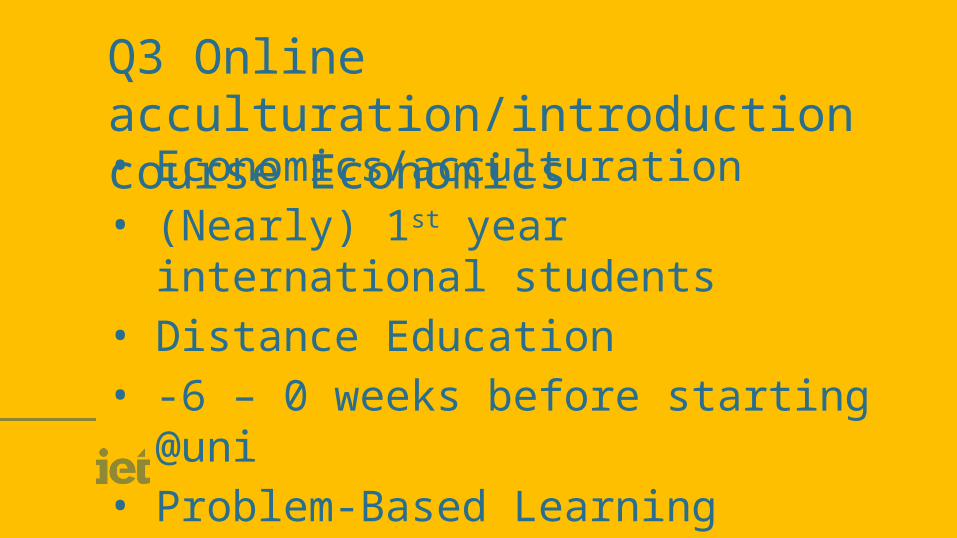
Q3 Online acculturation/introduction course Economics• Economics/acculturation• (Nearly) 1st year international students• Distance Education• -6 – 0 weeks before starting @uni• Problem-Based Learning• N=110


Dynamic interaction of sychronous and asychronous learning
Giesbers, B., Rienties, B., Tempelaar, D.T., & Gijselaers, W. H. (2014). A dynamic analysis of the interplay between asynchronous and synchronous communication in online learning: The impact of motivation. Journal of Computer Assisted Learning, 30(1), 30-50. Impact factor: 1.632.
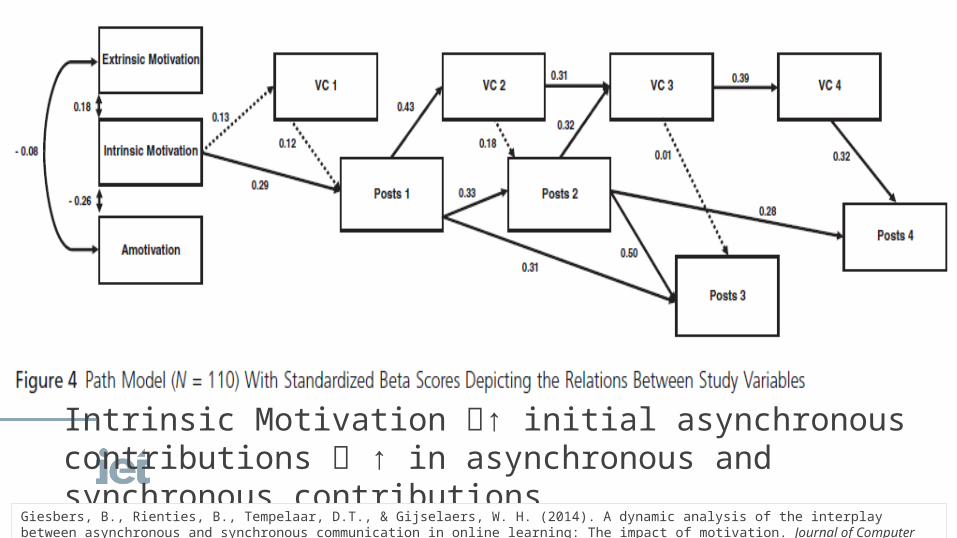
Intrinsic Motivation ↑ initial asynchronous contributions ↑ in asynchronous and synchronous contributions
Giesbers, B., Rienties, B., Tempelaar, D.T., & Gijselaers, W. H. (2014). A dynamic analysis of the interplay between asynchronous and synchronous communication in online learning: The impact of motivation. Journal of Computer Assisted Learning, 30(1), 30-50. Impact factor: 1.632.

Introduction math/stats
• Business• 1st year students• Blended• 0-12 weeks after start studying• Adaptive learning/Problem-Based
Learning• N=990

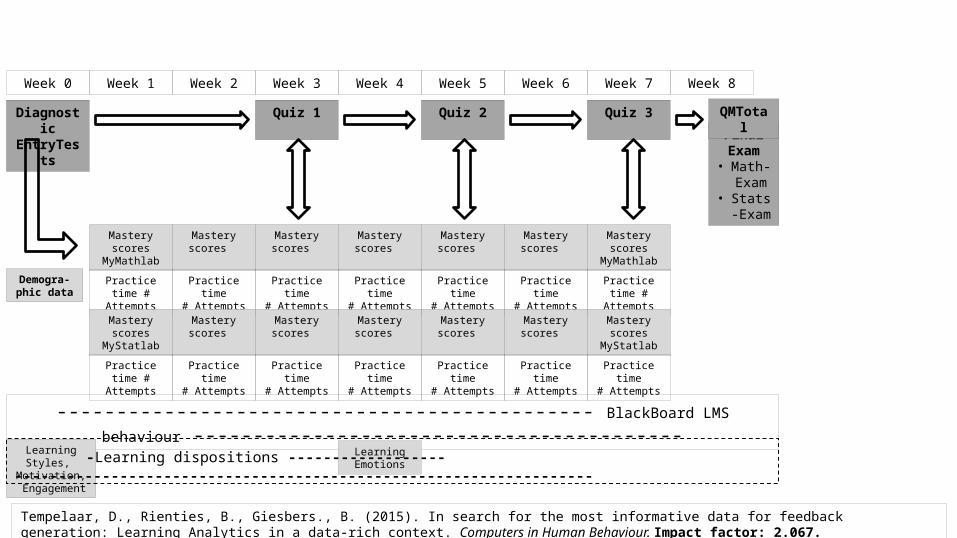
DiagnosticEntryTests
Week 0 Week 1 Week 2 Week 3 Week 4 Week 6Week 5
Quiz 1 Quiz 2 Quiz 3
Final Exam
• Math-Exam
• Stats-Exam
--------------------------------------------- BlackBoard LMS behaviour -----------------------------------------
Week 7
Mastery scores MyMathlab
Mastery scores
Practice time # Attempts
Practice time# Attempts
Mastery scores
Practice time# Attempts
Mastery scores
Practice time# Attempts
Mastery scores
Practice time# Attempts
Mastery scores
Practice time# Attempts
Mastery scores MyMathlab
Practice time # Attempts
Mastery scores MyStatlab
Mastery scores
Practice time # Attempts
Practice time# Attempts
Mastery scores
Practice time# Attempts
Mastery scores
Practice time# Attempts
Mastery scores
Practice time# Attempts
Mastery scores
Practice time# Attempts
Mastery scores MyStatlab
Practice time# Attempts
Demogra-phic data
QMTotal
Week 8
Learning Styles, Motivation,
Engagement
Learning Emotions -Learning dispositions ------------------ ------------------------------------------------------------------
Tempelaar, D., Rienties, B., Giesbers., B. (2015). In search for the most informative data for feedback generation: Learning Analytics in a data-rich context. Computers in Human Behaviour. Impact factor: 2.067.


LMS prediction Not great

E-tutorials prediction Substantial improvement!
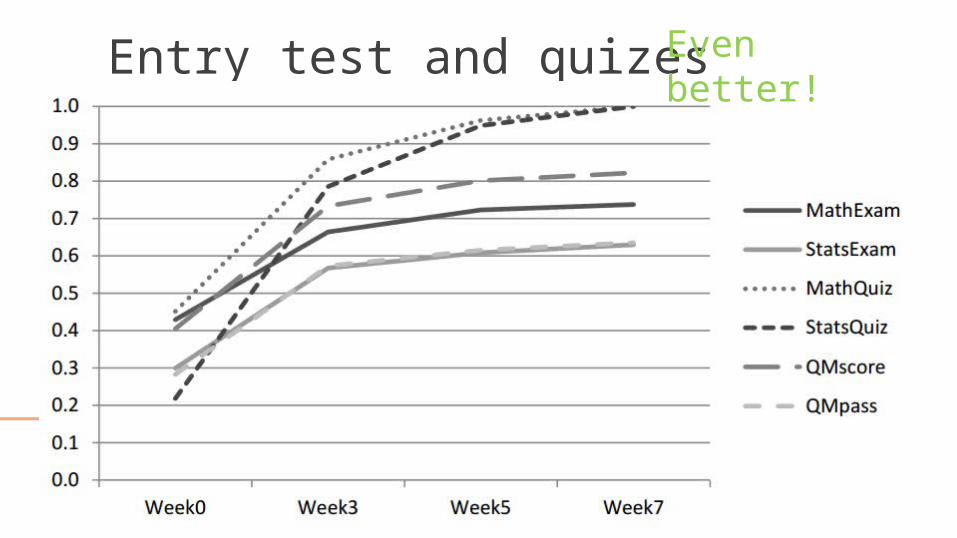
Entry test and quizes Even better!
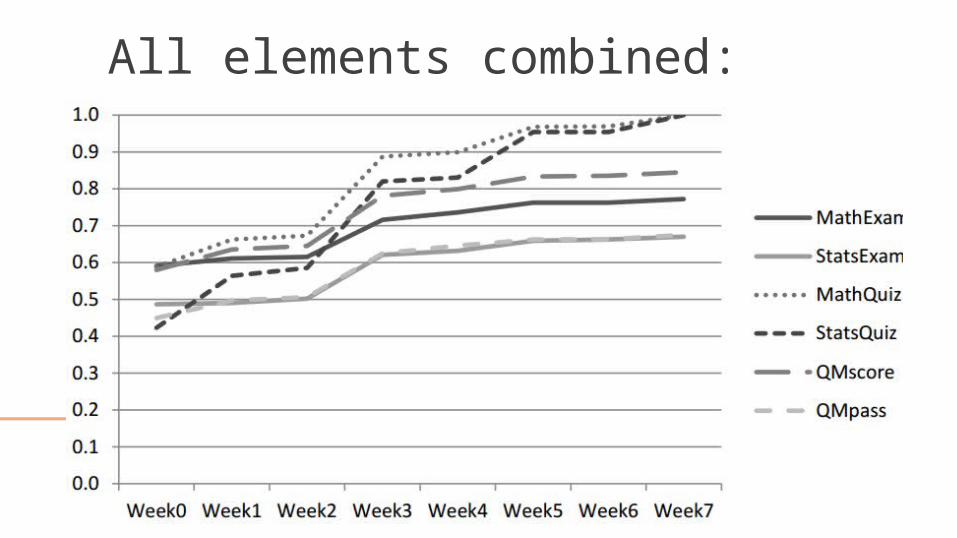
All elements combined:
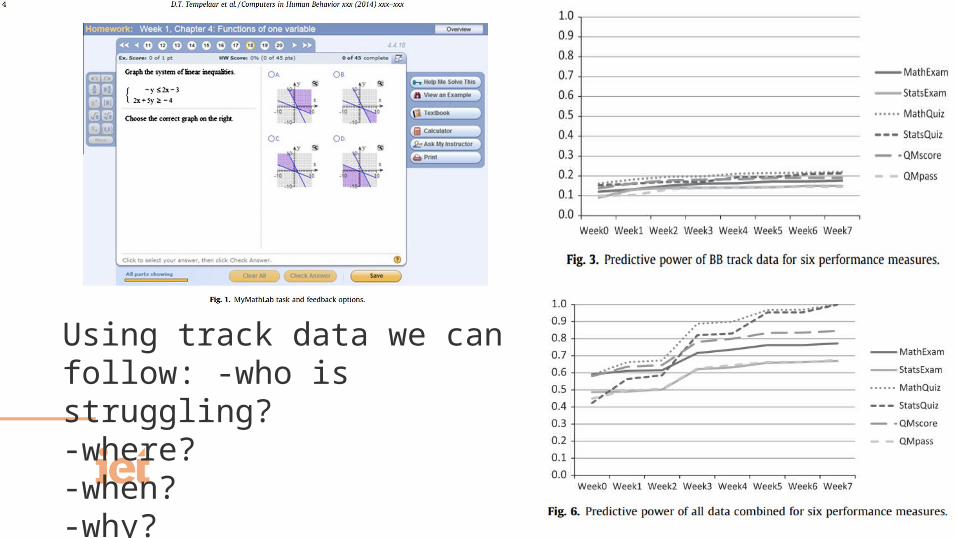
Using track data we can follow: -who is struggling?-where?-when?-why?
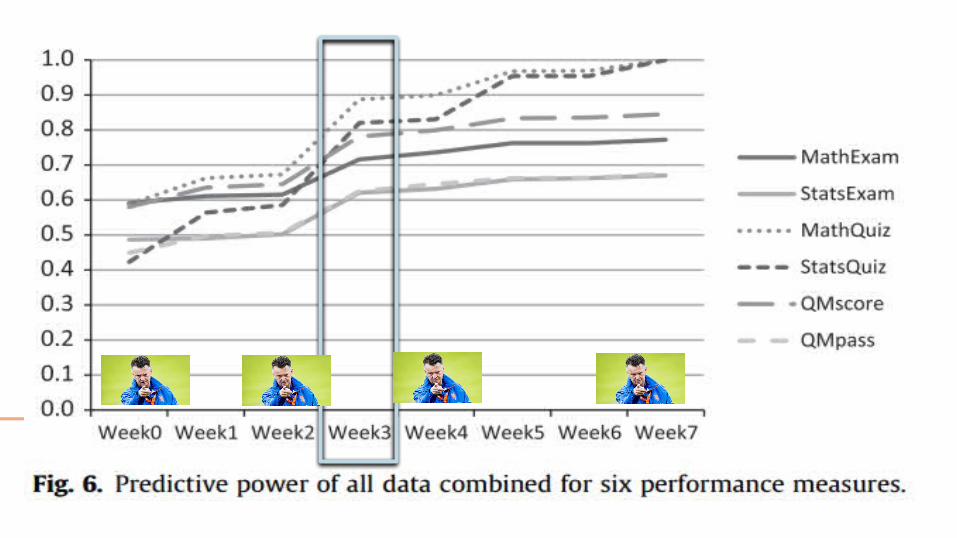

Who is struggling in week 3?
What can be done about this?• (Personalised) feedback• (Personalised) examples• Peer support• Emotional/learning support

Is data from Virtual Learning Environment systems (e.g., Blackboard, Moodle) useful for learning (analytics)? What else should we focus on to improve our understandings of social interaction?
• “Raw” VLE data does not seem very useful
• (entry)quizzes/formative learning outcomes in combination with learning dispositions provide good early-warning systems
Implications for EURO CALL1. What evidence is there that analytics actually helps learners to reach their potential?
• http://evidence.laceproject.eu/
2. How does the Open University UK use analytics to provide support for students and teachers?
• OU Analyse• Information Office Model• Predictive Z-score• Analytics4Action

Implications for EURO CALL3. How can we make learning more personalised, adaptive and meaningful, and what are the implications for Moodle?• Need to incorporate learning design• Individual differences? Learning
dispositions?• Emotions? • Ethics?
Learning Analytics: The good, the bad, or perhaps ugly?
@DrBartRienties
Reader in Learning Analytics
Related Documents