WIN – Week In a Nutshell 1 16 th Nov 2012 WEEK IN A NUTSHELL WIN-dow to the week that was Week in a Nutshell (WIN) In a curtailed trading week, frontline indices lost ~2% and the currency headed back above the 55 mark against the USD. The IIP data for Sep contributed in part registering a de growth of .4%. We have now had 4 of the 6 months of 1HFY13 showing contraction in the IIP. The Sept. data also had Cap goods and Consumer clocking much greater declines than anticipated. We project an expansion in IIP for FY13 by just .5% The positive surprise came in on the inflation front with Oct reading drop to 7.5% with declines in food and manf inflation. Core inflation dropped meaningfully close to the RBI tolerance level at 5%. We maintain expectation of 50bps cut in policy rates in FY13. Telecom Auction: As we have written in this space, the outcome of the telecom spectrum auctions for 1800MHz was nothing short of a disaster. What with no bidders in four circles accounting for ~50% of pan-India price; final winning price got capped at reserve price in all but Bihar, and only 102 slots out of the 236 on offer got allocated. Focused bidding by Telenor, Idea & Videocon as well as winning of top up spectrum by Vodafone across 14 circles suggest continuing competitive intensity between some / all of the incumbents in the respective circles. Conclusion of Result Season: This result season has come largely in line with estimates both among Sensex as well as broader MOSL universe. Our estimates for Sensex FY13 & FY14 est have seen a minor cut of .5% with growth of 8% and 14% resp. Cement, Technology, Health Care & Pvt Banks led PAT growth while Autos, Telecom, Metals contributed to declines. Some of the highlights of this edition: INR DIRECTION ASHOK LEYLAND COAL INDIA Q2 RESULT Key WIN-dicators Inflation at lower end of 7.5-8.0% range of FY13 1,800 MHz auction: Demand lagged supply in most circles COAL India: E-auction realization: 2nd consecutive quarter of decline Nifty (-2%) Week ended 16 th Nov 2012 WWW – WIN Weekend Wisdom In investing, what is comfortable is rarely profitable

Welcome message from author
This document is posted to help you gain knowledge. Please leave a comment to let me know what you think about it! Share it to your friends and learn new things together.
Transcript

WIN – Week In a Nutshell 1 16th Nov 2012
WEEK IN A NUTSHELL
WIN-dow to the week that was Week in a Nutshell (WIN)
In a curtailed trading week, frontline indices lost ~2% and the currency
headed back above the 55 mark against the USD. The IIP data for Sep
contributed in part registering a de growth of .4%. We have now had 4 of
the 6 months of 1HFY13 showing contraction in the IIP. The Sept. data
also had Cap goods and Consumer clocking much greater declines than
anticipated. We project an expansion in IIP for FY13 by just .5%
The positive surprise came in on the inflation front with Oct reading drop
to 7.5% with declines in food and manf inflation. Core inflation dropped
meaningfully close to the RBI tolerance level at 5%. We maintain
expectation of 50bps cut in policy rates in FY13.
Telecom Auction: As we have written in this space, the outcome of the
telecom spectrum auctions for 1800MHz was nothing short of a disaster.
What with no bidders in four circles accounting for ~50% of pan-India price;
final winning price got capped at reserve price in all but Bihar, and only 102
slots out of the 236 on offer got allocated.
Focused bidding by Telenor, Idea & Videocon as well as winning of top up
spectrum by Vodafone across 14 circles suggest continuing competitive
intensity between some / all of the incumbents in the respective circles.
Conclusion of Result Season: This result season has come largely in line
with estimates both among Sensex as well as broader MOSL universe. Our
estimates for Sensex FY13 & FY14 est have seen a minor cut of .5% with
growth of 8% and 14% resp. Cement, Technology, Health Care & Pvt Banks
led PAT growth while Autos, Telecom, Metals contributed to declines.
Some of the highlights of this edition:
INR DIRECTION
ASHOK LEYLAND
COAL INDIA Q2 RESULT
Key WIN-dicators Inflation at lower end of 7.5-8.0% range of FY13
1,800 MHz auction: Demand lagged supply in most circles
COAL India: E-auction realization: 2nd consecutive quarter of decline
Nifty (-2%)
Week ended
16th
Nov 2012
WWW – WIN Weekend Wisdom
In investing, what is comfortable is rarely profitable
Read more: http://www.investopedia.com/financial-edge/0511/the-
top-17-investing-quotes-of-all-time.aspx#ixzz2COSUMTpJ

WIN – Week In a Nutshell 2 16th Nov 2012
WEEK IN A NUTSHELL
WEEK IN A NUTSHELL
*W+INside this week’s edition
WIN-teresting data points ................................................................................................................................... 4
WIN-ning charts & chats ..................................................................................................................................... 5
WIN-ning charts & chats ..................................................................................................................................... 5
Global business barometer .............................................................................................................................................. 5
WIN-conomics .................................................................................................................................................... 6
ECONOMICS: Oct-12 inflation eases meaningfully to 7.5%, food inflation drops to 6.6% and core to 5.2% .................. 6
ECONOMICS: Sep-12 IIP plunges to de-growth; Consumption too weakens ................................................................... 6
INR DIRECTION: Assessment of India's External Sector ................................................................................................... 6
WIN Sector Updates ............................................................................................................................................ 9
GASOLINE: The oil & gas monthly – November 2012 ...................................................................................................... 9
TELECOM: Incumbents expect govt. to review spectrum pricing; recent auction not a benchmark ............................... 9
TELECOM: 1,800MHz auction ends up as damp squib; spectrum pricing unresolved ..................................................... 9
WIN Corporate Corner ...................................................................................................................................... 11
ANANTRAJ 2QFY13: Above est due to plot sales; Collections weak, expect uptick in 2HFY13 ...................................... 11
ASHOK LEYLAND: Revving up!; CV cycle to recover in FY14; Initiating Coverage with Buy ........................................... 11
BIRLA CORP 2QFY13: Above est; Rajasthan mining ban status quo; Upgrading EPS 17-25%; Buy ............................... 12
BPCL 2QFY13: Above est led by govt subsidy, inventory gain; Likely upside potential in E&P business ........................ 12
COAL INDIA: 2QFY13 operational perf. in line, Market linked realn down - key risk to earnings .................................. 13
CONCOR: Expect consolidation, and sharp jump in volumes post DFC; Payout ratio may increase ............................. 14
DLF Q2FY13: Below estimates due to disappointment in revenue booking .................................................................. 14
GSK PHARMA 3QCY12: In-line; Pharma sales up 11%; Sales growth impacted by manu. constraints ......................... 14
GVK POWER 2QFY13: Hit on all fronts; Contribution from new power projects crucial in FY14E ................................. 15
HDIL 2QFY13: Below est; Sales up in new launches; Easing approvals harbinger uptick in cash flow .......................... 15
JPA 2QFY13: Above estimates led by EPC business; Cement in line, RE performance disappoints ............................... 16
JPIN 2QFY13: Revenue below est; Sales, collections beat estimates; Interest dents PAT ............................................. 16
JSPL 2QFY13: Steel margins expansion, contrary to industry trend; power rates declined ........................................... 16
NESTLE 3QCY12: Below est; Volumes, Adj PAT down YoY ............................................................................................. 17
OPTO CIRCUITS 2QFY13: Below estimates; Mgmt guidance strong .............................................................................. 18
PANTALOON 5QFY12: Core Retail PAT down 91%; Restructuring continues ................................................................ 18
PFC 2QFY13: Above est; Healthy loan growth, asset quality; Margins improve QoQ ................................................... 18
SBI 2QFY13: A tough qtr on all fronts; Stress asset addition accelerates; 25bp NIM decline ........................................ 19

WIN – Week In a Nutshell 3 16th Nov 2012
WEEK IN A NUTSHELL
WEEK IN A NUTSHELL
SUN PHARMA 2QFY13 conf call: Upgrades FY13 Guidance; No immediate benefits from DUSA acqn ........................ 19
SUN TV 2QFY13: Below estimates; Muted ad growth despite low base; 4-6% earnings cut ........................................ 20
TATA MOTORS: JLR's Oct-12 volumes below est; New model wholesale from Nov-12 ................................................. 20
TATA STEEL 2QFY12: Below estimate; GBP500m pension deficit; net debt INR600b; cut FY14 EPS 15% ..................... 21
UNITECH 2QFY13: QoQ uptick in all aspects; INR7b re-financing a key positive; Execution to improve ....................... 21
UNITED SPIRITS: DIAGEO deal: Raising the “Bar”; changing the “game”; upgrade to BUY .......................................... 21
UNITED SPIRITS 2QFY13: Volume declines 1% due to state specific issues ................................................................... 22
WIN Collage ...................................................................................................................................................... 23
Changing guard- China shuffles its leadership, putting a “princeling” in command ..................................................... 23
Nifty Valuations at a glance ............................................................................................................................... 25

WIN – Week In a Nutshell 4 16th Nov 2012
WEEK IN A NUTSHELL
WEEK IN A NUTSHELL
WIN-teresting data points Global Indices
Last week
Current week
WoW change (%)
P/E Valuations Inflows MTD
YTD (Calendar)
Sensex 18684 18309 -2.00 15.88 FII (Rs B)
Nikkei 8758 9024 3.04 24.09 DII (Rs B)
Hang Seng 21384 21159 -1.05 11.03 Commodities Last week This week
WoW change (%)
Dow Jones 12815 12542 -2.13 12.78 Oil(US$/Bbl) 109.37 108.99 -0.35
FTSE 100 5770 5647 -2.13 13.53 Precious Metals
Gold ($/OZ) 1731 1709 -1.28 Sectoral Indices Silver ($/OZ) 33 32 -0.87
Bank Nifty 11476 11336 -1.22 12.96 Metals
CNX IT 6110 6031 -1.31 15.78 Copper(US$/MT) 7568 7631 0.83%
BSE Oil 8186 8067 -1 10.58 Zinc(US$/MT) 1863 1929 3.57%
Aluminum(US$/MT) 1902 1943 2.18%
Bond yields-India
Last Friday This week
WoW change (%)
Spread Vs US 10 yrs Steel HRC(Rs/T)
1 Year 8.04 8.10 0.01 #N/A Currency
10 Year 8.22 8.19 -0.26 6.61 Rs Vs Dollar 54.76 55.18 0.77
Euro Vs Dollar 1.27 1.27 0.17

WIN – Week In a Nutshell 5 16th Nov 2012
WEEK IN A NUTSHELL
WEEK IN A NUTSHELL
WIN-ning charts & chats Global business barometer BUSINESS people around the world are less glum than they were three months ago, according to a quarterly
Economist/FT survey
The balance of respondents who think the global economy will get better over those who think it will worsen rose from minus 25 percentage points in July to minus 11 in October.
Sentiment improved in all regions except eastern Europe, but only in the Middle East and Africa have executives become bullish.
Those in the chemicals industry and consumer goods are especially gloomy.
On the euro, 55% of respondents think the currency union will stick together, while 29% say Greece will leave.
As for the future of fashion, 46% of those asked reckon the necktie will be worn less frequently next year.

WIN – Week In a Nutshell 6 16th Nov 2012
WEEK IN A NUTSHELL
WEEK IN A NUTSHELL
WIN-conomics ECONOMICS: Oct-12 inflation eases meaningfully to 7.5%, food inflation drops to 6.6% and core to 5.2% Oct-12 inflation at 7.5% was significantly below expectations. Both, declining food and manufacturing inflation,
contributed to the fall.
Fall in vegetables prices and decline in fruits inflation overwhelmed moderate uptick in other food items. Also, decline in food inflation overcame the uptick in non-food primary articles and minerals group inflation resulting in a decline in the inflation of overall primary articles group.
Manufacturing inflation stood below 6% again after a gap of two months. Most significantly, core inflation at 5.2% cooled within striking distance of RBI’s tolerance level of 5%.
Going forward, we expect declining food and core inflation to establish as a trend as government has started releasing excess buffer stock and despite QE3 international commodity prices are falling, benefiting India’s core inflation.
Inflation at lower end of 7.5-8.0% range of FY13 Contribution of food and manufacturing group declines in overall inflation
ECONOMICS: Sep-12 IIP plunges to de-growth; Consumption too weakens Sep-12 IIP dipped into negative territory of -0.4%.
Wide variations were seen across sub-sectors. While Mining showed some acceleration and Electricity showed further recovery, de-growth in Manufacturing dragged down overall IIP into negative territory.
As four out of six months of 1HFY13 displayed negative growth, YTD performance barely showed any growth
We have downgraded our FY13 IIP growth estimate to 0.5% from 1.4% earlier and GDP growth estimate to 5.2% from 5.8% earlier. we feel it is imperative for monetary policy to shift gear towards growth. On its part, the government too must attempt to improve investment climate even as it keeps the fisc under control.
INR DIRECTION: Assessment of India's External Sector Assessment of FY13 and FY14 Balance of Payments
The first estimate for FY14 displays only slow improvement in the trade and current account deficit.
However, capital flows are likely to be under strain as lower growth reduce the attractiveness of India.
Coupled with lower expected inflation, this means moderate increase in the denominator, i.e., the nominal GDP growth (in USD terms) in FY14 in contrast with FY13 which would perhaps see near no growth as depreciation nullifies almost entire increase in nominal GDP growth in INR terms.
However, as interest rates are likely to reduce on deepening slowdown and lower inflation, debt flows becomes less attractive. Hence overall capital flow may fall short of current account deficit requiring further depletion of forex reserves.
The event that can dramatically alter the situation is the sudden variation in oil prices and further decline in gold demand in India.

WIN – Week In a Nutshell 7 16th Nov 2012
WEEK IN A NUTSHELL
WEEK IN A NUTSHELL
Balance of Payments on the edge
1QFY12 2QFY12 3QFY12 4QFY12 1QFY13 FY11 FY12 FY13E FY14E
In USDb
Exports 79 76 71 80 77 251 310 300 312
Imports 124 120 119 132 119 381 500 480 499
Trade Deficit -45 -43 -48 -52 -43 -130 -190 -180 -187
Invisible Surplus 28 25 28 30 26 85 112 110 115
Current A/c deficit -17 -18 -20 -22 -16 -46 -78 -70 -72
Net capital flow 24 17 8 17 17 62 68 60 55
BoP Surplus 6 -1 -11 -5 0 16 -10 -10 -17
As % of GDP
Exports 17.3 17.1 15.7 16.4 18.2 14.9 16.8 15.9 15.3
Imports 27.1 26.7 26.2 27.0 28.3 22.6 27.0 25.5 24.5
Trade Deficit -9.8 -9.7 -10.5 -10.6 -10.1 -7.7 -10.3 -9.6 -9.2
Invisible Surplus 6.0 5.6 6.2 6.2 6.2 5.0 6.0 5.8 5.7
Current A/c deficit -3.8 -4.1 -4.3 -4.5 -3.9 -2.7 -4.2 -3.7 -3.5
Net capital flow 5.2 3.8 1.8 3.4 4.0 3.7 3.7 3.2 2.7
BoP Surplus 1.4 -0.3 -2.5 -1.1 0.1 1.0 -0.6 -0.5 -0.8
Expanded current account deficit despite some improvement in invisibles; while capital flows remains short Current A/c and invisibles 1QFY
12 4QFY
12 1QFY
13 FY1
1 FY1
2 Capital flow and Financial A/c
1QFY12
4QFY12
1QFY13
FY11
FY12
1. Goods, net (merchandise) -45 -52 -43
-130
-190 1. Direct Investment (net) 9 1 4.2 9 22
2. Services, net 16 18 14 49 64 1.a In India 12 4 6.2 26 33
2.a Transport 0 0 1 0 2 1.b By India -3 -3 -2 -17 -11
2.b Travel 0 2 0 4 5 2. Portfolio Investment (net) 2 14 -2 28 17
2.c Construction 0 0 0 -1 0 2.a In India 3 14 -1.7 29 17 2.d Insurance and
pension 0 0 0 1 1 2.b By India 0 0 -0.3 -1 0
2.e Financial Services -1 0 0 -1 -2 3. Financial Derivatives & ESOPs 0 0 -0.5 0 0
2.f Intellectual property -1 -1 -1 -2 -3 4. Other investment 13 1 15.3 24 29 2.g Telecom, computer
and info 14 17 16 54 61 4.a Other equity
(ADRs/GDRs) 0 0 0.1 2 1 2.h Prsnl, cultural and
recreational 0 0 0 0 0 4.b Currency and
deposits 1 5 6.5 4 12 2.i Government goods &
services 0 0 0 0 0 NRI Deposits 1 5 6.6 3 12 2.j Other Business
services 0 0 0 -4 -1 4.c Loans* 15 0 3.8 19 17
2.k Others n.i.e 2 0 -1 -2 2 4.c.i To India 15 0 3.7 18 16
3. Primary Income, net -4 -5 -5 -17 -16 Deposit-taking
corporations 12 -3 3 1 4 3.a Compensation of
Employees 0 0 0 -1 1 General government 0 0 -0.1 5 3
3.b Investment Income -4 -5 -5 -16 -17 Extrnl Cmrcl Brrw
(ECB) 3 2 0.8 12 9
4. Secondary Income, net 15 17 17 53 64 4.c.ii By India 0 0 0.1 0 1
4.a Personal Transfers 14 16 16 52 62 4.d Trade credit 3 0 5.4 11 7 4.b. Other Current
Transfers 1 0 1 2 2 4.e Other A/cs -7 -3 -0.4 -11 -7 5. Current Account (1+2+3+4) -17 -22 -16 -46 -78 5. Reserve assets -5.4 5.7 -0.5 -13 13
6. Financial Account (1+2+3+4) 18.7 22.4 16.5 49 81

WIN – Week In a Nutshell 8 16th Nov 2012
WEEK IN A NUTSHELL
WEEK IN A NUTSHELL
Latest trade data – major takeaways
There has been some deterioration in trade position in recent months contributed by higher oil imports.
Despite a decline in oil prices, oil imports increased led by both demand as well as substitutions of domestic production by imports (e.g., KG D6).
Gold imports declined expectedly by 30% during 1HFY13. The latest reports however, indicate a pick up in festive demand for gold.
Latest trade data
USD b FY12 Apr-Oct FY12 Apr-Oct FY13
Imports 489 285 278
Petroleum crude & products imports 155 87 95
Non-POL items imports 334 198 183
Food & related items imports 13 7 8
Textile yarn fabrics, madeup articles imports 4 2 2
Chemicals and related products imports 37 17 18
Capital goods imports 65 31 29
Other non-POL items imports 203 106 87
Gold imports 56 29 20
Other commodities imports 11 5 9
Exports 303 178 165
Agricultural & allied products export 37 15 20
Ores & minerals export 8 4 3
Manufactured goods export 186 95 90
Petroleum & crude products export 56 29 25
Other commodities export 15 11 3
Latest capital flow – major takeaways
Capital flows have alternated between FDI and FII and India has been somewhat fortunate in this regard.
While FDI were buoyant in FY12 in FY13 so far FII flows have increased significantly.
Reports also indicate significant flow on account of NRI deposits and short-term debt a full picture of which would be available only by the end-Dec 2012.
Trend in capital flows (USD b)
FY12 1H FY12 1H FY13
Foreign investments total 64 30 25 FDI 47 28 19 FII 17 1 6
Conclusion: INR and REER value
INR has shown some weakness in recent times as trade data point to higher deficit at the margin and capital flows might be just adequate for overall BoP balance.
Moreover as the GDP growth is falling and INR has depreciated by 19% it might lead to no increase in USD GDP of India in FY13. This would make indicators like CAD/GDP look much worse than based on BoP strength.
Overall BoP hangs in balance and India remains critically dependent on capital flows
REER value (though different measures shows difference) at 106 still shows room for correction

WIN – Week In a Nutshell 9 16th Nov 2012
WEEK IN A NUTSHELL
WEEK IN A NUTSHELL
WIN Sector Updates GASOLINE: The oil & gas monthly – November 2012 Special Report: (a) Takeaways from meeting with PNGRB; (b) Hurricane Sandy Impact
Weak global demand keeps crude low and averaged USD112/bbl (-1% MoM) in Oct-12. IEA/OPEC oil demand growth estimates remain weak with 0.7-0.77mmbbl/d in 2012 and 0.8mmbbl/d in 2013.
Reuters Sing GRM down 7% MoM to USD8.3/bbl: led by drop in diesel and FO cracks. 2QFY13 GRM had avg USD9.1/bbl. we expect GRM's to remain subdued.
Polymer and Polyester margins up MoM except PE: Domestic polymer prices were down by ~2%; however demand is expected to improve led by upcoming festive season. Integrated polyester margins were up 4-5% MoM and 6-7% QoQ till date, led by fall in raw material prices.
Valuation and view: OMC's are trading at attractive valuations and BPCL is our top pick for its E&P upside potential. Likely further positive policy actions and attractive valuations augur well for ONGC and Oil India. Maintain Neutral on GAIL and GSPL due to headwinds on incremental gas in medium term. However, domestic gas scarcity augurs well for Petronet LNG.
TELECOM: Incumbents expect govt. to review spectrum pricing; recent auction not a benchmark We spoke with incumbent wireless operators to understand their views on recently concluded 1,800MHz spectrum auction and way forward. Key Highlights:
Operators believe that limited auction participation has put a question mark on the spectrum liability calculations towards excess spectrum and re-farming.
Spectrum price discovered in recent auction is not a meaningful benchmark given that total demand has been less than the minimum 8 slots on offer in 18/22 circles.
There has been no price discovery in four circles - Delhi, Mumbai, Karnataka, and Rajasthan – which together accounted for 51% of the pan-India reserve price.
Unless government takes a more accommodative stance like re-auctioning with a lower reserve price, we believe companies would take legal re-course to effect reduction in their spectrum liability.
We would closely watch out for the evolution of competitive landscape and whether government takes a more accommodative stance towards the industry which will provide more clarity on spectrum-related payments.
Telecom stocks are trading at an EV/EBITDA of 7.2-7.4x FY13E and 5.6-6.5x FY14E excluding regulatory outlay. We maintain Neutral rating on Bharti / RCom and Buy on Idea
Our target prices currently factor-in INR142/121b regulatory hit for Bharti/Idea. We would be re-visiting our view, target valuations and regulatory impact incorporated in the target prices post better clarity on government’s next steps towards spectrum price discovery
1,800 MHz auction: Demand lagged supply in most circles
TELECOM: 1,800MHz auction ends up as damp squib; spectrum pricing unresolved 1,800 MHz auction concluded after 14 rounds of bidding with no bidders in four circles which accounted for
51% of pan-India reserve price (Delhi, Mumbai, Karnataka, Rajasthan).
WIN – Week In a Nutshell 10 16th Nov 2012
WEEK IN A NUTSHELL
WEEK IN A NUTSHELL
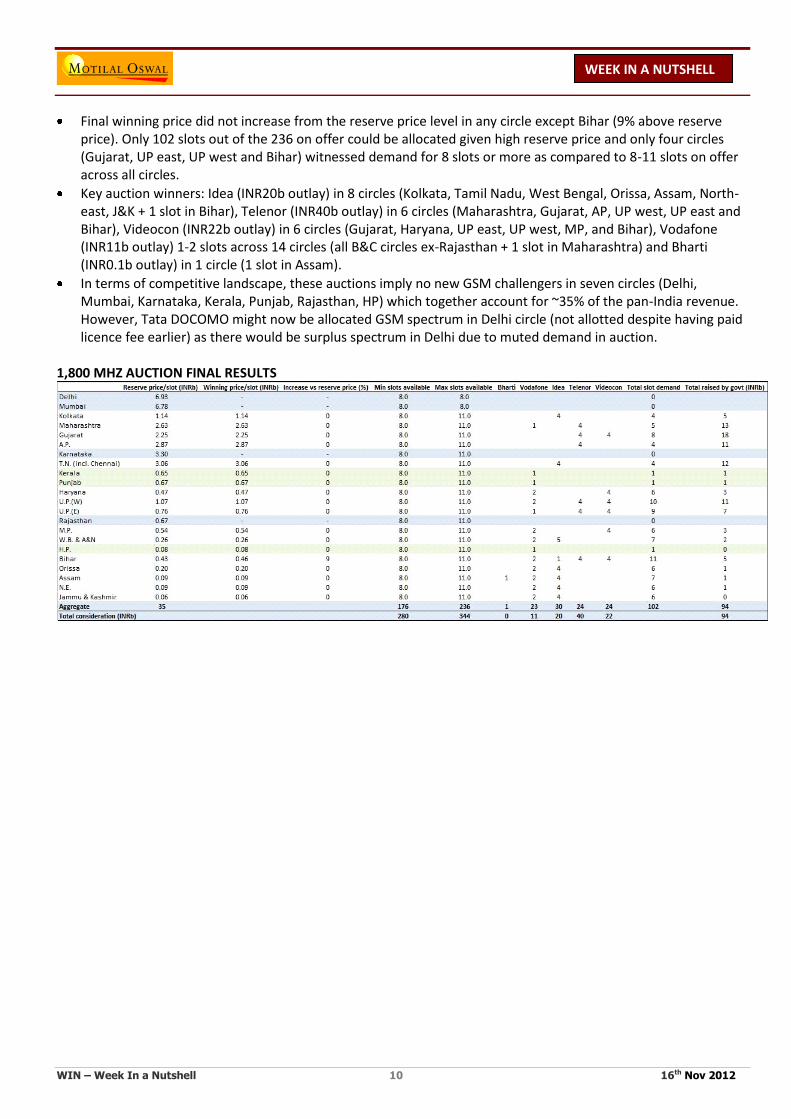
Final winning price did not increase from the reserve price level in any circle except Bihar (9% above reserve price). Only 102 slots out of the 236 on offer could be allocated given high reserve price and only four circles (Gujarat, UP east, UP west and Bihar) witnessed demand for 8 slots or more as compared to 8-11 slots on offer across all circles.
Key auction winners: Idea (INR20b outlay) in 8 circles (Kolkata, Tamil Nadu, West Bengal, Orissa, Assam, North-east, J&K + 1 slot in Bihar), Telenor (INR40b outlay) in 6 circles (Maharashtra, Gujarat, AP, UP west, UP east and Bihar), Videocon (INR22b outlay) in 6 circles (Gujarat, Haryana, UP east, UP west, MP, and Bihar), Vodafone (INR11b outlay) 1-2 slots across 14 circles (all B&C circles ex-Rajasthan + 1 slot in Maharashtra) and Bharti (INR0.1b outlay) in 1 circle (1 slot in Assam).
In terms of competitive landscape, these auctions imply no new GSM challengers in seven circles (Delhi, Mumbai, Karnataka, Kerala, Punjab, Rajasthan, HP) which together account for ~35% of the pan-India revenue. However, Tata DOCOMO might now be allocated GSM spectrum in Delhi circle (not allotted despite having paid licence fee earlier) as there would be surplus spectrum in Delhi due to muted demand in auction.
1,800 MHZ AUCTION FINAL RESULTS

WIN – Week In a Nutshell 11 16th Nov 2012
WEEK IN A NUTSHELL
WEEK IN A NUTSHELL
WIN Corporate Corner ANANTRAJ 2QFY13: Above est due to plot sales; Collections weak, expect uptick in 2HFY13 ARCP’s 2QFY13 revenue grew 51% YoY to INR1.4b. EBITDA grew 41% YoY to INR717m (margin stable QoQ at
52%), while PAT jumped 45% YoY to INR502m.
Sales de-grew QoQ at 0.1msf (INR0.7b) v/s 0.4msf (INR1.6b) with Golf Course Road project the key sales contributor during 2QFY13. We are disappointed with the progress in customer collection - ~INR3.8b (22%) out of sales of INR17.3b till Sep-12.
Going ahead, booking from Golf Course Road project will be key to revenue driver, as we expect POCM booking from other projects to moderate with 50-60% already been booked.
Rental income from commercial / hotel projects grew to INR280m v/s INR265m in 1Q. Incremental rental came from higher contribution from Kirti Nagar mall (INR88m v/s INR57m in 1QFY13).
We estimate total rental income of ~INR1.3b in FY13 v/s 0.9b in FY12, driven by (a) full year operations at Kirti Nagar Mall, and (b) contribution from Rai SEZ and Hotel at Manesar (tied up with Seasons at 21% revenue sharing and expected to commence in 2HFY13).
ARCP’s net debt stood at INR12.5b, up INR1.2b from 4QFY12, implying net DER of 0.32x owing to negative cash surplus in 1HFY13.
The management targets INR3.5b debt reduction over next 12 months (INR2.2b due in FY13) Valuation and view:
The stock trades at FY14E P/E of 13.3x, P/BV of 0.6x and at ~21% discount to our NAV of INR113. We are upgrading our target price by ~25% to INR100 (10% discount to NAV v/s 30% earlier due to recent favorable developments and improvement in outlook).
ASHOK LEYLAND: Revving up!; CV cycle to recover in FY14; Initiating Coverage with Buy CV cycle bottoming out, expect recovery in FY14: Expected monetary easing to drive pick-up in the industrial
activity, with estimated growth of ~5.3% in IIP in FY14 v/s ~1.4% in FY13. Improvement in infrastructure activity coupled with better outlook in agriculture (driven by late recovery in monsoon) augurs well for CV demand.
AL's volumes are estimated to grow 16.5% in FY14, with 12% M&HCV volume growth and ~29% volume growth of Dost.
JV with Nissan for LCVs to plug gap in product portfolio: The launch of LCV Dost by the AL-Nissan JV plugs the gap in AL's product portfolio and marks its entry into the high growth LCV segment.
The JV plans to launch two more LCVs, Stile and Partner, with overall intent to launch one product every six months.
While Dost would have an adverse impact on margins, it would contribute 14%/11% to profits.
Operating leverage and ramp-up at the excise/income tax exempt Pantnagar plant would offset the impact of higher discounts and increase in contribution from Dost (margin dilutive, but EBITDA accretive).
We expect EBITDA margin to improve by 20bp in FY13 to 10% and by 30bp in 10.3% in FY14.Softening commodity prices could drive up margins (not yet factored in our estimates).

WIN – Week In a Nutshell 12 16th Nov 2012
WEEK IN A NUTSHELL
WEEK IN A NUTSHELL
BIRLA CORP 2QFY13: Above est; Rajasthan mining ban status quo; Upgrading EPS 17-25%; Buy Birla Corp's 2QFY13 performance was above estimates, with EBITDA of INR1.1b (v/s est of INR766m) and PAT of
INR802m (v/s est of INR404m), led by higher-than-estimated cement volumes and realizations
Cement volumes grew ~11% YoY (-3% QoQ) to 1.57mt (v/s est 1.45mt), despite the mining ban on limestone at the Rajasthan plant, driven by purchased limestone/clinker.
Cement realizations declined by 2% QoQ (+25.6% YoY) to INR3,946/ton (v/s est INR4,065/ton), as resultant cement revenues grew by 40% YoY (-5% QoQ).
Net sales grew by 24% YoY (-5% QoQ) to INR6.3b (v/s est INR5.5b).
EBITDA margins improved by 13.6pp YoY (down 150pp QoQ) to 17.6%.
Cement business’ EBITDA/ton was at INR799 (v/s est INR736/ton; INR1,011/ton in 1QFY13, INR368/ton in 2QFY12). Mining ban at Rajasthan had an impact of ~INR800m in 2QFY13 (~INR500/ton).
Its appeal in the Supreme Court against the High Court order on mining ban at the Rajasthan plant remains sub judice, as the Supreme Court has assigned December 8, 2012 as the last day by which the petitioners will have to reply. Resolution of mining ban would be critical for future volumes growth and normalization of profitability.
The board announced an interim dividend of INR2.5/share (v/s INR6/share for FY12). Upgrading estimates: We are upgrading our EPS estimates for FY13/FY14 by 17%/25% to INR38.5/INR41.2
Trend in volumes and realizations Trend in cement EBITDA (INR/ton)
BPCL 2QFY13: Above est led by govt subsidy, inventory gain; Likely upside potential in E&P business EBITDA of INR42b (est INR 17.9b), led by net over-recoveries of INR18.3b (est nil) and inventory gain of INR4.4b.
PAT at INR50b (est INR10b) v/s PAT loss of INR32b in 2QFY12 and INR88b in 1QFY13. Variation at PAT level was higher due to (a) forex gain of INR11b, (b) lower interest cost and depreciation by INR1b each, and (c) nil tax (v/s est of INR2.5b). Given the ad hoc subsidy sharing, quarterly financials are not indicative
1HFY13 PAT negative despite government subsidy: BPCL’s 2QFY13 subsidy of INR72b from the government was for cumulative 1HFY13 (no subsidy in 1QFY13). However, this compensation was inadequate and resulted in INR38b loss for BPCL in 1HFY13. As in previous years, we model major portion of government subsidy to be given in 2H.
GRM at USD6.4/bbl vs USD1.7/bbl in 2QFY12 and USD2.6/bbl in 1QFY13. We believe that BPCL’s 2QFY13 GRM benefited from crude inventory gains as crude price was higher by USD14/bbl at the quarter-end.
Gross debt reduced to INR256b as on Sept-12 against INR286b on Jun-12 led by receipt of budgetary support from government during the quarter.

WIN – Week In a Nutshell 13 16th Nov 2012
WEEK IN A NUTSHELL
WEEK IN A NUTSHELL
Valuation & view: Trades at 14.1x FY13E EPS of INR23.9 and 1.4x FY13E BV. Maintain Buy. BPCL: Receives subsidy compensation in 2QFY13 from the government
COAL INDIA: 2QFY13 operational perf. in line, Market linked realn down - key risk to earnings Coal India reported 2QFY13 revenue of INR146b (vs est of INR147b), EBIDTA of INR28.6b (vs est of INR27b) and
PAT of INR30.8b (vs est of INR28b).
Market lined revenues and FSA revenues were in-line with our estimate, while EBIDTA was higher due to write-back of provision (negative INR745m, vs average of INR3b+ in last 5/6 quarters).
PAT was boosted due to higher other income at INR21b, vs estimate of INR18.5b.
Key highlight of the result was 2nd consecutive quarter of decline in E-auction / Washed coal prices – a rub off effect of lower global coal prices (down 30% YoY) and stabilizing rupee, in our view.
E-auction realization at INR2,282/ton is down 10% QoQ and was in-line with our estimate of INR2,300/ton.
Similarly, washed coal prices too declined by 10% QoQ. Management attributes the fall to seasonality and grade mix change and is hopeful of recovery in 2H.
Continued weakness in global prices and rupee appreciation remains key risk to earnings, as market linked volumes/revenues account for 22% of sales and 40%+ to revenues.
We model production/dispatch of 464/466m tons for COAL in FY13E, lower than management target of 470m tons of dispatch (production target is same at 464m tons).
Given asking rate of dispatch growth of 7.7% YoY in 2H (1H at 7.7% YoY), we believe that our estimate for dispatches are reasonable, more so given that rake availability is impacted in 2H due to diversion of rakes for other commodity, fertilizers, etc.
We now expect Coal India to report consolidated PAT of INR172b in FY13E (up 7% YoY, down from INR182b earlier) and INR177b in FY14E (up 3% YoY, vs earlier estimate of INR195b).
ACQ coal realization higher led by grade mix and GCV conversion E-auction realization: 2nd
consecutive quarter of decline
Production showing an uptrend (m tons) …as also dispatches (m tons)
WIN – Week In a Nutshell 14 16th Nov 2012
WEEK IN A NUTSHELL
WEEK IN A NUTSHELL
CONCOR: Expect consolidation, and sharp jump in volumes post DFC; Payout ratio may increase Key takeaways from interactions with management of Container Corporation of India (Concor):
Industry is likely to witness consolidation, further increasing Concor’s (CCRI IN, Mkt Cap USD2.5b, CMP INR1,001, Buy) dominance. CCRI’s key competitors are international shipping lines like APL/ MSC (accounting for ~13% market share). CTO (container transport operation) is both non-core for them, also a business in which they face significant constraints (dependent solely on their own cargo). CCRI is in talks with them for strategic partnerships
Standalone terminals by private players are unlikely to make any major impact and will most likely exert further pressure on their financials. CTO is essentially a network business and most of these players lack network advantage
During 2QFY13, for the first time post the opening of the CTO business to private players in FY06, Concor has increased its market share from ~74% in FY12 to ~76% (EXIM market share ~79%).
There has been pick-up in volumes in Oct-12; CCRI targets to end FY13 with double-digit volume growth (implying 2HFY13 residual growth of ~20%).
Following a directive to all PSUs to increase minimum dividend payout from ~20% to ~30%, CCRI payout is likely to increase (it has ~INR30b of idle cash and robust cash profit of ~INR12b). We believe higher payout ratio would positively impact CCRI’s valuations.
While the company has capex plans of ~INR60b over FY13-17, it does not expect to utilize more than ~INR40b from its internal funds. The remaining fund is likely to be funded through stake dilutions in JVs, by raising debt at JV level, partnerships with State Governments for land acquisitions, etc.
Valuation and view; Buy with target price of INR1,242, CCRI trades at 14x/ 13.2x its FY13/14 earnings
DLF Q2FY13: Below estimates due to disappointment in revenue booking Revenue de-grew 19.5%YoY (-7.2%QoQ) to INR20.4b (v/s est INR21.3b), which includes (1) annuity income of
INR4.8b (lease rental INR4b), (2) Hotel and Power (~INR1.6b) and (3) POCM revenue of ~INR13b. EBITDA de-grew 36.4%YoY (down 30.1% QoQ) to INR7.5b (v/s est INR8.8b), while EBITDA margin stood in line
with expectation at 41%. PAT declined 62.8%YoY (down 52.7%QoQ) to INR1.4b (v/s est INR2.3b), driven by lower revenue booking and other income.
Sales remain subdued on the back of lack of new launches at 1.59msf (estimated sales value of ~INR5.8b) v/s 1.34msf (INR6b) in 1QFY13 and 1.3msf (INR6.3b) in 2QFY12. It has guided for a strong pick up in new launches over 2HFY13 (9-10msf) with market-mix skewed towards Gurgaon (8.5mf of planned launches) and product-mix towards premium/luxury segment or plotted development. It targets for INR35-40b sales from Phase V and Gurgaon launches over 2HFY13.
Our estimate suggests for QoQ/YoY uptick in collections in Dev Co. However net cash flow posted a deficit of INR5.6b owing to (a) higher tax outflow, (b) dividend payment and (c) government charges. The government charges of INR3.5b pertains to license fees and development charges for upcoming launches.
A broad based estimate suggests inflow of ~INR31b Negative surplus of ~INR5.6b led to net debt at INR240b (net DER 0.92x). However post receipt of the final
tranche of NTC land deal (INR27.27b), the net debt stood at INR220b as on Nov-12. While DLF has achieved divestment of INR31.3b (NTC Mills and DLF Hotels) in 1HFY13, it remains confident of
~INR50b target Valuation and view: 1.2x FY14 BV and 19.3x FY14 EPS and 28% discount to NAV. While we model in INR20-22b annual debt reduction over FY13/14, resulting into net DER of 0.8x/0.69x, faster than expected monetization of Aman Resort and Wind Mill offers strong upside risk. Moreover, DLF offers a strong play on interest rate down-cycle.
GSK PHARMA 3QCY12: In-line; Pharma sales up 11%; Sales growth impacted by manu. constraints Topline grew 10% to INR6.68b (v/s est of INR6.67b), EBITDA grew 13% to INR1.99b (v/s est of INR2.08b) and Adj
PAT grew 12% to INR1.63b (v/s est of INR1.72b).
Topline growth was led by Pharma business (~96% of overall sales) which grew 11% YoY led by the specialities and vaccine segments. Growth was tempered down by (1) constraints in sterile manufacturing due to shutdown
WIN – Week In a Nutshell 15 16th Nov 2012
WEEK IN A NUTSHELL
WEEK IN A NUTSHELL
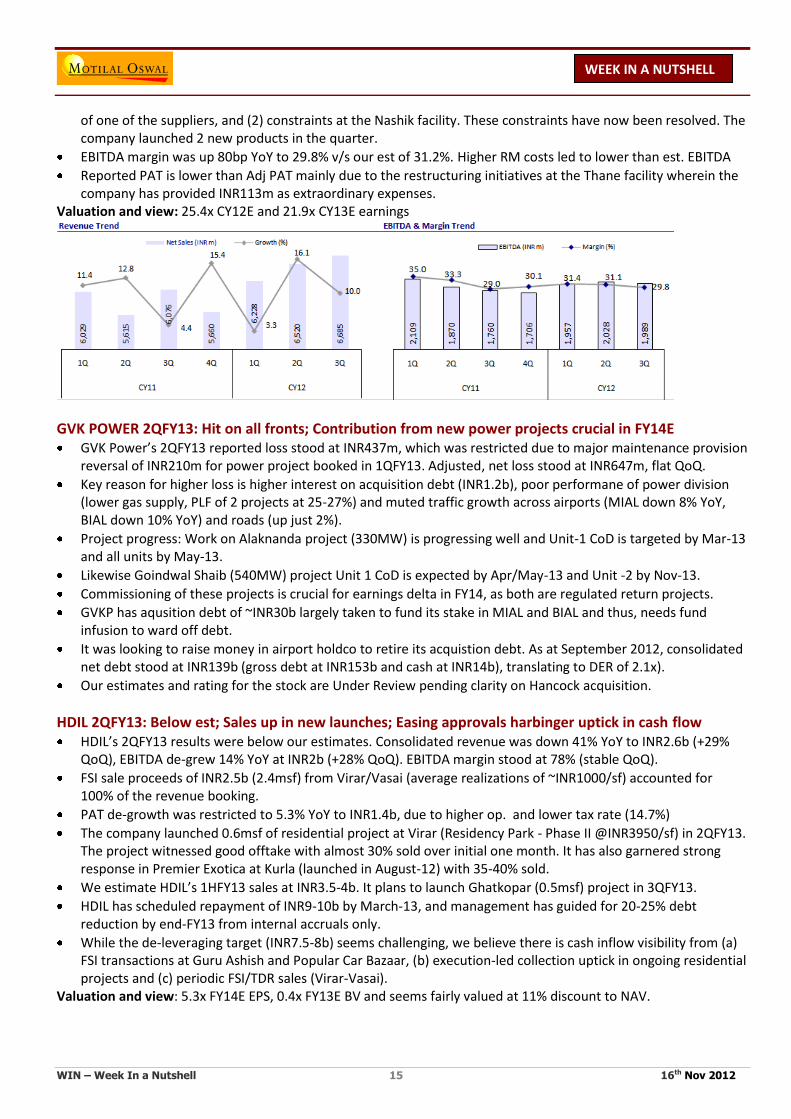
of one of the suppliers, and (2) constraints at the Nashik facility. These constraints have now been resolved. The company launched 2 new products in the quarter.
EBITDA margin was up 80bp YoY to 29.8% v/s our est of 31.2%. Higher RM costs led to lower than est. EBITDA
Reported PAT is lower than Adj PAT mainly due to the restructuring initiatives at the Thane facility wherein the company has provided INR113m as extraordinary expenses.
Valuation and view: 25.4x CY12E and 21.9x CY13E earnings
GVK POWER 2QFY13: Hit on all fronts; Contribution from new power projects crucial in FY14E GVK Power’s 2QFY13 reported loss stood at INR437m, which was restricted due to major maintenance provision
reversal of INR210m for power project booked in 1QFY13. Adjusted, net loss stood at INR647m, flat QoQ.
Key reason for higher loss is higher interest on acquisition debt (INR1.2b), poor performane of power division (lower gas supply, PLF of 2 projects at 25-27%) and muted traffic growth across airports (MIAL down 8% YoY, BIAL down 10% YoY) and roads (up just 2%).
Project progress: Work on Alaknanda project (330MW) is progressing well and Unit-1 CoD is targeted by Mar-13 and all units by May-13.
Likewise Goindwal Shaib (540MW) project Unit 1 CoD is expected by Apr/May-13 and Unit -2 by Nov-13.
Commissioning of these projects is crucial for earnings delta in FY14, as both are regulated return projects.
GVKP has aqusition debt of ~INR30b largely taken to fund its stake in MIAL and BIAL and thus, needs fund infusion to ward off debt.
It was looking to raise money in airport holdco to retire its acquistion debt. As at September 2012, consolidated net debt stood at INR139b (gross debt at INR153b and cash at INR14b), translating to DER of 2.1x).
Our estimates and rating for the stock are Under Review pending clarity on Hancock acquisition.
HDIL 2QFY13: Below est; Sales up in new launches; Easing approvals harbinger uptick in cash flow HDIL’s 2QFY13 results were below our estimates. Consolidated revenue was down 41% YoY to INR2.6b (+29%
QoQ), EBITDA de-grew 14% YoY at INR2b (+28% QoQ). EBITDA margin stood at 78% (stable QoQ).
FSI sale proceeds of INR2.5b (2.4msf) from Virar/Vasai (average realizations of ~INR1000/sf) accounted for 100% of the revenue booking.
PAT de-growth was restricted to 5.3% YoY to INR1.4b, due to higher op. and lower tax rate (14.7%)
The company launched 0.6msf of residential project at Virar (Residency Park - Phase II @INR3950/sf) in 2QFY13. The project witnessed good offtake with almost 30% sold over initial one month. It has also garnered strong response in Premier Exotica at Kurla (launched in August-12) with 35-40% sold.
We estimate HDIL’s 1HFY13 sales at INR3.5-4b. It plans to launch Ghatkopar (0.5msf) project in 3QFY13.
HDIL has scheduled repayment of INR9-10b by March-13, and management has guided for 20-25% debt reduction by end-FY13 from internal accruals only.
While the de-leveraging target (INR7.5-8b) seems challenging, we believe there is cash inflow visibility from (a) FSI transactions at Guru Ashish and Popular Car Bazaar, (b) execution-led collection uptick in ongoing residential projects and (c) periodic FSI/TDR sales (Virar-Vasai).
Valuation and view: 5.3x FY14E EPS, 0.4x FY13E BV and seems fairly valued at 11% discount to NAV.

WIN – Week In a Nutshell 16 16th Nov 2012
WEEK IN A NUTSHELL
WEEK IN A NUTSHELL
JPA 2QFY13: Above estimates led by EPC business; Cement in line, RE performance disappoints During 2QFY13, Jaiprakash Associates reported standalone PAT of INR1.3b, higher than our estimate of
~INR1.0b. EBIDTA was marginally higher (at INR7.7b) led by better operating performance of EPC division; better than expected PAT growth was partially driven by lower than expected interest cost.
Cement division performance was in-line on major counts, while EPC division EBIT margin at 36% surprised us (our est at 42%). RE division performance was a let down on both revenues bookings and margins front. Revenue bookings stood at INR2.7b (vs est of INR3.3b), while EBIT margins stood at 36% (vs est of 42%). However, given pre-sales of INR70b+, we expect real estate revenue bookings to accelerate going forward.
We maintain our earnings estimate for JPA and expect standalone net profit of INR7.4b in FY13E (down 28% YoY) and INR9.7b in FY14E (up 31% YoY).
Stock trades at PER of 17x and P/BV of 1.6x (RoE of 10%) on FY14E basis. BUY. Cement division performance
FY12
FY13E FY12 FY13E
Revenues 1Q 2Q 3Q 4Q
1Q 2Q 3Q 4Q
2QE
Volumes (m ton)
3.88 4.10 4.25 4.25
3.59 3.25 4.00 4.16 13.49 15.00 3.50
Revenues (INR m)
15,272 13,238 16,973 16,867
15,629 13,719 17,285 18,801 54,650 65,434 14,538
Realization (INR/t)
3,936 3,229 3,994 3,969
4,354 4,221 4,321 4,519 4,051 4,362 4,154
EBIT (INR m) 1,940 (295) 1,698 2,128
2,266 1,337 2,022 3,055 6,526 8,680 1,213 EBIT (INR/t) 500 (72) 400 501
631 411 505 734 484 579 347
EBIDTA (INR/t) 861 306 811 847
1,035 873 893 1,119 941 985 775
EPC division performance
FY12
FY13E FY12 FY13E
Revenues 1Q 2Q 3Q 4Q
1Q 2Q 3Q 4Q
2QE
Revenues (INR m) 12,748 15,540 12,421 17,706
12,160 12,859 15,200 17,300 58,423 57,519 13,750
EBIT (INR m) 2,500 5,458 3,707 4,232
3,603 4,393 2,508 3,014 16,054 13,517 2,956
EBIT margin (%) 19.6 35.1 29.8 23.9
29.6 34.2 16.5 17.4 27.5 23.5 21.5
Real estate division performance
FY12
FY13E FY12 FY13E
Revenues 1Q 2Q 3Q 4Q
1Q 2Q 3Q 4Q
2QE
Revenues (INR m) 3,469 2,018 3,078 5,604
1,651 2,678 4,200 6,471 14,170 15,000 3,250
EBIT (INR m) 1,851 872 1,477 2,447
666 951 1,743 2,640 6,647 6,000 1,365
EBIT margin (%) 53.4 43.2 48.0 43.7
40.4 35.5 41.5 40.8 46.9 40.0 42.0
JPIN 2QFY13: Revenue below est; Sales, collections beat estimates; Interest dents PAT Revenue disappointed with 2% YoY decline to INR7b (+4% QoQ); EBITDA down 9% YoY (+32% QoQ) to INR3.6b –
QoQ growth in EBITDA is attributable to margin expansion (51% v/s 40% in 1QFY13) on mix in favor of premium
Commencement of int. and depreciation from expressway project has dented PAT at INR1.8b (down 42% YoY)
Sluggish revenue booking in 1HFY13 is not a proper reflection of execution pace as we calculate its construction outflow over 1HFY13 in-line at INR12-12.5b (v/s FY13 est of ~INR24b).
JPIN sold 3.02msf (INR13.4b) in 2QFY13 v/s 2.5msf (INR9.3b) in 1QFY13. Average realizations improved to INR4,452/sf as against INR3,724/sf in 1QFY13. QoQ uptick in realization is attributable to higher sales in premium-end projects at Noida land parcel, while GB Nagar parcel accounted for 30-35% sales.
Despite lower revenue booking, our belief of no major impact of execution is attributable to its strong collection run-rate. It collected INR10.3b v/s INR8.1b in 1QFY13. With this, 1HFY13 sales stood at INR22.7b (v/s est of INR39.6b in FY13); collection stood at INR18.4b (v/s FY13E est of ~INR34b).
Valuation & view JPIN trades at 6.7x FY14E EPS and 0.9x FY14E BV and 35% discount to SOTP-value of INR74.
JSPL 2QFY13: Steel margins expansion, contrary to industry trend; power rates declined Jindal Steel and Power 2QFY13 consolidated PAT declined 6% QoQ to INR9b.
WIN – Week In a Nutshell 17 16th Nov 2012
WEEK IN A NUTSHELL
WEEK IN A NUTSHELL
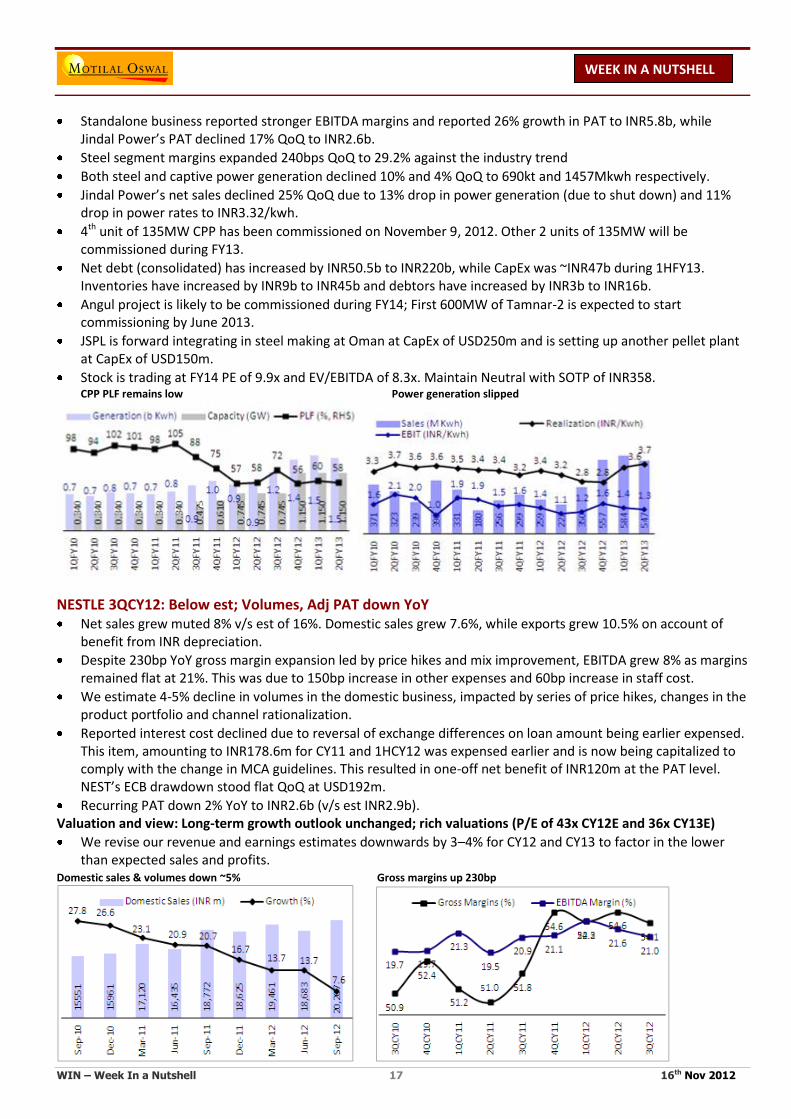
Standalone business reported stronger EBITDA margins and reported 26% growth in PAT to INR5.8b, while Jindal Power’s PAT declined 17% QoQ to INR2.6b.
Steel segment margins expanded 240bps QoQ to 29.2% against the industry trend
Both steel and captive power generation declined 10% and 4% QoQ to 690kt and 1457Mkwh respectively.
Jindal Power’s net sales declined 25% QoQ due to 13% drop in power generation (due to shut down) and 11% drop in power rates to INR3.32/kwh.
4th unit of 135MW CPP has been commissioned on November 9, 2012. Other 2 units of 135MW will be commissioned during FY13.
Net debt (consolidated) has increased by INR50.5b to INR220b, while CapEx was ~INR47b during 1HFY13. Inventories have increased by INR9b to INR45b and debtors have increased by INR3b to INR16b.
Angul project is likely to be commissioned during FY14; First 600MW of Tamnar-2 is expected to start commissioning by June 2013.
JSPL is forward integrating in steel making at Oman at CapEx of USD250m and is setting up another pellet plant at CapEx of USD150m.
Stock is trading at FY14 PE of 9.9x and EV/EBITDA of 8.3x. Maintain Neutral with SOTP of INR358. CPP PLF remains low Power generation slipped
NESTLE 3QCY12: Below est; Volumes, Adj PAT down YoY Net sales grew muted 8% v/s est of 16%. Domestic sales grew 7.6%, while exports grew 10.5% on account of
benefit from INR depreciation.
Despite 230bp YoY gross margin expansion led by price hikes and mix improvement, EBITDA grew 8% as margins remained flat at 21%. This was due to 150bp increase in other expenses and 60bp increase in staff cost.
We estimate 4-5% decline in volumes in the domestic business, impacted by series of price hikes, changes in the product portfolio and channel rationalization.
Reported interest cost declined due to reversal of exchange differences on loan amount being earlier expensed. This item, amounting to INR178.6m for CY11 and 1HCY12 was expensed earlier and is now being capitalized to comply with the change in MCA guidelines. This resulted in one-off net benefit of INR120m at the PAT level. NEST’s ECB drawdown stood flat QoQ at USD192m.
Recurring PAT down 2% YoY to INR2.6b (v/s est INR2.9b). Valuation and view: Long-term growth outlook unchanged; rich valuations (P/E of 43x CY12E and 36x CY13E)
We revise our revenue and earnings estimates downwards by 3–4% for CY12 and CY13 to factor in the lower than expected sales and profits.
Domestic sales & volumes down ~5% Gross margins up 230bp

WIN – Week In a Nutshell 18 16th Nov 2012
WEEK IN A NUTSHELL
WEEK IN A NUTSHELL
OPTO CIRCUITS 2QFY13: Below estimates; Mgmt guidance strong Opto Circuits’ 2Q results were below est with net sales up 8% to INR6.07b (v/s est of INR7.01b), EBITDA up 7%
to INR1.65b (v/s est of INR1.88b) and EBITDA margins at 27.2% vs our est of 26.9%.
Topline was impacted by (1) supply issues related to some components (now resolved), (2) focus on quality of receivables rather than sales growth and (3) Overall slowdown in some markets.
Non-invasive segment (80% of sales) grew by 5% YoY to INR4.86b (v/s est of INR5.56b), dragging overall topline growth. Invasive segment posted 24% YoY growth at INR 1.17b (v/s est of INR1.4b). PAT was down 4% to INR1.16b (v/s our est of INR1.33b). PAT was lower than our estimate on account of lower operational performance and –ve other income (mainly due to forex losses which have not been quantified).
We note that debtors (in absolute terms) have increased by 9% QoQ while sales have declined by 15% QoQ
Management has guided for a topline growth of 20-22% (incl. benefits of favourable currency) and EBITDA margins at 26-27%. If currency appreciates significantly, then this growth may not be achieved. R&D accounting policy has changed with future R&D expenses being routed through the P&L compared to the previous practice of capitalizing them
Outlook – Despite strong growth track record, we remain cautious on OPTC given high working capital requirement (leading to low free cash flows) and potential dilution in earnings due to proposed Eurocor fund-raising
Expensing R&D costs is also a positive step. Post the 2Q results, we have cut our EPS estimates for FY13 by 5% and FY14 by 1%. Based on our revised EPS estimates, the stock trades at 5.3x FY13E and 4.6x FY14E EPS. Maintain Neutral with TP of 125 (5x FY14E EPS).
PANTALOON 5QFY12: Core Retail PAT down 91%; Restructuring continues Results in line with our modest expectations. Core retail PAT was down 91% YoY to INR29m.
PF’s 5QFY12 sales grew 5% YoY to INR 30.6b, in line with estimates. Same store sales (SSS) growth was 10.8% for Lifestyle division, -0.2% for Value and -3.5% for Home. September quarter was partially impacted by shift in festive season, as per management.
Gross space addition during the quarter stood at 0.17msf; net addition was zero due to space optimization in unviable stores.
Core Retail EBITDA increased 5% to INR 2.6b, margins remained flat YoY at 8.7%. Despite 40bp improvement in gross margins and 30bp savings in employee costs, EBITDA margins were flat due to 80bp increase in rent and overheads.
35% YoY jump in interest cost to INR1.8b (higher rates and higher debt) and 18% higher depreciation expenses resulted in 91% decline in Adj PAT to INR29m. Excluding other income, which went up 67% YoY, PBT from operations reported a loss of INR88m.
PF has also restructured its core retail business. It has (a) Transferred Fashion business from PF and Future Ventures into a newly created entity, Future Fashion (to be listed) and transferred debt of INR12.26b to the new entity, (b) Merged its wholly owned sub Future Value Retail back into PF. This restructuring is preceded by sale of its Pantaloon format business to ABNL and divestment of PF’s 41.6% stake in Future Capital.
PFC 2QFY13: Above est; Healthy loan growth, asset quality; Margins improve QoQ PAT up 147% YoY (lower base due to high forex loss in 2QFY12) and 7% QoQ to INR10.4b (12% above est. of
INR9.3b) led by healthy asset growth and better margin performance.
NII up 37% YoY to INR14.8b (5% above est.). Reported NIMs improved 9bp QoQ to 4.28% as yields improved 27bp QoQ to 11.98% due to incremental loans offered to discoms (as Transitional Finance) at higher lending rates. Meanwhile, increase in cost of borrowings were contained at 16bp QoQ to 9.24%.
Loans up 27% YoY and 4% QoQ to INR1.4t, generation contributing 84% of incremental loans on a YoY basis. Loans to private sector grew much faster (+77% YoY and +9% QoQ). As a result, the share of loans to private sector increased to 12.2% from 11.7% QoQ, 8.7% YoY.
Sanctions remained volatile and after declining sharply in 1QFY13, it grew multifold (+107% YoY and 181% QoQ) to INR315b driven by sanctions made to discoms in the form of Transitional Finance to fill their funding gaps (~60% of incremental sanctions). O/s sanctions increased 6% QoQ to INR1.95t.
WIN – Week In a Nutshell 19 16th Nov 2012
WEEK IN A NUTSHELL
WEEK IN A NUTSHELL
Disbursements up 18% YoY, 25% QoQ to INR102b again led by higher disbursements to discoms as Transitional Finance (incrementally ~25%+ disbursements made to discoms under this scheme).
Asset quality remained stable QoQ with %GNPAs at ~1% levels; Provision coverage steady QoQ at ~11%. POWF had submitted a roadmap to the Ministry of Finance for adhering to prudential NBFC norms and thereby start making standard asset provisions (25bp) spread over a period of three years starting FY14. However, the management plans to start making standard asset provisions from 3QFY13 onwards and make 8bp provision in 2HFY13 and FY14 each followed by remaining 9bp provision in FY15.
Valuation & View: Trades at 1.1x FY13E BV of INR177 and 0.9x FY14E BV of INR200.
SBI 2QFY13: A tough qtr on all fronts; Stress asset addition accelerates; 25bp NIM decline PAT at INR36.9b (est INR36.6b). Operating profit was 13% below estimate, lower than expected provisions
(INR18.3b v/s Est INR28.2b) led to in-line PAT.
Moderation in overall NIM of ~25bp QoQ to 3.3% and fee income decline of 6% YoY were disappointments.
SBIN further lowered its coverage ratio by 150bp QoQ to 62.8%, which led to lower than estimated overall provisions. YTD, it has compromised 530bp of PCR to show higher earnings (lower provisions of INR30b, 25% of 1HFY13 PBT)
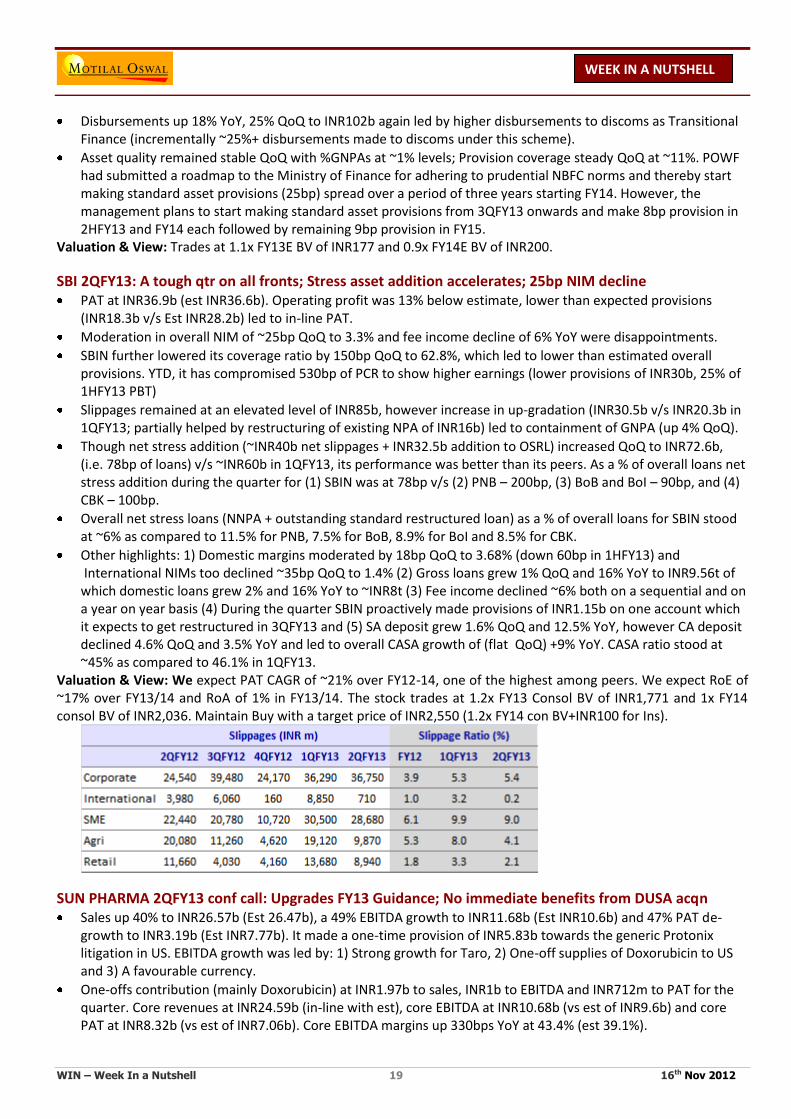
Slippages remained at an elevated level of INR85b, however increase in up-gradation (INR30.5b v/s INR20.3b in 1QFY13; partially helped by restructuring of existing NPA of INR16b) led to containment of GNPA (up 4% QoQ).
Though net stress addition (~INR40b net slippages + INR32.5b addition to OSRL) increased QoQ to INR72.6b, (i.e. 78bp of loans) v/s ~INR60b in 1QFY13, its performance was better than its peers. As a % of overall loans net stress addition during the quarter for (1) SBIN was at 78bp v/s (2) PNB – 200bp, (3) BoB and BoI – 90bp, and (4) CBK – 100bp.
Overall net stress loans (NNPA + outstanding standard restructured loan) as a % of overall loans for SBIN stood at ~6% as compared to 11.5% for PNB, 7.5% for BoB, 8.9% for BoI and 8.5% for CBK.
Other highlights: 1) Domestic margins moderated by 18bp QoQ to 3.68% (down 60bp in 1HFY13) and International NIMs too declined ~35bp QoQ to 1.4% (2) Gross loans grew 1% QoQ and 16% YoY to INR9.56t of which domestic loans grew 2% and 16% YoY to ~INR8t (3) Fee income declined ~6% both on a sequential and on a year on year basis (4) During the quarter SBIN proactively made provisions of INR1.15b on one account which it expects to get restructured in 3QFY13 and (5) SA deposit grew 1.6% QoQ and 12.5% YoY, however CA deposit declined 4.6% QoQ and 3.5% YoY and led to overall CASA growth of (flat QoQ) +9% YoY. CASA ratio stood at ~45% as compared to 46.1% in 1QFY13.
Valuation & View: We expect PAT CAGR of ~21% over FY12-14, one of the highest among peers. We expect RoE of ~17% over FY13/14 and RoA of 1% in FY13/14. The stock trades at 1.2x FY13 Consol BV of INR1,771 and 1x FY14 consol BV of INR2,036. Maintain Buy with a target price of INR2,550 (1.2x FY14 con BV+INR100 for Ins).
SUN PHARMA 2QFY13 conf call: Upgrades FY13 Guidance; No immediate benefits from DUSA acqn Sales up 40% to INR26.57b (Est 26.47b), a 49% EBITDA growth to INR11.68b (Est INR10.6b) and 47% PAT de-
growth to INR3.19b (Est INR7.77b). It made a one-time provision of INR5.83b towards the generic Protonix litigation in US. EBITDA growth was led by: 1) Strong growth for Taro, 2) One-off supplies of Doxorubicin to US and 3) A favourable currency.
One-offs contribution (mainly Doxorubicin) at INR1.97b to sales, INR1b to EBITDA and INR712m to PAT for the quarter. Core revenues at INR24.59b (in-line with est), core EBITDA at INR10.68b (vs est of INR9.6b) and core PAT at INR8.32b (vs est of INR7.06b). Core EBITDA margins up 330bps YoY at 43.4% (est 39.1%).

WIN – Week In a Nutshell 20 16th Nov 2012
WEEK IN A NUTSHELL
WEEK IN A NUTSHELL
Guidance Upgraded - The management has upped its FY13E revenue growth guidance from 18-20% to 30-32%, based on the strong performance in the first half.
Announces DUSA acqn - Sun Pharma has also announced the acquisition of DUSA Pharmaceuticals (USA) for a cash consideration of USD 230m, implying a valuation of 5x DUSA’s CY11 sales and 20x EBITDA (refer details below).
upgraded core EBITDA est for FY13E and FY14E by 6% and 3%. EPS estimates remain largely unchanged due to lower other income.
Valuation & View: Trades at 25.1x FY13E and 23.8x FY14E core earnings. While we are positive on SUNP’s business outlook, rich valuations have tempered down our bullishness.
SUN TV 2QFY13: Below estimates; Muted ad growth despite low base; 4-6% earnings cut Revenue/EBITDA declined 4/10% YoY and were 4-6% below estimates. Advertising and broadcast revenue grew
2.5% YoY to INR2.8b on a low base (1% growth in 2QFY12).
Subscription revenue up 4% YoY and QoQ to INR1.5b. Analog revenue from Arasu accruing from Aug 2012
PAT down 16% YoY to INR1.52b (Est 1.79b)
Mgmt commentary indicated improvement in ad outlook with expected double digit ad growth in 2HFY13, - low base effect. We factor-in advertising and broadcast revenue growth of 7% in FY13 and 13% in FY14 vs a 1% decline in FY12.
Implementation of digitization in Chennai has been impacted due to ongoing court case and non-readiness of state-run Arasu cable.
Cut EPS by 4-6% to reflect lower margins. Our FY14 estimates do not incorporate first year IPL loss (management expects ~INR0.3b loss in worst case scenario).
While digitization remains a structural positive, continued increase in content costs and weak ad growth continue to exert pressure on profitability.
Valuation & View: Trades at 19.1x FY13E EPS of INR17.1 and 16.9x FY14E EPS of INR19.4. Downgrade to Neutral with a revised target price of INR350 based on 18x FY14 EPS. Dividend yield of ~3% (INR 5/sh interim dividend during 1HFY13) should provide downside support.
TATA MOTORS: JLR's Oct-12 volumes below est; New model wholesale from Nov-12 JLR’s Oct-12 volumes grew by 6.6% YoY (+5.4% MoM) to 27,897 units (v/s est 30,000) impacted by model year
transition and impact of hurricane in the US market. Dispatches for new launches are expected to start from Nov-12 against our expectation of Oct-12.
JLR retail sales grew by 10% YoY, with growth being registered in all markets except US. China grew by 65% YoY, while UK and Europe grew by 14% and 7% respectively.
Phil Popham, Jaguar Land Rover’s Director of Group Sales Operations said “We have seen a strong sales performance across both the Jaguar and Land Rover brands in the first ten months of this year. During a very competitive year for premium car sales, and in an increasingly uncertain economic environment, I am delighted to see strong demand for our products and that we are still performing well across all our key markets.”
Tata Motors has maintained its FY13 volume guidance of ~360-370,000 units. Evoque continues to perform well with a healthy order book.
We expect JLR to outperform the industry growth due to ramp-up and full year benefit of Evoque (launched in Sep-11), other product actions coupled with de-bottlenecking of capacities.
While JLR volumes have disappointed over last 2-3 months impacted by model transition and production re-alignment, we would expect significant traction from Nov-12 wholesale numbers and hence still maintain our estimates. For JLR, we assume volumes of ~362,400 units in FY13 (~15.3% growth) and ~396,000 units in FY14 (~9% growth). Our FY13 estimate requires a volume run-rate of 34,721 units/month (9.7% YoY growth). We estimate EBITDA margins of 14.6%/15% (v/s 14.6% in 1HFY13) and PAT of GBP1.2b/GBP1.36b in FY13/FY14.
The stock trades at 8.2x FY13E consolidated EPS of INR33.1and 6.7x FY14E consolidated EPS of INR40.7. Maintain Buy

WIN – Week In a Nutshell 21 16th Nov 2012
WEEK IN A NUTSHELL
WEEK IN A NUTSHELL
TATA STEEL 2QFY12: Below estimate; GBP500m pension deficit; net debt INR600b; cut FY14 EPS 15% Tata steel reported 2QFY12 consolidated loss after tax of INR4b due to margin compression in Indian business
(TSI) and higher losses in overseas subsidiaries.
TSE EBITDA Loss at INR400m was on expected lines.
Tata Steel India’s sales volume increased 5% YoY to 1.73m while realization declined 6% QoQ to INR 48,459/t.
EBITDA per ton was down USD80 QoQ to USD244/t due to lower realization, high operating and raw material cost.
3rd party coke purchases adversely affected raw material costs to the extent of INR1.5b.
Tata Steel Europe EBITDA/t at –ve USD3/t was on expected line as realization declined 8% QoQ to USD1,070/t.
Sales tonnage were higher than expected at 3.4mt against the expectation of 2.9mt.
Other subsidiaries contributed –ve INR1,661m to the EBITDA against INR35m in 1QFY13.
Triennial valuation has been finalized with net deficit of around GBP 500m with 15 year recovery plan.
Net debt increased by INR75b to INR552b in 6 months. On including Hybrid bond of INR23b and acceptances of INR22b, the total net debt is ~INR600b.
We have cut TSI FY13E and FY14E EBITDA estimates by 4.2% and 3.5% respectively to account for persistent higher operating cost.
We have also cut TSE FY13E and FY14E EBITDA estimates by 29% and 7% respectively to account of much sharper fall in European realization. Therefore we have cut our FY13E and FY14E EPS by 45% and 15% respectively. Stock is trading at FY14 EV/EBITDA of 6.4x. Maintain Sell.
UNITECH 2QFY13: QoQ uptick in all aspects; INR7b re-financing a key positive; Execution to improve Unitech’s 2QFY13 numbers are positive QoQ, and can be perceived as early signs of recovery – revenue up 32%
QoQ at INR5.4b (v/s est of INR4.9b). EBITDA up 50% QoQ to INR818m (v/s est of INR709m), translating into margin of 15.2% (+1.8pp QoQ). PAT is up 7% QoQ to INR492m (in line with est).
Sequential improvement in revenue booking is a clear indication of uptick in construction progress, post improvement in refinancing visibility from 4QFY12. It has already refinanced ~INR7b of debt in 1HFY13, and remains confident of re-financing the balance over 2HFY13 (total repayment due of ~INR15b), thus inducing the much-awaited boost in execution.
UT targets to increase its current workforce from 20,000 to 25,000 by Mar-13 leading to a steady scale up in construction spending from current sub-INR3b/quarter level.
During 2QFY13, it launched 1.6msf (v/s 1.3msf in 1QFY13), including almost ~1msf in Noida Unihomes and Exquisite. It sold 1.6msf (INR8.4b) v/s. 1.5msf (INR7b) in 1QFY13. Sales have been largely led by mid-income housing projects at Noida (almost 60% of total sales), although average realization is up by ~INR860/sf QoQ to INR5471/sf.
Core operating cash flow was similar to 1QFY13 – collections of ~INR6.5b was spent in (1) construction of ~INR2.9b, (2) interest expense of INR1.25b, (3) UCP construction of INR1.2b, and (4) overheads of INR1.2b. There was a minor QoQ uptick in net debt to INR55.7b (net DER of 0.47x).
Valuation & view: The stock trades at 32% discount to NAV of INR39. Maintain Buy with target price of INR33 (15% discount to NAV).
UNITED SPIRITS: DIAGEO deal: Raising the “Bar”; changing the “game”; upgrade to BUY United Spirits has entered into an agreement to sell 27.4% stake (including 10% preferential allotment) to
Diageo for a consideration of INR 57.3b at a price of INR 1,440 per share.
Diageo will also make an offer to acquire additional 26% at the same price. If the open offer is fully subscribed, Diageo will eventually own 53.4% stake in UNSP after paying a consideration of INR 111.7B.
UB group will hold 13.4% stake in the post deal entity on enlarged capital base. Mr. Mallya will continue to remain the Chairman of UNSP. Diageo has the right to appoint CEO and CFO in UNSP.

WIN – Week In a Nutshell 22 16th Nov 2012
WEEK IN A NUTSHELL
WEEK IN A NUTSHELL
Diageo is paying 20x FY12 EBITDA multiple for the transaction, in line with the multiples for EM businesses.
UNSP balance sheet will receive INR 33b of cash infusion, which will be utilized to pay off debt.
It will help bring focus back on core IMFL business as indeed improve the operational as well as financial discipline of the business and bring more transparency in the operations, in our view.
We expect Diageo’s unwavering focus on premiumisation to a) help expand margins gradually (management mentioned 20% operating margins as an achievable target) b) improve the capital efficiency led by better working capital and judicious capital allocation decisions c) reduce leverage costs post the cash infusion.
However, we expect advertising and brand building investments to accelerate, going forward, as Diageo sets out to correct under-investment in premium brands.
Valuation & View: 17x EV/EBITDA on Sep-14E EBITDA, TP of INR 1843
We are revising our estimates to model a) 2QFY13 results b) better margins post Diageo transaction (We now expect 240bps margin improvement over FY12-15E) c) Reduction in interest expenses.
We model 15.3% EBITDA margins for FY15E as we expect margin improvement trajectory to be gradual. UNSP has leading market position across segments in India
UNITED SPIRITS 2QFY13: Volume declines 1% due to state specific issues United Spirits 2QFY13 Net sales grew by 24%. Volume declined 1% due to continued pressure in Tamil Nadu and
West Bengal.
In West Bengal, the sharp increase in excise duty in 2QFY12 continued to impact performance, resulting in state volumes declining by 3% (down by 50% in 2QFY12 and 20% in Q4FY12 and Q1FY13).
Sales contain an one off element of INR3.15b - excess bulk spirits sold – excluding which recurring sales grew 6%
UNSP’s Prestige and above brands posted 14% volume growth in 2QFY13 with ~7.4mn cases.
ENA prices increased by 4% YoY to INR159/case vs our estimate of flat ENA prices.
Gross margins decreased by 550bp during the quarter aggravated by one off element in revenues. EBITDA margins contracted by 290bp to 11.4% primarily on account of decline in gross margins, offset by contraction in ad-spends, employee costs and other expenses. Recurring EBITDA margins are up 150 bps YoY.
PBT from operations stood at INR643mn (down 33%) on account of spike in interest cost (up 18% )and lower other income.
Forex swing of INR 730mn – loss of INR 340m as against gain of INR394m.
Reported PAT declined 75% to INR393m. Adjusting for forex items, PAT declined 33% YoY. Gross Margins down 550bp YoY; EBITDA margins down 290bp Interest costs increased 18% YoY
WIN – Week In a Nutshell 23 16th Nov 2012
WEEK IN A NUTSHELL
WEEK IN A NUTSHELL
WIN Collage Changing guard- China shuffles its leadership, putting a “princeling” in command FOR the first time since the death of Mao Zedong in 1976, China’s most important reins of power have been handed over at the same time to a single man: Xi Jinping. The decision, revealed on November 15th, that Hu Jintao has stepped down not only as the Communist Party’s general secretary, but also as head of China’s army, was part of the biggest shake-up of the party’s leadership in a decade. But, although Mr Xi now has the titles of power, his ability to use them will be heavily constrained. That Mr Xi, who is 59, would succeed Mr Hu as party chief has been in little doubt since 2007. There was also little doubt that one day he would take over Mr Hu’s other important position as chairman of the party’s Central Military Commission, which controls the armed forces. But it was uncertain until the announcement was made whether Mr Hu would relinquish both titles at the same time. Mr Hu is constitutionally obliged to step down from his other post, as China’s president, next March, but that is a far less substantial job. His predecessors, Jiang Zemin and the late Deng Xiaoping, both kept the military post for a couple of years after leaving the Politburo, ostensibly to ensure a smooth transition. Not since Hua Guofeng took over on Mao’s death have both jobs been transferred simultaneously. Hua turned out to be little more than a transitional figure. Few people expect Mr Xi to be the same. But his new jobs by no means give him absolute power. Crucially, his two predecessors, Mr Hu and Mr Jiang, are still alive. Both will wield considerable influence: Mr Jiang, at the age of 86, probably even more than the 69-year-old Mr Hu. The membership of the Politburo Standing Committee, the party’s ruling body, bears Mr Jiang’s imprint. Mr Xi and the man expected to succeed Wen Jiabao as prime minister next March, Li Keqiang, are the only two left from the outgoing committee, which has been reduced from nine members to seven. Of the five newcomers, all but one are considered to be protégés of Mr Jiang. This is unlikely to displease Mr Xi, himself counted a Jiang-ist. Mr Li will be less enthused. Many observers believe that at one time Mr Hu was keen Mr Li should succeed him, not Mr Xi. As prime minister, Mr Li’s chief responsibility will be overseeing the economy. But he might find it difficult to get his way given the presence of two others in the standing committee who are Jiang’s men. One is Wang Qishan, who has played a central role in economic management for more than four years, and has now acquired a very powerful role as the party’s chief anti-corruption official. The other is Zhang Gaoli, the party leader in the port city of Tianjin, who is expected to take over Mr Wang’s economic portfolio. The body’s new membership does not suggest any clear policy shift. Reformers will be disappointed at the omission of two men once thought frontrunners for elevation: the party chief of Guangdong province, Wang Yang, and the head of the party’s Organisation Department, Li Yuanchao. Both are seen as Mr Hu’s men and are reputed to be relatively liberal. None of this necessarily means that Mr Xi will shy away from economic, or even political, reforms. Mr Hu has been widely criticised by liberals in China for letting reforms stagnate, especially in his second term. Some allow themselves a smidgen of hope that Mr Xi may prove bolder. As a “princeling”, the child of a senior leader, Mr Xi is assumed to be rather more self-confident than Mr Hu. His father was close to Mao (until he fell out with him), as well as to Deng. This gives Mr Xi clout that Mr Hu, a commoner, lacked in his dealings with China’s ruling families. Mr Xi offered little evidence of such confidence, however, in his remarks to journalists after the rubber-stamping of his appointment by the party’s newly chosen 376-member central committee. He seemed relaxed and upbeat in his delivery (in the purest Mandarin tones of any of China’s supreme leaders since the party came to power in 1949). But his comments were bland. After a year of huge scandal, involving the purge of a Politburo member, Bo Xilai, for alleged corruption and complicity in the cover-up of a murder, Mr Xi referred only briefly to the “serious challenges” the party now faces, including that of corruption and becoming “divorced from the people”. He took no questions. The party’s worries about Mr Bo’s unusually populist approach may explain why the new standing committee is filled with conformist faces. One is Zhang Dejiang, who took over from Mr Bo as party chief of the south-western region of Chongqing. Mr Zhang, a likely new head of the legislature, is thought to be relatively conservative. So are

WIN – Week In a Nutshell 24 16th Nov 2012
WEEK IN A NUTSHELL
WEEK IN A NUTSHELL
two other new appointees: Liu Yunshan, the party’s propaganda chief (a Hu-ist); and Yu Zhengsheng, party chief in Shanghai, who trained as a missile engineer. As many as four of the seven leaders are deemed princelings. China’s kingmakers may have decided to play safe for now, but leadership issues will again loom large in 2017 when the party’s next five-yearly congress is due to be held. By then the newcomers to the standing committee will be considered too old to carry on (all of them are in their mid-to-late 60s). Some of the powerful elders might have faded from the scene. Mr Xi and Li Keqiang might then have a freer hand to promote their own people, and perhaps more daring ones. If, that is, they manage to keep control until then.

WIN – Week In a Nutshell 25 16th Nov 2012
WEEK IN A NUTSHELL
WEEK IN A NUTSHELL
Nifty Valuations at a glance
Related Documents