Key Trends in the Global Power & Energy Market Jonathan Robinson, Senior Consultant Frost & Sullivan Frost & Sullivan 29 March 2012 © 2012 Frost & Sullivan. All rights reserved. This document contains highly confidential information and is the sole property of Frost & Sullivan. No part of it may be circulated, quoted, copied or otherwise reproduced without the written approval of Frost & Sullivan.

Welcome message from author
This document is posted to help you gain knowledge. Please leave a comment to let me know what you think about it! Share it to your friends and learn new things together.
Transcript

Key Trends in the Global Power & Energy Market
Jonathan Robinson, Senior Consultant
Frost & SullivanFrost & Sullivan
29 March 2012
© 2012 Frost & Sullivan. All rights reserved. This document contains highly confidential information and is the sole property of Frost & Sullivan. No part of it may be circulated, quoted, copied or otherwise reproduced without the written approval of Frost & Sullivan.

Functional Expertise
• 5 years of research & consulting experience, involvement in more than 40 projects. Particular expertise in:
• Opportunity Assessment
• Procurement Strategy
• Supply Chain Management Strategy
• Due Diligence for IPO/M&A activity
Industry Expertise
• Experience base covering broad range of energy sectors, leveraging long-standing working relationships with
leading industry participants:
• Renewables sector (wind, solar, tidal, hydro)
• Conventional thermal energy (coal, gas)
Today’s Presenter
2
Jonathan RobinsonSenior Consultant
Energy, Environment Practice & Building Technologies Practice
London (UK)
• Nuclear
• Oil & Gas
• Future energy (fuel cells, energy storage, smart energy)
What I bring to the Team
• Extensive track-record of energy focused research and consulting projects
• Knowledge of, and relationships with, key stakeholders in the energy sector
• Strong analytical skills
Career Highlights
• Before Frost & Sullivan, worked for a political consultancy in London and for the NSW State Government in
Australia.
Education and Nationality
• MBus, University of Sydney; BSc Politics & Law, University of Southampton, UK National.
Coal
Nuclear
Solar
Topics for Discussion
Wind
Smart Energy
Natural Gas & Shale Gas

Snapshot on Key Coal-fired Power Markets
Russia: Replacement of existing base – extremely poor
condition
Europe: Minimal orders in the next 5 years due to uncertainty
Orders coming from Eastern Europe, TurkeyCo-firing opportunities
New coal opportunities limited to key geographies; largely refurbishment and co-firing opportunities in Europe and North America
Poor Good
Prospect
United States: Refurbishing/retrofitting the
existing base
The United Arab Emirates and Oman:
Preservation of gas reserves
South Africa:Major orders placed, but continual need for power; diversification into
gas
India and China:Continued strong growth in both,
although China will gradually focus more on other fuels
Source: Frost & Sullivan
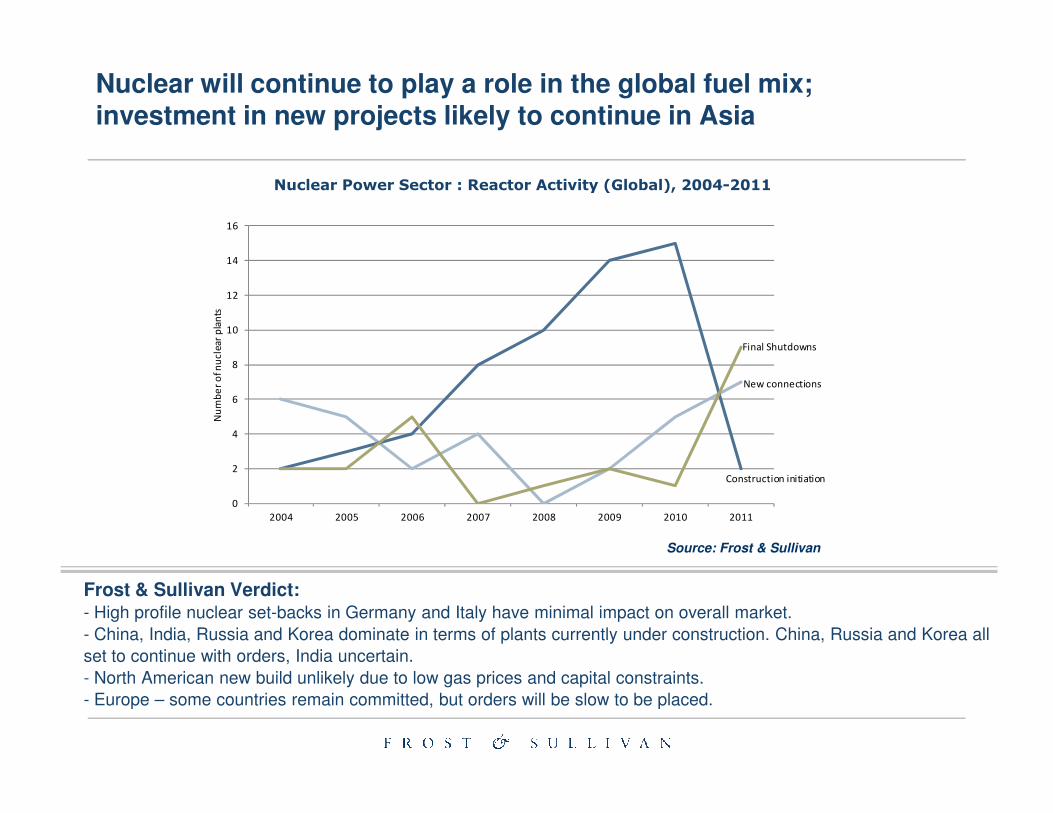
Nuclear will continue to play a role in the global fuel mix; investment in new projects likely to continue in Asia
Nuclear Power Sector : Reactor Activity (Global), 2004-2011
New connections
Final Shutdowns
6
8
10
12
14
16N
um
be
r o
f n
ucle
ar
pla
nts
Frost & Sullivan Verdict:- High profile nuclear set-backs in Germany and Italy have minimal impact on overall market.
- China, India, Russia and Korea dominate in terms of plants currently under construction. China, Russia and Korea all
set to continue with orders, India uncertain.
- North American new build unlikely due to low gas prices and capital constraints.
- Europe – some countries remain committed, but orders will be slow to be placed.
Source: Frost & Sullivan
Construction initiation
0
2
4
2004 2005 2006 2007 2008 2009 2010 2011
Nu
mb
er
of n
ucle
ar
pla
nts

Era of Europe’s dominance in solar PV is coming to an end
Key Solar PV Markets, Annual Installations, 2011-2012
Country Policy Impact
China
Solar FIT introduced in Aug, 2011; emerging domestic demand will take heat away from concerns of demand recovery in Europe
Japan
Solar FIT re-introduced in Aug, 2011 for residential and non-residential market segments
State RPS for solar provisions, state
China
4,000
Germany
5,500 MW
USA
1,600
3,000
3,500
7,500Japan
2,500
1,100
\
USA
State RPS for solar provisions, state rebates and tax credits. DoE’s Renewable Energy loans guarantee can be reduced after Solyndra scandal.
India
National Level Policy (JNNSM) – 3 phases with total 20,000 MW by 2022, State level policies, RPO and REC
Germany
Further cuts to FIT affect the market negatively. Efforts to cap the market at 2.5-3.5 GW yearly. Proposals for capping new installations at 1 GW a year.
Neutral Negative Positive
2,000
4,000
2011 2012 Annual installations, MW
Note: The graph is not drawn to scale

Solar costs will continue on a downward trend
Solar module cost breakdown, 2011-2012
0.60
0.80
1.00
1.20
Module gross profit
ASP/Cost per watt
1.10
0.96
0.00
0.20
0.40
0.60
end 2011E 2012E
Module gross profit
Module processing
Cell gross profit
Cell processing
Wafer gross profit
Wafer processing
Poly cost
Further drop-down in prices is likely to take place during 2012, bringing ASP below 1.00$/w by end of 2012. Over 40% of the drop will be attributed to per watt cost of poly.

Current policy developments increasingly put risk on subsidies
Key Wind Markets, Annual Installations MW, 2011-2012
Country Policy Development Impact on
Wind
FranceWind support hasn’t been changed, contrary to solar
Spain
Moratorium on new installations, proposal to cut FIT by 35%, plus other measures translating into insufficient returns
India
3,200
EuropeUSA
6,800
8,000
4,000
China
10,3009,600
18,00010,300
17,000
9,600
\
UK
New system based on long-term fixed contracts is proposed, which may reduce return for wind farms.
Germany
Solar FIT reduced, proposal to cap the market, Wind still supported.
US
Fed cash grant expires in Dec, Fed budget for clean energy programmes cut by the US Senate.
Neutral
Negative
Positive
3,000
3,200
2011 2012 Annual installations, MW
Note: The graph is not drawn to scale
17,000

Different timelines & priorities for key players over the next decade
• AMI
• Distributed Automation
• AMI (Smart Meters, Controls, Sensors, etc.)
• Accommodating all forms of generation
• Energy Monitors
• AMI (Smart Meter)
• Advanced Transmission • Sensing & • Interoperability/
Smart Thermostats
UtilityTechnology
Providers
Policymakers/Regu
latorsConsumer
2010
Transmission Technologies (HVDC, FACTS)
• Sensing & Measurement
• Interoperability/
open architecture• Smart Thermostats
• Integration of Distributed Generation
• Advanced Transmission Technologies
• Power Quality Devices
• Smart Appliances
• Security (Grid and information)
• Demand Response
• Electric Vehicles
• Open Architecture
• Energy Storage• Demand response
• Demand Response
• Electric Vehicles/Plug-in hybrid vehicles2020
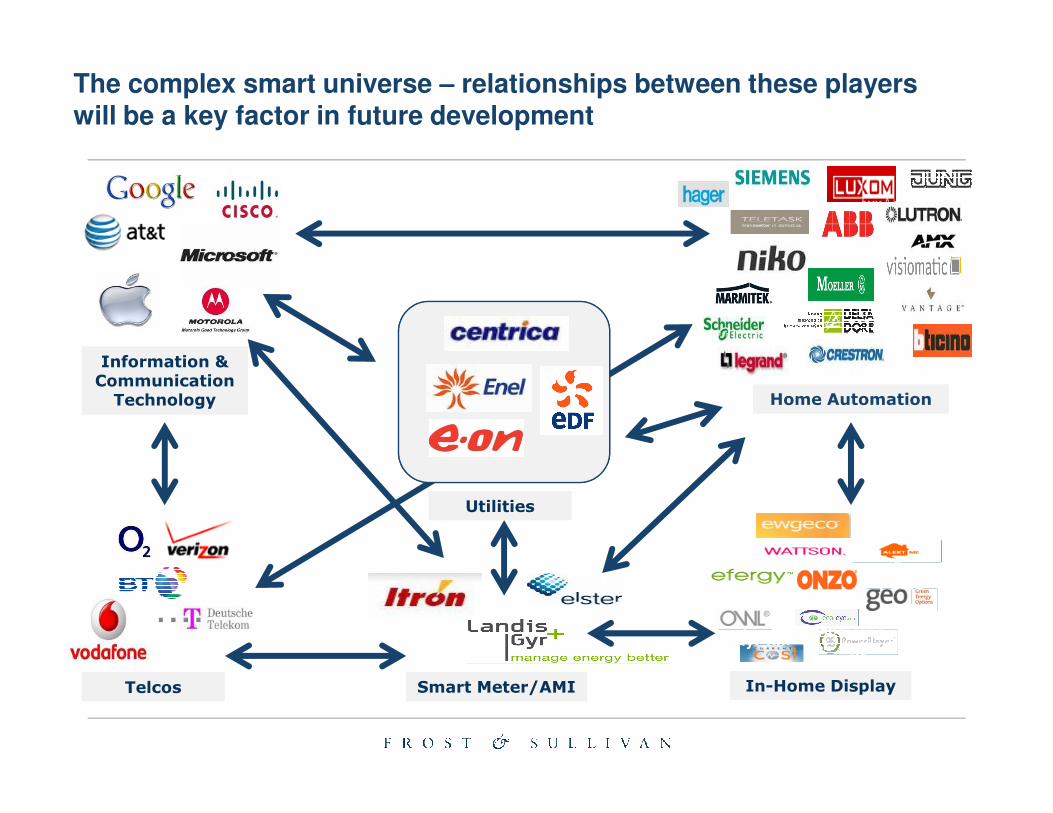
Information & Communication Technology Home Automation
The complex smart universe – relationships between these players will be a key factor in future development
Utilities
Telcos
Technology
Company
Company
Company
Company
Company
Company
Company
In-Home Display
Home Automation
Smart Meter/AMI
1,500
2,000
2,500
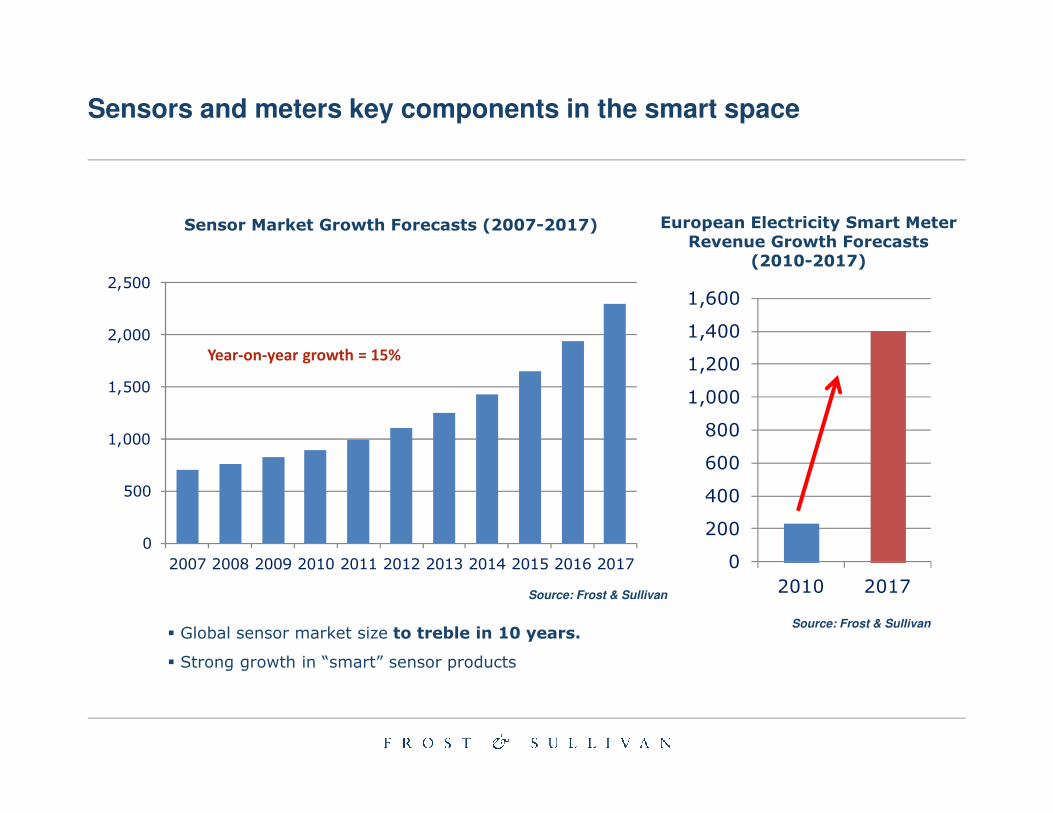
Year-on-year growth = 15%
Sensor Market Growth Forecasts (2007-2017)
Sensors and meters key components in the smart space
1,000
1,200
1,400
1,600
European Electricity Smart Meter Revenue Growth Forecasts
(2010-2017)
0
500
1,000
2007 2008 2009 2010 2011 2012 2013 2014 2015 2016 2017
� Global sensor market size to treble in 10 years.
� Strong growth in “smart” sensor products
0
200
400
600
800
1,000
2010 2017Source: Frost & Sullivan
Source: Frost & Sullivan

485
202020152010
2010 2015 2020
2010 2015 2020
North America
Europe Russia
China
Middle East
465500
200246
252
38
73
107139
202222
102107 108
Significant boost in gas expectations since last year forecasts
202020152010
202020152010
7469
50
202020152010
2010 2015 2020
2010 2015 2020
South America
Africa
East
4760
72
38
2010 2015 2020
India
2234
50
Source: World Energy Outlook, Frost & Sullivan
Globally the 2020 gas capacity forecasts was adjusted upwards by 7%, with the most significant regional adjustments for Asia and Europe.
The substantial slowdown and in some cases elimination of nuclear power from the fuel mix, together with improved prospects for shale gas and worsening prospects for coal in developed regions are key drivers behind the upgrades.

North America (USA, Canada, Mexico)
28 28
346
1,932
Europe (13 gas markets)
11 15
186
639
China107
1,275
Gas Market Production, Consumption and Reserves, (Selected Regions) 2011
(Trillion Cubic Feet)
Shale gas the hot global gas topic; high uncertainty over reserve levels due to lack of geological data
Source: EIA
* Libya, Algeria, South Africa, Tunisia, Morocco, Mauritania
South America
3.4 3.4
240
1,225
2.9 3.1
India
1.4 1.938
63
Africa*
3.6 1.6
217
1,042
Production
Consumption
Proven Reserves
Technically Recoverable
Reserves

Shale Gas Reserves in Detail
Shale Gas Reserves
Europe
US, 24395
Mexico, 19272
Canada, 10980 India, 1783
Pakistan, 1443
UK, 1700
Poland, 5292
France, 5094
Other , 7131
North America
Asia
Source: EIA, Frost & Sullivan estimates
Unit:
billion cubic metres (bcm)
19272
South Africa, 13726
Libya, 8207
Algeria, 6537
Others, 1019
Australia, 11207
China, 25100
Argentina, 21904
Brazil, 6396
Others, 6367
AustraliaAfrica
Latin America

The United StatesImpact already felt, shale to
account for 40% of gas
ChinaMassive potential, but
like Europe,
EuropeMajor impact 2020
onwards; challenges to be overcome,
Impact differs by region; likely to lead to greater amounts of gas-fired power generation, but unlikely to displace conventional gas/LNG
account for 40% of gas production by 2030
like Europe, challenges to be
overcomes
2010-2015 2015-2020 2020-2025 2025-2030
When could shale gas have
a significant impact?
to be overcome, some countries
opposed
Water Usage Water Usage
Cost uncertainty vs. other gas supply sourcesCost uncertainty vs. other gas supply sources
Lack of Infrastructure Lack of Infrastructure
Environmental ConcernsEnvironmental Concerns
Technical IssuesTechnical Issues

Who is active where in Europe?
UkraineUK
Germany
France (now halted)
Poland
Hungary
France (now halted)

European energy and environment policy: implications for shale gas
2
1
Shale gas could be covered by the EU ETSShale gas could be covered by the EU ETS
EU states sovereignty over natural resources – but EU regulates environment
and water
EU states sovereignty over natural resources – but EU regulates environment
and water
2
3
Shale gas could be covered by the EU ETSShale gas could be covered by the EU ETS
EU unlikely to provide substantial subsidies – some clearly benefit, some no
reserves or not exploiting
EU unlikely to provide substantial subsidies – some clearly benefit, some no
reserves or not exploiting

6
8
10
12
$/M
Btu
Cost uncertainty vs. other gas supply sources
Cost Comparison – Pipeline Gas, LNG and Shale Gas (2009)
0
2
4
$/M
Btu
Pipeline LNG Shale ( current estimates)
Source: EIA World Energy Outlook 2009
Concluding Thoughts
2
1
Renewable energy growth to continue, but subsidies under pressure – can solar
break through to grid parity?
Renewable energy growth to continue, but subsidies under pressure – can solar
break through to grid parity?
Gas’s prospects continue to improve as a global fuelGas’s prospects continue to improve as a global fuel
3 Nuclear not dead but badly damagedNuclear not dead but badly damaged
4 Distributed generation to grow, facilitated by smart/T&D investmentDistributed generation to grow, facilitated by smart/T&D investment

Next Steps
Develop Your Visionary and Innovative SkillsGrowth Partnership Service Share your growth thought leadership and ideas or
join our GIL Global Community
20
Join our GIL Community NewsletterKeep abreast of innovative growth opportunities

Follow Frost & Sullivan on Facebook, LinkedIn, SlideShare, and Twitter
http://www.facebook.com/FrostandSullivan
http://www.linkedin.com/companies/4506
21
http://twitter.com/frost_sullivan
http://www.linkedin.com/companies/4506
http://www.slideshare.net/FrostandSullivan

Your Feedback is Important to Us
Growth Forecasts?
Competitive Structure?
What would you like to see from Frost & Sullivan?
22
Emerging Trends?
Strategic Recommendations?
Other?
Please inform us by “Rating” this presentation.

For Additional Information
Chiara Carella
Head of Corporate Communications
Europe, Israel, Africa
+44 (0) 207 343 8314
Andrew Thorndyke
Sales Director
Environment & Building Technologies
+44 (0) 186 539 8645
23
John Raspin
DirectorEnergy and Environment +44 (0)20 7915 7814
Philipp Reuter
Director
+9 0212 244 69 41
Related Documents