KEY TRENDS, DRIVERS AND IMPLICATIONS OF POPULATION DYNAMICS by Graeme Hugo ARC Australian Professorial Fellow Professor of Geography and Director of the National Centre for Social Applications of GIS The University of Adelaide Dinner Presentation to Institute of Public Administration Australia National Roundtable Series Meeting on Sustainable Population Strategy – Public Policy and Implementation Challenges Canberra 11 th April 2011

KEY TRENDS, DRIVERS AND IMPLICATIONS OF POPULATION DYNAMICS by Graeme Hugo ARC Australian Professorial Fellow Professor of Geography and Director of the.
Dec 24, 2015
Welcome message from author
This document is posted to help you gain knowledge. Please leave a comment to let me know what you think about it! Share it to your friends and learn new things together.
Transcript
KEY TRENDS, DRIVERS AND IMPLICATIONS OF
POPULATION DYNAMICSby
Graeme HugoARC Australian Professorial Fellow
Professor of Geography and Director of the National Centrefor Social Applications of GIS
The University of Adelaide
Dinner Presentation to Institute of Public Administration Australia National Roundtable Series Meeting on Sustainable Population
Strategy – Public Policy and Implementation ChallengesCanberra
11th April 2011
Outline of Presentation
• Introduction• Myths and Population
Dynamics• Global Trends and Drivers• Australian Population
Issues• Developing a Way Forward• Conclusion
Exploding Myths About Population
• Population is dynamic, always changing, but the change is gradual which means it often escapes the attention of policy makers
• Population is influenced by economic changes but not purely a function of them
• Some population change is structural – inevitable and predictable – provides some certainties in looking to the future
• Population is amenable to policy intervention
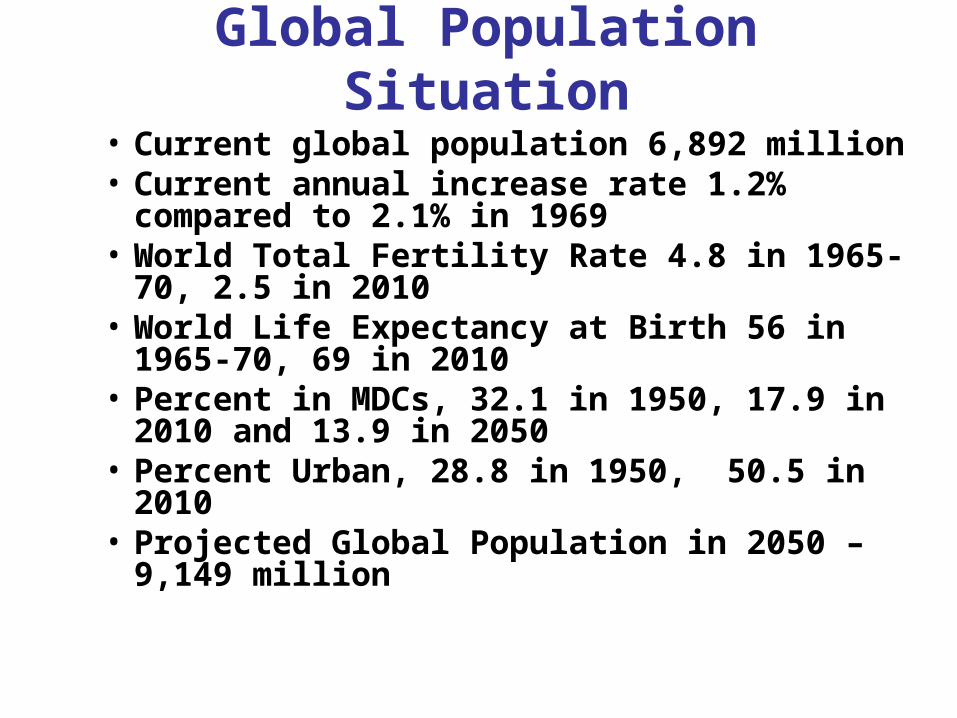
Global Population Situation
• Current global population 6,892 million• Current annual increase rate 1.2%
compared to 2.1% in 1969• World Total Fertility Rate 4.8 in 1965-70, 2.5
in 2010• World Life Expectancy at Birth 56 in 1965-
70, 69 in 2010• Percent in MDCs, 32.1 in 1950, 17.9 in 2010
and 13.9 in 2050• Percent Urban, 28.8 in 1950, 50.5 in 2010 • Projected Global Population in 2050 – 9,149
million
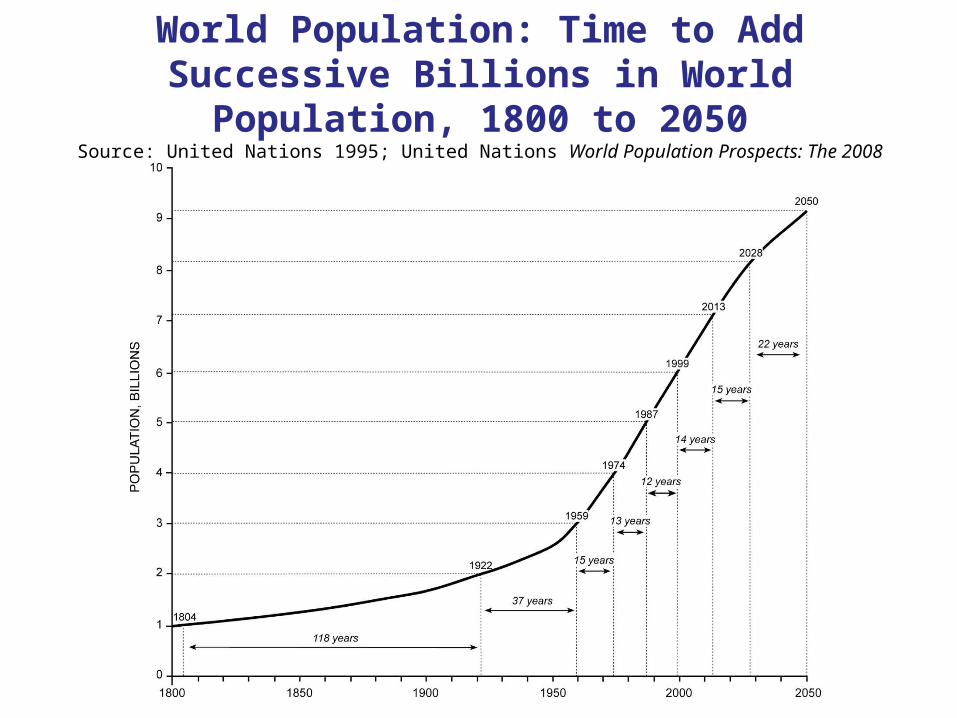
World Population: Time to Add Successive Billions in World Population, 1800 to 2050
Source: United Nations 1995; United Nations World Population Prospects: The 2008 Revision Population Database
Some Key Demographic Elements in Future Global Population Change
• Ageing
• The youth bulge
• China and India
• The Migration and Development Debate
• Climate Change

“Over the next couple of decades nothing will impact OECD economies more profoundly than demographic trends and, chief among them, ageing”
Jean-Philippe CotisChief Economist, OECDMarch 2005
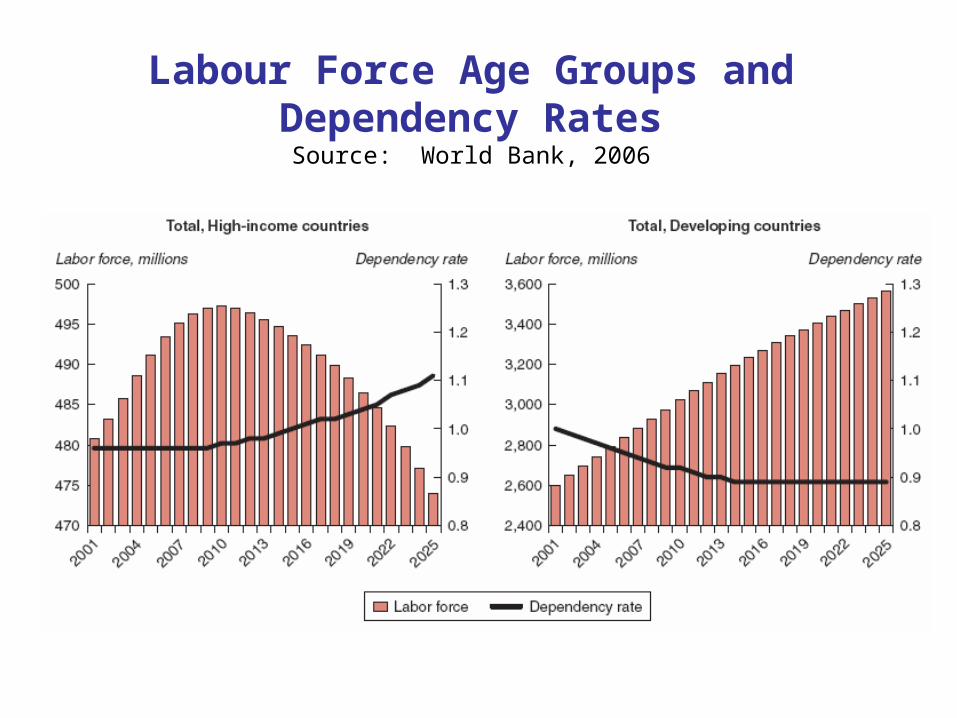
Labour Force Age Groups and Dependency Rates
Source: World Bank, 2006
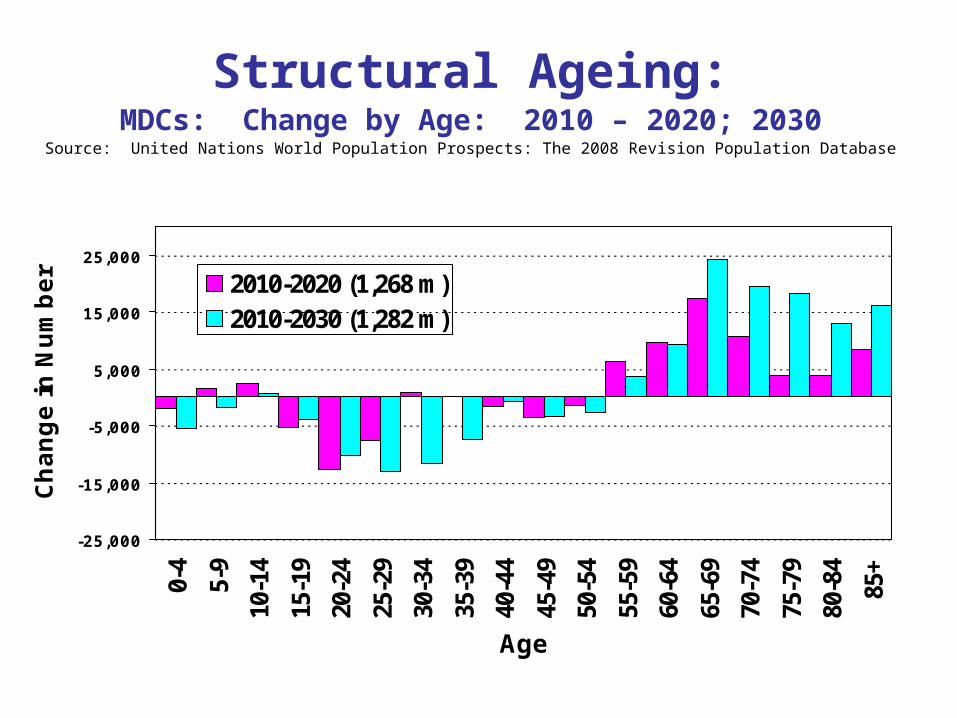
Structural Ageing:MDCs: Change by Age: 2010 – 2020; 2030
Source: United Nations World Population Prospects: The 2008 Revision Population Database
-25,000
-15,000
-5,000
5,000
15,000
25,000
0-4
5-9
10-
14
15-
19
20-
24
25-
29
30-
34
35-
39
40-
44
45-
49
50-
54
55-
59
60-
64
65-
69
70-
74
75-
79
80-
84
85+
Age
Change in N
um
ber
2010-2020 (1,268 m)2010-2030 (1,282 m)
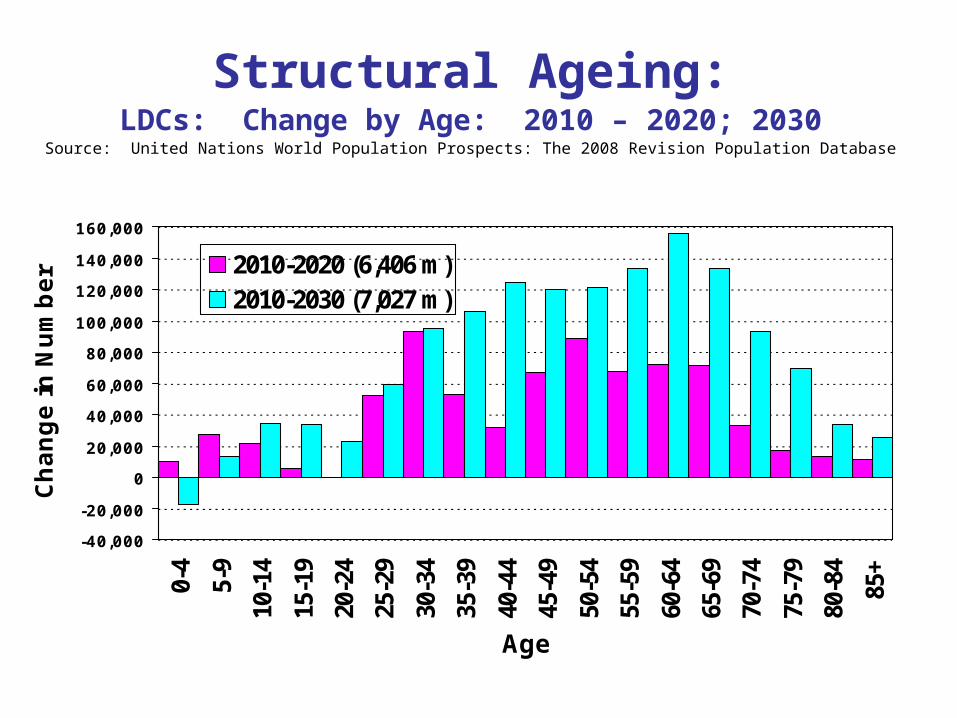
Structural Ageing:LDCs: Change by Age: 2010 – 2020; 2030
Source: United Nations World Population Prospects: The 2008 Revision Population Database
-40,000
-20,000
0
20,000
40,000
60,000
80,000
100,000
120,000
140,000
160,000
0-4
5-9
10-
14
15-
19
20-
24
25-
29
30-
34
35-
39
40-
44
45-
49
50-
54
55-
59
60-
64
65-
69
70-
74
75-
79
80-
84
85+
Age
Change in N
um
ber 2010-2020 (6,406 m)
2010-2030 (7,027 m)
Demographic Impacts of Fertility Decline
• Ageing
• The youth bulge and the demographic dividend

The Middle East Youth Bulge
• 1970-2007, 80% of outbreaks of violence in countries where 60% or more aged under 30
• 60% of region’s population aged under 30
• 20% of Egyptians aged 15-24
• Exacerbated in urban areas
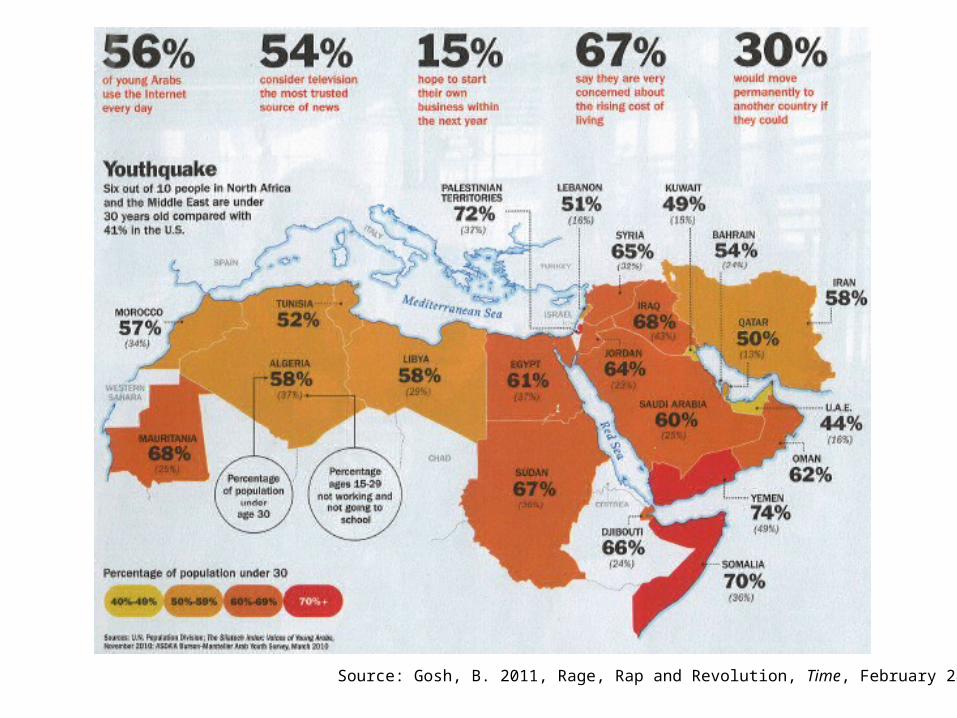
Source: Gosh, B. 2011, Rage, Rap and Revolution, Time, February 28, p.25
The Youth Bulge(Westley and Cho, 2002, 57)
“…is the result of a transition from high to low fertility about 15 years earlier. The youth bulge consists of large numbers of young adolescents and young adults who were born when fertility was high followed by declining numbers of children born after fertility declined”
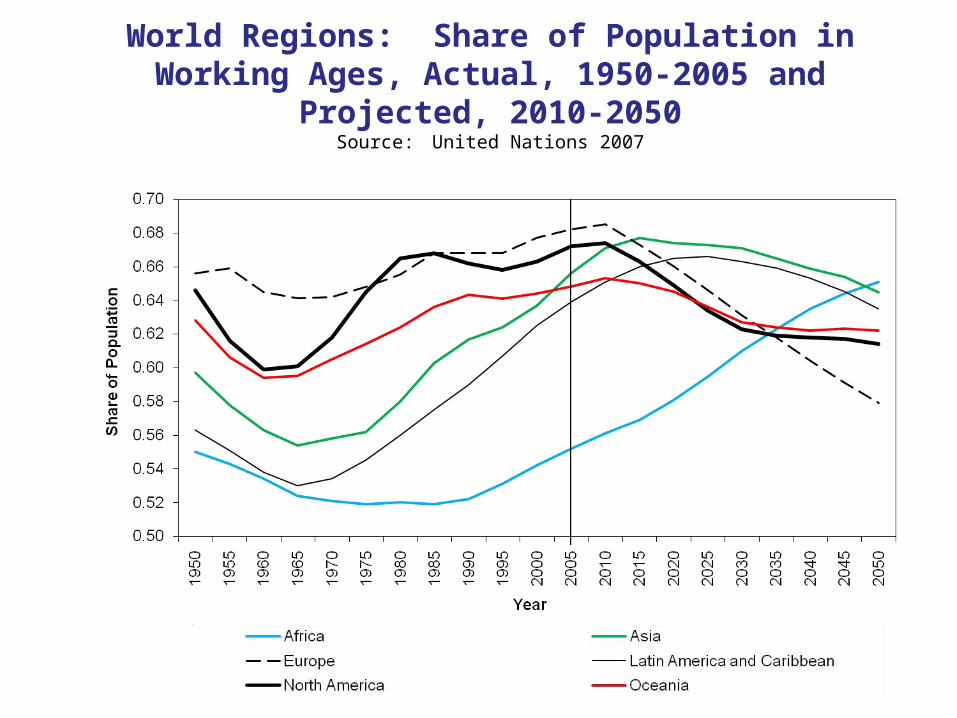
World Regions: Share of Population in Working Ages, Actual, 1950-2005 and Projected, 2010-2050
Source: United Nations 2007

Impacts of the Youth Bulge
• The demographic dividend impact on the economy
• Accounts for a fifth of China’s economic growth in 1990s (Mason, 2004)
• Potential for political unrest (Fuller and Hoch, 1998)
• Potential for increased population mobility
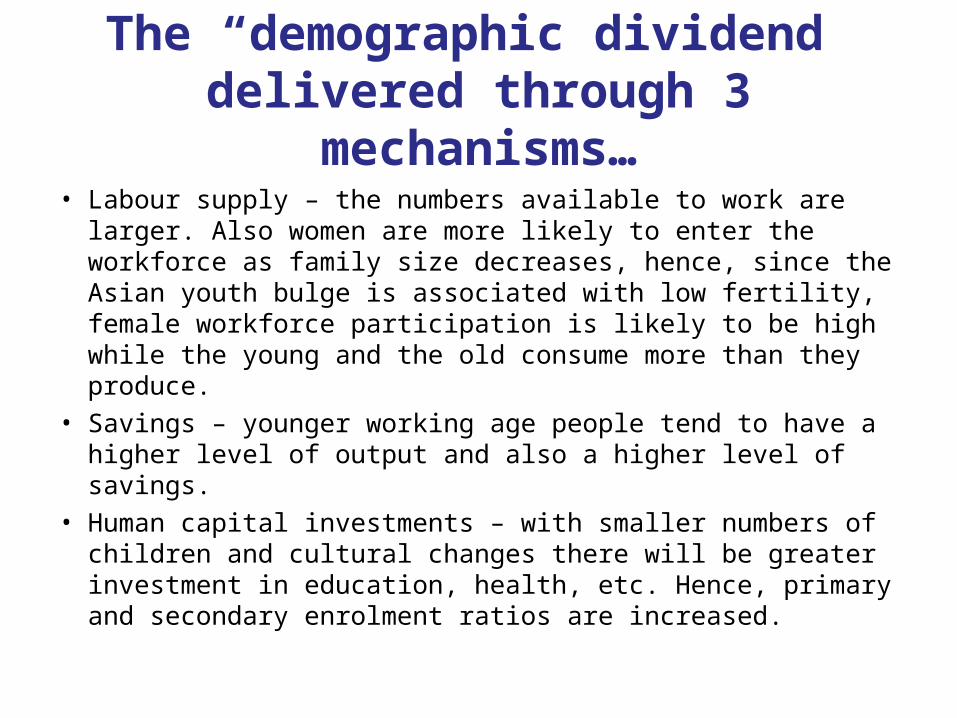
The “demographic dividend” delivered through 3 mechanisms…
• Labour supply – the numbers available to work are larger. Also women are more likely to enter the workforce as family size decreases, hence, since the Asian youth bulge is associated with low fertility, female workforce participation is likely to be high while the young and the old consume more than they produce.
• Savings – younger working age people tend to have a higher level of output and also a higher level of savings.
• Human capital investments – with smaller numbers of children and cultural changes there will be greater investment in education, health, etc. Hence, primary and secondary enrolment ratios are increased.
Impacts of Current Youth Bulge Exacerbated by …
• Disproportionate concentration in cities
• First generation with universal education
• First generation growing up with the internet and global communications
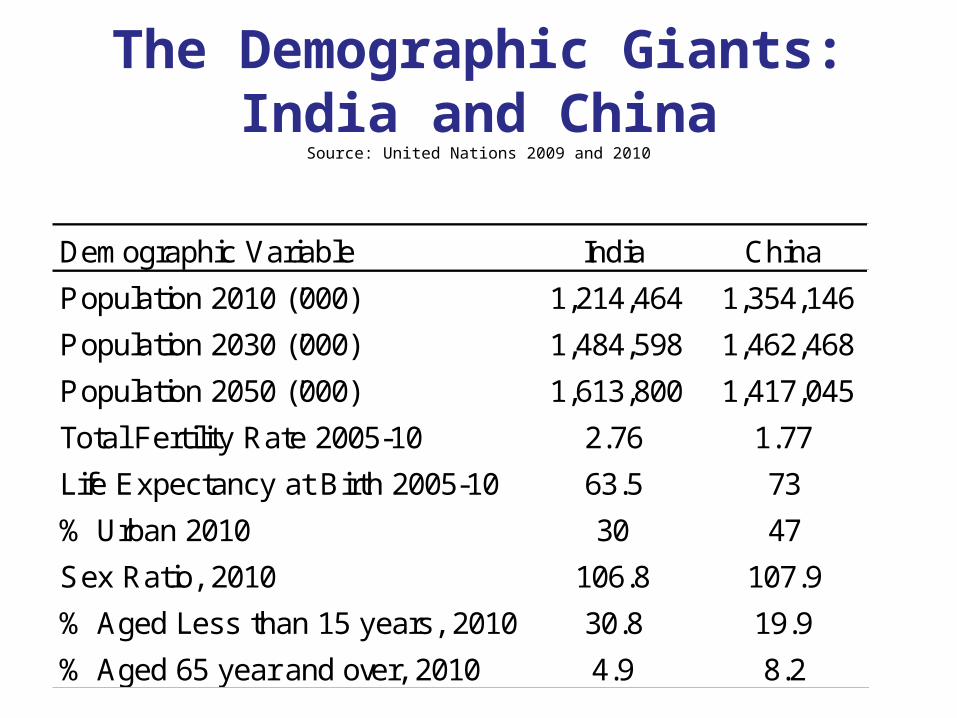
The Demographic Giants:India and China
Source: United Nations 2009 and 2010
Demographic Variable India China
Population 2010 ('000) 1,214,464 1,354,146
Population 2030 ('000) 1,484,598 1,462,468
Population 2050 ('000) 1,613,800 1,417,045
Total Fertility Rate 2005-10 2.76 1.77
Life Expectancy at Birth 2005-10 63.5 73
% Urban 2010 30 47
Sex Ratio, 2010 106.8 107.9
% Aged Less than 15 years, 2010 30.8 19.9
% Aged 65 year and over, 2010 4.9 8.2
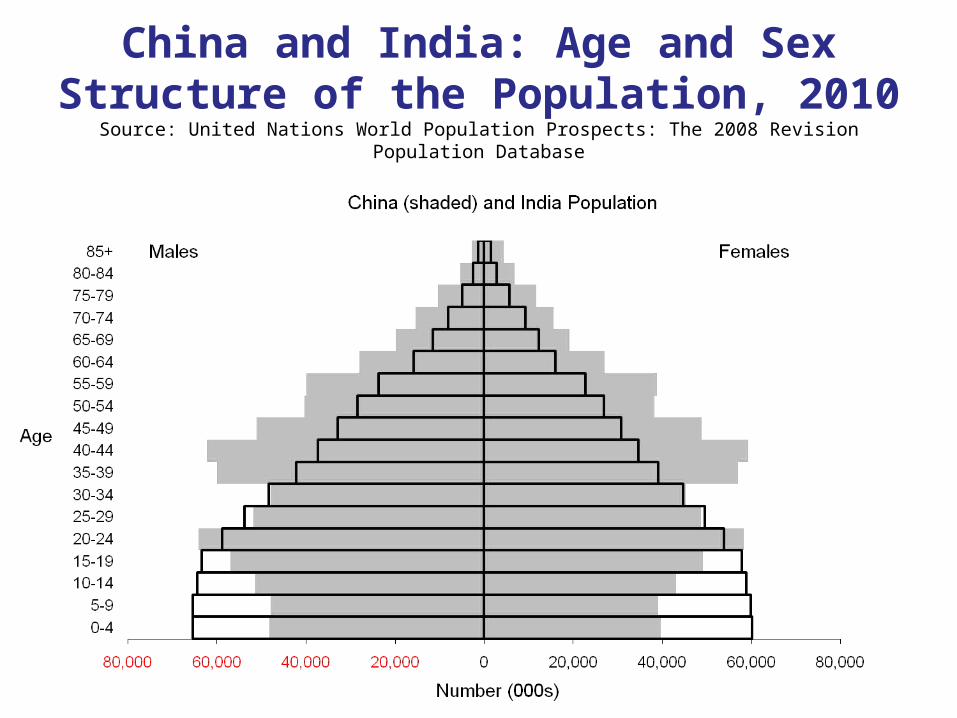
China and India: Age and Sex Structure of the Population, 2010
Source: United Nations World Population Prospects: The 2008 Revision Population Database
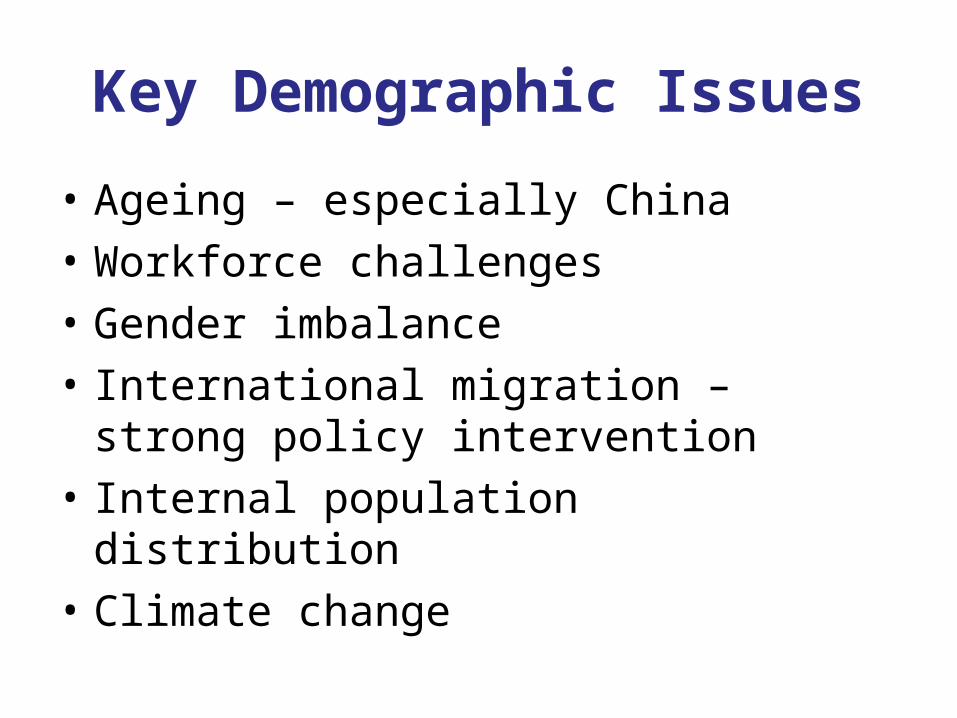
Key Demographic Issues
• Ageing – especially China
• Workforce challenges
• Gender imbalance
• International migration – strong policy intervention
• Internal population distribution
• Climate change
International Migration and Development
• Brain drain issues
• Remittances
• Diaspora impacts – new significance
• Role of policy
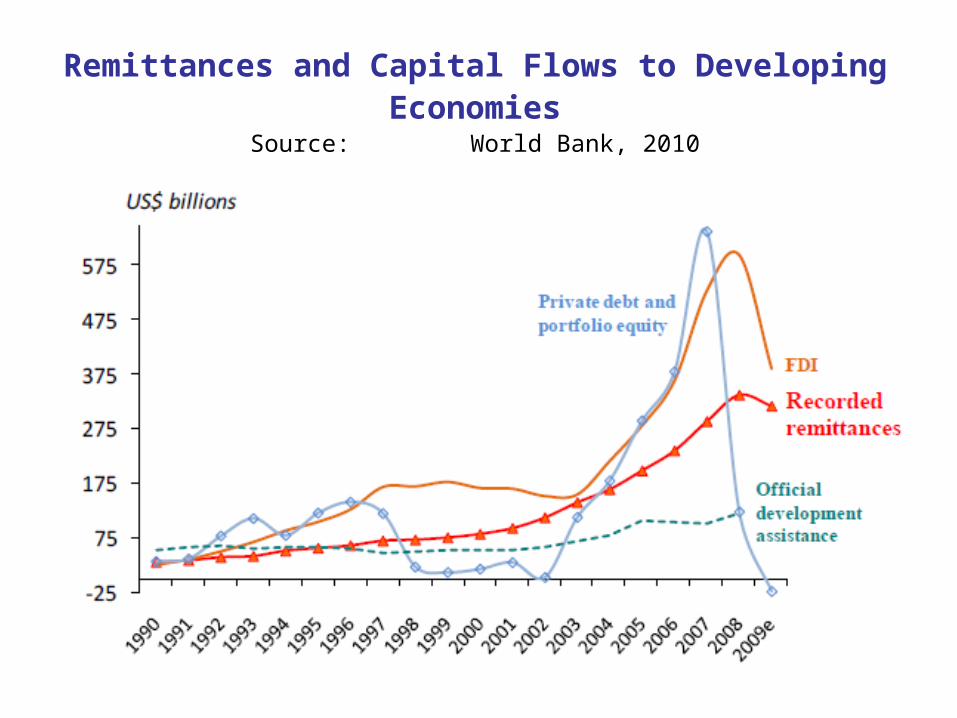
Remittances and Capital Flows to Developing EconomiesSource: World Bank, 2010
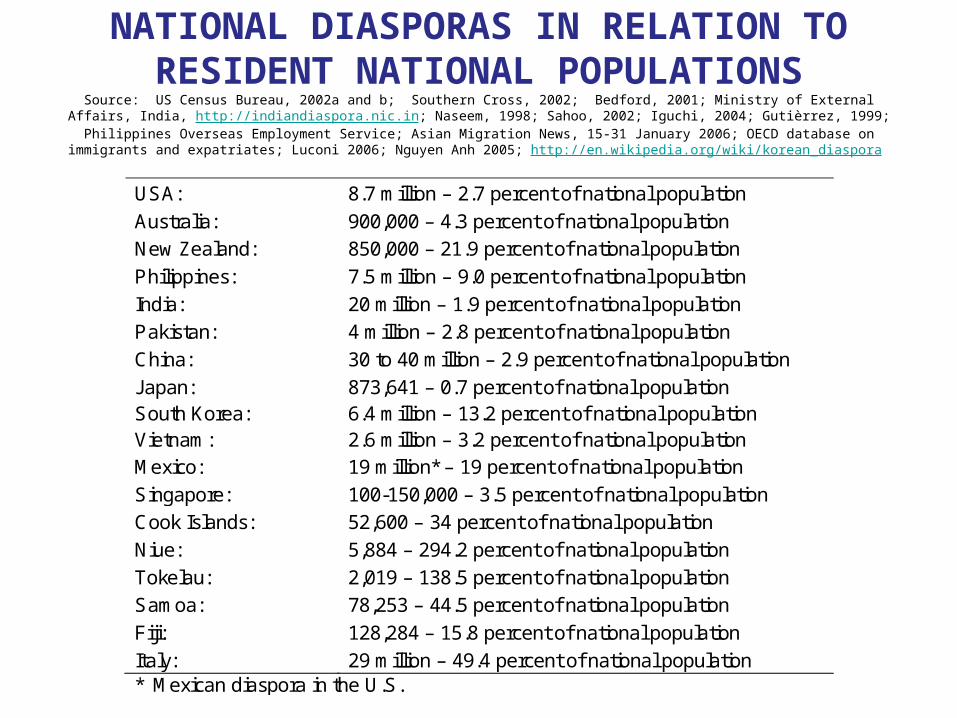
NATIONAL DIASPORAS IN RELATION TO RESIDENT NATIONAL POPULATIONS
Source: US Census Bureau, 2002a and b; Southern Cross, 2002; Bedford, 2001; Ministry of External Affairs, India, http://indiandiaspora.nic.in; Naseem, 1998; Sahoo, 2002; Iguchi, 2004; Gutièrrez, 1999; Philippines Overseas Employment Service; Asian Migration News, 15-31 January
2006; OECD database on immigrants and expatriates; Luconi 2006; Nguyen Anh 2005; http://en.wikipedia.org/wiki/korean_diaspora
USA: 8.7 million – 2.7 percent of national population
Australia: 900,000 – 4.3 percent of national population
New Zealand: 850,000 – 21.9 percent of national population
Philippines: 7.5 million – 9.0 percent of national population
India: 20 million – 1.9 percent of national population
Pakistan: 4 million – 2.8 percent of national population
China: 30 to 40 million – 2.9 percent of national population
Japan: 873,641 – 0.7 percent of national population South Korea: 6.4 million – 13.2 percent of national population Vietnam: 2.6 million – 3.2 percent of national population Mexico: 19 million* – 19 percent of national population
Singapore: 100-150,000 – 3.5 percent of national population
Cook Islands: 52,600 – 34 percent of national population
Niue: 5,884 – 294.2 percent of national population
Tokelau: 2,019 – 138.5 percent of national population
Samoa: 78,253 – 44.5 percent of national population
Fiji: 128,284 – 15.8 percent of national population
Italy: 29 million – 49.4 percent of national population * Mexican diaspora in the U.S.
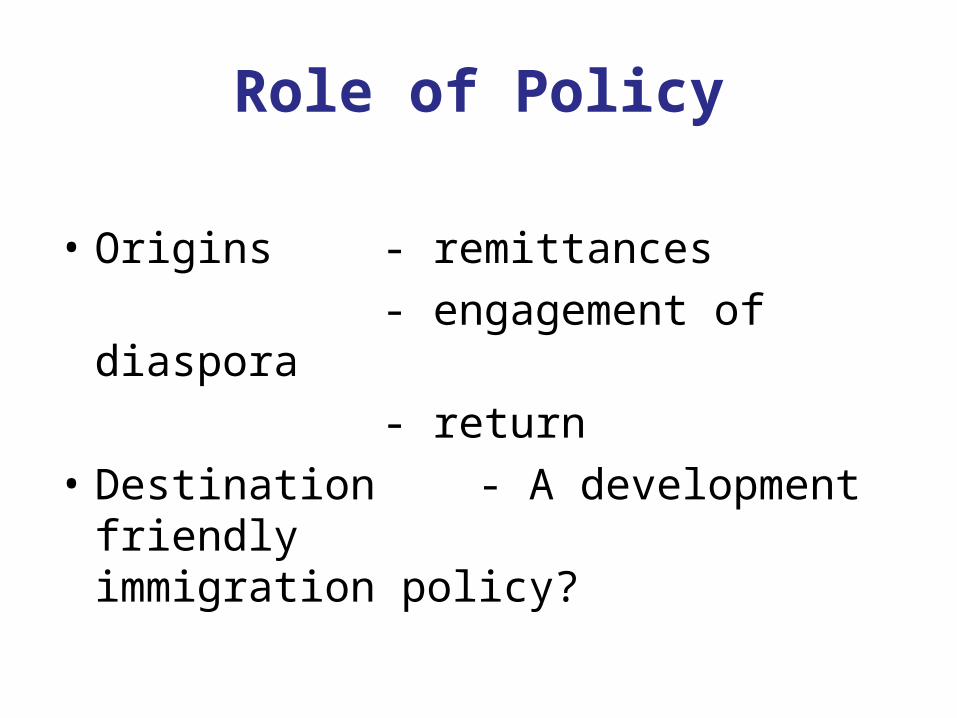
Role of Policy
• Origins - remittances
- engagement of diaspora
- return
• Destination - A development friendly immigration policy?
Climate Change and Population
• Coincidence of demographic and climate change hotspots
• Linkages with migration

Population and Climate Change HotspotsSource: www.populationaction.org/Publications

Hotspots of Climate Change Impact Within the Asia Pacific
• Coastal areas are vulnerable to inundation and the effect of storm surges associated with sea level rise (McGranahan et al., 2007).
• River valleys and deltas (Ericson et al., 2006) will be influenced by increased riparian flooding.
• Low lying island states, especially atolls, are at risk from the effects of sea level rise, surface warming and extreme weather events (Barnett and Adger, 2003).
• Semi-arid and low humidity areas where drought and availability of water are already problematic are likely to experience an exacerbation of those water shortage problems.
• Some other areas likely to be impacted by extreme weather events.
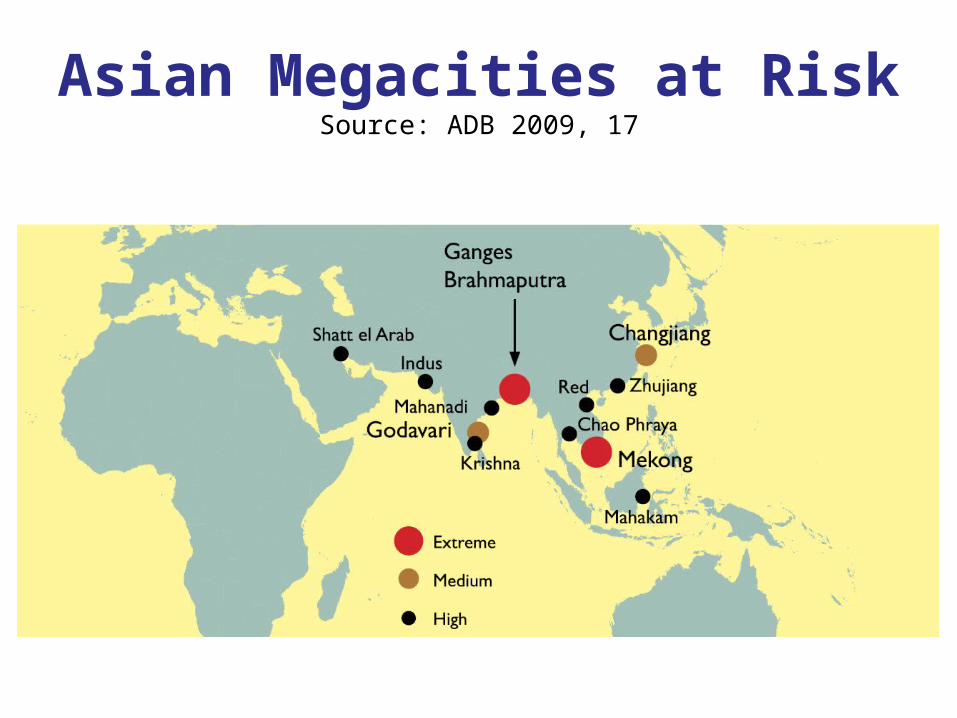
Asian Megacities at RiskSource: ADB 2009, 17

Differences in Population in the LECZ by Global
Region, 2000Source: McGranahan et al., 2007
Contemporary Dynamics of Australian Population
• Growth – Mortality, Fertility and Migration
• Composition
• Distribution
• Projections

Contemporary Population Growth Rates (% pa) Source: ESCAP 2009; Population Reference Bureau 2009 and 2010; ABS 2010
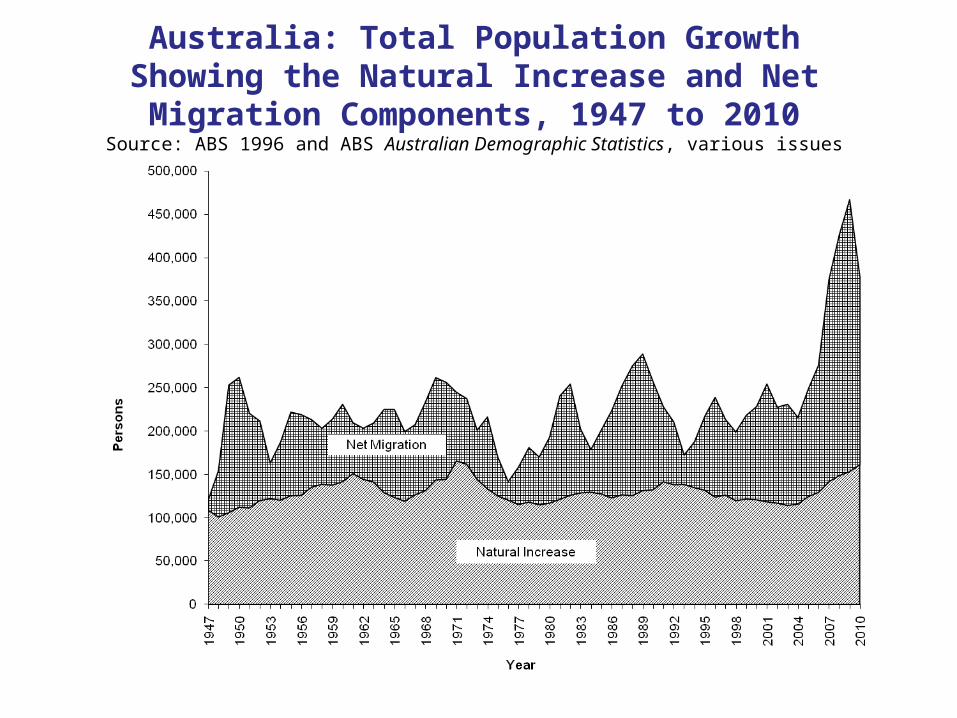
Australia: Total Population Growth Showing the Natural Increase and Net Migration Components,
1947 to 2010Source: ABS 1996 and ABS Australian Demographic Statistics, various issues

Australia: Expectation of Life at Birth, 1870-2009Source: Hugo 1986 and ABS Deaths Bulletins
Expectation of Life at Birth
Males Females
1947 66.1 70.6
2009 79.3 83.9

Australia: Expectation of Life at Age 50, 1901-1910, 1970-1972 and 2009
Source: ABS
Year Males Females
1901-1910 21.2 23.7
1970-1972 23.0 28.3
2009 31.7 35.3
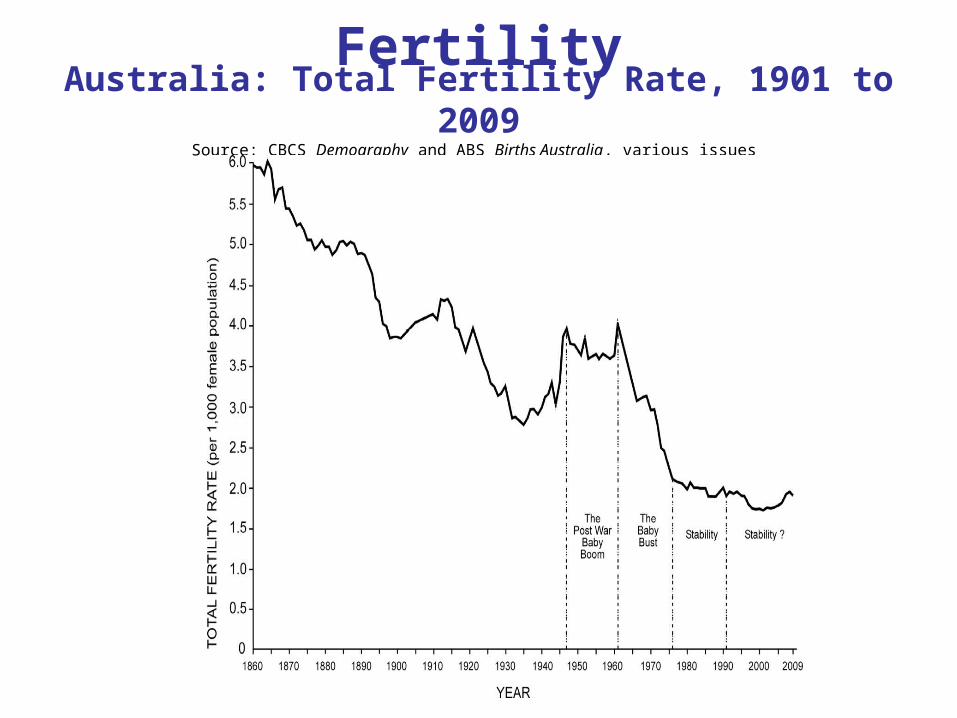
FertilityAustralia: Total Fertility Rate, 1901 to 2009
Source: CBCS Demography and ABS Births Australia, various issues

Australia: Permanent and Temporary Components of Net
Overseas Migration, 1983-2010Source: DIMIA Australian Immigration: Consolidated Statistics, DIAC Immigration Update and ABS Australian Demographic
Statistics, various issues
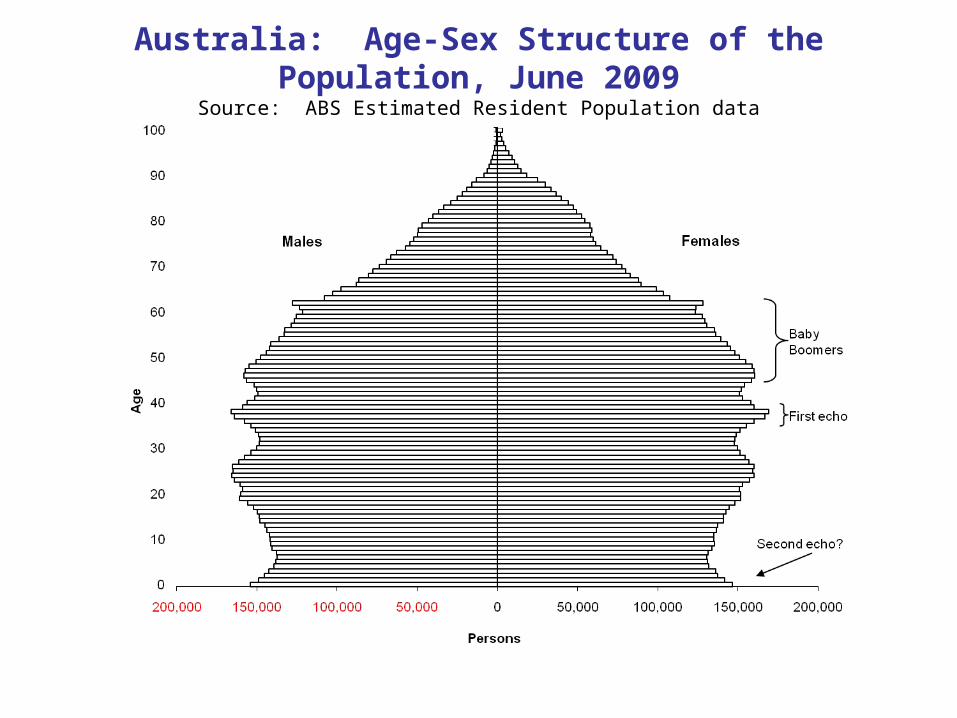
Australia: Age-Sex Structure of the Population, June 2009Source: ABS Estimated Resident Population data

Baby Boomers 2006
• 27.5% of Australian Population
• 41.8% of Australian Workforce

A Distinct Population Distribution
• 87% living in urban areas
• 64% living in capital cities
• 81% living 50 km from coast
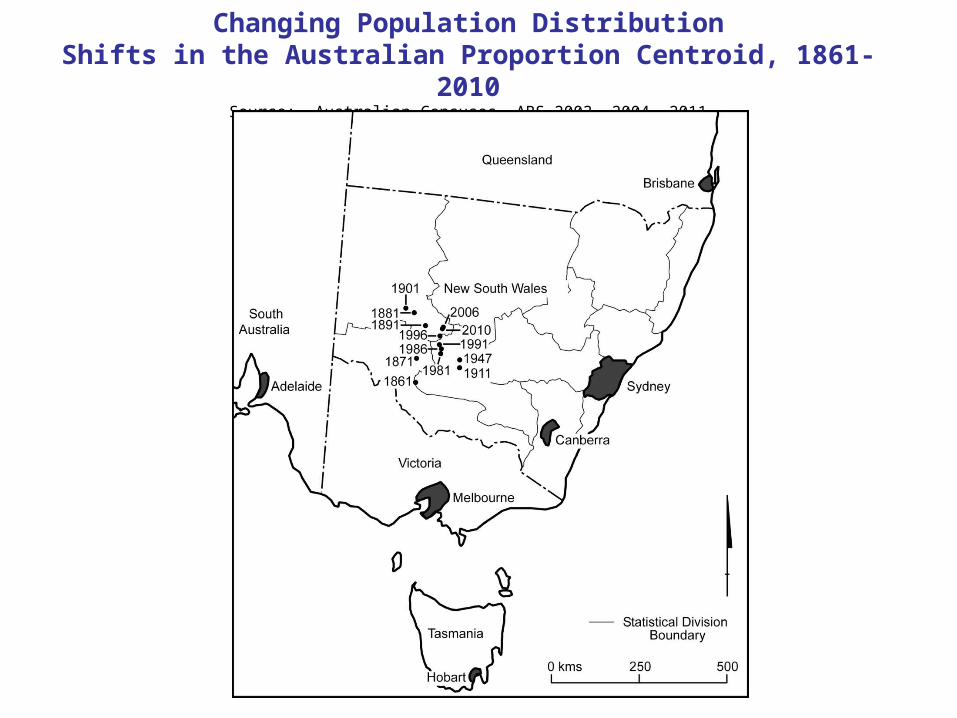
Changing Population DistributionShifts in the Australian Proportion Centroid, 1861-2010
Source: Australian Censuses, ABS 2003, 2004, 2011
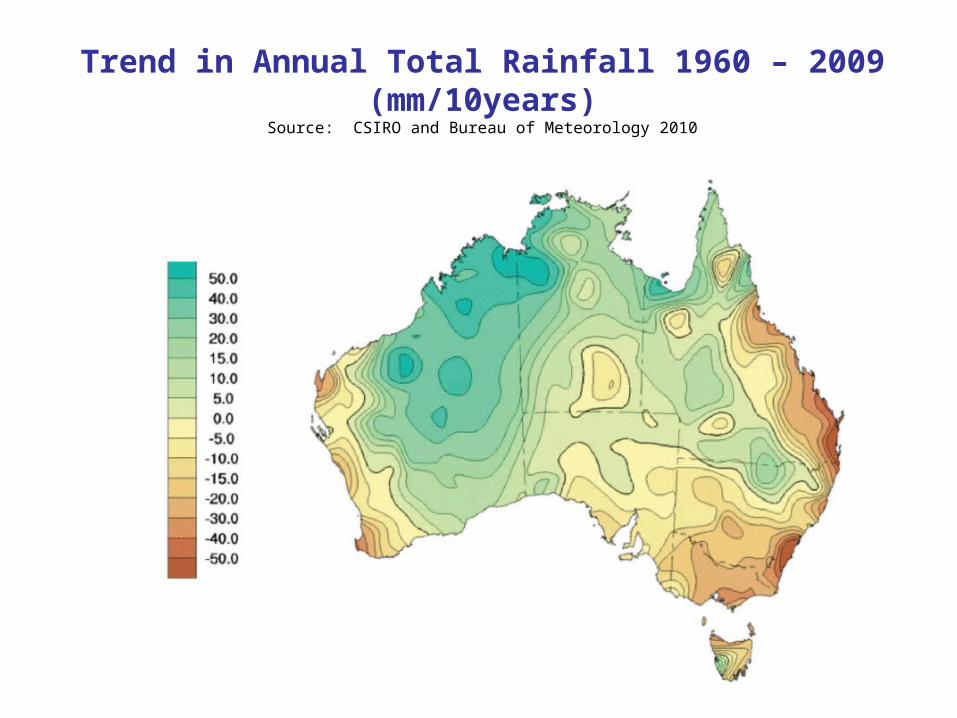
Trend in Annual Total Rainfall 1960 – 2009 (mm/10years)
Source: CSIRO and Bureau of Meteorology 2010

Australia: Rainfall and Population in 2006
Australian rainfall 2006
% of Population
2006 2006 population Growth ratePercent of Land Area
Below average 89.6 17,749,462 0.98 38Average 7.23 1,432,090 0.70 18Above average 3.17 628,865 -1.57 44
Projecting the Population
• Different to prediction
• ABS does every 3 years
• Assumptions regarding mortality, fertility and migration
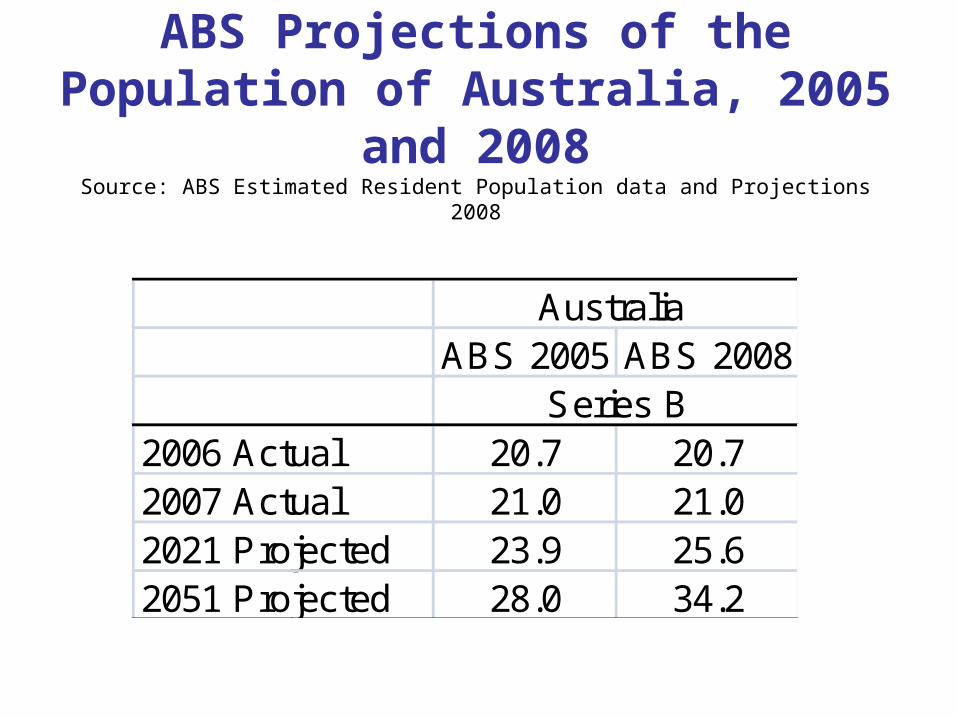
ABS Projections of the Population of Australia, 2005 and 2008
Source: ABS Estimated Resident Population data and Projections 2008
ABS 2005 ABS 2008
2006 Actual 20.7 20.72007 Actual 21.0 21.02021 Projected 23.9 25.62051 Projected 28.0 34.2
Australia
Series B
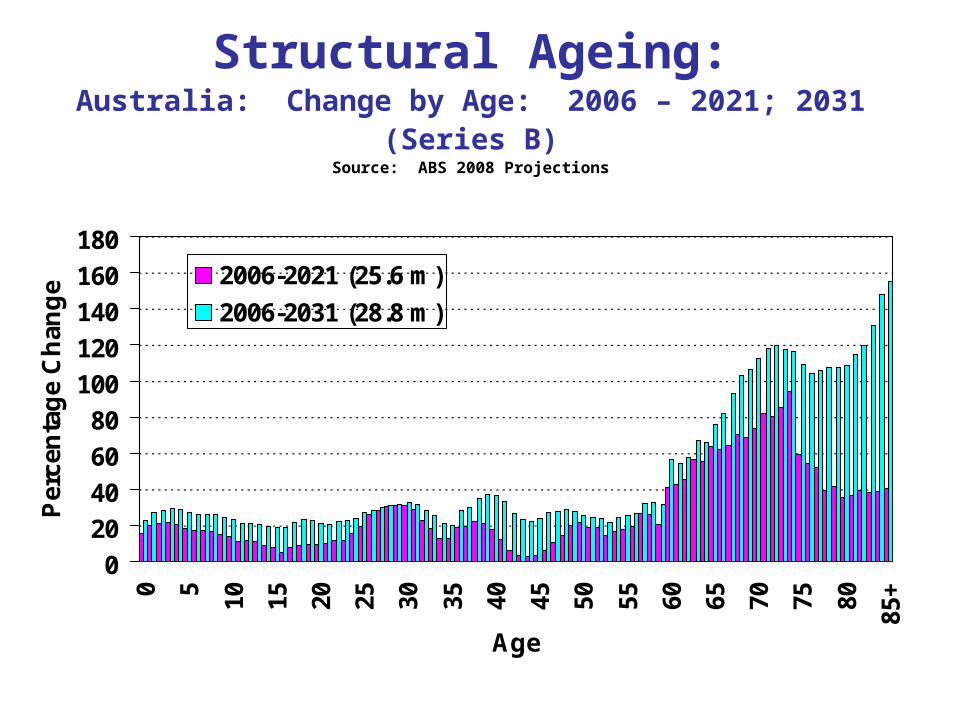
Structural Ageing:Australia: Change by Age: 2006 – 2021; 2031 (Series B)
Source: ABS 2008 Projections
0
20
40
60
80
100
120
140
160
180
0 5 10 15 20 25 30 35 40 45 50 55 60 65 70 75 80
85+
Age
Per
cen
tag
e C
han
ge 2006-2021 (25.6 m)
2006-2031 (28.8 m)

Australia’s Population Dilemma
• On the one hand there is a need to grow the population because- A replacement task – 42% of the present workforce are baby boomers- Net increases in demand for labour
• On the other there are substantial environmental constraints which will be exacerbated by climate change

Australia: Population by Selected Ages, 2010
Source: ABS Estimated Resident Population Data
Age
Persons as at 30th June
2010 Age
Persons as at 30th June
2010 Difference6 272,245 54 284,737 12,492
7 270,528 55 275,369 4,841 8 271,447 56 268,602 2,845- 9 276,570 57 267,590 8,980-
10 278,695 58 258,906 19,789- 11 278,877 59 255,546 23,331- 12 279,518 60 252,793 26,725- 13 282,344 61 244,204 38,140- 14 284,344 62 246,409 37,935- 15 291,967 63 254,966 37,001- 16 293,191 64 214,165 79,026- 17 297,283 65 204,634 92,649-

Addressing Ageing• There are no silver bullets – no single policy
intervention will counteract the effects of ageing• Introduction of a number of strategies involving
Productivity, Participation and Population is essential• To be most effective they need to be introduced well
before the ageing “crunch”. Planning is crucial.• Demographically Australia is better placed than any
OECD country to effectively cope with ageing but it needs to begin appropriate policy intervention now

Rethinking Australia’s Settlement System
• Most Australians will continue to live in capital cities and developing more sustainable large metropolitan areas is an important national priority
• However we must also consider to what extent our settlement system is the most efficient for the Twenty First Century and do the science to see whether modification of the settlement system would be advisable and possible
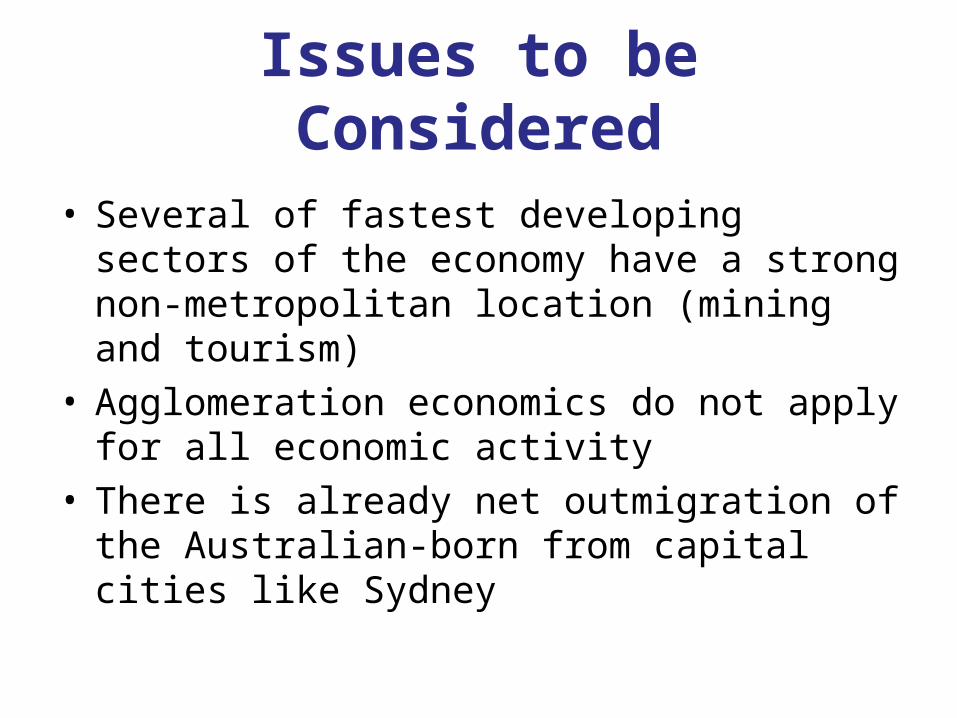
Issues to be Considered
• Several of fastest developing sectors of the economy have a strong non-metropolitan location (mining and tourism)
• Agglomeration economics do not apply for all economic activity
• There is already net outmigration of the Australian-born from capital cities like Sydney
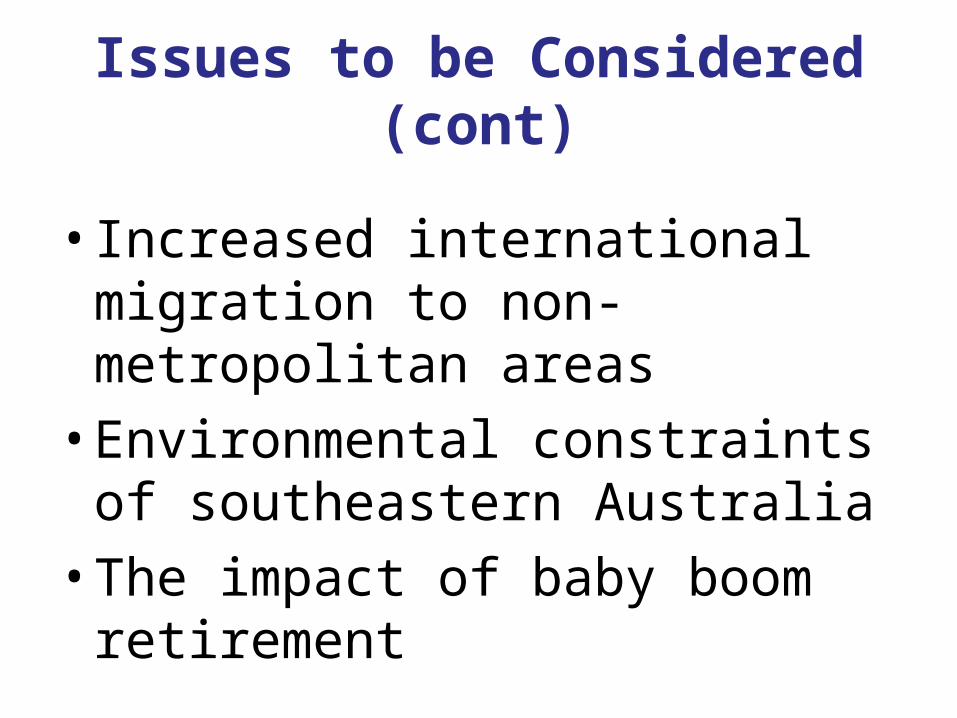
Issues to be Considered (cont)
• Increased international migration to non-metropolitan areas
• Environmental constraints of southeastern Australia
• The impact of baby boom retirement

Sydney Statistical Division: Net Internal and International Migration, 1971 to 2006
Source: NSW Department of Planning
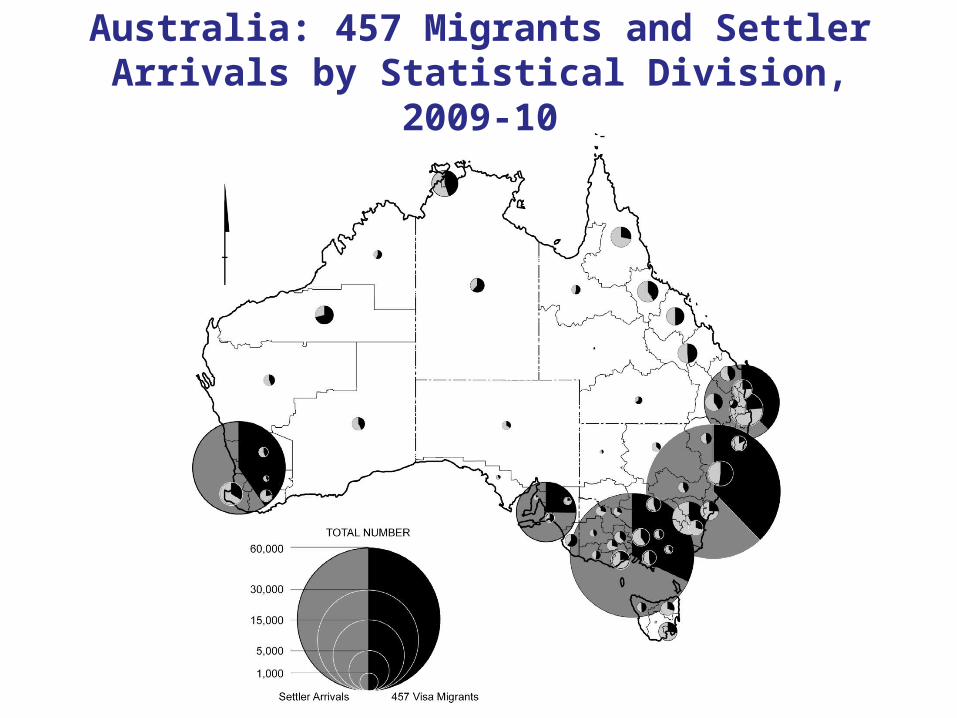
Australia: 457 Migrants and Settler Arrivals by Statistical Division, 2009-10
Source: DIAC
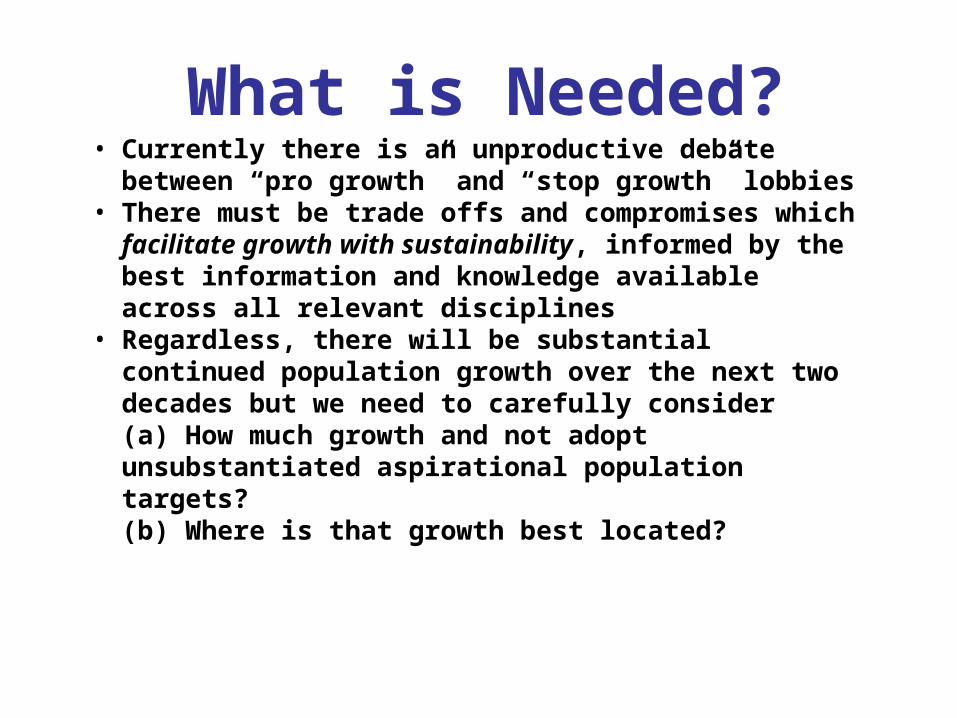
What is Needed?• Currently there is an unproductive debate
between “pro growth” and “stop growth” lobbies• There must be trade offs and compromises
which facilitate growth with sustainability, informed by the best information and knowledge available across all relevant disciplines
• Regardless, there will be substantial continued population growth over the next two decades but we need to carefully consider(a) How much growth and not adopt unsubstantiated aspirational population targets?(b) Where is that growth best located?
Conclusion• Australia is demographically better placed than most
OECD countries to cope with economic, demographic and environmental changes over the next two decades
• However Australia lacks a population policy which is informed not only by economic imperatives but also environmental and social inclusion concerns
• Need for development of a strategy which is based on the best science and is inclusive of the aspirations of all Australians
Related Documents