I I DEPARTMENT OF HEALTH AND HUMAN SERVICES Centers for Disease Control and Prevention F O R E V A L U A T N G C O M P R E H E N S VE T O B A C C O C O N T R O L P R O G R A M S May 2005 KEY OUTCOME INDICATORS

Welcome message from author
This document is posted to help you gain knowledge. Please leave a comment to let me know what you think about it! Share it to your friends and learn new things together.
Transcript
I I
DEPARTMENT OF HEALTH AND HUMAN SERVICES Centers for Disease Control and Prevention
F O R E V A L U A T N G C O M P R E H E N S V E
T O B A C C O C O N T R O L P R O G R A M S
May 2005
KEY OUTCOME INDICATORS
An OUTCOME INDICATOR is a specific, observable, and measurable characteristic or change that will represent achievement of the outcome. From: United Way of America. Measuring Program Outcomes: �A Practical Approach. Alexandria, VA: United Way of America; 1996. �
For more information, contact�CDC Office on Smoking and Health�770-488-5703�
For additional copies, e-mail your request to:�[email protected]�
Suggested citation
Starr G, Rogers T, Schooley M, Porter S, Wiesen E, Jamison N. Key Outcome Indicators for Evaluating Comprehensive Tobacco Control Programs. Atlanta, GA: Centers for Disease Control and Prevention; 2005.
Naming of surveillance systems, databases, and evaluation tools is for example purposes only and does not constitute endorsement by the Centers for Disease Control and Prevention or the U.S. Department of Health and Human Services.
K E Y O U T C O M E I N D I C A T O R S F O R�
Evaluating Comprehensive �Tobacco Control Programs�

Acknowledgments
We would like to extend special thanks to the following individuals for their assistance in preparing and reviewing this publication.
Expert Panel Members (Appendix C)
Centers for Disease Control and Prevention (in alphabetical order): Stephen Babb Patrick Cox Linda Crossett Martha Engstrom Reba Griffith Corinne Husten Kat Jackson Jerelyn Jordan Brian Judd Sharon Kohout Goldie MacDonald Allison MacNeil Helen McClintock Bill Marx Patrick Nadol Terry Pechacek Linda Pederson Lisa Petersen Jamilyn Renna Robert Robinson Abby Rosenthal Angela Trosclair
We also give special thanks to:
Pamela Clark Battelle Centers for Public Health Research and Evaluation Matthew Farrelly Research Triangle Institute Gary Giovino Roswell Park Cancer Institute
K E Y O U T C O M E I N D I C A T O R S for Evaluating Comprehensive Tobacco Control Programs ii
Preface�If the United States were to meet the Healthy People 2010 goal of reducing smoking prevalence to 12% among adults and 16% among young people aged 14 through 17 years, more than 7 million premature deaths after 2010 could be prevented.1,2 Studies show that investing in state tobacco control programs and implementing effective tobacco control policies significantly reduces cigarette consumption and improves health outcomes.3–9 To continue funding state programs, however, legislators, policy makers, and other funders of state programs want to see evidence that the program is effective and that resources are being used wisely.
To produce such evidence, state tobacco control programs must evaluate their programs. Good evaluation is the key to persuading policy makers that your program is producing results that will lead to improved health for the community.
If good evaluation is key to proving that your program is effective, then selecting the right indicators to measure is key to a good evaluation. That’s where this book will help.
This publication is a companion to the 2001 publication Introduction to Program Evaluation for Comprehensive Tobacco Control Programs, which is based on the Centers
10,11 for Disease Control and Prevention’s (CDC’s) Framework for Program Evaluation.In Introduction to Program Evaluation for Comprehensive Tobacco Control Programs, we discuss in detail the six steps of a good evaluation as they apply to tobacco prevention and control programs:
1. Engage stakeholders.
2. Describe the program.
3. Focus the evaluation.
4. Gather credible evidence.
5. Justify your conclusions.
6. Ensure evaluation findings are used and share lessons learned.
This new publication provides information on selecting indicators and linking them to outcomes, the main focus of step 3 (focus the evaluation) and step 4 (gather credible evidence).
In Introduction to Program Evaluation for Comprehensive Tobacco Control Programs, we described how to select indicators to measure program outcomes. We also gave exam-ples of indicators and suggested sources of data on those indicators.10 This publication goes further. Here we discuss in detail 120 evidence-based key indicators that have been scientifically linked to program outcomes. We also document the evidence that shows the value of using these indicators to measure the progress of a state tobacco control program.
P R E F A C E iii
To help you make informed choices about which indicators are most suitable for your program, we engaged a panel of experts in the field of tobacco control to rate each indicator on various criteria, including overall quality, resources needed, strength of evaluation evidence, utility, accepted practice, and face validity to policy makers. The ratings will help the reader decide, for example, which indicators can be measured within budget or which indicators are likely to carry the most weight with policy makers. In essence, this publication is a consumer’s guide to tobacco control indicators for program managers and evaluators.
In this publication we provide examples of data sources and survey questions that evaluators can use to gather data from their programs’ target populations. We were particularly careful about our choice of example data sources and survey questions. Most come from commonly used state and national surveys and surveil-lance systems, and using them will allow managers and evaluators to compare their findings with data from other states and over time.
Evaluation of key indicators over time will help monitor progress toward expected outcomes and refine program activities as needed. Using well designed evaluation methods will increase your program’s and your evaluation’s chance of success. We encourage you to read more about the multiple purposes of program evaluation in
10Introduction to Program Evaluation for Comprehensive Tobacco Control Programs.
We also hope that this publication will help to advance national evaluation and surveillance efforts by encouraging managers and evaluators of state tobacco control programs to use standard questions from commonly used state or national surveys or surveillance systems. If states use comparable indicators, questions, and collection methods, we will be better able to assess the national impact of state tobacco control programs.
Technical Assistance
CDC is ready to help state and territorial health departments plan, implement, and evaluate tobacco prevention and control programs. To contact CDC’s Office on Smoking and Health, please call (770) 488–5703 or e-mail at [email protected].
References
1. �U.S. Department of Health and Human Services. Healthy people 2010. 2nd edition. With Understanding and improving health and objectives for improving health. 2 vols. Washington, DC: Government Printing Office; 2000.
2. �U.S. Department of Health and Human Services. The health consequences of smoking: a report of the Surgeon General. Atlanta, GA: Centers for Disease Control and Prevention; 2004.
3. �Farrelly M, Pechacek T, Chaloupka F. The impact of tobacco control program expenditures on aggregate cigarette sales: 1981–2000. Journal of Health Economics. 2003;22(5):843–59.
K E Y O U T C O M E I N D I C A T O R S for Evaluating Comprehensive Tobacco Control Programs iv
4. �Sargent R, Shepard R, Glantz S. Reduced incidence of admissions for myocardial infarction associated with public smoking ban before and after study. British Medical Journal. 2004 Apr 24;328(7446):977–80.
5. �Cowling DW, Kwong SL, Schlag R, Lloyd JC, Bal DG. Declines in lung cancer rates: California, 1988–1997. Morbidity and Mortality Weekly Report. 2000;49:1066–9.
6. �Jemal A, Cokkinides VE, Shafey O, Thun MJ. Lung cancer trends in young adults: an early indicator of progress in tobacco control (United States). Cancer Causes & Control. 2003;14(6):579–85.
7. �Barnoya J, Glantz S. Association of the California tobacco control program with declines in lung cancer incidence. Cancer Causes & Control. 2004;15(7):689–95.
8. �Max W, Rice DP, Sung HY, Zhang X, Miller L. The economic burden of smoking in California. Tobacco Control. 2004;13(3):264–7.
9. �Tauras JA, Chaloupka FJ, Farrelly MC, Giovino GA, Wakefield M, Johnston LD, O’Malley PM, Kloska DD, Pechacek TF. State tobacco control spending and youth smoking. American Journal of Public Health. 2005;95:338–44.
10. MacDonald G, Starr G, Schooley M, Yee SL, Klimowski K, Turner K. Introduction to program evaluation for comprehensive tobacco control programs. Atlanta, GA: Centers for Disease Control and Prevention; 2001.
11. Centers for Disease Control and Prevention. Framework for program evaluation in public health practice. Morbidity and Mortality Weekly Report. 1999;48 (RR-11): 1–40.
P R E F A C E v

K E Y O U T C O M E I N D I C A T O R S for Evaluating Comprehensive Tobacco Control Programsvi
Table of Contents�Preface . . . . . . . . . . . . . . . . . . . . . . . . . . . . . . . . . . . . . . . . . . . . . . . . . . . . . . . . . .iii�How This Book Is Organized . . . . . . . . . . . . . . . . . . . . . . . . . . . . . . . . . . . . . . . . . . . . . . . . . . . . ix�
Chapter 1� Introduction . . . . . . . . . . . . . . . . . . . . . . . . . . . . . . . . . . . . . . . . . . . . . . . . . . . . . . 1
Chapter 2� Goal Area 1: Preventing Initiation of Tobacco Use Among Young People . . . . . . 17
▲▲
Logic Model: Preventing Initiation of Tobacco Use Among Young People. . . . . . 19�Outcome 6: Increased Knowledge of, Improved Anti-tobacco Attitudes �
Outcome 7: Increased Anti-tobacco Policies and Programs in Schools. . . . . . . . 39�Outcome 8: Increased Restriction and Enforcement of Restrictions on �
Outcome 9: Reduced Tobacco Industry Influences . . . . . . . . . . . . . . . . . . . . . . . . 72�Outcome 10: Reduced Susceptibility to Experimentation with �
Outcome 11: Decreased Access to Tobacco Products . . . . . . . . . . . . . . . . . . . . . . . . 98�. . . . . . . . . . . . . . . . . . . . . . . . . 108�
. . . . . . . . . . . 112�. . . . . . . . 116�
Outcome 12: Increased Price of Tobacco Products Outcome 13: Reduced Initiation of Tobacco Use by Young People Outcome 14: Reduced Tobacco-use Prevalence Among Young People
Toward, and Increased Support for Policies to Reduce �Youth Initiation. . . . . . . . . . . . . . . . . . . . . . . . . . . . . . . . . . . . . . . . . . . . 25�
Tobacco Sales to Minors . . . . . . . . . . . . . . . . . . . . . . . . . . . . . . . . . . . . 61�
Tobacco Products . . . . . . . . . . . . . . . . . . . . . . . . . . . . . . . . . . . . . . . . . . 89�
Chapter 3� Goal Area 2: Eliminating Nonsmokers’ Exposure to Secondhand Smoke . . . . . 121�▲
Logic Model: Eliminating Nonsmokers’ Exposure to Secondhand Smoke . . . . . 123�Outcome 3: Increased Knowledge of, Improved Attitudes Toward, and �
Increased Support for the Creation and Active Enforcement of Tobacco-free Policies . . . . . . . . . . . . . . . . . . . . . . . . . . . . . . . . . . . . 127�
Outcome 4: Creation of Tobacco-free Policies . . . . . . . . . . . . . . . . . . . . . . . . . . . . 147�Outcome 5: Enforcement of Tobacco-free Public Policies . . . . . . . . . . . . . . . . . . 159�Outcome 6: Compliance with Tobacco-free Policies . . . . . . . . . . . . . . . . . . . . . . 165�Outcome 7: Reduced Exposure to Secondhand Smoke . . . . . . . . . . . . . . . . . . . . 174�Outcome 8: Reduced Tobacco Consumption . . . . . . . . . . . . . . . . . . . . . . . . . . . . 184�
Chapter 4� Goal Area 3: Promoting Quitting Among Adults and Young People . . . . . . . . . . 191
▲
Logic Model: Promoting Quitting Among Adults and Young People . . . . . . . . 193�Outcome 7: Establishment or Increased Use of Cessation Services . . . . . . . . . . 197�Outcome 8: Increased Awareness, Knowledge, Intention to Quit, �
and Support for Policies That Support Cessation . . . . . . . . . . . . . . 209�Outcome 9: Increase in the Number of Health Care Providers and �
Outcome 10: Increased Insurance Coverage for Cessation Services . . . . . . . . . . 237�Outcome 11: Increased Number of Quit Attempts and Quit Attempts �
Outcome 12: Increased Price of Tobacco Products . . . . . . . . . . . . . . . . . . . . . . . . . 249�. . . . . . . . . 252�
. . . . . . . . . . . 259�Outcome 13: Increased Cessation Among Adults and Young People Outcome 14: Reduced Tobacco-use Prevalence and Consumption
Health Care Systems Following Public Health Service (PHS) �Guidelines . . . . . . . . . . . . . . . . . . . . . . . . . . . . . . . . . . . . . . . . . . . . . . . 223�
Using Proven Cessation Methods . . . . . . . . . . . . . . . . . . . . . . . . . . . 242�
T A B L E O F C O N T E N T S vii
▲
Chapter 5 Future Directions . . . . . . . . . . . . . . . . . . . . . . . . . . . . . . . . . . . . . . . . . . . . . . . . 267�
Appendices and Glossary . . . . . . . . . . . . . . . . . . . . . . . . . . . . . . . . . . . . . . . . . . . . . . . . . . . . 273�Appendix A: National Tobacco Control Program . . . . . . . . . . . . . . . . . . . . . . . . . . . 275�Appendix B: Selecting and Rating the Indicators . . . . . . . . . . . . . . . . . . . . . . . . . . . 279�Appendix C: Expert Panel Members . . . . . . . . . . . . . . . . . . . . . . . . . . . . . . . . . . . . . . 293�Appendix D: Data Source Indicator Table . . . . . . . . . . . . . . . . . . . . . . . . . . . . . . . . . 295�Glossary . . . . . . . . . . . . . . . . . . . . . . . . . . . . . . . . . . . . . . . . . . . . . . . . . . . . . . . . . . . . . . 301�
K E Y O U T C O M E I N D I C A T O R S for Evaluating Comprehensive Tobacco Control Programs viii
General Information�
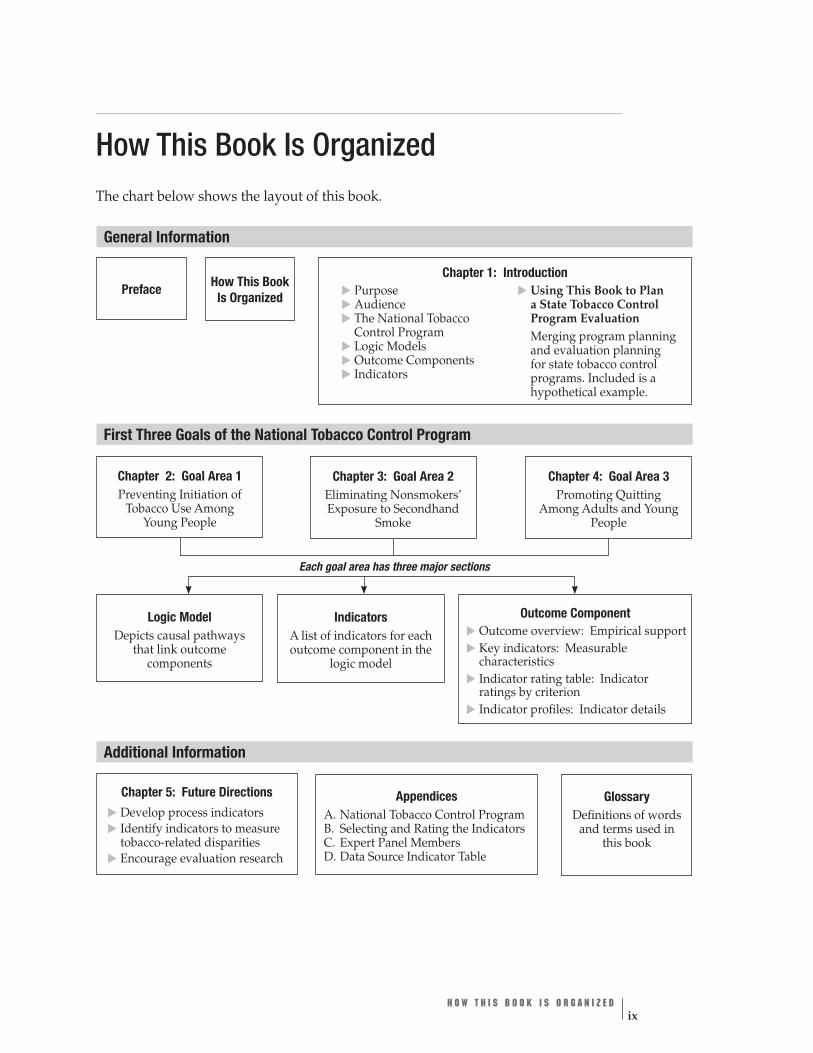
How This Book Is Organized The chart below shows the layout of this book.
Chapter 1: Introduction How This BookPreface Is Organized
▲
Purpose ▲
Audience ▲
Using This Book to Plan a State Tobacco Control ▲
The National Tobacco Program Evaluation Control Program ▲
Logic Models ▲
Outcome Components
Merging program planning and evaluation planning for state tobacco control ▲
Indicators programs. Included is a hypothetical example.
First Three Goals of the National Tobacco Control Program
Chapter 2: Goal Area 1 Chapter 3: Goal Area 2 Eliminating Nonsmokers’
Smoke
Chapter 4: Goal Area 3
People
Preventing Initiation of Tobacco Use Among
Young People Exposure to Secondhand
Promoting Quitting Among Adults and Young
Each goal area has three major sections
and terms used in this book
Appendices A.
Logic Model Depicts causal pathways
that link outcome components
Indicators
outcome component in the logic model
Outcome Component
▲
Outcome overview: Empirical support
▲
Key indicators: Measurable characteristics
▲
Indicator rating table: Indicator ratings by criterion
▲
Indicator details
Glossary Definitions of words National Tobacco Control Program
B. Selecting and Rating the Indicators C. Expert Panel Members D. Data Source Indicator Table
A list of indicators for each
Indicator profiles: ▲
▲▲
Additional Information
Chapter 5: Future Directions Develop process indicators Identify indicators to measure tobacco-related disparities Encourage evaluation research
H O W T H I S B O O K I S O R G A N I Z E D ix

Related Documents