Key messages from global assessments on urbanization and cities relevant to Asia in climate change mitigation Expert Group Meeting on Sustainable Urban Development in Asia and the Pacific: Towards a New Urban Agenda, 2‐3 December 2014 Shobhakar Dhakal, Ph.D. Associate Professor, Energy Field of Study [email protected], [email protected] * Coordinating Lead Author, IPCC AR5 WGIII, Chapter on Human Settlements ** Lead Author, Global Energy Assessment, Chapter on Urban Systems *** Co-chair, 2 nd Assessment Report on Cities and Climate Change ©http://www.unicef.org/sowc2012/urbanmap/

Welcome message from author
This document is posted to help you gain knowledge. Please leave a comment to let me know what you think about it! Share it to your friends and learn new things together.
Transcript
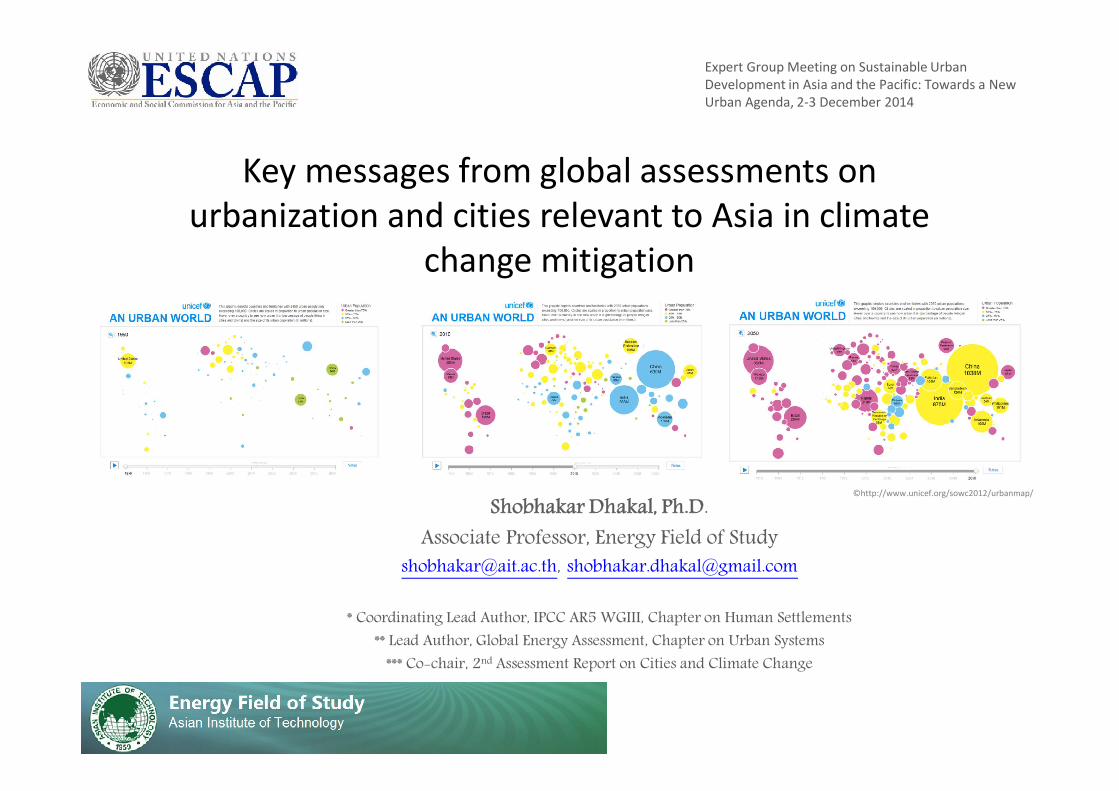
Key messages from global assessments on urbanization and cities relevant to Asia in climate
change mitigation
Expert Group Meeting on Sustainable Urban Development in Asia and the Pacific: Towards a New Urban Agenda, 2‐3 December 2014
Shobhakar Dhakal, Ph.D.
Associate Professor, Energy Field of Study
[email protected], [email protected]
* Coordinating Lead Author, IPCC AR5 WGIII, Chapter on Human Settlements
** Lead Author, Global Energy Assessment, Chapter on Urban Systems
*** Co-chair, 2nd Assessment Report on Cities and Climate Change
©http://www.unicef.org/sowc2012/urbanmap/
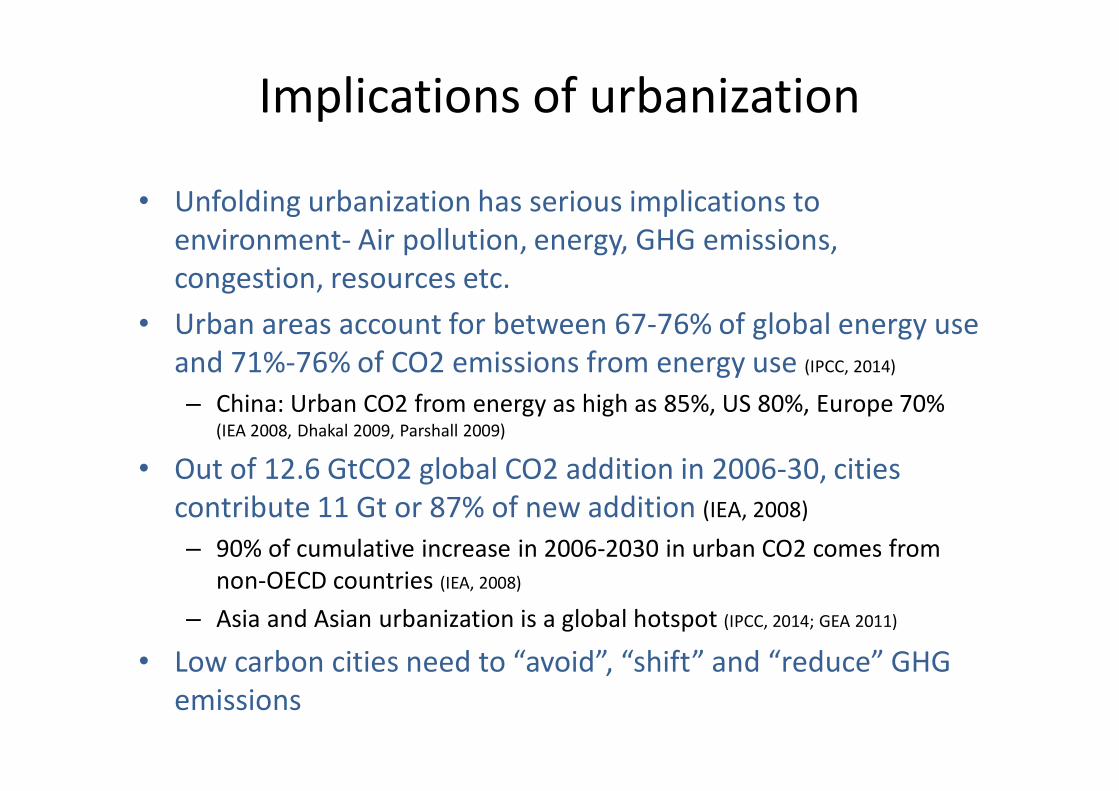
Implications of urbanization
• Unfolding urbanization has serious implications to environment‐ Air pollution, energy, GHG emissions, congestion, resources etc.
• Urban areas account for between 67‐76% of global energy use and 71%‐76% of CO2 emissions from energy use (IPCC, 2014)
– China: Urban CO2 from energy as high as 85%, US 80%, Europe 70% (IEA 2008, Dhakal 2009, Parshall 2009)
• Out of 12.6 GtCO2 global CO2 addition in 2006‐30, cities contribute 11 Gt or 87% of new addition (IEA, 2008)
– 90% of cumulative increase in 2006‐2030 in urban CO2 comes from non‐OECD countries (IEA, 2008)
– Asia and Asian urbanization is a global hotspot (IPCC, 2014; GEA 2011)
• Low carbon cities need to “avoid”, “shift” and “reduce” GHG emissions

Next two decade is crucial for global urban CO2 interventions‐ especially in Asia
• Urbanization is an opportunity
• Demographically, 2.8 billion new urbanites in 2010‐2050 (DESA,
2013)
• Urban physical expansion (IPCC, 2014; Schneider et al., 2009; Angel et al., 2011;
Seto et al., 2011, 2012; Potere and Schneider, 2007)
– Urban land expansion is taking place at twice the rate of urban pop growth
– 55% of the total urban land in 2030 is expected to be built in the first three decades of the 21st century
– Nearly half of the global growth in urban land will occur in Asia‐ 55% of this growth to take place in China and India alone
• Economically, urban GDP contribution rise from 80% in 2005 to far higher (Downscaled: Grubler et al 2007, GEA, 2011)
• Developing and rapidly urbanizing regions provide enormous opportunities to shape urbanization, urban form and associated infrastructure ‐ Cities are being built; not to lock‐in urban
form/design and infrastructure in high carbon pathways (IPCC, 2014; GEA, 2011)
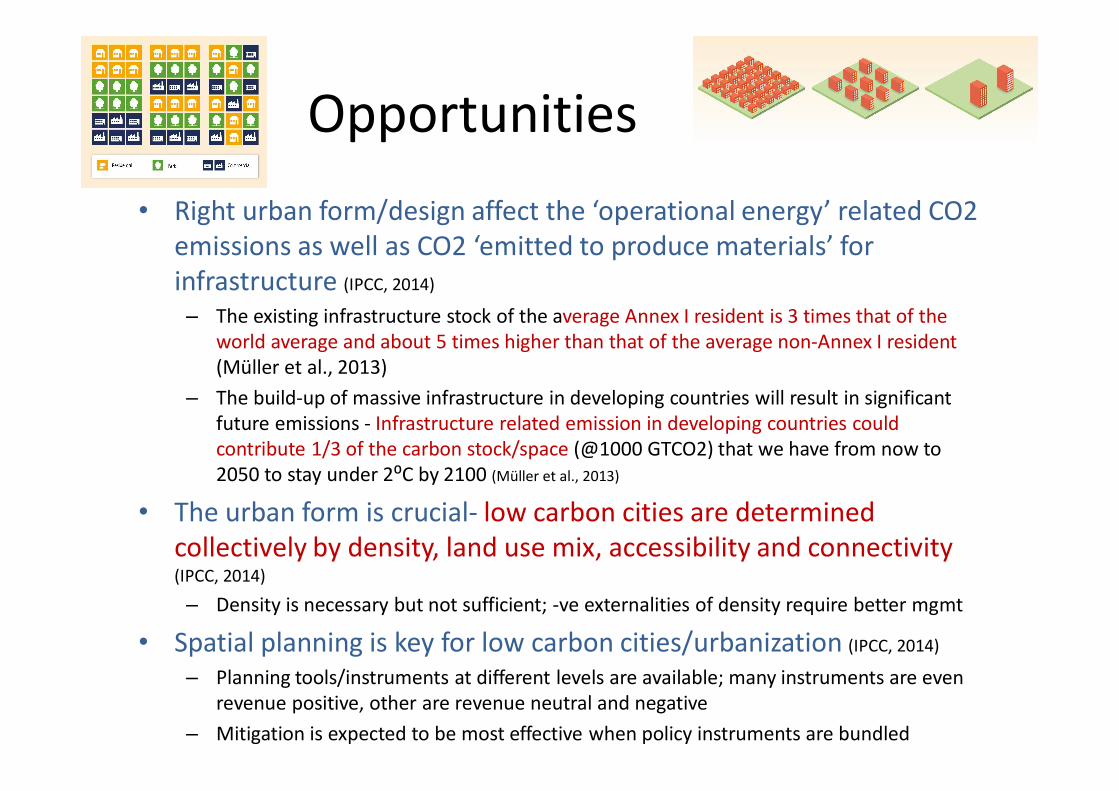
Opportunities
• Right urban form/design affect the ‘operational energy’ related CO2 emissions as well as CO2 ‘emitted to produce materials’ for infrastructure (IPCC, 2014)
– The existing infrastructure stock of the average Annex I resident is 3 times that of the world average and about 5 times higher than that of the average non‐Annex I resident (Müller et al., 2013)
– The build‐up of massive infrastructure in developing countries will result in significant future emissions ‐ Infrastructure related emission in developing countries could contribute 1/3 of the carbon stock/space (@1000 GTCO2) that we have from now to 2050 to stay under 2⁰C by 2100 (Müller et al., 2013)
• The urban form is crucial‐ low carbon cities are determined collectively by density, land use mix, accessibility and connectivity (IPCC, 2014)
– Density is necessary but not sufficient; ‐ve externalities of density require better mgmt
• Spatial planning is key for low carbon cities/urbanization (IPCC, 2014)
– Planning tools/instruments at different levels are available; many instruments are even revenue positive, other are revenue neutral and negative
– Mitigation is expected to be most effective when policy instruments are bundled

Key issues• Thousands of cities are undertaking Climate Action Plans and mitigation
commitments but their aggregate impact on urban emissions is uncertain (IPCC, 2014)
– Little systematic assessment on their implementation & the extent to which reduction targets are being achieved or emissions reduced
– Focus largely on energy efficiency and end‐of‐pipe small low impact options
– Limited consideration to systemic elements‐ land‐use planning strategies and other cross‐sectoral measures
– There are lots of rhetoric out there !! But these are needed for gathering momentum‐but we need to rise above rhetoric now
• Need to look beyond narrow view of mitigation, cross boundary linkages and implications are key‐‐‐‐‐ expand the horizon of environmental sustainability beyond cities
• Consumption dimensions are key in cities – a new measure for evaluating low carbon cities are necessary – industrial cities are not bad, someone has to produce !!!!! But they have more challenges

Tokyo consumption emissions
Direct CO2 emission
+ CO2 emitted in electricity prod outside
2 times
5 times
+ CO2 emissions embedded in consumed goods and services
Total, mn tCO2
Tokyo direct + indirect CO2 emissionsUsing Economic I-O analyses
‐ CO2 emissions embedded in exported goods and services
3 times
Kaneko & Dhakal, donot quote, under publication
Per capitamn tCO2
Just over the national figure of 9
Tokyo Gov’sestimate is close to this
Consumption emission of commercial cities are very high
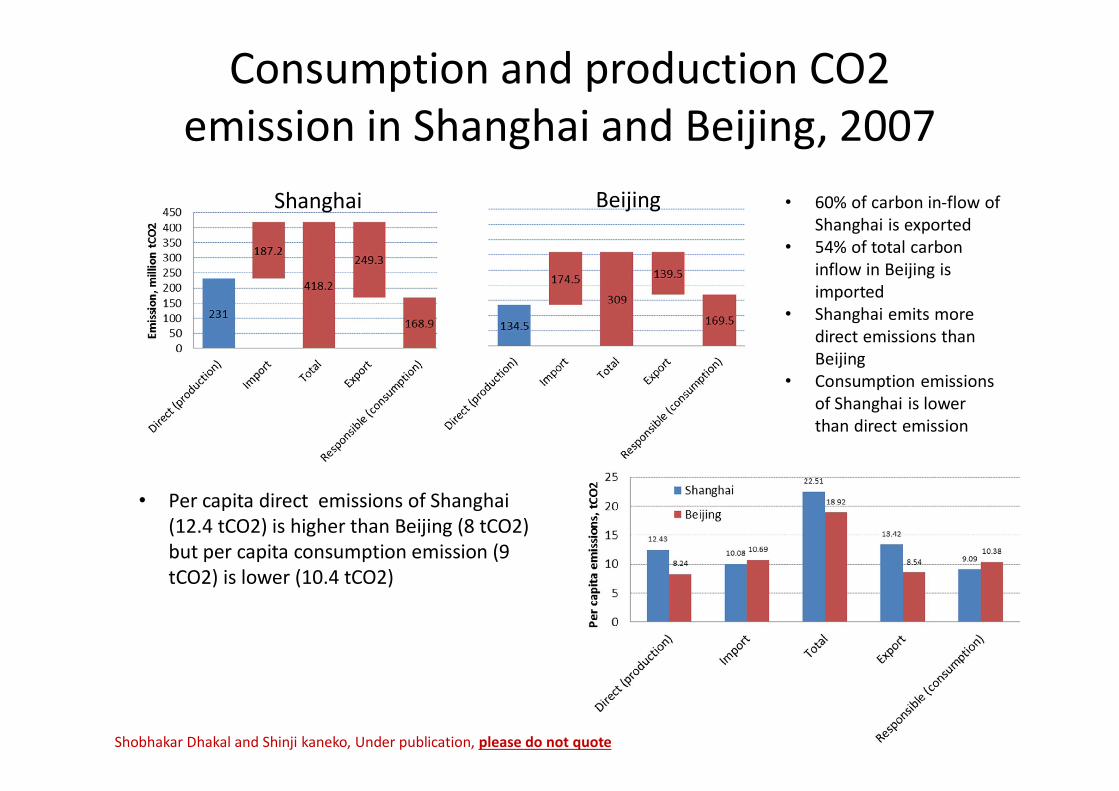
Consumption and production CO2 emission in Shanghai and Beijing, 2007
Shanghai Beijing
• Per capita direct emissions of Shanghai (12.4 tCO2) is higher than Beijing (8 tCO2) but per capita consumption emission (9 tCO2) is lower (10.4 tCO2)
Shobhakar Dhakal and Shinji kaneko, Under publication, please do not quote
• 60% of carbon in‐flow of Shanghai is exported
• 54% of total carbon inflow in Beijing is imported
• Shanghai emits more direct emissions than Beijing
• Consumption emissions of Shanghai is lower than direct emission

Other issues
• Climate change is just an ‘additional stressor’ but an overarching one‐ Action on urban‐scale mitigation strongly depends on our ability to relate to local co‐benefits
• Aggressive deployment of best practices technologies
• Key is to solve the ‘Governance paradox’
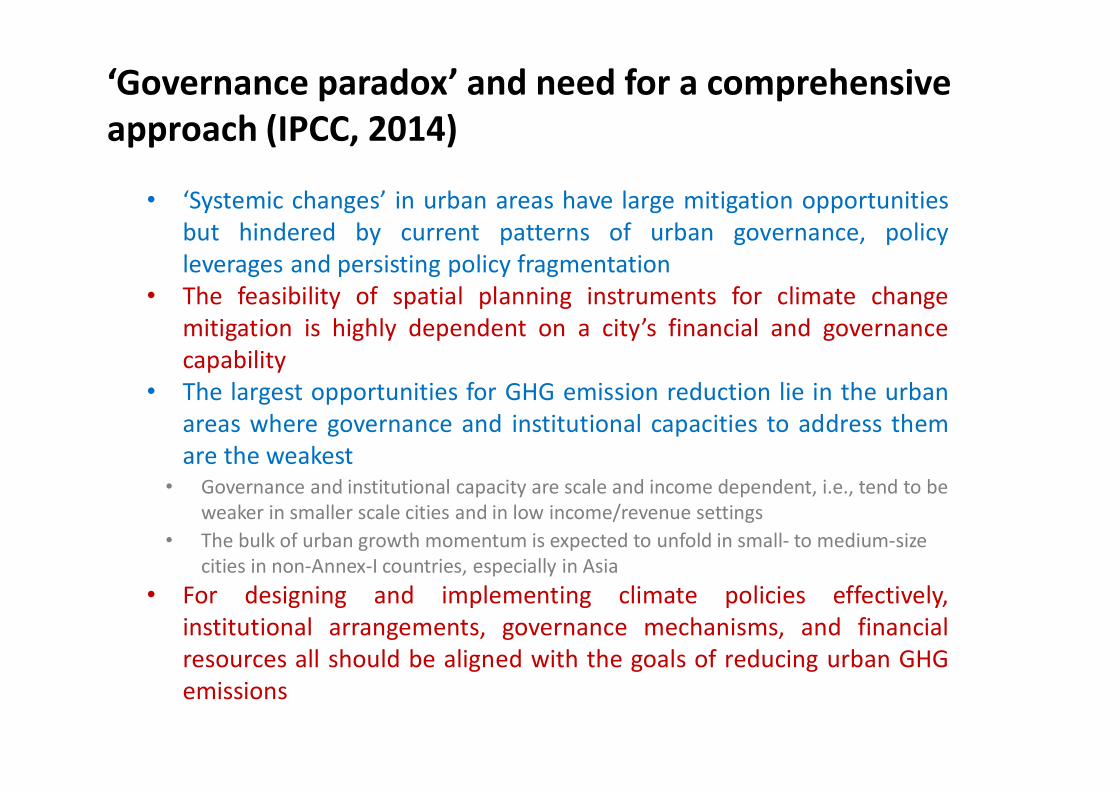
‘Governance paradox’ and need for a comprehensive approach (IPCC, 2014)
• ‘Systemic changes’ in urban areas have large mitigation opportunitiesbut hindered by current patterns of urban governance, policyleverages and persisting policy fragmentation
• The feasibility of spatial planning instruments for climate changemitigation is highly dependent on a city’s financial and governancecapability
• The largest opportunities for GHG emission reduction lie in the urbanareas where governance and institutional capacities to address themare the weakest
• Governance and institutional capacity are scale and income dependent, i.e., tend to be weaker in smaller scale cities and in low income/revenue settings
• The bulk of urban growth momentum is expected to unfold in small‐ to medium‐size cities in non‐Annex‐I countries, especially in Asia
• For designing and implementing climate policies effectively,institutional arrangements, governance mechanisms, and financialresources all should be aligned with the goals of reducing urban GHGemissions

Thank [email protected]@gmail.com
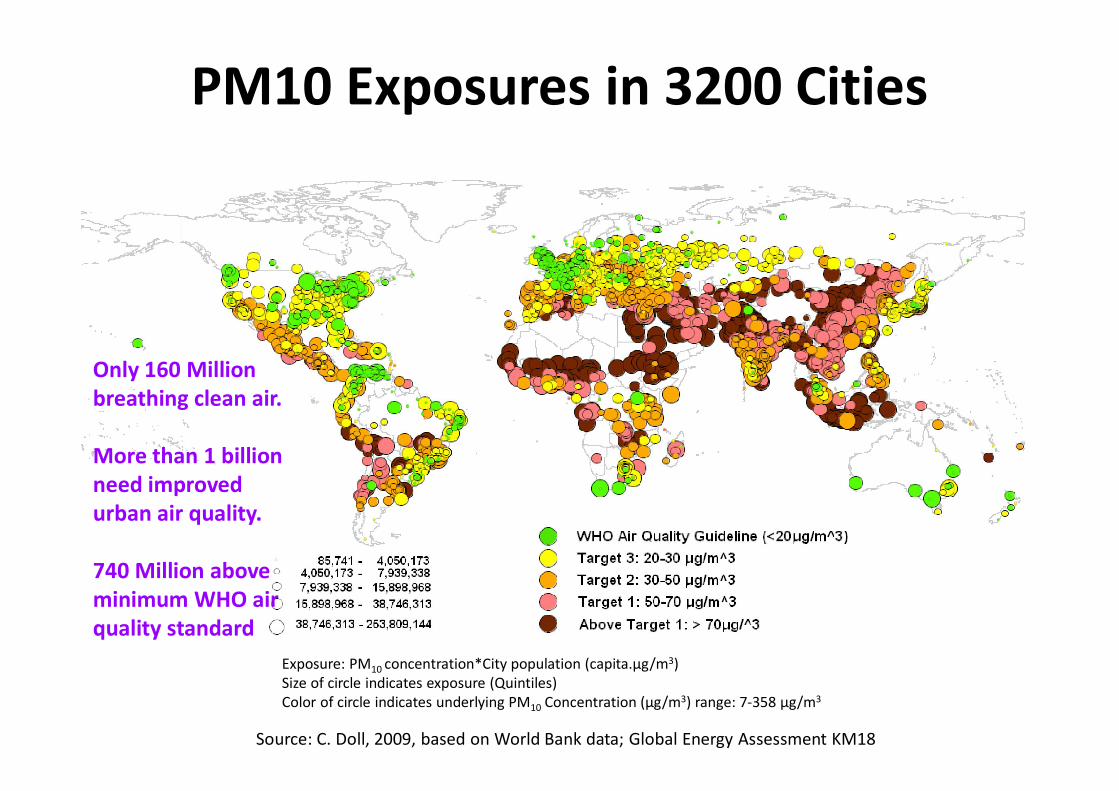
PM10 Exposures in 3200 Cities
Exposure: PM10 concentration*City population (capita.µg/m3)Size of circle indicates exposure (Quintiles)Color of circle indicates underlying PM10 Concentration (µg/m3) range: 7‐358 µg/m3
Source: C. Doll, 2009, based on World Bank data; Global Energy Assessment KM18
Only 160 Million breathing clean air.
More than 1 billion need improved urban air quality.
740 Million aboveminimum WHO air quality standard
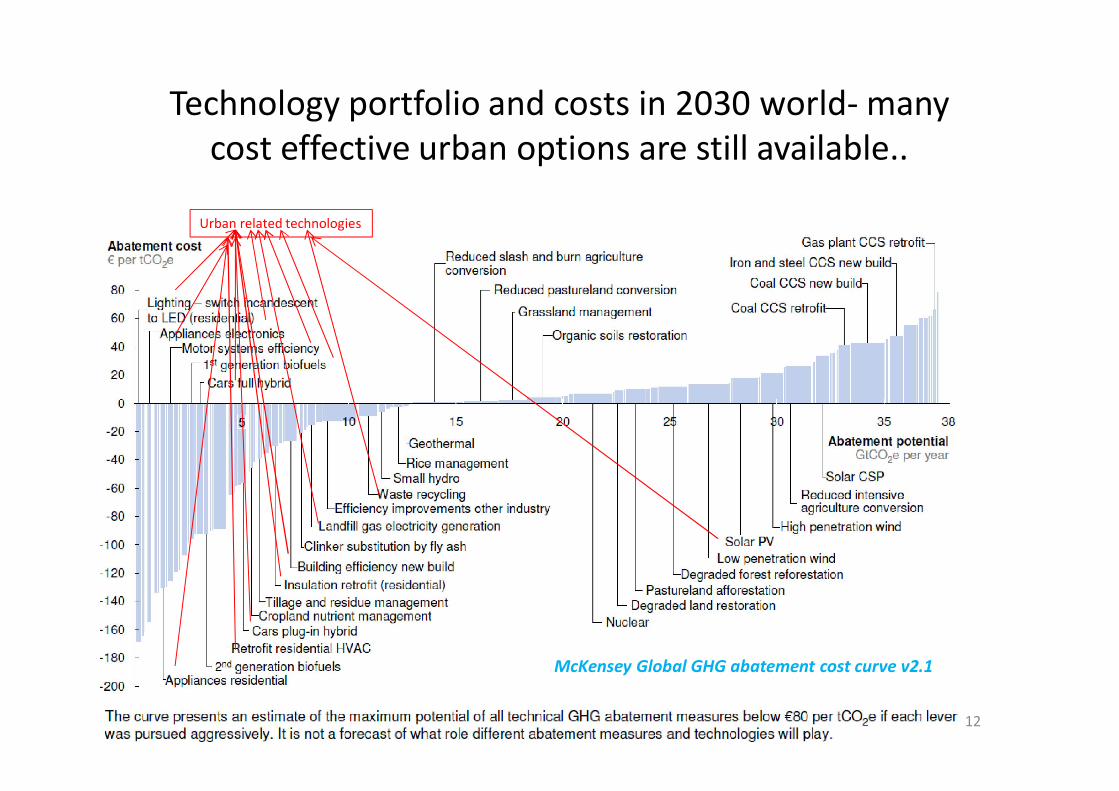
Technology portfolio and costs in 2030 world‐ many cost effective urban options are still available..
12
McKensey Global GHG abatement cost curve v2.1
Urban related technologies

Müller et al., 2013; IPCC 2014
Total CO2 emissions (per capita) needed to build up today’s infrastructure
Future CO2 emissions if developing countries catch up to average developed country level.
Future infrastructure emissions alone could require about a third of the 2°C emission budget.
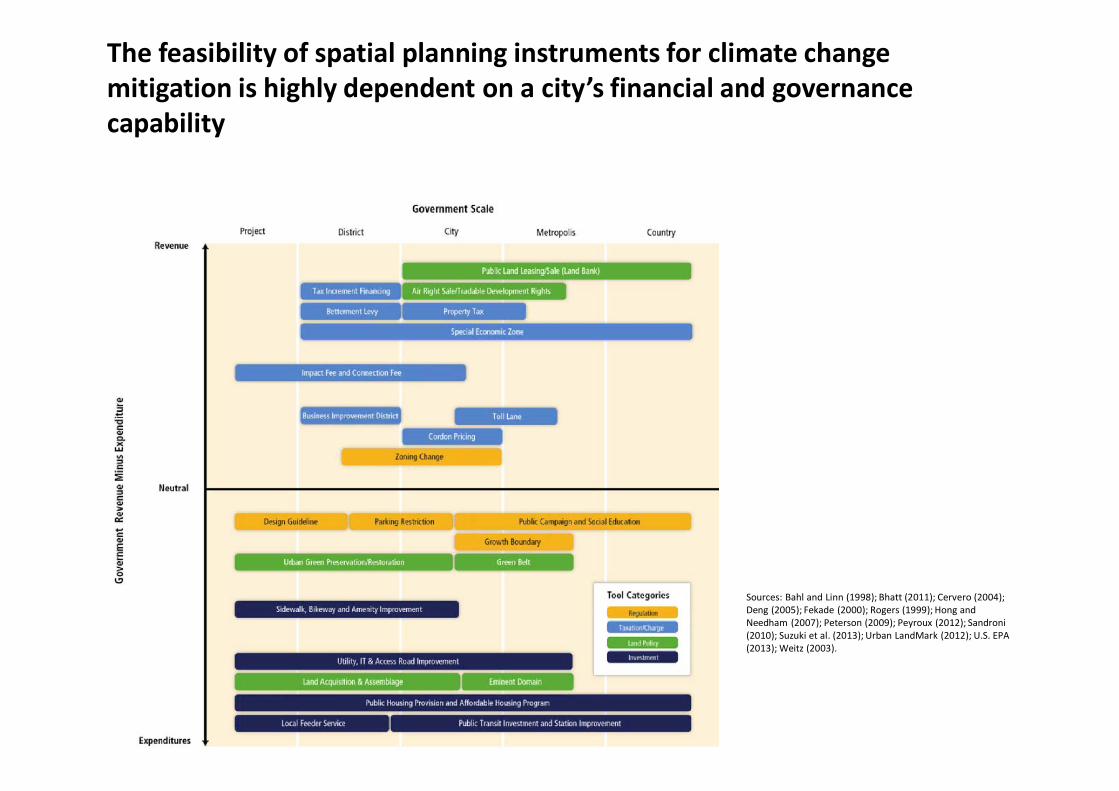
The feasibility of spatial planning instruments for climate change mitigation is highly dependent on a city’s financial and governance capability
Sources: Bahl and Linn (1998); Bhatt (2011); Cervero (2004); Deng (2005); Fekade (2000); Rogers (1999); Hong and Needham (2007); Peterson (2009); Peyroux (2012); Sandroni(2010); Suzuki et al. (2013); Urban LandMark (2012); U.S. EPA (2013); Weitz (2003).
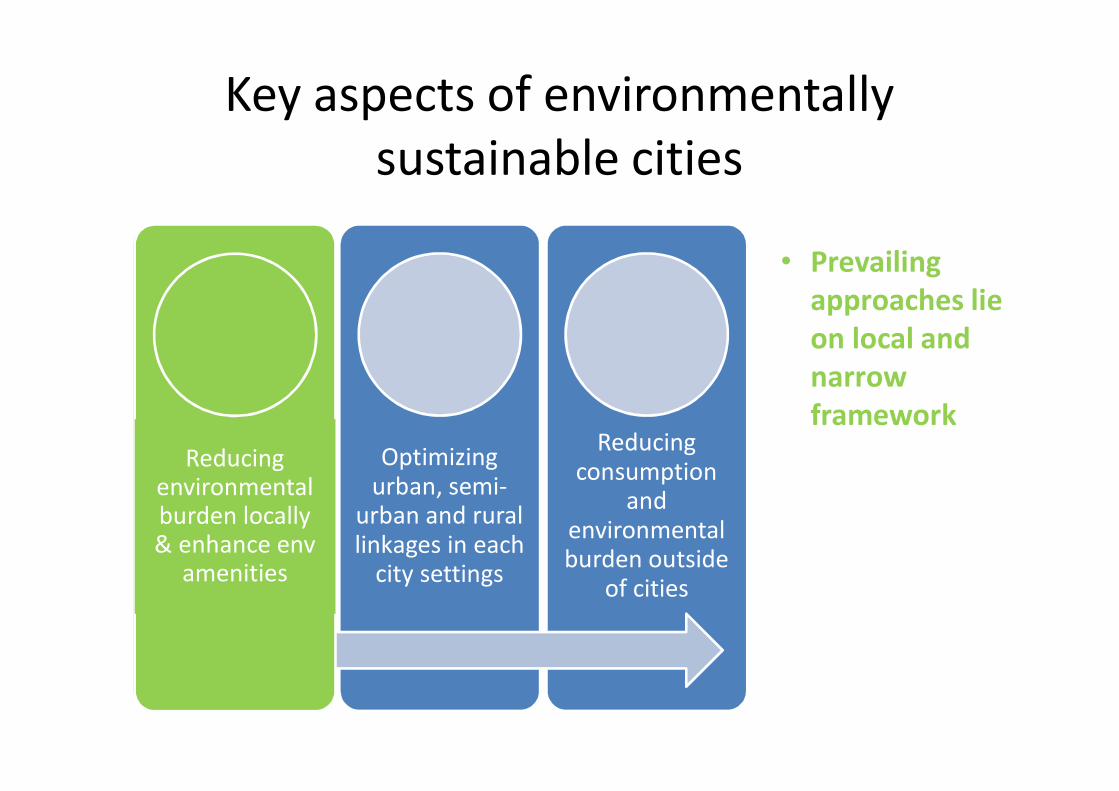
Key aspects of environmentally sustainable cities
Reduce environmental burden locally & enhance env
amenities
Optimizing urban, semi‐
urban and rural linkages in each
city settings
Reducing consumption
and environmental burden outside
of cities
• Prevailing approaches lie on local and narrow framework
Reducing environmental burden locally & enhance env
amenities
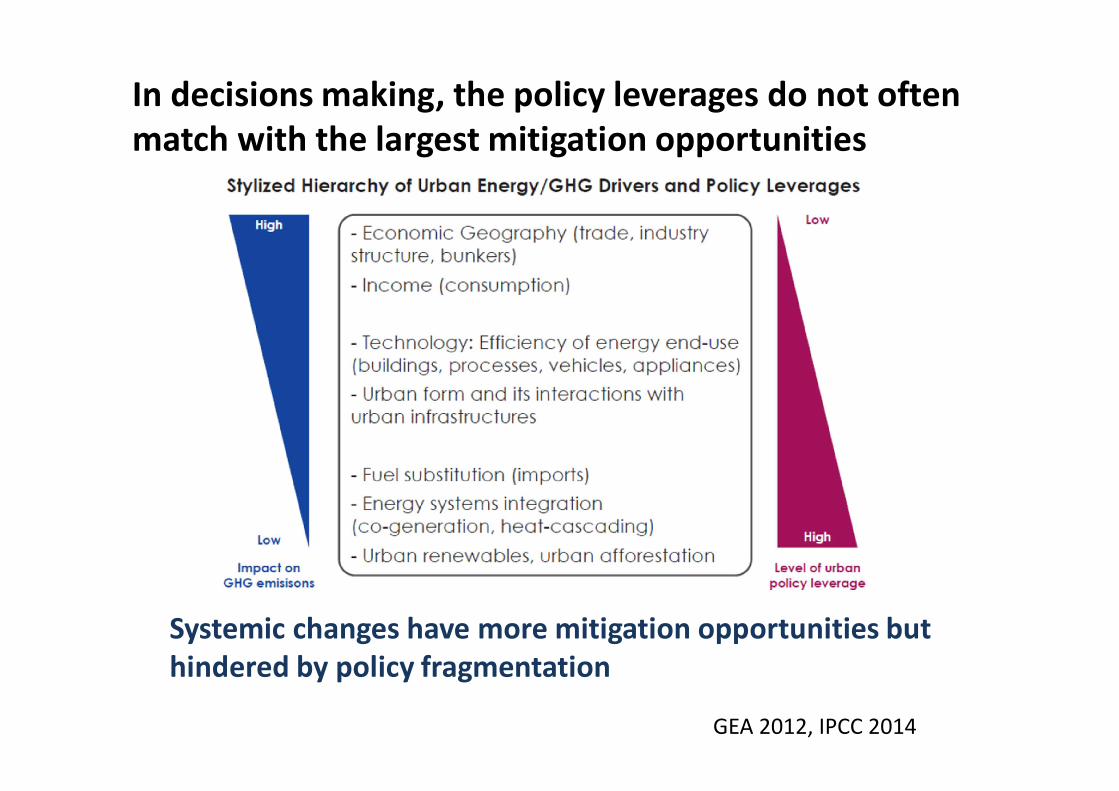
In decisions making, the policy leverages do not often match with the largest mitigation opportunities
Systemic changes have more mitigation opportunities but hindered by policy fragmentation
Source: synthesized from (Jaccard et al., 1997; Grubler et al., 2012)
GEA 2012, IPCC 2014

Enormous urban population live in slums
UNEP (2011). Keeping Track of Our Changing Environment: From Rio to Rio+20 (1992‐2012).
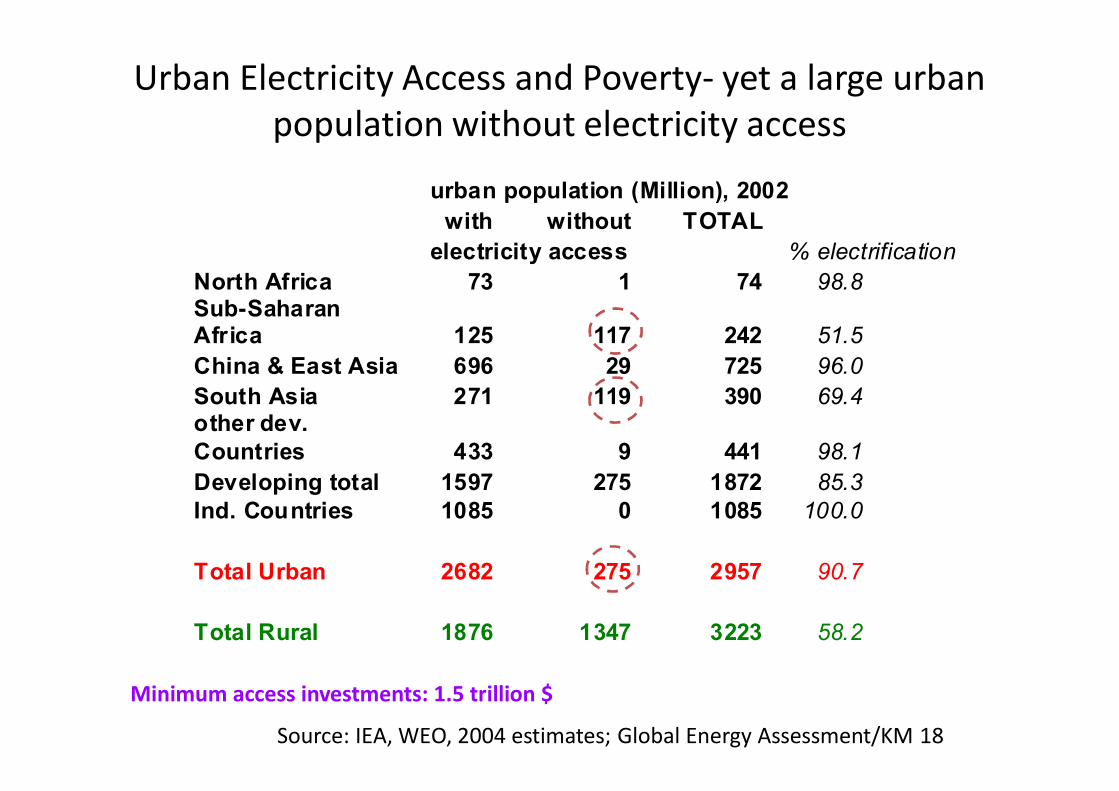
Urban Electricity Access and Poverty‐ yet a large urban population without electricity access
Source: IEA, WEO, 2004 estimates; Global Energy Assessment/KM 18
urban population (Million), 2002
with without TOTAL
electricity access % electrification
North Africa 73 1 74 98.8 Sub-Saharan Africa 125 117 242 51.5
China & East Asia 696 29 725 96.0
South Asia 271 119 390 69.4 other dev. Countries 433 9 441 98.1
Developing total 1597 275 1872 85.3 Ind. Countries 1085 0 1085 100.0 Total Urban 2682 275 2957 90.7
Total Rural 1876 1347 3223 58.2
Minimum access investments: 1.5 trillion $
Related Documents