WATER QUALITY IN IRELAND 2005 Key Indicators of the Aquatic Environment

Welcome message from author
This document is posted to help you gain knowledge. Please leave a comment to let me know what you think about it! Share it to your friends and learn new things together.
Transcript

WATER QUALITY IN IRELAND 2005Key Indicators of the Aquatic Environment

Agency StatusThe Environmental Protection Agency (EPA) is an independent public body established in July 1993 under the Environmental Protection Agency Act, 1992. Its sponsor in Government is the Department of the Environment, Heritage and Local Government.
The EPA is managed by a full time Executive Board consisting of a Director General and four Directors. Independence is assured through the selection procedures for the Director General and Directors and the freedom, as provided in the legislation, to act on its own initiative. The assignment, under the legislation, of direct responsibility for a wide range of functions underpins this independence. Under legislation, it is a specific offence to attempt to influence the Agency, or anyone acting on its behalf, in an improper manner.
The Agency is assisted by an Advisory Committee of twelve members, appointed by the Minister for the Environment, Heritage and Local Government.
ResponsibilitiesThe EPA has a wide range of statutory duties and powers under the Environmental Protection Act. In addition, the capacity of the EPA in relation to enforcement has been enhanced by powers contained in the Protection of the Environment Act 2003. The main responsibilities of the EPA include the following:
• licensing large/complex industrial and other processes with significant polluting potential;
• monitoring environmental quality, including the establishment of databases to which the public have access;
• publishing periodic reports on the state of the environment;
• promoting environmentally sound practices;
• promoting and co-ordinating environmental research;
• licensing all significant waste disposal and recovery activities, including landfills, and the preparation of a national hazardous waste management plan;
• implementing a system of permitting for the control of VOC emissions resulting from the storage of significant quantities of petrol at terminals;
• implementing and enforcing the GMO Regulations for the contained and deliberate release of GMOs into the environment;
• preparing and implementing a national hydrometric programme;
• implementing key reports of the Air and Water Framework Directives;
• drafting a National Allocation Plan for greenhouse gas emissions allowance trading; the establishment of a National Competent Authority for the issuing of trading permits and allowances to those covered by the scheme; the monitoring, overseeing and verification of emissions from participating companies; and the establishment of a National Emissions Trading Registry;
• preparing and implementing the National Waste Prevention Programme with specific focus on enterprise and local authority activities;
• enforcing producer responsibility obligations in relation to the management of waste electrical and electronic equipment (WEEE) and the restriction on hazardous substances (RoHS) in electrical and electronic equipment;
• co-ordinating the implementation of the EU ozone depleting regulation in Ireland;
and, under the Office of Environmental Enforcement, established in 2003 and dedicated to the implementation and enforcement of environmental legislation in Ireland:
• improving overall compliance with environmental protection legislation in Ireland;
• raising awareness about the importance of enforcement of environmental protection legislation in Ireland;
• enforcing IPPC licences and Waste licences issued by the EPA;
• auditing and reporting on the performance of local authorities in the discharge of their environmental protection functions, including:
• enforcement in respect of breaches of waste permits,
• taking action in relation to illegal dumping,
• implementation of waste collection permits, and
• enforcement of producer responsibility initiatives (for example, in the area of packaging waste);
• taking action against local authorities that are not discharging their environmental protection functions in an adequate manner;
• prosecuting, or assisting local authorities to prosecute, significant breaches of environmental protection legislation, in a timely manner; and
• assisting local authorities to improve their environmental protection performance on a case by case basis, through the establishment of an enforcement network to promote information exchange and best practice, and by the provision of appropriate guidance.
EnvironmEntal ProtEction agEncy
WatEr QUality in irElanD 2005Key indicators of the aquatic Environment
compiled by JoHn lUcEy
Environmental Protection agency
an ghníomhaireacht um chaomhnú comhshaoil
Po Box 3000
Johnstown castle Estate
county Wexford
ireland
telephone: +353 53 9160600
lo call: 1890 33 55 99
Fax: +353 53 9160699
Email: [email protected]
Web site: www.epa.ie

© Environmental Protection Agency 2006
although every effort has been made to ensure the accuracy of the material contained in this publication, complete
accuracy cannot be guaranteed. neither the Environmental Protection agency nor the author(s) accept any responsibility
whatsoever for loss or damage occasioned, or claimed to have been occasioned, in part or in full as a consequence of
any person acting or refraining from acting, as a result of a matter contained in this publication. all or part of this
publication may be reproduced without further permission, provided the source is acknowledged.
WatEr QUality in irElanD 2005Key indicators of the aquatic Environment
Published by the EnvironmEntal ProtEction agEncy, irElanD
iSBn: 1-84095-202-4
08/06/600

i
KEy inDicatorS oF tHE aQUatic EnvironmEnt
acKnoWlEDgEmEntS
the compiler wishes to gratefully acknowledge the following EPa colleagues for their help in providing, or facilitating the
acquisition of, information for the report:
Jim Bowman, Kevin clabby, matt craig, John Delaney, garrett Kilroy, micheál maccárthaigh, martin mcgarrigle, michael
neill, Shane o’Boyle, ciarán o’Donnell, gerard o’leary, cara o’loughlin, maeve Quinn, ray Smith, larry Stapleton, tom
Stafford, Deirdre tierney and robert Wilkes.
the following EPa colleagues are thanked for their help in relation to the production of the report:
co-ordination of the report layout and design: annmarie tuohy with assistance from yvonne Furlong.
Special thanks are due to those from other agencies who provided information and the local authority personnel who
provided original data for bathing waters and lakes:
central Fisheries Board (t. champ); Department of communications, marine and natural resources (J. carney); irish coast
guard (E. clonan); marine institute (E. mcgovern); cavan county council (m. lait and m. mcnulty); clare county council
(m. Burke and K. Hayes); cork county council (D. Sheehan); Donegal county council (D. casey, P. gallagher and g.
mcginley); Dublin city council (a. Boylan, a. carney and D. morrissey); Dun laoghaire rathdown county council (J.
White); Fingal county council (E. Whyte); galway city council (S. Kennelly); galway county council (l. Brennan, m. ni
chionna and D. connell); Kerry county council (D. lenihan); leitrim county council (m. coultry and E. gibbons); limerick
county council (t. tarpey and c. gleeson); longford county council (a. Brady); louth county council (S. o’callaghan);
mayo county council (a. Healy); meath county council (g. Duggan and a. leavy); monaghan county council (B. o’Flaherty
and g. Kelly); north Western regional Fisheries Board (H. lloyd and B. maguire); offaly county council (E. Killoran and c.
magee); roscommon county council (J. o’gorman); Sligo county council (P. Bergin); north tipperary county council (r.
Spain); South tipperary county council (D. maguire); Waterford county council (P. carroll); Westmeath county council (a.
Bonner); Wexford county council (S. casey and S. corcoran); Wicklow county council (E. Dillon, t. griffin and J. Sexton).

KEy inDicatorS oF tHE aQUatic EnvironmEnt
ii

iiiWate r Qua l i t y in i re land 2005
KEy inDicatorS oF tHE aQUatic EnvironmEnt
Acknowledgements i
Introduction 1
Summary 2
Water Quality Indicators
indicator 1: river Quality 3
indicator 2: nitrates in rivers 5
indicator 3: lake Quality 7
indicator 4: Fish Kills 9
indicator 5: Estuarine and coastal Water Quality 11
indicator 6: Quality of Shellfish Waters 13
indicator 7: Pollution at Sea incidents 15
indicator 8: Bathing Water Quality 17
indicator 9: Faecal coliforms in groundwater 19
indicator 10: nitrates in groundwater 21
taBlE oF contEntS

KEy inDicatorS oF tHE aQUatic EnvironmEnt
1 Water Qua l i t y in i re land 2005
introDUction
this report is the first in a new series of annual summary statistics to be published on the latest information regarding water
quality in ireland. its objective is to set out in a concise way some core indicators for water quality, based on the most up-
to-date data available. Such indicators are key statistics that summarise a particular water quality issue. their value is in
delivering timely, scientifically sound information to decision makers in particular as well as to the wider general public.
this indicator report focuses on a specific issue – the quality of aquatic ecosystems. as such it complements the national
environmental indicator reports, in which integrated assessment is usually guided by, driving forces, pressures, state,
impact and response (DPSir). in order to avoid unnecessary duplication, in this, the first of the series on the quality of the
aquatic environment, it has been decided to use only those that can be described as direct environmental indicators. in
other words only those indicators of impact or state are considered.
the report concentrates on what are perceived to be the ‘top ten’ indicators of ambient water quality in ireland. as well as
giving the current situation, regarding the state of the aquatic resource, the report also includes analyses of trends over time.
only by including historical information can improvement or deterioration be discerned and programmes of measures for
remediation instituted. in ireland biological data on river quality is gathered over a three-year cycle. the next cycle for
reporting is 2004-2006 and so the present report uses the years 2003-2005 to give the ‘current’ situation regarding irish
river quality. Similarly, although collected annually, information on estuarine and coastal waters as well as lakes and
groundwaters is reported in this rolling manner for present purposes. all indicators include information for 2005.
the style of presentation is that the indicators have been set out in a ‘stand alone’ fashion, of two-page maximum length
including graphics, so that a concise assessment is available for each.
in the most recent European Environment agency (EEa) report, the country’s perspective regarding water quality was
summarised as follows: ‘Eutrophication of rivers, lakes and tidal waters continues to be the main threat to surface waters
with agricultural run-off and municipal discharges being the key contributors’ (EEa, 2005). as will be seen from the present
report, this could again aptly describe the current position with the addition that the first of these pressures also poses the
greatest threat to the quality of the groundwater resource.
Reference
EEa (European Environment agency), 2005. The European Environment: State and Outlook. EEa, copenhagen.

2Water Qua l i t y in i re land 2005
KEy inDicatorS oF tHE aQUatic EnvironmEnt
SUmmary
the ten indicators used in this report, to reflect ambient water quality conditions in 2005 and preceding years, may be
summarised as follows:
• Quality in the 13,200 km of river and stream channel assessed in 2003-2005 showed some improvement, over the
previous period, with 70.2 per cent unpolluted, 18.1 per cent slightly polluted, 11.1 per cent moderately polluted and
0.6 per cent seriously polluted.
• nitrate levels in 11 large rivers showed differences across the country with the highest values recorded in the south-east.
With the exception of two, all of these rivers have significantly increased nitrate levels in 2005 as compared with when
first sampled in the late 1970s or early 1980s. the increase in nitrate values has coincided with the demise of the
pollution-sensitive pearl mussel in some rivers.
• Quality in the 1,050 km2 of lake surface area examined in 2003-2005 showed a slight deterioration, since the previous
period, with 89.9 per cent oligotrophic or mesotrophic (unpolluted), 6 per cent eutrophic and 4.1 per cent hypertrophic.
the number of lakes assessed was 421, of which 68 were less than satisfactory.
• in 2005 there were 45 reported fish kills compared with 43 the previous year. this annual rate, albeit reduced compared
with some previous years, is unacceptably high as each fish kill represents catastrophic environmental disturbance to
aquatic life.
• Quality in 67 water bodies from 20 estuarine and coastal areas in 2001-2005 showed that 27 (40.3%) were unpolluted,
25 (37.3%) intermediate, 5 (7.5%) potentially eutrophic and 10 (14.9%) eutrophic. this represents some improvement,
compared with previous periods, with the trend toward a decline in the percentage of water bodies being classified as
eutrophic.
• in 2005 the quality of shellfish waters showed 30 per cent of sites were class a (Highest Quality) and 54 per cent class
B (intermediate Quality) with none in class c (low Quality). this represents improvement, over the previous year, when
23 per cent were a, 59 per cent B and 2 per cent c.
• in 2005 there were 46 pollution-at-sea incidents, comprising approximately 72 per cent oil spillage and 28 per cent
other substances, e.g. algae or unidentified blooms. this number shows a reduction compared with the 59 reported
incidents for the previous year.
• Quality at the 131 bathing waters in 2005 showed 82 per cent of sites complying with the national limit values. there
was a six per cent increase in the compliance rate with national Standards in 2005 when compared with 2004.
However, the number of sites complying with EU mandatory values in 2005 showed a reduction of two per cent (to
96.2%) when compared with 2004.
• approximately 30 per cent of the 1,714 groundwater samples taken in 2003-2005 showed bacterial contamination
with some 11 per cent being grossly contaminated. Since 1995 there has been an increase in the number of samples
with zero contamination and a decrease showing gross contamination.
• approximately 23 per cent of groundwater locations exceeded the mean guide nitrate concentration for drinking water
with two per cent breaching the mandatory limit. Since 1995 there has been an increase of samples with concentrations
exceeding the guideline value. the occurrence of elevated nitrate appears to be mostly in the south-east although there
are raised concentrations at certain clusters of other areas such as counties louth and Kerry.

KEy inDicatorS oF tHE aQUatic EnvironmEnt
3 Water Qua l i t y in i re land 2005
inDicator 1: r ivEr QUality
the water quality situation in the 13,200 km of river and stream channel surveyed by the EPa, using a biological assessment
method, is regarded as a representative indicator of the national status of such waters and to reflect any overall trends in
conditions.
the total river length surveyed in 2003-2005 falling into the four biological water quality classes is shown in Figure 1a. this
shows that some 70 per cent of channel length to be satisfactory, indicating an improvement of one per cent since the
previous period of assessment (2001-2003). less than one per cent (0.6%), the same as in the last period, was again
classed in the most polluted condition.*
Figure 1a River Quality 2003-2005 – Percentage Channel Length in each Class
Unpolluted 70.2%
Slightly Polluted 18.1%
Moderately Polluted 11.1%
Seriously Polluted 0.6%
Source: EPA (K. Clabby, J. Lucey and M. McGarrigle)
Under the regulations (S.i. no. 722 of 2003) implementing the Water Framework Directive (WFD) seven of the eight river
basin districts (rBDs) or international rBDs (irBDs), into which the island of ireland is divided for water management
purposes, fall wholly or partly within the South. the following gives the latest quality breakdown of proportion of channel
length in each district with the corresponding percentage for the previous period shown in parentheses:
Region Unpolluted Slightly Polluted
Moderately Polluted
Seriously Polluted
South Western rBD 89% (89%) 8% (8%) 2% (3%) 0.2% (0.1%)
Western rBD 83% (84%) 11% (11%) 5% (5%) 0.3% (0.3%)
north Western irBD (South) 75% (76%) 15% (10%) 10% (12%) 0.6% (0.8%)
Shannon irBD 66% (63%) 21% (21%) 12% (15%) 0.6% (0.6%)
South Eastern rBD 59% (58%) 27% (28%) 14% (13%) 0.5% (0.6%)
neagh Bann irBD (South) 54% (55%) 17% (15%) 28% (30%) 0.1% (0.1%)
Eastern rBD 40% (41%) 28% (28%) 29% (30%) 2.3% (1.9%)
as would be expected, the less densely populated and less developed regions have the higher proportions of unpolluted
channel. at rBD level, recent improvements, i.e. increase in unpolluted length, are noted in the Shannon and South Eastern
rBDs.
* The following rivers and streams had seriously polluted stretches in 2003-2005: Ahavarraga Stream; Aighe; Avoca; Ballymascanlan; Blackwater (Munster); Bredagh; Broadford; Brogeen; Brosna; Browns Beck Brook; Camac; Clodiagh (Portlaw); Clodiagh (Tullamore); Conawary (Upper); Deel (Newcastle West); Erne; Figile; Garranacool Stream; Gowran; Greenhill Stream; Jiggy (Hind); Kilcullen Stream; Maggy’s Burn; Murlin; Owendalulleegh; Roechrow; Roosky; Slate; Tolka; Tubbercurry; Tubbercurry Stream; Tullahgobegley; Tullamore; Tully Stream; Ward.
4Water Qua l i t y in i re land 2005
KEy inDicatorS oF tHE aQUatic EnvironmEnt
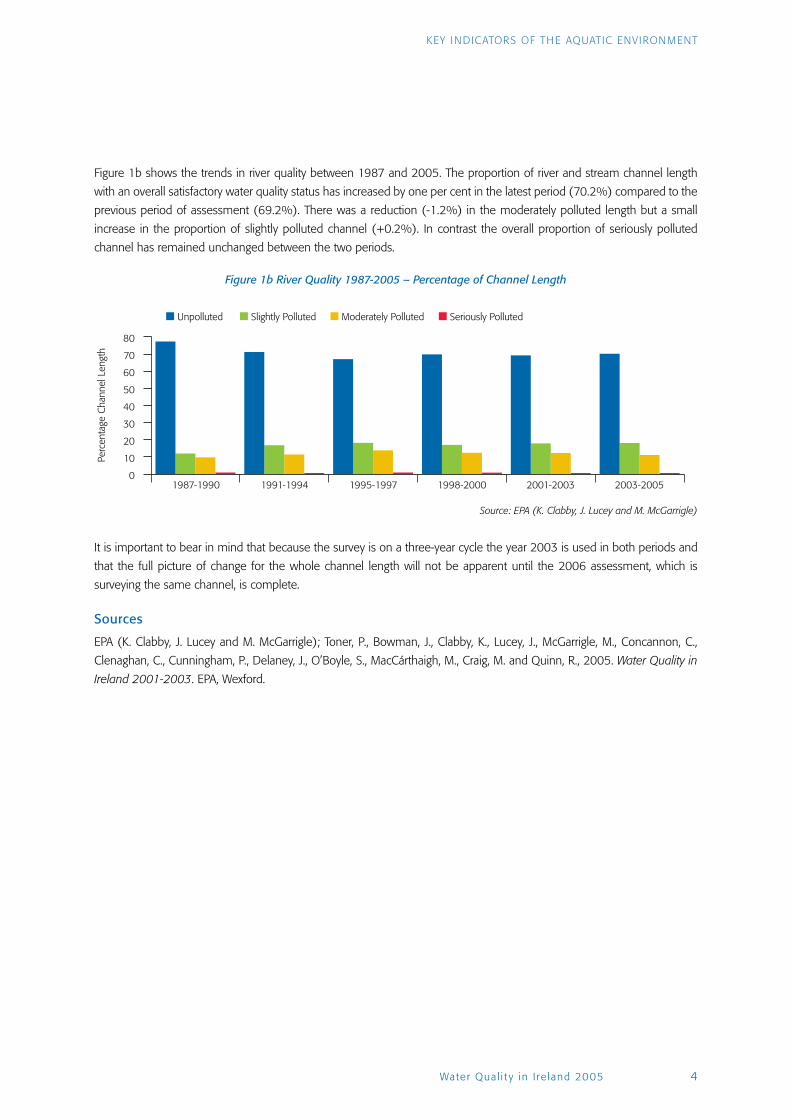
Figure 1b shows the trends in river quality between 1987 and 2005. the proportion of river and stream channel length
with an overall satisfactory water quality status has increased by one per cent in the latest period (70.2%) compared to the
previous period of assessment (69.2%). there was a reduction (-1.2%) in the moderately polluted length but a small
increase in the proportion of slightly polluted channel (+0.2%). in contrast the overall proportion of seriously polluted
channel has remained unchanged between the two periods.
Figure 1b River Quality 1987-2005 – Percentage of Channel Length
0
10
20
30
40
50
60
70
80
Unpolluted
1987-1990 1991-1994 1995-1997 1998-2000 2001-2003 2003-2005
Slightly Polluted Moderately Polluted Seriously Polluted
Perc
enta
ge C
hann
el L
engt
h
Source: EPA (K. Clabby, J. Lucey and M. McGarrigle)
it is important to bear in mind that because the survey is on a three-year cycle the year 2003 is used in both periods and
that the full picture of change for the whole channel length will not be apparent until the 2006 assessment, which is
surveying the same channel, is complete.
Sources
EPa (K. clabby, J. lucey and m. mcgarrigle); toner, P., Bowman, J., clabby, K., lucey, J., mcgarrigle, m., concannon, c.,
clenaghan, c., cunningham, P., Delaney, J., o’Boyle, S., maccárthaigh, m., craig, m. and Quinn, r., 2005. Water Quality in
Ireland 2001-2003. EPa, Wexford.

KEy inDicatorS oF tHE aQUatic EnvironmEnt
5 Water Qua l i t y in i re land 2005
inDicator 2: n itratES in r ivErS
the concentration of nitrate in rivers is a key quality indicator because of its enriching effect as a nutrient and importantly
because of the potential health implication of high nitrate concentration in river waters abstracted for potable supplies.
the EU nitrates Directive (91/676/EEc) requires member states to take specific measures to protect surface and
underground waters from nitrate contamination from agricultural activities. (the irish regulations implementing the
Directive, and incorporating the action plan, were enacted and published as the European communities (good agricultural
Practice for Protection of Waters) regulations 2005 (S.i. no. 788 of 2005)). in addition direct waste discharges, such as
sewage, may also contribute to such contamination and the EU Directive on urban wastewater treatment (91/271/EEc)
provides for the removal of nitrogen from such waste in certain circumstances.
the EU maximum and guideline limits for nitrate in abstracted water for human consumption are respectively 11.30 and
5.65 mg/l n. a dissolved inorganic nitrogen (Din) level of 2.6 mg/l n has been given as one element of a set of criteria
above which tidal fresh waters can be defined as eutrophic or enriched; however, criteria for chlorophyll and dissolved
oxygen must also be breached before an area is thus defined (see also indicator 5: Estuarine and coastal Water Quality).
nitrate can be reported as n or no3 but there is a four-fold difference in numerical terms between the two expressions
(see also indicator 10: nitrates in groundwater).
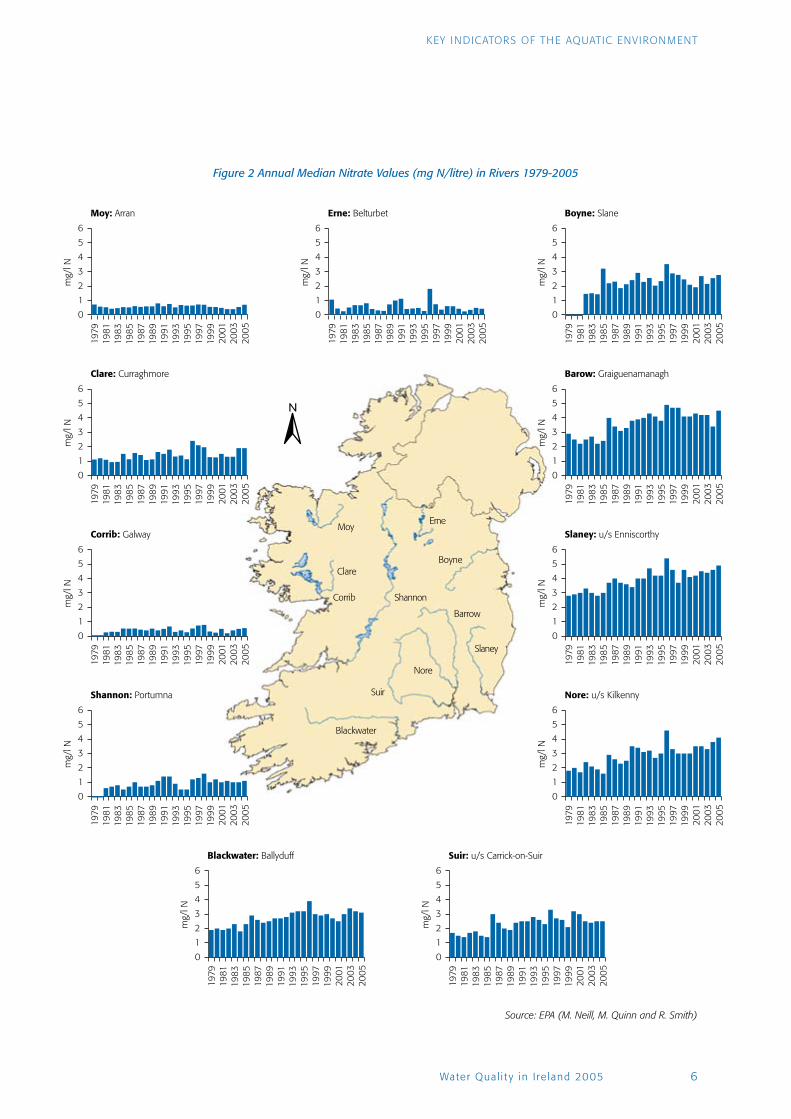
Figure 2 shows annual median nitrate levels at downstream locations on each of 11 large rivers over the last 25 years. From
this, it is apparent that, with the exception of the Erne at Belturbet, there is an increase in concentration from west to east.
a positive correlation between nitrate levels and the proportions of ploughed land in their catchments has been shown for
the rivers in the south-east. While most rivers in that region comply with the EU maximum value of 11.30 mg/l n many
exceed the guideline value of 5.65 mg/l n.
the quality requirements of pearl mussel water bodies has been given as <1.7 mg/l n. this protected species, Margaritifera
margaritifera, a sensitive indicator of water quality, has become extinct in the Barrow and Suir in the past 25-30 years and
occurs in depleted numbers in the nore, Slaney and Blackwater while its current status in the moy is quite unknown but it
is likely to be still living in that river since first recorded there in the late nineteenth century.
this indicator clearly shows the contrast between the regions; levels in the south-east are much higher than those in the
west. it is also clear, from Figure 2, that all the river locations, except the Erne and moy, have significantly increased nitrate
levels in 2005 as compared with when first sampled. in decreasing order the highest median values measured in 2005 at
the selected locations were: Slaney, Barrow, nore, Blackwater, Boyne, Suir, clare, Shannon, moy, corrib and Erne.
Sources
Flanagan, P.J., 1988. Parameters of Water Quality. Environmental research Unit, Dublin; neill, m., 1989. nitrate
concentrations in river waters in the south-east of ireland and their relationships with agricultural practice. Water Research
23, 1339-1355; convention on the conservation of European Wildlfie and natural Habitats Standing committee, 2000.
Action Plan for margaritifera margaritifera in Europe. council of Europe, Strasbourg; moorkens, E.a., 2000. conservation
management of the Freshwater Pearl mussel Margaritifera margaritifera. Part 2: Water Quality requirements. Irish Wildlife
Manuals, no. 9; EPa, 2001. An Assessment of the Trophic Status of Estuaries and Bays in Ireland. Prepared for the
Department of the Environment and local government. EPa, Wexford; toner, P., Bowman, J., clabby, K., lucey, J., mcgarrigle,
m., concannon, c., clenaghan, c., cunningham, P., Delaney, J., o’Boyle, S., maccárthaigh, m., craig, m. and Quinn, r., 2005.
Water Quality in Ireland 2001-2003. EPa, Wexford; Unpublished EPa biological monitoring survey data; neill, m., 2005.
River Water Quality in South-East Ireland, 2004. a report commissioned by the county councils of carlow, Kilkenny, laois,
tipperary (n&S), Waterford & Wexford and by Waterford city council. EPa, Kilkenny.
6Water Qua l i t y in i re land 2005
KEy inDicatorS oF tHE aQUatic EnvironmEnt
Figure 2 Annual Median Nitrate Values (mg N/litre) in Rivers 1979-2005
Source: EPA (M. Neill, M. Quinn and R. Smith)
0
1
2
3
4
5
6
Slaney: u/s Enniscorthym
g/l N
1979
1981
1983
1985
1987
1989
1991
1993
1995
1997
1999
2001
2003
2005
0
1
2
3
4
5
6
Moy: Arran
mg/
l N
1979
1981
1983
1985
1987
1989
1991
1993
1995
1997
1999
2001
2003
2005
0
1
2
3
4
5
6
Erne: Belturbet
mg/
l N
1979
1981
1983
1985
1987
1989
1991
1993
1995
1997
1999
2001
2003
2005
0
1
2
3
4
5
6
Corrib: Galway
mg/
l N
1979
1981
1983
1985
1987
1989
1991
1993
1995
1997
1999
2001
2003
2005
0
1
2
3
4
5
6
Blackwater: Ballyduff
mg/
l N
1979
1981
1983
1985
1987
1989
1991
1993
1995
1997
1999
2001
2003
2005
0
1
2
3
4
5
6
Suir: u/s Carrick-on-Suir
mg/
l N
1979
1981
1983
1985
1987
1989
1991
1993
1995
1997
1999
2001
2003
2005
0
1
2
3
4
5
6
Nore: u/s Kilkenny
mg/
l N
1979
1981
1983
1985
1987
1989
1991
1993
1995
1997
1999
2001
2003
2005
Blackwater
Barrow
Slaney
Nore
Suir
Shannon
BoyneClare
Corrib
MoyErne
0
1
2
3
4
5
6
Boyne: Slane
mg/
l N
1979
1981
1983
1985
1987
1989
1991
1993
1995
1997
1999
2001
2003
2005
0
1
2
3
4
5
6
Shannon: Portumna
mg/
l N
1979
1981
1983
1985
1987
1989
1991
1993
1995
1997
1999
2001
2003
2005
0
1
2
3
4
5
6
Clare: Curraghmore
mg/
l N
1979
1981
1983
1985
1987
1989
1991
1993
1995
1997
1999
2001
2003
2005
0
1
2
3
4
5
6
Barow: Graiguenamanagh
mg/
l N
1979
1981
1983
1985
1987
1989
1991
1993
1995
1997
1999
2001
2003
2005

KEy inDicatorS oF tHE aQUatic EnvironmEnt
7 Water Qua l i t y in i re land 2005
inDicator 3: laKE QUality
nutrient enrichment, resulting in eutrophication, is the principal pressure on lake quality in ireland. this form of pollution is
caused by inputs of nutrients, especially compounds of phosphorus and to a lesser extent nitrogen, either directly to lakes
or more commonly via inflowing rivers, at concentrations in excess of natural levels. these nutrient inputs result in plant
growth in lakes, particularly planktonic algal forms, whose presence is quantified by a measure of the algal pigment
chlorophyll. lake trophic status is determined by a consideration of the annual maximum chlorophyll values, according to
a modified version of a scheme developed by the oEcD.
the number of lakes assessed in the period 2003-2005 was 421. the following gives a breakdown of water quality
classification of the lakes by number and surface area.
Lake Quality 2003-2005
Trophic Status Number of Lakes Surface Area km2
oligotrophic 224 (53.2%) 400.9 (38.2%)
mesotrophic 129 (30.6%) 541.9 (51.7%)
moderately Eutrophic 18 (4.3%) 19.3 (1.8%)
Highly Eutrophic 27 (6.4%) 29.0 (2.8%)
Strongly Eutrophic 10 (2.4%) 14.6 (1.4%)
Hypertrophic 13 (3.1%) 42.8 (4.1%)
the majority (353 or 83.8%) of the 421 lakes examined in the period 2003-2005 were of satisfactory water quality, i.e.
oligotrophic or mesotrophic in status (Figure 3a). the water quality of the remaining 68 lakes was less than satisfactory. of
these 13 lakes were classified as hypertrophic, i.e. most enriched status.* the surface area of the 421 lakes examined
amounted to 1048.5 km2. lakes accounting for 943 km2 (89.9%) were in the unenriched oligotrophic/mesotrophic
categories. a further 62.9 km2 (6%) were classified as eutrophic and 42.8 km2 (4.1%) were assigned to the hypertrophic
category.
Figure 3a Lake Quality 2003-2005 – Percentage of Water Bodies in each Class
Oligotrophic/Mesotrophic 83.8%
Moderately Eutrophic 4.3%
Strongly/Highly Eutrophic 8.8%
Hypertrophic 3.1%
Source: EPA (D. Tierney)
the proportion of lakes with an overall satisfactory water quality status has remained relatively unchanged in the latest period
(84%) compared to the previous period of assessment (82%). likewise, the proportion of lake surface area (Figure 3b)
categorised as oligotrophic for the period 2003-2005 (90%) is comparable to that for the period 2001-2003 (91%).
* The 13 lakes classed as hypertrophic in the period 2003-2005 were: Creeve Upper (Co. Monaghan); Cross (Co. Mayo); Driminidy (Co. Cork); Drumsaul (Co. Monaghan); Gangin (Co. Leitrim); Gowna (Cos. Cavan and Longford); Inner (Co. Monaghan); Monalty (Co. Monaghan); Mullagh (Co. Cavan); na Glack (Co. Monaghan); Oony (Co. Monaghan); Oughter (Co. Cavan); Peters (Co. Monaghan).

8Water Qua l i t y in i re land 2005
KEy inDicatorS oF tHE aQUatic EnvironmEnt
Figure 3b Lake Quality 1991-2005 – Surface Area (km2)
0
20
40
60
80
100
Oligotrophic/Mesotrophic
1991-1994 1995-1997 1998-2000 2001-2003 2003-2005
Moderately Eutrophic Strongly/Highly Eutrophic Hypertrophic
Perc
enta
ge L
ake
Area
Source: EPA (D. Tierney)
Sources
EPa (D. tierney); oEcD, 1982. Eutrophication of Waters. Monitoring, Assessment and Control. oEcD, Paris; toner, P.,
Bowman, J., clabby, K., lucey, J., mcgarrigle, m., concannon, c., clenaghan, c., cunningham, P., Delaney, J., o’Boyle, S.,
maccárthaigh, m., craig, m. and Quinn, r., 2005. Water Quality in Ireland 2001-2003. EPa, Wexford.

KEy inDicatorS oF tHE aQUatic EnvironmEnt
9 Water Qua l i t y in i re land 2005
inDicator 4: F iSH KillS
the presence of healthy fish stocks, particularly salmon and trout, in rivers and lakes is considered to be an indicator of
good water quality. the demise of these fish, on the other hand, is a very striking manifestation of serious pollution. very
low oxygen concentration in water is the principal cause of fish kills in ireland. these conditions are brought about by
excessive inputs of organic matter to water or may result from excessive plant growth.
Data on fish kills in ireland are compiled annually by the central Fisheries Board, based on returns from the regional
fisheries boards. in 2005, 45 fish kills were reported. Based on investigations carried out by fisheries board environmental
staff the following causes were attributed:
Agriculture Industry Local Authority
Eutrophication Other Unknown Total
10 7 6 7 8 7 45*
as well as resulting from agricultural, industrial and sewage wastes entering water bodies, fish can be killed by other causes.
an example would be civil engineering works. in September 2005 a fish kill of up to 3000 juvenile trout occurred in the
upper nursery reaches of the river lee, near gouganebarra, in co. cork. on the day of the fish deaths a pH of 10.66, way
above the limit of tolerance for these salmonid fish, was measured at the EPa sampling site situated just downstream of
where concreting work on a small bridge over the river was taking place. more usually fish mortality is due to oxygen
depletion of the water. For example, in June 2005 silage effluent caused the deaths of hundreds of young cróneen, a
unique type of trout that migrates from lough Derg, in a spawning area of the river camcor in co. offaly. Successful legal
prosecutions were taken, respectively by the South Western regional Fisheries Board and the Shannon regional Fisheries
Board, in both these cases.
a marked upsurge in fish kills had occurred in irish rivers in the 1970s coinciding with the intensification of agriculture. in
response to this situation, a nationwide public information campaign was launched and an enforcement strategy was put
in place by the regional fisheries boards and local authorities.
Figure 4 Fish Kills 1986-2005
0
30
60
90
120
150
1986 1987 1988 1989 1990 1991 1992 1993 1994 1995 1996 1997 1998 1999 200520042003200220012000
Num
ber o
f Rep
orte
d Fi
sh K
ills
Source: Central Fisheries Board (T. Champ)
* In addition to these fish kills in fresh waters, a protracted bloom of the dinoflagellate Karenia mikimotoi occurred from late May to July 2005 in the northern half of the western coastline to be succeeded by a further bloom in the south-west in late July. These blooms caused major mortalities of benthic and pelagic marine organisms – and reports of dead fish and Crustacea were received by the Marine Institute from Donegal, Galway, West Cork and Kerry.

10Water Qua l i t y in i re land 2005
KEy inDicatorS oF tHE aQUatic EnvironmEnt
the trend in fish kills over the past 20 years (Figure 4) shows that the years 1987 and 1989 were the worst with in excess
of 100 fish kills reported, while 2001 had the least number. in 2003 the relatively high number of fish kills (72) was
inflated by recurring deaths of fish in the avoca river due to acid mine leachate, while in 2004 and 2005 reduced numbers
of fish kills were recorded. a pilot treatment plant has been commissioned to help alleviate the problem in the lower
reaches of the avoca river due to discharges from the copper mines which have been occurring for over 200 years.
a fish kill is a sign of catastrophic ecosystem disruption and, while the situation appears to have stabilised somewhat, the
number of reported fish kills remains unacceptably high.
Sources
central Fisheries Board data; EPa unpublished data; South Western regional Fisheries Board, 2006. Annual Report 2005.
South Western regional Fisheries Board, macroom; Eastern regional Fisheries Board unpublished data; Silke, J., o’Beirn, F.
and cronin, m. Karenia mikimotoi: An Exceptional Dinoflagellate Bloom in Western Irish Waters, Summer 2005. marine
Environment and Health Series, no. 21. marine institute, galway; anon., 2006. offaly farmer’s silage caused deaths of
hundreds of unique fish. Midland Tribune 1st march, 6.

KEy inDicatorS oF tHE aQUatic EnvironmEnt
11 Water Qua l i t y in i re land 2005
inDicator 5: EStUar inE anD coaStal WatEr QUality
as with fresh waters, increased nutrient loading resulting in eutrophication is an increasing pressure on irish estuarine and
coastal waters. a new classification scheme has been designed to provide a means of identifying the occurrence of
eutrophication in irish estuaries and near shore waters based on relevant measures of water quality.
the trophic status of 67 water bodies from 20 estuarine and coastal areas around ireland was assessed for the period
2001-2005. the assessment of these estuarine and coastal water bodies shows that 10 (14.9%) were classed as eutrophic,
5 (7.5%) as potentially eutrophic, 25 (37.3%) as intermediate and 27 (40.3%) were unpolluted (Figure 5a).
Figure 5a Estuarine and Coastal Water Quality – Percentage of Water Bodies in each Class 2001-2005
Unpolluted 40.3%
Intermediate 37.3%
Potentially Eutrophic 7.5%
Eutrophic 14.9%
Source: EPA (S. O’Boyle and R. Wilkes)
overall, the status of tidal waters in ireland is generally unchanged from the previous assessment period 1999-2003. a
total of 63 water bodies, or 94 per cent of those assessed, remained unchanged and only one area, the lower Suir estuary,
has shown a decline in status. While this water body improved from eutrophic to intermediate in the previous period, it is
classified as potentially eutrophic in the current assessment due to elevated dissolved inorganic nitrogen (Din) levels
during summer. the outer Barrow-nore-Suir estuary is now classified as unpolluted, an increase in quality status from both
previous assessment periods when it was assessed as intermediate. this improvement reflects a decrease in winter Din
levels.
Data from the marine institute’s winter nutrient monitoring programme, in coastal waters of the western irish Sea and
southern celtic Sea, indicate no instances of excessive nutrient enrichment.
of the 12 water bodies classified as eutrophic in the previous assessment period (1999-2003), 10 remain thus classified,
with lough mahon and the lower Slaney estuary having shown some improvement to potentially eutrophic. in both areas,
the improvement was indicated by a decrease in chlorophyll levels.
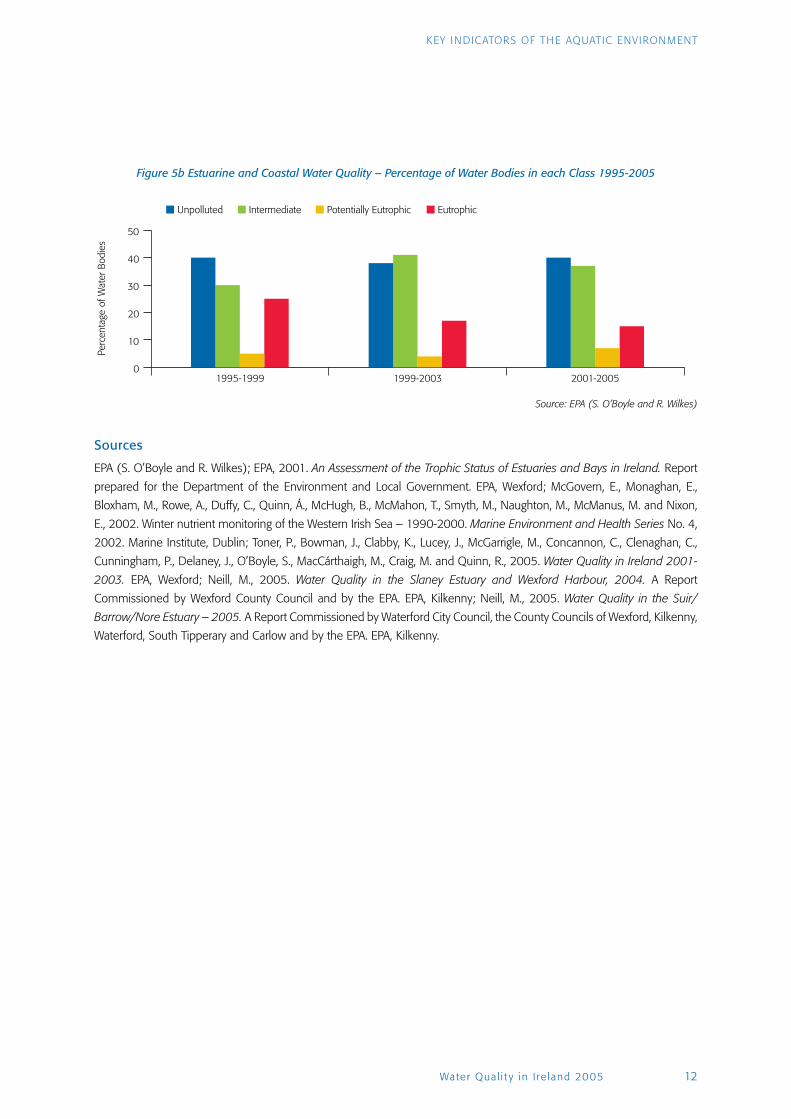
a comparison of the current assessment period with previous periods (1995-1999 and 1999-2003) shows a decline in
the percentage of water bodies being classified as eutrophic, with the proportion dropping from 25 per cent, in the period
1995-1999, to 15 per cent in the current period (Figure 5b). this is reflected, to a certain extent, in an increase in the
percentage of water bodies classed as potentially eutrophic and intermediate. the percentage of water bodies assessed as
unpolluted has changed little over the three assessment periods.
12Water Qua l i t y in i re land 2005
KEy inDicatorS oF tHE aQUatic EnvironmEnt
Figure 5b Estuarine and Coastal Water Quality – Percentage of Water Bodies in each Class 1995-2005
0
10
20
30
40
50
Unpolluted
1995-1999 1999-2003 2001-2005
Intermediate Potentially Eutrophic Eutrophic
Perc
enta
ge o
f Wat
er B
odie
s
Source: EPA (S. O’Boyle and R. Wilkes)
Sources
EPa (S. o’Boyle and r. Wilkes); EPa, 2001. An Assessment of the Trophic Status of Estuaries and Bays in Ireland. report
prepared for the Department of the Environment and local government. EPa, Wexford; mcgovern, E., monaghan, E.,
Bloxham, m., rowe, a., Duffy, c., Quinn, Á., mcHugh, B., mcmahon, t., Smyth, m., naughton, m., mcmanus, m. and nixon,
E., 2002. Winter nutrient monitoring of the Western irish Sea – 1990-2000. Marine Environment and Health Series no. 4,
2002. marine institute, Dublin; toner, P., Bowman, J., clabby, K., lucey, J., mcgarrigle, m., concannon, c., clenaghan, c.,
cunningham, P., Delaney, J., o’Boyle, S., maccárthaigh, m., craig, m. and Quinn, r., 2005. Water Quality in Ireland 2001-
2003. EPa, Wexford; neill, m., 2005. Water Quality in the Slaney Estuary and Wexford Harbour, 2004. a report
commissioned by Wexford county council and by the EPa. EPa, Kilkenny; neill, m., 2005. Water Quality in the Suir/
Barrow/Nore Estuary – 2005. a report commissioned by Waterford city council, the county councils of Wexford, Kilkenny,
Waterford, South tipperary and carlow and by the EPa. EPa, Kilkenny.

KEy inDicatorS oF tHE aQUatic EnvironmEnt
13 Water Qua l i t y in i re land 2005
inDicator 6: QUality oF SHEllF iSH WatErS
in order to ensure the quality of shellfish for human consumption controls are placed on the waters used for shellfish
cultivation and harvesting. these controls are driven by the EU Directive ‘laying down the health conditions for the production
and the placing on the market of live bivalve molluscs’ (91/492/EEc) and by 1996 regulations (S.i. no. 147 of 1996)
implementing the directive. the Department of communications, marine and natural resources (Dcmnr) is the competent
authority in ireland for classifying shellfish production areas.
a shellfish sanitation monitoring programme, based on a number of parameters including microbiological criteria, for
classifying shellfish-growing waters had been in operation in ireland since 1985. the scheme of classification has three
categories, corresponding with the criteria and conditions as laid down in the directive and may be summarised as
follows:
A Shellfish can be sold for direct human consumption
B Shellfish can be sold for human consumption following purification in an approved plant for two days
C Shellfish can be sold for human consumption following relaying in clean seawater for at least two months
Figure 6 shows the number of shellfish sites, as a percentage of total, in the three classes between the 1991-94 period
and 2005. it should be noted that percentages do not necessarily add up to 100 as sites with more than one class are
omitted.*
Figure 6 Classification of Shellfish Areas
0
10
20
30
40
50
60
70
80
A Can be consumed directly
1991-1994 1998-1999 2000 2003 2004 2005
C Can be consumed following relaying for at least two months
B Can be consumed after purification for 48 hours
Perc
enta
ge o
f She
llfis
h Si
tes
Source: Department of Communications, Marine and Natural Resources (J. Carney)
in addition the shellfish production areas are monitored, on a weekly or monthly basis, for the presence of phytoplankton
and marine biotoxins as part of a national monitoring programme operated by the marine institute on behalf of the Food
Safety authority of ireland (FSai). as well as causing illness in humans who consume affected shellfish some blooms can
kill shellfish and other marine life. For example, in 2005 the exceptional bloom of a dinoflagellate, not of direct human
health significance, did cause substantial stock losses to producers as shellfish died off. the mortalities have been suggested
to be due to a combination of the presence of a toxin affecting the marine organisms and anoxic conditions resulting from
the decomposition of the algae in the later stages of the bloom (see indicator 4: Fish Kills).
* In 2005, 30 per cent of sites were Class A waters compared to 23 the previous year but this is much less than the proportion in the 1991-94 period (55%). However, the downward trend in Class A waters appears to have halted in 2004 with the slight upward swing in the following year when also no Class C waters were reported.

14Water Qua l i t y in i re land 2005
KEy inDicatorS oF tHE aQUatic EnvironmEnt
Where biotoxins are detected, the production area is closed and harvesting prohibited until the danger of toxicity has
passed. closures of shellfish-growing areas, as a result of biotoxin contamination, are common in the summer and autumn
when toxic algae are present.
in accordance with the Directive (79/923/EEc), on the quality required of shellfish waters, which was transposed into irish
law by regulations made in 1994 (S.i. no. 200 of 1994), seawater samples are taken from designated shellfish waters
twice annually and analysed for trace metals and organohalogens. in 2005 all organochlorine pesticide and polychlorinated
biphenyl (PcB) results were below limits of detection. the metal results varied substantially, as would be expected for
seawater, and although mean results (of two samples) exceeded current irish standards for zinc in five locations and for
lead in one location, in each instance this only reflected one of the two samples exceeding the standard. these substances
are also monitored annually in shellfish flesh as this provides a better indicator of overall water quality than low frequency
spot sampling of water. this monitoring typically shows irish shellfish growing waters to be of high quality with respect to
the substances monitored.
Sources
Department of communications, marine and natural resources; marine institute unpublished data [test reports for trace
metal and organochlorine substances in seawater sampled from designated shellfish growing areas, summer and winter
2005]; anon., 2005. Workshop on irish shellfish safety. FSAI News, 7 (6), p. 11.

KEy inDicatorS oF tHE aQUatic EnvironmEnt
15 Water Qua l i t y in i re land 2005
inDicator 7: PollUtion at SEa inciDEntS
responsibility for the investigation of pollution incidents at sea rests with the irish coast guard (ircg), a division within the
Department of transport,* as part of its role in developing and co-ordinating an effective regime for marine pollution
response. the ircg’s functions regarding pollution incidents are mandated through government policy, national legislation
(e.g. Sea Pollution acts, 1991 and 1999), EU Directives and international conventions. the irish Pollution responsibility
Zone (iPrZ) covers an area (approx. 200, 000 km2) stretching to 200 miles off the west coast and to the median line
between ireland and the UK in the irish and celtic Seas.
the number of reported annual pollution incidents in the five-year period 2001-2005 is given in Figure 7.
Figure 7 Pollution at Sea 2001-2005
0
10
20
30
40
50
60
20052004200320022001
Num
ber o
f Rep
orte
d In
cide
nts
Source: Irish Coast Guard (E. Clonan)
the total number of incidents reported by category of pollution in the iPrZ in 2005 was:
Mineral Oil Garbage Sewage Chemicals Other Total
33 – – – 13 46
analysis of the 46 incident reports for the year indicates that the reported pollution comprised approximately 72 per cent
oil spillage and 28 per cent other substances, e.g. algae or unidentified blooms. Diesel and gas oils were the most
frequently identified polluting substances. the overall geographical pattern indicates that the majority of oil discharges
occurred in the smaller harbours and their surrounding areas. clusters of slicks were identified in bays and near shore
waters with eight reported in open sea. again the small percentage of slicks reported in open sea should be treated
cautiously as the ircg has no dedicated aerial surveillance capability and depends on reports from shipping and commercial
air traffic.
the distribution of incidents in 2005 by marine environmental zone within the iPrZ was:
Open Sea Tidal River/Estuary
Bay/Nearshore Waters
Beach/ Shore
Port/ Harbour
Total
8 2 11 12 13 46
* With effect from 1 January 2006 the responsibility for Marine Safety and Environment was transferred from the Department of Communications, Marine and Natural Resources to the Department of Transport.

16Water Qua l i t y in i re land 2005
KEy inDicatorS oF tHE aQUatic EnvironmEnt
the coast guard’s role in marine casualty incidents is to oversee, control, intervene and exercise ultimate command and
control to prevent/reduce the threat to the marine environment and the safety of the vessel or crew. During 2005 the ircg
intervened in a number of marine casualty incidents and closely monitored incidents, which posed a threat of marine
pollution. these incidents were mainly minor incidents, which were prevented from developing into more serious incidents.
Five more potentially serious incidents occurred during 2005.
Work is ongoing to draft the national oil spill contingency plan (ncP) and approve harbour oil spill contingency plans in
accordance with the Sea Pollution (amendment) act, 1999. the ircg has instructed maritime county councils to submit
their oil spill contingency plans. the coast guard also reviews and approves oil spill contingency plans for mobile offshore
drilling platforms intending to carry out drilling work within the iPrZ. review and approval of these plans is ongoing.
Source
irish coast guard (E. clonan).

KEy inDicatorS oF tHE aQUatic EnvironmEnt
17 Water Qua l i t y in i re land 2005
inDicator 8: BatHing WatEr QUality
local authorities are responsible for bathing water quality in their areas and for making information available to the public
during the summer season. the EPa collates the results of monitoring which are forwarded to the European commission
for inclusion in the compendium report published annually by the EU. the EPa also publishes an annual national bathing
water report, which is released prior to the start of the following bathing season.
the primary legislation is set out in regulations (S.i. no. 155 of 1992) and subsequent amendments giving effect to the
EU Directive (76/160/EEc) concerning the quality of bathing water. the regulations set more stringent limits for some
parameters than the Directive.
the number of designated bathing areas is 131 including both seawater (122) and freshwater (9) sites. results for 2005
show that the quality of bathing water in ireland is good, with 82 per cent (107 of 131) of sites complying with the national
limit values.
2005 Bathing Water Quality Areas: Compliance with EU and National Limit Values
Compliant Non-Compliant Total
Seawater 122
guide 112 10
mandatory 117 5
national 100 22
Freshwater 9
guide 7 2
mandatory 9 0
national 7 2
Overall 131
guide 119 12
mandatory 126 5
national 107 24
Source: EPA (J. Delaney)
assessing compliance using the European commission’s approach shows 96 per cent (126 of 131) of sites complying
with the minimum mandatory limit values specified in the Directive (Figure 8a) and 91 per cent (119 of 131) of sites with
the stricter guide values. these guide values can be regarded as quality objectives which all bathing sites should endeavour
to achieve. two bathing water areas in galway (Silver Strand and Salthill) have shown improvement in water quality since
2003, which is attributed to the commissioning of a new wastewater treatment facility at mutton island close to Salthill in
may 2004. Similarly, the ringsend treatment plant continues to have a positive impact on the water quality in Dublin Bay.
18Water Qua l i t y in i re land 2005
KEy inDicatorS oF tHE aQUatic EnvironmEnt
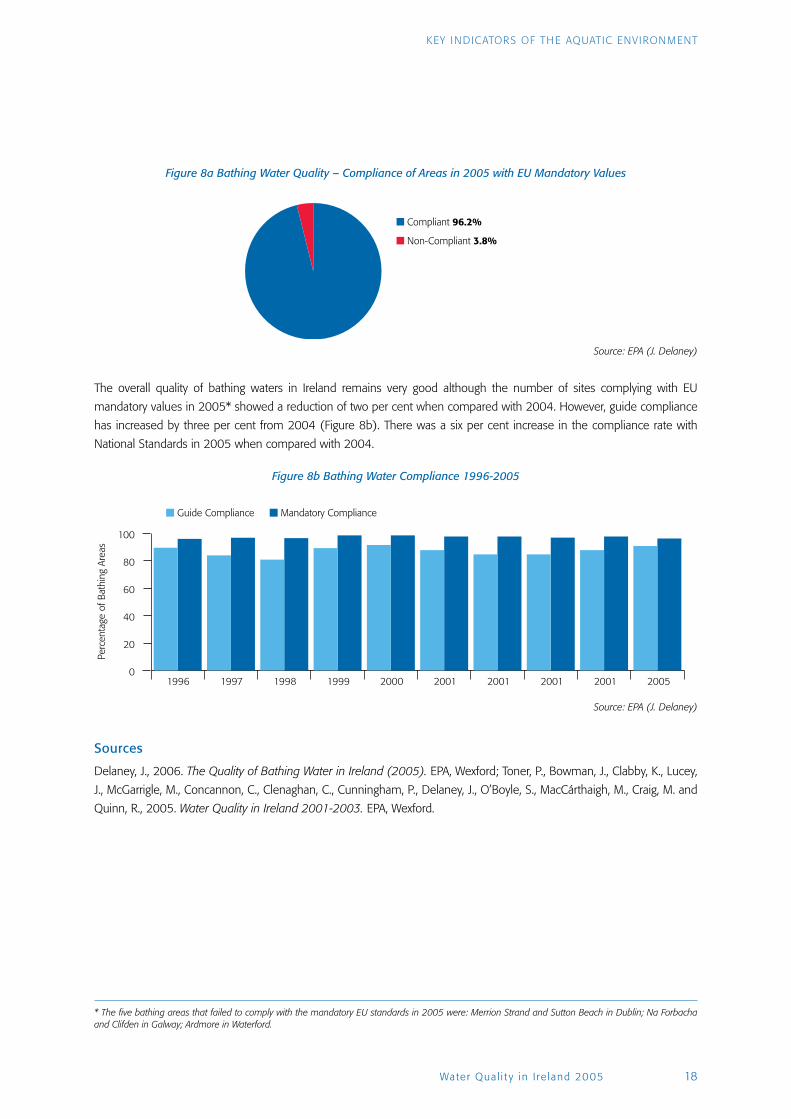
Figure 8a Bathing Water Quality – Compliance of Areas in 2005 with EU Mandatory Values
Compliant 96.2%
Non-Compliant 3.8%
Source: EPA (J. Delaney)
the overall quality of bathing waters in ireland remains very good although the number of sites complying with EU
mandatory values in 2005* showed a reduction of two per cent when compared with 2004. However, guide compliance
has increased by three per cent from 2004 (Figure 8b). there was a six per cent increase in the compliance rate with
national Standards in 2005 when compared with 2004.
Figure 8b Bathing Water Compliance 1996-2005
0
20
40
60
80
100
Guide Compliance
1996 1997 1998 1999 2000 2001 2001 2001 2001 2005
Mandatory Compliance
Perc
enta
ge o
f Bat
hing
Are
as
Source: EPA (J. Delaney)
Sources
Delaney, J., 2006. The Quality of Bathing Water in Ireland (2005). EPa, Wexford; toner, P., Bowman, J., clabby, K., lucey,
J., mcgarrigle, m., concannon, c., clenaghan, c., cunningham, P., Delaney, J., o’Boyle, S., maccárthaigh, m., craig, m. and
Quinn, r., 2005. Water Quality in Ireland 2001-2003. EPa, Wexford.
* The five bathing areas that failed to comply with the mandatory EU standards in 2005 were: Merrion Strand and Sutton Beach in Dublin; Na Forbacha and Clifden in Galway; Ardmore in Waterford.

KEy inDicatorS oF tHE aQUatic EnvironmEnt
19 Water Qua l i t y in i re land 2005
inDicator 9: FaEcal coliFormS in groUnDWatEr
groundwater is a valuable resource in ireland, used in food and industrial processing as well as being an important source
of drinking water. groundwater and springs account for approximately 16 per cent of the total drinking water supplied in
ireland rising to 86 per cent in some rural areas. although treated public water supplies account for approximately 92 per
cent of the total drinking water quantity in ireland, the actual number of group water schemes far exceeds that of public
supply schemes. in ireland, group water schemes supply drinking water to approximately 10 per cent of the population and
the majority of these schemes are privately managed. additionally, there are numerous private small groundwater
abstractions supplying individual dwellings or industries. therefore, there needs to be adequate protection of groundwater
as a resource, given that the majority of private groundwater supplies in ireland are untreated.
the presence in water of microbiological indicators such as faecal coliforms is taken as evidence of faecal contamination
and provides an indication that pathogens, i.e. the actual disease-causing organisms, may be present. the presence of a
single faecal coliform in a water supply is a breach of the Drinking Water regulations (S.i. no. 439 of 2000) in ireland and
is therefore unacceptable.
Figure 9a Faecal Coliforms in Groundwater 1995-2005
0
10
20
30
40
50
60
70
80
1995–1997
0 1-5 6-10
Number of Faecal Coliforms per 100 ml
11-100 >100
1998–2000 2001–2003 2003–2005
Perc
enta
ge o
f Sam
ples
Source: EPA (M. Craig)
the EPa national groundwater-monitoring network includes sampling at some locations that are used for the abstraction of
drinking water. approximately 30 per cent of all samples of groundwater taken between 2003-2005* showed bacteriological
contamination, with some 11 per cent of all samples being grossly contaminated, i.e. had greater than 10 faecal
coliforms/100 ml. Since 1995, generally there has been an increasing trend in the percentage of samples showing zero
contamination, with a decreasing trend in the percentage of samples showing gross contamination (see Figure 9a).
However, 52 per cent of all EPa monitoring locations showed bacteriological contamination at least once between 2003
and 2005, with 30 per cent of all EPa monitoring locations being grossly contaminated at least once during this period. the
groundwater monitoring locations in karst limestone areas appear to show the greatest degree of contamination (see
Figure 9b). this reflects the vulnerable nature of the more dynamic flow systems to pollution.
* Approximately 30 per cent of the 1,714 groundwater and spring samples taken as part of the EPA’s national groundwater monitoring programme, between 2003 and 2005, showed bacteriological contamination.

20Water Qua l i t y in i re land 2005
KEy inDicatorS oF tHE aQUatic EnvironmEnt
Figure 9b Maximum Faecal Coliform Count/100ml during 2003-2005
Aquifer Legend Maximum Faecal ColiformCount/100 ml
Gravel Aquifer
Productive Fissured Bedrock Aquifer
Productive Karstified Aquifer
Poorly Productive Bedrock Aquifer
Zero Faecal Coliforms
1-5 Faecal Coliforms
6-10 Faecal Coliforms
11-100 Faecal Coliforms
>100 Faecal Coliforms
Source: EPA (M. Craig)
Sources
EPa (m. craig); Page, D., moriarty, J., Doris, y. and crowe, m., 2004, The Quality of Drinking Water in Ireland. A report for
the year 2003 with a review of the period 2001-2003, EPa, Wexford; toner, P., Bowman, J., clabby, K., lucey, J., mcgarrigle,
m., concannon, c., clenaghan, c., cunningham, P., Delaney, J., o’Boyle, S., maccárthaigh, m., craig, m. and Quinn, r., 2005.
Water Quality in Ireland 2001-2003. EPa, Wexford.

KEy inDicatorS oF tHE aQUatic EnvironmEnt
21 Water Qua l i t y in i re land 2005
inDicator 10: n itratES in groUnDWatEr
relatively low concentrations of nitrate are found in groundwater under natural conditions, with most coming from organic
or inorganic sources. anthropogenic organic sources can include run-off from septic tanks and animal waste spreading,
whilst inorganic sources can include the spreading of artificial fertiliser. if a significant proportion of surface water flow is
derived from groundwater, then increased nitrate concentrations in groundwater may contribute to eutrophication in surface
waters.
the EPa national groundwater-monitoring network includes sampling at some locations that are also used for the abstraction
of drinking water. the presence of high nitrate concentrations in drinking waters has been linked internationally to
methaemoglobinaemia (blue baby syndrome) in bottle-fed infants if the nitrate converts to nitrite and reacts with blood
haemoglobin.
Figure 10a Nitrate in Groundwater
0
5
10
15
20
25
30
35
40
1995-1997
<5 5-10 10-25
mg/l NO3
25-40 40-50 >50
1998-2000 2001-2003 2003-2005
Perc
enta
ge o
f Mon
itorin
g Lo
catio
ns
Source: EPA (M. Craig)
nitrate can be reported as n or no3 but there is a four-fold difference in numerical terms between the two expressions
(see also indicator 2: nitrates in rivers). Between 2003 and 2005, the mean nitrate concentration exceeded the Drinking
Water regulations (S.i. no. 439 of 2000) guide concentration of 25 mg/l no3, at approximately 23 per cent of all EPa
monitoring locations and exceeded the maximum admissible concentration (mac) of 50 mg/l no3 at approximately two
per cent of all EPa monitoring locations. Since 1995 there has been a general increase in the percentage of samples with
nitrate concentrations between 25-40 mg/l no3. there also appears to be a decrease in the percentage of samples with
nitrate concentrations between 10-25 mg/l no3 (see Figure 10a). the elevated nitrate concentrations appear to be most
prevalent in the south-east although there are elevated nitrate concentrations at certain clusters of monitoring locations, for
example, in counties louth and Kerry (see Figure 10b).
Elevated nitrate concentrations may be observed in monitoring points that are in close proximity to potential point source
waste discharges. However, the spatial distribution of monitoring locations with elevated nitrate concentrations appears to
relate to areas with more intensive agricultural practices, which suggests that diffuse, agricultural sources are the cause. the
increased percentage of monitoring locations with nitrate concentrations greater than 25 mg/l no3 would appear to
indicate that this may develop into a widespread problem and without future nutrient management plans may result in a
greater need for drinking water treatment for nitrate.

22Water Qua l i t y in i re land 2005
KEy inDicatorS oF tHE aQUatic EnvironmEnt
Figure 10b Mean Nitrate Concentrations during 2003-2005
Aquifer Legend Mean Nitrate Concentration
Gravel Aquifer
Productive Fissured Bedrock Aquifer
Productive Karstified Aquifer
Poorly Productive Bedrock Aquifer
<5 mg/l NO3
5-10 mg/l NO3
10-25 mg/l NO3
25-40 mg/l NO3
40-50 mg/l NO3
>50 mg/l NO3
Source: EPA (M. Craig)
Sources
EPa (m. craig); Flanagan, P.J., 1988. Parameters of Water Quality. Environmental research Unit, Dublin; toner, P., Bowman,
J., clabby, K., lucey, J., mcgarrigle, m., concannon, c., clenaghan, c., cunningham, P., Delaney, J., o’Boyle, S., maccárthaigh,
m., craig, m and Quinn, r., 2005. Water Quality in Ireland 2001-2003. EPa, Wexford.

KEy inDicatorS oF tHE aQUatic EnvironmEnt
23 Water Qua l i t y in i re land 2005

Stádas na GníomhaireachtaIs comhlacht poiblí neamhspleách í an Ghníomhaireacht um Chaomhnú Comhshaoil (EPA) a bunaíodh i mí Iúil 1993 faoin Acht fán nGníomhaireacht um Chaomhnú Comhshaoil, 1992. Ó thaobh an Rialtais, is í an Roinn Comhshaoil agus Rialtais Áitiúil a dhéanann urraíocht uirthi.
Déanann Bord Feidhmeach lánaimseartha comhdhéanta d’Ard-Stiúrthóir agus ceathrar Stiúrthóirí bainistíocht ar an EPA. Cinntítear neamhspleáchas trí nósanna imeachta roghnaithe i gcás an Ard-Stiúrthóra agus na Stiúrthóirí agus an tsaoirse, de réir mar a sholáthraítear sa reachtaíocht, gníomhú as a stuaim féin. Tá an sannadh, faoin reachtaíocht, maidir le freagracht dhíreach as réimse leathan feidhmeanna mar bhonn taca ag an neamhspleáchas sin. Faoin reachtaíocht, is cion sainiúil é iarracht a dhéanamh tionchar a imirt ar an Ghníomhaireacht, nó ar aon duine a bhíonn ag gníomhú thar ceann na Gníomhaireachta, ar bhealach míchuí.
Cuidíonn Coiste Comhairleach ar a bhfuil dhá chomhalta déag arna gceapadh ag an Aire Comhshaoil, Oidhreachta agus Rialtais Áitiúil leis an nGníomhaireacht.
FreagrachtaíTá réimse leathan dualgas agus cumhachtaí reachtúla ag an EPA faoin Acht fán nGníomhaireacht um Chaomhnú Comhshaoil. Chomh maith leis sin, tá curtha le hacmhainn an EPA maidir le forfheidhmiú le cumhachtaí san Acht um Chaomhnú an Chomhshaoil 2003. Áirítear orthu seo a leanas príomhfhreagrachtaí an EPA:
• ceadúnú a dhéanamh ar phróisis thionsclaíocha mhóra/choimpléascacha a bhféadfadh cumas truaillithe suntasach a bheith ag baint leo;
• monatóireacht ar chaighdeán comhshaoil, lena n-áirítear bunachair shonraí a bhunú ar a mbeidh rochtain ag an bpobal;
• tuarascálacha tréimhsiúla maidir le staid an chomhshaoil a fhoilsiú;
• sárchleachtais comhshaoil a chur chun cinn;
• taighde comhshaoil a chur chun cinn agus a chomhordú;
• gníomhaíochtaí diúscartha dramhaíola agus aisghabhála suntasacha, lena n-áirítear láithreacha líonta talún a cheadúnú agus plean bainistíochta guaisdramhaíola náisiúnta a ullmhú;
• córas a chur i bhfeidhm a cheadaíonn rialú astaithe VOC a bhíonn mar thoradh ar scaoileadh GMOanna isteach sa chomhshaol in aon turas;
• rialacháin GMO a chur i bhfeidhm agus a fhorfheidhmiú ó thaobh GMOanna a choinneáil agus a scaoileadh amach sa chomhshaol in aon turas;
• clár hidriméadrach náisiúnta a ullmhú agus a chur i bhfeidhm;
• ag cur i bhfeidhm eochair-thuarascálacha na gCreat-Treoracha Aeir agus Uisce
• dréacht a chur le chéile de Phlean Leithroinnte Náisiúnta do thrádáil liúntas astaithe gáis ceaptha teasa; Údarás Inniúla Náisiúnta a bhunú le ceadanna trádála agus liúntais a eisiúint orthu siúd atá clúdaithe ag an scéim; monatóireacht, léargas, agus fíorú maidir le hastuithe ó chuideachtaí rannpháirteacha; agus Clár Trádála Astuithe Náisiúnta a bhunú;
• Réiteach agus cur i bhfeidhm an Chláir Náisiúnta um Chosc ar Dhramhaíl le fócas ar leith ar ghníomhaíochtaí fiontair agus údarás áitiúla
• Forfheidhmiú oibleagáidí freagrachta an táirgeora maidir le trealamh leictreach agus leictreonach dramhaíola (WEEE) a bhainistiú agus maidir leis an srian ar shubstaintí guaiseacha (RoHS) i dtrealamh leictreach agus leictreonach
• Cur i bhfeidhm rialachán an AE in Éirinn maidir le hózón a laghdú
agus, faoin Oifig Forfheidhmiúcháin Comhshaoil, a bunaíodh i 2003 agus atá tiomanta as reachtaíocht comhshaoil a chur i bhfeidhm agus a fhorfheidhmiú in Éirinn;
• feabhas a chur ar chomhlíonadh reachtaíocht cosanta comhshaoil in Éirinn;
• feasacht a ardú maidir leis an tábhacht a bhaineann le forfheidhmiú i gcás reachtaíochta cosanta comhshaoil in Éirinn;
• ceadúnais IPPC agus ceadúnais Dramhaíola a eisíonn an EPA a fhorfheidhmiú;
• iniúchadh agus tuairisciú ar fheidhmíocht údarás áitiúil maidir lena bhfeidhmeanna cosanta comhshaoil a chur ar bun, lena n-áirítear:
• forfheidhmiú maidir le ceadúnais dramhaíola a sháraítear;
• gníomh maidir le dumpáil mhídhleathach;
• ceadanna bailithe dramhaíola a chur i bhfeidhm, agus
• tionscnaimh a bheidh mar fhreagracht ar an táirgeoir a fhorfheidhmiú (mar shampla, sa réimse a bhaineann le dramhaíl pacáiste);
• gníomh in aghaidh údarás áitiúil nach bhfuil ag comhlíonadh a gcuid feidhmeanna cosanta comhshaoil ar bhealach cuí;
• an dlí a chur nó cuidiú le húdaráis áitiúla an dlí a chur ó thaobh sháraithe suntasacha reachtaíochta cosanta comhshaoil ar bhealach caoithiúil; agus
• cuidiú le húdaráis áitiúla a gcuid feidhmíocht cosanta comhshaoil a fheabhsú ar bhonn cás ar chás, trí ghréasán forfheidhmithe a bhunú le malartú eolais a chur chun cinn chomh maith le sárchleachtas, agus trí threoir chuí a sholáthar.
an gHníomHairEacHt Um cHaomHnú comHSHaoil

ENVIRONMENTAL PROTECTION AGENCY PO Box 3000, Johnstown Castle Estate,
Co. Wexford, Ireland
t +353 53 9160600 f +353 53 9160699 e [email protected] w http://www.epa.ie
Related Documents