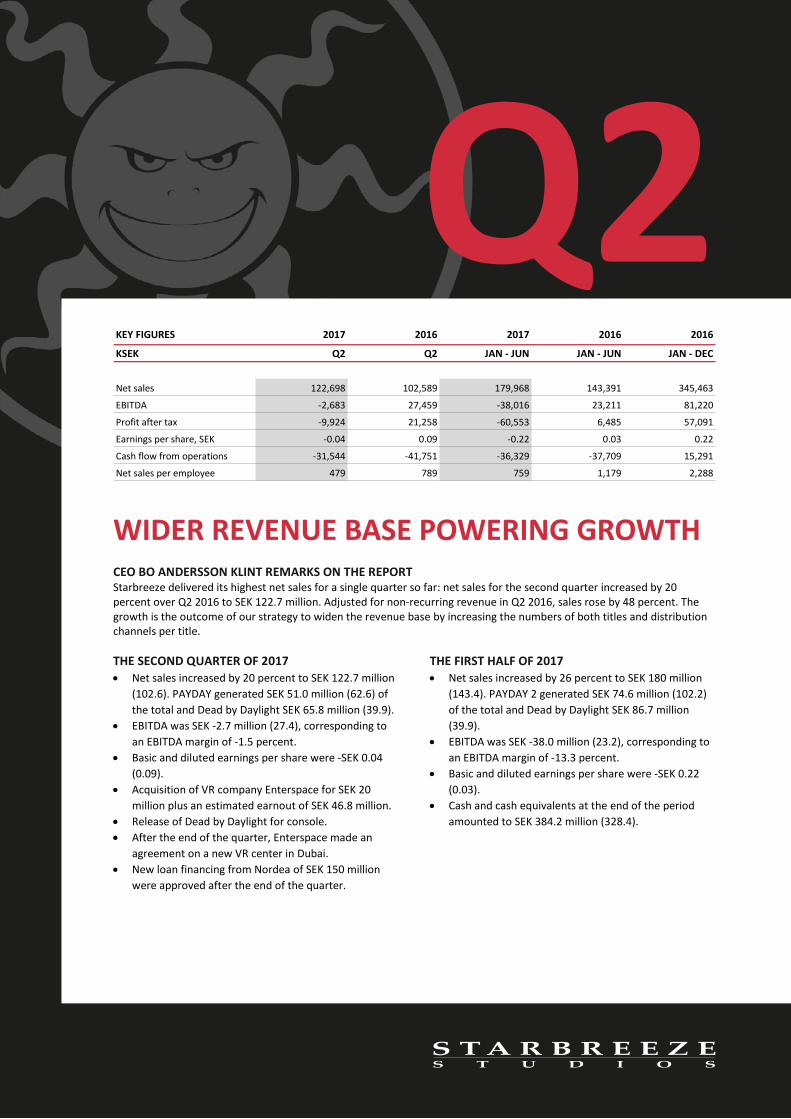
Q2 WIDER REVENUE BASE POWERING GROWTH CEO BO ANDERSSON KLINT REMARKS ON THE REPORT Starbreeze delivered its highest net sales for a single quarter so far: net sales for the second quarter increased by 20 percent over Q2 2016 to SEK 122.7 million. Adjusted for non-recurring revenue in Q2 2016, sales rose by 48 percent. The growth is the outcome of our strategy to widen the revenue base by increasing the numbers of both titles and distribution channels per title. THE SECOND QUARTER OF 2017 • Net sales increased by 20 percent to SEK 122.7 million (102.6). PAYDAY generated SEK 51.0 million (62.6) of the total and Dead by Daylight SEK 65.8 million (39.9). • EBITDA was SEK -2.7 million (27.4), corresponding to an EBITDA margin of -1.5 percent. • Basic and diluted earnings per share were -SEK 0.04 (0.09). • Acquisition of VR company Enterspace for SEK 20 million plus an estimated earnout of SEK 46.8 million. • Release of Dead by Daylight for console. • After the end of the quarter, Enterspace made an agreement on a new VR center in Dubai. • New loan financing from Nordea of SEK 150 million were approved after the end of the quarter. THE FIRST HALF OF 2017 • Net sales increased by 26 percent to SEK 180 million (143.4). PAYDAY 2 generated SEK 74.6 million (102.2) of the total and Dead by Daylight SEK 86.7 million (39.9). • EBITDA was SEK -38.0 million (23.2), corresponding to an EBITDA margin of -13.3 percent. • Basic and diluted earnings per share were -SEK 0.22 (0.03). • Cash and cash equivalents at the end of the period amounted to SEK 384.2 million (328.4). KEY FIGURES 2017 2016 2017 2016 2016 KSEK Q2 Q2 JAN - JUN JAN - JUN JAN - DEC Net sales 122,698 102,589 179,968 143,391 345,463 EBITDA -2,683 27,459 -38,016 23,211 81,220 Profit after tax -9,924 21,258 -60,553 6,485 57,091 Earnings per share, SEK -0.04 0.09 -0.22 0.03 0.22 Cash flow from operations -31,544 -41,751 -36,329 -37,709 15,291 Net sales per employee 479 789 759 1,179 2,288

Welcome message from author
This document is posted to help you gain knowledge. Please leave a comment to let me know what you think about it! Share it to your friends and learn new things together.
Transcript
Q2
WIDER REVENUE BASE POWERING GROWTH CEO BO ANDERSSON KLINT REMARKS ON THE REPORT Starbreeze delivered its highest net sales for a single quarter so far: net sales for the second quarter increased by 20 percent over Q2 2016 to SEK 122.7 million. Adjusted for non-recurring revenue in Q2 2016, sales rose by 48 percent. The growth is the outcome of our strategy to widen the revenue base by increasing the numbers of both titles and distribution channels per title.
THE SECOND QUARTER OF 2017 • Net sales increased by 20 percent to SEK 122.7 million
(102.6). PAYDAY generated SEK 51.0 million (62.6) of the total and Dead by Daylight SEK 65.8 million (39.9).
• EBITDA was SEK -2.7 million (27.4), corresponding to an EBITDA margin of -1.5 percent.
• Basic and diluted earnings per share were -SEK 0.04 (0.09).
• Acquisition of VR company Enterspace for SEK 20 million plus an estimated earnout of SEK 46.8 million.
• Release of Dead by Daylight for console. • After the end of the quarter, Enterspace made an
agreement on a new VR center in Dubai. • New loan financing from Nordea of SEK 150 million
were approved after the end of the quarter.
THE FIRST HALF OF 2017 • Net sales increased by 26 percent to SEK 180 million
(143.4). PAYDAY 2 generated SEK 74.6 million (102.2) of the total and Dead by Daylight SEK 86.7 million (39.9).
• EBITDA was SEK -38.0 million (23.2), corresponding to an EBITDA margin of -13.3 percent.
• Basic and diluted earnings per share were -SEK 0.22 (0.03).
• Cash and cash equivalents at the end of the period amounted to SEK 384.2 million (328.4).
KEY FIGURES 2017 2016 2017 2016 2016
KSEK Q2 Q2 JAN - JUN JAN - JUN JAN - DEC
Net sales 122,698 102,589 179,968 143,391 345,463
EBITDA -2,683 27,459 -38,016 23,211 81,220
Profit after tax -9,924 21,258 -60,553 6,485 57,091
Earnings per share, SEK -0.04 0.09 -0.22 0.03 0.22
Cash flow from operations -31,544 -41,751 -36,329 -37,709 15,291
Net sales per employee 479 789 759 1,179 2,288
2 STARBREEZE • INTERIM REPORT • Q2 2017
Q2
2017
ABOUT STARBREEZE Starbreeze is an independent creator, publisher and distributor of high-quality entertainment products. With studios in Stockholm, Paris, Los Angeles, Barcelona and Brussels, we create games and virtual reality products based on proprietary design and licensed content. Starbreeze hottest game titles include PAYDAY 2®, the VR shooter John Wick and the upcoming survival shooter, OVERKILL’s The Walking Dead. Under the aegis of the company’s publishing business, Starbreeze successfully released the horror thriller Dead by Daylight in partnership with the Canadian studio Behaviour Digital.
Starbreeze is creating truly immersive virtual reality (VR) experiences by integrating software and hardware in the company’s StarVR® headset, produced in partnership with Acer. Together with Enterspace, a Starbreeze subsidiary, the company is further developing its involvement in the location-based VR market. StarVR is also found at the IMAX VR centers in Los Angeles and New York.
Headquartered in Stockholm, Sweden, Starbreeze shares are listed on Nasdaq Stockholm First North Premier under the tickers STAR A and STAR B, ISIN codes SE0007158928 (class A) and SE0005992831 (class B). The company’s Certified Adviser is Remium Nordic.
More information: starbreeze.com, starvr. com, overkillsoftware.com
PAYDAY 2
8+ MILLION NEW PLAYERS IN Q2

3 STARBREEZE • INTERIM REPORT • Q2 2017
Q2
2017
WIDER REVENUE BASE POWERING GROWTH
CEO Bo Andersson Klint remarks on the report: Starbreeze delivered its highest net sales for a single quarter so far: net sales for the second quarter increased by 20 percent over Q2 2016 to SEK 122.7 million. Adjusted for non-recurring revenue in Q2 2016, sales rose by 48 percent. The growth is the outcome of our strategy to widen the revenue base by increasing the numbers of both titles and distribution channels per title.
Compared to the second quarter of 2016, our costs excluding royalties to partners, increased by 50 percent, mainly attributable to higher activity in our core business. The rate of cost increase has slowed significantly compared to the first quarter as the development teams are approaching full staffing.
EBITDA for the quarter was slightly negative at SEK -2.7 million and until we release our major titles, such as OVERKILL’s The Walking Dead (OTWD) and Crossfire, which are progressing according to plan, we may report both negative EBITDA and/or negative cash flow in some quarters.
PAYDAY ALL-TIME HIGH ON STEAM PAYDAY is aging in style and year-on-year sales in the second quarter were up by SEK 8.3 million, mainly due to the introduction of the PAYDAY 2: Ultimate Edition collection. Prior to the update, we wanted as many as possible to have the chance to complete their collections with DLCs before we changed the pricing model, and at the same time we were looking to increase the installed base of the stand-alone game. In early June, we offered the base game for free during a limited time, giving gamers the option to purchase DLCs at à la carte pricing or upgrade to the Ultimate Edition to get the full catalog of content at a discounted price. We started out with a campaign to give away five million copies for free and after an overwhelmingly positive response we achieved the goal in less than 36 hours. Prolonging the campaign, the ultimate outcome was almost eight million new players in less than five days and an all-time peak of 247,628 concurrent players on Steam. This is the sixth-highest concurrent player stat ever recorded on the platform, in all categories.
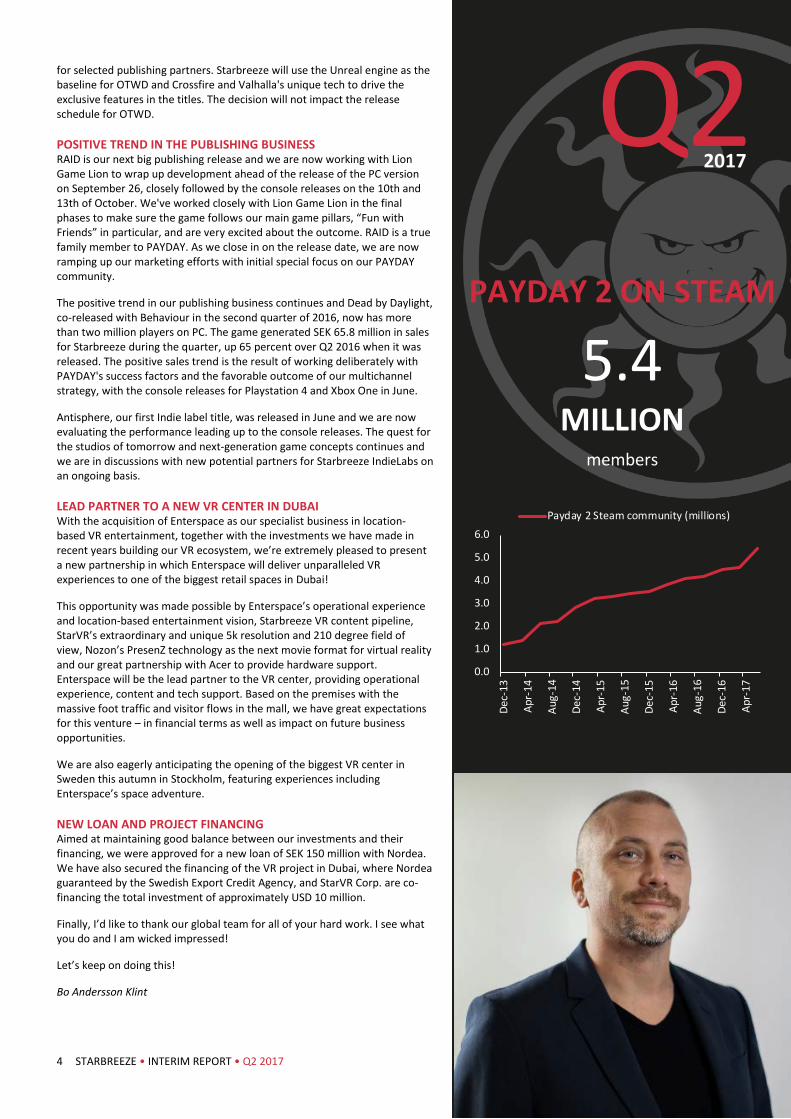
We’ve managed to generate significant revenues from PAYDAY 2 over four years, thanks to our Games as a Service model, commitment to the game and our strategy of applying sales pulses by frequent updates, constant community interaction and careful use of discounts and campaigns. We now move into phase 2 of the life cycle of PAYDAY 2 and will continue to provide free updates to the game and keep our community interaction at the same levels. With 5.4 million members, we have the biggest community on Steam by far and are confident that PAYDAY will continue to generate significant revenue for Starbreeze and that the gaming community is looking forward to our upcoming titles.
NEW ADDITIONAL TECHNOLOGY FOR OTWD AND CROSSFIRE After a focused technology roadmap review and testing period of Unreal Engine’s capabilities, we have decided that Starbreeze will continuously support and develop Valhalla as a plugin but will further move to being an engine agnostic company. The Valhalla technology remains the cornerstone of ongoing product development, especially for OTWD. With Valhalla, we have created unique tech, specifically for randomization of worlds and dynamically generated gameplay, which has attracted the attention of multiple industry leaders. After lengthy talks with various partners, Epic, parent of the Unreal Engine, and Starbreeze have agreed to integrate the technology as a plugin to the Unreal Engine for internal use at Starbreeze and
PAYDAY 2
Source: steamcharts.com
At peak
247,628 concurrent PAYDAY 2 players in June
0
50,000
100,000
150,000
200,000
250,000
300,000
Jun-
14
Sep-
14
Dec-
14
Mar
-15
Jun-
15
Sep-
15
Dec-
15
Mar
-16
Jun-
16
Sep-
16
Dec-
16
Mar
-17
Jun-
17
Concurrent players (avg)Concurrent players (peak)
4 STARBREEZE • INTERIM REPORT • Q2 2017
Q2
2017
for selected publishing partners. Starbreeze will use the Unreal engine as the baseline for OTWD and Crossfire and Valhalla's unique tech to drive the exclusive features in the titles. The decision will not impact the release schedule for OTWD.
POSITIVE TREND IN THE PUBLISHING BUSINESS RAID is our next big publishing release and we are now working with Lion Game Lion to wrap up development ahead of the release of the PC version on September 26, closely followed by the console releases on the 10th and 13th of October. We've worked closely with Lion Game Lion in the final phases to make sure the game follows our main game pillars, “Fun with Friends” in particular, and are very excited about the outcome. RAID is a true family member to PAYDAY. As we close in on the release date, we are now ramping up our marketing efforts with initial special focus on our PAYDAY community.
The positive trend in our publishing business continues and Dead by Daylight, co-released with Behaviour in the second quarter of 2016, now has more than two million players on PC. The game generated SEK 65.8 million in sales for Starbreeze during the quarter, up 65 percent over Q2 2016 when it was released. The positive sales trend is the result of working deliberately with PAYDAY's success factors and the favorable outcome of our multichannel strategy, with the console releases for Playstation 4 and Xbox One in June.
Antisphere, our first Indie label title, was released in June and we are now evaluating the performance leading up to the console releases. The quest for the studios of tomorrow and next-generation game concepts continues and we are in discussions with new potential partners for Starbreeze IndieLabs on an ongoing basis.
LEAD PARTNER TO A NEW VR CENTER IN DUBAI With the acquisition of Enterspace as our specialist business in location-based VR entertainment, together with the investments we have made in recent years building our VR ecosystem, we’re extremely pleased to present a new partnership in which Enterspace will deliver unparalleled VR experiences to one of the biggest retail spaces in Dubai!
This opportunity was made possible by Enterspace’s operational experience and location-based entertainment vision, Starbreeze VR content pipeline, StarVR’s extraordinary and unique 5k resolution and 210 degree field of view, Nozon’s PresenZ technology as the next movie format for virtual reality and our great partnership with Acer to provide hardware support. Enterspace will be the lead partner to the VR center, providing operational experience, content and tech support. Based on the premises with the massive foot traffic and visitor flows in the mall, we have great expectations for this venture – in financial terms as well as impact on future business opportunities.
We are also eagerly anticipating the opening of the biggest VR center in Sweden this autumn in Stockholm, featuring experiences including Enterspace’s space adventure.
NEW LOAN AND PROJECT FINANCING Aimed at maintaining good balance between our investments and their financing, we were approved for a new loan of SEK 150 million with Nordea. We have also secured the financing of the VR project in Dubai, where Nordea guaranteed by the Swedish Export Credit Agency, and StarVR Corp. are co-financing the total investment of approximately USD 10 million.
Finally, I’d like to thank our global team for all of your hard work. I see what you do and I am wicked impressed!
Let’s keep on doing this!
Bo Andersson Klint
PAYDAY 2 ON STEAM
5.4 MILLION
members
0.0
1.0
2.0
3.0
4.0
5.0
6.0
Dec-
13
Apr-
14
Aug-
14
Dec-
14
Apr-
15
Aug-
15
Dec-
15
Apr-
16
Aug-
16
Dec-
16
Apr-
17
Payday 2 Steam community (millions)

5 STARBREEZE • INTERIM REPORT • Q2 2017
Q2 2017
SIGNIFICANT EVENTS DURING THE QUARTER
ACQUISITION OF VR COMPANY ENTERSPACE Starbreeze signed an agreement in June to acquire the Swedish location-based VR company Enterspace AB for SEK 20 million (SEK 17.0 million in class B shares in Starbreeze and SEK 3.0 million in cash) and a conditional earnout estimated at SEK 46.8 million, which is linked to future sales and may be triggered in the next six years. See Note 5 and the “Parent company” section for more information.
Enterspace, founded in 2016, develops an entirely new type of location-based entertainment and the founders have extensive experience from location-based entertainment at planetariums all over the world. The company’s debut signature experience, Ringwalker™, is a multi-user interactive space adventure. The story mixes a thought-provoking narrative and unexpected twists with inspiring science. Enterspace will open its first VR center in downtown Stockholm in the autumn of 2017.
CONTRACT RENEGOTIATIONS ON IMAX VR CENTERS ENDED Contract negotiations with IMAX on starting a joint venture for IMAX VR Centers were ended in June. The partnership will instead continue through a content licensing agreement with customary terms for revenue sharing and StarVR Corp. will take over hardware sales and support. In the company’s judgment, this solution will give Starbreeze and StarVR Corp. greater scope to widen product offerings and the customer base.
RELEASE OF DEAD BY DAYLIGHT FOR CONSOLE Starbreeze and Behaviour co-released the publishing title Dead by Daylight for PlayStation 4 and Xbox One in Europe and the US in late June.
DELAYED RELEASE OF OVERKILL’S THE WALKING DEAD It was announced in May that release of the ongoing OTWD development project had been postponed until the second half of 2018. The company had previously communicated that the game would be finished in the latter part of 2017.
SIGNIFICANT EVENTS AFTER THE END OF THE PERIOD Agreement on a new VR center in Dubai In August, Starbreeze recently acquired subsidiary Enterspace signed a five-year cooperation agreement for a new VR center in Dubai. Under the agreement, Enterspace will be the lead partner, providing operational experience, installation and content to the new VR center. The agreement entails an investment of approximately USD 10 million, fully financed by Nordea guaranteed by the Swedish Export Credit Agency and StarVR Corp. Starbreeze will receive 20-25 percent of the future net sales.
New loan financing In addition to the project financing for the VR center in Dubai, Starbreeze were approved a loan of SEK 150 million after the end of the period from Nordea, on customary market terms.
Release date for RAID It was announced in August that Starbreeze, Lion Game Lion and 505 Games will release the publishing title RAID: World War II for PC on 26 September and for PlayStation 4 and Xbox One on 10 October in North America and 13 October in Europe, the Middle East and Asia.
At peak
22,352 gamers played
DEAD BY DAYLIGHT
concurrently during the quarter
0
10,000
20,000
30,000
40,000
50,000Se
p-16
Oct
-16
Nov
-16
Dec-
16
Jan-
17
Feb-
17
Mar
-17
Apr-
17
May
-17
Jun-
17
Concurrent players (avg)Concurrent players (peak)
6 STARBREEZE • INTERIM REPORT • Q2 2017
Q2 2017
SALES AND PROFIT The comparison period for profit and loss is the corresponding period in the preceding year.
SALES
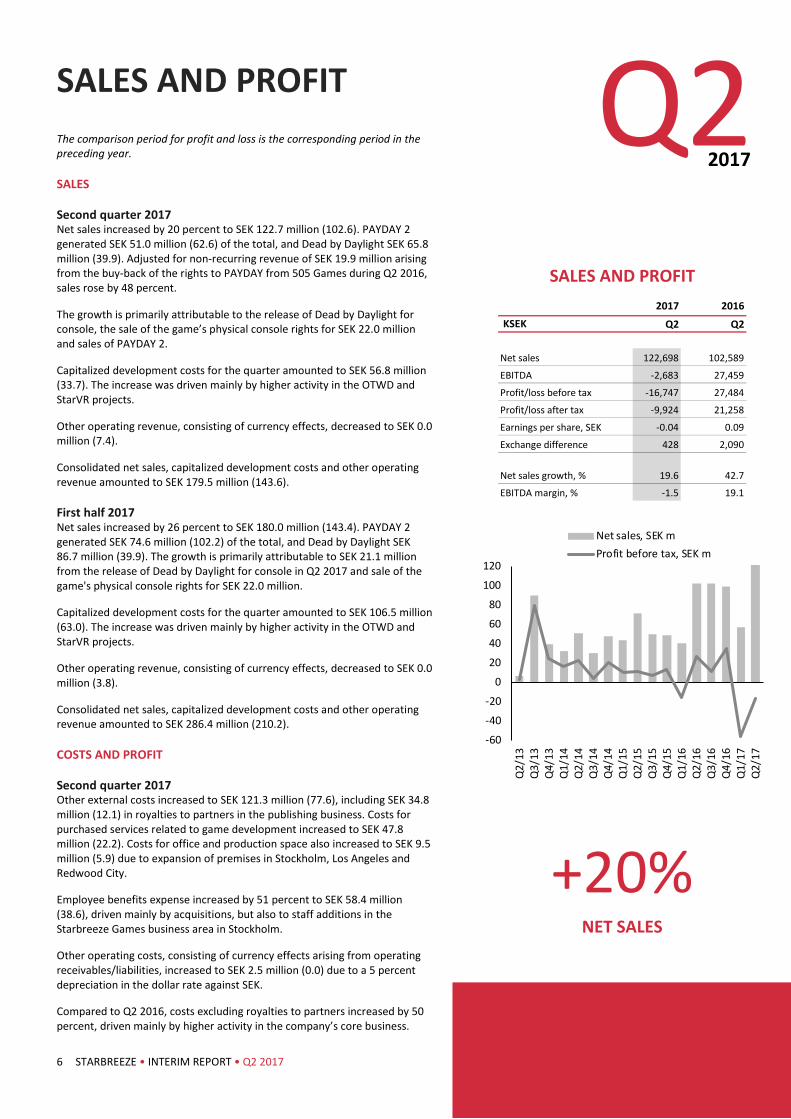
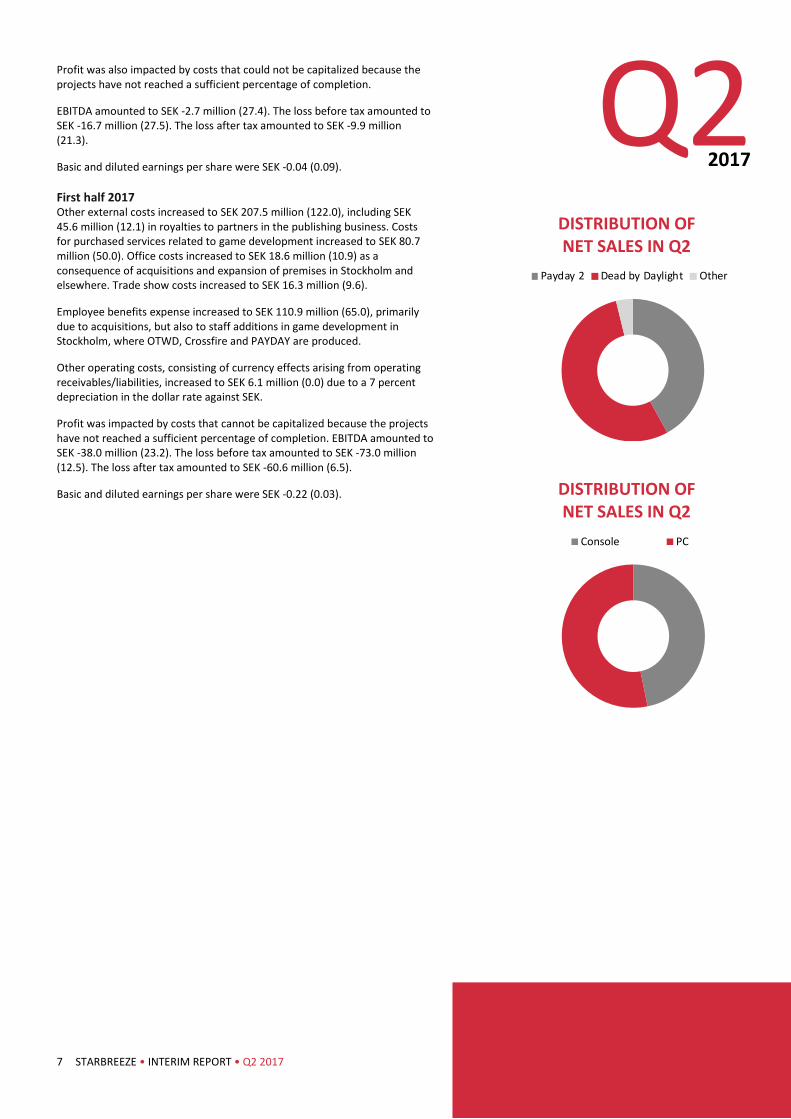
Second quarter 2017 Net sales increased by 20 percent to SEK 122.7 million (102.6). PAYDAY 2 generated SEK 51.0 million (62.6) of the total, and Dead by Daylight SEK 65.8 million (39.9). Adjusted for non-recurring revenue of SEK 19.9 million arising from the buy-back of the rights to PAYDAY from 505 Games during Q2 2016, sales rose by 48 percent.
The growth is primarily attributable to the release of Dead by Daylight for console, the sale of the game’s physical console rights for SEK 22.0 million and sales of PAYDAY 2.
Capitalized development costs for the quarter amounted to SEK 56.8 million (33.7). The increase was driven mainly by higher activity in the OTWD and StarVR projects.
Other operating revenue, consisting of currency effects, decreased to SEK 0.0 million (7.4).
Consolidated net sales, capitalized development costs and other operating revenue amounted to SEK 179.5 million (143.6).
First half 2017 Net sales increased by 26 percent to SEK 180.0 million (143.4). PAYDAY 2 generated SEK 74.6 million (102.2) of the total, and Dead by Daylight SEK 86.7 million (39.9). The growth is primarily attributable to SEK 21.1 million from the release of Dead by Daylight for console in Q2 2017 and sale of the game's physical console rights for SEK 22.0 million.
Capitalized development costs for the quarter amounted to SEK 106.5 million (63.0). The increase was driven mainly by higher activity in the OTWD and StarVR projects.
Other operating revenue, consisting of currency effects, decreased to SEK 0.0 million (3.8).
Consolidated net sales, capitalized development costs and other operating revenue amounted to SEK 286.4 million (210.2).
COSTS AND PROFIT
Second quarter 2017 Other external costs increased to SEK 121.3 million (77.6), including SEK 34.8 million (12.1) in royalties to partners in the publishing business. Costs for purchased services related to game development increased to SEK 47.8 million (22.2). Costs for office and production space also increased to SEK 9.5 million (5.9) due to expansion of premises in Stockholm, Los Angeles and Redwood City.
Employee benefits expense increased by 51 percent to SEK 58.4 million (38.6), driven mainly by acquisitions, but also to staff additions in the Starbreeze Games business area in Stockholm.
Other operating costs, consisting of currency effects arising from operating receivables/liabilities, increased to SEK 2.5 million (0.0) due to a 5 percent depreciation in the dollar rate against SEK.
Compared to Q2 2016, costs excluding royalties to partners increased by 50 percent, driven mainly by higher activity in the company’s core business.
SALES AND PROFIT
+20% NET SALES
2017 2016KSEK Q2 Q2
Net sales 122,698 102,589
EBITDA -2,683 27,459
Profit/loss before tax -16,747 27,484
Profit/loss after tax -9,924 21,258
Earnings per share, SEK -0.04 0.09
Exchange difference 428 2,090
Net sales growth, % 19.6 42.7
EBITDA margin, % -1.5 19.1
-60
-40
-20
0
20
40
60
80
100
120
Q2/
13Q
3/13
Q4/
13Q
1/14
Q2/
14Q
3/14
Q4/
14Q
1/15
Q2/
15Q
3/15
Q4/
15Q
1/16
Q2/
16Q
3/16
Q4/
16Q
1/17
Q2/
17
Net sales, SEK mProfit before tax, SEK m
7 STARBREEZE • INTERIM REPORT • Q2 2017
Q2 2017
Profit was also impacted by costs that could not be capitalized because the projects have not reached a sufficient percentage of completion.
EBITDA amounted to SEK -2.7 million (27.4). The loss before tax amounted to SEK -16.7 million (27.5). The loss after tax amounted to SEK -9.9 million (21.3).
Basic and diluted earnings per share were SEK -0.04 (0.09).
First half 2017 Other external costs increased to SEK 207.5 million (122.0), including SEK 45.6 million (12.1) in royalties to partners in the publishing business. Costs for purchased services related to game development increased to SEK 80.7 million (50.0). Office costs increased to SEK 18.6 million (10.9) as a consequence of acquisitions and expansion of premises in Stockholm and elsewhere. Trade show costs increased to SEK 16.3 million (9.6).
Employee benefits expense increased to SEK 110.9 million (65.0), primarily due to acquisitions, but also to staff additions in game development in Stockholm, where OTWD, Crossfire and PAYDAY are produced.
Other operating costs, consisting of currency effects arising from operating receivables/liabilities, increased to SEK 6.1 million (0.0) due to a 7 percent depreciation in the dollar rate against SEK.
Profit was impacted by costs that cannot be capitalized because the projects have not reached a sufficient percentage of completion. EBITDA amounted to SEK -38.0 million (23.2). The loss before tax amounted to SEK -73.0 million (12.5). The loss after tax amounted to SEK -60.6 million (6.5).
Basic and diluted earnings per share were SEK -0.22 (0.03).
DISTRIBUTION OF NET SALES IN Q2
DISTRIBUTION OF NET SALES IN Q2
Payday 2 Dead by Daylight Other
Console PC
8 STARBREEZE • INTERIM REPORT • Q2 2017
Q2 2017
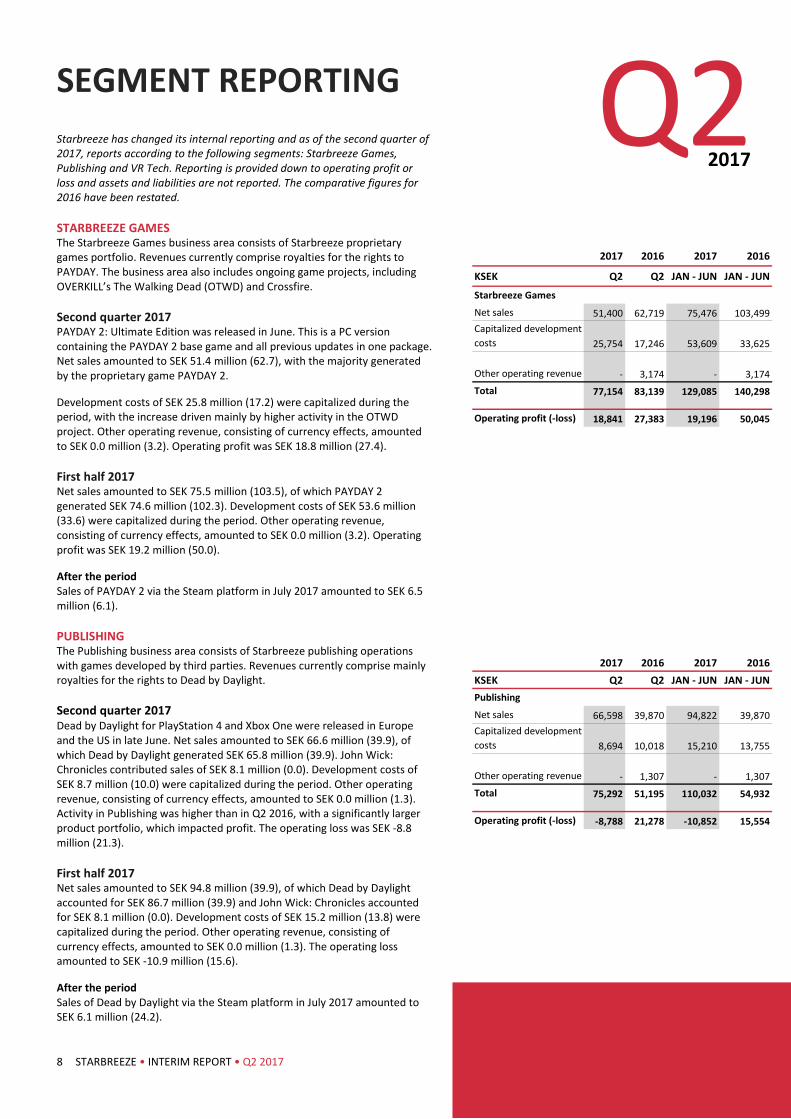
SEGMENT REPORTING Starbreeze has changed its internal reporting and as of the second quarter of 2017, reports according to the following segments: Starbreeze Games, Publishing and VR Tech. Reporting is provided down to operating profit or loss and assets and liabilities are not reported. The comparative figures for 2016 have been restated.
STARBREEZE GAMES The Starbreeze Games business area consists of Starbreeze proprietary games portfolio. Revenues currently comprise royalties for the rights to PAYDAY. The business area also includes ongoing game projects, including OVERKILL’s The Walking Dead (OTWD) and Crossfire.
Second quarter 2017 PAYDAY 2: Ultimate Edition was released in June. This is a PC version containing the PAYDAY 2 base game and all previous updates in one package. Net sales amounted to SEK 51.4 million (62.7), with the majority generated by the proprietary game PAYDAY 2.
Development costs of SEK 25.8 million (17.2) were capitalized during the period, with the increase driven mainly by higher activity in the OTWD project. Other operating revenue, consisting of currency effects, amounted to SEK 0.0 million (3.2). Operating profit was SEK 18.8 million (27.4).
First half 2017 Net sales amounted to SEK 75.5 million (103.5), of which PAYDAY 2 generated SEK 74.6 million (102.3). Development costs of SEK 53.6 million (33.6) were capitalized during the period. Other operating revenue, consisting of currency effects, amounted to SEK 0.0 million (3.2). Operating profit was SEK 19.2 million (50.0).
After the period Sales of PAYDAY 2 via the Steam platform in July 2017 amounted to SEK 6.5 million (6.1).
PUBLISHING The Publishing business area consists of Starbreeze publishing operations with games developed by third parties. Revenues currently comprise mainly royalties for the rights to Dead by Daylight. Second quarter 2017 Dead by Daylight for PlayStation 4 and Xbox One were released in Europe and the US in late June. Net sales amounted to SEK 66.6 million (39.9), of which Dead by Daylight generated SEK 65.8 million (39.9). John Wick: Chronicles contributed sales of SEK 8.1 million (0.0). Development costs of SEK 8.7 million (10.0) were capitalized during the period. Other operating revenue, consisting of currency effects, amounted to SEK 0.0 million (1.3). Activity in Publishing was higher than in Q2 2016, with a significantly larger product portfolio, which impacted profit. The operating loss was SEK -8.8 million (21.3).
First half 2017 Net sales amounted to SEK 94.8 million (39.9), of which Dead by Daylight accounted for SEK 86.7 million (39.9) and John Wick: Chronicles accounted for SEK 8.1 million (0.0). Development costs of SEK 15.2 million (13.8) were capitalized during the period. Other operating revenue, consisting of currency effects, amounted to SEK 0.0 million (1.3). The operating loss amounted to SEK -10.9 million (15.6).
After the period Sales of Dead by Daylight via the Steam platform in July 2017 amounted to SEK 6.1 million (24.2).
2017 2016 2017 2016
KSEK Q2 Q2 JAN - JUN JAN - JUN
Starbreeze Games
Net sales 51,400 62,719 75,476 103,499Capitalized development costs 25,754 17,246 53,609 33,625
Other operating revenue - 3,174 - 3,174Total 77,154 83,139 129,085 140,298
Operating profit (-loss) 18,841 27,383 19,196 50,045
2017 2016 2017 2016KSEK Q2 Q2 JAN - JUN JAN - JUNPublishing
Net sales 66,598 39,870 94,822 39,870Capitalized development costs 8,694 10,018 15,210 13,755
Other operating revenue - 1,307 - 1,307Total 75,292 51,195 110,032 54,932
Operating profit (-loss) -8,788 21,278 -10,852 15,554

9 STARBREEZE • INTERIM REPORT • Q2 2017
Q2 2017
VR TECH The VR Tech business area consists of Starbreeze technology and software development in virtual reality (VR), which includes the StarVR venture. VR technology is also included in the acquired companies Starbreeze Paris (formerly ePawn) and Enterspace, as well as Nozon’s PresenZ technology.
Second quarter 2017 The VR company Enterspace AB was acquired during the quarter. Enterspace plans to open a VR center in Stockholm in autumn 2017. After the end of the quarter, Enterspace signed an agreement on a new VR center in Dubai.
Contract negotiations with IMAX over a joint venture for IMAX VR Centers were terminated and replaced with license agreements regarding content for the centers.
Net sales amounted to SEK 0.0 million (0.0). Development costs of SEK 22.4 million (6.4) were capitalized during the quarter. The increase was due mainly to a higher level of activity in the StarVR venture. Other operating revenue, consisting of currency effects, amounted to SEK 0.0 million (1.2). Operating profit was SEK 0.6 million (-11.4).
First half 2017 Net sales amounted to SEK 0.0 million (0.0). Development costs of SEK 37.7 million (15.5) were capitalized during the period. Other operating revenue, consisting of currency effects, amounted to SEK 0.0 million (1.2). Operating profit was SEK 3.0 million (-17.1).
OTHER Group-wide costs and minor projects that are not attributable to the above segments, including Nozon’s operating activities, are reported under “Other.”
Second quarter 2017 Net sales amounted to SEK 4.7 million (0.0). Development costs of SEK 0.0 million (0.0) were capitalized during the quarter. Other operating revenue, consisting of currency effects, amounted to SEK 0.0 million (1.6). Costs increased in Q2 2017 compared to Q2 2016 due to completed acquisitions. The operating loss was SEK -29.3 million (-14.5).
First half 2017 Net sales amounted to SEK 9.6 million (0.0). Development costs of SEK 0.0 million (0.0) were capitalized during the period. Other operating revenue, consisting of currency effects, amounted to SEK 0.0 million (1.9). Costs were higher than in the corresponding period in 2016, according to plan, due to acquisitions. Marketing, legal and acquisition costs also increased over the corresponding period in 2016. The operating loss was SEK -80.8 million (-35.3).
2017 2016 2017 2016KSEK Q2 Q2 JAN - JUN JAN - JUNVR Tech
Net sales 29 - 70 -Capitalized development costs 22,389 6,357 37,651 15,534
Other operating revenue - 1,237 - 1,237Total 22,418 7,594 37,721 16,771
Operating profit (-loss) 634 -11,401 2,984 -17,082
2017 2016 2017 2016KSEK Q2 Q2 JAN - JUN JAN - JUNOther
Net sales 4,672 - 9,600 22Capitalized development costs - 77 - 77
Other operating revenue - 1,635 - -1,923Total 4,672 1,712 9,600 -1,824
Operating profit (-loss) -29,311 -14,529 -80,752 -35,285

10 STARBREEZE • INTERIM REPORT • Q2 2017
Q2 2017
OTHER FINANCIAL INFORMATION The comparison period for profit and loss is the corresponding period in the preceding year. The comparison period for balance sheet items is the balance at 31 December 2016.
FINANCIAL POSITION Goodwill at the end of the period amounted to SEK 468.2 million (404.5).
Goodwill is recognized using the exchange rate on the reporting date. The acquisition of Enterspace increased this item in the balance sheet by SEK 68.8 million. The preliminary acquisition analysis of Starbreeze Paris (formerly ePawn) has been completed, which resulted in a downwards adjustment of the acquisition price and goodwill by SEK 5 million. The adjustment had no effect on profit and loss.
Other non-current assets amounted to SEK 584.2 million (594.7). Capitalized development expenditure increased by SEK 178.7 million to SEK 482.5 million (303.8) and consisted of proprietary game development projects such as OTWD and technology development within StarVR. Also included are investments in the publishing project of SEK 140.5 million (71.5), which are posted directly to the balance sheet and are therefore not included in capitalized development costs on the income statement, but do affect cash flow. Intangible assets were amortized by SEK 12.1 million (7.2) during the first half year 2017.
Trade and other receivables amounted to SEK 32.5 million (25.6).
Prepaid expenses and accrued income at the end of the quarter amounted to SEK 103.5 million (56.2), of which SEK 31.3 million (35.1) related to receivables for sales via Steam.
Deferred tax assets relating to outstanding loss carryforwards in the parent company Starbreeze AB amounted to SEK 17.7 million (5.3) at the end of the quarter. Deferred tax assets relating to outstanding loss carryforwards in foreign subsidiaries amounted to SEK 28.4 million (12.1). In the Swedish subsidiaries, deferred tax assets relating to loss carryforwards amounted to SEK 37.3 million (13.4). The increase is due to the Group having reported a loss.
Consolidated equity on the reporting date was SEK 1,352.8 million (1,370.2) and the equity to assets ratio was 59.8 percent (63.8).
Non-current liabilities for earnouts increased to SEK 343.3 million (309.5). The balance sheet item relates to earnouts for completed company acquisitions. The acquisition of Enterspace increased this item in the balance sheet by SEK 46.8 million. Adjusted for currency effects, the remeasurement of earnouts had a positive effect on profit and loss of SEK 12.4 mllion for the first half of the year and SEK 12.3 million for the second quarter.
Trade and other payables at the end of the quarter amounted to SEK 75.5 million (420), of which SEK 17.7 million relates to development advances for OTWD. Accrued expenses and deferred income at the end of the quarter amounted to SEK 60.7 million (45.0). The revenue share liability for Dead by Daylight increased from SEK 13.1 million to SEK 24.6 million due to increased sales.
CASH FLOW
Second quarter 2017 Cash and cash equivalents at the beginning of the quarter were SEK 516.9 million (416.5).
SEK 384 M CASH AND CASH EQUIVALENTS
ON 30 JUNE 2017
11 STARBREEZE • INTERIM REPORT • Q2 2017
Q2 2017
Cash flow from (-used in) operating activities amounted to SEK -31.7 million (41.8).
Cash flow from (-used in) investing activities was SEK -120.9 million (-55.9). Refer to the “Investments” section for further information. Cash flow from financing activities was SEK 22.0 million (8.6).
Total cash flow (-used) for the quarter was SEK -130.6 million (-89.0). Cash and cash equivalents at the end of the period amounted to SEK 384.2 million (328.4)
First half 2017 Cash and cash equivalents on 1 January 2017 amounted to SEK 669.4 million (85.4).
Cash flow from (-used in) operating activities amounted to SEK -36.5 million (37.7). Cash flow from (-used in) investing activities was SEK -267.5 million (110.1). Cash flow from financing activities was SEK 22.0 million (393.5).
Total cash flow (-used) for the period was SEK -281.9 million (245.8). Cash and cash equivalents at the end of the period amounted to SEK 384.2 million (328.4)
INVESTMENTS During the second quarter, the Group’s investments in property, plant and equipment amounted to SEK 15.1 million (1.2), investments in the form of capitalized expenditure for games development amounted to SEK 99.3 million (36.9) and investments through corporate acquisitions amounted to SEK +0.3 million (12.5).
During the first half of the year, the Group’s investments in property, plant and equipment amounted to SEK 29.2 million (2.7), investments in the form of capitalized expenditure for games development amounted to SEK 183.5 million (89.1) and investments through corporate acquisitions amounted to SEK +0.3 million (12.5). Investments in financial fixed assets increased by SEK 53.8 million to SEK 54.2 million (SEK 0.4 million), of which SEK 37.5 million in StarVR corp. and SEK 16.2 million in loan receivables in e.g. Enterspace AB.
PARENT COMPANY The Group’s operations are conducted in the parent company Starbreeze AB (publ) and its subsidiaries Starbreeze Production AB, Starbreeze Studios AB, Starbreeze Publishing AB, Starbreeze VR AB, Starbreeze Ventures AB, Starbreeze USA Inc, Starbreeze LA Inc, Starbreeze IP LUX, Starbreeze IP LUX II Sarl, Starbreeze Barcelona SL and Starbreeze Paris SAS, Nozon, Parallaxter and Enterspace.
The parent company’s net sales for the second quarter 2017 amounted to SEK 12.7 million (48.4). The loss before tax for the same period was SEK -31.8 million (3.1) and the loss after tax was SEK -24.5 million (2.0). The parent company’s net sales for the first half of 2017 amounted to SEK 23.9 million (64.7). The loss before tax for the same period was SEK -57.3 million (-26.6) and the loss after tax was SEK -44.8 million (-1.8).
Cash and cash equivalents at the end of the period amounted to SEK 300.5 million (540.1) and parent company equity amounted to SEK 1,208.2 million (1,222.0). Investments in subsidiaries increased by SEK 223.9 million to SEK 914.0 million (690.1), with the increase consisting mainly of shareholder contributions to subsidiaries of SEK 180.0 million and the acquisition of Enterspace of SEK 20.0 million. Investments in joint ventures increased by SEK 37.5 million to SEK 46.0 million (8.5) through a capital injection to StarVR Corp. In connection with the formation of StarVR Corp., in which Starbreeze AB and Acer Inc. each own 50 percent, the parties agreed to each contribute USD 12.5 million. As of 30 June 2017 the parties had each contributed USD 5.0 million.
Non-current liabilities consisting of convertible loans and earnouts increased by SEK 39.4 million to SEK 604.6 million (565.2). The change is largely a
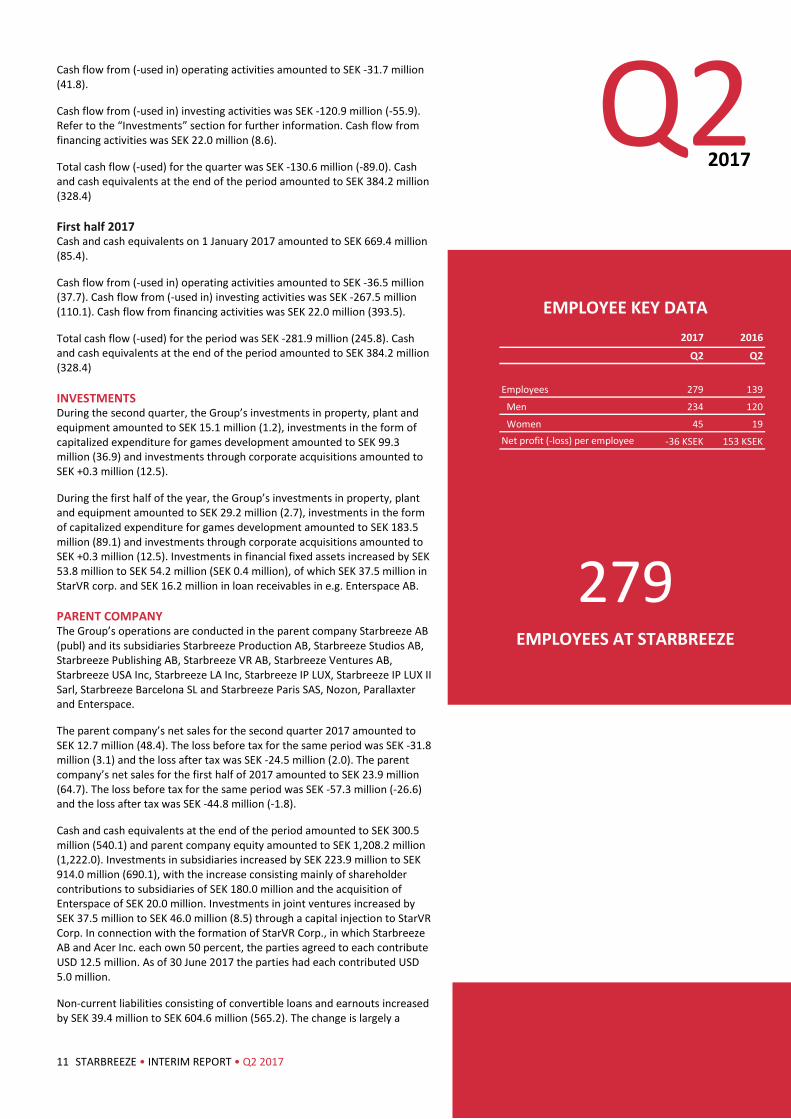
EMPLOYEE KEY DATA
279 EMPLOYEES AT STARBREEZE
2017 2016
Q2 Q2
Employees 279 139
Men 234 120
Women 45 19Net profit (-loss) per employee -36 KSEK 153 KSEK
12 STARBREEZE • INTERIM REPORT • Q2 2017
Q2 2017
consequence of the acquisition of Enterspace, with the earnout valued at SEK 46.8 million as of the reporting date.
EMPLOYEES The company had 279 (139) employees at the end of the period, of whom 234 men and 45 women. The increase is mainly due to completed acquisitions, but is also a consequence of staff additions in game development in Stockholm. The average number of full-time employees for the quarter was 256 (130). The average age was 34 (33).
THE SHARE The Starbreeze share is listed on Nasdaq Stockholm First North Premier. At the end of the period, the closing price was SEK 14.65 (19.90) for the class A share and SEK 14.80 (19.80) for the class B share. Total market capitalization amounted to SEK 4,130 million (5,048).
SHARE CAPITAL At the end of the period, the share capital was SEK 5,613 thousand (5,092) distributed among 280,690,355 shares (254,644,490). Total shares outstanding comprised 55,971,982 class A shares (57,465,828) and 224,718,353 class B shares (197,178,662).
During the period, the number of class B shares increased by 1,071,203 through a non-cash issue in connection with the acquisition of Enterspace and the issue of 2,739,412 class B shares through exercise of warrants. Of the exercised warrants, 2,000,000 class B shares related to the settlement of a hedge for employee stock options, which increased consolidated equity by SEK 30.9 million. As of the closing date, the above 1,071,203 class B shares were not registered with the Swedish Companies Registration Office.
SHAREHOLDERS Starbreeze had 26,840 shareholders (23,240) at the end of the period. A list of the company’s ten largest shareholders is updated monthly on the company's website at starbreeze.com.
ACCOUNTING AND MEASUREMENT POLICIES This interim report has been prepared in accordance IAS 34, Interim Financial Reporting. The accounting policies and calculation methods are the same as those applied in the 2016 Annual Report. As of the second quarter of 2017 Starbreeze reports per segment. More information in Segment Reporting. The interim report for the parent company has been prepared in accordance with the Swedish Annual Accounts Act and the Swedish Financial Reporting Board’s recommendation RFR 2 Accounting for Legal Entities. No new or revised IFRSs have entered into force that are expected to have any material impact on the Group.
The carrying amount of all financial assets and liabilities is a good approximation of fair value.
Impact of forthcoming standards IFRS 15: The analysis in the Annual Report 2016 is unchanged.
IFRS 9: The Group has begun an analysis and will report the impact upon completion.
RISKS AND UNCERTAINTIES The preparation of interim reports and annual reports in accordance with generally accepted accounting practices requires management to make estimates, judgments and assumptions that affect the value of assets, liabilities and sales reported in the financial statements. Actual outcomes may differ from these estimates and judgments.
The short-term effect on profit and loss from fluctuations in exchange rates can be positive or negative, depending on the current currency exposure from trade receivables, bank balances and other assets and liabilities
26,840
SHAREHOLDERS as of 30 June 2017
13 STARBREEZE • INTERIM REPORT • Q2 2017
Q2
2017
denominated in foreign currency. However, a falling dollar rate in the longer term always has a negative impact on profit margins. Due to the acquisition of several foreign subsidiaries, the Group also has translation exposure. The largest risks and uncertainties are low sales in connection with game releases and project delays. These and other risks such as copyright infringements, loss of key people and exchange rate fluctuations are described in Starbreeze 2016 Annual Report in the Report of the Board of Directors on page 57, and in Note 3.
Furthermore, the value of certain assets and liabilities is based on expected outcomes. Consequently, these items must be regularly remeasured and thus may affect future profit and loss.
Based upon the sales trend for PAYDAY 2 and Dead by Daylight, the release of new games and the capital contributed by Smilegate, Acer, Första AP-fonden (a Swedish national pension fund) and others in 2016, as well as the loan financing arranged in the third quarter of 2017, the company estimates that current financing is sufficient to operate the business at its current scope for at least the next 12 months. The company’s board and management continually evaluate the Group’s long-term capital requirements and financing options.
RELATED-PARTY TRANSACTIONS There were no transactions with related parties during the period.
INVESTOR RELATIONS Up-to-date information about Starbreeze is available on the company’s website at www.starbreeze.com You may contact the company via email: [email protected], phone: +46 8 209 208 or mail: Box 7731, 103 95 Stockholm, Sweden
FOR FURTHER INFORMATION Bo Andersson Klint, CEO +46 8 209 208 [email protected]
Sebastian Ahlskog, CFO +46 8 209 208 [email protected]
The reports are published on the company’s website at starbreeze.com.
The Board of Directors and CEO certify that this report presents a true and fair view of the operations, financial position and results of the parent company and the Group and describes the significant risks and uncertainties faced by the parent company and the companies included in the Group.
Stockholm, 24 August 2017
Michael Hjorth Chairman
Directors Ulrika Hagdahl Harold Kim
Matias Myllyrinne Eva Redhe
Bo Andersson Klint CEO
Starbreeze AB is required to disclose this information under the EU Market Abuse Regulation and the Securities Market Act. The information was provided by the above contact persons for publication on 24 August 2017 at 8:00 CET.
FINANCIAL CALENDAR INTERIM REPORT Q3 2017
16 November 2017
YEAR-END REPORT 2017
15 February 2018
ANNUAL REPORT 2017
12 April 2018

14 STARBREEZE • INTERIM REPORT • Q2 2017
CONSOLIDATED STATEMENT OF COMPREHENSIVE INCOME
2017 2016 2017 2016 2016
KSEK Q2 Q2 JAN - JUN JAN - JUN JAN - DEC
Net sales 122,698 102,589 179,968 143,391 345,463Capitalized development costs 56,838 33,698 106,470 62,991 154,450Other operating revenue - 7,353 - 3,795 23,132Total 179,536 143,640 286,438 210,177 523,045
Other external expenses -121,308 -77,574 -207,484 -122,003 -292,106Employee benefits expense -58,432 -38,607 -110,914 -64,963 -148,517
Amortization of intangible assets -12,148 -3,557 -25,308 -7,742 -20,600
Depreciation of property, plant and equipment -3,793 -1,171 -6,100 -2,237 -4,166Other operating expenses -2,479 - -6,056 - -1,202Operating profit (-loss) -18,624 22,731 -69,424 13,232 56,454
Financial income 9,706 108 9,780 118 17,511Financial expenses -7,368 4,645 -12,693 -820 -18,196
Share of profit or loss after tax from associates -461 - -666 - 131Profit (-loss) before tax -16,747 27,484 -73,003 12,530 55,900
Income tax 6,823 -6,226 12,450 -6,045 1,191Net profit (-loss) for the period -9,924 21,258 -60,553 6,485 57,091
Other comprehensive income that may subsequently be reclassified to profit and loss
Exchange differences 428 2,090 -3,790 1,438 -4,375Total comprehensive income for the period -9,496 23,348 -64,343 7,923 52,716
As there are no non-controlling interests in the Group, net profit (-loss) and total comprehensive income are attributable entirely to owners of the parent.
Earnings per share attributable to owners of the parent during the period (SEK): - Basic -0.04 0.09 -0.22 0.03 0.22 - Diluted -0.04 0.09 -0.22 0.03 0.22

15 STARBREEZE • INTERIM REPORT • Q2 2017
CONSOLIDATED BALANCE SHEET
KSEK NOTE 2017/06/30 2016/06/30 2016/12/31
ASSETSIntangible assets
Goodwill 468,175 141,807 404,530
Other non-current assets 584,249 483,801 594,728
482,493 186,484 303,763
Financial assets
Financial assets 30,242 20,331 31,971
Investments in joint ventures 6 45,424 8,638
Deferred tax assets 83,422 5,252 30,712
Property, plant and equipment
Computers and other equipment 48,625 17,258 23,458
Total non-current assets 1,742,630 854,933 1,397,800
Current assets
Inventories 2 2
Trades and other receivables 32,537 22,059 25,576
Prepaid expenses and accrued income 103,511 69,946 56,183
Cash and cash equivalents 384,249 328,356 669,380
Total current assets 520,297 420,363 751,141
TOTAL ASSETS 2,262,927 1,275,296 2,148,941
EQUITY AND LIABILITIES
Share capital 5,613 5,093 5,538
Other contributed capital 1,224,841 745,180 1,175,563
Reserves -119 9,484 3,671
122,526 134,845 185,451
Total equity 1,352,861 894,652 1,370,223
Non-current liabilities
Non-current liabilities, earnouts 343,368 40,638 307,099
Deferred tax liability 155,072 52,601 119,134
Other non-current liabilities 276,059 192,339 265,535
Total non-current liabilities 774,499 285,578 691,768
Current liabilities
Trade and other payables 75,500 45,716 41,990
Accrued expenses and deferred income 60,067 49,350 44,960
Total current liabilities 135,567 95,066 86,950
TOTAL EQUITY AND LIABILITIES 2,262,927 1,275,296 2,148,941
Equity attributable to owners of the parent
Capitalized expenditure for games and technology development
Retained earnings including net profit for the period
16 STARBREEZE • INTERIM REPORT • Q2 2017
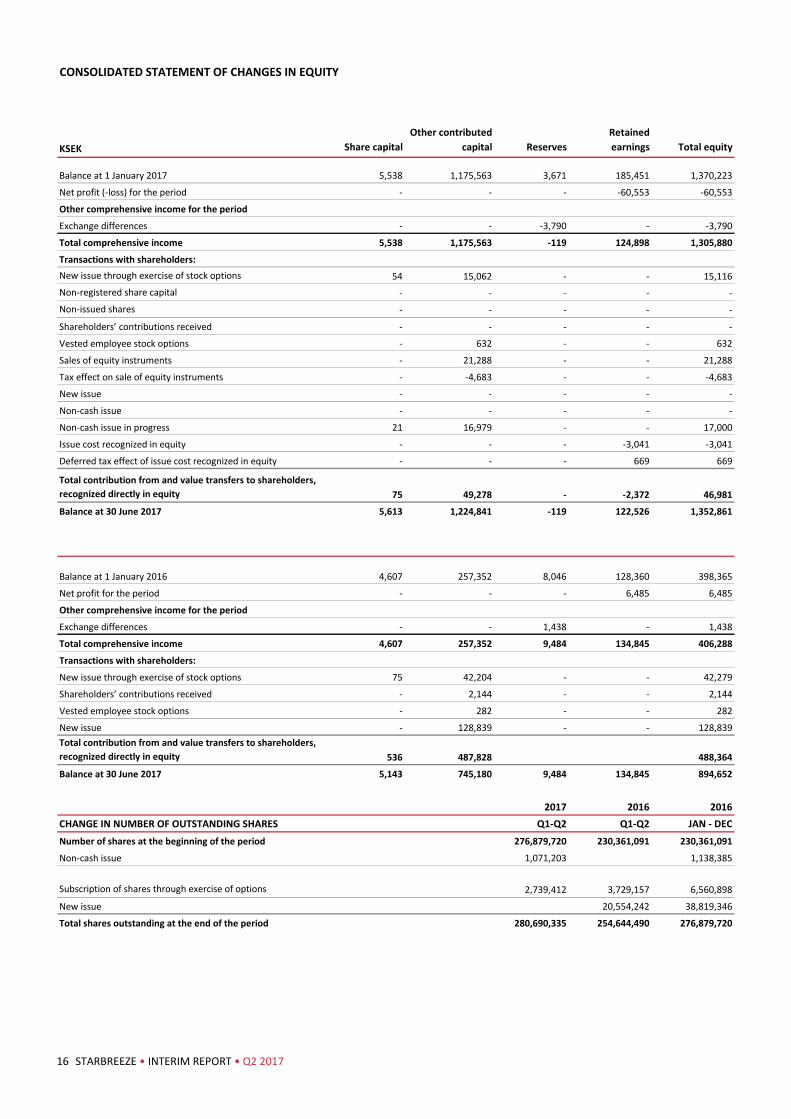
CONSOLIDATED STATEMENT OF CHANGES IN EQUITY
KSEK Share capitalOther contributed
capital ReservesRetained earnings Total equity
Balance at 1 January 2017 5,538 1,175,563 3,671 185,451 1,370,223
Net profit (-loss) for the period - - - -60,553 -60,553
Other comprehensive income for the period
Exchange differences - - -3,790 - -3,790
Total comprehensive income 5,538 1,175,563 -119 124,898 1,305,880
Transactions with shareholders:New issue through exercise of stock options 54 15,062 - - 15,116Non-registered share capital - - - - -Non-issued shares - - - - -
Shareholders’ contributions received - - - - -
Vested employee stock options - 632 - - 632
Sales of equity instruments - 21,288 - - 21,288
Tax effect on sale of equity instruments - -4,683 - - -4,683
New issue - - - - -
Non-cash issue - - - - -
Non-cash issue in progress 21 16,979 - - 17,000
Issue cost recognized in equity - - - -3,041 -3,041
Deferred tax effect of issue cost recognized in equity - - - 669 669
Total contribution from and value transfers to shareholders, recognized directly in equity 75 49,278 - -2,372 46,981
Balance at 30 June 2017 5,613 1,224,841 -119 122,526 1,352,861
Balance at 1 January 2016 4,607 257,352 8,046 128,360 398,365
Net profit for the period - - - 6,485 6,485
Other comprehensive income for the period
Exchange differences - - 1,438 - 1,438
Total comprehensive income 4,607 257,352 9,484 134,845 406,288
Transactions with shareholders:
New issue through exercise of stock options 75 42,204 - - 42,279
Shareholders’ contributions received - 2,144 - - 2,144
Vested employee stock options - 282 - - 282
New issue - 128,839 - - 128,839Total contribution from and value transfers to shareholders, recognized directly in equity 536 487,828 488,364
Balance at 30 June 2017 5,143 745,180 9,484 134,845 894,652
2017 2016 2016CHANGE IN NUMBER OF OUTSTANDING SHARES Q1-Q2 Q1-Q2 JAN - DECNumber of shares at the beginning of the period 276,879,720 230,361,091 230,361,091
Non-cash issue 1,071,203 1,138,385
Subscription of shares through exercise of options 2,739,412 3,729,157 6,560,898
New issue 20,554,242 38,819,346
Total shares outstanding at the end of the period 280,690,335 254,644,490 276,879,720
17 STARBREEZE • INTERIM REPORT • Q2 2017
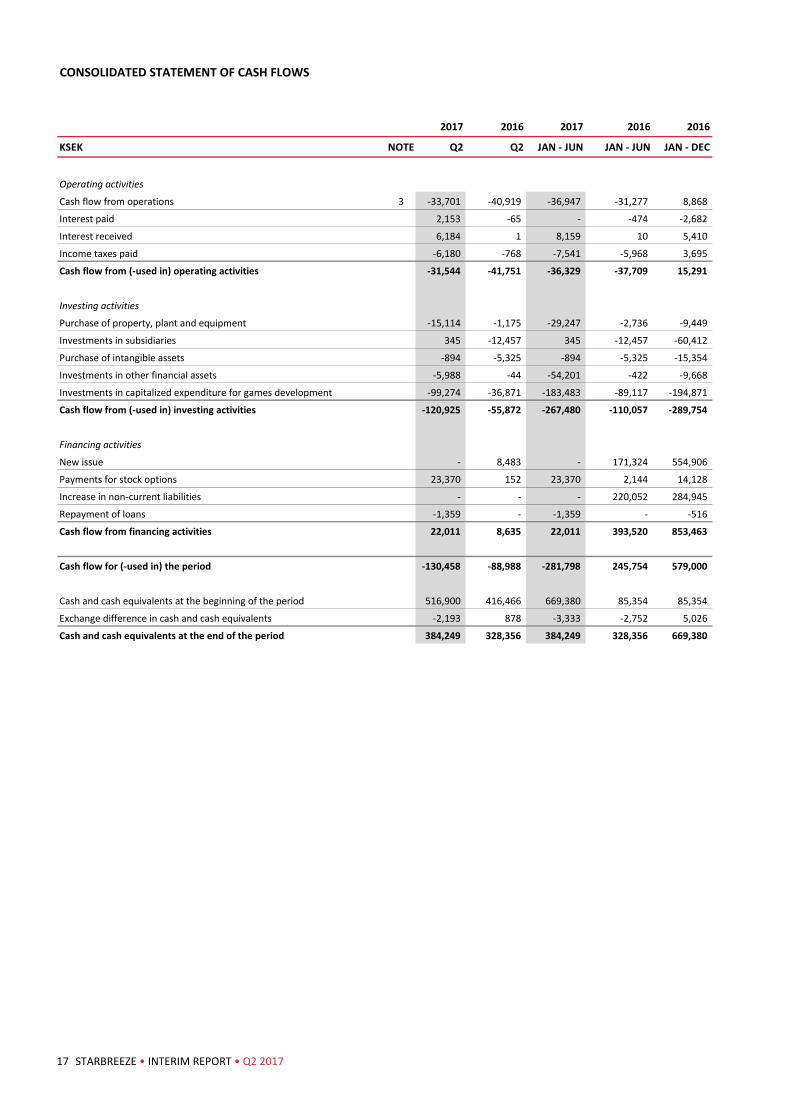
CONSOLIDATED STATEMENT OF CASH FLOWS
2017 2016 2017 2016 2016
KSEK NOTE Q2 Q2 JAN - JUN JAN - JUN JAN - DEC
Operating activities
Cash flow from operations 3 -33,701 -40,919 -36,947 -31,277 8,868
Interest paid 2,153 -65 - -474 -2,682
Interest received 6,184 1 8,159 10 5,410
Income taxes paid -6,180 -768 -7,541 -5,968 3,695
Cash flow from (-used in) operating activities -31,544 -41,751 -36,329 -37,709 15,291
Investing activities
Purchase of property, plant and equipment -15,114 -1,175 -29,247 -2,736 -9,449
Investments in subsidiaries 345 -12,457 345 -12,457 -60,412
Purchase of intangible assets -894 -5,325 -894 -5,325 -15,354
Investments in other financial assets -5,988 -44 -54,201 -422 -9,668
Investments in capitalized expenditure for games development -99,274 -36,871 -183,483 -89,117 -194,871
Cash flow from (-used in) investing activities -120,925 -55,872 -267,480 -110,057 -289,754
Financing activities
New issue - 8,483 - 171,324 554,906
Payments for stock options 23,370 152 23,370 2,144 14,128
Increase in non-current liabilities - - - 220,052 284,945
Repayment of loans -1,359 - -1,359 - -516
Cash flow from financing activities 22,011 8,635 22,011 393,520 853,463
Cash flow for (-used in) the period -130,458 -88,988 -281,798 245,754 579,000
Cash and cash equivalents at the beginning of the period 516,900 416,466 669,380 85,354 85,354
Exchange difference in cash and cash equivalents -2,193 878 -3,333 -2,752 5,026
Cash and cash equivalents at the end of the period 384,249 328,356 384,249 328,356 669,380

18 STARBREEZE • INTERIM REPORT • Q2 2017
KEY DATA FOR THE GROUP
EBITDA Operating profit or loss before depreciation, amortization and impairments (Earnings Before Interest, Taxes, Depreciation and Amortization).
EBIT Operating profit or loss after depreciation and amortization (Earnings Before Interest and Taxes).
EBITDA margin EBITDA as a percentage of the sum of net sales and capitalized development costs.
EBIT margin EBIT as a percentage of the sum of net sales and capitalized development costs.
Profit margin Profit or loss after net financial income or loss as a percentage of the sum of net sales and capitalized development costs.
Equity to assets ratio Equity as a percentage of total assets.
Earnings per share Profit or loss after tax divided by the average number of shares during the period.
Equity Recognized equity including 78 percent of untaxed reserves.
KEY FIGURES, GROUP
2017 2016 2017 2016 2016
Q2 Q2 JAN - JUN JAN - JUN JAN - DEC
Net sales, KSEK 122,698 102,589 179,968 143,391 345,463
EBITDA, KSEK -2,683 27,459 -38,016 23,211 81,220
EBIT, KSEK -18,624 22,731 -69,424 13,232 56,454
Profit (-loss) before tax, KSEK -16,747 27,484 -73,003 12,530 55,900
Profit (-loss) after tax, KSEK -9,924 21,258 -60,553 6,485 57,091
EBITDA margin, % -1.5 19.1 -13.3 11.0 15.5
EBIT margin, % -10.4 15.8 -24.2 6.3 10.8
Profit margin, % -9.3 19.1 -25.5 6.0 10.7
Equity to assets ratio, % 59.8 70.2 59.8 70.2 63.8
Closing price of A share for the period, SEK 14.65 19.90 14.65 19.90 19.20
Closing price of B share for the period, SEK 14.80 19.80 14.80 19.80 19.30
Earnings per share before dilution, SEK -0.04 0.09 -0.22 0.03 0.22
Earnings per share after dilution, SEK -0.04 0.09 -0.22 0.03 0.22
Number of shares at end of period before dilution 280,690,335 251,644,490 280,690,335 251,664,490 276,879,720
Number of shares at end of period after dilution 304,108,618 257,040,569 304,108,618 257,040,569 304,352,451
Average number of shares before dilution 278,926,835 247,338,353 277,928,273 243,420,559 255,276,469
Average number of shares after dilution 279,622,772 249,734,431 278,647,736 245,816,638 257,234,798
Average number of employees 256 130 237 122 151
Number of employees at the end of the period 279 139 279 139 212

19 STARBREEZE • INTERIM REPORT • Q2 2017
Reconciliation of Alternative Performance Measures
2017 2016 2017 2016 2016Q2 Q2 JAN - JUN JAN - JUN JAN - DEC
EBITDA
Operating profit (-loss), KSEK -18,624 22,731 -69,424 13,232 56,454Less: Amortization of intangible assets, KSEK 12,148 3,557 25,308 7,742 20,600Less: Depreciation of property, plant and equipment, KSEK 3,793 1,171 6,100 2,237 4,166
EBITDA -2,683 27,459 -38,016 23,211 81,220
EBITDA margin, %
EBITDA, KSEK -2,683 27,459 -38,016 23,211 81,220Sum of net sales, capitalized development costs and other operating revenue 179,536 143,640 286,438 210,177 523,045
EBITDA margin, % -1.5 19.1 -13.3 11.0 15.5
EBIT margin, %
Operating profit (-loss), KSEK -18,624 22,731 -69,424 13,232 56,454Sum of net sales, capitalized development costs and other operating revenue 179,536 143,640 286,438 210,177 523,045
EBIT margin, % -10.37 15.82 -24.24 6.30 10.79
Profit margin, %
Profit (-loss) before tax, KSEK -16,747 27,484 -73,003 12,530 55,900Sum of net sales, capitalized development costs and other operating revenue 179,536 143,640 286,438 210,177 523,045
Profit margin, % -9.3 19.1 -25.5 6.0 10.7
Equity to assets ratio, %
Total equity 1,352,861 894,652 1,352,861 894,652 1,370,223
Total equity and liabilities, KSEK 2,262,927 1,275,296 2,262,927 1,275,296 2,148,941
Equity to assets ratio, % 59.8 70.2 59.8 70.2 63.8
Alternative Performance Measures (APMs) are financial indicators of performance, financial position and cash flow not defined in the applicable reporting framework (IFRS). These are considered to be important additional key figures for the Group's performance. Since not all entities calculate financial measurements in the same way, they are not always comparable to those used by other entities.

20 STARBREEZE • INTERIM REPORT • Q2 2017
PARENT COMPANY INCOME STATEMENT
2017 2016 2017 2016 2016
KSEK Q2 Q2 JAN - JUN JAN - JUN JAN - DEC
Net sales 12,716 48,425 23,860 64,744 101,935
Other operating revenue 522 3,263 522 3,263 13,905
Total sales 13,238 51,688 24,382 68,007 115,840
Other external expenses -25,982 -55,242 -44,760 -77,220 -97,970
Employee benefit expense -12,920 -12,269 -25,371 -18,228 -35,498
Depreciation of property, plant and equipment -178 -178 -359 -344 -703
Other operating expenses 228 2,238 -
Operating profit (-loss) -25,614 -13,763 -46,108 -27,785 -18,331
Other financial income 678 735 1,005 1,544 13,870
Financial expenses -6,851 5,010 -12,154 -398 -17,794
Profit (-loss) after net financial income -31,787 -8,018 -57,257 -26,639 -22,255
Appropriations 11,108 24,821 30,247
Profit (-loss) before tax -31,787 3,090 -57,257 -1,818 7,992
Income tax 7,309 -1,101 12,454 -1 -1
Net profit (-loss) for the period -24,478 1,989 -44,803 -1,819 7,991
For the parent company, net profit or loss for the period corresponds to total comprehensive income.

21 STARBREEZE • INTERIM REPORT • Q2 2017
PARENT COMPANY BALANCE SHEET
KSEK 2017/06/30 2016/06/30 2016/12/31
ASSETS
Non-current assets
Computers and other equipment 933 1,530 1,265
Investments in group companies 914,015 249,122 690,126
Deferred tax assets 17,706 5,252 5,252
Investments in associates 45,958 - 8,507
Total non-current assets 978,612 255,904 705,150
Current assets
Receivables from Group companies 770,219 644,701 761,308
Other receivables 1,681 1,163 549
Prepaid expenses and accrued income 1,616 711 1,295
Cash and cash equivalents 300,525 227,137 540,118
Total current assets 1,074,041 873,712 1,303,270
TOTAL ASSETS 2,052,653 1,129,616 2,008,420
EQUITY AND LIABILITIES
Equity
Share capital 5,613 5,093 5,538
Fair value reserve 328 981 2,054
Share premium reserve 1,162,135 699,083 1,129,465
Retained earnings 84,934 76,945 76,945
Net profit (-loss) for the period -44,803 -1,819 7,991
Total equity 1,208,207 780,333 1,221,993
Untaxed reserves
Accumulated excess depreciation 16 16 16
Total untaxed reserves 16 16 16
Non-current liabilities
Other non-current liabilities 604,571 227,610 565,179
Total non-current liabilities 604,571 227,610 565,179
Current liabilities
Trade payables 3,475 2,059 3,391
Liabilities to Group companies 218,751 101,742 195,499
Other liabilities 2,938 2,225 6,664
Accrued expenses and deferred income 14,695 15,631 15,678
Total current liabilities 239,859 121,657 221,232
TOTAL EQUITY AND LIABILITIES 2,052,653 1,129,616 2,008,420
22 STARBREEZE • INTERIM REPORT • Q2 2017
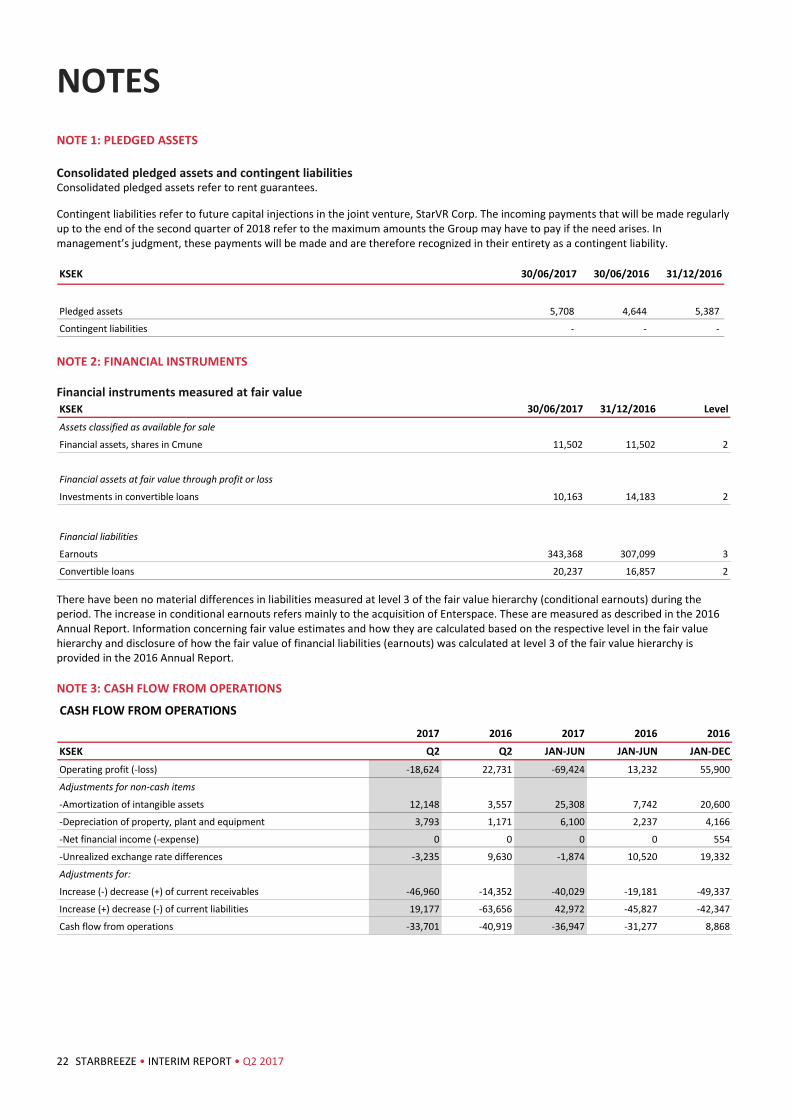
NOTES NOTE 1: PLEDGED ASSETS
Consolidated pledged assets and contingent liabilities Consolidated pledged assets refer to rent guarantees.
Contingent liabilities refer to future capital injections in the joint venture, StarVR Corp. The incoming payments that will be made regularly up to the end of the second quarter of 2018 refer to the maximum amounts the Group may have to pay if the need arises. In management’s judgment, these payments will be made and are therefore recognized in their entirety as a contingent liability.
NOTE 2: FINANCIAL INSTRUMENTS
Financial instruments measured at fair value
There have been no material differences in liabilities measured at level 3 of the fair value hierarchy (conditional earnouts) during the period. The increase in conditional earnouts refers mainly to the acquisition of Enterspace. These are measured as described in the 2016 Annual Report. Information concerning fair value estimates and how they are calculated based on the respective level in the fair value hierarchy and disclosure of how the fair value of financial liabilities (earnouts) was calculated at level 3 of the fair value hierarchy is provided in the 2016 Annual Report.
NOTE 3: CASH FLOW FROM OPERATIONS
KSEK 30/06/2017 30/06/2016 31/12/2016
Pledged assets 5,708 4,644 5,387
Contingent liabilities - - -
KSEK 30/06/2017 31/12/2016 Level
Assets classified as available for sale
Financial assets, shares in Cmune 11,502 11,502 2
Financial assets at fair value through profit or loss
Investments in convertible loans 10,163 14,183 2
Financial liabilities
Earnouts 343,368 307,099 3
Convertible loans 20,237 16,857 2
CASH FLOW FROM OPERATIONS
2017 2016 2017 2016 2016KSEK Q2 Q2 JAN-JUN JAN-JUN JAN-DEC
Operating profit (-loss) -18,624 22,731 -69,424 13,232 55,900
Adjustments for non-cash items
-Amortization of intangible assets 12,148 3,557 25,308 7,742 20,600
-Depreciation of property, plant and equipment 3,793 1,171 6,100 2,237 4,166
-Net financial income (-expense) 0 0 0 0 554
-Unrealized exchange rate differences -3,235 9,630 -1,874 10,520 19,332
Adjustments for:
Increase (-) decrease (+) of current receivables -46,960 -14,352 -40,029 -19,181 -49,337
Increase (+) decrease (-) of current liabilities 19,177 -63,656 42,972 -45,827 -42,347
Cash flow from operations -33,701 -40,919 -36,947 -31,277 8,868

23 STARBREEZE • INTERIM REPORT • Q2 2017
NOTE 4: SEGMENT REPORTING, GROUP
2017 2016 2017 2016
KSEK Q2 Q2 JAN - JUN JAN - JUN
Starbreeze Games
Net sales 51,400 62,719 75,476 103,499
Capitalized development costs 25,754 17,246 53,609 33,625
Other operating revenue - 3,174 - 3,174
Total 77,154 83,139 129,085 140,298
Operating profit (-loss) 18,841 27,383 19,196 50,045
Publishing
Net sales 66,598 39,870 94,822 39,870
Capitalized development costs 8,694 10,018 15,210 13,755
Other operating revenue - 1,307 - 1,307
Total 75,292 51,195 110,032 54,932
Operating profit (-loss) -8,788 21,278 -10,852 15,554
VR Tech
Net sales 29 - 70 -
Capitalized development costs 22,389 6,357 37,651 15,534
Other operating revenue - 1,237 - 1,237Total 22,418 7,594 37,721 16,771
Operating profit (-loss) 634 -11,401 2,984 -17,082
Other
Net sales 4,672 - 9,600 22
Capitalized development costs - 77 - 77
Other operating revenue - 1,635 - -1,923
Total 4,672 1,712 9,600 -1,824
Operating profit (-loss) -29,311 -14,529 -80,752 -35,285
Total
Net sales 122,699 102,589 179,968 143,391Capitalized development costs 56,837 33,698 106,470 62,991
Other operating revenue - 7,353 - 3,795
Total 179,536 143,640 286,438 210,177
Operating profit (-loss) -18,624 22,731 -69,424 13,232
Starbreeze Games 18,841 27,383 19,196 50,045
Publishing -8,788 21,278 -10,852 15,554
VR Tech 634 -11,401 2,984 -17,082
Other -29,311 -14,529 -80,752 -35,285
Total -18,624 22,731 -69,424 13,232
Net financial income (-expense) 1,877 4,753 -3,579 -702
Profit (-loss) before tax -16,747 27,484 -73,003 12,530
There are no revenues from internal transactions between the segments. All stated net sales are derived from external customers.
Operating profit or loss is reconciled with profit or loss before tax as follows:
Profit or loss is allocated among the segments down to operating profit or loss.

24 STARBREEZE • INTERIM REPORT • Q2 2017
NOTE 5: ACQUISITION OF ENTERSPACE The company acquired 100 percent of equity in Enterspace AB on 30 June 2017 for preliminary purchase consideration of SEK 66.8 million through a non-cash issue of 1,071,203 new class B shares in Starbreeze AB valued at SEK 17.0 million, cash consideration of SEK 3.0 million, and a conditional earnout linked to future sales, which has been estimated at SEK 46.8 million and may be triggered in the next six years. The figure of SEK 46.8 million is the present value of the maximum purchase consideration of SEK 75 million, calculated at a discount rate of 12 percent. Enterspace develops technology and content for location-based entertainment. The goodwill that arose in connection with the acquisition consists mainly of the company’s commercial relationships.
The acquisition affected cash flow in the second quarter by SEK 0.2 million net, comprising cash consideration of SEK 3.0 million, acquisition costs of SEK 0.5 million and acquired cash and cash equivalents of SEK 3.3 million.
If Enterspace had been acquired on 1 January 2017, the company would have contributed a revenue stream of SEK 0.3 million and a loss after tax of SEK -3.0 million. The recognized goodwill for this acquisition is not expected to be tax deductible.
Preliminary costs for the acquisition of Enterspace of SEK 0.5 million have been charged to consolidated profit and are included in “Other external costs.” Information on the preliminary value of acquired net assets and goodwill in Enterspace as of acquisition date, KSEK:
NOTE 6: JOINT VENTURE
Joint Venture StarVR Corporation, the company’s joint venture with Acer, is a sales and marketing company that manages the sales process vis-à-vis business customers, support and aftermarket support for StarVR HMD (Head Mounted Display). Under the terms of the joint venture, Starbreeze owns and controls IP rights related to StarVR, while Acer manufactures the product. R&D and reference design work for the StarVR headset will be carried out jointly by Starbreeze and Acer. StarVR Corporation absorbs all costs of marketing and selling StarVR, but as long as Starbreeze retains the IP rights, Starbreeze will bear R&D related costs. Acer is responsible for production costs. The reconciliation below reflects adjustments made by the Group upon application of the equity method, including adjustments to fair value at acquisition date and adjustments for differences in accounting policies.
The table below provides condensed financial information for the holding in the joint venture company (StarVR Corporation) that the Group considers material. The information shows the amounts recognized in the financial reports for the joint venture company, and not Starbreeze share of these amounts. The reconciliation of Starbreeze share is shown above.
Total consideration:Cash consideration 3,000
Shares in Starbreeze AB (publ) 17,000
Earnout 46,831
Fair value of assets acquired as follows -5,762
Excess value of intangible assets 3,762
Goodwill 68,831
Assets and liabilities included in the acquisition
Intangible assets/capitalized development costs 10,406
Other assets 4,728
Cash and cash equivalents 3,344
Deferred tax -828
Liabilities -23,412Identifiable net assets acquired -5,762
KSEK 30/06/2017Reconciliation of net carrying amount:
Opening balance of net assets 1 January 17,276
Net profit for the period -1,331
Exchange differences -180
Capital injection 75,082
Closing balance net assets 90,847
Group's share in % 50%
Group's share in KSEK 45,424
Net carrying amount 45,424
KSEK 30/06/2017Balance sheet in summary:
Current assets 91,883
Non-current assets 1,763
Current liabilities 2,799
Net assets 90,847
Income statement in summary:
Sales 5,047
Net profit (-loss) for the period -1,331
Total comprehensive income for the period -1,331

25 STARBREEZE • INTERIM REPORT • Q2 2017
AUDITOR’S REVIEW REPORT Starbreeze AB (publ), corporate ID no. 556551-8932
INTRODUCTION We have reviewed the summarized interim financial information (the interim report) for Starbreeze AB (publ) as of 30 June 2017 and the six-month period then ended. The directors and management are responsible for the preparation and fair presentation of this interim financial information in accordance with IAS 34 and the Swedish Annual Accounts Act. Our responsibility is to express a conclusion on this interim financial information based on our review.
FOCUS AND SCOPE OF REVIEW We conducted our review in accordance with International Standard on Review Engagements ISRE 2410, “Review of Interim Financial Information Performed by the Independent Auditor of the Entity.” A review of interim financial information consists of making inquiries, primarily of persons responsible for financial and accounting matters, and applying analytical and other review procedures. A review differs from and is substantially less in scope than an audit conducted in accordance with ISA and generally accepted auditing practices otherwise, and consequently does not enable us to obtain assurance that we would become aware of all significant matters that might be identified in an audit. The conclusion expressed based on a review therefore does not provide the same level of assurance as an audit opinion.
CONCLUSION Based on our review, nothing has come to our attention that causes us to believe that the interim financial information was not prepared with regard to the Group in accordance with IAS 34 and the Annual Accounts Act and with regard to the parent company in accordance with the Annual Accounts Act.
Stockholm, 24 August 2017
Öhrlings PricewaterhouseCoopers AB
Nicklas Kullberg Authorized Public Accountant
This is a translation of the Swedish version of the Interim Report. In case of any discrepancies between this version and the Swedish, the Swedish version shall prevail.

26 STARBREEZE • INTERIM REPORT • Q2 2017
Related Documents