Kevin J. Kennedy Director and General Counsel Wisconsin Government Accountability Board Wisconsin Election Cost Data Voting in America Conference 2012 The Price of Elections

Kevin J. Kennedy Director and General Counsel Wisconsin Government Accountability Board Wisconsin Election Cost Data Voting in America Conference 2012.
Dec 14, 2015
Welcome message from author
This document is posted to help you gain knowledge. Please leave a comment to let me know what you think about it! Share it to your friends and learn new things together.
Transcript
Kevin J. KennedyDirector and General CounselWisconsin Government Accountability Board
Wisconsin Election Cost Data
Voting in America Conference 2012The Price of Elections

Wisconsin Election Statistics
• 1,923 Jurisdictions– 72 Counties
– 1,851 Municipalities
• 3,541 Reporting Units (2012 General Election)
• 6,676 Wards
• Approximately 30,000 Election Inspectors (Poll
Workers) each election

2012 Wisconsin Statewide Elections
• April 3, 2012 – Presidential Preference and Spring Election
• May 8, 2012 – Recall Primary • June 5, 2012 – Recall Election • August 14, 2012 – Partisan Primary• November 6, 2012 – Presidential and
General Election*(cost data not yet available)

Wisconsin Election Costs Year-To-Date Training
1267658.00675%
Ballots3404704.3353
13%
Memory Devices310740.6874
1%
Programming2743131.1277
10%
Ballot Bags77482.4992
0%
Wages - Poll Workers and Board of Canvassers9189231.5292
34%
L.E.O. Staff7058692.2773
26%
Polling Place Rental117590.07
0%
Notices1053494.2218
4%
Polling Place Documents440144.0784
2%
Miscellaneous1430881.4932
5%
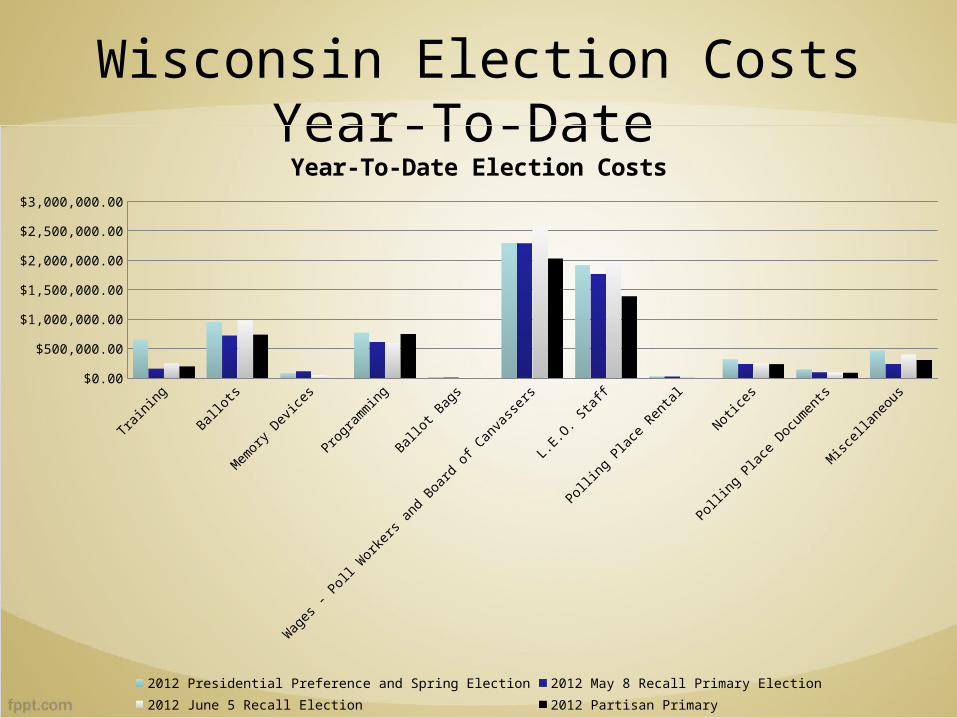
Wisconsin Election Costs Year-To-Date
Traini
ng
Ballot
s
Mem
ory
Device
s
Progr
amm
ing
Ballot
Bag
s
Wag
es -
Poll W
orke
rs a
nd B
oard
of C
anva
sser
s
L.E.O
. Sta
ff
Polling
Plac
e Ren
tal
Notice
s
Polling
Plac
e Doc
umen
ts
Misc
ellan
eous
$0.00
$500,000.00
$1,000,000.00
$1,500,000.00
$2,000,000.00
$2,500,000.00
$3,000,000.00
Year-To-Date Election Costs
2012 Presidential Preference and Spring Election 2012 May 8 Recall Primary Election
2012 June 5 Recall Election 2012 Partisan Primary
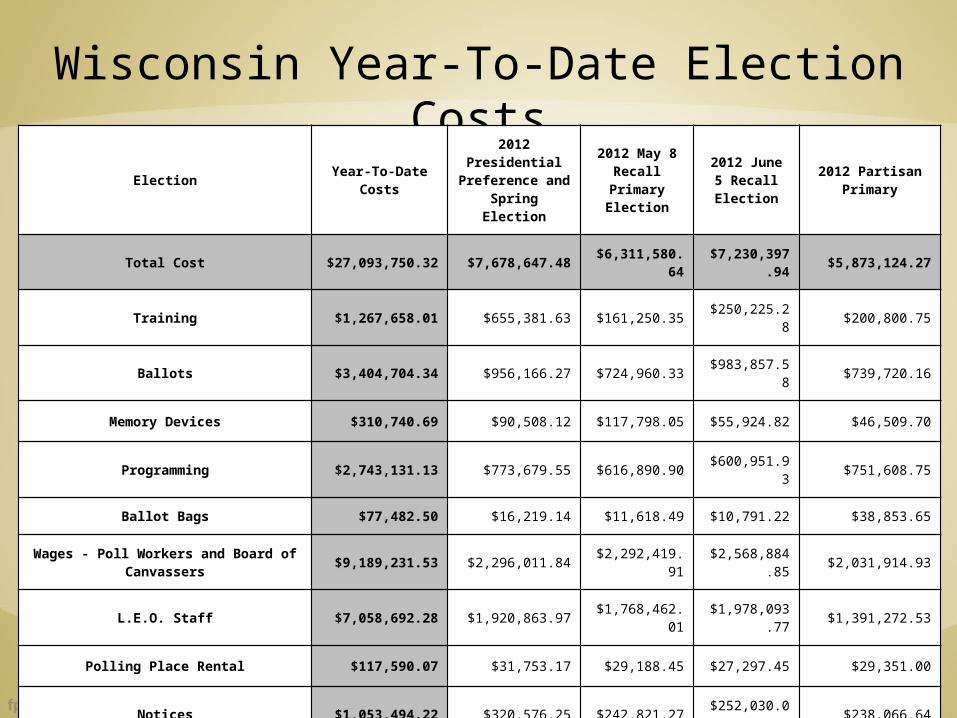
Wisconsin Year-To-Date Election CostsElection Year-To-Date Costs
2012 Presidential Preference and Spring Election
2012 May 8 Recall Primary
Election
2012 June 5 Recall Election
2012 Partisan Primary
Total Cost $27,093,750.32 $7,678,647.48 $6,311,580.64 $7,230,397.94 $5,873,124.27
Training $1,267,658.01 $655,381.63 $161,250.35 $250,225.28 $200,800.75
Ballots $3,404,704.34 $956,166.27 $724,960.33 $983,857.58 $739,720.16
Memory Devices $310,740.69 $90,508.12 $117,798.05 $55,924.82 $46,509.70
Programming $2,743,131.13 $773,679.55 $616,890.90 $600,951.93 $751,608.75
Ballot Bags $77,482.50 $16,219.14 $11,618.49 $10,791.22 $38,853.65
Wages - Poll Workers and Board of Canvassers $9,189,231.53 $2,296,011.84 $2,292,419.91 $2,568,884.85 $2,031,914.93
L.E.O. Staff $7,058,692.28 $1,920,863.97 $1,768,462.01 $1,978,093.77 $1,391,272.53
Polling Place Rental $117,590.07 $31,753.17 $29,188.45 $27,297.45 $29,351.00
Notices $1,053,494.22 $320,576.25 $242,821.27 $252,030.07 $238,066.64
Polling Place Documents $440,144.08 $148,522.09 $101,366.65 $97,442.97 $92,812.37
Miscellaneous $1,430,881.49 $468,965.46 $244,804.24 $404,898.01 $312,213.79
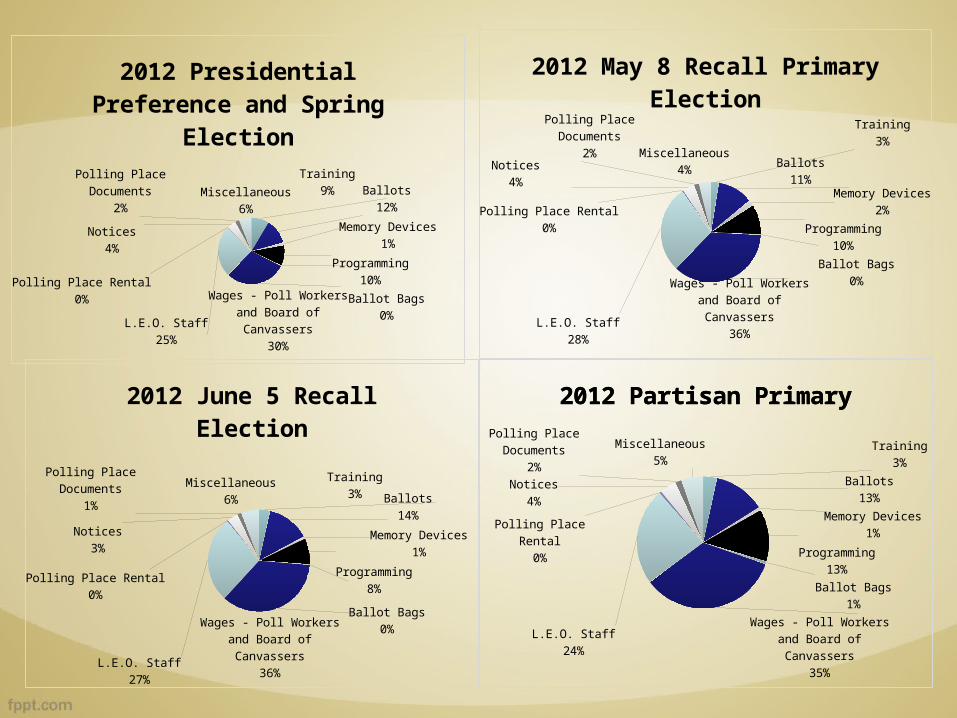
2012 Partisan Primary
Training9%
Ballots12%
Memory Devices1%
Programming10%
Ballot Bags0%
Wages - Poll Workers and Board of Canvassers
30%
L.E.O. Staff25%
Polling Place Rental0%
Notices4%
Polling Place Doc-uments
2%Miscellaneous
6%
2012 Presidential Preference and Spring Election Training
3%
Ballots11%
Memory Devices2%
Programming10%
Ballot Bags0%
Wages - Poll Workers and Board of Canvassers
36%L.E.O. Staff
28%
Polling Place Rental0%
Notices4%
Polling Place Documents2% Miscellaneous
4%
2012 May 8 Recall Primary Election
Training3%
Ballots14%
Memory Devices1%
Programming8%
Ballot Bags0%
Wages - Poll Workers and Board of Canvassers
36%
L.E.O. Staff27%
Polling Place Rental
0%
Notices3%
Polling Place Documents
1%
Miscellaneous6%
2012 June 5 Recall ElectionTraining
3%
Ballots13%
Memory Devices1%
Programming13%
Ballot Bags1%
Wages - Poll Workers and Board of Canvassers
35%
L.E.O. Staff24%
Polling Place Rental
0%
Notices4%
Polling Place Documents2%
Miscellaneous5%
2012 Partisan Primary

Wisconsin Voter Turnout General Elections
Year and Election Voting Age Population (VAP)
Votes Cast Percentage of VAP Voting
2012 General** 4,378,741 3,071,434 70.1%
2012 Recall* 4,378,741 2,516,371 57.4%
2010 General 4,372347 2,171,331 49.7%
2008 General 4,330,695 2,996,869 69.2%
2006 General 4,260,038 2,166,671 50.9%
2004 General 4,118,621 3,016,288 72.9%
2002 General 4,060,973 1,785,710 44.0%
2000 General 3,908,533 2,619,184 67.0%
*2012 June 5 Recall Election included with General Elections** 2012 Presidential and General Election Votes and Turnout based on official results for the office of President of the United States
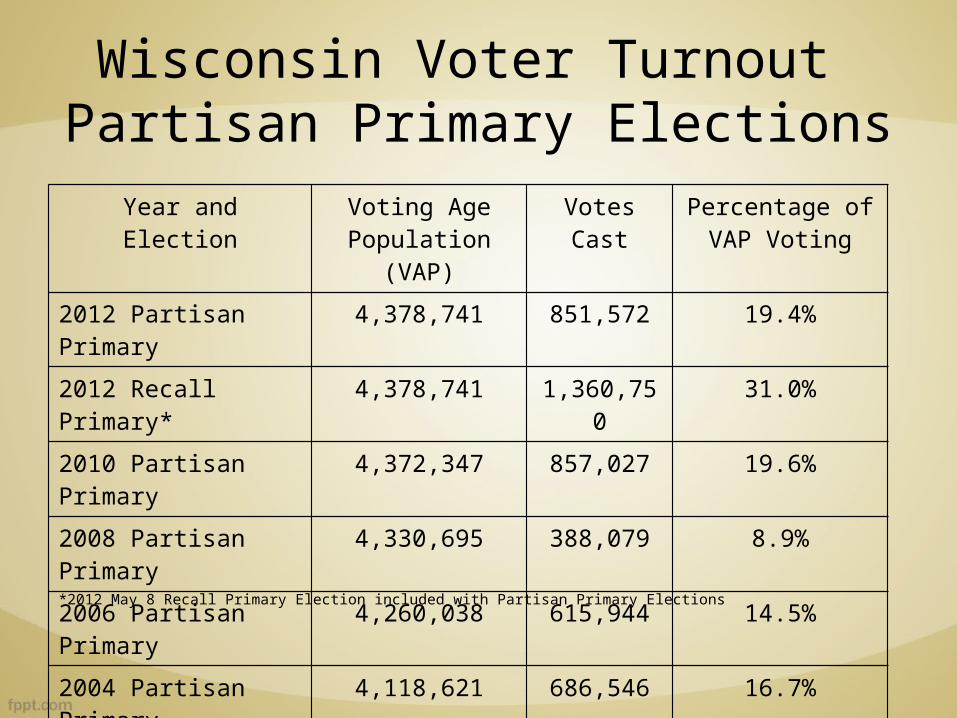
Wisconsin Voter Turnout Partisan Primary Elections
Year and Election Voting Age Population (VAP)
Votes Cast Percentage of VAP Voting
2012 Partisan Primary 4,378,741 851,572 19.4%
2012 Recall Primary* 4,378,741 1,360,750 31.0%
2010 Partisan Primary 4,372,347 857,027 19.6%
2008 Partisan Primary 4,330,695 388,079 8.9%
2006 Partisan Primary 4,260,038 615,944 14.5%
2004 Partisan Primary 4,118,621 686,546 16.7%
2002 Partisan Primary 4,060,973 913,523 22.5%
2000 Partisan Primary 3,908,533 406,665 10.4%
*2012 May 8 Recall Primary Election included with Partisan Primary Elections

Wisconsin Voter Turnout Presidential Preference Elections
Year and Election Voting Age Population (VAP)
Votes Cast Percentage of VAP Voting
2012 Presidential Preference 4,378,741 1,144,351 26.1%
2008 Presidential Preference 4,330,695 1,511,639 34.9%
2004 Presidential Preference 4,118,621 992,242 24.1%
2000 Presidential Preference 3,908,533 866,965 22.2%
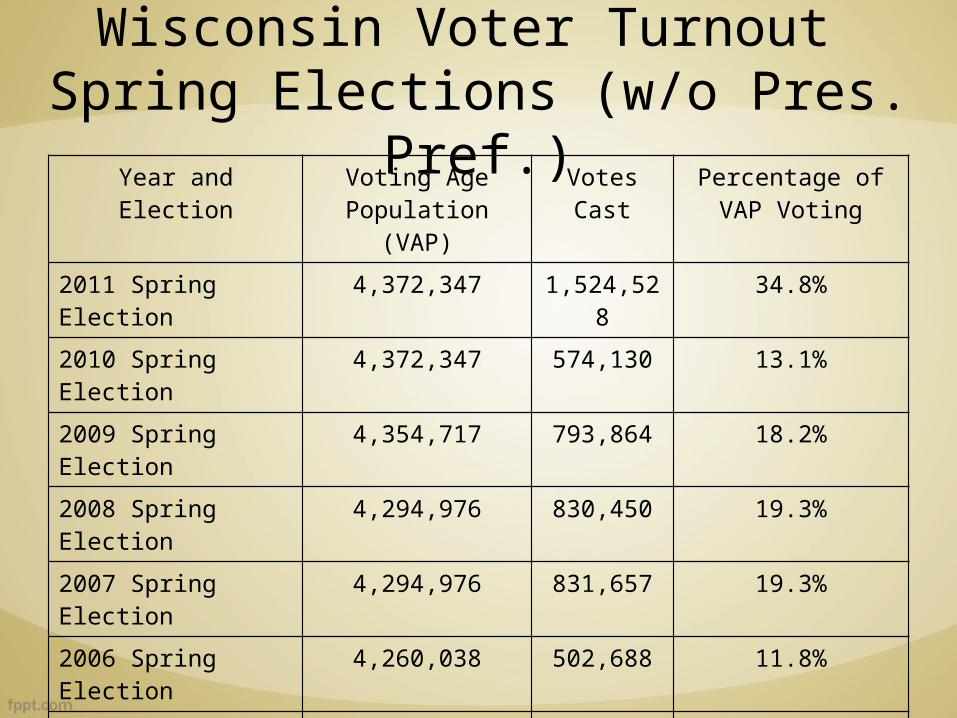
Wisconsin Voter Turnout Spring Elections (w/o Pres. Pref.)Year and Election Voting Age
Population (VAP)Votes Cast Percentage of VAP
Voting
2011 Spring Election 4,372,347 1,524,528 34.8%
2010 Spring Election 4,372,347 574,130 13.1%
2009 Spring Election 4,354,717 793,864 18.2%
2008 Spring Election 4,294,976 830,450 19.3%
2007 Spring Election 4,294,976 831,657 19.3%
2006 Spring Election 4,260,038 502,688 11.8%
2005 Spring Election 4,220,645 723,623 17.1%
2004 No Statewide Election
2003 Spring Election 4,088,085 814,641 19.9%
2002 No Statewide Election
2001 Spring Election 4,021,482 552,549 13.7%
2000 Spring Election 3,908,533 817,749 20.9%
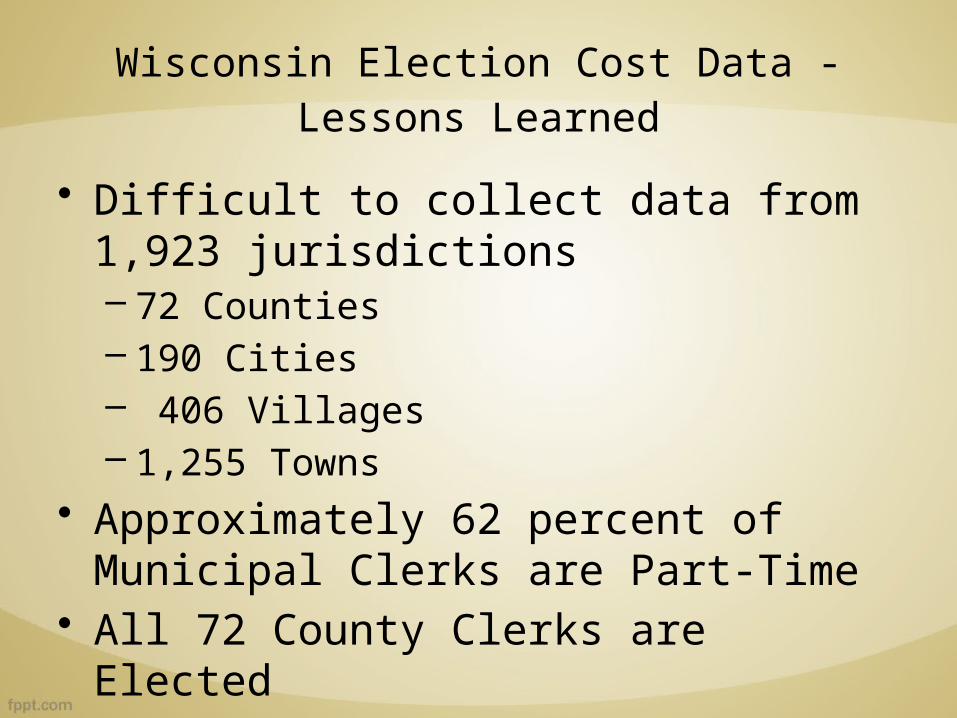
Wisconsin Election Cost Data - Lessons Learned
• Difficult to collect data from 1,923 jurisdictions– 72 Counties– 190 Cities– 406 Villages– 1,255 Towns
• Approximately 62 percent of Municipal Clerks are Part-Time
• All 72 County Clerks are Elected
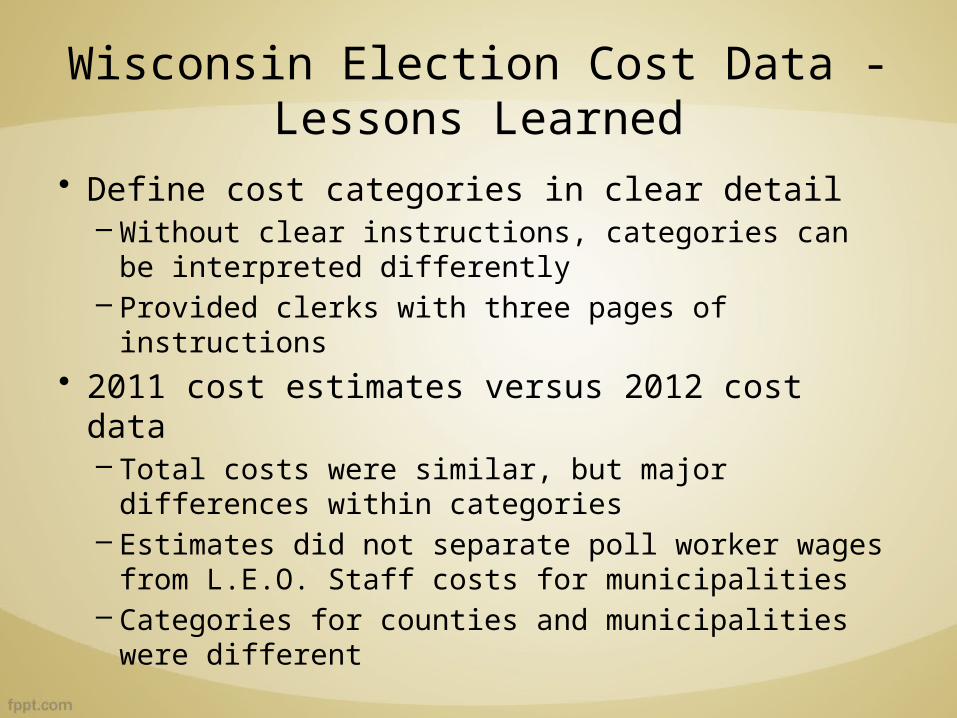
Wisconsin Election Cost Data - Lessons Learned
• Define cost categories in clear detail– Without clear instructions, categories can be
interpreted differently– Provided clerks with three pages of instructions
• 2011 cost estimates versus 2012 cost data– Total costs were similar, but major differences
within categories– Estimates did not separate poll worker wages
from L.E.O. Staff costs for municipalities– Categories for counties and municipalities were
different

Wisconsin Election Cost Data - Lessons Learned
• Fixed Costs– Notices– Polling place rental
• Variable Costs– Ballots (including absentee
costs)– Programming electronic voting
equipment
• Each Election– Poll worker wages– Ballots
• Annually– Purchasing voting equipment
or memory devices– Training– L.E.O. Staff
• Determining the frequency and timing of collection election cost data
Wisconsin Election Cost Data - Lessons Learned
• Elections costs provide a valuable tool– Policy change analysis– Performance management– Budgeting – Identifying potential cost savings

Kevin J. KennedyDirector and General Counsel
(608) 261-8683
Brian M. Bell, M.P.A.Election Data Manager
(608) 261-2011
Wisconsin Government Accountability BoardHomepage: http://gab.wi.govStatistics: http://gab.wi.gov/elections-voting/statistics
Related Documents