Ketamine induces toxicity in human neurons differentiated from embryonic stem cells via mitochondrial apoptosis pathway Zeljko J. Bosnjak a,b , Yasheng Yan a , Scott Canfield a,b , Maria Y. Muravyeva a , Chika Kikuchi a , Clive Wells c , John Corbett d , and Xiaowen Bai a,* a Department of Anesthesiology, The Medical College of Wisconsin, 8701 Watertown Plank, Milwaukee, WI 53226, USA b Department of Physiology, The Medical College of Wisconsin, 8701 Watertown Plank, Milwaukee, WI 53226, USA c Department of Electron Microscopy Core Facility, The Medical College of Wisconsin, 8701 Watertown Plank, Milwaukee, WI 53226, USA d Department of Biochemistry, The Medical College of Wisconsin, 8701 Watertown Plank, Milwaukee, WI 53226, USA Abstract Ketamine is widely used for anesthesia in pediatric patients. Growing evidence indicates that ketamine causes neurotoxicity in a variety of developing animal models. Our understanding of anesthesia neurotoxicity in humans is currently limited by difficulties in obtaining neurons and performing developmental toxicity studies in fetal and pediatric populations. It may be possible to overcome these challenges by obtaining neurons from human embryonic stem cells (hESCs) in vitro. hESCs are able to replicate indefinitely and differentiate into every cell type. In this study, we investigated the toxic effect of ketamine on neurons differentiated from hESCs. Two-week-old neurons were treated with different doses and durations of ketamine with or without the reactive oxygen species (ROS) scavenger, Trolox. Cell viability, ultrastructure, mitochondrial membrane potential (ΔΨ m ), cytochrome c distribution within cells, apoptosis, and ROS production were evaluated. Here we show that ketamine induced ultrastructural abnormalities and dose- and time- dependently caused cell death. In addition, ketamine decreased ΔΨ m and increased cytochrome c release from mitochondria. Ketamine also increased ROS production and induced differential expression of oxidative stress-related genes. Specifically, abnormal ultrastructural and ΔΨ m changes occurred earlier than cell death in the ketamine-induced toxicity process. Furthermore, Trolox significantly decreased ROS generation and attenuated cell death caused by ketamine in a dose-dependent manner. In conclusion, this study illustrates that ketamine time- and dose- dependently induces human neurotoxicity via ROS-mediated mitochondrial apoptosis pathway and that these side effects can be prevented by the antioxidant agent Trolox. Thus, hESC-derived neurons might provide a promising tool for studying anesthetic-induced developmental neurotoxicity and prevention strategies. * Correspondence to Dr. Xiaowen Bai, Department of Anesthesiology, Medical College of Wisconsin, 8701 Watertown Plank Road, Milwaukee WI, 53226, Phone: 414-456-5755, Fax: 414-456-6122, [email protected]. Part of this work has been presented at the EXPERIMENTAL BIOLOGY meeting, Washington, April 19, 2011 and at the AMERICAN SOCIETY OF ANESTHESIOLOGIST ANNUAL meeting, Chicago, October 16, 2011. CONFLICT OF INTEREST The authors have no conflict of interest. NIH Public Access Author Manuscript Curr Drug Saf. Author manuscript; available in PMC 2013 June 18. Published in final edited form as: Curr Drug Saf. 2012 April ; 7(2): 106–119. NIH-PA Author Manuscript NIH-PA Author Manuscript NIH-PA Author Manuscript

Welcome message from author
This document is posted to help you gain knowledge. Please leave a comment to let me know what you think about it! Share it to your friends and learn new things together.
Transcript

Ketamine induces toxicity in human neurons differentiated fromembryonic stem cells via mitochondrial apoptosis pathway
Zeljko J. Bosnjaka,b, Yasheng Yana, Scott Canfielda,b, Maria Y. Muravyevaa, Chika Kikuchia,Clive Wellsc, John Corbettd, and Xiaowen Baia,*
aDepartment of Anesthesiology, The Medical College of Wisconsin, 8701 Watertown Plank,Milwaukee, WI 53226, USAbDepartment of Physiology, The Medical College of Wisconsin, 8701 Watertown Plank,Milwaukee, WI 53226, USAcDepartment of Electron Microscopy Core Facility, The Medical College of Wisconsin, 8701Watertown Plank, Milwaukee, WI 53226, USAdDepartment of Biochemistry, The Medical College of Wisconsin, 8701 Watertown Plank,Milwaukee, WI 53226, USA
AbstractKetamine is widely used for anesthesia in pediatric patients. Growing evidence indicates thatketamine causes neurotoxicity in a variety of developing animal models. Our understanding ofanesthesia neurotoxicity in humans is currently limited by difficulties in obtaining neurons andperforming developmental toxicity studies in fetal and pediatric populations. It may be possible toovercome these challenges by obtaining neurons from human embryonic stem cells (hESCs) invitro. hESCs are able to replicate indefinitely and differentiate into every cell type. In this study,we investigated the toxic effect of ketamine on neurons differentiated from hESCs. Two-week-oldneurons were treated with different doses and durations of ketamine with or without the reactiveoxygen species (ROS) scavenger, Trolox. Cell viability, ultrastructure, mitochondrial membranepotential (ΔΨm), cytochrome c distribution within cells, apoptosis, and ROS production wereevaluated. Here we show that ketamine induced ultrastructural abnormalities and dose- and time-dependently caused cell death. In addition, ketamine decreased ΔΨm and increased cytochrome crelease from mitochondria. Ketamine also increased ROS production and induced differentialexpression of oxidative stress-related genes. Specifically, abnormal ultrastructural and ΔΨmchanges occurred earlier than cell death in the ketamine-induced toxicity process. Furthermore,Trolox significantly decreased ROS generation and attenuated cell death caused by ketamine in adose-dependent manner. In conclusion, this study illustrates that ketamine time- and dose-dependently induces human neurotoxicity via ROS-mediated mitochondrial apoptosis pathwayand that these side effects can be prevented by the antioxidant agent Trolox. Thus, hESC-derivedneurons might provide a promising tool for studying anesthetic-induced developmentalneurotoxicity and prevention strategies.
*Correspondence to Dr. Xiaowen Bai, Department of Anesthesiology, Medical College of Wisconsin, 8701 Watertown Plank Road,Milwaukee WI, 53226, Phone: 414-456-5755, Fax: 414-456-6122, [email protected].
Part of this work has been presented at the EXPERIMENTAL BIOLOGY meeting, Washington, April 19, 2011 and at theAMERICAN SOCIETY OF ANESTHESIOLOGIST ANNUAL meeting, Chicago, October 16, 2011.
CONFLICT OF INTERESTThe authors have no conflict of interest.
NIH Public AccessAuthor ManuscriptCurr Drug Saf. Author manuscript; available in PMC 2013 June 18.
Published in final edited form as:Curr Drug Saf. 2012 April ; 7(2): 106–119.
NIH
-PA Author Manuscript
NIH
-PA Author Manuscript
NIH
-PA Author Manuscript

KeywordsEmbryonic stem cells; neurons; differentiation; neurotoxicity; ketamine
INTRODUCTIONIn the United States millions of infants and young children are exposed annually to variousanesthetics. In addition, up to 2% of pregnant women undergo anesthesia during theirpregnancy for surgery unrelated to the delivery. However, growing evidence shows thatgeneral anesthetic exposure during the very active brain growth in immature animals resultsin considerable brain neuronal death and subsequent learning disabilities [1–4]. Ketamine isa noncompetitive N-Methyl-D-aspartate receptor antagonist and widely used in pediatricanesthesia to provide sedation/analgesia to children for painful procedures [5]. In addition,ketamine is one of the most studied anesthetics for addressing neurotoxicity issues in bothanimal models and animal-derived cell culture system. Neuroapoptosis is one of thecommonly recognized mechanisms for the anesthetic-induced developing neurotoxicity. Ithas been shown that 5 hours of ketamine exposure significantly induced neuroapoptosis in7-day-old mice [6]. A significant increase in neuroapoptosis was also observed in the cortexof 122 days of gestational and 5-day postnatal rhesus monkeys but not in 35-day postnatalanimals [4].
The findings from animal studies raise a real question whether similar neuroapoptosis alsooccurs in the developing human brain. However, there is considerable controversy aboutwhether rodent and primate data regarding anesthetic-induced neuroapoptosis are clinicallyrelevant. So far, there is no direct evidence that would link exposure to anesthesia orsedative drugs to neurotoxicity. Several retrospective epidemiological studies suggest thatanesthesia administration early in life is associated with learning and behavioralabnormalities later in life [7–9]. However, it is clearly very hard to separate the effects ofanesthetics alone from other quite relevant variables including the impact of surgery and thefactors associated with diseases [10]. In fact, anesthetic neurotoxicity studies in humans arenot feasible because it is difficult to obtain neurons and perform developmental toxicitystudies in pediatric and fetal populations. No one would consider either avoiding surgery insick children or exposing healthy children to anesthetic drugs for studying these effects.Since the use of anesthetics cannot be avoided, an understanding of the effects of anestheticsin human neurons is crucial for the safety of fetus, infant, and the young child. It may bepossible to overcome these challenges by obtaining developing neurons from humanembryonic stem cells (hESCs) in vitro.
hESCs are pluripotent stem cells obtained from the inner cell mass of human embryos atpreimplantation stage. hESCs are able to replicate indefinitely and virtually differentiate intoevery cell type found in the adult body [11]. The differentiation ability of hESCs intocommitted cell types is potentially valuable for studying cellular and molecular eventsinvolved in early human development under physiological and pathological conditionswhich is almost impossible to perform in humans [12–15]. It has been shown that hESC-derived neurons were similar to human neurons at morphological and structural levels [16].In one recent study, Nash and colleagues used an in vitro hESC-based neurogenesis systemto study ethanol-induced early developmental toxicity. They found that ethanol induced acomplex mix of phenotypic changes, including inappropriate increase in stem cellproliferation and loss of trophic astrocytes [17]. In the present study, we recapitulatedneurogenesis from hESCs in vitro and used the differentiated human neurons to studyketamine-induced neurotoxicity and the underlying mechanisms. We hypothesized that
Bosnjak et al. Page 2
Curr Drug Saf. Author manuscript; available in PMC 2013 June 18.
NIH
-PA Author Manuscript
NIH
-PA Author Manuscript
NIH
-PA Author Manuscript

ketamine induced neuroapoptosis via reactive oxygen species (ROS)-mediatedmitochondrial pathway.
MATERIALS AND METHODShESC Culture
Mitotically inactivated mouse embryonic fibroblasts (MEFs) by mitomycin C (Sigma) wereused as feeder cells to support the growth and maintenance of hESCs (H1 cell line, WiCellResearch Institute Inc.). Inactivated MEFs were plated in 0.1% gelatin-coated 60 mm culturePetri dishes containing Dulbecco’s modified Eagle’s medium (DMEM) supplemented with10% fetal bovine serum (Gibco) in a humidified incubator under normoxic condition (20%O2 /5% CO2) at 37°C. The following day, hESCs were plated on the layer of MEFs withhESC culture medium and incubated in a hypoxic incubator (4% O2/5% CO2). hESC culturemedium consisted of DMEM/F12 supplemented with 20% knock-out serum (Gibco), 1%non-essential amino acids, 1% penicillin-streptomycin, 1 mM L-glutamine (Chemicon), 0.1mM β-mercaptoethanol (Sigma), and 4 ng/mL human recombinant basic fibroblast growthfactor (bFGF; Invitrogen). The medium was changed daily. hESCs were passaged every 5–7days using a mechanical microdissection method. hESCs with passage numbers between 70and 80 were used in this study.
Neuronal Differentiation of hESCshESCs underwent a four-step progression that includes embryoid body (EB) culture(initiation of differentiation), rosette cell formation, neural stem cell (NSC) expansion, andneuronal differentiation as follows: (1) EB culture. hESCs in the culture were digestedusing dispase (1.5 unit/mL) (Invitrogen) for 30 min. Digested hESCs were then transferredto 60 mm ultra-low-attachment dishes (Corning) and cultured in hESC medium withoutbFGF under normoxic conditions. The medium was changed every day, and the EBs werevisible one day after culturing. Four days later, EBs were switched to neural inductionmedium consisting of DMEM/F12 supplemented with 1% N2 (Invitrogen), 1% non-essentialamino acids, 5 ng/mL bFGF, and 1mg/mL heparin (Sigma) for 4 days. (2) Rosetteformation. EBs were transferred to Growth Factor Reduced BD Matrigel-coated 60 mmculture dishes and cultured with neural induction medium at day 8. The medium waschanged every other day. EBs attached to the dishes and formed neural tube-like rosetteswith radial arrangements of columnar cells within 5 days. (3) NSC expansion. Two daysafter rosette formation, rosette cells were gently removed with a 5 ml serological pipette toother dishes and cultured with neural expansion medium containing DMEM/F12supplemented with 1% N2, 2% B27 (Invitrogen), 1% non-essential amino acids, 20 ng/mLbFGF, and 1mg/mL heparin. One day later, rosette cells rolled up to form a round spherescalled NSCs. Half of the medium was replaced by fresh medium every other day. NSCsgrew as monolayer while cultured in Matrigel-coated dishes. The seeding density of NSCswas 5 × 10⁵/60 mm dish. NSCs were passaged every 5–6 days by digestion with accutase(Innovative Cell Technology). NSCs at passages 4 to 12 were used for neuronaldifferentiation. (4) Neuronal differentiation. Half a million NSCs were cultured in 60 mmMatrigel-coated dishes with neuronal differentiation medium consisting of Neurobasal, 2%B27 (Invitrogen), 0.1 μM cyclic adenosine monophosphate, 100 ng/mL ascorbic acid(Sigma), 10 ng/mL brain-derived neurotrophic factor, 10 ng/mL glial cell-derivedneurotrophic factor, and 10 ng/mL insulin-like growth factor 1 (Pepro Tech Inc.). Themedium was changed every other day for 2 weeks. Two-week-old neurons differentiatedfrom three independently prepared NSCs (passages 5 to 12) were used in this study.
Bosnjak et al. Page 3
Curr Drug Saf. Author manuscript; available in PMC 2013 June 18.
NIH
-PA Author Manuscript
NIH
-PA Author Manuscript
NIH
-PA Author Manuscript

Immunofluorescence StainingCells cultured on matrigel-coated glass coverslips were fixed with 1% paraformaldehyde for30 min. Cells were then washed three times with phosphate buffered saline (PBS) alone orPBS containing 0.5% Triton X-100 (Sigma) and blocked with 10% donkey serum for 30 minat room temperature followed by incubation with primary antibodies in a moist chamber for1 hour at 37°C. The primary antibodies were mouse anti-Sox2 (Millipore), microtubule-associated protein 2 (MAP2) (abcam) and cytochrome c (BD Pharmingen), rabbit anti-nestin, synapsin I and cleaved caspase-3 (Millipore). After three wash, cells were incubatedwith an Alexa Fluor 485 donkey anti-mouse IgG and/or with an Alexa Fluor 594 donkeyanti-rabbit IgG (Invitrogen) for 1 hour at room temperature. Cell nuclei were stained withTO-PRO®-3 (Invitrogen). The coverslips were then mounted onto the slides and thefluorescence images were recorded using a laser-scanning confocal microscope (NikonEclipse TE2000-U). Neuron differentiation efficiency was determined by calculating thepercentage of MAP2-positive cells over the total cells stained with TO-PRO®-3. Resultswere obtained from at least 100 cells in each of three independently differentiated neuronsamples.
Ketamine TreatmentNSCs were cultured in either 60 mm dishes (5 × 10⁵ cells/dish) or 96-well tissue cultureplates (1 × 10⁴ cells/well) with neuron differentiation medium. Two weeks later, neuronswere incubated with different doses of ketamine (Phoenix Pharmaceutical, Inc.) with orwithout ROS inhibitor Trolox. It was reported that peak blood levels of ketamine were ashigh as 108 μM [18]. Ketamine levels required to maintain anesthesia were approximately10–20 μM [19]. In addition, experimental evidence from in vitro cell culture and in vivoanimal studies demonstrated that ketamine could induce neurotoxicity when administered athigh doses and/or for prolonged periods [20–24]. Thus, in this study we treated neurons witha wide range of ketamine concentrations (20–4000 μM) for 6, 12, or 24 hours. Cell viability(LDH and MTT assays), apoptosis analysis (cleaved caspase-3 staining, quantification ofcaspase-3 activity, TUNEL staining and cytochrome c release), and ROS measurement wereperformed immediately after ketamine exposure for indicated durations (6, 12, or 24 hours).
MTT Assay3-(4,5-dimethyithiazol-2-yl)-2,5-diphenyl-tetrazolium bromide (MTT) assay was used todetermine cell viability using a Cell Proliferation Kit I (Roche) by measuring mitochondrialdehydrogenase activity that reduces MTT dye to a colored product. Thus, the extent of MTTmetabolism is an indicator of mitochondrial function and cell viability. Neurons werecultured in 96-well plate with 100 μL neuronal differentiation medium. Four hours afteradding 10 μL of the MTT solution to each well, MTT reduction product, formazan, wasdissolved in SDS solution at 37°C overnight. The absorbance of the purple formazanproduct was then determined spectrophotometrically at 580 nm with a reference wavelengthof 650 nm using a microtiter plate reader. The amount of MTT reduction product(representing cell viability) in the ketamine-treated neurons was expressed as % of no-treatment control.
LDH Release AssayLactate dehydrogenase (LDH) release into the culture media is an index of cell membranedamage. LDH activity was analyzed using a LDH assay kit (Roche) following themanufacturer’s protocol. Briefly, NSCs differentiated from hESCs were cultured in 96-wellculture plates with 100 μL neuronal differentiation medium. The medium was changedevery two days. Two weeks later, 100 μL of substrate mix was added to each well in theplates and incubated for 20 min at room temperature. The reaction was terminated with a
Bosnjak et al. Page 4
Curr Drug Saf. Author manuscript; available in PMC 2013 June 18.
NIH
-PA Author Manuscript
NIH
-PA Author Manuscript
NIH
-PA Author Manuscript

stop solution and the sample was quantified spectrophotometrically at 490 nm (referencewavelength is 600 nm) with a Microplate Reader (Bio Tek). LDH release from ketamine-treated neurons was presented as fold increase over no-treatment control.
Caspase-3 Activity QuantificationCaspase-3 activity was measured using Caspase-3 Colorimetric Assay Kit (Genescript)following the manufacturer’s protocol. Neurons cultured in 60 mm dishes were washedtwice with PBS and lysed with 50 μL lysis buffer followed by adding 50 μL reaction bufferas well as 5 μL substrate. After 4-hour incubation at 37°C, caspase-3 activity was measuredusing a Microplate Reader at 400 nm. The values of optical density at 400 nm wasnormalized to total protein content of the samples as determined by DC Protein AssayReagents Package Kit (Bio-Rad).
TUNEL AssayDNA fragmentation associated with apoptosis was analyzed by performing terminaldeoxynucleotidyl transferase-mediated deoxyuridine triphosphate in situ nick end labeling(TUNEL) staining using an in situ apoptotic cell death detection kit (Roche Applied BioSciences) following the manufacturer’s instruction. The cells cultured on coverslips wererinsed with PBS, fixed with ice-cold 1% paraformaldehyde. Terminal deoxynucleotidyltransferase, a template-independent polymerase, was used to incorporate nucleotides at thesites of DNA breaks. Nuclei were stained with TO-PRO®-3, and the fluorescent imageswere taken at three different fields for each coverslip using the confocol microscope.Apoptotic index was calculated as a percentage according to the following formula:TUNEL-positive nuclei number/the number of total cell nuclei.
Electron Microscopy-Ultrastructural AnalysisNeurons cultured on matrigel-coated coverslips from each experimental condition werefixed with 2% glutaraldehyde in 0.1M sodium cacodylate buffer at 4°C, washed in the samebuffer, and post-fixed with 1% osmium tetroxide for 60 min on ice. Cells were then washedbriefly in distilled water and dehydrated through graded methanol (50%, 20 min; 70%, 20min; 95%, 20 min; 100%, 3 × 20 min) and acetonitrile (2 × 10 min). The cells wereinfiltrated with epoxy resin (EMbed-812; Electron Microscopy Sciences, Hatfield, PA), andpolymerized overnight at 70°C. Ultra-thin sections (~60 nm) were cut, stained with uranylacetate and lead citrate according to standard procedures and viewed with a Hitachi H600EM.
Mitochondrial Membrane Potential (ΔΨm) AssayTetramethylrhodamine ethyl ester (TMRE) is a lipophilic, positively charged dye. TMREcan penetrate intact live cells and enter the negatively charged mitochondria where itaccumulates in an inner-membrane potential-dependent manner. When the ΔΨm collapsesin apoptotic cells, TMRE no longer accumulates inside the mitochondria and becomes moreevenly distributed throughout the cytosol. When dispersed in this manner, overall cellularfluorescence levels drop dramatically and this event can easily be visualized by fluorescencemicroscopy. Neurons cultured on glass coverslips were loaded with 50 nM TMRE(Invitrogen) for 20 min at room temperature. TMRE fluorescence intensity representingΔΨm was recorded with the confocol microscope and analyzed by ImageJ software 1.41(Wayne Rasband). Results were obtained from at least 100 cells in each of three samples pergroup.
Bosnjak et al. Page 5
Curr Drug Saf. Author manuscript; available in PMC 2013 June 18.
NIH
-PA Author Manuscript
NIH
-PA Author Manuscript
NIH
-PA Author Manuscript

Labeling Mitochondria and Characterization of Distribution of Cytochrome C in NeuronsTo indentify if ketamine induces cytochrome c release from mitochondria into cytosol, welabeled mitochondria as described as follows. Ten days after NSCs were cultured inneuronal differentiation medium, differentiated neurons were transduced with the virusCellLight™ mitochondria-GFP (green fluorescence protein) (Invitrogen) to label themitochondria following the instructions provided by the company. This fluorescent protein-based reagent contains the leader sequence of E1alpha pyruvate dehydrogenase fused toemerald GFP. Transduced neurons expressed GFP within mitochondria. Four days later, thelabeled neurons were used for the analysis of the effect of ketamine on the cytochrome ctranslocation. The distribution of cytochrome c in the neurons expressing GFP withinmitochondria was analyzed with antibody against cytochrome c (BD Pharmingen) usingimmunofluorescence staining.
ROS MeasurementThe intracellular ROS level in neurons was detected by labeling neurons with 5-(and-6)-chloromethyl-2′,7′-dichlorodihydrofluorescein diacetate, acetyl ester (CM-H2DCFDA)(Invitrogen), a ROS-sensitive membrane permeable fluorescent probe. Upon penetration intothe cells, the acetate groups of CM-H2DCFDA are cleaved by cytoplasmic esterases to formmembrane impermeable non-fluorescent CM-H2DCF trapped within the cells. CM-H2DCFis then rapidly oxidized by ROS to produce highly fluorescent dye DCF. DCF fluorescentintensity represents ROS production. The neuron-contained coverslips were placed in apolycarbonate recording chamber (Warner Instruments) on the stage of the confocalmicroscope with the ×60/1.4 oil-immersion objective. Neurons were loaded with 10 μMCM-H2DCFDA for 30 min in the presence/absence of ketamine with or without Troloxfollowed by 20-min washout. The DCF fluorescence of cells was acquired with the confocolmicroscope at excitation (by argon laser) and emission wavelengths: λex/λem=488/500–550within 8 min. DCF intensity was quantified with ImageJ software 1.41 (Wayne Rasband).Results were obtained from at least 100 neurons in each of five experiments per group.
Real-Time PCR AnalysisTotal RNA was extracted from cells using RNAqueous-micro scale RNA isolation kit(Ambion) and was reverse transcribed to cDNA using iScriptTM cDNA systhesis kit (Bio-Rad). cDNA was then subjected to PCR amplification using iQ™ SYBR green supermix(Bio-Rad) in a final volume of 25 μl with each specific primer set using the iCycler iQDetection System (Bio-Rad Laboratories). PCR reaction cycles were programmed asfollows: 95°C for 3 min, 50 cycles of 10 s denaturation at 95°C, 60 s at 60°C. The thresholdcycle (Ct) of each well was determined. The relative expression of each mRNA wascalculated by the comparative Ct method and normalized to the housekeeping gene, beta-2-microglobulin, using the formula: ΔCt = Ct of the gene of interest − Ct of beta-2-microglobulin. The fold change of the individual gene expression was presented by the2−ΔΔCt formula in which ΔΔCt = ΔCt of ketamine group − ΔCt of no-treatment group. Thefollowing oxidative stress-related genes were analyzed: glutathione synthetase (GSS),glutathione reductase (GSR), oxidation resistance 1 (OXR1), oxidative-stress responsive 1(OXSR1), superoxide dismutase 1 (SOD1), and glutathione peroxidase 1 (GPX1). Theprimers used were purchased from RealTimePrimers.COM.
Statistical AnalysisReported values were expressed as means ± standard deviation from results obtained fromthree independent neuronal differentiations. The statistically significant differences betweengroups were tested by using one-way analysis of variance or Student’s t-test using SPSSsoftware version 15. A level of P≤0.05 was considered to be statistically significant.
Bosnjak et al. Page 6
Curr Drug Saf. Author manuscript; available in PMC 2013 June 18.
NIH
-PA Author Manuscript
NIH
-PA Author Manuscript
NIH
-PA Author Manuscript

RESULTSDifferentiation of hESCs into Neurons
hESCs were induced to differentiate into neurons in vitro via NSC step. NSCs wereconfirmed by the expression of NSC-specific markers Sox2 and nestin (Fig. 1A). NSCsshowed strong proliferation potential. They were passaged every 5–6 days for over 12passages. Obvious neuronal differentiation could be observed in the culture 3 days afterNSCs were cultured in neuronal differentiation medium. Differentiated neurons formedextensive neuron networks over time. Two-week-old cultured neurons expressed neuron-specific marker MAP2. Over 90% of the NSCs differentiated into MAP2-positive neuronswithin 2 weeks of protocol initiation. In addition to MAP2, differentiated neurons were alsopositive for synapsin I, the marker used to define the presence of presynaptic vesicles [25].Puncta-like synapsin 1 could be observed around cell bodies and along radially orientedaxons (Fig. 1B). These hESC-derived cells were similar to human neurons at morphologicaland structural levels as previously described [16].
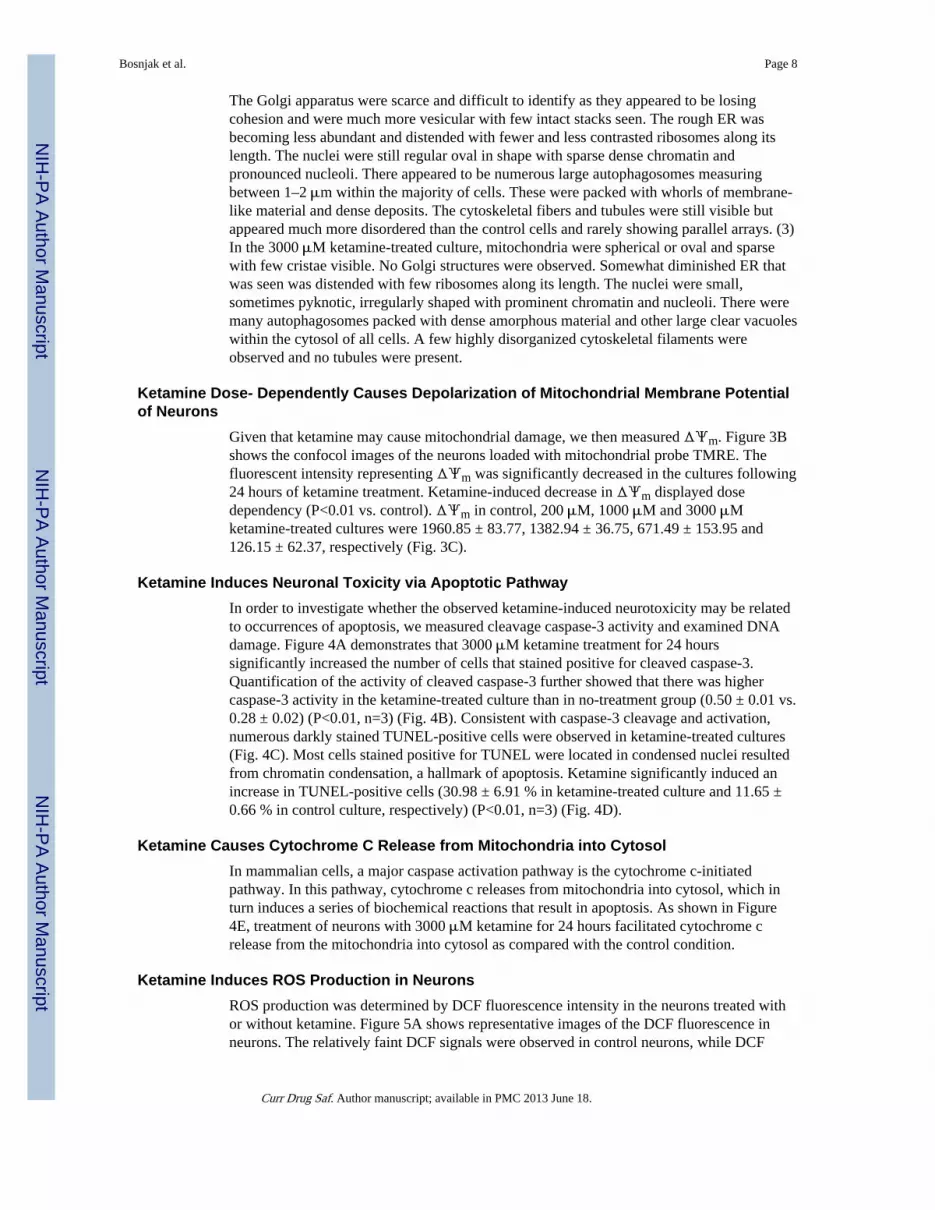
Ketamine Time- and Dose-Dependently Decreased Neuronal ViabilityWe next investigated whether ketamine caused neuronal death. Two-week-old neurons weretreated with increasing concentrations of ketamine (20–4000 μM) for different durations.Lower dose ketamine (20 to 2000 μM) treatment for 24 hours did not influence the overallcellular morphology. However, 2500 μM ketamine caused cellular projection retraction andcell detachment. Most cells were detached in the 4000 μM ketamine-treated culture (Fig.2A). We then used two methods to analyze cell viability: MTT and LDH assays. Using MTTassay, we found that at the concentrations up to 2000 μM, ketamine did not modify cellviability. However, 3500 μM ketamine treatment for 6 hours significantly decreased cellviability (P<0.01, n=3). In addition, higher concentrations and longer treatment durationsinduced more cell death. Cell viability was 92 ± 2%, 72 ± 5%, and 59 ± 2% of the no-treatment control after 6, 12, or 24 hours of incubation with 3000 μM ketamine (P<0.01,n=3) (Fig. 2B). In accordance with this loss of cell viability (MTT assay), higherconcentrations and longer exposures to ketamine resulted in the enhanced LDH release inthe culture. LDH release in the 4000 μM ketamine-treated cells for 24 hours was 1.57-fold ±0.06 higher than in no-treatment culture (Fig. 2C). Collectively, these combined datashowed that ketamine dose- and time- dependently caused neuronal death.
Ketamine Leads to Neuronal Ultrastructural AbnormalitiesWe next investigated if ketamine caused ultrastructural change in the neurons using electronmicroscope. Figure 3A shows the representative images of neurons treated with variousconcentrations of ketamine for 24 hours. Normal neurons had very elongated mitochondriawith varying lengths of up to and over 4 μm. Other organelles such as Golgi apparatus andrough endoplasmic reticulum (ER) appeared regular. The cytoskeleton (filaments andtubules) of the cells was regularly ordered and appeared in numerous parallel arrays alongthe length of the cells. However, ketamine caused abnormal ultrastructure in neurons.Specifically, as shown in Figure 2, the lower concentrations (200 and 1000 μM) ofketamine-treated cultures did not induce cell death. However, Figure 3A shows therepresentative electron microscope images indicating a clear ultrastructural change in theselow-dose ketamine-treated cultures. The detailed descriptions of ultrastructuralabnormalities in the ketamine-treated neurons are as follows: (1) In the 200 μM ketamine-treated culture, the length of mitochondria was short indicating mitochondrial fragmentation.Golgi structures were not observed. Autophagosomes were very pronounced and found inalmost every cell often occupying the majority of cytosol volume. (2) Neurons treated with1000 μM ketamine showed signs of traumatic damage. Mitochondria were much shorter (1–1.5 μm long) than in the controls. The cristae appeared somewhat irregular and disrupted.
Bosnjak et al. Page 7
Curr Drug Saf. Author manuscript; available in PMC 2013 June 18.
NIH
-PA Author Manuscript
NIH
-PA Author Manuscript
NIH
-PA Author Manuscript
The Golgi apparatus were scarce and difficult to identify as they appeared to be losingcohesion and were much more vesicular with few intact stacks seen. The rough ER wasbecoming less abundant and distended with fewer and less contrasted ribosomes along itslength. The nuclei were still regular oval in shape with sparse dense chromatin andpronounced nucleoli. There appeared to be numerous large autophagosomes measuringbetween 1–2 μm within the majority of cells. These were packed with whorls of membrane-like material and dense deposits. The cytoskeletal fibers and tubules were still visible butappeared much more disordered than the control cells and rarely showing parallel arrays. (3)In the 3000 μM ketamine-treated culture, mitochondria were spherical or oval and sparsewith few cristae visible. No Golgi structures were observed. Somewhat diminished ER thatwas seen was distended with few ribosomes along its length. The nuclei were small,sometimes pyknotic, irregularly shaped with prominent chromatin and nucleoli. There weremany autophagosomes packed with dense amorphous material and other large clear vacuoleswithin the cytosol of all cells. A few highly disorganized cytoskeletal filaments wereobserved and no tubules were present.
Ketamine Dose- Dependently Causes Depolarization of Mitochondrial Membrane Potentialof Neurons
Given that ketamine may cause mitochondrial damage, we then measured ΔΨm. Figure 3Bshows the confocol images of the neurons loaded with mitochondrial probe TMRE. Thefluorescent intensity representing ΔΨm was significantly decreased in the cultures following24 hours of ketamine treatment. Ketamine-induced decrease in ΔΨm displayed dosedependency (P<0.01 vs. control). ΔΨm in control, 200 μM, 1000 μM and 3000 μMketamine-treated cultures were 1960.85 ± 83.77, 1382.94 ± 36.75, 671.49 ± 153.95 and126.15 ± 62.37, respectively (Fig. 3C).
Ketamine Induces Neuronal Toxicity via Apoptotic PathwayIn order to investigate whether the observed ketamine-induced neurotoxicity may be relatedto occurrences of apoptosis, we measured cleavage caspase-3 activity and examined DNAdamage. Figure 4A demonstrates that 3000 μM ketamine treatment for 24 hourssignificantly increased the number of cells that stained positive for cleaved caspase-3.Quantification of the activity of cleaved caspase-3 further showed that there was highercaspase-3 activity in the ketamine-treated culture than in no-treatment group (0.50 ± 0.01 vs.0.28 ± 0.02) (P<0.01, n=3) (Fig. 4B). Consistent with caspase-3 cleavage and activation,numerous darkly stained TUNEL-positive cells were observed in ketamine-treated cultures(Fig. 4C). Most cells stained positive for TUNEL were located in condensed nuclei resultedfrom chromatin condensation, a hallmark of apoptosis. Ketamine significantly induced anincrease in TUNEL-positive cells (30.98 ± 6.91 % in ketamine-treated culture and 11.65 ±0.66 % in control culture, respectively) (P<0.01, n=3) (Fig. 4D).
Ketamine Causes Cytochrome C Release from Mitochondria into CytosolIn mammalian cells, a major caspase activation pathway is the cytochrome c-initiatedpathway. In this pathway, cytochrome c releases from mitochondria into cytosol, which inturn induces a series of biochemical reactions that result in apoptosis. As shown in Figure4E, treatment of neurons with 3000 μM ketamine for 24 hours facilitated cytochrome crelease from the mitochondria into cytosol as compared with the control condition.
Ketamine Induces ROS Production in NeuronsROS production was determined by DCF fluorescence intensity in the neurons treated withor without ketamine. Figure 5A shows representative images of the DCF fluorescence inneurons. The relatively faint DCF signals were observed in control neurons, while DCF
Bosnjak et al. Page 8
Curr Drug Saf. Author manuscript; available in PMC 2013 June 18.
NIH
-PA Author Manuscript
NIH
-PA Author Manuscript
NIH
-PA Author Manuscript

fluorescence intensity was increased in the cultured treated with 3000 μM ketamine for 24hours. Ketamine stimulated 2.52-fold increase in the production of ROS in neuronscompared with control (258.72 ± 100.72 vs. 102.78 ± 19.49) (Fig. 5B).
Ketamine Induces Differential Regulation of Oxidative Stress-Related GenesWe examined the expression of six oxidative stress-related genes (GSS, GSR 1, OXR1,OXSR, SOD1, and GPX1) in neurons using real-time PCR. GSS, OXR1, and OXSR1 areinvolved in oxidative stress. GSR and GPX1 are involved in peroxidase activity andoxidoreductase activity. SOD1 is involved in superoxide metabolism and oxidoreductaseactivity. These six oxidative stress-related genes were found to be differentially regulatedwith ketamine treatment. There were up-regulations of GSS (1.89-fold), GSR (9.69-fold),OXR1 (11.13-fold), OXSR1 (5.31-fold), and SOD1 (14.02-fold). There was a down-regulation of GPX1 (0.55-fold) (Fig. 5C).
ROS Scavenger Trolox Protects Neurons against Ketamine-Induced NeurotoxicityTo determine if ROS production mediates the cleavage of capsase-3 and induces neuronaldeath, differentiated neurons were treated with ketamine with or without Trolox. Asexpected, Trolox (250 μM) had a significant inhibitory effect on ROS generation in the3000 μM ketamine-treated neurons for 24 hours (2.52-fold ± 0.98 in ketamine alone groupvs. 1.02-fold ± 0.26 in ketamine plus Trolox group, n=3) (Figs. 6A and B). This inhibition ofROS was associated with an attenuation in ketamine-induced caspase-3 activation (1.77-fold± 0.05 in ketamine group vs. 1.36-fold ± 0.19 in ketamine plus Trolox group) (P<0.05, n=3)(Figs. 6C and D). We then determined if Trolox completely reversed ketamine-induced celldeath. Neurons were treated with different concentrations of Trolox (range 0–1000 μM).Following 24-hour incubation with ketamine, there was a 41% decrease in neuronalviability. Trolox (250 μM) significantly increased cell viability to 75%. In addition, Troloxexhibited concentration-related protective effects. Ketamine-induced cell death wascompletely attenuated by 1000 μM Trolox (Cell viability: 59.27 ± 2.30 % of control inketamine group vs. 74.75 ± 6.00 % in ketamine + 250 μM Trolox and 103.56 ± 6.50 % inketamine + 1000 μM Trolox) (Figs. 6E and F).
DISCUSSIONIn this study, we investigated the toxic effect of ketamine on the human neuronsdifferentiated from hESCs. Our major findings are summarized as follows: (1) Ketaminedecreased neuronal viability in a concentration- and time-dependent manner; (2) Ketamineincreased caspase-3 activity and DNA damage, decreased ΔΨm and induced cytochrome crelease from mitochondria into cytosol, indicating that ketamine-treated neurons undergomitotochondria-mediated apoptosis; (3) Ketamine significantly induced ultrastructuralabnormalities in neurons, including mitochondrial fragmentation, a dramatic decrease inGolgi and rough ER, and an increase in autophagosomes; (4) Ketamine-treated neuronsgenerated higher levels of ROS than control cells; and (5) Trolox, a ROS scavenger,significantly attenuated ketamine-induced ROS formation, the increased caspase-3 activity,and cell death.
To study ketamine-induced neurotoxicity we mimicked developmental principles to obtainhESC-derived neurons that were similar to human neurons at morphological and structurallevels (Fig. 1B). These differentiated neurons were reported to generate action potentials andinduce the synaptic transmission [16]. We then used multiple methods to analyze multi-parametric indicators of cellular toxicity inferring mechanisms of cell death and covering awide spectrum of cytopathological changes including cell viability, apoptosis, mitochondrialdysfunction, ultrastructural pathology and ROS production. The data from MTT and LDH
Bosnjak et al. Page 9
Curr Drug Saf. Author manuscript; available in PMC 2013 June 18.
NIH
-PA Author Manuscript
NIH
-PA Author Manuscript
NIH
-PA Author Manuscript

assays revealed that ketamine at concentrations lower than 2000 μM did not induce celldeath even after prolonged exposures (24 hours). A significant decrease in neuronal viabilitywas observed only when ketamine concentration was raised to greater than 2000 μM. Theseresults were largely in line with several recent studies by others who also found thatketamine-induced neurotoxicity in vitro occurred after prolonged exposures with highconcentrations. For instance, Mak et al. demonstrated that administration of 4000 μMketamine for 48 hours caused significant death of differentiated neurons from human SH-SYY5 neuroblastoma cell line [22]. This finding was supported by Braun et al. who showeda significant increase in the number of apoptotic neurons differentiated from human SHEPneuroblastoma cell line after 24 hours of 2000 μM ketamine treatment [20]. A similarfinding was also reported in primary cortical neurons harvested from postnatal day 2–8mice. In this study, clinically relevant anesthetic concentrations of ketamine had nosignificant neurotoxic effects, and only reaching significant levels of neurotoxicity when theketamine concentration was raised to above clinically applied concentrations (e.g., 1–3 mMketamine) [21]. In contrast, some studies showed the toxic effect of comparatively lowconcentrations of ketamine on cultured neurons. For instance, treatment of fetal rat neuronsafter 18–19 days gestation with 100 μM of ketamine for 48 hours resulted in the loss of 45%of neurons by apoptosis [26].
The reasons why different studies showed various toxic thresholds of ketamine-inducedneuronal death may be explained as follows. First, the sensitivity of neurons obtained fromdifferent species to ketamine may differ. Second, neurons used in different studies might beat different developmental stages or contain different percentage of population of neuronsinfluencing the vulnerability to ketamine exposure. It is commonly considered thatdeveloping mammals are at greatest apoptotic risk during the most rapid period of growth oftheir central nervous system. In rats, brain growth peaks at approximately 7 days after birth.For rhesus monkeys the peak growth takes place after approximately 115 days of gestation[27] [28]. In humans, neurogenesis is the most active during first trimester of pregnancy [29]while synaptogenesis starts during the third trimester and continues for up to 2 to 3 years[30]. Thus, neurons at different stages of brain growth burst might also exhibit differentsensitivity to ketamine. Third, in vitro neuronal culture system excludes the influence ofother environmental factors in vivo that may increase toxic threshold of ketamine. Last,neuron death may be the severe side effect caused only by high doses of ketamine. In ourcurrent study, our criteria for neurotoxicity was a significant decrease in the cell viabilityanalyzed by MTT and LDH assay. Thus, we cannot rule out the possibility that neuronswere compromised by clinically relevant dose of ketamine exposure and this impact was notdetected by our assays.
An increase in LDH release and a decrease in MTT metabolism resulted from 3000 μMketamine treatment only suggest the damage of cell membrane and impaired mitochondrialfunction (Fig. 2). Thus, we hypothesized that low concentration of ketamine might also exertother harmful effects in addition to cell death. We then used electron microscope to studythe ketamine-induced toxic effect. Specifically, we found for the first time that lower dosesof ketamine (200 and 1000 μM) led to significant ultrastructural abnormalities (includingmitochondrial fragmentation, a decrease in Golgi and rough ER, and an increase inautophagosomes) (Fig. 3A). ΔΨm was also significantly decreased in the 200 μMketamine-treated culture (Fig. 3B and C). These data indicate that abnormal ultrastructureand ΔΨm are earlier indicators for ketamine-induced neurotoxicity compared with thedecrease in cell viability. Ketamine might also alter other cell physiological activities, suchas neuronal receptor expression, structure and branching of neurons’ dendrites andsynaptogenesis, eventually resulting in impaired neuronal function.
Bosnjak et al. Page 10
Curr Drug Saf. Author manuscript; available in PMC 2013 June 18.
NIH
-PA Author Manuscript
NIH
-PA Author Manuscript
NIH
-PA Author Manuscript

It is widely accepted that general anesthetics cause neuronal loss by the inappropriateactivation of apoptotic cell death pathways [20, 26, 31, 32]. Apoptosis plays a veryimportant role in development, aging and disease such as neurological disorders (e.g.,Alzheimer’s disease) [33]. Apoptosis is mediated by two central pathways involving eitherthe intrinsic (or mitochondrial) pathway or the activation of the extrinsic (or death receptors)pathway. Both pathways converge with the activation of caspases followed by the cleavageof specific substrates, leading to the cell death. The mitochondrial pathway of apoptosisbegins with the permeabilization of the mitochondrial outer membrane. The mechanismsthrough which this occurs remain controversial. However, it is thought that loss of ΔΨm andrelease of cytochrome c from the mitochondria are key events in initiating mitochondria-involved apoptosis [34, 35]. The released cytochrome c in the cytosol activates caspase-9,which consequently induces caspase-3 activation, resulting in the cleavage of severalcellular proteins, finally leading to the typical alterations related to cell apoptosis (e.g., DNAfragmentation in cell nuclei) [20, 36]. In this study, following ketamine exposure, there wasa significant increase in the caspase-3 activity as well as TUNEL-positive cells withcondensed and fragmented nuclei (Fig. 4A to D). In addition, ketamine-induced neuronalapoptosis was accompanied by a significant decrease in ΔΨm (Fig. 3C) and the release ofcytochrome c from mitochondria into cytosol (Fig. 4E), suggesting that ketamine induceshuman neurons to undergo mitochondria-mediated apoptosis pathway.
The mechanistic details by which anesthetics induce or trigger neuroapoptosis have yet to beestablished. We hypothesized that ketamine-induced ROS formation mediated the toxicity inthe differentiated neurons. Several metabolic pathways, including the mitochondrial electrontransport chain, are known to produce ROS [37]. Oxidative stress resulted from the cellularaccumulation of ROS has been shown to be important in the execution of neuronalapoptosis, contributing to the pathogenesis of neurodegeneration in various disease such asAlzheimer’s and Parkinson’s disease [38]. One recent study demonstrated that ROSproduction was increased following the exposure of mouse neurons isolated from mouse atgestation stage of day 15 to volatile anesthetic isoflurane [36]. In this present study, inresponse to ketamine, there was a significant increase in ROS production (2.4-fold ofcontrol) in the neurons. In addition, ketamine induced differential regulation of oxidativestress-related gene expression. There was a significant up-regulation of antioxidant enzymes(GSR and SOD1) for elimination of ROS and the enzymes (GSS, OXR1, and OXSR1) thatare involved in oxidative stress (Fig. 5). Importantly, Trolox, a ROS scavenger, not onlyattenuated ketamine-induced ROS production, but also decreased caspase-3 activation andprevented cell death (Fig. 6), suggesting that ketamine-induced neuroapoptosis is directlyassociated with enhanced ROS production.
Mitochondria are highly dynamic organelles that undergo continual fusion and fission toform networks which are controlled by multiple proteins including dynamin-related GTPaseprotein 1 (Drp1). Unbalanced fission-fusion could affect a variety of biological processessuch as apoptosis, leading to various pathological processes including neurodegeneration[39–41]. Increased mitochondrial fission in apoptotic cells apparently paralleled the releaseof cytochrome c while inhibition of fission by Drp1-RNA interference delayed the release ofcytochrome c [42]. Increased mitochondrial ROS-mediated mitochondrial fission wasreported to be followed by cellular dysfunction [43]. As we showed in Figure 3A, ketaminealso induced mitochondrial fission in the neurons which might be involved in ketamine-induced neuroapoptosis.
CONCLUSIONWe utilized differentiated neurons from stem cells to study ketamine-induced humanneurotoxicity by analyzing multi-parametric indicators of cellular toxicity including cell
Bosnjak et al. Page 11
Curr Drug Saf. Author manuscript; available in PMC 2013 June 18.
NIH
-PA Author Manuscript
NIH
-PA Author Manuscript
NIH
-PA Author Manuscript

viability, apoptosis, mitochondrial dysfunction, ultrastructural pathology and ROSproduction. The results demonstrate that (1) ketamine induces toxicity in human neurons viaROS-involved mitochondria-mediated apoptosis pathway in a dose- and time-dependentfashion; (2) abnormal ultrastructural and ΔΨm changes occur earlier than cell death in theketamine-induced toxicity process; (3) this harmful effect could be prevented by the ROSscavenger Trolox; and (4) neurons differentiated from hESCs might be a promising tool forstudying neurotoxicity caused by various anesthetics and the underlying mechanisms underthe controlled condition (e.g., anesthetic dose and exposure period).
AcknowledgmentsThis work has been supported in part by P01GM066730, R01HL034708 from the NIH, Bethesda, MD, and byFP00003109 from Advancing a Healthier Wisconsin Research and Education Initiative Fund (to ZJB).
References1. Chalon J, Tang CK, Ramanathan S, Eisner M, Katz R, Turndorf H. Exposure to halothane and
enflurane affects learning function of murine progeny. Anesth Analg. 1981; 60(11):794–7.[PubMed: 7197490]
2. Jevtovic-Todorovic V, Hartman RE, Izumi Y, Benshoff ND, Dikranian K, Zorumski CF, Olney JW,Wozniak DF. Early exposure to common anesthetic agents causes widespread neurodegeneration inthe developing rat brain and persistent learning deficits. J Neurosci. 2003; 23(3):876–82. [PubMed:12574416]
3. Mazoit JX, Roulleau P, Baujard C. Isoflurane-induced neuroapoptosis in the neonatal rhesusmacaque brain: isoflurane or ischemia-reperfusion? Anesthesiology. 2010; 113(5):1245. authorreply 1245–6. [PubMed: 20966672]
4. Slikker W Jr, Zou X, Hotchkiss CE, Divine RL, Sadovova N, Twaddle NC, Doerge DR, Scallet AC,Patterson TA, Hanig JP, Paule MG, Wang C. Ketamine-induced neuronal cell death in the perinatalrhesus monkey. Toxicol Sci. 2007; 98(1):145–58. [PubMed: 17426105]
5. Haley-Andrews S. Ketamine: the sedative of choice in a busy pediatric emergency department. JEmerg Nurs. 2006; 32(2):186–8. [PubMed: 16580488]
6. Young C, Jevtovic-Todorovic V, Qin YQ, Tenkova T, Wang H, Labruyere J, Olney JW. Potential ofketamine and midazolam, individually or in combination, to induce apoptotic neurodegeneration inthe infant mouse brain. Br J Pharmacol. 2005; 146(2):189–97. [PubMed: 15997239]
7. Wilder RT, Flick RP, Sprung J, Katusic SK, Barbaresi WJ, Mickelson C, Gleich SJ, Schroeder DR,Weaver AL, Warner DO. Early exposure to anesthesia and learning disabilities in a population-based birth cohort. Anesthesiology. 2009; 110(4):796–804. [PubMed: 19293700]
8. Kalkman CJ, Peelen L, Moons KG, Veenhuizen M, Bruens M, Sinnema G, de Jong TP. Behaviorand development in children and age at the time of first anesthetic exposure. Anesthesiology. 2009;110(4):805–12. [PubMed: 19293699]
9. Mellon RD, Simone AF, Rappaport BA. Use of anesthetic agents in neonates and young children.Anesth Analg. 2007; 104(3):509–20. [PubMed: 17312200]
10. Loepke AW, Soriano SG. An assessment of the effects of general anesthetics on developing brainstructure and neurocognitive function. Anesth Analg. 2008; 106(6):1681–707. [PubMed:18499597]
11. Thomson JA, Itskovitz-Eldor J, Shapiro SS, Waknitz MA, Swiergiel JJ, Marshall VS, Jones JM.Embryonic stem cell lines derived from human blastocysts. Science. 1998; 282(5391):1145–7.[PubMed: 9804556]
12. Shin S, Dalton S, Stice SL. Human motor neuron differentiation from human embryonic stem cells.Stem Cells Dev. 2005; 14(3):266–9. [PubMed: 15969621]
13. Vidarsson H, Hyllner J, Sartipy P. Differentiation of human embryonic stem cells tocardiomyocytes for in vitro and in vivo applications. Stem Cell Rev. 2010; 6(1):108–20. [PubMed:20091143]
Bosnjak et al. Page 12
Curr Drug Saf. Author manuscript; available in PMC 2013 June 18.
NIH
-PA Author Manuscript
NIH
-PA Author Manuscript
NIH
-PA Author Manuscript

14. Bissonnette CJ, Lyass L, Bhattacharyya BJ, Belmadani A, Miller RJ, Kessler JA. The controlledgeneration of functional Basal forebrain cholinergic neurons from human embryonic stem cells.Stem Cells. 2011; 29(5):802–11. [PubMed: 21381151]
15. Laposa R. Stem cells for Drug Screening. J Cardiovasc Pharmacol 2011. 2011; 27(12):3069–77.
16. Johnson MA, Weick JP, Pearce RA, Zhang SC. Functional neural development from humanembryonic stem cells: accelerated synaptic activity via astrocyte coculture. J Neurosci. 2007;27(12):3069–77. [PubMed: 17376968]
17. Nash R, Krishnamoorthy M, Jenkins A, Csete M. Human embryonic stem cell model of ethanol-mediated early developmental toxicity. Exp Neurol. 2011; X:XX–X.
18. Domino EF, Zsigmond EK, Domino LE, Domino KE, Kothary SP, Domino SE. Plasma levels ofketamine and two of its metabolites in surgical patients using a gas chromatographic massfragmentographic assay. Anesth Analg. 1982; 61(2):87–92. [PubMed: 7198883]
19. McLean RF, Baker AJ, Walker SE, Mazer CD, Wong BI, Harrington EM. Ketamineconcentrations during cardiopulmonary bypass. Can J Anaesth. 1996; 43(6):580–4. [PubMed:8773864]
20. Braun S, Gaza N, Werdehausen R, Hermanns H, Bauer I, Durieux ME, Hollmann MW, StevensMF. Ketamine induces apoptosis via the mitochondrial pathway in human lymphocytes andneuronal cells. Br J Anaesth. 2010; 105(3):347–54. [PubMed: 20659914]
21. Campbell LL, Tyson JA, Stackpole EE, Hokenson KE, Sherrill H, McKeon JE, Kim SA, EdmandsSD, Suarez C, Hall AC. Assessment of general anaesthetic cytotoxicity in murine corticalneurones in dissociated culture. Toxicology. 2011; 283(1):1–7. [PubMed: 21277931]
22. Mak YT, Lam WP, Lu L, Wong YW, Yew DT. The toxic effect of ketamine on SH-SY5Yneuroblastoma cell line and human neuron. Microsc Res Tech. 2010; 73(3):195–201. [PubMed:19725066]
23. Ibla JC, Hayashi H, Bajic D, Soriano SG. Prolonged exposure to ketamine increases brain derivedneurotrophic factor levels in developing rat brains. Curr Drug Saf. 2009; 4(1):11–6. [PubMed:19149520]
24. Brambrink AM, Evers AS, Avidan MS, Farber NB, Smith DJ, Martin LD, Dissen GA, Creeley CE,Olney JW. Ketamine-induced neuroapoptosis in the fetal and neonatal rhesus macaque brain.Anesthesiology. 2012; 116(2):372–84. [PubMed: 22222480]
25. Hirokawa N, Sobue K, Kanda K, Harada A, Yorifuji H. The cytoskeletal architecture of thepresynaptic terminal and molecular structure of synapsin 1. J Cell Biol. 1989; 108(1):111–26.[PubMed: 2536030]
26. Takadera T, Ishida A, Ohyashiki T. Ketamine-induced apoptosis in cultured rat cortical neurons.Toxicol Appl Pharmacol. 2006; 210(1–2):100–7. [PubMed: 16307766]
27. Dobbing J, Sands J. Comparative aspects of the brain growth spurt. Early Hum Dev. 1979; 3(1):79–83. [PubMed: 118862]
28. Morrow BA, Roth RH, Redmond DE Jr, Sladek JR Jr, Elsworth JD. Apoptotic natural cell death indeveloping primate dopamine midbrain neurons occurs during a restricted period in the secondtrimester of gestation. Exp Neurol. 2007; 204(2):802–7. [PubMed: 17313945]
29. Samuelsen GB, Larsen KB, Bogdanovic N, Laursen H, Graem N, Larsen JF, Pakkenberg B. Thechanging number of cells in the human fetal forebrain and its subdivisions: a stereologicalanalysis. Cereb Cortex. 2003; 13(2):115–22. [PubMed: 12507942]
30. Dekaban AS. Changes in brain weights during the span of human life: relation of brain weights tobody heights and body weights. Ann Neurol. 1978; 4(4):345–56. [PubMed: 727739]
31. Zou X, Patterson TA, Sadovova N, Twaddle NC, Doerge DR, Zhang X, Fu X, Hanig JP, PauleMG, Slikker W, Wang C. Potential neurotoxicity of ketamine in the developing rat brain. ToxicolSci. 2009; 108(1):149–58. [PubMed: 19126600]
32. Soriano SG, Liu Q, Li J, Liu JR, Han XH, Kanter JL, Bajic D, Ibla JC. Ketamine activates cellcycle signaling and apoptosis in the neonatal rat brain. Anesthesiology. 2010; 112(5):1155–63.[PubMed: 20418696]
33. Thompson CB. Apoptosis in the pathogenesis and treatment of disease. Science. 1995; 267(5203):1456–62. [PubMed: 7878464]
Bosnjak et al. Page 13
Curr Drug Saf. Author manuscript; available in PMC 2013 June 18.
NIH
-PA Author Manuscript
NIH
-PA Author Manuscript
NIH
-PA Author Manuscript

34. Crow MT, Mani K, Nam YJ, Kitsis RN. The mitochondrial death pathway and cardiac myocyteapoptosis. Circ Res. 2004; 95(10):957–70. [PubMed: 15539639]
35. Budd SL, Tenneti L, Lishnak T, Lipton SA. Mitochondrial and extramitochondrial apoptoticsignaling pathways in cerebrocortical neurons. Proc Natl Acad Sci U S A. 2000; 97(11):6161–6.[PubMed: 10811898]
36. Zhang Y, Dong Y, Wu X, Lu Y, Xu Z, Knapp A, Yue Y, Xu T, Xie Z. The mitochondrial pathwayof anesthetic isoflurane-induced apoptosis. J Biol Chem. 2010; 285(6):4025–37. [PubMed:20007710]
37. Liu M, Liu H, Dudley SC Jr. Reactive oxygen species originating from mitochondria regulate thecardiac sodium channel. Circ Res. 2010; 107(8):967–74. [PubMed: 20724705]
38. de Grey AD. Antioxidants and redox signaling: Internet resources. Antioxid Redox Signal. 2000;2(4):937–40. [PubMed: 11213493]
39. Himeda T, Kanbara S, Oki C, Kato H, Araki T. Effects of chronic administration with nilvadipineagainst immunohistochemical changes related to aging in the mouse hippocampus. Metab BrainDis. 2005; 20(2):141–53. [PubMed: 15938132]
40. Perfettini JL, Roumier T, Kroemer G. Mitochondrial fusion and fission in the control of apoptosis.Trends Cell Biol. 2005; 15(4):179–83. [PubMed: 15817372]
41. Youle RJ, Karbowski M. Mitochondrial fission in apoptosis. Nat Rev Mol Cell Biol. 2005; 6(8):657–63. [PubMed: 16025099]
42. Lee YJ, Jeong SY, Karbowski M, Smith CL, Youle RJ. Roles of the mammalian mitochondrialfission and fusion mediators Fis1, Drp1, and Opa1 in apoptosis. Mol Biol Cell. 2004; 15(11):5001–11. [PubMed: 15356267]
43. Wu S, Zhou F, Zhang Z, Xing D. Mitochondrial oxidative stress causes mitochondrialfragmentation via differential modulation of mitochondrial fission-fusion proteins. FEBS J. 2011;278(6):941–54. [PubMed: 21232014]
Bosnjak et al. Page 14
Curr Drug Saf. Author manuscript; available in PMC 2013 June 18.
NIH
-PA Author Manuscript
NIH
-PA Author Manuscript
NIH
-PA Author Manuscript

Figure 1. hESCs differentiate into neurons via neural stem cells (NSCs)(A) Characterization of NSCs using immunofluorescence staining. Differentiated NSCsexpressed NSC-specific marker nestin (upper panels, red) and Sox2 (bottom panels, green).Blue are cellular nuclei stained with TO-PRO®-3. (B) Neuronal characterization. Followingtwo-week culture in neuronal differentiation medium, NSCs differentiated into neurons withsmall round cell body with extending long projections. Differentiated neurons were positivefor neuron-specific marker MAP2 (upper panels, green) and synapse-specific markersynapsin 1 (bottom panels, red). Scale bar=20 μm.
Bosnjak et al. Page 15
Curr Drug Saf. Author manuscript; available in PMC 2013 June 18.
NIH
-PA Author Manuscript
NIH
-PA Author Manuscript
NIH
-PA Author Manuscript
Figure 2. Ketamine induces cell death in a concentration- and time-dependent fashion(A) Representative phase contrast images of differentiated neurons treated with the indicatedconcentrations of ketamine for 24 hours. In response to 2500 μM ketamine, neurons clearlybegan to retract their projections. In the 4000 μM ketamine-contained culture, nearly all ofthe cells were detached. Scale bar is 20 μm. (B) MTT assay of mitochondrial dehydrogenaseactivity representing cell viability. Y-axis is the percentage of viable cells when comparedwith the control group after ketamine treatment. (C) LDH assay. Y-axis is the fold change inOD490 representing LDH release from the damaged cells. Higher dose and longer durationof exposure to ketamine resulted in greater cell death and LDH release. The arrows indicateat which point the difference are significantly different between ketamine treatment andcontrol group (P<0.01, n=3).
Bosnjak et al. Page 16
Curr Drug Saf. Author manuscript; available in PMC 2013 June 18.
NIH
-PA Author Manuscript
NIH
-PA Author Manuscript
NIH
-PA Author Manuscript

Figure 3. Ketamine at lower dosages induces abnormal cellular changes in ultrastructure andalteration in mitochondrial membrane potential (ΔΨm) in a dose-depend manner(A) Representative electron microscope images of differentiated neurons treated with theindicated concentrations of ketamine for 24 hours. Ketamine-treated neurons showed clearsigns of the toxic effect on the cellular ultrastructure. Abnormal ultrastructure of neuronsincluded fragmentation of mitochondria, decreased and distended rough ER, and manyautophagosomes with or without being packed with dense amorphous material and otherlarge clear vacuoles within the cytosol of all cells. Red, blue, and yellow arrows indicatemitochondria, autophagosome, and ER, respectively. Scale bars=500 nm. (B and C)Ketamine decreases ΔΨm. Cells treated with ketamine for 24 hours were loaded withmitochondrial probe TMRE and imaged with the confocol microscope. Fluorescent intensityof TMRE represents ΔΨm. The results show that ketamine treatment for 24 hours decreasedΔΨm in a dose-dependent fashion (**P<0.01, vs. control group, n=3). Scale bars=20 μm.
Bosnjak et al. Page 17
Curr Drug Saf. Author manuscript; available in PMC 2013 June 18.
NIH
-PA Author Manuscript
NIH
-PA Author Manuscript
NIH
-PA Author Manuscript

Figure 4. Ketamine stimulates active cleaved caspase-3- and TUNEL-positive apoptotic neurons,and induces the release of cytochrome c from mitochondria into cytosol(A) Fluorescence images of active cleaved caspase-3 (red) in the neurons treated with 3000μM ketamine for 24 hours analyzed using immunofluorescent staining. (B) Measurement ofcaspase-3 activity in the lysate of neurons treated with or without 3000 μM ketamine for 24hours using Caspase-3 Colorimetric Assay Kits. (C) TUNEL staining. TUNEL staining (red)was used to identify cells containing DNA damage after 3000 μM ketamine treatment for 24hours. Cellular nuclei (blue) were stained with TO-PRO®-3. Overlaid images demonstratedthat most of the TUNEL staining was located in the condensed or fragmented nuclei inketamine-treated cells. The inset in the top right corner of each image is the magnified boxindicated by arrow. Scale bars=20 μm. (D) Quantification of TUNEL-positive cells.Statistically significant increases in caspase-3 activity and TUNEL-positive cells wereobserved in ketamine-treated cultures compared with untreated controls (B and D;**P<0.01, n=3). (E) The distribution of cytochrome c within the neurons. In order to labelmitochondria, neurons were treated with CellLight™ mitochondria-GFP reagent. Thedistribution of cytotochrome c in cells was analyzed by immunofluorescence staining.Column 1 is the image of mitochondria (green); column 2 is the image of cytochrome c(red); and column 3 is the merged image. The orange color in the merged images indicatesthe existence of cytochrome c inside the mitochondria and the red signals in the mergedimages indicate the existence of cytochrome c outside the mitochondria. The inset in thebottom left corner of each image is the magnified box indicated by arrow. The results showthat 3000 μM ketamine treatment for 24 hours resulted in the cytochrome c release from themitochondria into cytosol as compared with the control condition.
Bosnjak et al. Page 18
Curr Drug Saf. Author manuscript; available in PMC 2013 June 18.
NIH
-PA Author Manuscript
NIH
-PA Author Manuscript
NIH
-PA Author Manuscript

Figure 5. Ketamine increases reactive oxygen species (ROS) production and induces differentialregulation of oxidative stress-related gene expression in neurons(A) Confocol images of ROS production of neurons in the control and 3000 μM ketamine-treated culture for 24 hours. Neurons were loaded with oxidative fluorescent indicator dyeCM-H2DCFDA and the produced ROS (green) is observed in the cells. Scale bar=20 μm.(B) Quantification of ROS production in neurons. ROS level was significantly higher in theketamine-treated cells than in the no-treatment culture (*P<0.05, n=3). (C) Real-time PCRanalysis of fold changes of oxidative stress-related gene expression in neurons following3000 μM ketamine exposure for 24 hours compared with no-treatment control. n=3.Glutathione synthetase (GSS), glutathione reductase (GSR), oxidation resistance 1 (OXR1),oxidative-stress responsive 1 (OXSR1), superoxide dismutase 1 (SOD1), and glutathioneperoxidase 1 (GPX1).
Bosnjak et al. Page 19
Curr Drug Saf. Author manuscript; available in PMC 2013 June 18.
NIH
-PA Author Manuscript
NIH
-PA Author Manuscript
NIH
-PA Author Manuscript

Figure 6. ROS inhibitor Trolox attenuates ketamine-induced neurotoxicityNeurons were treated with 3000 μM ketamine in the presence or absence of Trolox for 24hours and then subjected to ROS measurement, caspase-3 activity analysis and MTT assay.(A) Confocol images of ROS production of neurons in the cultures with or without ketamineand Trolox (250 μM) treatment. (B) Trolox significantly decreased ketamine-induced ROSproduction. (C) Fluorescence images of active cleaved caspase-3 (red) in the neurons treatedwith or without ketamine and Trolox (250 μM). (D) Trolox decreased cleaved caspase 3activity of neurons following ketamine exposure. (E) Phase contrast images of differentiatedneurons treated with or without ketamine and Trolox (250 μM). (F) Trolox attenuated theketamine-induced decrease in cell viability in a dose-dependent manner (*P<0.05,**P<0.01, vs. ketamine alone group, n=3). Scale bars are 20 μm.
Bosnjak et al. Page 20
Curr Drug Saf. Author manuscript; available in PMC 2013 June 18.
NIH
-PA Author Manuscript
NIH
-PA Author Manuscript
NIH
-PA Author Manuscript
Related Documents