TABLE OF CONTENT Invited Article: The Essence of Telemedicine for Bridging the Gap in Health Services ................................................................... 66-70 Budi Wiweko, Sarah Chairani Zakirah, Atha Luthfi Research Articles: The Determinants of Stunting for Children Aged 24-59 Months in Kulon Progo District 2019 ............................... 71-77 Chatrine Aprilia Hendraswari, Yuliasti Eka Purnamaningrum, Tri Maryani, Yani Widyastuti, Sakinah Harith A Path Analysis Model for Explaining the Factors Influencing Wearing a Mask among Commuting Workers Using Commuter Line Bogor-Jakarta ......................................................................................................................... 78-83 David Kusmawan, Shofi Andari, Ira Gustina, Indri H Susilowati, Mufti Wirawan Empowering Health Cadres to Support Drug-Resistant Tuberculosis (DR-TB) Patient to Enroll in Treatment ...... 84-90 Esty Febriani, Adik Wibowo, Neeraj Kak, Hala J Al-Mossawi National Health Insurance Scheme: Internal and External Barriers in the Use of Reproductive Health Services among Women .......................................................................................................................................................... 91-99 Evi Martha, Herna Lestari, Resvi Siti Zulfa, Yoslien Sopamena Prevalence and Determinants of Pre-lacteal Feeding: Insights from the 2017 Indonesia Demographic and Health Survey ........................................................................................................................................................... 100-107 Siti Nurokhmah, Siti Masitoh, Kusuma Estu Werdani The Effect of Smoking on Carbon Monoxide Respiration among Active Smokers in Palembang City, Indonesia ... 108-112 Rico Januar Sitorus, Imelda G Purba, Merry Natalia, Kraichat Tantrakarnapa The Significance of Super Depo Sutorejo: Waste Management Project in Surabaya Municipality, Indonesia ......... 113-119 Yohanes Kambaru Windi, Dyah Wijayanti, Eko Rustamaji Wiyatno, Loetfia D Rahariyani Inter-related Factors Influencing Sexual Quality of Life among Women Living with HIV in Banten Province, Indonesia: A Mixed Methods Study .......................................................................................................................... 120-130 Dyah Juliastuti, Judith Dean, Yati Afiyanti, Lisa Fitzgerald Attitudes Concerning Sexual Behavior towards Risky Sexual Behavior of Sexual Transmitted Infections among Male Adolescents in Indonesia ..................................................................................................................... 131-136 Helda, Nurul Muchlisa Nationally accredited and indexed in SINTA-S1 by Ministry of Education and Culture of the Republic of Indonesia & SCOPUS coverage years from 2016-present Kesmas Jurnal Kesehatan Masyarakat Nasional (National Public Health Journal) Volume 16, Issue 2, May 2021 p-ISSN 1907-7505 e-ISSN 2460-0601

Welcome message from author
This document is posted to help you gain knowledge. Please leave a comment to let me know what you think about it! Share it to your friends and learn new things together.
Transcript
TABLE OF CONTENT
Invited Article:The Essence of Telemedicine for Bridging the Gap in Health Services ................................................................... 66-70Budi Wiweko, Sarah Chairani Zakirah, Atha Luthfi
Research Articles:The Determinants of Stunting for Children Aged 24-59 Months in Kulon Progo District 2019 ............................... 71-77 Chatrine Aprilia Hendraswari, Yuliasti Eka Purnamaningrum, Tri Maryani, Yani Widyastuti, Sakinah Harith
A Path Analysis Model for Explaining the Factors Influencing Wearing a Mask among Commuting Workers Using Commuter Line Bogor-Jakarta ......................................................................................................................... 78-83David Kusmawan, Shofi Andari, Ira Gustina, Indri H Susilowati, Mufti Wirawan
Empowering Health Cadres to Support Drug-Resistant Tuberculosis (DR-TB) Patient to Enroll in Treatment ...... 84-90Esty Febriani, Adik Wibowo, Neeraj Kak, Hala J Al-Mossawi
National Health Insurance Scheme: Internal and External Barriers in the Use of Reproductive Health Services among Women .......................................................................................................................................................... 91-99Evi Martha, Herna Lestari, Resvi Siti Zulfa, Yoslien Sopamena
Prevalence and Determinants of Pre-lacteal Feeding: Insights from the 2017 Indonesia Demographic and Health Survey ........................................................................................................................................................... 100-107Siti Nurokhmah, Siti Masitoh, Kusuma Estu Werdani
The Effect of Smoking on Carbon Monoxide Respiration among Active Smokers in Palembang City, Indonesia ... 108-112 Rico Januar Sitorus, Imelda G Purba, Merry Natalia, Kraichat Tantrakarnapa
The Significance of Super Depo Sutorejo: Waste Management Project in Surabaya Municipality, Indonesia ......... 113-119Yohanes Kambaru Windi, Dyah Wijayanti, Eko Rustamaji Wiyatno, Loetfia D Rahariyani
Inter-related Factors Influencing Sexual Quality of Life among Women Living with HIV in Banten Province,Indonesia: A Mixed Methods Study .......................................................................................................................... 120-130Dyah Juliastuti, Judith Dean, Yati Afiyanti, Lisa Fitzgerald
Attitudes Concerning Sexual Behavior towards Risky Sexual Behavior of Sexual Transmitted Infectionsamong Male Adolescents in Indonesia ..................................................................................................................... 131-136Helda, Nurul Muchlisa
Nationally accredited and indexed in SINTA-S1 by Ministry of Education and Culture ofthe Republic of Indonesia & SCOPUS coverage years from 2016-present
KesmasJurnal Kesehatan Masyarakat Nasional (National Public Health Journal)
Volume 16, Issue 2, May 2021 p-ISSN 1907-7505e-ISSN 2460-0601
KesmasJurnal Kesehatan Masyarakat Nasional (National Public Health Journal)
Volume 16, Issue 2, May 2021 p-ISSN 1907-7505e-ISSN 2460-0601
Kesmas: Jurnal Kesehatan Masyarakat Nasional (National Public Health Journal) is a journal that containsboth research articles and invited review articles in the field of public health and published quarterly
Editor in ChiefDewi Susanna
International Editorial BoardDumilah Ayuningtyas (Faculty of Public Health Universitas Indonesia, Indonesia)
Ahmad Syafiq (Faculty of Public Health Universitas Indonesia, Indonesia)Zarfiel Tafal (Faculty of Public Health Universitas Indonesia, Indonesia)
Doni Hikmat Ramdhan (Faculty of Public Health Universitas Indonesia, Indonesia)Ahmad Sulaeman (Faculty of Human Ecology Bogor Agricultural University, Indonesia)
Tris Eryando (Faculty of Public Health Universitas Indonesia, Indonesia)Tri Yunis Miko Wahyono (Faculty of Public Health Universitas Indonesia, Indonesia)
Upik Kusumawati Hadi (Faculty of Veterinary Medicine Bogor Agricultural University, Indonesia)Yodi Mahendradhata (Faculty of Medicine Gadjah Mada University, Indonesia)
Rajendra Prasad (Merit India Consultant Pvt Ltd, India)Peter D Sly (Faculty of Medicine and Biomedical Science, University of Queensland, Australia)
Budi Haryanto (Faculty of Public Health, Universitas Indonesia, Indonesia)Prathurng Hongsranagon (University of Chulalongkorn, Thailand)
Hidayatulfathi Othman (Faculty of Health Sciences, National University of Malaysia, Malaysia)Don Eliseo Lucero-Prisno III (London School of Hygiene and Tropical Medicine, England)
Orawan Kaewboonchoo (Mahidol University, Thailand)Dian Kusuma (Imperial College London, the United Kingdom)
Mellissa Withers (University of Southern California, the United State of America)Jalaludin Bin Badrudin (University of New South Wales, Australia)
Managing EditorElla Ayu Septia Mustika
Web ProgrammerEddy Afriansyah
Nico Kurnia Pratama
Language EditorAnandani Difratia Prihabida
Editorial SecretaryNinez Dwiandra Sekarsari
Published byFaculty of Public Health Universitas Indonesia
G301 Building G 3rd Floor Kampus Baru UI, Depok 16424
Mobile Phone: +62815-1141-6600E-mail: [email protected] or [email protected]
Website: http://journal.fkm.ui.ac.id/kesmas
Kesmas: Jurnal Kesehatan Masyarakat Nasional (National Public Health Journal) editorial teamaccepts any criticism, feedback, and recommendation related to published articles and the journalprogress which can be submitted through e-mail: [email protected]. Please kindly informyour name, affiliation, and address. We will publish the criticism, feedback, and recommendationreceived on Reader Mail section in the next edition. We will provide an interesting souvenir for thereader whose criticism/feedback/recommendation is published on the reader mail. Thank you.(Editorial Team)
Every article published is charged an Article Processing Charge (APC) of USD 450.00 sinceVolume 16 Issue 3 (August 2021).
Please make a payment to the following account:UNIVERSITAS INDONESIA BHPP
Bank BNI UI DepokAccount Number: 1273000568
Swift Code: BNINIDJA
Please send the receipt to:Secretariat of Kesmas: Jurnal Kesehatan Masyarakat (National Public Health Journal)
Faculty of Public Health Universitas IndonesiaG301 Building G 3rd Floor
Kampus Baru UI, Depok 16424 or e-mail: [email protected] or [email protected]
READER MAIL
Dear Editorial Team, Authors, Viewers, Subscribers, and Readers
Even though the COVID-19 pandemic is still not going anywhere, the great works behind thepublication of Kesmas: Jurnal Kesehatan Masyarakat Nasional (National Public Health Journal)Volume 16 Issue 1 deserve an appreciation. Moreover, it became a beginning of a new journey ofthe COVID-19 pandemic in 2021. Great job, everyone!
The article I want to highlight is “Analysis of Measles Vaccination Refusal on Social Media(Facebook) among Anti-Vaccine Communities in Indonesia”. We all know that in this hard time be-cause of the COVID-19 pandemic, the vaccination program, moreover in Indonesia, is still becomea contradictive discourse, even though the government has already made it free and accessible foreveryone. I hope that the world, moreover Indonesia, will get better soon, and we can go back toour daily routines without practicing the health protocol anymore. (Haikal, Surabaya)
INFORMATION
1. Kesmas: Jurnal Kesehatan Masyarakat Nasional (National Public
Health Journal) publishes articles in the field of public health that in-
cludes Biostatistics, Epidemiology, Health Policy and Administration,
Occupational Health and Safety, Environmental Health, Health
Education and Behavioral Science, Public Health Nutrition, and
Sexual and Reproductive Health.
2. Submitted articles must be research articles and invited review articles
that should not have been previously published or be currently under
consideration for publication anywhere else and free of plagiarism.
Each submitted article will be checked by Ithenticate, an application
for detecting plagiarism.
3. Components of Articles:
• The title is written in English with a maximum of 20 words.
• The author’s identity is written under the title, which includes name,
affiliation, and correspondence address, phone number and e-mail.
• Abstract is written in English with a maximum of 200 words. The ab-
stract should be one paragraph covering introduction, aim, method,
results, and conclusion with a maximum of 5 (five) keywords separated
by comma.
• Introduction contains background, brief and relevant literature review
and the aim of study.
• Method includes design, population, sample, data sources, techniques/
instruments of data collection, data analysis procedure, and ethics.
• Results are research findings and should be clear and concise.
• Discussion should properly and argumentatively define results of study
with any relevant theory and prior finding.
• Tables should be single-spaced and numbered consecutively in accor-
dance with presentation in the text. Figures, pictures, or formulas
should be original. Ensure that each illustration has a caption. Supply
captions separately, not attached to the figure. A caption should com-
prise a brief title (not on the figure itself) and a description of the illus-
tration. Keep text in the illustrations themselves to a minimum but ex-
plain all symbols and abbreviations used. Then, for resolution, raste -
rized based files (e.g., with .tiff or .jpeg extension) require a resolution
of at least 1,000 dpi (dots per inch). Line art should be supplied with
a minimum resolution of 1,000 dpi. Tables and/or figures should be
no more than 6 (six) as presented in Result.
• Conclusion and Recommendation (if any), should answer problems of
study not exceeding the capacity of finding. Recommendation should
refer to the aims and conclusion in form of narration, be logical and ef-
fective.
4. Abbreviations consist of abbreviations mentioned in the article (from
Abstract to Conclusion).
5. Ethics Approval and Consent to Participate inform license obtained
from institution and research subject.
6. Competing Interest stated whether the author(s) have interest in re-
search.
7. Availability of Data and Materials clarifies sources of data or informa-
tion used as study materials.
8. Authors’ Contribution explain about contribution done by each author
to the study.
9. Acknowledgment mention thank-you note to all components support-
ing the study, including funding (grant).
10. Additional Information confirms the names of authors if the study
consist of more than 6 (six) authors and/or other additional informa-
tion if necessary.
11. References should be written with Vancouver style.
• Please ensure that every reference cited in the text is also present in the
reference list (and vice versa).
• Reference number must be numbered consecutively in accordance with
the whole text and recent journal references are preferred.
• For the author’s name, please write the last name and the first name,
and initials if any, with a maximum of 6 (six) names of authors. If
more than 6 (six) authors, the following author should be written with
“et al”.
• The first letter of reference tittle should be capitalized and the remain-
ing should be written in lowercase letters, except name of person, place
and time. Latin terms should be written in italics. Title should not be
underlined and written in bold.
• Please provide the URL of the referred article.
• When referencing in the body of text use superscript after full stop (.),
e.g.: ..... .10. If the sentence stating the other author’s name as refer-
ence, use the reference number by the end of the author`s name then
continue the sentence till full stop (.), e.g.: Abood,2...; or Latief, et
al,1...).
Example of References :
• Journal Article :
Hoq MN. Effects of son preference on contraceptive use in
Bangladesh. Kesmas: National Public Health Journal. 2019; 14 (1):
21-7. Available from :
http://dx.doi.org/10.21109/kesmas.v14i1.2848
• Book :
Grech ED. ABC of interventional cardiology. 2nd ed. Chichester:
Wiley blackwell; 2011. Available from: https://ebookcentral.pro-
quest.com/lib/imperial/detail.action?docID=822522
• Online article :
Pullen LC. Antibiotic resistance continues to be a problem in chil-
dren. Medscape; 2017. Available from:
https://www.medscape.com/viewarticle/860801
• Thesis and Dissertation :
Slawsky E. An evaluation of greenspace exposure as a protective factor
in dementia risk among U.S adults 75 years or older [Thesis].
University of Washington; 2019.
12. Manuscript should be typed using word processors (Microsoft Word
or Open Office) software. The font type for the paper is Times New
Roman with font size 12. The paper size is A4 (e.g., 210 x 297 mm).
Then it should be one-column format with all margin 3 cm, double
spaced and maximum at 5,000 words. Manuscript must be submitted
via website http://journal.fkm.ui.ac.id/kesmas. Please include
Covering Letter and Statements and Ethics Approval Form in a sepa-
rated document file containing the summary of scientific finding and
uploaded on Supplementary Files in PDF format.
AUTHOR GUIDELINES
Copyright @ 2021 Kesmas: Jurnal Kesehatan Masyarakat Nasional (National Public Health Journal), p-ISSN: 1907-7505, e-ISSN: 2460-0601, SINTA-S1 accredited,http://journal.fkm.ui.ac.id/kesmas, Licensed under Creative Commons Attribution-ShareAlike 4.0 International
Correspondence*: Budi Wiweko, Division of Reproductive, Endocrinology, andInfertility, Department of Obstetrics and Gynecology, Faculty of Medicine,Universitas Indonesia, Salemba Raya Street No. 6, Central Jakarta, Indonesia,Email: [email protected], Phone: :+62 816 1440 025
Wiweko et al. Kesmas: Jurnal Kesehatan Masyarakat Nasional (National Public HealthJournal). 2021; 16 (2): 66-70DOI: 10.21109/kesmas.v16i2.4896
AbstractThis study aimed to review the essence of telemedicine in this modern era of technology and innovation, especially in developing countries. It also investigatedthe regulation aspect as the main component for healthcare services. There were five main categories of telemedicine: revenue stream and technologyliteracy, health facilities, human resources, data authorization and security, and health protocol. Furthermore, when combined with wearable devices, it en-hanced healthcare delivery opportunities. There were two major components of global electronic health, namely telehealth and health informatics, based one-commerce and e-learning systems. The World Health Organization (WHO) has been able to describe the roles of telehealth services in developing countries.However, some related issues were needed to be well managed, such as the patient data security. It was found that the regular training and evaluation ofpeople with poor educational background, low income, and stress were the main reasons most communities attend healthcare services despite mild sickness.Therefore, those need to be enlightened on the roles and importance of telehealth services.
Keywords: medical development, technology disruption, telemedicine
The Essence of Telemedicine for Bridging the Gap in HealthServices
Budi Wiweko1,2,3*, Sarah Chairani Zakirah1,3, Atha Luthfi3
1Division of Reproductive, Endocrinology, and Infertility, Department of Obstetrics and Gynecology, Faculty of Medicine, Universitas Indonesia,Jakarta, Indonesia2Yasmin IVF Clinic, Cipto Mangunkusumo General Hospital, Jakarta, Indonesia3Indonesian Medical Education and Research Institute (IMERI), Faculty of Medicine, Universitas Indonesia, Jakarta, Indonesia
IntroductionInformation and technology have played an important
role in transforming the way people live especially in thehealthcare sector. Furthermore, it has contributed to im-proving the knowledge of healthcare providers and thebehaviors of some communities. Based on NationalHealth Services, people tend to use telemedicine in along-term span in order to easily get connected withhealthcare services. This includes using a smartphoneapp lication, wearable devices, remote monitoring, andreading the genome. Furthermore, it is known for reduc-ing costs, energy, time limitation, and distance.1Telemedicine has been widely used since the 1990s,when healthcare providers used telephones whenever apatient felt sick, and later on, the development becameaccelerated in this modern era.2 It is divided into threeactivities: teleconsultation involving telemonitoring, tele-expertise, and teleassistance. A further technological en-hancement that also needs to be implemented in thehealth sector includes virtual and augmented reality, ar-tificial intelligence, robotics, and gene writing. However,these developments have resulted in some argumentsconcerning ethical considerations and people’s percep-
tions.1Telehealth comes from the word “tele” meaning dis-
tant and “health” which means the well-being status ofan individual. It is commonly referred to as telemedicineand has also been used to define of health services in var-ious communities. Furthermore, according to WorldHealth Organization (WHO), telehealth and telemedi-cine are classified as two different terms. Telehealth co -vers almost the whole aspects of health services commu-nication, especially in promotive and preventive medi-cine. In contrast, telemedicine is one of the main rootsenclosing the activity of curative medicine. Based onthese findings, it was concluded that this currative med-icine is the part of telehealth which provided health ser -vices in various communities.2
Primary physicians and nurses or midwives are themain people that mostly interact with patients. They ei-ther recommend patients to an expert or administer tem-porary medicine and observe the condition. Furthermore,each activity would be recorded in the patient’s medicalrecord which becomes an important criterion for thetelematics and informatics approach.3
Received : March18, 2021Accepted : April 24, 2021Published : May 28, 2021
Kesmas: Jurnal Kesehatan Masyarakat Nasional(National Public Health Journal)
Wiweko et al, the Essence of Telemedicine for Bridging the Gap in Health Services
67
MethodThis study aimed to review telemedicine in this mod-
ern era of technology and innovation, especially indevelop ing countries. It also investigated the re gulationaspect as the main component for healthcare services.Furthermore, some sub-topics were evaluated, namelytelemedicine regulation and evaluation, health data por-tal, and medical technology-related issues.
Results and DiscussionTelemedicine regulation and evaluation
Global electronic health has two crucial components;telehealth, based on the e-commerce system, and healthinformatics, which is based on the e-learning system.These components are both synergized to make up theglobal system of e-health. Some aspects needed to be im-proved in health informatics, including decision supportsystems and surveillance systems, electronic healthrecords, and health portals as the comprehensive evalua-tion of system health management. Furthermore, the ma-turity of telehealth needs to be encouraged in each medi -cal specialties, especially for emerging diseases.5
There are five main categories used in managingtelemedicine: revenue stream and technology literacy,health facilities, human resources, data authorization andsecurity, and health protocol. This was stated on theCircular Letter from the Ministry of Health of theRepublic of Indonesia No. 303 of 2020 and theRegulation of Indonesian Medical Council No. 74 of2020.6,7 Furthermore, these regulations were used duringthe pandemic where non-emergency cases and healthservices were available. This country also needs improve-ment in regulations associated with virtual healthcareservices when transferring patients and emergency cases.
National Health Services made the regulation oftelemedicine based on the capitation system. It stated thathealthcare providers need to be certified by Membership
of the Royal College of General Practitioners (MRCGP)and National Health Services (NHS).8 Furthermore, o -ther countries' systems, such as the American College ofObstetrics and Gynecology was used as a model in thisstudy. This involved reviewing their insurance regula-tions concerning telemedicine in overcoming the impactof Coronavirus disease 2019 (COVID-19), such as cod-ing diagnosis remote-patient monitoring, treatment andconsultation, and patient-cost sharing.4,9 In addition,several international health organizations, such as WHOhave described telehealth services in developing coun-tries using teleconsultation and telemonitoring betweenhealthcare facilities.10,11
Health data portalPrecision medicine foundation is divided into three
main categories: the big-data of the medical field; clinical,genomics, and research. Genomics is one of the majorpillars in promoting health management and can also beused as a guide in accele rating the development of health-care delivery. Furthermore, sequencing genomics has re-sulted in genome mapping which has a great potentialbenefit associated with health and nutrition. Large biodi-versity and microorganism were also used for genomemapping to know the importance of metabolic, physio-logical, and degenerative processes of a human being.Furthermore, knowledge sharing of genomics is alsovaluable in supporting biobank and in the developmentof drug materials.12
The second important category is research, and it in-volves the expansion and evolution of health knowledge.Furthermore, laboratory facilities, collaboration, funding,and the biobank integration are areas that need improve-ment for individuals to carry out a successful study.12
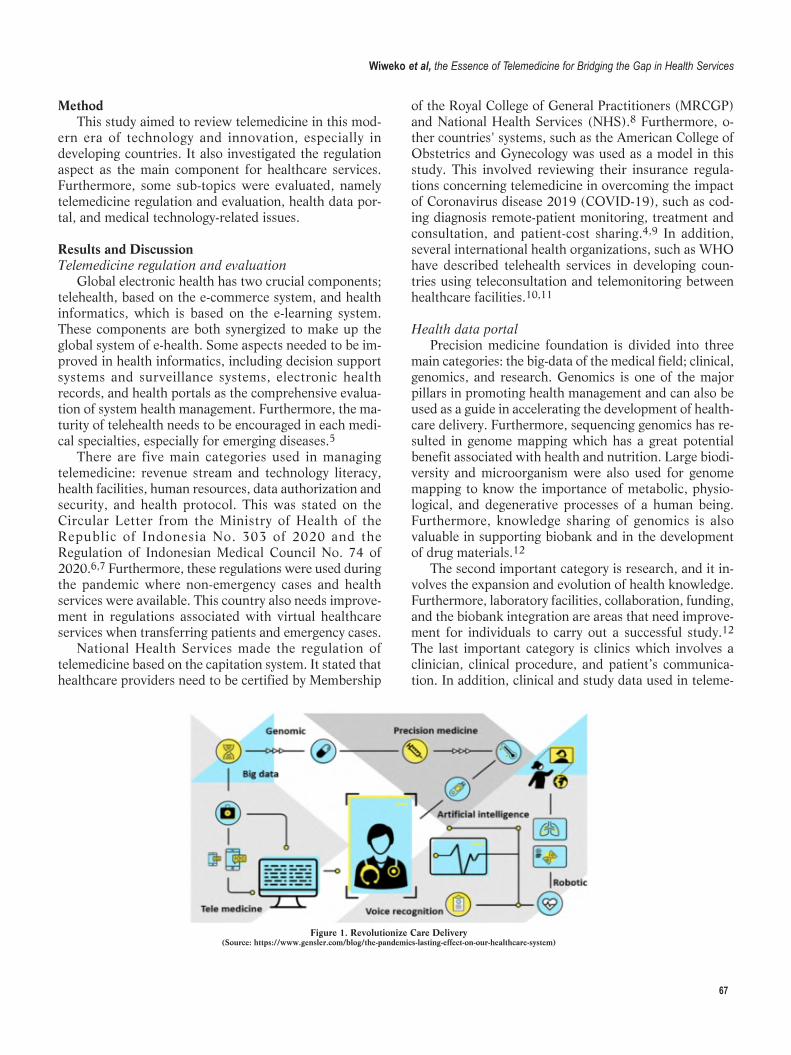
The last important category is clinics which involves aclinician, clinical procedure, and patient’s communica-tion. In addition, clinical and study data used in teleme -
Figure 1. Revolutionize Care Delivery(Source: https://www.gensler.com/blog/the-pandemics-lasting-effect-on-our-healthcare-system)
68
dicine and artificial intelligence are normally processedin the cloud data system (Figure 1).
Some components were expected to support the de-velopment of telemedicine. However, genomic and bigdata were the main pillars used in precision medicine.The use of modern technology in the medical sector suchas carrying out a simple physical examination using wear-able devices, teleradiology, or other static imaging, couldbe processed and transferred through artificial intelli-gence. At the same time, robotic technology could alsoaid in diagnostic or treatment procedures. For easyrecording, these data were reported to healthcareproviders and recorded into electronic medical records.
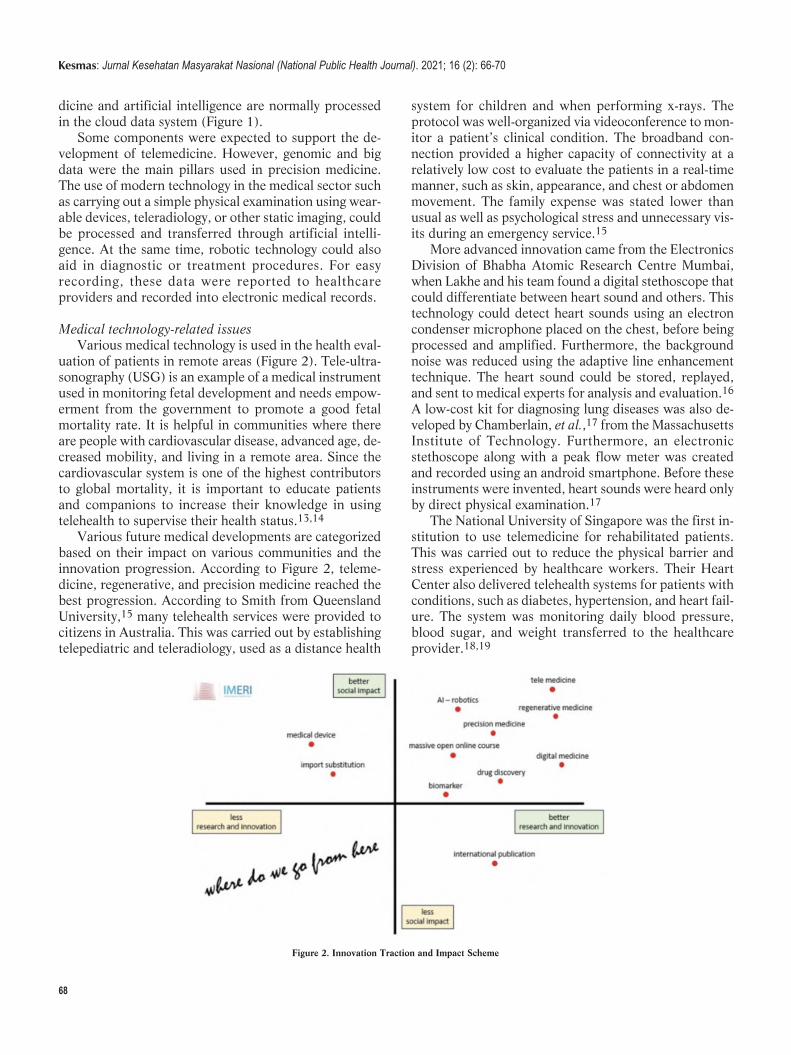
Medical technology-related issuesVarious medical technology is used in the health eval-
uation of patients in remote areas (Figure 2). Tele-ultra-sonography (USG) is an example of a medical instrumentused in monitoring fetal development and needs empow-erment from the government to promote a good fetalmortality rate. It is helpful in communities where thereare people with cardiovascular disease, advanced age, de-creased mobility, and living in a remote area. Since thecardiovascular system is one of the highest contributorsto global mortality, it is important to educate patientsand companions to increase their knowledge in usingtelehealth to supervise their health status.13,14
Various future medical developments are categorizedbased on their impact on various communities and theinnovation progression. According to Figure 2, teleme -dicine, regenerative, and precision medicine reached thebest progression. According to Smith from QueenslandUniversity,15 many telehealth services were provided tocitizens in Australia. This was carried out by establishingtelepediatric and teleradiology, used as a distance health
system for child ren and when performing x-rays. Theprotocol was well-organized via videoconference to mon-itor a patient’s clinic al condition. The broadband con-nection provided a higher capacity of connectivity at arelatively low cost to evaluate the patients in a real-timemanner, such as skin, appearance, and chest or abdomenmovement. The family expense was stated lower thanusual as well as psychological stress and unnecessary vis-its during an emergency service.15
More advanced innovation came from the ElectronicsDivision of Bhabha Atomic Research Centre Mumbai,when Lakhe and his team found a digital stethoscope thatcould differentiate between heart sound and others. Thistechnology could detect heart sounds using an electroncondenser microphone placed on the chest, before beingprocessed and amplified. Furthermore, the backgroundnoise was reduced using the adaptive line enhancementtechnique. The heart sound could be stored, replayed,and sent to medical experts for analysis and evaluation.16
A low-cost kit for diagnos ing lung diseases was also de-veloped by Chamberlain, et al.,17 from the MassachusettsInstitute of Technology. Furthermore, an electronicstethoscope along with a peak flow meter was createdand recorded using an android smartphone. Before theseinstruments were invented, heart sounds were heard onlyby direct physical examination.17
The National University of Singapore was the first in-stitution to use telemedicine for rehabilitated patients.This was carried out to reduce the physical barrier andstress experienced by healthcare workers. Their HeartCenter also delivered telehealth systems for patients withconditions, such as diabetes, hypertension, and heart fail-ure. The system was monitoring daily blood pressure,blood sugar, and weight transferred to the healthcareprovider.18,19
Kesmas: Jurnal Kesehatan Masyarakat Nasional (National Public Health Journal). 2021; 16 (2): 66-70
Figure 2. Innovation Traction and Impact Scheme
69
The telemedicine system requires further develop-ment, especially in situations whereby emergency casesand homecare needs urgent attention before being trans-ferred to advanced healthcare facilities. Some exampleswere shown in the pilot study conducted by Finkelstein,et al.,20, which involved managing more than twenty pa-tients with chronic diseases such as heart failure, chronicobstructive pulmonary disease, and chronic wound suc-cessfully. Pre-hospital telecardiology was also reported inreducing the time of segment elevation myocardial infarc-tion (STEMI) diagnosis and management. Moreover, live-remote monitoring and diagnosis of stroke increased thetime management of drug administration followed by thequality of treatment and prognosis.20
Nevertheless, some issues relating to telehealth needto be managed, such as patient data security of healthservices. Regular training and evaluation for people withpoor educational background, low income, and stresswere the main reasons most communities attendedhealthcare services despite mild sickness. For example, amother rushed to the hospital because the child had afever solved through a telehealth platform. The other as-pect that also needed improvement was the presence of aphysician. Direct communication, gesture, and contactcould not be denied as many patients came to doctorsjust to seek some health tips. Sometimes, some situationsled to misunderstandings between the healthcareprovider and patients, but this was resolved through ef-fective communication using video call confer-ences.10,12,21
Telemedicine is also an approach to increase the pre-cision of medical care in which patients could be moni-tored continuously. Patients can reach physicians even ifthey were limited by the distance, by communicatingthrough telemedicine in a real-time manner or a live-video conversation. A combination of telemedicine andwearable devices improves healthcare. Furthermore, acombination of both telemedicine and wearable devices
improved healthcare delivery opportunities by enhancingremote patient monitoring. Imaging and ultrasoundrecording could also be improved using teleradiology(Figure 1,22). Currently, many health platforms were uti-lized to empowering patients about essential self-care foroptimal treatment, such as using mobile health applica-tions, which were normally used as a predictive, preven-tive, participatory, and personalized tool.4
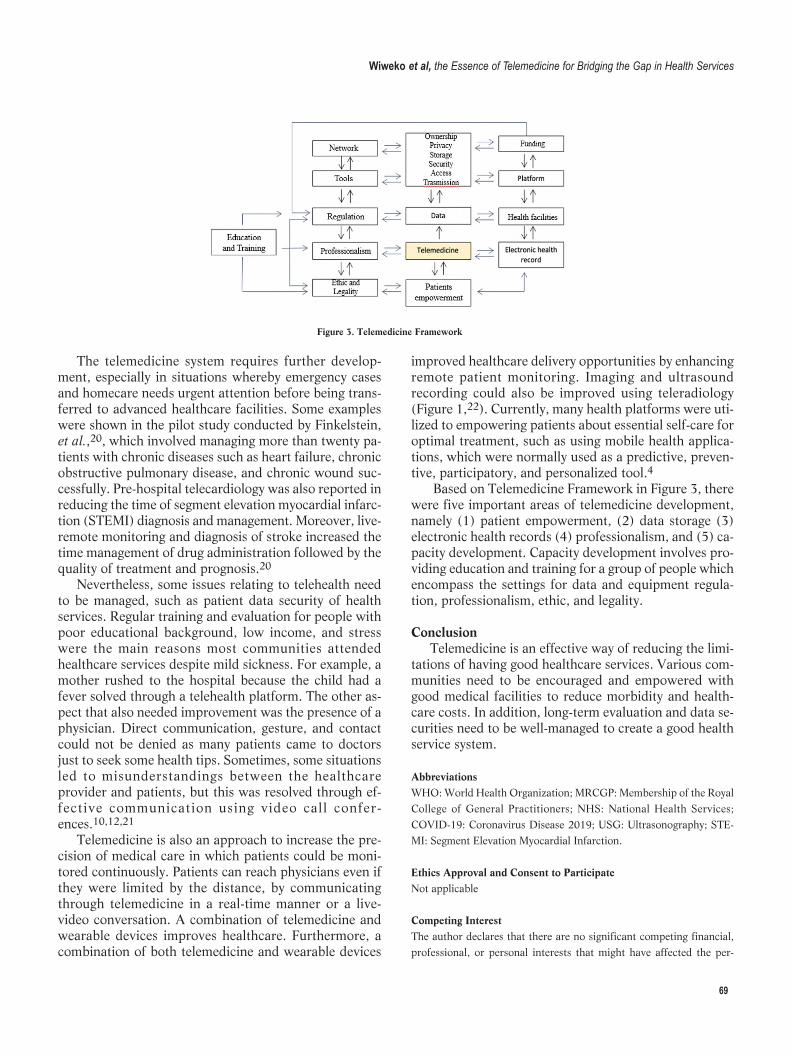
Based on Telemedicine Framework in Figure 3, therewere five important areas of telemedicine development,namely (1) patient empowerment, (2) data storage (3)electronic health records (4) professionalism, and (5) ca-pacity development. Capacity development involves pro-viding education and training for a group of people whichencompass the settings for data and equipment regula-tion, professionalism, ethic, and legality.
Conclusion Telemedicine is an effective way of reducing the limi-
tations of having good healthcare services. Various com-munities need to be encouraged and empowered withgood medical facilities to reduce morbidity and health-care costs. In addition, long-term evaluation and data se-curities need to be well-managed to create a good healthservice system.
AbbreviationsWHO: World Health Organization; MRCGP: Membership of the RoyalCollege of General Practitioners; NHS: National Health Services;COVID-19: Coronavirus Disease 2019; USG: Ultrasonography; STE-MI: Segment Elevation Myocardial Infarction.
Ethics Approval and Consent to ParticipateNot applicable
Competing InterestThe author declares that there are no significant competing financial,professional, or personal interests that might have affected the per-
Figure 3. Telemedicine Framework
Wiweko et al, the Essence of Telemedicine for Bridging the Gap in Health Services
70
formance or presentation of the work described in this manuscript.
Availability of Data and MaterialsNot applicable
Authors’ ContributionBW contributed to the conception of the manuscript and joined SCZ inwriting the first draft, while SCZ and AL wrote each section.Furthermore, all authors contributed in reviewing the manuscript andalso read and approved the submitted version.
AcknowledgmentThe authors are grateful to the Faculty of Medicine, University ofIndonesia, and all of the Indonesian Medical Education and ResearchInstitute staff and stakeholders.
References1. Topol E. Preparing the healthcare workforce to deliver the digital fu -
ture. NHS Constitution for England; 2019.
2. Darkins A, Margaret C. Telemedicine and telehealth: principles, poli-
cies, performances, and pitfalls. New York: Springer Publishing
Company; 2000.
3. Kamsu-foguem B, Tiako P, Fotso L, Foguem C, Kamsu-foguem B,
Tiako P, et al. Modeling for effective collaboration in telemedicine.
Telematics and Informatics. 2015; 32 (4): 776–86.
4. The American College of Obstetricians and Gynecologist.
Implementing telehealth in practice. American College of Obstetricians
and Gynecologist. 2020; 135 (798): 73–9.
5. Wootton R, Patil NG, Scott RE, Ho K. Telehealth in the developing
world. UK: Royal Society of Medicine Press; 2009.
6. Konsil Kedokteran Indonesia. Peraturan konsil kedokteran Indonesia.
Jakarta; 2004.
7. Putranto TA. Surat edaran Menteri Kesehatan: penyelenggaraan
pelayanan kesehatan melalui pemanfaatan teknologi informasi dan ko-
munikasi dalam rangka pencegahan penyebaran COVID-19. Jakarta;
2020.
8. National Health Services. Now GP; 2016.
9. The American College of Obstetricians and Gynecologist. Managing
patients remotely: billing for digital and telehealth services. American
College of Obstetricians and Gynecologist; 2020.
10. World Health Organization. Telemedicine: opportunities and develop-
ments in member states. Global Observatory for eHealth Service.
2010; 2.
11. Stroetmann K, Kubitschke L, Robinson S, Stroetmann V, Cullen K,
McDaid D. How can telehealth help in the provision of integrated
care?. World Health Organization Regional Office for Europe; 2010.
12. Ngiam KY, Khor IW. Series digital oncology 2 big data and machine
learning algorithms for health-care delivery. Lancet Oncology. 2019;
20: e262-73.
13. Eddin EN, Wiweko B, Jatmiko W, Bowolaksono A. Building business
process on tele-ultrasonography: an international collaboration of
medical technology development. Journal of Computational and
Theoretical Nanoscience. 2017; 23 (7): 6861–5.
14. Jatmiko W, Isa SM, Imah EM, Rahmatullah R, Wiweko B, Mas'um
MA. Developing smart telehealth system in Indonesia: progress and
challenge. Conference: International Conference on Advanced
Computer Science and Information Systems (ICACSIS). 2015; 29–36.
15. Smith AC, Bensink M, Armfield N, Stillman J, Caffery L. Telemedicine
and rural health care applications. Postgraduate Medicine. 2005; 51
(4): 286–93.
16. Lakhe A, Sodhi I, Warrier J, Sinha V. Development of digital stetho-
scope for telemedicine. Journal of Medical Engineering & Technology.
2016; 1902.
17. Chamberlain DB, Kodgule R, Fletcher RR. Towards a pulmonary diag-
nostic kit for telemedicine and global health point-of-care diagnosis.
Conference Paper: NIH-IEEE 2015 Strategic Conference on
Healthcare Innovations and Point-of-Care Technologies for Precision
Medicine; 2015.
18. Koh GC, Yen SC, Tay A, Cheong A, Ng YS, Silva DA De, et al.
Singapore tele-technology aided rehabilitation in stroke (STARS) trial:
protocol of a randomized clinical trial on tele-rehabilitation for stroke
patients. BMC Neurology. 2015; 1–14.
19. National University Heart Centre, Singapore. TeleConsult. Retrieved
May 20, 2021.
20. Finkelstein J, Eunme C, Scharf SM. Chronic obstructive pulmonary
disease as an independent risk factor for cardiovascular morbidity.
International Journal of Chronic Obstructive Pulmonary Disease.
2009; 4: 337–49.
21. Loeb AE, Rao SS, Ficke JR, Morris CD, Riley LH, Levin AS.
Departmental experience and lessons learned with accelerated intro -
duction of telemedicine during the COVID-19 crisis abstract. Journal
of the American Academy of Orthopaedic Surgeons. 2020; 28 (11):
469–76.
22. Latimer S. The pandemic’s lasting effect on our healthcare system.
Glenser; 2020.
Kesmas: Jurnal Kesehatan Masyarakat Nasional (National Public Health Journal). 2021; 16 (2): 66-70
AbstractThis study pertains to stunting in children in Indonesian with z-scores of less than -2 Standard Deviation (SD) and less than -3 SD. The preliminary studyresults showed the highest prevalence of stunting to be 22.6%, at the Temon II Primary Health Care in Kulon Progo District. The study aimed to assess thedeterminants of stunting children aged 24–59 months. This study was conducted from September 2018–May 2019. The design of this study was analyticalobservational with study design case-control. The sample was 60 children aged 24–59 months. The method utilized proportional sampling, whereas the dataanalysis applied chi-square and logistic regression.The analysis of statistical tests showed a significant correlation between the stunting children and energyintake factor (p-value = 0.030; α = 0.05; CI = 95%). Risk factors were energy intake, protein intake, suffering from acute respiratory tract infections, andsuffering diarrhea. A non-risk factor was immunization status. Protective factors were access to clean water and the history of exclusive breastfeeding. Themost influential factor for stunting children aged 24–59 months was energy intake.
Keywords: determinant, energy intake, stunting
The Determinants of Stunting for Children Aged 24-59 Monthsin Kulon Progo District 2019
Chatrine Aprilia Hendraswari1*, Yuliasti Eka Purnamaningrum1, Tri Maryani1, Yani Widyastuti1, Sakinah Harith2
1Department of Midwifery, Politeknik Kesehatan Kementerian Kesehatan Yogyakarta, Special Region of Yogyakarta, Indonesia2Faculty of Health Science, Universiti Sultan Zainal Abidin, Malaysia
IntroductionStunting is a nutrient issue that concerns developing
countries, especially.1 Stunting, or being too short forone’s age, is defined as a height of more than two stan-dard deviations (SD) below the World HealthOrganization (WHO) Child Growth Standards median.2Malnutrition occurs during pregnancy and the newbornperiod.
Children are considered stunted and severely stuntedif the body length and the height based on the age rangeare less than the WHO-Multicentre Growth ReferenceStudy (MGRS) median standard.3 The IndonesiaMinistry of Health considers the value of the z-score ofstunted children is less than -2 SD and severely stuntedchildren is less than -3 SD.4 Wasting in children is asymptom of acute undernutrition, usually due to insuffi-cient food intake or a high incidence of infectious disease,as indicated by a weight-to-height ratio less than -2 SDof the WHO Child Growth Standards median.5
Children who suffer from growth retardation due tolow diets or recurrent infections tend to be at greater riskfor illness and death. Stunting is the result of long-termnutritional deprivation and often results in delayed men-
tal development, poor school performance, and reducedintellectual capacity. These, in turn, affect economic pro-ductivity at the national level. Women of short statureare at greater risk for obstetric complications due tosmaller pelvis. Small women are at greater risk of deliver -ing infants with low birth weights, contributing to theintergenerational cycle of malnutrition. As infants of lowbirth weight or retarded intrauterine growth, they tendto be smaller as adults.5
According to the National Basic Health Research(Riset Kesehatan Dasar/Riskesdas) by the NationalInstitute of Health Research and Development, Ministryof Health, the prevalence of stunting in Indonesia as awhole fell from 37.2% in 2013 to 30.8% in 2018.6Annual stunting percentage, according to the NutritionalMonitoring Status (Pemantauan Status Gizi/PSG) was28.9% in 2014, 29% in 2015, 27.5% in 2016, and29.6% in 2017. In the province of Yogyakarta, the preva-lence of stunting was quite a bit lower–13.86% in 2017,dropping to 12.37 in 2018.6
Based on Rahmayana's study,7 children aged 24–59months from Bangladesh, India, and Pakistan were atgreater risk of obstruction. The causative factors must
Hendraswari et al. Kesmas: Jurnal Kesehatan Masyarakat Nasional (National PublicHealth Journal). 2021; 16 (2): 71-77DOI: 10.21109/kesmas.v16i2.3305
Kesmas: Jurnal Kesehatan Masyarakat Nasional(National Public Health Journal)
Correspondence*: Chatrine Aprilia Hendraswari, Department of Midwifery,Politeknik Kesehatan Kementerian Kesehatan Yogyakarta, Mangkuyudan street,MJ III/304, Yogyakarta 55143, Indonesia, E-mail: [email protected],Phone: +62 857 2776 3335
Received : September 06, 2019Accepted : January 02, 2021Published : May 28, 2021
Copyright @ 2021, Kesmas: Jurnal Kesehatan Masyarakat Nasional (National Public Health Journal), p-ISSN: 1907-7505, e-ISSN: 2460-0601, SINTA-S1 accredited,http://journal.fkm.ui.ac.id/kesmas, Licensed under Creative Commons Attribution-ShareAlike 4.0 International
72
be known to control the incidence of stunting. Those areinsufficient food intake, infectious diseases, lack of moth-er's knowledge, bad parenting, unsanitary conditions,and low health services.1,8 Of those, according to theUnited Nations Children's Fund (UNICEF), direct andindirect factors most influence the nutritional status ofchildren and the causes of malnutrition. Food intake anddisease could directly cause low nutrients, while thereare three indirect causes of malnutrition–food security,child care patterns, and health and environmental ser -vices. Based on those problems and the continuing highprevalence of stunting in children, further investigationis needed to determine its causes.9 The study aimed todetermine the determinants of stunting children aged 24–59 months.
MethodThis study was an observational analytic study with a
case-controlled design. The study was conducted be-tween September 2018–May 2019 in Temon II PrimaryHealth Care, Kulon Progo District. The population wasall children aged 24–59 months. The case sample was 30stunted children; the control sample was 30, not stuntedchildren. Respondents were the mothers of the cases andthe control sample children. Sampling in this study wasproportional sampling, taken from seven villages inTemon II Primary Health Care (PHC). Examinations ofchildren in each village were performed according to in-clusion and exclusion criteria. The inclusion criteria werechildren aged 24–59 months residing in the study area,with z-score limits of ≥-2 SD to 2 SD. The mothers werewilling to follow the study by signing informed consent.They were randomly chosen following a proportional dis-tribution determined by each village to be equally repre-sented.
The histories of exclusive breastfeeding variable isobtained from the respondent's acknowledgment ofbreastfeeding for 0–6 months. Energy intake pertainedto the total energy sourced from respondents' food andbeverages, as inputted in the NutriSurvey 2007. “Low”was <80%, sufficient was ≥80%. Protein intake wasdrawn from total protein sourced from animal and ve -getable proteins and inputted in the Nutrisurvey 2007,again with a low category of <80% and sufficient ≥80%.Immunization status was based on the Mother and ChildHealth/MCH (Kesehatan Ibu dan Anak/KIA) book fol-lowing the basic immunization requirements, as obtainedaccording to age and the Immunization DevelopmentProgram's government poli cy. Suffering from acute res-piratory infections (ARIs) was obtained from the respon-dent's recognition of the frequency of sick children af-fected by ARIs (tuberculosis (TB), cough, colds, and o -ther respiratory diseases) in the past year with categoriesof frequent (≥6 times a year) and rare (<6 times a year).
Incidence of diarrhea was obtained from the respondents’recognition of the frequency of sick children affected bydiarrhea in the past year, with “frequent” being ≥3 timesa year and “rare” <3 times a year. Testimony regardingaccess to clean water was obtained from the respondent'sacknowledgment and inspection of the respondent'shouse.
Data were obtained from interviews with the ques-tionnaire. Data of respondents' food intake were ob-tained from interviews based on a 24-hour food recallquestionnaire. Those were then analyzed by NutriSurvey2007 software to obtain the percentage of energy intakeand protein intake, compared with the nutritional ade-quacy rate. Data on infectious diseases (incidence of di-arrhea and ARI, September 2018 to May 2019) were col-lected from respondent testimonies and the PHC regis terbook from the previous year (2018). Primary immuniza-tion data is collected from the MCH handbook and theregister of Temon II Primary Health Care immunizations.Environmental sanitation was based on toilet use and ac-cess to clean water.
This study data retrieval is done by an enumerator,with a nutrition team consisting of two nutrition expertsand three applied nutrition students. Initial preparationwas data collection at the PHC, then the inclusion andexclusion criteria from select respondents. If the respon-dent matches the inclusion, then an interview is conduct-ed using a questionnaire. The immunization status in thequestionnaire is secondary data from the MCH book.Then the nutrition team conducted a direct interview tofill in 24-hour food recall. Interviews with the 24-hourfood recall method were conducted twice in one weekwith an interval of two days.
Data analysis included univariate, bivariate, and mul-tivariate. Univariate involved a frequency distributiontest. The bivariate analysis used a chi-square test with asignificance level (p-value = 0.05) and 95%CI. Inter -pretation of odd ratio (OR) values was used to determinethe risk of each factor and the most influential factors. Amultivariate logistic regression analysis was performedon the variable results of the bivariate analysis with va -lues of p-value < 0.25 to see the most dominant factors.This study has been approved by the Health ResearchEthics Committee (KEPK) of the Health Ministry ofHealth Polytechnic, Yogyakarta No.LB.01.01/KE-01/VII/249/2019.
ResultsTable 1 showed that gender could affect the level of
children stunting. Male children experience stunting(53.3%) more than female children, while those whowere not stunted were found to be more in the female by(46.7%) than male children. The mother's work can alsoaffect the level of children stunting. It is known that
Kesmas: Jurnal Kesehatan Masyarakat Nasional (National Public Health Journal). 2021; 16 (2): 71-77
73
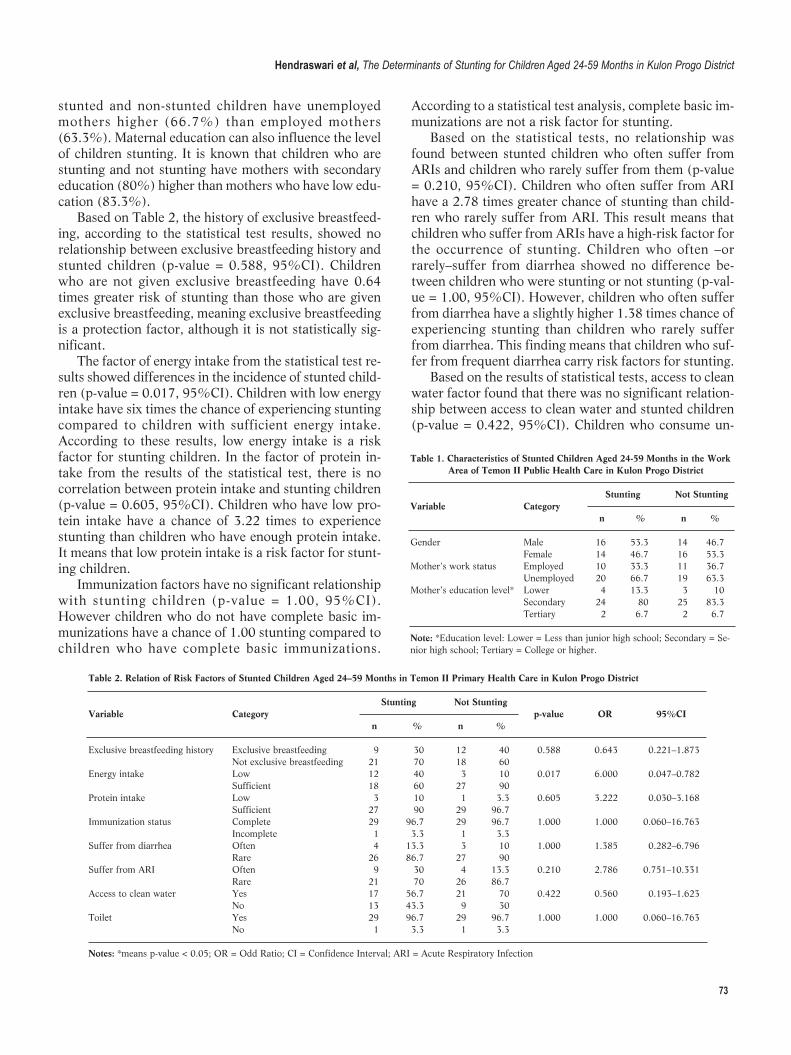
stunted and non-stunted children have unemployedmothers higher (66.7%) than employed mothers(63.3%). Maternal education can also influence the levelof children stunting. It is known that children who arestunting and not stunting have mothers with secondaryeducation (80%) higher than mothers who have low edu -cation (83.3%).
Based on Table 2, the history of exclusive breastfeed-ing, according to the statistical test results, showed norelationship between exclusive breastfeeding history andstunted children (p-value = 0.588, 95%CI). Childrenwho are not given exclusive breastfeeding have 0.64times greater risk of stunting than those who are givenexclusive breastfeeding, meaning exclusive breastfeedingis a protection factor, although it is not statistically sig-nificant.
The factor of energy intake from the statistical test re-sults showed differences in the incidence of stunted child -ren (p-value = 0.017, 95%CI). Children with low energyintake have six times the chance of experiencing stuntingcompared to children with sufficient energy intake.According to these results, low energy intake is a riskfactor for stunting children. In the factor of protein in-take from the results of the statistical test, there is nocorrelation between protein intake and stunting children(p-value = 0.605, 95%CI). Children who have low pro-tein intake have a chance of 3.22 times to experiencestunting than children who have enough protein intake.It means that low protein intake is a risk factor for stunt-ing children.
Immunization factors have no significant relationshipwith stunting children (p-value = 1.00, 95%CI).However children who do not have complete basic im-munizations have a chance of 1.00 stunting compared tochildren who have complete basic immunizations.
According to a statistical test analysis, complete basic im-munizations are not a risk factor for stunting.
Based on the statistical tests, no relationship wasfound between stunted children who often suffer fromARIs and children who rarely suffer from them (p-value= 0.210, 95%CI). Children who often suffer from ARIhave a 2.78 times greater chance of stunting than child -ren who rarely suffer from ARI. This result means thatchild ren who suffer from ARIs have a high-risk factor forthe occurrence of stunting. Children who often –orrarely–suffer from diarrhea showed no difference be-tween children who were stunting or not stunting (p-val-ue = 1.00, 95%CI). However, children who often sufferfrom diarrhea have a slightly higher 1.38 times chance ofexperiencing stunting than children who rarely sufferfrom diarrhea. This finding means that children who suf-fer from frequent diarrhea carry risk factors for stunting.
Based on the results of statistical tests, access to cleanwater factor found that there was no significant relation-ship between access to clean water and stunted children(p-value = 0.422, 95%CI). Children who consume un-
Table 1. Characteristics of Stunted Children Aged 24-59 Months in the Work Area of Temon II Public Health Care in Kulon Progo District
Stunting Not StuntingVariable Category n % n %
Gender Male 16 53.3 14 46.7 Female 14 46.7 16 53.3Mother's work status Employed 10 33.3 11 36.7 Unemployed 20 66.7 19 63.3Mother’s education level* Lower 4 13.3 3 10 Secondary 24 80 25 83.3 Tertiary 2 6.7 2 6.7
Note: *Education level: Lower = Less than junior high school; Secondary = Se -nior high school; Tertiary = College or higher.
Table 2. Relation of Risk Factors of Stunted Children Aged 24–59 Months in Temon II Primary Health Care in Kulon Progo District
Stunting Not StuntingVariable Category p-value OR 95%CI n % n %
Exclusive breastfeeding history Exclusive breastfeeding 9 30 12 40 0.588 0.643 0.221–1.873 Not exclusive breastfeeding 21 70 18 60 Energy intake Low 12 40 3 10 0.017 6.000 0.047–0.782 Sufficient 18 60 27 90 Protein intake Low 3 10 1 3.3 0.605 3.222 0.030–3.168 Sufficient 27 90 29 96.7 Immunization status Complete 29 96.7 29 96.7 1.000 1.000 0.060–16.763 Incomplete 1 3.3 1 3.3 Suffer from diarrhea Often 4 13.3 3 10 1.000 1.385 0.282–6.796 Rare 26 86.7 27 90 Suffer from ARI Often 9 30 4 13.3 0.210 2.786 0.751–10.331 Rare 21 70 26 86.7 Access to clean water Yes 17 56.7 21 70 0.422 0.560 0.193–1.623 No 13 43.3 9 30Toilet Yes 29 96.7 29 96.7 1.000 1.000 0.060–16.763 No 1 3.3 1 3.3
Notes: *means p-value < 0.05; OR = Odd Ratio; CI = Confidence Interval; ARI = Acute Respiratory Infection
Hendraswari et al, The Determinants of Stunting for Children Aged 24-59 Months in Kulon Progo District
74
sanitized water have a 0.56 times greater chance of expe-riencing stunting than those who consume sanitized wa-ter. It means that access to clean water is a protective, orpreventive, factor for stunting.
Based on Table 2, the toilet factor found no differencein stunting between children who had good toilets andthose who did not (p-value = 1.00, 95%CI). Childrenwho do not use good toilets have a 1.00 time chance ofstunting than those who use good toilets. Judging fromthe odds ratio, the toilet is not a risk factor for stunting.
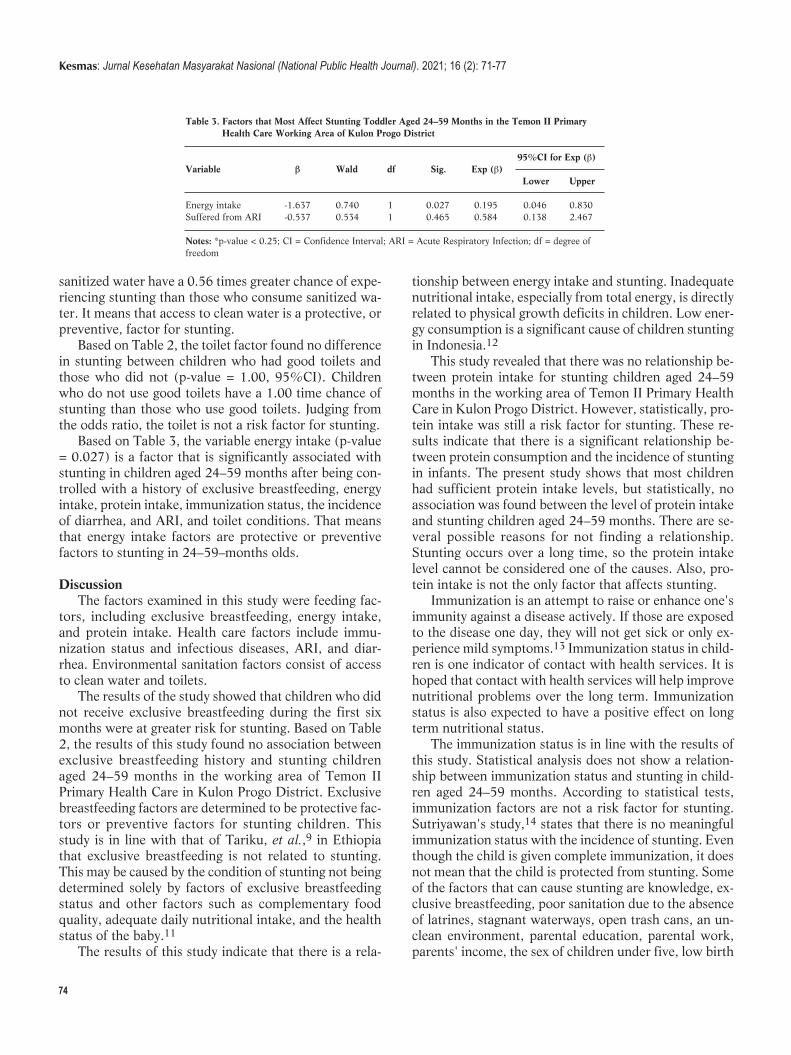
Based on Table 3, the variable energy intake (p-value= 0.027) is a factor that is significantly associated withstunting in children aged 24–59 months after being con-trolled with a history of exclusive breastfeeding, energyintake, protein intake, immunization status, the incidenceof diarrhea, and ARI, and toilet conditions. That meansthat energy intake factors are protective or preventivefactors to stunting in 24–59–months olds.
DiscussionThe factors examined in this study were feeding fac-
tors, including exclusive breastfeeding, energy intake,and protein intake. Health care factors include immu-nization status and infectious diseases, ARI, and diar-rhea. Environmental sanitation factors consist of accessto clean water and toilets.
The results of the study showed that children who didnot receive exclusive breastfeeding during the first sixmonths were at greater risk for stunting. Based on Table2, the results of this study found no association betweenexclusive breastfeeding history and stunting childrenaged 24–59 months in the working area of Temon IIPrimary Health Care in Kulon Progo District. Exclusivebreastfeeding factors are determined to be protective fac-tors or preventive factors for stunting children. Thisstudy is in line with that of Tariku, et al.,9 in Ethiopiathat exclusive breastfeeding is not related to stunting.This may be caused by the condition of stunting not beingdetermined solely by factors of exclusive breastfeedingstatus and other factors such as complementary foodquality, adequate daily nutritional intake, and the healthstatus of the baby.11
The results of this study indicate that there is a rela-
tionship between energy intake and stunting. Inadequatenutritional intake, especially from total energy, is directlyrelated to physical growth deficits in children. Low ener-gy consumption is a significant cause of children stuntingin Indonesia.12
This study revealed that there was no relationship be-tween protein intake for stunting children aged 24–59months in the working area of Temon II Primary HealthCare in Kulon Progo District. However, statistically, pro-tein intake was still a risk factor for stunting. These re-sults indicate that there is a significant relationship be-tween protein consumption and the incidence of stuntingin infants. The present study shows that most childrenhad sufficient protein intake levels, but statistically, noassociation was found between the level of protein intakeand stunting children aged 24–59 months. There are se -veral possible reasons for not finding a relationship.Stunting occurs over a long time, so the protein intakelevel cannot be considered one of the causes. Also, pro-tein intake is not the only factor that affects stunting.
Immunization is an attempt to raise or enhance one'simmunity against a disease actively. If those are exposedto the disease one day, they will not get sick or only ex-perience mild symptoms.13 Immunization status in child -ren is one indicator of contact with health services. It ishoped that contact with health services will help improvenutritional problems over the long term. Immunizationstatus is also expected to have a positive effect on longterm nutritional status.
The immunization status is in line with the results ofthis study. Statistical analysis does not show a relation-ship between immunization status and stunting in child -ren aged 24–59 months. According to statistical tests,immunization factors are not a risk factor for stunting.Sutriyawan's study,14 states that there is no meaning fulimmunization status with the incidence of stunting. Eventhough the child is given complete immunization, it doesnot mean that the child is protected from stunting. Someof the factors that can cause stunting are knowledge, ex-clusive breastfeeding, poor sanitation due to the absenceof latrines, stagnant waterways, open trash cans, an un-clean environment, parental education, parental work,parents' income, the sex of children under five, low birth
Table 3. Factors that Most Affect Stunting Toddler Aged 24–59 Months in the Temon II Primary Health Care Working Area of Kulon Progo District
95%CI for Exp (b)Variable b Wald df Sig. Exp (b) Lower Upper
Energy intake -1.637 0.740 1 0.027 0.195 0.046 0.830Suffered from ARI -0.537 0.534 1 0.465 0.584 0.138 2.467
Notes: *p-value < 0.25; CI = Confidence Interval; ARI = Acute Respiratory Infection; df = degree offreedom
Kesmas: Jurnal Kesehatan Masyarakat Nasional (National Public Health Journal). 2021; 16 (2): 71-77
75
weight, the length of birth of children, and mothers whorarely wash their hands using clean water and soap.15
In contrast to this study, however, one of the studyconducted by Neldawati in Mugianti, et al.,21 showedthat immunization status had a significant relationship tothe nutritional status index. Children who were not givencomplete primary immunization did not immediately suf-fer from infectious diseases. Children immunity is influ-enced by other factors such as nutritional status and thepresence of pathogens. There are forms of herd immunityor immunity in immunization, where individuals who arenot immunized are still protected because most of theother individuals in the group are immune to the diseaseafter receiving immunization.11
Infection is a factor that directly affects nutritionalstatus in addition to adequate nutrition. Infection de-creases food intake, interferes with nutrient absorption,causes direct loss of nutrients, increases metabolic re-quirements or catabolic loss of nutrients, and interfereswith nutrient transport to target tissues, including foodintake. One infectious disease, including diarrhea, is asymptom of gastrointestinal disease or other diseases out-side the digestive tract.
The study was not in line with the results of this studythat there was no association between diarrheal infec-tions in stunting children aged 24–59 months. However,in Table 3, children who suffered from frequent diarrheahave a 1.38 times greater risk of stunting, meaning diar-rheal infections are a risk factor for stunting. The absenceof a meaningful relationship in this study was due to thedirect impact of diarrhea, that is weight loss compared tostunting. Children who experience diarrhea are usuallyalso found with anorexia and dehydration. If not properlytreated, diarrhea impact on weight loss, which is a signof acute malnutrition, while stunting signifies repeatedchronic malnutrition. The other factor is the duration ofthe infection experienced.11
Acute Respiratory Infections (ARI) and diarrhea areamong the infectious diseases to which children underthe age of five are especially prone. The children periodis a vulnerable age for health problems, especially ARI,because of their undeveloped immune systems. Acute res-piratory infections are acute inflammation of the upperand lower respiratory tracts caused by bacterial, viral, orrickets infections, both with or without inflammation ofpulmonary paren chy ma.16
The results of this study do not indicate a significantrelationship between ARI infectious disease and stuntingin children aged 24–59 months. Nonetheless, infectiousdisease is a risk factor for stunting. The results of thisstudy are following study conducted by Nasikhah in EastSemarang Subdistrict,16 which shows that a history ofinfectious diseases, in this case, acute upper respiratorytract infection, is a non-significant risk factor for stunt-
ing. Unlike the Agrina and Ameliwati’s study,13 there isa significant influence between the nutritional status oftoddlers with ARI. This is due to stunting being affectedby the frequency of infectious diseases and the durationof the and nutrient intake during infectious diseaseepisode.17 Access to clean water and sanitation is thesixth target of SDGs. Without clean water and adequatesanitation, a decrease in the prevalence of stunting willnot be achieved.18 Exposure to the environment and poorhygiene can result in stunting due to inadequate nutritionabsorption and the intestines' inability to function as adisease barrier.19 It is not in line with this study that thereis no relationship between access to clean water andstunting in children aged 24–59 months in the Temon IIPrimary Health Care work area. However, it is a protect -ive or preventive factor for the occurrence of stunting.
In Kusumawati, et al.,11 Van der Hoek's study findsthat children from families with clean water facilitieshave a lower prevalence of diarrhea and stunting thanthose from families without clean water and toilet facili-ties. The indicators for the short-term number of childrenare due to the lack of availability of clean, decent drinkingwater. As many as 47% of the population of Indonesiadrink water containing germs, even though the water hasbeen boiled and 340 children die from diarrhea everyweek in Indonesia.12 There is no relationship betweenstunting and access to clean water as a source of drink.
Exposure to the environment and cleanliness are inline with primary sanitation factors. According toYulestari's study,20 children with stunting were moreprevalent in families with poor basic sanitation.Households with poor sanitation are 1.3 times more like-ly to have children with stunting than households withadequate basic sanitation. In this study, there was no re-lationship between toilet ownership and stunted childrenaged 24–59 months, meaning that this toilet factor wasnot a risk factor for stunting. According to this study, theproportion of res pondents with good toilets and cleanwater sources (sani tation) was more significant than poorsanitation.
The logistic regression test results in Table 3 showthat energy intake is the dominant factor associated withstunting in children aged 24–59 months in the Temon IIPrimary Health Care work area. In Yensasnidar's study,18
there is a significant relationship between energy intakeand the incidence of stunting in these students. Study byTessema, et al.,15 shows that inadequate protein and en-ergy intake may be a predictor of childhood linear growthfailure in rural Ethiopia. Most children’s energy intake instunted and non-stunted children was below the estimat-ed average requirement. All children with protein defi-ciency were also energy deficient. The median energydensity of the child’s complementary foods was 1.4kcal/g, with no significant difference between stunted
Hendraswari et al, The Determinants of Stunting for Children Aged 24-59 Months in Kulon Progo District
76
and non-stunted children. Nova and Afriyanti's study,19
showed that the incidence of stunting in children is most-ly in children whose energy intake is less than childrenwith sufficient intake energy. Children with energy intakeless than 1.2 times that of children with sufficient energyintake, experienced stunting.11 Based on the theoreticaland factual results, authors assume that low energy in-take is the factor with the highest percentage as a factorin stunting because total energy is directly related tophysical growth deficits in children.
The efforts to increase energy intake in children areby making foods that make children interested in con-suming them. Infectious diseases that occur in stuntingchildren result in a loss of appetite, such that children’sfood consumption decreases.12 Contrarily, coachingfami lies to improve the nutritional status of children iscritical. Development of health promotion media relatedto children nutrition and counseling to families with mal-nutrition problems in children needs to be adjusted tothe characteristics of the family. Extension media andmaterial must be adjusted to the level of family educationso that the effectiveness of the information delivery runsoptimally. For example, a flip sheet with sentence selec-tion is easy to understand. Besides that, refreshment forcadres providing health edu cation, especially nutritionfor children, is critically important.
ConclusionRespondent characteristics in Temon II Primary
Health Care, Kulon Progo, according to gender, stuntedchildren were more likely to be male while those whowere not stunted were female. Employed mothers con-tributed to stunting rather than unemployed motherswith secondary education. Energy intake factor has a sig-nificant relationship to stunting children aged 24–59months, while feeding factors (exclusive breastfeedinghistory and protein intake), immunization status, infect -ious diseases (suffered from diarrhea and ARI), and toi-lets are not associated with stunting children aged 24–59months.
Risk factors in stunting children aged 24–59 monthsin the Temon II Primary Health Care working area inKulon Progo District are feeding factors (energy and pro-tein intake), infectious diseases (suffered from diar- rheaand ARI). Non-risk factors are immunization and toiletstatus, while the protective factor is the history of exclu-sive breastfeeding and access to clean water. The mostinfluential stunting factor in Temon II Primary HealthCare working area in Kulon Progo District is ener gy in-take.
RecommendationIncrease revitalization efforts for nutrition-conscious
families on the importance of increasing the balanced nu-
tritional needs of children to prevent stunting. Increaseinformation dissemination to the community regardingstunting, through media booklets or counseling and makepolicies for the first one thousand days of a child’s life toimprove the nutritional status of pregnant women, nurs-ing mothers, and children under five. Provide informa-tion and education counseling for practitioners aboutproviding balanced, dietary needs for children under fiveto prevent stunting. Then give education for motherswith children under five, including prevention followingpregnancy, which in turn encourages them to activelyparticipate in Maternal and Child Health Services. Thisway, children’s growth and development can be moni-tored to support stunting prevention efforts. Improve theability of Maternal and Child Health Services cadresthrough guidance and training on monitoring the growthand development of children under five, so that they arenot overly dependent on Maternal and Child HealthServices officers.
AbbreviationsWHO: World Health Organization; SD: Standard Deviation; UNICEF:United Nations Children's Fund; ARI: Acute Respiratory Infection;SDG: Sustainable Development Goals; WHO-MGRS: World HealthOrganization Multicentre Growth Reference Study; MCH: MotherChild Health; OR: Odd Ratio; CI: Confidence Interval.
Ethics Approval and Consent to ParticipateThis study has been approved by the Health Research Ethics Committee(KEPK) of the Health Ministry of Health Polytechnic YogyakartaNo.LB.01.01/KE-01/VII/249/2019.
Competing InterestThe author declares that there are no significant competing financial,professional, or personal interests that might have affected the per-formance or presentation of the work described in this manuscript.
Availability of Data and MaterialsThe data that support the findings of this study are available from thecorresponding author upon reasonable request.
Authors’ ContributionCAH, YEP, TM, and YW were involved in the design study, analyze da-ta, compile, and revise the script. SH was involved in preparing thepublication journal. All authors read and approved the final manu-script.
AcknowledgmentAuthors express gratitude to the Health Ministry of Health PolytechnicYogyakarta for funding this study.
References 1. Lembaga Penelitian dan Pengabdian kepada Masyarakat STIKes Hang
Tuah Pekanbaru. Permasalahan anak pendek (stunting) dan intervensi
Kesmas: Jurnal Kesehatan Masyarakat Nasional (National Public Health Journal). 2021; 16 (2): 71-77
77
untuk mencegah terjadinya stunting (suatu kajian kepustakaan) stunt-
ing problems and interventions to prevent stunting (a literature re-
view). Jurnal Kesehatan Komunitas. 2015; 2 (6): 254–61.
2. Trihono A, Tjandrarini DH, Irawati A, Utami NH, Tejayanti T, et al.
Pendek (stunting) di Indonesia, masalah dan solusi. Sudomo M, edi-
tor. Jakarta: Lembaga Penerbit Balitbangkes; 2015.
3. Dinas kesehatan kabupaten Kulon Progo. Profil kesehatan Kabupaten
Kulon Progo tahun 2016 (Data 2015). Wates: Dinas Kesehatan Kulon
Progo; 2015.
4. World Health Organization. Interpretation guide. Nutrition Landacape
Information System. 2012. p. 1–51
5. Riset Kesehatan Dasar. Hasil utama riset kesehatan dasar (RISKES-
DAS). Journal of Physics A. 2018; 44 (8): 1–200.
6. Dwi Pratiwi T, Yerizel E. Hubungan pola asuh ibu dengan status gizi
balita di wilayah kerja puskesmas Belimbing Kota Padang. Jurnal
Kesehatan Andalas. 2016; 5 (3): 661–5.
7. Rahmayana. Hubungan pola asuh ibu dengan kejadian stunting anak
usia 24-59 bulan di Posyandu Asoka II wilayah pesisir Kelurahan
Barombong Kecamatan Tamalate Kota Makassar tahun 2014. Al-
Sihah: The Public Health Science Journal. 2014; VI (2): 424–36.
8. United Nations Children ‘s Fund. Improving child nutrition. The
achievable imperative for global progress. NCSL Legisbrief. 2010.
9. Tariku A, Biks GA, Derso T, Wassie MM, Abebe SM. Stunting and its
determinant factors among children aged 6–59 months in Ethiopia.
Italian Journal of Pediatrics. 2017.
10. Setiawan E, Machmud R, Masrul. Faktor-faktor yang berhubungan
dengan kejadian stunting pada anak usia 24–59 bulan di wilayah kerja
Puskesmas Andalas Kecamatan Padang Timur Kota Padang tahun
2018. Jurnal Kesehatan Andalas. 2018; 7 (2): 275–84.
11. Mugianti S, Mulyadi A, Anam AK, Najah ZL. Faktor penyebab anak
stunting usia 25-60 bulan di Kecamatan Sukorejo Kota Blitar. Jurnal
Ners dan Kebidanan. 2018; 5 (3): 268–78.
12. Kementerian Kesehatan Republik Indonesia. Buku ajar imunisasi.
Jakarta: Pusat Pendidikan dan Pelatihan Tenaga Kesehatan; 2014.
13. Agrina S, Arneliwati. Analisa aspek balita terhadap kejadian infeksi
saluran pernafasan akut (ISPA) di rumah. 2014; 5: 115–20.
14. Sutriyawan, Agung D. Hubungan status imunisasi dan riwayat penya -
kit infeksi dengan kejadian stunting pada balita: studi retrospektif. J
Midwifery. 2020; 8 (2).
15. Tessema M, Gunaratna NS, Brouwer ID, Donato K, Cohen JL,
McConnell M, et al. Associations among high-quality protein and ener-
gy intake, serum transthyretin, serum amino acids and linier growth of
children in Ethiopia. Nutrients. 2018; 10 (11): 1-17.
16. Stephenson K, Amthor R, Mallowa S, Nungo R, Maziya-Dixon B, et
al. Consuming cassava as a staple food places children 2–5 years old at
risk for inadequate protein intake, an observational study in Kenya
and Nigeria. Nutrition Journal. 2010; 9 (1): 9.
17. World Health Organization. WHA global nutrition targets 2025:
stunting policy brief. 2014; 9.
18. Yensasnidar, Adfar TD, Hastini B. Hubungan asupan energi, protein
dan zink terhadap kejadian stunting di SD Negeri 11 Kampung Jua
Kecamatan Lubuk Begalung. 2019; 2 (1): 41–6.
19. Nova M, Afriyanti O. Hubungan berat badan, ASI eksklusif, MP-ASI
dan asupan energi dengan stunting pada balita usia 24-59 bulan di
Puskesmas Lubuk Buaya. Jurnal Kesehatan Perintis (Perintis’s Health
Journal). 2018; 5 (1): 39-45.
20. Yulestri. Analisis faktor-faktor sosio-ekonomi dan lingkungan ter-
hadap kejadian stunting pada balita 10-59 bulan di Pulau Jawa tahun
2010 (analisis data Riskesdas 2010). 2013. p. 1-13.
21. Mugianti S, Mulyadi A, Anam AK, Najah ZL. Faktor Penyebab Anank
Stunting Usia 25-60 Bulan di Kecamatan Sukorejo Kota Blitar. Journal
Ners dan Kebidanan. 2018; 5 (3): 268-78.
Hendraswari et al, The Determinants of Stunting for Children Aged 24-59 Months in Kulon Progo District
IntroductionNumerous studies have shown that workplace acci-
dents have occurred due to commuting and health risksfrom pollution.1 Air pollution is a major environmentalrisk to health. The government can reduce the burden ofdisease from stroke, heart disease, lung cancer, and bothchronic and acute respiratory diseases, including asthma,acute lower respiratory, chronic obstructive pulmonarydisease, stroke, ischemic heart disease, and lung cancerby reducing air pollution.1 Meanwhile, a student's expo-sure to air pollution can increase the health risk associat-ed with neurodegenerative aging processes.2
Jakarta is one of the most air-polluted cities in theworld, which can increase the health risk of its commut-ing workers exposed to pollutants. In Jakarta, Bogor,Depok, Tangerang, and Bekasi (Jabodetabek) City, thenumber of commuters continued to increase from 6 to 7million in 2014, and they are at risk of being exposed toparticulate matter (PM). The level of exposure was influ-enced by the mode of transportation used as reported inthe study conducted by Gilliland, et al.3 Another danger-ous pollutant exposure is ultrafine particles (UFPs),4,5
with an increased level of urinary 1-Hydroxypyrene (1-
OHP), which is a biomarker of polycyclic aromatic hy-drocarbons (PAHs) exposure in urine,6 pleural anthra-cosis,7 a respiratory disorder due to air pollution,4 andischemic heart disease due to transportation noise expo-sure.8
According to the theory of the Health Belief Modeldeveloped by Rosenstock with assumptions of an indi-vidual suffering from a disease, they become more awareof prevention and protection or healthy behavior, suchas wearing personal protective equipment (PPE) andmask in the workplace and when commuting to work.Furthermore, healthy behavior at work is needed to re-duce the risk of accidents and health. The lack of ha -zardous knowledge in the workplace can increase theworkers’ accidents and health risks.9 The previous studyrelated to commuters using Commuter Line Bogor-Jakarta reported the perception of inconvenience whencommuting to work. About 67.1% of respondents statedthat they felt uncomfortable with the air pollution whilecommuting to work.10
Previous study has been conducted on healthy behav-ior in working with various workplace settings.9However, the information related to the factors influenc-
AbstractJakarta is one of the most air-polluted cities in the world, which can increase the health risk of commuting workers exposed to pollutants. This study aimed todetermine the factors that directly and indirectly affect healthy behavior (wearing a mask) for commuters using the Bogor-Jakarta Commuter Line. Furthermore,a total of 155 respondents participated and the data collected were analyzed using descriptive and path analysis. The commuters aware of the hazardpotential related to air pollution during commuting were 137 people (88.4%). While 104 people (67.1%) were aware of the good perception of pollution and125 uses masks during commuting (80.6%). The healthy behavior in commuting workers using Commuter Line was affected by some factors, both directlyand indirectly. The knowledge and commuting experience toward healthy behavior were two variables that significantly influenced on healthy behavior. Theknowledge was also the only mediated variable with a significant indirect effect of education on healthy behavior.
Keywords: commuting workers, healthy behavior, Commuter Line, mask, path analysis
A Path Analysis Model for Explaining the Factors InfluencingWearing a Mask among Commuting Workers Using CommuterLine Bogor-Jakarta
David Kusmawan1*, Shofi Andari2,3, Ira Gustina4, Indri H Susilowati5, Mufti Wirawan5
Correspondence*: David Kusumawan, Program Study of Public Health, Facultyof Medicine and Health Science, Universitas Jambi, Letjen Suprapto Street,Telanipura, Jambi City, Indonesia, E-mail: [email protected], Phone:+62 898 4844 020
1Program Study of Public Health, Faculty of Medicine and Health Science, Universitas Jambi, Jambi, Indonesia2Bioinformatics and Computational Biology Graduate Program, Iowa State University, USA3Department of Statistics, Faculty of Science and Data Analytics, Institut Teknologi Sepuluh Nopember (ITS), Surabaya, Indonesia4Statistics Clinic Research Center, Indonesia5Department of Occupational Health and Safety, Faculty of Public Health, Universitas Indonesia, Depok, Indonesia
Kusmawan et al. Kesmas: Jurnal Kesehatan Masyarakat Nasional (National PublicHealth Journal). 2021; 16 (2): 78-83DOI: 10.21109/kesmas.v16i2.3280
Received : August 27, 2019Accepted : January 21, 2021Published : May 28, 2021
Copyright @ 2021, Kesmas: Jurnal Kesehatan Masyarakat Nasional (National Public Health Journal), p-ISSN: 1907-7505, e-ISSN: 2460-0601, SINTA-S1 accredited,http://journal.fkm.ui.ac.id/kesmas, Licensed under Creative Commons Attribution-ShareAlike 4.0 International
Kesmas: Jurnal Kesehatan Masyarakat Nasional(National Public Health Journal)
79
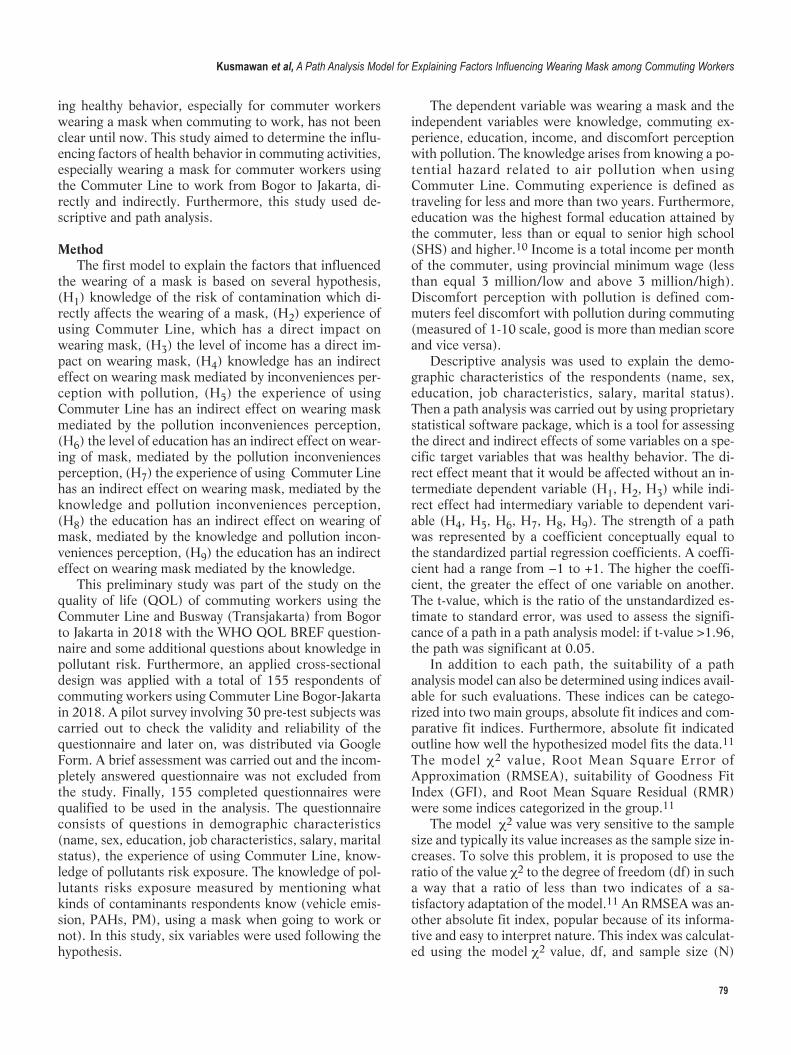
ing healthy behavior, especially for commuter workerswearing a mask when commuting to work, has not beenclear until now. This study aimed to determine the influ-encing factors of health behavior in commuting activities,especially wearing a mask for commuter workers usingthe Commuter Line to work from Bogor to Jakarta, di-rectly and indirectly. Furthermore, this study used de-scriptive and path analysis.
MethodThe first model to explain the factors that influenced
the wearing of a mask is based on several hypothesis,(H1) knowledge of the risk of contamination which di-rectly affects the wearing of a mask, (H2) experience ofusing Commuter Line, which has a direct impact onwearing mask, (H3) the level of income has a direct im-pact on wearing mask, (H4) knowledge has an indirecteffect on wearing mask mediated by inconveniences per-ception with pollution, (H5) the experience of usingCommuter Line has an indirect effect on wearing maskmediated by the pollution inconveniences perception,(H6) the level of education has an indirect effect on wear-ing of mask, mediated by the pollution inconveniencesperception, (H7) the experience of using Commuter Linehas an indirect effect on wearing mask, mediated by theknowledge and pollution inconveniences perception,(H8) the education has an indirect effect on wearing ofmask, mediated by the knowledge and pollution incon-veniences perception, (H9) the education has an indirecteffect on wearing mask mediated by the knowledge.
This preliminary study was part of the study on thequality of life (QOL) of commuting workers using theCommuter Line and Busway (Transjakarta) from Bogorto Jakarta in 2018 with the WHO QOL BREF question-naire and some additional questions about knowledge inpollutant risk. Furthermore, an applied cross-sectionaldesign was applied with a total of 155 respondents ofcommuting workers using Commuter Line Bogor-Jakartain 2018. A pilot survey involving 30 pre-test subjects wascarried out to check the validity and reliability of thequestionnaire and later on, was distributed via GoogleForm. A brief assessment was carried out and the incom-pletely answered questionnaire was not excluded fromthe study. Finally, 155 completed questionnaires werequalified to be used in the analysis. The questionnaireconsists of questions in demographic characteristics(name, sex, education, job characteristics, salary, maritalstatus), the experience of using Commuter Line, know -ledge of pollutants risk exposure. The knowledge of pol-lutants risks exposure measured by mentioning whatkinds of contaminants respondents know (vehicle emis-sion, PAHs, PM), using a mask when going to work ornot). In this study, six variables were used following thehypothesis.
The dependent variable was wearing a mask and theindependent variables were knowledge, commuting ex-perience, education, income, and discomfort perceptionwith pollution. The knowledge arises from knowing a po-tential hazard related to air pollution when usingCommuter Line. Commuting experience is defined astraveling for less and more than two years. Furthermore,education was the highest formal education attained bythe commuter, less than or equal to senior high school(SHS) and higher.10 Income is a total income per monthof the commuter, using provincial minimum wage (lessthan equal 3 million/low and above 3 million/high).Discomfort perception with pollution is defined com-muters feel discomfort with pollution during commuting(measured of 1-10 scale, good is more than median scoreand vice versa).
Descriptive analysis was used to explain the demo-graphic characteristics of the respondents (name, sex,edu cation, job characteristics, salary, marital status).Then a path analysis was carried out by using proprietarystatistical software package, which is a tool for assessingthe direct and indirect effects of some variables on a spe-cific target variables that was healthy behavior. The di-rect effect meant that it would be affected without an in-termediate dependent variable (H1, H2, H3) while indi-rect effect had intermediary variable to dependent vari-able (H4, H5, H6, H7, H8, H9). The strength of a pathwas represented by a coefficient conceptually equal tothe standardized partial regression coefficients. A coeffi-cient had a range from −1 to +1. The higher the coeffi-cient, the greater the effect of one variable on another.The t-value, which is the ratio of the unstandardized es-timate to standard error, was used to assess the signifi-cance of a path in a path analysis model: if t-value >1.96,the path was significant at 0.05.
In addition to each path, the suitability of a pathanalysis model can also be determined using indices avail-able for such evaluations. These indices can be catego-rized into two main groups, absolute fit indices and com-parative fit indices. Furthermore, absolute fit indicatedoutline how well the hypothesized model fits the data.11
The model c2 value, Root Mean Square Error ofApproximation (RMSEA), suitability of Goodness FitIndex (GFI), and Root Mean Square Residual (RMR)were some indices categorized in the group.11
The model c2 value was very sensitive to the samplesize and typically its value increases as the sample size in-creases. To solve this problem, it is proposed to use theratio of the value c2 to the degree of freedom (df) in sucha way that a ratio of less than two indicates of a sa -tisfactory adaptation of the model.11 An RMSEA was an-other absolute fit index, popular because of its informa-tive and easy to interpret nature. This index was calculat-ed using the model c2 value, df, and sample size (N)
Kusmawan et al, A Path Analysis Model for Explaining Factors Influencing Wearing Mask among Commuting Workers
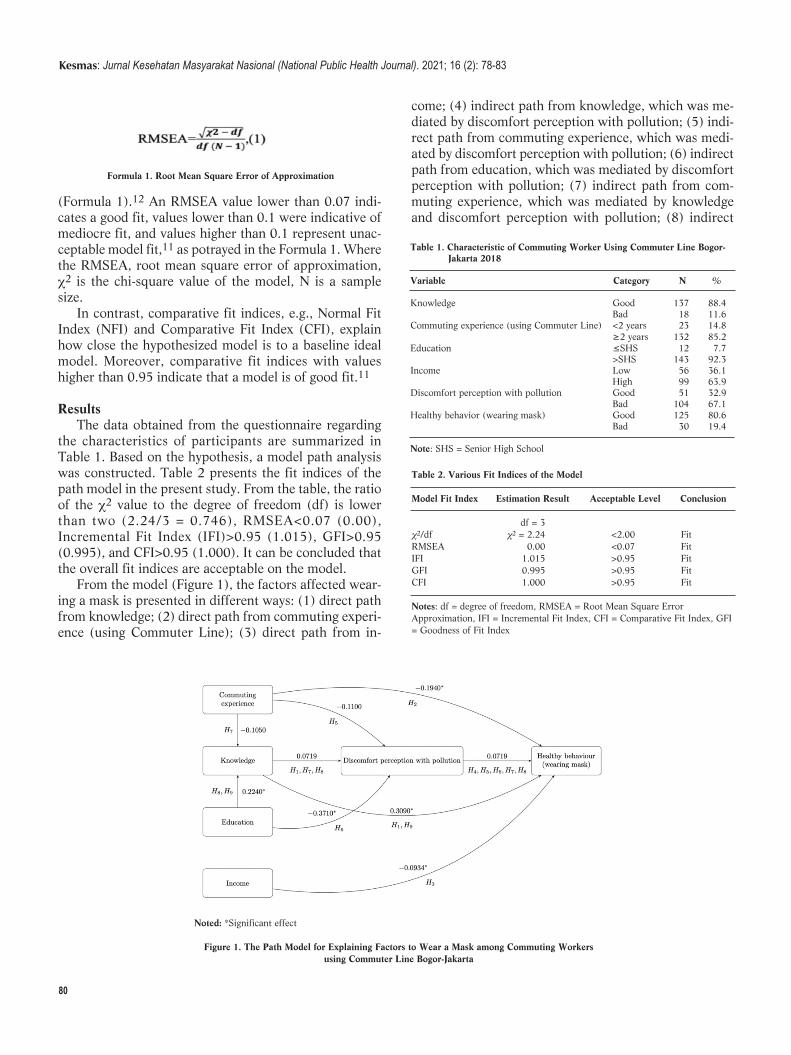
80
(Formula 1).12 An RMSEA value lower than 0.07 indi-cates a good fit, values lower than 0.1 were indicative ofmediocre fit, and values higher than 0.1 re present unac-ceptable model fit,11 as potrayed in the Formula 1. Wherethe RMSEA, root mean square error of approximation,c2 is the chi-square value of the model, N is a samplesize.
In contrast, comparative fit indices, e.g., Normal FitIndex (NFI) and Comparative Fit Index (CFI), explainhow close the hypothesized model is to a baseline idealmodel. Moreover, comparative fit indices with valueshigher than 0.95 indicate that a model is of good fit.11
ResultsThe data obtained from the questionnaire regarding
the characteristics of participants are summarized inTable 1. Based on the hypothesis, a model path analysiswas constructed. Table 2 presents the fit indices of thepath model in the present study. From the table, the ratioof the c2 value to the degree of freedom (df) is lowerthan two (2.24/3 = 0.746), RMSEA<0.07 (0.00),Incremental Fit Index (IFI)>0.95 (1.015), GFI>0.95(0.995), and CFI>0.95 (1.000). It can be concluded thatthe overall fit indices are acceptable on the model.
From the model (Figure 1), the factors affected wear-ing a mask is presented in different ways: (1) direct pathfrom knowledge; (2) direct path from commuting experi-ence (using Commuter Line); (3) direct path from in-
come; (4) indirect path from knowledge, which was me-diated by discomfort perception with pollution; (5) indi-rect path from commuting experience, which was medi-ated by discomfort perception with pollution; (6) indirectpath from education, which was mediated by discomfortperception with pollution; (7) indirect path from com-muting experience, which was mediated by knowledgeand discomfort perception with pollution; (8) indirect
Formula 1. Root Mean Square Error of Approximation
Table 1. Characteristic of Commuting Worker Using Commuter Line Bogor- Jakarta 2018
Variable Category N %
Knowledge Good 137 88.4 Bad 18 11.6Commuting experience (using Commuter Line) <2 years 23 14.8 ≥2 years 132 85.2Education ≤SHS 12 7.7 >SHS 143 92.3Income Low 56 36.1 High 99 63.9Discomfort perception with pollution Good 51 32.9 Bad 104 67.1Healthy behavior (wearing mask) Good 125 80.6 Bad 30 19.4
Note: SHS = Senior High School
Table 2. Various Fit Indices of the Model
Model Fit Index Estimation Result Acceptable Level Conclusion
df = 3c2/df c2 = 2.24 <2.00 FitRMSEA 0.00 <0.07 FitIFI 1.015 >0.95 FitGFI 0.995 >0.95 FitCFI 1.000 >0.95 Fit
Notes: df = degree of freedom, RMSEA = Root Mean Square ErrorApproximat ion, IFI = Incremental Fit Index, CFI = Comparative Fit Index, GFI= Goodness of Fit Index
Kesmas: Jurnal Kesehatan Masyarakat Nasional (National Public Health Journal). 2021; 16 (2): 78-83
Noted: *Significant effect
Figure 1. The Path Model for Explaining Factors to Wear a Mask among Commuting Workersusing Commuter Line Bogor-Jakarta
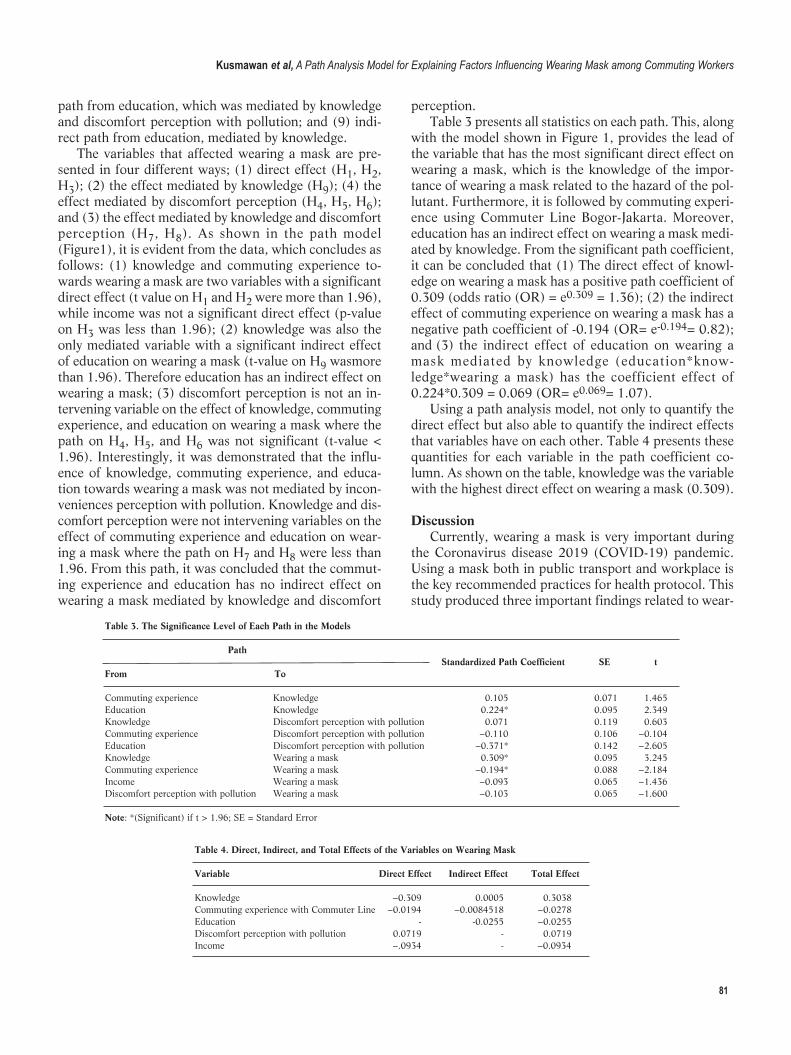
81
path from education, which was mediated by knowledgeand discomfort perception with pollution; and (9) indi-rect path from education, mediated by knowledge.
The variables that affected wearing a mask are pre-sented in four different ways; (1) direct effect (H1, H2,H3); (2) the effect mediated by knowledge (H9); (4) theeffect mediated by discomfort perception (H4, H5, H6);and (3) the effect mediated by knowledge and discomfortperception (H7, H8). As shown in the path model(Figure1), it is evident from the data, which concludes asfollows: (1) knowledge and commuting experience to-wards wearing a mask are two variables with a significantdirect effect (t value on H1 and H2 were more than 1.96),while income was not a significant direct effect (p-valueon H3 was less than 1.96); (2) knowledge was also theonly mediated variable with a significant indirect effectof education on wearing a mask (t-value on H9 wasmorethan 1.96). Therefore education has an indirect effect onwearing a mask; (3) discomfort perception is not an in-tervening variable on the effect of knowledge, commutingexperience, and education on wearing a mask where thepath on H4, H5, and H6 was not significant (t-value <1.96). Interestingly, it was demonstrated that the influ-ence of knowledge, commuting experience, and educa-tion towards wearing a mask was not mediated by incon-veniences perception with pollution. Knowledge and dis-comfort perception were not intervening variables on theeffect of commuting experience and education on wear-ing a mask where the path on H7 and H8 were less than1.96. From this path, it was concluded that the commut-ing experience and education has no indirect effect onwearing a mask mediated by knowledge and discomfort
perception.Table 3 presents all statistics on each path. This, along
with the model shown in Figure 1, provides the lead ofthe variable that has the most significant direct effect onwearing a mask, which is the knowledge of the impor-tance of wearing a mask related to the hazard of the pol-lutant. Furthermore, it is followed by commuting experi-ence using Commuter Line Bogor-Jakarta. Moreover,edu cation has an indirect effect on wearing a mask medi-ated by knowledge. From the significant path coefficient,it can be concluded that (1) The direct effect of knowl-edge on wearing a mask has a positive path coefficient of0.309 (odds ratio (OR) = e0.309 = 1.36); (2) the indirecteffect of commuting experience on wearing a mask has anegative path coefficient of -0.194 (OR= e-0.194= 0.82);and (3) the indirect effect of education on wearing amask mediated by knowledge (education*know -ledge*wear ing a mask) has the coefficient effect of0.224*0.309 = 0.069 (OR= e0.069= 1.07).
Using a path analysis model, not only to quantify thedirect effect but also able to quantify the indirect effectsthat variables have on each other. Table 4 presents thesequantities for each variable in the path coefficient co -lumn. As shown on the table, knowledge was the variablewith the highest direct effect on wearing a mask (0.309).
DiscussionCurrently, wearing a mask is very important during
the Coronavirus disease 2019 (COVID-19) pandemic.Using a mask both in public transport and workplace isthe key recommended practices for health protocol. Thisstudy produced three important findings related to wear-
Table 3. The Significance Level of Each Path in the Models
Path Standardized Path Coefficient SE tFrom To Commuting experience Knowledge 0.105 0.071 1.465Education Knowledge 0.224* 0.095 2.349Knowledge Discomfort perception with pollution 0.071 0.119 0.603Commuting experience Discomfort perception with pollution −0.110 0.106 −0.104Education Discomfort perception with pollution −0.371* 0.142 −2.605Knowledge Wearing a mask 0.309* 0.095 3.245Commuting experience Wearing a mask −0.194* 0.088 −2.184Income Wearing a mask −0.093 0.065 −1.436Discomfort perception with pollution Wearing a mask −0.103 0.065 −1.600
Note: *(Significant) if t > 1.96; SE = Standard Error
Table 4. Direct, Indirect, and Total Effects of the Variables on Wearing Mask
Variable Direct Effect Indirect Effect Total Effect
Knowledge −0.309 0.0005 0.3038Commuting experience with Commuter Line −0.0194 −0.0084518 −0.0278Education - -0.0255 −0.0255Discomfort perception with pollution 0.0719 - 0.0719Income −.0934 - −0.0934
Kusmawan et al, A Path Analysis Model for Explaining Factors Influencing Wearing Mask among Commuting Workers
82
ing a mask of commuter workers using Commuter Linetransportation.
The factors that directly and indirectly influencedwearing a mask were factors of knowledge, educationand risk perception. This finding was in line with the fac-tors affecting workers/community that influence wearinga mask during the COVID-19 pandemic.20 The direct ef-fect of knowledge on wearing a mask had a positive pathcoefficient of 0.309 (odds ratio (OR) = e0.309 = 1.36).As a result, the commuter that knew about the potentialhazard of air pollution had OR to wear masks by 1.36units higher than commuters that do not know.
The direct effect of commuting experience on wearinga mask has a negative path coefficient of -0.194 (OR= e-0.194= 0.82). Therefore, the commuter with experienceusing the Commuter Line Bogor-Jakarta for more thanequal two years had OR to wear a mask by 0.82 unitslower than the commuter with experience less than twoyears using Commuter Line Bogor-Jakarta. In otherwords, commuters with experience in using theCommuter Line Bogor-Jakarta for less than two yearshave OR to wear mask 1.22 units higher than commuterswith an experience of more than equal two years.
The indirect effect of education on wearing a maskmediated by knowledge (education to knowledge towearing a mask) has a coefficient effect of 0.224*0.309= 0.069 (OR= e0.069= 1.07). Therefore, the commuterwith higher education than SHS had OR to wear a maskby 1.07 units, higher than the commuters with lower edu -cational level than SHS.
Healthy behavior is required during labor. Most studyrelated to healthy and safe behavior are being carried outin the workplace.9,13,14 However, a study has also shownthat safe behavior is important in commuting activities,especially in the transportation industry.14 In this study,the assessment of healthy behavior related to wearing amask was carried out for commuters using CommuterLine Bogor-Jakarta. Furthermore, wearing a mask is oneof the indicators studied concerning healthy behavior be-cause it reduces the risk of exposure to various pollu-tants.15,16 This study reported that knowledge of the riskof contaminants was the greatest significant effect direct-ly on safety or healthy behavior (wearing a mask). Thisresult is in line with the findings of the previous study,according to Ghasemi, et al.17
Previous study showed that the perception of risk wasdirectly significant to healthy or safe behavior.18
However, this study also demonstrated that the discom-fort perception about pollution (bad and good) did notsignificantly affect the commuter wearing a mask both asa direct and indirect effect (intermediary factor) throughknowledge, commuter experience, and education.Furthermore, the perception of pollution was only mea -sured by bad and good. The perception of risk of hazard
(pollution) could affect commuters in healthy behavior;therefore, the bad perception of inconvenience feelingabout pollution is not dangerous for them, especiallyfrom an occupational health and safety perspective.There was a positive effect between perceived severityand preventive behavior, and people with a high per-ceived severity increased preventive behavior comparedto people with low perceived severity. In summary, themodel presented provides important findings on how theeffects of wearing a mask on healthy behavior are notmediated by other variables such as perceived complaintsabout pollution.
Path analysis is a powerful method for assessing directand indirect impacts, but it has limitations. Some of theselimitations are discussed by Jeon. For example, pathanalysis can only be used for explanation and not for pre-diction.18,19 This study also needs a qualitative methodto investigate further and validate healthy and safe be-havior. The bias may arise from the distributed question-naires. However, this problem has been minimized byconducting the validity and reliability test of the ques-tionnaire.
Despite the limitations of this study, the findings con-tributes to the literature with important information onhealthy behavior related to wearing a mask for commut-ing workers
ConclusionThe healthy behavior (wearing a mask) for commut-
ing workers using Commuter Line Bogor-Jakarta is influ-enced by some factors, both directly and indirectly. Theknowledge and commuting experience towards healthybehavior were two variables with a significant direct in-fluence on healthy behavior. Knowledge was also the on-ly mediated variable with a significant indirect effect ofeducation on healthy behavior.
AbbreviationsPM: Particulate Matter; UFPs: Ultrafine Particles; 1-OHP: 1-Hydroxypyrene; PAHs: PolycyclicAromatic Hydrocarbons; PPE:Personal Protective Equipment; QOL: Quality of Life; SHS: SeniorHigh School; df: Degree of Freedom; RMSEA: Root Mean Square Errorof Approximation; GFI: Goodness Fits Index; RMR: Root Mean SquareResidual; NFI: Normal Fit Index; CFI: Comparative Fit Index; IFI:Incremental Fit Index; Covid-19: Coronavirus disease 2019; OR: OddRatio.
Ethics Approval and Consent to ParticipateThe study questionnaire was approved in regards to ethical studies bythe Directorate of Research and Community Service, Faculty of PublicHealth, Universitas Indonesia with Approval Number296/UN2.F10PPM.00.02/2018.industr
Competing Interest
Kesmas: Jurnal Kesehatan Masyarakat Nasional (National Public Health Journal). 2021; 16 (2): 78-83
83
The author declares that there are no significant competing financial,professional, or personal interests that might have affected the per-formance or presentation of the work described in this manuscript.
Availability of Data and MaterialsThe authors confirm that the data supporting the finding of this studyare available within the article and its supplementary materials.
Authors’ ContributionDK was the principal investigator of the study. DK managed data col-lection, controlled the framework and reporting. IG was in charge ofstatistical analysis and their interpretation. SA was collaborating inwriting the manuscript. HIS and MW support grant for collecting data.
AcknowledgmentThe study is funded by The Directorate of Research and CommunityEngagement of Universitas Indonesia 2018.
References1. World Health Organization. Ambient air pollution: a global assessment
of exposure and burden of disease; 2016.
2. Woodward N, Haghani A, Johnson R, Hsu T, Saffari A, Sioutas C, et al.
Prenatal and early life exposure to air pollution induced hippocampal
vascular leakage and impaired neurogenesis in association with behav-
ioral deficits. Translational Psychiatry. 2018; 8: 261.
3. Gilliland J, Maltby M, Xu X, Luginaah I, Loebach J, Shah T. Is active
travel a breath of fresh air? Examining children's exposure to air pollu-
tion during the school commute. Spatial and Spatio-temporal
Epidemiology. 2019; 29: 51-7.
4. Zuurbier M, Hoek G, Oldenwening M, Meliefste K, van den Hazel P,
Brunekreef B. Respiratory effects of commuters' exposure to air pollu-
tion in traffic. Epidemiology. 2011: 219-27.
5. Knibbs LD, Cole-Hunter T, Morawska L. A review of commuter expo-
sure to ultrafine particles and its health effects. Atmospheric
Environment. 2011; 45: 2611-22.
6. Miao Q, Bouchard M, Chen D, Rosenberg MW, Aronson KJ.
Commuting behaviors and exposure to air pollution in Montreal,
Canada. Science of the Total Environment. 2015; 508: 193.
7. Takano APC, Justo LT, dos Santos NV, Marquezini MV, de André PA,
da Rocha FMM, et al. Pleural anthracosis as an indicator of lifetime ex-
posure to urban air pollution: an autopsy-based study in Sao Paulo.
Environmental Research. 2019; 173: 23-32.
8. Vienneau D, Schindler C, Perez L, Probst-Hensch N, Röösli M. The re-
lationship between transportation noise exposure and ischemic heart
disease: a meta-analysis. Environmental Research. 2015; 138: 372-80.
9. Pandit B, Albert A, Patil Y, Al-Bayati AJ. Impact of safety climate on
hazard recognition and safety risk perception. Safety Science. 2019;
113: 44-53.
10. Kusmawan D, Susilowati IH, Wirawan M. Study of quality of life at
worker user train commuter line and transjakarta busway Bogor-Jakarta
2018. Indian Journal of Public Health Research & Development. 2018;
9.
11. Hooper D, Coughlan J, Mullen M. Structural equation modelling: guide-
lines for determining model fit. Articles. 2008: 2.
12. Kline RB. Principles and practice of structural equation modeling.
Guilford Publications; 2015.
13. Fogarty GJ, Shaw A. Safety climate and the theory of planned behavior:
towards the prediction of unsafe behavior. Accident Analysis &
Prevention. 2010; 42: 1455-9.
14. Hazavehei S, Shadzi S, Asgari T, Pourabdian S, Hasanzadeh A. The ef-
fect of safety education based on health belief model (HBM) on the
workers practice of Borujen industrial town in using the personal pro-
tection respiratory equipments. Iran Occupational Health. 2008; 5: 21-
30.
15. Patel D, Shibata T, Wilson J, Maidin A. Challenges in evaluating PM
concentration levels, commuting exposure, and mask efficacy in reduc-
ing PM exposure in growing, urban communities in a developing coun-
try. Science of The Total Environment. 2016; 543: 416-24.
16. Pacitto A, Amato F, Salmatonidis A, Moreno T, Alastuey A, Reche C, et
al. Effectiveness of commercial face masks to reduce personal PM expo-
sure. Science of The Total Environment. 2019; 650: 1582-90.
17. Ghasemi F, Kalatpour O, Moghimbeigi A, Mohhamadfam I. A path
analysis model for explaining unsafe behavior in workplaces: the effect
of perceived work pressure. International journal of occupational safety
and ergonomics. 2018; 24: 303-10.
18. Dewi RD, Rahardjo SS, Murti B. Path analysis on the factors affecting
the use of personal protection equipment among airport construction
workers in Yogyakarta. Journal of Health Promotion and Behavior.
2019; 4: 12-21.
19. Jeon J. The strengths and limitations of the statistical modeling of com-
plex social phenomenon: focusing on SEM, path analysis, or multiple
regression models. nternational Journal of Social, Behavioral,
Educational, Economic, Business and Industrial Engineering. 2015; 9:
1594-602.
20. Irfan M, Akhtar N, Ahmad M, Shahzad F, Elavarasan RM, Wu H, Yang
C. Assessing public willingness to wear face masks during the COVID-
19 pandemic: fresh insights from the theory of planned behavior.
International Journal of Environmental Research and Public Health.
2021;18 (9): 4577.
Kusmawan et al, A Path Analysis Model for Explaining Factors Influencing Wearing Mask among Commuting Workers
Correspondence*: Esty Febriani, Public Health Master Degree Program, STIKESKuningan, Lingkar Bayuning Street No.2, Kadugede, Kuningan District, WestJawa 45561, Indonesia, E-mail: [email protected], Phone: +62 81314388171
Febriani et al. Kesmas: Jurnal Kesehatan Masyarakat Nasional (National Public HealthJournal). 2021; 16 (2): 84-90DOI: 10.21109/kesmas.v16i2.3307
Empowering Health Cadres to Support Drug-ResistantTuberculosis (DR-TB) Patient to Enroll in Treatment
Esty Febriani1,2*, Adik Wibowo3, Neeraj Kak4, Hala J Al-Mossawi4
1Technical Tuberculosis Advisor at Lembaga Kesehatan Nahdlathul Ulama (LKNU), Indonesia2Lecturer of Public Health Master Degree Program STIKES Kuningan, Kuningan, West Java, Indonesia3Department of Health Policy and Administration, Faculty of Public Health, Universitas Indonesia, Depok, Indonesia4University Research Co., LLC, Chevy Chase, MD, USA
AbstractTuberculosis (TB) remains a big challenge globally, while the involvement of health cadres’ constitutes one of the key strategies for the TB program inIndonesia. These roles were further expanded to providing support to DR-TB patients. This study was a qualitative study, conducted in 2015 to explore thevarious factors which influence the performance of health cadres’ in supporting DR-TB patients to enroll in treatment. A total of 39 informants consisting of 24health cadres, three nurses, four DR-TB patients, and three family members, two peer support, a head of primary health care, and two TB staffs from theDistrict Health Office were recruited for this study. Meanwhile, a refresher training for health cadres was conducted regarding knowledge on TB, communitysupport, effective communication, as well as patient tracing. There was no significant difference in the pre and post-test results; however the health cadresshowed great capability in communicating and assessing the condition of patients. In addition, the health cadres assisted in carrying out patient tracingprocess, an important initial step to better understand patients's overall condition and identify problems faced while seeking treatment. Health cadres needto work with various parties such as family members, close relative to the patient, peer support groups, and nurses to encourage patients to enroll in treat-ment.
Keywords: default patient, drug resistant-tuberculosis, health cadres, patient tracing
IntroductionTuberculosis (TB) remains a big challenge globally,
the World Health Organization (WHO) reported the es-timated TB incidence rate to be 9.6 million and 13% co-infected with HIV, 1.5 million died of TB where 1.1 wasHIV negative and 400,000 positive. Besides, there wasalso a challenge where 480,000 Drug-ResistantTuberculosis (DR-TB) occurred in 2014, but only123,000 cases were detected and reported.1 UntreatedTB cases continued to transmit disease rapidly; hence itwas important that all case needed to be placed underevidence-based treatment and to ensure that each patientcomplete the treatment successfully. Moreover, when pa-tients failed in DR-TB treatment, it potentially results inExtensively Drug-Resistant (XDR-TB). The average pro-portion of DR-TB cases that became XDR-TB was 9%.1In 2018, WHO reported that the estimated number ofDR-TB in Indonesia was 2.4% new cases, 13% andpreviously treated cases, 24,000.2
In 2013, the Minister of Health of the Republic ofIndonesia No. 13 of 2013 was launched. It explained that
DR-TB is a man-made phenomenon, while the three maincomponents that contributed towards the occurrence ofDR-TB include health workers, patients, and the TB con-trol program. The main factor causing resistance towardsTB drugs was the human factor which failed to carry outTB treatment management properly. This factor is con-cerned with health workers' skills and performance, non-adherent patients, and a weak TB control program.3-5
Based on previous studies, the determinants of DR-TBinclude side effect during first-line treatment, negligenceby health care work er, interruption of treatment,previous default, and duration of treatment between 2-6months.6-8
Matebesi and Timmerman,9 concluded that lack ofknowledge about TB, unsustainable TB education, sideeffects of drugs, hunger, lack of family support, stigma,and various factors were all related to health services.Similar situation was also reported in PersahabatanHospital, Jakarta, Indonesia. Based on data collect edfrom 2009 to 2013, of 595 confirmed cases for DR-TB,
Received : September 08, 2019Accepted : January 21, 2021Published : May 28, 2021
Kesmas: Jurnal Kesehatan Masyarakat Nasional(National Public Health Journal)
Copyright @ 2021, Kesmas: Jurnal Kesehatan Masyarakat Nasional (National Public Health Journal), p-ISSN: 1907-7505, e-ISSN: 2460-0601, SINTA-S1 accredited,http://journal.fkm.ui.ac.id/kesmas, Licensed under Creative Commons Attribution-ShareAlike 4.0 International
85
only 402 (67%) enrolled in the treatment. The most sta-ted reason for the failure in follow-up was transportationcost and living expenses (57%), followed by side effects(22%), psychosocial problems (6%), work reasons(6%), while 5% were unknown, and 4% were due to ot-her reasons.10
Overall, the DR-TB enrollment rate was not improvedand even worse. Based on the global TB report and theresults of the joint evaluation monitoring mission,11 thesituation has not changed. The treatment outcome of DR-TB patients in Indonesia has not changed and even tendsto decline at 50%.2,11
According to the National Tuberculosis ControlGuidelines, the Direct Observer Treatment (DOT) offi-cer is responsible for tracking default TB patients.Whereas, based on the Technical Guidelines forIntegrated Program Management of Drug-ResistantTuberculosis Control (PMDT), health workers in hospi-tals or Primary Health Care are responsible for preven-ting and minimizing loss to follow-up cases includingtracking default patients. However, this procedure hasnot always been carried out in reality. Limitations in timeamong health workers as well as incomplete patient in-formation failed to track patients that did not enrol fortreatment.4,12
As an effort to control various public health problem,community involvement has been applied in providingsupport to TB patients. Involvement of health cadres inimproving case tracking and supporting drug-sensitiveTB patients has long been applied in Indonesia, althoughthis role is yet fully implemented. In other countries, thecommunity-based approach tends to improve the cure ra-tes for DR-TB patients. A psycho-social support group(PSSG) consisting of psychologists, social workers, andTB nurses jointly improved treatment adherence from47% to 97% in Kazakhstan.13 In Bangladesh, the invol-vement of community health worker (CHW) in suppor-ting DR-TB treatment reduced follow-up loss from 27%in 2008 to 14% in 2011.14
Since June 2014, there were 30-72 health cadres inNorth Jakarta and Central Jakarta. This community inter-vention was to increase the enrollment rate of DR-TB pa-tients. Based on the pre-study, the health cadres success-fully encouraged five out of 21 DR-TB patients thatdelayed treatment, three out of the default patients con-tinued the treatment. Hence, it was concluded that therole of health cadres in encouraging patients to increasethe enrollment rate of TB patients is not yet effective.This was an exploratory study conducted to evaluate themain roles of cadres and the various factors influencingthe performance in supporting DR-TB patients' enroll-ment for treatment.
The logic model developed by Naimoli, et al.,15 andwas used to explore various factors influencing the per-
formance of health cadres in supporting DR-TB patient.It is a pathway or theoretical flow about the causal per-formance of CHW as well as mapping the relationshipbetween program planning and goals to be achieved.Using this model, it was concluded that when various ac-tivities at the program and system-level are well perfor-med, there is improvement in CHW performance and theprogram goals are achieved.15
MethodThe explanatory study conducted using qualitative
methods from April to July 2015. It aimed to explore themain roles of health cadres in encouraging patients to en-rolled for treatment and explore various factors influen-cing the health cadres’ performance. The study results we-re expected to provide basis for the development of moreappropriate strategies to increase the enrollment rate ofDR-TB patients.
Data collection was carried out with focused groupdiscuss ion, in-depth interview with key informants, com-munication skill observation, and review of routine datamonitoring. There were two Focus Group Discussions(FGDs) with health cadres from Central and NorthJakarta. In-depth interview conducted with six healthcadres, three nurses, two DR-TB patients that compliedwith treatment, one defaulter patient, a DR-TB patientwith experience as a defaulter and three family members,two TB staffs at North and Central Jakarta RegionalHealth Office staff, and the head of primary health care.A self-administered questionnaire was used to describethe characteristic of the 24 health cadres, including vari-ables, such as socio-demographic data, history TB experi-ence, motivation and perspective about the training mate-rial, non-material incentive, and work satisfaction.
Data were analyzed through several stages namely co-dification based on interview transcript and FGD, group -ing theme, data validation using the triangulation methodand conclusions. The result was used to identify the keytopics that expected to be covered in the refresher trai-ning. In September 2015, a three-day refresher trainingwas conducted to improve the capacity of 24 healthcadres. The topics covered in training include TB know-ledge, improving effective communication and conductingpatient assessment skill, collaborating with former patientgroups, and carrying out report recording.
A pretest was performed to measure the knowledge ofrespondents while the posttest was done three months af-ter the training. In addition, communication skills obser-vations were conducted to observe the capability of thehealth cadres while conducting home visits. The routinemonitoring data were reviewed to analyze the progress ofhealth cadres in providing support to DR-TB patients inthree months.
The study fulfilled the standards set by Komisi Ahli
Febriani et al, Empowering Helath Cadres to Support Tuberculosis (DR-TB) Patient to Enroll in Treatment
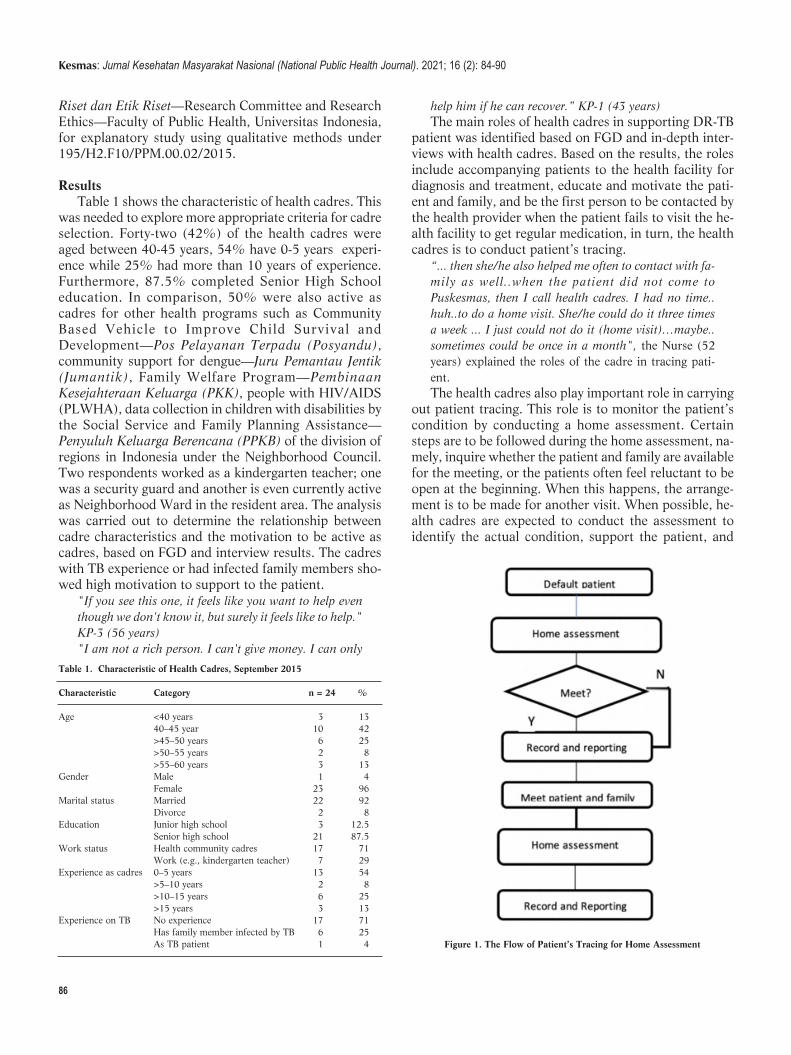
86
Riset dan Etik Riset—Research Committee and ResearchEthics—Faculty of Public Health, Universitas Indonesia,for explanatory study using qualitative methods under195/H2.F10/PPM.00.02/2015.
ResultsTable 1 shows the characteristic of health cadres. This
was needed to explore more appropriate criteria for cadreselection. Forty-two (42%) of the health cadres wereaged between 40-45 years, 54% have 0-5 years experi-ence while 25% had more than 10 years of experience.Furthermore, 87.5% completed Senior High Schooleducation. In comparison, 50% were also active ascadres for other health programs such as CommunityBased Vehicle to Improve Child Survival andDevelopment—Pos Pelayanan Terpadu (Posyandu),community support for dengue—Juru Pemantau Jentik(Jumantik), Family Welfare Program—PembinaanKesejahteraan Keluarga (PKK), people with HIV/AIDS(PLWHA), data collection in children with disabilities bythe Social Service and Family Planning Assistance—Penyuluh Keluarga Berencana (PPKB) of the division ofregions in Indonesia under the Neighborhood Council.Two respondents worked as a kindergarten teacher; onewas a security guard and another is even currently activeas Neighborhood Ward in the resident area. The analysiswas carried out to determine the relationship betweencadre characteristics and the motivation to be active ascadres, based on FGD and interview results. The cadreswith TB experience or had infected family members sho-wed high motivation to support to the patient.
"If you see this one, it feels like you want to help eventhough we don't know it, but surely it feels like to help."KP-3 (56 years)"I am not a rich person. I can't give money. I can only
help him if he can recover.” KP-1 (43 years)The main roles of health cadres in supporting DR-TB
patient was identified based on FGD and in-depth inter-views with health cadres. Based on the results, the rolesinclude accompanying patients to the health facility fordiagnosis and treatment, educate and motivate the pati-ent and family, and be the first person to be contacted bythe health provider when the patient fails to visit the he-alth facility to get regular medication, in turn, the healthcadres is to conduct patient’s tracing.
“... then she/he also helped me often to contact with fa-mily as well..when the patient did not come toPuskesmas, then I call health cadres. I had no time..huh..to do a home visit. She/he could do it three timesa week ... I just could not do it (home visit)…maybe..sometimes could be once in a month", the Nurse (52years) explained the roles of the cadre in tracing pati-ent.The health cadres also play important role in carrying
out patient tracing. This role is to monitor the patient’scondition by conducting a home assessment. Certainsteps are to be followed during the home assessment, na-mely, inquire whether the patient and family are availablefor the meeting, or the patients often feel reluctant to beopen at the beginning. When this happens, the arrange-ment is to be made for another visit. When possible, he-alth cadres are expected to conduct the assessment toidentify the actual condition, support the patient, and
Kesmas: Jurnal Kesehatan Masyarakat Nasional (National Public Health Journal). 2021; 16 (2): 84-90
Table 1. Characteristic of Health Cadres, September 2015
Characteristic Category n = 24 %
Age <40 years 3 13 40–45 year 10 42 >45–50 years 6 25 >50–55 years 2 8 >55–60 years 3 13Gender Male 1 4 Female 23 96Marital status Married 22 92 Divorce 2 8Education Junior high school 3 12.5 Senior high school 21 87.5Work status Health community cadres 17 71 Work (e.g., kindergarten teacher) 7 29Experience as cadres 0–5 years 13 54 >5–10 years 2 8 >10–15 years 6 25 >15 years 3 13Experience on TB No experience 17 71 Has family member infected by TB 6 25 As TB patient 1 4 Figure 1. The Flow of Patient’s Tracing for Home Assessment
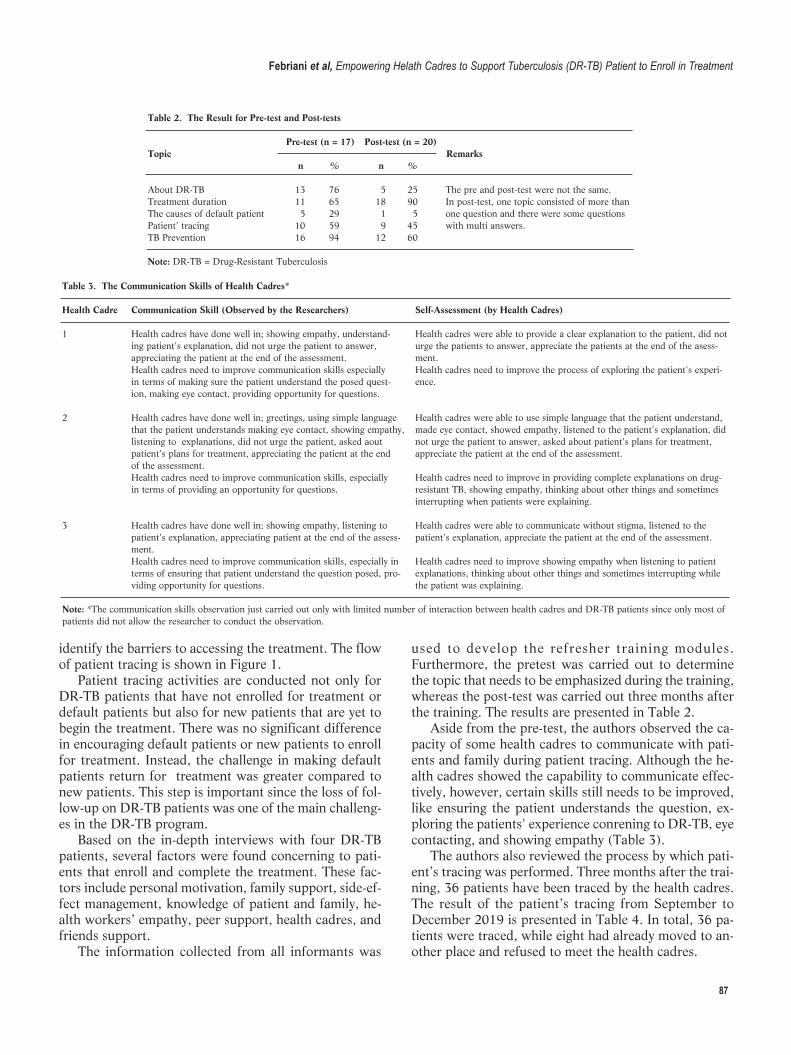
87
identify the barriers to accessing the treatment. The flowof patient tracing is shown in Figure 1.
Patient tracing activities are conducted not only forDR-TB patients that have not enrolled for treatment ordefault patients but also for new patients that are yet tobegin the treatment. There was no significant differencein encouraging default patients or new patients to enrollfor treatment. Instead, the challenge in making defaultpatients return for treatment was greater compared tonew patients. This step is important since the loss of fol-low-up on DR-TB patients was one of the main challeng-es in the DR-TB program.
Based on the in-depth interviews with four DR-TBpatients, several factors were found concerning to pati-ents that enroll and complete the treatment. These fac-tors include personal motivation, family support, side-ef-fect management, knowledge of patient and family, he-alth workers’ empathy, peer support, health cadres, andfriends support.
The information collected from all informants was
used to develop the refresher training modules.Furthermore, the pretest was carried out to determinethe topic that needs to be emphasized during the training,whereas the post-test was carried out three months afterthe training. The results are presented in Table 2.
Aside from the pre-test, the authors observed the ca-pacity of some health cadres to communicate with pati-ents and family during patient tracing. Although the he-alth cadres showed the capability to communicate effec-tively, however, certain skills still needs to be improved,like ensuring the patient understands the question, ex-ploring the patients' experience conrening to DR-TB, eyecontacting, and showing empathy (Table 3).
The authors also reviewed the process by which pati-ent’s tracing was performed. Three months after the trai-ning, 36 patients have been traced by the health cadres.The result of the patient’s tracing from September toDecember 2019 is presented in Table 4. In total, 36 pa-tients were traced, while eight had already moved to an -other place and refused to meet the health cadres.
Febriani et al, Empowering Helath Cadres to Support Tuberculosis (DR-TB) Patient to Enroll in Treatment
Table 3. The Communication Skills of Health Cadres*
Health Cadre Communication Skill (Observed by the Researchers) Self-Assessment (by Health Cadres)
1 Health cadres have done well in; showing empathy, understand- Health cadres were able to provide a clear explanation to the patient, did not ing patient's explanation, did not urge the patient to answer, urge the patients to answer, appreciate the patients at the end of the asess- appreciating the patient at the end of the assessment. ment. Health cadres need to improve communication skills especially Health cadres need to improve the process of exploring the patient's experi- in terms of making sure the patient understand the posed quest- ence. ion, making eye contact, providing opportunity for questions.
2 Health cadres have done well in; greetings, using simple language Health cadres were able to use simple language that the patient understand, that the patient understands making eye contact, showing empathy, made eye contact, showed empathy, listened to the patient's explanation, did listening to explanations, did not urge the patient, asked aout not urge the patient to answer, asked about patient's plans for treatment, patient's plans for treatment, appreciating the patient at the end appreciate the patient at the end of the assessment. of the assessment. Health cadres need to improve communication skills, especially Health cadres need to improve in providing complete explanations on drug- in terms of providing an opportunity for questions. resistant TB, showing empathy, thinking about other things and sometimes interrupting when patients were explaining.
3 Health cadres have done well in; showing empathy, listening to Health cadres were able to communicate without stigma, listened to the patient's explanation, appreciating patient at the end of the assess- patient's explanation, appreciate the patient at the end of the assessment. ment. Health cadres need to improve communication skills, especially in Health cadres need to improve showing empathy when listening to patient terms of ensuring that patient understand the question posed, pro- explanations, thinking about other things and sometimes interrupting while viding opportunity for questions. the patient was explaining.
Note: *The communication skills observation just carried out only with limited number of interaction between health cadres and DR-TB patients since only most ofpatients did not allow the researcher to conduct the observation.
Table 2. The Result for Pre-test and Post-tests
Pre-test (n = 17) Post-test (n = 20)Topic Remarks n % n %
About DR-TB 13 76 5 25 The pre and post-test were not the same.Treatment duration 11 65 18 90 In post-test, one topic consisted of more than The causes of default patient 5 29 1 5 one question and there were some questionsPatient’ tracing 10 59 9 45 with multi answers.TB Prevention 16 94 12 60
Note: DR-TB = Drug-Resistant Tuberculosis
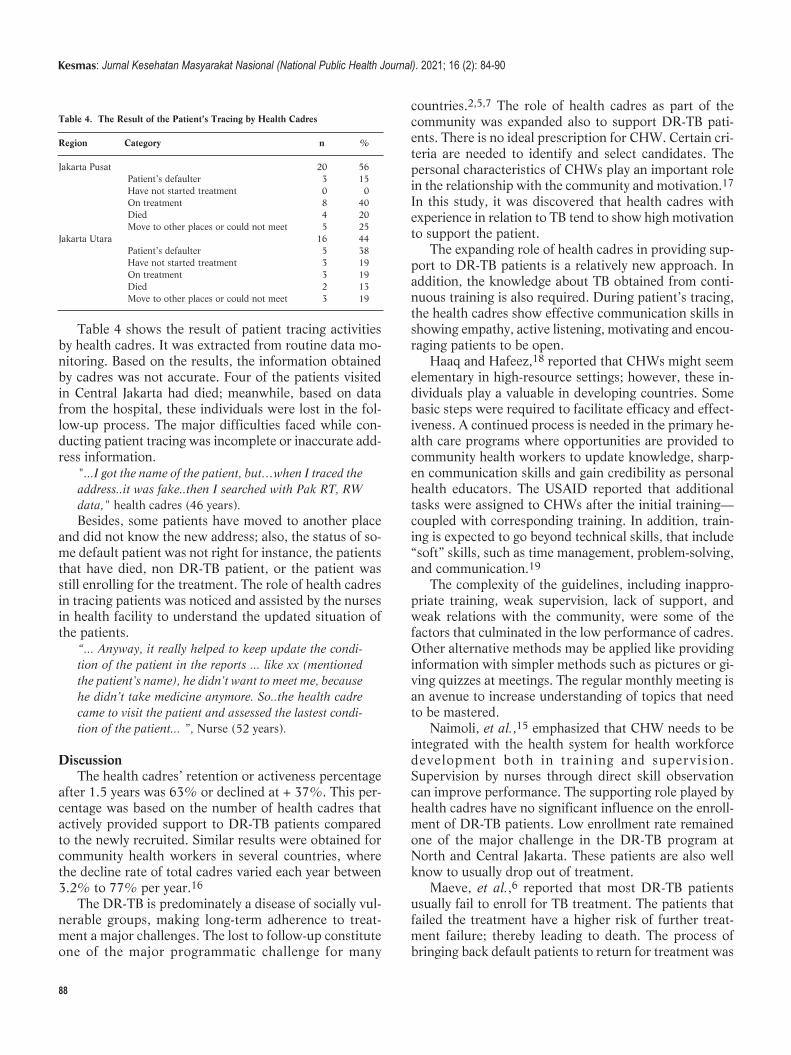
88
Table 4 shows the result of patient tracing activitiesby health cadres. It was extracted from routine data mo-nitoring. Based on the results, the information obtainedby cadres was not accurate. Four of the patients visitedin Central Jakarta had died; meanwhile, based on datafrom the hospital, these individuals were lost in the fol-low-up process. The major difficulties faced while con-ducting patient tracing was incomplete or inaccurate add-ress information.
"...I got the name of the patient, but…when I traced theaddress..it was fake..then I searched with Pak RT, RWdata," health cadres (46 years).Besides, some patients have moved to another place
and did not know the new address; also, the status of so-me default patient was not right for instance, the patientsthat have died, non DR-TB patient, or the patient wasstill enrolling for the treatment. The role of health cadresin tracing patients was noticed and assisted by the nursesin health facility to understand the updated situation ofthe patients.
“... Anyway, it really helped to keep update the condi-tion of the patient in the reports ... like xx (mentionedthe patient's name), he didn't want to meet me, becausehe didn’t take medicine anymore. So..the health cadrecame to visit the patient and assessed the lastest condi-tion of the patient... ”, Nurse (52 years).
DiscussionThe health cadres’ retention or activeness percentage
after 1.5 years was 63% or declined at + 37%. This per-centage was based on the number of health cadres thatactively provided support to DR-TB patients comparedto the newly recruited. Similar results were obtained forcommunity health workers in several countries, wherethe decline rate of total cadres varied each year between3.2% to 77% per year.16
The DR-TB is predominately a disease of socially vul-nerable groups, making long-term adherence to treat-ment a major challenges. The lost to follow-up constituteone of the major programmatic challenge for many
countries.2,5,7 The role of health cadres as part of thecommunity was expanded also to support DR-TB pati-ents. There is no ideal prescription for CHW. Certain cri-teria are needed to identify and select candidates. Thepersonal characteristics of CHWs play an important rolein the relationship with the community and motivation.17
In this study, it was discovered that health cadres withexperience in relation to TB tend to show high motivationto support the patient.
The expanding role of health cadres in providing sup-port to DR-TB patients is a relatively new approach. Inaddition, the knowledge about TB obtained from conti-nuous training is also required. During patient’s tracing,the health cadres show effective communication skills inshowing empathy, active listening, motivating and encou-raging patients to be open.
Haaq and Hafeez,18 reported that CHWs might seemelementary in high-resource settings; however, these in-dividuals play a valuable in developing countries. Somebasic steps were required to facilitate efficacy and effect -iveness. A continued process is needed in the primary he-alth care programs where opportunities are provided tocommunity health workers to update knowledge, sharp -en communication skills and gain credibility as personalhealth educators. The USAID reported that additionaltasks were assigned to CHWs after the initial training—coupled with corresponding training. In addition, train -ing is expected to go beyond technical skills, that include“soft” skills, such as time management, problem-solving,and communication.19
The complexity of the guidelines, including inappro-priate training, weak supervision, lack of support, andweak relations with the community, were some of thefactors that culminated in the low performance of cadres.Other alternative methods may be applied like providinginformation with simpler methods such as pictures or gi-ving quizzes at meetings. The regular monthly meeting isan avenue to increase understanding of topics that needto be mastered.
Naimoli, et al.,15 emphasized that CHW needs to beintegrated with the health system for health workforcedevelopment both in training and supervision.Supervision by nurses through direct skill observationcan improve performance. The supporting role played byhealth cadres have no significant influence on the enroll-ment of DR-TB patients. Low enrollment rate remainedone of the major challenge in the DR-TB program atNorth and Central Jakarta. These patients are also wellknow to usually drop out of treatment.
Maeve, et al.,6 reported that most DR-TB patientsusually fail to enroll for TB treatment. The patients thatfailed the treatment have a higher risk of further treat-ment failure; thereby leading to death. The process ofbringing back default patients to return for treatment was
Kesmas: Jurnal Kesehatan Masyarakat Nasional (National Public Health Journal). 2021; 16 (2): 84-90
Table 4. The Result of the Patient’s Tracing by Health Cadres
Region Category n %
Jakarta Pusat 20 56 Patient’s defaulter 3 15 Have not started treatment 0 0 On treatment 8 40 Died 4 20 Move to other places or could not meet 5 25Jakarta Utara 16 44 Patient’s defaulter 5 38 Have not started treatment 3 19 On treatment 3 19 Died 2 13 Move to other places or could not meet 3 19
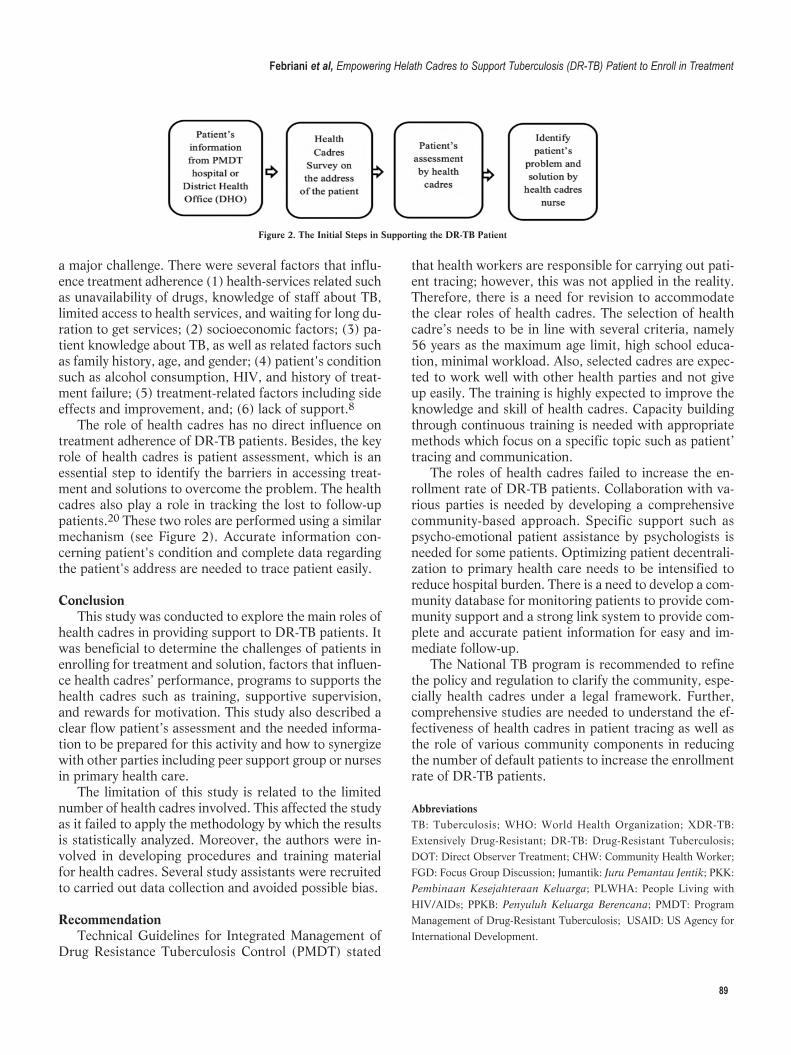
89
a major challenge. There were several factors that influ-ence treatment adherence (1) health-services related suchas unavailability of drugs, knowledge of staff about TB,limited access to health services, and waiting for long du-ration to get services; (2) socioeconomic factors; (3) pa-tient knowledge about TB, as well as related factors suchas family history, age, and gender; (4) patient's conditionsuch as alcohol consumption, HIV, and history of treat-ment failure; (5) treatment-related factors including sideeffects and improvement, and; (6) lack of support.8
The role of health cadres has no direct influence ontreatment adherence of DR-TB patients. Besides, the keyrole of health cadres is patient assessment, which is anessential step to identify the barriers in accessing treat-ment and solutions to overcome the problem. The healthcadres also play a role in tracking the lost to follow-uppatients.20 These two roles are performed using a similarmechanism (see Figure 2). Accurate information con -cern ing pa tient's condition and complete data regardingthe pa tient's address are needed to trace patient easily.
ConclusionThis study was conducted to explore the main roles of
health cadres in providing support to DR-TB patients. Itwas beneficial to determine the challenges of patients inenrolling for treatment and solution, factors that influen-ce health cadres’ performance, programs to supports thehealth cadres such as training, supportive supervision,and rewards for motivation. This study also described aclear flow patient’s assessment and the needed informa-tion to be prepared for this activity and how to synergizewith other parties including peer support group or nursesin primary health care.
The limitation of this study is related to the limitednumber of health cadres involved. This affected the studyas it failed to apply the methodology by which the resultsis statistically analyzed. Moreover, the authors were in-volved in developing procedures and training materialfor health cadres. Several study assistants were recruitedto carried out data collection and avoided possible bias.
RecommendationTechnical Guidelines for Integrated Management of
Drug Resistance Tuberculosis Control (PMDT) stated
that health workers are responsible for carrying out pati-ent tracing; however, this was not applied in the reality.Therefore, there is a need for revision to accommodatethe clear roles of health cadres. The selection of healthcadre’s needs to be in line with several criteria, namely56 years as the maximum age limit, high school educa-tion, minimal workload. Also, selected cadres are expec-ted to work well with other health parties and not giveup easily. The training is highly expected to improve theknowledge and skill of health cadres. Capacity buildingthrough continuous training is needed with appropriatemethods which focus on a specific topic such as patient’tracing and communication.
The roles of health cadres failed to increase the en-rollment rate of DR-TB patients. Collaboration with va-rious parties is needed by developing a comprehensivecommunity-based approach. Specific support such aspsycho-emotional patient assistance by psychologists isneeded for some patients. Optimizing patient decentrali-zation to primary health care needs to be intensified toreduce hospital burden. There is a need to develop a com-munity database for monitoring patients to provide com-munity support and a strong link system to provide com-plete and accurate patient information for easy and im-mediate follow-up.
The National TB program is recommended to refinethe policy and regulation to clarify the community, espe-cially health cadres under a legal framework. Further,comprehensive studies are needed to understand the ef-fectiveness of health cadres in patient tracing as well asthe role of various community components in reducingthe number of default patients to increase the enrollmentrate of DR-TB patients.
AbbreviationsTB: Tuberculosis; WHO: World Health Organization; XDR-TB:Extensively Drug-Resistant; DR-TB: Drug-Resistant Tuberculosis;DOT: Direct Observer Treatment; CHW: Community Health Worker;FGD: Focus Group Discussion; Jumantik: Juru Pemantau Jentik; PKK:Pembinaan Kesejahteraan Keluarga; PLWHA: People Living withHIV/AIDs; PPKB: Penyuluh Keluarga Berencana; PMDT: ProgramManagement of Drug-Resistant Tuberculosis; USAID: US Agency forInternational Development.
Febriani et al, Empowering Helath Cadres to Support Tuberculosis (DR-TB) Patient to Enroll in Treatment
Figure 2. The Initial Steps in Supporting the DR-TB Patient
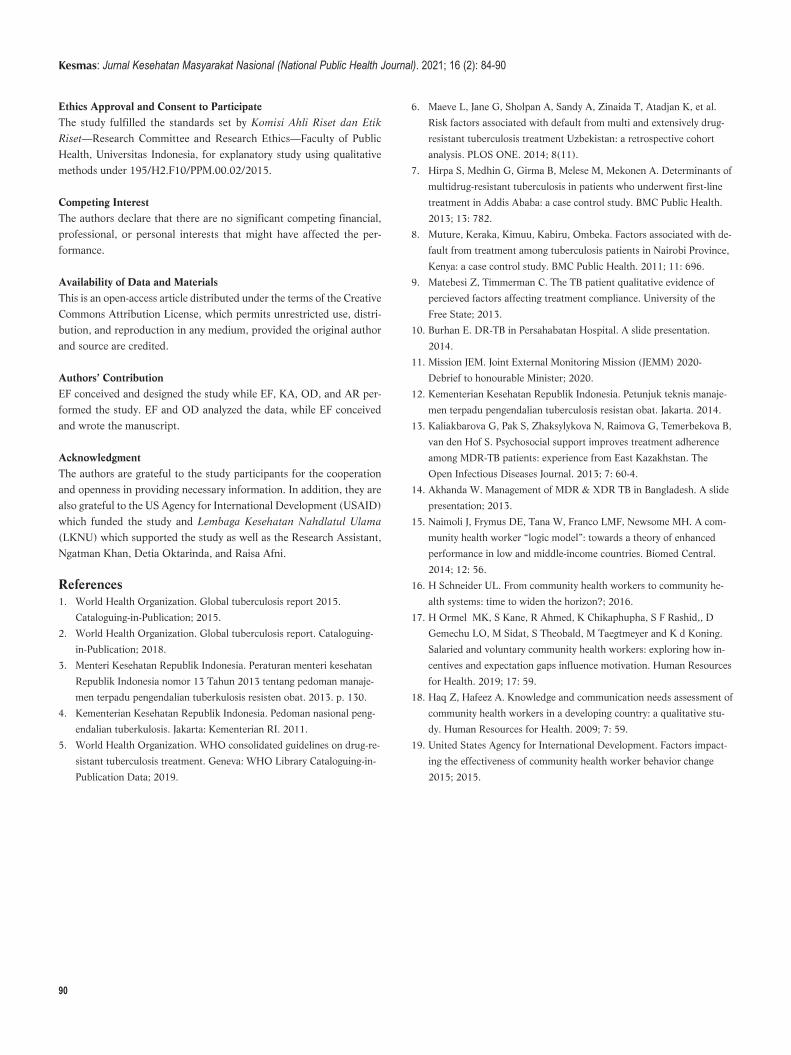
Ethics Approval and Consent to ParticipateThe study fulfilled the standards set by Komisi Ahli Riset dan EtikRiset—Research Committee and Research Ethics—Faculty of PublicHealth, Universitas Indonesia, for explanatory study using qualitativemethods under 195/H2.F10/PPM.00.02/2015.
Competing InterestThe authors declare that there are no significant competing financial,professional, or personal interests that might have affected the per-formance.
Availability of Data and MaterialsThis is an open-access article distributed under the terms of the CreativeCommons Attribution License, which permits unrestricted use, distri-bution, and reproduction in any medium, provided the original authorand source are credited.
Authors’ ContributionEF conceived and designed the study while EF, KA, OD, and AR per-formed the study. EF and OD analyzed the data, while EF conceivedand wrote the manuscript.
AcknowledgmentThe authors are grateful to the study participants for the cooperationand openness in providing necessary information. In addition, they arealso grateful to the US Agency for International Development (USAID)which funded the study and Lembaga Kesehatan Nahdlatul Ulama(LKNU) which supported the study as well as the Research Assistant,Ngatman Khan, Detia Oktarinda, and Raisa Afni.
References1. World Health Organization. Global tuberculosis report 2015.
Cataloguing-in-Publication; 2015.
2. World Health Organization. Global tuberculosis report. Cataloguing-
in-Publication; 2018.
3. Menteri Kesehatan Republik Indonesia. Peraturan menteri kesehatan
Republik Indonesia nomor 13 Tahun 2013 tentang pedoman manaje-
men terpadu pengendalian tuberkulosis resisten obat. 2013. p. 130.
4. Kementerian Kesehatan Republik Indonesia. Pedoman nasional peng-
endalian tuberkulosis. Jakarta: Kementerian RI. 2011.
5. World Health Organization. WHO consolidated guidelines on drug-re-
sistant tuberculosis treatment. Geneva: WHO Library Cataloguing-in-
Publication Data; 2019.
6. Maeve L, Jane G, Sholpan A, Sandy A, Zinaida T, Atadjan K, et al.
Risk factors associated with default from multi and extensively drug-
resistant tuberculosis treatment Uzbekistan: a retrospective cohort
analysis. PLOS ONE. 2014; 8(11).
7. Hirpa S, Medhin G, Girma B, Melese M, Mekonen A. Determinants of
multidrug-resistant tuberculosis in patients who underwent first-line
treatment in Addis Ababa: a case control study. BMC Public Health.
2013; 13: 782.
8. Muture, Keraka, Kimuu, Kabiru, Ombeka. Factors associated with de -
fault from treatment among tuberculosis patients in Nairobi Province,
Kenya: a case control study. BMC Public Health. 2011; 11: 696.
9. Matebesi Z, Timmerman C. The TB patient qualitative evidence of
percieved fac tors affecting treatment compliance. University of the
Free State; 2013.
10. Burhan E. DR-TB in Persahabatan Hospital. A slide presentation.
2014.
11. Mission JEM. Joint External Monitoring Mission (JEMM) 2020-
Debrief to honourable Minister; 2020.
12. Kementerian Kesehatan Republik Indonesia. Petunjuk teknis manaje-
men terpadu pengendalian tuberculosis resistan obat. Jakarta. 2014.
13. Kaliakbarova G, Pak S, Zhaksylykova N, Raimova G, Temerbekova B,
van den Hof S. Psychosocial support improves treatment adherence
among MDR-TB patients: experience from East Kazakhstan. The
Open Infectious Diseases Journal. 2013; 7: 60-4.
14. Akhanda W. Management of MDR & XDR TB in Bangladesh. A slide
presentation; 2013.
15. Naimoli J, Frymus DE, Tana W, Franco LMF, Newsome MH. A com -
munity health worker “logic model”: towards a theory of enhanced
performance in low and middle-income countries. Biomed Central.
2014; 12: 56.
16. H Schneider UL. From community health workers to community he -
alth systems: time to widen the horizon?; 2016.
17. H Ormel MK, S Kane, R Ahmed, K Chikaphupha, S F Rashid,, D
Gemechu LO, M Sidat, S Theobald, M Taegtmeyer and K d Koning.
Salaried and voluntary community health workers: exploring how in-
centives and expectation gaps influence motivation. Human Resources
for Health. 2019; 17: 59.
18. Haq Z, Hafeez A. Knowledge and communication needs assessment of
community health workers in a developing country: a qualitative stu-
dy. Human Resources for Health. 2009; 7: 59.
19. United States Agency for International Development. Factors impact -
ing the effectiveness of community health worker behavior change
2015; 2015.
90
Kesmas: Jurnal Kesehatan Masyarakat Nasional (National Public Health Journal). 2021; 16 (2): 84-90
https://apps.who.int/iris/bitstream/handle/10665/191102/9789241565059_eng.pdf?sequence=1&isAllowed=y
Correspondence*: Evi Martha, Department of Health Education and BehavioralScience, Faculty of Public Health, Universitas Indonesia, D Building 1st FloorKampus Baru UI Depok 16424, Indonesia, E-mail: [email protected],Phone: +62 817 488 3103
Martha et al. Kesmas: Jurnal Kesehatan Masyarakat Nasional (National Public HealthJournal). 2021; 16 (2): 91-99DOI: 10.21109/kesmas.v16i2.3712
IntroductionThe International Conference on Population and
Development (ICPD) in Cairo (1994), which set out abold call-to-action on Sexual and Reproductive Healthand Rights (SRHR), affirmed that choice and self-determination, gender equality, and human rightsconstitute the keystone of population policies.1-3 Thegoals of Sustainable Development Goals (SDGs) are toensure healthy lives and promote the well-being of all atall ages (SDG 3), in order to achieve gender equality andwomen’s empowerment (SDG 5), which signifies theincreased access toward SRH services, ensure theiraffordability, and advance sex evenness.4
Health is one of the basic needs of every individualregardless of their gender. Access to complete sexual andreproductive health services (RHSs) was crucial to thewell-being of individuals, families, and communities.5Global efforts to improve women's health are largelyfocused on improving their reproductive wellness.6,7
Since 2014, the Government of the Republic of Indonesiahad organized a National Health Insurance (NHI)
National Health Insurance Scheme: Internal and ExternalBarriers in the Use of Reproductive Health Services amongWomen
Evi Martha1*, Herna Lestari2, Resvi Siti Zulfa1, Yoslien Sopamena1
1Department of Health Education and Behavioral Science, Faculty of Public Health, Universitas Indonesia, Depok, Indonesia2Yayasan Kesehatan Perempuan, South Jakarta, Jakarta, Indonesia
AbstractLack of familiarity among the community, medical workers, and administrative staff regarding reproductive health services covered by Badan PenyelenggaraJaminan Sosial (BPJS) or the National Health Insurance (NHI) in Indonesia remained a problem. Therefore, this resulted in sub-optimal use of the medicalservices, as shown by surveys from the Women's Health Foundation for three consecutive years (2015-2017). This qualitative study was conducted with aRapid Assessment Procedure design in three cities within Indonesia: Padang Pariaman, Manado, and Kupang. Data were collected through IDIs (n = 47informants) and 6 FGDs (7 persons/group). Participants also consisted of NHI RHS users (mothers and young women), administrative officers at healthfacilities, medical services providers, and officials related to the NHI assistance. Data were managed using NVivo version 2.0 software, accompanied bythematic analysis. The internal barriers in NHI use included inadequate knowledge of RHS covered by NHI, and a culture of shame in informants. Externalbarriers included additional costs for medicines not covered by NHI, the dissatisfaction of health services provided by medical workers, busy work andhousehold activities, and lack of women's role in decision-making within families, which related to reproductive wellness.
Keywords: National Health Insurance, reproductive health, the Social Security Administrative Body for Health, women
program, administered by the Social SecurityAdministrative Body for Health, to ensure the fulfillmentof basic medical needs, including RHSs. Expectationswere that by 2019, all Indonesian citizens are likely tobecome NHI participants.
Reproductive health services in primary health carehad numerous benefits.8 A study conducted on 39women in India demonstrated that participants werereceptive to the availability of RHSs in primary care andthe benefits of streamlining it, provided cliniciansapproach these services in a manner that respects patientautonomy and reproductive desires.8 In other study,RHSs at private hospitals that enrolled in the NHIscheme of India were 2%. Over 75% of respondentswere unaware of RHSs availability, through NHI. It waspossible for respondents with some education to havethis knowledge, while poorer families were less likely tobe aware.9 Improvements in using existing publicresources were also important for efficiency, quality, andequity gains.4
Based on a survey by the Women's Health Foundation
Received : January 23, 2020Accepted : January 02, 2021Published : May 28, 2021
Copyright @ 2021, Kesmas: Jurnal Kesehatan Masyarakat Nasional (National Public Health Journal), p-ISSN: 1907-7505, e-ISSN: 2460-0601, SINTA-S1 accredited,http://journal.fkm.ui.ac.id/kesmas, Licensed under Creative Commons Attribution-ShareAlike 4.0 International
Kesmas: Jurnal Kesehatan Masyarakat Nasional(National Public Health Journal)
92
the informants. Despite the guidelines had been arrangedin such a pattern, the interviewer was still provided withthe freedom to explore and develop deep questions forthe informants, as the objectives were achieved.
The total informants for IDI were 47 for the threelocations (Padang Pariaman, Kupang, and Manado). Thenumber of informants in Padang Pariaman was 20 forIDI, with two groups each consisting seven of respon -dents for FGD. However, in Kupang and Manado City,the total informants that participated for IDI were 12 and13, with two groups each for FGD, respectively.Informants of the IDI were users of NHI-RHSs, parti -cular ly mothers and families (including young women),NHI administrative staffs at health facilities, clinicalofficers (midwives and doctors) as medical careproviders, and officials related to the program (NHI)services. The program officials included the head ofprimary health care at the region medical office level andunits related to NHI and their staffs.
All IDIs and FGDs were conducted, recorded, andtranscribed verbatim. Furthermore, the data transcriptswere cleaned initially by re-checking the suitability withthe contents of the recordings on the audio recorder andfield notes for data accuracy purposes. Afterwards thedata were processed using NVivo version 2.0 software(license of the software is available). The purpose ofusing this software was to minimize subjectivity from theauthors by looking at the data obtained in detail.12
Moreover, data analysis was carried out usingthematic assessment to discover "patterns" that otherparties were unable to observe clearly.13 Patterns orthemes occurred randomly in the pile of availableinformation. After finding a pattern, classification wasconducted, by providing labels, definitions, ordescriptions.14,15
ResultsThe participants of this study are summarized in Table
1. According to Table 1, the informants in this researchbased on RHSs utilization in health care facilities in thethree provinces were both married women and theadolescent groups. For the stakeholders, the informantsconsisted of midwives, health care doctors, NHIadministrators at clinical centers and hospitals, with theheads of medical district offices and National HealthInsurance at the areas.
The two themes developed from eight sub-themesdiscovered in the study were briefly summarized in Table2. The description of all the observations of knowledgewas divided into four sub-themes.
Informant knowledge about RHSs covered by NHIhad not been evenly distributed, especially among thosefrom the community having inadequate awareness,compared to the health workers and administrative staff
in 15 provinces within Indonesia in 2015 - 2017, the useof RHSs by the community was not optimal. Theutilization of services was mostly carried out for antenatalcare (24.5%) and normal delivery (31.7%). Moreover,with clinical and administrative officers, the communitywas not fully aware about the types of women's RHSsbeing covered by the NHI. The Women's HealthFoundation study also showed that most respondentsknew that RHSs were limited to antenatal care, normaldelivery, complications, and family planning services.6However, there were numerous reproductive servicesprovided by NHI, such as general screening, post-natalservice, breast and cervical cancer analysis, and more.
This qualitative study aimed to explore the in-depthreasons for the low utilization of the NHI scheme forwomen's RHSs, in three regions of Indonesia. The resultswere expected to be used as advocacy material to therelevant government, to make policies and increase RHSsusage covered by NHI.
MethodThis study was conducted after ethical approval was
obtained from the Institutional Review Board at theUniversity of Indonesia, with the numbersLB.02.01/2/KE.296/2018. Study participants wererequired to sign the informed consent form. Beforeseeking their consent, participants were also assured thattheir personal information was to be kept confidentialwhen the study results are published. This qualitativestudy was conducted in three areas, represented byspecific regions within Indonesia. The Western, Central,and Eastern Indonesia regions were represented byPadang Pariaman District, Manado City, and KupangCity. The design used in this study was the RapidAssessment Procedure (RAP), a qualitative approach thatwas likely to be carried out quickly (around 1-2 months)regarding health-related behavior.10
In this study, the validity and reliability wereexamined through the triangulation of sources andmethods. Triangulation was carried out to check thevalidity of the data.11 To establish credibility, the authorshad well-established cooperation with the participants.The external key informant's reviews of the informationwere carried out, with additional comments also beingused.
Data collection was carried out in two ways, namelyfocus group discussions (FGD) and in-depth interviews(IDI), through a semi-structured interview approach. Thestudy instrument in the qualitative study was the author.The study instrument in the qualitative study was theauthor. Interviewers were equipped with semi- structuredguidelines for the questions to be identified properly,both in FGDs and IDIs. These guidelines were used as abenchmark for interviewers to gather information from
Kesmas: Jurnal Kesehatan Masyarakat Nasional (National Public Health Journal). 2021; 16 (2): 91-99
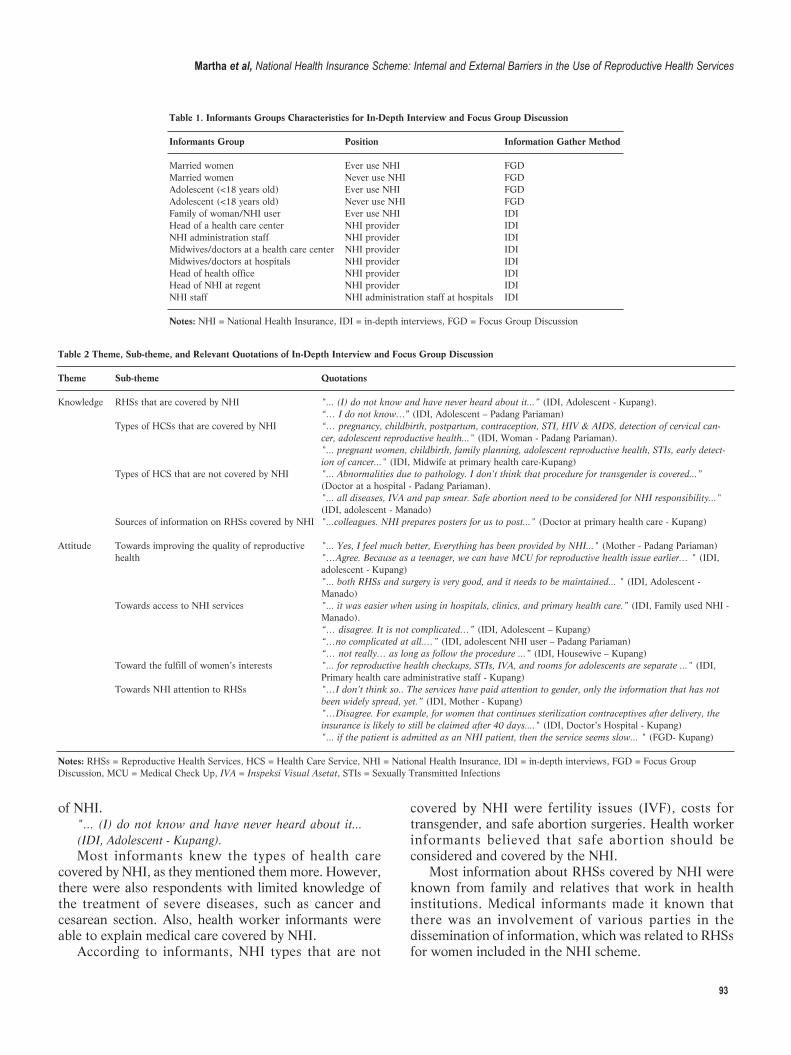
93
of NHI."... (I) do not know and have never heard about it...(IDI, Adolescent - Kupang).Most informants knew the types of health care
covered by NHI, as they mentioned them more. However,there were also respondents with limited knowledge ofthe treatment of severe diseases, such as cancer andcesarean section. Also, health worker informants wereable to explain medical care covered by NHI.
According to informants, NHI types that are not
covered by NHI were fertility issues (IVF), costs fortransgender, and safe abortion surgeries. Health workerinformants believed that safe abortion should beconsidered and covered by the NHI.
Most information about RHSs covered by NHI wereknown from family and relatives that work in healthinstitutions. Medical informants made it known thatthere was an involvement of various parties in thedissemination of information, which was related to RHSsfor women included in the NHI scheme.
Table 1. Informants Groups Characteristics for In-Depth Interview and Focus Group Discussion
Informants Group Position Information Gather Method
Married women Ever use NHI FGDMarried women Never use NHI FGDAdolescent (<18 years old) Ever use NHI FGDAdolescent (<18 years old) Never use NHI FGDFamily of woman/NHI user Ever use NHI IDIHead of a health care center NHI provider IDINHI administration staff NHI provider IDIMidwives/doctors at a health care center NHI provider IDIMidwives/doctors at hospitals NHI provider IDIHead of health office NHI provider IDIHead of NHI at regent NHI provider IDINHI staff NHI administration staff at hospitals IDI Notes: NHI = National Health Insurance, IDI = in-depth interviews, FGD = Focus Group Discussion
Table 2 Theme, Sub-theme, and Relevant Quotations of In-Depth Interview and Focus Group Discussion
Theme Sub-theme Quotations
Knowledge RHSs that are covered by NHI "... (I) do not know and have never heard about it...” (IDI, Adolescent - Kupang). “… I do not know…” (IDI, Adolescent – Padang Pariaman) Types of HCSs that are covered by NHI “… pregnancy, childbirth, postpartum, contraception, STI, HIV & AIDS, detection of cervical can- cer, adolescent reproductive health..." (IDI, Woman - Padang Pariaman). "... pregnant women, childbirth, family planning, adolescent reproductive health, STIs, early detect- ion of cancer..." (IDI, Midwife at primary health care-Kupang) Types of HCS that are not covered by NHI "... Abnormalities due to pathology. I don't think that procedure for transgender is covered...” (Doctor at a hospital - Padang Pariaman). "... all diseases, IVA and pap smear. Safe abortion need to be considered for NHI responsibility..." (IDI, adolescent - Manado) Sources of information on RHSs covered by NHI "...colleagues. NHI prepares posters for us to post..." (Doctor at primary health care - Kupang)
Attitude Towards improving the quality of reproductive "... Yes, I feel much better, Everything has been provided by NHI..." (Mother - Padang Pariaman) health "…Agree. Because as a teenager, we can have MCU for reproductive health issue earlier… " (IDI, adolescent - Kupang) "... both RHSs and surgery is very good, and it needs to be maintained... " (IDI, Adolescent - Manado) Towards access to NHI services "... it was easier when using in hospitals, clinics, and primary health care.” (IDI, Family used NHI - Manado). “… disagree. It is not complicated…” (IDI, Adolescent – Kupang) “…no complicated at all.…” (IDI, adolescent NHI user – Padang Pariaman) “… not really… as long as follow the procedure ...” (IDI, Housewive – Kupang) Toward the fulfill of women’s interests "... for reproductive health checkups, STIs, IVA, and rooms for adolescents are separate ..." (IDI, Primary health care administrative staff - Kupang) Towards NHI attention to RHSs "…I don’t think so.. The services have paid attention to gender, only the information that has not been widely spread, yet.” (IDI, Mother - Kupang) "…Disagree. For example, for women that continues sterilization contraceptives after delivery, the insurance is likely to still be claimed after 40 days...." (IDI, Doctor’s Hospital - Kupang) "... if the patient is admitted as an NHI patient, then the service seems slow... " (FGD- Kupang)
Notes: RHSs = Reproductive Health Services, HCS = Health Care Service, NHI = National Health Insurance, IDI = in-depth interviews, FGD = Focus GroupDiscussion, MCU = Medical Check Up, IVA = Inspeksi Visual Asetat, STIs = Sexually Transmitted Infections
Martha et al, National Health Insurance Scheme: Internal and External Barriers in the Use of Reproductive Health Services
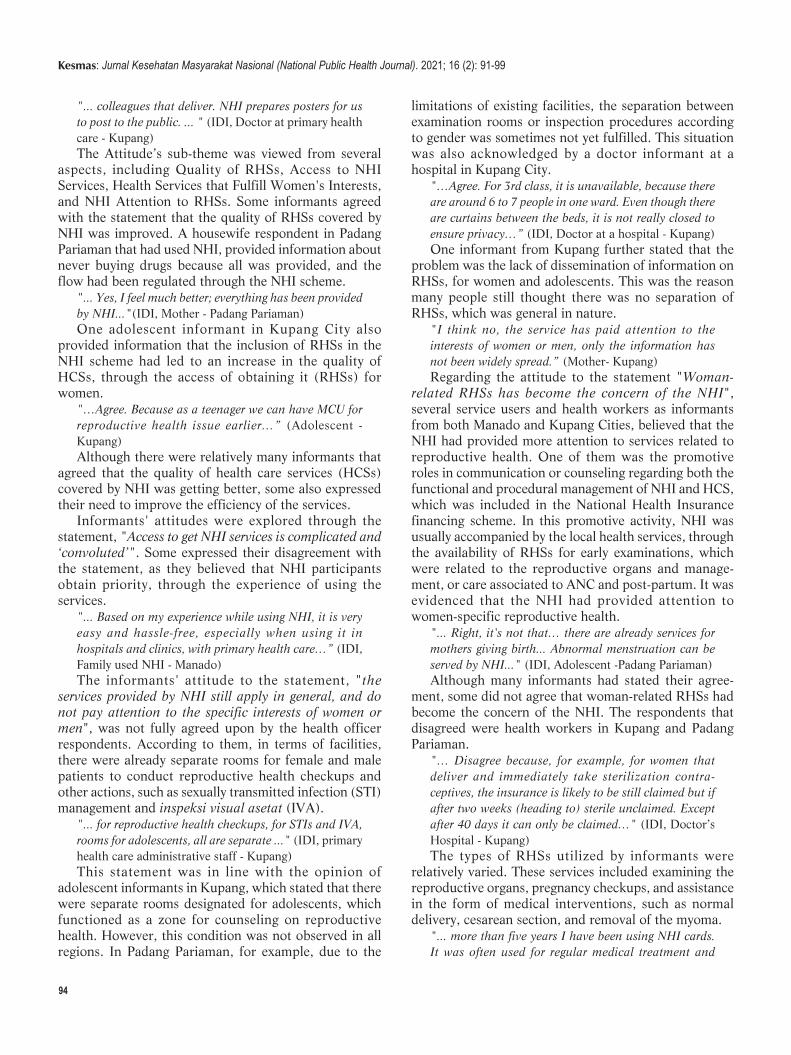
94
limitations of existing facilities, the separation betweenexamination rooms or inspection procedures accordingto gender was sometimes not yet fulfilled. This situationwas also acknowledged by a doctor informant at ahospital in Kupang City.
"…Agree. For 3rd class, it is unavailable, because thereare around 6 to 7 people in one ward. Even though thereare curtains between the beds, it is not really closed toensure privacy…” (IDI, Doctor at a hospital - Kupang)One informant from Kupang further stated that the
problem was the lack of dissemination of information onRHSs, for women and adolescents. This was the reasonmany people still thought there was no separation ofRHSs, which was general in nature.
"I think no, the service has paid attention to theinterests of women or men, only the information hasnot been widely spread.” (Mother- Kupang)Regarding the attitude to the statement "Woman-
related RHSs has become the concern of the NHI",several service users and health workers as informantsfrom both Manado and Kupang Cities, believed that theNHI had provided more attention to services related toreproductive health. One of them was the promotiveroles in communication or counseling regard ing both thefunctional and procedural management of NHI and HCS,which was included in the National Health Insurancefinancing scheme. In this promotive activity, NHI wasusually accompanied by the local health services, throughthe availability of RHSs for early examinations, whichwere related to the reproduct ive organs and manage -ment, or care associated to ANC and post-partum. It wasevidenced that the NHI had provided attention towomen-specific reproductive health.
"... Right, it's not that… there are already services formothers giving birth... Abnormal menstruation can beserved by NHI..." (IDI, Adolescent -Padang Pariaman)Although many informants had stated their agree -
ment, some did not agree that woman-related RHSs hadbecome the concern of the NHI. The respondents thatdisagreed were health workers in Kupang and PadangPariaman.
"… Disagree because, for example, for women thatdeliver and immediately take sterilization contra -ceptives, the insurance is likely to be still claimed but ifafter two weeks (heading to) sterile unclaimed. Exceptafter 40 days it can only be claimed…" (IDI, Doctor’sHospital - Kupang)The types of RHSs utilized by informants were
relatively varied. These services included examining thereproductive organs, pregnancy checkups, and assistancein the form of medical interventions, such as normaldelivery, cesarean section, and removal of the myoma.
"... more than five years I have been using NHI cards.It was often used for regular medical treatment and
"... colleagues that deliver. NHI prepares posters for usto post to the public. ... " (IDI, Doctor at primary healthcare - Kupang)The Attitude’s sub-theme was viewed from several
aspects, including Quality of RHSs, Access to NHIServices, Health Services that Fulfill Women's Interests,and NHI Attention to RHSs. Some informants agreedwith the statement that the quality of RHSs covered byNHI was improved. A housewife respondent in PadangPariaman that had used NHI, provided information aboutnever buying drugs because all was provided, and theflow had been regulated through the NHI scheme.
"... Yes, I feel much better; everything has been providedby NHI..."(IDI, Mother - Padang Pariaman)One adolescent informant in Kupang City also
provided information that the inclusion of RHSs in theNHI scheme had led to an increase in the quality ofHCSs, through the access of obtaining it (RHSs) forwomen.
"…Agree. Because as a teenager we can have MCU forreproductive health issue earlier…” (Adolescent -Kupang)Although there were relatively many informants that
agreed that the quality of health care services (HCSs)covered by NHI was getting better, some also expressedtheir need to improve the efficiency of the services.
Informants' attitudes were explored through thestatement, "Access to get NHI services is complicated and‘convoluted’". Some expressed their disagreement withthe statement, as they believed that NHI participantsobtain priority, through the experience of using theservices.
"... Based on my experience while using NHI, it is veryeasy and hassle-free, especially when using it inhospitals and clinics, with primary health care…” (IDI,Family used NHI - Manado)The informants' attitude to the statement, "the
services provided by NHI still apply in general, and donot pay attention to the specific interests of women ormen", was not fully agreed upon by the health officerrespondents. According to them, in terms of facilities,there were already separate rooms for female and malepatients to conduct reproductive health checkups andother actions, such as sexually transmitted infection (STI)management and inspeksi visual asetat (IVA).
"... for reproductive health checkups, for STIs and IVA,rooms for adolescents, all are separate ..." (IDI, primaryhealth care administrative staff - Kupang)This statement was in line with the opinion of
adolescent informants in Kupang, which stated that therewere separate rooms designated for adolescents, whichfunctioned as a zone for counseling on reproductivehealth. However, this condition was not observed in allregions. In Padang Pariaman, for example, due to the
Kesmas: Jurnal Kesehatan Masyarakat Nasional (National Public Health Journal). 2021; 16 (2): 91-99
95
most recently for cesarean delivery ..." (FGD - Kupang)Practically, the community had barriers in using NHI
membership to obtain RHSs. The barriers were dividedinto two, namely internal and external barriers, originat -ing from within and outside the individual.
Aspects from within the informant that hindered theuse of RHSs, was a culture of shame and fear ofreproductive health checkups. In some areas, discussingreproductive-related problems was still considered ataboo. Therefore, there was a reluctance to have areproduct ive health checkup.
"...From women themselves, for example, a culture ofshame and fear. Don't let it be examined by a maledoctor, embarrassed about revealing personal matter,embarrassed when you have to take off your clotheswhile checking up, getting scared to know if there is anillness...” (IDI, Doctor at primary health care - Kupang)Lack of knowledge about RHSs was also one of the
barriers to the use of RHSs. External barriers includedthe costs incurred despite using NHI cards to getservices. Some medicines were not covered by theinsurance program, therefore ensuring patients pay out-of-pocket.
"…Medicines above IDR 30,000 are paid by NHI, butpatients themselves redeem the medicines above IDR50,000 ..." (FGD - Kupang)The slow handling of NHI participant patients also
made the informants reluctant to use cards for treatment.Conversely, general patients that pay out-of-pockettended to get services and treatment immediately.Furthermore, one of the heads of primary health care inManado City stated that being busy with work andhousehold activities that could not be left behind, causedthe loss of time to have reproductive health checkups.
"...What hampers women's access to the NHI was moreto themselves, due to being busy with work and otheractivities ..." (IDI, Head of primary health care -Manado)The family also played a role in women's access to
RHSs. In some cases, the husband had a role in decidingon contraceptives for the wife. The husband and familyalso played an important role in determining wherepregnant women were to deliver.
"... Lack of sex education. However, some women alsocame, but for contraception, it is still the husband thatplays an important role even though we have explainedit, or they already have many children..." (IDI, Doctorat a hospital - Kupang)
DiscussionHealth insurance played a role in healthcare access
and service utilization.16 Information, education, andcommunication campaigns were necessary to enhance
the utilization of health insurance coverage.17 Based onthe results obtained from a study conducted by Kurfi,18
gene ral knowledge of the NHI scheme had a positive andsignificant relationship with client’s satisfaction. The re-sults of this study indicated that informants' knowledgeof RHSs covered by NHI, had not been evenly distrib-uted. Knowledges of the health workers and administra-tive officers were better than the community res pon -dents. Some community informants knew that the RHSscovered by NHI were pregnancy checkups, postpartumexaminations, early detection of cancer, family planningservices, and other diseases related to reproductive or-gans. Health services that were not covered by NHI in-cluded treatment for infertility, sex reassignment proce-dure for transgender, and safe abortion (medical abor-tion), in cases of pregnancy complications. A study byOyenike, et al.,19 showed a significant influence ofknowledge (R2 = 0.683, p-value = 0.000) on the utiliza-tion of the NHI scheme.19 Effective strategies should beimplemented towards increasing awareness and know -ledge about health insurance.20
The information on RHSs covered by NHI, was gen-erally obtained from the closest people, health workers,and medical insurance officers. Furthermore, visual me-dia such as posters were also displayed at health facilities.One of the factors associated with low access to RHSswith the NHI scheme was the low knowledge and aware-ness about the availability of the program.9,21 Lack ofknowledge on health insurance, particularly about cover-age on preventive care, also led consumers to avoid assis-tance due to perceived costs.22 In conveying the informa -tion, visual media had to be accompanied by direct infor-mation from the person concerned, for data to be com-prehensively received in more detail. In a study byYakong, et al.,23 the community needs for family plan-ning information were not met. Though the FamilyPlanning posters were displayed at health facilities, theydid not significantly impact due to the lack of educationor illiteracy.
Lack of knowledge about HCS also led to the under-utilization of health services. A study among Thai immi-grants by Akerman, et al.,24 showed that 52% of respon-dents were not aware of the location to seek RHSs, dueto the lack of information. To increase know ledge, appli-cations through various platforms and technologiesshould be available to the community, such as mass orsocial media. In a previous study, expanding understand-ing of RHSs, especially among adolescents, showed a sig-nificant relationship between knowledge and exposure tothe mass media.25
The attitude is a psychological tendency expressed byevaluating certain entities with several levels, for exam-ple, agree or disagree.26 Attitude was useful in predictingbehavior, when it is not considered a problem by the per-
Martha et al, National Health Insurance Scheme: Internal and External Barriers in the Use of Reproductive Health Services
96
son. This was accompanied by social acceptance of ac-tions, which were in line with the person’s attitude.27
Some informants had positive attitudes, which improvedthe quality of health services for NHI participants.Generally, the explanations cited for considering the im-proved quality were the ease of locating medicines be-cause they had been determined. Furthermore, the in-volvement of reproductive health in the services co veredby NHI, also made it easier for the public to access RHSs.
Although RHSs were available in the community, theutilization remained low due to the perceived negativeattitude from the health workers, lack of privacy, and so-cial norms.28 A study conducted by Adjei,29 in Ghana,showed that health insurance beneficiaries had high trustin their primary care provider by giving them quality as-sistance. However, in this study, the negative attitudeshown by the informants was due to dissatisfaction withthe services from health workers that seemed to discrim-inate between patients that pay out-of-pocket and NHIparticipants. Also, a negative attitude was shown in thestatement on access to obtain NHI services, which werecomplicated and ‘convoluted’. This meant that inform-ants considered that the pathway to be followed by NHIparticipants to receive health services was not complicat-ed. Complicating matters were when the administrativerequirements were incomplete. A study by Campbell, etal.,30 among the artisans, showed that an insufficient le -vel of knowledge and awareness of health insurancetranslated to a negative attitude towards the scheme.There was a need for a substantial stakeholders’ enlight-enment campaign to increase coverage.
Additionally, some informants disagreed with thestatement that the services provided under NHI did notpay attention to the specific interests of women or men.According to the health worker informants, there was al-ready room partitioning to perform actions, such as STIsmanagement and IVA. Even when there were barriers, itwas due to the inequality of facilities and infrastructureat health structures. Lack of attention to patients’ priva-cy, especially in RHSs, played a role in using health facili -ties.21,31 A study by Adetona, et al.,19 showed a signifi-cant influence of attitude (R2 = 0.872, p-value = 0.000)on the utilization of the NHI scheme. Informants in thisstudy agreed to the women's RHSs had become the con-cern of the NHI. This utilization was indicated the coun-seling on the functions and procedures for managingNHI, including RHS as one of the services covered bythe insurance scheme. In the Regulation of BPJS No. 1 of2014, the scope of NHI ser vices included promotive ser -vices and preventive care.32 However, informants thatdisagreed expressed that they still felt the facilities andinfrastructure for RHSs had not been optimal.
The types of RHSs used by informants were relativelyvaried. These services included examining reproductive
organs, pregnancy examinations, and services in the formof medical interventions, such as normal delivery, cesare-an section, and removal of myoma. The factor that en-couraged informants to use RHSs using NHI, was thecost relief (free of charge) offered to register participants.
The barriers shown by the informants were dividedinto internal and external barriers. The internal barriersincluded lack of knowledge about RHSs covered by NHI,therefore allowing informants feel uncertain about usinghealth services covered by the insurance scheme. Also,there was still a culture of shame for informants, as theywere reluctant to have checkups at the health facility.Shyness was influenced by the values prevailing in thesociety, for example, religion. The norms and character-istics of some religious groups encouraged negative atti-tudes to medical matters. These facts are shown by thestudies of Gyimah,33 Tlaye,25 Ansha,31, and Negash,21
which stated that shame and fear of some social valuesmade respondents reluctant to access RHSs, unlike thosethat were already sexually active.
Conversely, external barriers that made people reluc-tant to use NHI for health checkups included the addi-tional costs incurred because some medicines were notcovered by the insurance scheme. This observation indi-cated that affordability was still an obstacle, even for theinsured informants, to utilize health ser vices and join theNHI scheme. This was in line with the results from stud-ies by Gobah,34 and Mensah,35 which showed that diffi-culties in affording the cost of health care, were one ofthe major obstacles to the enrollment of the NHI scheme.
Besides that, dissatisfaction with health services pro-vided by health workers also made informants reluctantto use NHI. Informants argued that non-NHI patientswere prioritized and treated faster than those insured.Similar to existing studies, most of the insured patientsperceived and experienced long waiting times, verbalabuse, not being physically examined, and discriminationin favor of the affluent and uninsured.36 Patient satisfac-tion influenced the decision in selecting a health facili tyas a place of treatment. A study by Gan-Yadam, et al.,37
in Mongolia, showed that patients that were satisfiedwith the services at the health facilities were more likelyto select the same medical infrastructure repetitively. Thestudy by Yakong, et al.,23 also showed that dissatisfact -ion with the services by health workers had a role in thechoice of treatment. In this study, patients were not onlywanted to be treated, they were also accompanied byclear information to address the health problems beingencountered. The government should further adjust NHIschemes and optimize the allocation of health resourcesto alleviate the inequality across policies and enhance theeffective utilization of medical care services.38
In this study, busy work and household chores alsomade informants lose time for a reproductive health
Kesmas: Jurnal Kesehatan Masyarakat Nasional (National Public Health Journal). 2021; 16 (2): 91-99
97
checkups. Inconvenient service hours remained a consid-erable reason for respondents not utilizing reproductivehealth services.21 Concerning health insurance, encour-agement by friends and family was observed to motivatesubscription to health insurance.39 For example, the hus-band had a role in determining contraceptives for thewife, or in determining the location for pregnant womento deliver. In reproductive health, women's autonomywas an important socio-cultural factor, which played arole in using of health facilities.40 This study, consistentwith other results, showed that the husband had a role inmaking decisions in the family, and that women's auton-omy in decision-making was very limited, including thebasis of the female reproductive health.41,42 Husbandsas the head of households should be motivated by healthpractitioners on the utilization of the National HealthInsurance scheme, as this ensured the achievement ofuniversal medical coverage.19 These results further indi-cated the need for demand-side intervention among en-rolled families to maximize the government's efforts inincreasing access to health services.
The researchers observed some weaknesses in thisstudy, such as locating informants, which was in line withthe inclusion criterion. Thematic analysis in this studyhad limited the formation of themes based on informa-tion provided by informants. Another weakness was thedifferent interviewers for every three locations, which inturn became an obstacle in data analysis. However, theresearchers discovered numerous information thatshould be investigated further, through quantitative re-search for a huge population, such as knowledge abouttypes of RHSs covered by NHI or about the health insur-ance itself. Alongside good coordination with the coun-terpart in three different provinces, this study had a pat-tern of reproductive health services by NHI, whichshould be shared as a recommendation to the govern-ment, as a continuous improvement.
ConclusionInformants' knowledge towards reproductive health
and RHSs covered by NHI varied. Some informants havethe knowledge about the type of services covered by theNHI, as others from the youth and maternal groups werestill unaware. Albeit the dissemination of NHI informa-tion and what RHSs covered was all about, more equi-table distribution was needed by health workers or NHIstaff, as information was to be delivered accurately to thecommunity.
Generally, informants had a good assessment of NHIand RHSs, and also a positive attitude to improve theprograms. Community informants and health workers al-so had a positive attitude toward women RHSs by NHI.However, most informants disagreed with the statementthat access to get NHI services is complicated. Also, most
informants agreed with NHI services nowadays in termsof considering gender.
Internal barriers in the use of NHI for RHSs alsoshowed a culture of shame and fear of being examined,with lack of information. External barriers felt by inform-ants included works and household activities, with in -adequacy of women's participation in family decision-making, including reproductive health issues. Other bar-riers were dissatisfaction with the services provided byhealth workers, and additional costs for medicines notcovered by NHI.
AbbreviationsBPJS: Badan Penyelenggara Jaminan Sosial; NHI: National HealthInsurance; IDI: In-Depth Interview; RHS: Reproductive HealthServices; FGD: Focus Group Discussion; ICPD: The InternationalConference on Population and Development; HCS: Health CareService; SRHR: Sexual and Reproductive Health and Rights; SDG:Sustainable Development Goal; STI: Sexually Transmitted Infection;IVA: Inspeksi Visual Asetat.
Ethics Approval and Consent to ParticipateThis study was conducted after ethical approval was obtained fromInstitutional Review Board at the University of Indonesia, with numbersLB.02.01/2/KE.296/2018. Moreover, before data collection, informedconsent had been provided by all the informants and key respondentsin the three provinces.
Competing InterestThe authors declare declared that there are no significant competing fi-nancial, professional, or personal interests that was likely to have af-fected the performance or presentation of the work described in thismanuscript.
Availability of Data and MaterialsData was available from the corresponding author on request.
Authors’ ContributionEM and HL conceived the proposal of the study, data collection, andanalysis. EM also wrote the initial draft of the manuscript. RSZ studiedliterature, data analysis, and wrote the initial draft of the manuscript.YS re-analyzed data, updated the literature, and made the improvementof the final manuscript.
AcknowledgmentThe authors were grateful to all participants of NHI user and MAMPU-AUSAID as regards funding. They are also grateful to YayasanKesehatan Perempuan, PIAR NTT in Kupang City, Swara ParangpuanManado, LP2M in Padang District, and Jaringan Perempuan PeduliKesehatan, for generously collaborating, in order to perform this study.
References1. United Nations General Assembly. Principle 1 and principle 4,
respectively, of the ICPD programme of action, uphold human rights
Martha et al, National Health Insurance Scheme: Internal and External Barriers in the Use of Reproductive Health Services
98
and gender equality and equity and women’s empowerment. In:
Report of the International Conference on Population and
Development A/94/10/18 Programme of Action. New York: United
Nations. 1995. p. 11–2.
2. Plesons M, Cole CB, Hainsworth G, Avila R, Va Eceéce Biaukula K,
Husain S, et al. Forward, together: a collaborative path to
comprehensive adolescent sexual and reproductive health and rights in
our time. Journal of Adolescent Health. 2019; 65 (6): S51–62.
3. Ravindran TKS, Govender V. Sexual and reproductive health services
in universal health coverage: a review of recent evidence from low-
and middle-income countries. Sex Reprod Heal Matters. 2020; 28 (2).
4. Kieny MP, Evans DB. Universal health coverage. Eastern
Mediterranean Health Journal. 2013; 19 (4): 305–6.
5. Hasstedt K, Desai S, Ansari-Thomas Z. Immigrant women’s access to
sexual and reproductive health coverage and care in the United States.
Issue Brief (Commonw Fund). 2018. p. 1–10.
6. Yayasan Kesehatan Perempuan. Laporan studi pelaksanaan skema
jaminan kesehatan nasional (JKN) dalam kaitannya dengan kebutuhan
perempuan dan pelayanan kesehatan reproduksi dan seksual; 2017.
7. Peters SAE, Woodward M, Jha V, Kennedy S, Norton R. Women’s
health: a new global agenda. BMJ Global Health. 2016; 1 (3): 1–8.
8. Manze MG, Romero DR, Sumberg A, Gagnon M, Roberts L, Jones H.
Women’s perspectives on reproductive health services in primary care.
Family Medicine. 2020; 52 (2): 112–9.
9. Mozumdar A, Aruldas K, Jain A, Reichenbach L. Understanding the
use of India’s national health insurance scheme for family planning
and reproductive health services in Uttar Pradesh. International
Journal of Health Planning and Management. 2018; 33 (4): 823–35.
10. Scrimshaw Nevin S and Gleason Gary R. Rapid assessment
procedures: qualitative methodologies for planning and evaluation of
health related programmes (international nutrition foundation for
developing countries- INFDC). Scrimshaw Nevin S and Gleason Gary
R., editor. Boston, Ma.: Library of Congress Cataloging-in-Publication-
Data. 1996. p. 588.
11. Din N. Manajemen penerapan perilaku hidup bersih dan sehat (PHBS)
tatanan rumah tangga di Kelurahan Kurao Pagang Kota Padang tahun
2016. J Endur. 2016; 1.
12. Zamawe FC. The implication of using NVivo software in qualitative
data analysis: evidence-based reflections. Malawi Medical Journal.
2015; 27 (1): 13–5.
13. Nowell LS, Norris JM, White DE, Moules NJ. Thematic analysis:
striving to meet the trustworthiness criteria. International Journal of
Qualitative Methods. 2017; 16 (1): 1–13.
14. Boyatzis RE. Transforming qualitative information: thematic analysis
and code development. Thousand Oaks, California: Sage Publications,
Inc.; 1998.
15. Stuckey H. The second step in data analysis: coding qualitative
research data. Journal of Social Health and Diabetes. 2015; 03 (01):
007–10.
16. Allcock SH, Young EH, Sandhu MS. Sociodemographic patterns of
health insurance coverage in Namibia. International Journal for Equity
in Health. 2019; 18 (1): 1–11.
17. Nguyen TD, Wilson A. Coverage of health insurance among the near-
poor in rural Vietnam and associated factors. International Journal of
Public Health. 2017; 62 (s1): 63–73.
18. Mustapha Kurfi M, Hussaini Aliero I, Author C. A study on clients’
satisfaction on the national health insurance scheme among staff of
Usmanu Danfodiyo University Sokoto. IOSR Journal of Economics
and Finance. 2017; 8 (5): 44–52.
19. Adetona TO, Kio JO. Determinants of national health insurance
scheme utilization among heads of households in selected
communities in Ogun State, Nigeria. International Journal of
Academic Research in Business, Arts & Science. 2020; 7354: 142–54.
20. Yusuf HO, Kanma-Okafor OJ, Ladi-Akinyemi TW, Eze UT,
Egwuonwu CC, Osibogun AO. Health insurance knowledge, attitude
and the uptake of community-based health insurance scheme among
residents of a suburb in Lagos, Nigeria. West African Journal of
Medicine. 2019; 36 (2): 103–11.
21. Negash W, Dessalegn M, Yitayew B, Demsie M, Wagnew M, Nyagero
J. Reproductive health service utilization and associated factors: the
case of North Shewa zone youth, Amhara region, Ethiopia. Pan
African Medical Journal. 2016; 25 (Supp 2): 3.
22. Smith KT, Monti D, Mir N, Peters E, Tipirneni R, Politi MC. Access is
necessary but not sufficient: factors influencing delay and avoidance of
health care services. MDM Policy & Practice. 2018; 3(1):
238146831876029.
23. Yakong VN, Rush KL, Bassett-Smith J, Bottorff JL, Robinson C.
Women’s experiences of seeking reproductive health care in rural
Ghana: challenges for maternal health service utilization. Journal of
Advanced Nursing. 2010; 66 (11): 2431–41.
24. Åkerman E, Östergren P, Essén B, Fernbrant C, Westerling R.
Knowledge and utilization of sexual and reproductive healthcare
services among Thai immigrant women in Sweden. BMC International
Health and Human Rights. 2016; 1–14.
25. Tlaye KG, Belete MA, Demelew TM, Getu MA, Astawesegn FH.
Reproductive health services utilization and its associated factors
among adolescents in Debre Berhan town, Central Ethiopia: a
community-based cross-sectional study. Reprod Health. 2018; 15 (1):
1–11.
26. Schwarz N, Bohner G. The Construction of attitudes. Blackwell
Handbook of Social Psychology; 2001.
27. Chaiklin H. Attitudes, behavior, and social practice. The Journal of
Sociology and & Social Welfare. 2011; 38 (1).
28. Kyilleh JM, Tabong PTN, Konlaan BB. Adolescents’ reproductive
health knowledge, choices and factors affecting reproductive health
choices: a qualitative study in the West Gonja District in Northern
region, Ghana. BMC International Health and Human Rights. 2018;
18 (1): 1–12.
29. Andoh-Adjei FX, Cornelissen D, Asante FA, Spaan E, Van Der Velden
K. Does capitation payment under national health insurance affect
subscribers’ trust in their primary care provider? a cross-sectional
survey of insurance subscribers in Ghana. BMC Health Services
Research. 2016; 16 (1): 1–10.
30. Campbell P, Owoka O, Odugbemi T. National health insurance
scheme: are the artisans benefitting in Lagos state, Nigeria?. Journal of
Clinical Sciences. 2016; 13( 3): 122.
31. Ansha MG, Bosho CJ, Jaleta FT. Reproductive health services
utilization and associated factors among adolescents in Anchar
Kesmas: Jurnal Kesehatan Masyarakat Nasional (National Public Health Journal). 2021; 16 (2): 91-99
99
District, East Ethiopia. Journal of Family & Reproductive Health.
2017; 11 (2): 110–8.
32. Badan Penyelenggara Jaminan Sosial Kesehatan. Peraturan Badan
Penyelenggara Jaminan Sosial Kesehatan Nomor 1 tahun 2014 tentang
penyelenggaraan jaminan kesehatan. Jakarta; 2013.
33. Gyimah SO, Takyi BK, Addai I. Challenges to the reproductive-health
needs of African women: on religion and maternal health utilization in
Ghana. Social Science & Medicine. 2006; 62 (12): 2930–44.
34. Gobah FK, Zhang L. The national health insurance scheme in Ghana:
prospects and challenges: a cross-sectional evidence. Global Journal of
Health Science. 2011; 3 (2): 90–101.
35. Mensah J, Oppong JR, Schmidt CM. Ghana’s national health insurance
scheme in the context of the health MDGs: an empirical evaluation
using propensity score matching. Health Economics. 2010; 19 (Suppl.
1): 95–106.
36. Dalinjong PA, Laar AS. The national health insurance scheme:
perceptions and experiences of health care providers and clients in two
districts of Ghana. Health Econ Rev. 2012; 2 (1): 1–13.
37. Gan-Yadam A, Shinohara R, Sugisawa Y, Tanaka E, Watanabe T,
Hirano M, et al. Factors associated with health service utilization in
Ulaanbaatar, Mongolia: a population-based survey. Journal of
Epidemiology. 2013; 23 (5): 320–8.
38. Wang Z, Li X, Chen M, Si L. Social health insurance, healthcare
utilization, and costs in middle-aged and elderly community-dwelling
adults in China. International Journal for Equity in Health. 2018; 17
(1): 1–13.
39. Kumi-Kyereme A, Amu H, Darteh EKM. Barriers and motivations for
health insurance subscription in Cape Coast, Ghana: a qualitative
study. ARC Journal of Public Health and Community Medicine. 2017;
75 (1): 1–10.
40. Haque SE, Rahman M, Mostofa MG, Zahan MS. Reproductive health
care utilization among young mothers in Bangladesh: does autonomy
matter?. Women’s Health Issues. 2012; 22 (2): e171–80.
41. Ganle JK, Obeng B, Segbefia AY, Mwinyuri V, Yeboah JY, Baatiema
L. How intra-familial decision-making affects women’s access to, and
use of maternal healthcare services in Ghana: a qualitative study. BMC
Pregnancy Childbirth. 2015; 15 (1): 1–17.
42. Jalu MT, Ahmed A, Hashi A, Tekilu A. Exploring barriers to
reproductive, maternal, child and neonatal (RMNCH) health-seeking
behaviors in Somali region, Ethiopia. PLoS One. 2019; 14 (3): 1–15.
Martha et al, National Health Insurance Scheme: Internal and External Barriers in the Use of Reproductive Health Services
Correspondence*: Siti Nurokhmah, Department of Nutrition Science, Faculty ofHealth Science, Universitas Muhammadiyah Surakarta, A. Yani Street, TromolPos I Pabelan, Surakarta 16424, Indonesia, Email: [email protected],Phone: +62 271 717417
Nurokhmah et al. Kesmas: Jurnal Kesehatan Masyarakat Nasional (National PublicHealth Journal). 2021; 16 (2): 100-107DOI: 10.21109/kesmas.v16i2.4283
AbstractPre-lacteal feeding is widely known as a distraction to exclusive breastfeeding, and the malpractice continues to be prevalent in Indonesia. Therefore, thisstudy aimed to explore the potential determinants of pre-lacteal feeding among mothers of infants below 24 months. A sample of 6,455 mother-infant pairsfrom the 2017 Indonesia Demographic and Health Survey (IDHS) was used. Also, multivariate logistic regression was employed to identify factors associatedwith pre-lacteal feeding practice. In Indonesia, 44% of infants were introduced to solid/liquid feeds in their first three days of life. Infant formula was the mostcommon pre-lacteal feed given, followed by any other milk, plain and sugar water, and honey. Early initiation of breastfeeding and living in an urban area wasprotective method against pre-lacteal feeding (AOR: 0.24; 95%CI: 0.21-0.28; AOR: 0.76; 95%CI: 0.65-0.90, respectively), while cesarean delivery acted as arisk factor (AOR: 1.36; 95%CI: 1.14-1.63). Meanwhile, gender role attitude, parity, perceived birth size, and household wealth index was also associated withpre-lacteal feeding. Overall, the percentage of mothers introducing pre-lacteal feeds was still high. The modifiable covariates associated with pre-lacteal feed-ings, such as early initiation of breastfeeding, parity, and birth size, were the major factors discouraging this practice.
Keywords: breastfeeding, determinants, early initiation of breastfeeding, Indonesia, pre-lacteal feeding
Prevalence and Determinants of Pre-lacteal Feeding: Insightsfrom the 2017 Indonesia Demographic and Health Survey
Siti Nurokhmah1*, Siti Masitoh2, Kusuma Estu Werdani3
1Department of Nutrition Science, Faculty of Health Science, Universitas Muhammadiyah Surakarta, Surakarta, Indonesia2National Institute of Health Research and Development, Indonesian Ministry of Health, Central Jakarta, Indonesia3Department of Public Health, Faculty of Health Sciences, Universitas Muhammadiyah Surakarta, Surakarta, Indonesia
Introduction Breastfeeding has a wide range of benefits for infants
throughout their life cycle.1 It protects from illnesses orinfections, contributing to the reduction of mor bidity andmortality.2 Besides the short-term benefits, this practiceis also associated with a lower risk of several diseases,such as type 2 diabetes, leukemia, celiac, atopic, andinflammatory bowel diseases.3 From an economicstandpoint, breastfeeding save costs associated withseveral illnesses, in addition to the costs of using othersubstitutes.4
Generally, pre-lacteal feeding is defined asintroducting any solid or liquid feed besides breastmilkin the first three days of life. This has been proven as oneof the barriers towards the recommended breastfeedingpractices, as well as other factors, such as delayinginitiation, shortening the duration, and disruptingexclusive breastfeeding.5 The common pre-lacteal feedsgiven to infants differ across regions and parts of theworld, such as in the Maldives, where honey and dateswere parts of ritual food given in the first three days oflife. Meanwhile, in Ethiopia, raw butter, plain water, and
milk (besides breastmilk) were among the mostcommonly found pre-lacteal feeds.6,7 In Indonesia, mostmothers, preferred infant formula, which is similar inSouth Africa, Bangladesh, and Nepal.8-11
Pre-lacteal feeding is practiced in many regions, evenwhere the breastfeeding rate is high, such as Uganda andIndonesia. In both countries, breastfeeding and given asubstitute feed in the first three days of life are believedto be norms.12 A study also found that for almost allwomen, introducing pre-lacteal feeding is not based onhealth or nutritional concerns. However, it is determinedby cultural beliefs or family influence.13 Infants givenpre-lacteal feeding are not exclusively breastfed by de -finition. Therefore, encouragements on the avoidance ofthis practice are crucial for improvement. Also,information about the factors associated with it needs tobe obtained. Studies on the determinants of pre-lactealfeeding are found in this literature, while for theIndonesian context, this topic has not been extensivelyexplored. This study aimed to identify factors associatedwith pre-lacteal feeding among infants under two yearsof age using the data from the Indonesia Demographic
Received : October 05, 2020Accepted : February 02, 2021Published : May 28, 2021
Copyright @ 2021, Kesmas: Jurnal Kesehatan Masyarakat Nasional (National Public Health Journal), p-ISSN: 1907-7505, e-ISSN: 2460-0601, SINTA-S1 accredited,http://journal.fkm.ui.ac.id/kesmas, Licensed under Creative Commons Attribution-ShareAlike 4.0 International
Kesmas: Jurnal Kesehatan Masyarakat Nasional(National Public Health Journal)
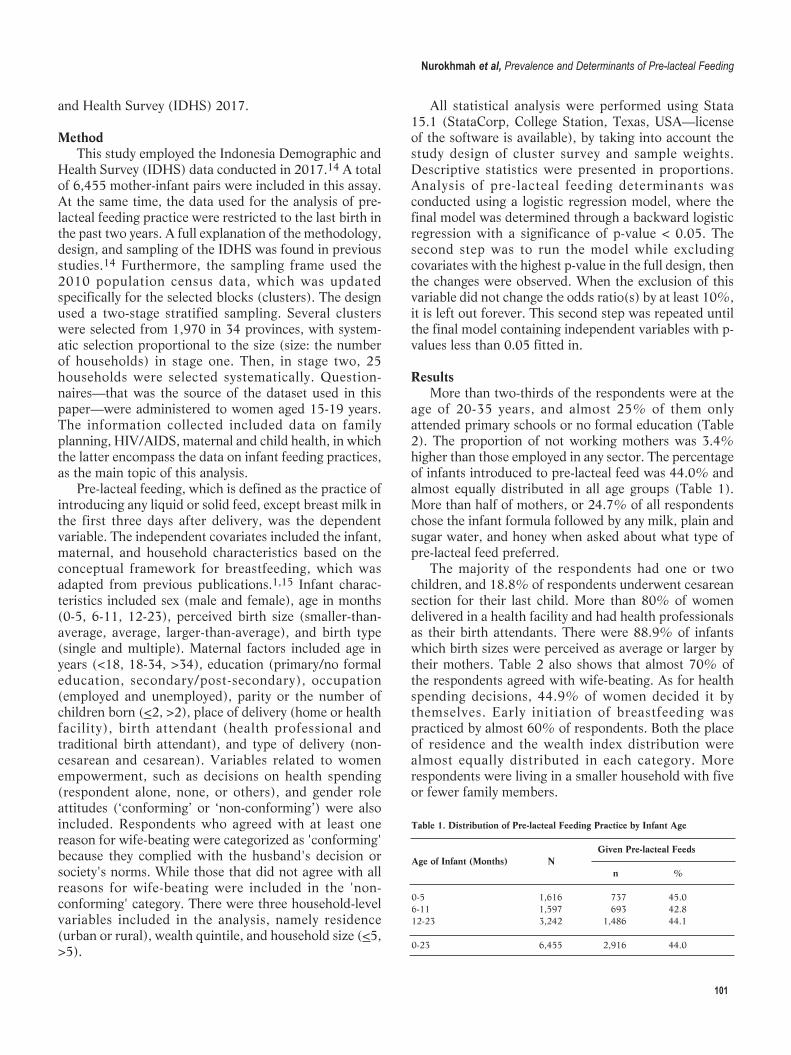
101
and Health Survey (IDHS) 2017.
MethodThis study employed the Indonesia Demographic and
Health Survey (IDHS) data conducted in 2017.14 A totalof 6,455 mother-infant pairs were included in this assay.At the same time, the data used for the analysis of pre-lacteal feeding practice were restricted to the last birth inthe past two years. A full explanation of the methodology,design, and sampling of the IDHS was found in previousstudies.14 Furthermore, the sampling frame used the2010 population census data, which was updatedspecifically for the selected blocks (clusters). The designused a two-stage stratified sampling. Several clusterswere selected from 1,970 in 34 provinces, with system -atic selection proportional to the size (size: the numberof households) in stage one. Then, in stage two, 25households were selected systematically. Question -naires—that was the source of the dataset used in thispaper—were administered to women aged 15-19 years.The information collected included data on familyplanning, HIV/AIDS, maternal and child health, in whichthe latter encompass the data on infant feeding practices,as the main topic of this analysis.
Pre-lacteal feeding, which is defined as the practice ofintroducing any liquid or solid feed, except breast milk inthe first three days after delivery, was the dependentvariable. The independent covariates included the infant,maternal, and household characteristics based on theconceptual framework for breastfeeding, which wasadapted from previous publications.1,15 Infant charac -teristics included sex (male and female), age in months(0-5, 6-11, 12-23), perceived birth size (smaller-than-average, average, larger-than-average), and birth type(single and multiple). Maternal factors included age inyears (<18, 18-34, >34), education (primary/no formaleducation, secondary/post-secondary), occupation(employed and unemployed), parity or the number ofchildren born (<2, >2), place of delivery (home or healthfacility), birth attendant (health professional andtraditional birth attendant), and type of delivery (non-cesarean and cesarean). Variables related to womenempowerment, such as decisions on health spending(respondent alone, none, or others), and gender roleattitudes (‘conforming’ or ‘non-conforming’) were alsoincluded. Respondents who agreed with at least onereason for wife-beating were categorized as 'conforming'because they complied with the husband's decision orsociety's norms. While those that did not agree with allreasons for wife-beating were included in the 'non-conforming' category. There were three household-levelvariables included in the analysis, namely residence(urban or rural), wealth quintile, and household size (<5,>5).
All statistical analysis were performed using Stata15.1 (StataCorp, College Station, Texas, USA—licenseof the software is available), by taking into account thestudy design of cluster survey and sample weights.Descriptive statistics were presented in proportions.Analysis of pre-lacteal feeding determinants wasconducted using a logistic regression model, where thefinal model was determined through a backward logisticregression with a significance of p-value < 0.05. Thesecond step was to run the model while excludingcovariates with the highest p-value in the full design, thenthe changes were observed. When the exclusion of thisvariable did not change the odds ratio(s) by at least 10%,it is left out forever. This second step was repeated untilthe final model containing independent variables with p-values less than 0.05 fitted in.
ResultsMore than two-thirds of the respondents were at the
age of 20-35 years, and almost 25% of them onlyattended primary schools or no formal education (Table2). The proportion of not working mothers was 3.4%higher than those employed in any sector. The percentageof infants introduced to pre-lacteal feed was 44.0% andalmost equally distributed in all age groups (Table 1).More than half of mothers, or 24.7% of all respondentschose the infant formula followed by any milk, plain andsugar water, and honey when asked about what type ofpre-lacteal feed preferred.
The majority of the respondents had one or twochildren, and 18.8% of respondents underwent cesareansection for their last child. More than 80% of womendelivered in a health facility and had health professionalsas their birth attendants. There were 88.9% of infantswhich birth sizes were perceived as average or larger bytheir mothers. Table 2 also shows that almost 70% ofthe respondents agreed with wife-beating. As for healthspending decisions, 44.9% of women decided it bythemselves. Early initiation of breastfeeding waspracticed by almost 60% of respondents. Both the placeof residence and the wealth index distribution werealmost equally distributed in each category. Morerespondents were living in a smaller household with fiveor fewer family members.
Table 1. Distribution of Pre-lacteal Feeding Practice by Infant Age
Given Pre-lacteal FeedsAge of Infant (Months) N n %
0-5 1,616 737 45.06-11 1,597 693 42.812-23 3,242 1,486 44.1
0-23 6,455 2,916 44.0
Nurokhmah et al, Prevalence and Determinants of Pre-lacteal Feeding
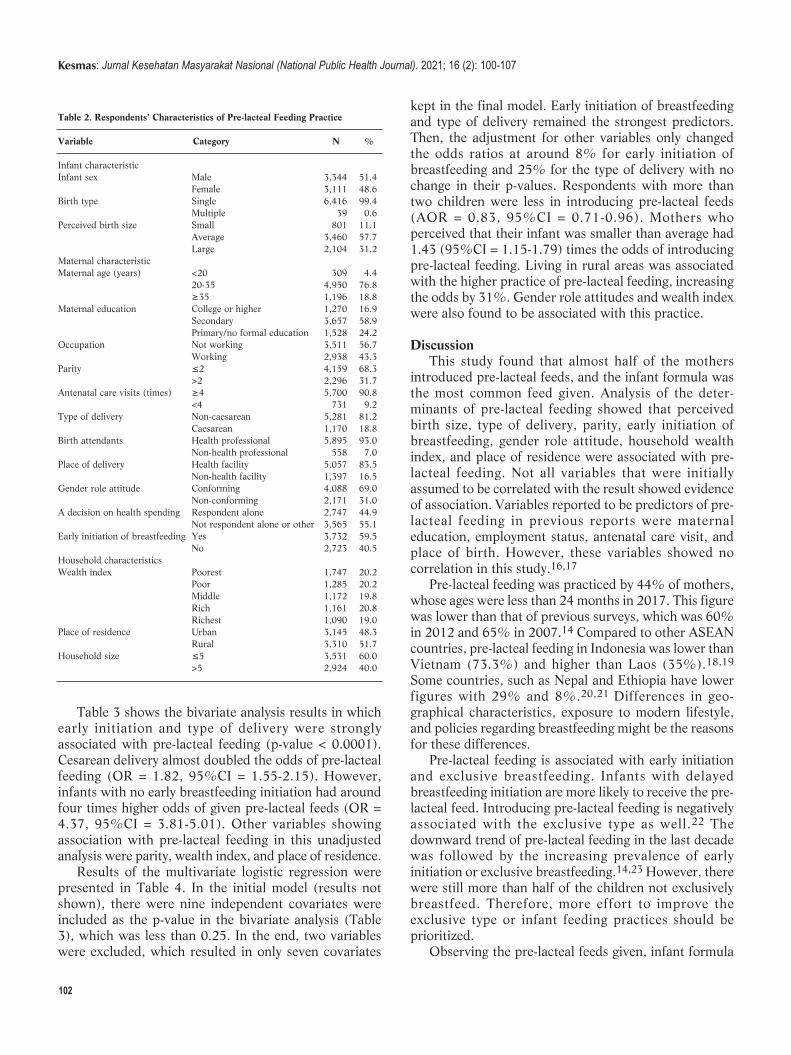
102
Table 3 shows the bivariate analysis results in whichearly initiation and type of delivery were stronglyassociated with pre-lacteal feeding (p-value < 0.0001).Cesarean delivery almost doubled the odds of pre-lactealfeeding (OR = 1.82, 95%CI = 1.55-2.15). However,infants with no early breastfeeding initiation had aroundfour times higher odds of given pre-lacteal feeds (OR =4.37, 95%CI = 3.81-5.01). Other variables showingassociation with pre-lacteal feeding in this unadjustedanalysis were parity, wealth index, and place of residence.
Results of the multivariate logistic regression werepresented in Table 4. In the initial model (results notshown), there were nine independent covariates wereincluded as the p-value in the bivariate analysis (Table3), which was less than 0.25. In the end, two variableswere excluded, which resulted in only seven covariates
kept in the final model. Early initiation of breastfeedingand type of delivery remained the strongest predictors.Then, the adjustment for other variables only changedthe odds ratios at around 8% for early initiation ofbreastfeeding and 25% for the type of delivery with nochange in their p-values. Respondents with more thantwo children were less in introducing pre-lacteal feeds(AOR = 0.83, 95%CI = 0.71-0.96). Mothers whoperceived that their infant was smaller than average had1.43 (95%CI = 1.15-1.79) times the odds of introducingpre-lacteal feeding. Living in rural areas was associatedwith the higher practice of pre-lacteal feeding, increasingthe odds by 31%. Gender role attitudes and wealth indexwere also found to be associated with this practice.
DiscussionThis study found that almost half of the mothers
introduced pre-lacteal feeds, and the infant formula wasthe most common feed given. Analysis of the deter -minants of pre-lacteal feeding showed that perceivedbirth size, type of delivery, parity, early initiat ion ofbreastfeeding, gender role attitude, household wealthindex, and place of residence were associated with pre-lacteal feeding. Not all variables that were initiallyassumed to be correlated with the result showed evidenceof association. Variables reported to be predictors of pre-lacteal feeding in previous reports were maternaleducation, employment status, antenatal care visit, andplace of birth. However, these variables showed nocorrelation in this study.16,17
Pre-lacteal feeding was practiced by 44% of mothers,whose ages were less than 24 months in 2017. This figurewas lower than that of previous surveys, which was 60%in 2012 and 65% in 2007.14 Compared to other ASEANcountries, pre-lacteal feeding in Indonesia was lower thanVietnam (73.3%) and higher than Laos (35%).18,19
Some countries, such as Nepal and Ethiopia have lowerfigures with 29% and 8%.20,21 Differences in geo -graphical charac teristics, exposure to modern lifestyle,and policies regarding breastfeeding might be the reasonsfor these differences.
Pre-lacteal feeding is associated with early initiationand exclusive breastfeeding. Infants with delayedbreastfeeding initiation are more likely to receive the pre-lacteal feed. Introducing pre-lacteal feeding is negativelyassociated with the exclusive type as well.22 Thedownward trend of pre-lacteal feeding in the last decadewas followed by the increasing prevalence of earlyinitiation or exclusive breastfeeding.14,23 However, therewere still more than half of the children not exclusivelybreastfeed. Therefore, more effort to improve theexclusive type or infant feeding practices should beprioritized.
Observing the pre-lacteal feeds given, infant formula
Table 2. Respondents’ Characteristics of Pre-lacteal Feeding Practice
Variable Category N %
Infant characteristic Infant sex Male 3,344 51.4 Female 3,111 48.6Birth type Single 6,416 99.4 Multiple 39 0.6Perceived birth size Small 801 11.1 Average 3,460 57.7 Large 2,104 31.2Maternal characteristic Maternal age (years) <20 309 4.4 20-35 4,950 76.8 ≥35 1,196 18.8Maternal education College or higher 1,270 16.9 Secondary 3,657 58.9 Primary/no formal education 1,528 24.2Occupation Not working 3,511 56.7 Working 2,938 43.3Parity ≤2 4,159 68.3 >2 2,296 31.7Antenatal care visits (times) ≥4 5,700 90.8 <4 731 9.2Type of delivery Non-caesarean 5,281 81.2 Caesarean 1,170 18.8Birth attendants Health professional 5,895 93.0 Non-health professional 558 7.0Place of delivery Health facility 5,057 83.5 Non-health facility 1,397 16.5Gender role attitude Conforming 4,088 69.0 Non-conforming 2,171 31.0A decision on health spending Respondent alone 2,747 44.9 Not respondent alone or other 3,565 55.1Early initiation of breastfeeding Yes 3,732 59.5 No 2,723 40.5Household characteristics Wealth index Poorest 1,747 20.2 Poor 1,285 20.2 Middle 1,172 19.8 Rich 1,161 20.8 Richest 1,090 19.0Place of residence Urban 3,145 48.3 Rural 3,310 51.7Household size ≤5 3,531 60.0 >5 2,924 40.0
Kesmas: Jurnal Kesehatan Masyarakat Nasional (National Public Health Journal). 2021; 16 (2): 100-107
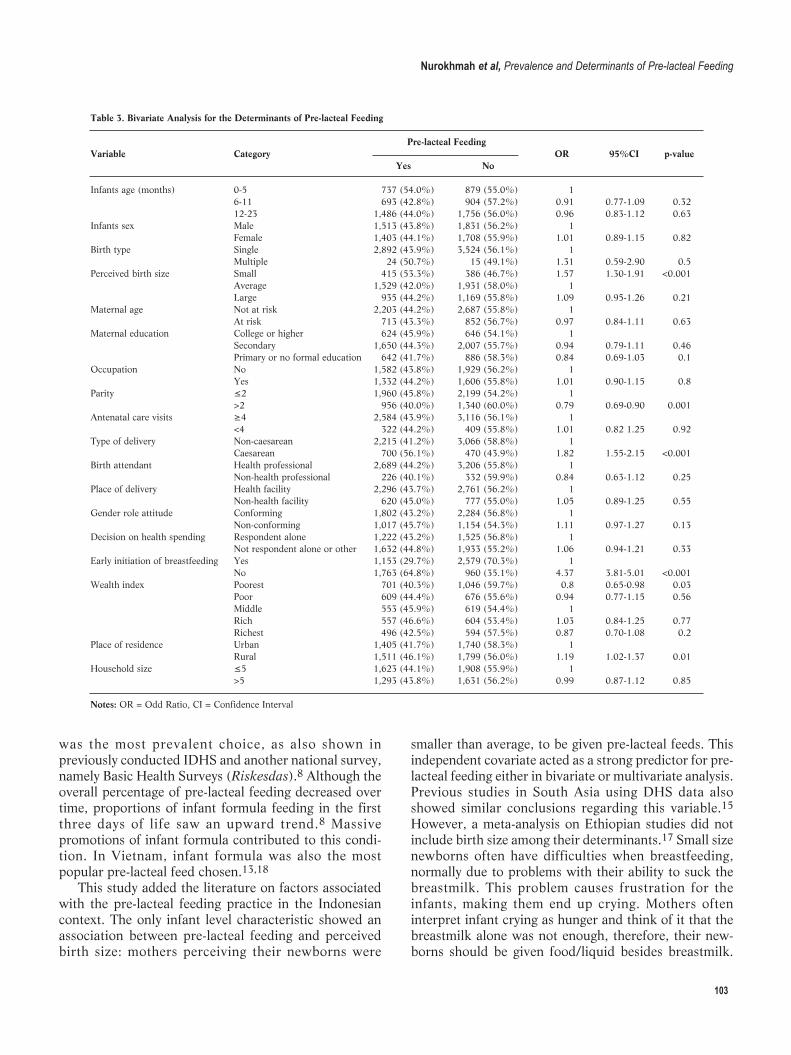
103
was the most prevalent choice, as also shown inpreviously conducted IDHS and another national survey,namely Basic Health Surveys (Riskesdas).8 Although theoverall percentage of pre-lacteal feeding decreased overtime, proportions of infant formula feeding in the firstthree days of life saw an upward trend.8 Massivepromotions of infant formula contributed to this condi -tion. In Vietnam, infant formula was also the mostpopular pre-lacteal feed chosen.13,18
This study added the literature on factors associatedwith the pre-lacteal feeding practice in the Indonesiancontext. The only infant level characteristic showed anassociation between pre-lacteal feeding and perceivedbirth size: mothers perceiving their newborns were
smaller than average, to be given pre-lacteal feeds. Thisindependent covariate acted as a strong predictor for pre-lacteal feeding either in bivariate or multivariate analysis.Previous studies in South Asia using DHS data alsoshowed similar conclusions regarding this variable.15
However, a meta-analysis on Ethiopian studies did notinclude birth size among their determinants.17 Small sizenewborns often have difficulties when breastfeeding,normally due to problems with their ability to suck thebreastmilk. This problem causes frustration for theinfants, making them end up crying. Mothers ofteninterpret infant crying as hunger and think of it that thebreastmilk alone was not enough, therefore, their new-borns should be given food/liquid besides breastmilk.
Table 3. Bivariate Analysis for the Determinants of Pre-lacteal Feeding
Pre-lacteal FeedingVariable Category OR 95%CI p-value Yes No
Infants age (months) 0-5 737 (54.0%) 879 (55.0%) 1 6-11 693 (42.8%) 904 (57.2%) 0.91 0.77-1.09 0.32 12-23 1,486 (44.0%) 1,756 (56.0%) 0.96 0.83-1.12 0.63Infants sex Male 1,513 (43.8%) 1,831 (56.2%) 1 Female 1,403 (44.1%) 1,708 (55.9%) 1.01 0.89-1.15 0.82Birth type Single 2,892 (43.9%) 3,524 (56.1%) 1 Multiple 24 (50.7%) 15 (49.1%) 1.31 0.59-2.90 0.5Perceived birth size Small 415 (53.3%) 386 (46.7%) 1.57 1.30-1.91 <0.001 Average 1,529 (42.0%) 1,931 (58.0%) 1 Large 935 (44.2%) 1,169 (55.8%) 1.09 0.95-1.26 0.21Maternal age Not at risk 2,203 (44.2%) 2,687 (55.8%) 1 At risk 713 (43.3%) 852 (56.7%) 0.97 0.84-1.11 0.63Maternal education College or higher 624 (45.9%) 646 (54.1%) 1 Secondary 1,650 (44.3%) 2,007 (55.7%) 0.94 0.79-1.11 0.46 Primary or no formal education 642 (41.7%) 886 (58.3%) 0.84 0.69-1.03 0.1Occupation No 1,582 (43.8%) 1,929 (56.2%) 1 Yes 1,332 (44.2%) 1,606 (55.8%) 1.01 0.90-1.15 0.8Parity ≤2 1,960 (45.8%) 2,199 (54.2%) 1 >2 956 (40.0%) 1,340 (60.0%) 0.79 0.69-0.90 0.001Antenatal care visits ≥4 2,584 (43.9%) 3,116 (56.1%) 1 <4 322 (44.2%) 409 (55.8%) 1.01 0.82 1.25 0.92Type of delivery Non-caesarean 2,215 (41.2%) 3,066 (58.8%) 1 Caesarean 700 (56.1%) 470 (43.9%) 1.82 1.55-2.15 <0.001Birth attendant Health professional 2,689 (44.2%) 3,206 (55.8%) 1 Non-health professional 226 (40.1%) 332 (59.9%) 0.84 0.63-1.12 0.25Place of delivery Health facility 2,296 (43.7%) 2,761 (56.2%) 1 Non-health facility 620 (45.0%) 777 (55.0%) 1.05 0.89-1.25 0.55Gender role attitude Conforming 1,802 (43.2%) 2,284 (56.8%) 1 Non-conforming 1,017 (45.7%) 1,154 (54.3%) 1.11 0.97-1.27 0.13Decision on health spending Respondent alone 1,222 (43.2%) 1,525 (56.8%) 1 Not respondent alone or other 1,632 (44.8%) 1,933 (55.2%) 1.06 0.94-1.21 0.33Early initiation of breastfeeding Yes 1,153 (29.7%) 2,579 (70.3%) 1 No 1,763 (64.8%) 960 (35.1%) 4.37 3.81-5.01 <0.001Wealth index Poorest 701 (40.3%) 1,046 (59.7%) 0.8 0.65-0.98 0.03 Poor 609 (44.4%) 676 (55.6%) 0.94 0.77-1.15 0.56 Middle 553 (45.9%) 619 (54.4%) 1 Rich 557 (46.6%) 604 (53.4%) 1.03 0.84-1.25 0.77 Richest 496 (42.5%) 594 (57.5%) 0.87 0.70-1.08 0.2Place of residence Urban 1,405 (41.7%) 1,740 (58.3%) 1 Rural 1,511 (46.1%) 1,799 (56.0%) 1.19 1.02-1.37 0.01Household size ≤5 1,623 (44.1%) 1,908 (55.9%) 1 >5 1,293 (43.8%) 1,631 (56.2%) 0.99 0.87-1.12 0.85
Notes: OR = Odd Ratio, CI = Confidence Interval
Nurokhmah et al, Prevalence and Determinants of Pre-lacteal Feeding
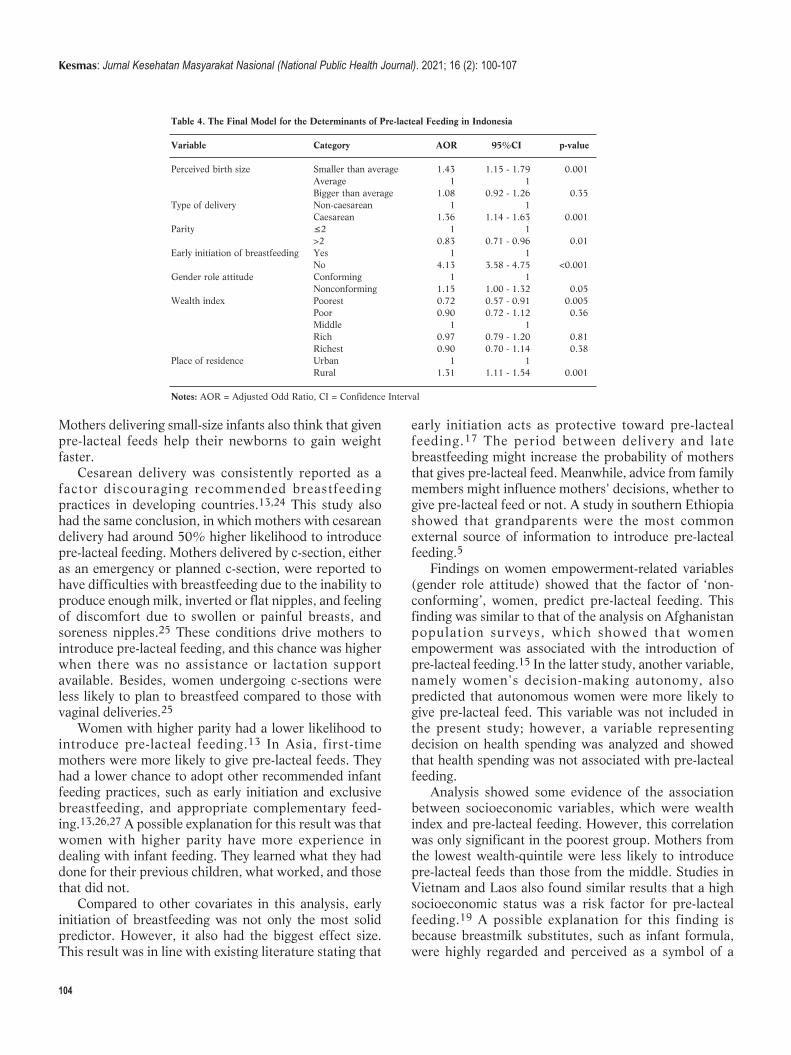
104
Mothers delivering small-size infants also think that givenpre-lacteal feeds help their newborns to gain weightfaster.
Cesarean delivery was consistently reported as afactor discouraging recommended breastfeedingpractices in developing countries.13,24 This study alsohad the same conclusion, in which mothers with cesareandelivery had around 50% higher likelihood to introducepre-lacteal feeding. Mothers delivered by c-section, eitheras an emergency or planned c-section, were reported tohave difficulties with breastfeeding due to the inability toproduce enough milk, inverted or flat nipples, and feelingof discomfort due to swollen or painful breasts, andsoreness nipples.25 These conditions drive mothers tointroduce pre-lacteal feeding, and this chance was higherwhen there was no assistance or lactation supportavailable. Besides, women undergoing c-sections wereless likely to plan to breastfeed compared to those withvaginal deliveries.25
Women with higher parity had a lower likelihood tointroduce pre-lacteal feeding.13 In Asia, first-timemothers were more likely to give pre-lacteal feeds. Theyhad a lower chance to adopt other recommended infantfeeding practices, such as early initiation and exclusivebreastfeeding, and appropriate complementary feed -ing.13,26,27 A possible explanation for this result was thatwomen with higher parity have more experience indealing with infant feeding. They learned what they haddone for their previous children, what worked, and thosethat did not.
Compared to other covariates in this analysis, earlyinitiation of breastfeeding was not only the most solidpredictor. However, it also had the biggest effect size.This result was in line with existing literature stating that
early initiation acts as protective toward pre-lactealfeeding.17 The period between delivery and latebreastfeeding might increase the probability of mothersthat gives pre-lacteal feed. Meanwhile, advice from familymembers might influence mothers' decisions, whether togive pre-lacteal feed or not. A study in southern Ethiopiashowed that grandparents were the most commonexternal source of information to introduce pre-lactealfeeding.5
Findings on women empowerment-related variables(gender role attitude) showed that the factor of ‘non-conforming’, women, predict pre-lacteal feeding. Thisfinding was similar to that of the analysis on Afghanistanpopulation surveys, which showed that womenempowerment was associated with the introduction ofpre-lacteal feeding.15 In the latter study, another variable,namely women's decision-making autonomy, alsopredicted that autonomous women were more likely togive pre-lacteal feed. This variable was not included inthe present study; however, a variable representingdecision on health spending was analyzed and showedthat health spending was not associated with pre-lactealfeeding.
Analysis showed some evidence of the associationbetween socioeconomic variables, which were wealthindex and pre-lacteal feeding. However, this correlationwas only significant in the poorest group. Mothers fromthe lowest wealth-quintile were less likely to introducepre-lacteal feeds than those from the middle. Studies inVietnam and Laos also found similar results that a highsocioeconomic status was a risk factor for pre-lactealfeeding.19 A possible explanation for this finding isbecause breastmilk substitutes, such as infant formula,were highly regarded and perceived as a symbol of a
Table 4. The Final Model for the Determinants of Pre-lacteal Feeding in Indonesia
Variable Category AOR 95%CI p-value
Perceived birth size Smaller than average 1.43 1.15 - 1.79 0.001 Average 1 1 Bigger than average 1.08 0.92 - 1.26 0.35Type of delivery Non-caesarean 1 1 Caesarean 1.36 1.14 - 1.63 0.001Parity ≤2 1 1 >2 0.83 0.71 - 0.96 0.01Early initiation of breastfeeding Yes 1 1 No 4.13 3.58 - 4.75 <0.001Gender role attitude Conforming 1 1 Nonconforming 1.15 1.00 - 1.32 0.05Wealth index Poorest 0.72 0.57 - 0.91 0.005 Poor 0.90 0.72 - 1.12 0.36 Middle 1 1 Rich 0.97 0.79 - 1.20 0.81 Richest 0.90 0.70 - 1.14 0.38Place of residence Urban 1 1 Rural 1.31 1.11 - 1.54 0.001
Notes: AOR = Adjusted Odd Ratio, CI = Confidence Interval
Kesmas: Jurnal Kesehatan Masyarakat Nasional (National Public Health Journal). 2021; 16 (2): 100-107
105
modern lifestyle. Women of higher socioeconomic statuswere able to afford it, unlike the underprivileged. Asimilar finding was also reported on the associationbetween breast feeding and socioeconomic factors that,breastfeeding was more common in lower socioeconomicwomen.2
Living in rural areas increased the odds of introducingpre-lacteal feeding, as shown in this analysis, was alsoreported by several studies on African populations.17,28
Cultural beliefs and local norms are more commonlypracticed by rural communities. The lack of access toinformation related to optimal infant feeding practiceswas among the reasons behind the higher proportion ofrural women introducing pre-lacteal feeding. Besides,variables related to cultural practices and informationabout Infant and Young Child Feeding (IYCF) were notincluded in this study.
This study used a nationally representative dataset ona large scale which provides reliable results for theanalysis. The variables also used international definitionsto be compared with previous studies. Analysis con duct -ed in this report also took into account a complex surveydesign. Some limitations were unavoidable, while dataon pre-lacteal feeding were obtained using the recallmethod, resulting in memory bias as respondents wereasked, what happened in 0-22 months before theinterview. Secondly, analyzing data from a cross-sectional design, reflected the association betweenvariables, while causal inference was restricted. Therewas also one variable with several missing values thatwere not excluded in the multivariate analysis due to itsvery strong association with the results. However, thispotential bias caused by missing data should not besignificant since the data missing did not differ betweenclusters.
ConclusionPerceived birth size, type of delivery, parity, early
initiation of breastfeeding, and place of residence werefound to strongly associate with pre-lacteal feeding.Infants born with smaller-size than average, such as thosedelivered by cesarean section, are more likely to receivea pre-lacteal feed. Mothers with one or two children havehigher odds of introducing and engaging in this practice.By contrast, respondents that initiated breastfeedingwithin the first hour after delivery have lower odds ofgiving a pre-lacteal feed. In contrast, urban women havea higher likelihood of giving this feed. Household wealthindex and gender role attitude showed some evidence ofassociation with pre-lacteal feeding. The poorestrespondents had a higher risk of introducing solid/ liquidfeeds in the first three days after delivery. The 'non-conforming women' were more likely to engage in thispractice. Therefore, interventions are needed to
discourage mothers from introducing pre-lacteal feeding. Efforts should also be made by directly targeting
modifiable covariates, such as early initiation ofbreastfeeding and specific measures on cesarean delivery.Health facilities need to ensure that early initiation ofbreastfeeding is part of the procedure either for normalor cesarean delivery. This was also found in previousstudies which showed that early initiation ofbreastfeeding rate was lower in women with cesareancompared to those with normal delivery. Health staffsalso need sufficient skills and knowledge to educatewomen and their families about the recommended infantfeeding practices. This effort is effective when theprocedures in the health facilities include this activity.Further studies explaining the associations between earlyinitiation of breastfeeding, cesarean delivery, and pre-lacteal feeding are needed to formulate more effectiveinterventions.
Women with more than two children were chosen tobe part of the community-based interventions related toinfant feeding and targeting pregnant women as theyalready have experience dealing with this practice. Theanalysis also showed that they were less likely tointroduce pre-lacteal feeding. Moreover, it is importantto address this issue, as the smaller-size-born infants aremore prone to receive pre-lacteal feeds, and the edu -cation from health staff on how to prevent low-birth-weight is also crucial. Special attention should be givento women from the lowest socioeconomic backgroundand those with non-conforming gender role attitudes, asthey have a higher chance of giving pre-lacteal feeds.
In Indonesia, all these efforts should be integratedinto community health centers with more massiveeducation and counseling, targeting the pregnant womenand the family. In delivery, health facilities play a crucialrole in counseling and education on infant feeding, and itis to support all breastfeeding-friendly policies.
AbbreviationsAOR: Adjusted Odds Ratio; CI: Confidence Interval; IDHS: IndonesiaDemographic and Health Survey; HIV/AIDS: Human Immuno -deficiency Virus/Acquired Immune Deficiency Syndrome; OR: OddsRatio; ASEAN: The Association of Southeast Asian Nations; AOR:Adjusted Odds Ratio; CI: Confidence Interval; DHS: Demographic andHealth Survey; IYCF: Infant and Young Child Feeding.
Ethics Approval and Consent to ParticipateThe ethics approval of the 2017 IDHS was received from ICF MacroInstitutional Review Board (IRB), Maryland, USA. This study was asecondary data analysis of publicly accessible data. Informed consentwas obtained from all participants.
Competing Interest
Nurokhmah et al, Prevalence and Determinants of Pre-lacteal Feeding
106
The author declares that there are no significant competing financial,professional, or personal interests that might have affected the per-formance or presentation of the work described in this manuscript.
Availability of Data and MaterialsThe materials and dataset used in this study were accessed athttps://dhsprogram.com/data/available-datasets.cfm.
Authors’ ContributionSN was responsible for the overall concept of the study, analysis, andwriting the manuscript. SM helped the concept and statistical analysis,while KEW contributed to the writing. All authors discussed the con-tent of this manuscript and approved the final version.
AcknowledgmentThe authors would like to acknowledge Indonesia Demographic andHealth Survey (IDHS) and ICF Macro Institutional Review Board forpermission to use the dataset collected in 2017. Sincere gratitude toDr. Aurélie Bechoff for proofreading this report.
References1. Victora CG, Bahl R, Barros AJD, França GVA, Horton S, Krasevec J,
et al. Breastfeeding in the 21st century: epidemiology, mechanisms,
and lifelong effect. Lancet. 2016; 387 (10017): 475–90.
2. Rollins NC, Bhandari N, Hajeebhoy N, Horton S, Lutter CK, Martines
JC, et al. Why invest, and what it will take to improve breastfeeding
practices?. Lancet. 2016; 387 (10017): 491–504.
3. Brahm P, Valdés V. The benefits of breastfeeding and risks associated
with not breastfeeding. Revista Chilena de Pediatría. 2017; 88 (1): 7–
14.
4. Walters D, Horton S, Siregar AYM, Pitriyan P, Hajeebhoy N,
Mathisen R, et al. The cost of not breastfeeding in Southeast Asia.
Health Policy and Planning. 2016; 31 (8): 1107–16.
5. Amele EA, Demissie BW, Desta KW, Woldemariam EB. Prelacteal
feeding practice and its associated factors among mothers of children
age less than 24 months old in Southern Ethiopia. Italian Journal of
Pediatrics. 2019; 45 (1): 15.
6. Belachew AB, Kahsay AB, Abebe YG. Individual and community-level
factors associated with introduction of prelacteal feeding in Ethiopia.
Archives of Public Health. 2016; 74 (1): 1–11.
7. Raheem RA, Binns CW, Chih HJ, Sauer K. Determinants of the
introduction of prelacteal feeds in the Maldives. Breastfeeding
Medicine. 2014; 9 (9): 473–8.
8. Kementerian Kesehatan Republik Indonesia. Laporan nasional riset
kesehatan dasar 2018. 2018. p. 1–582.
9. Doherty T, Sanders D, Jackson D, Swanevelder S, Lombard C, Zembe
W, et al. Early cessation of breastfeeding amongst women in South
Africa: an area needing urgent attention to improve child health. BMC
Pediatrics. 2012; 12: 105.
10. Karkee R, Lee AH, Khanal V, Binns CW. Initiation of breastfeeding
and factors associated with prelacteal feeds in Central Nepal. Journal
of Human Lactation. 2014; 30 (3): 353–7.
11. Ara G, Khanam M, Papri N, Nahar B, Haque MA, Kabir I, et al. Peer
counselling improves breastfeeding practices: a cluster randomized
controlled trial in urban Bangladesh. Maternal & Child Nutrition.
2018; 14 (3): e12605.
12. Flax VL, Hawley I, Ryan J, Chitukuta M, Mathebula F, Nakalega R, et
al. After their wives have delivered, a lot of men like going out:
perceptions of HIV transmission risk and support for HIV prevention
methods during breastfeeding in sub-Saharan Africa. Maternal &
Child Nutrition; 2020.
13. Champeny M, Pries AM, Hou K, Adhikary I, Zehner E, Huffman SL.
Predictors of breast milk substitute feeding among newborns in
delivery facilities in urban Cambodia and Nepal. Maternal & Child
Nutrition. 2019; 15 (S4): e12754.
14. National Population and Family Planning Board, Indonesia. Indonesia
demographic and health survey 2017. Jakarta, Indonesia: BKKBN,
BPS, Kemenkes, and ICF; 2018.
15. Benedict RK, Craig HC, Torlesse H, Stoltzfus RJ. Trends and
predictors of optimal breastfeeding among children 0-23 months,
South Asia: analysis of national survey data. Maternal & Child
Nutrition. 2018; 14 Suppl 4: e12698.
16. Agho KE, Ogeleka P, Ogbo FA, Ezeh OK, Eastwood J, Page A. Trends
and predictors of prelacteal feeding practices in Nigeria (2003-2013).
Nutrients. 2016; 8 (8).
17. Temesgen H, Negesse A, Woyraw W, Getaneh T, Yigizaw M.
Prelacteal feeding and associated factors in Ethiopia: systematic review
and meta-analysis. Int Breastfeed J. 2018; 13 (1): 49.
18. Nguyen PH, Keithly SC, Nguyen NT, Nguyen TT, Tran LM, Hajeebhoy
N. Prelacteal feeding practices in Vietnam: problems and determinant
factors. BMC Public Health. 2013; 13: 1–11.
19. Kounnavong S, Pak-gorstein S, Akkhavong K, Palaniappan U. Key
determinants of optimal breastfeeding practices in Laos. Food and
Nutrition Sciences. 2013; 04 (10).
20. Ministry of Health, Nepal. New ERA: inner city fund international.
Nepal demographic and health survey 2016. Kathmandu, Nepal:
MOH/Nepal, New ERA, and ICF; 2017.
21. Central Statistical Agency, Ethiopia; Inner City Fund International.
Ethiopia demographic and health survey 2016. Addis Ababa, Ethiopia:
CSA and ICF; 2017.
22. Paramashanti BA, Hadi H, Gunawan IMA. Timely initiation of
breastfeeding is associated with the practice of exclusive breastfeeding
in Indonesia. Asia Pacific Journal of Clinical Nutrition. 2016; 25
(Suppl 1): S52–6.
23. Saputri NS, Spagnoletti BRM, Morgan A, Wilopo SA, Singh A,
McPake B, et al. Progress towards reducing sociodemographic
disparities in breastfeeding outcomes in Indonesia: a trend analysis
from 2002 to 2017. BMC Public Health. 2020; 20 (1): 1–15.
24. Saaka M, Hammond AY. Caesarean section delivery and risk of poor
childhood growth. Journal of Nutrition and Metabolism. 2020; 1–12.
25. Hobbs AJ, Mannion CA, Mcdonald SW, Brockway M, Tough SC. The
impact of caesarean section on breastfeeding initiation, duration and
difficulties in the first four months pospartum. BMC Pregnancy
Childbirth. 2016; 16 (90): 1–9.
26. Senarath U, Dibley MJ, Agho KE. Factors associated with
nonexclusive breastfeeding in 5 east and southeast Asian countries: a
multilevel analysis. Journal of Human Lactation. 2010; 26 (3): 248–
57.
Kesmas: Jurnal Kesehatan Masyarakat Nasional (National Public Health Journal). 2021; 16 (2): 100-107
107
27. Patel A, Banerjee A, Kaletwad A. Factors associated with prelacteal
feeding and timely initiation of breastfeeding in hospital-delivered
infants in India. Journal of Human Lactation. 2013; 29 (4): 572–8.
28. Berde AS, Ozcebe H. Risk factors for prelacteal feeding in sub-
Saharan Africa: a multilevel analysis of population data from twenty-
two countries. Public Health Nutrition. 2017; 20 (11): 1953–62.
Nurokhmah et al, Prevalence and Determinants of Pre-lacteal Feeding
Sitorus et al. Kesmas: Jurnal Kesehatan Masyarakat Nasional (National Public HealthJournal). 2021; 16 (2): 108-112DOI: 10.21109/kesmas.v16i2.3297
AbstractSmoking leads to disease and disability as well as harms nearly every organ of the body. Furthermore, tobacco-smoking is known to cause pulmonary dys-function and lead to complications, pain, or even death. This study aimed to measure the risk factors for the respiration of carbon monoxide among smokers.A cross-sectional design was implemented by involving 156 smokers in Karyajaya Subdistrict, Palembang City. The dependent variable was carbon monoxidelevels (ppm), while the independent variables were smoking frequency, duration, and the last period of smoking. The carbon monoxide levels (ppm) measuredwith a PiCO + Smokerlyzer® device from Bedfont Scientific Limited were the study tool and the independent variables of the questionnaire. The PearsonCorrelation and multiple linear regression were used for the analysis. The multiple linear regression analysis results revealed that smoking duration assessmentis related to carbon monoxide respiration after controlling smoking frequency, the last period of smoking, and the distance of residence to sources of exposure.The smoker's respiration of carbon monoxide level was 72.5% influenced by the duration, frequency, last period of smoking, and distance of residence tosources of exposure. Reducing the frequency of smoking and stopping may prevent and control carbon monoxide respiration.
Keywords: carbon monoxide level, smoking duration, swamp, tobacco smoke
The Effect of Smoking on Carbon Monoxide Respiration amongActive Smokers in Palembang City, Indonesia
Rico Januar Sitorus1*, Imelda G Purba2, Merry Natalia3, Kraichat Tantrakarnapa4
1Department of Epidemiology, Faculty of Public Health, Universitas Sriwijaya, Indonesia 2Department of Environmental and Occupational Health, Universitas Sriwijaya, Indonesia3Staff of Port Health Office, Ministry of Health, Palembang, Indonesia4Department of Social and Environmental Medicine, Faculty of Tropical Medicine, Mahidol University, Bangkok, Thailand
IntroductionSmoking is a risk factor for several diseases, including
cardiovascular disease, chronic obstructive pulmonarydisease, and lung cancer. However, the specific role ofthe smoke of cigarette in the disease remained unclear.Furthermore, it is a complex aerosol made up of thou-sands of chemicals compounds identified as carcino -gens.1
One of the more toxic substances in the tobacco gasphase is Carbon monoxide (CO), which can cause tissuehypoxia toxicity because it can bind 200 to 240 times theamount of oxygen to hemoglobin that can decrease oxy-gen transport capacity and inhibit the release of oxygenin cells.2 Furthermore, CO can also cause cardiovasculardysfunctions such as angina, myocardial infarction, ar-rhythmias, left ventricular dysfunction, myocardial tran-sient fainting, cardiogenic shock, and sudden death.3
The acute effects of cigarette smoke containing COinfluenced the biochemical conditions of the lungs, whichcan lead to lung disease.1,4 The CO content exhaled bythe body is influenced by physiological factors and dis-ease in which endogenous and exogenous factors influ-
ence the amount of carbon monoxide stored in the body.5Furthermore, its poisoning occurred in different popula-tions and was influenced by the type of work, and thejobs at risk were workers exposed to the gas.6
The CO monitoring each individual can identify pop-ulations at high risk for respiratory diseases related to airpollution. Exposure to CO has been shown to correlatewith concentrations of particles that can cause respirato-ry problems, lung disease, increase the risk of asthma,and even death.7-9 Lung disease and respiratory disorderscan cause disability and poor quality of life.10,11 Peoplethat survive severe CO poisoning may suffer long-termhealth problems. Furthermore, the CO is quick to con-nect with the red blood cells but slow to exit the body.12
The average CO level of smokers was higher than that ofnon-smokers, proving that exposure to cigarettes affectsbiological conditions in the body.13
The acute effects of smoking influence the biochemi-cal conditions in the lungs.14 This study played an im-portant role to determine the levels of CO in the lungs ofactive smokers, which accumulates over a long period oftime. The main objective of this study was to measure ac-
Correspondence*: Rico Januar Sitorus, Department of Epidemiology, Faculty ofPublic Health, Sriwijaya University, Kampus Universitas Sriwijaya Indralaya,Ogan Ilir District, South Sumatera Province, Indonesia, E-mail:[email protected], Phone: +62 813 6771 2221
Received : September 03, 2019Accepted : February 05, 2021Published : May 28, 2021
Copyright @ 2021, Kesmas: Jurnal Kesehatan Masyarakat Nasional (National Public Health Journal), p-ISSN: 1907-7505, e-ISSN: 2460-0601, SINTA-S1 accredited,http://journal.fkm.ui.ac.id/kesmas, Licensed under Creative Commons Attribution-ShareAlike 4.0 International
Kesmas: Jurnal Kesehatan Masyarakat Nasional(National Public Health Journal)
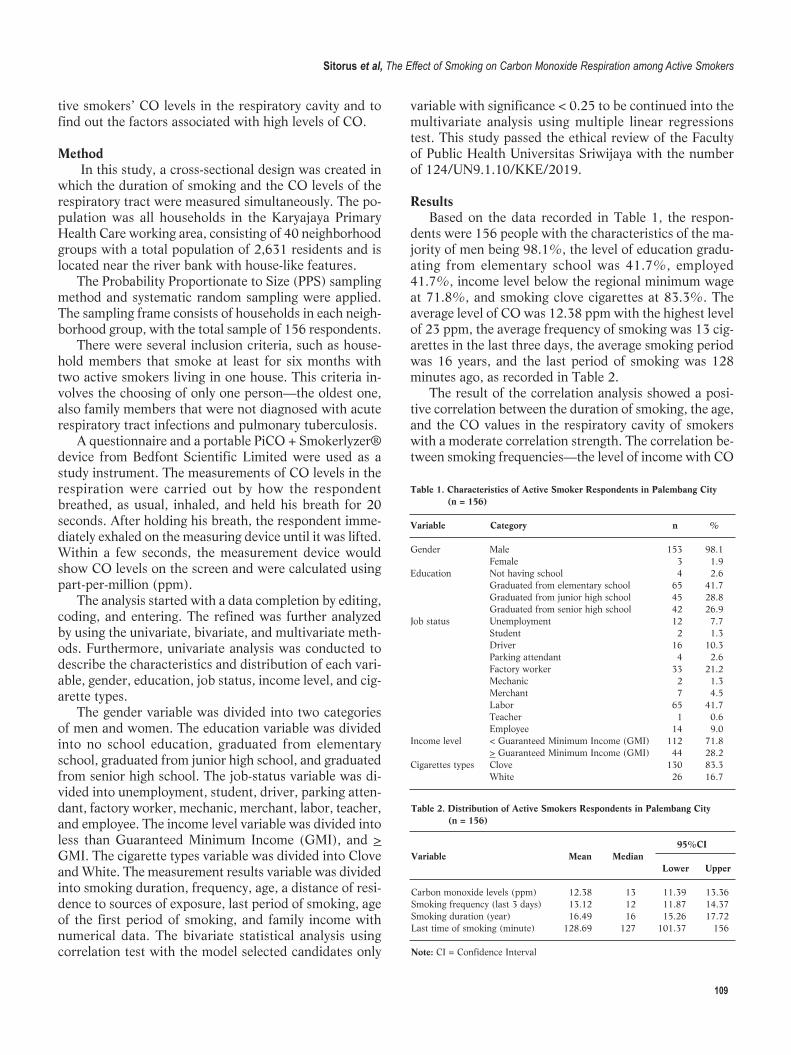
109
tive smokers’ CO levels in the respiratory cavity and tofind out the factors associated with high levels of CO.
MethodIn this study, a cross-sectional design was created in
which the duration of smoking and the CO levels of therespiratory tract were measured simultaneously. The po -pu lation was all households in the Karyajaya PrimaryHealth Care working area, consisting of 40 neighborhoodgroups with a total population of 2,631 residents and islocated near the river bank with house-like features.
The Probability Proportionate to Size (PPS) samplingmethod and systematic random sampling were applied.The sampling frame consists of households in each neigh-borhood group, with the total sample of 156 respondents.
There were several inclusion criteria, such as house-hold members that smoke at least for six months withtwo active smokers living in one house. This criteria in-volves the choosing of only one person—the oldest one,also family members that were not diagnosed with acuterespiratory tract infections and pulmonary tuberculosis.
A questionnaire and a portable PiCO + Smokerlyzer®device from Bedfont Scientific Limited were used as astudy instrument. The measurements of CO levels in therespiration were carried out by how the respondentbreathed, as usual, inhaled, and held his breath for 20seconds. After holding his breath, the respondent imme-diately exhaled on the measuring device until it was lifted.Within a few seconds, the measurement device wouldshow CO levels on the screen and were calculated usingpart-per-million (ppm).
The analysis started with a data completion by editing,coding, and entering. The refined was further analyzedby using the univariate, bivariate, and multivariate meth-ods. Furthermore, univariate analysis was conducted todescribe the characteristics and distribution of each vari-able, gender, education, job status, income level, and cig-arette types.
The gender variable was divided into two categoriesof men and women. The education variable was dividedinto no school education, graduated from elementaryschool, graduated from junior high school, and graduatedfrom senior high school. The job-status variable was di-vided into unemployment, student, driver, parking atten-dant, factory worker, mechanic, merchant, labor, teacher,and employee. The income level variable was divided intoless than Guaranteed Minimum Income (GMI), and >GMI. The cigarette types variable was divided into Cloveand White. The measurement results variable was dividedinto smoking duration, frequency, age, a distance of resi -dence to sources of exposure, last period of smoking, ageof the first period of smoking, and family income withnumerical data. The bivariate statistical analysis usingcorrelation test with the model selected candidates only
variable with significance < 0.25 to be continued into themultivariate analysis using multiple linear regressionstest. This study passed the ethical review of the Facultyof Public Health Universitas Sriwijaya with the numberof 124/UN9.1.10/KKE/2019.
ResultsBased on the data recorded in Table 1, the respon-
dents were 156 people with the characteristics of the ma-jority of men being 98.1%, the level of education gradu-ating from elementary school was 41.7%, employed41.7%, income level below the regional minimum wageat 71.8%, and smoking clove cigarettes at 83.3%. Theaverage level of CO was 12.38 ppm with the highest levelof 23 ppm, the average frequency of smoking was 13 cig-arettes in the last three days, the average smoking periodwas 16 years, and the last period of smoking was 128minutes ago, as recorded in Table 2.
The result of the correlation analysis showed a posi-tive correlation between the duration of smoking, the age,and the CO values in the respiratory cavity of smokerswith a moderate correlation strength. The correlation be-tween smoking frequencies—the level of income with CO
Sitorus et al, The Effect of Smoking on Carbon Monoxide Respiration among Active Smokers
Table 1. Characteristics of Active Smoker Respondents in Palembang City (n = 156)
Variable Category n %
Gender Male 153 98.1 Female 3 1.9Education Not having school 4 2.6 Graduated from elementary school 65 41.7 Graduated from junior high school 45 28.8 Graduated from senior high school 42 26.9Job status Unemployment 12 7.7 Student 2 1.3 Driver 16 10.3 Parking attendant 4 2.6 Factory worker 33 21.2 Mechanic 2 1.3 Merchant 7 4.5 Labor 65 41.7 Teacher 1 0.6 Employee 14 9.0Income level < Guaranteed Minimum Income (GMI) 112 71.8 > Guaranteed Minimum Income (GMI) 44 28.2Cigarettes types Clove 130 83.3 White 26 16.7
Table 2. Distribution of Active Smokers Respondents in Palembang City (n = 156)
95%CIVariable Mean Median Lower Upper
Carbon monoxide levels (ppm) 12.38 13 11.39 13.36Smoking frequency (last 3 days) 13.12 12 11.87 14.37Smoking duration (year) 16.49 16 15.26 17.72Last time of smoking (minute) 128.69 127 101.37 156
Note: CI = Confidence Interval
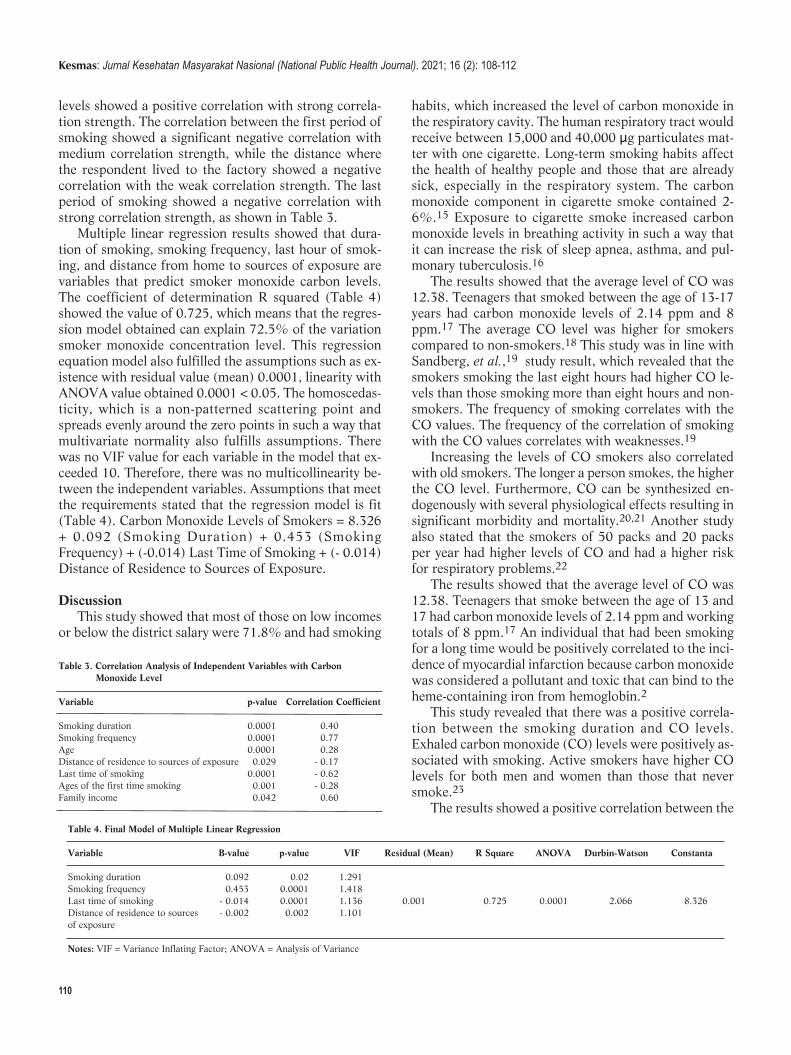
110
levels showed a positive correlation with strong correla-tion strength. The correlation between the first period ofsmoking showed a significant negative correlation withmedium correlation strength, while the distance wherethe respondent lived to the factory showed a negativecorrelation with the weak correlation strength. The lastperiod of smoking showed a ne gative correlation withstrong correlation strength, as shown in Table 3.
Multiple linear regression results showed that dura-tion of smoking, smoking frequency, last hour of smok-ing, and distance from home to sources of exposure arevariables that predict smoker monoxide carbon levels.The coefficient of determination R squared (Table 4)showed the value of 0.725, which means that the regres-sion model obtained can explain 72.5% of the variationsmoker monoxide concentration level. This regressionequation model also fulfilled the assumptions such as ex-istence with residual value (mean) 0.0001, linearity withANOVA value obtained 0.0001 < 0.05. The homoscedas-ticity, which is a non-patterned scattering point andspreads evenly around the zero points in such a way thatmultivariate normality also fulfills assumptions. Therewas no VIF value for each variable in the model that ex-ceeded 10. Therefore, there was no multicollinearity be-tween the independent variables. Assumptions that meetthe requirements stated that the regression model is fit(Table 4). Carbon Monoxide Levels of Smokers = 8.326+ 0.092 (Smoking Duration) + 0.453 (SmokingFrequency) + (-0.014) Last Time of Smoking + (- 0.014)Distance of Residence to Sources of Exposure.
DiscussionThis study showed that most of those on low incomes
or below the district salary were 71.8% and had smoking
habits, which increased the level of carbon monoxide inthe respiratory cavity. The human respiratory tract wouldreceive between 15,000 and 40,000 µg particulates mat-ter with one cigarette. Long-term smoking habits affectthe health of healthy people and those that are alreadysick, especially in the respiratory system. The carbonmonoxide component in cigarette smoke contained 2-6%.15 Exposure to cigarette smoke increased carbonmonoxide levels in breathing activity in such a way thatit can increase the risk of sleep apnea, asthma, and pul-monary tuberculosis.16
The results showed that the average level of CO was12.38. Teenagers that smoked between the age of 13-17years had carbon monoxide levels of 2.14 ppm and 8ppm.17 The average CO level was higher for smokerscompared to non-smokers.18 This study was in line withSandberg, et al.,19 study result, which revealed that thesmokers smoking the last eight hours had higher CO le -vels than those smoking more than eight hours and non-smokers. The frequency of smoking correlates with theCO values. The frequency of the correlation of smokingwith the CO values correlates with weaknesses.19
Increasing the levels of CO smokers also correlatedwith old smokers. The longer a person smokes, the higherthe CO level. Furthermore, CO can be synthesized en-dogenously with several physiological effects resulting insignificant morbidity and mortality.20,21 Another studyalso stated that the smokers of 50 packs and 20 packsper year had higher levels of CO and had a higher riskfor respiratory problems.22
The results showed that the average level of CO was12.38. Teenagers that smoke between the age of 13 and17 had carbon monoxide levels of 2.14 ppm and workingtotals of 8 ppm.17 An individual that had been smokingfor a long time would be positively correlated to the inci-dence of myocardial infarction because carbon monoxidewas considered a pollutant and toxic that can bind to theheme-containing iron from hemoglobin.2
This study revealed that there was a positive correla-tion between the smoking duration and CO levels.Exhaled carbon monoxide (CO) levels were positively as-sociated with smoking. Active smokers have higher COlevels for both men and women than those that neversmoke.23
The results showed a positive correlation between the
Kesmas: Jurnal Kesehatan Masyarakat Nasional (National Public Health Journal). 2021; 16 (2): 108-112
Table 3. Correlation Analysis of Independent Variables with Carbon Monoxide Level
Variable p-value Correlation Coefficient
Smoking duration 0.0001 0.40Smoking frequency 0.0001 0.77Age 0.0001 0.28Distance of residence to sources of exposure 0.029 - 0.17Last time of smoking 0.0001 - 0.62Ages of the first time smoking 0.001 - 0.28Family income 0.042 0.60
Table 4. Final Model of Multiple Linear Regression
Variable B-value p-value VIF Residual (Mean) R Square ANOVA Durbin-Watson Constanta
Smoking duration 0.092 0.02 1.291 Smoking frequency 0.453 0.0001 1.418 Last time of smoking - 0.014 0.0001 1.136 0.001 0.725 0.0001 2.066 8.326Distance of residence to sources - 0.002 0.002 1.101 of exposure
Notes: VIF = Variance Inflating Factor; ANOVA = Analysis of Variance
111
smoking frequencies with carbon monoxide levels in therespiratory cavity. This research was in line with Zhang,et al.,23 which stated that the a verage CO levels werehigher in people who smoke cigarettes every day thannon-smokers. The respondent's living near the industry(factory) and landfills are exposed to higher le vel of COof about 23.1%. Further more, CO exposure can also in-crease due to environmental pollution and living close tothe source of pollution. The last time of smoking wasnegatively correlated with CO levels in the respiratorycavity. The longer the CO level was measured in the lungsof a smoker, the lower the level of CO level. People thatsmoke had higher levels of CO than non-smokers.23
The strength of this study was to determine the levelsof respiratory carbon monoxide in smokers. The mea -surements were made directly using a reliable measuringinstrument with a valid result and the data can be usedto control diseases in smokers. The weakness of the cho-sen design was the lack of strong causality between ciga-rette smoke exposure and respiratory CO levels amongsmokers.
ConclusionThe duration of smoking influences the respiratory
carbon monoxide content of 72.5% in smokers. Otherfactors influence the frequency of smoking, the last peri-od of smoking, the distance of residence to sources of ex-posure, and 28.5%.
RecommendationReducing the frequency of smoking and even stopping
smoking may prevent and control the respiratory of car-bon monoxide.
AbbreviationsCO: Carbon monoxide; PPS: Probability Proportional to Size; PPM:Part-Per-Million; VIF: Variance Inflating Factor; GMI: GuaranteedMinimum Income; CI: Confidence Interval.
Ethics Approval and Consent to ParticipateThis research has passed the ethical review in the Faculty of PublicHealth with the number of 124/UN9.1.10/KKE/2019.
Competing InterestThe author declares that there are no significant competing financial,professional, or personal interests that might have affected the per-formance or presentation of the work described in this manuscript.
Availability of Data and MaterialsData and all related materials from this study are available by the firstauthor.
Authors’ ContributionRJS designed the study, developed data instrument for collecting the
data, data analysis, and drafted the manuscript. Other authors assistedin the analyzing and interpreting data, finding the supporting journals,correcting the writing procedures, and finalizing manuscripts.
AcknowledgmentThe authors express profound gratitude to Universitas Sriwijaya,Karyajaya Primary Health Care, and all study’s team members.
References1. Liu J, Liang Q, Frost-Pineda K, Muhammad-Kah R, Rimmer L,
Roethig H, et al. Relationship between biomarkers of cigarette smoke
exposure and biomarkers of inflammation, oxidative stress, and
platelet activation in adult cigarette smokers. Cancer Epidemiology,
Biomarkers & Prevention. 2011; 20 (8): 1760–9.
2. Lee F-Y, Chen W-K, Lin C-L, Kao C-H. Carbon monoxide poisoning
and subsequent cardiovascular disease risk: a nationwide population-
based cohort study. Medicine (Baltimore). 2015; 94 (10): e624.
3. Garg J, Krishnamoorthy P, Palaniswamy C, Khera S, Ahmad H, Jain
D, et al. Cardiovascular abnormalities in carbon monoxide poisoning.
American Journal of Therapeutics. 2018; 25 (3): e339–48.
4. Bagaitkar J, Demuth DR, Daep CA, Renaud DE, Pierce DL, Scott DA.
Tobacco upregulates P. gingivalis fimbrial proteins which induce
TLR2 hyposensitivity. PLoS One. 2010; 5 (5).
5. Owens EO. Endogenous carbon monoxide production in disease.
Clinical Biochemistry. 2010; 43 (15): 1183.
6. Brvar M, Luzar B, Finderle Ž, Šuput D, Bunc M. The time-dependent
protective effect of hyperbaric oxygen on neuronal cell apoptosis in
carbon monoxide poisoning. Inhalation Toxicology. 2010; 22 (12):
1026–31.
7. Moore E, Chatzidiakou L, Kuku M-O, Jones RL, Smeeth L, Beevers S,
et al. Global associations between air pollutants and chronic obstruc-
tive pulmonary disease hospitalizations. A systematic review. Annals
of the American Thoracic Society. 2016; 13 (10): 1814–27.
8. McCracken JP, Schwartz J, Diaz A, Bruce N, Smith KR. Longitudinal
relationship between personal CO and personal PM2.5 among women
cooking with woodfired cookstoves in Guatemala. PLoS One. 2013; 8
(2).
9. McLeish AC, Zvolensky MJ. Asthma and cigarette smoking: a review
of the empirical literature. ournal of Asthma. 2010; 47 (4): 345–61.
10. Santus P, Bassi L, Radovanovic D, Airoldi A, Raccanelli R, Triscari F,
et al. Pulmonary rehabilitation in COPD: a reappraisal (2008–2012).
Pulmonary Medicine. 2013.
11. Sahin H, Naz I, Varol Y, Aksel N, Tuksavul F, Ozsoz A. COPD pa-
tients with severe diffusion defect in carbon monoxide diffusing capa -
city predict a better outcome for pulmonary rehabilitation. Revista
Portuguesa de Pneumologia (English Ed.). 2016; 22 (6): 323–30.
12. Centers for Disease Control and Prevention. Carbon monoxide poison-
ing. National Environmental Public Health Tracking Network, Centers
for Disease Control and Prevention; 2016.
13. Javors MA, Hatch JP, Lamb RJ. Sequential combination of self-report,
breath carbon monoxide, and saliva cotinine to assess smoking status.
Drug and Alcohol Dependence. 2011; 113 (2): 242–4.
14. Koczulla A-R, Noeske S, Herr C, Jörres RA, Römmelt H, Vogelmeier
C, et al. Acute and chronic effects of smoking on inflammation mark-
Sitorus et al, The Effect of Smoking on Carbon Monoxide Respiration among Active Smokers
112
ers in exhaled breath condensate in current smokers. Respiration.
2010; 79 (1): 61–7.
15. Sangani RG, Ghio AJ. Lung injury after cigarette smoking is particle
related. International Journal of Chronic Obstructive Pulmonary
Disease. 2011; 6: 191.
16. Jayes L, Haslam PL, Gratziou CG, Powell P, Britton J, Vardavas C, et
al. SmokeHaz: systematic reviews and meta-analyses of the effects of
smoking on respiratory health. Chest. 2016; 150 (1): 164–79.
17. Nur Atikah AH, Wee LH, Nur Zakiah MS, Chan CMH, Mohamed
Haniki NM, Swinderjit JS, et al. Factors associated with different
smoking statuses among Malaysian adolescent smokers: a cross-sec-
tional study. BMC Public Health. 2019; 19 (4) :579.
18. Maga M, Janik MK, Wachsmann A, Chrząstek-Janik O, Koziej M,
Bajkowski M, et al. Influence of air pollution on exhaled carbon
monoxide levels in smokers and non-smokers. A prospective cross-sec-
tional study. Environmental Research. 2017; 152: 496–502.
19. Sandberg A, Sköld CM, Grunewald J, Eklund A, Wheelock ÅM.
Assessing recent smoking status by measuring exhaled carbon monox-
ide levels. PLoS One. 2011; 6 (12).
20. Hampson NB, Piantadosi CA, Thom SR, Weaver LK. Practice recom-
mendations in the diagnosis, management, and prevention of carbon
monoxide poisoning. American Journal of Respiratory and Critical
Care Medicine. 2012; 186 (11): 1095–101.
21. Milne B, Vandenkerkhof E, Phelan R, Brien J, Forkert L, Nakatsu K.
Does carbon monoxide play a role in cigarette smoke dependence?.
Addiction Research & Theory. 2012; 20 (2): 138–44.
22. Musallam KM, Rosendaal FR, Zaatari G, Soweid A, Hoballah JJ, Sfeir
PM, et al. Smoking and the risk of mortality and vascular and respira-
tory events in patients undergoing major surgery. JAMA Surgery.
2013; 148 (8): 755–62.
23. Zhang Q, Li L, Smith M, Guo Y, Whitlock G, Bian Z, et al. Exhaled
carbon monoxide and its associations with smoking, indoor household
air pollution and chronic respiratory diseases among 512,000 Chinese
adults. International Journal of Epidemiology. 2013; 42 (5): 1464–75.
Kesmas: Jurnal Kesehatan Masyarakat Nasional (National Public Health Journal). 2021; 16 (2): 108-112
AbstractThe Super Depo Sutorejo Surabaya (SDSS) project was created to separate household waste into fractions, but its separation effect is unknown. This studyassessed the significance of the project in sorting general waste into biodegradable, non-biodegradable, and assorted. The t-test compared the means of ge -neral and biodegradable waste (normally distributed). The non-biodegradable and assorted waste were not significantly distributed; therefore, the WilcoxonSigned Ranks Test was used to compare their medians against general waste. The multivariate analysis compared the significance level of each wastefraction. Each statistical analysis showed that the SDSS significantly sorts the general waste. The p-values were (0.000) < 0.05 for each type of waste fraction.Furthermore, the multivariate analysis showed that all variables were similar, and p-values (0.00) < 0.05. The biodegradable waste was the most significantfraction (Mean = 176,715.9; SD = 57,990.8), followed by the assorted (Mean = 171,412.5; SD = 94,631.3), and non-biodegradable (Mean = 35,243.8; SD =17,290.7). The results showed that the SDSS significantly segregates general waste into biodegradable, non-biodegradable, and assorted, therefore hypoth-esis (H1) is accepted. This study recommends the Government of Surabaya to maintain and expand this waste management project throughout the city along-side the improvement of the community participation program.
Keywords: assorted waste, biodegradable, non-biodegradable, sorting, waste
The Significance of Super Depo Sutorejo: Waste ManagementProject in Surabaya Municipality, Indonesia
Yohanes Kambaru Windi1,2*, Dyah Wijayanti1, Eko Rustamaji Wiyatno1, Loetfia D Rahariyani1
1Department of Nursing, Politeknik Kesehatan Kementerian Kesehatan Surabaya, Surabaya, Indonesia2Department of Epidemiology and Preventive Medicine, Faculty Medicine, Nursing and Health Science, School of Public Health and Preventive,Monash University, Australia
IntroductionCities located in both developed and developing coun-
tries worldwide are confronted with devastating wastegeneration.1,2 The Department of Ecology, State ofWashington reported that city waste reached 9.7 milliontons a year.3 Melbourne City produced 10 million tons ofgarbage in 2016.4 Furthermore, Kuala Lumpur,Malaysia, produced 3,000 tons of waste per day.5 TheCapital of Indonesia, Jakarta, generated 6,500 tons ofwaste each day, and Surabaya generated 1,450-2,000tons per day.6-8
Waste handling requires adequate resources, ad-vanced technology, and innovation. However, fundingshortages, limited waste collection coverage, lack ofknowledge on handling waste, coupled with irresponsiblebehaviors and practices of the residents in treating house-hold waste pose challenges to city authorities.9 TheWorld Bank stated that waste management is expensiveand may take up 50% of the budget of cities.10
The Government of Surabaya (GoS) has made sub-stantial achievements in waste management. This madethe city to have one of the best practices in waste man-
agement in Indonesia.11-13 Various environment-friendlyprograms have been implemented, such as community-based composting, use of waste bank (residents deposittheir recyclable waste for money). Other practices in-clude spreading net between river banks to catch trashesand riverbank cleaning competition for residents livingalong the bank to maintain the rivers cleanliness.Currently, the GoS has introduced the “bus waste” inwhich passengers use plastic mineral water bottles astheir tickets. The city also introduced the Black SoldierFlies (BSF) using the black flies' larvae to consume thebiodegradable waste.14-16
Regardless of the tireless efforts of the GoS in caringfor the waste of the city, the waste generation of residentsis still alarming. Currently, it is obvious that the afore-mentioned waste handling practices have not entirely re-solved waste matters. In 2015, waste production rangedbetween 1,450–2,000 tons per day.7,13 The amount ofwaste generated in 2018 was 1,600 tons daily.17 Wastebegan to pose a serious problem when adequate wastemanagement was unavailable. The situation was wors-ened when households as the main generator of waste
Windi et al. Kesmas: Jurnal Kesehatan Masyarakat Nasional (National Public HealthJournal). 2021; 16 (2): 113-119DOI: 10.21109/kesmas.v16i2.3808
Correspondence*: Yohanes Kambaru Windi, Department of Nursing, PoliteknikKesehatan Kementerian Kesehatan Surabaya, Pucang Jajar Tengah Street No.56, Surabaya, Indonesia, Email: [email protected],Phone: +62 811 347 5137
Received : March 03, 2020Accepted : February 05, 2021Published : May 28, 2021
Copyright @ 2021, Kesmas: Jurnal Kesehatan Masyarakat Nasional (National Public Health Journal), p-ISSN: 1907-7505, e-ISSN: 2460-0601, SINTA-S1 accredited,http://journal.fkm.ui.ac.id/kesmas, Licensed under Creative Commons Attribution-ShareAlike 4.0 International
Kesmas: Jurnal Kesehatan Masyarakat Nasional(National Public Health Journal)
114
failed to treat waste properly at home. Studies in differentareas of Indonesia showed that community participationand poor awareness of residents to segregate garbage atthe household level are still low.18-20
Responding to this issue, the GoS introduced ad-vanced waste management, known as Super DepoSutorejo Surabaya (SDSS) project. This is a collaborativeproject between the city of Surabaya and its sister city,Kitakyushu, Japan. The Nishihara Cooperation in Japanprovides supervision, managerial, and technical supportsfor SDSS management. The project is aimed to separatethe household general waste into three fractions; recycla-ble (non-biodegradable), organic (biodegradable), andassorted (miscellaneous) wastes. The management usedbiodegradable waste as raw materials for composting,sold non-biodegradable waste to recycling companies,and disposed of the miscellaneous or assorted waste tolandfills.
Furthermore, the GoS claimed that the SDSS projectis one of the city’s best practices on waste manage-ment.21,22 The project has been operating for nearly sev-en years since 2013. Based on the authors' point of view,the significance of the project in sorting waste beforedumps from unusable fractions into landfills is unknown.This study aimed to assess the significance of the SDSSproject in sorting general waste into biodegradable, non-biodegradable, and unusable-assorted waste. It was hy-pothesized (H1) that the SDSS project significantly sort-ed general waste into biodegradable, non-biodegradable,and assorted waste. Furthermore, this study was essentialto assess the significance of the SDSS project as a sus-tainable waste management for the city of Surabaya.
MethodThis study took place in the SDSS warehouse at
Dukuh Village, Mulyorejo Subdistrict, Surabaya, EastJava Province, Indonesia. It occupies nearly 1,483 m2
alongside Kali Waron Street surrounded by crowdedhousing. A small river, called Kali Waron, flows just afew meters in front of the depo. The SDSS site is used asa temporary waste dumpsite for households before thedump trucks collect and disposed of the rubbish into thelandfills. Additionally, the project sorted the generalwaste of two villages (Dukuh and Kalisari) comprising atotal of 8,564 households. The waste collectors (knownas Tukang Sampah in the Indonesian term) collect thegeneral waste from door to door and drop the garbage atthe SDSS warehouse, while residents pay them for theseservices.
This is a quantitative study using statistical tools fordata analysis, comparing the means between the generalwaste and the means of the three fractions of waste sort-ed (biodegradable, non-biodegradable, assorted waste).The SDSS has a well-documented data of the general
waste processed and the three waste fractions startingfrom January 2014 to December 2018. The record showsthat the total weight of the general waste (4,599,256kgs), biodegradable (2,120,519 kgs), non-biodegradable(422,926 kgs), and assorted waste (2,056,944 kgs). Thewaste records from 2014 to 2018 were all taken as thesamples of the study. Data collection began with scruti-nizing the weight (kgs) records of general wasteprocessed from January 2014 to December 2018. The to-tal number of each general, biodegradable, non-biodegradable, and assorted waste were recorded in aspreadsheet file. Afterwards, the authors calculated thetotal monthly waste of each group. The data were thensimplified into the annually based calculation (see Table1).
Data were statistically analyzed and followed thethree steps. Firstly, the analysis began with the testing ofdata normality using the Kolmogorov-Smirnov test. Thistest showed that the biodegradable waste fell into a nor-mal distribution, p-value (0.191) > 0.05. Meanwhile, thedistribution of the non-biodegradable waste was identi-fied (p-value = 0.01) < 0.05, and the remaining waste de-bris (p-value = 0.00)< 0.05 were not normally distri -buted. Secondly, the paired t-test was used to comparethe means of general and biodegradable waste. Sinceboth non-biodegradable and assorted waste were notnormally distributed, the Non-Parametric WilcoxonSigned Ranks test was performed to compare the medi-ans of the general waste against non-biodegradable andassorted waste. Thirdly, multivariate analysis was alsoused to identify the most significant fractions of wastesorted from the waste processed.
ResultsThe SDSS is a warehouse which contains two waste
conveyor belts, a waste-washing machine, a grinding orcrusher machine, and a packing machine. A small officeis available for three staff of Dinas Kebersihan danPertamanan Kota Surabaya (DKPK), the department re-sponsible for waste management and city park mainte-nance. The management installed a digital scale at theentrance floor to measure the weight of waste before andafter the sorting process, and these records constitutedthe data set for this study.
The SDSS management employed 25 people to sortthe waste. They were previously self-employed wastepickers at this temporary dumpsite, while some were itin-erant waste pickers. The workers were bound to a one-year formal contract, which was extendable. The man-agement paid USD 66.32 a month to the waste sorters,including a top-up incentive, approximately USD 22.11-29.48 per month, from the money earned, from sellingnon-biodegradable waste. Therefore, the workers tookhome payments of about USD 88-99.8 a month.
Kesmas: Jurnal Kesehatan Masyarakat Nasional (National Public Health Journal). 2021; 16 (2): 113-119
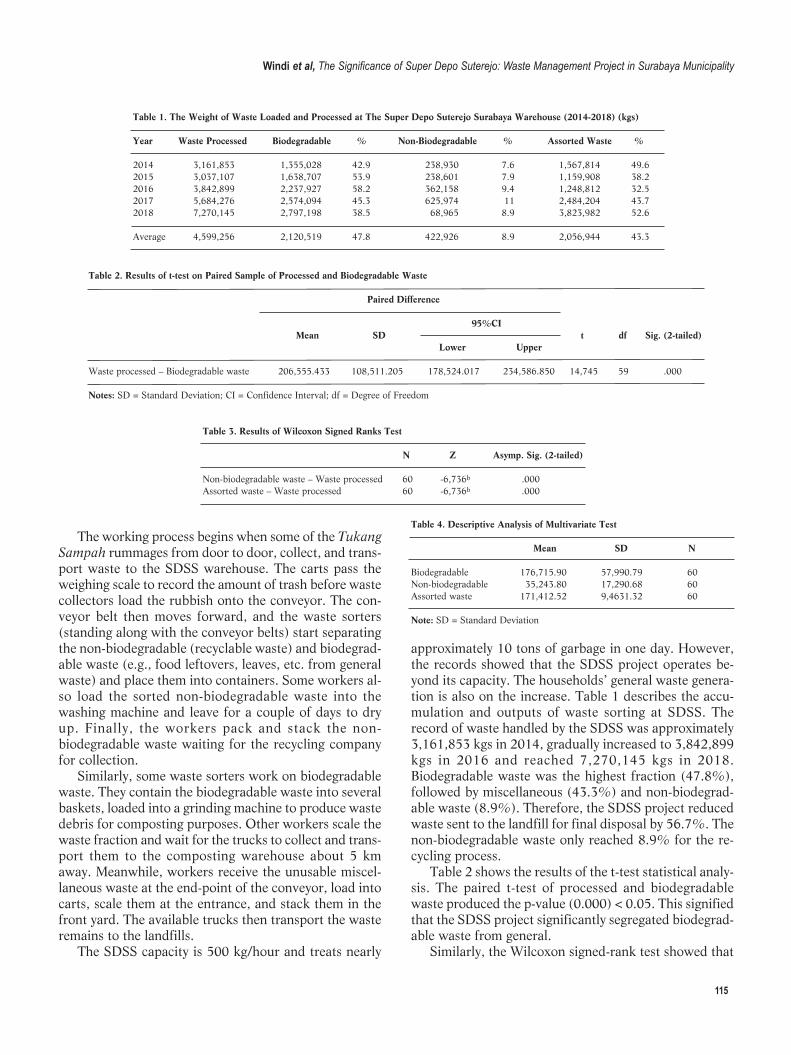
115
The working process begins when some of the TukangSampah rummages from door to door, collect, and trans-port waste to the SDSS warehouse. The carts pass theweighing scale to record the amount of trash before wastecollectors load the rubbish onto the conveyor. The con-veyor belt then moves forward, and the waste sorters(standing along with the conveyor belts) start separat ingthe non-biodegradable (recyclable waste) and biodegrad-able waste (e.g., food leftovers, leaves, etc. from generalwaste) and place them into containers. Some workers al-so load the sorted non-biodegradable waste into thewashing machine and leave for a couple of days to dryup. Finally, the workers pack and stack the non-biodegradable waste waiting for the recycling companyfor collection.
Similarly, some waste sorters work on biodegradablewaste. They contain the biodegradable waste into severalbaskets, loaded into a grinding machine to produce wastedebris for composting purposes. Other workers scale thewaste fraction and wait for the trucks to collect and trans-port them to the composting warehouse about 5 kmaway. Meanwhile, workers receive the unusable miscel-laneous waste at the end-point of the conveyor, load intocarts, scale them at the entrance, and stack them in thefront yard. The available trucks then transport the wasteremains to the landfills.
The SDSS capacity is 500 kg/hour and treats nearly
approximately 10 tons of garbage in one day. However,the records showed that the SDSS project operates be-yond its capacity. The households’ general waste genera-tion is also on the increase. Table 1 describes the accu-mulation and outputs of waste sorting at SDSS. Therecord of waste handled by the SDSS was approximately3,161,853 kgs in 2014, gradually increased to 3,842,899kgs in 2016 and reached 7,270,145 kgs in 2018.Biodegradable waste was the highest fraction (47.8%),followed by miscellaneous (43.3%) and non-biodegrad-able waste (8.9%). Therefore, the SDSS project reducedwaste sent to the landfill for final disposal by 56.7%. Thenon-biodegradable waste only reached 8.9% for the re-cycling process.
Table 2 shows the results of the t-test statistical analy-sis. The paired t-test of processed and biodegradablewaste produced the p-value (0.000) < 0.05. This signifiedthat the SDSS project significantly segregated biodegrad-able waste from general.
Similarly, the Wilcoxon signed-rank test showed that
Windi et al, The Significance of Super Depo Suterejo: Waste Management Project in Surabaya Municipality
Table 1. The Weight of Waste Loaded and Processed at The Super Depo Suterejo Surabaya Warehouse (2014-2018) (kgs)
Year Waste Processed Biodegradable % Non-Biodegradable % Assorted Waste %
2014 3,161,853 1,355,028 42.9 238,930 7.6 1,567,814 49.62015 3,037,107 1,638,707 53.9 238,601 7.9 1,159,908 38.22016 3,842,899 2,237,927 58.2 362,158 9.4 1,248,812 32.52017 5,684,276 2,574,094 45.3 625,974 11 2,484,204 43.72018 7,270,145 2,797,198 38.5 68,965 8.9 3,823,982 52.6
Average 4,599,256 2,120,519 47.8 422,926 8.9 2,056,944 43.3
Table 2. Results of t-test on Paired Sample of Processed and Biodegradable Waste
Paired Difference
95%CI Mean SD t df Sig. (2-tailed) Lower Upper
Waste processed – Biodegradable waste 206,555.433 108,511.205 178,524.017 234,586.850 14,745 59 .000
Notes: SD = Standard Deviation; CI = Confidence Interval; df = Degree of Freedom
Table 4. Descriptive Analysis of Multivariate Test
Mean SD N
Biodegradable 176,715.90 57,990.79 60Non-biodegradable 35,243.80 17,290.68 60Assorted waste 171,412.52 9,4631.32 60
Note: SD = Standard Deviation
Table 3. Results of Wilcoxon Signed Ranks Test
N Z Asymp. Sig. (2-tailed)
Non-biodegradable waste – Waste processed 60 -6,736b .000Assorted waste – Waste processed 60 -6,736b .000
116
the medians of both non-biodegradable and miscella-neous waste were considerably lower after processing atthe SDSS warehouse, p-values (0.00) < 0.05. Both pairedt-test and Wilcoxon Signed-Rank tests confirmed that theSDSS project significantly separated general waste intonon-biodegradable and assorted waste (Table 3).
To identify the most significant among the three out-puts of waste processing, the descriptive analysis of themultivariate test showed that the biodegradable waste(Mean = 176,715.9; SD = 57,990.8) was the most signi -ficant fraction, followed by the assorted (Mean =171,412.5; SD = 94,631.3), and non-biodegradable(Mean = 35,243.8; SD = 17,290.7) (Table 4). Therefore,the SDSS sorts more biodegradable waste compared tothe other waste fractions.
Wilks’ Lambada analysis was used to measure the si-multaneous comparison of variables. It was observed thatthe value of F = 7.391 and p-value (0.00) < 0.05.Therefore, the SDSS significantly sorted general wasteinto three different waste fractions (Table 5).
DiscussionSorting waste at the household level is a good waste
management practice. It requires a strong commitmentof residents to participate in treating their trash beforedisposal to the landfills. However, studies worldwideshowed that community participation in waste segrega-tion was still poor regardless of a continuous cam-paign.23-26 Similarly, this study showed that waste sort-ing among residents around the SDSS working area wasabsent, as indicated by the increasing amount of wastesent to the SDSS project for sorting.
The GoS competed with uncontrollable waste gene -ration, low community participation in waste separation,overloading of the landfills, and high cost of waste man-agement. The SDSS project may be a solution to tacklethe waste issue of the city. Furthermore, the SDSS projectfulfilled the standard of waste management stated in theAct No. 18 of 2008 regarding Waste Management, whichrequires collection, sorting, and recycling, before finaldisposal of waste, Reduce, Reuse and Recycle (3Rs) prin-ciples of waste management. The 3Rs principles consti-tute feasible waste management practiced throughout theworld.9,27,28 These principles were applied by the SDSSproject in handling the waste of households in both vil-
lages. The sorting process substantially reduced general
waste up to 57.7%, which comprises 47.76% for bio -degrad able, and 8.96% for non-biodegradable waste.Furthermore, only 42.5% of the household wastes endedup in landfills. This waste handling was a good practiceto extend the operation time of the landfills. The city au-thority of Surabaya will save millions of dollars if thiswaste treatment operated throughout the city.
The t-test of biodegradable waste concluded that thep-values (0.00) < 0.05. This showed that the SDSS suc-ceeds in separating biodegradable waste from the general.The Wilcoxon Signed-Rank Test also showed that the p-values of both non-biodegradable and assorted wastewere lower than 0.05, which signified that the SDSS sig-nificantly segregates non-biodegradable and assortedwaste from general waste. Therefore, the SDSS was areasonable waste management for the city of Surabaya.
The results of multivariate analysis were similar to themean comparison above. The multivariate descriptiveanalysis showed that the waste sorting process at SDSSproduced more biodegradable waste (Mean =176,715.9). This percentage was slightly bigger than thedisposed waste (Mean = 171,412.5). Moreover,biodegradable waste was far bigger than non-biodegrad-able (Mean = 35,243.8). These results reconfirmed thatthe percentage of biodegradable waste (47.8%) exceededthe other fractions; non-biodegradable (43.3%) and dis-posed waste (8.9%). Also, the overall process of wastesorting signified that the SDSS significantly separated thegeneral waste into biodegradable, non-biodegradable,and assorted.
Waste sorting at the point where it is produced, (e.g.,households, community, construction, public facilities,industry, etc.) is widely practiced worldwide.29-31 For ex-ample, waste separation was introduced in Bali, knownas the Gianyar Waste Recovery Project, which sorted thewaste of over 500,000 households. The sorting processproduced biodegradable (85%), non-biodegradable(5%), and assorted waste fractions.29 Furthermore, astudy in India showed that waste segregation before finaldisposal was a workable technology for waste manage-ment, as it produced 50% biodegradable for composting,and 18-20% reusable or recyclable waste.30 Norbu, etal.,32 also observed that the pretreatment of waste for
Table 5. Multivariate Test
Effect Value F Hypothesis df Error df Sig. Partial Eta Square
Intercept Pillai’s Trace .284 7.391b 3.000 56.000 .000 .284 Wilks’ Lambada .716 7.391b 3.000 56.000 .000 .284 Hotelling’s Trace .396 7.391b 3.000 56.000 .000 .284 Roy Largets Root .396 7.391b 3.000 56.000 .000 .284
Note: df = Degree of Freedom
Kesmas: Jurnal Kesehatan Masyarakat Nasional (National Public Health Journal). 2021; 16 (2): 113-119
117
composting reduced nearly 40% of solid waste thrownin landfills. A pilot project in China, at source-separatedcollection became the priority to overcome householdwaste.33
Waste is a disaster for both health and the environ-ment, but it is an economic opportunity for some people(e.g., waste pickers) and recycle businesses. Besides re-ducing waste sent to, and prolonging the operation of thelandfills, the SDSS project provided additional benefitsfor the city of Surabaya. The project separated nearly 9%of non-biodegradable waste and earned money from thesales of these recyclable materials. In addition, the recy-clable waste generated benefits for both the worker andthe SDSS management. Waste sorters potentially earnmore incentive when the percentage of re-sellable wasteis increased.
Biodegradable waste becomes an investment of theGoS. On average, the SDSS project generated biodegrad-able waste of 2,121 tonnes/year for raw material of com-post. According to the experience of the Gianyar Project,one ton of biodegradable waste produces 300 kgs of com-post.32 The SDSS project produced 636.3 tonnes(636,300 kgs) compost in a year. Furthermore, the mar-ket value of a bag of 40 kgs compost in Surabaya is IDR30,000 (USD 2.96).34 The calculation of the economicbenefit of the compost is IDR 477,225,00 (USD 47,086)a year. This signifies that compost enables the GoS tosave approximately 50% funding to purchase fertiliz-ers.35
Waste separation at the source before dumping intolandfills are a sustainable and effective strategy to dealwith the waste problem. The SDSS project is a successstory of waste management in the City of Surabaya. Thesorting process reduces nearly 60% of the waste beforetransport for final disposal. Waste management practicesworldwide showed that waste sorting at the source is asuccessful mechanism to reduce waste send to landfills,and increase the recycling rate.36 For example, theSweden Waste Management Association reported thatsource separation reduced waste thrown in landfills from62% in 1975 to 1% in 2016.37
Regardless of the success of SDSS, there are certaindrawbacks which require solutions. The project maylessen community participation in waste handling.Although community participation is one of the bestwaste management practices, improving the awarenessof the people is still a major problem in many developingcountries.38-40 The SDSS could also be contra-produc-tive with a community participation campaign in wastemanagement. Therefore, improving the community-based waste sorting through the “waste bank” and wastereuse-recycling home industries are essential to maintainhousehold participation and a source of extra income forresidents.38-42
Millions of waste pickers in developing countries relyon collecting, sorting, and selling recyclable waste.43
Waste production, especially recyclable or reused waste,is important for their survival. Therefore, an advancedwaste program or technology may be a threat to wastepickers. The integration of waste pickers is practicedworldwide to ensure that the hazardous impacts of wasteare properly contained and waste pickers sustain theirlivelihoods.44-46 The policy of the SDSS management toemploy waste pickers is a good practice in integratingthem into the city waste management. Therefore, the ex-pansion of SDSS in the region of Surabaya also needs tosecure the livelihood of waste pickers by involving themwithin the program.
The success of the SDSS program is not problem-freeand bears challenges in the future. The results of thisstudy showed a lacking of community participation andawareness of residents about waste pre-treatment at thehousehold level. A further study is also important tooverview the implication of the SDSS project towardthese issues. Although the SDSS integrates some wastepickers within the program, further insight is importantto overview the implications of the project against theitinerant and waste pickers working in landfills.
ConclusionThis study concludes that poor awareness of residents
to sort waste at the source reflects the consistent increaseof waste generation at the household level. The SDSSprojects succeeds in separating biodegradable and non-biodegradable waste from general waste. This results inthe reduction of waste for final disposal at landfills.Furthermore, the SDSS is also economically beneficialfor the waste sorter as well as the GoS Municipal. Theseshow that the SDSS is a sustainable and reliable wastemanagement for the city of Surabaya. This study, there-fore suggests that the GoS expands or duplicates this typeof waste management throughout the city and provide amore reliable payment for waste sorters.
AbbreviationsBSF: Black Soldier Flies; GoS: Government of Surabaya; 3Rs: Reduce,Reuse, and Recycle; SDSS: Super Depo Sutorejo Surabaya; CI:Confident Interval; SD: Standard Deviation; df: Degree of Freedom.
Ethics Approval and Consent to ParticipateThe certificate of Ethical Approval was granted by Monash UniversityHuman Research Ethics Committee (MUHREC) No. CF14/2364-2014001267. The respondents were provided with written informedconsent.
Competing InterestThe author declares that there are no significant competing financial,professional, or personal interests that might have affected the per-
Windi et al, The Significance of Super Depo Suterejo: Waste Management Project in Surabaya Municipality
118
formance or presentation of the work described in this manuscript.
Availability of Data and MaterialsResearch data can be provided upon reasonable request.
Authors’ ContributionYKW designed the research protocol, developed the research methodsand data collection tools, conducted data collection, analyzed the data,and drafted the manuscript. DW developed the research methodology,collected data, and drafted the manuscript. Furthermore, ERW con-tributed to arranging the research permission, handling data collectiontools, collecting, and compiling the data. LDR contributed to develop-ing methods and data collection tools, collecting and analyzing data.
AcknowledgmentThe authors convey their appreciation to Monash University for fundingthe corresponding author’s doctoral degree under the scheme ofInternational Postgraduate Research Scholarship (IPRA) and AustraliaPostgraduate Award (APA). The author is also grateful to the Directorof Poltekkes Kemenkes Surabaya for providing administrative assis-tance related to research permission. Furthermore, the author also ex-presses gratitude to the Head and staff of Dinas Kebersihan danPertamanan Kota Surabaya, including staff at the SDSS site for pro-viding permission, data, and assistance during data collection.
References 1. Manus Coffey, Coad A. Collection of municipal solid waste in develop-
ing countries. UN-HABITAT; 2010.
2. Hoornweg D, Perinaz Bhada-Tata. What a waste: a global review of
solid waste management. Washington: The World Bank; 2015.
3. The Department of Ecology State of Washington reported (DESW).
Solid waste and material recovery data; 2016.
4. Balfour C. Waste authority’s move to scrap landfills, boost recycling.
Herald Sun. Melbourne; 2016.
5. Desa A, Kadir NBA, Yusooff F. Waste education and awareness strat-
egy: towards solid waste management (SWM) program at UKM.
Procedia - Social and Behavioral Sciences. 2012; 59: 47–50.
6. Belarminus R. Basuki: Jakarta butuh “Incenerator.” Kompas.com;
2013.
7. Fransilia M. Sampah Surabaya 2.000 ton tiap hari, hanya 500 ton dio-
lah. Surya; 2015.
8. Hakim A. Surabaya siap jadi contoh pengelolaan sampah. Antaranews;
2018.
9. Adrian Coad. Collection of municipal solid waste. UN-HABITAT;
2011.
10. The World Bank. Solid waste management. The World Bank; 2019.
11. Riski P. Surabaya, kota percontohan pengolahan sampah terbaik
Indonesia. Mongabay; 2014.
12. Kurnia D. Surabaya dijadikan percontohan pengolahan sampah.
Republika; 2018.
13. Hakim A. 2016, Surabaya hasilkan sampah 1.500 ton/hari.
www.Metrotvnews.com; 2017.
14. Dhokhikah Y, Trihadiningrum Y. Solid waste management in Asian
developing countries: challenges and opportunities. Journal of Applied
Environmental and Biological Sciences. 2012.
15. Effendi Z. Ini solusi Pemkot Surabaya kurangi sampah masuk ke TPA
dan pantai. Detiknews; 2017.
16. Pemerintah Kota Surabaya. Pemkot Surabaya kembangkan pengola-
han sampah dengan larva; 2018.
17. Marzuki MB. Volume sampah di Surabaya mencapai 1,6 ribu ton per-
hari. Surabaya Times; 2018.
18. Haswindy S, Yuliana F. Partisipasi masyarakat dalam pengelolaan
sampah pemukiman pada Kecamatan Tungkil Ilir Kabupaten Tanjung
Jabung Barat. Jurnal Ilmu Lingkungan. 2018; 15 (2): 96.
19. Ahmad F. Partisipasi masyarakat dalam pengelolaan sampah berbasis
komunitas lokal. Universitas Indonesia; 2012.
20. Lapik F. Partisipasi masyarakat dalam pengelolaan sampah rumah
tangga di Desa Mpanau Kecamatan Sigi Biromaru Kabupaten Sigi. E-
Journal Geo-Tadulako. 2017.
21. Wiweko S, Hakim A, Leksono AS, Riniwati H. The people-based
waste management model in Super Depo Sutorejo Surabaya.
International Journal of Humanities, Religion and Social Science.
2018; 2 (6): 2548–5725.
22. Sari N. Metode pengolahan sampah Depo Sutorejo meniru Jepang;
2015.
23. Sheau-Ting L, Sin-Yee T, Weng-Wai C. Preferred attributes of waste
separation behaviour: an empirical study. Procedia Engineering. 2016;
145: 738–45.
24. Mukama T, Ndejjo R, Musoke D, Musinguzi G, Halage AA, Carpenter
DO, et al. Practices, concerns, and willingness to participate in solid
waste management in two urban slums in Central Uganda. Journal of
Environmental and Public Health. 2016; 2016.
25. Otitoju TA, Seng L. Municipal solid waste management: household
waste segregation in Kuching South City, Sarawak, Malaysia.
American Journal of Energy Engineering. 2014; 03 (06): 82–91.
26. Sinthumule N, Mkumbuzi S. Participation in community-based solid
waste management in Nkulumane Suburb, Bulawayo, Zimbabwe.
Resources. 2019; 8 (1): 30.
27. Sakai SI, Yoshida H, Hirai Y, Asari M, Takigami H, Takahashi S, et
al. International comparative study of 3R and waste management poli-
cy developments. Journal of Material Cycles and Waste Management.
2011; 13 (2): 86–102.
28. Samiha B. The importance of the 3R principle of municipal solid
waste management for achieving sustainable development.
Mediterranean Journal of Social Sciences. 2013; 4 (3): 129–35.
29. Banga M, Banga M. Household knowledge, attitudes and practices in
solid waste segregation and recycling: the case of Urban Kampala recy-
cling. Zambia Social Science Journal. 2011; 2 (1).
30. Ajayi SO, Oyedele LO, Akinade OO, Alaka HA. Critical management
practices influencing on-site waste minimization in construction proj-
ects. Waste Management. 2016; 56: 330–9.
31. Johnson KM, González ML, Dueñas L, Mario G, Relyea G, Luque LE,
et al. Improving waste segregation while reducing costs in a tertiary-
care hospital in a lower–middle-income country in Central America.
Waste Management & Research. 2013.
32. Zurbrügg C, Gfrerer M, Ashadi H, Brenner W, Küper D.
Determinants of sustainability in solid waste management - the
Gianyar waste recovery project in Indonesia. Waste Management.
Kesmas: Jurnal Kesehatan Masyarakat Nasional (National Public Health Journal). 2021; 16 (2): 113-119
https://www.mongabay.co.id/2014/02/27/surabaya-kota-percontohan-pengolahan-sampah-terbaik-indonesia/
119
2012; 32 (11): 2126–33.
33. Jun Tai, Zhanga W, Chea Y, Feng D. Municipal solid waste source-
separated collection in China: a comparative analysis. Waste
Management. 2011; 31 (8): 1673–82.
34. Kushairi. Jual pupuk organik BOKASI; 2017.
35. Hartini D. Sampah disulap jadi pupuk kompos, Pemkot Surabaya
hemat anggaran 50 persen!. KompasTV; 2020.
36. Xevgenos D, Papadaskalopoulou C, Panaretou V, Moustakas K,
Malamis D. Success stories for recycling of MSWat municipal level: a
review. Waste and Biomass Valorization. Springer Netherlands. 2015;
6: 657–84.
37. Rousta K. Household waste sorting at source: a procedure for im-
provement. University of Boras; 2018.
38. Sinthumle NI, Mkumbuzi SH. Participation in community-based solid
waste management in Nkulumane Suburb, Bulawayo, Zimbabwe.
Resources. 2019; 8 (1).
39. Yakubu KN, Mado H. Assessment of community participation in solid
waste management in Kaduna Metropolis. In: Nigerian Environmental
Society National Conference: Deployment of Green Initiatives for
Economic Diversification in Africa; 2018.
40. Tanuwijaya F. Partisipasi masyarakat dalam pengelolaan sampah di
Bank Sampah Pitoe Jambangan Kota Surabaya. Universitas Airlangga
Surabaya; 2016.
41. Sudati Nur Sarfiah WJ. Manfaat bank sampah bagi masyarakat di
Dusun Semali Desa Salamkanci Kecamatan Bandongan Kabupaten
Magelang. Jurnal REP (Riset Ekonomi Pembangunan). 2017; 2 (2):
165–84.
42. Hakim A. Puluhan warga Surabaya peroleh manfaat kelola bank sam-
pah. Antara Jatim; 2018.
43. Women in Informal Employment: Globalizing and Organizing
(WIEGO). Waste pickers. WIEGO; 2012.
44. Chikarmane P. Integrating waste pickers into municipal solid waste
management in Pune, India. WIEGO Policy Br (Urban Policies); 2012.
45. Masood M, Barlow CY. Framework for integration of informal waste
management sector with the formal sector in Pakistan. Waste
Management & Research. 2013; 31 (10 SUPPL.): 93–105.
46. Sembiring E, Nitivattananon V. Sustainable solid waste management
toward an inclusive society: integration of the informal sector.
Resources, Conservation & Recycling. 2010; 54 (11): 802–9.
Windi et al, The Significance of Super Depo Suterejo: Waste Management Project in Surabaya Municipality
https://jatim.antaranews.com/berita/254206/puluhan-warga-surabaya-peroleh-manfaat-kelola-bank-sampah
AbstractSocio-cultural concerns often restrict women's sexual rights and well-being living with HIV (WLHIV) in developing countries. These convergent parallel mixedmethods study combined quantitative and qualitative approaches to explore factors influencing WLHIV sexual quality of life in Banten Province, Indonesia. A2017 cross-sectional survey of 207 reproductive-aged WLHIV was analyzed using univariate and multivariate logistic regression statistics. Furthermore, in-depth interviews with a sub-sample of survey participants (n = 30) were thematically analyzed. Most of the women (60%) involved reported loss of sexualpleasure and depressed sexual life. Meanwhile, 48% affirmed low sexual quality of life which was associated with unemployment (aOR = 2.90, and 95%CI =1.51–5.58), limited sexual activities (aOR = 2.89, and 95%CI = 1.20–6.93), living with extended family (aOR = 2.68, and 95%CI = 1.27–5.65), and experiencingintimate partner violence (aOR = 2.28, and 95%CI = 1.03–5.03). The respondents described unsatisfactory sexual life in a belief that having sex is a wife'sduty and choosing not to talk about sexual issues or refuse sexual invitation in fear of triggering intimate partner violence. Inter-related personal, social,cultural, and religious factors affected the sufferers’ sexual life.
Keywords: HIV, mixed-methods, sexual life, women
Inter-related Factors Influencing Sexual Quality of Life amongWomen Living with HIV in Banten Province, Indonesia: AMixed Methods Study
Dyah Juliastuti1,2*, Judith Dean1, Yati Afiyanti3, Lisa Fitzgerald1
1School of Public Health, Faculty of Medicine, University of Queensland, Queensland, Australia2Nursing Program, Sekolah Tinggi Ilmu Kesehatan Ichsan Medical Centre Bintaro, South Tangerang, Indonesia3Department of Women’s Health and Maternity Nursing, Faculty of Nursing, Universitas Indonesia, Depok, Indonesia
IntroductionIn 2019, approximately 300,000 new human immun-
odeficiency virus (HIV) cases were detected, bringing thenumber of people living with HIV (PLHIV) in the Asia-Pacific region to 5.8 million.1 In the same year, an addi-tional 50,300 were reported, making 641,700 PLHIV inIndonesia.2 New HIV cases proportion among this coun-ty's women is lower than men (35.5% vs 64.5%).However, new women cases have been more than dou-bled from 8,300 in 2010 to 17,800 in 2019.3
Banten has the eighth highest cases of new HIV infec-tion among 34 provinces in Indonesia because there wasa four-fold increase in the diagnoses rates from 433 in2011 to 1,600 in 2019.2 According to 2019 NationalIndonesian acquired immunodeficiency syndrome(AIDS) data, the dominant occupations of the newly di-agnosed women were non-professional employees(1,800), housewives (1,100), and entrepreneurs (752),while the sex workers (113) were historically identifiedto be at risk. Over the past decade, AIDS cases amonghousewives have also notably increased,3 suggesting pos-sible prevalence of late diagnosis among this population.
Respecting the sexual and reproductive health (SRH)rights of women living with HIV (WLHIV) is crucial forimproving their dignity, health, and wellbeing,4 as postu-lated by United Nations Population Fund (UNFPA),5 ”…able to have a satisfying and safe sex life, the capabilityto reproduce, and the freedom to decide if, when, andhow often to do so”. When women express their SRHneeds and rights, they attain better SRH and lower riskof ill-health.6 Support ing these also contribute of elimi-nating the worldwide HIV epidemic along with reducingonwards transmission of other sexually transmitted in-fection (STI) and negative SRH outcomes.
Post-HIV diagnosis, varied bio-socio-cultural deter-minants lead to women experiencing less active andsatisfy ing sexual lives. According to the past reviews,HIV disclosure removes sexual desire, intimacy, andsatis faction among WLHIV.7,8 Some PLHIV fear infect-ing their partner/s, feel guilty for having sex, and alsostruggle to talk about sexual topics.9 The high prevalenceof sexual inactivity among WLHIV is influenced by HIV-related stigma, being single, and low-income status.10
Some WLHIV, particularly young and unmarried, feel
Juliastuti et al. Kesmas: Jurnal Kesehatan Masyarakat Nasional (National Public HealthJournal). 2021; 16 (2): 120-130DOI: 10.21109/kesmas.v16i2.4862
Kesmas: Jurnal Kesehatan Masyarakat Nasional(National Public Health Journal)
Correspondence*: Dyah Juliastuti, Nursing Program, Sekolah Tinggi IlmuKesehatan Ichsan Medical Centre Bintaro, Jombang Raya Street No. 56, Ciputat,South Tangerang, Banten, Indonesia, Email: [email protected],Phone: +62 813 1938 2704
Received : March 08, 2021Accepted : April 13, 2021Published : May 28, 2021
Copyright @ 2021, Kesmas: Jurnal Kesehatan Masyarakat Nasional (National Public Health Journal), p-ISSN: 1907-7505, e-ISSN: 2460-0601, SINTA-S1 accredited,http://journal.fkm.ui.ac.id/kesmas, Licensed under Creative Commons Attribution-ShareAlike 4.0 International
121
forced to be sexually abstinent to prevent HIV transmis-sion.11 Social structures leading to gender inequalities,economic powerlessness, and disproportionate healthburdens experienced by many women when combinedwith an HIV diagnosis increase the risk of living in abu-sive marriages and further restrictions to sexual and re-productive rights.12-14
A systematic literature review exploring the SRH ofWLHIV in Muslim-majority countries found that afterdiagnosis, the women experience disappointment to-wards their sexual life, including stressful intimacy.15
However, there has been limited examination ofIndonesian WLHIV sexual life and satisfaction.Therefore, this mixed-methods study aimed to explorethe multiple factors influencing WLHIV sexual quality oflife in Banten Province, Indonesia. It was conducted aspart of a pilot project entitled ‘The Sexual and Repro -duct ive Health of WLHIV in Banten Province,Indonesia’. A more contextualized understanding ofthese women's sexual lives is expected by combiningquantitative and qualitative approaches.16,17 Context ual -iz ing the social, cultural, and religious determinants ofWLHIV’s sexual life is important for supporting SRHneeds and rights. Furthermore, the invaluable under-standing informs a development of much-needed appro-priate and acceptable SRH health policy and strategies inpreventing further HIV/STI transmission, intimate part-ner violence (IPV), and unplanned pregnancy.
New HIV cases high rates and increasing numbers ofWLHIV in Indonesia, particularly in Banten province,supports the urgent need to understand the personal, so-cial, cultural, and social caveats affecting WLHIV’s sex-ual life since sexual dysfunction impacts women’s repro-ductive outcomes, life quality, and further HIV transmis-sion. Therefore, the objectives of this study were to carryout the following, (1) explore demographic characteris-tics, clinical history, sexual activities, and SQoL of theWLHIV; (2) analyze multiple factors associated withtheir sexual life quality; and (3) describe the inter-relatedfactors contributing to the sexual life quality.
MethodA convergent parallel mixed-method study, combin-
ing a cross-sectional survey with in-depth interviews, in-volving WLHIV of reproductive age (18–50-year-old) liv-ing in Banten Province, was conducted from June toNovember 2017. The quantitative and qualitative datacollect ion, analysis, and interpretation were performedconcurrently to reveal convergence, supporting evidence,and validation.18,19 The WLHIV used as participantswent for treatment in four public and one private hospi-tal, as well as four primary health cares in BantenProvince. They were recruited by five trained peer re-cruiters (PR) providing support for PLHIV that visit local
health care services, appointed by the collaborative studypartner, Yayasan Kotex Mandiri. Yayasan Kotex Mandiriis a local non-governmental organization that providescare and support for PLHIV in DKI Jakarta and BantenProvince through individual or group peer-accompani-ment. The PRs were women with a minimum of highschool education and trained on approaching the poten-tial participants ethically and assist them in completingquestionnaire.
The cross-sectional survey applied convenience and asnowball sampling to recruit 207 WLHIV of reproduct -ive age (18–50-year-old) living in Banten Province andhad a current or past history of sexual activity. Based ona target population of 1,721 WLHIV in the region in2015,20 the required sample size was estimated to be315.21 However, this minimum size was not achievedduring six-month data collection as the available budgetand timeframes were limited. After signing the informedconsent, the participants completed an Indonesian ver-sion of a self-administered paper-based questionnairewith the PRs assistance. Each survey was conductedwithin 30 minutes in the place chosen by the women.
Quantitative data were collected using a structuredquestionnaire first prepared in English, then translatedto Indonesian. The instrument was designed using itemsfrom the Women’s Health questionnaire (WHQ) of the2012 Indonesia Demographic and Health Survey(IDHS),22 and the Sexual Quality of Life-Female (SQoL-F) questionnaire,23 that adjoined questions about WL-HIV demographic characteristics and HIV-clinical histo-ries. The WHQ sought information on varied topics ofwomen’s SRH, including HIV, reproductive behaviorsand intentions, as well as other sexually transmitted in-fections. Meanwhile, the SQoL-F was developed bySymonds and colleagues,24 to measure women sexualdysfunction.
The survey instrument included 12 demographiccharacteristics variables (age, educational background,place of residence, religion, occupation, marital status,family income, and main source of income) and clinicalhistories (partner’s HIV status, diagnosis time andknowledge, as well as infection source). This also con-tains eight sexual activities variables (first sexual en-counter, number of lifetime sexual partners, last sexualintercourse, sexual-intimate partner violence (IPV) his-tory, sexual activities, number and type of sexual partnersin the past 12 months, and condom use) extracted fromthe WHQ- 2012 IDHS. Eighteen variables related to sex-ual quality of life from the SQoL-F scale were added.Each SQoL-F item has a six-point response (completelyagree to completely disagree) and is scored 1-6. A totalsexual quality of life (SQoL) score (0–100) was calculat-ed according to an algorithm ([unstandardized score-18]*100/90) used for the initial questionnaire analysis,
Juliastuti et al, Inter-related Factors Influencing Sexual Quality of Life among Women Living with HIV
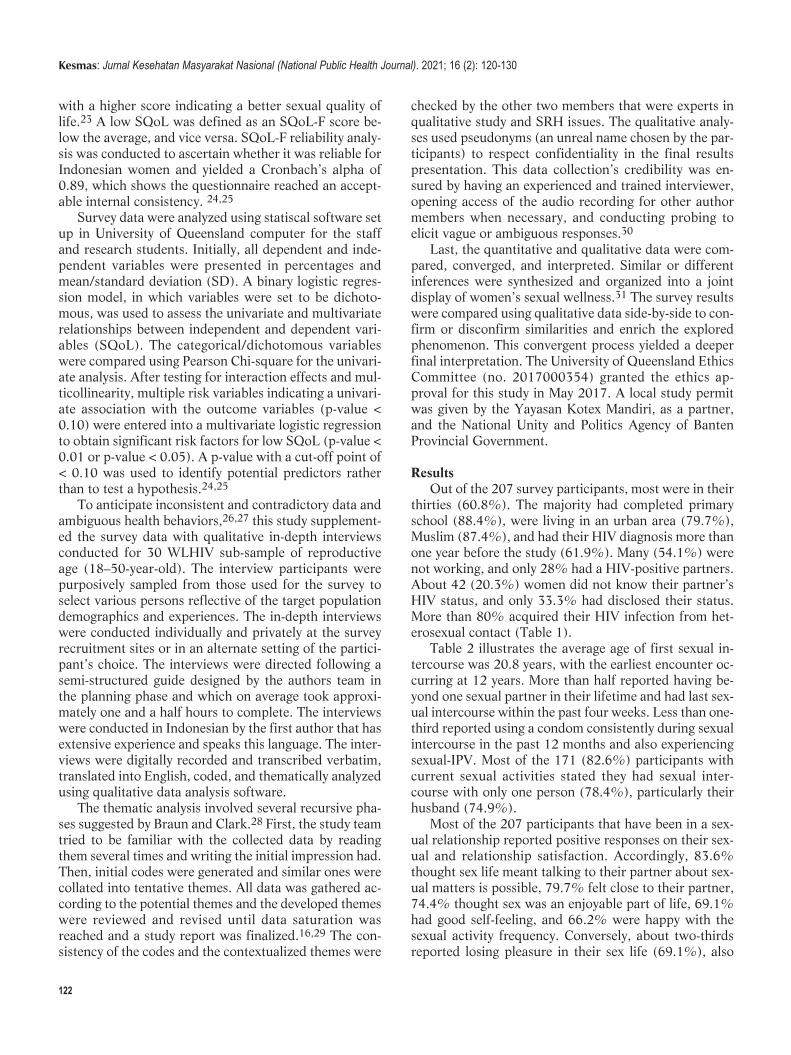
122
with a higher score indicating a better sexual quality oflife.23 A low SQoL was defined as an SQoL-F score be-low the average, and vice versa. SQoL-F reliability analy-sis was conducted to ascertain whether it was reliable forIndonesian women and yielded a Cronbach’s alpha of0.89, which shows the questionnaire reached an accept-able internal consistency. 24,25
Survey data were analyzed using statiscal software setup in University of Queensland computer for the staffand research students. Initially, all dependent and inde-pendent variables were presented in percentages andmean/standard deviation (SD). A binary logistic regres-sion model, in which variables were set to be dichoto-mous, was used to assess the univariate and multivariaterelationships between independent and dependent vari-ables (SQoL). The categorical/dichotomous variableswere compared using Pearson Chi-square for the univari-ate analysis. After testing for interaction effects and mul-ticollinearity, multiple risk variables indicating a univari-ate association with the outcome variables (p-value <0.10) were entered into a multivariate logistic regressionto obtain significant risk factors for low SQoL (p-value <0.01 or p-value < 0.05). A p-value with a cut-off point of< 0.10 was used to identify potential predictors ratherthan to test a hypothesis.24,25
To anticipate inconsistent and contradictory data andambiguous health behaviors,26,27 this study supplement-ed the survey data with qualitative in-depth interviewsconducted for 30 WLHIV sub-sample of reproductiveage (18–50-year-old). The interview participants werepurposively sampled from those used for the survey toselect various persons reflective of the target populationdemographics and experiences. The in-depth interviewswere conducted individually and privately at the surveyrecruitment sites or in an alternate setting of the partici-pant’s choice. The interviews were directed following asemi-structured guide designed by the authors team inthe planning phase and which on average took approxi-mately one and a half hours to complete. The interviewswere conducted in Indonesian by the first author that hasextensive experience and speaks this language. The inter-views were digitally recorded and transcribed verbatim,translated into English, coded, and thematically analyzedusing qualitative data analysis software.
The thematic analysis involved several recursive pha -ses suggested by Braun and Clark.28 First, the study teamtried to be familiar with the collected data by readingthem several times and writing the initial impression had.Then, initial codes were generated and similar ones werecollated into tentative themes. All data was gathered ac-cording to the potential themes and the developed themeswere reviewed and revised until data saturation wasreached and a study report was finalized.16,29 The con-sistency of the codes and the contextualized themes were
checked by the other two members that were experts inqualitative study and SRH issues. The qualitative analy-ses used pseudonyms (an unreal name chosen by the par-ticipants) to respect confidentiality in the final resultspresentation. This data collection’s credibility was en-sured by having an experienced and trained interviewer,opening access of the audio recording for other authormembers when necessary, and conducting probing toelicit vague or ambiguous responses.30
Last, the quantitative and qualitative data were com-pared, converged, and interpreted. Similar or differentinferences were synthesized and organized into a jointdisplay of women’s sexual wellness.31 The survey resultswere compared using qualitative data side-by-side to con-firm or disconfirm similarities and enrich the exploredphenomenon. This convergent process yielded a deeperfinal interpretation. The University of Queensland EthicsCommittee (no. 2017000354) granted the ethics ap-proval for this study in May 2017. A local study permitwas given by the Yayasan Kotex Mandiri, as a partner,and the National Unity and Politics Agency of BantenProvincial Government.
ResultsOut of the 207 survey participants, most were in their
thirties (60.8%). The majority had completed primaryschool (88.4%), were living in an urban area (79.7%),Muslim (87.4%), and had their HIV diagnosis more thanone year before the study (61.9%). Many (54.1%) werenot working, and only 28% had a HIV-positive partners.About 42 (20.3%) women did not know their partner’sHIV status, and only 33.3% had disclosed their status.More than 80% acquired their HIV infection from het-erosexual contact (Table 1).
Table 2 illustrates the average age of first sexual in-tercourse was 20.8 years, with the earliest encounter oc-curring at 12 years. More than half reported having be-yond one sexual partner in their lifetime and had last sex-ual intercourse within the past four weeks. Less than one-third reported using a condom consistently during sexualintercourse in the past 12 months and also experiencingsexual-IPV. Most of the 171 (82.6%) participants withcurrent sexual activities stated they had sexual inter-course with only one person (78.4%), particularly theirhusband (74.9%).
Most of the 207 participants that have been in a sex-ual relationship reported positive responses on their sex-ual and relationship satisfaction. Accordingly, 83.6%thought sex life meant talking to their partner about sex-ual matters is possible, 79.7% felt close to their partner,74.4% thought sex was an enjoyable part of life, 69.1%had good self-feeling, and 66.2% were happy with thesexual activity frequency. Conversely, about two-thirdsreported losing pleasure in their sex life (69.1%), also
Kesmas: Jurnal Kesehatan Masyarakat Nasional (National Public Health Journal). 2021; 16 (2): 120-130
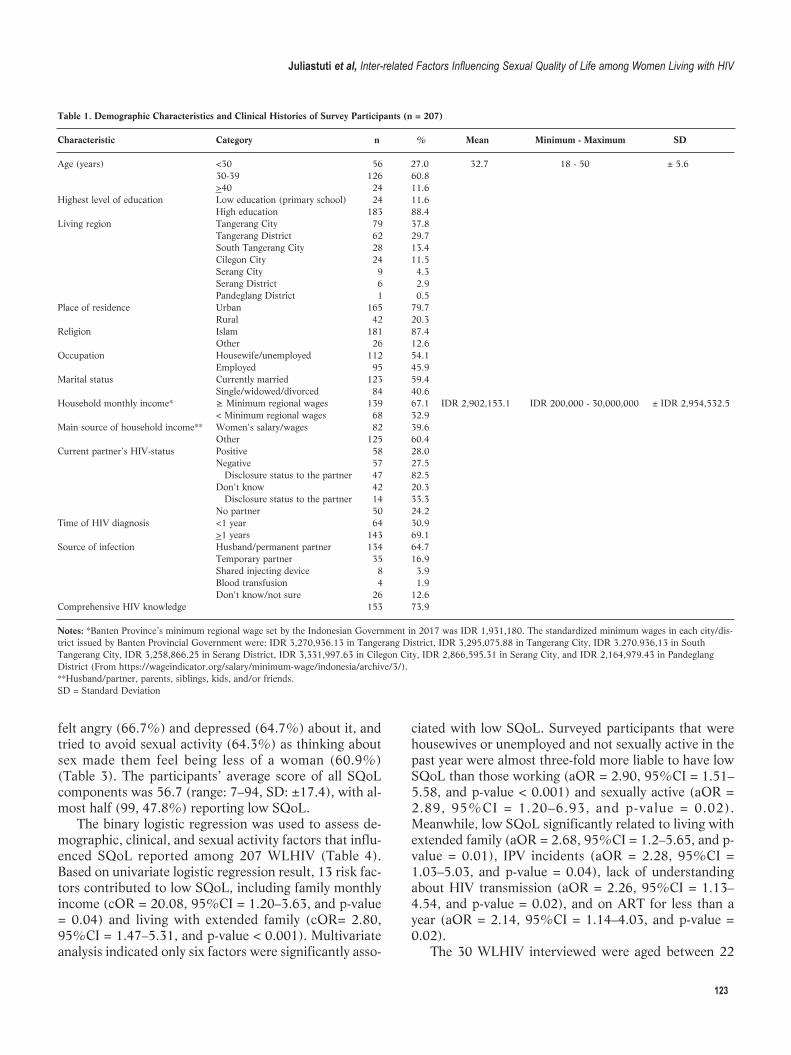
123
felt angry (66.7%) and depressed (64.7%) about it, andtried to avoid sexual activity (64.3%) as thinking aboutsex made them feel being less of a woman (60.9%)(Table 3). The participants’ average score of all SQoLcomponents was 56.7 (range: 7–94, SD: ±17.4), with al-most half (99, 47.8%) reporting low SQoL.
The binary logistic regression was used to assess de-mographic, clinical, and sexual activity factors that influ-enced SQoL reported among 207 WLHIV (Table 4).Based on univariate logistic regression result, 13 risk fac-tors contributed to low SQoL, including family monthlyincome (cOR = 20.08, 95%CI = 1.20–3.63, and p-value= 0.04) and living with extended family (cOR= 2.80,95%CI = 1.47–5.31, and p-value < 0.001). Multivariateanalysis indicated only six factors were significantly asso-
ciated with low SQoL. Surveyed participants that werehousewives or unemployed and not sexually active in thepast year were almost three-fold more liable to have lowSQoL than those working (aOR = 2.90, 95%CI = 1.51–5.58, and p-value < 0.001) and sexually active (aOR =2.89, 95%CI = 1.20–6.93, and p-value = 0.02).Meanwhile, low SQoL significantly related to living withextended family (aOR = 2.68, 95%CI = 1.2–5.65, and p-value = 0.01), IPV incidents (aOR = 2.28, 95%CI =1.03–5.03, and p-value = 0.04), lack of understandingabout HIV transmission (aOR = 2.26, 95%CI = 1.13–4.54, and p-value = 0.02), and on ART for less than ayear (aOR = 2.14, 95%CI = 1.14–4.03, and p-value =0.02).
The 30 WLHIV interviewed were aged between 22
Table 1. Demographic Characteristics and Clinical Histories of Survey Participants (n = 207)
Characteristic Category n % Mean Minimum - Maximum SD Age (years) <30 56 27.0 32.7 18 - 50 ± 5.6 30-39 126 60.8 >40 24 11.6 Highest level of education Low education (primary school) 24 11.6 High education 183 88.4 Living region Tangerang City 79 37.8 Tangerang District 62 29.7 South Tangerang City 28 13.4 Cilegon City 24 11.5 Serang City 9 4.3 Serang District 6 2.9 Pandeglang District 1 0.5 Place of residence Urban 165 79.7 Rural 42 20.3 Religion Islam 181 87.4 Other 26 12.6 Occupation Housewife/unemployed 112 54.1 Employed 95 45.9 Marital status Currently married 123 59.4 Single/widowed/divorced 84 40.6 Household monthly income* ≥ Minimum regional wages 139 67.1 IDR 2,902,153.1 IDR 200,000 - 30,000,000 ± IDR 2,954,532.5 < Minimum regional wages 68 32.9 Main source of household income** Women's salary/wages 82 39.6 Other 125 60.4 Current partner's HIV-status Positive 58 28.0 Negative 57 27.5 Disclosure status to the partner 47 82.5 Don't know 42 20.3 Disclosure status to the partner 14 33.3 No partner 50 24.2 Time of HIV diagnosis <1 year 64 30.9 >1 years 143 69.1 Source of infection Husband/permanent partner 134 64.7 Temporary partner 35 16.9 Shared injecting device 8 3.9 Blood transfusion 4 1.9 Don't know/not sure 26 12.6 Comprehensive HIV knowledge 153 73.9
Notes: *Banten Province’s minimum regional wage set by the Indonesian Government in 2017 was IDR 1,931,180. The standardized minimum wages in each city/dis-trict issued by Banten Provincial Government were: IDR 3,270,936.13 in Tangerang District, IDR 3,295,075.88 in Tangerang City, IDR 3.270.936,13 in SouthTangerang City, IDR 3,258,866.25 in Serang District, IDR 3,331,997.63 in Cilegon City, IDR 2,866,595.31 in Serang City, and IDR 2,164,979.43 in PandeglangDistrict (From https://wageindicator.org/salary/minimum-wage/indonesia/archive/3/).**Husband/partner, parents, siblings, kids, and/or friends.SD = Standard Deviation
Juliastuti et al, Inter-related Factors Influencing Sexual Quality of Life among Women Living with HIV
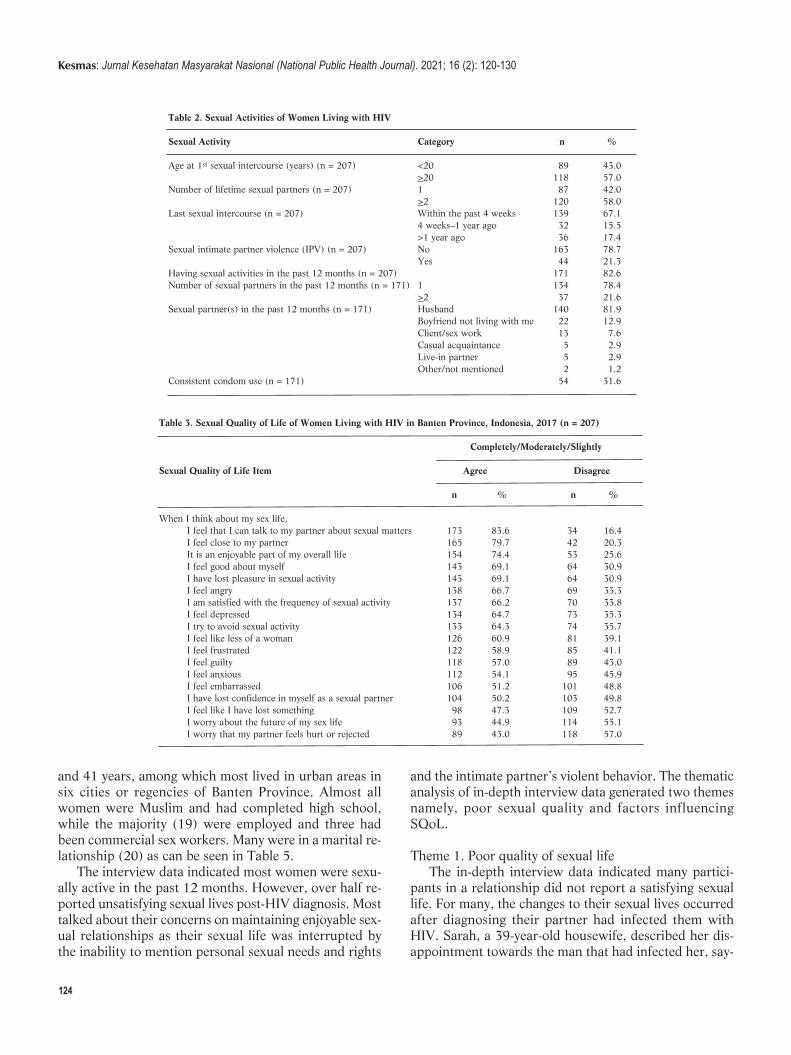
124
and 41 years, among which most lived in urban areas insix cities or regencies of Banten Province. Almost allwomen were Muslim and had completed high school,while the majority (19) were employed and three hadbeen commercial sex workers. Many were in a marital re-lationship (20) as can be seen in Table 5.
The interview data indicated most women were sexu-ally active in the past 12 months. However, over half re-ported unsatisfying sexual lives post-HIV diagnosis. Mosttalked about their concerns on maintaining enjoyable sex-ual relationships as their sexual life was interrupted bythe inability to mention personal sexual needs and rights
and the intimate partner’s violent behavior. The thematicanalysis of in-depth interview data generated two themesnamely, poor sexual quality and factors influencingSQoL.
Theme 1. Poor quality of sexual lifeThe in-depth interview data indicated many partici-
pants in a relationship did not report a satisfying sexuallife. For many, the changes to their sexual lives occurredafter diagnosing their partner had infected them withHIV. Sarah, a 39-year-old housewife, described her dis-appointment towards the man that had infected her, say-
Table 2. Sexual Activities of Women Living with HIV
Sexual Activity Category n %
Age at 1st sexual intercourse (years) (n = 207) <20 89 43.0 >20 118 57.0Number of lifetime sexual partners (n = 207) 1 87 42.0 >2 120 58.0Last sexual intercourse (n = 207) Within the past 4 weeks 139 67.1 4 weeks–1 year ago 32 15.5 >1 year ago 36 17.4Sexual intimate partner violence (IPV) (n = 207) No 163 78.7 Yes 44 21.3Having sexual activities in the past 12 months (n = 207) 171 82.6Number of sexual partners in the past 12 months (n = 171) 1 134 78.4 >2 37 21.6Sexual partner(s) in the past 12 months (n = 171) Husband 140 81.9 Boyfriend not living with me 22 12.9 Client/sex work 13 7.6 Casual acquaintance 5 2.9 Live-in partner 5 2.9 Other/not mentioned 2 1.2Consistent condom use (n = 171) 54 31.6
Table 3. Sexual Quality of Life of Women Living with HIV in Banten Province, Indonesia, 2017 (n = 207)
Completely/Moderately/Slightly
Sexual Quality of Life Item Agree Disagree
n % n %
When I think about my sex life, I feel that I can talk to my partner about sexual matters 173 83.6 34 16.4 I feel close to my partner 165 79.7 42 20.3 It is an enjoyable part of my overall life 154 74.4 53 25.6 I feel good about myself 143 69.1 64 30.9 I have lost pleasure in sexual activity 143 69.1 64 30.9 I feel angry 138 66.7 69 33.3 I am satisfied with the frequency of sexual activity 137 66.2 70 33.8 I feel depressed 134 64.7 73 35.3 I try to avoid sexual activity 133 64.3 74 35.7 I feel like less of a woman 126 60.9 81 39.1 I feel frustrated 122 58.9 85 41.1 I feel guilty 118 57.0 89 43.0 I feel anxious 112 54.1 95 45.9 I feel embarrassed 106 51.2 101 48.8 I have lost confidence in myself as a sexual partner 104 50.2 103 49.8 I feel like I have lost something 98 47.3 109 52.7 I worry about the future of my sex life 93 44.9 114 55.1 I worry that my partner feels hurt or rejected 89 43.0 118 57.0
Kesmas: Jurnal Kesehatan Masyarakat Nasional (National Public Health Journal). 2021; 16 (2): 120-130
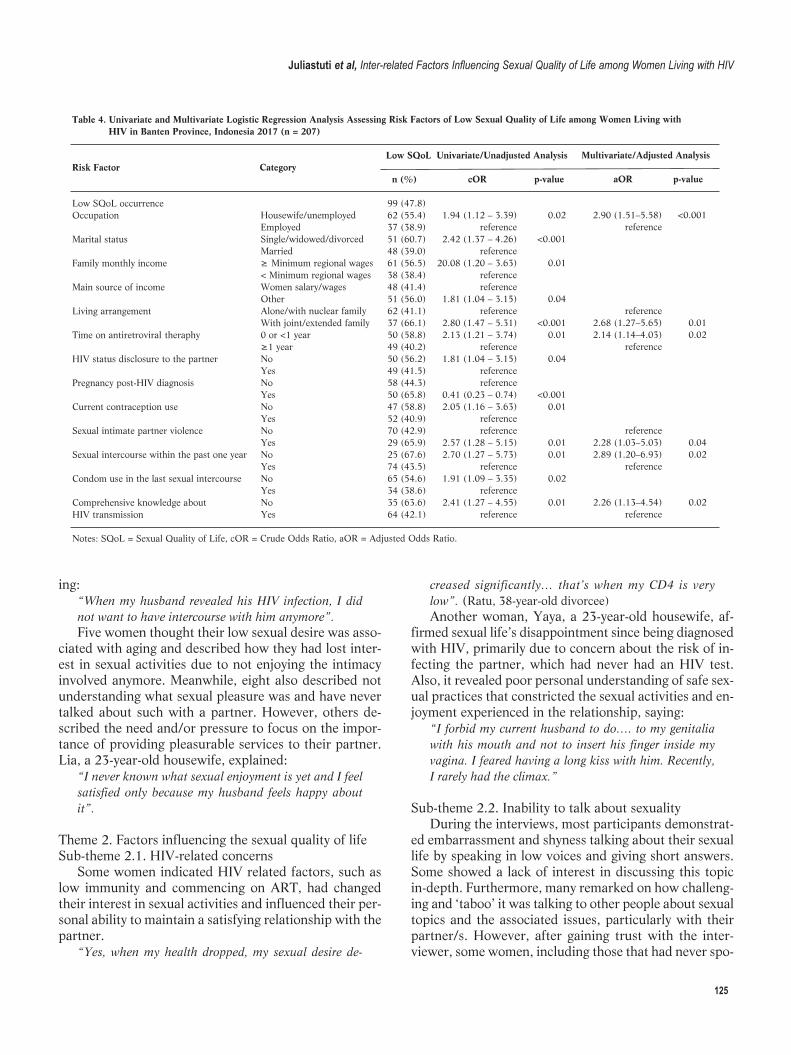
125
ing: “When my husband revealed his HIV infection, I didnot want to have intercourse with him anymore”.Five women thought their low sexual desire was asso-
ciated with aging and described how they had lost inter-est in sexual activities due to not enjoying the intimacyinvolved anymore. Meanwhile, eight also described notunderstanding what sexual pleasure was and have nevertalked about such with a partner. However, others de-scribed the need and/or pressure to focus on the impor-tance of providing pleasurable services to their partner.Lia, a 23-year-old housewife, explained:
“I never known what sexual enjoyment is yet and I feelsa tis fied only because my husband feels happy aboutit”.
Theme 2. Factors influencing the sexual quality of lifeSub-theme 2.1. HIV-related concerns
Some women indicated HIV related factors, such aslow immunity and commencing on ART, had changedtheir interest in sexual activities and influenced their per-sonal ability to maintain a satisfying relationship with thepartner.
“Yes, when my health dropped, my sexual desire de-
creased significantly… that’s when my CD4 is verylow”. (Ratu, 38-year-old divorcee)Another woman, Yaya, a 23-year-old housewife, af-
firmed sexual life’s disappointment since being diagnosedwith HIV, primarily due to concern about the risk of in-fecting the partner, which had never had an HIV test.Also, it revealed poor personal understanding of safe sex-ual practices that constricted the sexual activities and en-joyment experienced in the relationship, saying:
“I forbid my current husband to do…. to my genitaliawith his mouth and not to insert his finger inside myvagina. I feared having a long kiss with him. Recently,I rarely had the climax.”
Sub-theme 2.2. Inability to talk about sexuality During the interviews, most participants demonstrat-
ed embarrassment and shyness talking about their sexuallife by speaking in low voices and giving short answers.Some showed a lack of interest in discussing this topicin-depth. Furthermore, many remarked on how challeng-ing and ‘taboo’ it was talking to other people about sexualtopics and the associated issues, particularly with theirpartner/s. However, after gaining trust with the inter-viewer, some women, including those that had never spo-
Table 4. Univariate and Multivariate Logistic Regression Analysis Assessing Risk Factors of Low Sexual Quality of Life among Women Living with HIV in Banten Province, Indonesia 2017 (n = 207)
Low SQoL Univariate/Unadjusted Analysis Multivariate/Adjusted AnalysisRisk Factor Category n (%) cOR p-value aOR p-value
Low SQoL occurrence 99 (47.8) Occupation Housewife/unemployed 62 (55.4) 1.94 (1.12 – 3.39) 0.02 2.90 (1.51–5.58) <0.001 Employed 37 (38.9) reference reference Marital status Single/widowed/divorced 51 (60.7) 2.42 (1.37 – 4.26) <0.001 Married 48 (39.0) reference Family monthly income ≥ Minimum regional wages 61 (56.5) 20.08 (1.20 – 3.63) 0.01 < Minimum regional wages 38 (38.4) reference Main source of income Women salary/wages 48 (41.4) reference Other 51 (56.0) 1.81 (1.04 – 3.15) 0.04 Living arrangement Alone/with nuclear family 62 (41.1) reference reference With joint/extended family 37 (66.1) 2.80 (1.47 – 5.31) <0.001 2.68 (1.27–5.65) 0.01Time on antiretroviral theraphy 0 or <1 year 50 (58.8) 2.13 (1.21 – 3.74) 0.01 2.14 (1.14–4.03) 0.02 ≥1 year 49 (40.2) reference reference HIV status disclosure to the partner No 50 (56.2) 1.81 (1.04 – 3.15) 0.04 Yes 49 (41.5) reference Pregnancy post-HIV diagnosis No 58 (44.3) reference Yes 50 (65.8) 0.41 (0.23 – 0.74) <0.001 Current contraception use No 47 (58.8) 2.05 (1.16 – 3.63) 0.01 Yes 52 (40.9) reference Sexual intimate partner violence No 70 (42.9) reference reference Yes 29 (65.9) 2.57 (1.28 – 5.15) 0.01 2.28 (1.03–5.03) 0.04Sexual intercourse within the past one year No 25 (67.6) 2.70 (1.27 – 5.73) 0.01 2.89 (1.20–6.93) 0.02 Yes 74 (43.5) reference reference Condom use in the last sexual intercourse No 65 (54.6) 1.91 (1.09 – 3.35) 0.02 Yes 34 (38.6) reference Comprehensive knowledge about No 35 (63.6) 2.41 (1.27 – 4.55) 0.01 2.26 (1.13–4.54) 0.02HIV transmission Yes 64 (42.1) reference reference Notes: SQoL = Sexual Quality of Life, cOR = Crude Odds Ratio, aOR = Adjusted Odds Ratio.
Juliastuti et al, Inter-related Factors Influencing Sexual Quality of Life among Women Living with HIV
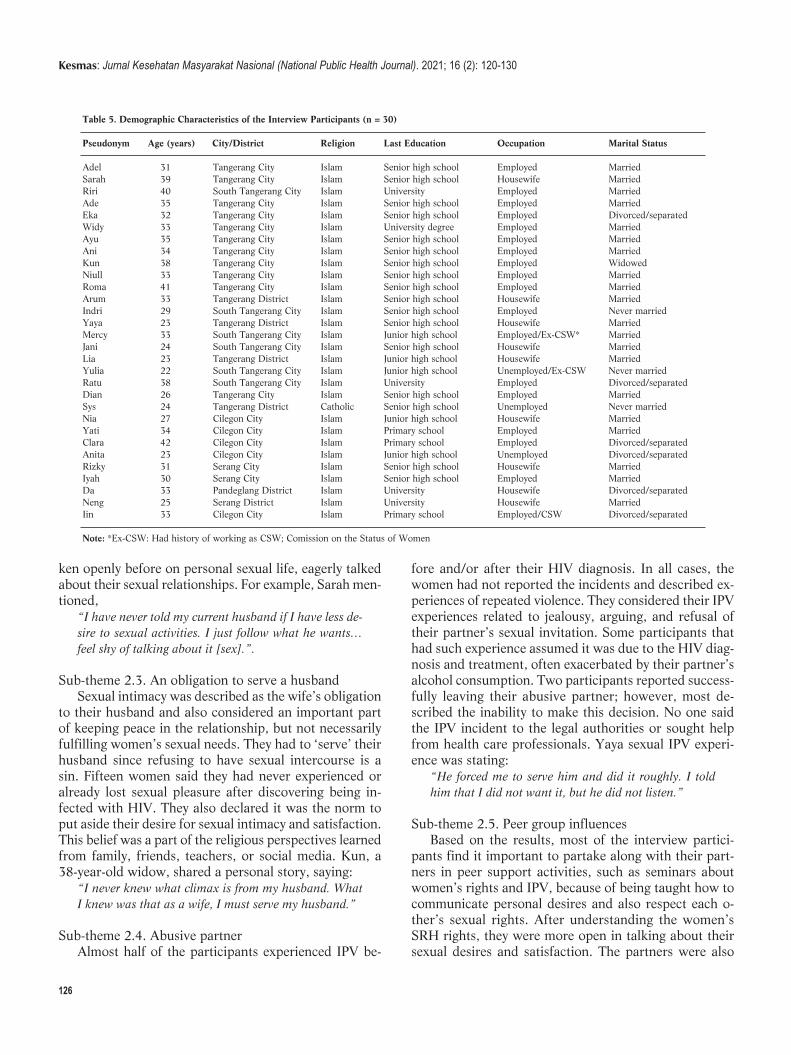
ken openly before on personal sexual life, eagerly talkedabout their sexual relationships. For example, Sarah men-tioned,
“I have never told my current husband if I have less de-sire to sexual activities. I just follow what he wants…feel shy of talking about it [sex].”.
Sub-theme 2.3. An obligation to serve a husbandSexual intimacy was described as the wife’s obligation
to their husband and also considered an important partof keeping peace in the relationship, but not necessarilyfulfilling women’s sexual needs. They had to ‘serve’ theirhusband since refusing to have sexual intercourse is asin. Fifteen women said they had never experienced oralready lost sexual pleasure after discovering being in-fected with HIV. They also declared it was the norm toput aside their desire for sexual intimacy and satisfaction.This belief was a part of the religious perspectives learnedfrom family, friends, teachers, or social media. Kun, a38-year-old widow, shared a personal story, saying:
“I never knew what climax is from my husband. WhatI knew was that as a wife, I must serve my husband.”
Sub-theme 2.4. Abusive partnerAlmost half of the participants experienced IPV be-
fore and/or after their HIV diagnosis. In all cases, thewomen had not reported the incidents and described ex-periences of repeated violence. They considered their IPVexperiences related to jealousy, arguing, and refusal oftheir partner’s sexual invitation. Some participants thathad such experience assumed it was due to the HIV diag-nosis and treatment, often exacerbated by their partner’salcohol consumption. Two participants reported success-fully leaving their abusive partner; however, most de-scribed the inability to make this decision. No one saidthe IPV incident to the legal authorities or sought helpfrom health care professionals. Yaya sexual IPV experi-ence was stating:
“He forced me to serve him and did it roughly. I toldhim that I did not want it, but he did not listen.”
Sub-theme 2.5. Peer group influences Based on the results, most of the interview partici-
pants find it important to partake along with their part-ners in peer support activities, such as seminars aboutwomen’s rights and IPV, because of being taught how tocommunicate personal desires and also respect each o -ther’s sexual rights. After understanding the women’sSRH rights, they were more open in talking about theirsexual desires and satisfaction. The partners were also
126
Table 5. Demographic Characteristics of the Interview Participants (n = 30)
Pseudonym Age (years) City/District Religion Last Education Occupation Marital Status
Adel 31 Tangerang City Islam Senior high school Employed MarriedSarah 39 Tangerang City Islam Senior high school Housewife MarriedRiri 40 South Tangerang City Islam University Employed MarriedAde 35 Tangerang City Islam Senior high school Employed MarriedEka 32 Tangerang City Islam Senior high school Employed Divorced/separatedWidy 33 Tangerang City Islam University degree Employed MarriedAyu 35 Tangerang City Islam Senior high school Employed MarriedAni 34 Tangerang City Islam Senior high school Employed MarriedKun 38 Tangerang City Islam Senior high school Employed WidowedNiull 33 Tangerang City Islam Senior high school Employed MarriedRoma 41 Tangerang City Islam Senior high school Employed MarriedArum 33 Tangerang District Islam Senior high school Housewife MarriedIndri 29 South Tangerang City Islam Senior high school Employed Never marriedYaya 23 Tangerang District Islam Senior high school Housewife MarriedMercy 33 South Tangerang City Islam Junior high school Employed/Ex-CSW* MarriedJani 24 South Tangerang City Islam Senior high school Housewife MarriedLia 23 Tangerang District Islam Junior high school Housewife MarriedYulia 22 South Tangerang City Islam Junior high school Unemployed/Ex-CSW Never marriedRatu 38 South Tangerang City Islam University Employed Divorced/separatedDian 26 Tangerang City Islam Senior high school Employed MarriedSys 24 Tangerang District Catholic Senior high school Unemployed Never marriedNia 27 Cilegon City Islam Junior high school Housewife MarriedYati 34 Cilegon City Islam Primary school Employed MarriedClara 42 Cilegon City Islam Primary school Employed Divorced/separatedAnita 23 Cilegon City Islam Junior high school Unemployed Divorced/separatedRizky 31 Serang City Islam Senior high school Housewife MarriedIyah 30 Serang City Islam Senior high school Employed MarriedDa 33 Pandeglang District Islam University Housewife Divorced/separatedNeng 25 Serang District Islam University Housewife MarriedIin 33 Cilegon City Islam Primary school Employed/CSW Divorced/separated
Note: *Ex-CSW: Had history of working as CSW; Comission on the Status of Women
Kesmas: Jurnal Kesehatan Masyarakat Nasional (National Public Health Journal). 2021; 16 (2): 120-130
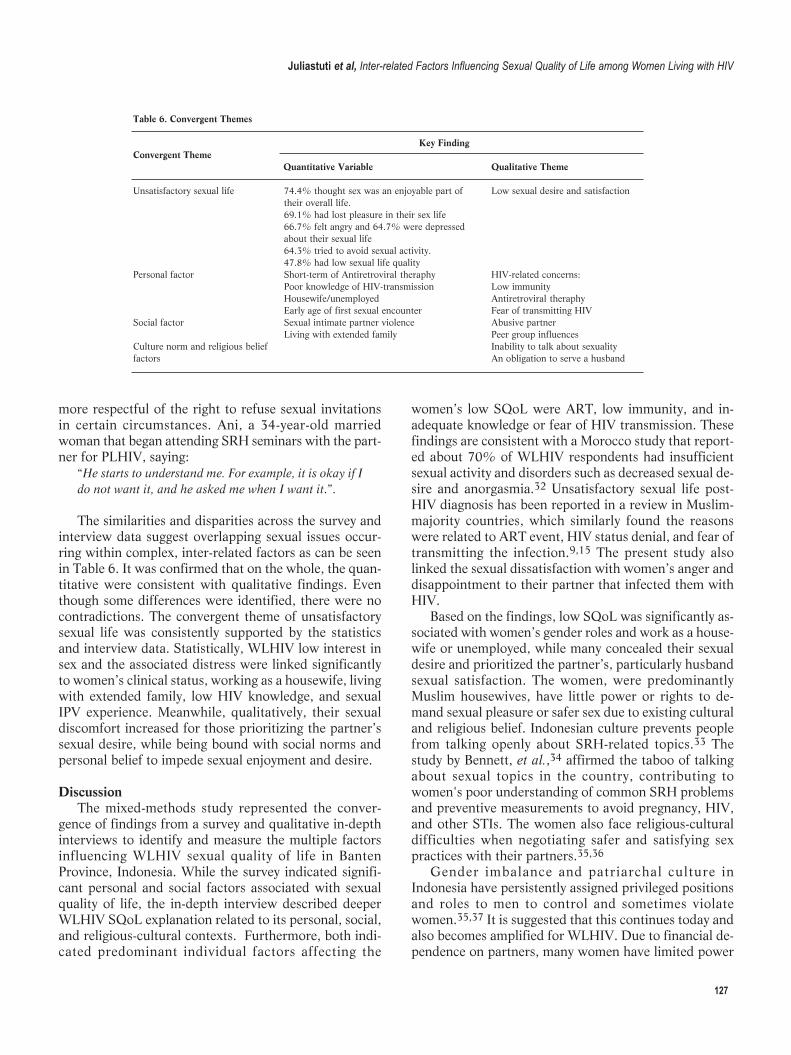
more respectful of the right to refuse sexual invitationsin certain circumstances. Ani, a 34-year-old marriedwoman that began attending SRH seminars with the part-ner for PLHIV, saying:
“He starts to understand me. For example, it is okay if Ido not want it, and he asked me when I want it.”.
The similarities and disparities across the survey andinterview data suggest overlapping sexual issues occur-ring within complex, inter-related factors as can be seenin Table 6. It was confirmed that on the whole, the quan-titative were consistent with qualitative findings. Eventhough some differences were identified, there were nocontradictions. The convergent theme of unsatisfactorysexual life was consistently supported by the statisticsand interview data. Statistically, WLHIV low interest insex and the associated distress were linked significantlyto women’s clinical status, working as a housewife, livingwith extended family, low HIV knowledge, and sexualIPV experience. Meanwhile, qualitatively, their sexualdiscomfort increased for those prioritizing the partner’ssexual desire, while being bound with social norms andpersonal belief to impede sexual enjoyment and desire.
DiscussionThe mixed-methods study represented the conver-
gence of findings from a survey and qualitative in-depthinterviews to identify and measure the multiple factorsinfluencing WLHIV sexual quality of life in BantenProvince, Indonesia. While the survey indicated signifi-cant personal and social factors associated with sexualquality of life, the in-depth interview described deeperWLHIV SQoL explanation related to its personal, social,and religious-cultural contexts. Furthermore, both indi-cated predominant individual factors affecting the
women’s low SQoL were ART, low immunity, and in -adequate knowledge or fear of HIV transmission. Thesefindings are consistent with a Morocco study that report-ed about 70% of WLHIV respondents had insufficientsexual activity and disorders such as decreased sexual de-sire and anorgasmia.32 Unsatisfactory sexual life post-HIV diagnosis has been reported in a review in Muslim-majority countries, which similarly found the reasonswere related to ART event, HIV status denial, and fear oftransmitting the infection.9,15 The present study alsolinked the sexual dissatisfaction with women’s anger anddisappointment to their partner that infected them withHIV.
Based on the findings, low SQoL was significantly as-sociated with women’s gender roles and work as a house-wife or unemployed, while many concealed their sexualdesire and prioritized the partner’s, particularly husbandsexual satisfaction. The women, were predominantlyMuslim housewives, have little power or rights to de-mand sexual pleasure or safer sex due to existing culturaland religious belief. Indonesian culture prevents peoplefrom talking openly about SRH-related topics.33 Thestudy by Bennett, et al.,34 affirmed the taboo of talkingabout sexual topics in the country, contributing towomen's poor understanding of common SRH problemsand preventive measurements to avoid pregnancy, HIV,and other STIs. The women also face religious-culturaldifficulties when negotiating safer and satisfying sexpractices with their partners.35,36
Gender imbalance and patriarchal culture inIndonesia have persistently assigned privileged positionsand roles to men to control and sometimes violatewomen.35,37 It is suggested that this continues today andalso becomes amplified for WLHIV. Due to financial de-pendence on partners, many women have limited power
127
Juliastuti et al, Inter-related Factors Influencing Sexual Quality of Life among Women Living with HIV
Table 6. Convergent Themes
Key FindingConvergent Theme Quantitative Variable Qualitative Theme
Unsatisfactory sexual life 74.4% thought sex was an enjoyable part of Low sexual desire and satisfaction their overall life. 69.1% had lost pleasure in their sex life 66.7% felt angry and 64.7% were depressed about their sexual life 64.3% tried to avoid sexual activity. 47.8% had low sexual life quality Personal factor Short-term of Antiretroviral theraphy HIV-related concerns: Poor knowledge of HIV-transmission Low immunity Housewife/unemployed Antiretroviral theraphy Early age of first sexual encounter Fear of transmitting HIVSocial factor Sexual intimate partner violence Abusive partner Living with extended family Peer group influences Culture norm and religious belief Inability to talk about sexuality factors An obligation to serve a husband
in their family to request or enforce condom utilization,refuse sex, including sexual practices that place them atincreased risk of HIV, unplanned pregnancy and otheradverse SRH outcomes, and ultimately to defend theirSRH rights.38,39 These align with Shahhosseini, et al.,40
findings that reported low sexual satisfaction among WL-HIV with no or low income and poor interpersonal com-munication skills. Also, many WLHIV described sexualactivity as a means to maintain their relationships, not toobtain pleasure. These correspond with Asian culturalbeliefs that women should prioritize their duty and obli-gation for their husbands.41 According to similar findingsin Bangladesh, women maintained sexual activities onlyto prevent conflict between partners.42 Personal andcommunity values strongly affected the WLHIV partici-pants’ sexual wellbeing. Moreover, religious and culturalgender norms and values hindered the ability to voicetheir sexual needs, as men maintain power to control andviolate women. These gender inequalities have stoppedmany women, including WLHIV, in middle and low-in-come countries, from achieving their right to a safe andenjoyable sexual life.15,35
The interviews suggested women diagnosed over along time and also involved in peer support activitiesdemonstrated and reported higher levels of SRH literacyand confidence in negotiating their needs and rights. Thisindicates women's ability to negotiate SRH rights tendsto be developed with community peer groups’ support.The finding is consistent with the study that stated peercounselling, education, and accompaniment worked suc-cessfully in improving WLHIV SRH outcomes.43,44
This study has several limitations, such as being con-ducted primarily among WLHIV that accessed treatmentin public HIV treatment facilities and Yayasan KotexMandiri. Furthermore, the surveyed sample size was re -latively small and recruited using a non-probability sam-pling method. Therefore, this possibly lacks the perspect -ives of WLHIV that were not engaged in HIV care. Theresults tend not to be generalizable to WLHIV in ruralsettings and those not accessing tertiary referral hospi-tals. Data were self-reported by the participants in rela-tion to issues considered sensitive, which gives rise to po-tential social desirability bias.
This study's major strength was that the mixed me -thods not only provided a quantification of sexual lifequality but also more detailed information on the influ-encing factors. It is the first to comprehensively explorequality of sexual life among WLHIV in Indonesia usingmixed methods approach. The results provided advancedinsights into the socio-cultural factors impactingWLHIV’s sexual quality of life. This is useful for inform-ing future SRH health strategies and interventions forthe wellness of WLHIV and the women population ge -nerally.
ConclusionConclusively, the intersection of personal, social, and
cultural factors attributing to women living with HIV ex-periencing unsatisfactory sexual life was identified. Theseinter-related factors, such as slow adjustment to HIV in-fection and treatment, abusive relationships, women’s in-ability to express their sexual needs and to refuse invita-tions, present significant barriers to achieving healthy lifeand wellness by WLHIV. The support from their partner,family, peers, health professional, and community tendsto offset some of these experiences and are also essentialwhen WLHIV needs to achieve their SRH rights andwell-being.
The findings highlighted the need for health systemsenabling women to build confidence to voice their sexualneeds and advocate personal rights. Support structures,local religious-cultural norms, and public policy are ac-knowledged and prepared to empower women in meetingtheir sexual health. Multi-discipline professionals, includ-ing sexuality specialists, psychologists, and public healthpractitioners, need to partner with the WLHIV to de -velop a health system and network of peer support thatmitigates the challenges faced. Free availability of theseservices to the sufferers and all women at adverse SRHoutcomes risk is necessary. Future study needs to developskill-based interventions that increase women’s commu-nication and negotiation skills for safer sex practices andmanage the IPV issues among WLHIV.
AbbreviationsaOR: Adjusted Odds Ratio; ART: Antiretroviral Therapy; cOR: CrudeOdds Ratio; HIV: Human Immunodeficiency Virus; IDHS: IndonesiaDemographic Health Survey; IPV: Intimate partner violence; PLHIV:People living with HIV; PR: Peer Recruiter; SRH: Sexual andReproductive Health; STI: Sexually Transmitted Infection; SQoL:Sexual Quality of Life; SQoL-F: Sexual Quality of Life-Female; UQ:The University of Queensland; WHQ: Women Health Questionnaire;WLHIV: Women living with HIV.
Ethics Approval and Consent to ParticipateEthical approval was issued by the University of Queensland HumanResearch Ethical Committee (Approval Number: 2017000354). All in-dividual participants recruited signed the research consent precedingthe interview
Competing InterestThe author declares that there are no significant competing financial,professional, or personal interests that might have affected the per-formance or presentation of the work described in this manuscript.
Availability of Data and MaterialsAll data were stored electronically in the University of Queensland datamanagement system accessible by the authors team only considering
128
Kesmas: Jurnal Kesehatan Masyarakat Nasional (National Public Health Journal). 2021; 16 (2): 120-130
Juliastuti et al, Inter-related Factors Influencing Sexual Quality of Life among Women Living with HIV
the topics' sensitiveness, but the information is available upon request.
Authors’ ContributionDJ initiated the research concept, while LF and JD assisted in develop-ing the final protocol used. In addition, DJ collected the data whichwere analyzed by DJ, LF, and JD. This manuscript was drafted by DJ,while all authors interpreted the findings, contributed to the revisions,read, and approved the final manuscript.
AcknowledgmentThe authors are grateful to all WLHIV agreed to participate in the sur-vey and interview, and to the peer recruiters, and Yayasan KotexMandiri for their collaboration. The authors are also grateful to theAustralian Awards and the University of Queensland for the financialsupport. Besides, this article’s contents are solely the responsibility ofthe authors.
References1. Joint United Nations Programme on HIV and AIDS. Global HIV &
AIDS statistics - 2020 fact sheet. Geneva: UNAIDS; 2020.
2. Kementerian Kesehatan Republik Indonesia. Profil kesehatan
Indonesia tahun 2019. Jakarta: Kementerian Kesehatan Republik
Indonesia; 2020.
3. Kementerian Kesehatan Republik Indonesia. Laporan perkembangan
HIV-AIDS triwulan I tahun 2020. Jakarta: Direktorat Jenderal
Pencegahan dan Pengendalian Penyakit, Kementerian Kesehatan
Republik Indonesia; 2020.
4. Khosla R, Van Belle N, Temmerman M. Advancing the sexual and re-
productive health and human rights of women living with HIV: a re-
view of UN, regional and national human rights norms and standards.
Journal of the International AIDS Society. 2015; 18 (Suppl 5): 20280.
5. United Nations Population Fund. Sexual and reproductive health.
Washington DC.: UNFPA; 2021.
6. World Health Organization. Consolidate guideline on sexual and re-
productive health and rights of women living with HIV. Geneva:
World Health Organization; 2017.
7. Adekanle DA, Olowookere SA, Adewole AD, Adeleke NA, Abioye-
Kuteyi EA, Ijadunola MY. Sexual experiences of married HIV positive
women in Osogbo, Southwest Nigeria: role of inappropriate status dis-
closure. BMC Women's Health. 2015; 15: 6.
8. Maeri I, El Ayadi A, Getahun M, Charlebois E, Akatukwasa C,
Tumwebaze D, et al. "How can I tell?" Consequences of HIV status
disclosure among couples in Eastern African communities in the con-
text of an ongoing HIV "test-and-treat" trial. AIDS care. 2016; 28
Suppl 3: 59-66.
9. Closson EF, Mimiaga MJ, Sherman SG, Tangmunkongvorakul A,
Friedman RK, Limbada M, et al. Intimacy versus isolation: a qualita-
tive study of sexual practices among sexually active HIV-infected pa-
tients in HIV care in Brazil, Thailand, and Zambia. PloS one. 2015; 10
(3): e0120957.
10. Kaida A, Carter A, de Pokomandy A, Patterson S, Proulx-Boucher K,
Nohpal A, et al. Sexual inactivity and sexual satisfaction among
women living with HIV in Canada in the context of growing social, le-
gal and public health surveillance. Journal of the International AIDS
Society. 2015; 18 (Suppl 5): 20284.
11. World Health Organization. Sexual health, human rights and the law.
Geneva: World Health Organization; 2015.
12. Chakraborty H, Patted S, Gan A, Islam F, Revankar A. Determinants
of Intimate Partner Violence Among HIV-Positive and HIV-Negative
Women in India. J Interpers Violence. 2016; 31 (3): 515-30.
13. Chin YM. Does HIV increase the risk of spousal violence in sub-
Saharan Africa?. Journal of health economics. 2013; 32 (5): 997-1006.
14. Okareh OT, Akpa OM, Okunlola JO, Okoror TA. Management of con-
flicts arising from disclosure of HIV status among married women in
southwest Nigeria. Health Care for Women International. 2015; 36
(2): 149-60.
15. Juliastuti D, Dean J, Fitzgerald L. Sexual and reproductive health of
women living with HIV in Muslim-majority countries: a systematic
mixed studies review. BMC International Health and Human Rights.
2020; 20 (1): 5.
16. Creswell JW. Research design: qualitative, quantitative, and mixed-
methods approaches. Sage Publications; 2013.
17. Kaur M. Application of mixed method approach in public health re -
search. Indian Journal of Community Medicine: Official Publication of
Indian Association of Preventive & Social Medicine. 2016; 41 (2): 93-
7.
18. Shorten A, Smith J. Mixed methods research: expanding the evidence
base. Evidence Based Nursing. 2017; 20 (3): 74-5.
19. Creswell JW, Plano Clark VL. Designing and conducting mixed meth-
ods research. Sage Publications. 2017.
20. Dinas Kesehatan Provinsi Banten. Profil kesehatan Provinsi Banten
2015 Serang, Banten; 2016.
21. Reaves CC. Quantitative research for the behavioral sciences. New
York: John Wiley & Sons, Inc.; 1992.
22. Statistics Indonesia, National Population and Family Planning Board,
Kementrian Kesehatan Republik Indonesia, ICF International.
Indonesia demographic and health survey 2012. Jakarta, Indonesia:
BPS, BKKBN, Kemenkes, ICF International; 2013.
23. Symonds T, Boolell M, Quirk F. Development of a questionnaire on
sexual quality of life in women. Journal of Sex & Marital Therapy.
2005; 31 (5): 385-97.
24. Pallant J. SPoS survival manual: a step by step guide to data analysis
using IBM SPSS. 6th ed. London, UK: McGraw-Hill Education; 2016.
25. Ranganathan P, Pramesh CS, Aggarwal R. Common pitfalls in statisti-
cal analysis: logistic regression. Perspectives in Clinical Research.
2017; 8 (3): 148-51.
26. Boateng GO, Neilands TB, Frongillo EA, Melgar-Quiñonez HR, Young
SL. Best practices for developing and validating scales for health, so-
cial, and behavioral research: a primer. Front Public Health. 2018; 6:
149.
27. Brown KM, Elliott SJ, Leatherdale ST, Robertson-Wilson J. Searching
for rigour in the reporting of mixed methods population health re-
search: a methodological review. Health Education Research. 2015; 30
(6): 811-39.
28. Braun V, Clarke V. Using thematic analysis in psychology. Qualitative
Research in Psychology. 2006; 3 (2): 77-101.
29. Padgett D. Qualitative and mixed methods in public health. Thousand
Oaks, California: Sage Publications, Inc; 2012.
129
30. Curry LA, Nembhard IM, Bradley EH. Qualitative and mixed methods
provide unique contributions to outcomes research. Circulation. 2009;
119 (10): 1442-52.
31. Guetterman TC, Fetters MD, Creswell JW. Integrating quantitative
and qualitative results in health science mixed methods research
through joint displays. Annals of Family Medicine. 2015; 13 (6): 554-
61.
32. El Fane M, Bensghir R, Sbai S, Chakib A, Kadiri N, Ayouch A, et al.
Quality of sexual life for people living with HIV (PLWHA).
Sexologies. 2011; 20 (3): 158-62.
33. Utomo ID, McDonald P. Adolescent Reproductive Health in
Indonesia: Contested Values and Policy Inaction. Studies in family
planning. 2009; 40 (2): 133-46.
34. Bennett LR. Zina and the enigma of sex education for Indonesian
Muslim youth. Sex Education. 2007; 7 (4): 371-86.
35. Amin A. Addressing gender inequalities to improve the sexual and re-
productive health and wellbeing of women living with HIV. Journal of
the International AIDS Society. 2015; 18 (6S5): 20302.
36. Bennett LR, Davies SG. Sex and sexualities in contemporary
Indonesia: sexual politics, health, diversity and representations.
Routledge; 2014.
37. Aisyah S, Parker L. Problematic conjugations: women’s agency, mar-
riage and domestic violence in Indonesia. Asian Studies Review. 2014;
38 (2): 205-23.
38. Jacubowski N. Marriage is not a safe place: heterosexual marriage and
HIV-related vulnerability in Indonesia. Culture, Health and Sexuality.
2008; 10 (1): 87-97.
39. Puradiredja DI, Coast E, Sear R. Why do female sex workers in
Indonesia not use condoms?: a mixed methods study of the heteroge-
neous contexts of condom use. European Population Conference;
Barcelona, Spain: LSE Research Online; 2008.
40. Shahhosseini Z, Gardeshi ZH, Pourasghar M, Salehi F. A review of af-
fecting factors on sexual satisfaction in women. Materia Socio-Medica.
2014; 26 (6): 378-81.
41. United Nations Development Programme, WAP+, APN+, Unzip the
Lips. Discussion paper: linkages between violence against women and
HIV in Asia and the Pacific. Bangkok: UNDP; 2013.
42. Anwar N, Khan SI. Sexual life after HIV infection: an exploratory
study among HIV positive adult males and females in Dhaka,
Bangladesh. International Journal of Interdisciplinary Social Sciences.
2010; 5( 2): 589-602.
43. Richter L, Rotheram-Borus MJ, Van Heerden A, Stein A, Tomlinson
M, Harwood JM, et al. Pregnant women living with HIV (WLH) sup-
ported at clinics by peer WLH: a cluster randomized controlled trial.
AIDS and Behavior. 2014; 18 (4): 706-15.
44. Robinson JL, Narasimhan M, Amin A, Morse S, Beres LK, Yeh PT, et
al. Interventions to address unequal gender and power relations and
improve self-efficacy and empowerment for sexual and reproductive
health decision-making for women living with HIV: a systematic re-
view. PloS one. 2017; 12 (8): e0180699-e.
130
Kesmas: Jurnal Kesehatan Masyarakat Nasional (National Public Health Journal). 2021; 16 (2): 120-130
AbstractThere has been an increase of sexually transmitted infections (STIs) such as HIV/AIDS worldwide, especially in Indonesia. Several studies on adolescent be-havior, especially the male as the main predictor, reported increased in STIs’ cases due to risky sexual behavior. This study aimed to show the relationshipbetween attitudes, sexual behavior, and the risks of STIs among male adolescents in Indonesia based on the Indonesia Demographic and Health Survey(IDHS) data in 2017. This cross-sectional study involved 10,547 male adolescents using the total sampling method according to the inclusion and exclusioncriteria. Data were analyzed using a complex sample logistic regression test. This study was found that the proportion of risky sexual behavior of STIs was10% of which 29.8% agreeable attitude male adolescents. Agreeable attitude male adolescents were found able to improve the risk of engaging in risky sexualbehaviors of STIs (p-value = 0.018; prevalence odd ratio (POR) = 1.135). The male adolescents who had an agreeable attitude towards sexual behavior couldimprove the risk of having risky sexual behavior of STIs 1,135 times; however, the attitude variable was not necessarily a major risk factor for the risky sexualbehavior of STIs. Knowledge and education were not related to the risky sexual behavior of STIs.
Keywords: attitudes, Indonesia, male adolescents, risky sexual behavior, sexually transmitted infections
Attitudes Concerning Sexual Behavior towards Risky SexualBehavior of Sexual Transmitted Infections among MaleAdolescents in Indonesia
Helda1*, Nurul Muchlisa2
1Department of Epidemiology, Faculty of Public Health, Universitas Indonesia, Depok, Indonesia2Department of Reproductive Health, Faculty of Public Health, Universitas Pejuang Republik Indonesia, Makassar, Indonesia
IntroductionOvercoming health problems is one of the main focus
of many countries in reducing mortality rates. Currently,four out of ten ailments that leads to death originate frominfectious diseases.1 Furthermore, based on the Institutefor Health Metrics and Evaluation (IHME) data, it wasstated that during the Global Burden of Disease (GBD)in 2017 about 16.5 million people died due to infectiousdiseases continues to increase annually.2 An example ofan infectious disease that needs special attention is sexu-ally transmitted infections (STIs). More than one millioncases of this disease occur every day worldwide,3 with anincreasing number of both curable and incurable STIs.4-6
Sexually transmitted infection cases have become amajor health problem in Indonesia. Based on theIntegrated Biological and Behavioral Surveillance (IBBS)data in 2015, it was found that the prevalence rate ofSTIs has increased, especially for syphilis, which in-creased from 5 to 6% annually.7 The human immunode-ficiency virus (HIV) cases have also increased and are es-timated to continue until 2025.6
Meanwhile, based on the age level, the highest num-ber of HIV cases were experienced by age groups morethan 30 years, followed by those between 15 to 24, andsomeone exposed to HIV would not show symptoms foran average of 8 years. Therefore, the age for first expo-sure is around 23 years.7
The increase in STI cases is inseparable from the re-sult of risky sexual behavior. This behavior in adolescentsinitially started with premarital sex and can damage anindividual's behavior, thereby leading to several adversehealth consequences including an increase in cases of sex-ually transmitted infections.8-11 There are factors that in-fluence risky sexual behavior in adolescents, which ulti-mately results in sexually transmitted infections, namelyage, gender, place of residence, attitudes, education,knowledge, media roles, lifestyle, and peer influence.10
Based on the description above, these factors are ge -nerally individual characteristics and an example is theattitude towards sexual behavior. Furthermore, severalstudies have shown a relationship between attitudes andrisky sexual behavior of STIs. A study in Hong Kongrecorded about 6.7 times the risk (95%CI = 4.10-10.96)
Helda et al. Kesmas: Jurnal Kesehatan Masyarakat Nasional (National Public HealthJournal). 2021; 16 (2): 131-136DOI: 10.21109/kesmas.v16i2.4845
Kesmas: Jurnal Kesehatan Masyarakat Nasional(National Public Health Journal)
Correspondence*: Helda, Department of Epidemiology, Faculty of Public HealthUniversitas Indonesia, A Building 1st Floor Kampus Baru UI Depok 16424,Indonesia, E-mail: [email protected], Phone: +62-852-1668-8437
Received : February 27, 2021Accepted : April 14, 2021Published : May 28, 2021
Copyright @ 2021, Kesmas: Jurnal Kesehatan Masyarakat Nasional (National Public Health Journal), p-ISSN: 1907-7505, e-ISSN: 2460-0601, SINTA-S1 accredited,http://journal.fkm.ui.ac.id/kesmas, Licensed under Creative Commons Attribution-ShareAlike 4.0 International
132
of adolescents engaging in risky sexual behavior.11
Another study conducted on male adolescents in Tehran,Iran, showed that the attitudes towards sexuality 1.97(95%CI = 1.28-3.04) affected risky sexual behavior.12
In addition, based on the data from the 2017 IndonesiaDemographic and Health Survey (IDHS), it was reportedthat the attitudes of adolescents that undergo sexual in-tercourse before marriage increased from 7% to 8%.13
Various studies have reported several factors affectingrisky STIs other than attitudes. For example, the surveyby Maryatun stated that street children with a lack ofknow ledge have four times greater chance of engaging inrisky premarital sexual behavior than those with goodknowledge (OR = 4.42, 95%CI = 1.797-10.894.14 Astudy in France reported that the influence from peerswas 2.7 times effect on risky sexual behavior (95%CI =1.42-5.50).15 Education and the use of alcohol and drugsare also other factors associated with it.16-20
The involvement of male adolescents in risky sexualbehavior has become a significant public health problem.Furthermore, negative consequences as a result of thisbehavior and the risk of contacting sexually transmittedinfections are often associated with males as the mainpredictor.18 The proportion of male adolescents havingmultiple sexual relationship is four times compared to fe-males.19 They also experienced a twofold increase in hav-ing relationships with different partners,20 and with con-dom use, they are substantially lower than adult males.21
Based on the data and information above, and sinceSTIs have a significant impact on the health sector.Therefore, this study aimed to know relationship betweenattitudes, sexual behaviors, and sexually transmitted dis-eases among male adolescents in Indonesia by measuringthe data and performing multivariate analysis. It alsoaimed to know the interactions and its confounders.
MethodThis study was conducted using secondary data ob-
tained from the 2017 Indonesian Demographic andHealth Survey (IDHS) and used a cross-sectional design.The 2017 IDHS used a two-stage sampling design withstratification into urban and rural areas. At stage one,the samples were selected based on the IDHS frame,while the second stage involved a complete listing ofhouseholds in each selected cluster. This study was ana-lyzed in March to July 2020 in Depok City, West Java.The sample in this study were all-male adolescents be-tween the ages of 15 to 24, total population, and met theinclusion and exclusion criteria. The inclusion criteriawere all male adolescents in Indonesia that were respon-dents in the 2017 IDHS between ages 15 to 24, not mar-ried, and had complete data. While the exclusion criteriawere male adolescents without complete data and weremarried. The sampling flow started from a households
sample totaling 49,261 and from 13,860 respondents ofunmarried male adolescents between ages 15 to 24.However, only 13,079 were successfully interviewed,while 10,574 male adolescents had complete data. Outof the total samples used from the data of IDHS, only10,547 met the criteria.
The dependent variable of this study was male ado-lescents that had sexual intercourse before marriage.22,23
The independent variable was their statement on riskysexual relations that was obtained from the answers agreeor disagree of questions 718, 719, 720a-e, as well as se -veral confounding variables including: 1) Age refers tothe lifespan of the respondents from birth to the time2017 IDHS data were collected and divided into two cat-egories, namely “15-19” and “20-24”; 2) Education wasdefined as the last level that the res pondent completedand was categorized into “Low” (primary and junior highschool) and “High” (senior high school, diploma, andbachelor); 3) Residence refers to the dwelling place ofthe respondents’ and was divided into “Urban” and“Rural” categories; 4) Knowledge refers to everything therespondents knew about STIs and risky sexual behaviorthat categorized into “Less” and “Good”; 5) Access to in-formation refers to the use of the media in receiving in-formation on reproductive health and STIs and was cat-egorized into “Less” and “Good”; 6) Use of substancesrefer to the use of cigarettes/alcoholic drinks/drug, andwas divided into “Yes” and “No”; and 7) Peer influenceis the encouragement from friends that had sexual inter-course, which was used in shaping the respondents’ sex-ual behavior. It was divided into “Take effect” and “Noeffect”.
The analysis was carried out in stages starting fromunivariate, bivariate, and finally multivariate analysis.The univariate analysis displayed the percentage of eachstudy variable based on its category. At the same timethe bivariate was conducted to examine the relationshipbetween the independent (attitude) and the dependentvariables (sexual behavior), and also evaluated the con-founding variables. A multivariate analysis was carriedout using complex sample logistic regression based onthe bivariate analysis’ selection result. Furthermore, aninteraction and confounding test was carried out by elim-inating variable, starting with the one with the highest p-value.
ResultsThe total number of respondents was 10,547. Based
on Table 1, it was found that 10.0% of male adolescentswere at risk of contacting STIs and 29.8% had an agree-able attitude. Based on the results from the analysis inTable 2, statistically, there were differences in the sexualbehavior among male adolescents that posses the attitudeof agreeing and disagreeing (p-value = 0.016). Those who
Kesmas: Jurnal Kesehatan Masyarakat Nasional (National Public Health Journal). 2021; 16 (2): 131-136
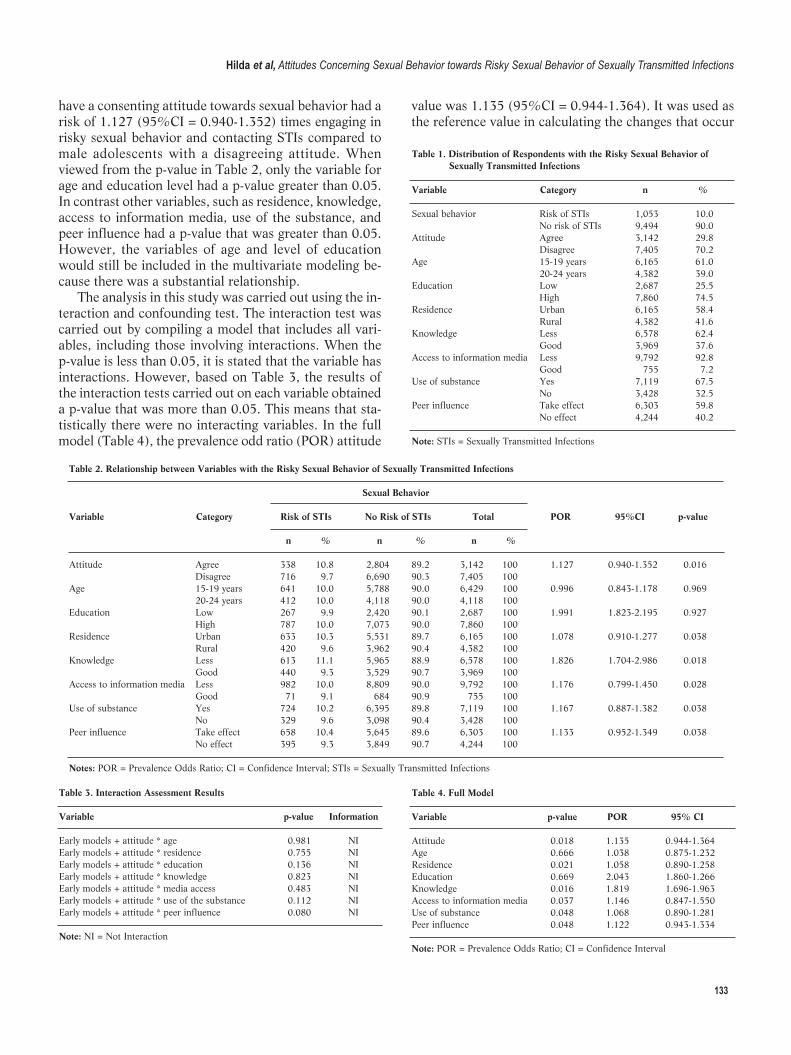
133
have a consenting attitude towards sexual behavior had arisk of 1.127 (95%CI = 0.940-1.352) times engaging inrisky sexual behavior and contacting STIs compared tomale adolescents with a disagreeing attitude. Whenviewed from the p-value in Table 2, only the variable forage and education level had a p-value greater than 0.05.In contrast other variables, such as residence, knowledge,access to information media, use of the substance, andpeer influence had a p-value that was greater than 0.05.However, the variables of age and level of educationwould still be included in the multivariate modeling be-cause there was a substantial relationship.
The analysis in this study was carried out using the in-teraction and confounding test. The interaction test wascarried out by compiling a model that includes all vari-ables, including those involving interactions. When thep-value is less than 0.05, it is stated that the variable hasinteractions. However, based on Table 3, the results ofthe interaction tests carried out on each variable obtaineda p-value that was more than 0.05. This means that sta-tistically there were no interacting variables. In the fullmodel (Table 4), the prevalence odd ratio (POR) attitude
value was 1.135 (95%CI = 0.944-1.364). It was used asthe reference value in calculating the changes that occur
Table 2. Relationship between Variables with the Risky Sexual Behavior of Sexually Transmitted Infections
Sexual Behavior Variable Category Risk of STIs No Risk of STIs Total POR 95%CI p-value
n % n % n %
Attitude Agree 338 10.8 2,804 89.2 3,142 100 1.127 0.940-1.352 0.016 Disagree 716 9.7 6,690 90.3 7,405 100 Age 15-19 years 641 10.0 5,788 90.0 6,429 100 0.996 0.843-1.178 0.969 20-24 years 412 10.0 4,118 90.0 4,118 100 Education Low 267 9.9 2,420 90.1 2,687 100 1.991 1.823-2.195 0.927 High 787 10.0 7,073 90.0 7,860 100 Residence Urban 633 10.3 5,531 89.7 6,165 100 1.078 0.910-1.277 0.038 Rural 420 9.6 3,962 90.4 4,382 100 Knowledge Less 613 11.1 5,965 88.9 6,578 100 1.826 1.704-2.986 0.018 Good 440 9.3 3,529 90.7 3,969 100 Access to information media Less 982 10.0 8,809 90.0 9,792 100 1.176 0.799-1.450 0.028 Good 71 9.1 684 90.9 755 100 Use of substance Yes 724 10.2 6,395 89.8 7,119 100 1.167 0.887-1.382 0.038 No 329 9.6 3,098 90.4 3,428 100 Peer influence Take effect 658 10.4 5,645 89.6 6,303 100 1.133 0.952-1.349 0.038 No effect 395 9.3 3,849 90.7 4,244 100
Notes: POR = Prevalence Odds Ratio; CI = Confidence Interval; STIs = Sexually Transmitted Infections
Hilda et al, Attitudes Concerning Sexual Behavior towards Risky Sexual Behavior of Sexually Transmitted Infections
Table 1. Distribution of Respondents with the Risky Sexual Behavior of Sexually Transmitted Infections
Variable Category n %
Sexual behavior Risk of STIs 1,053 10.0 No risk of STIs 9,494 90.0Attitude Agree 3,142 29.8 Disagree 7,405 70.2Age 15-19 years 6,165 61.0 20-24 years 4,382 39.0Education Low 2,687 25.5 High 7,860 74.5Residence Urban 6,165 58.4 Rural 4,382 41.6Knowledge Less 6,578 62.4 Good 3,969 37.6Access to information media Less 9,792 92.8 Good 755 7.2Use of substance Yes 7,119 67.5 No 3,428 32.5Peer influence Take effect 6,303 59.8 No effect 4,244 40.2
Note: STIs = Sexually Transmitted Infections
Table 3. Interaction Assessment Results
Variable p-value Information
Early models + attitude * age 0.981 NIEarly models + attitude * residence 0.755 NIEarly models + attitude * education 0.136 NIEarly models + attitude * knowledge 0.823 NIEarly models + attitude * media access 0.483 NIEarly models + attitude * use of the substance 0.112 NIEarly models + attitude * peer influence 0.080 NI
Note: NI = Not Interaction
Table 4. Full Model
Variable p-value POR 95% CI
Attitude 0.018 1.135 0.944-1.364Age 0.666 1.038 0.875-1.232Residence 0.021 1.058 0.890-1.258Education 0.669 2.043 1.860-1.266Knowledge 0.016 1.819 1.696-1.963Access to information media 0.037 1.146 0.847-1.550Use of substance 0.048 1.068 0.890-1.281Peer influence 0.048 1.122 0.943-1.334
Note: POR = Prevalence Odds Ratio; CI = Confidence Interval
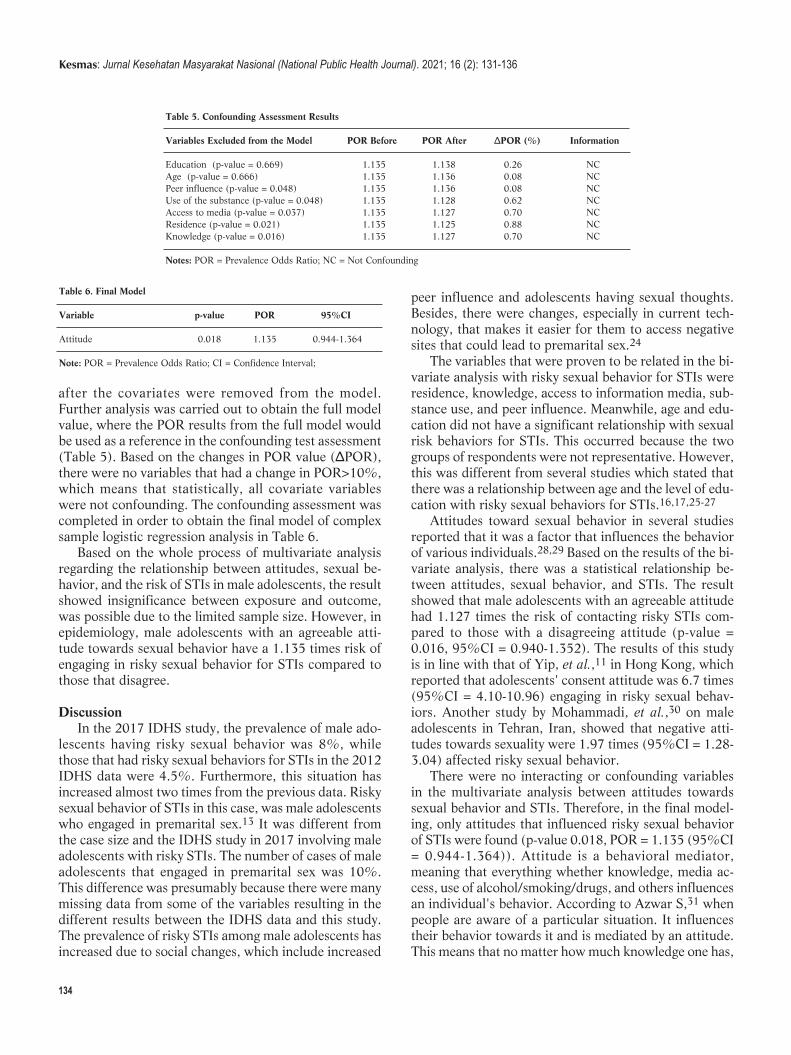
134
after the covariates were removed from the model.Further analysis was carried out to obtain the full modelvalue, where the POR results from the full model wouldbe used as a reference in the confounding test assessment(Table 5). Based on the changes in POR value (ΔPOR),there were no variables that had a change in POR>10%,which means that statistically, all covariate variableswere not confounding. The confounding assessment wascompleted in order to obtain the final model of complexsample logistic regression analysis in Table 6.
Based on the whole process of multivariate analysisregarding the relationship between attitudes, sexual be-havior, and the risk of STIs in male adolescents, the resultshowed insignificance between exposure and outcome,was possible due to the limited sample size. However, inepidemiology, male adolescents with an agreeable atti-tude towards sexual behavior have a 1.135 times risk ofengaging in risky sexual behavior for STIs compared tothose that disagree.
DiscussionIn the 2017 IDHS study, the prevalence of male ado-
lescents having risky sexual behavior was 8%, whilethose that had risky sexual behaviors for STIs in the 2012IDHS data were 4.5%. Furthermore, this situation hasincreased almost two times from the previous data. Riskysexual behavior of STIs in this case, was male adolescentswho engaged in premarital sex.13 It was different fromthe case size and the IDHS study in 2017 involving maleadolescents with risky STIs. The number of cases of maleadolescents that engaged in premarital sex was 10%.This difference was presumably because there were manymissing data from some of the variables resulting in thedifferent results between the IDHS data and this study.The prevalence of risky STIs among male adolescents hasincreased due to social changes, which include increased
peer influence and adolescents having sexual thoughts.Besides, there were changes, especially in current tech-nology, that makes it easier for them to access negativesites that could lead to premarital sex.24
The variables that were proven to be related in the bi-variate analysis with risky sexual behavior for STIs wereresidence, knowledge, access to information media, sub-stance use, and peer influence. Meanwhile, age and edu-cation did not have a significant relationship with sexualrisk behaviors for STIs. This occurred because the twogroups of respondents were not representative. However,this was different from several stu dies which stated thatthere was a relationship between age and the level of edu -cation with risky sexual behaviors for STIs.16,17,25-27
Attitudes toward sexual behavior in several studiesreported that it was a factor that influences the behaviorof various individuals.28,29 Based on the results of the bi-variate analysis, there was a statistical relationship be-tween attitudes, sexual behavior, and STIs. The resultshowed that male adolescents with an agreeable attitudehad 1.127 times the risk of contacting risky STIs com-pared to those with a disagreeing attitude (p-value =0.016, 95%CI = 0.940-1.352). The results of this studyis in line with that of Yip, et al.,11 in Hong Kong, whichreported that adolescents' consent attitude was 6.7 times(95%CI = 4.10-10.96) engaging in risky sexual behav-iors. Another study by Mohammadi, et al.,30 on maleadolescents in Tehran, Iran, showed that negative atti-tudes towards sexuality were 1.97 times (95%CI = 1.28-3.04) affected risky sexual behavior.
There were no interacting or confounding variablesin the multivariate analysis between attitudes towardssexual behavior and STIs. Therefore, in the final model-ing, only attitudes that influenced risky sexual behaviorof STIs were found (p-value 0.018, POR = 1.135 (95%CI= 0.944-1.364)). Attitude is a behavioral mediator,meaning that everything whether knowledge, media ac-cess, use of alcohol/smoking/drugs, and others influencesan individual's behavior. According to Azwar S,31 whenpeople are aware of a particular situation. It influencestheir behavior towards it and is mediated by an attitude.This means that no matter how much knowledge one has,
Table 5. Confounding Assessment Results
Variables Excluded from the Model POR Before POR After ΔPOR (%) Information
Education (p-value = 0.669) 1.135 1.138 0.26 NCAge (p-value = 0.666) 1.135 1.136 0.08 NCPeer influence (p-value = 0.048) 1.135 1.136 0.08 NCUse of the substance (p-value = 0.048) 1.135 1.128 0.62 NCAccess to media (p-value = 0.037) 1.135 1.127 0.70 NCResidence (p-value = 0.021) 1.135 1.125 0.88 NCKnowledge (p-value = 0.016) 1.135 1.127 0.70 NC
Notes: POR = Prevalence Odds Ratio; NC = Not Confounding
Table 6. Final Model
Variable p-value POR 95%CI
Attitude 0.018 1.135 0.944-1.364
Note: POR = Prevalence Odds Ratio; CI = Confidence Interval;
Kesmas: Jurnal Kesehatan Masyarakat Nasional (National Public Health Journal). 2021; 16 (2): 131-136
135
when a positive attitude does not support it, the effect onthe behavior would be insufficient.
Although no interactions and confounders were foundin this study, other studies reported that in addition to at-titudes there are factors that influence risky sexual be-haviors for STIs, including substance use such as alco-hol/drugs.32,33 The perception that using substances, inthis case, alcohol to narcotics, has a disinhibiting effect(behavior that is not following with prevailing socialnorms due to disruption or loss of self-control function)on an individual's decision to engage in risky sexual be-havior.
Adolescents usually make decisions that are more in-fluenced by emotions than reason. Therefore, substanceuse could increase the likelihood of engaging in risky sex-ual behaviors.34 A study has has shown that peer groupinfluence has an effect on the sexual behaviors of adoles-cents.15 Male adolescents would encourage their peergroup to be sexually active even though they are not readyor interested. They are only challenged with courage andmostly do not know about safe sex.35
Conclusion and RecommendationIt can be concluded that male adolescents who had an
agreeable attitude towards sexual behavior could im-prove the risk of having risky sexual behavior of STIs1,135 times; however, the attitude variable was not nec-essarily a major risk factor for the risky sexual behaviorof STIs. Knowledge and education were not related tothe risky sexual behavior of STIs.
The agencies and policymakers need to add question-naires relating to the exposure to pornography and createa parent education program that involves pa rents andtheir male teenagers in forming positive attitudes.
AbbreviationsSTIs: Sexually Transmitted Infections; HIV/AIDS: (HumanImmunodeficiency Virus/Acquired Immunodeficiency Syndrome);GDB: Global Burden of Disease; IHME: Institute for Health Metricsand Evaluation; IBBS: Integrated Biological and BehavioralSurveillance; POR: Prevalence Odds Ratio; CI: Confidence Interval; NI:Not Interaction; NC: Not Confounding.
Ethics Approval and Consent to ParticipateEthics approval was obtained by the Ethics Committee of the Faculty ofPublic Health Universitas Indonesia (Ethical Approval:233/UN2.F10.D11/PPM.00.02/2020).
Competing InterestThe author declares that there is no significant competing financial,professional, or personal interest that might have affected the perform-ance or presentation of the work described in this manuscript.
Availability of Data and MaterialsThe original data was made public in https://dhsprogram.com/
Authors’ ContributionH and NM conceptualized this study, H created the methodology andjoined NM in editing, reviewing, and writing the manuscript. In addi-tion, they wrote the original draft.
AcknowledgmentThe authors are grateful to the ICF International and IDHS for provid-ing the data set used to undertake this study, and Universitas Indonesiafor funding this study through PUTI Grant with contract number NKB-5/UN2.RST/HKP.05.00/2020).
References1. World Health Organization. Top 10 causes of death; 2018.
2. Institute of Health Metrix and Evaluations. Findings from the global
burden of disease study 2017. Seattle, WA: IHME. 2018.
3. World Health Organization. Sexually transmitted infections: imple-
menting the global STI strategy. World Health Organization. 2017; 10
(12): 1–8.
4. World Health Organization Department of Reproductive Health and
Research. Report on global sexually transmitted infection surveillance,
2018. Geneva: World Health Organization. 2018. p. 6-7.
5. Newman L, Rowley J, Vander Hoorn S, Wijesooriya NS, Unemo M,
Low N, et al. Global estimates of the prevalence and incidence of four
curable sexually transmitted infections in 2012 based on systematic re-
view and global reporting. PLoS One. 2015; 10 (12): e0143304.
6. Joint United Nations Programme on HIV and AIDS. UNAIDS data
2019. UNAIDS; 2019.
7. Kementerian Kesehatan Republik Indonesia. Laporan STBP 2015;
2015.
8. Kugler KC, Vasilenko SA, Butera NM, Coffman DL. Long-term conse-
quences of early sexual initiation on young adult health. J Early
Adolesc. 2017; 37 (5): 662–76.
9. Savolainen J, Mason WA, Hughes LA, Ebeling H, Hurtig TM, Taanila
AM. Pubertal development and sexual intercourse among adolescent
girls. Youth Soc. 2015; 47 (4): 520–38.
10. Darmasih R. Faktor yang mempengaruhi perilaku seks pranikah pada
remaja SMA di Surakarta. Universitas Muhammadiyah Surakarta;
2019.
11. Yip PS, Zhang H, Lam TH, Lam KF, Lee AM, Chan J, et al. Sex
knowledge, attitudes, and high-risk sexual behaviors among unmarried
youth in Hong Kong. BMC Public Health. 2013; 13: 691.
12. Sah RB, Ghimire A, Parajuli P. Knowledge and attitude on sexual be-
haviour among school adolescents. Health Renaissance. 2012; 10 (3):
224–8.
13. Badan Kependudukan dan Keluarga Berencana Nasional. 2017 Survei
demografi dan kesehatan Indonesia. SDKI; 2017.
14. Maryatun, Purwaningsih W. Hubungan pengetahuan dan peran kelu-
arga dengan perilaku seks pranikah pada remaja anak jalanan di Kota
Surakarta. Gaster. 2012; 9 (1): 22–9.
15. Potard C, Courtois R, Rusch E. The influence of peers on risky sexual
behaviour during adolescence. European Journal of Contraception and
Hilda et al, Attitudes Concerning Sexual Behavior towards Risky Sexual Behavior of Sexually Transmitted Infections
136
Reproductive Health Care. 2008; 13 (3): 264–70.
16. Thato R, Jenkins RA, Dusitsin N. Effects of the culturally-sensitive
comprehensive sex education programme among Thai secondary
school students. Journal of Advanced Nursing. 2008; 62 (4): 457–69.
17. Haque MR, Soonthorndhada A. Risk perception and condom-use
among thai youths: Findings from Kanchanaburi demographic surveil-
lance system site in Thailand. Journal of Health, Population and
Nutrition. 2009; 27 (6): 772–83.
18. Widman L, Choukas-Bradley S, Helms SW, Prinstein MJ. Adolescent
susceptibility to peer influence in sexual situations. Journal of
Adolescent Health. 2016; 58 (3): 323–9.
19. Joint United Nations Programme on HIV/AIDS. UNAIDS report on
the global AIDS epidemic, 2010. UNAIDS. 2010. p. 1-112.
20. Hindin JM, Fatusi AO. Adolescent sexual and reproductive health in
developing countries: an overview of trends and interventions.
International Perspectives on Sexual and Reproductive Health. 2009;
32 (2): 58–62.
21. Upreti D, Regmi P, Pant P, Simkhada P. Young people’s knowledge,
attitude, and behaviour on STI/HIV/AIDS in the context of Nepal: a
systematic review. Kathmandu University Medical Journal. 2009; 7
(28): 383–91.
22. Fentahun N, Mamo A. Risky sexual behaviors and associated factors
among male and female students in Jimma zone preparatory schools,
South West Ethiopia: comparative study. Ethiop J Health Sci. 2014;
24 (1): 59–68.
23. Tura G, Alemseged F, Dejene S. Risky sexual behavior and predispos-
ing factors among students of Jimma University, Ethiopia. Ethiopian
Journal of Health Services. 2012; 22 (3): 170–80.
24. Arma AJA. Pengaruh perubahan sosial terhadap perilaku seks remaja
dan pengetahuan kespro sebagai alternatif penangkalnya. Universitas
Sumatera Utara. 2015. p.189-97.
25. Berhan Y, Berhan A. A meta-analysis of risky sexual behaviour among
male youth in developing countries. AIDS Research and Treatment.
2015; 2015.
26. Agajie M. Risky sexual behavior and associated factors among high
school youth in Pawe Woreda Benishangul Gumuz Region. Science
Journal of Clinical Medicine. 2015; 4 (4): 67-75.
27. Amare H, Azage M, Negash M, Getachew A, Desale A, Abebe N.
Risky sexual behavior and associated factors among adolescent stu-
dents in Tana Haik High School, Bahir Dar, Northern Ethiopia.
International Journal of HIV/AIDS Prevention, Education and
Behavioural Science. 2017; 3 (4): 41–7.
28. Montes KS, Blanco L, LaBrie JW. The relationship between perceived
hookup attitudes and negative hookup consequences: do perceived at-
titudes of close friends matter?. Journal of Sex Research. 2017; 54 (9):
1128–40.
29. Rahmah, R, Wahyudina AAAN, Sari WW. Attitude and behavior sex-
ual among adolescents in Yogyakarta. Indonesian Journal of Nursing
Practices. 2017; 1 (2): 64–8.
30. Mohammadi MR, Mohammad K, Farahani FKA, Alikhani S, Zare M,
Tehrani FR, et al. Reproductive knowledge, attitudes and behavior
among adolescent males in Tehran, Iran. International Family Planning
Perspectives. 2006; 32 (1): 35–44.
31. Azwar S. Sikap manusia: teori dan pengukurannya. Edisi ke-2.
Yogyakarta: Pustaka Pelajar; 2011.
32. Browne DC, Clubb PA, Wang Y, Wagner F. Drug use and high-risk
sexual behaviors among African American men who have sex with
men and men who have sex with women. American Journal of Public
Health. 2009; 99 (6): 1062–6.
33. Lee GY, Choi YJ. Analysis of Korean adolescents’ sexual experience
and substance use. Social Behavior and Personality. 2017; 45 (5):
809–18.
34. Ritchwood TD, Ford H, DeCoster J, Sutton M, Lochman JE. Risky
sexual behavior and substance use among adolescents: a meta-analysis.
Children and Youth Services Review. 2015; 52: 74–88.
35. Peҫi B. Peer influence and adolescent sexual behavior trajectories:
links to sexual initation. European Journal of Multidisciplinary
Studies. 2017; 2 (3): 96.
Kesmas: Jurnal Kesehatan Masyarakat Nasional (National Public Health Journal). 2021; 16 (2): 131-136
The undersigned:
Name : .............................................................................................................Address : .............................................................................................................
.............................................................................................................
.............................................................................................................Phone Number : .............................................................................................................E-mail : .............................................................................................................Edition : .............................................................................................................
is willing to be Kesmas: Jurnal Kesehatan Masyarakat Nasional (National Public HealthJournal) customer paying the cost amount Rp. 400,000,-/year/4 edition (exclude deliverycost).
..................................., ....................
(......................................................)
Please make a bank transfer payment to: UNIVERSITAS INDONESIA BHPP
BANK BNI UI DEPOKACCOUNT NO. 1273000568
SWIFT CODE: BNINIDJA
Then please send the proof of payment to: Secretariat of Kesmas: Jurnal Kesehatan Masyarakat Nasional (National Public Health Journal)
G301 Building G 3rd FloorFaculty of Public Health Universitas Indonesia
Kampus Baru UI Depok 16424Mobile Phone: +62815-1141-6600
or email: [email protected] or [email protected]
SUBSCRIPTION FORM
Related Documents