See discussions, stats, and author profiles for this publication at: http://www.researchgate.net/publication/275359217 Keratin 8 absence downregulates colonocyte HMGCS2 and modulates colonic ketogenesis and energy metabolism ARTICLE in MOLECULAR BIOLOGY OF THE CELL · APRIL 2015 Impact Factor: 5.98 · DOI: 10.1091/mbc.E14-02-0736 · Source: PubMed DOWNLOADS 9 VIEWS 42 11 AUTHORS, INCLUDING: Julia Misiorek Åbo Akademi University 2 PUBLICATIONS 11 CITATIONS SEE PROFILE Aida Habtezion Stanford University 38 PUBLICATIONS 1,181 CITATIONS SEE PROFILE Muhammad Nadeem Asghar Åbo Akademi University 10 PUBLICATIONS 20 CITATIONS SEE PROFILE Diana M Toivola Åbo Akademi University 63 PUBLICATIONS 2,304 CITATIONS SEE PROFILE Available from: Julia Misiorek Retrieved on: 10 August 2015

Welcome message from author
This document is posted to help you gain knowledge. Please leave a comment to let me know what you think about it! Share it to your friends and learn new things together.
Transcript

Seediscussions,stats,andauthorprofilesforthispublicationat:http://www.researchgate.net/publication/275359217
Keratin8absencedownregulatescolonocyteHMGCS2andmodulatescolonicketogenesisandenergymetabolism
ARTICLEinMOLECULARBIOLOGYOFTHECELL·APRIL2015
ImpactFactor:5.98·DOI:10.1091/mbc.E14-02-0736·Source:PubMed
DOWNLOADS
9
VIEWS
42
11AUTHORS,INCLUDING:
JuliaMisiorek
ÅboAkademiUniversity
2PUBLICATIONS11CITATIONS
SEEPROFILE
AidaHabtezion
StanfordUniversity
38PUBLICATIONS1,181CITATIONS
SEEPROFILE
MuhammadNadeemAsghar
ÅboAkademiUniversity
10PUBLICATIONS20CITATIONS
SEEPROFILE
DianaMToivola
ÅboAkademiUniversity
63PUBLICATIONS2,304CITATIONS
SEEPROFILE
Availablefrom:JuliaMisiorek
Retrievedon:10August2015
1
Keratin 8 absence downregulates colonocyte HMGCS2 and modulates colonic ketogenesis and energy metabolism
Terhi O. Helenius*#, Julia O. Misiorek*#, Joel H. Nyström*#, Lina E. Fortelius*, Aida
Habtezion†, Jian Liaoǂ, M. Nadeem Asghar*, Haiyan Zhang§, Salman Azhar§, M. Bishr
Omaryǁ and Diana M. Toivola*
*Cell Biology/Biosciences, Faculty of Science and Engineering, Åbo Akademi University,
Tykistökatu 6A, Turku 20520, Finland, [email protected], [email protected],
[email protected], [email protected], [email protected]; †Stanford University School of
Medicine, Division of Gastroenterology and Hepatology, Palo Alto, CA 94305, USA,
[email protected]; ǂApplied Biomics, CA 94545, USA,
[email protected]; §Geriatric Research, Education and Clinical Center, VA Palo Alto
Health Care System and Stanford University School of Medicine, Palo Alto, CA 94304, USA,
[email protected], [email protected]; ǁDepartment of Molecular and Integrative
Physiology, University of Michigan, Ann Arbor, Michigan, MI 48109 USA and VA Ann
Arbor Health Care System, Ann Arbor, Michigan, MI 48105, USA, [email protected].
# Equal contribution
Address correspondence to:
Diana M. Toivola
Cell Biology/Biosciences, Faculty of Science and Engineering, Åbo Akademi University,
Biocity, Tykistökatu 6A, FIN-20520 Turku, Finland
Telephone: +358 2 2154092, E-mail: [email protected]
Running title: Keratins in colonocyte energy metabolism
Abbreviations: ACC, acetyl CoA carboxylase; AMPKα, adenosine monophosphate-activated
protein kinase α; AMPKβ1, adenosine monophosphate-activated protein kinase β; COX IV,
cytochrome C oxidase; Glut 4, glucose transporter 4; HMGCS2, mitochondrial 3-hydroxy-3-
methylglutaryl Coenzyme A synthase 2; IBD, inflammatory bowel disease; IF, Intermediate
filaments; K, keratin; K8+/+, keratin 8 wild type; K8-/-, keratin 8 knock-out; MCT1,
monocarboxylate transporter 1; P-ACC, phospho-acetyl-CoA carboxylase; PPARα,
peroxisome proliferator-activated receptor α; TEM, transmission electron microscope.
2
ABSTRACT Simple-type epithelial keratins are intermediate filament proteins important for mechanical
stability and stress-protection. Keratin mutations predispose to human liver disorders, while
their roles in intestinal diseases remain unclear. Absence of keratin 8 (K8) in mice leads to
colitis, decreased Na/Cl uptake, protein mistargeting and longer crypts, suggesting that
keratins contribute to intestinal homeostasis. We describe the rate-limiting enzyme of the
ketogenic energy metabolism pathway, mitochondrial 3-hydroxy-3-methylglutaryl-coenzyme-
A-synthase-2 (HMGCS2), as a major down-regulated protein in K8-/- colon. K8 absence
leads to decreased quantity and activity of HMGCS2, and the down-regulation is not
dependent on the inflammatory state since HMGCS2 is not decreased in dextran sulphate
sodium-induced colitis. Peroxisome proliferator-activated receptor α (PPARα), a
transcriptional activator of HMGCS2, is similarly down-regulated. Ketogenic conditions,
starvation or ketogenic diet, increase K8+/+ HMGCS2, while this response is blunted in the
K8-/- colon. Microbiota-produced short chain fatty acids (SCFA), substrates in the colonic
ketone body pathway, are increased in stool, which correlates with decreased levels of their
transporter MCT1. Microbial populations, including the main SCFA-butyrate producers in the
colon, were not altered after K8 inactivation. In summary, the regulation of the SCFA-MCT1-
HMGCS2 axis is disrupted in K8-/- colonocytes, suggesting a role for keratins in colonocyte
energy metabolism and homeostasis.
3
1. INTRODUCTION
Keratins (K), the intermediate filament (IF) proteins of epithelial cells, are divided into acidic
type I (K9-K28) and basic type II (K1-K8 and K71-K80) keratins (Coulombe and Omary,
2002; Schweizer et al., 2006), and make up the largest subgroup of IFs. These two types of
keratins form non-covalent obligate heteropolymers in a 1:1 ratio. Keratins are accordingly
expressed in specific pairs and in a tissue-specific manner (Quinlan et al., 1984). Intestinal
simple epithelial cells express K7, K8, K18-K20 and K23, while adult hepatocytes express
only K8 and K18 (Omary et al., 2009). One established role of keratins is to protect epithelia
from mechanical and non-mechanical stresses, and keratins participate in signaling events
regulating processes such as cellular architecture, growth, proliferation and apoptosis (Omary
et al., 2009; Toivola et al., 2010; Pan et al., 2013). The major type II keratin in intestinal
epithelia is K8. The K8 knockout (K8-/-) mouse colonocytes that lack almost all cytoplasmic
keratins develop colonic epithelial hyperproliferation (Baribault et al., 1994), a Th2-type
colitis, and an ulcerative colitis-like state that is reversed after antibiotic therapy (Habtezion et
al., 2005). K8-/- mice also develop diarrhea due to colonocyte Na and Cl ion transporter
mistargeting (Toivola et al., 2004). The colonic hyperproliferation in K8-/- mice is linked to a
decreased capacity of K8-/- colonocytes to undergo normal apoptosis at the upper part of the
colonic crypt (Habtezion et al., 2011). Notably, K8-/- small intestine is spared from any major
inflammatory response (Baribault et al., 1994; Ameen et al., 2001), which is likely related to
the relative lack of bacteria mostly found in the colon.
Mitochondrial 3-hydroxy-3-methylglutaryl coenzyme A synthase 2 (HMGCS2) catalyzes the
rate limiting step of ketogenesis in which ketone bodies (β-hydroxybutyrate, acetoacetate and
acetone) are produced during ketogenic conditions such as starvation, untreated diabetes and
other conditions in which carbohydrate levels are low (Hegardt, 1999). In the ketogenic
pathway, acetyl-CoA, mostly derived from the β-oxidation of fatty acids, is converted into
ketone bodies through a cascade of enzymatic reactions (Hegardt, 1999). The expression of
HMGCS2 is regulated by peroxisome proliferator-activated receptor α (PPARα) (Serra et al.,
1996a; Meertens et al., 1998), which also regulates many changes in fatty acid and glucose
metabolism (Lefebvre et al., 2006) by heterodimerizing with retinoid X receptor (RXR) and
by binding to peroxisome proliferator hormone response elements (PPREs) on DNA of target
genes (Hegardt, 1999). Ketogenesis occurs mainly in the liver, but also in the colon of adult
mammals (Serra et al., 1996a; Hegardt, 1999).
4
Short chain fatty acids (SCFA) are products of intestinal bacterial fermentation of mainly
dietary carbohydrates. Butyrate, a major SCFA, constitutes the main energy source for
colonocytes and is involved in the regulation of HMGCS2 expression, and thus ketone body
production (Roediger, 1980; Hegardt, 1999; Cherbuy et al., 2004). Butyrate is thus an
important intermediate in maintaining colonic homeostasis and health (Hamer et al., 2008;
Bultman, 2014). Absorption of luminal butyrate is mainly mediated by monocarboxylate
transporter 1 (MCT1), the expression and function of which is regulated by butyrate
(Hadjiagapiou et al., 2000; Cuff et al., 2002; Borthakur et al., 2012) and further upstream by
PPARα (König B, 2008).
Using a proteomic approach, we identified HMGCS2 as a major down-regulated protein in
colonic crypts isolated from K8-/- mice. The decreased HMGCS2 levels correlated with
decreased enzyme activity, a blunted response to ketogenic conditions as well as a down-
regulation of the upstream MCT1 transporter, feeding into the ketogenic pathway, thereby
leading to increased luminal SCFA in K8-/-.
2. RESULTS 2.1. HMGCS2 is a major down-regulated protein in K8-/- colonocytes. Proteins isolated from colonic crypt lysates of K8+/+ and K8-/- mice were compared using 2D-
DIGE coupled with mass spectrometry to identify differentially regulated (Fig. 1A-B)
proteins. In K8-/- colonocytes, the major down-regulated proteins were as expected K8, K19
and their fragments (not shown). Most differentially expressed proteins are mitochondrial,
cytoplasmic or ER proteins involved in metabolism and oxidative stress (Suppl. Table 1).
One of the most prominently down-regulated proteins in the K8-/- colon was the rate-limiting
enzyme of ketogenesis, HMGCS2. Its 4 isoforms were, on average, 4-fold decreased in K8-/-
colonocytes (Fig. 1A-B, spots 1032, 1033, 1035 and 1044) when compared to K8+/+. Western
blot analysis of HMGCS2 in isolated K8+/+ and K8-/- colonic crypts (Fig. 1C) confirmed the
down-regulation of HMGCS2 (See also Fig. 2A, 4A-F, 5C, Suppl. Fig. 2-3 for total colon
lysate and purified mitochondrial samples). Similarly, HMGCS2 was slightly but consistently
downregulated also in K8-silenced HT-29 and Caco-2 colorectal cancer cells (Suppl. Fig. 1).
In order to determine if HMGCS2 enzyme activity is modulated in K8-/-, HMGCS2 activity
and quantity were determined in the same batch of mitochondria isolated from colonic
epithelial scrapings (Fig 1D; Suppl. Fig. 2). HMGCS2 activity (K8+/+ = 0.98 ± 0.11, K8-/- =
5
0.54 ± 0.12, p < 0.01) and relative protein quantity (K8+/+ = 1.00 ± 0.20, K8-/- = 0.53 ± 0.18, p
< 0.05) were both significantly decreased in K8-/- colonocytes (Fig. 1D-E). The enzyme
activity in K8-/- mice correlated with the decrease in enzyme quantity (HMGCS2
activity/quantity ratio: K8+/+ = 0.92 ± 0.19, K8-/- = 1.0 ± 0.38) (Fig. 1F), and decreased protein
levels thus cause the decreased activity.
2.2. K8-knockout induced HMGCS2 down-regulation is a distinct non-inflammatory phenotype unique for the colon and associates with a decrease in PPARα. To investigate if the K8-related down-regulation of HMGCS2 in the colon also occurs in
other digestive organs, HMGCS2 levels were analyzed in K8-/- distal and proximal colon,
small intestine and liver. HMGCS2 down-regulation was clearly observed in both parts of the
colon, and the levels of HMGCS2 in the proximal colon were in general higher than in the
distal colon in both K8+/+ and K8-/- genotypes (Fig. 2A, Suppl. Fig. 3). This is expected since
HMGCS2 levels correlate with luminal fermenting bacteria, which are more numerous in the
proximal than distal colon, therefore producing more SCFA (Topping and Clifton, 2001;
Hamer et al., 2008). PPARα was also significantly decreased 1.3-1.8-fold (p-value = 0.03 for
DC) in K8-/- (Fig. 2A). Confocal immunofluorescence microscopy analysis confirmed that
HMGCS2 levels are decreased in K8-/- colonocytes, and that the remaining HMGCS2
accumulated in the apical part of the colonocytes (Fig. 2B). HMGCS2 was undetectable in
small intestine (Fig. 2C) as previously described (Hegardt, 1999). The liver, which is the main
ketogenic organ, contains more HMGCS2 compared to the proximal colon (Suppl. Fig. 3) but
did not reveal any major difference in HMGCS2 levels between the genotypes (Fig. 2C,
Suppl. Fig. 3). Our results were confirmed using two independent HMGCS2 antibodies
(Suppl. Fig. 3). Furthermore, HMGCS2 down-regulation is likely not caused by colitis in
general since HMGCS2 levels were unchanged or increased after experimentally DSS-
induced colitis (Fig. 2D).
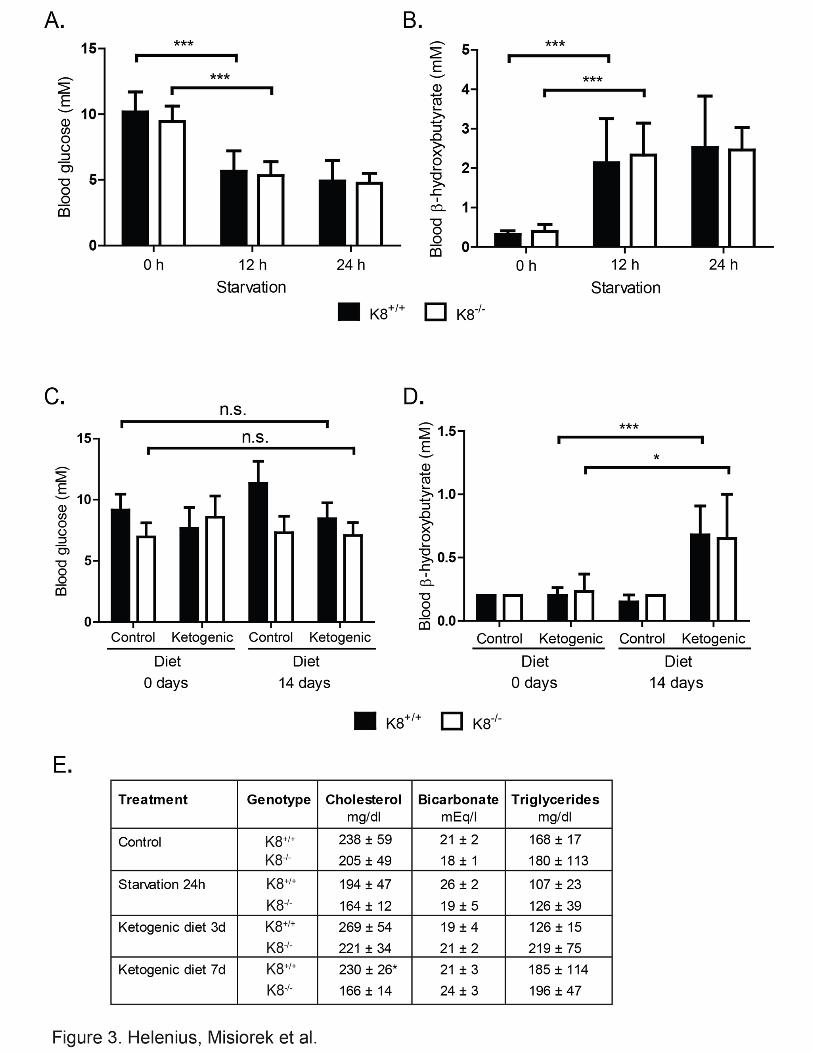
2.3. Ketogenesis is blunted in the K8-/- colon. To study if the decreased levels of HMGCS2 in K8-/- colonocytes is enough to respond to
ketogenic conditions, mice were starved for 12 and 24 hours, or given a ketogenic diet for 3
or 14 days after which HMGCS2, blood glucose and blood β-hydroxybutyrate levels were
assayed. Ketogenesis was readily induced since K8+/+ and K8-/- blood glucose levels
decreased consistently with starvation at 12 hours and remained low at 24 hours (Fig. 3A),
while blood β-hydroxybutyrate, which is the most prominent ketone body, simultaneously
6
increased 3-4-fold (Fig. 3B). The ketogenic diet did not dramatically affect blood glucose
levels, but β-hydroxybutyrate was moderately increased in both genotypes 14 days after onset
of the ketogenic diet (Fig. 3C-D). Serum cholesterol, bicarbonate and triglycerides were not
markedly different between K8+/+ and K8-/-, except for a slight decrease of cholesterol in K8-/-
7 days after onset of ketogenic diet (Fig. 3E). No differences in food ingestion or weight gain
were detected between genotypes (Suppl. Fig. 4). Since the liver is the main ketogenic organ
controlling blood ketone levels, these baseline data suggest that liver ketogenesis remains
unchanged despite K8 deletion and that a ketogenic diet and starvation should be useful
models for assessing colonocyte ketogenesis.
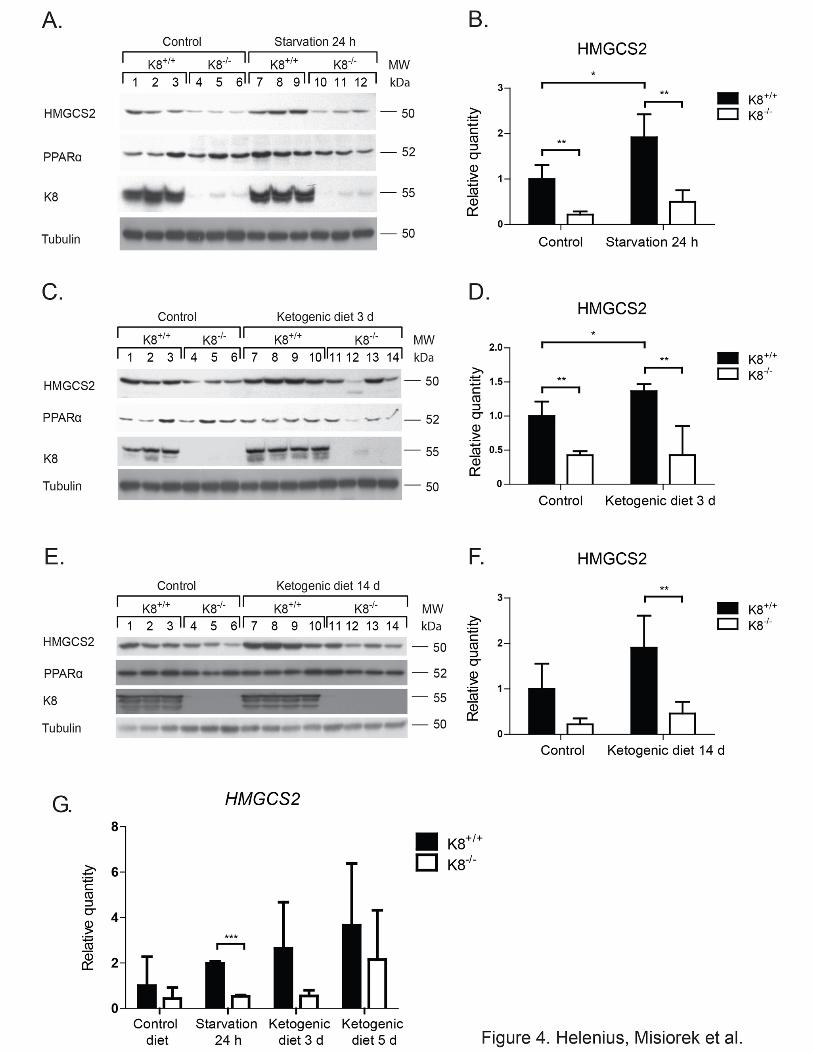
Western blot analysis showed, as expected, that both starvation and 3 days of ketogenic diet
significantly increased HMGCS2 levels in K8+/+, while no significant changes in HMGCS2
levels were observed in K8-/- at any time point following starvation (Fig. 4A-B) or ketogenic
diet (Fig. 4C-F). The decrease of K8-/- HMGCS2 was, in comparison to K8+/+, on average 3-
fold during normal conditions and 4-fold during ketogenic conditions (Fig. 4A-F).
The corresponding decrease of HMGCS2 mRNA levels was 3.8-fold during normal diet
conditions and on average 3.7-fold after starvation and 3 days of ketogenic diet (Fig. 4G).
The protein levels of PPARα, in general follow the same pattern as HMGCS2 levels (Fig. 4A,
C and E). A slight up-regulation of PPARα was observed after ketogenic conditions in K8+/+
mice, while a slight down-regulation in K8-/- was seen after both normal and ketogenic
conditions. K8 knockdown, thus, clearly leads to a blunted colonic ketogenic response.
2.4. Normal colonic mitochondrial ultrastructure and AMPK signaling in K8-/- colon. We next assessed if the K8-/- colon ketogenic phenotype could stem from abnormalities in
mitochondria and common energy metabolism pathways. In contrast to K8-/- hepatocytes
which are smaller than K8+/+ mitochondria, (Tao et al., 2009) no differences in mitochondria
size were noted in K8-/- colonocyts, even if there were less cristae per mitochondria section
area and compared to K8+/+ (Suppl. Fig. 5B-C). The protein levels of mitochondrial prohibitin
and cytochrome c were comparable in K8-/- and K8+/+ (Suppl. Fig. 2), suggesting that the
mitochondrial function is still unaltered in the K8-/- colonocytes. To analyze if there are
additional changes in K8-/- colon energy metabolism, a panel of proteins involved in energy
metabolism pathways was analyzed under baseline and ketogenic conditions. ACC, a central
enzyme in the biosynthesis of fatty acids, converts acetyl-CoA into malonyl-CoA and
functions as an inhibitor of β-oxidation (Lopaschuk et al., 2010). Ketogenic conditions induce
β-oxidation of fatty acids into acetyl-CoA (Hegardt, 1999), while ACC activity remains low

7
(Lopaschuk et al., 2010) in order to maintain the availability of acetyl-CoA for conversion
into ketone bodies through ketogenesis. The expression of ACC in K8+/+ and K8-/- colons was
unaltered under basal conditions, but remains high under ketogenic conditions in K8-/- but not
in K8+/+ colon (Suppl. Fig. 6A-C; a significant 2.5-fold decrease in K8+/+ (p = 0.0005), while
only 1.4-fold (not significant) in K8-/- after 3 days of ketogenic diet when quantified from
western blots), thus supporting the notion of a blunted ketogenic pathway after K8
inactivation. No changes were observed in the expression patterns of ACC inhibitors AMPKα
and AMPKβ, and their inactive phosphorylated forms in K8+/+ and K8-/- colons (Suppl. Fig.
6A-C). Independent of basal or active ketogenesis, the expression levels of glucose
transporter Glut4 and COX IV (cytochrome C oxidase, a mitochondrial enzyme of the
respiratory chain; Suppl. Fig. 6A-C) were marginally decreased in total colon lysates of K8-/-
mice and unchanged in colonic epithelium isolated from K8-/- mice in comparison to K8+/+
(not shown). Analysis of ADP/ATP and NAD/NADH ratios in epithelial scrapings did not
reveal any major differences between the genotypes (data not shown). Together these results
confirm that ketogenesis is activated under the ketogenic conditions used herein, blunted in
K8-/- and that mitochondria ultrastructure and energy intermediates are unchanged following
K8 inactivation.
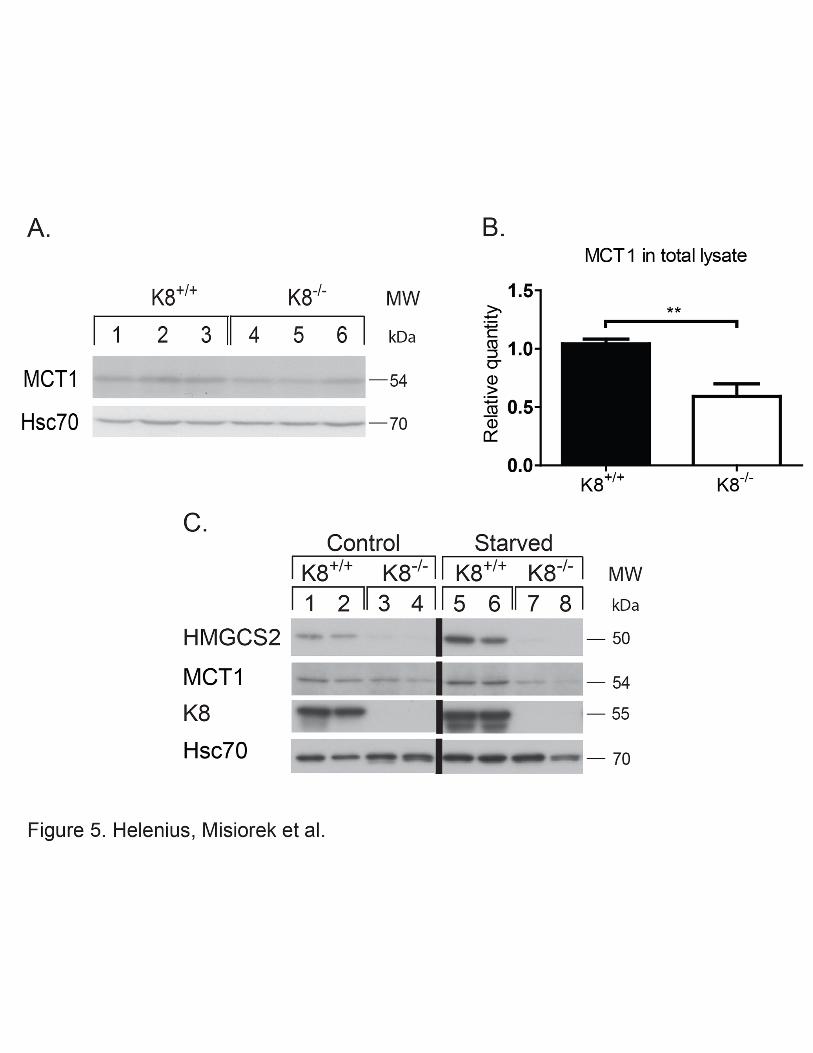
2.5. The SCFA transporter MCT1 is down-regulated in K8-/- while luminal SCFA acid levels are increased, upstream of HMGCS2.
Absorption of luminal SCFA is mainly mediated by MCT1 (Hadjiagapiou et al., 2000). In
order to assess whether expression of MCT1, and consequently the absorption of SCFA,
could be perturbed in the absence of keratins, K8-/- colon MCT1 levels were assayed by
immunoblotting. A significant down-regulation of MCT1 was observed in total lysates of K8-
/- (0.59 ± 0.10: p < 0.005) in comparison to K8+/+ (1.04 ± 0.04) (Fig. 5A-B) and in isolated
K8-/- colonic epithelium (0.40 ± 0.11) compared to K8+/+ (1.00 ± 0.11) (Fig. 5C) both at
control and starved conditions. The decrease in MCT1 levels was also confirmed in HT-29
and Caco-2 cells where K8 has been down-regulated (Suppl. Fig. 1). This decrease in MCT1
could also be appreciated in MCT1 immunostainings in K8-/- colon and in Caco-2 cells treated
with K8 siRNA (Suppl. Fig. 7). However, K8 downregulation or absence, did not lead to any
differences in MCT1 localization, which is seen as a tight plasma membrane staining in Caco-
2 cells, and mostly laterally between the epithelial cells in the colon in vivo (Suppl. Fig. 7).
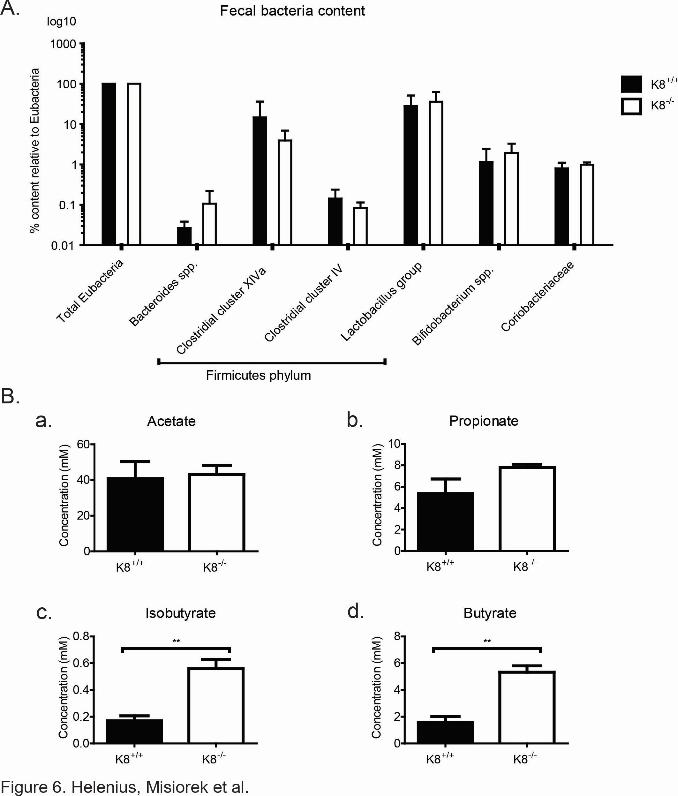
Since MCT1 expression and function is upregulated by butyrate (Cuff et al., 2002), the ratio
of butyrate producing bacteria to total Eubacteria in K8+/+ and K8-/- were assayed. No
8
differences in K8-/- and K8+/+ stool microbial populations were seen, including the two
clusters of butyrate producing bacteria of the Firmicutes phylum, Clostridial cluster XIVa and
Clostridial cluster IV (Pryde et al., 2002) (Fig 6A). Therefore the metabolic state of the K8-/-
phenotype is not caused by a difference in the microbial balance and butyrate-producing
bacteria. The SCFA levels in K8+/+ and K8-/- stool were furthermore profiled to determine
whether the observed down-regulation of MCT1 could be due to diminished production of
butyrate by the microflora in K8-/-. Interestingly, a significant increase in the levels of butyric
acid (K8+/+ = 1.59 mM ± 0.72 mM, K8-/- = 5.33 mM ± 0.83 mM, p < 0.005) and isobutyric
acid (K8+/+ = 0.17 mM ± 0.062 mM, K8-/- = 0.56 mM ± 0.12 mM, p < 0.01) were detected in
K8-/- stool in comparison to K8+/+ (Fig. 6B), indicating that bacterial production of SCFA is
not perturbed, while the uptake may be compromised due to decreased levels of MCT1.
3. DISCUSSION The molecular functions of keratins in the colonic epithelium are largely unclear, even if it is
well established that K8 ablation in mice leads to early and chronic colitis (Baribault et al.,
1994; Toivola et al., 2004; Habtezion et al., 2005; Habtezion et al., 2011). In order to
understand how keratins may help maintain intestinal homeostasis, we used a proteomic
approach to identify differentially expressed proteins in K8-/- colonocytes. We show that; (i)
HMGCS2 is decreased and that the reduced HMGCS2 levels in K8-/- colonocytes correlate
with decreased enzyme activity in mitochondria. (ii) The HMGCS2 down-regulation
phenotype is colon-specific, and not related to an acute inflammation per se as determined
using the DSS colitis model. (iii) The decrease of HMGCS2 leads to a blunted ketogenesis in
K8-/- colon. By studying upstream regulation of HMGCS2, we found that (iv) the HMGCS2
transcriptional regulator PPARα and the SCFA (butyrate) transporter MCT1 are down-
regulated in the K8-/- colon while (v) luminal butyrate levels are increased (vi) without
changes in the composition of the butyrate producing bacteria. This, to our knowledge, is the
first study describing IF keratins as modulators of colonocyte energy metabolism.
HMGCS2 is an important and unique player in the colonic epithelium, since ketogenesis only
occurs in a few other organs apart from the liver (Serra et al., 1996b; Hegardt, 1999). Colonic
HMGCS2 is regulated by bacterially produced SCFA (mainly butyrate), and the pathway
consequently produces ketone bodies that generate energy and promotes colonic health e.g. by
the inhibition of inflammatory responses and by strengthening of the colonic defense barrier

9
(Hamer et al., 2008). Adult small intestine, on the other hand, does not express HMGCS2 and
is fueled by glucose and glutamine in the fed state, and liver-derived ketone bodies during
starvation (Ardawi and Majzoub, 1988). Moreover, there is no major disease phenotype in the
K8-/- small intestine (Baribault et al., 1994; Ameen et al., 2001), while the colitis phenotype is
prominent especially in the proximal colon in these mice (Habtezion et al., 2005). HMGCS2
is highly expressed in the proximal colon, where also the vast majority of the colonic
microflora resides. Since K8-/- mice have less luminal bacteria, and the colitis is reversible
with antibiotics (Habtezion et al., 2005; Habtezion et al., 2011), it is conceivable that
HMGCS2 plays a contributory role in the development of colitis.
Since the decreased HMGCS2 protein amount correlates with decreased enzyme activity
(Hegardt, 1999) also in the K8-/- colon, it is unlikely that keratins directly regulate HMGCS2
activity. The management of energy stores during ketogenic conditions is regulated by
PPARα (Kersten et al., 1999), which has been shown to have a stimulatory effect on hepatic
HMGCS2 expression (Rodriguez et al., 1994). We also noted down-regulation of colonic
PPARα under baseline and ketogenic conditions in K8-/- mice, in line with the expression of
HMGCS2 (Fig. 2 and 4). Clinically, low HMGCS2 levels are also observed in colon cancer
(Camarero et al., 2006), and mutations in HMGCS2 lead to decreased protein and hypoketotic
hypoglycemia upon prolonged starvation (Aledo et al., 2006). HMGCS2 is highly expressed
in the liver, where keratins have established cytoprotective roles (Omary et al., 2009; Toivola
et al., 2010). However, no major change in HMGCS2 expression was found in K8-/- liver,
despite that these hepatocytes are smaller than wild-type mitochondria (Tao et al., 2009), and
consequently no differences were seen in serum ketone body levels between genotypes. In the
K8-/- liver, mitochondrial and cytoplasmic proteins were also the two groups of proteins
mostly affected, out of which transferrin and ALDH were altered in both organs (Tao et al.,
2009). Since the liver is lacking the microbial component, these findings further suggest the
central involvement of microflora and/or SCFA in the down-regulation of K8-/- colonic
HMGCS2. Moreover, the modulation of HMGCS2 described herein is likely specifically due
to the ablation of K8 and not due to the inflammatory status of the K8-/- colon phenotype,
since the expression of HMGCS2 was rather increased than decreased in DSS-colitis (Naito et
al., 2010).
The ramifications of low HMGCS2 levels in K8-/- are noticeable after exposing mice to
ketogenic conditions, upon which K8-/- mice were not able to increase colonic HMGCS2 in
10
contrast to wild type mice. Ketogenic conditions, such as the intake of a high fat-low
carbohydrate diet or starvation, activates β-oxidation of fatty acids, generates an excess of
acetyl-CoA that is converted into ketone bodies (Cullingford, 2004). The blunted ketogenic
response in K8-/- was supported by our observation that ACC levels remained relatively
unchanged in K8-/- colon under ketogenic conditions. ACC catalyzes the conversion of acetyl-
CoA into malonyl-CoA, which is an inhibitor of carnitine palmitoyltranferase I (CPT I), the
rate-limiting enzyme of fatty acid β-oxidation (McGarry and Brown, 1997). Since the main
function of ACC in liver is to provide malonyl-CoA and therefore inhibit β-oxidation
(McGarry and Brown, 1997), lower levels of ACC under ketogenic conditions are expected
due to decreased levels of acetyl-CoA (Guzman et al., 2000). These results also suggest
diminished β-oxidation in K8-/- colon. How keratins modulate this pathway needs further
studies, but could be linked to that K8/K18 have been described to be inhibitory of hepatic
CPTI activity (Velasco et al., 1998). Changes in proteins involved in ketone body metabolism
(decreased acetoacetyl-CoA thiolase in the first step of ketogenesis) and β-oxidation has also
been described in desmin-null mouse muscle (Fountoulakis et al., 2005). In contrast to
hepatocyte mitochondria, which are smaller after K8-knockdown (Tao et al., 2009), colon
mitochondrial size appear normal, even if alterations in cristae can be seen (Suppl. Fig. 5).
Hence, mitochondrial morphology changes are unrelated to the observed changes in
colonocyte HMGCS2.
It is known that mice raised in a germfree environment have diminished metabolic processes,
since the butyrate producing bacteria are non-existent (Donohoe et al., 2011). HMGCS2
expression is dependent on colonic microflora and SCFA (Cherbuy et al., 2004), and the K8-/-
colonic microflora consists of fewer microorganisms compared to K8+/+ (Habtezion et al.,
2011). This data, together with the fact that HMGCS2 is not altered in K8-/- hepatocytes (Fig.
2C), suggest that the decreased HMGCS2 in the absence of K8 could be due to diminished
availability of luminal SCFA, or due to aberrant transport of SCFA across the cell membrane.
SCFA are transported into colonocytes mainly through MCT1, the expression and function of
which is upregulated by butyrate (Cuff et al., 2002) and PPARα (König B, 2008). Since
butyrate is the primary source of colonocyte energy, and inhibits inflammation and
carcinogenesis, it is feasible that diminished availability of luminal butyrate or the inability of
colonocytes to oxidize butyrate could contribute to the onset of inflammation in the colon
(Roediger, 1990; Hamer et al., 2008). We show here that the absence of K8 correlates with
lower epithelial levels of MCT1 and higher levels of K8-/- fecal butyrate, which however is
11
not caused by changes in the ratios of butyrate-producing bacterial species in the microbiome
(Figs. 5-6). These results suggest that the K8-/- microbiome is capable of producing SCFA,
which however, may not enter colonocytes properly and hence, impact the fuel for
ketogenesis. A similar association between keratins and butyrate levels was also seen in a
human colorectal cancer study, where higher levels of fecal butyrate corresponded with
decreased K8 levels (Khan et al., 2011). Apart from the down-regulation of MCT1, a down-
regulation of PPARα is also seen when K8 absent in colonocytes, confirming that PPARα
upregulates genes involved in fatty acid oxidation and ketogenesis (König B, 2008).
Keratins could participate in the entry of SCFA to epithelial cells by allowing proper targeting
of MCT1 to the cell membrane. This hypothesis is supported by the generalized mistargeting
of membrane proteins in the K8-/- colon, including ion transporters AE1/2 and ENACγ
(Toivola et al., 2004). Lack or mutation of keratins and other IF proteins lead to altered
distribution of macromolecules in several contexts, including GLUT-transporters in
embryonic epithelia (Vijayaraj et al., 2009) and the endocrine pancreas (Alam et al., 2013),
and of cholesterol in the adrenal gland (Shen et al., 2012). In this study, we could however
not detect any major mistargeting of MCT1 in the absence of K8, indicating that keratins may
affect MCT1 stability in the cell. Interestingly, butyrate is an inhibitor of histone deacetylases,
and it has been shown that also colonic K8 lysines are acetylated and that this is regulated by
butyrate levels (Drake et al., 2009; Kilner et al., 2012).
Taken together, these results suggest a model whereby absorption of SCFA is decreased in
K8-/- colonocytes, leading to elevated levels of butyrate in the lumen and a down-regulation of
MCT1 and HMGCS2, which are perturbations that likely contribute to the inflammatory
phenotype observed in the K8-/- mouse (Fig.7).
4. MATERIALS AND METHODS 4.1. Mice
K8-/- and K8+/+ mice in the FVB/n background were generated by interbreeding K8
heterozygote (K8+/-) mice, and genotyped as described (Baribault et al., 1994). Balb/c mice
were purchased from Turku Central Animal facility where all mice were housed. Animals
were treated according to an approved animal study protocol by The State Provincial Office
of South Finland.
12
4.2. Antibodies
Primary antibodies used for western blotting and immunostaining were chicken anti-
HMGCS2 (Genway), rabbit anti-HMGCS2 (AVIVA; different epitope than Genway
antibody), chicken anti-MCT1 (Chemicon), rabbit anti-MCT1, goat anti-PPARα (Santa Cruz
Biotechnology), rabbit anti-alpha smooth muscle actin, rabbit anti-prohibitin (Abcam), rabbit
anti-cytochrome c, rabbit anti-vimentin, rabbit anti-glut 4, rabbit anti-COX IV, rabbit anti-
acetyl CoA carboxylase (ACC), rabbit anti-P-ACC, rabbit anti-adenosine monophosphate-
activated protein kinase (AMPK) α, rabbit anti-P-AMPKα, rabbit anti-AMPKβ1, rabbit anti-
P-AMPKβ1 (Cell Signaling Technology), rat anti-Hsc70 (Enzo Life Sciences), rat anti-K8
(Troma I) and anti-K19 (Troma III) (Developmental Studies Hybridoma Bank), and mouse
anti-tubulin (Sigma). Secondary antibodies used for western blotting were anti-mouse IgG-
HRP (GE healthcare), anti-rat IgG-HRP (GE healthcare), anti-rabbit IgG-HRP (Cell Signaling
Technology), anti-chicken IgG-HRP (Genway), and anti-goat IgG-HRP (Cell Signaling
Technology). Secondary antibodies used for immunostaining were anti-rabbit Alexa Fluor
488 and anti-rat Alexa Fluor 546 (Life Technologies). Nuclei were stained with Toto-3 (Life
Technologies) or DRAQ5 (Cell Signaling Technology) and F-actin was stained with Alexa
Fluor 488 phalloidin (Life Technologies).
4.3. Isolation of colonic crypts and enrichment of the colonic epithelium
Colonic crypts used for the proteomics study were isolated using MatriSperse Cell Recovery
Solution (BD Biosciences, Bedford, USA) as described (Perreault and Beaulieu, 1998). For
enrichment of colonic epithelium used in HMGCS2 activity assays, the colon was excised,
placed on an ice-cold glass surface, cut open longitudinally and rinsed with ice-cold PBS,
after which the colonic epithelium was collected by scraping with a glass slide.
4.4. 2D-DIGE
Colonic crypts from 2 pairs of K8+/+ and K8-/- mice were isolated. K8+/+ and K8-/- colonic
protein samples were labeled with Cy3 and Cy5, respectively, pooled then separated by 2-
dimensional differential in-gel electrophoresis (2D DIGE) (Fig.1). Differentially expressed
proteins were excised from gels, identified and quantified by mass spectrometry and
numbered (Fig. 1 and Supplemental table 1).
13
4.5. Ketogenic conditions
K8+/+ mice (females: n=9, males: n=5) and K8-/- mice (females: n=9, males: n=6) 3 months of
age were subjected to 24 hours of starvation with unlimited access to water. Weight as well as
blood glucose and β-hydroxybutyrate levels were measured at 0, 12 and 24 hours after the
beginning of food starvation. Blood glucose and β-hydroxybutyrate levels were measured
with blood obtained from the submandibular vein using goldenrod lancets (Medipoint Inc.
NY, USA) and a glucose/β-hydroxybutyrate meter (Precision Xceed by Abbott Diabetes Care
Ltd, Alameda, CA, USA). Mice were sacrificed by CO2 asphyxiation at the end of 24 h of
starvation.
K8+/+ mice (females: n=3, males: n=2) and K8-/- mice (females: n=3, males: n=3) 3-6 months
of age were subjected to ketogenic diet (TD.96355, Harlan Teklad Laboratories, Madison,
USA) for 3, 7 or 14 days. Corresponding K8+/+ and K8-/- mice were subjected to control diet
(TD.00606, Harlan Teklad Laboratories, Madison, USA). The macronutrient composition of
the ketogenic diet (by weight) was: 15.3% protein, 0.5% carbohydrate and 67.4% fat with an
energy content of 6.7 kcal/g. The corresponding composition of the control diet was: 9.2%
protein, 70.9% carbohydrate and 5.1% fat with an energy content of 3.7 kcal/g. Since the
ketogenic diet contains twice as much calories, mice have been shown to eat less of the
ketogenic diet than the control diet (manufactures suggestion). Therefore the intake of protein,
minerals and vitamins is halved in the ketogenic diet. Cages, water and the control diet were
changed on day 7, and the ketogenic diet was changed on days 1, 2, 4, 6, 7, 9 and 11. The
control diet consists of pellets administered with normal feeder-systems, while the ketogenic
diet, which has a butter-like texture, was administered by a feeder designed for powdered
food. Daily measurements of mouse and food weight as well as blood glucose and β-
hydroxybutyrate levels were done. Blood glucose and blood β-hydroxybutyrate were
measured at days 0, 3, 7 and 14 with a glucose/β-hydroxybutyrate meter (Precision Xceed by
Abbott Diabetes Care Ltd, Alameda, CA, USA). Mice were sacrificed by CO2 inhalation on
day 14. Liver, small intestine and distal and proximal colon samples were excised and stored
in liquid nitrogen (for protein analysis), in optimum cutting temperature compound (Miles
Inc, for immunofluorescence), in RNAlater® (for RNA quantitation, Qiagen, Valencia , USA)
and in collidin-glutaraldehyde buffer (for electron microscopy).
14
4.6. DSS-induced colitis
2% dextran sulfate sodium (DSS; 40 000 Da, TdB Consultancy AB, Uppsala, Sweden) was
administered in autoclaved drinking water to 2.5 month old Balb/c mice for 8 days to induce
acute colitis (Wirtz et al., 2007). Control Balb/c mice were given normal drinking water, and
mice were sacrificed on day 8 of the experiment. Distal and proximal colon samples were
excised and stored in liquid nitrogen for protein analysis.
4.7. Mitochondria isolation, HMGCS2 activity assay and ADP/ATP and NAD/NADH assays For HMGCS2 enzyme activity measurements, mitochondria were purified from colonic
epithelium scrapings, isolated from K8+/+ and K8-/- 5-6 month old mice starved overnight for
18 hours, by a modification of a method described by Nonn et al. (Nonn et al., 2003). Colonic
scrapings were suspended in MSH-buffer (250 mM Mannitol, 75 mM Sucrose, 5 mM
HEPES; pH 7.4) with 1 mM EDTA directly after isolation and homogenized manually with a
Dounce homogenizer (75 strokes), following by pelleting (10 minutes, 600 g, 4°C). The
supernatants were re-centrifuged for 15 minutes at 6800 g and 4°C, and the pellets containing
mitochondria were resuspended in ice-cold MSH-buffer. The protein content of the isolated
mitochondria was determined with the Pierce BCA Protein Assay Kit (Thermo Scientific,
Rockford, USA). HMGCS2 activity in the isolated mitochondria was assayed by a
modification of a method described by Patel et al. (Patel et al., 2007). The activity of
HMGCS2 was determined as the difference in the rate of disappearance of acetoacetyl-CoA at
303 nm prior to and following the addition of acetyl-CoA and phosphotransacetylase (PTA)
in a pairwise analysis of K8+/+ and K8-/- samples with equal amounts of mitochondrial proteins
as input. Reagents for the enzyme assay were obtained from Sigma-Aldrich (Sigma-Aldrich,
Munich, Germany). Briefly, a 1 ml quartz cuvette containing 50 mM Tris-HCl (pH 8.0), 10
mM MgCl2, 0.2 mM dithiothreitol and 5 mM acetyl phosphate to a total volume of 827 μl was
prewarmed to 30°C. 75 μg of isolated mitochondria were lysed by incubation with Triton X-
100 (1.4%, v/v) for 4 minutes at 30°C. Following addition of 10 μM acetoacetyl-CoA and the
lysed mitochondria to the cuvette, the absorbance was measured at 303 nm for 1 minute after
2 minutes of incubation. Acetyl-CoA (100 μM) and PTA (10 units) were added to the cuvette
and the change in absorbance was measured. HMGCS2 activity was then calculated as: HMG-CoA synthase activity = [activity following addition of AcCoA + regeneration system
(AcacCoA hydrolase + HMG-CoA synthase activity)] - [activity (2-3 minutes) prior to
addition of AcCoA + regeneration system (AcacCoA hydrolase activity)].
15
HMGCS2 activities were related to HMGCS2 protein levels that in turn were determined by
immunoblotting of the same mitochondrial preparations, and normalized to the levels of the
mitochondrial marker prohibitin.
The intracellular ADP/ATP ratios in colonocytes isolated from K8+/+ and K8-/-
mice were measured using a bioluminescent ADP/ATP ratio assay kit (Abnova, Taipei,
Taiwan) according to the manufacturer’s instructions. The luminescence readings were
performed using a Hidex Sense microplate reader (Hidex, Turku, Finland). The intracellular
levels of NAD and NADH were measured using a colorimetric NAD/NADH assay kit
(Abcam, Taipei, Taiwan) according to the manufacturer’s instructions. Total NAD and
NADH levels were determined through colorimetric detection of absorbance at 450 nm with a
Wallac 1420 VICTOR2 multilabel counter (PerkinElmer, Boston, USA).
4.8. Immunoblotting and immunostaining
Samples for protein analysis were homogenized in a homogenization buffer (0.187M Tris-
HCl pH 6.8, 3% SDS, 5mM EDTA) to obtain total tissue lysates. Equal parts of the central
distal and proximal colons were mixed for colon lysates, unless otherwise stated. Protein
concentrations were measured with a Pierce BCA protein assay kit (Thermo scientific,
Waltham, MA, USA); the samples were normalized and separated by SDS-PAGE, transferred
to a polyvinylidene fluoride membrane and analyzed by immunoblotting. Western blot bands
were quantified with the Image J software (National Institutes of Health) and normalized to
loading control (tubulin, Hsc70 or prohibitin). Fresh frozen K8+/+ and K8-/- colon samples
were cryosectioned (6 μm) and fixed in -20°C acetone for 10 minutes, Caco-2 cells were fixed
in 1% PFA for 10 minutes and the fixed tissue and cell samples were immunostained as
described (Ku et al., 2004). Samples were analyzed with a Leica TCS SP5 (Leica, Mannhein,
Germany) confocal microscope.
4.9. Transmission electron microscopy and cristae quantification For transmission electron microscopy (TEM) K8+/+ and K8-/- mice were starved for 18 hours
before sacrifice and the colon was excised and fixed directly in 5% glutaraldehyde in 0.16 M
collidine buffer (pH 7.4). After dehydration and embedding, 70 nm sections were cut and
stained with 12.5% uranyl acetate in methanol with 0.001% acetone and 0.25% lead citrate,
and analyzed with a TEM JEM-100S (Jeol Ltd, Tokyo, Japan) and JEM-1400 Plus TEM. For
quantifying cristae, the number of cristae per mitochondria section area was counted using

16
Image J (National Institutes of Health). Fold change with standard deviation was calculated
on n =3 mice, 6 mitochondria/genotype.
4.10. RNA quantification Samples for RNA quantification were homogenized with an ultra-turrax T8 (IKA-
Analysentechnik GmbH) homogenizer and RNA was isolated with a RNeasy kit (Qiagen,
Hilden, Germany). After normalization of the RNA concentrations, DNase treatment
(Promega, Madison, WI, USA) and cDNA synthesis (Promega, Madison, WI, USA) were
performed. RT-PCR analysis by Taqman 7900HT (Applied Biosystems, CA, USA) was done
for HMGCS2 with forward and reverse primers (forward: CCGAGTGTCCAAGGATGC,
reverse: TGGGCAGATCTGACACACTAGA; Oligomer, Helsinki, Finland) and probes (#80;
Universal Probe Library, Roche, Basel, Switzerland). Actin was used as an endogenous
control. Fold change differences were analyzed with RQ Manager (Applied Biosystems, CA,
USA) and Microsoft Excel (Washington, USA).
4.11. Profiling of fecal SCFA and bacterial levels
Approximately 200 mg of fresh mouse stool was collected immediately after defecation from
K8+/+ and K8-/- mice (n = 3 per genotype) and profiled for SCFA by gas chromatography
(Alimetrics Ltd Espoo, Finland) and for a panel of butyrate-producing and other bacteria by
quantitative PCR (Alimetrics Ltd, Espoo, Finland).
4.12. K8 and K18 knockdown in HT-29 cells and Caco-2 cells HT-29 colon cancer cells were transfected for 8 hours and overnight for 24 hours with Pre-
design Chimera RNAi (Abnova, Taipei, Taiwan) designed for KRT8 (Cat #H00003856-R01),
KRT18 (Cat #H00003875-R01) and scrambled negative control Naito1 (Cat #R0017).
Transfections of 30 % confluent HT-29 cells were performed with 400 nM RNAi in
Lipofectamine2000 (Invitrogen) and diluted in Opti-MEM medium (GIBCO). Cells were
harvested after 72 hours.
Caco-2 cells were transfected with siMAX siRNA (Eurofins Genomics, Ebersberg, Germany)
designed for KRT8 (5'-GCCUCCUUCAUAGACAAGGUA(dTdT)-3'). The sequence for the
K8 siRNA (clone ID TRCN0000062384) was obtained from the TRC Library Database, and
non-target (scr) siRNA (5'-CCUACAUCCCGAUCGAUGAUG(dTdT)-3') was used as a
control. Transfections of 20-30 % confluent Caco-2 cells were performed with 50 pmol
17
siRNA in Lipofectamine2000 (Invitrogen, Carlsbad, CA, USA) and diluted in Opti-MEM
medium (GIBCO). Cells were harvested after 72 hours.
4.13. Statistical analysis. Statistical calculations were performed using Excel and GraphPad PRISM with student’s t-
test.
Acknowledgements: We thank Catharina Alam (ÅAU) for help with statistical analysis. Helena Saarento, Mary
Mohlin, Lijiao Yang, Jolanta Lundgren, Bianca Forsell, Cecilia Antman and Carl-Gustaf
Stenvall (ÅAU), Kaija Ollikainen (Stanford University) the personnel at the Central Animal
laboratory, Turku Centre for Disease Modeling and The Cell Imaging Core at BTK and
members of the Toivola lab for skillful technical assistance; Héléne Baribault (Amgen) for
providing the K8-/- mouse strain; J. Peter Slotte (ÅAU) for discussions on enzyme activity
measurements and Margaretha Gustafsson for advice and assistance in analyzing the
mitochondrial ultrastructure. This work was supported by the Academy of Finland, Sigrid
Juselius Foundation, Stiftelsen Liv och Hälsa, FP7 IRG, ÅAU Center of Excellence, EU FP7
Marie Curie IRG, and Åbo Akademi University Center of Excellence (DT); Victoriastiftelsen
(TH); Turku Doctoral Programme for Biomedical Sciences (JM); NIH grant DK47918 and
the Department of Veterans Affairs (MBO); and the Department of Veterans Affairs Office of
Research and Development Medical Service, and NIH grant HL92473 (SA).
REFERENCES
Alam, C.M., Silvander, J.S., Daniel, E.N., Tao, G.Z., Kvarnstrom, S.M., Alam, P., Omary, M.B., Hanninen, A., and Toivola, D.M. (2013 ). Keratin 8 modulates beta-cell stress responses and normoglycaemia. Journal of cell science 126, 5635-5644. Aledo, R., Mir, C., Dalton, R.N., Turner, C., Pie, J., Hegardt, F.G., Casals, N., and Champion, M.P. (2006 ). Refining the diagnosis of mitochondrial HMG-CoA synthase deficiency. J Inherit Metab Dis 29, 207-211. Ameen, N.A., Figueroa, Y., and Salas, P.J. (2001 ). Anomalous apical plasma membrane phenotype in CK8-deficient mice indicates a novel role for intermediate filaments in the polarization of simple epithelia. J Cell Sci 114, 563-575.
18
Ardawi, M.S., and Majzoub, M.F. (1988 ). Glutamine and ketone-body metabolism in the small intestine of starved peak-lactating rats. Biochimie 70, 749-755. Baribault, H., Penner, J., Iozzo, R.V., and Wilson-Heiner, M. (1994 ). Colorectal hyperplasia and inflammation in keratin 8-deficient FVB/N mice. Genes & development 8, 2964-2973. Borthakur, A., Priyamvada, S., Kumar, A., Natarajan, A.A., Gill, R.K., Alrefai, W.A., and Dudeja, P.K. (2012 ). A novel nutrient sensing mechanism underlies substrate-induced regulation of monocarboxylate transporter-1. Am J Physiol Gastrointest Liver Physiol 303, G1126-1133. Bultman, S.J. (2014 ). Molecular pathways: gene-environment interactions regulating dietary fiber induction of proliferation and apoptosis via butyrate for cancer prevention. Clinical cancer research : an official journal of the American Association for Cancer Research 20, 799-803. Camarero, N., Mascaro, C., Mayordomo, C., Vilardell, F., Haro, D., and Marrero, P.F.
(2006 ). Ketogenic HMGCS2 Is a c-Myc target gene expressed in differentiated cells of human colonic epithelium and down-regulated in colon cancer. Mol Cancer Res 4, 645-653. Cherbuy, C., Andrieux, C., Honvo-Houeto, E., Thomas, M., Ide, C., Druesne, N., Chaumontet, C., Darcy-Vrillon, B., and Duee, P.H. (2004 ). Expression of mitochondrial HMGCoA synthase and glutaminase in the colonic mucosa is modulated by bacterial species. Eur J Biochem 271, 87-95. Coulombe, P.A., and Omary, M.B. (2002 ). 'Hard' and 'soft' principles defining the structure, function and regulation of keratin intermediate filaments. Curr Opin Cell Biol 14, 110-122. Cuff, M.A., Lambert, D.W., and Shirazi-Beechey, S.P. (2002 ). Substrate-induced regulation of the human colonic monocarboxylate transporter, MCT1. J Physiol 539, 361-371. Cullingford, T.E. (2004 ). The ketogenic diet; fatty acids, fatty acid-activated receptors and neurological disorders. Prostaglandins Leukot Essent Fatty Acids 70, 253-264. Donohoe, D.R., Garge, N., Zhang, X., Sun, W., O'Connell, T.M., Bunger, M.K., and Bultman, S.J. (2011 ). The microbiome and butyrate regulate energy metabolism and autophagy in the mammalian colon. Cell metabolism 13, 517-526. Drake, P.J., Griffiths, G.J., Shaw, L., Benson, R.P., and Corfe, B.M. (2009 ). Application of high-content analysis to the study of post-translational modifications of the cytoskeleton. Journal of proteome research 8, 28-34. Fountoulakis, M., Soumaka, E., Rapti, K., Mavroidis, M., Tsangaris, G., Maris, A., Weisleder, N., and Capetanaki, Y. (2005 ). Alterations in the heart mitochondrial proteome in a desmin null heart failure model. J Mol Cell Cardiol 38, 461-474.
19
Guzman, M., Velasco, G., and Geelen, M.J. (2000 ). Do cytoskeletal components control fatty acid translocation into liver mitochondria? Trends Endocrinol Metab 11, 49-53. Habtezion, A., Toivola, D.M., Asghar, M.N., Kronmal, G.S., Brooks, J.D., Butcher, E.C., and Omary, M.B. (2011 ). Absence of keratin 8 confers a paradoxical microflora-dependent resistance to apoptosis in the colon. Proc Natl Acad Sci U S A 108, 1445-1450. Habtezion, A., Toivola, D.M., Butcher, E.C., and Omary, M.B. (2005 ). Keratin-8-deficient mice develop chronic spontaneous Th2 colitis amenable to antibiotic treatment. J Cell Sci 118, 1971-1980. Hadjiagapiou, C., Schmidt, L., Dudeja, P.K., Layden, T.J., and Ramaswamy, K. (2000 ). Mechanism (s ) of butyrate transport in Caco-2 cells: role of monocarboxylate transporter 1. Am J Physiol Gastrointest Liver Physiol 279, G775-780. Hamer, H.M., Jonkers, D., Venema, K., Vanhoutvin, S., Troost, F.J., and Brummer, R.J.
(2008 ). Review article: the role of butyrate on colonic function. Aliment Pharmacol Ther 27, 104-119. Hegardt, F.G. (1999 ). Mitochondrial 3-hydroxy-3-methylglutaryl-CoA synthase: a control enzyme in ketogenesis. Biochem J 338 ( Pt 3 ), 569-582. Kersten, S., Seydoux, J., Peters, J.M., Gonzalez, F.J., Desvergne, B., and Wahli, W.
(1999 ). Peroxisome proliferator-activated receptor alpha mediates the adaptive response to fasting. J Clin Invest 103, 1489-1498. Khan, A.Q., Bury, J.P., Brown, S.R., Riley, S.A., and Corfe, B.M. (2011 ). Keratin 8 expression in colon cancer associates with low faecal butyrate levels. BMC gastroenterology 11, 2. Kilner, J., Waby, J.S., Chowdry, J., Khan, A.Q., Noirel, J., Wright, P.C., Corfe, B.M., and Evans, C.A. (2012 ). A proteomic analysis of differential cellular responses to the short-chain fatty acids butyrate, valerate and propionate in colon epithelial cancer cells. Molecular bioSystems 8, 1146-1156. Ku, N.O., Toivola, D.M., Zhou, Q., Tao, G.Z., Zhong, B., and Omary, M.B. (2004 ). Studying simple epithelial keratins in cells and tissues. Methods Cell Biol 78, 489-517. König B, K.A., Giggel K, Dordschbal B, Eder K, Stangl GI. (2008 ). Monocarboxylate transporter (MCT )-1 is up-regulated by PPARalpha. Biochim Biophys Acta. 6, 899-904. Lefebvre, P., Chinetti, G., Fruchart, J.C., and Staels, B. (2006 ). Sorting out the roles of PPAR alpha in energy metabolism and vascular homeostasis. J Clin Invest 116, 571-580. Lopaschuk, G.D., Ussher, J.R., Folmes, C.D., Jaswal, J.S., and Stanley, W.C. (2010 ). Myocardial fatty acid metabolism in health and disease. Physiol Rev 90, 207-258. McGarry, J.D., and Brown, N.F. (1997 ). The mitochondrial carnitine palmitoyltransferase system. From concept to molecular analysis. Eur J Biochem 244, 1-14.

20
Meertens, L.M., Miyata, K.S., Cechetto, J.D., Rachubinski, R.A., and Capone, J.P. (1998 ). A mitochondrial ketogenic enzyme regulates its gene expression by association with the nuclear hormone receptor PPARalpha. EMBO J 17, 6972-6978. Naito, Y., Takagi, T., Okada, H., Omatsu, T., Mizushima, K., Handa, O., Kokura, S., Ichikawa, H., Fujiwake, H., and Yoshikawa, T. (2010 ). Identification of inflammation-related proteins in a murine colitis model by 2D fluorescence difference gel electrophoresis and mass spectrometry. J Gastroenterol Hepatol 25 Suppl 1, S144-148. Nonn, L., Williams, R.R., Erickson, R.P., and Powis, G. (2003 ). The absence of mitochondrial thioredoxin 2 causes massive apoptosis, exencephaly, and early embryonic lethality in homozygous mice. Mol Cell Biol 23, 916-922. Omary, M.B., Ku, N.O., Strnad, P., and Hanada, S. (2009 ). Toward unraveling the complexity of simple epithelial keratins in human disease. J Clin Invest 119, 1794-1805. Pan, X., Hobbs, R.P., and Coulombe, P.A. (2013 ). The expanding significance of keratin intermediate filaments in normal and diseased epithelia. Current opinion in cell biology 25, 47-56. Patel, V.B., Spencer, C.H., Young, T.A., Lively, M.O., and Cunningham, C.C. (2007 ). Effects of 4-hydroxynonenal on mitochondrial 3-hydroxy-3-methylglutaryl (HMG-CoA ) synthase. Free Radic Biol Med 43, 1499-1507. Perreault, N., and Beaulieu, J.F. (1998 ). Primary cultures of fully differentiated and pure human intestinal epithelial cells. Exp Cell Res 245, 34-42. Pryde, S.E., Duncan, S.H., Hold, G.L., Stewart, C.S., and Flint, H.J. (2002 ). The microbiology of butyrate formation in the human colon. FEMS microbiology letters 217, 133-139. Quinlan, R.A., Cohlberg, J.A., Schiller, D.L., Hatzfeld, M., and Franke, W.W. (1984 ). Heterotypic tetramer (A2D2 ) complexes of non-epidermal keratins isolated from cytoskeletons of rat hepatocytes and hepatoma cells. J Mol Biol 178, 365-388. Rodriguez, J.C., Gil-Gomez, G., Hegardt, F.G., and Haro, D. (1994 ). Peroxisome proliferator-activated receptor mediates induction of the mitochondrial 3-hydroxy-3-methylglutaryl-CoA synthase gene by fatty acids. J Biol Chem 269, 18767-18772. Roediger, W.E. (1980 ). Role of anaerobic bacteria in the metabolic welfare of the colonic mucosa in man. Gut 21, 793-798. Roediger, W.E. (1990 ). The starved colon--diminished mucosal nutrition, diminished absorption, and colitis. Dis Colon Rectum 33, 858-862. Schweizer, J., Bowden, P.E., Coulombe, P.A., Langbein, L., Lane, E.B., Magin, T.M., Maltais, L., Omary, M.B., Parry, D.A., Rogers, M.A., and Wright, M.W. (2006 ). New consensus nomenclature for mammalian keratins. J Cell Biol 174, 169-174.
21
Serra, D., Bellido, D., Asins, G., Arias, G., Vilaro, S., and Hegardt, F.G. (1996a ). The expression of mitochondrial 3-hydroxy-3-methylglutaryl-coenzyme-A synthase in neonatal rat intestine and liver is under transcriptional control. Eur J Biochem 237, 16-24. Serra, D., Fillat, C., Matas, R., Bosch, F., and Hegardt, F.G. (1996b ). Tissue-specific expression and dietary regulation of chimeric mitochondrial 3-hydroxy-3-methylglutaryl coenzyme A synthase/human growth hormone gene in transgenic mice. J Biol Chem 271, 7529-7534. Shen, W.J., Zaidi, S.K., Patel, S., Cortez, Y., Ueno, M., Azhar, R., Azhar, S., and Kraemer, F.B. (2012 ). Ablation of vimentin results in defective steroidogenesis. Endocrinology 153, 3249-3257. Tao, G.Z., Looi, K.S., Toivola, D.M., Strnad, P., Zhou, Q., Liao, J., Wei, Y., Habtezion, A., and Omary, M.B. (2009 ). Keratins modulate the shape and function of hepatocyte mitochondria: a mechanism for protection from apoptosis. J Cell Sci 122, 3851-3855. Toivola, D.M., Krishnan, S., Binder, H.J., Singh, S.K., and Omary, M.B. (2004 ). Keratins modulate colonocyte electrolyte transport via protein mistargeting. J Cell Biol 164, 911-921. Toivola, D.M., Strnad, P., Habtezion, A., and Omary, M.B. (2010 ). Intermediate filaments take the heat as stress proteins. Trends Cell Biol 20, 79-91. Topping, D.L., and Clifton, P.M. (2001 ). Short-chain fatty acids and human colonic function: roles of resistant starch and nonstarch polysaccharides. Physiol Rev 81, 1031-1064. Velasco, G., Geelen, M.J., Gomez del Pulgar, T., and Guzman, M. (1998 ). Malonyl-CoA-independent acute control of hepatic carnitine palmitoyltransferase I activity. Role of Ca2+/calmodulin-dependent protein kinase II and cytoskeletal components. J Biol Chem 273, 21497-21504. Vijayaraj, P., Kroger, C., Reuter, U., Windoffer, R., Leube, R.E., and Magin, T.M. (2009 ). Keratins regulate protein biosynthesis through localization of GLUT1 and -3 upstream of AMP kinase and Raptor. J Cell Biol 187, 175-184. Wirtz, S., Neufert, C., Weigmann, B., and Neurath, M.F. (2007 ). Chemically induced mouse models of intestinal inflammation. Nat Protoc 2, 541-546.
FIGURE LEGENDS
Figure 1. HMGCS is a major down-regulated protein in K8-/- colon. Colonic crypts from
K8-/- and K8+/+ mice were isolated and protein lysates labeled with Cy3 (green) for K8+/+ and
Cy5 (red) for K8-/- (A). The mixed lysates were separated by 2-dimensional differential in-gel

22
electrophoresis (2D DIGE) and differentially expressed proteins were given individual spot
numbers and detected by mass spectrometry (Supplementary Table 1). Unchanged protein
spots appear yellow. The major down-regulated protein is HMGCS2 (spots 1032, 1033, 1035
and 1044), as shown separately for K8+/+, K8-/- and as an overlay (B). Lysates of isolated
colonic crypts from 3 K8+/+ and 3 K8-/- were analyzed by western blotting for HMGCS2, K8
and Hsc70 as a loading control (C). Measured HMGCS2 activity values (Supplemental Fig. 1)
for K8-/- shown as fold decrease relative to HMGCS2 activity in K8+/+ colonocytes (D).
HMGCS2 levels were assayed by immunoblotting of the same mitochondrial preparations
that were used for measuring HMGCS2 activity. The results were quantified with ImageJ
software and normalized to mitochondrial marker prohibitin, which is not altered in K8-/- (E).
K8+/+ to K8-/- HMGCS2 enzyme activity and quantity ratios were calculated and the
correlation between HMGCS2 enzyme activity and quantity was analyzed (F). The results are
based on three independent experiments (each experiment involving one K8+/+ and one K8-/-
mouse) and represent the average ± SD with significant differences shown as * = p < 0.05 and
** = p < 0.01.
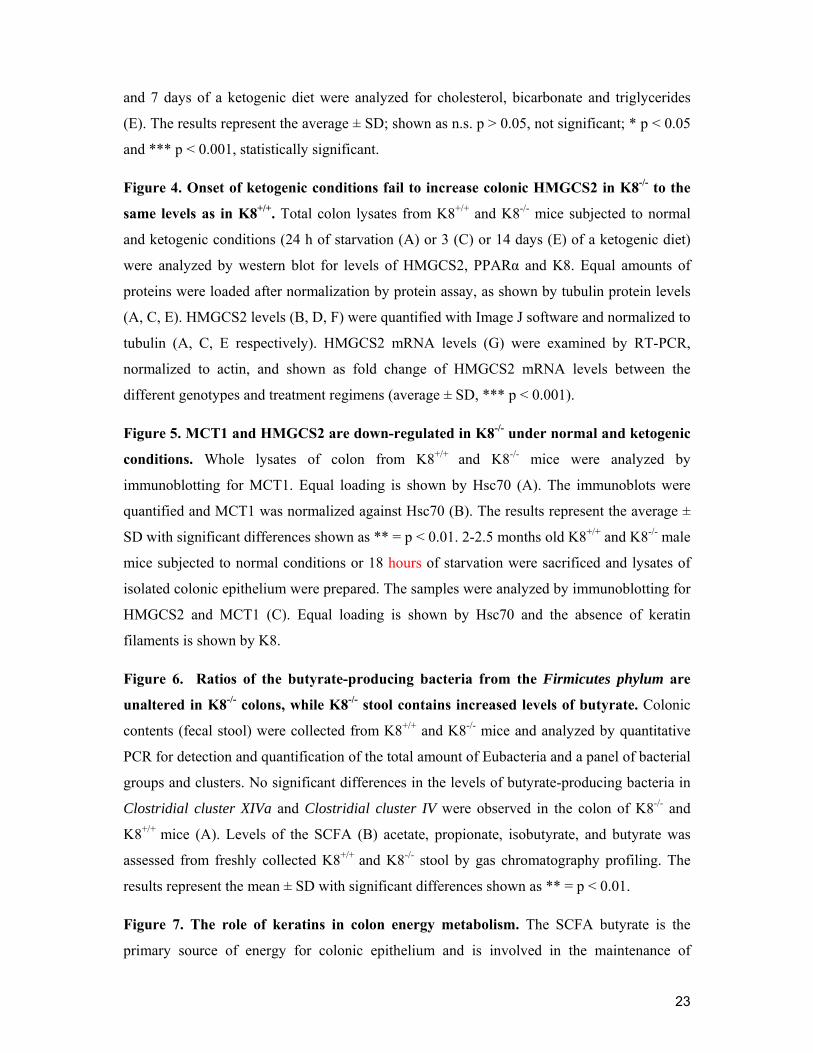
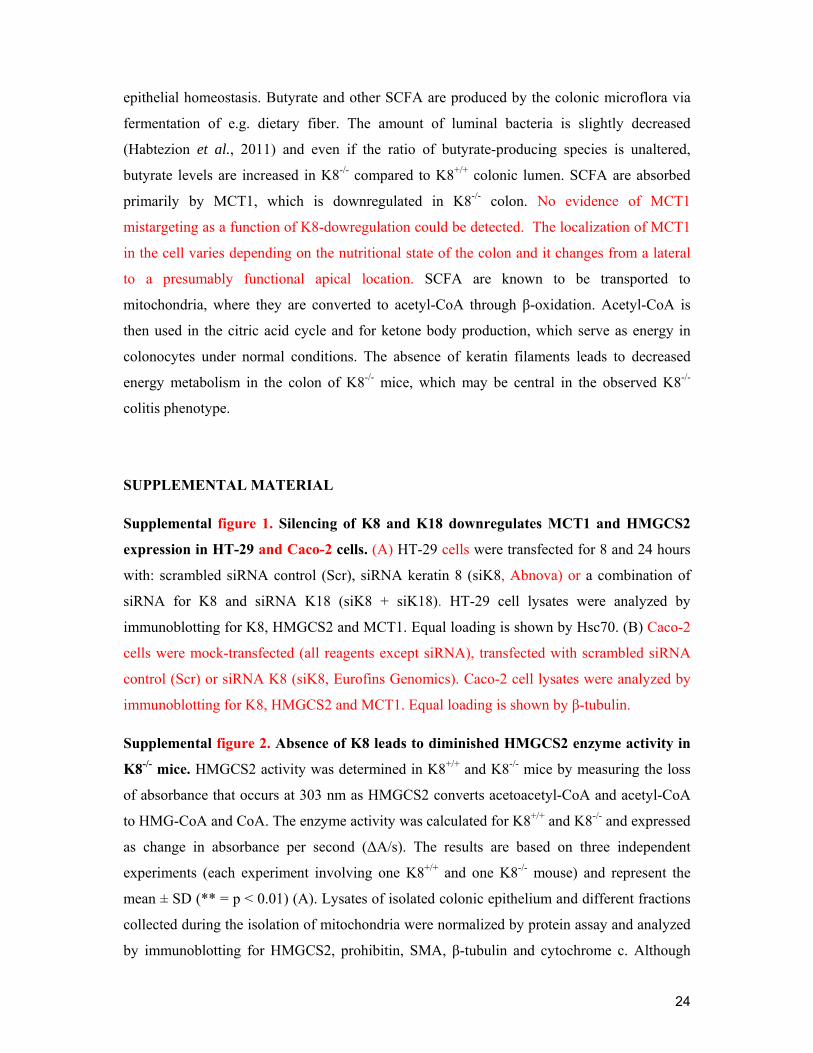
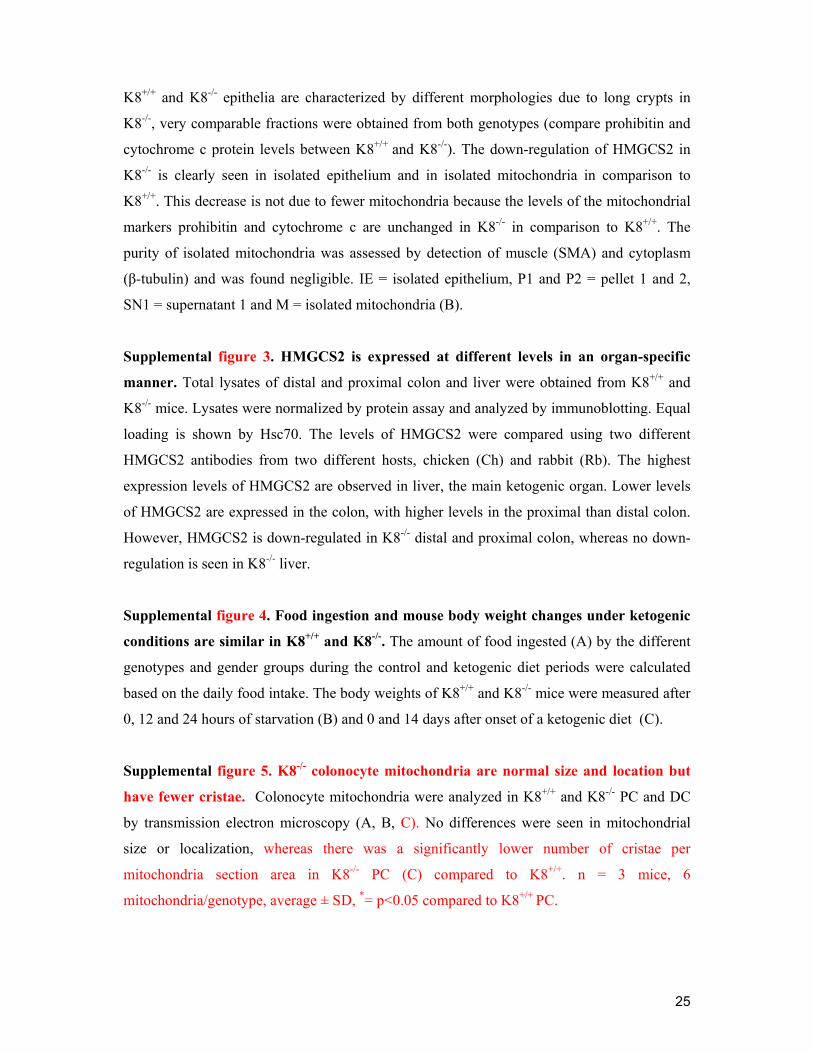
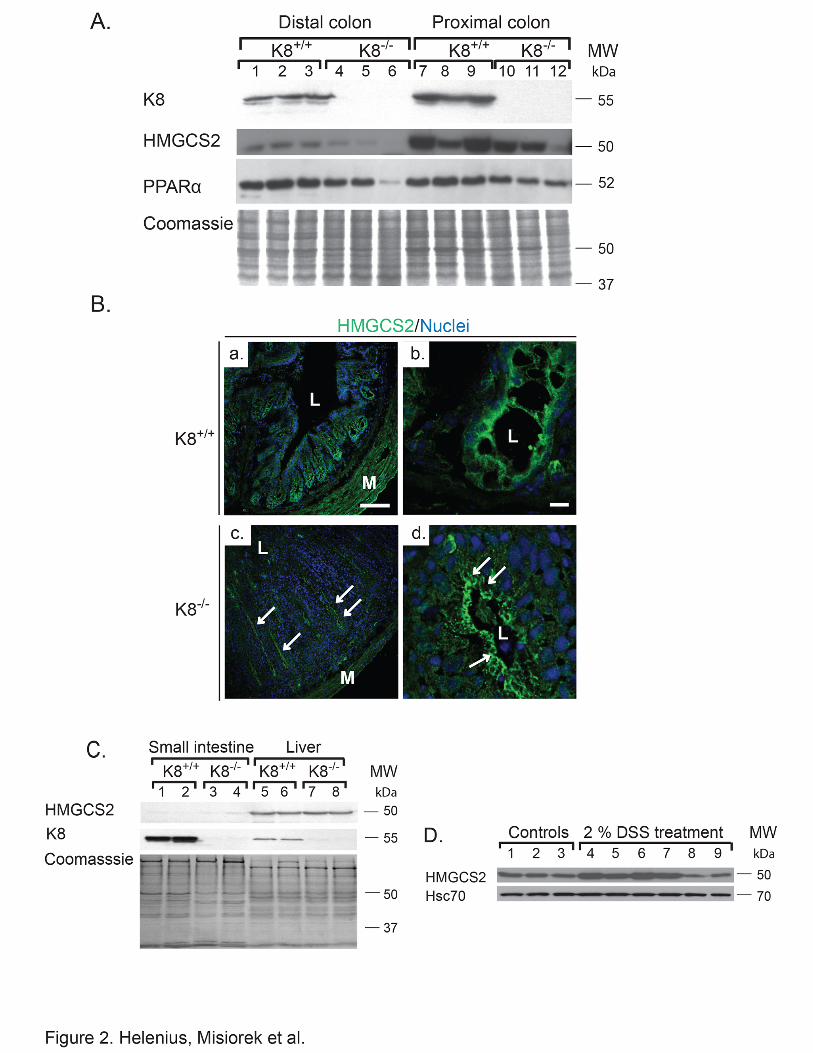
Figure 2. HMGCS2 and PPARα are decreased and HMGCS2 is mislocalized in adult colon, but not in small intestine or liver of K8-/- mice. Lysates of distal and proximal colon
(A), small intestine and liver (C) were obtained from K8+/+ and K8-/- mice and the lysates
were normalized by protein assay. Protein levels of HMGCS2, PPARα and K8 were analyzed
by immunoblotting and equal loading was confirmed by Coomassie Brilliant Blue staining (A
and C). Immunostaining of colonic HMGCS2 (B) showed decreased cytoplasmic pools of
HMGCS2 (green) in crypts, with the remaining HMGCS2 located apically in the colonocytes
(arrows). Scale bars: 100 μm (a and c) and 10 μm (b and d), L = lumen, M = muscles. (D)
Proximal colon lysates were obtained from 2.5 months old Balb/c mice treated with 2% DSS
or without DSS (control) for 8 days. Samples were analyzed by immunoblotting for
HMGCS2. Equal loading is shown by Hsc70.
Figure 3. Blood and serum parameters are similar in K8+/+ and K8-/- mice under baseline and ketogenic conditions. Mice were starved for 24 hours (A, B, E), or fed with a control or
ketogenic diet (C, D, E) as outlined in Materials and Methods section. Blood samples from
male and female K8+/+ and K8-/- mice were taken from the submandibular vein 0, 12 and 24
hours after onset of starvation (A, B) and after 0 and 14 days of a ketogenic diet (C, D), and
were assayed for the levels of blood glucose (A, C), blood β-hydroxybutyrate (B, D) and a
panel of blood markers (E). Serum samples from mice subjected to 24 h of starvation or to 3
23
and 7 days of a ketogenic diet were analyzed for cholesterol, bicarbonate and triglycerides
(E). The results represent the average ± SD; shown as n.s. p > 0.05, not significant; * p < 0.05
and *** p < 0.001, statistically significant.
Figure 4. Onset of ketogenic conditions fail to increase colonic HMGCS2 in K8-/- to the same levels as in K8+/+. Total colon lysates from K8+/+ and K8-/- mice subjected to normal
and ketogenic conditions (24 h of starvation (A) or 3 (C) or 14 days (E) of a ketogenic diet)
were analyzed by western blot for levels of HMGCS2, PPARα and K8. Equal amounts of
proteins were loaded after normalization by protein assay, as shown by tubulin protein levels
(A, C, E). HMGCS2 levels (B, D, F) were quantified with Image J software and normalized to
tubulin (A, C, E respectively). HMGCS2 mRNA levels (G) were examined by RT-PCR,
normalized to actin, and shown as fold change of HMGCS2 mRNA levels between the
different genotypes and treatment regimens (average ± SD, *** p < 0.001).
Figure 5. MCT1 and HMGCS2 are down-regulated in K8-/- under normal and ketogenic conditions. Whole lysates of colon from K8+/+ and K8-/- mice were analyzed by
immunoblotting for MCT1. Equal loading is shown by Hsc70 (A). The immunoblots were
quantified and MCT1 was normalized against Hsc70 (B). The results represent the average ±
SD with significant differences shown as ** = p < 0.01. 2-2.5 months old K8+/+ and K8-/- male
mice subjected to normal conditions or 18 hours of starvation were sacrificed and lysates of
isolated colonic epithelium were prepared. The samples were analyzed by immunoblotting for
HMGCS2 and MCT1 (C). Equal loading is shown by Hsc70 and the absence of keratin
filaments is shown by K8.
Figure 6. Ratios of the butyrate-producing bacteria from the Firmicutes phylum are unaltered in K8-/- colons, while K8-/- stool contains increased levels of butyrate. Colonic
contents (fecal stool) were collected from K8+/+ and K8-/- mice and analyzed by quantitative
PCR for detection and quantification of the total amount of Eubacteria and a panel of bacterial
groups and clusters. No significant differences in the levels of butyrate-producing bacteria in
Clostridial cluster XIVa and Clostridial cluster IV were observed in the colon of K8-/- and
K8+/+ mice (A). Levels of the SCFA (B) acetate, propionate, isobutyrate, and butyrate was
assessed from freshly collected K8+/+ and K8-/- stool by gas chromatography profiling. The
results represent the mean ± SD with significant differences shown as ** = p < 0.01.
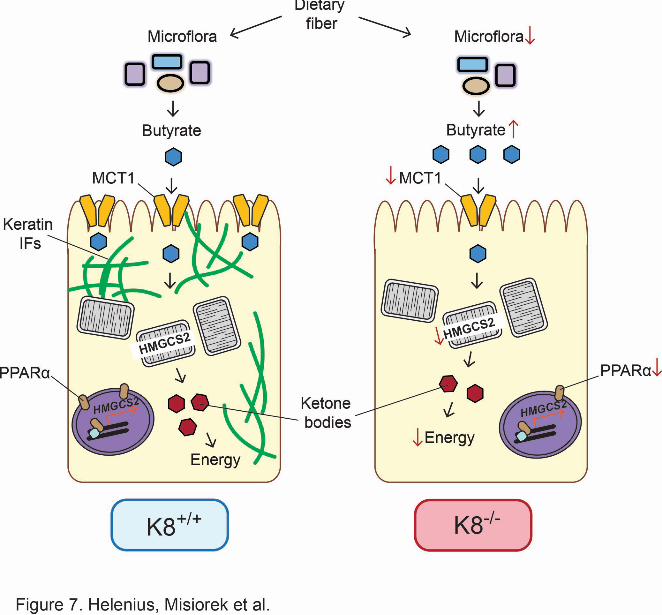
Figure 7. The role of keratins in colon energy metabolism. The SCFA butyrate is the
primary source of energy for colonic epithelium and is involved in the maintenance of
24
epithelial homeostasis. Butyrate and other SCFA are produced by the colonic microflora via
fermentation of e.g. dietary fiber. The amount of luminal bacteria is slightly decreased
(Habtezion et al., 2011) and even if the ratio of butyrate-producing species is unaltered,
butyrate levels are increased in K8-/- compared to K8+/+ colonic lumen. SCFA are absorbed
primarily by MCT1, which is downregulated in K8-/- colon. No evidence of MCT1
mistargeting as a function of K8-dowregulation could be detected. The localization of MCT1
in the cell varies depending on the nutritional state of the colon and it changes from a lateral
to a presumably functional apical location. SCFA are known to be transported to
mitochondria, where they are converted to acetyl-CoA through β-oxidation. Acetyl-CoA is
then used in the citric acid cycle and for ketone body production, which serve as energy in
colonocytes under normal conditions. The absence of keratin filaments leads to decreased
energy metabolism in the colon of K8-/- mice, which may be central in the observed K8-/-
colitis phenotype.
SUPPLEMENTAL MATERIAL
Supplemental figure 1. Silencing of K8 and K18 downregulates MCT1 and HMGCS2 expression in HT-29 and Caco-2 cells. (A) HT-29 cells were transfected for 8 and 24 hours
with: scrambled siRNA control (Scr), siRNA keratin 8 (siK8, Abnova) or a combination of
siRNA for K8 and siRNA K18 (siK8 + siK18). HT-29 cell lysates were analyzed by
immunoblotting for K8, HMGCS2 and MCT1. Equal loading is shown by Hsc70. (B) Caco-2
cells were mock-transfected (all reagents except siRNA), transfected with scrambled siRNA
control (Scr) or siRNA K8 (siK8, Eurofins Genomics). Caco-2 cell lysates were analyzed by
immunoblotting for K8, HMGCS2 and MCT1. Equal loading is shown by β-tubulin.
Supplemental figure 2. Absence of K8 leads to diminished HMGCS2 enzyme activity in K8-/- mice. HMGCS2 activity was determined in K8+/+ and K8-/- mice by measuring the loss
of absorbance that occurs at 303 nm as HMGCS2 converts acetoacetyl-CoA and acetyl-CoA
to HMG-CoA and CoA. The enzyme activity was calculated for K8+/+ and K8-/- and expressed
as change in absorbance per second (ΔA/s). The results are based on three independent
experiments (each experiment involving one K8+/+ and one K8-/- mouse) and represent the
mean ± SD (** = p < 0.01) (A). Lysates of isolated colonic epithelium and different fractions
collected during the isolation of mitochondria were normalized by protein assay and analyzed
by immunoblotting for HMGCS2, prohibitin, SMA, β-tubulin and cytochrome c. Although
25
K8+/+ and K8-/- epithelia are characterized by different morphologies due to long crypts in
K8-/-, very comparable fractions were obtained from both genotypes (compare prohibitin and
cytochrome c protein levels between K8+/+ and K8-/-). The down-regulation of HMGCS2 in
K8-/- is clearly seen in isolated epithelium and in isolated mitochondria in comparison to
K8+/+. This decrease is not due to fewer mitochondria because the levels of the mitochondrial
markers prohibitin and cytochrome c are unchanged in K8-/- in comparison to K8+/+. The
purity of isolated mitochondria was assessed by detection of muscle (SMA) and cytoplasm
(β-tubulin) and was found negligible. IE = isolated epithelium, P1 and P2 = pellet 1 and 2,
SN1 = supernatant 1 and M = isolated mitochondria (B).
Supplemental figure 3. HMGCS2 is expressed at different levels in an organ-specific manner. Total lysates of distal and proximal colon and liver were obtained from K8+/+ and
K8-/- mice. Lysates were normalized by protein assay and analyzed by immunoblotting. Equal
loading is shown by Hsc70. The levels of HMGCS2 were compared using two different
HMGCS2 antibodies from two different hosts, chicken (Ch) and rabbit (Rb). The highest
expression levels of HMGCS2 are observed in liver, the main ketogenic organ. Lower levels
of HMGCS2 are expressed in the colon, with higher levels in the proximal than distal colon.
However, HMGCS2 is down-regulated in K8-/- distal and proximal colon, whereas no down-
regulation is seen in K8-/- liver.
Supplemental figure 4. Food ingestion and mouse body weight changes under ketogenic conditions are similar in K8+/+ and K8-/-. The amount of food ingested (A) by the different
genotypes and gender groups during the control and ketogenic diet periods were calculated
based on the daily food intake. The body weights of K8+/+ and K8-/- mice were measured after
0, 12 and 24 hours of starvation (B) and 0 and 14 days after onset of a ketogenic diet (C).
Supplemental figure 5. K8-/- colonocyte mitochondria are normal size and location but have fewer cristae. Colonocyte mitochondria were analyzed in K8+/+ and K8-/- PC and DC
by transmission electron microscopy (A, B, C). No differences were seen in mitochondrial
size or localization, whereas there was a significantly lower number of cristae per
mitochondria section area in K8-/- PC (C) compared to K8+/+. n = 3 mice, 6
mitochondria/genotype, average ± SD, *= p<0.05 compared to K8+/+ PC.

26
Supplemental figure 6. Minor differences in energy homeostasis between K8-/- mice subjected to normal and ketogenic conditions. Total lysates of equal parts of distal and
proximal colons from K8+/+ and K8-/- mice subjected to normal and different ketogenic
conditions (A: 24 h of starvation, B: 3 days of ketogenic diet, C: 14 days of ketogenic diet)
were analyzed for a panel of proteins related to cellular energy metabolism.
Supplemental figure 7. MCT1 localization remains unchanged while the levels of MCT1 are decreased in K8-/- proximal colon and in K8 siRNA-treated Caco-2 cells. A. K8+/+ (a,
c, e) and K8-/- (b, d, f) proximal colon were cryosectioned and analyzed by immunostaining
for MCT1 (green), K8 (red) and DNA (blue). The blown-up images in c-f show representative
areas of mid-crypt lateral plasma membrane MCT1 staining, and MCT staining in the plasma
membrane near the basal part of crypt cells from K8+/+ and K8-/- distal colon, showing similar
MCT1 distribution independent of the presence of K8. B. Caco-2 cells were mock-transfected
(a) or K8 siRNA-treated (b) for 72 hours and analyzed by immunostaining for MCT1 (green),
and nuclei (blue). K8 siRNA treatment decreases K8-levels with 50-70% (see Supplemental
Figure 1B. Scale bars: 25 μm, L = lumen.

Related Documents