Kenya Water Security and Climate Resilience Project

Welcome message from author
This document is posted to help you gain knowledge. Please leave a comment to let me know what you think about it! Share it to your friends and learn new things together.
Transcript
Kenya Water Security and Climate Resilience Project
Kenya Water Security and Climate Resilience Project
Final National Plan August 2020 ii
Executive Summary E1. Background, context and objectives
The Government of Kenya received financing from the World Bank toward the cost of implementing
the Kenya Water Security and Climate Resilience Project Phase 1 (KWSCRP-1), to be implemented
through the Ministry of Water, Sanitation and Irrigation and which is made up of two components,
namely:
▪ Component 1: Water Resources Development. This component supports climate resilience and
water security for economic growth by financing water investments and by building a longer-term
investment pipeline.
▪ Component 2: Effective Water Sector Institutions. This component aims to support the current water
sector institutions as well as the preparation, implementation and full function of the new and
proposed legal and institutional framework resulting from the alignments with the 2010 Constitution.
Ultimately, it aims for improved management and development of Kenya’s water resources for its
growth and development.
This National Plan fits in under KWSCRP-1/Sub-component 2.2 Strengthening Water Resource
Management and Planning. The overall objective of this sub-component is to strengthen WRA’s
capacity in terms of tools, skills and infrastructure to deliver on its mandate related to water resources
in Kenya. Kenya’s water sector reforms introduced new functions that require new capacities within
WRA and its de-centralised structures. Existing capacities also need strengthening to address water
resources development and management issues in a knowledge-driven manner.
A key set of deliverables under Sub-component 2.2 was the development of six Basin Plans for the six
main river basins in Kenya, namely Lake Victoria North, Lake Victoria South, Rift Valley, Athi, Tana and
Ewaso Ng’iro North. This document constitutes the consolidation of these Basin Plans and forms the
National Plan for the six basins of Kenya.
The main objective of this National Plan is to provide a clear pathway for the sustainable utilisation and
development of the water resources of the six river basins of Kenya. The Plan provides a description of
the current state of the six basins, establishes a shared vision for the future development of the basins
and identifies key strategic areas and actions for effective development and management of the basin
water resources. The National Plan draws information from the six basin plans, other relevant existing
plans and strategies, incorporates comprehensive inputs from various stakeholders and presents
information based on updated analyses.
E2. Key issues and challenges
The water resources of Kenya are currently threatened by many issues. These include human conflict,
water quality, soil erosion and sedimentation, climate change, catchment degradation, inadequate
monitoring, planning and management, water availability and supply issues, inadequate resources,
uneven spatial and temporal distribution of water resources, anthropogenic encroachment on
environmentally sensitive areas, inadequate flood and drought management and various other issues.
In addition, each basin has location-specific challenges and issues which, coupled with its unique basin
characteristics, are an important consideration for effective water resources management and planning
at basin and sub-basin level.
Kenya Water Security and Climate Resilience Project
Final National Plan August 2020 iii
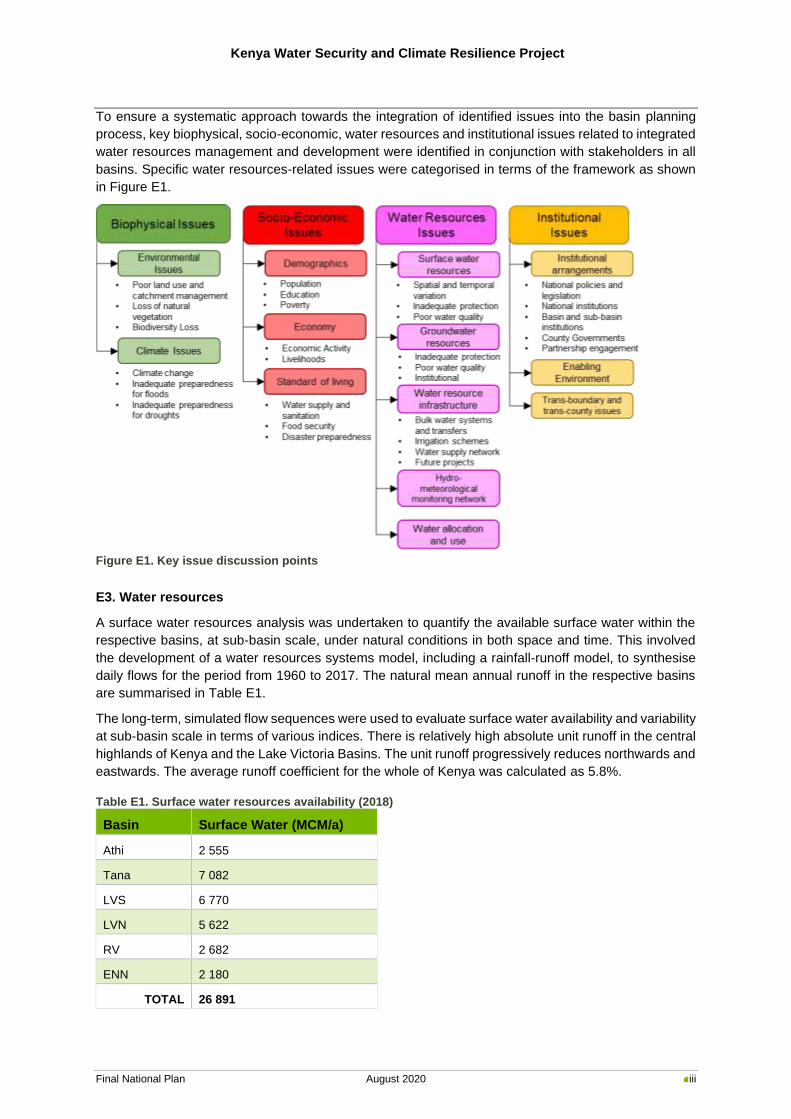
To ensure a systematic approach towards the integration of identified issues into the basin planning
process, key biophysical, socio-economic, water resources and institutional issues related to integrated
water resources management and development were identified in conjunction with stakeholders in all
basins. Specific water resources-related issues were categorised in terms of the framework as shown
in Figure E1.
Figure E1. Key issue discussion points
E3. Water resources
A surface water resources analysis was undertaken to quantify the available surface water within the
respective basins, at sub-basin scale, under natural conditions in both space and time. This involved
the development of a water resources systems model, including a rainfall-runoff model, to synthesise
daily flows for the period from 1960 to 2017. The natural mean annual runoff in the respective basins
are summarised in Table E1.
The long-term, simulated flow sequences were used to evaluate surface water availability and variability
at sub-basin scale in terms of various indices. There is relatively high absolute unit runoff in the central
highlands of Kenya and the Lake Victoria Basins. The unit runoff progressively reduces northwards and
eastwards. The average runoff coefficient for the whole of Kenya was calculated as 5.8%.
Table E1. Surface water resources availability (2018)
Basin Surface Water (MCM/a)
Athi 2 555
Tana 7 082
LVS 6 770
LVN 5 622
RV 2 682
ENN 2 180
TOTAL 26 891
Kenya Water Security and Climate Resilience Project
Final National Plan August 2020 iv
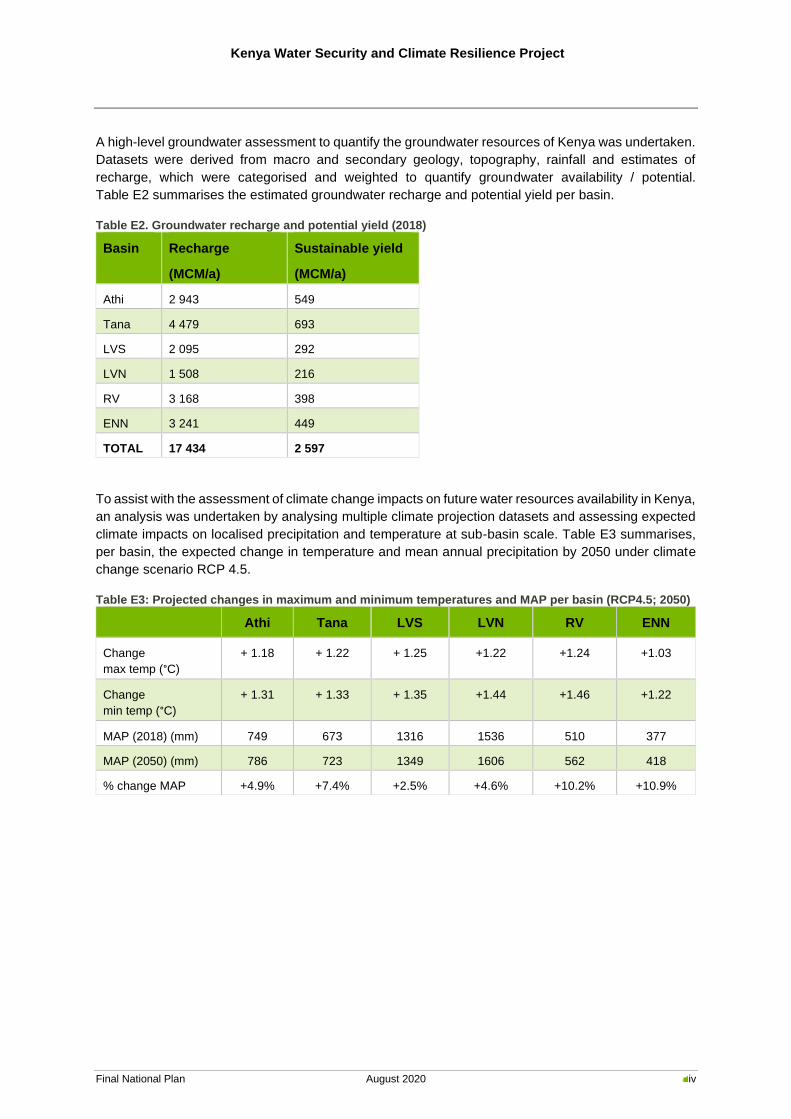
A high-level groundwater assessment to quantify the groundwater resources of Kenya was undertaken.
Datasets were derived from macro and secondary geology, topography, rainfall and estimates of
recharge, which were categorised and weighted to quantify groundwater availability / potential.
Table E2 summarises the estimated groundwater recharge and potential yield per basin.
Table E2. Groundwater recharge and potential yield (2018)
Basin Recharge
(MCM/a)
Sustainable yield
(MCM/a)
Athi 2 943 549
Tana 4 479 693
LVS 2 095 292
LVN 1 508 216
RV 3 168 398
ENN 3 241 449
TOTAL 17 434 2 597
To assist with the assessment of climate change impacts on future water resources availability in Kenya,
an analysis was undertaken by analysing multiple climate projection datasets and assessing expected
climate impacts on localised precipitation and temperature at sub-basin scale. Table E3 summarises,
per basin, the expected change in temperature and mean annual precipitation by 2050 under climate
change scenario RCP 4.5.
Table E3: Projected changes in maximum and minimum temperatures and MAP per basin (RCP4.5; 2050)
Athi Tana LVS LVN RV ENN
Change
max temp (°C)
+ 1.18 + 1.22 + 1.25 +1.22 +1.24 +1.03
Change
min temp (°C)
+ 1.31 + 1.33 + 1.35 +1.44 +1.46 +1.22
MAP (2018) (mm) 749 673 1316 1536 510 377
MAP (2050) (mm) 786 723 1349 1606 562 418
% change MAP +4.9% +7.4% +2.5% +4.6% +10.2% +10.9%
Kenya Water Security and Climate Resilience Project
Final National Plan August 2020 v
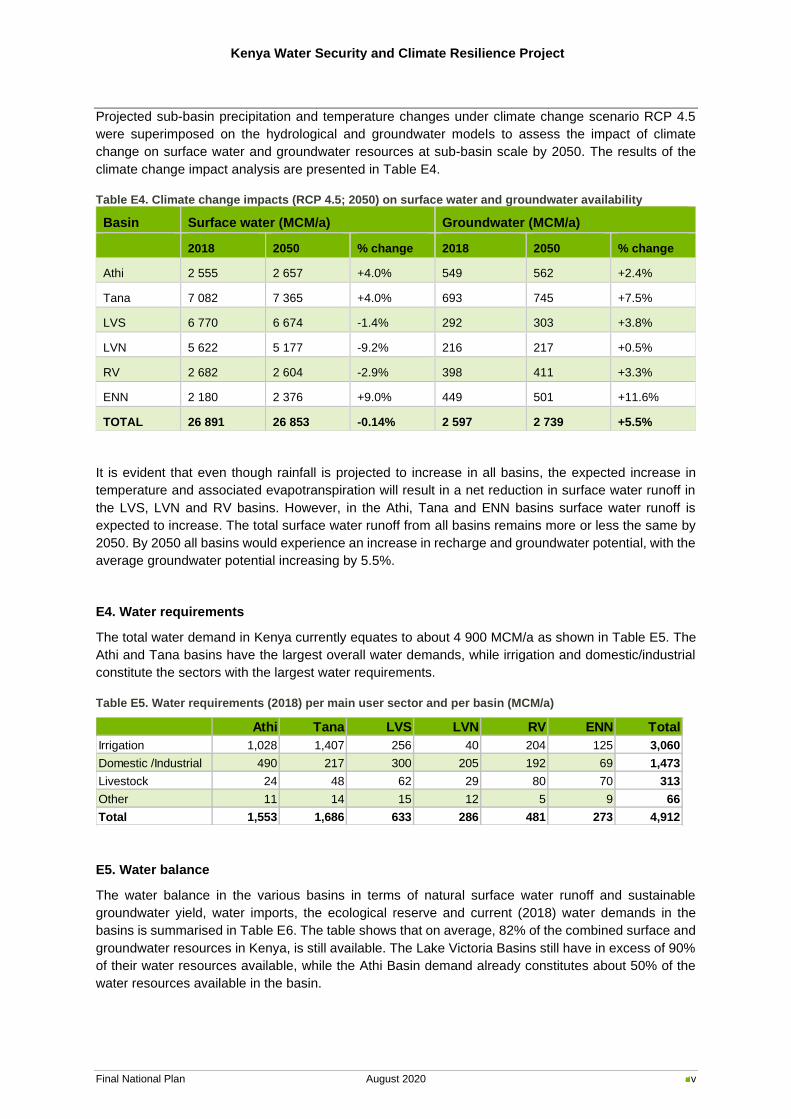
Projected sub-basin precipitation and temperature changes under climate change scenario RCP 4.5
were superimposed on the hydrological and groundwater models to assess the impact of climate
change on surface water and groundwater resources at sub-basin scale by 2050. The results of the
climate change impact analysis are presented in Table E4.
Table E4. Climate change impacts (RCP 4.5; 2050) on surface water and groundwater availability
Basin Surface water (MCM/a) Groundwater (MCM/a)
2018 2050 % change 2018 2050 % change
Athi 2 555 2 657 +4.0% 549 562 +2.4%
Tana 7 082 7 365 +4.0% 693 745 +7.5%
LVS 6 770 6 674 -1.4% 292 303 +3.8%
LVN 5 622 5 177 -9.2% 216 217 +0.5%
RV 2 682 2 604 -2.9% 398 411 +3.3%
ENN 2 180 2 376 +9.0% 449 501 +11.6%
TOTAL 26 891 26 853 -0.14% 2 597 2 739 +5.5%
It is evident that even though rainfall is projected to increase in all basins, the expected increase in
temperature and associated evapotranspiration will result in a net reduction in surface water runoff in
the LVS, LVN and RV basins. However, in the Athi, Tana and ENN basins surface water runoff is
expected to increase. The total surface water runoff from all basins remains more or less the same by
2050. By 2050 all basins would experience an increase in recharge and groundwater potential, with the
average groundwater potential increasing by 5.5%.
E4. Water requirements
The total water demand in Kenya currently equates to about 4 900 MCM/a as shown in Table E5. The
Athi and Tana basins have the largest overall water demands, while irrigation and domestic/industrial
constitute the sectors with the largest water requirements.
Table E5. Water requirements (2018) per main user sector and per basin (MCM/a)
E5. Water balance
The water balance in the various basins in terms of natural surface water runoff and sustainable
groundwater yield, water imports, the ecological reserve and current (2018) water demands in the
basins is summarised in Table E6. The table shows that on average, 82% of the combined surface and
groundwater resources in Kenya, is still available. The Lake Victoria Basins still have in excess of 90%
of their water resources available, while the Athi Basin demand already constitutes about 50% of the
water resources available in the basin.
Athi Tana LVS LVN RV ENN Total
Irrigation 1,028 1,407 256 40 204 125 3,060
Domestic /Industrial 490 217 300 205 192 69 1,473
Livestock 24 48 62 29 80 70 313
Other 11 14 15 12 5 9 66
Total 1,553 1,686 633 286 481 273 4,912
Kenya Water Security and Climate Resilience Project
Final National Plan August 2020 vi
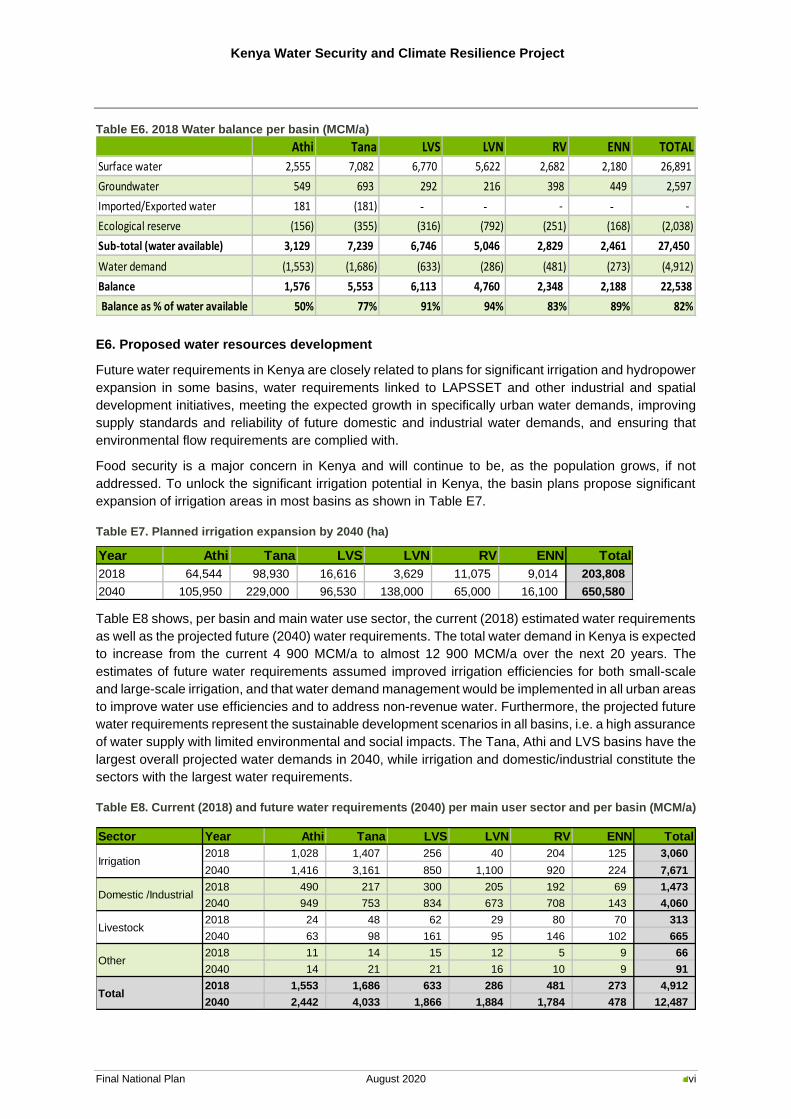
Table E6. 2018 Water balance per basin (MCM/a)
E6. Proposed water resources development
Future water requirements in Kenya are closely related to plans for significant irrigation and hydropower
expansion in some basins, water requirements linked to LAPSSET and other industrial and spatial
development initiatives, meeting the expected growth in specifically urban water demands, improving
supply standards and reliability of future domestic and industrial water demands, and ensuring that
environmental flow requirements are complied with.
Food security is a major concern in Kenya and will continue to be, as the population grows, if not
addressed. To unlock the significant irrigation potential in Kenya, the basin plans propose significant
expansion of irrigation areas in most basins as shown in Table E7.
Table E7. Planned irrigation expansion by 2040 (ha)
Table E8 shows, per basin and main water use sector, the current (2018) estimated water requirements
as well as the projected future (2040) water requirements. The total water demand in Kenya is expected
to increase from the current 4 900 MCM/a to almost 12 900 MCM/a over the next 20 years. The
estimates of future water requirements assumed improved irrigation efficiencies for both small-scale
and large-scale irrigation, and that water demand management would be implemented in all urban areas
to improve water use efficiencies and to address non-revenue water. Furthermore, the projected future
water requirements represent the sustainable development scenarios in all basins, i.e. a high assurance
of water supply with limited environmental and social impacts. The Tana, Athi and LVS basins have the
largest overall projected water demands in 2040, while irrigation and domestic/industrial constitute the
sectors with the largest water requirements.
Table E8. Current (2018) and future water requirements (2040) per main user sector and per basin (MCM/a)
Athi Tana LVS LVN RV ENN TOTAL
Surface water 2,555 7,082 6,770 5,622 2,682 2,180 26,891
Groundwater 549 693 292 216 398 449 2,597
Imported/Exported water 181 (181) - - - - -
Ecological reserve (156) (355) (316) (792) (251) (168) (2,038)
Sub-total (water available) 3,129 7,239 6,746 5,046 2,829 2,461 27,450
Water demand (1,553) (1,686) (633) (286) (481) (273) (4,912)
Balance 1,576 5,553 6,113 4,760 2,348 2,188 22,538
Balance as % of water available 50% 77% 91% 94% 83% 89% 82%
Year Athi Tana LVS LVN RV ENN Total
2018 64,544 98,930 16,616 3,629 11,075 9,014 203,808
2040 105,950 229,000 96,530 138,000 65,000 16,100 650,580
Sector Year Athi Tana LVS LVN RV ENN Total
2018 1,028 1,407 256 40 204 125 3,060
2040 1,416 3,161 850 1,100 920 224 7,671
2018 490 217 300 205 192 69 1,473
2040 949 753 834 673 708 143 4,060
2018 24 48 62 29 80 70 313
2040 63 98 161 95 146 102 665
2018 11 14 15 12 5 9 66
2040 14 21 21 16 10 9 91
2018 1,553 1,686 633 286 481 273 4,912
2040 2,442 4,033 1,866 1,884 1,784 478 12,487
Irrigation
Livestock
Domestic /Industrial
Other
Total
Kenya Water Security and Climate Resilience Project
Final National Plan August 2020 vii
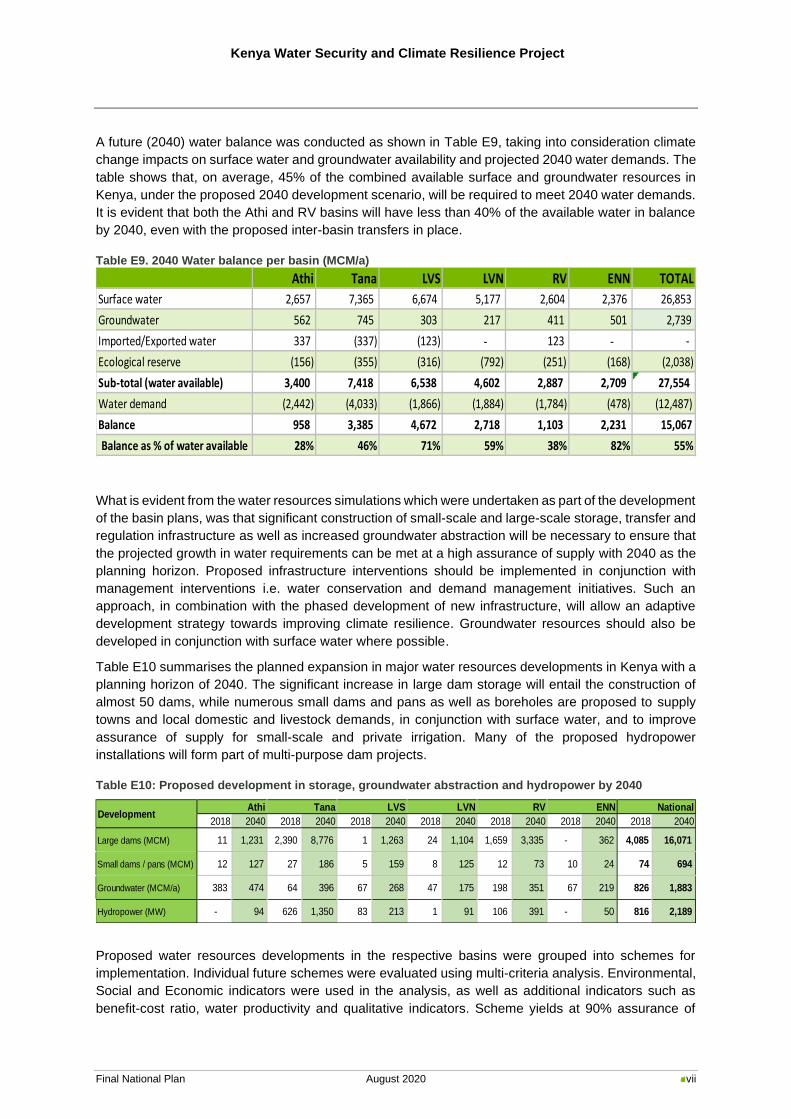
A future (2040) water balance was conducted as shown in Table E9, taking into consideration climate
change impacts on surface water and groundwater availability and projected 2040 water demands. The
table shows that, on average, 45% of the combined available surface and groundwater resources in
Kenya, under the proposed 2040 development scenario, will be required to meet 2040 water demands.
It is evident that both the Athi and RV basins will have less than 40% of the available water in balance
by 2040, even with the proposed inter-basin transfers in place.
Table E9. 2040 Water balance per basin (MCM/a)
What is evident from the water resources simulations which were undertaken as part of the development
of the basin plans, was that significant construction of small-scale and large-scale storage, transfer and
regulation infrastructure as well as increased groundwater abstraction will be necessary to ensure that
the projected growth in water requirements can be met at a high assurance of supply with 2040 as the
planning horizon. Proposed infrastructure interventions should be implemented in conjunction with
management interventions i.e. water conservation and demand management initiatives. Such an
approach, in combination with the phased development of new infrastructure, will allow an adaptive
development strategy towards improving climate resilience. Groundwater resources should also be
developed in conjunction with surface water where possible.
Table E10 summarises the planned expansion in major water resources developments in Kenya with a
planning horizon of 2040. The significant increase in large dam storage will entail the construction of
almost 50 dams, while numerous small dams and pans as well as boreholes are proposed to supply
towns and local domestic and livestock demands, in conjunction with surface water, and to improve
assurance of supply for small-scale and private irrigation. Many of the proposed hydropower
installations will form part of multi-purpose dam projects.
Table E10: Proposed development in storage, groundwater abstraction and hydropower by 2040
Proposed water resources developments in the respective basins were grouped into schemes for
implementation. Individual future schemes were evaluated using multi-criteria analysis. Environmental,
Social and Economic indicators were used in the analysis, as well as additional indicators such as
benefit-cost ratio, water productivity and qualitative indicators. Scheme yields at 90% assurance of
Athi Tana LVS LVN RV ENN TOTAL
Surface water 2,657 7,365 6,674 5,177 2,604 2,376 26,853
Groundwater 562 745 303 217 411 501 2,739
Imported/Exported water 337 (337) (123) - 123 - -
Ecological reserve (156) (355) (316) (792) (251) (168) (2,038)
Sub-total (water available) 3,400 7,418 6,538 4,602 2,887 2,709 27,554
Water demand (2,442) (4,033) (1,866) (1,884) (1,784) (478) (12,487)
Balance 958 3,385 4,672 2,718 1,103 2,231 15,067
Balance as % of water available 28% 46% 71% 59% 38% 82% 55%
2018 2040 2018 2040 2018 2040 2018 2040 2018 2040 2018 2040 2018 2040
Large dams (MCM) 11 1,231 2,390 8,776 1 1,263 24 1,104 1,659 3,335 - 362 4,085 16,071
Small dams / pans (MCM) 12 127 27 186 5 159 8 125 12 73 10 24 74 694
Groundwater (MCM/a) 383 474 64 396 67 268 47 175 198 351 67 219 826 1,883
Hydropower (MW) - 94 626 1,350 83 213 1 91 106 391 - 50 816 2,189
ENN NationalDevelopment
Athi Tana LVS LVN RV
Kenya Water Security and Climate Resilience Project
Final National Plan August 2020 viii
supply were incorporated in the benefit-cost analysis to estimate potential future water revenue streams.
The outcome of the multi-criteria analysis provided a ranking of future schemes. Based on the ranking
and taking into consideration schemes where implementation is imminent as well as current and future
levels of water supply deficits based on projected growth curves in water demand, an investment
programme for each basin was developed, which provides information on the timing and phasing of
schemes and associated capital, operations and maintenance expenditure from 2020 to 2040.
Investment plans for the basins are presented in the respective basin plans.
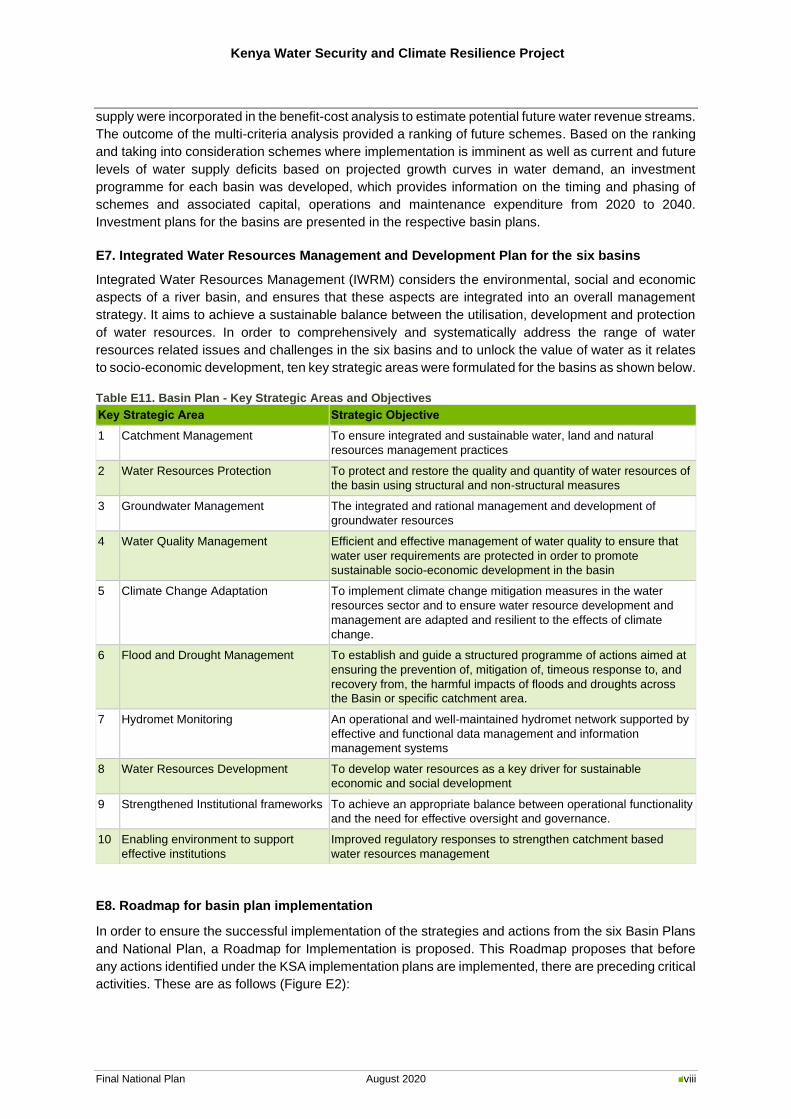
E7. Integrated Water Resources Management and Development Plan for the six basins
Integrated Water Resources Management (IWRM) considers the environmental, social and economic
aspects of a river basin, and ensures that these aspects are integrated into an overall management
strategy. It aims to achieve a sustainable balance between the utilisation, development and protection
of water resources. In order to comprehensively and systematically address the range of water
resources related issues and challenges in the six basins and to unlock the value of water as it relates
to socio-economic development, ten key strategic areas were formulated for the basins as shown below.
Table E11. Basin Plan - Key Strategic Areas and Objectives
Key Strategic Area Strategic Objective
1 Catchment Management To ensure integrated and sustainable water, land and natural
resources management practices
2 Water Resources Protection To protect and restore the quality and quantity of water resources of
the basin using structural and non-structural measures
3 Groundwater Management The integrated and rational management and development of
groundwater resources
4 Water Quality Management Efficient and effective management of water quality to ensure that
water user requirements are protected in order to promote
sustainable socio-economic development in the basin
5 Climate Change Adaptation To implement climate change mitigation measures in the water
resources sector and to ensure water resource development and
management are adapted and resilient to the effects of climate
change.
6 Flood and Drought Management To establish and guide a structured programme of actions aimed at
ensuring the prevention of, mitigation of, timeous response to, and
recovery from, the harmful impacts of floods and droughts across
the Basin or specific catchment area.
7 Hydromet Monitoring An operational and well-maintained hydromet network supported by
effective and functional data management and information
management systems
8 Water Resources Development To develop water resources as a key driver for sustainable
economic and social development
9 Strengthened Institutional frameworks To achieve an appropriate balance between operational functionality
and the need for effective oversight and governance.
10 Enabling environment to support
effective institutions
Improved regulatory responses to strengthen catchment based
water resources management
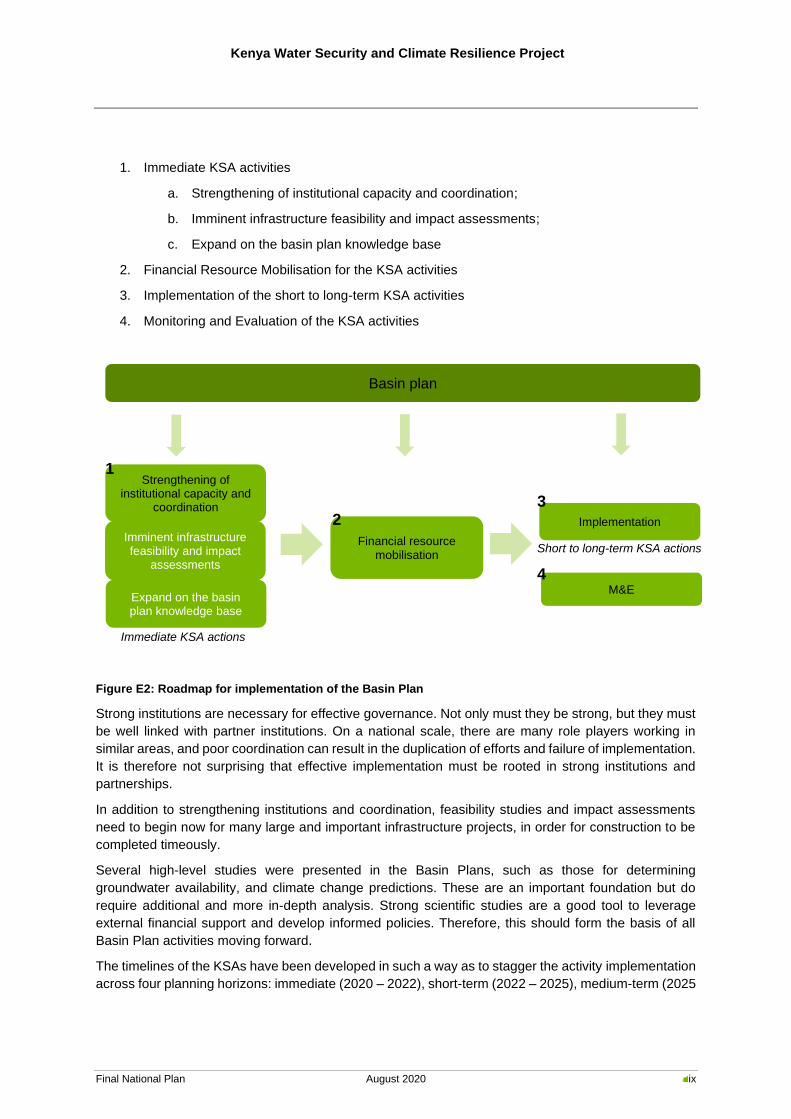
E8. Roadmap for basin plan implementation
In order to ensure the successful implementation of the strategies and actions from the six Basin Plans
and National Plan, a Roadmap for Implementation is proposed. This Roadmap proposes that before
any actions identified under the KSA implementation plans are implemented, there are preceding critical
activities. These are as follows (Figure E2):
Kenya Water Security and Climate Resilience Project
Final National Plan August 2020 ix
1. Immediate KSA activities
a. Strengthening of institutional capacity and coordination;
b. Imminent infrastructure feasibility and impact assessments;
c. Expand on the basin plan knowledge base
2. Financial Resource Mobilisation for the KSA activities
3. Implementation of the short to long-term KSA activities
4. Monitoring and Evaluation of the KSA activities
Figure E2: Roadmap for implementation of the Basin Plan
Strong institutions are necessary for effective governance. Not only must they be strong, but they must
be well linked with partner institutions. On a national scale, there are many role players working in
similar areas, and poor coordination can result in the duplication of efforts and failure of implementation.
It is therefore not surprising that effective implementation must be rooted in strong institutions and
partnerships.
In addition to strengthening institutions and coordination, feasibility studies and impact assessments
need to begin now for many large and important infrastructure projects, in order for construction to be
completed timeously.
Several high-level studies were presented in the Basin Plans, such as those for determining
groundwater availability, and climate change predictions. These are an important foundation but do
require additional and more in-depth analysis. Strong scientific studies are a good tool to leverage
external financial support and develop informed policies. Therefore, this should form the basis of all
Basin Plan activities moving forward.
The timelines of the KSAs have been developed in such a way as to stagger the activity implementation
across four planning horizons: immediate (2020 – 2022), short-term (2022 – 2025), medium-term (2025
Short to long-term KSA actions
M&E
Strengthening of institutional capacity and
coordination
Financial resource mobilisation
Implementation
1
2 3
4
Basin plan
Immediate KSA actions
Imminent infrastructure feasibility and impact
assessments
Expand on the basin plan knowledge base
Kenya Water Security and Climate Resilience Project
Final National Plan August 2020 x
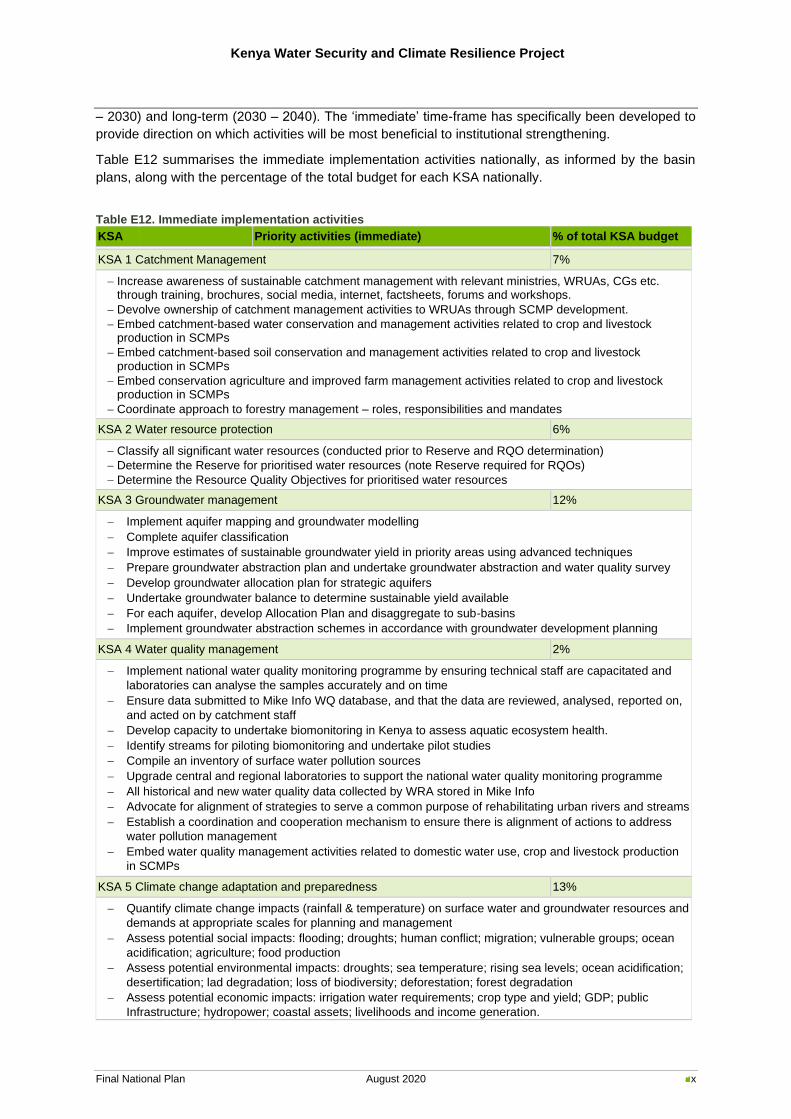
– 2030) and long-term (2030 – 2040). The ‘immediate’ time-frame has specifically been developed to
provide direction on which activities will be most beneficial to institutional strengthening.
Table E12 summarises the immediate implementation activities nationally, as informed by the basin
plans, along with the percentage of the total budget for each KSA nationally.
Table E12. Immediate implementation activities
KSA Priority activities (immediate) % of total KSA budget
KSA 1 Catchment Management 7%
− Increase awareness of sustainable catchment management with relevant ministries, WRUAs, CGs etc. through training, brochures, social media, internet, factsheets, forums and workshops.
− Devolve ownership of catchment management activities to WRUAs through SCMP development.
− Embed catchment-based water conservation and management activities related to crop and livestock production in SCMPs
− Embed catchment-based soil conservation and management activities related to crop and livestock production in SCMPs
− Embed conservation agriculture and improved farm management activities related to crop and livestock production in SCMPs
− Coordinate approach to forestry management – roles, responsibilities and mandates
KSA 2 Water resource protection 6%
− Classify all significant water resources (conducted prior to Reserve and RQO determination)
− Determine the Reserve for prioritised water resources (note Reserve required for RQOs)
− Determine the Resource Quality Objectives for prioritised water resources
KSA 3 Groundwater management 12%
− Implement aquifer mapping and groundwater modelling
− Complete aquifer classification
− Improve estimates of sustainable groundwater yield in priority areas using advanced techniques
− Prepare groundwater abstraction plan and undertake groundwater abstraction and water quality survey
− Develop groundwater allocation plan for strategic aquifers
− Undertake groundwater balance to determine sustainable yield available
− For each aquifer, develop Allocation Plan and disaggregate to sub-basins
− Implement groundwater abstraction schemes in accordance with groundwater development planning
KSA 4 Water quality management 2%
− Implement national water quality monitoring programme by ensuring technical staff are capacitated and
laboratories can analyse the samples accurately and on time
− Ensure data submitted to Mike Info WQ database, and that the data are reviewed, analysed, reported on,
and acted on by catchment staff
− Develop capacity to undertake biomonitoring in Kenya to assess aquatic ecosystem health.
− Identify streams for piloting biomonitoring and undertake pilot studies
− Compile an inventory of surface water pollution sources
− Upgrade central and regional laboratories to support the national water quality monitoring programme
− All historical and new water quality data collected by WRA stored in Mike Info
− Advocate for alignment of strategies to serve a common purpose of rehabilitating urban rivers and streams
− Establish a coordination and cooperation mechanism to ensure there is alignment of actions to address
water pollution management
− Embed water quality management activities related to domestic water use, crop and livestock production
in SCMPs
KSA 5 Climate change adaptation and preparedness 13%
− Quantify climate change impacts (rainfall & temperature) on surface water and groundwater resources and
demands at appropriate scales for planning and management
− Assess potential social impacts: flooding; droughts; human conflict; migration; vulnerable groups; ocean
acidification; agriculture; food production
− Assess potential environmental impacts: droughts; sea temperature; rising sea levels; ocean acidification;
desertification; lad degradation; loss of biodiversity; deforestation; forest degradation
− Assess potential economic impacts: irrigation water requirements; crop type and yield; GDP; public
Infrastructure; hydropower; coastal assets; livelihoods and income generation.
Kenya Water Security and Climate Resilience Project
Final National Plan August 2020 xi
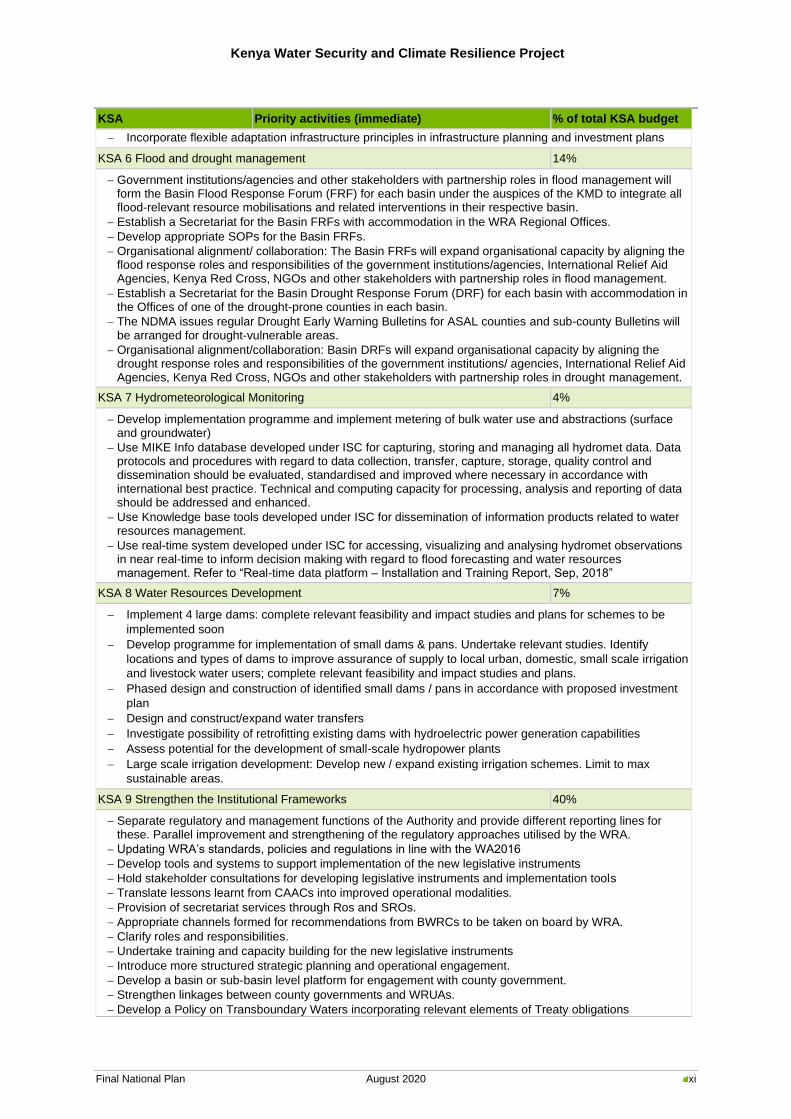
KSA Priority activities (immediate) % of total KSA budget
− Incorporate flexible adaptation infrastructure principles in infrastructure planning and investment plans
KSA 6 Flood and drought management 14%
− Government institutions/agencies and other stakeholders with partnership roles in flood management will form the Basin Flood Response Forum (FRF) for each basin under the auspices of the KMD to integrate all flood-relevant resource mobilisations and related interventions in their respective basin.
− Establish a Secretariat for the Basin FRFs with accommodation in the WRA Regional Offices.
− Develop appropriate SOPs for the Basin FRFs.
− Organisational alignment/ collaboration: The Basin FRFs will expand organisational capacity by aligning the flood response roles and responsibilities of the government institutions/agencies, International Relief Aid Agencies, Kenya Red Cross, NGOs and other stakeholders with partnership roles in flood management.
− Establish a Secretariat for the Basin Drought Response Forum (DRF) for each basin with accommodation in the Offices of one of the drought-prone counties in each basin.
− The NDMA issues regular Drought Early Warning Bulletins for ASAL counties and sub-county Bulletins will be arranged for drought-vulnerable areas.
− Organisational alignment/collaboration: Basin DRFs will expand organisational capacity by aligning the drought response roles and responsibilities of the government institutions/ agencies, International Relief Aid Agencies, Kenya Red Cross, NGOs and other stakeholders with partnership roles in drought management.
KSA 7 Hydrometeorological Monitoring 4%
− Develop implementation programme and implement metering of bulk water use and abstractions (surface and groundwater)
− Use MIKE Info database developed under ISC for capturing, storing and managing all hydromet data. Data protocols and procedures with regard to data collection, transfer, capture, storage, quality control and dissemination should be evaluated, standardised and improved where necessary in accordance with international best practice. Technical and computing capacity for processing, analysis and reporting of data should be addressed and enhanced.
− Use Knowledge base tools developed under ISC for dissemination of information products related to water resources management.
− Use real-time system developed under ISC for accessing, visualizing and analysing hydromet observations in near real-time to inform decision making with regard to flood forecasting and water resources management. Refer to “Real-time data platform – Installation and Training Report, Sep, 2018”
KSA 8 Water Resources Development 7%
− Implement 4 large dams: complete relevant feasibility and impact studies and plans for schemes to be
implemented soon
− Develop programme for implementation of small dams & pans. Undertake relevant studies. Identify
locations and types of dams to improve assurance of supply to local urban, domestic, small scale irrigation
and livestock water users; complete relevant feasibility and impact studies and plans.
− Phased design and construction of identified small dams / pans in accordance with proposed investment
plan
− Design and construct/expand water transfers
− Investigate possibility of retrofitting existing dams with hydroelectric power generation capabilities
− Assess potential for the development of small-scale hydropower plants
− Large scale irrigation development: Develop new / expand existing irrigation schemes. Limit to max
sustainable areas.
KSA 9 Strengthen the Institutional Frameworks 40%
− Separate regulatory and management functions of the Authority and provide different reporting lines for these. Parallel improvement and strengthening of the regulatory approaches utilised by the WRA.
− Updating WRA’s standards, policies and regulations in line with the WA2016
− Develop tools and systems to support implementation of the new legislative instruments
− Hold stakeholder consultations for developing legislative instruments and implementation tools
− Translate lessons learnt from CAACs into improved operational modalities.
− Provision of secretariat services through Ros and SROs.
− Appropriate channels formed for recommendations from BWRCs to be taken on board by WRA.
− Clarify roles and responsibilities.
− Undertake training and capacity building for the new legislative instruments
− Introduce more structured strategic planning and operational engagement.
− Develop a basin or sub-basin level platform for engagement with county government.
− Strengthen linkages between county governments and WRUAs.
− Develop a Policy on Transboundary Waters incorporating relevant elements of Treaty obligations
Kenya Water Security and Climate Resilience Project
Final National Plan August 2020 xii
KSA Priority activities (immediate) % of total KSA budget
− Updating WRA’s standards, policies and regulations in line with the WA2016
− Complete the development of a National Policy for the Protection of Groundwater with all key stakeholders involved.
− Review cross-sector policies, legislation and regulations relating to wastewater; streamline/clarify the roles of the Line Ministries, WRA, NEMA, the Counties and WSPs in relation to wastewater, to eliminate the dual mandates that the WRA and NEMA currently operate under in relation to ‘polluter pays’ and these agencies’ revenue
− Develop / Update Guidelines on:
− Relevant Codes of Practice for Water Resources Planning and Management
− Develop / Update National Manuals relevant to WRPM
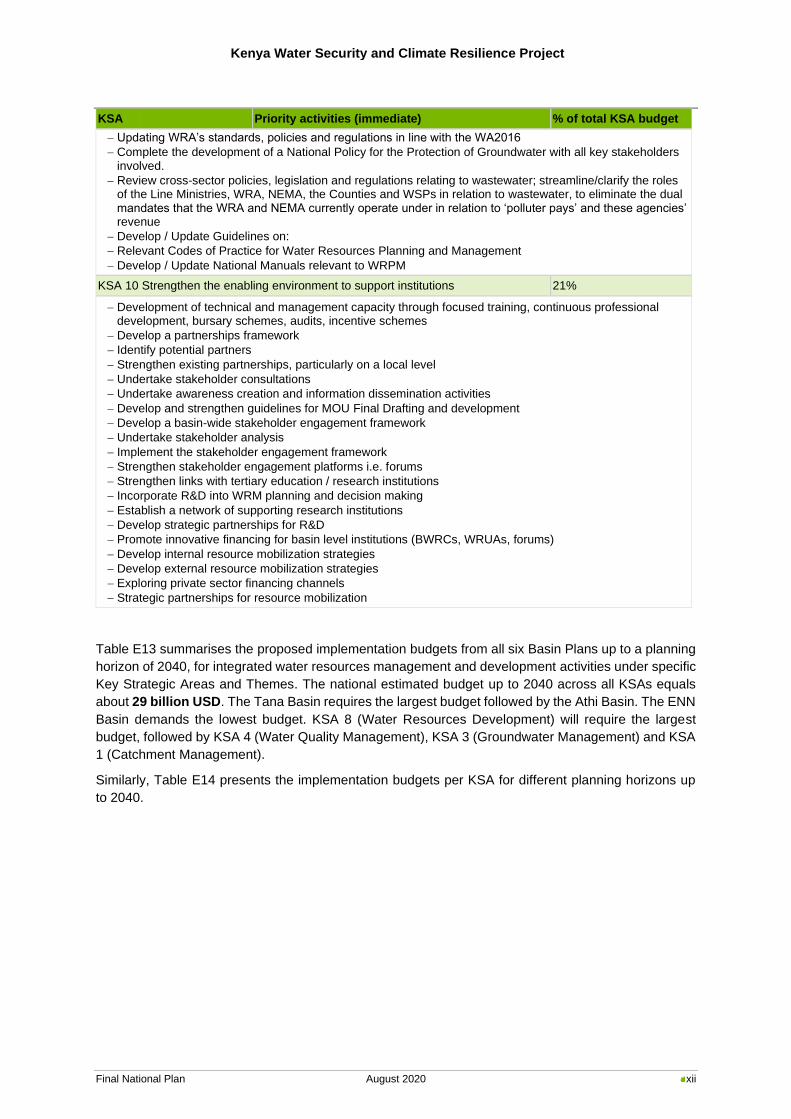
KSA 10 Strengthen the enabling environment to support institutions 21%
− Development of technical and management capacity through focused training, continuous professional development, bursary schemes, audits, incentive schemes
− Develop a partnerships framework
− Identify potential partners
− Strengthen existing partnerships, particularly on a local level
− Undertake stakeholder consultations
− Undertake awareness creation and information dissemination activities
− Develop and strengthen guidelines for MOU Final Drafting and development
− Develop a basin-wide stakeholder engagement framework
− Undertake stakeholder analysis
− Implement the stakeholder engagement framework
− Strengthen stakeholder engagement platforms i.e. forums
− Strengthen links with tertiary education / research institutions
− Incorporate R&D into WRM planning and decision making
− Establish a network of supporting research institutions
− Develop strategic partnerships for R&D
− Promote innovative financing for basin level institutions (BWRCs, WRUAs, forums)
− Develop internal resource mobilization strategies
− Develop external resource mobilization strategies
− Exploring private sector financing channels
− Strategic partnerships for resource mobilization
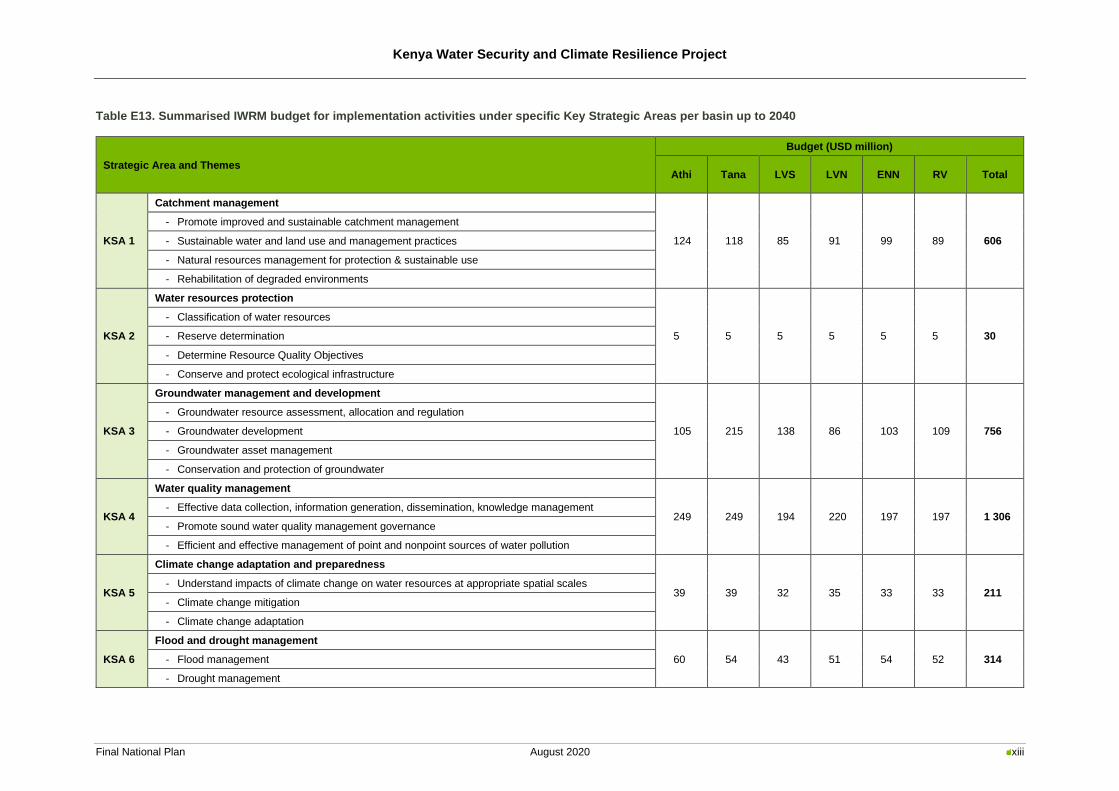
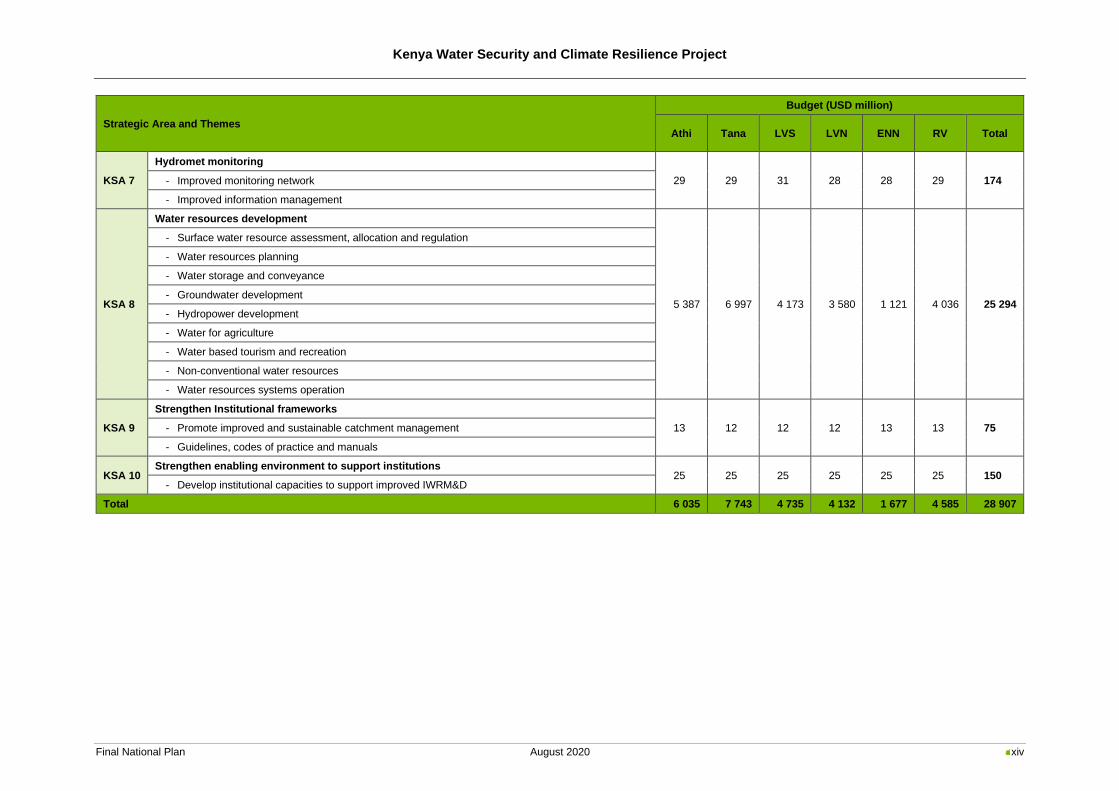
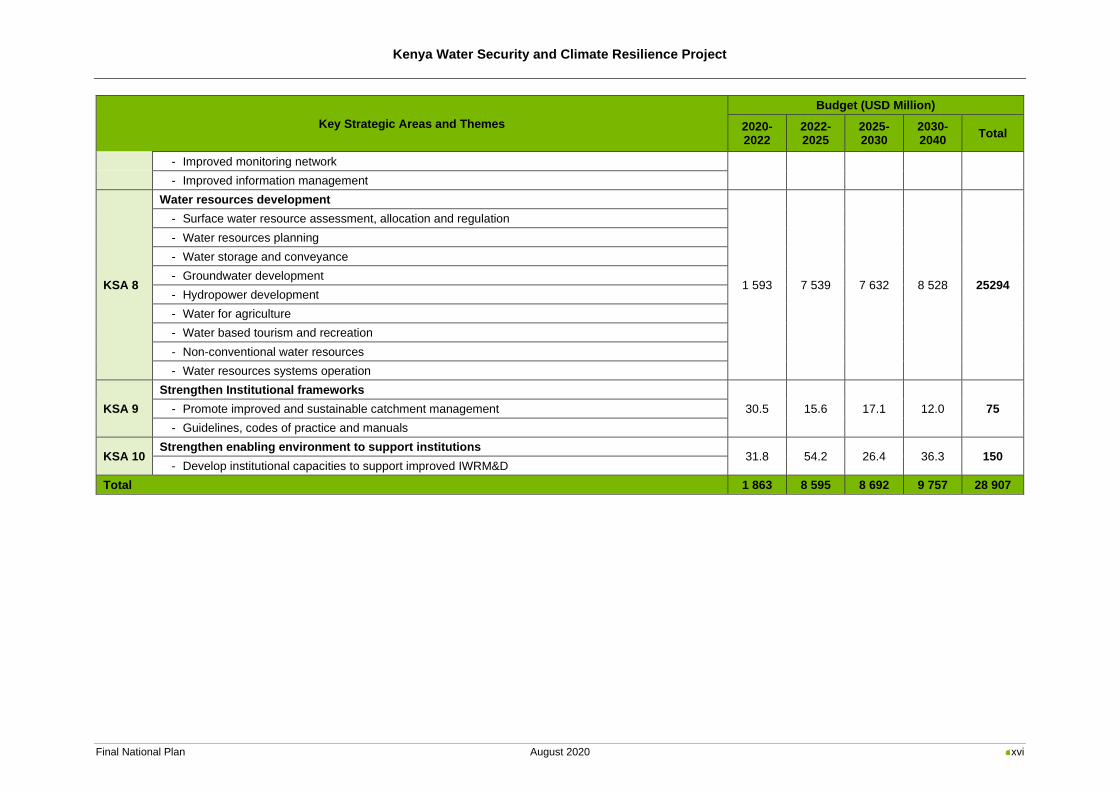
Table E13 summarises the proposed implementation budgets from all six Basin Plans up to a planning
horizon of 2040, for integrated water resources management and development activities under specific
Key Strategic Areas and Themes. The national estimated budget up to 2040 across all KSAs equals
about 29 billion USD. The Tana Basin requires the largest budget followed by the Athi Basin. The ENN
Basin demands the lowest budget. KSA 8 (Water Resources Development) will require the largest
budget, followed by KSA 4 (Water Quality Management), KSA 3 (Groundwater Management) and KSA
1 (Catchment Management).
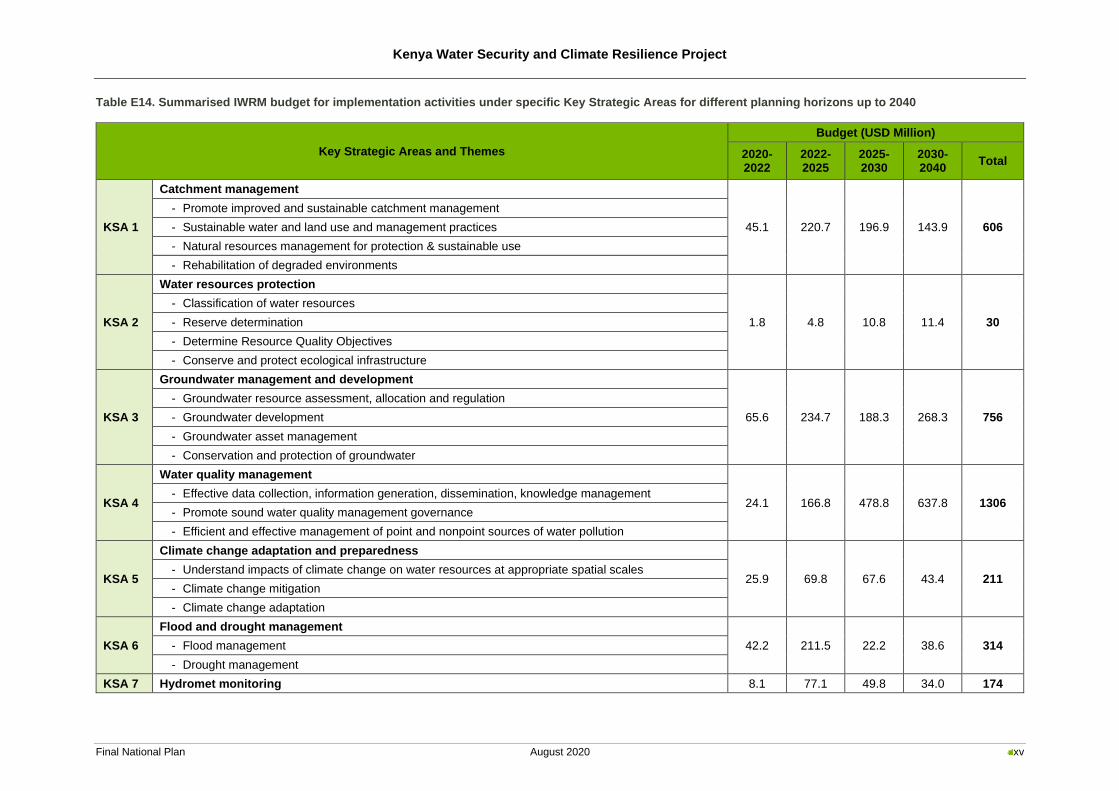
Similarly, Table E14 presents the implementation budgets per KSA for different planning horizons up
to 2040.
Kenya Water Security and Climate Resilience Project
Final National Plan August 2020 xiii
Table E13. Summarised IWRM budget for implementation activities under specific Key Strategic Areas per basin up to 2040
Strategic Area and Themes
Budget (USD million)
Athi Tana LVS LVN ENN RV Total
KSA 1
Catchment management
124 118 85 91 99 89 606
- Promote improved and sustainable catchment management
- Sustainable water and land use and management practices
- Natural resources management for protection & sustainable use
- Rehabilitation of degraded environments
KSA 2
Water resources protection
5 5 5 5 5 5 30
- Classification of water resources
- Reserve determination
- Determine Resource Quality Objectives
- Conserve and protect ecological infrastructure
KSA 3
Groundwater management and development
105 215 138 86 103 109 756
- Groundwater resource assessment, allocation and regulation
- Groundwater development
- Groundwater asset management
- Conservation and protection of groundwater
KSA 4
Water quality management
249 249 194 220 197 197 1 306 - Effective data collection, information generation, dissemination, knowledge management
- Promote sound water quality management governance
- Efficient and effective management of point and nonpoint sources of water pollution
KSA 5
Climate change adaptation and preparedness
39 39 32 35 33 33 211 - Understand impacts of climate change on water resources at appropriate spatial scales
- Climate change mitigation
- Climate change adaptation
KSA 6
Flood and drought management
60 54 43 51 54 52 314 - Flood management
- Drought management
Kenya Water Security and Climate Resilience Project
Final National Plan August 2020 xiv
Strategic Area and Themes
Budget (USD million)
Athi Tana LVS LVN ENN RV Total
KSA 7
Hydromet monitoring
29 29 31 28 28 29 174 - Improved monitoring network
- Improved information management
KSA 8
Water resources development
5 387 6 997 4 173 3 580 1 121 4 036 25 294
- Surface water resource assessment, allocation and regulation
- Water resources planning
- Water storage and conveyance
- Groundwater development
- Hydropower development
- Water for agriculture
- Water based tourism and recreation
- Non-conventional water resources
- Water resources systems operation
KSA 9
Strengthen Institutional frameworks
13 12 12 12 13 13 75 - Promote improved and sustainable catchment management
- Guidelines, codes of practice and manuals
KSA 10 Strengthen enabling environment to support institutions
25 25 25 25 25 25 150 - Develop institutional capacities to support improved IWRM&D
Total 6 035 7 743 4 735 4 132 1 677 4 585 28 907
Kenya Water Security and Climate Resilience Project
Final National Plan August 2020 xv
Table E14. Summarised IWRM budget for implementation activities under specific Key Strategic Areas for different planning horizons up to 2040
Key Strategic Areas and Themes
Budget (USD Million)
2020-2022
2022-2025
2025-2030
2030-2040
Total
KSA 1
Catchment management
45.1 220.7 196.9 143.9 606
- Promote improved and sustainable catchment management
- Sustainable water and land use and management practices
- Natural resources management for protection & sustainable use
- Rehabilitation of degraded environments
KSA 2
Water resources protection
1.8 4.8 10.8 11.4 30
- Classification of water resources
- Reserve determination
- Determine Resource Quality Objectives
- Conserve and protect ecological infrastructure
KSA 3
Groundwater management and development
65.6 234.7 188.3 268.3 756
- Groundwater resource assessment, allocation and regulation
- Groundwater development
- Groundwater asset management
- Conservation and protection of groundwater
KSA 4
Water quality management
24.1 166.8 478.8 637.8 1306 - Effective data collection, information generation, dissemination, knowledge management
- Promote sound water quality management governance
- Efficient and effective management of point and nonpoint sources of water pollution
KSA 5
Climate change adaptation and preparedness
25.9 69.8 67.6 43.4 211 - Understand impacts of climate change on water resources at appropriate spatial scales
- Climate change mitigation
- Climate change adaptation
KSA 6
Flood and drought management
42.2 211.5 22.2 38.6 314 - Flood management
- Drought management
KSA 7 Hydromet monitoring 8.1 77.1 49.8 34.0 174
Kenya Water Security and Climate Resilience Project
Final National Plan August 2020 xvi
Key Strategic Areas and Themes
Budget (USD Million)
2020-2022
2022-2025
2025-2030
2030-2040
Total
- Improved monitoring network
- Improved information management
KSA 8
Water resources development
1 593 7 539 7 632 8 528 25294
- Surface water resource assessment, allocation and regulation
- Water resources planning
- Water storage and conveyance
- Groundwater development
- Hydropower development
- Water for agriculture
- Water based tourism and recreation
- Non-conventional water resources
- Water resources systems operation
KSA 9
Strengthen Institutional frameworks
30.5 15.6 17.1 12.0 75 - Promote improved and sustainable catchment management
- Guidelines, codes of practice and manuals
KSA 10 Strengthen enabling environment to support institutions
31.8 54.2 26.4 36.3 150 - Develop institutional capacities to support improved IWRM&D
Total 1 863 8 595 8 692 9 757 28 907
Kenya Water Security and Climate Resilience Project
Final National Plan August 2020 xvii
Contents 1 Introduction ...................................................................................................................................... 2
1.1 Background and context............................................................................................................. 2
1.2 Objectives of the National Plan .................................................................................................. 3
1.3 Structure of the National Plan .................................................................................................... 3
2 National overview ............................................................................................................................ 6
2.1 Introduction ................................................................................................................................. 6
2.2 Bio-physical ................................................................................................................................ 9
2.2.1 Physiography ................................................................................................................... 9
2.2.2 Climate ........................................................................................................................... 32
2.2.3 Environment ................................................................................................................... 37
2.2.4 Land cover and land use ................................................................................................ 45
2.3 Socio-economic ........................................................................................................................ 48
2.3.1 Demographics ................................................................................................................ 48
2.3.2 Economy ........................................................................................................................ 49
2.3.3 Standard of living ........................................................................................................... 51
2.4 Water resources and development .......................................................................................... 54
2.4.1 Surface water resources ................................................................................................ 54
2.4.2 Groundwater resources ................................................................................................. 57
2.4.3 Impacts of climate change on water resources availability ............................................ 60
2.4.4 Current water requirements ........................................................................................... 61
2.4.5 Current water resources developments ......................................................................... 62
2.4.6 Water balance ................................................................................................................ 69
2.4.7 Surface water allocations ............................................................................................... 71
2.4.8 Water quality .................................................................................................................. 71
2.4.9 Current hydro-meteorological monitoring network ......................................................... 73
3 Institutional overview .................................................................................................................... 79
3.1 Legislative, Policy and Institutional Framework ....................................................................... 79
3.1.1 Introduction .................................................................................................................... 79
3.1.2 National policies ............................................................................................................. 79
3.1.3 Legislation ...................................................................................................................... 85
3.1.4 National institutions ........................................................................................................ 89
3.1.5 Basin and sub-basin institutions .................................................................................... 91
3.1.6 Regional and local-level institutions ............................................................................... 95
3.1.7 County governments ...................................................................................................... 96
3.2 Existing Development Plans and Partners ............................................................................... 97
3.2.1 Introduction .................................................................................................................... 97
3.2.2 National Water Master Plan 2030 .................................................................................. 97
3.2.3 Sub-catchment management plans ............................................................................... 97
3.2.4 Catchment management strategies ............................................................................... 98
3.2.5 County integrated development plans ........................................................................... 98
3.2.6 Other .............................................................................................................................. 98
Kenya Water Security and Climate Resilience Project
Final National Plan August 2020 xviii
4 Key Issues, Challenges and Trends .......................................................................................... 101
4.1 Introduction ............................................................................................................................. 101
4.2 Stakeholder engagement ....................................................................................................... 101
4.3 Biophysical issues .................................................................................................................. 102
4.3.1 Environmental Issues ................................................................................................... 102
4.3.2 Climate issues .............................................................................................................. 110
4.4 Socio-economic issues ........................................................................................................... 115
4.4.1 Demographics .............................................................................................................. 115
4.4.2 Economy ...................................................................................................................... 117
4.4.3 Standard of living ......................................................................................................... 119
4.5 Water resources availability, management and development issues .................................... 123
4.5.1 Surface water resources .............................................................................................. 123
4.5.2 Groundwater resources ............................................................................................... 127
4.5.3 Inadequate water resources infrastructure .................................................................. 132
4.5.4 Hydro-meteorological monitoring network ................................................................... 133
4.5.5 Water allocation and use ............................................................................................. 133
4.6 Institutional issues .................................................................................................................. 134
4.6.1 Institutional arrangements ............................................................................................ 134
4.6.2 Enabling environment .................................................................................................. 138
4.6.3 Transboundary and trans-county issues ...................................................................... 142
5 Key Strategic Areas ..................................................................................................................... 145
5.1 Introduction ............................................................................................................................. 145
5.2 Catchment Management ........................................................................................................ 147
5.2.1 Introduction .................................................................................................................. 147
5.2.2 Strategy ........................................................................................................................ 147
5.3 Water Resources Protection .................................................................................................. 155
5.3.1 Introduction .................................................................................................................. 155
5.3.2 Strategy ........................................................................................................................ 156
5.4 Groundwater Management..................................................................................................... 157
5.4.1 Introduction .................................................................................................................. 157
5.4.2 Strategy ........................................................................................................................ 158
5.5 Water Quality Management.................................................................................................... 163
5.5.1 Introduction .................................................................................................................. 163
5.5.2 Strategy ........................................................................................................................ 164
5.6 Climate Change Adaptation ................................................................................................... 169
5.6.1 Introduction .................................................................................................................. 169
5.6.2 Strategy ........................................................................................................................ 170
5.7 Flood and Drought Management ........................................................................................... 172
5.7.1 Introduction .................................................................................................................. 172
5.7.2 Strategy ........................................................................................................................ 172
5.8 Hydro-meteorological Monitoring ........................................................................................... 179
5.8.1 Introduction .................................................................................................................. 179
5.8.2 Strategy ........................................................................................................................ 179
5.9 Water Resources Development ............................................................................................. 181
5.9.1 Introduction .................................................................................................................. 181
5.9.2 Strategy ........................................................................................................................ 181
Kenya Water Security and Climate Resilience Project
Final National Plan August 2020 xix
5.10 Institutional Strengthening and Enabling Environment .......................................................... 184
5.10.1 Introduction .................................................................................................................. 184
5.10.2 Strategy ........................................................................................................................ 184
6 Way Forward ................................................................................................................................. 189
6.1 Introduction ............................................................................................................................. 189
6.2 Key Outcomes ........................................................................................................................ 189
6.2.1 Key Strategic Areas, Themes and Budgets ................................................................. 190
6.3 Water resources development up to 2040 ............................................................................. 193
6.4 Context ................................................................................................................................... 196
6.4.1 Linkages with the UN sustainable development goals ................................................ 196
6.4.2 Linkages with existing plans ........................................................................................ 197
6.4.3 Linkages with other sectors ......................................................................................... 197
6.5 Roadmap for the Basin Plans ................................................................................................ 197
6.5.1 Immediate actions ........................................................................................................ 198
6.5.2 Implementation and Financial resource mobilisation ................................................... 202
7 Conclusion .................................................................................................................................... 207
8 References .................................................................................................................................... 208
Kenya Water Security and Climate Resilience Project
Final National Plan August 2020 xx
Figures
Figure 2-1: Overview map showing the six basins of Kenya .................................................................. 7 Figure 2-2: Kenya counties in relation to the six main basins ................................................................. 8 Figure 2-3: Elevation zones .................................................................................................................. 10 Figure 2-4: Slope categories ................................................................................................................. 11 Figure 2-5: Landforms ........................................................................................................................... 12 Figure 2-6: Soils .................................................................................................................................... 13 Figure 2-7: Inherent soil erosion risk (C and P factor not included)...................................................... 15 Figure 2-8: Potential soil erosion risk .................................................................................................... 16 Figure 2-9: Geology .............................................................................................................................. 19 Figure 2-10: Geology legend................................................................................................................. 20 Figure 2-11: Proposed aquifer classification ......................................................................................... 24 Figure 2-12: Basins and sub-basins ..................................................................................................... 27 Figure 2-13: Ondiri Swamp - in the headwaters of the Nairobi River (2018) ........................................ 29 Figure 2-14: Major lakes and wetlands ................................................................................................. 31 Figure 2-15: Mean annual precipitation ................................................................................................ 33 Figure 2-16: ASAL regions .................................................................................................................... 34 Figure 2-17: Visualisation of GCM predictions of temp (top) and rainfall (bottom) for Africa by 2100 . 35 Figure 2-18: Vegetation cover ............................................................................................................... 38 Figure 2-19: Protected areas ................................................................................................................ 44 Figure 2-20: Land cover and land use .................................................................................................. 46 Figure 2-21: Landcover legend ............................................................................................................. 47 Figure 2-22: Unit runoff at sub-basin scale (mm).................................................................................. 55 Figure 2-23: Runoff coefficients at sub-basin scale .............................................................................. 56 Figure 2-24: Estimated annual potential groundwater recharge ........................................................... 58 Figure 2-25: Estimated annual potential groundwater yield .................................................................. 59 Figure 2-26: Locations of operational stream flow gauging stations..................................................... 76 Figure 2-27: Locations of operational meteorological stations ............................................................. 77 Figure 3-1: Kenya Water Institutions ..................................................................................................... 88 Figure 3-2: WRA Offices ....................................................................................................................... 94 Figure 3-3: WRUA status ...................................................................................................................... 99 Figure 4-1: Key issues discussion points ................................................ Error! Bookmark not defined. Figure 4-2: Urban flooding in Nairobi (The Associated Press, 2018) ..... Error! Bookmark not defined. Figure 4-3: Flooding from the Yala River in the LVN Basin (Ndonga, 2018) ......... Error! Bookmark not
defined. Figure 4-4: Seasonal flooding in Mandera county impacting crop production (Mandera County
Government) ......................................................................... Error! Bookmark not defined. Figure 5-1: Catchment management considerations for the six basins of Kenya .............................. 148 Figure 5-2: The different levels of water resources protection in Kenya ............................................ 155 Figure 5-3: Existing flood management plans ..................................................................................... 173 Figure 6-1: Integration of key issues into the KSAs ............................................................................ 190 Figure 6-2: Interconnectivity of the KSAs ............................................................................................ 193 Figure 6-3: Integration of the SDGs into the six Basin Plans .............................................................. 197 Figure 6-4: Roadmap for implementation of the Basin Plans ............................................................. 198
Tables
Table 2-1: Soil index list and description .............................................................................................. 14 Table 2-2: Current classification of aquifers (Water Resources Management Authority (2007)) ......... 22 Table 2-3: Drainage characteristics of six main basins ........................................................................ 25 Table 2-4: Lakes and wetlands ............................................................................................................. 28 Table 2-5: Comparison of seasonal maximum and minimum day temperatures and MAPs per basin 32 Table 2-6: Projected changes in maximum and minimum temperatures and MAP (RCP4.5; 2050) ... 36 Table 2-7: Biodiversity hotspots ............................................................................................................ 41 Table 2-8: Main protected areas ........................................................................................................... 43 Table 2-9: Demographics per Basin ..................................................................................................... 48 Table 2-10: Average poverty rates per basin ........................................................................................ 51
Kenya Water Security and Climate Resilience Project
Final National Plan August 2020 xxi
Table 2-11: Existing access (%) to water supply infrastructure in 2010 (WRMA 2013) ....................... 52 Table 2-12: Existing access (%) to sanitation services in 2010 per basin (WRMA, 2013) ................... 53 Table 2-13: Surface water resources availability (2018) ....................................................................... 54 Table 2-14: Groundwater recharge and potential yield (2018) ............................................................. 60 Table 2-15: Climate change impacts (RCP 4.5; 2050) on surface water and groundwater ................. 61 Table 2-16: Water requirements (2018) per main user sector and per basin (MCM/a) ........................ 62 Table 2-17: Existing large dams in Kenya ............................................................................................ 63 Table 2-18: Storage in small dams and pans (Water Resources Management Authority, 2013) ........ 64 Table 2-19: Existing hydropower installations....................................................................................... 64 Table 2-20: Inter-basin water transfers ................................................................................................. 65 Table 2-21: Intra-basin water transfers ................................................................................................. 66 Table 2-22: Current irrigation areas per basin ...................................................................................... 66 Table 2-23: Existing large-scale irrigation schemes ............................................................................. 67 Table 2-24: Current (2018) groundwater use (MCM/a) ........................................................................ 67 Table 2-25: 2018 Water balance per basin (MCM/a) ............................................................................ 70 Table 2-26: Surface water allocation status per basin .......................................................................... 71 Table 2-27: Current stream flow monitoring stations in the six basins of Kenya .................................. 74 Table 2-28: Number of water quality monitoring stations per basin (2018) .......................................... 74 Table 2-29: Surface water quality parameters currently analysed........................................................ 75 Table 2-30: Number of operational groundwater monitoring points per basin (2018) .......................... 75 Table 2-31: Groundwater quality parameters analysed ........................................................................ 75 Table 3-1: Guiding NEP principles for basin planning .......................................................................... 80 Table 3-2: National level public entities that have relevance to basin plans ........................................ 90 Table 3-3: WRA sub-regions, offices and CMUs in Kenya ................................................................... 93 Table 3-4: NEMA regional offices ......................................................................................................... 95 Table 3-5: Regional development bodies ............................................................................................. 95 Table 3-6: Water Works Development Agencies in the six basins of Kenya ........................................ 96 Table 3-7: Stages of formation of WRUAs and number of SCMPs developed .................................... 98 Table 4-1: Proposed transboundary aquifer (TA) policy measures .................................................... 129 Table 5-1: Basin visions ...................................................................................................................... 145 Table 5-2: Key Strategic Areas and Objectives .................................................................................. 146 Table 5-3: Strategic Framework - Catchment Management ............................................................... 149 Table 5-4: Strategic Framework - Water Resources Protection ......................................................... 156 Table 5-5: Strategic Framework – Groundwater management ........................................................... 158 Table 5-6: Strategic Framework - Water Quality Management .......................................................... 165 Table 5-7: Priority climate change actions (Government of Kenya, 2018b) ....................................... 170 Table 5-8: Strategic Framework - Climate Change Mitigation, Adaptation and Preparedness .......... 171 Table 5-9: Strategic Framework – flood and drought management ................................................... 174 Table 5-10: Strategic Framework – Hydro-meteorological Monitoring ............................................... 179 Table 5-11: Strategic Framework – Water resources development ................................................... 181 Table 5-12: Strategic Framework – Institutional Strengthening .......................................................... 185 Table 5-13: Strategic Framework – Enabling environment to support effective water resources
planning and management ................................................................................................ 186 Table 6-1: Summarised KSA budget per basin................................................................................... 191 Table 6-2: Planned irrigation expansion by 2040 (ha) ........................................................................ 194 Table 6-3: Current (2018) and future water requirements (2040) per main user sector per basin ..... 195 Table 6-4: 2040 Water balance per basin (MCM/a) ............................................................................ 195 Table 6-5: Proposed development in storage, groundwater abstraction and hydropower by 2040 ... 196 Table 6-6: Implementation plan key role players ............................................................................... 199 Table 6-7: Immediate implementation activities .................................................................................. 200 Table 6-8: Summarised National plan budget under the 10 Key Strategic Areas ............................. 204
Kenya Water Security and Climate Resilience Project
Final National Plan August 2020 xxii
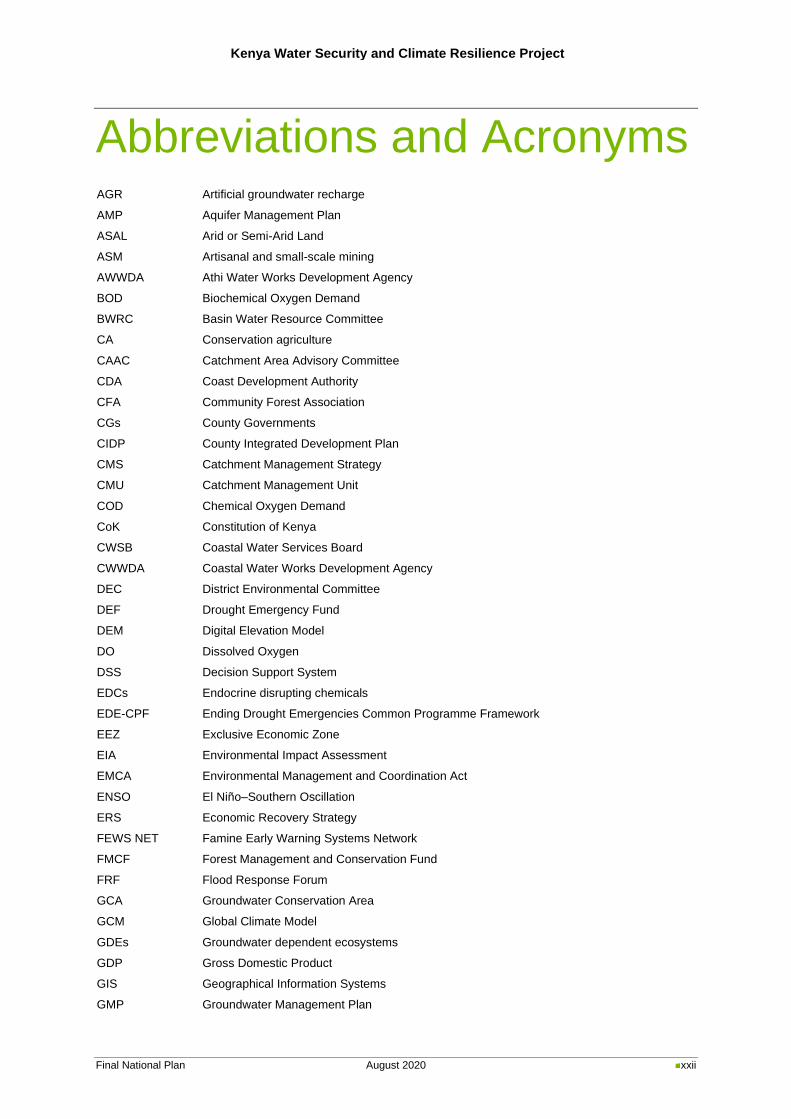
Abbreviations and Acronyms AGR Artificial groundwater recharge
AMP Aquifer Management Plan
ASAL Arid or Semi-Arid Land
ASM Artisanal and small-scale mining
AWWDA Athi Water Works Development Agency
BOD Biochemical Oxygen Demand
BWRC Basin Water Resource Committee
CA Conservation agriculture
CAAC Catchment Area Advisory Committee
CDA Coast Development Authority
CFA Community Forest Association
CGs County Governments
CIDP County Integrated Development Plan
CMS Catchment Management Strategy
CMU Catchment Management Unit
COD Chemical Oxygen Demand
CoK Constitution of Kenya
CWSB Coastal Water Services Board
CWWDA Coastal Water Works Development Agency
DEC District Environmental Committee
DEF Drought Emergency Fund
DEM Digital Elevation Model
DO Dissolved Oxygen
DSS Decision Support System
EDCs Endocrine disrupting chemicals
EDE-CPF Ending Drought Emergencies Common Programme Framework
EEZ Exclusive Economic Zone
EIA Environmental Impact Assessment
EMCA Environmental Management and Coordination Act
ENSO El Niño–Southern Oscillation
ERS Economic Recovery Strategy
FEWS NET Famine Early Warning Systems Network
FMCF Forest Management and Conservation Fund
FRF Flood Response Forum
GCA Groundwater Conservation Area
GCM Global Climate Model
GDEs Groundwater dependent ecosystems
GDP Gross Domestic Product
GIS Geographical Information Systems
GMP Groundwater Management Plan
Kenya Water Security and Climate Resilience Project
Final National Plan August 2020 xxiii
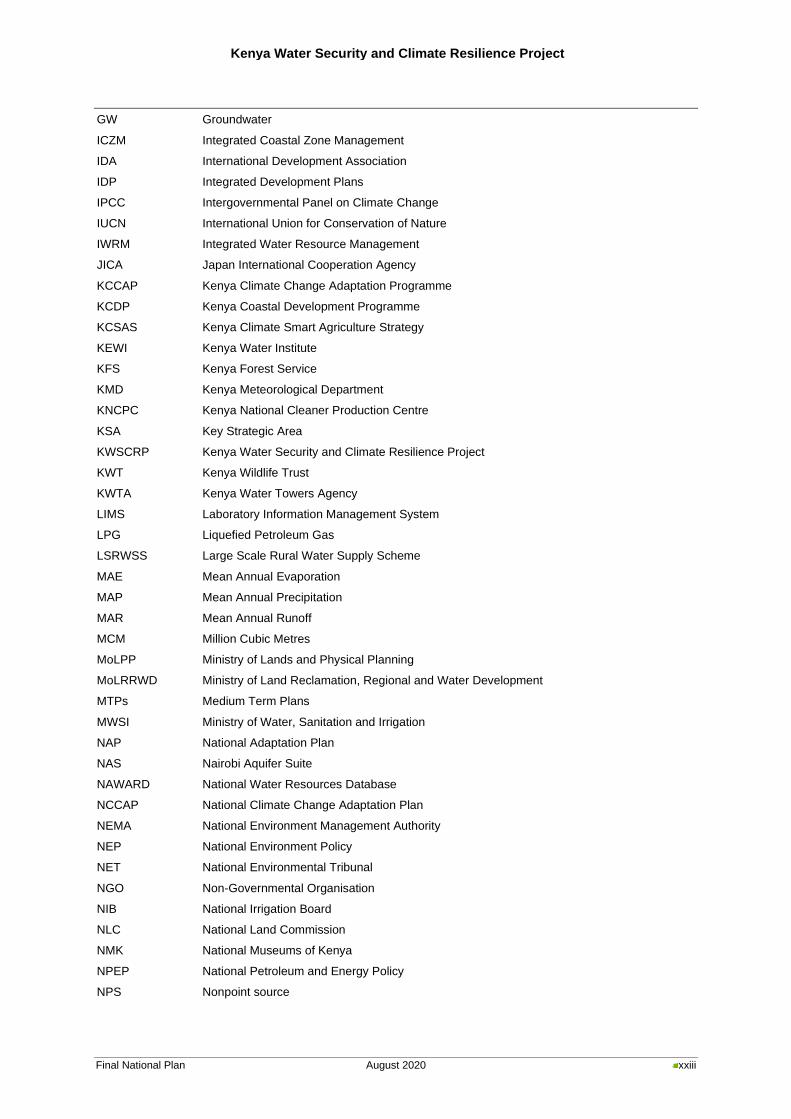
GW Groundwater
ICZM Integrated Coastal Zone Management
IDA International Development Association
IDP Integrated Development Plans
IPCC Intergovernmental Panel on Climate Change
IUCN International Union for Conservation of Nature
IWRM Integrated Water Resource Management
JICA Japan International Cooperation Agency
KCCAP Kenya Climate Change Adaptation Programme
KCDP Kenya Coastal Development Programme
KCSAS Kenya Climate Smart Agriculture Strategy
KEWI Kenya Water Institute
KFS Kenya Forest Service
KMD Kenya Meteorological Department
KNCPC Kenya National Cleaner Production Centre
KSA Key Strategic Area
KWSCRP Kenya Water Security and Climate Resilience Project
KWT Kenya Wildlife Trust
KWTA Kenya Water Towers Agency
LIMS Laboratory Information Management System
LPG Liquefied Petroleum Gas
LSRWSS Large Scale Rural Water Supply Scheme
MAE Mean Annual Evaporation
MAP Mean Annual Precipitation
MAR Mean Annual Runoff
MCM Million Cubic Metres
MoLPP Ministry of Lands and Physical Planning
MoLRRWD Ministry of Land Reclamation, Regional and Water Development
MTPs Medium Term Plans
MWSI Ministry of Water, Sanitation and Irrigation
NAP National Adaptation Plan
NAS Nairobi Aquifer Suite
NAWARD National Water Resources Database
NCCAP National Climate Change Adaptation Plan
NEMA National Environment Management Authority
NEP National Environment Policy
NET National Environmental Tribunal
NGO Non-Governmental Organisation
NIB National Irrigation Board
NLC National Land Commission
NMK National Museums of Kenya
NPEP National Petroleum and Energy Policy
NPS Nonpoint source
Kenya Water Security and Climate Resilience Project
Final National Plan August 2020 xxiv
NRW Non-Revenue Water
NWHSA National Water Harvesting and Storage Authority
NWMP National Water Master Plan
NWQMS National Water Quality Management Strategy
PDB Permit Database
PFM Participatory Forest Management
POPs Persistent organic pollutants
PPP Public Private Partnership
PV Photovoltaic
RCP Representative Concentration Pathways
REA Rural Electrification Agency
RO Regional Office
RQOs Resource Quality Objectives
RUSLE Revised Universal Soil Loss Equation
SANBI South African National Biodiversity Institute
SCMP Sub-Catchment Management Plan
SEA Strategic Environmental Assessment
SME Small and Medium Enterprise
SOPs Standard operating procedures
SRO Sub-Regional Office
SSWRS Small Scale Rural Water Supply Scheme
TA Transboundary aquifer
TARDA Tana and Athi River Development Authority
TNC The Nature Conservancy
USAID United States Agency for International Development
UWSS Urban Water Supply System
W/S Water Supply
WAP Water Allocation Plan
WASREB Water Services Regulatory Board
WASSIP Water Supply and Sanitation Improvement Project
WFP World Food Programme
Wp Watt peak
WRA Water Resources Authority
WRM Water resources management (also integrated WRM)
WRMA Water Resources Management Authority
WRUA Water Resource User Association
WSB Water Services Board
WSP Water Service Provider
WSSP Water Sector Strategic Plan
WSTF Water Sector Trust Fund
WT Water Tribunal
WWDA Water Works Development Agency
WWF World Wildlife Fund
Kenya Water Security and Climate Resilience Project
Final National Plan August 2020 xxv
Kenya Water Security and Climate Resilience Project
Final National Plan August 2020 1
Kenya Water Security and Climate Resilience Project
Final National Plan August 2020 2
1 Introduction
1.1 Background and context
The water resources of Kenya, a water-scarce country, are currently threatened on various fronts.
Addressing this, demands capacity for comprehensive water resources management and planning,
coupled with extensive investment in climate resilient water infrastructure.
Under the guidance of the Economic Recovery Strategy, the Kenyan economy has recovered and
resumed a path of rapid growth. The Strategy expired in 2007 and the updated long-term vision to guide
development in Kenya is the Kenya Vision 2030 (Government of Kenya, 2007a). The aim of this Vision
for the water and sanitation sector is “to ensure water and improved sanitation availability and access
to all by 2030” while aiming to transform Kenya into “a newly industrialising, middle income country
providing a high quality of life to all its citizens in a clean and secure environment”.
The critical importance of proper water resources planning and management is also evident in relation
to Kenya’s Big Four Agenda: Food security, Manufacturing, Affordable universal health care and
Affordable housing.
As set out in the Constitution of Kenya (2010), the national government is responsible for water
resources management through the Ministry of Water, Sanitation and Irrigation (MWSI) as the sector
leader taking responsibility for policy development. The constitution also introduced a decentralised
system of 47 county governments. To align the water sector with the Constitution of Kenya (2010), the
Water Act (No. 43 of 2016) was promulgated in September 2016. It recognises that water related
functions are a shared responsibility between the national government and the county governments
and that water resources are vested in and held by the national government in trust for the people of
Kenya. To give effect to the constitutional requirement for devolution of functions from national to county
level, the Government of Kenya has embarked on a wide-ranging water sector reform programme.
The Act prioritises water user categories, outlines an array of institutional shifts and established the new
Water Resources Authority (WRA) to protect, conserve, control and regulate the management and
use of water resources. WRA also supports the Cabinet Secretary in the establishment of a National
Water Resource Management Strategy. WRA responsibilities include the formulation and enforcement
of procedures and regulations, policy development, water abstraction permitting and collecting of water
use fees.
The Government of Kenya received financing from the World Bank toward the cost of implementing the
Kenya Water Security and Climate Resilience Project Phase 1 (KWSCRP-1), to be implemented
through the Ministry of Water, Sanitation and Irrigation. KWSCRP-1 is made up of two components,
namely:
▪ Component 1: Water Resources Development. This component supports climate resilience and
water security for economic growth by financing water investments and by building a longer-term
investment pipeline.
▪ Component 2: Effective Water Sector Institutions. This component aims to support the current
water sector institutions as well as the preparation, implementation and full function of the new and
proposed legal and institutional framework resulting from the alignments with the 2010 Constitution.
Ultimately, it aims for improved management and development of Kenya’s water resources for its
growth and development.
Kenya Water Security and Climate Resilience Project
Final National Plan August 2020 3
This Consultancy covers Sub-component 2.2 Strengthening Water Resource Management and
Planning of the KWSCRP-1. The overall objective of this Consultancy is to strengthen WRA’s capacity
in terms of tools, skills and infrastructure to deliver on its mandate related to water resources in Kenya.
Kenya’s water sector reforms have also introduced new functions that require new capacities within
WRA and its de-centralised structures. Existing capacities also need strengthening to address water
resources development and management issues in a knowledge-driven manner. The scope of this
Consultancy therefore aims to strengthen WRA’s capacity to deliver on core functions that are new,
have been expanded, or have in the past not been delivered on. A key set of deliverables under Sub-
component 2.2 is the development of six Basin Plans for the six main river basins in Kenya, namely
Lake Victoria North, Lake Victoria South, Rift Valley, Athi, Tana and Ewaso Ng’iro North. This document
constitutes the consolidation of these Basin Plans and forms the National Plan for the six basins of
Kenya.
1.2 Objectives of the National Plan
Integrated Water Resources Management (IWRM) considers the environmental, social and economic
aspects of a river basin, and ensures that these aspects are integrated into an overall management
strategy. It aims to achieve a sustainable balance between the utilisation, development and protection
of water resources.
The main objective of this National Plan is to provide a clear pathway for the sustainable utilisation and
development of the water resources of the six river basins of Kenya. The Plan provides a description of
the current state of the six basins, establishes a shared vision for the future development of the basins
and identifies key strategic areas and actions for effective development and management of the basin
water resources. The National Plan draws information from the six Basin Plans as well as relevant
existing plans and strategies, incorporates comprehensive inputs from various stakeholders and
presents information based on updated analyses. The National Plan in combination with the Basin Plans
provide an updated situation assessment of the current state of the water resources in Kenya, along
with relevant strategies and action plans to support integrated water resources development and
management. As such, these documents constitute key reference sources for future updates of the
national water resources management strategy, which will ensure strong alignment and seamless
integration across all levels of water resources management in Kenya.
1.3 Structure of the National Plan
This report is structured as follows:
Section 2 provides an overview of the six main river basins of Kenya including basin characteristics,
the bio-physical and socio-economic environments, and information on water availability and demands,
existing large-scale water resources infrastructure, water balances, water quality and the existing
hydrometeorological network.
Section 3 presents the current legislative, policy and institutional framework in relation to water
resources management as well as summarises the existing development plans and sectoral
perspectives which link to water resource planning, management and development in the six basins of
Kenya.
Section 4 highlights typical water resource-related issues, challenges and trends in the six basins in
Kenya.
Section 5 summarises the Integrated Water Resources Management and Development Plans which
have been developed for the six basins of Kenya. It presents the strategic framework for sustainable
water resources development and management in the basins. Key strategic areas and objectives along
with prioritised themes, strategies and actions are also presented.
Kenya Water Security and Climate Resilience Project
Final National Plan August 2020 4
Section 6 provides the way forward, includes key outcomes and recommendations, provides the
broader context and a roadmap for implementation of the Basin Plans.
Section 7 provides a conclusion.
Section 8 lists the references.

Kenya Water Security and Climate Resilience Project
Final National Plan August 2020 5
Kenya Water Security and Climate Resilience Project
Final National Plan August 2020 6
2 National overview
2.1 Introduction
Kenya has a land area of approximately 580 000 km2 and a surface water area of about 11 200 km2,
mostly consisting of Lake Victoria and Lake Turkana. A large part of the country is mostly arid and semi-
arid land (ASAL). Kenya is surrounded by Uganda to the west, South Sudan to the north-west, Ethiopia
and Somalia to the north, the Indian Ocean coastline to the east and Tanzania to the south (Figure 2-1).
The main rivers and surface water resources within Kenya have been delineated into six basins: Athi,
Tana, Lake Victoria South (LVS), Lake Victoria North (LVN), Rift Valley (RV) and Ewaso Ng’iro North
(ENN).
The Athi Basin, with a catchment area of 66 559 km2, has a high population density and significant
economic activity. It hosts the two largest cities in Kenya viz. Nairobi and Mombasa. The Tana Basin
has a catchment area of 126 208 km2 and a relatively low population density, except in the upper part
of the basin. The LVS and LVN Basins have relatively small catchment areas of 26 906 km2 and
18 500 km2 respectively and accommodate a large portion of the national population (37%). The RV
Basin has an area of 131 423 km2, with Lake Turkana in the north. The ENN Basin covers an area of
209 918 km2, which is approximately 36% of the total area of Kenya. It is the largest of the six river
basins in Kenya, but with the least population as it falls mostly within Arid and Semi-Arid Land (ASAL).
There are 47 counties within Kenya (Figure 2-2), some of which cross hydrological basin boundaries.
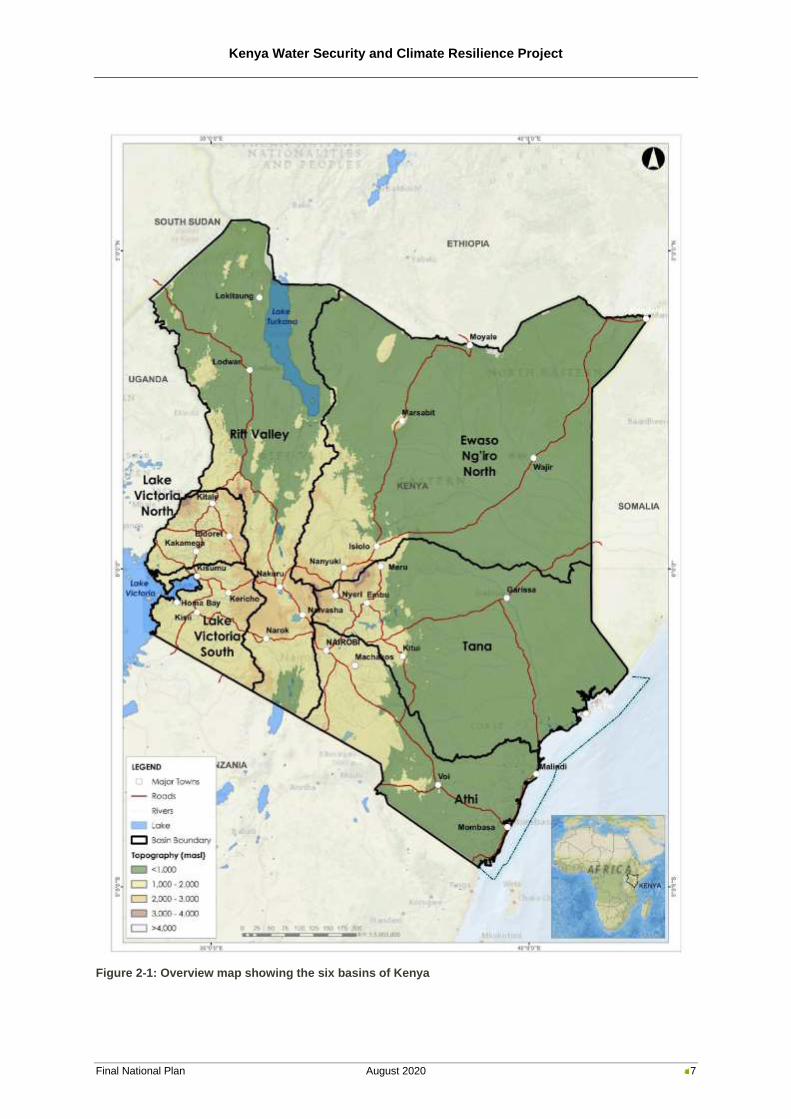
Kenya Water Security and Climate Resilience Project
Final National Plan August 2020 7
Figure 2-1: Overview map showing the six basins of Kenya
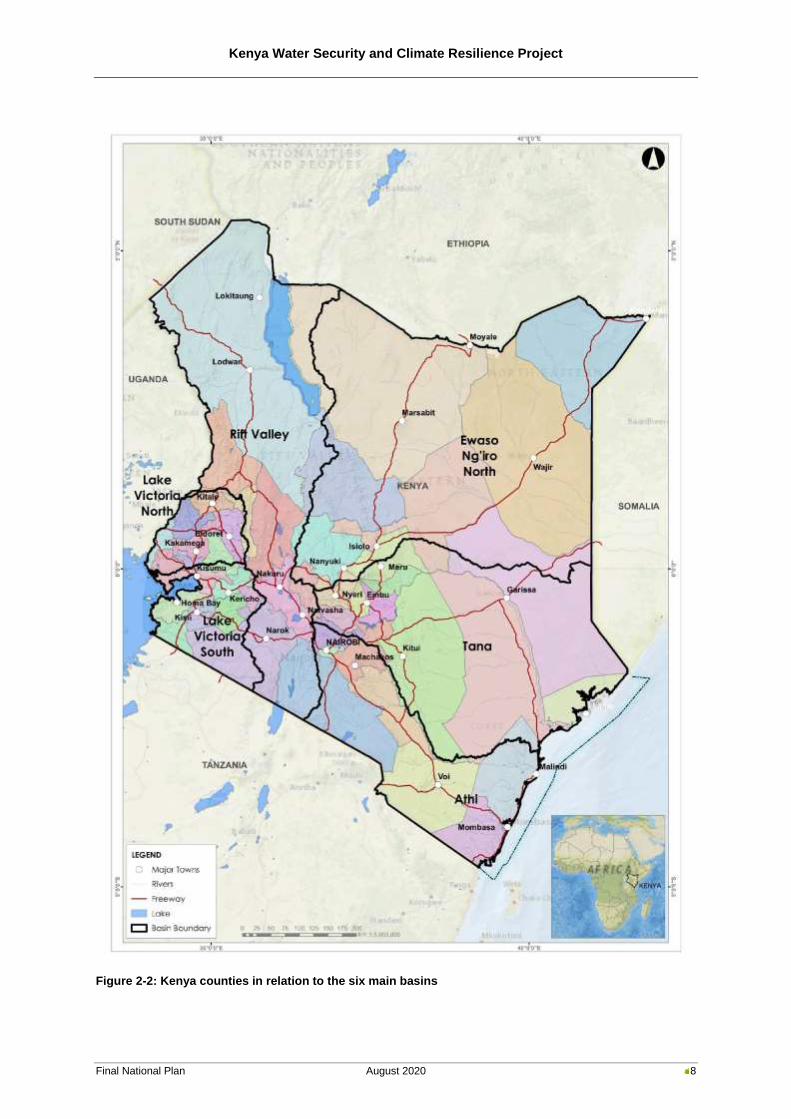
Kenya Water Security and Climate Resilience Project
Final National Plan August 2020 8
Figure 2-2: Kenya counties in relation to the six main basins
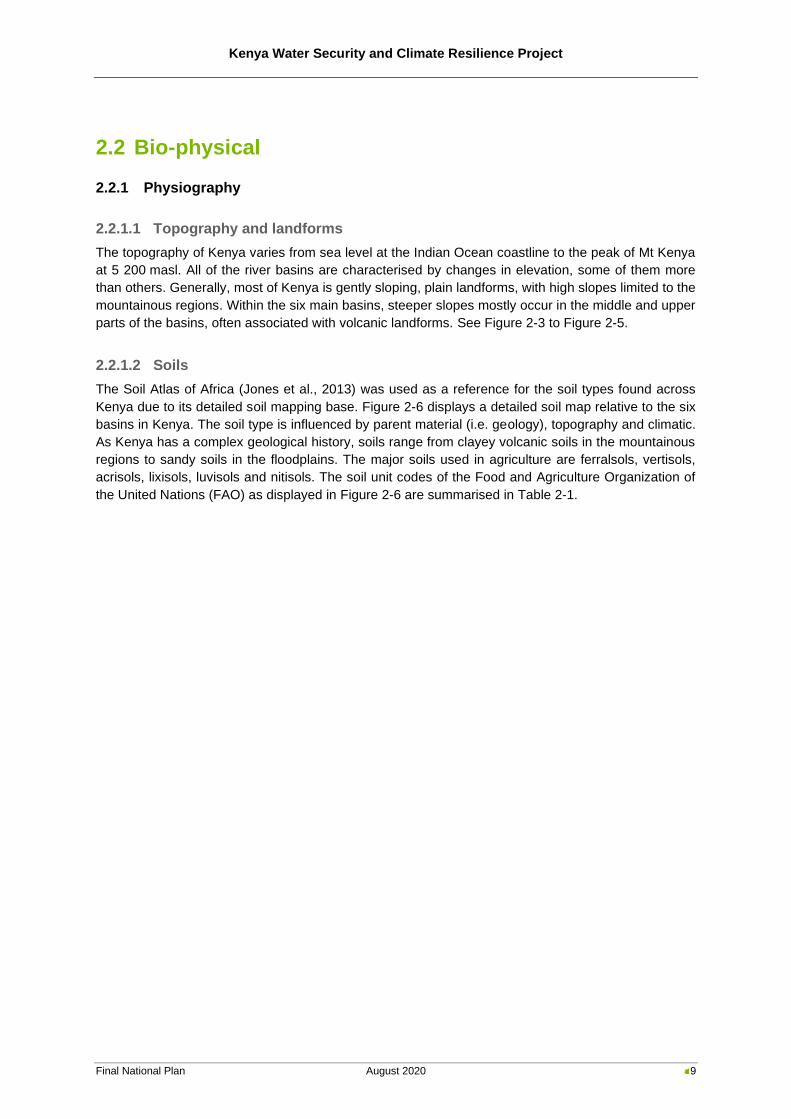
Kenya Water Security and Climate Resilience Project
Final National Plan August 2020 9
2.2 Bio-physical
2.2.1 Physiography
2.2.1.1 Topography and landforms
The topography of Kenya varies from sea level at the Indian Ocean coastline to the peak of Mt Kenya
at 5 200 masl. All of the river basins are characterised by changes in elevation, some of them more
than others. Generally, most of Kenya is gently sloping, plain landforms, with high slopes limited to the
mountainous regions. Within the six main basins, steeper slopes mostly occur in the middle and upper
parts of the basins, often associated with volcanic landforms. See Figure 2-3 to Figure 2-5.
2.2.1.2 Soils
The Soil Atlas of Africa (Jones et al., 2013) was used as a reference for the soil types found across
Kenya due to its detailed soil mapping base. Figure 2-6 displays a detailed soil map relative to the six
basins in Kenya. The soil type is influenced by parent material (i.e. geology), topography and climatic.
As Kenya has a complex geological history, soils range from clayey volcanic soils in the mountainous
regions to sandy soils in the floodplains. The major soils used in agriculture are ferralsols, vertisols,
acrisols, lixisols, luvisols and nitisols. The soil unit codes of the Food and Agriculture Organization of
the United Nations (FAO) as displayed in Figure 2-6 are summarised in Table 2-1.
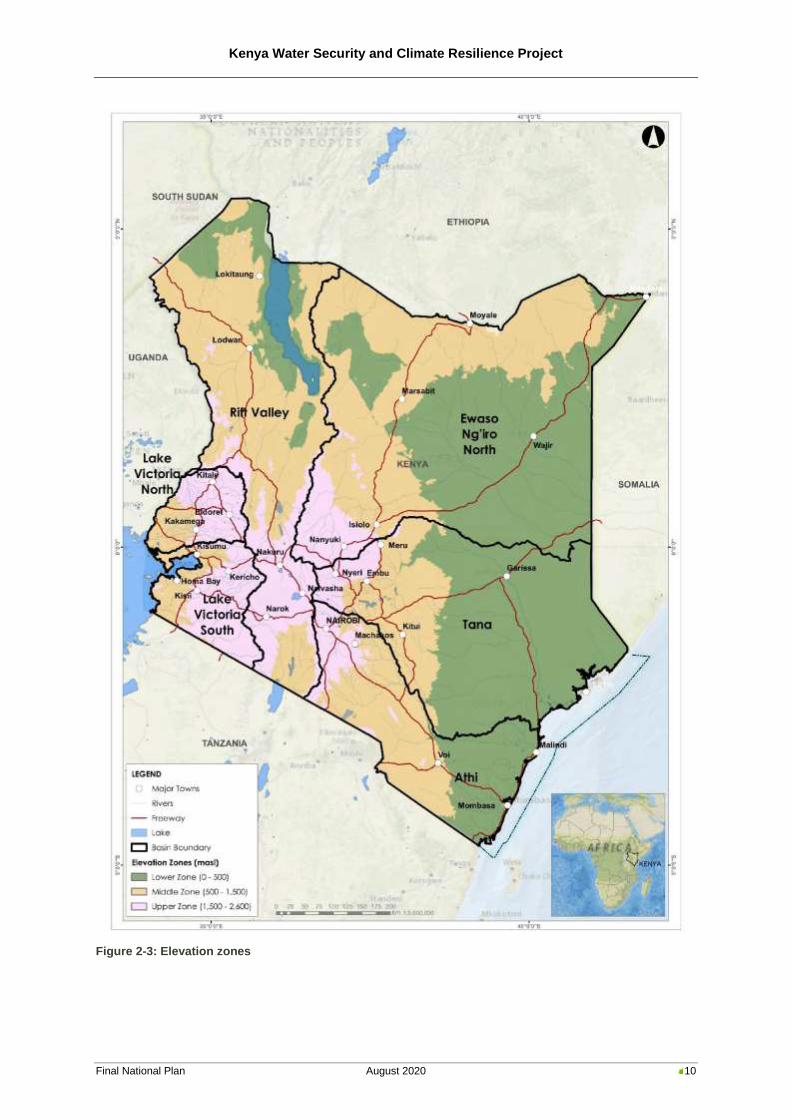
Kenya Water Security and Climate Resilience Project
Final National Plan August 2020 10
Figure 2-3: Elevation zones
Kenya Water Security and Climate Resilience Project
Final National Plan August 2020 11
Figure 2-4: Slope categories
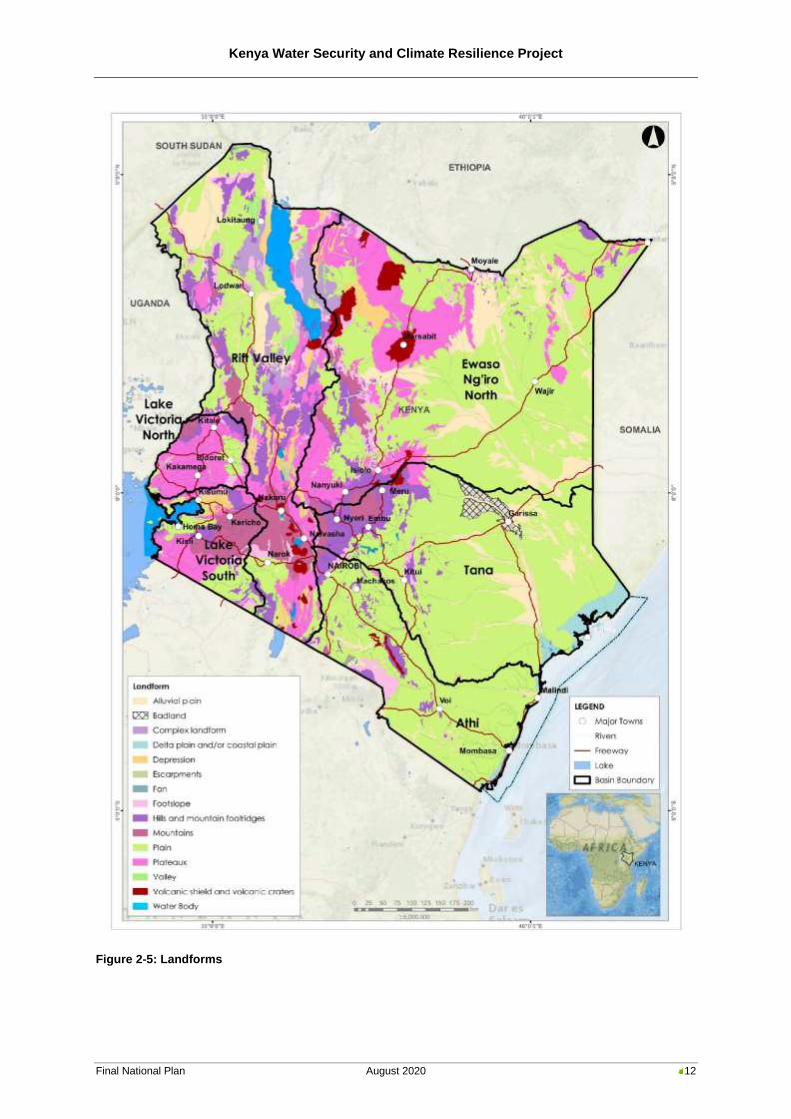
Kenya Water Security and Climate Resilience Project
Final National Plan August 2020 12
Figure 2-5: Landforms
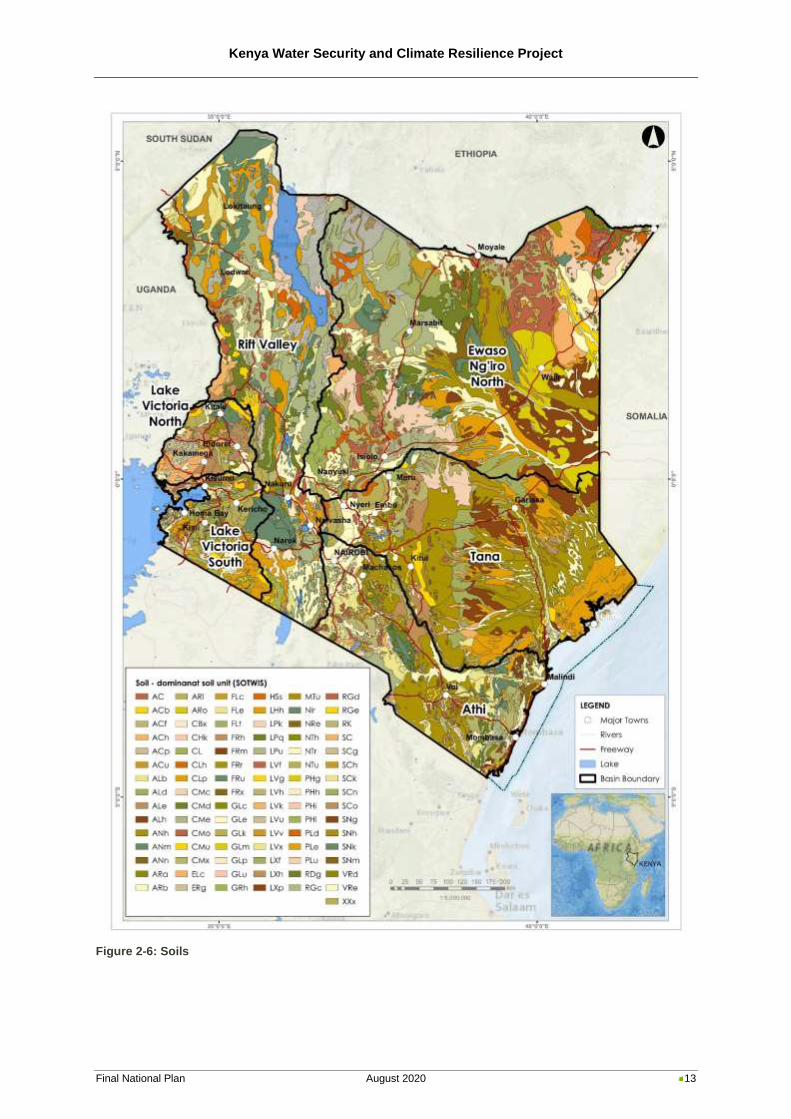
Kenya Water Security and Climate Resilience Project
Final National Plan August 2020 13
Figure 2-6: Soils
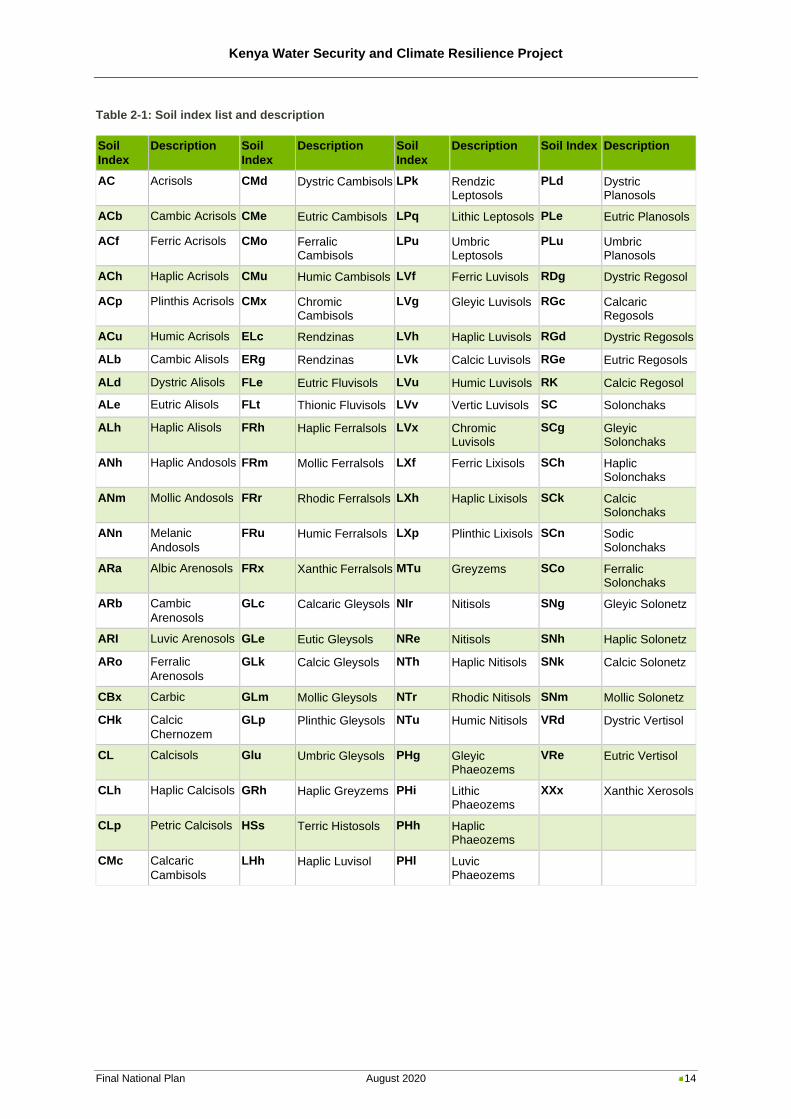
Kenya Water Security and Climate Resilience Project
Final National Plan August 2020 14
Table 2-1: Soil index list and description
Soil
Index
Description Soil
Index
Description Soil
Index
Description Soil Index Description
AC Acrisols CMd Dystric Cambisols LPk Rendzic Leptosols
PLd Dystric Planosols
ACb Cambic Acrisols CMe Eutric Cambisols LPq Lithic Leptosols PLe Eutric Planosols
ACf Ferric Acrisols CMo Ferralic Cambisols
LPu Umbric Leptosols
PLu Umbric Planosols
ACh Haplic Acrisols CMu Humic Cambisols LVf Ferric Luvisols RDg Dystric Regosol
ACp Plinthis Acrisols CMx Chromic Cambisols
LVg Gleyic Luvisols RGc Calcaric Regosols
ACu Humic Acrisols ELc Rendzinas LVh Haplic Luvisols RGd Dystric Regosols
ALb Cambic Alisols ERg Rendzinas LVk Calcic Luvisols RGe Eutric Regosols
ALd Dystric Alisols FLe Eutric Fluvisols LVu Humic Luvisols RK Calcic Regosol
ALe Eutric Alisols FLt Thionic Fluvisols LVv Vertic Luvisols SC Solonchaks
ALh Haplic Alisols FRh Haplic Ferralsols LVx Chromic Luvisols
SCg Gleyic Solonchaks
ANh Haplic Andosols FRm Mollic Ferralsols LXf Ferric Lixisols SCh Haplic Solonchaks
ANm Mollic Andosols FRr Rhodic Ferralsols LXh Haplic Lixisols SCk Calcic Solonchaks
ANn Melanic
Andosols
FRu Humic Ferralsols LXp Plinthic Lixisols SCn Sodic Solonchaks
ARa Albic Arenosols FRx Xanthic Ferralsols MTu Greyzems SCo Ferralic Solonchaks
ARb Cambic
Arenosols
GLc Calcaric Gleysols NIr Nitisols SNg Gleyic Solonetz
ARI Luvic Arenosols GLe Eutic Gleysols NRe Nitisols SNh Haplic Solonetz
ARo Ferralic
Arenosols
GLk Calcic Gleysols NTh Haplic Nitisols SNk Calcic Solonetz
CBx Carbic GLm Mollic Gleysols NTr Rhodic Nitisols SNm Mollic Solonetz
CHk Calcic
Chernozem
GLp Plinthic Gleysols NTu Humic Nitisols VRd Dystric Vertisol
CL Calcisols Glu Umbric Gleysols PHg Gleyic Phaeozems
VRe Eutric Vertisol
CLh Haplic Calcisols GRh Haplic Greyzems PHi Lithic Phaeozems
XXx Xanthic Xerosols
CLp Petric Calcisols HSs Terric Histosols PHh Haplic Phaeozems
CMc Calcaric
Cambisols
LHh Haplic Luvisol PHl Luvic Phaeozems
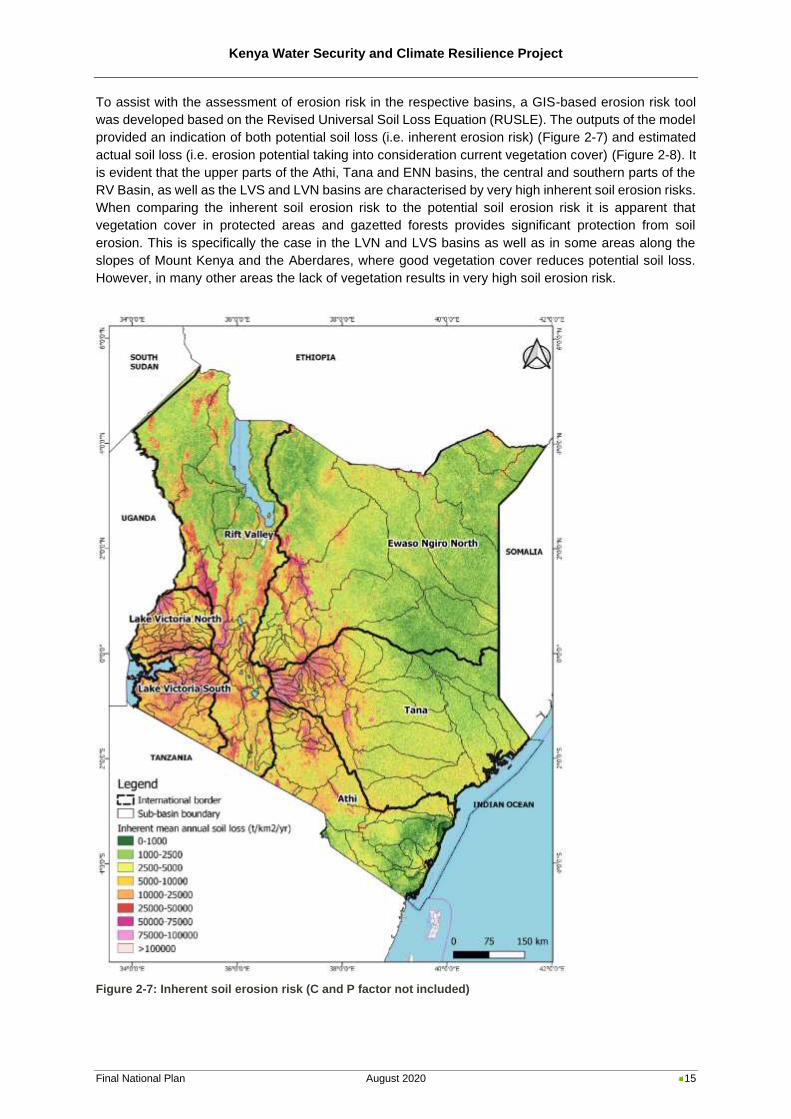
Kenya Water Security and Climate Resilience Project
Final National Plan August 2020 15
To assist with the assessment of erosion risk in the respective basins, a GIS-based erosion risk tool
was developed based on the Revised Universal Soil Loss Equation (RUSLE). The outputs of the model
provided an indication of both potential soil loss (i.e. inherent erosion risk) (Figure 2-7) and estimated
actual soil loss (i.e. erosion potential taking into consideration current vegetation cover) (Figure 2-8). It
is evident that the upper parts of the Athi, Tana and ENN basins, the central and southern parts of the
RV Basin, as well as the LVS and LVN basins are characterised by very high inherent soil erosion risks.
When comparing the inherent soil erosion risk to the potential soil erosion risk it is apparent that
vegetation cover in protected areas and gazetted forests provides significant protection from soil
erosion. This is specifically the case in the LVN and LVS basins as well as in some areas along the
slopes of Mount Kenya and the Aberdares, where good vegetation cover reduces potential soil loss.
However, in many other areas the lack of vegetation results in very high soil erosion risk.
Figure 2-7: Inherent soil erosion risk (C and P factor not included)
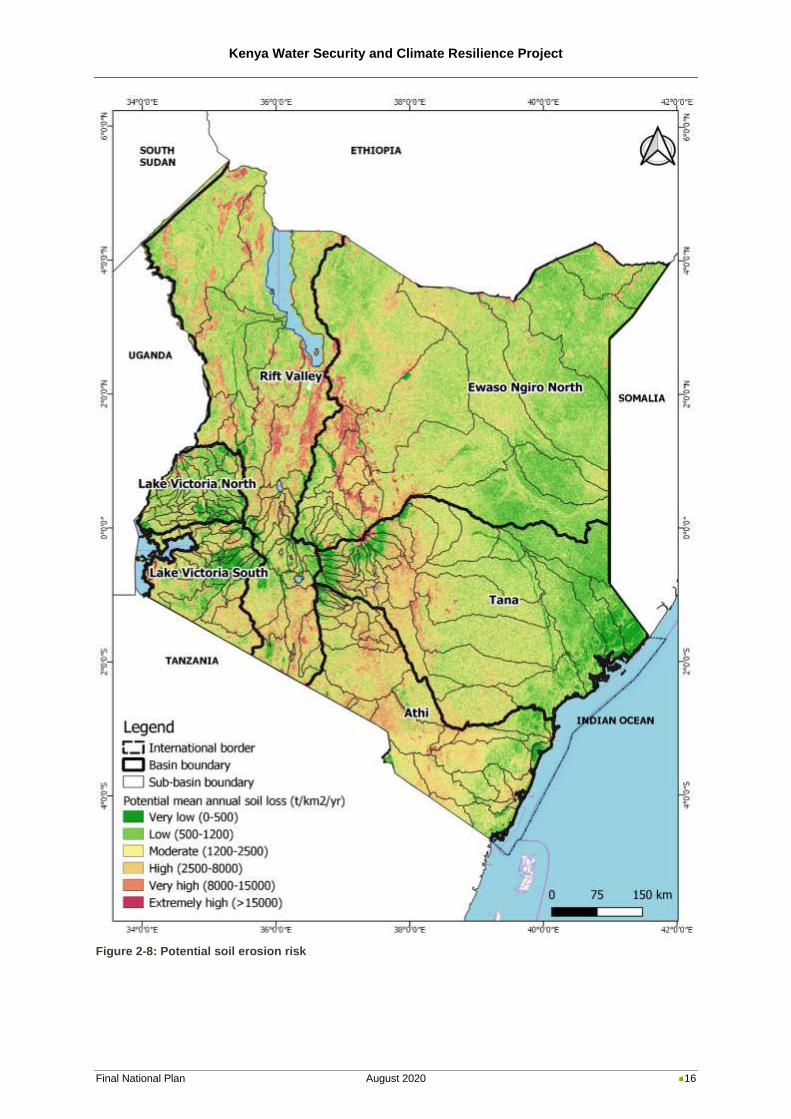
Kenya Water Security and Climate Resilience Project
Final National Plan August 2020 16
Figure 2-8: Potential soil erosion risk
Kenya Water Security and Climate Resilience Project
Final National Plan August 2020 17
2.2.1.3 Geology and hydrogeology
Geology and groundwater characteristics
The geology of Kenya may generally be grouped into the following five major geological successions
(Figure 2-9 and Figure 2-10): Archaean, Proterozoic, Palaeozoic/Mesozoic sediments,
Tertiary/Quaternary volcanics and Tertiary/Quaternary sediments. Adjacent to Lake Victoria are the
Archaean Nyanzian meta-volcanics and the Kavirondian meta-sediments. Central Kenya consists of
mainly Neo-Proterozoic Mozambique belt rocks aligned by the Tertiary volcanics associated with the
East African Rift System. The eastern parts of Kenya are dominated by sedimentary rock ranging in
age from the Jurassic to Recent.1
The Athi Basin is characterised by the Nairobi Suite aquifer system composed of Pleistocene to
Miocene volcanic, Chyulu volcanic, Mt Kilimanjaro volcanic, coastal sediments and Precambrian
basement systems. The basin also has several major springs e.g. Mzima, Kikuyu, Njoro Kubwa,
Nolturesh and Marere. The upper zone of the basin is predominately volcanic and has relatively good
aquifers, which are a valuable water supply for the domestic and commercial sectors. Kikuyu Springs
is a significant water source for Nairobi and Kikuyu. The springs are recharged by the Manguo and
Ondiri Swamp, which lie on a fault line leading to the springs. Alluvial aquifers are of local importance
in the middle zone, and Chyulu Hills is home to the source aquifer supplying Mzima Springs. The coastal
zone is threatened by salt water intrusion, which worsens with proximity to the coastline. The Tiwi and
Baricho aquifers provide an essential water supply to the coastal zone.
The Tana Basin is characterised by humid highlands feeding the perennial Tana River, which flows
generally east and then south towards the coast, where it emerges into the Indian Ocean at Kipini, in
Tana River County. The upper part of the Tana Basin is underlain by Miocene, Pliocene and recent
volcanic rocks which overlie Precambrian metamorphic Basement at depth. This zone hosts the vast
majority of the Basin’s population and most of its high-value agricultural land. As the river flows east to
lower elevations, it crosses over metamorphic Basement rocks, which underlie the semi-arid counties.
Metamorphic Basement hosts locally useful aquifers and supports sand dams and shallow wells in
eastern Machakos and Kitui Counties. Alluvial aquifers are of local importance in the middle/lower zone,
astride the Tana River. Basement rocks give way to younger sediments as the river flows south east
towards the Indian Ocean, flowing between Tana River and Garissa Counties; and the northern tip of
Kilifi County. Lamu County lies north east of Kipini, and the coastal strip is underlain by young coastal
sediments. The coastal zone is threatened by salt water intrusion, which worsens with proximity to the
coastline.
The lower parts of the LVS Basin are underlain by metamorphic Basement and by metasediments of
the Nyanzian and Kavirondan groups. Where these are weathered they constitute useful localised
aquifer systems that provide water to numerous springs and shallow wells, and a smaller number of
boreholes. Groundwater availability in the Mara sub-basin is of poor quality, although in the upper
reaches groundwater conditions are likely to be similar to those in the Kericho area. On the western
flank of the Loita Hills, and within the Mara ecosystem, there are several perennial springs. Homa Bay
County in the west hosts a complex geological sequence. Groundwater south of the Kendu Fault on the
Nyambondo Plateau is shallow and abundant, occurring in weathered phonolites overlying Basement
geology. The lower parts of the Nyando River east and south of Kisumu (the Kano Plain) are underlain
by recent sediments draped over thick lake sediments and occasional phonolite lava flows (Olago,
2018). The highlands to the east are underlain by Oligocene-Miocene-Pliocene volcanics. These form
locally useful aquifers in Kericho and Bomet Counties (and in the small fragments in the Basin in Nandi,
Uasin Gishu, Baringo and Nakuru Counties).
Overall, the geology of the LVN Basin is the Archaean-Paleoproterozoic granite-greenstone terrain,
which is found in western Kenya around Lake Victoria. The Nyanzian rock group is overlain by the
1 Akech, N.O., Omuombo, C.A. and Masibo, M., 2013. General geology of Kenya. In Developments in Earth Surface Processes (Vol. 16, pp. 3-10). Elsevier.
Kenya Water Security and Climate Resilience Project
Final National Plan August 2020 18
younger Kavirondian rock group. The structural geology is characterised by a series of east-west
orientated folds, and faults and shear zones are common. The major rock types in the Basin are
metamorphic rocks. In the upper part of the Basin the underlying geology comprises Basement geology
of the Mozambique Group. The lower parts of the Basin are underlain by metasediments, the Nyanzian
and Kavirondan groups. Where these are weathered they constitute a useful aquifer system that
provides water to numerous springs, shallow wells and a much smaller number of boreholes. In the
upper elevations of the Basin, younger (Oligocene-Miocene) volcanics overlie the metamorphic rocks.
Two volcanic centres exist, the extrusive Mount Elgon volcano on the Kenya-Uganda border; and the
plateau phonolites of Uasin Gishu, which were extruded from the western edge of the Rift Valley and
flowed westwards. Both host moderate aquifers, locally useful for small-scale water supplies.
The RV Basin is characterised by complex, faulted and internally-drained basins all contained within
the Gregory Rift Valley. This is made up of the Ewaso Ng’iro South basin, Magadi basin, Naivasha
basin, Lake Elmenteita basin, Nakuru basin, Bogoria basin, Baringo basin, Suguta basin, Kerio,
Turkwel, Turkana and Loperot. Generally, groundwater flows from the elevated, humid Rift rims, that lie
east and west of the Valley, towards the lakes that form the sump in each basin.
The ENN Basin is made up of Quaternary sediments, Quaternary Volcanics, Cretaceous, Jurassic and
Basement geology. The groundwater of the northern part of the basin is complex. The north-western
part of the basin is partly internally drained. Further east it either drains south eastwards towards the
Lagh Dera or Lagh Bor, or north eastwards to the Daua River, which forms the north eastern
international boundary with Ethiopia. From west to east, significant physiographical features include Ol
Doinyo Nyuru and Ol Doinyo Mara (basement geology); Mount Kulal (Miocene volcanics); and Marsabit
Mountain (Pleistocene and Holocene volcanics). All host or recharge aquifers of varying significance.
The Marsabit volcanics host springs (at Bakuli) and a good aquifer in the Logologo area. Springs along
the edges of the Chalbi Basin occur. There are numerous basement geology hills and mountains in the
western/central part of the basin including the Karisia, Ol Doinyo Nyiru/Mara, the Ndotos and the
Mathews range. Many of these feed into the ephemeral Milgis River, which ultimately joins the Ewaso
Ng’iro River north west of Sericho. The south-western part of the basin comprises humid uplands on
Miocene and Pliocene volcanic rocks (the Aberdare Mountains, Mount Kenya and the Nyambeni Hills)
with some of the highest annual rainfall in Kenya. These form a number of complex aquifer systems, all
of which ultimately drain north then eastwards towards the arid lowlands that makes up most of the
Basin. The southern part of the Basin is drained by the Ewaso Ng’iro River and its tributaries. Significant
spring flow and diffuse groundwater flow maintains surface water flows in the reach between the
Samburu National Reserve and Gotu, some 90 km downstream. The Merti Aquifer is the most
significant groundwater resource in the ENN Basin, and probably the largest groundwater resource in
Kenya. It underlies the Lagh Dera, the ephemeral drainage system that forms the eastwards
continuation of the Ewaso Ngiro North river. It is of Pliocene age, and comprises semi-cemented to
cemented sands, intercalated clays and (in the east) intercalated limestone beds. The Merti comprises
both fresh and saline facies, and covers a total area of 77 000 km2 (including that part that lies in the
Tana Basin, in Garissa County); the aquifer is fresh to marginally potable over an area of approximately
29 000 km2. Despite intensive and focussed abstraction over a protracted period (since the early
1990s), depletion is minimal if it exists at all; early boreholes, now decommissioned, see a return to as-
drilled static water levels (Blandenier, 2015).
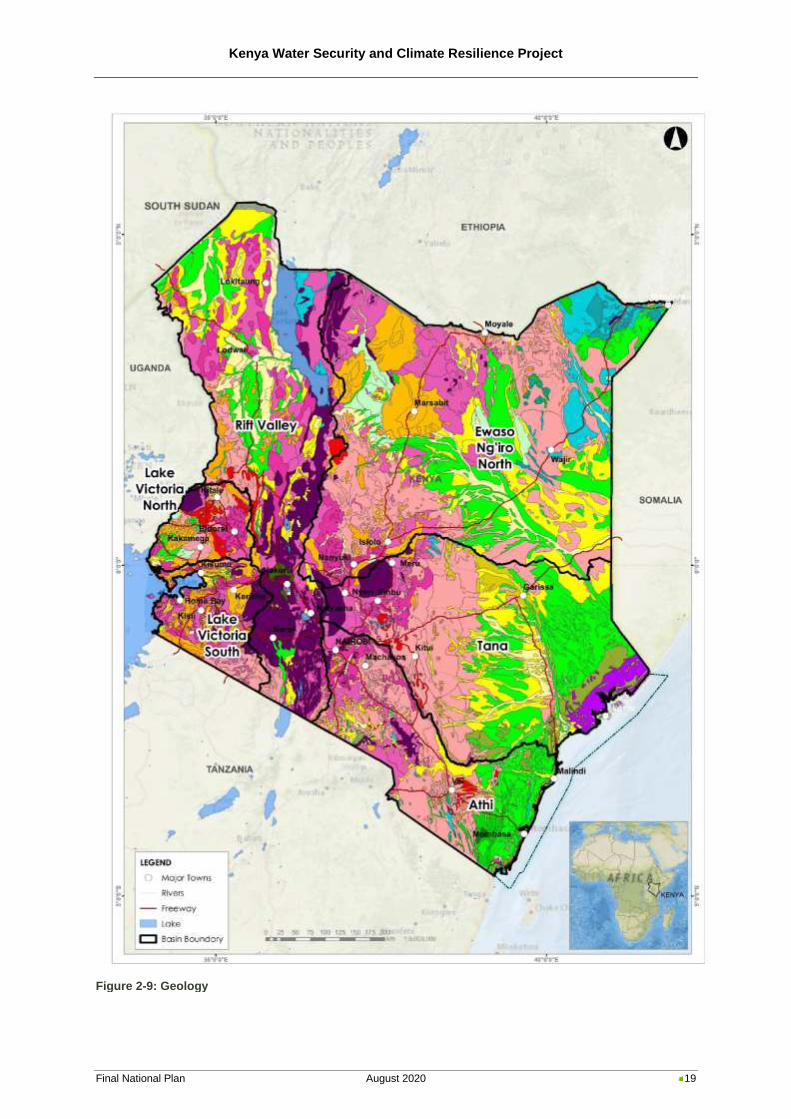
Kenya Water Security and Climate Resilience Project
Final National Plan August 2020 19
Figure 2-9: Geology
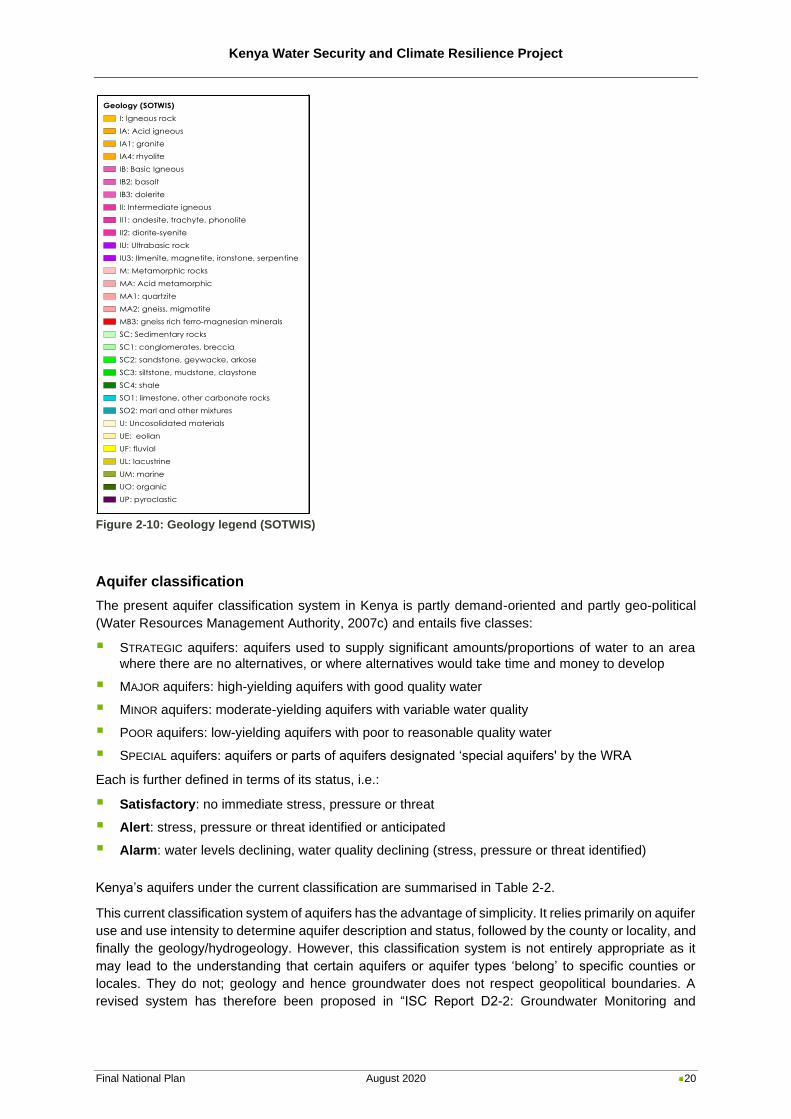
Kenya Water Security and Climate Resilience Project
Final National Plan August 2020 20
Figure 2-10: Geology legend (SOTWIS)
Aquifer classification
The present aquifer classification system in Kenya is partly demand-oriented and partly geo-political
(Water Resources Management Authority, 2007c) and entails five classes:
▪ STRATEGIC aquifers: aquifers used to supply significant amounts/proportions of water to an area
where there are no alternatives, or where alternatives would take time and money to develop
▪ MAJOR aquifers: high-yielding aquifers with good quality water
▪ MINOR aquifers: moderate-yielding aquifers with variable water quality
▪ POOR aquifers: low-yielding aquifers with poor to reasonable quality water
▪ SPECIAL aquifers: aquifers or parts of aquifers designated ‘special aquifers' by the WRA
Each is further defined in terms of its status, i.e.:
▪ Satisfactory: no immediate stress, pressure or threat
▪ Alert: stress, pressure or threat identified or anticipated
▪ Alarm: water levels declining, water quality declining (stress, pressure or threat identified)
Kenya’s aquifers under the current classification are summarised in Table 2-2.
This current classification system of aquifers has the advantage of simplicity. It relies primarily on aquifer
use and use intensity to determine aquifer description and status, followed by the county or locality, and
finally the geology/hydrogeology. However, this classification system is not entirely appropriate as it
may lead to the understanding that certain aquifers or aquifer types ‘belong’ to specific counties or
locales. They do not; geology and hence groundwater does not respect geopolitical boundaries. A
revised system has therefore been proposed in “ISC Report D2-2: Groundwater Monitoring and
Geology (SOTWIS)
I: Igneous rock
IA: Acid igneous
IA1: granite
IA4: rhyolite
IB: Basic Igneous
IB2: basalt
IB3: dolerite
II: Intermediate igneous
II1: andesite, trachyte, phonolite
II2: diorite-syenite
IU: Ultrabasic rock
IU3: Ilmenite, magnetite, ironstone, serpentine
M: Metamorphic rocks
MA: Acid metamorphic
MA1: quartzite
MA2: gneiss, migmatite
MB3: gneiss rich ferro-magnesian minerals
SC: Sedimentary rocks
SC1: conglomerates, breccia
SC2: sandstone, geywacke, arkose
SC3: siltstone, mudstone, claystone
SC4: shale
SO1: limestone, other carbonate rocks
SO2: marl and other mixtures
U: Uncosolidated materials
UE: eolian
UF: fluvial
UL: lacustrine
UM: marine
UO: organic
UP: pyroclastic
Kenya Water Security and Climate Resilience Project
Final National Plan August 2020 21
Management Guideline”. This revised system ignores geopolitical boundaries and relies wholly on the
geology of the Basin’s aquifers (Figure 2-11).
It is acknowledged that this approach does not specifically capture those aquifer units or parts of aquifer
units that are of key importance as water supply sources. However, these should ultimately be captured
by Aquifer Management Plans and numerical models developed for them. They would be designated
Priority Aquifers.
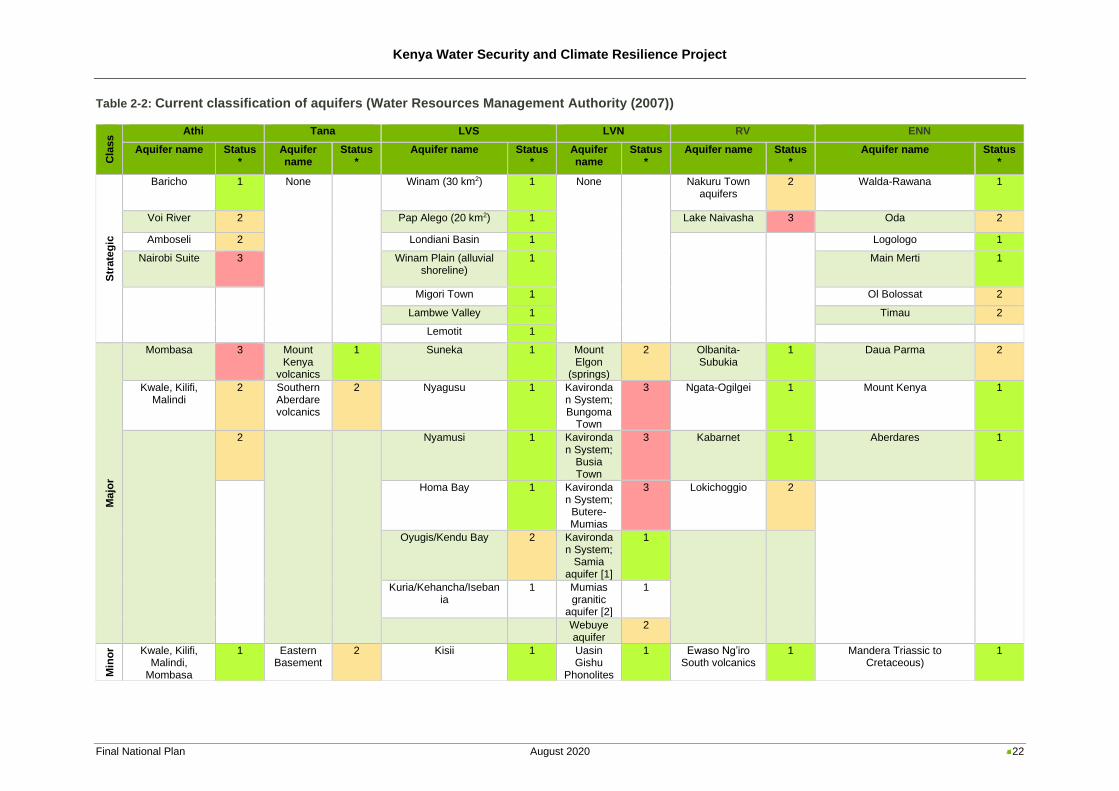
Kenya Water Security and Climate Resilience Project
Final National Plan August 2020 22
Table 2-2: Current classification of aquifers (Water Resources Management Authority (2007))
Cla
ss Athi Tana LVS LVN RV ENN
Aquifer name Status*
Aquifer name
Status*
Aquifer name Status*
Aquifer name
Status*
Aquifer name Status*
Aquifer name Status*
Str
ate
gic
Baricho 1 None
Winam (30 km2) 1 None
Nakuru Town aquifers
2 Walda-Rawana 1
Voi River 2 Pap Alego (20 km2) 1 Lake Naivasha 3 Oda 2
Amboseli 2 Londiani Basin 1
Logologo 1
Nairobi Suite 3 Winam Plain (alluvial shoreline)
1 Main Merti 1
Migori Town 1 Ol Bolossat 2
Lambwe Valley 1 Timau 2
Lemotit 1
Ma
jor
Mombasa 3 Mount Kenya
volcanics
1 Suneka 1 Mount Elgon
(springs)
2 Olbanita-Subukia
1 Daua Parma 2
Kwale, Kilifi, Malindi
2 Southern Aberdare volcanics
2 Nyagusu 1 Kavirondan System; Bungoma
Town
3 Ngata-Ogilgei 1 Mount Kenya 1
2
Nyamusi 1 Kavironda
n System; Busia Town
3 Kabarnet 1 Aberdares 1
Homa Bay 1 Kavironda
n System; Butere-Mumias
3 Lokichoggio 2
Oyugis/Kendu Bay 2 Kavirondan System;
Samia aquifer [1]
1
Kuria/Kehancha/Isebania
1 Mumias granitic
aquifer [2]
1
Webuye aquifer
2
Min
or Kwale, Kilifi,
Malindi, Mombasa
1 Eastern Basement
2 Kisii 1 Uasin Gishu
Phonolites
1 Ewaso Ng’iro South volcanics
1 Mandera Triassic to Cretaceous)
1
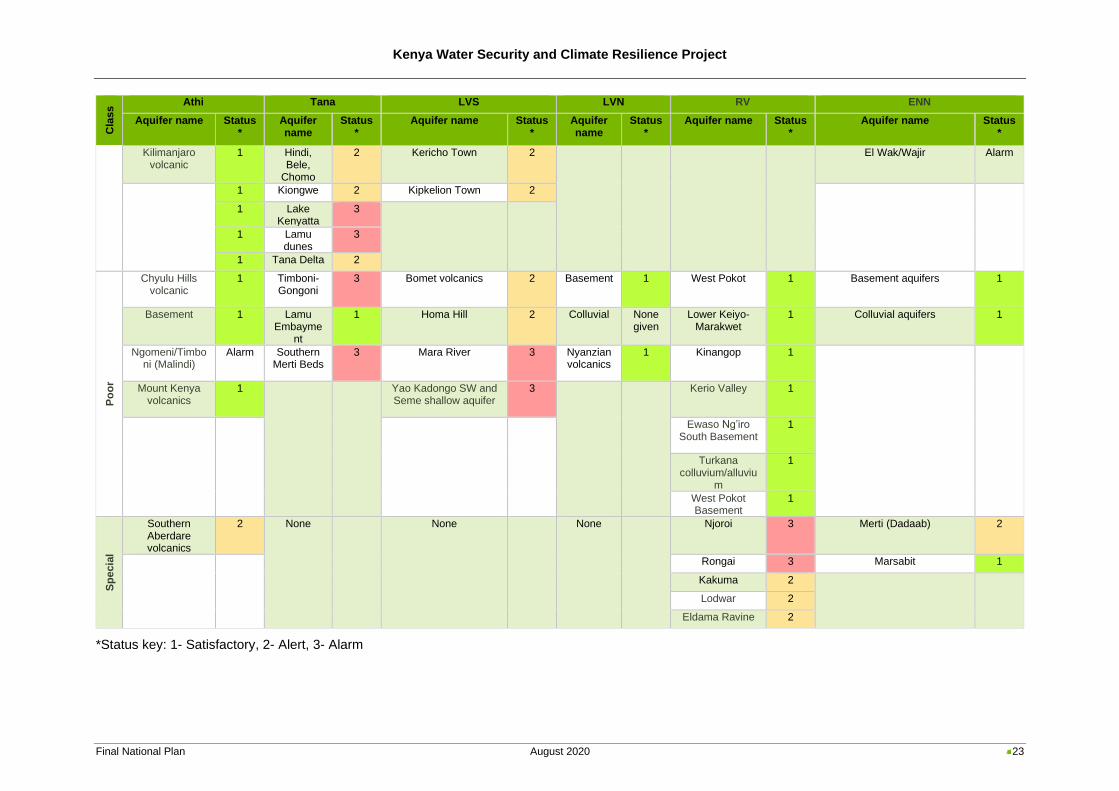
Kenya Water Security and Climate Resilience Project
Final National Plan August 2020 23
Cla
ss Athi Tana LVS LVN RV ENN
Aquifer name Status*
Aquifer name
Status*
Aquifer name Status*
Aquifer name
Status*
Aquifer name Status*
Aquifer name Status*
Kilimanjaro volcanic
1 Hindi, Bele,
Chomo
2 Kericho Town 2
El Wak/Wajir Alarm
1 Kiongwe 2 Kipkelion Town 2
1 Lake Kenyatta
3
1 Lamu dunes
3
1 Tana Delta 2
Po
or
Chyulu Hills volcanic
1 Timboni-Gongoni
3 Bomet volcanics 2 Basement 1 West Pokot 1 Basement aquifers 1
Basement 1 Lamu Embayme
nt
1 Homa Hill 2 Colluvial None given
Lower Keiyo-Marakwet
1 Colluvial aquifers 1
Ngomeni/Timboni (Malindi)
Alarm Southern Merti Beds
3 Mara River 3 Nyanzian volcanics
1 Kinangop 1
Mount Kenya volcanics
1
Yao Kadongo SW and Seme shallow aquifer
3
Kerio Valley 1
Ewaso Ng’iro
South Basement 1
Turkana colluvium/alluviu
m
1
West Pokot Basement
1
Sp
ecia
l
Southern Aberdare volcanics
2 None
None
None
Njoroi 3 Merti (Dadaab) 2
Rongai 3 Marsabit 1
Kakuma 2
Lodwar 2
Eldama Ravine 2
*Status key: 1- Satisfactory, 2- Alert, 3- Alarm
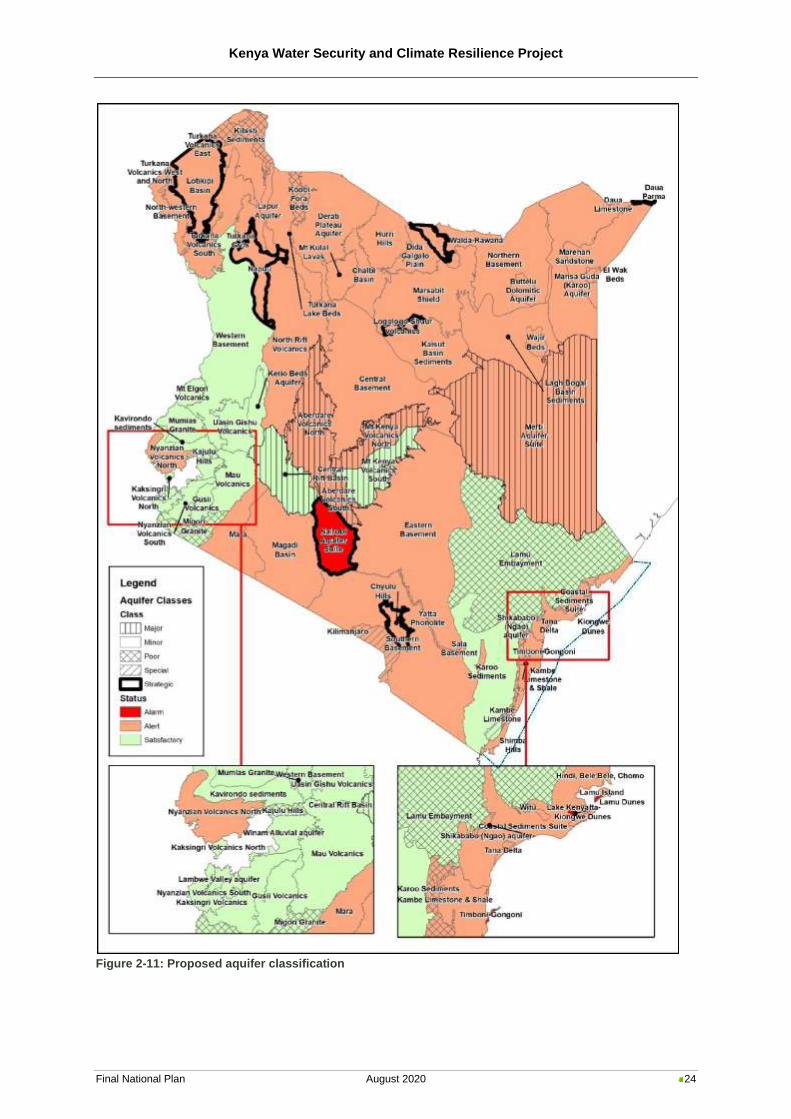
Kenya Water Security and Climate Resilience Project
Final National Plan August 2020 24
Figure 2-11: Proposed aquifer classification
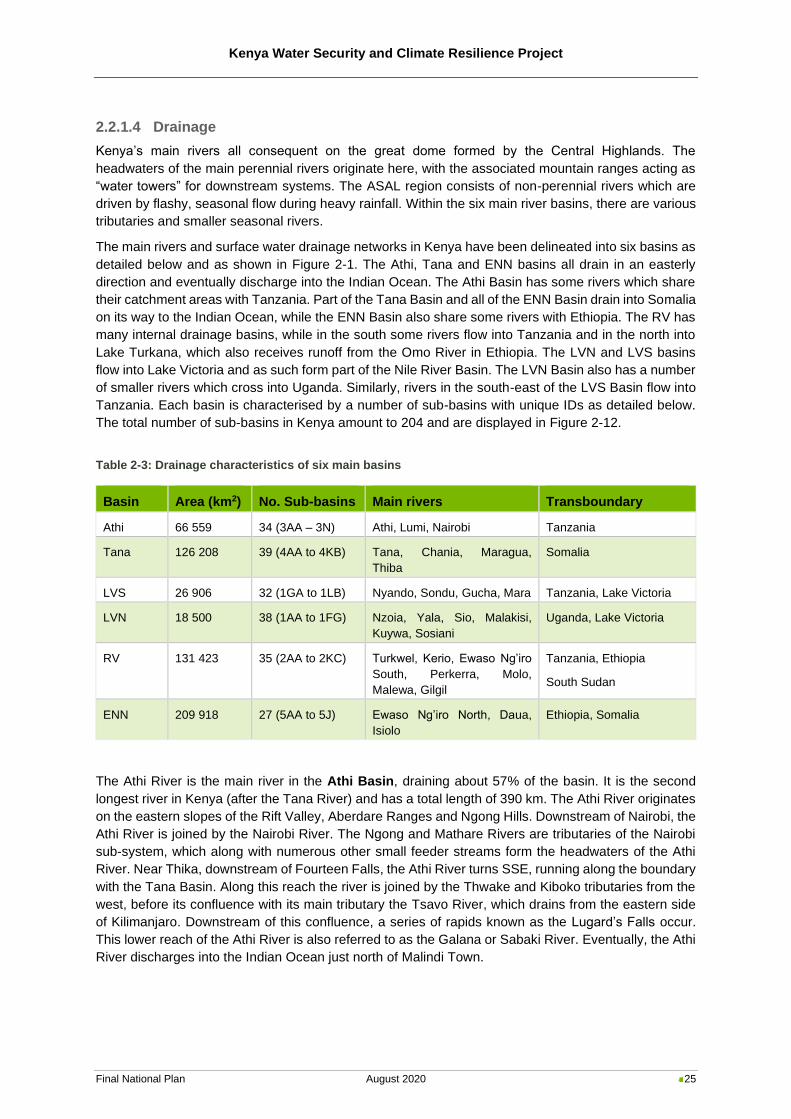
Kenya Water Security and Climate Resilience Project
Final National Plan August 2020 25
2.2.1.4 Drainage
Kenya’s main rivers all consequent on the great dome formed by the Central Highlands. The
headwaters of the main perennial rivers originate here, with the associated mountain ranges acting as
“water towers” for downstream systems. The ASAL region consists of non-perennial rivers which are
driven by flashy, seasonal flow during heavy rainfall. Within the six main river basins, there are various
tributaries and smaller seasonal rivers.
The main rivers and surface water drainage networks in Kenya have been delineated into six basins as
detailed below and as shown in Figure 2-1. The Athi, Tana and ENN basins all drain in an easterly
direction and eventually discharge into the Indian Ocean. The Athi Basin has some rivers which share
their catchment areas with Tanzania. Part of the Tana Basin and all of the ENN Basin drain into Somalia
on its way to the Indian Ocean, while the ENN Basin also share some rivers with Ethiopia. The RV has
many internal drainage basins, while in the south some rivers flow into Tanzania and in the north into
Lake Turkana, which also receives runoff from the Omo River in Ethiopia. The LVN and LVS basins
flow into Lake Victoria and as such form part of the Nile River Basin. The LVN Basin also has a number
of smaller rivers which cross into Uganda. Similarly, rivers in the south-east of the LVS Basin flow into
Tanzania. Each basin is characterised by a number of sub-basins with unique IDs as detailed below.
The total number of sub-basins in Kenya amount to 204 and are displayed in Figure 2-12.
Table 2-3: Drainage characteristics of six main basins
Basin Area (km2) No. Sub-basins Main rivers Transboundary
Athi 66 559 34 (3AA – 3N) Athi, Lumi, Nairobi Tanzania
Tana 126 208 39 (4AA to 4KB) Tana, Chania, Maragua,
Thiba
Somalia
LVS 26 906 32 (1GA to 1LB) Nyando, Sondu, Gucha, Mara Tanzania, Lake Victoria
LVN 18 500 38 (1AA to 1FG) Nzoia, Yala, Sio, Malakisi,
Kuywa, Sosiani
Uganda, Lake Victoria
RV 131 423 35 (2AA to 2KC) Turkwel, Kerio, Ewaso Ng’iro
South, Perkerra, Molo,
Malewa, Gilgil
Tanzania, Ethiopia
South Sudan
ENN 209 918 27 (5AA to 5J) Ewaso Ng’iro North, Daua,
Isiolo
Ethiopia, Somalia
The Athi River is the main river in the Athi Basin, draining about 57% of the basin. It is the second
longest river in Kenya (after the Tana River) and has a total length of 390 km. The Athi River originates
on the eastern slopes of the Rift Valley, Aberdare Ranges and Ngong Hills. Downstream of Nairobi, the
Athi River is joined by the Nairobi River. The Ngong and Mathare Rivers are tributaries of the Nairobi
sub-system, which along with numerous other small feeder streams form the headwaters of the Athi
River. Near Thika, downstream of Fourteen Falls, the Athi River turns SSE, running along the boundary
with the Tana Basin. Along this reach the river is joined by the Thwake and Kiboko tributaries from the
west, before its confluence with its main tributary the Tsavo River, which drains from the eastern side
of Kilimanjaro. Downstream of this confluence, a series of rapids known as the Lugard’s Falls occur.
This lower reach of the Athi River is also referred to as the Galana or Sabaki River. Eventually, the Athi
River discharges into the Indian Ocean just north of Malindi Town.
Kenya Water Security and Climate Resilience Project
Final National Plan August 2020 26
The Tana River is the main river in the Tana Basin and drains approximately 76% of the Tana Basin.
It originates on the slopes of Mount Kenya and flows eastward until it reaches Garissa town, after which
it flows southwards and pours into the Indian Ocean at the Tana Delta. The upper part of the Tana
Basin constitutes the headwaters of the Tana River. Upstream tributaries include the Chania, Thiba,
Maragua and Thika rivers. Eastwards-draining, seasonal tributaries join the main stem of the Tana River
downstream of Garissa and include Nihunguthu, Maua, Komoli, Galole and Kokani rivers. Smaller rivers
in the north-eastern part of the basin drain to Somalia and the Indian Ocean. The Tana River discharges
into the Indian Ocean at the Tana Delta.
The LVS Basin is one of two basins in Kenya which drains to Lake Victoria. The basin is characterised
by the Mau Forest Complex along its north-eastern border with the Rift Valley Basin from where its
major rivers originate, including the Nyando, Sondu, Mara and Gucha-Migori rivers. The Mara River
crosses the border into Tanzania in the Masai Mara National Reserve. Collectively, these 4 rivers drain
almost 80% of the Lake Victoria South Basin. The remainder of the basin is drained by smaller
catchments discharging into the Winum Gulf of Lake Victoria.
The Nzoia River is the largest river in the LVN Basin and drains 70% of the catchment, followed by the
Yala River which drains 18% of the basin. Both rivers drain into Lake Victoria. The Sio River flows
across the Ugandan border before draining into Lake Victoria. The Nzoia River is a permanent river
with seasonal variability and high flows during rainy seasons between March and November, which
frequently cause the river to burst its banks and cause flooding of the lower plains. Surface water quality
is degraded due to effluent discharges from major towns, urban areas and factories and return flows
from irrigation schemes. North of the Sio River, the Malakisi and Malaba Rivers originate on the slopes
of Mount Elgon and cross the border into Uganda.
Drainage in the RV Basin is characterised by seven major lakes with their respective drainage basins.
Lake Turkana in the north of the basin is the largest lake in the basin and has a drainage area of about
123 000 km2, including the Omo River catchment in Ethiopia. The lake has a surface area of
approximately 7 500 km2. The lake receives most of its inflow (more than 80%) from the Omo River,
which enters the lake from Ethiopia in the North. The Kerio and Turkwel rivers are the major Kenyan
rivers which drain to Lake Turkana from the south-west. The Turkwel River originates from the eastern
slopes of Mount Elgon and the Chengani Hills and has a catchment area of 19 820 km2, while the Kerio
River originates from the Mau Forest Complex and has a catchment area of 13 930 km2. The Kerio and
Turkwel rivers are perennial along their upper reaches but intermittent along their lower reaches due to
high seepage and evaporation losses. Smaller seasonal rivers which drain into Lake Turkana from the
western side include Lokichar and Kalakoi rivers. The second largest drainage basin (8 350 km2) is
Lake Magadi in the south of the RV Basin, which is mainly fed by underground rivers. The major rivers
which feed Lake Baringo in the central part of the basin, with a drainage area of 6 530 km2, include the
Perkerra River and the Molo River from the south and the Mukutan River from the east. Lake Naivasha,
next to Naivasha Town, has a drainage area of 3 130 km2. The perennial Malewa and Gilgil rivers
account for nearly 90% of the lake’s inflow, with the seasonal Karati River also contributing. The
Turasha River is a major tributary of the Malewa River. In the central part of the basin, Lake Bogoria’s
drainage area is 1 140 km2. The Waseges River (or Sandai River) is a river that rises on the slopes of
the Nyandarua Plateau below the Aberdare Range. It enters Lake Bogoria from the north after passing
through a swamp. Lakes Nakuru (1 624 km2) and Elementaita (543 km2) have much smaller drainage
areas and are located close to Nakuru Town. In addition to the above lakes and their respective
drainage areas, the RV Basin has three more river basins: the Tarash River in the north-western part
of the basin is a seasonal river which feeds the Lotikipi Swamp; the Suguta River is a seasonal river
directly south of Lake Turkana which flows northward through the Suguta Valley in the rainy season,
forming the temporary Lake Alablad, a dry lake that combines with Lake Logipi at the northern end of
the valley; and the perennial Ewaso Ng’iro South River in the southern RV Basin which originates on
the Mau Escarpment. It flows southwards and crosses the border into Tanzania, where it empties into
Lake Natron.
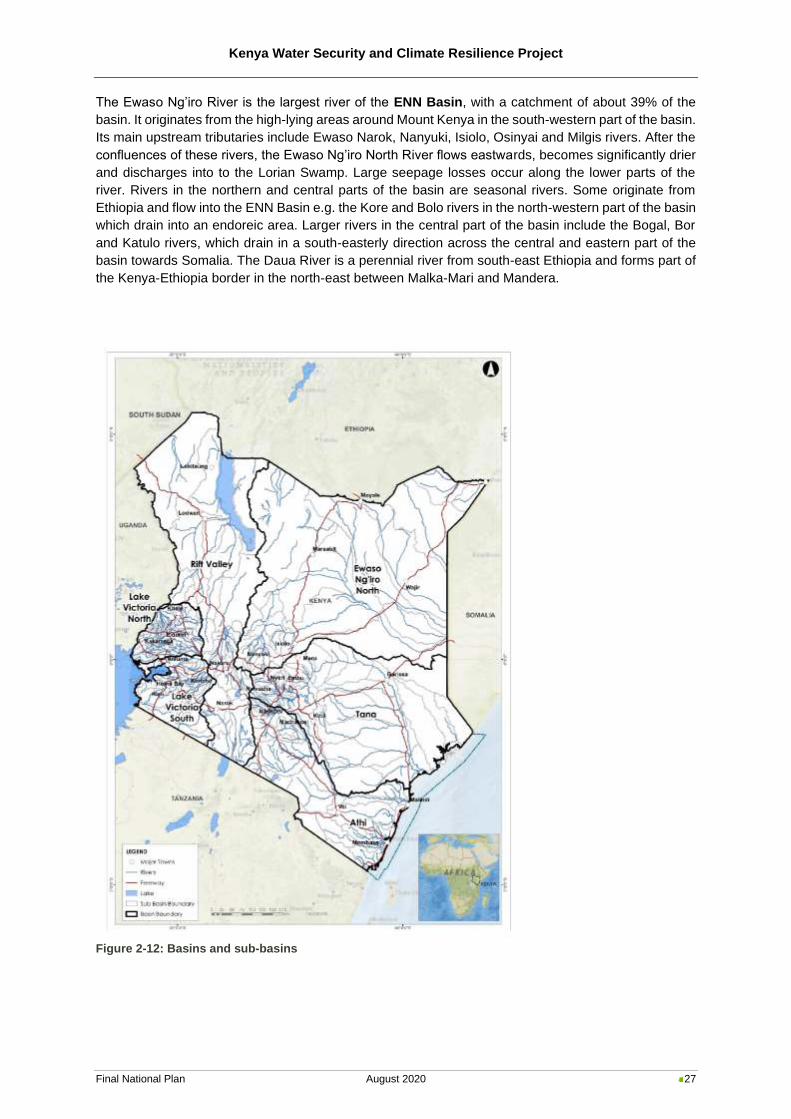
Kenya Water Security and Climate Resilience Project
Final National Plan August 2020 27
The Ewaso Ng’iro River is the largest river of the ENN Basin, with a catchment of about 39% of the
basin. It originates from the high-lying areas around Mount Kenya in the south-western part of the basin.
Its main upstream tributaries include Ewaso Narok, Nanyuki, Isiolo, Osinyai and Milgis rivers. After the
confluences of these rivers, the Ewaso Ng’iro North River flows eastwards, becomes significantly drier
and discharges into to the Lorian Swamp. Large seepage losses occur along the lower parts of the
river. Rivers in the northern and central parts of the basin are seasonal rivers. Some originate from
Ethiopia and flow into the ENN Basin e.g. the Kore and Bolo rivers in the north-western part of the basin
which drain into an endoreic area. Larger rivers in the central part of the basin include the Bogal, Bor
and Katulo rivers, which drain in a south-easterly direction across the central and eastern part of the
basin towards Somalia. The Daua River is a perennial river from south-east Ethiopia and forms part of
the Kenya-Ethiopia border in the north-east between Malka-Mari and Mandera.
Figure 2-12: Basins and sub-basins
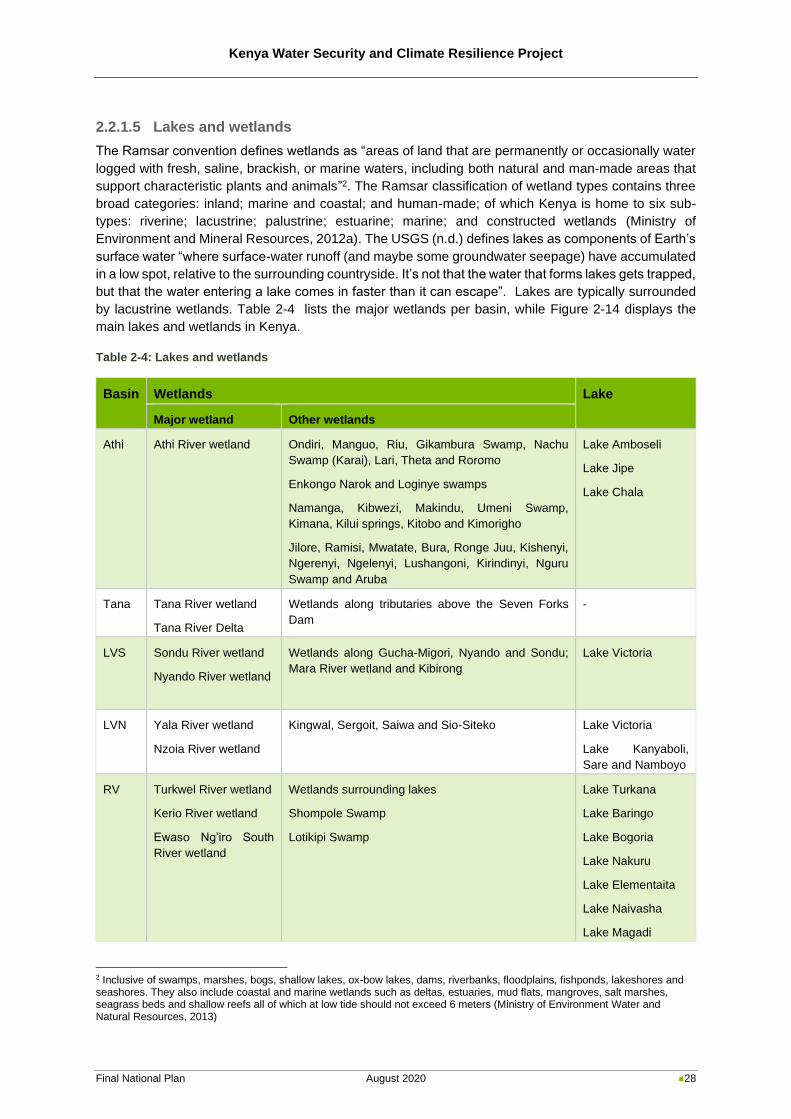
Kenya Water Security and Climate Resilience Project
Final National Plan August 2020 28
2.2.1.5 Lakes and wetlands
The Ramsar convention defines wetlands as “areas of land that are permanently or occasionally water
logged with fresh, saline, brackish, or marine waters, including both natural and man-made areas that
support characteristic plants and animals”2. The Ramsar classification of wetland types contains three
broad categories: inland; marine and coastal; and human-made; of which Kenya is home to six sub-
types: riverine; lacustrine; palustrine; estuarine; marine; and constructed wetlands (Ministry of
Environment and Mineral Resources, 2012a). The USGS (n.d.) defines lakes as components of Earth’s
surface water “where surface-water runoff (and maybe some groundwater seepage) have accumulated
in a low spot, relative to the surrounding countryside. It’s not that the water that forms lakes gets trapped,
but that the water entering a lake comes in faster than it can escape”. Lakes are typically surrounded
by lacustrine wetlands. Table 2-4 lists the major wetlands per basin, while Figure 2-14 displays the
main lakes and wetlands in Kenya.
Table 2-4: Lakes and wetlands
Basin Wetlands Lake
Major wetland Other wetlands
Athi Athi River wetland
Ondiri, Manguo, Riu, Gikambura Swamp, Nachu
Swamp (Karai), Lari, Theta and Roromo
Enkongo Narok and Loginye swamps
Namanga, Kibwezi, Makindu, Umeni Swamp,
Kimana, Kilui springs, Kitobo and Kimorigho
Jilore, Ramisi, Mwatate, Bura, Ronge Juu, Kishenyi,
Ngerenyi, Ngelenyi, Lushangoni, Kirindinyi, Nguru
Swamp and Aruba
Lake Amboseli
Lake Jipe
Lake Chala
Tana Tana River wetland
Tana River Delta
Wetlands along tributaries above the Seven Forks
Dam
-
LVS Sondu River wetland
Nyando River wetland
Wetlands along Gucha-Migori, Nyando and Sondu;
Mara River wetland and Kibirong
Lake Victoria
LVN Yala River wetland
Nzoia River wetland
Kingwal, Sergoit, Saiwa and Sio-Siteko Lake Victoria
Lake Kanyaboli,
Sare and Namboyo
RV Turkwel River wetland
Kerio River wetland
Ewaso Ng’iro South
River wetland
Wetlands surrounding lakes
Shompole Swamp
Lotikipi Swamp
Lake Turkana
Lake Baringo
Lake Bogoria
Lake Nakuru
Lake Elementaita
Lake Naivasha
Lake Magadi
2 Inclusive of swamps, marshes, bogs, shallow lakes, ox-bow lakes, dams, riverbanks, floodplains, fishponds, lakeshores and seashores. They also include coastal and marine wetlands such as deltas, estuaries, mud flats, mangroves, salt marshes, seagrass beds and shallow reefs all of which at low tide should not exceed 6 meters (Ministry of Environment Water and Natural Resources, 2013)
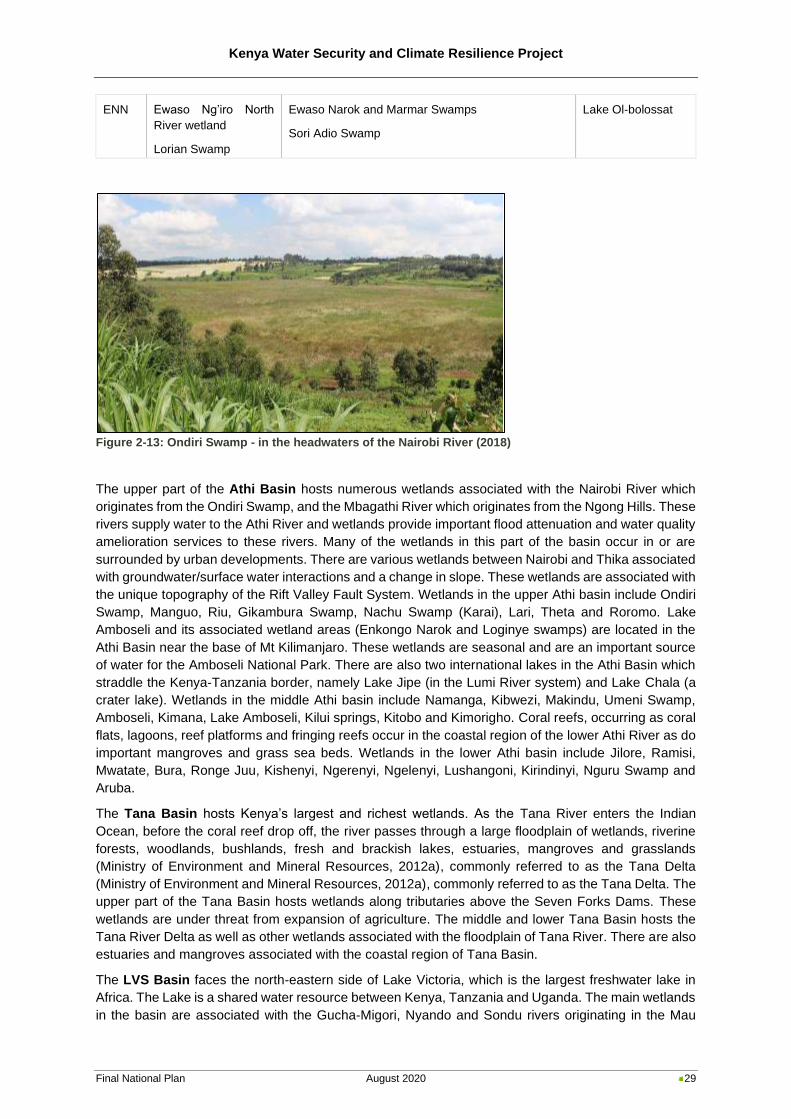
Kenya Water Security and Climate Resilience Project
Final National Plan August 2020 29
ENN Ewaso Ng’iro North
River wetland
Lorian Swamp
Ewaso Narok and Marmar Swamps
Sori Adio Swamp
Lake Ol-bolossat
Figure 2-13: Ondiri Swamp - in the headwaters of the Nairobi River (2018)
The upper part of the Athi Basin hosts numerous wetlands associated with the Nairobi River which
originates from the Ondiri Swamp, and the Mbagathi River which originates from the Ngong Hills. These
rivers supply water to the Athi River and wetlands provide important flood attenuation and water quality
amelioration services to these rivers. Many of the wetlands in this part of the basin occur in or are
surrounded by urban developments. There are various wetlands between Nairobi and Thika associated
with groundwater/surface water interactions and a change in slope. These wetlands are associated with
the unique topography of the Rift Valley Fault System. Wetlands in the upper Athi basin include Ondiri
Swamp, Manguo, Riu, Gikambura Swamp, Nachu Swamp (Karai), Lari, Theta and Roromo. Lake
Amboseli and its associated wetland areas (Enkongo Narok and Loginye swamps) are located in the
Athi Basin near the base of Mt Kilimanjaro. These wetlands are seasonal and are an important source
of water for the Amboseli National Park. There are also two international lakes in the Athi Basin which
straddle the Kenya-Tanzania border, namely Lake Jipe (in the Lumi River system) and Lake Chala (a
crater lake). Wetlands in the middle Athi basin include Namanga, Kibwezi, Makindu, Umeni Swamp,
Amboseli, Kimana, Lake Amboseli, Kilui springs, Kitobo and Kimorigho. Coral reefs, occurring as coral
flats, lagoons, reef platforms and fringing reefs occur in the coastal region of the lower Athi River as do
important mangroves and grass sea beds. Wetlands in the lower Athi basin include Jilore, Ramisi,
Mwatate, Bura, Ronge Juu, Kishenyi, Ngerenyi, Ngelenyi, Lushangoni, Kirindinyi, Nguru Swamp and
Aruba.
The Tana Basin hosts Kenya’s largest and richest wetlands. As the Tana River enters the Indian
Ocean, before the coral reef drop off, the river passes through a large floodplain of wetlands, riverine
forests, woodlands, bushlands, fresh and brackish lakes, estuaries, mangroves and grasslands
(Ministry of Environment and Mineral Resources, 2012a), commonly referred to as the Tana Delta
(Ministry of Environment and Mineral Resources, 2012a), commonly referred to as the Tana Delta. The
upper part of the Tana Basin hosts wetlands along tributaries above the Seven Forks Dams. These
wetlands are under threat from expansion of agriculture. The middle and lower Tana Basin hosts the
Tana River Delta as well as other wetlands associated with the floodplain of Tana River. There are also
estuaries and mangroves associated with the coastal region of Tana Basin.
The LVS Basin faces the north-eastern side of Lake Victoria, which is the largest freshwater lake in
Africa. The Lake is a shared water resource between Kenya, Tanzania and Uganda. The main wetlands
in the basin are associated with the Gucha-Migori, Nyando and Sondu rivers originating in the Mau
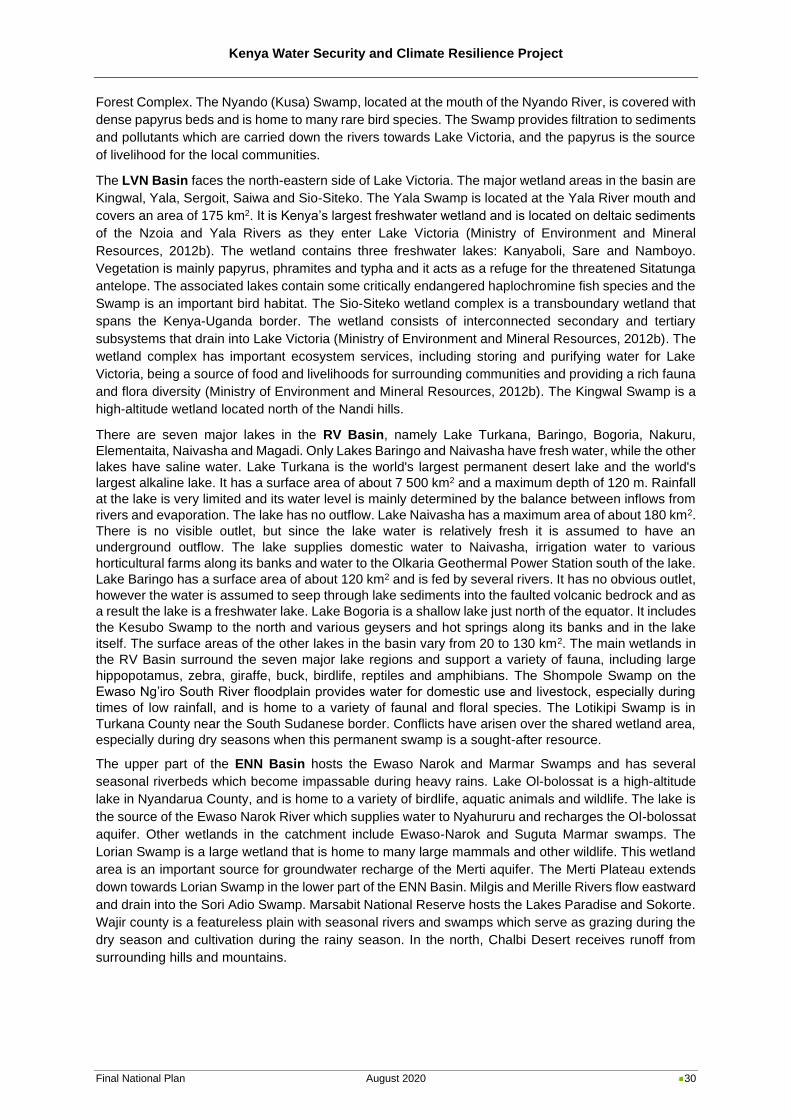
Kenya Water Security and Climate Resilience Project
Final National Plan August 2020 30
Forest Complex. The Nyando (Kusa) Swamp, located at the mouth of the Nyando River, is covered with
dense papyrus beds and is home to many rare bird species. The Swamp provides filtration to sediments
and pollutants which are carried down the rivers towards Lake Victoria, and the papyrus is the source
of livelihood for the local communities.
The LVN Basin faces the north-eastern side of Lake Victoria. The major wetland areas in the basin are
Kingwal, Yala, Sergoit, Saiwa and Sio-Siteko. The Yala Swamp is located at the Yala River mouth and
covers an area of 175 km2. It is Kenya’s largest freshwater wetland and is located on deltaic sediments
of the Nzoia and Yala Rivers as they enter Lake Victoria (Ministry of Environment and Mineral
Resources, 2012b). The wetland contains three freshwater lakes: Kanyaboli, Sare and Namboyo.
Vegetation is mainly papyrus, phramites and typha and it acts as a refuge for the threatened Sitatunga
antelope. The associated lakes contain some critically endangered haplochromine fish species and the
Swamp is an important bird habitat. The Sio-Siteko wetland complex is a transboundary wetland that
spans the Kenya-Uganda border. The wetland consists of interconnected secondary and tertiary
subsystems that drain into Lake Victoria (Ministry of Environment and Mineral Resources, 2012b). The
wetland complex has important ecosystem services, including storing and purifying water for Lake
Victoria, being a source of food and livelihoods for surrounding communities and providing a rich fauna
and flora diversity (Ministry of Environment and Mineral Resources, 2012b). The Kingwal Swamp is a
high-altitude wetland located north of the Nandi hills.
There are seven major lakes in the RV Basin, namely Lake Turkana, Baringo, Bogoria, Nakuru,
Elementaita, Naivasha and Magadi. Only Lakes Baringo and Naivasha have fresh water, while the other
lakes have saline water. Lake Turkana is the world's largest permanent desert lake and the world's
largest alkaline lake. It has a surface area of about 7 500 km2 and a maximum depth of 120 m. Rainfall
at the lake is very limited and its water level is mainly determined by the balance between inflows from
rivers and evaporation. The lake has no outflow. Lake Naivasha has a maximum area of about 180 km2.
There is no visible outlet, but since the lake water is relatively fresh it is assumed to have an
underground outflow. The lake supplies domestic water to Naivasha, irrigation water to various
horticultural farms along its banks and water to the Olkaria Geothermal Power Station south of the lake.
Lake Baringo has a surface area of about 120 km2 and is fed by several rivers. It has no obvious outlet,
however the water is assumed to seep through lake sediments into the faulted volcanic bedrock and as
a result the lake is a freshwater lake. Lake Bogoria is a shallow lake just north of the equator. It includes
the Kesubo Swamp to the north and various geysers and hot springs along its banks and in the lake
itself. The surface areas of the other lakes in the basin vary from 20 to 130 km2. The main wetlands in
the RV Basin surround the seven major lake regions and support a variety of fauna, including large
hippopotamus, zebra, giraffe, buck, birdlife, reptiles and amphibians. The Shompole Swamp on the
Ewaso Ng’iro South River floodplain provides water for domestic use and livestock, especially during
times of low rainfall, and is home to a variety of faunal and floral species. The Lotikipi Swamp is in
Turkana County near the South Sudanese border. Conflicts have arisen over the shared wetland area,
especially during dry seasons when this permanent swamp is a sought-after resource.
The upper part of the ENN Basin hosts the Ewaso Narok and Marmar Swamps and has several
seasonal riverbeds which become impassable during heavy rains. Lake Ol-bolossat is a high-altitude
lake in Nyandarua County, and is home to a variety of birdlife, aquatic animals and wildlife. The lake is
the source of the Ewaso Narok River which supplies water to Nyahururu and recharges the Ol-bolossat
aquifer. Other wetlands in the catchment include Ewaso-Narok and Suguta Marmar swamps. The
Lorian Swamp is a large wetland that is home to many large mammals and other wildlife. This wetland
area is an important source for groundwater recharge of the Merti aquifer. The Merti Plateau extends
down towards Lorian Swamp in the lower part of the ENN Basin. Milgis and Merille Rivers flow eastward
and drain into the Sori Adio Swamp. Marsabit National Reserve hosts the Lakes Paradise and Sokorte.
Wajir county is a featureless plain with seasonal rivers and swamps which serve as grazing during the
dry season and cultivation during the rainy season. In the north, Chalbi Desert receives runoff from
surrounding hills and mountains.
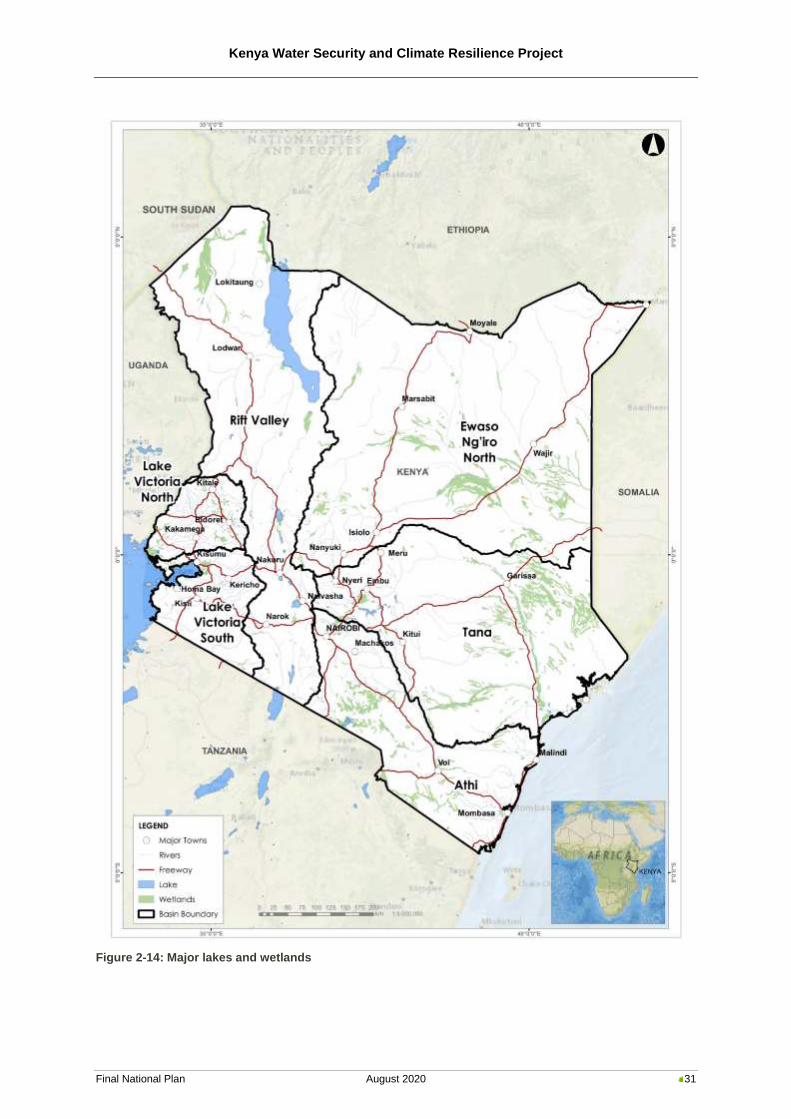
Kenya Water Security and Climate Resilience Project
Final National Plan August 2020 31
Figure 2-14: Major lakes and wetlands
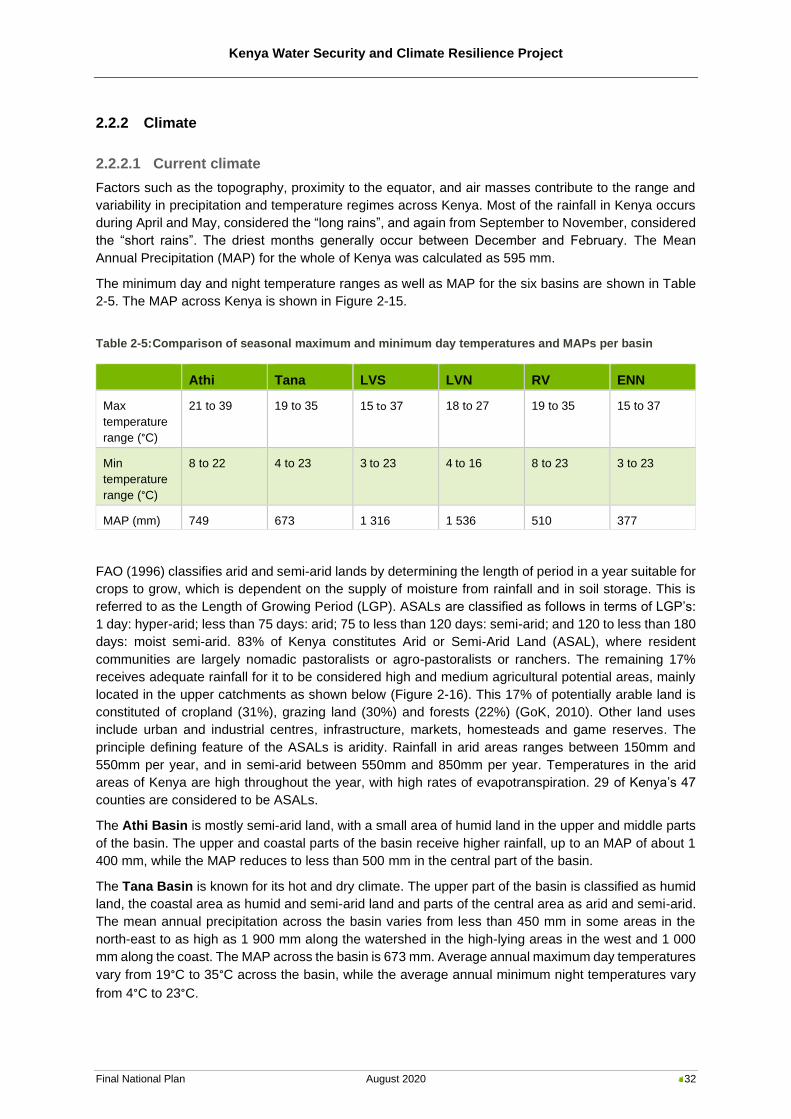
Kenya Water Security and Climate Resilience Project
Final National Plan August 2020 32
2.2.2 Climate
2.2.2.1 Current climate
Factors such as the topography, proximity to the equator, and air masses contribute to the range and
variability in precipitation and temperature regimes across Kenya. Most of the rainfall in Kenya occurs
during April and May, considered the “long rains”, and again from September to November, considered
the “short rains”. The driest months generally occur between December and February. The Mean
Annual Precipitation (MAP) for the whole of Kenya was calculated as 595 mm.
The minimum day and night temperature ranges as well as MAP for the six basins are shown in Table
2-5. The MAP across Kenya is shown in Figure 2-15.
Table 2-5: Comparison of seasonal maximum and minimum day temperatures and MAPs per basin
Athi Tana LVS LVN RV ENN
Max
temperature
range (°C)
21 to 39 19 to 35 15 to 37 18 to 27 19 to 35 15 to 37
Min
temperature
range (°C)
8 to 22 4 to 23 3 to 23 4 to 16 8 to 23 3 to 23
MAP (mm) 749 673 1 316 1 536 510 377
FAO (1996) classifies arid and semi-arid lands by determining the length of period in a year suitable for
crops to grow, which is dependent on the supply of moisture from rainfall and in soil storage. This is
referred to as the Length of Growing Period (LGP). ASALs are classified as follows in terms of LGP’s:
1 day: hyper-arid; less than 75 days: arid; 75 to less than 120 days: semi-arid; and 120 to less than 180
days: moist semi-arid. 83% of Kenya constitutes Arid or Semi-Arid Land (ASAL), where resident
communities are largely nomadic pastoralists or agro-pastoralists or ranchers. The remaining 17%
receives adequate rainfall for it to be considered high and medium agricultural potential areas, mainly
located in the upper catchments as shown below (Figure 2-16). This 17% of potentially arable land is
constituted of cropland (31%), grazing land (30%) and forests (22%) (GoK, 2010). Other land uses
include urban and industrial centres, infrastructure, markets, homesteads and game reserves. The
principle defining feature of the ASALs is aridity. Rainfall in arid areas ranges between 150mm and
550mm per year, and in semi-arid between 550mm and 850mm per year. Temperatures in the arid
areas of Kenya are high throughout the year, with high rates of evapotranspiration. 29 of Kenya’s 47
counties are considered to be ASALs.
The Athi Basin is mostly semi-arid land, with a small area of humid land in the upper and middle parts
of the basin. The upper and coastal parts of the basin receive higher rainfall, up to an MAP of about 1
400 mm, while the MAP reduces to less than 500 mm in the central part of the basin.
The Tana Basin is known for its hot and dry climate. The upper part of the basin is classified as humid
land, the coastal area as humid and semi-arid land and parts of the central area as arid and semi-arid.
The mean annual precipitation across the basin varies from less than 450 mm in some areas in the
north-east to as high as 1 900 mm along the watershed in the high-lying areas in the west and 1 000
mm along the coast. The MAP across the basin is 673 mm. Average annual maximum day temperatures
vary from 19°C to 35°C across the basin, while the average annual minimum night temperatures vary
from 4°C to 23°C.
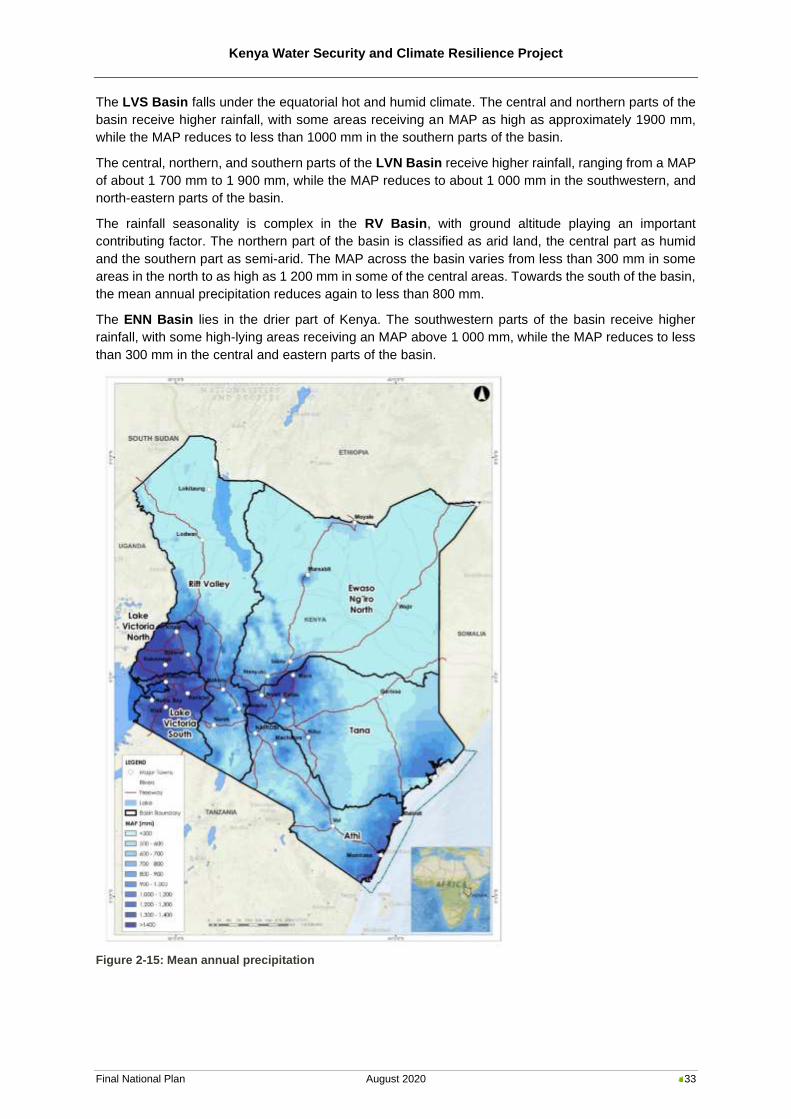
Kenya Water Security and Climate Resilience Project
Final National Plan August 2020 33
The LVS Basin falls under the equatorial hot and humid climate. The central and northern parts of the
basin receive higher rainfall, with some areas receiving an MAP as high as approximately 1900 mm,
while the MAP reduces to less than 1000 mm in the southern parts of the basin.
The central, northern, and southern parts of the LVN Basin receive higher rainfall, ranging from a MAP
of about 1 700 mm to 1 900 mm, while the MAP reduces to about 1 000 mm in the southwestern, and
north-eastern parts of the basin.
The rainfall seasonality is complex in the RV Basin, with ground altitude playing an important
contributing factor. The northern part of the basin is classified as arid land, the central part as humid
and the southern part as semi-arid. The MAP across the basin varies from less than 300 mm in some
areas in the north to as high as 1 200 mm in some of the central areas. Towards the south of the basin,
the mean annual precipitation reduces again to less than 800 mm.
The ENN Basin lies in the drier part of Kenya. The southwestern parts of the basin receive higher
rainfall, with some high-lying areas receiving an MAP above 1 000 mm, while the MAP reduces to less
than 300 mm in the central and eastern parts of the basin.
Figure 2-15: Mean annual precipitation
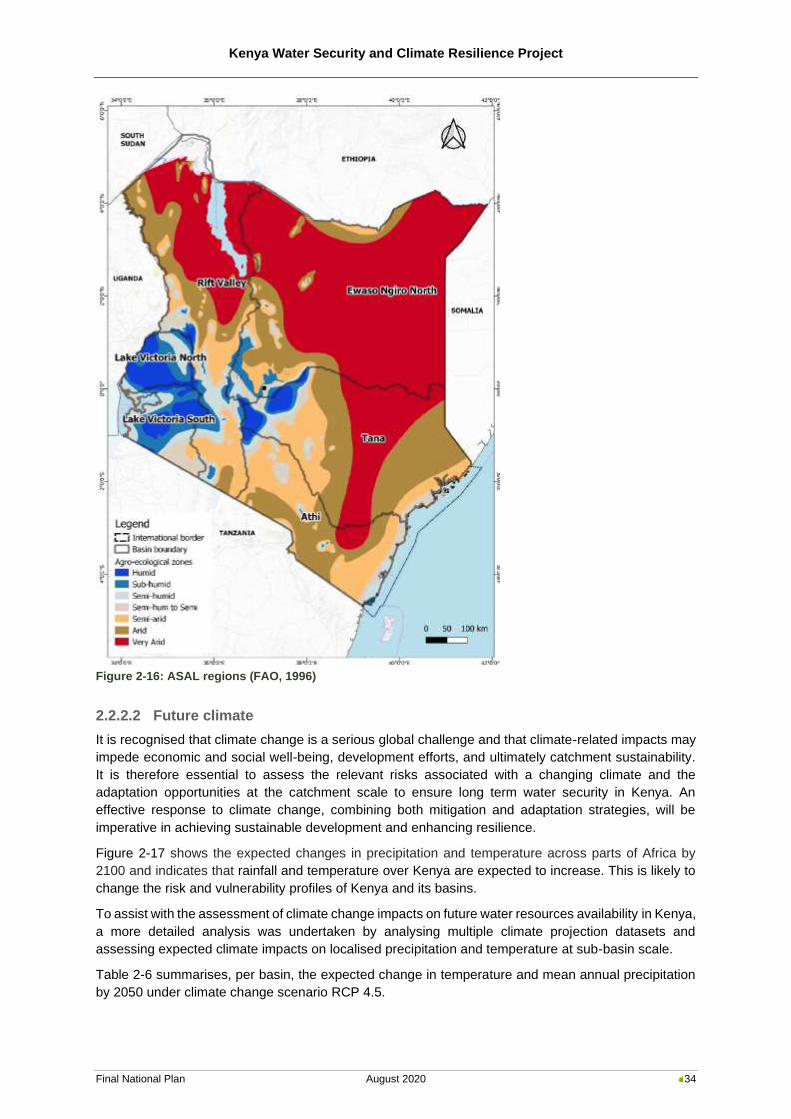
Kenya Water Security and Climate Resilience Project
Final National Plan August 2020 34
Figure 2-16: ASAL regions (FAO, 1996)
2.2.2.2 Future climate
It is recognised that climate change is a serious global challenge and that climate-related impacts may
impede economic and social well-being, development efforts, and ultimately catchment sustainability.
It is therefore essential to assess the relevant risks associated with a changing climate and the
adaptation opportunities at the catchment scale to ensure long term water security in Kenya. An
effective response to climate change, combining both mitigation and adaptation strategies, will be
imperative in achieving sustainable development and enhancing resilience.
Figure 2-17 shows the expected changes in precipitation and temperature across parts of Africa by
2100 and indicates that rainfall and temperature over Kenya are expected to increase. This is likely to
change the risk and vulnerability profiles of Kenya and its basins.
To assist with the assessment of climate change impacts on future water resources availability in Kenya,
a more detailed analysis was undertaken by analysing multiple climate projection datasets and
assessing expected climate impacts on localised precipitation and temperature at sub-basin scale.
Table 2-6 summarises, per basin, the expected change in temperature and mean annual precipitation
by 2050 under climate change scenario RCP 4.5.
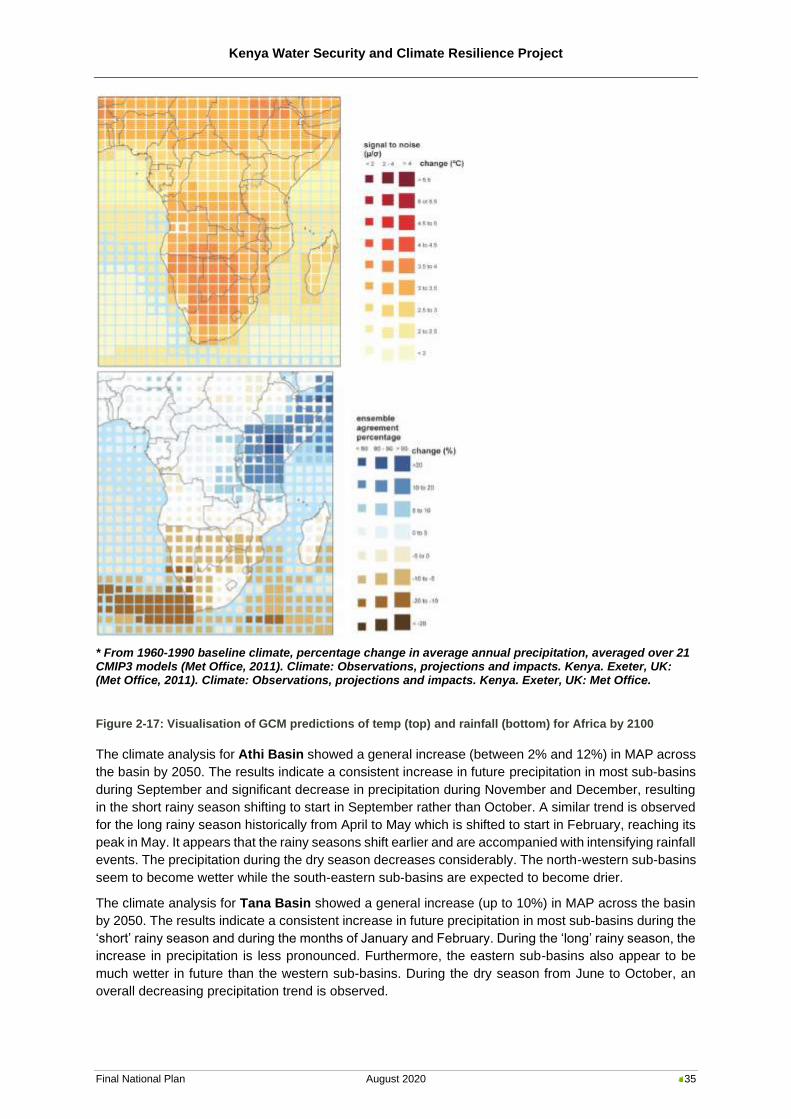
Kenya Water Security and Climate Resilience Project
Final National Plan August 2020 35
* From 1960-1990 baseline climate, percentage change in average annual precipitation, averaged over 21 CMIP3 models (Met Office, 2011). Climate: Observations, projections and impacts. Kenya. Exeter, UK: (Met Office, 2011). Climate: Observations, projections and impacts. Kenya. Exeter, UK: Met Office.
Figure 2-17: Visualisation of GCM predictions of temp (top) and rainfall (bottom) for Africa by 2100
The climate analysis for Athi Basin showed a general increase (between 2% and 12%) in MAP across
the basin by 2050. The results indicate a consistent increase in future precipitation in most sub-basins
during September and significant decrease in precipitation during November and December, resulting
in the short rainy season shifting to start in September rather than October. A similar trend is observed
for the long rainy season historically from April to May which is shifted to start in February, reaching its
peak in May. It appears that the rainy seasons shift earlier and are accompanied with intensifying rainfall
events. The precipitation during the dry season decreases considerably. The north-western sub-basins
seem to become wetter while the south-eastern sub-basins are expected to become drier.
The climate analysis for Tana Basin showed a general increase (up to 10%) in MAP across the basin
by 2050. The results indicate a consistent increase in future precipitation in most sub-basins during the
‘short’ rainy season and during the months of January and February. During the ‘long’ rainy season, the
increase in precipitation is less pronounced. Furthermore, the eastern sub-basins also appear to be
much wetter in future than the western sub-basins. During the dry season from June to October, an
overall decreasing precipitation trend is observed.
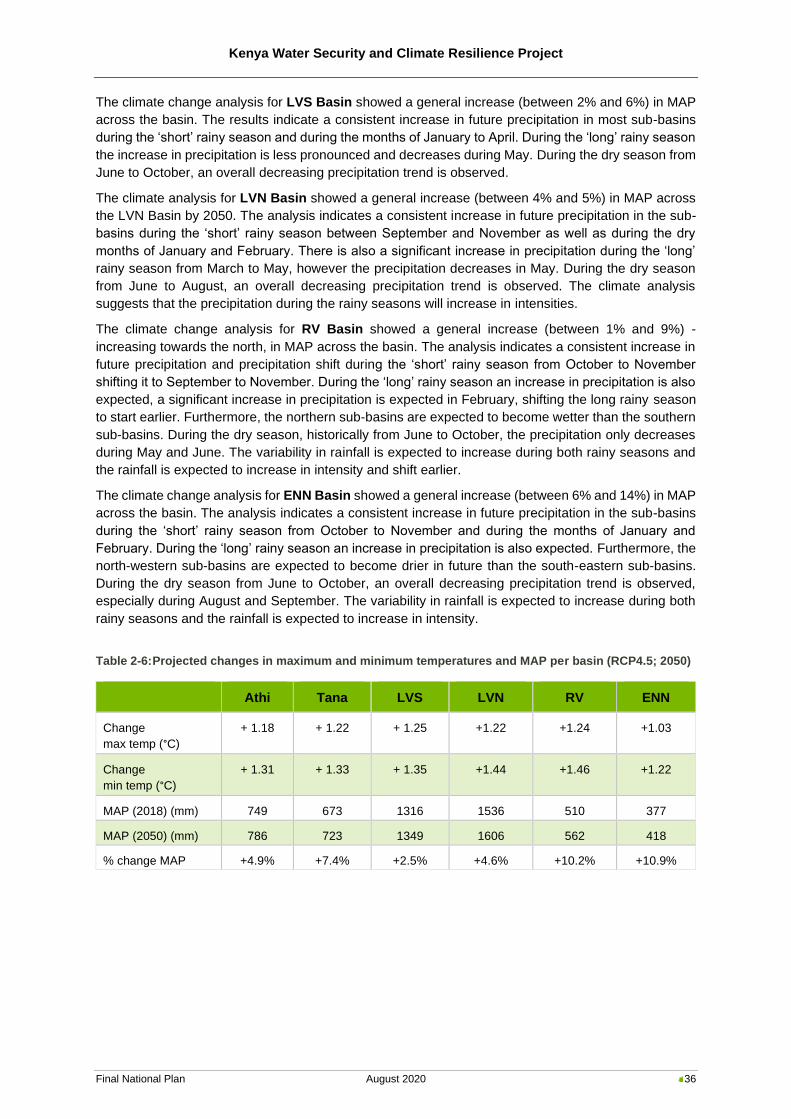
Kenya Water Security and Climate Resilience Project
Final National Plan August 2020 36
The climate change analysis for LVS Basin showed a general increase (between 2% and 6%) in MAP
across the basin. The results indicate a consistent increase in future precipitation in most sub-basins
during the ‘short’ rainy season and during the months of January to April. During the ‘long’ rainy season
the increase in precipitation is less pronounced and decreases during May. During the dry season from
June to October, an overall decreasing precipitation trend is observed.
The climate analysis for LVN Basin showed a general increase (between 4% and 5%) in MAP across
the LVN Basin by 2050. The analysis indicates a consistent increase in future precipitation in the sub-
basins during the ‘short’ rainy season between September and November as well as during the dry
months of January and February. There is also a significant increase in precipitation during the ‘long’
rainy season from March to May, however the precipitation decreases in May. During the dry season
from June to August, an overall decreasing precipitation trend is observed. The climate analysis
suggests that the precipitation during the rainy seasons will increase in intensities.
The climate change analysis for RV Basin showed a general increase (between 1% and 9%) -
increasing towards the north, in MAP across the basin. The analysis indicates a consistent increase in
future precipitation and precipitation shift during the ‘short’ rainy season from October to November
shifting it to September to November. During the ‘long’ rainy season an increase in precipitation is also
expected, a significant increase in precipitation is expected in February, shifting the long rainy season
to start earlier. Furthermore, the northern sub-basins are expected to become wetter than the southern
sub-basins. During the dry season, historically from June to October, the precipitation only decreases
during May and June. The variability in rainfall is expected to increase during both rainy seasons and
the rainfall is expected to increase in intensity and shift earlier.
The climate change analysis for ENN Basin showed a general increase (between 6% and 14%) in MAP
across the basin. The analysis indicates a consistent increase in future precipitation in the sub-basins
during the ‘short’ rainy season from October to November and during the months of January and
February. During the ‘long’ rainy season an increase in precipitation is also expected. Furthermore, the
north-western sub-basins are expected to become drier in future than the south-eastern sub-basins.
During the dry season from June to October, an overall decreasing precipitation trend is observed,
especially during August and September. The variability in rainfall is expected to increase during both
rainy seasons and the rainfall is expected to increase in intensity.
Table 2-6: Projected changes in maximum and minimum temperatures and MAP per basin (RCP4.5; 2050)
Athi Tana LVS LVN RV ENN
Change
max temp (°C)
+ 1.18 + 1.22 + 1.25 +1.22 +1.24 +1.03
Change
min temp (°C)
+ 1.31 + 1.33 + 1.35 +1.44 +1.46 +1.22
MAP (2018) (mm) 749 673 1316 1536 510 377
MAP (2050) (mm) 786 723 1349 1606 562 418
% change MAP +4.9% +7.4% +2.5% +4.6% +10.2% +10.9%
Kenya Water Security and Climate Resilience Project
Final National Plan August 2020 37
2.2.3 Environment
2.2.3.1 Vegetation cover
Vegetation cover is important, as dense vegetation cover will act to protect the land from erosion and
increase the infiltration rates, whilst overgrazed and cleared land is more exposed. The density of
vegetation cover reflects the influence of cropping practices, vegetation canopy and general ground
cover. Maintaining a dense and diverse vegetation cover is therefore very important in catchment
management. Figure 2-18 shows the spatial variation of vegetation cover in the six basins of Kenya (a
high cover management factor indicates poor vegetation cover and vice versa). The central high lying
areas of Kenya have good vegetation cover due to natural forests. These forests are regarded as the
major water towers and groundwater recharge areas of the basin, protecting the watershed and
influencing the quality, quantity and seasonal flow of rivers. The semi-arid to arid plains in the country
have limited cover provided by the vegetation. The plains also host cropland and rangeland, with
rangeland moving more towards agro-pastoralism and urbanisation. Along the coastal zones, areas of
rainforest, swamp forest and mangroves occur.
The humid, high lying part of the upper Athi Basin generally has good vegetation cover due to natural
forests. The main forests within the basin occur in areas which receive above 800 mm of rainfall per
year. They are regarded as the major water towers and groundwater recharge areas of the basin,
protect the watershed and influence the quality, quantity and seasonal flow of rivers. The semi-arid
plains in the middle basin have limited cover provided by the vegetation. The plains also host cropland
and rangeland, with rangeland moving more towards agro-pastoralism and urbanisation. Along the
coastal zone, areas of rainforest, swamp forest and mangroves occur. The mangrove forest is an
important ecosystem in this region.
The upper Tana Basin has a region of high-rainfall that is characterised by good vegetation cover,
although this is also a region of agricultural land use therefore vegetation cover has seasonal
fluctuations. The lower and middle basin is characterised by a semi-arid climate and reduced vegetation
cover. This is a region of pastoralism with limited agriculture. There is improved vegetation cover in the
protected forests in the coastal strip.
The LVS Basin forms part of the highest rainfall region in the country. The vegetation cover is mainly
mosaics of forest and evergreen vegetation, with mountain forest vegetation in the highlands. The LVN
Basin vegetation cover is mainly a mosaic of forest and evergreen vegetation, with mountain forest
vegetation in the highlands.
In the RV Basin the northern catchment surrounding Lake Turkana is mainly semi-desert vegetation
covered with scattered shrubs. The southern parts of the basin are covered by bushland and grassland
vegetation, while the mountainous central region is covered by forest vegetation.
The semi-arid, high lying part of the upper ENN Basin generally has good vegetation cover. The
footslopes of the Aberdares host important forest ecosystems that form a critical part of the hydrological
system and provide important natural resources to surrounding wildlife and communities. The ASAL in
the remainder of the ENN Basin has limited cover provided by vegetation. The plains also host cropland
and rangeland, with rangeland moving more towards agro-pastoralism and urbanisation. Mount
Marsabit has good vegetation cover.
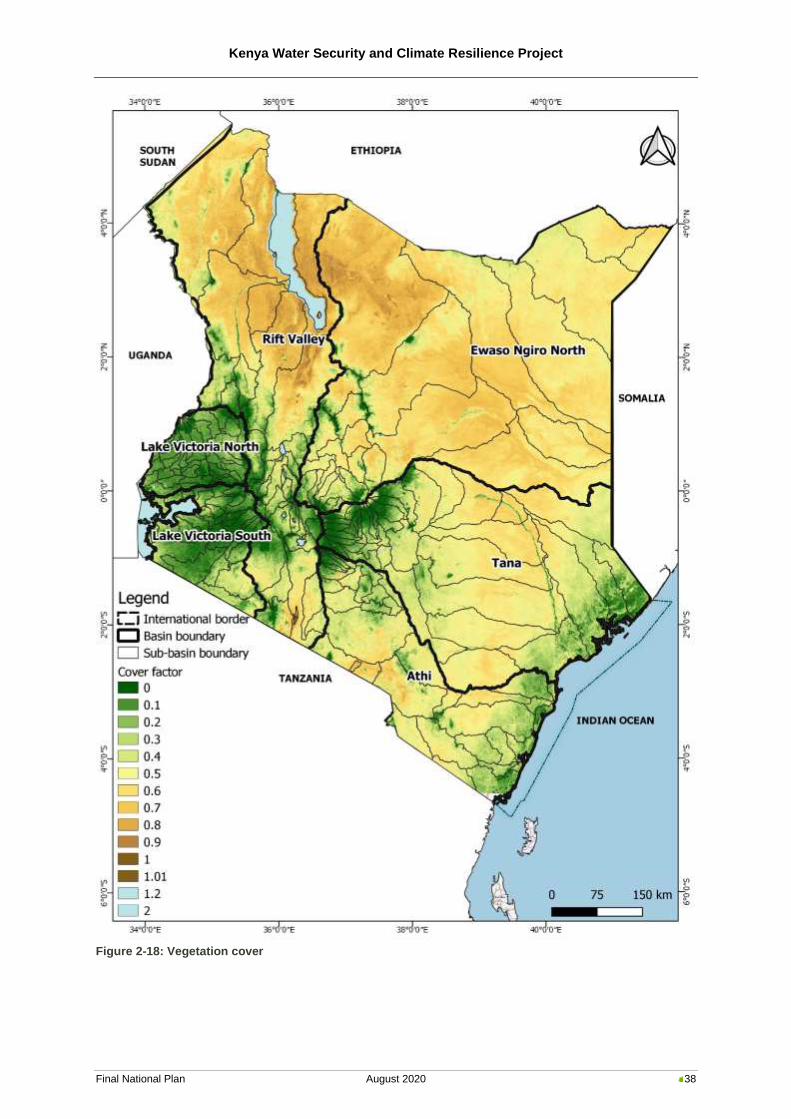
Kenya Water Security and Climate Resilience Project
Final National Plan August 2020 38
Figure 2-18: Vegetation cover
Kenya Water Security and Climate Resilience Project
Final National Plan August 2020 39
2.2.3.2 Biodiversity
Biodiversity in Kenya is linked to water resources and forest reserves or protected areas. According to
BirdLife International3 Kenya is home to 1 056 types of birds, of which 43 are globally threatened. There
are 68 Important Bird Areas (IBAs) in the country, covering 6 650 062 ha. Most of the IBAs relate to the
protected areas in Kenya. Of these IBAs, 21 are in danger. Currently the country has 6 sites designated
as Wetlands of International Importance (i.e. Ramsar sites4) covering 265 449 ha. There are three
UNESCO5 natural heritage sites in the country.
At least 58 species of fish are known to occur in the Athi River system, four of which were introduced.
Lake Jipe is of global importance as it is the habitat of the only remaining Oreochromis jipe, a fish
species which is on the verge of extinction. Along the coastal zone in the Athi Basin, areas of rainforest,
swamp forest and mangroves occur. The mangrove forest is an important ecosystem in this region. In
the Athi Basin the Athi River system has a greater diversity of fish species along the lower reaches of
the river than along the upper reaches (Wanja, 2013).
The main biodiversity area in Tana Basin is the Tana River Delta, which is known to include many
endemic plants, primates, amphibians and reptiles (Ministry of Environment and Mineral Resources,
2012a). The Delta provides a habitat for 320 plant taxa and hosts seven plants on the IUCN Red list
(Ministry of Environment and Mineral Resources, 2012a). It is a critical feeding and wintering ground
for several migratory water birds such as waders, gulls and terns (Birdlife International, 2019b;
RAMSAR, 2020). The estuaries, mangroves and shorelines provide a habitat for a wide range of fish
species and CITES (Convention on International Trade in Endangered Species of Wild Fauna & Flora)
shark species have been recorded in the Delta area (Ministry of Environment and Mineral Resources,
2012a).
Biodiversity in LVS Basin is linked to water resources and forest reserves or protected areas. An
important forest reserve is the Mau Forest Complex. The forest occurs on the Mau Escarpment, a block
of raised land that forms the western wall of the Rift Valley. There are four main Forest Reserves in
LVS Basin: Eastern, Western and South-western Mau and Trans-Mara. The forest is a water tower for
streams such as the Sondu and Mara river systems, which flow into Lake Victoria. The areas
surrounding the forest are intensively farmed, with human population densities about twice as high on
the western side of the forest as on the east (Birdlife International, 2019a). Vegetation patterns are
complex, but there is a broad altitudinal zonation from west to east, lower montane forest below 2,300
m giving way to thickets of bamboo Arundinaria alpina mixed with forest and grassland, and finally to
montane sclerophyllous forest near the escarpment crest (Birdlife International, 2019a). The forest has
a rich highland bird community and rare mammals, insects and other plant life. The Maasai Mara is
home to approximately 25% of Kenya’s wildlife (East Africa Natural History Society, 2017) and is well
known for the annual migration of wildebeest. The Reserve has a varied habitat ranging from grassland
to forests. Grasslands host the migratory corn crake and the Jackson’s widow bird and the woodlands
host the grey-crested helmet shrike. The deltaic Nyando wetlands perform important ecosystem
services due to its location fringing Lake Victoria. Kusa Swamp has dense stands of Cyperus papyrus,
Vossia cuspidate and Phragmites spp. with associated rare animals and birds (Birdlife International,
2019a).
3 BirdLife International’s national partner in Kenya is Nature Kenya 4 Kenya ramified the Ramsar convention in 1990 5 Kenya accepted the UNESCO World Heritage Convention in 1991
Kenya Water Security and Climate Resilience Project
Final National Plan August 2020 40
The major wetland areas in the LVN Basin are Kingwal, Yala, Sergoit, Saiwa and Sio-Siteko. Although
the Yala Swamp is not a designated protected area, the ecosystem provides major ecological and
hydrological functions and is a major source of livelihood for the surrounding communities. Its vegetation
is dominated by papyrus, phragmites and typha. The Swamp houses many species, including the
threatened Sitatunga antelope and birdlife and endangered fish species. The Sio-Siteko wetland system
is shared between Kenya and Uganda. The wetland is an important ecosystem and source of livelihood
for surrounding communities, and stores and purifies water flowing into Lake Victoria. Wetland
degradation and encroachment is a significant issue in the basin, especially in areas where wetlands
are not protected. The Kingwal Swamp is a high-altitude wetland located north of the Nandi hills. It is
well known as a breeding site for the Sitatunga antelope (Ministry of Environment and Mineral
Resources, 2012b). It is also a habitat for crane bird population and the water berry tree which is used
by communities.
Biodiversity in RV Basin is linked to water resources, wetlands and forest reserves or protected areas.
There are several lakes and wetlands in the basin, which are important habitats for a variety of birdlife
and wildlife. This includes crocodiles, several endangered bird species and large mammals such as
hippopotamus. Lake Turkana is designated as a UNESCO World Heritage Site, while five of the lakes
in the basin are designated as Ramsar sites, including Lakes Baringo, Bogoria, Elmenteita, Naivasha
and Nakuru.
In the dry ENN Basin water is life and maintains diverse and dynamic habitats linked to seasonal water
availability. The Lorian swamp is maintained by seasonal flow, which supports acacia woodlands along
the course of the Ewaso Ng’iro River floodplain. Sedge and grass species populate the swamped
floodplains providing grazing for the large fauna: buffalo and African elephant, as well as habitat for
Vervet monkey and Nile crocodile
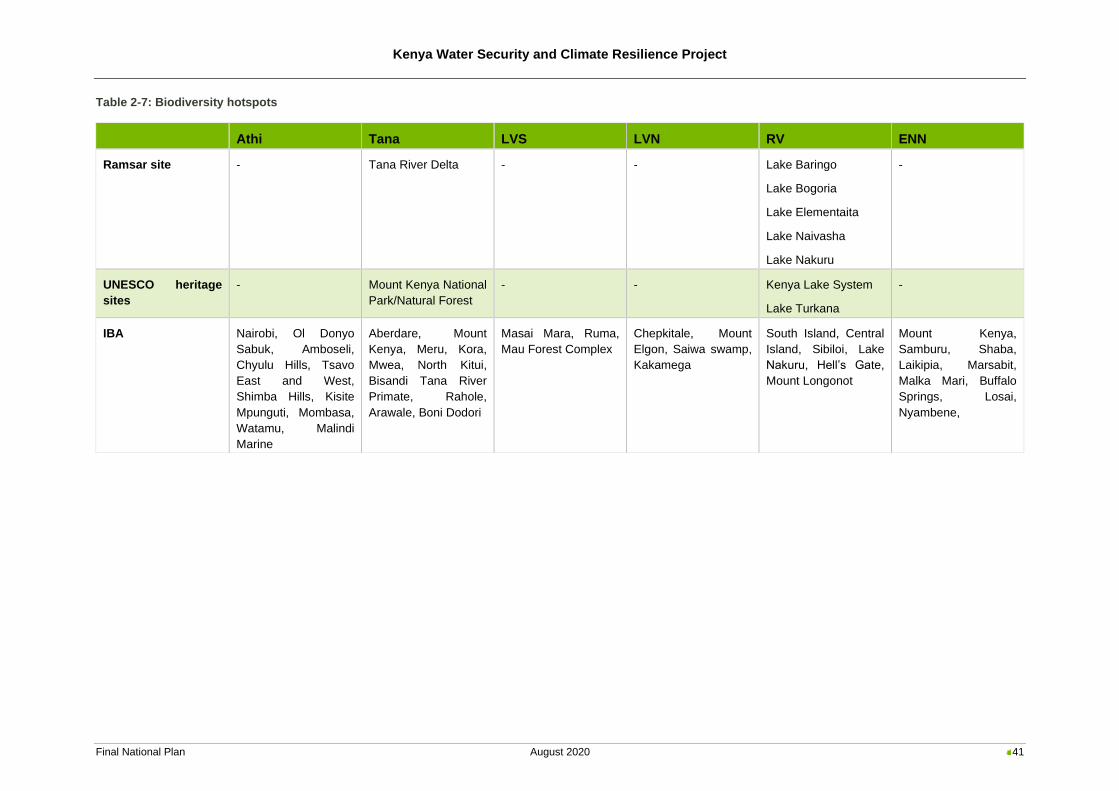
Kenya Water Security and Climate Resilience Project
Final National Plan August 2020 41
Table 2-7: Biodiversity hotspots
Athi Tana LVS LVN RV ENN
Ramsar site - Tana River Delta - - Lake Baringo
Lake Bogoria
Lake Elementaita
Lake Naivasha
Lake Nakuru
-
UNESCO heritage
sites
- Mount Kenya National
Park/Natural Forest
- - Kenya Lake System
Lake Turkana
-
IBA Nairobi, Ol Donyo
Sabuk, Amboseli,
Chyulu Hills, Tsavo
East and West,
Shimba Hills, Kisite
Mpunguti, Mombasa,
Watamu, Malindi
Marine
Aberdare, Mount
Kenya, Meru, Kora,
Mwea, North Kitui,
Bisandi Tana River
Primate, Rahole,
Arawale, Boni Dodori
Masai Mara, Ruma,
Mau Forest Complex
Chepkitale, Mount
Elgon, Saiwa swamp,
Kakamega
South Island, Central
Island, Sibiloi, Lake
Nakuru, Hell’s Gate,
Mount Longonot
Mount Kenya,
Samburu, Shaba,
Laikipia, Marsabit,
Malka Mari, Buffalo
Springs, Losai,
Nyambene,
Kenya Water Security and Climate Resilience Project
Final National Plan August 2020 42
2.2.3.3 Protected areas
The main institution involved in environmental protection in Kenya is the Ministry of Environment and
Forestry; enacted through the Kenya Forest Service (KFS), Kenya Wildlife Service (KWS) and Kenya
Water Towers Agency (KWTA). These departments have mandates for protecting Kenya’s natural
resources, ranging from forests, rivers and wetlands. The Forest Management and Conservation
division under the KFS is charged with the management and conservation of the natural forests in
Kenya, of which most form water towers. The KWS is responsible for the management of National
Reserves in Kenya and the management of Ramsar sites. The KWTA is responsible for the
management of areas considered to be water towers for downstream water supply. Figure 2-19 shows
the location of the main protected areas in Kenya.
The Athi Basin hosts 6 National Parks and 1 National Reserve, which provide important wildlife habitats
and stimulates tourism in the area. The Tsavo National Park is the largest protected area in the country,
with a total area of about 20,800 km2. The protected marine areas in the basin have a total combined
area of 690 km2, and include the Diani-Chale, Malindi and Mombasa Marine National Reserves.
There are 19 National Parks/Reserves in the Tana Basin, including the Kiunga Marine Reserve. The
Tsavo East National Park falls partly within the Basin and is one of the largest protected areas in the
country. The Tana Basin has three gazetted Water Towers and 18 non-gazetted Water Towers.
Although the Tana River Delta is not a protected area, it is an important wetland ecosystem and is one
of the most ecologically important wetlands in the country. The Delta is a Ramsar wetland and therefore
KWS has a mandate to protect the ecosystem, although this does not exclude sustainable human use.
The LVS Basin contains several environmentally protected areas. The Mau Forest Complex, located
in the northern part of the catchment, is one of the country’s main water towers. It is important to
conserve the Mau Forest Complex as it is the main water source of the major rivers in the LVS Basin.
Other protected areas include the Ndere Island and Ruma National Parks, the Masai Mara National
Reserve and several National Sanctuaries. The LVS Basin has 1 gazetted Water Tower and 10 non-
gazetted Water Towers.
The LVN Basin contains several environmentally protected areas and is rich in freshwater and forest
vegetation. The Mount Elgon National Park is shared between the LVN Basin and the RV Basin, with a
total protected area of 169 km2. Other protected areas are the Kakamega Forest (44 km2) and
Chapkitale (178 km2) National Reserves, and the Mount Elgon, Cherangani Hills and Mau Forest
Complex water conservation forests. The LVN Basin has three important Water Towers: Mount Elgon,
Cherangani and Mau Complex forest.
The RV Basin contains several environmentally protected areas, including six National Parks and four
National Reserves. The largest protected areas are the Sibiloi National Park, with an area of 1 570 km2
and the South Turkana National Reserve, with an area of 1 109 km2. Deforestation and forest
degradation are rampant in the catchment, especially in the Mau Forest Complex and private forests to
the west of Lake Naivasha. The RV Basin has seven gazetted Water Towers and five Ramsar sites.
The Shaba, Buffalo Springs and Samburu National Reserves are situated along the Ewaso Ng’iro River
while a large area of the slopes of Mount Kenya is designated as a National Park. The ENN Basin has
nine Water Towers and two non-gazetted Water Towers (Ngaya Hills and Mukogodo).
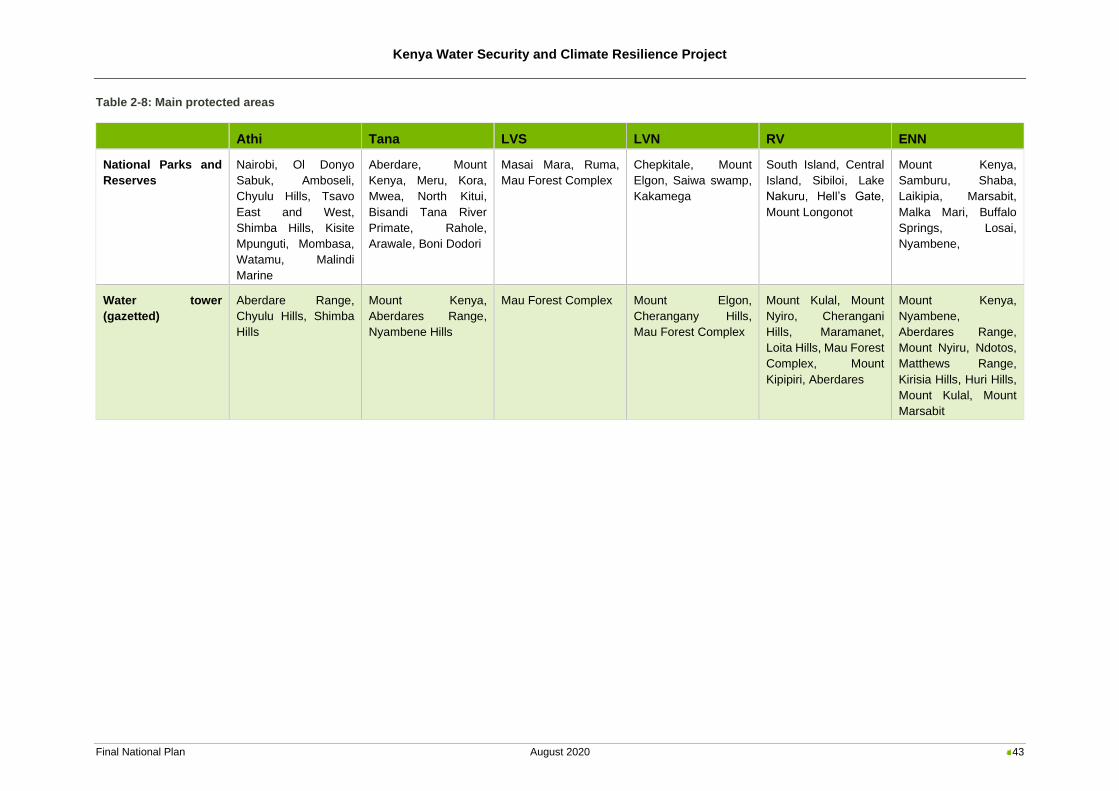
Kenya Water Security and Climate Resilience Project
Final National Plan August 2020 43
Table 2-8: Main protected areas
Athi Tana LVS LVN RV ENN
National Parks and
Reserves
Nairobi, Ol Donyo
Sabuk, Amboseli,
Chyulu Hills, Tsavo
East and West,
Shimba Hills, Kisite
Mpunguti, Mombasa,
Watamu, Malindi
Marine
Aberdare, Mount
Kenya, Meru, Kora,
Mwea, North Kitui,
Bisandi Tana River
Primate, Rahole,
Arawale, Boni Dodori
Masai Mara, Ruma,
Mau Forest Complex
Chepkitale, Mount
Elgon, Saiwa swamp,
Kakamega
South Island, Central
Island, Sibiloi, Lake
Nakuru, Hell’s Gate,
Mount Longonot
Mount Kenya,
Samburu, Shaba,
Laikipia, Marsabit,
Malka Mari, Buffalo
Springs, Losai,
Nyambene,
Water tower
(gazetted)
Aberdare Range,
Chyulu Hills, Shimba
Hills
Mount Kenya,
Aberdares Range,
Nyambene Hills
Mau Forest Complex Mount Elgon,
Cherangany Hills,
Mau Forest Complex
Mount Kulal, Mount
Nyiro, Cherangani
Hills, Maramanet,
Loita Hills, Mau Forest
Complex, Mount
Kipipiri, Aberdares
Mount Kenya,
Nyambene,
Aberdares Range,
Mount Nyiru, Ndotos,
Matthews Range,
Kirisia Hills, Huri Hills,
Mount Kulal, Mount
Marsabit
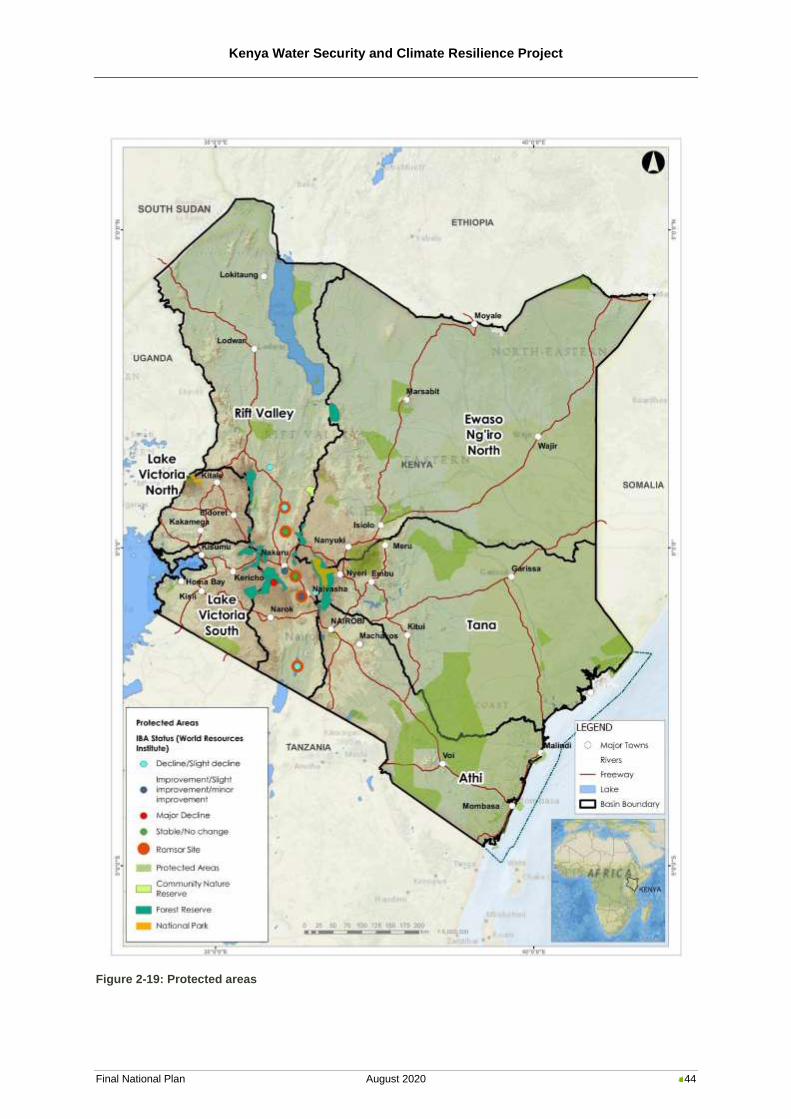
Kenya Water Security and Climate Resilience Project
Final National Plan August 2020 44
Figure 2-19: Protected areas
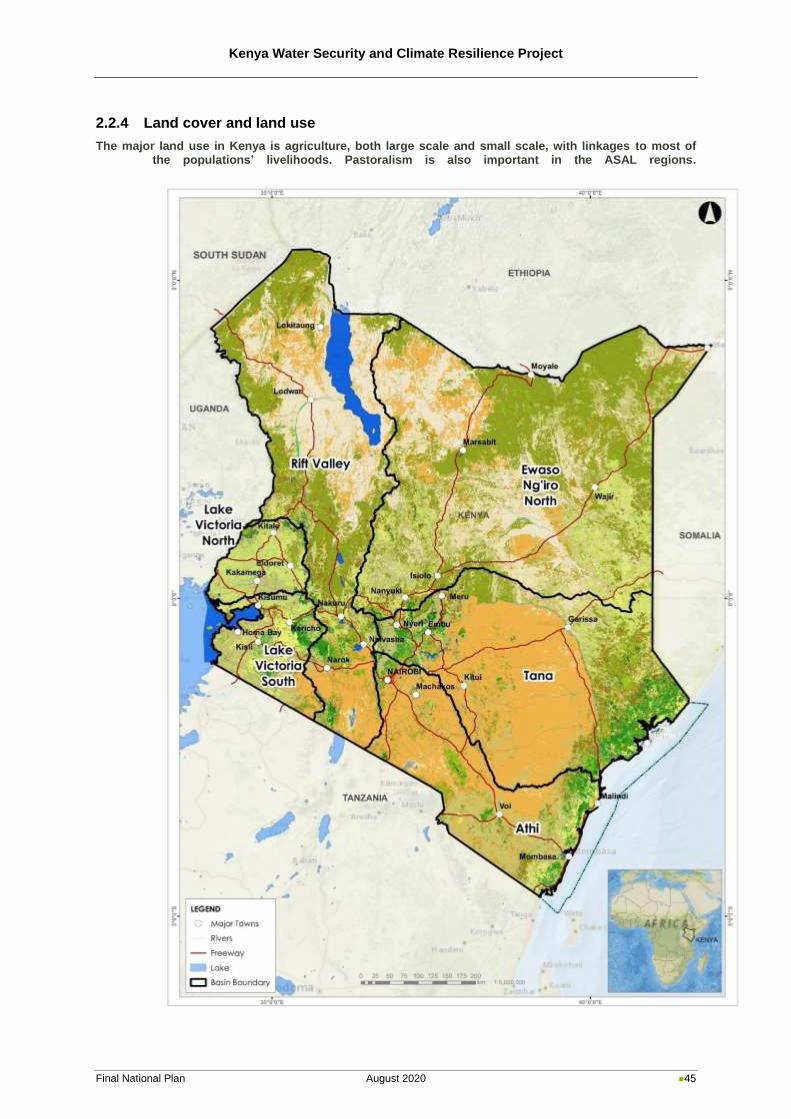
Kenya Water Security and Climate Resilience Project
Final National Plan August 2020 45
2.2.4 Land cover and land use
The major land use in Kenya is agriculture, both large scale and small scale, with linkages to most of the populations’ livelihoods. Pastoralism is also important in the ASAL regions.
Kenya Water Security and Climate Resilience Project
Final National Plan August 2020 46
Figure 2-20 shows the major land use and land cover types in Kenya.
The Athi Basin includes the country’s two largest cities, Nairobi and Mombasa, and therefore has a
significant portion of urban and built-up areas. Typical impacts associated with built-up environments
include erosion of river banks, encroachment of wetlands and riparian zones, poor solid waste disposal
and pollution. The dominant land use in the basin are croplands and rangelands. The Tana Basin has
a high population density and scattered urban and built-up areas in the upper sections of the basin with
the dominant land use as rain-fed agriculture and rangeland. The LVS Basin has a high population
density and scattered urban and built-up areas. The dominant land use in the basin is rain-fed
agriculture and rangeland. The productivity is often low due to land fragmentation and rainfall variability.
Land use in the LVN Basin is dominated by agricultural use, with small urban and industrial areas. The
basin has the highest population density of all the river basins in Kenya. The dominant land use in the
basin is croplands. The RV Basin has a high population density and scattered urban and built-up areas
in the middle sections of the basin with the dominant land use being rain-fed agriculture and rangeland.
The ENN Basin has a low population density and therefore few and scattered urban and built-up areas,
except in the most upper part of the basin. The dominant land use in the basin are rangelands.
To assist with the assessment of land capability and sustainable land use in the respective basins, a
GIS-based land capability tool was developed based on the USDA Land Capability Classification.
Placing soils into these classes allows for an understanding of the crop and management constraints.
From the assessment, it became apparent that most basins have a land capability of 1-3 (i.e. arable
land), except in general the tops of hills and mountains and steep slopes which have a land capability
of 5-8 (i.e. non-arable land). Overlaying the Land Capability map with the current land use in Kenya,
provided an indication of the level of sustainable land use in Kenya under current conditions.
Sustainable land use occurs where crops occur on arable land, and unsustainable land use where crops
occur on non-arable land:
In the Athi Basin the mountainous regions have unsustainable land uses as does Ngong Hills. Other
non-woody vegetation in the southern part of the upper basin also occurs on non-arable land.
Otherwise, forest, grassland, shrubs and herbaceous vegetation occurs on suitable land. The northern
part of the central Athi Basin has non-woody vegetation and crops on non-arable land, while there are
small areas along the coast with unsustainable land uses. Most of the Tana Basin has sustainable
cropland use, except in the upper zone of the basin. While large parts of the LVS Basin have
sustainable cropland use, areas in the upper Nyando and Sondu river catchments, Mau Forest
Complex, as well as areas in the central part of the basin in Kisii and Nyamira Counties have
unsustainable land use. In LVN Basin the mountainous regions have unsustainable land uses,
particularly around the lower slopes of Mount Elgon and on the boundary of the upper basin. Most of
the RV Basin has sustainable cropland use, except in the upper zones of the catchments. Most of the
ENN Basin has sustainable crop land use, except some parts in the upper south-western parts of the
basin and areas near the border with Ethiopia in the north-east.
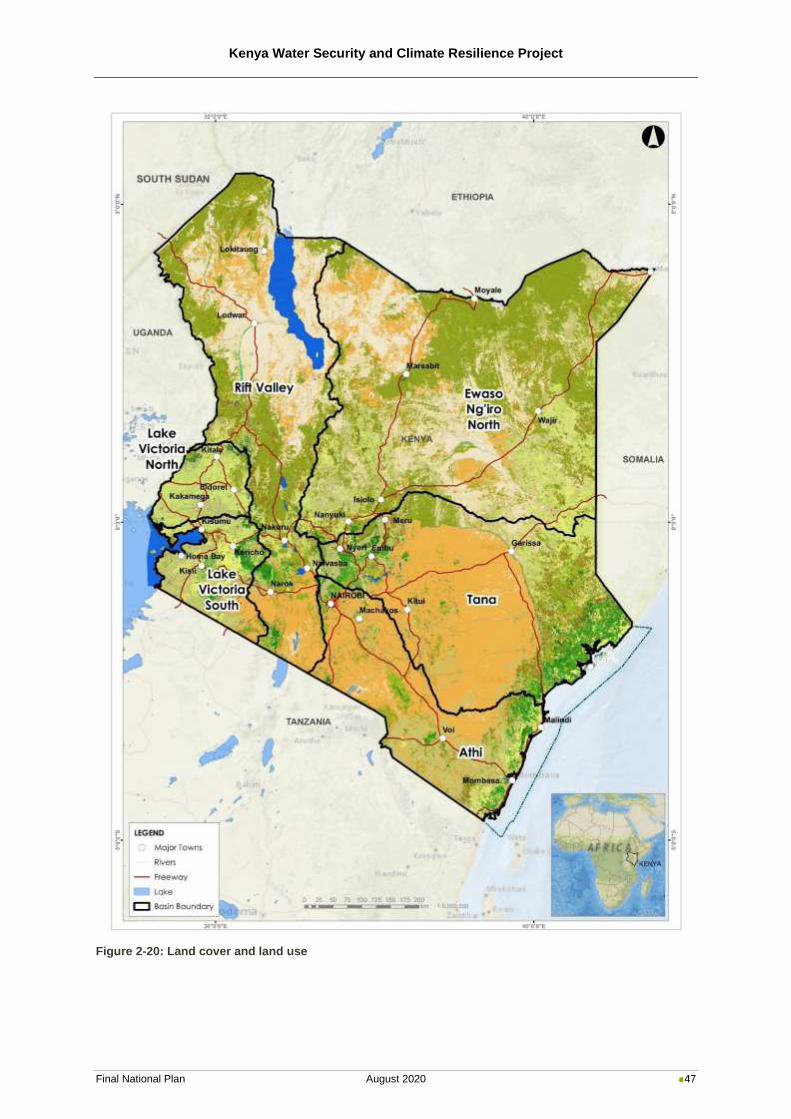
Kenya Water Security and Climate Resilience Project
Final National Plan August 2020 47
Figure 2-20: Land cover and land use
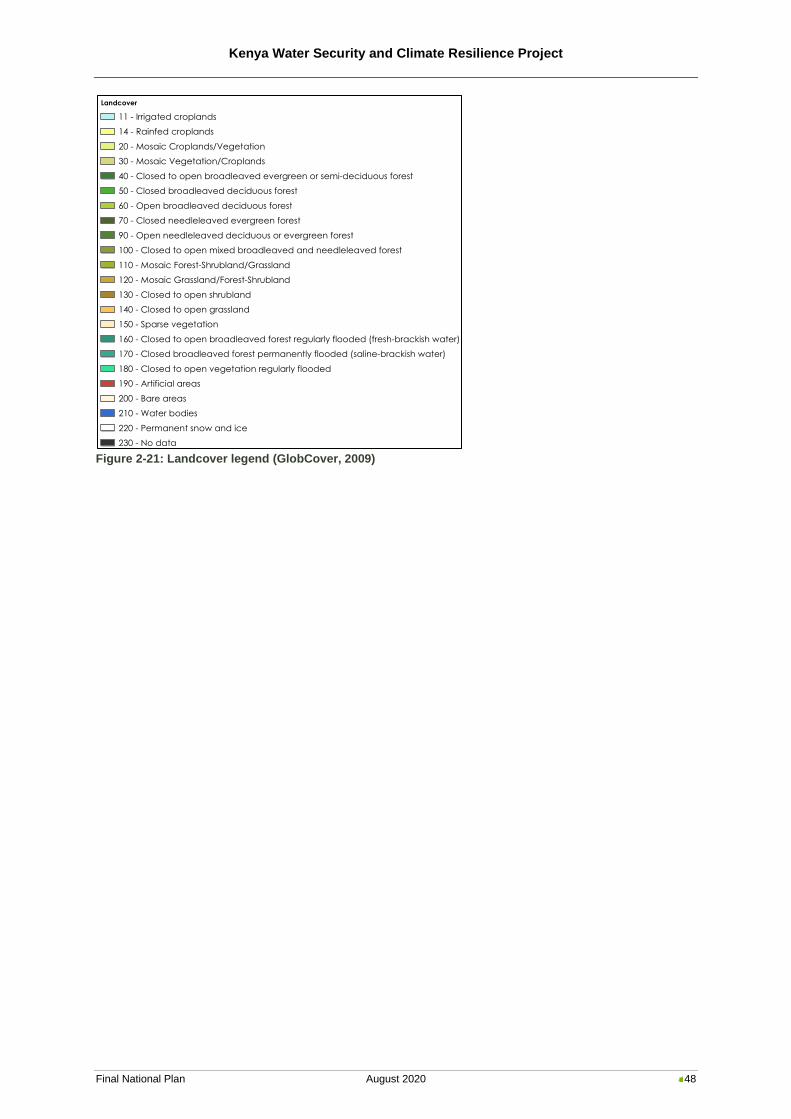
Kenya Water Security and Climate Resilience Project
Final National Plan August 2020 48
Figure 2-21: Landcover legend (GlobCover, 2009)
Landcover
11 - Irrigated croplands
14 - Rainfed croplands
20 - Mosaic Croplands/Vegetation
30 - Mosaic Vegetation/Croplands
40 - Closed to open broadleaved evergreen or semi-deciduous forest
50 - Closed broadleaved deciduous forest
60 - Open broadleaved deciduous forest
70 - Closed needleleaved evergreen forest
90 - Open needleleaved deciduous or evergreen forest
100 - Closed to open mixed broadleaved and needleleaved forest
110 - Mosaic Forest-Shrubland/Grassland
120 - Mosaic Grassland/Forest-Shrubland
130 - Closed to open shrubland
140 - Closed to open grassland
150 - Sparse vegetation
160 - Closed to open broadleaved forest regularly flooded (fresh-brackish water)
170 - Closed broadleaved forest permanently flooded (saline-brackish water)
180 - Closed to open vegetation regularly flooded
190 - Artificial areas
200 - Bare areas
210 - Water bodies
220 - Permanent snow and ice
230 - No data
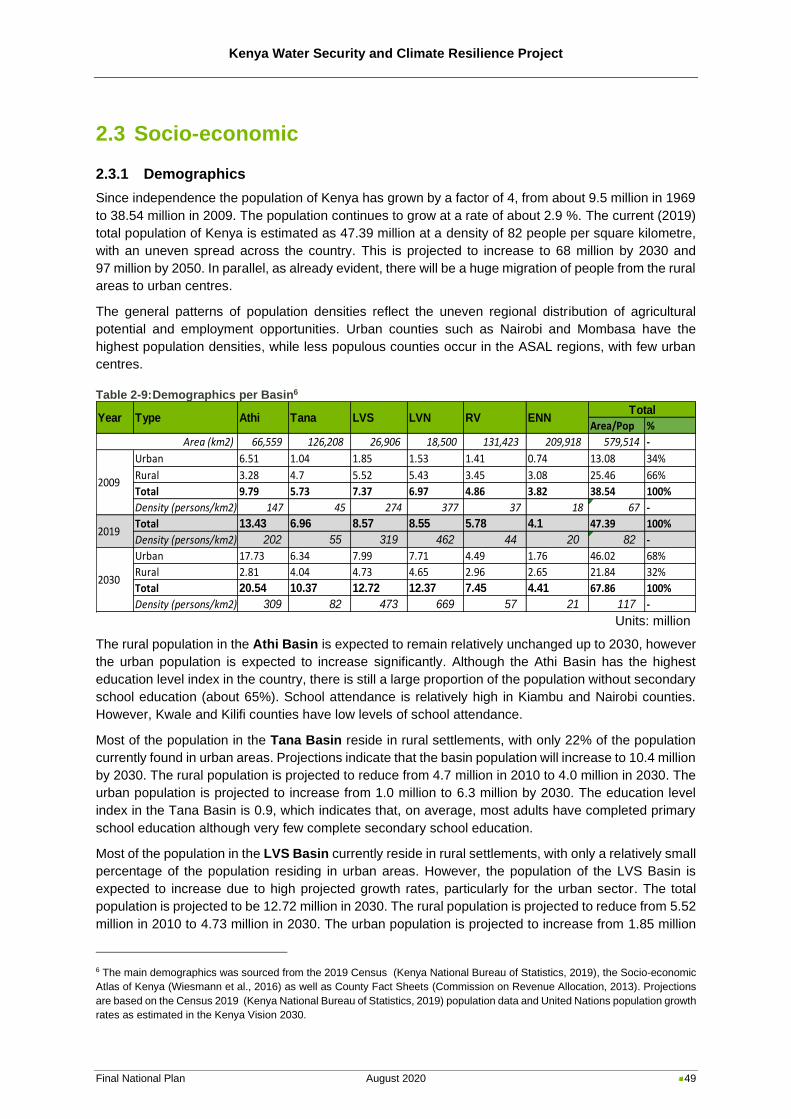
Kenya Water Security and Climate Resilience Project
Final National Plan August 2020 49
2.3 Socio-economic
2.3.1 Demographics
Since independence the population of Kenya has grown by a factor of 4, from about 9.5 million in 1969
to 38.54 million in 2009. The population continues to grow at a rate of about 2.9 %. The current (2019)
total population of Kenya is estimated as 47.39 million at a density of 82 people per square kilometre,
with an uneven spread across the country. This is projected to increase to 68 million by 2030 and
97 million by 2050. In parallel, as already evident, there will be a huge migration of people from the rural
areas to urban centres.
The general patterns of population densities reflect the uneven regional distribution of agricultural
potential and employment opportunities. Urban counties such as Nairobi and Mombasa have the
highest population densities, while less populous counties occur in the ASAL regions, with few urban
centres.
Table 2-9: Demographics per Basin6
Units: million
The rural population in the Athi Basin is expected to remain relatively unchanged up to 2030, however
the urban population is expected to increase significantly. Although the Athi Basin has the highest
education level index in the country, there is still a large proportion of the population without secondary
school education (about 65%). School attendance is relatively high in Kiambu and Nairobi counties.
However, Kwale and Kilifi counties have low levels of school attendance.
Most of the population in the Tana Basin reside in rural settlements, with only 22% of the population
currently found in urban areas. Projections indicate that the basin population will increase to 10.4 million
by 2030. The rural population is projected to reduce from 4.7 million in 2010 to 4.0 million in 2030. The
urban population is projected to increase from 1.0 million to 6.3 million by 2030. The education level
index in the Tana Basin is 0.9, which indicates that, on average, most adults have completed primary
school education although very few complete secondary school education.
Most of the population in the LVS Basin currently reside in rural settlements, with only a relatively small
percentage of the population residing in urban areas. However, the population of the LVS Basin is
expected to increase due to high projected growth rates, particularly for the urban sector. The total
population is projected to be 12.72 million in 2030. The rural population is projected to reduce from 5.52
million in 2010 to 4.73 million in 2030. The urban population is projected to increase from 1.85 million
6 The main demographics was sourced from the 2019 Census (Kenya National Bureau of Statistics, 2019), the Socio-economic
Atlas of Kenya (Wiesmann et al., 2016) as well as County Fact Sheets (Commission on Revenue Allocation, 2013). Projections
are based on the Census 2019 (Kenya National Bureau of Statistics, 2019) population data and United Nations population growth
rates as estimated in the Kenya Vision 2030.
Area/Pop %
66,559 126,208 26,906 18,500 131,423 209,918 579,514 -
Urban 6.51 1.04 1.85 1.53 1.41 0.74 13.08 34%
Rural 3.28 4.7 5.52 5.43 3.45 3.08 25.46 66%
Total 9.79 5.73 7.37 6.97 4.86 3.82 38.54 100%
Density (persons/km2) 147 45 274 377 37 18 67 -
Total 13.43 6.96 8.57 8.55 5.78 4.1 47.39 100%
Density (persons/km2) 202 55 319 462 44 20 82 -
Urban 17.73 6.34 7.99 7.71 4.49 1.76 46.02 68%
Rural 2.81 4.04 4.73 4.65 2.96 2.65 21.84 32%
Total 20.54 10.37 12.72 12.37 7.45 4.41 67.86 100%
Density (persons/km2) 309 82 473 669 57 21 117 -
Area (km2)
2009
TotalYear Type Athi Tana LVS LVN RV ENN
2019
2030
Kenya Water Security and Climate Resilience Project
Final National Plan August 2020 50
to 7.99 million by 2030. The education level index in the LVS Basin is 1.0, which indicates that, on
average, all adults have completed primary school education and very few completed secondary school
education.
Most of the population in the LVN Basin reside in rural settlements, with only 20% of the population
located in urban areas. The population of the basin is expected to increase due to high projected growth
rates, particularly for the urban sector. The total population is projected to be 12.36 million in 2030. The
rural population is projected to reduce from 5.43 million in 2010 to 4.65 million in 2030. The urban
population is projected to increase from 1.53 million to 7.71 million by 2030. The education level index
in the basin is 1.0/3.0, which indicates that, on average, all adults completed primary school education,
but that very few completed secondary school education.
Most of the population in the RV Basin currently reside in rural settlements, with only 24% of the
population being located in urban areas. The population of the basin is expected to increase
significantly, especially in urban areas. The population is expected to increase by 53% to 7.45 million
in 2030. The rural population is projected to reduce from 3.45 million in 2010 to 2.96 million in 2030.
The urban population is projected to increase from 1.41 million to 4.49 million by 2030. The education
level index in the bBasin is 0.8, which indicates that, on average, about two thirds of adults have
completed primary school education and few complete secondary school education.
Most of the population in the ENN Basin reside in rural settlements, with only 24% of the population
being located in urban areas. The population of the basin is expected to increase due to high projected
growth rates, particularly for the urban sector. The total population is projected to be 4.4 million in 2030.
The rural population is projected to reduce from 3.08 million in 2010 to 2.64 million in 2030. The urban
population is projected to increase from 0.74 million to 1.76 million by 2030. The education level index
in the basin is 0.4, which indicates that, on average, all adults have not completed primary school
education and very few completed secondary school education.
2.3.2 Economy
2.3.2.1 Economic activity
As a response to past economic and social challenges, Kenya adopted the Economic Recovery
Strategy (ERS) over 2003 to 2007 (Government of Kenya, 2003). In 2008, Kenya Vision 2030 was
launched as the new long-term development blueprint for the country. The Kenya Vision 2030 scaled
up the projections to move the economy from a long-term growth path of 4% per annum to 10% per
annum. Achieving this growth rate will shift Kenya from a low-income country to a middle-income
country. Although at the macro-economic scale there have been reforms to deliver high levels of growth,
employment and poverty reduction, at the local level these improvements will take time. Water and
Sanitation has been identified as a key social sector towards the building of “a just and cohesive society,
that enjoys equitable social development in a clean and secure environment” (Kenya Vision 2030).
Agriculture, as the mainstay of Kenya’s economy, is critical to the growth of the national economy.
Following independence, the agricultural sector recorded a high growth rate and during this time small-
scale agriculture grew rapidly as land and technology was made available (Government of Kenya,
2010a). Agricultural extension and research was also well supported by the government. Since then
there has been a gradual decline, followed by growth when the Government identified the agriculture
sector as a priority. The ERS (Government of Kenya, 2003) emphasised economic growth and creation
of wealth and employment as a means of eradicating poverty and achieving food security. The
development of the agricultural sector is considered a top priority in reducing poverty because it is the
most important economic activity for the poor in rural areas.
Kenya Water Security and Climate Resilience Project
Final National Plan August 2020 51
At the macro-economic scale, the development of the Northern Corridor and the Lamu Port-Southern
Sudan- Ethiopia Transport project (LAPSET) is expected to enhance growth in the transport sector and
trade among countries which aligns with Kenya’s Vision 2030 of a 10% GDP growth rate.
There is significant economic activity in the Athi Basin, mainly in the two large economic centres of
Nairobi and Mombasa. Industrial activities occur in the capital city of Nairobi include agricultural
equipment, brewing and beverages, cement, chemicals and pharmaceuticals, coffee processing,
construction material, electricity appliances, food processing, shoes, glass, leather, light industries,
meat processing, painting material, paper industry, plastic products, printing, soap, steel, textile, timber
and timber products, tobacco and automobile accessories. Other well-known industrial activities in the
basin include the textile industry at Voi town and the food processing industries at Malindi and Kilifi
towns. The coastal zone hosts significant economic activities due to the marine industry, tourism and
the Port of Mombasa, while industrial activities in Mombasa city include brewing and beverages,
cement, construction material, food processing, glass, light industry, meat processing, oil refinery,
paper, plastic products, ship repair, soap, steel, textile, automobiles and shoes. The basin is also a
busy transport corridor for products within the country and with neighbouring countries.
There is limited economic activity in the Tana Basin and the average poverty rate in the Basin is at
40%. Agriculture is the main economy for most counties, with farming and nomadic pastoralism being
the main economic activities in Garissa and Tana River counties. The counties surrounding Mt Kenya
have a high agricultural production due to high rainfall and fertile conditions. Mt Kenya and Aberdare
National Parks also attract many tourists. Commerce is high in the urban centres within this productive
region. Lamu County is a rich heritage site including preserved Swahili architecture and festivals such
as the Lamu food festival which attracts tourists to the area. The construction of a port at Lamu is
currently ongoing which is planned to boost the county’s economy.
There is limited economic activity in the LVS Basin and the average poverty rate in the Basin is at 46%.
The counties bordering Lake Victoria are involved in fishing and fish processing. Other counties are
involved in agriculture and many households keep cattle for beef and dairy products. Kericho county is
famous for its extensive tea industry, and many large tea companies are based in this area. Narok
County hosts the Maasai Mara National Reserve, which is famous for its annual wildebeest migration,
and the tourist industry is the largest economic contributor in the county. Agriculture is also practised,
especially wheat and barley.
The main economic activities in the LVN Basin are agriculture and fishing. The LVN Basin’s location
adjacent to Lake Victoria makes the production of fish a strategic opportunity for the catchment.
However, the fisheries sub-sector has been declining since 2014, with the total fish output decreasing
by 12% from 2015 to 2016. Lake Victoria continues to account for over 80% of the total freshwater fish
production in the country, however its output is decreasing partly due to the presence of water hyacinth
and unsustainable fishing practises. Industrial activity in the Basin is limited to the processing of locally
produced raw materials from agriculture and fishing, for example: sugar and flour milling; paper,
tobacco, coffee, dairy and chemical production; and fish processing factories. Industries are in the urban
areas of Eldoret (Uasin Gishu County), Bungoma, Nzoia and Webuye (Bungoma County), Kakamega
(Kakamega County), Kitale (Trans Nzoia County), Busia (Busia County), Siaya (Siaya County). Limited
gold mining taking place in the Basin, with potential existing for mining of other minerals. Sand mining
and quarrying for building materials occurs throughout the Basin. Tourism occurs at present, and there
is significant potential for expansion of this sector in the Basin.
There is limited economic activity in the RV Basin and the average poverty rate in the Basin is at 52%.
The RV Basin includes 12 counties, some of them only partly. Fishing is practiced in the various lakes
in the Basin and livestock keeping is common in the pastoral areas. The lakes also provide a tourist
attraction due to the variety of wildlife, fish and birds. Nakuru county has a manufacturing sector, where
most of the industrial activities in the RV Basin take place. The Narok County hosts the Maasai Mara
National Reserve.
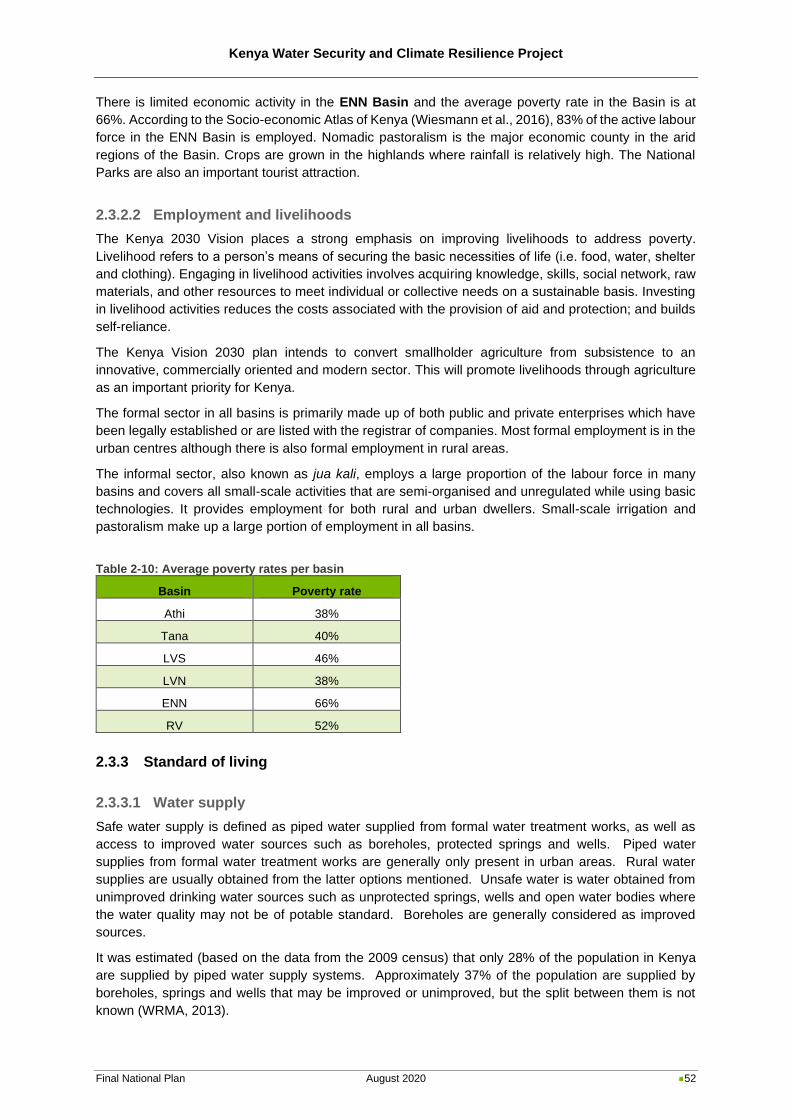
Kenya Water Security and Climate Resilience Project
Final National Plan August 2020 52
There is limited economic activity in the ENN Basin and the average poverty rate in the Basin is at
66%. According to the Socio-economic Atlas of Kenya (Wiesmann et al., 2016), 83% of the active labour
force in the ENN Basin is employed. Nomadic pastoralism is the major economic county in the arid
regions of the Basin. Crops are grown in the highlands where rainfall is relatively high. The National
Parks are also an important tourist attraction.
2.3.2.2 Employment and livelihoods
The Kenya 2030 Vision places a strong emphasis on improving livelihoods to address poverty.
Livelihood refers to a person’s means of securing the basic necessities of life (i.e. food, water, shelter
and clothing). Engaging in livelihood activities involves acquiring knowledge, skills, social network, raw
materials, and other resources to meet individual or collective needs on a sustainable basis. Investing
in livelihood activities reduces the costs associated with the provision of aid and protection; and builds
self-reliance.
The Kenya Vision 2030 plan intends to convert smallholder agriculture from subsistence to an
innovative, commercially oriented and modern sector. This will promote livelihoods through agriculture
as an important priority for Kenya.
The formal sector in all basins is primarily made up of both public and private enterprises which have
been legally established or are listed with the registrar of companies. Most formal employment is in the
urban centres although there is also formal employment in rural areas.
The informal sector, also known as jua kali, employs a large proportion of the labour force in many
basins and covers all small-scale activities that are semi-organised and unregulated while using basic
technologies. It provides employment for both rural and urban dwellers. Small-scale irrigation and
pastoralism make up a large portion of employment in all basins.
Table 2-10: Average poverty rates per basin
Basin Poverty rate
Athi 38%
Tana 40%
LVS 46%
LVN 38%
ENN 66%
RV 52%
2.3.3 Standard of living
2.3.3.1 Water supply
Safe water supply is defined as piped water supplied from formal water treatment works, as well as
access to improved water sources such as boreholes, protected springs and wells. Piped water
supplies from formal water treatment works are generally only present in urban areas. Rural water
supplies are usually obtained from the latter options mentioned. Unsafe water is water obtained from
unimproved drinking water sources such as unprotected springs, wells and open water bodies where
the water quality may not be of potable standard. Boreholes are generally considered as improved
sources.
It was estimated (based on the data from the 2009 census) that only 28% of the population in Kenya
are supplied by piped water supply systems. Approximately 37% of the population are supplied by
boreholes, springs and wells that may be improved or unimproved, but the split between them is not
known (WRMA, 2013).
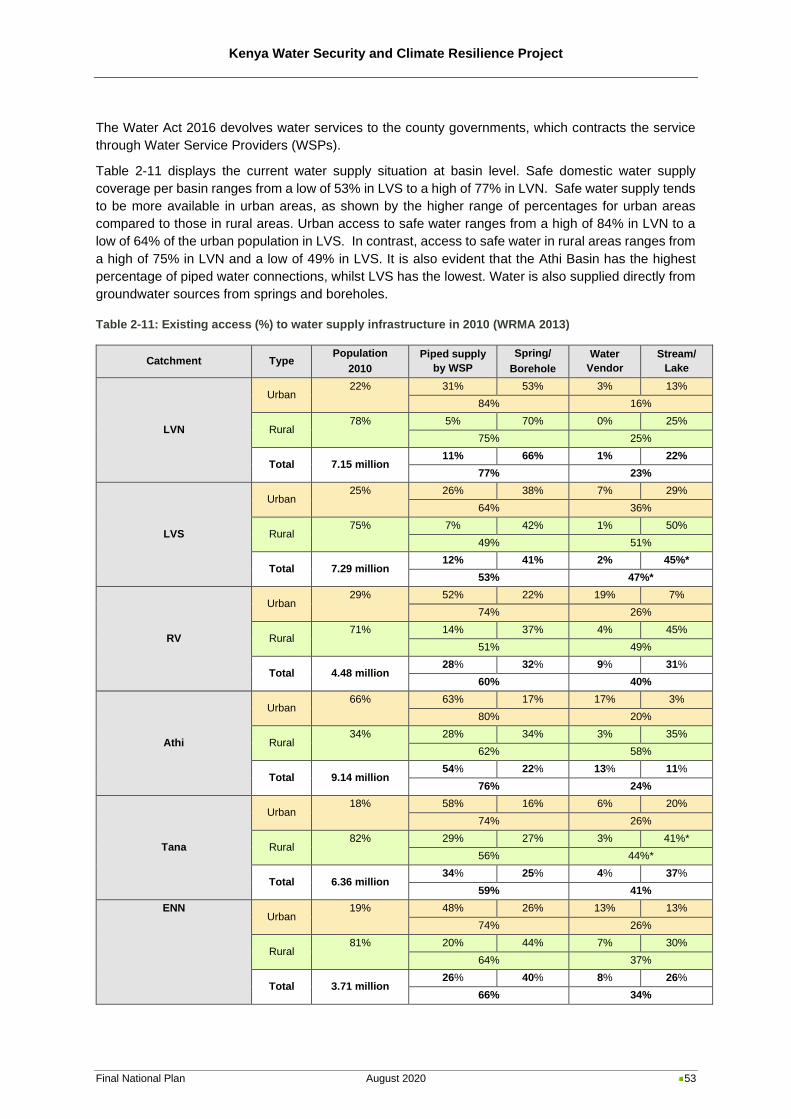
Kenya Water Security and Climate Resilience Project
Final National Plan August 2020 53
The Water Act 2016 devolves water services to the county governments, which contracts the service
through Water Service Providers (WSPs).
Table 2-11 displays the current water supply situation at basin level. Safe domestic water supply
coverage per basin ranges from a low of 53% in LVS to a high of 77% in LVN. Safe water supply tends
to be more available in urban areas, as shown by the higher range of percentages for urban areas
compared to those in rural areas. Urban access to safe water ranges from a high of 84% in LVN to a
low of 64% of the urban population in LVS. In contrast, access to safe water in rural areas ranges from
a high of 75% in LVN and a low of 49% in LVS. It is also evident that the Athi Basin has the highest
percentage of piped water connections, whilst LVS has the lowest. Water is also supplied directly from
groundwater sources from springs and boreholes.
Table 2-11: Existing access (%) to water supply infrastructure in 2010 (WRMA 2013)
Catchment Type Population
2010
Piped supply
by WSP
Spring/
Borehole
Water
Vendor
Stream/
Lake
LVN
Urban 22% 31% 53% 3% 13%
84% 16%
Rural 78% 5% 70% 0% 25%
75% 25%
Total 7.15 million 11% 66% 1% 22%
77% 23%
LVS
Urban 25% 26% 38% 7% 29%
64% 36%
Rural 75% 7% 42% 1% 50%
49% 51%
Total 7.29 million 12% 41% 2% 45%*
53% 47%*
RV
Urban 29% 52% 22% 19% 7%
74% 26%
Rural 71% 14% 37% 4% 45%
51% 49%
Total 4.48 million 28% 32% 9% 31%
60% 40%
Athi
Urban 66% 63% 17% 17% 3%
80% 20%
Rural 34% 28% 34% 3% 35%
62% 58%
Total 9.14 million 54% 22% 13% 11%
76% 24%
Tana
Urban 18% 58% 16% 6% 20%
74% 26%
Rural 82% 29% 27% 3% 41%*
56% 44%*
Total 6.36 million 34% 25% 4% 37%
59% 41%
ENN Urban
19% 48% 26% 13% 13%
74% 26%
Rural 81% 20% 44% 7% 30%
64% 37%
Total 3.71 million 26% 40% 8% 26%
66% 34%
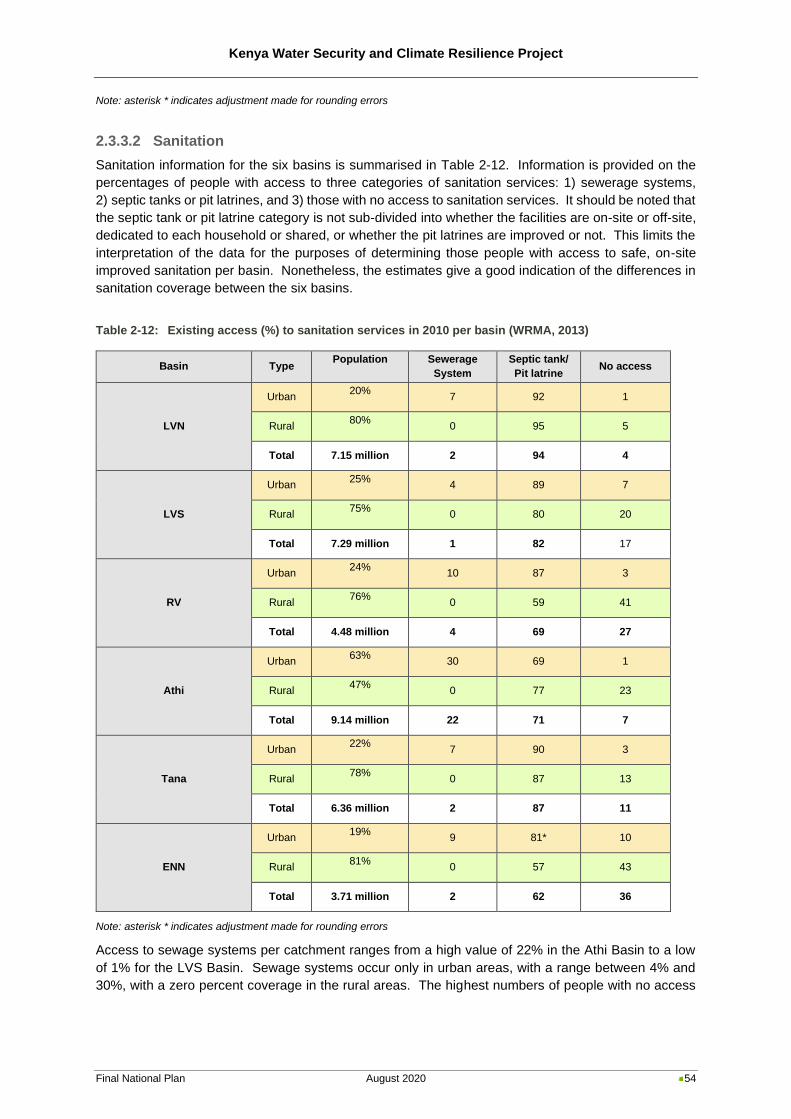
Kenya Water Security and Climate Resilience Project
Final National Plan August 2020 54
Note: asterisk * indicates adjustment made for rounding errors
2.3.3.2 Sanitation
Sanitation information for the six basins is summarised in Table 2-12. Information is provided on the
percentages of people with access to three categories of sanitation services: 1) sewerage systems,
2) septic tanks or pit latrines, and 3) those with no access to sanitation services. It should be noted that
the septic tank or pit latrine category is not sub-divided into whether the facilities are on-site or off-site,
dedicated to each household or shared, or whether the pit latrines are improved or not. This limits the
interpretation of the data for the purposes of determining those people with access to safe, on-site
improved sanitation per basin. Nonetheless, the estimates give a good indication of the differences in
sanitation coverage between the six basins.
Table 2-12: Existing access (%) to sanitation services in 2010 per basin (WRMA, 2013)
Basin Type Population Sewerage
System
Septic tank/
Pit latrine No access
LVN
Urban 20%
7 92 1
Rural 80%
0 95 5
Total 7.15 million 2 94 4
LVS
Urban 25%
4 89 7
Rural 75%
0 80 20
Total 7.29 million 1 82 17
RV
Urban 24%
10 87 3
Rural 76%
0 59 41
Total 4.48 million 4 69 27
Athi
Urban 63%
30 69 1
Rural 47%
0 77 23
Total 9.14 million 22 71 7
Tana
Urban 22%
7 90 3
Rural 78%
0 87 13
Total 6.36 million 2 87 11
ENN
Urban 19%
9 81* 10
Rural 81%
0 57 43
Total 3.71 million 2 62 36
Note: asterisk * indicates adjustment made for rounding errors
Access to sewage systems per catchment ranges from a high value of 22% in the Athi Basin to a low
of 1% for the LVS Basin. Sewage systems occur only in urban areas, with a range between 4% and
30%, with a zero percent coverage in the rural areas. The highest numbers of people with no access
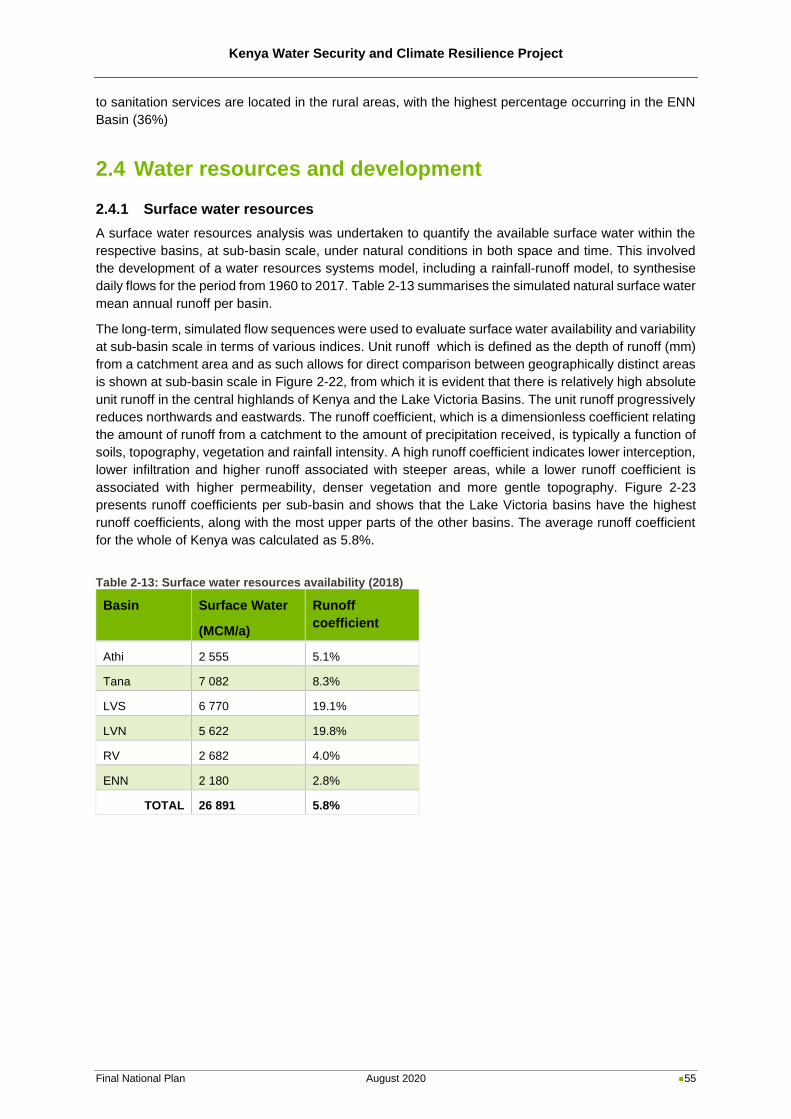
Kenya Water Security and Climate Resilience Project
Final National Plan August 2020 55
to sanitation services are located in the rural areas, with the highest percentage occurring in the ENN
Basin (36%)
2.4 Water resources and development
2.4.1 Surface water resources
A surface water resources analysis was undertaken to quantify the available surface water within the
respective basins, at sub-basin scale, under natural conditions in both space and time. This involved
the development of a water resources systems model, including a rainfall-runoff model, to synthesise
daily flows for the period from 1960 to 2017. Table 2-13 summarises the simulated natural surface water
mean annual runoff per basin.
The long-term, simulated flow sequences were used to evaluate surface water availability and variability
at sub-basin scale in terms of various indices. Unit runoff which is defined as the depth of runoff (mm)
from a catchment area and as such allows for direct comparison between geographically distinct areas
is shown at sub-basin scale in Figure 2-22, from which it is evident that there is relatively high absolute
unit runoff in the central highlands of Kenya and the Lake Victoria Basins. The unit runoff progressively
reduces northwards and eastwards. The runoff coefficient, which is a dimensionless coefficient relating
the amount of runoff from a catchment to the amount of precipitation received, is typically a function of
soils, topography, vegetation and rainfall intensity. A high runoff coefficient indicates lower interception,
lower infiltration and higher runoff associated with steeper areas, while a lower runoff coefficient is
associated with higher permeability, denser vegetation and more gentle topography. Figure 2-23
presents runoff coefficients per sub-basin and shows that the Lake Victoria basins have the highest
runoff coefficients, along with the most upper parts of the other basins. The average runoff coefficient
for the whole of Kenya was calculated as 5.8%.
Table 2-13: Surface water resources availability (2018)
Basin Surface Water
(MCM/a)
Runoff
coefficient
Athi 2 555 5.1%
Tana 7 082 8.3%
LVS 6 770 19.1%
LVN 5 622 19.8%
RV 2 682 4.0%
ENN 2 180 2.8%
TOTAL 26 891 5.8%
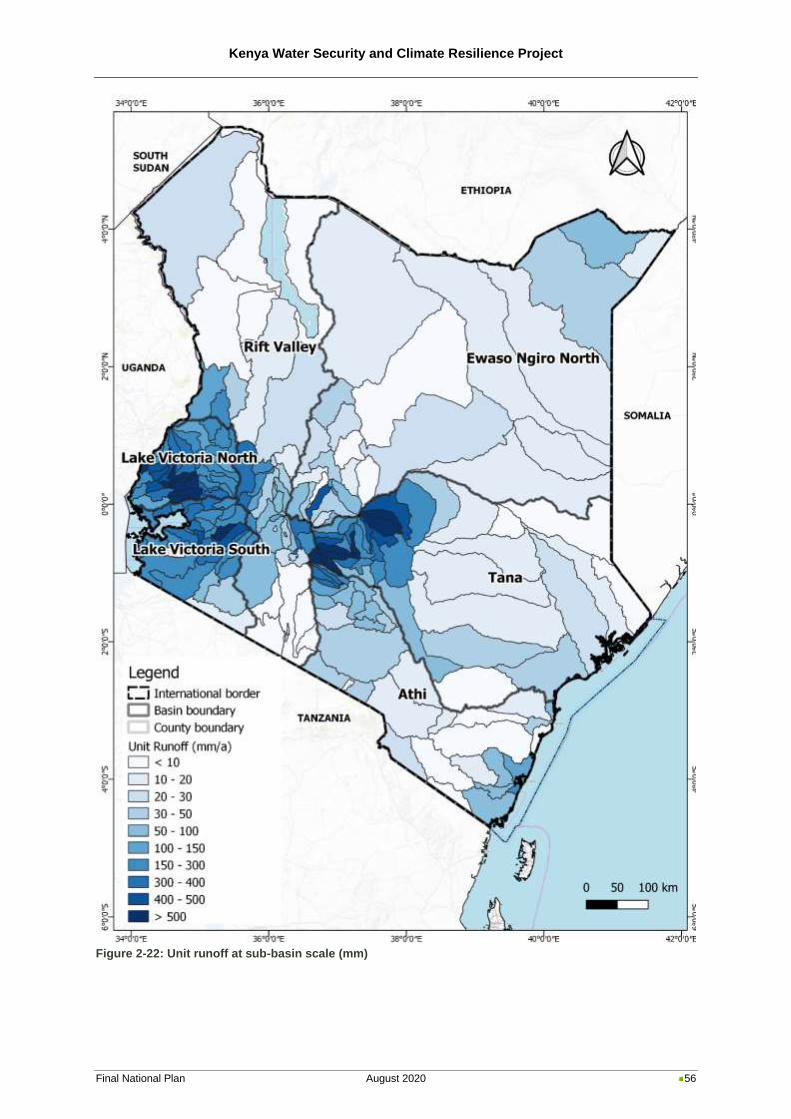
Kenya Water Security and Climate Resilience Project
Final National Plan August 2020 56
Figure 2-22: Unit runoff at sub-basin scale (mm)
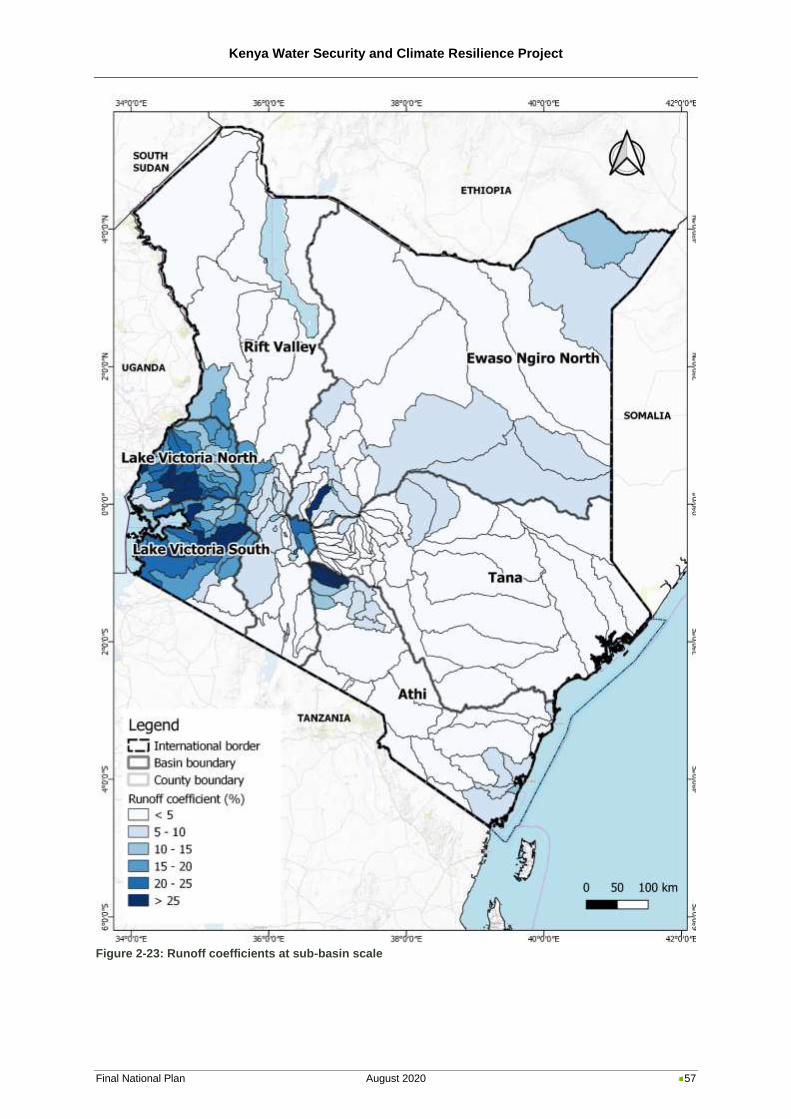
Kenya Water Security and Climate Resilience Project
Final National Plan August 2020 57
Figure 2-23: Runoff coefficients at sub-basin scale
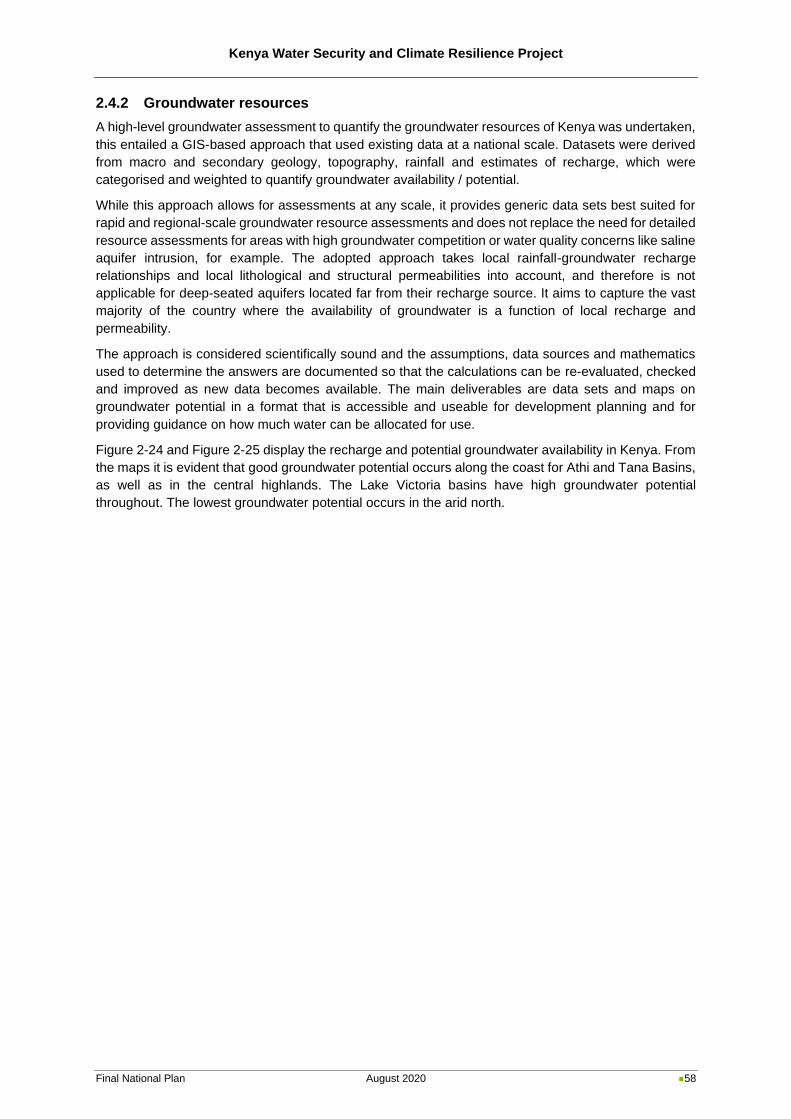
Kenya Water Security and Climate Resilience Project
Final National Plan August 2020 58
2.4.2 Groundwater resources
A high-level groundwater assessment to quantify the groundwater resources of Kenya was undertaken,
this entailed a GIS-based approach that used existing data at a national scale. Datasets were derived
from macro and secondary geology, topography, rainfall and estimates of recharge, which were
categorised and weighted to quantify groundwater availability / potential.
While this approach allows for assessments at any scale, it provides generic data sets best suited for
rapid and regional-scale groundwater resource assessments and does not replace the need for detailed
resource assessments for areas with high groundwater competition or water quality concerns like saline
aquifer intrusion, for example. The adopted approach takes local rainfall-groundwater recharge
relationships and local lithological and structural permeabilities into account, and therefore is not
applicable for deep-seated aquifers located far from their recharge source. It aims to capture the vast
majority of the country where the availability of groundwater is a function of local recharge and
permeability.
The approach is considered scientifically sound and the assumptions, data sources and mathematics
used to determine the answers are documented so that the calculations can be re-evaluated, checked
and improved as new data becomes available. The main deliverables are data sets and maps on
groundwater potential in a format that is accessible and useable for development planning and for
providing guidance on how much water can be allocated for use.
Figure 2-24 and Figure 2-25 display the recharge and potential groundwater availability in Kenya. From
the maps it is evident that good groundwater potential occurs along the coast for Athi and Tana Basins,
as well as in the central highlands. The Lake Victoria basins have high groundwater potential
throughout. The lowest groundwater potential occurs in the arid north.
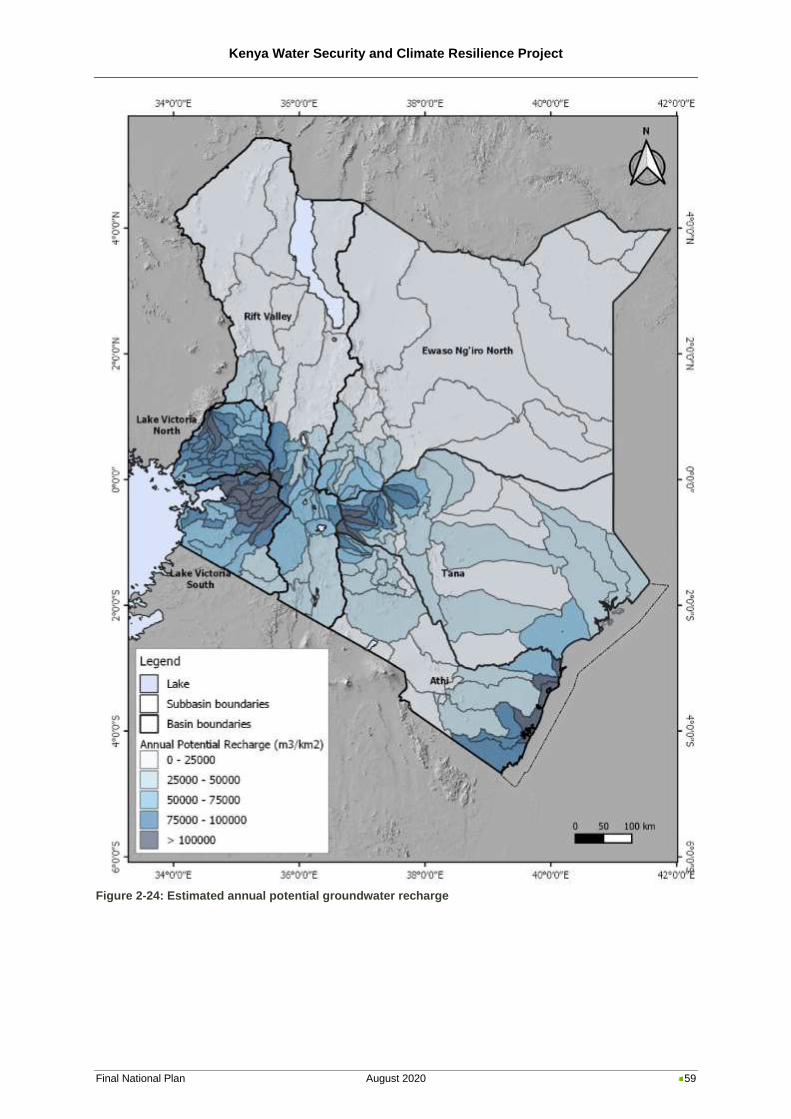
Kenya Water Security and Climate Resilience Project
Final National Plan August 2020 59
Figure 2-24: Estimated annual potential groundwater recharge
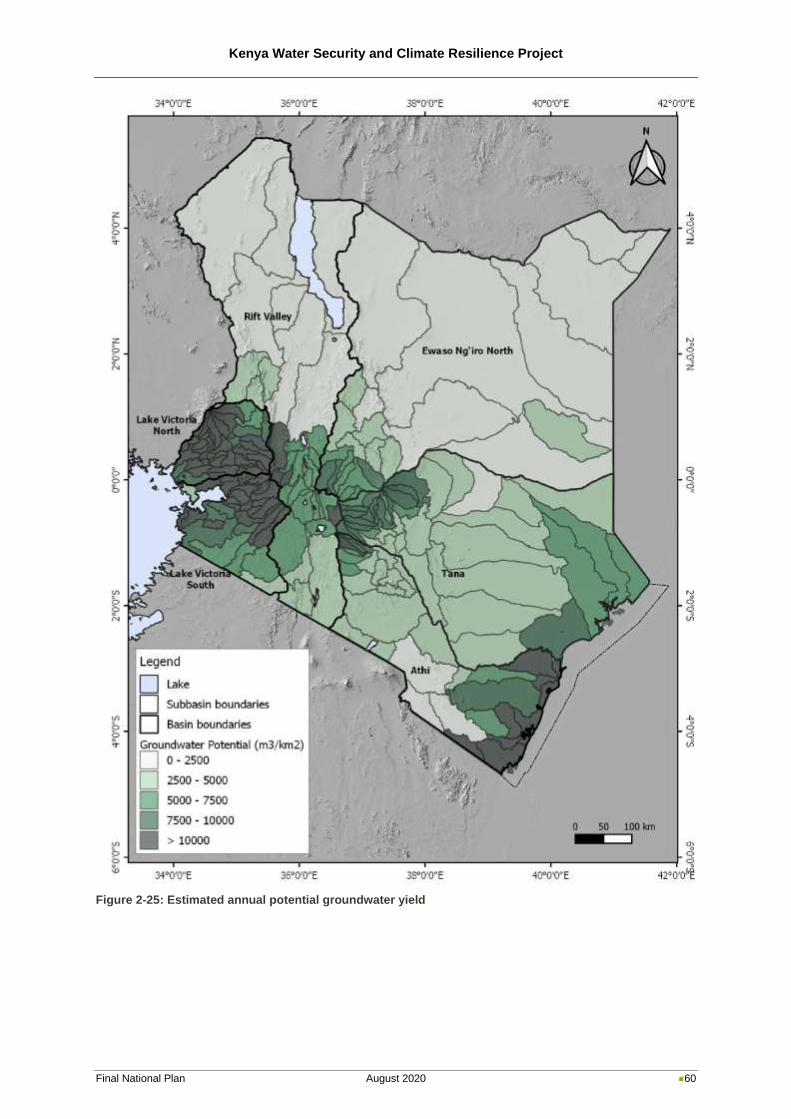
Kenya Water Security and Climate Resilience Project
Final National Plan August 2020 60
Figure 2-25: Estimated annual potential groundwater yield
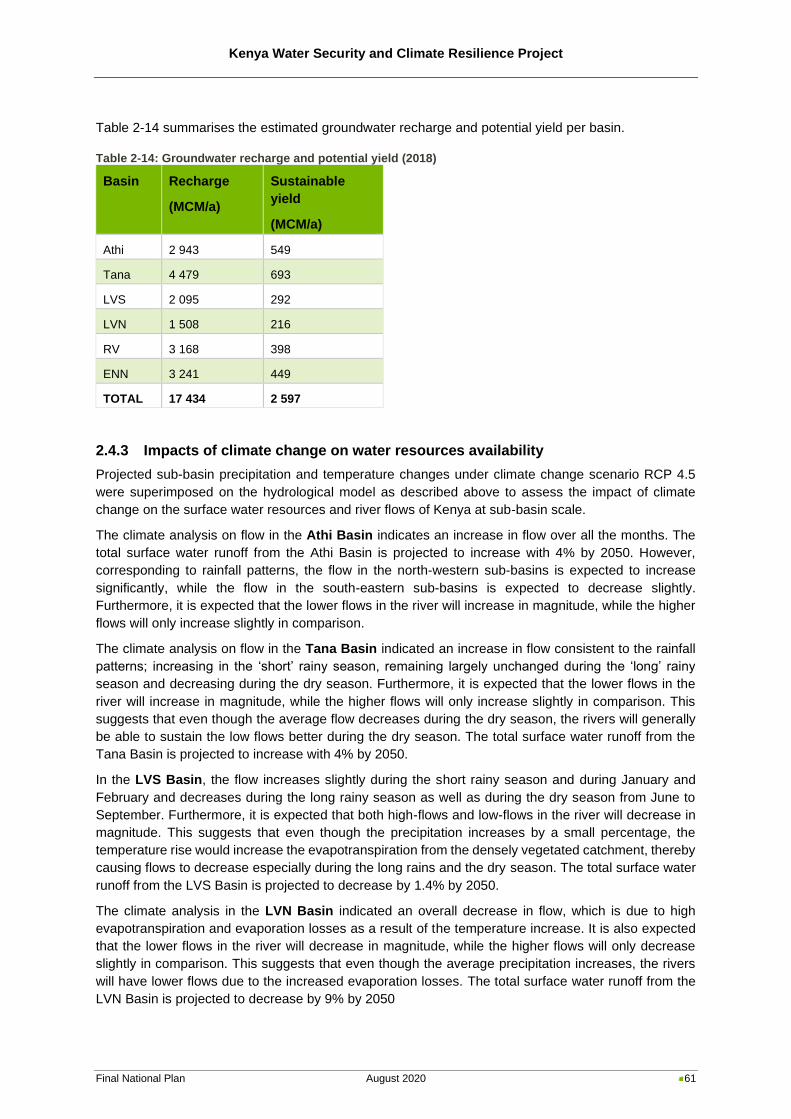
Kenya Water Security and Climate Resilience Project
Final National Plan August 2020 61
Table 2-14 summarises the estimated groundwater recharge and potential yield per basin.
Table 2-14: Groundwater recharge and potential yield (2018)
Basin Recharge
(MCM/a)
Sustainable
yield
(MCM/a)
Athi 2 943 549
Tana 4 479 693
LVS 2 095 292
LVN 1 508 216
RV 3 168 398
ENN 3 241 449
TOTAL 17 434 2 597
2.4.3 Impacts of climate change on water resources availability
Projected sub-basin precipitation and temperature changes under climate change scenario RCP 4.5
were superimposed on the hydrological model as described above to assess the impact of climate
change on the surface water resources and river flows of Kenya at sub-basin scale.
The climate analysis on flow in the Athi Basin indicates an increase in flow over all the months. The
total surface water runoff from the Athi Basin is projected to increase with 4% by 2050. However,
corresponding to rainfall patterns, the flow in the north-western sub-basins is expected to increase
significantly, while the flow in the south-eastern sub-basins is expected to decrease slightly.
Furthermore, it is expected that the lower flows in the river will increase in magnitude, while the higher
flows will only increase slightly in comparison.
The climate analysis on flow in the Tana Basin indicated an increase in flow consistent to the rainfall
patterns; increasing in the ‘short’ rainy season, remaining largely unchanged during the ‘long’ rainy
season and decreasing during the dry season. Furthermore, it is expected that the lower flows in the
river will increase in magnitude, while the higher flows will only increase slightly in comparison. This
suggests that even though the average flow decreases during the dry season, the rivers will generally
be able to sustain the low flows better during the dry season. The total surface water runoff from the
Tana Basin is projected to increase with 4% by 2050.
In the LVS Basin, the flow increases slightly during the short rainy season and during January and
February and decreases during the long rainy season as well as during the dry season from June to
September. Furthermore, it is expected that both high-flows and low-flows in the river will decrease in
magnitude. This suggests that even though the precipitation increases by a small percentage, the
temperature rise would increase the evapotranspiration from the densely vegetated catchment, thereby
causing flows to decrease especially during the long rains and the dry season. The total surface water
runoff from the LVS Basin is projected to decrease by 1.4% by 2050.
The climate analysis in the LVN Basin indicated an overall decrease in flow, which is due to high
evapotranspiration and evaporation losses as a result of the temperature increase. It is also expected
that the lower flows in the river will decrease in magnitude, while the higher flows will only decrease
slightly in comparison. This suggests that even though the average precipitation increases, the rivers
will have lower flows due to the increased evaporation losses. The total surface water runoff from the
LVN Basin is projected to decrease by 9% by 2050
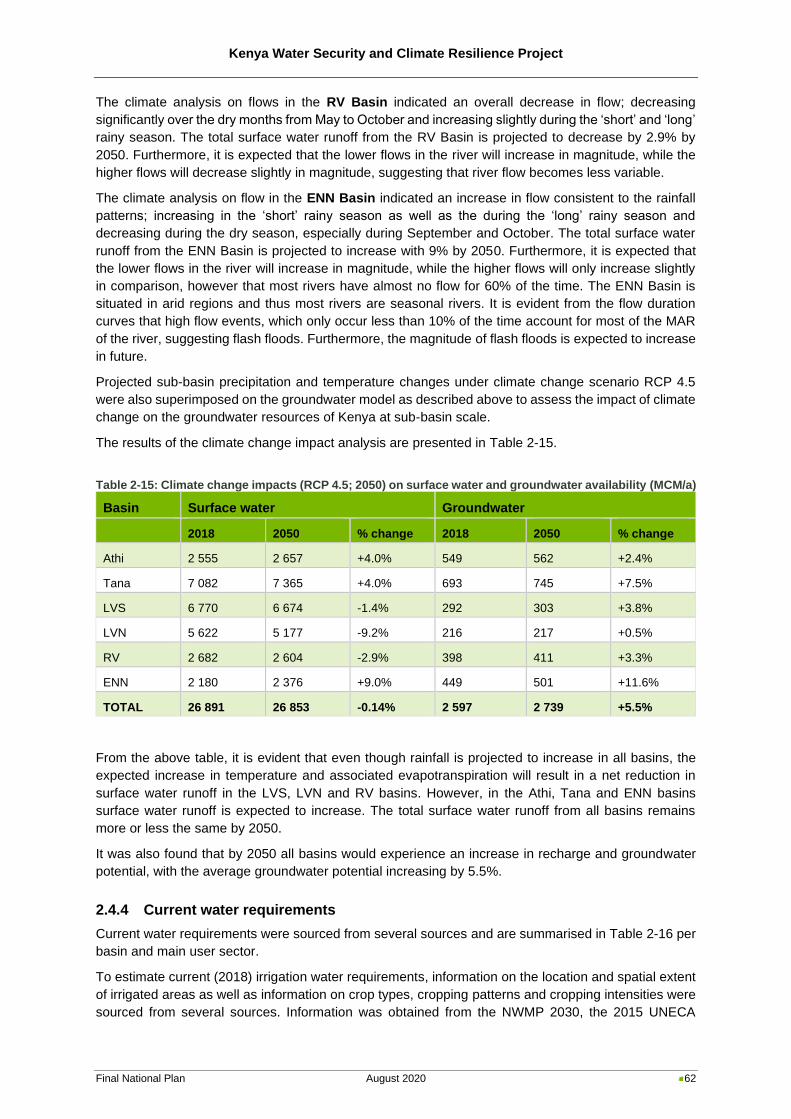
Kenya Water Security and Climate Resilience Project
Final National Plan August 2020 62
The climate analysis on flows in the RV Basin indicated an overall decrease in flow; decreasing
significantly over the dry months from May to October and increasing slightly during the ‘short’ and ‘long’
rainy season. The total surface water runoff from the RV Basin is projected to decrease by 2.9% by
2050. Furthermore, it is expected that the lower flows in the river will increase in magnitude, while the
higher flows will decrease slightly in magnitude, suggesting that river flow becomes less variable.
The climate analysis on flow in the ENN Basin indicated an increase in flow consistent to the rainfall
patterns; increasing in the ‘short’ rainy season as well as the during the ‘long’ rainy season and
decreasing during the dry season, especially during September and October. The total surface water
runoff from the ENN Basin is projected to increase with 9% by 2050. Furthermore, it is expected that
the lower flows in the river will increase in magnitude, while the higher flows will only increase slightly
in comparison, however that most rivers have almost no flow for 60% of the time. The ENN Basin is
situated in arid regions and thus most rivers are seasonal rivers. It is evident from the flow duration
curves that high flow events, which only occur less than 10% of the time account for most of the MAR
of the river, suggesting flash floods. Furthermore, the magnitude of flash floods is expected to increase
in future.
Projected sub-basin precipitation and temperature changes under climate change scenario RCP 4.5
were also superimposed on the groundwater model as described above to assess the impact of climate
change on the groundwater resources of Kenya at sub-basin scale.
The results of the climate change impact analysis are presented in Table 2-15.
Table 2-15: Climate change impacts (RCP 4.5; 2050) on surface water and groundwater availability (MCM/a)
Basin Surface water Groundwater
2018 2050 % change 2018 2050 % change
Athi 2 555 2 657 +4.0% 549 562 +2.4%
Tana 7 082 7 365 +4.0% 693 745 +7.5%
LVS 6 770 6 674 -1.4% 292 303 +3.8%
LVN 5 622 5 177 -9.2% 216 217 +0.5%
RV 2 682 2 604 -2.9% 398 411 +3.3%
ENN 2 180 2 376 +9.0% 449 501 +11.6%
TOTAL 26 891 26 853 -0.14% 2 597 2 739 +5.5%
From the above table, it is evident that even though rainfall is projected to increase in all basins, the
expected increase in temperature and associated evapotranspiration will result in a net reduction in
surface water runoff in the LVS, LVN and RV basins. However, in the Athi, Tana and ENN basins
surface water runoff is expected to increase. The total surface water runoff from all basins remains
more or less the same by 2050.
It was also found that by 2050 all basins would experience an increase in recharge and groundwater
potential, with the average groundwater potential increasing by 5.5%.
2.4.4 Current water requirements
Current water requirements were sourced from several sources and are summarised in Table 2-16 per
basin and main user sector.
To estimate current (2018) irrigation water requirements, information on the location and spatial extent
of irrigated areas as well as information on crop types, cropping patterns and cropping intensities were
sourced from several sources. Information was obtained from the NWMP 2030, the 2015 UNECA
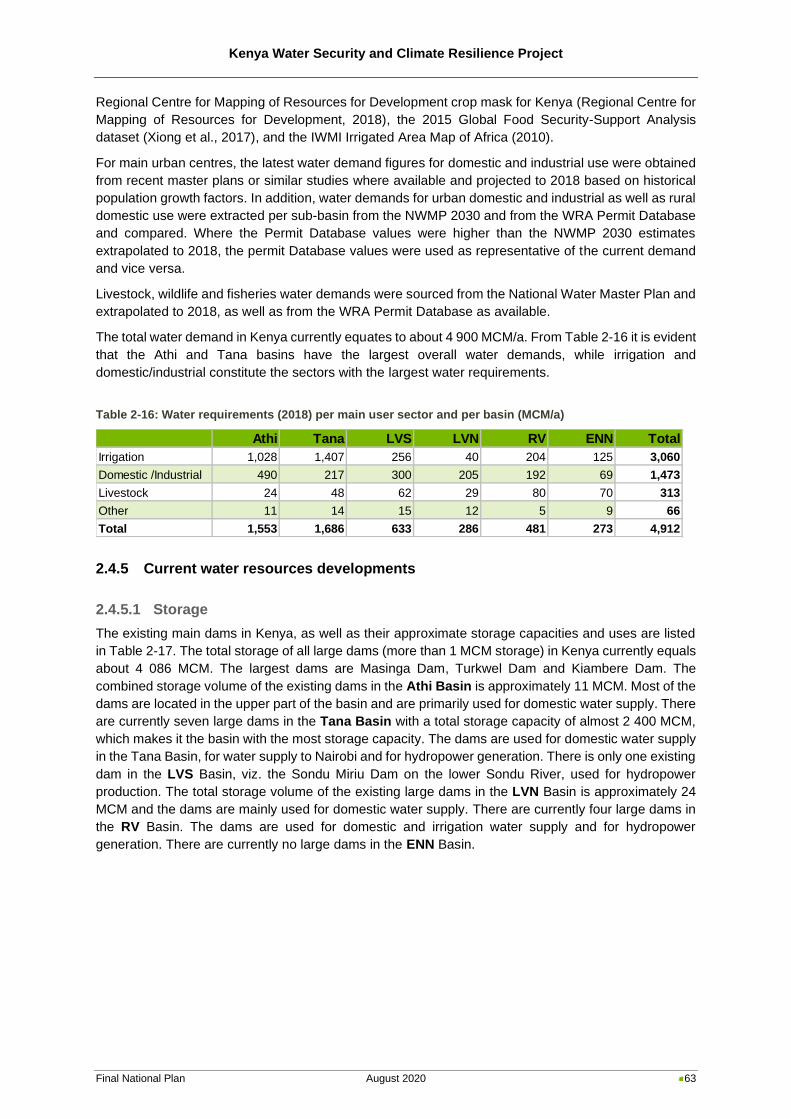
Kenya Water Security and Climate Resilience Project
Final National Plan August 2020 63
Regional Centre for Mapping of Resources for Development crop mask for Kenya (Regional Centre for
Mapping of Resources for Development, 2018), the 2015 Global Food Security-Support Analysis
dataset (Xiong et al., 2017), and the IWMI Irrigated Area Map of Africa (2010).
For main urban centres, the latest water demand figures for domestic and industrial use were obtained
from recent master plans or similar studies where available and projected to 2018 based on historical
population growth factors. In addition, water demands for urban domestic and industrial as well as rural
domestic use were extracted per sub-basin from the NWMP 2030 and from the WRA Permit Database
and compared. Where the Permit Database values were higher than the NWMP 2030 estimates
extrapolated to 2018, the permit Database values were used as representative of the current demand
and vice versa.
Livestock, wildlife and fisheries water demands were sourced from the National Water Master Plan and
extrapolated to 2018, as well as from the WRA Permit Database as available.
The total water demand in Kenya currently equates to about 4 900 MCM/a. From Table 2-16 it is evident
that the Athi and Tana basins have the largest overall water demands, while irrigation and
domestic/industrial constitute the sectors with the largest water requirements.
Table 2-16: Water requirements (2018) per main user sector and per basin (MCM/a)
2.4.5 Current water resources developments
2.4.5.1 Storage
The existing main dams in Kenya, as well as their approximate storage capacities and uses are listed
in Table 2-17. The total storage of all large dams (more than 1 MCM storage) in Kenya currently equals
about 4 086 MCM. The largest dams are Masinga Dam, Turkwel Dam and Kiambere Dam. The
combined storage volume of the existing dams in the Athi Basin is approximately 11 MCM. Most of the
dams are located in the upper part of the basin and are primarily used for domestic water supply. There
are currently seven large dams in the Tana Basin with a total storage capacity of almost 2 400 MCM,
which makes it the basin with the most storage capacity. The dams are used for domestic water supply
in the Tana Basin, for water supply to Nairobi and for hydropower generation. There is only one existing
dam in the LVS Basin, viz. the Sondu Miriu Dam on the lower Sondu River, used for hydropower
production. The total storage volume of the existing large dams in the LVN Basin is approximately 24
MCM and the dams are mainly used for domestic water supply. There are currently four large dams in
the RV Basin. The dams are used for domestic and irrigation water supply and for hydropower
generation. There are currently no large dams in the ENN Basin.
Athi Tana LVS LVN RV ENN Total
Irrigation 1,028 1,407 256 40 204 125 3,060
Domestic /Industrial 490 217 300 205 192 69 1,473
Livestock 24 48 62 29 80 70 313
Other 11 14 15 12 5 9 66
Total 1,553 1,686 633 286 481 273 4,912
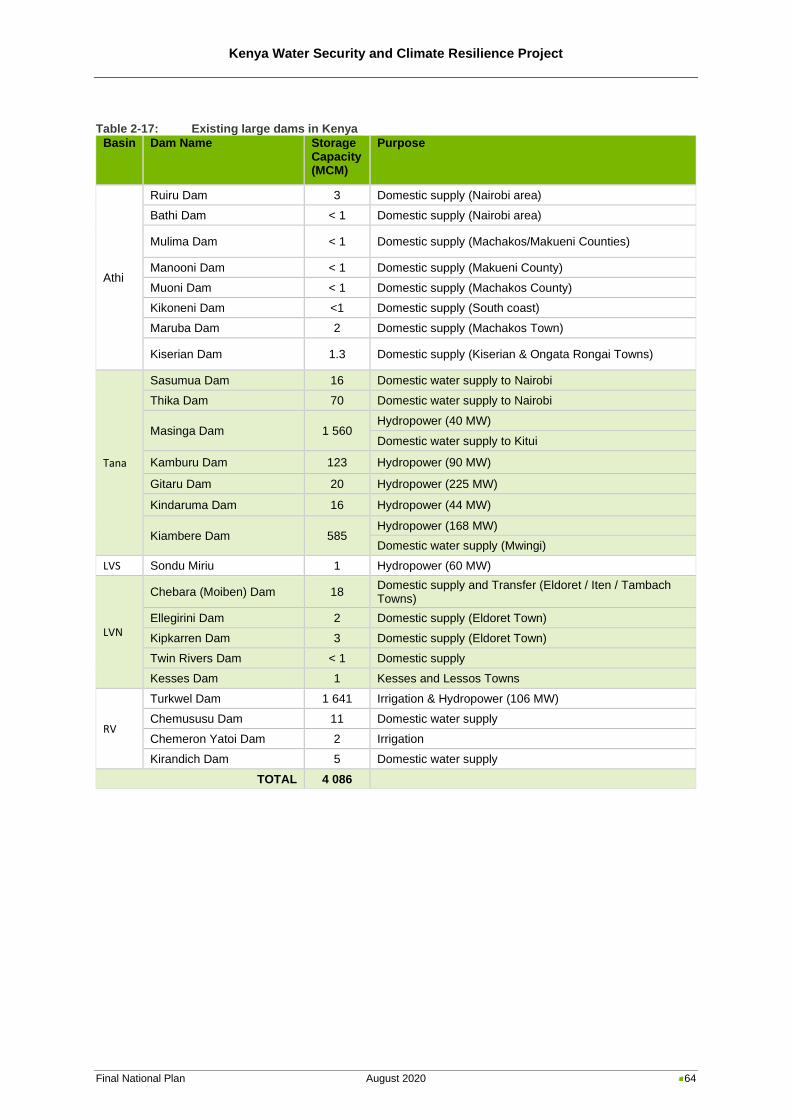
Kenya Water Security and Climate Resilience Project
Final National Plan August 2020 64
Table 2-17: Existing large dams in Kenya
Basin Dam Name Storage Capacity (MCM)
Purpose
Athi
Ruiru Dam 3 Domestic supply (Nairobi area)
Bathi Dam < 1 Domestic supply (Nairobi area)
Mulima Dam < 1 Domestic supply (Machakos/Makueni Counties)
Manooni Dam < 1 Domestic supply (Makueni County)
Muoni Dam < 1 Domestic supply (Machakos County)
Kikoneni Dam <1 Domestic supply (South coast)
Maruba Dam 2 Domestic supply (Machakos Town)
Kiserian Dam 1.3 Domestic supply (Kiserian & Ongata Rongai Towns)
Tana
Sasumua Dam 16 Domestic water supply to Nairobi
Thika Dam 70 Domestic water supply to Nairobi
Masinga Dam 1 560 Hydropower (40 MW)
Domestic water supply to Kitui
Kamburu Dam 123 Hydropower (90 MW)
Gitaru Dam 20 Hydropower (225 MW)
Kindaruma Dam 16 Hydropower (44 MW)
Kiambere Dam 585 Hydropower (168 MW)
Domestic water supply (Mwingi)
LVS Sondu Miriu 1 Hydropower (60 MW)
LVN
Chebara (Moiben) Dam 18 Domestic supply and Transfer (Eldoret / Iten / Tambach Towns)
Ellegirini Dam 2 Domestic supply (Eldoret Town)
Kipkarren Dam 3 Domestic supply (Eldoret Town)
Twin Rivers Dam < 1 Domestic supply
Kesses Dam 1 Kesses and Lessos Towns
RV
Turkwel Dam 1 641 Irrigation & Hydropower (106 MW)
Chemususu Dam 11 Domestic water supply
Chemeron Yatoi Dam 2 Irrigation
Kirandich Dam 5 Domestic water supply
TOTAL 4 086
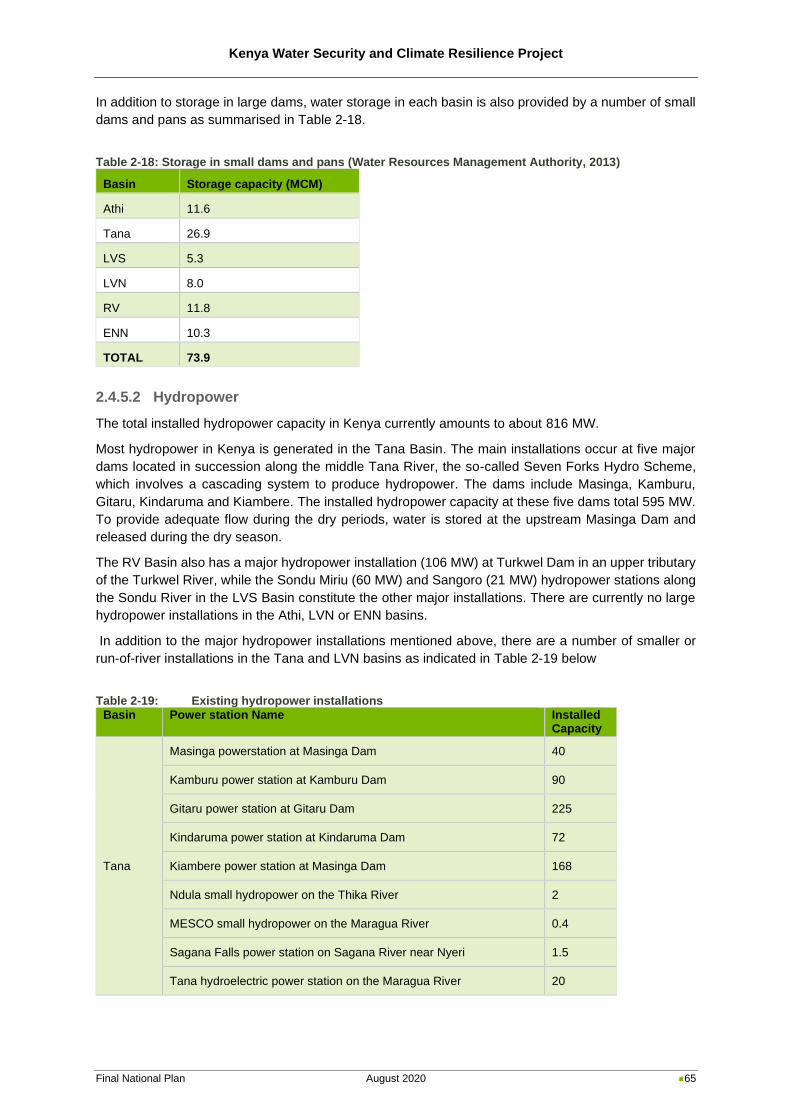
Kenya Water Security and Climate Resilience Project
Final National Plan August 2020 65
In addition to storage in large dams, water storage in each basin is also provided by a number of small
dams and pans as summarised in Table 2-18.
Table 2-18: Storage in small dams and pans (Water Resources Management Authority, 2013)
Basin Storage capacity (MCM)
Athi 11.6
Tana 26.9
LVS 5.3
LVN 8.0
RV 11.8
ENN 10.3
TOTAL 73.9
2.4.5.2 Hydropower
The total installed hydropower capacity in Kenya currently amounts to about 816 MW.
Most hydropower in Kenya is generated in the Tana Basin. The main installations occur at five major
dams located in succession along the middle Tana River, the so-called Seven Forks Hydro Scheme,
which involves a cascading system to produce hydropower. The dams include Masinga, Kamburu,
Gitaru, Kindaruma and Kiambere. The installed hydropower capacity at these five dams total 595 MW.
To provide adequate flow during the dry periods, water is stored at the upstream Masinga Dam and
released during the dry season.
The RV Basin also has a major hydropower installation (106 MW) at Turkwel Dam in an upper tributary
of the Turkwel River, while the Sondu Miriu (60 MW) and Sangoro (21 MW) hydropower stations along
the Sondu River in the LVS Basin constitute the other major installations. There are currently no large
hydropower installations in the Athi, LVN or ENN basins.
In addition to the major hydropower installations mentioned above, there are a number of smaller or
run-of-river installations in the Tana and LVN basins as indicated in Table 2-19 below
Table 2-19: Existing hydropower installations
Basin Power station Name Installed Capacity (MW)
Tana
Masinga powerstation at Masinga Dam 40
Kamburu power station at Kamburu Dam 90
Gitaru power station at Gitaru Dam 225
Kindaruma power station at Kindaruma Dam 72
Kiambere power station at Masinga Dam 168
Ndula small hydropower on the Thika River 2
MESCO small hydropower on the Maragua River 0.4
Sagana Falls power station on Sagana River near Nyeri 1.5
Tana hydroelectric power station on the Maragua River 20
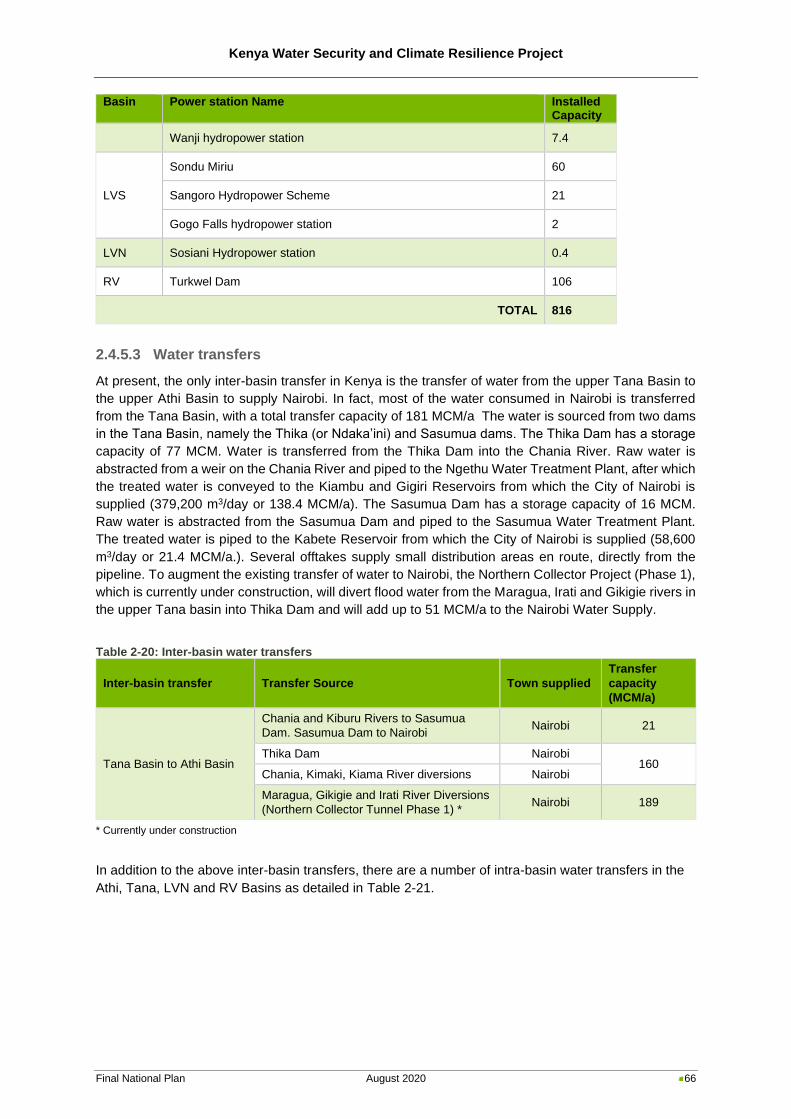
Kenya Water Security and Climate Resilience Project
Final National Plan August 2020 66
Basin Power station Name Installed Capacity (MW)
Wanji hydropower station 7.4
LVS
Sondu Miriu 60
Sangoro Hydropower Scheme 21
Gogo Falls hydropower station 2
LVN Sosiani Hydropower station 0.4
RV Turkwel Dam 106
TOTAL 816
2.4.5.3 Water transfers
At present, the only inter-basin transfer in Kenya is the transfer of water from the upper Tana Basin to
the upper Athi Basin to supply Nairobi. In fact, most of the water consumed in Nairobi is transferred
from the Tana Basin, with a total transfer capacity of 181 MCM/a The water is sourced from two dams
in the Tana Basin, namely the Thika (or Ndaka’ini) and Sasumua dams. The Thika Dam has a storage
capacity of 77 MCM. Water is transferred from the Thika Dam into the Chania River. Raw water is
abstracted from a weir on the Chania River and piped to the Ngethu Water Treatment Plant, after which
the treated water is conveyed to the Kiambu and Gigiri Reservoirs from which the City of Nairobi is
supplied (379,200 m3/day or 138.4 MCM/a). The Sasumua Dam has a storage capacity of 16 MCM.
Raw water is abstracted from the Sasumua Dam and piped to the Sasumua Water Treatment Plant.
The treated water is piped to the Kabete Reservoir from which the City of Nairobi is supplied (58,600
m3/day or 21.4 MCM/a.). Several offtakes supply small distribution areas en route, directly from the
pipeline. To augment the existing transfer of water to Nairobi, the Northern Collector Project (Phase 1),
which is currently under construction, will divert flood water from the Maragua, Irati and Gikigie rivers in
the upper Tana basin into Thika Dam and will add up to 51 MCM/a to the Nairobi Water Supply.
Table 2-20: Inter-basin water transfers
Inter-basin transfer Transfer Source Town supplied
Transfer
capacity
(MCM/a)
Tana Basin to Athi Basin
Chania and Kiburu Rivers to Sasumua
Dam. Sasumua Dam to Nairobi Nairobi 21
Thika Dam Nairobi 160
Chania, Kimaki, Kiama River diversions Nairobi
Maragua, Gikigie and Irati River Diversions
(Northern Collector Tunnel Phase 1) * Nairobi 189
* Currently under construction
In addition to the above inter-basin transfers, there are a number of intra-basin water transfers in the
Athi, Tana, LVN and RV Basins as detailed in Table 2-21.
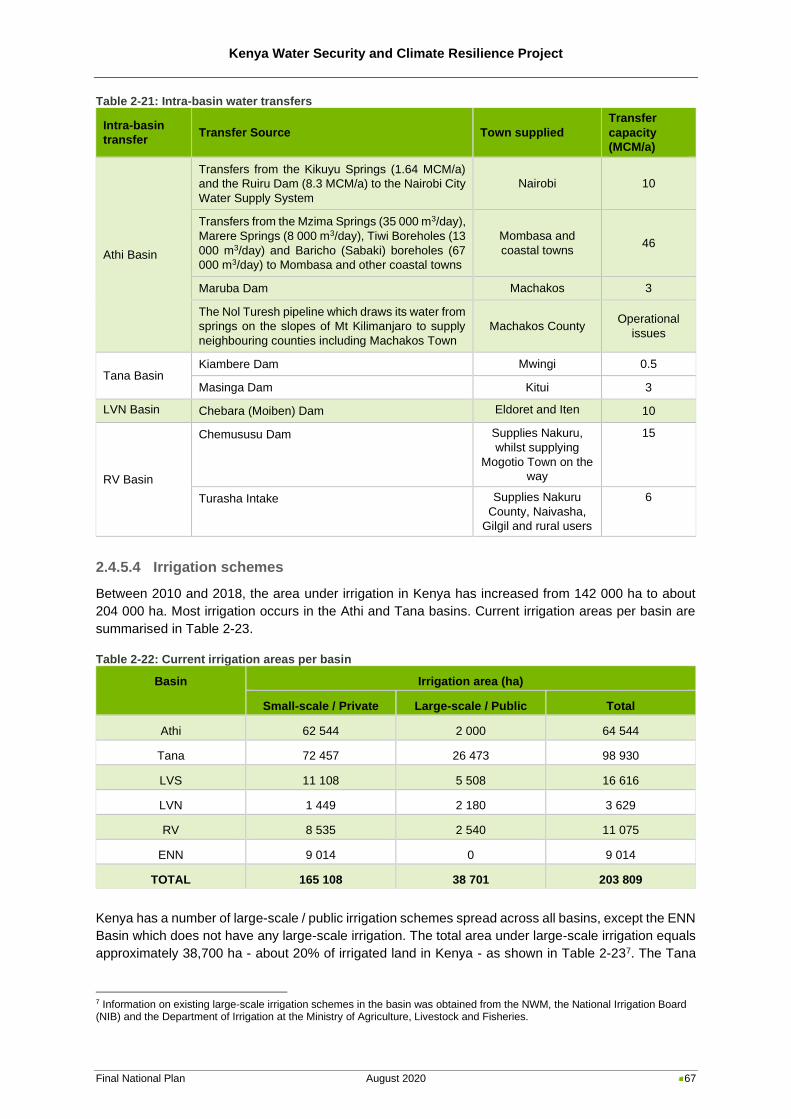
Kenya Water Security and Climate Resilience Project
Final National Plan August 2020 67
Table 2-21: Intra-basin water transfers
Intra-basin
transfer Transfer Source Town supplied
Transfer
capacity
(MCM/a)
Athi Basin
Transfers from the Kikuyu Springs (1.64 MCM/a)
and the Ruiru Dam (8.3 MCM/a) to the Nairobi City
Water Supply System
Nairobi 10
Transfers from the Mzima Springs (35 000 m3/day),
Marere Springs (8 000 m3/day), Tiwi Boreholes (13
000 m3/day) and Baricho (Sabaki) boreholes (67
000 m3/day) to Mombasa and other coastal towns
Mombasa and
coastal towns 46
Maruba Dam Machakos 3
The Nol Turesh pipeline which draws its water from
springs on the slopes of Mt Kilimanjaro to supply
neighbouring counties including Machakos Town
Machakos County Operational
issues
Tana Basin Kiambere Dam Mwingi 0.5
Masinga Dam Kitui 3
LVN Basin Chebara (Moiben) Dam Eldoret and Iten 10
RV Basin
Chemususu Dam Supplies Nakuru,
whilst supplying
Mogotio Town on the
way
15
Turasha Intake Supplies Nakuru
County, Naivasha,
Gilgil and rural users
6
2.4.5.4 Irrigation schemes
Between 2010 and 2018, the area under irrigation in Kenya has increased from 142 000 ha to about
204 000 ha. Most irrigation occurs in the Athi and Tana basins. Current irrigation areas per basin are
summarised in Table 2-23.
Table 2-22: Current irrigation areas per basin
Basin Irrigation area (ha)
Small-scale / Private Large-scale / Public Total
Athi 62 544 2 000 64 544
Tana 72 457 26 473 98 930
LVS 11 108 5 508 16 616
LVN 1 449 2 180 3 629
RV 8 535 2 540 11 075
ENN 9 014 0 9 014
TOTAL 165 108 38 701 203 809
Kenya has a number of large-scale / public irrigation schemes spread across all basins, except the ENN
Basin which does not have any large-scale irrigation. The total area under large-scale irrigation equals
approximately 38,700 ha - about 20% of irrigated land in Kenya - as shown in Table 2-237. The Tana
7 Information on existing large-scale irrigation schemes in the basin was obtained from the NWM, the National Irrigation Board (NIB) and the Department of Irrigation at the Ministry of Agriculture, Livestock and Fisheries.
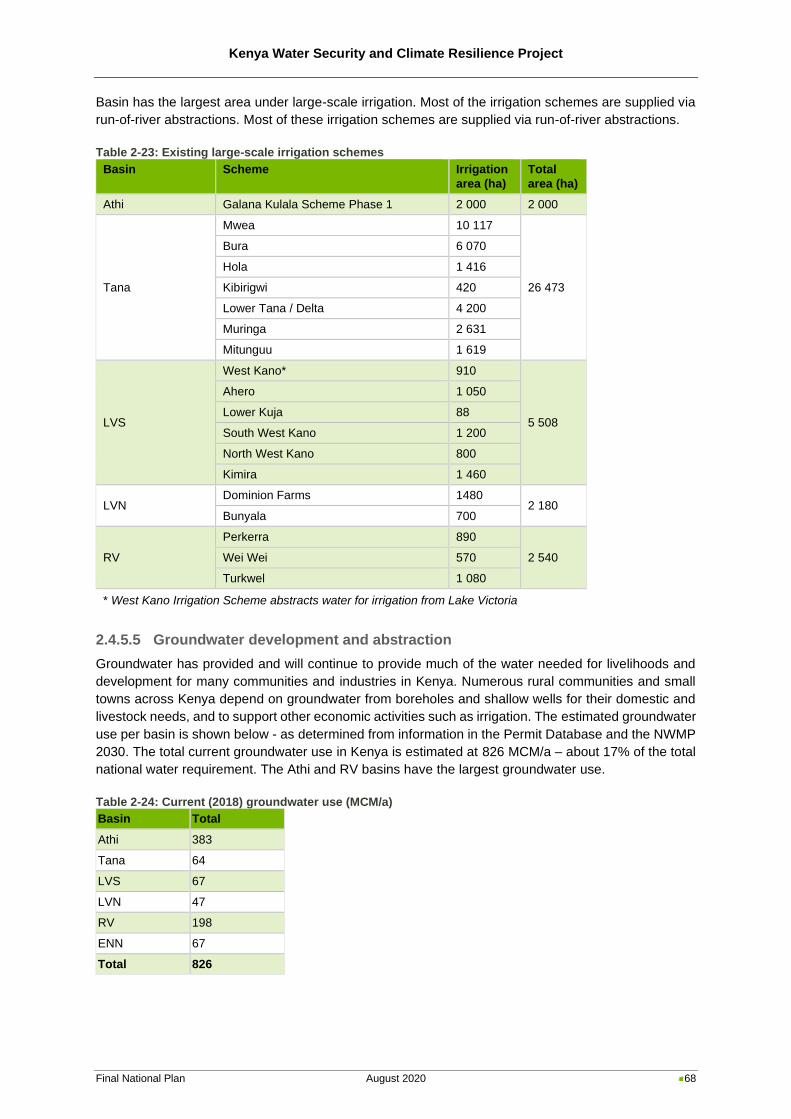
Kenya Water Security and Climate Resilience Project
Final National Plan August 2020 68
Basin has the largest area under large-scale irrigation. Most of the irrigation schemes are supplied via
run-of-river abstractions. Most of these irrigation schemes are supplied via run-of-river abstractions.
Table 2-23: Existing large-scale irrigation schemes
Basin Scheme Irrigation
area (ha)
Total
area (ha)
Athi Galana Kulala Scheme Phase 1 2 000 2 000
Tana
Mwea 10 117
26 473
Bura 6 070
Hola 1 416
Kibirigwi 420
Lower Tana / Delta 4 200
Muringa 2 631
Mitunguu 1 619
LVS
West Kano* 910
5 508
Ahero 1 050
Lower Kuja 88
South West Kano 1 200
North West Kano 800
Kimira 1 460
LVN Dominion Farms 1480
2 180 Bunyala 700
RV
Perkerra 890
2 540 Wei Wei 570
Turkwel 1 080
* West Kano Irrigation Scheme abstracts water for irrigation from Lake Victoria
2.4.5.5 Groundwater development and abstraction
Groundwater has provided and will continue to provide much of the water needed for livelihoods and
development for many communities and industries in Kenya. Numerous rural communities and small
towns across Kenya depend on groundwater from boreholes and shallow wells for their domestic and
livestock needs, and to support other economic activities such as irrigation. The estimated groundwater
use per basin is shown below - as determined from information in the Permit Database and the NWMP
2030. The total current groundwater use in Kenya is estimated at 826 MCM/a – about 17% of the total
national water requirement. The Athi and RV basins have the largest groundwater use.
Table 2-24: Current (2018) groundwater use (MCM/a)
Basin Total
Athi 383
Tana 64
LVS 67
LVN 47
RV 198
ENN 67
Total 826
Kenya Water Security and Climate Resilience Project
Final National Plan August 2020 69
2.4.5.6 Ongoing major water projects
Construction of Thwake Multipurpose Dam (storage capacity 681 MCM) in the Athi Basin was planned
to commence in early 2018. The dam, which borders Makueni and Kitui counties, is positioned on the
confluence of the Thwake and Athi rivers. The multipurpose dam is meant to supply water for domestic
and irrigation water use, as well as to provide hydropower generation. A key purpose of the dam will be
water supply to the proposed Konza Technopolis - a large technology hub south of Nairobi planned by
the Government of Kenya. Also in the Athi Basin invitation for pre-qualification for the construction of
Mwache Multipurpose Dam in Kwale County has been published. The Mwache Dam, with a planned
capacity of 136 MCM, will provide water for domestic, irrigation and livestock use to Kwale County as
well as domestic water for Mombasa County. It will also have hydropower installed. The Athi Water
Service Board has actively pursued the development of deep groundwater resources in the Kiunyu and
Ruiru areas, with a proposed abstraction of 64 800 m3/day (23.7 MCM/a). Exploratory boreholes were
constructed in 2013/14 and showed that there were good prospects for deep groundwater at Kiunyu,
while shallower aquifers in the Ruiru area were also of reasonable potential. The future status of
planned abstraction from these sources is unclear.
The Northern Collector Project (Phase I) in the Tana Basin, currently under construction, will take flood
flows from the Maragua, Irati and Gikigie Rivers and divert them into a tributary flowing into Thika
(Ndaka’ini) Dam. It will add up to 140 000 m3/day (51.1 MCM/a) to Nairobi water supply.
Construction on various large dams in the Tana Basin is about to start, is currently underway, or has
started but are currently on hold due to contractual and/or other issues. These dams include:
▪ Yatta Dam on the Thika River for domestic and irrigation supply;
▪ Thiba Dam on the Nyamindi River – mainly to be used for supplying Mwea Irrigation Scheme Extension;
▪ Karimenu II Dam on the Karimenu River from where water will be supplied to Kiambu and Nairobi counties
▪ Umaa Dam on the Nzeu River – to be used for domestic water supply.
In addition, the Government of Kenya has approved the construction of the High Grand Falls Dam at
Kivuka along the Tana River in the Tana Basin. The dam, which forms part of the LAPSSET project,
will be located on the borders Tharaka-Nithi, Kitui and Tana River counties. Furthermore, the Northern
Collector Project (Phase 1), which is currently under construction, will divert flood water from the
Maragua, Irati and Gikigie rivers in the upper Tana Basin into Thika Dam and will add up to 57 MCM/a
to the Nairobi Water Supply.
In LVS Basin, the Ministry of Agriculture, Livestock and Fisheries recently completed the feasibility
study for the Lower Kuja Irrigation Project in Migori County. This scheme, which will eventually comprise
10 0000 ha, will be close to the shores of Lake Victoria, downstream of the confluence of the Gucha
and Migori Rivers, and will be supplied from the new Gogo Falls Dam – a multipurpose dam at the
location of the existing Gogo Falls hydropower plant. The dam will have an installed capacity of 15 MW.
Kengen plans to increase the hydropower capacity even further in future.
The Lake Basin Development Authority is prioritising the construction of Magwagwa Multipurpose Dam
on the Sondu-Miriu River in Nyamira County in LVS to generate hydropower, to supply domestic and
industrial demands in Nyamira, Homa Bay and Kisii counties, to supply water for large scale irrigation
development on the Kano Plains and for flood control along the lower Sondu River.
The Lake Victoria South Water Works Development Agency is moving ahead with the Implementation
of the Bunyunyu Dam Project on the upper Gucha River in Kisii County to supply water to Kisii Town
and other surrounding towns in Kisii and Nyamira counties.
Kenya Water Security and Climate Resilience Project
Final National Plan August 2020 70
In order to improve the reliability of supply to Kisumu Town, and to ensure that the expected growth in
water demand is met, Kibos Dam on the Kibos River in Nandi County, upstream of Kisumu, has been
identified for imminent construction by Kisumu Water and Sanitation Company.
The Rift Valley Water Works Development Agency has started with implementation of Itare Dam on the
Itare River, an upper tributary of the Sondu River, in Nakuru County. This dam will supply water to towns
in Kericho, Bomet and Nakuru counties in the LVS Basin as well as to Nakuru Town and other smaller
towns in the adjacent Rift Valley Basin via an inter-basin transfer (tunnel). Contractual disputes have
halted implementation of this dam.
The planned Bosto Dam in Bomet County has a proposed capcity of 30 MCM and was meant to serve
a population of 550 000 people in the county. This is currently a priority for the Government of Kenya.
However, environmental activist groups are strongly opposing the construction of the dam on the
Kipsonoi River inside the South West Mau Forest, which is a biodiversity hotspot and Kenya’s most
significant catchment.
Ongoing water resources development projects in the LVN Basin include the Lower Nzoia Irrigation
Scheme, which involves developing 4 000 ha on the left bank of the lower Nzoia River (Phase 1) and a
further 3 800 ha (Phase 2) on the right (northern) bank of the Lower Nzoia River. Water for irrigation
will be abstracted directly from the Nzoia River.
Construction on various large dams in the RV Basin is about to start, is underway, or has started but
are currently on hold due to contractual, financial and/or other issues. These dams include the Muruny-
Siyoi Dam in West Pokot as part of the Kapenguria Water Supply Project and the Arror multipurpose
dams on upper tributaries of the Kerio River in Elgiyo Marakwet County, which will have installed hydro-
electric capacity of 60 MW and will supply water for about 3 000 ha of irrigation. The Lowaat Dam on
the Kerio River and the Radat Dam on the Perkerra River in Turkana and Baringo counties respectively,
will also be used for irrigation supply.
Imminent water resources development projects in the ENN Basin include the Crocodile Jaws (Isiolo)
Dam Water Project, as well as Nanyuki and Rumuruti dams.
2.4.6 Water balance
The 2018 water balance in the various basins in terms of natural surface water runoff and sustainable
groundwater yield, water imports, the ecological reserve and current (2018) water demands in the
basins is summarised in Table 2-25.
The table shows that on average, 82% of the combined surface and groundwater resources in Kenya,
is still available. The Lake Victoria Basins still have in excess of 90% of their water resources available,
while the Athi Basin demand already constitutes about 50% of the water resources available in the
basin. It is important to remember that this table considers annual average values and does not take
into account inter- and intra- annual variability in demand and water availability, which often result in
shortfalls during the dry season and/or during dry years. This highlights the need for storage and
regulation as well as conjunctive use. Furthermore, it is important to bear in mind that Kenya, as a Nile
riparian country, is a signatory to the Nile Cooperative Framework Agreement, which implies that there
might be a need for future Nile strategic water resources commitments from the Lake Victoria basins.
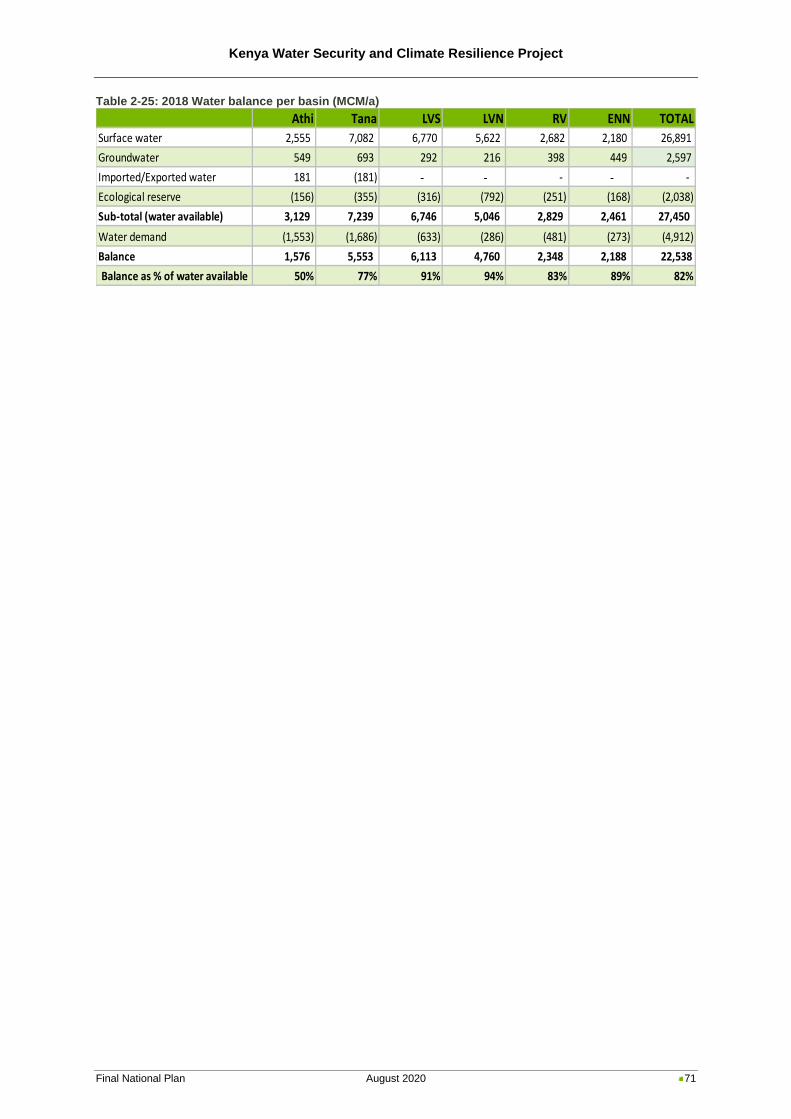
Kenya Water Security and Climate Resilience Project
Final National Plan August 2020 71
Table 2-25: 2018 Water balance per basin (MCM/a)
Athi Tana LVS LVN RV ENN TOTAL
Surface water 2,555 7,082 6,770 5,622 2,682 2,180 26,891
Groundwater 549 693 292 216 398 449 2,597
Imported/Exported water 181 (181) - - - - -
Ecological reserve (156) (355) (316) (792) (251) (168) (2,038)
Sub-total (water available) 3,129 7,239 6,746 5,046 2,829 2,461 27,450
Water demand (1,553) (1,686) (633) (286) (481) (273) (4,912)
Balance 1,576 5,553 6,113 4,760 2,348 2,188 22,538
Balance as % of water available 50% 77% 91% 94% 83% 89% 82%
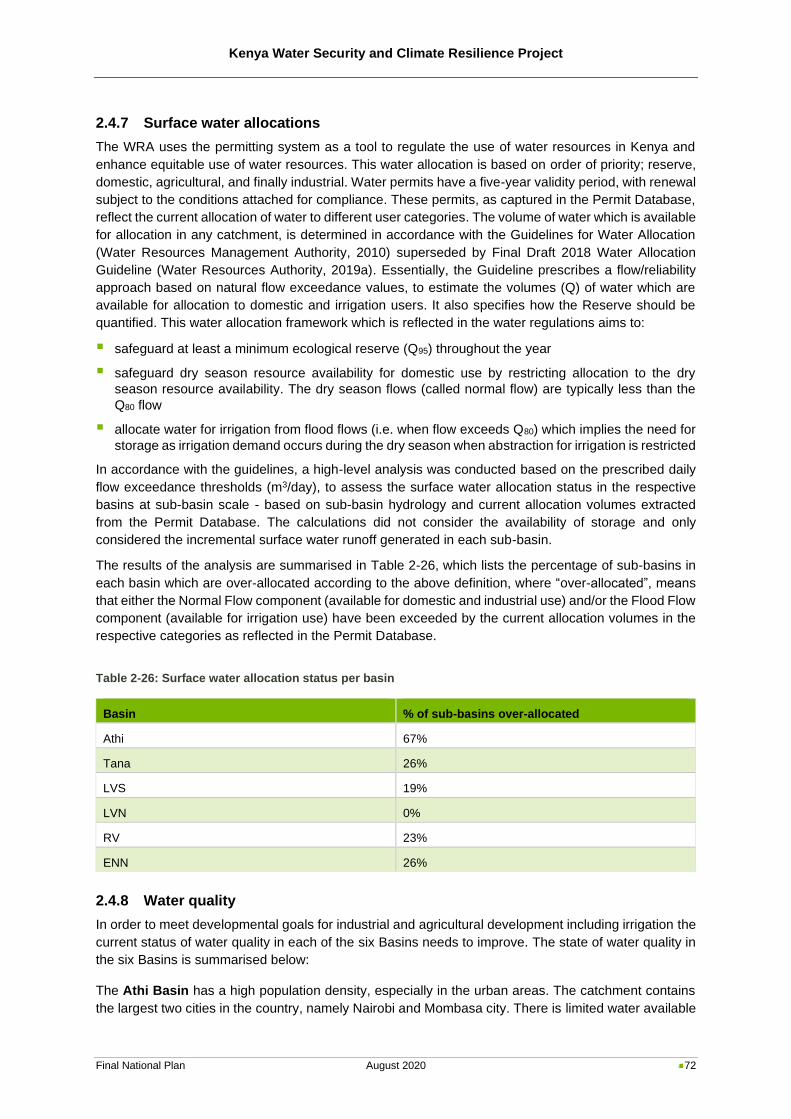
Kenya Water Security and Climate Resilience Project
Final National Plan August 2020 72
2.4.7 Surface water allocations
The WRA uses the permitting system as a tool to regulate the use of water resources in Kenya and
enhance equitable use of water resources. This water allocation is based on order of priority; reserve,
domestic, agricultural, and finally industrial. Water permits have a five-year validity period, with renewal
subject to the conditions attached for compliance. These permits, as captured in the Permit Database,
reflect the current allocation of water to different user categories. The volume of water which is available
for allocation in any catchment, is determined in accordance with the Guidelines for Water Allocation
(Water Resources Management Authority, 2010) superseded by Final Draft 2018 Water Allocation
Guideline (Water Resources Authority, 2019a). Essentially, the Guideline prescribes a flow/reliability
approach based on natural flow exceedance values, to estimate the volumes (Q) of water which are
available for allocation to domestic and irrigation users. It also specifies how the Reserve should be
quantified. This water allocation framework which is reflected in the water regulations aims to:
▪ safeguard at least a minimum ecological reserve (Q95) throughout the year
▪ safeguard dry season resource availability for domestic use by restricting allocation to the dry
season resource availability. The dry season flows (called normal flow) are typically less than the
Q80 flow
▪ allocate water for irrigation from flood flows (i.e. when flow exceeds Q80) which implies the need for
storage as irrigation demand occurs during the dry season when abstraction for irrigation is restricted
In accordance with the guidelines, a high-level analysis was conducted based on the prescribed daily
flow exceedance thresholds (m3/day), to assess the surface water allocation status in the respective
basins at sub-basin scale - based on sub-basin hydrology and current allocation volumes extracted
from the Permit Database. The calculations did not consider the availability of storage and only
considered the incremental surface water runoff generated in each sub-basin.
The results of the analysis are summarised in Table 2-26, which lists the percentage of sub-basins in
each basin which are over-allocated according to the above definition, where “over-allocated”, means
that either the Normal Flow component (available for domestic and industrial use) and/or the Flood Flow
component (available for irrigation use) have been exceeded by the current allocation volumes in the
respective categories as reflected in the Permit Database.
Table 2-26: Surface water allocation status per basin
Basin % of sub-basins over-allocated
Athi 67%
Tana 26%
LVS 19%
LVN 0%
RV 23%
ENN 26%
2.4.8 Water quality
In order to meet developmental goals for industrial and agricultural development including irrigation the
current status of water quality in each of the six Basins needs to improve. The state of water quality in
the six Basins is summarised below:
The Athi Basin has a high population density, especially in the urban areas. The catchment contains
the largest two cities in the country, namely Nairobi and Mombasa city. There is limited water available
Kenya Water Security and Climate Resilience Project
Final National Plan August 2020 73
in the basin, and almost 80% of the water used in the basin is transferred from the Tana Basin. The
main sources of surface water pollution in the Athi Basin are untreated domestic sewage and industrial
effluents from towns, pesticide residue and nutrients from agro-based industries and flower farms,
mining wastes, soil erosion and sediment from degraded catchments and encroachment of wetland and
forest areas, and river riparian areas. Nairobi River is the most polluted river in the country as it receives
wastes from the city of Nairobi. The pollution of Nairobi River which is a tributary of the Athi is felt as far
downstream as Machakos. For this reason, both the upper and middle Athi River have high pollution
levels rendering the water unfit for domestic uses without treatment. Athi River shows high levels of
colour and turbidity, has bacterial contamination, diminished dissolved oxygen levels and moderately
high levels of Biochemical Oxygen Demand (BOD) and Chemical Oxygen Demand (COD). The waters
also contain high levels of nutrients and pesticide residues from the agricultural activities in the upper
reaches. There is a lot of reliance on groundwater in the basin. However, groundwater quality in the
basin is varied. Some boreholes show slightly high levels of salinity, high fluoride and moderate
hardness. Boreholes around the Taita Taveta region also show high levels of iron and manganese.
The Tana Basin has a relatively low population density. The main river is the Tana River. Agriculture
and agro-pastoralism are common in the upper basin where rainfall is high, while households rely on
pastoralism in the drier areas. The major sources of surface water pollution in the Tana Basin are
untreated domestic sewage and industrial effluents from towns, pesticide residue and nutrients from
agro-based industries such as tea and coffee, mining wastes, soil erosion and sediment from degraded
catchments and encroachment of wetland and forest areas, and river riparian areas. The surface water
quality of Tana River and its tributaries is fair. The waters in some rivers such as Chania, appear to be
laden with silt and sediment. Some river waters also exhibit high levels of colour and turbidity, have
high bacterial contamination, diminished dissolved oxygen levels and moderately high levels of BOD
and COD. The waters also contain high levels of nutrients and pesticide residues from the agricultural
activities in the upper part of the basin. About 50% of the boreholes drilled have water with high levels
of Total Dissolved Solids (TDS), total hardness, and salinity and fluoride levels.
The LVS Basin has a high population density and is the second wettest basin in the country. Agriculture
and fishing are the main activities. The main sources of surface water pollution are the agro-based
industries of tea, coffee and sugar cane, domestic and industrial effluents from the major towns and
mining. Encroachment on wetlands and riparian areas and poor land husbandry, has led to erosion and
sedimentation in the rivers. The main rivers, Nyando, Sondu-Miriu, Gucha and the Mara and their
tributaries, look brown and turbid mainly due to silt and sediment. All these rivers show high levels of
colour and turbidity, have bacterial contamination, diminished dissolved oxygen levels and moderately
high levels of BOD and COD. The waters also contain high levels of nutrients and pesticide residues
from the agricultural activities. In their current state the rivers can only be used for domestic purposes
after some form of treatment. Because the surface water quality is not good people tend to rely on
shallow ground water sources and springs for their drinking water. In general groundwater quality is
good. The water is fresh soft and non-saline. Only a few boreholes drilled along the shore of Lake
Victoria show elevated levels of total dissolved solids.
The LVN Basin has a high population density, is the wettest in the country and depends mainly on
agriculture. Fishing, especially on the shores of Lake Victoria, is also a common source of livelihood.
Although the LVN Basin experiences high rainfall, water resources are both spatially and temporally
unevenly distributed. The main sources of surface water pollution are the agro-based industries of tea,
coffee and sugar cane, Domestic and industrial effluents from the major towns and gold and sand
mining. Encroachment on wetlands and riparian areas and poor land husbandry, has led to erosion and
sedimentation in the rivers. The main rivers, Nzoia and Yala and their tributaries, are laden with silt and
sediment from erosion due to agricultural activities. The waters also contain nutrients from the fertilizers
used on farms as well as pesticide residues. All these rivers show high levels of colour and turbidity,
have bacterial contamination, diminished dissolved oxygen levels and moderately high levels of BOD
and COD. In their current state the rivers can only be used for domestic purposes with caution. Because
Kenya Water Security and Climate Resilience Project
Final National Plan August 2020 74
the poor quality of surface water sources, most of the population relies on shallow groundwater sources
for their domestic purposes. In general ground water quality is good. The water is fresh and non-saline
except for wells drilled along the shores of Lake Victoria, which show some elevated levels of total
dissolved salts.
The RV Basin has a low population density, which is concentrated in the central basin. The northern
parts of the basin are very dry, and most of the households in Turkana County rely on pastoralism. The
highlands (central basin) receive higher rainfall, and agricultural activities are common. The main
sources of surface water pollution in the RV Basin are untreated domestic sewage and industrial
effluents from towns, pesticide residue and nutrients from agro-based industries and flower farms,
mining wastes and soil erosion and sediment from degraded catchments and encroachment of wetland
and forest areas, and river riparian areas. The general water quality in the main rivers of Kerio, Turkwel,
Molo, Perkerra, Gilgil and Malewa is not good. The waters look turbid and brown and are laden with silt
and sediment. All these rivers show high levels of colour and turbidity, have bacterial contamination,
diminished dissolved oxygen levels and moderately high levels of BOD and COD. The waters also
contain high levels of nutrients and pesticide residues from the agricultural activities. In their current
state the rivers can only be used for domestic purposes after some form of treatment. Because the
surface water quality is not good people tend to rely on ground water for domestic purposes. In general
groundwater quality varies. Most boreholes drilled have moderately to high saline water. The water has
also high levels of hardness and fluoride. Like surface water, groundwater should be used with caution
or with treatment to improve its quality. Only Lakes Baringo and Naivasha are fresh. The other lakes
are saline but act as good habitats for aquatic biodiversity. Maintaining good water quality in the lakes
is imperative as many of the lakes are important tourist destinations.
The ENN Basin is the driest catchment and has the lowest population density in the country. Activities
include nomadic pastoralism in the drier areas and agricultural activities in the higher-rainfall areas. The
major water pollution threats are untreated domestic sewage and industrial effluents from towns,
pesticide residue and nutrients from agro-based industries such as tea and coffee, mining wastes and
soil erosion and sediment from degraded catchments and encroachment of wetland and forest areas,
and river riparian areas. The water quality of surface water is fair, except for those sections of the rivers
in the upper catchments downstream of farming activities or industries such as flower farms or urban
settlements. Here the waters also exhibit high levels of colour and turbidity, have high bacterial
contamination, diminished dissolved oxygen levels and moderately high levels of BOD and COD. In
some areas, the waters exhibit high levels of nutrients and pesticide residues from upstream agricultural
activities. Groundwater appears to have varying levels of high salinity, fluoride and hardness. It should
be exploited with caution.
2.4.9 Current hydro-meteorological monitoring network
2.4.9.1 Stream flow monitoring
All of the basins have had a loss of operational flow gauging stations. Of the original 200 the Athi Basin
only has 27 operational; Tana Basin has 59 operational from 69; LVS Basin has 38 operational from
50, LVN Basin has 44 operational from 54; RV Basin has 64 operational from 79; and ENN Basin has
41 operational from 51 (Table 2-27).
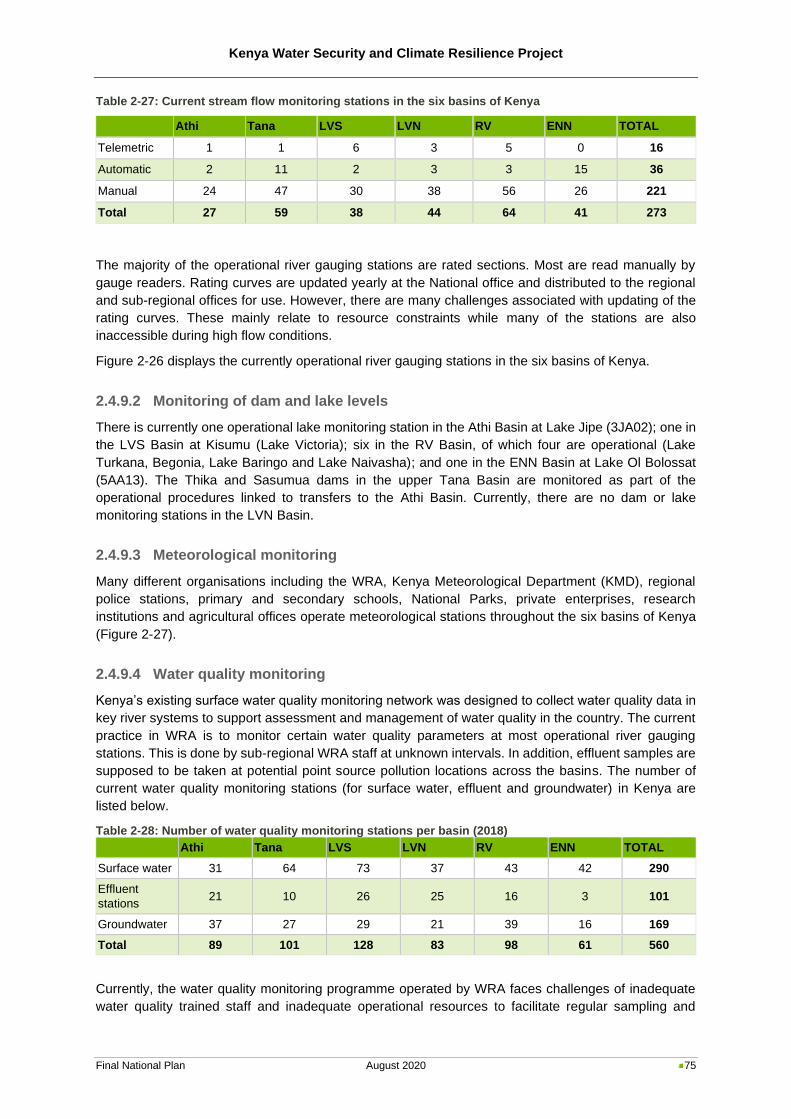
Kenya Water Security and Climate Resilience Project
Final National Plan August 2020 75
Table 2-27: Current stream flow monitoring stations in the six basins of Kenya
Athi Tana LVS LVN RV ENN TOTAL
Telemetric 1 1 6 3 5 0 16
Automatic 2 11 2 3 3 15 36
Manual 24 47 30 38 56 26 221
Total 27 59 38 44 64 41 273
The majority of the operational river gauging stations are rated sections. Most are read manually by
gauge readers. Rating curves are updated yearly at the National office and distributed to the regional
and sub-regional offices for use. However, there are many challenges associated with updating of the
rating curves. These mainly relate to resource constraints while many of the stations are also
inaccessible during high flow conditions.
Figure 2-26 displays the currently operational river gauging stations in the six basins of Kenya.
2.4.9.2 Monitoring of dam and lake levels
There is currently one operational lake monitoring station in the Athi Basin at Lake Jipe (3JA02); one in
the LVS Basin at Kisumu (Lake Victoria); six in the RV Basin, of which four are operational (Lake
Turkana, Begonia, Lake Baringo and Lake Naivasha); and one in the ENN Basin at Lake Ol Bolossat
(5AA13). The Thika and Sasumua dams in the upper Tana Basin are monitored as part of the
operational procedures linked to transfers to the Athi Basin. Currently, there are no dam or lake
monitoring stations in the LVN Basin.
2.4.9.3 Meteorological monitoring
Many different organisations including the WRA, Kenya Meteorological Department (KMD), regional
police stations, primary and secondary schools, National Parks, private enterprises, research
institutions and agricultural offices operate meteorological stations throughout the six basins of Kenya
(Figure 2-27).
2.4.9.4 Water quality monitoring
Kenya’s existing surface water quality monitoring network was designed to collect water quality data in
key river systems to support assessment and management of water quality in the country. The current
practice in WRA is to monitor certain water quality parameters at most operational river gauging
stations. This is done by sub-regional WRA staff at unknown intervals. In addition, effluent samples are
supposed to be taken at potential point source pollution locations across the basins. The number of
current water quality monitoring stations (for surface water, effluent and groundwater) in Kenya are
listed below.
Table 2-28: Number of water quality monitoring stations per basin (2018) Athi Tana LVS LVN RV ENN TOTAL
Surface water 31 64 73 37 43 42 290
Effluent
stations 21 10 26 25 16 3 101
Groundwater 37 27 29 21 39 16 169
Total 89 101 128 83 98 61 560
Currently, the water quality monitoring programme operated by WRA faces challenges of inadequate
water quality trained staff and inadequate operational resources to facilitate regular sampling and
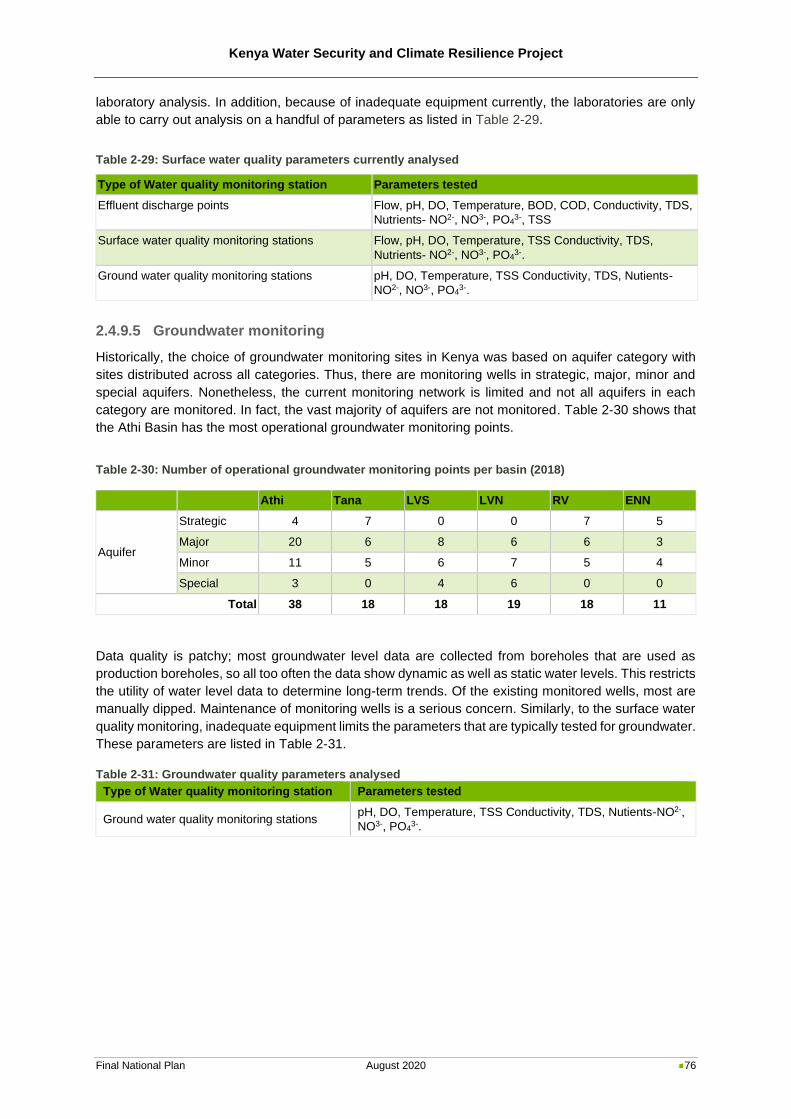
Kenya Water Security and Climate Resilience Project
Final National Plan August 2020 76
laboratory analysis. In addition, because of inadequate equipment currently, the laboratories are only
able to carry out analysis on a handful of parameters as listed in Table 2-29.
Table 2-29: Surface water quality parameters currently analysed
Type of Water quality monitoring station Parameters tested
Effluent discharge points Flow, pH, DO, Temperature, BOD, COD, Conductivity, TDS,
Nutrients- NO2-, NO3-, PO43-, TSS
Surface water quality monitoring stations Flow, pH, DO, Temperature, TSS Conductivity, TDS,
Nutrients- NO2-, NO3-, PO43-.
Ground water quality monitoring stations pH, DO, Temperature, TSS Conductivity, TDS, Nutients-
NO2-, NO3-, PO43-.
2.4.9.5 Groundwater monitoring
Historically, the choice of groundwater monitoring sites in Kenya was based on aquifer category with
sites distributed across all categories. Thus, there are monitoring wells in strategic, major, minor and
special aquifers. Nonetheless, the current monitoring network is limited and not all aquifers in each
category are monitored. In fact, the vast majority of aquifers are not monitored. Table 2-30 shows that
the Athi Basin has the most operational groundwater monitoring points.
Table 2-30: Number of operational groundwater monitoring points per basin (2018)
Athi Tana LVS LVN RV ENN
Aquifer
Strategic 4 7 0 0 7 5
Major 20 6 8 6 6 3
Minor 11 5 6 7 5 4
Special 3 0 4 6 0 0
Total 38 18 18 19 18 11
Data quality is patchy; most groundwater level data are collected from boreholes that are used as
production boreholes, so all too often the data show dynamic as well as static water levels. This restricts
the utility of water level data to determine long-term trends. Of the existing monitored wells, most are
manually dipped. Maintenance of monitoring wells is a serious concern. Similarly, to the surface water
quality monitoring, inadequate equipment limits the parameters that are typically tested for groundwater.
These parameters are listed in Table 2-31.
Table 2-31: Groundwater quality parameters analysed
Type of Water quality monitoring station Parameters tested
Ground water quality monitoring stations pH, DO, Temperature, TSS Conductivity, TDS, Nutients-NO2-,
NO3-, PO43-.
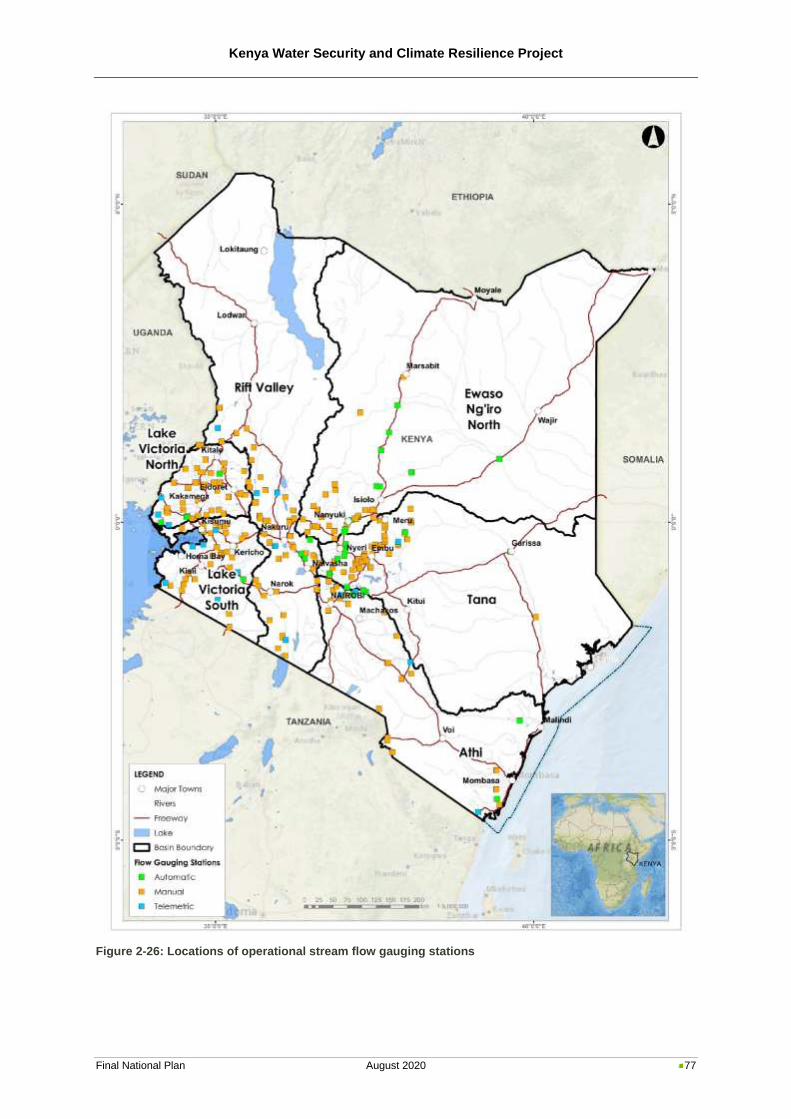
Kenya Water Security and Climate Resilience Project
Final National Plan August 2020 77
Figure 2-26: Locations of operational stream flow gauging stations
Kenya Water Security and Climate Resilience Project
Final National Plan August 2020 78
Figure 2-27: Locations of operational meteorological stations
Kenya Water Security and Climate Resilience Project
Final National Plan August 2020 79
Kenya Water Security and Climate Resilience Project
Final National Plan August 2020 80
3 Institutional overview
3.1 Legislative, Policy and Institutional Framework
3.1.1 Introduction
The Constitution of Kenya (2010) provides the basis for water resources management in the country
and recognises this through the right to a clean and healthy environment, through the management and
sustainable development of natural resources (which includes both surface and ground water), as well
as through the economic and social right “to clean and safe water of adequate quantities”. Importantly,
the State has the obligation to ensure that water is conserved, that development is managed to be
sustainable and to ensure that the benefits accrued are shared equitably. Whilst it is noted that the
utilisation of natural resources should be for the benefit of the people of Kenya, there is important
emphasis placed upon the needs of marginalised communities. Also of importance is the recognition of
the link between water and land. As such, this recognition provides the basis for improved integration
in the planning, management and sustainable development of natural resources. In this regard,
institutional arrangements from national to county level are imperative for leading efforts in socio-
economic development at national scale and for implementing national government policies on natural
resource and environmental conservation at a local scale.
3.1.2 National policies
3.1.2.1 Water
Worldwide, there is increased recognition of the importance of water in terms of socio-economic
development. This is increasingly emerging through the nexus discussions which acknowledge the
interfaces between water, food, energy, and more recently, climatic risks. The findings of the World
Economic Forum through their Global Risks Reports which repeatedly reflect water and climate related
risks as being the most significant to economic growth.
At national level in Kenya, this sentiment has been mirrored in the development of various forms of
national development plans. The Kenya Vision 2030, published in 2007, provides the national
development blueprint. It is structured around economic, social and political dimensions and notes the
important role of water in catalysing growth. National targets outlined in the Vision 2030 that have
implications for the water sector include:
▪ Water and sanitation - to ensure that improved water and sanitation are available and accessible
to all by 2030
▪ Agriculture - to significantly increase the area under irrigation by 2030 for increase of agricultural
production
▪ Environment - to be a nation that has a clean, secure and sustainable environment by 2030
▪ Energy - to generate more energy and increase efficiency in the energy sector
The 2010 Kenya Constitution had two main implications for the water supply and sanitation sectors:
▪ The right to clean and safe water in adequate quantities
▪ Division of responsibilities between National and County Governments with respect to water supply
and sanitation; The Fourth Schedule of the Constitution of Kenya 2010 stipulates that the functions
and powers of the county governments include water and sanitation services, storm water
management in ‘built-up areas’, and solid waste management. Section 22 of the Fourth Schedule
places the responsibility for developing policy and regulation for water resource management with
the national government, while counties are responsible for implementing these policies.
Kenya Water Security and Climate Resilience Project
Final National Plan August 2020 81
The Kenya National Water Resources Management Strategy (2006) provides the overarching policy
framework for water resource management and development in Kenya, despite a number of successive
adjustments in the core water legislation. This consistency in policy intent has been critical in guiding
the water sector, with legislative amendments being progressively utilised to improve and strengthen
the way that policy is affected. At the time of its introduction, the ‘Sessional paper no. 1 of 1999 on
national policy on water resources management policy and development’ (Government of Kenya, 1999)
introduced key shifts in policy such as the separation of functions (including water resource
management, water service delivery, policy, regulation, financing), the devolution of decision making to
regional and local levels, the commercialisation of water (i.e. water to be treated as an economic and
social good) and stakeholder participation through community and private sector participation.
The National Plan in combination with the Basin Plans as developed as part of this Consultancy, provide
an updated situation assessment of the current state of the water resources in Kenya, along with
relevant strategies and action plans to support integrated water resources development and
management. As such, these documents constitute key reference sources for future updates of the
national water resources management strategy, which will ensure strong alignment and seamless
integration across all levels of water resources management in Kenya.
3.1.2.2 Environment and natural resources
In conjunction with the ‘Sessional paper no. 1 of 1999 on national policy on water resources
management policy and development’, the National Environment Policy (NEP) (Government of Kenya,
2013a) provides an important framework in terms of improved river basin management in that the NEP
has the goal of ensuring a “better quality of life for present and future generations through sustainable
management and use of the environment and natural resources”. As such, this framework policy has
relevance to a number of differing sectors that are engaged in the management of natural resources,
including water resources. The objectives of this policy that have relevance to the management of the
Athi River Basin include, amongst others:
▪ Provide a framework for an integrated approach to planning and sustainable management of
Kenya’s environment and natural resources;
▪ Strengthen the legal and institutional framework for good governance, effective coordination and
management of the environment and natural resources;
▪ Ensure sustainable management of the environment and natural resources, such as unique
terrestrial and aquatic ecosystems, for national economic growth and improved livelihoods;
▪ Promote and support research and capacity development as well as use of innovative
environmental management tools such as incentives, disincentives, total economic valuation,
indicators of sustainable development;
▪ Promote and enhance cooperation, collaboration, synergy, partnerships and participation in the
protection, conservation, sustainable management of the environment and natural resources;
▪ Ensure inclusion of cross-cutting and emerging issues such as poverty reduction, gender, disability,
HIV&AIDS and other diseases in the management of the environment and natural resources.
Incorporated in the NEP are a number of important principles to take into consideration in undertaking
planning in the basins and these are presented in Table 3-1.
Table 3-1: Guiding NEP principles for basin planning
Environmental Right Every person in Kenya has a right to a clean and healthy environment and a duty to
safeguard and enhance the environment
Right to Development The right to development will be exercised taking into consideration sustainability,
resource efficiency and economic, social and environmental needs.
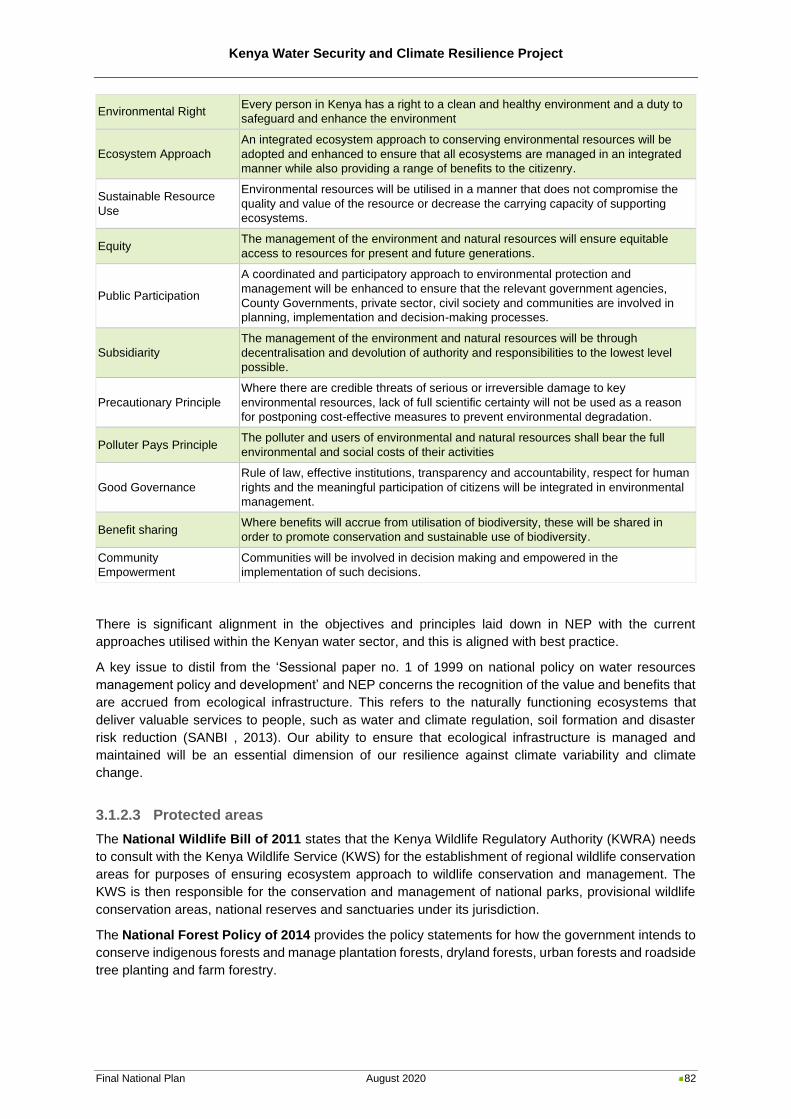
Kenya Water Security and Climate Resilience Project
Final National Plan August 2020 82
Environmental Right Every person in Kenya has a right to a clean and healthy environment and a duty to
safeguard and enhance the environment
Ecosystem Approach
An integrated ecosystem approach to conserving environmental resources will be
adopted and enhanced to ensure that all ecosystems are managed in an integrated
manner while also providing a range of benefits to the citizenry.
Sustainable Resource
Use
Environmental resources will be utilised in a manner that does not compromise the
quality and value of the resource or decrease the carrying capacity of supporting
ecosystems.
Equity The management of the environment and natural resources will ensure equitable
access to resources for present and future generations.
Public Participation
A coordinated and participatory approach to environmental protection and
management will be enhanced to ensure that the relevant government agencies,
County Governments, private sector, civil society and communities are involved in
planning, implementation and decision-making processes.
Subsidiarity
The management of the environment and natural resources will be through
decentralisation and devolution of authority and responsibilities to the lowest level
possible.
Precautionary Principle
Where there are credible threats of serious or irreversible damage to key
environmental resources, lack of full scientific certainty will not be used as a reason
for postponing cost-effective measures to prevent environmental degradation.
Polluter Pays Principle The polluter and users of environmental and natural resources shall bear the full
environmental and social costs of their activities
Good Governance
Rule of law, effective institutions, transparency and accountability, respect for human
rights and the meaningful participation of citizens will be integrated in environmental
management.
Benefit sharing Where benefits will accrue from utilisation of biodiversity, these will be shared in
order to promote conservation and sustainable use of biodiversity.
Community
Empowerment
Communities will be involved in decision making and empowered in the
implementation of such decisions.
There is significant alignment in the objectives and principles laid down in NEP with the current
approaches utilised within the Kenyan water sector, and this is aligned with best practice.
A key issue to distil from the ‘Sessional paper no. 1 of 1999 on national policy on water resources
management policy and development’ and NEP concerns the recognition of the value and benefits that
are accrued from ecological infrastructure. This refers to the naturally functioning ecosystems that
deliver valuable services to people, such as water and climate regulation, soil formation and disaster
risk reduction (SANBI , 2013). Our ability to ensure that ecological infrastructure is managed and
maintained will be an essential dimension of our resilience against climate variability and climate
change.
3.1.2.3 Protected areas
The National Wildlife Bill of 2011 states that the Kenya Wildlife Regulatory Authority (KWRA) needs
to consult with the Kenya Wildlife Service (KWS) for the establishment of regional wildlife conservation
areas for purposes of ensuring ecosystem approach to wildlife conservation and management. The
KWS is then responsible for the conservation and management of national parks, provisional wildlife
conservation areas, national reserves and sanctuaries under its jurisdiction.
The National Forest Policy of 2014 provides the policy statements for how the government intends to
conserve indigenous forests and manage plantation forests, dryland forests, urban forests and roadside
tree planting and farm forestry.
Kenya Water Security and Climate Resilience Project
Final National Plan August 2020 83
3.1.2.4 Agriculture and land
The Kenya Vision 2030 identified agriculture as one of the key sectors to deliver the desired economic
growth rate of 10% per annum and resulted in the development of various policies and strategies for
the agricultural and irrigation sectors to guide the development, transformation and strengthening of
these sectors. The transformation of smallholder agriculture from that of subsistence to an innovative,
commercially oriented and modern agricultural sector has been identified as a fundamental component
for achieving agricultural growth. It is realised that this transformation will be achieved through
transforming key institutions in agriculture, livestock, forestry and wildlife to promote agricultural growth;
increasing productivity of crops, livestock and tree cover; introducing land-use policies for better use of
high- and medium-potential lands; developing more irrigable areas in ASALs for both crops and
livestock; improving market access for smallholders through better supply chain management; and
adding value to farm, livestock and forestry products before they reach local, regional and international
markets.
Increasing the productivity of agricultural water use in Kenya is a national priority given the country’s
low water endowment, growing population, and changing climate. Increasing productivity will also help
contribute to achieving one of the primary targets of the Big Four Agenda; food security. Expanding the
use of modern irrigation technology, such as drip and sprinkler systems, will be fundamental to
achieving water productivity because of the potential for such systems to increase yields relative to
water withdrawals.
The National Agricultural Policy (2016), which is currently under review, undertakes to address the
identified challenges in the agricultural sector by providing guidelines to the National and County
governments; specifying the different roles towards ensuring household and National food and nutrition
security; increasing agricultural production and productivity through the use of appropriate good quality
and affordable inputs; facilitating access to premium domestic, regional and international markets and
reducing post-harvest losses while promoting agribusiness, value addition and product development.
Other guidelines outlined in the Policy include strengthening inter-governmental relations, agricultural
institutions, developing institutional linkages and enhancing collaboration in order to create harmony
and synergy in developing agricultural resources; harnessing resources for improved agricultural output
in partnership with the private sector and introducing appropriate financing and insurance systems in
the agricultural sector; promoting demand-driven research and timely dissemination of research
findings in the agricultural sector and conserving bio-diversity of different crops, livestock and fish. The
broad objective of the Agricultural Policy (2016) is to improve food and nutrition security and maximize
incomes through optimal utilization of resources in the agricultural sector. In actualizing the broad
objective, the National and County governments will ensure that household and National food and
nutrition security are attained through innovative and cost-effective measures linked to the country’s
long-term development goals.
Irrigation services in Kenya remain as an important function of the national government because of its
important role in food security. The Final Draft National Irrigation Policy (2017) of the Ministry of
Agriculture, Livestock and Fisheries (MoALF) presents a concise set of principles and guidelines,
designated to facilitated rapid development and improved performance of the irrigation sector, based
on the government’s commitment to improve agricultural productivities for food security, poverty
reduction, and employment and wealth creation. The implementation of the National Irrigation Policy
will be realised through accelerated development of irrigation infrastructure, increased productivity per
unit volume of water, increased water harvesting and storage, improved scheme management,
enhanced stakeholder participation and improved business orientation in the sector. The Policy has
proposed that the irrigation and drainage functions are performed by the Irrigation and Drainage
Department (IDD), while the implementation and related services are provided by a reformed National
Irrigation Board (NIB), namely the National Irrigation Service (NIS).
The National Land Policy (2009) was established to provide guidance towards equitable and
sustainable land use for the wellbeing of Kenya’s people and economy. It is a framework to address
Kenya Water Security and Climate Resilience Project
Final National Plan August 2020 84
critical land related issues in the country, including equitable land access, historical injustices and
disparities, land use conflicts and sustainable utilization and management of land and its resources.
The Policy recognizes land as a significant finite resource that holds cultural heritage, which should be
managed sustainably and productively for economic benefit as well provision of livelihoods. Land in
Kenya is classified into Public Land, Community Land and Private Land. Communal land is based on
traditional customary rights. Several statutes involving land use matters were enacted following the
promulgation of the Constitution. However, lack of institutional coordination poses a challenge for
effective land use management across the country. The National Land Use Policy was therefore
established in 2017 to provide institutional coordination among the relevant stakeholders. Furthermore,
the Policy seeks to optimize the utilization and productivity of land and its resources in a sustainable
and equitable manner.
The Final Draft National Livestock Policy (2019) recognizes the role the sub-sector plays in the
economy and thus guides national and county governments in the development and management of
the livestock industry towards commercialization. This aligns with the Kenya Vision 2030 and the
Constitution (2010). Subsistence livestock keeping is also important at a household level as it supports
food and nutrition security, provides income, creates jobs and supports sustainable livelihoods. This
policy seeks to enhance collaboration between national and county governments, livestock institutions
and other stakeholders involved in service delivery. Furthermore, it promotes an enhanced enabling
environment through training and capacity development.
The National Policy for the Sustainable Development of Northern Kenya and other Arid Lands
(2012) (also referred to as the “Releasing our full potential” policy) refers to previous biased distribution
of public investment established under colonial rule. Resources were directed towards the so-called
‘high potential’ areas of crop production, overlooking the wealth of lowland livestock-based economies
and creating the deep inequalities in human development which we see in Kenya today. The defining
feature of the ASALs is their aridity therefore the primary policy challenge is how to ensure food and
nutrition security in a sustainable manner in environments that are prone to drought, where people’s
access to and control over critical livelihood resources such as land is insecure, and where
unpredictability is set to increase as climate change takes hold. Pastoralists in Kenya are found in all
the arid counties and in some of the semi-arid. Pastoralism is the extensive production of livestock in
rangeland environments. It takes many forms, but its principal defining features are livestock mobility
and the communal management of natural resources. The main objectives of the Policy are to
strengthen the integration of Northern Kenya and other arid lands with the rest of the country and
mobilise the resources necessary to ensure equity and release the region’s potential, to improve the
enabling environment for development in Northern Kenya and other arid lands by establishing the
necessary foundations for development, to develop alternative approaches to service delivery,
governance and public administration which accommodate the specific realities of Northern Kenya and
pastoral areas, and to strengthen the climate resilience of communities in the ASALs and ensure
sustainable livelihoods.
3.1.2.5 Energy
Kenya embarked on fundamental reforms in the energy sector after the mid-1990s following the
enactment of the Electric Power Act, No. 11 of 1997, Geothermal Resources Act, No. 12 of 1982, the
Petroleum (exploration and production) Act, Cap 308 of 1984 and the Petroleum Development Fund
Act, No. 4 of 1991, the Sessional Paper No 4 of 2004 on Energy and later by the Energy Act, No. 12 of
2006. This legislation created the foundation for the separation of generation, from transmission and
distribution in the electricity sub-sectors (Institute of Economic Affairs, 2015). However, with the
adoption, in 2008, of the Kenya Vision 2030 as the country's new development blueprint and the
promulgation of the Constitution in 2010, it was necessary to review the Energy Policy, applicable
legislation and regulations to align them with the Vision and the Constitution. In January 2015, the
Ministry of Energy and Petroleum (MoEP) released the Final Draft National Energy and Petroleum
Kenya Water Security and Climate Resilience Project
Final National Plan August 2020 85
Policy and the updated National Energy Policy was then published on 2018. The Energy Act, 2019 was
signed into law on 12 March 2019 and is now in force.
Kenya Vision 2030 identified energy as one the key sectors and one of the infrastructure enablers of
its socio-economic pillar to enable Kenya’s transformation into “a newly-industrialising, middle-income
country providing a high quality of life to all its citizens in a clean and secure environment”. For achieving
this vison, access by all citizens to sustainable, competitive, affordable and reliable energy is essential
(Government of Kenya, 2018a).
The Constitution of Kenya provides for a two-tier structure of government, i.e. the National and the
County Governments and distributes the functions and powers between these two levels. With regard
to the energy sector, Part 1 of the Fourth Schedule provides that the National Government shall be
responsible for:
a) Protection of the environment and natural resources with a view to establishing a durable and
sustainable system of development including water protection, securing sufficient residual
water, hydraulic engineering and the safety of dams
b) Energy policy including electricity and gas reticulation and energy regulation; and
c) Public investment.
With regard to the County Governments, Part 2 of the Fourth Schedule provides that County
Governments shall be responsible for county planning and development including electricity and gas
reticulation and energy regulation.
The Feed-in-Tariffs (FIT) Policy 2008, which was last revised in 2012, seeks to promote the generation
of power from renewable energy sources, such as wind, biomass, small hydro, geothermal, biogas,
solar and municipal waste energy and allows a power producer to sell renewable energy generated
electricity to a buyer at a predetermined tariff for a given period of time.
The National Energy Policy 2018 document provides a comprehensive description of the current state
of the energy sector and of the policy framework as of 2018, and contains policy recommendations for
various sub-themes: coal, renewable energy (including geothermal and hydro in particular), electricity,
energy efficiency and conservation, land, environment, health and safety, energy services, energy
financing, pricing and socioeconomic issues (International Energy Agency (IEA) & International
Renewable Energy Agency (IRENA), 2019).
3.1.2.6 Mining
The Constitution of Kenya 2010 provides for natural or mineral resources through the following
articles:
▪ Article 62: All minerals are held in trust for the people of Kenya by the national government
▪ Article 66: Parliament to enact legislation to ensure investments benefit local communities and their
economies
▪ Article 69: State to ensure sustainable development and management of natural or (mineral)
resources and environment and equitable sharing of accruing benefits
▪ Article 71: Requires mineral agreements to be ratified by Parliament
▪ Article 232: Requires participation by people in policy making
Kenya Vision 2030 and its Third Medium Term Plan (2018-2022) has included the mining sector as a
priority sector under the economic pillar. Its contribution to GDP is expected to increase to three percent
by 2017 and 10 percent by 2030, making mining a key driver of economic growth and transformation.
The Final Draft National Energy and Petroleum Policy (Government of Kenya, 2015) proposed
framework legislation on natural resources revenue management, which includes the creation of a
sovereign wealth fund.
Kenya Water Security and Climate Resilience Project
Final National Plan August 2020 86
The Mining and Minerals Policy, Sessional Paper No. 7 of 2016 (Mining and Minerals Policy
Sessional Paper No. 7 of 2016, 2016) provides a framework for ensuring sustainable utilization of
mineral resources; harmonizing mining and environmental legislations; mainstreaming activities of
artisanal and small-scale miners; local participation in the mining investment ventures; a well-structured
mining fiscal regime and equitable sharing of mineral benefits.
The Policy comprehensively addresses the gaps that have existed in the mining sector and provides a
basis for reviewing the sector’s almost obsolete legal framework and ad hoc regulations. It further aligns
the country’s mining sector with the aspirations of Kenya Vision 2030, the provisions of the Constitution
of Kenya (2010) and the African Union Mining Vision (2009) which aims at positioning mining as a key
driver of Africa’s socio-economic development.
The policy provides a firm foundation and basis for establishment of an enabling framework for
accelerated and sustainable development of the country’s mining and minerals resources sector. The
policy is expected to ensure that benefits from the sector are shared by stakeholders, including
investors, local artisanal and small-scale miners, national and county governments, local communities
and the people of Kenya.
3.1.3 Legislation
3.1.3.1 Agriculture and land
There are a range of legislative instruments that underpin the development of agriculture in Kenya.
Amongst these is the Agriculture, Fisheries and Food Authority Act (Act No 13 of 2013) which
provides for the regulation and promotion of agriculture. This is supported through the establishment of
the Agriculture, Fisheries and Food Authority that is charged with, in consultation with County
Governments, administering the Crops Act, (Act No 16 of 2013) and the Fisheries Act (Chapter 378
of 1989). The drive to increase agricultural development will require ongoing development in irrigation
capacity. As such, a Final Draft Irrigation Bill was developed in 2015 intended to repeal the Irrigation
Act (Chapter 347 of 2013). This amendment bill has yet to be enacted and provides for the
establishment of a National Irrigation Development Service and strengthening of irrigation regulations.
The Fisheries Management and Development Act (Act No 35 of 2016) was developed along with
the establishment of the Kenya Fisheries Service to conserve, manage and develop Kenya’s fisheries
resources.
3.1.3.2 Forestry
The Forest Conservation and Management Act No 34 of 2016, was operationalized on 31st March
2017. This Act makes provision for:
▪ the conservation and management of public, community and private forests and areas of forest land
that require special protection;
▪ defines the rights in forests and prescribes rules for the use of forest land;
▪ community participation of forest lands by community forest association, the trade in forest
products;
▪ the protection of indigenous forests and the protection of water resources.
The Act establishes the Kenya Forest Service (KFS) as a body corporate and the Forest Conservation
and Management Trust Fund. The Act states the Service's mandate as "to provide for the development
and sustainable management, including conservation and rational utilization of all forest resources for
the socio-economic development of the country and for connected purposes"
The Service shall, among other things:
▪ conserve, protect and manage all public forests in accordance with the provisions of the Act;
Kenya Water Security and Climate Resilience Project
Final National Plan August 2020 87
▪ prepare and implement management plans for all public forests and, where requested, assist in
preparation of management plans for community forests or private forests in consultation with the
relevant owners;
▪ receive applications for and issue licences and permits;
▪ establish and implement benefit sharing arrangements in accordance with the provisions of the Act;
▪ manage water catchment areas in relation to soil and water conservation, carbon sequestration and
other environmental services in collaboration with relevant stakeholders;
▪ prepare regularly a Forest Status Report and a Resource Assessment Report;
▪ establish forest conservancy areas.
The Act also stated that the KFS shall only give its consent for quarrying operations in a forest areas,
only if it does not contain any rare species or is used for protection of water resources. The Act also
establishes the Kenya Forestry College and defines Forestry functions of County Governments (FAO,
2016).
The Agriculture Act cap 318: Agriculture (Farm Forestry) Rules, 2009 (Cap. 318) require farmers
to establish and maintain farm forestry on at least ten percent of every agricultural land holding. One of
the objectives of the Rules is to preserve and sustain the environment and combating climate change
and global warming. Other declared objectives include: the conservation of water, soil and biodiversity;
the protection of riverbanks.
3.1.3.3 Water
The promulgation of the Water Act 2016 aligned Kenya’s water sector with the 2010 Constitution and
enables amendments to support the improved management of water resources. The Water Act (Act No
12 of 2016) revises the institutional mandates of key water sector institutions and sets out the role of
counties in the water sector. The Act recognises that water related functions are a shared responsibility
between the National Government and the County Governments. The mandate for the provision of
water and sanitation services and the development of county water works is delegated to country
governments. The Act defines a clear role for the WRA in the regulation of water resources, which
provides a potential strengthening in the way that water resource development is regulated. The Act
gives priority to domestic water users over irrigation and other water users. However, there are some
ambiguities in the Act which require resolution in order to clarify institutional matters.
The national government remains in charge of the regulation of water services and water resources. It
also continues to manage national public water works, which extend across more than one county by
nature of the water resource they use and are funded from the national government budget.
The Water Act does not allocate detailed functions of national and county governments in water
resource management but provides instead for a National Water Resource Strategy to address this.
The Act established some new institutions and made changes to others, as listed below:
▪ Ministry of Water, Sanitation and Irrigation (MoWSI) as the sector leader and coordinator, taking
responsibility to policy development
▪ The Water Resources Authority (WRA): mandated to protect, conserve, control and regulate the
management and use of water resources and to support the Cabinet Secretary in policy formulation
and the establishment of a National Water Resource Strategy. Their role includes the formulation
and enforcement of procedures/regulations, water abstraction permitting and collecting of water
use fees, flood mitigation and advising the Cabinet Secretary generally on the management and
use of water resources. The Act requires the development of water resources allocation plans at
basin level, and the WRA needs to permit the development of any water source (surface or
groundwater).
Kenya Water Security and Climate Resilience Project
Final National Plan August 2020 88
▪ Water Services Regulatory Board (WASREB) for regulation of water services’ providers. Its
functions comprise: issuing of licenses to water services boards and approval of Service Provision
Agreements, developing tariff guidelines and carrying out tariff negotiations, setting standards and
developing guidelines for service provision, publishing the results of sector monitoring in the form
of comparative reports.
▪ National Water Harvesting and Storage Authority for major water infrastructural development,
▪ Water Tribunal for dispute resolution,
▪ Water Sector Trust Fund for water services development towards the un-served and poor
segments of the society in peri-urban and rural areas,
▪ Water Works Development Agencies to replace the Water Service Boards. The Water Act
provides the Cabinet Secretary for Water with the power to establish an undefined number of Water
Works Development Agencies to manage such national public water works, thus replacing the
current Water Services Boards.
▪ Basin Water Resources Committees to replace Catchment Advisory Committees (CAACs).
▪ Water Services Providers (WSPs) who, with the county governments, provide water and
sanitation services in the counties. Operations must be in accordance with a Service Agreement
entered between each WSP and WASREB.
▪ In rural areas where services are not commercially viable, counties are now responsible for
facilitating access to services, for developing the required infrastructure for distribution, and for
contracting community associations, public benefit organizations or private operators to manage
such systems (KEWASNET, 2017)
▪ The Water Resource User Associations (WRUAs): provide community-based management of
water resources and resolution of associated conflicts.
Key water sector institutions are shown in Figure 3-1.
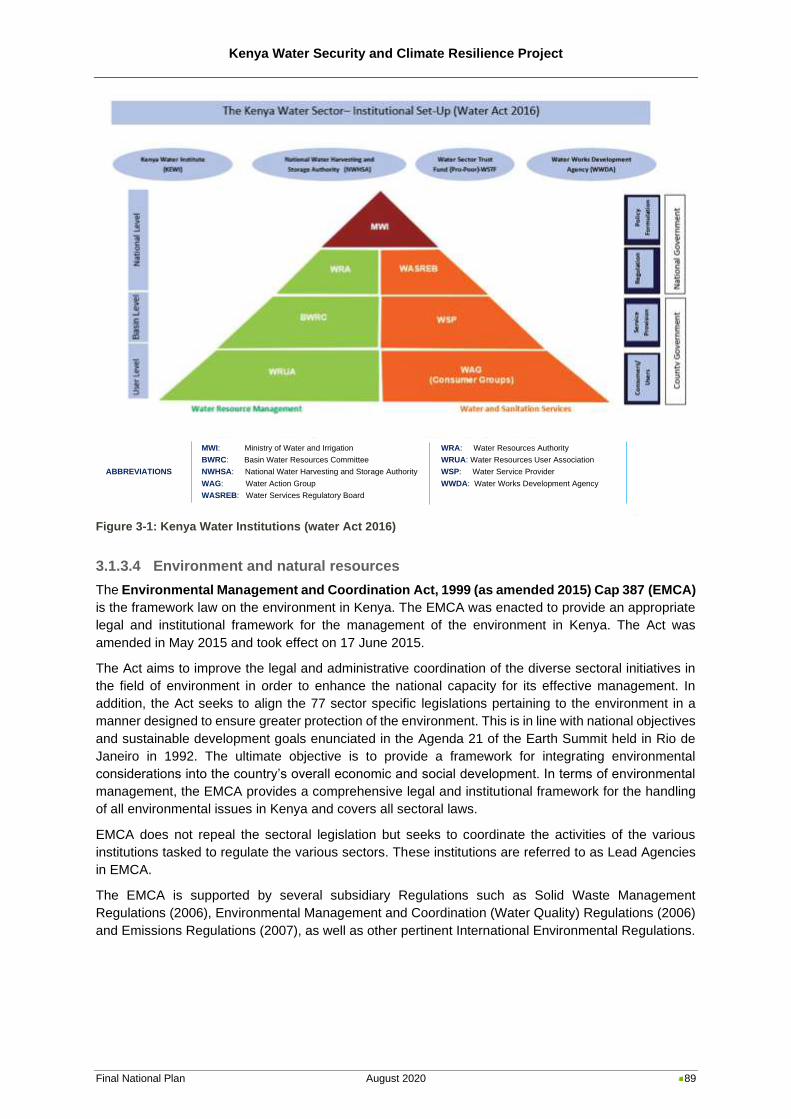
Kenya Water Security and Climate Resilience Project
Final National Plan August 2020 89
Figure 3-1: Kenya Water Institutions (water Act 2016)
3.1.3.4 Environment and natural resources
The Environmental Management and Coordination Act, 1999 (as amended 2015) Cap 387 (EMCA)
is the framework law on the environment in Kenya. The EMCA was enacted to provide an appropriate
legal and institutional framework for the management of the environment in Kenya. The Act was
amended in May 2015 and took effect on 17 June 2015.
The Act aims to improve the legal and administrative coordination of the diverse sectoral initiatives in
the field of environment in order to enhance the national capacity for its effective management. In
addition, the Act seeks to align the 77 sector specific legislations pertaining to the environment in a
manner designed to ensure greater protection of the environment. This is in line with national objectives
and sustainable development goals enunciated in the Agenda 21 of the Earth Summit held in Rio de
Janeiro in 1992. The ultimate objective is to provide a framework for integrating environmental
considerations into the country’s overall economic and social development. In terms of environmental
management, the EMCA provides a comprehensive legal and institutional framework for the handling
of all environmental issues in Kenya and covers all sectoral laws.
EMCA does not repeal the sectoral legislation but seeks to coordinate the activities of the various
institutions tasked to regulate the various sectors. These institutions are referred to as Lead Agencies
in EMCA.
The EMCA is supported by several subsidiary Regulations such as Solid Waste Management
Regulations (2006), Environmental Management and Coordination (Water Quality) Regulations (2006)
and Emissions Regulations (2007), as well as other pertinent International Environmental Regulations.
MWI: Ministry of Water and Irrigation WRA: Water Resources Authority
BWRC: Basin Water Resources Committee WRUA: Water Resources User Association
ABBREVIATIONS NWHSA: National Water Harvesting and Storage Authority WSP: Water Service Provider
WAG: Water Action Group WWDA: Water Works Development Agency
WASREB: Water Services Regulatory Board
Kenya Water Security and Climate Resilience Project
Final National Plan August 2020 90
3.1.3.5 Energy and mining
Alongside the 2015 Final Draft policy, the Energy Bill 2015 was published. The bill is intended to align
the current regulatory framework in the energy sector to the devolved structure of government outlined
in the Constitution, as well as implement the recommendations contained in the 2015 Final Draft policy.
The Energy Act, No.1 of 2019 (The Energy Act No 1 of 2019, 2019) was signed into law on 12 March
2019 and is now in force. The new Act introduced several amendments to the repealed Energy Act to
consolidate the laws relating to energy, to properly delineate the functions of the national and devolved
levels of government in relation to energy, to provide for the exploitation of renewable energy sources,
to regulate midstream and downstream petroleum and coal activity and for the supply and use of
electricity and other forms of electricity. The new Energy Act has also established several new ‘energy
sector entities’ that replaced those existing under the repealed laws and has gone further to restate and
expand their mandates where this is necessary for them to properly discharge their functions (Munyaka,
2019).
The Mining Act, No. 12 of 2016 (The Mining Act, No. 12 of 2016, 2016) came into force on 27 May
2016, followed by the Mining Regulations and Guidelines came into force on 19 May 2017. The Act
applies to coal and coal seam gas, although it does not apply to petroleum and hydrocarbon gases.
The new Act also expands on the definition of a person who is eligible to be issued a prospecting right
and appears to be aimed at reducing the incidences of speculation in the mining sector. The Mining Act
sets out the obligations of the state with regards to the use of the environment in particular a sustainable
manner.
Artisanal Miners have also been legalised under the new Mining Act. Transparency and accountability
are promoted through use of the Online Mining Cadastre portal for licensing and management of mineral
rights and permits, as well as separate licensing regimes for small-scale and large-scale mining
operations. Licences for large-scale operations can be issued to both local and international investors.
Small-scale licensees will however only be awarded to local investors who are citizens of Kenya or body
corporates wholly owned by Kenyan citizens. The new mining legislation ensures that investments
benefit local communities and their economies as licence applications require submission of a local
employment plan and a plan for local procurement of goods and services (GLI, 2017).
Alongside the 2015 Final Draft policy, the Petroleum (Exploration Development and Production)
Bill 2015 was published. This Bill intended to align the current regulatory framework in the mining
sector to the devolved structure of government outlined in the Constitution, as well as implement the
recommendations contained in the 2015 Final Draft policy. The Petroleum (Exploration Development
and Production) Bill 2015 will update the regulatory framework established under the Petroleum
(Exploration and Production) Act, establishing a new Upstream Petroleum Regulatory Authority and
providing the terms of a new model production-sharing contract (GLI, 2017). On 12 March 2019 the
Petroleum Act, No. 2 of 2019 (The Petroleum Act No 2 of 2019, 2019) was signed and it is now in
force, providing a framework for contracting, exploration, development and production of petroleum. In
addition to providing a new model petroleum agreement, the Act addresses the regulation of midstream
and downstream petroleum operations previously covered in the repealed Energy Act, 2006.
3.1.4 National institutions
The 2010 Constitution provides for two tiers of Government with national government being broadly
responsible for policy development and regulation to ensure that policies are effectively implemented.
Some of the key functions, articulated in detail within the fourth schedule of the Constitution, relate to
socio-economic development and natural resources management and are critically important from a
basin planning perspective. These include, for example: the use of international waters and water
resources; national economic policy and planning; national statistics and data on population, the
economy and society generally; education; national public works; general principles of land planning
and the coordination of planning by the counties; protection of the environment and natural resources
with a view to establishing a durable and sustainable system of development, including, in particular -
Kenya Water Security and Climate Resilience Project
Final National Plan August 2020 91
fishing, hunting and gathering; protection of animals and wildlife; water protection, securing sufficient
residual water, hydraulic engineering and the safety of dams; and energy policy; disaster management;
agricultural policy; energy policy including electricity and gas reticulation and energy regulation;
capacity building and technical assistance to the counties; public investment; and tourism policy and
development.
In the aftermath of the 2017 national elections, the national government in Kenya has undergone some
changes in configuration to support a more effective and efficient Government. Whilst there are a
number of Ministries that can be seen as enablers (e.g. Education, Justice etc), the key sector ministries
from a basin planning perspective include:
▪ Ministry of Water, Sanitation and Irrigation
▪ Ministry of Environment and Forestry
▪ Ministry of Agriculture, Livestock and Fisheries
▪ Ministry of Energy and Petroleum
▪ Ministry of Devolution and ASAL.
Whilst these Ministries have the broad ambit to develop policy, under legislation they have established
various national level public entities that have the mandate to perform regulatory and developmental
functions. These public entities that function at a national level are tabulated, in Table 3-2.
Table 3-2: National level public entities that have relevance to basin plans
Institution Roles and responsibilities*
Water Resources
Authority (WRA)
- Formulate and enforce standards, procedures and Regulations for the management and use of water resources and flood mitigation.
- Regulate the management and use of water resources. - Receive water permit applications for water abstraction, water use and recharge and
determine, issue, vary water permits; and enforce the conditions of those permits. - Determine and set permit and water use fees as well as collect water permit fees and
water use charges. - Provide information and advice to the Cabinet Secretary for formulation of policy on
national water resource management, water storage and flood control strategies.
Water Services
Regulatory Board
(WASREB)
- Protect the interests and rights of consumers in the provision of water services. - Determine and prescribe national standards for the provision of water services and asset
development for water services providers. - Evaluate and recommend water and sewerage tariffs to the county water services
providers and approve the imposition of such tariffs in line with consumer protection standards.
- Set licence conditions and accredit water services providers. - Monitor and regulate licensees and enforce licence conditions.
National
Environmental
Management
Authority (NEMA)
- Co-ordinate environmental management activities being undertaken by lead agencies and promote the integration of environmental considerations into development policies, plans, programmes and projects to ensure the proper management and rational utilisation of environmental resources.
- Take stock of natural resources in Kenya and their utilisation and conservation. - Establish and review in consultation with the relevant lead agencies, land use guidelines. - Monitor and assess activities, including activities being carried out by relevant lead
agencies, to ensure that the environment is not degraded by such activities and environmental management objectives are adhered to.
Energy
Regulatory
Commission
(ERC)
- Issue, renew, modify, suspend or revoke licences and permits for all undertakings and activities in the energy sector.
- Develop regulations which may be necessary or expedient for the regulation of the energy.
- Formulate, enforce and review environmental, health, safety and quality standards for the energy sector, in coordination with other statutory authorities.
Water Sector
Trust Fund
(WSTF)
- Financing provision of water and sanitation to disadvantaged groups and includes: - Community level initiatives for the sustainable management of water resources.
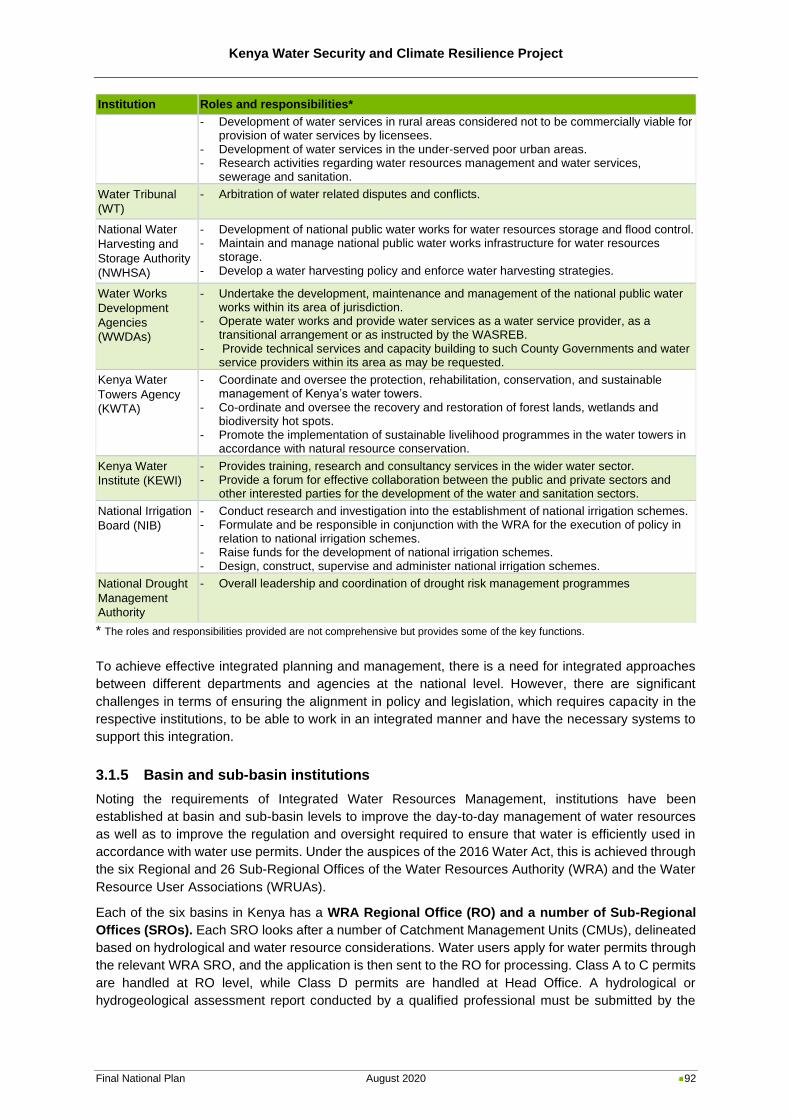
Kenya Water Security and Climate Resilience Project
Final National Plan August 2020 92
Institution Roles and responsibilities*
- Development of water services in rural areas considered not to be commercially viable for provision of water services by licensees.
- Development of water services in the under-served poor urban areas. - Research activities regarding water resources management and water services,
sewerage and sanitation.
Water Tribunal
(WT)
- Arbitration of water related disputes and conflicts.
National Water
Harvesting and
Storage Authority
(NWHSA)
- Development of national public water works for water resources storage and flood control. - Maintain and manage national public water works infrastructure for water resources
storage. - Develop a water harvesting policy and enforce water harvesting strategies.
Water Works
Development
Agencies
(WWDAs)
- Undertake the development, maintenance and management of the national public water works within its area of jurisdiction.
- Operate water works and provide water services as a water service provider, as a transitional arrangement or as instructed by the WASREB.
- Provide technical services and capacity building to such County Governments and water service providers within its area as may be requested.
Kenya Water
Towers Agency
(KWTA)
- Coordinate and oversee the protection, rehabilitation, conservation, and sustainable management of Kenya’s water towers.
- Co-ordinate and oversee the recovery and restoration of forest lands, wetlands and biodiversity hot spots.
- Promote the implementation of sustainable livelihood programmes in the water towers in accordance with natural resource conservation.
Kenya Water
Institute (KEWI)
- Provides training, research and consultancy services in the wider water sector. - Provide a forum for effective collaboration between the public and private sectors and
other interested parties for the development of the water and sanitation sectors.
National Irrigation
Board (NIB)
- Conduct research and investigation into the establishment of national irrigation schemes. - Formulate and be responsible in conjunction with the WRA for the execution of policy in
relation to national irrigation schemes. - Raise funds for the development of national irrigation schemes. - Design, construct, supervise and administer national irrigation schemes.
National Drought
Management
Authority
- Overall leadership and coordination of drought risk management programmes
* The roles and responsibilities provided are not comprehensive but provides some of the key functions.
To achieve effective integrated planning and management, there is a need for integrated approaches
between different departments and agencies at the national level. However, there are significant
challenges in terms of ensuring the alignment in policy and legislation, which requires capacity in the
respective institutions, to be able to work in an integrated manner and have the necessary systems to
support this integration.
3.1.5 Basin and sub-basin institutions
Noting the requirements of Integrated Water Resources Management, institutions have been
established at basin and sub-basin levels to improve the day-to-day management of water resources
as well as to improve the regulation and oversight required to ensure that water is efficiently used in
accordance with water use permits. Under the auspices of the 2016 Water Act, this is achieved through
the six Regional and 26 Sub-Regional Offices of the Water Resources Authority (WRA) and the Water
Resource User Associations (WRUAs).
Each of the six basins in Kenya has a WRA Regional Office (RO) and a number of Sub-Regional
Offices (SROs). Each SRO looks after a number of Catchment Management Units (CMUs), delineated
based on hydrological and water resource considerations. Water users apply for water permits through
the relevant WRA SRO, and the application is then sent to the RO for processing. Class A to C permits
are handled at RO level, while Class D permits are handled at Head Office. A hydrological or
hydrogeological assessment report conducted by a qualified professional must be submitted by the
Kenya Water Security and Climate Resilience Project
Final National Plan August 2020 93
water user with the application. The water permits are recorded in the Water Permit Database at the
RO.
At a more localised level, the establishment of the Water Resource User Associations (WRUAs) has
been essential in ensuring a focus on the operational management functions within a sub-basin. WRA
has delineated Kenya into 1 237 sub-catchment areas with the intention of forming Water Resources
User Associations (WRUAs) for each. The WRUAs are community-based, voluntary associations made
up of water users and riparian owners interested in proper management of their water resources and
were established to enable the collaborative management of water resources and to provide essential
support in the resolution of conflicts concerning the use of water resources. Crucially, the Water Act
2016 makes provision for BWRCs to be able to finance WRUAs for services rendered under contract.
To date, WRUAs have performed important local functions, but have faced an array of challenges that
have served to hinder their effectiveness. Many of these are enabling factors such as capacity in terms
of having sufficient skills and training, but also include such issues as inadequate equipment and in
sufficient financial resources. These challenges will require redress in order to support the
implementation of this Basin Plan and realise the local level capacitation that can unlock the localised
socio-economic development required to support Vision 2030. This is supported by the 2016 Water Act
that provides in Section 29 (3) that “basin area water resources management strategy shall facilitate
the establishment and operation of water resources user associations”.
Sub catchment management plans (SCMP) is a planning tool that is developed by the Water User
Associations (WRUA) under regulation by the Water Resources Authority (WRA). Its main objective is
to guide the implementation of water resources management and regulation activities within a defined
period of time in any given sub catchment. The activities, in most cases, relate to catchment protection,
pollution control and water infrastructure development.
The 2016 Water Act in effect strives to strengthen the management of water resources at the basin and
sub-basin level, whilst strengthening the regulatory role of WRA both at national and basin scales. This
not only removes the dichotomy that WRA faced as being manager and regulator, but also attempts to
create a stronger management regime within the basins and sub-basins, noting that counties have a
key role to play in water service delivery as well as ensuring that water is used efficiently within their
jurisdictions. To this end, the 2016 Water Act introduced Basin Water Resource Committees
(BWRCs) as a replacement for the previous Catchment Area Advisory Committees (CAACs), with a
more managerial intent than the purely advisory role that was played by the CAACs. At this juncture,
during what is effectively a period of transition, the BWRCs will initially provide a more advisory function,
however, it will be critically important to learn from the challenges that were experienced with the CAACs
so that the BWRCs become more effective in supporting water resource management. The regulatory
function of the WRA will continue to be strengthened and, in the transition period, ring-fencing of staff
within the Regional and Sub-Regional Offices will be essential to separate staff and functions that are
managerial in nature, and as such, supportive of the BWRCs. The BWRCs fall under the WRA, and
their responsibilities (which must be delegated by WRA) include the formulation of Basin Water
Resources Strategies, management of basins, advice to WRA and the facilitation of WRUA
establishment. The BWRCs may contract WRUAs as agents to perform certain duties in water resource
management. There are conflicting mandates for the BWRCs in the Water Act (2016) where they have
both advisory and management functions. ISC has an understanding that the BWRCs will remain
advisory for the foreseeable future with a long-term plan of making the BWRCs have an executive role.
There is a need to develop tools to support the operationalisation of the BWRCs, when they are finally
established, and to ring-fence WRA staff at the Ros who will provide both technical and secretariat
services to the BWRCs. The actual responsibility and how the BWRCs will work with WRA at the
regional offices will only be clear once the mandates are agreed upon.
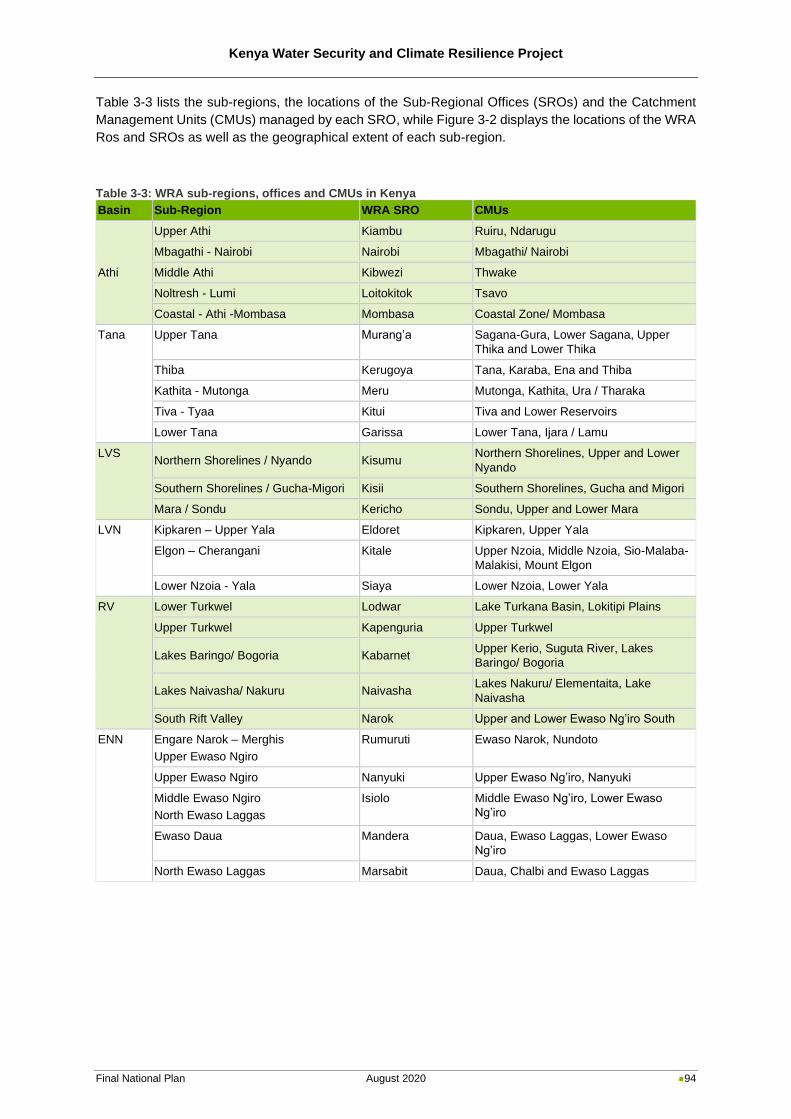
Kenya Water Security and Climate Resilience Project
Final National Plan August 2020 94
Table 3-3 lists the sub-regions, the locations of the Sub-Regional Offices (SROs) and the Catchment
Management Units (CMUs) managed by each SRO, while Figure 3-2 displays the locations of the WRA
Ros and SROs as well as the geographical extent of each sub-region.
Table 3-3: WRA sub-regions, offices and CMUs in Kenya
Basin Sub-Region WRA SRO CMUs
Athi
Upper Athi Kiambu Ruiru, Ndarugu
Mbagathi - Nairobi Nairobi Mbagathi/ Nairobi
Middle Athi Kibwezi Thwake
Noltresh - Lumi Loitokitok Tsavo
Coastal - Athi -Mombasa Mombasa Coastal Zone/ Mombasa
Tana Upper Tana Murang’a Sagana-Gura, Lower Sagana, Upper
Thika and Lower Thika
Thiba Kerugoya Tana, Karaba, Ena and Thiba
Kathita - Mutonga Meru Mutonga, Kathita, Ura / Tharaka
Tiva - Tyaa Kitui Tiva and Lower Reservoirs
Lower Tana Garissa Lower Tana, Ijara / Lamu
LVS Northern Shorelines / Nyando Kisumu
Northern Shorelines, Upper and Lower
Nyando
Southern Shorelines / Gucha-Migori Kisii Southern Shorelines, Gucha and Migori
Mara / Sondu Kericho Sondu, Upper and Lower Mara
LVN Kipkaren – Upper Yala Eldoret Kipkaren, Upper Yala
Elgon – Cherangani Kitale Upper Nzoia, Middle Nzoia, Sio-Malaba-
Malakisi, Mount Elgon
Lower Nzoia - Yala Siaya Lower Nzoia, Lower Yala
RV Lower Turkwel Lodwar Lake Turkana Basin, Lokitipi Plains
Upper Turkwel Kapenguria Upper Turkwel
Lakes Baringo/ Bogoria Kabarnet Upper Kerio, Suguta River, Lakes
Baringo/ Bogoria
Lakes Naivasha/ Nakuru Naivasha Lakes Nakuru/ Elementaita, Lake
Naivasha
South Rift Valley Narok Upper and Lower Ewaso Ng’iro South
ENN Engare Narok – Merghis
Upper Ewaso Ngiro
Rumuruti Ewaso Narok, Nundoto
Upper Ewaso Ngiro Nanyuki Upper Ewaso Ng’iro, Nanyuki
Middle Ewaso Ngiro
North Ewaso Laggas
Isiolo Middle Ewaso Ng’iro, Lower Ewaso
Ng’iro
Ewaso Daua Mandera Daua, Ewaso Laggas, Lower Ewaso
Ng’iro
North Ewaso Laggas Marsabit Daua, Chalbi and Ewaso Laggas
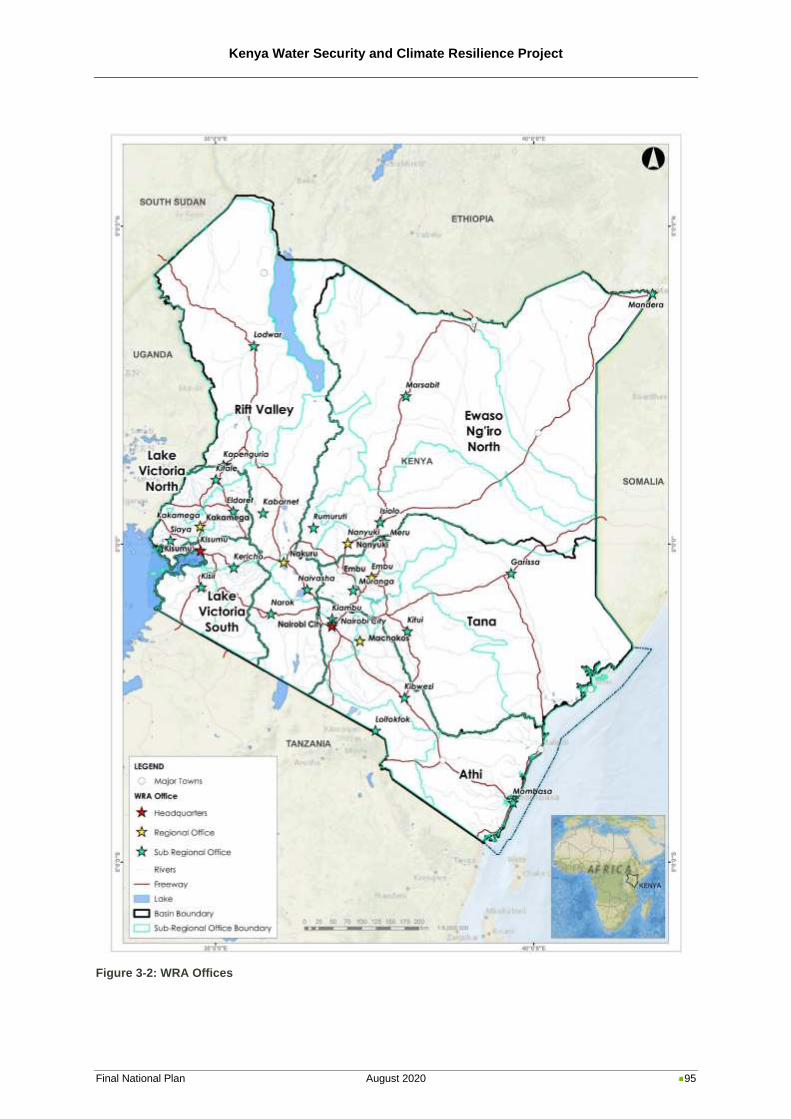
Kenya Water Security and Climate Resilience Project
Final National Plan August 2020 95
Figure 3-2: WRA Offices
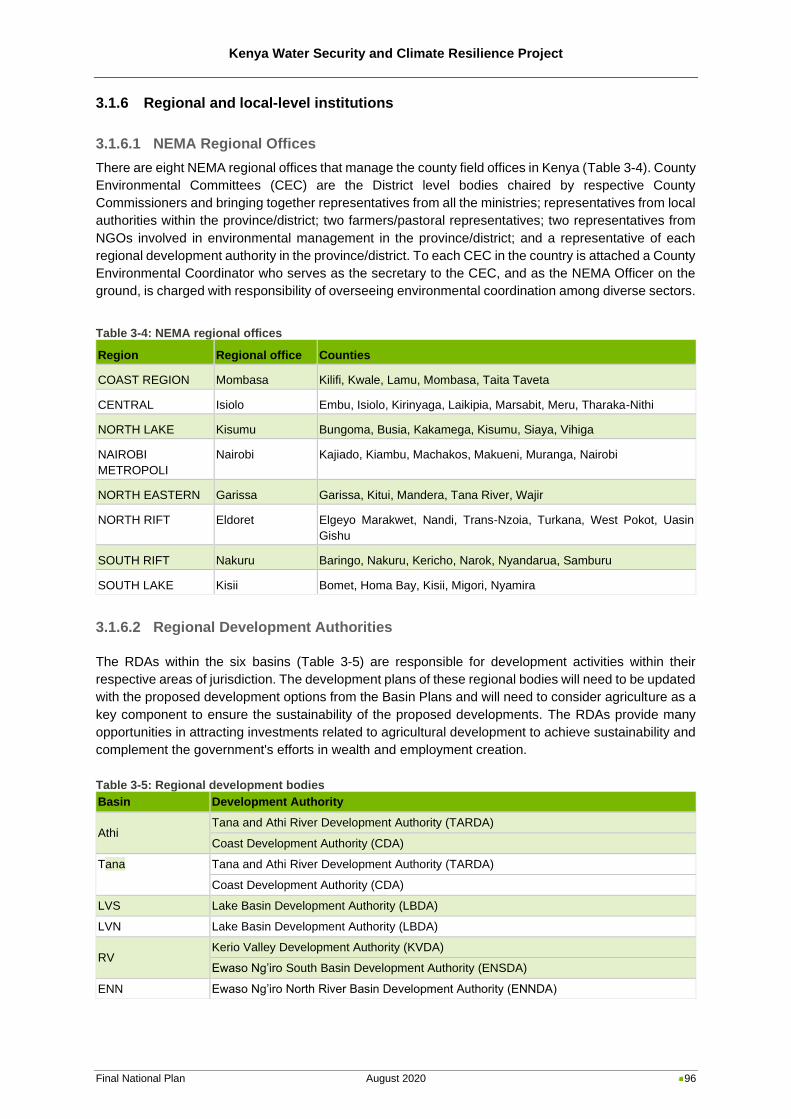
Kenya Water Security and Climate Resilience Project
Final National Plan August 2020 96
3.1.6 Regional and local-level institutions
3.1.6.1 NEMA Regional Offices
There are eight NEMA regional offices that manage the county field offices in Kenya (Table 3-4). County
Environmental Committees (CEC) are the District level bodies chaired by respective County
Commissioners and bringing together representatives from all the ministries; representatives from local
authorities within the province/district; two farmers/pastoral representatives; two representatives from
NGOs involved in environmental management in the province/district; and a representative of each
regional development authority in the province/district. To each CEC in the country is attached a County
Environmental Coordinator who serves as the secretary to the CEC, and as the NEMA Officer on the
ground, is charged with responsibility of overseeing environmental coordination among diverse sectors.
Table 3-4: NEMA regional offices
Region Regional office Counties
COAST REGION Mombasa Kilifi, Kwale, Lamu, Mombasa, Taita Taveta
CENTRAL Isiolo Embu, Isiolo, Kirinyaga, Laikipia, Marsabit, Meru, Tharaka-Nithi
NORTH LAKE Kisumu Bungoma, Busia, Kakamega, Kisumu, Siaya, Vihiga
NAIROBI
METROPOLI
Nairobi Kajiado, Kiambu, Machakos, Makueni, Muranga, Nairobi
NORTH EASTERN Garissa Garissa, Kitui, Mandera, Tana River, Wajir
NORTH RIFT Eldoret Elgeyo Marakwet, Nandi, Trans-Nzoia, Turkana, West Pokot, Uasin
Gishu
SOUTH RIFT Nakuru Baringo, Nakuru, Kericho, Narok, Nyandarua, Samburu
SOUTH LAKE Kisii Bomet, Homa Bay, Kisii, Migori, Nyamira
3.1.6.2 Regional Development Authorities
The RDAs within the six basins (Table 3-5) are responsible for development activities within their
respective areas of jurisdiction. The development plans of these regional bodies will need to be updated
with the proposed development options from the Basin Plans and will need to consider agriculture as a
key component to ensure the sustainability of the proposed developments. The RDAs provide many
opportunities in attracting investments related to agricultural development to achieve sustainability and
complement the government's efforts in wealth and employment creation.
Table 3-5: Regional development bodies
Basin Development Authority
Athi Tana and Athi River Development Authority (TARDA)
Coast Development Authority (CDA)
Tana Tana and Athi River Development Authority (TARDA)
Coast Development Authority (CDA)
LVS Lake Basin Development Authority (LBDA)
LVN Lake Basin Development Authority (LBDA)
RV Kerio Valley Development Authority (KVDA)
Ewaso Ng’iro South Basin Development Authority (ENSDA)
ENN Ewaso Ng’iro North River Basin Development Authority (ENNDA)
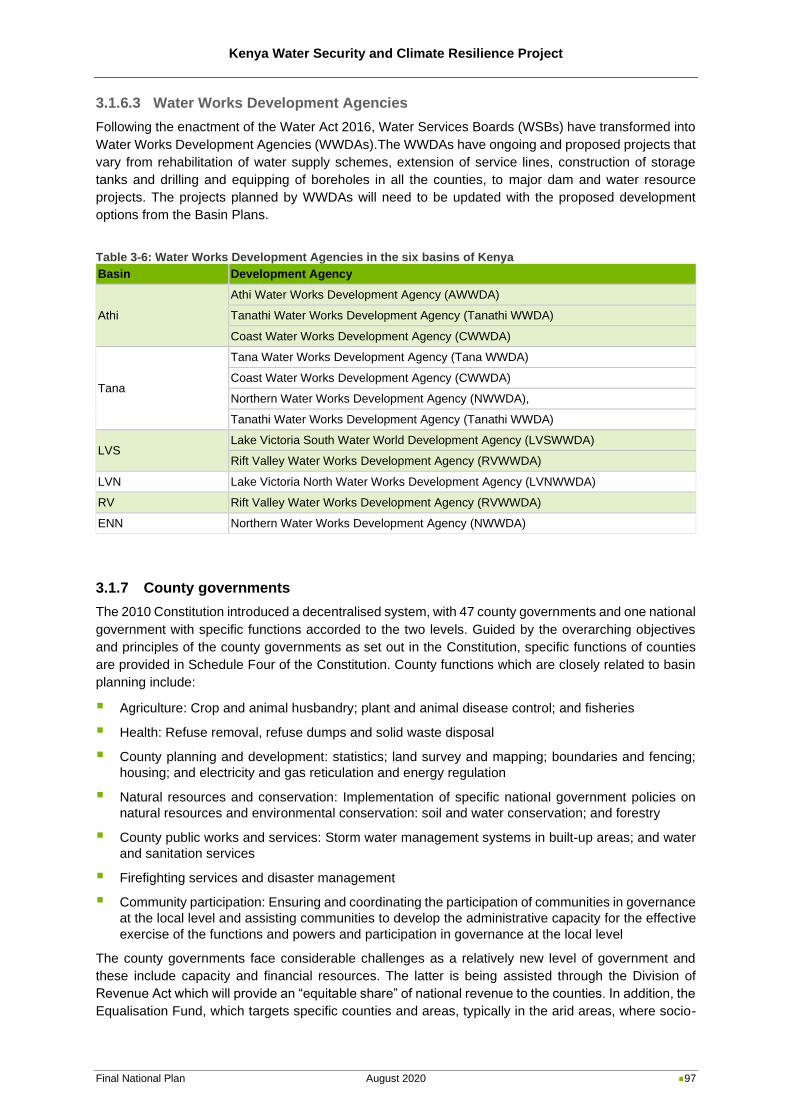
Kenya Water Security and Climate Resilience Project
Final National Plan August 2020 97
3.1.6.3 Water Works Development Agencies
Following the enactment of the Water Act 2016, Water Services Boards (WSBs) have transformed into
Water Works Development Agencies (WWDAs).The WWDAs have ongoing and proposed projects that
vary from rehabilitation of water supply schemes, extension of service lines, construction of storage
tanks and drilling and equipping of boreholes in all the counties, to major dam and water resource
projects. The projects planned by WWDAs will need to be updated with the proposed development
options from the Basin Plans.
Table 3-6: Water Works Development Agencies in the six basins of Kenya
Basin Development Agency
Athi
Athi Water Works Development Agency (AWWDA)
Tanathi Water Works Development Agency (Tanathi WWDA)
Coast Water Works Development Agency (CWWDA)
Tana
Tana Water Works Development Agency (Tana WWDA)
Coast Water Works Development Agency (CWWDA)
Northern Water Works Development Agency (NWWDA),
Tanathi Water Works Development Agency (Tanathi WWDA)
LVS Lake Victoria South Water World Development Agency (LVSWWDA)
Rift Valley Water Works Development Agency (RVWWDA)
LVN Lake Victoria North Water Works Development Agency (LVNWWDA)
RV Rift Valley Water Works Development Agency (RVWWDA)
ENN Northern Water Works Development Agency (NWWDA)
3.1.7 County governments
The 2010 Constitution introduced a decentralised system, with 47 county governments and one national
government with specific functions accorded to the two levels. Guided by the overarching objectives
and principles of the county governments as set out in the Constitution, specific functions of counties
are provided in Schedule Four of the Constitution. County functions which are closely related to basin
planning include:
▪ Agriculture: Crop and animal husbandry; plant and animal disease control; and fisheries
▪ Health: Refuse removal, refuse dumps and solid waste disposal
▪ County planning and development: statistics; land survey and mapping; boundaries and fencing;
housing; and electricity and gas reticulation and energy regulation
▪ Natural resources and conservation: Implementation of specific national government policies on
natural resources and environmental conservation: soil and water conservation; and forestry
▪ County public works and services: Storm water management systems in built-up areas; and water
and sanitation services
▪ Firefighting services and disaster management
▪ Community participation: Ensuring and coordinating the participation of communities in governance
at the local level and assisting communities to develop the administrative capacity for the effective
exercise of the functions and powers and participation in governance at the local level
The county governments face considerable challenges as a relatively new level of government and
these include capacity and financial resources. The latter is being assisted through the Division of
Revenue Act which will provide an “equitable share” of national revenue to the counties. In addition, the
Equalisation Fund, which targets specific counties and areas, typically in the arid areas, where socio-
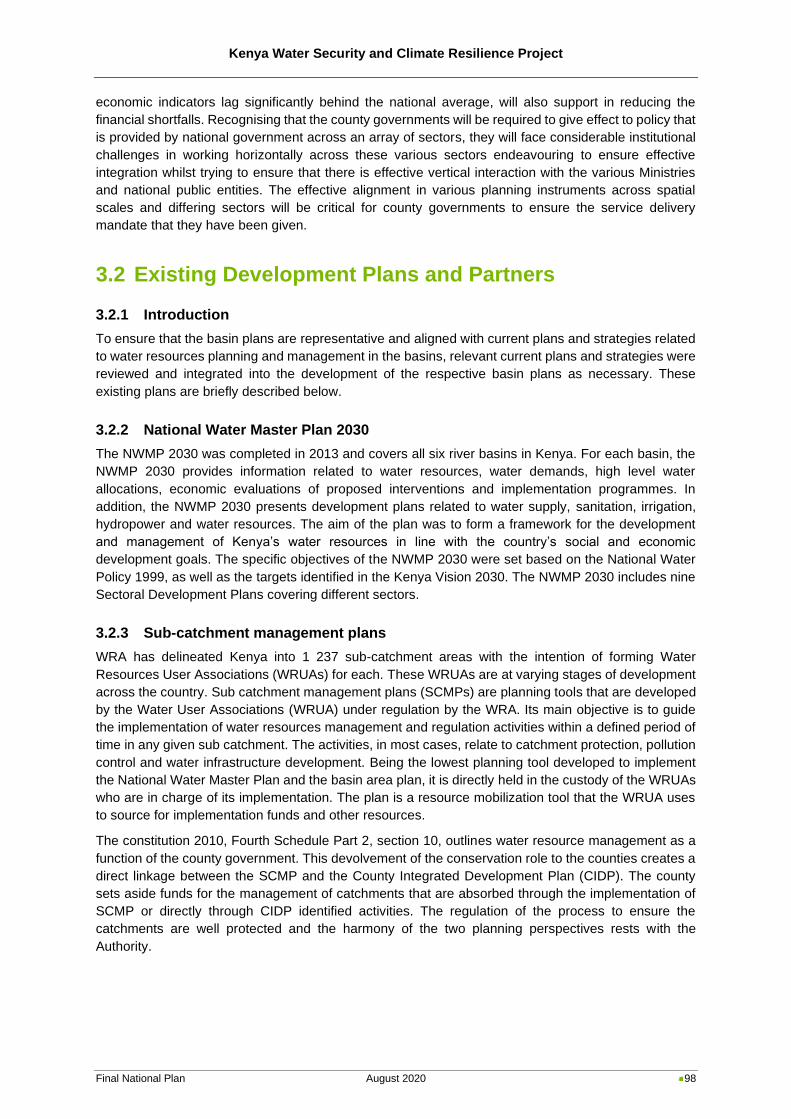
Kenya Water Security and Climate Resilience Project
Final National Plan August 2020 98
economic indicators lag significantly behind the national average, will also support in reducing the
financial shortfalls. Recognising that the county governments will be required to give effect to policy that
is provided by national government across an array of sectors, they will face considerable institutional
challenges in working horizontally across these various sectors endeavouring to ensure effective
integration whilst trying to ensure that there is effective vertical interaction with the various Ministries
and national public entities. The effective alignment in various planning instruments across spatial
scales and differing sectors will be critical for county governments to ensure the service delivery
mandate that they have been given.
3.2 Existing Development Plans and Partners
3.2.1 Introduction
To ensure that the basin plans are representative and aligned with current plans and strategies related
to water resources planning and management in the basins, relevant current plans and strategies were
reviewed and integrated into the development of the respective basin plans as necessary. These
existing plans are briefly described below.
3.2.2 National Water Master Plan 2030
The NWMP 2030 was completed in 2013 and covers all six river basins in Kenya. For each basin, the
NWMP 2030 provides information related to water resources, water demands, high level water
allocations, economic evaluations of proposed interventions and implementation programmes. In
addition, the NWMP 2030 presents development plans related to water supply, sanitation, irrigation,
hydropower and water resources. The aim of the plan was to form a framework for the development
and management of Kenya’s water resources in line with the country’s social and economic
development goals. The specific objectives of the NWMP 2030 were set based on the National Water
Policy 1999, as well as the targets identified in the Kenya Vision 2030. The NWMP 2030 includes nine
Sectoral Development Plans covering different sectors.
3.2.3 Sub-catchment management plans
WRA has delineated Kenya into 1 237 sub-catchment areas with the intention of forming Water
Resources User Associations (WRUAs) for each. These WRUAs are at varying stages of development
across the country. Sub catchment management plans (SCMPs) are planning tools that are developed
by the Water User Associations (WRUA) under regulation by the WRA. Its main objective is to guide
the implementation of water resources management and regulation activities within a defined period of
time in any given sub catchment. The activities, in most cases, relate to catchment protection, pollution
control and water infrastructure development. Being the lowest planning tool developed to implement
the National Water Master Plan and the basin area plan, it is directly held in the custody of the WRUAs
who are in charge of its implementation. The plan is a resource mobilization tool that the WRUA uses
to source for implementation funds and other resources.
The constitution 2010, Fourth Schedule Part 2, section 10, outlines water resource management as a
function of the county government. This devolvement of the conservation role to the counties creates a
direct linkage between the SCMP and the County Integrated Development Plan (CIDP). The county
sets aside funds for the management of catchments that are absorbed through the implementation of
SCMP or directly through CIDP identified activities. The regulation of the process to ensure the
catchments are well protected and the harmony of the two planning perspectives rests with the
Authority.
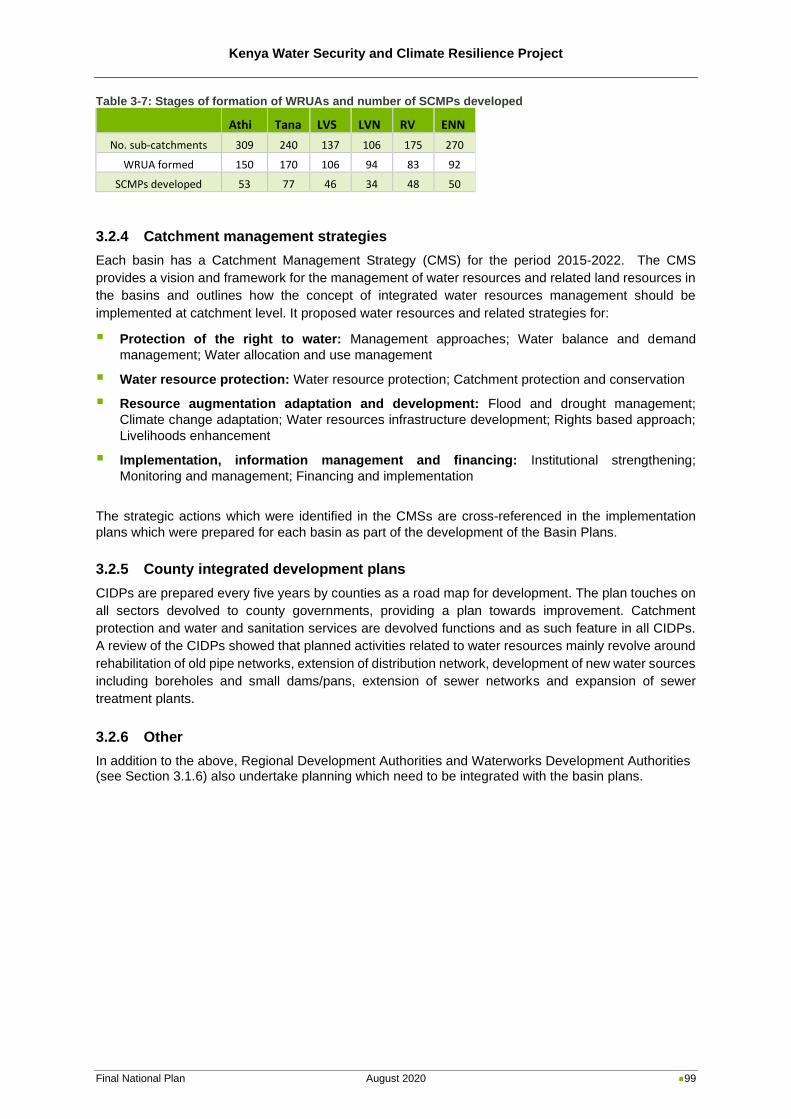
Kenya Water Security and Climate Resilience Project
Final National Plan August 2020 99
Table 3-7: Stages of formation of WRUAs and number of SCMPs developed
Athi Tana LVS LVN RV ENN
No. sub-catchments 309 240 137 106 175 270
WRUA formed 150 170 106 94 83 92
SCMPs developed 53 77 46 34 48 50
3.2.4 Catchment management strategies
Each basin has a Catchment Management Strategy (CMS) for the period 2015-2022. The CMS
provides a vision and framework for the management of water resources and related land resources in
the basins and outlines how the concept of integrated water resources management should be
implemented at catchment level. It proposed water resources and related strategies for:
▪ Protection of the right to water: Management approaches; Water balance and demand
management; Water allocation and use management
▪ Water resource protection: Water resource protection; Catchment protection and conservation
▪ Resource augmentation adaptation and development: Flood and drought management;
Climate change adaptation; Water resources infrastructure development; Rights based approach;
Livelihoods enhancement
▪ Implementation, information management and financing: Institutional strengthening;
Monitoring and management; Financing and implementation
The strategic actions which were identified in the CMSs are cross-referenced in the implementation
plans which were prepared for each basin as part of the development of the Basin Plans.
3.2.5 County integrated development plans
CIDPs are prepared every five years by counties as a road map for development. The plan touches on
all sectors devolved to county governments, providing a plan towards improvement. Catchment
protection and water and sanitation services are devolved functions and as such feature in all CIDPs.
A review of the CIDPs showed that planned activities related to water resources mainly revolve around
rehabilitation of old pipe networks, extension of distribution network, development of new water sources
including boreholes and small dams/pans, extension of sewer networks and expansion of sewer
treatment plants.
3.2.6 Other
In addition to the above, Regional Development Authorities and Waterworks Development Authorities (see Section 3.1.6) also undertake planning which need to be integrated with the basin plans.
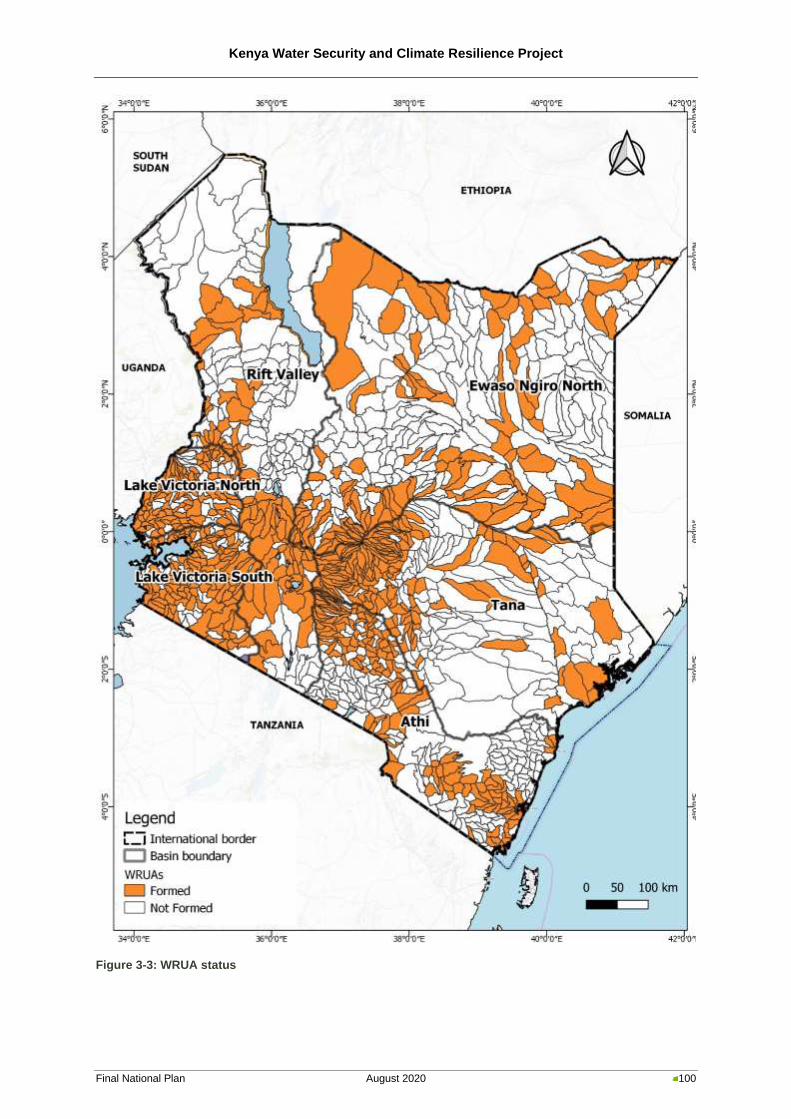
Kenya Water Security and Climate Resilience Project
Final National Plan August 2020 100
Figure 3-3: WRUA status
Kenya Water Security and Climate Resilience Project
Final National Plan August 2020 101
Kenya Water Security and Climate Resilience Project
Final National Plan August 2020 102
4 Key Issues, Challenges and Trends
4.1 Introduction
The water resources of Kenya are currently threatened by many issues. These include human conflict,
water quality, soil erosion and sedimentation, climate change, catchment degradation, inadequate
monitoring, planning and management, water availability and supply issues, inadequate financial
resources and technical capacity, uneven spatial and temporal distribution of water resources,
anthropogenic encroachment on environmentally sensitive areas, inadequate flood and drought
management and various other issues. In addition to the above issues, each basin has location-specific
challenges and issues which, coupled with its unique basin characteristics, are an important
consideration for effective water resources management and planning at basin and sub-basin level.
Main concerns were identified for each basin through stakeholder engagement and further research.
This Section presents a general overview of the main issues, challenges and trends for all six basins in
Kenya. Where relevant specific examples are highlighted. The information presented in this Section
informed the development of a strategic framework under which implementation plans were developed
for each basin (Section 5).
4.2 Stakeholder engagement
Specific water resources-related issues within the six basins were identified and prioritised during
various workshops with key stakeholders.
Issues were identified under the following main categories:
▪ Biophysical issues;
▪ Socio-economic issues;
▪ Water resources issues;
▪ Institutional issues.
To ensure a systematic approach towards the integration of the identified issues into the basin planning
process, the framework as depicted in Figure 4-1 was conceptualised .
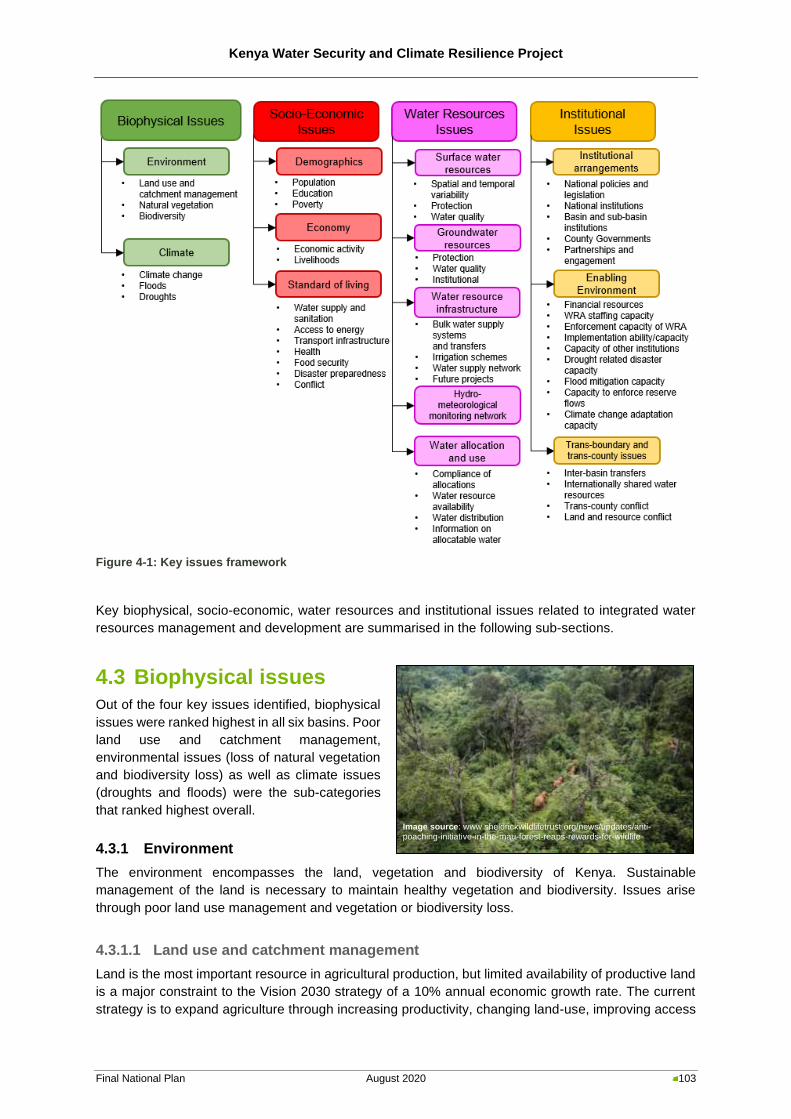
Kenya Water Security and Climate Resilience Project
Final National Plan August 2020 103
Figure 4-1: Key issues framework
Key biophysical, socio-economic, water resources and institutional issues related to integrated water
resources management and development are summarised in the following sub-sections.
4.3 Biophysical issues
Out of the four key issues identified, biophysical
issues were ranked highest in all six basins. Poor
land use and catchment management,
environmental issues (loss of natural vegetation
and biodiversity loss) as well as climate issues
(droughts and floods) were the sub-categories
that ranked highest overall.
4.3.1 Environment
The environment encompasses the land, vegetation and biodiversity of Kenya. Sustainable
management of the land is necessary to maintain healthy vegetation and biodiversity. Issues arise
through poor land use management and vegetation or biodiversity loss.
4.3.1.1 Land use and catchment management
Land is the most important resource in agricultural production, but limited availability of productive land
is a major constraint to the Vision 2030 strategy of a 10% annual economic growth rate. The current
strategy is to expand agriculture through increasing productivity, changing land-use, improving access
Image source: www.sheldrickwildlifetrust.org/news/updates/anti-poaching-initiative-in-the-mau-forest-reaps-rewards-for-wildlife
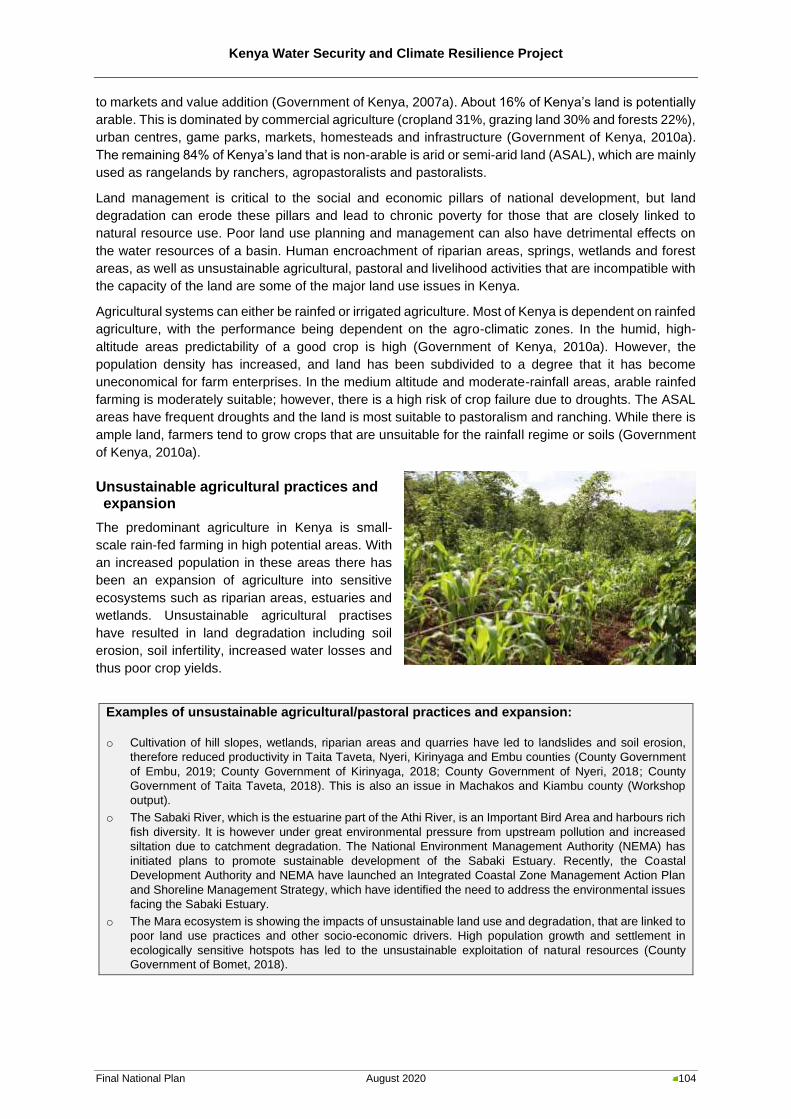
Kenya Water Security and Climate Resilience Project
Final National Plan August 2020 104
to markets and value addition (Government of Kenya, 2007a). About 16% of Kenya’s land is potentially
arable. This is dominated by commercial agriculture (cropland 31%, grazing land 30% and forests 22%),
urban centres, game parks, markets, homesteads and infrastructure (Government of Kenya, 2010a).
The remaining 84% of Kenya’s land that is non-arable is arid or semi-arid land (ASAL), which are mainly
used as rangelands by ranchers, agropastoralists and pastoralists.
Land management is critical to the social and economic pillars of national development, but land
degradation can erode these pillars and lead to chronic poverty for those that are closely linked to
natural resource use. Poor land use planning and management can also have detrimental effects on
the water resources of a basin. Human encroachment of riparian areas, springs, wetlands and forest
areas, as well as unsustainable agricultural, pastoral and livelihood activities that are incompatible with
the capacity of the land are some of the major land use issues in Kenya.
Agricultural systems can either be rainfed or irrigated agriculture. Most of Kenya is dependent on rainfed
agriculture, with the performance being dependent on the agro-climatic zones. In the humid, high-
altitude areas predictability of a good crop is high (Government of Kenya, 2010a). However, the
population density has increased, and land has been subdivided to a degree that it has become
uneconomical for farm enterprises. In the medium altitude and moderate-rainfall areas, arable rainfed
farming is moderately suitable; however, there is a high risk of crop failure due to droughts. The ASAL
areas have frequent droughts and the land is most suitable to pastoralism and ranching. While there is
ample land, farmers tend to grow crops that are unsuitable for the rainfall regime or soils (Government
of Kenya, 2010a).
Unsustainable agricultural practices and expansion
The predominant agriculture in Kenya is small-
scale rain-fed farming in high potential areas. With
an increased population in these areas there has
been an expansion of agriculture into sensitive
ecosystems such as riparian areas, estuaries and
wetlands. Unsustainable agricultural practises
have resulted in land degradation including soil
erosion, soil infertility, increased water losses and
thus poor crop yields.
Examples of unsustainable agricultural/pastoral practices and expansion:
o Cultivation of hill slopes, wetlands, riparian areas and quarries have led to landslides and soil erosion,
therefore reduced productivity in Taita Taveta, Nyeri, Kirinyaga and Embu counties (County Government
of Embu, 2019; County Government of Kirinyaga, 2018; County Government of Nyeri, 2018; County
Government of Taita Taveta, 2018). This is also an issue in Machakos and Kiambu county (Workshop
output).
o The Sabaki River, which is the estuarine part of the Athi River, is an Important Bird Area and harbours rich
fish diversity. It is however under great environmental pressure from upstream pollution and increased
siltation due to catchment degradation. The National Environment Management Authority (NEMA) has
initiated plans to promote sustainable development of the Sabaki Estuary. Recently, the Coastal
Development Authority and NEMA have launched an Integrated Coastal Zone Management Action Plan
and Shoreline Management Strategy, which have identified the need to address the environmental issues
facing the Sabaki Estuary.
o The Mara ecosystem is showing the impacts of unsustainable land use and degradation, that are linked to
poor land use practices and other socio-economic drivers. High population growth and settlement in
ecologically sensitive hotspots has led to the unsustainable exploitation of natural resources (County
Government of Bomet, 2018).
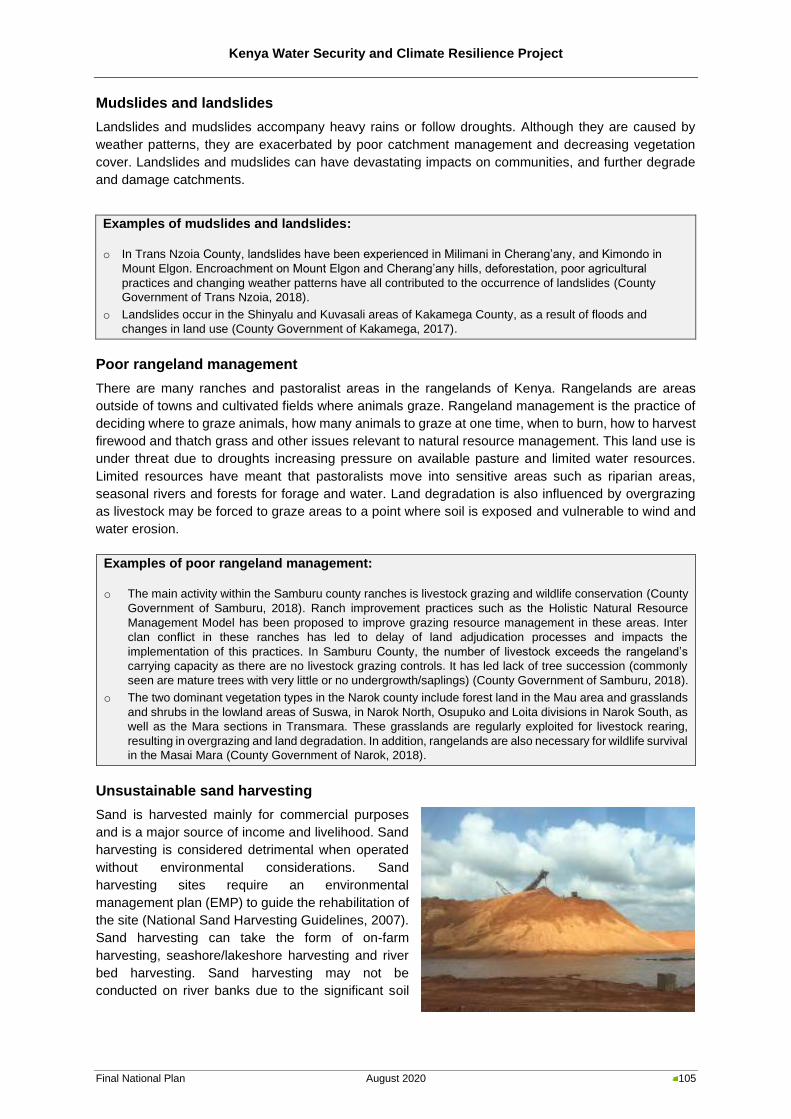
Kenya Water Security and Climate Resilience Project
Final National Plan August 2020 105
Mudslides and landslides
Landslides and mudslides accompany heavy rains or follow droughts. Although they are caused by
weather patterns, they are exacerbated by poor catchment management and decreasing vegetation
cover. Landslides and mudslides can have devastating impacts on communities, and further degrade
and damage catchments.
Examples of mudslides and landslides:
o In Trans Nzoia County, landslides have been experienced in Milimani in Cherang’any, and Kimondo in
Mount Elgon. Encroachment on Mount Elgon and Cherang’any hills, deforestation, poor agricultural
practices and changing weather patterns have all contributed to the occurrence of landslides (County
Government of Trans Nzoia, 2018).
o Landslides occur in the Shinyalu and Kuvasali areas of Kakamega County, as a result of floods and
changes in land use (County Government of Kakamega, 2017).
Poor rangeland management
There are many ranches and pastoralist areas in the rangelands of Kenya. Rangelands are areas
outside of towns and cultivated fields where animals graze. Rangeland management is the practice of
deciding where to graze animals, how many animals to graze at one time, when to burn, how to harvest
firewood and thatch grass and other issues relevant to natural resource management. This land use is
under threat due to droughts increasing pressure on available pasture and limited water resources.
Limited resources have meant that pastoralists move into sensitive areas such as riparian areas,
seasonal rivers and forests for forage and water. Land degradation is also influenced by overgrazing
as livestock may be forced to graze areas to a point where soil is exposed and vulnerable to wind and
water erosion.
Examples of poor rangeland management:
o The main activity within the Samburu county ranches is livestock grazing and wildlife conservation (County
Government of Samburu, 2018). Ranch improvement practices such as the Holistic Natural Resource
Management Model has been proposed to improve grazing resource management in these areas. Inter
clan conflict in these ranches has led to delay of land adjudication processes and impacts the
implementation of this practices. In Samburu County, the number of livestock exceeds the rangeland’s
carrying capacity as there are no livestock grazing controls. It has led lack of tree succession (commonly
seen are mature trees with very little or no undergrowth/saplings) (County Government of Samburu, 2018).
o The two dominant vegetation types in the Narok county include forest land in the Mau area and grasslands
and shrubs in the lowland areas of Suswa, in Narok North, Osupuko and Loita divisions in Narok South, as
well as the Mara sections in Transmara. These grasslands are regularly exploited for livestock rearing,
resulting in overgrazing and land degradation. In addition, rangelands are also necessary for wildlife survival
in the Masai Mara (County Government of Narok, 2018).
Unsustainable sand harvesting
Sand is harvested mainly for commercial purposes
and is a major source of income and livelihood. Sand
harvesting is considered detrimental when operated
without environmental considerations. Sand
harvesting sites require an environmental
management plan (EMP) to guide the rehabilitation of
the site (National Sand Harvesting Guidelines, 2007).
Sand harvesting can take the form of on-farm
harvesting, seashore/lakeshore harvesting and river
bed harvesting. Sand harvesting may not be
conducted on river banks due to the significant soil
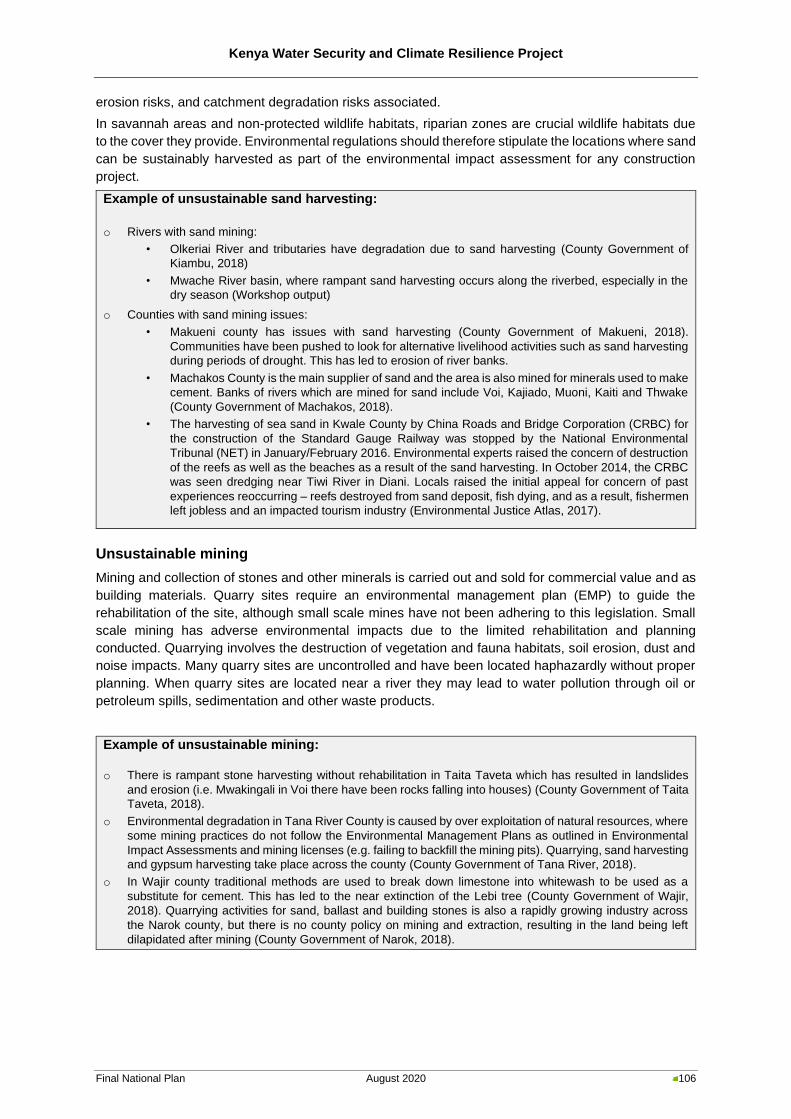
Kenya Water Security and Climate Resilience Project
Final National Plan August 2020 106
erosion risks, and catchment degradation risks associated.
In savannah areas and non-protected wildlife habitats, riparian zones are crucial wildlife habitats due
to the cover they provide. Environmental regulations should therefore stipulate the locations where sand
can be sustainably harvested as part of the environmental impact assessment for any construction
project.
Example of unsustainable sand harvesting:
o Rivers with sand mining:
• Olkeriai River and tributaries have degradation due to sand harvesting (County Government of
Kiambu, 2018)
• Mwache River basin, where rampant sand harvesting occurs along the riverbed, especially in the
dry season (Workshop output)
o Counties with sand mining issues:
• Makueni county has issues with sand harvesting (County Government of Makueni, 2018).
Communities have been pushed to look for alternative livelihood activities such as sand harvesting
during periods of drought. This has led to erosion of river banks.
• Machakos County is the main supplier of sand and the area is also mined for minerals used to make
cement. Banks of rivers which are mined for sand include Voi, Kajiado, Muoni, Kaiti and Thwake
(County Government of Machakos, 2018).
• The harvesting of sea sand in Kwale County by China Roads and Bridge Corporation (CRBC) for
the construction of the Standard Gauge Railway was stopped by the National Environmental
Tribunal (NET) in January/February 2016. Environmental experts raised the concern of destruction
of the reefs as well as the beaches as a result of the sand harvesting. In October 2014, the CRBC
was seen dredging near Tiwi River in Diani. Locals raised the initial appeal for concern of past
experiences reoccurring – reefs destroyed from sand deposit, fish dying, and as a result, fishermen
left jobless and an impacted tourism industry (Environmental Justice Atlas, 2017).
Unsustainable mining
Mining and collection of stones and other minerals is carried out and sold for commercial value and as
building materials. Quarry sites require an environmental management plan (EMP) to guide the
rehabilitation of the site, although small scale mines have not been adhering to this legislation. Small
scale mining has adverse environmental impacts due to the limited rehabilitation and planning
conducted. Quarrying involves the destruction of vegetation and fauna habitats, soil erosion, dust and
noise impacts. Many quarry sites are uncontrolled and have been located haphazardly without proper
planning. When quarry sites are located near a river they may lead to water pollution through oil or
petroleum spills, sedimentation and other waste products.
Example of unsustainable mining:
o There is rampant stone harvesting without rehabilitation in Taita Taveta which has resulted in landslides
and erosion (i.e. Mwakingali in Voi there have been rocks falling into houses) (County Government of Taita
Taveta, 2018).
o Environmental degradation in Tana River County is caused by over exploitation of natural resources, where
some mining practices do not follow the Environmental Management Plans as outlined in Environmental
Impact Assessments and mining licenses (e.g. failing to backfill the mining pits). Quarrying, sand harvesting
and gypsum harvesting take place across the county (County Government of Tana River, 2018).
o In Wajir county traditional methods are used to break down limestone into whitewash to be used as a
substitute for cement. This has led to the near extinction of the Lebi tree (County Government of Wajir,
2018). Quarrying activities for sand, ballast and building stones is also a rapidly growing industry across
the Narok county, but there is no county policy on mining and extraction, resulting in the land being left
dilapidated after mining (County Government of Narok, 2018).
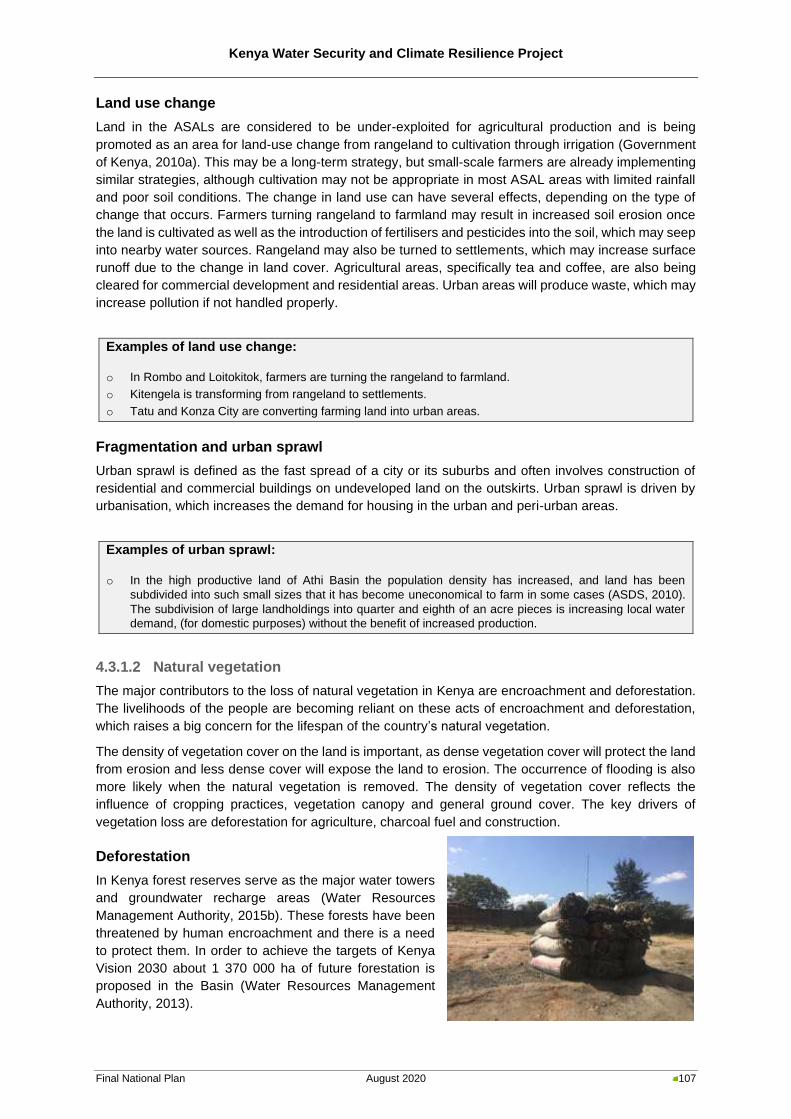
Kenya Water Security and Climate Resilience Project
Final National Plan August 2020 107
Land use change
Land in the ASALs are considered to be under-exploited for agricultural production and is being
promoted as an area for land-use change from rangeland to cultivation through irrigation (Government
of Kenya, 2010a). This may be a long-term strategy, but small-scale farmers are already implementing
similar strategies, although cultivation may not be appropriate in most ASAL areas with limited rainfall
and poor soil conditions. The change in land use can have several effects, depending on the type of
change that occurs. Farmers turning rangeland to farmland may result in increased soil erosion once
the land is cultivated as well as the introduction of fertilisers and pesticides into the soil, which may seep
into nearby water sources. Rangeland may also be turned to settlements, which may increase surface
runoff due to the change in land cover. Agricultural areas, specifically tea and coffee, are also being
cleared for commercial development and residential areas. Urban areas will produce waste, which may
increase pollution if not handled properly.
Examples of land use change:
o In Rombo and Loitokitok, farmers are turning the rangeland to farmland.
o Kitengela is transforming from rangeland to settlements.
o Tatu and Konza City are converting farming land into urban areas.
Fragmentation and urban sprawl
Urban sprawl is defined as the fast spread of a city or its suburbs and often involves construction of
residential and commercial buildings on undeveloped land on the outskirts. Urban sprawl is driven by
urbanisation, which increases the demand for housing in the urban and peri-urban areas.
Examples of urban sprawl:
o In the high productive land of Athi Basin the population density has increased, and land has been
subdivided into such small sizes that it has become uneconomical to farm in some cases (ASDS, 2010).
The subdivision of large landholdings into quarter and eighth of an acre pieces is increasing local water
demand, (for domestic purposes) without the benefit of increased production.
4.3.1.2 Natural vegetation
The major contributors to the loss of natural vegetation in Kenya are encroachment and deforestation.
The livelihoods of the people are becoming reliant on these acts of encroachment and deforestation,
which raises a big concern for the lifespan of the country’s natural vegetation.
The density of vegetation cover on the land is important, as dense vegetation cover will protect the land
from erosion and less dense cover will expose the land to erosion. The occurrence of flooding is also
more likely when the natural vegetation is removed. The density of vegetation cover reflects the
influence of cropping practices, vegetation canopy and general ground cover. The key drivers of
vegetation loss are deforestation for agriculture, charcoal fuel and construction.
Deforestation
In Kenya forest reserves serve as the major water towers
and groundwater recharge areas (Water Resources
Management Authority, 2015b). These forests have been
threatened by human encroachment and there is a need
to protect them. In order to achieve the targets of Kenya
Vision 2030 about 1 370 000 ha of future forestation is
proposed in the Basin (Water Resources Management
Authority, 2013).
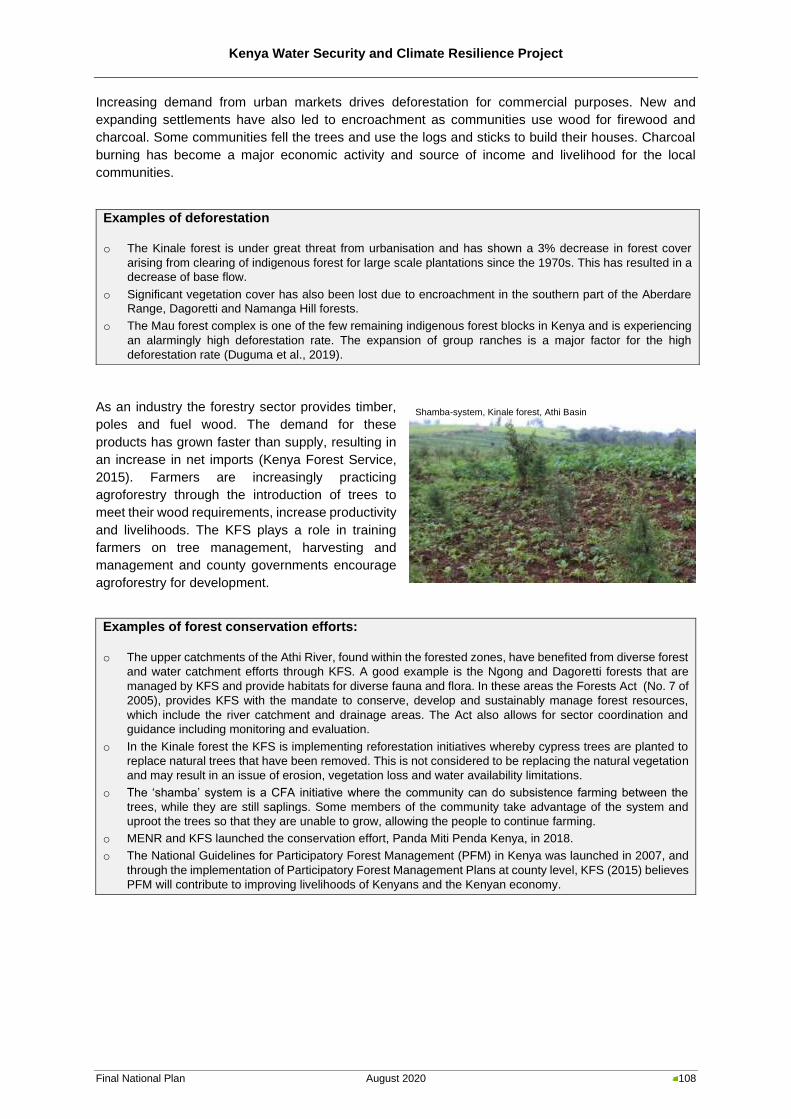
Kenya Water Security and Climate Resilience Project
Final National Plan August 2020 108
Increasing demand from urban markets drives deforestation for commercial purposes. New and
expanding settlements have also led to encroachment as communities use wood for firewood and
charcoal. Some communities fell the trees and use the logs and sticks to build their houses. Charcoal
burning has become a major economic activity and source of income and livelihood for the local
communities.
As an industry the forestry sector provides timber,
poles and fuel wood. The demand for these
products has grown faster than supply, resulting in
an increase in net imports (Kenya Forest Service,
2015). Farmers are increasingly practicing
agroforestry through the introduction of trees to
meet their wood requirements, increase productivity
and livelihoods. The KFS plays a role in training
farmers on tree management, harvesting and
management and county governments encourage
agroforestry for development.
Examples of forest conservation efforts:
o The upper catchments of the Athi River, found within the forested zones, have benefited from diverse forest
and water catchment efforts through KFS. A good example is the Ngong and Dagoretti forests that are
managed by KFS and provide habitats for diverse fauna and flora. In these areas the Forests Act (No. 7 of
2005), provides KFS with the mandate to conserve, develop and sustainably manage forest resources,
which include the river catchment and drainage areas. The Act also allows for sector coordination and
guidance including monitoring and evaluation.
o In the Kinale forest the KFS is implementing reforestation initiatives whereby cypress trees are planted to
replace natural trees that have been removed. This is not considered to be replacing the natural vegetation
and may result in an issue of erosion, vegetation loss and water availability limitations.
o The ‘shamba’ system is a CFA initiative where the community can do subsistence farming between the
trees, while they are still saplings. Some members of the community take advantage of the system and
uproot the trees so that they are unable to grow, allowing the people to continue farming.
o MENR and KFS launched the conservation effort, Panda Miti Penda Kenya, in 2018.
o The National Guidelines for Participatory Forest Management (PFM) in Kenya was launched in 2007, and
through the implementation of Participatory Forest Management Plans at county level, KFS (2015) believes
PFM will contribute to improving livelihoods of Kenyans and the Kenyan economy.
Examples of deforestation
o The Kinale forest is under great threat from urbanisation and has shown a 3% decrease in forest cover
arising from clearing of indigenous forest for large scale plantations since the 1970s. This has resulted in a
decrease of base flow.
o Significant vegetation cover has also been lost due to encroachment in the southern part of the Aberdare
Range, Dagoretti and Namanga Hill forests.
o The Mau forest complex is one of the few remaining indigenous forest blocks in Kenya and is experiencing
an alarmingly high deforestation rate. The expansion of group ranches is a major factor for the high
deforestation rate (Duguma et al., 2019).
Shamba-system, Kinale forest, Athi Basin
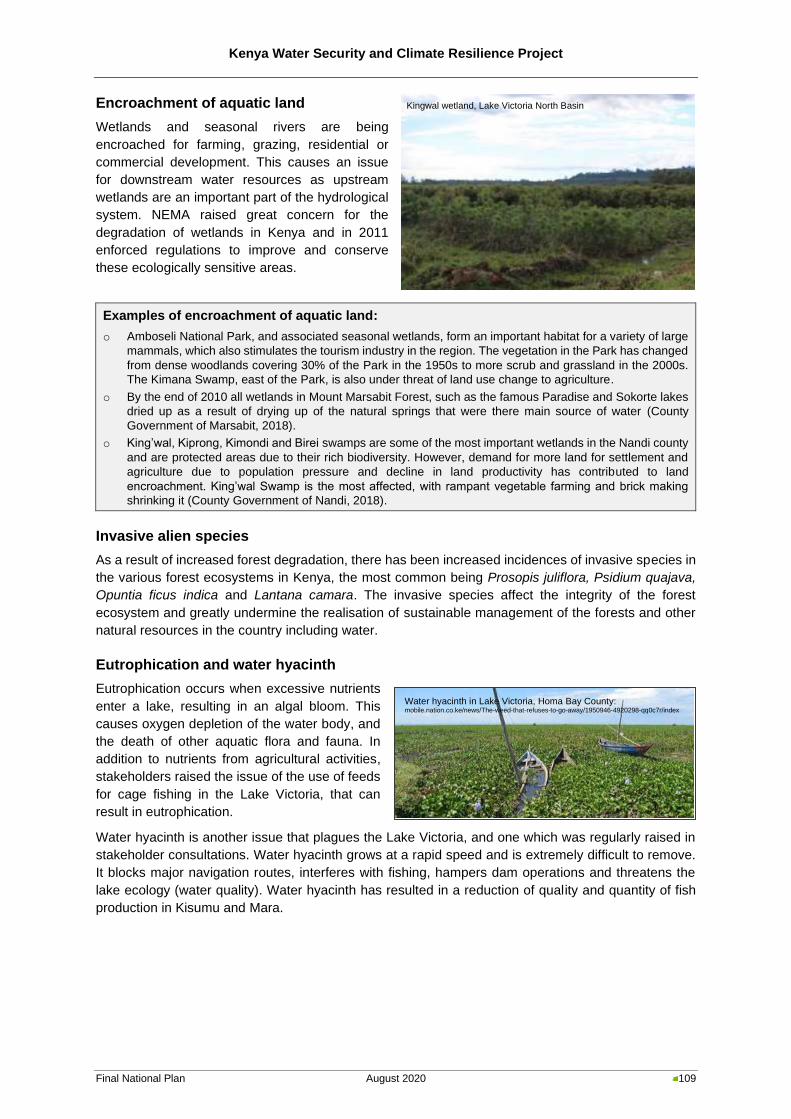
Kenya Water Security and Climate Resilience Project
Final National Plan August 2020 109
Encroachment of aquatic land
Wetlands and seasonal rivers are being
encroached for farming, grazing, residential or
commercial development. This causes an issue
for downstream water resources as upstream
wetlands are an important part of the hydrological
system. NEMA raised great concern for the
degradation of wetlands in Kenya and in 2011
enforced regulations to improve and conserve
these ecologically sensitive areas.
Examples of encroachment of aquatic land:
o Amboseli National Park, and associated seasonal wetlands, form an important habitat for a variety of large
mammals, which also stimulates the tourism industry in the region. The vegetation in the Park has changed
from dense woodlands covering 30% of the Park in the 1950s to more scrub and grassland in the 2000s.
The Kimana Swamp, east of the Park, is also under threat of land use change to agriculture.
o By the end of 2010 all wetlands in Mount Marsabit Forest, such as the famous Paradise and Sokorte lakes
dried up as a result of drying up of the natural springs that were there main source of water (County
Government of Marsabit, 2018).
o King’wal, Kiprong, Kimondi and Birei swamps are some of the most important wetlands in the Nandi county
and are protected areas due to their rich biodiversity. However, demand for more land for settlement and
agriculture due to population pressure and decline in land productivity has contributed to land
encroachment. King’wal Swamp is the most affected, with rampant vegetable farming and brick making
shrinking it (County Government of Nandi, 2018).
Invasive alien species
As a result of increased forest degradation, there has been increased incidences of invasive species in
the various forest ecosystems in Kenya, the most common being Prosopis juliflora, Psidium quajava,
Opuntia ficus indica and Lantana camara. The invasive species affect the integrity of the forest
ecosystem and greatly undermine the realisation of sustainable management of the forests and other
natural resources in the country including water.
Eutrophication and water hyacinth
Eutrophication occurs when excessive nutrients
enter a lake, resulting in an algal bloom. This
causes oxygen depletion of the water body, and
the death of other aquatic flora and fauna. In
addition to nutrients from agricultural activities,
stakeholders raised the issue of the use of feeds
for cage fishing in the Lake Victoria, that can
result in eutrophication.
Water hyacinth is another issue that plagues the Lake Victoria, and one which was regularly raised in
stakeholder consultations. Water hyacinth grows at a rapid speed and is extremely difficult to remove.
It blocks major navigation routes, interferes with fishing, hampers dam operations and threatens the
lake ecology (water quality). Water hyacinth has resulted in a reduction of quality and quantity of fish
production in Kisumu and Mara.
Water hyacinth in Lake Victoria, Homa Bay County: mobile.nation.co.ke/news/The-weed-that-refuses-to-go-away/1950946-4920298-qq0c7r/index
Kingwal wetland, Lake Victoria North Basin
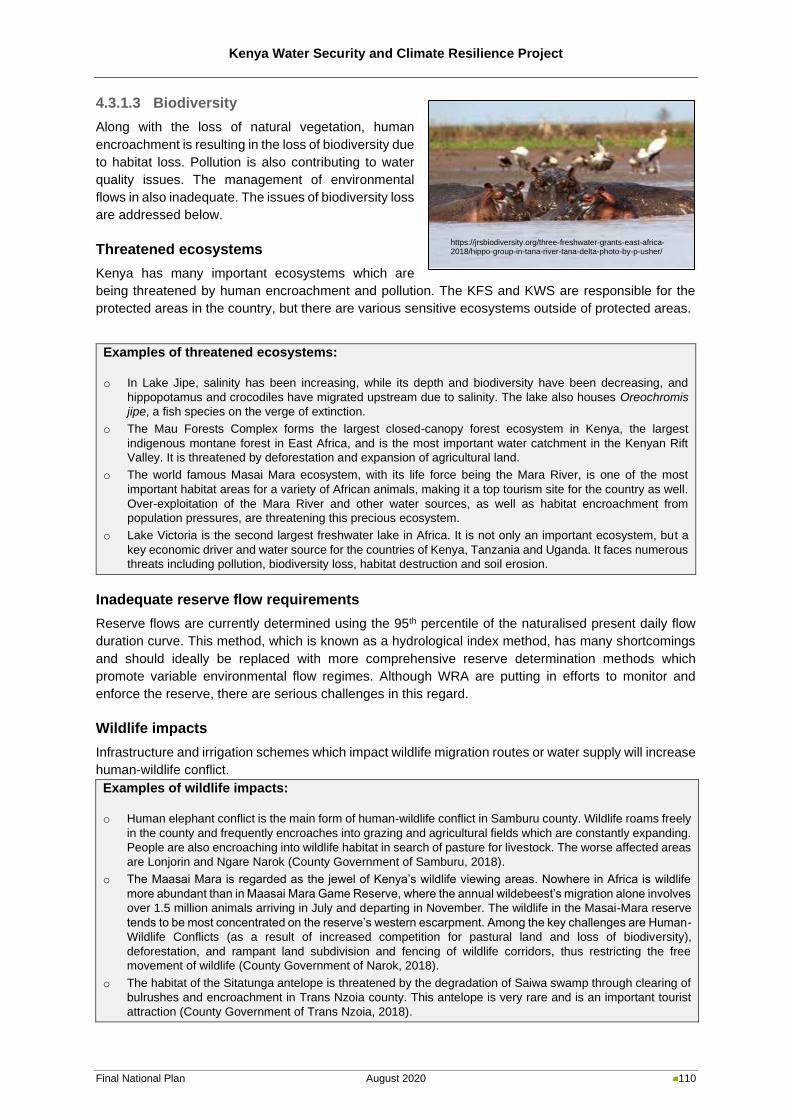
Kenya Water Security and Climate Resilience Project
Final National Plan August 2020 110
4.3.1.3 Biodiversity
Along with the loss of natural vegetation, human
encroachment is resulting in the loss of biodiversity due
to habitat loss. Pollution is also contributing to water
quality issues. The management of environmental
flows in also inadequate. The issues of biodiversity loss
are addressed below.
Threatened ecosystems
Kenya has many important ecosystems which are
being threatened by human encroachment and pollution. The KFS and KWS are responsible for the
protected areas in the country, but there are various sensitive ecosystems outside of protected areas.
Examples of threatened ecosystems:
o In Lake Jipe, salinity has been increasing, while its depth and biodiversity have been decreasing, and
hippopotamus and crocodiles have migrated upstream due to salinity. The lake also houses Oreochromis
jipe, a fish species on the verge of extinction.
o The Mau Forests Complex forms the largest closed-canopy forest ecosystem in Kenya, the largest
indigenous montane forest in East Africa, and is the most important water catchment in the Kenyan Rift
Valley. It is threatened by deforestation and expansion of agricultural land.
o The world famous Masai Mara ecosystem, with its life force being the Mara River, is one of the most
important habitat areas for a variety of African animals, making it a top tourism site for the country as well.
Over-exploitation of the Mara River and other water sources, as well as habitat encroachment from
population pressures, are threatening this precious ecosystem.
o Lake Victoria is the second largest freshwater lake in Africa. It is not only an important ecosystem, but a
key economic driver and water source for the countries of Kenya, Tanzania and Uganda. It faces numerous
threats including pollution, biodiversity loss, habitat destruction and soil erosion.
Inadequate reserve flow requirements
Reserve flows are currently determined using the 95th percentile of the naturalised present daily flow
duration curve. This method, which is known as a hydrological index method, has many shortcomings
and should ideally be replaced with more comprehensive reserve determination methods which
promote variable environmental flow regimes. Although WRA are putting in efforts to monitor and
enforce the reserve, there are serious challenges in this regard.
Wildlife impacts
Infrastructure and irrigation schemes which impact wildlife migration routes or water supply will increase
human-wildlife conflict.
Examples of wildlife impacts:
o Human elephant conflict is the main form of human-wildlife conflict in Samburu county. Wildlife roams freely
in the county and frequently encroaches into grazing and agricultural fields which are constantly expanding.
People are also encroaching into wildlife habitat in search of pasture for livestock. The worse affected areas
are Lonjorin and Ngare Narok (County Government of Samburu, 2018).
o The Maasai Mara is regarded as the jewel of Kenya’s wildlife viewing areas. Nowhere in Africa is wildlife
more abundant than in Maasai Mara Game Reserve, where the annual wildebeest’s migration alone involves
over 1.5 million animals arriving in July and departing in November. The wildlife in the Masai-Mara reserve
tends to be most concentrated on the reserve’s western escarpment. Among the key challenges are Human-
Wildlife Conflicts (as a result of increased competition for pastural land and loss of biodiversity),
deforestation, and rampant land subdivision and fencing of wildlife corridors, thus restricting the free
movement of wildlife (County Government of Narok, 2018).
o The habitat of the Sitatunga antelope is threatened by the degradation of Saiwa swamp through clearing of
bulrushes and encroachment in Trans Nzoia county. This antelope is very rare and is an important tourist
attraction (County Government of Trans Nzoia, 2018).
https://jrsbiodiversity.org/three-freshwater-grants-east-africa-2018/hippo-group-in-tana-river-tana-delta-photo-by-p-usher/
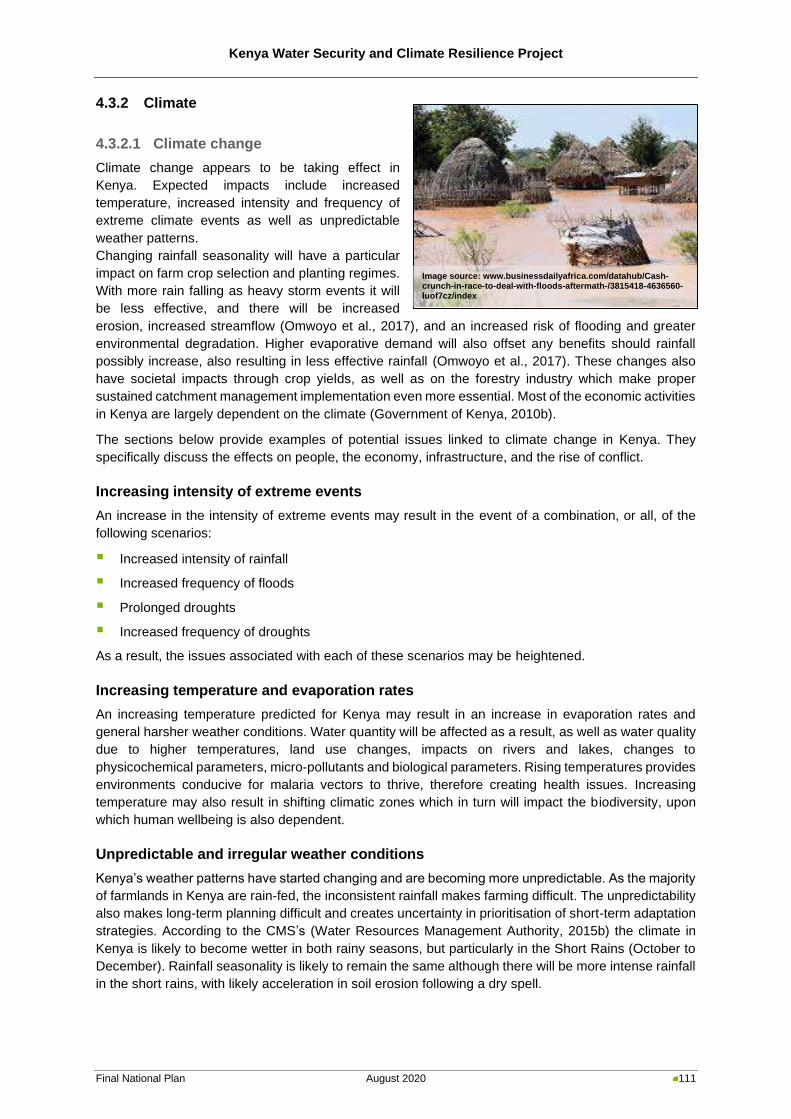
Kenya Water Security and Climate Resilience Project
Final National Plan August 2020 111
4.3.2 Climate
4.3.2.1 Climate change
Climate change appears to be taking effect in
Kenya. Expected impacts include increased
temperature, increased intensity and frequency of
extreme climate events as well as unpredictable
weather patterns.
Changing rainfall seasonality will have a particular
impact on farm crop selection and planting regimes.
With more rain falling as heavy storm events it will
be less effective, and there will be increased
erosion, increased streamflow (Omwoyo et al., 2017), and an increased risk of flooding and greater
environmental degradation. Higher evaporative demand will also offset any benefits should rainfall
possibly increase, also resulting in less effective rainfall (Omwoyo et al., 2017). These changes also
have societal impacts through crop yields, as well as on the forestry industry which make proper
sustained catchment management implementation even more essential. Most of the economic activities
in Kenya are largely dependent on the climate (Government of Kenya, 2010b).
The sections below provide examples of potential issues linked to climate change in Kenya. They
specifically discuss the effects on people, the economy, infrastructure, and the rise of conflict.
Increasing intensity of extreme events
An increase in the intensity of extreme events may result in the event of a combination, or all, of the
following scenarios:
▪ Increased intensity of rainfall
▪ Increased frequency of floods
▪ Prolonged droughts
▪ Increased frequency of droughts
As a result, the issues associated with each of these scenarios may be heightened.
Increasing temperature and evaporation rates
An increasing temperature predicted for Kenya may result in an increase in evaporation rates and
general harsher weather conditions. Water quantity will be affected as a result, as well as water quality
due to higher temperatures, land use changes, impacts on rivers and lakes, changes to
physicochemical parameters, micro-pollutants and biological parameters. Rising temperatures provides
environments conducive for malaria vectors to thrive, therefore creating health issues. Increasing
temperature may also result in shifting climatic zones which in turn will impact the biodiversity, upon
which human wellbeing is also dependent.
Unpredictable and irregular weather conditions
Kenya’s weather patterns have started changing and are becoming more unpredictable. As the majority
of farmlands in Kenya are rain-fed, the inconsistent rainfall makes farming difficult. The unpredictability
also makes long-term planning difficult and creates uncertainty in prioritisation of short-term adaptation
strategies. According to the CMS’s (Water Resources Management Authority, 2015b) the climate in
Kenya is likely to become wetter in both rainy seasons, but particularly in the Short Rains (October to
December). Rainfall seasonality is likely to remain the same although there will be more intense rainfall
in the short rains, with likely acceleration in soil erosion following a dry spell.
Image source: www.businessdailyafrica.com/datahub/Cash-crunch-in-race-to-deal-with-floods-aftermath-/3815418-4636560-luof7cz/index
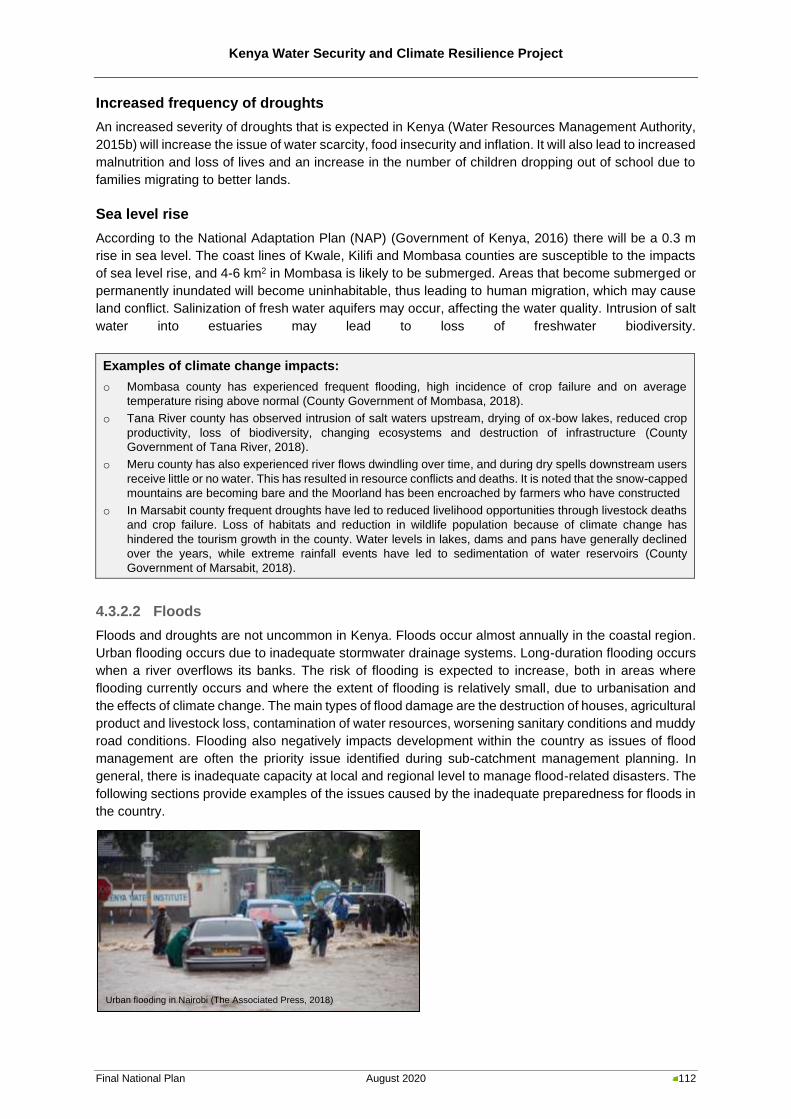
Kenya Water Security and Climate Resilience Project
Final National Plan August 2020 112
Increased frequency of droughts
An increased severity of droughts that is expected in Kenya (Water Resources Management Authority,
2015b) will increase the issue of water scarcity, food insecurity and inflation. It will also lead to increased
malnutrition and loss of lives and an increase in the number of children dropping out of school due to
families migrating to better lands.
Sea level rise
According to the National Adaptation Plan (NAP) (Government of Kenya, 2016) there will be a 0.3 m
rise in sea level. The coast lines of Kwale, Kilifi and Mombasa counties are susceptible to the impacts
of sea level rise, and 4-6 km2 in Mombasa is likely to be submerged. Areas that become submerged or
permanently inundated will become uninhabitable, thus leading to human migration, which may cause
land conflict. Salinization of fresh water aquifers may occur, affecting the water quality. Intrusion of salt
water into estuaries may lead to loss of freshwater biodiversity.
Examples of climate change impacts:
o Mombasa county has experienced frequent flooding, high incidence of crop failure and on average
temperature rising above normal (County Government of Mombasa, 2018).
o Tana River county has observed intrusion of salt waters upstream, drying of ox-bow lakes, reduced crop
productivity, loss of biodiversity, changing ecosystems and destruction of infrastructure (County
Government of Tana River, 2018).
o Meru county has also experienced river flows dwindling over time, and during dry spells downstream users
receive little or no water. This has resulted in resource conflicts and deaths. It is noted that the snow-capped
mountains are becoming bare and the Moorland has been encroached by farmers who have constructed
o In Marsabit county frequent droughts have led to reduced livelihood opportunities through livestock deaths
and crop failure. Loss of habitats and reduction in wildlife population because of climate change has
hindered the tourism growth in the county. Water levels in lakes, dams and pans have generally declined
over the years, while extreme rainfall events have led to sedimentation of water reservoirs (County
Government of Marsabit, 2018).
4.3.2.2 Floods
Floods and droughts are not uncommon in Kenya. Floods occur almost annually in the coastal region.
Urban flooding occurs due to inadequate stormwater drainage systems. Long-duration flooding occurs
when a river overflows its banks. The risk of flooding is expected to increase, both in areas where
flooding currently occurs and where the extent of flooding is relatively small, due to urbanisation and
the effects of climate change. The main types of flood damage are the destruction of houses, agricultural
product and livestock loss, contamination of water resources, worsening sanitary conditions and muddy
road conditions. Flooding also negatively impacts development within the country as issues of flood
management are often the priority issue identified during sub-catchment management planning. In
general, there is inadequate capacity at local and regional level to manage flood-related disasters. The
following sections provide examples of the issues caused by the inadequate preparedness for floods in
the country.
Urban flooding in Nairobi (The Associated Press, 2018)
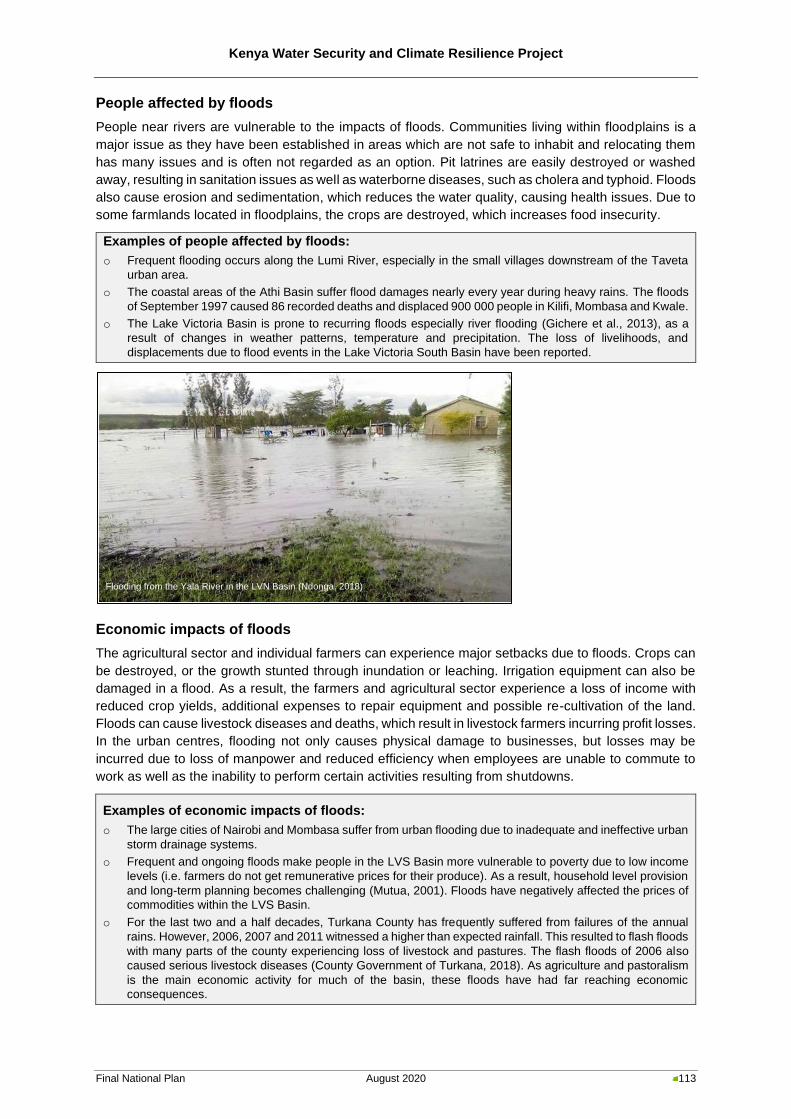
Kenya Water Security and Climate Resilience Project
Final National Plan August 2020 113
People affected by floods
People near rivers are vulnerable to the impacts of floods. Communities living within floodplains is a
major issue as they have been established in areas which are not safe to inhabit and relocating them
has many issues and is often not regarded as an option. Pit latrines are easily destroyed or washed
away, resulting in sanitation issues as well as waterborne diseases, such as cholera and typhoid. Floods
also cause erosion and sedimentation, which reduces the water quality, causing health issues. Due to
some farmlands located in floodplains, the crops are destroyed, which increases food insecurity.
Examples of people affected by floods:
o Frequent flooding occurs along the Lumi River, especially in the small villages downstream of the Taveta
urban area.
o The coastal areas of the Athi Basin suffer flood damages nearly every year during heavy rains. The floods
of September 1997 caused 86 recorded deaths and displaced 900 000 people in Kilifi, Mombasa and Kwale.
o The Lake Victoria Basin is prone to recurring floods especially river flooding (Gichere et al., 2013), as a
result of changes in weather patterns, temperature and precipitation. The loss of livelihoods, and
displacements due to flood events in the Lake Victoria South Basin have been reported.
Economic impacts of floods
The agricultural sector and individual farmers can experience major setbacks due to floods. Crops can
be destroyed, or the growth stunted through inundation or leaching. Irrigation equipment can also be
damaged in a flood. As a result, the farmers and agricultural sector experience a loss of income with
reduced crop yields, additional expenses to repair equipment and possible re-cultivation of the land.
Floods can cause livestock diseases and deaths, which result in livestock farmers incurring profit losses.
In the urban centres, flooding not only causes physical damage to businesses, but losses may be
incurred due to loss of manpower and reduced efficiency when employees are unable to commute to
work as well as the inability to perform certain activities resulting from shutdowns.
Examples of economic impacts of floods:
o The large cities of Nairobi and Mombasa suffer from urban flooding due to inadequate and ineffective urban
storm drainage systems.
o Frequent and ongoing floods make people in the LVS Basin more vulnerable to poverty due to low income
levels (i.e. farmers do not get remunerative prices for their produce). As a result, household level provision
and long-term planning becomes challenging (Mutua, 2001). Floods have negatively affected the prices of
commodities within the LVS Basin.
o For the last two and a half decades, Turkana County has frequently suffered from failures of the annual
rains. However, 2006, 2007 and 2011 witnessed a higher than expected rainfall. This resulted to flash floods
with many parts of the county experiencing loss of livestock and pastures. The flash floods of 2006 also
caused serious livestock diseases (County Government of Turkana, 2018). As agriculture and pastoralism
is the main economic activity for much of the basin, these floods have had far reaching economic
consequences.
Flooding from the Yala River in the LVN Basin (Ndonga, 2018)
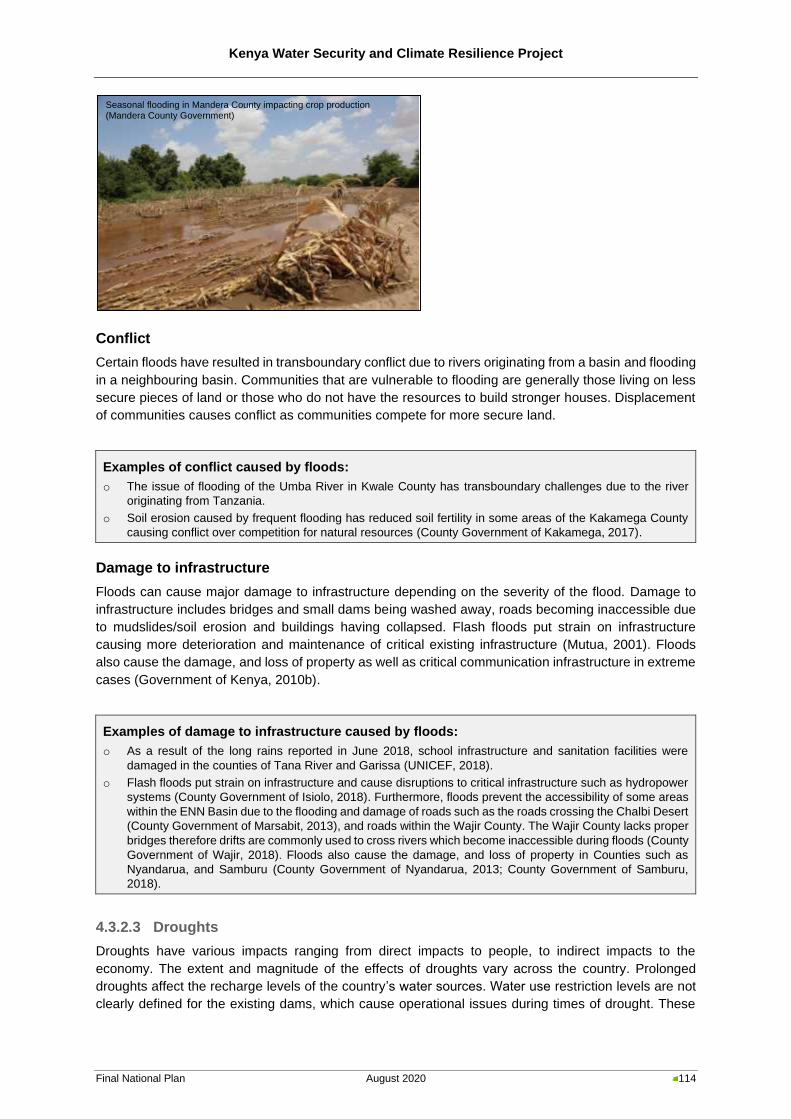
Kenya Water Security and Climate Resilience Project
Final National Plan August 2020 114
Conflict
Certain floods have resulted in transboundary conflict due to rivers originating from a basin and flooding
in a neighbouring basin. Communities that are vulnerable to flooding are generally those living on less
secure pieces of land or those who do not have the resources to build stronger houses. Displacement
of communities causes conflict as communities compete for more secure land.
Examples of conflict caused by floods:
o The issue of flooding of the Umba River in Kwale County has transboundary challenges due to the river
originating from Tanzania.
o Soil erosion caused by frequent flooding has reduced soil fertility in some areas of the Kakamega County
causing conflict over competition for natural resources (County Government of Kakamega, 2017).
Damage to infrastructure
Floods can cause major damage to infrastructure depending on the severity of the flood. Damage to
infrastructure includes bridges and small dams being washed away, roads becoming inaccessible due
to mudslides/soil erosion and buildings having collapsed. Flash floods put strain on infrastructure
causing more deterioration and maintenance of critical existing infrastructure (Mutua, 2001). Floods
also cause the damage, and loss of property as well as critical communication infrastructure in extreme
cases (Government of Kenya, 2010b).
Examples of damage to infrastructure caused by floods:
o As a result of the long rains reported in June 2018, school infrastructure and sanitation facilities were
damaged in the counties of Tana River and Garissa (UNICEF, 2018).
o Flash floods put strain on infrastructure and cause disruptions to critical infrastructure such as hydropower
systems (County Government of Isiolo, 2018). Furthermore, floods prevent the accessibility of some areas
within the ENN Basin due to the flooding and damage of roads such as the roads crossing the Chalbi Desert
(County Government of Marsabit, 2013), and roads within the Wajir County. The Wajir County lacks proper
bridges therefore drifts are commonly used to cross rivers which become inaccessible during floods (County
Government of Wajir, 2018). Floods also cause the damage, and loss of property in Counties such as
Nyandarua, and Samburu (County Government of Nyandarua, 2013; County Government of Samburu,
2018).
4.3.2.3 Droughts
Droughts have various impacts ranging from direct impacts to people, to indirect impacts to the
economy. The extent and magnitude of the effects of droughts vary across the country. Prolonged
droughts affect the recharge levels of the country’s water sources. Water use restriction levels are not
clearly defined for the existing dams, which cause operational issues during times of drought. These
Seasonal flooding in Mandera County impacting crop production (Mandera County Government)
Kenya Water Security and Climate Resilience Project
Final National Plan August 2020 115
need to be reframed. In addition, dam operating rules should be adhered to, and new ones should be
developed to mitigate the impacts of droughts and floods.
The following sections provide examples of the issues caused by the inadequate preparedness for
droughts in Kenya.
People affected by droughts
People, in both rural and urban areas are affected by droughts due to water scarcity and food insecurity
as well as the livelihoods of those earning an income from the agricultural sector. Droughts increase
food insecurity due to poor crop growth or lower crop yields and a decrease in milk production. As a
result of lower crop yields, crop prices increase, which reduces the household purchasing power. Water
scarcity increases, which decreases water supply and the communities who collect water from a water
source may need to travel further. Water quality issues increase during droughts, which increases the
number of health issues of the population. The environment and living standards during a drought
increase people’s susceptibility to diseases. With an increase in droughts, leading to food insecurity
and water scarcity, the percentage of the population suffering from malnutrition is likely to increase.
Examples of people affected by droughts:
o In 1975, 1976, 1980, 1981, 1983, 2001, 2004, and 2009 the Tana River County experienced drought
conditions, with the Central and North regions being mostly affected (Ngaina et al., 2014).
o In May 2019, the National Drought Management Authority reported that Tana River County is one of the
ASAL counties experiencing drought alarming conditions as a result of prolonged dry spells (National
Drought Management Authority, 2019a).
o Future projections for the climate of Tana River County, indicate that it will continue to be affected greatly
by droughts. As a result, about 67% of the population will be food insecure and ultimately continue relying
on food aid annually. (Kenya County Climate Risks Profiles Series).
Economic impacts of droughts
The agricultural and livestock sectors experience major losses due to droughts. Due to a large amount
of the farmlands in Kenya being rain-fed agriculture, droughts result in low crop yields, poor quality of
produce, and a change in varieties. Although crop prices increase to counter the lower crop yields, the
agricultural sector usually experiences a reduction in sales. The livestock sector experiences several
issues as a result of droughts. The lack of water for cattle results in decreased milk production. Water
scarcity also contributes to livestock diseases and deaths. There is concern that pastoralists and crop
farmers may desert the agricultural sector in the hope of finding new work opportunities in the urban
centres.
Examples of economic impacts of droughts:
o The prices of essential commodities were reported to be high in 2019, causing households to experience a
deficit of food stocks (National Drought Management Authority, 2019b).
o The Tana River county experiences severe droughts, causing food security factors to be stressed as there
is a reduction in harvests because of depressed rains (National Drought Management Authority, 2019b).
o In Samburu county, rainfall periods are becoming shorter and more unpredictable, and prolonged droughts
more frequent and severe, leading to massive loss of livestock, poor crop yields, increased vulnerability to
food insecurity, high prevalence of malaria and livestock diseases, and migration and displacements.
Persistent drought has over the years remained a challenge to livestock keeping in Samburu County, which
is a key sub-sector in the economy of the county (County Government of Samburu, 2018).
Conflict due to droughts
Droughts result in scarcity of water for both wildlife and people. This gives rise to conflicts between
various groups. Conflict arises between locals and pastoralists when the migration of the pastoralists’
livestock increases competition for available resources (resource-based conflict). The probability of
humans coming into contact with wildlife also increases during droughts as both humans and animals
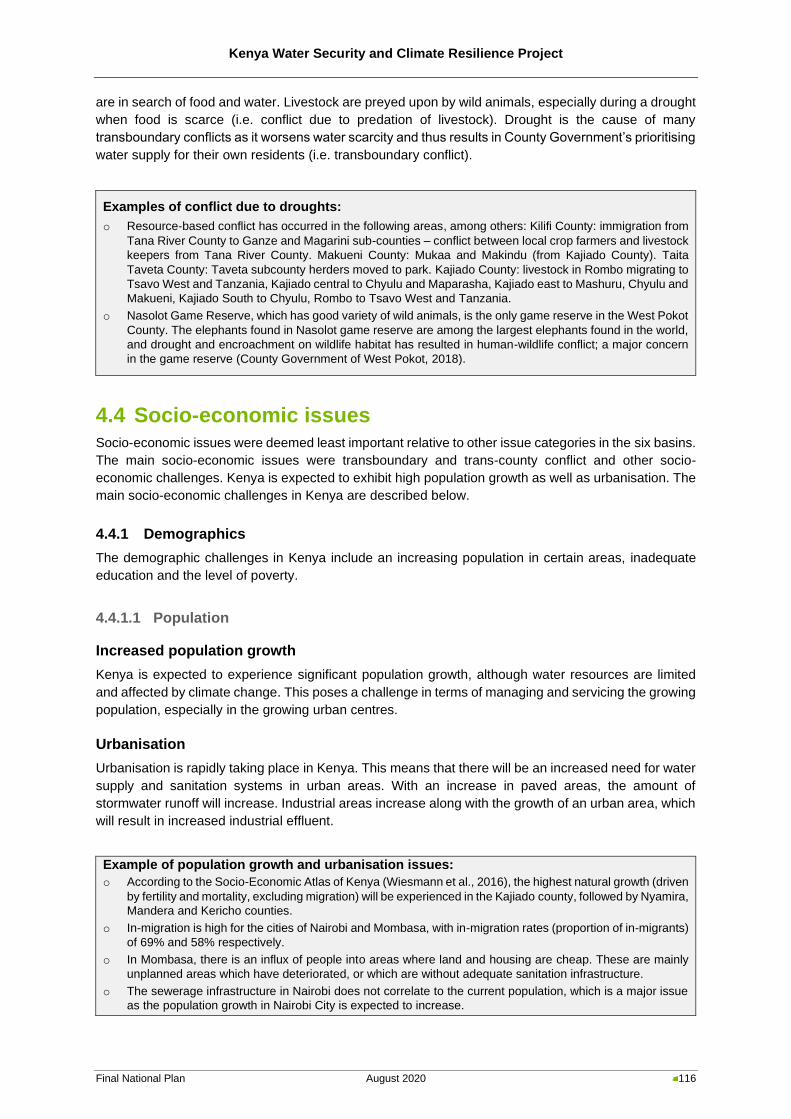
Kenya Water Security and Climate Resilience Project
Final National Plan August 2020 116
are in search of food and water. Livestock are preyed upon by wild animals, especially during a drought
when food is scarce (i.e. conflict due to predation of livestock). Drought is the cause of many
transboundary conflicts as it worsens water scarcity and thus results in County Government’s prioritising
water supply for their own residents (i.e. transboundary conflict).
Examples of conflict due to droughts:
o Resource-based conflict has occurred in the following areas, among others: Kilifi County: immigration from
Tana River County to Ganze and Magarini sub-counties – conflict between local crop farmers and livestock
keepers from Tana River County. Makueni County: Mukaa and Makindu (from Kajiado County). Taita
Taveta County: Taveta subcounty herders moved to park. Kajiado County: livestock in Rombo migrating to
Tsavo West and Tanzania, Kajiado central to Chyulu and Maparasha, Kajiado east to Mashuru, Chyulu and
Makueni, Kajiado South to Chyulu, Rombo to Tsavo West and Tanzania.
o Nasolot Game Reserve, which has good variety of wild animals, is the only game reserve in the West Pokot
County. The elephants found in Nasolot game reserve are among the largest elephants found in the world,
and drought and encroachment on wildlife habitat has resulted in human-wildlife conflict; a major concern
in the game reserve (County Government of West Pokot, 2018).
4.4 Socio-economic issues
Socio-economic issues were deemed least important relative to other issue categories in the six basins.
The main socio-economic issues were transboundary and trans-county conflict and other socio-
economic challenges. Kenya is expected to exhibit high population growth as well as urbanisation. The
main socio-economic challenges in Kenya are described below.
4.4.1 Demographics
The demographic challenges in Kenya include an increasing population in certain areas, inadequate
education and the level of poverty.
4.4.1.1 Population
Increased population growth
Kenya is expected to experience significant population growth, although water resources are limited
and affected by climate change. This poses a challenge in terms of managing and servicing the growing
population, especially in the growing urban centres.
Urbanisation
Urbanisation is rapidly taking place in Kenya. This means that there will be an increased need for water
supply and sanitation systems in urban areas. With an increase in paved areas, the amount of
stormwater runoff will increase. Industrial areas increase along with the growth of an urban area, which
will result in increased industrial effluent.
Example of population growth and urbanisation issues:
o According to the Socio-Economic Atlas of Kenya (Wiesmann et al., 2016), the highest natural growth (driven
by fertility and mortality, excluding migration) will be experienced in the Kajiado county, followed by Nyamira,
Mandera and Kericho counties.
o In-migration is high for the cities of Nairobi and Mombasa, with in-migration rates (proportion of in-migrants)
of 69% and 58% respectively.
o In Mombasa, there is an influx of people into areas where land and housing are cheap. These are mainly
unplanned areas which have deteriorated, or which are without adequate sanitation infrastructure.
o The sewerage infrastructure in Nairobi does not correlate to the current population, which is a major issue
as the population growth in Nairobi City is expected to increase.
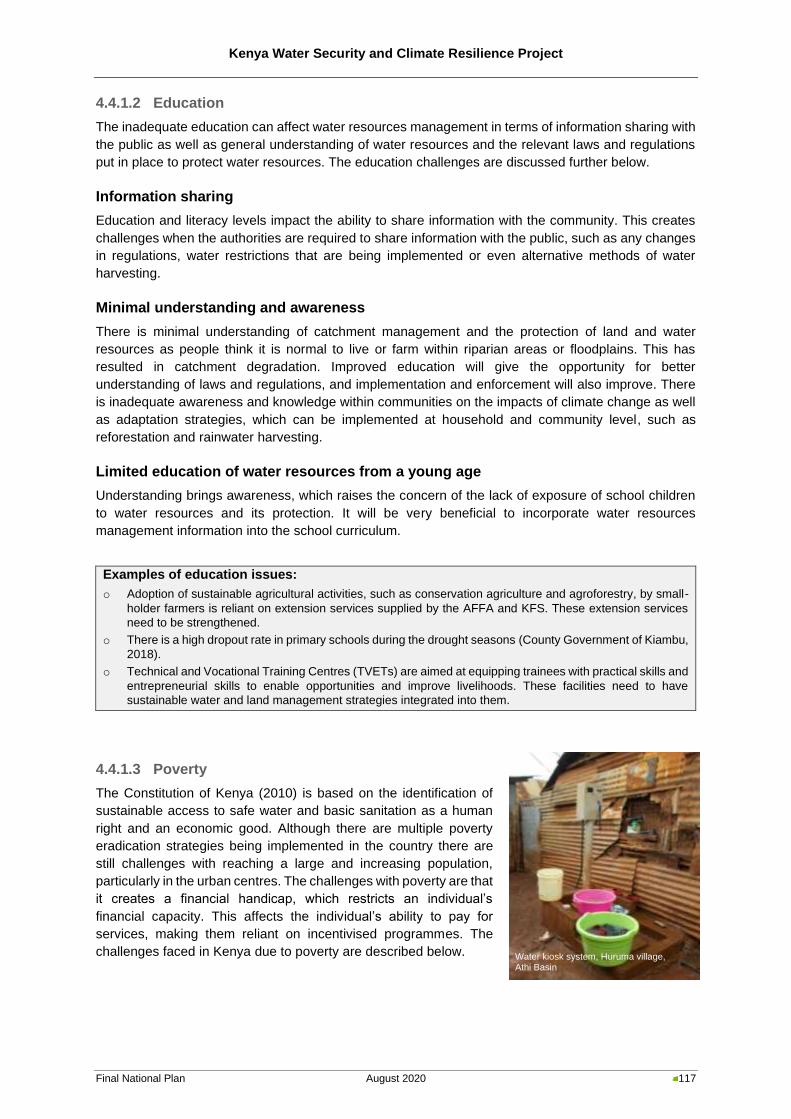
Kenya Water Security and Climate Resilience Project
Final National Plan August 2020 117
4.4.1.2 Education
The inadequate education can affect water resources management in terms of information sharing with
the public as well as general understanding of water resources and the relevant laws and regulations
put in place to protect water resources. The education challenges are discussed further below.
Information sharing
Education and literacy levels impact the ability to share information with the community. This creates
challenges when the authorities are required to share information with the public, such as any changes
in regulations, water restrictions that are being implemented or even alternative methods of water
harvesting.
Minimal understanding and awareness
There is minimal understanding of catchment management and the protection of land and water
resources as people think it is normal to live or farm within riparian areas or floodplains. This has
resulted in catchment degradation. Improved education will give the opportunity for better
understanding of laws and regulations, and implementation and enforcement will also improve. There
is inadequate awareness and knowledge within communities on the impacts of climate change as well
as adaptation strategies, which can be implemented at household and community level, such as
reforestation and rainwater harvesting.
Limited education of water resources from a young age
Understanding brings awareness, which raises the concern of the lack of exposure of school children
to water resources and its protection. It will be very beneficial to incorporate water resources
management information into the school curriculum.
Examples of education issues:
o Adoption of sustainable agricultural activities, such as conservation agriculture and agroforestry, by small-
holder farmers is reliant on extension services supplied by the AFFA and KFS. These extension services
need to be strengthened.
o There is a high dropout rate in primary schools during the drought seasons (County Government of Kiambu,
2018).
o Technical and Vocational Training Centres (TVETs) are aimed at equipping trainees with practical skills and
entrepreneurial skills to enable opportunities and improve livelihoods. These facilities need to have
sustainable water and land management strategies integrated into them.
4.4.1.3 Poverty
The Constitution of Kenya (2010) is based on the identification of
sustainable access to safe water and basic sanitation as a human
right and an economic good. Although there are multiple poverty
eradication strategies being implemented in the country there are
still challenges with reaching a large and increasing population,
particularly in the urban centres. The challenges with poverty are that
it creates a financial handicap, which restricts an individual’s
financial capacity. This affects the individual’s ability to pay for
services, making them reliant on incentivised programmes. The
challenges faced in Kenya due to poverty are described below. Water kiosk system, Huruma village, Athi Basin
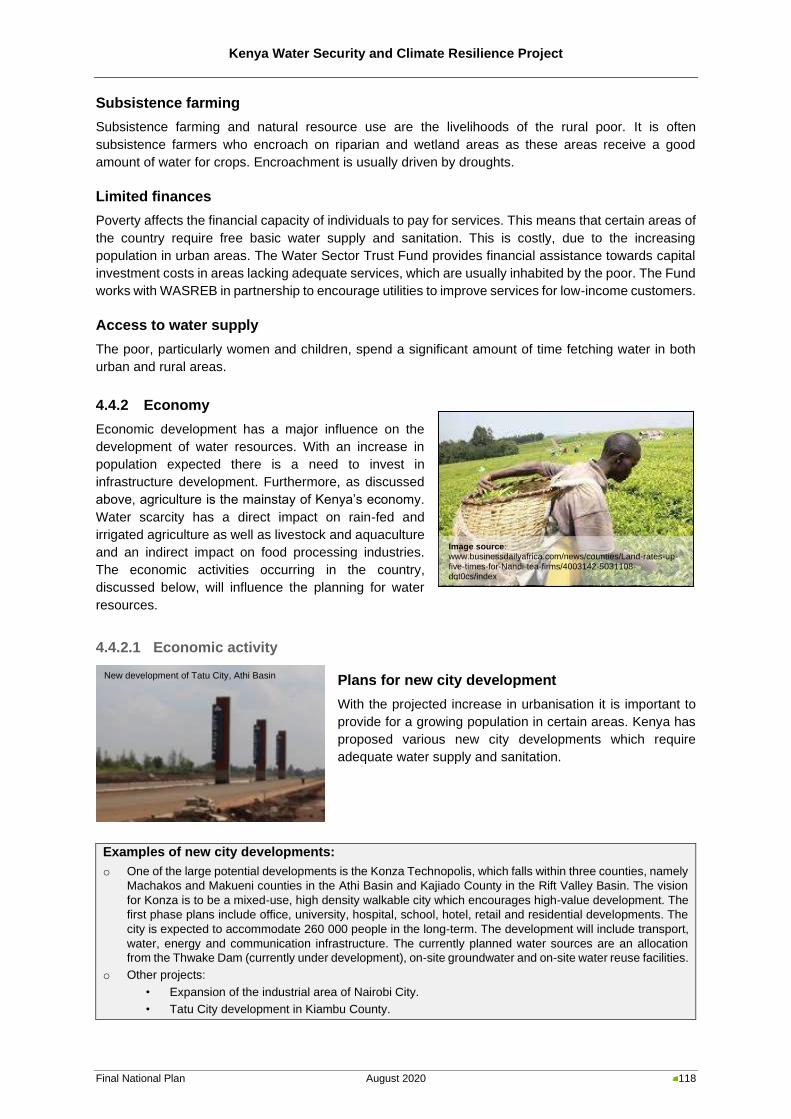
Kenya Water Security and Climate Resilience Project
Final National Plan August 2020 118
Subsistence farming
Subsistence farming and natural resource use are the livelihoods of the rural poor. It is often
subsistence farmers who encroach on riparian and wetland areas as these areas receive a good
amount of water for crops. Encroachment is usually driven by droughts.
Limited finances
Poverty affects the financial capacity of individuals to pay for services. This means that certain areas of
the country require free basic water supply and sanitation. This is costly, due to the increasing
population in urban areas. The Water Sector Trust Fund provides financial assistance towards capital
investment costs in areas lacking adequate services, which are usually inhabited by the poor. The Fund
works with WASREB in partnership to encourage utilities to improve services for low-income customers.
Access to water supply
The poor, particularly women and children, spend a significant amount of time fetching water in both
urban and rural areas.
4.4.2 Economy
Economic development has a major influence on the
development of water resources. With an increase in
population expected there is a need to invest in
infrastructure development. Furthermore, as discussed
above, agriculture is the mainstay of Kenya’s economy.
Water scarcity has a direct impact on rain-fed and
irrigated agriculture as well as livestock and aquaculture
and an indirect impact on food processing industries.
The economic activities occurring in the country,
discussed below, will influence the planning for water
resources.
4.4.2.1 Economic activity
Plans for new city development
With the projected increase in urbanisation it is important to
provide for a growing population in certain areas. Kenya has
proposed various new city developments which require
adequate water supply and sanitation.
Examples of new city developments:
o One of the large potential developments is the Konza Technopolis, which falls within three counties, namely
Machakos and Makueni counties in the Athi Basin and Kajiado County in the Rift Valley Basin. The vision
for Konza is to be a mixed-use, high density walkable city which encourages high-value development. The
first phase plans include office, university, hospital, school, hotel, retail and residential developments. The
city is expected to accommodate 260 000 people in the long-term. The development will include transport,
water, energy and communication infrastructure. The currently planned water sources are an allocation
from the Thwake Dam (currently under development), on-site groundwater and on-site water reuse facilities.
o Other projects:
• Expansion of the industrial area of Nairobi City.
• Tatu City development in Kiambu County.
Image source: www.businessdailyafrica.com/news/counties/Land-rates-up-five-times-for-Nandi-tea-firms/4003142-5031108-dgt0cs/index
New development of Tatu City, Athi Basin
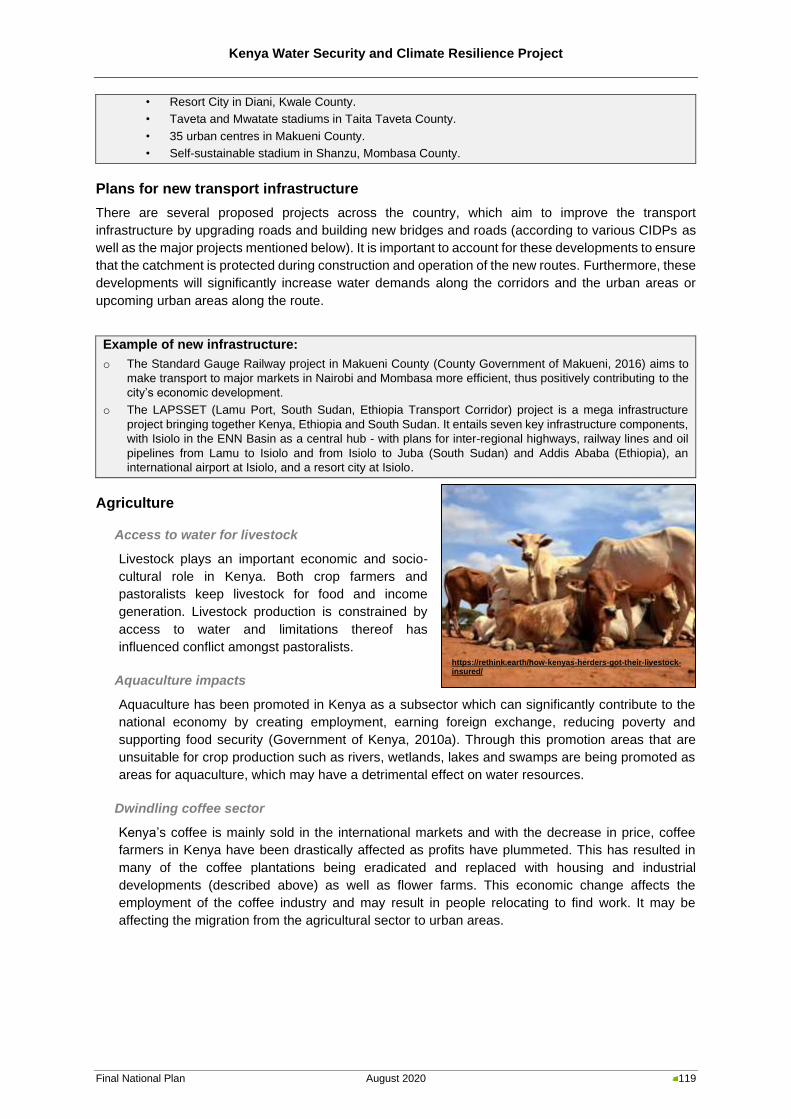
Kenya Water Security and Climate Resilience Project
Final National Plan August 2020 119
• Resort City in Diani, Kwale County.
• Taveta and Mwatate stadiums in Taita Taveta County.
• 35 urban centres in Makueni County.
• Self-sustainable stadium in Shanzu, Mombasa County.
Plans for new transport infrastructure
There are several proposed projects across the country, which aim to improve the transport
infrastructure by upgrading roads and building new bridges and roads (according to various CIDPs as
well as the major projects mentioned below). It is important to account for these developments to ensure
that the catchment is protected during construction and operation of the new routes. Furthermore, these
developments will significantly increase water demands along the corridors and the urban areas or
upcoming urban areas along the route.
Example of new infrastructure:
o The Standard Gauge Railway project in Makueni County (County Government of Makueni, 2016) aims to
make transport to major markets in Nairobi and Mombasa more efficient, thus positively contributing to the
city’s economic development.
o The LAPSSET (Lamu Port, South Sudan, Ethiopia Transport Corridor) project is a mega infrastructure
project bringing together Kenya, Ethiopia and South Sudan. It entails seven key infrastructure components,
with Isiolo in the ENN Basin as a central hub - with plans for inter-regional highways, railway lines and oil
pipelines from Lamu to Isiolo and from Isiolo to Juba (South Sudan) and Addis Ababa (Ethiopia), an
international airport at Isiolo, and a resort city at Isiolo.
Agriculture
Access to water for livestock
Livestock plays an important economic and socio-
cultural role in Kenya. Both crop farmers and
pastoralists keep livestock for food and income
generation. Livestock production is constrained by
access to water and limitations thereof has
influenced conflict amongst pastoralists.
Aquaculture impacts
Aquaculture has been promoted in Kenya as a subsector which can significantly contribute to the
national economy by creating employment, earning foreign exchange, reducing poverty and
supporting food security (Government of Kenya, 2010a). Through this promotion areas that are
unsuitable for crop production such as rivers, wetlands, lakes and swamps are being promoted as
areas for aquaculture, which may have a detrimental effect on water resources.
Dwindling coffee sector
Kenya’s coffee is mainly sold in the international markets and with the decrease in price, coffee
farmers in Kenya have been drastically affected as profits have plummeted. This has resulted in
many of the coffee plantations being eradicated and replaced with housing and industrial
developments (described above) as well as flower farms. This economic change affects the
employment of the coffee industry and may result in people relocating to find work. It may be
affecting the migration from the agricultural sector to urban areas.
https://rethink.earth/how-kenyas-herders-got-their-livestock-insured/
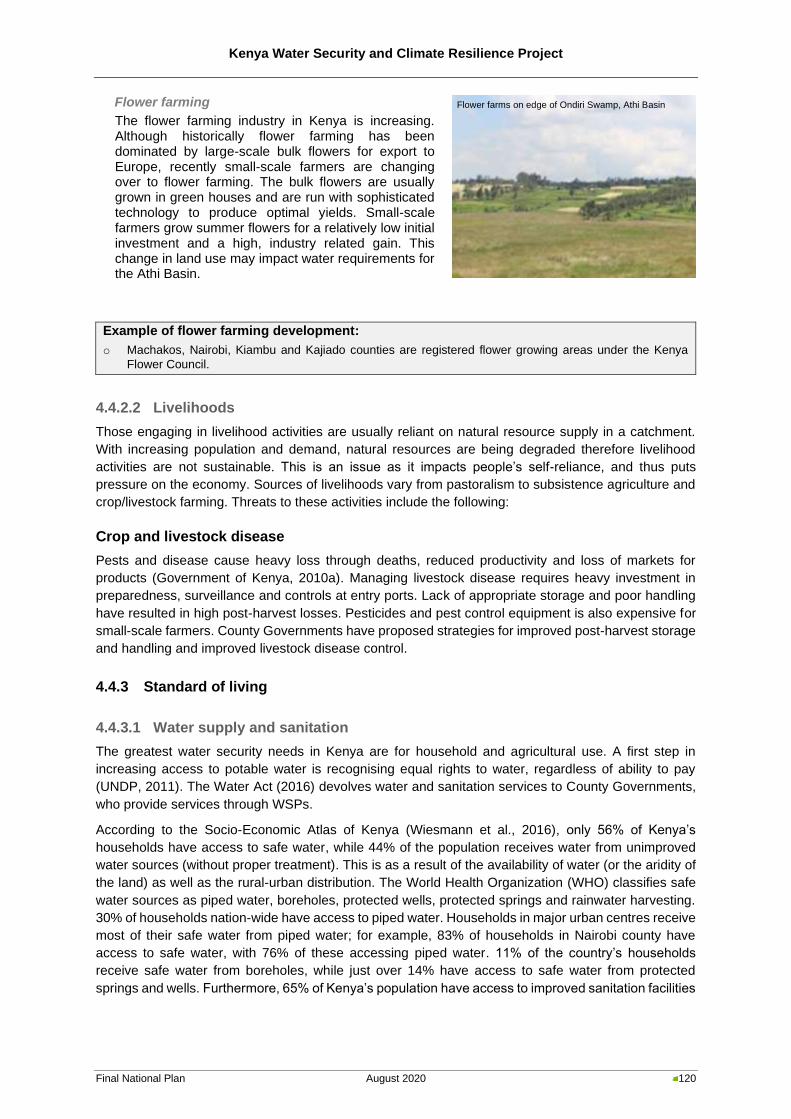
Kenya Water Security and Climate Resilience Project
Final National Plan August 2020 120
Flower farming
The flower farming industry in Kenya is increasing. Although historically flower farming has been dominated by large-scale bulk flowers for export to Europe, recently small-scale farmers are changing over to flower farming. The bulk flowers are usually grown in green houses and are run with sophisticated technology to produce optimal yields. Small-scale farmers grow summer flowers for a relatively low initial investment and a high, industry related gain. This change in land use may impact water requirements for the Athi Basin.
Example of flower farming development:
o Machakos, Nairobi, Kiambu and Kajiado counties are registered flower growing areas under the Kenya
Flower Council.
4.4.2.2 Livelihoods
Those engaging in livelihood activities are usually reliant on natural resource supply in a catchment.
With increasing population and demand, natural resources are being degraded therefore livelihood
activities are not sustainable. This is an issue as it impacts people’s self-reliance, and thus puts
pressure on the economy. Sources of livelihoods vary from pastoralism to subsistence agriculture and
crop/livestock farming. Threats to these activities include the following:
Crop and livestock disease
Pests and disease cause heavy loss through deaths, reduced productivity and loss of markets for
products (Government of Kenya, 2010a). Managing livestock disease requires heavy investment in
preparedness, surveillance and controls at entry ports. Lack of appropriate storage and poor handling
have resulted in high post-harvest losses. Pesticides and pest control equipment is also expensive for
small-scale farmers. County Governments have proposed strategies for improved post-harvest storage
and handling and improved livestock disease control.
4.4.3 Standard of living
4.4.3.1 Water supply and sanitation
The greatest water security needs in Kenya are for household and agricultural use. A first step in
increasing access to potable water is recognising equal rights to water, regardless of ability to pay
(UNDP, 2011). The Water Act (2016) devolves water and sanitation services to County Governments,
who provide services through WSPs.
According to the Socio-Economic Atlas of Kenya (Wiesmann et al., 2016), only 56% of Kenya’s
households have access to safe water, while 44% of the population receives water from unimproved
water sources (without proper treatment). This is as a result of the availability of water (or the aridity of
the land) as well as the rural-urban distribution. The World Health Organization (WHO) classifies safe
water sources as piped water, boreholes, protected wells, protected springs and rainwater harvesting.
30% of households nation-wide have access to piped water. Households in major urban centres receive
most of their safe water from piped water; for example, 83% of households in Nairobi county have
access to safe water, with 76% of these accessing piped water. 11% of the country’s households
receive safe water from boreholes, while just over 14% have access to safe water from protected
springs and wells. Furthermore, 65% of Kenya’s population have access to improved sanitation facilities
Flower farms on edge of Ondiri Swamp, Athi Basin
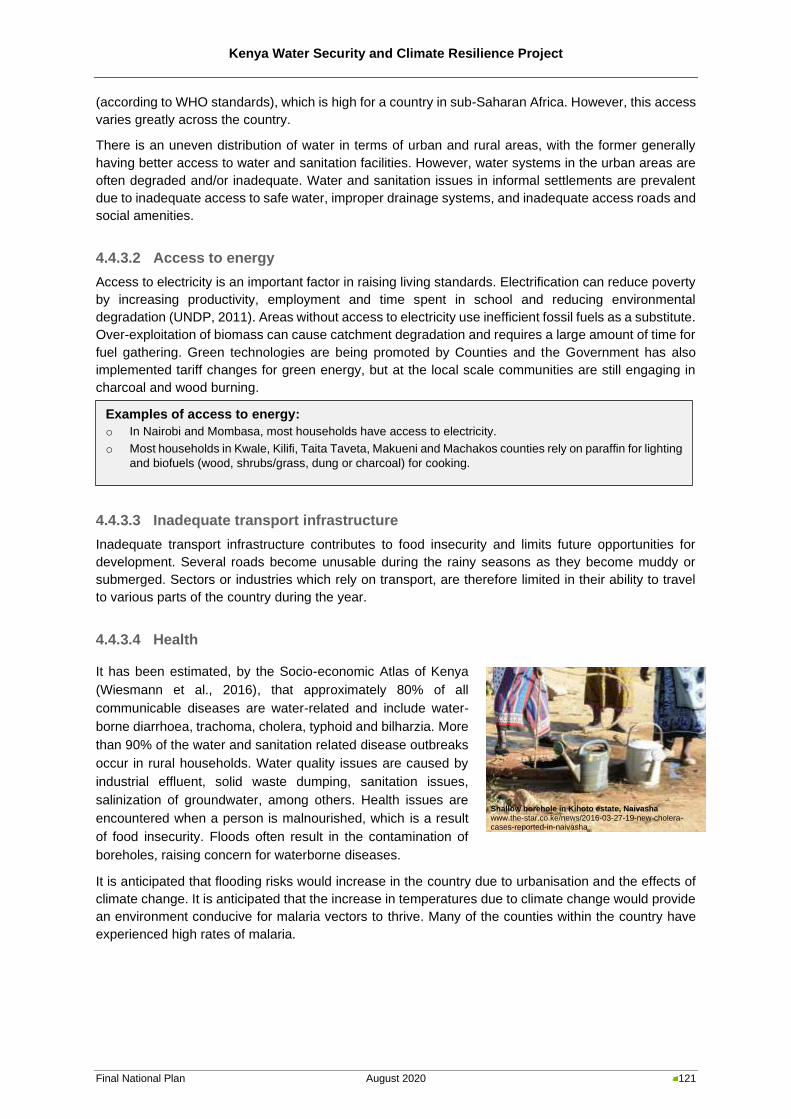
Kenya Water Security and Climate Resilience Project
Final National Plan August 2020 121
(according to WHO standards), which is high for a country in sub-Saharan Africa. However, this access
varies greatly across the country.
There is an uneven distribution of water in terms of urban and rural areas, with the former generally
having better access to water and sanitation facilities. However, water systems in the urban areas are
often degraded and/or inadequate. Water and sanitation issues in informal settlements are prevalent
due to inadequate access to safe water, improper drainage systems, and inadequate access roads and
social amenities.
4.4.3.2 Access to energy
Access to electricity is an important factor in raising living standards. Electrification can reduce poverty
by increasing productivity, employment and time spent in school and reducing environmental
degradation (UNDP, 2011). Areas without access to electricity use inefficient fossil fuels as a substitute.
Over-exploitation of biomass can cause catchment degradation and requires a large amount of time for
fuel gathering. Green technologies are being promoted by Counties and the Government has also
implemented tariff changes for green energy, but at the local scale communities are still engaging in
charcoal and wood burning.
4.4.3.3 Inadequate transport infrastructure
Inadequate transport infrastructure contributes to food insecurity and limits future opportunities for
development. Several roads become unusable during the rainy seasons as they become muddy or
submerged. Sectors or industries which rely on transport, are therefore limited in their ability to travel
to various parts of the country during the year.
4.4.3.4 Health
It has been estimated, by the Socio-economic Atlas of Kenya
(Wiesmann et al., 2016), that approximately 80% of all
communicable diseases are water-related and include water-
borne diarrhoea, trachoma, cholera, typhoid and bilharzia. More
than 90% of the water and sanitation related disease outbreaks
occur in rural households. Water quality issues are caused by
industrial effluent, solid waste dumping, sanitation issues,
salinization of groundwater, among others. Health issues are
encountered when a person is malnourished, which is a result
of food insecurity. Floods often result in the contamination of
boreholes, raising concern for waterborne diseases.
It is anticipated that flooding risks would increase in the country due to urbanisation and the effects of
climate change. It is anticipated that the increase in temperatures due to climate change would provide
an environment conducive for malaria vectors to thrive. Many of the counties within the country have
experienced high rates of malaria.
Examples of access to energy:
o In Nairobi and Mombasa, most households have access to electricity.
o Most households in Kwale, Kilifi, Taita Taveta, Makueni and Machakos counties rely on paraffin for lighting
and biofuels (wood, shrubs/grass, dung or charcoal) for cooking.
Shallow borehole in Kihoto estate, Naivasha www.the-star.co.ke/news/2016-03-27-19-new-cholera-cases-reported-in-naivasha
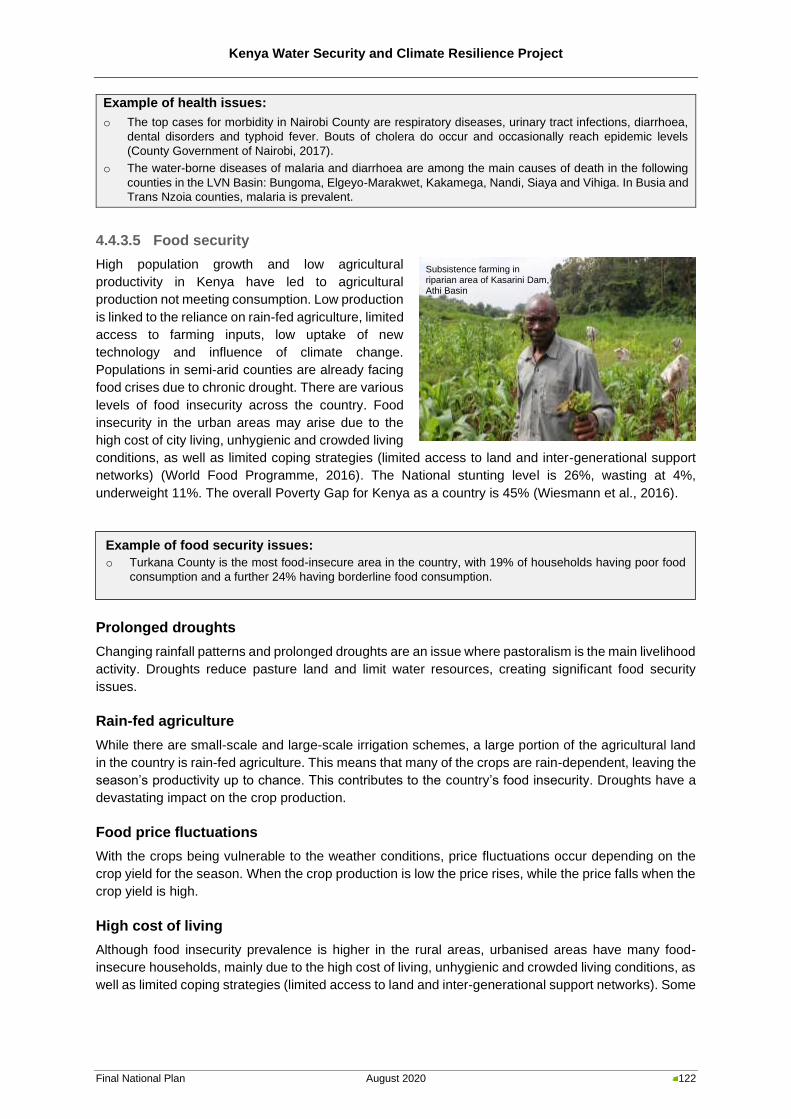
Kenya Water Security and Climate Resilience Project
Final National Plan August 2020 122
Example of health issues:
o The top cases for morbidity in Nairobi County are respiratory diseases, urinary tract infections, diarrhoea,
dental disorders and typhoid fever. Bouts of cholera do occur and occasionally reach epidemic levels
(County Government of Nairobi, 2017).
o The water-borne diseases of malaria and diarrhoea are among the main causes of death in the following
counties in the LVN Basin: Bungoma, Elgeyo-Marakwet, Kakamega, Nandi, Siaya and Vihiga. In Busia and
Trans Nzoia counties, malaria is prevalent.
4.4.3.5 Food security
High population growth and low agricultural
productivity in Kenya have led to agricultural
production not meeting consumption. Low production
is linked to the reliance on rain-fed agriculture, limited
access to farming inputs, low uptake of new
technology and influence of climate change.
Populations in semi-arid counties are already facing
food crises due to chronic drought. There are various
levels of food insecurity across the country. Food
insecurity in the urban areas may arise due to the
high cost of city living, unhygienic and crowded living
conditions, as well as limited coping strategies (limited access to land and inter-generational support
networks) (World Food Programme, 2016). The National stunting level is 26%, wasting at 4%,
underweight 11%. The overall Poverty Gap for Kenya as a country is 45% (Wiesmann et al., 2016).
Prolonged droughts
Changing rainfall patterns and prolonged droughts are an issue where pastoralism is the main livelihood
activity. Droughts reduce pasture land and limit water resources, creating significant food security
issues.
Rain-fed agriculture
While there are small-scale and large-scale irrigation schemes, a large portion of the agricultural land
in the country is rain-fed agriculture. This means that many of the crops are rain-dependent, leaving the
season’s productivity up to chance. This contributes to the country’s food insecurity. Droughts have a
devastating impact on the crop production.
Food price fluctuations
With the crops being vulnerable to the weather conditions, price fluctuations occur depending on the
crop yield for the season. When the crop production is low the price rises, while the price falls when the
crop yield is high.
High cost of living
Although food insecurity prevalence is higher in the rural areas, urbanised areas have many food-
insecure households, mainly due to the high cost of living, unhygienic and crowded living conditions, as
well as limited coping strategies (limited access to land and inter-generational support networks). Some
Example of food security issues:
o Turkana County is the most food-insecure area in the country, with 19% of households having poor food
consumption and a further 24% having borderline food consumption.
Subsistence farming in riparian area of Kasarini Dam, Athi Basin
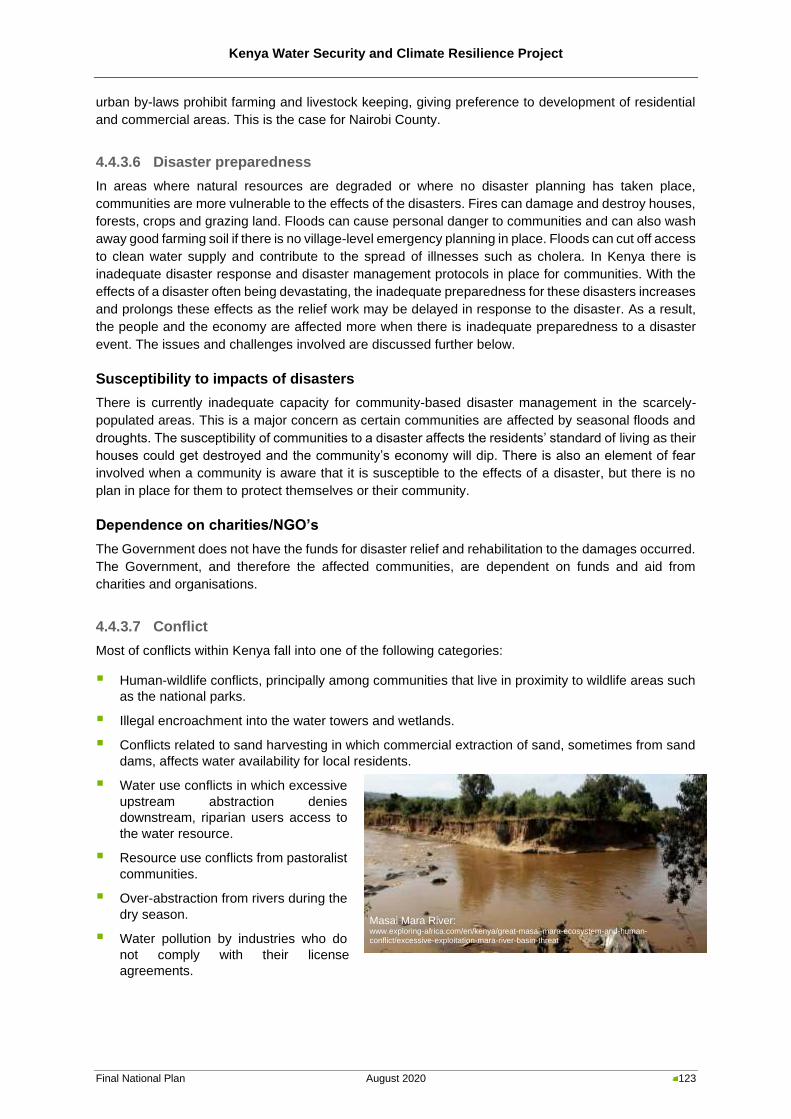
Kenya Water Security and Climate Resilience Project
Final National Plan August 2020 123
urban by-laws prohibit farming and livestock keeping, giving preference to development of residential
and commercial areas. This is the case for Nairobi County.
4.4.3.6 Disaster preparedness
In areas where natural resources are degraded or where no disaster planning has taken place,
communities are more vulnerable to the effects of the disasters. Fires can damage and destroy houses,
forests, crops and grazing land. Floods can cause personal danger to communities and can also wash
away good farming soil if there is no village-level emergency planning in place. Floods can cut off access
to clean water supply and contribute to the spread of illnesses such as cholera. In Kenya there is
inadequate disaster response and disaster management protocols in place for communities. With the
effects of a disaster often being devastating, the inadequate preparedness for these disasters increases
and prolongs these effects as the relief work may be delayed in response to the disaster. As a result,
the people and the economy are affected more when there is inadequate preparedness to a disaster
event. The issues and challenges involved are discussed further below.
Susceptibility to impacts of disasters
There is currently inadequate capacity for community-based disaster management in the scarcely-
populated areas. This is a major concern as certain communities are affected by seasonal floods and
droughts. The susceptibility of communities to a disaster affects the residents’ standard of living as their
houses could get destroyed and the community’s economy will dip. There is also an element of fear
involved when a community is aware that it is susceptible to the effects of a disaster, but there is no
plan in place for them to protect themselves or their community.
Dependence on charities/NGO’s
The Government does not have the funds for disaster relief and rehabilitation to the damages occurred.
The Government, and therefore the affected communities, are dependent on funds and aid from
charities and organisations.
4.4.3.7 Conflict
Most of conflicts within Kenya fall into one of the following categories:
▪ Human-wildlife conflicts, principally among communities that live in proximity to wildlife areas such
as the national parks.
▪ Illegal encroachment into the water towers and wetlands.
▪ Conflicts related to sand harvesting in which commercial extraction of sand, sometimes from sand
dams, affects water availability for local residents.
▪ Water use conflicts in which excessive
upstream abstraction denies
downstream, riparian users access to
the water resource.
▪ Resource use conflicts from pastoralist
communities.
▪ Over-abstraction from rivers during the
dry season.
▪ Water pollution by industries who do
not comply with their license
agreements.
Masai Mara River: www.exploring-africa.com/en/kenya/great-masai-mara-ecosystem-and-human-conflict/excessive-exploitation-mara-river-basin-threat
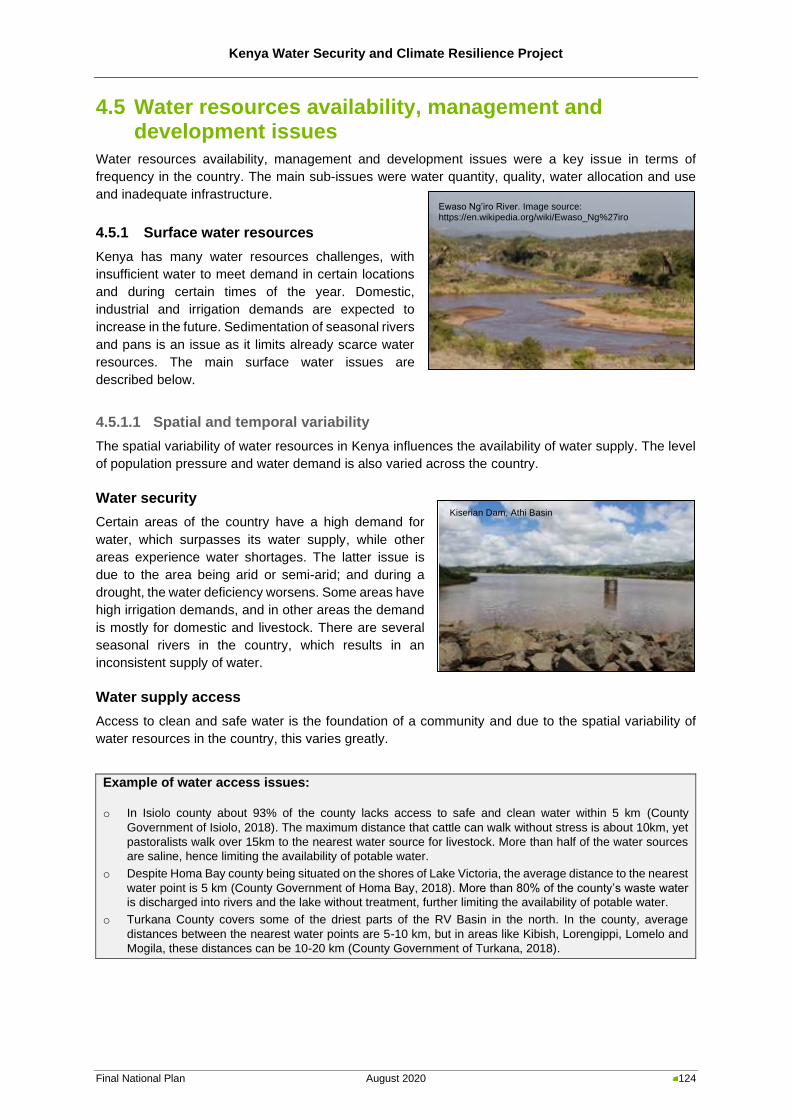
Kenya Water Security and Climate Resilience Project
Final National Plan August 2020 124
4.5 Water resources availability, management and development issues
Water resources availability, management and development issues were a key issue in terms of
frequency in the country. The main sub-issues were water quantity, quality, water allocation and use
and inadequate infrastructure.
4.5.1 Surface water resources
Kenya has many water resources challenges, with
insufficient water to meet demand in certain locations
and during certain times of the year. Domestic,
industrial and irrigation demands are expected to
increase in the future. Sedimentation of seasonal rivers
and pans is an issue as it limits already scarce water
resources. The main surface water issues are
described below.
4.5.1.1 Spatial and temporal variability
The spatial variability of water resources in Kenya influences the availability of water supply. The level
of population pressure and water demand is also varied across the country.
Water security
Certain areas of the country have a high demand for
water, which surpasses its water supply, while other
areas experience water shortages. The latter issue is
due to the area being arid or semi-arid; and during a
drought, the water deficiency worsens. Some areas have
high irrigation demands, and in other areas the demand
is mostly for domestic and livestock. There are several
seasonal rivers in the country, which results in an
inconsistent supply of water.
Water supply access
Access to clean and safe water is the foundation of a community and due to the spatial variability of
water resources in the country, this varies greatly.
Example of water access issues:
o In Isiolo county about 93% of the county lacks access to safe and clean water within 5 km (County
Government of Isiolo, 2018). The maximum distance that cattle can walk without stress is about 10km, yet
pastoralists walk over 15km to the nearest water source for livestock. More than half of the water sources
are saline, hence limiting the availability of potable water.
o Despite Homa Bay county being situated on the shores of Lake Victoria, the average distance to the nearest
water point is 5 km (County Government of Homa Bay, 2018). More than 80% of the county’s waste water
is discharged into rivers and the lake without treatment, further limiting the availability of potable water.
o Turkana County covers some of the driest parts of the RV Basin in the north. In the county, average
distances between the nearest water points are 5-10 km, but in areas like Kibish, Lorengippi, Lomelo and
Mogila, these distances can be 10-20 km (County Government of Turkana, 2018).
Ewaso Ng’iro River. Image source: https://en.wikipedia.org/wiki/Ewaso_Ng%27iro
Kiserian Dam, Athi Basin
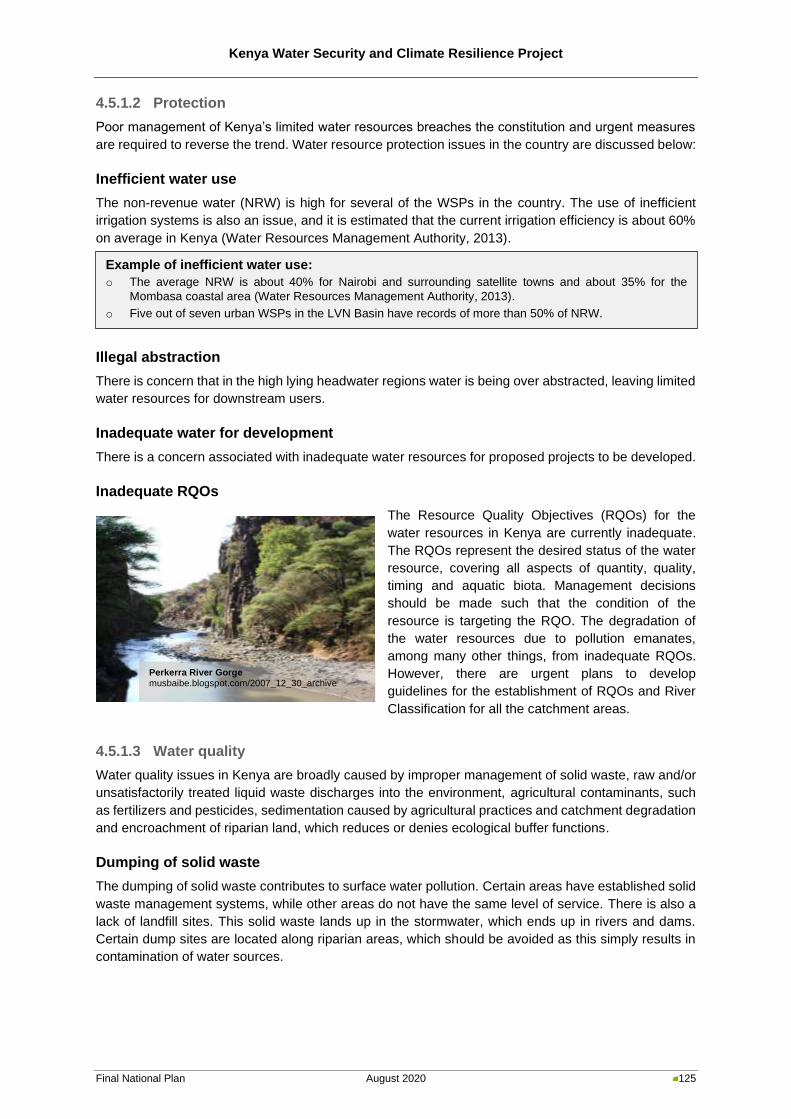
Kenya Water Security and Climate Resilience Project
Final National Plan August 2020 125
4.5.1.2 Protection
Poor management of Kenya’s limited water resources breaches the constitution and urgent measures
are required to reverse the trend. Water resource protection issues in the country are discussed below:
Inefficient water use
The non-revenue water (NRW) is high for several of the WSPs in the country. The use of inefficient
irrigation systems is also an issue, and it is estimated that the current irrigation efficiency is about 60%
on average in Kenya (Water Resources Management Authority, 2013).
Illegal abstraction
There is concern that in the high lying headwater regions water is being over abstracted, leaving limited
water resources for downstream users.
Inadequate water for development
There is a concern associated with inadequate water resources for proposed projects to be developed.
Inadequate RQOs
The Resource Quality Objectives (RQOs) for the
water resources in Kenya are currently inadequate.
The RQOs represent the desired status of the water
resource, covering all aspects of quantity, quality,
timing and aquatic biota. Management decisions
should be made such that the condition of the
resource is targeting the RQO. The degradation of
the water resources due to pollution emanates,
among many other things, from inadequate RQOs.
However, there are urgent plans to develop
guidelines for the establishment of RQOs and River
Classification for all the catchment areas.
4.5.1.3 Water quality
Water quality issues in Kenya are broadly caused by improper management of solid waste, raw and/or
unsatisfactorily treated liquid waste discharges into the environment, agricultural contaminants, such
as fertilizers and pesticides, sedimentation caused by agricultural practices and catchment degradation
and encroachment of riparian land, which reduces or denies ecological buffer functions.
Dumping of solid waste
The dumping of solid waste contributes to surface water pollution. Certain areas have established solid
waste management systems, while other areas do not have the same level of service. There is also a
lack of landfill sites. This solid waste lands up in the stormwater, which ends up in rivers and dams.
Certain dump sites are located along riparian areas, which should be avoided as this simply results in
contamination of water sources.
Example of inefficient water use:
o The average NRW is about 40% for Nairobi and surrounding satellite towns and about 35% for the
Mombasa coastal area (Water Resources Management Authority, 2013).
o Five out of seven urban WSPs in the LVN Basin have records of more than 50% of NRW.
Perkerra River Gorge musbaibe.blogspot.com/2007_12_30_archive
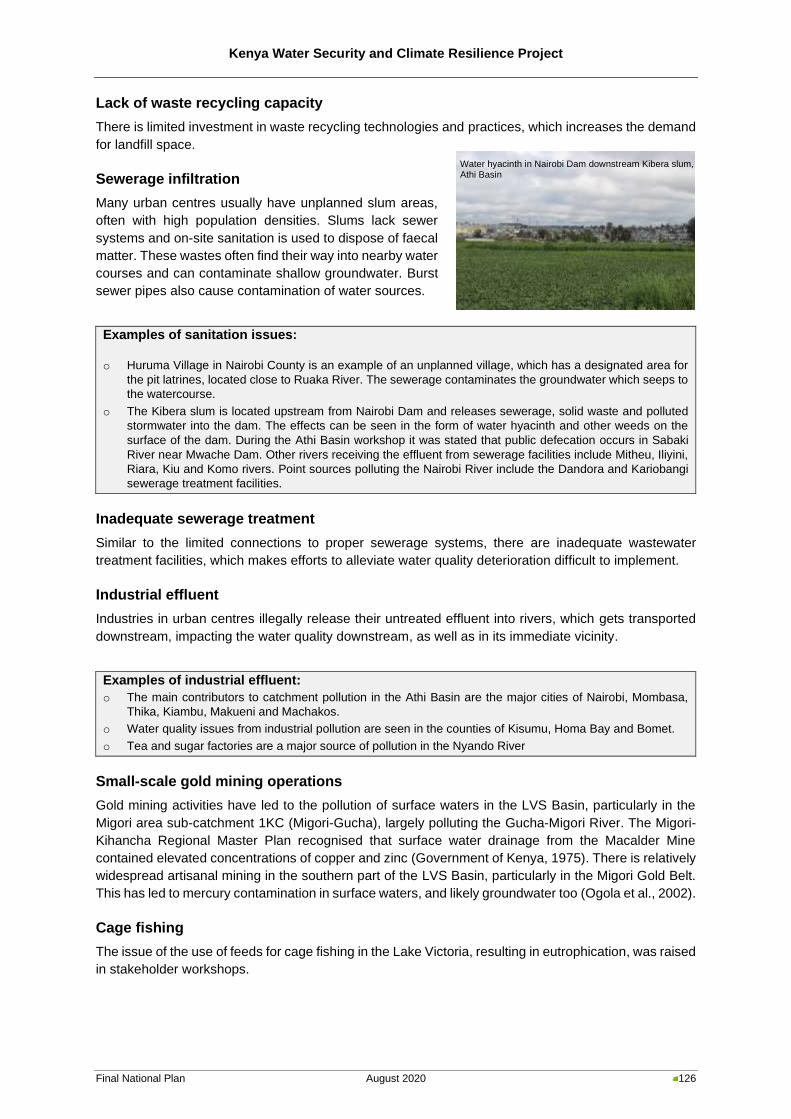
Kenya Water Security and Climate Resilience Project
Final National Plan August 2020 126
Lack of waste recycling capacity
There is limited investment in waste recycling technologies and practices, which increases the demand
for landfill space.
Sewerage infiltration
Many urban centres usually have unplanned slum areas,
often with high population densities. Slums lack sewer
systems and on-site sanitation is used to dispose of faecal
matter. These wastes often find their way into nearby water
courses and can contaminate shallow groundwater. Burst
sewer pipes also cause contamination of water sources.
Examples of sanitation issues:
o Huruma Village in Nairobi County is an example of an unplanned village, which has a designated area for
the pit latrines, located close to Ruaka River. The sewerage contaminates the groundwater which seeps to
the watercourse.
o The Kibera slum is located upstream from Nairobi Dam and releases sewerage, solid waste and polluted
stormwater into the dam. The effects can be seen in the form of water hyacinth and other weeds on the
surface of the dam. During the Athi Basin workshop it was stated that public defecation occurs in Sabaki
River near Mwache Dam. Other rivers receiving the effluent from sewerage facilities include Mitheu, Iliyini,
Riara, Kiu and Komo rivers. Point sources polluting the Nairobi River include the Dandora and Kariobangi
sewerage treatment facilities.
Inadequate sewerage treatment
Similar to the limited connections to proper sewerage systems, there are inadequate wastewater
treatment facilities, which makes efforts to alleviate water quality deterioration difficult to implement.
Industrial effluent
Industries in urban centres illegally release their untreated effluent into rivers, which gets transported
downstream, impacting the water quality downstream, as well as in its immediate vicinity.
Examples of industrial effluent:
o The main contributors to catchment pollution in the Athi Basin are the major cities of Nairobi, Mombasa,
Thika, Kiambu, Makueni and Machakos.
o Water quality issues from industrial pollution are seen in the counties of Kisumu, Homa Bay and Bomet.
o Tea and sugar factories are a major source of pollution in the Nyando River
Small-scale gold mining operations
Gold mining activities have led to the pollution of surface waters in the LVS Basin, particularly in the
Migori area sub-catchment 1KC (Migori-Gucha), largely polluting the Gucha-Migori River. The Migori-
Kihancha Regional Master Plan recognised that surface water drainage from the Macalder Mine
contained elevated concentrations of copper and zinc (Government of Kenya, 1975). There is relatively
widespread artisanal mining in the southern part of the LVS Basin, particularly in the Migori Gold Belt.
This has led to mercury contamination in surface waters, and likely groundwater too (Ogola et al., 2002).
Cage fishing
The issue of the use of feeds for cage fishing in the Lake Victoria, resulting in eutrophication, was raised
in stakeholder workshops.
Water hyacinth in Nairobi Dam downstream Kibera slum, Athi Basin
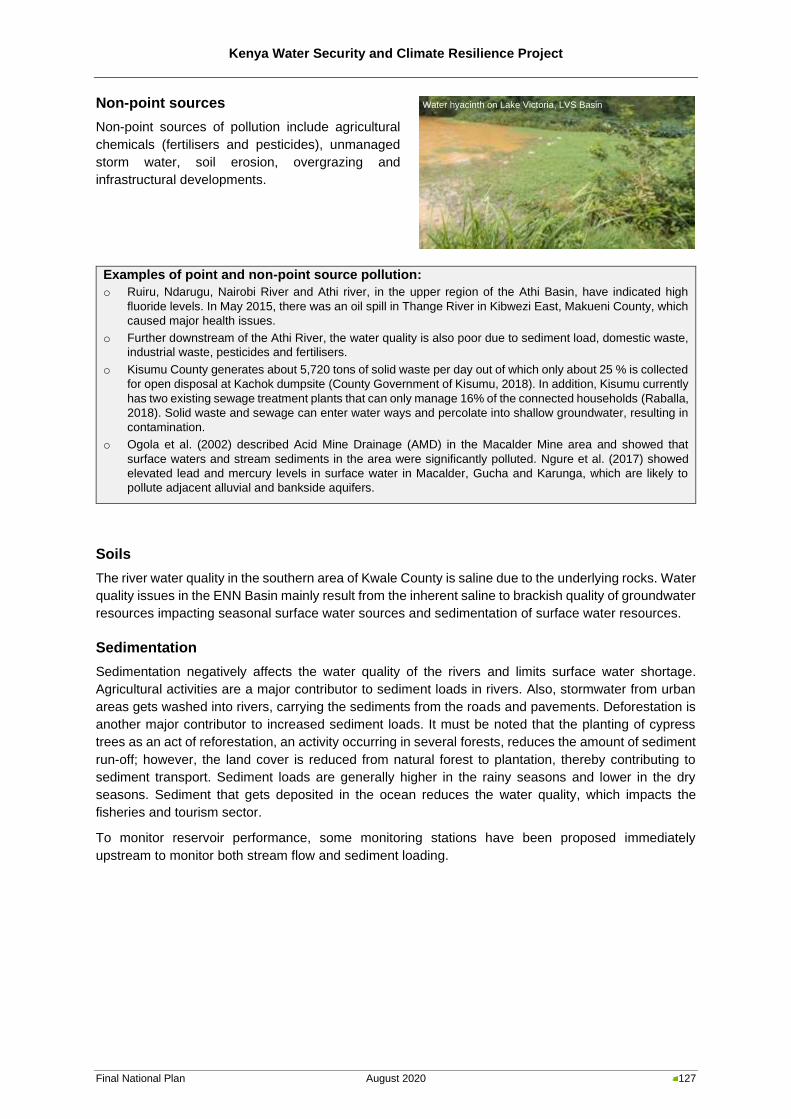
Kenya Water Security and Climate Resilience Project
Final National Plan August 2020 127
Non-point sources
Non-point sources of pollution include agricultural
chemicals (fertilisers and pesticides), unmanaged
storm water, soil erosion, overgrazing and
infrastructural developments.
Examples of point and non-point source pollution:
o Ruiru, Ndarugu, Nairobi River and Athi river, in the upper region of the Athi Basin, have indicated high
fluoride levels. In May 2015, there was an oil spill in Thange River in Kibwezi East, Makueni County, which
caused major health issues.
o Further downstream of the Athi River, the water quality is also poor due to sediment load, domestic waste,
industrial waste, pesticides and fertilisers.
o Kisumu County generates about 5,720 tons of solid waste per day out of which only about 25 % is collected
for open disposal at Kachok dumpsite (County Government of Kisumu, 2018). In addition, Kisumu currently
has two existing sewage treatment plants that can only manage 16% of the connected households (Raballa,
2018). Solid waste and sewage can enter water ways and percolate into shallow groundwater, resulting in
contamination.
o Ogola et al. (2002) described Acid Mine Drainage (AMD) in the Macalder Mine area and showed that
surface waters and stream sediments in the area were significantly polluted. Ngure et al. (2017) showed
elevated lead and mercury levels in surface water in Macalder, Gucha and Karunga, which are likely to
pollute adjacent alluvial and bankside aquifers.
Soils
The river water quality in the southern area of Kwale County is saline due to the underlying rocks. Water
quality issues in the ENN Basin mainly result from the inherent saline to brackish quality of groundwater
resources impacting seasonal surface water sources and sedimentation of surface water resources.
Sedimentation
Sedimentation negatively affects the water quality of the rivers and limits surface water shortage.
Agricultural activities are a major contributor to sediment loads in rivers. Also, stormwater from urban
areas gets washed into rivers, carrying the sediments from the roads and pavements. Deforestation is
another major contributor to increased sediment loads. It must be noted that the planting of cypress
trees as an act of reforestation, an activity occurring in several forests, reduces the amount of sediment
run-off; however, the land cover is reduced from natural forest to plantation, thereby contributing to
sediment transport. Sediment loads are generally higher in the rainy seasons and lower in the dry
seasons. Sediment that gets deposited in the ocean reduces the water quality, which impacts the
fisheries and tourism sector.
To monitor reservoir performance, some monitoring stations have been proposed immediately
upstream to monitor both stream flow and sediment loading.
Water hyacinth on Lake Victoria, LVS Basin
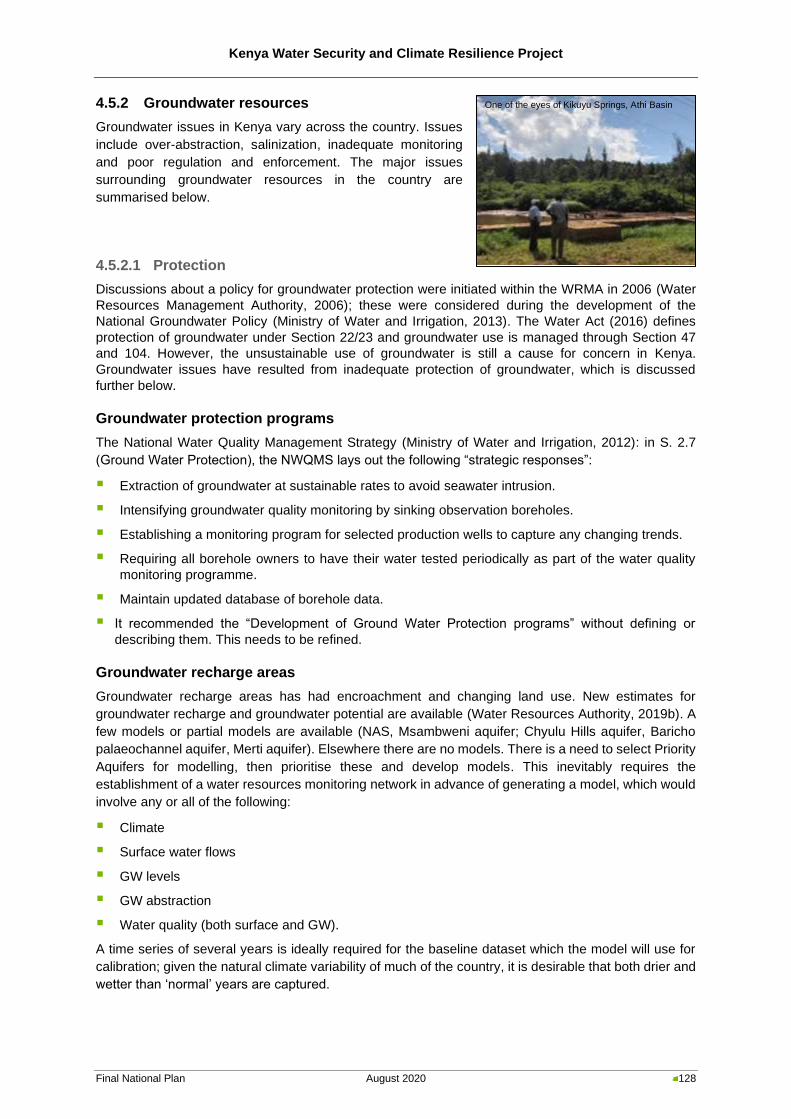
Kenya Water Security and Climate Resilience Project
Final National Plan August 2020 128
4.5.2 Groundwater resources
Groundwater issues in Kenya vary across the country. Issues
include over-abstraction, salinization, inadequate monitoring
and poor regulation and enforcement. The major issues
surrounding groundwater resources in the country are
summarised below.
4.5.2.1 Protection
Discussions about a policy for groundwater protection were initiated within the WRMA in 2006 (Water
Resources Management Authority, 2006); these were considered during the development of the
National Groundwater Policy (Ministry of Water and Irrigation, 2013). The Water Act (2016) defines
protection of groundwater under Section 22/23 and groundwater use is managed through Section 47
and 104. However, the unsustainable use of groundwater is still a cause for concern in Kenya.
Groundwater issues have resulted from inadequate protection of groundwater, which is discussed
further below.
Groundwater protection programs
The National Water Quality Management Strategy (Ministry of Water and Irrigation, 2012): in S. 2.7
(Ground Water Protection), the NWQMS lays out the following “strategic responses”:
▪ Extraction of groundwater at sustainable rates to avoid seawater intrusion.
▪ Intensifying groundwater quality monitoring by sinking observation boreholes.
▪ Establishing a monitoring program for selected production wells to capture any changing trends.
▪ Requiring all borehole owners to have their water tested periodically as part of the water quality
monitoring programme.
▪ Maintain updated database of borehole data.
▪ It recommended the “Development of Ground Water Protection programs” without defining or
describing them. This needs to be refined.
Groundwater recharge areas
Groundwater recharge areas has had encroachment and changing land use. New estimates for
groundwater recharge and groundwater potential are available (Water Resources Authority, 2019b). A
few models or partial models are available (NAS, Msambweni aquifer; Chyulu Hills aquifer, Baricho
palaeochannel aquifer, Merti aquifer). Elsewhere there are no models. There is a need to select Priority
Aquifers for modelling, then prioritise these and develop models. This inevitably requires the
establishment of a water resources monitoring network in advance of generating a model, which would
involve any or all of the following:
▪ Climate
▪ Surface water flows
▪ GW levels
▪ GW abstraction
▪ Water quality (both surface and GW).
A time series of several years is ideally required for the baseline dataset which the model will use for
calibration; given the natural climate variability of much of the country, it is desirable that both drier and
wetter than ‘normal’ years are captured.
One of the eyes of Kikuyu Springs, Athi Basin
Kenya Water Security and Climate Resilience Project
Final National Plan August 2020 129
Examples of groundwater recharge areas issues:
o During a field visit in Nairobi and Kiambu counties, there was evidence of encroachment into groundwater recharge areas, such as Manguo swamp, which lies on the fault line recharging the groundwater source of Kikuyu Springs. Manguo Swamp also receives the effluent from an abattoir, thus polluting the groundwater source of the springs.
o Other vulnerable systems include the Baricho paleochannel aquifer, which is at risk from upstream development (dams and consumptive water use; and irrigation water demand from the Sabaki River for the Galana-Kulalu Project).
Unsustainable groundwater use
Due to inadequate enforcement, groundwater is under major stress as over abstraction of groundwater
has been occurring for an extended period in certain areas of the country.
Examples of unsustainable groundwater use:
o Some Basement aquifers have suffered localised depletion, as well as springs in parts of the Laikipia/Mount
Kenya volcanics.
o The WRA identified two aquifers that are at risk of over-abstraction (Water Resources Management Authority, 2007b). These are the Kericho aquifer (a minor aquifer); and the Mara River aquifer (a poor aquifer in the Mara basin). Given the relatively high density of boreholes in the Migori area (Onyango, 2014), this aquifer should be studied to determine whether over-abstraction is taking place. Migori hosts one of the WRA monitoring boreholes (Water Resources Management Authority, 2015a).
Coastal aquifers
In the lower catchment of the Athi Basin, the marine environment is characterised by fragile ecosystems
which are sensitive to water resources fluctuations. Thin perched fresh water aquifers are underlain by
sea water at shallow depths. Abstraction of these aquifers is limited by salinization occasioned by sea
water intrusion consequent from the pumping, and natural discharge from the coast. The coastal
aquifers are faced with a myriad of challenges including inadequate information, inadequate monitoring,
limited understanding of the dynamics and lack of water supply alternatives. Furthermore, shallow
aquifers beneath leaking sewers and from pit latrines in informal settlements are at risk of direct
pollution. Finally, open shallow wells exploited by bucket lift are exposed to the atmosphere and the
introduction of foreign materials into the wellbore (including dropped and none too clean buckets and
jerry cans).
Saltwater intrusion has occurred in the Shela sand dune aquifer, Lamu. This may be due to over-
abstraction or that only a small part of the aquifer is exploited. A simple numerical model will be
developed for the Shela aquifer during 2019, after which it will be possible to draw up a coherent
management plan. There may be grounds for concern about over-abstraction in the Lake Kenyatta coral
and sand aquifer. The aquifer lies close to sea level, and there is a potential risk of saltwater intrusion.
Pollution risks elsewhere
The NAS may be under threat from polluted surface waters; there is no doubt that Nairobi’s surface
waters are polluted, and there is evidence that recharge may occur via impoundments and floodplains
(Oiro et al., 2018). Consequently, uncontrolled release of wastewaters from wastewater treatment
plants, significant oil spills, industrial plants and pollution from informal settlements all pose a risk to the
NAS. Uncontrolled release of organic wastes from abattoirs into surface waters is a further threat.
Example of coastal aquifers issues:
o A notable example of shallow aquifers beneath leaking sewers are Kisauni; in 2005, most of the pit latrines
in Mombasa County were located in low-income residential areas, and a full 55% of the 34,000 pit latrines
in the County were located in Kisauni (Munga et al., 2005).
o Saltwater intrusion has occurred in the Shela sand dune aquifer, Lamu. This may be due to over-
abstraction or that only a small part of the aquifer is exploited.
o There may be grounds for concern about over-abstraction in the Lake Kenyatta coral and sand aquifer.
The aquifer lies close to sea level, and there is a potential risk of saltwater intrusion.

Kenya Water Security and Climate Resilience Project
Final National Plan August 2020 130
Transboundary aquifers
The East African Community Protocol on Environment and Natural Resource Management (East
African Community, 2018) Article 13 (Management of Water Resources): “The Partner States shall
develop, harmonise and adopt common national policies, laws and programmes relating to the
management and sustainable use of water resources” is not yet ratified by Tanzania. The Final Draft
National Policy on Trans-Boundary Waters (Ministry of Water and Irrigation, 2009), provides limited
guidance or intent on transboundary groundwater resources. There is also the National Land Use Policy
(Ministry of Lands and Physical Planning, 2017), which specifically describes measures to be adopted
in relation to the definition and management of transboundary groundwater resources.
A transboundary aquifer policy needs to be developed; the National GW Policy (Ministry of Water and
Irrigation, 2013), lists the following activities required to improve transboundary GW management
(“Issue 9”):
Table 4-1: Proposed transboundary aquifer (TA) policy measures
Issue Objective Policy direction Activity Timeframe
Transboundary
aquifers not well
known,
characterised nor
managed
TAs well known,
characterised and
managed by
countries sharing
TAs
Implement
appropriate new
policies and
institutions to ensure
seamless
management of TAs
a) Identify and demarcate TAs;
b) Collect information;
c) Promote information sharing
and adopt international good
practices;
d) Expand transboundary
water unit to Department
Short- to long-
term
There is also the National Land Use Policy (Ministry of Lands and Physical Planning, 2017), which
specifically describes measures to be adopted in relation to the definition and management of
transboundary groundwater resources.
4.5.2.2 Water quality
Sewerage, salinisation, natural contaminants, agricultural activities
and mining activities are the main contributors to poor groundwater
in the country. Natural contaminants (TDS, fluoride, chloride, iron
and manganese) are distributed in groundwaters across Kenya.
There are currently no Groundwater Quality Management Plans for
areas with a high level of risk to groundwater quality issues.
Basement groundwaters often contain water with elevated TDS,
particularly in Arid and Semi-Arid Lands (ASALs). Shallow aquifers
face the greatest threat of pollution by human wastes, especially in
areas of high population density and in informal peri-urban
settlements. Shallow aquifer and well pollution is associated with pit
latrines and is a serious cause for concern. Nyabayo et al. (2016)
found that the concentrations of faecal coliforms in shallow well
waters correlated with distance between well and pit latrine – the
closer the pit latrine to the shallow well, the higher the faecal coliform
count.
Sand harvesting contributes to the turbidity of water, which decreases the water quality.
Pit latrine, Huruma village, Athi Basin
Kenya Water Security and Climate Resilience Project
Final National Plan August 2020 131
Examples of groundwater quality issues:
o Kimani-Murage & Ngindu (2007) found bacterial prevalence patterns in an informal settlement in Kisumu, confirming earlier work in the Migosi and Manyatta residential areas carried out by Orwa (2001). All are associated with high densities of pit latrines and shallow wells. Wright et al. (2013) found that nitrate and bacterial contamination in shallow groundwaters beneath Kisumu were linked. Again, pit latrine concentrations correlated strongly with excessive nitrate.
o There is widespread natural fluoride in the NAS and some other volcanic and Basement aquifers, as well as elevated natural iron and manganese in much of the basement aquifers.
o Despite intensive and focussed abstraction over a protracted period in the Merti Aquifer (since the early 1990s), groundwater abstraction does not have a significant impact on the water levels and quality on a large scale. However, local groundwater abstraction from the Merti beds, particularly at the edge of a fresh water facies, has the high risk of over-abstraction and salinization (Blandenier, 2015). This should therefore be monitored closely, as it is the sole source of water for the Dadaab refugee camp.
4.5.2.3 Institutional
Regulations
There is limited planning and water allocation when it comes to considering surface water and
groundwater allocation. The two remain divided, and effectively treated as different water resources.
The recent Water Allocation Plan Guideline (Water Resources Authority, 2019a) should help to resolve
this, as it treats both resources in a given area in its approach to WAPs. There is coinciding NEMA and
WRA mandates with regards to wastewater management and licensing. NEMA legislation (Act in 1999
and effluent regulations in the Environmental Management and Coordination (Water Quality)
Regulations, 2006) pre-date water legislation (Water Act in 2002, and effluent regulations in the WRM
Amendment Rules, 2012). Communication of mandates between counties and the WRA are also
uncertain, with counties in particular drilling boreholes without the benefit of WRA Authorisations and
sometimes of poor technical quality (installing mild steel casing/screen in low pH GW environments, for
example). Further potential conflict between National and County Governments is likely, regarding the
sharing of natural resources benefits (The Natural Resources (Benefit Sharing) Bill, 2014; The Natural
Resources (Benefit Sharing) Bill, 2018); the 2014 Bill was shelved, and the 2018 Bill has yet to be
debated. Both Bills specifically include water resources mandates between different state actors are
trans-sectoral.
Inadequate monitoring
Monitoring status has improved significantly in the past decade. However, data quality is patchy; most
groundwater level data are collected from boreholes that are used as production boreholes, so all too
often the data show dynamic as well as static water levels. This restricts the utility of water level data
to determine long-term trends. This is changing, however; as there are dedicated monitoring boreholes
being constructed across the country in 2018-19.
Private sector or NGO players may operate their own monitoring networks, such as that operated by
Base Titanium Ltd in the South Coast (covering both water levels and water chemistry). The water level
monitoring network operated by UNICEF/CARE Kenya in the Dadaab part of the Merti aquifer has been
terminated. Field water quality data collection is also improving, with a broader range of measurements
planned in order that resource-quality objectives (RQOs) can be determined. Abstraction monitoring is
done on an ad hoc basis at best. Groundwater users are required to submit abstraction data monthly
or quarterly as evidence to support their water charge payments, but these are rarely checked in the
field by the WRA. The capacity to improve abstraction monitoring will be boosted by the adoption of
formal guidelines for groundwater abstraction surveys, using electromagnetic flow meters (Water
Resources Authority, 2018).
Kenya Water Security and Climate Resilience Project
Final National Plan August 2020 132
Borehole inventory
Borehole data have been and are stored in a number of separate systems. The 1992 NWMP initiated
the National Water Resources Database (NAWARD), which remains a source of data though it has not
been updated since 2005; in the period 2005-10 the data collection role was taken up by the WRA, and
during the handover period, there was a measure of confusion as to which agency drilling contractors
should submit drilling data to (Ministry of Water and Irrigation, 2012); NAWARD included, inter alia, the
paper-based borehole data set in Nairobi. The WRA currently collects and stores borehole data in a
combination of paper and digital formats, with the long-term intention of digitising all records. The first
attempt at digitising borehole data was made in 2010-11 as part of the Nairobi Borehole Census. All
borehole records that could be found across a wide range of sources were digitised and established in
a Microsoft Access database system, protected by password access. Completion of the digitisation
exercise is essential. This should be digitally linked to/interfaced with the PDB.
Unclassified groundwater applications in the PDB
The PDB of the WRA has had challenges, including numerous duplicate or out-of-date entries. As an
example, one large-scale water user on the South Kenya Coast has six production boreholes, six small-
scale domestic groundwater sources, numerous monitoring piezometers and two surface water
offtakes. However, the database shows it to have 53 files, as follows:
▪ 18 files: 15 groundwater and three surface water Authorisations (which include some dedicated
piezometer and exploratory boreholes);
▪ Two files: two old boreholes described as ‘Deferred’, for which “Notification Approval for
Construction of Works and Use of Water” (Form WRMA OA3) have been issued;
▪ Five files: four groundwater sites and one surface water site described as ‘Pending HQ Verification’.
▪ Thirteen files: Permits issued (this conforms with paperwork held by this water user, except for two
GW sites which are uncertain);
▪ Two files: Inspection reports received, permits yet to be issued;
▪ One file for a site that was drilled but for which no Water Permit was sought, described as ‘Received
Completion Certificate’;
▪ Twelve files that were rejected.
This water user is understandably confused and has sought clarification from the WRA. A good deal of
the confusion in this case appears to be because the name of the Company making the applications
changed half-way through the process, which necessitated striking out and re-issuing paperwork with
new file numbers; in addition, a number of Authorisations were issued for piezometer and exploratory
boreholes, for which permits were not ultimately sought.
For water permit classification it is necessary to determine whether dedicated monitoring boreholes (or
piezometers) require a Water Permit. In cases where a monitoring borehole may be periodically used
to obtain small quantities of water for analysis (<<1m3), a Category A Permit should potentially be
issued. Prior to 2014, applications to construct monitoring boreholes were issued with Authorisations
but not Water Permits; since 2014 there has apparently been no requirement for either Authorisations
or Permits for monitoring boreholes (diameters <4”/102mm). It is necessary to determine whether true
exploratory boreholes require a Water Permit after completion if they are not to be commissioned as
production boreholes. There is a need to clarify the role and application of the Form WRMA 0A3
(Notification Approval for Construction of Work and Use of Water).
For Class A, the applicant will get an Approval. For Class B, C and D, the applicant is issued with a
Permit. For all Classes, the applicant is mandatorily required to obtain an Authorization.
Kenya Water Security and Climate Resilience Project
Final National Plan August 2020 133
4.5.3 Water resources infrastructure
On top of current water supply shortages across Kenya, increasing demands due to population growth
and urbanisation will further extrapolate this problem if no interventions are implemented. The key
issues regarding water resources infrastructure in Kenya are described below.
4.5.3.1 Bulk water supply systems and transfers
The main issue of bulk water supply systems in Kenya is inadequate storage for various uses. There is
also a concern that the current infrastructure will not meet the growing demands. The design of dams
and other infrastructure is important to maintain the capacity designed for. There has been evidence
that some dams as well other infrastructure are undersized for floods, which raises the question of
whether floods were considered during the design of the infrastructure.
4.5.3.2 Hydropower schemes
There are currently a few hydropower schemes in Kenya, with additional proposed hydropower projects
as part of proposed dam projects.
4.5.3.3 Irrigation schemes
There are a few large-scale irrigation schemes in Kenya, while most of the small-scale agriculture is
rain-fed. The lack of major irrigation schemes is a concern for the country. There are proposed irrigation
schemes, which should help relieve the problem of food insecurity.
4.5.3.4 Water supply network
The water supply and sanitation systems suffer from various issues including losses due to leakages,
bursts and blockages, illegal connections, inefficient and wasteful water use and overflow of sewers.
4.5.3.5 Future projects
Inadequate capacity for infrastructure development
The WRA and the Water Works Department do not have sufficient capabilities and financial resources
for the regulatory, monitoring and technical aspects of water resource infrastructure development. The
high cost of assessment of potential dam sites inhibits the Water Works Department’s ability to support
the development of new reservoirs. There is also inadequate capacity at WRUA level to initiate the
development of storage infrastructure.
Lack of investments into infrastructure development
An article by Business Daily (Wafula, 2010), highlights the issue that potential investors in the water
sector are put off by Kenya’s regulatory framework. Investors are hesitant to invest in the high-risk water
sector of Kenya where there are no guaranteed payments from consumers.
Priority areas for groundwater resource development
There is currently inadequate information regarding the groundwater potential across the country, and
priority areas have not been identified for groundwater resource development.
Example of investment issues:
o The CIDP for Taita Taveta County listed several projects which have been halted due to inadequate
funds. Some of these projects include Bomeni water pan, Chala water pan and Gimba irrigation scheme.
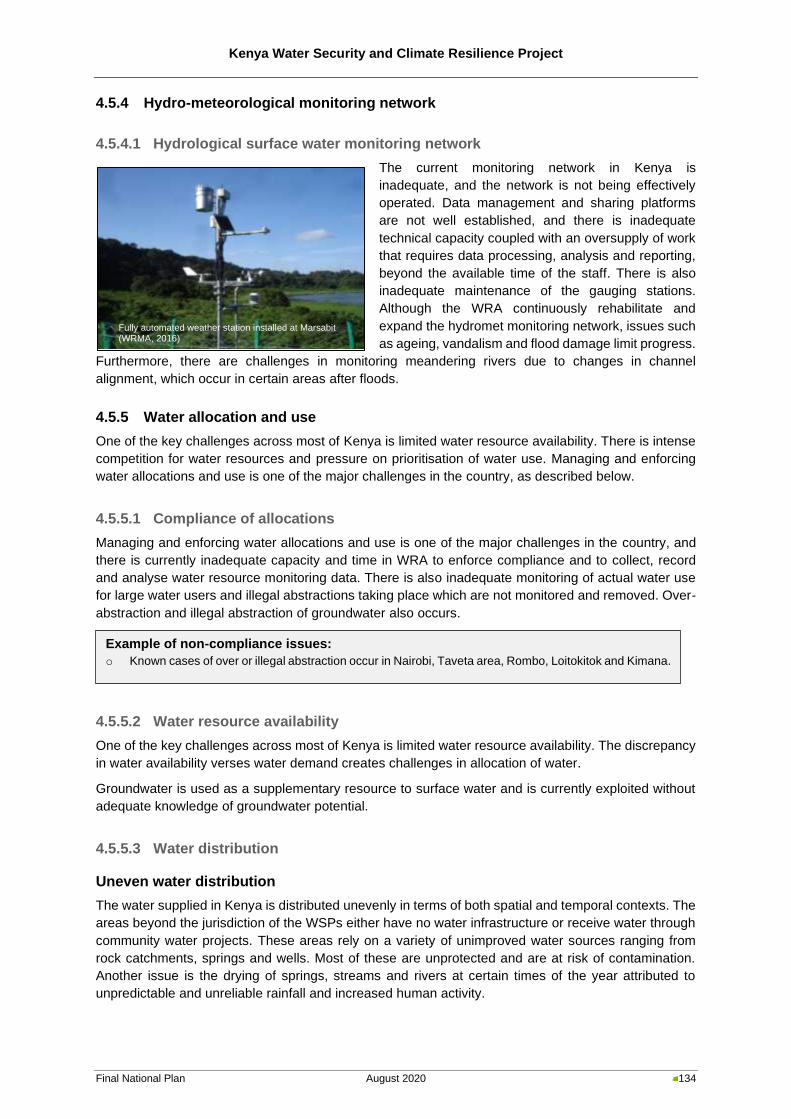
Kenya Water Security and Climate Resilience Project
Final National Plan August 2020 134
4.5.4 Hydro-meteorological monitoring network
4.5.4.1 Hydrological surface water monitoring network
The current monitoring network in Kenya is
inadequate, and the network is not being effectively
operated. Data management and sharing platforms
are not well established, and there is inadequate
technical capacity coupled with an oversupply of work
that requires data processing, analysis and reporting,
beyond the available time of the staff. There is also
inadequate maintenance of the gauging stations.
Although the WRA continuously rehabilitate and
expand the hydromet monitoring network, issues such
as ageing, vandalism and flood damage limit progress.
Furthermore, there are challenges in monitoring meandering rivers due to changes in channel
alignment, which occur in certain areas after floods.
4.5.5 Water allocation and use
One of the key challenges across most of Kenya is limited water resource availability. There is intense
competition for water resources and pressure on prioritisation of water use. Managing and enforcing
water allocations and use is one of the major challenges in the country, as described below.
4.5.5.1 Compliance of allocations
Managing and enforcing water allocations and use is one of the major challenges in the country, and
there is currently inadequate capacity and time in WRA to enforce compliance and to collect, record
and analyse water resource monitoring data. There is also inadequate monitoring of actual water use
for large water users and illegal abstractions taking place which are not monitored and removed. Over-
abstraction and illegal abstraction of groundwater also occurs.
4.5.5.2 Water resource availability
One of the key challenges across most of Kenya is limited water resource availability. The discrepancy
in water availability verses water demand creates challenges in allocation of water.
Groundwater is used as a supplementary resource to surface water and is currently exploited without
adequate knowledge of groundwater potential.
4.5.5.3 Water distribution
Uneven water distribution
The water supplied in Kenya is distributed unevenly in terms of both spatial and temporal contexts. The
areas beyond the jurisdiction of the WSPs either have no water infrastructure or receive water through
community water projects. These areas rely on a variety of unimproved water sources ranging from
rock catchments, springs and wells. Most of these are unprotected and are at risk of contamination.
Another issue is the drying of springs, streams and rivers at certain times of the year attributed to
unpredictable and unreliable rainfall and increased human activity.
Example of non-compliance issues:
o Known cases of over or illegal abstraction occur in Nairobi, Taveta area, Rombo, Loitokitok and Kimana.
Fully automated weather station installed at Marsabit (WRMA, 2016)
Kenya Water Security and Climate Resilience Project
Final National Plan August 2020 135
The fair allocation of water resources is affected by the social standing in society. For example, in Kwale
County, corruption, chauvinism and bias results in the uneven allocation and development of resources
(County Government of Kwale, 2013).
Growing water demands within competing sectors
There is intense competition for water resources and pressure on prioritisation of water use where there
are multiple sectors at play, such as large domestic demands, industrial sector, tourism and irrigated
agriculture. These areas face the challenge of ensuring the equitable and sustainable allocation of water
to domestic, industrial and agricultural users.
Water is a necessity for all sectors, which, when the availability is low or restricted, can result in tension.
When one sector is favoured in terms of water supply above another, conflict arises.
4.5.5.4 Inadequate information on allocatable water
There is currently inadequate information on surface and groundwater availability for the purpose of
water allocation management. Only limited estimates of allocatable water are available.
4.6 Institutional issues
Generally, institutional issues ranked third in terms of frequency in the country. These issues include
institutional arrangements, enabling environment and transboundary and trans-county issues.
4.6.1 Institutional arrangements
Key institutional issues in the country include inadequate capacity of the WRUAs, inadequate capacity
and knowledge of integrated water resource management in the County Governments, and inadequate
reporting framework to the public.
4.6.1.1 National policies and legislation
Promulgation of the Constitution (2010)
Kenya’s new Constitution (2010) introduced the County Governments structure that was aimed at
decentralising some of the national functions to the 47 counties. The Water Act (2016) provides policy
direction and relegates catchment management and water supply services to County Governments.
Examples of uneven water distribution:
o In Kwale County, the existing water systems are based around the urban and commercial centres,
resulting in uneven distribution and low access to water in the sparsely populated rural areas.
o In Nairobi, the bulk water supply is unreliable during droughts, with only 40% of household connections
receiving water continuously (County Government of Nairobi, 2017).
o An example is the domestic water supply to Eldoret is a higher priority than water supply to the people
living in the catchment area of the dam that supplies Eldoret.
Example of competing sectors and water allocation issues:
o While the upper part of Kiambu County has a high density of agricultural activity, the water in this upper
catchment area is stored and used to supply Nairobi.
Kenya Water Security and Climate Resilience Project
Final National Plan August 2020 136
Conflicting policies, regulations and mandates
Conflict exists in certain counties where either the County Government or Water Service Provider acts
in contention with the WRA mandates in order to increase income or to gain favour with the public. This
results in animosity towards the WRA.
A major issue is the mandates on wetlands and riparian lands. The Physical Planning Act, and
Agricultural/Land Acts, hold different definitions to the Water Act regulations as to what constitutes
riparian land. This has created mandate conflict on a national level and has also made it easy for people
to encroach on riparian land or for developers to bypass the law. However, at its sixteenth meeting held
on 2 June 2020, the National Development Implementation and Communication Cabinet Committee
noted the need for sustainable restoration of the Riparian reserve ecosystems. Through this need there
has been a Final Draft amendment to EMCA, Water Act 2016 and physical planning act to harmonize
these definitions. The preferred definition adopted by all Acts is: “Riparian reserve means the buffer of
earth surface not being the bed of a stream, river, ocean, natural or artificial lake, swamp or riverine
wetlands measured horizontally from the highest water mark and may include part of any land parcel
situated at any distance from the bank, that is protected under this Act or any other written law”. The
document is at the Attorney General for Final Drafting the Acts.
During some of the basin workshops, minimal coordination between National Government and County
Government was also highlighted as a key challenge. There is need to carry out a mapping and analysis
of key institutions in the national and County Governments, civil and private sectors and their
overlapping mandates while identifying opportunities of synergy. A detailed stakeholder analysis is to
be undertaken at the beginning of the Strategic Environmental Assessment (SEA) process. This will
include a governance and institutional assessment of the various institutions and how these are
envisaged to change in the proposed Basin Plans. Organisations such as NEMA and Kenya Wildlife
Trust (KWT) have acts in place, which conflict with WRA regulations. A range of institutions and
organisations are directly involved in forest management and conservation of forests in the basin. Most
of the forests in the basin forests are found on protected areas whose management is vested in the
KFS. There are also closed canopy forests gazetted as national parks and national reserves managed
by KWS. Moreover, a significant forest area is found in trust land and vested in the respective County
Governments. There are also indigenous forest areas under private ownership, either as units held
individually or within group ranches.
Revenue collection and resource mobilisation challenges
Currently, the billing system is not integrated with the Permitting Data Base (PDB) thus lowering
revenue billed. Initial consultations by ISC indicate that there is need to explore innovative additional
revenue streams to increase revenue base such as: (a) Further developing a policy directive/caveat on
all future development projects to include a 10-15 % budget to be set aside for conservation of water
resources management activities. Such a policy caveat has been developed, and the percentages are
the only remaining bit under discussion with the MWSI; (b) Commercialise water testing labs through
accreditation; and (c) Establish a Water Payment for Ecosystem Services Scheme anchored on
‘beneficiary pays principle’. Revenue collection rates for WRA are low due to inadequate resources to
facilitate this process. However, since 2009 the Authority has incorporated electronic payment services
through Mpesa, a mobile money transfer platform that will significantly increase the revenue collected
Examples of conflicting policies, regulations and mandates:
o The County Government of Kajiado County has a financial policy whereby the County Government
collects taxes from water users and abstractors and issues licenses to increase revenue within the
county, which is against WRA’s mandate.
o Mombasa Water and Sewerage Company (MOWASCO) was shutting down wells and confiscating
equipment (e.g. standpipes supplying water) from people who were complying with WRA’s mandate.
WRA had to intervene.
o NEMA’s physical planning act, which is not in alignment with WRA regulations.
Kenya Water Security and Climate Resilience Project
Final National Plan August 2020 137
because of the convenience it offers the water users. Also, there are on-going discussions on acquiring
an integrated system that will increase efficiency in the permitting and commercial processes at WRA.
Furthermore, there is on-going installation of automated telemetric consumer meters to enhance
revenue collection, while also minimising time for WRA staff to travel for meter readings.
Non-compliance to effluent discharge regulations
Poor water quality is one of the pressing challenges affecting the integrity of water resources in the
basin. There is an inadequate number of ED permits awarded to dischargers, which results in a decline
in compliance to effluent discharge regulations; thus, declining quality of effluent discharged. As a result,
water quality gets deteriorated. Furthermore, this signifies that there has been poor oversight and
pollution control from the WRA which could be attributed to inadequate resources such as technical
skills, monitoring equipment and financial resources to enforce effluent discharge regulation. Given the
widespread water quality challenges affecting the country, strengthening the capacity of the WRA to
enforce effluent discharge regulations, conduct water quality testing and compliance checks is pertinent
for reversing the trend of non-compliance amongst effluent dischargers.
4.6.1.2 National institutions
Uncoordinated institutional roles
The uncoordinated roles of the various organisations cause not only poor efficiency, but also conflict
between the organisations. WRA, KFS and KWT all have a catchment protection mandate, which
creates conflict when all three organisations have their set roles to fulfil. Similarly, there is conflict
between CFAs and WRUAs in terms of forest management, where the river sources are in the forest
which falls under the jurisdiction of the CFAs, while the WRUA usually manages the sub catchment
outside the jurisdiction of CFAs.
There is inadequate coordination between CGs and WRA. This makes it difficult for the WRUAs, whose
responsibility lies between that of the CGs and WRA, to implement sub-catchment based water
resources management interventions. Also, water resources management is a function that has
devolved to the CG, while WRA performs regulation of the CG’s management of water resources.
4.6.1.3 Basin and sub-basin institutions
Dormant or potential WRUAs
The gap of dormant or potential WRUAs needs to be addressed to ensure country-wide coverage of
WRUAs is increased. Even among the existing WRUAs, there are capacity concerns and disparities in
levels of development and maturity of the WRUAs. This denotes the need for continued capacity
building for the existing WRUAs in addition to continued technical and financial support.
The unclear role of the BWRCs
BWRCs replaced the former CAACs which previously played a regulatory function at a regional level
and maintained certain levels of autonomy. In terms of the Water Act 2016, BWRCs have not been
Examples of effluent discharge issues:
o According to Athi River Restoration Programme (Water Resources Management Authority, 2015c), the
following dischargers had not complied to WRA’s effluent discharge regulations: Limuru Water and
Sewerage Company, Export Processing Zone Authority, Machakos Water and Sewerage Company,
Kariobangi Sewerage Treatment Works and Kahawa West Sewage Treatment ponds. Dandora
Sewerage Treatment Works partially complied to WRA’s effluent discharge regulations.
o In 2014, 30 major effluent dischargers were registered in the LVS Basin of which only 3 complied with
the Effluent Discharge Control Plan (EDCP) and were issued with effluent discharge (ED) permits
(Water Resources Management Authority, 2015d).
Kenya Water Security and Climate Resilience Project
Final National Plan August 2020 138
assigned regulatory powers and are committees of the WRA. The placement of BWRCs under the WRA
creates a confusion at a regional level about who is responsible for conducting certain water resources
management activities between the BWRCs and WRA sub regional offices. Clarity regarding the
mandate BWRCs is important for ensuring that the governance of water resources at a regional level is
undertaken adequately, in addition it is critical for ensuring that BWRCs are allocated with sufficient
resources in order to perform their functions.
ISC has an understanding that the BWRCs will remain advisory for the foreseeable future with a long-
term plan of making the BWRCs have an executive role. There is a need to develop tools to support
the operationalisation of the BWRCs, when they are finally established.
Expansive area of jurisdiction
Some of the WRA offices in the country have jurisdiction over expansive areas. This, combined with
the issue of understaffing, makes it difficult to manage the entire area.
Inadequate institutions in forestry sector
The inadequate institutions arise from weak governance structures and inadequate capacity for law
enforcement and weak stakeholder participation in forest management and governance. This is
exacerbated by inadequate funding of the forestry sector from the exchequer, civil and public sectors.
Since the enactment of the new Constitution in 2010, the level of public support to the conservation of
forests has increased significantly but has not been matched by an equal measure of resource
allocation in all sectors. For example, the Forest Management and Conservation Fund (FMCF)
established in the Forests Act 2005 and the Forest Conservation and Management Act, 2016 to
promote the development of forests, maintenance and conservation of indigenous forests, the
promotion of commercial forest plantation, provision of forest extension services, the establishment of
arboreta and botanical gardens, and a variety of other purposes outlined in Forest Act is yet to be fully
operationalised. Furthermore, there are conflicting institutional mandates as is evident from the
overlapping mandates, programmes, projects, and conflicting policies and legislation. Overall, forest
conservation has witnessed increased cases of political interference in the management of forests, poor
governance as well as inadequate and/or weak structural/institutional capacity for forest law
enforcement and governance.
4.6.1.4 County Governments
Governance issues
Water resources management decisions in Kenya are often influenced by political agendas, which are
not always aligned with scientific, engineering and resource realities. This creates unrealistic
expectations and often leads to frustration. Furthermore, there is sometimes a misconception that WRA
acts as a barrier to people’s desire to get access to water resources. This in return occasionally creates
animosity amongst community members towards WRA, which can negatively impact WRA’s activities
on the ground. Another instance of political opportunism involves politicians announcing unrestricted
access to water, which for example results in people drilling illegal boreholes.
Examples of expansive areas of jurisdiction:
o Kitui SRO and Garissa SRO oversee the middle and lower Tana Basin on a staff complement of 24
people combined.
o The ENN Basin is the largest of Kenya’s basin areas for which WRA’s current presence, with only 6
offices, pauses a great challenge in terms of being able to effectively cover the entire basin.
o Admittedly the LVS has a small land area in relation to the Tana or ENN Basins; however, this does not
take away from the reality that the whole basin is served by only three offices. Issues of understaffing,
inadequate vehicles, insufficient monitoring infrastructure and limited financial resources affect these
offices thus making it difficult for the WRA to effectively manage the entire basin.
Kenya Water Security and Climate Resilience Project
Final National Plan August 2020 139
Limited coordination
Since 2013, Counties are given mandate to independently plan their land, however this has created
siloed planning and has led to loss of coordination regarding the management of natural resources such
as wildlife and water. Given the boundless nature of water, there is need for policy action to ensure
integration of planning and decision-making at a trans-county level.
4.6.1.5 Partnerships and engagement
Inadequate partnerships
Partnerships are very important for different categories of users within the basins. Initial discussions
with WRA indicate that there are a few partnerships in place, majority being nationwide partnerships
with key strategic partners whose focus is nationwide. Given the strategic need to have more localised
partnerships e.g. with industries in the basins etc., more effort needs to be vested in ensuring this
becomes a reality. This is particularly needed as some of the potential partners have already entered
into agreements with other players on the ground such as KFS, NEMA, Kenya Water Towers Agency
(KWTA), NGOs etc.
Limited coordination between stakeholders
There is currently weak coordination between the WRA, WRUAs and the County Governments, which
leads to poor urban planning and uncontrolled development. The inadequate coordination and
subsequent misalignment between the institutions can largely be attributed to the fact that there are
currently no effective platforms at a basin level, that facilitate for improved planning and coordination,
where stakeholders from the various institutions are represented. The inadequate coordination has led
to siloed planning, limited data sharing and duplication of activities.
Low public awareness of WRA’s mandate
Generally, there is low public awareness of WRA in the country. Some of the stakeholders are unaware
of WRA’s role in regulating the use and management of water resources. There is urgent need to create
awareness and understanding of WRA mandate as a Regulator through activism and engagement with
other partners, articulate WRA’s functions well, demonstrate ways of measuring results achieved and
package those results in ways attractive to different stakeholders in the basins.
4.6.2 Enabling environment
Key enabling environment issues in Kenya include inadequate resources (financial, equipment,
materials, office space, monitoring stations and laboratories). These issues and challenges are cross-
cutting across all regional offices of WRA and are described below.
4.6.2.1 Financial resources
WRA has insufficient funding, which results in a clear gap in financing, that in turn affects operational
activities which have a bearing on quality and quantity of outputs by the Authority. This has negatively
affected procurement of modern equipment, upgrading existing stations, improving monitoring
networks, increasing staffing capacity, training etc. However, although approved recurrent budgets over
the years has increased steadily, though with a small percentage and actual funds released for
operations have also improved over recent years in line with the available funding, the financing gap
has been significant with FY2016/17 having a financing gap of KES 819 million. Opportunities that exist
within the sector with regard to financing water and sewerage infrastructure include:
▪ Donor finance – there exist several international organisations that supports this sector. Projects
like KIWASH, WSUP are opportunities that can be explored in bridging the financing gap.
Kenya Water Security and Climate Resilience Project
Final National Plan August 2020 140
▪ Market finance – Commercial banks are currently supporting water utilities in expansion activities.
This initially happened under Output Based Aid and has supported several water utilities. The water
utility must demonstrate that it is commercially viable to benefit from the loan facility.
▪ Water Sector Trust Fund (WSTF) – The Water Sector Trust Fund targets to improve service in pro-
poor areas. The water utilities can take advantage of this facility to increase access to services in
low income areas where the population is limited by the ability to pay for connection to services.
▪ Public Private Partnership – The sector in recognition of the financing gap and the need to achieve
vision 2030 has embraced PPP arrangement.
Current funding includes WSTF financing for WRUAs as well as African Development Bank funding for
the Kenya towns sustainable water supply and sanitation programme through which WRA is being
facilitated in institutional strengthening and funding of WRUAs.
In addition, there are programmes by international banks that target the sector under special conditions
such as the Kenya Towns Sustainable Water and Sanitation Program being implemented by the African
Development Bank Group.
Some of the issues arising from inadequate financial resources are inadequate office space and
equipment, inadequate vehicles and/or fuel and inadequate laboratory facilities.
Inadequate office space and equipment
Certain ROs and SROs are under-capacitated with inadequate office space and equipment to effectively
undertake tasks. Data collection tools/equipment and infrastructure at gauging stations are often in
need of maintenance, repair or upgrade, e.g. survey equipment, meter readers, water quality monitoring
equipment and manual data collection tools. This is a major concern considering that there are
internationally and locally shared rivers and aquifers which require regular monitoring to ensure that
water use activities do not negatively impact on users downstream.
Inadequate vehicles and/or fuel
The inadequate number of vehicles at RO and SRO level poses a huge challenge that affects all
functions of the offices. Inadequate funds assigned for vehicle maintenance and operational costs has
had a negative effect on day to day activities. This has for example affected data collection, monitoring
and compliance activities. Unquestionably, more vehicles are needed at the WRA regional and sub-
regional offices to improve the capacity of the WRA to cover more area and improve their overall
effectiveness and efficiency.
Inadequate laboratory facilities
Overall there is a need to upgrade existing laboratory facilities as well as construct new facilities at ROs
and SROs in order to improve operational efficiency of the WRA.
Examples of inadequate office space and equipment:
o The Machakos RO and Mombasa and Loitokitok SROs have adequate office space, while the Kiambu,
Kibwezi and Nairobi SROs and satellite offices indicated that they have inadequate office space and
equipment including computers, monitoring equipment amongst others during a recent institutional
assessment exercise carried out by ISC in November 2017.
o In 2016 only 52 surface water monitoring stations in the Tana Basin were collecting data 4 times a year
and there were only 12 operational groundwater monitoring stations collecting data.
Kenya Water Security and Climate Resilience Project
Final National Plan August 2020 141
4.6.2.2 WRA staffing capacity
A recent institutional assessment exercise carried out by the ISC in November 2017 revealed that WRA
is understaffed country-wide. This varies greatly between regions and between the different
departments. The total number of WRA staff countrywide was estimated at 7638 across all 6 regional
offices. This situation is exacerbated by many staff who are retiring soon which may result in institutional
memory loss if no comprehensive knowledge transfer mechanism is put in place. This will also create
a huge gap in technical expertise that may be difficult to replace. Given the expansive area of jurisdiction
served by certain SROs, the WRA needs to urgently recruit personnel to increase staff complement in
these areas.
Overall the WRA needs to increase staff complement on technical areas such as water quality testing
and monitoring including professional areas. In addition, the WRA needs to conduct training, upskilling
and reskilling of the current staff complement. This should cover all the important aspects necessary
for effective operation such as basic legislative and policy frameworks, good governance practices and
advocacy; resource use conflict management, resource mobilisation and management, project
management; and participatory resource mapping and management (Zeleke et al., 2019).
4.6.2.3 Enforcement capacity of WRA
The result of the inadequate staff is the inadequate capacity to conduct compliance and enforcement
activities. Weak oversight and inadequate enforcement capacity at a basin level have led to water use
irregularities such as illegal abstractions and over abstraction. Given the deteriorating water quality
levels due to limited oversight of effluent dischargers and the projected negative impacts climate change
will have on water recourse, there is a need to increate compliance and enforcement capacity in the
basins.
The legal department that is taking the lead on enforcement issues is currently a centralised function
operating from HQ and serves all the six regional offices based on demand and occurrence of legal
enforcement matters. WRA has approximately 17 trained legal prosecutors drawn from various
departments such as water rights. The number of trained legal prosecutors keeps reducing as some of
the members have retired and others are going to retire soon. There has been inadequate capacity
building to continue growing this number to ensure that WRA has the capacity to handle all issues
arising periodically. There is also an inadequate number of enforcement teams on the ground for cases
of polluters resulting in WRA having to involve policemen.
4.6.2.4 Implementation ability/capacity
The WRA has developed several catchment plans and strategic plans to strengthen the enabling
environment; however, there is a concern that the WRA does not have sufficient capacity to implement
the plans. To date there has been slow progress in implementing actions coming out of these strategic
plans. This is in part due to inadequate capacity to undertake actions as well as inadequate financial
resources. Going forward there is a need to ensure that strategic plans that are developed are
8 The total number of current WRMA staff varies between 763 or 799 based on numbers provided during expert
review workshops. WRMA has no digitised HRIS hence staff data and information is manually kept.
Examples of inadequate laboratory facilities:
o The central water testing laboratory located at the Nairobi SRO requires additional rehabilitation and
new equipment. The AAS used for determination of heavy metals, is not functional and a new one is
needed. A GLC needs to be procured as well as a Flame Photometer.
o The WRA laboratory facilities in Murang'a SRO are not equipped to analyse certain parameters
regarding water quality such as Total Suspended Solids (TSS).
Kenya Water Security and Climate Resilience Project
Final National Plan August 2020 142
adequately resourced with human and financial resources. Furthermore, robust monitoring and
evaluation mechanisms to track implementation of strategic plans needs to be established.
4.6.2.5 Capacity of other institutions
There are capacity challenges in some of the offices of the other institutions, including KFS, NEMA, and
in some of the County Governments. This in turn affects the quality of outcomes that are implemented
jointly with WRA. There is need for increased training and capacity as well as investment in all areas
that need enhancement such as funding, equipment, human resources etc.
4.6.2.6 Capacity in WRA to deal with drought related disasters
Although the WRA implements water use restrictions during times of drought, reference water levels for
the restrictions are not clearly determined, leading to operational issues. The inadequate drought
disaster management programme and plan is likely due to inadequate technical expertise in drought
planning.
4.6.2.7 Capacity in WRA with regards to flood mitigation
There is currently no systematic flood management taking place in the six basins. Some areas that
experience severe floods do not have flood control measures (structural and non-structural) and flood
warning levels have not been confirmed at major river gauging stations. There is also inadequate timely
data collection and subsequent analysis necessary for setting up of early warning systems. The
mapping of flood prone areas has not been undertaken in most areas and there is no clear indication
whether the WRA has a flood forecasting system (Water Resources Management Authority, 2013).
4.6.2.8 Capacity to enforce reserve flows
There is currently inadequate capacity (number of staff and technical capacity) in the WRA to carry out
environmental monitoring and to enforce the implementation of reserve flows. The absence of sufficient
environmental policies and regulations at county level also constrains efforts to enforce environmental
conservation.
4.6.2.9 Capacity of WRA with regards to climate change adaptation strategies
The Government of Kenya has developed various climate change tools to steer climate change
response including and not limited to the National Climate Change Action Plan (Government of Kenya,
2013b), NDC submitted to UNFCCC in 2016 and the National Adaptation Plan (Government of Kenya,
2016). Available funding and investments for continuous implementation, assessment and maintenance
of the strategies poses an issue. Certain WRA staff are trained on the Nordic Climate Facility Program,
while others have undergone climate change training. WRA does not have a department or unit to
specifically address climate change issues, rather climate change is blended into programme and
project activities on a case by case basis.
Example of inadequate capacity of other institutions:
o A part of Kinale Forest in Kiambu County is used for a community initiative whereby community
members may farm around the trees while they are still saplings. Some people take advantage of this
by uprooting the trees, which kills the trees, thus enabling them to continue farming on the land. This is
a result of inadequate enforcement capacity of the CFA’s and/or KFS.
Kenya Water Security and Climate Resilience Project
Final National Plan August 2020 143
4.6.3 Transboundary and trans-county issues
Shared water resources can potentially cause major conflicts if they are not managed and developed
cooperatively. Conflict between counties also arises when water availability is low, when they are
required to share resources or due to disparities in water use between upstream and downstream users.
4.6.3.1 Inter-basin transfers
The Athi Basin receives about 80% of its water from the Tana Basin via an inter-basin transfer from the
Thika and Sasumua dams to Nairobi. Any future developments within the Tana Basin could therefore
potentially impact on the quantity, quality and seasonality of flows transferred to Nairobi. There is also
an intrabasin transfer in the Tana Basin from Masinga and Kiambere dams to support domestic water
use at a transfer volume of 4 MCM/year. Developments undertaken upstream of the Masinga dam need
to be carefully monitored for potential impacts on water quality and quantity.
There are currently no inter-basin and intra-basin transfers in the LVS Basin. However, with the
completion of Itare and Londiani there will be an inter-basin transfer of 41 MCM/year to Nakuru to
support domestic use. There is also a planned inter-basin transfer of 82 MCM/year from Amala Dam to
the Rift Valley Basin (Water Resources Management Authority, 2013). The transfer will support
domestic use, irrigation and hydropower generation in the Rift Valley. The Itare dam is set for completion
in 2021, however the construction of the dam has been met with some opposition. Elders from the
Kipsigis, Luo, Kuria, Abagusii and Ogiek communities were opposed to the project in Nakuru County.
The elders complained that the project would directly affect water supply to their counties and render
their lands dry (Matheka, 2019). Furthermore, there is also the planned Nandi Forest Dam Project in
the LVN Basin, which will transfer water into the LVS Basin for irrigation development, while generating
hydropower.
4.6.3.2 Internationally shared water resources
There are several internationally shared water resources in Kenya. Any future developments or
activities upstream could negatively impact the quantity, quality and seasonality of flows downstream.
It is therefore essential to ensure cooperative management and development of the water resources
shared with other countries. Challenges often arise when the bordering countries are unwilling to
participate or have institutional limitations themselves. The difference in national policies and legislation
can also pose a challenge when forming a Memorandum of Understanding (MoU). Other challenges
include past conflicts and current tensions between riparian states
Examples of internationally shared water resources issues:
o Cross-border tensions between Kenya and Uganda over the waters of Turkwel drainage basin have
been reported. Ugandan tribes relying on water from the basin are fighting with the Kenyan tribes over
the availability of water.
o There are transboundary conflicts between Kenya and Tanzania over the management and use of water
in the Mara River Basin. There is increasing demand on the Mara’s water resources, and more water is
being abstracted from the river. Inadequate coordinated water resources management between Kenya
and Tanzania, and the lack of an agreement for the transboundary flow of the Mara river, compounds
this problem. Unless an agreement is negotiated soon there is a real danger that the cross-border dry
season flow will be reduced to a trickle, potentially leading to an international dispute.
o To minimise water related conflicts and move towards the long-term sustainable water management of
Lake Victoria waters, the Lake Victoria Basin Commission (LVBC) was established in 1999 and
operationalised in 2004. Despite the presence of this institution conflicts in Lake Victoria persist.
According to Okumu (2010) over the past five years, there has been a serious dispute between Uganda
and her neighbours over the cause of a drop in the water level of the lake by 1.5 metres between 2004
and 2006 (Okumu, 2010). While Tanzania and Kenya have blamed Uganda for causing the decline by
over-draining the lake for hydroelectric production, Uganda has attributed the drop to climate change.
Uganda was also in July 2008 accused of entering into a secret agreement with Egypt to release more
water into the Nile to meet Egypt’s increasing needs (Okumu, 2010).
Kenya Water Security and Climate Resilience Project
Final National Plan August 2020 144
4.6.3.3 Trans-county conflict
Water related conflicts may arise between counties due to the following:
▪ counties do not always want to share water resources
▪ a false idea whereby the county believes that the water belongs to them if the source is within their
county
▪ prioritisation of water supply to another county, which results in a lack of water supply to users
within the water resource’s immediate location
▪ tension arises when there is water scarcity during dry seasons
▪ upstream users negatively impact downstream users through activities such as water pollution and
over abstraction
▪ the misuse of riparian land or wetlands causing conflict
▪ a county might feel that it bears the environmental cost incurred due to the development of
infrastructure (e.g. a dam), while neighbouring or downstream counties reap the benefits (e.g. water
supply)
▪ the negative downstream impacts to the ecosystem due to water resources infrastructure in another
county
4.6.3.4 Land and resource conflict
An analysis conducted by OCHA Kenya stated that there were over 112 deaths due to conflict of
resources in pastoralist areas between January and May of 2011. Compared to the 68 deaths during
the same period in 2010, this indicated an increase in deaths due to conflict. Transboundary conflict
hot-spot areas include the Uganda-Kenya and Kenya-Ethiopia borders.
Land conflicts in Nandi county exist in Tindiret and Mosop where adjudication and issuing of title deeds
still needs to be done. Squatters were evicted by the government from Kipkurere forest, Nandi South
forest, Cengalo forest and other public land, resulting in Internally Displaced persons without land.
There is tension over land held by multinational companies who took over land previously annexed by
colonialists. Tensions across ethnic communities resulted in conflict in 1992, 1997 and 2007, and still
needs to be resolved (County Government of Nandi, 2018).
Examples of trans-county conflict:
o There has been a lot of tension between Muranga and Nairobi counties during the construction of the
Northern Water Collector Tunnel. Recent tension arose when AWWDA neglected to uphold the
agreement, which involved ensuring water supply to the locals in Muranga County (the start of the
tunnel) before commencing construction of the tunnel to Nairobi.
o There has been upset in Kwale County due to their water scarcity, while Mombasa is supplied with
water from Kwale. There is conflict between Mombasa, Kwale, Kilifi and Taita Taveta counties over
shared water resources.
o The Lake Basin Development Authority plans to build a dam inside the South Nandi Forest that will lead
to the clearing of 1 185 ha of closed canopy rainforest, including 10 million indigenous trees (Temper et
al., 2015). The Nandi county local communities are strongly opposed to the project because the
proposed benefits are not attractive enough; and for political reasons, where they feel they will bear the
cost of the dam, with benefits being reaped by the downstream community members and counties
(Temper et al., 2015). The Nandi county council has threatened to move to court to challenge the
proposed project. Street protest have been held by the affected community groups and interest groups
(Temper et al., 2015). The continuation of the project has potential to escalate levels of intra county
tensions as well as inter county tensions.
o Intra-basin and trans-county disputes over water and land in Turkana and West Pokot counties have
been reported. The conflicts are due to the limited availability of water to support domestic and livestock
as well as unwillingness to share water resources by tribes. Furthermore, the conflict is also in part
fuelled by the cultural practice of livestock raiding and the associated desire for revenge.
Kenya Water Security and Climate Resilience Project
Final National Plan August 2020 145
Kenya Water Security and Climate Resilience Project
Final National Plan August 2020 146
5 Key Strategic Areas
5.1 Introduction
The key aim of the Basin Plans is to provide a clear way forward for the integrated management and
development of the water resources of the basins as a pathway towards a future which achieves a
sustainable balance between utilisation and development of water resources and the protection of the
natural environment, i.e. minimising environmental and social impacts and maximising socio-economic
benefits, taking into consideration the availability of water.
In light of an improved understanding of the current situation in the basins as described in Sections 2
to 4, scenario evaluations were undertaken and the outcomes incorporated into identifying sustainable
development pathways for the respective basins that are aligned with their unique Visions. To evaluate
the potential impacts and benefits of different development and management alternatives in the basins
towards identifying a sustainable development pathway, various scenarios representing a possible
2040 future were defined and analysed using analytical tools. This typically involved the following
scenarios:
• Scenario 0: Baseline
• Scenario 1: Business as usual/Lack of funding
• Scenario 2: Full development
• Scenario 3: Sustainable development
These scenarios were evaluated according to the Vision for each basin as defined with stakeholders
and as set out below (Table 5-1).
Table 5-1: Basin visions
Basin Vision
Athi A well-managed and protected river basin characterised by good governance, sustainable socio-
economic development for all, and a clean, safe and water secure environment, which enhances
quality of life from the Aberdares to the Indian Ocean.
Tana To be the leading basin in sustainable water conservation, protection, regulation, management and use for socio-economic development and ecosystem services for all by 2040.
LVS A sustainably conserved and climate resilient basin providing equitable ecosystem services through
integrated water resources management by 2040.
LVN Becoming a model basin in collaborative catchment management, protection, conservation and
control; equitably allocating good quality water for sustainable socio-economic development and
preservation of ecosystems by 2040.
ENN A leading basin in catchment conservation and sustainable management of water resources, providing
equitable allocation of adequate and safe water for high quality of life and socio-economic
development by 2040.
RV A model and sustainable basin providing equitable, adequate and high-quality water and ecological
services for socio-economic development by 2040.
To comprehensively and systematically address the range of water resources related issues and
challenges in the respective basins, while unlocking the value of water as it relates to socio-economic
development and in line with the sustainable development pathways identified for each basin- ten Key
Strategic Areas (KSAs) as presented in Table 5-2 were formulated and used as a strategic planning
framework for each basin. Strategic themes and strategies under each KSA along with a prioritised
implementation / action plan were prepared. Collectively, the ten KSAs constitute an Integrated Water
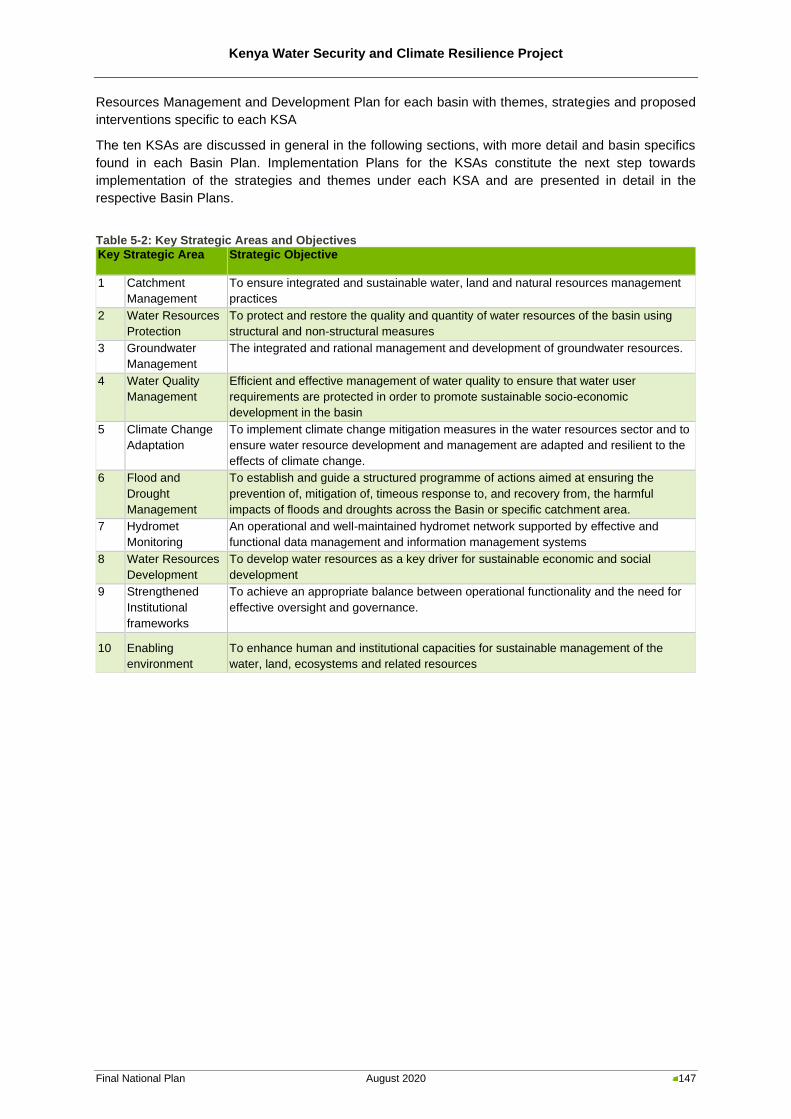
Kenya Water Security and Climate Resilience Project
Final National Plan August 2020 147
Resources Management and Development Plan for each basin with themes, strategies and proposed
interventions specific to each KSA
The ten KSAs are discussed in general in the following sections, with more detail and basin specifics
found in each Basin Plan. Implementation Plans for the KSAs constitute the next step towards
implementation of the strategies and themes under each KSA and are presented in detail in the
respective Basin Plans.
Table 5-2: Key Strategic Areas and Objectives
Key Strategic Area Strategic Objective
1 Catchment
Management
To ensure integrated and sustainable water, land and natural resources management
practices
2 Water Resources
Protection
To protect and restore the quality and quantity of water resources of the basin using
structural and non-structural measures
3 Groundwater
Management
The integrated and rational management and development of groundwater resources.
4 Water Quality
Management
Efficient and effective management of water quality to ensure that water user
requirements are protected in order to promote sustainable socio-economic
development in the basin
5 Climate Change
Adaptation
To implement climate change mitigation measures in the water resources sector and to
ensure water resource development and management are adapted and resilient to the
effects of climate change.
6 Flood and
Drought
Management
To establish and guide a structured programme of actions aimed at ensuring the
prevention of, mitigation of, timeous response to, and recovery from, the harmful
impacts of floods and droughts across the Basin or specific catchment area.
7 Hydromet
Monitoring
An operational and well-maintained hydromet network supported by effective and
functional data management and information management systems
8 Water Resources
Development
To develop water resources as a key driver for sustainable economic and social
development
9 Strengthened
Institutional
frameworks
To achieve an appropriate balance between operational functionality and the need for
effective oversight and governance.
10 Enabling
environment
To enhance human and institutional capacities for sustainable management of the
water, land, ecosystems and related resources
Kenya Water Security and Climate Resilience Project
Final National Plan August 2020 148
5.2 Catchment Management
5.2.1 Introduction
Water resources degradation is intimately linked to land degradation and influenced by various
catchment management and land use factors. Implementing effective catchment management
therefore requires a bigger picture perspective and an understanding of the role of natural resource use
within a water resources context. People, animals and plants constitute those components of a
catchment that make use of the physical resources of land and water. Misuse of these resource
elements will therefore lead to unstable natural and social systems, often resulting in further land and
water degradation. Integrated catchment management acknowledges the relationships between
households, villages, communities and the broader catchment and envisages that individuals take
ownership of their role in catchment management - as opposed to a top-down approach lead by
legislation and regulations. This is the cornerstone of Integrated Water Resources Management. A key
issue in many catchments in Kenya relates to the influence of population pressures on the existing
landscape-biodiversity dynamics. With an increasing demand for natural resources and under the
influence of historic-political and socio-economic drivers, the human footprint has pushed many natural
systems beyond a stable threshold. Any disruption to the natural system impacts the human population,
more so in rural areas where communities still live and work very closely to the natural environment.
The objective of Catchment Management is to enable communities, county governments and other
relevant governing bodies and institutions to implement integrated catchment management
interventions through increased knowledge. As water is the common link among resource users in a
catchment, it is appropriate that the catchment is used as a planning unit for resource management.
Integrated catchment management is aimed at deriving the greatest possible mix of sustainable benefits
for future generations and the communities in a catchment, whilst protecting the natural resources upon
which these communities rely. This approach seeks to maintain a balance between the competing
pressures exerted by the need to maintain natural resources in the long-term, against the need for
continuous economic growth and use of these resources.
5.2.2 Strategy
In Section 4 of this Report, many critical issues related to catchment management have been identified
including the need for sustainable land use, improved management and protection of natural resources,
and land restoration and rehabilitation. In addition, erosion risk scenarios have demonstrated the
impacts and potential benefits of improved land management (
Figure 5-1).
In order to comprehensively and systematically address the catchment management issues and
challenges in Kenya, Table 5-3 sets out 4 Strategic Themes with specific Strategies under each Theme.
The Themes address Improved and Sustainable Catchment Management, Sustainable Water and Land
Use Practices, Natural Resources Management, and Rehabilitation of Degraded Environments.
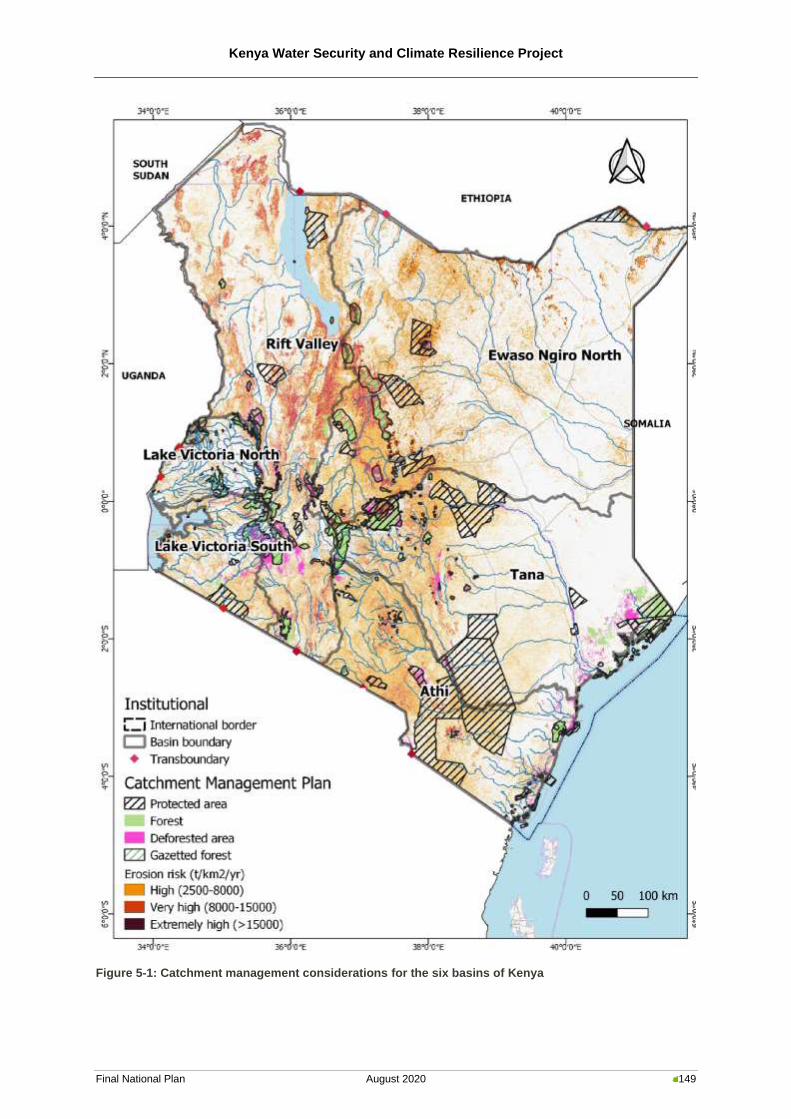
Kenya Water Security and Climate Resilience Project
Final National Plan August 2020 149
Figure 5-1: Catchment management considerations for the six basins of Kenya
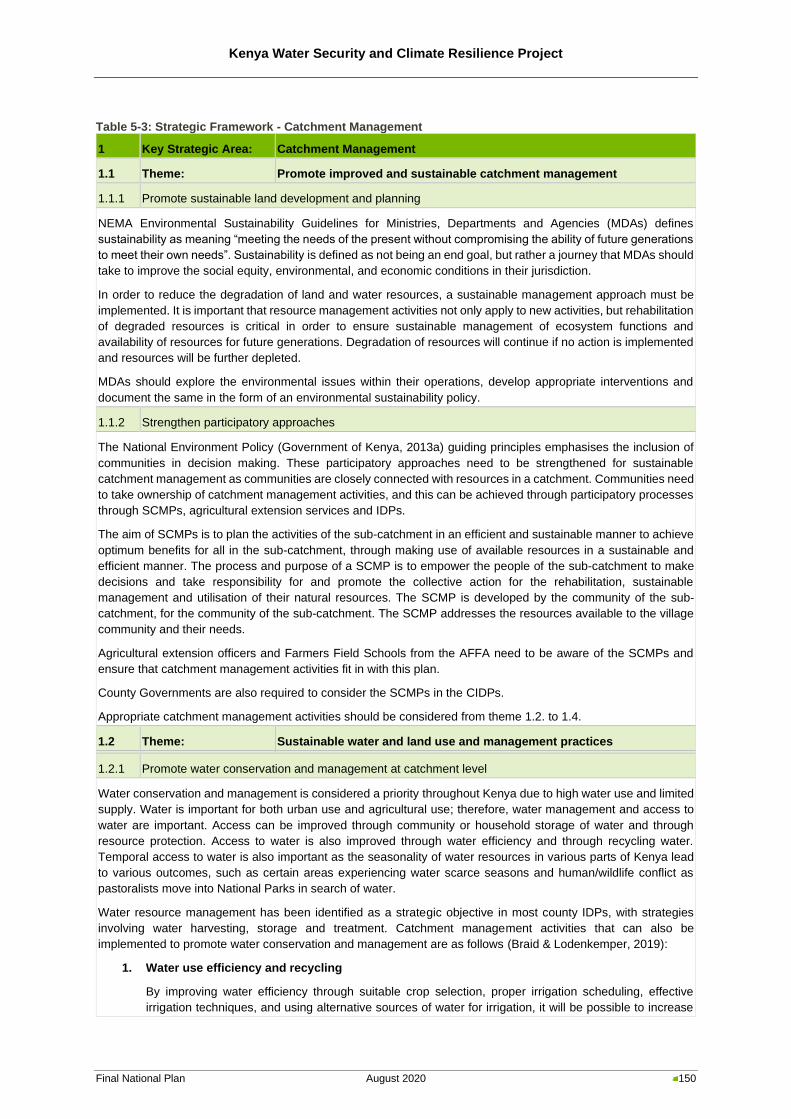
Kenya Water Security and Climate Resilience Project
Final National Plan August 2020 150
Table 5-3: Strategic Framework - Catchment Management
1 Key Strategic Area: Catchment Management
1.1 Theme: Promote improved and sustainable catchment management
1.1.1 Promote sustainable land development and planning
NEMA Environmental Sustainability Guidelines for Ministries, Departments and Agencies (MDAs) defines
sustainability as meaning “meeting the needs of the present without compromising the ability of future generations
to meet their own needs”. Sustainability is defined as not being an end goal, but rather a journey that MDAs should
take to improve the social equity, environmental, and economic conditions in their jurisdiction.
In order to reduce the degradation of land and water resources, a sustainable management approach must be
implemented. It is important that resource management activities not only apply to new activities, but rehabilitation
of degraded resources is critical in order to ensure sustainable management of ecosystem functions and
availability of resources for future generations. Degradation of resources will continue if no action is implemented
and resources will be further depleted.
MDAs should explore the environmental issues within their operations, develop appropriate interventions and
document the same in the form of an environmental sustainability policy.
1.1.2 Strengthen participatory approaches
The National Environment Policy (Government of Kenya, 2013a) guiding principles emphasises the inclusion of
communities in decision making. These participatory approaches need to be strengthened for sustainable
catchment management as communities are closely connected with resources in a catchment. Communities need
to take ownership of catchment management activities, and this can be achieved through participatory processes
through SCMPs, agricultural extension services and IDPs.
The aim of SCMPs is to plan the activities of the sub-catchment in an efficient and sustainable manner to achieve
optimum benefits for all in the sub-catchment, through making use of available resources in a sustainable and
efficient manner. The process and purpose of a SCMP is to empower the people of the sub-catchment to make
decisions and take responsibility for and promote the collective action for the rehabilitation, sustainable
management and utilisation of their natural resources. The SCMP is developed by the community of the sub-
catchment, for the community of the sub-catchment. The SCMP addresses the resources available to the village
community and their needs.
Agricultural extension officers and Farmers Field Schools from the AFFA need to be aware of the SCMPs and
ensure that catchment management activities fit in with this plan.
County Governments are also required to consider the SCMPs in the CIDPs.
Appropriate catchment management activities should be considered from theme 1.2. to 1.4.
1.2 Theme: Sustainable water and land use and management practices
1.2.1 Promote water conservation and management at catchment level
Water conservation and management is considered a priority throughout Kenya due to high water use and limited
supply. Water is important for both urban use and agricultural use; therefore, water management and access to
water are important. Access can be improved through community or household storage of water and through
resource protection. Access to water is also improved through water efficiency and through recycling water.
Temporal access to water is also important as the seasonality of water resources in various parts of Kenya lead
to various outcomes, such as certain areas experiencing water scarce seasons and human/wildlife conflict as
pastoralists move into National Parks in search of water.
Water resource management has been identified as a strategic objective in most county IDPs, with strategies
involving water harvesting, storage and treatment. Catchment management activities that can also be
implemented to promote water conservation and management are as follows (Braid & Lodenkemper, 2019):
1. Water use efficiency and recycling
By improving water efficiency through suitable crop selection, proper irrigation scheduling, effective
irrigation techniques, and using alternative sources of water for irrigation, it will be possible to increase
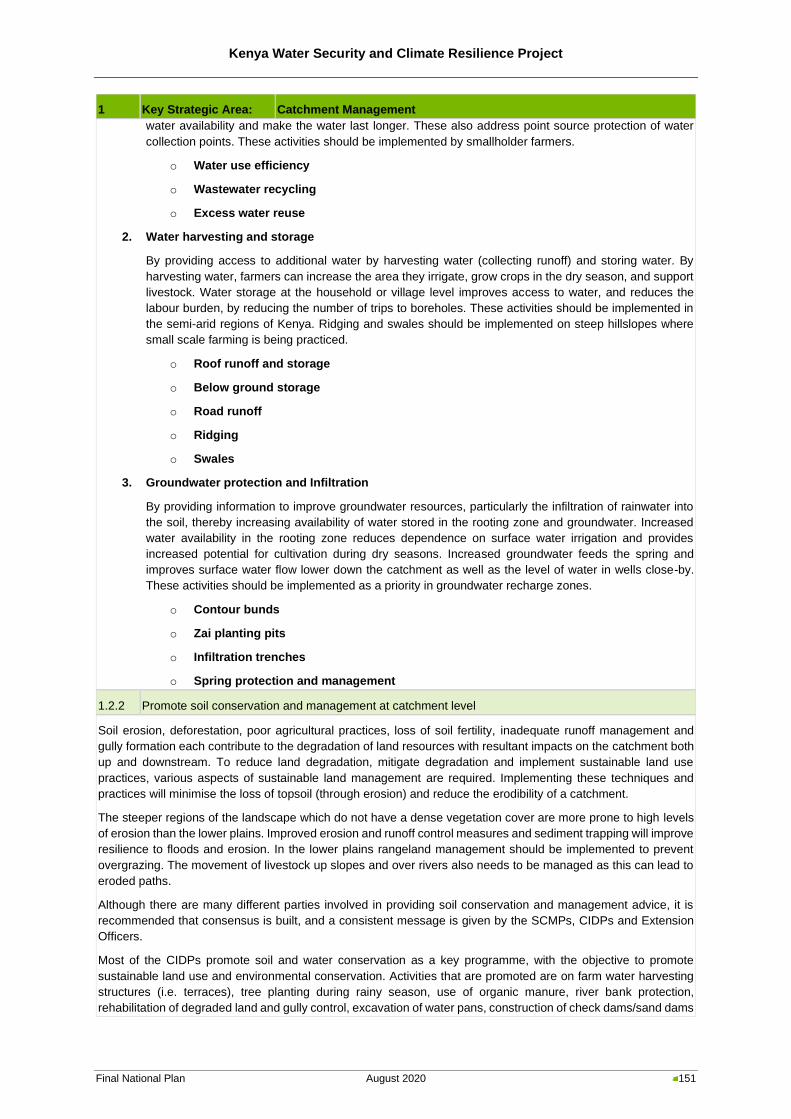
Kenya Water Security and Climate Resilience Project
Final National Plan August 2020 151
1 Key Strategic Area: Catchment Management
water availability and make the water last longer. These also address point source protection of water
collection points. These activities should be implemented by smallholder farmers.
o Water use efficiency
o Wastewater recycling
o Excess water reuse
2. Water harvesting and storage
By providing access to additional water by harvesting water (collecting runoff) and storing water. By
harvesting water, farmers can increase the area they irrigate, grow crops in the dry season, and support
livestock. Water storage at the household or village level improves access to water, and reduces the
labour burden, by reducing the number of trips to boreholes. These activities should be implemented in
the semi-arid regions of Kenya. Ridging and swales should be implemented on steep hillslopes where
small scale farming is being practiced.
o Roof runoff and storage
o Below ground storage
o Road runoff
o Ridging
o Swales
3. Groundwater protection and Infiltration
By providing information to improve groundwater resources, particularly the infiltration of rainwater into
the soil, thereby increasing availability of water stored in the rooting zone and groundwater. Increased
water availability in the rooting zone reduces dependence on surface water irrigation and provides
increased potential for cultivation during dry seasons. Increased groundwater feeds the spring and
improves surface water flow lower down the catchment as well as the level of water in wells close-by.
These activities should be implemented as a priority in groundwater recharge zones.
o Contour bunds
o Zai planting pits
o Infiltration trenches
o Spring protection and management
1.2.2 Promote soil conservation and management at catchment level
Soil erosion, deforestation, poor agricultural practices, loss of soil fertility, inadequate runoff management and
gully formation each contribute to the degradation of land resources with resultant impacts on the catchment both
up and downstream. To reduce land degradation, mitigate degradation and implement sustainable land use
practices, various aspects of sustainable land management are required. Implementing these techniques and
practices will minimise the loss of topsoil (through erosion) and reduce the erodibility of a catchment.
The steeper regions of the landscape which do not have a dense vegetation cover are more prone to high levels
of erosion than the lower plains. Improved erosion and runoff control measures and sediment trapping will improve
resilience to floods and erosion. In the lower plains rangeland management should be implemented to prevent
overgrazing. The movement of livestock up slopes and over rivers also needs to be managed as this can lead to
eroded paths.
Although there are many different parties involved in providing soil conservation and management advice, it is
recommended that consensus is built, and a consistent message is given by the SCMPs, CIDPs and Extension
Officers.
Most of the CIDPs promote soil and water conservation as a key programme, with the objective to promote
sustainable land use and environmental conservation. Activities that are promoted are on farm water harvesting
structures (i.e. terraces), tree planting during rainy season, use of organic manure, river bank protection,
rehabilitation of degraded land and gully control, excavation of water pans, construction of check dams/sand dams
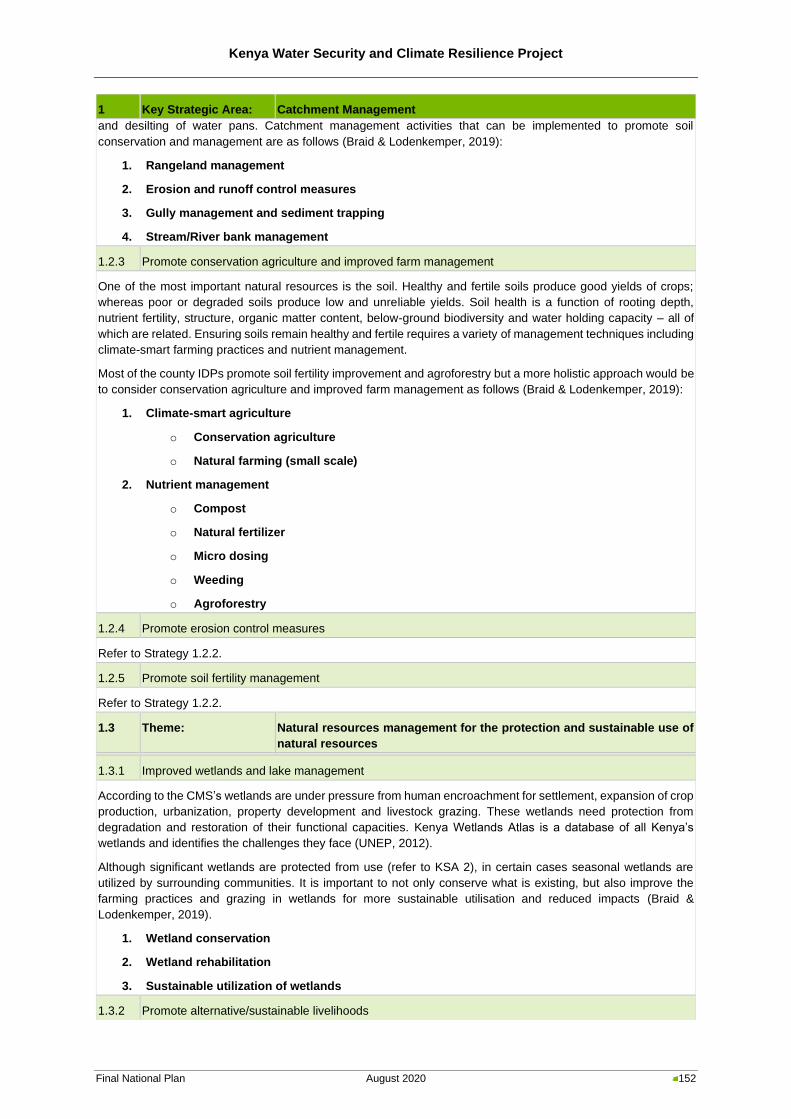
Kenya Water Security and Climate Resilience Project
Final National Plan August 2020 152
1 Key Strategic Area: Catchment Management
and desilting of water pans. Catchment management activities that can be implemented to promote soil
conservation and management are as follows (Braid & Lodenkemper, 2019):
1. Rangeland management
2. Erosion and runoff control measures
3. Gully management and sediment trapping
4. Stream/River bank management
1.2.3 Promote conservation agriculture and improved farm management
One of the most important natural resources is the soil. Healthy and fertile soils produce good yields of crops;
whereas poor or degraded soils produce low and unreliable yields. Soil health is a function of rooting depth,
nutrient fertility, structure, organic matter content, below-ground biodiversity and water holding capacity – all of
which are related. Ensuring soils remain healthy and fertile requires a variety of management techniques including
climate-smart farming practices and nutrient management.
Most of the county IDPs promote soil fertility improvement and agroforestry but a more holistic approach would be
to consider conservation agriculture and improved farm management as follows (Braid & Lodenkemper, 2019):
1. Climate-smart agriculture
o Conservation agriculture
o Natural farming (small scale)
2. Nutrient management
o Compost
o Natural fertilizer
o Micro dosing
o Weeding
o Agroforestry
1.2.4 Promote erosion control measures
Refer to Strategy 1.2.2.
1.2.5 Promote soil fertility management
Refer to Strategy 1.2.2.
1.3 Theme: Natural resources management for the protection and sustainable use of
natural resources
1.3.1 Improved wetlands and lake management
According to the CMS’s wetlands are under pressure from human encroachment for settlement, expansion of crop
production, urbanization, property development and livestock grazing. These wetlands need protection from
degradation and restoration of their functional capacities. Kenya Wetlands Atlas is a database of all Kenya’s
wetlands and identifies the challenges they face (UNEP, 2012).
Although significant wetlands are protected from use (refer to KSA 2), in certain cases seasonal wetlands are
utilized by surrounding communities. It is important to not only conserve what is existing, but also improve the
farming practices and grazing in wetlands for more sustainable utilisation and reduced impacts (Braid &
Lodenkemper, 2019).
1. Wetland conservation
2. Wetland rehabilitation
3. Sustainable utilization of wetlands
1.3.2 Promote alternative/sustainable livelihoods
Kenya Water Security and Climate Resilience Project
Final National Plan August 2020 153
1 Key Strategic Area: Catchment Management
Communities rely on natural resources to live and earn an income. Over utilisation leads to the depletion of natural
resources. Natural resources need to be managed and utilised in a sustainable manner, to maximise the goods
and services received from them, while still maintaining their function and production capacity. Natural forests,
grasslands and wetlands are finite resources that must be managed sustainably; similarly, alien vegetation can
provide useful resources but needs to be managed to prevent uncontrollable spread.
1.3.3 Improved solid waste management
To ensure that catchment management activities and resource protection activities can be implemented, it is
important that activities around the household, farm and village are also sustainable and of a high standard. These
include activities such as waste management. Waste management involves the generation, collection,
transportation, and disposal of garbage, sewage and other waste products. Responsible waste management is
the process of treating solid wastes and offers a variety of solutions for waste with the ultimate aim of changing
mind-sets to regard waste as a valuable resource rather than something that must be thrown away. The
government is constitutionally bound to provide sanitation services to all of its citizens, this includes the removal
and proper treatment of solid waste. In reality this is not being done in many parts of the country, particularly in
remote rural areas. Water resources nearby urban areas are particularly at risk, as evident in the county IDPs. It
is important to ensure that the mindset of waste management extend to individuals and communities as it is
important for a clean and safe environment.
1. Household waste management
2. Village waste management
3. Buy back centres
1.3.4 Improved forestry management
Forests are important to return moisture to the air through evapotranspiration, which then generates rain, as well
as to stabilise soils with their root systems; they can also be rich in terms of biodiversity as well as stores of carbon.
Sustainable management of forests both natural and plantation, for reforesting of areas where forests have been
removed including the selection of beneficial tree species.
The Vision 2030 requires the country to work towards achieving a forest cover of at least 10% of the land area to
ensure sustainable resource use, growth and employment creation. The National Forest Policy (Ministry of
Environment and Natural Resources, 2014) indicates that the sustainable management of forests includes:
• Indigenous forests
• Plantation forests
• Dryland forests
• Urban forests and roadside tree planting
• Farm forestry
To achieve the national forest cover target of 10% of land area, the major afforestation effort will have to be in
community and private lands. Dryland forests offer great potential for intensified afforestation but woody vegetation
in the arid and semi-arid areas are unique and require special attention. Most county IDPs promote reforestation
through agroforestry, and in some cases water catchment areas are being protected through the use of alien trees
(i.e. eucalyptus). Consideration needs to be made to the objective of these programmes as there could be
significant long-term challenges associated with planting trees with high water requirements in counties with limited
water supply.
1.3.5 Removal of alien invasive species
Community knowledge base on how to sustainably manage invasive and alien species should be strengthened.
This is because there is knowledge but not strong understanding on the general approaches to sustainably
manage invasive and alien plant species. The KFS and KWTA need to consider alien invasive vegetation
management as invasive alien plant species are a threat to water resources and water availability. By managing
them and preventing their further spread, these plants can also provide useful resources and alternatives to rapidly
depleting indigenous vegetation.
Kenya Water Security and Climate Resilience Project
Final National Plan August 2020 154
1 Key Strategic Area: Catchment Management
1. Controlling alien invasive vegetation
2. Utilising and controlling blue gum (eucalyptus) trees
3. Utilising and controlling pine trees
4. Utilising and controlling Bamboo
5. Utilising and controlling Prosopis species
6. Utilising and controlling water weed/hyacinth
1.3.6 Improved fisheries management
Promote the sustainable development and management of fisheries in lakes, dams, wetlands and rivers.
1.3.7 Improved energy management
To ensure that catchment management activities and resource protection activities can be implemented, it is
important that activities around the household, farm and village are also sustainable and of a high standard. These
include activities such as energy management. Renewable sources of energy should be promoted to generate
electric power for use in the household, or community, as a replacement for the burning of wood or charcoal.
Most county IDPs promote “green energy” as an alternative fuel to wood and charcoal.
1.3.8 Improved sand mine management
Develop policies for sand harvesting. Consider alternative sources of sand.
1.4 Theme: Rehabilitation of degraded environments
1.4.1 Rehabilitation and Restoration Plan
Develop a restoration and rehabilitation programme. Also refer to Strategy 1.2.2.
1.4.2 Land restoration and rehabilitation of specific priority areas
Implement restoration and rehabilitation programme.
1.4.3 Site specific rehabilitation of degraded riparian areas
Rehabilitation planning, implementation and associated management is a long-term commitment to a natural
resource. The successful rehabilitation of freshwater ecosystems, and thus the overall resilience and sustainability
of the system, can only be achieved through engagement of all the stakeholders reliant on the natural capital.
Through the Reserve process studies should be conducted to delineate riparian areas of significant water
resources. These studies are required to understand the riparian functioning so that an effective rehabilitation
strategy can be developed. The level and type of rehabilitation adopted is case/site specific, as rehabilitation
planning is largely dependent on the extent and duration of historical and current disturbances, the cultural
landscape in which the ecosystem is located and the opportunities available for rehabilitation. Understanding the
overall functioning of the system, particularly in a landscape where the community is dependent on the natural
resource, is key for the success of any rehabilitation project. This is further supported by ensuring that an adaptive
management approach is incorporated into the planning and aftercare of the system, thus ensuring the ecosystem
is maintained at a desirable level and offering it resilience to stressors.
1.4.4 Site specific rehabilitation of degraded wetlands
Prioritize wetlands in need of rehabilitation. Once these have been prioritised, rehabilitation and restoration plans
should be developed, that will result in increased natural vegetation cover. Local CBOs and NGOs should be
involved in this process.
1.4.5 Site specific rehabilitation of Gazetted forests or protected forests that have been degraded
Gazetted forests or protected forests that have been degraded need to have new trees planted in order to meet
the Kenya Vision 2030. When KFS engage in re-planting trees, it should be done considering appropriate soil and
water conservation techniques and beneficial/natural trees as a part of an integrated catchment management
approach.
Kenya Water Security and Climate Resilience Project
Final National Plan August 2020 155
1 Key Strategic Area: Catchment Management
According to the CMS’s several forest reserves have had significant vegetation cover loss or are under threat of
encroachment. There was also a high probability of significant decline of the mangrove along the Indian Ocean
Coast between 2001 and 2013 The county IDPs have promoted tree planting for agroforestry, woodlots for
alternative energy and provided education about the detrimental effects of deforestation for communities and the
environment.
1.4.6 Mining area rehabilitation
Mining removes the protective covering from the land and exposes soils to soil erosion as well as pollution impacts.
During mining activities exposed soils must be revegetated and soil conservation techniques implemented.
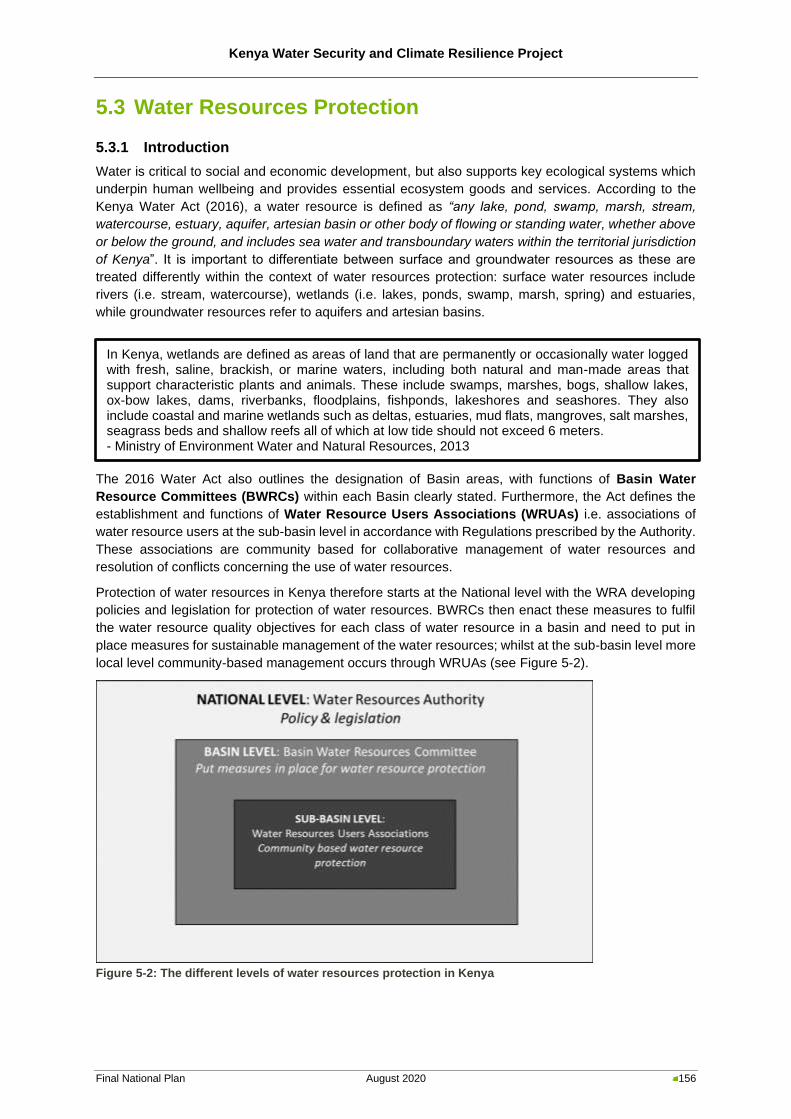
Kenya Water Security and Climate Resilience Project
Final National Plan August 2020 156
5.3 Water Resources Protection
5.3.1 Introduction
Water is critical to social and economic development, but also supports key ecological systems which
underpin human wellbeing and provides essential ecosystem goods and services. According to the
Kenya Water Act (2016), a water resource is defined as “any lake, pond, swamp, marsh, stream,
watercourse, estuary, aquifer, artesian basin or other body of flowing or standing water, whether above
or below the ground, and includes sea water and transboundary waters within the territorial jurisdiction
of Kenya”. It is important to differentiate between surface and groundwater resources as these are
treated differently within the context of water resources protection: surface water resources include
rivers (i.e. stream, watercourse), wetlands (i.e. lakes, ponds, swamp, marsh, spring) and estuaries,
while groundwater resources refer to aquifers and artesian basins.
The 2016 Water Act also outlines the designation of Basin areas, with functions of Basin Water
Resource Committees (BWRCs) within each Basin clearly stated. Furthermore, the Act defines the
establishment and functions of Water Resource Users Associations (WRUAs) i.e. associations of
water resource users at the sub-basin level in accordance with Regulations prescribed by the Authority.
These associations are community based for collaborative management of water resources and
resolution of conflicts concerning the use of water resources.
Protection of water resources in Kenya therefore starts at the National level with the WRA developing
policies and legislation for protection of water resources. BWRCs then enact these measures to fulfil
the water resource quality objectives for each class of water resource in a basin and need to put in
place measures for sustainable management of the water resources; whilst at the sub-basin level more
local level community-based management occurs through WRUAs (see Figure 5-2).
Figure 5-2: The different levels of water resources protection in Kenya
In Kenya, wetlands are defined as areas of land that are permanently or occasionally water logged with fresh, saline, brackish, or marine waters, including both natural and man-made areas that support characteristic plants and animals. These include swamps, marshes, bogs, shallow lakes, ox-bow lakes, dams, riverbanks, floodplains, fishponds, lakeshores and seashores. They also include coastal and marine wetlands such as deltas, estuaries, mud flats, mangroves, salt marshes, seagrass beds and shallow reefs all of which at low tide should not exceed 6 meters. - Ministry of Environment Water and Natural Resources, 2013
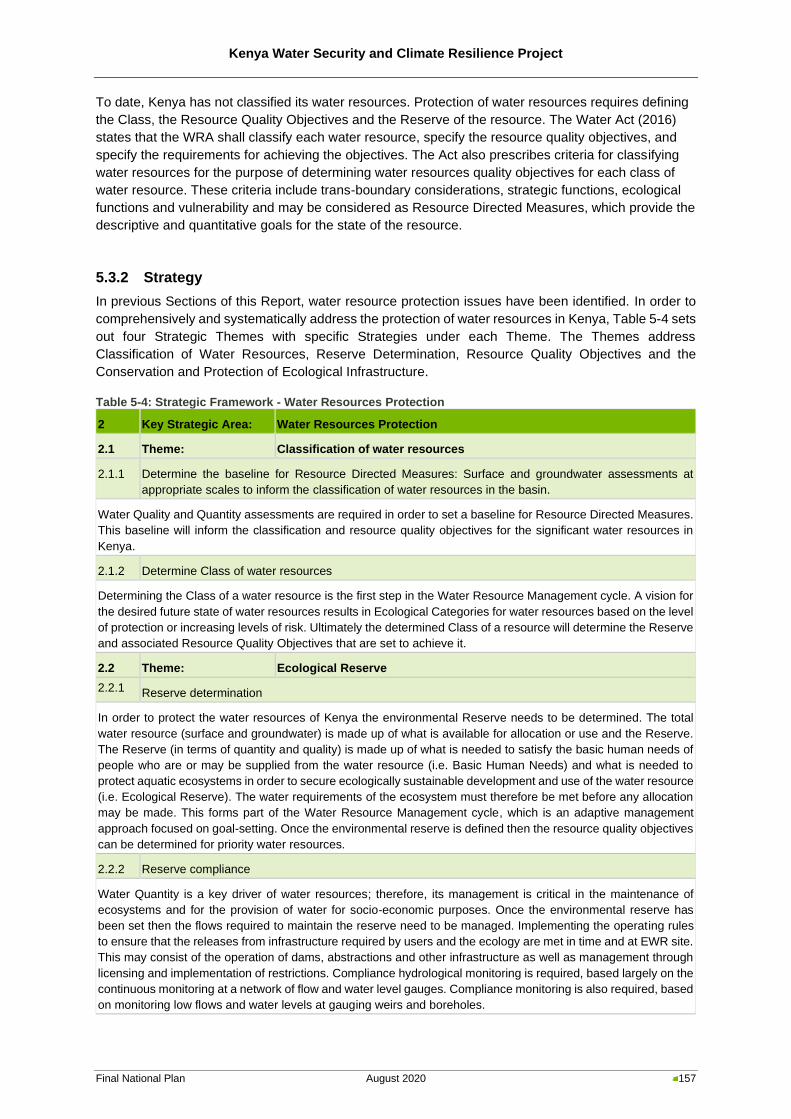
Kenya Water Security and Climate Resilience Project
Final National Plan August 2020 157
To date, Kenya has not classified its water resources. Protection of water resources requires defining
the Class, the Resource Quality Objectives and the Reserve of the resource. The Water Act (2016)
states that the WRA shall classify each water resource, specify the resource quality objectives, and
specify the requirements for achieving the objectives. The Act also prescribes criteria for classifying
water resources for the purpose of determining water resources quality objectives for each class of
water resource. These criteria include trans-boundary considerations, strategic functions, ecological
functions and vulnerability and may be considered as Resource Directed Measures, which provide the
descriptive and quantitative goals for the state of the resource.
5.3.2 Strategy
In previous Sections of this Report, water resource protection issues have been identified. In order to
comprehensively and systematically address the protection of water resources in Kenya, Table 5-4 sets
out four Strategic Themes with specific Strategies under each Theme. The Themes address
Classification of Water Resources, Reserve Determination, Resource Quality Objectives and the
Conservation and Protection of Ecological Infrastructure.
Table 5-4: Strategic Framework - Water Resources Protection
2 Key Strategic Area: Water Resources Protection
2.1 Theme: Classification of water resources
2.1.1 Determine the baseline for Resource Directed Measures: Surface and groundwater assessments at
appropriate scales to inform the classification of water resources in the basin.
Water Quality and Quantity assessments are required in order to set a baseline for Resource Directed Measures.
This baseline will inform the classification and resource quality objectives for the significant water resources in
Kenya.
2.1.2 Determine Class of water resources
Determining the Class of a water resource is the first step in the Water Resource Management cycle. A vision for
the desired future state of water resources results in Ecological Categories for water resources based on the level
of protection or increasing levels of risk. Ultimately the determined Class of a resource will determine the Reserve
and associated Resource Quality Objectives that are set to achieve it.
2.2 Theme: Ecological Reserve
2.2.1 Reserve determination
In order to protect the water resources of Kenya the environmental Reserve needs to be determined. The total
water resource (surface and groundwater) is made up of what is available for allocation or use and the Reserve.
The Reserve (in terms of quantity and quality) is made up of what is needed to satisfy the basic human needs of
people who are or may be supplied from the water resource (i.e. Basic Human Needs) and what is needed to
protect aquatic ecosystems in order to secure ecologically sustainable development and use of the water resource
(i.e. Ecological Reserve). The water requirements of the ecosystem must therefore be met before any allocation
may be made. This forms part of the Water Resource Management cycle, which is an adaptive management
approach focused on goal-setting. Once the environmental reserve is defined then the resource quality objectives
can be determined for priority water resources.
2.2.2 Reserve compliance
Water Quantity is a key driver of water resources; therefore, its management is critical in the maintenance of
ecosystems and for the provision of water for socio-economic purposes. Once the environmental reserve has
been set then the flows required to maintain the reserve need to be managed. Implementing the operating rules
to ensure that the releases from infrastructure required by users and the ecology are met in time and at EWR site.
This may consist of the operation of dams, abstractions and other infrastructure as well as management through
licensing and implementation of restrictions. Compliance hydrological monitoring is required, based largely on the
continuous monitoring at a network of flow and water level gauges. Compliance monitoring is also required, based
on monitoring low flows and water levels at gauging weirs and boreholes.
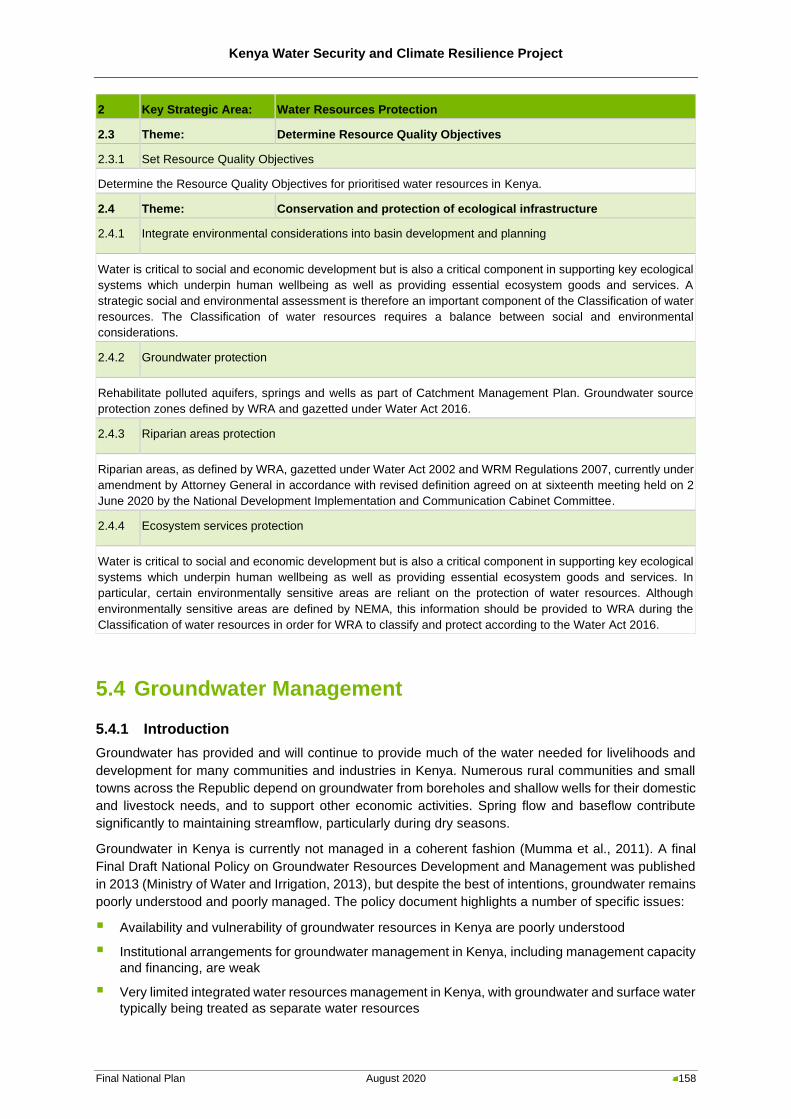
Kenya Water Security and Climate Resilience Project
Final National Plan August 2020 158
2 Key Strategic Area: Water Resources Protection
2.3 Theme: Determine Resource Quality Objectives
2.3.1 Set Resource Quality Objectives
Determine the Resource Quality Objectives for prioritised water resources in Kenya.
2.4 Theme: Conservation and protection of ecological infrastructure
2.4.1 Integrate environmental considerations into basin development and planning
Water is critical to social and economic development but is also a critical component in supporting key ecological
systems which underpin human wellbeing as well as providing essential ecosystem goods and services. A
strategic social and environmental assessment is therefore an important component of the Classification of water
resources. The Classification of water resources requires a balance between social and environmental
considerations.
2.4.2 Groundwater protection
Rehabilitate polluted aquifers, springs and wells as part of Catchment Management Plan. Groundwater source
protection zones defined by WRA and gazetted under Water Act 2016.
2.4.3 Riparian areas protection
Riparian areas, as defined by WRA, gazetted under Water Act 2002 and WRM Regulations 2007, currently under
amendment by Attorney General in accordance with revised definition agreed on at sixteenth meeting held on 2
June 2020 by the National Development Implementation and Communication Cabinet Committee.
2.4.4 Ecosystem services protection
Water is critical to social and economic development but is also a critical component in supporting key ecological
systems which underpin human wellbeing as well as providing essential ecosystem goods and services. In
particular, certain environmentally sensitive areas are reliant on the protection of water resources. Although
environmentally sensitive areas are defined by NEMA, this information should be provided to WRA during the
Classification of water resources in order for WRA to classify and protect according to the Water Act 2016.
5.4 Groundwater Management
5.4.1 Introduction
Groundwater has provided and will continue to provide much of the water needed for livelihoods and
development for many communities and industries in Kenya. Numerous rural communities and small
towns across the Republic depend on groundwater from boreholes and shallow wells for their domestic
and livestock needs, and to support other economic activities. Spring flow and baseflow contribute
significantly to maintaining streamflow, particularly during dry seasons.
Groundwater in Kenya is currently not managed in a coherent fashion (Mumma et al., 2011). A final
Final Draft National Policy on Groundwater Resources Development and Management was published
in 2013 (Ministry of Water and Irrigation, 2013), but despite the best of intentions, groundwater remains
poorly understood and poorly managed. The policy document highlights a number of specific issues:
▪ Availability and vulnerability of groundwater resources in Kenya are poorly understood
▪ Institutional arrangements for groundwater management in Kenya, including management capacity
and financing, are weak
▪ Very limited integrated water resources management in Kenya, with groundwater and surface water
typically being treated as separate water resources
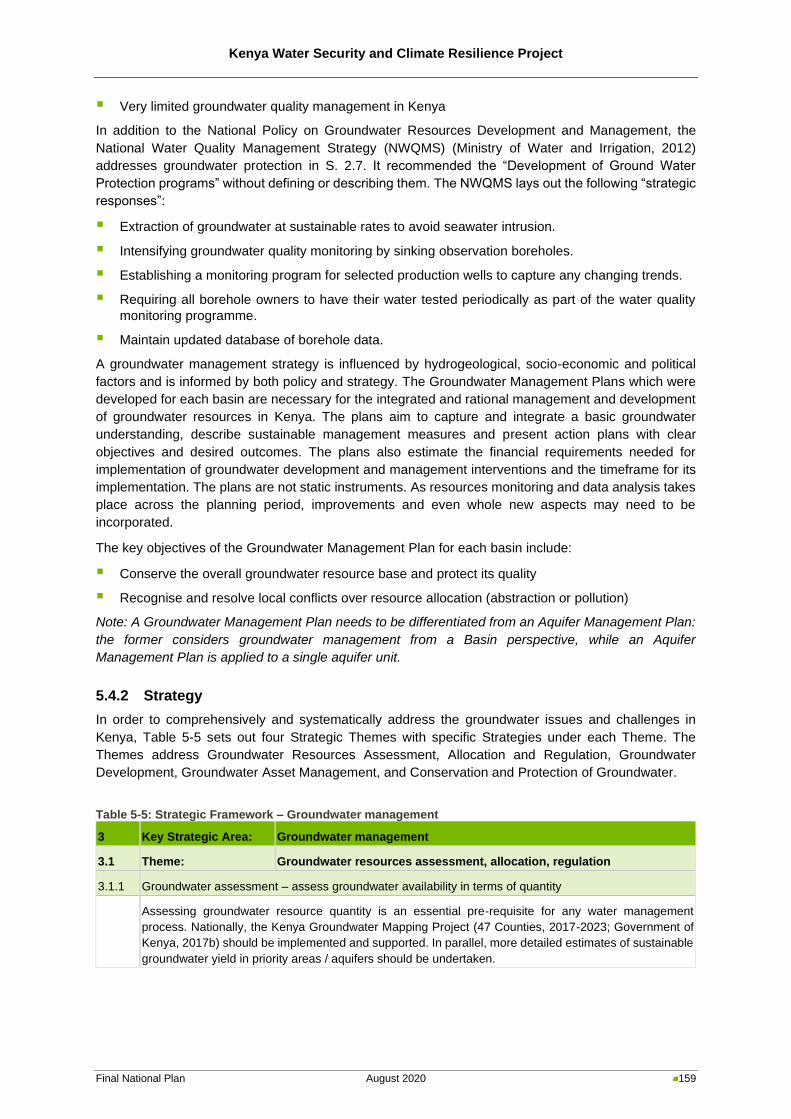
Kenya Water Security and Climate Resilience Project
Final National Plan August 2020 159
▪ Very limited groundwater quality management in Kenya
In addition to the National Policy on Groundwater Resources Development and Management, the
National Water Quality Management Strategy (NWQMS) (Ministry of Water and Irrigation, 2012)
addresses groundwater protection in S. 2.7. It recommended the “Development of Ground Water
Protection programs” without defining or describing them. The NWQMS lays out the following “strategic
responses”:
▪ Extraction of groundwater at sustainable rates to avoid seawater intrusion.
▪ Intensifying groundwater quality monitoring by sinking observation boreholes.
▪ Establishing a monitoring program for selected production wells to capture any changing trends.
▪ Requiring all borehole owners to have their water tested periodically as part of the water quality
monitoring programme.
▪ Maintain updated database of borehole data.
A groundwater management strategy is influenced by hydrogeological, socio-economic and political
factors and is informed by both policy and strategy. The Groundwater Management Plans which were
developed for each basin are necessary for the integrated and rational management and development
of groundwater resources in Kenya. The plans aim to capture and integrate a basic groundwater
understanding, describe sustainable management measures and present action plans with clear
objectives and desired outcomes. The plans also estimate the financial requirements needed for
implementation of groundwater development and management interventions and the timeframe for its
implementation. The plans are not static instruments. As resources monitoring and data analysis takes
place across the planning period, improvements and even whole new aspects may need to be
incorporated.
The key objectives of the Groundwater Management Plan for each basin include:
▪ Conserve the overall groundwater resource base and protect its quality
▪ Recognise and resolve local conflicts over resource allocation (abstraction or pollution)
Note: A Groundwater Management Plan needs to be differentiated from an Aquifer Management Plan:
the former considers groundwater management from a Basin perspective, while an Aquifer
Management Plan is applied to a single aquifer unit.
5.4.2 Strategy
In order to comprehensively and systematically address the groundwater issues and challenges in
Kenya, Table 5-5 sets out four Strategic Themes with specific Strategies under each Theme. The
Themes address Groundwater Resources Assessment, Allocation and Regulation, Groundwater
Development, Groundwater Asset Management, and Conservation and Protection of Groundwater.
Table 5-5: Strategic Framework – Groundwater management
3 Key Strategic Area: Groundwater management
3.1 Theme: Groundwater resources assessment, allocation, regulation
3.1.1 Groundwater assessment – assess groundwater availability in terms of quantity
Assessing groundwater resource quantity is an essential pre-requisite for any water management
process. Nationally, the Kenya Groundwater Mapping Project (47 Counties, 2017-2023; Government of
Kenya, 2017b) should be implemented and supported. In parallel, more detailed estimates of sustainable
groundwater yield in priority areas / aquifers should be undertaken.
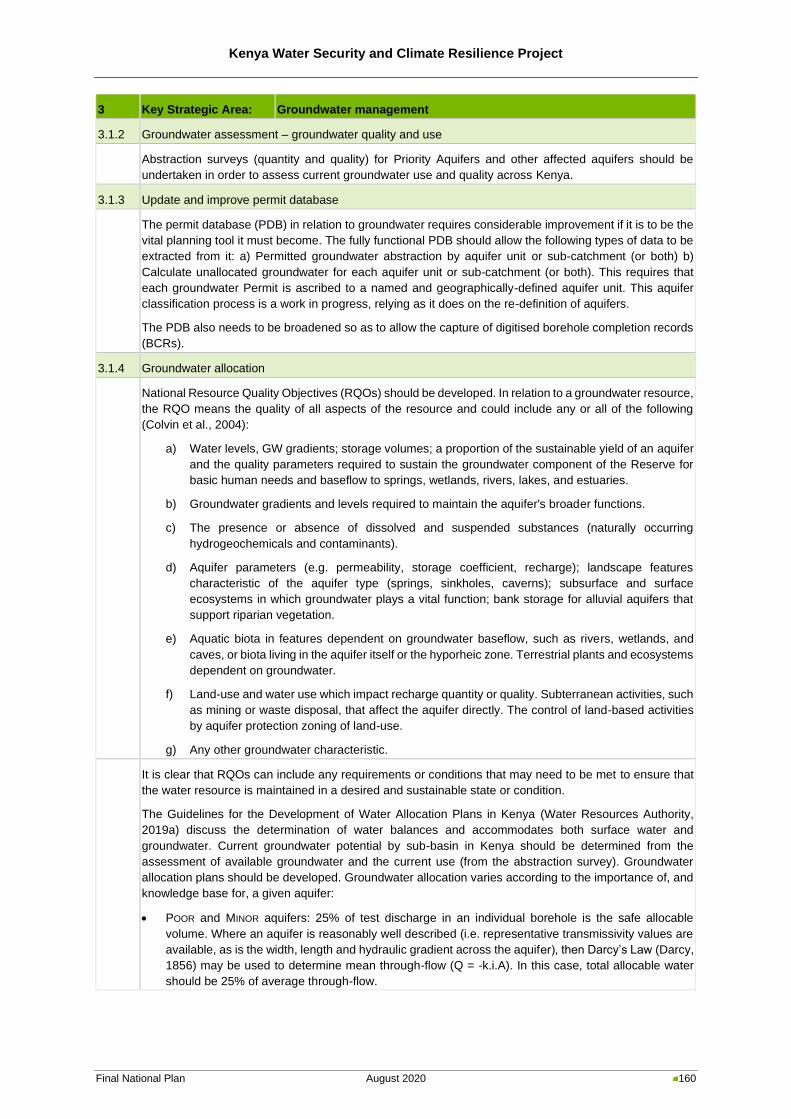
Kenya Water Security and Climate Resilience Project
Final National Plan August 2020 160
3 Key Strategic Area: Groundwater management
3.1.2 Groundwater assessment – groundwater quality and use
Abstraction surveys (quantity and quality) for Priority Aquifers and other affected aquifers should be
undertaken in order to assess current groundwater use and quality across Kenya.
3.1.3 Update and improve permit database
The permit database (PDB) in relation to groundwater requires considerable improvement if it is to be the
vital planning tool it must become. The fully functional PDB should allow the following types of data to be
extracted from it: a) Permitted groundwater abstraction by aquifer unit or sub-catchment (or both) b)
Calculate unallocated groundwater for each aquifer unit or sub-catchment (or both). This requires that
each groundwater Permit is ascribed to a named and geographically-defined aquifer unit. This aquifer
classification process is a work in progress, relying as it does on the re-definition of aquifers.
The PDB also needs to be broadened so as to allow the capture of digitised borehole completion records
(BCRs).
3.1.4 Groundwater allocation
National Resource Quality Objectives (RQOs) should be developed. In relation to a groundwater resource,
the RQO means the quality of all aspects of the resource and could include any or all of the following
(Colvin et al., 2004):
a) Water levels, GW gradients; storage volumes; a proportion of the sustainable yield of an aquifer
and the quality parameters required to sustain the groundwater component of the Reserve for
basic human needs and baseflow to springs, wetlands, rivers, lakes, and estuaries.
b) Groundwater gradients and levels required to maintain the aquifer's broader functions.
c) The presence or absence of dissolved and suspended substances (naturally occurring
hydrogeochemicals and contaminants).
d) Aquifer parameters (e.g. permeability, storage coefficient, recharge); landscape features
characteristic of the aquifer type (springs, sinkholes, caverns); subsurface and surface
ecosystems in which groundwater plays a vital function; bank storage for alluvial aquifers that
support riparian vegetation.
e) Aquatic biota in features dependent on groundwater baseflow, such as rivers, wetlands, and
caves, or biota living in the aquifer itself or the hyporheic zone. Terrestrial plants and ecosystems
dependent on groundwater.
f) Land-use and water use which impact recharge quantity or quality. Subterranean activities, such
as mining or waste disposal, that affect the aquifer directly. The control of land-based activities
by aquifer protection zoning of land-use.
g) Any other groundwater characteristic.
It is clear that RQOs can include any requirements or conditions that may need to be met to ensure that
the water resource is maintained in a desired and sustainable state or condition.
The Guidelines for the Development of Water Allocation Plans in Kenya (Water Resources Authority,
2019a) discuss the determination of water balances and accommodates both surface water and
groundwater. Current groundwater potential by sub-basin in Kenya should be determined from the
assessment of available groundwater and the current use (from the abstraction survey). Groundwater
allocation plans should be developed. Groundwater allocation varies according to the importance of, and
knowledge base for, a given aquifer:
• POOR and MINOR aquifers: 25% of test discharge in an individual borehole is the safe allocable
volume. Where an aquifer is reasonably well described (i.e. representative transmissivity values are
available, as is the width, length and hydraulic gradient across the aquifer), then Darcy’s Law (Darcy,
1856) may be used to determine mean through-flow (Q = -k.i.A). In this case, total allocable water
should be 25% of average through-flow.
Kenya Water Security and Climate Resilience Project
Final National Plan August 2020 161
3 Key Strategic Area: Groundwater management
• For MAJOR aquifers, the approach proposed in the NWMP 2030 is proposed. The NWMP 2030 adopts
a cautious approach to determining sustainable groundwater abstraction; this is defined as 10% of
recharge, but specifically excludes the riparian zone, which it determines as total river length x 1km.
Recharge was defined as annual renewable resource minus annual surface water runoff, with ‘annual
renewable resource’ defined as precipitation minus evapotranspiration.
• For STRATEGIC and SPECIAL aquifers that are not (or not yet) designated Priority Aquifers and
subjected to modelling, the NWMP 2030 approach should be used.
• For Priority Aquifers that have been modelled, allocable GW is 10% of mean annual recharge. Mean
annual recharge should, wherever possible, take into account both wet and dry years in order to
recognise natural recharge variability.
• The allocation of GW from aquifers that experience episodic recharge or are fossil aquifers remains
unresolved, e.g. the Merti aquifer (Blandenier, 2015). How they should be treated in Kenya requires
further debate and ultimately, a policy decision.
All of the above require the completion of the aquifer classification exercise.
3.2 Theme: Groundwater development
3.2.1 Aquifer recharge
Estimates of recharge per sub-basin in the six river basins were undertaken as part of this Consultancy.
These are not based on ground studies, geophysics, drilling or modelling; therefore, it is necessary to
conduct a preliminary assessment of recharge areas from existing data.
Definition of Recharge Areas: At present, the accurate definition of the recharge areas for almost all
aquifers remains unclear. This makes it difficult to protect such areas. (Exceptions: Kikuyu Springs
Recharge Zone; Msambweni Aquifer; Chyulu Hills Aquifer). Recharge areas for Priority Aquifers should
therefore be defined.
Augmenting/preserving natural recharge: The Sponge City Kajiado concept (Oord, 2017), aims to
manage and improve natural recharge by protecting land where significant recharge occurs. Other
‘Sponge City’ initiatives may be possible in other ASAL Basement aquifers.
Managed aquifer recharge: First mentioned in the 1999 Policy document (Government of Kenya, 1999)
and the Water Design Manual (Ministry of Water and Irrigation, 2005), Managed Aquifer Recharge is
covered in the Water Resources Management Rules (2007). Efforts were made to encourage managed
aquifer recharge by developing a Code of Practice that discussed methods and management approaches,
and considered a few instances of Managed Aquifer Recharge potential in Kenya (Water Resources
Management Authority, 2007a). It has been developed further since (Water Resources Management
Authority, 2015b; A Njuguna, personal communication, December 2018), but has yet to be published. A
study of the potential for Managed Aquifer Recharge in Kenya, commissioned by the National Water
Conservation & Pipeline Corporation in 2006, provides a useful introduction to MAR and describes a
number of possible MAR schemes across the country.
At a practical level, sand dams (masonry or concrete weirs across sand rivers which accumulate coarse
sands that act as a storage reservoir) also act as MAR structures (Borst & de Haas, 2006; Mutiso, 2003).
These are in widespread use in ASALs underlain by siliceous metamorphic Basement and have been in
use for decades.
Ad hoc Managed Aquifer Recharge: Ad hoc Managed Aquifer Recharge was observed during the 2010-
11 borehole Census of Nairobi (Athi Basin). Ad hoc Managed Aquifer Recharge may occur in the
remaining five basins but has yet to be described.
Managed Aquifer Recharge potential: The scope of, and potential for, managed aquifer recharge has
been assessed at various levels across the country, with the main research area being the NAS (Athi
Basin). The limited understanding of existing aquifers (extent, potential storage) limits the application of
MAR.
Kenya Water Security and Climate Resilience Project
Final National Plan August 2020 162
3 Key Strategic Area: Groundwater management
Managed aquifer recharge could also be employed as saltwater intrusion protection. Infiltration basins
could recharge rainwater runoff from roads. Also, recharge via sand dams in seasonal streams in areas
underlain by siliceous metamorphic Basement.
3.2.2 Local groundwater development
Areas of unexploited groundwater resources should be identified and linked to small centre water demand
estimates to determine if groundwater resources could meet these demands. Local groundwater
development is largely ad hoc at present, heavily under-written at the WWDA and County level for rural
water supply (single or a few boreholes to meet demands of small rural centres, schools and other
institutions).
3.2.3 Large-scale groundwater development
The potential for groundwater development at a large scale should be assessed as part of integrated
planning for bulk water resources development (Refer to Strategy 8.2.1), specifically as part of updated
master planning for bulk water resources development to Nairobi and Mombasa and as part of regional
water supply schemes.
Specific aquifers that hold good potential and should be assessed are as follows:
• The Merti aquifer
• The Neogene (i.e. Miocene/Pliocene) aquifer system
• The Nairobi Aquifer Suite
3.2.4 Conjunctive use
Areas of unexploited groundwater resources should be identified and linked to water demand estimates
to determine if groundwater resources could meet these demands as part of conjunctive use schemes.
3.3 Theme: Groundwater asset management
3.3.1 Develop asset inventory
An asset inventory should itemise all dedicated groundwater equipment in a readily accessible database.
The asset inventory shall be available to those staff that may need it, and particularly to staff who will plan
and coordinate activities or studies that require specific assets to support them. The inventory should
include a list of assets determined during a formal inspection and verification process, complete with
supporting paperwork:
• Vehicles/heavy plant; at present, WRA GW does not own or operate its own vehicles or GW
plant. There may come a time when it will operate its own drilling rigs (to construct monitoring
boreholes) or other dedicated equipment
• Office infrastructure (dedicated GW computers and printers, laptops/notebooks, PDAs, licensed
software, storage facilities etc.)
• Laboratory infrastructure: it is not expected that GW sections would have laboratories tied
exclusively to GW, but laboratory facilities must be expanded to include the capacity to measure
GW-specific parameters, e.g. bromide, strontium and boron to determine extent/degree of
seawater intrusion (to low ppm Limits of Detection, better than 0.01mg/L)
• Field equipment (geophysics equipment [surface and down-hole], GPS instruments, water
chemistry meters and associated equipment, dipmeters and sonic dippers, GW sampling
equipment, electro-magnetic flowmeters etc.)
• Static field equipment (monitoring boreholes, loggers/barometric loggers and telemetry [covering
both pressure/water level and field chemistry parameters such as temperature and electrical
conductivity], monitoring flowmeters owned by the WRA etc.)
• Mobile equipment that will be left in the field for the duration of a study (Automatic Weather
Stations and associated meteorological equipment, rainfall samplers, evaporation pans, portable
weirs, time-series water quality probes etc.)
Kenya Water Security and Climate Resilience Project
Final National Plan August 2020 163
3 Key Strategic Area: Groundwater management
An Asset Inventory database system should be developed:
• Each asset should be tagged with a unique number
• Each item and its tag number should be entered into the inventory database, together with all
relevant details (year purchased/acquired, office allocated to, office lent to, last service or
maintenance period, next recommended service/maintenance etc.). The database system must
allow that major components (such as a multi-parameter water quality probe), are linked to
related spare parts (such as individual parameter probes or calibration reagents).
• Where an item is available for rent to the public (such as geophysics equipment), the relevant
details should be included in the inventory database; this will include, but not necessarily limited
to, the following:
o Rental cost (per day or per week, as relevant)
o Rental requirements (items rented must be insured by the renter and proof of insurance
provided to the WRA)
o Any other condition of rental
o Name, address and relevant details of the renter, and the anticipated duration of the
rental period
3.3.2 Develop asset management plan
Asset management is necessary to ensure that assets are used for the correct purpose and contribute to
meeting the objectives of the WRA at National, basin and sub-basin levels. The asset management plan
should ensure that the location and status of all assets are known to relevant staff. An asset management
plan should be developed which must list all equipment and facilities that require refurbishing, along with
a corresponding programme and budget. This should involve appropriate consultation with basin and sub-
basin offices:
• For each item, determine what refurbishment is required
• Draw up a priority list of the items to be refurbished, together with a deadline for its refurbishment
• Determine the cost and duration of the refurbishment process
• Draw up a Refurbishment Plan, containing the deadlines, costs and duration of refurbishment,
and feed this into the annual procurement planning process
• When refurbishment commences, ensure that the process is monitored, and funds spent on it
are tracked
• After refurbishment, update the Asset Inventory to reflect change of status
• Amend Asset Management Plan as necessary
The asset management plan will ensure that all equipment is fit for purpose at all times, and that
equipment requiring servicing, maintenance or calibration is serviced, maintained or calibrated when it is
required.
The Plan should also indicate:
• The value of each asset
• The need for spare parts, and what a practical spare parts/consumable inventory would be
• Maintenance frequency for all assets and the typical life cycle of the asset
• The frequencies of planned maintenance
• A calendar showing when each item must be released for maintenance;
• The type of maintenance required (some may be maintained in-house within the WRA; other
items may require maintenance by a dedicated supplier, or even sent overseas for maintenance).
Kenya Water Security and Climate Resilience Project
Final National Plan August 2020 164
3 Key Strategic Area: Groundwater management
• The maintenance cost, or anticipated cost
The asset management plan will feed into the annual procurement planning process.
3.4 Theme: Conservation and protection of groundwater
3.4.1 Source protection
GW vulnerability assessment: Once a National Policy for the Protection of Groundwater has been
formulated and put into place, Vulnerability Assessments should be conducted for groundwater.
Saltwater intrusion prevention: As above for saltwater intrusion prevention; assess significance of
groundwater saltwater intrusion, prioritise and select aquifers requiring active intervention to contain or
reverse saltwater intrusion. Draw up Plans for intervention to prevent, mitigate or reverse seawater
intrusion;
Groundwater conservation areas (GCAs): As above for GCAs; assess which aquifers or parts of
aquifers require formal protection. Draw up Plans for the protection of Priority Aquifers or parts of Priority
Aquifers.
Groundwater dependent ecosystems (GDEs): As above for GDEs; assess which aquifers contain
important GDEs. Draw up Plans to protect important GDEs.
3.4.2 Rehabilitation of polluted aquifers, springs and wells
Where groundwater protections have failed, measures need to be taken to address polluted aquifers.
Here aquifers, springs and wells are lumped together as ‘aquifers’.
Define Kenya’s polluted aquifers: Use the Guidelines for Groundwater Quality Surveys in Kenya (Water
Resources Authority, 2018) to define the extent of polluted aquifers, and determine what pollutants are
present. Follow guidance presented in the NWQMS (Ministry of Water and Irrigation, 2012).
For each polluted aquifer, determine the optimum and most cost-effective way to rehabilitate it.
The approach to be adopted will depend on the following:
• Whether the aquifer is confined or unconfined;
• The nature of the pollutant; e.g. dense non-aqueous phase liquids (DNAPLs) require a different
treatment approach – pump, treat, return - compared with an aquifer polluted with human
wastewater – eliminate the pollution source(s) followed by natural attenuation and remediation;
• Whether the source of the pollution is diffuse or from a point source;
• The affected aquifer area.
• Prioritise aquifers for rehabilitation and implement rehabilitation programmes.
5.5 Water Quality Management
5.5.1 Introduction
Water quality refers to the physical, chemical, biological and aesthetic properties of water that determine
its fitness for its intended use, and that are necessary for protecting the health of aquatic ecosystems.
Water quality management therefore concerns the maintenance of the fitness for use of surface water
and groundwater resources, on a sustainable basis. Fitness for use is an evaluation of how suitable
water is for its intended purpose (e.g. domestic, agricultural or industrial water supply) or for protecting
the health of aquatic ecosystems. Fitness for use evaluations are typically based on scientific evidence
in the form of water quality guidelines or standards for different water uses (e.g. drinking water
standards).
In essence, the proposed approach towards the management of water quality in Kenya concerns the
protection and restoration of the quality of water resources using structural and non-structural
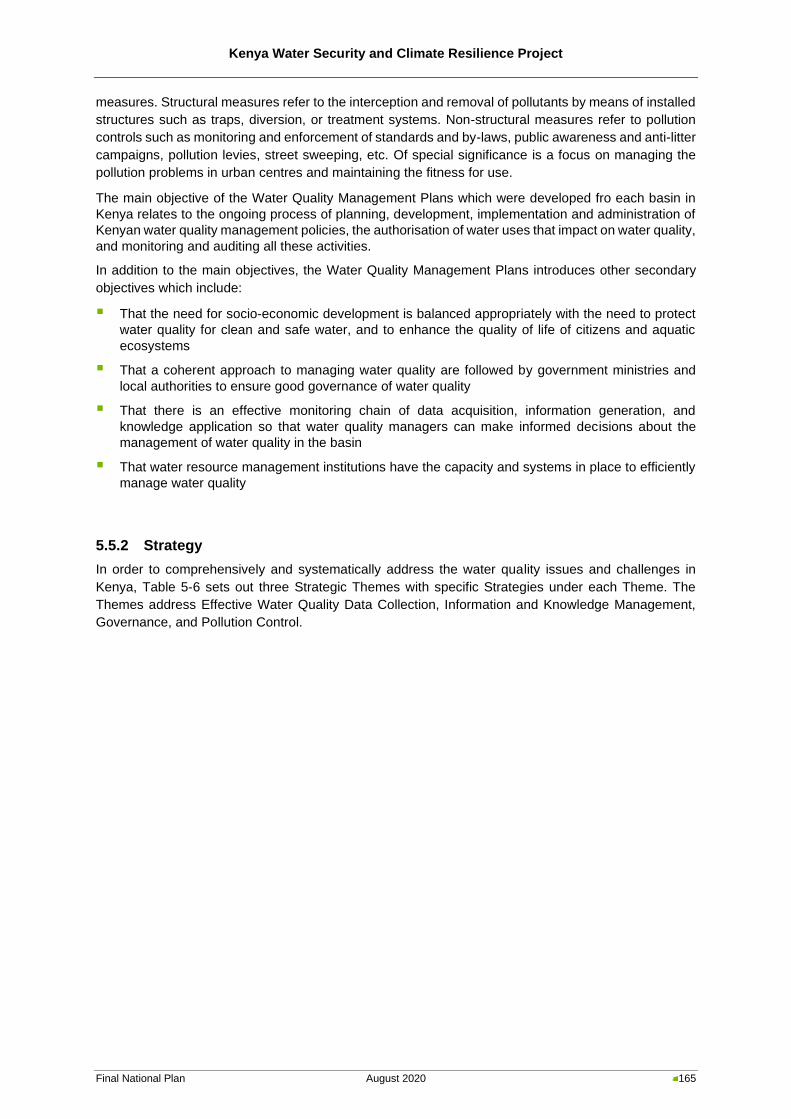
Kenya Water Security and Climate Resilience Project
Final National Plan August 2020 165
measures. Structural measures refer to the interception and removal of pollutants by means of installed
structures such as traps, diversion, or treatment systems. Non-structural measures refer to pollution
controls such as monitoring and enforcement of standards and by-laws, public awareness and anti-litter
campaigns, pollution levies, street sweeping, etc. Of special significance is a focus on managing the
pollution problems in urban centres and maintaining the fitness for use.
The main objective of the Water Quality Management Plans which were developed fro each basin in
Kenya relates to the ongoing process of planning, development, implementation and administration of
Kenyan water quality management policies, the authorisation of water uses that impact on water quality,
and monitoring and auditing all these activities.
In addition to the main objectives, the Water Quality Management Plans introduces other secondary
objectives which include:
▪ That the need for socio-economic development is balanced appropriately with the need to protect
water quality for clean and safe water, and to enhance the quality of life of citizens and aquatic
ecosystems
▪ That a coherent approach to managing water quality are followed by government ministries and
local authorities to ensure good governance of water quality
▪ That there is an effective monitoring chain of data acquisition, information generation, and
knowledge application so that water quality managers can make informed decisions about the
management of water quality in the basin
▪ That water resource management institutions have the capacity and systems in place to efficiently
manage water quality
5.5.2 Strategy
In order to comprehensively and systematically address the water quality issues and challenges in
Kenya, Table 5-6 sets out three Strategic Themes with specific Strategies under each Theme. The
Themes address Effective Water Quality Data Collection, Information and Knowledge Management,
Governance, and Pollution Control.
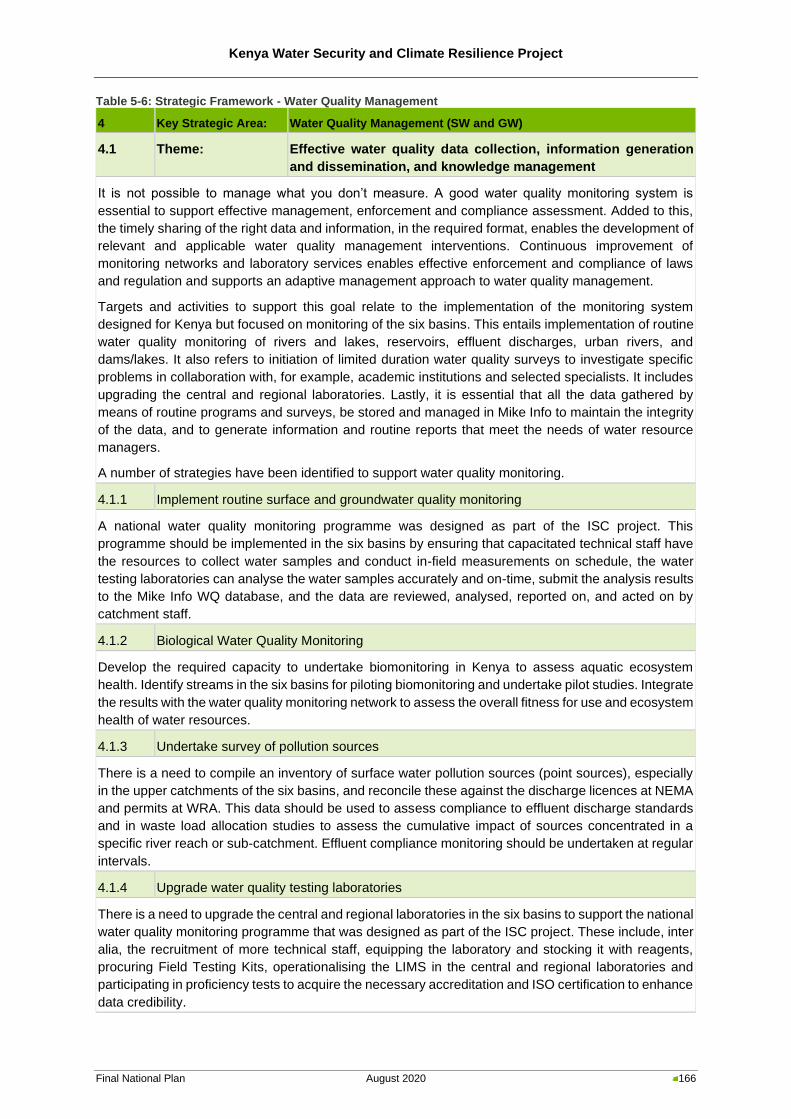
Kenya Water Security and Climate Resilience Project
Final National Plan August 2020 166
Table 5-6: Strategic Framework - Water Quality Management
4 Key Strategic Area: Water Quality Management (SW and GW)
4.1 Theme: Effective water quality data collection, information generation
and dissemination, and knowledge management
It is not possible to manage what you don’t measure. A good water quality monitoring system is
essential to support effective management, enforcement and compliance assessment. Added to this,
the timely sharing of the right data and information, in the required format, enables the development of
relevant and applicable water quality management interventions. Continuous improvement of
monitoring networks and laboratory services enables effective enforcement and compliance of laws
and regulation and supports an adaptive management approach to water quality management.
Targets and activities to support this goal relate to the implementation of the monitoring system
designed for Kenya but focused on monitoring of the six basins. This entails implementation of routine
water quality monitoring of rivers and lakes, reservoirs, effluent discharges, urban rivers, and
dams/lakes. It also refers to initiation of limited duration water quality surveys to investigate specific
problems in collaboration with, for example, academic institutions and selected specialists. It includes
upgrading the central and regional laboratories. Lastly, it is essential that all the data gathered by
means of routine programs and surveys, be stored and managed in Mike Info to maintain the integrity
of the data, and to generate information and routine reports that meet the needs of water resource
managers.
A number of strategies have been identified to support water quality monitoring.
4.1.1 Implement routine surface and groundwater quality monitoring
A national water quality monitoring programme was designed as part of the ISC project. This
programme should be implemented in the six basins by ensuring that capacitated technical staff have
the resources to collect water samples and conduct in-field measurements on schedule, the water
testing laboratories can analyse the water samples accurately and on-time, submit the analysis results
to the Mike Info WQ database, and the data are reviewed, analysed, reported on, and acted on by
catchment staff.
4.1.2 Biological Water Quality Monitoring
Develop the required capacity to undertake biomonitoring in Kenya to assess aquatic ecosystem
health. Identify streams in the six basins for piloting biomonitoring and undertake pilot studies. Integrate
the results with the water quality monitoring network to assess the overall fitness for use and ecosystem
health of water resources.
4.1.3 Undertake survey of pollution sources
There is a need to compile an inventory of surface water pollution sources (point sources), especially
in the upper catchments of the six basins, and reconcile these against the discharge licences at NEMA
and permits at WRA. This data should be used to assess compliance to effluent discharge standards
and in waste load allocation studies to assess the cumulative impact of sources concentrated in a
specific river reach or sub-catchment. Effluent compliance monitoring should be undertaken at regular
intervals.
4.1.4 Upgrade water quality testing laboratories
There is a need to upgrade the central and regional laboratories in the six basins to support the national
water quality monitoring programme that was designed as part of the ISC project. These include, inter
alia, the recruitment of more technical staff, equipping the laboratory and stocking it with reagents,
procuring Field Testing Kits, operationalising the LIMS in the central and regional laboratories and
participating in proficiency tests to acquire the necessary accreditation and ISO certification to enhance
data credibility.
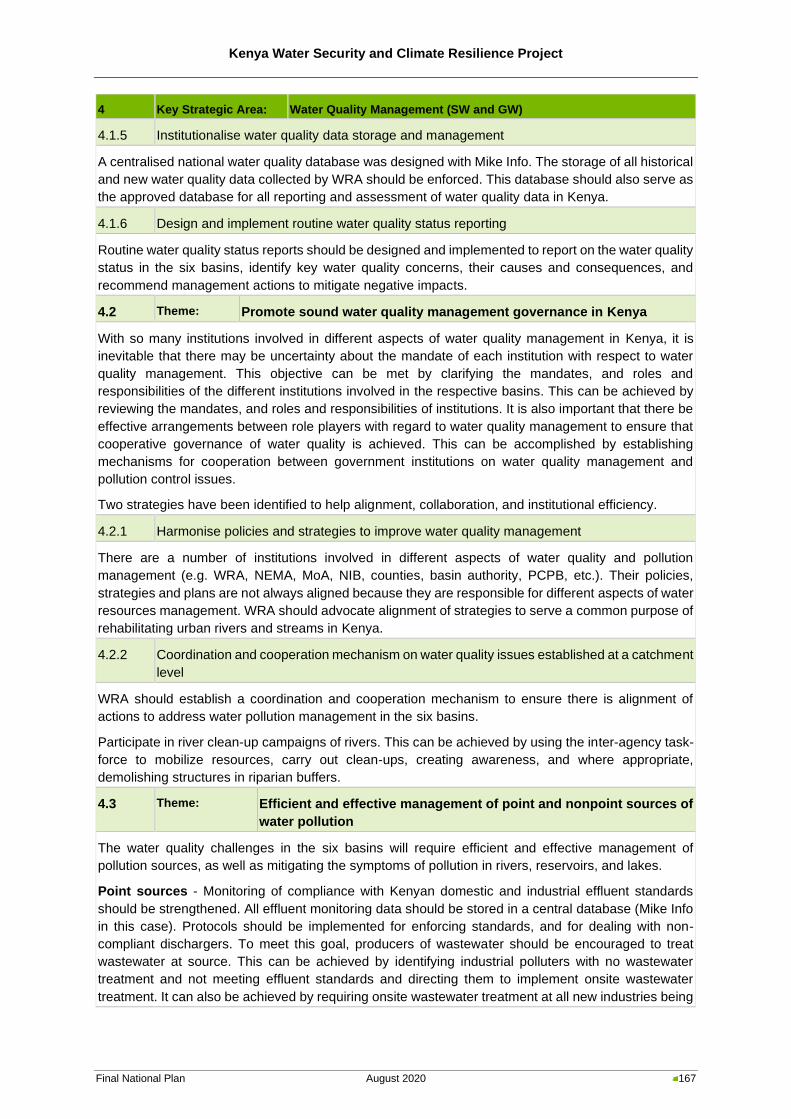
Kenya Water Security and Climate Resilience Project
Final National Plan August 2020 167
4 Key Strategic Area: Water Quality Management (SW and GW)
4.1.5 Institutionalise water quality data storage and management
A centralised national water quality database was designed with Mike Info. The storage of all historical
and new water quality data collected by WRA should be enforced. This database should also serve as
the approved database for all reporting and assessment of water quality data in Kenya.
4.1.6 Design and implement routine water quality status reporting
Routine water quality status reports should be designed and implemented to report on the water quality
status in the six basins, identify key water quality concerns, their causes and consequences, and
recommend management actions to mitigate negative impacts.
4.2 Theme: Promote sound water quality management governance in Kenya
With so many institutions involved in different aspects of water quality management in Kenya, it is
inevitable that there may be uncertainty about the mandate of each institution with respect to water
quality management. This objective can be met by clarifying the mandates, and roles and
responsibilities of the different institutions involved in the respective basins. This can be achieved by
reviewing the mandates, and roles and responsibilities of institutions. It is also important that there be
effective arrangements between role players with regard to water quality management to ensure that
cooperative governance of water quality is achieved. This can be accomplished by establishing
mechanisms for cooperation between government institutions on water quality management and
pollution control issues.
Two strategies have been identified to help alignment, collaboration, and institutional efficiency.
4.2.1 Harmonise policies and strategies to improve water quality management
There are a number of institutions involved in different aspects of water quality and pollution
management (e.g. WRA, NEMA, MoA, NIB, counties, basin authority, PCPB, etc.). Their policies,
strategies and plans are not always aligned because they are responsible for different aspects of water
resources management. WRA should advocate alignment of strategies to serve a common purpose of
rehabilitating urban rivers and streams in Kenya.
4.2.2 Coordination and cooperation mechanism on water quality issues established at a catchment
level
WRA should establish a coordination and cooperation mechanism to ensure there is alignment of
actions to address water pollution management in the six basins.
Participate in river clean-up campaigns of rivers. This can be achieved by using the inter-agency task-
force to mobilize resources, carry out clean-ups, creating awareness, and where appropriate,
demolishing structures in riparian buffers.
4.3 Theme: Efficient and effective management of point and nonpoint sources of
water pollution
The water quality challenges in the six basins will require efficient and effective management of
pollution sources, as well as mitigating the symptoms of pollution in rivers, reservoirs, and lakes.
Point sources - Monitoring of compliance with Kenyan domestic and industrial effluent standards
should be strengthened. All effluent monitoring data should be stored in a central database (Mike Info
in this case). Protocols should be implemented for enforcing standards, and for dealing with non-
compliant dischargers. To meet this goal, producers of wastewater should be encouraged to treat
wastewater at source. This can be achieved by identifying industrial polluters with no wastewater
treatment and not meeting effluent standards and directing them to implement onsite wastewater
treatment. It can also be achieved by requiring onsite wastewater treatment at all new industries being
Kenya Water Security and Climate Resilience Project
Final National Plan August 2020 168
4 Key Strategic Area: Water Quality Management (SW and GW)
established. Consideration should also be given to the design and construction of centralised WWTWs
and sludge treatment facilities for large urban centres, and to progressively connect households and
large wastewater producers to the sewerage network. Lastly, the focal areas of the Kenya National
Cleaner Production Centre (KNCPC) should be supported, and industries should be encouraged to
participate in this initiative.
Nonpoint sources - Nonpoint sources of pollution probably have the greatest impacts on water quality.
Erosion and sedimentation from agricultural lands is probably a major concern and interventions to
manage its impacts should be implemented. It has also been the focus of several soil conservation
initiatives undertaken in Kenya over many years. Reducing erosion and sedimentation also has a large
positive impact on water pollution as many pollutants attach onto sediment particles, and intercepting
the particles before they enter water courses, also prevents these pollutants from entering streams,
rivers, and lakes. To meet this objective, a number of target sources have been identified dealing with
urban stormwater, riparian buffer strips, hydrocarbon pollution, runoff from informal settlements, other
agricultural impacts, and runoff from unpaved roads.
The management of stormwater in urban areas is important because it is the conduit for transporting
pollutants into urban streams, and eventually nearby rivers and lakes. This requires promoting the use
of structural stormwater control and treatment facilities (e.g. instream detention ponds) in urban areas,
as well as reducing stormwater runoff by improved rainfall infiltration systems, efficient drainage
network, and improved rainwater harvesting by households, complexes, and commercial buildings.
Riparian buffer strips are an important measure to intercepting and filtering polluted runoff. The
installation and maintenance of riparian buffer zones and vegetated buffer strips should be promoted
and enforced. Hydrocarbon pollution from the dumping of used oil into stormwater drains can
contaminate large volumes of water rendering it unfit for use. The installation of oil separators at all
garages and vehicle workshops should be enforced, and illegal dumping of used oil at informal
workshops should be policed and culprits be prosecuted.
Informal settlements, especially in the City of Nairobi, have a huge negative impact on urban water
quality due to indiscriminate disposal of liquid and solid household wastes. The measures in the Urban
Development Master Plan for the City of Nairobi dealing with water pollution, sanitation, and solid waste
management should be supported. Agriculture also have impacts on nutrient enrichment and pollution
from the use of agrochemical to control pests. To deal with these impacts, authorities should promote
climate smart agriculture, encourage farmers to use a combination of organic and inorganic fertilisers
on their fields, and promote integrated pest management and the use of biodegradable pesticides
where possible. Roads, particularly unpaved roads have a large impact on erosion and sediment
production. It is recommended that gravel road drainage infrastructure be maintained to reduce
erosion, and to implement dust suppression measures on unpaved urban roads to manage wash-off
of fine sediments into the stormwater drainage system during rainfall events.
A number of strategies have been identified to focus management of water pollution.
4.3.1 Improve sewerage systems and treatment
Promote wastewater treatment at source, especially at industrial sites, housing estates, hospitals, etc.
This could be in the form of septic tanks for households or package plants for larger housing or
industrial estates. The objective is to improve the quality of effluent discharges before it enters the
environment or sewerage network.
4.3.2 Cleaner production methods
Support initiatives by the Kenya National Cleaner Production Centre (KNCPC) to promote excellence
in Resource Efficient and Cleaner Production in industries in order to reduce water usage and effluents,
as well as their impacts on water quality in receiving water bodies.
Kenya Water Security and Climate Resilience Project
Final National Plan August 2020 169
4 Key Strategic Area: Water Quality Management (SW and GW)
4.3.3 Urban stormwater, sanitation, and solid waste management, and protection of upper reaches
of rivers
Control sediment pollution from construction sites and unpaved urban roads in urban areas by adopting
best urban stormwater management practices such as erecting sediment traps or screens, sediment
detention ponds, etc.
Compel county governments to maintain sewerage infrastructure and fix leaks or blockages as a matter
of urgency to minimise sewage leaks into stormwater drains.
Promote solid waste removal in urban centres and disposal at solid waste disposal sites that meet best
national or international design standards. Rehabilitate existing solid waste dumps to intercept and
treat poor quality drainage water and prevent it from running into water courses.
Compel county governments to delineate and maintain riverine buffer zones to prevent encroachment.
Stop encroachment of wetlands.
4.3.4 Sanitation management in informal settlements
Protect receiving streams from pollution, especially urban rivers by installing sewers or septic tanks to
contain domestic wastes, by managing urban solid wastes, and monitoring receiving streams for BOD
and COD.
Create sewerage infrastructure to intercept and convey grey and black wastewater to wastewater
treatment works.
Control of organic pollution from unplanned and unsewered settlements/slums in all the major urban
centres by planning to install sewers or septic tanks and promoting solid waste collection and removal
from these settlements.
Support international aid projects that are designed to upgrade informal settlements and slums.
4.3.5 Management of hydrocarbon pollution
Control of oil and grease pollution from petrol stations and oil storage facilities by ensuring that all are
equipped with functional oil and grease traps and monitoring nearby surface and groundwater for
hydrocarbons.
Control dumping of used motor oil at informal workshops by promoting recycling of used oil, and
monitoring stormwater drains for hydrocarbon pollution.
Protect groundwater against hydrocarbon contamination near petrol stations and dump sites by drilling
observation wells at high risk areas and monitoring boreholes for hydrocarbons.
4.3.6 Sedimentation from unpaved roads
Control sediment pollution from unpaved roads by erecting sediment traps or vegetated buffer strips
next to dirt and paved roads. Maintain stormwater drainage to prevent erosion next to roads and
rehabilitate erosion gullies near roads.
4.3.7 Management of agricultural impacts on sediments, nutrients, and agrochemicals
Control nutrient pollution from agricultural activities (N & P) in all farmed areas by compiling &
maintaining inventories of fertilizer use, and monitoring nutrients in receiving water bodies (rivers,
reservoirs and lakes).
Control agrochemical (pesticides and herbicides) residue pollution from farmlands by compiling an
inventory of pesticide usage and monitoring affected water bodies for residues. Promote efficient use
agrochemicals in the agricultural sector.
Kenya Water Security and Climate Resilience Project
Final National Plan August 2020 170
4 Key Strategic Area: Water Quality Management (SW and GW)
Promote best irrigation management practices and encourage irrigators to retain, treat and recycle
irrigation return flows before discharging it to the environment.
Encourage adoption of good land management practices such as avoiding overstocking and
overgrazing, avoiding cultivation on steep slopes or use terracing, minimum tillage, etc.
4.3.8 Enforcement of effluent standards
Use the results of compliance monitoring of effluent discharge licence or permit conditions to prosecute
offenders that consistently violate their licence/permit conditions and demonstrate no intention of
meeting them.
4.3.9 Control discharges from sand mining operations
Control sediment pollution from sand harvesting operations by enacting by-laws for its control,
delineating sand harvest areas away from river riparian, and implementing good sand mining
guidelines to mitigate their impacts. See for example the River Sand Mining Management Guidelines
of Malaysia for good management practices to consider.
4.3.10 Rehabilitation of polluted aquifers, springs and wells
See Strategy 3.4.2
5.6 Climate Change Adaptation
5.6.1 Introduction
In the face of a changing climate, adaptation and resilience are Africa’s and indeed Kenya’s priority
responses to address vulnerabilities and risks. The 15th African Ministerial Conference on the
Environment 2015 strongly promoted investment in building resilience as a top funding priority and an
integral part of national development funding. This aligns very well with Kenya’s approach of
mainstreaming climate adaptation in national and sub-national development planning.
The Kenya National Climate Change Response Strategy (NCCRS) (Government of Kenya, 2010b)
acknowledged that the impacts of observed and projected climatic change pose serious threats to
sustainable development. These predominantly relate to severe weather and changes in the climate
extremes which will reduce the resilience in many sectors of the economy.
The Government of Kenya Adaptation Technical Analysis Report (Government of Kenya, 2012)
highlights the way forward as “integrating climate change adaptation into the medium term planning and
budgeting process at national level and ensuring that it is also captured during development of the
County Development Profiles” as well as considering and understanding the sectoral impacts of climate
changes such that adaptation can “address these impacts or maximise on the opportunities that some
of the impacts provide”. The monitoring of the integration of climate change adaptation into long term
developments is also required to ensure systems are not compromised into the climate changed future.
The Kenya Climate Change Act 2016 aims to strengthen climate change governance coordination
structures and outlines the key climate change duties of public and non-state actors. The Act is to be
applied across all sectors of the economy, at both national and county government levels.
Mainstreaming of climate change has, to some extent, been undertaken at the county government level,
where some counties have taken measures to include climate change in their County Integrated
Development Plans (CIDPs) and to develop relevant county legislation.
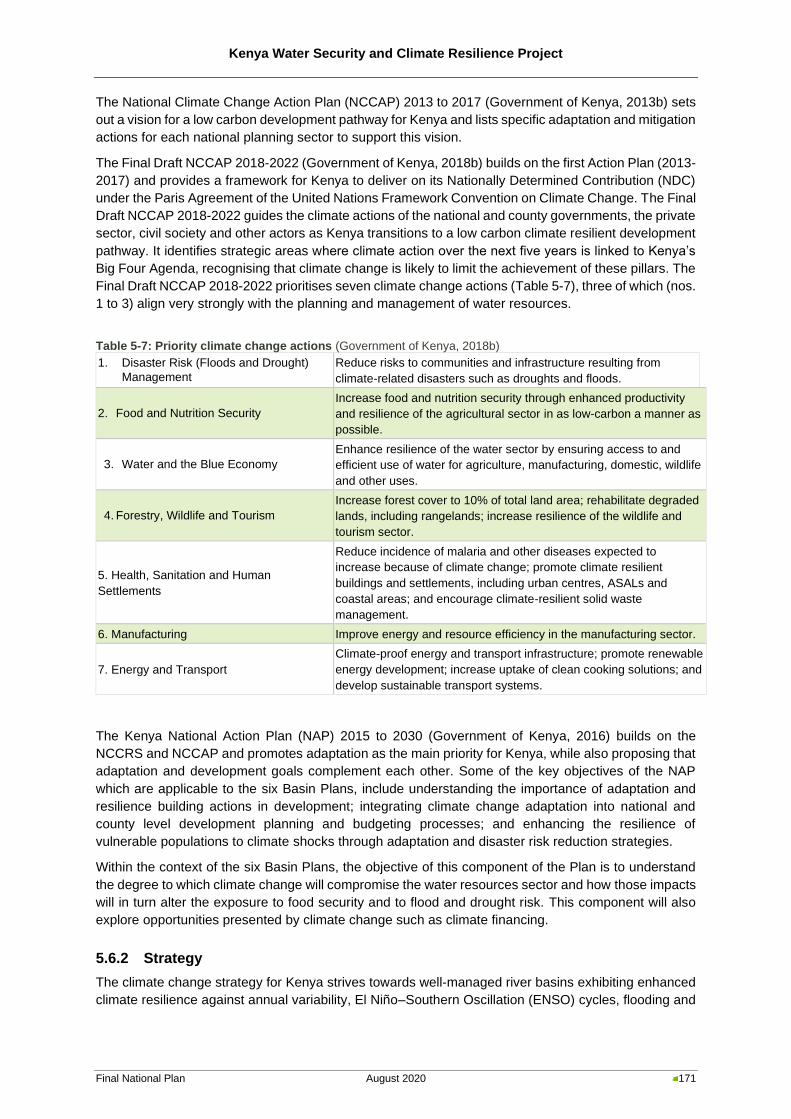
Kenya Water Security and Climate Resilience Project
Final National Plan August 2020 171
The National Climate Change Action Plan (NCCAP) 2013 to 2017 (Government of Kenya, 2013b) sets
out a vision for a low carbon development pathway for Kenya and lists specific adaptation and mitigation
actions for each national planning sector to support this vision.
The Final Draft NCCAP 2018-2022 (Government of Kenya, 2018b) builds on the first Action Plan (2013-
2017) and provides a framework for Kenya to deliver on its Nationally Determined Contribution (NDC)
under the Paris Agreement of the United Nations Framework Convention on Climate Change. The Final
Draft NCCAP 2018-2022 guides the climate actions of the national and county governments, the private
sector, civil society and other actors as Kenya transitions to a low carbon climate resilient development
pathway. It identifies strategic areas where climate action over the next five years is linked to Kenya’s
Big Four Agenda, recognising that climate change is likely to limit the achievement of these pillars. The
Final Draft NCCAP 2018-2022 prioritises seven climate change actions (Table 5-7), three of which (nos.
1 to 3) align very strongly with the planning and management of water resources.
Table 5-7: Priority climate change actions (Government of Kenya, 2018b)
1. Disaster Risk (Floods and Drought)
Management
Reduce risks to communities and infrastructure resulting from
climate-related disasters such as droughts and floods.
2. Food and Nutrition Security
Increase food and nutrition security through enhanced productivity
and resilience of the agricultural sector in as low-carbon a manner as
possible.
3. Water and the Blue Economy
Enhance resilience of the water sector by ensuring access to and
efficient use of water for agriculture, manufacturing, domestic, wildlife
and other uses.
4. Forestry, Wildlife and Tourism
Increase forest cover to 10% of total land area; rehabilitate degraded
lands, including rangelands; increase resilience of the wildlife and
tourism sector.
5. Health, Sanitation and Human
Settlements
Reduce incidence of malaria and other diseases expected to
increase because of climate change; promote climate resilient
buildings and settlements, including urban centres, ASALs and
coastal areas; and encourage climate-resilient solid waste
management.
6. Manufacturing Improve energy and resource efficiency in the manufacturing sector.
7. Energy and Transport
Climate-proof energy and transport infrastructure; promote renewable
energy development; increase uptake of clean cooking solutions; and
develop sustainable transport systems.
The Kenya National Action Plan (NAP) 2015 to 2030 (Government of Kenya, 2016) builds on the
NCCRS and NCCAP and promotes adaptation as the main priority for Kenya, while also proposing that
adaptation and development goals complement each other. Some of the key objectives of the NAP
which are applicable to the six Basin Plans, include understanding the importance of adaptation and
resilience building actions in development; integrating climate change adaptation into national and
county level development planning and budgeting processes; and enhancing the resilience of
vulnerable populations to climate shocks through adaptation and disaster risk reduction strategies.
Within the context of the six Basin Plans, the objective of this component of the Plan is to understand
the degree to which climate change will compromise the water resources sector and how those impacts
will in turn alter the exposure to food security and to flood and drought risk. This component will also
explore opportunities presented by climate change such as climate financing.
5.6.2 Strategy
The climate change strategy for Kenya strives towards well-managed river basins exhibiting enhanced
climate resilience against annual variability, El Niño–Southern Oscillation (ENSO) cycles, flooding and
Kenya Water Security and Climate Resilience Project
Final National Plan August 2020 172
extreme events and continuous drought years. Furthermore, it envisions the six basins to apply climate
mitigation and mainstreaming into development, while comprehending and promoting adaptation
practices.
In order to comprehensively and systematically address the range of climate change issues, Table 5-8
sets out three Strategic Themes with specific Strategies under each Theme. The Themes address an
Improved understanding of the impacts of climate change on water resources at appropriate scales, as
well as Mitigation and Adaptation.
Table 5-8: Strategic Framework - Climate Change Mitigation, Adaptation and Preparedness
5 Key Strategic Area: Climate Change Adaptation and Preparedness
5.1 Theme: Understand impacts of climate change on water resources at appropriate
spatial scales
5.1.1 Quantify climate change impacts (rainfall & temperature) on surface water and groundwater resources
and demands in the six basins at appropriate scales for planning and management
This is undertaken though research and public consultation processes, and where necessary, engaging with the
private sectors for further insights. Climate change impacts on surface water and groundwater availability and
variability at sub-basin scale as well as changing demand patterns, mainly linked to irrigation, should be
investigated using scientific based approaches. As the impacts will be felt in a practical sense, this process should
also focus on the in-situ impacts, thresholds and exposer accounts rather than as only a technical theoretical
review.
5.1.2 Assess relevance, and scale of potential social, environmental and economic climate change impacts as
defined in NCCAP in the six basins and its relation to water resources planning and management;
prioritise areas for interventions
This will assess climatic trends to evaluate frequency and magnitude of extreme climate events. Furthermore, the
highlighting of hotspot areas will act as a pre-emptive measure building resilience. Assessment of meteorological
data relative to the ENSO cycle and associated hydrological and water requirement impacts may provide
forewarning into future drought occurrence and severity. Furthermore, there should be analysis of rainfall onset
and cessation, particularly in rainfed agricultural areas and areas highly reliant on surface water rather than
reticulation. Engage local private sector, NGOs and knowledgeable individuals to facilitate wider experience
transfer of adaptation practices.
5.2 Theme: Climate change mitigation
5.2.1 Undertake reforestation
Promote protection of sensitive areas and ensure that natural systems are not compromised. Prevent slash and
burn agriculture. Promote active reforestation initiatives and give education of ecosystem services of forests
beyond utilisation as a timber resource.
5.2.2 Promote the generation and use of clean energy
Promote the usage of renewable energy source as more than just hydropower, wind power and solar geysers
5.2.4 Improve efficiency of water use
Promote water use which is energy efficient e.g. solar heating, energy efficient water treatment, reducing water
use which will save energy etc.
5.3 Theme: Climate change adaptation
5.3.1 Promote climate resilient infrastructure
Promote the development in low risk areas and increase setback from rivers and ocean interfaces. Build to
increased threshold specifications to address future climate impacts for both road and stormwater infrastructure.
5.3.2 Climate-related disaster risk management
Kenya Water Security and Climate Resilience Project
Final National Plan August 2020 173
5 Key Strategic Area: Climate Change Adaptation and Preparedness
Reduce the risk of disasters linked to climate change e.g. floods, droughts, health-related risks, crop production
etc. by understanding the potential threats and risks and by implementing structural and non-structural mitigation
measures.
5.3.3 Promote water conservation
Employ likely increased stress impact principles promoting soil quality, better drainage and weed/disease control
in agricultural practices.
5.3.4 Promote agroforestry
Enhance the CO2 sink by promoting varied land usage to increase biodiversity and minimise soil erosion and
increase soil nutrients retention. Actively plant living fences, medicinal and fruit trees.
5.3.5 Mainstream climate change adaptation in water resources strategy, planning and management at basin
and catchment level
Implementation and enforcement of practical mainstreaming practices and enhance the awareness of potential
climate impacts on communities to promote uptake of adaptation.
5.3.6 Enhance resilience of agriculture sector through climate smart agriculture
Employ likely increased stress impact principles promoting soil quality, better drainage and weed/disease control
in agricultural practices.
5.7 Flood and Drought Management
5.7.1 Introduction
Floods and droughts are caused by extreme climatic events and can have devastating consequences
for the socio-economic welfare of rural and urban communities and regions.
Flooding of land surfaces occurs when heavy rainfall leads to runoff volumes that exceed the carrying
and storage capacities of stream channels and urban drainage systems. In the process, crop and
grazing lands, villages and urban neighbourhoods become inundated, transport infrastructure
destroyed, and powerlines flattened. Floods can cause displacement of people, loss of life (human and
livestock), increases in water related-diseases, severe soil erosion, land-slides, increased food
insecurity and significant losses to the economy of a country and region.
Drought can be defined as an extended period (consecutive months or years) of unusually low rainfall,
depleted soil moisture and groundwater levels and a severe reduction in availability of surface water
resources in streams, reservoirs and lakes. Drought can be referred to as a “creeping disaster” since
its effects accumulate slowly and may linger for years after the termination of the event. Droughts can
decimate dryland crop production, severely curtail irrigated crop production, cause severe loss of life of
livestock and game, diminish freshwater fish-stocks, result in severely restricted municipal and industrial
water supplies and give rise to substantial losses to the economy of a country and region.
It follows from the above that systematic preparedness planning for floods and droughts is an imperative
to ensure mitigation of and protection against the above negative consequences of extreme floods and
droughts.
5.7.2 Strategy
In order to comprehensively and systematically address the flood and drought issues and challenges
in Kenya, Table 5-9 sets out two Strategic Themes with specific Strategies under each Theme. The
Themes address Flood and Drought Management.
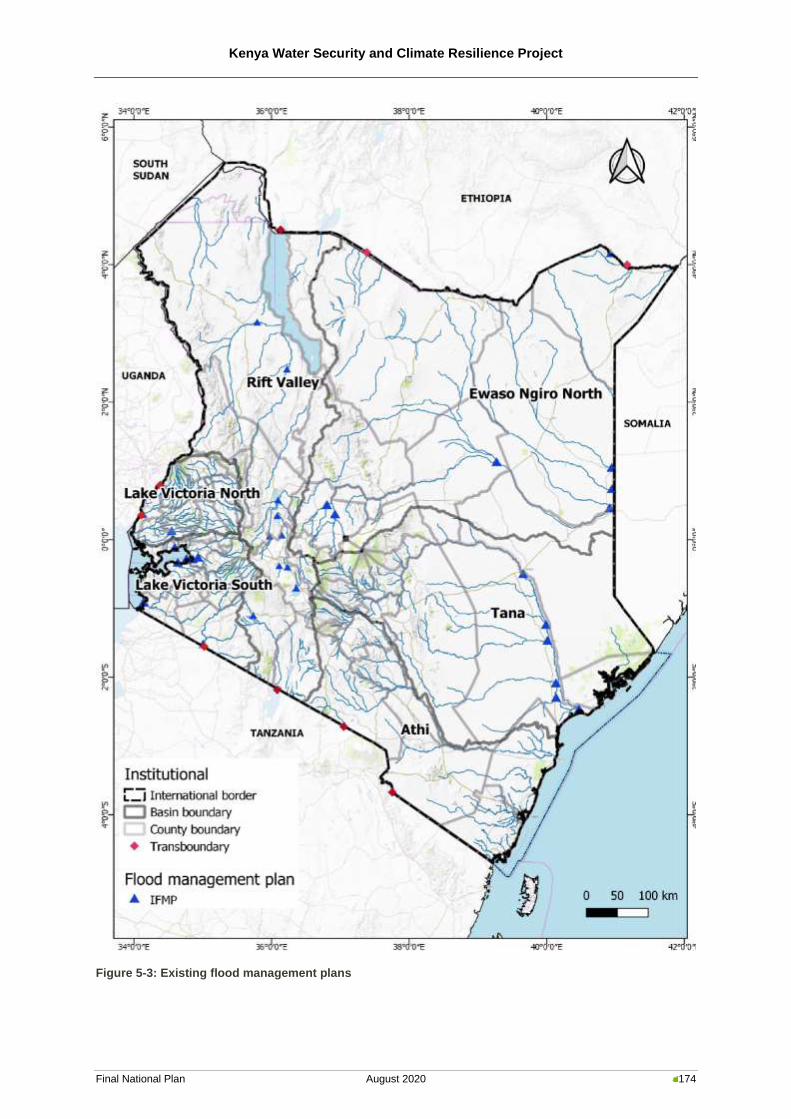
Kenya Water Security and Climate Resilience Project
Final National Plan August 2020 174
Figure 5-3: Existing flood management plans
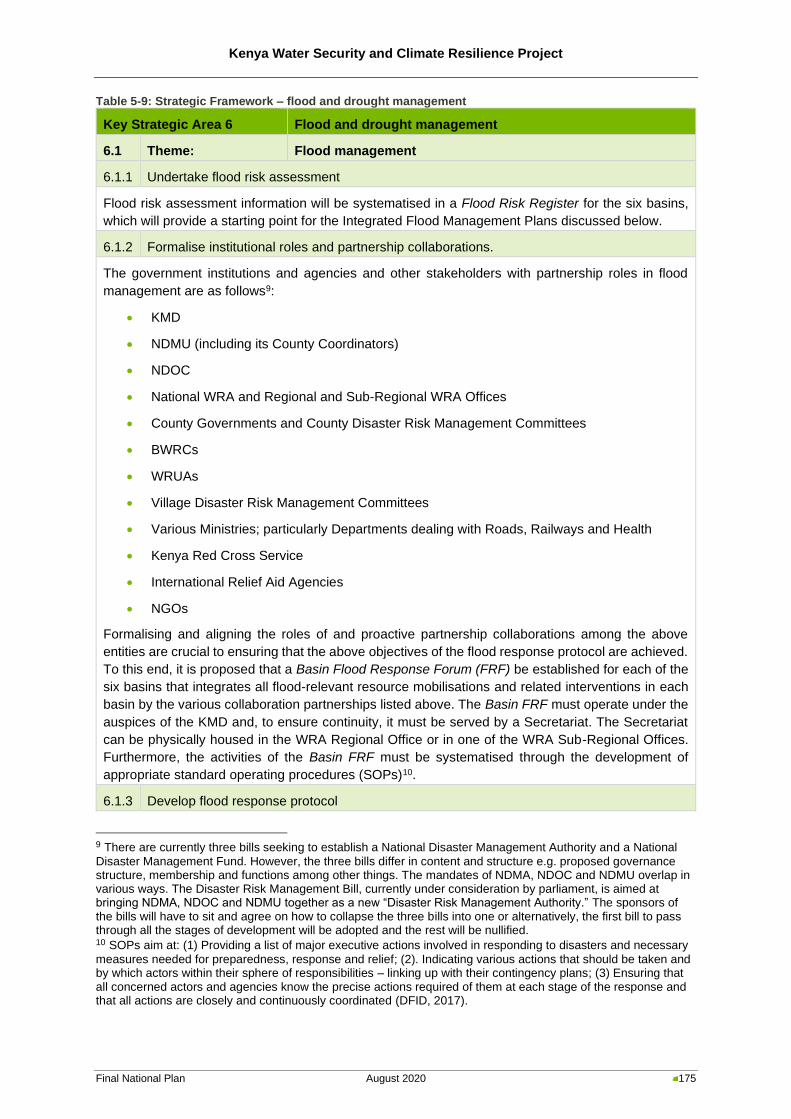
Kenya Water Security and Climate Resilience Project
Final National Plan August 2020 175
Table 5-9: Strategic Framework – flood and drought management
Key Strategic Area 6 Flood and drought management
6.1 Theme: Flood management
6.1.1 Undertake flood risk assessment
Flood risk assessment information will be systematised in a Flood Risk Register for the six basins,
which will provide a starting point for the Integrated Flood Management Plans discussed below.
6.1.2 Formalise institutional roles and partnership collaborations.
The government institutions and agencies and other stakeholders with partnership roles in flood
management are as follows9:
• KMD
• NDMU (including its County Coordinators)
• NDOC
• National WRA and Regional and Sub-Regional WRA Offices
• County Governments and County Disaster Risk Management Committees
• BWRCs
• WRUAs
• Village Disaster Risk Management Committees
• Various Ministries; particularly Departments dealing with Roads, Railways and Health
• Kenya Red Cross Service
• International Relief Aid Agencies
• NGOs
Formalising and aligning the roles of and proactive partnership collaborations among the above
entities are crucial to ensuring that the above objectives of the flood response protocol are achieved.
To this end, it is proposed that a Basin Flood Response Forum (FRF) be established for each of the
six basins that integrates all flood-relevant resource mobilisations and related interventions in each
basin by the various collaboration partnerships listed above. The Basin FRF must operate under the
auspices of the KMD and, to ensure continuity, it must be served by a Secretariat. The Secretariat
can be physically housed in the WRA Regional Office or in one of the WRA Sub-Regional Offices.
Furthermore, the activities of the Basin FRF must be systematised through the development of
appropriate standard operating procedures (SOPs)10.
6.1.3 Develop flood response protocol
9 There are currently three bills seeking to establish a National Disaster Management Authority and a National
Disaster Management Fund. However, the three bills differ in content and structure e.g. proposed governance structure, membership and functions among other things. The mandates of NDMA, NDOC and NDMU overlap in various ways. The Disaster Risk Management Bill, currently under consideration by parliament, is aimed at bringing NDMA, NDOC and NDMU together as a new “Disaster Risk Management Authority.” The sponsors of the bills will have to sit and agree on how to collapse the three bills into one or alternatively, the first bill to pass through all the stages of development will be adopted and the rest will be nullified. 10 SOPs aim at: (1) Providing a list of major executive actions involved in responding to disasters and necessary
measures needed for preparedness, response and relief; (2). Indicating various actions that should be taken and by which actors within their sphere of responsibilities – linking up with their contingency plans; (3) Ensuring that all concerned actors and agencies know the precise actions required of them at each stage of the response and that all actions are closely and continuously coordinated (DFID, 2017).
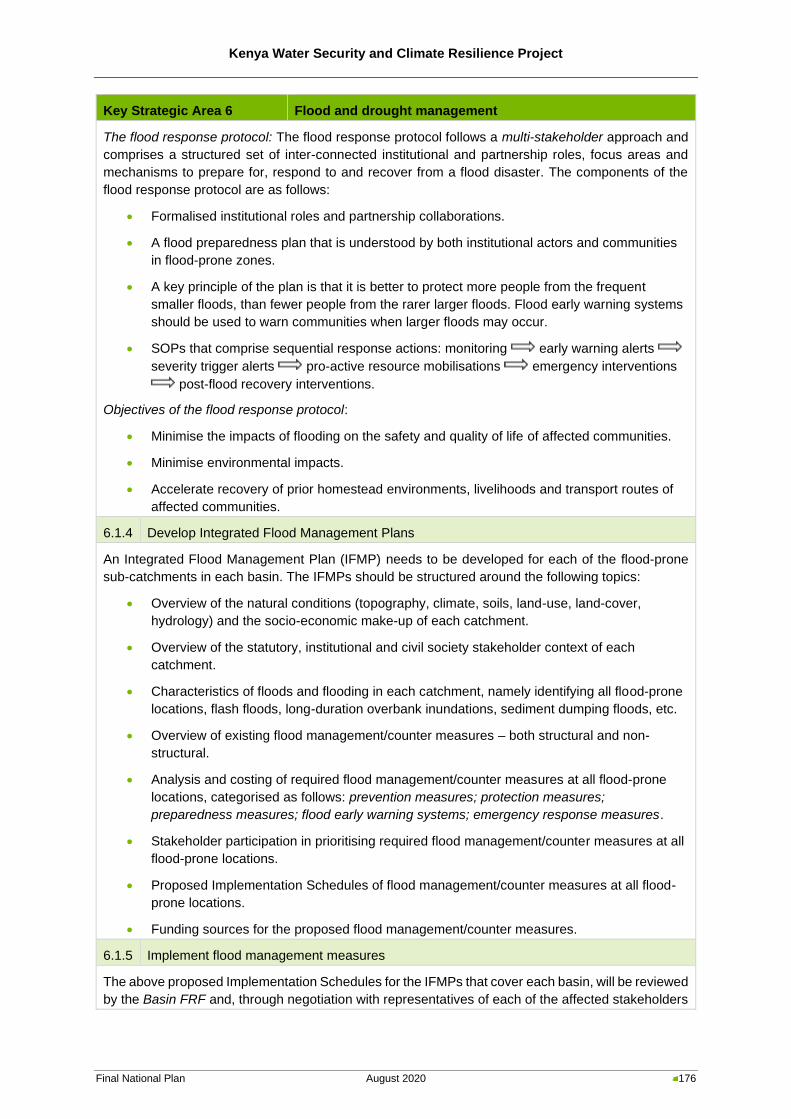
Kenya Water Security and Climate Resilience Project
Final National Plan August 2020 176
Key Strategic Area 6 Flood and drought management
The flood response protocol: The flood response protocol follows a multi-stakeholder approach and
comprises a structured set of inter-connected institutional and partnership roles, focus areas and
mechanisms to prepare for, respond to and recover from a flood disaster. The components of the
flood response protocol are as follows:
• Formalised institutional roles and partnership collaborations.
• A flood preparedness plan that is understood by both institutional actors and communities
in flood-prone zones.
• A key principle of the plan is that it is better to protect more people from the frequent
smaller floods, than fewer people from the rarer larger floods. Flood early warning systems
should be used to warn communities when larger floods may occur.
• SOPs that comprise sequential response actions: monitoring early warning alerts
severity trigger alerts pro-active resource mobilisations emergency interventions
post-flood recovery interventions.
Objectives of the flood response protocol:
• Minimise the impacts of flooding on the safety and quality of life of affected communities.
• Minimise environmental impacts.
• Accelerate recovery of prior homestead environments, livelihoods and transport routes of
affected communities.
6.1.4 Develop Integrated Flood Management Plans
An Integrated Flood Management Plan (IFMP) needs to be developed for each of the flood-prone
sub-catchments in each basin. The IFMPs should be structured around the following topics:
• Overview of the natural conditions (topography, climate, soils, land-use, land-cover,
hydrology) and the socio-economic make-up of each catchment.
• Overview of the statutory, institutional and civil society stakeholder context of each
catchment.
• Characteristics of floods and flooding in each catchment, namely identifying all flood-prone
locations, flash floods, long-duration overbank inundations, sediment dumping floods, etc.
• Overview of existing flood management/counter measures – both structural and non-
structural.
• Analysis and costing of required flood management/counter measures at all flood-prone
locations, categorised as follows: prevention measures; protection measures;
preparedness measures; flood early warning systems; emergency response measures.
• Stakeholder participation in prioritising required flood management/counter measures at all
flood-prone locations.
• Proposed Implementation Schedules of flood management/counter measures at all flood-
prone locations.
• Funding sources for the proposed flood management/counter measures.
6.1.5 Implement flood management measures
The above proposed Implementation Schedules for the IFMPs that cover each basin, will be reviewed
by the Basin FRF and, through negotiation with representatives of each of the affected stakeholders
Kenya Water Security and Climate Resilience Project
Final National Plan August 2020 177
Key Strategic Area 6 Flood and drought management
and villages/communities, be re-prioritised according to both non-structural and structural measures
that cover all the short-term, medium-term and long-term flood management/counter measures that
are required across the each basin at all flood-prone locations.
The above re-prioritised non-structural and structural flood management/counter measures will
encompass the following: prevention measures; protection measures; preparedness measures; flood
early warning systems; emergency response measures. These measures will be focused on flood-
prone river reaches and flood-plains in certain sub-catchments in each basin. Wherever feasible,
community-based flood early warning and flood preparedness approaches will be followed.
The Basin FRF will provide a platform for coordinating the resourcing and supervision of the funding
of the above re-prioritised non-structural and structural flood management/counter measures. In all
instances, labour-intensive approaches will be followed.
6.1.6 Capacity development
Capacity for flood management in each basin will be assessed according to three categories, namely,
organisational alignment/collaboration, technical skills and community preparedness. The outcomes
of these assessments will inform the strategy for development of capacity in each of the three
categories.
Organisational alignment/collaboration: The strategy is to expand organisational capacity by aligning
the flood response roles and responsibilities of the government institutions/agencies, International
Relief Aid Agencies, Kenya Red Cross, NGOs and other stakeholders with partnership roles in flood
management. The vehicle for this strategy will be the Basin Flood Response Forum (FRF) introduced
in Sub-Section 7.1.2.
Institutional technical skills: The strategy is to strategically expand institutional technical skills
relevant to flood response activities across three different sets of competencies, namely, (i)
competence at translating Flood Early Warning Bulletin information to support prioritisation of
resource mobilisations for humanitarian interventions; (ii) competence at logistical planning of
required interventions followed by subsequent operationalisation; (iii) competence at communicating
technical and logistical information in multi-stakeholder environments.
Community preparedness: Community-based flood early warning drills as well as emergency
evacuation drills will be prioritised by the Secretariat of the Basin FRF. The resources and experience
of the NDMU/NDOC (or their successor institution) can make valuable contributions to developing
community self-help awareness in terms of flood management.
6.2 Theme: Drought management
6.2.1 Formalise institutional roles and partnership collaborations.
The government institutions and agencies and other stakeholders with partnership roles in drought
management are as follows11:
• National Drought Management Authority (NDMA)
• NDMU (including its County Coordinators)
• NDOC
11 There are currently three bills seeking to establish a National Disaster Management Authority and a National
Disaster Management Fund. However, the three bills differ in content and structure e.g. proposed governance structure, membership and functions among other things. The mandates of NDMA, NDOC and NDMU overlap in various ways. The Disaster Risk Management Bill, currently under consideration by parliament, is aimed at bringing NDMA, NDOC and NDMU together as a new “Disaster Risk Management Authority.” The sponsors of the bills will have to sit and agree on how to collapse the three bills into one or alternatively, the first bill to pass through all the stages of development will be adopted and the rest will be nullified.
Kenya Water Security and Climate Resilience Project
Final National Plan August 2020 178
Key Strategic Area 6 Flood and drought management
• KMD
• National WRA and Regional and Sub-Regional WRA Offices
• County Governments and County Disaster Risk Management Committees
• BWRCs
• WRUAs
• Village Disaster Risk Management Committees
• Ministry of Agriculture, Livestock and Fisheries as well as Ministry of Health
• Kenya Red Cross Service
• International Relief Aid Agencies
• NGOs
Formalising and aligning the roles of and proactive partnership collaborations among the above
entities are crucial to ensuring that the above objectives of the drought response protocol are
achieved. To this end, it is proposed that the Basin Drought Response Forum (DRF) be established
for each basin that integrates all drought-relevant resource mobilisations and related interventions in
each basin by the various collaboration partnerships listed above. The Basin DRF must operate
under the auspices of the NDMA and, to ensure continuity, it must be served by a Secretariat. The
Secretariat can be physically housed in one of the drought-prone counties’ offices. Furthermore, the
activities of the Basin DRF must be systematised through the development of appropriate standard
operating procedures (SOPs.)
6.2.2 Develop drought response protocol.
The drought response protocol: The drought response protocol should follow a multi-stakeholder
approach to comprise a structured set of inter-connected institutional and partnership roles, focus
areas and mechanisms to prepare for, respond to and recover from a drought disaster. The
components of the proposed protocol are as follows:
• Formalised institutional roles and partnership collaborations.
• A drought preparedness plan that is understood by both institutional actors and
communities in drought-prone zones.
• SOPs that comprise sequential response actions: monitoring early warning alerts
severity trigger alerts pro-active resource mobilisations recovery interventions.
Objectives of the drought response protocol:
• Minimise the impact of water shortages on the quality of life of affected communities.
• Minimise environmental impacts.
• Ensure equitable allocation of water despite systematic restrictions of supply.
• Accelerate restoration of prior homestead environments and livelihoods of affected
communities.
6.2.3 Improve drought preparedness.
The above Basin DRF must address five primary drought response needs, i.e. drought monitoring,
drought early warning, drought severity assessment, mitigation interventions and recovery
interventions.
Kenya Water Security and Climate Resilience Project
Final National Plan August 2020 179
Key Strategic Area 6 Flood and drought management
Currently, drought monitoring, drought early warning and severity assessment are conducted by the
NDMA, who issues regular Drought Early Warning Bulletins for ASAL counties, with inputs from KMD,
the above two Ministries and WRA Offices. Regarding mitigation interventions and recovery
interventions, NDMA oversees two coordinating bodies at the national level that bring together
various stakeholders in drought preparedness. These are the Kenya Food Security Meeting and the
Kenya Food Security Steering Group. At the county level, this is organised under County Steering
Groups.
The drought severity assessments of the national and county-level coordinating structures of the
NDMA relevant to each Basin must be reviewed and deliberated by the collaboration partnership
participants in the Basin DRF. In the case of an adverse severity assessment, the Basin DRF
participants will have a common point of reference from which to launch and systematically
coordinate their various drought-relevant resource mobilisations and related interventions.
6.2.4 Develop drought early warning system
The NDMA currently issues regular Drought Early Warning Bulletins for ASAL counties. There are
additional drought-prone counties, which should be issued with Bulletins.
SOP responses based on the Bulletins’ early warning findings and alerts must be an integrating force
in the above Basin DRF. The sub-county scale of the Bulletins’ reporting ensures that such responses
can be spatially accurately focused. Furthermore, such informed responses will secure appropriate
and timeous resource mobilisations and humanitarian interventions across all the collaborating
partnerships at county, sub-county and local community scales across the drought-prone counties in
Kenya.
The Famine Early Warning Systems Network (FEWS NET), which produces monthly reports and
maps detailing current and projected food insecurity in a number of regions in the world, has a
Regional Office in Kenya and FEWS NET outputs will support the deliberations by the participants in
the Basin DRF.
6.2.4 Capacity development
Capacity for drought management in each basin will be assessed according to three categories,
namely, funding, organisational alignment and institutional technical skills. The outcomes of these
assessments will inform the strategy for development of capacity in each of the three categories.
Funding: The funding strategy is to secure a standing allocation from the recently-established
National Drought Emergency Fund (DEF) to Kenya’s drought-prone counties to ensure that finance
for early drought response will always be available when needed. This will avoid the hitherto time-
consuming approach of emergency budgetary re-allocations, which is also counter-productive,
because it takes resources away from the long-term development that should enhance resilience to
drought.
Organisational alignment/collaboration: The strategy is to expand organisational capacity in each
basin by aligning the drought response roles and responsibilities of the government
institutions/agencies, International Relief Aid Agencies, Kenya Red Cross, NGOs and other
stakeholders with partnership roles in drought management. The vehicle for this strategy will be the
Basin Drought Response Forum (DRF) introduced in Sub-Section 7.2.1.
Institutional technical skills: The strategy is to strategically expand institutional technical skills
relevant to drought response activities across three different sets of competencies, namely, (i)
competence at translating Drought Early Warning Bulletin information to support prioritisation of
resource mobilisations for humanitarian interventions; (ii) competence at logistical planning of
required interventions followed by subsequent operationalisation; (iii) competence at communicating
technical and logistical information in multi-stakeholder environments.
Kenya Water Security and Climate Resilience Project
Final National Plan August 2020 180
5.8 Hydro-meteorological Monitoring
5.8.1 Introduction
An operational and well-maintained hydro-meteorological network is critical to support water resources
planning and management in Kenya. The WRA is responsible for all aspects related to the monitoring
(quantity and quality) of surface water and groundwater in Kenya, including the construction and
maintenance of monitoring stations, related equipment, data collection, transmission, capturing and
storage, and dissemination of information.
5.8.2 Strategy
In order to comprehensively and systematically address the hydro-meteorological monitoring issues
and challenges in Kenya, Table 5-10 sets out two Strategic Themes with specific Strategies under each
Theme. The Themes address Improvements to the Monitoring Network as well as Improved Data and
Information Management.
Under this Consultancy, the current flow gauging station, water quality monitoring, rainfall station and
flood early warning networks in Kenya were assessed in terms of operational status, challenges,
maintenance and equipment needs and data quality. Stations were prioritised for rehabilitation, for
improvements and upgrades and for re-calibration. New station locations were identified based on pre-
defined criteria and recommendations were documented in the Monitoring Network Design Report.
Table 5-10: Strategic Framework – Hydro-meteorological Monitoring
7 Key Strategic Area: Hydro-meteorological Monitoring
7.1 Theme: Improved monitoring network
7.1.1 Surface water monitoring: River flow
New station locations should be implemented according to the recommendations made in the
Monitoring Network Design Report under this Consultancy. A maintenance plan with budgets,
timeframes and structured responsibilities should be prepared. The type of flow gauging stations to
be installed should take into account that changes in river channel form due to floods often lead to
changes in the rating curve, which requires re-calibration. Consideration should therefore also be
given to fixed weirs (concrete structures) as opposed to rated sections.
7.1.2 Monitoring: Dams and lakes
The current instrumentation and level gauging network in dams and lakes in Kenya should be
assessed in terms of operational status, challenges, maintenance and equipment needs and data
quality. Stations should be prioritised for rehabilitation where required, for improvements and
upgrades and for re-calibration. New station locations should be identified based on pre-defined
criteria and designed and implemented according to an implementation plan. A maintenance plan with
budgets, timeframes and structured responsibilities should be prepared. Bathymetric surveys of dams
and lakes should also be included in the plan.
7.1.3 Groundwater monitoring
Priority aquifers in Kenya should be defined and monitoring requirements for each aquifer specified.
A Groundwater Monitoring Network Design should be undertaken and necessary monitoring
instrumentation procured and installed in accordance with an Implementation Plan.
7.1.4 Water quality monitoring: Surface water and groundwater
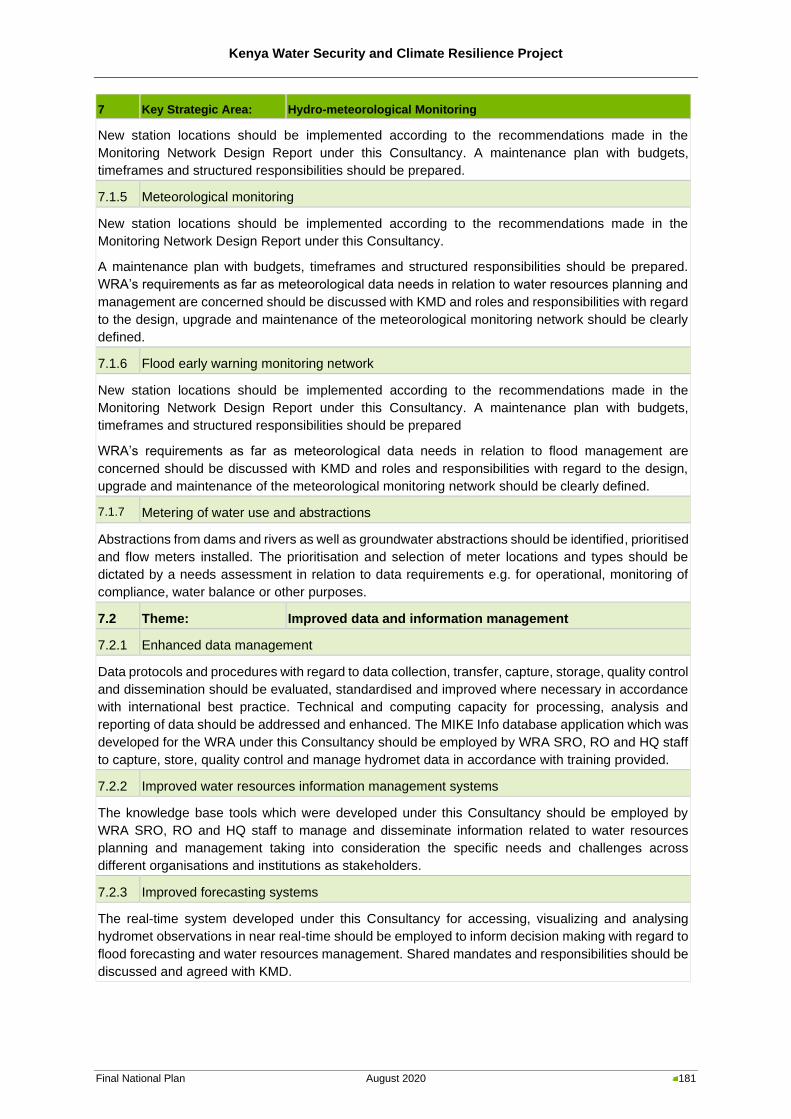
Kenya Water Security and Climate Resilience Project
Final National Plan August 2020 181
7 Key Strategic Area: Hydro-meteorological Monitoring
New station locations should be implemented according to the recommendations made in the
Monitoring Network Design Report under this Consultancy. A maintenance plan with budgets,
timeframes and structured responsibilities should be prepared.
7.1.5 Meteorological monitoring
New station locations should be implemented according to the recommendations made in the
Monitoring Network Design Report under this Consultancy.
A maintenance plan with budgets, timeframes and structured responsibilities should be prepared.
WRA’s requirements as far as meteorological data needs in relation to water resources planning and
management are concerned should be discussed with KMD and roles and responsibilities with regard
to the design, upgrade and maintenance of the meteorological monitoring network should be clearly
defined.
7.1.6 Flood early warning monitoring network
New station locations should be implemented according to the recommendations made in the
Monitoring Network Design Report under this Consultancy. A maintenance plan with budgets,
timeframes and structured responsibilities should be prepared
WRA’s requirements as far as meteorological data needs in relation to flood management are
concerned should be discussed with KMD and roles and responsibilities with regard to the design,
upgrade and maintenance of the meteorological monitoring network should be clearly defined.
7.1.7 Metering of water use and abstractions
Abstractions from dams and rivers as well as groundwater abstractions should be identified, prioritised
and flow meters installed. The prioritisation and selection of meter locations and types should be
dictated by a needs assessment in relation to data requirements e.g. for operational, monitoring of
compliance, water balance or other purposes.
7.2 Theme: Improved data and information management
7.2.1 Enhanced data management
Data protocols and procedures with regard to data collection, transfer, capture, storage, quality control
and dissemination should be evaluated, standardised and improved where necessary in accordance
with international best practice. Technical and computing capacity for processing, analysis and
reporting of data should be addressed and enhanced. The MIKE Info database application which was
developed for the WRA under this Consultancy should be employed by WRA SRO, RO and HQ staff
to capture, store, quality control and manage hydromet data in accordance with training provided.
7.2.2 Improved water resources information management systems
The knowledge base tools which were developed under this Consultancy should be employed by
WRA SRO, RO and HQ staff to manage and disseminate information related to water resources
planning and management taking into consideration the specific needs and challenges across
different organisations and institutions as stakeholders.
7.2.3 Improved forecasting systems
The real-time system developed under this Consultancy for accessing, visualizing and analysing
hydromet observations in near real-time should be employed to inform decision making with regard to
flood forecasting and water resources management. Shared mandates and responsibilities should be
discussed and agreed with KMD.
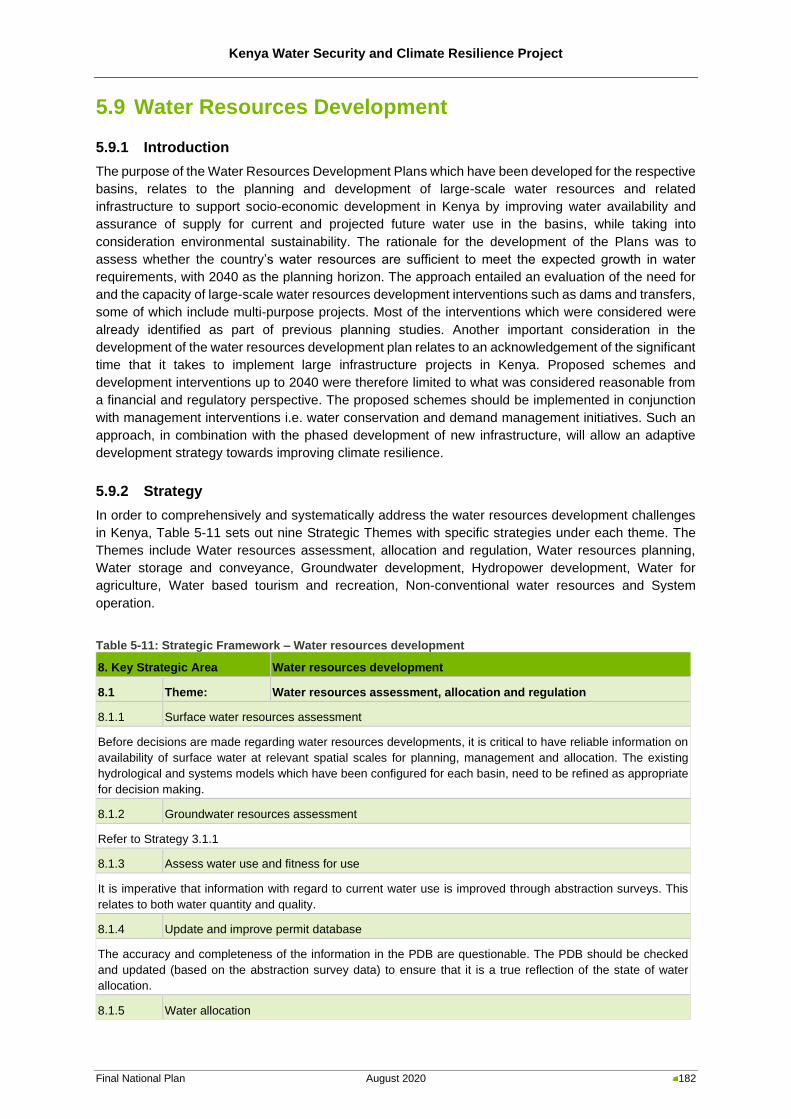
Kenya Water Security and Climate Resilience Project
Final National Plan August 2020 182
5.9 Water Resources Development
5.9.1 Introduction
The purpose of the Water Resources Development Plans which have been developed for the respective
basins, relates to the planning and development of large-scale water resources and related
infrastructure to support socio-economic development in Kenya by improving water availability and
assurance of supply for current and projected future water use in the basins, while taking into
consideration environmental sustainability. The rationale for the development of the Plans was to
assess whether the country’s water resources are sufficient to meet the expected growth in water
requirements, with 2040 as the planning horizon. The approach entailed an evaluation of the need for
and the capacity of large-scale water resources development interventions such as dams and transfers,
some of which include multi-purpose projects. Most of the interventions which were considered were
already identified as part of previous planning studies. Another important consideration in the
development of the water resources development plan relates to an acknowledgement of the significant
time that it takes to implement large infrastructure projects in Kenya. Proposed schemes and
development interventions up to 2040 were therefore limited to what was considered reasonable from
a financial and regulatory perspective. The proposed schemes should be implemented in conjunction
with management interventions i.e. water conservation and demand management initiatives. Such an
approach, in combination with the phased development of new infrastructure, will allow an adaptive
development strategy towards improving climate resilience.
5.9.2 Strategy
In order to comprehensively and systematically address the water resources development challenges
in Kenya, Table 5-11 sets out nine Strategic Themes with specific strategies under each theme. The
Themes include Water resources assessment, allocation and regulation, Water resources planning,
Water storage and conveyance, Groundwater development, Hydropower development, Water for
agriculture, Water based tourism and recreation, Non-conventional water resources and System
operation.
Table 5-11: Strategic Framework – Water resources development
8. Key Strategic Area Water resources development
8.1 Theme: Water resources assessment, allocation and regulation
8.1.1 Surface water resources assessment
Before decisions are made regarding water resources developments, it is critical to have reliable information on
availability of surface water at relevant spatial scales for planning, management and allocation. The existing
hydrological and systems models which have been configured for each basin, need to be refined as appropriate
for decision making.
8.1.2 Groundwater resources assessment
Refer to Strategy 3.1.1
8.1.3 Assess water use and fitness for use
It is imperative that information with regard to current water use is improved through abstraction surveys. This
relates to both water quantity and quality.
8.1.4 Update and improve permit database
The accuracy and completeness of the information in the PDB are questionable. The PDB should be checked
and updated (based on the abstraction survey data) to ensure that it is a true reflection of the state of water
allocation.
8.1.5 Water allocation
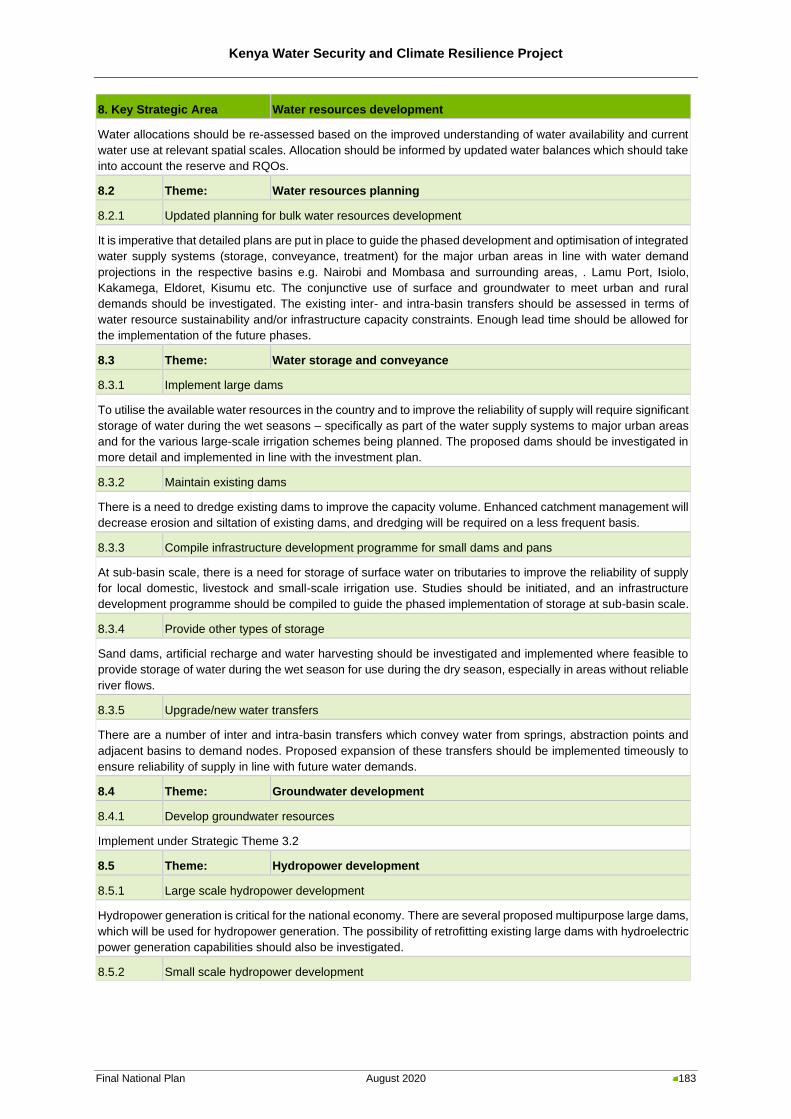
Kenya Water Security and Climate Resilience Project
Final National Plan August 2020 183
8. Key Strategic Area Water resources development
Water allocations should be re-assessed based on the improved understanding of water availability and current
water use at relevant spatial scales. Allocation should be informed by updated water balances which should take
into account the reserve and RQOs.
8.2 Theme: Water resources planning
8.2.1 Updated planning for bulk water resources development
It is imperative that detailed plans are put in place to guide the phased development and optimisation of integrated
water supply systems (storage, conveyance, treatment) for the major urban areas in line with water demand
projections in the respective basins e.g. Nairobi and Mombasa and surrounding areas, . Lamu Port, Isiolo,
Kakamega, Eldoret, Kisumu etc. The conjunctive use of surface and groundwater to meet urban and rural
demands should be investigated. The existing inter- and intra-basin transfers should be assessed in terms of
water resource sustainability and/or infrastructure capacity constraints. Enough lead time should be allowed for
the implementation of the future phases.
8.3 Theme: Water storage and conveyance
8.3.1 Implement large dams
To utilise the available water resources in the country and to improve the reliability of supply will require significant
storage of water during the wet seasons – specifically as part of the water supply systems to major urban areas
and for the various large-scale irrigation schemes being planned. The proposed dams should be investigated in
more detail and implemented in line with the investment plan.
8.3.2 Maintain existing dams
There is a need to dredge existing dams to improve the capacity volume. Enhanced catchment management will
decrease erosion and siltation of existing dams, and dredging will be required on a less frequent basis.
8.3.3 Compile infrastructure development programme for small dams and pans
At sub-basin scale, there is a need for storage of surface water on tributaries to improve the reliability of supply
for local domestic, livestock and small-scale irrigation use. Studies should be initiated, and an infrastructure
development programme should be compiled to guide the phased implementation of storage at sub-basin scale.
8.3.4 Provide other types of storage
Sand dams, artificial recharge and water harvesting should be investigated and implemented where feasible to
provide storage of water during the wet season for use during the dry season, especially in areas without reliable
river flows.
8.3.5 Upgrade/new water transfers
There are a number of inter and intra-basin transfers which convey water from springs, abstraction points and
adjacent basins to demand nodes. Proposed expansion of these transfers should be implemented timeously to
ensure reliability of supply in line with future water demands.
8.4 Theme: Groundwater development
8.4.1 Develop groundwater resources
Implement under Strategic Theme 3.2
8.5 Theme: Hydropower development
8.5.1 Large scale hydropower development
Hydropower generation is critical for the national economy. There are several proposed multipurpose large dams,
which will be used for hydropower generation. The possibility of retrofitting existing large dams with hydroelectric
power generation capabilities should also be investigated.
8.5.2 Small scale hydropower development
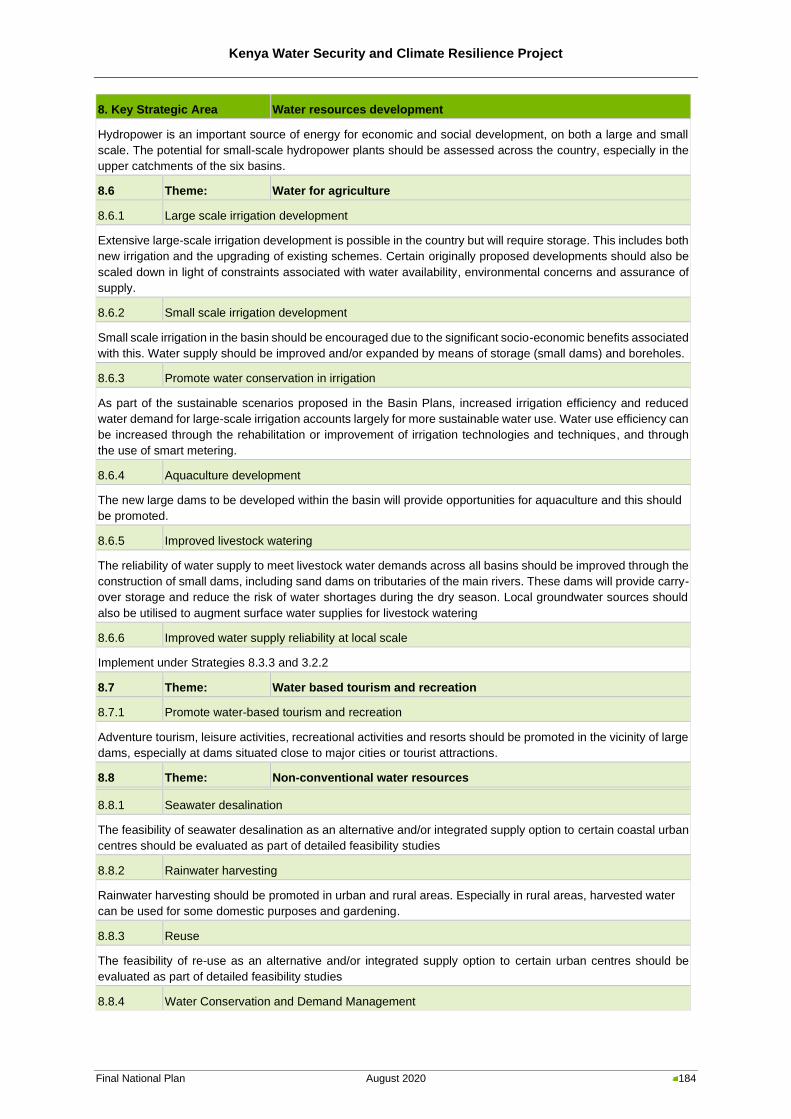
Kenya Water Security and Climate Resilience Project
Final National Plan August 2020 184
8. Key Strategic Area Water resources development
Hydropower is an important source of energy for economic and social development, on both a large and small
scale. The potential for small-scale hydropower plants should be assessed across the country, especially in the
upper catchments of the six basins.
8.6 Theme: Water for agriculture
8.6.1 Large scale irrigation development
Extensive large-scale irrigation development is possible in the country but will require storage. This includes both
new irrigation and the upgrading of existing schemes. Certain originally proposed developments should also be
scaled down in light of constraints associated with water availability, environmental concerns and assurance of
supply.
8.6.2 Small scale irrigation development
Small scale irrigation in the basin should be encouraged due to the significant socio-economic benefits associated
with this. Water supply should be improved and/or expanded by means of storage (small dams) and boreholes.
8.6.3 Promote water conservation in irrigation
As part of the sustainable scenarios proposed in the Basin Plans, increased irrigation efficiency and reduced
water demand for large-scale irrigation accounts largely for more sustainable water use. Water use efficiency can
be increased through the rehabilitation or improvement of irrigation technologies and techniques, and through
the use of smart metering.
8.6.4 Aquaculture development
The new large dams to be developed within the basin will provide opportunities for aquaculture and this should
be promoted.
8.6.5 Improved livestock watering
The reliability of water supply to meet livestock water demands across all basins should be improved through the
construction of small dams, including sand dams on tributaries of the main rivers. These dams will provide carry-
over storage and reduce the risk of water shortages during the dry season. Local groundwater sources should
also be utilised to augment surface water supplies for livestock watering
8.6.6 Improved water supply reliability at local scale
Implement under Strategies 8.3.3 and 3.2.2
8.7 Theme: Water based tourism and recreation
8.7.1 Promote water-based tourism and recreation
Adventure tourism, leisure activities, recreational activities and resorts should be promoted in the vicinity of large
dams, especially at dams situated close to major cities or tourist attractions.
8.8 Theme: Non-conventional water resources
8.8.1 Seawater desalination
The feasibility of seawater desalination as an alternative and/or integrated supply option to certain coastal urban
centres should be evaluated as part of detailed feasibility studies
8.8.2 Rainwater harvesting
Rainwater harvesting should be promoted in urban and rural areas. Especially in rural areas, harvested water
can be used for some domestic purposes and gardening.
8.8.3 Reuse
The feasibility of re-use as an alternative and/or integrated supply option to certain urban centres should be
evaluated as part of detailed feasibility studies
8.8.4 Water Conservation and Demand Management
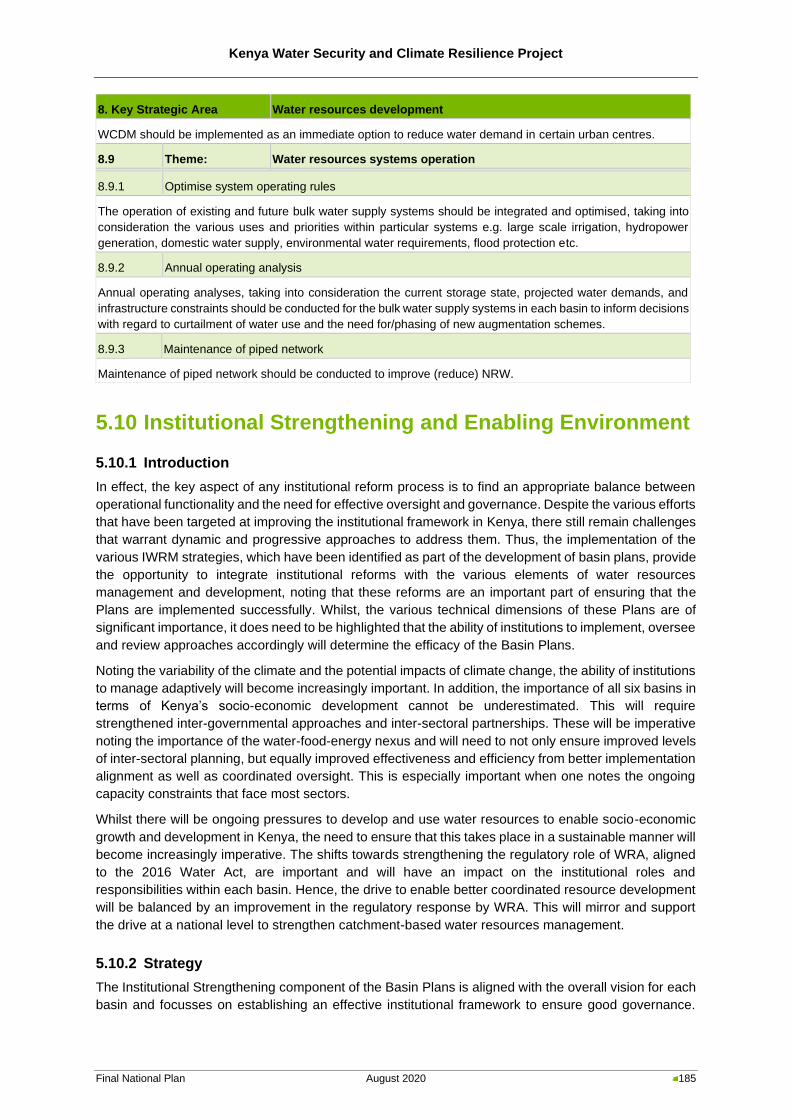
Kenya Water Security and Climate Resilience Project
Final National Plan August 2020 185
8. Key Strategic Area Water resources development
WCDM should be implemented as an immediate option to reduce water demand in certain urban centres.
8.9 Theme: Water resources systems operation
8.9.1 Optimise system operating rules
The operation of existing and future bulk water supply systems should be integrated and optimised, taking into
consideration the various uses and priorities within particular systems e.g. large scale irrigation, hydropower
generation, domestic water supply, environmental water requirements, flood protection etc.
8.9.2 Annual operating analysis
Annual operating analyses, taking into consideration the current storage state, projected water demands, and
infrastructure constraints should be conducted for the bulk water supply systems in each basin to inform decisions
with regard to curtailment of water use and the need for/phasing of new augmentation schemes.
8.9.3 Maintenance of piped network
Maintenance of piped network should be conducted to improve (reduce) NRW.
5.10 Institutional Strengthening and Enabling Environment
5.10.1 Introduction
In effect, the key aspect of any institutional reform process is to find an appropriate balance between
operational functionality and the need for effective oversight and governance. Despite the various efforts
that have been targeted at improving the institutional framework in Kenya, there still remain challenges
that warrant dynamic and progressive approaches to address them. Thus, the implementation of the
various IWRM strategies, which have been identified as part of the development of basin plans, provide
the opportunity to integrate institutional reforms with the various elements of water resources
management and development, noting that these reforms are an important part of ensuring that the
Plans are implemented successfully. Whilst, the various technical dimensions of these Plans are of
significant importance, it does need to be highlighted that the ability of institutions to implement, oversee
and review approaches accordingly will determine the efficacy of the Basin Plans.
Noting the variability of the climate and the potential impacts of climate change, the ability of institutions
to manage adaptively will become increasingly important. In addition, the importance of all six basins in
terms of Kenya’s socio-economic development cannot be underestimated. This will require
strengthened inter-governmental approaches and inter-sectoral partnerships. These will be imperative
noting the importance of the water-food-energy nexus and will need to not only ensure improved levels
of inter-sectoral planning, but equally improved effectiveness and efficiency from better implementation
alignment as well as coordinated oversight. This is especially important when one notes the ongoing
capacity constraints that face most sectors.
Whilst there will be ongoing pressures to develop and use water resources to enable socio-economic
growth and development in Kenya, the need to ensure that this takes place in a sustainable manner will
become increasingly imperative. The shifts towards strengthening the regulatory role of WRA, aligned
to the 2016 Water Act, are important and will have an impact on the institutional roles and
responsibilities within each basin. Hence, the drive to enable better coordinated resource development
will be balanced by an improvement in the regulatory response by WRA. This will mirror and support
the drive at a national level to strengthen catchment-based water resources management.
5.10.2 Strategy
The Institutional Strengthening component of the Basin Plans is aligned with the overall vision for each
basin and focusses on establishing an effective institutional framework to ensure good governance.
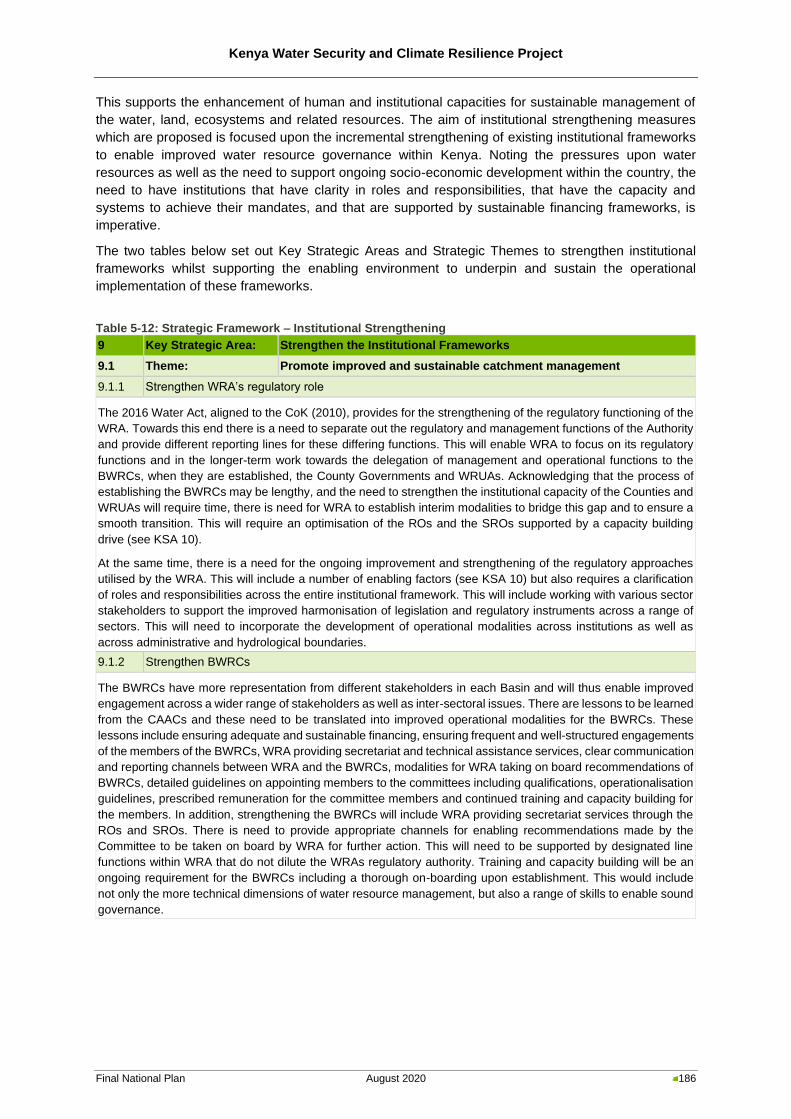
Kenya Water Security and Climate Resilience Project
Final National Plan August 2020 186
This supports the enhancement of human and institutional capacities for sustainable management of
the water, land, ecosystems and related resources. The aim of institutional strengthening measures
which are proposed is focused upon the incremental strengthening of existing institutional frameworks
to enable improved water resource governance within Kenya. Noting the pressures upon water
resources as well as the need to support ongoing socio-economic development within the country, the
need to have institutions that have clarity in roles and responsibilities, that have the capacity and
systems to achieve their mandates, and that are supported by sustainable financing frameworks, is
imperative.
The two tables below set out Key Strategic Areas and Strategic Themes to strengthen institutional
frameworks whilst supporting the enabling environment to underpin and sustain the operational
implementation of these frameworks.
Table 5-12: Strategic Framework – Institutional Strengthening
9 Key Strategic Area: Strengthen the Institutional Frameworks
9.1 Theme: Promote improved and sustainable catchment management
9.1.1 Strengthen WRA’s regulatory role
The 2016 Water Act, aligned to the CoK (2010), provides for the strengthening of the regulatory functioning of the
WRA. Towards this end there is a need to separate out the regulatory and management functions of the Authority
and provide different reporting lines for these differing functions. This will enable WRA to focus on its regulatory
functions and in the longer-term work towards the delegation of management and operational functions to the
BWRCs, when they are established, the County Governments and WRUAs. Acknowledging that the process of
establishing the BWRCs may be lengthy, and the need to strengthen the institutional capacity of the Counties and
WRUAs will require time, there is need for WRA to establish interim modalities to bridge this gap and to ensure a
smooth transition. This will require an optimisation of the ROs and the SROs supported by a capacity building
drive (see KSA 10).
At the same time, there is a need for the ongoing improvement and strengthening of the regulatory approaches
utilised by the WRA. This will include a number of enabling factors (see KSA 10) but also requires a clarification
of roles and responsibilities across the entire institutional framework. This will include working with various sector
stakeholders to support the improved harmonisation of legislation and regulatory instruments across a range of
sectors. This will need to incorporate the development of operational modalities across institutions as well as
across administrative and hydrological boundaries.
9.1.2 Strengthen BWRCs
The BWRCs have more representation from different stakeholders in each Basin and will thus enable improved
engagement across a wider range of stakeholders as well as inter-sectoral issues. There are lessons to be learned
from the CAACs and these need to be translated into improved operational modalities for the BWRCs. These
lessons include ensuring adequate and sustainable financing, ensuring frequent and well-structured engagements
of the members of the BWRCs, WRA providing secretariat and technical assistance services, clear communication
and reporting channels between WRA and the BWRCs, modalities for WRA taking on board recommendations of
BWRCs, detailed guidelines on appointing members to the committees including qualifications, operationalisation
guidelines, prescribed remuneration for the committee members and continued training and capacity building for
the members. In addition, strengthening the BWRCs will include WRA providing secretariat services through the
ROs and SROs. There is need to provide appropriate channels for enabling recommendations made by the
Committee to be taken on board by WRA for further action. This will need to be supported by designated line
functions within WRA that do not dilute the WRAs regulatory authority. Training and capacity building will be an
ongoing requirement for the BWRCs including a thorough on-boarding upon establishment. This would include
not only the more technical dimensions of water resource management, but also a range of skills to enable sound
governance.
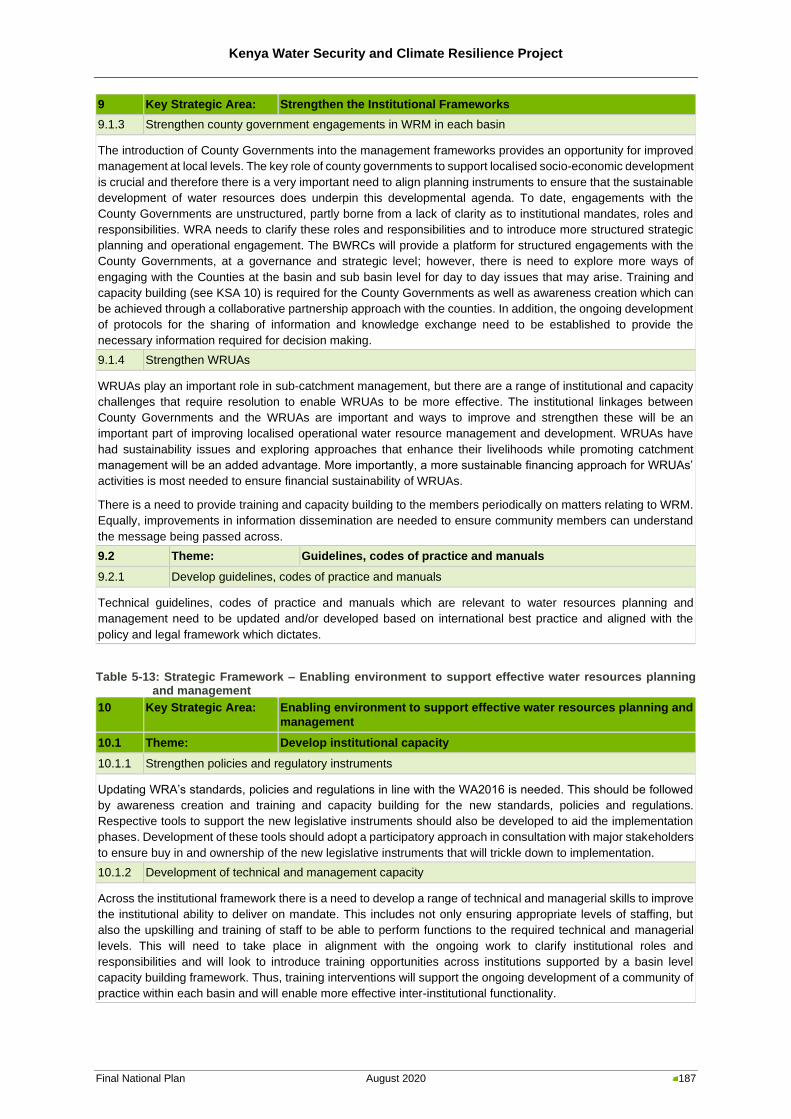
Kenya Water Security and Climate Resilience Project
Final National Plan August 2020 187
9 Key Strategic Area: Strengthen the Institutional Frameworks
9.1.3 Strengthen county government engagements in WRM in each basin
The introduction of County Governments into the management frameworks provides an opportunity for improved
management at local levels. The key role of county governments to support localised socio-economic development
is crucial and therefore there is a very important need to align planning instruments to ensure that the sustainable
development of water resources does underpin this developmental agenda. To date, engagements with the
County Governments are unstructured, partly borne from a lack of clarity as to institutional mandates, roles and
responsibilities. WRA needs to clarify these roles and responsibilities and to introduce more structured strategic
planning and operational engagement. The BWRCs will provide a platform for structured engagements with the
County Governments, at a governance and strategic level; however, there is need to explore more ways of
engaging with the Counties at the basin and sub basin level for day to day issues that may arise. Training and
capacity building (see KSA 10) is required for the County Governments as well as awareness creation which can
be achieved through a collaborative partnership approach with the counties. In addition, the ongoing development
of protocols for the sharing of information and knowledge exchange need to be established to provide the
necessary information required for decision making.
9.1.4 Strengthen WRUAs
WRUAs play an important role in sub-catchment management, but there are a range of institutional and capacity
challenges that require resolution to enable WRUAs to be more effective. The institutional linkages between
County Governments and the WRUAs are important and ways to improve and strengthen these will be an
important part of improving localised operational water resource management and development. WRUAs have
had sustainability issues and exploring approaches that enhance their livelihoods while promoting catchment
management will be an added advantage. More importantly, a more sustainable financing approach for WRUAs’
activities is most needed to ensure financial sustainability of WRUAs.
There is a need to provide training and capacity building to the members periodically on matters relating to WRM.
Equally, improvements in information dissemination are needed to ensure community members can understand
the message being passed across.
9.2 Theme: Guidelines, codes of practice and manuals
9.2.1 Develop guidelines, codes of practice and manuals
Technical guidelines, codes of practice and manuals which are relevant to water resources planning and
management need to be updated and/or developed based on international best practice and aligned with the
policy and legal framework which dictates.
Table 5-13: Strategic Framework – Enabling environment to support effective water resources planning and management
10 Key Strategic Area: Enabling environment to support effective water resources planning and
management
10.1 Theme: Develop institutional capacity
10.1.1 Strengthen policies and regulatory instruments
Updating WRA’s standards, policies and regulations in line with the WA2016 is needed. This should be followed
by awareness creation and training and capacity building for the new standards, policies and regulations.
Respective tools to support the new legislative instruments should also be developed to aid the implementation
phases. Development of these tools should adopt a participatory approach in consultation with major stakeholders
to ensure buy in and ownership of the new legislative instruments that will trickle down to implementation.
10.1.2 Development of technical and management capacity
Across the institutional framework there is a need to develop a range of technical and managerial skills to improve
the institutional ability to deliver on mandate. This includes not only ensuring appropriate levels of staffing, but
also the upskilling and training of staff to be able to perform functions to the required technical and managerial
levels. This will need to take place in alignment with the ongoing work to clarify institutional roles and
responsibilities and will look to introduce training opportunities across institutions supported by a basin level
capacity building framework. Thus, training interventions will support the ongoing development of a community of
practice within each basin and will enable more effective inter-institutional functionality.
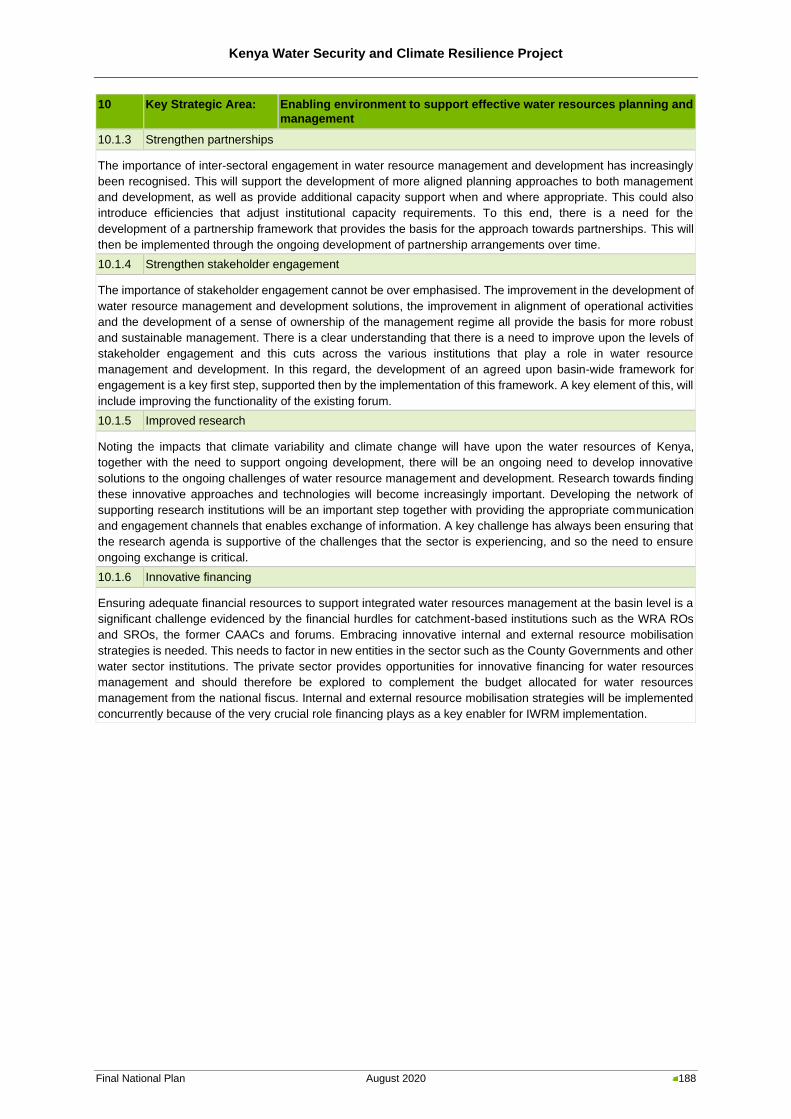
Kenya Water Security and Climate Resilience Project
Final National Plan August 2020 188
10 Key Strategic Area: Enabling environment to support effective water resources planning and
management
10.1.3 Strengthen partnerships
The importance of inter-sectoral engagement in water resource management and development has increasingly
been recognised. This will support the development of more aligned planning approaches to both management
and development, as well as provide additional capacity support when and where appropriate. This could also
introduce efficiencies that adjust institutional capacity requirements. To this end, there is a need for the
development of a partnership framework that provides the basis for the approach towards partnerships. This will
then be implemented through the ongoing development of partnership arrangements over time.
10.1.4 Strengthen stakeholder engagement
The importance of stakeholder engagement cannot be over emphasised. The improvement in the development of
water resource management and development solutions, the improvement in alignment of operational activities
and the development of a sense of ownership of the management regime all provide the basis for more robust
and sustainable management. There is a clear understanding that there is a need to improve upon the levels of
stakeholder engagement and this cuts across the various institutions that play a role in water resource
management and development. In this regard, the development of an agreed upon basin-wide framework for
engagement is a key first step, supported then by the implementation of this framework. A key element of this, will
include improving the functionality of the existing forum.
10.1.5 Improved research
Noting the impacts that climate variability and climate change will have upon the water resources of Kenya,
together with the need to support ongoing development, there will be an ongoing need to develop innovative
solutions to the ongoing challenges of water resource management and development. Research towards finding
these innovative approaches and technologies will become increasingly important. Developing the network of
supporting research institutions will be an important step together with providing the appropriate communication
and engagement channels that enables exchange of information. A key challenge has always been ensuring that
the research agenda is supportive of the challenges that the sector is experiencing, and so the need to ensure
ongoing exchange is critical.
10.1.6 Innovative financing
Ensuring adequate financial resources to support integrated water resources management at the basin level is a
significant challenge evidenced by the financial hurdles for catchment-based institutions such as the WRA ROs
and SROs, the former CAACs and forums. Embracing innovative internal and external resource mobilisation
strategies is needed. This needs to factor in new entities in the sector such as the County Governments and other
water sector institutions. The private sector provides opportunities for innovative financing for water resources
management and should therefore be explored to complement the budget allocated for water resources
management from the national fiscus. Internal and external resource mobilisation strategies will be implemented
concurrently because of the very crucial role financing plays as a key enabler for IWRM implementation.
Kenya Water Security and Climate Resilience Project
Final National Plan August 2020 189
Kenya Water Security and Climate Resilience Project
Final National Plan August 2020 190
6 Way Forward
6.1 Introduction
The main challenges associated with water resources development and management in Kenya vary
across the country and include water quality, the spatial and temporal variability of water, assurance of
supply, impacts of climate change, the expected growth in water demand linked to population growth
and socio-economic and irrigation development, challenges associated with the successful
implementation of large-scale water resources and related infrastructure, inadequate planning, etc.
These challenges are exacerbated by various management and institutional issues. Furthermore,
environmental sustainability needs to form an integral part of the decision-making processes during
development of Kenya’s water resources.
The Basin Plans aim to achieve a sustainable balance between the utilisation, development and
protection of water resources and provide a clear pathway for the sustainable utilisation and
development of the water resources of Kenya. In essence, the rationale for the development of the six
Basin Plans was to assess whether the respective basins’ water resources are sufficient to sustainably
meet the socio-economic development needs and the associated growth in water requirements, with
2040 as the planning horizon. It is important to remember that the Basin Plans are “living documents”,
which should accommodate adjustments and/or updates. Ideally the Basin Plans should be reviewed
and updated every five years.
This Section provides a high-level summary of the main outcomes of the basin planning process,
contextualises the Basin Plans and provides a roadmap to guide implementation of the Basin Plans
within the framework of IWRM. Whilst this National Plan consolidates the outcomes from the basin
planning process the six Basin Plans themselves present the actions for implementation and
monitoring/evaluation.
6.2 Key Outcomes
The six Basin Plans are key deliverables toward the overall objective of the KWSCRP, namely to
strengthen WRA’s capacity in terms of tools, skills and infrastructure to deliver on its mandate for water
resources regulation in the country. It constitutes IWRM and Development Plans for the six river basins,
which consider the environmental, social and economic aspects of each basin, address the key issues
and challenges, and ensure that these aspects are integrated into overall management strategies.
The essence of the proposed Basin Plans for Kenya’s six basins, up to 2040, is to address the expected
growth in urban water demands at an improved assurance of supply, ensure reliable water availability
for the proposed large-scale irrigation developments, improve existing and future water resources
availability for smaller towns and basin-wide domestic, livestock and small-scale irrigation water
demands, increase hydropower production and unlock socio-economic development through the
construction of large, multi-purpose water resources development projects, including flood control. This
will necessitate the construction of small-scale and large-scale storage, transfer and regulation
infrastructure, the expansion of existing and the development of new intra- and inter-basin transfers,
and increased groundwater abstraction. In addition, water conservation and demand management
measures should be introduced as a matter of urgency across all water user sectors It is also
recommended that a detailed hydro-census be undertaken in all six basins to confirm surface and
groundwater use and supply sources and to improve the understanding of water quality issues across
the country.
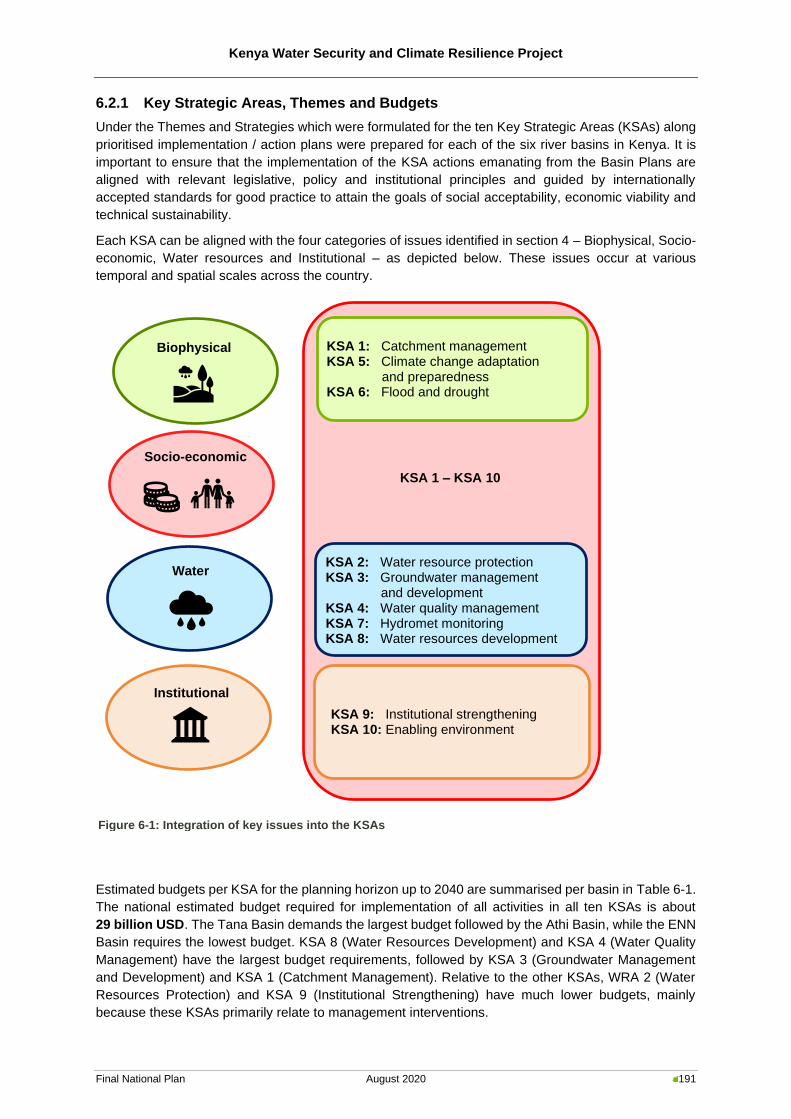
Kenya Water Security and Climate Resilience Project
Final National Plan August 2020 191
6.2.1 Key Strategic Areas, Themes and Budgets
Under the Themes and Strategies which were formulated for the ten Key Strategic Areas (KSAs) along
prioritised implementation / action plans were prepared for each of the six river basins in Kenya. It is
important to ensure that the implementation of the KSA actions emanating from the Basin Plans are
aligned with relevant legislative, policy and institutional principles and guided by internationally
accepted standards for good practice to attain the goals of social acceptability, economic viability and
technical sustainability.
Each KSA can be aligned with the four categories of issues identified in section 4 – Biophysical, Socio-
economic, Water resources and Institutional – as depicted below. These issues occur at various
temporal and spatial scales across the country.
Estimated budgets per KSA for the planning horizon up to 2040 are summarised per basin in Table 6-1.
The national estimated budget required for implementation of all activities in all ten KSAs is about
29 billion USD. The Tana Basin demands the largest budget followed by the Athi Basin, while the ENN
Basin requires the lowest budget. KSA 8 (Water Resources Development) and KSA 4 (Water Quality
Management) have the largest budget requirements, followed by KSA 3 (Groundwater Management
and Development) and KSA 1 (Catchment Management). Relative to the other KSAs, WRA 2 (Water
Resources Protection) and KSA 9 (Institutional Strengthening) have much lower budgets, mainly
because these KSAs primarily relate to management interventions.
Institutional
Biophysical
Socio-economic
Water resources
KSA 1: Catchment management KSA 5: Climate change adaptation and preparedness KSA 6: Flood and drought management
KSA 2: Water resource protection KSA 3: Groundwater management and development KSA 4: Water quality management KSA 7: Hydromet monitoring KSA 8: Water resources development
KSA 9: Institutional strengthening KSA 10: Enabling environment
KSA 1 – KSA 10
Figure 6-1: Integration of key issues into the KSAs
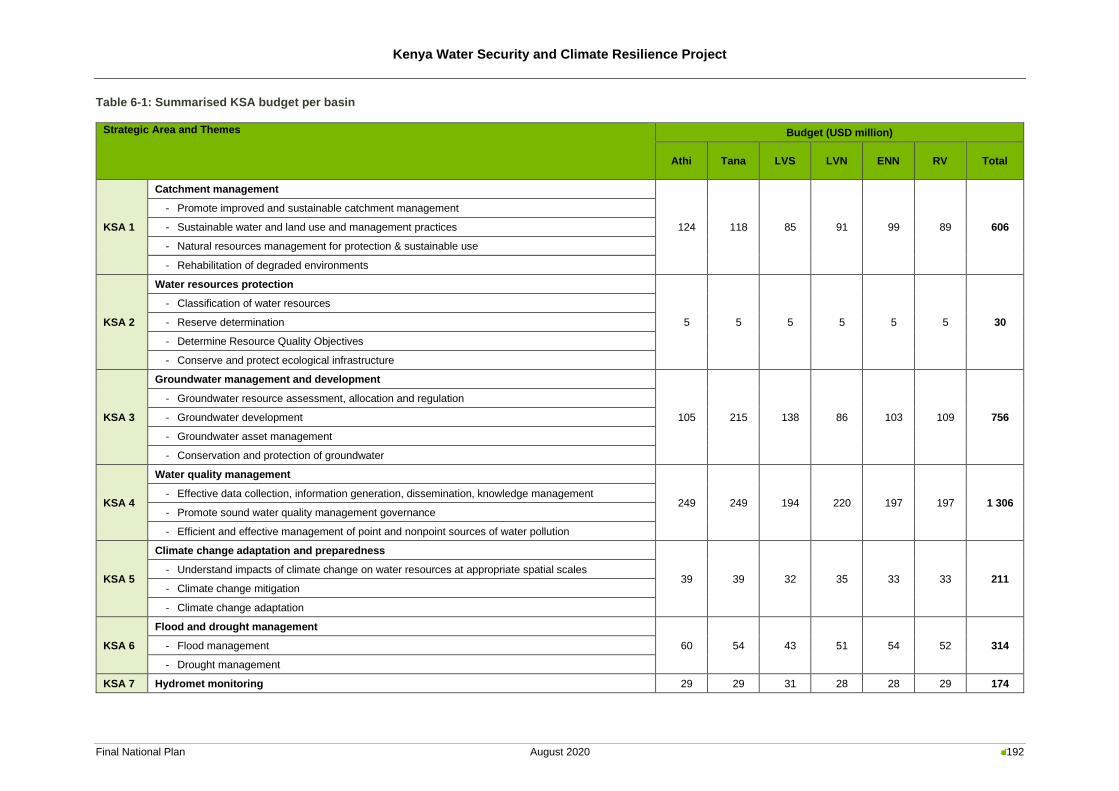
Kenya Water Security and Climate Resilience Project
Final National Plan August 2020 192
Table 6-1: Summarised KSA budget per basin
Strategic Area and Themes Budget (USD million)
Athi Tana LVS LVN ENN RV Total
KSA 1
Catchment management
124 118 85 91 99 89 606
- Promote improved and sustainable catchment management
- Sustainable water and land use and management practices
- Natural resources management for protection & sustainable use
- Rehabilitation of degraded environments
KSA 2
Water resources protection
5 5 5 5 5 5 30
- Classification of water resources
- Reserve determination
- Determine Resource Quality Objectives
- Conserve and protect ecological infrastructure
KSA 3
Groundwater management and development
105 215 138 86 103 109 756
- Groundwater resource assessment, allocation and regulation
- Groundwater development
- Groundwater asset management
- Conservation and protection of groundwater
KSA 4
Water quality management
249 249 194 220 197 197 1 306 - Effective data collection, information generation, dissemination, knowledge management
- Promote sound water quality management governance
- Efficient and effective management of point and nonpoint sources of water pollution
KSA 5
Climate change adaptation and preparedness
39 39 32 35 33 33 211 - Understand impacts of climate change on water resources at appropriate spatial scales
- Climate change mitigation
- Climate change adaptation
KSA 6
Flood and drought management
60 54 43 51 54 52 314 - Flood management
- Drought management
KSA 7 Hydromet monitoring 29 29 31 28 28 29 174
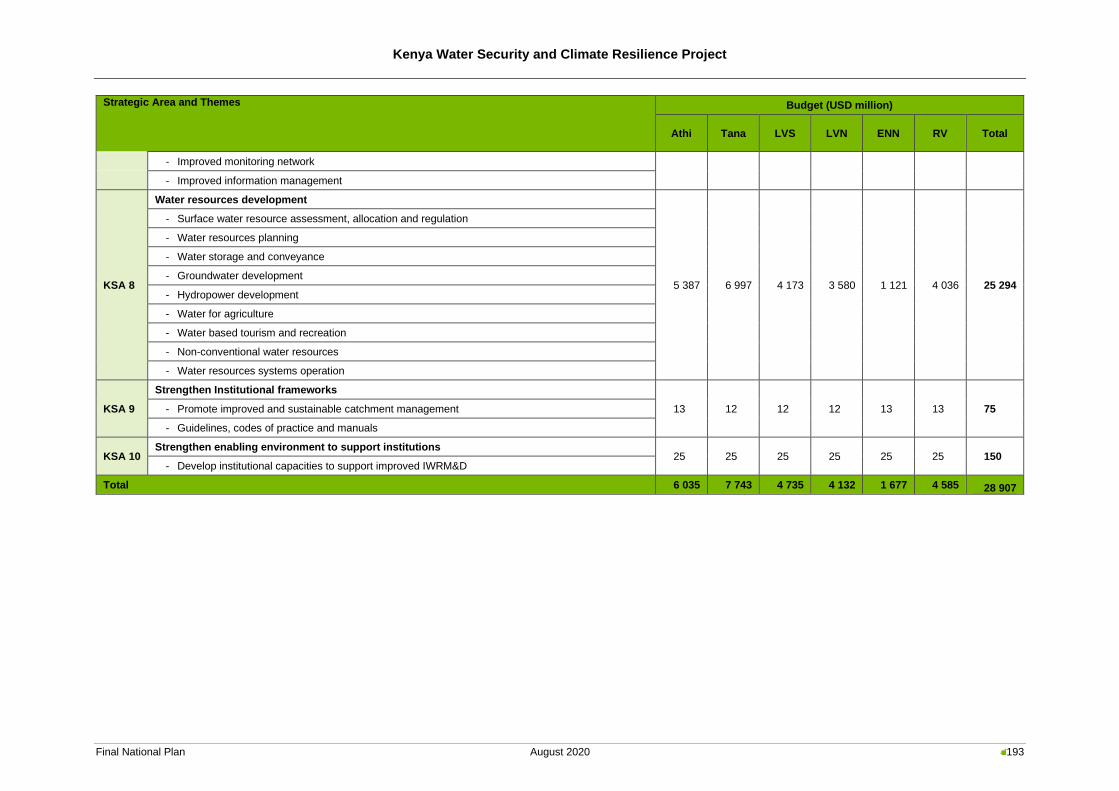
Kenya Water Security and Climate Resilience Project
Final National Plan August 2020 193
Strategic Area and Themes Budget (USD million)
Athi Tana LVS LVN ENN RV Total
- Improved monitoring network
- Improved information management
KSA 8
Water resources development
5 387 6 997 4 173 3 580 1 121 4 036 25 294
- Surface water resource assessment, allocation and regulation
- Water resources planning
- Water storage and conveyance
- Groundwater development
- Hydropower development
- Water for agriculture
- Water based tourism and recreation
- Non-conventional water resources
- Water resources systems operation
KSA 9
Strengthen Institutional frameworks
13 12 12 12 13 13 75 - Promote improved and sustainable catchment management
- Guidelines, codes of practice and manuals
KSA 10 Strengthen enabling environment to support institutions
25 25 25 25 25 25 150 - Develop institutional capacities to support improved IWRM&D
Total 6 035 7 743 4 735 4 132 1 677 4 585 28 907
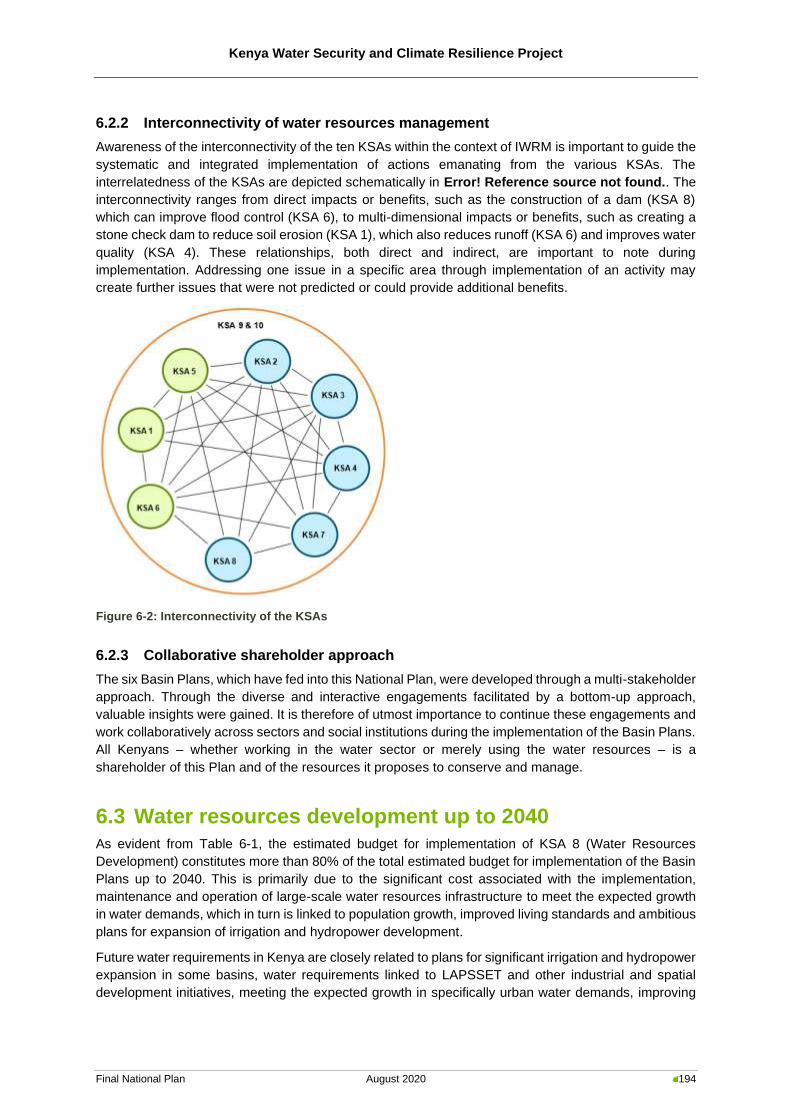
Kenya Water Security and Climate Resilience Project
Final National Plan August 2020 194
6.2.2 Interconnectivity of water resources management
Awareness of the interconnectivity of the ten KSAs within the context of IWRM is important to guide the
systematic and integrated implementation of actions emanating from the various KSAs. The
interrelatedness of the KSAs are depicted schematically in Error! Reference source not found.. The
interconnectivity ranges from direct impacts or benefits, such as the construction of a dam (KSA 8)
which can improve flood control (KSA 6), to multi-dimensional impacts or benefits, such as creating a
stone check dam to reduce soil erosion (KSA 1), which also reduces runoff (KSA 6) and improves water
quality (KSA 4). These relationships, both direct and indirect, are important to note during
implementation. Addressing one issue in a specific area through implementation of an activity may
create further issues that were not predicted or could provide additional benefits.
6.2.3 Collaborative shareholder approach
The six Basin Plans, which have fed into this National Plan, were developed through a multi-stakeholder
approach. Through the diverse and interactive engagements facilitated by a bottom-up approach,
valuable insights were gained. It is therefore of utmost importance to continue these engagements and
work collaboratively across sectors and social institutions during the implementation of the Basin Plans.
All Kenyans – whether working in the water sector or merely using the water resources – is a
shareholder of this Plan and of the resources it proposes to conserve and manage.
6.3 Water resources development up to 2040
As evident from Table 6-1, the estimated budget for implementation of KSA 8 (Water Resources
Development) constitutes more than 80% of the total estimated budget for implementation of the Basin
Plans up to 2040. This is primarily due to the significant cost associated with the implementation,
maintenance and operation of large-scale water resources infrastructure to meet the expected growth
in water demands, which in turn is linked to population growth, improved living standards and ambitious
plans for expansion of irrigation and hydropower development.
Future water requirements in Kenya are closely related to plans for significant irrigation and hydropower
expansion in some basins, water requirements linked to LAPSSET and other industrial and spatial
development initiatives, meeting the expected growth in specifically urban water demands, improving
Figure 6-2: Interconnectivity of the KSAs
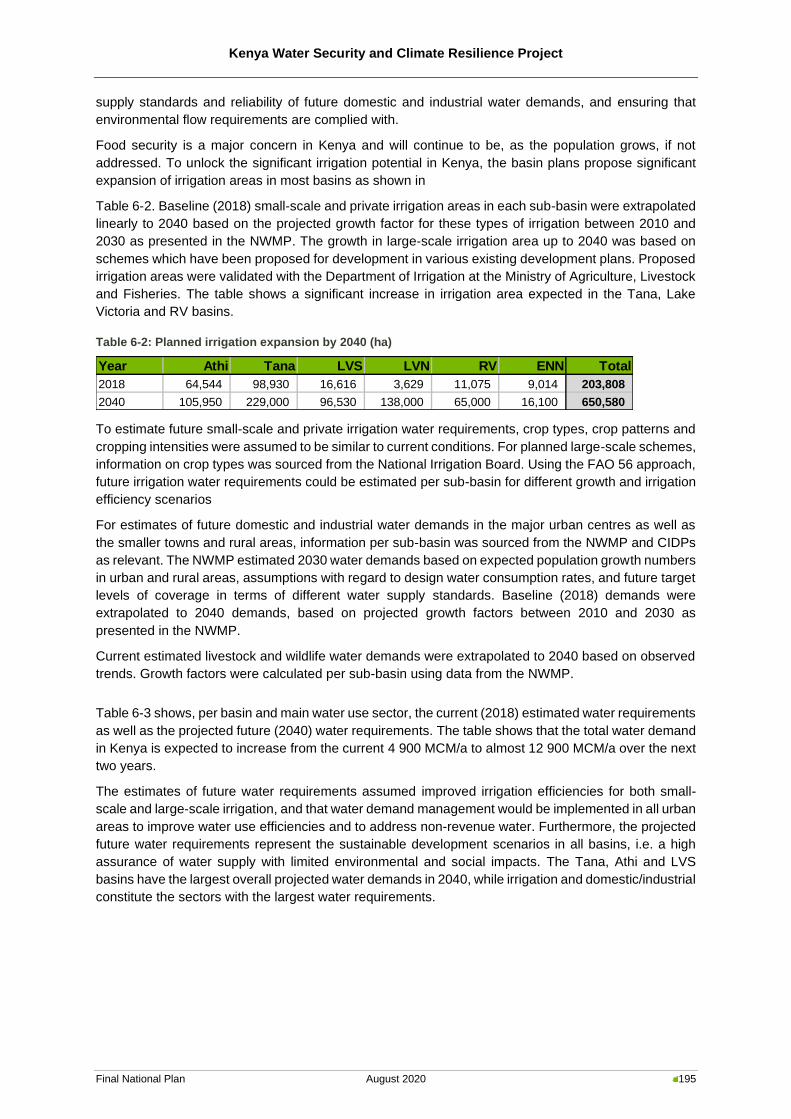
Kenya Water Security and Climate Resilience Project
Final National Plan August 2020 195
supply standards and reliability of future domestic and industrial water demands, and ensuring that
environmental flow requirements are complied with.
Food security is a major concern in Kenya and will continue to be, as the population grows, if not
addressed. To unlock the significant irrigation potential in Kenya, the basin plans propose significant
expansion of irrigation areas in most basins as shown in
Table 6-2. Baseline (2018) small-scale and private irrigation areas in each sub-basin were extrapolated
linearly to 2040 based on the projected growth factor for these types of irrigation between 2010 and
2030 as presented in the NWMP. The growth in large-scale irrigation area up to 2040 was based on
schemes which have been proposed for development in various existing development plans. Proposed
irrigation areas were validated with the Department of Irrigation at the Ministry of Agriculture, Livestock
and Fisheries. The table shows a significant increase in irrigation area expected in the Tana, Lake
Victoria and RV basins.
Table 6-2: Planned irrigation expansion by 2040 (ha)
To estimate future small-scale and private irrigation water requirements, crop types, crop patterns and
cropping intensities were assumed to be similar to current conditions. For planned large-scale schemes,
information on crop types was sourced from the National Irrigation Board. Using the FAO 56 approach,
future irrigation water requirements could be estimated per sub-basin for different growth and irrigation
efficiency scenarios
For estimates of future domestic and industrial water demands in the major urban centres as well as
the smaller towns and rural areas, information per sub-basin was sourced from the NWMP and CIDPs
as relevant. The NWMP estimated 2030 water demands based on expected population growth numbers
in urban and rural areas, assumptions with regard to design water consumption rates, and future target
levels of coverage in terms of different water supply standards. Baseline (2018) demands were
extrapolated to 2040 demands, based on projected growth factors between 2010 and 2030 as
presented in the NWMP.
Current estimated livestock and wildlife water demands were extrapolated to 2040 based on observed
trends. Growth factors were calculated per sub-basin using data from the NWMP.
Table 6-3 shows, per basin and main water use sector, the current (2018) estimated water requirements
as well as the projected future (2040) water requirements. The table shows that the total water demand
in Kenya is expected to increase from the current 4 900 MCM/a to almost 12 900 MCM/a over the next
two years.
The estimates of future water requirements assumed improved irrigation efficiencies for both small-
scale and large-scale irrigation, and that water demand management would be implemented in all urban
areas to improve water use efficiencies and to address non-revenue water. Furthermore, the projected
future water requirements represent the sustainable development scenarios in all basins, i.e. a high
assurance of water supply with limited environmental and social impacts. The Tana, Athi and LVS
basins have the largest overall projected water demands in 2040, while irrigation and domestic/industrial
constitute the sectors with the largest water requirements.
Year Athi Tana LVS LVN RV ENN Total
2018 64,544 98,930 16,616 3,629 11,075 9,014 203,808
2040 105,950 229,000 96,530 138,000 65,000 16,100 650,580
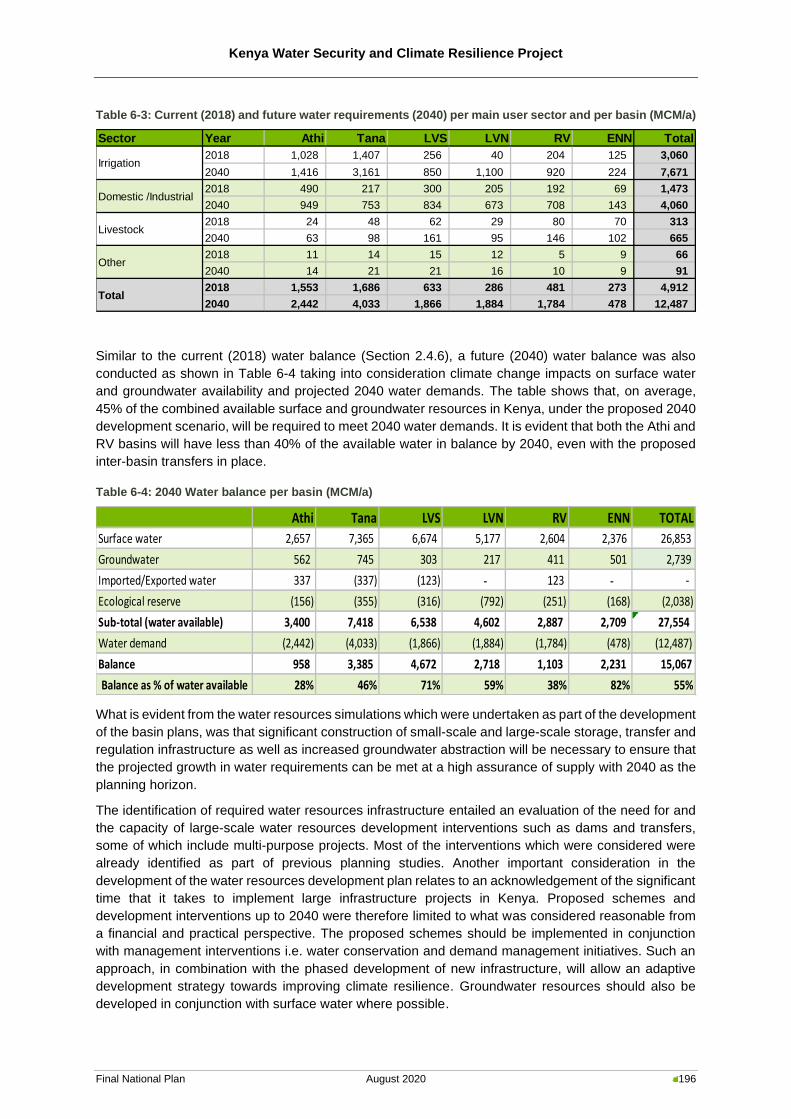
Kenya Water Security and Climate Resilience Project
Final National Plan August 2020 196
Table 6-3: Current (2018) and future water requirements (2040) per main user sector and per basin (MCM/a)
Similar to the current (2018) water balance (Section 2.4.6), a future (2040) water balance was also
conducted as shown in Table 6-4 taking into consideration climate change impacts on surface water
and groundwater availability and projected 2040 water demands. The table shows that, on average,
45% of the combined available surface and groundwater resources in Kenya, under the proposed 2040
development scenario, will be required to meet 2040 water demands. It is evident that both the Athi and
RV basins will have less than 40% of the available water in balance by 2040, even with the proposed
inter-basin transfers in place.
Table 6-4: 2040 Water balance per basin (MCM/a)
What is evident from the water resources simulations which were undertaken as part of the development
of the basin plans, was that significant construction of small-scale and large-scale storage, transfer and
regulation infrastructure as well as increased groundwater abstraction will be necessary to ensure that
the projected growth in water requirements can be met at a high assurance of supply with 2040 as the
planning horizon.
The identification of required water resources infrastructure entailed an evaluation of the need for and
the capacity of large-scale water resources development interventions such as dams and transfers,
some of which include multi-purpose projects. Most of the interventions which were considered were
already identified as part of previous planning studies. Another important consideration in the
development of the water resources development plan relates to an acknowledgement of the significant
time that it takes to implement large infrastructure projects in Kenya. Proposed schemes and
development interventions up to 2040 were therefore limited to what was considered reasonable from
a financial and practical perspective. The proposed schemes should be implemented in conjunction
with management interventions i.e. water conservation and demand management initiatives. Such an
approach, in combination with the phased development of new infrastructure, will allow an adaptive
development strategy towards improving climate resilience. Groundwater resources should also be
developed in conjunction with surface water where possible.
Sector Year Athi Tana LVS LVN RV ENN Total
2018 1,028 1,407 256 40 204 125 3,060
2040 1,416 3,161 850 1,100 920 224 7,671
2018 490 217 300 205 192 69 1,473
2040 949 753 834 673 708 143 4,060
2018 24 48 62 29 80 70 313
2040 63 98 161 95 146 102 665
2018 11 14 15 12 5 9 66
2040 14 21 21 16 10 9 91
2018 1,553 1,686 633 286 481 273 4,912
2040 2,442 4,033 1,866 1,884 1,784 478 12,487
Irrigation
Livestock
Domestic /Industrial
Other
Total
Athi Tana LVS LVN RV ENN TOTAL
Surface water 2,657 7,365 6,674 5,177 2,604 2,376 26,853
Groundwater 562 745 303 217 411 501 2,739
Imported/Exported water 337 (337) (123) - 123 - -
Ecological reserve (156) (355) (316) (792) (251) (168) (2,038)
Sub-total (water available) 3,400 7,418 6,538 4,602 2,887 2,709 27,554
Water demand (2,442) (4,033) (1,866) (1,884) (1,784) (478) (12,487)
Balance 958 3,385 4,672 2,718 1,103 2,231 15,067
Balance as % of water available 28% 46% 71% 59% 38% 82% 55%
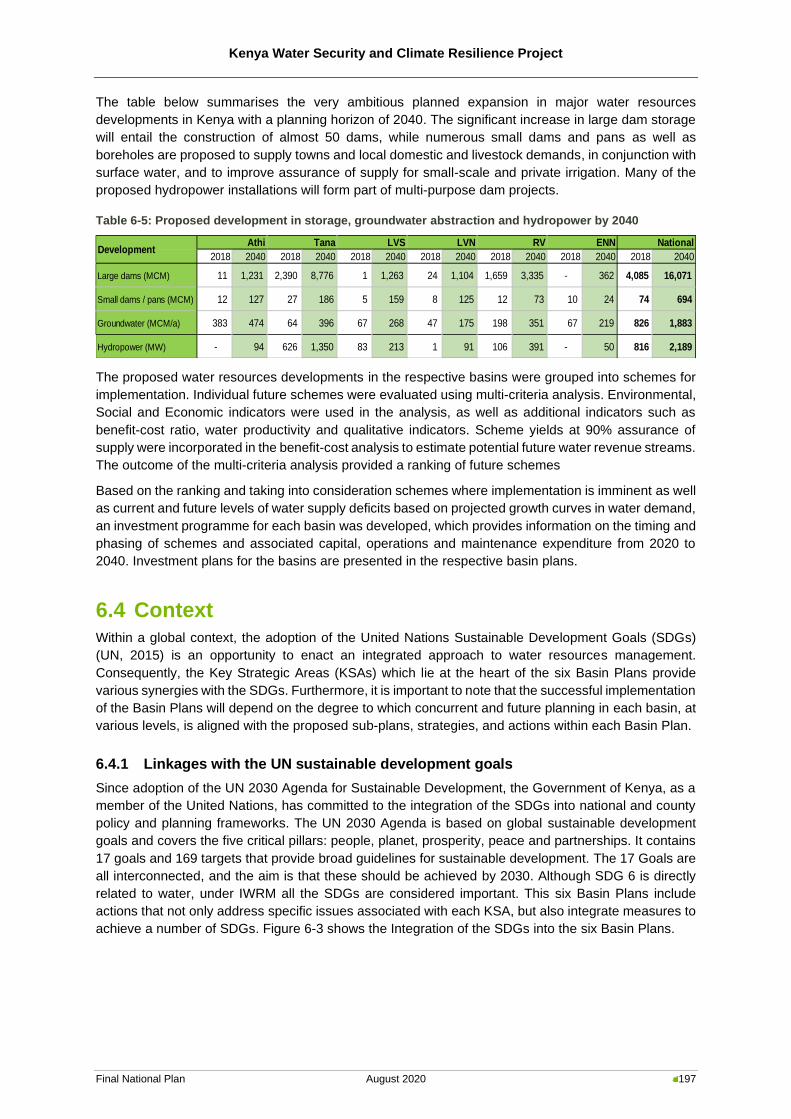
Kenya Water Security and Climate Resilience Project
Final National Plan August 2020 197
The table below summarises the very ambitious planned expansion in major water resources
developments in Kenya with a planning horizon of 2040. The significant increase in large dam storage
will entail the construction of almost 50 dams, while numerous small dams and pans as well as
boreholes are proposed to supply towns and local domestic and livestock demands, in conjunction with
surface water, and to improve assurance of supply for small-scale and private irrigation. Many of the
proposed hydropower installations will form part of multi-purpose dam projects.
Table 6-5: Proposed development in storage, groundwater abstraction and hydropower by 2040
The proposed water resources developments in the respective basins were grouped into schemes for
implementation. Individual future schemes were evaluated using multi-criteria analysis. Environmental,
Social and Economic indicators were used in the analysis, as well as additional indicators such as
benefit-cost ratio, water productivity and qualitative indicators. Scheme yields at 90% assurance of
supply were incorporated in the benefit-cost analysis to estimate potential future water revenue streams.
The outcome of the multi-criteria analysis provided a ranking of future schemes
Based on the ranking and taking into consideration schemes where implementation is imminent as well
as current and future levels of water supply deficits based on projected growth curves in water demand,
an investment programme for each basin was developed, which provides information on the timing and
phasing of schemes and associated capital, operations and maintenance expenditure from 2020 to
2040. Investment plans for the basins are presented in the respective basin plans.
6.4 Context
Within a global context, the adoption of the United Nations Sustainable Development Goals (SDGs)
(UN, 2015) is an opportunity to enact an integrated approach to water resources management.
Consequently, the Key Strategic Areas (KSAs) which lie at the heart of the six Basin Plans provide
various synergies with the SDGs. Furthermore, it is important to note that the successful implementation
of the Basin Plans will depend on the degree to which concurrent and future planning in each basin, at
various levels, is aligned with the proposed sub-plans, strategies, and actions within each Basin Plan.
6.4.1 Linkages with the UN sustainable development goals
Since adoption of the UN 2030 Agenda for Sustainable Development, the Government of Kenya, as a
member of the United Nations, has committed to the integration of the SDGs into national and county
policy and planning frameworks. The UN 2030 Agenda is based on global sustainable development
goals and covers the five critical pillars: people, planet, prosperity, peace and partnerships. It contains
17 goals and 169 targets that provide broad guidelines for sustainable development. The 17 Goals are
all interconnected, and the aim is that these should be achieved by 2030. Although SDG 6 is directly
related to water, under IWRM all the SDGs are considered important. This six Basin Plans include
actions that not only address specific issues associated with each KSA, but also integrate measures to
achieve a number of SDGs. Figure 6-3 shows the Integration of the SDGs into the six Basin Plans.
2018 2040 2018 2040 2018 2040 2018 2040 2018 2040 2018 2040 2018 2040
Large dams (MCM) 11 1,231 2,390 8,776 1 1,263 24 1,104 1,659 3,335 - 362 4,085 16,071
Small dams / pans (MCM) 12 127 27 186 5 159 8 125 12 73 10 24 74 694
Groundwater (MCM/a) 383 474 64 396 67 268 47 175 198 351 67 219 826 1,883
Hydropower (MW) - 94 626 1,350 83 213 1 91 106 391 - 50 816 2,189
ENN NationalDevelopment
Athi Tana LVS LVN RV
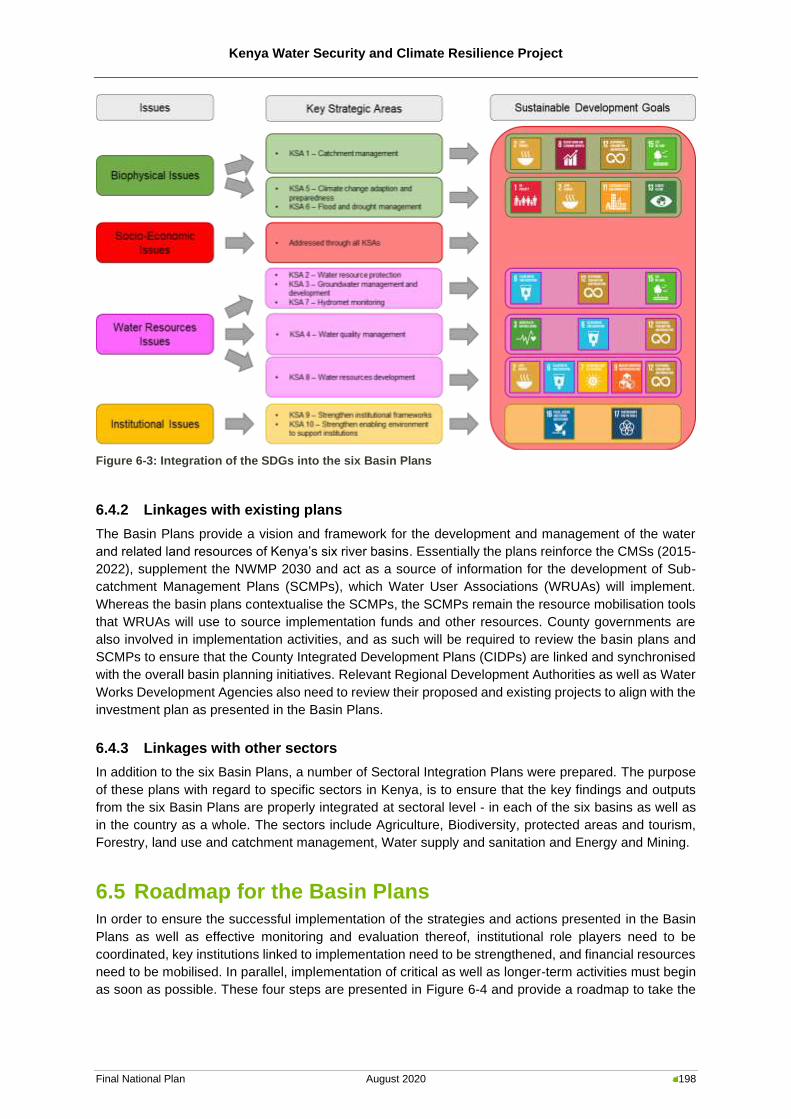
Kenya Water Security and Climate Resilience Project
Final National Plan August 2020 198
Figure 6-3: Integration of the SDGs into the six Basin Plans
6.4.2 Linkages with existing plans
The Basin Plans provide a vision and framework for the development and management of the water
and related land resources of Kenya’s six river basins. Essentially the plans reinforce the CMSs (2015-
2022), supplement the NWMP 2030 and act as a source of information for the development of Sub-
catchment Management Plans (SCMPs), which Water User Associations (WRUAs) will implement.
Whereas the basin plans contextualise the SCMPs, the SCMPs remain the resource mobilisation tools
that WRUAs will use to source implementation funds and other resources. County governments are
also involved in implementation activities, and as such will be required to review the basin plans and
SCMPs to ensure that the County Integrated Development Plans (CIDPs) are linked and synchronised
with the overall basin planning initiatives. Relevant Regional Development Authorities as well as Water
Works Development Agencies also need to review their proposed and existing projects to align with the
investment plan as presented in the Basin Plans.
6.4.3 Linkages with other sectors
In addition to the six Basin Plans, a number of Sectoral Integration Plans were prepared. The purpose
of these plans with regard to specific sectors in Kenya, is to ensure that the key findings and outputs
from the six Basin Plans are properly integrated at sectoral level - in each of the six basins as well as
in the country as a whole. The sectors include Agriculture, Biodiversity, protected areas and tourism,
Forestry, land use and catchment management, Water supply and sanitation and Energy and Mining.
6.5 Roadmap for the Basin Plans
In order to ensure the successful implementation of the strategies and actions presented in the Basin
Plans as well as effective monitoring and evaluation thereof, institutional role players need to be
coordinated, key institutions linked to implementation need to be strengthened, and financial resources
need to be mobilised. In parallel, implementation of critical as well as longer-term activities must begin
as soon as possible. These four steps are presented in Figure 6-4 and provide a roadmap to take the
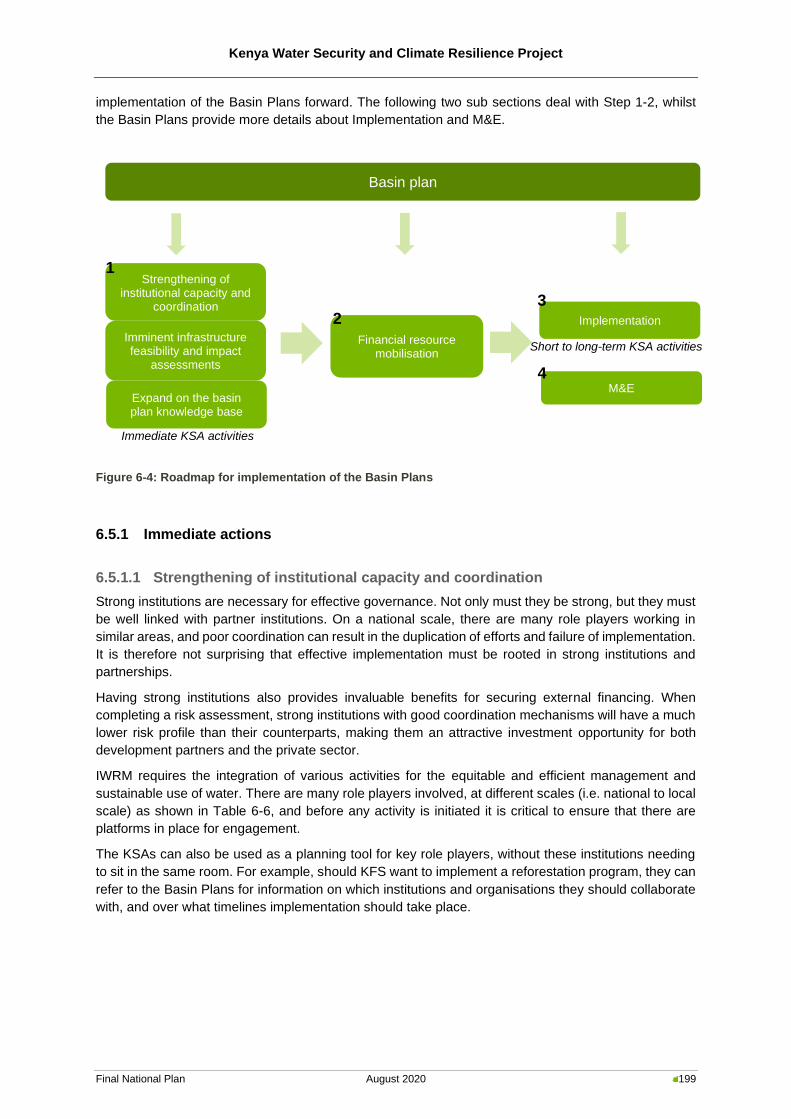
Kenya Water Security and Climate Resilience Project
Final National Plan August 2020 199
implementation of the Basin Plans forward. The following two sub sections deal with Step 1-2, whilst
the Basin Plans provide more details about Implementation and M&E.
Figure 6-4: Roadmap for implementation of the Basin Plans
6.5.1 Immediate actions
6.5.1.1 Strengthening of institutional capacity and coordination
Strong institutions are necessary for effective governance. Not only must they be strong, but they must
be well linked with partner institutions. On a national scale, there are many role players working in
similar areas, and poor coordination can result in the duplication of efforts and failure of implementation.
It is therefore not surprising that effective implementation must be rooted in strong institutions and
partnerships.
Having strong institutions also provides invaluable benefits for securing external financing. When
completing a risk assessment, strong institutions with good coordination mechanisms will have a much
lower risk profile than their counterparts, making them an attractive investment opportunity for both
development partners and the private sector.
IWRM requires the integration of various activities for the equitable and efficient management and
sustainable use of water. There are many role players involved, at different scales (i.e. national to local
scale) as shown in Table 6-6, and before any activity is initiated it is critical to ensure that there are
platforms in place for engagement.
The KSAs can also be used as a planning tool for key role players, without these institutions needing
to sit in the same room. For example, should KFS want to implement a reforestation program, they can
refer to the Basin Plans for information on which institutions and organisations they should collaborate
with, and over what timelines implementation should take place.
Imminent infrastructure feasibility and impact
assessments
Expand on the basin plan knowledge base
Short to long-term KSA activities
M&E
Strengthening of institutional capacity and
coordination
Financial resource mobilisation
Implementation
1
2 3
4
Basin plan
Immediate KSA activities
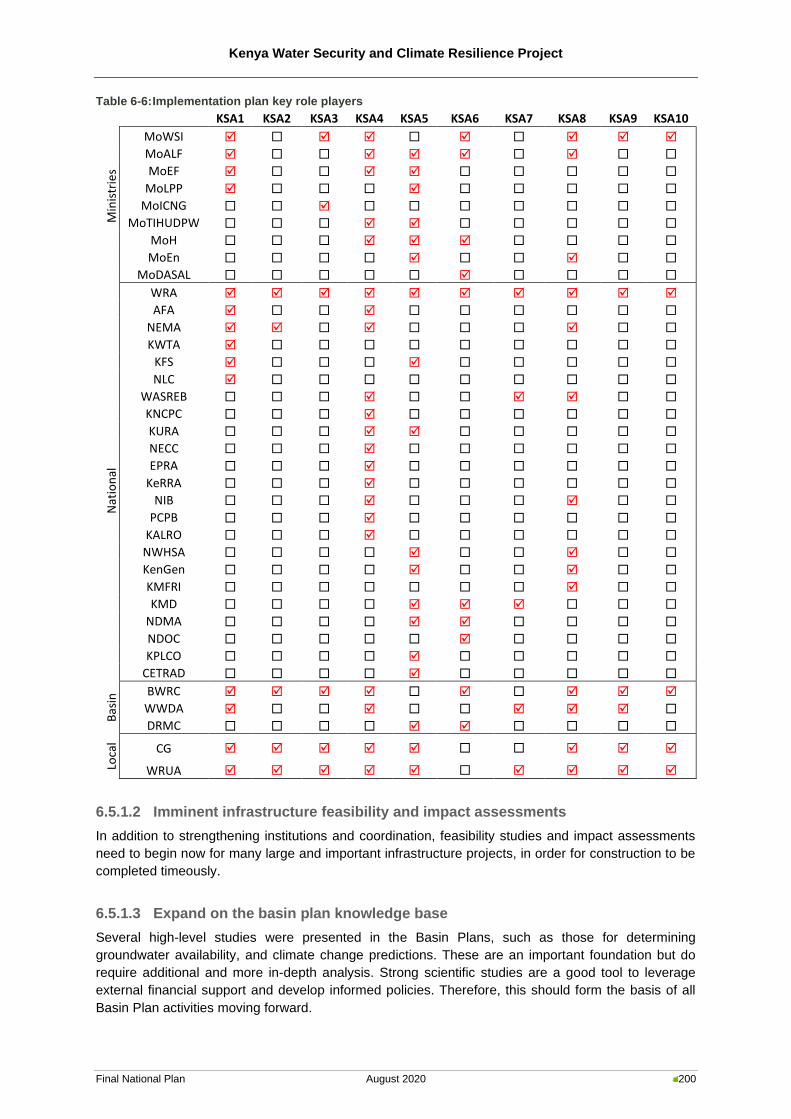
Kenya Water Security and Climate Resilience Project
Final National Plan August 2020 200
Table 6-6: Implementation plan key role players
KSA1 KSA2 KSA3 KSA4 KSA5 KSA6 KSA7 KSA8 KSA9 KSA10 M
inis
trie
s
MoWSI
MoALF
MoEF
MoLPP
MoICNG
MoTIHUDPW
MoH
MoEn
MoDASAL
WRA
Nat
ion
al
AFA
NEMA
KWTA
KFS
NLC
WASREB
KNCPC
KURA
NECC
EPRA
KeRRA
NIB
PCPB
KALRO
NWHSA
KenGen
KMFRI
KMD
NDMA
NDOC
KPLCO
CETRAD
Bas
in BWRC
WWDA
DRMC
Loca
l
CG
WRUA
6.5.1.2 Imminent infrastructure feasibility and impact assessments
In addition to strengthening institutions and coordination, feasibility studies and impact assessments
need to begin now for many large and important infrastructure projects, in order for construction to be
completed timeously.
6.5.1.3 Expand on the basin plan knowledge base
Several high-level studies were presented in the Basin Plans, such as those for determining
groundwater availability, and climate change predictions. These are an important foundation but do
require additional and more in-depth analysis. Strong scientific studies are a good tool to leverage
external financial support and develop informed policies. Therefore, this should form the basis of all
Basin Plan activities moving forward.
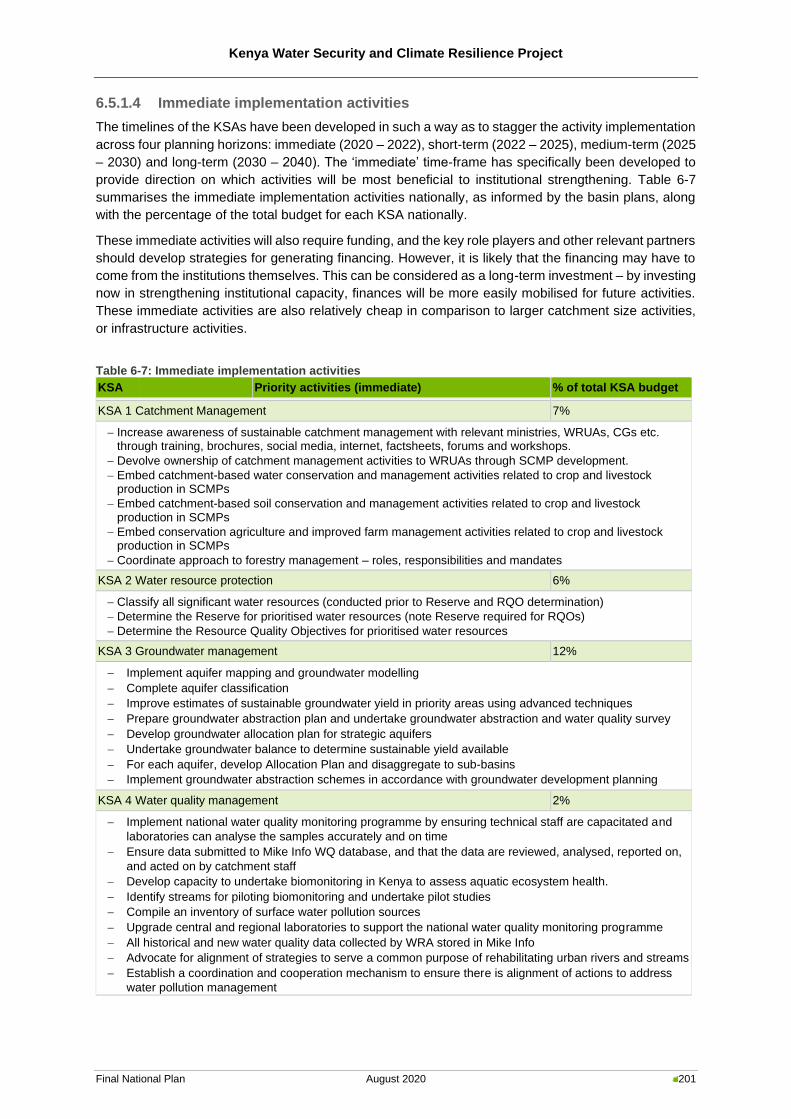
Kenya Water Security and Climate Resilience Project
Final National Plan August 2020 201
6.5.1.4 Immediate implementation activities
The timelines of the KSAs have been developed in such a way as to stagger the activity implementation
across four planning horizons: immediate (2020 – 2022), short-term (2022 – 2025), medium-term (2025
– 2030) and long-term (2030 – 2040). The ‘immediate’ time-frame has specifically been developed to
provide direction on which activities will be most beneficial to institutional strengthening. Table 6-7
summarises the immediate implementation activities nationally, as informed by the basin plans, along
with the percentage of the total budget for each KSA nationally.
These immediate activities will also require funding, and the key role players and other relevant partners
should develop strategies for generating financing. However, it is likely that the financing may have to
come from the institutions themselves. This can be considered as a long-term investment – by investing
now in strengthening institutional capacity, finances will be more easily mobilised for future activities.
These immediate activities are also relatively cheap in comparison to larger catchment size activities,
or infrastructure activities.
Table 6-7: Immediate implementation activities
KSA Priority activities (immediate) % of total KSA budget
KSA 1 Catchment Management 7%
− Increase awareness of sustainable catchment management with relevant ministries, WRUAs, CGs etc. through training, brochures, social media, internet, factsheets, forums and workshops.
− Devolve ownership of catchment management activities to WRUAs through SCMP development.
− Embed catchment-based water conservation and management activities related to crop and livestock production in SCMPs
− Embed catchment-based soil conservation and management activities related to crop and livestock production in SCMPs
− Embed conservation agriculture and improved farm management activities related to crop and livestock production in SCMPs
− Coordinate approach to forestry management – roles, responsibilities and mandates
KSA 2 Water resource protection 6%
− Classify all significant water resources (conducted prior to Reserve and RQO determination)
− Determine the Reserve for prioritised water resources (note Reserve required for RQOs)
− Determine the Resource Quality Objectives for prioritised water resources
KSA 3 Groundwater management 12%
− Implement aquifer mapping and groundwater modelling
− Complete aquifer classification
− Improve estimates of sustainable groundwater yield in priority areas using advanced techniques
− Prepare groundwater abstraction plan and undertake groundwater abstraction and water quality survey
− Develop groundwater allocation plan for strategic aquifers
− Undertake groundwater balance to determine sustainable yield available
− For each aquifer, develop Allocation Plan and disaggregate to sub-basins
− Implement groundwater abstraction schemes in accordance with groundwater development planning
KSA 4 Water quality management 2%
− Implement national water quality monitoring programme by ensuring technical staff are capacitated and
laboratories can analyse the samples accurately and on time
− Ensure data submitted to Mike Info WQ database, and that the data are reviewed, analysed, reported on,
and acted on by catchment staff
− Develop capacity to undertake biomonitoring in Kenya to assess aquatic ecosystem health.
− Identify streams for piloting biomonitoring and undertake pilot studies
− Compile an inventory of surface water pollution sources
− Upgrade central and regional laboratories to support the national water quality monitoring programme
− All historical and new water quality data collected by WRA stored in Mike Info
− Advocate for alignment of strategies to serve a common purpose of rehabilitating urban rivers and streams
− Establish a coordination and cooperation mechanism to ensure there is alignment of actions to address
water pollution management
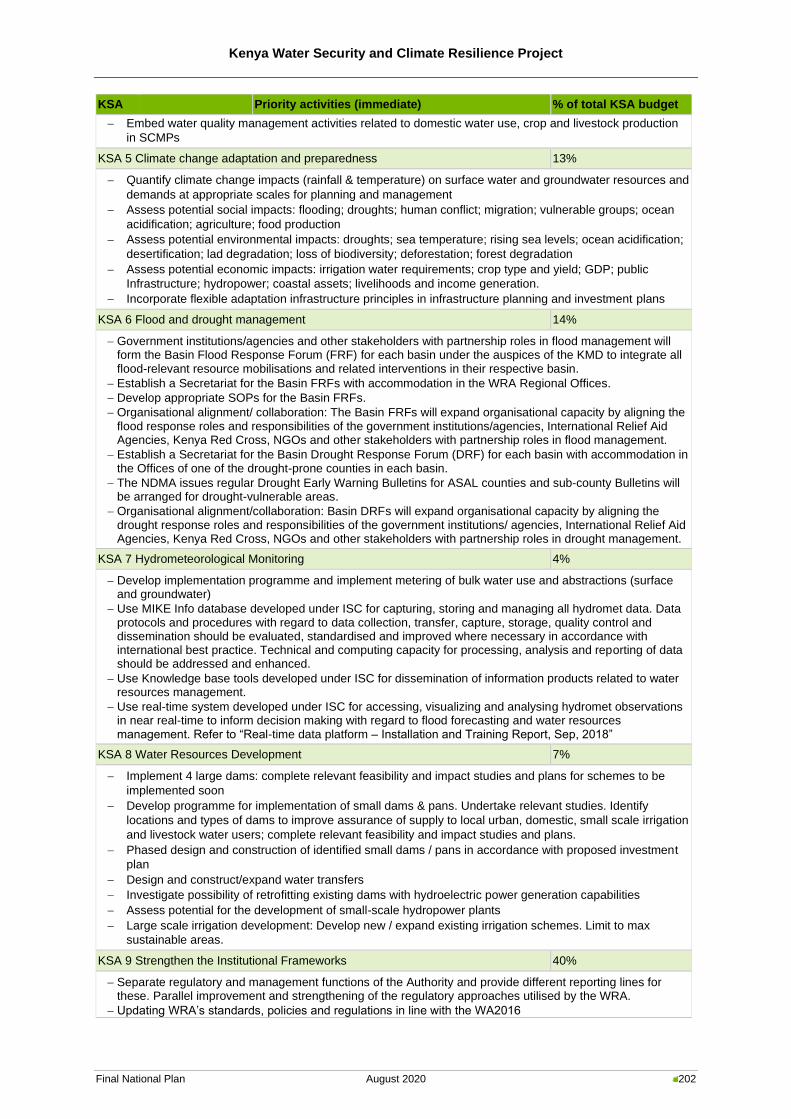
Kenya Water Security and Climate Resilience Project
Final National Plan August 2020 202
KSA Priority activities (immediate) % of total KSA budget
− Embed water quality management activities related to domestic water use, crop and livestock production
in SCMPs
KSA 5 Climate change adaptation and preparedness 13%
− Quantify climate change impacts (rainfall & temperature) on surface water and groundwater resources and
demands at appropriate scales for planning and management
− Assess potential social impacts: flooding; droughts; human conflict; migration; vulnerable groups; ocean
acidification; agriculture; food production
− Assess potential environmental impacts: droughts; sea temperature; rising sea levels; ocean acidification;
desertification; lad degradation; loss of biodiversity; deforestation; forest degradation
− Assess potential economic impacts: irrigation water requirements; crop type and yield; GDP; public
Infrastructure; hydropower; coastal assets; livelihoods and income generation.
− Incorporate flexible adaptation infrastructure principles in infrastructure planning and investment plans
KSA 6 Flood and drought management 14%
− Government institutions/agencies and other stakeholders with partnership roles in flood management will form the Basin Flood Response Forum (FRF) for each basin under the auspices of the KMD to integrate all flood-relevant resource mobilisations and related interventions in their respective basin.
− Establish a Secretariat for the Basin FRFs with accommodation in the WRA Regional Offices.
− Develop appropriate SOPs for the Basin FRFs.
− Organisational alignment/ collaboration: The Basin FRFs will expand organisational capacity by aligning the flood response roles and responsibilities of the government institutions/agencies, International Relief Aid Agencies, Kenya Red Cross, NGOs and other stakeholders with partnership roles in flood management.
− Establish a Secretariat for the Basin Drought Response Forum (DRF) for each basin with accommodation in the Offices of one of the drought-prone counties in each basin.
− The NDMA issues regular Drought Early Warning Bulletins for ASAL counties and sub-county Bulletins will be arranged for drought-vulnerable areas.
− Organisational alignment/collaboration: Basin DRFs will expand organisational capacity by aligning the drought response roles and responsibilities of the government institutions/ agencies, International Relief Aid Agencies, Kenya Red Cross, NGOs and other stakeholders with partnership roles in drought management.
KSA 7 Hydrometeorological Monitoring 4%
− Develop implementation programme and implement metering of bulk water use and abstractions (surface and groundwater)
− Use MIKE Info database developed under ISC for capturing, storing and managing all hydromet data. Data protocols and procedures with regard to data collection, transfer, capture, storage, quality control and dissemination should be evaluated, standardised and improved where necessary in accordance with international best practice. Technical and computing capacity for processing, analysis and reporting of data should be addressed and enhanced.
− Use Knowledge base tools developed under ISC for dissemination of information products related to water resources management.
− Use real-time system developed under ISC for accessing, visualizing and analysing hydromet observations in near real-time to inform decision making with regard to flood forecasting and water resources management. Refer to “Real-time data platform – Installation and Training Report, Sep, 2018”
KSA 8 Water Resources Development 7%
− Implement 4 large dams: complete relevant feasibility and impact studies and plans for schemes to be
implemented soon
− Develop programme for implementation of small dams & pans. Undertake relevant studies. Identify
locations and types of dams to improve assurance of supply to local urban, domestic, small scale irrigation
and livestock water users; complete relevant feasibility and impact studies and plans.
− Phased design and construction of identified small dams / pans in accordance with proposed investment
plan
− Design and construct/expand water transfers
− Investigate possibility of retrofitting existing dams with hydroelectric power generation capabilities
− Assess potential for the development of small-scale hydropower plants
− Large scale irrigation development: Develop new / expand existing irrigation schemes. Limit to max
sustainable areas.
KSA 9 Strengthen the Institutional Frameworks 40%
− Separate regulatory and management functions of the Authority and provide different reporting lines for these. Parallel improvement and strengthening of the regulatory approaches utilised by the WRA.
− Updating WRA’s standards, policies and regulations in line with the WA2016
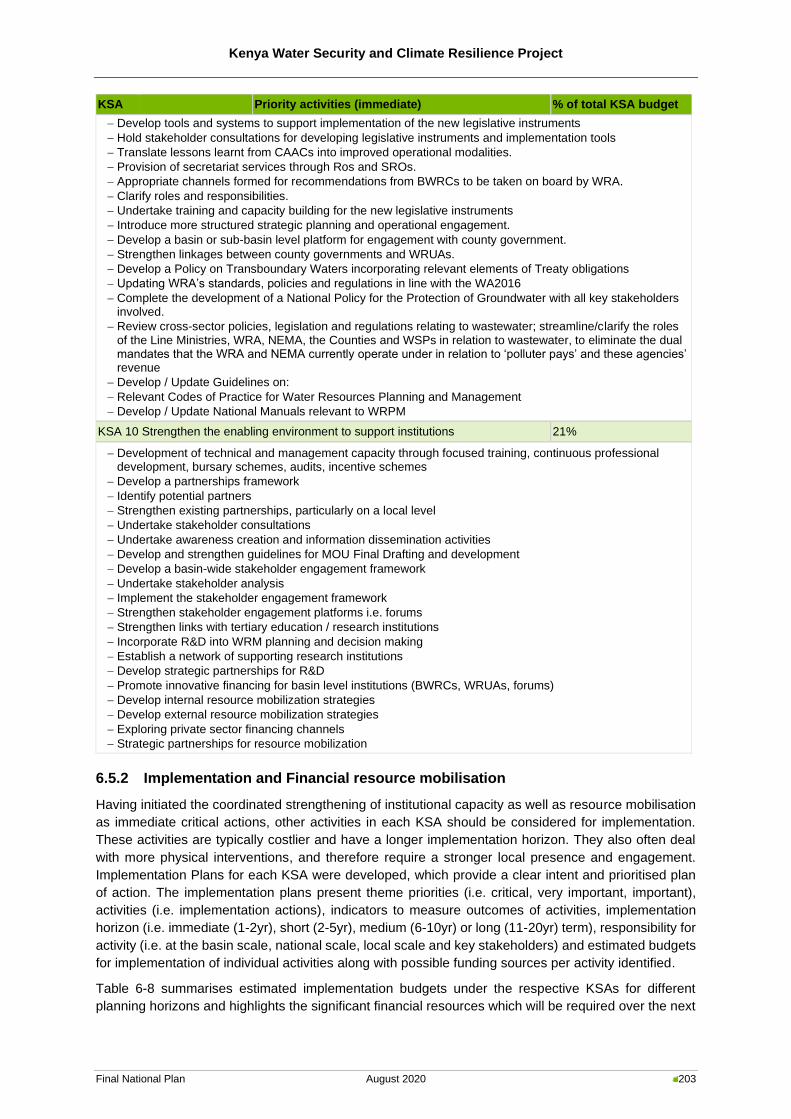
Kenya Water Security and Climate Resilience Project
Final National Plan August 2020 203
KSA Priority activities (immediate) % of total KSA budget
− Develop tools and systems to support implementation of the new legislative instruments
− Hold stakeholder consultations for developing legislative instruments and implementation tools
− Translate lessons learnt from CAACs into improved operational modalities.
− Provision of secretariat services through Ros and SROs.
− Appropriate channels formed for recommendations from BWRCs to be taken on board by WRA.
− Clarify roles and responsibilities.
− Undertake training and capacity building for the new legislative instruments
− Introduce more structured strategic planning and operational engagement.
− Develop a basin or sub-basin level platform for engagement with county government.
− Strengthen linkages between county governments and WRUAs.
− Develop a Policy on Transboundary Waters incorporating relevant elements of Treaty obligations
− Updating WRA’s standards, policies and regulations in line with the WA2016
− Complete the development of a National Policy for the Protection of Groundwater with all key stakeholders involved.
− Review cross-sector policies, legislation and regulations relating to wastewater; streamline/clarify the roles of the Line Ministries, WRA, NEMA, the Counties and WSPs in relation to wastewater, to eliminate the dual mandates that the WRA and NEMA currently operate under in relation to ‘polluter pays’ and these agencies’ revenue
− Develop / Update Guidelines on:
− Relevant Codes of Practice for Water Resources Planning and Management
− Develop / Update National Manuals relevant to WRPM
KSA 10 Strengthen the enabling environment to support institutions 21%
− Development of technical and management capacity through focused training, continuous professional development, bursary schemes, audits, incentive schemes
− Develop a partnerships framework
− Identify potential partners
− Strengthen existing partnerships, particularly on a local level
− Undertake stakeholder consultations
− Undertake awareness creation and information dissemination activities
− Develop and strengthen guidelines for MOU Final Drafting and development
− Develop a basin-wide stakeholder engagement framework
− Undertake stakeholder analysis
− Implement the stakeholder engagement framework
− Strengthen stakeholder engagement platforms i.e. forums
− Strengthen links with tertiary education / research institutions
− Incorporate R&D into WRM planning and decision making
− Establish a network of supporting research institutions
− Develop strategic partnerships for R&D
− Promote innovative financing for basin level institutions (BWRCs, WRUAs, forums)
− Develop internal resource mobilization strategies
− Develop external resource mobilization strategies
− Exploring private sector financing channels
− Strategic partnerships for resource mobilization
6.5.2 Implementation and Financial resource mobilisation
Having initiated the coordinated strengthening of institutional capacity as well as resource mobilisation
as immediate critical actions, other activities in each KSA should be considered for implementation.
These activities are typically costlier and have a longer implementation horizon. They also often deal
with more physical interventions, and therefore require a stronger local presence and engagement.
Implementation Plans for each KSA were developed, which provide a clear intent and prioritised plan
of action. The implementation plans present theme priorities (i.e. critical, very important, important),
activities (i.e. implementation actions), indicators to measure outcomes of activities, implementation
horizon (i.e. immediate (1-2yr), short (2-5yr), medium (6-10yr) or long (11-20yr) term), responsibility for
activity (i.e. at the basin scale, national scale, local scale and key stakeholders) and estimated budgets
for implementation of individual activities along with possible funding sources per activity identified.
Table 6-8 summarises estimated implementation budgets under the respective KSAs for different
planning horizons and highlights the significant financial resources which will be required over the next
Kenya Water Security and Climate Resilience Project
Final National Plan August 2020 204
20 years to ensure the successful implementation of the basin plans. Detailed implementation plans
are provided in the respective basin plans.
Resource mobilisation refers to the various activities involved in making better use of existing resources
to maximum benefit, whilst ensuring the ongoing acquisition of additional resources to ensure the
achievement of organisational intent. These resources include financial resources, but also include
human resources and their organisational management, equipment, services, and technical
cooperation. The range of these resources and their impact is outlined in the resource mobilisation
position paper.
Section 6.5.1.1 outlined the importance of developing strong institutions for financing. Part of this
strengthening refers to developing the human and organisational resources. While this is a vital
component, financial resources are needed to strengthen these other resources, as well as implement
projects.
A review of successive WRA performance reports reflects the challenges that WRA has faced
financially, and shows successive funding gaps (WRA, 2017). These have considerable institutional
implications for the WRA that require consideration in developing an approach to not only strengthen
the WRA, but to also underpin this with a sustained funding regime. Without this strategic intent to
coherently develop the business model together with resource mobilization, the overall sustainability of
the institution is at risk.
There are numerous forms of external financing, each with their own type of stakeholders and
investment mechanisms.
▪ Innovative financing avenues can include philanthropic and public, water funds and facilitates,
payment for ecosystem services, effluent charges, climate change funding schemes, carbon
finance, corporate grants, impact investments and conservation finance.
▪ The key stakeholders and partners for these avenues can include development agencies,
governments, multilateral development banks, public private partnerships, private or state banks,
private sector, NGOs, asset managers and international councils and secretariats.
▪ The investment mechanisms can include grants, subsidies, guarantees, soft/hard loans,
guaranteed philanthropy, result based payments, equity, loans, environmental impact bonds and
microfinance.
It is important to note that different KSA activities will require different levels of partnership and will
therefore have to tap into different financing avenue. Using the resource mobilization strategy as a
base, it will be necessary for the WRA or the key implementing agency (as outlined in the KSA) to
develop a resource mobilization and financier engagement strategy that is applicable to each specific
activity.
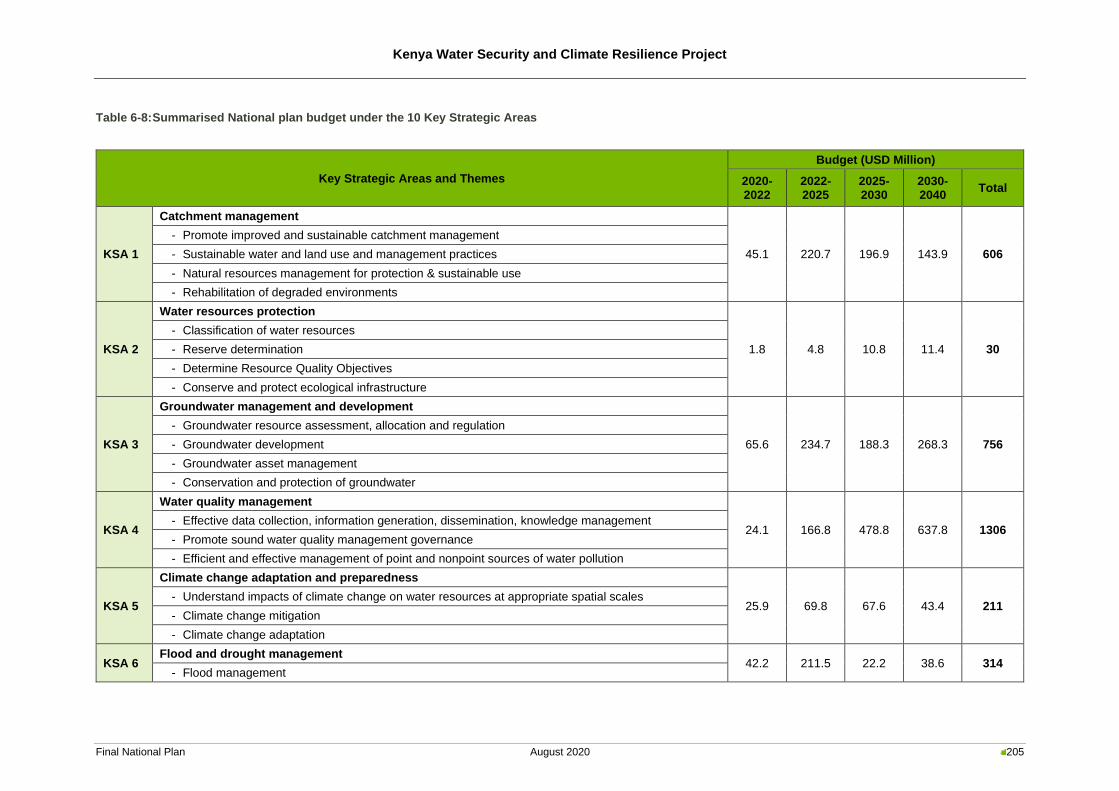
Kenya Water Security and Climate Resilience Project
Final National Plan August 2020 205
Table 6-8: Summarised National plan budget under the 10 Key Strategic Areas
Key Strategic Areas and Themes
Budget (USD Million)
2020-2022
2022-2025
2025-2030
2030-2040
Total
KSA 1
Catchment management
45.1 220.7 196.9 143.9 606
- Promote improved and sustainable catchment management
- Sustainable water and land use and management practices
- Natural resources management for protection & sustainable use
- Rehabilitation of degraded environments
KSA 2
Water resources protection
1.8 4.8 10.8 11.4 30
- Classification of water resources
- Reserve determination
- Determine Resource Quality Objectives
- Conserve and protect ecological infrastructure
KSA 3
Groundwater management and development
65.6 234.7 188.3 268.3 756
- Groundwater resource assessment, allocation and regulation
- Groundwater development
- Groundwater asset management
- Conservation and protection of groundwater
KSA 4
Water quality management
24.1 166.8 478.8 637.8 1306 - Effective data collection, information generation, dissemination, knowledge management
- Promote sound water quality management governance
- Efficient and effective management of point and nonpoint sources of water pollution
KSA 5
Climate change adaptation and preparedness
25.9 69.8 67.6 43.4 211 - Understand impacts of climate change on water resources at appropriate spatial scales
- Climate change mitigation
- Climate change adaptation
KSA 6 Flood and drought management
42.2 211.5 22.2 38.6 314 - Flood management
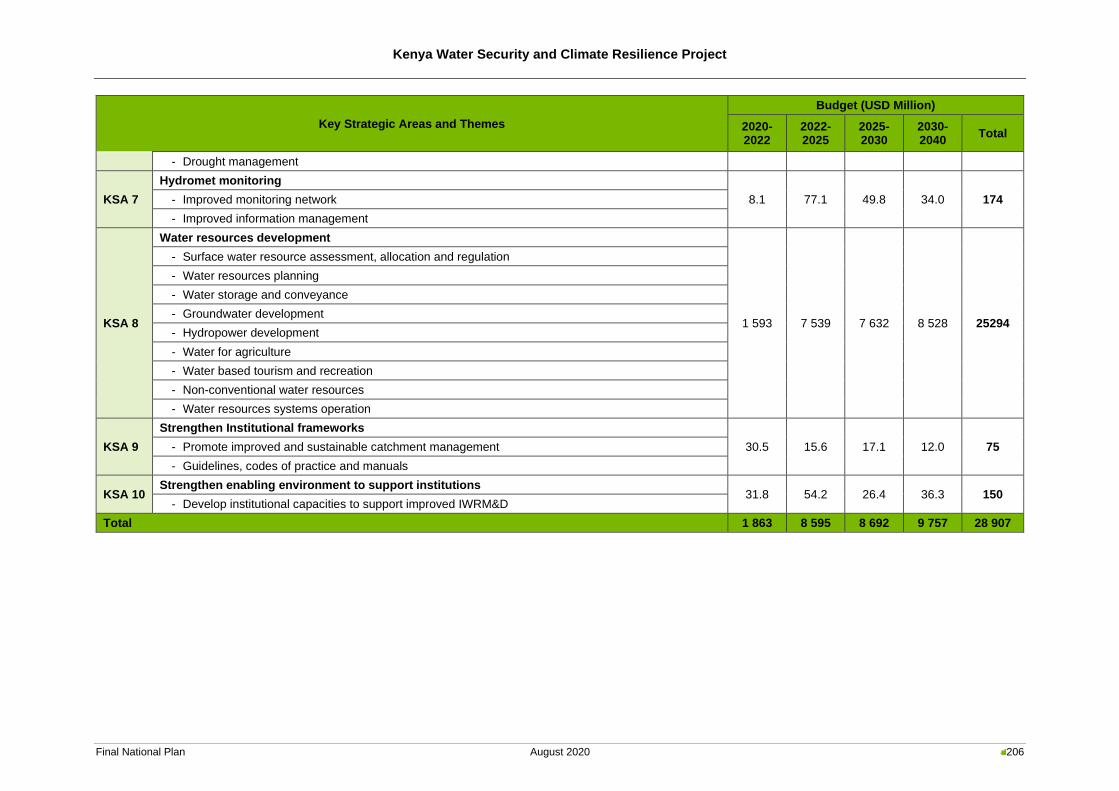
Kenya Water Security and Climate Resilience Project
Final National Plan August 2020 206
Key Strategic Areas and Themes
Budget (USD Million)
2020-2022
2022-2025
2025-2030
2030-2040
Total
- Drought management
KSA 7
Hydromet monitoring
8.1 77.1 49.8 34.0 174 - Improved monitoring network
- Improved information management
KSA 8
Water resources development
1 593 7 539 7 632 8 528 25294
- Surface water resource assessment, allocation and regulation
- Water resources planning
- Water storage and conveyance
- Groundwater development
- Hydropower development
- Water for agriculture
- Water based tourism and recreation
- Non-conventional water resources
- Water resources systems operation
KSA 9
Strengthen Institutional frameworks
30.5 15.6 17.1 12.0 75 - Promote improved and sustainable catchment management
- Guidelines, codes of practice and manuals
KSA 10 Strengthen enabling environment to support institutions
31.8 54.2 26.4 36.3 150 - Develop institutional capacities to support improved IWRM&D
Total 1 863 8 595 8 692 9 757 28 907
Kenya Water Security and Climate Resilience Project
Final National Plan August 2020 207
Kenya Water Security and Climate Resilience Project
Final National Plan August 2020 208
7 Conclusion
Integrated Water Resources Management considers the environmental, social and economic
aspects of a river basin, and ensures that these aspects are integrated into an overall management
strategy. It aims to achieve a sustainable balance between the utilisation, development and
protection of water resources. It is based on the equitable and efficient management and
sustainable use of water and recognises that water is an integral part of the ecosystem, a natural
resource, and a social and economic good, whose quantity and quality determine the nature of its
utilisation. This emphasises the importance of an integrated approach towards water resources
planning, development and management - focusing on an enabling environment, institutional
framework and setting up the management instruments required by institutions to understand
mandates, roles and responsibilities to effectively and seamlessly do their job. There is no correct
administrative model to ensure successful implementation of basin plans. However, the principles
of IWRM allow for selecting, adjusting and applying a mix of tools for a given situation and agreeing
on milestones and timeframes critical for success.
The main challenges associated with water resources development and management in Kenya
vary across the country and include water quality, the spatial and temporal variability of water,
assurance of supply, impacts of climate change, the expected growth in water demand linked to
population growth and socio-economic and irrigation development, challenges associated with the
successful implementation of large-scale water resources and related infrastructure, inadequate
planning, etc. These challenges are exacerbated by various management and institutional issues.
Furthermore, environmental sustainability needs to form an integral part of the decision-making
processes during development of Kenya’s water resources.
The main objective of this National Plan is to provide a clear pathway for the sustainable utilisation
and development of the water resources of the six river basins of Kenya. The Plan provides an
overview of the status quo of the current water resources management situation in the six basins
of Kenya and a plan for future management. It draws on the six Basin Plans which have been
developed and aims to achieve a sustainable balance between the utilisation, development and
protection of water resources and the utilisation and development thereof. In essence, the rationale
for the development of the six Basin Plans was to assess whether the respective basins’ water
resources are sufficient to sustainably meet the socio-economic development needs and the
associated growth in water requirements, with 2040 as the planning horizon. What is evident from
the water resources simulations which were undertaken as part of the development of the basin
plans, was that significant construction of small-scale and large-scale storage, transfer and
regulation infrastructure as well as increased groundwater abstraction will be necessary to ensure
that the projected growth in water requirements can be met at a high assurance of supply with 2040
as the planning horizon.
This National Plan is a key deliverable towards the overall objective of the KWSCRP namely to
strengthen WRA’s capacity in terms of tools, skills and infrastructure to deliver on its mandate for
water resources regulation in the country. It is important to remember that Basin Plans are “living
documents”, which should accommodate adjustments and/or updates.
Kenya Water Security and Climate Resilience Project
Final National Plan August 2020 209
8 References
Ahmed, H. (2017, March 23). Kenyan Met Office predicts rains to fail sparking crisis worse than 2011. Retrieved from Climate Home News: http://www.climatechangenews.com/2017/03/23/kenyan-met-office-predicts-rains-fail-sparking-crisis-worse-2011/
Ali, Y. S. (2014). The impact of soil erosion in the Upper Blue Nileon downstream reservoir sedimentation, Ph.D. Thesis. Netherlands: Techni-cal University of Delft.
Ashun, E. & Bansah, K.J. (2017). Groundwater quality index of Upper Athi River Basin in Kenya. Int. J. Global Environmental Issues, Vol. 16(No. 4), pp. 217-230.
Aurecon AMEI Limited. (2017). Review of Water Supplies in Nairobi and Kisumu - Final Report. East African Breweries.
Braid, S. G., & Lodenkemper, L. K. (2019). Catchment Management Guidelines and Training. Pretoria: Water Research Commission. Report No K5/2508.
CCAFS Program Management Unit. (2017). Research Program on Climate Change, Agriculture and Food Security. Retrieved from CGIAR: https://ccafs.cgiar.org/kenya#.WrqIDIhuZPY
Commission on Revenue Allocation (CRA). (2013). Kenya County Fact Sheets. County Government of Kiambu. (2013). County Integrated Development Plan 2013-2017. County Government of Kwale. (2013). First County Integrated Development Plan 2013-2017. County Government of Machakos. (2015). Machakos County Integrated Development Plan. DEAT. (2002). Ecological Risk Assessment, Integrated Environmental Management, Information
Series 6. Pretoria: Department of Environmental Affairs and Tourism. DEAT. (2004). Strategic Environmental Assessment, Integrated Environmental Management,
Information Series 10. Pretoria: Department of Environmental Affairs and Tourism. Del Bello, L. (2017, July 13). Scientists say east Africa will get wetter, so why is it drying out?
Retrieved from Climate Home News: http://www.climatechangenews.com/2017/07/13/scientists-say-east-africa-will-get-wetter-drying/
DHI. (2017). MIKE HYDRO Basin. Water and Environment. Danish Hydraulic Institute, Hørsholm, . Retrieved from www.dhigroup.com/
DWA. (2007). Development of the water resource classification system: overview and 7-step classification procedure. Pretoria: Department of Water Affairs.
Environmental Justice Atlas authors. (2017, December 28). Offshore sea sand harvest in Kwale district, south of Mombasa, Kenya. Retrieved from Environmental Justice Atlas: https://ejatlas.org/conflict/offshore-sea-sand-harvest-from-in-south-coast-of-the-indian-ocean-kenya
FAO. (2016). Atlas of aquaculture potential in coastal Kenya. FAO. FAO. (2016, August 31). FAOLEX Database. Retrieved from Kenya. Forest Conservation and
Management Act, 2016 (No. 34 of 2016).: http://www.fao.org/faolex/results/details/en/c/LEX-FAOC160882/
GLI. (2017). Global Legal Insights - Kenya Energy 2017. Retrieved October 24, 2017, from https://www.globallegalinsights.com/practice-areas/energy/global-legal-insights---energy-5th-ed./kenya
GLI. (2017). Global Legal Insigths - Kenya Energy 2018. Retrieved November 8, 2017, from https://www.globallegalinsights.com/practice-areas/energy-laws-and-regulations/kenya
Government of Kenya. (2013). National Climate Change Action Plan 2013-2017. Government of Kenya. (2016). Kenya National Adaptation Plan 2015-2030. Government of Makueni County. (2016). Vision 2025. Hijioka , Y., Matsuoka, H., Nishimoto, H., & Masui, M. (2008). Global GHG emissions scenarios
under GHG concentration stabilization targets. Journal of Global Environmental Engineering, 13: 97-108.
Howard, G & Bartram, J. (2003). Domestic Water Quantity, Service Level and Health. Geneva, Switzerland: World Health Organization.
Hughes, D. A., & Münster, F. (2000). Hydrological information and techniques to support the determination of the water quantity component of the ecological reserve for rivers. Pretoria: Water Research Commission.
Huho, J. M., Mashahara, J. N., & Musyimi, P. (2016). Profiling Disaster in Kenya and their Causes. Academic Research International, 1-17.
HyCRISTAL Team. (2018). HyCRISTAL: Integrated Hydro-Climate Science into Policy Decisions for Climate-Resilient Infrastructure and Livelihoods in East Africa. Retrieved from Future Climate for Africa: http://www.futureclimateafrica.org/project/hycristal/
Kenya Water Security and Climate Resilience Project
Final National Plan August 2020 210
IEA. (2015). Situational Analysis of Energy Industry, Policy and Strategy for Kenya. Nairobi, Kenya: Institute of Economic Affairs (IEA).
IFRC. (2010, January 08). Retrieved from Kenya: Floods cause chaos: http://www.ifrc.org/en/news-and-media/news-stories/africa/kenya/kenya-floods-cause-chaos/
IPCC. (2014). Climate Change 2014: Impacts, Adaptation, and Vulnerability. Part A: Global and Sectoral Aspects. In Contribution of Working Group II to the Fifth Assessment Report of the Intergovernmental Panel on Climate Change. Cambridge: Cambridge University Press.
IPCC. (2014). Summary for Policymakers. In Climate Change 2014: Mitigation of Climate Change. Contribution of Working Group III to the Fifth Assessment Report of the Intergovernmental Panel on Climate Change. Cambridge: Cambridge University Press.
JICA. (2013). The National Water Master Plan 2030. Ministry of Environment, Water and Natural Resources, WRMA.
JICA. (2013). The National Water Master Plan 2030. Ministry of Environment, Water and Natural Resources, WRMA.
JICA. (2014). The project on Integrated Urban Development Master Plan for the City of Nairobi in the Republic of Kenya. Nairobi: JICA.
Jones, A. (2013). Soil Atlas of Africa. Luxembourg: European Union. Kamau, M. (2017, February 2). Economic woes linked to low investment in water, State told.
Standard Digital. Kanyi, F. (2014). Hydrological Study of the Upper Athi River Basin. University of Nairobi. KenInvest. (2017, September 26). Retrieved from
http://www.investmentkenya.com/index.php?option=com_content&view=article&id=49&Itemid=105
Kithiia, S. M. (2006). The Effects of Land Use Types on the Hydrology and Water Quality of the Upper-Athi River Basin. Nairobi: University of Nairobi.
Kithiia, S. M. (2012). Effects of Sediments Loads on Water Quality within the Nairobi River Basins, Kenya. International Journal of Environmental Protection, Vol. 2(Iss. 6), pp. 16-20.
Lal, R. A. (2001). Soil degradation by erosion. Land degradation & development., 12(6):519-39. Lapworth, D. e. (2017). Urban groundwater quality in sub-Saharan Africa: current status and
implications for water. Hydrogeology and Human Health, 1093-1116. LTS International, & Acclimatise. (2013). Government of Kenya Adaptation Technical Analysis
Report. DFID & DGIS. Meade, R. H. (1982). Sources, sinks, and storage of river sediment in the Atlantic drainage of the
United States. The Journal of Geology, 90:3: 235-252. Ministry of Environment and Mineral Resources. (2012). Kenya Wetlands Atlas. Mombasa County Government. (2013). First County Integrated Development Plan 2013-2017. Mwau, G. (2012). Kenya Post-Disaster Needs Assessment (PDNA): 2008-2011 Drought.
Republic of Kenya. Nairobi City County. (2017). County Integrated Development Plan 2018-2022. National Drought Management Authority. (2018). Kilifi County: Drought Early Warning Bulletin for
January 2018. Kilifi: Government of Kenya. National Drought Management Authority. (2018). Kilifi County: Drought Early Warning Bulletin for
January 2018. Kilifi: Government of Kenya. National Drought Management Authority. (2018). Makueni County: Drought Early Warning
Bulletin for April 2018. Makueni: Government of Kenya. National Drought Management Authority. (2018). Taita Taveta County: Drought Early Warning
Bulletin for April 2018. Taveta: Government of Kenya. Ndetei, R. (2004). The role of wetlands in a lake ecological functions and sustainable livelihoods
in lake environment: A case study on cross border Lake Jipe - Kenya/Tanzania. Nairobi: Kenya Wildlife Service.
NEMA. (2011). National Guidelines for Strategic Environmental Assessment in Kenya. Nairobi: National Environment and Management Authority.
Nielsen, S. A., & Hansen, E. (1973). Numerical simulation of the rainfall-runoff process on a daily basis. Hydrology Research, 4:3:171-190.
OCHA. (2011). Eastern Africa Humanitarian Report No.3. Nairobi: Sub-Regional Office for Eastern Africa.
Oord, A. (2017). Hydrology and hydrogeology of Sponge City Kajiado, Kenya. Acacia Water. PACT and Alliance for Responsible Mining (ARM). (2018). Economic Contributions of Artisanal
and Small-Scale Mining in Kenya: Gold and Gemstones. DFID. Parnell, J. (2012, July 07). Climate change conflict in Africa a concern says SA minister.
Retrieved from Climate Home News:
Kenya Water Security and Climate Resilience Project
Final National Plan August 2020 211
http://www.climatechangenews.com/2012/11/07/climate-change-conflict-in-africa-a-concern-says-sa-minister/
Reliefweb. (2018). Kenya: Drought - 2014-2018. Retrieved from https://reliefweb.int/disaster/dr-2014-000131-ken
Renard, K. G., Foster, G. R., Weesies, G. A., & Porter, J. P. (1991). RUSLE: Revised universal soil loss equation. Journal of soil and Water Conservation, 46:1:30-33.
Riahi, K., Gruebler, A., & Nakicenovic , N. (2007). Scenarios of long-term socio-economic and environmental development under climate stabilization. Technological Forecasting and Social Change, 74, 7, 887-935.
Tahal Group. (2013). Consultancy Services for Water Supply Master Plan for Mobasa and Other Towns Within Coast Province. Ministry of Environment, Water and Natural Resources, CWSB.
Taita Taveta County Government. (2013). The First Taita Taveta County Integrated Development Plan 2013-2017.
Thornton, N. (n.d.). Climate Change in Kenya: focus on children. United Kingdom: UNICEF UK. UNEP. (2007). Guidelines for Impact Assessment in Western Indian Ocean Region. Nairobi:
United Nations Environment Programme. USAID, & FEWSNET. (2011). Livelihoods Zoning “Plus” Activity in Kenya. van Vuuren, D., den Elzen, M., Lucas, P., Eickhou, B., Strengers, B., van Ruijven, B., . . . van
Houdt, R. (2007). Stabilizing greenhouse gas concentrations at low levels: an assessment of reduction strategies and costs. Climatic Change.
Wafula, P. (2010, July 16). Lack of investment in water sector leaves Kenyan towns parched. Business Daily.
Wafula, P. (2016, July 16). Business Daily. Retrieved from https://www.businessdailyafrica.com/news/539546-958756-pssc71/index.html
Water Resources Management Authority of Kenya. (2015). Athi Catchment Area Catchment Managmement Strategy (CMS). WRMA.
Wiesmann, U., Kiteme, B., & Mwangi, Z. (2016). Socio-Economic Atlas of Kenya: Depicting the National Population Census by County and Sub-Location. Nairobi: KNBS.
Wise, M. A., Calvin, K. V., Thomson, A. M., Clarke, L. E., Bond-Lamberty, B., Sands, R. D., . . . Edmonds, J. A. (2009). Implications of Limiting CO2 Concentrations for Land Use and Energy. Science, 324:1183-1186.
World Food Programme. (2016). Comprehensive Food Security and Vulnerability Analysis: Kenya 2016.
WRMA. (2015). Athi River Restoration Programme. Water Resources Authority. WRMA. (2015). Catchment Management Strategy for Athi Catchment Area. Nairobi. WRMA. (2015c). Athi Catchment Area (ACA). Catchment Management Strategy (2015-2022).
Nairobi, Kenya: Water Resources Management Authority (WRMA). WRMA. (2016). National Water Resources Situation Report for FY2015/2016. Nairobi.

Aurecon offices are located in:
Angola, Australia, Botswana, China,
Ghana, Hong Kong, Indonesia, Kenya,
Lesotho, Macau, Mozambique,
Namibia, New Zealand, Nigeria,
Philippines, Qatar, Singapore, South Africa,
Swaziland, Tanzania, Thailand, Uganda,
United Arab Emirates, Vietnam.
Document prepared by Aurecon AMEI Limited Registration No: C087142-C1/GBL (MAU)
Ebéne House 3rd Floor
33 Cybercity
Ebéne
Mauritius
T F E W
+27 21 526 9400 +27 21 526 9500 [email protected] aurecongroup.com
Related Documents