UNIVERSITY OF NAIROBI SCHOOL OF COMPUTING AND INFORMATICS EFFECTS OF HANDOFF ON NETWORK CAPACITY AND QUALITY OF SERVICE: KENYA GSM NETWORKS CASE STUDY. \ BY MBURU. DAVID NG’ANG’A P56/71604/2008 SUPERVISOR PROF. OKELO ODONGO May 2011- University of NAIROBfCibrary 0478763 6 Submitted in partial fulfillment of the requirement of Master of Science in Information Science of the University of Nairobi.

Welcome message from author
This document is posted to help you gain knowledge. Please leave a comment to let me know what you think about it! Share it to your friends and learn new things together.
Transcript
UNIVERSITY OF NAIROBI
SCHOOL OF COMPUTING AND INFORMATICS
EFFECTS OF HANDOFF ON NETWORK CAPACITY AND
QUALITY OF SERVICE: KENYA GSM NETWORKS CASE STUDY.
\ BY
MBURU. DAVID NG’ANG’A
P56/71604/2008
SUPERVISOR
PROF. OKELO ODONGO
May 2011-
University of NAIROBfCibrary
0478763 6
Submitted in partial fulfillment o f the requirement o f Master o f Science in Information Science o f the University o f Nairobi.
DECLARATION
I David N. Mburu hereby declare that this research project is my original work and where there's work
or contributions of other individuals, it has been dully acknowledged. To the best of my knowledge,
this research work has not been carried out before or previously presented to any other education
institution in the world for similar purposes or forum.
Zi I OS I Zell
David Ng'ang'a Mburu
P56/71604/2008
this research project has been submitted with my approval as the University of Nairobi Supervisor.
Signature Date / > /V '
Professor W. Okelo Odongo
/\ f
Effects of Handoffon network capacity and quality of service: Kenya GSM networks case study

DEDICATION
I dedicate this project to my wife Monicah, and children Daniel, Bernard and Michelle for their
invariable and unrelenting support, encouragement, sacrifice and patience during my difficult times in
the course o f my studies.
I truly cherish all of you.
May the Almighty God bless you today and forever more.
/\ I
ii
Effects of Handoff on network capacity and quality of service: Kenya GSM networks case study

ACKNOWLEDGEMENT
Many people have offered assistance during this Msc project and I cannot name all of them here.
However a number of people come to mind when I look back.
My sincere gratitude goes to the supervisor Pro. W. Okelo Odongo for constant guidance, positive
criticisms and above all his viable suggestions and priceless advice that was very important and which
tremendously contributed to the successful writing of this report.
This work would not have been possible without the constructive criticisms of Mr.Ruhiu and Mr.
Mburu. Your inputs during the proposal and progress presentations were most invaluable. It is the
result of this build up that kept me on course.
1 also w'ant to recognize the contributions of the Course Coordinator Mr. Christopher Chepken and the
Project Coordinator Mr. E. Miriti, the entire staff o f the School of Computing and Informatics,
University of Nairobi. I also want to recognize the contribution offered by Mr. Peter Muturi Msc (11),
your criticism and encouragement during the entire project time contributed immensely to the success
of this project.
In addition, I would also like to extend my gratitude to the management and staff of the three
Telecommunication operators namely Safaricom, Airtel and Orange who endured time and again in
responding to my interviews and providing the required data and for their patience and cooperation.
I also wish to acknowledge all my classmates with whom we brainstormed and worked
towards the successful accomplishment of this task. Special thanks go to F. Mugambi. P. Mokodir, O.
Mogire and Kyalo all of the MSc IS (12) class.
1 further pay a multitude of thanks to my Employer Multimedia University college for according me an
opportunity and sponsorship to train and undertake such a challenging project. May the Success in this
project inspire the MMU management to sponsor more staff to undertake similar training.
Finally, my utmost gratitude goes to our creator the Almighty God for giving me good health and
strength without which I would not have come this far.
Thank you Lord.
>\ I
iii
Effects of Handoff on network capacity and quality of service: Kenya GSM networks case study

ABSTRACT
Telecommunication has evolved from the early days where information was conveyed using smoke
signs and drum beating through fixed wire communication to today’s modem mobile wireless cellular
communication systems. In a Public Land Mobile Network, coverage is achieved through application
of the cellular concept and the principle o f frequency reuse. The overall region is subdivided into small
units of area called cells which are covered with radio waves radiated from Base Stations and which
provide connection of the Mobile Stations to the Network. As the mobile Subscriber traverses the
network, there is need to have the resources that maintain and manage the connection transparently
transferred between neighbouring cells. This process is referred to as Handoff and requires to be
catered for in planning of the network through implementation of an efficient Handoff Scheme. The
effects of Handoff is determined through the PCB and PHD, and their cumulative resultant the GoS.
The methods encountered in literature highlight theoretical methods of determining Network GoS.
Most of these methods start by modeling hypothetical networks for analysis where factors that
influence the quantities (PCB and PHD) to be determined like cell shape, capacity, MS speed are
approximated. As a result of the inefficiency of these existing methods for determining QoS, a case
study was conducted to determine the QoS offered by the Kenyan GSM mobile Operators.
Two sets of data were collected from the leading three GSM operators. In the first set of data it was
deduced that the three Telecommunication Operators have implemented the non priority Handoff
scheme.
The numerical data obtained carried details of the recorded numbers of request to setup calls and to
handoff calls to the neighboring cells. This data was analyzed using simple statistics and probability'
methods. The results revealed that Telecommunication Operator One offered a GoS of 41% during
busy Hour. This indicated a lot of congestion in the network. Due to this extremely high GoS another
set of data was acquired from the same Operator covering the non BH. On analysis of non busy hour
data it gave a GoS of 1.7% which is within the recommended limits. The deterioration of QoS during
busy hour has been attributed to the big number of Customers being served using equal resources to TO
with less than a fifth of the customers. Analysis of the other data from Telecommunication Operator
Two and Three revealed that the networks did not suffer from the problem of overload. The good QoS
found with TO two and Three was due to their small customer bases.
A solution to the problem of congestion was conceptualized in the form of Advanced Adaptive Multi-
Rate (AAMR) Codec and its suitability assessed. It was established that if deployed it is capable of
reducing congestion in TO Ones Network from 41% to 2%. This solution does not call for major
modification of the network and as demonstrated manages to reduce congestion during BH by a factor
of more than twenty.
Further research is recommended in the field of capacity expansion with minimal network changes.
Such network improvement can be achieved through exploration of the possible increase of the number% i *
of timeslots per the 200Khz frequency channel and revision 6f the modulation schemes employed.
iv
Effects of Handoff on network capacity and quality of service: Kenya GSM networks case study
Declaration. ............................................................................................................................................... i
Dedication ..............................................................................................................................................ii
Acknowledgement............................................................................................................................................iii
Abstract............................................................................................................................................................. iv
Table of Contents.............................................................................................................................................v
List of Fgures......■............................................................................................................................................vii
List of tables................................................................................................................................................... viii
List of abbreviations.........................................................................................................................................ix
CHAPTER 1: INTRODUCTION..............................................................................................................1
1.1 Background Information........................................................................................................................ 1
1.1 Problem Statement................................................................................................................................. 2
1.2 Research Objectives...............................................................................................................................3
1.3 Research Questions................................................................................................................................4
1.4 Justification...........................................................................................................................................4
1.5 Scope of the study.................................................................................................................................. 5
1.6 Assumptions and limitations................................................................................................................. 5
CHAPTER 2: LITERATURE REVIEW................................................................................................ 6
2.1 Introduction...........................................................................................................................................6
2.2. The cellular concept...............................................................................................................................6
2. 3. Handoff (Handover)............................................................................................................................. 11
2.4 Global Systems for Mobile communication (GSM)....................................................................... 17
2.5 Quality of Service (QoS)...................................................................................................................24
2.6 Network Planning and QoS............................................................................................................... 26
2.7 Handover analysis through traffic prediction and approximation................................................. 28
2.8 Approximate analysis of handoff traffic in mobile Cellular Networks........... ,...........................29
2.9 H/O interference, performance and effects on voice quality in wireless cellular networks...... 3 1
CHAPTER 3 PROPOSED SOLUTION.............................................................................................. 37
3.1 Introduction.........................................................................................................................................37
3.2 GSM Channels................................................................................................................................... 39
3.3 GSM Codecs...................................................................................................................................... 39
3.4 Advanced Adaptive Multi-Rate Codec (AAMR)............................................................................40
CHAPTER 4: RESEARCH METHODOLOGY.................................................................................47
4.1 Research design.................................................................................................................................. 47
4.2 Target population............................................................................................................................... 47
4.3 Sampling technique............................................................................................................................48
4.4 Data Collection Methods.................................................................................................................. 48
4.5 Data analysis...................................................................................................................................... 49
ty i 5
» /
TABLE OF CONTENTS
v
Effects of Handoff on network capacity and quality of service: Kenya GSM networks case study
51
52
52
68
71
.75
75
76
77
77
78
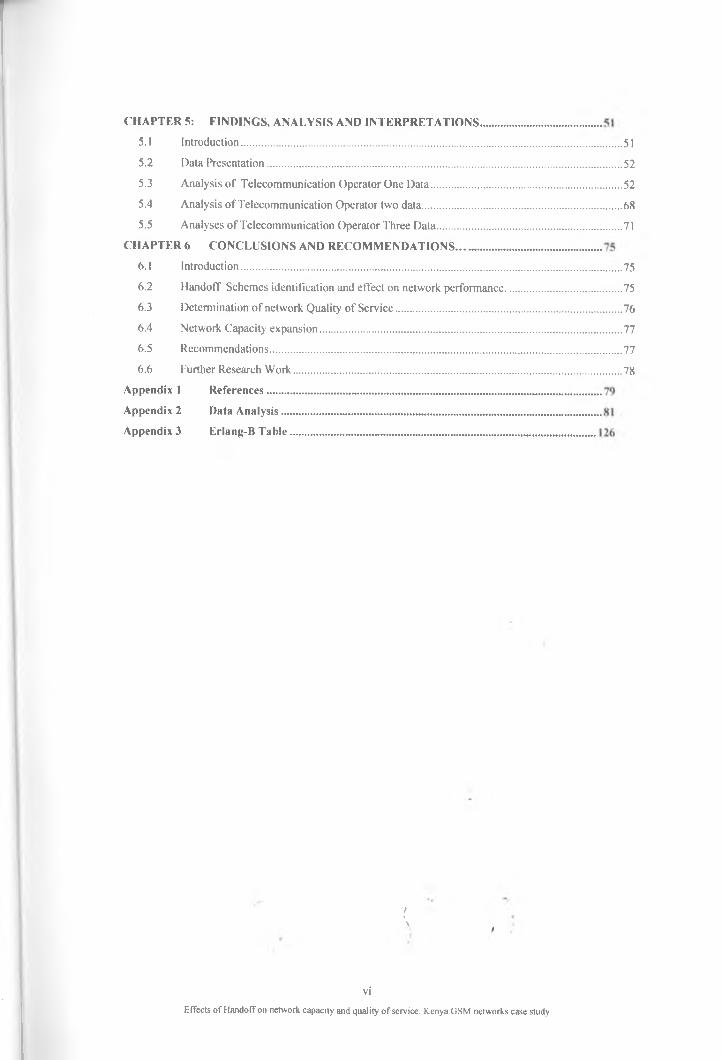
CHAPTER 5: FINDINGS, ANALYSIS AND INTERPRETATIONS...........
5.1 Introduction................................................................................................
5.2 Data Presentation.......................................................................................
5.3 Analysis of Telecommunication Operator One Data............................
5.4 Analysis of Telecommunication Operator two data...............................
5.5 Analyses of Telecommunication Operator Three Data..........................
CHAPTER 6 CONCLUSIONS AND RECOMMENDATIONS...................
6.1 Introduction................................................................................................
6.2 Handoff Schemes identification and effect on network performance..
6.3 Determination of network Quality of Service.........................................
6.4 Network Capacity expansion....................................................................
6.5 Recommendations......................................................................................
6.6 Further Research Work.............................................................................
Appendix I References.......................................................................................
Appendix 2 Data Analysis..................................................................................
Appendix 3 Erlang-B Table...............................................................................
/\ i
vi
Effects of Handoff oil network capacity and quality of service: Kenya GSM networks case study
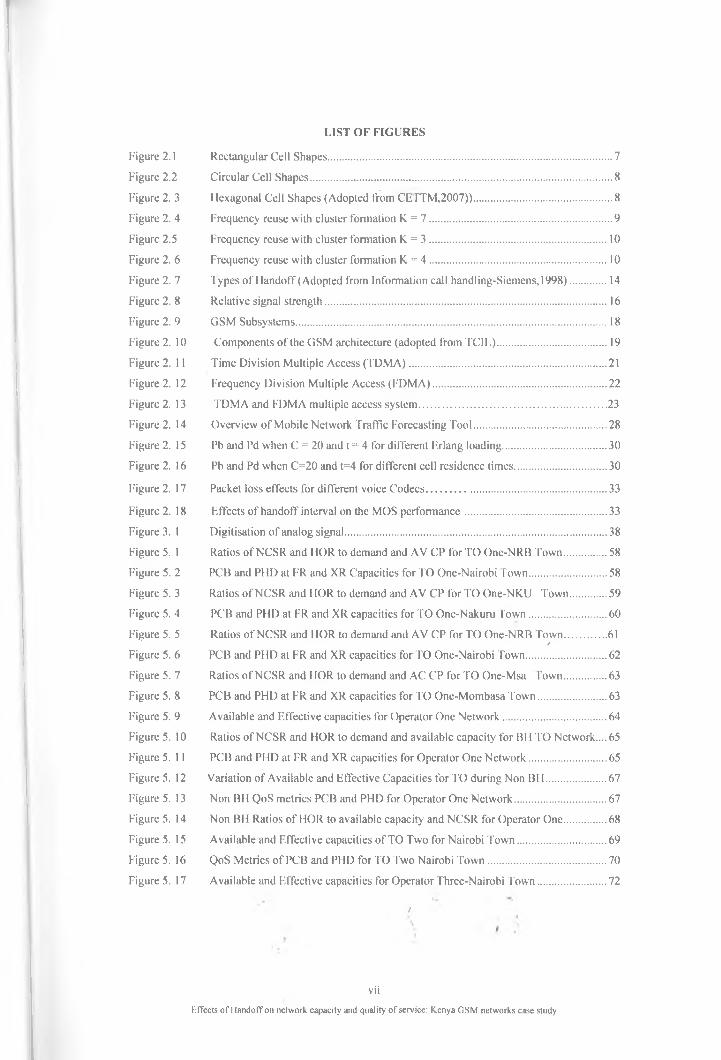
LIST OF FIGURES
Figure 2.1 Rectangular Cell Shapes........................................................................................................7
Figure 2.2 Circular Cell Shapes.............................................................................................................. 8
Figure 2. 3 Hexagonal Cell Shapes (Adopted from CEITM.2007)).................................................. 8
Figure 2. 4 Frequency reuse with cluster formation K = 7 ...................................................................9
Figure 2.5 Frequency reuse with cluster formation K. = 3 ................................................................. 10
Figure 2. 6 Frequency reuse with cluster formation K = 4 .................................................................10
Figure 2. 7 Types of Handofif (Adopted from Information call handling-Siemens,1998)................14
Figure 2. 8 Relative signal strength........................................................................................................16
Figure 2. 9 GSM Subsystems..................................................................................................................18
Figure 2. 10 Components of the GSM architecture (adopted from TCIL)........................................19
Figure 2. 11 Time Division Multiple Access (TDMA).........................................................................21
Figure 2. 12 Frequency Division Multiple Access (FDMA)................................................................22
Figure 2. 13 TDMA and FDMA multiple access system..................................................................... 23
Figure 2. 14 Overview of Mobile Network Traffic Forecasting Tool..................................................28
Figure 2.15 Pb and Pd when C = 20 and t = 4 for different Iirlang loading.......................................30
Figure 2.16 Pb and Pd when C=20 and t=4 for different cell residence times...................................30
Figure 2. 17 Packet loss effects for different voice Codecs...................................................................33
Figure 2.18 Effects of handoff interval on the MOS performance..................................................... 33
Figure 3. 1 Digitisation of analog signal................................................................................................38
Figure 5. 1 Ratios of NCSR and HOR to demand and AV CP for TO One-NRB Town................. 58
Figure 5. 2 PCB and PHD at FR and XR Capacities for TO One-Nairobi Town............................. 58
Figure 5. 3 Ratios of NCSR and HOR to demand and AV CP for TO One-NKU Town...............59
Figure 5. 4 PCB and PHD at FR and XR capacities for TO One-Nakuru Town..............................60
Figure 5. 5 Ratios of NCSR and HOR to demand and AV CP for TO One-NRB Town.................61/Figure 5. 6 PCB and PHD at FR and XR capacities for TO One-Nairobi Town.............................. 62
Figure 5. 7 Ratios of NCSR and HOR to demand and AC CP for TO One-Msa Town.................63
Figure 5. 8 PCB and PHD at FR and XR capacities for TO One-Mombasa Town.......................... 63
Figure 5. 9 Available and Effective capacities for Operator One Network.......................................64
Figure 5. 10 Ratios ofNCSR and HOR to demand and available capacity for BH TO Network.... 65
Figure 5.11 PCB and PHD at FR and XR capacities for Operator One Network............................. 65
Figure 5.12 Variation of Available and Effective Capacities for TO during Non BH...................... 67
Figure 5. 13 Non BH QoS metrics PCB and PHD for Operator One Network...................................67
Figure 5.14 Non BH Ratios of HOR to available capacity and NCSR for Operator One.................68
Figure 5. 15 Available and Effective capacities of TO Two for Nairobi Town..................................69
Figure 5.16 QoS Metrics of PCB and PHD for TO Two Nairobi Town............................................ 70
Figure 5.17 Available and Effective capacities for Operator Three-Nairobi Town.......................... 72
/
vii
Effects of Handoff on network capacity and quality of service: Kenya GSM networks case study
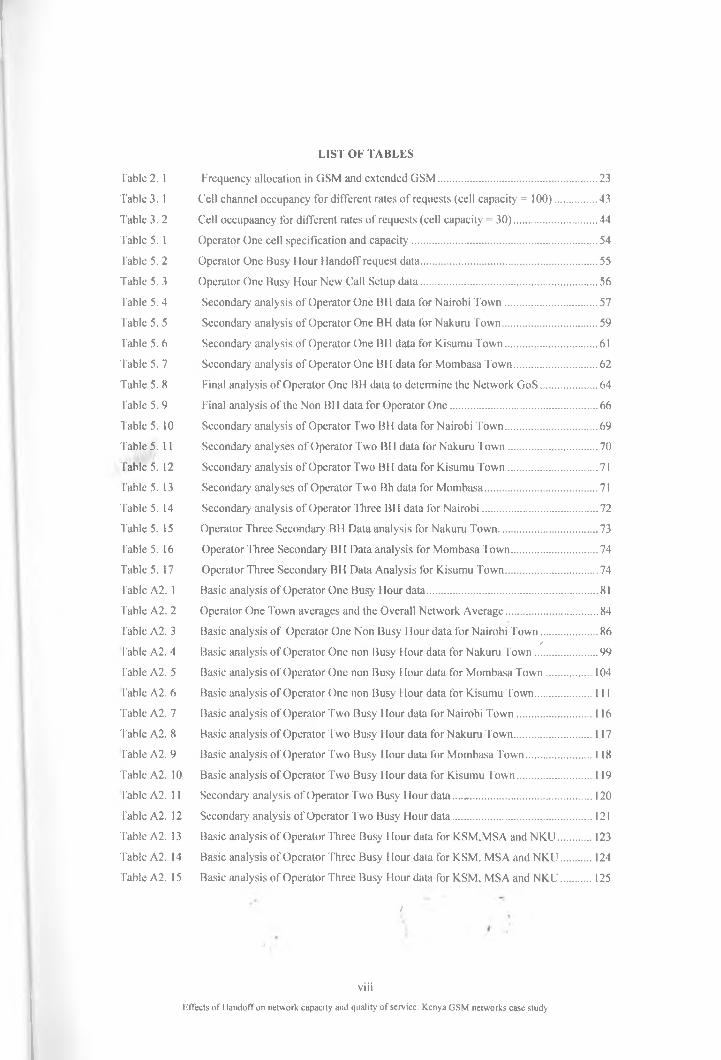
LIST OF TABLES
Table 2. 1 Frequency allocation in GSM and extended GSM.......................................................... 23
Table 3. 1 Cell channel occupancy for different rates o f requests (cell capacity = 100)............... 43
Table 3. 2 Cell occupaancy for different rates of requests (cell capacity = 30).............................. 44
Table 5. 1 Operator One cell specification and capacity....................................................................54
fable 5. 2 Operator One Busy Hour HandofTrequest data................................................................ 55
Table 5. 3 Operator One Busy Hour New Call Setup data.................................................................56
Table 5. 4 Secondary analysis of Operator One BH data for Nairobi Town...................................57
Table 5. 5 Secondary analysis of Operator One BH data for Nakuru Town....................................59
Table 5. 6 Secondary analysis of Operator One BH data for Kisumu Town...................................61
Table 5. 7 Secondary analysis of Operator One BH data for Mombasa Town................................62
Table 5. 8 Final analysis of Operator One BH data to detennine the Network GoS....................... 64
Table 5. 9 Final analysis of the Non BH data for Operator O ne....................................................... 66
Table 5. 10 Secondary analysis of Operator Two BH data for Nairobi Town...................................69
Table 5. 11 Secondary analyses of Operator Two BH data for Nakuru Town..................................70
Table 5. 12 Secondary' analysis of Operator Two BH data for Kisumu Town..................................71
Table 5. 13 Secondary analyses of Operator Two Bh data for Mombasa.......................................... 71
Table 5.14 Secondary analysis of Operator Three BH data for Nairobi........................................... 72
Table 5. 15 Operator Three Secondary BH Data analysis for Nakuru Town.....................................73
Table 5. 16 Operator Three Secondary BH Data analysis for Mombasa T own.................................74
Table 5. 17 Operator Three Secondary BH Data Analysis for Kisumu Town...................................74
Table A2. 1 Basic analysis of Operator One Busy Hour data............................................................... 81
Table A2. 2 Operator One Town averages and the Overall Network Average...................................84
Table A2. 3 Basic analysis of Operator One Non Busy Hour data for Nairobi Town...................... 86/
fable A2. 4 Basic analysis of Operator One non Busy Hour data for Nakuru Town........................99
Table A2. 5 Basic analysis of Operator One non Busy Hour data for Mombasa Town..................104
fable A2. 6 Basic analysis of Operator One non Busy Hour data for Kisumu Town......................111
Table A2. 7 Basic analysis of Operator Two Busy Hour data for Nairobi Town............................ 116
Table A2. 8 Basic analysis of Operator Two Busy Hour data for Nakuru Town............................. 117
Table A2. 9 Basic analysis of Operator Two Busy Hour data for Mombasa Town......................... 118
Table A2. 10 Basic analysis of Operator Two Busy Hour data for Kisumu Town............................ 119
fable A2. 11 Secondary analysis of Operator Two Busy Hour data..................................................120
Table A2. 12 Secondaiy analysis of Operator Two Busy Hour data................................................... 121
Table A2. 13 Basic analysis of Operator Three Busy Hour data for KSM.MSA and NKU..............123
Table A2. 14 Basic analysis o f Operator Three Busy Flour data for KSM, MSA and NKU.............124
Table A2. 15 Basie analysis of Operator Three Busy Hour data for KSM. MSA and NKU.............125
/
viii
Effects of HandofTon network capacity and quality of service: Kenya GSM networks case study
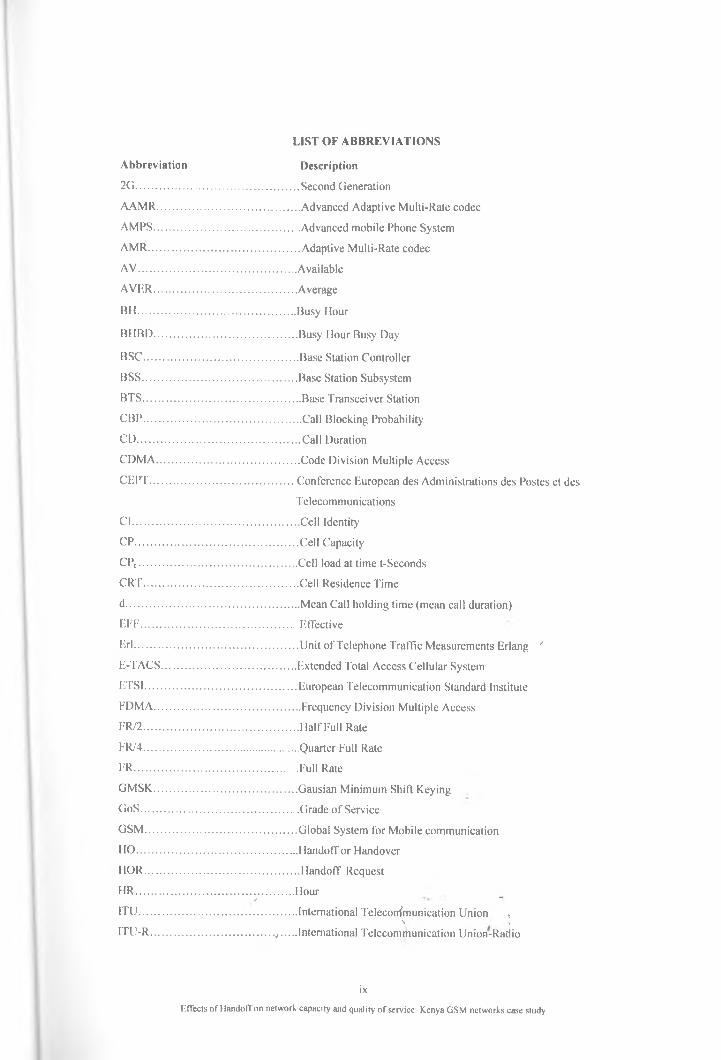
LIST OF ABBREVIATIONS
Abbreviation Description
2G.........................................................Second Generation
AAMR................................................. Advanced Adaptive Multi-Rate codec
AMPS...................................................Advanced mobile Phone System
AMR.....................................................Adaptive Multi-Rate codec
AV....................................................... Available
AVER..................................................Average
BH....................................................... Busy Hour
BHBD.................................................. Busy Hour Busy Day
BSC....................................................... Base Station Controller
BSS...........................................................................Base Station Subsystem
BTS.......................................................Base Transceiver Station
CBP...................................................... Call Blocking Probability
CD...........................................................Call Duration
CDMA..................................................Code Division Multiple Access
CEPT...................................................Conference European des Administrations des Postes et des
Telecommunications
Cl............................................................Cell Identity
CP...........................................................Cell Capacity
CP,........................................................Cell load at time t-Seconds
CRT...................................................... Cell Residence Time
d............................................................Mean Call holding time (mean call duration)
EFF...................................................... Effective
Erl..........................................................Unit of Telephone Traffic Measurements Erlang '
E-TACS................................................Extended Total Access Cellular System
ETSI......................................................European Telecommunication Standard Institute
FDMA....................................................Frequency Division Multiple Access
FR/2...................................................... Half Full Rate
FR/4...................................................... Quarter Full Rate
FR..........................................................Full Rate
GMSK................................................. Gausian Minimum Shift Keying
GoS....................................................... Grade of Service
GSM.....................................................Global System for Mobile communication
HO.........................................................Handoff or Handover
HOR......................................................Handoff Request
HR.........................................................HourV • *ITU....................................................... International Telecommunication Union, ,
\ •»
ITU-R............................................ , ..... International Telecommunication Union-Radio
ix
Effects of Handoff on network capacity and quality of service: Kenya GSM networks case study
ITU-T................................................International Telecommunication Union-Telecommunication
KPI...................................................Key Performance Indicators
KSM................................................ Kisumu
LC...................................................... Location
MAHO............................................Mobile Assisted HO
MOS.................................................Mean Opinion Score
MOScqe................. .........................MOS Conversational Quality Estimated
MSA.................................................Mombasa
MSC..................................................Mobile Switching Center
NBC................................................. Number of Blocked Channels
NBC................................................. Number of Blocked Calls
NCSR...............................................New Call Setup Request
NHO................................................Number of HandOffs
NKU................................................... Nakuru
NMT.................................................Nordic Mobile Telephone
NP.....................................................No Priority(Zero)
NRB................................................ Nairobi
NSS.................................................. Network Sub-System
NTCHD............................................Number of TCH Denied
OMC.................................................. Operation and Maintenance Center
Pb...................................................... Probability of Call Blocking
PCB................................................. Probability of Call Blocking
Pd......................................................Probability of Handoff Dropping
PHD.................................................Probability of Handoff Dropping
QoS...................................................Quality of Service
R........................................................Transmission Rating factor
r......................................................... TCH requests as a percent of Cell capacity
RQ.....................................................Request
RSS................................................... Received Signal Strength
SIR.................................................... Signal - Interference- Ratio
SSS....................................................Switching Sub-System
STC................................................... Sub Technical Committee
TAGS................................................ Total Access Cellular System
TDMA............................................. Time Division Multiple Access
TMN................................................. Telecommunication Management Network
TO..................................................... Telecommunication Operator
TRX..................................................Transceiver i.e. Transmitter/Receiver
TTL.................................................. Total
WLAN............................................. Wireless Local Area Network'
XR......................................................Unspecific bit rate (or Any intermediate btyrate).
x
Effects of Handoff on network capacity and quality o f service: Kenya GSM networks case study
CHAPTER 1: INTRODUCTION
1.1 Background Information.
Telecommunication has its roots in the 1888 discovery of electromagnetic waves by Hertz, and the
demonstration of the Transatlantic radio telephony by Marcon in 1897 (Rappaport, 1996). There were
many advances in research that lead to the discovery of telephone by Graham Bell in 1946.
There has been a lot of evolution of technologies in this field of telecommunications since the
introduction of the fixed telephone services. Fixed telephone networks that were optimized for voice
were the most common mode of telecommunication before 1980. Due to demand for Data
communication data handling equipments were installed in the network switching nodes together with
Data circuit terminating equipments to enable the network carry data. This appeared to be like a single
network but it was truly a parallel combination of two networks, the voice network and the data
networks. The demand from different categories of users like businesspersons, researchers and people
on holiday (Tourists) could not be met by fixed telecommunication networks services. To satisfy the
market new technologies that could offer more flexibility in access were the short term solutions. T his
lead to the 1980’s increased deployment of the wireless systems. Later the need for high capacity
connectionless systems was found to be the ultimate solution.
The first wireless systems of the 1980s were analog. Most of the technologically developed countries
manufactured their own systems. Britain developed and deployed an analog System called Total
Access System (ETACS), America Advanced Mobile Phone System (AMPS), Nordic Countries
(Finland, Sweden, Norway and Denmark) Nordic Mobile Telephone (Rappaport, 1996). The problem
of mobility was reduced but not fully solved.
The world had perches of network coverages’ where a given Mobile equipment could not communicate
between any pair of networks. This was due to diverse technology standards applied in the
development of the network hardware. As a result there was no inter-region service provision. This
reduced the network subscriber mobility'. To solve this problem a group of standards organizations
from different countries came together to try and harmonize the standards so that equipments
specifications would no longer depend on the manufacturers. The Groupe Special Mobile was formed
to develop a pan-European digital cellular system in 1982. This group later worked under the European
Telecommunications Standards Institute (ETSI) and produced the GSM specifications in 1989 (De
vriendt, et al.2002).
GSM was later interpreted to mean Global System for Mobile Communication. This basically intended
to mean that the system was targeted to make the whole globe (world) appear like it’s covered by a
single network.
Telecommunication has evolved from the fixed line services that were the dominant type of
telecommunications up to the early 1990s, to the present mobile telecommunication. The main
difference between the mobile and fixed telecommunications systems is the ability of the mobile
system to maintain connection irrespective of the location of the'communication'terminal devices. This
unlimited mobility is achieved through two major modifications of the telecommunications service
I
Effects of Handoff on network capacity and quality of service: Kenya GSM networks case study
area. One is the subdivision of the service area into smaller areas called cells and the allocation of the
radio resources necessary to establish and maintain connection to the network. The other one is the
implementation of the necessary technology to allow the sustenance of the radio resources to maintain
a session as the subscribers crosses the cell boundaries i.e. efficient handovers.
The handover criteria are based on signal quality and distance. These two factors have a lot o f effect on
the quality of service and the communication systems capacity. Signal quality that is the bit error rate
determines the clarity of the voice. Bit error rate is reduced through introduction of redundancy bits and
coding. The distance from the base station determines the delay due to the distance covered, while
sharing of the channels results to scheduling delay, these delays are countered through timing advance.
When handoff is implemented additional negative effects arise such as handoff interference, handoff
delay, handoff dropping and increased chances of call blocking.
1.1 Problem Statement
In mobile telecommunication the area served by a given base station (macro, micro or Pico cell) and
its immediate neighbourhood appear to be like (he only network to a subscriber considering a mean call
duration time of 2minutes and vehicular mobility. This is so because within such a duration any given
subscriber can only cross one cell boundary. In such a situation a number of subscribers gel the
impression of the whole network as got from the Quality offered by two or one cell only.
The success of setting up a call and transferring a call from a given cell to the neighbouring cell
depends on the planning of the specific area/region. Due to the population distribution and the
anticipated pattern of daily movement, cell capacity and the overall planning are never identical for any
given two cells. As a result resource demands are not uniform over the whole network. The gravity of
this problem is further complicated by the fact that Handoff must be catered for in the network for it to
qualify to be a mobile network but it offers varying and unpredictable network resource demands.
Furthermore in developing countries there are regions where the coverage or network availability is not
normally provided due to demand but is done to meet licensing requirements and telecommunication
regulator incentives. It follows that the quality of service for a given network turns out to be almost
guaranteed in some regions and in the areas where it is less it falls below the expected level.
Telecommunications standards are set and enforced by the International Telecommunications Union
(ITU) through the local communication regulators. Standards are defined as references for delivery of
services. In mobile voice communication the chances of failure, to establish a connection and, to
transfer an on going call to a new cell are some of the most important standards. ITU has set a standard
of less than 2% for the combined call failure (stated as the failure to acquire a traffic channel) that is
both call blocking and handoff dropping. A more critical investigation of the determination of this 2%
QoS reveals some assumptions of homogeneity in the networks and combination of the network Busy
and non Busy Hours. Even though the set standard seem to be adequate as a probability of 0.02
according to statistics is justified to be considered negligibly small. While this is supposed to be the
2
Effects of Handoff on network capacity and quality of service: Kenya GSM networks case study
actual situation, the effects of handoff dropping and call blocking are not uniformly distributed (over
the network and on time basis) as the standard generalizes.
As expected in any public telecommunication network there turns out to be regions of high, medium,
low and sparse network demands. The two Quality of service performance standards of Handoff and
Calldrop are more pronounced in the high demand regions. This means that if these two metrics of
measurement standards are combined and determined with reference to the affected regions only, i.e.
by establishing both the probabilities of call dropping and (meaning-as used in probability) handoff
failure by considering the capacities of the congested regions, the result would be expected to be higher
than the 2% and hence indicate a worse quality of service than the allowable upper limit. As noted by
Leu (2008) most of handoff performance deal with simplified scenarios, which may not fully
characterize the overall performance of the network. The actual quality of service prevailing in these
networks w hich is brought about by the effect of handoff on the network capacity is not known.
Both the network operators and their subscribers have used and continue to use the generalized ITU
formula irrespective of the important factors like time and the location of the circuits under
consideration. The resulting QoS is normally found acceptable to subscribers since it gives a success
rate of at least 98% when averaged over a long duration and an expansive area of the network. But the
actual state in the field is that if there is any chance of being affected by the network constraints that
lead to excessive call drops and handoff failures then the Grade of Service (GoS) can only be higher as
it actually need to be determined as a fraction of the subscribers in the affected area only and small
time durations. The impact of this problem is averaging lower GoS than the allowed 2% in isolated
regions and very good GoS of almost 0% in the major part of the network. The resulting GoS is
normally of a value less than 1%. With such a small value or chance of failure it gives a wrong
impression of very good GoS. Hence there is need to carry out practical research to determine the effect
of Handoff capacity demand on the available capacity and its subsequent negative effects on the GoS,/when the network is expected to be experiencing the heaviest load.
1.2 Research Objectives
The objectives of this study were to:
1. Identify the Handoff schemes implemented by the three leading GSM network operators in Kenya
and evaluate their performance by determining the effect of catering/provisioning for Handoff calls
on network capacity.
2. Determine the effect of Handoff calls on the network Quality of Service using the probability of
handoff call dropping, probability of call blocking and the probability of failure of allocation of
traffic channel (GoS) metrics o f measurement.
3. Develop a suitable conceptual Handoff and network configuration framework that optimizes the
network capacity and Quality of service.
>\ « *\ /
3
Effects of Handoff on network capacity and quality of service: Kenya GSM networks case study
1.3 Research Questions
a) What are the different types of Handoff schemes (algorithms) deployed by the three leading
mobile Network operators in Kenya?
b) What are the effects of the Handoff schemes used by the three Network Operators in Kenya on
network available capacity?
e) What are the effects of the Handoff schemes used by the three Network Operators in Kenya on
network Quality of Service with reference to probability of call blocking, probability of handoff
dropping and GoS metrics of measurement?
d) How can a Handoff and network configuration conceptual framework be synthesized that can
perform better than those handoff schemes being used by the three leading network operators?
1.4 Justification
The effect of handoff on system capacity is not as well understood as other aspects of cellular systems,
such as equalization, modulation, and coding. Most studies of handoff performance deal with
simplified scenarios, which may not fully characterize the overall performance of the network. Handoff
performance is typically quantified in terms of assignment probability and handoff probability at each
point along a trajectory taken by a given mobile station (Leu et al, 2008). The system capacity is what
determines the two QoS factors of CBP and HDP which are the most valued metrics by the network
operator and the subscribers’ respectivefully. It follows that to determine the GoS of a network for the
purpose of comparing the results with the ITU stated value of 2% a quantitative study was required.
The main cause for handoff is the channel deterioration as the MS nears the cell boundary. The highest
contributor to the signal decay is the effect of the inverse square law in propagation of electromagnetic
waves. The other cause for signal power reduction is multipath effects. As noted by Zhang, (2010), the
fading channel is time-varying, unreliable, and erroneous. Seriously degraded signal may lead to
physical link breakdown, and hence, the forced termination of an active call. As a result, similar to the/
limited bandwidth, the fading channel also plays an equally important role on handoff performance.
The number of handoffs recorded by the Telecommunication Management Network (TMN) cannot be
differentiated on the basis of their causes. This is true for handoff calls which are directed to new cells.
It is clear that handoffs are triggered by multiple effects where some of these effects are time
deterministic. This means that the best method to determine such effects is through a survey.
Yu and Lung (2001) argued that it is impractical to completely eliminate handoff call dropping (Phd),
the best one could do is to keep Phd below a target level. Moreover, maximizing resource utilization
while keeping probability of new call blocking P„b> below a target value is another critical factor for
evaluating call admission control algorithms. This means that in a handoff scheme a compromise
acceptable value of the Phd and P„b is derived through a balancing act.
It is against the culmination of the above observations that we found it justifiable to cany out a case
study to determine the effects of handoff on network capacity and handoff calls on the quality of
service. The research also catpe up with a suitable conceptual framework that optimized capacity' and/
quality of service. \ 1 '
4
Effects of Handoff on network capacity and quality of service: Kenya GSM networks case study
1.5 Scope of the study
In this research we evaluated the performance of the various handover algorithms employed by the
leading mobile telecommunications operators with a view towards establishing their effects on quality
of service and the network capacity. The network planning was studied together with the 1TU/GSM
guidelines on the recommended standards and reference made to the key performance indicators
intended to be achieved by the networks. This research collected data from the leading three Kenyan
telecommunication operators for the total number of the new calls and handoff requests, total
successful new calls, handoff requests and the total number of active calls from both newly generated
and handoff calls within the cell under study. The data was analyzed and interpreted in line with the
existing ITU set standards. Finally a conceptual framework was synthesized that if deployed could
perform better and hence mitigate on the problem of congestion. This study was not meant to address
other factors that affect quality of service e.g. delay, jitter, Doppler Effect etc. Handoff in this study has
been used to represent the net Handoffs into the cell under investigations and specifically voice calls
and not other types of communication as referred to as a call.
1.6 Assumptions and limitations
For a research such as this one to yield the desired results the telecommunications network to be
investigated required to have well established networks. Networks which have not matured enough
have problems of prolonged durations of idle capacity. This results from the fact that the networks
subscriber base is in the stage of development. As a consequence any handover request has a chance of
one to succeed since the required resources are abundantly available. Thus the quality of service is
almost guaranteed. In this case the three leading networks were assumed to have stabilized with respect
to the subscriber base growth rate.
The network available capacity was taken to be the maximum number of calls that the section of the/
network could concurrently maintain. This is different from effective capacity which was taken to
mean the number of new calls that could be setup and be supported by the section of the network.
Hence the handoff effect was conspicuously brought out through the comparison of the available and
effective capacities. Another major presumption was that at the time of observation of the Network the
call setup time was negligible because the wireless system is open all the way to near acquisition of
TCH. Also adherence to ErlangB planning techniques which do not take queuing into consideration
was assumed.
However the network availability is contrary to the Erlang theory which assumes that a network cannot
be available throughout. Due to the availability of the medium (air-space)with sufficient RACH, and
the fact that our analysis focused on the high demand time, it was legitimate to assume that a given
channel could be engaged practically through out since the calls destination was unlikely to be the same
It was also assumed that the system was to achieve its upper limit at FR (fixed bit-rate). That is there
was no (or zero) chance'of the system increasing capacity through extra resource sharing.
The calling behavior of the network subscribers was assumed to be independent of the number of the
week of the month and the Month, but dependent on the day of the week.
5
Effects of Handoff on network capacity and quality of service. Kenya GSM networks case study
CHAPTER 2: LITERATURE REVIEW
2.1 Introduction
Wireless transmission systems send signals through air or space without being tied to a physical line.
All wireless media rely on various parts of the electromagnetic spectrum. Some types of wireless
transmission, such as Microwave or Infrared, by nature occupy specific spectrum frequency ranges.
Other types of wireless transmissions, such as Cellular telephones and paging devices, have been
assigned a specific range of frequencies by National regulatory agencies and international agreements.
Each frequency range has characteristics that determine the specific function or data communications
niche assigned to it.
Cellular telephones work by using radio waves to communicate with radio antennas (towers) placed
within adjacent geographic areas called cells. A telephone message is transmitted to the local cell by
the cellular telephone and then is passed from antenna to antenna cell to cell until it reaches the cell of
its destination, where it is transmitted to the receiving telephone. Old cellular systems are analog and
newer cellular systems are digital.
Digital cellular services use several different competing standards that do not interoperate with each
other. This means that digital cellular handsets cannot work on networks that use another wireless
standard. The two widely deployed second-generation (2G) cellular systems are GSM and CDMA
(Code Division Multiple Access).
In Europe and much of the rest of the world outside the United States, the standard used is GSM, short
for Global Systems for Mobile communication. (Khan, 2009)
The design objective of the early mobile radio systems was to achieve a large coverage area by using a
single, high powered transmitter with an antenna mounted on a tall tower. While this approach
achieved very good coverage, it also meant that it w'as impossible to reuse those same frequencies
throughout the system, since any attempts to achieve frequency reuse would result in interference.
Faced with the fact that government regulatory agencies do not make spectrum -allocations in
proportion to the increasing demand for wireless services, it becomes imperative to restructure the
radio telephone system to achieve high capacity with limited radio spectrum, while at the same time
covering very large areas. The demand for radio coverage with limited resource (frequency spectrum)
calls for utilization of the cellular concept through the principle of frequency reuse and implementation
of efficient handoff schemes.
2.2. The cellular concept
In a Public Land Mobile Telecommunication Network (PLMN) system, Mobile Subscribers (MS)
traversing the area covered by the network require communication services through a wireless
connection. In such a system, coverage area is normally divided into smaller regions referred to as cells
to allow' the reuse of frequency spectrum to increase the network capacity. Each cell is served by its
own transmitter and receiver (base transceiver station, B I S) to manage the mobiles within their area of
jurisdiction. As the number of mobile subscribers’ increases, cell capacities can tie increased or new
cells can be deployed to accommodate the growth. This is practical since frequencies used in one cell
6Effects of Handoff on network capacity and quality o f service: Kenya GSM networks case study

cluster can be reused in other cells. The planning and network management is done such that
conversations can be handed over from cell to cell to maintain constant phone service as the subscriber
moves between cells.
Problem o f Spectral congestion and user capacity is solved using frequency reuse
Advantages o f frequency reuse include:
>■ Offers high capacity with limited spectrum allocation
> Covers the whole service area using a number o f low power transmitters
A portion o f the total channels available is allocated to each base station.
To reduce interference, neighboring cells are assigned different set o f frequency channels. It is
important then to establish the cell shape that can achieve the best coverage. Consider rectangular cells
shown figure 2.1
The distance from the center to the edge o f the cells varies as indicated by R| and R2 hence this choice
cannot provide uniform signal coverage at the cell edges. Another possible choice is circular cell shape
as shown in figure 2.2 The circular cell shapes have a problem o f dark areas i.e. regions that do not
have any signal coverage at all. The advantage o f this cell type is its uniform radius. But this advantage
is undermined by the presence o f the dark regions which have no signal at all.
The third possible cell shape is the hexagonal shape, as shown in figure 2.3.
I
R ,'
*1 /
r
/
Figure 2.1 Rectangular Cell Shapes (Adopted from CETTM ,2007)
/\ >
7
Effects o f HandolTon network capacity and quality o f service: Kenya GSM networks case study
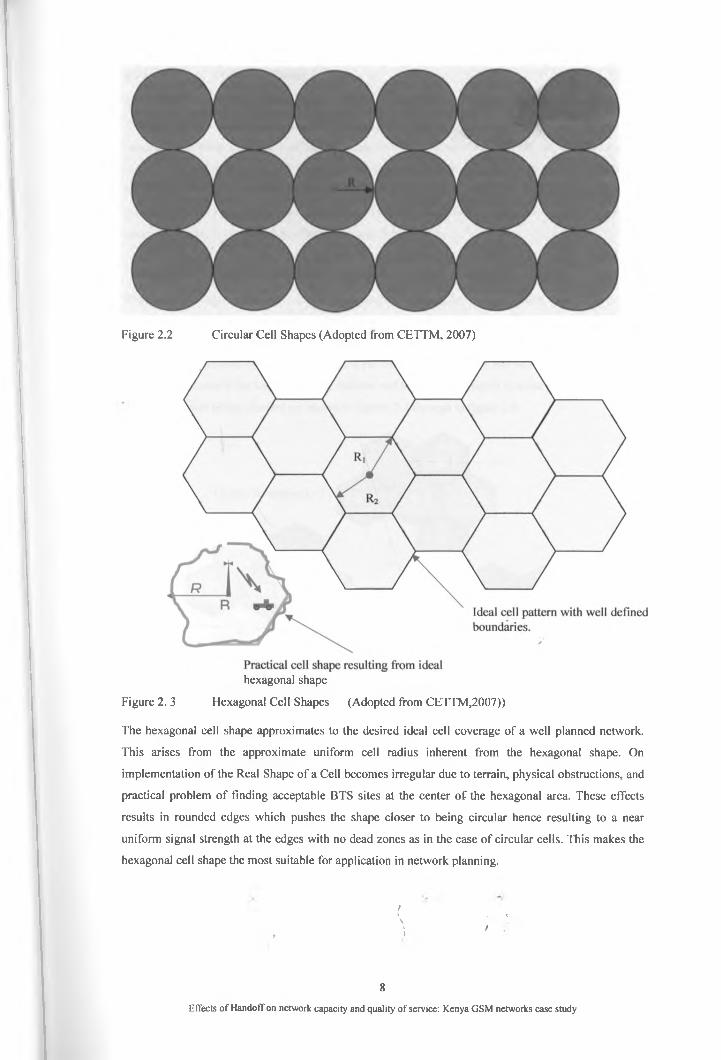
Figure 2.2 Circular Cell Shapes (Adopted from CETTM, 2007)
hexagonal shape
Figure 2. 3 Hexagonal Cell Shapes (Adopted from CETTM,2007))
The hexagonal cell shape approximates to the desired ideal cell coverage o f a well planned network.
This arises from the approximate uniform cell radius inherent from the hexagonal shape. On
implementation o f the Real Shape o f a Cell becomes irregular due to terrain, physical obstructions, and
practical problem o f finding acceptable BTS sites at the center o f the hexagonal area. These effects
results in rounded edges which pushes the shape closer to being circular hence resulting to a near
uniform signal strength at the edges with no dead zones as in the case o f circular cells. This makes the
hexagonal cell shape the most suitable for application in network planning.
t\ i %\
* t* <
8
Effects o f Handoff on network capacity and quality o f service: Kenya GSM networks case study
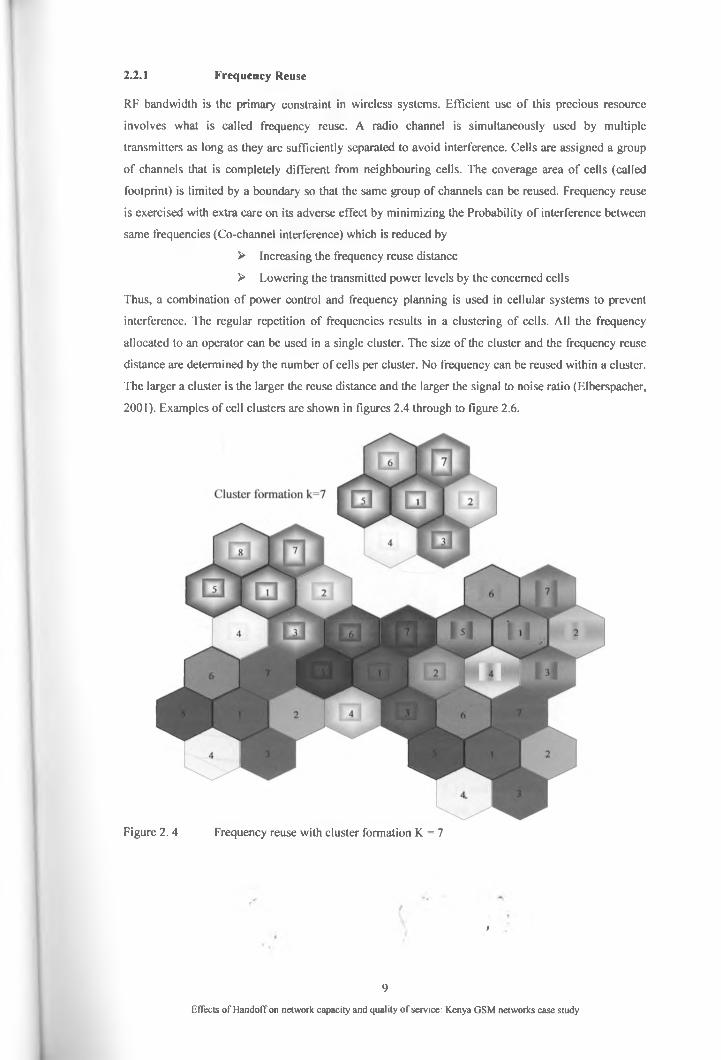
2.2.1 Frequency Reuse
RF bandwidth is the primary constraint in wireless systems. Efficient use o f this precious resource
involves what is called frequency reuse. A radio channel is simultaneously used by multiple
transmitters as long as they are sufficiently separated to avoid interference. Cells are assigned a group
o f channels that is completely different from neighbouring cells. The coverage area o f cells (called
footprint) is limited by a boundary so that the same group of channels can be reused. Frequency reuse
is exercised with extra care on its adverse effect by minimizing the Probability o f interference between
same frequencies (Co-channel interference) which is reduced by
> Increasing the frequency reuse distance
> Lowering the transmitted power levels by the concerned cells
Thus, a combination o f power control and frequency planning is used in cellular systems to prevent
interference. The regular repetition of frequencies results in a clustering o f cells. All the frequency
allocated to an operator can be used in a single cluster. The size o f the cluster and the frequency reuse
distance are determined by the number o f cells per cluster. No frequency can be reused within a cluster.
The larger a cluster is the larger the reuse distance and the larger the signal to noise ratio (Elberspacher,
2001). Examples of cell clusters are shown in figures 2.4 through to figure 2.6.
Figure 2. 4 Frequency reuse with cluster formation K = 7
/
9
Effects o f Handoff on network capacity and quality o f service: Kenya GSM networks case study
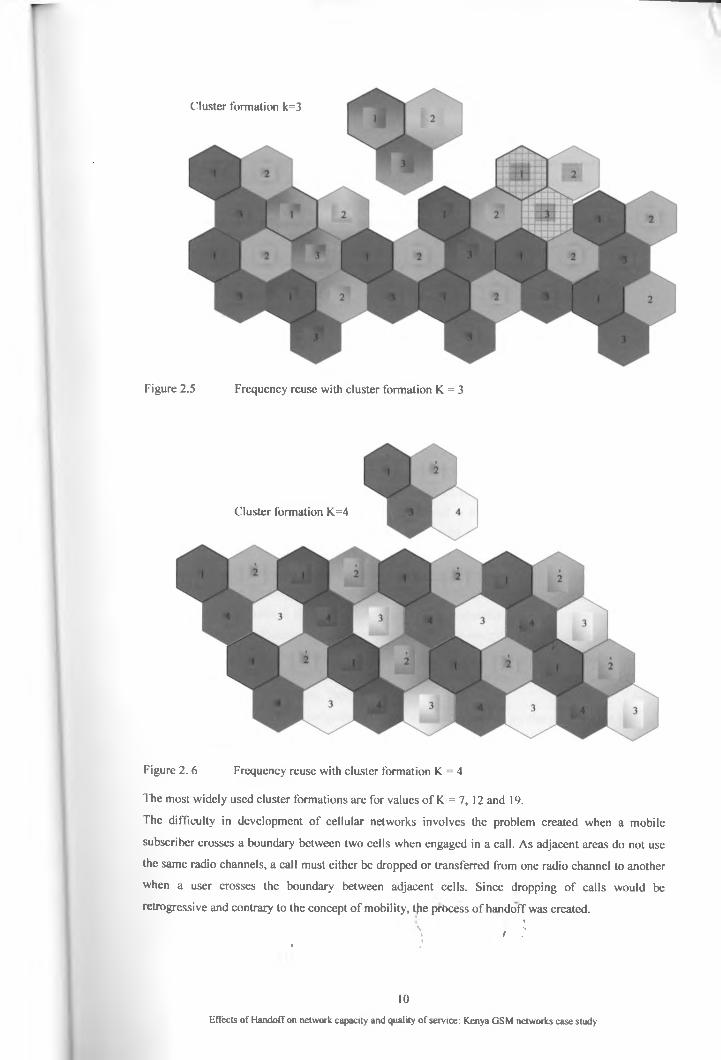
Cluster formation k=3
Figure 2. 6 Frequency reuse with cluster formation K = 4
The most widely used cluster formations are for values o f K = 7, 12 and 19.
The difficulty in development o f cellular networks involves the problem created when a mobile
subscriber crosses a boundary between two cells when engaged in a call. As adjacent areas do not use
the same radio channels, a call must either be dropped or transferred from one radio channel to another
when a user crosses the boundary between adjacent cells. Since dropping o f calls would be
retrogressive and contrary to the concept o f mobility, the prbcess o f handoff was created.t t
\ , ;l* ,
10
Effects of Handoff on network capacity and quality o f service: Kenya GSM networks case study
Figure 2.5 Frequency reuse with cluster formation K = 3
Cluster formation K.=4
2. 3. ■ landoff (Handover)
HandofT in wireless mobile networks deal with the mobility of the end users in a mobile network, it
guarantees the continuity' of the wireless services when the mobile user moves across the cellular
boundaries. In first and second-generation mobile networks, hard handoff is employed; in third and
fourth generation networks, which are predominantly based on the code division multiple access
(CDMA) technology', the soft handoff concept is introduced. Compared with the conventional hard
handoff, soft handoff has the advantages of smoother transmission and less ping-pong effects. Handoffs
in wireless mobile networks are mainly used for maintaining service continuity during mobility through
Handoff Management. (Akyildiz, et al., 1999).
Cellular systems apply smaller radii cells in order to get high capacity systems. This is because of the
limited frequency spectrum. The frequency band is divided into smaller bands and those bands are
reused in non interfering cells. Smaller cells cause an active mobile station (MS) to cross several cells
during an ongoing conversation. This active call should be transferred from one cell to another one in
order to maintain call continuity' during boundary crossings. Handoff (or handover) process is
transferring an active call from one cell to another. The transfer of current communication channel
could be in terms of time slot, frequency band, or code word to a new cell. If new cell has some
unoccupied channels then it assigns one of them to the handed off call. If all of the channels are in use
at the handoff time there are two possibilities, to drop the call or to delay it for a while. Different
handoff techniques are proposed in literature and two of the most important metrics for evaluating a
handoff technique are forced call termination (dropping) probability (HDP) and call blocking
probability (PCB). The forced termination probability is the probability of dropping an active call due
to handoff failure and the call blocking probability is probability of blocking a new call request. The
aim of a handoff procedure is to decrease forced termination probability while not increasing call
blocking probability significantly. Handoff represents a process of changing the channel (frequency,
time slot, spreading code, or combination of them) associated with the current connectidn while a call
is in progress. It is often initiated either by a cell boundary crossing or by a deteriorated quality of
signal in the current channel (Hentschl, 2009).
Handoff is divided into two broad categories, hard and soft handoffs. They are also characterized by
“break before make” and “make before break”. As the name implies, in hard handoff, current resources
are released before new resources are utilized, while in soft handoff, both existing and new resources
are used during the handoff process.
Handoff is a process of automatically transferring a call in progress from one radio cell to another one
while e.g. the subscriber is roaming. This process is started each time the base station controller (BSC)
in charge has selected a new radio cell which can offer a better radio transmission quality. This will
occur if for example the subscriber moves into the new radio cell during a call or if the radio reception
characteristics change for any other reason. The switching element is informed so that communication
can be switched over from a channel in a given cell to anbther channel in apother cell. However, in
order to efficiently allocate radio, resources to a mobile station (MS) requiring so, a handoff can be
11Effects of Handoff on network capacity and quality of service: Kenya GSM networks case study
initiated in an earlier phase, i.e. before call setup has been started. In the assignment phase the
switching element requests specific radio resources from the BSC. If a proper source is not available
due to congestion or another unfavorable radio condition, the BSC can initiate a handoff to another cell
as early as in the assignment phase. GSM recommendation 03.09 denotes this as a directed retry
handoff. As a consequence of such handoff, the serving cell is replaced by a redirected cell during the
assignment. The physical connection path between the mobile station and the switching element is
improved. In this way, handoff ensures that the connection is always assigned to the most suitable radio
link.
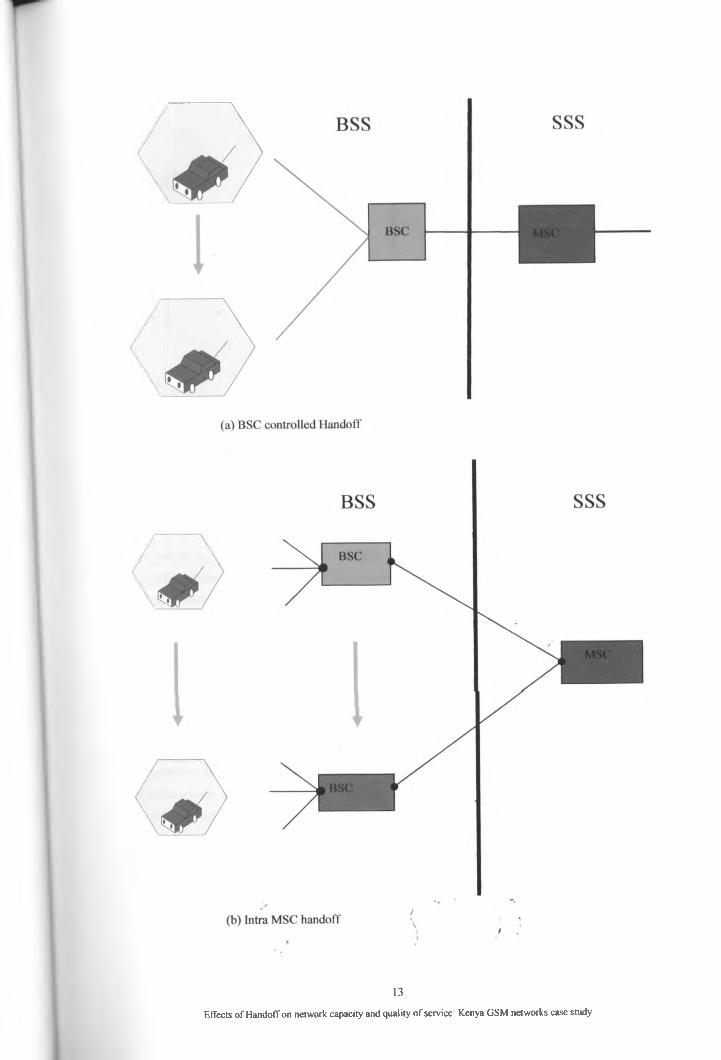
There are different types of handoffs (Fig. 2.7), depending on the switching element controlling the old
radio cell and new radio cell within the network. The location of the switching element strongly affects
the procedures to be used as stipulated below.
> BSC-controlled handover
Old and new radio cell belong to the same Base Station Controller (BSC). This BSC is the switching
element and executes the handover process all by itself because it is aware of all relevant information.
However, its Mobile-services Switching Center (MSC) is informed about the new radio cell.
> lntra-MSC handover is MSC-controlled
Old and new radio cell belong to the same MSC, but to different BSCs. The handover process is
completely controlled by this MSC.
> Inter-MSC handover too is MSC-controlled
Old and new radio cell now belong to different MSCs. In this case, the first MSC (at which handover is
originated) is the switching element. Call control (including charge data registration and signaling)
remains in this first MSC for the entire duration of the connection; this is the anchor principle to which
GSM Recommendation 03.09 refers (Siemens, 1998)
t\ /
12Effects of Handoff on network capacity and quality of service: Kenya GSM networks case study
13
Effects o f Handoffon network capacity and quality o f service: Kenya GSM networks case study
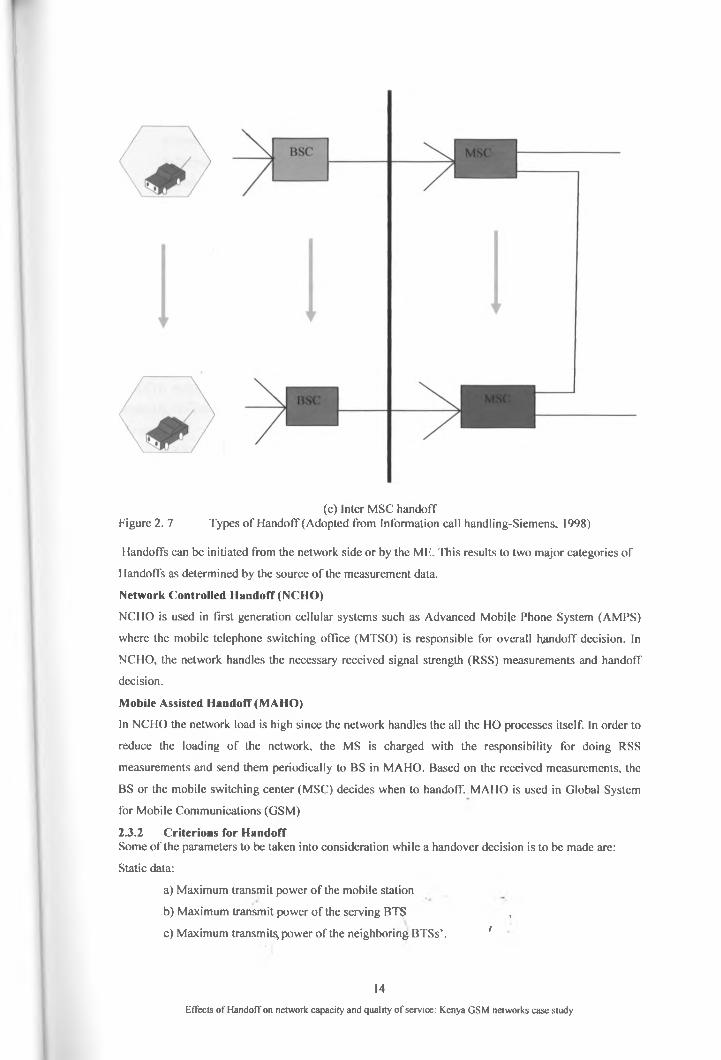
(c) Inter MSC handoffFigure 2. 7 Types of Handoff (Adopted from Information call handling-Siemens, 1998)
Handoffs can be initiated from the network side or by the ME. This results to two major categories o f
Handoffs as determined by the source o f the measurement data.
Network Controlled Handoff (NCHO)
NCHO is used in first generation cellular systems such as Advanced Mobile Phone System (AMPS)
where the mobile telephone switching office (MTSO) is responsible for overall handoff decision. In
NCHO, the network handles the necessary received signal strength (RSS) measurements and handoff
decision.
Mobile Assisted Handoff (MAHO)
In NCHO the network load is high since the network handles the all the HO processes itself. In order to
reduce the loading o f the network, the MS is charged with the responsibility for doing RSS
measurements and send them periodically to BS in MAHO. Based on the received measurements, the
BS or the mobile switching center (MSC) decides when to handoff. MAHO is used in Global System
for Mobile Communications (GSM)
2.3.2 Criterions for HandoffSome o f the parameters to be taken into consideration while a handover decision is to be made are:
Static data:
a) Maximum transmit power o f the mobile station
b) Maximum transmit power o f the serving BTS ,
c) Maximum transmit^ power of the neighboring BTSs’. '
14
Effects o f Handoff on network capacity and quality o f service: Kenya GSM networks case study
Measurements made by Mobile station:
a) Downlink transmission quality (Bit error rate)
b) Downlink reception level of the serving cell
c) Downlink reception level of the neighboring cells
Measurements made by the BTS:
a) Uplink transmission quality
b) Uplink reception level on current channel
c) Timing advance.
Traffic considerations: Cell capacity and load of the serving and neighboring cells are the traffic
considerations done to assess the need for handoff..
2.3.3 Handover Process
For making a handover decision the BSS will process, store and compare certain parameters from the
measurements made and predefined thresholds. During every slow associated control channel
(SACCH) multiframe, the BSS compares each of the processed measurements with the relevant
thresholds. We can broadly classify the handover causes into four broad
categories.
a) RXLEV-Received signal level.
b) RXQUAU-Reeeived signal quality.
c) DISTANCE
d) PGBT (Power budget) (Hentscthel, 2009)
2.3.4 Handoff SchemesHandover scheme is the implementation of the necessary technology which automatically changes
channel/frequency to maintain an active speech connection over cell boundaries when a mobile station
moves from one cell to another during an ongoing conversation.
When allocating a channel, a simple scheme employed by cellular technologies handles both types of
calls (new calls and handoffs) without preference. This means that the probabilities of new call
blocking and handoff failure are the same. This scheme is referred to as the non-prioritized scheme
(NPS). However, from the user’s point of view, the forced termination of an ongoing call is considered
to be worse than blocking a new call attempt. Therefore, it becomes necessary to introduce methods for
decreasing the probability of handoff failure as well as new call blocking.
There exist various handoff'prioritization schemes which can be sorted into four classes:
> Reserving a number of channels exclusively for handoffs
> Queuing handoff requests
> Sub-rating an existing call to accommodate a handoff *
> Combination of the above classes
Different handoff techniques are proposed in literature and two of the most important metrics for
evaluating a handoff technique are forced termination probability and call blocking probability. The
forced termination probability is the probability of dropping an active call due to handoff failure and
the call blocking probability' is the probability of blocking a ilew call request (CBP). Reserving a
number of channels exclusively for handoffs greatly improves the HDP. Whil^ dedicating a number of
15
Effects of Handoff on network capacity and quality of service: Kenya GSM netw-orks case study
channels to be used for newly generated calls improves the CBP. The best handoff scheme is the one
that is able to strike a compromise to optimize on the two performance indices. Political issues and
market forces create a very dynamic situation such that it is difficult to zero onto a perfect Handoff
scheme. Another cause o f unprecedented changes are frequent enforcement o f Regulatory requirements
e.g. number portability requirement enforcement by the Communication Commission o f Kenya (CCK)
Kenyan Government communication regulator (Nyabiage 2010) and lowering o f inter-connection rate.
These changes cause subscriber movement among the Operators which causes unexpected
redistribution o f resource demands.
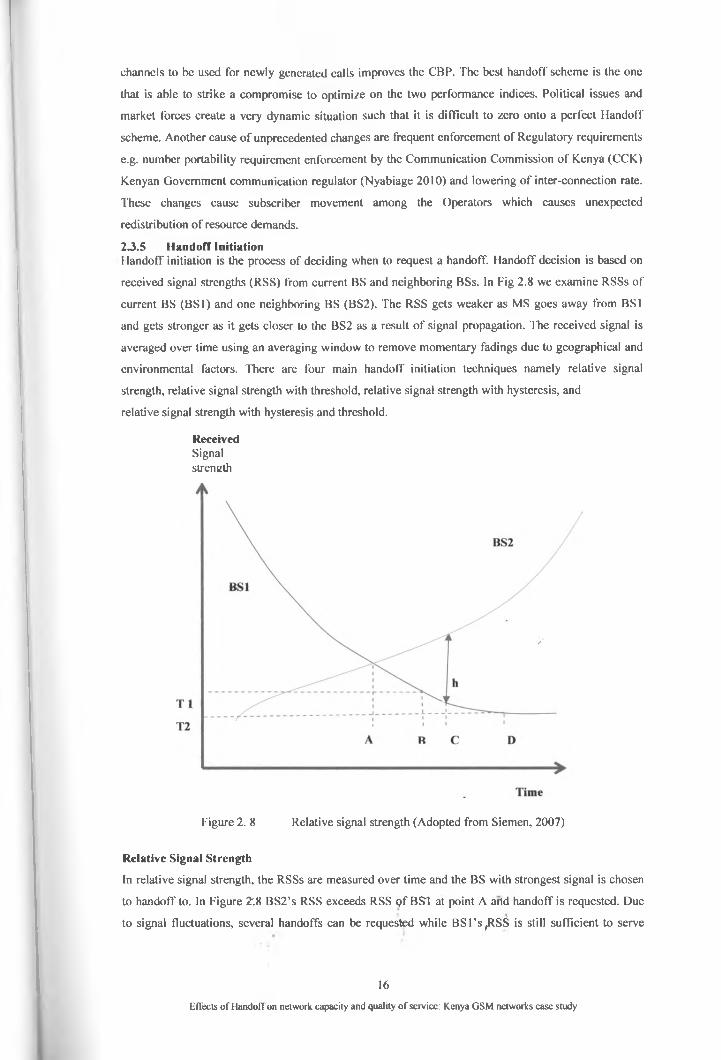
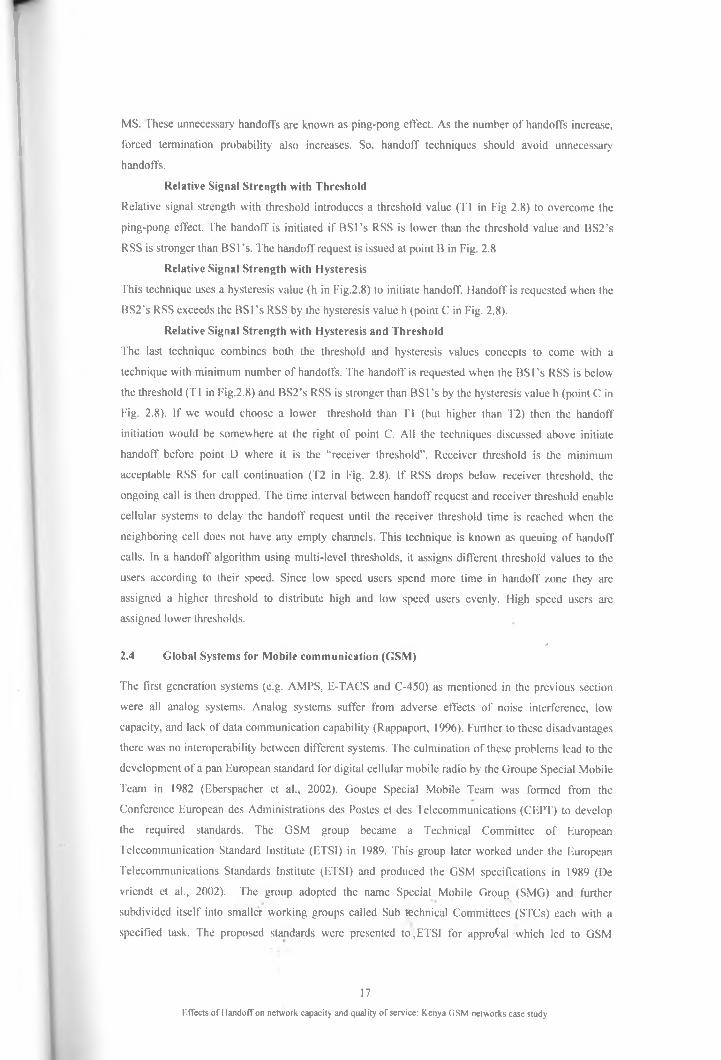
23 .5 Handoff InitiationHandoff initiation is the process o f deciding when to request a handoff. Handoff decision is based on
received signal strengths (RSS) from current BS and neighboring BSs. In Fig 2.8 we examine RSSs of
current BS (BS1) and one neighboring BS (BS2). The RSS gets weaker as MS goes away from BS1
and gets stronger as it gets closer to the BS2 as a result o f signal propagation. The received signal is
averaged over time using an averaging window to remove momentary fadings due to geographical and
environmental factors. There are four main handoff initiation techniques namely relative signal
strength, relative signal strength with threshold, relative signal strength with hysteresis, and
relative signal strength with hysteresis and threshold.
ReceivedSignalstrength
Figure 2. 8 Relative signal strength (Adopted from Siemen, 2007)
Relative Signal Strength
In relative signal strength, the RSSs are measured over time and the BS with strongest signal is chosen
to handoff to. In Figure 2:8 BS2’s RSS exceeds RSS Qf BS1 at point A and handoff is requested. Due
to signal fluctuations, several handoffs can be requested while B S l’s (RSS is still sufficient to serve
16
Effects o f Handoff on network capacity and quality o f service: Kenya GSM networks case study
MS. These unnecessary handoffs are known as ping-pong effect. As the number of handoffs increase,
forced termination probability also increases. So, handoff techniques should avoid unnecessary
handoffs.
Relative Signal Strength with Threshold
Relative signal strength with threshold introduces a threshold value (T1 in Fig 2.8) to overcome the
ping-pong effect. The handoff is initiated if B SPs RSS is lower than the threshold value and BS2’s
RSS is stronger than B S l’s. The handoff request is issued at point B in Fig. 2.8
Relative Signal Strength with Hysteresis
This technique uses a hysteresis value (h in Fig.2.8) to initiate handoff. Handoff is requested when the
BS2's RSS exceeds the B S l’s RSS by the hysteresis value h (point C in Fig. 2.8).
Relative Signal Strength with Hysteresis and Threshold
The last technique combines both the threshold and hysteresis values concepts to come with a
technique with minimum number of handoffs. The handoff is requested when the B S l’s RSS is below
the threshold (T1 in Fig.2.8) and BS2’s RSS is stronger than B S l’s by the hysteresis value h (point C in
Fig. 2.8). If we would choose a lower threshold than T1 (but higher than T2) then the handoff
initiation would be somewhere at the right of point C. All the techniques discussed above initiate
handoff before point D where it is the “receiver threshold”. Receiver threshold is the minimum
acceptable RSS for call continuation (T2 in Fig. 2.8). If RSS drops below receiver threshold, the
ongoing call is then dropped. The time interval between handoff request and receiver threshold enable
cellular systems to delay the handoff request until the receiver threshold time is reached when the
neighboring cell does not have any empty channels. This technique is known as queuing of handoff
calls. In a handoff algorithm using multi-level thresholds, it assigns different threshold values to the
users according to their speed. Since low speed users spend more time in handoff zone they are
assigned a higher threshold to distribute high and low speed users evenly. High speed users are
assigned lower thresholds.
/2.4 Global Systems for Mobile communication (GSM)
The first generation systems (e.g. AMPS, E-TACS and C-450) as mentioned in the previous section
were all analog systems. Analog systems suffer from adverse effects of noise interference, low
capacity, and lack of data communication capability (Rappaport, 1996). Further to these disadvantages
there was no interoperability between different systems. The culmination of these problems lead to the
development of a pan European standard for digital cellular mobile radio by the Groupe Special Mobile
Team in 1982 (Eberspacher et al., 2002). Goupe Special Mobile Team was formed from the
Conference European des Administrations des Postes et des Telecommunications (CEPT) to develop
the required standards. The GSM group became a Technical Committee of European
Telecommunication Standard Institute (ETSI) in 1989. This group later worked under the European
Telecommunications Standards Institute (ETSI) and produced the GSM specifications in 1989 (De
vriendt et al., 2002). The group adopted the name Special Mobile Group (SMG) and further
subdivided itself into smaller working groups called Sub technical Committees (STCs) each with a
specified task. The proposed standards were presented to ; ETSI for approval which led to GSM
17
Effects of Handoff on network capacity and quality of service: Kenya GSM networks case study

networks official launch in 1992. By the end of 1993 more than 1 million subscribers made calls in
GSM networks. In 2000 all the SMG work was transferred to the Third Generation Partnership Project
(3GPP) which was to develop the third Generation (3G) system (Eberspacher et al., 2002).
GSM was later interpreted to mean Global System for Mobile Communication. This was basically
intended to mean that the system was targeted to make the whole globe (world) appear like it’s covered
by a single network through application of common standards by all telecommunication equipment
manufacturers. This goal was not achieved but as De vriendt et al.( 2002), noted GSM Market had
grown to 60% and was still rising in 2000. In a recent study Khan (2009) noted that GSM was the
dominant wireless cellular standard with over 3.5 billion subscribers worldwide covering more than
85% o f the global mobile market.
2.4.1 GSIM Architecture
GSM network as shown in figure 2.9 is comprised o f three subsystems namely Operation Subsystem
(OSS) also referred to as Operation and Maintenance Subsystem (OMS), Network Subsystem (NSS)
and the Base Station Subsystem (BSS).
Other PLMN/PSTNGSM MS (Subscriber)
Figure 2. 9
GSM Network operation and maintenance center
GSM Subsystems (Adopted from CETTM, 2007)
/\
i
18
Effects o f Handoff on network capacity and quality o f service: Kenya GSM networks case study
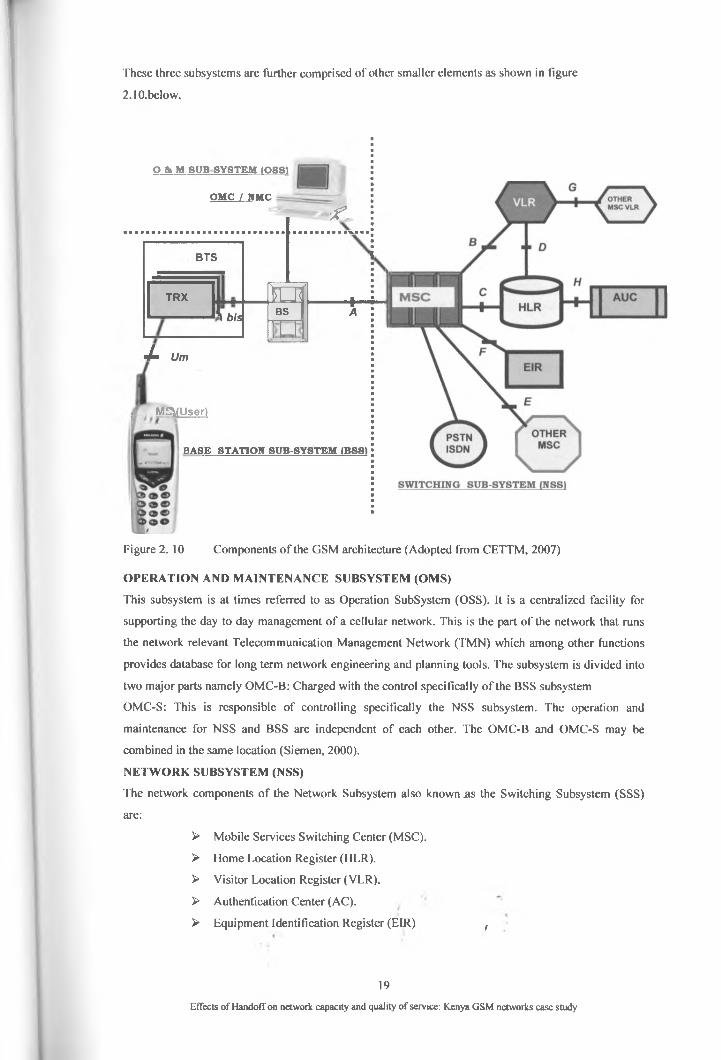
These three subsystems are further comprised o f other smaller elements as shown in figure
2.10.below.
O & M SUB SYSTEM IOSSI
OMC / NMC
BTS
TRX
1 bis
X Urn
M SUUser)
r .
tat*BS f
BASE STATION SUB-SYSTEM (BBS)
Figure 2. 10 Components o f the GSM architecture (Adopted from CETTM, 2007)
OPERATION AND MAINTENANCE SUBSYSTEM (OMS)
This subsystem is at times referred to as Operation Subsystem (OSS). It is a centralized facility for
supporting the day to day management o f a cellular network. This is the part o f the network that runs
the network relevant Telecommunication Management Network (TMN) which among other functions
provides database for long term network engineering and planning tools. The subsystem is divided into
two major parts namely OMC-B: Charged with the control specifically o f the BSS subsystem
OMC-S: This is responsible o f controlling specifically the NSS subsystem. The operation and
maintenance for NSS and BSS are independent o f each other. The OMC-B and OMC-S may be
combined in the same location (Siemen, 2000).
NETWORK SUBSYSTEM (NSS)
The network components o f the Network Subsystem also known a s the Switching Subsystem (SSS)
are:
> Mobile Services Switching Center (MSC).
> Home Location Register (HLR).
> Visitor Location Register (VLR).
> Authentication Center (AC).
> Equipment Identification Register (EIR) ,
19
Effects o f Handoff on network capacity and quality o f service: Kenya GSM networks case study

THE NETWORK ELEMENT MSC.
The MSC is the major unit of the NSS the other four components are actually data bases for its use.
MSC is responsible for establishing traffic channels to the BSS, other MSCs and to other networks (e.g.
Public Switched Telephone Network [PSTN]). The databases contain information for the routing of
traffic channel connections and handling of the basic and supplementary services. The MSC also
performs administration of cells and location areas.
THE NETWORK ELEMENTS HLR AND VLR.
Due to Subscriber mobility where the MS is allowed to traverse areas which are administered by
different MSCs. The subscriber administration is not performed by the exchanges. The mobile
subscribers’ current location determines which MSC is responsible for the mobile subscriber at that
moment. Therefore, the PLMN contains a network component called Home Location Register (HLR)
that administers the subscriber’s data. The HLR is a data base where the mobile subscribers are created,
deleted, and barred by the operator. It contains all the permanent subscriber identities, as well as the
services that a mobile subscriber is authorized to use. The VLR contains the most current data of all
mobile subscribers currently located within the MSCs area served by the VLR. The formation of
working data (stored in VLR) from the permanent data (stored in HLR) reduces congestion to the HLR.
THE NETWORK ELEMENT AUC
This is the network element that protects the network from unauthorized users. Authentication means
ensuring that an entity is truly the one it alleges to be. Subscriber authentication is performed at each
registration and at each call set-up attempt (mobile originating or terminating). For an MS to access the
network the VLR uses authentication parameters, called triples, that are generated regularly by the
Authentication Center (AUC). The triples consist of RAND (Random Number) SRE (Signed
Response) and Kf (Cipher Key). The network element AUC is associated with the HLR. The VLR
requests the AUC to provide a copy of the triples for authentication. On completion of the exercise the
VLR sends back to the AUC a new SRE and continues with the call processing with reference to the
results of the authentication process. /
THE NETWORK ELEMENT E1R
The network element Equipment Identification Register (E1R) is a data base that stores the
International Mobile equipment identity (1MEI) for all the registered Mobile Equipment (ME). The
IMEI uniquely identifies all registered ME.
This database has three parts which are maintained according to the behavior of the ME in the network.
For the ME with no known problem are put in the white register. The ME which have minor problems
e.g. failure to exactly synchronize to the channel are put in the grey register for further observation. The
ME which have major problems e.g. reported stolen, suffers critically to lack of adherence to the
network requirements are recorded in the black register. MEs’ in the black register are not allowed to
use the network.
f\
i
20
Effects of Handoffon network capacity and quality of service: Kenya GSM networks case study
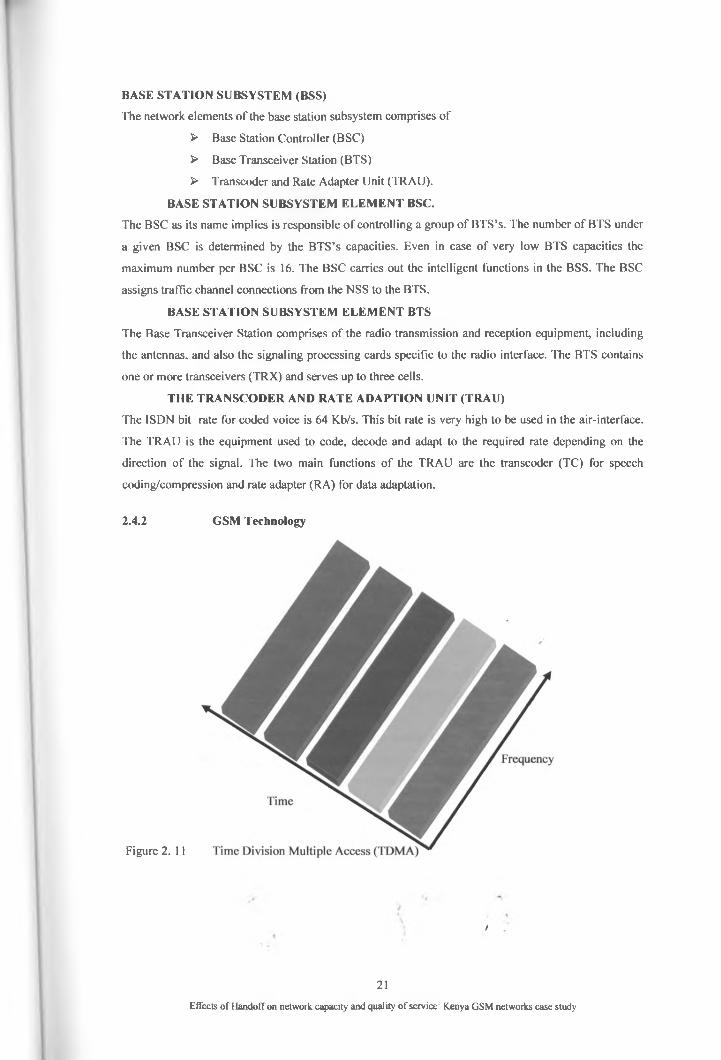
BASE STATION SUBSYSTEM (BSS)
The network elements o f the base station subsystem comprises of
> Base Station Controller (BSC)
> Base Transceiver Station (BTS)
> Transcoder and Rate Adapter Unit (TRAU).
BASE STATION SUBSYSTEM ELEMENT BSC.
The BSC as its name implies is responsible o f controlling a group o f BTS’s. The number of BTS under
a given BSC is determined by the BTS’s capacities. Even in case o f very low BTS capacities the
maximum number per BSC is 16. The BSC carries out the intelligent functions in the BSS. The BSC
assigns traffic channel connections from the NSS to the BTS.
BASE STATION SUBSYSTEM ELEMENT BTS
The Base Transceiver Station comprises o f the radio transmission and reception equipment, including
the antennas, and also the signaling processing cards specific to the radio interface. The BTS contains
one or more transceivers (TRX) and serves up to three cells.
THE TRANSCODER AND RATE ADAPTION UNIT (TRAU)
The ISDN bit rate for coded voice is 64 Kb/s. This bit rate is very high to be used in the air-interface.
The TRAU is the equipment used to code, decode and adapt to the required rate depending on the
direction o f the signal. The two main functions o f the TRAU are the transcoder (TC) for speech
coding/compression and rate adapter (RA) for data adaptation.
2.4.2 GSM Technology
Figure 2. 11
i
21
Effects o f Handoff on network capacity and quality o f service: Kenya GSM networks case study

One of the most important requirements of the new GSM technology was that the new
Standard should employ Time Division Multiple Access (TDMA) technology. This technology ensures
that subscribers share the channel on time bases as shown in figure 2.11
Figure 2. 12 Frequency Division Multiple Access (FDMA)
This ensured the support o f major corporate players like Nokia, Ericsson and Siemens, and the
flexibility o f having access to a broad range o f suppliers and the potential to get product faster into the
marketplace (siemens, 2000)
As stated earlier GSM was destined to employ digital rather than analog technology and operate in the
900 MHz frequency band. Most GSM systems operate in the 900 MHz and 1.8 GHz frequency bands,/
except in North America where they operate in the 1.9 GHz band. To increase capacity through
frequency reuse the new technology was to use Frequency Division Multiple Access (FDMA). FDMA
divides the whole frequency band into smaller frequency bands as shown in figure 2.12.
This meant that GSM divides up the radio spectrum bandwidth by using a combination of Time- and
Frequency Division Multiple Access (TDMA/FDMA) schemes on its 25 MHz wide frequency
spectrum, dividing it into 124 carrier frequencies (spaced 200 K.Hz apart). In FDMA the frequency is
divided into small bands figure 2.13. Each frequency is then divided into eight time slots using TDMA,
and one or more carrier frequencies are assigned to each base station.
22
Effects o f Handoff on network capacity and quality o f service: Kenya GSM networks case study
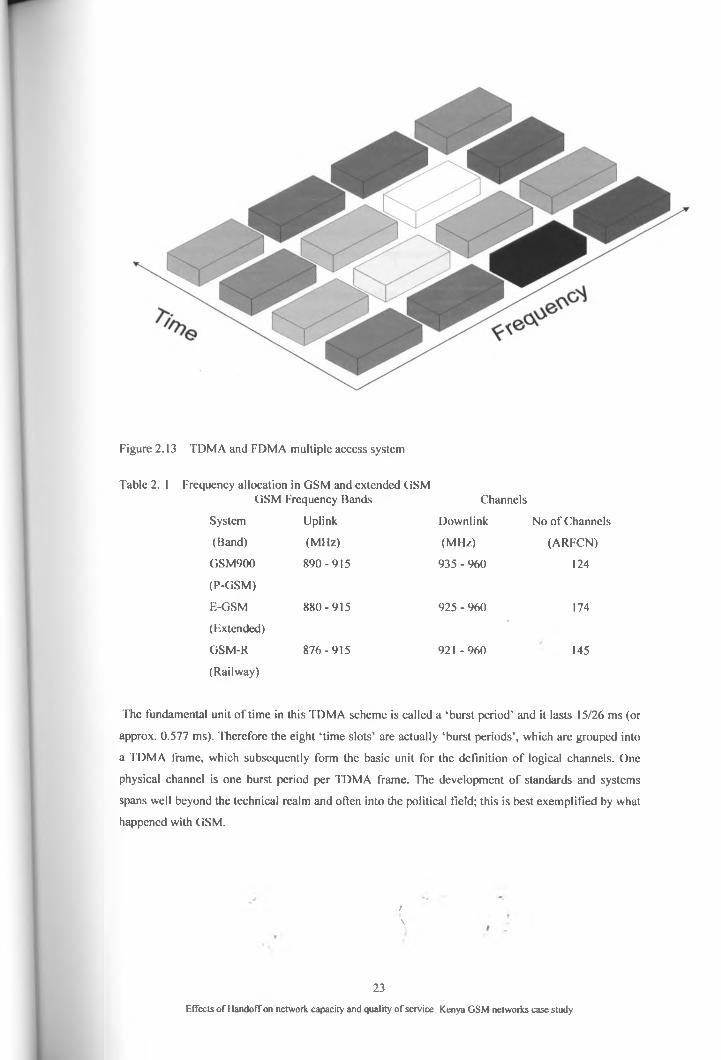
Figure 2.13 TDMA and FDMA multiple access system
Table 2. 1 Frequency allocation in GSM and extended GSMGSM Frequency Bands Channels
System Uplink Downlink No o f Channels
(Band) (MHz) (MHz) (ARFCN)
GSM900 890-915 935 - 960 124
(P-GSM)
E-GSM 880-915 925 - 960 174
(Extended)
GSM-R 876-915 921 -960 145
(Railway)
The fundamental unit o f time in this TDMA scheme is called a ‘burst period’ and it lasts 15/26 ms (or
approx. 0.577 ms). Therefore the eight ‘time slots’ are actually ‘burst periods’, which are grouped into
a TDMA frame, which subsequently form the basic unit for the definition o f logical channels. One
physical channel is one burst period per TDMA frame. The development o f standards and systems
spans well beyond the technical realm and often into the political field; this is best exemplified by what
happened with GSM.
/v
23
Effects o f Handoff on network capacity and quality o f service: Kenya GSM networks case study
2.5 Quality of Service (QoS)
International Telecommunication Union- Telecommunication( ITU-T -94) has given two definitions of
QoS:
1. The collective effect of service performance which determines the degree of satisfaction of a
user of the service, where
Network Performance: Is defined as- the ability o f a network or network
portion to provide the functions related to communication between users,
and
2. User domain: throughput, accuracy, dependability (reliability, availability),.. .(ITU-T, 2005)
In line with these definitions Quality of Service is generalized to mean the quantification used for
evaluating the performance, reliability' and usability of a telecommunications service. Many factors
affect the quality of service of a mobile network. It is correct to look at QoS mainly from the
customer's point of view, that is, QoS as judged by the user. There are standard metrics of measure of
QoS that can be used to rate the QoS from the users perspective. These metrics are:
> The coverage,
> Accessibility (includes GoS), and the
> Audio quality'
In coverage the strength of the signal is measured using test equipment and this can be used to
estimate the size of the cell. Accessibility is about determining the ability of the network to handle
successfully, calls from mobile-to-fixed networks and from mobile-to-mobile networks. The audio
quality considers monitoring a successful call for a period of time for the clarity of the communication
channel. All these indicators are used by the telecommunications industry' to rate the quality of service
of a network.
As expected Mobility adds complication to the QoS mechanisms. There are several reasons, some of
the main ones being:
> A phone call or other session may be interrupted after a handoff, if The new base
station is overloaded. Unpredictable handoffs make it impossible to give an absolute
QoS guarantee during a session initiation phase.
> The pricing structure is often based on per-minute or per-megabyte fee rather than
flat rate, and may be different for different content services.
A crucial part of QoS in mobile communications is grade of service, involving outage probability (the
probability that the mobile station is outside the service coverage area, or affected by co-channel
interference, i.e. crosstalk) blocking probability (the probability that the required level of QoS can not
be offered) and scheduling starvation. These performance measures are affected by mechanisms such
as mobility management, radio resource management, admission control, fair scheduling, channel-
dependent scheduling etc
>\
24
Effects of Handoff on network capacity and quality of service: Kenya GSM networks case study
2.5. Factors affecting QoS
Many factors affect the quality of service of a mobile network. It is correct to look at QoS mainly from
the customer's point o f view, that is, QoS as judged by the user. There are standard metrics of QoS to
the user that can be measured to rate the QoS. These metrics are: the coverage, accessibility (includes
GOS), and the audio quality. In coverage the strength of the signal is measured using test equipment
and this can be used to estimate the size o f the cell. Accessibility is about determining the ability of the
network to handle successful calls from mobile-to-fixed networks and from mobile-to-mobile
networks. The audio quality considers monitoring a successful call for a period of time for the clarity of
the communication channel. All these indicators are used by the telecommunications industry to rate
the quality of service of a network.
2.5.2 Measurement of QoSThe QoS in industry is also measured from the perspective of an expert (e.g. teletraffic engineer). This
involves assessing the network to see if it delivers the quality that the network planner has been
required to target (KPI). Certain tools and methods (protocol analyzers, drive tests and Operation and
Maintenance measurements), are used for this QoS measurement:
> Protocol analyzers are connected to BTSs, BSCs, and MSCs for a period of time to
check for problems in the cellular network. When a problem is discovered the staff
can record it and it can be analyzed.
> Drive tests allow the mobile network to be tested through the use of a team of people
who take the role of users and take the QoS measures discussed above to rate the
QoS of the network. This test does not apply to the entire network, so it is always a
statistical sample.
> In the Operation and Maintenance Centers (OMCs), counters are used in the system
for various events which provide the network operator with information on the state
and quality of the network./
> Finally, customer complaints are a vital source of feedback on the QoS, and must not
be ignored.
2.5.3 Cellular audio qualityThe audio quality of a cellular network depends on, among other factors, the modulation scheme (e.g.
FSK, QPSK) in use, matching to the channel characteristics and the processing of the received signal at
the receiver.
2.5.4 Cellular Grade of ServiceIn general, grade of service (GoS) is measured by looking at traffic-carried, traffic offered and
calculating the traffic blocked and lost. The proportion of lost calls is the measure of GOS. For cellular
circuit groups an acceptable GOS is 0.02. This means that two users of the circuit group out of a
hundred will encounter a call refusal during the busy hour at the end of the planning period. The grade
of service standard is thus the acceptable level of traffic that the network can loose. GOS is calculated
from the Erlang-B formula, as a function of the number oj" chaftnels required for the offered traffic
intensity. \ '
25
Effects of Handoffon network capacity and quality of service: Kenya GSM networks case study
2.6 Network Planning and QoS.
Network planning entails provisioning for resources necessary for establishing, managing and
termination of communication sessions. In wireless networks there is the initial planning process and
subsequent planning processes as determined from the data collected from the network management
system. The first planning is the major determinant of the network capacity to handle the
communication requirements. This is because the network coverage if not well designed and planned
even future refinements becomes impossible to implement. The most popular planning tool uses the
Erlang B formula which applies to lossy systems, such as telephone systems on both fixed and mobile
networks, which do not provide traffic buffering, and are not intended to do so.
The goal of Erlang’s traffic theory is to determine exactly how many service-providing elements
should be provided in order to satisfy users, without wasteful over-provisioning. To do this, a target is
set for the grade of service (GoS) or quality of service (QoS). For example, in a system where there is
no queuing, the GoS may be that no more than 1 call in 100 is blocked (i.e., rejected) due to all circuits
being in use (a GoS of 0.01), which becomes the target probability of call blocking, /**, when using the
ErlangB formula.
According to International Telecommunication Union (ITU) the grade of service should range between
1 to 5%, an average value of 2% is taken as the bench mark for telecommunication regulators to ensure
adequate and satisfactory service delivery. The 2% QoS is calculated using the formula below.
Telephony Service Non - Accessibility [%unsuccessful call attempts
all call attemptsX I 0 0 %
(Tabbane 2009)
The numerator is the total number of failed (new and handoff) call attempts and the denominator is the
network total call attempts.
In any telecommunication network whether fixed or mobile the distribution of the network resources
follows the population distribution and subscribers routine movement. Wireless systefns apply the
principle of frequency reuse in macro cell planning. This principle is adapted to boost network
capacity. However there is a maximum capacity limit allowable due to the number of frequencies used
per cell and the number of cells per cluster. The resulting scenario is that some regions end up having
adequate coverage while others experience sporadic excess resource demand. It follows that the actual
QoS which does not take into consideration the unaffected regions can be expressed as the ratio o f the
unsuccessful call attempts to the total call attempts in the affected regions. This is expressed in the
formula below:
ActualTelephoney - QoS Unsuccessful Call Attempts \00°/Total Call Attempts in Affected Regions
This is the actual chance of being affected since for a subscriber to be affected must be within the
regions which suffers from scarcity of resources.
The ITU formula results to a huge number of call attempts htncc giving the operators a lee way to offerv
poor quality o f service. i '
26
Effects of Handoff on network capacity and quality of service: Kenya GSM networks case study

There are a number of previous studies that explore the determination of the effects of handover on
quality of service for voice communication and its impact on the network capacity. The most relevant
studies are the ones that bring out the probabilities of handoff dropping and call blocking as the key
determining factors of the grade of service and by extension the quality of service.
In planning network capacity is normally arrived at by considering the handoff algorithm to be
implemented. There exists a variety of algorithms with varying degree of effects on the network
capacities.
There are two major categories of handovers. Handover implemented in the network design such as the
one where all new calls are set-up in Micro-cells and soon handed over to a Macrocell. . In such a
situation the effect of this handover on quality of service is minimal, since it is well catered for in
planning and does not arise out of pressure in allocation of resources. The other type is where the
handover is triggered due to channel deterioration and distance of the mobile subscriber from the base
station. This is different from the handover that is network designed. In this type of handover, the
quality o f service to be offered normally depends on time and availability of resources. Thus such
quality can only be determined through a survey.
This research does not match exactly other researches that have been done in the past. But it compares
to a big extent with a number of theoretical research papers that chronologically identifies the same
focus area, quantities to be determined and comes up with the necessary approximations for analysis as
follows.
The network capacity is evaluated during Busy Day Busy Hour (BDBH), at which time it is expected
to have a lot of handoff requests. So if planning is done with reservation of Handoff channels all the
reserved channels will be utilized and the network result to operate at full capacity. Any more handover
requests will result to forced termination. Hence upon establishing the extra handover requests got in a
packed system that utilizes handover request reservation algorithms, we can get the forced termination
probability. In the same set-up the number of calls originated in the same cell cannot exceed the limit
provided for in the planning. Any extra request to set-up a call will be rejected. The proportion of the
unsuccessful requests to set up a call to the total traffic will give the blocking probability. The
combination of blocking probability and handover dropping probability is a measure of quality of
service as this is the same as the Grade of Service (GoS). ITU recommends that this grade of service
should not be worse than 2% of the total calls.
In network systems that do not put in place algorithms that separate handover channels from ordinary
channels. All channels are allocated on basis of first come first served. The blocking and forced
termination probabilities are evaluated out of the total traffic.
There are other systems that provide queuing for both handoff and new call requests with varying
priorities. These systems give allowance for a very short time in the queue since voice communication
is real time. Such algorithms are rarely implemented and are unlikely to be encountered.
There are a number of researches done to approximate the effects of handover on network capacity and
quality of service. Most of these studies use approximate npdelsf o f the network's to estimate formulae
for analysis to determine the PHD and PCB. \ . '
27
Effects of Handoff on network capacity and quality of service: Kenya GSM networks case study
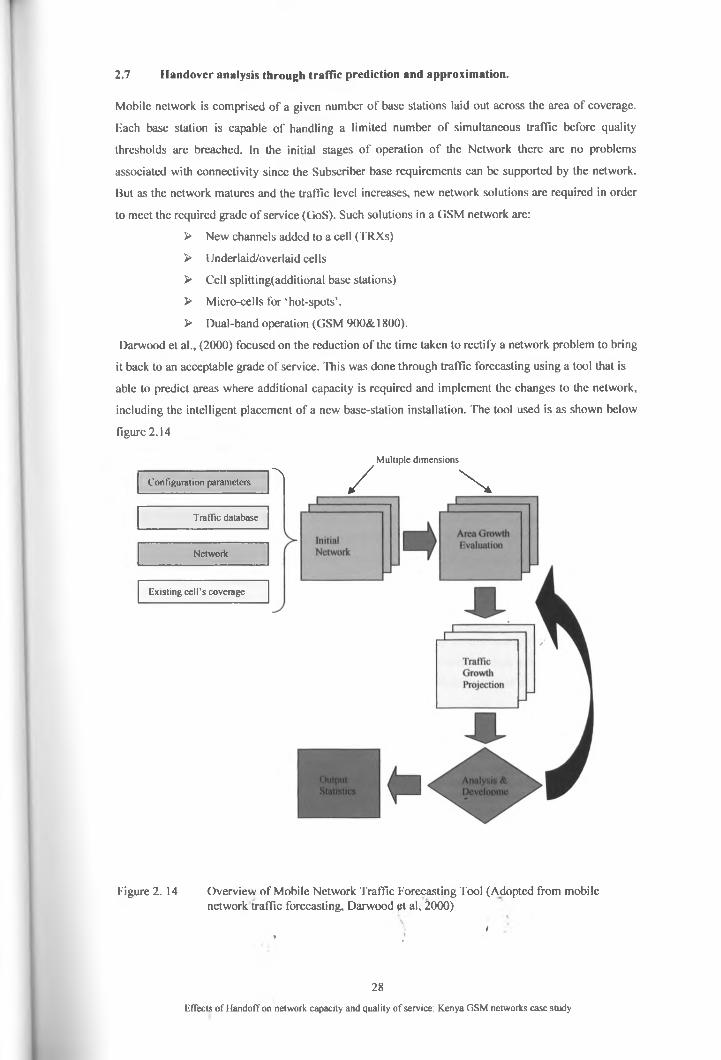
2.7 Handover analysis through traffic prediction and approximation.
Mobile network is comprised o f a given number o f base stations laid out across the area o f coverage.
Each base station is capable o f handling a limited number o f simultaneous traffic before quality
thresholds are breached. In the initial stages o f operation o f the Network there are no problems
associated with connectivity since the Subscriber base requirements can be supported by the network.
But as the network matures and the traffic level increases, new network solutions are required in order
to meet the required grade o f service (GoS). Such solutions in a GSM network are:
> New channels added to a cell (TRXs)
> Underlaid/overlaid cells
> Cell splitting(additional base stations)
> Micro-cells for ‘hot-spots’.
> Dual-band operation (GSM 900& 1800).
Darwood et al., (2000) focused on the reduction o f the time taken to rectify a network problem to bring
it back to an acceptable grade o f service. This was done through traffic forecasting using a tool that is
able to predict areas where additional capacity is required and implement the changes to the network,
including the intelligent placement o f a new base-station installation. The tool used is as shown below
figure 2.14
Configuration parameters~ \
Multiple dimensions
/ X
Traffic database
Network
Existing cell’s coverage
Figure 2. 14 Overview o f Mobile Network Traffic Forecasting Tool (Adopted from mobile network traffic forecasting, Darwood et al, 2000)
t> }
28
Effects o f HandofT on network capacity and quality o f service: Kenya GSM networks case study
Mobile network traffic forecasting helps in fore telling the capacity to be required in the near future,
but it does not aid in establishing the effects of this extra requirements if it fails to be provided for. This
tool attempts to solve the problem without assessing its impact if it was to occur. Further the tool uses
new hardware to solve the detected problem of capacity. There are a myriad of problems in installing
and activating of additional hardware. Some of them being financial and technical requirements, and
the fact that during the none busy hour, idle capacity is further increased. I'he best solution is the one
where attempt is made to solve the problem before it affects the system operation.
To concur with the current research the tool should predict the impact of extra capacity requirements
basing it on the same hardware. The solution should be found on variation of quality without new
installations and activation of new previously installed capacities. The suggested system should be
dynamic such that during none pick hours the system switches back to high quality service. Where in
this new model o f solution the system should not be let to lower quality of service below the ITU
stipulated standard.
2.8 Approximate analysis of handoff traffic in mobile Cellular Networks
In mobile communication the scarce radio resources are used to provide network coverage. As stated
earlier in the introduction the area served by a given set of radio frequencies is called a cell. This cell
can support a given number of subscribers depending on the number of frequencies allocated. To
increase capacity for a given bandwidth the cell size requires to be small to allow for reuse of the same
frequencies in a short distance away. As noted by Kwon (2000) in his paper titled '‘An approximate
Analysis of Handoff Traffic in Mobile Cellular Networks”, as the cell size becomes smaller, the impact
of handoff traffic on quality of service (QoS) in mobile cellular networks becomes more and more
significant. In this research paper it specifies three QoS performance measures namely: - the
probability of call blocking (Pb), the probability of handoff dropping (IV). and the probability of forced
termination during a call (Pf). It is observed that Pf is almost directly proportional to Pd and therefore
we scrutinize the analysis of Pb and Pd. This paper describes a model in which a Mobile terminal
moves a long an arbitrary topology of cells. An approximate analysis is arrived at on making the
following assumptions:-
> Each cell has the same capacity of channels.
> In each cell new calls are generated according to a Poisson process with a specified
mean rate
> Spatial homogeneous traffic distribution
> Exponential call duration time with a mean
> Exponential call residence time with a mean.
An estimate of handoff call arrival rate into a cell is obtained assuming a trunk reservation call
admission control (CAC) algorithm.
The expressions for the call blocking probability Pband the handoff dropping probability are derived.
A graphical representation of these estimates for different Erlang load and cell resident times are as
shown below figures 2.15 and 2.16 >
29
Effects of Handoff on network capacity and quality of service: Kenya GSM networks case study

l . q10 15 20 25
0.1
CL-a
0.0
0.001 IF
0.0001 Erlang
Analysis Pb — Simulation
Analysis PdSimulation Pd
Figure 2. 15 Pb and Pd when C = 20 and t = 4 for different Erlang loading. (Adopted from An approximate Analysis o f Handoff Traffic in Mobile cellular Networks, K.won et al., 2000)
Analysis (Pd)
Figure 2. 16 Pb and Pd when C=20 and t=4 for different cell residence-times.(Adopted from An Approximation Analysis o f Handoff Traffic in Mobile cellular
Networks, Kwon et al. 2000) \ ,
30
Effects o f Handoff on network capacity and quality o f service: Kenya GSM networks case study
From graph of figure 2.15 it is evident that both Pb and Pd increase with increase in load as expected.
Figure 2.16 reveals a peculiar scenario where the chance of blocking Pb decreases with decrease in time
spent by MS in the cell(cell resident time CR T).
This research clearly indicates the effects of handoff on quality of service in a hypothetical scenario.
With reference to the results got we can answer the question- does handoff affect the Quality of service
of a network? The answer is yes as indicated in the graphs. But due to the estimates on traffic load and
the cell resident times the impact of the handoff effect remains a very rough estimate. The
unpredictability of direction and duration of a call in Mobile communication makes any estimates give
a very vague picture of the true situation. This research gives an estimate of handoff effect which can
be extrapolated to show the effects on both busy hour and non busy hour. The research should have
gone a head and suggest a solution for handling the extra traffic load requirements caused by handotfs.
It should also have provided the extent to which the facilities can lie idle if the network design was
optimized to eradicate the network QoS degradation due to handoff. To an investor in any commercial
entity the driving force is the average rate of return on the investment. In the case of telecommunication
both busy hour and non busy hour have negative effects on average rate of return on the investment.
Hence there require a workable average which ensures optimum productivity.
It is also difficult to rate the performance of a system which has been analyzed this way since the
available data on performance combines these two metrics to come up with the well known GoS. But
it is important to note that the metrics of Pb and Pd as used in this analysis are used by Network
Operators in fixing the desired Key Performance Indicators (KP1). Hence this research is important for
one to observe variation of these metrics as CRT and traffic intensity varies.
2.9 Handoff interference, performance and effects on voice quality in wireless cellular networks.
Horizontal and vertical Handoff and the use of Mean Opinion Score (MOS)Networks that were initially designed for data communication have been enhanced for voice
/communication. These networks that are designed in conformity to IEEE802.11 standards utilize
handheld WLAN-based devices. The terminal devices are constructed such that they can be used for
both Data and Voice. WLANs networks are normally limited to a small radius where the access points
can be accessed by the terminal devices. This makes the WLAN network appear like clusters or spots.
In WLANS areas which are also covered by cellular mobile networks it is possible to use the free
WLAN network to relieve the cellular network some of its load (voice) as the demand may dictate. In
such a situation the cellular terminal device require to be dual band to be capable of handling the Wifi
frequency and the cellular frequency ranges. When a mobile session is handed over from one network
to another network where the two networks are technologically different the handoff is referred to as
vertical handoff. One can then therefore refer to the handoff from one network to another network
where the two networks use the same technology as horizontal handoff. In vertical handoff the effect of
handoff can be measured through the fraction of the packet lost.
The importance of handoff as stated in the introduction is to facilitate continued connection of the
mobile terminal to the network irrespective of the mobile,terminals position of location. To fully> t
maintain such a connection it is necessary to provide for vertical handoff since the mobile terminals
31
Effects of Handoff on network capacity and quality of service: Kenya GSM networks case study
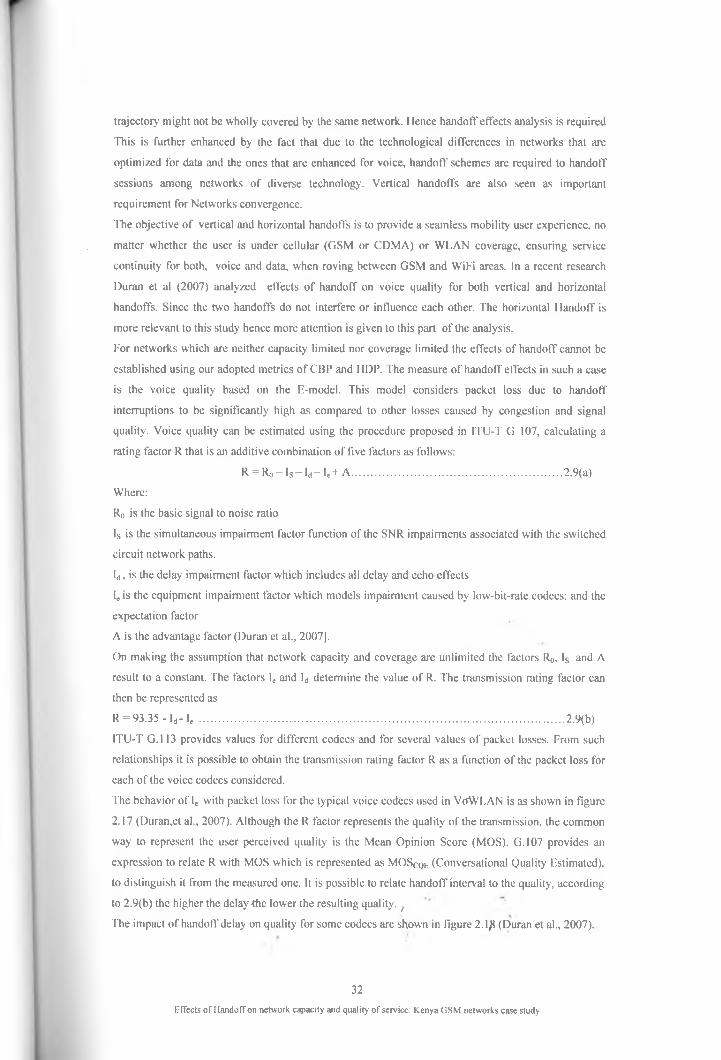
trajectory might not be wholly covered by the same network. Hence handoff effects analysis is required
This is further enhanced by the fact that due to the technological differences in networks that arc
optimized for data and the ones that are enhanced for voice, handoff schemes are required to handoff
sessions among networks of diverse technology. Vertical handoffs are also seen as important
requirement for Networks convergence.
The objective of vertical and horizontal handoffs is to provide a seamless mobility user experience, no
matter whether the user is under cellular (GSM or CDMA) or WLAN coverage, ensuring service
continuity for both, voice and data, when roving between GSM and WiFi areas. In a recent research
Duran et al (2007) analyzed effects of handoff on voice quality for both vertical and horizontal
handoffs. Since the two handoffs do not interfere or influence each other. The horizontal Handoff is
more relevant to this study hence more attention is given to this part of the analysis.
For networks which are neither capacity limited nor coverage limited the effects of handoff cannot be
established using our adopted metrics of CBP and HDP. The measure of handoff effects in such a case
is the voice quality based on the E-model. This model considers packet loss due to handoff
interruptions to be significantly high as compared to other losses caused by congestion and signal
quality. Voice quality can be estimated using the procedure proposed in ITU-T G 107, calculating a
rating factor R that is an additive combination of five factors as follows:
R = R o - I s - I d - l e+ A ...........................................................................2.9(a)
Where:
R0 is the basic signal to noise ratio
Is is the simultaneous impairment factor function of the SNR impairments associated with the switched
circuit network paths.
Id, is the delay impairment factor which includes all delay and echo effects
L is the equipment impairment factor which models impairment caused by low-bit-rate codecs: and the
expectation factor
A is the advantage factor (Duran et al., 2007],
On making the assumption that network capacity and coverage are unlimited the factors R0. Is and A
result to a constant. The factors Ie and Id determine the value of R. The transmission rating factor can
then be represented as
R = 93.35 - Id- Ie .................................................................................................................................. 2.9(b)
ITU-T G.l 13 provides values for different codecs and for several values of packet losses. From such
relationships it is possible to obtain the transmission rating factor R as a function of the packet loss for
each of the voice codecs considered.
The behavior of le with packet loss for the typical voice codecs used in VtfWLAN is as shown in figure
2.17 (Duran,et al., 2007). Although the R factor represents the quality of the transmission, the common
way to represent the user perceived quality is the Mean Opinion Score (MOS). G.107 provides an
expression to relate R with MOS which is represented as MOScqe (Conversational Quality Estimated),
to distinguish it from the measured one. It is possible to relate handoff interval to the quality, according
to 2.9(b) the higher the delay the lower the resulting quality. f
The impact of handoff delay on quality for some codecs are shown in figure 2.1£ (Duran et al., 2007).
32
Effects of Handoff on network capacity and quality of service: Kenya GSM networks case study
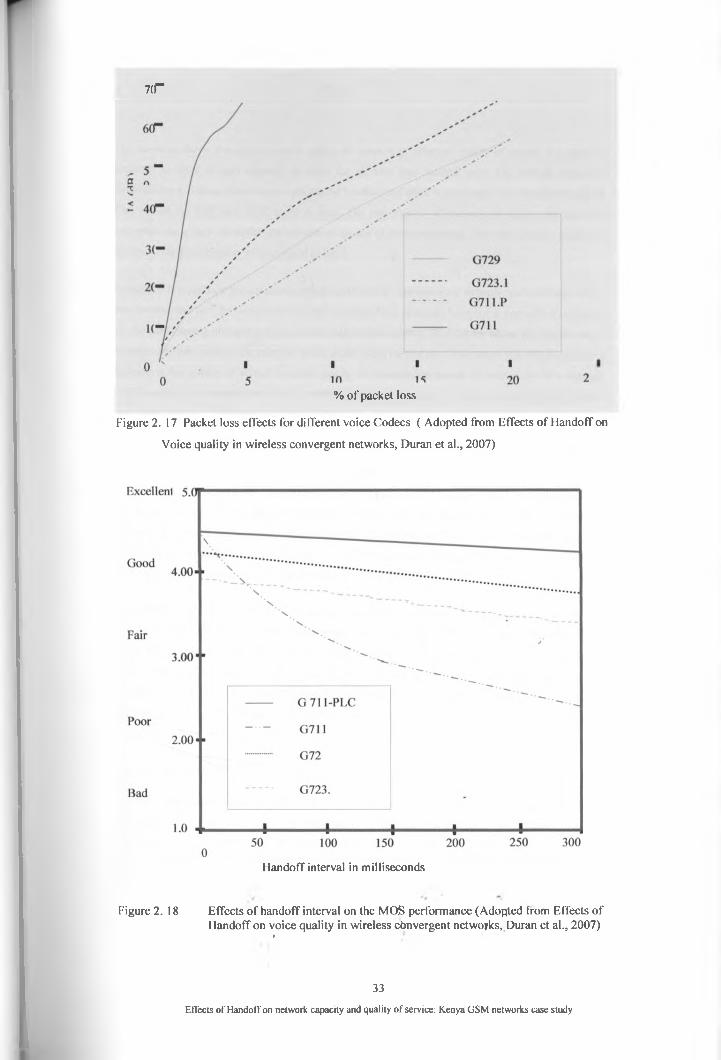
7(T
% o f packet loss
Figure 2. 17 Packet loss effects for different voice Codecs ( Adopted from Effects o f Handoff on
Voice quality in wireless convergent networks, Duran et al., 2007)
Handoff interval in milliseconds
Figure 2. 18 Effects o f handoff interval on the MQS performance (Adopted from Effects o f Handoff on voice quality in wireless convergent networks, Duran et al., 2007)
9
33
Effects o f Handoff on network capacity and quality o f service: Kenya GSM networks case study
The research shows the use of a lower metric of measure of effect of quality of service in a network
assumed to have enough capacity to cater for all new and handoff calls. On making these two
assumptions it follows that no new call can be blocked and there is no chance of a handoff dropping.
This makes the CBP and HDP equal to zero. The two metrics of measure of quality are the most
important since they determine the success or failure of communicating. The other metrics assess the
quality of the transmission whether good or band.
In practice it is unlikely for a mature network to be free of limitations of capacity and coverage. Hence
this research can only be carried out in a new network. New networks behavior is normally transitional,
i.e. the performance changes as the networks subscription grows. So research where the results cannot
be utilized to add value to the network is not worth being carried out. This means that this research that
determines the quality of service through quality of transmission cannot be carried out in a network
implemented in the normal prevailing conditions of resource scarcity (Radio frequency, space, license
conditions etc). As noted earlier in the introduction there are limiting factors in the implementation,
operation, management and maintenance of mobile network just like in any other business entity.
The analytical method drawn from the ITU-T guidelines used in this research to relate, the quality of
service to equipment and delay impairment, quality rating factor R to the practical Mean Opinion Score
(MOS) will be used to analyze the proposed framework. In our research the solution to the stated
problems was the modification of codec to develop the conceptual framework. In the analysis of our
framework we made the same assumption as made in this research. Hence this research is applicable in
justifying the appropriateness of our proposed conceptual framework.
Handoff has a number of effects on wireless networks which have critical impact on the overall
Network system performance. MS power output has classes, the device is normally directed on the
power level to apply by the Base Station (BTS). Since Handoff algorithms are based on the power
levels it happens that on the point of handing off, the MS is normally at the peak power output
provided for in all the power level classes. The maximum power output encountered at the point of
hand off contributes to interference or rather is another source of negative effects of handoff on
network performance.
Handoff interference
Leu et al. (2008) published their research findings on the “Analysis of Handoff interference and outage
along Arbitrary Trajectories in Cellular Networks”. In this research there was the application of the
handoff interference metric as an indicator of the effect of handoff on system performance. The handoff
interference characterizes the additional interference noise caused by the handoff process. The Handoff
noises emanate from the extra information required to be exchanged for efficient management of the
call transfer and the fact that'at the point of handoff the MS/is normally at full power. The higher the
amount of power used by MS the higher the interference Caused by the power dissipated. In this
34
Effects of Handoff on network capacity and quality of service. Kenya GSM networks case study
research a presentation of the handoff interference and outage probability as metrics of measuring the
handoff effects for an Ms moving along an arbitrary trajectory is analyzed. Outage probability is the
fraction of time that the received power from the attached UTS falls below the required threshold. T his
is another handoff performance metric.
To characterize handoff performance for arbitrary trajectories in a cellular network, Alexe et al. (2008)
approximated a general path by a piecewise linear path within a reduced geometric structure derived
from the cellular network geometry. In this way a concise characterization of handoff performance over
a wide range of mobile trajectories in the network geometry was obtained. This characterization
provided a measure of the overall signaling load incurred by the handoff algorithm.
A recursive procedure for computing the mean handoff interference by using bivariate functions is used
to compute the expected value of handoff interference corresponding to the communication link.
Analytical methods are used to draw analytical outage probability curves. The results show the larger
the hysteresis level the more likely an outage event occurs. It is also observed that along a given
trajectory between two base stations the outage probability first increases until around the midpoint
between the two base stations and then decreases from this point. This is because the outage event
happens more frequently around the midpoint between the two base stations, where the received signal
strength is smaller.
This research serves to introduce a new handoff performance measure that characterizes handoff
behaviour called handoff interference. It defines the maximum interference point along a trajectory at
which the handoff margin is achieved and show that it generalizes to the concept of the crossover point.
The mean number of handoffs and handoff margins are used to compute the overall signaling load due
to handoffs in the network./
As stated earlier the Handoff performance metrics can be put into two major categories. The most
important are the metrics that determine whether the call can be sustained or not. The other category
gives an impression of the extent of the adverse effect on event that it impacts. The metrics of handoff
interference and outage are in the second category. This means that their effects in a voice cellular
network is not critical. The presence of interference cannot totally block a call from going on unless the
interference is so high to render the communication unintelligible. The outage probability is a time
based metric that must be reached to trigger handoff.
As it can be noted these two effects that are measurable using handoff interference and outage
probability metrics cannot be eradicated but range from tolerable to intolerable levels.
This research reveals two more metrics of determining handoff effects on network performance.
Though the effects cited in this research are not critical, it is important to note that the number of
handoff effects and their corresponding measurements metrics have been increased. The effects of
handoff on network performance .now include interference and outage.
35
Effects of Handoff on network capacity and quality of service: Kenya GSM networks case study
Zhang (2010) noted that a wireless system has two inherent challenges namely limited bandwidth and
unreliable radio channel. These two limitations simultaneously serve as the fundamental constraints for
the capacity improvement and quality of service improvement in wireless networks. It is further noted
that Handoff is an indispensable operation in wireless networks to guarantee continuous, effective, and
resilient services during a mobile station mobility. This paper also identifies Handoff counting, handoff
rate, and handoff probability as important metrics to characterize the handoff performance. Handoff
counting is the number of handoff operations during an active call connection. Handoff rate specifies
the expected number of handoff operations during an active call, or equivalently, the average handoff
counting. Handoff probability refers to the probability that an MS will perform a handoff before call
completion. The fading channel is time varying, unreliable and erroneous. Extensively degraded signal
may lead to physical link breakdown, and hence the forced termination of an active call. As a result,
similar to the limited bandwidth , the fading channel also plays an equally important role on handoff
performance.
The impact of the fading channel on the handoff metrics are compared in the presence and absence of
Rayleigh fading.
Zhang (2010) did research and developed the results of handoff counting, handoff rate and handoff
probability to demonstrate the explicit relationship between the handoff metrics and the physical layer.
These three metrics are used to indicate performance when the handoff is already performed as can be
deduced from the title “Handoff performance”. Another fact is that like most of the research involving
handoff there is a lot of assumption and approximations e.g. Rayleigh signal and device power
approximations
With reference to Signal -Interference-Ratio (SIR) threshold a call can either progress or be
discontinued. The Rayleigh fading channel is the main contributor of the interfefence and hence the
main determinant of the SIR. In case of a handoff the quality of the communication depends on the
amount of the interference. The worst extreme is when the interference is so intense to warrant the
dropping of the call. In such a case the faded channel brings a limitation equivalent to capacity
limitation. Hence the investigation of Handoff performance in Wireless Mobile Networks with
unreliable Fading Channels is similar to establishing one of the effects of handoff on network capacity.
This is directly meeting one of the objectives of our research though from an approximated analytical
approach.
/
36
Effects of Handoff on network capacity and quality of service: Kenya GSM networks case study
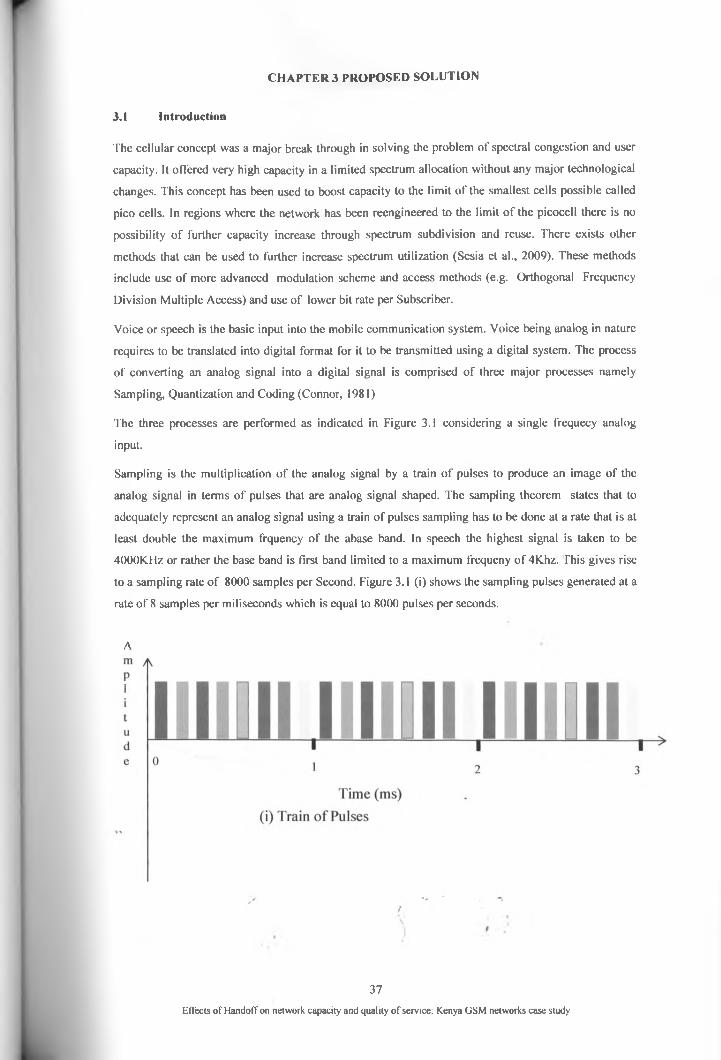
CHAPTER 3 PROPOSED SOLUTION
3.1 Introduction
The cellular concept was a major break through in solving the problem o f spectral congestion and user
capacity. It offered very high capacity in a limited spectrum allocation without any major technological
changes. This concept has been used to boost capacity to the limit o f the smallest cells possible called
pico cells. In regions where the network has been reengineered to the limit o f the picocell there is no
possibility o f further capacity increase through spectrum subdivision and reuse. There exists other
methods that can be used to further increase spectrum utilization (Sesia et al., 2009). These methods
include use o f more advanced modulation scheme and access methods (e.g. Orthogonal Frequency
Division Multiple Access) and use of lower bit rate per Subscriber.
Voice or speech is the basic input into the mobile communication system. Voice being analog in nature
requires to be translated into digital format for it to be transmitted using a digital system. The process
o f converting an analog signal into a digital signal is comprised o f three major processes namely
Sampling, Quantization and Coding (Connor, 1981)
The three processes are performed as indicated in Figure 3.1 considering a single frequecy analog
input.
Sampling is the multiplication o f the analog signal by a train o f pulses to produce an image o f the
analog signal in terms o f pulses that are analog signal shaped. The sampling theorem states that to
adequately represent an analog signal using a train o f pulses sampling has to be done at a rate that is at
least double the maximum frquency o f the abase band. In speech the highest signal is taken to be
4000KHz or rather the base band is first band limited to a maximum frequeny o f 4K.hz. This gives rise
to a sampling rate o f 8000 samples per Second. Figure 3.1 (i) shows the sampling pulses generated at a
rate o f 8 samples per miliseconds which is equal to 8000 pulses per seconds.
A
37
Effects o f Handoff on network capacity and quality o f service: Kenya GSM networks case study
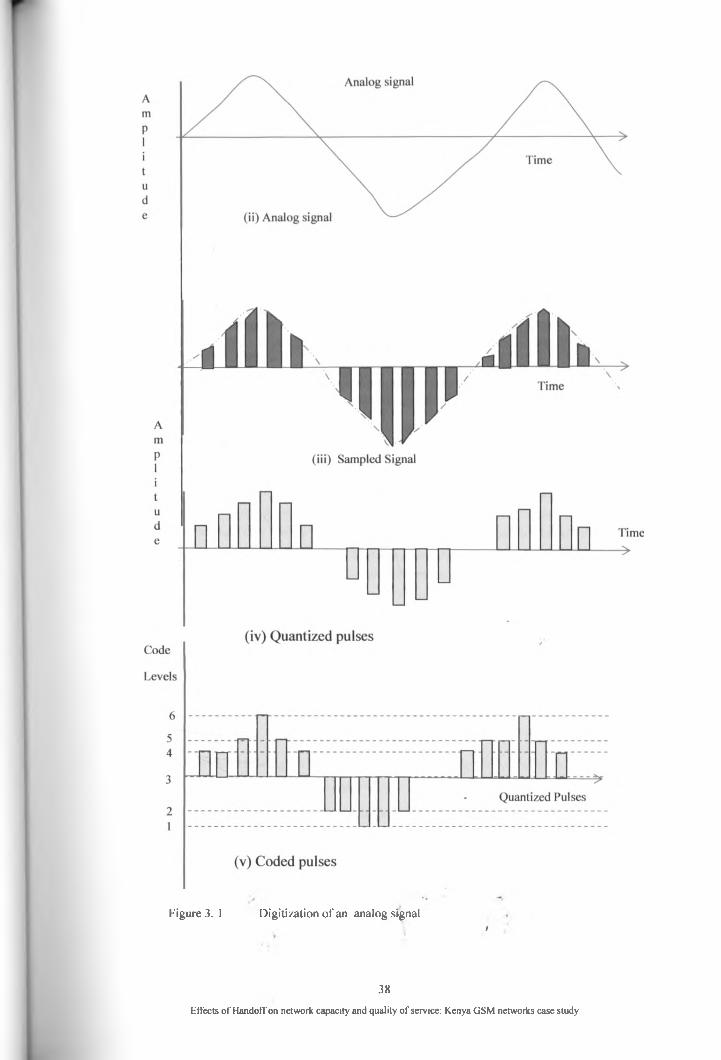
Figure 3. 1 Digitization o f an analog signal/
38
Effects o f Handoff on network capacity and quality o f service: Kenya GSM networks case study
The sampled pulses are rounded off to the nearest quantised level in the quantiser and the quantised
samples are converted into groups according to the binary code in the encoder. The process of
approximation is refered to as Quantization. Each quantised level is then converted into a binary
number in a process refered to as Coding. Each quantized level in ISDN is represented using an eight
bit code word. This results to a bit rate of 8000X8 bits per Second per source or per speech channel.
The 64Kbits/s is the ISDN standard used in fixed telephones for speech data (Conor, 1981).
In GSM the 8000 samples are coded using 13 bit words resulting to a speech data stream of
104kbit/s. This data stream is then compressed to 13kbit/s(FR). This is the full data rate for speech
with 5.6 as the coresponding half rate TCH (TCI 1/2 or TCH/H).
The reverse of digitization or coding is refered to as decoding and is done by the receiver. Since most
of the modem devices are meant to serve as both Transmitters and Receivers (Transceivers) the same
device is constructed such that in a foreward direction it codes and in the reverse direction it decodes
the information. The device that does the coding and decoding is called a CODEC which is the short
for COding and DECoding. Codecs have like the network they are used in undergone a lot of
evolution.
3.2 GSM Channels
GSM defines two sets of channels the Physical and Logical Chaneels. The Physical Channels are the
bearer that is to mean that they are meant for transportation of the Logical Channels. Physical Channels
on the air -interface uses time division multiple access where one Radio Frequency Channel (RFC)
consists of eight TDMA Channels. A physical Channel is defined by a specific carier (RFC) in the
uplink band, the corresponding carrier in the downlink and by the timeslot number in the TDMA
frame. A Physical channel can function as a traffic channel(for transmission of speech and information)
or as asignaling channel (Siemens, 2001).
Logical Channels are the contents of the physical channels that is to say that logical channels constitute
the physical channel load. Logical channels are divided into two categories i.e. the Traffic Channels
and the signaling (control) channels. Traffic channels are used for transmission of user payload data
(speech, fax or data)
3.3 GSM Codecs
Codec performance has been improved as the overall network technology evolved from low bit rate
low capacity to the present high capacity and high bit rate.
In the 2nd generation GSM System a TCH may either be fully used (full-rate TCH i.e. TCH/F) or be
split into two half-rate channels (half-rate TCH i.e.TCH/H), which can be allocated to two different
subscribers (Elberspacher et al., 2001). This splitting of the traffic channel results to double the
capacity. The higher rate channels are designated Bm channel (mobile B channel) and the lower rate
Lm channel (lower-rate mobile channel) in line with the Integrated System Digital Network (ISDN)
terminology. A Bm channel is a TCH for the transmission of (>it streams of either 1 AKbits/s of digitally
39
Effects of Handoff on network capacity and quality of service: Kenya GSM networks case study
coded speech. Lm channels are TCH channels with less transmission bandwidth than Bm channels and
transport speech signals of half the bit rate (TCH/H) of 5. 6 Kbit/s.
3.3.1 Half rate Codec
The need for higher capacity systems emerged as soon as GSM networks became the most widely
deployed standard in the late 1990s. The reason for improved bandwidth utilization is to increase the
network capacity and the spectral efficiency (i.e. traffic carried per cell area and frequency band).
Capacity was expanded through the use of half rate codecs. Under good channel conditions, this codec
achieves, in spite of the half bit rate, almost the same speech quality as the full rate codec.
3.3.2 Enhanced Full-rate Codec
This is a full rate codec with a net bit rate of 12.2Kbits/s. But it achieves speech quality clearly superior
to the previously used full-rate codec. It achieves better clarity through the additional error detection on
the most significant bits (Elberspacher, 2001)
3.3.3 Adaptive Multi-Rate (AMR) codec
Adaptive Multi Rate (AMR) is the fourth speech codec defined for the GSM system. The goal when
specifying the AMR codec was to combine the benefits of the EFR and HR codes in order to achieve
an improved standard of voice quality and greater capacity. AMR achieves this goal by dynamically
adapting its bit-rate allocation between speech and channel coding, thereby optimizing speech quality'
in various radio channel conditions. Depending on the conditions, AMR dynamically uses either the
GSM full rate traffic channel with a gross bit rate of 22.8 kbps or the GSM half rate traffic channel
with a gross bit rate of 11.4 kbps. A part of this bit rate is used for speech coded bits and a part for error
control. To be more precise, AMR has two principles of adoptability: channel mode adaptation and
codec mode adaptation.
Channel mode adaptation dynamically selects the type of traffic channel that a connection should be
assigned to, which is either a full-rate (TCH/F) or a half-rate traffic channel (TCH/H). The basic idea/
being to adapt a user’s gross bit rate in order to optimize the usage of radio resources. If the traffic load
in a cell is high, those connections using a TCH/F (gross bit rate 22.8kbit/s and having good channel
quality should be switched to a TCH/H (1 i.4kbit/s). On the other hand, if the load is low, the speech
quality of several TCH/H connections can be improved by switching them to a TCH/F.
Codec mode adaptation is to adapt the coding rate ( i.e. the trade-off between the level of error
protection versus the source bit rate) according to the current channel conditions. When the radio
channel is bad, the encoder operates at low source bit rates at its input and uses more bits for forward
error protection.
3.4 Advanced Adaptive Multi-Rate Codec (AAMR)
Ideally the channels(TCH) can be split into any number, but the increase in capacity through logical
channel sharing (splitting) comes with a cost of reduced QoS. Hence there is need to have controlled
channel sharing which does not lead to many channels with unnecessarily very low'QoS.
40
Effects of Handoff on network capacity and quality of service: Kenya GSM networks case study

The low bit rate solution is equivalent to the sharing of the logical channels. This is one of the solutions
free of further spectrum or physical channel considerations.
In our solution to the problem as explained in the problem statement, we propose the use of an
Advanced Adaptive Multi-Rate Codec capable of dynamically splitting the logical channels to enable
multiple sharing as demand increases. The proposed AAMR is designed such that it switches to the
Channel mode adaptation dynamically and selects the type of traffic channel that a connetion should be
assigned to depending on the prevailing traffic load. The bit-rate of the new channel to be allocated is
based on the percentage of the remaining channels and the rate at which request for the channels are
received.
The AAMR codec is also designed to dynamically adapt to the codec mode. Though with limited bits
due to increased capacity, the codec is capable of adjusting the proportion of protection bits to cater for
the adverse channel effects.
3.4.1 Advanced Adaptive Multi-Rate Codec (AAMR) performance optimization
In most of the telecommunication equipment designs there are no specific values that are calculated to
a stipulated accuracy. GSM is itself a set of standards that were agreed upon by a consortium of
National standard bodies from European countries. One of the standards in GSM is the use of 156.25
bit periods per time slot. There is no design formula that was used to arrive at this value. But the use of
this value is said to result to adequate capacity, range of transmission and considerable ease in
equipment fabrication (Siemens, 2000). The guiding factor here is the balancing of the requirements
visa viz the equipment availability i.e. cost. Equally in our modification of the Codec we optimize on
the trade off between the GoS and Capacity.
The Codec design parameters are based on mean call duration d Seconds. The expected responce is
such that when half the cell capacity is engaged. The codec assesses the rate (r) of arrival of requests
for TCH expressed as a percent o f the available capacity per second. If the rate of TCH requests is
equal or more than the set value and the cell is at least 50% loaded the AAMR switches to channel/
mode. It is also designed to function through out in codec mode. The modelling equation for adaptation
to channel mode is delived as follows:
Consider a cell of available capacity (AV. CP) x and whose TCH requests arrive at a rate of r%. Where
r is expressed as a percentage of the available capacity. It follws that if we start our analysis when the
cell load reaches 50%. Assuming that all the r% requests come at the end of each seconds, then the
number of the engaged channels) load) during the first one seconds is CP, given as
CP\ = \ ......................................................................................................... .'....3.4.1(a)
At the end of the first one second the cell load which is the second(2nd) second load is got as the sum
of the previously occupied channels less the released(cleared) channels plus the new requests. The
resulting 2nd second load CP2 is given as• / * '
+ rx .................................................... \ ...........................f ......'.................. 3.4.1(b). i
CP2 = - 2 2
d - 1
41
Effects of Handoff on network capacity and quality of service: Kenya GSM networks case study

At the end of this one second 1/d of the occupied channels will be released and another new set of
requests got, this results to the loading shown in 3.4.1(c) during the third seconds
3.4.1(c)
Similarly CP4 is given as
3.4.1(d)
From equation 3.4.1(a) through 3.4.1(d), it follows that the cell load during the t"1 second is given as
arrives at a rate of r% per second, the mean call duration (CD) is d-seconds and the cell available
capacity is x(TCH).
For d= 40s it follows that the t,h second load is given as
Tables 3.1 and 3.2 are generated using equation 4.3.1(f). The cell capacities are chosen for a high
(CP=100) and a low (CP=30) capacity cells respectively.
engaged channels are being cleared then the cell’s channel load reduces with time. The converse is also
true i. e. when the rate o f TCH requests is higher than the rate of release of the occuppied channels.
The cell load continues increasing with time. Since the overshoot of demand results from unexpected
random requirements for resources. With good updated planning the rate of requests per seconds
(denoted here as r) rarely goes above 7%. The best rate to use then is 8% to ensure optimization of
quality and capacity. From the tabulated data we find that during the eighth seconds that is t = 8 the cell
load is in both cases equal or above the the cell design capacity. To get rid of unnecessary blocking
and dropping of calls the AAMR Codec is designed such that on detecting that the cell load is 50% and
the rate of requests for TCFI is 8% or more. Then it automatically adapts to the channel mode and
allocates new speech channels at Half-Rate. On reaching 75% of the old capacity, if the rate of requests
is equal to or higher than 8% then subsequent new speech channel allocations are to be done at quarter-
Rate i.e half of half-rate (FR/4).V . . . -
3.4.1(e)
(For t = 1,2,3, 4, _, _, J
Equation 3.4.1(e) gives the cell loading CP at time t seconds where the rate of new requests for TCHs
.3.4.1(f)
From these tables as expected if the rate of requests for TCH is lower than the rate at" which the
\
42
Effects of Handoff on network capacity and quality of service: Kenya GSM networks case study
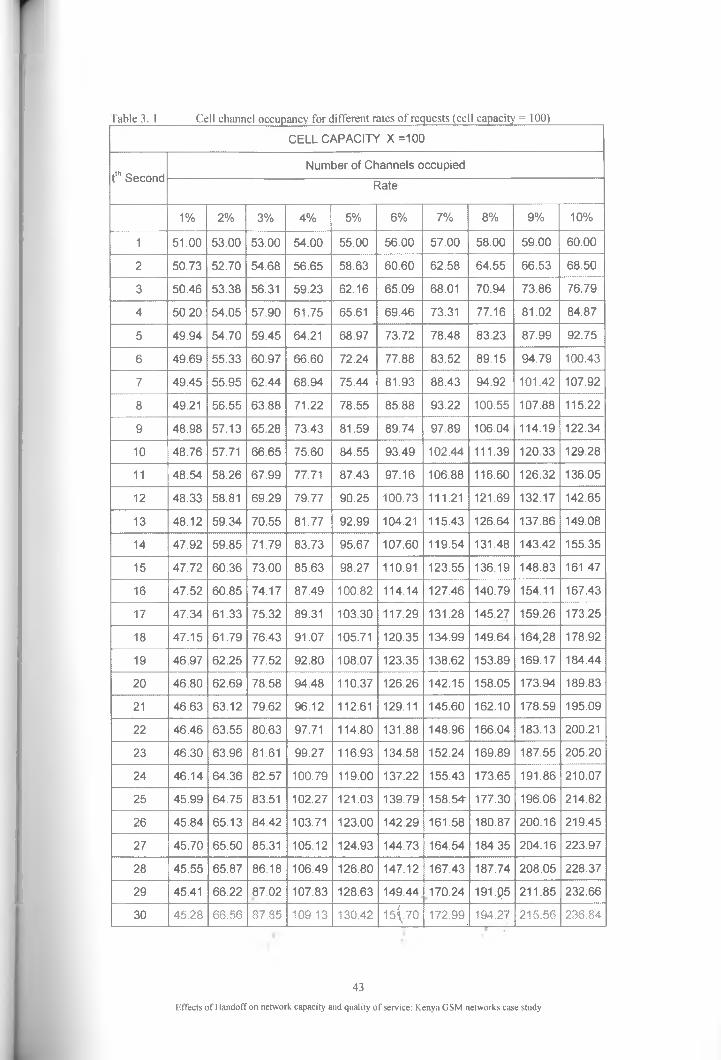
Fable 3. I_______Cell channel occupancy For different rates oF requests (cell capacity = 100)
CELL CAPACITY X =100
t,h SecondNumber of Channels occupied
Rate
1% 2% 3% 4% 5% 6% 7% 8% 9% 10%1 51.00 53.00 53.00 54.00 55.00 56.00 57.00 58.00 59.00 60.002 50.73 52.70 54.68 56.65 58.63 60.60 62.58 64.55 66.53 68.503 50.46 53.38 56.31 59.23 62.16 65.09 68.01 70.94 73.86 76.794 50.20 54.05 57.90 61.75 65.61 69.46 73.31 77.16 81.02 84.875 49.94 54.70 59.45 64.21 68.97 73.72 78.48 83.23 87.99 92.756 49.69 55.33 60.97 66.60 72.24 77.88 83.52 89.15 94.79 100.437 49.45 55.95 62.44 68.94 75.44 81.93 88.43 94.92 101.42 107.928 49.21 56.55 63.88 71.22 78.55 85.88 93.22 100.55 107.88 115.229 48.98 57.13 65.28 73.43 81.59 89.74 97.89 106.04 114.19 122.3410 48.76 57.71 66.65 75.60 84.55 93.49 102.44 111.39 120.33 129.2811 48.54 58.26 67.99 77.71 87.43 97.16 106.88 116.60 126.32 136.0512 48.33 58.81 69.29 79.77 90.25 100.73 111.21 121.69 132.17 142.6513 48.12 59.34 70.55 81.77 92.99 104.21 115.43 126.64 137.86 149.0814 47.92 59.85 71.79 83.73 95.67 107.60 119.54 131.48 143.42 155.3515 47.72 60.36 73.00 85.63 98.27 110.91 123.55 136.19 148.83 161.4716 47.52 60.85 74.17 87.49 100.82 114.14 127.46 140.79 154.11 167.4317 47.34 61.33 75.32 89.31 103.30 117.29 131.28 145.27 159.26 173.2518 47.15 61.79 76.43 91.07 105.71 120.35 134.99 149.64 164,28 178.9219 46.97 62.25 77.52 92.80 108.07 123.35 138.62 153.89 169.17 184.4420 46.80 62.69 78.58 94.48 110.37 126.26 142.15 158.05 173.94 189.8321 46.63 63.12 79.62 96.12 112.61 129.11 145.60 162.10 178.59 195.0922 46.46 63.55 80.63 97.71 114.80 131.88 148.96 166.04 183.13 200.2123 46.30 63.96 81.61 99.27 116.93 134.58 152.24 169.89 187.55 205.2024 46.14 64.36 82.57 100.79 119.00 137.22 155.43 173.65 191.86 210.0725 45.99 64.75 83.51 102.27 121.03 139.79 158.5* 177.30 196.06 214.8226 45.84 65.13 84.42 103.71 123.00 142.29 161.58 180.87 200.16 219.4527 45.70 65.50 85.31 105.12 124.93 144.73 164.54 184.35 204.16 223.9728 45.55 65.87 86.18 106.49 126.80 147.12 167.43 187.74 208.05 228.3729 45.41 66.22 87.02 107.83 128.63 149.44 170.24 191.05 211.85 232.6630 45,28 66.56 87,85 109.13 130.42 15^.70 172.99 194.27 215.56 236,84
43
Effects of Handoff on network capacity and quality of service: Kenya GSM networks case study
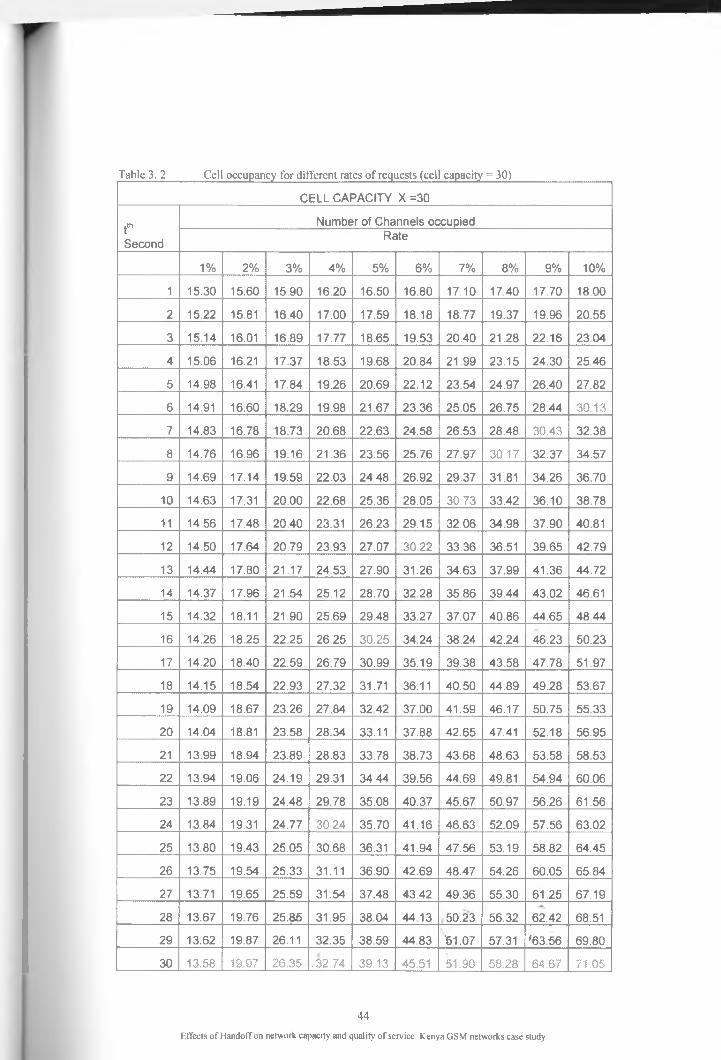
Table 3. 2 Cell occupancy for different rates of requests (cell capacity = 30)
CELL CAPACITY X =30t.hSecond
Number of Channels occupiedRate
1% 2% 3% 4% 5% 6% 7% 8% 9% 10%1 15.30 15.60 15.90 16.20 16.50 16.80 17.10 17.40 17.70 18.002 15.22 15.81 16.40 17.00 17.59 18.18 18.77 19.37 19.96 20.553 15.14 16.01 16.89 17.77 18.65 19.53 20.40 21.28 22.16 23.044 15.06 16.21 17.37 18.53 19.68 20.84 21.99 23.15 24.30 25.465 14.98 16.41 17.84 19.26 20.69 22.12 23.54 24.97 26.40 27.826 14.91 16.60 18.29 19.98 21.67 23.36 25.05 26.75 28.44 30.137 14.83 16.78 18.73 20.68 22.63 24.58 26.53 28.48 30.43 32.388 14.76 16.96 19.16 21.36 23.56 25.76 27.97 30.17 32.37 34.579 14.69 17.14 19.59 22.03 24.48 26.92 29.37 31.81 34.26 36.70
10 14.63 17.31 20.00 22.68 25.36 28.05 30.73 33.42 36.10 38.7811 14.56 17.48 20.40 23.31 26.23 29.15 32.06 34.98 37.90 40.8112 14.50 17.64 20.79 23.93 27.07 30.22 33.36 36.51 39.65 42.7913 14.44 17.80 21.17 24.53 27.90 31.26 34.63 37.99 41.36 44.7214 14.37 17.96 21.54 25.12 28.70 32.28 35.86 39.44 43.02 46.6115 14.32 18.11 21.90 25.69 29.48 33.27 37.07 40.86 44.65 48 4416 14.26 18.25 22.25 26.25 30.25 34.24 38.24 42.24 46.23 50.2317 14.20 18.40 22.59 26.79 30.99 35.19 39.38 43.58 47.78 51.9718 14.15 18.54 22.93 27.32 31.71 36.11 40.50 44.89 49.28 53.6719 14.09 18.67 23.26 27.84 3242 37.00 41.59 46.17 50.75 55.3320 14.04 18.81 23.58 28.34 33.11 37.88 42.65 47.41 52.18 56.9521 13.99 18.94 23.89 28.83 33.78 38.73 43.68 48.63 53.58 58.5322 13.94 19.06 24.19 29.31 34.44 39.56 44.69 49.81 54.94 60.0623 13.89 19.19 24.48 29.78 35.08 40.37 45.67 50.97 56.26 61.5624 13.84 19.31 24.77 30.24 35.70 41.16 46.63 52.09 57.56 63.0225 13.80 19.43 25.05 30.68 36.31 41.94 47.56 53.19 58.82 64.4526 13.75 19.54 25.33 31.11 36.90 42.69 48.47 54.26 60.05 65.8427 13.71 19.65 25.59 31.54 37.48 43.42 49.36 55.30 61.25 67.1928 13.67 19.76 25.85 31.95 38.04 44.13 50.23 56.32 62.42 68.5129 13.62 19.87 26.11 32.35 38.59 44.83 '51.07 57.31 '63.56 69.8030 13.58 19.97 26.35 .32.74 39.13 45.51 51.90 58.28 64.67 71.05
44
Effects of Handoff on network capacity and quality of service: Kenya GSM networks case study
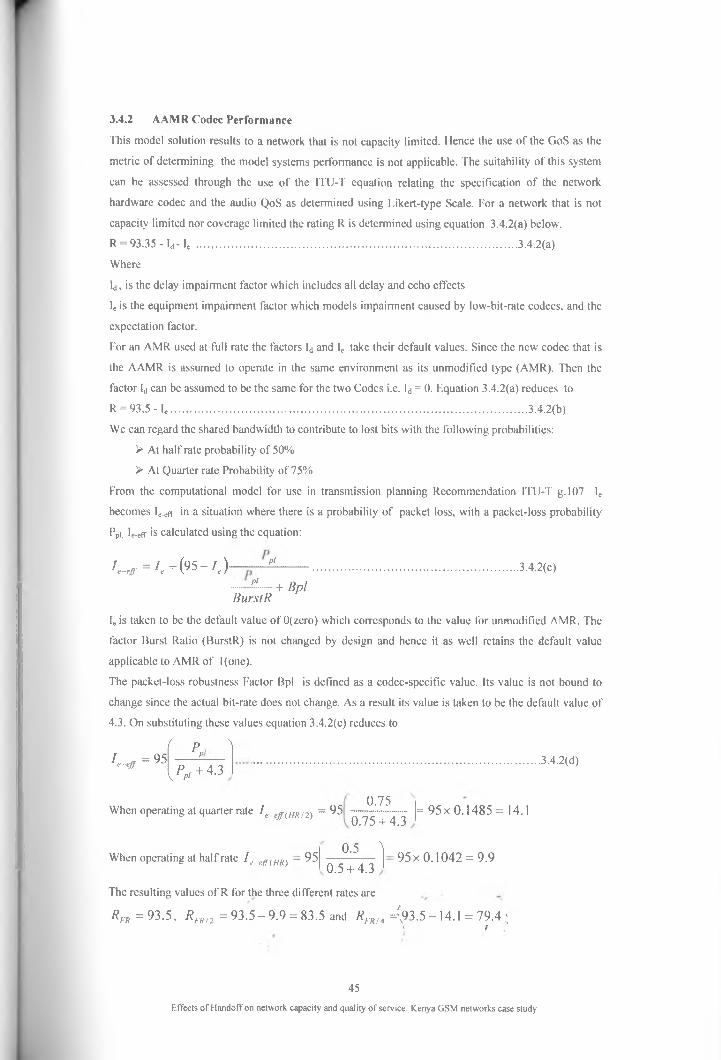
3.4.2 AAMR Codec Performance
This model solution results to a network that is not capacity limited. Hence the use of the GoS as the
metric of determining the model systems performance is not applicable. The suitability of this system
can be assessed through the use of the ITU-T equation relating the specification of the network
hardware codec and the audio QoS as determined using Likert-type Scale. For a network that is not
capacity limited nor coverage limited the rating R is determined using equation 3.4.2(a) below.
R = 93.35 - Id- Ie .................................................................................................................. 3.4.2(a)
Where
Id, is the delay impairment factor which includes all delay and echo effects
I0 is the equipment impairment factor which models impairment caused by low-bit-rate codecs, and the
expectation factor.
For an AMR used at full rate the factors ld and Ie take their default values. Since the new codec that is
the AAMR is assumed to operate in the same environment as its unmodified type (AMR). Then the
factor Id can be assumed to be the same for the two Codes i.e. ld = 0. Equation 3.4.2(a) reduces to
R = 93.5 - le ............................................................................................................................... 3.4.2(b)
We can regard the shared bandwidth to contribute to lost bits with the following probabilities:
> At half rate probability of 50%
> At Quarter rate Probability of 75%
From the computational model for use in transmission planning Recommendation ITU-T g. 107 le
becomes Ie-efr in a situation where there is a probability of packet loss, with a packet-loss probability
Ppi, le-eff is calculated using the equation:
W = /<+ (95- 0 -pl ..3.4.2(c)
pi + BplBurstR
I„ is taken to be the default value of 0(zero) which corresponds to the value for unmodified AMR. The
factor Burst Ratio (BurstR) is not changed by design and hence it as well retains the default value
applicable to AMR of l(one).
The packet-loss robustness Factor Bpl is defined as a codec-specific value. Its value is not bound to
change since the actual bit-rate does not change. As a result its value is taken to be the default value of
4.3. On substituting these values equation 3.4.2(c) reduces to
t P \P ....................................................................................................... 3.4.2(d)W - 95
V^ + 4 '3
When operating at quarter rate / e eff(HR!2) = 950.75
0.75 + 4.3= 95x0.1485= 14.1
When operating at half rate I e_e/r(HR) — 95 0.5 \
0.5+ 4.395x0.1042 = 9.9
The resulting values of R for the three different rates are
Rfr = 93.5, RFRn =93.5-9.9 = 83.5 and Rfr/a 4,93.5 - 1 4 .1 = 79.4 ;i i
45
Effects of Handoff on network capacity and quality o f service: Kenya GSM networks case study

There are three categories of services available from this device:
> Full rate
> Half rate
> Quarter rate
The best service is offered when 50% of the channels is availed at Full-rate. 25% at half -rate
and 25% at quarter rate. All the percentages being expressed out of the old capacity before sharing is
effected This results to a new capacity which is 200% of the old capacity. The R value is calculated and
indicated against the new percentage after sharing.
Phis implies that 25% (FR) will have an R = 93.5
25% (FR/2) “ R = 83.5
50% (FR/4) “ R =79.4
The resultant value of R is 0.25 x 93.5 + 0 .2 5 x 83.5 + 0.5 x 79.4 = 83.95
From recommendation ITU-T G.107 of 2009 the R factor is related to the MOSCqr for values of R
ranging from 0 to 100 as
MOScqf = 1 + 0.035/?+ R ( R - 600(100- R)lx 10"*............3.4.2(e)
The resulting value of MOSCqe is 3.94
The other extreme is when all the channels that would have been allocated at full-rate happen to have
been relinquished and reallocated at quarter rate. This gives rise to 25% of the channels being allocated
at half rate and the remaining 75% at Quarter rate. The resulting capacity is 350%.
This implies that 14.28% (HR) will have an R = 83.5
85.72% (HR/2) “ R = 79.4
The average value of R = 79.96 which corresponds to a MOSCqe of 3.84
This indicates that the AAMR would operate between the range of MOSCqe of 3.84 and'3.94. If we
take the worst performance then the AAMR Codec would be rated as FAIR on the Good or Better
(GoB) scale i.e. the biggest percentage of users would be satisfied (ITU-T G. 107, 2009).
This model solution is capable of reducing congestion by dynamically increasing the cell capacity and
trading off the bit rate and hence reducing the QoS. The advantages of such a solution is its adaptability
to the load demand and minimal network modification requirements. When deployed this modified
Codec can be used to achieve any value of Grade of service by adjusting the load trigger level and the
rate of increase of the new requests r.
It is not possible for demand to overshoot 350% of the planned capacity in a moderately well planned
network. This means that our solution qualifies to solve all the networks Busy Hour congestion
problems as observed from increased rates of HO dropping and call blocking.
>\ \ '
46
Effects of Handoff on network capacity and quality of service: Kenya GSM networks case study
4.1 Research design
This is an academic research whose main objective was to gain a thorough understanding of the
handoff algorithms implemented by the three leading mobile operators in Kenya and their effects on
network capacity and quality of service. The methodology used was interviews to determine the type of
handoff algorithms and surveys to collect numerical data for analysis to determine the quality of
service offered.
The data was obtained from the Telecommunication Operators (TO) Network Management System.
The source of the data is reliable since it was an excerpt from the programmed network management
logs. Both types of data were obtained from the TOs employees, this means that the data is actually
secondary data (secondary Data means data that are already available i.e. they refer to the data which
have already been collected by someone else (Kothari, 2007)) .Data suitability and adequacy was
ensured as the sources were statistically suitable representation of all the regions studied.
The design of the research therefore was a combination of descriptive survey and case study. The
findings of our research concurred with our expectation of congestion in the network during the Busy
Hour period. Out of the past experience in using the available GSM networks it was evident that a
solution is required to mitigate on the problem of BH congestion in the Networks. As a result of this
observation a solution was conceptualized and its performance analyzed along the collected data final
analysis
4.2 Target population
The target population for this research was in two categories. First part required information from the
network planners on the planned network capacity and the type of the deployed handoff algorithms.
The second categoiy was the staff in Operation and Maintenance Center (OMC) in charge of the
Telecommunication Management Network (TMN) monitoring and data log consoles for availing data
captured by the TMN system. The data required was a fraction of a few entries in a spread sheet that is
recorded and stored as a company requirement for company use for Network management and
optimization.
Telecommunication Operator One provided us with the required data as requested and from the
heavily loaded cells within the four big towns as follows: Kisumu-5 Cells, Mombasa-5 Cells, Nairobi-
10 Cells and Nakuru-6 Cells. Telecommunication Operators Two and Three gave out data for all the
cells within the four Towns.
V>\
. 1
CHAPTER 4: RESEARCH METHODOLOGY
47
Effects of Handoff on network capacity and quality of service: Kenya GSM networks case study
4.3 Sampling technique
Telecommunications Operators are known to deploy the same Handoff algorithm in the entire Network.
Therefore there was no sampling required to get the information on the implemented types of handoff
algorithms. However to collect data for analysis to determine the handoff effects on capacity and
quality of service, requires identification of busy cells in busy neighborhood. Consequently purpose
sampling was used to get the cells that experience congestion and whose neighborhood is comprised of
other heavily loaded cells.
The ITU guide line on determination of the Quality' of Service (QoS) and specifically Grade of Service
(GoS) does not take into consideration the size of the population to be studied. It states that any group
of circuits should offer at worst 2% GoS. Sample sizes (number of cells) in the three sets of data were
taken to be adequate and no formula was used to arrive at the specified numbers.
Since this research was concerned with the network response when the service demand was at the
peak. We scheduled our investigation to be conducted for one hour for five days of the week. The one
hour for the data collection was within 8.00Hr to 17.00Hr and the one with the most traffic that day
identified as a busy hour (BH). Due to the expected changes in the required data within short periods of
time. The data was required to be recorded within periods of two minutes. But due to Operators
technical short falls the data was given as recorded over one hour periods.
4.4 Data Collection Methods
In order to acquire the required data, formal requests were made to the Telecommunication operators to provide the following information:
> Handoff algorithms implemented in the networks
> Cells that operate at over 100% planned capacity/
> The number of new call setup requests
> The number of the net Handoff requests into the cells under observation.
4.4.1 Handoff performance data
The handoff algorithms implemented in the network was given as statements out of personal
interviews with the network Engineers. This information was necessary to explain the determined
network performance out of the analysis of QoS data collected.
4.4.2 Network Data
All telecommunication network operators have installed Telecommunication Management Network
systems which collect and record on disks and tapes the network performance and condition data which
includes such data as the one required for this research. The only other important exercise other than
getting the permission to acquire the data was extraction of the required parts.
/
48
Effects of Handoff on network capacity and quality of service: Kenya GSM networks case study
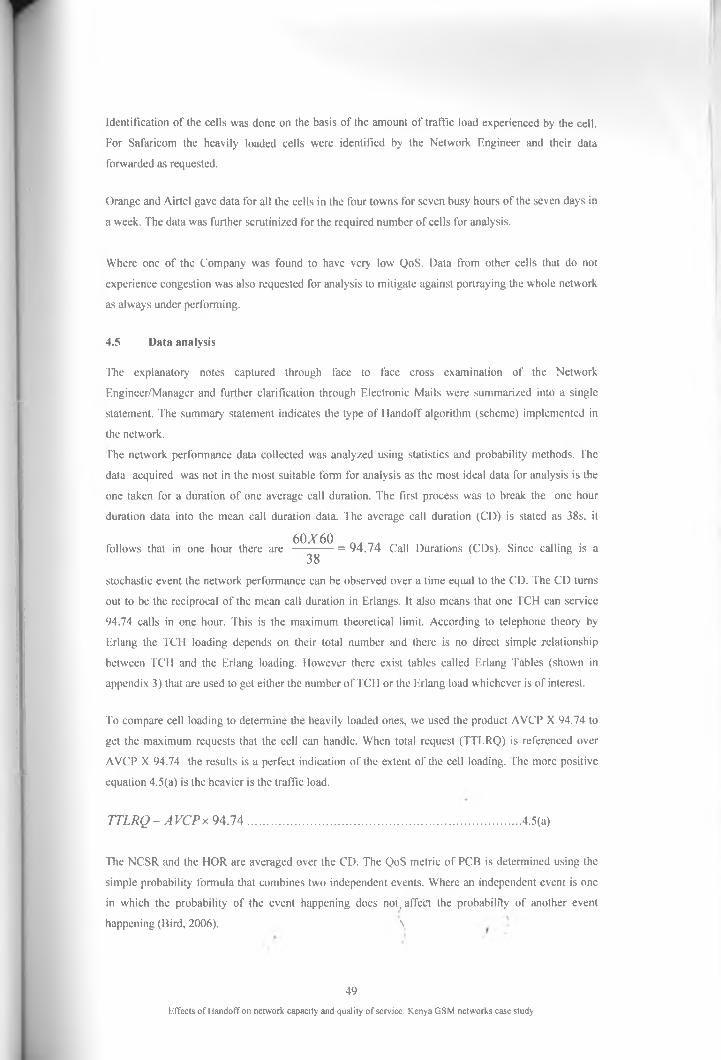
Identification of the cells was done on the basis of the amount of traffic load experienced by the cell.
For Safaricom the heavily loaded cells were identified by the Network Engineer and their data
forwarded as requested.
Orange and Airtel gave data for all the cells in the four towns for seven busy hours of the seven days in
a week. The data was further scrutinized for the required number of cells for analysis.
Where one of the Company was found to have very low QoS. Data from other cells that do not
experience congestion was also requested for analysis to mitigate against portraying the whole network
as always under performing.
4.5 Data analysis
The explanatory notes captured through face to face cross examination of the Network
Engineer/Manager and further clarification through Electronic Mails were summarized into a single
statement. The summary statement indicates the type of Handoff algorithm (scheme) implemented in
the network.
The network performance data collected was analyzed using statistics and probability methods. The
data acquired was not in the most suitable form for analysis as the most ideal data for analysis is the
one taken for a duration of one average call duration. The first process was to break the one hour
duration data into the mean call duration data. The average call duration (CD) is stated as 38s, it
6 0 * 6 0follows that in one hour there are
38= 94.74 Call Durations (CDs). Since calling is a
stochastic event the network performance can be observed over a time equal to the CD. The CD turns
out to be the reciprocal of the mean call duration in Erlangs. It also means that one TCH can service
94.74 calls in one hour. This is the maximum theoretical limit. According to telephone theory by
Erlang the TCH loading depends on their total number and there is no direct simple relationship
between TCH and the Erlang loading. However there exist tables called Erlang Tables (shown in
appendix 3) that are used to get either the number of TCH or the Erlang load whichever is of interest.
To compare cell loading to determine the heavily loaded ones, we used the product AVCP X 94.74 to
get the maximum requests that the cell can handle. When total request (TTLRQ) is referenced over
AVCP X 94.74 the results is a perfect indication of the extent of the cell loading. The more positive
equation 4.5(a) is the heavier is the traffic load.
TTLRQ- AVCPx 9 4 . 7 4 ................................................................................................. 4.5(a)
The NCSR and the HOR are averaged over the CD. The QoS metric of PCB is determined using the
simple probability formula that combines two independent events. Where an independent event is one
in which the probability of the event happening does not, affect the probability of another event
happening (Bird, 2006). \ '
49
Effects of Handoff on network capacity and quality of service: Kenya GSM networks case study
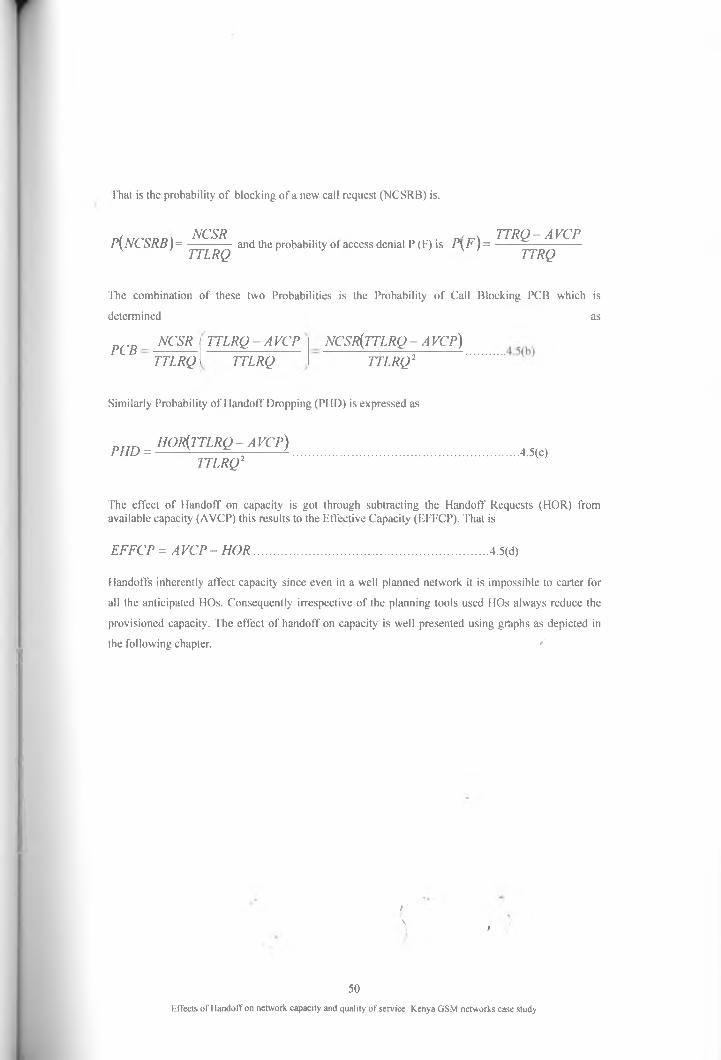
That is the probability of blocking of a new call request (NCSRB) is.
n /ir / , nn NCSR , , TTRQ-AVCPP(NCSRB) = ------------ and the probability ot access denial P (F) is P\F) = -----------------------
V ’ TTLRQ TTRQ
The combination of these two Probabilities is the Probability o f Call Blocking PCB which is
determined as
PCBNCSR
TTLRQTTLRQ-AVCP
TTLRQNCSRjTTLRQ- AVCP)
TTLRQ2
Similarly Probability of Handoff Dropping (PHD) is expressed as
PHD =HORjTTLRQ- AVCP)
TTLRQ2.4.5(c)
The effect of Handoff on capacity is got through subtracting the Handoff Requests (HOR) from available capacity (AVCP) this results to the Effective Capacity (EFFCP). That is
EFFCP = A VCP - HOR ................................................................................... 4.5(d)
Handoffs inherently affect capacity since even in a well planned network it is impossible to carter for
all the anticipated HOs. Consequently irrespective of the planning tools used HOs always reduce the
provisioned capacity. The effect of handoff on capacity is well presented using graphs as depicted in
the following chapter. /
>\ i
50
Effects of Handoff on network capacity and quality of service: Kenya GSM networks case study

CHAPTER 5: FINDINGS, ANALYSIS AND INTERPRETATIONS
5.1 Introduction
The purpose for going to the field to collect the data was to identify the HO algorithms used and
determine their effect on quality of service through the two metrics of PCB and PHD. In this chapter,
the research findings are presented following analysis and interpretation of the data we collected from
the three Telecommunication Operators. Data was sourced and received from three Mobile
telecommunication Companies. The three sources of data have been referred to as Telecommunication
Operators One, Two and Three. The findings are mainly presented using tables, line graphs and column
bar charts where statistical methods have been used to determine probabilities as described in
methodology.
Numerical data analyses has been done using the network capacity stated and the hypothesized capacity
from the model solution. The practical results are interpreted and comparison made with the theoretical
results. The results have consistently indicated far much better performance of the model gadget as
compared to the existing hardware in the network. This comparison in the whole of the data analysis
and the determination of the MOSCqe of the proposed Codec in methodology covers the required
validation of device performance
5.1 Data Processing and Analysis
Prom Telecommunication Operator (TO) One the Busy Hour (Bf l) data obtained was for 10 cells in
Nairobi, 5 each from Mombasa and Kisumu, and 6 from Nakuru resulting to a total of 26 cells. This
data has been presented in its raw form just as received from the network operator. Due to the nature of
results found from analysis of BH data another set of data covering the non Busy Hour period was
requested and acquired. Therefore two sets of data from TO One have been analyzed.
Telecommunication Operator two gave data for all the cells taken for seven days for Kisumu,
Mombasa. Nairobi and Nakuru. From the received lot twenty seven cells were identified for analysis.
Telecommunication Operator Three gave data for all High trafficking cells within Kisumu. Mombasa,
Nairobi and Nakuru. The highest trafficking 26 cells were identified and their data has been analyzed
t\
, *
51
Effects of Handoff on network capacity and quality of service: Kenya GSM networks case study
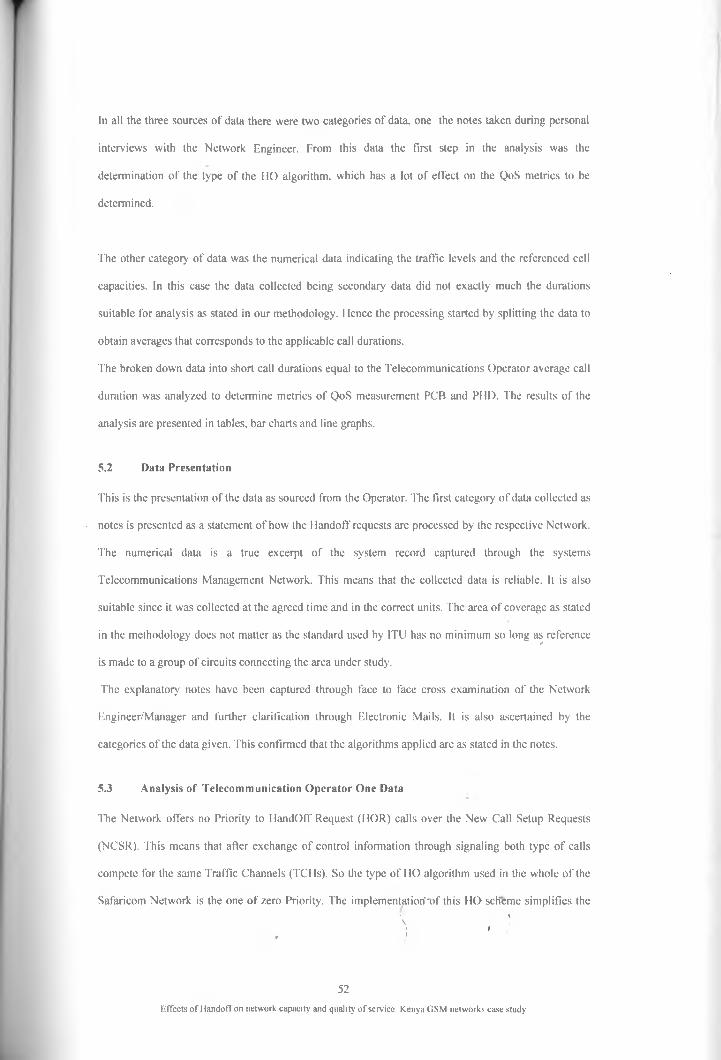
In all the three sources of data there were two categories of data, one the notes taken during personal
interviews with the Network Engineer. From this data the first step in the analysis was the
determination of the type of the HO algorithm, which has a lot of effect on the QoS metrics to be
determined.
The other category of data was the numerical data indicating the traffic levels and the referenced cell
capacities. In this case the data collected being secondary data did not exactly much the durations
suitable for analysis as stated in our methodology. Hence the processing started by splitting the data to
obtain averages that corresponds to the applicable call durations.
The broken down data into short call durations equal to the Telecommunications Operator average call
duration was analyzed to determine metrics of QoS measurement PCB and PHD. The results of the
analysis are presented in tables, bar charts and line graphs.
5.2 Data Presentation
This is the presentation of the data as sourced from the Operator. The first category of data collected as
notes is presented as a statement of how the Handoff requests are processed by the respective Network.
The numerical data is a true excerpt of the system record captured through the systems
Telecommunications Management Network. This means that the collected data is reliable. It is also
suitable since it was collected at the agreed time and in the correct units. The area of coverage as stated
in the methodology does not matter as the standard used by ITU has no minimum so long as reference/
is made to a group of circuits connecting the area under study.
The explanatory notes have been captured through face to face cross examination of the Network
Engineer/Manager and further clarification through Electronic Mails. It is also ascertained by the
categories of the data given. This confirmed that the algorithms applied are as stated in the notes.
5.3 Analysis of Telecommunication Operator One Data
The Network offers no Priority to HandOff Request (HOR) calls over the New Call Setup Requests
(NCSR). This means that after exchange of control information through signaling both type of calls
compete for the same Traffic Channels (TCHs). So the type of HO algorithm used in the whole of the
Safaricom Network is the one of zero Priority. The implementation''of this HO scheme simplifies the* i 5\ ' /
* ‘
52
Effects of Handoff on network capacity and quality of service: Kenya GSM networks case study

analysis since the two categories o f requests can be analyzed together as there is no special treatment
given to any one of them.
There are two sets of Data obtained from Operator One . The first set of data corresponds to the busy
hour period when as earlier suggested the Network is supposed to experience the heaviest amount of
Traffic Load. On analysis of this set of data it revealed a serious over stretch of the network resources
over the BH period. To establish how the network performed outside the BH period. Another set of
data was collected. On second analysis of the non busy hour data it has ascertained that the network
performs within the expected range of performance index.
Tabulation, analysis and findings of the two sets of data are presented in this section.
5.3.1 Analysis of BH data from Telecommunication Operator One
To determine the network BH prevailing probabilities of call blocking and handoff dropping the raw
data is organized further, and then analyzed in phases. The first phase of the analysis is to get the
average data to represent the demand per cell in each town. The resulting data is a better indication of
the network demand in the respective cell per call duration. The resulting averaged data has been used
to determine the QoS metrics of PCB and PHD.
Each town result is presented using bar charts for ease of comparison. As far as the research is
concerned even a single town is enough to give an indication of the Network quality of service with
reference to the ITU guidelines.
Further analysis is done to combine all the individual town data to have one presentation of the four
towns while having taken the individual town demand into consideration. In this final presentation is
the average for the four towns which is an adequate representation of the whole Network.
In the determination of the towns QoS we presented results got using the network available capacity at
Full Rate (FR) and another column of results that are got on implementation of the model solution that
increases capacity to varying bit rates (XR).
Due to the simplieity of the HO algorithm used, GoS is got as a direct sum of PCB and PHD. This
important QoS metric has been quoted for the whole network at the end of all the analysis.
The raw BH data is comprised of three tables the first table (Table 5.1) contains the specification of
the cells under study, the second one (Table 5.2) is a tabulation of the busy hour handoff requests
(HOR) while the third one (Table 5.3) is the corresponding BH new call setup requests (NCSR).
)\
\
53
Effects of Handoff on network capacity and quality of service: Kenya GSM networks case study
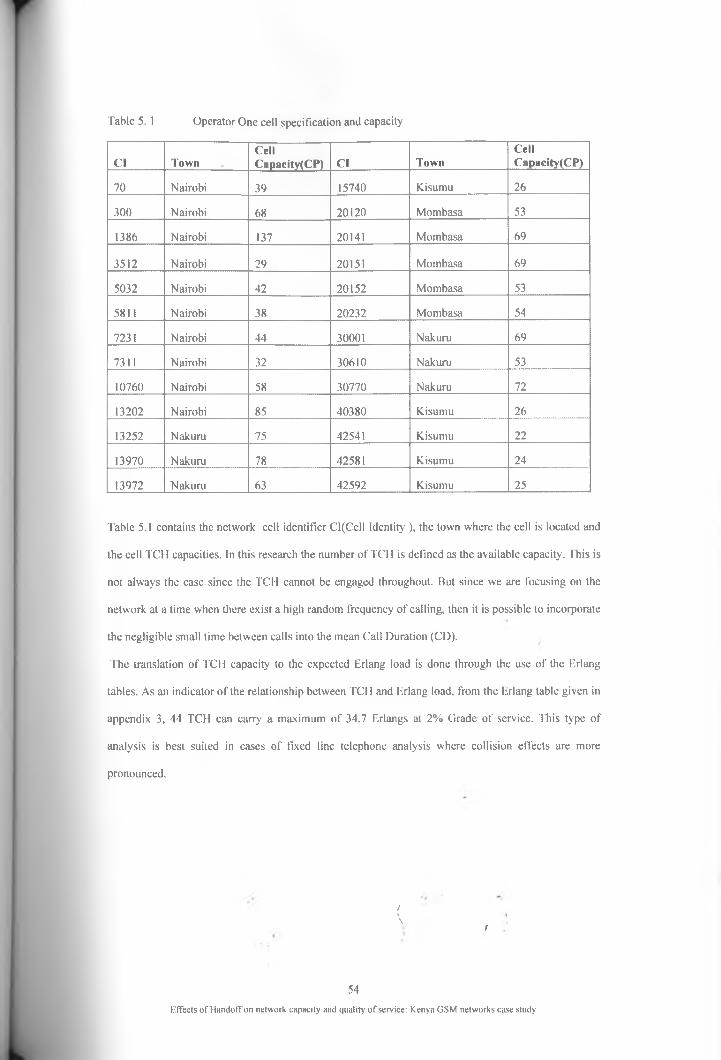
Table 5. 1 Operator One cell specification and capacity
Cl TownCellCapacity(CP) Cl Town
CellCapacity(CP)
70 Nairobi 39 15740 Kisumu 26
300 Nairobi 68 20120 Mombasa 53
1386 Nairobi 137 20141 Mombasa 69
3512 Nairobi 29 20151 Mombasa 69
5032 Nairobi 42 20152 Mombasa 53
5811 Nairobi 38 20232 Mombasa 54
7231 Nairobi 44 30001 Nakuru 69
7311 Nairobi 32 30610 Nakuru 53
10760 Nairobi 58 30770 Nakuru 72
13202 Nairobi 85 40380 Kisumu 26
13252 Nakuru 75 42541 Kisumu 22
13970 Nakuru 78 42581 Kisumu 24
13972 Nakuru 63 42592 Kisumu 25
Table 5.1 contains the network cell identifier Cl(Cell Identity ), the town where the cell is located and
the cell TCH capacities. In this research the number of TCH is defined as the available capacity. This is
not always the case since the TCH cannot be engaged throughout. But since we are focusing on the
network at a time when there exist a high random frequency of calling, then it is possible to incorporate
the negligible small time between calls into the mean Call Duration (CD).
The translation of TCH capacity to the expected Erlang load is done through the use of the Erlang
tables. As an indicator of the relationship between TCH and Erlang load, from the Erlang table given in
appendix 3, 44 TCH can carry a maximum of 34.7 Erlangs at 2% Grade of service. This type of
analysis is best suited in cases of fixed line telephone analysis where collision effects are more
pronounced.
/\ t
54
Effects of Handoff on network capacity and quality of service: Kenya GSM networks case study
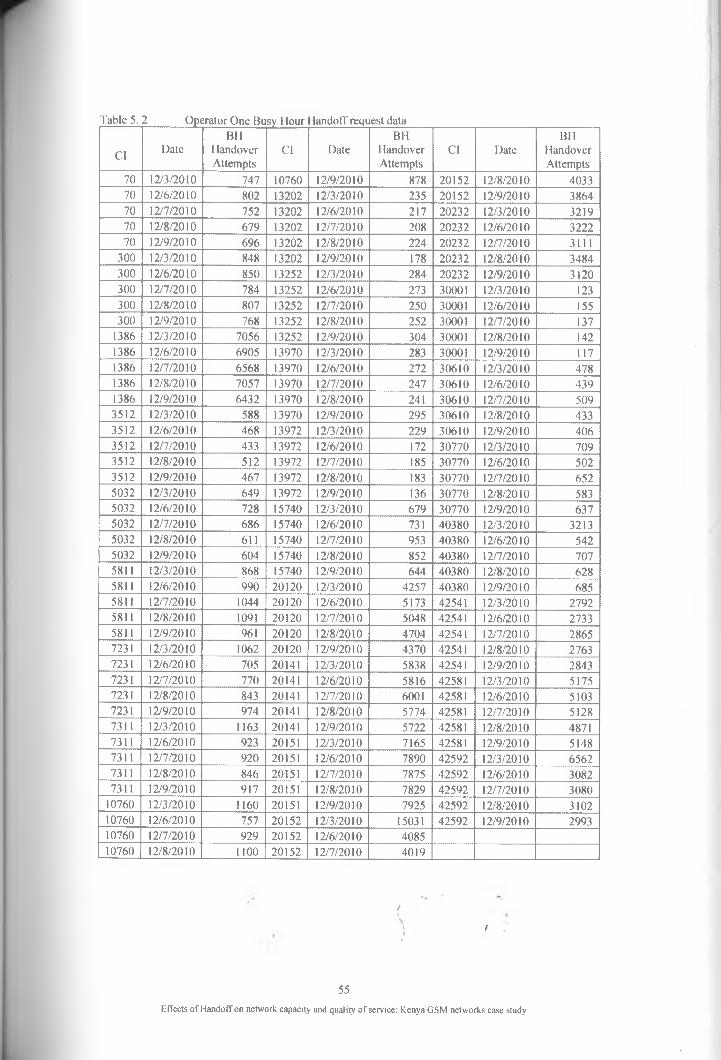
Table 5. 2______ Operator One Busy Hour I landotT request data
CI DateBH
HandoverAttempts
Cl DateBH
HandoverAttempts
CI DateBH
HandoverAttempts
70 12/3/2010 747 10760 12/9/2010 878 20152 12/8/2010 403370 12/6/2010 802 13202 12/3/2010 235 20152 12/9/2010 386470 12/7/2010 752 13202 12/6/2010 217 20232 12/3/2010 321970 12/8/2010 679 13202 12/7/2010 208 20232 12/6/2010 322270 12/9/2010 696 13202 12/8/2010 224 20232 12/7/2010 3111
300 12/3/2010 848 13202 12/9/2010 178 20232 12/8/2010 3484300 12/6/2010 850 13252 12/3/2010 284 20232 12/9/2010 3120300 12/7/2010 784 13252 12/6/2010 273 30001 12/3/2010 123300 12/8/2010 807 13252 12/7/2010 250 30001 12/6/2010 155300 12/9/2010 768 13252 12/8/2010 252 30001 12/7/2010 137
1386 12/3/2010 7056 13252 12/9/2010 304 30001 12/8/2010 1421386 12/6/2010 6905 13970 12/3/2010 283 30001 12/9/2010 1171386 12/7/2010 6568 13970 12/6/2010 272 30610 12/3/2010 4781386 12/8/2010 7057 13970 12/7/2010 247 30610 12/6/2010 4391386 12/9/2010 6432 13970 12/8/2010 241 30610 12/7/2010 5093512 12/3/2010 588 13970 12/9/2010 295 30610 12/8/2010 4333512 12/6/2010 468 13972 12/3/2010 229 30610 12/9/2010 4063512 12/7/2010 433 13972 12/6/2010 172 30770 12/3/2010 7093512 12/8/2010 512 13972 12/7/2010 185 30770 12/6/2010 5023512 12/9/2010 467 13972 12/8/2010 183 30770 12/7/2010 6525032 12/3/2010 649 13972 12/9/2010 136 30770 12/8/2010 5835032 12/6/2010 728 15740 12/3/2010 679 30770 12/9/2010 6375032 12/7/2010 686 15740 12/6/2010 731 40380 12/3/2010 32135032 12/8/2010 611 15740 12/7/2010 953 40380 12/6/2010 5425032 12/9/2010 604 15740 12/8/2010 852 40380 12/7/2010 7075811 12/3/2010 868 15740 12/9/2010 644 40380 12/8/2010 6285811 12/6/2010 990 20120 12/3/2010 4257 40380 12/9/2010 6855811 12/7/2010 1044 20120 12/6/2010 5173 42541 12/3/2010 27925811 12/8/2010 1091 20120 12/7/2010 5048 42541 12/6/2010 27335811 12/9/2010 961 20120 12/8/2010 4704 42541 12/7/2010 28657231 12/3/2010 1062 20120 12/9/2010 4370 42541 12/8/2010 27637231 12/6/2010 705 20141 12/3/2010 5838 42541 12/9/2010 28437231 12/7/2010 770 20141 12/6/2010 5816 42581 12/3/2010 51757231 12/8/2010 843 20141 12/7/2010 6001 42581 12/6/2010 51037231 12/9/2010 974 20141 12/8/2010 5774 42581 12/7/2010 51287311 12/3/2010 1163 20141 12/9/2010 5722 42581 12/8/2010 48717311 12/6/2010 923 20151 12/3/2010 7165 42581 12/9/2010 51487311 12/7/2010 920 20151 12/6/2010 7890 42592 12/3/2010 65627311 12/8/2010 846 20151 12/7/2010 7875 42592 12/6/2010 30827311 12/9/2010 917 20151 12/8/2010 7829 42592 12/7/2010 3080
10760 12/3/2010 1160 20151 12/9/2010 7925 42592 12/8/2010 310210760 12/6/2010 757 20152 12/3/2010 15031 42592 12/9/2010 299310760 12/7/2010 929 20152 12/6/2010 408510760 12/8/2010 1100 20152 12/7/2010 4019
/
55Effects of Handofif on network capacity and quality of service: Kenya GSM networks case study
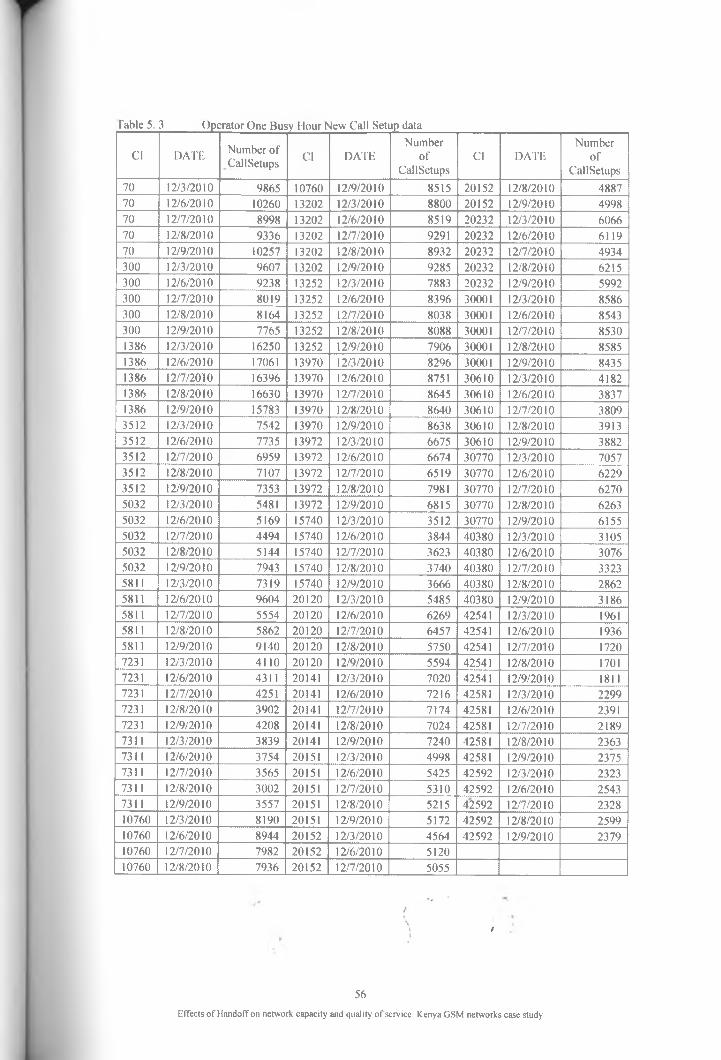
Table 5. 3 ()perator One Busy Hour New Call Setup data
Cl DATE Number of Call Setups Cl DATE
Numberof
CallSetupsCl DATE
Numberof
CallSetups70 12/3/2010 9865 10760 12/9/2010 8515 20152 12/8/2010 488770 12/6/2010 10260 13202 12/3/2010 8800 20152 12/9/2010 499870 12/7/2010 8998 13202 12/6/2010 8519 20232 12/3/2010 606670 12/8/2010 9336 13202 12/7/2010 9291 20232 12/6/2010 611970 12/9/2010 10257 13202 12/8/2010 8932 20232 12/7/2010 4934300 12/3/2010 9607 13202 12/9/2010 9285 20232 12/8/2010 6215300 12/6/2010 9238 13252 12/3/2010 7883 20232 12/9/2010 5992300 12/7/2010 8019 13252 12/6/2010 8396 30001 12/3/2010 8586300 12/8/2010 8164 13252 12/7/2010 8038 30001 12/6/2010 8543300 12/9/2010 7765 13252 12/8/2010 8088 30001 12/7/2010 85301386 12/3/2010 16250 13252 12/9/2010 7906 30001 12/8/2010 85851386 12/6/2010 17061 13970 12/3/2010 8296 30001 12/9/2010 84351386 12/7/2010 16396 13970 12/6/2010 8751 30610 12/3/2010 41821386 12/8/2010 16630 13970 12/7/2010 8645 30610 12/6/2010 38371386 12/9/2010 15783 13970 12/8/2010 8640 30610 12/7/2010 38093512 12/3/2010 7542 13970 12/9/2010 8638 30610 12/8/2010 39133512 12/6/2010 7735 13972 12/3/2010 6675 30610 12/9/2010 38823512 12/7/2010 6959 13972 12/6/2010 6674 30770 12/3/2010 70573512 12/8/2010 7107 13972 12/7/2010 6519 30770 12/6/2010 62293512 12/9/2010 7353 13972 12/8/2010 7981 30770 12/7/2010 62705032 12/3/2010 5481 13972 12/9/2010 6815 30770 12/8/2010 62635032 12/6/2010 5169 15740 12/3/2010 3512 30770 12/9/2010 61555032 12/7/2010 4494 15740 12/6/2010 3844 40380 12/3/2010 31055032 12/8/2010 5144 15740 12/7/2010 3623 40380 12/6/2010 30765032 12/9/2010 7943 15740 12/8/2010 3740 40380 12/7/2010 33235811 12/3/2010 7319 15740 12/9/2010 3666 40380 12/8/2010 28625811 12/6/2010 9604 20120 12/3/2010 5485 40380 12/9/2010 31865811 12/7/2010 5554 20120 12/6/2010 6269 42541 12/3/2010 19615811 12/8/2010 5862 20120 12/7/2010 6457 42541 12/6/2010 19365811 12/9/2010 9140 20120 12/8/2010 5750 42541 12/7/2010 17207231 12/3/2010 4110 20120 12/9/2010 5594 42541 12/8/2010 17017231 12/6/2010 4311 20141 12/3/2010 7020 42541 12/9/2010 18117231 12/7/2010 4251 20141 12/6/2010 7216 42581 12/3/2010 22997231 12/8/2010 3902 20141 12/7/2010 7174 42581 12/6/2010 23917231 12/9/2010 4208 20141 12/8/2010 7024 42581 12/7/2010 21897311 12/3/2010 3839 20141 12/9/2010 7240 42581 12/8/2010 23637311 12/6/2010 3754 20151 12/3/2010 4998 42581 12/9/2010 23757311 12/7/2010 3565 20151 12/6/2010 5425 42592 12/3/2010 23237311 12/8/2010 3002 20151 12/7/2010 5310 42592 12/6/2010 25437311 12/9/2010 3557 20151 12/8/2010 5215 42592 12/7/2010 232810760 12/3/2010 8190 20151 12/9/2010 5172 42592 12/8/2010 259910760 12/6/2010 8944 20152 12/3/2010 4564 42592 12/9/2010 237910760 12/7/2010 7982 20152 12/6/2010 512010760 12/8/2010 7936 20152 12/7/2010 5055
i
56
Effects of Handoffon network capacity and quality of service: Kenya GSM networks case study
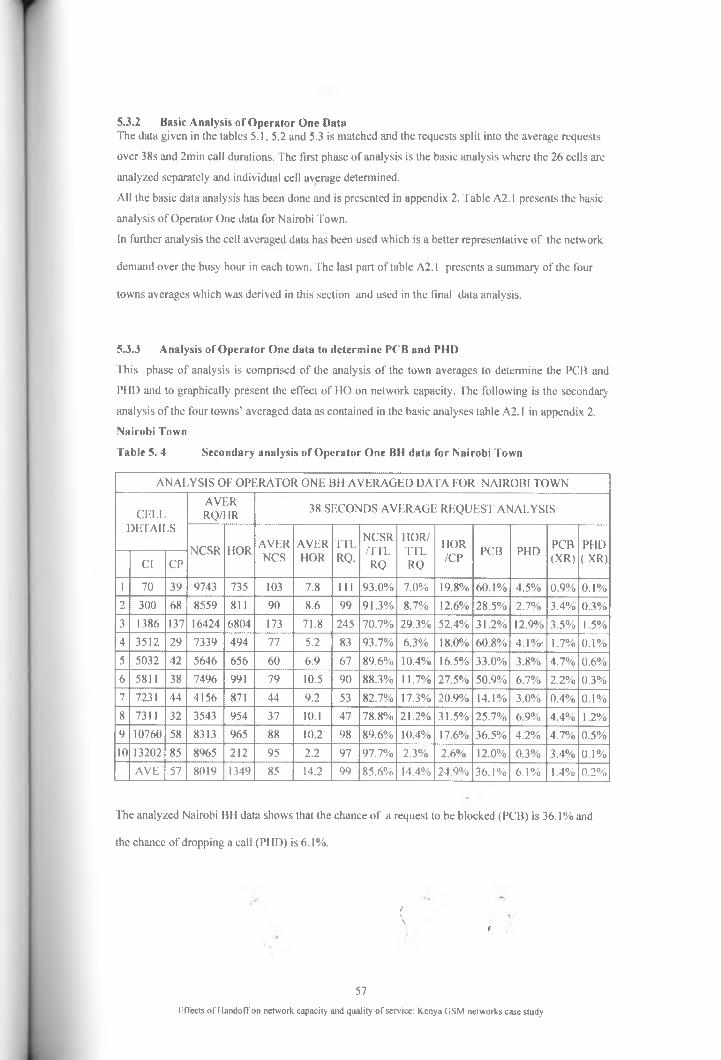
5.3.2 Basic Analysis of Operator One DataThe data given in the tables 5.1, 5.2 and 5.3 is matched and the requests split into the average requests
over 38s and 2min call durations. The first phase of analysis is the basic analysis where the 26 cells are
analyzed separately and individual cell average determined.
All the basic data analysis has been done and is presented in appendix 2. Table A2.1 presents the basic
analysis of Operator One data for Nairobi Town.
In further analysis the cell averaged data has been used which is a better representative of the network
demand over the busy hour in each town. The last part of table A2.1 presents a summary of the four
towns averages which was derived in this section and used in the final data analysis.
5.3.3 Analysis of Operator One data to determine PCB and PHD
This phase of analysis is comprised of the analysis of the town averages to determine the PCB and
PHD and to graphically present the effect of HO on network capacity. The following is the secondary
analysis of the four towns' averaged data as contained in the basic analyses table A2.1 in appendix 2.
Nairobi Town
Table 5. 4 Secondary analysis of Operator One BH data for Nairobi Town
ANALYSIS OF OPERATOR ONE BH AVERAGED DATA FOR NAIROBI TOWN
CELLDETAILS
AVERRQ/HR 38 SECONDS AVERAGE REQUEST ANALYSIS
NCSR HOR AVERNCS
AVERHOR
TTLRQ.
NCSR/TTLRQ
HOR/TTLRQ
HOR/CP PCB PHD PCB
(XR)PHD(XR)Cl CP
1 70 39 9743 735 103 7.8 I l l 93.0% 7.0% 19.8% 60.1% 4.5% 0.9% 0.1%2 300 68 8559 811 90 8.6 99 91.3% 8.7% 12.6% 28.5% 2.7% 3.4% 0.3%3 1386 137 16424 6804 173 71.8 245 70.7% 29.3% 52.4% 31.2% 12.9% 3.5% 1.5%4 3512 29 7339 494 77 5.2 83 93.7% 6.3% 18.0% 60.8% 4.1%* 1.7% 0.1%5 5032 42 5646 656 60 6.9 67 89.6% 10.4% 16.5% 33.0% 3.8% 4.7% 0.6%6 5811 38 7496 991 79 10.5 90 88.3% 11.7% 27.5% 50.9% 6.7% 2.2% 0.3%7 7231 44 4156 871 44 9.2 53 82.7% 17.3% 20.9% 14.1% 3.0% 0.4% 0.1%8 7311 32 3543 954 37 10.1 47 78.8% 21.2% 31.5% 25.7% 6.9% 4.4% 1.2%9 10760 58 8313 965 88 10.2 98 89.6% 10.4% 17.6% 36.5% 4.2% 4.7% 0.5%10 13202 85 8965 212 95 2.2 97 97.7% 2.3% 2.6% 12.0% 0.3% 3.4% 0.1%
AVE 57 8019 1349 85 14.2 99 85.6% 14.4% 24.9% 36.1% 6.1% 1.4% 0.2%
The analyzed Nairobi BH data shows that the chance of a request to be blocked (PCB) is 36.1% and
the chance of dropping a call (PHD) is 6.1%.
/\ i
57
Effects of Handoff on network capacity and quality of service: Kenya GSM networks case study
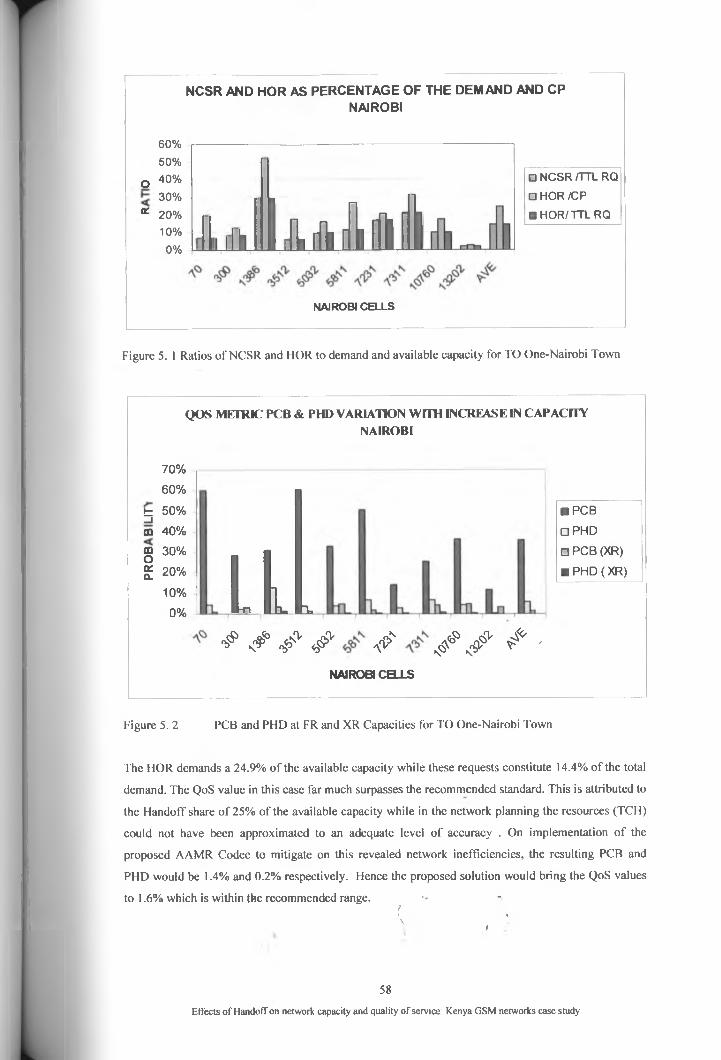
NCSR AND HOR AS PERCENTAGE OF THE DEMAND AND CPNAIROBI
60%50%
O 40%30%
* 20% 10%
0% li ilh I rill [ft fa ilNAIROBI CELLS
□ N C S R /T T L R Q
□ HOR /CP■ HOR/TTL RQ
Figure 5. 1 Ratios o f NCSR and HOR to demand and available capacity for TO One-Nairobi Town
QOS METRIC PCB & PHD VARIATION WITH INCREAS E IN CAPACITYNAIROBI
70%
60%
t 50%_icd 40%
g 30%o£ 20%
10%
0% L i l
^ $
■ PCB□ PHD□ PCB (XR)■ PHD(XR)
* ^ ^ ^ ^ ^ ^ '
NAIROBI c a r s
Figure 5. 2 PCB and PHD at FR and XR Capacities for TO One-Nairobi Town
The HOR demands a 24.9% o f the available capacity while these requests constitute 14.4% o f the total
demand. The QoS value in this case far much surpasses the recommended standard. This is attributed to
the Handoff share o f 25% of the available capacity while in the network planning the resources (TCH)
could not have been approximated to an adequate level o f accuracy . On implementation o f the
proposed AAMR Codec to mitigate on this revealed network inefficiencies, the resulting PCB and
PHD would be 1.4% and 0.2% respectively. Hence the proposed solution would bring the QoS values
to 1.6% which is within the recommended range. •- -/\ ' '\ /
58
Effects o f Handoff on network capacity and quality o f service: Kenya GSM networks case study

Nakuru
The table below shows Secondary analysis o f the averaged data for Nakuru town as drawn from Table
A 2.1 in appendix 2
Table 5. 5 Secondary analysis o f Operator One BH data for Nakuru TownSECONDARY ANALYSIS OF OPERATOR ONE BH AVERAGED DATA FOR NAKURU TOWN
CELLSPECIFICATION
AVERAGE REQUEST ANALYSIS WITH REFERENCE TO 38S CALL DURATION
AVERNCSR/
HR
AVER-HO/HR
AVERNCS
AVER-HOR
TTLRQ
NCSR/T T L
RQ
HOR/TTL
RQ
H O R /CP
PCB PHD PCB(XR)
PHD(X R )Cl CP
1 13252 75 8062 273 85.1 2.88 88 96.7% 3.3% 3.8% 14.3% 0.5% 1.9% 0.1%
2 13970 78 8594 268 90.7 2.82 93.5 97.0% 3.0% 3.6% 16.1% 0.5% 4.0% 0.1%
3 13972 63 6933 181 73.2 1.91 75.1 97.5% 2.5% 3.0% 15.7% 0.4% 3.4% 0.1%
4 30001 69 8536 135 90.1 1.42 91.5 98.4% 1.6% 2.1% 24.2% 0.4% 2.0% 0.0%
5 30610 53 3925 453 41.4 4.78 46.2 89.7% 10.3% 9.0% 0.0% 0.0% 2.0% 0.2%
6 30770 72 6395 617 67.5 6.51 74 91.2% 8.8% 9.0% 2.5% 0.2% 2.5% 0.2%
AV 68 7074.0 321 74.67 3.39 78.1 95.7% 4.3% 5.0% 11.9% 0.5% 1.9% 0.1%
NCSR AND HOR AS PERCENTAGES OF CAPACITYNAKURU TOWN
120.0%
PERCENTAGE
JH Ltu
□ NCSR/ TTLRQ ■ HOR /TTL RQ□ HOR/ CP
13252 13970 13972 30001 30610 30770
N A K U R U C E LLS
AVER
Figure 5. 3 Ratios o f NCSR and HOR to demand and available capacity for TO One-Nakuru Town
This analysis shows that in Nakuru Mobile Subscribers are almost stationary during busy hour and if
they ever move they do so within radius o f the cells. As a result the HO calls demand a very small
percentage o f capacity which has been shown to be equal to 4.3%. The 0.5% PHD is equally small as
the number o f requests is also small. The PCB is 11.9% which is high but does not necessarily require
our proposed solution since the effect o f HO in this town is minimal.\* t. 1
59
Effects o f Handoff on network capacity and quality o f service: Kenya GSM networks case study
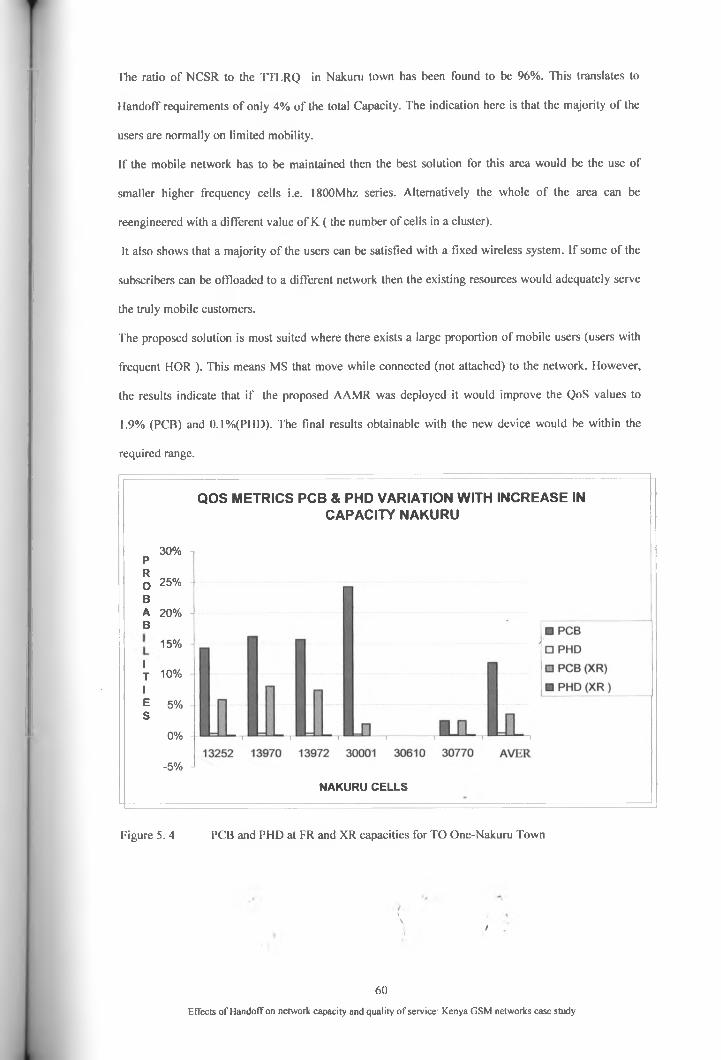
The ratio o f NCSR to the TTLRQ in Nakuru town has been found to be 96%. This translates to
Handoff requirements o f only 4% o f the total Capacity. The indication here is that the majority o f the
users are normally on limited mobility.
If the mobile network has to be maintained then the best solution for this area would be the use of
smaller higher frequency cells i.e. 1800Mhz series. Alternatively the whole o f the area can be
reengineered with a different value o f K. ( the number o f cells in a cluster).
It also shows that a majority o f the users can be satisfied with a fixed wireless system. If some o f the
subscribers can be offloaded to a different network then the existing resources would adequately serve
the truly mobile customers.
The proposed solution is most suited where there exists a large proportion o f mobile users (users with
frequent HOR ). This means MS that move while connected (not attached) to the network. However,
the results indicate that if the proposed AAMR was deployed it would improve the QoS values to
1.9% (PCB) and 0.1%(PHD). The final results obtainable with the new device would be within the
required range.
QOS METRICS PCB & PHD VARIATION WITH INCREASE IN CAPACITY NAKURU
30%PR0 25% BA 20% B
15%
1T 10% IE 5% S
0%
-5%N A K U R U C E LLS
Figure 5. 4 PCB and PHD at FR and XR capacities for TO One-Nakuru Town
\ f
60
Effects o f Handoff on network capacity and quality o f service: Kenya GSM networks case study
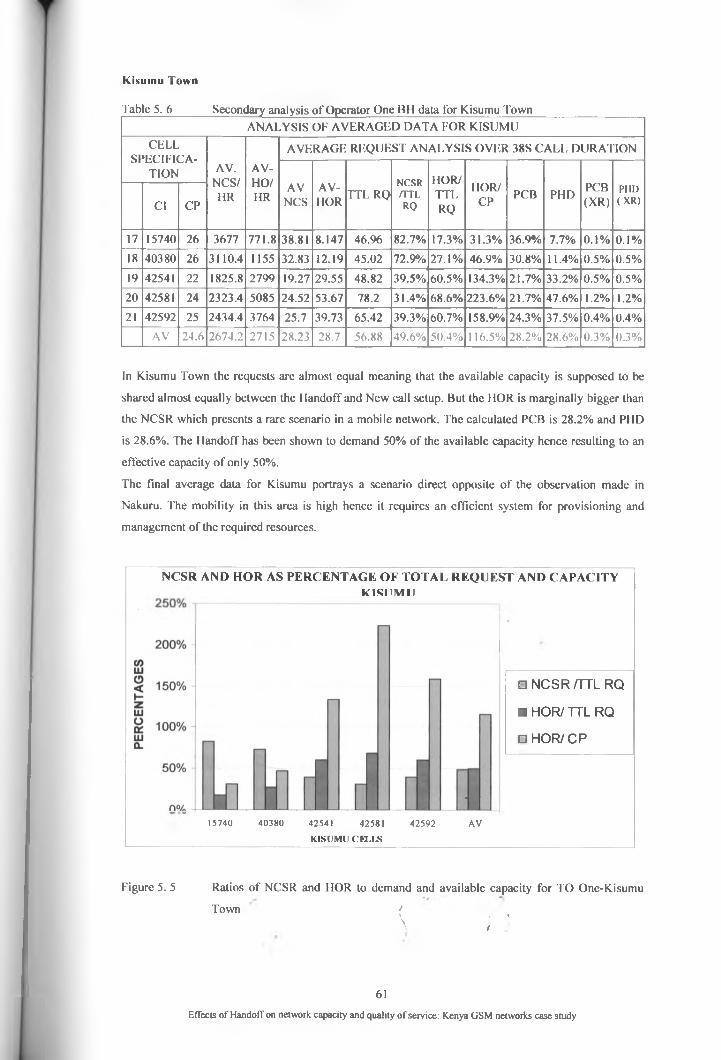
Kisuinu Town
Table 5. 6_______Secondary analysis o f Operator One BH data for Kisumu TownANALYSIS OF AVERAGED DATA FOR KISUMU
CELLSPECIFICA
TION AV.NCS/
HR
AV-HO/HR
AVERAGE REQUEST ANALYSIS OVER 38S CALL DURA HON
AVNCS
AV-IIOR
TTL RQN C SR/T T LRQ
HOR/TTLRQ
HOR/CP
PCB PHD PCB(XR)
P ill)( X R )Cl CP
17 15740 26 3677 771.8 38.81 8.147 46.96 82.7% 17.3% 31.3% 36.9% 7.7% 0.1% 0.1%18 40380 26 3110.4 1155 32.83 12.19 45.02 72.9% 27.1% 46.9% 30.8% 11.4% 0.5% 0.5%
19 42541 22 1825.8 2799 19.27 29.55 48.82 39.5% 60.5% 134.3% 21.7% 33.2% 0.5% 0.5%20 42581 24 2323.4 5085 24.52 53.67 78.2 31.4% 68.6% 223.6% 21.7% 47.6% 1.2% 1.2%21 42592 25 2434.4 3764 25.7 39.73 65.42 39.3% 60.7% 158.9% 24.3% 37.5% 0.4% 0.4%
AV 24.6 2674.2 2715 28.23 28.7 56.88 49.6% 50.4% 116.5% 28.2% 28.6% 0.3% 0.3%
In Kisumu Town the requests are almost equal meaning that the available capacity is supposed to be
shared almost equally between the Handoff and New call setup. But the HOR is marginally bigger than
the NCSR which presents a rare scenario in a mobile network. The calculated PCB is 28.2% and PHD
is 28.6%. The Handoff has been shown to demand 50% o f the available capacity hence resulting to an
effective capacity o f only 50%.
The final average data for Kisumu portrays a scenario direct opposite o f the observation made in
Nakuru. The mobility in this area is high hence it requires an efficient system for provisioning and
management o f the required resources.
NCSR AND HOR AS PERCENTAGE OF TO TAL REQUEST AND CAPACITYK IS I I M I I
□ NCSR /TTL RQ ■ HOR/ TTL RQ□ HOR/CP
15740 40380 42541 42581 42592 A V
K ISU M U C E L L S
Figure 5. 5 Ratios o f NCSR and HOR to demand and available capacity for TO One-Kisumu
Town f\ , \\ f
61
Effects o f Handoff on network capacity and quality o f service: Kenya GSM networks case study
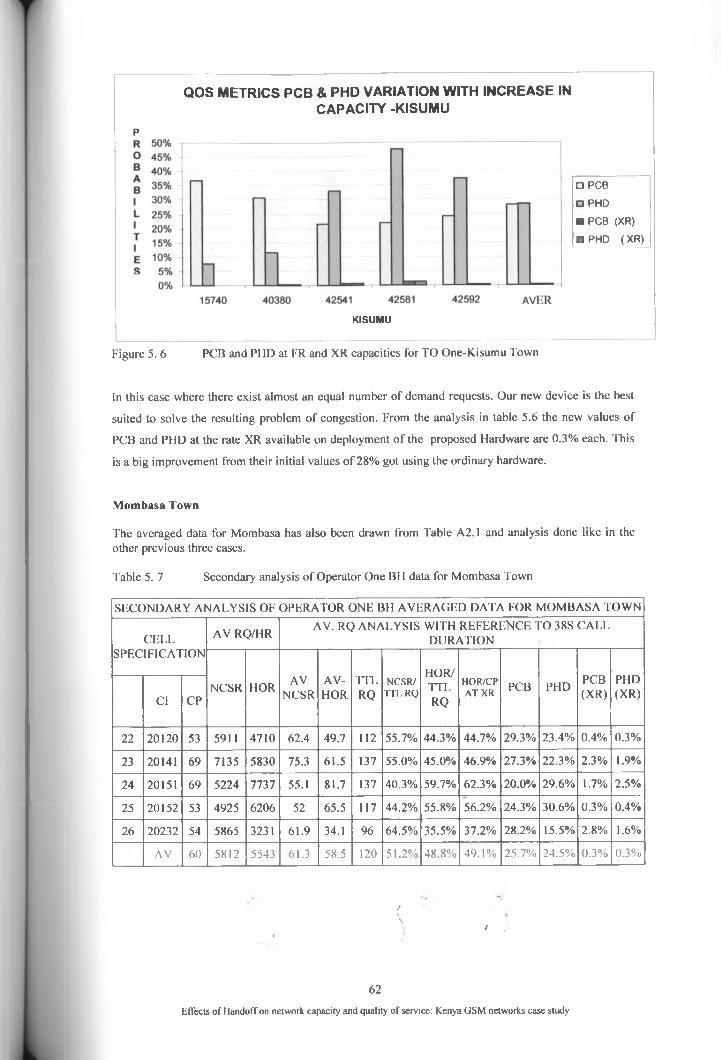
QOS METRICS PCB & PHD VARIATION WITH INCREASE IN CAPACITY -KISUMU
p
□ PCB□ PHD■ PCB (XR)□ PHD ( XR)
KISUMU
Figure 5. 6 PCB and PHD at FR and XR capacities for TO One-Kisumu Town
In this case where there exist almost an equal number of demand requests. Our new device is the best
suited to solve the resulting problem o f congestion. From the analysis in table 5.6 the new values of
PCB and PHD at the rate XR available on deployment o f the proposed Hardware are 0.3% each. This
is a big improvement from their initial values o f 28% got using the ordinary hardware.
Mombasa Town
The averaged data for Mombasa has also been drawn from Table A2.1 and analysis done like in the other previous three cases.
Table 5. 7 Secondary analysis o f Operator One BH data for Mombasa Town
SECONDARY ANALYSIS OF OPERA FOR ONE BH AVERAGED DATA FOR MOMBASA TOWN
CELLSPECIFICATION
AV RQ/HR AV. RQ ANALYSIS WITH REFERENCE TO 38S CALL DURATION
NCSR HOR AVNCSR
AV-HOR
TTLRQ
N CSR/ T T l. RQ
HOR/TTLRQ
HOR/CP A T X R
PCB PHD PCB(XR)
PHD(XR)Cl CP
22 20120 53 5911 4710 62.4 49.7 112 55.7% 44.3% 44.7% 29.3% 23.4% 0.4% 0.3%
23 20141 69 7135 5830 75.3 61.5 137 55.0% 45.0% 46.9% 27.3% 22.3% 2.3% 1.9%
24 20151 69 5224 7737 55.1 81.7 137 40.3% 59.7% 62.3% 20.0% 29.6% 1.7% 2.5%
25 20152 53 4925 6206 52 65.5 117 44.2% 55.8% 56.2% 24.3% 30.6% 0.3% 0.4%
26 20232 54 5865 3231 61.9 34.1 96 64.5% 35.5% 37.2% 28.2% 15.5% 2.8% 1.6%
AV 60 5812 5543 61.3 58.5 120 51.2% 48.8% 49.1% 25.7% 24.5% 0.3% 0.3%
>\ /
62
Effects o f Handoff on network capacity and quality o f service: Kenya GSM networks case study
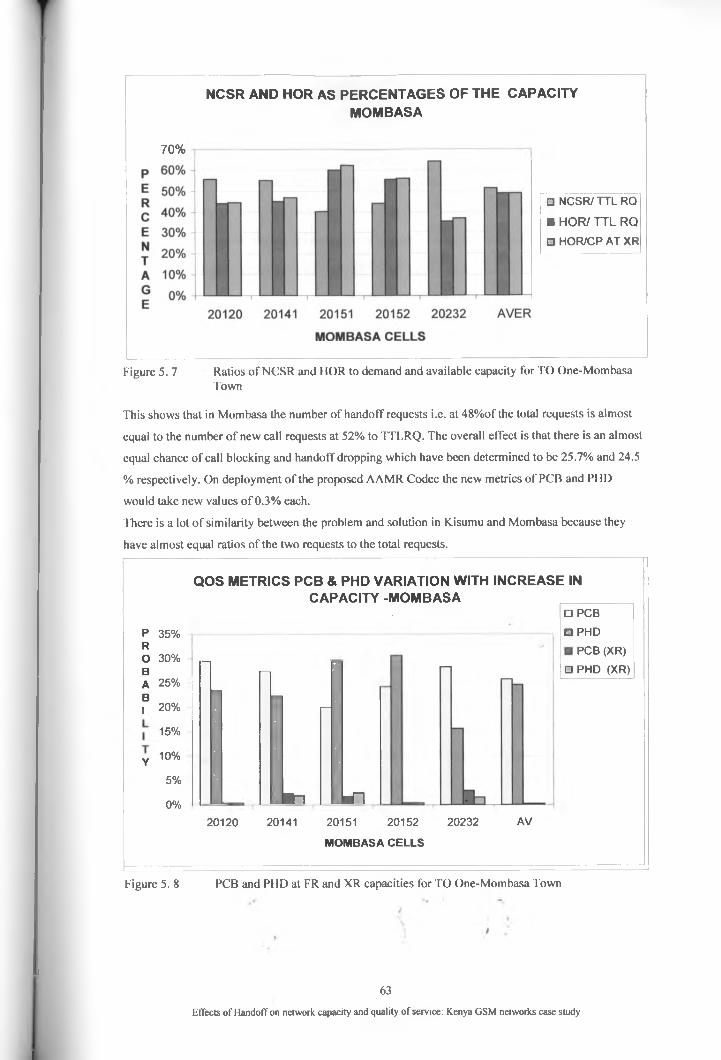
NCSR AND HOR AS PERCENTAGES OF TH E CAPACITYMOMBASA
70%
□ NCSR/TTL RQ ■ HOR/ TTL RQ□ HOR/CP AT XR
Figure 5. 7 Ratios o f NCSR and HOR to demand and available capacity for TO One-MombasaTown
This shows that in Mombasa the number of handoff requests i.e. at 48% of the total requests is almost
equal to the number o f new call requests at 52% to TTLRQ. The overall effect is that there is an almost
equal chance o f call blocking and handoff dropping which have been determined to be 25.7% and 24.5
% respectively. On deployment o f the proposed AAMR Codec the new metrics o f PCB and PHD
would take new values o f 0.3% each.
There is a lot o f similarity between the problem and solution in Kisumu and Mombasa because they
have almost equal ratios o f the two requests to the total requests.
QOS METRICS PCB & PHD VARIATION WITH INCREASE IN CAPACITY -MOMBASA
P 35%R0 30%BA 25%B1 20%
15%Y 10%
5%0%
20120 20141 20151 20152 20232 AV111
□ PCB□ PHD
PCB (XR)□ PHD (XR)
M O M B A S A C E LLS
Figure 5. 8 PCB and PHD at FR and XR capacities for TO One-Mombasa Town
,
63
Effects o f Handoff on network capacity and quality o f service: Kenya GSM networks case study
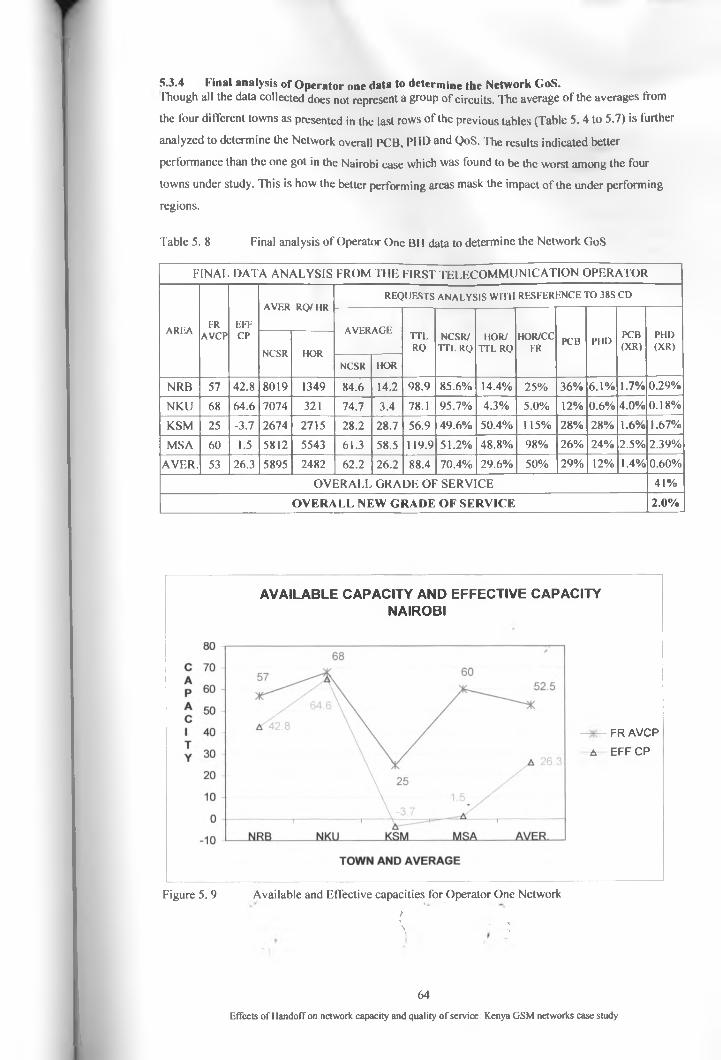
5.3.4 Final analysis of Operator one data to determine the Network GoS.Though all the data collected does not represent a group of circuits. The average o f the averages from
the four different towns as presented in the last rows o f the previous tables (Table 5. 4 to 5.7) is further
analyzed to determine the Network overall PCB, PH 17 and QoS. The results indicated better
performance than the one got in the Nairobi case which was found to be the worst among the four
towns under study. This is how the better performing areas mask the impact o f the under performing
regions.
Table 5. 8 Final analysis o f Operator One BH data to determine the Network GoS
FINAL DATA ANALYSIS FROM THE FIRST TELECOMMUNICATION OPERATOR
A R E AER
A V C PE F FC P
A V E R RQ/ HRR E Q U E S T S A N A L Y S IS W ITH R E S F E R E N C E T O 38S C D
A V E R A G ET T LRQ
N CSR/ T T L RQ
HOR/ T T L RQ
H O R/CCFR
PCB PHDPCB(X R )
PHD(X R )
N CSR HORN CSR HOR
NRB 57 42.8 8019 1349 84.6 14.2 98.9 85.6% 14.4% 25% 36% 6.1% 1.7% 0.29%
NK.U 68 64.6 7074 321 74.7 3.4 78.1 95.7% 4.3% 5.0% 12% 0.6% 4.0% 0.18%
K.SM 25 -3.7 2674 2715 28.2 28.7 56.9 49.6% 50.4% 115% 28% 28% 1.6% 1.67%
MSA 60 1.5 5812 5543 61.3 58.5 119.9 51.2% 48.8% 98% 26% 24% 2.5% 2.39%
AVER. 53 26.3 5895 2482 62.2 26.2 88.4 70.4% 29.6% 50% 29% 12% 1.4% 0.60%
OVERALL GRADE OF SERVICE 41%
OVERALL NEW GRADE OF SERVICE 2.0%
AVAILABLE CAPACITY AND EFFECTIVE CAPACITY NAIROBI
FR AVCP
A EFF CP
Figure 5. 9 Available and Effective capacities for Operator One Network
/\ ' :
64
Effects o f Handoff on network capacity and quality o f service: Kenya GSM networks case study
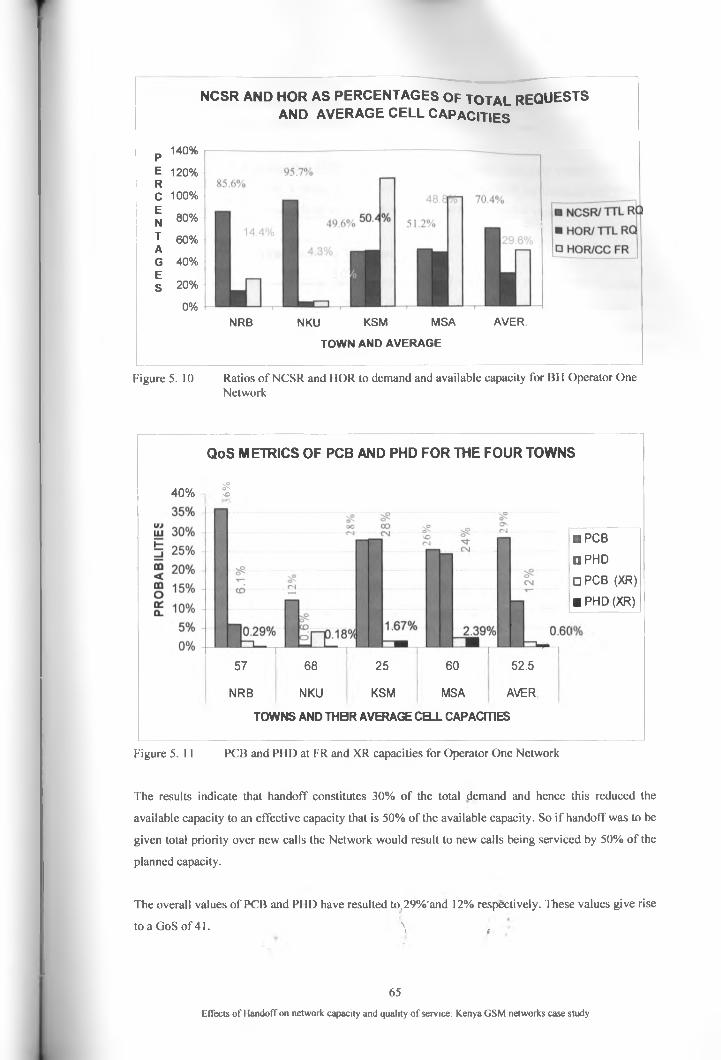
NCSR AND HOR AS PERCENTAGES OF TO TA L REQUESTS AND AVERAGE CELL CAPACITIES
p 140%
E 120%Rc 100%^ 80%
T 60%AG 40%Es 20%
0%NRB NKU KSM MSA AVER.
TO W N A N D A V E R A G E
Figure 5. 10 Ratios o f NCSR and HOR to demand and available capacity for BH Operator One Network
QoS METRICS OF PCB AND PHD FOR THE FOUR TOWNS
40% i I
□ PCB□ PHD□ PCB (XR) ■ PHD (XR)
57 68 25 60 52.5
NRB NKU KSM MSA AVER
TOWNS AND THEIR AVERAGE CELL CAPACITIES
Figure 5. 11 PCB and PHD at FR and XR capacities for Operator One Network
The results indicate that handoff constitutes 30% o f the total demand and hence this reduced the
available capacity to an effective capacity that is 50% o f the available capacity. So if handoff was to be
given total priority over new calls the Network would result to new calls being serviced by 50% o f the
planned capacity.
The overall values of PCB and PHD have resulted to,29% 'and 12% respectively. These values give rise
to a GoS o f 41. \ .
65
Effects o f Handoff on network capacity and quality o f service: Kenya GSM networks case study

From this analysis o f the final averaged data it shows that though HO has not been given any priority
over New Call setup. Available Network capacity does not meet the prevailing demand o f which HO
constitutes 30%. This is a clear indication that the low GoS o f 41% has resulted out o f the effect of
handoff on Capacity.
On application o f the proposed A AMR device, PCB and PHD would take new values o f 1.4% and
0.6% respectively, and GoS a value o f 2%. This is a significant network performance improvement
making the performance change from an intolerable state to the recommended standard.
5.3.5 Analysis of non BH data from Operator One
The bad state o f affairs observed in the analyses o f the BH data can be misconstrued to create an
impression that the Telecommunication Operator One’s Network performance is always very poor.
As a result o f trying to allay fears that an operators market can be affected by our research findings
which have revealed serious flaws in the network performance. We requested for the non busy hour
data for analysis
The non BH data is analyzed in a similar way to the BH data. The data was taken from cells selected
randomly and data recorded for duration o f one hour for 60 days. The basic analysis o f this data is
contained in Table A2.3 in appendix 2.
This non BH data has resulted into almost the expected values o f QoS. Since values o f the two Metrics
that is PCB and PHD have ranged between 0 and 2, there has been no need o f suggesting any
mitigation factors since the network seems to be managing the existing load. If the device (AAMR)
was deployed to the network it would maintain all the channels at full rate and hence create zero
change in GoS.
5.3.6 Final analysis of Operator One non BH data
Table 5. 9 Final analysis o f the Non BH data for Operator OneNON BUSY HOUR (BH) DATA ANALYSIS
AREA AVERNTCHD
AVERNCB
AVERNCS
AVERNHO
TTLTCHALL.
QoS Metrics/
HO/ AV. CP
HO /NCS RQ
PCB PHD
NRB 11.9 6.3 1377.1 1068.1 2445.2 0.46% 1.11% 43.68% 77.56%NKU 6.0 5.8 760.5 888.0 1648.4 0.76% 0.68% 53.87% 116.77%MSA 10.1 14.1 823.4 231.3 1054.7 1.71% 4.35% 21.93% 28.09%KSM 15.2 41.7 1571.0 1093.5 2664.4 2.65% 1.39% 41.04% 69.61%
AVER. 10.8 17.0 1133.0 820.2 1953.2 1.47% 1.30% 41.99% 72.39%
OVERALL GRADE OF SERVICE 1.42%
/
66
Effects o f Handoff on network capacity and quality o f service: Kenya GSM networks case study
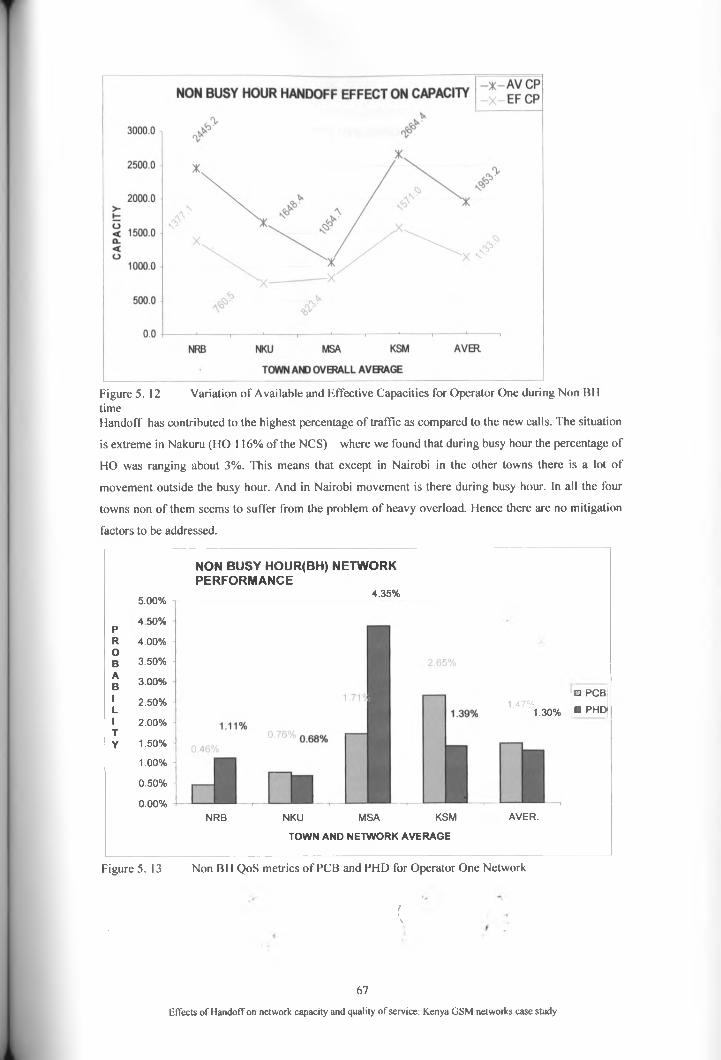
Figure 5. 12 Variation o f Available and Effective Capacities for Operator One during Non BH timeHandoff has contributed to the highest percentage o f traffic as compared to the new calls. The situation
is extreme in Nakuru (HO 116% o f the NCS) where we found that during busy hour the percentage o f
HO was ranging about 3%. This means that except in Nairobi in the other towns there is a lot o f
movement outside the busy hour. And in Nairobi movement is there during busy hour. In all the four
towns non o f them seems to suffer from the problem o f heavy overload. Hence there are no mitigation
factors to be addressed.
pR0 B A B1LITY
5.00% 4 50% 4 .00% 3.50% 3.00% 2.50% 2.00%
1.50% 1.00%
0.50% 0 .00%
NON BUSY HOUR(BH) NETWORK PERFORMANCE
4 .35%
NRB NKU MSA KSM
TOWN AND NETWORK AVERAGE
1.47%1.30%□ PCB ■ PHD
AVER.
Figure 5. 13 Non BH QoS metrics o f PCB and PHD for Operator One Network
/\
67
Effects o f Handoff on network capacity and quality o f service: Kenya GSM networks case study

C A P A C ITY U T ILIZA T IO N □ HO/ AV. CP
■ HO/NCSReq
Figure 5. 14 Non BH Ratios o f HOR to available capacity and NCSR for Operator One
Analysis for the non Busy Hour (non peak hour) data was consolidated together that is the basic and
the second level o f analysis to be able to indicate the prevailing level o f QoS. As stated earlier QoS can
be established for any duration o f time and for any group of circuits.
The result o f this analysis is that the network performs as expected outside the BH time. The average
GoS o f 1.42% is actually better than the stated upper limit value o f 2%.
But this does not mean that in the two towns o f Kisumu and Mombasa where the performance has
resulted to GoS o f 2.13% and 2.3% respectively should not be investigated further. The overshoot is
not marginal for all practical purposes. Possible causes o f low GoS in these two towns is the effect o f
water on signal propagation and the resulting difficult in positioning o f the base stations.
One way o f improving the GoS in the two affected towns would be conversion o f some of the SDCCH
to TCH channels. Such a network configuration would establish a different equilibrium point at a better
GoS.
5.4 Analysis o f Telecommunication Operator two data
Telecommunication Operator (TO) Two gave data for all the sites referred to by the names o f the four
towns we quoted. All the data for the high trafficking cells in Kisumu, Mombasa, Nakuru and Nairobi
was given for seven days ranging from 6th February to 12th February, 2011.
This data has been filtered to get the cells with the most traffic per TCH. Ten cells were identified in
Nairobi, five in Kisumu, seven in Nakuru and six in Mombasa. The analysis has been carried out\ ' '
following the same formulae as for the Operator One data. In the casetf where calculated values result
68
Effects o f Handoff on network capacity and quality o f service: Kenya GSM networks case study
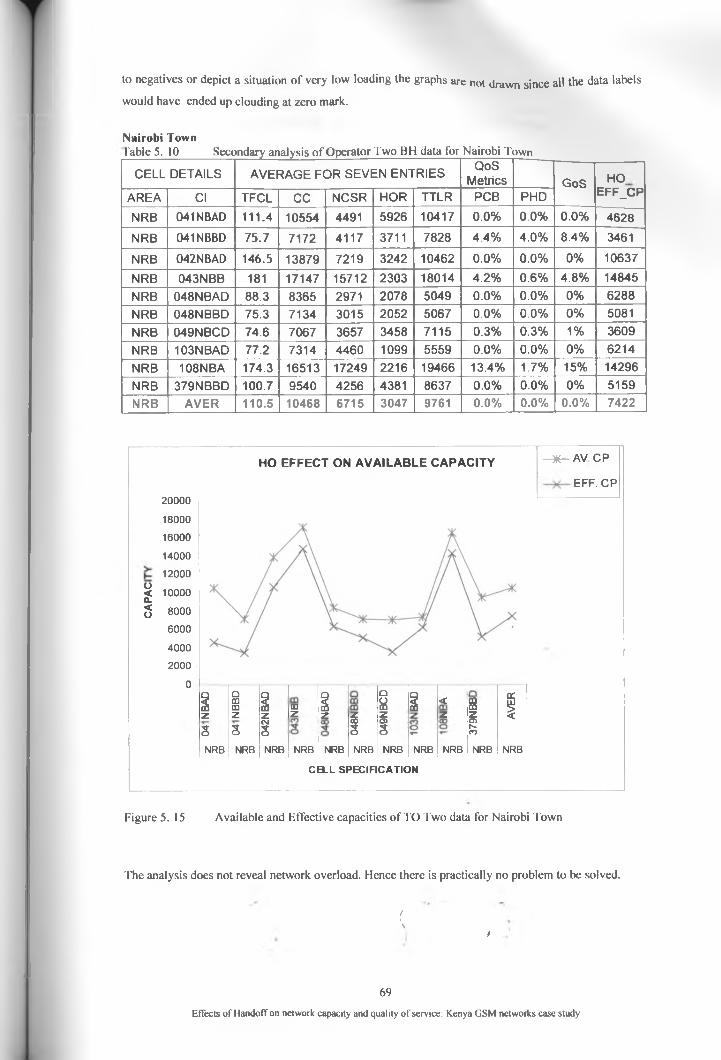
to negatives or depict a situation o f very low loading the graphs are not drawn since all the data labels
would have ended up clouding at zero mark.
Nairobi TownTable 5. 10______Secondary analysis o f Operator Two BH data for Nairobi Town
CELL DETAILS AVERAGE FOR SEVEN ENTRIES QoSMetrics GoS HO
EFF_CPAREA Cl TFCL CC NCSR HOR TTLR PCB PHDNRB 041NBAD 111.4 10554 4491 5926 10417 0.0% 0.0% 0.0% 4628NRB 041NBBD 75.7 7172 4117 3711 7828 4.4% 4.0% 8.4% 3461NRB 042NBAD 146.5 13879 7219 3242 10462 0.0% 0.0% 0% 10637NRB 043NBB 181 17147 15712 2303 18014 4.2% 0.6% 4.8% 14845NRB 048N BAD 88.3 8365 2971 2078 5049 0.0% 0.0% 0% 6288NRB 048NBBD 75.3 7134 3015 2052 5067 0.0% 0.0% 0% 5081NRB 049NBCD 74.6 7067 3657 3458 7115 0.3% 0.3% 1% 3609NRB 103NBAD 77.2 7314 4460 1099 5559 0.0% 0.0% 0% 6214NRB 108NBA 174.3 16513 17249 2216 19466 13.4% 1.7% 15% 14296NRB 379NBBD 100.7 9540 4256 4381 8637 0.0% 0.0% 0% 5159NRB AVER 110.5 10468 6715 3047 9761 0.0% 0.0% 0.0% 7422
HO EFFECT ON AVAILABLE CAPACITY
o2<o
20000
18000160001400012000
10000
8000600040002000
0
1QCO 1z CDz zCNJ
3 3 3NRB NRB NRB
1 Oy 1 < S SCD
z zi
m
I v—Z 1r-co
%NRB NRB NRB NRB NRB NRB NRB NRB
CELL SPECIFICATION
- * -A V CP EFF. CP
Figure 5. 15 Available and Effective capacities o f TO Two data for Nairobi Town
The analysis does not reveal network overload. Hence there is practically no problem to be solved.
/\ i
69
Effects o f Handoffon network capacity and quality o f service: Kenya GSM networks case study
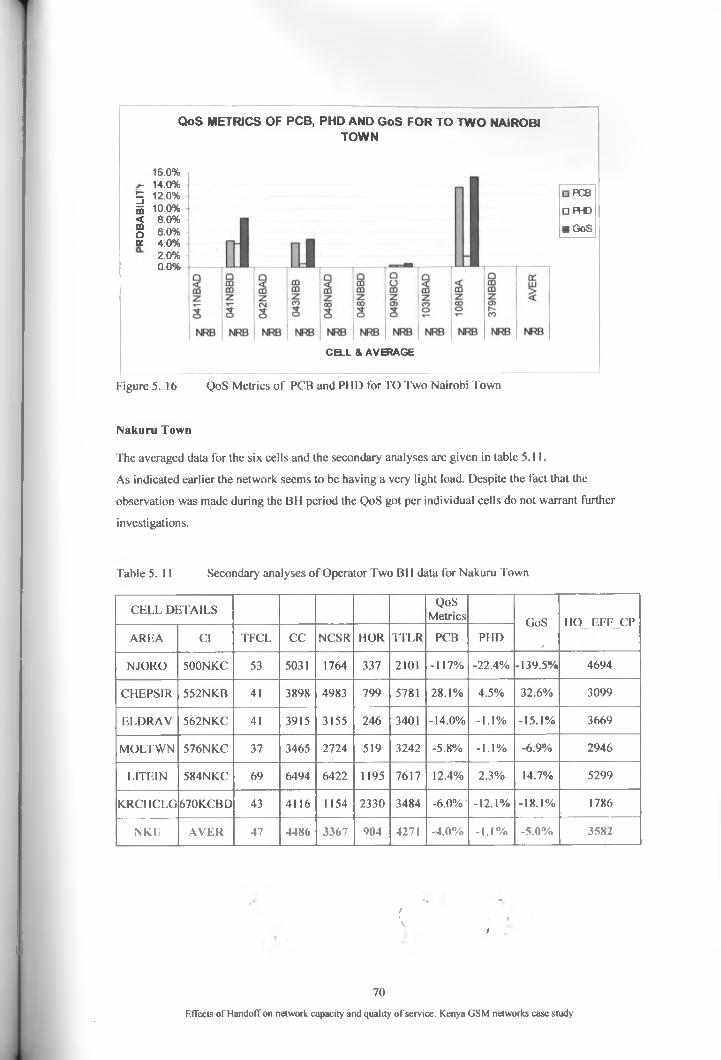
QoS METRICS OF PCB, PHD AND GoS FOR TO TWO NAIROBITOWN
16.0% j - 14.0% 5 12.0% 5 10.0% < 8.0% g 6.0%tr 4 .0%
2.0%0.0%
□ FOB
□ PHD
■ GoS
CELL & AVERAGE
Figure 5. 16 QoS Metrics o f PCB and PHD for TO Two Nairobi Town
INakuru Town
The averaged data for the six cells and the secondary analyses are given in table 5.11.
As indicated earlier the network seems to be having a very light load. Despite the fact that the
observation was made during the BH period the QoS got per individual cells do not warrant further
investigations.
fable 5. 11 Secondary analyses o f Operator Two BH data for Nakuru Town
CELL DETAILSQoS
Metrics GoS
/
HO EFF CPAREA Cl TFCL CC NCSR HOR TTLR PCB PHD
NJORO 500NK.C 53 5031 1764 337 2101 -117% -22.4% -139.5% 4694
CHEPS1R 552NK.B 41 3898 4983 799 5781 28.1% 4.5% 32.6% 3099
ELDRAV 562NK.C 41 3915 3155 246 3401 -14.0% -1.1% -15.1% 3669
MOLTWN 576NK.C 37 3465 2724 519 3242 -5.8% -1.1% -6.9% 2946
LITEIN 584NK.C 69 6494 6422 1195 7617 12.4% 2.3% 14.7% 5299
K.RCHCLG 670K.CBD 43 4116 1154 2330 3484 -6.0% -12.1% -18.1% 1786
1NKL) AVER 47 4486 3367 904 4271 -4.0% -1.1% -5.0% 3582
>\ i
70
Effects o f Handoff on network capacity and quality o f service: Kenya GSM networks case study
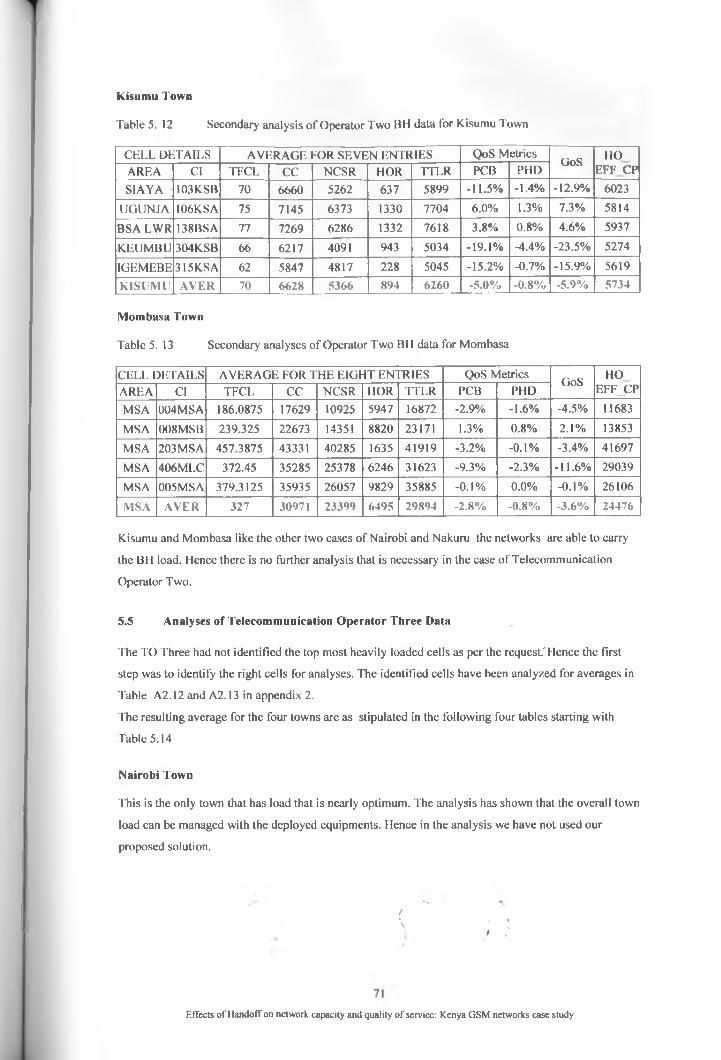
Kisumu Town
Table 5. 12 Secondary analysis o f Operator Two BH data for Kisumu Town
CELL DETAILS AVERAGE FOR SEVEN ENTRIES QoS MetricsGoS HO
E F F C PAREA Cl TFCL CC NCSR HOR TTLR PCB PHD
S1AYA 103KSB 70 6660 5262 637 5899 -11.5% -1.4% -12.9% 6023
UGUNJA I06KSA 75 7145 6373 1330 7704 6.0% 1.3% 7.3% 5814
BSA LWR 138BSA 77 7269 6286 1332 7618 3.8% 0.8% 4.6% 5937
KEUMBU 304KSB 66 6217 4091 943 5034 -19.1% -4.4% -23.5% 5274
1GEMEBE 315KSA 62 5847 4817 228 5045 -15.2% -0.7% -15.9% 5619
KISUMU AVER 70 6628 5366 894 6260 -5.0% -0.8% -5.9% 5734
Mombasa Town
Table 5. 13 Secondary analyses of Operator Two BH data for Mombasa
CELL DETAILS AVERAGE FOR THE EIGHT ENTRIES QoS MetricsGoS HO
E F F C PAREA Cl TFCL CC NCSR HOR TTLR PCB PHD
MSA 004MSA 186.0875 17629 10925 5947 16872 -2.9% -1.6% -4.5% 11683
MSA 008MSB 239.325 22673 14351 8820 23171 1.3% 0.8% 2.1% 13853
MSA 203MSA 457.3875 43331 40285 1635 41919 -3.2% -0.1% -3.4% 41697
MSA 406MLC 372.45 35285 25378 6246 31623 -9.3% -2.3% -11.6% 29039
MSA 005 MSA 379.3125 35935 26057 9829 35885 -0.1% 0.0% -0.1% 26106
MSA AVER 327 30971 23399 6495 29894 -2.8% -0.8% -3.6% 24476
Kisumu and Mombasa like the other two cases o f Nairobi and Nakuru the networks are able to carry
the BH load. Hence there is no further analysis that is necessary in the case o f Telecommunication
Operator Two.
5.5 Analyses of Telecommunication Operator Three Data
The TO Three had not identified the top most heavily loaded cells as per the request.'Hence the first
step was to identify the right cells for analyses. The identified cells have been analyzed for averages in
Table A2.12 and A 2.13 in appendix 2.
The resulting average for the four towns are as stipulated in the following four tables starting with
fable 5.14
Nairobi Town
This is the only town that has load that is nearly optimum. The analysis has shown that the overall town
load can be managed with the deployed equipments. Hence in the analysis we have not used our
proposed solution.
t\
Effects o f Handoff on network capacity and quality o f service: Kenya GSM networks case study
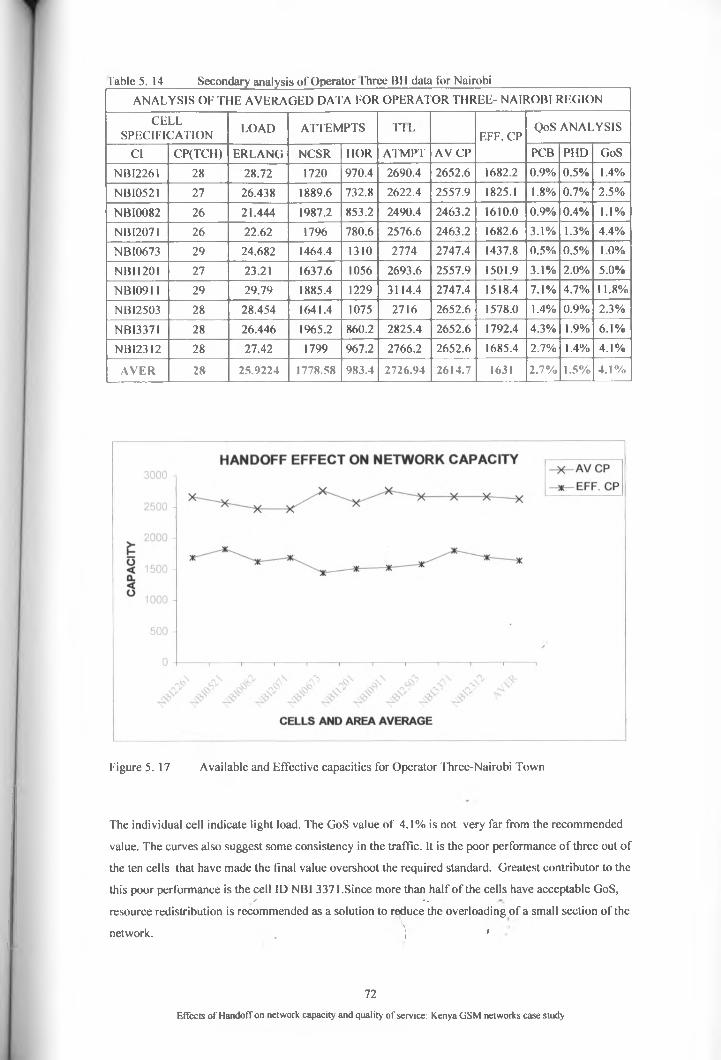
Table 5. 14______Secondary analysis o f Operator Three BH data for Nairobi
ANALYSIS OF THE AVERAGED DATA FOR OPERATOR THREE- NAIROBI REGION
CELLSPECIFICATION LOAD ATTEMPTS T IL
EFF. CPQoS ANALYSIS
Cl CP(TCH) ERLANG NCSR HOR ATMPT AV CP PCB PHD GoS
N B12261 28 28.72 1720 970.4 2690.4 2652.6 1682.2 0.9% 0.5% 1.4%
NB10521 27 26.438 1889.6 732.8 2622.4 2557.9 1825.1 1.8% 0.7% 2.5%
NB10082 26 21.444 1987.2 853.2 2490.4 2463.2 1610.0 0.9% 0.4% 1.1%
NBI2071 26 22.62 1796 780.6 2576.6 2463.2 1682.6 3.1% 1.3% 4.4%
NBI0673 29 24.682 1464.4 1310 2774 2747.4 1437.8 0.5% 0.5% 1.0%
NB1120I 27 23.21 1637.6 1056 2693.6 2557.9 1501.9 3.1% 2.0% 5.0%
NBI0911 29 29.79 1885.4 1229 3114.4 2747.4 1518.4 7.1% 4.7% 11.8%
NBI2503 28 28.454 1641.4 1075 2716 2652.6 1578.0 1.4% 0.9% 2.3%
NBI3371 28 26.446 1965.2 860.2 2825.4 2652.6 1792.4 4.3% 1.9% 6.1%
NBI2312 28 27.42 1799 967.2 2766.2 2652.6 1685.4 2.7% 1.4% 4.1%
AVER 28 25.9224 1778.58 983.4 2726.94 2614.7 1631 2.7% 1.5% 4.1%
Figure 5 .17 Available and Effective capacities for Operator Three-Nairobi Town
The individual cell indicate light load. The GoS value of 4.1% is not very far from the recommended
value. The curves also suggest some consistency in the traffic. It is the poor performance o f three out o f
the ten cells that have made the final value overshoot the required standard. Greatest contributor to the
this poor performance is the cell ID NBI 3371.Since more than half o f the cells have acceptable GoS,'/ •#
resource redistribution is recommended as a solution to reduce the overloading o f a small section of the
network. . ] '
72
Effects o f Handoff on network capacity and quality o f service: Kenya GSM networks case study
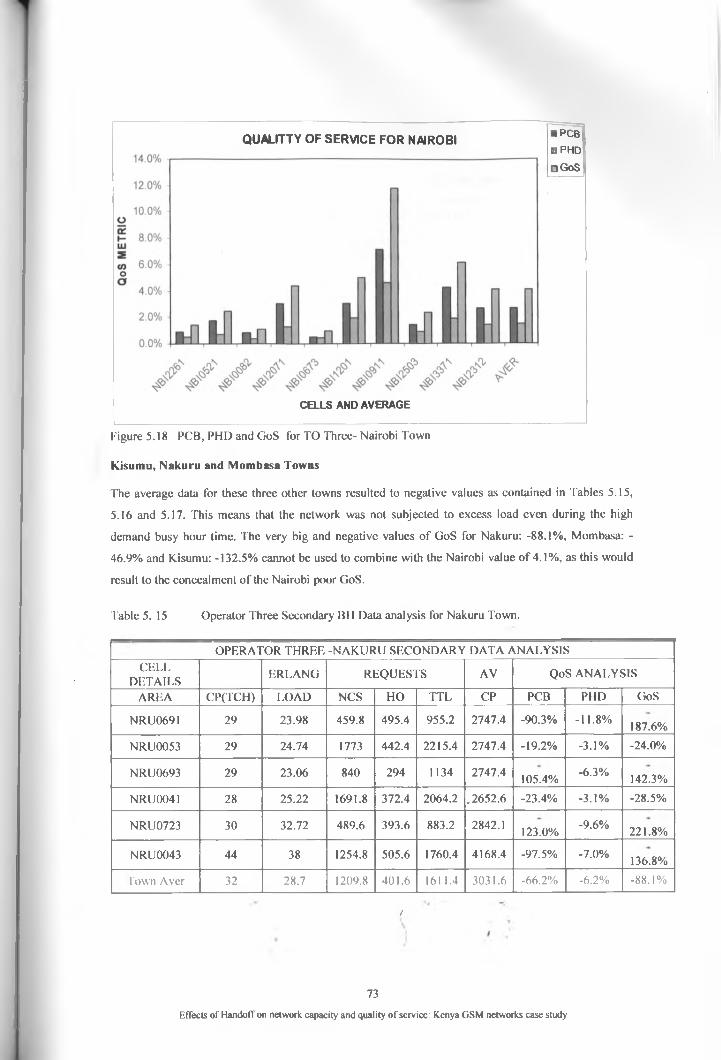
QUALITTY OF SERVICE FOR NAIROBI
CELLS AND AVERAGE
■ PCB□ PHD□ GoS
Figure 5.18 PCB, PHD and GoS for TO Three-Nairobi Town
Kisumu, Nakuru and Mombasa Towns
The average data for these three other towns resulted to negative values as contained in Tables 5.15,
5.16 and 5.17. This means that the network was not subjected to excess load even during the high
demand busy hour time. The very big and negative values o f GoS for Nakuru: -88.1%, Mombasa: -
46.9% and Kisumu: -132.5% cannot be used to combine with the Nairobi value o f 4.1%, as this would
result to the concealment o f the Nairobi poor GoS.
Table 5. 15 Operator Three Secondary BH Data analysis for Nakuru Town.
OPF.RATOR THREE -NAKURU SECONDARY DATA ANALYSISCELL
DETAILSERLANG REQUESTS AV QoS ANALYSIS
AREA CP(TCH) LOAD NCS HO TTL CP PCB PHD GoS
NRU0691 29 23.98 459.8 495.4 955.2 2747.4 -90.3% -11.8% 187.6%
NRU0053 29 24.74 1773 442.4 2215.4 2747.4 -19.2% -3.1% -24.0%
NRU0693 29 23.06 840 294 1134 2747.4 105.4% -6.3% 142.3%
NRU0041 28 25.22 1691.8 372.4 2064.2 .2652.6 -23.4% -3.1% -28.5%
NRU0723 30 32.72 489.6 393.6 883.2 2842.1 123.0% -9.6% 221.8%
NRU0043 44 38 1254.8 505.6 1760.4 4168.4 -97.5% -7.0% 136.8%
Town Aver 32 28.7 1209.8 401.6 1611.4 3031.6 -66.2% -6.2% -88.1%
>
73
Effects o f Handoff on network capacity and quality o f service: Kenya GSM networks case study
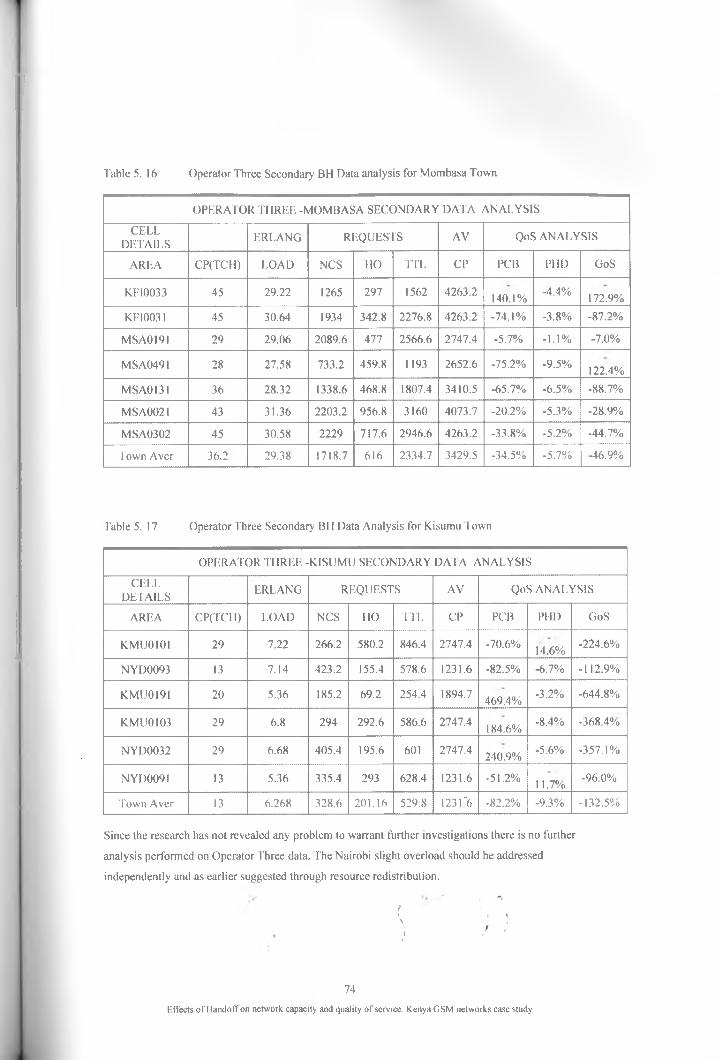
Table 5. 16 Operator Three Secondary BH Data analysis for Mombasa Town
OPERATOR THREE -MOMBASA SECONDARY DATA ANALYSIS
CELLDETAILS ERLANG REQUESTS AV QoS ANALYSIS
AREA CP(TCH) LOAD NCS HO TTL CP PCB PHD GoS
KFI0033 45 29.22 1265 297 1562 4263.2 140.1% -4.4% 172.9%
KFI0031 45 30.64 1934 342.8 2276.8 4263.2 -74.1% -3.8% -87.2%
MSA0191 29 29.06 2089.6 477 2566.6 2747.4 -5.7% -1.1% -7.0%
MSA0491 28 27.58 733.2 459.8 119.3 2652.6 -75.2% -9.5% 122.4%
MSA0131 36 28.32 1338.6 468.8 1807.4 3410.5 -65.7% -6.5% -88.7%
MSA0021 43 31.36 2203.2 956.8 3160 4073.7 -20.2% -5.3% -28.9%
MSA0302 45 30.58 2229 717.6 2946.6 4263.2 -33.8% -5.2% -44.7%
Town Aver 36.2 29.38 1718.7 616 2334.7 3429.5 -34.5% -5.7% -46.9%
Table 5. 17 Operator Three Secondary BH Data Analysis for Kisumu Town
OPERATOR THREE -KISUMU SECONDARY DA TA ANALYSIS
CELLDETAILS ERLANG REQUESTS AV QoS ANALYSIS
AREA CP(TCH) LOAD NCS HO TTL CP PCB PHD GoS
KMU0101 29 7.22 266.2 580.2 846.4 2747.4 -70.6% 14.6% -224.6%
NYD0093 13 7.14 423.2 155.4 578.6 1231.6 -82.5% -6.7% -112.9%
KMU0191 20 5.36 185.2 69.2 254.4 1894.7 469.4% -3.2% -644.8%
KMU0103 29 6.8 294 292.6 586.6 2747.4 184.6% -8.4% -368.4%
NYD0032 29 6.68 405.4 195.6 601 2747.4 240.9% -5.6% -357.1%
NYD0091 13 5.36 335.4 293 628.4 1231.6 -51.2% 11.7% -96.0%
Town Aver 13 6.268 328.6 201.16 529.8 1231*6 -82.2% -9.3% -132.5%
Since the research has not revealed any problem to warrant further investigations there is no further
analysis performed on Operator Three data. The Nairobi slight overload should be addressed
independently and as earlier suggested through resource redistribution.
>\
» j
74
Effects of Ilandoff on network capacity and quality of service: Kenya GSM networks case study
CHAPTER 6 CONCLUSIONS AND RECOMMENDATIONS
6.1 Introduction
Telecommunication Operators are licensed and supervised by the National Communication Regulatory
Authorities. The communication standards bodies set the relevant standards and regulations with
reference to the ITU recommendations. The subscribers who are Customers to the TOs do not get to
know the licensing requirements on the QoS to be offered by the Service Providers. Although the
quality thresholds are available majority of the Customers either do not know or take that these
references are of no use to them.
Some of the technical requirements quoted in the licenses are Quality of Service standards specifically
the requirement on the GoS. The standard GoS is normally administered through the two factors of
Network unavailability (call blocking) and forced termination (call dropping).
The problems of call blocking and call dropping have become so prevalent these days. This is why we
decided to carry out a practical determination of the gravity of these two problems.
The main purpose of this study was to determine the Quality of Service being offered by the leading
Mobile Telecommunication Operators and compare with the internationally recommended value. This
objective was met through the successful achievements of the following:
> Identification of the Handoff schemes implemented by the three leading GSM network
operators in Kenya and evaluation of their performance by determination of the effect of
catering/provisioning for Handoff calls on network capacity.
> Determination of the effect of Handoff calls on the network Quality of Service using the
probability of handoff call dropping, probability of call blocking and the probability of failure
of allocation of traffic channel (GoS) metrics of measurement.
> Development of a suitable conceptual Handoff and network configuration framework that
optimizes the network capacity and Quality of service.
Based on the presented results this study achieved its objectives and the following conclusions have
been drawn.
6.2 Handoff Schemes identification and effect on network performance.
The handoff schemes determine the number or fraction of the available TCH that is provisioned for
handoff. As the total number of TCH equal to the available capacity, it means that the employed
scheme determines the resulting effective capacity.
The network operator decides on the scheme to employ through the identification of suitable Key
performance Indicators (KPI). The three Operators stated that the schemes in use within their Networks
were the Zero Priority Schemes (ZPS). That is the Handoff algorithms in use by the three TOs are the
same. The ZPS means a scheduling algorithm that ensures that the new calls and the handoff calls are
given equal chances of acquiring new TCH. The effect on performance is that new calls are blocked
only if there are no free TCH. The overall effect is that the GoS got-with Zero priority schemes is the>
best that can be obtained. Any other algorithm serves to satisfy a section of the'Subscribers and
worsens the GoS. So the employed HO scheme has no direct effect on the networks GoS.
75
Effects of Handoff on network capacity and quality of service: Kenya GSM networks case study
6.3 Determination of network Quality of Service
Quality of Service is one of the Networks measures of performance. For rolled out networks then, it is
only fair to comment on the QoS after it is practically determined. In the literature review a number of
studies to determine the network QoS were discussed. All of the highlighted studies and practically all
of the published network performance research findings are theoretical. The problem is the fact that the
studies rely on modeling of the networks under investigation. It was argued that non of those methods
would be appropriate for application to a live or existing Network.
It is also noted that the previous researches do not focus on the time the Networks are likely to offer
lower quality than the standard stipulated in the Key Performance Indicators (KPI). Under normal
circumstances the BU is the time when the network load is at the peak. I'his is the same time that the
Network underperforms. It was also noted that since it is not feasible for outsiders(researchers) to
conduct research on a live system. There are no research findings on BH available determined from
real Networks. The research that are conducted by the TOs tend to generalize so that the network
weakness is not clearly brought out. Whereas it is recommended that the Network consistently meets
the stipulated level of GoS very little attention has been paid to the BU period.
In this study on analysis of the data collected, it has shown that during Busy Hour, both
Telecommunication Operators Two and Three offer GoS that is better than the upper limit of 2%
expected in the worst case scenario. In these two cases the networks overall GoS has not been analyzed
beyond the secondary analysis. This is because for TO Two the four towns GoS results of Nairobi:0%,
Nakuru:-5%, Mombasa:-3.6% and Kisumu: -5.9% got from the secondary' data analysis, confirms that
the network is under utilized and hence the overall GoS is 0%. For TO Three the GoS results got for
the four towns were Nairobi: 4.1%, Nakuru: -88.1%, Mombasa: -46.9% and Kisumu: -132.5%. The
Network indicated some light overload in Nairobi. Combination of the Nairobi small positive GoS with
the big Negative values of Nakuru, Mombasa and Kisumu would result to a negative value for the
whole Network. This indicates that Operator Three has no overload problem, the revealed low GoS
value within Nairobi can be solved through resource redistribution.
The BH GoS for Operator One found in this research was 41%. t his value is too big as compared to
the set maximum allowable value of 2%. As a result of this extremely high GoS a second set of data
(non BH) was collected. The non BH data revealed a GoS of 1.42%. In the secondary analysis of the
BH data we have used both Full rate Available Capacity and X-rate the conceptualized rate capacity
from the model solution. It has been demonstrated that in the new X-rate codec can improve the
Operator one GoS from 41% to the maximum allowed 2%. There is provision for more improvement of
GoS to even lower values less than 2%. but such configurations would result to unoccupied low bit-rate
channels.
The conceptual solution designed was based on network expansion through modification of the
network hardware codec. f , ,\ i, I
76
Effects of Handoff on network capacity and quality of service: Kenya GSM networks case study
6.4 Network Capacity expansion
The problem of congestion means that the network is unable to service the demand at that time of
observation. This comes as a result of all the available resources being engaged. In case of a congested
network the major observation by the network users is high rate of call drops and call blocking. The
solution to this problem has been achieved through capacity expansion.
The proposed solution is a modification of a network device the Codec that is capable of
accommodating higher number of subscribers than the number the network is planned for. This new
device is capable of making subscribers share a TCH (during high demand time) which would under
optimum loading be meant for a single user.
The designed Advanced Adaptive Multi-Rate Codec (AARM) is triggered by the network load level
and the rate of increase of the cell load as generalized using equation 3.4.1(e). The rate of change of
the network load to trigger the codec to start splitting channels was determined using equation 3.4.1(f)
that was derived using the network average call duration time d of 40s. optimization of the timing t and
the rate of request r% . The two trigger factors of load level and rate of requests-r% can be varied and
the resulting action can as well be more refined to achieve any desired accuracy and corresponding
KPI.
The AAMR system can allocate one TCH to one, two or four subscribers. It is however noble to have it
adapt to any denomination of rate. But due to the symmetry of the GSM digital frame used to transmit
the payload data. Odd number and fractional sharing of TCH would result to a technical problem due to
synchronization and delay jitter.
The parallel analysis of Operator One BIT data using the Available full rate capacity and the modeled
X-rate capacity has shown great improvement of the GoS (from 41% to 2%). This'shows that Network
Capacity Expansion is the solution to BH congestion. A lot of care has been taken to chuse minimal
changes to the network to minimize on the costs and time to implement the changes.
6.5 Recommendations
There are no publications of research by mobile TO to reveal their operational Qos values. This is a
strong indicator that Mobile TOs do not always adhere to the set standard of QoS.
Since anybody else would only be in a position to conduct theoretical research. It should therefore be
the responsibility of the regulator to measure the Mobile Networks Qos. This can be done by ensuring
that the Regulator has access or can intercept all the TMNs Network Management information. This
can serve to increase the Qos offered, since the Operator would have no control of when the assessment
is conducted.
The research has shown that during Busy Hour the performance of the network with a big number of
customers deteriorates to a,level below the minimum stipulated by ITU. The-network performancet
during other times has also been established to be within the'recommended range. '
77
Effects of Handoff on network capacity and quality of service: Kenya GSM networks case study
As the performance declines to below standard for only a short time. It is strongly recommended to the
Mobile Operators to deploy hardware that can dynamically adapt to the changing and unpredictable
traffic load. The existing AMR was designed to reduce the impact of this problem. But later on
Planners planned the network with its extended capacity under consideration and hence the increased
capacity could not be used to cater for unprecedented load overshoots.
This is where the AAMR comes in handy. Its capability to adapt to three different rates and the
resulting acceptable performance (MOS), makes it indispensable.
We therefore recommend its deployment to reduce this problem of periodic congestion.
6.6 Further Research Work
In this research, it was established that for mature highly subscribed Networks there is congestion
during the Busy Hour period. It would be desirable to have the subscribers acquire and use the services
to their satisfaction, at all times. This would require a lot of network resources, which can be
incorporated into the network at the time their requirements arises. Any new equipment (or new
resources) would call for major network re-planning.
The resulting problem can be solved through capacity expansion using the existing resources. There
exists a number of ways through which the network existing capacity can be expanded at minimum
change in the network major components and protocols. The modification of the AMR codec used as a
solution in this study is one of the appropriate expansion methods. The other method is the
improvement of the spectral efficiency through a better modulation scheme that can allow a single 200
KHz channel to be used by more than 8 Subscribers. Further research is recommended in this line.
We also recommend research on new network hardware that can enable any intermediate level of
sharing of traffic channels. The Network hardware device that can be used to facilitate splitting of
channels to any fraction of user payload other than the existing fractions of powers of two, for example
enabling odd number of (three, five e.t.c.) subscribers share a single channel as opposed to die existing
level of sharing by even number (two, four e.t.c.) of Subscribers.
There is a wide field of research that is relevant to the identified problem. But such research should be
limited to the sections of the network where a big fraction of the network existing hardware would
continue being usable without major alterations or changes in the protocols applied.
\i
78
Effects ofHandoffon network capacity and quality of service: Kenya GSM networks case study
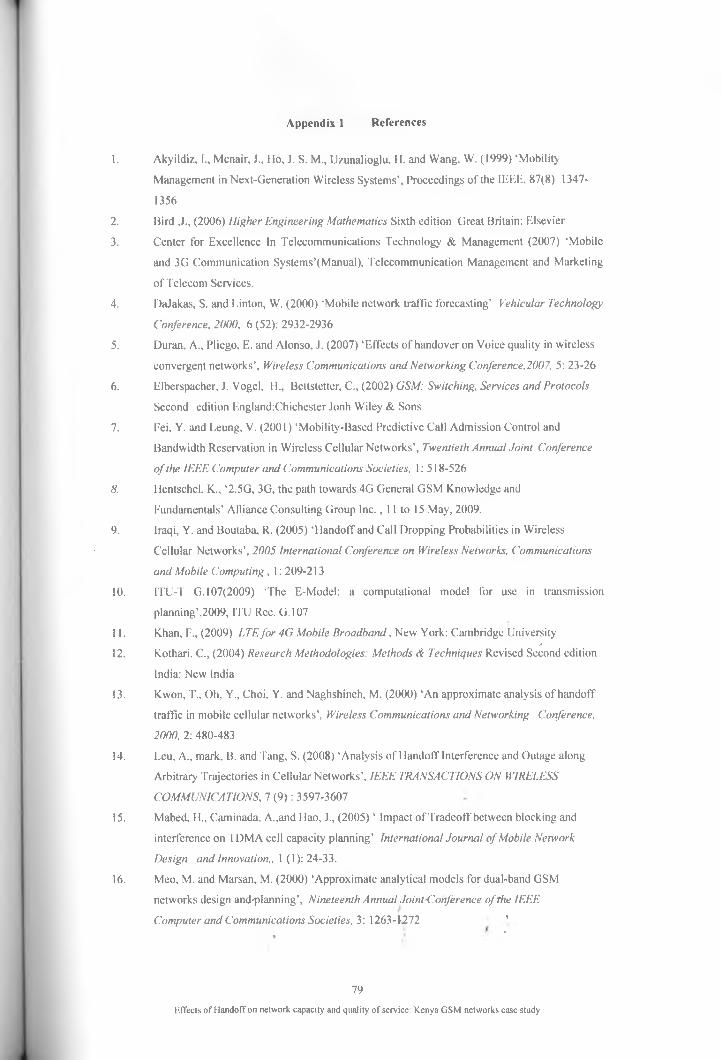
Appendix 1 References
1. Akyildiz, I., Mcnair, J., Ho, J. S. M., Uzunalioglu, H. and Wang, W. (1999) ‘Mobility
Management in Next-Generation Wireless Systems’, Proceedings of the IEEE, 87(8) 1347-
1356
2. Bird ,J., (2006) Higher Engineering Mathematics Sixth edition Great Britain: Elsevier
3. Center for Excellence In Telecommunications Technology & Management (2007) ‘Mobile
and 3G Communication Systems’( Manual), Telecommunication Management and Marketing
of Telecom Services.
4. DaJakas, S. and Linton, W. (2000) ‘Mobile network traffic forecasting' Vehicular Technology
Conference, 2000, 6 (52): 2932-2936
5. Duran, A., Pliego, E. and Alonso, J. (2007) ‘Effects of handover on Voice quality in wireless
convergent networks’, Wireless Communications and Networking Conference,2007, 5: 23-26
6. Elberspacher, J. Vogel, H., Bettstetter, C., (2002) GSM: Switching, Services and Protocols
Second edition England:Chichester Jonh Wiley & Sons
7. Fei, Y. and Leung, V. (2001) ‘Mobility-Based Predictive Call Admission Control and
Bandwidth Reservation in Wireless Cellular Networks’, Twentieth Annual Joint Conference
o f the IEEE Computer and Communications Societies, 1:518-526
8. Hentschel, K„ ‘2.5G, 3G, the path towards 4G General GSM Knowledge and
Fundamentals’ Alliance Consulting Group Inc., 11 to 15 May, 2009.
9. Iraqi, Y. and Boutaba, R. (2005) ‘Handolf and Call Dropping Probabilities in Wireless
Cellular Networks’, 2005 International Conference on Wireless Networks, Communications
and Mobile Computing , 1: 209-213
10. ITU-T G.107(2009) ‘The E-Model: a computational model for use in transmission
planning’,2009, ITU Rec. G.107
11. Khan, F., (2009) LTEfor 4G Mobile Broadband, New York: Cambridge University/
12. Kothari, C., (2004) Research Methodologies: Methods A Techniques Revised Second edition
India: New India
13. Kwon, T., Oh, Y., Choi, Y. and Naghshineh, M. (2000) ‘An approximate analysis of handoff
traffic in mobile cellular networks’, Wireless Communications and Networking Conference,
2000, 2: 480-483
14. Leu, A., mark, B. and Tang, S. (2008) ‘Analysis of Handoff Interference and Outage along
Arbitrary Trajectories in Cellular Networks’, IEEE TRANSACTIONS ON WIRELESS
COMMUN1CA TIONS, 7 (9): 3 597-3607
15. Mabed, H., Caminada, A.,and Hao, J., (2005) ‘ Impact of Tradeoff between blocking and
interference on TDMA cell capacity planning’ International Journal o f Mobile Network
Design and Innovation,. 1(1): 24-33.
16. Meo, M. and Marsan, M. (2000) ‘Approximate analytical models for dual-band GSM
networks design and-planning’, Nineteenth Annual Joint-Conference o f The IEEE
Computer and Communications Societies, 3: 1263-1272 '’ ■ ’
79
Effects of Handoff on network capacity and quality of service: Kenya GSM networks case study
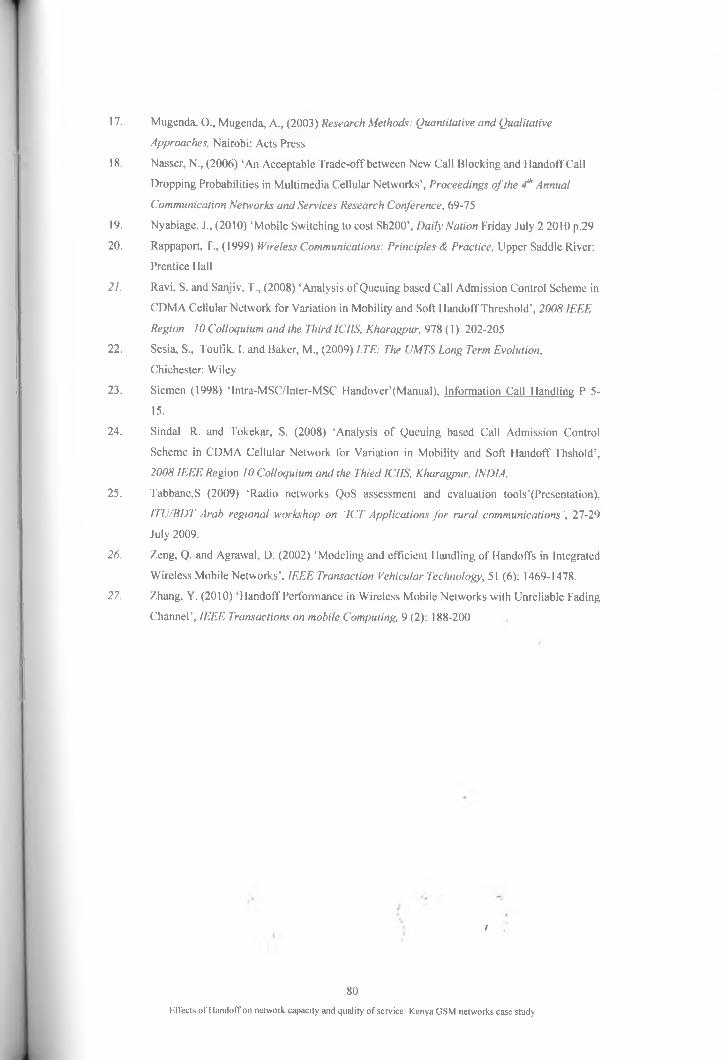
17. Mugenda, O., Mugenda, A., (2003) Research Methods: Quantitative and Qualitative
Approaches, Nairobi: Acts Press
18. Nasser, N., (2006) ‘An Acceptable Trade-off between New Call Blocking and Uandoff Call
Dropping Probabilities in Multimedia Cellular Networks’, Proceedings o f the 4'h Annual
Communication Networks and Services Research Conference, 69-75
19. Nyabiage, J., (2010) ‘Mobile Switching to cost Sh200\ Daily Nation Friday July 2 2010 p.29
20. Rappaport, T., (1999) Wireless Communications: Principles & Practice, Upper Saddle River:
Prentice Hall
21. Ravi, S. and Sanjiv, T., (2008) ‘Analysis of Queuing based Call Admission Control Scheme in
CDMA Cellular Network for Variation in Mobility and Soft Uandoff Threshold', 2008 IEEE
Region 10 Colloquium and the Third ICIIS, Kharagpur, 978 (1) 202-205
22. Scsia, S., Toufik, I. and Baker, M., (2009) LTE: The UMTS Long Term Evolution,
Chichester: Wiley
23. Siemen (1998) ‘lntra-MSC/lnter-MSC Handover’(Manual), Information Call Handling P 5-
15.
24. Sindal R. and Tokekar, S. (2008) ‘Analysis of Queuing based Call Admission Control
Scheme in CDMA Cellular Network for Variation in Mobility and Soft Handoff Thshold’,
2008 IEEE Region 10 Colloquium and the Thied ICIIS, Kharagpur, INDIA,
25. Tabbane,S (2009) ‘Radio networks QoS assessment and evaluation tools’(Presentation),
ITU/BDT Arab regional workshop on ACT Applications for rural communications', 27-29
July 2009.
26. Zeng, Q. and Agrawal, D. (2002) ‘Modeling and efficient Handling of Handoffs in Integrated
Wireless Mobile Networks’. IEEE Transaction Vehicular Technology, 5 1 (6): 1469-1478.
27. Zhang, Y. (2010) ‘Handoff Performance in Wireless Mobile Networks with Unreliable Fading
Channel’, IEEE Transactions on mobile Computing, 9 (2): 188-200
/
80
Effects of Handoff on network capacity and quality of service: Kenya GSM networks case study
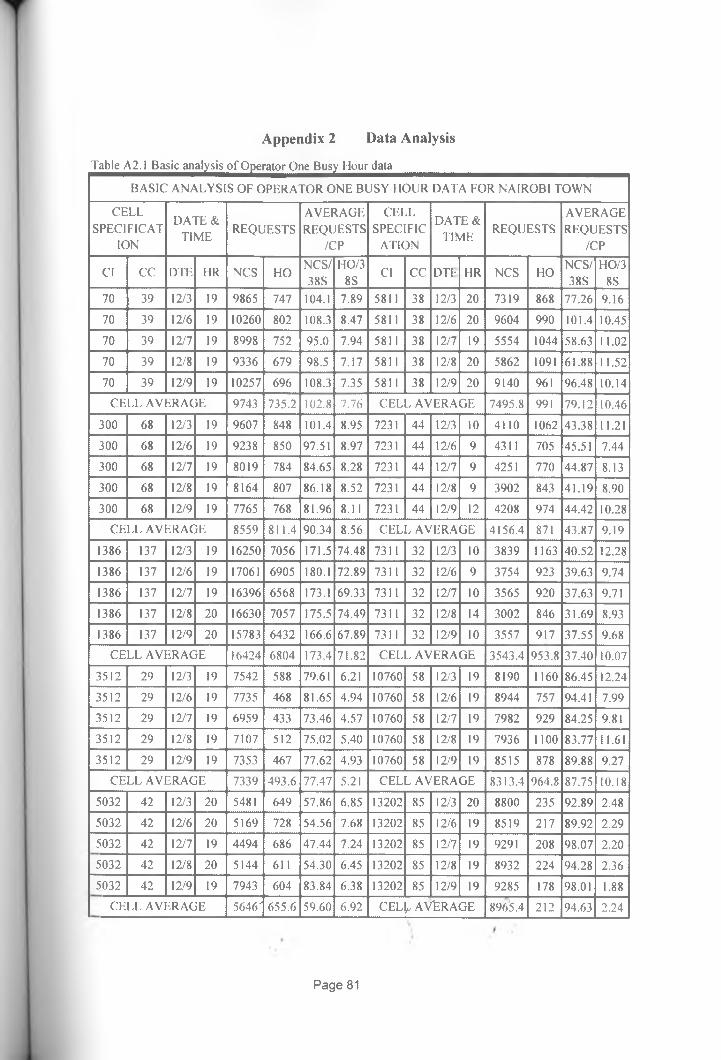
Append ix 2 Data Analysis^bl^A^^)asi^naj^i^^peratoi^n^us^^ouMlata^^^^^^
BASIC ANALYSIS OF OPERATOR ONE BUSY HOUR DATA FOR NAIROBI TOWN
CELLSPECIFICAT
ION
DATE & TIME REQUESTS
AVERAGEREQUESTS
/CP
CELLSPECIFIC
ATION
DATE & TIME
REQUESTSAVERAGEREQUESTS
/CP
Cl CC DTE HR NCS HONCS/38S
HO/38S
Cl CC DTI- HR NCS HONCS/38S
HO/38S
70 39 12/3 19 9865 747 104.1 7.89 5811 38 12/3 20 7319 868 77.26 9.16
70 39 12/6 19 10260 802 108.3 8.47 5811 38 12/6 20 9604 990 101.4 10.45
70 39 12/7 19 8998 752 95.0 7.94 5811 38 12/7 19 5554 1044 58.63 11.02
70 39 12/8 19 9336 679 98.5 7.17 5811 38 12/8 20 5862 1091 61.88 11.52
70 39 12/9 19 10257 696 108.3 7.35 5811 38 12/9 20 9140 961 96.48 10.14
CELL AVERAGE 9743 735.2 102.8 7.76 CELL AVERAGE 7495.8 991 79.12 10.46
300 68 12/3 19 9607 848 101.4 8.95 7231 44 12/3 10 4110 1062 43.38 11.21
300 68 12/6 19 9238 850 97.51 8.97 7231 44 12/6 9 4311 705 45.51 7.44
300 68 12/7 19 8019 784 84.65 8.28 7231 44 12/7 9 4251 770 44.87 8.13
300 68 12/8 19 8164 807 86.18 8.52 7231 44 12/8 9 3902 843 41.19 8.90
300 68 12/9 19 7765 768 81.96 8.11 7231 44 12/9 12 4208 974 44.42 10.28
CELL AVERAGE 8559 811.4 90.34 8.56 CELL AVERAGE 4156.4 871 43.87 9.19
1386 137 12/3 19 16250 7056 171.5 74.48 7311 32 12/3 10 3839 1163 40.52 12.28
1386 137 12/6 19 17061 6905 180.1 72.89 7311 32 12/6 9 3754 923 39.63 9.74
1386 137 12/7 19 16396 6568 173.1 69.33 7311 32 12/7 10 3565 920 37.63 9.71
1386 137 12/8 20 16630 7057 175.5 74.49 7311 32 12/8 14 3002 846 31.69 8.93
1386 137 12/9 20 15783 6432 166.6 67.89 7311 32 12/9 10 3557 917 37.55 9.68
CELL AVERAGE 16424 6804 173.4 71.82 CELL AVERAGE .3543.4 953.8 37.40 10.07
3512 29 12/3 19 7542 588 79.61 6.21 10760 58 12/3 19 8190 1160 86.45 12.24
3512 29 12/6 19 7735 468 81.65 4.94 10760 58 12/6 19 8944 757 94.41 7.99
3512 29 12/7 19 6959 433 73.46 4.57 10760 58 12/7 19 7982 929 84.25 9.81
3512 29 12/8 19 7107 512 75.02 5.40 10760 58 12/8 19 7936 1100 83.77 11.61
3512 29 12/9 19 7353 467 77.62 4.93 10760 58 12/9 19 8515 878 89.88 9.27
CELL AVERAGE 7339 493.6 77.47 5.21 CELL AVERAGE 8313.4 964.8 87.75 10.18
5032 42 12/3 20 5481 649 57.86 6.85 13202 85 12/3 20 8800 235 92.89 2.48
5032 42 12/6 20 5169 728 54.56 7.68 13202 85 12/6 19 8519 217 89.92 2.29
5032 42 12/7 19 4494 686 47.44 7.24 13202 85 12/7 19 9291 208 98.07 2.20
5032 42 12/8 20 5144 611 54.30 6.45 13202 85 12/8 19 8932 224 94.28 2.36
5032 42 12/9 19 7943 604 83.84 6.38 13202 85 12/9 19 9285 178 98.01 1.88
CELL AVERAGE 5646' 655.6 59.60 6.92 CEU*. AVERAGE 8965.4 212 94.63 2.24
Page 81
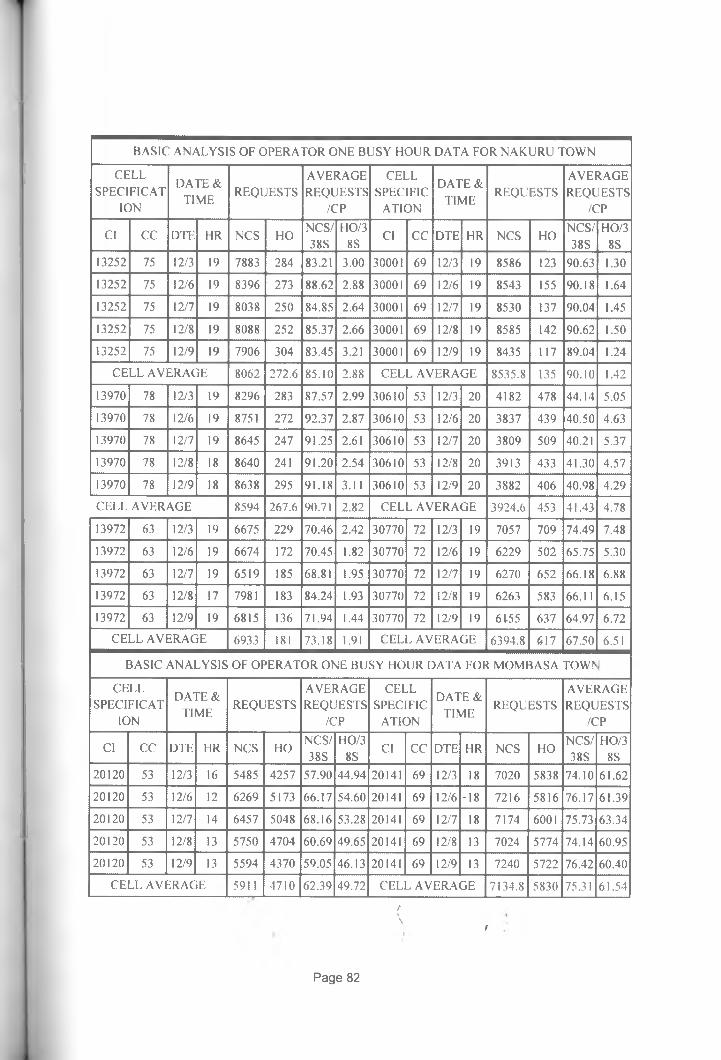
BASIC ANALYSIS OF OPERATOR ONE BUSY HOUR DATA FOR NAKURU TOWN
CELLSPECIFICAT
ION
DATE & TIME
REQUESTSAVERAGEREQUESTS
/CP
CELL SPECIFIC
ATI ON
DATE & TIME
REQUESTSAVERAGEREQUESTS
/CP
Cl CC DTE HR NCS HONCS/38S
110/38S
Cl CC DTE HR NCS HONCS/38S
HO/38S
13252 75 12/3 19 7883 284 83.21 3.00 30001 69 12/3 19 8586 123 90.63 1.30
13252 75 12/6 19 8396 273 88.62 2.88 30001 69 12/6 19 8543 155 90.18 1.64
13252 75 12/7 19 8038 250 84.85 2.64 30001 69 12/7 19 8530 137 90.04 1.45
13252 75 12/8 19 8088 252 85.37 2.66 30001 69 12/8 19 8585 142 90.62 1.50
13252 75 12/9 19 7906 304 83.45 3.21 30001 69 12/9 19 8435 117 89.04 1.24
CELL AVERAGE 8062 272.6 85.10 2.88 CELL AVERAGE 8535.8 135 90.10 1.42
13970 78 12/3 19 8296 283 87.57 2.99 30610 53 12/3 20 4182 478 44.14 5.05
13970 78 12/6 19 8751 272 92.37 2.87 30610 53 12/6 20 3837 439 40.50 4.63
13970 78 12/7 19 8645 247 91.25 2.61 30610 53 12/7 20 3809 509 40.21 5.37
13970 78 12/8 18 8640 241 91.20 2.54 30610 53 12/8 20 3913 433 41.30 4.57
13970 78 12/9 18 8638 295 91.18 3.11 30610 53 12/9 20 3882 406 40.98 4.29
CELL AVERAGE 8594 267.6 90.71 2.82 CELL AVERAGE 3924.6 453 41.43 4.78
13972 63 12/3 19 6675 229 70.46 2.42 30770 72 12/3 19 7057 709 74.49 7.48
13972 63 12/6 19 6674 172 70.45 1.82 30770 72 12/6 19 6229 502 65.75 5.30
13972 63 12/7 19 6519 185 68.81 1.95 30770 72 12/7 19 6270 652 66.18 6.88
13972 63 12/8 17 7981 183 84.24 1.93 30770 72 12/8 19 6263 583 66.11 6.15
13972 63 12/9 19 6815 136 71.94 1.44 30770 72 12/9 19 6155 637 64.97 6.72
CELL AVERAGE 6933 181 73.18 1.91 CELL AVERAGE 6394.8 617 67.50 6.51
BASIC ANALYSIS OF OPERATOR ONE BUSY HOUR DATA FOR MOMEIASA TOW'S
CELLSPECIFICAT
ION
DATE & TIME
REQUESTSAVERAGEREQUESTS
/CP
CELLSPECIFIC
ATION
DATE & TIME
REQUESTSAVERAGEREQUESTS
/CP
Cl CC DTE HR NCS HONCS/38S
140/38S
Cl CC DTE HR NCS HONCS/38S
HO/38S
20120 53 12/3 16 5485 4257 57.90 44.94 20141 69 12/3 18 7020 5838 74.10 61.62
20120 53 12/6 12 6269 5173 66.17 54.60 20141 69 12/6 -18 7216 5816 76.17 61.39
20120 53 12/7 14 6457 5048 68.16 53.28 20141 69 12/7 18 7174 6001 75.73 63.34
20120 53 12/8 13 5750 4704 60.69 49.65 20141 69 12/8 13 7024 5774 74.14 60.95
20120 53 12/9 13 5594 4370 59.05 46.13 20141 69 12/9 13 7240 5722 76.42 60.40
CELL AVERAGE 5911 4710 62.39 49.72 CELL AVERAGE 7134.8 5830 75.31 61.54
f\ t
I
Page 82

BASIC ANALYSIS OF OPERATOR ONE BUSY HOUR DATA FOR MOMBASA TOWN
CELLSPECIFICAT
ION
DATE & TIME REQUESTS
AVERAGEREQUESTS
/CP
CELLSPECIFIC
ATION
DATE & TIME
REQUESTSAVERAGEREQUESTS
/CP
Cl CC DTE HR NCS HONCS/38S
HO/38S
Cl CC D IE HR NCS HONCS/38S
HO/38S
20151 69 12/3 13 4998 7165 52.76 75.63 20232 54 12/3 21 6066 3219 64.03 33.9820151 69 12/6 13 5425 7890 57.26 83.28 20232 54 12/6 21 6119 3222 64.59 34.0120151 69 12/7 13 5310 7875 56.05 83.13 20232 54 12/7 22 4934 3111 52.08 32.8420151 69 12/8 13 5215 7829 55.05 82.64 20232 54 12/8 21 6215 3484 65.60 36.7820151 69 12/9 13 5172 7925 54.59 83.65 20232 54 12/9 21 5992 3120 63.25 32.93
CELL AVERAGE 5224 7737 55.14 81.67 CELL AVERAGE 5865.2 3231 61.91 34.1120152 53 12/3 13 4564 15031 48.18 158.720152 53 12/6 13 5120 4085 54.04 43.1220152 53 12/7 14 5055 4019 53.36 42.4220152 53 12/8 12 4887 4033 51.59 42.5720152 53 12/9 13 4998 3864 52.76 40.79
CELL AVERAGE 4925 6206 51.98 65.51
BASIC ANALYSIS OF OPERATOR CNE BUSY HOUR DATA FOR K1SUMU TOWN
CELLSPECIFICAT
ION
DATE & TIME
REQUESTSAVERAGEREQUESTS
/CP
CELLSPECIFIC
ATION
DATE & TIME
REQUESTSAVERAGEREQUESTS
/CP
Cl CC DTE HR NCS HONCS/38S
HO/38S
Cl CC DTE HR NCS HONCS/38S
HO/38S
15740 26 12/3 21 3512 679 37.07 7.17 42581 24 12/3 21 2299 5175 24.27 54.6315740 26 12/6 21 3844 731 40.58 7.72 42581 24 12/6 21 2391 5103 25.24 53.8715740 26 12/7 20 3623 953 38.24 10.06 42581 24 12/7 22 2189 5128 23.11 54.1315740 26 12/8 20 3740 852 39.48 8.99 42581 24 12/8 21 2363 4871 24.94 51.4215740 26 12/9 21 3666 644 38.70 6.80 42581 24 12/9 21 2375 5148 25.07 54.34
CELL AVERAGE 3677 771.8 38.81 8.15 CELL AVERAGE 2323.4 5085 24.52 53.6840380 26 12/3 21 3105 3213 32.78 33.92 42592 25 12/3 21 2323 6562 24.52 69.2740380 26 12/6 21 3076 542 32.47 5.72 42592 25 12/6 21 2543 3082 26.84 32.5340380 26 12/7 21 3323 707 35.08 7.46 42592 25 12/7 22 2328 3080 24.57 32.5140380 26 12/8 21 2862 628 30.21 6.63 42592 25 12/8 21 2599 3102 27.43 32.7440380 26 12/9 20 3186 685 33.63 7.23 42592 25 12/9 21 2379 2993 25.11 31.59
CELL AVERAGE 3110 1155 32.83 12.19 CELL AVERAGE 2434.4 3764 25.70 39.7342541 22 12/3 21 1961 2792 20.70 29.4742541 22 12/6 21 1936 2733 20.44 28.8542541 22 12/7 21 1720 2865 18.16 30.2442541 22 12/8 21 1701 2763 17.96 29.1742541 22 12/9 21 1811 2843 19.12 30.01
CELL AVERAGE 1826- 2799 19.27 29.55\ /
Page 83
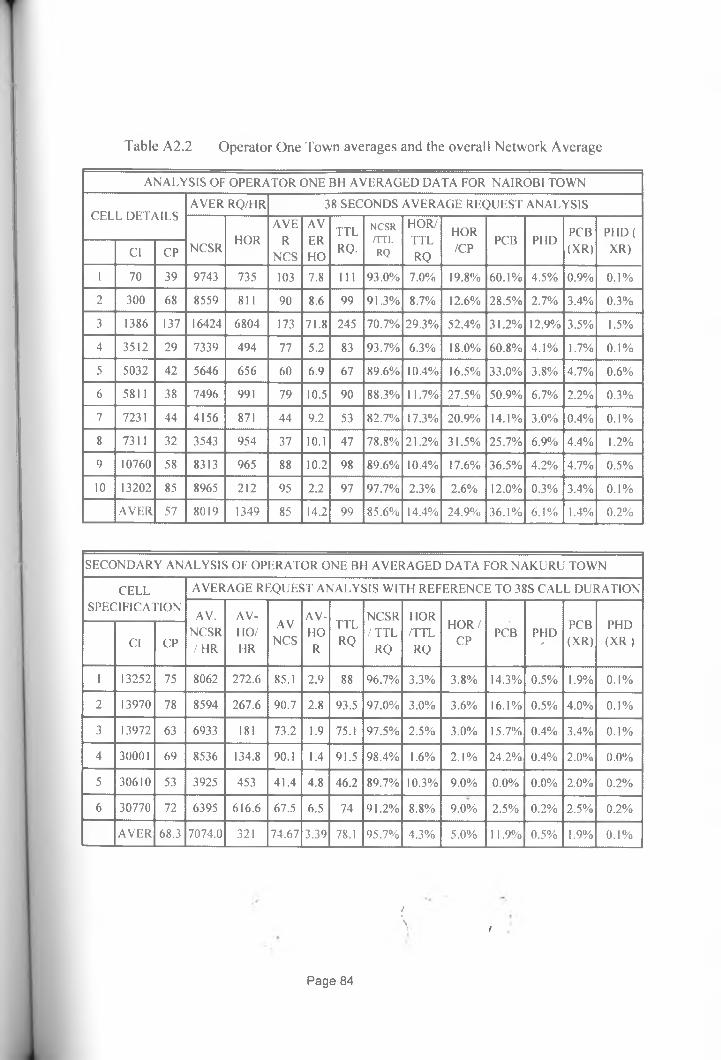
Table A2.2 Operator One Town averages and the overall Network Average
ANALYSIS OF OPERATOR ONE BH AVERAGED DATA FOR NAIROBI TOWN
CELL DETAILSAVER RQ/HR 38 SECONDS AVERAGE REQUEST ANALYSIS
NCSRHOR
AVER
NCS
AVERHO
TTLRQ.
N CSR /TT L RQ
HOR/'TTLRQ
HOR/CP
PCB PHDPCB(XR)
PHD ( XR)Cl CP
1 70 39 9743 735 103 7.8 I l l 93.0% 7.0% 19.8% 60.1% 4.5% 0.9% 0.1%
2 300 68 8559 811 90 8.6 99 91.3% 8.7% 12.6% 28.5% 2.7% 3.4% 0.3%
3 1386 137 16424 6804 173 71.8 245 70.7% 29.3% 52.4% 31.2% 12.9% 3.5% 1.5%
4 3512 29 7339 494 77 5.2 83 93.7% 6.3% 18.0% 60.8% 4.1% 1.7% 0.1%
5 5032 42 5646 656 60 6.9 67 89.6% 10.4% 16.5% 33.0% 3.8% 4.7% 0.6%
6 5811 38 7496 991 79 10.5 90 88.3% 11.7% 27.5% 50.9% 6.7% 2 .2 % 0.3%
7 7231 44 4156 871 44 9.2 53 82.7% 17.3% 20.9% 14.1% 3.0% 0.4% 0.1%
8 7311 32 3543 954 37 10.1 47 78.8% 21.2% 31.5% 25.7% 6.9% 4.4% 1.2 %
9 10760 58 8313 965 88 10.2 98 89.6% 10.4% 17.6% 36.5% 4.2% 4.7% 0.5%
10 13202 85 8965 212 95 2.2 97 97.7% 2.3% 2.6% 12.0% 0.3% 3.4% 0.1%
AVER 57 8019 1349 85 14.2 99 85.6% 14.4% 24.9% 36.1% 6 .1 % 1.4% 0.2%
SECONDARY ANALYSIS OF OPERATOR ONE BH AVERAGED DATA FOR NAKURU TOWN
CELL AVERAGE REQUEST ANALYSIS WITH REFERENCE TO 38S CALL DURATIONSPECIFICATION
AV. AV-AV
NCS
AV-TTLRQ
NCSR HORHOR /
CPPCB(XR)
PHD(X R )Cl CP
NCSR / HR
HO/HR
HOR
/ TTLRQ
/TTLRQ
PCB PHD/
1 13252 75 8062 272.6 85.1 2.9 88 96.7% 3.3% 3.8% 14.3% 0.5% 1.9% 0.1%
2 13970 78 8594 267.6 90.7 2.8 93.5 97.0% 3.0% 3.6% 16.1% 0.5% 4.0% 0.1%
3 13972 63 6933 181 73.2 1.9 75.1 97.5% 2.5% 3.0% 15.7% 0.4% 3.4% 0.1%
4 30001 69 8536 134.8 90.1 1.4 91.5 98.4% 1.6% 2.1% 24.2% 0.4% 2.0% 0.0%
5 30610 53 3925 453 41.4 4.8 46.2 89.7% 10.3% 9.0% 0.0% 0.0% 2.0% 0.2%
6 30770 72 6395 616.6 67.5 6.5 74 91.2% 8.8% 9.0% 2.5% 0.2% 2.5% 0.2%
AVER 68.3 7074.0 321 74.67 3.39 78.1 95.7% 4.3% 5.0% 11.9% 0.5% 1.9% 0.1%
f
\ t
Page 84

ANALYSIS OF AVERAGED DATA FOR MOMBASA
CELLAV RQ/HR AV. RQ ANALYSIS WITH REFERENCE TO 38S CALL DURATION
SPECIFICATIONAV AV-
TTL NCSR/HOR/
IIOR/CP PCB PHDNCSR HOR NCS HO
RQTTL PCB PHD
Cl CP R RI 1 L RQ
RQA T X R (XR) (XR)
22 20120 53 5911 4710.4 62.4 49.7 112.1 55.7% 44.3% 44.7% 29.3% 23.4% 0.4% 0.3%
23 20141 69 7135 5830.2 75.3 61.5 136.9 55.0% 45.0% 46.9% 27.3% 22.3% 2.3% 1.9%
24 20151 69 5224 7736.8 55.1 81.7 136.8 40.3% 59.7% 62.3% 20.0% 29.6% 1.7% 2.5%
25 20152 53 4925 6206.4 52.0 65.5 117.5 44.2% 55.8% 56.2% 24.3% 30.6% 0.3% 0.4%
26 20232 54 5865 3231.2 61.9 34.1 96.0 64.5% 35.5% 37.2% 28.2% 15.5% 2.8% 1.6%
AV 59.6 5812 5543 61.3 58.5 119.9 5 1 .2 % 48.8% 49.1% 25.7% 24.5% 0.3% 0.3%
ANALYSIS OF AVERAGED DATA FOR KISUMU
CELL SPECIFICA TION
AVERAGE REQUEST ANALYSIS WITH REFERENCE TO 38S CALL DURATION
AV.NCS/
HR
AV-HO/HR
AVNCS
AV-HOR
TTLRQ
N CSRru hRQ
HOR/TTLRQ
HOR/CP
PCB PHDPCB(XR)
PHD ( X R )
Cl CP
17 15740 26 3677 771.8 38.8 8.1 47 82.7% 17.3% 31.3% 36.9% 7.7% 0.1% 0.1%
18 40380 26 3110 1155 32.8 12 45 72.9% 27.1% 46.9% 30.8% 11.4% j0.5% 0.5%
19 42541 22 1826 2799.2 19.3 30 48.8 39.5% 60.5% 134.3% 21.7% 33.2% 0.5% 0.5%
20 42581 24 2323 5085 24.5 54 78.2 31.4% 68.6% 223.6% 21.7% 47.6% 1.2% 1.2%
21 42592 25 2434 3763.8 25.7 40 65.4 39.3% 60.7% 158.9% 24.3% 37.5% 0.4% 0.4%
AV 24.6 2674.2 2715 28.2 28.7 56.9 49.6% 50.4% 116.5% 28.2% 28.6% 0.3% 0.3%
S U M M A R Y OF THE FOUR T O W N S D A T A
N O / AV TOTAL R EQ UE ST S - A V E R A G E A V E R A G E /38S CP
TOW N C CP N C S R HOR N C S R /H R HOR/HR N C S R H O
NAIROBI 10 5 7 4 0 0 9 2 8 6 7 4 6 0 8 0 1 8 .5 6 1 3 4 9 .2 8 4 .6 4 14.24
N A K U R U 6 6 8 2 1 2 2 2 1 9 6 2 8 7 0 7 4 .0 3 3 2 0 .9 7 4 .6 7 3 .3 9
K ISUM U 5 25 6 6 8 5 5 6 7 8 7 4 2 6 7 4 . 2 0 2 7 1 5 .0 2 8 .2 3 2 8 .6 6
M O M B A S A 5 5 9 .6 1 4 5 2 9 9 1 3 8 5 7 5 5 8 1 1 .9 6 . ' 5 5 4 3 .0 ■■ 6 1 .3 5 58 .51
N ETW ORK 1 5 3 .8 8 3 1 7 4 2 .4 2 3 1 7 0 8 8 4 5 8 9 4 . 6 9 \ 2 4 8 2 . 0 , ' 6 2 .2 2 2 6 .2 0
Page 85
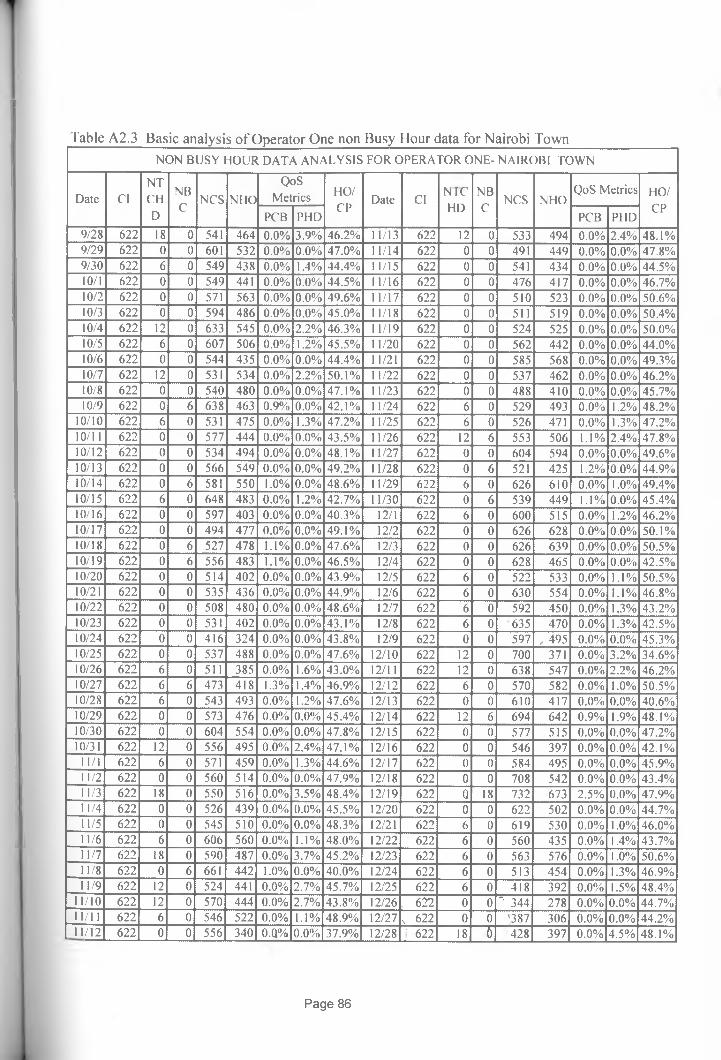
Table A2.3 Basic analysis o f Operator One non Busy Hour data for Nairobi TownNON BUSY HOUR DATA ANALYSIS FOR OPERATOR ONE- NAIROBI TOWN
Date ClNTCHD
NBC
NCS M IO
QoSMetrics HO/
CPDate Cl
N ICHD
NBC
NCS NHOQoS Metrics HO/
CPPCB PHD PCB PHD
9/28 622 18 0 541 464 0.0% 3.9% 46.2% 11/13 622 12 0 533 494 0.0% 2.4% 48.1%9/29 622 0 0 601 532 0.0% 0.0% 47.0% 11/14 622 0 0 491 449 0.0% 0.0% 47.8%9/30 622 6 0 549 438 0.0% 1.4% 44.4% 11/15 622 0 0 541 434 0.0% 0.0% 44.5%10/1 622 0 0 549 441 0.0% 0.0% 44.5% 11/16 622 0 0 476 417 0.0% 0.0% 46.7%10/2 622 0 0 571 563 0.0% 0.0% 49.6% 11/17 622 0 0 510 523 0.0% 0.0% 50.6%10/3 622 0 0 594 486 0.0% 0.0% 45.0% 11/18 622 0 0 511 519 0.0% 0.0% 50.4%10/4 622 12 0 633 545 0.0% 2.2% 46.3% 11/19 622 0 0 524 525 0.0% 0.0% 50.0%10/5 622 6 0 607 506 0.0% 1.2% 45.5% 11/20 622 0 0 562 442 0.0% 0.0% 44.0%10/6 622 0 0 544 435 0.0% 0.0% 44.4% 11/21 622 0 0 585 568 0.0% 0.0% 49.3%10/7 622 12 0 531 534 0.0% 2.2% 50.1% 11/22 622 0 0 537 462 0.0% 0.0% 46.2%10/8 622 0 0 540 480 0.0% 0.0% 47.1% 11/23 622 0 0 488 410 0.0% 0.0% 45.7%10/9 622 0 6 638 463 0.9% 0.0% 42.1% 11/24 622 6 0 529 493 0.0% 1.2% 48.2%
10/10 622 6 0 531 475 0.0% 1.3% 47.2% 11/25 622 6 0 526 471 0.0% 1.3% 47.2%10/11 622 0 0 577 444 0.0% 0.0% 43.5% 11/26 622 12 6 553 506 1.1% 2.4% 47.8%10/12 622 0 0 534 494 0.0% 0.0% 48.1% 11/27 622 0 0 604 594 0.0% 0.0% 49.6%10/13 622 0 0 566 549 0.0% 0.0% 49.2% 11/28 622 0 6 521 425 1.2% 0.0% 44.9%10/14 622 0 6 581 550 1.0% 0.0% 48.6% 11/29 622 6 0 626 610 0.0% 1.0% 49.4%10/15 622 6 0 648 483 0.0% 1.2% 42.7% 11/30 622 0 6 539 449 1.1% 0.0% 45.4%10/16 622 0 0 597 403 0.0% 0.0% 40.3% 12/1 622 ~ 6 0 600 515 0.0% 1.2% 46.2%10/17 622 0 0 494 477 0.0% 0.0% 49.1% 12/2 622 0 0 626 628 0.0% 0.0% 50.1%10/18 622 0 6 527 478 1.1% 0.0% 47.6% 12/3 622 — 0 0 626 639 0.0% 0.0% 50.5%10/19 622 0 6 556 483 1.1% 0.0% 46.5% 12/4 622 0 0 628 465 0.0% 0.0% 42.5%10/20 622 0 0 514 402 0.0% 0.0% 43.9% 12/5 622 ~ 6 0 522 533 0.0% 1.1% 50.5%10/21 622 0 0 535 436 0.0% 0.0% 44.9% 12/6 622 6 0 630 554 0.0% 1.1% 46.8%10/22 622 0 0 508 480 0.0% 0.0% 48.6% 12/7 622 6 0 592 450 0.0% 1.3% 43.2%10/23 622 0 0 531 402 0.0% 0.0% 43.1% 12/8 622 6 0 635 470 0.0% 1.3% 42.5%10/24 622 0 0 416 324 0.0% 0.0% 43.8% 12/9 622 0 0 597 , 495 0.0% 0.0% 45.3%10/25 622 0 0 537 488 0.0% 0.0% 47.6% 12/10 622 12 0 700 371 0.0% 3.2% 34.6%10/26 622 6 0 511 385 0.0% 1.6% 43.0% 12/11 622 12 0 638 547 0.0% 2.2% 46.2%10/27 622 6 6 473 418 1.3% 1.4% 46.9% 12/12 622 6 0 570 582 0.0% 1.0% 50.5%10/28 622 6 0 543 493 0.0% 1.2% 47.6% 12/13 622 0 0 610 417 0.0% 0.0% 40.6%10/29 622 0 0 573 476 0.0% 0.0% 45.4% 12/14 622 12 6 694 642 0.9% 1.9% 48.1%10/30 622 0 0 604 554 0.0% 0.0% 47.8% 12/15 622 0 0 577 515 0.0% 0.0% 47.2%10/31 622 12 0 556 495 0.0% 2.4% 47.1% 12/16 622 0 0 546 397 0.0% 0.0% 42.1%
11/1 622 6 0 571 459 0.0% 1.3% 44.6% 12/17 622 0 0 584 495 0.0% 0.0% 45.9%11/2 622 0 0 560 514 0.0% 0.0% 47.9% 12/18 622 0 0 708 542 0.0% 0.0% 43.4%11/3 622 18 0 550 516 0.0% 3.5% 48.4% 12/19 622 Q 18 732 673 2.5% 0.0% 47.9%11/4 622 0 0 526 439 0.0% 0.0% 45.5% 12/20 622 0 0 622 502 0.0% 0.0% 44.7%11/5 622 0 0 545 510 0.0% 0.0% 48.3% 12/21 622 6 0 619 530 0.0% 1.0% 46.0%11/6 622 6 0 606 560 0.0% 1.1% 48.0% 12/22 622 6 0 560 435 0.0% 1.4% 43.7%11/7 622 18 0 590 487 0.0% 3.7% 45.2% 12/23 622 6 0 563 576 0.0% 1.0% 50.6%11/8 622 0 6 661 442 1.0% 0.0% 40.0% 12/24 622 6 0 513 454 0.0% 1.3% 46.9%11/9 622 12 0 524 441 0.0% 2.7% 45.7% 12/25 622 6 0 418 392 0.0% 1.5% 48.4%
11/10 622 12 0 570 444 0.0% 2.7% 43.8% 12/26 . 622 0 0 '■ 344 278 0.0% 0.0% 44.7%11/11 622 6 0 546 522 0.0% 1.1% 48.9% 12/27 , 622 0 0 '387 306 0.0% 0.0% 44.2%11/12 622 0 0 556 340 0.Q% 0.0% 37.9% 12/28 ’ 622 18 T 428 397 0.0% 4.5% 48.1%
Page 86
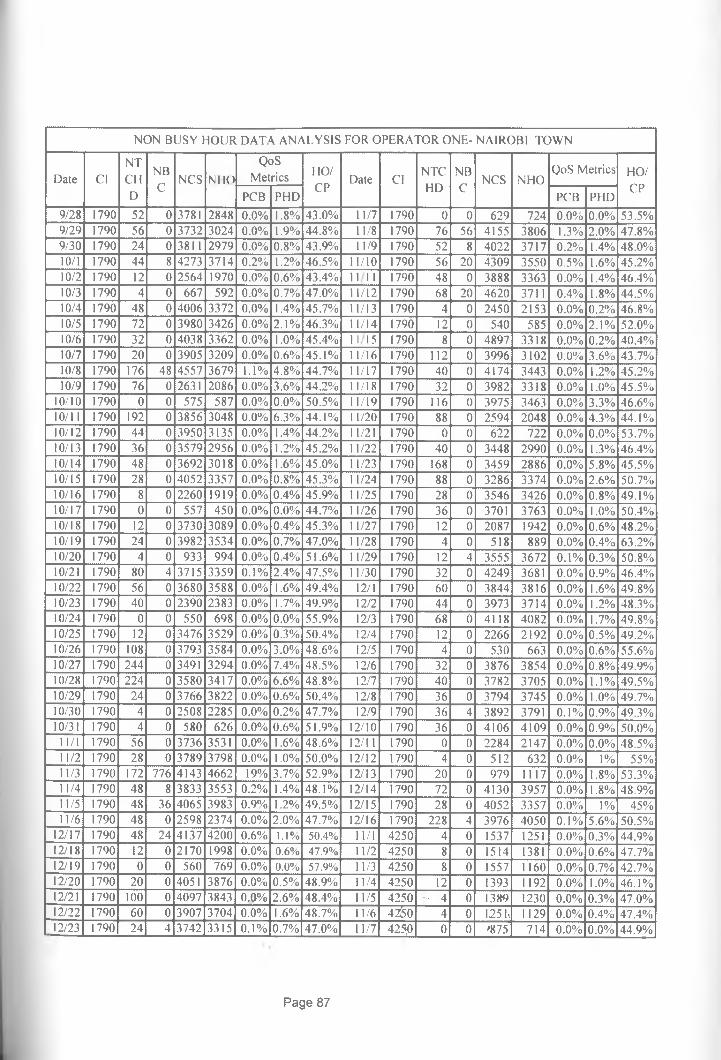
NON BUSY HOUR DATA ANALYSIS FOR OPERATOR ONE- NAIROBI TOWN
Date ClNTCHD
NBC
NCS NIK)
QoSMetrics HO/
CPDate Cl
NTCHD
NBC
NCS NHOQoS Metrics HO/
CPPCB PHD PCB PHD
9/28 1790 52 0 3781 2848 0.0% 1.8% 43.0% 11/7 1790 0 0 629 724 0.0% 0.0% 53.5%9/29 1790 56 0 3732 3024 0.0% 1.9% 44.8% 11/8 1790 76 56 4155 3806 1.3% 2.0% 47.8%9/30 1790 24 0 3811 2979 0.0% 0.8% 43.9% 11/9 1790 52 8 4022 3717 0.2% 1.4% 48.0%10/1 1790 44 8 4273 3714 0.2% 1.2% 46.5% 11/10 1790 56 20 4309 3550 0.5% 1.6% 45.2%10/2 1790 12 0 2564 1970 0.0% 0.6% 43.4% M i l 1790 48 0 3888 3363 0.0% 1.4% 46.4%10/3 1790 4 0 667 592 0.0% 0.7% 47.0% 11/12 1790 68 20 4620 3711 0.4% 1.8% 44.5%10/4 1790 48 0 4006 3372 0.0% 1.4% 45.7% 11/13 1790 4 0 2450 2153 0.0% 0.2% 46.8%10/5 1790 72 0 3980 3426 0.0% 2.1% 46.3% 11/14 1790 12 0 540 585 0.0% 2.1% 52.0%10/6 1790 32 0 4038 3362 0.0% 1.0% 45.4% 1115 1790 8 0 4897 3318 0.0% 0.2% 40.4%10/7 1790 20 0 3905 3209 0.0% 0.6% 45.1% 11/16 1790 112 0 3996 3102 0.0% 3.6% 43.7%10/8 1790 176 48 4557 3679 1.1% 4.8% 44.7% 11/17 1790 40 0 4174 3443 0.0% 1.2% 45.2%10/9 1790 76 0 2631 2086 0.0% 3.6% 44.2% 11/18 1790 32 0 3982 3318 0.0% 1.0% 45.5%
10/10 1790 0 0 575 587 0.0% 0.0% 50.5% 11/19 1790 116 0 3975 3463 0.0% 3.3% 46.6%10/11 1790 192 0 3856 3048 0.0% 6.3% 44.1% 11/20 1790 88 0 2594 2048 0.0% 4.3% 44.1%10/12 1790 44 0 3950 3135 0.0% 1.4% 44.2% 11/21 1790 0 0 622 722 0.0% 0.0% 53.7%10/13 1790 36 0 3579 2956 0.0% 1.2% 45.2% 11/22 1790 40 0 3448 2990 0.0% 1.3% 46.4%10/14 1790 48 0 3692 3018 0.0% 1.6% 45.0% 11/23 1790 168 0 3459 2886 0.0% 5.8% 45.5%10/15 1790 28 0 4052 3357 0.0% 0.8% 45.3% 11/24 1790 88 0 3286 3374 0.0% 2.6% 50.7%10/16 1790 8 0 2260 1919 0.0% 0.4% 45.9% 11/25 1790 28 0 3546 3426 0.0% 0.8% 49.1%10/17 1790 0 0 557 450 0.0% 0.0% 44.7% 11/26 1790 36 0 3701 3763 0.0% 1.0% 50.4%10/18 1790 12 0 3730 3089 0.0% 0.4% 45.3% 11/27 1790 12 0 2087 1942 0.0% 0.6% 48.2%10/19 1790 24 0 3982 3534 0.0% 0.7% 47.0% 11/28 1790 4 0 518 889 0.0% 0.4% 63.2%10/20 1790 4 0 933 994 0.0% 0.4% 51.6% 11/29 1790 12 4 3555 3672 0.1% 0.3% 50.8%10/21 1790 80 4 3715 3359 0.1% 2.4% 47.5% 11/30 1790 32 0 4249 3681 0.0% 0.9% 46.4%10/22 1790 56 0 3680 3588 0.0% 1.6% 49.4% 12/1 1790 60 0 3844 3816 0.0% 1.6% 49.8%10/23 1790 40 0 2390 2383 0.0% 1.7% 49.9% 12/2 1790 44 0 3973 3714 0.0% 1.2% 48.3%10/24 1790 0 0 550 698 0.0% 0.0% 55.9% 12/3 1790 68 0 4118 4082 0.0% 1.7% 49.8%10/25 1790 12 0 3476 3529 0.0% 0.3% 50.4% 12/4 1790 12 0 2266 2192 0.0% 0.5% 49.2%10/26 1790 108 0 3793 3584 0.0% 3.0% 48.6% 12/5 1790 4 0 530 663 0.0% 0.6% 55.6%10/27 1790 244 0 3491 3294 0.0% 7.4% 48.5% 12/6 1790 32 0 3876 3854 0.0% 0.8% 49.9%10/28 1790 224 0 3580 3417 0.0% 6.6% 48.8% 12/7 1790 40 0 3782 3705 0.0% 1.1% 49.5%10/29 1790 24 0 3766 3822 0.0% 0.6% 50.4% 12/8 1790 36 0 3794 3745 0.0% 1.0% 49.7%10/30 1790 4 0 2508 2285 0.0% 0.2% 47.7% 12/9 1790 36 4 3892 3791 0.1% 0.9% 49.3%10/31 1790 4 0 580 626 0.0% 0.6% 51.9% 12/10 1790 36 0 4106 4109 0.0% 0.9% 50.0%
11/1 1790 56 0 3736 3531 0.0% 1.6% 48.6% 12/11 1790 0 0 2284 2147 0.0% 0.0% 48.5%11/2 1790 28 0 3789 3798 0.0% 1.0% 50.0% 12/12 1790 4 0 512 632 0.0% 1% 55%11/3 1790 172 776 4143 4662 19% 3.7% 52.9% 12/13 1790 20 0 979 1117 0.0% 1.8% 53.3%11/4 1790 48 8 3833 3553 0.2% 1.4% 48.1% 12/14 1790 72 0 4130 3957 0.0% 1.8% 48.9%11/5 1790 48 36 4065 3983 0.9% 1.2% 49.5% 12/15 1790 28 0 4052 3357 0.0% 1% 45%11/6 1790 48 0 2598 2374 0.0% 2.0% 47.7% 12/16 1790 228 4 3976 4050 0.1% 5.6% 50.5%
12/17 1790 48 24 4137 4200 0.6% 1.1% 50.4% 11/1 4250 4 0 1537 1251 0.0% 0.3% 44.9%12/18 1790 12 0 2170 1998 0.0% 0.6% 47.9% 11/2 4250 8 0 1514 1381 0.0% 0.6% 47.7%12/19 1790 0 0 560 769 0.0% 0.0% 57.9% 11/3 4250 8 0 1557 1160 0.0% 0.7% 42.7%12/20 1790 20 0 4051 3876 0.0% 0.5% 48.9% 11/4 4250 12 0 1393 1192 0.0% 1.0% 46.1%12/21 1790 100 0 4097 3843 0.0% 2.6% 48.4% 11/5 4250 • 4 0 1389 1230 0.0% 0.3% 47.0%12/22 1790 60 0 3907 3704 0.0% 1.6% 48.7% 11/6 4250 4 0 1251, 1129 0.0% 0.4% 47.4%12/23 1790 24 4 3742 3315 0.1% 0.7% 47.0% 11/7 4250 0 0 '875 714 0.0% 0.0% 44.9%
Page 87
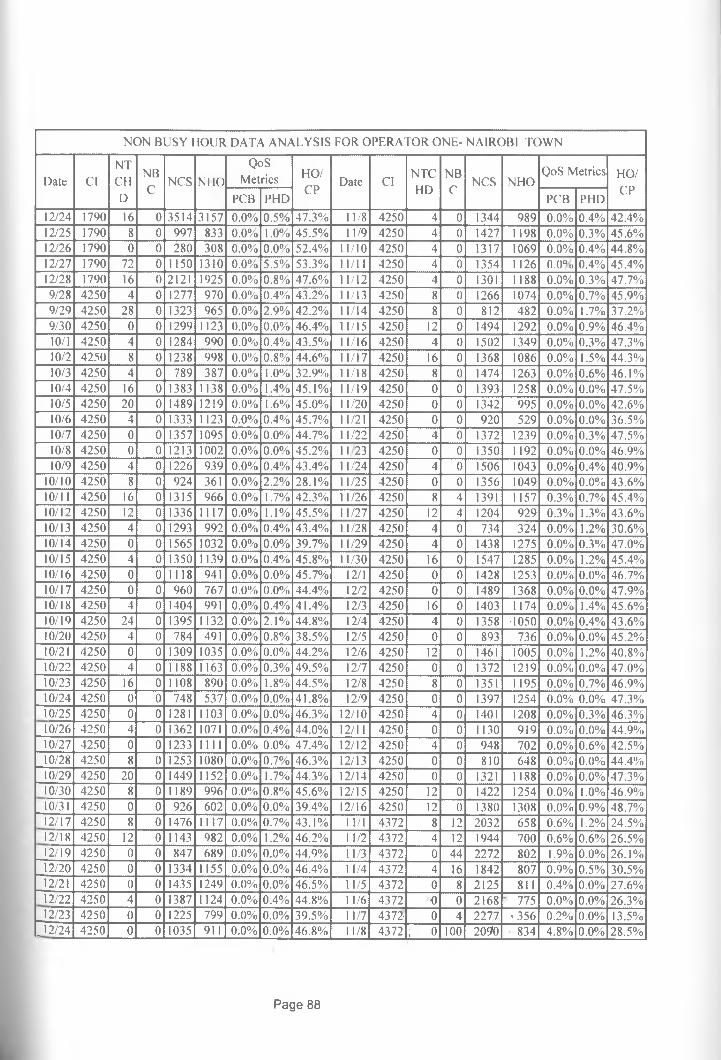
NON BUSY HOUR DATA ANALYSIS FOR OPERATOR ONE- NAIROBI TOWN
Date ClNTCHD
NBC
NCS NIK)
QoSMetrics HO/
CPDate Cl
NTCHD
NBC
NCS NHOQoS Metrics HO/
CPPCB PHD PCB PHD
12/24 1790 16 0 3514 3157 0.0% 0.5% 47.3% 11/8 4250 4 0 1344 989 0.0% 0.4% 42.4%12/25 1790 8 0 997 833 0.0% 1.0% 45.5% 11/9 4250 4 0 1427 1198 0.0% 0.3% 45.6%12/26 1790 0 0 280 308 0.0% 0.0% 52.4% 11/10 4250 4 0 1317 1069 0.0% 0.4% 44.8%12/27 1790 72 0 1150 1310 0.0% 5.5% 53.3% 11/11 4250 4 0 1354 1126 0.0" o 0.4% 45.4%12/28 1790 16 0 2121 1925 0.0% 0.8% 47.6% 11/12 4250 4 0 1301 1188 0.0% 0.3% 47.7%9/28 4250 4 0 1277 970 0.0% 0.4% 43.2% 11/13 4250 8 0 1266 1074 0.0% 0.7% 45.9%9/29 4250 28 0 1323 965 0.0% 2.9% 42.2% 11/14 4250 8 0 812 482 0.0% 1.7% 37.2%9/30 4250 0 0 1299 1123 0.0% 0.0% 46.4% 11/15 4250 12 0 1494 1292 0.0% 0.9% 46.4%10/1 4250 4 0 1284 990 0.0% 0.4% 43.5% 11/16 4250 4 0 1502 1349 0.0% 0.3% 47.3%10/2 4250 8 0 1238 998 0.0% 0.8% 44.6% 11/17 4250 16 0 1368 1086 0.0% 1.5% 44.3%10/3 4250 4 0 789 387 0.0% 1.0% 32.9% 11/18 4250 8 0 1474 1263 0.0% 0.6% 46.1%10/4 4250 16 0 1383 1138 0.0% 1.4% 45.1% 11/19 4250 0 0 1393 1258 0.0% 0.0% 47.5%10/5 4250 20 0 1489 1219 0.0% 1.6% 45.0% 11/20 4250 0 0 1342 995 0.0% 0.0% 42.6%10/6 4250 4 0 1333 1123 0.0% 0.4% 45.7% 11/21 4250 0 0 920 529 0.0% 0.0% 36.5%10/7 4250 0 0 1357 1095 0.0% 0.0% 44.7% 11/22 4250 4 0 1372 1239 0.0% 0.3% 47.5%10/8 4250 0 0 1213 1002 0.0% 0.0% 45.2% 1 1 23 4250 0 0 1350 1192 0.0% 0.0% 46.9%10/9 4250 4 0 1226 939 0.0% 0.4% 43.4% 11/24 4250 4 0 1506 1043 0.0% 0.4% 40.9%
10/10 4250 8 0 924 361 0.0% 2.2% 28.1% 11/25 4250 0 0 1356 1049 0.0% 0.0% 43.6%10/11 4250 16 0 1315 966 0.0% 1.7% 42.3% 11/26 4250 8 4 1391 1157 0.3% 0.7% 45.4%10/12 4250 12 0 1336 1117 0.0% 1.1% 45.5% 11/27 4250 12 4 1204 929 0.3% 1.3% 43.6%10/13 4250 4 0 1293 992 0.0% 0.4% 43.4% 11/28 4250 4 0 734 324 0.0% 1.2% 30.6%10/14 4250 0 0 1565 1032 0.0% 0.0% 39.7% 11/29 4250 4 0 1438 1275 0.0% 0.3% 47.0%10/15 4250 4 0 1350 1139 0.0% 0.4% 45.8% 11/30 4250 16 0 1547 1285 0.0% 1.2% 45.4%10/16 4250 0 0 1118 941 0.0% 0.0% 45.7% 12/1 4250 0 0 1428 1253 0.0% 0.0% 46.7%10/17 4250 0 0 960 767 0.0% 0.0% 44.4% 12/2 4250 0 0 1489 1.368 0.0% 0.0% 47.9%10/18 4250 4 0 1404 991 0.0% 0.4% 41.4% 12/3 4250 16 0 1403 1174 0.0% 1.4% 45.6%10/19 4250 24 0 1395 1132 0.0% 2.1% 44.8% 12/4 4250 4 0 1358 •1050 0.0% 0.4% 43.6%10/20 4250 4 0 784 491 0.0% 0.8% 38.5% 12/5 4250 0 0 893 736 0.0% 0.0% 45.2%10/21 4250 0 0 1309 1035 0.0% 0.0% 44.2% 12/6 4250 12 0 1461 1005 0.0% 1.2% 40.8%10/22 4250 4 0 1188 1163 0.0% 0.3% 49.5% 12/7 4250 0 0 1372 1219 0.0% 0.0% 47.0%10/23 4250 16 0 1108 890 0.0% 1.8% 44.5% 12/8 4250 8 0 1351 1195 0.0% 0.7% 46.9%10/24 4250 0 0 748 537 0.0% 0.0% 41.8% 12/9 4250 0 0 1397 1254 0.0% 0.0% 47.3%10/25 4250 0 0 1281 1103 0.0% 0.0% 46.3% 12/10 4250 4 0 1401 1208 0.0% 0.3% 46.3%10/26 4250 4 0 1362 1071 0.0% 0.4% 44.0% 12/11 4250 0 0 1130 919 0.0% 0.0% 44.9%10/27 4250 0 0 1233 m i 0.0% 0.0% 47.4% 12/12 4250 4 0 948 702 0.0% 0.6% 42.5%10/28 4250 8 0 1253 1080 0.0% 0.7% 46.3% 12/13 4250 0 0 810 648 0.0% 0.0% 44.4%10/29 4250 20 0 1449 1152 0.0% 1.7% 44.3% 12/14 4250 0 0 1321 1188 0.0% 0.0% 47.3%10/30 4250 8 0 1189 996 0.0% 0.8% 45.6% 12/15 4250 12 0 1422 1254 0.0% 1.0% 46.9%10/31 4250 0 0 926 602 0.0% 0.0% 39.4% 12/16 4250 12 0 1380 1.308 0.0% 0.9% 48.7%12/17 4250 8 0 1476 1117 0.0% 0.7% 43.1% 11/1 4.372 8 12 2032 658 0.6% 1.2% 24.5%12/18 4250 12 0 1143 982 0.0% 1.2% 46.2% 11/2 4372 4 12 1944 700 0.6% 0.6% 26.5%12/19 4250 0 0 847 689 0.0% 0.0% 44.9% 11/3 4372 0 44 2272 802 1.9% 0.0% 26.1%12/20 4250 0 0 1334 1155 0.0% 0.0% 46.4% 11/4 4372 4 16 1842 807 0.9% 0.5% 30.5%12/21 4250 0 0 1435 1249 0.0% 0.0% 46.5% 11/5 4372 0 8 2125 811 0.4% 0.0% 27.6%12/22 4250 4 0 1387 1124 0.0% 0.4% 44.8% 11/6 4372 0 0 2168 775 0.0% 0.0% 26.3%12/23 4250 0 0 1225 799 0.0% 0.0% 39.5% 11/7 4372' 0 4 2277 '3 5 6 0.2% 0.0% 1.3.5%
_ 12/24 4250 0 0 1035 911 0.0% 0.0% 46.8% 11/8 4372 j 0 100 2090 834 4.8% 0.0% 28.5%
Page 88
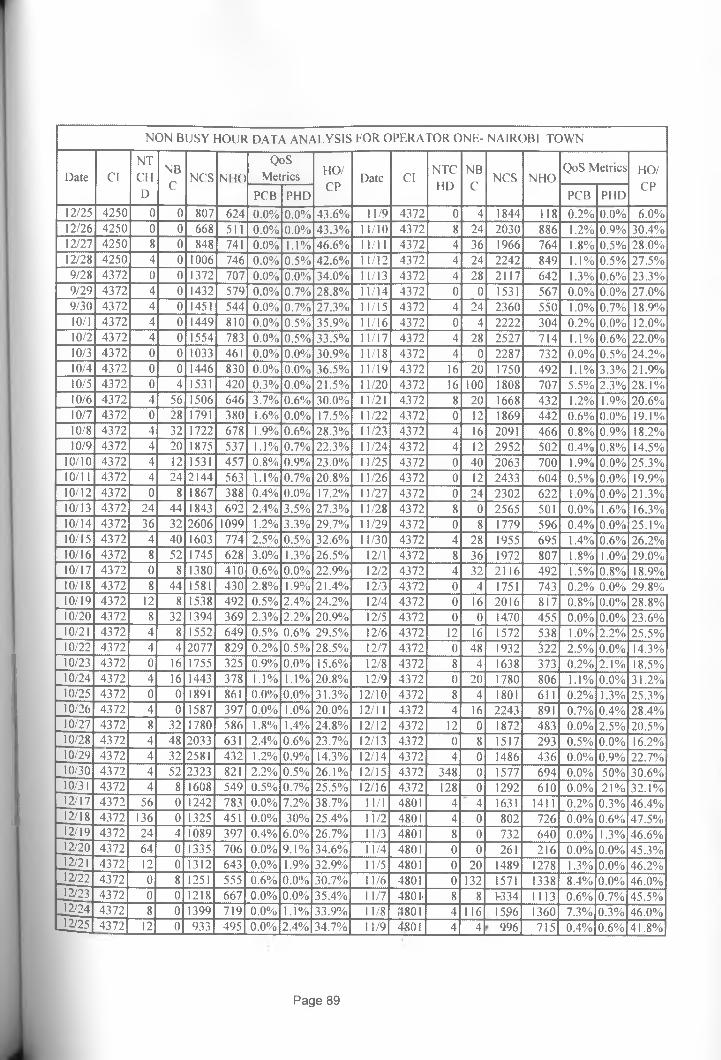
NON BUSY HOUR DATA ANALYSIS FOR OPERATOR ONE- NAIROBI TOWN
Date ClNTCHD
NBC
NC'S NIK)QoS
Metrics HO/CP
Date ClNTCHD
NBC
NCS NHOQoS Metrics HO/
CPPCB PHD PCB PHD
12/25 4250 0 0 807 624 0.0% 0.0% 43.6% 11/9 4372 0 4 1844 118 0.2% 0.0% 6.0%12/26 4250 0 0 668 511 0.0% 0.0% 43.3% 11/10 4372 8 24 2030 886 1.2% 0.9% 30.4%12/27 4250 8 0 848 741 0.0% 1.1% 46.6% 11/11 4372 4 36 1966 764 1.8% 0.5% 28.0%12/28 4250 4 0 1006 746 0.0% 0.5% 42.6% 11/12 4372 4 24 2242 849 1.1% 0.5% 27.5%9/28 4372 0 0 1372 707 0.0% 0.0% 34.0% 11/13 4372 4 28 2117 642 1.3% 0.6% 23.3%9/29 4372 4 0 1432 579 0.0% 0.7% 28.8% 11/14 4372 0 0 1531 567 0.0% 0.0% 27.0%9/30 4372 4 0 1451 544 0.0% 0.7% 27.3% 11/15 4372 4 24 2360 550 1.0% 0.7% 18.9%10/1 4372 4 0 1449 810 0.0% 0.5% 35.9% 11/16 4372 0 4 2222 304 0.2% 0.0% 12.0%10/2 4372 4 0 1554 783 0.0% 0.5% 33.5% 11/17 4372 4 28 2527 714 1.1% 0.6% 22.0%10/3 4372 0 0 1033 461 0.0% 0.0% 30.9% 11/18 4372 4 0 2287 732 0.0% 0.5% 24.2%10/4 4372 0 0 1446 830 0.0% 0.0% 36.5% 11/19 4372 16 20 1750 492 1.1% 3.3% 21.9%10/5 4372 0 4 1531 420 0.3% 0.0% 21.5% 11/20 4372 16 100 1808 707 5.5% 2.3% 28.1%10/6 4372 4 56 1506 646 3.7% 0.6% 30.0% 11/21 4372 8 20 1668 432 1.2% 1.9% 20.6%10/7 4372 0 28 1791 380 1.6% 0.0% 17.5% 11/22 4372 0 12 1869 442 0.6% 0.0% 19.1%10/8 4372 4 32 1722 678 1.9% 0.6% 28.3% 11/23 4372 4 16 2091 466 0.8% 0.9% 18.2%10/9 4372 4 20 1875 537 1.1% 0.7% 22.3% 11/24 4372 4 12 2952 502 0.4% 0.8% 14.5%
10/10 4372 4 12 1531 457 0.8% 0.9% 23.0% 11/25 4372 0 40 2063 700 1.9% 0.0% 25.3%10/11 4372 4 24 2144 563 1.1% 0.7% 20.8% 11/26 4372 ~ T 12 2433 604 0.5% 0.0% 19.9%10/12 4372 0 8 1867 388 0.4% 0.0% 17.2% 11/27 4372 0 24 2302 622 1.0% 0.0% 21.3%10/13 4372 24 44 1843 692 2.4% 3.5% 27.3% 11/28 4372 8 0 2565 501 0.0% 1.6% 16.3%10/14 4372 36 32 2606 1099 1.2% 3.3% 29.7% 11/29 4372 0 8 1779 596 0.4% 0.0% 25.1%10/15 4372 4 40 1603 774 2.5% 0.5% 32.6% 11/30 4372 4 28 1955 695 1.4% 0.6% 26.2%10/16 4372 8 52 1745 628 3.0% 1.3% 26.5% 12/1 4372 8 36 1972 807 1.8% 1.0% 29.0%10/17 4372 0 8 1380 410 0.6% 0.0% 22.9% 12/2 4372 4 32 2116 492 1.5% 0.8% 18.9%10/18 4372 8 44 1581 430 2.8% 1.9% 21.4% 12/3 4372 0 4 1751 743 0.2% 0.0% 29.8%10/19 4372 12 8 1538 492 0.5% 2.4% 24.2% 12/4 4372 0 16 2016 817 0.8% 0.0% 28.8%10/20 4372 8 32 1394 369 2.3% 2.2% 20.9% 12/5 4372 0 0 14.70 455 0.0% 0.0% 23.6%10/21 4372 4 8 1552 649 0.5% 0.6% 29.5% 12/6 4372 12 16 1572 538 1.0% 2.2% 25.5%10/22 4372 4 4 2077 829 0.2% 0.5% 28.5% 12/7 4372 0 48 1932 522 2.5% 0.0% 14.3%10/23 4372 0 16 1755 325 0.9% 0.0% 15.6% 12/8 4372 8 4 1638 373 0.2% 2.1% 18.5%10/24 4372 4 16 1443 378 1.1% 1.1% 20.8% 12/9 4372 0 20 1780 806 1.1% 0.0% 31.2%10/25 4372 0 0 1891 861 0.0% 0.0% 31.3% 12/10 4372 8 4 1801 611 0.2% 1.3% 25.3%10/26 4372 4 0 1587 397 0.0% 1.0% 20.0% 12/11 4372 4 16 2243 891 0.7% 0.4% 28.4%10/27 4372 8 32 1780 586 1.8% 1.4% 24.8% 12/12 4372 12 0 1872 483 0.0% 2.5% 20.5%10/28 4372 4 48 2033 631 2.4% 0.6% 23.7% 12/13 4372 0 8 1517 293 0.5% 0.0% 16.2%10/29 4372 4 32 2581 432 1.2% 0.9% 14.3% 12/14 4372 4 0 I486 436 0.0% 0.9% 22.7%10/30 4372 4 52 2323 821 2.2% 0.5% 26.1% 12/15 4372 348 0 1577 694 0.0% 50% 30.6%10/31 4372 4 8 1608 549 0.5% 0.7% 25.5% 12/16 4372 128 0 1292 610 0.0% 21% 32.1%12/17 4372 56 0 1242 783 0.0% 7.2% 38.7% 11/1 4801 4 4 1631 1411 0.2% 0.3% 46.4%12/18 4372 136 0 1325 451 0.0% 30% 25.4% 11/2 4801 4 0 802 726 0.0% 0.6% 47.5%12/19 4372 24 4 1089 397 0.4% 6.0% 26.7% 11/3 4801 8 0 732 640 0.0% 1.3% 46.6%12/20 4372 64 0 1335 706 0.0% 9.1% 34.6% 11/4 4801 0 0 261 216 0.0% 0.0% 45.3%12/21 4372 12 0 1312 643 0.0% 1.9% 32.9% 11/5 4801 0 20 1489 1278 1.3% 0.0% 46.2%12/22 4372 0 8 1251 555 0.6% 0.0% 30.7% 11/6 4801 0 132 1571 1338 8.4% 0.0% 46.0%12/23 4372 0 0 1218 667 0.0% 0.0% 35.4% 11/7 4801- 8 8 1-334 1113 0.6% 0.7% 45.5%12/24 4372 8 0 1399 719 0.0% 1.1% 33.9% 11/8 4801 4 116 15,96 1360 7.3% 0.3% 46.0%12/25 4372 12 0 933 495 0.0% 2.4% 34.7% 11/9 4801 4 4 996 715 0.4% 0.6% 41.8%
Page 89
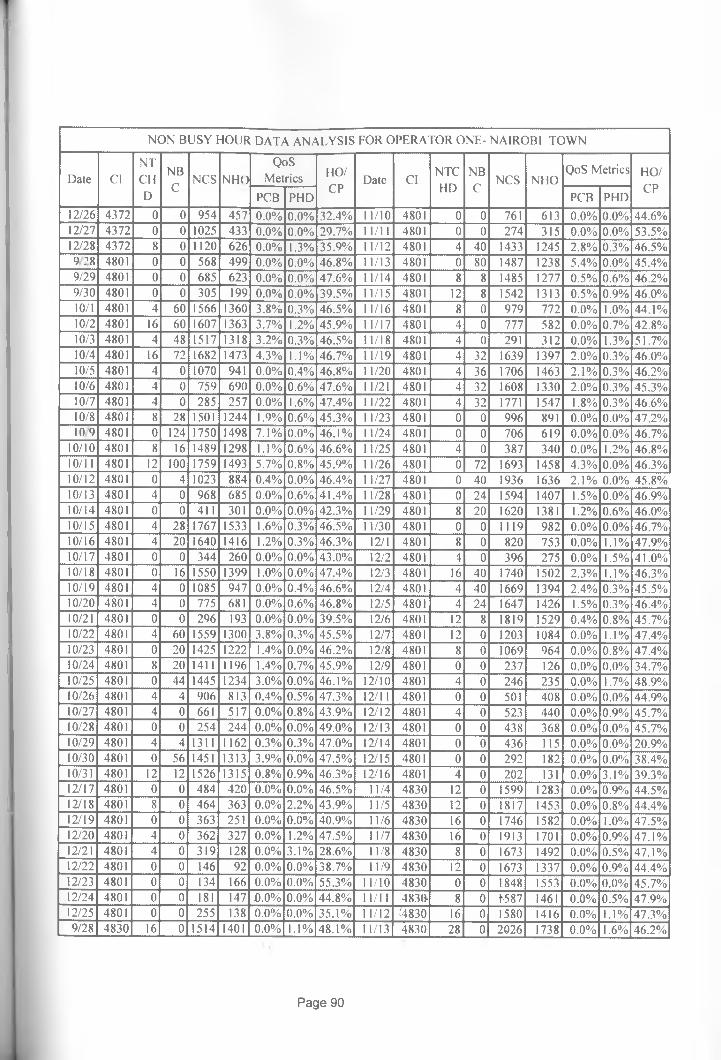
NON BUSY HOUR DATA ANALYSIS FOR OPERATOR ONE- NAIROBI TOWN
Date ClNTCHD
NBC
NCS \ H < )
QoSM e tr ic s
HO/CP
Date ClNTCHD
NBC
NCS NHOQoS Metrics HO/
CPPCB PHD PCB PHD
12/26 4372 0 0 954 457 0.0% 0.0% 32.4% 11/10 4801 O 0 761 613 0.0% 0.0% 44.6%12/27 4372 0 0 1025 433 0.0% 0.0% 29.7% 11/11 4801 ~ 0 0 274 315 0.0% 0.0% 53.5%12/28 4372 8 0 1120 626 0.0% 1.3% 35.9% 11/12 4801 T 40 1433 1245 2.8% 0.3% 46.5%9 ."X 4801 0 0 568 499 0.0% 0.0% 46.8% 11/13 4801 0 80 1487 1238 5.4% 0.0% 45.4%9/29 4801 0 0 685 623 0.0% 0.0% 47.6% 11/14 4801 8 8 1485 1277 0.5% 0.6% 46.2%9/30 4801 0 0 305 199 0.0% 0.0% 39.5% 11/15 4801 12 8 1542 1313 0.5% 0.9% 46.0%10/1 4801 4 60 1566 1360 3.8% 0.3% 46.5% 11/16 4801 8 0 979 772 0.0% 1.0% 44.1%10/2 4801 16 60 1607 1363 3.7% 1.2% 45.9% 11/17 4801 4 0 777 582 0.0% 0.7% 42.8%10/3 4801 4 48 1517 1318 3.2% 0.3% 46.5% 11/18 4801 4 0 291 312 0.0% 1.3% 51.7%10/4 4801 16 72 1682 1473 4.3% 1.1% 46.7% 11/19 4801 4 32 1639 1397 2.0% 0.3% 46.0%10/5 4801 4 0 1070 941 0.0% 0.4% 46.8% 11/20 4801 4 36 1706 1463 2.1% 0.3% 46.2%10/6 4801 4 0 759 690 0.0% 0.6% 47.6% 11/21 4801 4 32 1608 1330 2.0% 0.3% 45.3%10/7 4801 4 0 285 257 0.0% 1.6% 47.4% 11/22 4801 4 32 1771 1547 1.8% 0.3% 46.6%10/8 4801 8 28 1501 1244 1.9% 0.6% 45.3% 11/23 4801 0 0 996 891 0.0% 0.0% 47.2%10 9 4801 0 124 1750 1498 7.1% 0.0% 46.1% 11/24 4801 ~ 0 0 706 619 0.0% 0.0% 46.7%
10/10 4801 8 16 1489 1298 1.1% 0.6% 46.6% 11/25 4801 4 0 387 340 0.0% 1.2% 46.8%10/11 4801 12 100 1759 1493 5.7% 0.8% 45.9% 11/26 4801 0 72 1693 1458 4.3% 0.0% 46.3%10/12 4801 0 4 1023 884 0.4% 0.0% 46.4% 11/27 4801 0 40 1936 1636 2.1% 0.0% 45.8%10/13 4801 4 0 968 685 0.0% 0.6% 41.4% 11/28 4801 0 24 1594 1407 1.5% 0.0% 46.9%10/14 4801 0 0 411 301 0.0% 0.0% 42.3% 11/29 4801 8 20 1620 1381 1.2% 0.6% 46.0%10/15 4801 4 28 1767 1533 1.6% 0.3% 46.5% 11/30 4801 0 0 1119 982 0.0% 0.0% 46.7%10/16 4801 4 20 1640 1416 1.2% 0.3% 46.3% 12/1 4801 8 0 820 753 0.0% 1.1% 47.9%10/17 4801 0 0 344 260 0.0% 0.0% 43.0% 12/2 4801 _ 41 0 396 275 0.0% 1.5% 41.0%10/18 4801 0 16 1550 1399 1.0% 0.0% 47.4% 12/3 4801 16 40 1740 1502 2.3% 1.1% 46.3%10/19 4801 4 0 1085 947 0.0% 0.4% 46.6% 12/4 4801 4 40 1669 1394 2.4% 0.3% 45.5%10/20 4801 4 0 775 681 0.0% 0.6% 46.8% 12/5 4801 4 24 1647 1426 1.5% 0.3% 46.4%10/21 4801 0 0 296 193 0.0% 0.0% 39.5% 12/6 4801 12 8 1819 1529 0.4% 0.8% 45.7%10/22 4801 4 60 1559 1300 3.8% 0.3% 45.5% 12/7 4801 12 0 1203 1084 0.0% 1.1% 47.4%10/23 4801 0 20 1425 1222 1.4% 0.0% 46.2% 12/8 4801 8 0 1069 964 0.0% 0.8% 47.4%10/24 4801 8 20 1411 1196 1.4% 0.7% 45.9% 12/9 4801 0 0 237 126 0.0% 0.0% 34.7%10/25 4801 0 44 1445 1234 3.0% 0.0% 46.1% 12/10 4801 4 0 246 235 0.0% 1.7% 48.9%10/26 4801 4 4 906 813 0.4% 0.5% 47.3% 12/11 4801 0 0 501 408 0.0% 0.0% 44.9%10/27 4801 4 0 661 517 0.0% 0.8% 43.9% 12/12 4801 4 0 523 440 0.0% 0.9% 45.7%10/28 4801 0 0 254 244 0.0% 0.0% 49.0% 12/13 4801 0 0 438 368 0.0% 0.0% 45.7%10/29 4801 4 4 1311 1162 0.3% 0.3% 47.0% 12/14 4801 0 0 436 115 0.0% 0.0% 20.9%10/30 4801 0 56 1451 1313 3.9% 0.0% 47.5% 12/15 4801 0 0 292 182 0.0% 0.0% 38.4%10/31 4801 12 12 1526 1315 0.8% 0.9% 46.3% 12/16 4801 4 0 202 131 0.0% 3.1% 39.3%12/17 4801 0 0 484 420 0.0% 0.0% 46.5% 11/4 4830 12 0 1599 1283 0.0% 0.9% 44.5%12/18 4801 8 0 464 363 0.0% 2.2% 43.9% 11/5 4830 12 0 1817 1453 0.0% 0.8% 44.4%12/19 4801 0 0 363 251 0.0% 0.0% 40.9% 11/6 4830 16 0 1746 1582 0.0% 1.0% 47.5%12/20 4801 4 0 362 327 0.0% 1.2% 47.5% 11/7 4830 16 0 1913 1701 0.0% 0.9% 47.1%12/21 4801 4 0 319 128 0.0% 3.1% 28.6% 11/8 4830 8 0 1673 1492 0.0% 0.5% 47.1%12/22 4801 0 0 146 92 0.0% 0.0% 38.7% 11/9 4830 12 0 1673 1337 0.0% 0.9% 44.4%12/23 4801 0 0 134 166 0.0% 0.0% 55.3% 11/10 4830 0 0 1848 1553 0.0% 0.0% 45.7%12/24 4801 0 0 181 147 0.0% 0.0% 44.8% 11/11 4830 8 0 F587 1461 0.0% 0.5% 47.9%12/25 4801 0 0 255 138 0.0% 0.0% 35.1% 11/12 ^4830 16 0 1580 1416 0.0% 1.1% 47.3%9/28 4830 16 0 1514 1401 0.0% 1.1% 48.1% 11/13 4830 28 0 2026 1738 0.0% 1.6% 46.2%
Page 90
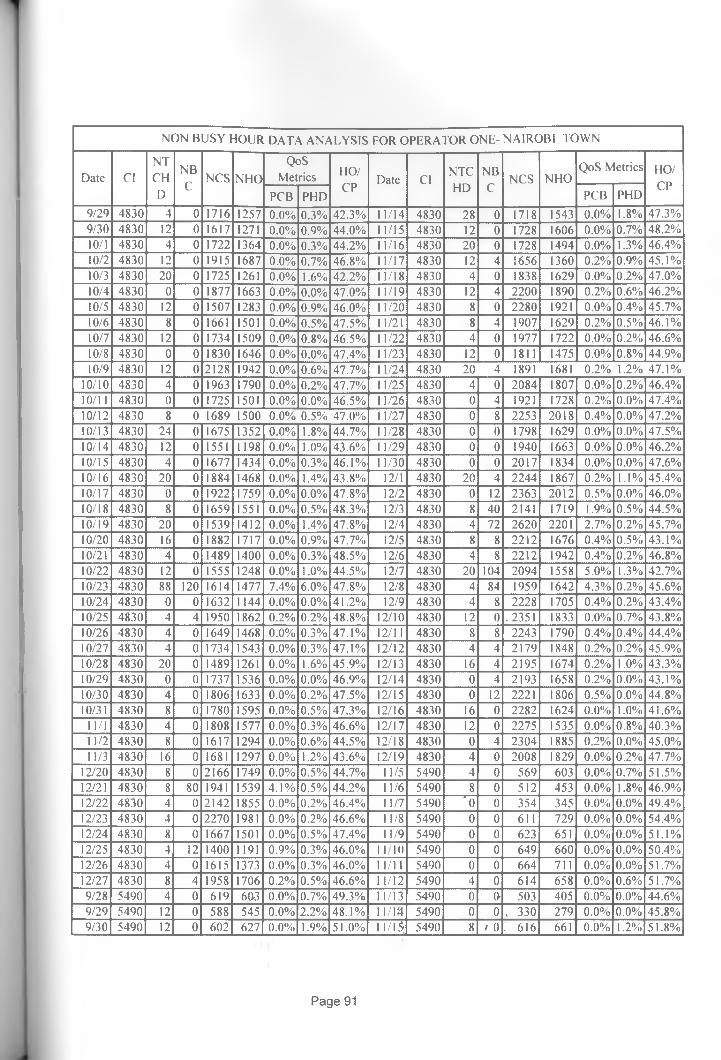
NON BUSY HOUR DATA ANALYSIS FOR OPERATOR ONE- NAIROBI TOWN
Date ClNTCHD
NBC
NCS NHOQoS
Metrics HO/CP
Date ClNTCHD
NBC
NCS NHOQoS Metrics HO/
CPPCB PHD PCB PHD
9/29 4830 4 0 1716 1257 0.0% 0.3% 42.3% 11/14 4830 28 0 1718 1543 0.0% 1.8% 47.3%9/30 4830 12 0 1617 1271 0.0% 0.9% 44.0% 11/15 4830 12 0 1728 1606 0.0% 0.7% 48.2%10/1 4830 4 0 1722 1364 0.0% 0.3% 44.2% 11/16 4830 20 0 1728 1494 0.0% 1.3% 46.4%10/2 4830 12 0 1915 1687 0.0% 0.7% 46.8% 11/17 4830 12 4 1656 1360 0.2% 0.9% 45.1%10/3 4830 20 0 1725 1261 0.0% 1.6% 42.2% 11/18 4830 4 0 1838 1629 0.0% 0.2% 47.0%10/4 4830 0 0 1877 1663 0.0% 0.0% 47.0% 11/19 4830 12 4 2200 1890 0.2% 0.6% 46.2%10/5 4830 12 0 1507 1283 0.0% 0.9% 46.0% 11/20 4830 8 0 2280 1921 0.0% 0.4% 45.7%10/6 4830 8 0 1661 1501 0.0% 0.5% 47.5% 11/21 4830 8 4 1907 1629 0.2% 0.5% 46.1%10/7 4830 12 0 1734 1509 0.0% 0.8% 46.5% 11/22 4830 4 0 1977 1722 0.0% 0.2% 46.6%10/8 4830 0 0 1830 1646 0.0% 0.0% 47.4% 11/23 4830 12 0 1811 1475 0.0% 0.8% 44.9%10/9 4830 12 0 2128 1942 0.0% 0.6% 47.7% 11/24 4830 20 4 1891 1681 0.2% 1.2% 47.1%
10/10 4830 4 0 1963 1790 0.0% 0.2% 47.7% 11/25 4830 4 0 2084 1807 0.0% 0.2% 46.4%10/11 4830 0 0 1725 1501 0.0% 0.0% 46.5% 11/26 4830 0 4 1921 1728 0.2% 0.0% 47.4%10/12 4830 8 0 1689 1500 0.0% 0.5% 47.0% 11/27 4830 0 8 2253 2018 0.4% 0.0% 47.2%10/13 4830 24 0 1675 1352 0.0% 1.8% 44.7% 11/28 4830 0 0 1798 1629 0.0% 0.0% 47.5%10/14 4830 12 0 1551 1198 0.0% 1.0% 43.6% 11/29 4830 0 0 1940 1663 0.0% 0.0% 46.2%10/15 4830 4 0 1677 1434 0.0% 0.3% 46.1% 11/30 4830 0 0 2017 1834 0.0% 0.0% 47.6%10/16 4830 20 0 1884 1468 0.0% 1.4% 43.8% 12/1 4830 20 4 2244 1867 0.2% 1.1% 45.4%10/17 4830 0 0 1922 1759 0.0% 0.0% 47.8% 12/2 4830 0 12 2363 2012 0.5% 0.0% 46.0%10/18 4830 8 0 1659 1551 0.0% 0.5% 48.3% 12/3 4830 8 40 2141 1719 1.9% 0.5% 44.5%10/19 4830 20 0 1539 1412 0.0% 1.4% 47.8% 12/4 4830 4 72 2620 2201 2.7% 0.2% 45.7%10/20 4830 16 0 1882 1717 0.0% 0.9% 47.7% 12/5 4830 8 8 2212 1676 0.4% 0.5% 43.1%10/21 4830 4 0 1489 1400 0.0% 0.3% 48.5% 12/6 4830 4 8 2212 1942 0.4% 0.2% 46.8%10/22 4830 12 0 1555 1248 0.0% 1.0% 44.5% 12/7 4830 20 104 2094 1558 5.0% 1.3% 42.7%10/23 4830 88 120 1614 1477 7.4% 6.0% 47.8% 12/8 4830 4 84 1959 1642 4.3% 0.2% 45.6%10/24 4830 0 0 1632 1144 0.0% 0.0% 41.2% 12/9 4830 4 8 2228 1705 0.4% 0.2% 43.4%10/25 4830 4 4 1950 1862 0.2% 0.2% 48.8% 12/10 4830 12 0 . 2351 1833 0.0% 0.7% 43.8%10/26 4830 4 0 1649 1468 0.0% 0.3% 47.1% 12/11 4830 8 8 2243 1790 0.4% 0.4% 44.4%10/27 4830 4 0 1734 1543 0.0% 0.3% 47.1% 12/12 4830 4 4 2179 1848 0.2% 0.2% 45.9%10/28 4830 20 0 1489 1261 0.0% 1.6% 45.9% 12/13 4830 16 4 2195 1674 0.2% 1.0% 43.3%10/29 4830 0 0 1737 1536 0.0% 0.0% 46.9% 12/14 4830 0 4 2193 1658 0.2% 0.0% 43.1%10/30 4830 4 0 1806 1633 0.0% 0.2% 47.5% 12/15 4830 0 12 2221 1806 0.5% 0.0% 44.8%10/31 4830 8 0 1780 1595 0.0% 0.5% 47.3% 12/16 4830 16 0 2282 1624 0.0% 1.0% 41.6%
11/1 4830 4 0 1808 1577 0.0% 0.3% 46.6% 12/17 4830 12 0 2275 15.35 0.0% 0.8% 40.3%11/2 4830 8 0 1617 1294 0.0% 0.6% 44.5% 12/18 4830 0 4 2304 1885 0.2% 0.0% 45.0%11/3 4830 16 0 1681 1297 0.0% 1.2% 43.6% 12/19 4830 4 0 2008 1829 0.0% 0.2% 47.7%
12/20 4830 8 0 2166 1749 0.0% 0.5% 44.7% 11/5 5490 4 0 569 603 0.0% 0.7% 51.5%12/21 4830 8 80 1941 1539 4.1% 0.5% 44.2% 11/6 5490 8 0 512 453 0.0% 1.8% 46.9%12/22 4830 4 0 2142 1855 0.0% 0.2% 46.4% 11/7 5490 '0 0 354 345 0.0% 0.0% 49.4%12/23 4830 4 0 2270 1981 0.0% 0.2% 46.6% 11/8 5490 0 0 611 729 0.0% 0.0% 54.4%12/24 4830 8 0 1667 1501 0.0% 0.5% 47.4% 11/9 5490 0 0 623 651 0.0% 0.0% 51.1%12/25 4830 4 12 1400 1191 0.9% 0.3% 46.0% II Id 5490 0 0 649 660 0.0% 0.0% 50.4%12/26 4830 4 0 1615 1373 0.0% 0.3% 46.0% 11/11 5490 0 0 664 711 0.0% 0.0% 51.7%12/27 4830 8 4 1958 1706 0.2% 0.5% 46.6% 11/12 5490 4 0 614 658 0.0% 0.6% 51.7%9/28 5490 4 0 619 603 0.0% 0.7% 49.3% 11/13 5490 0 0 503 405 0.0% 0.0% 44.6%9/29 5490 12 0 588 545 0.0% 2.2% 48.1% 11/14 5490 0 0 , 330 279 0.0% 0.0% 45.8%9/30 5490 12 0 602 627 0.0% 1.9% 51.0% 11/1$ 5490 8 / 0 . 616 661 0.0% 1.2% 51.8%
Page 91
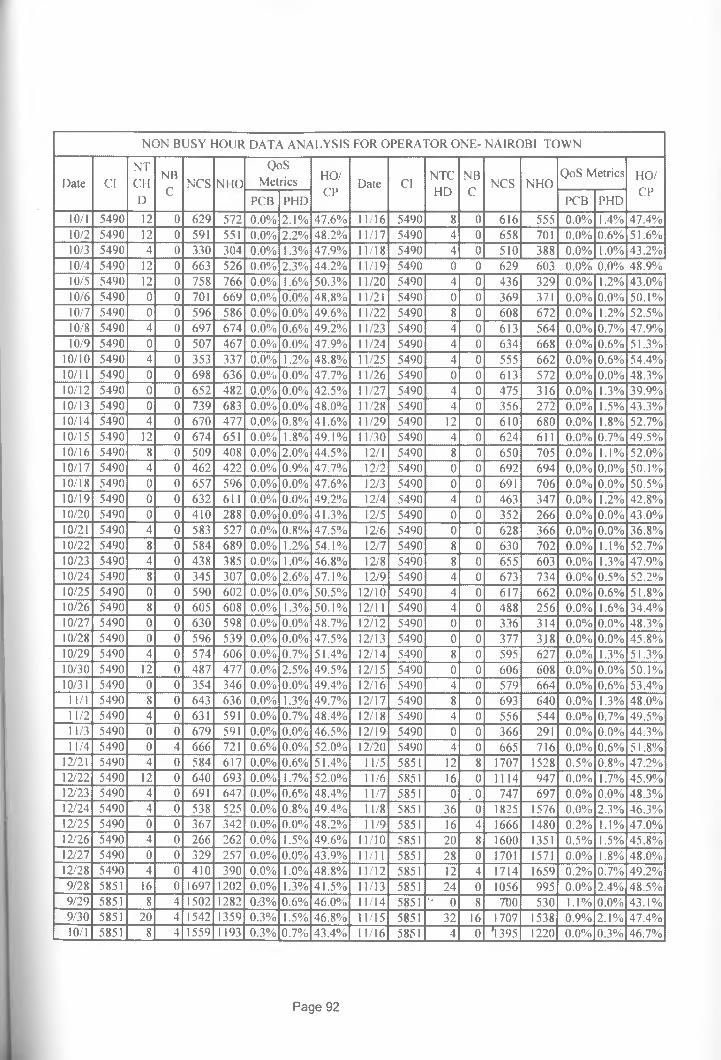
NON BUSY HOUR DATA ANALYSIS FOR OPERATOR ONE- NAIROBI TOWN
Date ClNTCHD
NBC
NCS NIK)
QoSMetrics HO/
CPDate Cl
NTCHD
NBC
NCS NHOQoS Metrics HO/
CPPCB PHD PCB PHD
10/1 5490 12 0 629 572 0.0% 2.1% 47.6% 11/16 5490 8 0 616 555 0.0% 1.4% 47.4%10/2 5490 12 0 591 551 0.0% 2.2% 48.2% 11/17 5490 4 0 658 701 0.0% 0.6% 51.6%10/3 5490 4 0 330 304 0.0% 1.3% 47.9% 11/18 5490 4 0 510 388 0.0% 1.0% 43.2%10/4 5490 12 0 663 526 0.0% 2.3% 44.2% 11/19 5490 0 0 629 603 0.0% 0.0% 48.9%10/5 5490 12 0 758 766 0.0% 1.6% 50.3% 11/20 5490 4 0 436 329 0.0% 1.2% 43.0%10/6 5490 0 0 701 669 0.0% 0.0% 48.8% 11/21 5490 0 0 369 371 0.0% 0.0% 50.1%10/7 5490 0 0 596 586 0.0% 0.0% 49.6% 11/22 5490 8 0 608 672 0.0% 1.2% 52.5%10/8 5490 4 0 697 674 0.0% 0.6% 49.2% 11/23 5490 4 0 613 564 0.0% 0.7% 47.9%10/9 5490 0 0 507 467 0.0% 0.0% 47.9% 11/24 5490 4 0 634 668 0.0% 0.6% 51.3%
10/10 5490 4 0 353 337 0.0% 1.2% 48.8% 11/25 5490 4 0 555 662 0.0% 0.6% 54.4%10/11 5490 0 0 698 636 0.0% 0.0% 47.7% 11/26 5490 0 0 613 572 0.0% 0.0% 48.3%10/12 5490 0 0 652 482 0.0% 0.0% 42.5% 11/27 5490 4 0 475 316 0.0% 1.3% 39.9%10/13 5490 0 0 739 683 0.0% 0.0% 48.0% 11/28 5490 4 0 356 272 0.0% 1.5% 43.3%10/14 5490 4 0 670 477 0.0% 0.8% 41.6% 11/29 5490 12 0 610 680 0.0% 1.8% 52.7%10/15 5490 12 0 674 651 0.0% 1.8% 49.1% 11/30 5490 4 0 624 611 0.0% 0.7% 49.5%10/16 5490 8 0 509 408 0.0% 2.0% 44.5% 12/1 5490 8 0 650 705 0.0% 1.1% 52.0%10/17 5490 4 0 462 422 0.0% 0.9% 47.7% 12/2 5490 0 0 692 694 0.0% 0.0% 50.1%10/18 5490 0 0 657 596 0.0% 0.0% 47.6% 12/3 5490 0 0 691 706 0.0% 0.0% 50.5%10/19 5490 0 0 632 611 0.0% 0.0% 49.2% 12/4 5490 4 0 463 347 0.0% 1.2% 42.8%10/20 5490 0 0 410 288 0.0% 0.0% 41.3% 12/5 5490 0 0 352 266 0.0% 0.0% 43.0%10/21 5490 4 0 583 527 0.0% 0.8% 47.5% 12/6 5490 0 0 628 366 0.0% 0.0% 36.8%10/22 5490 8 0 584 689 0.0% 1.2% 54.1% 12/7 5490 8 0 630 702 0.0% 1.1% 52.7%10/23 5490 4 0 438 385 0.0% 1.0% 46.8% 12/8 5490 8 0 655 603 0.0% 1.3% 47.9%10/24 5490 8 0 345 307 0.0% 2.6% 47.1% 12/9 5490 4 0 673 734 0.0% 0.5% 52.2%10/25 5490 0 0 590 602 0.0% 0.0% 50.5% 12/10 5490 4 0 617 662 0.0% 0.6% 51.8%10/26 5490 8 0 605 608 0.0% 1.3% 50.1% 12/11 5490 4 0 488 256 0.0% 1.6% 34.4%10/27 5490 0 0 630 598 0.0% 0.0% 48.7% 12/12 5490 0 0 336 314 0.0% 0.0% 48.3%10/28 5490 0 0 596 539 0.0% 0.0% 47.5% 12/1.3 5490 0 0 377 3J8 0.0% 0.0% 45.8%10/29 5490 4 0 574 606 0.0% 0.7% 51.4% 12/14 5490 8 0 595 627 0.0% 1.3% 51.3%10/30 5490 12 0 487 477 0.0% 2.5% 49.5% 12/15 5490 0 0 606 608 0.0% 0.0% 50.1%10/31 5490 0 0 354 346 0.0% 0.0% 49.4% 12/16 5490 4 0 579 664 0.0% 0.6% 53.4%
11/1 5490 8 0 643 636 0.0% 1.3% 49.7% 12/17 5490 8 0 693 640 0.0% 1.3% 48.0%11/2 5490 4 0 631 591 0.0% 0.7% 48.4% 12/18 5490 4 0 556 544 0.0% 0.7% 49.5%11/3 5490 0 0 679 591 0.0% 0.0% 46.5% 12/19 5490 0 0 366 291 0.0% 0.0% 44.3%11/4 5490 0 4 666 721 0.6% 0.0% 52.0% 12/20 5490 4 0 665 716 0.0% 0.6% 51.8%
12/21 5490 4 0 584 617 0.0% 0.6% 51.4% 11/5 5851 12 8 1707 1528 0.5% 0.8% 47.2%12/22 5490 12 0 640 693 0.0% 1.7% 52.0% 11/6 5851 16 0 1114 947 0.0% 1.7% 45.9%12/23 5490 4 0 691 647 0.0% 0.6% 48.4% 11/7 5851 0 .0 747 697 0.0% 0.0% 48.3%12/24 5490 4 0 538 525 0.0% 0.8% 49.4% 11/8 5851 36 0 1825 1576 0.0% 2.3% 46.3%12/25 5490 0 0 367 342 0.0% 0.0% 48.2% 11/9 5851 16 4 1666 1480 0.2% 1.1% 47.0%12/26 5490 4 0 266 262 0.0% 1.5% 49.6% 11/10 5851 20 8 1600 1351 0.5% 1.5% 45.8%12/27 5490 0 0 329 257 0.0% 0.0% 43.9% 11/11 5851 28 0 1701 1571 0.0% 1.8% 48.0%12/28 5490 4 0 410 390 0.0% 1.0% 48.8% 11/12 5851 12 4 1714 1659 0.2% 0.7% 49.2%9/28 5851 16 0 1697 1202 0.0% 1.3% 41.5% 11/13 5851 24 0 1056 995 0.0% 2.4% 48.5%9/29 5851 8 4 1502 1282 0.-3% 0.6% 46.0% 11/14 5851 •' 0 8 700 530 1.1% 0.0% 43.1%9/30 5851 20 4 1542 1359 0.3% 1.5% 46.8% 11/15 5851 32 16 1707 1538 0.9% 2.1% 47.4%10/1 5851 8 4 1559 1193 0.3% 0.7% 43.4% 11/16 5851 4 0 '1395 1220 0.0% 0.3% 46.7%
Page 92

NON BUSY HOUR DATA ANALYSIS FOR OPERATOR ONE- NAIROBI TOWN
Date ClNTCHD
NBC
NCS NIK)
QoSMetrics HO/
CPDate Cl
NTCHD
NBC
NCS NHOQoS Metrics HO/
CPPCB PHD PCB PHD
10/2 5851 16 4 1204 1042 0.3% 1.5% 46.4% 11/17 5851 8 16 1781 1482 0.9% 0.5% 45.4%10/3 5851 4 0 670 480 0.0% 0.8% 41.7% 11/18 5851 24 0 1628 1430 0.0% 1.7% 46.8%10/4 5851 32 4 1875 1628 0.2% 2.0% 46.5% 11/19 5851 12 8 1654 1460 0.5% 0.8% 46.9%10/5 5851 20 4 1792 1402 0.2% 1.4% 43.9% 11/20 5851 16 8 1149 1001 0.7% 1.6% 46.6%10/6 5851 20 8 1658 1274 0.5% 1.6% 43.5% 11/21 5851 4 8 674 580 1.2% 0.7% 46.3%10/7 5851 16 4 1633 1443 0.2% 1.1% 46.9% 11/22 5851 16 16 1871 1709 0.9% 0.9% 47.7%10/8 5851 0 4 1426 1169 0.3% 0.0% 45.0% 11/23 5851 48 4 1929 1577 0.2% 3.0% 45.0%10/9 5851 16 4 1196 984 0.3% 1.6% 45.1% 11/24 5851 32 8 1764 1506 0.5% 2.1% 46.1%
10/10 5851 8 0 745 597 0.0% 1.3% 44.5% 11/25 5851 20 0 1678 1544 0.0% 1.3% 47.9%10/11 5851 12 4 1794 1488 0.2% 0.8% 45.3% 11/26 5851 16 4 1576 1439 0.3% 1.1% 47.7%10/12 5851 12 8 1673 1307 0.5% 0.9% 43.9% 11/27 5851 24 0 1205 980 0.0% 2.4% 44.9%10/13 5851 12 0 1641 1339 0.0% 0.9% 44.9% 11/28 5851 8 0 616 387 0.0% 2.1% 38.6%10/14 5851 20 12 1704 1397 0.7% 1.4% 45.0% 11/29 5851 36 24 1949 1763 1.2% 2.0% 47.5%10/15 5851 12 0 1521 1232 0.0% 1.0% 44.8% 11/30 5851 12 12 1841 1538 0.7% 0.8% 45.5%10/16 5851 20 0 1088 902 0.0% 2.2% 45.3% 12/1 5851 36 12 1844 1598 0.7% 2.3% 46.4%10/17 5851 4 0 675 538 0.0% 0.7% 44.4% 12/2 5851 24 24 1918 1501 1.3% 1.6% 43.9%10/18 5851 20 4 1776 1435 0.2% 1.4% 44.7% 12/3 5851 12 16 1664 1505 1.0% 0.8% 47.5%10/19 5851 8 20 1765 1474 1.1% 0.5% 45.5% 12/4 5851 24 4 1194 1116 0.3% 2.2% 48.3%10/20 5851 0 0 843 533 0.0% 0.0% 38.7% 12/5 5851 8 4 636 457 0.6% 1.8% 41.8%10/21 5851 0 0 1604 1351 0.0% 0.0% 45.7% 12/6 5851 12 4 1986 1840 0.2% 0.7% 48.1%10/22 5851 16 8 1632 1503 0.5% 1.1% 47.9% 12/7 5851 32 20 1865 1653 1.1% 1.9% 47.0%10/23 5851 20 0 1190 1077 0.0% 1.9% 47.5% 12/8 5851 8 24 1697 1524 1.4% 0.5% 47.3%10/24 5851 0 0 653 639 0.0% 0.0% 49.5% 12/9 5851 36 28 1909 1750 1.5% 2.1% 47.8%10/25 5851 32 12 1841 1635 0.7% 2.0% 47.0% 12/10 5851 24 8 1707 1248 0.5% 1.9% 42.2%10/26 5851 4 4 1538 1292 0.3% 0.3% 45.7% 12/11 5851 0 0 1155 1034 0.0% 0.0% 47.2%10/27 5851 16 4 1479 1375 0.3% 1.2% 48.2% 12/12 5851 24 0 760 709 0.0% 3.4% 48.3%10/28 5851 16 0 1604 1459 0.0% 1.1% 47.6% 12/13 5851 0 0 1035 885 0.0% 0.0% 46.1%10/29 5851 24 0 1563 1469 0.0% 1.6% 48.4% 12/14 5851 32 0 1799 1588 0.0% 2.0% 46.9%10/30 5851 20 0 1130 940 0.0% 2.1% 45.4% 12/15 5851 16 4 1751 1592 0.2% 1.0% 47.6%10/31 5851 0 0 706 498 0.0% 0.0% 41.4% 12/16 5851 8 16 1800 1475 0.9% 0.5% 45.0%
11/1 5851 20 4 1810 1677 0.2% 1.2% 48.1% 12/17 5851 20 28 1713 1558 1.6% 1.3% 47.6%11/2 5851 12 8 1923 1708 0.4% 0.7% 47.0% 12/18 5851 4 4 1244 1200 0.3% 0.3% 49.1%11/3 5851 52 0 1869 1660 0.0% 3.1% 47.0% 12/19 5851 16 0 809 715 0.0% 2.2% 46.9%11/4 5851 40 20 1642 1491 1.2% 2.7% 47.6% 12/20 5851 8 4 1709 1601 0.2% 0.5% 48.4%
12/21 5851 12 0 1612 1579 0.0% 0.8% 49.5% 11/5 6111 6 0 449 402 0.0% 1.5% 47.2%12/22 5851 16 16 1738 1563 0.9% 1.0% 47.3% 11/6 6111 0 0 448 417 0.0% 0.0% 48.2%12/23 5851 4 8 1881 1768 0.4% 0.2% 48.5% 11/7 6111 6 6 408 425 1.5% 1.4% 51.0%12/24 5851 8 0 1228 1093 0.0% 0.7% 47.1% 11/8 6111 12 0 432 368 0.0% 3.3% 46.0%12/25 5851 4 0 618 542 0.0% 0.7% 46.7% 11/9 6111 6 0 414 330 0.0% 1.8% 44.4%12/26 5851 0 0 570 331 0.0% 0.0% 36.7% 11/10 6111 0 0 497 319 0.0% 0.0% 39.1%12/27 5851 8 4 1046 903 0.4% 0.9% 46.3% 11/11 6111 12 0 422 384 0.0% 3.1% 47.6%12/28 5851 12 4 1439 1228 0.3% 1.0% 46.0% 11/12 6111 0 0 416 304 0.0% 0.0% 42.2%9/28 6111 0 0 445 343 0.0% 0.0% 43.5% 11/13 6111 0 0 438 407 0.0% 0.0% 48.2%9/29 6111 0 0 362 379 0.0% 0.0% 51.1% 11/14 6111 0 0 402 335 0.0% 0.0% 45.5%9/30 6111 0 0 450 289 0.0% 0.0% 39.1% 11/15. 6M1 6 0 422 367 0.0% 1.6% 46.5%10/1 6111 6 0 425 349 0.0% 1.7% 45.1% 11/16 6111 0 0 < 445 395 0.0% 0.0% 47.0%10/2 6111 0 0 460 410 0.0% 0.0% 47.1% 11/17 6111 6 '0 ■ 409 370 0.0% 1.6% 47.5%
Page 93
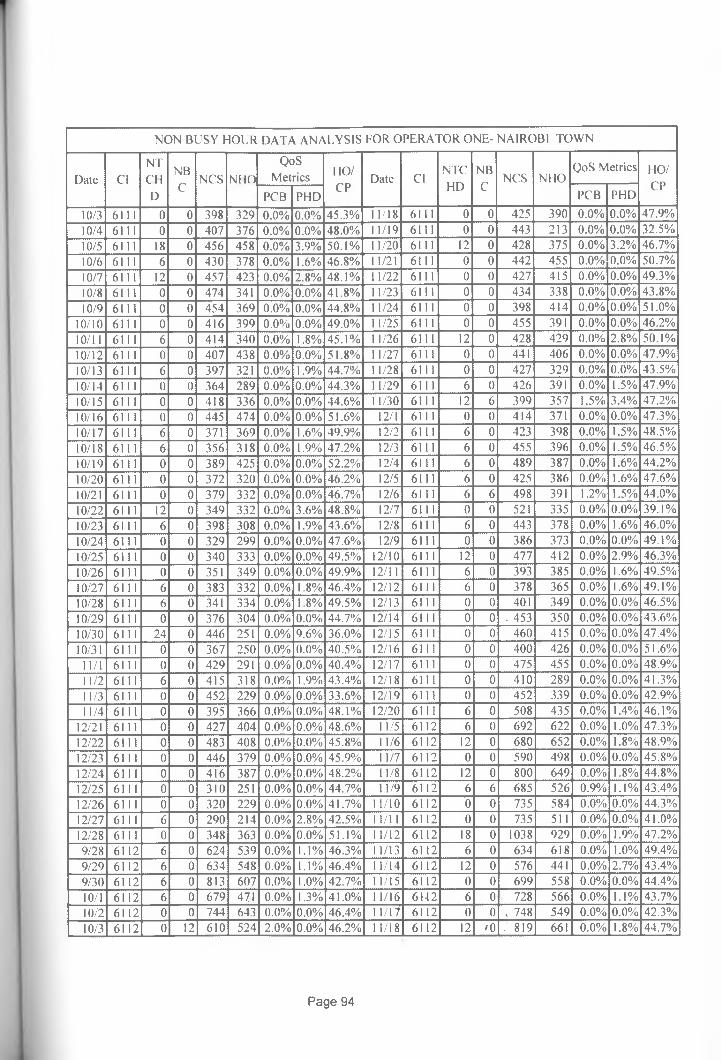
NON BUSY HOUR DATA ANALYSIS FOR OPERATOR ONE- NAIROBI TOWN
Date ClNTC'HD
NBC
NCS M IOQoS
Metrics HO/CP
Date ClNTCHD
NBC
NCS NHOQoS Metrics HO/
CPPCB PHD PCB PHD
10/3 6111 0 0 398 329 0.0% 0.0% 45.3% 11/18 6111 0 0 425 390 0.0% 0.0% 47.9%10/4 6111 0 0 407 376 0.0% 0.0% 48.0% 11/19 6111 0 0 443 213 0.0% 0.0% 32.5%10/5 6111 18 0 456 458 0.0% 3.9% 50.1% 11/20 6111 12 0 428 375 0.0% 3.2% 46.7%10/6 6111 6 0 430 378 0.0% 1.6% 46.8% 11/21 6111 0 0 442 455 0.0% 0.0% 50.7%10/7 6111 12 0 457 423 0.0% 2.8% 48.1% 11/22 6111 0 0 427 415 0.0% 0.0% 49.3%10/8 6111 0 0 474 341 0.0% 0.0% 41.8% 11/23 6111 0 0 434 338 0.0% 0.0% 43.8%10/9 6111 0 0 454 369 0.0% 0.0% 44.8% 11/24 6111 0 0 398 414 0.0% 0.0% 51.0%
10/10 6111 0 0 416 399 0.0% 0.0% 49.0% 11/25 6111 0 0 455 391 0.0% 0.0% 46.2%10/11 6111 6 0 414 340 0.0% 1.8% 45.1% 11/26 6111 12 0 428 429 0.0% 2.8% 50.1%10/12 6111 0 0 407 438 0.0% 0.0% 51.8% 11/27 6111 0 0 441 406 0.0% 0.0% 47.9%10/13 6111 6 0 397 321 0.0% 1.9% 44.7% 11/28 6111 0 0 427 329 0.0% 0.0% 43.5%10/14 6111 0 0 364 289 0.0% 0.0% 44.3% 11/29 6111 6 0 426 391 0.0% 1.5% 47.9%10/15 6111 0 0 418 336 0.0% 0.0% 44.6% 11/30 6111 12 6 399 357 1.5% 3.4% 47.2%10/16 6111 0 0 445 474 0.0% 0.0% 51.6% 12/1 6111 0 0 414 371 0.0% 0.0% 47.3%10/17 6111 6 0 371 369 0.0% 1.6% 49.9% 12/2 6111 6 0 423 398 0.0% 1.5% 48.5%10/18 6111 6 0 356 318 0.0% 1.9% 47.2% 12/3 6111 6 0 455 396 0.0% 1.5% 46.5%10/19 6111 0 0 389 425 0.0% 0.0% 52.2% 12/4 6111 6 0 489 387 0.0% 1.6% 44.2%10/20 6111 0 0 372 320 0.0% 0.0% 46.2% 12/5 6111 6 0 425 386 0.0% 1.6% 47.6%10/21 6111 0 0 379 332 0.0% 0.0% 46.7% 12/6 6111 6 6 498 391 1.2% 1.5% 44.0%10/22 6111 12 0 349 332 0.0% 3.6% 48.8% 12/7 6111 0 0 521 335 0.0% 0.0% 39.1%10/23 6111 6 0 398 308 0.0% 1.9% 43.6% 12/8 6111 6 0 443 378 0.0% 1.6% 46.0%10/24 6111 0 0 329 299 0.0% 0.0% 47.6% 12/9 6111 0 0 386 373 0.0% 0.0% 49.1%10/25 6111 0 0 340 333 0.0% 0.0% 49.5% 12/10 6111 12 0 477 412 0.0% 2.9% 46.3%10/26 6111 0 0 351 349 0.0% 0.0% 49.9% 12/11 6111 6 0 393 385 0.0% 1.6% 49.5%10/27 6111 6 0 383 332 0.0% 1.8% 46.4% 12/12 6111 6 0 378 365 0.0% 1.6% 49.1%10/28 6111 6 0 341 334 0.0% 1.8% 49.5% 12/13 6111 0 0 401 349 0.0% 0.0% 46.5%10/29 6111 0 0 376 304 0.0% 0.0% 44.7% 12/14 6111 0 0 . 453 350 0.0% 0.0% 43.6%10/30 6 1 11 24 0 446 251 0.0% 9.6% 36.0% 12/15 6111 0 0 460 415 0.0% 0.0% 47.4%10/31 6111 0 0 367 250 0.0% 0.0% 40.5% 12/16 6111 0 0 400 426 0.0% 0.0% 51.6%
11/1 6111 0 0 429 291 0.0% 0.0% 40.4% 12/17 6111 0 0 475 455 0.0% 0.0% 48.9%11/2 6111 6 0 415 318 0.0% 1.9% 43.4% 12/18 6111 0 0 410 289 0.0% 0.0% 41.3%11/3 6111 0 0 452 229 0.0% 0.0% 33.6% 12/19 6111 0 0 452 339 0.0% 0.0% 42.9%11/4 6111 0 0 395 366 0.0% 0.0% 48.1% 12/20 6111 6 0 508 435 0.0% 1.4% 46.1%
12/21 6111 0 0 427 404 0.0% 0.0% 48.6% 11/5 6112 6 0 692 622 0.0% 1.0% 47.3%12/22 6111 0 0 483 408 0.0% 0.0% 45.8% 11/6 6112 12 0 680 652 0.0% 1.8% 48.9%12/23 6111 0 0 446 379 0.0% 0.0% 45.9% 11/7 6112 0 0 590 498 0.0% 0.0% 45.8%12/24 6111 0 0 416 387 0.0% 0.0% 48.2% 11/8 6112 12 0 800 649 0.0% 1.8% 44.8%12/25 6111 0 0 3 10 251 0.0% 0.0% 44.7% 11/9 6112 6 6 685 526 0.9% 1.1% 43.4%12/26 6111 0 0 320 229 0.0% 0.0% 41.7% 11/10 6112 'o 0 735 584 0.0% 0.0% 44.3%12/27 6111 6 0 290 214 0.0% 2.8% 42.5% 11/11 6112 0 0 735 511 0.0% 0.0% 41.0%12/28 6111 0 0 348 363 0.0% 0.0% 51.1% 11/12 6112 18 0 1038 929 0.0% 1.9% 47.2%9/28 6112 6 0 624 539 0.0% 1.1% 46.3% 11/13 6112 6 0 634 618 0.0% 1.0% 49.4%9/29 6112 6 0 634 548 0.0% 1.1% 46.4% 11/14 6112 12 0 576 441 0.0% 2.7% 43.4%9/30 6112 6 0 813 607 0.0% 1.0% 42.7% 11/15 6112 0 0 699 558 0.0% 0.0% 44.4%10/1 6112 6 0 679 471 0.0% 1 .3% 41.0% 11/16 6142 6 0 728 566 0.0% 1.1% 43.7%10/2 6112 0 0 744 643 0.0% 0.0% 46.4% 11/17 6112 0 0 , 748 549 0.0% 0.0% 42.3%10/3 6112 0 12 610 524 2.0% 0.0% 46.2% 11/18 6112 12 >0 . 819 661 0.0% 1.8% 44.7%
Page 94

NON BUSY HOUR DATA ANALYSIS FOR OPERATOR ONE- NAIROBI TOWN
Date ClNTCHD
NBC
NCS NIK)
QoSMetrics HO/
CPDate Cl
NTCHD
NBC
NCS NHOQoS Metrics HO/
CPPCB PHD PCB PHD
10/4 6112 0 6 720 654 0.8% 0.0% 47.6% 11/19 6112 0 0 701 556 0.0% 0.0% 44.2%10/5 6112 0 0 670 508 0.0% 0.0% 43.1% 11/20 6112 0 6 657 585 0.9% 0.0% 47.1%10/6 6112 0 0 821 473 0.0% 0.0% 36.6% 11/21 6112 12 0 572 511 0.0% 2.3% 47.2%10/7 6112 12 0 762 569 0.0% 2.1% 42.7% 11/22 6112 0 6 731 596 0.8% 0.0% 44.9%10/8 6112 18 0 709 619 0.0% 2.9% 46.6% 11/23 6112 6 0 696 461 0.0% 1.3% 39.8%10/9 6112 12 0 662 606 0.0% 2.0% 47.8% 11/24 6112 6 0 954 511 0.0% 1.2% 34.9%
10/10 6112 0 6 556 497 1.1% 0.0% 47.2% 11/25 6112 18 0 692 589 0.0% 3.1% 46.0%10/11 6112 12 0 682 613 0.0% 2.0% 47.3% 11/26 6112 12 0 758 640 0.0% 1.9% 45.8%10/12 6112 0 0 681 556 0.0% 0.0% 44.9% 11/27 6112 0 0 638 587 0.0% 0.0% 47.9%10/13 6112 6 12 728 605 1.6% 1.0% 45.4% 11/28 6112 0 0 593 472 0.0% 0.0% 44.3%10/14 6112 0 0 745 498 0.0% 0.0% 40.1% 11/29 6112 0 0 690 641 0.0% 0.0% 48.2%10/15 6112 12 0 694 507 0 0 % 2.4% 42.2% 11/30 6112 0 6 720 596 0.8% 0.0% 45.3%10/16 6112 6 0 579 543 0.0% 1.1% 48.4% 12/1 6112 18 0 819 639 0.0% 2.8% 43.8%10/17 6112 0 0 505 552 0.0% 0.0% 52.2% 12/2 6112 12 18 683 627 2.6% 1.9% 47.9%10/18 6112 0 0 676 607 0.0% 0.0% 47.3% 12/3 6112 0 0 709 595 0.0% 0.0% 45.6%10/19 6112 6 0 666 587 0.0% 1.0% 46.8% 12/4 6112 0 0 738 635 0.0% 0.0% 46.2%10/20 6112 0 0 566 531 0.0% 0.0% 48.4% 12/5 6112 18 6 583 529 1.0% 3.4% 47.6%10/21 6112 12 0 630 594 0.0% 2.0% 48.5% 12/6 6112 6 6 710 572 0.8% 1.0% 44.6%10/22 6112 12 0 555 424 0.0% 2.8% 43.3% 12/7 6112 12 6 789 626 0.8% 1.9% 44.2%10/23 6112 0 0 617 548 0.0% 0.0% 47.0% 12/8 6112 0 6 759 621 0.8% 0.0% 45.0%10/24 6112 12 0 517 482 0.0% 2.5% 48.2% 12/9 6112 6 0 834 624 0.0% 1.0% 42.8%10/25 6112 6 0 623 485 0.0% 1.2% 43.8% 12/10 6112 0 0 995 787 0.0% 0.0% 44.2%10/26 6112 18 0 595 538 0.0% 3.3% 47.5% 12/11 6112 _ O1 0 1030 928 0.0% 0.0% 47.4%10/27 6112 0 0 707 605 0.0% 0.0% 46.1% 12/12 6112 6 24 729 638 3.3% 0.9% 46.7%10/28 6112 0 0 690 478 0.0% 0.0% 40.9% 12/13 6112 6 0 691 670 0.0% 0.9% 49.2%10/29 6112 0 0 750 566 0.0% 0.0% 43.0% 12/14 6112 0 12 817 557 1.5% 0.0% 40.5%10/30 6112 0 6 672 617 0.9% 0.0% 47.9% 12/15 6112 0 0 ■647 634 0.0% 0.0% 49.5%10/31 6112 0 0 587 563 0.0% 0.0% 49.0% 12/16 6112 0 6 697 532 0.9% 0.0% 43.3%
11/1 6112 6 0 691 555 0.0% 1.1% 44.5% 12/17 6112 0 0 688 705 0.0% 0.0% 50.6%11/2 6112 12 0 689 574 0.0% 2.1% 45.4% 12/18 6112 6 0 624 530 0.0% 1.1% 45.9%11/3 6112 0 0 725 639 0.0% 0.0% 46.8% 12/19 6112 6 6 602 519 1.0% 1.2% 46.3%11/4 6112 6 0 785 717 0.0% 0.8% 47.7% 12/20 6112 42 0 670 618 0.0% 6.8% 48.0%
12/21 6112 0 6 649 462 0.9% 0.0% 41.6% 11/5 6720 12 0 1314 1092 0.0% 1.1% 45.4%12/22 6112 12 12 616 566 1.9% 2.1% 47.9% 11/6 6720 18 0 816 829 0.0% 2.2% 50.4%12/23 6112 0 0 658 556 0.0% 0.0% 45.8% 11/7 6720 6 0 528 578 0.0% 1.0% 52.3%12/24 6112 6 0 583 544 0.0% 1.1% 48.3% 11/8 6720 30 0 1204 1118 0.0% 2.7% 48.1%12/25 6112 0 0 395 378 0.0% 0.0% 48.9% 11/9 6720 18 0 1143 1061 0.0% 1.7% 48.1%12/26 6112 0 0 366 357 0.0% 0.0% 49.4% 11/10 6720 12 0 1104 1123 0.0% 1.1% 50.4%12/27 6112 0 0 490 428 0.0% 0.0% 46.6% 11/11 6720 12 0 1300 1285 0.0% 0.9% 49.7%12/28 6112 6 0 436 377 0.0% 1.6% 46.4% 11/12 6720 12 0 1227 1074 0.0% 1.1% 46.7%9/28 6720 6 0 1754 1500 0.0% 0.4% 46.1% 11/13 6720 6 0 892 955 0.0% 0.6% 51.7%9/29 6720 12 0 1647 1332 0.0% 0.9% 44.7% 11/14 6720 6 0 467 503 0.0% 1.2% 51.9%9/30 6720 0 0 1751 1410 0.0% 0.0% 44.6% 11/15 6720 24 6 1224 1248 0.5% 1.9% 50.5%10/1 6720 18 0 1845 1686 0.0% 1.1% 47.7% 11/16 6720 6 0 1274 1080 0.0% 0.6% 45.9%10/2 6720 12 0 1530 1364 0.0% 0.9% 47.1% 11/17 6720 24 0 ■■ 1173 1136 0.0% 2.1% 49.2%10/3 6720 6 0 741 647 0.0% 0.9% 46.6% 11/18' 6720 12 0 '119.3 1202 0.0% 1.0% 50.2%10/4 6720 30 6 1715 1509 0.3% 2.0% 46.8% 11/19 1 6720 6 '0 ■1219 1246 0.0% 0.5% 50.5%
Page 95
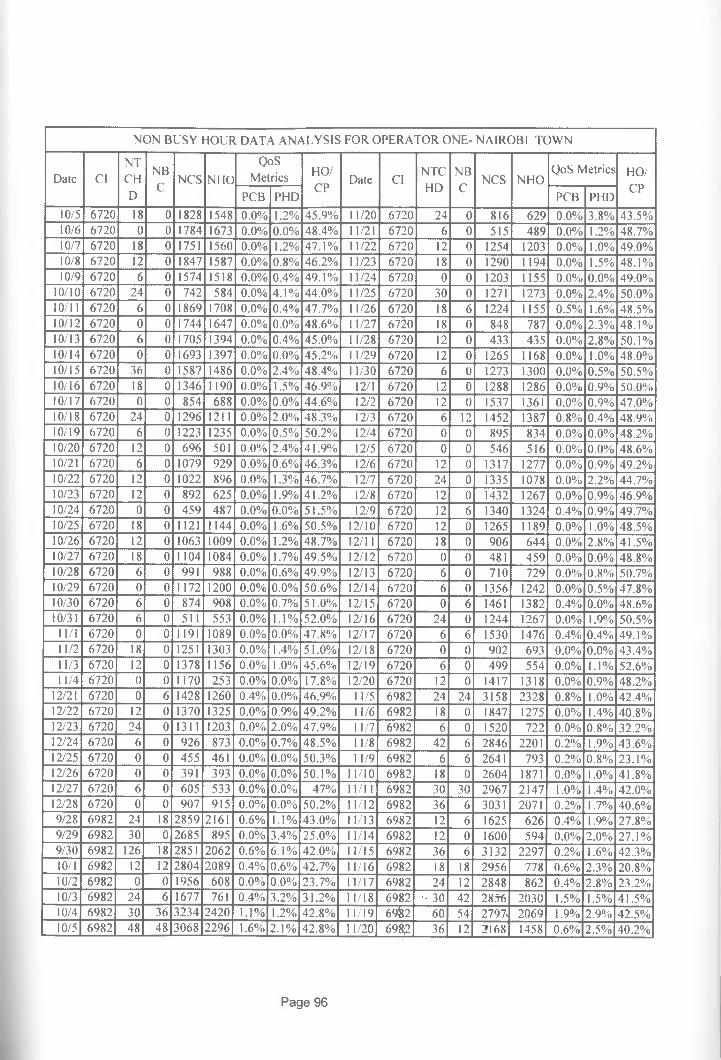
NON BUSY HOUR DATA ANALYSIS FOR OPERATOR ONE- NAIROBI TOWN
Date ClNTC'HD
NBC
NCS NIIOQoS
Metrics HO/Date Cl
NTCHD
NBC
NCS NHOQoS Metrics HO/
CPPCB PHD
CPPCB PHD
10/5 6720 18 0 1828 1548 0.0% 1.2% 45.9% 11/20 6720 24 0 816 629 0.0% 3.8% 43.5%10/6 6720 0 0 1784 1673 0.0% 0.0% 48.4% 11/21 6720 6 0 515 489 0.0% 1.2% 48.7%10/7 6720 18 0 1751 1560 0.0% 1.2% 47.1% 11/22 6720 12 0 1254 1203 0.0% 1.0% 49.0%10/8 6720 12 0 1847 1587 0.0% 0.8% 46.2% 11/23 6720 18 0 1290 1194 0.0% 1.5% 48.1%10/9 6720 6 0 1574 1518 0.0% 0.4% 49.1% 11/24 6720 0 0 1203 1155 0.0% 0.0% 49.0%
10/10 6720 24 0 742 584 0.0% 4.1% 44.0% 11/25 6720 30 0 1271 1273 0.0% 2.4% 50.0%10/11 6720 6 0 1869 1708 0.0% 0.4% 47.7% 11/26 6720 18 6 1224 1155 0.5% 1.6% 48.5%10/12 6720 0 0 1744 1647 0.0% 0.0% 48.6% 11/27 6720 18 0 848 787 0.0% 2.3% 48.1%10/13 6720 6 0 1705 1394 0.0% 0.4% 45.0% 11/28 6720 12 0 433 435 0.0% 2.8% 50.1%10/14 6720 0 0 1693 1397 0.0% 0.0% 45.2% 11/29 6720 12 0 1265 1168 0.0% 1.0% 48.0%10/15 6720 36 0 1587 1486 0.0% 2.4% 48.4% 11/30 6720 6 0 1273 1300 0.0% 0.5% 50.5%10/16 6720 18 0 1346 1190 0.0% 1.5% 46.9% 12/1 6720 12 0 1288 1286 0.0% 0.9% 50.0%10/17 6720 0 0 854 688 0.0% 0.0% 44.6% 12/2 6720 12 0 1537 1361 0.0% 0.9% 47.0%10/18 6720 24 0 1296 1211 0.0% 2.0% 48.3% 12/3 6720 6 12 1452 1387 0.8% 0.4% 48.9%10/19 6720 6 0 1223 1235 0.0% 0.5% 50.2% 12/4 6720 0 0 895 834 0.0% 0.0% 48.2%10/20 6720 12 0 696 501 0.0% 2.4% 41.9% 12/5 6720 0 0 546 516 0.0% 0.0% 48.6%10/21 6720 6 0 1079 929 0.0% 0.6% 46.3% 12/6 6720 12 0 1317 1277 0.0% 0.9% 49.2%10/22 6720 12 0 1022 896 0.0% 1.3% 46.7% 12/7 6720 24 0 1335 1078 0.0% 2.2% 44.7%10/23 6720 12 0 892 625 0.0% 1.9% 41.2% 12/8 6720 12 0 1432 1267 0.0% 0.9% 46.9%10/24 6720 0 0 459 487 0.0% 0.0% 51.5% 12/9 6720 12 6 1340 1324 0.4% 0.9% 49.7%10/25 6720 18 0 1121 1144 0.0% 1.6% 50.5% 12/10 6720 12 0 1265 1189 0.0% 1.0% 48.5%10/26 6720 12 0 1063 1009 0.0% 1.2% 48.7% 12/11 6720 18 0 906 644 0.0% 2.8% 41.5%10/27 6720 18 0 1104 1084 0.0% 1.7% 49.5% 12/12 6720 0 0 481 459 0.0% 0.0% 48.8%10/28 6720 6 0 991 988 0.0% 0.6% 49.9% 12/13 6720 6 0 710 729 0.0% 0.8% 50.7%10/29 6720 0 0 1172 1200 0.0% 0.0% 50.6% 12/14 6720 6 0 1356 1242 0.0% 0.5% 47.8%10/30 6720 6 0 874 908 0.0% 0.7% 51.0% 12/15 6720 0 6 1461 1382 0.4% 0.0% 48.6%10/31 6720 6 0 511 553 0.0% 1.1% 52.0% 12/16 6720 24 0 1244 1267 0.0% 1.9% 50.5%
11/1 6720 0 0 1191 1089 0.0% 0.0% 47.8% 12/17 6720 6 6 1530 1476 0.4% 0.4% 49.1%11/2 6720 18 0 1251 1303 0.0% 1.4% 51.0% 12/18 6720 0 0 902 693 0.0% 0.0% 43.4%11/3 6720 12 0 1378 1156 0.0% 1.0% 45.6% 12/19 6720 6 0 499 554 0.0% 1.1% 52.6%11/4 6720 0 0 1170 253 0.0% 0.0% 17.8% 12/20 6720 12 0 1417 1318 0.0% 0.9% 48.2%
12/21 6720 0 6 1428 1260 0.4% 0.0% 46.9% 11/5 6982 24 24 3158 2328 0.8% 1.0% 42.4%12/22 6720 12 0 1370 1325 0.0% 0.9% 49.2% 11/6 6982 18 0 1847 1275 0.0% 1.4% 40.8%12/23 6720 24 0 1311 1203 0.0% 2.0% 47.9% 11/7 6982 6 0 1520 722 0.0% 0.8% 32.2%12/24 6720 6 0 926 873 0.0% 0.7% 48.5% 11/8 6982 42 6 2846 2201 0.2% 1.9% 43.6%12/25 6720 0 0 455 461 0.0% 0.0% 50.3% 11/9 6982 6 6 2641 793 0.2% 0.8% 23.1%12/26 6720 0 0 391 393 0.0% 0.0% 50.1% 11/10 6982 18 0 2604 1871 0.0% 1.0% 41.8%12/27 6720 6 0 605 533 0.0% 0.0% 47% 11/11 6982 30 30 2967 2147 1.0% 1.4% 42.0%12/28 6720 0 0 907 915 0.0% 0.0% 50.2% 11/12 6982 36 6 3031 2071 0.2% 1.7% 40.6%9/28 6982 24 18 2859 2161 0.6% 1.1% 43.0% 11/13 6982 12 6 1625 626 0.4% 1.9% 27.8%9/29 6982 30 0 2685 895 0.0% 3.4% 25.0% 11/14 6982 12 0 1600 594 0.0% 2.0% 27.1%9/30 6982 126 18 2851 2062 0.6% 6.1% 42.0% 11/15 6982 36 6 3132 2297 0.2% 1.6% 42.3%10/1 6982 12 12 2804 2089 0.4% 0.6% 42.7% 11/16 6982 18 18 2956 778 0.6% 2.3% 20.8%10/2 6982 0 0 1956 608 0.0% 0.0% 23.7% 11/17 6982 24 12 2848 862 0.4% 2.8% 23.2%10/3 6982 24 6 1677 761 0.4% 3.2% 31.2% 11/18 6982 - 30 42 2856 2030 1.5% 1.5% 41.5%10/4 6982 30 36 3234 2420 1.1% 1.2% 42.8% 11/19 69&2 60 54 2797, 2069 1.9% 2.9% 42.5%10/5 6982 48 48 3068 2296 1.6% 2.1% 42.8% 11/20 6982 36 12 2168 1458 0.6% 2.5% 40.2%
Page 96
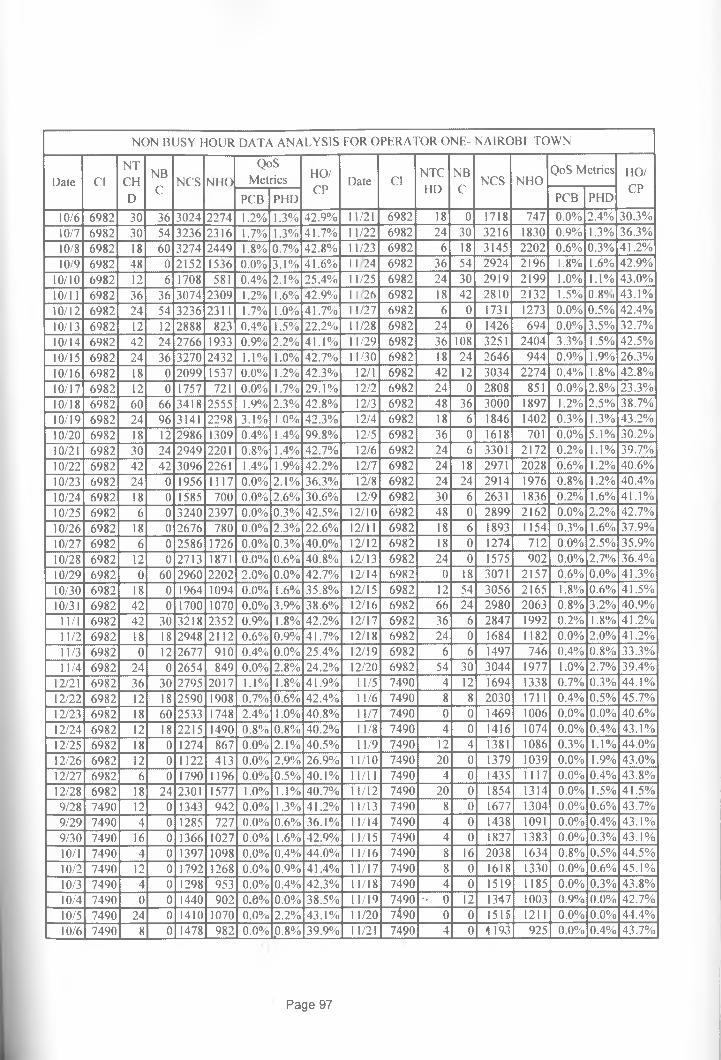
NON BUSY HOUR DATA ANALYSIS FOR OPERATOR ONE- NAIROBI TOWN
Date ClNTCHD
NBC
NC'S NIK)
QoSMetrics HO/
CPDate Cl
NTCHD
NBC
NCS NHOQoS Metrics HO/
CPPCB PHD PCB PHD
10/6 6982 30 36 3024 2274 1.2% 1.3% 42.9% 11/21 6982 18 0 1718 747 0.0% 2.4% 30.3%10/7 6982 30 54 3236 2316 1.7% 1.3% 41.7% 11/22 6982 24 .30 3216 1830 0.9% 1.3% 36.3%10/8 6982 18 60 3274 2449 1.8% 0.7% 42.8% 11/23 6982 6 18 3145 2202 0.6% 0.3% 41.2%10/9 6982 48 0 2152 1536 0.0% 3.1% 41.6% 1 1 24 6982 36 54 2924 2 196 1.8% 1.6% 42.9%
10/10 6982 12 6 1708 581 0.4% 2.1% 25.4% 11/25 6982 24 30 2919 2199 1.0% 1.1% 43.0%10/11 6982 36 36 3074 2309 1.2% 1.6% 42.9% 1 1 26 6982 18 42 2810 2132 1.5% 0.8” ,, 43.1%10/12 6982 24 54 3236 2311 1.7% 1.0% 41.7% 11/27 6982 6 0 1731 1273 0.0% 0.5% 42.4%10/13 6982 12 12 2888 823 0.4% 1.5% 22.2% 11/28 6982 24 0 1426 694 0.0% 3.5% 32.7%10/14 6982 42 24 2766 1933 0.9% 2.2% 41.1% 11/29 6982 36 108 3251 2404 3.3% 1.5% 42.5%10/15 6982 24 36 3270 2432 1.1% 1.0% 42.7% 11/30 6982 18 24 2646 944 0.9% 1.9% 26.3%10/16 6982 18 0 2099 1537 0.0% 1.2% 42.3% 12/1 6982 42 12 3034 2274 0.4% 1.8% 42.8%10/17 6982 12 0 1757 721 0.0% 1.7% 29.1% 12/2 6982 24 0 2808 851 0.0% 2.8% 23.3%10/18 6982 60 66 3418 2555 1.9% 2.3% 42.8% 12/3 6982 48 36 3000 1897 1.2% 2.5% 38.7%10/19 6982 24 96 3141 2298 3.1% 1.0% 42.3% 12/4 6982 18 6 1846 1402 0.3% 1.3% 43.2%10/20 6982 18 12 2986 1309 0.4% 1.4% 99.8% 12/5 6982 36 0 1618 701 0.0% 5.1% 30.2%10/21 6982 30 24 2949 2201 0.8% 1.4% 42.7% 12/6 6982 24 6 3301 2172 0.2% 1.1% 39.7%10/22 6982 42 42 3096 2261 1.4% 1.9% 42.2% 12/7 6982 24 18 2971 2028 0.6% 1.2% 40.6%10/23 6982 24 0 1956 1117 0.0% 2.1% 36.3% 12/8 6982 24 24 2914 1976 0.8% 1.2% 40.4%10/24 6982 18 0 1585 700 0.0% 2.6% 30.6% 12/9 6982 30 6 2631 1836 0.2% 1.6% 41.1%10/25 6982 6 0 3240 2397 0.0% 0.3% 42.5% 12/10 6982 48 0 2899 2162 0.0% 2.2% 42.7%10/26 6982 18 0 2676 780 0.0% 2.3% 22.6% 12/11 6982 18 6 1893 1154 0.3% 1.6% 37.9%10/27 6982 6 0 2586 1726 0.0% 0.3% 40.0% 12/12 6982 18 0 1274 712 0.0% 2.5% 35.9%10/28 6982 12 0 2713 1871 0.0% 0.6% 40.8% 12/13 6982 24 0 1575 902 0.0% 2.7% 36.4%10/29 6982 0 60 2960 2202 2.0% 0.0% 42.7% 12/14 6982 0 18 3071 2157 0.6% 0.0% 41.3%10/30 6982 18 0 1964 1094 0.0% 1.6% 35.8% 12/15 6982 12 54 3056 2165 1.8% 0.6% 41.5%10/31 6982 42 0 1700 1070 0.0% 3.9% 38.6% 12/16 6982 66 24 2980 2063 0.8% 3.2% 40.9%
11/1 6982 42 30 3218 2352 0.9% 1.8% 42.2% 12/17 6982 36 6 2847 1992 0.2% 1.8% 41.2%11/2 6982 18 18 2948 2112 0.6% 0.9% 41.7% 12/18 6982 24 0 1684 1182 0.0% 2.0% 41.2%11/3 6982 0 12 2677 910 0.4% 0.0% 25.4% 12/19 6982 6 6 1497 746 0.4% 0.8% 33.3%11/4 6982 24 0 2654 849 0.0% 2.8% 24.2% 12/20 6982 54 30 3044 1977 1.0% 2.7% 39.4%
12/21 6982 36 30 2795 2017 1.1% 1.8% 41.9% 11/5 7490 4 12 1694 1338 0.7% 0.3% 44.1%12/22 6982 12 18 2590 1908 0.7% 0.6% 42.4% 11/6 7490 8 8 2030 1711 0.4% 0.5% 45.7%12/23 6982 18 60 2533 1748 2.4% 1.0% 40.8% 11/7 7490 0 0 1469 1006 0.0% 0.0% 40.6%12/24 6982 12 18 2215 1490 0.8% 0.8% 40.2% 11/8 7490 4 0 1416 1074 0.0% 0.4% 43.1%12/25 6982 18 0 1274 867 0.0% 2.1% 40.5% 11/9 7490 12 4 1381 1086 0.3% 1.1% 44.0%12/26 6982 12 0 1122 413 0.0% 2.9% 26.9% 11/10 7490 20 0 1379 1039 0.0% 1.9% 43.0%12/27 6982 6 0 1790 1196 0.0% 0.5% 40.1% 11/11 7490 4 0 1435 1117 0.0% 0.4% 43.8%12/28 6982 18 24 2301 1577 1.0% 1.1% 40.7% 11/12 7490 20 0 1854 1314 0.0% 1.5% 41.5%9/28 7490 12 0 1343 942 0.0% 1.3% 41.2% 11/13 7490 8 0 1677 1304 0.0% 0.6% 43.7%9/29 7490 4 0 1285 727 0.0% 0.6% 36.1% 11/14 7490 4 0 1438 1091 0.0% 0.4% 43.1%9/30 7490 16 0 1366 1027 0.0% 1.6% 42.9% 11/15 7490 4 0 1827 1383 0.0% 0.3% 43.1%10/1 7490 4 0 1397 1098 0.0% 0.4% 44.0% 11/16 7490 8 16 2038 1634 0.8% 0.5% 44.5%10/2 7490 12 0 1792 1268 0.0% 0.9% 41.4% 11/17 7490 8 0 1618 1330 0.0% 0.6% 45.1%10/3 7490 4 0 1298 953 0.0% 0.4% 42.3% 11/18 7490 4 0 1519 1185 0.0% 0.3% 43.8%10/4 7490 0 0 1440 902 0.0% 0.0% 38.5% 11/19 7490 - 0 12 1347 1003 0.9% 0.0% 42.7%10/5 7490 24 0 1410 1070 0.0% 2.2% 43.1% 11/20 7^90 0 0 1515 1211 0.0% 0.0% 44.4%10/6 7490 8 0 1478 982 0.0% ,0.8% 39.9% 11/21 7490 4 0 119-3 925 0.0% 0.4% 43.7%
Page 97
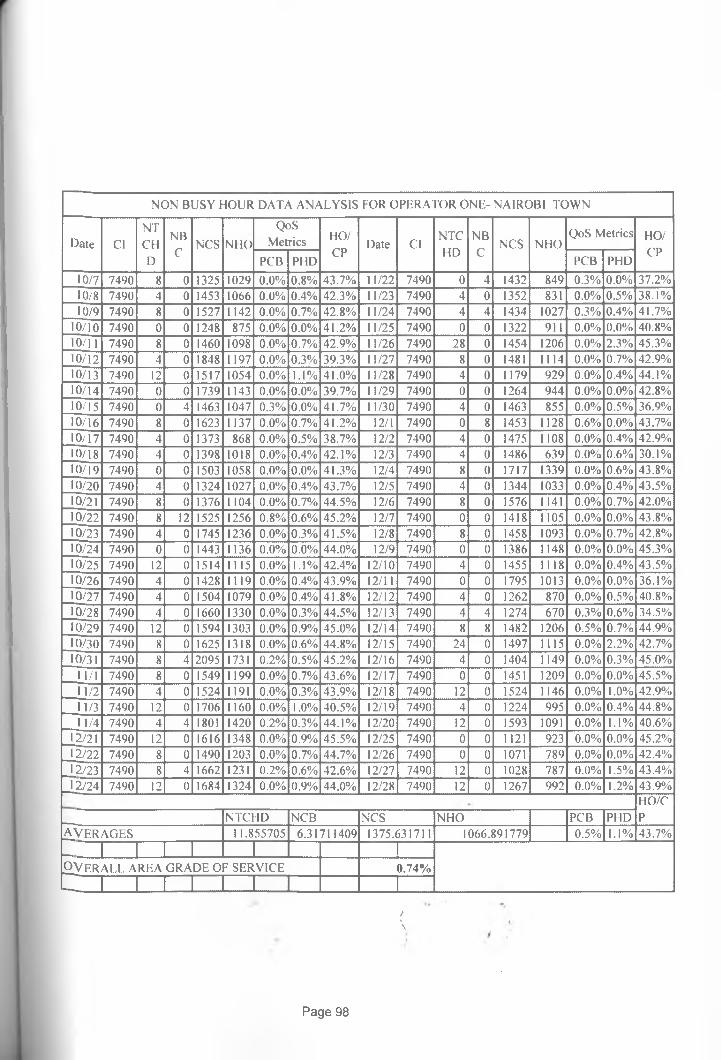
NON BUSY HOUR DATA ANALYSIS FOR OPERATOR ONE- NAIROBI TOWN
Date ClNTCM
NBC
NCS NIK)
QoSMetrics HO/
CPDate Cl
NTCHD
NBNCS NHO
QoS Metrics HO/CP
D PCB PHDC
PCB PHD
10/7 7490 8 0 1325 1029 0.0% 0.8% 43.7% 11/22 7490 0 4 1432 849 0.3% 0.0% 37.2%10/8 7490 4 0 1453 1066 0.0% 0.4% 42.3% 11/23 7490 4 0 1352 831 0.0% 0.5% 38.1%10/9 7490 8 0 1527 1142 0.0% 0.7% 42.8% 11/24 7490 4 4 1434 1027 0.3% 0.4% 41.7%
10/10 7490 0 0 1248 875 0.0% 0.0% 41.2% 11/25 7490 0 0 1322 911 0.0% 0.0% 40.8%10/H 7490 8 0 1460 1098 0.0% 0.7% 42.9% 11/26 7490 28 0 1454 1206 0.0% 2.3% 45.3%10/12 7490 4 0 1848 1197 0.0% 0.3% 39.3% 11/27 7490 8 0 1481 1114 0.0% 0.7% 42.9%10/13 7490 12 0 1517 1054 0.0% 1.1% 41.0% 11/28 7490 4 0 1179 929 0.0% 0.4% 44.1%10/14 7490 0 0 1739 1143 0.0% 0.0% 39.7% 11/29 7490 0 0 1264 944 0.0% 0.0% 42.8%10/15 7490 0 4 1463 1047 0.3% 0.0% 41.7% 11/30 7490 4 0 1463 855 0.0% 0.5% 36.9%10/16 7490 8 0 1623 1137 0.0% 0.7% 41.2% 12/1 7490 0 8 1453 1128 0.6% 0.0% 43.7%10/17 7490 4 0 1373 868 0.0% 0.5% 38.7% 12/2 7490 4 0 1475 1108 0.0% 0.4% 42.9%10/18 7490 4 0 1398 1018 0.0% 0.4% 42.1% 12/3 7490 4 0 1486 639 0.0% 0.6% 30.1%10/19 7490 0 0 1503 1058 0.0% 0.0% 41.3% 12/4 7490 8 0 1717 1339 0.0% 0.6% 43.8%10/20 7490 4 0 1324 1027 0.0% 0.4% 43.7% 12/5 7490 4 0 1344 1033 0.0% 0.4% 43.5%10/21 7490 8 0 1376 1104 0.0% 0.7% 44.5% 12/6 7490 8 0 1576 1141 0.0% 0.7% 42.0%10/22 7490 8 12 1525 1256 0.8% 0.6% 45.2% 12/7 7490 0 0 1418 1105 0.0% 0.0% 43.8%10/23 7490 4 0 1745 1236 0.0% 0.3% 41.5% 12/8 7490 8 0 1458 1093 0.0% 0.7% 42.8%10/24 7490 0 0 1443 1136 0.0% 0.0% 44.0% 12/9 7490 0 0 1386 1148 0.0% 0.0% 45.3%10/25 7490 12 0 1514 1115 0.0% 1.1% 42.4% 12/10 7490 4 0 1455 1118 0.0% 0.4% 43.5%10/26 7490 4 0 1428 1119 0.0% 0.4% 43.9% 12/11 7490 0 0 1795 1013 0.0% 0.0% 36.1%10/27 7490 4 0 1504 1079 0.0% 0.4% 41.8% 12/12 7490 4 0 1262 870 0.0% 0.5% 40.8%10/28 7490 4 0 1660 1330 0.0% 0.3% 44.5% 12/13 7490 4 4 1274 670 0.3% 0.6% 34.5%10/29 7490 12 0 1594 1303 0.0% 0.9% 45.0% 12/14 7490 8 8 1482 1206 0.5% 0.7% 44.9%10/30 7490 8 0 1625 1318 0.0% 0.6% 44.8% 12/15 7490 24 0 1497 1115 0.0% 2.2% 42.7%10/31 7490 8 4 2095 1731 0.2% 0.5% 45.2% 12/16 7490 4 0 1404 1149 0.0% 0.3% 45.0%
11/1 7490 8 0 1549 1199 0.0% 0.7% 43.6% 12/17 7490 0 0 1451 1209 0.0% 0.0% 45.5%11/2 7490 4 0 1524 1191 0.0% 0.3% 43.9% 12/18 7490 12 0 1524 1146 0.0% 1.0% 42.9%11/3 7490 12 0 1706 1160 0.0% 1.0% 40.5% 12/19 7490 4 0 1224 995 0.0% 0.4% 44.8%11/4 7490 4 4 1801 1420 0.2% 0.3% 44.1% 12/20 7490 12 0 1593 1091 0.0% 1.1% 40.6%
12/21 7490 12 0 1616 1348 0.0% 0.9% 45.5% 12/25 7490 0 0 1121 923 0.0% 0.0% 45.2%12/22 7490 8 0 1490 1203 0.0% 0.7% 44.7% 12/26 7490 0 0 1071 789 0.0% 0.0% 42.4%12/23 7490 8 4 1662 1231 0.2% 0.6% 42.6% 12/27 7490 12 0 1028 787 0.0% 1.5% 43.4%12/24 7490 12 0 1684 1324 0.0% 0.9% 44.0% 12/28 7490 12 0 1267 992 0.0% 1.2% 43.9%
HO/CNTCHD NCB NCS NHO PCB PHD P
a v e r a g e s 11.855705 6.31711409 1375.631711 1066.891779 0.5% 1.1% 43.7%
—1 ---- 1----OVERALL AREA GRADE OF SERVICE 0.74%
^ I Z ~ T T Z z ~ r ~/\
Page 98
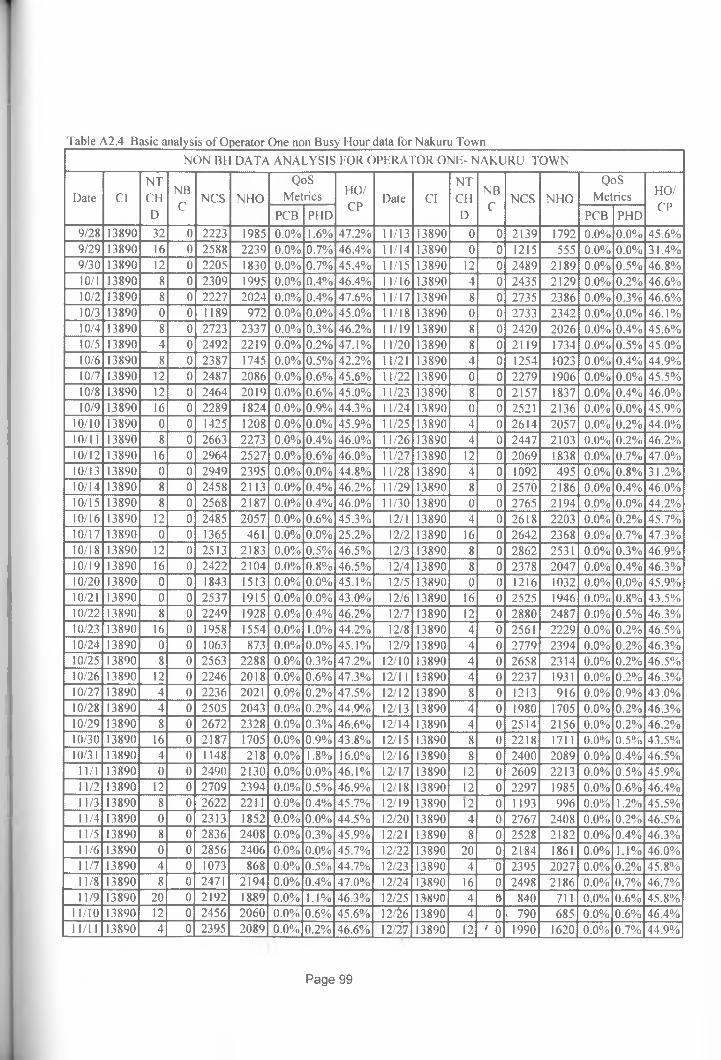
Table A2.4 Basic analysis o f Operator One non Busy Hour data for Nakuru Town_______________
NON BH DATA ANALYSIS FOR OPERATOR ONE- NAKURU TOWN
Date ClNTCHD
NBC
NCS NHO
QoSMetrics HO/
CPDate Cl
NTCHD
NBC
NCS NHO
QoSMetrics HO/
CPPCB PHD PCB PHD
9/28 13890 32 0 2223 1985 0.0% 1.6% 47.2% 11/13 13890 0 0 2139 1792 0.0% 0.0% 45.6%9/29 13890 16 0 2588 2239 0.0% 0.7% 46.4% 11/14 13890 0 0 1215 555 0.0% 0.0% 31.4%9/30 13890 12 0 2205 1830 0.0% 0.7% 45.4% 11/15 13890 12 0 2489 2189 0.0% 0.5% 46.8%10/1 13890 8 0 2309 1995 0.0% 0.4% 46.4% 11/16 13890 4 0 2435 2129 0.0% 0.2% 46.6%10/2 13890 8 0 2227 2024 0.0% 0.4% 47.6% 11/17 13890 8 0 2735 2386 0.0% 0.3% 46.6%10/3 13890 0 0 1189 972 0.0% 0.0% 45.0% 11/18 13890 0 0 2733 2342 0.0% 0.0% 46.1%10/4 13890 8 0 2723 2337 0.0% 0.3% 46.2% 11/19 13890 8 0 2420 2026 0.0% 0.4% 45.6%10/5 13890 4 0 2492 2219 0.0% 0.2% 47.1% 11/20 13890 8 0 2119 1734 0.0% 0.5% 45.0%10/6 13890 8 0 2387 1745 0.0% 0.5% 42.2% 11/21 13890 4 0 1254 1023 0.0% 0.4% 44.9%10/7 13890 12 0 2487 2086 0.0% 0.6% 45.6% 11/22 13890 0 0 2279 1906 0.0% 0.0% 45.5%10/8 13890 12 0 2464 2019 0.0% 0.6% 45.0% 11/23 13890 8 0 2157 1837 0.0% 0.4% 46.0%10/9 13890 16 0 2289 1824 0.0% 0.9% 44.3% 11/24 13890 0 0 2521 2136 0.0% 0.0% 45.9%
10/10 13890 0 0 1425 1208 0.0% 0.0% 45.9% 11/25 13890 4 0 2614 2057 0.0% 0.2% 44.0%10/11 13890 8 0 2663 2273 0.0% 0.4% 46.0% 11/26 13890 4 0 2447 2103 0.0% 0.2% 46.2%10/12 13890 16 0 2964 2527 0.0% 0.6% 46.0% 11/27 13890 12 0 2069 1838 0.0% 0.7% 47.0%10/13 13890 0 0 2949 2395 0.0% 0.0% 44.8% 11/28 13890 4 0 1092 495 0.0% 0.8% 31.2%10/14 13890 8 0 2458 2113 0.0% 0.4% 46.2% 11/29 13890 8 0 2570 2186 0.0% 0.4% 46.0%10/15 13890 8 0 2568 2187 0.0% 0.4% 46.0% 11/30 13890 0 0 2765 2194 0.0% 0.0% 44.2%10/16 13890 12 0 2485 2057 0.0% 0.6% 45.3% 12/1 13890 4 0 2618 2203 0.0% 0.2% 45.7%10/17 13890 0 0 1365 461 0.0% 0.0% 25.2% 12/2 13890 16 0 2642 2368 0.0% 0.7% 47.3%10/18 13890 12 0 2513 2183 0.0% 0.5% 46.5% 12/3 13890 8 0 2862 2531 0.0% 0.3% 46.9%10/19 13890 16 0 2422 2104 0.0% 0.8% 46.5% 12/4 13890 8 0 2378 2047 0.0% 0.4% 46.3%10/20 13890 0 0 1843 1513 0.0% 0.0% 45.1% 12/5 13890 0 0 1216 1032 0.0% 0.0% 45.9%10/21 13890 0 0 2537 1915 0.0% 0.0% 43.0% 12/6 13890 16 0 2525 1946 0.0% 0.8% 43.5%10/22 13890 8 0 2249 1928 0.0% 0.4% 46.2% 12/7 13890 12 0 2880 2487 0.0% 0.5% 46.3%10/23 13890 16 0 1958 1554 0.0% 1.0% 44.2% 12/8 13890 4 0 2561 2229 0.0% 0.2% 46.5%10/24 13890 0 0 1063 873 0.0% 0.0% 45.1% 12/9 13890 4 0 2779 2394 0.0% 0.2% 46.3%10/25 13890 8 0 2563 2288 0.0% 0.3% 47.2% 12/10 13890 4 0 2658 2314 0.0% 0.2% 46.5%10/26 13890 12 0 2246 2018 0.0% 0.6% 47.3% 12/11 13890 4 0 2237 1931 0.0% 0.2% 46.3%10/27 13890 4 0 2236 2021 0.0% 0.2% 47.5% 12/12 13890 8 0 1213 916 0.0% 0.9% 43.0%10/28 13890 4 0 2505 2043 0.0% 0.2% 44.9% 12/13 13890 4 0 1980 1705 0.0% 0.2% 46.3%10/29 13890 8 0 2672 2328 0.0% 0.3% 46.6% 12/14 13890 4 0 2514 2156 0.0% 0.2% 46.2%10/30 13890 16 0 2187 1705 0.0% 0.9% 43.8% 12/15 13890 8 0 2218 1711 0.0% 0.5% 43.5%10/31 13890 4 0 1148 218 0.0% 1.8% 16.0% 12/16 13890 8 0 2400 2089 0.0% 0.4% 46.5%
11/1 13890 0 0 2490 2130 0.0% 0.0% 46.1% 12/17 13890 12 0 2609 2213 0.0% 0.5% 45.9%11/2 13890 12 0 2709 2394 0.0% 0.5% 46.9% 12/18 13890 12 0 2297 1985 0.0% 0.6% 46.4%11/3 13890 8 0 2622 2211 0.0% 0.4% 45.7% 12/19 13890 12 0 1193 996 0.0% 1.2% 45.5%11/4 13890 0 0 2313 1852 0.0% 0.0% 44.5% 12/20 13890 4 0 2767 2408 0.0% 0.2% 46.5%11/5 13890 8 0 2836 2408 0.0% 0.3% 45.9% 12/21 13890 8 0 2528 2182 0.0% 0.4% 46.3%11/6 13890 0 0 2856 2406 0.0% 0.0% 45.7% 12/22 13890 20 0 2184 1861 0.0% 1.1% 46.0%11/7 13890 4 0 1073 868 0.0% 0.5% 44.7% 12/23 13890 4 0 2395 2027 0.0% 0.2% 45.8%11/8 13890 8 0 2471 2194 0.0% 0.4% 47.0% 12/24 13890 16 0 2498 2186 0.0% 0.7% 46.7%11/9 13890 20 0 2192 1889 0.0% 1.1% 46.3% 12/25 13890 4 0 840 711 0.0% 0.6% 45.8%
11/10 13890 12 0 2456 2060 0.0% 0.6% 45.6% 12/$6 13890 4 0 - 790 685 0.0% 0.6% 46.4%11/11 13890 4 0 2395 2089 0.0% 0.2% 46.6% 12/27 13890 12 ' 0 1990 1620 0.0% 0.7% 44.9%
Page 99
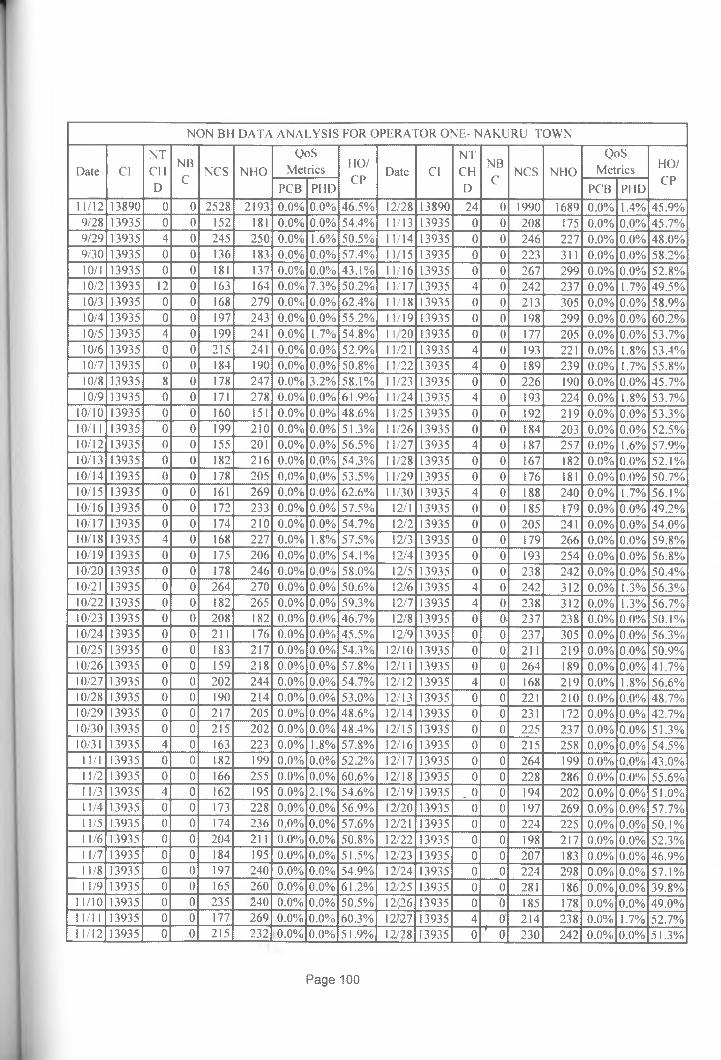
NON BH DATA ANALYSIS FOR OPERATOR ONE- NAKURU TOWN
Date ClNTCHD
NBC
NCS NHO
QoSMetrics HO/
CPDate Cl
NTCHD
NBC
NCS NHO
QoSMetrics HO/
CPPCB PHD PCB PHD
11/12 13890 0 0 2528 2193 0.0% 0.0% 46.5% 12/28 13890 24 0 1990 1689 0.0% 1.4% 45.9%9/28 13935 0 0 152 181 0.0% 0.0% 54.4% 11/13 13935 0 0 208 175 0.0% 0.0% 45.7%9/29 13935 4 0 245 250 0.0% 1.6% 50.5% 11/14 13935 0 0 246 227 0.0% 0.0% 48.0%9/30 13935 0 0 136 183 0.0% 0.0% 57.4% 11/15 13935 0 0 223 311 0.0% 0.0% 58.2%10/1 13935 0 0 181 137 0.0% 0.0% 43.1% 11/16 13935 0 0 267 299 0.0% 0.0% 52.8%10/2 13935 12 0 163 164 0.0% 7.3% 50.2% 11/17 13935 4 0 242 237 0.0% 1.7% 49.5%10/3 13935 0 0 168 279 0.0% 0.0% 62.4% 11/18 13935 0 0 213 305 0.0% 0.0% 58.9%10/4 13935 0 0 197 243 0.0% 0.0% 55.2% 11/19 13935 0 0 198 299 0.0% 0.0% 60.2%10/5 13935 4 0 199 241 0.0% 1.7% 54.8% 1 1 20 13935 0 0 177 205 0.0% 0.0% 53.7%10/6 13935 0 0 215 241 0.0% 0.0% 52.9% 11/21 13935 4 0 193 221 0.0% 1.8% 53.4%10/7 13935 0 0 184 190 0.0% 0.0% 50.8% 11/22 13935 4 0 189 239 0.0% 1.7% 55.8%10/8 13935 8 0 178 247 0.0% 3.2% 58.1% 11/23 13935 0 0 226 190 0.0% 0.0% 45.7%10/9 13935 0 0 171 278 0.0% 0.0% 61.9% 11/24 13935 4 0 193 224 0.0% 1.8% 53.7%
10/10 13935 0 0 160 151 0.0% 0.0% 48.6% 11/25 13935 0 0 192 219 0.0% 0.0% 53.3%10/11 13935 0 0 199 210 0.0% 0.0% 51.3% 11/26 13935 0 0 184 203 0.0% 0.0% 52.5%10/12 13935 0 0 155 201 0.0% 0.0% 56.5% 11/27 13935 4 0 187 257 0.0% 1.6% 57.9%10/13 13935 0 0 182 216 0.0% 0.0% 54.3% 11/28 13935 0 0 167 182 0.0% 0.0% 52.1%10/14 13935 0 0 178 205 0.0% 0.0% 53.5% 11/29 13935 0 0 176 181 0.0% 0.0% 50.7%10/15 13935 0 0 161 269 0.0% 0.0% 62.6% 11/30 1 3935 4 0 188 240 0.0% 1.7% 56.1%10/16 13935 0 0 172 233 0.0% 0.0% 57.5% 12/1 13935 0 0 185 179 0.0% 0.0% 49.2%10/17 13935 0 0 174 210 0.0% 0.0% 54.7% 12/2 13935 0 0 205 241 0.0% 0.0% 54.0%10/18 13935 4 0 168 227 0.0% 1.8% 57.5% 12/3 13935 0 0 179 266 0.0% 0.0% 59.8%10/19 13935 0 0 175 206 0.0% 0.0% 54.1% 12/4 13935 0 0 193 254 0.0% 0.0% 56.8%10/20 13935 0 0 178 246 0.0% 0.0% 58.0% 12/5 13935 0 0 238 242 0.0% 0.0% 50.4%10/21 13935 0 0 264 270 0.0% 0.0% 50.6% 12/6 13935 4 0 242 312 0.0% 1.3% 56.3%10/22 13935 0 0 182 265 0.0% 0.0% 59.3% 12/7 13935 4 0 238 312 0.0% 1.3% 56.7%10/23 13935 0 0 208 182 0.0% 0.0% 46.7% 12/8 13935 0 0- 237 238 0.0% 0.0% 50.1%10/24 13935 0 0 211 176 0.0% 0.0% 45.5% 12/9 13935 0 0 237 305 0.0% 0.0% 56.3%10/25 13935 0 0 183 217 0.0% 0.0% 54.3% 12/10 13935 0 0 211 219 0.0% 0.0% 50.9%10/26 13935 0 0 159 218 0.0% 0.0% 57.8% 12/11 13935 0 0 264 189 0.0% 0.0% 41.7%10/27 13935 0 0 202 244 0.0% 0.0% 54.7% 12/12 13935 4 0 168 219 0.0% 1.8% 56.6%10/28 13935 0 0 190 214 0.0% 0.0% 53.0% 12/13 13935 0 0 221 210 0.0% 0.0% 48.7%10/29 13935 0 0 217 205 0.0% 0.0% 48.6% 12/14 13935 0 0 231 172 0.0% 0.0% 42.7%10/30 13935 0 0 215 202 0.0% 0.0% 48.4% 12/15 13935 0 0 225 237 0.0% 0.0% 51.3%10/31 13935 4 0 163 223 0.0% 1.8% 57.8% 12/16 13935 0 0 215 258 0.0% 0.0% 54.5%
11/1 13935 0 0 182 199 0.0% 0.0% 52.2% 12/17 13935 0 0 264 199 0.0% 0.0% 43.0%11/2 13935 0 0 166 255 0.0% 0.0% 60.6% 12/18 13935 0 0 228 286 0.0% 0.0% 55.6%11/3 13935 4 0 162 195 0.0% 2.1% 54.6% 12/19 13935 . 0 0 194 202 0.0% 0.0% 51.0%11/4 13935 0 0 173 228 0.0% 0.0% 56.9% 12/20 13935 0 0 197 269 0.0% 0.0% 57.7%11/5 13935 0 0 174 236 0.0% 0.0% 57.6% 12/21 13935 0 0 224 225 0.0% 0.0% 50.1%11/6 13935 0 0 204 211 0.0% 0.0% 50.8% 12/22 13935 0 0 198 217 0.0% 0.0% 52.3%11/7 13935 0 0 184 195 0.0% 0.0% 51.5% 12/23 13935 0 0 207 183 0.0% 0.0% 46.9%11/8 13935 0 0 197 240 0.0% 0.0% 54.9% 12/24 13935 0 0 224 298 0.0% 0.0% 57.1%11/9 13935 0 0 165 260 0.0% 0.0% 61.2% 12/25 13935 0 0 281 186 0.0% 0.0% 39.8%
11/10 13935 0 0 235 240 0.0% 0.0% 50.5% 12/26 13935 0 0 185 178 0.0% 0.0% 49.0%11/11 13935 0 0 177 269 0.0% 0.0% 60.3% 12/27 13935 4 0 214 238 0.0% 1.7% 52.7%11/12 13935 0 0 215 232 0.0% 0.0% 51.9% !2/?8 13935 0 ’ 0 230 242 0.0% 0.0% 51.3%
Page 100
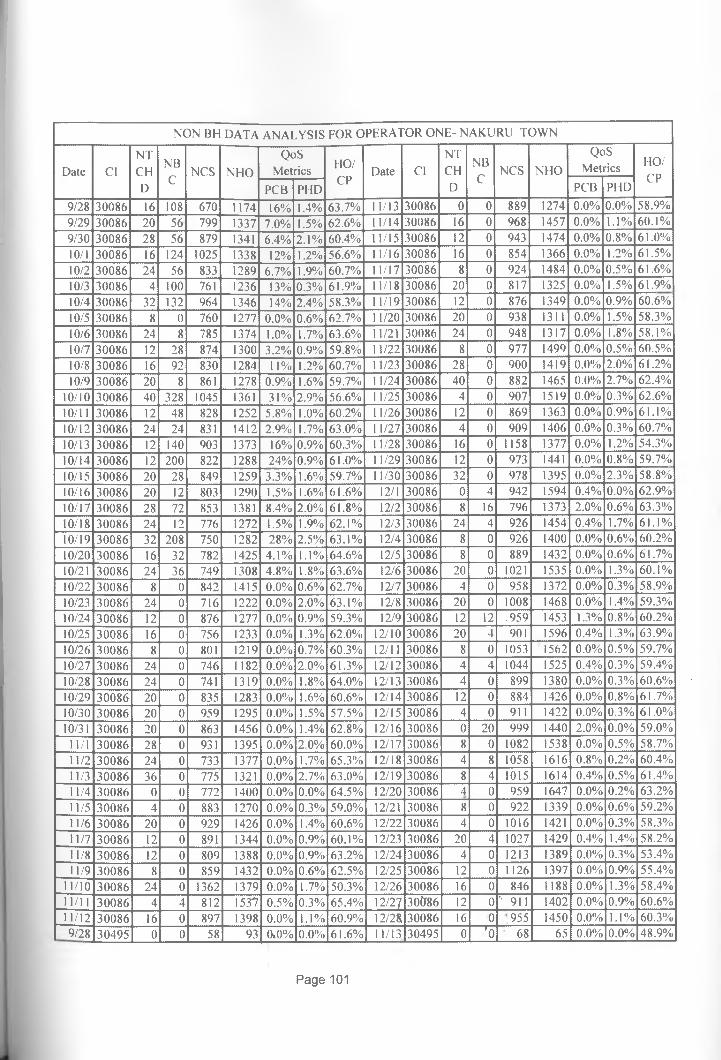
NON BH DATA ANALYSIS FOR OPERATOR ONE- NAKURU TOWN
Date ClNTCHD
NBC
NCS NHOQoS
Metrics HO/CP
Date ClNTCHD
NBC
NCS NHO
QoSMetrics HO/
CPPCB PHD PCB PHD
9/28 30086 16 108 670 1174 16% 1.4% 63.7% 11/13 30086 0 0 889 1274 0.0% 0.0% 58.9%9/29 30086 20 56 799 1337 7.0% 1.5% 62.6% 11/14 30086 16 0 968 1457 0.0% 1.1% 60.1%9/30 30086 28 56 879 1341 6.4% 2.1% 60.4% 11/15 30086 12 0 943 1474 0.0% 0.8% 61.0%10/1 30086 16 124 1025 1338 12% 1.2% 56.6% 11/16 .30086 16 0 854 1366 0.0% 1.2% 61.5%10/2 30086 24 56 833 1289 6.7% 1.9% 60.7% 11/17 30086 8 0 924 1484 0.0% 0.5% 61.6%10/3 30086 4 100 761 1236 13% 0.3% 61.9% 11/18 30086 20 0 817 1325 0.0% 1.5% 61.9%10/4 30086 32 132 964 1346 14% 2.4% 58.3% 11/19 30086 12 0 876 1349 0.0% 0.9% 60.6%10/5 30086 8 0 760 1277 0.0% 0.6% 62.7% 11/20 30086 20 0 938 1311 0.0% 1.5% 58.3%10/6 30086 24 8 785 1374 1.0% 1.7% 63.6% 11/21 30086 24 0 948 1317 0.0% 1.8% 58.1%10/7 30086 12 28 874 1300 3.2% 0.9% 59.8% 11/22 30086 8 0 977 1499 0.0% 0.5% 60.5%10/8 30086 16 92 830 1284 11% 1.2% 60.7% 11/23 30086 28 0 900 1419 0.0% 2.0% 61.2%10/9 30086 20 8 861 1278 0.9% 1.6% 59.7% 11/24 30086 40 0 882 1465 0.0% 2.7% 62.4%
10/10 30086 40 328 1045 1361 31% 2.9% 56.6% 11/25 30086 4 0 907 1519 0.0% 0.3% 62.6%10/11 30086 12 48 828 1252 5.8% 1.0% 60.2% 11/26 30086 12 0 869 1363 0.0% 0.9% 61.1%10/12 30086 24 24 831 1412 2.9% 1.7% 63.0% 11/27 30086 4 0 909 1406 0.0% 0.3% 60.7%10/13 30086 12 140 903 1373 16% 0.9% 60.3% 11/28 30086 16 0 1158 1377 0.0% 1.2% 54.3%10/14 30086 12 200 822 1288 24% 0.9% 61.0% 11/29 30086 12 0 973 1441 0.0% 0.8% 59.7%10/15 30086 20 28 849 1259 3.3% 1.6% 59.7% 11/30 30086 32 0 978 1395 0.0% 2.3% 58.8%10/16 30086 20 12 803 1290 1.5% 1.6% 61.6% 12/1 30086 0 4 942 1594 0.4% 0.0% 62.9%10/17 30086 28 72 853 1381 8.4% 2.0% 61.8% 12/2 30086 8 16 796 1373 2.0% 0.6% 63.3%10/18 30086 24 12 776 1272 1.5% 1.9% 62.1% 12/3 30086 24 4 926 1454 0.4% 1.7% 61.1%10/19 30086 32 208 750 1282 28% 2.5% 63.1% 12/4 30086 8 0 926 1400 0.0% 0.6% 60.2%10/20 30086 16 32 782 1425 4.1% 1.1% 64.6% 12/5 30086 8 0 889 1432 0.0% 0.6% 61.7%10/21 30086 24 36 749 1308 4.8% 1.8% 63.6% 12/6 30086 20 0 1021 1535 0.0% 1.3% 60.1%10/22 30086 8 0 842 1415 0.0% 0.6% 62.7% 12/7 30086 4 0 958 1372 0.0% 0.3% 58.9%10/23 30086 24 0 716 1222 0.0% 2.0% 63.1% 12/8 30086 20 0 1008 1468 0.0% 1.4% 59.3%10/24 30086 12 0 876 1277 0.0% 0.9% 59.3% 12/9 30086 12 12 .959 1453 1.3% 0.8% 60.2%10/25 30086 16 0 756 1233 0.0% 1.3% 62.0% 12/10 30086 20 4 901 1596 0.4% 1.3% 63.9%10/26 30086 8 0 801 1219 0.0% 0.7% 60.3% 12/11 30086 8 0 1053 1562 0.0% 0.5% 59.7%10/27 30086 24 0 746 1182 0.0% 2.0% 61.3% 12/12 30086 4 4 1044 1525 0.4% 0.3% 59.4%10/28 30086 24 0 741 1319 0.0% 1.8% 64.0% 12/13 30086 4 0 899 1380 0.0% 0.3% 60.6%10/29 30086 20 0 835 1283 0.0% 1.6% 60.6% 12/14 30086 12 0 884 1426 0.0% 0.8% 61.7%10/30 30086 20 0 959 1295 0.0% 1.5% 57.5% 12/15 30086 4 0 911 1422 0.0% 0.3% 61.0%10/31 30086 20 0 863 1456 0.0% 1.4% 62.8% 12/16 30086 0 20 999 1440 2.0% 0.0% 59.0%
11/1 30086 28 0 931 1395 0.0% 2.0% 60.0% 12/17 30086 8 0 1082 1538 0.0% 0.5% 58.7%11/2 30086 24 0 733 1377 0.0% 1.7% 65.3% 12/18 30086 4 8 1058 1616 0.8% 0.2% 60.4%11/3 30086 36 0 775 1321 0.0% 2.7% 63.0% 12/19 30086 8 4 1015 1614 0.4% 0.5% 61.4%11/4 30086 0 0 772 1400 0.0% 0.0% 64.5% 12/20 30086 4 0 959 1647 0.0% 0.2% 63.2%11/5 30086 4 0 883 1270 0.0% 0.3% 59.0% 12/21 30086 8 0 922 1339 0.0% 0.6% 59.2%11/6 30086 20 0 929 1426 0.0% 1.4% 60.6% 12/22 30086 4 0 1016 1421 0.0% 0.3% 58.3%11/7 30086 12 0 891 1344 0.0% 0.9% 60.1% 12/23 30086 20 4 1027 1429 0.4% 1.4% 58.2%11/8 30086 12 0 809 1388 0.0% 0.9% 63.2% 12/24 30086 4 0 1213 1389 0.0% 0.3% 53.4%11/9 30086 8 0 859 1432 0.0% 0.6% 62.5% 12/25 30086 12 0 1126 1397 0.0% 0.9% 55.4%
11/10 30086 24 0 1362 1379 0.0% 1.7% 50.3% 12/26 30086 16 0 846 1188 0.0% 1.3% 58.4%11/11 30086 4 4 812 1537 0.5% 0.3% 65.4% 12/27 30086 12 0 ’■ 911 1402 0.0% 0.9% 60.6%11/12 30086 16 0 897 1398 0.0% 1.1% 60.9% 12/28 30086 16 0 955 1450 0.0% 1.1% 60.3%9/28" 30495 0 0 58 93 (X0% 0.0% 61.6% 11/13 30495 0 'o 68 65 0.0% 0.0% 48.9%
Page 101
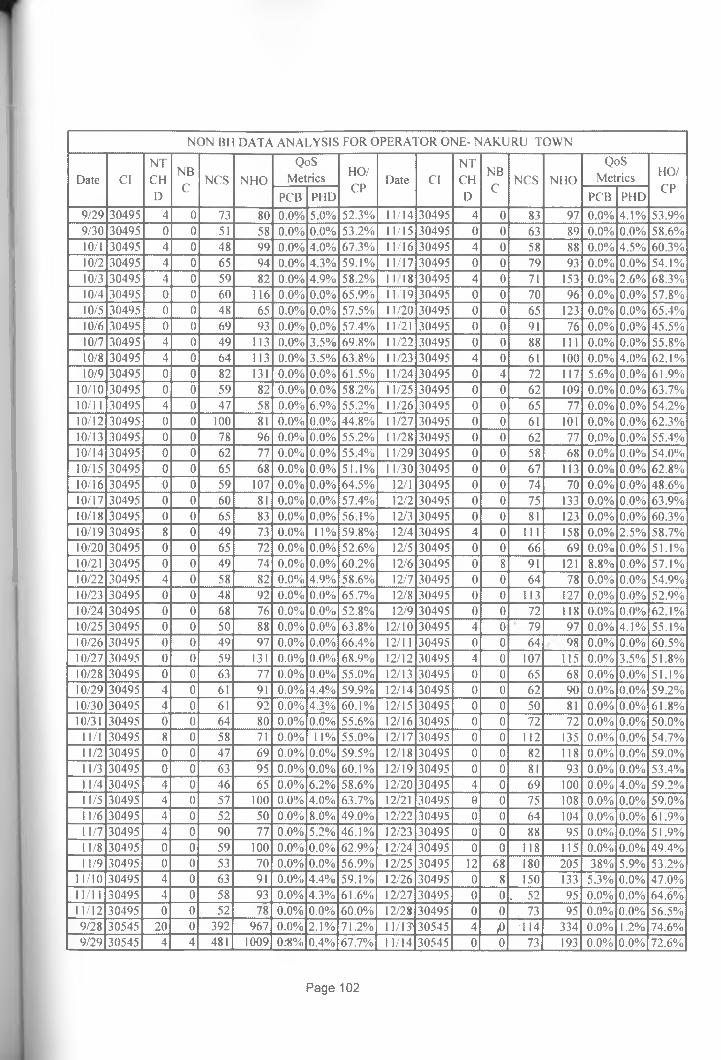
NON BH DATA ANALYSIS FOR OPERATOR ONE- NAKURU TOWN
Date ClNTCHD
NBC
NCS NHO
QoSMetrics HO/
CPDate Cl
NTCHD
NBC
NCS NHO
QoSMetrics HO/
CPPCB PHD PCB PHD
9/29 30495 4 0 73 80 0.0% 5.0% 52.3% 11/14 30495 4 0 83 97 0.0% 4.1% 53.9%9/30 30495 0 0 51 58 0.0% 0.0% 53.2% 11/15 30495 0 0 63 89 0.0% 0.0% 58.6%10/1 30495 4 0 48 99 0.0% 4.0% 67.3% 11/16 30495 4 0 58 88 0.0% 4.5% 60.3%10/2 30495 4 0 65 94 0.0% 4.3% 59.1% 11/17 30495 0 0 79 93 0.0% 0.0% 54.1%10/3 30495 4 0 59 82 0.0% 4.9% 58.2% 1 1 IS 30495 4 0 71 153 0.0% 2.6% 68.3%10/4 30495 0 0 60 116 0.0% 0.0% 65.9% 11/19 30495 0 0 70 96 0.0% 0.0% 57.8%10/5 30495 0 0 48 65 0.0% 0.0% 57.5% 11/20 30495 0 0 65 123 0.0% 0.0% 65.4%10/6 30495 0 0 69 93 0.0% 0.0% 57.4% 11/21 30495 0 0 91 76 0.0% 0.0% 45.5%10/7 30495 4 0 49 113 0.0% 3.5% 69.8% 11/22 30495 0 0 88 111 0.0% 0.0% 55.8%10/8 30495 4 0 64 113 0.0% 3.5% 63.8% 11/23 30495 4 0 61 100 0.0% 4.0% 62.1%10/9 30495 0 0 82 131 0.0% 0.0% 61.5% 11/24 30495 0 4 72 117 5.6% 0.0% 61.9%
10/10 30495 0 0 59 82 0.0% 0.0% 58.2% 11/25 30495 0 0 62 109 0.0% 0.0% 63.7%10/11 30495 4 0 47 58 0.0% 6.9% 55.2% 11/26 30495 0 0 65 77 0.0% 0.0% 54.2%10/12 30495 0 0 100 81 0.0% 0.0% 44.8% 11/27 30495 0 0 61 101 0.0% 0.0% 62.3%10/13 30495 0 0 78 96 0.0% 0.0% 55.2% 11/28 30495 0 0 62 77 0.0% 0.0% 55.4%10/14 30495 0 0 62 77 0.0% 0.0% 55.4% 11/29 30495 0 0 58 68 0.0% 0.0% 54.0%10/15 30495 0 0 65 68 0.0% 0.0% 51.1% 11/30 30495 0 0 67 113 0.0% 0.0% 62.8%10/16 30495 0 0 59 107 0.0% 0.0% 64.5% 12/1 30495 0 0 74 70 0.0% 0.0% 48.6%10/17 30495 0 0 60 81 0.0% 0.0% 57.4% 12/2 30495 0 0 75 133 0.0% 0.0% 63.9%10/18 30495 0 0 65 83 0.0% 0.0% 56.1% 12/3 30495 0 0 81 123 0.0% 0.0% 60.3%10/19 30495 8 0 49 73 0.0% 11% 59.8% 12/4 30495 4 0 111 158 0.0% 2.5% 58.7%10/20 30495 0 0 65 72 0.0% 0.0% 52.6% 12/5 30495 0 0 66 69 0.0% 0.0% 51.1%10/21 30495 0 0 49 74 0.0% 0.0% 60.2% 12/6 30495 0 8 91 121 8.8% 0.0% 57.1%10/22 30495 4 0 58 82 0.0% 4.9% 58.6% 12/7 30495 0 0 64 78 0.0% 0.0% 54.9%10/23 30495 0 0 48 92 0.0% 0.0% 65.7% 12/8 30495 0 0 113 127 0.0% 0.0% 52.9%10/24 30495 0 0 68 76 0.0% 0.0% 52.8% 12/9 30495 0 0 72 118 0.0% 0.0% 62.1%10/25 30495 0 0 50 88 0.0% 0.0% 63.8% 12/10 30495 4 0 79 97 0.0% 4.1% 55.1%10/26 30495 0 0 49 97 0.0% 0.0% 66.4% 12/11 30495 0 0 64 98 0.0% 0.0% 60.5%10/27 30495 0 0 59 131 0.0% 0.0% 68.9% 12/12 30495 4 0 107 115 0.0% 3.5% 51.8%10/28 30495 0 0 63 77 0.0% 0.0% 55.0% 12/13 30495 0 0 65 68 0.0% 0.0% 51.1%10/29 30495 4 0 61 91 0.0% 4.4% 59.9% 12/14 30495 0 0 62 90 0.0% 0.0% 59.2%10/30 30495 4 0 61 92 0.0% 4.3% 60.1% 12/15 30495 0 0 50 81 0.0% 0.0% 61.8%10/31 30495 0 0 64 80 0.0% 0.0% 55.6% 12/16 30495 0 0 72 72 0.0% 0.0% 50.0%
11/1 30495 8 0 58 71 0.0% 11% 55.0% 12/17 30495 0 0 112 135 0.0% 0.0% 54.7%11/2 30495 0 0 47 69 0.0% 0.0% 59.5% 12/18 30495 0 0 82 118 0.0% 0.0% 59.0%11/3 30495 0 0 63 95 0.0% 0.0% 60.1% 12/19 30495 0 0 81 93 0.0% 0.0% 53.4%11/4 30495 4 0 46 65 0.0% 6.2% 58.6% 12/20 30495 4 0 69 100 0.0% 4.0% 59.2%11/5 30495 4 0 57 100 0.0% 4.0% 63.7% 12/21 30495 0 0 75 108 0.0% 0.0% 59.0%11/6 30495 4 0 52 50 0.0% 8.0% 49.0% 12/22 30495 0 0 64 104 0.0% 0.0% 61.9%11/7 30495 4 0 90 77 0.0% 5.2% 46.1% 12/23 30495 0 0 88 95 0.0% 0.0% 51.9%11/8 30495 0 0 59 100 0.0% 0.0% 62.9% 12/24 30495 0 0 118 115 0.0% 0.0% 49.4%11/9 30495 0 0 53 70 0.0% 0.0% 56.9% 12/25 30495 12 68 180 205 38% 5.9% 53.2%
1 1/10 30495 4 0 63 91 0.0% 4.4% 59.1% 12/26 30495 0 8 150 133 5.3% 0.0% 47.0%11/11 30495 4 0 58 93 0.0% 4.3% 61.6% 12/27 30495 0 0 - 52 95 0.0% 0.0% 64.6%11/12 30495 0 0 52 78 0.0% 0.0% 60.0% 12/28 30495 0 0 73 95 0.0% 0.0% 56.5%9/28 30545 20 0 392 967 0.0% 2.1% 71.2% 11/135 30545 4 P •114 334 0.0% 1.2% 74.6%9/29 30545 4 4 481 1009 0:8% 0.4% 67.7% 11/14 30545 0 0 73 193 0.0% 0.0% 72.6%
Page 102

NON BH DATA ANALYSIS FOR OPERATOR ONE- NAKURU TOWN
Date ClNTCHD
NBC
NCS NHO
QoSMetrics HO/
CPDate Cl
NTCHD
NBC
NCS NHO
QoSMetrics 110/
CPPCB PHD PCB PHD
9/30 30545 8 0 434 1158 0.0% 0.7% 72.7% 11/15 30545 8 68 772 1288 8.8% 0.6% 62.5%I0/I 30545 4 12 541 1134 2.2% 0.4% 67.7% 11/16 30545 8 4 645 1155 0.6% 0.7% 64.2%10/2 30545 0 0 97 214 0.0% 0.0% 68.8% 11/17 30545 8 8 523 1004 1.5% 0.8% 65.7%10/3 30545 0 0 57 146 0.0% 0.0% 7 1.9% 11/18 30545 4 4 457 1122 0.9% 0.4% 71.1%10/4 30545 4 12 554 1371 2.2% 0.3% 71.2% 11/19 30545 0 0 483 986 0.0% 0.0% 67.1%10/5 30545 4 8 541 1149 1.5% 0.3% 68.0% 11/20 30545 0 0 93 281 0.0% 0.0% 75.1%10/6 30545 4 0 501 1126 0.0% 0.4% 69.2% 11/21 30545 0 0 50 151 0.0% 0.0% 75.1%10/7 30545 12 4 531 1102 0.8% 1.1% 67.5% 11/22 30545 0 8 586 1332 1.4% 0.0% 69.4%10/8 30545 4 0 460 1055 0.0% 0.4% 69.6% 11/23 30545 8 0 515 1111 0.0% 0.7% 68.3%10/9 30545 8 0 114 329 0.0% 2.4% 74.3% 11/24 30545 12 0 588 1139 0.0% 1.1% 66.0%
10/10 30545 0 0 67 149 0.0% 0.0% 69.0% 11/25 30545 12 0 448 940 0.0% 1.3% 67.7%10/11 30545 8 16 501 1382 3.2% 0.6% 73.4% 11/26 30545 0 8 505 1050 1.6% 0.0% 67.5%10/12 30545 8 0 487 1042 0.0% 0.8% 68.1% 11/27 30545 0 0 106 276 0.0% 0.0% 72.3%10/13 30545 0 24 574 1138 4.2% 0.0% 66.5% 11/28 30545 0 0 91 134 0.0% 0.0% 59.6%10/14 30545 4 0 577 1165 0.0% 0.3% 66.9% 11/29 30545 8 12 521 1252 2.3% 0.6% 70.6%10/15 30545 8 0 463 992 0.0% 0.8% 68.2% 11/30 30545 8 24 645 1277 3.7% 0.6% 66.4%10/16 30545 0 0 89 302 0.0% 0.0% 77.2% 12/1 30545 8 0 449 1127 0.0% 0.7% 71.5%10/17 30545 0 0 62 165 0.0% 0.0% 72.7% 12/2 30545 8 0 493 1145 0.0% 0.7% 69.9%10/18 30545 0 32 556 1214 5.8% 0.0% 68.6% 12/3 30545 12 0 505 1074 0.0% 1.1% 68.0%10/19 30545 8 0 463 1006 0.0% 0.8% 68.5% 12/4 30545 0 0 103 314 0.0% 0.0% 75.3%10/20 30545 0 0 55 160 0.0% 0.0% 74.4% 12/5 30545 0 0 51 151 0.0% 0.0% 74.8%10/21 30545 4 0 523 1095 0.0% 0.4% 67.7% 12/6 30545 16 28 575 1405 4.9% 1.1% 71.0%10/22 30545 12 0 543 955 0.0% 1.3% 63.8% 12/7 30545 12 4 505 1182 0.8% 1.0% 70.1%10/23 30545 0 0 98 329 0.0% 0.0% 77.0% 12/8 30545 8 8 518 1243 1.5% 0.6% 70.6%10/24 30545 0 0 60 169 0.0% 0.0% 73.8% 12/9 30545 4 0 492 1120 0.0% 0.4% 69.5%10/25 30545 4 24 560 1175 4.3% 0.3% 67.7% 12/10 30545 8 0 454 1107 0.0% 0.7% 70.9%10/26 30545 0 4 506 1074 0.8% 0.0% 68.0% 12/11 30545 4 0 • 87 275 0.0% 1.5% 76.0%10/27 30545 4 0 492 976 0.0% 0.4% 66.5% 12/12 30545 0 0 58 206 0.0% 0.0% 78.0%10/28 30545 0 0 5 13 1020 0.0% 0.0% 66.5% 12/13 30545 0 0 77 241 0.0% 0.0% 75.8%10/29 30545 8 4 431 973 0.9% 0.8% 69.3% 12/14 30545 4 48 552 1195 8.7% 0.3% 68.4%10/30 30545 0 0 85 248 0.0% 0.0% 74.5% 12/15 30545 16 8 563 1190 1.4% 1.3% 67.9%10/31 30545 0 0 62 159 0.0% 0.0% 71.9% 12/16 30545 12 4 509 1099 0.8% 1.1% 68.3%
11/1 30545 16 0 480 1310 0.0% 1.2% 73.2% 12/17 30545 4 4 538 1122 0.7% 0.4% 67.6%11/2 30545 4 80 619 1183 13% 0.3% 65.6% 12/18 30545 4 0 113 312 0.0% 1.3% 73.4%11/3 30545 0 12 534 1231 2.2% 0.0% 69.7% 12/19 30545 0 0 55 152 0.0% 0.0% 73.4%11/4 30545 0 12 482 1083 2.5% 0.0% 69.2% 12/20 30545 8 28 644 1371 4.3% 0.6% 68.0%11/5 30545 4 4 495 1246 0.8% 0.3% 71.6% 12/21 30545 12 0 566 1148 0.0% 1.0% 67.0%11/6 30545 0 0 82 308 0.0% 0.0% 79.0% 12/22 30545 Q 0 538 1143 0.0% 0.0% 68.0%11/7 30545 0 0 67 167 0.0% 0.0% 71.4% 12/23 30545 4 8 457 1152 1.8% 0.3% 71.6%11/8 30545 4 36 546 1413 6.6% 0.3% 72.1% 12/24 30545 0 0 375 1034 0.0% 0.0% 73.4%11/9 30545 12 0 512 1127 0.0% 1.1% 68.8% 12/25 30545 4 0 52 99 0.0% 4.0% 65.6%
11/10 30545 4 0 504 1181 0.0% 0.3% 70.1% 12/26 30545 0 0 66 159 0.0% 0.0% 70.7%11/11 30545 24 0 500 1180 0.0% 2.0% 70.2% 12/27 30545 4 0 218 529 0.0% 0.8% 70.8%11/12 30545 12 4 557 1067 0.7% 1.1% 65.7% 12/28 30545 4 0 282 733 0.0% 0.5% 72.2%
AREA 6 5.8 760 888 0.8% 0.7% 53.9% /OVERALL NAKURU TOWN GFIADE OF SERVICE 0.71%
\ ' •.f
Page 103
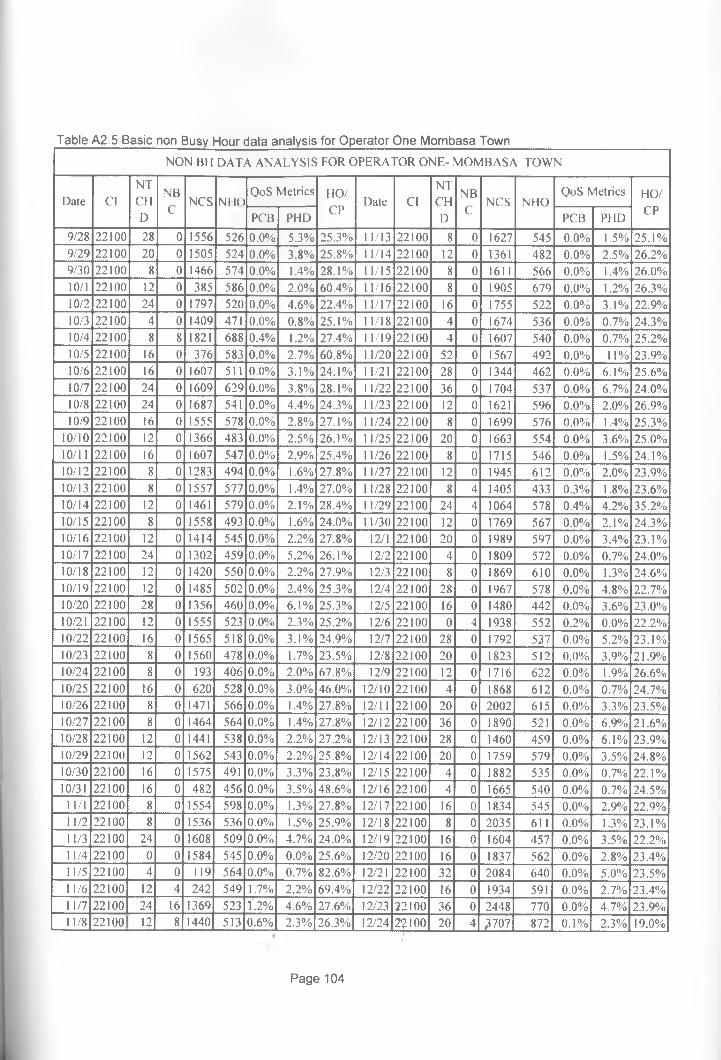
Table A2.5 Basic non Busy Hour data analysis for Operator One Mombasa TownNON BH DATA ANALYSIS FOR OPERATOR ONE- MOMBASA TOWN
Date ClNT
NB QoS Metrics HO/NT
NB QoS Metrics HO/CH NC'S NIK) Date Cl CH NCS NHOD
CPCB PHD
CPD
CPCB PHD CP
9/28 22100 28 0 1556 526 0.0% 5.3% 25.3% 11/13 22100 8 0 1627 545 0.0% 1.5% 25.1%9/29 22100 20 0 1505 524 0.0% 3.8% 25.8% 11/14 22100 12 0 1361 482 0.0% 2.5% 26.2%9/30 22100 8 0 1466 574 0.0% 1.4% 28.1% 11/15 22100 8 0 1611 566 0.0% 1.4% 26.0%10/1 22100 12 0 385 586 0.0% 2.0% 60.4% 11/16 22100 8 0 1905 679 0.0% 1.2% 26.3%10/2 22100 24 0 1797 520 0.0% 4.6% 22.4% 11/17 22100 16 0 1755 522 0.0% 3.1% 22.9%10/3 22100 4 0 1409 471 0.0% 0.8% 25.1% 11/18 22100 4 0 1674 536 0.0% 0.7% 24.3%10/4 22100 8 8 1821 688 0.4% 1.2% 27.4% 11/19 22100 4 0 1607 540 0.0% 0.7% 25.2%10/5 22100 16 0 376 583 0.0% 2.7% 60.8% 11/20 22100 52 0 1567 492 0.0% 11% 23.9%10/6 22100 16 0 1607 511 0.0% 3.1% 24.1% 11/21 22100 28 0 1344 462 0.0% 6.1% 25.6%10/7 22100 24 0 1609 629 0.0% 3.8% 28.1% 11/22 22100 36 0 1704 537 0.0% 6.7% 24.0%10/8 22100 24 0 1687 541 0.0% 4.4% 24.3% 11/23 22100 12 0 1621 596 0.0% 2.0% 26.9%10/9 22100 16 0 1555 578 0.0% 2.8% 27.1% 11/24 22100 8 0 1699 576 0.0% 1.4% 25.3%
10/10 22100 12 0 1366 483 0.0% 2.5% 26.1% 11/25 22100 20 0 1663 554 0.0% 3.6% 25.0%10/11 22100 16 0 1607 547 0.0% 2.9% 25.4% 11/26 22100 8 0 1715 546 0.0% 1.5% 24.1%10/12 22100 8 0 1283 494 0.0% 1.6% 27.8% 11/27 22100 12 0 1945 612 0.0% 2.0% 23.9%10/13 22100 8 0 1557 577 0.0% 1.4% 27.0% 11/28 22100 8 4 1405 433 0.3% 1.8% 23.6%10/14 22100 12 0 1461 579 0.0% 2.1% 28.4% 11/29 22100 24 4 1064 578 0.4% 4.2% 35.2%10/15 22100 8 0 1558 493 0.0% 1.6% 24.0% 11/30 22100 12 0 1769 567 0.0% 2.1% 24.3%10/16 22100 12 0 1414 545 0.0% 2.2% 27.8% 12/1 22100 20 0 1989 597 0.0% 3.4% 23.1%10/17 22100 24 0 1302 459 0.0% 5.2% 26.1% 12/2 22100 4 0 1809 572 0.0% 0.7% 24.0%10/18 22100 12 0 1420 550 0.0% 2.2% 27.9% 12/3 22100 8 0 1869 610 0.0% 1.3% 24.6%10/19 22100 12 0 1485 502 0.0% 2.4% 25.3% 12/4 22100 28 0 1967 578 0.0% 4.8% 22.7%10/20 22100 28 0 1356 460 0.0% 6.1% 25.3% 12/5 22100 16 0 1480 442 0.0% 3.6% 23.0%10/21 22100 12 0 1555 523 0.0% 2.3% 25.2% 12/6 22100 0 4 1938 552 0.2% 0.0% 22.2%10/22 22100 16 0 1565 518 0.0% 3.1% 24.9% 12/7 22100 28 0 1792 537 0.0% 5.2% 23.1%10/23 22100 8 0 1560 478 0.0% 1.7% 23.5% 12/8 22100 20 0 1823 512 0.0% 3.9% 21.9%10/24 22100 8 0 193 406 0.0% 2.0% 67.8% 12/9 22100 12 0 1716 622 0.0% 1.9% 26.6%10/25 22100 16 0 620 528 0.0% 3.0% 46.0% 12/10 22100 4 0 1868 612 0.0% 0.7% 24.7%10/26 22100 8 0 1471 566 0.0% 1.4% 27.8% 12/11 22100 20 0 2002 615 0.0% 3.3% 23.5%10/27 22100 8 0 1464 564 0.0% 1.4% 27.8% 12/12 22100 36 0 1890 521 0.0% 6.9% 21.6%10/28 22100 12 0 1441 538 0.0% 2.2% 27.2% 12/13 22100 28 0 1460 459 0.0% 6.1% 23.9%10/29 22100 12 0 1562 543 0.0% 2.2% 25.8% 12/14 22100 20 0 1759 579 0.0% 3.5% 24.8%10/30 22100 16 0 1575 491 0.0% 3.3% 23.8% 12/15 22100 4 0 1882 535 0.0% 0.7% 22.1%10/31 22100 16 0 482 456 0.0% 3.5% 48.6% 12/16 22100 4 0 1665 540 0.0% 0.7% 24.5%
11/1 22100 8 0 1554 598 0.0% 1.3% 27.8% 12/17 22100 16 0 1834 545 0.0% 2.9% 22.9%11/2 22100 8 0 1536 536 0.0% 1.5% 25.9% 12/18 22100 8 0 2035 611 0.0% 1.3% 23.1%11/3 22100 24 0 1608 509 0.0% 4.7% 24.0% 12/19 22100 16 0 1604 457 0.0% 3.5% 22.2%11/4 22100 0 0 1584 545 0.0% 0.0% 25.6% 12/20 22100 16 0 1837 562 0.0% 2.8% 23.4%11/5 22100 4 0 119 564 0.0% 0.7% 82.6% 12/21 22100 32 0 2084 640 0.0% 5.0% 23.5%11/6 22100 12 4 242 549 1.7% 2.2% 69.4% 12/22 22100 16 0 1934 591 0.0% 2.7% 23.4%11/7 22100 24 16 1369 523 1.2% 4.6% 27.6% 12/23 22100 36 0 2448 770 0.0% 4.7% 23.9%11/8 22100 12 8 1440 513 0.6% 2.3% 26.3% 12/24 2? 100 20 4 ,3707 872 0.1% 2.3% 19.0%
Page 104
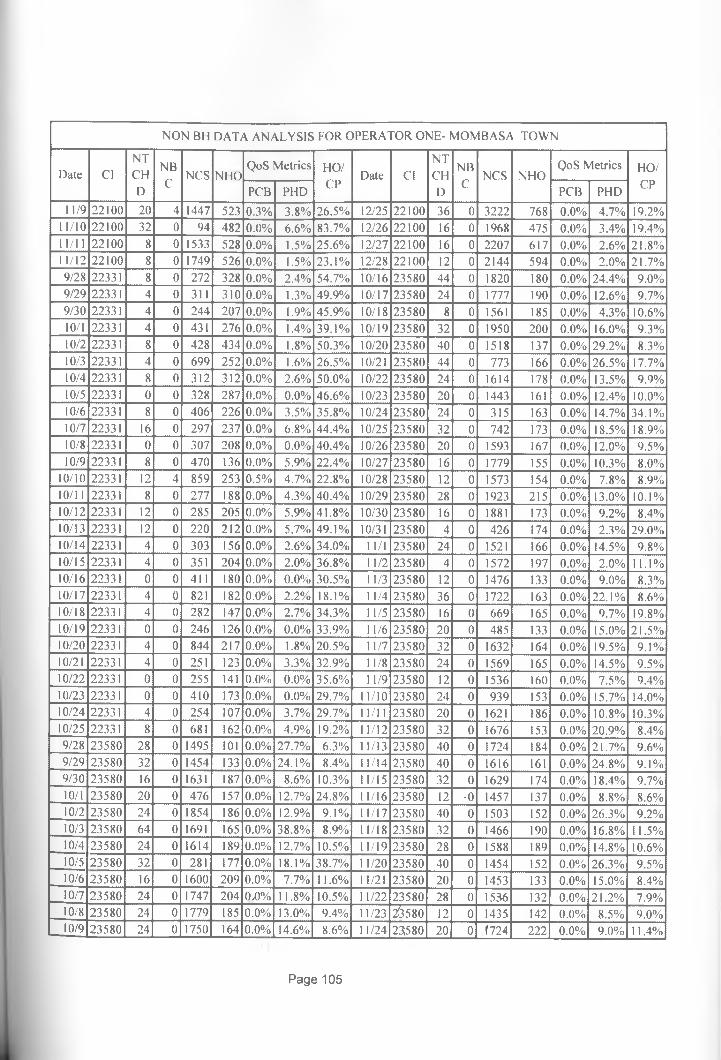
NON BH DATA ANALYSIS FOR OPERATOR ONE- MOMBASA TOWN
Date ClNTCHD
NBC
NCS NIK)QoS Metrics HO/
CPDate Cl
NTCHD
NBC
NCS NHOQoS Metrics HO/
CPPCB PHD PCB PHD11/9 22100 20 4 1447 523 0.3% 3.8% 26.5% 12/25 22100 36 0 3222 768 0.0% 4.7% 19.2%
11/10 22100 32 0 94 482 0.0% 6.6% 83.7% 12/26 22100 16 0 1968 475 0.0% 3.4% 19.4%11/11 22100 8 0 1533 528 0.0% 1.5% 25.6% 12/27 22100 16 0 2207 617 0.0% 2.6% 21.8%11/12 22100 8 0 1749 526 0.0% 1.5% 23.1% 12/28 22100 12 0 2144 594 0.0% 2.0% 21.7%9/28 22331 8 0 272 328 0.0% 2.4% 54.7% 10/16 23580 44 0 1820 180 0.0% 24.4% 9.0%9/29 22331 4 0 311 310 0.0% 1.3% 49.9% 10/17 23580 24 0 1777 190 0.0% 12.6% 9.7%9/30 22331 4 0 244 207 0.0% 1.9% 45.9% 10/18 23580 8 0 1561 185 0.0% 4.3% 10.6%10/1 22331 4 0 431 276 0.0% 1.4% 39.1% 10/19 23580 32 0 1950 200 0.0% 16.0% 9.3%10/2 22331 8 0 428 434 0.0% 1.8% 50.3% 10/20 23580 40 0 1518 137 0.0% 29.2% 8.3%10/3 22331 4 0 699 252 0.0% 1.6% 26.5% 10/21 23580 44 0 773 166 0.0% 26.5% 17.7%10/4 22331 8 0 312 312 0.0% 2.6% 50.0% 10/22 23580 24 0 1614 178 0.0% 13.5% 9.9%10/5 22331 0 0 328 287 0.0% 0.0% 46.6% 10/23 23580 20 0 1443 161 0.0% 12.4% 10.0%10/6 22331 8 0 406 226 0.0% 3.5% 35.8% 10/24 23580 24 0 315 163 0.0% 14.7% 34.1%10/7 22331 16 0 297 237 0.0% 6.8% 44.4% 10/25 23580 32 0 742 173 0.0% 18.5% 18.9%10/8 22331 0 0 307 208 0.0% 0.0% 40.4% 10/26 23580 20 0 1593 167 0.0% 12.0% 9.5%10/9 22331 8 0 470 136 0.0% 5.9% 22.4% 10/27 23580 16 0 1779 155 0.0% 10.3% 8.0%
10/10 22331 12 4 859 253 0.5% 4.7% 22.8% 10/28 23580 12 0 1573 154 0.0% 7.8% 8.9%10/11 22331 8 0 277 188 0.0% 4.3% 40.4% 10/29 23580 28 0 1923 215 0.0% 13.0% 10.1%10/12 22331 12 0 285 205 0.0% 5.9% 41.8% 10/30 23580 16 0 1881 173 0.0% 9.2% 8.4%10/13 22331 12 0 220 212 0.0% 5.7% 49.1% 10/31 23580 4 0 426 174 0.0% 2.3% 29.0%10/14 22331 4 0 303 156 0.0% 2.6% 34.0% 11/1 23580 24 0 1521 166 0.0% 14.5% 9.8%10/15 22331 4 0 351 204 0.0% 2.0% 36.8% 11/2 23580 4 0 1572 197 0.0% 2.0% 11.1%10/16 22331 0 0 411 180 0.0% 0.0% 30.5% 11/3 23580 12 0 1476 133 0.0% 9.0% 8.3%10/17 22331 4 0 821 182 0.0% 2.2% 18.1% 11/4 23580 36 0 1722 163 0.0% 22.1% 8.6%10/18 22331 4 0 282 147 0.0% 2.7% .34.3% 11/5 23580 16 0 669 165 0.0% 9.7% 19.8%10/19 22331 0 0 246 126 0.0% 0.0% 33.9% 11/6 23580 20 0 485 133 0.0% 15.0% 21.5%10/20 22331 4 0 844 217 0.0% 1.8% 20.5% 11/7 23580 32 0 1632 164 0.0% 19.5% 9.1%10/21 22331 4 0 251 123 0.0% 3.3% 32.9% 11/8 23580 24 0 1569 165 0.0% 14.5% 9.5%10/22 22331 0 0 255 141 0.0% 0.0% 35.6% 11/9 23580 12 0 1536 160 0.0% 7.5% 9.4%10/23 22331 0 0 410 173 0.0% 0.0% 29.7% 11/10 23580 24 0 939 153 0.0% 15.7% 14.0%10/24 22331 4 0 254 107 0.0% 3.7% 29.7% 11/11 23580 20 0 1621 186 0.0% 10.8% 10.3%10/25 22331 8 0 681 162 0.0% 4.9% 19.2% 11/12 23580 32 0 1676 153 0.0% 20.9% 8.4%9/28 23580 28 0 1495 101 0.0% 27.7% 6.3% 11/13 23580 40 0 1724 184 0.0% 21.7% 9.6%9/29 23580 32 0 1454 133 0.0% 24.1% 8.4% 11/14 23580 40 0 1616 161 0.0% 24.8% 9.1%9/30 23580 16 0 1631 187 0.0% 8.6% 10.3% 11/15 23580 32 0 1629 174 0.0% 18.4% 9.7%10/1 23580 20 0 476 157 0.0% 12.7% 24.8% 11/16 23580 12 -0 1457 137 0.0% 8.8% 8.6%10/2 23580 24 0 1854 186 0.0% 12.9% 9.1% 11/17 23580 40 0 1503 152 0.0% 26.3% 9.2%10/3 23580 64 0 1691 165 0.0% 38.8% 8.9% 11/18 23580 32 0 1466 190 0.0% 16.8% 11.5%10/4 23580 24 0 1614 189 0.0% 12.7% 10.5% 11/19 23580 28 0 1588 189 0.0% 14.8% 10.6%10/5 23580 32 0 281 177 0.0% 18.1% 38.7% 11/20 23580 40 0 1454 152 0.0% 26.3% 9.5%10/6 23580 16 0 1600 209 0.0% 7.7% 11.6% 11/21 23580 20 0 1453 133 0.0% 15.0% 8.4%10/7 23580 24 0 1747 204 0 JD% 11.8% 10.5% 11/22 23580 28 0 1536 132 0.0% 21.2% 7.9%10/8 23580 24 0 1779 185 0.0% 13.0% 9.4% 11/23 2^3580 12 0 1435 142 0.0% 8.5% 9.0%10/9 23580 24 0 1750 164 0.0% 14.6% 8.6% 11/24 23580 20 0 f 724 222 0.0% 9.0% 11.4%
Page 105

NON BH DATA ANALYSIS FOR OPERATOR ONE- MOMBASA TOWN
Date ClNTCHD
NBC
NCS NIK)QoS Metrics HO/
CPDate Cl
NTCHD
NBC
NCS NHOQoS Metrics HO/
CPPCB PHD PCB PHD10/10 23580 16 0 1665 165 0.0% 9.7% 9.0% 11/25 23580 36 0 1428 147 0.0% 24.5% 9.3%10/11 23580 12 0 1827 145 0.0% 8.3% 7.4% 11/26 23580 40 0 1571 193 0.0% 20.7% 10.9%10/12 23580 20 0 1664 161 0.0% 12.4% 8.8% 11/27 23580 8 0 1453 127 0.0% 6.3% 8.0%10/13 23580 8 0 1619 143 0.0% 5.6% 8.1% 11/28 23580 32 0 1758 144 0.0% 22.2% 7.6%10/14 23580 8 0 1842 164 0.0% 4.9% 8.2% 11/29 23580 36 0 1160 140 0.0% 25.7% 10.8%10/15 23580 12 0 1711 201 0.0% 6.0% 10.5% 11/30 23580 24 0 1645 152 0.0% 15.8% 8.5%
12/1 23580 16 0 1742 159 0.0% 10.1% 8.4% 10/16 23890 8 0 669 96 0.0% 8.3% 12.5%12/2 23580 36 0 1833 203 0.0% 17.7% 10.0% 10/17 23890 24 0 481 85 0.0% 28.2% 15.0%12/3 23580 12 0 1566 158 0.0% 7.6% 9.2% 10/18 23890 0 0 686 89 0.0% 0.0% 11.5%12/4 23580 36 0 1415 110 0.0% 32.7% 7.2% 10/19 23890 16 0 670 109 0.0% 14.7% 14.0%12/5 23580 20 0 1878 207 0.0% 9.7% 9.9% 10/20 23890 28 0 667 110 0.0% 25.5% 14.2%12/6 23580 44 0 1560 162 0.0% 27.2% 9.4% 10/21 23890 4 0 878 144 0.0% 2.8% 14.1%12/7 23580 16 0 1588 135 0.0% 11.9% 7.8% 10/22 23890 12 0 889 118 0.0% 10.2% 11.7%12/8 23580 28 0 1639 126 0.0% 22.2% 7.1% 10/23 23890 56 4 722 143 0.6% 39.2% 16.5%12/9 23580 24 0 1538 133 0.0% 18.0% 8.0% 10/24 23890 0 0 376 54 0.0% 0.0% 12.6%
12/10 23580 40 0 1480 177 0.0% 22.6% 10.7% 10/25 23890 8 0 803 114 0.0% 7.0% 12.4%12/11 23580 16 0 1685 159 0.0% 10.1% 8.6% 10/26 23890 4 0 636 84 0.0% 4.8% 11.7%12/12 23580 60 0 1818 168 0.0% 35.7% 8.5% 10/27 23890 0 0 649 106 0.0% 0.0% 14.0%12/13 23580 28 0 1430 138 0.0% 20.3% 8.8% 10/28 23890 4 0 625 87 0.0% 4.6% 12.2%12/14 23580 40 0 1326 136 0.0% 29.4% 9.3% 10/29 23890 0 0 587 94 0.0% 0.0% 13.8%12/15 23580 36 0 1584 153 0.0% 23.5% 8.8% 10/30 23890 36 4 668 99 0.6% 36.4% 12.9%12/16 23580 28 0 1705 140 0.0% 20.0% 7.6% 10/31 23890 8 0 398 56 0.0% 14.3% 12.3%12/17 23580 16 0 1625 146 0.0% 11.0% 8.2% 11/1 23890 0 0 570 89 0.0% 0.0% 13.5%12/18 23580 44 0 1706 183 0.0% 24.0% 9.7% 11/2 23890 0 0 498 94 0.0% 0.0% 15.9%12/19 23580 44 0 1750 185 0.0% 23.8% 9.6% 11/3 23890 20 0 669 97 0.0% 20.6% 12.7%12/20 23580 24 0 1739 144 0.0% 16.7% 7.6% 11/4 23890 8 8 592 116 1.4% 6.9% 16.4%12/21 23580 52 0 1801 180 0.0% 28.9% 9.1% 11/5 23890 4 0 59 ' 53 0.0% 7.5% 47.3%12/22 23580 56 0 1790 152 0.0% 36.8% 7.8% 11/6 23890 4 0 616 98 0.0% 4.1% 13.7%12/23 23580 20 0 1800 190 0.0% 10.5% 9.5% 11/7 23890 4 0 538 62 0.0% 6.5% 10.3%12/24 23580 12 0 1409 133 0.0% 9.0% 8.6% 11/8 23890 4 0 876 97 0.0% 4.1% 10.0%12/25 23580 40 0 1690 215 0.0% 18.6% 11.3% 11/9 23890 12 0 739 112 0.0% 10.7% 13.2%12/26 23580 8 0 1413 164 0.0% 4.9% 10.4% 11/10 23890 12 4 983 106 0.4% 11.3% 9.7%12/27 23580 24 0 1372 112 0.0% 21.4% 7.5% 11/11 23890 8 4 736 122 0.5% 6.6% 14.2%12/28 23580 12 0 1285 170 0.0% 7.1% 11.7% 11/12 23890 4 0 649 75 0.0% 5.3% 10.4%9/28 23890 12 0 616 110 0.0% 10.9% 15.2% 11/13 23890 44 4 726 117 0.6% 37.6% 13.9%9/29 23890 8 0 558 64 0.0% 12.5% 10.3% 11/14 23890 4 0 413 57 0.0% 7.0% 12.1%9/30 23890 4 0 717 97 0.0% 4.1% 11.9% 11/15 23890 0 0 645 93 0.0% 0.0% 12.6%10/1 23890 0 0 522 81 0.0% 0.0% 13.4% 11/16 23890 4 16 1416 81 1.1% 4.9% 5.4%10/2 23890 4 4 597 92 0.7% 4.3% 13.4% 11/17 23890 0 36 1097 91 3.3% 0.0% 7.7%10/3 23890 0 0 475 54 0.0% 0.0% 10.2% 11/18 23890 20 0 952 138 0.0% 14.5% 12.7%10/4 23890 8 4 722 61 0.6% 13.1% 7.8% 11/19 23890 4 0 772 106 0.0% 3.8% 12.1%10/5 23890 0 60 233 133. 26% 0.0% 36.3% 11/20 23890 4 4 -821 112 0.5% 3.6% 12.0%10/6 23890 16 16 959 120 1.7% 13.3% 11.1% \ M2 i 23890 20 0 737 52 0.0% 38.5% 6.6%10/7 23890 12 0 614| 91 0.0% 13.2% 12.9% 11/22 23890| 12 (/ 673 141 0.0% 8.5% 17.3%
Page 106
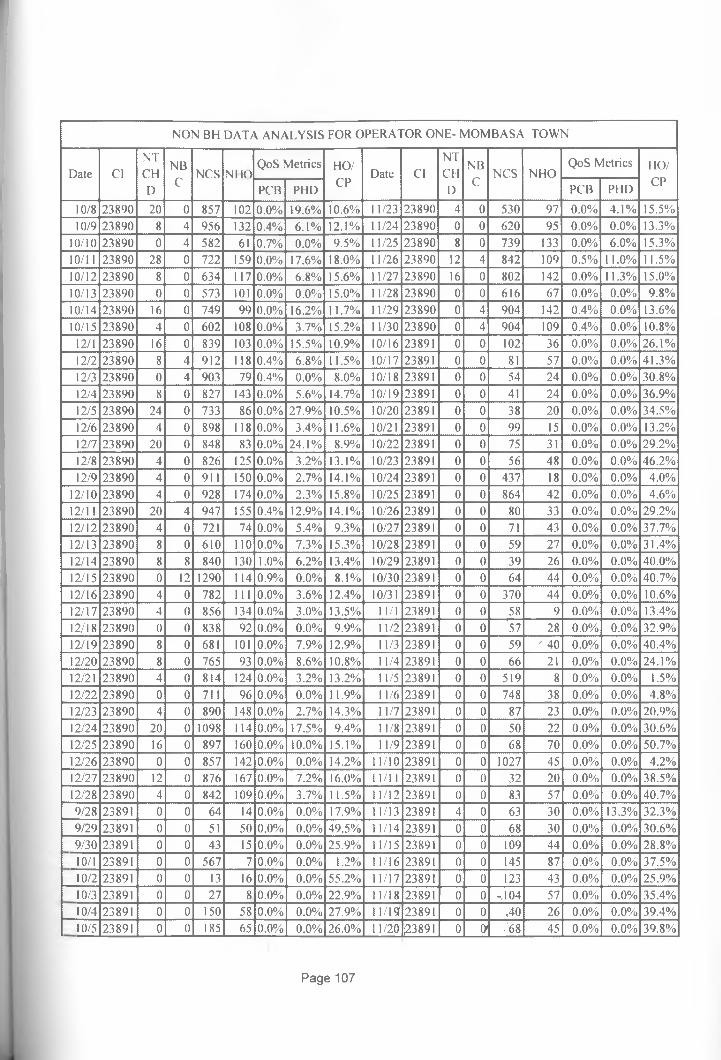
NON BH DATA ANALYSIS FOR OPERATOR ONE- MOMBASA TOWN
Date ClNTCHD
NBC
NCS NIK)QoS Metrics HO/
CPDate Cl
NTCHD
NBC
NCS NHOQoS Metrics HO/
CPPCB PHD PCB PHD
10/8 23890 20 0 857 102 0.0% 19.6% 10.6% 11/23 23890 4 0 530 97 0.0% 4.1% 15.5%10/9 23890 8 4 956 132 0.4% 6.1% 12.1% 11/24 23890 0 0 620 95 0.0% 0.0% 13.3%
10/10 23890 0 4 582 61 0.7% 0.0% 9.5% 11/25 23890 8 0 739 133 0.0% 6.0% 15.3%10 /1 1 23890 28 0 722 159 0.0% 17.6% 18.0% 11/26 23890 12 4 842 109 0.5% 11.0% 11.5%10/12 23890 8 0 634 117 0.0% 6.8% 15.6% 11/27 23890 16 0 802 142 0.0% 11.3% 15.0%10/13 23890 0 0 573 101 0.0% 0.0% 15.0% 11/28 23890 0 0 616 67 0.0% 0.0% 9.8%10/14 23890 16 0 749 99 0.0% 16.2% 11.7% 11/29 23890 0 4 904 142 0.4% 0.0% 13.6%10/15 23890 4 0 602 108 0.0% 3.7% 15.2% 11/30 23890 0 4 904 109 0.4% 0.0% 10.8%
12/1 23890 16 0 839 103 0.0% 15.5% 10.9% 10/16 23891 0 0 102 36 0.0% 0.0% 26.1%12/2 23890 8 4 912 118 0.4% 6.8% 11.5% 10/17 23891 0 0 81 57 0.0% 0.0% 41.3%12/3 23890 0 4 903 79 0.4% 0.0% 8.0% 10/18 23891 0 0 54 24 0.0% 0.0% 30.8%12/4 23890 8 0 827 143 0.0% 5.6% 14.7% 10/19 23891 0 0 41 24 0.0% 0.0% 36.9%12/5 23890 24 0 733 86 0.0% 27.9% 10.5% 10/20 23891 0 0 38 20 0.0% 0.0% 34.5%12/6 23890 4 0 898 118 0.0% 3.4% 11.6% 10/21 23891 0 0 99 15 0.0% 0.0% 13.2%12/7 23890 20 0 848 83 0.0% 24.1% 8.9% 10/22 23891 0 0 75 31 0.0% 0.0% 29.2%12/8 23890 4 0 826 125 0.0% 3.2% 13.1% 10/23 23891 0 0 56 48 0.0% 0.0% 46.2%12/9 23890 4 0 911 150 0.0% 2.7% 14.1% 10/24 23891 0 0 437 18 0.0% 0.0% 4.0%
12/10 23890 4 0 928 174 0.0% 2.3% 15.8% 10/25 23891 0 0 864 42 0.0% 0.0% 4.6%12/11 23890 20 4 947 155 0.4% 12.9% 14.1% 10/26 23891 0 0 80 33 0.0% 0.0% 29.2%12/12 23890 4 0 721 74 0.0% 5.4% 9.3% 10/27 23891 0 0 71 43 0.0% 0.0% 37.7%12/13 23890 8 0 610 110 0.0% 7.3% 15.3% 10/28 23891 0 0 59 27 0.0% 0.0% 31.4%12/14 23890 8 8 840 130 1.0% 6.2% 13.4% 10/29 23891 0 0 39 26 0.0% 0.0% 40.0%12/15 23890 0 12 1290 114 0.9% 0.0% 8.1% 10/30 23891 0 0 64 44 0.0% 0.0% 40.7%12/16 23890 4 0 782 111 0.0% 3.6% 12.4% 10/31 23891 0 0 370 44 0.0% 0.0% 10.6%12/17 23890 4 0 856 134 0.0% 3.0% 13.5% 11/1 23891 0 0 58 9 0.0% 0.0% 13.4%12/18 23890 0 0 838 92 0.0% 0.0% 9.9% 11/2 23891 0 0 ’57 28 0.0% 0.0% 32.9%12/19 23890 8 0 681 101 0.0% 7.9% 12.9% 11/3 23891 0 0 59 ' 40 0.0% 0.0% 40.4%12/20 23890 8 0 765 93 0.0% 8.6% 10.8% 11/4 23891 0 0 66 21 0.0% 0.0% 24.1%12/21 23890 4 0 814 124 0.0% 3.2% 13.2% 11/5 23891 0 0 519 8 0.0% 0.0% 1.5%12/22 23890 0 0 711 96 0.0% 0.0% 11.9% 11/6 23891 0 0 748 38 0.0% 0.0% 4.8%12/23 23890 4 0 890 148 0.0% 2.7% 14.3% 11/7 23891 0 0 87 23 0.0% 0.0% 20.9%12/24 23890 20 0 1098 114 0.0% 17.5% 9.4% 11/8 23891 0 0 50 22 0.0% 0.0% 30.6%12/25 23890 16 0 897 160 0.0% 10.0% 15.1% 11/9 23891 0 0 68 70 0.0% 0.0% 50.7%12/26 23890 0 0 857 142 0.0% 0.0% 14.2% 11/10 23891 0 0 1027 45 0.0% 0.0% 4.2%12/27 23890 12 0 876 167 0.0% 7.2% 16.0% 11/11 23891 0 0 32 20 0.0% 0.0% 38.5%12/28 23890 4 0 842 109 0.0% 3.7% 11.5% 11/12 23891 0 0 83 57 0.0% 0.0% 40.7%9/28 23891 0 0 64 14 0.0% 0.0% 17.9% 11/13 23891 4 0 63 30 0.0% 13.3% 32.3%9/29 23891 0 0 51 50 0.0% 0.0% 49.5% 11/14 23891 0 0 68 30 0.0% 0.0% 30.6%9/30 23891 0 0 43 15 0.0% 0.0% 25.9% 11/15 23891 0 0 109 44 0.0% 0.0% 28.8%10/1 23891 0 0 567 7 0.0% 0.0% 1.2% 11/16 23891 0 0 145 87 0.0% 0.0% 37.5%10/2 23891 0 0 13 16 0.0% 0.0% 55.2% 11/17 23891 0 0 123 43 0.0% 0.0% 25.9%10/3 23891 0 0 27 8 0.0% 0.0% 22.9% 11/18 23891 0 0 -.104 57 0.0% 0.0% 35.4%10/4 23891 0 0 150 58 0.0% 0.0% 27.9% 11/19 23891 0 0 ,40 26 0.0% 0.0% 39.4%10/5 23891 0 0 185 65 0.0% 0.0% 26.0% 11/20 ;2.3891 0 O' •'68 45 0.0% 0.0% 39.8%
Page 107
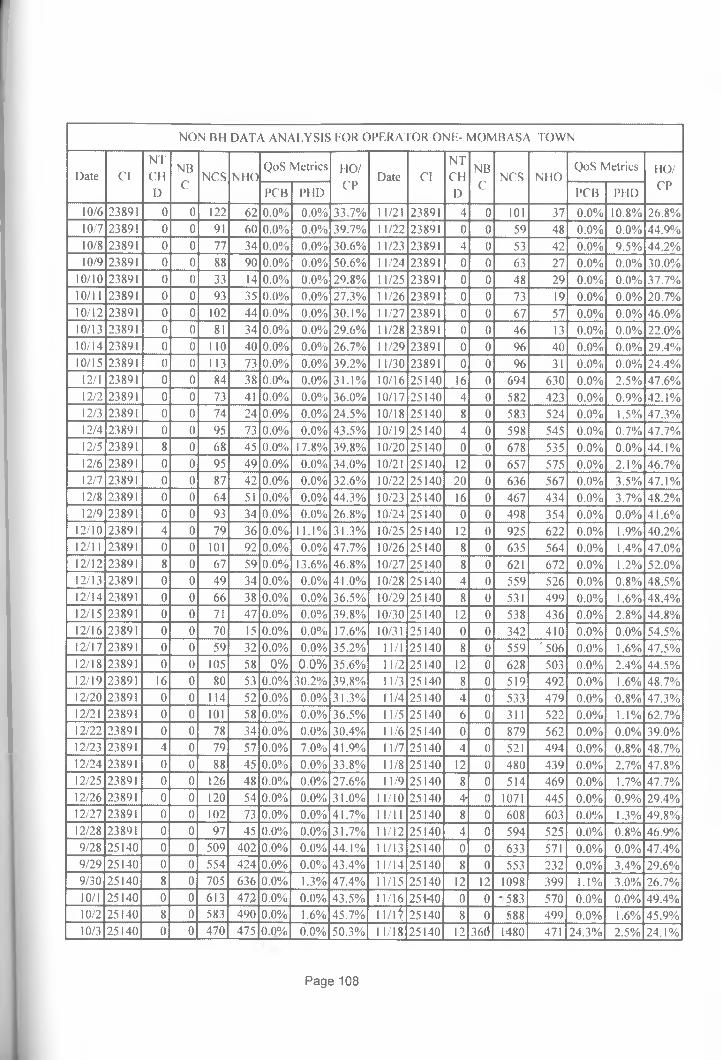
NON BH DATA ANALYSIS FOR OPERATOR ONE- MOMBASA TOWN
Date ClNTCHD
NBC
NCS NHOQoS Metrics HO/
CPDate Cl
NTCHD
NBC
NCS NHOQoS Metrics HO/
CPPCB PHD PCB PHD
10/6 23891 0 0 122 62 0.0% 0.0% 33.7% 11/21 23891 4 0 101 37 0.0% 10.8% 26.8%10/7 23891 0 0 91 60 0.0% 0.0% 39.7% 11/22 23891 0 0 59 48 0.0% 0.0% 44.9%10/8 23891 0 0 77 34 0.0% 0.0% 30.6% 11/23 23891 4 0 53 42 0.0% 9.5% 44.2%10/9 23891 0 0 88 90 0.0% 0.0% 50.6% 11/24 23891 0 0 63 27 0.0% 0.0% 30.0%
10/10 23891 0 0 33 14 0.0% 0.0% 29.8% 11/25 23891 0 0 48 29 0.0% 0.0% 37.7%10/11 23891 0 0 93 35 0.0% 0.0% 27.3% 11/26 23891 0 0 73 19 0.0% 0.0% 20.7%10/12 23891 0 0 102 44 0.0% 0.0% 30.1% 11/27 23891 0 0 67 57 0.0% 0.0% 46.0%10/13 23891 0 0 81 34 0.0% 0.0% 29.6% 11/28 23891 0 0 46 13 0.0% 0.0% 22.0%10/14 23891 0 0 110 40 0.0% 0.0% 26.7% 11/29 23891 0 0 96 40 0.0% 0.0% 29.4%10/15 23891 0 0 113 73 0.0% 0.0% 39.2% 11/30 23891 0 0 96 31 0.0% 0.0% 24.4%
12/1 23891 0 0 84 38 0.0% 0.0% 31.1% 10/16 25140 16 0 694 630 0.0% 2.5% 47.6%12/2 23891 0 0 73 41 0.0% 0.0% 36.0% 10/17 25140 4 0 582 423 0.0% 0.9% 42.1%12/3 23891 0 0 74 24 0.0% 0.0% 24.5% 10/18 25140 8 0 583 524 0.0% 1.5% 47.3%12/4 23891 0 0 95 73 0.0% 0.0% 43.5% 10/19 25140 4 0 598 545 0.0% 0.7% 47.7%12/5 23891 8 0 68 45 0.0% 17.8% 39.8% 10/20 25140 0 0 678 535 0.0% 0.0% 44.1%12/6 23891 0 0 95 49 0.0% 0.0% 34.0% 10/21 25140 12 0 657 575 0.0% 2.1% 46.7%12/7 23891 0 0 87 42 0.0% 0.0% 32.6% 10/22 25140 20 0 636 567 0.0% 3.5% 47.1%12/8 23891 0 0 64 51 0.0% 0.0% 44.3% 10/23 25140 16 0 467 434 0.0% 3.7% 48.2%12/9 23891 0 0 93 34 0.0% 0.0% 26.8% 10/24 25140 0 0 498 354 0.0% 0.0% 41.6%
12/10 23891 4 0 79 36 0.0% 11.1% 31.3% 10/25 25140 12 0 925 622 0.0% 1.9% 40.2%12/11 23891 0 0 101 92 0.0% 0.0% 47.7% 10/26 25140 8 0 635 564 0.0% 1.4% 47.0%12/12 23891 8 0 67 59 0.0% 13.6% 46.8% 10/27 25140 8 0 621 672 0.0% 1.2% 52.0%12/13 23891 0 0 49 34 0.0% 0.0% 41.0% 10/28 25140 4 0 559 526 0.0% 0.8% 48.5%12/14 23891 0 0 66 38 0.0% 0.0% 36.5% 10/29 25140 8 0 531 499 0.0% 1.6% 48.4%12/15 23891 0 0 71 47 0.0% 0.0% 39.8% 10/30 25140 12 0 538 436 0.0% 2.8% 44.8%12/16 23891 0 0 70 15 0.0% 0.0% 17.6% 10/31 25140 0 0 342 410 0.0% 0.0% 54.5%12/17 23891 0 0 59 32 0.0% 0.0% 35.2% 11/1 25140 8 0 559 / 506 0.0% 1.6% 47.5%12/18 23891 0 0 105 58 0% 0.0% 35.6% 11/2 25140 12 0 628 503 0.0% 2.4% 44.5%12/19 23891 16 0 80 53 0.0% 30.2% 39.8% 11/3 25140 8 0 519 492 0.0% 1.6% 48.7%12/20 23891 0 0 114 52 0.0% 0.0% 31.3% 11/4 25140 4 0 533 479 0.0% 0.8% 47.3%12/21 23891 0 0 101 58 0.0% 0.0% 36.5% 11/5 25140 6 0 311 522 0.0% 1.1% 62.7%12/22 23891 0 0 78 34 0.0% 0.0% 30.4% 11/6 25140 0 0 879 562 0.0% 0.0% 39.0%12/23 23891 4 0 79 57 0.0% 7.0% 41.9% 11/7 25140 4 0 521 494 0.0% 0.8% 48.7%12/24 23891 0 0 88 45 0.0% 0.0% 33.8% 11/8 25140 12 0 480 439 0.0% 2.7% 47.8%12/25 23891 0 0 126 48 0.0% 0.0% 27.6% 11/9 25140 8 0 514 469 0.0% 1.7% 47.7%12/26 23891 0 0 120 54 0.0% 0.0% 31.0% 11/10 25140 4- 0 1071 445 0.0% 0.9% 29.4%12/27 23891 0 0 102 73 0.0% 0.0% 41.7% 11/11 25140 8 0 608 603 0.0% 1.3% 49.8%12/28 23891 0 0 97 45 0.0% 0.0% 31.7% 11/12 25140 4 0 594 525 0.0% 0.8% 46.9%9/28 25140 0 0 509 402 0.0% 0.0% 44.1% 11/13 25140 0 0 633 571 0.0% 0.0% 47.4%9/29 25140 0 0 554 424 0.0% 0.0% 43.4% 11/14 25140 8 0 553 232 0.0% 3.4% 29.6%9/30 25140 8 0 705 636 0.0% 1.3% 47.4% 11/15 25140 12 12 1098 399 1.1% 3.0% 26.7%10/1 25140 0 0 613 472 0.0% 0.0% 43.5% 11/16 25140 0 0 -583 570 0.0% 0.0% 49.4%10/2 25140 8 0 583 490 0.0% 1.6% 45.7% 11 /l t 25140 8 0 588 499 0.0% 1.6% 45.9%10/3 25140 0 0 470 475 0.0% 0.0% 50.3% 11/18 25140 12 360 1480 471 24.3% 2.5% 24.1%
Page 108
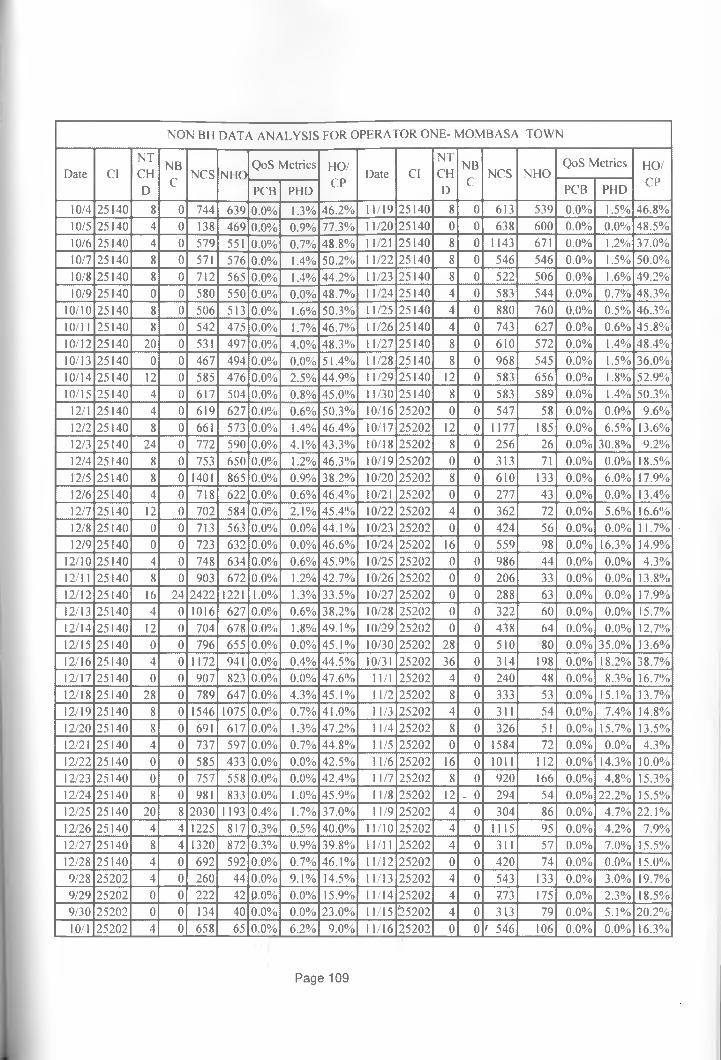
NON BH DATA ANALYSIS FOR OPERATOR ONE- MOMBASA TOWN
Date ClNTCHD
NBC
NCS NIK)QoS Metrics HO/
CPDate Cl
NTCHD
NBC
NCS NHOQoS Metrics HO/
CPPCB PHD PCB PHD
10/4 25140 8 0 744 639 0.0% 1.3% 46.2% 11/19 25140 8 0 613 539 0.0% 1.5% 46.8%10/5 25140 4 0 138 469 0.0% 0.9% 77.3% 11/20 25140 0 0 638 600 0.0% 0.0% 48.5%10/6 25140 4 0 579 551 0.0% 0.7% 48.8% 11/21 25140 8 0 1143 671 0.0% 1.2% 37.0%10/7 25140 8 0 571 576 0.0% 1.4% 50.2% 11/22 25140 8 0 546 546 0.0% 1.5% 50.0%10/8 25140 8 0 712 565 0.0% 1.4% 44.2% 11/23 25140 8 0 522 506 0.0% 1.6% 49.2%10/9 25140 0 0 580 550 0.0% 0.0% 48.7% 11/24 25140 4 0 583 544 0.0% 0.7% 48.3%
10/10 25140 8 0 506 513 0.0% 1.6% 50.3% 11/25 25140 4 0 880 760 0.0% 0.5% 46.3%10/11 25140 8 0 542 475 0.0% 1.7% 46.7% 11/26 25140 4 0 743 627 0.0% 0.6% 45.8%10/12 25140 20 0 531 497 0.0% 4.0% 48.3% 11/27 25140 8 0 610 572 0.0% 1.4% 48.4%10/13 25140 0 0 467 494 0.0% 0.0% 51.4% 11/28 25140 8 0 968 545 0.0% 1.5% 36.0%10/14 25140 12 0 585 476 0.0% 2.5% 44.9% 11/29 25140 12 0 583 656 0.0% 1.8% 52.9%10/15 25140 4 0 617 504 0.0% 0.8% 45.0% 11/30 25140 8 0 583 589 0.0% 1.4% 50.3%
12/1 25140 4 0 619 627 0.0% 0.6% 50.3% 10/16 25202 0 0 547 58 0.0% 0.0% 9.6%12/2 25140 8 0 661 573 0.0% 1.4% 46.4% 10/17 25202 12 0 1177 185 0.0% 6.5% 13.6%12/3 25140 24 0 772 590 0.0% 4.1% 43.3% 10/18 25202 8 0 256 26 0.0% 30.8% 9.2%12/4 25140 8 0 753 650 0.0% 1.2% 46.3% 10/19 25202 0 0 313 71 0.0% 0.0% 18.5%12/5 25140 8 0 1401 865 0.0% 0.9% 38.2% 10/20 25202 8 0 610 133 0.0% 6.0% 17.9%12/6 25140 4 0 718 622 0.0% 0.6% 46.4% 10/21 25202 0 0 277 43 0.0% 0.0% 13.4%12/7 25140 12 0 702 584 0.0% 2.1% 45.4% 10/22 25202 4 0 362 72 0.0% 5.6% 16.6%12/8 25140 0 0 713 563 0.0% 0.0% 44.1% 10/23 25202 0 0 424 56 0.0% 0.0% 11.7%12/9 25140 0 0 723 632 0.0% 0.0% 46.6% 10/24 25202 16 0 559 98 0.0% 16.3% 14.9%
12/10 25140 4 0 748 634 0.0% 0.6% 45.9% 10/25 25202 0 0 986 44 0.0% 0.0% 4.3%12/11 25140 8 0 903 672 0.0% 1.2% 42.7% 10/26 25202 0 0 206 33 0.0% 0.0% 13.8%12/12 25140 16 24 2422 1221 1.0% 1.3% 33.5% 10/27 25202 0 0 288 63 0.0% 0.0% 17.9%12/13 25140 4 0 1016 627 0.0% 0.6% 38.2% 10/28 25202 0 0 322 60 0.0% 0.0% 15.7%12/14 25140 12 0 704 678 0.0% 1.8% 49.1% 10/29 25202 0 0 438 64 0.0% 0.0% 12.7%12/15 25140 0 0 796 655 0.0% 0.0% 45.1% 10/30 25202 28 0 510 80 0.0% 35.0% 13.6%12/16 25140 4 0 1172 941 0.0% 0.4% 44.5% 10/31 25202 36 0 314 198 0.0% 18.2% 38.7%12/17 25140 0 0 907 823 0.0% 0.0% 47.6% 11/1 25202 4 0 240 48 0.0% 8.3% 16.7%12/18 25140 28 0 789 647 0.0% 4.3% 45.1% 11/2 25202 8 0 333 53 0.0% 15.1% 13.7%12/19 25140 8 0 1546 1075 0.0% 0.7% 41.0% 11/3 25202 4 0 311 54 0.0% 7.4% 14.8%12/20 25140 8 0 691 617 0.0% 1.3% 47.2% 11/4 25202 8 0 326 51 0.0% 15.7% 13.5%12/21 25140 4 0 737 597 0.0% 0.7% 44.8% 11/5 25202 0 0 1584 72 0.0% 0.0% 4.3%12/22 25140 0 0 585 433 0.0% 0.0% 42.5% 11/6 25202 16 0 1011 112 0.0% 14.3% 10.0%12/23 25140 0 0 757 558 0.0% 0.0% 42.4% 11/7 25202 8 0 920 166 0.0% 4.8% 15.3%12/24 25140 8 0 981 833 0.0% 1.0% 45.9% 11/8 25202 12 - 0 294 54 0.0% 22.2% 15.5%12/25 25140 20 8 2030 1193 0.4% 1.7% 37.0% 11/9 25202 4 0 304 86 0.0% 4.7% 22.1%12/26 25140 4 4 1225 817 0.3% 0.5% 40.0% 11/10 25202 4 0 1115 95 0.0% 4.2% 7.9%12/27 25140 8 4 1320 872 0.3% 0.9% 39.8% 11/11 25202 4 0 311 57 0.0% 7.0% 15.5%12/28 25140 4 0 692 592 0.0% 0.7% 46.1% 11/12 25202 0 0 420 74 0.0% 0.0% 15.0%9/28 25202 4 0 260 44 0.0% 9.1% 14.5% 11/13 25202 4 0 543 133 0.0% 3.0% 19.7%9/29 25202 0 0 222 42 0.0% 0.0% 15.9% 11/14 25202 4 0 7.73 175 0.0% 2.3% 18.5%9/30 25202 0 0 134 40 0.0% 0.0% 23.0% 11/15 J25202 4 0 313 79 0.0% 5.1% 20.2%10/1 25202 4 0 658 65 0.0% 6.2% 9.0% 11/16 25202 0 0 ' 546 106 0.0% 0.0% 16.3%
Page 109
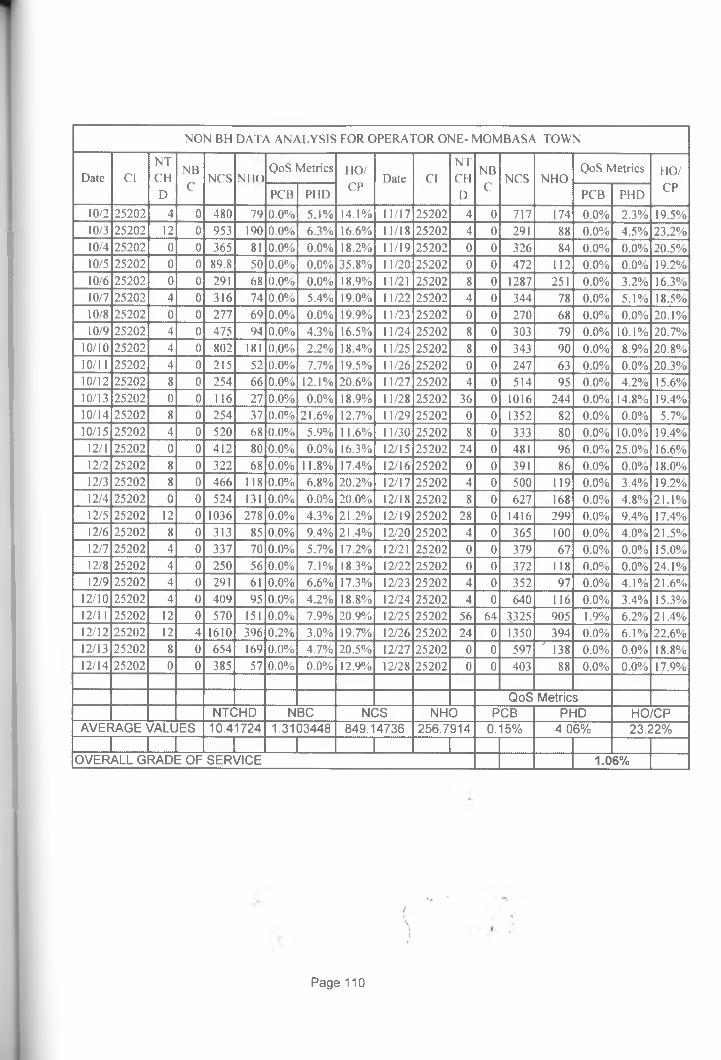
NON BH DATA ANALYSIS FOR OPERATOR ONE- MOMBASA TOWN
NTNB QoS Metrics HO/
NTNB QoS Metrics 110/Date Cl CH NCS Nl i n Date Cl CH NCS NHO
DC
PCB PUD CPD
C PCB PHD CP
10/2 25202 4 0 480 79 0.0% 5.1% 14.1% 11/17 25202 4 0 717 174 0.0% 2.3% 19.5%10/3 25202 12 0 953 190 0.0% 6.3% 16.6% 11/18 25202 4 0 291 88 0.0% 4.5% 23.2%10/4 25202 0 0 365 81 0.0% 0.0% 18.2% 11/19 25202 0 0 326 84 0.0% 0.0% 20.5%10/5 25202 0 0 89.8 50 0.0% 0.0% 35.8% 11/20 25202 0 0 472 112 0.0% 0.0% 19.2%10/6 25202 0 0 291 68 0.0% 0.0% 18.9% 11/21 25202 8 0 1287 251 0.0% 3.2% 16.3%10/7 25202 4 0 316 74 0.0% 5.4% 19.0% 11/22 25202 4 0 344 78 0.0% 5.1% 18.5%10/8 25202 0 0 277 69 0.0% 0.0% 19.9% 11/23 25202 0 0 270 68 0.0% 0.0% 20.1%10/9 25202 4 0 475 94 0.0% 4.3% 16.5% 11/24 25202 8 0 303 79 0.0% 10.1% 20.7%
10/10 25202 4 0 802 181 0.0% 2.2% 18.4% 11/25 25202 8 0 343 90 0.0% 8.9% 20.8%10/11 25202 4 0 215 52 0.0% 7.7% 19.5% 11/26 25202 0 0 247 63 0.0% 0.0% 20.3%10/12 25202 8 0 254 66 0.0% 12.1% 20.6% 11/27 25202 4 0 514 95 0.0% 4.2% 15.6%10/13 25202 0 0 116 27 0.0% 0.0% 18.9% 11/28 25202 36 0 1016 244 0.0% 14.8% 19.4%10/14 25202 8 0 254 37 0.0% 21.6% 12.7% 11/29 25202 0 0 1352 82 0.0% 0.0% 5.7%10/15 25202 4 0 520 68 0.0% 5.9% 11.6% 11/30 25202 8 0 333 80 0.0% 10.0% 19.4%
12/1 25202 0 0 412 80 0.0% 0.0% 16.3% 12/15 25202 24 0 481 96 0.0% 25.0% 16.6%12/2 25202 8 0 322 68 0.0% 11.8% 17.4% 12/16 25202 0 0 391 86 0.0% 0.0% 18.0%12/3 25202 8 0 466 118 0.0% 6.8% 20.2% 12/17 25202 4 0 500 119 0.0% 3.4% 19.2%12/4 25202 0 0 524 131 0.0% 0.0% 20.0% 12/18 25202 8 0 627 168 0.0% 4.8% 21.1%12/5 25202 12 0 1036 278 0.0% 4.3% 21.2% 12/19 25202 28 0 1416 299 0.0% 9.4% 17.4%12/6 25202 8 0 313 85 0.0% 9.4% 21.4% 12/20 25202 4 0 365 100 0.0% 4.0% 21.5%12/7 25202 4 0 337 70 0.0% 5.7% 17.2% 12/21 25202 0 0 379 67 0.0% 0.0% 15.0%12/8 25202 4 0 250 56 0.0% 7.1% 18.3% 12/22 25202 0 0 372 118 0.0% 0.0% 24.1%12/9 25202 4 0 291 61 0.0% 6.6% 17.3% 12/23 25202 4 0 352 97 0.0% 4.1% 21.6%
12/10 25202 4 0 409 95 0.0% 4.2% 18.8% 12/24 25202 4 0 640 116 0.0% 3.4% 15.3%12/11 25202 12 0 570 151 0.0% 7.9% 20.9% 12/25 25202 56 64 3325 905 1.9% 6.2% 21.4%12/12 25202 12 4 1610 396 0.2% 3.0% 19.7% 12/26 25202 24 0 1350 394 0.0% 6.1% 22.6%12/13 25202 8 0 654 169 0.0% 4.7% 20.5% 12/27 25202 0 0 597 ' 138 0.0% 0.0% 18.8%12/14 25202 0 0 385 57 0.0% 0.0% 12.9% 12/28 25202 0 0 403 88 0.0% 0.0% 17.9%
QoS MetricsNTCHD NBC NCS NHO PCB PHD HO/CP
AVERAGE VALUES 10.41724 1.3103448 849.14736 256.7914 0.15% 4 06% 23.22%
OVERALL GRADE OF SERVICE 1.06%
Page 110

Table A2.6 Basic analysis ofOperator One Busy Hour data for Kisumu Town__________NON BH DATA ANALYSIS FOR OPERATOR ONE -KISUMU TOWN
Date ClNTCHD
NBC
Ncs
NHO
QoS Metrics HO/CP
Date Cl
NTCHn
NBC NCS
NHO
QoS Metrics HO/CP
PCB PHD PCB PHD9/28 15000 8 0 1538 918 0.0% 0.9% 37.4% 11/6 15000 24 0 871 829 0.0% 2.9% 48.8%9/29 15000 16 0 1654 847 0.0% 1.9% 33.9% 11/7 15000 16 0 596 417 0.0% 3.8% 41.2%9/30 15000 12 0 1504 893 0.0% 1.3% 37.3% 11/8 15000 28 0 1908 1066 0.0% 2.6% 35.8%lO/l 15000 8 0 2755 1164 ().()'/( 0.7% 29.7% 11/9 15000 16 0 1716 919 0.0% 1.7% 34.9%10/2 15000 20 0 1544 787 0.0% 2.5% 33.8% 11/10 15000 12 0 2632 976 0.0% 1.2% 27.1%10/3 15000 8 0 626 459 0.0% 1.7% 42.3% 11/11 15000 8 0 1554 1064 0.0%. 0.8% 40.6%10/4 15000 12 0 1757 1064 0.0% 1.1% 37.7% 11/12 15000 12 0 1749 1066 0.0% 1.1% 37.9%10/5 15000 12 0 2640 1007 0.0% 1.2% 27.6% 11/13 15000 24 0 1372 773 0.0% 3.1% 36.0%10/6 15000 12 0 1799 1001 0.0% 1.2% 35.8% 11/14 15000 4 0 521 440 0.0% 0.9% 45.8%10/7 15000 8 0 1642 872 0.0% 0.9%. 34.7% 11/15 15000 24 0 1597 1020 0.0% 2,4'.; 39.0%10/8 15000 12 0 1879 1073 0.0% 1.1% 36.3% 11/16 15000 28 0 1548 940 0.0% 3.0% 37.8%10/9 15000 12 0 1457 814 0.0% 1.5%. 35.8 % 11/17 15000 12 0 1577 916 0.0% 1.3% 36.7%
10/10 15000 4 0 589 352 0.0% 1.1% 37.4% 11/18 15000 28 0 1725 1018 0.0% 2.8% 37.1%10/11 15000 20 0 1746 943 ().()', 2.1% 35.1% 11/19 15000 0 0 1848 1105 0.0% 0.0% 37.4%10/12 15000 12 0 1437 887 0.0%. 1.4% 38.2% 11/20 15000 24 0 1437 798 0.0% 3.0% 35.7%10/13 15000 16 0 1518 915 0.0% 1.7% 37.6% 11/21 15000 12 0 684 372 0.0% 3.2% 35.2%10/14 15000 16 0 1459 973 0.0% 1.6% 40.0% 11/22 15000 12 0 1765 1058 0.0% 1.1% 37.5%10/15 15000 8 0 1562 1052 0.0% 0.8% 40.2% 11/23 15000 8 0 1663 988 0.0% 0.8% 37.3%10/16 15000 8 0 1351 738 0.0% 1.1% 35.3% 11/24 15000 20 0 1609 927 0.0%. 2.2% 36.6%10/17 15000 8 0 537 355 0.0% 2.3% 39.8% 11/25 15000 12 0 1551 996 0.0% 1.2% 39.1%10/18 15000 16 0 1728 980 0.0%. 1.6% 36.2% 11/26 15000 20 0 1820 1083 0.0% 1.8% 37.3%10/19 15000 16 0 1593 957 0.0%. 1.1% 37.5% 11/27 15000 8 0 1318 637 0.0%. 1.3% 32.6%10/20 15000 24 0 856 535 0.0%. 4.5% 38.5% 11/28 15000 0 0 469 274 0.0%. 0.0% 36.9%10/21 15000 24 0 1539 874 0.0% 2.7% 36.2% 11/29 15000 20 0 932 1164 0.0% 1.7% 55.5%10/22 15000 16 0 1471 981 0.0% 1.6% 40.0% 11/30 15000 0 0 2098 1006 0.0%) 0.0% 32.4%10/23 15000 4 0 1635 765 0.0% 0.5% 31.9% 12/1 15000 8 0 1912 1191 0.0% 0.7% 38.4%10/24 15000 12 0 1347 313 0.0%. 3.8% 18.9% 12/2 15000 20 0 1897 1083 0.0% 1.8% 36.3%10/25 15000 20 0 1167 896 0.0%. 2.2% 43.4% 12/3 15000 8 0 1996 1354 0.0% 0.6% 40.4%10/26 15000 8 0 1467 813 0.0% 1.0% 35.7% 12/4 15000 12 0 1617 820 0.0% 1.5% 33.6%10/27 15000 8 0 1369 793 0.0% 1.0% 36.7% 12/5 15000 0 0 738 350 0.0% 0.0% 32.2%10/28 15000 4 0 1541 944 0.0% 0.4% 38.0% 12/6 15000 20 0 2014 1199 0.0% 1.7% 37.3%10/29 15000 12 0 1690 1043 0.0% 1.2% 38.2% 12/7 15000 16 0 1991 1145 0.0% 1.4% 36.5%10/30 15000 0 0 1809 777 0.0% 0.0% 30.0% 12/8 15000 28 0 1741 1091 0.0% 2.6% 38.5%10/31 15000 4 0 2563 445 0.0% 0.9%. 14.8% 12/9 15000 16 0 1925 1045 0.0% 1.5% 35.2%1 1/1 15000 28 0 1663 953 0.0% 2.9% 36.4% 12/10 15000 20 0 2057 1173 0.0% 1.7% 36.3%11/2 15000 24 0 1823 959 0.0% 2.5% 34.5% 12/11 15000 0 0 1522 896 0.0% 0.0% 37.1%11/3 15000 28 0 1727 1111 0.0% 2.5% 39.1% 12/12 15000 16 0 723 401 0.0% 4.0% 35.7%11/4 15000 32 0 1809 1091 0.0% 2.9% 37.6% 12/13 15000 12 0 1149 569 0.0% 2.1% 33.1%11/5 15000 4 0 1146 1292 0.0% 0.3% 53.0% 12/14 15000 24 •o 1900 1125 0.0% 2.1% 37.2%
12/15 15000 8 0 1815 1011 0.0% 0.8% 35.8% 10/23 40170 4 64 2600 1746 2.5% 0.2 % 40.2%12/16 15000 8 0 1671 980 0.0% 0.8% 37.0% 10/24 40170 4 0 1311 463 0.0% 0.9% 26.1%12/17 15000 20 0 2007 1140 0.0% 1.8% 36.2% 10/25 40170 12 100 1131 1701 8.8% 0.7% 60.1%12/18 15000 4 0 1333 857 0.0% 0.5% 39.1% 10/26 40170 28 100 2424 1948 4.1% 1.4% 44.6%12/19 15000 12 0 595 391 0.0% 3.1% 39.7% 10/27 40170 16 108 2346 1772 4.6% 0.9% 43.0%12/20 15000 12 0 2053 1152 0,0% 1.0% 35.9% 10/28 40170 4 88 2251 1853 3.9% 0.2% 45.2%12/21 15000 16 0 2043 1042 0.0% 1.5% 33.8% 10/29 40170 16 116 253,4 2074 4.6% 0.8% 45.0%12/22 15000 8 0 2021 1071 0.0% 0.7% 34.6% 10/30 40170 12 108 <261.2 1904 4.1% 0.6% 42.2%12/23 15000 20 0 1980 1152 0.0% ' 1.7% 36.8% 10/31 40170 16 0 448 466 0.0% 3.4% 51.0%
Page 111
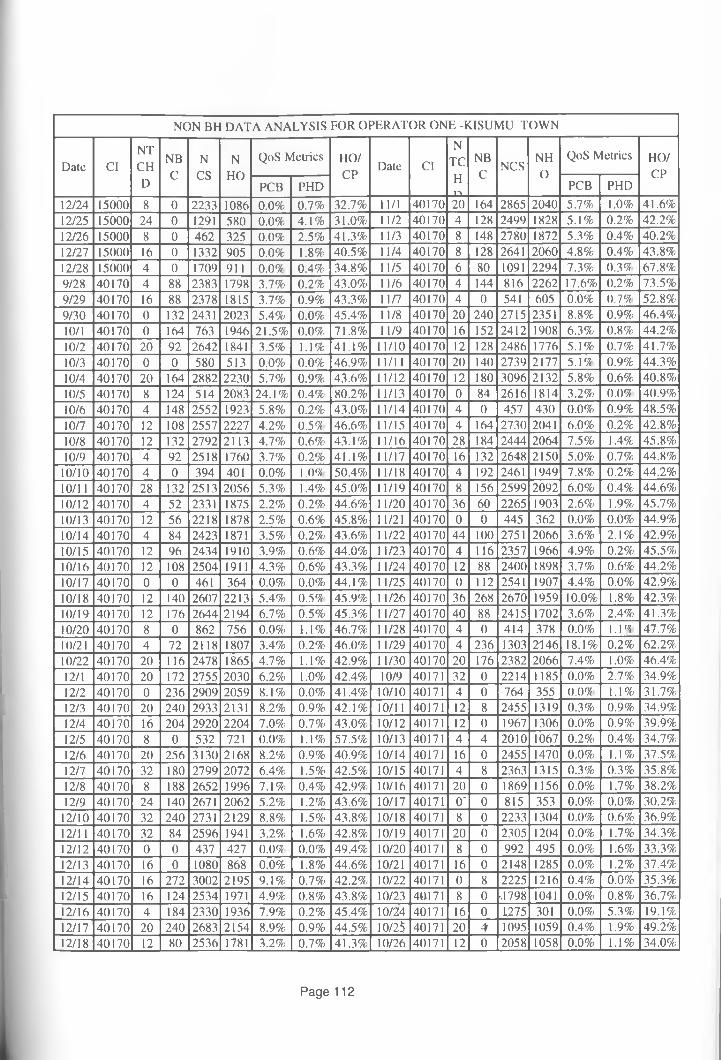
NON BH DATA ANALYSIS FOR OPERATOR ONE -KISUMU TOWN
Date ClNTCHD
NBC
NCS
NHO
QoS Metrics HO/CP
Date Cl
NTCHn
NBC
NCSNHO
QoS Metrics HO/CP
PCB PHD PCB PHD
12/24 15000 8 0 2233 1086 0.0% 0.7% 32.7%) 11/1 40170 20 164 2865 2040 5.7%) 1,0%. 41.6%)12/25 15000 24 0 1291 580 0.0% 4.1% 31.0%) 11/2 40170 4 128 2499 1828 5.1% 0.2%. 42.2%12/26 15000 8 0 462 325 0.0% 2.5% 41.3%. 11/3 40170 8 148 2780 1872 5.3% 0.4% 40.2%12/27 15000 16 0 1332 905 0.0% 1.8% 40.5%) 11/4 40170 8 128 2641 2060 4.8%) 0.4%) 43.8%12/28 15000 4 0 1709 911 0.0% 0.4% .34.8% 11/5 40170 6 80 1091 2294 7.3% 0.3% 67.8%9/28 40170 4 88 2383 1798 3.7% 0.2% 43.0% 11/6 40170 4 144 816 2262 17.6%) 0.2%) 7.3.5%)9/29 40170 16 88 2378 1815 3.7% 0.9%. 43.3% 11/7 40170 4 0 541 605 0.0% 0.7% 52.8%)9/30 40170 0 132 2431 2023 5.4% 0.0% 45.4% 11/8 40170 20 240 2715 2351 8.8%) 0.9%) 46.4%)10/1 40170 0 164 763 1946 21.5% 0.0%. 71.8%) 11/9 40170 16 152 2412 1908 6.3%) 0.8%) 44.2%10/2 40170 20 92 2642 1841 3.5% 1.1% 41.1% 11/10 40170 12 128 2486 1776 5.1%) 0.1% 41.7%10/3 40170 0 0 580 513 0.0% 0.0%. 46.9%) 11/11 40170 20 140 27.39 2177 5.1% 0.9% 44.3%10/4 40170 20 164 2882 2230 5.7% 0.9%. 43.6%) 11/12 40170 12 180 .3096 21.32 5.8 % 0.6%) 40.8 %10/5 40170 8 124 514 2083 24.1% 0.4% 80.2%) 11/13 40170 0 84 2616 1814 3.2%) 0.0% 40.9%,10/6 40170 4 148 2552 1923 5.8% 0.2% 4.3.0%) 11/14 40170 4 0 457 430 0.0%- 0.9% 48.5%10/7 40170 12 108 2557 2227 4.2% 0.5% 46.6%) 11/15 40170 4 164 2730 2041 6.0%) 0.2% 42.8%)10/8 40170 12 132 2792 2113 4.7% 0.6% 43.1%) 11/16 40170 28 184 2444 2064 7.5% 1.4% 45.8%)10/9 40170 4 92 2518 1760 3.7% 0.2% 41.1%) 11/17 40170 16 132 2648 2150 5.0%) 0.7% 44.8%)
10/10 40170 4 0 394 401 0.0% 1.0% 50.4% 11/18 40170 4 192 2461 1949 7.8%) 0.2%) 44.2%)10/11 40170 28 132 2513 2056 5.3% 1.4%. 45.0% 11/19 40170 8 156 2599 2092 6.0% 0.4%) 44.6%10/12 40170 4 52 2331 1875 2.2% 0.2% 44.6%) 11/20 40170 36 60 2265 1903 2.6%) 1.9%) 45.7%10/13 40170 12 56 2218 1878 2.5% 0.6% 45.8%) 11/21 40170 0 0 445 362 0.0%. 0.0% 44.9%)10/14 40170 4 84 2423 1871 3.5% 0.2% 43.6%) 11/22 40170 44 100 2751 2066 3.6%. 2.1%) 42.9%10/15 40170 12 96 2434 1910 3.9% 0.6% 44.0%) 11/23 40170 4 116 2357 1966 4.9%) 0.2% 45.5%10/16 40170 12 108 2504 1911 4.3% 0.6% 4.3.3%) 11/24 40170 12 88 2400 1898 3.7% 0.6% 44.2%10/17 40170 0 0 461 364 0.0% 0.0%. 44.1%) 11/25 40170 0 112 2541 1907 4.4%) 0.0%) 42.9%.10/18 40170 12 140 2607 2213 5.4% 0.5% 45.9%) 11/26 40170 36 268 2670 1959 10.0%) 1.8% 42.3%.10/19 40170 12 176 2644 2194 6.7% 0.5% 45.3% 11/27 40170 40 88 2415 1702 3.6% 2.4% 41.3%)10/20 40170 8 0 862 756 0.0% 1.1% 46.7%) 11/28 40170 4 0 414 378 0.0% 1.1", 47.7%10/21 40170 4 72 2118 1807 3.4% 0.2%. 46.0%) 11/29 40170 4 236 1303 2146 18.1%) 0.2% 62.2%)10/22 40170 20 116 2478 1865 4.7% 1.1% 42.9%) 11/30 40170 20 176 2382 2066 7.4%) 1.0% 46.4%)12/1 40170 20 172 2755 2030 6.2% 1.0% 42.4%) 10/9 40171 32 0 2214 1185 0.0%) 2.7%) 34.9%)12/2 40170 0 236 2909 2059 8.1% 0.0%. 41.4% 10/10 40171 4 0 764 355 0.0% 1.1%) 31.7%12/3 40170 20 240 2933 2131 8.2% 0.9%. 42.1%) 10/11 40171 12 8 2455 13 19 0.3% 0.9%) .34.9%)12/4 40170 16 204 2920 2204 7.0% 0.7%. 43.0% 10/12 40171 12 0 1967 1306 0.0%. 0.9%) .39.9%12/5 40170 8 0 532 721 0.0% 1.1%. 57.5%) 10/13 40171 4 4 2010 1067 0.2%) 0.4%) 34.7%12/6 40170 20 256 3130 2168 8.2% 0.9% 40.9% 10/14 40171 16 0 2455 1470 0.0% 1.1% .37.5%12/7 40170 32 180 2799 2072 6.4% 1.5% 42.5% 10/15 40171 4 8 236.3 1315 0.3% 0.3% 35.8%12/8 40170 8 188 2652 1996 7.1% 0.4%) 42.9% 10/16 40171 20 0 1869 1156 0.0%. 1.7%) 38.2%12/9 40170 24 140 2671 2062 5.2% 1.2% 43.6% 10/17 40171 O' 0 815 353 0.0%) 0.0% 30.2%
12/10 40170 32 240 2731 2129 8.8% 1.5%) 4.3.8% 10/18 40171 8 0 2233 1304 0.0%) 0.6% 36.9%12/11 40170 32 84 2596 1941 3.2% 1.6%. 42.8% 10/19 40171 20 0 2.305 1204 0.0% 1.7% 34.3%12/12 40170 0 0 437 427 o.o% 0.0% 49.4%) 10/20 40171 8 0 992 495 0.0%. 1.6%) 33.3%12/13 40170 16 0 1080 868 0.0% 1.8% 44.6%) 10/21 40171 16 0 2148 1285 0.0%) 1.2%) 37.4%)12/14 40170 16 272 3002 2195 9.1% 0.7% 42.2% 10/22 40171 0 8 2225 1216 0.4% 0.0% 35.3%)12/15 40170 16 124 2534 1971, 4.9% 0.8%) 43.8% 10/23 40171 8 0 -.1798 1041 0.0%) 0.8%) 36.7%)12/16 40170 4 184 2330 1936 7.9% 0.2%) 45.4%. 10/24 40171 16 0 L275 301 0.0% 5.3% 19.1%,12/17 40170 20 240 2683 2154 8.9% 0.9%) 44.5% 10/25 40171 20 4 1095 1059 0.4% 1.9% 49.2%)12/18 40170 12 80 2536 1781 3.2% 0.7%> 41.3% 10/26 40171 12 0 2058 1058 0.0% 1.1% 34.0%)
Page 112
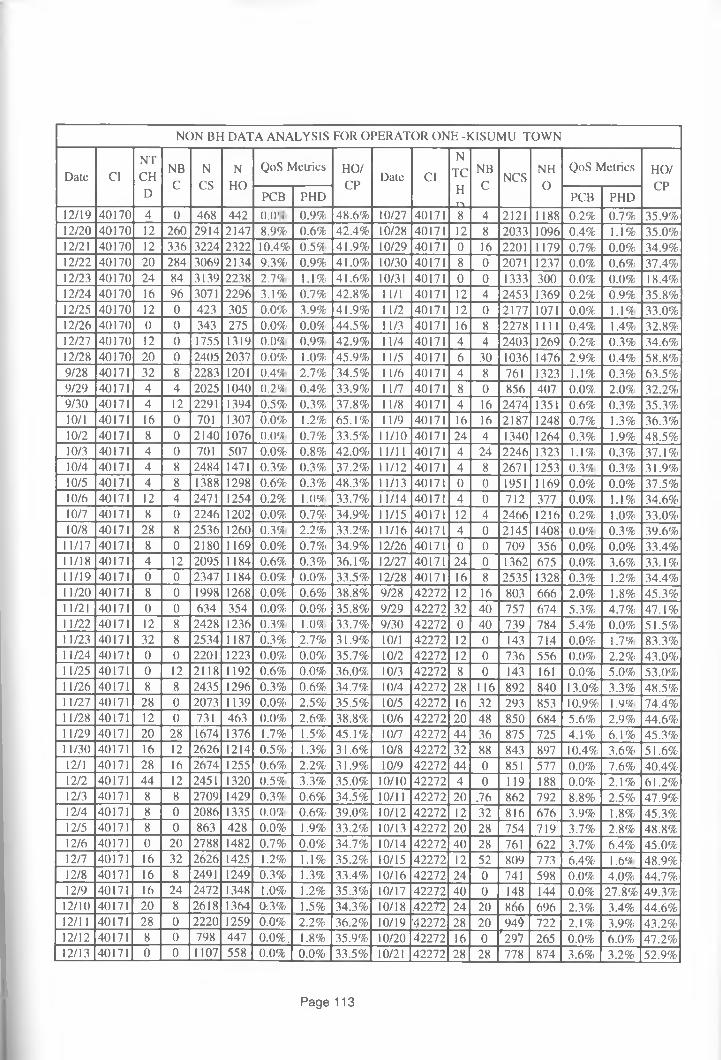
NON BH DATA ANALYSIS FOR OPERATOR ONE -KISUMU TOWN
Dale ClNTCHD
NBC
NCS
NHO
QoS Metrics HO/CP
Dale Cl
NTCHrv
NBC
NCSNHO
QoS Metrics HO/CP
PCB PHD PCB PHD12/19 40170 4 0 468 442 0.0 ', 0.9% 48.6% 10/27 40171 8 4 2121 1188 0.2% 0.7% 35.9%12/20 40170 12 260 2914 2147 8.9% 0.6% 42.4% 10/28 40171 12 8 2033 1096 0.4% 1.1% 35.0%12/21 40170 12 336 3224 2322 10.4% 0.5% 41.9% 10/29 40171 0 16 2201 1179 0.7% 0.0% 34.9%12/22 40170 20 284 3069 2134 9.3% 0.9% 41.0% 10/30 40171 8 0 2071 1237 0.0% 0.6% 37.4%12/23 40170 24 84 3139 2238 2.7V, 1.1% 41.6% 10/31 40171 0 0 1333 300 0.0% 0.0% 18.4%12/24 40170 16 96 3071 2296 3.1% 0.7% 42.8% 11/1 40171 12 4 2453 1369 0.2% 0.9% 35.8%12/25 40170 12 0 423 305 0.0% 3.9% 41.9% 11/2 40171 12 0 2177 1071 0.0%, 1.1V, 33.0%12/26 40170 0 0 343 275 0.0%, 0.0%, 44.5% 11/3 40171 16 8 2278 1111 0.4% 1.4% 32.8%12/27 40170 12 0 1755 1319 o.ov 0.9% 42.9% 11/4 40171 4 4 2403 1269 0.2% 0.3% 34.6%12/28 40170 20 0 2405 2037 0.0% 1.0% 45.9% 11/5 40171 6 30 1036 1476 2.9% 0.4% 58.8%9/28 40171 32 8 2283 1201 0.4% 2.7% 34.5% 11/6 40171 4 8 761 1323 1.1% 0.3% 63.5%9/29 40171 4 4 2025 1040 0.2% 0.4% 33.9% 11/7 40171 8 0 856 407 0.0% 2.0% 32.2%9/30 40171 4 12 2291 1394 0.5% 0.3% 37.8% 11/8 40171 4 16 2474 1351 0.6% 0.3% 35.3%10/1 40171 16 0 701 1307 0.0% 1.2% 65.1% 11/9 40171 16 16 2187 1248 0.7% 1.3% 36.3%10/2 40171 8 0 2140 1076 0.0% 0.7%- 33.5% 11/10 40171 24 4 1340 1264 0.3% 1.9% 48.5%10/3 40171 4 0 701 507 0.0% 0.8% 42.0% 11/11 40171 4 24 2246 1323 1.1% 0.3% 37.1%10/4 40171 4 8 2484 1471 0.3% 0.3%, 37.2% 11/12 40171 4 8 2671 1253 0.3V, 0.3% 31.9%10/5 40171 4 8 1388 1298 0.6% 0.3% 48.3% 11/13 40171 0 0 1951 1169 0.0% 0.0% 37.5%10/6 40171 12 4 2471 1254 0.2%, 1.0% 33.7% 11/14 40171 4 0 712 377 0.0% 1.1% 34.6%10/7 40171 8 0 2246 1202 0.0% 0.7% 34.9% 11/15 40171 12 4 2466 1216 0.2% 1.0% 33.0%10/8 40171 28 8 2536 1260 0.3% 2.2% 33.2% 11/16 40171 4 0 2145 1408 O.OV, 0.3% 39.6%
11/17 40171 8 0 2180 1169 0.0% 0.7%, 34.9% 12/26 40171 0 0 709 356 0.0% 0.0% 33.4%11/18 40171 4 12 2095 1184 0.6% 0.3% 36.1% 12/27 40171 24 0 1362 675 0.0% 3.6% 33.1%11/19 40171 0 0 2347 1184 0.0%- 0.0%, 33.5% 12/28 40171 16 8 2535 1328 0.3% 1.2% 34.4%11/20 40171 8 0 1998 1268 0.0% 0.6% 38.8% 9/28 42272 12 16 803 666 2.0% 1.8% 45.3%11/21 40171 0 0 634 354 0.0%, 0.0%, 35.8% 9/29 42272 32 40 757 674 5.3% 4.7% 47.1%11/22 40171 12 8 2428 1236 0.3% 1.0% 33.7% 9/30 42272 0 40 739 784 5.4% 0.0% 51.5%11/23 40171 32 8 2534 1187 0.3% 2.7% 31.9% 10/1 42272 12 0 143 71,4 0.0% 1.7V 83.3%11/24 40171 0 0 2201 1223 0.0% 0.0% 35.7% 10/2 42272 12 0 736 556 0.0% 2.2% 43.0%11/25 40171 0 12 2118 1192 0.6% 0.0% 36.0% 10/3 42272 8 0 143 161 0.0% 5.0% 53.0%11/26 40171 8 8 2435 1296 0.3% 0.6% 34.7% 10/4 42272 28 116 892 840 13.0% 3.3% 48.5%11/27 40171 28 0 2073 1139 0.0% 2.5% 35.5% 10/5 42272 16 32 293 853 10.9% 1,9 V 74.4%11/28 40171 12 0 731 463 0.0% 2.6% 38.8% 10/6 42272 20 48 850 684 5.6% 2.9% 44.6%11/29 40171 20 28 1674 1376 1.7% 1.5% 45.1% 10/7 42272 44 36 875 725 4.1% 6.1% 45.3%11/30 40171 16 12 2626 1214 0.5% 1.3% 31.6% 10/8 42272 32 88 843 897 10.4% 3.6% 51.6%12/1 40171 28 16 2674 1255 0.6% 2.2% 31.9% 10/9 42272 44 0 851 577 0.0% 7.6% 40.4%12/2 40171 44 12 2451 1320 0.5% 3.3% 35.0% 10/10 42272 4 0 119 188 0.0% 2.1% 61.2%12/3 40171 8 8 2709 1429 0.3% 0.6% 34.5% 10/11 42272 20 .76 862 792 8.8% 2.5% 47.9%12/4 40171 8 0 2086 1335 0.0% 0.6% 39.0% 10/12 42272 12 32 816 676 3.9% 1.8% 45.3%12/5 40171 8 0 863 428 0.0% 1.9% 33.2% 10/13 42272 20 28 754 719 3.7% 2.8% 48.8%12/6 40171 0 20 2788 1482 0.7% 0.0% 34.7% 10/14 42272 40 28 761 622 3.7% 6.4% 45.0%12/7 40171 16 32 2626 1425 1.2% 1.1% 35.2% 10/15 42272 12 52 809 773 6.4% 1,6V 48.9%12/8 40171 16 8 2491 1249 0.3% 1.3% 33.4% 10/16 42272 24 0 741 598 0.0% 4.0% 44.7%12/9 40171 16 24 2472 1348 1.0% 1.2% 35.3% 10/17 42272 40 0 148 144 0.0% 27.8% 49.3%
12/10 40171 20 8 2618 1364 Or 3% h 1.5% 34.3% 10/18 42272 24 20 866 696 2.3% 3.4% 44.6%12/11 40171 28 0 2220 1259 0.0% 2.2% 36.2% 10/19 42272 28 20 949 722 2.1% 3.9% 43.2%12/12 40171 8 0 798 447 0.0%. 1.8% 35.9% 10/20 42272 16 0 '297 265 0.0% 6.0% 47.2%12/13 40171 0 0 1107 558 0.0% 0.0% 33.5% 10/21 42272 28 28 778 874 3.6% 3.2% 52.9%
Page 113
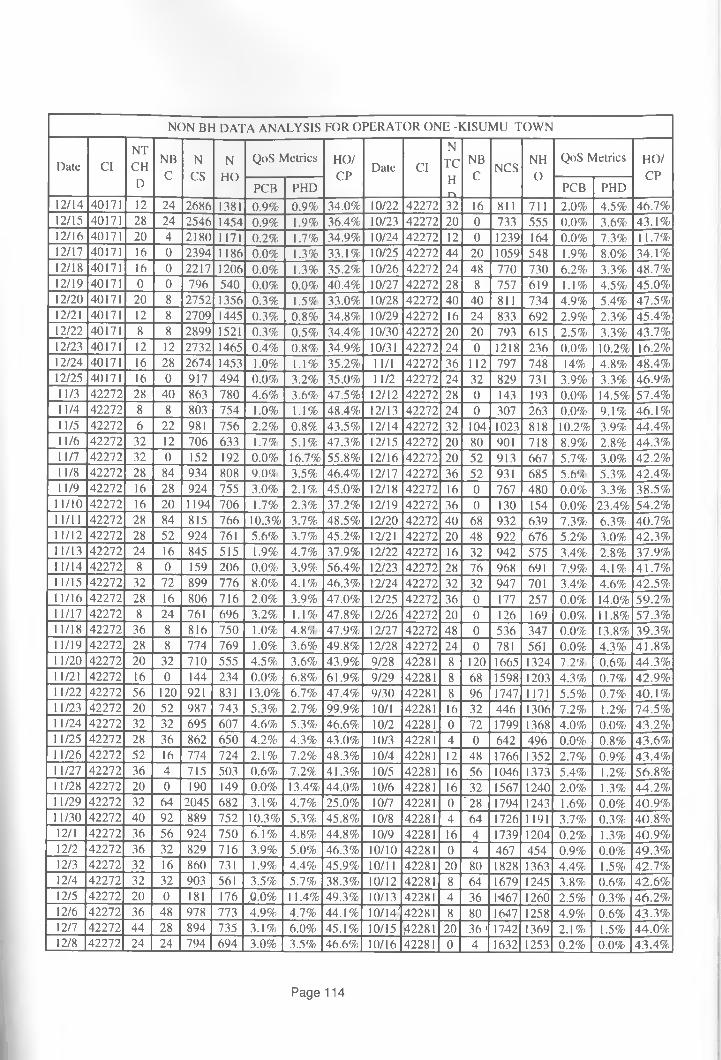
NON BH DATA ANALYSIS FOR OPERATOR ONE -KISUMU TOWN
Date ClNTCHD
NBC
NCS
NHO
QoS Metrics HO/CP
Date Cl
NTCHn
NBC
NCSNHO
QoS Metrics HO/CP
PCB PHD PCB PHD12/14 40171 12 24 2686 1381 0.9% 0.9% 34.0% 10/22 42272 32 16 811 711 2.0% 4.5% 46.7%12/15 40171 28 24 2546 1454 0.9% 1.9% 36.4% 10/23 42272 20 0 733 555 0.0% 3.6% 43.1%12/16 40171 20 4 2180 1171 0.2% 1.7% 34.9% 10/24 42272 12 0 1239 164 0.0% 7.3% 11.7%12/17 40171 16 0 2394 1186 0.0% 1.3% 33.1% 10/25 42272 44 20 1059 548 1.9% 8.0% 34.1%12/18 40171 16 0 2217 1206 0.0% 1.3% 35.2% 10/26 42272 24 48 770 730 6.2% 3.3% 48.7%12/19 40171 0 0 796 540 0.0% 0.0% 40.4% 10/27 42272 28 8 757 619 1.1% 4.5% 45.0%12/20 40171 20 8 2752 1356 0.3% 1.591 33.0% 10/28 42272 40 40 811 734 4.9% 5.4% 47.5%12/21 40171 12 8 2709 1445 0.3% 0.8% 34.8% 10/29 42272 16 24 833 692 2.9% 2.3% 45.4%12/22 40171 8 8 2899 1521 0.3% 0.5% 34.4% 10/30 42272 20 20 793 615 2.5% 3.3% 43.7%12/23 40171 12 12 2732 1465 0.4% 0.8% 34.9% 10/31 42272 24 0 1218 236 0.0% 10.2% 16.2%12/24 40171 16 28 2674 1453 1.0% 1.1% 35.2% 11/1 42272 36 112 797 748 14% 4.8% 48.4%12/25 40171 16 0 917 494 0.0% 3.2% 35.0% 11/2 42272 24 32 829 731 3.9% 3.3% 46.9%)11/3 42272 28 40 863 780 4.6% 3.6% 47.5% 12/12 42272 28 0 143 193 0.0% 14.5% 57.4%11/4 42272 8 8 803 754 1.0% 1.1% 48.4% 12/13 42272 24 0 307 263 0.0% 9.1% 46.1%11/5 42272 6 22 981 756 2.2% 0.8% 43.5% 12/14 42272 32 104 1023 818 10.2% 3.9% 44.4%11/6 42272 32 12 706 633 1 .7% 5.1% 47.3% 12/15 42272 20 80 901 718 8.9% 2.8% 44.3%)11/7 42272 32 0 152 192 0.0% 16.7% 55.8% 12/16 42272 20 52 913 667 5.7% 3.0% 42.2%11/8 42272 28 84 934 808 9.0% 3.5% 46.4% 12/17 42272 36 52 931 685 5.6'/! 5.3% 42.4%)11/9 42272 16 28 924 755 3.0% 2.1% 45.0% 12/18 42272 16 0 767 480 0.0% 3.3% 38.5%.
11/10 42272 16 20 1194 706 1.7% 2.3% 37.2% 12/19 42272 36 0 130 154 0.0% 23.4% 54.2%11/11 42272 28 84 815 766 10.3% 3.7% 48.5% 12/20 42272 40 68 932 639 7.3% 6.3% 40.7%)11/12 42272 28 52 924 761 5.6% 3.7% 45.2% 12/21 42272 20 48 922 676 5.2% 3.0% 42.3%11/13 42272 24 16 845 515 1.9% 4.7% 37.9% 12/22 42272 16 32 942 575 3.4% 2.8% 37.9%)11/14 42272 8 0 159 206 0.0% 3.9% 56.4% 12/23 42272 28 76 968 691 7.9% 4.1% 41.7%)11/15 42272 32 72 899 776 8.0% 4.1% 46.3% 12/24 42272 32 32 947 701 3.4% 4.6% 42.5%11/16 42272 28 16 806 716 2.0% 3.9% 47.0% 12/25 42272 36 0 177 257 0.0% 14.0% 59.2%11/17 42272 8 24 761 696 3.2% 1.1% 47.8% 12/26 42272 20 0 126 169 0.0% 11.8% 57.3%11/18 42272 36 8 816 750 1.0% 4.8'/! 47.9% 12/27 42272 48 0 536 347 0.0% 13.8% 39.3%11/19 42272 28 8 774 769 1.0% 3.6% 49.8% 12/28 42272 24 0 781 561 0.0% 4.3% 41.8%11/20 42272 20 32 710 555 4.5% 3.6% 43.9% 9/28 42281 8 120 1665 1324 7.2'/, 0.6% 44.3%.11/21 42272 16 0 144 234 0.0% 6.8% 61.9% 9/29 42281 8 68 1598 1203 4.3% 0.7% 42.9%11/22 42272 56 120 921 831 13.0% 6.7% 47.4% 9/30 42281 8 96 1747 1171 5.5% 0.7% 40.1%)11/23 42272 20 52 987 743 5.3% 2.7% 99.9% 10/1 42281 16 32 446 1306 7.2% 1.2% 74.5%11/24 42272 32 32 695 607 4.6% 5.3% 46.6% 10/2 42281 0 72 1799 1368 4.0% 0.0% 43.2%11/25 42272 28 36 862 650 4.2% 4.3% 43.0% 10/3 42281 4 0 642 496 0.0% 0.8% 43.6%11/26 42272 52 16 774 724 2.1% 7.2% 48.3% 10/4 42281 12 48 1766 1352 2.7% 0.9% 43.4%11/27 42272 36 4 715 503 0.6% 7.2% 41.3% 10/5 42281 16 56 1046 1373 5.4% 1.2% 56.8 %11/28 42272 20 0 190 149 0.0% 13.4% 44.0% 10/6 42281 16 32 1567 1240 2.0% 1.3% 44.2%11/29 42272 32 64 2045 682 3.1% 4.7% 25.0% 10/7 42281 0 '2 8 1794 1243 1.6% 0.0% 40.9%11/30 42272 40 92 889 752 10.3% 5.3% 45.8% 10/8 42281 4 64 1726 1191 3.7% 0.3% 40.8%12/1 42272 36 56 924 750 6.1% 4.8% 44.8% 10/9 42281 16 4 1739 1204 0.2% 1.3% 40.9%12/2 42272 36 32 829 716 3.9% 5.0% 46.3% 10/10 42281 0 4 467 454 0.9% 0.0% 49.3%12/3 42272 32 16 860 731 1.9% 4.4% 45.9% 10/11 42281 20 80 1828 1363 4.4% 1.5% 42.7%12/4 42272 32 32 903 561 3.5% 5.7% 38.3% 10/12 42281 8 64 1679 1245 3.8% 0.6% 42.6%12/5 42272 20 0 181 176 .0.0% 11.4% 49.3% 10/13 42281 4 36 1467 1260 2.5% 0.3% 46.2%)12/6 42272 36 48 978 773 4.9% 4.7% 44.1% 10/14' 42281 8 80 1647 1258 4.9% 0.6% 43.3%12/7 42272 44 28 894 735 3.1% 6.0% 45.1% 10/15 42281 20 36 1 1742 1369 2.1% 1.5% 44.0%12/8 42272 24 24 794 694 3.0% 3.5% 46.6% 10/16 42281 0 4 1632 1253 0.2% 0.0% 43.4%
Page 114
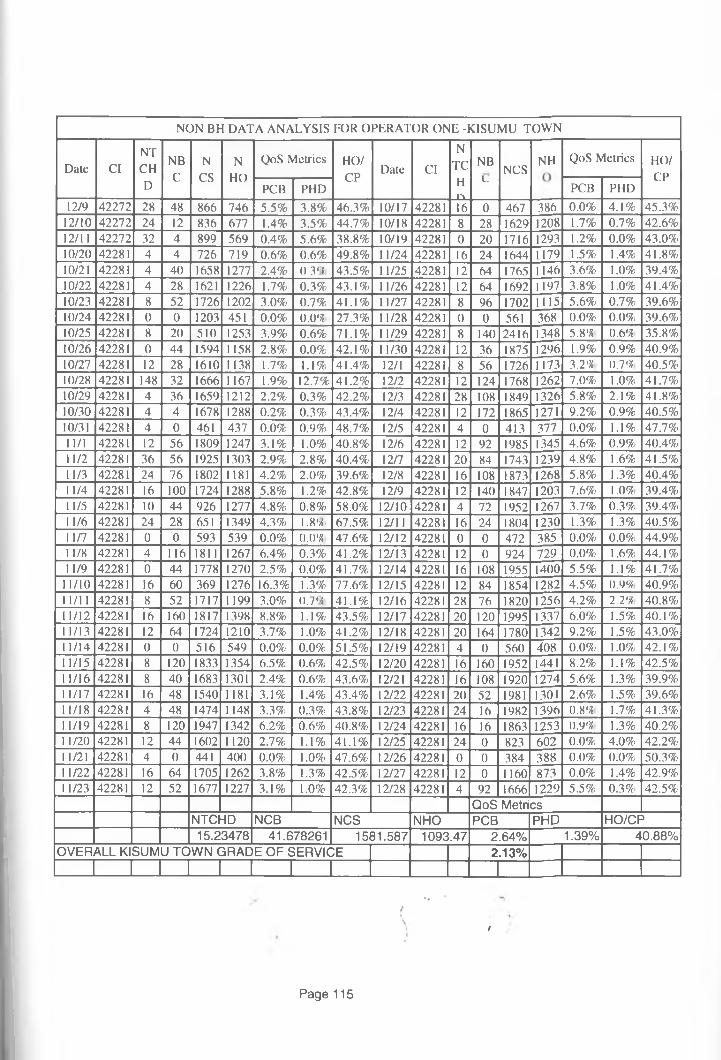
NON BH DATA ANALYSIS FOR OPERATOR ONE -KISUMU TOWN
Date ClNT
NB N N QoS Metrics HO/N
TC NB NH QoS Metrics HO/CH Date Cl NCS CPC CS HO CPD PCB PHD H
I A
LPCB PHD
12/9 42272 28 48 866 746 5.5% 3.8% 46.3% 10/17 42281 16 0 467 386 0.0% 4.1% 45.3%12/10 42272 24 12 836 677 1.4% 3.5% 44.7% 10/18 42281 8 28 1629 1208 1.7% 0.7% 42.6%12/11 42272 32 4 899 569 0.4% 5.6% 38.8% 10/19 42281 0 20 17 16 1293 1.2% 0.0% 43.0%,10/20 42281 4 4 726 719 0.6% 0.6% 49.8% 11/24 42281 16 24 1644 1179 1.5% 1.4% 41.8%,10/21 42281 4 40 1658 1277 2.4% 0.3 '; 43.5% 11/25 42281 12 64 1765 1146 3.6% 1.0% 39.4%10/22 42281 4 28 1621 1226 1.7% 0.3% 43.1% 11/26 42281 12 64 1692 1197 3.8% 1.0% 41.4%10/23 42281 8 52 1726 1202 3.0% 0.7% 41.1% 11/27 42281 8 96 1702 1115 5.6% 0.7% 39.6%10/24 42281 0 0 1203 451 0.0% 0.0 '/ 27.3% 11/28 42281 0 0 561 368 0 . 0 % 0.0%) 39.6%10/25 42281 8 20 510 1253 3.9% 0.6% 71.1% 11/29 42281 8 140 2 4 16 1348 5.8'/, 0 .6 '/ 35.8%10/26 42281 0 44 1594 1158 2.8% 0.0% 42.1% 11/30 42281 12 36 1875 1296 1.9% 0.9%) 40.9%10/27 42281 12 28 1610 1138 1.7% 1.1 % 41.4% 12/1 42281 8 56 1726 1173 3.2 '/ 0 .7 '/ 40.5%10/28 42281 148 32 1666 1167 1.9% 12.7% 41.2% 12/2 42281 12 124 1768 1262 7.0% 1.0%) 41.7%10/29 42281 4 36 1659 1212 2.2% 0.3% 42.2% 12/3 42281 28 108 1849 1326 5.8% 2.1%) 41.8%,10/30 42281 4 4 1678 1288 0.2% 0.3% 43.4% 12/4 42281 12 172 1865 1271 9.2% 0.9%) 40.5%10/31 42281 4 0 461 437 0.0% 0.9% 48.7% 12/5 42281 4 0 413 377 0.0% 1.1%, 47.7%,11/1 42281 12 56 1809 1247 3.1% 1.0% 40.8% 12/6 42281 12 92 1985 1345 4.6% 0.9%, 40.4%,11/2 42281 36 56 1925 1303 2.9% 2.8% 40.4% 12/7 42281 20 84 1743 1239 4.8% 1.6%, 41.5%,11/3 42281 24 76 1802 1181 4.2% 2.0% 39.6% 12/8 42281 16 108 1873 1268 5.8% 1.3%, 40.4%)11/4 42281 16 100 1724 1288 5.8% 1.2% 42.8% 12/9 42281 12 140 1847 1203 7.6% 1.0% 39.4%,11/5 42281 10 44 926 1277 4.8% 0.8% 58.0% 12/10 42281 4 72 1952 1267 3.7% 0.3%, 39.4%,11/6 42281 24 28 651 1349 4.3% 1.8'/! 67.5% 12/11 42281 16 24 1804 1230 1.3% 1.3%, 40.5%,11/7 42281 0 0 593 539 0 . 0 % <).()'/ 47.6% 12/12 42281 0 0 472 385 0.0% 0.0%, 44.9%,11/8 42281 4 116 1811 1267 6.4% 0.3% 41.2% 12/13 42281 12 0 924 729 0.0% 1.6% 44.1%11/9 42281 0 44 1778 1270 2.5% 0.0% 41.7% 12/14 42281 16 108 1955 1400 5.5% 1.1% 41.7%
11/10 42281 16 60 369 1276 16.3% 1.3% 77.6% 12/15 42281 12 84 1854 1282 4.5% 0.9% 40.9%,11/11 42281 8 52 1717 1199 3.0% 0.7'-; 41.1% 12/16 42281 28 76 1820 1256 4.2% 2.2'/ 40.8%,11/12 42281 16 160 1817 1398 8.8% i. i% 43.5% 12/17 42281 20 120 1995 1337 6.0% 1.5% 40.1%,11/13 42281 12 64 1724 1210 3.7% 1.0% 41.2% 12/18 42281 20 164 1780 1342 9.2% 1.5% 43.0%,11/14 42281 0 0 516 549 0.0% 0.0% 51.5% 12/19 42281 4 0 560 408 0.0% 1.0% 42.1%,11/15 42281 8 120 1833 1354 6.5% 0.6% 42.5% 12/20 42281 16 160 1952 1441 8.2% 1.1% 42.5%11/16 42281 8 40 1683 1301 2.4% 0.6% 43.6% 12/21 42281 16 108 1920 1274 5.6% 1.3% 39.9%11/17 42281 16 48 1540 1181 3.1% 1.4% 43.4% 12/22 42281 20 52 1981 1301 2.6% 1.5% 39.6%11/18 42281 4 48 1474 1148 3.3% 0.3% 43.8% 12/23 42281 24 16 1982 1396 0.8 '/ 1.7% 41.3%11/19 42281 8 120 1947 1342 6.2% 0.6% 40.8% 12/24 42281 16 16 1863 1253 03)'/ 1.3% 40.2%11/20 42281 12 44 1602 1120 2.7% 1.1% 41.1% 12/25 42281 24 0 823 602 0.0% 4.0%, 42.2%11/21 42281 4 0 441 400 0.0% 1.0% 47.6% 12/26 42281 0 0 384 388 0.0% 0.0%, 50.3%11/22 42281 16 64 1705 1262 3.8% 1.3% 42.5% 12/27 42281 12 0 1160 873 0.0% 1.4% 42.9%11/23 42281 12 52 1677 1227 3.1% 1.0% 42.3% 12/28 42281 4 92 1666 1229 5.5% 0.3% 42.5%
QoS MetricsNTCHD NCB NCS NHO PCB PHD H O /CP15.23478 41.678261 1581.587 1093.47 2.64% 1.39% 40.88%
OVERALL KISUMU TOWN GRADE OF SERVICE 2.13%
/
Page 115

Table A2.7 Basic analysis of Operator Two Busy Hour data for Nairobi TownBASIC ANALYSIS OF OPERATOR TWO BUSY HOUR DATA FOR NAIROBI TOWN
01-041NBAD TRAFFIC LOAD 111.4 ERLANGS CI-048NBBD TRAFFIC LOAD 75.3 ERLANGS
DTE CCREQUESTS
QoSMetrics
HO_ EFF C
P DTE CCREQUESTS
QoSMetrics
HO_ EFF C
PNCSR HOR TTLR PCB PHD NCSR HOR TTLR PCB PHD2/1 10554 4336 6174 10510 0.0% 0.0% 4380 2/1 7134 3558 2814 6372 0.0% 0.0% 43202/2 10554 4280 6265 10545 0.0% 0 0 % 4289 2/2 7134 3518 2360 5878 0.0% 0.0% 47742/3 10554 45 1 7 6481 10998 1.7% 2.4% 4073 2/3 7134 3784 2571 6355 0.0% 0.0% 45632/4 10554 4107 6345 10452 0.0% 0.0% 4209 2/4 7134 3720 2460 6180 0.0% 0.0% 46742/5 10554 6068 5850 11918 5.8% 5.6% 4704 2/5 7134 1828 1040 2868 0.0% 0.0% 60942/6 10554 3423 3479 6902 0.0% 0 0 % 7075 2/6 7134 928 617 1545 0.0% 0.0% 65172/7 10554 4708 6886 11594 3.6% 5.3% 3668 2/7 7134 3767 2504 6271 0.0% 0.0% 4630
AVER 10554 4491 5926 10417 0.0% 0.0% 4628 AVER 7134 3015 2052 5067 0 .0 % 0.0% 5081CI-041NBBD TRAFFIC LOAD 75.7 ERLANGS CI-049NBCD TRAFFIC LOAD 74.6 ERLANGS
2/1 7172 4643 4551 9194 11% 11% 2621 2/1 7067 4059 3837 7896 5.4% 5 1% 32302/2 7172 4152 4367 8519 7.7% 8 1% 2805 2/2 7067 4011 4282 8293 7.1% 7.6% 27852/3 7172 4609 4232 8841 9.8% 9.0% 2940 2/3 7067 4169 4236 8405 7.9% 8.0% 28312/4 7172 4204 3794 7998 5.4% 4.9% 3378 2/4 7067 4012 3923 7935 5.5% 5.4% 31442/5 7172 3981 3207 7188 0.1% 0.1% 3965 2/5 7067 3250 2593 5843 0.0% 0.0% 44742/6 7172 2898 1883 4781 0.0% 0.0% 5289 2/6 7067 2374 1413 3787 0.0% 0.0% 56542/7 7172 4333 3943 8276 7.0% 6.4% 3229 2/7 7067 3724 3925 7649 3.7% 3.9% 3142
AVER 7172 4117 3711 7828 4.4% 4.0% 3461 AVER 7067 3657 3458 7115 0.3% 0.3% 3609CI-042NBAD TRAFFIC LOAD 146.5 ERLANGS C1-103NBAD TRAFFIC LOAD 77.2 ERLANGS
2/1 13879 6889 3603 10492 0.0% 0.0% 10276 2/1 7314 5447 1161 6608 0.0% 0.0% 61532/2 13879 7324 3335 10659 0.0% 0.0% 10544 2/2 7314 5365 1177 6542 0.0% 0.0% 61372/3 13879 6593 2847 9440 0.0% 0.0% 11032 2/3 7314 5300 1184 6484 0.0% 0.0% 61302/4 13879 6131 2967 9098 0.0% 0.0% 10912 2/4 7314 4794 1017 5811 0.0% 0.0% 62972/5 13879 7816 3796 11612 0.0% 0.0% 10083 2/5 7314 2858 684 3542 0.0% 0.0% 66302/6 13879 5994 2663 8657 0.0% 0.0% 11216 2/6 7314 3190 1240 4430 0.0% 0.0% 60742/7 13879 9788 3485 13273 0.0% 0.0% 10394 2/7 7314 4263 1233 5496 0.0% 0.0% 6081
AVER 13879 7219 3242 10462 0.0% 0.0% 10637 AVER 7314 4460 1099 5559 0.0% 0.0% 6214CI-043NBB TRAFFIC LOAD 181 ERLANGS C1-108NBA TRAFFIC LOAD 174".3 ERLANGS
2/1 17147 17821 2783 20604 14.5% 2.3% 14364 2/1 16513 13940 1361 15301 0.0% 0.0% 151522/2 17147 15863 2508 18371 5.8% 0.9% 14639 2/2 16513 20164 2681 22845 24.5% 3.3% 138322/3 17147 10773 2376 13149 0.0% 0.0% 14771 2/3 16513 20691 2961 23652 26.4% 3.8% 135522/4 17147 10634 2210 12844 0.0% 0.0% 14937 2/4 16513 18403 2439 20842 18.3% 2.4% 140742/5 17147 17887 2323 20210 13.4% 1.7% 14824 2/5 16513 16867 2272 19139 12.1% 1.6% 142412/6 17147 17126 1619 18745 7.8% 0.7% 15528 2/6 16513 15314 1797 17111 3.1% 0.4% 147162/7 17147 19877 2299 22176 20.3% 2.4% 14848 2/7 16513 15367 2002 17369 4.4% 0.6% 14511
AVER 17147 15712 2303 18014 4.2% 0.6% 14845 AVER 16513 17249 2216 19466 13.4% 1.7% 14296CI-048NBAD TRAFFIC LOAD 88.3 ERLANGS CI-379NBBD TRAFFIC LOAD 100.7 ERLANGS
2/1 8365 4008 2786 6794 0.0% 0.0% 5579 2/1 9540 4931 4069 9000 0.0% 0.0% 54712/2 8365 3384 2244 5628 0.0% 0.0% 6121 2/2 9540 4219 5360 9579 0.2% 0.2% 41802/3 8365 3686 2677 6363 0.0% 0.0% 5688 2/3 9540 4844 5100 9944 2.0% 2.1% 44402/4 8365 3691 2814 6505 0.0% 0.0% 5551 2/4 9540 5232 5288 10520 4.6% 4.7% 42522/5 8365 1716 994 2710 0.0% 0.0% 7371 2/5 9540 4007 3484 7491 0.0% 0 0 % 60562/6 8365 916 534 1450 0.0% 0.0% 7831 2/6 9540 2509 2279 4788 0.0% 0.0% 72612/7 8365 3398 2494 5892 - 0.0% 0.0% 5871 2/7 9540 4048 5087 9135 0.0% 0.0% 4453
AVER 8365 2971 2078 5049 0.0% 0.0% 6288 AVER . 9540 4256 4381 8637 0 .0 % 0.0% 5159
Page 116
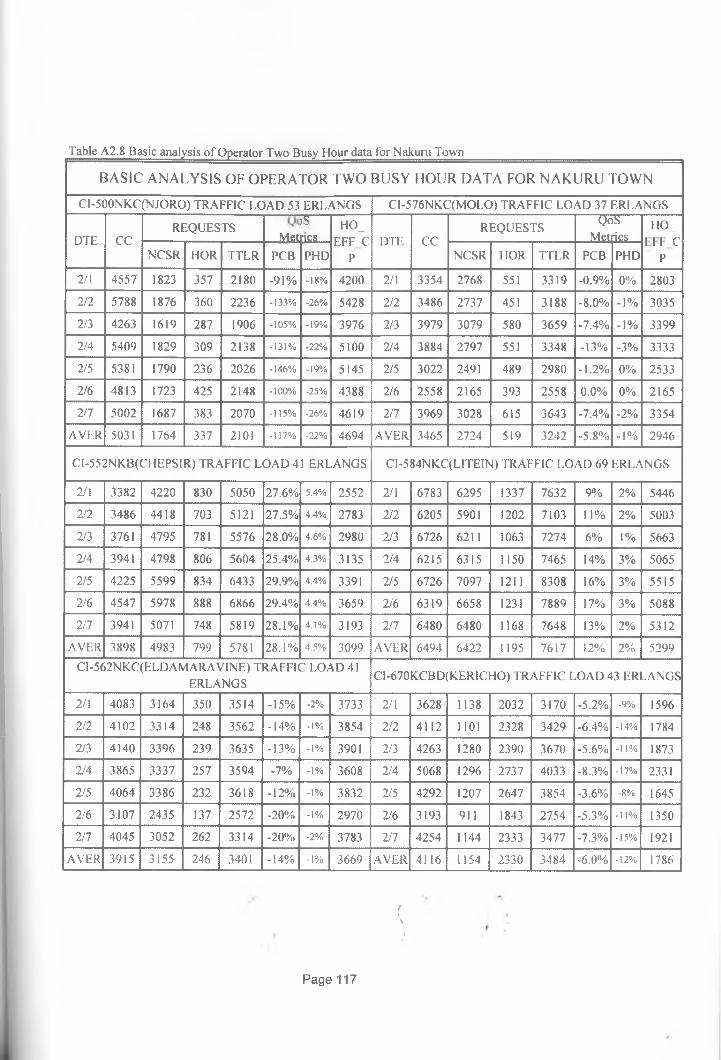
BASIC ANALYSIS OF OPERATOR TWO BUSY HOUR DATA FOR NAKURU TOWN
Table A2.8 Basic analysis o f Operator Two Busy Hour data for Nakuru Town_________________________________
CI-500NKC(NJORO) TRAFFIC LOAD 53 ERLANGS CI-576NKC(MOLO) TRAFFIC LOAD 37 ERLANGS
DTE CCREQUESTS
Metsrics
HO_EFF C
PDTE CC
REQUESTSQc
Met)Srics
HOI I I C
PNCSR HOR TTLR PCB PHD NCSR HOR TTLR PCB PHD
2/1 4557 1823 357 2180 -91% -18% 4200 2/1 3354 2768 551 3319 -0.9% 0% 2803
2/2 5788 1876 360 2236 -133% -26% 5428 2/2 3486 2737 451 3188 -8.0% -1% 3035
2/3 4263 1619 287 1906 -105% -19% 3976 2/3 3979 3079 580 3659 -7.4% -1% 3399
2/4 5409 1829 309 2138 -131% -22% 5100 2/4 3884 2797 551 3348 -13% -3% 3333
2/5 5381 1790 236 2026 -146% -19% 5145 2/5 3022 2491 489 2980 -1.2% 0% 2533
2/6 4813 1723 425 2148 -100% -25% 4388 2/6 2558 2165 393 2558 0.0% 0% 2165
2/7 5002 1687 383 2070 -115% -26% 4619 2/7 3969 3028 615 3643 -7.4% -2% 3354
AVER 5031 1764 337 2101 -117% -22% 4694 AVER 3465 2724 519 3242 -5.8% - 1 % 2946
CI-552NKB(CHEPSIR) TRAFFIC LOAD 41 ERLANGS CI-584NKC(L1TEIN) TRAFFIC LOAD 69 ERLANGS
2/1 3382 4220 830 5050 27.6% 5.4% 2552 2/1 6783 6295 1337 7632 9% 2% 5446
2/2 3486 4418 703 5121 27.5% 4.4% 2783 2/2 6205 5901 1202 7103 11% 2% 5003
2/3 3761 4795 781 5576 28.0% 4.6% 2980 2/3 6726 6211 1063 7274 6% 1% 5663
2/4 3941 4798 806 5604 25.4% 4.3% 3135 2/4 6215 6315 1150 7465 14% 3% 5065
2/5 4225 5599 834 6433 29.9% 4.4% 3391 2/5 6726 7097 1211 8308 16% 3% 5515
2/6 4547 5978 888 6866 29.4% 4.4% 3659 2/6 6319 6658 1231 7889 17% 3% 5088
2/7 3941 5071 748 5819 28.1% 4.1% 3193 2/7 6480 6480 1168 7648 13% 2% 5312
AVER 3898 4983 799 5781 28.1% 4.5% 3099 AVER 6494 6422 1195 7617 12% 2% 5299
CI-562NKC(ELDAMARAVINE) TRAFFIC LOAD 41 ERLANGS
CI-670KCBD(K.ERICHO) TRAFFIC LOAD 43 ERLANGS
2/1 4083 3164 350 3514 -15% -2% 3733 2/1 3628 1138 2032 3170 -5.2% -9% 1596
2/2 4102 3314 248 3562 -14% -1% 3854 2/2 4112 1101 2328 3429 -6.4% -14% 1784
2/3 4140 3396 239 3635 -13% -1% 3901 2/3 4263 1280 2390 3670 -5.6% -11% 1873
2/4 3865 3337 257 3594 -7% -1% 3608 2/4 5068 1296 2737 4033 -8.3% -17% 2331
2/5 4064 3386 232 3618 -12% -1% 3832 2/5 4292 1207 2647 3854 -3.6% -8% 1645
2/6 3107 2435 137 2572 -20% -!% 2970 2/6 3193 911 1843 2754 -5.3% -11% 1350
2/7 4045 3052 262 3314 -20% -2% 3783 2/7 4254 1144 2333 3477 -7.3% -15% 1921
AVER 3915 3155 246 3401 -14% -1% 3669 AVER 4116 1154 2330 3484 -6.0% -12% 1786
f
\
Page 117
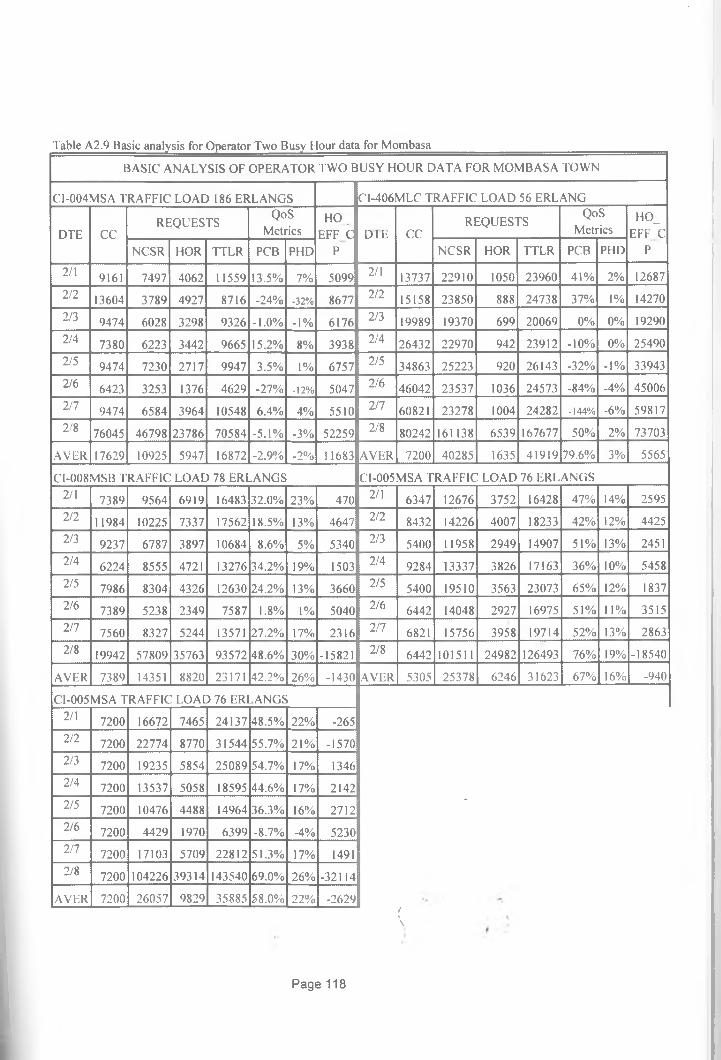
Table A2.9 Basic analysis for Operator Two Busy Hour data for Mombasa
BASIC ANALYSIS OF OPERATOR TWO BUSY HOUR DATA FOR MOMBASA TOWN
CI-004MSA TRAFFIC LOAD 186 ERLANGS CI-406MLC TRAFFIC LOAD 56 ERLANG
DTE CCREQUESTS
QoSMetrics
H O . EFF C
PD IE CC
REQUESTSQoS
MetricsHO_
EFF C PNCSR HOR TTLR PCB PHD NCSR HOR TTLR PCB PHD
2/1 9161 7497 4062 11559 13.5% 7% 5099 2/1 13737 22910 1050 23960 41% 2% 126872/2 13604 3789 4927 8716 -24% -32% 8677 2/2 15158 23850 888 24738 37% 1% 142702/3 9474 6028 3298 9326 -1.0% -1% 6176 2/3 19989 19370 699 20069 0% 0% 192902/4 7380 6223 3442 9665 15.2% 8% 3938 2/4 26432 22970 942 23912 -10% 0% 254902/5 9474 7230 2717 9947 3.5% 1% 6757 2/5 34863 25223 920 26143 -32% -1% 339432/6 6423 3253 1376 4629 -27% -12% 5047 2/6 46042 23537 1036 24573 -84% -4% 450062/7 9474 6584 3964 10548 6.4% 4% 5510 2/7 60821 23278 1004 24282 -144% -6% 598172/8 76045 46798 23786 70584 -5.1% -3% 52259 2/8 80242 161138 6539 167677 50% 2% 73703
AVER 17629 10925 5947 16872 -2.9% -2% 11683 AVER 7200 40285 1635 41919 79.6% 3% 5565
CI-008MSB TRAFFIC LOAD 78 ERLANGS C1-005MSA TRAFFIC LOAD 76 ERLANGS2/1 7389 9564 6919 16483 32.0% 23% 470 2/1 6347 12676 3752 16428 47% 14% 25952/2 11984 10225 7337 17562 18.5% 13% 4647 2/2 8432 14226 4007 18233 42% 12% 44252/3 9237 6787 3897 10684 8.6% 5% 5340 2/3 5400 11958 2949 14907 51% 13% 24512/4 6224 8555 4721 13276 34.2% 19% 1503 2/4 9284 13337 3826 17163 36% 10% 54582/5 7986 8304 4326 12630 24.2% 13% 3660 2/5 5400 19510 3563 23073 65% 12% 18372/6 7389 5238 2349 7587 1.8% 1% 5040 2/6 6442 14048 2927 16975 51% 11% 35152/7 7560 8327 5244 13571 27.2% 17% 2316 2/7 6821 15756 3958 19714 52% 13% 28632/8 19942 57809 35763 93572 48.6% 30% -15821 2/8 6442 101511 24982 126493 76% 19% -18540
AVER 7389 14351 8820 23171 42.2% 26% -1430 AVER 5305 25378 6246 31623 67% 16% -940
C1-005MSA TRAFFIC LOAD 76 ERLANGS2/1 7200 16672 7465 24137 48.5% 22% -265
-
2/2 7200 22774 8770 31544 55.7% 21% -15702/3 7200 19235 5854 25089 54.7% 17% 13462/4 7200 13537 5058 18595 44.6% 17% 21422/5 7200 10476 4488 14964 36.3% 16% 27122/6 7200 4429 1970 6399 -8.7% -4% 52302/7 7200 17103 5709 22812 51.3% 17% 14912/8 7200 104226 39314 143540 69.0% 26% -32114
AVER 7200 26057 9829 35885 58.0% 22% -2629/\
Page 118
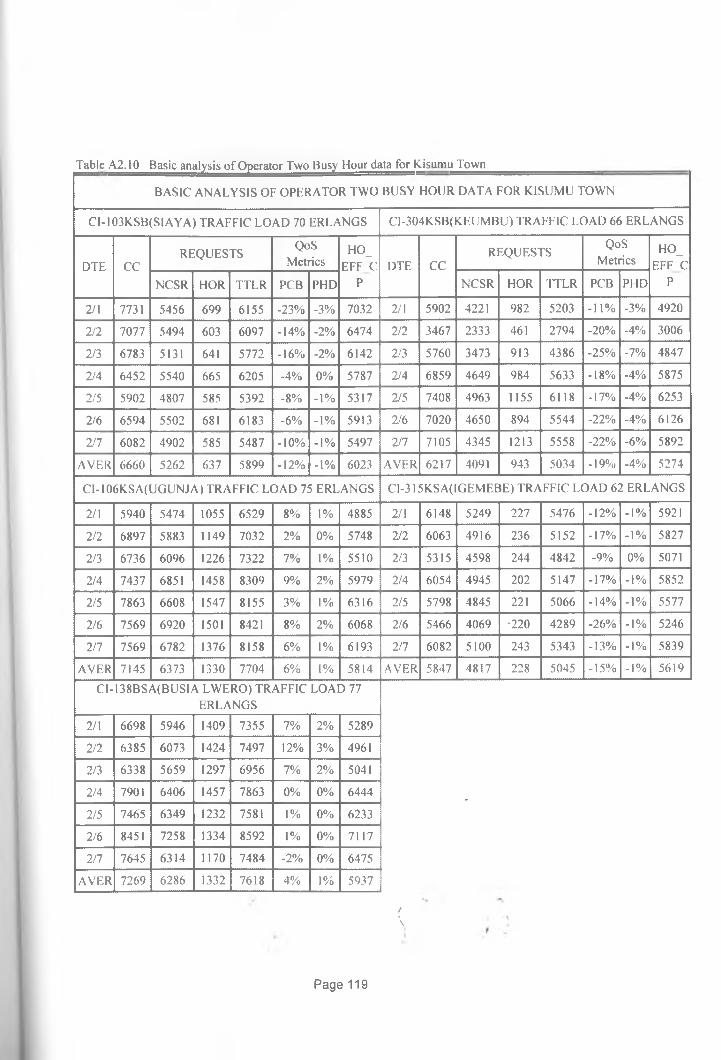
^^e_A^J^_Basic_anal^si^^O£er^o^Tw^_Rus^_Hour_data^r_Kjsurni^Tbw^
BASIC ANALYSIS OF OPERATOR TWO BUSY HOUR DATA FOR KISUMU TOWN
CI-I03KSB(SIAYA) TRAFFIC LOAD 70 ERLANGS C1-304KSB(K.EUMBU) TRAFFIC LOAD 66 ERLANGS
DTE CCREQUESTS
QoSMetrics
HO_ EFF C
PDTE CC
REQUESTSQoS
MetricsHO_
EFF C PNCSR NOR TTLR PCB PHD NCSR HOR TTLR PCB PHD
2/1 7731 5456 699 6155 -23% -3% 7032 2/1 5902 4221 982 5203 -11% -3% 4920
2/2 7077 5494 603 6097 -14% -2% 6474 2/2 3467 2333 461 2794 -20% -4% 3006
2/3 6783 5131 641 5772 -16% -2% 6142 2/3 5760 3473 913 4386 -25% -7% 4847
2/4 6452 5540 665 6205 -4% 0% 5787 2/4 6859 4649 984 5633 -18% -4% 5875
2/5 5902 4807 585 5392 -8% -1% 5317 2/5 7408 4963 1155 6118 -17% -4% 6253
2/6 6594 5502 681 6183 -6% -1% 5913 2/6 7020 4650 894 5544 -22% -4% 6126
2/7 6082 4902 585 5487 -10% -1% 5497 2/7 7105 4345 1213 5558 -22% -6% 5892
AVER 6660 5262 637 5899 -12% -1% 6023 AVER 6217 4091 943 5034 -19% -4% 5274
Cl-I06KSA(UGUNJA) TRAFFIC LOAD 75 ERLANGS C I-315KSA(IGEMEBE) TRAFFIC LOAD 62 ERLANGS
2/1 5940 5474 1055 6529 8% 1% 4885 2/1 6148 5249 227 5476 -12% -1% 5921
2/2 6897 5883 1149 7032 2% 0% 5748 2/2 6063 4916 236 5152 -17% -1% 5827
2/3 6736 6096 1226 7322 7% 1% 5510 2/3 5315 4598 244 4842 -9% 0% 5071
2/4 7437 6851 1458 8309 9% 2% 5979 2/4 6054 4945 202 5147 -17% -1% 5852
2/5 7863 6608 1547 8155 3% 1% 6316 2/5 5798 4845 221 5066 -14% -1% 5577
2/6 7569 6920 1501 8421 8% 2% 6068 2/6 5466 4069 •220 4289 -26% -1% 5246
2/7 7569 6782 1376 8158 6% 1% 6193 2/7 6082 5100 243 5343 -13% -1% 5839
AVER 7145 6373 1330 7704 6% 1% 5814 AVER 5847 4817 228 5045 -15% -1% 5619
CI-138BSA(BUSIA LWERO) TRAFFIC LOAD 77 ERLANGS
-
2/1 6698 5946 1409 7355 7% 2% 5289
2/2 6385 6073 1424 7497 12% 3% 4961
2/3 6338 5659 1297 6956 7% 2% 5041
2/4 7901 6406 1457 7863 0% 0% 6444
2/5 7465 6349 1232 7581 1% 0% 6233
2/6 8451 7258 1334 8592 1% 0% 7117
2/7 7645 6314 1170 7484 -2% 0% 6475
AVER 7269 6286 1332 7618 4% 1% 5937
/
\
Page 119
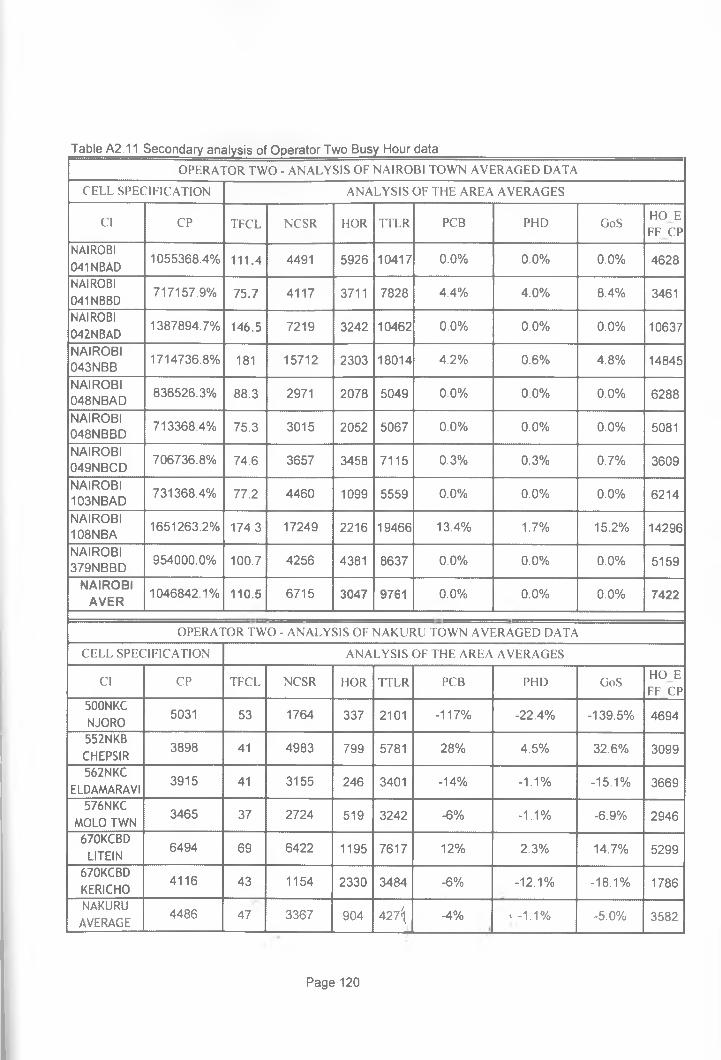
Table A2.11 Secondary analysis of Operator Two Busy Hour data
OPERATOR TWO - ANALYSIS OF NAIROBI TOWN AVERAGED DATA
CELL SPECIFICATION ANALYSIS OF THE AREA AVERAGES
Cl CP TFCL NCSR HOR TTLR PCB PHD GoSHO E FF CP
NAIROBI041NBAD 1055368.4% 111.4 4491 5926 10417 0.0% 0.0% 0.0% 4628NAIROBI041NBBD 717157.9% 75.7 4117 3711 7828 4.4% 4.0% 8.4% 3461NAIROBI042NBAD 1387894.7% 146.5 7219 3242 10462 0.0% 0.0% 0.0% 10637NAIROBI043NBB 1714736.8% 181 15712 2303 18014 4.2% 0.6% 4.8% 14845NAIROBI048NBAD 836526.3% 88.3 2971 2078 5049 0.0% 0.0% 0.0% 6288NAIROBI048NBBD 713368 4% 75.3 3015 2052 5067 0.0% 0.0% 0.0% 5081NAIROBI049NBCD 706736.8% 74.6 3657 3458 7115 0.3% 0.3% 0.7% 3609NAIROBI103NBAD 731368.4% 77.2 4460 1099 5559 0.0% 0.0% 0.0% 6214NAIROBI108NBA 1651263.2% 174.3 17249 2216 19466 13.4% 1.7% 15.2% 14296NAIROBI379NBBD 954000.0% 100.7 4256 4381 8637 0.0% 0.0% 0.0% 5159
NAIROBIAVER 1046842.1% 110.5 6715 3047 9761 0.0% 0.0% 0.0% 7422
OPERATOR TWO - ANALYSIS OF NAKURU TOWN AVERAGED DATA
CELL SPECIFICATION ANALYSIS OF THE AREA AVERAGES
Cl CP TFCL NCSR HOR TTLR PCB PHD GoSH O E FF CP
500NKCNJORO 5031 53 1764 337 2101 -117% -22.4% -139.5% 4694552NKBCHEPSIR 3898 41 4983 799 5781 28% 4.5% 32.6% 3099562NKC
ELDAMARAVI 3915 41 3155 246 3401 -14% -1.1% -15.1% 3669576NKC
MOLO TWN 3465 37 2724 519 3242 -6% -1.1% -6.9% 2946670KCBDLITEIN 6494 69 6422 1195 7617 12% 2.3% 14.7% 5299
670KCBDKERICHO 4116 43 1154 2330 3484 -6% -12.1% -18.1% 1786NAKURU
AVERAGE4486 47 3367 904 427^ -4% * -1.1% -5.0% 3582
Page 120
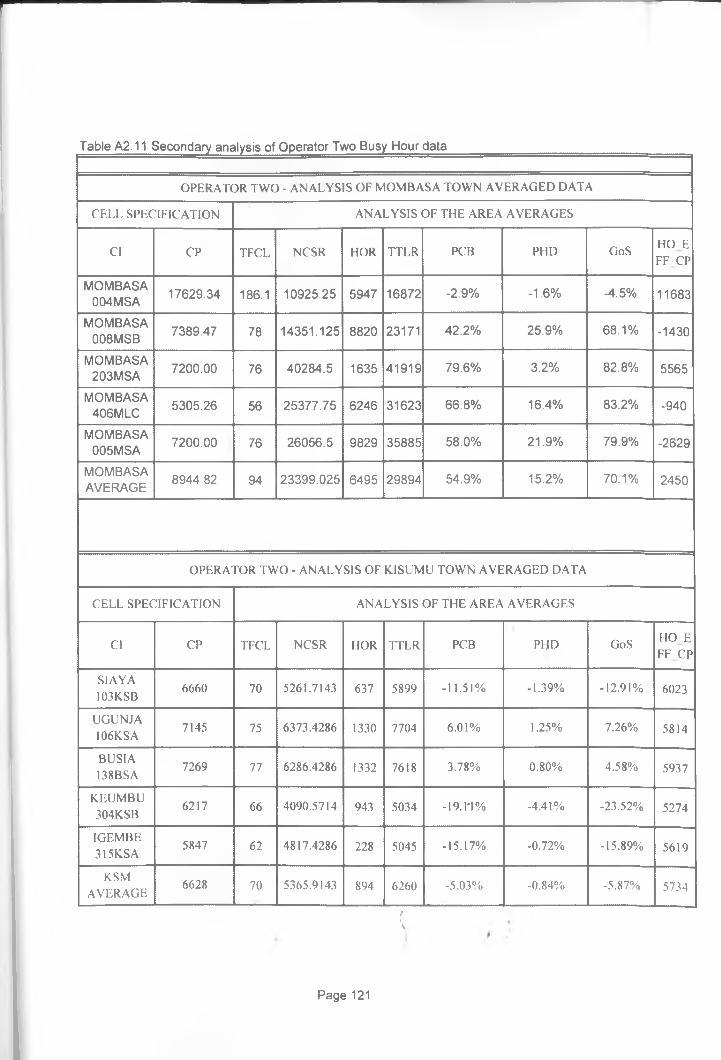
Table A2.11 Secondary analysis of Operator Two Busy Hour data
OPERATOR TWO - ANALYSIS OF MOMBASA TOWN AVERAGED DATA
CELL SPECIFICATION ANALYSIS OF THE AREA AVERAGES
Cl CP TFCL NCSR HOR TTI.R PCB PHD GoS H O E FF CP
MOMBASA004MSA 17629.34 186.1 10925.25 5947 16872 -2.9% -1.6% -4.5% 11683
MOMBASA008MSB 7389.47 78 14351.125 8820 23171 42.2% 25.9% 68.1% -1430
MOMBASA203MSA 7200.00 76 40284.5 1635 41919 79.6% 3.2% 82.8% 5565
MOMBASA406MLC 5305.26 56 25377.75 6246 31623 66.8% 16.4% 83.2% -940
MOMBASA005MSA 7200.00 76 26056.5 9829 35885 58.0% 21.9% 79.9% -2629
MOMBASAAVERAGE 8944 82 94 23399.025 6495 29894 54.9% 15.2% 70.1% 2450
OPERATOR TWO - ANALYSIS OF K.ISUMU TOWN AVERAGED DATA
CELL SPECIFICATION ANALYSIS OF THE AREA AVERAGES
Cl CP TFCL NCSR HOR TTLR PCB PFJD GoS H O E FF CP
S1AYA103K.SB
6660 70 5261.7 143 637 5899 -11.51% -1.39% -12.91% 6023
UGUNJA106K.SA
7145 75 6373.4286 1330 7704 6.01% 1.25% 7.26% 5 8 14
BUSIA138BSA
7269 77 6286.4286 1332 7 6 18 3.78% 0.80% 4.58% 5937
KEUMBU304KSB
6217 66 4090.5714 943 5034 -19.1-1% -4.41% -23.52% 5274
IGEMBE315K.SA
5847 62 4817.4286 228 5045 -15.17% -0.72% -15.89% 5619
KSMAVERAGE
6628 70 5365.9143 894 6260 -5.03% -0.84% -5.87% 5734
/\
Page 121
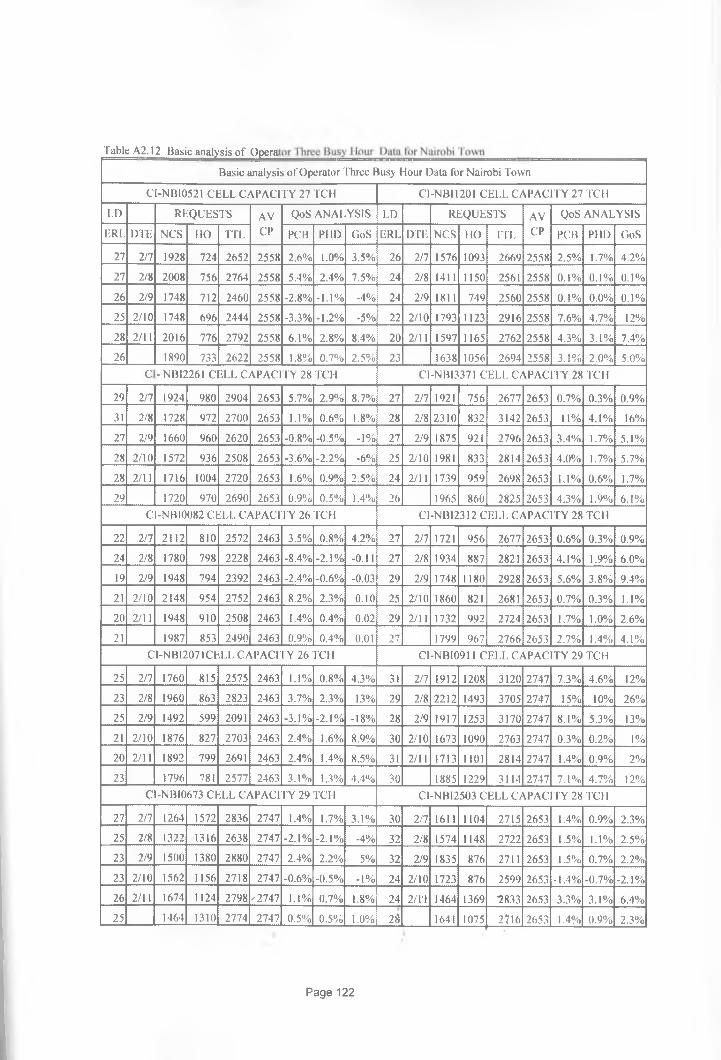
Basic analysis of Operator Three Busy Hour Data for Nairobi Town
Tabje_A2M£_J?tasicjinal^sisj)£_0£^
CT-NB10521 CELL CAPACITY 27 TCH C1-NB11201 CELL CAPACITY 27 TCH
LD REQUESTS AV QoS ANALYSIS LD REQUESTS AV QoS ANALYSIS
ERL DTE NCS HO TTL. CP PCB PHD GoS ERL DTE NCS HO TTL CP PCB PHD GoS
27 2/7 1928 724 2652 2558 2.6% 1.0% 3.5% 26 2/7 1576 1093 2669 2558 2.5% 1.7% 4.2%
27 2/8 2008 756 2764 2558 5.4% 2.4% 7.5% 24 2/8 1411 1150 2561 2558 0.1% 0.1% 0.1%
26 2/9 1748 712 2460 2558 -2.8% -1.1% -4% 24 2/9 1811 749 2560 2558 0.1% 0.0% 0.1%
25 2/10 1748 696 2444 2558 -3.3% -1.2% -5% 22 2/10 1793 1123 2916 2558 7.6% 4.7% 12%
28 2/11 2016 776 2792 2558 6.1% 2.8% 8.4% 20 2/11 1597 1165 2762 2558 4.3% 3.1% 7.4%
26 1890 733 2622 2558 1.8% 0.7% 2.5% 23 1638 1056 2694 2558 3.1% 2.0% 5.0%C - NB12261 CELL CAPACITY 28 TCH C1-NB13371 CELL CAPACITY 28 TCH
29 2/7 1924 980 2904 2653 5.7% 2.9% 8.7% 27 2/7 1921 756 2677 2653 0.7% 0.3% 0.9%
31 2/8 1728 972 2700 2653 1.1% 0.6% 1.8% 28 2/8 2310 832 3142 2653 11% 4.1% 16%
27 2/9 1660 960 2620 2653 -0.8% -0.5% -1% 27 2/9 1875 921 2796 2653 3.4% 1.7% 5.1%
28 2/10 1572 936 2508 2653 -3.6% -2.2% -6% 25 2/10 1981 833 2814 2653 4.0% 1.7% 5.7%
28 2/11 1716 1004 2720 2653 1.6% 0.9% 2.5% 24 2/11 1739 959 2698 2653 1.1% 0.6% 1.7%
29 1720 970 2690 2653 0.9% 0.5% 1.4% 26 1965 860 2825 2653 4.3% 1.9% 6.1%CI-NBI0082 CELL CAPACITY 26 TCH C1-NBI2312 CELL CAPACITY 28 TCH
22 2/7 2112 810 2572 2463 3.5% 0.8% 4.2% 27 2/7 1721 956 2677 2653 0.6% 0.3% 0.9%
24 2/8 1780 798 2228 2463 -8.4% -2.1% -0.11 27 2/8 1934 887 2821 2653 4.1% 1.9% 6.0%
19 2/9 1948 794 2392 2463 -2.4% -0.6% -0.03 29 2/9 1748 1180 2928 2653 5.6% 3.8% 9.4%
21 2/10 2148 954 2752 2463 8.2% 2.3% 0.10 25 2/10 I860 821 2681 2653 0.7% 0.3% 1.1%
20 2/11 1948 910 2508 2463 1.4% 0.4% 0.02 29 2/11 1732 992 2724 2653 1.7% 1.0% 2.6%
21 1987 853 2490 2463 0.9% 0.4% 0.01 27 1799 967 2766 2653 2.7% 1.4% 4.1%C1-NBI2071CELL CAPACITY 26 TCH C1-NBI0911 CELL CAPACITY 29 TCH
25 2/7 1760 815 2575 2463 1.1% 0.8% 4.3% 31 2/7 1912 1208 3120 2747 7.3% 4.6% 12%
23 2/8 1960 863 2823 2463 3.7% 2.3% 13% 29 2/8 2212 1493 3705 2747 15% 10% 26%
25 2/9 1492 599 2091 2463 -3.1% -2.1% -18% 28 2/9 1917 1253 3170 2747 8.1% 5.3% 13%
21 2/10 1876 827 2703 2463 2.4% 1.6% 8.9% 30 2/10 1673 1090 2763 2747 0.3% 0.2% 1%20 2/11 1892 799 2691 2463 2.4% 1.4% 8.5% 31 2/11 1713 1101 2814 2747 1.4% 0.9% 2%
23 1796 781 2577 2463 3.1% 1.3% 4.4% 30 1885 1229 3114 2747 7.1% 4.7% 12%CI-NBI0673 CELL CAPACITY 29 TCH C1-NB12503 CELL CAPACITY 28 TCH
27 2/7 1264 1572 2836 2747 1.4% 1.7% 3.1% 30 2/7 1611 1104 2715 2653 1.4% 0.9% 2.3%25 2/8 1322 1316 2638 2747 -2.1% -2.1% -4% 32 2/8 1574 1148 2722 2653 1.5% 1.1% 2.5%23 2/9 1500 1380 2880 2747 2.4% 2.2% 5% 32 2/9 1835 876 2711 2653 1.5% 0.7% 2.2%23 2/10 1562 1156 2718 2747 -0.6% -0.5% -1% 24 2/10 1723 876 2599 2653 -1.4% -0.7% -2.1%26 2/11 1674 1124 2798 - 2747 1.1% 0.7% 1.8% 24 2/ri 1464 1369 •2833 2653 3.3% 3.1% 6.4%25 1464 1310 2774 2747 0.5% 0.5% 1.0% 28 1641 1075 2? 16 2653 1.4% 0.9% 2.3%
Page 122
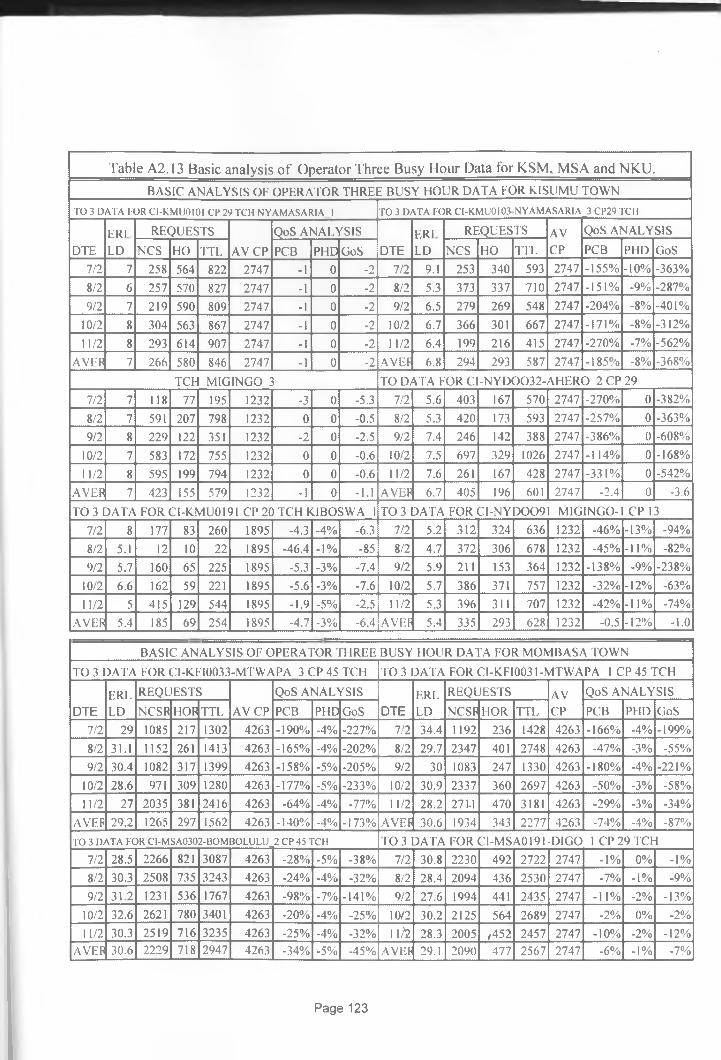
Table A2.13 Basic analysis o f Operator Three Busy Hour Data for KSM, MSA and NK.U.BASIC ANALYSIS OF OPERATOR THREE BUSY HOUR DATA FOR KISUMU TOWN
TO 3 DATA FOR CI-K.MU010I CP 29 TCH NYAMASAR1A 1 TO 3 DATA FOR CI-KMU0103-NYAMASAR1A_3 CP29 TCH
ERI REQUESTS QoS ANALYSIS ERI REQUESTS AV QoS ANALYSIS
DTE LD NCS HO TTL AV CP PCB PHD GoS DTE LD NCS HO TTL CP PCB PHD GoS
7/2 7 258 564 822 2747 -1 0 _2 7/2 9.1 253 340 593 2747 -155% -10% -363%
8/2 6 257 570 827 2747 -1 0 -2 8/2 5.3 373 337 710 2747 -151% -9% -287%
9/2 7 219 590 809 2747 -1 0 -2 9/2 6.5 279 269 548 2747 -204% -8% -401%
10/2 8 304 563 867 2747 -1 0 -2 10/2 6.7 366 301 667 2747 -171% -8% -312%
11/2 8 293 614 907 2747 -1 0 -2 11/2 6.4 199 216 415 2747 -270% -7% -562%
AVER 7 266 580 846 2747 -1 0 -2 AVEF 6.8 294 293 587 2747 -185% -8% -368%
TCH MIG1NGO 3 TO DATA FOR C1-N Y D0032-A HER0 2 CP 29
7/2 7 118 77 195 1232 -3 0 -5.3 7/2 5.6 403 167 570 2747 -270% 0 -382%
8/2 7 591 207 798 1232 0 0 -0.5 8/2 5.3 420 173 593 2747 -257% 0 -363%
9/2 8 229 122 351 1232 -2 0 -2.5 9/2 7.4 246 142 388 2747 -386% 0 -608%
10/2 7 583 172 755 1232 0 0 -0.6 10/2 7.5 697 329 1026 2747 -114% 0 -168%
11/2 8 595 199 794 1232 0 0 -0.6 11/2 7.6 261 167 428 2747 -331% 0 -542%
AVER 7 423 155 579 1232 -1 0 -1.1 AVEF 6.7 405 196 601 2747 -2.4 0 -3.6
TO 3 DATA FOR CI-K.MU0191 CP 20 TCH KIBOSWA 1 TO 3 DATA FOR C1-NYD0091 M1GINGO-1 CP 13
7/2 8 177 83 260 1895 -4.3 -4% -6.3 7/2 5.2 312 324 636 1232 -46% -13% -94%
8/2 5.1 12 10 22 1895 -46.4 -1% -85 8/2 4.7 372 306 678 1232 -45% -11% -82%
9/2 5.7 160 65 225 1895 -5.3 -3% -7.4 9/2 5.9 211 153 364 1232 -138% -9% -238%
10/2 6.6 162 59 221 1895 -5.6 -3% -7.6 10/2 5.7 386 371 757 1232 -32% -12% -63%
11/2 5 415 129 544 1895 -1.9 -5% -2.5 11/2 5.3 396 311 707 1232 -42% -11% -74%
AVER 5.4 185 69 254 1895 -4.7 -3% -6.4 AVER 5.4 335 293 628 1232 -0.5 -12% -1.0
BASIC ANALYSIS OF OPERATOR THREE BUSY HOUR DATA FOR MOMBASA TOWN
TO 3 DATA FOR CI-KFI0033-MTWAPA 3 CP 45 TCH TO 3 DATA FOR CI-KF10031 -MTWAPA 1 CP 45 TCH
ERL REQUESTS QoS ANALYSIS ERL REQUESTS AV QoS ANALYSIS
DTE LD NCSR HOR TTL AV CP PCB PHD GoS DTE LD NCSR HOR TTL CP PCB PHD GoS
7/2 29 1085 217 1302 4263 -190% -4% -227% 7/2 34.4 1192 236 1428 4263 -166% -4% -199%
8/2 31.1 1152 261 1413 4263 -165% -4% -202% 8/2 29.7 2347 401 2748 4263 -47% -3% -55%
9/2 30.4 1082 317 1399 4263 -158% -5% -205% 9/2 30 1083 247 1330 4263 -180% -4% -221%
10/2 28.6 971 309 1280 4263 -177% -5% -233% 10/2 30.9 2337 360 2697 4263 -50% -3% -58%
11/2 27 2035 381 2416 4263 -64% -4% -77% 11/2 28.2 271-1 470 3181 4263 -29% -3% -34%
AVER 29.2 1265 297 1562 4263 -140% -4% -173% AVEF 30.6 1934 343 2277 4263 -74% -4% -87%
TO 3 DATA FOR CI-MSA0302-BOMBOLULU_ 2 CP 45 TCH TO 3 DATA FOR C1-MSA0191 -D1GO 1 CP 29 TCH
7/2 28.5 2266 821 3087 4263 -28% -5% -38% 7/2 30.8 2230 492 2722 2747 -1% 0% -1%8/2 30.3 2508 735 3243 4263 -24% -4% -32% 8/2 28.4 2094 436 2530 2747 -7% -1% -9%
9/2 31.2 1231 536 1767 4263 -98% -7% -141% 9/2 27.6 1994 441 2435 2747 -11% -2% -13%
10/2 32.6 2621 780 3401 4263 -20% -4% -25% 10/2 30.2 2125 564 2689 2747 -2% 0% -2%11/2 30.3 2519 716 3235 4263 -25% -4% -32% 11/2 28.3 2005 ,452 2457 2747 -10% -2% -12%
AVER 30.6 2229 718 2947 4263 -34% -5% -45% AVEF 29.1 2090 ' 477 2567 2747 -6% -1% -7%
Page 123
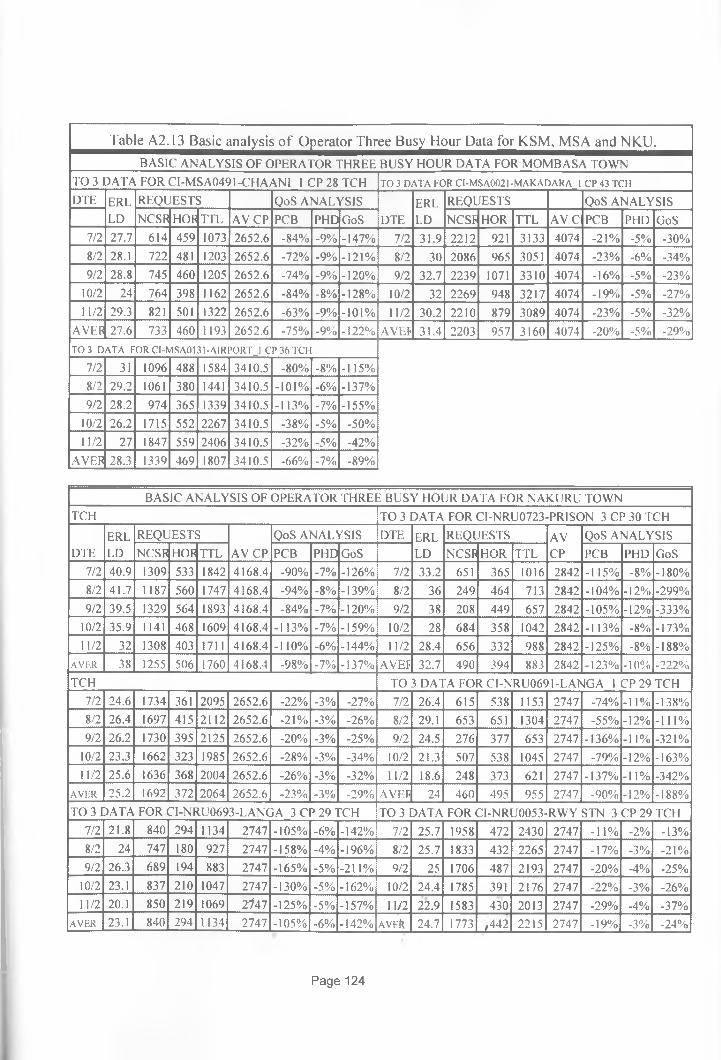
Table A2.13 Basic analysis o f Operator Three Busy Hour Data for KSM, MSA and NKU.
BASIC ANALYSIS OF OPERATOR THREE BUSY HOUR DATA FOR MOMBASA TOWNTO 3 DATA FOR CI-MSA0491-CHAANI 1 CP 28 TCH T O 3 D A T A FO R C I-M SA 0021-M A K .A D A R A J C P 43 TCH
DTE ERL REQUESTS QoS ANALYSIS ERL REQUESTS QoS ANALYSISLD NCSR HOR TTL AV CP PCB PHD GoS DTE LD NCSF HOR TTL AV C PCB PHD GoS
7/2 27.7 614 459 1073 2652.6 -84% -9% -147% 7/2 31.9 2212 921 3133 4074 -21% -5% -30%8/2 28.1 722 481 1203 2652.6 -72% -9% -121% 8/2 30 2086 965 3051 4074 -23% -6% -34%9/2 28.8 745 460 1205 2652.6 -74% -9% -120% 9/2 32.7 2239 1071 3310 4074 -16% -5% -23%
10/2 24 764 398 1162 2652.6 -84% -8% -128% 10/2 32 2269 948 3217 4074 -19% -5% -27%11/2 29.3 821 501 1322 2652.6 -63% -9% -101% 11/2 30.2 2210 879 3089 4074 -23% -5% -32%
AVEF 27.6 733 460 1193 2652.6 -75% -9% - 1 2 2 % AVEF 31.4 2203 957 3160 4074 - 2 0 % -5% -29%TO 3 D A T A FO R C I-M S A 0 1 3 1 -A IR P O R T J CP 36 TCH
7/2 31 1096 488 1584 3410.5 -80% -8% -115%8/2 29.2 1061 380 1441 3410.5 -101% -6% -137%9/2 28.2 974 365 1339 3410.5 -113% -7% -155%
10/2 26.2 1715 552 2267 3410.5 -38% -5% -50%11/2 27 1847 559 2406 3410.5 -32% -5% -42%
AVER 28.3 1339 469 1807 3410.5 -66% -7% -89%
BASIC ANALYSIS OF OPERATOR THREE BUSY HOUR DATA FOR NAK.URU TOWNTCH TO 3 DATA FOR CI-NRU0723-PRISON 3 CP 30 TCH
ERL REQUESTS QoS ANALYSIS DTE ERL REQUESTS AV QoS ANALYSISDTE LD NCSR HOR TTL AV CP PCB PHD GoS LD NCSR HOR TTL CP PCB PHD GoS
7/2 40.9 1309 533 1842 4168.4 -90% -7% -126% 7/2 33.2 651 365 1016 2842 -115% -8% -180%8/2 41.7 1187 560 1747 4168.4 -94% -8% -139% 8/2 36 249 464 713 2842 -104% -12% -299%9/2 39.5 1329 564 1893 4168.4 -84% -7% -120% 9/2 38 208 449 657 2842 -105% -12% -333%
10/2 35.9 1141 468 1609 4168.4 -113% -7% -159% 10/2 28 684 358 1042 2842 -113% -8% -173%11/2 32 1308 403 1711 4168.4 -110% -6% -144% 11/2 28.4 656 332 988 2842 -125% -8% -188%
A V E R 38 1255 506 1760 4168.4 -98% -7% -137% AVEF 32.7 490 394 883 2842 -123% - 1 0 % - 2 2 2 %
TCH TO 3 DATA FOR CI-NRU0691-LANGA 1 CP 29 TCH7/2 24.6 1734 361 2095 2652.6 -22% -3% -27% 7/2 26.4 615 538 1153 2747 -74% -11% -138%8/2 26.4 1697 415 2112 2652.6 - 2 1 % -3% -26% 8/2 29.1 653 651 1304 2747 -55% -12% -111%9/2 26.2 1730 395 2125 2652.6 -20% -3% -25% 9/2 24.5 276 377 653 2747 -136% -11% -321%
10/2 23.3 1662 323 1985 2652.6 -28% -3% -34% 10/2 21.3 507 538 1045 2747 -79% - 1 2 % -163%11/2 25.6 1636 368 2004 2652.6 -26% -3% -32% 11/2 18.6 248 373 621 2747 -137% -11% -342%
A V E R 25.2 1692 372 2064 2652.6 -23% -3% -29% AVEF 24 460 495 955 2747 -90% - 1 2 % -188%TO 3 DATA FOR CI-NRU0693-LANGA 3 CP 29 TCH TO 3 DATA FOR CI-NRU0053-RWY STN 3 CP 29 TCH
7/2 21.8 840 294 1134 2747 -105% -6% -142% 7/2 25.7 1958 472 2430 2747 -11% -2% -13%8/2 24 747 180 927 2747 -158% -4% -196% 8/2 25.7 1833 432 2265 2747 -17% -3% -21%9/2 26.3 689 194 883 2747 -165% -5% -211% 9/2 25 1706 487 2193 2747 -20% -4% -25%
10/2 23.1 837 210 1047 2747 -130% -5% -162% 10/2 24.4 1785 391 2176 2747 -22% -3% -26%11/2 20.1 850 219 1069 2747 -125% -5% -157% 11/2 22.9 1583 430 2013 2747 -29% -4% -37%
A V E R 23.1 840 294 1134 2747 -105% -6% -142% AVEfc 24.7 1773 ,442 2215 2747 -19% -3% -24%
Page 124
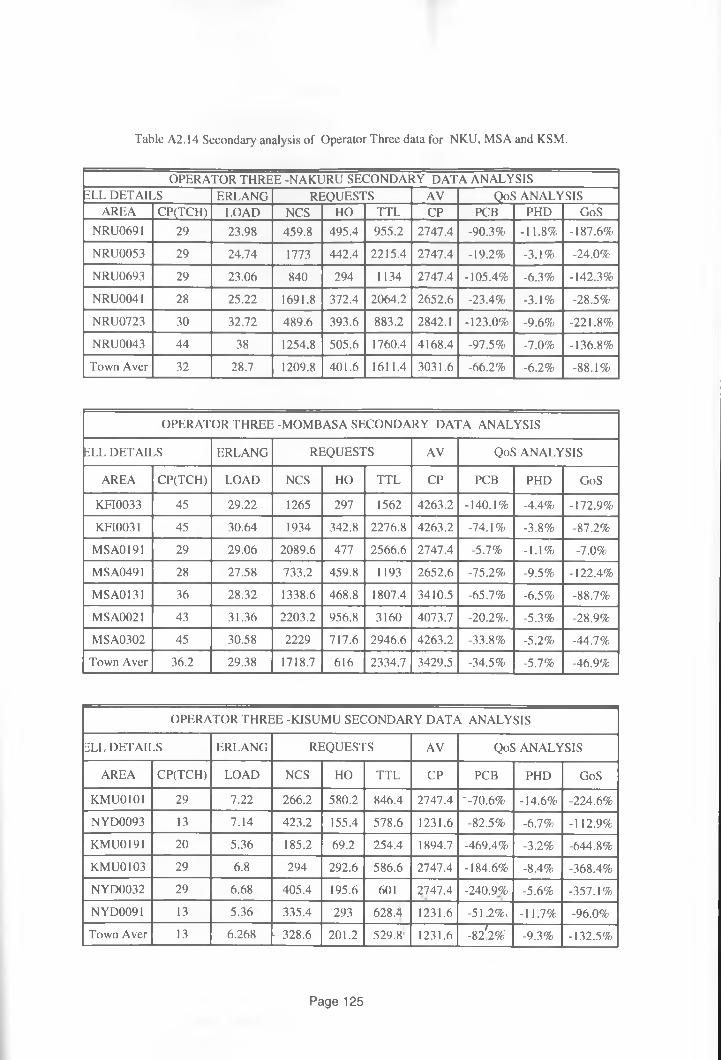
Table A 2.14 Secondary analysis o f Operator Three data for NKU, MSA and KSM.
OPERATOR THREE -NAKURU SECONDARY DATA ANALYSISELL DETAILS ERLANG REQUESTS AV QoS ANALYSIS
AREA CP(TCH) LOAD NCS HO TTL CP PCB PHD GoSNRU0691 29 23.98 459.8 495.4 955.2 2747.4 -90.3% -11.8% -187.6%
NRU0053 29 24.74 1773 442.4 2215.4 2747.4 -19.2% -3.1% -24.0%
NRU0693 29 23.06 840 294 1134 2747.4 -105.4% -6.3% -142.3%
NRU0041 28 25.22 1691.8 372.4 2064.2 2652.6 -23.4% -3.1% -28.5%
NRU0723 30 32.72 489.6 393.6 883.2 2842.1 -123.0% -9.6% -221.8%
NRU0043 44 38 1254.8 505.6 1760.4 4168.4 -97.5% -7.0% -136.8%
Town Aver 32 28.7 1209.8 401.6 1611.4 3031.6 -66.2% -6.2% -88.1%
OPERATOR THREE -MOMBASA SECONDARY DATA ANALYSIS
ELL DETAILS ERLANG REQUESTS AV QoS ANALYSIS
AREA CP(TCH) LOAD NCS HO TTL CP PCB PHD GoS
KFI0033 45 29.22 1265 297 1562 4263.2 -140.1% -4.4% -172.9%
KFI0031 45 30.64 1934 342.8 2276.8 4263.2 -74.1% -3.8% -87.2%
MSA0191 29 29.06 2089.6 477 2566.6 2747.4 -5.7% -1.1% -7.0%
MSA0491 28 27.58 733.2 459.8 1193 2652.6 -75.2% -9.5% -122.4%
MSA0131 36 28.32 1338.6 468.8 1807.4 3410.5 -65.7% -6.5% -88.7%
MSA0021 43 31.36 2203.2 956.8 3160 4073.7 -20.2%. -5.3% -28.9%
MSA0302 45 30.58 2229 717.6 2946.6 4263.2 -33.8% -5.2% -44.7%
Town Aver 36.2 29.38 1718.7 616 2334.7 .3429.5 -34.5% -5.7% -46.9%
OPERATOR THREE -KISUMU SECONDARY DATA ANALYSIS
ELL DETAILS ERLANG REQUESTS AV QoS ANALYSIS
AREA CP(TCH) LOAD NCS HO TTL CP PCB PHD GoS
KMU0101 29 7.22 266.2 580.2 846.4 2747.4 •-70.6% -14.6% -224.6%
NYD0093 13 7.14 423.2 155.4 578.6 1231.6 -82.5% -6.7% -112.9%
KMU0191 20 5.36 185.2 69.2 254.4 1894.7 -469.4% -3.2% -644.8%
KMU0103 29 6.8 294 292.6 586.6 2747.4 -184.6% -8.4% -368.4%
NYD0032 29 6.68 405.4 195.6 601 2747.4 -240.9% -5.6% -357.1%
NYD0091 13 5.36 335.4 293 628.4 1231.6 -51.2%, -11.7% -96.0%
Town Aver 13 6.268 • 328.6 201.2 529.8' 1231.6 -82'2% -9.3% -132.5%
Page 125
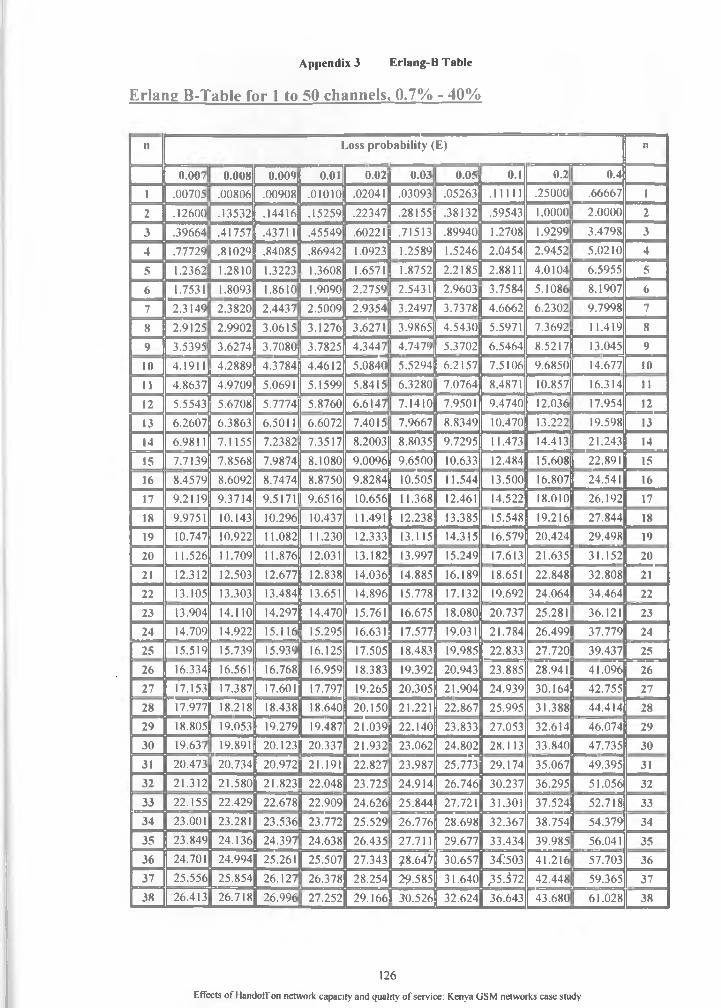
Appendix 3 Erlang-B Table
Erlang B-Table for 1 to 50 channels, 0.7% - 40%
n Loss probability (E) n
0.007 0.008 0.009 0.01 0.02 0.03 0.05 0.1 0.2| 0.4
i .00705 .00806 .00908 .01010 .02041 .03093 .05263 .11111 .25000 .66667 i
2 .12600 .13532 .14416 .15259 .22347 .28155 .38132 .59543 1.0000 2.0000 2
3 .39664 .41757 .43711 .45549 .60221 .71513 .89940 1.2708 1.9299 3.4798 3
4 .77729 .81029 .84085 .86942 1.0923 1.2589 1.5246 2.0454 2.9452 5.0210 4
5 1.2362 1.2810 1.3223 1.3608 1.6571 1.8752 2.2185 2.8811 4.0104 6.5955 5
6 1.7531 1.8093 1.8610 1.9090 2.27591 2.5431 2.9603 3.7584 5.1086 8.1907 6
7 2.3149 2.3820 2.4437 2.5009 2.9354 3.2497 3.7378 4.6662 6.2302 9.7998 7
8 2.9125 2.9902 3.0615 3.1276 3.6271 3.9865 4.5430 5.5971 7.3692 11.419 8
9 3.5395' 3.6274 3.7080 3.7825 4.3447' 4.7479 5.3702 6.5464 8.5217 13.045 9
10 4.1911 4.2889 4.3784 4.4612 5.0840 5.5294 6.2157 7.5106 9.6850 14.677 10
II 4.8637 4.9709 5.0691 5.1599 5.8415 6.3280 7.0764 8.4871 10.857 16.314 <112 5.5543 5.6708 5.7774 5.8760 6.6147 7.1410 7.9501 9.4740 12.036 17.954 12
13 6.2607 6.3863 6.5011 6.6072 7.4015 7.9667 8.8349 10.470 13.222 19.598 1314 6.9811 7.1155 7.2382 7.3517 8.2003 8.8035 9.7295 11.473 14.413 21.243 14
15 7.7139 7.8568 7.9874 8.1080 9.0096 9.6500 10.633 12.484 15.608 22.891 15
16 8.4579 8.6092 8.7474 8.8750 9.8284 10.505 11.544 13.500 16.807 24.541 16
17 9.2119 9.3714 9.5171 9.6516 10.656 11.368 12.461 14.522 18.010 26.192 17
18 9.9751 10.143 10.296 10.437 11.491 12.238 13.385 15.548 19.216 27.844 1819 10.747 10.922 11.082 11.230 12.333 13.115 14.315 16.579 20.424 29.498 19
20 11.526 11.709 11.876 12.031 13.182 13.997 15.249 17.613 21.635 31.152 20
21 12.312 12.503 12.677 12.838 14.036 14.885 16.189 18.651 22.848 32.808 21
22 13.105 13.303 13.484 13.651 14.896 15.778 17.132 19.692 24.064 34.464 22
23 13.904 14.110 14.297 14.470 15.761 16.675 18.080 20.737 25.281 36.121 2324 14.709 14.922 15.116 15.295 16.631 17.577 19.031 21.784 26.499 37.779 24
25 15.519 15.739 15.939 16.125 17.505 18.483 19.985 22.833 27.720 39.437 25
26 16.334 16.561 16.768 16.959 18.383 19.392 20.943 23.885 28.941 41.096 2627 17.153 17.387 17.601 17.797 19.265 20.305 21.904 24.939 30.164 42.755 27
28 17.977 18.218 18.438 18.640 20.150 21.221 22.867 25.995 31.388 44.414 2829 18.805 19.053 19.279 19.487 21.039 22.140 23.833 27.053 32.614 46.074 2930 19.637 19.891 20.123 20.337 21.932 23.062 24.802 28.1 13 33.840 47.735 3031 20.473 20.734 20.972 21.191 22.827 | 23.987 25.773 29.174 35.067 49.395 3132 21.312 21.580 21.823 22.048 23.725 | 24.914 26.746 30.237 36.295 51.056 3233 22.155 22.429 22.678 22.909 24.626 | 25.844 27.721 31.301 37.524 52.718 3334 23.001 23.281 23.536 23.772 25.529 j 26.776 28.698 32.367 38.754 54.379 3435 23.849 24.136 24.397 24.638 26.435 | 27.711 29.677 33.434 39.985 56.041 3536 24.701 24.994 25.261 25.507 27.343 28.647 30.657 3£503 41.216 57.703 3637 25.556 25.854 26.127 26.378 28.254 29.585 31.640 ,35.372 42.448 59.365 3738 26.413 26.718 26.996 27.252 29.166 30.526 32.624 36.643 43.680 61.028 38
126
Effects o f Handoff on network capacity and quality o f service: Kenya GSM networks case study
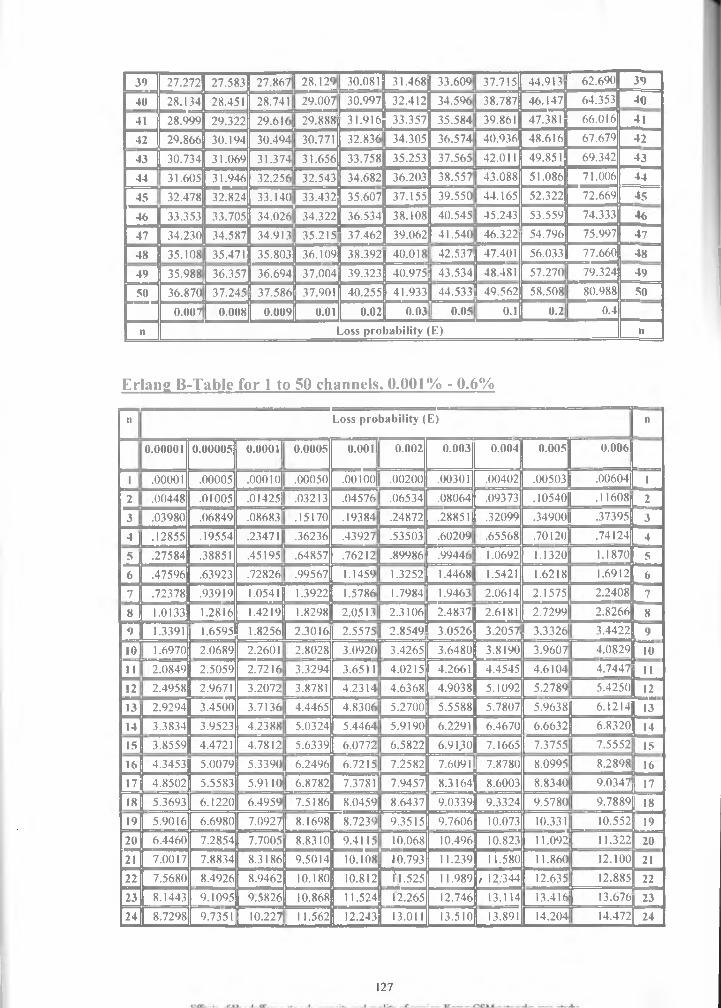
39 27.272 27.583 27.867 28.129 30.081 31.468 33.609| 37.715 44.913 62.690 39
40 28.134 28.451 28.741 29.007 30.997 32.412 34.596 38.787 46.147 64.353 40
41 28.999 29.322 29.616 29.888 31.916 33.357 35.584 39.861 47.381 66.016 41
42 29.866 30.194 30.494 30.771 32.836 34.305 36.574 40.936 48.616 67.679 42
43 30.734 31.069 31.374 31.656 33.758 35.253 37.565 42.011 49.851 69.342 43
44 31.605 31.946 32.256 32.543 34.682 36.203 38.557 43.088 51.086 71.006 44
45 32.478 32.824 33.140 33.432 35.607 37.155 39.550 44.165 52.322 72.669 45
46 33.353 33.705 34.026 34.322 36.534 38.108 40.545 45.243 53.559 74.333 46
47 34.230 34.587 34.913 35.215 37.462 39.062 41.540 46.322 54.796 75.997 47
48 35.108 35.471 35.803 36.109 38.392 40.018 [ 42.537 47.401 56.033 77.660 48
49 35.988 | 36.357 36.694 37.004 39.323 40.975 43.534 48.481 57.270 79.324 49
50 36.870 | 37.245 37.586 37.901 40.255 41.933 44.533 49.562 58.508 80.988 SO
0.007 | 0.008 0.009 0.01 0.02 0.03 l o o s L _ i i 0.2 0.4
n Loss probability (E) n
Erlang B-Table for 1 to 50 channels, 0.001% - 0.6%
n Loss probability (E) n
0.00001 0.00005 0.0001| 0.0005 O.OOll 0.002 0.003 0.004 0.005 0.0061
i .00001 .00005 .000 loj .00050 .001 oo| .00200 .00301 .00402 .00503 ,00604| 1
2 .00448 .01005 ,01425| .03213 ,04576| .06534 .08064 .09373 .10540 .11608 2
3 .03980 .06849 .086831 .15170 .19384 .24872 .28851 .32099 .34900 .37395 3
4 .12855 .19554 .23471 .36236 .43927 .53503 .60209 .65568 .7012()| .74124 4
5 .27584 .38851 .45195| .64857 .76212 .89986 .99446 1.0692 1.1320| 1.1870 5
6 .47596 .63923 ,72826| .99567 1.1459 1.3252 1.4468 1.5421 1.6218| 1.6912 67 .72378 .93919 1.0541 1.3922 1.5786 1.7984 1.9463 2.0614 2.1575| 2.2408 7
8 1.0133 1.2816 1.4219 1.8298 2.0513 2.3106 2.4837 2.6181 2.7299| 2.8266 89 1.3391 1.6595 1.8256 2.3016 2.5575 2.8549 3.0526 3.2057 3.3326) 3.4422 9
10 1.6970 2.0689 2.2601 2.8028 3.0920 3.4265 3.6480 3.8190 3.9607 4.0829 10
11 2.0849 2.5059 2.7216 3.3294 3.6511 4.0215 4.2661 4.4545 4.6104 4.7447 11
12 2.4958 2.9671 3.2072 3.8781 4.2314 4.6368 4.9038 5.1092 5.2789 5.4250 12
13 2.9294 3.4500 3.7136 4.4465 4.8306 5.2700 5.5588 5.7807 5.9638 6.1214 1314 3.3834 3.9523 4.2388 5.0324 5.4464 5.9190 6.2291 6.4670 6.6632 6.8320 1415 3.8559 4.4721 4.7812 5.6339 6.0772 6.5822 6.9 ijjo 7.1665 7.3755 7.5552 1516 4.3453 5.0079 5.3390 6.2496 6.7215 7.2582 7.6091 [ 7.8780 8.0995 8.2898 1617 4.8502 5.5583 5.9110 6.8782 7.3781 7.9457 8.3164 8.6003 8.8340 9.0347 1718 5.3693 6.1220 6.4959 7.5186 8.0459 8.6437 9.0339 9.3324 9.5780 9.7889 1819 5.9016 6.6980 7.0927 8.1698 8.7239 9.3515 9.7606 10.073 10.331 10.552 19
20 6.4460 7.2854 7.7005 8.8310 9.4115 | 10.068 10.496 10.823 11.092 11.322 20
21 7.0017 7.8834 8.3186 9.5014 10.108 | 10.793 11.239 1 i .580 11.860 12.100 21
22 7.5680 8.4926 8.9462 10.180 10.812 f 1.525 11.989 , 12:344 12.635 12.885 22
23 8.1443 9.1095 9.5826 10.868 11.524 12.265 12.746 13.114 13.416 13.676 2324 8.7298 9.7351 10.227 | 11.562 12.243 13.011 13.510 13.891 14.204 14.472 24
127
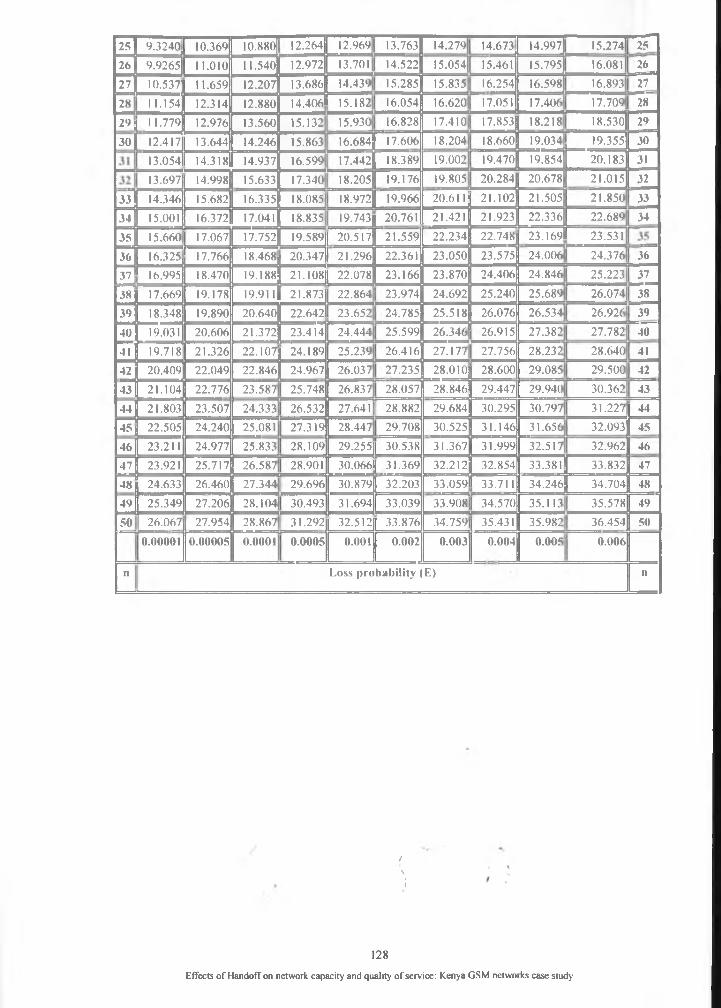
25 9.3240 10.369 10.880| 12.264 12.969| 13.763 14.279| 14.673 14.997| I5.274| 2526 9.9265 11.010 11.540 12.972 13.701 14.522 15.054| 15.461 I5.795| 16.081 jU26
27 10.537 11.659 12.207 13.686 14.439 15.285 15.835 16.254 16.598| I6.893| 27
28 11.154 12.314 12.880 14.406 15.182 16.054 16.620 17.051 17.406 17.709 28
29 11.779 12.976 13.560 15.132 15.930 16.828 17.410 17.853 18.218 18.530 29
30 12.417 13.644 14.246 15.863 16.684 17.606 18.204 18.660 19.034 19.355 30
13.054 14.318 14.937 16.599 17.442 18.389 19.002 19.470 19.854 20.183 31
13.697 14.998 15.633 17.340 18.205 19.176 19.805 20.284 20.678 21.015 32
33 14.346 15.682 16.335 18.085 18.972 19.966 20.611 21.102 21.505 21.850 33
34 15.001 16.372 17.041 18.835 19.743 20.761 21.421 21.923 22.336 22.689 34
35 15.660 17.067 17.752 19.589 20.517 21.559 22.234 22.748 23.169 23.531 , —36 16.325 17.766 18.468 20.347 21.296 22.361 23.050 23.575 24.006 24.376 36
37 16.995 18.470 19.188 21.108 22.078 23.166 23.870 24.406 24.846 25.223 37
38 17.669 19.178 19.911 21.873 22.864 23.974 24.692 25.240 25.689 26.074 38
39 18.348 19.890 20.640 22.642 23.652 24.785 25.518 26.076 26.534 26.926 39
40 19.031 20.606 21.372 23.414 24.444 25.599 26.346 26.915 27.382 27.782 40
41 19.718 21.326 22.107 24.189 25.239 26.416 27.177 27.756 28.232 28.640 41
42 20.409 22.049 22.846 24.967 26.037 27.235 28.010 28.600 29.085 29.500 42
43 21.104 22.776 23.587 25.748 26.837 28.057 28.846 29.447 29.940 30.362 43
44 21.803 23.507 24.333 26.532 27.641 [ 28.882 29.684 30.295 30.797 31.227 44
45 22.505 24.240 25.081 27.319 28.447 29.708 30.525 31.146 31.656 32.093 45
46 23.211 24.977 25.833 28.109 29.255 30.538 31.367 31.999 32.517 32.962 46
47 23.921 25.717 26.587 28.901 30.066 31.369 32.212 32.854 33.381 33.832 47
48 24.633 26.460 27.344 j 29.696 30.879 32.203 33.059 33.711 34.246 34.704 48
49 25.349 27.206 28.104 30.493 31.694 33.039 33.908 34.570 35.113 35.578 49
50 j 26.067 27.954 28.867 | 31.292 32.512 33.876 34.759 35.431 35.982 36.454 50
0.00001 0.00005 0.0001 0.0005 0.001 0.002 0.003 0.004 0.005 0.006
"j Loss probability (E) 11
/V
lt
128
Effects o f Handoff on network capacity and quality o f service: Kenya GSM networks case study
Related Documents