Nile Basin Initiative Transboundary Environmental Action Project National Nile Basin Water Quality Monitoring Baseline Report for KENYA March 2005

Welcome message from author
This document is posted to help you gain knowledge. Please leave a comment to let me know what you think about it! Share it to your friends and learn new things together.
Transcript

Nile Basin Initiative Transboundary Environmental Action Project
National
Nile Basin Water Quality Monitoring Baseline Report
for
KENYA
March 2005

ii
NILE BASIN INITIATIVE
NILE TRANSBOUNDARY ENVIRONMENTAL ACTION PROJECT
STATUS OF WATER QUALITY MONITORING IN THE KENYAN PORTION OF
LAKE VICTORIA BASIN
PREPARED BY: P. W. KARANI WATER & ENVIRONMENT MANAGEMENT CONSULTANTS P. O. BOX 144-00517 UHURU GARDENS NAIROBI E-mail: [email protected]

iii
ACRONYMS Alk - Alkalinity AMREF - Africa Medical & Research Foundation ASAL - Arid and Semi-Arid Lands BCM - Billion Cubic Metres BOD - Biological Oxygen Demand CAAC - Catchment Area Advisory Committee CBO - Community Based Organization CBS - Central Bureau of Statistics Chl - Chlorophyll COD - Chemical Oxygen Demand DO - Dissolved Oxygen DON - Dissolved Organic Nitrogen DOP - Dissolved Organic Phosphorous EC - Electric Conductivity EIA - Environmental Impact Assessment GDP - Gross Domestic Product ITCZ - Inter-Tropical Convergence Zone KCC - Kenya Co-operative Creameries KEMFRI - Kenya Marine Fisheries Research Institute KEWI - Kenya Water Institute KWAHO - Kenya Water for Health Organization LBDA - Lake Basin Development Authority LoI - Loss on Ignition LVEMP - Lake Victoria Environmental Monitoring Programme MWI - Ministry of Water 7 Irrigation N - Nitrogen NGO - Non-Governmental Organization NH3 - Ammonia NO2 - Nitrite NO3 - Nitrate NTEAP - Nile Transboundary Environment Action Project NWC &PC - National Water Conservation and Pipeline Corporation P - Phosphorous PCB’s - Polychlorinated Biphenyls pH - Hydrogen Iron Concentration PO4 - Phosphate Si - Silicon T - Temperature TBSI - Total Biogenic Silica TDN - Total Dissolved Nitrogen TDP - Total Dissolved Phosphorous TDS - Total Dissolved Solids TN - Total nitrogen TON - Total Organic Nitrogen TP - Total Phosphorous TPC - Total Particulate Carbon TPN - Total Particulate Nitrogen TPP - Total Particulate Phosphorous TSS - Total Suspended Solids Turb - Turbidity WAB - Water Appeal Board WRMA - Water Resources Management Authority WSB - Water Services Board WSRB - Water Services Regulatory Board WSTF - Water Services Trust Fund
iv
WWF - World Wildlife Fund TABLE OF CONTENTS 1. PHYSIOGRAPHY.............................................................................................................................. 1 2. KENYA WATER RESOURCES....................................................................................................... 2
2.1 Drainage System ................................................................................................. 2 2.2 Shared Water Resources ..................................................................................... 3
3. CHALLENGES IN WATER MANAGEMENT .............................................................................. 4 4. POLICY FRAMEWORK .................................................................................................................. 4 5. LEGAL FRAMEWORK................................................................................................................... 6 6. INSTITUTIONAL FRAMEWORK-WATER SECTOR PLAYERS............................................. 8
6.1 Ministry of Water and Irrigation......................................................................... 8 6.2 The Ministry of Local Authorities ..................................................................... 9 6.3 Ministry of Health............................................................................................... 9 6.4 Ministry of Agriculture .................................................................................... 10 6.5 The Ministry of Regional Development .......................................................... 11 6.6 Ministry of Environment, Natural Resources and Wildlife (MENR & W)...... 11 6.7 Other Institutions .............................................................................................. 11
7. WATER QUALITY AND POLLUTION CONTROL PROGRAMME...................................... 11
7.1 Water Quality Guidelines and Standards.......................................................... 11 7.2. Policy Direction in Water Quality Monitoring ................................................. 13
8. THE LAKE VICTORIA BASIN IN KENYA................................................................................. 14
8.1 Introduction....................................................................................................... 14 8.2 Water Quality Monitoring Programme............................................................. 14
9. WATER POLLUTION MONITORING PROGRAMME............................................................ 15
9.1 Point Sources of Pollution ................................................................................ 16 9.2 Non-Point Sources ............................................................................................ 16
10. IMPACTS OF POINT AND NON-POINT SOURCES OF POLLUTION TO MAJOR
RIVERS IN LAKE VICTORIA BASIN .................................................................................... 17 10.1 Rivers ................................................................................................................ 17
10.1.1 Sio River ................................................................................................... 17 10.1.2 Nzoia River ............................................................................................... 19 10.1.3 River Yala ................................................................................................. 22 10.1.4 River Nyando............................................................................................ 24 10.1.5 River Sondu/Miriu .................................................................................... 27 10.1.6 Gucha /Migori River ................................................................................. 29 10.1.7 The Mara River ......................................................................................... 33
10.2 Lakes ................................................................................................................. 36 10.3 Wetlands ........................................................................................................... 37
11. LABORATORY FACILITIES ................................................................................................... 39
11.1 LVEMP-MWI Nyanza Laboratory Facilities at Kisumu.................................. 40

v
11.2 MWI Western Laboratory Facilities at Kakamega ........................................... 42 11.3 Lake Basin Laboratory Facilities at Kisumu .................................................... 43 11.4 Kenya Marine Fisheries Research Institute Laboratory Facilities at Kisumu .. 44
12. WATER QUALITY MONITORING NETWORK................................................................... 46
12.1 Ministry of Water-LVEMP Water Quality Monitoring Network..................... 46 12.2 Ministry of Water-Water Quality Monitoring Network in Western Province.. 50 12.3 Lake Basin Development Authority Water Quality Monitoring Stations ........ 52 12.4 Kenya Marine Fisheries Research Institute Water Quality Monitoring Network …………………………………………………………………………………54
13. GEO-REFERENCED WATER QUALITY MONITORING STATIONS ............................. 56
13.1 Geo-referenced Water Quality Monitoring Stations under LVEMP and MWI 56 13.2 Geo-referenced Water Quality Monitoring Stations under KMFRI ................. 58
14. MANPOWER ASSESSMENT.................................................................................................... 60
14.1 LVEMP-MWI Manpower Position in Nyanza-Kisumu ................................... 60 14.2 MWI Manpower Position in Western Province-Kakamega ............................. 61 14.3 Lake Basin Manpower Position-Kisumu.......................................................... 62 14.4 Kenya Marine Fisheries Research Institute Manpower Position-Kisumu........ 63
15. WATER QUALITY BENCHMARKS ....................................................................................... 64 16. COMMUNITY INVOLVEMENT IN WATER QUALITY CONTROL ACTIVITIES........ 66 17. RECOMMENDATIONS............................................................................................................. 67
vi
LIST OF TABLES Table 1: Kenya Drainage Basins and their Surface Water Potentials ........................................... 3 Table 2: Water quality characteristics for Sio River ................................................................... 18 Table 3: Major Point sources in the Nzoia River Catchment ...................................................... 19 Table 4: Water quality characteristics of Nzoia River ................................................................ 20 Table 5: Major Sources of Point Pollution in Yala River ........................................................... 22 Table 6: Water quality characteristics of Yala River ................................................................... 23 Table 7: Major Point Sources of Pollution in River Nyando ...................................................... 24 Table 8: Water quality characteristics for Nyando River ............................................................. 25 Table 9: The Major Point Pollution Sources in River Sondu/Miriu............................................ 27 Table 10: Water quality characteristics for Sondu/Miriu River ................................................... 28 Table 11: The Major Sources of Point Pollution in Gucha/Migori River ..................................... 29 Table 12: Water quality characteristics for Gucha-Migori River................................................. 30 Table 13: Water quality characteristics for Mara River ............................................................... 34 Table 14: Average Discharge and Pollutants Concentration and Loading For Rivers in the
Kenyan Catchment of Lake Victoria............................................................................. 36 Table 15: Inlake Stations............................................................................................................... 36 Table 16: Water Quality Characteristics for the Kenyan Part of Lake Victoria............................ 37 Table 17: Ministry of Water Resources/ LVEMP-Kisumu Laboratory Facilities......................... 40 Table 18: Ministry of Water and Irrigation Western Province-Kakamega Laboratory Facilities . 42 Table 19: Lake Basin Development Authority (LBDA)-Kisumu Laboratory Facilities............... 43 Table 20: Kenya Marine Fisheries Research Institute (KEMFRI)-Kisumu Laboratory Facilities
…………………………………………………………………………………………44 Table 21: Ministry of Water and Irrigation-Lake Victoria Environmental Management
Programme -Water Quality Monitoring Network......................................................... 46 Table 22: Ministry of Water and Irrigation-Provincial Water Office-Kakamega Water Quality
Monitoring Network...................................................................................................... 50 Table 23: Lake Basin Development Authority Water Quality Monitoring Network.................... 52 Table 24: Kenya Marine Fisheries Research Institute Water Quality Monitoring Network......... 54 Table 25: Geo-Referenced Hydrological River Gauging Stations adopted in the Lake Victoria
Water Quality Monitoring Network in The Lake Victoria Basin. ................................ 56 Table 26: Kenya Marine Fisheries Research Institute Water Quality Monitoring Network......... 58 Table 27: LVEMP and Ministry of Water and Irrigation Manpower Assessment Form .............. 60 Table 28: Ministry of Water and Irrigation-Provincial Water Office-Kakamega Manpower
Assessment Form .......................................................................................................... 61 Table 29: Lake Basin Development Authority Manpower Assessment Form.............................. 62 Table 30: Kenya Marine Fisheries Research Institute (KEMFRI) Manpower Assessment Form..
....................................................................................................................................... 63 Table 31 Existing Standards for Discharge of Effluents into Aquatic Environment ................... 65 Table 32: River Gauging Stations ................................................................................................. 69

vii
LIST OF ANNEXES ANNEX 1: KENYA: LOCATION AND DRAINAGE MAP…………………….. 71 ANNEX 2: LAKE VICTORIA BASIN IN KENYA………………………………. 72 ANNEX 3: WATER QUALITY MONITORING IN THE LAKE VICTORIA
BASIN-INLAKE WATER MONITORING STATIONS…………. 73

viii
EXECUTIVE SUMMARY This water quality baseline report has been prepared in line with the terms of reference (TOR) issued by the Nile Transboundary Environmental Action Project. The report focuses closely on the water quality of the Lake Victoria basin in a particular area and that of the Republic of Kenya at large. The preparation of this report has involved both desktop studies covering previous reports relating to the water quality aspects. It also involved field visits, consultations and interviews with various stakeholders. The scope of this study report covers the country’s water resources potential, their management challenges, policy, legal and institutional framework as well as the operations of the country’s water quality monitoring programme. The report is divided into two parts: The first part concentrates on the national aspects of the management of water resources, its availability and distribution, the challenges in the water sector, and the commencement of comprehensive reforms in the water sector following the enactment of a new Water Act 2002. It also discusses the national water quality monitoring programme and its major constraints. The second part deals specifically with the water quality monitoring issues in the Lake Victoria basin in Kenya. This basin, comprising 8% of the territorial area of Kenya contains over 50% of the national surface water resources. Being an internationally shared basin, the Lake Victoria basin is of special interest nationally and internationally. The basin is drained by such major rivers as the Gucha Migori, Sondu Miriu, Nyando, Yala which all drain into Lake Victoria. The second part also highlights some of these constraints in the basin which include its water resources potential, the monitoring network, the status of laboratory equipment, staffing levels, geo-referencing of stations, the database management as well as exchange of information has been covered. The water quality stations of transboundary significance have been provided. The water quality monitoring network is operated by four different institutions whose work is loosely co-ordinated with overlapping mandates and differing levels of staffing. The network is partly geo-referenced and most of the laboratories are not accredited. There is little in terms of information exchange. Recommendations on improving the operations of the water quality monitoring activities and database management as well as training has been advanced. In conclusion, the report indicates that there is need for the harmonization of water quality monitoring stations operated by different stakeholders, the accreditation of the laboratories and their operation on commercial basis, creation of awareness at community level on water quality aspects and the creation of a forum to discuss water quality management issues within the basin. There is also need to embark on data and information exchange within the Kenyan Lake Victoria Basin and at the national level among the various stakeholders.

ix

1
THE NILE BASIN INITIATIVE
NILE TRANSBOUNDARY ENVIRONMENT ACTION PROJECT
THE STATUS OF WATER QUALITY MONITORING IN THE KENYA PORTION OF THE NILE BASIN (LAKE VICTORIA BASIN)
A: NATIONAL OVERVIEW 1. PHYSIOGRAPHY The Republic of Kenya lies on the eastern side of the African continent, between Latitudes 5°40’N and 4°4’S and Longitudes 33°50’ and 41°45’E. The country has a territorial area of 582,640km 2 which includes a water surface area of 11,230km2 . Kenya is characterized by tremendous topographical diversity, in which nearly every landform type ranging from the glaciated mountain to a true desert landscape is represented. The land elevation varies greatly from sea level at the Indian Ocean to over 5,000 m. at the peak of Mt. Kenya. The entire landscape is dominated by a flight of plateaus which conveys the impression of extensive upland plains rather than mountainous environment. The Kenyan climate is primarily controlled by the Inter-Tropical Convergence Zone (ITCZ) and the wide range of topographic relief. As a result of the ITCZ, most parts of the country are characterized by two rainy seasons, March to May (long rains) and October to December (short rains). Air temperatures vary from 40°C. in the low altitude arid areas to below freezing on Mt. Kenya, The average annual rainfall over the country is approximately 620mm and this ranges from less than 250mm in the Arid and Semi-Arid Lands (ASAL) to over l800 mm in the Lake Victoria Basin. Socio-Economic Aspects The economy of Kenya, with a population of 32.2 million people (CBS 2003 population estimate), is largely dependent on agriculture and tourism which are the largest contributors to the GDP. The finance and manufacturing sectors constitute the second largest contributors in terms of GDP. Water plays a key role in the economy as a resource for urban and rural consumption, energy generation, agricultural development, industrial growth and livestock development. Kenya is however classified as a chronically water scarce country with a limited endowment of less than 650M3 per capita per year of fresh water.
2
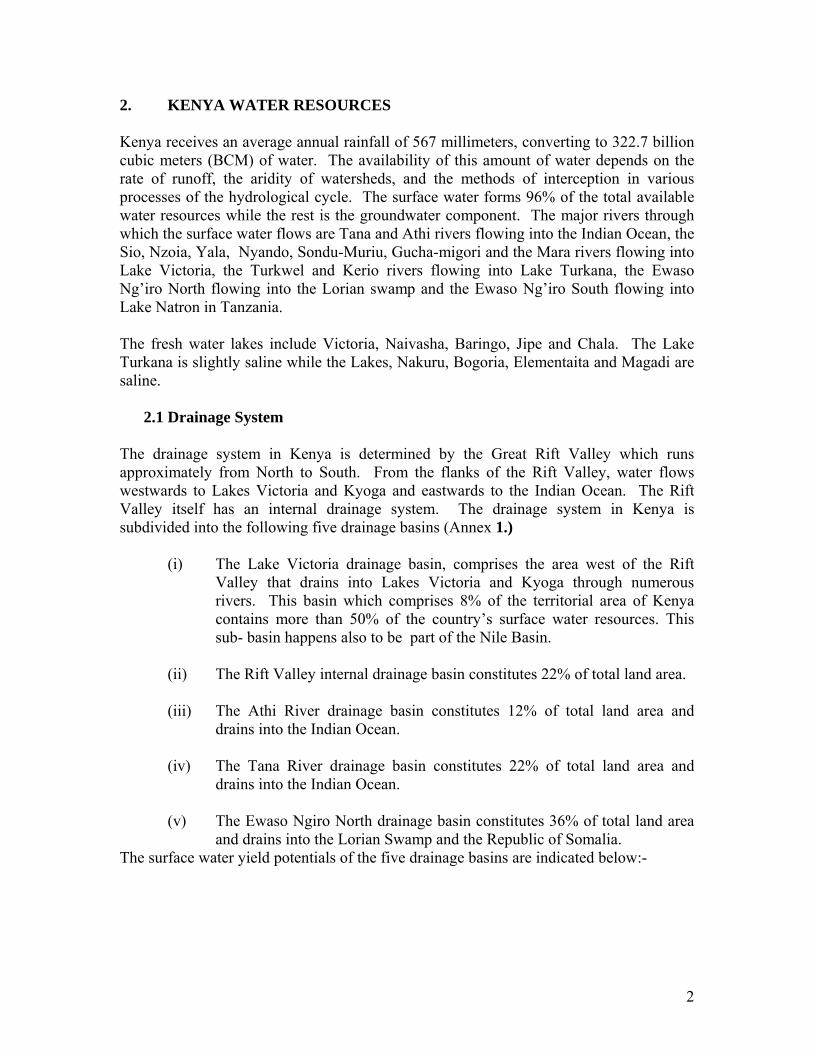
2. KENYA WATER RESOURCES Kenya receives an average annual rainfall of 567 millimeters, converting to 322.7 billion cubic meters (BCM) of water. The availability of this amount of water depends on the rate of runoff, the aridity of watersheds, and the methods of interception in various processes of the hydrological cycle. The surface water forms 96% of the total available water resources while the rest is the groundwater component. The major rivers through which the surface water flows are Tana and Athi rivers flowing into the Indian Ocean, the Sio, Nzoia, Yala, Nyando, Sondu-Muriu, Gucha-migori and the Mara rivers flowing into Lake Victoria, the Turkwel and Kerio rivers flowing into Lake Turkana, the Ewaso Ng’iro North flowing into the Lorian swamp and the Ewaso Ng’iro South flowing into Lake Natron in Tanzania. The fresh water lakes include Victoria, Naivasha, Baringo, Jipe and Chala. The Lake Turkana is slightly saline while the Lakes, Nakuru, Bogoria, Elementaita and Magadi are saline.
2.1 Drainage System The drainage system in Kenya is determined by the Great Rift Valley which runs approximately from North to South. From the flanks of the Rift Valley, water flows westwards to Lakes Victoria and Kyoga and eastwards to the Indian Ocean. The Rift Valley itself has an internal drainage system. The drainage system in Kenya is subdivided into the following five drainage basins (Annex 1.)
(i) The Lake Victoria drainage basin, comprises the area west of the Rift Valley that drains into Lakes Victoria and Kyoga through numerous rivers. This basin which comprises 8% of the territorial area of Kenya contains more than 50% of the country’s surface water resources. This sub- basin happens also to be part of the Nile Basin.
(ii) The Rift Valley internal drainage basin constitutes 22% of total land area. (iii) The Athi River drainage basin constitutes 12% of total land area and
drains into the Indian Ocean. (iv) The Tana River drainage basin constitutes 22% of total land area and
drains into the Indian Ocean. (v) The Ewaso Ngiro North drainage basin constitutes 36% of total land area
and drains into the Lorian Swamp and the Republic of Somalia. The surface water yield potentials of the five drainage basins are indicated below:-

3
Table 1: Kenya Drainage Basins and their Surface Water Potentials
BASIN Area (km2) Mean Annual Rainfall (mm)
Annual Basin Runoff X109M3
Lake Victoria 49,000 1,370 13.80
Rift Valley 130,452 560 3.26
Athi River 66,837 740 1.31
Tana River 126,026 700 3.70
Ewaso Ng’iro North 210,226 410 0.34
2.2 Shared Water Resources
Kenya has a fair proportion of shared water resources with Tanzania, Uganda, Somalia and Ethiopia. Besides the rivers flowing to Lake Victoria and hence forming the headwaters of the River Nile, the Omo River flows to Lake Turkana from Ethiopia, the Daua River from Ethiopia highlands and along the Kenya-Ethiopia border before entering into Somalia while the Umba River flows from Tanzania through Kenya to the Indian ocean, and the Mara river flows from Kenya to Tanzania and enters into Lake Victoria at Mwanza. So far no conflicts have emerged between the riparian countries concerning the utilization of water in these rivers. However, as more projects are proposed and developed in future, conflicts may arise between riparian countries as a result of over-utilization of water from rivers with low flows. In recent years, the water quality for the rivers discharging into Lake Victoria and the lake itself has deteriorated. The discharge of raw or partially treated municipal and industrial pollutants as well as the high levels of silt-laden runoff from the agricultural land and urban areas into the water have posed serious environmental and health problems. The management of the Lake Victoria Basin environment therefore demands the application of an integrated approach in order to achieve an effective reduction of pollutant levels and to conserve the natural resources. To achieve this objective, Kenya is participating in the Lake Victoria Environmental Management Programme which was initiated in 1994 through a Tripartite Agreement between Kenya, Uganda and Tanzania. It is expected that with the implementation of the program, the environmental degradation of the Lake Victoria basin will be greatly reduced and sustainable utilization and development will proceed. There is one principle aquifer at the Kenya/Somalia boundary, the Merti aquifer. Abstraction from this aquifer has so far been low. Although no significant problem is foreseen, detailed studies on shared aquifers will be needed to adequately regulate its usage in the future.

4
3. CHALLENGES IN WATER MANAGEMENT
The management of Kenya water resources has faced serious challenges as a result of factors both within and outside the water sector. These challenges include:-
Resource scarcity leading to intense competition and water use conflicts amongst and between various users. Current water apportionment and enforcement are weak and are fundamentally responsible for the conflicts.
Climate variability leading to frequent floods and droughts and consequently causing massive economic damage.
Growing population with increased demand on water for domestic use, food security, hydropower generation leading to large unmet demand.
Catchment degradation resulting in increased runoff, flash floods, reduced infiltration, erosion and siltation.
Water pollution from urban and rural sewerage and sanitation facilities, industry, agriculture and mines are undermining the country’s water resources, escalating public health risk, curbing economic development and intensifying poverty.
Uncontrolled groundwater development, encroachment on recharge areas and poor management of the resource is causing salt-water intrusion, contamination as well as depletion of the resource.
Proliferation of invasive plant and animal species is imposing a huge cost on the use and operations of water supply and energy facilities, navigation, fishery and public health.
Low investment in water storage facilities. Inadequate capacity for resource assessment. Inadequate water supply and sanitation services in the country. Lack of comprehensive policy, legal and institutional framework to
guide and manage development in the water sector. Lack of effective implementation and coordination mechanisms in the
management and development of water resources. Lack of a strong financial base in the water sector. Lack of coordination between the different water sector actors. Lack of sustainability of water management activities
4. POLICY FRAMEWORK The water policy in application prior to 2003 was not documented but based on government directives and as articulated in various sessional papers and government gazette notices. In most cases, the policy directives were sector specific, while in a few incidences they would touch on national issues and therefore fall squarely on the Water Ministry which, for all practical purposes was and is the custodian of the country’s water resources.

5
The ownership of the country’s water resources is vested on the government. The government has in turn placed this responsibility on the Minister of Water Resources who executes this mandate on the lines laid down in Water Act Cap. 372. The government policy as articulated before the year 2003 laid emphasis on sector specific management. In order to address the weaknesses and challenges facing the water sector and to achieve sustainable management and development of the water resources, the Kenya Government, through various policy documents, had in the past introduced various initiatives aimed at improving the management of water resources and provision of water and sanitation services. These initiatives did not achieve the expected goals. Consequently, the Government prepared Sessional Paper No. 1 of 1999 on National Policy on Water Resources Management and Development, a paper that set-out the framework intended to bring about a culture and practice that would promote comprehensive water resources management and development, bring in decentralization of operational activities from the Central Government to other actors as well as introducing the Private Sector involvement and increased participation of communities in order to improve efficiency in service delivery. The water policy addressed the following four aspects:-
1. Water Resources Management To preserve, conserve, and protect available water resources and to allocate it in a sustainable, rational and economical way;
2. Water Supply and Sewerage Development To supply water of good quality and in sufficient quantities to meet the various water needs, including poverty alleviation, while ensuring safe disposal of wastewater and environmental protection;
3. Institutional Framework To establish an efficient and effective institutional framework able to achieve a systematic management and development of the water sector;
4. Financing of the Water and Sanitation Sector To develop a sustainable financing mechanism for effective water resources management, water supply, and sanitation development.
The policy adopted an integrated water resources management approach as a framework for addressing water requirements in the domestic, agriculture, industry, livestock sectors, etc. The policy also clarified the roles of the different actors along the following lines:
• The Government to provide regulatory and policy guidelines to the sector; • The private and public sector to provide water supply and sanitation services; • The communities to play a role in water resources management.
The policy further adopts the river basin as the management and planning unit and proposes that catchment bodies become responsible for advising on water allocation decisions.

6
The policy also proposes application/introduction of volumetric fees on water abstraction in order to meet costs on assessment, monitoring, conservation and the general management of water resources and adopts a polluter-pays principle as a mechanism towards effective control of water pollution. 5. LEGAL FRAMEWORK Until the year 2002, the Water Act Cap. 372 of the Laws of Kenya constituted the legal document for the management of water resources in Kenya. Its objective was to make better the provision for the conservation, control, apportionment and use of the water resources of Kenya and for other purposes incidental to and connected with the management of the same. The Water Act was first enacted in 1962 and revised in 1972. The custodian of the Water Act was the Water Apportionment Board which ensured the implementation of water management requirements as stipulated within the Act. The Board was under the technical advise of water development department and its powers stemmed from those of the Minister in-charge of water development matters. The minister appointed the Board as stipulated in the Act. The ownership of water in Kenya is vested in the Government and the Minister is empowered to discharge those powers arising out of the Act or to delegate such powers to the Board. Under the technical advise of the Director of Water Development, the Board was mandated to make further regulations for the better management of the country’s water resources. It was also empowered to issue permits or licenses pertaining to water usage and to cancel or withdraw any water rights issued to the user subject to such action being in line with the requirements of the Water Act. The Water Apportionment Board was also empowered to direct the better protection and conservation of the country’s water resources and catchment areas. The Water Act Cap 372 was found to fall short of closely facilitating the management of the country’s water resources particularly from water pollution. In this regard, the Act has been revised and it is envisaged that the revised edition which has now been enacted and released for implementation will allow the management of water resources to be in conformity with day-to-day technological and legal requirements. The Water Act 2002 became operational on 18th March, 2003 and provides an enabling institutional and legal framework for the implementation and realization of the objectives stated in the National Policy on Water Resources Management and Development in the country. The Act provides the basis for the commencement of comprehensive reforms in the water sector which include:
(i) Defining the roles of the various actors in the water sector and thereby minimizing or eliminating conflicts in institutional responsibilities.
(ii) Establishment of effective, efficient and autonomous institutions to manage water resources and provide water and sanitation services.

7
(iii) Attract investment through partnership with water and sewerage companies formed by Local Authorities and lending from the international and local financial institutions. To realize this objective, a Water Services Trust Fund (WSTF) has been established to provide the financial resources for the development of water and sewerage infrastructure mainly in the areas without adequate water services.
(iv) Refocus the role of the Ministry in charge of water affairs to policy formulation, guidance and sourcing for investment funds.
Towards this end, the following institutions have been established to operate as state corporations:-
(a) The Water Resources Management Authority (WRMA) has the
overall responsibility of ensuring the good management of the country’s water resources.
(b) The Water Services Regulatory Board (WSRB) is responsible for
the regulation of water and sewerage services in partnership with Kenyans.
(c) The Water Services Boards (WSBs) of which there are seven in the
country are responsible for the efficient and economical provision of water and sewerage services within their areas of jurisdiction.
(d) The Water Appeal Board (WAB) will provide a mechanism for
dispute resolution.
The WRMA is responsible for the following:
• To develop principles, guidelines and procedures for the allocation of water resources.
• To monitor, and from time to time to re-assess, the national water resources management strategy.
• To receive and determine applications for water use permits. • To monitor and enforce conditions attached to permits for water
use. • To regulate and protect water resources quality from adverse
impacts. • To manage and protect water catchment areas. • To determine charges to be imposed for the use of water from any
water resource. • To appoint Catchment Area Advisory Committees (CAACs) who
will advise officers of the Authority at the appropriate regional office on:-
• Water resources conservation, use and apportionment; • The grant, adjustment, cancellation or variation of any permit;

8
• To deal with any other matters pertinent to the proper management of water resources in the country.
The Water Act 2002 further provides for the formulation of a National Water Resources Management Strategy and National Water Services Strategy to operationalise the National Policy on Water Resources Management and Development. In this regard, the Government through the Ministry of Water and Irrigation has drafted a Country Strategy Paper on Integrated Water Resources Management addressing the problems facing water resources management. These problems are centred around:
Inadequate and unsustainable water resources management practices. Weak water allocation procedures. Lack of clear roles of different actors. Weak enforcement capacity and inadequate financing.
Water Sector Reforms The on-going water sector reforms in Kenya are expected to positively affect the management of water resources and water quality in that the Government, through the Water Resources Management Authority, has identified the weaknesses in the current water resources management processes and is establishing the necessary institutions to effectively and efficiently mange the water resources. It will strengthen the National Water Quality monitoring Program to achieve effective water quality monitoring. 6. INSTITUTIONAL FRAMEWORK-WATER SECTOR PLAYERS Prior to 2003, the institutional framework for water resources management in Kenya was complex entailing many actors mandated by the Water Act Cap. 372 of the Laws of Kenya as well as sub-sectoral legislation. The ultimate responsibility for water resources management however rested with the Ministry of Water Resources which operated a large number of rural water supply schemes and was responsible for monitoring both its quantity and its quality. At the same time, there were other agencies who were engaged in either separate, augmenting or parallel water management activities. The institutions involved in the water management are as follows:
6.1 Ministry of Water and Irrigation.
The Ministry of Water & Irrigation is the main custodian of water resources in Kenya and has the responsibility for policy formulation and regulation of the water sector activities.
The functions of the Ministry include planning, implementing and operating gazetted water supplies in rural and urban areas with some exceptions which are either under respective local authorities. The Ministry is also responsible for water resources management which encompasses the following:
• Regular Review of the Water Act.

9
• Assessment of water resources. • Development of strategies and methods of preservation, conservation,
utilization and apportionment of water resources. • Enforcement of water pollution control regulations in accordance
with the provisions of the Water Act. • Review of national water drinking standards. • Coordination, collection, analysis and maintenance of water resources
data.
(a) The National Water Conservation and Pipeline Corporation (NWC&PC) The National Water Conservation and Pipeline Corporation was established in 1988 as a parastatal body in the Ministry of Water Resources with a long term objective of managing water supplies in a self sustaining manner and to supply water to users at an affordable level. In pursuit of the stated objectives, several water schemes which were under the Ministry of Water both operational and at the planning, design and construction stages were transferred to the Corporation shortly after its formation including the operation and maintenance personnel attached to the schemes. Currently, the Corporation operates and maintains many water supplies in rural and urban areas throughout the country.
(b) The Kenya Water Institute (KEWI) The Kenya Water Institute was started in the 1960s as a staff training school in the Ministry of Water Development. Its role was in the training of para-professionals in the water sector who were absorbed by the Ministry. The Institute has since expanded its role from training of para-professionals for the Ministry’s exclusive use to offering training of more diversified personnel on water management and development for the entire water sector.
6.2 The Ministry of Local Authorities
The Ministry of Local Authorities through powers delegated by the Minister for Water Resources undertakes to manage and develop water resources within the urban areas which have been identified and agreed on between the two parties. The Ministry has been responsible through the respective local authorities for water and sewerage services in the towns and municipalities encompassing all the various stages of project development.
6.3 Ministry of Health
There are two major departments under the Ministry of Health, which are closely associated with water management issues. These include the Public Health and the Government Chemist Departments.

10
(a) Public Health Department The Ministry of Health through the Public Health Division is involved in the provision of preventive health-care through:-
Mobilizing and sensitizing of communities on water and sanitation matters through identification, planning and selecting appropriate technologies.
Water Quality Surveillance. Water supply improvement at household and small groups levels. Water quality monitoring and prosecution of offenders. Environmental sanitation and hygiene promotion.
In the execution of these roles, the Public Heath Department collaborates with other actors notably the Ministry in charge of Water Affairs, the Ministry of Culture and Social Services, NGOs, and donors. The Ministry of Health lays emphasis on promotion of preventive health and hygiene and in this regard, management of water quality and adequate sanitation are given prominent consideration. (b) Government Chemist Department
The Government Chemist functions were recently put under the Ministry of Health. Its roles in the water sector include:_ • Testing and analysis of water for drinking, industrial, agricultural,
fisheries; • Undertakes the analysis of water and effluent samples to acquire evidence
presentable in court as evidence for the enforcement of various regulations relating to water pollution.
6.4 Ministry of Agriculture
The Ministry of Agriculture involvement in the water resources sector is currently limited to soil and water conservation . The soil and conservation operations are directed towards catchment protection for improved water resources management. The Ministry of Agriculture through the soil and water conservation operations aims at the following: (i)Training on identification, planning, implementation, and operation and
maintenance of the various necessary structures. (ii) Water spreading banks. (iii)Soil erosion control banks. (iv) Rock water catchment. (v) Water collection pans. (vi) Sub-surface bunks. (vii)Rehabilitation of rangelands. (vii)Tree nurseries.

11
6.5 The Ministry of Regional Development
The regional development authorities include the Lake Victoria Development Authority, the Tana and Athi Rivers Development Authority, the Ewaso Ng’iro North Development Authority, the Ewaso Ng’iro South Development Authority, Kerio Valley Development Authority and the Coast Development Authority. These authorities are catchment based and their roles in water resources management involve coordinating the abstraction and use of water resources, water-based developments, water conservation measures, promotion and participating in catchment protection and data collection.
6.6 Ministry of Environment, Natural Resources and Wildlife (MENR & W)
The Ministry is responsible for the national environmental protection and plays a significant role in catchment, water quality and quantity protection.
(a) The National Environment Management Authority (NEMA)
The Environment Management and Coordination Act of 1999 (EMCA) which operates under the MENR & W has elaborate provisions for the protection and conservation of the environment with specific references to rivers, lakes and wetlands. In this regard, the Act enables NEMA in consultation with the relevant agencies to issue guidelines for the management of the rivers’ and lakes’ environment. The act ensures the preparation of Environmental Impact Assessment Reports and Audit(s) for all projects as one way of ensuring that development and on-going projects have minimal impact on the environment and in particular on the state of the water resources in the country.
6.7 Other Institutions Other institutions playing minor roles in the water sector include:
• Ministry of Livestock and Fisheries Development. • Ministry of Home Affairs, National Heritage and Social Services. • Ministry of Transport and Communications (Kenya Meteorological Department). • Ministry of Energy.
7. WATER QUALITY AND POLLUTION CONTROL PROGRAMME
7.1 Water Quality Guidelines and Standards The long-term objective of the Kenya Government is to ensure that all residents in the country have access to clean and potable water, and that water is available for various economic activities such as agriculture, industry, power generation, tourism etc. This is only possible if the available water resources are protected from pollution. Surface and ground water resources in Kenya are increasingly becoming polluted from both point and non-point sources caused by the activities in agriculture, urbanization,

12
industry, leaches from garbage dumps, sediments, salts, fertilizers and pesticide residues as well as the increased catchment degradation. Lack of effective pollution control compromises the quality of water posing potential health hazards and increasing treatment and maintenance costs. Water pollution exacerbates water scarcity because it limits the use by, or imposes a higher cost for treatment to down stream users. Most municipal sewerage plants in the country discharge partially treated or untreated wastewater into surface water courses, posing significant health hazards and localized eutrophication. Pit latrines and septic tanks located in recharge zones constitute a risk in form of groundwater contamination. Tanneries, pulp and paper mills, coffee processing factories, breweries and sugar cane processing facilities typically do not have properly functioning wastewater treatment plants and their effluents contribute significant organic loads, heavy metals and other toxic substances to receiving waters. As an effort to address the pollution problem and maintain acceptable water quality in the rivers and lakes of Kenya in the face of increasing pollution problems, a Water Quality and Pollution Control Division was established in 1973 in the Water Department of the then Ministry of Agriculture. Its responsibilities included water pollution control, monitoring of water quality, drinking water surveillance and environmental impact assessment. The Ministry established field monitoring stations and stationed officers in the provinces to monitor water quality and enforce water pollution control regulations. The World Health Organization (WHO) recommended the adoption and application of WHO drinking water standards and the Royal Commission standards for effluent discharge. In 1980, the Kenya Government initiated a nationwide Water Quality Monitoring Programme through the then Ministry of Water Development. The Ministry also issued guidelines for effluents standards for control of water pollution.. Under the programme, two basic types of stations were established:-
(i) Reference/baseline stations were established in the upper catchments of the major rivers and designed to provide baseline data on natural water quality in upland areas relatively unaffected by human activity.
(ii) Impact stations were sited downstream of major agricultural activities and industrial as well as municipal areas near to known point sources of pollution specifically for water pollution assessment purposes. Similar sampling stations were located further downstream of such point sources to assess the self purification capacity of such rivers.
The programme called for each station to be sampled four times each year in January / February (dry hot period), April/May (long rains period), June/July (dry, cold period), and October / November, (short rains period). Samples from other sources outside the network were to be collected and anlysed on an irregular basis or as the need arose.

13
This monitoring programme was however constrained by lack of adequate of funding which lead to other logistical problems such as lack of adequate analytical capacity and facilities. Consequently, there has been inadequate pollution control and enforcement measures and weak institutional capacity to monitor water quality and effluent discharges from industries and sewerage works. Further, there is a general lack of awareness of the impacts of pollution and a general disregard of the needs and rights of other water users.
7.2. Policy Direction in Water Quality Monitoring Under the new legal framework established by the Water Act 2002, the Kenya Government, through the Water Resources Management Authority, intends to strengthen the National Water Quality Monitoring Programme to achieve effective monitoring of the country’s water resources. In this regard, water abstraction and effluent disposal licenses will be constantly reviewed and effluent discharge levies introduced as instruments for pollution control. The level of the levy will be set to cover the cost of treatment required for individual effluent discharges in line with the Polluter – Pays Principle as stipulated in the Water Act 2002. The Government has approved the following strategic process to operationalise an effective water quality and pollution control programme for sustainable water resources management:-
(i) Establishment of effective water quality and effluent discharge standards and guidelines and enforcement system for water quality and pollution control.
(ii) Strengthening the capacity to monitor and enforce water quality and effluent discharge standards.
(iii) Ensuring implementation of activities geared towards classifying water bodies according to quality.
(iv) Creating awareness on the effects of pollution. This strategic plan has proposed the following activities:-
Undertake studies on the extent and effect of pollution. Prepare standards and guidelines for effluent discharge. Strengthen the National Water Testing Laboratory and its regional branches for
effective water testing. Develop, implement and monitor water quality and pollution control management
plans. Enforce Environmental Impact Assessment (EIA) on proposed projects and land
use changes. Establish laboratory linkages and accreditation mechanisms for the analytical
laboratories. Involve the land owners in water pollution control. Cross-check implementation of related activities of classifying water bodies
according to quality. Create awareness.

14
B: THE LAKE VICTORIA BASIN WATER QUALITY MONITORING PROGRAMME
8. THE LAKE VICTORIA BASIN IN KENYA
8.1 Introduction The Lake Victoria sub-basin in Kenya is part of the Nile Basin system. This sub-basin has a drainage area of 49,000 km2, and includes 4,000km2 of lake surface area. The sub-basin comprises the whole area west of the Rift Valley draining into both Lake Victoria and Lake Kyoga through numerous perennial rivers. Rivers discharging directly into Lake Victoria include Nzoia, Yala, Nyando, Sondu-Miriu and Gucha-Migori. River Mara on the other hand crosses the national boundary and discharges into Lake Victoria through the Republic of Tanzania. River Sio discharges into Lake Victoria along the Kenya/Uganda border while the Malaba – Malakisi river system discharges into Lake Kyoga. (Annex 2) The basin has a mean annual water volume potential of 13X109 m3/year with a standard deviation of 5 x10⁹ m3/year. The basin constitutes 8% of the total land area of the country and contributes over 50% of the available surface water resources in the country. The Lake Basin has a climate which is humid and receives on average 1300 mm. of rainfall per year. The basin is vulnerable to floods in the lower catchment areas and to environmental and land degradation in the upper catchment areas. Lake Victoria constitutes a medium in which fish thrives and this constitutes a source of protein for local consumption and a major export product. The lake is also a medium for aquatic biodiversity, transportation, recreation and moderation of local climate. The lake also acts as a medium for disposal of wastes and is also a source of water borne diseases. The lake catchment area with its high rainfall potential is particularly important for its agricultural and infrastructural uses. This rainfall also contributes a high proportion of surface runoff which is carried into rivers and eventually into Lake Victoria bringing with it a broad spectrum of large amounts of pollutants.
8.2 Water Quality Monitoring Programme A nationwide Water Quality Monitoring Program was initiated by the Ministry of Water in 1980 through which a number of monitoring stations were established. The Lake Victoria Basin network covered all the major rivers and the Lake Victoria part of Kenya. While the Kenyan portion of Lake Victoria is a relatively small in size, its self-purification capabilities are affected by its configuration and the shallow depth averaging about six metres. With a population of about 12 million people in the basin, the demands for water has been, and will continue to exert pressure on the resources within the lake basin.
15
Anthropogenic pollutants have led to changes in the lake ecosystem. Fish stocks have been decreasing as well as biodiversity and algae blooms are frequent while turbidity drastically reduces transparency. The water hyacinth which has been a problem in the lake due to its rapid proliferation has now been put under control although occasional infestations are reported now and then. Since the late 1990’s the three East African countries of Kenya, Tanzania and Uganda have been implementing the Lake Victoria Environmental Management Project (LVEMP) as a comprehensive environmental program for the conservation of Lake Victoria waters and its catchment. Water quality sampling and analysis is undertaken mainly by the following institutions:
(i) The Ministry of Water and Irrigation jointly with the Lake Victoria Environmental Management Programme (LVEMP) operates most of the stations established by the ministry. There are however a few monitoring stations which are operated independently by the provincial staff in Western province.
(ii) The Lake Victoria Environmental Management Program operates about 100 monitoring stations which are aligned to the hydrological river gauging network in the basin.
(iii) The Kenya Marine Fisheries Research Institute (KEMFRI) operates eighteen water quality monitoring stations located at the major river mouths, at the bays and islands in the Lake Victoria. Table 24.
(iv) The Lake Basin Development Authority (LBDA) operates over thirty water quality monitoring stations within the basin. Most of these stations coincide with the stations operated by the LVEMP.
A summary of the water quality monitoring network, the frequency of sampling and parameters tested is contained in tables 21, 22, 23, 24. The sampling stations which are currently geo-referenced and are operated by the Ministry of Water and Irrigation and LVEMP are contained in table 25 while table 26 provides geographic sites of the stations operated by the Kenya Marine Fisheries Research Institute. 9. WATER POLLUTION MONITORING PROGRAMME The pollution of Lake Victoria waters can be attributed to the discharge of domestic sewage and industrial effluents, agricultural runoff laden with silt, residual fertilizers, agrochemicals and other indeterminate range of pollutants from urban areas and direct atmospheric depositions. This deterioration is further exacerbated by in-lake pollution activities mostly along the lake littoral zone and interference with littoral and terrestrial wetlands. These wetlands act as traps and sinks of pollutants in addition to being rich in biodiversity and a source of wetland products. All these problems are attributed to increasing population, which exerts pressure on the natural resources.

16
Pollution sources in the Lake Victoria Basin fall into two categories, namely point and non-point sources.
Point sources have traceable and quantifiable origins e.g. sewage effluent outlets which can be controlled at source and efforts should always be made to ensure that this is realized.
Non-point sources cannot be attributed to a particular spot but originates from diffuse sources. Regulation of such pollutants can be realized through good practices and management in the farmland and such other areas.
9.1 Point Sources of Pollution
The following have been identified as the main point pollution sources that require attention and closer monitoring:
• Industrial wastes sources: Sugar Industries-Miwani, Nzoia, Chemilil, Muhoroni, Sony. Paper Industries-Webuye. Fish Industries-Migori/Homa Bay.
• Municipal sewage works and related sources. Kericho, Kitale, Webuye, Kakamega, Homa Bay, Kisii, Eldoret, Kisumu, Busia, Bungoma, Kendu Bay.
• Oils and lubricants from workshops, garages and fuelling stations, such as Kenya Railways locomotive shed and marine workshops, petrol stations and Jua kali garages.
• Human wastes and refuse from market and urban centres and fish landing villages.
Most of the industrial and municipal wastes are inadequately treated or treatment suffers from poor maintenance of the existing effluent treatment systems.
9.2 Non-Point Sources As man strives for development and provision of his needs he maximizes on the exploitation of the natural resources around him or destroys some resources to give room for other development activities without regard to his future needs. Sustainable utilization of the resources is never considered. This results in:
• Environmental degradation especially catchment and wetlands destruction. • Release of high nitrate and phosphate quantities into the environment due to poor
application of agricultural chemicals. • Soil erosion due to poor agricultural practices resulting in soil cover destruction or
overgrazing.

17
10. IMPACTS OF POINT AND NON-POINT SOURCES OF POLLUTION TO MAJOR RIVERS IN LAKE VICTORIA BASIN
As one will observe, different rivers experience differing magnitudes of pollution problems, depending on the type of activities being undertaken in the basin. The following is a brief on some of the major rivers in the Lake Victoria Basin and their water quality status based on parameters monitored from time to time.
10.1 Rivers 10.1.1 Sio River The Sio River discharges its waters into Lake Victoria along the Kenya/Uganda border. It has a catchment area of 1437 km2. Sio River is an important national and transboundary river system, which supplies water for agricultural activities to livestock and for domestic purposes. Due to the absence of major industries and towns in this catchment area, the magnitude of water pollution of the river is mainly from non-point sources. The major pollutants include fertilizers, pesticides as well as soil erosion arising from confined agricultural practices, soil cover destruction and overgrazing. The Sio River water quality can be considered as suitable for agricultural and livestock watering purposes at the present time but water treatment would be essential to render the waters suitable for domestic and industrial water supply purposes. A summary of water quality characteristics of Sio River are indicated in table 2.

18
Table 2 : Water quality characteristics for Sio River date sampled
date received
sample details
TN (mg/l)
NO2 (mg/l)
NO3 (mg/l
NH3 (mg/l)
TDN (mg/l)
TPN(mg/l)
DON (mg/l)
TP (mg/l)
PO4(mg/l
TDP(mg/l
3/15/02 3/17/02 Sio IHA1 0.0562 0.4821 0.13 0.107 0.08
3/15/02 3/17/02 Sio walatsi 0.0996 0.5647 0.179 0.079 0.105
3/15/02 3/17/02
Sio/Kosumu IAH Misc 0.0642 0.4545 0.138 0.097 0.064
9/24/02 9/26/02
Sio-Mandike water point 0.065
date sampled
date received
sample details elec p.h temp
DO (mg/l)
Turb (n.tu)
TN (mg/l)
NO2 (mg/l)
NO3 (mg/l
NH3 (mg/l)
TDN (mg/l)
TPN (mg/l)
DON (mg/l)
TP (mg/l)
PO4 (mg/l
TDP (mg/l)
TPP (mg/l)
7/15/2003 7/18/03 Sio IAH 0.061 0.027 0.033
9/4/2004 9/10/04 Sio IAH MISC 1.36 0.87
7/17/2003 7/18/03 Sio IAH1 0.381 0.047 0.076
5/29/2004 6/10/04 Sio IAH1 0.002 0.351 0.246 0.099 0.136 0.09
9/4/2004 9/10/04 Sio IAH1 0.91 0.5
3/14/2004 3/17/04 Sio IAHmisc 0.053 0.163 0.079 0.047
3/15/2004 3/17/04 Sio IAHmisc 0.019 0.166 0.078 0.039
5/29/2004 6/10/04 Sio IAHnew 0.59 0.002 0.466 0.301 0.011 0.08 0.002
3/15/02 3/17/02 Sio IHA1 7.56 0.0562 0.4821 0.13 0.107 0.08
3/15/02 3/17/02
IAH Misc Sio Walatsi 7.34 0.0996 0.5647 0.179 0.079 0.105
3/15/02 3/17/02
Sio at Kosumu IAH Misc 7.55 0.0642 0.4545 0.138 0.097 0.064
9/24/02 9/26/02
Sio-Mandike water point 0.065
19
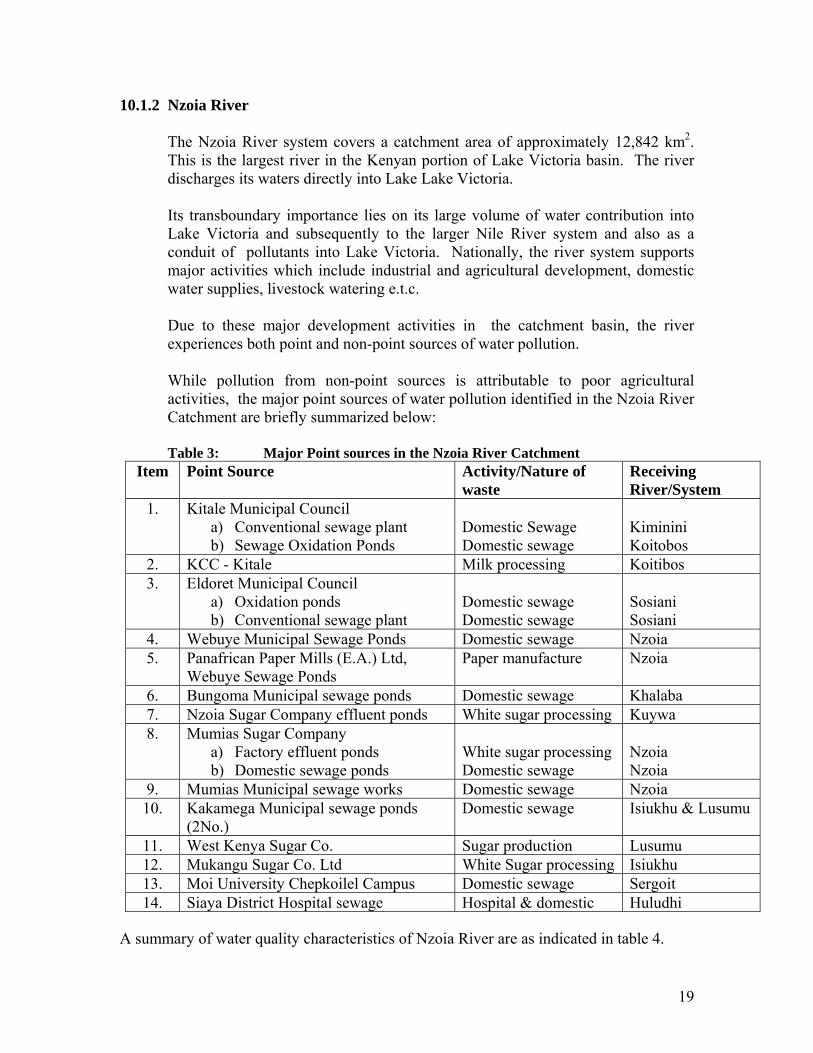
10.1.2 Nzoia River The Nzoia River system covers a catchment area of approximately 12,842 km2. This is the largest river in the Kenyan portion of Lake Victoria basin. The river discharges its waters directly into Lake Lake Victoria. Its transboundary importance lies on its large volume of water contribution into Lake Victoria and subsequently to the larger Nile River system and also as a conduit of pollutants into Lake Victoria. Nationally, the river system supports major activities which include industrial and agricultural development, domestic water supplies, livestock watering e.t.c. Due to these major development activities in the catchment basin, the river experiences both point and non-point sources of water pollution. While pollution from non-point sources is attributable to poor agricultural activities, the major point sources of water pollution identified in the Nzoia River Catchment are briefly summarized below:
Table 3: Major Point sources in the Nzoia River Catchment Item Point Source Activity/Nature of
waste Receiving River/System
1. Kitale Municipal Council a) Conventional sewage plant b) Sewage Oxidation Ponds
Domestic Sewage Domestic sewage
Kiminini Koitobos
2. KCC - Kitale Milk processing Koitibos 3. Eldoret Municipal Council
a) Oxidation ponds b) Conventional sewage plant
Domestic sewage Domestic sewage
Sosiani Sosiani
4. Webuye Municipal Sewage Ponds Domestic sewage Nzoia 5. Panafrican Paper Mills (E.A.) Ltd,
Webuye Sewage Ponds Paper manufacture Nzoia
6. Bungoma Municipal sewage ponds Domestic sewage Khalaba 7. Nzoia Sugar Company effluent ponds White sugar processing Kuywa 8. Mumias Sugar Company
a) Factory effluent ponds b) Domestic sewage ponds
White sugar processing Domestic sewage
Nzoia Nzoia
9. Mumias Municipal sewage works Domestic sewage Nzoia 10. Kakamega Municipal sewage ponds
(2No.) Domestic sewage Isiukhu & Lusumu
11. West Kenya Sugar Co. Sugar production Lusumu 12. Mukangu Sugar Co. Ltd White Sugar processing Isiukhu 13. Moi University Chepkoilel Campus Domestic sewage Sergoit 14. Siaya District Hospital sewage Hospital & domestic Huludhi
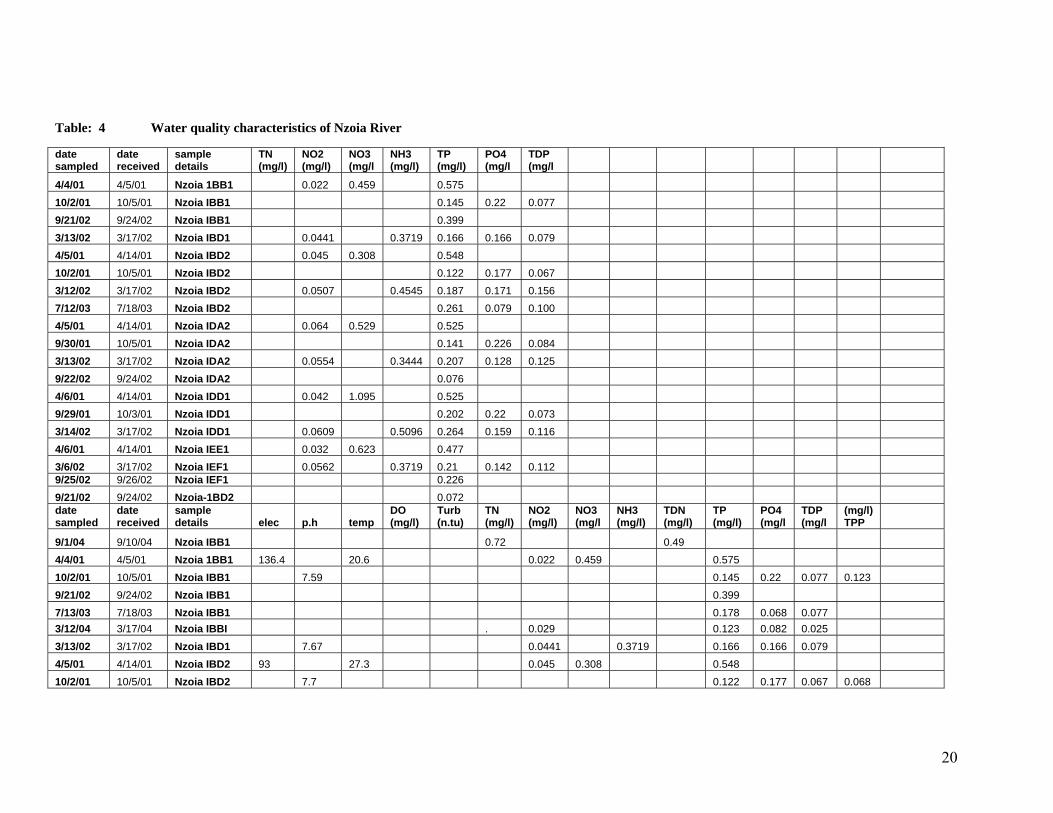
A summary of water quality characteristics of Nzoia River are as indicated in table 4.
20
Table: 4 Water quality characteristics of Nzoia River date sampled
date received
sample details
TN (mg/l)
NO2 (mg/l)
NO3 (mg/l
NH3 (mg/l)
TP (mg/l)
PO4 (mg/l
TDP (mg/l
4/4/01 4/5/01 Nzoia 1BB1 0.022 0.459 0.575 10/2/01 10/5/01 Nzoia IBB1 0.145 0.22 0.077 9/21/02 9/24/02 Nzoia IBB1 0.399 3/13/02 3/17/02 Nzoia IBD1 0.0441 0.3719 0.166 0.166 0.079 4/5/01 4/14/01 Nzoia IBD2 0.045 0.308 0.548 10/2/01 10/5/01 Nzoia IBD2 0.122 0.177 0.067 3/12/02 3/17/02 Nzoia IBD2 0.0507 0.4545 0.187 0.171 0.156 7/12/03 7/18/03 Nzoia IBD2 0.261 0.079 0.100 4/5/01 4/14/01 Nzoia IDA2 0.064 0.529 0.525 9/30/01 10/5/01 Nzoia IDA2 0.141 0.226 0.084 3/13/02 3/17/02 Nzoia IDA2 0.0554 0.3444 0.207 0.128 0.125 9/22/02 9/24/02 Nzoia IDA2 0.076 4/6/01 4/14/01 Nzoia IDD1 0.042 1.095 0.525 9/29/01 10/3/01 Nzoia IDD1 0.202 0.22 0.073 3/14/02 3/17/02 Nzoia IDD1 0.0609 0.5096 0.264 0.159 0.116 4/6/01 4/14/01 Nzoia IEE1 0.032 0.623 0.477 3/6/02 3/17/02 Nzoia IEF1 0.0562 0.3719 0.21 0.142 0.112 9/25/02 9/26/02 Nzoia IEF1 0.226 9/21/02 9/24/02 Nzoia-1BD2 0.072 date sampled
date received
sample details elec p.h temp
DO (mg/l)
Turb (n.tu)
TN (mg/l)
NO2 (mg/l)
NO3 (mg/l
NH3 (mg/l)
TDN (mg/l)
TP (mg/l)
PO4 (mg/l
TDP (mg/l
(mg/l) TPP
9/1/04 9/10/04 Nzoia IBB1 0.72 0.49 4/4/01 4/5/01 Nzoia 1BB1 136.4 20.6 0.022 0.459 0.575 10/2/01 10/5/01 Nzoia IBB1 7.59 0.145 0.22 0.077 0.123 9/21/02 9/24/02 Nzoia IBB1 0.399 7/13/03 7/18/03 Nzoia IBB1 0.178 0.068 0.077 3/12/04 3/17/04 Nzoia IBBI . 0.029 0.123 0.082 0.025
3/13/02 3/17/02 Nzoia IBD1 7.67 0.0441 0.3719 0.166 0.166 0.079 4/5/01 4/14/01 Nzoia IBD2 93 27.3 0.045 0.308 0.548 10/2/01 10/5/01 Nzoia IBD2 7.7 0.122 0.177 0.067 0.068

21
3/12/02 3/17/02 Nzoia IBD2 7.78 0.0507 0.4545 0.187 0.171 0.156 7/12/03 7/18/03 Nzoia IBD2 0.261 0.079 0.100
3/11/04 3/17/04 Nzoia IBD2 0.019 0.088 0.075 0.037
5/26/04 6/10/04 Nzoia IBD2 0.741 0.002 0.435 0.476 0.11 0.078 0.051
5/26/04 6/10/04 Nzoia IBD2 0.003 0.222 0.356 0.146 0.108 0.08
9/1/04 9/10/04 Nzoia IBD2 0.49 0.32 4/5/01 4/14/01 Nzoia IDA2 95.4 22.4 0.064 0.529 0.525 9/30/01 10/5/01 Nzoia IDA2 7.88 0.141 0.226 0.084 0.002 3/13/02 3/17/02 Nzoia IDA2 7.34 0.0554 0.3444 0.207 0.128 0.125 9/22/02 9/24/02 Nzoia IDA2 0.076 7/15/03 7/18/03 Nzoia IDA2 0.278 0.071 0.124
3/12/04 3/17/04 Nzoia IDA2 0.054 0.144 0.108 0.047
5/27/04 6/10/04 Nzoia IDA2 0.76 0.003 0.553 0.671 0.207 0.099 0.051
9/1/04 9/10/04 Nzoia IDA2 0.67 0.3 4/6/01 4/14/01 Nzoia IDD1 81.2 22.9 0.042 1.095 0.525 9/29/01 10/3/01 Nzoia IDD1 7.49 0.202 0.22 0.073 0.082 3/14/02 3/17/02 Nzoia IDD1 7 0.0609 0.5096 0.264 0.159 0.116 7/15/03 7/18/03 Nzoia IDD1 0.314 0.068 0.135
3/14/04 3/17/04 Nzoia IDD1 0.033 0.179 0.119 0.051
5/28/04 6/10/04 Nzoia IDD1 0.884 0.005 0.506 0.482 0.146 0.101 0.061
9/1/04 9/10/04 Nzoia IDD1 0.62 0.47 4/6/01 4/14/01 Nzoia IEE1 78 24.3 0.032 0.623 0.477
3/16/04 3/17/04 Nzoia IEE1 0.027 0.136 0.117 0.066 3/16/02 3/17/02 Nzoia IEF1 7.59 0.0562 0.3719 0.21 0.142 0.112 9/25/02 9/26/02 Nzoia IEF1 0.226 7/17/03 7/18/03 Nzoia IEF1 0.175 0.045 0.054
3/17/04 3/18/04 Nzoia IEF1 0.031 0.139 0.115 0.051 5/30/04 6/10/04 Nzoia IEF1 0.937 0.002 0.481 0.365 0.097 0.101 0.072
9/3/04 9/10/04 Nzoia IEF1 0.82 0.3 9/21/02 9/24/02 Nzoia-BD2 0.072

22
10.1.3 River Yala The Yala River with a catchment area of 3,357 km2 discharges into Lake Victoria directly from its Yala catchment basin. Its transboundary importance lies on its volume of water contribution into Lake Victoria and as a carrier of pollutants into Lake Victoria. Nationally, the Yala River system supports major activities which include domestic water supplies to the towns within its catchments, minor industrial concerns and agricultural activities. The river system is prone to both non-point and point sources of pollution. The non-point sources of pollution encompass:
• Environmental degradation through catchment and wetlands destruction • Release of high nitrate and phosphate quantities and other chemicals into the
environment as a result to poor application on land. • Soil erosion due to poor agricultural practices, soil cover destruction and
overgrazing The major sources of point pollution are presented in Table 5. Table 5: Major Sources of Point Pollution in Yala River
Item Identifiable Source Type of waste Receiving River System
1. Moi University Sewage treatment works Domestic sewage Kesses 2. Kapsabet Municipal sewage works Domestic sewage Mokong’ 3. KCC- Kapsabet Milk processing Kesses 4. Bondo T. T. C. Sewage Works Domestic sewage Yala
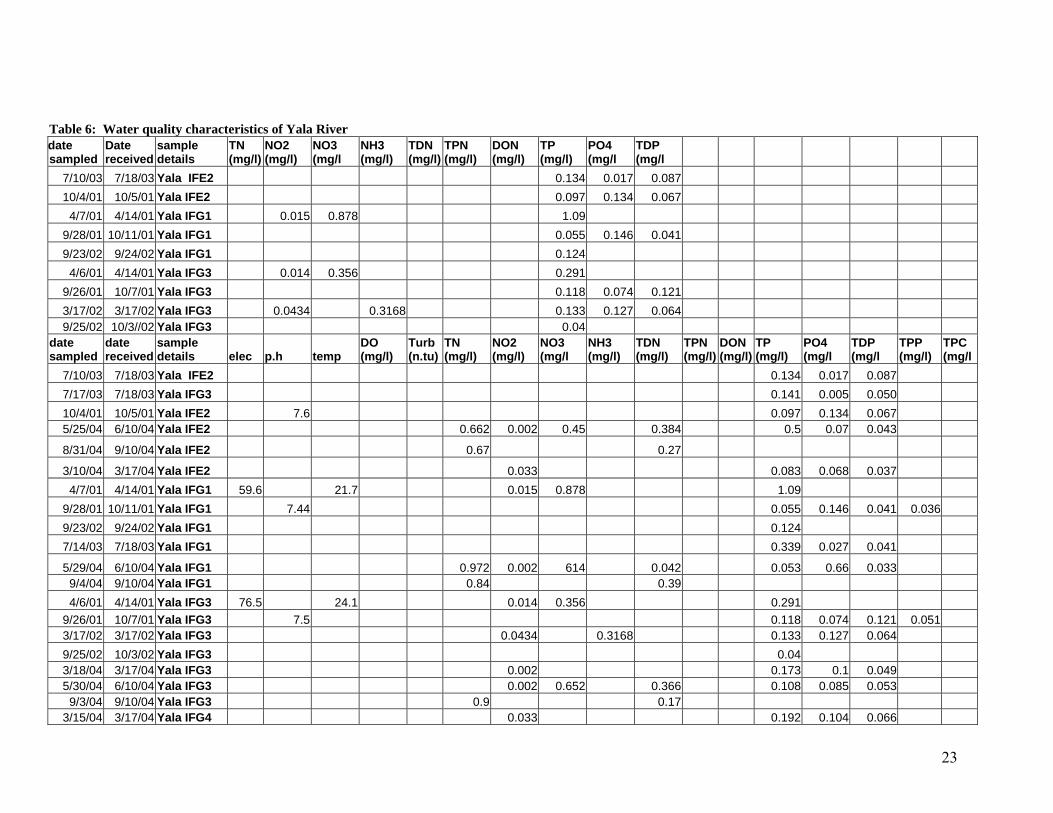
The water quality characteristics of the River Yala at the monitoring points are indicated in table 6.
23
Table 6: Water quality characteristics of Yala River date sampled
Date received
sample details
TN (mg/l)
NO2 (mg/l)
NO3 (mg/l
NH3 (mg/l)
TDN (mg/l)
TPN (mg/l)
DON (mg/l)
TP (mg/l)
PO4 (mg/l
TDP (mg/l
7/10/03 7/18/03 Yala IFE2 0.134 0.017 0.087 10/4/01 10/5/01 Yala IFE2 0.097 0.134 0.067 4/7/01 4/14/01 Yala IFG1 0.015 0.878 1.09
9/28/01 10/11/01 Yala IFG1 0.055 0.146 0.041 9/23/02 9/24/02 Yala IFG1 0.124 4/6/01 4/14/01 Yala IFG3 0.014 0.356 0.291
9/26/01 10/7/01 Yala IFG3 0.118 0.074 0.121 3/17/02 3/17/02 Yala IFG3 0.0434 0.3168 0.133 0.127 0.064 9/25/02 10/3//02 Yala IFG3 0.04
date sampled
date received
sample details elec p.h temp
DO (mg/l)
Turb (n.tu)
TN (mg/l)
NO2 (mg/l)
NO3 (mg/l
NH3 (mg/l)
TDN (mg/l)
TPN (mg/l)
DON (mg/l)
TP (mg/l)
PO4 (mg/l
TDP (mg/l
TPP (mg/l)
TPC (mg/l
7/10/03 7/18/03 Yala IFE2 0.134 0.017 0.087 7/17/03 7/18/03 Yala IFG3 0.141 0.005 0.050 10/4/01 10/5/01 Yala IFE2 7.6 0.097 0.134 0.067 5/25/04 6/10/04 Yala IFE2 0.662 0.002 0.45 0.384 0.5 0.07 0.043
8/31/04 9/10/04 Yala IFE2 0.67 0.27
3/10/04 3/17/04 Yala IFE2 0.033 0.083 0.068 0.037 4/7/01 4/14/01 Yala IFG1 59.6 21.7 0.015 0.878 1.09
9/28/01 10/11/01 Yala IFG1 7.44 0.055 0.146 0.041 0.036 9/23/02 9/24/02 Yala IFG1 0.124 7/14/03 7/18/03 Yala IFG1 0.339 0.027 0.041
5/29/04 6/10/04 Yala IFG1 0.972 0.002 614 0.042 0.053 0.66 0.033 9/4/04 9/10/04 Yala IFG1 0.84 0.39 4/6/01 4/14/01 Yala IFG3 76.5 24.1 0.014 0.356 0.291
9/26/01 10/7/01 Yala IFG3 7.5 0.118 0.074 0.121 0.051 3/17/02 3/17/02 Yala IFG3 0.0434 0.3168 0.133 0.127 0.064 9/25/02 10/3/02 Yala IFG3 0.04 3/18/04 3/17/04 Yala IFG3 0.002 0.173 0.1 0.049 5/30/04 6/10/04 Yala IFG3 0.002 0.652 0.366 0.108 0.085 0.053 9/3/04 9/10/04 Yala IFG3 0.9 0.17
3/15/04 3/17/04 Yala IFG4 0.033 0.192 0.104 0.066

24
10.1.4 River Nyando The Nyando River drains a catchment area of approximately 3,652 km2. The river discharges its water directly into Lake Victoria from its Kenyan catchment area. While its transboundary importance lies on its volumetric water contribution into Lake Victoria, it also acts as conduit of pollutant transfer into the lake. Nationally, the river system supports major agro-based industrial development activities as well as being a source for domestic and livestock water supplies. The development activities which are based in the river basin contribute to river water pollution through both non-point and point sources. The major point sources of pollution include: Table 7: Major Point Sources of Pollution in River Nyando
Item Identifiable source Type of waste Receiving River System
1. Agro-Chemicals and Food Company factory effluent
Alcohol distillery and Yeast manufacture
Nyando
2. Muhoroni Sugar Factory effluent White Sugar processing Nyando 3. Chemelil Sugar Factory effluent White Sugar processing Mbogo 4. Chemelil Sugar Company sewage
ponds Domestic sewage Osengeteti
The water quality characteristics for the Nyando River are indicated in Table 8.

25
Table 8: Water quality characteristics for Nyando River date sampled
date received Sample details TN(mg/l)
NO2 (mg/l)
NO3 (mg/l
NH3 (mg/l)
TDN (mg/l)
TPN (mg/l)
DON (mg/l)
TP (mg/l)
PO4 (mg/l
TDP (mg/l
7/17/03 7/18/03 Nyando IGD7 0.379 0.242
7/15/03 7/18/03 Nyando d/s Ahero sch. 0.549 0.416
4/12/01 4/14/01 Nyando IGD3 0.025 1.375 1.127
3/23/02 3/23/02 Nyando IGD3 0.012 1.5289 0.185 0.148
7/14/03 7/18/03 Nyando IGD3 0.517 0.248
4/12/02 4/14/01 Nyando IGD7 0.019 0.991 0.634
9/3/01 9/11/01 Nyando IGD7 1.39 0.044 0.07395 1.49 0.517 0.148
3/23/02 3/23/02 Nyando IGD7 0.0955 0.4821 0.058 0.125
7/11/03 7/18/03 Nyando Muho-NBI Rd 0.252 0.172
7/17/03 7/18/03 Nyando u/s effl muhoroni 0.26 0.194
date sampled
date received sample details elec p.h temp DO(mg/l)
Turb (n.tu)
TN (mg/l)
NO2 (mg/l)
NO3 (mg/l
NH3 (mg/l)
TDN (mg/l)
TPN (mg/l)
DON (mg/l)
TP (mg/l)
PO4 (mg/l
TDP (mg/l
TPP (mg/l)
TPC (mg/l
7/17/03 7/18/03 Nyando IGD7 0.379 0.242
9/23/03 9/26/03 Nyando 5kmd/s ahero mkt 0.048 0.65 0.49 0.385
8/18/03 8/19/03 Nyando at Ahero bridge 0.085 0.800 0.517 0.575
8/18/03 8/19/03 Nyando d/s Ahero market 0.061 0.742 0.573 0.501
3/14/04 3/18/04 Nyando d/s ahero market 0.04 0.511 0.36
7/15/03 7/18/03 Nyando d/s Ahero sch. 0.549 0.416
9/20/03 9/26/03 Nyando IGC3 0.047 0.517 0.144 0.109
11/24/03 11/28/03 Nyando IGC3 0.023 0.037
3/15/04 3/18/04 Nyando IGC3 0.047 0.615 0.078
11/24/03 11/28/03 Nyando IGC6 0.018 0.036
9/23/03 9/26/03 Nyando IGD2 0.058 0.728 0.44 0.358
3/13/04 3/18/04 Nyando IGD2 0.041 0.575 0.325
4/12/01 4/14/01 Nyando IGD3 176.3 24.3 0.025 1.375 1.127

26
3/23/02 3/23/02 Nyando IGD3 7.7 0.012 1.5289 0.185 0.148
7/14/03 7/18/03 Nyando IGD3 0.517 0.248
7/24/03 7/24/03 Nyando IGD3 0.51 0.177 0.208
8/17/03 8/19/03 Nyando IGD3 0.052 0.670 0.417 0.375
9/22/03 9/26/03 Nyando IGD3 0.036 0.71 0.382 0.299
12/1/03 12/1/03 Nyando IGD3 0.139 0.815 0.105 0.279
3/15/04 3/18/04 Nyando IGD3 0.058 0.584 0.406
6/7/04 6/8/04 Nyando IGD3 0.003 0.724 430 0.047 0.096 0.043
9/9/04 9/10/04 Nyando IGD3 0.62
3/10/04 3/17/04 Nyando IGD3 0.034 0.46 0.368 0.369
4/12/01 4/14/01 Nyando IGD7 147.6 23.8 0.019 0.991 0.634
9/3/01 9/11/01 Nyando IGD7 1.39 0.044 0.07395 1.49 0.517 0.148 0.369
3/23/02 3/23/02 Nyando IGD7 7.79 0.0955 0.4821 0.058 0.125
8/16/03 8/19/03 Nyando IGD7 0.059 0.362 0.347 0.293
9/22/03 9/26/03 Nyando IGD7 0.038 0.669 0.344 0.261
3/15/04 3/18/04 Nyando IGD7 0.095 0.288 0.678
3/15/04 3/18/04 Nyando muho-ker BG 0.05 0.678 0.133
7/11/03 7/18/03 Nyando Muho-NBI Rd 0.252 0.172
9/22/03 9/26/03 Nyando Muho-NBI Rd 0.041 0.764 0.216 0.13
8/16/03 8/19/03 Nyando u/s Ahero 0.058 0.752 0.317 0.297
7/17/03 7/18/03 Nyando u/s effl muhoroni 0.26 0.194
27
10.1.5 River Sondu/Miriu The Sondu-Miriu River system with a catchment area of 3,508 km2 discharges into Lake Victoria directly from its Kenyan catchment area. It is an important transboundary river partly due to its volumetric water contribution into Lake Victoria and partly as a conduit for carrying pollutants into the Lake system. Nationally, the river is economically of significance as it contributes to both domestic and industrial water supplies. It is a source of agricultural and livestock water. As a result of these activities, the river is exposed to both non-point and point sources of pollution. Table 9: The Major Point Pollution Sources in River Sondu/Miriu
Item Identifiable Source Type of waste Receiving River System
1. Kericho Municipal sewage plant Domestic sewage Dionsoyet 2. Kericho Teachers College sewage ponds Domestic sewage Kimugu 3. Premier Dairies factory effluent Milk processing Ainapkoi 4. KCC –Sotik factory effluent Milk processing Kipsonoi
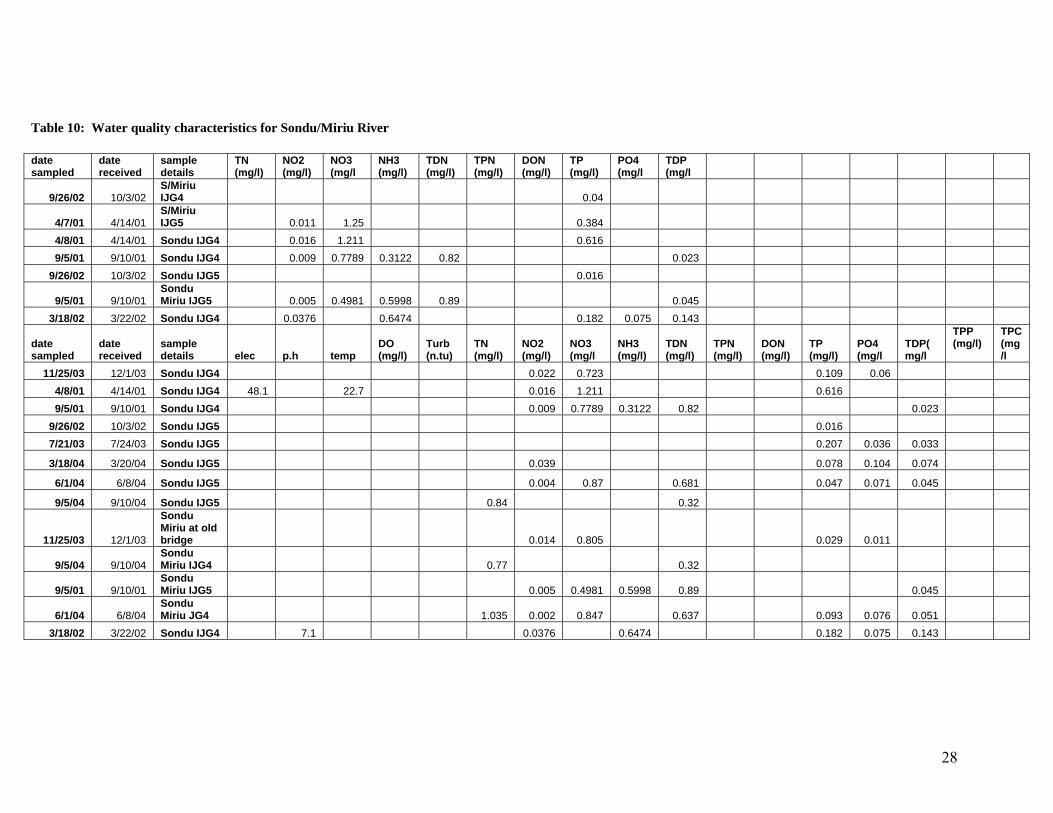
The water quality characteristics for the Sondu-Miriu River are indicated in table 10.
28
Table 10: Water quality characteristics for Sondu/Miriu River date sampled
date received
sample details
TN (mg/l)
NO2 (mg/l)
NO3 (mg/l
NH3 (mg/l)
TDN (mg/l)
TPN (mg/l)
DON (mg/l)
TP (mg/l)
PO4 (mg/l
TDP (mg/l
9/26/02 10/3/02 S/Miriu IJG4 0.04
4/7/01 4/14/01 S/Miriu IJG5 0.011 1.25 0.384
4/8/01 4/14/01 Sondu IJG4 0.016 1.211 0.616 9/5/01 9/10/01 Sondu IJG4 0.009 0.7789 0.3122 0.82 0.023
9/26/02 10/3/02 Sondu IJG5 0.016
9/5/01 9/10/01 Sondu Miriu IJG5 0.005 0.4981 0.5998 0.89 0.045
3/18/02 3/22/02 Sondu IJG4 0.0376 0.6474 0.182 0.075 0.143
date sampled
date received
sample details elec p.h temp
DO (mg/l)
Turb (n.tu)
TN (mg/l)
NO2 (mg/l)
NO3 (mg/l
NH3 (mg/l)
TDN (mg/l)
TPN (mg/l)
DON (mg/l)
TP (mg/l)
PO4 (mg/l
TDP(mg/l
TPP (mg/l)
TPC(mg/l
11/25/03 12/1/03 Sondu IJG4 0.022 0.723 0.109 0.06 4/8/01 4/14/01 Sondu IJG4 48.1 22.7 0.016 1.211 0.616 9/5/01 9/10/01 Sondu IJG4 0.009 0.7789 0.3122 0.82 0.023
9/26/02 10/3/02 Sondu IJG5 0.016 7/21/03 7/24/03 Sondu IJG5 0.207 0.036 0.033
3/18/04 3/20/04 Sondu IJG5 0.039 0.078 0.104 0.074
6/1/04 6/8/04 Sondu IJG5 0.004 0.87 0.681 0.047 0.071 0.045
9/5/04 9/10/04 Sondu IJG5 0.84 0.32
11/25/03 12/1/03
Sondu Miriu at old bridge 0.014 0.805 0.029 0.011
9/5/04 9/10/04 Sondu Miriu IJG4 0.77 0.32
9/5/01 9/10/01 Sondu Miriu IJG5 0.005 0.4981 0.5998 0.89 0.045
6/1/04 6/8/04 Sondu Miriu JG4 1.035 0.002 0.847 0.637 0.093 0.076 0.051
3/18/02 3/22/02 Sondu IJG4 7.1 0.0376 0.6474 0.182 0.075 0.143

29
10.1.6 Gucha /Migori River The Gucha-Migori River system has a catchment area which spans over 6,600 km2 . The river discharges into Lake Victoria from its Kenyan catchment area. Its transboundary importance lies on its volumetric water contribution into Lake Victoria and as an agent for carrying pollutants into the lake. Nationally, the river system supports major farming activities as well as being important as a source of water for domestic and industrial water use. Due to the catchment based development activities, the system experiences pollution from both non-point and point sources. Table 11: The Major Sources of Point Pollution in Gucha/Migori River
Item Identifiable Source Type of waste Receiving River System
1. Kisii Municipal sewage treatment works
Domestic sewage Riana
2. St. Joseph’s Mission Hospital, Ombo Domestic sewage Migori 3. Prinsals Limited Fish processing Migori 3. Sony Sugar wastewater treatment
works White sugar processing Sare
Table 12 represents water quality characteristics of the Gucha/Migori Rivers at the monitoring stations indicated:

30
Table 12: Water quality characteristics for Gucha-Migori River date sampled
date received
Sample details
TN (mg/l)
NO2 (mg/l)
NO3 (mg/l
NH3 (mg/l)
TDN (mg/l)
TPN (mg/l)
DON (mg/l)
TP (mg/l)
PO 4(mg/l
TDP (mg/l
8/26/01 9/11/01 Gucha 0.039 0.2629 1.53 0.214 0.034
4/8/01 4/14/01 Gucha IKB1/A 0.042 1.998 ..416
3/20/02 3/22/02 Gucha IKB1/A 0.12 0.4545 0.199 0.122 0.121
3/20/02 3/22/02
Gucha/Migori- Wathong'er IKB5 0.0923 0.4821 0.296 0.253 0.274
3/21/02 3/22/02 Gucha IKB3 0.0394 0.3168 0.187 0.177
4/9/01 4/14/01 Gucha IKB3 0.028 2.372 0.566
8/29/01 9/11/01 Kuja IKB1/A 1.75 0.032
1.3569 0.5998 1.03 0.113 0.061
8/27/01 9/11/01 Kuja IKB3 3 0.027 1.3251 0.3779 1.64 0.046 0.03
9/28/02 10/3/02 Kuja IKB1/A 0.061
9/28/02 10/3/02
Kuja Migori-IKB5 0.122
9/27/02 10/3/02 Kuja IKB3 0.031
4/9/01 4/14/01 Migori IKC3 0.033 1.157 0.878
8/29/01 9/11/01 Migori IKC3 0.83 0.026
0.7417 0.5177 0.81 0.08 0.029
3/20/22 3/22/02 Migori IKC3 0.0707 0.5647 0.166 0.122 0.135
9/28/02 10/3/02 Migori W/S 0.07
4/10/01 4/14/01 Migori-Kilgoris 0.037 0.903 0.762
date sampled
date received
sample details elec p.h temp
DO (mg/l)
Turb (n.tu)
TN (mg/l)
NO2 (mg/l)
NO3 (mg/l
NH3 (mg/l)
TDN (mg/l)
TPN (mg/l)
DON (mg/l)
TP (mg/l)
PO4 (mg/l
TDP (mg/l
TPP (mg/l)
TPC (mg/l)
4/8/01 4/14/01 G/Migori IKB5 73.2 22.9 0.033 1.107 0.762
8/29/01 9/11/01 G/Migori IKB5 1.44 0.025 1.1131 0.1233 1.13 0.143 0.052 0.091

31
8/26/01 9/11/01 Gucha 0.039 0.2629 1.53 0.214 0.034 0.18
4/8/01 4/14/01 Gucha IKB1/A 64.4 23 0.042 1.998 ..416
3/20/02 3/22/02 Gucha IKB1/A 7.39 0.12 0.4545 0.199 0.122 0.121
6/3/04 6/8/04 Gucha IKB1A 0.002 1.32 0.669 0.408 0.03 0.086
9/6/04 9/10/04 Gucha IKB1A 2.16 1.35
9/7/04 9/10/04 Gucha IKB2 1.7 1.47
7/20/03 7/24/03 Gucha IKB9 0.217 0.018 0.057
9/6/04 9/10/04
Gucha Migori IKB5 2.28 1.38
6/2/04 6/8/04
Gucha Rakwaro IKB3 0.002 1.138 1.089 0.431 0.083 0.039
3/19/04 3/20/04 Gucha/Migori 0.04 0.111 0.165 0.112
6/3/04 6/8/04 Gucha/Migori 0.002 0.884 0.607 0.156 0.05 0.092
3/20/02 3/22/02 Gucha/Migori- IKB5 7.3 0.0923 0.4821 0.296 0.253 0.274
3/21/02 3/22/02 Gucha IKB3 6.91 0.0394 0.3168 0.187 0.177
4/9/01 4/14/01 Gucha-IKB3 55.5 21.8 0.028 2.372 0.566
11/27/03 12/1/03 Kuja IKB13 0.071 0.617 0.089 0.063
11/26/03 12/1/03 Kuja IKB1/A 0.086 1.015 1.168 0.16
11/26/03 12/1/03 Kuja at IKB5 0.096 1.06 0.633 0.152
8/29/01 9/11/01 Kuja IKB1/A 1.75 0.032 1.3569 0.5998 1.03 0.113 0.061 0.052
8/27/01 9/11/01 Kuja IKB3 3 0.027 1.3251 0.3779 1.64 0.046 0.03 0.016 7/19/03 7/24/03 Kuja IKBIA 0.119 0.047 0.068
9/28/02 10/3/02 Kuja –IKB1/A 0.061
9/28/02 10/3/02
Kuja Migori-IKB5 0.122

32
9/27/02 10/3/02 Kuja IKB3 0.031
4/9/01 4/14/01 Migori IKC3 79.7 21.1 0.033 1.157 0.878
8/29/01 9/11/01 Migori IKC3 0.83 0.026 0.7417 0.5177 0.81 0.08 0.029 0.057
3/20/22 3/22/02 Migori IKC3 7.55 0.0707 0.5647 0.166 0.122 0.135
7/19/03 7/24/03 Migori IKC3 0.107 0.018 0.055
11/26/03 12/1/03 Migori IKC3 0.073 0.577 0.168 0.055
6/2/04 6/8/04 Migori IKC3 0.001 0.877 0.758 0.11 0.086 0.092
9/6/04 9/10/04 Migori IKC3 1.26 0.88
9/28/02 10/3/02 Migori W/S 0.07
4/10/01 4/14/01 Migori-Kilgoris 87.2 22.1 0.037 0.903 0.762

33
10.1.7 The Mara River The Mara River with a catchment area of 9,000 km2 flows from Kenya through Tanzania and discharges into Lake Victoria at Mwanza. This river receives its waters through its two main tributaries namely; Amala and Nyangores. The Mara River is characterized by major pollution problems occasioned by extensive land degradation and inappropriate agricultural activities in the upper catchments and lack of adequate sanitation within the tourist establishments based in the Masai Mara Game Camps. The water quality characteristics of Mara River at the monitoring stations are indicated in table 13.

34
Table 13: Water quality characteristics for Mara River date sampled
date received
sample details
TN (mg/l)
NO2 (mg/l)
NO3 (mg/l
NH3 (mg/l)
TDN (mg/l)
TPN (mg/l)
DON (mg/l)
TP (mg/l)
PO4 (mg/l
TDP (mg/l
8/31/01 9/11/01 Amala ILB2 0.7 0.015 0.4399 0.5012 0.67 0.08 0.021
3/23/02 3/23/02 Amala ILB2 0.105 0.6027 0.099 0.087 0.069
9/30/02 10/3/02
Amala-Bomet/Narok
8/30/01 9/11/01 Mara 1.12 0.018 0.5724 0.1233 0.82 0.059 0.027
4/10/01 4/14/01
Mara-Transmara/Narok border 0.037 1.863 0.89
9/30/02 10/3/02 Nyangores ILA3 0.043
4/11/01 4/14/01 Nyangores ILA3 0.014 2.126 0.384
8/31/01 9/11/01 Nyangores ILA3 0.81 0.014 0.6731 0.1397 0.67 0.057 0.009
3/23/02 3/23/02 Nyangores ILA3 0.0106 0.9241 0.106 0.064 0.078
date sampled
date received
sample details elec p.h temp
DO (mg/l)
Turb (n.tu)
TN (mg/l)
NO2 (mg/l)
NO3 (mg/l
NH3 (mg/l)
TDN (mg/l)
TPN (mg/l)
DON (mg/l)
TP (mg/l)
PO4 (mg/l)
TDP (mg/l)
TPP (mg/l)
TPC (mg/l
8/31/01 9/11/01 Amala ILB2 0.7 0.015 0.4399 0.5012 0.67 0.08 0.021
0.059
3/23/02 3/23/02 Amala ILB2 6.58 0.105 0.6027 0.099 0.087 0.069
7/22/03 7/24/03 Amala ILB2 0.208 0.036 0.052
11/28/03 12/1/03 Amala ILB2 0.045 0.461 0.037 0.044
6/5/04 6/8/04 Amala ILB2 0.002 1.239 0.662 0.201 0.003 0.041
9/7/04 9/10/04 Amala ILB2 0.58 0.88
9/30/02 10/3/02
Amala-Bomet/Narok
8/30/01 9/11/01 Mara 1.12 0.018 0.5724 0.1233 0.82 0.059 0.027 0.032
7/22/03 7/24/03 Mara ILA3 0.285 0.03 0.030

35
11/29/03 12/1/03 Mara ILA5 0.028 0.497 0.071 0.038
6/5/04 6/8/04 Mara ILA5 0.004 1.455 0.932 0.044 0.065 0.041
9/8/04 9/10/04 Mara ILA5 0.9 0.62
4/10/01 4/14/01
Mara-transmara/Narok border 67.6 21.1 0.037 1.863 0.89
9/30/02 10/3/02 Nyangores Bomet 0.043
4/14/01 4/14/01 Nyangores ILA3 37 17 0.014 2.126 0.384
8/31/01 9/11/01 Nyangores ILA3 0.81 0.014 0.6731 0.1397 0.67 0.057 0.009
0.048
3/23/02 3/23/02 Nyangores ILA3 6.5
0.0106 0.9241 0.106 0.064 0.078
7/22/03 7/24/03 Nyangores ILA3 0.164 0.005 0.030
11/28/03 12/1/03 Nyangores ILA3 0.02 0.836 0.034 0.023
6/5/04 6/8/04 Nyangores ILA3 0.696 0.001 1.11 0.501 0.053 0.003 0.043
9/7/04 9/10/04 Nyangores ILA3 0.44 0.15

36
The following is a summary on pollutant concentrations and loading for rivers discharging into Lake Victoria from Kenya. Table 14: Average Discharge and Pollutants Concentration and Loading For Rivers in
the Kenyan Catchment of Lake Victoria River Discharge,
m3/s TN, mg/L
TP, mg/L
Si, mg/L
TSS, mg/L
N- (t/yr)
P- (t/yr)
Si- (t/yr)
TSS- (t/yr)
Sio 7.26 0.650 0.12 11.29 172 149 28 2586 39498 Nzoia 170.27 0.897 0.25 10.87 466 4820 1365 58386 2504367 Yala 34.99 1.155 0.12 10.34 223 1275 130 11413 246044 Nyando 13.07 1.12 0.38 16.20 364 462 156 6682 150272 Sondu 44.92 1.080 0.02 12.00 202 1531 24 17011 286106 Kuja 66.06 1.440 0.14 17.00 419 3002 298 35440 873800
10.2 Lakes Lake Victoria at Winam Gulf: The Lake Victoria is a transboundary lake and constitutes the major source of the waters of the River Nile. The lake receives inflows from the major rivers indicated above as well as other minor ones not indicated above. As a result of discharge of partially polluted waters, the river deltas/mouths are physically and chemically polluted/altered. While the extent of the pollution has not been sufficiently qualified at these discharge points, there is need for regular monitoring as a way of assessing the levels of pollution and instituting necessary remedial measures. Towards this end, the LVEMP Water Quality has established nine inlake water quality monitoring stations whose location details are as follows: Table 15: Inlake Stations
Code Location KL1 0° 0.007' S 34° 0.043' E KL2 0° 0.013' S 34° 0.040' E KL3 0° 0.015' S 34° 0.031' E KL4 0° 0.023' S 34° 0.023' E KL5 0° 0.021' S 34° 0.014' E KL6 0° 0.001' S 33° 0.058' E KP1 0° 0.019' S 33° 0.060' E KP2 0° 0.037' S 33° 0.057' E KP3 0° 0.054' S 34° 0.004' E
The inlake station locations/sites are displayed in Annex 3. The water quality characteristics for Lake Victoria on the Kenyan portion are indicated in table 16.

37
Table 16: Water Quality Characteristics for the Kenyan Part of Lake Victoria Temp Light DO EC pH TN TPN DON NO2 NO3 NH4 IN
Min 20.9 #N/A 0.2 24.8 6.1 0.2 -0.7 -0.1 0.0 0.0 0.0 0.0 Avg 25.8 #N/A 6.3 116.3 8.1 0.8 0.2 0.5 0.0 0.1 0.1 0.1 Max 226.5 #N/A 11.8 999.1 10.0 3.1 1.7 2.4 0.0 3.5 1.4 3.6
Count 998 0 997 998 997 194 129 199 261 218 221 203 TP TPP DOP PO4-P PBSi Si TSS ALK LOI CH SECCHI TURB
Min 0.0 0.0 0.0 0.0 0.0 0.0 0.0 22.0 1.4 0.0 0.4 0.0 Avg 0.3 0.0 0.0 0.1 2.8 2.1 7.2 58.7 4.6 0.0 1.7 9.0 Max 3.8 0.2 0.3 2.3 189.2 11.5 197.0 92.0 12.0 0.0 4.0 127.2
Count 243 112 171 259 199 219 170 92 84 129 82 738 NH3F NH4F SO4-S #REF! #REF! TDS NEW8 NEW9 NEW10
Min 1.0 15.1 0.0 0.0 0.0 #N/A #N/A #N/A #N/A Avg 1.5 22.5 0.3 0.2 0.3 #N/A #N/A #N/A #N/A Max 2.4 37.6 0.6 8.4 1.6 #N/A #N/A #N/A #N/A
Count 24 24 25 370 369 0 0 0 0
10.3 Wetlands These are brief details on some of the wetlands in the Lake Victoria Basin in Kenya.
(i) The Yala Swamp This is an extensive wetland near the Yala River mouth. It provides habitat for a wide range of flora and fauna and also acts as a purification facility for the liquid wastes before discharging into the lake.
(ii) The Kano Plains Wetlands These wetlands are at the lower reaches of River Nyando and provide purification capacity facility for pollutants brought in downstream by the Nyando river system. The wetland forms an ozone where livestock do foraging.
(iii) Sondu River Mouth Wetland This wetland is at the mouth of Sondu-Miriu River and acts as a purification facility for pollutants in the Sondu-Miriu River
(iv) Gucha-Migori River mouth Wetland This wetland is at the mouth of Gucha River and acts as a purification facility for the waters of the Gucha-Migori River.

38
LABORATORY FACILITIES

39
11. LABORATORY FACILITIES In the Lake Victoria basin, there are two laboratories under the Ministry of Water and Irrigation. These laboratories include the Central laboratory in Kisumu utilized by both the Ministry, LVEMP and Kakamega laboratory which serves the western province. The KEMFRI and LBDA have their own laboratories. The status of the equipment and the parameters analysed in each of the laboratories is as shown below.
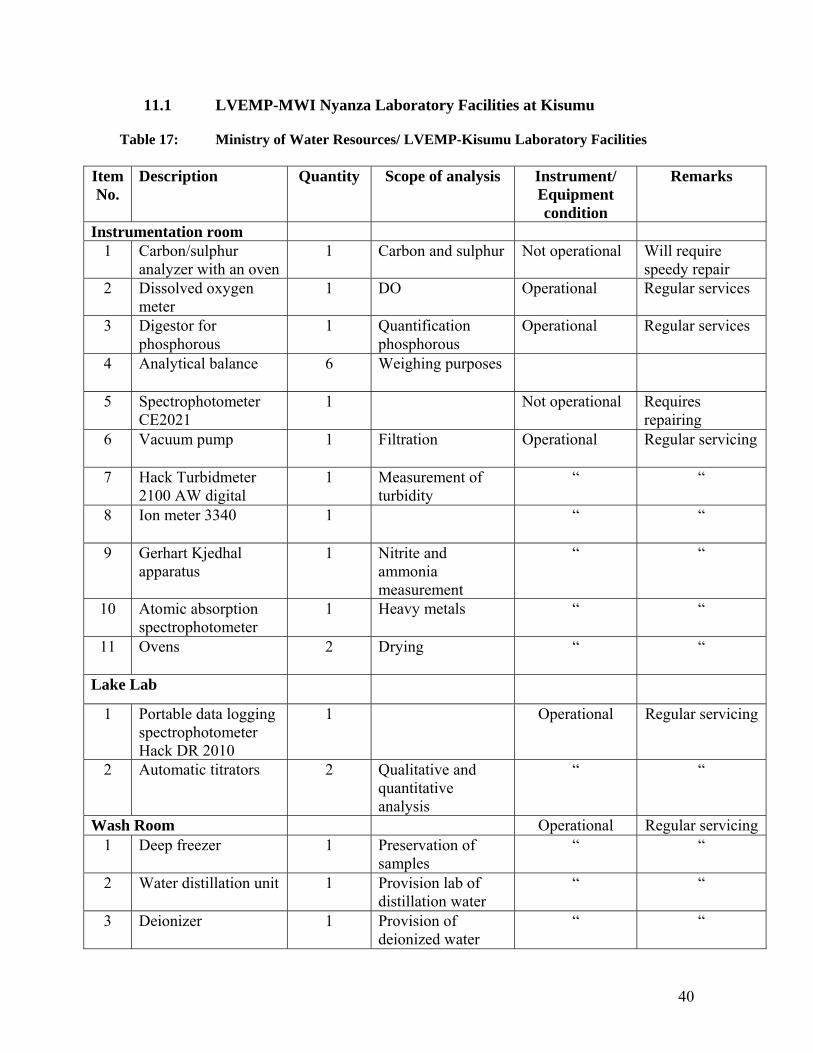
40
11.1 LVEMP-MWI Nyanza Laboratory Facilities at Kisumu Table 17: Ministry of Water Resources/ LVEMP-Kisumu Laboratory Facilities
Item No.
Description Quantity Scope of analysis Instrument/ Equipment condition
Remarks
Instrumentation room 1 Carbon/sulphur
analyzer with an oven 1 Carbon and sulphur Not operational Will require
speedy repair 2 Dissolved oxygen
meter 1 DO Operational Regular services
3 Digestor for phosphorous
1 Quantification phosphorous
Operational Regular services
4 Analytical balance 6 Weighing purposes
5 Spectrophotometer CE2021
1 Not operational Requires repairing
6 Vacuum pump 1 Filtration Operational Regular servicing
7 Hack Turbidmeter 2100 AW digital
1 Measurement of turbidity
“ “
8 Ion meter 3340 1 “ “
9 Gerhart Kjedhal apparatus
1 Nitrite and ammonia measurement
“ “
10 Atomic absorption spectrophotometer
1 Heavy metals “ “
11 Ovens 2 Drying “ “
Lake Lab
1 Portable data logging spectrophotometer Hack DR 2010
1 Operational Regular servicing
2 Automatic titrators 2 Qualitative and quantitative analysis
“ “
Wash Room Operational Regular servicing1 Deep freezer 1 Preservation of
samples “ “
2 Water distillation unit 1 Provision lab of distillation water
“ “
3 Deionizer 1 Provision of deionized water
“ “

41
Water & Wastewater laboratory
1 BOD track kits 1 BOD measurement Operational Regular servicing
2 Spectrophotometer DR 2010
1 “ “
3 HACK COD reactors 2 COD analysis “ “
4 Hannah HI 8424 microcomputer pH meter
1 pH measurement “ “
5 Portable DO meters 3 DO New and unused Reserved
6 Conductivity meter 2 Conductivity New and unused Reserved
7 Rotary evaporator 4 New and unused Reserved
8 Sediment sampler 1 Sediment sampling Operational Regular servicing
9 Colony counter 1 Total and E-coli tests
Operational “
10 DR-2010 spectrophotometer
1 Operational “
11 Hydrolab surveyor 4 7 For field measurement of temp, cond, salinity, TSS, DO, pH, Turbidity, Redox potential flow, ammonia, nitrate, Cl, TDS, chlorophyll, light penetration
Operational “
12 GPS 1 For global positioning
operational “
13 Total organic carbon analyzer
1 For TOC analysis Not operational Requires speedy repairs
14 Automatic samplers 7 For water sampling Operational Normal servicing

42
11.2 MWI Western Laboratory Facilities at Kakamega Table 18: Ministry of Water and Irrigation Western Province-Kakamega Laboratory
Facilities
Item No.
Description Qty. Scope of analysis
Instrument Equipment condition
Remarks
1 HACH 2100 A Turbidmeter 1 Turbidity Out of order Will require repair
2 Digital Titrator 1 Volumetric analysis
Out of order Will require repair
3 HACH Conductivity Meter 1 Conductivity TDS
In working order
Will require regular servicing
4 pH Conductivity meter 1 Conductivity pH measurement
In working order
“
5 Water Bath 1 Heating Out of order Will require repair
6 COD Heating mantle with 6 plates
1 COD analysis In working order
Will require regular servicing
7 Refrigerator 1 Preservation of samples
In working order
“

43
11.3 Lake Basin Laboratory Facilities at Kisumu Table 19: Lake Basin Development Authority (LBDA)-Kisumu Laboratory Facilities
Item No.
Description Qty. Scope of analysis
Instrument Equipment condition
Remarks
1 Turbidmenter 16800 1 Turbidity 0-100 NTU
In working condition
Would require regular servicing
2 Conductivity Meters (115) 1 Conductivity Range 1 Temp range 2 Salinity, TDS range 3 Solids Range 4
“ “
3 Weighing Balance (sartorius) 1 Weight 10.1-110 gm
“ “
4 Centrifuge 1 0-9000 RPM “ “ 5 Desicator 1 Solids “ “ 6 Farnace 1 Solids-TDS,
TSS 0-2000˚ C
“ “
7 Drying oven 1 Solids-TDS, TSS
“ “
8 Olympus inverted microscope
1 Identification of micro-organisms e.g. planktons, 200 planktons, filtration 40x1000x
“ “
9 Diaphragm vacuum pump 1 Extraction 0-20 l/min
“ “
10 Incubator 1 Microbiological 0-68˚ C
“ “
11 Spectrophotometer 21D 1 Colour, phosphorous, nitrogen, COD 320-1000nm
“ “

44
11.4 Kenya Marine Fisheries Research Institute Laboratory Facilities at Kisumu
Table 20: Kenya Marine Fisheries Research Institute (KEMFRI)-Kisumu Laboratory
Facilities Item No.
Description Qty. Scope of analysis
Instrument Equipment condition
Remarks
1 Current meter In working condition
Requires regular servicing
2 Wind Sensor 1 “ “ 3 Autoclave 2 “ “ 4 Incubator 2 “ “ 5 Refrigerated Incubator 1 “ “ 6 Microscope 1 “ “ 7 Camera mounted microscope 1 “ “ 8 Dissecting microscope 1 “ “ 9 Compound microscope 1 “ “
10 Phase contrast microscope 1 “ “ 11 Zooplankton nets Assorted “ “ 12 Spectrophotometer 3 Nutrients,
chlorophylla “ “
13 YSI Env. Monitoring equipment
1 Physical and chemical parameters
“ “
14 Light photometer 1 “ “ 15 BOD apparatus 1 “ “ 16 COD mantles 1 COD “ “ 17 Eckman 1 Bottom mud
sampler “ “
18 Van Dorn water sampler 1 Depth water sampler
“ “
19 Rotary shaker 1 Mixing centrifuging
“ “
20 Water distillation unit 1 Supply distilled water
“ “
21 Water deionizer 1 Supply of deionized water
“ “
22 Kjedhal apparatus 1 Analysis of nitrogen
“ “
23 Analytical balances Various Weighing “ “ 24 Icemaking machine 1 Production and
supply of ice cubes
“ “
25 Boats 4 For servicing lake stations
“ “
26 Hydrolabs 4 For field data acquisition
“ “
45
WATER QULAITY MONITORING NETWORK, FREQUENCY OF SAMPLING
AND ANALYSED PARAMETERS

46
12. WATER QUALITY MONITORING NETWORK
12.1 Ministry of Water-LVEMP Water Quality Monitoring Network
Table 21: Ministry of Water and Irrigation-Lake Victoria Environmental Management Programme -Water Quality Monitoring Network
ITEM NO.
NARRATIVE DESCRIPTION OF THE STATION
FREQUENCY OF SAMPLING
STATION CODE PARAMETERS ANALYSIS
WATER QUALITY
HYDROLOGY
FIELD PARAME-TERS
LAB ANALYSIS PARAME-TERS
1 SIO AT MUNDIKA QUARTERLY 1AHO1 Temp, Sp. Cond, Cond, Rest, TDS, pH, Turbidity, DO
NH4, NH3, NO2, TDN, TN, Orth PO4, TDP, TP, TSS
2 SUO AT KUSUMO QUARTERLY 1AH MISC. “ “
3 WALATSI AT NAMBALE
QUARTERLY 1AH MISC. “ “
4 MOIBEN INFREQUENT 1BA01 “ “ 5 NZOIA AT MOIS
BRIDGE QUARTERLY 1BB01 “ “
6 LITTLE NZOIA AT MATUNDA
INFREQUENT 1BD01 “ “
7 NZOIA AT MAWETATU
QUARTERLY 1BD02 “ “
8 KWOITTOBOS AT KITALE
QUARTERLY 1BE06 “ “
9 EWASO RONGAI QUARTERLY 1BG07 “ “
10 KAMUKUYWA QUARTERLY 1BH05 “ “ 11 KIMILILI QUARTERLY 1BH01 “ “
12 KIBISI AT WEBUYE
QUARTERLY 1BH MISC. “ “
13 SERGOIT AT TURBO
QUARTERLY 1CA02 “ “
14 SOSIAN AT TURBO QUARTERLY 1CB05 “ “ 15 OLARE NYOIKE
AT ELDORET INFREQUENT 1CC03 “ “
16 KIPKARREN AT KIPKARREN
QUARTERLY 1CE01 “ “
17 NZOIA AT WEBUYE
QUARTERLY 1DA02 “ “
18 KUYWA AT NZOIA SUGAR
QUARTERLY 1DB01/A “ “

47
ITEM NO.
NARRATIVE DESCRIPTION OF THE STN.
FREQUENCY OF SAMPLING
STATION CODE PARAMETERS ANALYSIS
WATER QUALITY
HYDROLOGY FIELD PARAME-TERS
LAB ANALYSIS PARAME-TERS
19 NZOIA AT MUMIAS
QUARTERLY 1DD01 Temp, Sp. Cond, Cond, Rest, TDS, pH, Turbidity, DO
NH4, NH3, NO2, TDN, TN, Orth PO4, TDP, TP, TSS
20 ISIUKHU AT KAKAMEGA
QUARTERLY 1EB02 “ “
21 LUSUMU AT MUMIAS
QUARTERLY 1ED01 “ “
22 LOWER NZOIA AT UGUNJA
INFREQUENT 1EE01 “ “
23 NZOIA AT RWAMBWA
QUARTERLY 1EF01 “ “
24 WUOROYA AT UHURU
QUARTERLY 1EG02 “ “
25 KIMONDI AT KAPSABET
QUARTERLY 1FC01 “ “
26 MOKONG QUARTERLY 1FD02 “ “
27 YALA AT KAPSABET
INFREQUENT 1FE01 “ “
28 YALA AT TINDINYO
QUARTERLY 1FE02 “ “
29 EDZAWA AT YALA
QUARTERLY 1FFNEW “ “
30 YALA AT YALA TOWN
QUARTERLY 1FG01 “ “
31 YALA AT KADENGE
QUARTERLY 1FG03 “ “
32 AINAMOTUA AT KIBIGORI
QUARTERLY 1GB03 “ “
33 AINAMOTUA AT K’OPERE
QUARTERLY 1GB05 “ “
34 AINAPNGETUNY AT K’OPERE
QUARTERLY 1GB MISC. “ “
35 MBOGO AT CHEMELIL
QUARTERLY 1GB6A “ “
36 AINAPISIWA AT K’OPERE
QUARTERLY 1GB11 “ “

48
ITEM NO.
NARRATIVE DESCRIPTION OF THE STATION
FREQUENCY OF SAMPLING
STATION CODE PARAMETERS ANALYSIS
WATER QUALITY
HYDROLOGY
FIELD PARAME-TERS
LAB ANALYSIS PARAME-TERS
37 TUGUNONI QUARTERLY 1GC04 Temp, Sp. Cond, Cond, Rest, TDS, pH, Turbidity, DO
NH4, NH3, NO2, TDN, TN, Orth PO4, TDP, TP, TSS
38 NYANDO AT KIPKELLION
QUARTERLY 1GC03 “ “
39 MASAITA DAM QUARTERLY 1GC01 “ “
40 MASAITA QUARTERLY 1GC05 “ “
41 MASAITA QUARTERLY 1GC06 “ “
42 MASAITA QUARTERLY 1GC07 “ “
43 NYANDO AT OGILO
QUARTERLY 1GD03 “ “
44 NYANDO AT MUHORONI
QUARTERLY 1GD07 “ “
45 NAMUTING QUARTERLY 1GG01 “ “
46 GREAT OROBA QUARTERLY 1HA01 “ “
47 LITTLE OROBA QUARTERLY 1HA02 “ “
48 AWACH KIBOS AT WATHOREGO
QUARTERLY 1HA14 “ “
49 NYAMASARIA QUARTERLY 1HA09 “ “
50 AWACH SEME QUARTERLY 1HB05 “ “
51 AWACH KABONDO
QUARTERLY 1HD03 “ “
52 AWACH KASIPUL AT ATEMO
QUARTERLY 1HD05 “ “
53 AWACH KIBUON AT KENDUBAY
QUARTERLY 1HD09 “ “
54 AWACH TENDE AT NYANGWESO
QUARTERLY 1HE01 “ “
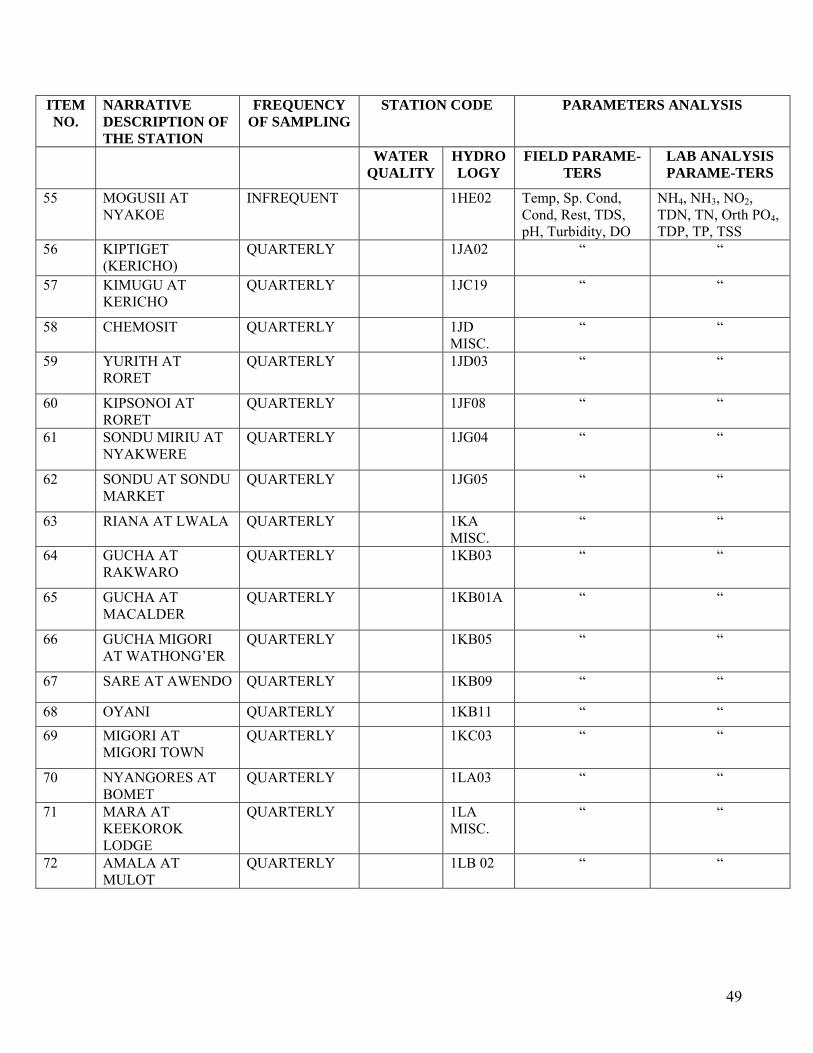
49
ITEM NO.
NARRATIVE DESCRIPTION OF THE STATION
FREQUENCY OF SAMPLING
STATION CODE PARAMETERS ANALYSIS
WATER QUALITY
HYDROLOGY
FIELD PARAME-TERS
LAB ANALYSIS PARAME-TERS
55 MOGUSII AT NYAKOE
INFREQUENT 1HE02 Temp, Sp. Cond, Cond, Rest, TDS, pH, Turbidity, DO
NH4, NH3, NO2, TDN, TN, Orth PO4, TDP, TP, TSS
56 KIPTIGET (KERICHO)
QUARTERLY 1JA02 “ “
57 KIMUGU AT KERICHO
QUARTERLY 1JC19 “ “
58 CHEMOSIT QUARTERLY 1JD MISC.
“ “
59 YURITH AT RORET
QUARTERLY 1JD03 “ “
60 KIPSONOI AT RORET
QUARTERLY 1JF08 “ “
61 SONDU MIRIU AT NYAKWERE
QUARTERLY 1JG04 “ “
62 SONDU AT SONDU MARKET
QUARTERLY 1JG05 “ “
63 RIANA AT LWALA QUARTERLY 1KA MISC.
“ “
64 GUCHA AT RAKWARO
QUARTERLY 1KB03 “ “
65 GUCHA AT MACALDER
QUARTERLY 1KB01A “ “
66 GUCHA MIGORI AT WATHONG’ER
QUARTERLY 1KB05 “ “
67 SARE AT AWENDO QUARTERLY 1KB09 “ “
68 OYANI QUARTERLY 1KB11 “ “ 69 MIGORI AT
MIGORI TOWN QUARTERLY 1KC03 “ “
70 NYANGORES AT BOMET
QUARTERLY 1LA03 “ “
71 MARA AT KEEKOROK LODGE
QUARTERLY 1LA MISC.
“ “
72 AMALA AT MULOT
QUARTERLY 1LB 02 “ “

50
12.2 Ministry of Water-Water Quality Monitoring Network in Western Province Table 22: Ministry of Water and Irrigation-Provincial Water Office-Kakamega Water
Quality Monitoring Network ITEM NO.
NARRATIVE DESCRIPTION OF THE STATION
FREQUENCY OF SAMPLING
STATION CODE PARAMETERS ANALYSIS
WATER QUALITY
HYDROLOGY
FIELD PARAME-TERS
LAB ANALYSIS PARAME-TERS
1 On Lwandeti River Lugari District Had been damaged by floods
Once a year 1DA4 Temperature pH
Colour, Turbidity, E-cond., Fe, Mn, Cl, F, NO2, NO3, NH3, SO4, T. Hardness, T. Alkalinity
2 On Kivaywa R. Lugari District. Requires rehabilitation
“ NEW “ “
3 On Sosio River, Mt. Elgon District. Affected by floods. To be rehabilitated
“ NEW “ “
4 On Kuywa River. Mt. Elgon District. In good condition
“ 1DB3 “ “
5 On R. Yala. But-Mumias Vandalized. Needs complete rehabilitation
“ 1FE1 “ “
6 On Nzoia R. But/Mumias Districts. Requires rehabilitation
“ 1DD1 “ “
7 On R. Sio-Busia District. 4 stave gauges. Certain parts should be replaced
“ 1AH1 “ “
8 On Walatsi R. 1st gauge washed away. 2 gauge plates functional
“ 1AF “ “
9 On Malakisi R.-Teso District. Functional. Certain parts need replacement
“ 1AD2 “ “
10 On R. Abai. Teso District. Functional. Site in bad shape
“ NEW “ “
11 On R. Edzawa. 1st plate not in place. Damaged by floods. Vihiga district
" 1FF5 “ “

51
ITEM NO.
NARRATIVE DESCRIPTION OF THE STATION
FREQUENCY OF SAMPLING
STATION CODE PARAMETERS ANALYSIS
WATER QUALITY
HYDROLOGY
FIELD PARAME-TERS
LAB ANALYSIS PARAME-TERS
12 On Zaaba R.-Vihiga District. 2 staves on bridge. To be rehabilitated
Once a year 1FF2 Temperature pH
Colour, Turbidity, E-C., Fe, Mn, Cl, F, NO2, NO3, NH3, SO4, Total Hardness, Total Alkalinity
13 On Khalaba R-Bungoma. 1st plate requires replacement. Bushy site
“ 1DD2 “ “
14 On Kuywa R. at Matisi. Not functional. Requires rehabilitation. Bungoma
“ 1DB1 “ “
15 On Yala R. Vihiga District. 1st and 2nd plate not in place. Requires replacement
“ 1FE2 “ “
16 On Sasata R.-Kakamega District. Functional. 1st and 2nd gauges need replacement
“ 1EB3 “ “
17 On Sivilie R.-Kakamega District. In good functional condition
“ 1DA6 “ “
18 On Isiukhu R.-Kakamega District. Not functional. Vandalized. To be replaced.
“ 1EB2 “ “
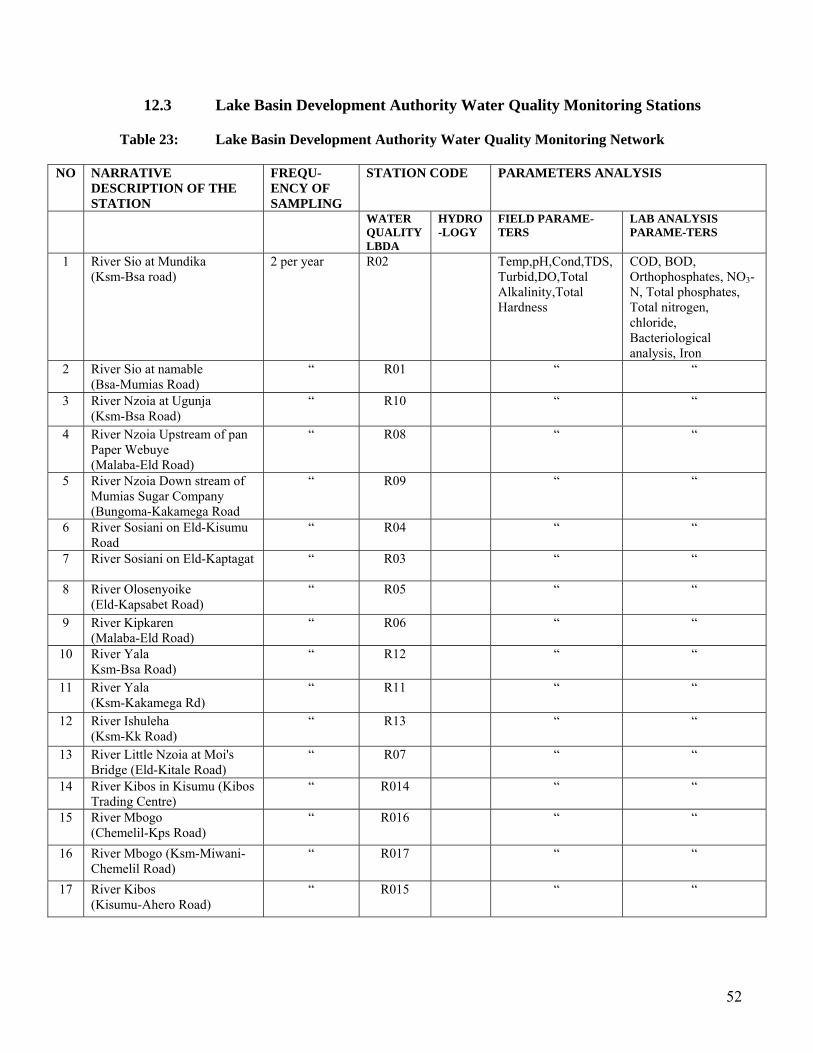
52
12.3 Lake Basin Development Authority Water Quality Monitoring Stations Table 23: Lake Basin Development Authority Water Quality Monitoring Network
NO NARRATIVE
DESCRIPTION OF THE STATION
FREQU-ENCY OF SAMPLING
STATION CODE PARAMETERS ANALYSIS
WATER QUALITY LBDA
HYDRO-LOGY
FIELD PARAME-TERS
LAB ANALYSIS PARAME-TERS
1 River Sio at Mundika (Ksm-Bsa road)
2 per year R02 Temp,pH,Cond,TDS,Turbid,DO,Total Alkalinity,Total Hardness
COD, BOD, Orthophosphates, NO3-N, Total phosphates, Total nitrogen, chloride, Bacteriological analysis, Iron
2 River Sio at namable (Bsa-Mumias Road)
“ R01 “ “
3 River Nzoia at Ugunja (Ksm-Bsa Road)
“ R10 “ “
4 River Nzoia Upstream of pan Paper Webuye (Malaba-Eld Road)
“ R08 “ “
5 River Nzoia Down stream of Mumias Sugar Company (Bungoma-Kakamega Road
“ R09 “ “
6 River Sosiani on Eld-Kisumu Road
“ R04 “ “
7 River Sosiani on Eld-Kaptagat “ R03 “ “
8 River Olosenyoike (Eld-Kapsabet Road)
“ R05 “ “
9 River Kipkaren (Malaba-Eld Road)
“ R06 “ “
10 River Yala Ksm-Bsa Road)
“ R12 “ “
11 River Yala (Ksm-Kakamega Rd)
“ R11 “ “
12 River Ishuleha (Ksm-Kk Road)
“ R13 “ “
13 River Little Nzoia at Moi's Bridge (Eld-Kitale Road)
“ R07 “ “
14 River Kibos in Kisumu (Kibos Trading Centre)
“ R014 “ “
15 River Mbogo (Chemelil-Kps Road)
“ R016 “ “
16 River Mbogo (Ksm-Miwani-Chemelil Road)
“ R017 “ “
17 River Kibos (Kisumu-Ahero Road)
“ R015 “ “
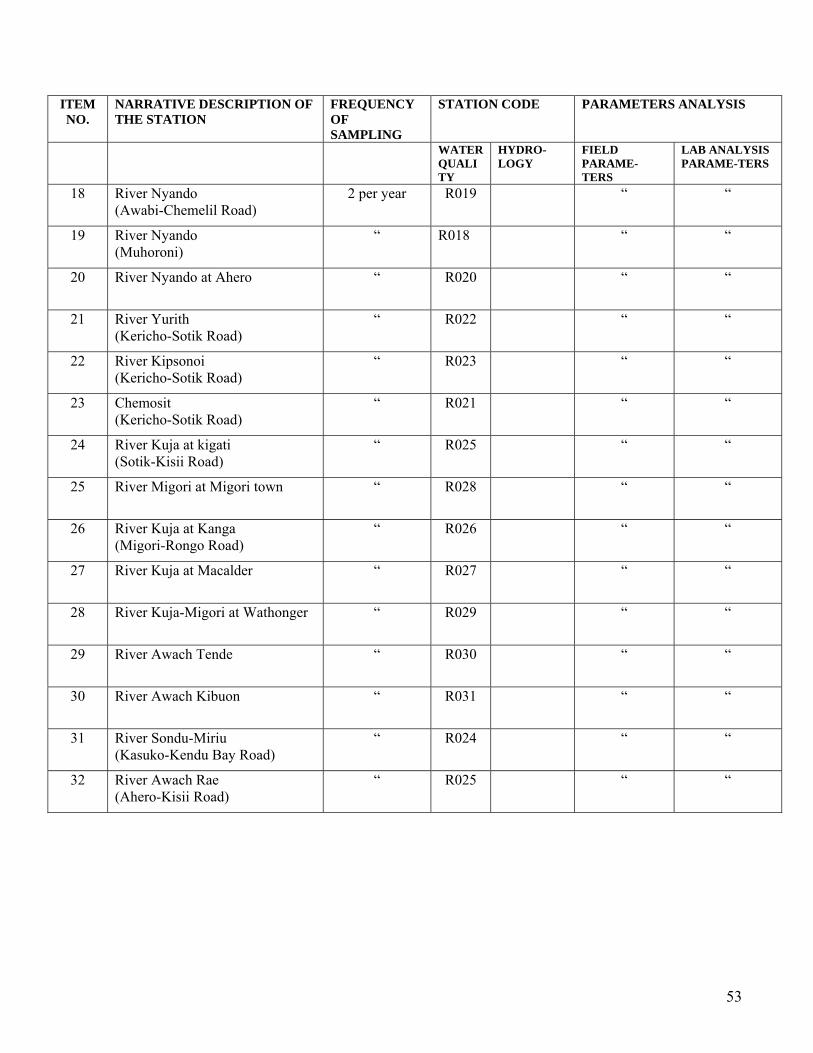
53
ITEM NO.
NARRATIVE DESCRIPTION OF THE STATION
FREQUENCY OF SAMPLING
STATION CODE PARAMETERS ANALYSIS
WATER QUALITY
HYDRO-LOGY
FIELD PARAME-TERS
LAB ANALYSIS PARAME-TERS
18 River Nyando (Awabi-Chemelil Road)
2 per year R019 “ “
19 River Nyando (Muhoroni)
“ R018 “ “
20 River Nyando at Ahero “ R020 “ “
21 River Yurith (Kericho-Sotik Road)
“ R022 “ “
22 River Kipsonoi (Kericho-Sotik Road)
“ R023 “ “
23 Chemosit (Kericho-Sotik Road)
“ R021 “ “
24 River Kuja at kigati (Sotik-Kisii Road)
“ R025 “ “
25 River Migori at Migori town “ R028 “ “
26 River Kuja at Kanga (Migori-Rongo Road)
“ R026 “ “
27 River Kuja at Macalder “ R027 “ “
28 River Kuja-Migori at Wathonger “ R029 “ “
29 River Awach Tende “ R030 “ “
30 River Awach Kibuon “ R031 “ “
31 River Sondu-Miriu (Kasuko-Kendu Bay Road)
“ R024 “ “
32 River Awach Rae (Ahero-Kisii Road)
“ R025 “ “

54
12.4 Kenya Marine Fisheries Research Institute Water Quality Monitoring Network
Table 24: Kenya Marine Fisheries Research Institute Water Quality Monitoring Network
STATION NO.
NARRATIVE DESCRIPTION OF THE STATION
FREQUENCY OF SAMPLING/ YEAR
STATION CODE PARAMETERS ANALYSIS
WATER QUALITY
HYDRO-LOGY
FIELD PARAME-TERS
LAB ANALYSIS PARAME-TERS
10 KISUMU BAY 00˚ 6’12S; 34˚ 44’38”E
3 √ X Physical and chemical data
Nutrients Chlorophyll
17 KIBOS 00˚ 09’16”S; 034˚44’19”E
“ “ “ “ “
1 NYANDO RIVERMOUTH 00˚ 16’14”S; 034˚ 49’20”E
“ “ “ “ “
2 SONDU MIRIU RIVER MOUTH 00˚ 17’ 21”S; 034˚ 45’ 14”E
“ “ “ “ “
3 KENDU AWACH 00˚ 20’ 51”S; 034˚ 39’ 00”E
“ “ “ “ “
31 NDERE ISLAND 00˚ 13’ 28”S; 034˚ 30’ 26”E
“ “ “ “ “
26 ASEMBO BAY 00˚ 11’ 40”S; 034˚ 24’ 02”E
“ “ “ “ “
4 NGINGRA ROCKS 00˚ 20’ 50”S; 034˚ 26’ 51”E
“ “ “ “ “
9 HOMABAY 00˚ 31’ 06”S; 034˚ 27’ 44”E
“ “ “ “ “
37 00˚ 26’ 35”S; 034˚ 26’ 34”E “ “ “ “ “ 36 KOPIATA
00˚21’ 17”S; 034˚ 23’ 16”E “ “ “ “ “
34 RUSINGA CHANNEL 00˚21’ 22”S; 034˚ 13’ 59”E
“ “ “ “ “
8 MBITA CAUSEWAY 00˚ 24’ 58”S; 034˚ 12’ 28”E
“ “ “ “ “
32 BRIDGE ISLAND 00˚ 20’ 35”S; 034˚ 06’ 34”E
“ “ “ “ “
54 YALA RIVER MOUTH 00˚ 03’ 44”S; 034˚ 02’ 18”E
“ “ “ “ “
51 SUMBA CHANNEL 00˚ 06’ 07”N; 033˚ 55’ 32”E
“ “ “ “ “
53 NZOIA RIVER MOUTH 00˚ 03’ 16”N; 034˚ 56’ 56”E
“ “ “ “ “
30 MABOKO ISLAND 00˚ 10’ 23”S; 034˚ 36’ 45”E
“ “ “ “ “
55
GEO-REFERENCED WATER QUALITY
MONITORING STATIONS

56
13. GEO-REFERENCED WATER QUALITY MONITORING STATIONS
13.1 Geo-referenced Water Quality Monitoring Stations under LVEMP and MWI
Table 25: Geo-Referenced Hydrological River Gauging Stations adopted in the Lake Victoria Water Quality Monitoring Network in The Lake Victoria Basin.
RGS NO RIVER/STN NAME LATITUDE LONGITUDE ALT. M ASL
1. IAHI * SIO N 00 23.005 E 34 08.745 1181 2. IBB1 * NZOIA (M/Bridge) N 00 55.127 E 35 07.953 1811 3. IBD2 * NZOIA (At M/Tatu) N 00 45.622 E 35 03.756 1752 4. IBE6 * KWOITTOBOS / SABWANI N 00 57.763 E 35 05.384 1805 5. IBG7 * EWASO RONGAI N 00 46.309 E 34 55.617 1662 6. IBH1 * KAMUKUYWA N 00 47.045 E 34 48.198 1659 7. ICA2 * SERGOIT N 00 37.877 E 35 03.928 1835 8. ICB5 * SOSIAN N 00 37.570 E 35 03.405 1838 9. ICEI * KIPKARREN N 00 36.404 E 34 57.892 1661 10. IDA2 * NZOIA (Webuye) N 00 35.157 E 34 48.411 1479 11. IDB1/A * KUYWA N 00 34.377 E 34 40.831 1437 12. IDD1 * NZOIA ( Mumias) N 00 22.165 E 34 28.962 1284 13. IEB2 * ISIUKHU N 00 15.273 E 34 45.029 1479 14. IED1 * LUSUMU N 00 18.383 E 34 28.761 1275 15. IEE1 * LOWER NZOIA N 00 10.400 E 34 13.346 1195 16. IEF1 * NZOIA ( Rwambwa) N 00 07.280 E 34 05.452 1166 17. IFD2 * MOKONG N 00 08.138 E 35 07.515 1923 18. IFE2 * YALA (At Tindinyo) N 00 10.875 E 34 56.238 1724 19. IFF3 * EDZAWA N 00 18.344 E 34 34.169 1419 20. IFG1 * YALA ( Yala Mkt) N 00 05.083 E 34 32.544 1416 21. IFG3 * YALA (Daraja Mkt) S 00 00.128 E 34 08.401 1162 22. IGB3 * AINAMOTUA S 00 04.536 E 35 03.358 1177 23. IGC4 * TUGUNONI S 00 15.284 E 35 24.926 1996 24. IGD3 * NYANDO S 00 07.544 E 35 00.003 1179 25. IGD7 * NYANDO S 00 09.929 E 35 09.739 1265 26. IGG1 * NAMUTING S 00 12.245 E 35 20.873 1516 27. IHA14 * AWACH KIBOS S 00 02.879 E 34 48.339 1194 28. IHB5 * AWACH SEME S 00 05.705 E 34 28.489 1201 29. IHD3 * AWACH KABONDO S 00 27.100 E 34 53.058 1434 30. IHD9 * AWACH KIBUON S 00 22.929 E 34 38.208 1172 31. IHD5 * AWACH KASIPUL S 00 30.230 E 34 50.325 1519 32. IHE1 * AWACH TENDE S 00 28.087 E 34 32.968 1141 33. IHE2 * MOGUSII S 00 37.188 E 34 45.438 1526 34. IJA2 * KIPTIGET S 00 06.101 E 35 15.257 35. IJC19 * KIMUGU S 00 28.664 E 35 10.524 1732 36. IJDMisc* CHEMOSIT S 00 28.666 E 35 10.523 1734 37. IJD3 * YURITH S 00 29.036 E 35 04.750 1651

57
38. IJF8 * KIPSONOI S 00 30.847 E 35 04.770 1621 39. IJG4 * SONDU MIRIU S 00 21.267 E 34 48.330 1156 40. IKA5 * NYAKOMISARO 41. IKA9 * RIANA (At Lwala) S 00 41.227 E 34 32.291 1341 42. IKB1/A * GUCHA (Macalder) S 00 58.267 E 34 15.652 1177 43. IKB3 * GUCHA ( Rakwaro) S 00 48.556 E 34 34.325 1359 44. IKB5 * GUCHA MIGORI S 00 57.004 E 34 12.582 1158 45. IKB9 * SARE S 00 54.274 E 34 32.103 1426 46. IKB11 * OYANI S 00 54.276 E 34 32.100 1426 47. IKB13 * MOGUNGA S 00 51.698 E 34 45.860 1701 48. IKC3 * MIGORI S 00 04.295 E 34 28.331 1358 49. ILA3 * NYANGORES S 00 47.383 E 35 20.794 1906 50. ILA4 * MARA S 01 13.380 E 35 02.178 1601 51. ILB2 * AMALA S 00 26.247 E 35 26.247 1869

58
13.2 Geo-referenced Water Quality Monitoring Stations under KMFRI Table 26: Kenya Marine Fisheries Research Institute Water Quality Monitoring Network
STATION NO.
NARRATIVE DESCRIPTION OF THE STATION
FREQUENCY OF SAMPLING/ YEAR
STATION CODE PARAMETERS ANALYSIS
WATER QUALITY
HYDRO-LOGY
FIELD PARAME-TERS
LAB ANALYSIS PARAME-TERS
10 KISUMU BAY 00˚ 6’12S; 34˚ 44’38”E
3 √ X Physical and chemical data
Nutrients Chlorophyll
17 KIBOS 00˚ 09’16”S; 034˚44’19”E
“ “ “ “ “
1 NYANDO RIVERMOUTH 00˚ 16’14”S; 034˚ 49’20”E
“ “ “ “ “
2 SONDU MIRIU RIVER MOUTH 00˚ 17’ 21”S; 034˚ 45’ 14”E
“ “ “ “ “
3 KENDU AWACH 00˚ 20’ 51”S; 034˚ 39’ 00”E
“ “ “ “ “
31 NDERE ISLAND 00˚ 13’ 28”S; 034˚ 30’ 26”E
“ “ “ “ “
26 ASEMBO BAY 00˚ 11’ 40”S; 034˚ 24’ 02”E
“ “ “ “ “
4 NGINGRA ROCKS 00˚ 20’ 50”S; 034˚ 26’ 51”E
“ “ “ “ “
9 HOMABAY 00˚ 31’ 06”S; 034˚ 27’ 44”E
“ “ “ “ “
37 00˚ 26’ 35”S; 034˚ 26’ 34”E “ “ “ “ “ 36 KOPIATA
00˚21’ 17”S; 034˚ 23’ 16”E “ “ “ “ “
34 RUSINGA CHANNEL 00˚21’ 22”S; 034˚ 13’ 59”E
“ “ “ “ “
8 MBITA CAUSEWAY 00˚ 24’ 58”S; 034˚ 12’ 28”E
“ “ “ “ “
32 BRIDGE ISLAND 00˚ 20’ 35”S; 034˚ 06’ 34”E
“ “ “ “ “
54 YALA RIVER MOUTH 00˚ 03’ 44”S; 034˚ 02’ 18”E
“ “ “ “ “
51 SUMBA CHANNEL 00˚ 06’ 07”N; 033˚ 55’ 32”E
“ “ “ “ “
53 NZOIA RIVER MOUTH 00˚ 03’ 16”N; 034˚ 56’ 56”E
“ “ “ “ “
30 MABOKO ISLAND 00˚ 10’ 23”S; 034˚ 36’ 45”E
“ “ “ “ “

59
MANPOWER ASSESSMENT

60
14. MANPOWER ASSESSMENT
14.1 LVEMP-MWI Manpower Position in Nyanza-Kisumu The staffing position in the laboratories is as follows: Table 27: LVEMP and Ministry of Water and Irrigation Manpower Assessment Form
LVEMP & MINISTRY OF WATER AND IRRIGATION-NYANZA PROVINCE-KISUMU
NAME OF INSTITUTION:…………………………………………….. ITEM NO.
STAFF QUALIFICATIONS EXPERIENCE AREA OF DEPLOYMENT
I Top Management 1 Senior Chemist MSc. Over 20 years Project Manager
2 Chemist (3) MSc. Over 15 years Task Leaders (TL)
3 Chemist (3) BSc. Over 15 years Task Leaders
4 Hydrologist (1) MSc. Task Leaders
5 Hydrologist (1) BSc. Task Leaders
6 4 Technologists HND Field and Laboratory
7 4 Technologists OD Field and laboratory
HND: Higher National Diploma OD: Ordinary Diploma

61
14.2 MWI Manpower Position in Western Province-Kakamega
Table 28: Ministry of Water and Irrigation-Provincial Water Office-Kakamega Manpower Assessment Form
MINISTRY OF WATER AND IRRIGATION-PROVINCIAL WATER OFFICE-KAKAMEGA
NAME OF INSTITUTION:…………………………………………….. ITEM NO.
STAFF QUALIFICATIONS EXPERIENCE AREA OF DEPLOYMENT
I Top Management Provincial Water
Officer MSc. Over 20 years
experience Overseeing water matters (Incl. Water quality in the province)
II Technologists
1 Lab Technologist I
Higher Diploma (Biology) Over 15 years experience
General lab administration and lab analysis
2 Lab. Technologist II
Higher diploma (Chemistry) Over 10 years experience
Lab analysis and report writing
3 Environment Assistant II
Diploma (Environment) Almost 10 years experience
Lab analysis and report writing

62
14.3 Lake Basin Manpower Position-Kisumu Table 29: Lake Basin Development Authority Manpower Assessment Form
LAKE BASIN DEVELOPMENT AUTHORITY
NAME OF INSTITUTION:…………………………………………….. ITEM NO.
STAFF QUALIFICATIONS EXPERIENCE AREA OF DEPLOYMENT
I Top Management 1 Bio-Chemist BSc.; MSc. Over 10 years Effluent Monitoring
and pollution control 2 Micro-Biologist BSc. 9 years Microbiology
3 Ecologist BSc.; Mphil (on-going) Over 10 years Limnology
II Technicians/Lab Technologists
Lab Technicians Diploma in Chemical Engineering
10 years Analysis

63
14.4 Kenya Marine Fisheries Research Institute Manpower Position-Kisumu Table 30: Kenya Marine Fisheries Research Institute (KEMFRI) Manpower Assessment
Form
KENYA MARINE FISHERIES RESEARCH INSTITUTE (KEMFRI) NAME OF INSTITUTION:…………………………………………….. ITEM NO.
STAFF QUALIFICATIONS EXPERIENCE AREA OF DEPLOYMENT
I Top Management
1 1 C.R.O PhD 25 years RESEARCH
2 4 SRO PhD 14 years “
3 1 SRO MSc. 16 years “ 4 2 ROI MSc. 23 years “
5 1 ROI MSc. 14 years “
6 12 ROII MSc 14 years “
II Graduate Officers
1 6 ARO’S BA/BSC/DIP 10 years RESEARCH
2 1 ACCT II B.COM 10 years ACCOUNTS
3 2 ADM OFFICERS II B.A 8 years ADMINSITRAITON 4 1 PO II B COM/PGD 12 years PERSONNEL III Technicians/Lab
Technologists
1 1 PLT HND 32 years TECHNICAL
2 2 L. TECHN I HND 25 years “
3 1 L. TECHNO II ND 16 years “
4 2 L. TECHNO II CERTIFICATE 25 years “
5 12 TECHNICIANS CERTIDICATE 20 years “
6 ENG TECH I DIP. ELECT. ENG 16 years TECHNICAL
7 LIB II HND 21 years LIBRARY
KEY: CRO - CHIEF RESEARCH OFFICER SRO - SENIOR RESEARCH OFFIER RO - RESEARCH OFFIER ARO - ASSITANT RESEARCH OFFIER PLT - PRINCIPAL LAB TECHNOLOGIST PO - PERSONNEL OFFICER

64
15. WATER QUALITY BENCHMARKS In Kenya, effluent discharge standards have not been established. There are however guidelines which have been set to regulate the quality of effluents that are discharged directly into a water body in which case full treatment is necessary or a public sewer where pre-treatment is required. These generalized effluent discharge guidelines (interim pollution control guidelines) are adopted from the British Royal Commission Standards. A list of the same appears as Table 31 of this report. The effluent quality guidelines for discharge into the aquatic environment constitute the water quality benchmarks which will ensure the attainment of water quality for various uses.

65
Table 31 Existing Standards for Discharge of Effluents into Aquatic Environment Parameter Limits Remarks PH 6.0 - 9.0 BOD (5 Days at 20°C) 20 mgO2/l COD 50 mgO2/l Suspended solids 30 mg/l Total phenols 0.001 mg/l (2.0 mg/l in some cases) Copper 3 mg/l (0.05 mg/l in some cases) Zinc 0.5 mg/l Sulphates 250 mg/l (500 mg/l in some cases) Dissolved iron 10 mg/ Dissolved manganese 10 mg/l (0.1 mg/l in some cases) Chromium (Total) 2 mg/l Chromium (Hexavalent) 0.5 mg/l Chloride 200 mg/l (1000 mg/l) in some cases) Fluoride 2.0 mg/l Free ammonia 0.2 mg/l Coliform Bacteria 300 mg/100ml (1000/100ml in some cases) Colour (Hazen units) 5 (Not objectionable to the eye) Dyes Nil Sulphide 0.1 mg/l Cadmium 0.1 mg/l (0.05 mg/l in some cases) Cyanide 0.1 mg/l Organic phosphorus 1.0 mg/l Nickel 1.0 mg/l Selenium 0.05 mg/l Barium 2.0 mg/l Lead 1.0 mg/l Arsenic 0.02 mg/l Total mercury 0.005 mg/l Alkyl mercury Not detectable (0.001 mg/l in some cases) Polychlorinated biphenyls, 0.003 mg/l Smell Not objectionable to the nose Toxic substances Nil Pesticides Nil (0.05 mg/l in some cases) Oils and grease Nil Degreasing solvents Nil Calcium carbide Nil Chloroform Nil Condensing water Nil Inflammable solvents Nil Temperature 30°C (±2°C of ambient) Dissolved solids (total 1200 mg/l n-Hexane extract 30 mg/l

66
16. COMMUNITY INVOLVEMENT IN WATER QUALITY CONTROL ACTIVITIES
Community involvement in the planning and implementation of projects leads to sustainable water resources management and development. However, due to lack of awareness on the value of water resources information, the communities either through the CBOs or the NGOs have not participated effectively in water resources management and especially water quality control activities in the Lake Victoria basin. This omission has been identified by the LVEMP management which recommended that an officer be engaged to work with the communities in awareness creation and initiate a process of assimilating the communities and other stakeholders into the water quality control activities. AWARENESS IN WATER QUALITY MONITORING, MANAGEMENT AND INFORMATION EXCHANGE It has been observed that the level of awareness on water quality monitoring is high among the technical personnel working with the various departmental institutions. This awareness does not appear to be there in all stakeholders. For effective management of water quality control, there is need to involve all stakeholders. The LVEMP has in this regard initiated a programme to incorporate all industries working in the basin in the management of water quality control through workshops and seminars where the results of the project activities would be presented and the industrialists advised on methods to improve on the quality of industrial effluents through various measures so as to conserve the quality of receiving waters. On data and information exchange, it was observed that no official channels have been established which would ensure smooth data exchange between the various institutions which are undertaking water quality control activities in the Lake Victoria Basin. Release of data and information is also based on personal relationships among the officers involved. This was observed to the practice at Kenya Marine & Fisheries Research Institute, which does not exchange its information with the other institutions in the basin.

67
17. RECOMMENDATIONS (a) Staffing levels in the laboratories within the Lake Victoria Basin. It was observed that while KEMFRI laboratory was adequately staffed, MWI and LBDA staffing levels in the laboratories were inadequate to effectively undertake water quality monitoring activities. In this regard, it is recommended that the staffing of these laboratories be enhanced. (b) Level of awareness on water quality issues.
It was noted that the level of awareness on water quality issues is low and in order to raise the level of awareness, the following activities are recommended.
• Creation of awareness by mounting public awareness campaigns through public
meetings, the electronic and print media. The public would need to be made aware of their responsibilities as the custodians of the environment
• Publication and distribution of posters and leaflets depicting the benefits of improved water quality.
The NTEAP could facilitate the above tasks by providing the necessary financial and backstopping support.
(c) Data and information exchange and networking between stakeholders:
The current situation on data and information exchange and networking between stakeholders is low and in order to improve the situation, the following measures are recommended:
(i) Establishing a forum for the stakeholders to discuss and identify areas of common
interest (ii) Undertake inter-laboratory calibration to ensure data quality control. (iii) Standardize data and information collection, processing and storage procedures (iv) Develop a common database structure (v) Encourage the publication of water quality bulletins
(d) Funding for water quality Monitoring: In order to improve and attract adequate funding for water quality monitoring which is currently low, the following processes are recommended:
(i) Commercialize the operations of the laboratories (ii) Introduce a levy on water abstraction and allocate part of the collected levy to the
water quality monitoring (iii) Introduce a levy on effluent discharge and apply the polluter-pays principle with part
of the funds raised being ploughed back into water quality management activities.

68
(e) Existing Laboratory Facilities The existing laboratory facilities in the Lake Victoria Basin have adequate capacity for the task of water quality analysis. There is need however to improve equipment and the co-ordination of staff. On the monitoring of water quality, it is important to include the following parameters and monitoring process in the list of important parameters monitored:
• Mercury, lead and cadmium (Hg, Pb, Cd). • Biological monitoring as a warming system on the changes in water quality in the
stream/rivers. • Enhance sediment load monitoring
(f) Transboundary and basin-wide water quality parameters The following parameters which have bio-accumulation effects in aquatic systems and biota are of transboundary and basin wide importance.
• Nitrates • Phosphates • Mercury • Cadmium • Lead • Copper • Chromium • PCBs
(g) Laboratory accredition and water quality assurance It was noted that only KEMFRI laboratory is internationally accredited. It is recommended that MWI and LBDA laboratories should also be accredited. On water quality assurance, it is recommended that a programme for ensuring water quality assurance be initiated. (h) Water Quality Monitoring Stations The following stations are recommended for consideration as transboundary/basin wide stations:
(i) All stations established in the lake: KL1, KL2, KL3, KL4, KL5, KL6, KP1, KP2, KP3. These stations are fully geo-referenced (Refer to Annex 3).
(ii) All river gauging stations near the outlets of all major rivers and at or near border crossings. These stations are tabulated in the table below:

69
Table 32: River Gauging Stations
RIVER STATION 1 SIO IAH1 2 NZOIA IEF1 3 YALA IFG3 4 NYANDO IGD3 5 SONDU-MIRIU IJG4 6 GUCHA-MIGORI IKB5 7 AMALA ILB2 8 NYANGORES ILA3
Establishment of National Water Quality Monitoring Programs Based on the experience gained from the national Water Quality Monitoring Program, which was initiated by the Government in 1980, the following recommendations should be considered in the implementation of an effective water quality monitoring program.
• The water quality monitoring operations should be given priority in budgetary allocations • Training of water quality personnel is crucial. • Identification and provision of appropriate laboratory and field equipment is essential • Establish a comprehensive water quality monitoring network of stations is necessary • Development of a good database is necessary • Training of database managers is essential • Inter-laboratory calibration is essential for the generation of credible data • It is important to pull resources and avoid duplication in order to maximize outputs and
minimize wastage • Water quality monitoring should be carried out on continuous basis and not at random.
Further, it is recommended that the Nile Transboundary Environmental Action Project undertake the following actions towards addressing other gaps that have been identified in water quality monitoring in the Lake Victoria portion in Kenya. Recommendations for the Nile Transboundary Environmental Action Project to address the identified gaps in water quality monitoring in the Lake Victoria Basin in Kenya.
1. Train database management team to collect in the collation of available data, its analysis, safe storage and retrieval mechanisms.
2. Train instrument technicians to be able to service and maintain laboratory equipment. 3. Establish an appropriate data and information exchange programme between the
various organizations dealing with water quality data in the lake region. 4. Ensure that laboratory inter-calibration is initiated and maintained for the production
of reliable results. 5. Facilitates accredition of the laboratories 6. Facilitate the smooth flow of funds between donors e.g. (LVEMP funds) to the
laboratories to ensure the smooth execution of laboratory work.

70
7. Explores methods of boosting the laboratory staff to ensure the timely and speedy execution of field and laboratory work.
8. Encourage the identification and retention of professionals who are knowledgeable in water quality matters to head the water quality monitoring operations.
9. Facilitate procurement of HPLC and mass spectrophotometer for the Regional office in Kisumu.
10. Strengthen the personnel at the Kakamega laboratory for improved field and laboratory work.
11. Facilitate harmonization of water quality monitoring network in the Lake Victoria Basin to eliminate overlaps and duplication between the various institutions.
12. Facilitate harmonization of laboratory analysis, database development and management and train staff.
13. Initiate a program to assimilate the communities and other stakeholders into the water quality monitoring activities.
.

71
ANNEX 1: KENYA: LOCATION AND DRAINAGE MAP

72
ANNEX 2: LAKE VICTORIA BASIN IN KENYA

73
ANNEX 3: WATER QUALITY MONITORING IN THE LAKE VICTORIA BASIN-INLAKE WATER MONITORING STATIONS
Related Documents