Report No. 627a-KE Kenya FILE COPY Appraisal of the Gitaru Hydroelectric Project May 23, 1975 Public Utilities ProjectsDivision Eastern Africa Regional Office Not for Public Use Document of the International Bankfor Reconstruction and Development InternationalDevelopment Association This report was prepared tor r)fficial use only by the Bank Group. It may not be published, quoted or cited without BankGroup authorization.The BankGroup does not accept responsibilityfor the accuracy or completeness of the report. Public Disclosure Authorized Public Disclosure Authorized Public Disclosure Authorized Public Disclosure Authorized

Welcome message from author
This document is posted to help you gain knowledge. Please leave a comment to let me know what you think about it! Share it to your friends and learn new things together.
Transcript

Report No. 627a-KE
Kenya FILE COPYAppraisal of theGitaru Hydroelectric ProjectMay 23, 1975
Public Utilities Projects DivisionEastern Africa Regional Office
Not for Public Use
Document of the International Bank for Reconstruction and DevelopmentInternational Development Association
This report was prepared tor r)fficial use only by the Bank Group. It may notbe published, quoted or cited without Bank Group authorization. The Bank Group doesnot accept responsibility for the accuracy or completeness of the report.
Pub
lic D
iscl
osur
e A
utho
rized
Pub
lic D
iscl
osur
e A
utho
rized
Pub
lic D
iscl
osur
e A
utho
rized
Pub
lic D
iscl
osur
e A
utho
rized

KENYA
APPRAISAL OF GITARU HYDROELECTRIC FROJECT
Currency Equivalents
Currency Unit = Shilling (Sh)Kenya Cents 100 = ShlSh20 - Kenyan Pound (KE) 1 *Kz 1 - US$2.80KE 1,000,000 = US$2,800,000US Cent 1 =Kenyan cents 7.142US$1 - Sh 7.142US$1,000,000 -K 357,000Swedish Kroner (Sw Kr) 1 -Sh 1.64Pound Sterling (kStg.) 1 -Sh 16.42Ki 1 - Sw Kr 12.2US$1 - Sw Kr 4.35
* The KE is not now used in Kenya as a unit of currency but is usedin accounting, economics and reporting as a covenient measure ofvalue or unit of account.
Abreviations and Acronyms
kV =Kilovolt = 1,000 VoltskW =Kilowatt =1,000 WattskWh =Kilowatt hour = 1,000 Watt hoursMWh = Megawatt hour =1,000 Kilowatt hoursGWh = Gigawatt hour = 1,0000,000 Kilowatt hourskVa = Kilovolt Ampere = 1,000 Volt AmperesMVA =Megavolt Ampere -1,000 Kilovolt AmperesMW =Megawatt = 1,000 Kilowattsm = Meterm3 = Cubic meterscumecs = Cubic meters per secondkm = KilometerOC = Degrees centigradeBar =14.5 pounds per square inchGDP =Gross domestic productGovernment =Government of KenyaCDC = Commonwealth Development CorporationSIDA =Swedish International Development AuthorityEPDC - Engineering Pbwer Development ConsultantsEAP&L = The East Africa Power and Lighting Company LimitedKPC = The Kenya Fbwer Company LimitedTRDC = The Tana River Development Company LimitedTRDA =The Tana River Development AuthorityPSC =Power Securities CorporationUEB =The Uganda Electricity BoardTANESCO = Tanzania Electric Supply Company LimitedUK =United Kingdom
TRDC's financial year - Calendar Year

KENYA
CITARU HYDROELECTRIC PROJECT
TANA RIVER DEVELOPMENT COMPANY LIMITED
TABLE OF CONTENTS
Page No.
SUMMARY ...................................... i-iii
1. INTRODUCTION ................................. 1
Background ....... ............................ 2
2. GENERAL ECONOMY AND THE POWER SECTOR ......... 2
The Country and the Economy ..... ............. 2Energy Resources ............................. 3The Power Sector ............................. 3Existing Facilities .......................... 4Future Development .................. : 6Rural Electrification ........................ 6Geothermal Exploration Program .... ........... 7
3. THE PROJECT .................................. 8
Description .................................. 8Estimated Cost ............................... 8Financing ........ ............................ 10Basis for Estimates .......................... 10Status of Engineering and Construction ....... 10Procurement .................................. 11Disbursements ................................. 11Ecological Aspects ........................... 12Irrigation Aspects ........................... 12
4. JUSTIFICATION OF THE PROJECT .... ............. 14
The Power Market ............................. 14Need for Additional Capacity .... ............. 14Comparison of Alternatives ..... .............. 14Economic Rate of Return ..... ................. 15
This report was prepared by Messrs. A.E. Bailey, E. Bolte, J. Shaukat andP. Owusu.
TABLE OF CONTENTS (Continued)
Page No.
5. THE BORROWER - TANA RIVER DEVELOPMENT COMPANYLIMITED ......... ............................. 16
Structure of the Electricity Supply Industry .. 16Organization and Management ..... ............. 17Training ......... ............................ 19
6. FINANCIAL ASPECTS ............................ 20
Introduction ....... .......................... 20Past Operations and Present Financial
Position ....... ......................... 20EAP&L's Tariffs ....... ....................... 21Proposed Financing Plan ................... ... 21Future Earnings ....... ....................... 24Accounts and Audit ...... ..................... 24Debt Limitation ... ........................... 25Security Arrangements ...... .................. 25Project Monitoring System .................. .. 25
7. RECOHMENDATIONS . ............................ . 25

LIST OF ANNEXES
Annex 1: Actual and Estimated GlWh Generated and Sold, System Demand,
Installed and Firm Capacity and Productive Capability(Interconnected System)
Annex 2: FAP&L - Actual and Forecast Sales of G1Th in each Consumer
Category
Annex 3: Existing Generating Plant
Annex 4: Rural Electrification in Kenya - The Market, Costs andPotential for Development
Annex 5: Description of the Project
Annex 6: Project Cost Estimates
Annex 7: Construction Schedule
Annex 8: Estimated Schedule of Disbursements
Annex 9: Possible New Major Loads to be Supplied by EAP&L between
1975 and 1980
Annex 10: Chart - Maximum Demand, Installed and Firm Generating Capacity
Annex 11: Chart - Energy Demand and Dry Year Productive Capability
Annex 12: Chart - Energy Demand and Average Year Productive Capability
Annex 13: Comparison of Project with Thermal Alternatives
Annex 14: Method and Assumptions made to Determine the Rate of Return
on the Investment
Annex 15: The Hlistory of the Power Companies
Annex 16: TRDC(a) Balance Sheets 1972-1980(b) Rcvenue Accounts 1972-1 RV(c) Sources and Application of Funds 1972-1980
Annex 17: KPC(a) Balance Sheets 1972-1980(b) Revenue Accounts 1972-1980

LIST OF ANNEXES
Annex 18: KPC and TRDC Pro-Forma Combined Statements AssumingConventional Depreciation Accounting
(a) Balance Sheets 1972-1980(b) Revenue Accounts 1972-1980
Annex 19: EAP&L
(a) Balance Sheets 1972-1980(b) Revenue Accounts 1972-1980(c) Sources and Applications of Funds 1972-1980
Annex 20: KPC, TRDC and EAP&L Pro-Forma Combined Statements AssumingConventional Depreciation Accounting
(a) Balance Sheets 1972-1980(b) Revenue Accounts 1972-1980(c) Sources and Applications of Funds 1972-1980
Annex 21: Notes and Assumptions for Financial Statements
Annex 22: Economic Analysis of EAP&L's Tariffs 1
Annex 23: Loan Capital and Security Arrangements of EAP&L, KPC and TRDC
Annex 24: Project Monitoring System
MAP
IBRD 3169x2
KENYA
TANA RIVER DEVELOPMENT COMPANY LIMITED
APPRAISAL OF THE GITARU HYDROELECTRIC PROJECT
SUMMARY AND CONCLUSIONS
i. This report covers the appraisal of the Gitaru Hydroelectric Projecton the River Tana in Kenya. The Project is to be built by the Tana RiverDevelopment Company Limited (TRDC) and its estimated cost is US$123.6 millionequivalent excluding interest during construction. The Government of Kenyahas asked the Bank to assist in financing the Project and a Bank Loan ofUS$63 million, which includes interest during construction of US$8 millionis proposed. The Borrower has obtained Supplier/Export Credit commitmentsto finance about 80% of the offshore costs of the main plant contracts. Theremaining costs including interest during construction on the Supplier/ExportCredits and local bank loans are being financed by the Borrower. The loanwould be the Bank's second to the power sector in Kenya.
ii. The first Loan (745-KE) together with a credit from the SwedishInternational Development Agency (SIDA), jointly financed the offshore costof the Kamburu hydroelectric project. Construction of this project proceededsatisfactorily, although there was some delay in completion due to slow progressin the construction of the tailrace tunnel, and the plant went into commercialoperation in July/August 1974, some five months behind schedule. Project costsincreased by about 7% over the appraisal estimate principally because of cur-rency revaluations, a sales tax, and increased consultants costs. The costoverrun was financed by the Government.
iii. The Project consists of an underground power station containingtwo 67 MW generating sets (rated at 72 MW for individual operation), and pro-vision for a third set later; a transmission line about 8 kms in length link-ing Gitaru with Kamburu and a line about 111 kms in length from Kamburu toNairobi.
iv. Demand for electrical energy in Kenya was growing at a rate ofabout 10% per year during the period 1968-1972, falling slightly in 1973 and1974. In the three years 1975-1977 the increase of non-industrial demand forpower is expected to fall below its long-term trend due to a projected slow-down in Kenya's economic growth. However power consumption in the industrialsector, where some major projects are coming on stream, will increase morerapidly than in the past, compensating for the reduction in other sectors.It is, therefore, expected that total power demand in the period .1975-1977will grow at more than 10%, falling thereafter to an average annual growthrate of 9%.

v. The Project is necessary to meet the growth in demand and is theleast cost method of doing so. It has been compared with the next best alter-native program which would involve the prior installation of 66 MW of gasturbine capacity located at Nairobi. The analysis gave an equalizing dis-count rate of 11% and a sensitivity analysis showed that a 10% increase inthe capital cost of Gitaru reduces this to 10.5% and a 10% reduction in demandgrowth reduces it to 9.5%. A combination of the two reduces the equalizingdiscount rate to 8%. In these cases, the equalizing discount rate falls belowthe range of the opportunity cost of capital, which is estimated at 11% to 13%.The internal economic return on the project is 14%, which is satisfactory.It is sensitive to variations in costs and revenues; a 10% increase in costsreduces the rate to 12% and a reduction in the growth of electricity demandby 10% leads to a rate of 13.5%. When both coincide it is just under 12%.
vi. Kenya presently takes a bulk supply of 30 MW from Uganda under along-term agreement and hopes to negotiate a further 5 MW under a separateagreement. There is also potential for a bulk transfer of power from Tanzaniaby the early 1980's and the advantages of cooperation between neighbouringterritories in the interchange of power should, together with the developmentof geothermal power, be considered in future development planning.
vii. Three companies are responsible for public electricity supply inKenya. The East African Power and Lighting Company Limited (EAP&L), a cor-poration with widespread private ownership of its stock, was the only onefor many years. EAP&L formed two subsidiaries, the Kenya Power CompanyLimited (KPC) and TRDC, with Government participation, in 1955 and 1964,respectively, to be responsible for specific new projects. TRDC, the secondof these two companies, was charged with development of the Tana River. TheGovernment has a controlling interest in EAP&L and has acquired all the sharesof TRDC and KPC. EAP&L is responsible for distribution of electricity, andit supplements its own output by buying in bulk at actual operating cost plusdebt service from the two subsidiaries, which have the main responsibilityfor generation. EAP&L staffs and manages the two subsidiaries. EAP&L is areasonably well-managed utility and it will be capable of managing TRDCefficiently when that company has to carry out the Project.
viii. The financing plan includes provision for a 10% increase in EAP&L'stariffs from July 1, 1975 together with a fuel surcharge of 4 Kenyan centsper kWh and the investment of the Government's revenues from EAP&L in TRDC'sequity by the issue of shares of a per value of KL 6 million. This togetherwith a long-term loan from the Government in the amount of Kb 3.86 millionwill enable EAP&L and TRDC to finance the balance of costs not covered by theBank loan and Supplier/Export Credits.
ix. The bulk sales agreement between EAP&L and TRDC requires EAP6L topurchase from TRDC a minimum amount of power so as to provide sufficientrevenues to meet TRDC's ascertained costs. Additionally a development sur-charge has been paid by EAP&L to TRDC since 1971, principally to provide thelatter with part of the funds to meet the local costs of the Kamburu project.It is proposed as part of the costs payable by EAP&L to continue the develop-ment surcharge which together with a loan from EAP&L to TRDC, will cover partof the local currency costs of the Project.

- iii -
x. The financing method described is satisfactory. The surcharge willbe fixed so as to produce about the same average return on average net fixedassets including work in progress, for KPC and TRDC combined, as for EAP&L.This return would be 8-1/2% per year.
xi. Procurement for works and materials which are to be financed fromthe proposed Bank Loan will be on the basis of international competitive bid-ding. Procurement of equipment and materials to be financed by SupplierCredits would be on a competitive basis.
xii. As in the case of Kamburu there are not expected to be any undesir-able side effects on the ecology of the area, but SIDA who is financing anecological study, which is being carried out to determine the effects ofKamburu on land usage, disease vectors, etc., has agreed to include the areaof the Project in this study.
xiii. There are conflicting claims on the Upper Tana waters for irrigationand other purposes and the Tana River Development Authority (TRDA) has beenestablished to carry out studies to determine the most efficient usage of theUpper Tana waters. Their consultant's report, which has recently been pub-lished and is presently being examined by the Government, recommends theestablishment of an Upper Reservoir to regulate the flow of the river. TRDAhad previously recommended to the Government that no further abstraction ofwater for irrigation or other purposes which would adversely affect hydroelectriccapacity should be permitted before the Upper Reservoir is constructed. TheGovernment has no long-term plans for irrigation or other major development inthe Upper Tana but with the construction of the Upper Reservoir by the early1980's as presently foreseen, such plans would not be adversely affected bythe Project.
xiv. With the assurances proposed in Chapter 7 the Project would besuitable for a Bank Loan of US$63 million for a term of 25 years including5 years grace.

KENYA
TANA RIVER DEVELOPMENT COMPANY LIMITED
APPRAISAL OF THE GITARU HYDROELECTRIC PROJECT
1. INTRODUCTION
1.01 This report appraises the Tana River Development Company Limited's(TRDC) hydroelectric power station at Gitaru in Kenya with an initial capacityof 134 MW and associated transmission lines. The estimated cost of the Projectis KE 44.1 million (US$123.6 million) excluding interest during constructionon the various loans and credits, aggregating about US$12.4 million. TheGovernment of Kenya has asked the Bank to assist in financing the Project.The proposed Bank Loan would be US$63 million which would be used to financepart of the costs of the civil works, the foreign costs of miscellaneouselectrical and mechanical works and engineering and administration, a manage-ment review and interest during construction. The Government has obtainedSupplier/Export Credit commitments estimated at Ki 7.79 million (US$21.8million) to finance about 80% of the foreign exchange costs of the main plantcontracts. TRDC will finance the balance of the project costs, includinginterest during construction on the local loans and credits, aggregating aboutKh 18.3 million (US$51.2 million) from (i) surpluses accruing to it, (ii) acontribution to equity from the Government, and (iii) a long term Governmentor local bank loan. The proposed Bank Loan of US$63 million would representabout 46% of the total cost of the Project.
1.02 This will be the second Bank loan for power in Kenya, Loan No. 745-KE having been made in 1970 for US$23 million to finance part of the foreignexchange costs of the Kamburu hydroelectric project. This project was joint-ly financed, with a SIDA Credit of US$6 million financing the balance of theforeign exchange. The loan was made to TRDC which is a "paper company" estab-lished in 1964, for political purposes, to develop the hydroelectric potentialof the Upper Tana River. EAP&L staffs and manages TRDC and buys its entireoutput. Since EAP&L is the sole revenue earning company it had to provideall the assurances normally required of the borrower, and the same requirementwill apply in the case of the loan for the proposed Project.
1.03 Construction of the Kamburu project has proceeded satisfactorily,although project costs have increased by about 7% over the appraisal estimate.The cost overrun of about US$2.8 million which has been financed by the Govern-ment is due principally to currency revaluations, the imposition of a salestax during the construction period and to escalation in the costs of super-vision and other consulting services. Work proceeded broadly in line withthe construction schedule, although time was lost due to slow progress ofconstruction of the tailrace tunnel through fault sections, and the plantwas commissioned during July/August 1974, some five months behind the targetfor completion set at the time the major contracts were awarded.

-2-
Background
1.04 EAP&L commissioned Mlessrs. Merz & McLellan (UK consultants) inSeptember 1972 to examine and recoirmend a plan of development for the period1973 through 1992, and to determine the form and location of the power gene-ration source which would be required by 1978. The report concltuded thatthere would be a slight economic advantage in favor of the Gitaru flydroelec-tric Project but, for a number of reasons including dry year risks and un-certainties of irrigation abstraction, it would be prudent to construct firsta 120 MW thermal power station at M-lombasa for commissioning in 1978 to befollowed by the Gitaru lhydroelectric project in 1981. This recommendation wassubsequently overtaken by events; following the substantial increases in thecost of fuel oil during late 1973 and early 1974 the position was re-examinedand it was demonstrated that Gitaru is now the preferred project, that defermentcould no longer be justified for the reasons previously stated and construc-tion should proceed with a minimum of delay to ensure completion of the Proj-ect by early 1978.
1.05 EAP&L's consultants for the Kamburu project, Engineering PowerDevelopment Consultants (EPDC) of the UK, had submitted a geology report onGitaru in 1970 and, in view of the extent of their previous involvement, EAP&Ldecided to engage them for the Gitaru engineering, design and supervision ofthe Project. The appraisal originally scheduled for March/April 1974 was post-poned to allow completion of geological survey work and preparation of an en-gineering report which was subsequently published in May 1974.
1.06 This report is based.on information provided by (i) EPDC's DraftEngineering Report of May 1974, and the Supplement to the Draft EngineeringReport of August 1974, (ii) EAP&L, and (iii) an appraisal by Messrs. A.E.Bailey, E. Bolte, J. Shaukat and P. Owusu in August/September 1974.
2. GENERAL ECONOMY AND THE POWER SECTOR
The Country and the Economy
2.01 Kenya, a country covering an area of 583,000 sq. kms, has apopulation of 12.9 million growing at a rate of 3.3% per year. About 90%(1970) of the total population are living in rural areas, but urban popu-lation is increasing fast. The main urban centers, the capital Nairobi andMombasa, are growing at 9% and 5% per year respectively.
2.02 During the eleven years since Independence in late 1963, GDP atconstant prices has grown at an average rate of 6.7% per year. GDP per capitareached about US$180 in 1973 ard is the highest in East Africa. Agriculturedominates Kenya's economy; it produces a livelihood for nearly 90% of thepopulation and constitutes about one third of GDP. Monetized agriculture hasgrown by 6% per year; 45% of the country's foreign exchange earnings are agri-cultural exports (mainly coffee, tea, and meat products). Industry has grownat about 8% per year during the last decade; its output is now about 12% of

- 3 -
GDP. Services, including tourism, had a high growth rate and account for 28%of GDP. In response to the serious impact of world inflation, including theoil prices, on Kenya's economy, the Government has adopted an action programto restructure the economy. While this will hopeful]y bring about a highgrowth rate in the long run, growth in the next few years will be below pre-vious performance as a result of the serious balance of payments constraint.
Energy Resources
2.03 The known main indigenous energy resource is hydroelectric power.Its physical potential is estimated at over 30,000 GWh half scattered oversmall rivers mostly uneconomic to exploit. The Tana River accounts for theother 15,000 GWh of which about 2,700 GWh is economically exploitable. Sur-veys have shown no coal seams of economic value 1/ and the geological structureof most of Kenya seems to preclude the occurrence of oil except in a stripbordering Somalia in the northeast. Imported oil is processed in the refineryin Mombasa, which was enlarged in 1974 to a capacity of 3.3 million tons peryear. Furnace oil for electricity generation at EAP&L's main thermal powerstation in Mombasa is supplied from the refinery at a price of KSh500 perton, compared to KSh90-120 before October 1973. Kenya imports over 30 MW ofelectric power at 95% load factor from the Uganda Electricity Board (UEB)which is also prepared to supply a smaller amount of non-firm power ("spill.units"), as permitted by plant and energy availability. When the secondstage of Tanzania's Kidatu Power Station is completed (about 1979/80), Kenyacould import for some years, limited amounts (up to 20 MW) of electricity fromTanzania. There is also the possibility of developing geothermal power bythe early 1980's (see paragraph 2.22 to 2.25).
The Power Sector
2.04 The electricity supply industry in Kenya consists of three companies;The East African Power and Lighting Company Ltd. (EAP&L), The Kenya PowerCompany (KPC) and The Tana River Development Company Ltd. (TRDC). EAP&Lis the sole distributor and it coordinates all sources of power and staffsand manages the other two companies. The background and description of thethree companies are explained in detail in Chapter 5.
2.05 EAP&L's sales increased at an average of 8% per year during theperiod 1964 to 1974 with a tendency towards higher growth rates in recentyears; sales increased by about 10% per year during the period 1968-1972,falling to just over 8% during 1973 and 1974, compared to 5.5% per year duringthe period 1964-1968. The Kenyan economy is expected to have a substantiallylower growth rate during the period 1975-1977 than in the past, which will leadto a sharp drop in the growth rate of non-industrial power demand. On the otherhand, several new power consuming industries will go into operatirn during thisperiod, which are largely independent of a temporary reduction of economicgrowth in Kenya and the average annual growth rate of industrial power demand
1/ Coal deposits have been found in neighboring Tanzania and should beconsidered when assessing Kenya's future thermal development program.

- 4 -
during 1975-1977 is expected to be about 16.5%. Total power consumption willincrease by about 10% per year during this period. In the long term, with animprovement in the growth rate of Kenya's economy, and with expansion ofindustry back to a normal level, electricity demand in Kenya is expected toreturn to a growth rate of 9% per year. Detailed statistics for the Inter-connected System for the period 1970 through 1980 and actual and forecastsales of GWh during the same period are shown in Annexes 1 and 2.
2.06 With 75 kWh per capita, electricity consumption in Kenya is stillat a low level. Nearly 100,000 household connections give 600,000 to 700,000people access to electricity, which is 5-6% of the total and about half ofthe urban population. 350,000 to 400,000 of the population supplied withelectricity are Kenyans with low incomes, living mostly in high densityhousing built by the Government or city councils. This group is presentlygrowing at an annual rate of about 35,000.
2.07 Domestic electricity consumption increased about 6% per annumduring the last six years but its part in total sales dropped from 19% in1968 to 15*% in 1974. Low income domestic consumers had a higher rate ofgrowth of 10% per year, but due to the low consumption per connection (20kWh per month), such small domestic consumers account for only 1% of EAP&L'stotal electricity sales. Depending on the rate of government and city councilconstruction of low cost housing, annual growth of small domestic electricityconsumption is expected to average 10% until 1980. The growth rate of thelarger domestic consumer will continue at a lower annual rate of between 3%and 4% improving to 6% by 1980.
2.08 Electricity consumption in the commercial sector increased at 13%per year between 1968 and 1974, mainly due to the high rate of developmentof Nairobi which is the administrative and commercial center of Kenya, andby 1974 accounted for 26% of total sales. In future, the growth rate in thissector is expected to be lower, at about 8% per annum.
2.09 Industry is the largest consumer of electricity in Kenya with anaverage annual rate of increase of 12% between 1968 and 1974. Industrypresently accounts for 43% of total sales but with substantial new loadscoming up and the demand forecast to increase at a rate of about 13% perannum, more than half of all electricity supplied in Kenya will be consumedby the industrial sector by 1980.
Existing Facilities
2.10 Electricity is distributed by EAP&L in four areas of Kenya, namelythe Nairobi district and the Rift, Coast and Western areas (see map). Gen-erating plant operated by the three companies (shown in detail in Annex 3)consists of:

Interconnected Sjstein Isolated Stations
Hydro 130 MW
Steam 65 NW
Diesel 29 MW 3.9 MW
Gas Turbine 30 MW _
Total 254 MW 3.9 MW
2.11 In addition to the above plant availability, EAP&L takes a 30 MWbulk supply from the Uganda Electricity Board (UEB) under a long-term agree-ment, extending to year 2005 (see para 2.03), giving a total installedcapacity of 284 MW on the interconnected system. The effective capacity is268 MW due to the need to derate some of the older diesel and gas turbineplant.
2.12 The two largest hydroelectric power stations, Kindaruma (44 MW)and Kamburu (60 MW) located on the Tana River some 70 miles from Nairobiare owned by TRDC and the 65 MW Kipevu steam.station located at Mombasais owned by EAP&L. These three power stations are interconnected with theNairobi area by means of 132 kV single circuit transmission lines. One ofthe transmission lines between Kamburu and Nairobi is constructed for 275 kVbut there are no plans for operating the line at this voltage before the early1980's.
2.13 Other installations include seven small hydroelectric developments,the largest of which are Tana (15.2 MW) and Wainjii (7.4 MW), both run ofriver schemes on the Tana River, owned by KPC. The remaining five hydro-electric installations together with eight diesel-electric power stationsincluding Nairobi South and the gas turbine generating plant are owned byEAP&L. All of this plant including the larger power stations described inparagraph 2.12 above are interconnected by means of 132 kV and 33 kV trans-mission and subtransmission lines. This system is linked to Uganda bya 132 KV double-circuit transmission line for the transfer of the 30 MW bulkpower (see paragraph 2.11). UEB has also supplied 'spill units" under asupplementary agreement with EAP&L, in accordance with availability of plant,and EAP&L was hoping to negotiate a further firm bulk supply of 5 MW undera separate agreement, but with seemingly inadequate plant maintenance inUganda and UEB's recent inability, at times, to supply even the 30 MW on afirm basis, EAP&L is not very hopeful that a further 5 MW will be possible.EAP&L also operates four isolated diesel electric power stations aggregating3.9 14W.
2.14 Distribution voltages are 11 KV and 415/240 v. The supply isreliable and losses at 15% of units sent out are reasonable.

-6-
Future Development
2.15 The construction of the third Kamburu 30 MW hydroelectric generat-ing unit (24 MW firm) and the Kipevu No. 7 steam turbine generating unit(30 MW) are currently in progress with commissioning in each case scheduledfor 1976. The Project (134 MW) is scheduled for commissioning in 1978 andit is expected that the third generating unit will be required by 1982.Further thermal back-up plant will be required by 1981 and EAP&L is provision-ally planning for the first 60 MW steam generating unit at a new Mombasapower station to be commissioned by 1980/81 but firm proposals must awaitthe outcome of the current geothermal exploration program (see paragraphs2.22-2.25). The capacity of the existing 132 KV line between Mombasa andNairobi is 58 MW and a second line constructed for 275 KV will be requiredby the early 1980's.
2.16 The advantages of cooperation between neighboring territories inthe interchange of power must also be considered in future developmentplanning. It is doubtful if much more than the present 30 MW bulk transferwill be available from Uganda in the medium term due to a slow down inplanning the development of its own hydro resources during recent years,but a bulk transfer of power from Tanzania after Kidatu II is commissioned -by about 1980 - has distinct possibilities. Full cooperation between thetwo countries and utilities could defer the next large thermal project andpossibly provide much needed time to get a major geothermal installationinto operation. The possibility of cooperation with Tanzania in the inter-change of power by 1980 was discussed with EAP&L and the Government duringnegotiations but EAP&L were of'the opinion, following talks with the TanzaniaElectric Supply Company Limited (TANESCO) that little spare power could bemade available after 1980 and, since long-term availability could not beguaranteed they were disinclined at this point in time to consider importedpower from Tanzania in their future development plans.
Rural Electrification
2.17 EAP&L normally apportions 1% of its net operating income to thedevelopment of supplies in the rural areas. Schemes likely to becomefinancially remunerative in time have been selected from a list of townshipsnominated by the Government. This program has been proceeding slowly duringrecent years due to financial constraints.
2.18 Additionally, the Government requires that the surplus createdby the difference between the soft terms of the SIDA Credit for the Kamburuproject and the harder on-lending terms to TRDC should be used to financean expanded rural electrification program. SIDA provided consultants toexamine the proposal and put up a program of development. Despite somedelay, this rural development program is now going ahead; SIDA has made abridging grant of Kn423,000 equivalent pending receipt of revenues underthe SIDA Credit on-lending agreement and Swedish staff, comprising a planningengineer and two construction foremen, has been seconded to EAP&L to takecharge of the program.

- 7 -
2.19 The arrangements provide for all revenues to be paid into a Govern-ment fund; EAP&L will manage the schemes as these are commissioned, on amanagement fee basis and all operating costs will be paid from the fund,which will thus carry operating losses. Provision is made for EAP&L to"buy out" schemes as these become viable, and absorb them in their ownorganization.
2.20 SIDA is also carrying out a socio/economic study on the effect ofrural electrification in Kenya and the report should be available by mid-1975. A copy will be made available to the Bank as soon as this is published.
2.21 Rural electrification in Kenya, the market, costs and potentialfor development are discussed in Annex 4.
Geothermal Exploration Program
2.22 Geothermal survey and exploration have been in progress, with UNDPassistance, for the past three years and the first successful exploration/working well has been drilled in the Lake Naivasha area (two wells had beendrilled at the time of appraisal, one of which was dry). The successful wellis running steam (and a little water) at 240'C in the ground at 31 bars. Thearea under test is approximately 7 sq km and the field should, in the opinionof the UNDP geologist, be capable of supporting a power demand of 400 MN: (80wells at 20 acres spacing, allowing 5 MW per well).
2.23 This matter was discussed during negotiations and the EAP&L repre-sentatives advised that two fdrther wells have since been drilled at 200 mspacing from the successful well. Both wells are running some steam butinsufficient, together with the one successful well, to support a pilotinstallation. If the steam flow cannot be improved by other means, it isproposed to deepen the wells from 1,200 m to 1,700 m. If successful, EAP&Lproposes to drill a further two wells and, contingent upon the recommendationsof a feasibility study (see paragraph 2.24), proceed with a pilot installation.of at least 10 MW.
2.24 Consultants (SWECO of Sweden) have been appointed to carry out thefeasibility study of exploiting the reservoir and to recommend a program ofdevelopment and costs. The study, which was scheduled to start in December1974 for completion by mid 1975 has been delayed, but EAP&L is hopeful that astart will be made by mid 1975. Both the Government and EAP&L confirmed theircommitments to the development of Kenya's geothermal potential and, dependentupon the recommendations made in this study, EAP&L will consider, in additionto the pilot installation, a large scale drilling program with a view toestablishing a large geothermal power station. The reservoir is located some12 km from the existing 132 kV double circuit transmission line from Tororoto Nairobi. and feeding the power into the system should present no problem.

- 8 -
2.25 It is.unlikely that EAP&L would wish to place firm orders forgeothermal plant until working experience has been gained with a pilotinstallation and adequate results have been obtained from the drilling.program. Assuming therefore the program proceeds as envisaged, the pilotplant could be in operation by 1977, with the main plant ordered by thelate 1970's for commissioning by the early 1980's.
3. THE PROJECT
Description
3.01 The Project is described in detail in Annex 5; it consists of:
(a) a rock and earth-fill diversion dam, with integral spillwayand vertical intake shafts with short headrace tunnels to theunderground power station;
(b) an underground power station designed for three 67 MW generatingsets (rated at 72 MW for individual operation) driven by Francisturbines, with two sets installed under the Project;
(c) a partially lined tailrace tunnel about 4700 m long emptyinginto the Kindaruma reservoir;
(d) a 132 kV double circuit transmission line from Gitaru to Kamburu(8 KMf) and a single circuit 275 kV transmission line fromKamburu to just outside Nairobi (111 KM). This line willoperate initially at 132 kV; and
(e) a management review and a study of EAP&L's tariff structure.
3.02 Gitaru is located between the existing Kamburu and Kindaruma hydro-electric power stations. The three power stations operate in cascade i.e.,they all use the same water, one following the other, to generate power, andGitaru completes the development of the hydro resources of the Upper TanaRiver referred to as the "Seven Forks" development. Gitaru will produceenergy at varying weekly load factors depending not only upon the river flowbut also on the ability of the power system to absorb the energy produced.The estimated annual output in an average year would be about 750 GWh risingto 900 GWh when the third unit is installed.
Estimated Cost
3.03 The estimated cost of the Project is Kh44.1 million (US$123.6million) with a foreign currency component of KL31.1 million (US$87.1 million)excluding interest during construction. The estimated costs of the principalfeatures of the Project are shown in the following table and in more detailin Annex 6.

-9-
Local Foreign Total Local Foreign Total----- Ki Thousand --- US$ Thousand-----
Part AMain Civil Works 5,800 11,380 17,180 16,240 31,864 48,104Misc. Electrical Works 100 575 675 280 1,610 1,890
Misc. Mechanical Works 60 220 280 168 616 784Physical Contingency
Civil 20% E&M 10% 1,200 2,350 3,550 3,360 6,580 9,940Price Contingency 27% 1,920 3,900 5,820 5,376 10,920 16,296Engineering &
Administratio / 240 2,985 3,225 672 83.58 9 030Total 9,320 21,410 30,730 26,096 0
Part BTurbines Generators
Gates, Screens, etc. 350 4,520 4,870 980 12,656 13,636Trans. Line Substations
and Transformers 700 2,430 3,130 1,960 6,804 8,764Physical Contingnecy 10% 200 700 900 560 1,960 2,520Price Contingency 27% 330 2,055 2.385 924 5,754 6,678
Tbtal 1,580 9,705 11,285 4,424 27,174 Ii-598
Import Duty & Sales Tax 2,120 - -2120 5,936 5.936
Total Cost of Project 13,020 31,115 44,135 36,456 87,122 123,578
Interest during Con-struction on Bank Loan - 2,857 2,857 - 8,000 8,000
Interest during Con-struction on LocalBank Loans 690 - 690 1,932 - 1,932
Interest during Con-struction on SupplierCredits _ 869 869 -2,433
GRAND TOTAL 13.710 34,841 48,551 38388 97,555
1/ Includes the cost of the Management Review estimated at Ki 25,000
(US$70,000).
Note: The estimate includes provision for a 6 month delay in completionof construction.

- 10 -
3.04 Preliminary works comprising, principally, access roads and associatedconsultants costs have been completed and have not therefore been included inthe cost estimates. The costs of these works amounting to KE1.286 million werefinanced by TRDC by means of a local bank loan of K-1.5 million.
Financing
3.05 The proposed Bank Loan of US$63 million would be used to financepart of the civil works, the foreign exchange costs of the miscellaneouselectrical and mechanical works and engineering and administration, themanagement review 1/ and interest during construction on the Loan. 80% ofthe foreign exchange costs of Part B estimated at KE 9.7 million (US$27.2million), comprising all the major plant, the transmission line, transformersand substations would be financed through Supplier/Export Credits. Local costsand the balance of foreign costs of Part B, and the costs of Part A which arenot financed from the Bank Loan, together with import duties, sales tax andinterest during construction on the Supplier Credits and the local loan (para.3.04) estimated at KL 18.3 million (US$51.2 million) are being financed by theBorrower.
Basis for Estimates
3.06 The estimates are based on actual lowest tenders received for themain civil works and plant contracts which were being evaluated at the timeof negotiations. The consultants' knowledge of local conditions and of mate-rials and labor costs and also their experience with Kamburu has facilitateda reasonably reliable assessment of additional costs due to risk conditionsand other physical factors. Nevertheless a physical contingency of 20% hasbeen allowed on civil works to provide for unforeseeable bad rock conditionsand possible delay in project completion. This, together with a 10% physicalcontingency for E&M works and an additional 10% on local costs to provide fordelay in project completion is considered reasonable. The price contingencyof 27% is based on an estimated general rate of inflation during the periodof construction. The way in which this contingency is calculated is demon-strated on page 2 of Annex 6.
3.07 The area to be inundated by the Project is relatively small; thereare no permanent human habitations and cultivations in the area and conse-quently no provision for resettlement costs has been included in the estimates.
Status of Engineering and Construction
3.08 The Project is being designed by Engineering and Power DevelopmentConsultants of England. This firm or its affiliate, Balfour Beatty andCompany Limited, has been responsible for designing all EAP&L's major devel-opment projects and for TRDC's Kindaruma and Kamburu hydroelectric power proj-ects. They are responsible fcr the preparation of all documents and evaluationof tenders and will superviae construction of the Project.
1/ The study of EAP&L's tariffs is being carried out by the Bank in coopera-tion with EAP&L's staff.

3.09 The construction program is tight, principally because EAP&L wasobliged to reassess the development program following the large increase infuel oil costs during late 1973 and early 1974. This led to a decision todefer the proposal for a thermal development at Mombasa and to proceed in-stead with the Gitaru Project. Fortunately a great deal of the engineering,geological survey and the associated work had already been carried out. Thepresent position is that specifications for the civil works and all major plantcontracts have been completed; tenders which were invited at the end of 1974have been received and evaluated and it is planned to award contracts immedi-ately after approval by the Board of the Bank Loan. The construction scheduleis shown in Annex 7. As already mentioned, the program is tight but, bearingin mind the consultants' recent experience with Kamburu and familiarity withthe local conditions, it is achievable providing no unforeseen risk area orother problem arises. Nevertheless, the cost estimates provide for the possi-bility of a six-month delay in completion of construction. EAP&L has no plansto purchase interim gas turbine plant and if it becomes apparent that commis-sioning is likely to be substantially delayed the possibility of selective loadshedding will be accepted by EAP&L. The consequences would not be serious.
Procurement
3.10 Procurement for works and materials under Part A of the cost esti-mates, part of which are to be financed from the proposed Bank Loan, will beon the basis of international competitive bidding. Procurement of equipmentand materials covered by Part B of the cost estimates will be through Supplier/Export Credits on as wide a competitive basis as possible. It was confirmedduring negotiations that firm commitments have been obtained for 80% of theforeign costs of plant and equipment to be financed by Supplier/Export Credits.Completion of all conditions precedent to the effectiveness of these credits,will be a condition of effectiveness of the proposed Loan.
3.11 In the case of minor items of ecuipment not exceeding USS5O,000equivalent, contracts will be awgarded, where appropriate, on the basis ofcompetitive bidding advertized locally, and in accordance with local proce-dures, satisfactory to the Bank.
Disbursements
3.12 Preliminary works, which have been financed by a local bank loan,have been completed, but no other work on the Project has commenced otherthan the engineering design and preparation of bidding documents, and com-pletion of geological field works. Because of the late change in develop-ment plans (see para 3.09) and the consequent need to expedite work on theproject if the expected demand in 1978 is to be met, consultants' expendituresof US$2 million enuivalent (foreign component USq1.5 million equ.ivalent) willbe incurred prior to loan presentation. These costs have been included inthe cost estimates and the foreign component (USS1.5 million) should beeligible for disbursement under the Bank Loan.

- 12 -
3.13 With the sole exception of the main civil works, disbursement ofthe Bank Loan will be made for the actual foreign exchange cost of equipment,material and services procured under the Loan and for interest during con-struction on the Loan. In the case of the civil works, 60% of the paymentunder each certified pay certificate will be disbursed from the Bank Loan.A disbursement schedule is given in Annex 8.
Ecological Aspects
3.14 An ecological study, financed by the Swedish International Develop-ment Agency (SIDA), is being carried out to determine if ecological changesare likely to result from the Kamburu project, and to determine what steps,if any, need be taken to avoid or mitigate any undesirable side effects.This study is being carried out by Nairobi University staff.
3.15 The cost of the study is estimated at 240,000 Swedish Kroner andthe team carrying out the work comprises 7 groups all qualified in their par-ticular field, plus 16 field assistants. The University of Nairobi is usedas a base with the team also drawing on the resources of the GovernmentResearch Laboratories.
3.16 SIDA were asked if there would be any objection to the inclusionof Gitaru within the scope of the study and ho objection was raised providingthis can be carried out within the financial provision of 240,000 SwedishKroner. The inclusion of Gitaru in the study has since been confirmed.
I rigation Aspects
3.17 There are conflicting claims on the Upper Tana waters for irrig-ation and other purposes and, dependent upon the degree of abstraction forthese purposes, the output from Gitaru and the other two hydro power stations(Kamburu and Kindaruma) would be adversely affected. The effect of abstrac-tion on Kamburu's output was recognized during negotiations for the Kamburuloan and the Government agreed, at that time, that Kenya would not commititself to a development program which involved abstraction of water from theUpper Tana and its tributaries upstream of Seven Forks to an extent whichwould interfere substantially with the ability of the Borrower to generatepower at Kamburu power station, pending completion of studies to determinethe most efficient usage of the Upper Tana waters. The Tana River Develop-ment Authority (TRDA) was formed in 1972 to carry out these studies.
3.18 An integral part of the studies is the need to exanine the pro-posal for an Upper Reservoir which will impound flood waters and permitregulation of the river to ensure the most efficient usage of its watersfor hydro power and other purposes. TRDA's consultants 1/ started the
1/ TRDA's consultants are:
Ewbank and Partners (UK) - Power Studies;Watermeyer, Legge, Piesold and Uhlmann (UK) - Civil & HydrologicalStudies;
Peat, Marwick and Mitchell (UK) - Management Consultants.

- 13 -
prefeasibility study of the Upper Reservoir on May 1, 1974, and their finalreport has been published and is currently being examined by the Government.
3.19 Copies of the report will be made available to the Bank as soon asthis is released by the Government. In the meantime discussion of this matterduring negotiations elicited the information that the report outlines the costof developing storage at the different potential dam sites and makes specificrecommendations for the establishment of the Upper Reservoir.
3.20 The benefits of an Upper Reservoir will include availability ofwater for irrigation, public water and rural supplies in the Upper Tana, andthe provision of firm hydro power of about 80 lclq in the average year. It willnot significantly change the amount of energy which can be generated by theProject (and the other hydroelectric installations) because it only impoundsthe flood flow and there are losses due to evaporation. Also there are no sig-nificant savings in the capacity of standby thermal plant, as total thermalplant installed by 1985 would be about 250 MW. However, analysis shows thatthe firm energy availability after the Upper Reservoir is constructed willrestult in a reduction of thermal energy output, rising to a maximum of 112GWh per annum by 1985. On present fuel cost this would represent a savingof about US$2.5 million equivalent per annum.
3.21 The view of TRDA is that with the population in the Upper TanaBasin rising to a forecast of 4.5 million (3 million can be supported on rainfed waters), pressure will mount for the establishment of an Upper Reservoir.Without it, it is doubtful if any further hydro development after Gitaru willbe possible; further irrigation in the Lower Tana will be limited and therewill be little or no irrigation in the Upper Tana without depletion of hydropotential. Bearing these facts in mind and also the Importance of fuel savingswhich can be made by substituting thermal power with hydro-power, the Board ofTRDA has recommended that no irrigation development in the Upper Tana Basinshould be permitted prior to the development of the Upper Reservoir.
3.22 These matters were also discussed with the Government and EAP&I.during negotiations; EAP&L intimated that present thinking indicates construc-tion of the dam during the early 1980's and Government agreed that all neces-sary measures will be taken to ensure that abstraction of water from theUpper Tana Basin for large scale irrigation and other major schemes will notbe authorized prior to development of the Upper Reservoir. The Governmenthas no long-term plans for irrigation or other major development in the UpperTana but any such plans maturing after the early 1980's would not be adverselyaffected by the Project.
- 14 -
4. JUSTIFICATION OF THE PROJECT
The Power Market
4.01 Past and future trends in EAP&L's sales of KWh have been discussedin paragraphs 2.05 through 2.09. The latest (1975) EAP&L forecast assumesan annual increase of sales of 9% in 1975 increasing to 11% in 1976 then fallingto the longer term growth rate of 9% by 1979. This latest forecast, which isbroadly in line with the forecast made at the time of the appraisal, was care-fully checked by the appraisal mission by making independent surveys and pro-jections. Taking into consideration all known major developments which aredetailed in Annex 9 and ignoring the possible establishment of a large fertilizerindustry by the late 1970's, the independent survey indicated that EAP&L's fore-cast was if anything, a little conservative. Their forecasts were thereforeaccepted for determining the timing for the next major generation developmentprogram.
Need for Additional Capacity
4.02 The existing generating facilities (see paragraphs 2.10 through2.13) comprise a blend of thermal and hydro generating plant and since thehydroelectric power stations are all virtually "run of river" developmentswith the storage afforded by the Kamburu dam insufficient to control the river,the flow available for power generation is not constant throughout the year,or from year to year. The capacity is lowest during the dry months of theyear (February/March and September/October). Records which have beenmaintained since 1947, include 'several dry years with a recurrence periodof 10 years and the generation development program is based on this factor.
4.03 With the commissioning of the Kamburu No. 3 generating unit andthe Kipevu 30 MW steam generating unit in 1976, the Interconnected Systemis capable of meeting capacity requirements until 1978 and energy require-ments until 1979. This is demonstrated by Annex 10 which shows the pro-jected maximum demand together with the installed and firm capacity andAnnex 11 which shows the energy demand and the dry year productive capability.Annex 12 shows the energy demand and the average year productive capability.Difficulty could be experienced in meeting energy requirements during theSeptember-October dry months of 1978 if it is an exceptionally dry year andthis together with shortage of capacity in that year, indicates that EAP&Lwill require additional generating capacity to meet the growing power demandof the Interconnected System by 1978.
Comparison of Alternatives
4.04 The proposed project represents the first development of the mosteconomic generation development program in Kenya until 1983. The first stepof the next best alternative development program would be 66 MW of gas turbinecapacity, to be installed in three stages in the Nairobi area. These andother development strategies have been analyzed, including construction of

- 15 -
a second thermal power plant in Mombasa based on fuel oil or coal, andimport of power from Tanzania. The comparison of the different developmentstrategies is described in detail in Annex 13.
4.05 The installation of three gas turbines of 22 MW each and the thirdunit of Kindaruma power station would postpone the heavy capital expenditurefor Gitaru by three years at the cost of spending more on imported fuel. Thecomparison between the proposed strategy with Gitaru as the first stage andthe strategy of postponing Gitaru by three years shows an equalizing discountrate of 11%, applying shadow prices for the cost of both alternatives andassuming a slow drop of 2% per year until 1980 in "real" fuel prices. Thisis at the lower end of the range of the opportunity cost of capital in Kenya(estimated at 11% to 13%) and the decision in favor of Gitaru is thereforeclose. However, the Government and EAP&L have expressed a strong preferencefor Gitaru and this has been accepted as the preferred alternative. Theequalizing discount rate would be reduced to 10% if Kenya would import 20 MWof relatively cheap hydro power from Tanzania, where excess capacity isexpected to be available from 1980 onward. Kenya already imports a substantialamount of energy from Uganda (more than 25% of its total consumption in 1974)which EAP&L feels is no longer entirely dependable (see paragraph 2.13).Because of this and the Government's reluctance to rely too heavily on importedpower from Tanzania (see paragraph 2.16) and the probability of this not beingavailable by 1980 when planned, the alternatives which include importing pJwerfrom Tanzania have been excluded from further analysis and 11% is the bestestimate of the equalizing discount rate. The rate is sensitive to variationsin the most uncertain factors of the two alternatives. A 10% increase in thecapital cost of Gitaru and the gas turbines reduces the equalizing discount rateto 10.5% and a rise of 10% in Gltaru's capital cost only, reduces the rate to10%. A sharp reduction of the fuel costs from their end 1974 level by about40% until 1980 would reduce the equalizing discount rate to 10%; unchangedfuel prices during the period of comparison (1975-1983) increase the rate to12%. If demand growth is 10% lower than projected, the equalizing discountrate would fall to 9.5%. If two of the three changes from the basic estimates--an increase in Gitaru's capital cost, a substantial fall in fuel prices, a dropin projected demand growth--occur simultaneously the equalizing discount ratewould be reduced to about 9% and if all three occurred simultaneously the ratewould drop below 8%. These rates are lower than the opportunity cost of capitalin Kenya. However, such a combined development of prices and demand growth isimprobable and the comparison of different development strategies demonstratesthat Gitaru is the most economic project to meet the increase of power demandbetween 1978 and 1981.
Economic Rate of Return
4.06 The economic rate of return, which relates economic pro,ect capitaland operating costs to the revenue attributable to it, is 14%. Economicproject costs used in the calculation differ from financial costs due to theuse of a 75% shadow price ratio for unskilled labor and of a shadow ratewhich is 33Z above the official exchange rate. The economic rate of returnwas subjected to sensitivity tests. A reduction in revenues due to a 10%

- 16 -
lower demand growth reduced the rate of return to about 13.5% and a 10% increasein capital and operating costs reduces it to about 12%. If the cost increaseand the reduction in demand growth coincides, the economic rate of return wouldbe a little below 12%, which is still satisfactory. The assumptions and metho-dology underlying these calculations are described in Annex 14.
5. THE BORROWER - TANA RIVER DEVELOPMENT COMPANY LIMITED
Structure of the Electricity Supply Industry
5.01 Of the three companies which comprise the electricity supply in-dustry in Kenya (see paragraph 2.04) EAP&L, which is the sole distributor,was founded in 1922 by the amalgamation of two private companies which hadsupplied Nairobi and Mombasa since 1907 and 1909. Both KPC and TRDC werecreated by EAP&L, the former in 1955 principally to finance the intercon-nection with Uganda and sell to EAP&L power imported, and the latter in1964 to develop the potential of the Tana River. At the time these companieswere formed, the stock of EAP&L was privately owned by a large number ofshareholders. Almost all of the capital raised for KPC and TRDC was loancapital. EAP&L shared the ownership of the nominal equity with the Govern-ment which became the owner of one third of KPC's equity capital and onequarter of TRDC's. A brief description of the history of the power companiesis in Annex 15.
5.02 The Government in 1969 decided to obtain control of EAP&L bypurchasing its shares. As a result of market purchases and a bid made earlyin 1970 for all the Company's shares on the London stock register, theGovernment became, in July 1970, the majority shareholder in the companyand consequently of KPC. The Government acquired all the shares of TRDC andKPC in February 1971.
5.03 Government has accepted that rationalization of the structure ofthe power industry could best be achieved by integrating all three companies.However, this cannot be achieved immediately; about 6Stg. 3.2 million of debenturestock in KPC is held by outside shareholders - chiefly the CommonwealthDevelopment Corporation (CDC) with a IStg. 3.17 million holding. Government,which holds the rest, intends to gradually buy up the miscellaneous share-holders and when this is completed it intends to negotiate with CDC for thepurchase of CDC's hStg. 3.17 million holding on completion of which, the mergerof TRDC and KPC can proceed. In the case of EAP&L, Government and itsassociated institutions, which together hold about 60% of the equity, arecontinuing to buy up shares on the Nairobi register as and when these becomeavailable. When a sufficiently large holding is acquired and TRDC and KPCare merged, the merger of all three companies can proceed. The target forcompletion is difficult to forecast, but the present arrangement, whilstcomplicated, is operating efficiently and it is not of significant importanceif this cannot be achieved in the short term.

- 17 -
5.04 EAP&L purchases the entire output of KPC and TRDC at ascertained cost(see para. 6.02 for definition) and is the only company with surplus revenueearning capacity. The funds required to enable the proposed borrower to coverits operating expenses, pay its debt service and meet the local currency costsof the Project must therefore come from EAP&L, and appropriate arrangementsare necessary to assure TRDC's revenues. Discussions were held with theGovernment and EAP&L during negotiations concerning these matters and agree-ment was reached on the continuation of the development surcharge, agreedduring the Kamburu negotiations, to meet the needs of TRDC's development pro-gram. It was also agreed during negotiations that since the Bulk Supply Agree-ment refers to all the Seven Forks hydro developments, including Gitaru, theamendment agreed at the time of the Kamburu negotiations concerning the pur-chase of a minimum amount of power to provide sufficient revenues to meetTRDC's ascertained costs, applies equally to Gitaru and no further amendmentis necessary.
5.05 It was also confirmed during-negotiations that a generating stationlicence, which is required under the Electric Power Act, would be issued inrespect of the Project. The issue of the licence will be a condition of effec-tiveness of the proposed loan.
Organization and Management
5.06 EAP&L is a reasonably well managed utility and is operated inaccordance with sound commercial principles. The Chairman, a Kenyan, isa competent administrator and many of the senior management staff are ex-patriates with wide experience in public utilities. The Board of Directorsconsists of nine members including the Chairman and General Manager of thecompany and two government representatives; the remaining five members areleading Kenyan businessmen.
5.07 The staff of EAP&L at December 31, 1974 inclusive of staff attachedto KPC and TRDC, numbered 2914 which includes 120 expatriate professionalstaff, (includes 38 Asian non-citizens) and 369 senior local staff. Thenumber of connected consumers was just over 112,000 and consumers peremployee about 38. This suggests the company is rather top heavy in staffbut this is acceptable bearing in mind the number of installations (some 21power stations spread over Kenya), the distances involved and the amount ofconstruction work carried out by the company.
5.08 The number of expatriate professional staff has fallen from 189in 1970; maintaining the establishment at full strength and at the same timeavoiding a deterioration in the quality of staff are continuing problems.The expatriate staff have generally been replaced with qualified local staff,but there are a number of vacancies which EAP&L is having difficulty in fillingand there is a high turnover of remaining expatriate staff with the new ex-patriate staff recruited usually of a lower calibre than the staff they havereplaced. For these reasons the standard of management of the companies hasdeteriorated since the Kamburu project was appraised in 1970.

- 18 -
5.09 There is no quick solution to this problem and the situation canonly be relieved as the establishment becomes progressively more Kenyanized.In the meantime EAP&L will have to rely on expatriates for some years aheadbut to a decreasing extent as qualified Kenyans can be trained to replace them.
5.10 Although EAP&L is still well managed there are weaknesses in itsinternal reporting system and there are aspects of its top managerent structurewhich merit investigation. For instance, the need for a General Manager inaddition to the full-tine executive Chairman is questioned. Also, since theAssistant General Mtanager (Engineering) retired, the post appears to havebeen abolished and, as a consequence, there are four Chief Engineers atEAP&L's headquarters all operating independently with no coordinating manager(EAP&L has since created a post for a Chief Coordinating Engineer.) The sameapplies to the Districts where there are three District Engineers and aDistrict Accountant, but no District Manager. A brief investigation raisesdoubts that (a) EAP&L's internal reporting system is producing the informa-tion required for efficient management and (b) the computer is being used inthe most efficient manner possible. These matters were discussed duringnegotiations and agreement was reached with EAP&L to appoint consultantssatisfactory to the Bank to carry out a review of the management structure ofEAP&L, the recommendations arising therefrom to be jointly examined by theBank and EAP&L and all such recommendations as are mutually acceptable to beimplemented by EAP&L.
5.11 The present staff are competent to operate the companies, tocarry out the Project with the assistance of consultants, and to carry outother works covered by EAP&L's development program. Assurances were obtainedduring negotiations that TRDC will continue to employ consultants satisfactoryto the Bank in carrying out the Project.
5.12 The additional responsibilities to be incurred by TRDC if it isto carry out and successfully operate the Project will necessitate a revisionof the agreement by which EAP&L manages TRDC. The amendment should providethat EAP&L will make available to TRDC comprehensive management servicesrelevant to Gitaru which are not provided under the present agreement. It isimportant also to ensure that EAP&L is under sound management at all timesand is capable of continued efficient operation. These matters were discussedduring negotiations and agreement was reached with EAP&L on the following points:
(a) the need for consultation with the Bank about changesin the appointments of Chief Coordinating Engineer andChief Accountant;
(b) the need for revision to the Management Agreement, to includethe operation and management of the Gitaru hydroelectricdevelopment within the scope of the Agreement.
The revision of the management agreement in a form satisfactory to the Bankwill be a condition of effectiveness of the Bank Loan.

- 19 -
5.13 EAP&L will also be required to enter into the covenants usuallymade by the beneficiary of a Bank Loan with respect to operating in accord-ance with sound business, public utility and financial practices, insuranceand exchange of information with the Bank.
Training
5.14 It is EAP&L's intention to fill all senior posts with Kenyan nationalsas quickly as suitably qualified staff can be brought forward. To achievethis EAP&L has a training program which is tailored to meet its foreseeablerequirements. The scheme depends mainly upon the local university. EAP&Lsponsors 6 entrants annually and, given a three year course, there are 18 inthe stream at any given time. On completion of the university course thestudent does 2 years post graduate work training, usually overseas, beforebeing absorbed into the workforce for on the job training. The output fromthe local university is frequently augmented with direct appointments ofgovernment sponsored students from overseas universities. The program willbe reviewed from time to time and the number of sponsored students willgradually be reduced to a level commensurate with the normal expansion andturnover requirements. At the time of the appraisal 21 electrical and 3mechanical engineers were in the program (including engineers on post grad-uate training).
5.15 EAP&L also operates a well staffed and equipped residential train-ing school for all grades of staff up to technician level. Recruits are takenstraight from school (after a minimum of 7 to 11 years of education) fortraining as craftsmen and technicians. The two categories go into separateinduction courses but the basic.training is the same for both groups. Thisconsists of the school classroom and simple workshop training for the first9 months, followed by a 3 month course at the local polytechnic, then alternate3 months at the training school and the polytechnic for the next 12 months.At the end of two years they are trade tested and starting from the thirdyear the courses differ; the craftsmen continue for a further year at the endsf which they qualify for a Grade II trade test certificate but the techniciansgo on for a further three years, alternating 3 months at the polytechnic with3 months in the field, and at the end of 5 years qualify for a full technologycertificate.
5.16 This is probably one of the most efficient utility operatedtraining schools in East Africa; the courses are well organized and beingresidential, the students are well fed and housed and the "turn out" isof a high standard; the intake is 30 per year; 20 for technician trainingand 10 for craftsman training.
5.17 There is no sponsored training program for accountants as, usually,requirements can be met from local university students who pass oat withappropriate accounting qualifications. Because of the wide demand for suchqualified Kenyans, it is not easy to maintain the establisment (12) atstrength (there were 2 vacancies as of September 1974). Clerical staffpresent no problem as they receive adequate on-the-job training.

- 20 -
6. FINANCIAL ASPECTS
Introduction
6.01 The activities of the three companies comprising the power sectorin Kenya are closely connected through common management. The financialposition of the borrower, TRDC, should not therefore be evaluated in isola-tion, but jointly with that of KPC and EAP&L. The published financial state-ments of KPC and TRDC are prepared on the basis of cash accounting, consistentwith the definition of ascertained cost on which their revenues are determined.It has therefore been necessary, in their case, to prepare pro forma statementswhich assume the use of conventional depreciation accounting so that theirearnings and financial position can be compared with those of EAP&L in accor-dance with the key factors customarily used by the Bank to appraise publicutility projects. These statements are presented in Annexes 16 to 20 coveringthe period 1972-1974 (actual) and 1975-1980 (estimated). Assumptions made inthese statements are given in Annex 21 together with explanatory notes.
6.02 The revenues of KPC and TRDC are determined on the basis of "ascer-tained cost" as defined in their respective bulk-supply agreements. Ascertainedcost is described in greater detail in Annex 21 and, stated briefly, comprisesoperating and administration costs, interest,and redemption payments for debt,income and other taxes and an amount to meet abnormal expenses and a part ofthe development expenses.
Past Operations and Present Financial Position
6.03 As will be seen from Annex 16 (a), TRDC had net assets (fixed assets,investments and working capital) of over Kh 20 million at the end of 1974.While virtually all of these assets had been financed by borrowing, about 23%of the foreign debt was payable in sterling, and the net gain from the deval-uation of the pound from time to time since 1967 is reflected as a part ofequity. The debt equity ratio at the end of 1974 was 84/16. By the end of1978 after completion of the project, net assets are expected to be about KL 69million and the debt equity ratio 73/27, which is higher than normally would beconsidered desirable, but it is more significant to consider the financial posi-tion of TRDC on a combined basis with the other two companies (paragraph 6.06).
6.04 During the period 1972-1974, the earnings of EAP&L were satisfactory.The rate of return for the period 1972-1974 was 9% and was lower than for thebulk supply companies in 1972 and 1973 and higher in 1974 as a result of pay-ment of the Development Surcharge (see Annex 21) to TRDC during the years 1972and 1973 which was more than required to equalize the rate and less than therequired amount in 1974. If the correct amount of Development Surcharge waspaid during this period, the rate of return would have been almost 10%. Thefinancial covenants of the IBRD loan 745-KE require that the minimum rate ofreturn in 1972 through 1974 should be 9.5% and 8% thereafter.
6.05 EAP&L uses depreciation accounting and, as will be seen from Annex19 (a) it is conservatively capitalized. At the end of 1973 its total netassets were about K6 25.6 million and its debt equity ratio was 29/71. By

- 21 -
the end of 1978 EAP&L's net assets are expected to be about KL 32 million,and its debt equity ratio 27/73.
6.06 The combined balance sheet contained in Annex 20 (a) shows that,at the end of 1974, the total net assets of the three companies were K647million and the debt equity ratio was 51/49. By the end of 1978, the totalnet assets are estimated to be about KE 100 million and the debt equity ratio56/44. It is apparent, therefore, that on a combined basis, the three companiesare conservatively capitalized.
6.07 The effect of currency rate fluctuations in the past has had noadverse effect on the foreign currency debt of the company as the officialrate of exchange of the Kenya shilling has remained quite stable. It wasagreed during negotiations that the rate of return covenant would make provisionfor the revaluation of assets, annually, on a price index to be agreed betweenEAP&L and the Bank to take into account the increases in the replacement costof fixed assets as well as the fluctuations of the exchange rate of Kenyacurrency.
6.08 Annex 20(a) indicates that the three companies have adequateworking capital and satisfactory cash positions. The cash forecasts havebeen made on a conservative basis and internal generation of funds may behigher than estimated. There has been a good control of debtors, accountsreceivable amounted to only a little more than six weeks' billing at the endof 1974. Net income of the three companies for the years 1972, 1973 and 1974(Annex 20(b)), expressed in million K& was 3.19, 2.34 and 2.09 as against theestimates of 2.00, 2.07 and 2.38, respectively, and show a satisfactory posi-tion, except for 1974 when there was a decline, caused principally by higherfuel prices.
EAP&L's Tariffs
6.09 On the basis of a consultant's study, new uniform tariffs were in-troduced throughout the country in May 1968, and present rates brought in anaverage revenue of 23 Kenya cents or 3.2 US cents per kWh in 1973. In 1974a fuel oil surcharge was added to the tariff which allows EAP&L to recoverfrom its consumers the bulk of the increase in the cost of fuel used inpower generation. The tariff structure in its differentiation between class-es of consumers, which is discussed in detail in Annex 22, now requires furtherreview. Such a review is being carried out jointly by the Bank and EAP&L.Recommendations arising from the review will be discussed and agreed with theGovernment before implementation.
Proposed Financing Plan
6.10 The financing plan agreed during negotiations includes an increasei. EAP&L's tariffs by an average of 10% and a new fuel oil surcharge at 4Kenya cents per kWh to replace the present surcharge, both from July 1, 1975,continuation of the development surcharge payable by EAP&L to TRDC, issue tothe Government of Kenya of TRDC shares of par value of KE 6 million and alocal loan of KE 3.86 million. The development surcharge serves to provide

- 22 -
the two bulk supply companies TRDC and KPC, with a rate of return which issimilar to that of EAP&L. EAP&L has suggested that, as TRDC's cash requirementsduring the construction period of Gitaru project will be considerable, the ratebase should be inclusive of work in progress in order to provide a larger amountof development surcharge to TRDC than would be provided if the rate base usedwas exclusive of work in progress. This will also reduce the income tax burdenof the power sector during the construction period of the Project by increasingTRDC's income which is exempt from income tax and by reducing EAP&L's taxableincome. This suggestion which is reasonable has been used for calculation ofthe development surcharge from 1975 in the financial statements. On this basis,the surcharge is estimated to make available about K67 million from 1975through 1978 (compared with less than KM million if the rate base excludedwork in progress). Thus the balance of the project costs other than those costsfinanced through the proposed Bank Loan and Supplier/Export Credits will be pro-vided by the continuation of the development surcharge, a loan of KL 2 millionfrom EAP&L to TRDC, and the balance under a Government commitment of an equitysubscription of KE 6 million and a loan of not less than Kn 3.5 million (assumedto be KE 3.86 million in the financing plan). Completion of arrangements toprovide the financing under the Government commitment will be a condition ofeffectiveness of the proposed Bank Loan.
6.11 A forecast of TRDC's sources and application of funds for the period1975-1980 is presented in Annex 16(c). The financing plan of TRDC for theproject construction period 1975-1978 along with that of the three companiescombined is given below:
- 23 -
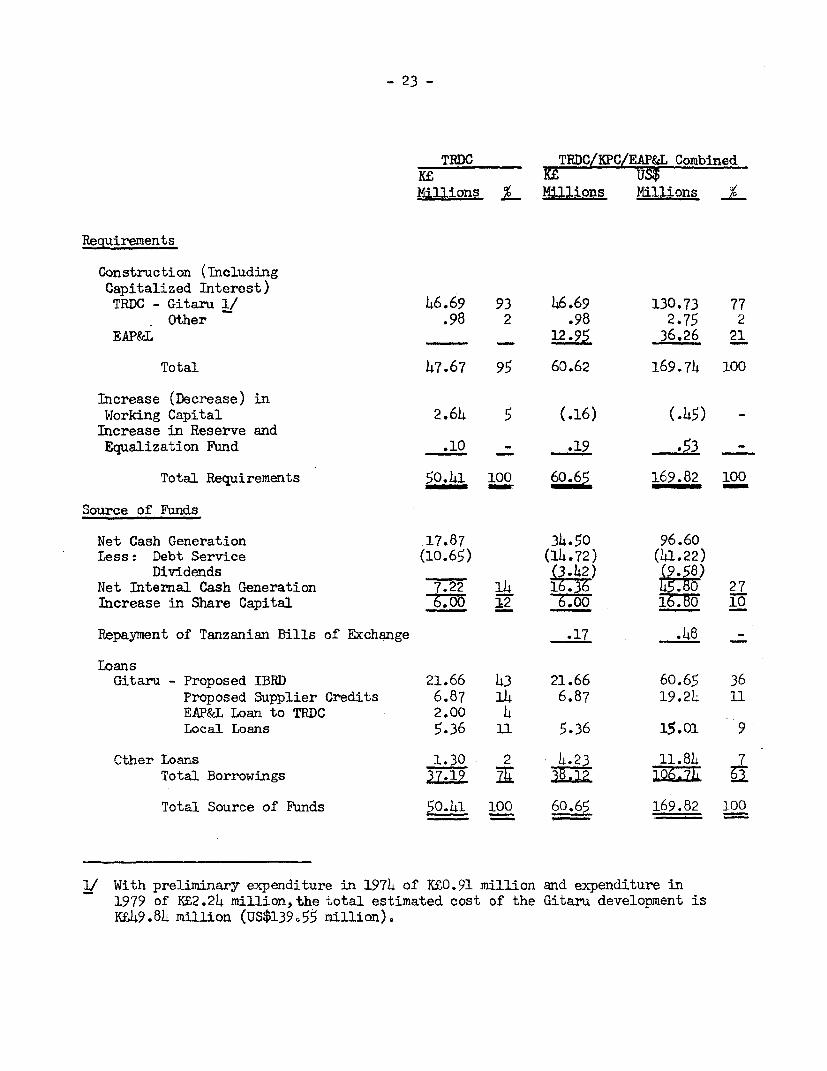
TRDC TRDC/KPC/EAP&L Combined'e - EC US$
Millions % Millions Millions i
Requirements
Construction (IncludingCapitalized Interest)TRDC - Gitaru 1/ 46.69 93 46.69 130.73 77
' Other .98 2 .98 2.75 2EAP&L - 12.95 36.26 21
Total 47.67 95 60.62 169.74 100
Increase (Decrease) inWorking Capital 2.64 5 (.16) (.45) -Increase in Reserve and
Equalization Fund .10 - .19 53 -
Total Requirements 50.41 100 60.65 169.82 100
Source of Fhnds
Net Cash Generation 17.87 34.50 96.60Less: Debt Service (10.65) (14.72) (41.22)
Dividends (3.42) 8Net Internal Cash Generation 7.22 14 16.364. 27Increase in Share Capital -.0 12 6.00 0 10
Repayment of Tanzanian Bills of Exchange .17 .48 -
LoansGitaru - Proposed IBRD 21.66 43 21.66 60.65 36
Proposed Supplier Credits 6.87 14 6.87 19.2L 11EAP&L Loan to TRDC 2.00 4Local Loans 5.36 11 5.36 15.01 9
Cther Loans 1.30 2 4.23 11.84 7Total Borrowings 37.19 E 38.12 l-7 g
Total Source of Funds 50.41 100 60.65 169.82 100
With preliminary expenditure in 1974 of K£0.91 million and expenditure in1979 of' K£2.24 million, the total estimated cost of the Gitaru development isK.49.84 million (US$139-55 million).

- 24 -
6.12 It is more significant to consider the financing plan on the basis ofthe combined sources and requirements of the three companies, eliminating inter--company payments, as though they were merged into one company. The forecastof the combined requirements and sources of funds on this basis, of TRDC, KPCand EAP&L for the period 1975-1980 is presented in Annex 20(c). The financingplan summary of the three companies given in the table in the preceeding para-graph shows that, of the total construction and working capital requirementsof the three companies for 1975-1978, 27% would be financed by net internalcash generation after providing for debt service and dividends, 10% from in-crease in share capital and the balance by borrowings: 36% by the proposedIBRD loan, 11% by Suppliers' Credits and 16% by other loans. As indicated inAnnex 20(c), the internal cash generation covers the annual debt servicerequirements by an ample margin ranging from an estimated 2.6 times in 1978to about 1.9 times in 1979 which is adequate.
6.13 It was agreed during negotiations that if additional funds are re-quired to complete the project because of cost overruns, or due to outsideloans and credits being insufficient, the Government would make satisfactoryarrangements to provide additional financing requirements.
Future Earnings
6.14 Forecasts of revenues and expenses are attached for TRDC (Annex 16(b)), for TRDC and KPC combined (Annex 18(b)) for EAP&L (Annex 19(b)), and forthe three companies combined (Annex 20(b)).
6.15 The development surcharge has been calculated to provide the samerate of return for KPC/TRDC combined and for EAP&L, measured in terms of netoperating income as a percentage of average net assets including work inprogress. The rate of return is estimated to average 8.7% during 1976-1978and 9.1% during 1979-1980.
6.16 It was agreed during negotiations that EAP&L would take all necess-ary steps to ensure that its net operating income for any year is not lessthan 8-1/2% of its average net fixed assets including work in progress. TheGovernment agreed that it would take or cause to be taken all action necessaryto permit EAP&L to obtain revenues sufficient to yield this rate of return.
Accounts and Audit
6.17 It was agreed during negotiations that the financial statements ofTRDC and KPC, individually and combined, will be prepared on depreciationaccounting basis and that the financial statements of TRDC/KPC as so preparedwill be combined with those of EAP&L. It was also agreed that the annualaccounts of TRDC, KPC and EAP&L, including the accounts on depreciation basisfor TRDC and KPC, would be audited by independent auditors acceptable to theBank, and that copies of the certified financial statements and of the auditor'sreports would be submitted to the Bank.

- 25 -
Debt Limitation
6.18 Debt service coverage is relevant only in relation to the combinedposition of the three companies particularly because of the equated rate ofreturn requirement for KPC/TRDC and EAP&L (paragraph 6.10), and the debtservice of the bulk supply companies KPC/TRDC being payable by EAP&L as apart of ascertained cost (Annex 21). It was agreed during negotiations thatno long term-debt would be incurred without prior Bank approval, unless cashearnings before provision for depreciation are at least 1.5 times the maximumdebt service for any succeeding fiscal year, on all debt including the debtto be incurred. This test is made on the basis of combined revenue accountsand debt service, eliminating inter-company payments and assuming conventionaldepreciation accounting.
Security Arrangements
6.19 Annex 23 describes the security arrangements for the loan capitalof EAP&L, KPC and TRDC. The outstanding foreign debt of TRDC, estimated tobe about US$38 million equivalent in 1974 is secured, except for the SIDAloan of about US$7 million, by a floating charge or lien on all present andfuture assets. The Bank has a pari passu charge on these assets for Loan745-KE and consent of the-existing creditors of TRDC will be required forsecuring the proposed Bank loan also on a pari passu basis. Completion ofthe legal formalities finalizing the arrangements will be a condition ofeffectiveness of the loan.
Project Monitoring System
6.20 Proposed guidelines for a project monitoring system which arepresented in Annex 24 were discussed and agreed with EAP&L.
7. RECOMMENDATIONS
7.01 During negotiations the following issues were raised with theGovernment and satisfactory agreement or assurances obtained with regard to:
(a) abstraction of water from the Upper Tana Basin for largescale irrigation development and other purposes, whichshould not be authorized prior to development of the UpperReservoir (para. 3.22);
(b) the Government commitment in the financing plan for theProject (para. 6.10); and
(c) provision of any additional financing which might be requiredto complete the Project in accordance with arrangementssatisfactory to the Bank (para. 6.13).
- 26 -
7.02 During negotiations the following issues were raised with EAP&Land satisfactory agreement or assurances obtained with regard to:
(a) the availability of credit financing (para. 3.10);
(b) the engagement of consultants satisfactory to the Bankto carry out a management study, the recommendationsarising therefrom to be jointly examined by the Bankand EAP&L (para. 5.10);
(c) the employment of consultants satisfactory to the Bankin carrying out the Project (para. 5.11);
(d) consultation with the Bank about any changes in the appoint-ments of Chief Coordinating Engineer and Chief Accountant(para. 5.12(a));
(e) revision to the Management Agreement to include the operationand management of the Project (para. 5.12(b));
(f) operation in accordance with sound business, public utilityand financial practices, insurance and exchange of informationwith the Bank (para. 5.13);
(g) the continued employment of auditors satisfactory to theBank and the submission to the Bank of copies of annualauditors reports and certified financial statements forEAP&L, TRDC and KPC Cpara. 6.17);
(h) a limitation on the amount of long-term debt which may beincurred by EAP&L, TRDC and KPC (para. 6.18); and
(i) obtaining consent of the existing creditors of TRDC forsecuring the proposed Bank Loan on a pari passu basis(para. 6.19).
7.03 During negotiations the following issues were raised with theGovernment and EAP&L and satisfactory agreement or assurances obtained withregard to:
(a) continuation of the development surcharge (para. 5.04);
(b) the issue of a generating station licence in respect to theProject (para. 5.05); and
(c) the minimum rate of return on net fixed assets in operationand under construction which should be not less than 8-1/2%per year and revaluation of assets annually which will beon a price index to be agreed between EAP&L and the Bankto take into account the increases in the replacement valueof fixed assets (paras. 6.16 and 6.07).
- 27 -
7,04 The following events will be conditions of effectiveness of theproposed loan:
(a) completion of all conditions precedent to the effectivenessof the credit financing (para. 7.02(a));
(b) completion of arrangements evidencing the Government Commit-ment (para. 7.01(b));
(c) issue of a generating station licence for the Project(para. 7.03(b));
(d) revision to the Management Agreement (para. 7.02(e)); and
(e) completion of the legal formalities finalizing the securityarrangements (para. 7.02(i)).
7.05 Subject to the foregoing assurances the Project will be suitablefor a Bank Loan of US$63 million for 25 years including a grace period of5 years.
May 1975


K E N Y A
GITARU HYDROELECTRIC PROJECT
EAP&L SYSTrEl
Actual & Estimated GWh Generated. Sent Det r Sol System Nuxlmu,n Dend, lnstalled and firm PAp Pno!otive Caoabiltty(InLerconneted System)
Productive Capability (GW]i)
Year Generated & Maximum Installed Effective Firm Hy o Hydr o Thermal Total Total
Actual Purchased Sent Out Sold % Increase Demand MW Capacity MM Ca!aIty MW Capacity MM Average Tear Dry Year _ !orted Average Year Dry Yca1-
1970 747 727 636 - 121 192 171 146 316 - 641 957 -
1971 849 935 704 10.7 131 216 201 145 318 - 875 1192 -
1972 946 924 784 11.4 146 211 195 140 374 - 852 1226 -
1973 1617 994 850 8.5 161 224 208 151 387 - 942 1329 -
1974 1095 1074 919 8.1 171 284 268 208 820 520 942 1762 1462
Estimated
1975 1185 1166 1002 9.0 191 284 268 208 820 520 942 1762 1462
1976 1323 1305 1116 11.4 221 344 322 248 864 540 1179 2043 1719
1977 1482 1454 1243 11.4 242 344 322 248 864 540 1179 2043 1719
1978 1603 1593 1368 10.0 263 484 462 362 1699 890 1179 2878 2069
1979 1748 1737 1491 9.0 287 484 462 362 1699 890 1179 2878 2069
1980 1911 1899 1626 9.0 313 484 462 362 1699 890 1178 2878 2069
1971 Kipevu 30 MW unit commissioned. 6 MW of old diesel plant retired.1972 Kepevu 5 MW set retired.1973 Nairobi South 13 MW gas turbine commissioned.1974 Kamburu 2 x 30 MW sets commissioned.1976 Kipevu 30 MW set and Kamburu 30 MW (24 MW effective capacity) due to be comlissioned.1978 Gitaru 2 x 70 MW sets due to be commissioned.
Note: Firm capacity is the effective capacity less 30 M1W plus 15% of remaining plant,
May 1975

K E N Y A
GITARU HYDROELECTRIC PROJECT
EAP&L SYSTEM
Actual and Forecast Sales of GWh in Each Consumer Category
Domestic Commercial Industrial Public Lighting Off Peak Others TotalUnits Growth Units Growth Units Growth Units Growth Units Growth Units Crowth Units GrowthGWh % GWh 7 GWh % GWh W7 GWh % GWh =/
Actual
1968 98.77 3.9 118.90 18.2 121.41 8.9 8.39 3.1 82.24 5.4 9.27 4.0 529.98 9.11969 99.61 0.8 151.10 27.0 219.06 3.1 8.60 2.5 87.13 5.9 9.27 5.4 575.27 8.51970 105.09 5.5 170.75 13.0 254.23 16.0 8.67 0.8 96.24 10.4 10.77 10,2 645.75 12.21971 112.1 6.7 186.2 9.0 290.4 14.2 9.2 6.1 105.5 9.6 11.9 10.2 715.2 10.81972 120.5 7.5 204.3 9.7 330.3 13.7 9.4 2.2 118.0 11.9 12.4 4.2 794.8 11.11973 126.7 5.2 223.9 9.6 364.1 10.2 10.4 10.6 121.3 2.8 13.2 6.5 859.7 8.21974 136.5 7.7 239.5 6.9 403.2 10.7 10.1 -3.0 120.7 -0.5 15 10.6 925.0 7.6
Forecast
1975 141.0 3.3 254.0 6.1 460.0 14.1 10 - 124 2.7 16 5 1005 8.61976 146.0 3,5 272.0 7.1 538.0 16.9 11 10.0 136 9.6 17 5 1120 11.41977 151.0 3.4 294,o 8.0 527.0 16.5 12 9.5 143 5.0 18 6 1245 11.21978 157.0 4.0 320.0 9.0 706.0 12.6 13 9,0 155 8.5 19 8 1370 10.01979 165.0 5.1 349.0 9.0 778.0 10.2 13 - 168 8.5 20 8 1493 9,01980 176.0 6.0 380.0 9.o 856.0 10.0 13 - 182 8.5 21 8 1628 9.0
May 1975

K N YA ANEX 3
GITARIU HIUO}LECTRC PROJECT
EAP&L SYSTEM
EXISTIN GENERATING PIANT
Station Set Rating Year Station Set Rating YearNo. kW No. kW
Kamburu 1 30,000 1974 Kericho 1 700 1960Hydro 2 30,000 1974 Diesel 2 700 1960(TRDC)
KLdoret 1 550 1952Kindarawa 1 22,000 1967 DLesel 2 550 1952}ydro 2 22,000 1967 3 400 1954(TRDC)
Lanet 1 550 1952Wanjii 1 2,700 1952 Diesel 2 550 1952Hydro 2 2,700 1952 3 1,100 1955(KPC) 3 1,000 1952 4 750 1957
4 1,000 1952 5 750 1958
Tana 1 2,000 1933 *Homa Bay 1 169 1967Hydro 2 2,000 1933 Diesel 2 169 1967(KPC) 3 2,400 1950 3 169 1967
4 4,400 1953 4 169) Transferred 19735 4,400 1953 5 450)
Ndula 1 1,000 1925 *Kitale 1 150 1949Hydro 2 1,000 1925 Diesel 2 150 1949
3 150 1949-50Mesco 1 380 1933 4 180 1954Hydro 5 300 1962
6 320 1958Sagana Falls 1 500 1955 7 850 Transferred 1973Hydro 2 500 1955
3 500 1962 KipevuSteam Turbine 1 5,000 1955
Selby Falls 1 180 1952 2 5,000 1961Hydro 2 180 1952 3 12,500 1962
4 12,500 1965Nairobi South 1 2,240 1956 5 30,000 1971Diesel 2 2,240 1956 Gas Turbine 6 12,200 1970Gas Turbine 3 2,200 1955-56
it " 4 2,200 1956 MbarakiDiesel 5 1,050 1959 Diesel 1 800 1947
6 1,050 1959 2 800 19507 1,050 1954 3 800 19518 1,050 1955 4 800 19519 2,188 1957 5 800 1940
10 2,188 195711 2,188 1957 Malindi 1 80 1959
Gas Turbine 12 13,500 1973 Diesel 2 80 19593 80 1 963
Ruiru 1 1,500 1949Diesel 2 1,500 1950 *tamu 1 105 1969
Diesel 2 65 1969Kisumu 1 200 1947 3 105) Transferred 1973Diesel 2 200 1947 4 105)
3 200 19474 380 1949 *Gasissa 1 102 19725 380 1952 Diesel 2 102 19726 605 1955 3 70 1972
*Isolated Diesel power stations.
Note: Diesel power stations and plants ihich areno longer in service are omitted.
May, 1975

ANNEX 4Page 1 of 3 pages
K E N Y A
GITARU HYDROELECTRIC PROJECT
TANA RIVER DEVELOPMENT COMPANY LIMITED
Rural Electrification in Kenya; the Market, Costs, and Potential for Development
Population Centers
1. The total population of Kenya is about 12.9 million of which about1.5 million live in the larger towns, about 9 million live in the fertileagricultural areas, which comprise about 10% of the land area of 583,000 sqkms and the balance of about 2.million are settled over the remaining 90%of the land area of the country. The classification of population centersare described below.
Urban Center
Population of more than 5,000 and containing a full range ofservices associated with a town. Serves a hinterland of some 120,000 peopleand houses the main district administrative offices of the area. Containshealth, education, postal, shopping, banking and hotel facilities and anairstrip. Included under this heading are all the major towns excludingNairobi.
Rural Center
Serves a hinterland of some 40,000 people and is a focus of localtrade and commerce. Contains local divisional administrative offices andpolice, health, social, education, market, postal and banking facilities toa lower level than an Urban Center. Will have a resident population ofbetween 1,000 and 5,000.
Market Center
Serves an area of at least 150 sq kilometers with a minimumhinterland population of 15,000. Contains education, health, social, market,postal and police facilities to a lower level than a Rural Center. Will nothave a large residential population.
Local Center
Serves populace within walking distance of that center. In wellpopulated areas will have a hinterland of some 50-70 square kilometerscontaining a minimum of 5,000 people. Will have a primary school, medicaldispensary, postal agency, shops and an open market. Not intended as anadministrative center.

ANNEX 4Page 2 of 3 pages
2. All the centers in Kenya are defined in one or other of the aboveclassifications and although not all the facilities described exist inevery case, they are gradually being introduced. No firm figures areavailable but the 1974-1978 Development Plan forecasts the number ofcenters showing those which it is hoped will be receiving a public supplyof electricity by the end of 1974 and 1978 respectively.
Center Total No. No. on Supply1974 1975
No. %_ No. ___
Urban 86 59 68.6 81 94.2Rural 150 31 20.7 31 20.7Market 420 73 17.4 73 17.4Local 1,015 64 6.3 64 6.3
Total 1 681 227 13.5 259 15.4
Basic Cost of Rural Electrification
Tne cost of electrifying rural areas in Kenya can be based on the followingapproximate 1974 costs:
33,000 volt lines - Kb 1,200 per km
Medium voltage distribution - KX 700-1,000 per km
Transformers - KL 10-50 per KVA depending upon size and whethersingle or three phase
Service Lines - Kb 15-35 per service
W'here the center is remote from the existing network (of the remainingcenters in the country, these are now probably in the majority) dieselgenerating plant has to be installed. The cost per KVA of such plant isof the order of Kb 250-300.
Principal Usage and Revenues
The principal use of electricity by consumers in rural areas is for lightingand with an estimated per capita income of KE 40 per annum in the rural areas,potential revenues are limited. Annual consumption for lighting for housesand shops is 80-90 kWh with an after diversity maximum demand of about0.05 kW per consumer. Other types of load in rural areas are:
(i) The maize mill, situated in all rural and most market centers.This has a loading of between 10 and 30 HP and a consumptionof between 6,000 and 12,000 kWh per year;

ANNEX 4Page 3 of 3 pages
(ii) Irrigation and water pumping, generally located outside thecenters; load and consumption is difficult to define as it variesconsiderably from center to center.
What little industry there is in the rural areas tends to be associatedwith tea, coffee, rice and cotton production.
Revenues and of course, costs of supply, vary considerably, dependent uponthe remoteness of the center and its population and type of supply.Typical average annual revenues in 1974 are:
Domestic Consumer - KL 6-12
Shop - Kb 12
Maize Mill - Kb 200
General
It is generally accepted that the electrification of rural areas will havean ultimate impact on the social, commercial and industrial activities ofthe community and will tend to check the migration to the larger towns.The rural electrification program in Kenya has not been in existence for asufficient period for any definite trend to become apparent in this respect.
November 1974

ANNEX 5Page 1 of 4 pages
K E N Y A
GITARU HYDROELECTRIC PROJECT
TANA RIVER DEVELOPMENT COMPANY LIMITED
Detailed Description of the Project
1. That stretch of the River Tana which lies between existinghydroelectric installations at Low Tana, (upstream) and Kindaruma(downstream) falls about 270 m over a distance of 94 km. The steepestgradients are however, concentrated in the downstream region of thestretch, and it is here that most of the power potential lies. A studyof this potential and of future demands for power, indicated that itwould be advantageous to develop the river in two stages, stage 1 betweenkm 64 and 80 (measured down the river), and stage 2 between km 80 and 94t9and to consider the upstream region as a site for a major reservoir, wfithlimited power output, possibly for development later on. Stage 1 of thisarrangement, the Kamburu development designed for three 30 14HW generatingunits but initially comprising 2 units was commissioned in July 1974.Stage 2, the Gitaru development which is located between Kamburu andKi-ndarama at approximately km 83, constitutes the Project.
2. The Project comprises a low diversion dam with an integralspillway, vertical intake shafts with short headrace tunnels to the under-ground power station and a along tailrace tunnel to the Kindaruma reservoir.The power station would be designed for 3 units each of 67 Mi output whenoperating together and rated at 72 MW to take advantage of the increasedhead available when operating individually. The Project includes onlythe first two units but the constructional works include provision forthe third unit. Principal data for the Project are listed in the table atthe end of this Annex.
Geology
3. The geology of the area was initially investigated between Marchand June 1969, at the same time as the geological investigations for theKamburu development were carried out and copies of the consultants reportwere sent to the Bank. There were some areas where further investigationsremained to be done and the program of work to complete these investigationswhich was started in March 1974 comprised principally a drilling programalong the tailrace tunnel and in the area of the underground power house.The predominant rocks in the area are gneisses, forming part of a geolog-ical structure known as the Basement Complex System.
4. In the bed of the river, hard rock exists over most of the areato be covered by the dam except in the main channel some 20-25 m wide whererock is decomposed and has been eroded to a depth of about 5 m and wheresealing would have to be carried out against percolation of water underpressure. The dam would be 30 m high and would have a crest length of 580 mn;
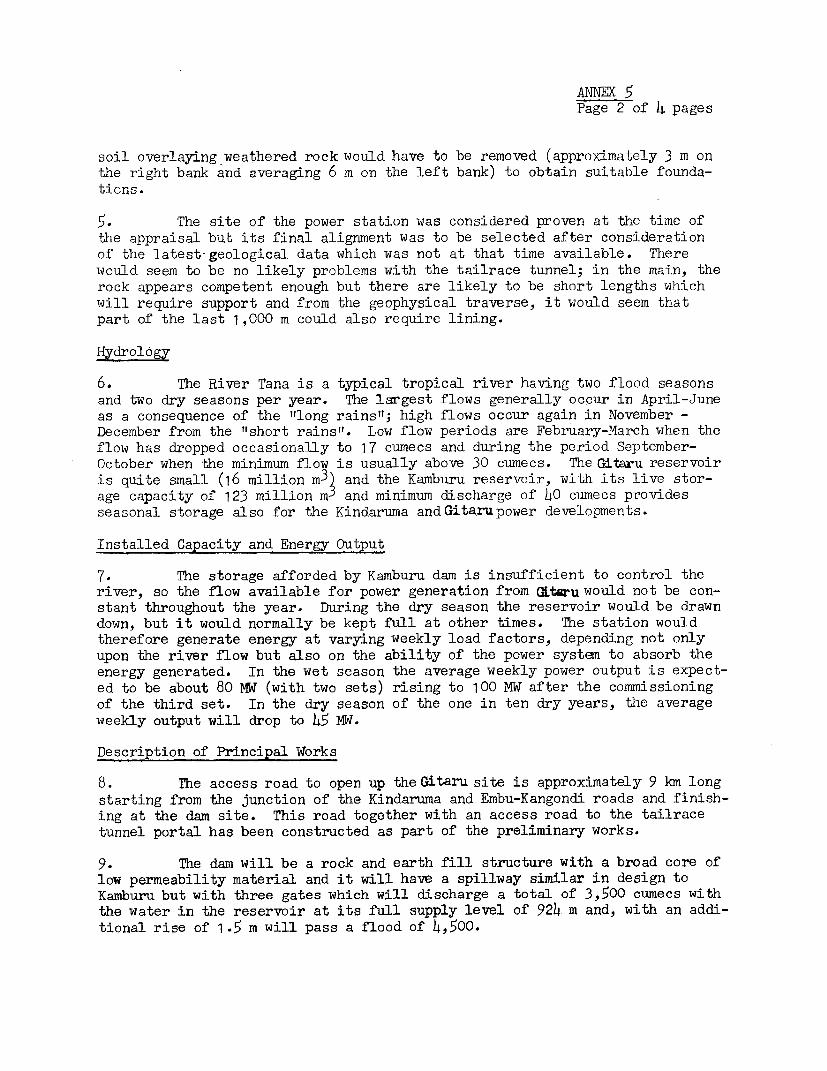
ANNEX 5Page 2 of 4 pages
soil overlaying weathered rock would have to be removed (approximately 3 m onthe right bank and averaging 6 m on the left bank) to obtain suitable founda-tions.
5. The site of the power station was considered proven at the time ofthe appraisal b-ut its final alignment was to be selected after considerationof the latest-geological data which was not at that time available. Therewould seem to be no likely problems with the tailrace tunnel; in the main, therock appears competent enough but there are likely to be short lengths whichwill require support and from the geophysical traverse, it would seem thatpart of the last 1,000 m could also require lining.
Hydrol6gy
6. The River Tana is a typical tropical river having two flood seasonsand two dry seasons per year. The largest flows generally occur in April-Juneas a consequence of the "long rains"; high flows occur again in November -December from the "short rains". Low flow periods are February-March when theflow has dropped occasionally to 17 cumecs and during the period September-October when the minimum flow is usually above 30 cumecs. The Gitaru reservoiris quite small (16 million m3t and the Kamburu reservoir, with its live stor-age capacity of 123 million mi and minimum discharge of 40 cumecs providesseasonal storage also for the Kindaruma and Gitarupower developments.
Installed Capacity and Energy Output
7. The storage afforded by Kamburu dam is insufficient to control theriver, so the flow available for power generation from GLtsru would not be con-stant throughout the year. During the dry season the reservoir would be drawndown, but it would normally be kept full at other times. The station wouldtherefore generate energy at varying weekly load factors, depending not onlyupon the river flow but also on the ability of the power system to absorb theenergy generated. In the wet season the average weekly power output is expect-ed to be about 80 MW (with two sets) rising to 100 MW after the commissioningof the third set. In the dry season of the one in ten dry years, the averageweekly output will drop to 145 MW.
Description of Principal Works
8. The access road to open up the Gitaru site is approximately 9 km longstarting from the junction of the Kindaruma and Embu-Kangondi roads and finish-ing at the dam site. This road together with an access road to the tailracetunnel portal has been constructed as part of the preliminary works.
9. The dam will be a rock and earth fill structure with a broad core oflow permeability material and it will have a spillway similar in design toKamburu but with three gates which will discharge a total of 3,500 cumecs withthe water in the reservoir at its full supply level of 924 m and, with an addi-tional rise of 1.5 m will pass a flood of 4,500.
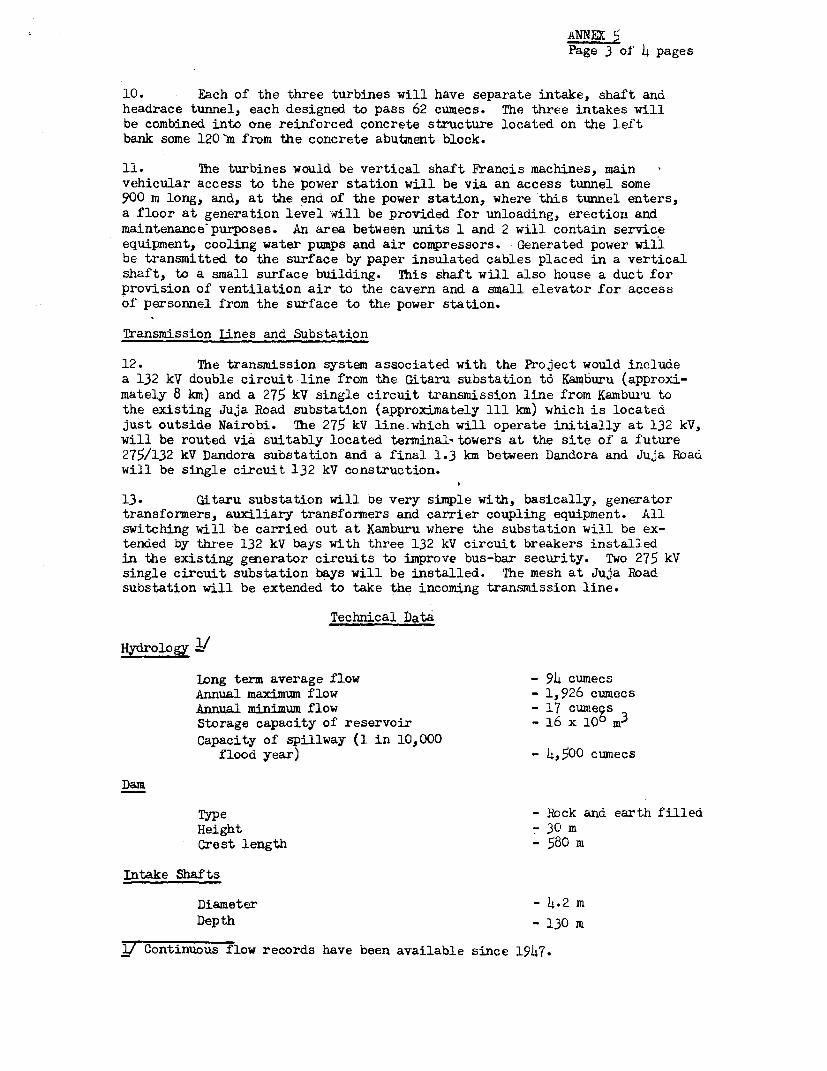
ANNEX 5Page 3 of 4 pages
10. Each of the three turbines will have separate intake, shaft andheadrace tunnel, each designed to pass 62 cumecs. The three intakes willbe combined into one reinforced concrete structure located on the leftbank some 120 m from the concrete abutment block.
11. The turbines would be vertical shaft Francis machines, mainvehicular access to the power station will be via an access tunnel some900 m long, and, at the end of the power station, where this tunnel enters,
a floor at generation level will be provided for unloading, erection and
maintenance purposes. An area between units 1 and 2 will contain serviceequipment, cooling water pumps and air compressors. Generated power willbe transmitted to the surface by paper insulated cables placed in a verticalshaft, to a small surface building. This shaft will also house a duct forprovision of ventilation air to the cavern and a small elevator for access
of personnel from the surface to the power station.
Trtansmission Lines and Substation
12. The transmission system associated with the Project would include
a 132 kV double circuit line from the Gitaru substation to Kamburu (approxi-
mately 8 km) and a 275 kV single circuit transmission line from Kamburu to
the existing Juja Road substation (approximately 111 km) which is locatedjust outside Nairobi. The 275 kV line.which will operate initially at 132 kV,
will be routed via suitably located terminal'1towers at the site of a future
275/132 kV Dandora substation and a final 1.3 km between Dandora and Juja Road
will be single circuit 132 kV construction.
13. Gitaru substation will be very simple with, basically, generatortransformers, auxiliary transformers and carrier coupling equipment. Allswitching will be carried out at Kamburu where the substation will be ex-tended by three 132 kV bays with three 132 kV circuit breakers installed
in the existing generator circuits to improve bus-bar security. Two 275 kV
single circuit substation bays will be installed. The mesh at Juja Road
substation will be extended to take the incoming transmission line.
Technical Data
,,ydrology 1/
Long term average flow - 94 cumecsAnnual maximum flow - 1,926 cumecsAnnual minimum flow - 17 cumegsStorage capacity of reservoir - 16 x 1 0 m3
Capacity of spillway (1 in 10,000flood year) - 4,500 cumecs
Dam
Type - Rock and earth filledHeight - 30 mCrest length - 580 m
Intake Shafts
Diameter - 4.2 m
Depth - 130 m
1/ Continuous flow records have been available since 1947.
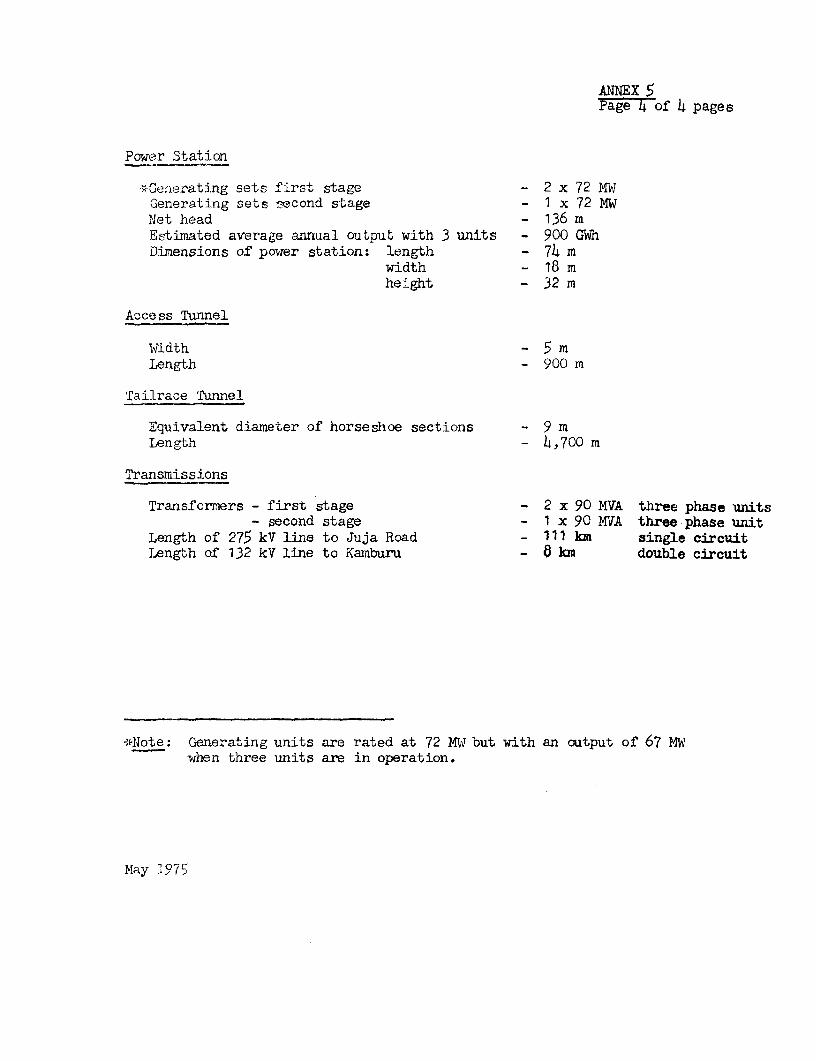
ANNEX SPage 4 of 4 pages
Power Station
*3Generating sets first stage - 2 x 72 MWGenerating sets second stage - 1 x 72 MWNet head - 136 mEstimated average annual output with 3 units - 900 GWhDimensions of power station: length - 74 m
width - 18 mheight - 32 m
Access Tunnel
Width - 5 mLength - 900 m
Tailrace Tuunnel
Equivalent diameter of horseshoe sections - 9 mLength - 4,700 m
Transmissions
Transformers - first stage - 2 x 90 MVA three phase units- second stage - 1 x 90 MVA three phase unit
Length of 275 kV line to Juja Road _ 111 km single circuitLength of 132 kV line to Kamburu - 8 km double circuit
*Note: Generating units are rated at 72 MW but with an autput of 67 MWwhen three units are in operation.
May I975
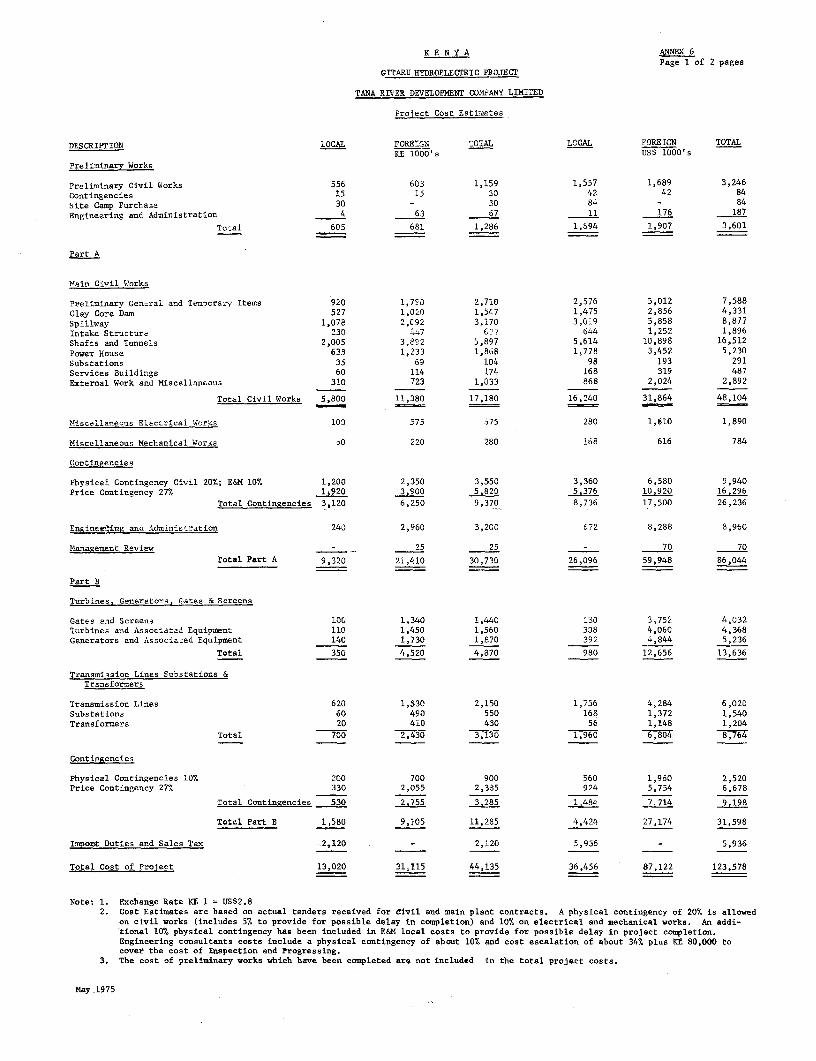
K E N Y A ANNEX 6Page 1 of 2 pages
GITARU HYDROELECTRIC PROJECT
TANA RIVER DEVELOPMENT COM8ANY LIMITED
Pro4ect Cost Estinates
DESCRIPTION LOCAL FORE:KN TOTAL LOCAL FOREIGN TOTALKE 1000's US$ 1000's
Preliminary Works
Preliminary Civil Works 556 603 1,159 1,557 1,689 3,246Contingencies 15 15 30 42 42 84
Site Camp Purchase 30 - 30 84 - 84
Engineering and Administration 4 63 67 11 176 187
Iccal 605 681 1,286 1,694 1,907 3,601
Part A
Main Civil Works
Preliminary Gen_ral and Temporary Items 920 1,7S0 2,710 2,576 5,012 7,588
Clay Core Dam 527 1,020 1,547 1,475 2,856 4,331
Spillway 1,078 2,C92 3,170 3,019 5,858 8,877
Intake Structure 230 4 7 677 644 1,252 1,896Shafts and Tunnels 2,005 3,8S2 5,897 5,614 10,898 16,512
Power House 635 1,233 1,868 1,778 3,452 5,230Substations 35 69 104 98 193 291
Services Buildirngs 60 114 174 168 319 487
External Work and Miscellaneous 310 723 1,033 868 2,024 2,892
Total Civil Works 5,800 11,380 17,180 16,240 31,864 48,104
Miscellaneous El. ctrical Works 100 575 675 280 1,610 1,890
Miscellaneous Mechanical Works so 120 280 168 616 784
Contingencies
Physical Contingency Civil 20%,; E&M 10% 1,200 2,350 3,550 3,360 6,580 9,940Price Contingency 27% li920 3,900 5,820 5,376 10,920 16,296
Total Contingencies 3,120 6,250 9,370 8,736 17,500 26,236
Engineeting and Administration 240 2,960 3,200 672 8,288 8,960
Management Review - 25 25 - 70 70
Total Part A 9,320 21,410 30,730 26,096 59,948 86,044
Part B
Turbines. Generators, Cates & Screens
Gates anad Screens l0C 1,340 1,440 '30 3,752 4,032Turbines and Associated Equipment 110 1,450 1,560 338 4,060 4,368Generators and Associated Equipment 140 1,730 1,870 392 4,844 5,236
Total 350 4,520 4,870 980 12,656 13,636
Transmission Lines Substations &Transformers
Transmission Li-nes 620 1,530 2,150 1,736 4,284 6,020Substations 60 490 550 168 1,372 1,540Transformers 20 410 430 56 1,148 1,204
Total 700 2,430 30 9 6,804 8,764
Contingencies
Physical Contirngencies 10% 200 700 900 560 1,960 2,520Price Contingency 27% 330 2,055 2,385 924 5,754 6,678
Total Contingencies 530 2,755 3,285 1.48- 7.714 9,198
TotLl Part B 1,580 9,705 11,285 4,424 27,174 31,598
Import Duties and Sales Tax -2,120 - 2,120 5,936 - 5,936
Total Cost of Project 13,020 31,115 44,135 36,456 87,122 123,578
Note: 1. Exchange Rate KE 1 = US$2.82. Cost Estimates are based on actual tenders received for divil and main plant contracts. A physical contingency of 20°/ is allowed
on civil works (includes 5% to provide for possible delay in completion) and 10% on electrical and mechanical works. An addi-tional 10% physical contingency has been included in ERM local costs to provide for possible delay in project completion.Engineering consultants costs include a physical contingency of about 10% and cost escalation of about 34% plus KE 80,000 tocover the cost of Inspection and Progressing.
3. The cost of preliminary works which have been completed are not included in the total project costs.
May 1975

Calculation of Expected Price Increases
EtSndlitures durnJ year (Commencing June 1)thousands)
CIVIL WORKS 197`/76 1976/77 1977/78 1978/79 1979/80 TOTAL
Base Cost Esti;mate 5,200 5,900 4,500 1,300 280 17,180Physical Contingency 1, 0O)O l,lo8 900 260 60 3,440
Total 6,240 7,080 34400 1,560 340 20,620
Expected Price Increase 500 1,700 2,170 890 260 5,520% of Base Cost plus Physical Contingency 27%
ELECTRICAL..AND MECHANICAL WORKS
Base Cost Estimate 900 2,600 2,800 1,800 855 8,955Physical Continge my 100 300 310 200 100 1,010
'Total 1,000 2,900 3,110 2,000 955 9,965
Expected Price Increase 60 510 870 770 480 2,685% of Base Cost plus Physical Contingency 27%
Note: Annual price factors are calculated by compounding the rates of price increases in prior years and are halfthe rate of price increase in the year concerned. 'The following price increases which have been assumedhave been applied to boLh local and foreign costs.
1. Civil 'Works: Year 1 - 16%, Year 2 - 14%, Year 3 - 12%, Year 4 - 12%, Year 5 - 12%.
2. Electrical and Mechanical Works: Year 1 12%, Year 2 - 10%, Year 3 - 8%, Year 4 - 8%, Year 5 - 8%.
May 1975
01
N ,
iow

KENYAGITARU HYDROELECTRIC PROJECT
TANA RIVER DEVELOPMENT COMPANY LIMITEDCONSTRUCTION PROGRAM
1974 1975 1976 1977 1978
MAM A J J A S O N D JF|IMIA M J J A S O No D F M A MI J J S N D JFl M|A MIJd IJA SOND iJF M A MiJd A S_O
MAINCIVIL WORKS ril. H 0I ST I IE I U U Fi U T I I -I
TRANSFRMERS '-'' j+d|l I l I-- -- A A
GATES, SCREENS & HOISTS - , _. J ONIITII 1 1.
TU R BI NES & VA LVE 0/ES SPIA. -!,TUREt No
GENERATORS 4COMBINED INGUIRY * *7
TRANSFORMERS 4
SUB-STATIONS - INCLUDINGSUB CONTRACT FOR CONTRON SS -TOWER
TRANSMISSION LINES
COMBINED INQUIRY * **
MISCELLANEOUS MECHANICAL } t S tGENERAL ELECTRICAL I *II1
INSPECTION 7
.- m w w Draft document preparation, finalization & printing p Place order
Approval by the Borrower F.O.B.
*Ieti1 iII Tender period (iclidirg ev-ital-t)o Erection/Construction
* Basic fender evaluation to Borrower and I BR D CommissionedQ Publish aduertisement W-
World Bank-9167(R)

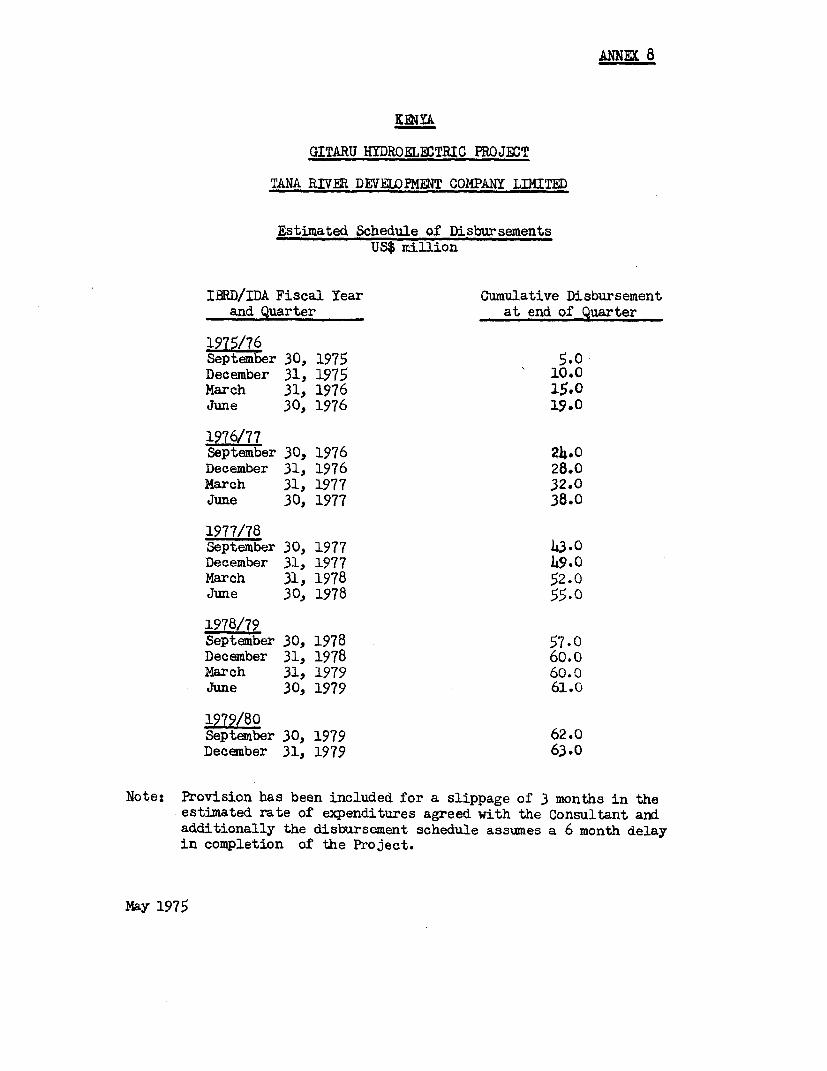
ANNEX 8
KENYA.
GITARU HYDROELIETRIC PROJECT
TANA RIVER DEVELOPMENT COMPANY LIMITED
Estimated Schedule of DisbursementsUS$ million
I3MD/IDA Fiscal Year Cumulative Disbursementand Quarter at end of Quarter
1975/76September 30, 1975 5.0December 31, 1975 10.0March 31, 1976 15.0June 30, 1976 19.0
1976/77September 30, 1976 24.0December 31, 1976 28.0March 31, 1977 32.0June 30, 1977 38.0
1977/78September 30, 1977 43.0December 31, 1977 19.0March 31, 1978 52.0June 30, 1978 55.0
1918/79September 30, 1978 57.0December 31, 1978 60.0March 31, 1979 60.0June 30, 1979 61.0
1979/80September 30, 1979 62.0December 31, 1979 63.0
Note: Provision has been included for a slippage of 3 months in theestimated rate of expenditures agreed with the Consultant andadditionally the disbursement schedule assunes a 6 month delayin completion of the Project.
May 1975
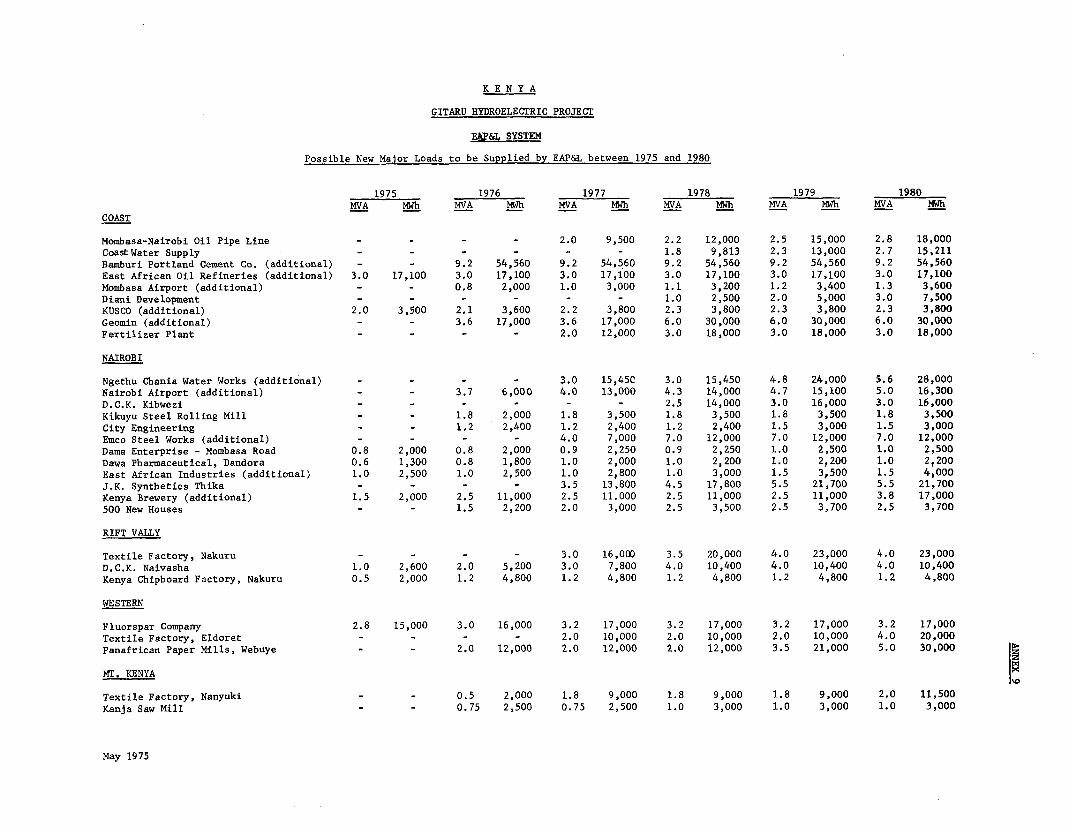
K E N Y A
GITARU HYDROELECTRIC PROJECT
EAA&L SYSTEM
Possible New Major Loads to be Supplied by EAP&L between 1975 and 1980
1975 1976 1977 1978 1979 1980MVA MWh MVA MWh MVA MWh MVA MWh MVA Wh MVA MWh
COAST
Mombasa-Nairobi Oil Pipe Line - - - - 2.0 9,500 2.2 12,000 2.5 15,000 2.8 18,000CoastWater Supply - - - - - - 1.8 9,813 2.3 13,000 2.7 15,211Bamburi Portland Cement Co. (additional) - - 9.2 54,560 9.2 54,560 9.2 54,560 9.2 54,560 9.2 54,560East African Oil Refineries (additional) 3.0 17,100 3.0 17,100 3.0 17,iO0 3.0 17,100 3.0 17,100 3.0 17,100Mombasa Airport (additional) - - 0.8 2,000 1.0 3,000 1.1 3,200 1.2 3,400 1.3 3,600Diani Development - - - - - - 1.0 2,500 2.0 5,000 3.0 7,500KUSCO (additional) 2.0 3,500 2.1 3,600 2.2 3,800 2.3 3,800 2.3 3,800 2.3 3,800Geomin (additional) - - 3.6 17,000 3.6 17,000 6.0 30,000 6.0 30,000 6.0 30,000Fertilizer Plant - - - - 2.0 12,000 3.0 18,000 3.0 18,000 3.0 18,000
NAIROBI
Ngethu Chania Water Works (additional) - - - - 3.0 15,45C 3.0 15,450 4.8 24,000 5.6 28,000Nairobi Airport (additional) - - 3.7 6,000 4.0 13,000 4.3 14,000 4.7 15,100 5.0 16,300D.C.K. Kibwezi - - - - - - 2.5 14,000 3.0 16,000 3.0 16,000Kikuyu Steel Rolling Mill - - 1.8 2,000 1.8 3,500 1.8 3,500 1.8 3,500 1.8 3,500City Engineering - - 1.2 2,400 1.2 2,400 1.2 2,400 1.5 3,000 1.5 3,000Emco Steel Works (additional) - - - - 4.0 7,000 7.0 12,000 7.0 12,000 7.0 12,000Dama Enterprise - Mombasa Road 0.8 2,000 0.8 2,000 0.9 2,250 0.9 2,250 1.0 2,500 1.0 2,500Dawa Pharmaceutical, Dandora 0.6 1,300 0.8 1,800 1.0 2,000 1.0 2,200 1.0 2,200 1.0 2,200East African Industries (additional) 1.0 2,500 1.0 2,500 1.0 2,800 1.0 3,000 1.5 3,500 1.5 4,000J.K. Synthetics Thika - - - - 3.5 13,800 4.5 17,800 5.5 21,700 5.5 21,700Kenya Brewery (additional) 1.5 2,000 2.5 11,000 2.5 11.000 2.5 11,000 2.5 11,000 3.8 17,000500 New Houses - - 1.5 2,200 2.0 3,000 2.5 3,500 2.5 3,700 2.5 3,700
RIFT VALLY
Textile Factory, Nakuru - - - - 3.0 16,000 3.5 20,000 4.0 23,000 4.0 23,000D.C.K. Naivasha 1.0 2,600 2.0 5,200 3.0 7,800 4.0 10,400 4.0 10,400 4.0 10,400Kenya Chipboard Factory, Nakuru 0.5 2,000 1.2 4,800 1.2 4,800 1.2 4,800 1.2 4,800 1.2 4,800
WESTERN
Fluorspar Company 2.8 15,000 3.0 16,000 3.2 17,000 3.2 17,000 3.2 17,000 3.2 17,000Textile Factory, Eldoret - - - - 2.0 10,000 2.0 10,000 2.0 10,000 4.0 20,000Panafrican Paper Mills, Webuye - - 2.0 12,000 2.0 12,000 2.0 12,000 3.5 21,000 5.0 30,000
MT. KENYA
Textile Factory, Nanyuki - - 0.5 2,000 1.8 9,000 1.8 9,000 1.8 9,000 2.0 11,500Kanja Saw Mill - - 0.75 2,500 0.75 2,500 1.0 3,000 1.0 3,000 1.0 3,000
May 1975

KENYAGITARU HYDROELECTRIC PROJECT
EAP&L SYSTEM - EFFECTIVE AND FIRM CAPACITY AND MAX. DEMAND
500 F
450: ,.,, .....,., , .EfFrECTIVE CAPACITY450 X
400
o I-D * - -FIRMCAPACITY
350 -c350 I D 1 MAX. DEMAND
0 -
300 Y,,~~~ .. ,,....................................
300 c
250
200
150
100
50
1974 1975 1976 1977 1978 1979 1980 1981
YEARWorld Bank-9168(2R)


KENYAGITARU HYDROELECTRIC PROJECT
EAP&L SYSTEM - PROGRAM OF DEVELOPMENT BASED ON PRODUCTIVE CAPABILITY IN DRY YEAR
2500
2400
2200
FORECAST GWHGENERATED AND PURCHASED
2000
1800 A(
16E00 C
1400 C
THERMAL PRODUCTIVE CAPABILITY
6t~~~~~~~~~~~~~~~~~~~~~~~~I L ;EA trS
.Xi~~~~~~~~~~~~~~~~~~~~~~~~~~~~~~~~~~~~~~~~~~~~~~~~~~~~~~~i
UGANDA BIJI K SIIPPIY
1973 1974 1915 1976 1977 1978 1979 19S0 198? 1982 1983
YEARi
'IF POSITIVF RESULTS ARE DBTAINED FROM THE GEOTHERiMAL STUDIES Biy T1iE LATE T70 ,THE THflMAL DEVELOPMENT SHOWN IN 1981 COULD BE INTERIM GAS TUiRBINES PENDINGCOMPLETION OF A LARGE GECTHEHMAL PROEiCT
World B-ik 9161 (2RI

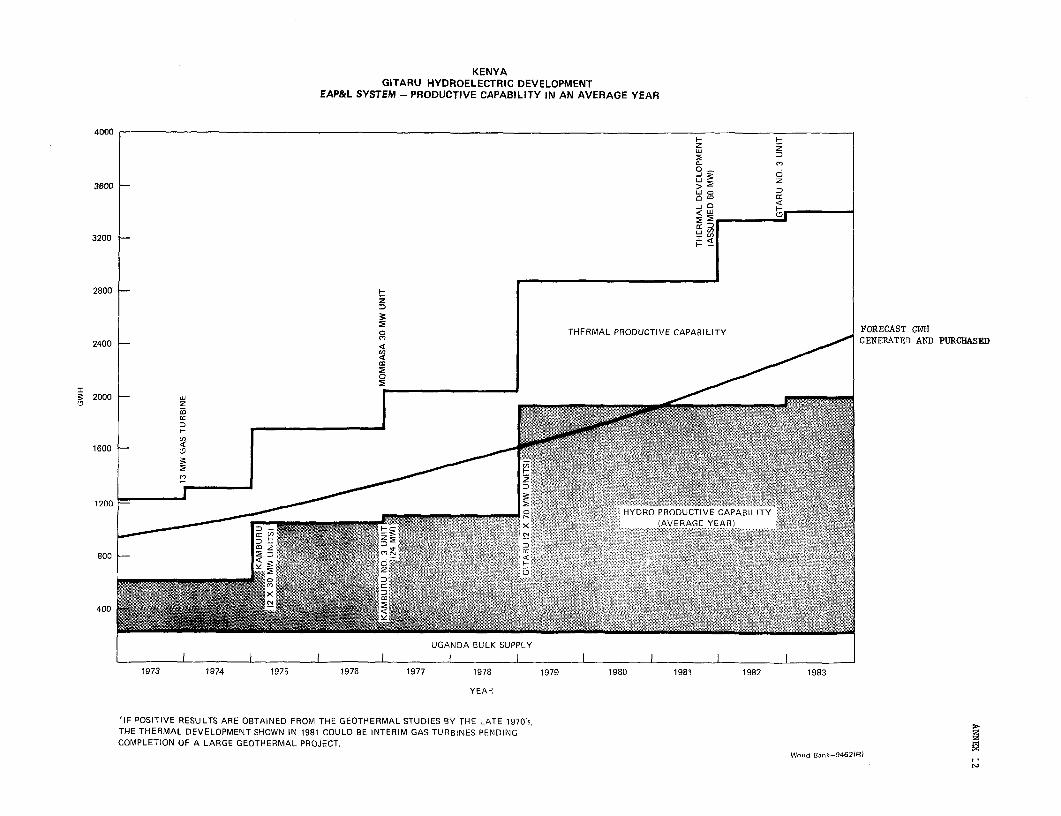
KENYAGITARU HYDROELECTRIC DEVELOPMENT
EAP&L SYSTEM - PRODUCTIVE CAPABILITY IN AN AVERAGE YEAR
4000
z _ r
C~~~~~~~~~~~~~~~~~~~~~~~~~~~~~C
0ul ~~z3600) >
E ~~~~~~~~~~~~~~~~~~~~~~~~~~~~EI _~~~~~~~~~~~~~~~~~~~~~~~~~~~~~~~~~~~~~~~~~~~~~~~~~~~~~~~~I
en~~~~(
3200
2800 I
120 , o 4: . . :: THERMAL PRODUCTIVE CAPABILITY : GWHGENERATED AND PURCHASED2400<
1:2000L
81001200
1973 1974 1975 1976 1977 1978 1979 1980 1981 1982 1983
YEAR
NIF POSITIVE RESULTS ARE OBTAINED FROM THE GEOTHERMAL STUDIES BY THE LATE 1970's, ,THE THERMAL DEVELOPMENT SHOWN IN 1981 COULD BE INTERIM GAS TURBINES PENDING zCOMPLETION OF A LARGE GEOTHERMAL PROJECT.
WAorld Bank-9462tR)

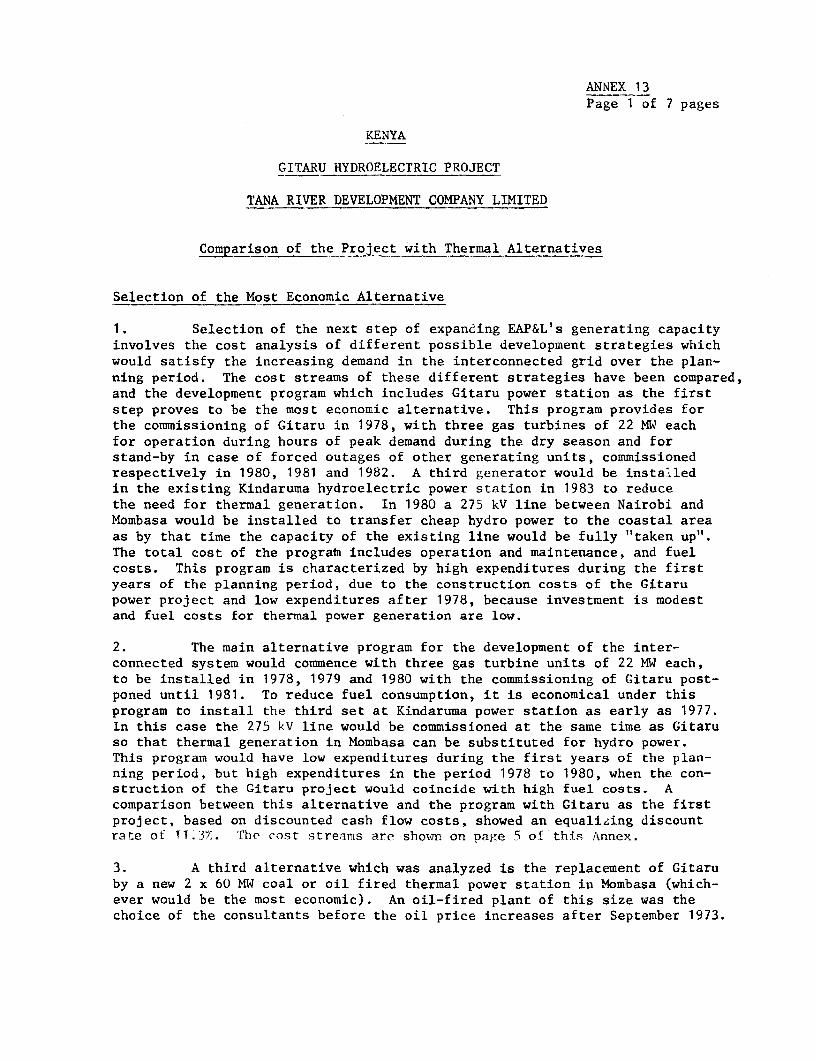
ANNEX 13Page 1 of 7 pages
KENYA
GITARU HYDROELECTRIC PROJECT
TANA RIVER DEVELOPMENT COMPANY LIMITED
Comparison of the Project with Thermal Alternatives
Selection of the Most Economic Alternative
1. Selection of the next step of expanding EAP&L's generating capacityinvolves the cost analysis of different possible development strategies whichwould satisfy the increasing demand in the interconnected grid over the plan-ning period. The cost streams of these different strategies have been compared,and the development program which includes Gitaru power station as the firststep proves to be the most economic alternative. This program provides forthe commissioning of Gitaru in 1978, with three gas turbines of 22 MW eachfor operation during hours of peak demand during the dry season and forstand-by in case of forced outages of other generating units, commissionedrespectively in 1980, 1981 and 1982. A third generator would be installedin the existing Kindaruma hydroelectric power station in 1983 to reducethe need for thermal generation. In 1980 a 275 kV line between Nairobi andMombasa would be installed to transfer cheap hydro power to the coastal areaas by that time the capacity of the existing line would be fully "taken up".The total cost of the progratn includes operation and maintenance, and fuelcosts. This program is characterized by high expenditures during the firstyears of the planning period, due to the construction costs of the Gitarupower project and low expenditures after 1978, because investment is modestand fuel costs for thermal power generation are low.
2. The main alternative program for the development of the inter-connected system would commence with three gas turbine units of 22 MW each,to be installed in 1978, 1979 and 1980 with the commissioning of Citaru post-poned until 1981. To reduce fuel consumption, it is economical under thisprogram to install the third set at Kindaruma power station as early as 1977.In this case the 275 kV line would be commissioned at the same time as Gitaruso that thermal generation in Mombasa can be substituted for hydro power.This program would have low expenditures during the first years of the plan-ning period, but high expenditures in the period 1978 to 1980, when the con-struction of the Gitaru project would coincide with high fuel costs. Acomparison between this alternative and the program with Gitaru as the firstproject, based on discounted cash flow costs, showed an equalifiing discountrate of 11.3;. The cost streams are shown on page 5 of this Annex.
3. A third alternative which was analyzed is the replacement of Gitaruby a new 2 x 60 MW coal or oil fired thermal power station in Mombasa (which-ever would be the most economic). An oil-fired plant of this size was thechoice of the consultants before the oil price increases after September 1973.

ANNEX 13Page 2 of 7 pages
The equalizing discount rate is 15.5%, when Gitaru followed by a coal-firedplant is compared with a coal-fired thermal station followed by Gitaru, assum-ing a low coal price of US$30 per ton CIF Mombasa. The equalizing discountrate increases to 19% if the coal price is US$40 per ton and to 20% if thethermal plant is fired by oil.
4. The possibilities of geothermal power and imported power fromTanzania were also considered; since the geothermal exploration program isincomplete and, on the best assumptions, a large geothermal power stationcould not be commissioned before 1983, this was excluded from the develop-ment alternatives.
5. With regard to the possibility of imported energy, surplus powershould be available from Tanzania after commissioning Kidatu II power station(presently scheduled early 1980). A-transmission line would have to be builtbetween the town of Tanga in Tanzania and Mombasa to interconnect the twonational grids. Tanzania could supply excess power which, because of lossesand stability problems would be limited to about 20 MW and the input of 20 MWfrom Tanzania has therefore been analyzed and introduced into the strategies.The assumed annual load factor of the imported power is 85% and the sale priceis Ki 10 per KWH (in 1975 prices). Import of power from Tanzania would of coursehave the greater impact on the gas turbine followed by the Gitaru program. Onthe above assumption the equalizing discount rate between the two strategieswould fall to 10% if 20 MW of power is imported from Tanzania each year.Because of Kenya's reluctance to import more power than at present, the possi-bility of delay in commissioning Kidatu II and the lack of long-term availa-bility, EAP&L would prefer not to include imported power from Tanzania in itsdevelopment planning. This was therefore excluded from the further analysisof EAP&L's most economic development strategy as the economic advantage wasminimal.
Shadow Pricing
6. The comparison of alternatives in the previous paragraphs of thisAnnex are based on shadow pricing. All local costs have been turned intoforeign cost equivalents using shadow price ratios as listed on page 7 ofthis Annex. The most important shadow price ratios used are 0.75 for un-skilled labor and 1.33 for all local costs. The shadow price ratio for localcosts is implictly used in all shadow prices listed and corresponds to anexchange rate, which is 33% above the official rates. These shadow priceswere estimated by a study group from Oxford University headed by M.F.G.Scott 1/ in 1970, 1972 and 1973. Some shadow prices may have changed in themeantime, especially due to the effect of the fuel price increase on relativeprices in Kenya. However, they represent the best estimate of shadow pricesavailable at the present time.
1/ The most important study prepared by the group is "Estimates of ShadowWages in Kenya" by M.F.G. Scott, February 1973.

ANNEX 13Page 3 of 7 pages
Sensitivity Analysis
7. The sensitivity of the equalizing discount rate between the coststreams of the two basic strategies--Gitaru followed by gas turbines and gasturbines followed by Gitaru--was analyzed by changing the main variables,capital costs, fuel costs and load forecast.
8. Gitaru cost estimates are based on experience with Kamburu powerstation and bid prices for major contracts and ample provision has been in-cluded for physical contingency (20% for civil works, 10% for equipment) toprovide for unforeseen construction problems. However, considering the amountof rock excavation involved, cost increases above the amounts included in theestimates for physical contingencies are possible, which would change thestructure in the cost streams of the alternatives compared. A relative costincrease of Gitaru (over the other costs included in the comparison) of 10%would reduce the equalizing discount rate to 10%. A simultaneous increase inthe cost of the gas turbines, which is less probable, since unforeseen con-struction problems are not expected, would result in an equalizing discountrate of 10.5%.
9. The comparison of the two basic alternatives includes a slow dropof 2% per year until 1980 in "real" fuel prices from its end 1974 level ofKsh 500 per ton of furnace oil in Mombasa; i.e., current fuel prices areexpected to rise until 1980 at a somewhat lower rate than the capital andoperating costs of the two alternatives. A fall in "real" fuel prices of 7%per year until 1980 from their present level would reduce the equalizingdiscount rate to 10%, and unchanged "real" fuel prices, i.e. fuel priceswhich rise at the same rate as the other commodities included in the compar-ison would result in an equalizing discount rate of 12%.
10. The growth of demand has been projected on the basis of a detailedanalysis of future electricity consumption of large industrial consumers andon the correlation between demand of the remaining consumers and the expecteddevelopment of Kenya's economy. If the expectation of economic growth inKenya--a slow-down in 1975 and 1976, and a recovery with a return to theprevious economic trend in 1977--are too optimistic, then the load growthcould be lower than projected. A lower load growth would lead to a reductionin fuel consumption if gas turbines are installed first, and to a longerperiod of under-utilization of generating capacity if Gitaru is commissionedin 1978. A reduction in load growth by 10% would reduce the equalizingdiscount rate to 9%.
11. A simultaneous occurrence of two of the three events analyzed above--an increase of Gitaru capital cost, a sharp drop in "real" fuel prices, areduction in demand growth by 10%--would reduce the equalizing discount rateto 8%. Under conditions most unfavorable to the strategy of building Gtarufirst with all three events occurring simultaneously, the equalizing discountrate would fall below 7%. However, the likelihood of a simultaneous occurrenceis small. The mission estimates that the likelihood of a drop in load growth

ANNEX 13Page 4 of 7 pages
by 10% is 25%; of 10% higher capital cost of Gitaru 33%, and of a sharp dropin "real" fuel prices 25%. The joint probability of simultaneous occurrenceof two or three of the events, therefore, would be less than 10%.
May 1975

ANTNEX 13Page 5 of 7 pages
KENYA
GITARU HYDROELECTRIC PROJECT
TANA RIVER DEVELOPNENT COIPANY LIMITED
Calculation of Equalizing Discount RateCost in a: Million
Develonment Strategy: Gitaru First275 kV Gas Kindarama Oprat. & Fuel Total
Year Gitaru Line Turbines III Maint. Cost Costs
1975 6.1 - - - 6.11976 9.4 - - - - 9.1b1977 8.9 - - - - 9 11.31978 5.2 0.4 - - 0.2 0.6 6.41979 2.1 4.1 O0L4 - 0.2 0.7 7.51980 - 2.7 1.4 - 0.2 0.9 5.21981 - 0.5 1.4 - 0.4 1.5 3.81982 - - 1.2 0.4 0.4 2.4 4.41983 - - 0.3 1.2 0.4 3.3 5.2
Development Strategy: Gas Turbines First
1975 _- - - o.41976 - - - 0.4 - o.41977 - - 0.4 1.2 - 2.6 L.o1978 6.1 - 1.4 - 0.1 3.1 10.71979 9.4 0.4 1.4 - 0.1 4.3 15.61980 8.9 4.1 1.2 - 0.2 5.5 19.91981 5.2 2.7 0.3 - 0.4 1.5 10.11982 2.1 0.5 - - 0.4 2.5 5.51983 - - - 0.4 3.6 4.0
Equalizing Discount Rate: 11.3%0
If the estimated amounts of tied aid are shown in the capital coststreams at the time the actual payments are made the equalizingdiscount rate improves slightly to 11.5%.

AINEX 13Page 6 of 7 pages
KENYA
GITARU HYDROELECTRIC PROJECT
TANA RIVER DEVELOPMENT COMPkAY LIMITED
Local and Foreign Costs of Projects(K£I Million)
Local Foreign Total
Gitaru
Civil Works 6.7 13.8 20.5Electro-Mechanical Equip. 1.4 8e6 100Engineering 0.3 3,0 3.3
Total 8.h 25.4 33.3
Gas-Turbines
Civil Works 0.5 0e2 0.7Equipment 0.5 3.4 3.9Engineering 0.1 0e2 0.3
Total 1.1 3.8 4.9
275 kV Line
Civil Works 0.6 0.2 0O8Equipment 1.3 5.5 6,8Engineering 0.2 0.4 o.6
Total 2.1 6.1 8.2
Kindaruma III
Equipment 0.1 1.3 i.4Engineering 00 0.2 0e2
Total 0O1 1.5 1.6
Grand Total 11.7 36.a e48.5
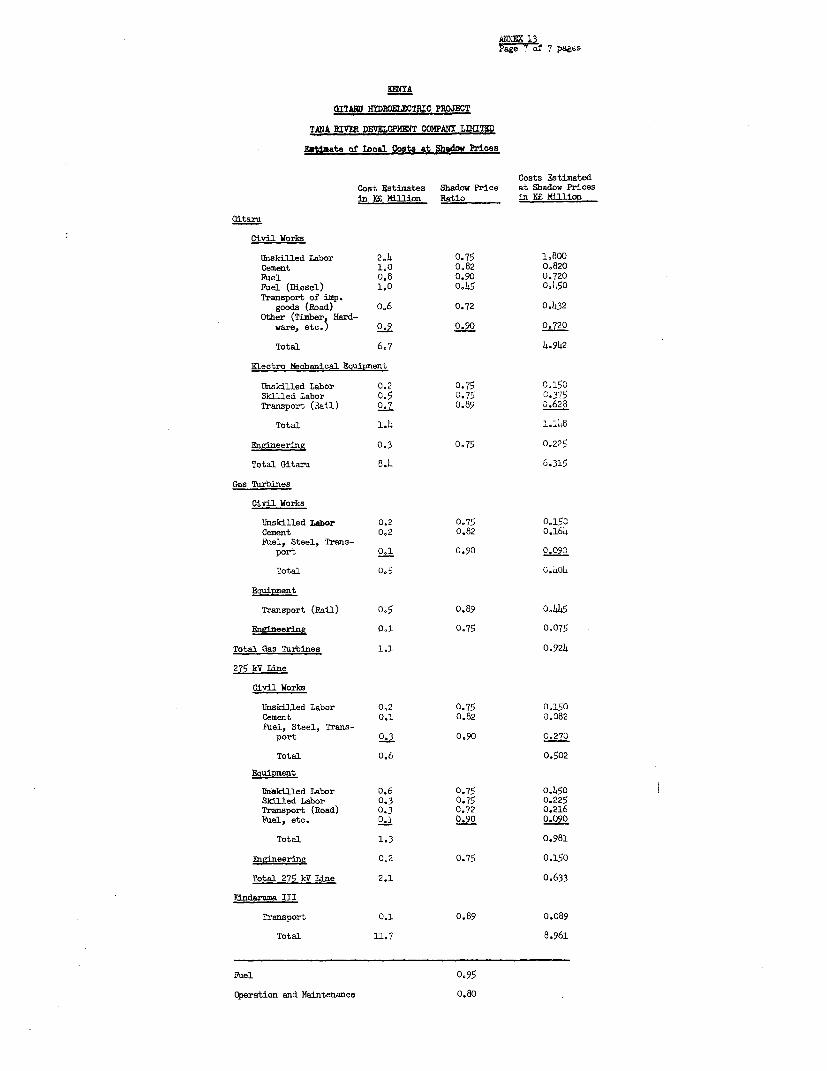
FNge 7 0!7 pag&s
GITARU H7DROELCTRIC PROJECT
TANA RIVMR DEVLOPMT COMPANY LJaTED
EZUaate of local Costs at Shidow Prices
Costs FstimatedCost Estimates Shadow Price at Shadow Pricesin X£ MiMlion Ratio in Ei, Million
Gitaru
Civil Works
Unskilled Labor 2.h 0.75 1,800Cement 1.0 0.82 0.820Fuel 0.8 0.90 0.720Fuel (Diesel) 1.0 0.45 01450Transport of imp.
goods (Road) o06 0.72 O.432Other (Timber Hard-
ware, etc. 50.9 °.90 0.720
Total 6.7 4.942
ELectro Mechanical Equipment
Unskilled Labor 0.2 0.75 0.150Skilled Labor 0.5 0-75 0.375Transport (Rail) 0.7 0.89 0.628
Total 1.4 il48
Engineering 0.3 0°75 0.225
Total Gitaru 8.4 6.315
Gas Turbines
Civil Works
Unskilled Labor 0.2 0.75 0,150Cement 0.2 0.82 0.164Fuel, Steel, Trans-
port 0.1 0.90 0.090
Total 0,5 0.404
Ecuipment
Transport (Rail) 0,5 0.89 02445
Engineering 01 0.75 0,075
Total Gas Turbines 1.1 0,9214
275 kV Line
Civil Works
Unskilled Labor 0,2 0.75 0.150Cement 0,1 0.82 0,082Fuel, Steel, Trans-
port 0.3 0,90 0.270
Total o.6 0.502
Equinment
llnakilled labor 0.6 0.75 0.450Skilled Labor 0.3 0.75 0.225Transport (Road) 0.3 0.72 0.216Fuel, etc. 0.1 0-90 0-°90
Total 1.3 0.981
Engineering 0,2 0.75 0.150
Total 275 kV Line 2.1 0.633
Kindaruxaa III
Transport 0.1 0.89 0.089
Total 11.7 8.961
Fuel 0°95
Operation and Maintenance 0,80

ANNEX 14Page 1 of 3 pages
KENYA
GITARU HYDROELECTRIC PROJECT
TANA RIVER DEVELOPMENT COMPANY LIMITED
Method and Assumptions Made to Determine theRate of Return on Investment
1. The rate of return on the investment is defined as the equalizingdiscount rate between all project related capital and operating costs andthe revenues (over 50 years) attributable to the project.
2. The capital costs of Gitaru, which include the costs of the thirdunit to be installed in 1982, are estimated at April 1975 constant prices. Theinvestments in distribution and secondary transmission, necessary to supplythe power generated by Gitaru to the consumers are part of EAP&L's developmentprogram for the period 1977 to 1982. The economic life of Gitaru was assumedto be 50 years and of transmission and distribution equipment 25 years.Operating costs have been estimated by the Consultants.
3. Shadow pricing was applied to foreign cost and unskilled labor.The shadow exchange rate was assumed to be 33% above the official exchangerate and local unskilled labor was shadow priced at 75% of actual cost.
4. The revenues attributable to the project, are Gitaru's estimatedoutput reduced by losses in transmission and distribution (about 15% of unitssent out) and multiplied by EAP&L's average sales price per kWh as of April1975. Sales of Gitaru power will start in 1978 with 334 GWh, rising to amaximum of 761 GWh in 1986; thereafter they remain constant. The appliedaverage sales price, based on EAP&L's present tariff system, has threecomponents:
(i) A base price of Ki 25.3 in 1978, K4 25.1 in 1979 and Ki 24.8in 1980 and thereafter;
(ii) A Government tax of K4 1 per kWh; and
(iii) The fuel oil price surcharge, which will vary dependingon the amount of energy generated by thermal power.EAP&L forecasts a fuel oil price surcharge per kWh ofKE 0.1 in 1978, El 0.3 in 1979 and El 0.8 in 1980.Mission estimates of the fuel oil price surcharge in thefollowing years are: KE 1.1 in 1981, K4 1.4 in 1982 andKE 1.6 in 1983 and thereafter.

ANNEX 14Page 2 of 3 pages
5. The streams of costs and revenues are presented in the table onpage three of this annex. The rate of return on investment is 14.3%.,
6. The rate of return on the investment is sensitive to changes in costsand revenues. A 10% increase in total costs would reduce the rate from 14.3%to 12.2%, and a drop in growth of demand by 10% results in a rate of 13.6%A joint cost increase of 10% and reduction in the demand growth of 10% wouldresult in a rate of return of 11.8%.
May 1975
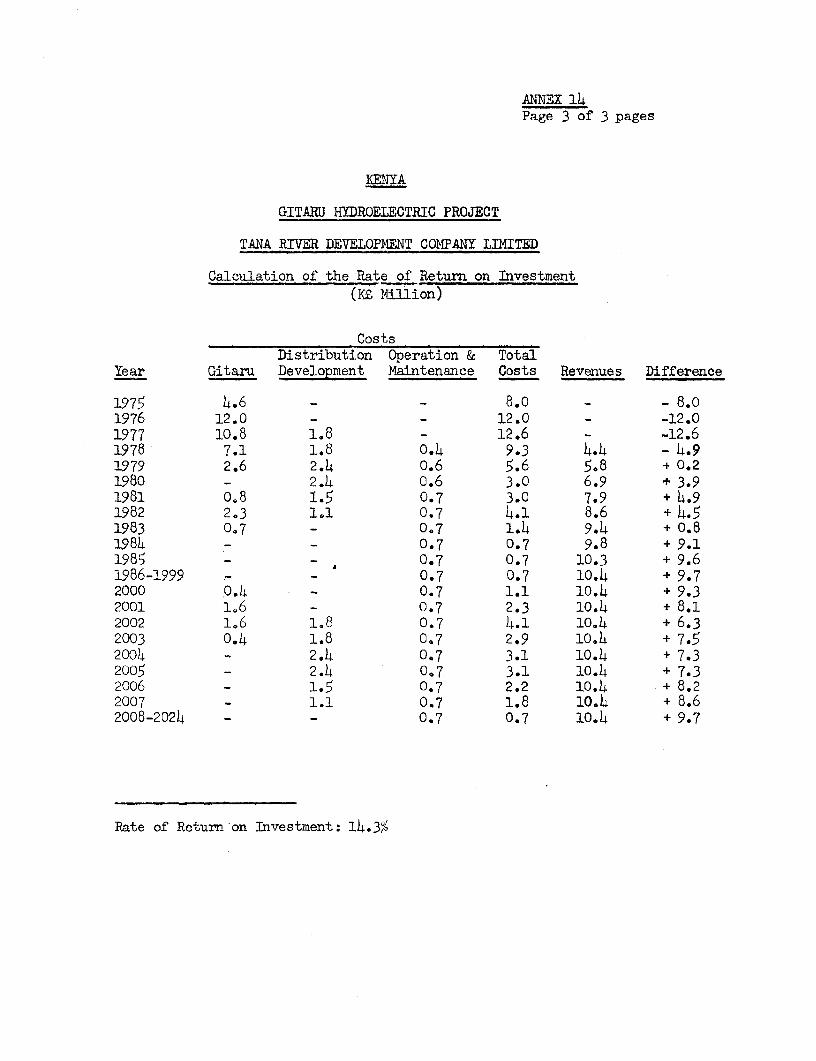
ANNEX 14Page 3 of 3 pages
KENYA
GITARU HYDROELECTRIC PROJECT
TANA RIVER DEVELOPMENT COMPANY LIMITED
Calculation of the Rate of Return on Investment(K£ Million)
CostsDistribution Operation & Total
Year Gitaru Development Maintenance Costs Revenues Difference
1975 4.6 - 8.0 - 8.01976 12.0 - - 12.0 - -12.01977 10.8 1.8 - 12.6 - -12.61978 7.1 1.8 0.4 9.3 4.4 - 4.91979 2.6 2.4 0.6 5.6 5.8 + 0.21980 _ 2.4 0.6 3.0 6.9 + 3.91981 0.8 1.5 0.7 3.0 7.9 + 4.91982 2.3 1.1 0,7 4.1 8.6 + 4.51983 0.7 - 0,7 1.4 9.4 + 0.81984 - - 0.7 0.7 9.8 + 9.11985 - - 0.7 0.7 10.3 + 9.61986-1999 - 0.7 0.7 10.4 + 9,72000 0.4 . 0.7 1.1 10.4 + 9.32001 1.6 _ 0.7 2.3 10.4 + 8.12002 1.6 1.8 0.7 4.1 10.4 + 6.32003 o.4 1.8 0.7 2.9 10.4 + 7X52004 - 2.4 0.7 3.1 10.4 + 7.32005 _ 2.4 0.7 3.1 10.4 + 7.32006 - 1.5 0.7 2.2 10.4 + 8.22007 - 1.1 0.7 1.8 10.4 + 8.62008-2024 - - 0.7 0.7 lOe4 + 9.7
Rate of Return on Investment: 14.3%

ANNEX 15Page 1 of 2 pages
KENYA
GITARU HYDROELECTRIC PROJECT
TANA RIVER DEVELOPMENT COMPANY LIMITED
History of the Power Companies
1. The Kenya Electricity Supply Industry is presently comprised ofthree companies:
(a) The East African Power & Lighting Company Limited (EAP&L)
(b) The Kenya Power Company Limited (KPC)
(c) Tana River Development Company Limited (TRDC)
The East African Power & Lighting Company Limited
2. EAP&L, which is the sole distribution company, was incorporatedin 1922 by the amalgamation of two undertakings which had supplied Nairobiand Mombasa since 1907 and 1909, respectively. It is a local private enter-prise company with authorized share capital of KL 10,000,000 of whichKL 9,741,504 is issued. In addition, loan capital amounting to KE 4,165,653was outstanding as at the end of 1973. Although formerly operating through-out Kenya, Uganda and Tanzania, its activities have been confined to Kenyasince 1964 due to purchase of the Uganda and Tanzania undertakings by therespective Governments. The Company is primarily concerned with the com-mercial distribution of electricity throughout Kenya, but presently it alsogenerates the entire power requirements of the Coast System, provides thenecessary thermal back-up for the main grid system and operates generatingstations in centres not connected to the grid. It also co-ordinates allsources of power, and staffs and manages the other two Companies (KPC andTRDC).
3 In 1970, the Government acquired a controlling interest in EAP&Lwhen it made a successful bid for all the shares on the London Register.Since then, the Government has been purchasing shares as they come in theEast African Market and its total holding together with. that of Government-controlled agencies is now probably in the neighborhood of 60%.
The Kenya Power Company Limited (KPC)
4 In 1955 EAP&L was faced with the problem of financing the con-struction of a 132 kV transmission line to interconnect the power systems ofUganda and Kenya as well as other expansion requirements. The Company didnot consider it practicable to raise the required finances through newequity issues because of conservative dividend policies due to politicalpressures and the need for increased self financing. There was also revived
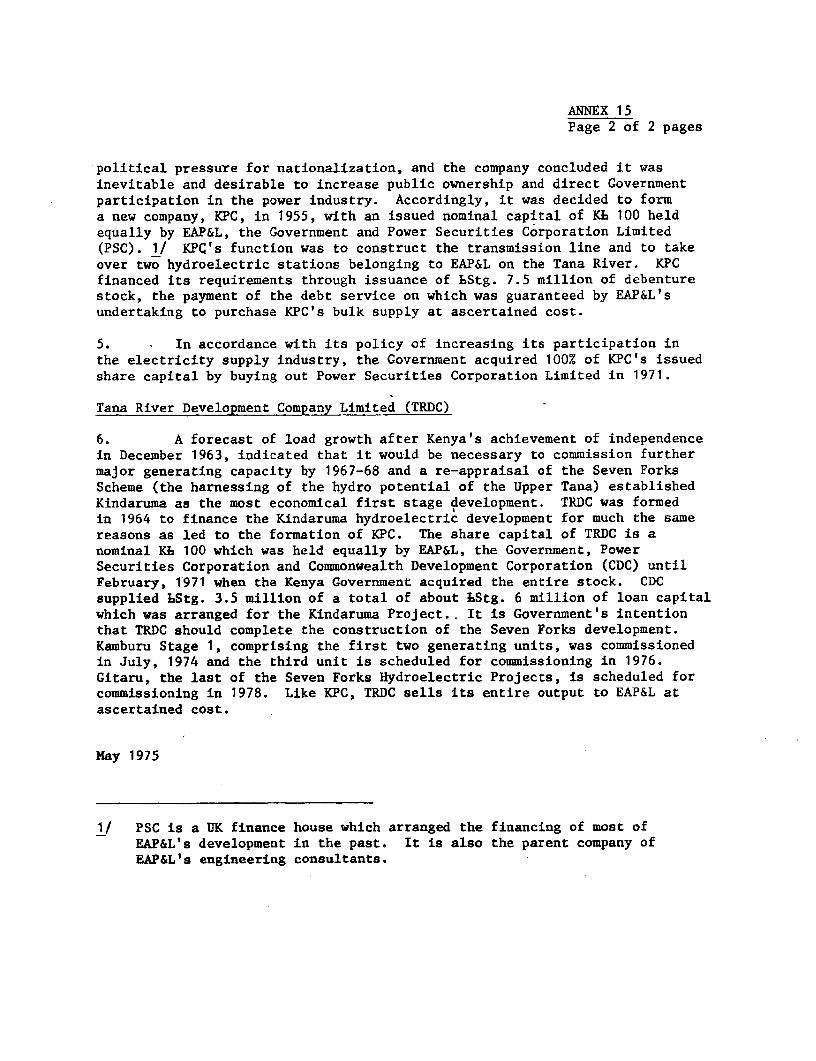
ANNEX 15Page 2 of 2 pages
political pressure for nationalization, and the company concluded it wasinevitable and desirable to increase public ownership and direct Governmentparticipation in the power industry. Accordingly, it was decided to forma new company, KPC, in 1955, with an issued nominal capital of Kb 100 heldequally by EAP&L, the Government and Power Securities Corporation Limited(PSC). 1/ KPC's function was to construct the transmission line and to takeover two hydroelectric stations belonging to EAP&L on the Tana River. KPCfinanced its requirements through issuance of LStg. 7.5 million of debenturestock, the payment of the debt service on which was guaranteed by EAP&L'sundertaking to purchase KPC's bulk supply at ascertained cost.
5. In accordance with its policy of increasing its participation inthe electricity supply industry, the Government acquired 100% of KPC's issuedshare capital by buying out Power Securities Corporation Limited in 1971.
Tana River Development Company Limited (TRDC)
6. A forecast of load growth after Kenya's achievement of independencein December 1963, indicated that it would be necessary to commission furthermajor generating capacity by 1967-68 and a re-appraisal of the Seven ForksScheme (the harnessing of the hydro potential of the Upper Tana) establishedKindaruma as the most economical first stage development. TRDC was formedin 1964 to finance the Kindaruma hydroelectric development for much the samereasons as led to the formation of KPC. The share capital of TRDC is anominal Kb 100 which was held equally by EAP&L, the Government, PowerSecurities Corporation and Commonwealth Development Corporation (CDC) untilFebruary, 1971 when the Kenya Government acquired the entire stock. CDCsupplied LStg. 3.5 million of a total of about LStg. 6 million of loan capitalwhich was arranged for the Kindaruma Project.. It is Government's intentionthat TRDC should complete the construction of the Seven Forks development.Kamburu Stage 1, comprising the first two generating units, was commissionedin July, 1974 and the third unit is scheduled for commissioning in 1976.Gitaru, the last of the Seven Forks Hydroelectric Projects, is scheduled forcommissioning in 1978. Like KPC, TRDC sells its entire output to EAP&L atascertained cost.
May 1975
1/ PSC is a UK finance house which arranged the financing of most ofEAP&L's development in the past. It is also the parent company ofEAP&L's engineering consultants.

tKENYA ARNEX 16(a)
GITbARU HJYDROELEC,RIC . ROJEC-.
AN.R 77VER DEVELOPHENT COP'PANY LIMITED
,b7w~~~~~~~~i DECsBRq lc St4 -~8CKL THOUSMs
ESTIMATED
ASSETS
PLANT IN nPERATION S514 5975 20939 2200F 22030 2'20G3 69627 71867 71867LESSI DFPRECIATION 47 5 716 2 ljt tk . 2 p533 398P 8490
_- - -- -- -_ -- - - --- -- --- - ------- ---- - --- -- ------- _____ _ _ ___ _
NET PLANT t2 s36 20223 ?0esa 20417 t ,997 67094 6t77q 66377
WORK IN PROGRESS 566? t1675 ;.011 1027R 25!1? 0 a 0
R&E FUND TNVEST 106 134 t61 18J ?13 23A 263 28P 313
CURRENT ASSFTS-CASH AND 8ANKS-OEPOSITS & DEBTRS !40 2 37 0 0 0 0
TEMPORARY SURP I 0 0 300 894 779 1688 297P 4346
TOTAL 14f 2 37 300 Aq4 779 168P 2978 4346
TOTAL A113o 17' 9S 21434 'l162o 4ti6U+ $16t7 695045 71149 71n36
LIABILTIES
EQUITY-CAPITAL 1/ 1 '764 437t ,¼o0 6000 6000 6000-DEV. SURC.i OTiLR 2' i 1363 17* 787 3L44 -39 8862 1C630 120n7-GAIN ON FXCH 792. 649 645-R&F FUND V' 1i4 -; 2 263 78P. 313
TET REP LESS *E 37 71iY X-2 2658 2977 3630__G.-- ----- ----- ---- ---- -- __----wO_r_ ----- -- -- --- e_ _ ;.________ _
TOTAt _ - 2625 ,822z 548! I 0222;, i';l l 8428 ?7Co4 22595
LONG TERM tF8T 5/ 4207 '7ŽOt 26i39 3h4.3 90617 06 60 0 4844!
CUR'NT LIABTLITTES-FAPL 0 C, 0 ? ,q 0 O-OTHER 1! 205 73-i 0 0
TOTAL 55Q 263 994' 0 O 0 0 0 0
----- - ------- _-_---*- ---- __ __ ---- _-__- -_ -- v- ---- - ---- -------
TOTAL 113) 07tq9 2I43 4 31620 43 . 6904S 7 1!4, 71036
DE8T/DEST & ECUITY 81 83 3 4 8! 79 70t 73 71 68
]1 T<uLC HAtS A NL:tiNAL ShsAWE CAPTAL OF KIL-, WHOLLY OWNED ,' TE GOVERN:!EENT, THIS IS PROPOSEDTO BE :NCkEASZD TO K-56 ILLION ItVN GOVERNMENT SUDSCRZPTIONS 3.5 KL._ 8 ml.LLIOt IN 1975, Kk2.6MILLION 'N 1976 A;D KD .6 MILLION IN 1977.
2/ 'DEV SURCiH 0 OTHER' COlPRISES {') AMOUNTS RECEIVED FROM EAP.> AS DEVELOPMENT SURCHARGE INCLUDEDIN THE PRICE OF ELECTRICITY SOLD TO IT, AND CII) PROCEEDS FiR&5 INSURANCE CLAIM, Kt 148 THOUSAND,RECEIVED IN 1970 IN RESPECT OF DELAYED COMMISSIONING OF K_NDRA2UMA PROJECT AND THE RESULTINGINCREASED CAPITAL COST.
.3/ THE ESTIMATES DO NOT ALLOW FOR ANY INTEREST INCOME, GAINS OR LOSSES WHICH MAY BE REALIZED ONRESERVE AND EQUALIZATION FLND INVESTMENTS.
4/ TRDC DOES NOT USE DEPRECIATION ACCOUNTING BUT INSTEAD CHARGES AS AN EXPENSE THE AMOUNT SPENTEACH YEAR TO REPAY LOANS. THE CUMULATIVE AMOUNT OF DEBT REPAYMENTS EXCEEDS THE AHOUNT WHICHIS PROVIDED IN THIS STATEMENT FOR DEPRECIATION AND CONSEQUENTLY THIS EXCESS IS SHOWN AS A PARTOF EQUITY.
./ DETAIL OF 'LONG TERM DEBT' OF 1 9 74 IS PROVIDED IN ANNEX 21.

KENYA ANNEX 16(b)
GITARU HYDROELECTRIC PROJECT
TANA RIVER DEVELOPMENT COMPANY LIMITED
REVENUE ACCOIJNTS FOR THE YEARS 1972 - 1980CK6 THOUSANDS)
ACTUAL ESTIMlATED1972 1973 1974 197S 1976 1977 197A 1979 1980
OPERATING RFVENUFS__________________
nPERATION K ADMIN 65 7S 96 165 180 196 405 1442 482INTEREST 348 338 818 1427 1184 1341 2712 4231 4193DFBT REPAYMENT 258 278 283 848 III? 1051 775 1770 2159R&E FUND 25 25 25 2S 2S 2; 2S 2S 25
…______ ------- ------- ------- ------- ------- ------- ------- -------TOTAL 696 716 1222 2465 2701 261F 3917 6468 bA99
DEv SURCHARGE 447 480 375 44 11457 1991 3627 1777 136R
ASCFRTAINED COST 1/ 1143 1196 1S97 2509 4158 46h0 7544 824S 8227
OPERATING EXPENSES_____.____________
OPER t ADMIN 65 79 96 16S 180 196 405 442 48?DEPRECIATION tl1 119 125 438 459 460 460 145S :50?
TOTAL 183 194 221 603 639 656 865 1897 tQ84
OPERATING INCOME 960 1002 1376 1906 3s19 3950 6679 6348 6243OTHER INCOME NET 382 152 -145 0 0 0 0 0 0
NET INCOMF REF TNT 1342 1154 1231 1906 39:Q 3950 6679 61*8 h243INT CHARGFD OP 348 338 818 1427 1384 1341 2712 423t 4193
NET INCOME 994 816 413 479 2135 2600 3967 2117 2050
1/ TRDC'S REVENUES ARE DETEPMINED IN ACCORDANCE WIlIt THE DEFINITION OF 'A!<CERTAINED COST'IN ITS BULK SUPPLY LICENCE, DESCRIBED IN ANNEX 21.

KENYA ANM 16(c)
GITARU HYDROELECTRIC PROJECT
TANA RLVER DEVELOPMENT COtMPANY LI MITED
ESTIM4ATED SOURCES AND APPLICATION OF FUNDS, 1975-1980CKk THOUSANDS)
1q7S iq76 1977 197A 197R i97q lnlTOTAi_
INTERNAL SOURCES-NET INCOME fBEF IN 1906 35 1 q 3950 6679 16054 6348 6243-DEPRECIATInN 438 450 460 460 1817 1455 150?
…a - - -- - - - -- - - - - - -…------ - - -- - -
TOTAL 234qt 397T 4410 7139 17871 7803 7745
OPERATIONAL RF-QUIREMENTS
-WORKING CAPITAL 957 n 0 0 957 0 0-DEBT SERVICE 2275 2496 2394 3487 10115? 6001 635?
TOTAL 3232 2496 2394 31187 11609 6001 635?e-- - - - - - - -- - - - - - - - - - --- e-- -- -
NET AVAILABLEF.ROM OPFRATIONS -A88 1482 2016 3652 6262 1802 1393
CONSTRUCTIONREGUTREMFNTS
KAMBURU II shl 2? 0 nA 0 0GITARU 9175 14834 15231 7254 46694 22'40 0RRE FUNO TNVEST 25 2N 29 2R 1on 25 25
TOTAL 10361 14881 15256 7?79 47777 2265 25
BALANCE Tn FINANCF 11249 13399 13240 3627 41515 463 -1368
FINANCED BY!
EAPL (KAMB) 234 o 0 ° 231 0 0GOVT (KAMRj ?08 0 n 0 I 0 0IBRO (KAMB) 663 0 0 663 0 0SIDA (KAMR) 1n n 201 0 0STDBK (GITARUi 1S00 o 0 1500 0 0LOCAL (GITARu0 lS00 200n 360 0 3s60 0 0EAPL (GITARU) 700 700 600 n 2000 0 0IBRO (GITARU) 4224 6534 8106 2800 21664 A36 0SUPP CR (GITARU) 555 2152 2430 1736 6873 917 0-EQUITY 1764 2607 1629 n 6000 0 0
TOTAL 11949 13993 13125 4936 43203 1753 0
SURPLUS(rFFTCITiOF FUNDS -ion 99 -115 909 1688 1290 13bPACCUMULATED 300 894 779 1688 1688 2978 4346
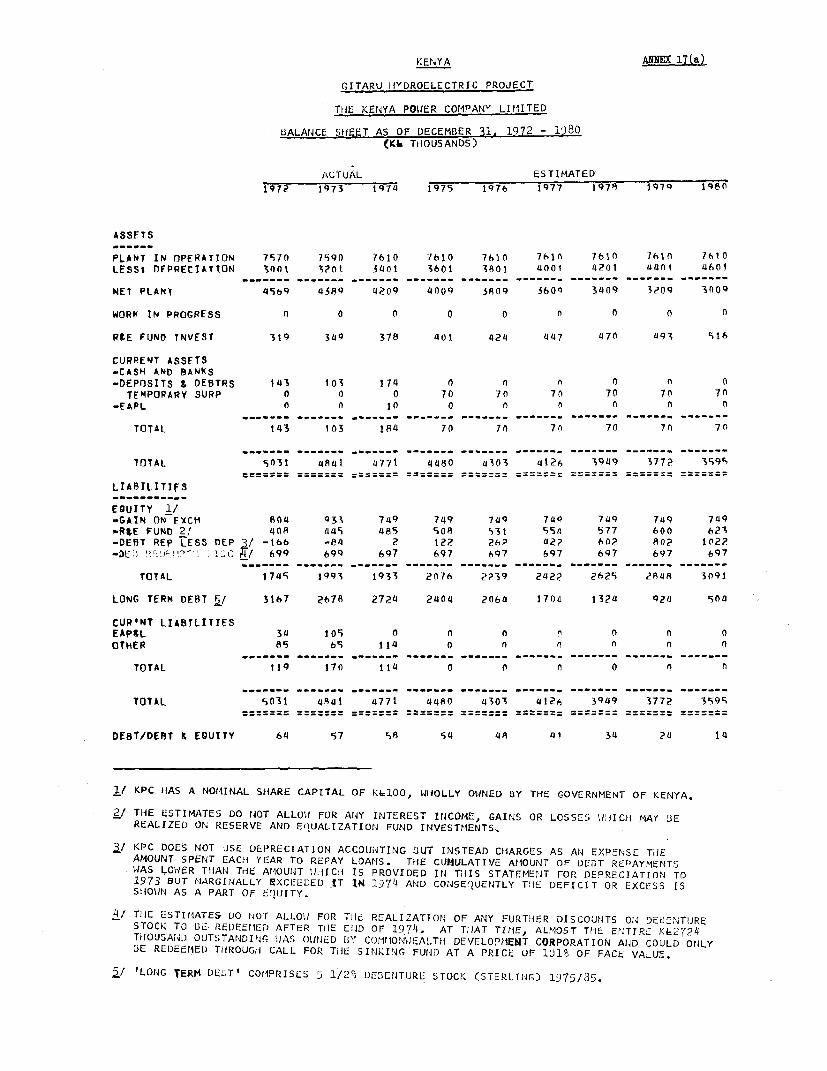
KENYA ACEX 17(a)
GITARU tlYDROELECTRIC PROJECT
THE KENYA POWER COMPANY LItMITED
BALANCE SHEET AS OF DECEMBER 31. 1972 - 1980(Kb THiOUSANDS)
ACTUAL ESTIMATED1972 1973 1974 1975 1976 1977 1978 19h7 1980
ASSETS
PLANT IN OPERATTON 7970 7590 7610 7hlO 7610 761A 7b1( 7610 76t0LESSi DFPRECIATION 300t 3?ot 3401 3601 3001 4001 4201 an01 i4601
NET PLANT 45h9 4389 4209 4009 3809 360S 3409 3?09 HnoQ
WORK IN PROGRESS 0 0 0 0 0 n n 0 0
RtE FUNO TNVEST 3t9 349 318 401 424 447 1170 a49 916
CURRENT ASSFTS-CASH AND BANKS-DEPOSITS & OEBTRS 143 103 174 0 n 0 0 0 0
TEMPORARY SURP 0 0 0 70 70 70 70 7° 7n-EAPL 0 0 tO 0 0 n 0 n O
TOTAL 143 I03 184 70 70 70 70 70 70
TOTAL 9031 4841 4771 4480 4303 '4126 3949 5772 399
LIABILITIFS___________
EQUITY 1/-GAIN ON EXCt 804 433 749 749 749 740 749 749 749-RtF FUND 2/ 408 449 485 908 931 594i 577 600 623-DEBT REP LESS nEP 3/ -166 -84 2 122 26? 42? 602 802 1022-DE~ * r ... :I i,C -$ ....4/ 699 699 697 697 697 697 697 697 697
TOTAL 174S 1993 1933 2076 2?39 2422 2629 2A48 3091
LONG TERM DEBT k/ 3167 2678 2724 2404 206a 170i4 13241 92M t501
CUR'NT LIABTLITIESEAP&L 3a1 105 0 0 0 0 0 nOTHER 8A 69 114 0 n n 0 0
TOTAL 119 17a t14 0 0 n 0 0 n
TOTAL S031 4 41 4771 4480 4110 '412 3949 3772 399
DEBT/DEBT & EQUITY 64 57 58 54 4A 41 34 ?L 14
1/ KPC HAS A NOM-1INAL SHARE CAPITAL OF K1OO, WHOLLY OWlNED BY THE GOVERNMENT OF KENYA.
2/ THE ESTIMATES DO NOT ALLOWI FOR ANY INTEREST INCOME, GAINS OR LOSSES /1ICHrl MAY 3EREALIZED ON RESERVE AND EOUALIZATIOrJ FUND INVESTMENTS.
3J KPC DOES NOT USE DEPRECIATION ACCOUNTING BUT INSTEAD CHARGES AS AN EXPENSE TiEAMOUNT SPENT EACHl YEAR To REPAY LOANS. TilE CUMULATIVE A11OUNT OF DEBT REDAYMENTSWAS LOWER THAN TriE AMOUNT WHdICH IS PROVIDED IN T,IS STATEMENT FOR DEPRECIATION TO1973 oUT MARGINALLY EXCEEDED iT IN 1l74 AND CONSEOUENTLY THlE DEFICIT OR EXCESS ISSHOWN AS A PART OF E')[JITY.
4/ THlE ESTIPiATES DO NOT ALLOW FOR TIIE REALIZATION OF ANY FURTHlER DISCOUNTS ON DEi3E>JTURESTOCK; TO BE REDEEMED AFTER TiJE EiiD OF 1974. AT THlAT TIME, ALMOST THE ENTIRE KL2724THIOUSAND) OUTSTANDItNG IAS OWINED BY COMHONWEALTH DEVELOPMiENT CORPORATION AND COULD ONLYWE REDEEM1ED THiROUGH CALL FOR T,lE SINKING FUND AT A PRICE OF 101J. OF FACE VALUE,
2/ ILONG TERM DElT' COMiPRISES 5 1/2' DE5ENTURE STOCK (STERLING) 1975/85.

KENYA AM= 17(b)
GITARU HYDROELECTRIC PROJECT
TtiE KENYA POWER COMPANY LIMITED
REVENUE-ACCOUNTS FOR THE YEARS 1972 - 1980Ck THOUSANDS)
ACTUAL EST IMATED1972 1973 1974 197S 1q76 tq7 7 1978 1979 198n
OPERATING REVENUES…_____._..________
OPERATION & ADMTN 177 161 174 183 197 21? 23? L 247 268
INTEREST t81 160 155 126 1t6 86 66 46 26
DEBT REPAYMENT 257 282 286 320 34f 36n 380 400 a2n
RIE FUND 22 2? 23 ?3 23 23 23 23
PURCHASED ENERGY 525 599 398 S98 390 398 39R 39p
A.S4ERTAINED COST,1, Itb2 1224 t?l1 1050 in64 1079 1099 1til 1115
OPEPATING EXPENSES__________________
OPER 6 AOMIN 177 161 I7q 183 197 21? ?3? ?47 RhR
PURCHASFD ENERGY 525 599 573 398 398 390 398 39P 39p
DEPRECIATTnN 197 P20 200 200 ?on Pon 200 Pon 200
TOTAL 899 960 9d7 781 795 A1o 830 809 R66
OPERATING INCOME 263 264 26L 2 ?69 269 269 ?69 269
OTHER INCOMF NET 353 144 -169 0 0 n 0
NET INCOMF REF TNT 616 408 95 269 Ph9 ?60 269 269 269
INT CHARGFD OP 181 160 159 126 106 A 66 46 26
NET INCOMF 435 248 -60 143 163 183 ?03 223 243
1/ KPC'S REVENUES ARE DETERMINED IN ACCORDANCE WITH THE DEFINITION OF ASCERTAINED
COST IN ITS BULK SUPPLY LICENCE, DESCRIBED IN ANNEX 21.

K.ENYA A\mNEX 1l&a)
GITARU -IYDROELECTRIC PROJECT
TiE KENYA POIJER COMrAPNY LIMIlTED
TAtJA RIVER DEVELOPMENT COMiPAt-Y LIMITED
COl;3I.JED 3ALANCE SHEET AS OF DECEtMBER 31, 1972-1980
ACTUAL ESTIMATED1972 1973 1974 1975 1076 1977 1978 1979 198ia
ASSFTS
PLANT IN npFRATION 1 264 13965 ?28949 29618 29h4an 2964e 77?37 791177 791477LFSS: DFPRECIATTON 3473 3792 411' 4755 59ial/ 607/i h7S4 83814 10091
NET PLANT 9791 9773 24432 ?4963 24226 23966 70903i 110HR 6918k
WORK IN PRQGRFSS 5662 11675 10,1 l0278 251'2 G0343 0 n In
R&E FUlND TNVEST 425 483 941 S89 637 6h8F 733 781 s2s
ClJRRENT ASSFTS-CASH AND BANKS-DEPOSITS g DE8TRS 283 105 211 n 0 n O o
TFMPORARY SURP 0 n 0 370 964 6.1p 1751 3048 41416-EAPL 0 0 10 0 0 n 0
TOTAL 283 10t 221 370 9/ 8149 178 3018 01416
TOTAL 1661 22036 26209 36100 90 39 64143 72994 74917 7a43
LIABILITIFS
E QUIT Y-CAPITAL 0 V I 1764 4371 600on 60O 60n0n 6000=DEV SURCH & OTHER 888 1368 1743 1787 324/i 523 886? 106314 12n07-GAIN ON EXCH 1449 1727 1394 1394 1394 13914 t394 139/1 1914-R9E FUND 5114 579 648 h96 7414 79? 8140 88P 9336-DEBT REP LESS DEP 204 445 689 1219 201? 276c 32?O 3775 465?'DF1HT RFDEMPTN DISC 699 699 697 697 697 697 697 647 697
TOTAL 3754 4818 9171 7557 1216? 16883 21093 23393 P2968
LONG TERM DFBT 11738 t6785 19926 28543 38477 a1856n 519a41 ,1924 48141
CUR'NT LIA8TLITTES-EAPL 70 163 267 o n n 0 n-OTHER 599 270 841 0 n n 0 n n
TOTAL 669 433 1to8 0 o n- 0 0 0
TnTAL 16161 22036 26205 36100 90939 65443 7299a 74917 714s1
DEaT/DEBT & EQUITY 76 73 79 73 76 74 71 59 66
STATUTORY 8SE RATE OF RETURN 1/ 18926 25240 29560 39896 54752 69983 77237 79477 79477
AVERAGE NET FIXEDASSETS 2/ 9926 9732 17102 30292 4224n 56624 67206 70796 70237
1/ UNDER SECTION 47 OF THE ELECTRIC POWER ACT OF K,rENYA, A POWER COMPANY 'S TARIFFS WOULD3E SUBJECT TO REDUCTION TO THE EXTENT OF FIVE-SIXTHS OF THE AMOUNT BY W4HICH OPERATINGINCOtME BEFORE INCOME TAX FOR ANY YEAR EXCEEDS 12 1/2 OF T,1E 'CAPITAL EXPENDED ON T,iEUNDERTAKING' AS OF THE END OF THE YEAR. THIS STATUTORY ASSETS BASE IS SH{OWN AS THETOTAL OF FIXED ASSETS AT COST INCLUDINIG ',IORK Itl PROGRESS AND INVENTORIES AT TiHE Er-DOF iACH YEAR.
2/ AVERAGE NET FIXED ASSETS EXCLUDE WORK IN PROGRESS TO 1974, AtlD INCLUDE IT TiHEREAFTER.
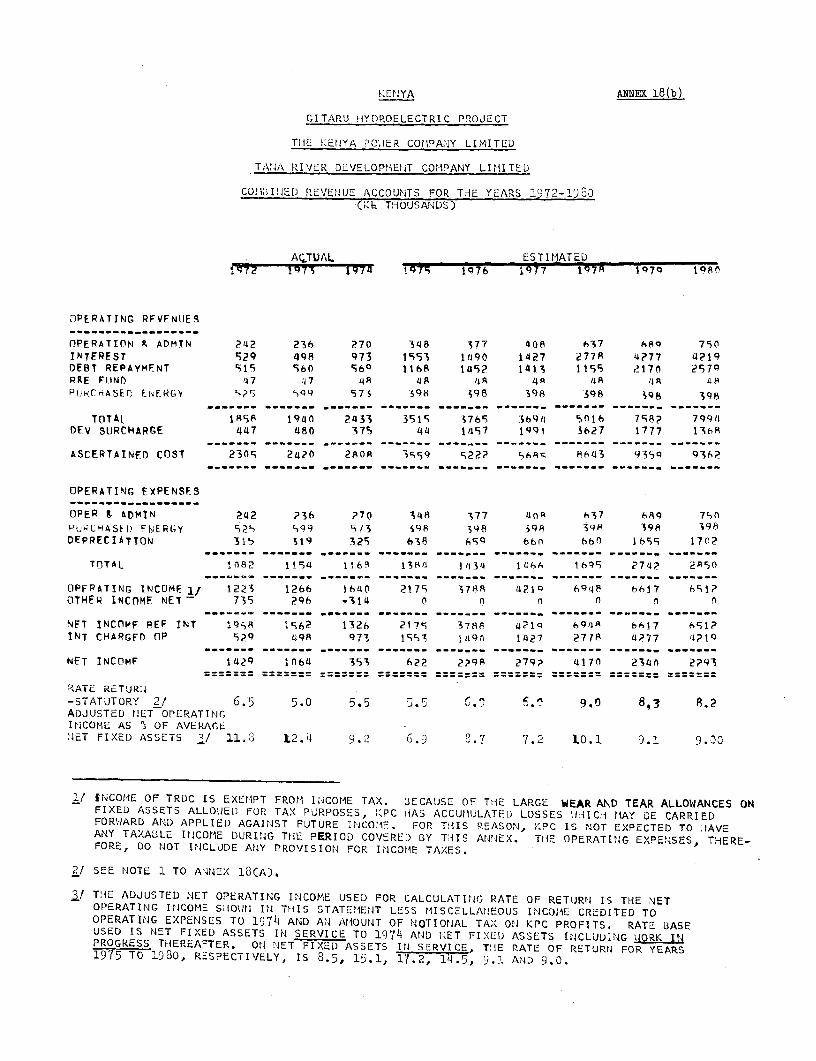
KENYA ANNEX 18(b)
GITARU HYDROELECTRIC PROJECT
TN-E liEtNYA CEllER COMPANoY LIMIITED
TAN4A lIVER DE:V/ELOP,MENiT COMiPANY LI1MITED
COUIUINED REVENUE ACCOUNTS FOR T 1E YEAPS 1Q72- 9Z0(iK6 T:iOUSANDS)
ACTUAL ESTIMATEDI1972 1973 197 1980
OPERATING RFVENUlES_______.__________
nPFRATION K ADMYN ?42 236 270 348 377 40P 637 68A 790INTFREST 929 498 973 1S93 11190 1427 277R 4777 4219DEBT REPAYMENT 919 960 s6Q 1168 149? 1413 11595 217A 2597RPE FlND 47 4J7 4R Li8 4A 4R /4A A 48Pl fCIASEr ENFRGY Sp5 599 957 398 398 398 39$ 398
TOTAL --- S- 1940 2433 3S1S - 76- 3-9- 5016 798; 7994DEV SURCHARGE 447 480 379 44 1497 1991 3627 1777 13b8
ASCERTAINFD CnST 2309 24?0 280A 3's9 922? 5h8r M643 9359 936?
OPERATING EXPENSFS__________________
OPER & &DMTN 242 ?36 ?70 348 377 4o0 637 689 750PUPCHASF[i FNERGY 525 i99 13 698 S98 698 q99 398 39$DEPRECIATION 31*, 319 325 638 6bq bhn 66n 16b9 170?
TnTAL tn82 1154 1168 138/4 I'13' 14b6 1699 ?749 g890
OPFRATING INCOMF 1/ 1223 1266 1640 2179 ;788 421o 6'4p 6617 h51?,OTHEN INCOME NET - 735 296 -314 0 nn n
NET INCOMF PEF INT 4958A 16? 132h 2179 3788 4214 6914j 6617 - 91?INT CHARGFD OP 92q 498 973 1993 1 l9(f 1427 27tA 4?77 4? 1
NET INCOMF 14I 1064 393 62? 2?9R 279? 417n 234n 2?93
RATL RETURH-STATUTORY 2/ 6.5 5.0 5,5 5.5 So 9 8,3 8.2ADJUSTED NET OPERATINGINCOME AS S OF AVERAGEJET FIXED ASSETS q/ 11.3 12.4 9.2 6.9 0.7 7.2 10.1 9.1 9.90
1/ INCOtME OF TRDC IS EXEMlPT FROM INCOME TAX. SECAUSE OF T1E LARGE WEAR AND TEAR ALLOWANCES ONFIXED ASSETS ALLOlEII FOR TAX PURPOSES, KPC HAS ACCUMIUJLATED LOSSES lliICH tMAY BE CARRIEDFOR;lARD AND APPLIED AGAIrNST FUTURE iNCOi1E. FOP. THIS REASON, KPC IS NOT EXPECTED TO AAVEANY TAXABLE INCOtME DURING THE PERIOD COVERED BY TlIS ANNEX. THE OPERATING EXPENSES, THERE-FORE, DO NOT INCLUDE ANY PROVISION FOR INCOMIE TAXES.
21 SEE NOTE 1 TO ANNEX 13(A).
31 THE ADJUSTED NET OPERATING INCOME USED FOR CALCULATING RATE OF RETURN IS THE NETOPERATING INJCOME S-OUNr ItJ THIS STATEMiE,JT LESS MISCELLANEOUS INCOME CREDITED TOOPERATING EXPENSES TO 1974 AND AN AMOUNT OF NOTIONAL TAX ON KPC PROFITS. RATE DASEUSED IS NET FIXED ASSETS IN SERVICE TO 1974 ArND NET FIXED ASSETS INCLUDING !WORK INPROGRESS TH/EREAFTER. ON NET FIXED ASSETS IN SERVICE, TIE RATE OF RETURN FOR YEARS1975 TO 1980, RESPECTIVELY, IS 8.5, 15.1, 17.2, 14.5, 9.1 AND 9.0.

KENYA AN= C19(a)
GITARU IYDROELECTPIC PROJECT
THlE EAST AFRICAN POWER AND LICTHTING COMPANY, LIMITED
BALANCE SHlEET AS OF DECEMEBER 31, 197?-1980
(KI&TH0US AN DS )
ACTUAL ESTIMATEDtk72 t973 1974 Mg75 X9IQ i977 1978 1979 1980
ASSETS
PLANT IN nPFRATTON ?7h6 279,52 29281 32922 38474 4017"1 41974 43874 4s874LESS: DEPRECIATION l0829 11669 12486 13934 14713 16090 17528 t9n31 ?0602
NET PLANT 1497t 15887 16795 19388 23761 24084 24446 24843 25?72
WnRK TN PR1GRFSS A91 1217 2748 36SS n A 3000 6000 8000
L/T INVFSTMFNTS 1/ 2378 4009 3863 4934 SL13? 9621. 9500 4701 3892
CURRENT ASSFTS-CASH AND PBANKS-CASH & DFPOSITS 3732 1334 2S42 0 0 A n 0
TEMPORARY SURP 0 0 0 183 8R n 149 984 2612-DERTRS & PREPMNTS 1298 1324 1r9c99 1709 I899 2009 2tS5 230F 24S9-INVENTORIES 1609 1720 19S;9 2004 2094 2t04 2194 220o 2?S4-DUF FROM KPC/TRDC 70 163 2S7 0 0 0 0
TOTAL 666.9 4941 6308 3892 3q97 410q 4t98 9493 7321
TOTAL 24909 256S4 ?9714 I1469 S329n 338!1/ 37404 41n07 4414P89
LIARILITIFS-------- _ 22_==-= =-:- _=m--=-- -=== =
EQUTTY-CAPITAL 9742 9742 97£42 974? 9 4Y? '7 974? 974? 974?-RETAINED EARNINGS 5999 6384 7269 8205 927R 9%; 11623 1333R 1S326
TOTAL 1970t 16126 177 17Q947 19n20 197Tn 2.36s 2308n 290b8
LONG TERM DEBT 4979 41{66 68 9 7228 6711 6nir 7704 9261 10243
CUR'NT LIABILTTIES-ACCOU)NTS PAYABLE 1898 2QDF 2443 2468 2493 ZS1M 2543 2568 2593-CONSUMER DEPnSITS 933 697 612 707 73? 757 782 807 AS?-PROV FOR TAXES 1198 lriO >J71,S 763 1241 IO? 1793 1900 1714-OVERDRAFTS 0 a O 0 0 84 0 n O
TOTAL 3e27 3712 4i58 3938 4466 5091 9119 5279 5139
DEF TAX PROVISION Ioor, 16s0 1650 2356 2h93 2976 3217 3421 4035
TOTAL ?4909 29694 ?29714 31469 32A9O 33R14 37404 41037 44489
DEST/DEBT E enliTY 23 Zi. 2 -2 2- 23 27 2! 29STATUTORY BASE FOR -RATE OW RETURN 2P 28296 30489 33983 38581 4G528 42278 47128 520C78 56128
AVERAGE NET FIXEDASSETS j2/ 14991 15429 16341 21293 23402 23922 25765 29144 32057
1/ 'L/T INVESTMENTS' COMPRI.SE (I) GOVERNMENT OF TANZANIA BILLS OF EXCHANGE WHICH WILL BEFULLY REPAID IN 1975, AND (II) LOANS TO TRDC.
21 SEE NOTE 1 TO ANNEX 18(A).
I/ SEE NOTE 2 TO ANNEX 18(B).

K>E,'IYA MflItb 12
GITARU HYDROELECTRIC PROJECT
TilE EAST AFRtCAN POWER AND LIGHTING COMPANY, LlrI1TED
REVENU ACCOUNTS FOR 1HE YEARS 1972 - 1980(Kh THOUSANDS, EXCEPT AS OTHERWISE INDICATED)
-. TH 7 ASj M ERATEE IN97I 998
ACTUAL 47 47 7 s7A1 1972 1973 1974 175 1767
ENERGY SALES, GwH 795 860 925 1nos 1120 1?4s 1370 taq3 ' 162'
OPFRATING RFYFNUES
AT BASIC PATES 9122 9A76 10615 11357 125441 1382n 15070 16274 17r11?FUEL SURCHAQGF 0 0 12S3 1456 2?40 ?'49n 2740 2908 0256TARIFF TNCRFASE 0 0 0 567 1?54 138? t507 1627 17SS
TOTAL SALES PEV 9t22 9R76 1186, 1-330 16030 116;9? 1931? 20087 P2'596
OPERATING EXPFNSES
OPERATInN a ADMTN 3231 3740 S431 590A 6106 7h97 467; S34oi .,20KPC ASC COST 1162 12?4 1211 1050 10601 1079 1n99 llll 1137TRDC ASr COST 696 716 1222 2465 2701 261F 3917 646A 6099TRDC DEV SURCH 447 1180 375 04 1457 1Q91 3627 1777 136,0DFPRECIATION 10n40 1000 905 1048 1179 1377 1438 1501 1971TAXES 131q 1700 900 1469 1570 1268 2034 2100 ?32P
TOTAl 7095 8900 t01t4 1 4 14011 16040 1078B 183°7 19781
OPERATING INCOMF 1227 976 1744 1396 1953 1h4R 2S29 25sn 2015OTHER INC(IE NET 1/ Q13 653 332 717 410 410 400Q 390 377
NFT INCOMF REF INT 214A 1629 2n76 2113 237t 2050 2929 2970 319rINT CHARGED OP 381 348 339 317 402 487 0403 ;9q 300R
NET INCOME 1759 1281 1737 1796, 1929 1571 2056 2571 2011
AVERAGE SALES REVENUEPER ?tli IN KENYACENTS 22.95 22.997 25.66 26.63 28.64 28.42 23.20 27.93 27.76
RATE OF RETURNSTATUTORY 2/ 9.3 9.1 8.0 7.6 3.) 7.1 9.3 ').1 9.3
ADJUSTED NET OPERATINGINCOME AS °i OF tIETFIXED ASSETS j./ 3,. 6.9 11.2 6.9 8.7 7.2 10.1 9.1 9.0
1/ 'OTllER INCOME NET' IS MAINLY GAINS AND LOSSES ON UR: LOANJS REPAYA3LE IN L STERLING ARISING FRON,CHANlGES IN TIlE VALUE OF - STERLING IN RELATION TO TiiE OFFICIAL EXCHiANGE PATE OF KL. IN ADDITION,IT INCLUDES GAItN ONl DISPOSAL OF FIXED ASSETS AND UNCLAIMIED CUSTOMEgS' DEPOSITS CREDITED TO INiCOtME.
2/ SEE NOTE 1 TO ANlNEX 1'(A)
3/ TIE ADJUSTED NET OPERATING ICOtE USED FOR CALCIJLATING RATE OF RHTURN IS T.It TOTAL OF NET O1ERATINGINCOME SiODUN IN' TrlIS STAT.ME'T AND RENTAL INCOME. RA,TE ;ASE- USED IS NET FlN-D ASSETS I'l SE.RIC- To1974 AND NiET FIXED ASSETS INCLUDING 'dORK IN PPOGRESS, T:;EREAFTER. ON i;ET FIXED ASSETS IN SERVICETitE RATE OF RETURI4 FOP YEARS 1975 TO 1933 RESPECTIVELY IS 8.2, 9.4, 7.2, 10., 1G.U, ANO 11.j.

KENYA ANNEX 19(c)
GITARU HYDROELECTRIC PROJECT,
TrIE EAST AFRICAtJ POVIER AND LIGHTING COIMPANIY. LIMITED
ESTItMATED SOURCES AND APPLICATION OF FUNDS, 1975-1980(KS THOUSANDS)
1975 1976 1977 197A 1978 1979 19q30TfOTAI
INTERNAL SOURCES-NET TNCfME BEF IN 2113 2371 205R 292q 9471 2970 3192-DEPRECIATION 1048 1179 1377 1.438 504? 1503 1571
.DEF TAX 706 337 283 ?41 1567 204 h !
INVEST DECREASE 0 0 0 121 121 799. 8o9
TOTAL 3867 3887 3718 I4729 1201 5U7h 618
OPERATIONAL RE-DUIREMFNTS-WORKING CAPITAL -237q -328 389 -6111 -2959 43 336-DEBT SERVICE 701 1003 1186 1151 0in44 1242 966-DIVIDENDS 856 A5 8 56 856 3424 R56 856
TOTAL -A19 1531 2431 1366 4509 2141 2158--- -- ------ ------- _------ ------- ------- -------
NET AVAILABIEFROM OPERATIONS 4686 2356 1287 3363 1169? 3335 4028
CONSTRUCTIONREQUIRFMFNTSNORMAL 2175 1600 1700 1A0n 7?75 jQ0O 2000N-M LINE o n 0 3000 3nOO 3000 2000
KTrUVU 7 1873 297 0 n 2170 0 0GEOTHERMAL 9oo n 0 n 900 0 n
INVFST INCRFASE 671 59A 489 e 1758 0 0
TOTAL 5 1Q 249F 2189 4800 14703 4900 4000
BALANCE TO FINANCF 933 13Q 90? 1437 3011 1565 -28
FINANCED RY:
GLYN 71-80 716 411 0 n 7&n 0 0PROPOSED FOR N-M 0 n 0 2400 21J00 2400 1600
TOTAL 716 411 n 2410n 3160 2400 1600
SllRPLUS(DFFTCIT)OF FUNnS 183 -9r -902 Q63 149 835 1628
ACCUMULATED 183 88 -814 14Q 149 984 261?

KENYA ANXf 20(a)
GITARU HYDROELECTRIC PROJECT
THE P.ENYA POWER COMPANY LIM1TED,
TANA RIVER DEVELOPMENT COMPANY LIMITED
THtE EAST AFRICAN POWER AND LIGrHTING COMAPNY LIMITED
CO11INED BALANJCE SJEET AS OF DECEMBER 31. 1972-1980(KL THOUSANDS)
ACTUAL ESTIMATED
T72 973 M7W 1975 1976 1977 1978 1979 1980
ASSETS
PLANT IN OPFRATION 39060 41117 57830 62540 681h14 6q8It 119211 1?335¶ ¶5351LESS: DEPRECIATION 14129R 15457 16603 18289 20127 22164 24262 27420 30693
NFT PLANT 24762 25660 41227 44251 47987 4765n 94949 95931 94658
WORK IN PROGRESS 6553 12892 3759 I3933 25112 4Q343 3000 60on 8n00
L/T TNVFSTMFNTS 966 832 710 589 637 68F 733 781 829
CURRENT ASSFTS-CASH AND BANKS
OPERAtIONAL REQU 4005 1435 2672 0 n 0 n TEMPORARY SURP 0 0 0 553 1052 35 10; '403? 7028
-DERTRS & PREPAMTS 1268 1328 1636 1705 1855 200F 21S5 ?30' 2455-INVENTORIES 1609 1720 1954 2004 2054 2104 2154 2204 2254
TOTAL 6882 4483 6262 4262 o961 ql44 6216 8541 11737
TOTAL s9163 43867 51958 63035 78697 92A22 104898 111253 115224
LIABILITIFS___________
EGUITY-CAPITAI 9742 9742 9742 11506 t1413 1574? :5742 t5742 15742-RETND FARNGS TROC 2009 2825 3238 3717 585? 84lt3 12428 14545 16I595-RE7ND EARNGS KPC 1745 1993 1933 2076 2?39 242? 2625 2848 3091-RETND EARNGS EAPL 5959 6384 7?65 8205 9278 999s 11623 13338 15326
TOTAL 19455 20944 22178 2504 3148? 361P '12418 46473 50754
LONG TERM nF8T 14480 17291 23131 31237 40056 48951 54145 56084 55296
CUR'NT LIABILITIES-ACCOUNTS PAYABLE 2497 2275 3284 2468 2493 25 8 2543 2568 2q93-CONSUMFR DFPOSITS 533 657 682 707 732 757 782 807 R32-PROV FOR TAXES 1198 I050 1033 763 1?41 loo? 1793 190Q 1714
TOTAL 4228 3982 4999 3938 4066 4?77 5118 5275 5139
DEF TAX PROVN 1000 1650 1650 2356 2693 297A 3217 3421 4035…______ ------- ------- ------- ------- ------- ------- ------- -------
TOTAL 39163 43867 S19s8 63035 78697 92822 104898 111253 115224==:==== ======= ====:=== ====:=Z= =%=z =====~= =-====2 = =:=====:::: :==::===
DEBT/DEBT & EQUITY 43 45 51 55 S6 57 56 55 52
STATUYTORY BASE FOP 12 IS5115 36RATE OF RETUR, _1/ J7222 5?2 6353 TT 95280 I1UI- 1 5 =555 i 5
AVERAGE NET FIXEDASSETS 2 249I7 25211I 33443 51585 65642 80546 92971 99940 102294
1/ SEE NOTE 1 TO ANNEX 18(A)
2/ SEE NOTE 2 TO ANNEX 18(B)

KENYA ANNEX 20(b)
GITARU HYDROELECTRIC PROJECT
THE KENYA PO!IER COtMPANY LIIMITED
TANA RIVER DEVELOPMENT COM1APNY LIMITED
TrlE EAST AFRICAN POWER AND LIGHTING COMPANY, LIMITED
CONiJINED REVENKUE ACCOUNT FOR THiE YEARS 1972 - 1980(CK ThOUSANDS)
ACTUAL ESTIMJATED
- ?72 1973 1974 197S 1976 1977 1978 1979 1980
OPERATING RFVFNUES__________________
AT BASIC RATES 912? 9876 10615 11357 125U1 1382n 15070 16274 17982FUEL SUPC,ARGE n 0 1293 1456 2?40 ?t49( 2740 2986 3256
TARIFF TNCRFASE 0 0 0 567 1?54 138; 1507 1627 1758
TOTAL SAIES REV st22 9876 1 1 8b8 13380 16038 1769? 19317 20887 2259h
OPERATING FXPENSES__________________
OPERATI7N g ADMIN 3473 3976 5701 6256 6U83 810F 5310 60t310 72?70PURCHASFD ENERGY S25 599 573 398 39A 39P 39A 39A 398
DFPRECIATTON 1355 1359 1310 1686 183R 2037 ?098 315A 3?73TAxES (EAPL) 1319 100 900 1469 1578 1281 2D34 2104 228
TOTAL 6672 76314 8484 9809 10297 11829 9A4c 1i1h69 13269
OPERATING, YkC'MF- 24t0 2242 3384 3571 5741 58&7 9a77 9197 9327
OTHER INC.-MF NET 1587 870 -166 370 R0 S8r 80 8nf
NET I%C:G>-- ;F !'T 4037 3112 3218 3941 5821 5947 9557 9277 9i07
INT CHARGF'! cP 8U,9 767 1128 1923 15914 158k 29011 4366 4270
NET TNCnMF 3188s 2345 2090 2418 4;?27 4363 6696 4911 5137
RATE OF RETURNSTATUTORY 1/ 8.2 7.2 6.9 6.5 7.3 6.4 9.3 3.7 3.7
ADJUSTED NET OPERATINGINCOME AS % OF AVERAGEFIXED ASSETS 2/ 10.2 9.2 10.4 6.9 8.7 7.2 10.1 9.1 Cl.o
7/ SEE NOTE I TO ANNEX .3(A)
2/ SEE NOTE 2 TO ANNEX 18(A)

KENYA WNW 20(
GATIAR.U tHYDROELECTRIC PRCLiECT
THE KENYA POVIER COMPANY LIMITED
TANA RIVER DEVELOPMENT COMPANY LIMITED
T_E EAST AFRICAN POWIER AND LIGHTING COMA?kVN LliMITED
COMBINiED SOURCE AND APPLICATION OF FUNDS, 1975 - 1980(K6 THOUSANDS)
1975 1976 1977 197R 1978 1979 1980
INTFRNAL SOlJRCES-NET INCOME BFF IN 3941. 5821 5947 9 597 ?5?6f% 9?77 9407-DEPRFCTATION 1686 1838 2037 2n0A 7659 3158 3273
-DEF TAX 706 337 283 241 1Sb7 20 4 6114-INVESTMENTS 121 0 0 121 0 0
TOTAL 63454 2.4Z7 11 9 S4 A - 1-239 13?9a
OPERATIONAL RE-QUIRFMFNTS
-WORKING CAPITAL -1149? -328 389 -&41 -2072 43 336-DEPT SERVICE 2984 3riol 3585 46k3 147 7 6580 hhb5-DIVIDENDS 896 856 8Sh P56 3t124 A56 k56
TOTAL 2148 4 43 i PiQ830 4PSP 7 479 7A50
NET AVAILABLEFROM CPERATIONS 4106 3 q, 3437 7s< A J 5Ib0 5t4 4
CONSTRUCTTONREQIJ RFMFNTS
-GITARU PROJECT 9179 1 4 15231 7?<14 14669/i 2240 0-OTHER TRnC 9b 2 0 0 93 0 0
-EAPL 4S4 A P. 1700 4'0 12945 490 4000
L/T INVFSTMENTS n4 a I44 1 F
TOTAL 1a 84 L 6e,l l6979 '21O? 607 6 74AB A 404A
BALANCE Tn FTNANCE I r;3 7-AI 342 .m 4:>i?2 ?o 8 -1396
FINANCEn BY:-TROC nEBT 8P51 10686 1 0896 4916 3 41Jo 1753 A-FAPL DEBT 716 41 0 2400 3160 2400 1600-EQUITY 1764 2W07 1629 0 6n0o 0 0
TOTAL 11331 13X37 12525 6936 44129 4153 1600
SURPLUS(DFFICIT)OF FUNDS 193 49 -1017 1A72 1907 2125 2996ACCUMULATED 553 1052 35 1907 1907 4032 7028
DEBT SERVICF COVER 2> ?.3 2.6 24 1.9 2

ANNEX 21Page 1 of 5 pages
KENYA
GITARU HYDROELECTRIC PROJECT
TANA RIVER DEVELOPMENT COMPANY LIMITED
Notes and Assumptions for Financial Statements
Revenues
1. EAP&L's revenues are based on the present tariffs to June 1975and, thereafter, an increase of 10% over the present rates has been assumed.In addition, a fuel surcharge is included in revenues which, in accordancewith the present Government regulations,-allows EAP&L to recover the bulk ofthe increase in fuel cost over a fixed level of fuel price. This will bereplaced by a new surcharge at 4 cents per KWh after June 1975. Salesvolume is assumed to increase by about 11% in 1976 reducing gradually toabout 9% annually from 1979.
2. Changes in EAP&L's tariffs require Government approval. Under theElectric Power Act of Kenya, tariffs must be reduced when operating in-come before income tax for any year exceeds 12-1/2% of the capital expendedon the undertaking. The base for measuring the rate of return for thisstatutory standard is equivalent to the gross fixed assets, including workin progress, plus inventories. EAP&L's earnings have never exceeded thestatutory limit and, in recent years, the highest statutory return achievedwas about 9.8% in 1970.
3. TRDC's revenues include a Development Surcharge, described inpara 6 below, as part of ascertained costs, the amount payable by EAP&Lfor electricity purchased by it from TRDC.
4. KPC's revenues are estimated in accordance with the definition ofAscertained Cost in its bulk supply licence described in the next para.
Ascertained Cost
5. The bulk supply licences of KPC and TRDC define ascertained cost(on the basis of which their revenues are determined) as the actual auditedcost each year for the following items:
(a) Operations and administration. For KPC this alsoincludes the cost of purchasing power from Uganda;
(b) interest and redemption payments for debt;
(c) income or other taxes. TRDC's income is exempt frompayment of income tax and KPC has had no taxable in-come because of large depreciation allowance deduct-able for tax purposes (see footnote 2 to Annex 18 (b);
and
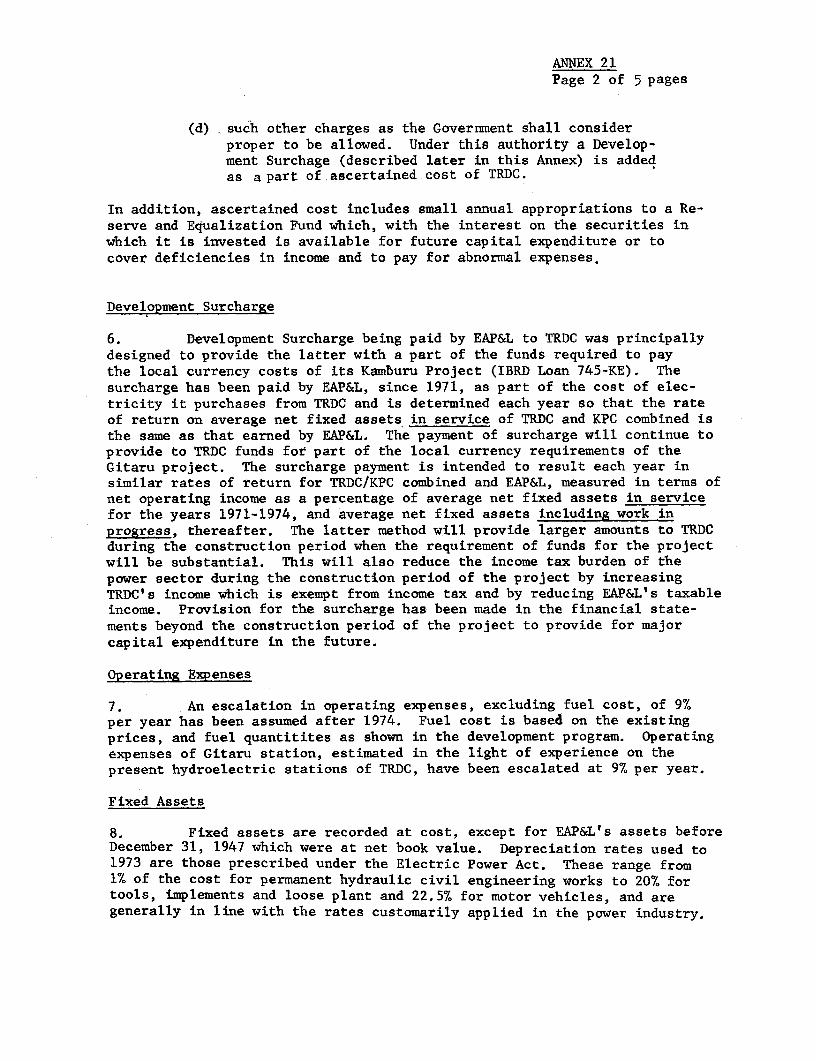
ANNEX 21Page 2 of 5 pages
(d) such other charges as the Government shall considerproper to be allowed. Under this authority a Develop-ment Surchage (described later in this Annex) is addedas a part of ascertained cost of TRDC.
In addition, ascertained cost includes small annual appropriations to a Re-serve and Equalization Fund which, with the interest on the securities inwhich it is invested is available for future capital expenditure or tocover deficiencies in income and to pay for abnormal expenses.
Development Surcharge
6. Development Surcharge being paid by EAP&L to TRDC was principallydesigned to provide the latter with a part of the funds required to paythe local currency costs of its Kamburu Project (IBRD Loan 745-KE). Thesurcharge has been paid by EAP&L, since 1971, as part of the cost of elec-tricity it purchases from TRDC and is determined each year so that the rateof return on average net fixed assets in service of TRDC and KPC combined isthe same as that earned by EAP&L. The payment of surcharge will continue toprovide to TRDC funds for part of the local currency requirements of theGitaru project. The surcharge payment is intended to result each year insimilar rates of return for TRDC/KPC combined and EAP&L, measured in terms ofnet operating income as a percentage of average net fixed assets in servicefor the years 1971-1974, and average net fixed assets including work inprogress, thereafter. The latter method will provide larger amounts to TRDCduring the construction period when the requirement of funds for the projectwill be substantial. This will also reduce the income tax burden of thepower sector during the construction period of the project by increasingTRDC's income which is exempt from income tax and by reducing EAP&L's taxableincome. Provision for the surcharge has been made in the financial state-ments beyond the construction period of the project to provide for majorcapital expenditure in the future.
Operating Expenses
7. An escalation in operating expenses, excluding fuel cost, of 9%per year has been assumed after 1974. Fuel cost is based on the existingprices, and fuel quantitites as shown in the development program. Operatingexpenses of Gitaru station, estimated in the light of experience on thepresent hydroelectric stations of TRDC, have been escalated at 9% per year.
Fixed Assets
8. Fixed assets are recorded at cost, except for EAP&L's assets beforeDecember 31, 1947 which were at net book value. Depreciation rates used to1973 are those prescribed under the Electric Power Act. These range from1% of the cost for permanent hydraulic civil engineering works to 20% fortools, implements and loose plant and 22.5% for motor vehicles, and aregenerally in line with the rates customarily applied in the power industry.
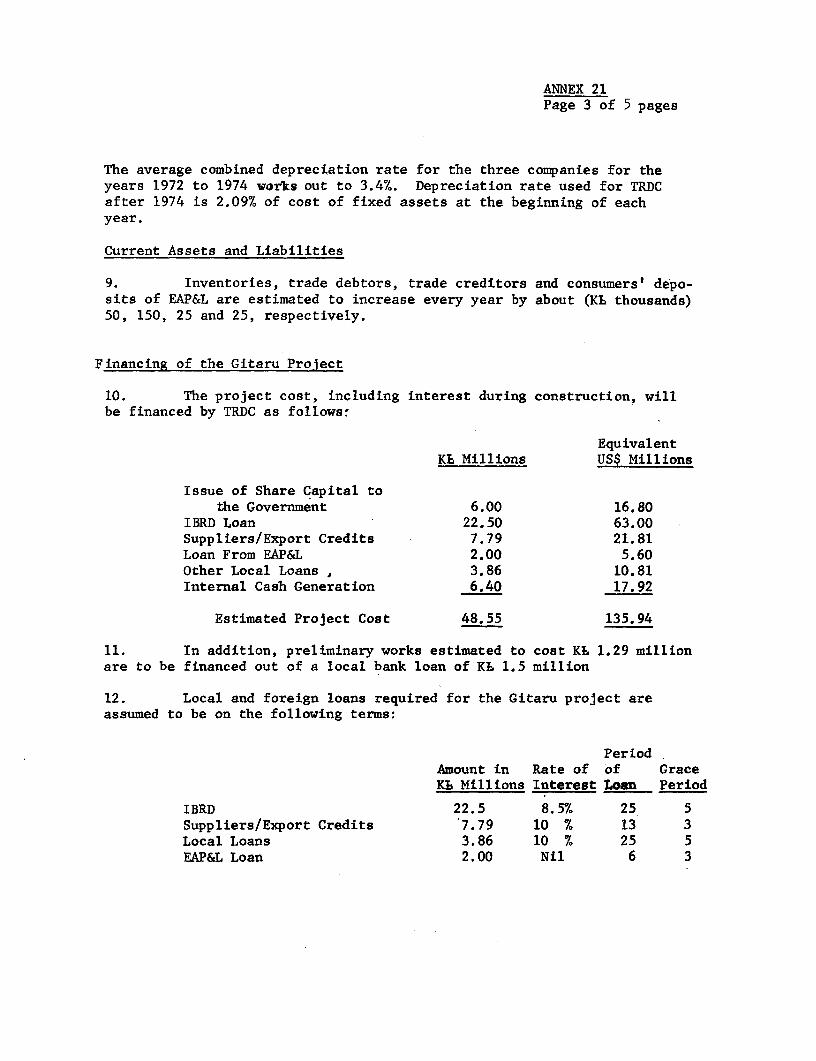
ANNEX 21Page 3 of 5 pages
The average combined depreciation rate for the three companies for theyears 1972 to 1974 works out to 3.4%. Depreciation rate used for TRDCafter 1974 is 2.09% of cost of fixed assets at the beginning of eachyear.
Current Assets and Liabilities
9. Inventories, trade debtors, trade creditors and consumers' depo-sits of EAP&L are estimated to increase every year by about (KL thousands)50, 150, 25 and 25, respectively.
Financing of the Gitaru Project
10. The project cost, including interest during construction, willbe financed by TRDC as follows:
EquivalentKL Millions US$ Millions
Issue of Share Capital tothe Government 6.00 16.80
IBRD Loan 22.50 63.00Suppliers/Export Credits 7.79 21.81Loan From EAP&L 2.00 5.60Other Local Loans , 3.86 10.81Internal Cash Generation 6.40 17.92
Estimated Project Cost 48.55 135.94
11. In addition, preliminary works estimated to cost KL 1.29 millionare to be financed out of a local bank loan of KL 1.5 million
12. Local and foreign loans required for the Gitaru project areassumed to be on the following terms:
PeriodAmount in Rate of of GraceKL Millions Interest Loan Period
IBRD 22.5 8.5% 25 5Suppliers/Export Credits 7.79 10 % 13 3Local Loans 3.86 10 % 25 5EAP&L Loan 2.00 Nil 6 3

ANNEX 21Page 4 of 5 pages
Interest during construction on the suppliers'/export credits and the localloans is assumed to be payable by TRDC; but on IBRD loan it will be providedout of the loan amount. Loan from EAP&L to TRDC is assumed to be free ofinterest since any interest payable to EAP&L will have to be reimbursed toTRDC by EAP&L as part of the ascertained cost. In addition a local bank loanof K£1.5 million for preliminary works has been arranged at annual interestrate of 9% and repayable in 4 years.
Provision for Deferred Income Tax
13. Depreciation on fixed assets of EAP&L expected to be allowed fordetermining the income tax payable during the period to 1980 is considerablymore than the amount provided for in the financial ststements. A provisionfor deferred tax liability has, therefore, been made each year in EAP&L'saccounts to reflect the tax saving due to difference in the two depreciationamounts. This provision relating to the 1971-1980 period will decrease infuture years when the tax depreciation on those fixed assets will be lessthan the accounting depreciation and, consequently, the tax payable on thehigher taxable income will include an amount relating to the income of pastyears. The present tax rate of 45% has been applied to income of futureyears.
Share Capital
14. Additional share capital of K£6 million will be issued by TRDC tothe Government of Kenya. The payment will be made by the Government to TRDCduring the period 1975-1977 and will be used by TRDC for the expenditure onthe project.
Long-Term Debt - TRDC
15. Loan capital of TRDC outstanding on December 31, 1974 consisted ofthe following:
Kg Thousands
William and Glyn, 5.5% 'D' Stock -Total Outstanding 276
Less: Portion Allocable to EAP&L 48Net Amount Payable by TRDC 228Commonwealth Development Corporation 'A' Stock 2,730IBRD Loan for Kamburu, 745-KE 7,551SIDA Credit, Relent by the Government to TRDC 2,199EAP L&'B' & 'C' Stock for Kindaruma 921
'E' Stock for Kamburu 2,773Government Loan for Kamburu 8o0
17,202
16. The 'A', 'B' and 'C' debenture stock are at annual interest ratesranging from 7.75% to 9.625% and repayable in eciuated annual installments ofprincipal and interest over the period 1971-1987. The 'D' stock is repayablein 19 semi-annual installments ending December 1976. The 'E' stock is at 9%annual interest and repayable in 21 installments over the period 1975-1995.

ANNEX 21Page 5 of 5 pages
SIDA credit to the Government for Kamburn project has been relent to TRDCby the latter on the same terms as the IBRD loan 745-KE which are 7,5Z .interest and repayment in 43 semi-annual installments commencing July 1, 1975.Government's loan to finance the Kamburu project cost overrun is on the sameterms as the IBRD loand 745-KE.
Dividends
17. EAP&L has been paying dividends on its ordinary shares at the rateof 10% of the par value since 1972, when it was raised from 9%. It is assumedthat the 10% rate will be maintained unchanged through 1980.
General
18. The figures for the years 1972 and 1973 in the financial statementsare based on the audited accounts for those years, and for 1974 on provisionalaccounts.
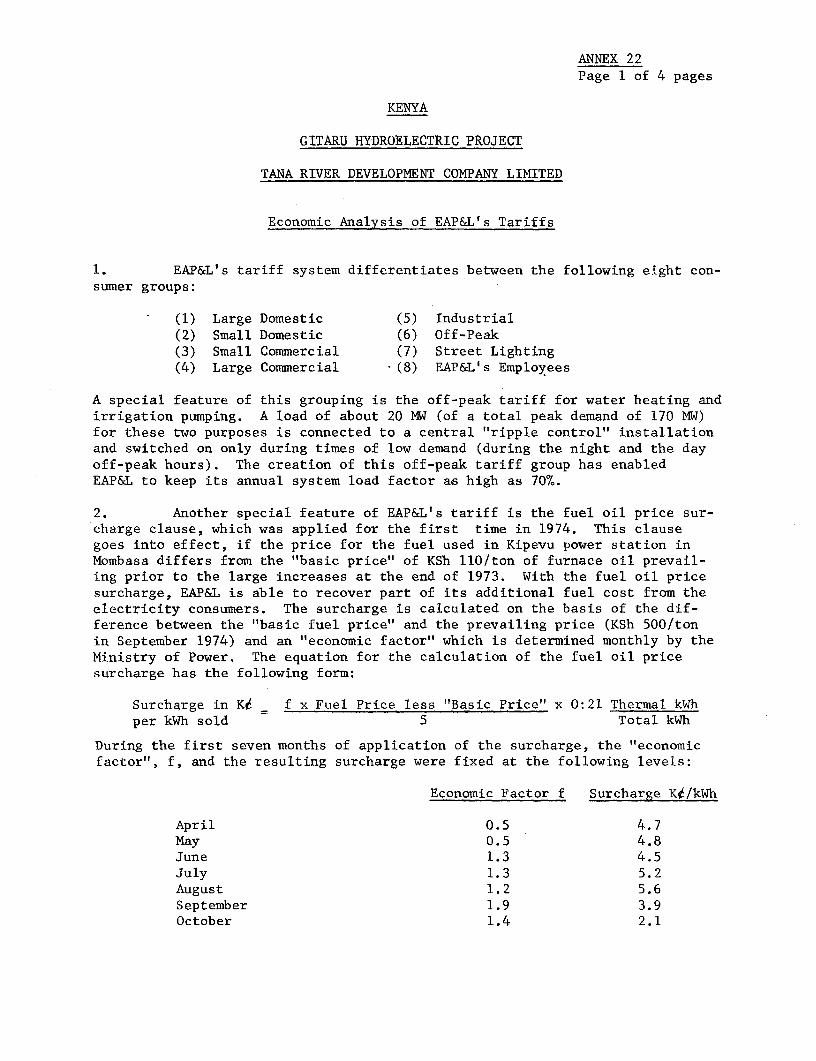
ANNEX 22Page 1 of 4 pages
KENYA
GITARU HYDROELECTRIC PROJECT
TANA RIVER DEVELOPMENT COMPANY LIMITED
Economic Analysis of EAP&L's Tariffs
1. EAP&L's tariff system differentiates between the following eight con-sumer groups:
(1) Large Domestic (5) Industrial(2) Small Domestic (6) Off-Peak(3) Small Commercial (7) Street Lighting(4) Large Commercial (8) EAP&L's Employees
A special feature of this grouping is the off-peak tariff for water heating andirrigation pumping. A load of about 20 MW (of a total peak demand of 170 MW)for these two purposes is connected to a central "ripple control" installationand switched on only during times of low demand (during the night and the dayoff-peak hours). The creation of this off-peak tariff group has enabledEAP&L to keep its annual system load factor as high as 70%.
2. Another special feature of EAP&L's tariff is the fuel oil price sur-charge clause, which was applied for the first time in 1974. This clausegoes into effect, if the price for the fuel used in Kipevu power station inMombasa differs from the "basic price" of KSh 110/ton of furnace oil prevail-ing prior to the large increases at the end of 1973. With the fuel oil pricesurcharge, EAP&L is able to recover part of its additional fuel cost from theelectricity consumers. The surcharge is calculated on the basis of the dif-ference between the "basic fuel price" and the prevailing price (KSh 500/tonin September 1974) and an "economic factor" which is determined monthly by theMinistry of Power. The equation for the calculation of the fuel oil pricesurcharge has the following form:
Surcharge in Ki _ f x Fuel Price less "Basic Price" x 0:21 Thermal kWhper kWh sold 5 Total kWh
During the first seven months of application of the surcharge, the "economicfactor", f, and the resulting surcharge were fixed at the following levels:
Economic Factor f Surcharge Kd/kWh
April 0.5 4.7May 0.5 4.8June 1.3 4.5July 1.3 5.2August 1.2 5.6September 1.9 3.9October 1.4 2.1
ANNEX 22Page 2 of 4 pages
From July 1, 1975, the fuel price surcharge will be absorbed into thetariff by the addition of Kg 4 per kWh to all tariffs. The basic fuel price inthe clause will then simultaneously be increased to the then prevailing fuelprice.
3. Following a cursory examination of EAP&L's tariff structure it isapparent that improvements can be made. Some of the possible improvements arediscussed in the following paragraphs.
4. The present structure does not reflect the cost of power generation,since basically, it does not differentiate between electricity supplied duringdifferent times of the day and different times of the year. During the tworainy seasons of the year (April to June and November to December) largeamounts of cheap hydro power are available, while during the two dry seasons(February to March and September to October) generation is more expensivewith a larger component of thermal power. Similarly, there is a difference incosts of generation for power supply during the night, when demand is low, andthe hours of peak demand during the day. Therefore, charges should be higherduring the dry season and during peak hours and lower during the rainy seasonand during off-peak. A season and a time-of-day tariff, reflecting thesecost differences could appropriately be applied to industrial and larger com-mercial consumers, where additional metering costs would not matter. Thiswould encourage these consumer groups to adjust their pattern of electricityconsumption to the cost of supply, which,. in turn, would improve EAP&L's sys-tem load factor, which now has a tendency to drop.
5. The difference between the average price per kWh for the differentconsumer groups in EAP&L's tariffs (see attached table) would appear to belarger than can be justified by the difference in the cost of supply. Dif-ferences in the average price per kWh are only justified in so far as consum-er groups use electricity during different times of the day and of the yearor because of lower related costs. To quote an example, the cost to smallcommercial consumers is on average KO 41.1 per kWh whilst the cost to largecommercial consumers, generally connected at the same voltage level is muchlower at Kg 23.6 per kWh. On the other hand, only a 2% discount is granted tolarge commercial and industrial consumers who have a high voltage supply.EAP&L's tariffs should be restructured to reflect more correctly the differencesin distribution costs.
6. Declining block tariffs applied to all tariff groups with the ex-ception of large domestic consumers, give a reduction to the large consumer,which is, in most cases, not justified by the lower cost of supply. The lastblocks in the industrial tariff - KO 6 per kWh and KSh 18 per KVA of peak de-mand - probably do not cover the cost of supply, which means that other con-sumer groups are probably subsidizing large industrial consumers. Decliningblocks should be abolished in favor of a uniform tariff, perhaps even intro-ducing an increasing block tariff for households with a cheap first block forsmall consumers.

ANNEX 22Page 3 of 4 pages
7. The application of the fuel oil price surcharge has rad-callychanged EAP&L's tariff structure. The surcharge is applied to all kWh consumed,not only to consumption during times of thermal generation - and it is addedas an absolute amount-. This has had a different impact on different consumergroups: Large industrial consumers are now paying between 15% and 43% more forelectricity, while the cost to small domestic consumers has been increased by2% to 5% only. The surcharge has its main adverse effect on the off-peak ta-riff, which applies to consumption of hydrogenerated power, but has been in-creased by the highest rate of all tariff groups (up to 45%). The attractive-ness of off-peak consumption has been reduced, and if implemented for a longtime the surcharge will have a reverse effect on EAP&L's system load factor.A revision of EAP&L's tariff structure should provide for the present fuel oilprice surcharge to be integrated into the tariff system. The surcharge clausecould remain part of EAP&L's tariff bylaws to protect EAP&L financially, iffuel prices should increase further. The clause should, however, be changed inthe following two respects:
(i) The surcharge should only be levied on kWh generatedby thermal power, not on all kWh supplied. Thus, thetariff would remain cost reflecting;
(ii) the surcharge should be calculated so as to relate tofuture consumption. At present, the amount to be sur-charged during the followirg month is based on fuelconsumed during the past month. Since fuel consump-tion changes according to season, this time-lag of twomonths often leads to a high surcharge in a month oflow thermal generation and vice versa.
8. The large difference in average revenues for different consumer groupsindicates that the present tariff is not equitable. For example, in 1974 re-venue per kWh was K4 25 for large domestic consumers but Kg 119 for small do-mestic consumers. Large industrial consumers on special agreement paid onlyK4 13 on average. The tariff for small domestic consumers could be loweredsubstantially by cross-subsidization from other consumer groups. Since thisgroup consumes only 1% of total electricity sold, the subsidy would be small.

K E N Y A
GITARU HYDROELECTRIC PROJECT
TANA RIVER DEVELOPMENT COMPANY LIMITED
EAP&L's Tariff System
Charge Per kWh(Based on Monthly Minimum Charge Average Revenue
-consuaptioq _ Fixed Chat_ Letr MouLthi _ Per Month Other Criteria Per kWh in 1974
GROUP 1: Domestic 14¢ Sh 30 25.3¢
GROUP 2: Small Domestic 0 to 30 kWh - 100¢Over 30 kWh - 70¢ Sh 4 Sh 10 109.1¢
GROUP 3: Small Commercial 0 to 200 kWh - 75¢201 to 500 kWh - 35¢ Restricted to maximum ofOver 500 kWh - 30c Sh 30 7,000 kWh per month 41.1¢
GROUP 4: Large Commercial 11¢ 0 to 100 KVA-Sh 45 per KVA of MD Restricted to consumers exceedingOver 100 KVA-Sh 30 per KVA of MD - 7,000 kWh per month. (2% discount
for high voltage connection). 23.6c
GROUP 5: Industrial 0 to 400 kWh per KVA-10.6c 0 to 60 KVA-Sh 30 per KVA of MID Restricted to consumers exceedingOver 400 kWh per KVA- 6.0¢ 61 to 1,000 KVA-Sh 20 per KVA of MD 21,000 kWh per quarter. (2% dis-
Over 1,000 KVA-Sh 18 per KVA of MD - count for high voltage connection) 17.8¢
GROUP 6: Off-Peak Consumption (1) 12¢ Sh 14(heating and Irriga- For up to 116 kWhtion pumping) per month ) 12.5¢
(2) 12¢ Sb 160For connected loads exceeding 70 kW -
GROUP 7: Street Lighting 0 to 3,000 kWh-66¢3,001 to3O,000 kwh - 32¢Over 30,000 kWh - 26¢
orOver 400,000 kWh - 224 - Available 11 hrs per night only 27.84
GROUP 8: EAP&L Employees 10e Sh 5 10.54
Special Contracts (to Group 5) 13.04
Total 25.7¢
Note: 1. GROUP 5: Industrial, is a quarterly tariff but rates have been shown on a monthly basis for simplicity of comparison.
GROUP 6: Off-Peak Consumption, two alternative tariffs are illustrated. m 043
Hay 1975
mOQ'0

ANNEX 23Page 1 of 2 pages
KENYA
GITARU HYDROELECTRIC PROJECT
TANA RIVER DEVELOPMENT COMPANY LIMITED
Loan Capital and Security Arrangements of EAP&L, KPC and TRDC
1. This annex describes the loan capital of power companies ofKenya and the arrangements securing this loan capital. The amounts statedrepresent the total amount of the loans contracted and not the amountsoutstanding, which are given in Annexes 15 (a), 16 and 18 (a). All refer-ences to L are references to TStg.
EAP&L
2 EAP&L's loan capital amounting to i 10,862,240 comprises loansfrom Commonwealth Development Corporation (CDC) (L 350,000, h 2,944,000and b 1,500,000), and from Glyn, Mills and Company syndicate (E 2,887,520,L 216,400, L 2,724,320 and E 240,000). The CDC loan of L 350,000 wassecured by (i) EAP&L's 8-1/2% Debentures 1971-85; and (ii) a Trust Deeddated November 1, 1968, which provided for a first legal charge on specifiedleasehold properties of EAP&L. The L 2,944,000 CDC loan and the L 2,887,520loan from the Glyn, Mills and Company syndicate were respectively securedby Debenture Stock 1975-91 and 1971-80 respectively, as well as a TrustDeed dated May 16, 1969. This' Trust Deed created mortgages and chargeson certain of EAP&L's properties and assets and also stipulated that EAP&Lwas not to create any mortgage or charge ranking in priority to or pari passuwith that mortgage or charge. The h 216,400 loan from the Glyn, Mills andCompany syndicate represents the portion of the loan to TRDC referred toin item (iv) under TRDC below, which was used to purchase equipment for EAP&Land the debt service for which EAP&L has undertaken to reimburse TRDC. Thei 1,500,000 CDC loan and Glyn syndicate loans of L 2,724,320 and L 240,000were secured by Debenture Stock 1979-88, and 1978-80 respectively, as wellas a supplemental Trust Deed dated August 29, 1974 which made these loansto rank pari passu with the loans secured by the Trust Deed dated May 16,1969.
KPC
3. In 1955 KPC floated a i 7,500,000 loan by the issue of a i 7,500,0005-1/2% Debenture Stock 1975/85. b 3,500,000 of this loan was subscribed byCDC, and the balance was underwritten for public sale. The Debenture Stockwas secure by a Trust Deed dated June 27, 1956, which, among other things,created a first legal charge and a floating charge in respect of KPC'sproperty and assets and stipulated that KPC was not to create any further

ANNEX 23Page 2 of 2 pages
charges or incumbtances upon its undertakings and assets ranking in priorityto or pari passu with the charges created under the Trust Deed except inspecial stated circumstances. The Trust Deed also provided that any schemefor the reconstruction should require an extraordinary resolution of thestockholders which means in effect the consent of three-fourths of thestockholders.
TRDC
4. TRDC's loan capital amounting to about KS 21 million came fromCDC, the Glyn, Mills and Company syndicate, EAP&L, IBRD, Government ofKenya and out of a SIDA credit to the Government of Kenya. Security for theloans consists of (i) b 3,742,911 A Debenture Stock 1971-87, (ii) Shs9,240,500 and Shs. 5,380,000 B Debenture Stock 1971-87, (iii) Shs. 6,040,000C Debenture Stock 1971-87, (iv) b 1,844,661 D Debenture Stock 1967-77(of which b 216,400 is underwritten by EAP&L), (v) Shs 81,300,000 E DebentureStock 1975-96, (vi) US$23,000,000 Bonds 1975-96 to be issued to IBRD, and(vii) a Trust Deed dated May 26, 1966 as modified and extended by two Supple-mental Trust Deeds dated December 5, 1968 and December 16, 1971. The TrustDeed provided for the creation of a floating charge of TRDC's undertakings,property and assets and also required TRDC (i) not to (A) create withoutthe Trustee's consent any mortgage or charge ranking in priority to or paripassu with the floating charge or (B) create any specific mortgage or chargeover any of its immovable property or other assets without the prior writtenconsent of the Trustee; or (ii) not to borrow money without the writtenconsent of the Trustee or have any subsidiary, except with the prior writtenconsent of the Trustee. The Trust Deed also provides for the creation andissue in specified circumstances of additional stock to rank pari passu inpoint of security with the original stock created under the Trust Deed. Thesecircumstances include the need to secure any loan TRDC would need to financelater stages of the Seven Forks Hydroelectric Project.
May 1975

ANNEX 24Page 1 of 2 pages
KENYA
GITARU HYDROELECTRIC PROJECT
TANA RIVER DEVELOPMENT COMPANY LIMITED
Project Monitoring
There are a number of areas described in this annex which arekey factors in the efficient operation of the utility and the success ofthe Project. These have been discussed with the Borrower.
EAP&I is a sophisticated and reasonably well staffed utilitywith well developed commercial, statistical and engineering departmentswhere up-to-date records on system technical perfoxmance, load and con-sumer statistics are maintained. -There is therefore no need to establisha monitoring system for these aspects.
Main areas for establishing a monitoring system are describedbelow:
1. Construction of Project
Performance achievements for construction should be measuredmonthly in terms of percentage completion at the end of eachmonth against the target completion date for each phase ofbonus earning construction shown in the bidding documents formain civil and plant contracts.
2. Staffing
Staffing levels should be monitored bi-annually under the followingheadings, referring to target esta bLishments in each category.
Targets for 1975-1977
(a) Management 26
(b) Professional Staff (including Accountants) 150
(c) Technicians and other Supervisory Staff(including Computer Personnel) 250
(d) Clerical (including Secretaries & Typists) 450
(e) Unskilled Workers (including Auxilliary Staff) 1,600
(f) Staff in Training 160
ANNEX 24Page 2 of 2 pages
Overall, the number of employees should not normally exceed about25 per 1,000 consumers. Where staffing levels are excessive,efforts should be made to reduce staff through limitation onrecruitment, early retirement, etc.
3. Training
Personnel under training, totalling 160 in 1975, should be monitoredon an annual basis under the following headings, and the numbersin training under each heading should be reviewed annually toensure that these are commensurate with normal growth and withreplaceaent and turnover requirements:
(a) Graduate Engineers in University (by classification)
(b) Graduate Engineers on works or field training (byclassification)
(c) Technicians in training (by classification)
(d) Craftsmen in training (by classification).
4. Rural Electrification
Annual records should be maintained, showing against the targetswhich have been set:
(a) Number of townships connected, under EAJPL and Governmentfinancing respectively;
(b) Number of connections in each area; and
(c) KWh sales in each area.
5. Financial Indicators
(a) Cost of fuel used in power generation should be comparedquarterly with estimates, as follows:
i) total fuel costii) quantity of fuel usediii) fuel cost per unit of thermal generation
iv) fuel cost per unit of total power salesv) fuel cost recovered from customers as surcharge
(b) Average revenue per unit sold.
May 1975

IBRD 3169R2
'MAY 1975
S U D A N 'KENYA POWER SYSTEM.... - -k- .... ~-~* . . .GENERATING STATIONS, & MAIN .. TRANSMISSION LINES
g46 \ n ! - t \. ~ / 8 p -- - : i '
fi 'J'] ~~~/ Z Ž4
- . .12 /t
Lodwsa0/
I |OEi Molo Camp
o Mcrsabit
z 0i' R T E H
2 ' ( ̂e RFT Ket ?E N Y Aw 0 Habaswein
AEldoret
( fdl o< VeA L L E Y o slob--. , ''-' .., '' Thomsons
/t M7snoo>z; /D Fals °\lNanyuk_ °Meruj
Z KatWrn -A MoloO ke) C E N T R A t.sjG-<~bKericho Aouu;i 4k <
PH-omo Bay meNscos " /EmbN~0 Lilel " I I I1 MeaIs L Embs
G,/ iitOrei Klndaruma~~ (ISO / Noivosho Wanj/ ~~~~~~T Kamburu s
Kiambu dulo \ ; |
Ngong s< NAbROBE>; OKitui
_4 _ _', \ \ \~~~~~~~~~~~~~~~~~~~~~~~O ,°Grulole\
.he boundaries h Machakos
The boundarfks .shrole on lAts map do 1ol ',f * -
mply .ose,menet or acep y r hoe bp U TWorld Bank and its affibartcn I -\
T AA N Z A \. -I _ Mando Iss
.' & Diesel Power Sttios \Stations ~~~~~~N ~Tsao\o,
pa Steam Power Stations IQ ,
3 Existing Hydro Power StationS ) V j
... 3 Projected Hylyro Power Station .,
275kV, Tronsmission line (Projected) \ . /
-______-- 275 kV, Transmission line (Existing) -\ , o pev
132 kW, Trtansmission lines (Existing) \'rl Momn as, R IC
66 kV, Transmission and Distribution lines N - .Mombos1
… --- 33kV, Distribution linesPO 0 50 40 50 50 Io Mt 0 40 so 6 X,KM. 4N
g . - ' - C - I
Related Documents