Kentucky Water Resources Annual Symposium March 2, 2006 Marriott’s Griffin Gate Resort Lexington, Kentucky Sponsored by Kentucky Water Resources Research Institute USGS Kentucky Water Science Center Ohio River Basing Commission Kentucky Waterways Alliance Kentucky Geological Survey Kentucky Division of Water

Welcome message from author
This document is posted to help you gain knowledge. Please leave a comment to let me know what you think about it! Share it to your friends and learn new things together.
Transcript
Kentucky Water Resources Annual Symposium
March 2, 2006
Marriott’s Griffin Gate Resort Lexington, Kentucky
Sponsored by Kentucky Water Resources Research Institute
USGS Kentucky Water Science Center Ohio River Basing Commission
Kentucky Waterways Alliance Kentucky Geological Survey Kentucky Division of Water
i
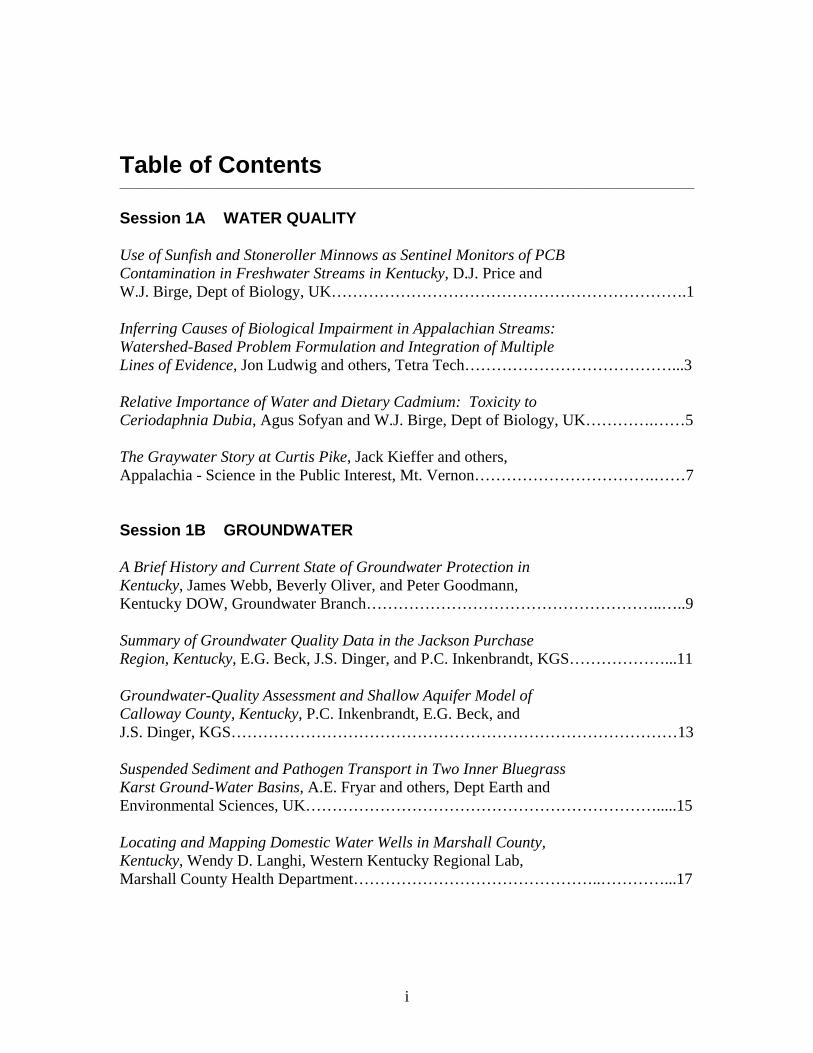
Table of Contents ____________________________________________________________________________________________________________ Session 1A WATER QUALITY Use of Sunfish and Stoneroller Minnows as Sentinel Monitors of PCB Contamination in Freshwater Streams in Kentucky, D.J. Price and W.J. Birge, Dept of Biology, UK………………………………………………………….1 Inferring Causes of Biological Impairment in Appalachian Streams: Watershed-Based Problem Formulation and Integration of Multiple Lines of Evidence, Jon Ludwig and others, Tetra Tech…………………………………...3 Relative Importance of Water and Dietary Cadmium: Toxicity to Ceriodaphnia Dubia, Agus Sofyan and W.J. Birge, Dept of Biology, UK………….……5 The Graywater Story at Curtis Pike, Jack Kieffer and others, Appalachia - Science in the Public Interest, Mt. Vernon…………………………….……7 Session 1B GROUNDWATER A Brief History and Current State of Groundwater Protection in Kentucky, James Webb, Beverly Oliver, and Peter Goodmann, Kentucky DOW, Groundwater Branch………………………………………………..…..9 Summary of Groundwater Quality Data in the Jackson Purchase Region, Kentucky, E.G. Beck, J.S. Dinger, and P.C. Inkenbrandt, KGS………………...11 Groundwater-Quality Assessment and Shallow Aquifer Model of Calloway County, Kentucky, P.C. Inkenbrandt, E.G. Beck, and J.S. Dinger, KGS…………………………………………………………………………13 Suspended Sediment and Pathogen Transport in Two Inner Bluegrass Karst Ground-Water Basins, A.E. Fryar and others, Dept Earth and Environmental Sciences, UK………………………………………………………….....15 Locating and Mapping Domestic Water Wells in Marshall County, Kentucky, Wendy D. Langhi, Western Kentucky Regional Lab, Marshall County Health Department………………………………………..…………...17
ii
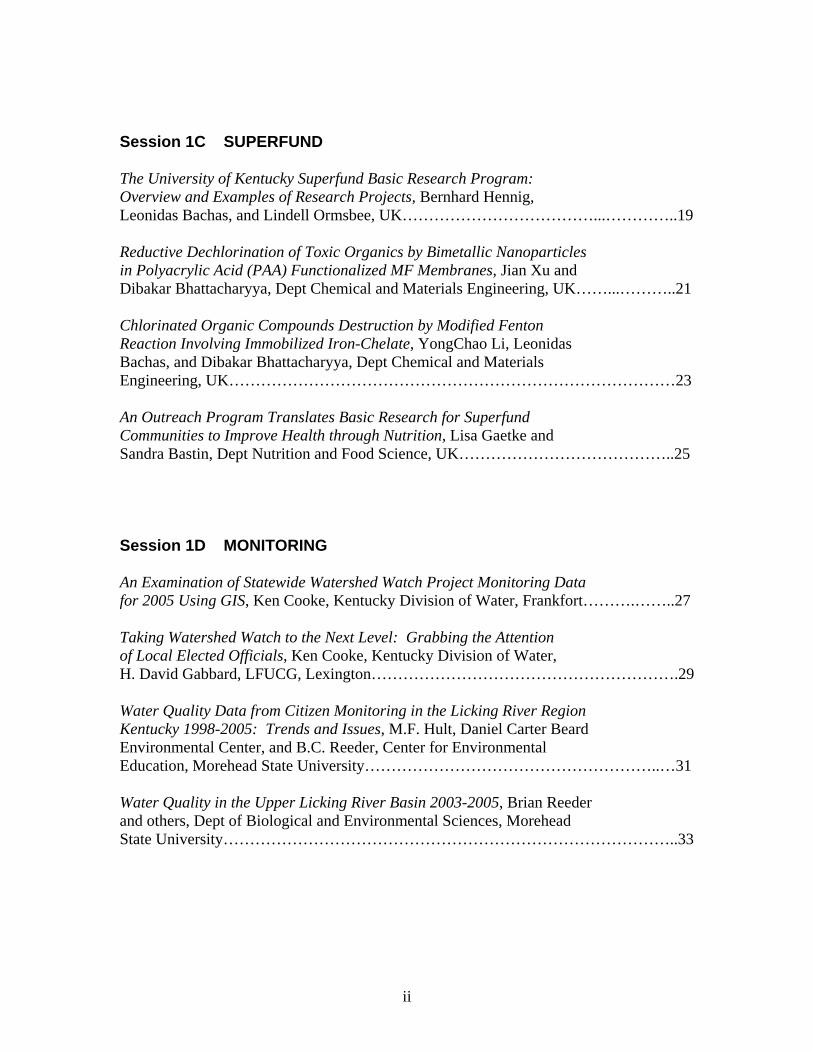
Session 1C SUPERFUND The University of Kentucky Superfund Basic Research Program: Overview and Examples of Research Projects, Bernhard Hennig, Leonidas Bachas, and Lindell Ormsbee, UK………………………………...…………..19 Reductive Dechlorination of Toxic Organics by Bimetallic Nanoparticles in Polyacrylic Acid (PAA) Functionalized MF Membranes, Jian Xu and Dibakar Bhattacharyya, Dept Chemical and Materials Engineering, UK……...………..21 Chlorinated Organic Compounds Destruction by Modified Fenton Reaction Involving Immobilized Iron-Chelate, YongChao Li, Leonidas Bachas, and Dibakar Bhattacharyya, Dept Chemical and Materials Engineering, UK…………………………………………………………………………23 An Outreach Program Translates Basic Research for Superfund Communities to Improve Health through Nutrition, Lisa Gaetke and Sandra Bastin, Dept Nutrition and Food Science, UK…………………………………..25 Session 1D MONITORING An Examination of Statewide Watershed Watch Project Monitoring Data for 2005 Using GIS, Ken Cooke, Kentucky Division of Water, Frankfort……….……..27 Taking Watershed Watch to the Next Level: Grabbing the Attention of Local Elected Officials, Ken Cooke, Kentucky Division of Water, H. David Gabbard, LFUCG, Lexington………………………………………………….29 Water Quality Data from Citizen Monitoring in the Licking River Region Kentucky 1998-2005: Trends and Issues, M.F. Hult, Daniel Carter Beard Environmental Center, and B.C. Reeder, Center for Environmental Education, Morehead State University………………………………………………..…31 Water Quality in the Upper Licking River Basin 2003-2005, Brian Reeder and others, Dept of Biological and Environmental Sciences, Morehead State University…………………………………………………………………………..33

iii
Session 2A NONPOINT SOURCE Little River Watershed Delineation and “Misbehaved” Karst Drainage, J.A. Ray and R.J. Blair, Kentucky Division of Water………………………………...…35 Comprehensive Commonwealth Water Education Project, David Howarth, Keith Mountain, and Kristen Dunaway, Dept of Geography and Geosciences, U of L…………………………………………………………………...…37 Assessment of Water Quality Trends in the Upper Cumberland River Basin: Focus on Pathogen Impairment, Lindell Ormsbee and Ramesh Teegavarapu, KWRRI, UK………………………………………………………………39 Watershed & Land Use Planning: A BMP Technology Transfer Project (A Case Study of the Dry Run Watershed Basin), Rachel Phillips, Brad Frazier, and Sandy Camargo, Georgetown/Scott County Planning Commission…….....41 Session 2B SEDIMENTS The New Contractor EPSC Certification Program Developed by the City of Bowling Green Kentucky: Educating and Involving Contractors in NPDES Phase II Compliance, Jeff Lashlee, City of Bowling Green, Beth Chesson, CEC, Inc., and April Barker, AMEC Earth and Environmental, Nashville, TN……………………….…………………………………..43 Kentucky Best Management Practices for Controlling Erosion, Sediment, and Pollutant Runoff from Construction Sites: Planning and Technical Specifications Manual, Richard Walker and Barry Tonning, Tetra Tech, Lexington…………………………………………………............45 Sediment Monitoring Efforts in the Upper Green River Basin in Support of the Kentucky Conservation Reserve Enhancement Program, S.T. Kenworthy, Dept of Geography and Geology, WKU……………………………………47 Land-Use Fingerprinting Techniques to Measure the Source of Fine Sediments in Central Kentucky, J.F. Fox and others, Dept of Civil Engineering, UK…………………………………………………………………...…….49 Multi-Scalar Geomorphological Characterization of the Muddy Creek Watershed, Michael Albright, Danita LaSage, and Alice Jones, Eastern Kentucky Environmental Research Institute, EKU……………………………………...51

iv
Session 2C PLANNING US EPA’s New Guidance on Watershed-Based Plans for Restoration and Protection, Barry Tonning, Tetra Tech, Mount Sterling, KY……………...……….53 Louisville Water Company – Wellhead Protection Plan, Marsha L. Taylor Meyer, Louisville Water Company……………………….…………………..….55 Lessons Learned Reforesting the Bluegrass, H. David Gabbard, LFUCG, Lexington, KY…………………………………………………………………57 Low-Flow Characteristics of Streams in Kentucky, G.R. Martin, D.W. Evans, and K.R. Odom, USGS, Louisville……………………...………………...59 Session 2D MODELING Simplification of Access to Hydrologic Data for Kentucky through an Online, Interactive GIS Tool, K. R. Odom and M. A. Ayers, USGS, Louisville…………………………………………………………...……………61 The Kentucky Watershed Modeling Information Portal’s User Needs Assessment, Data Matrix and Use Case, K. L. Schaffer, K. R. Odom, and others, FMSM and USGS…………………………………………………...………63 A Comparison of Manually and DEM Delineated Watersheds, Andrew Kellie, Jane Benson, and Mike Kemp, Dept of Industrial and Engineering Technology, Murray State University……………………………………………………65 Of Farm Ponds and Sinkholes: Automated Feature Extraction from Kentucky’s NAIP Imagery, Demetrio Zourarakis, Kentucky Division of Geographic Information………………………………………………………………….67 POSTER SESSION Limestone-Based Material for Arsenic Removal from Drinking Water, Chelsea Campbell and others, Dept of Chemistry, WKU……………………………….69 Opportunistic Water Education, Amanda Abnee Gumbert, Extension Associate for Environmental and Natural Resources Issues, UK………….…………….71 Ten-Year Solute Concentration Patterns in Two Streams of Contrasting Land-Use in Western Kentucky and Tennessee, Susan P. Hendricks, Hancock Biological Station, Murray State University………………………….……….73
v
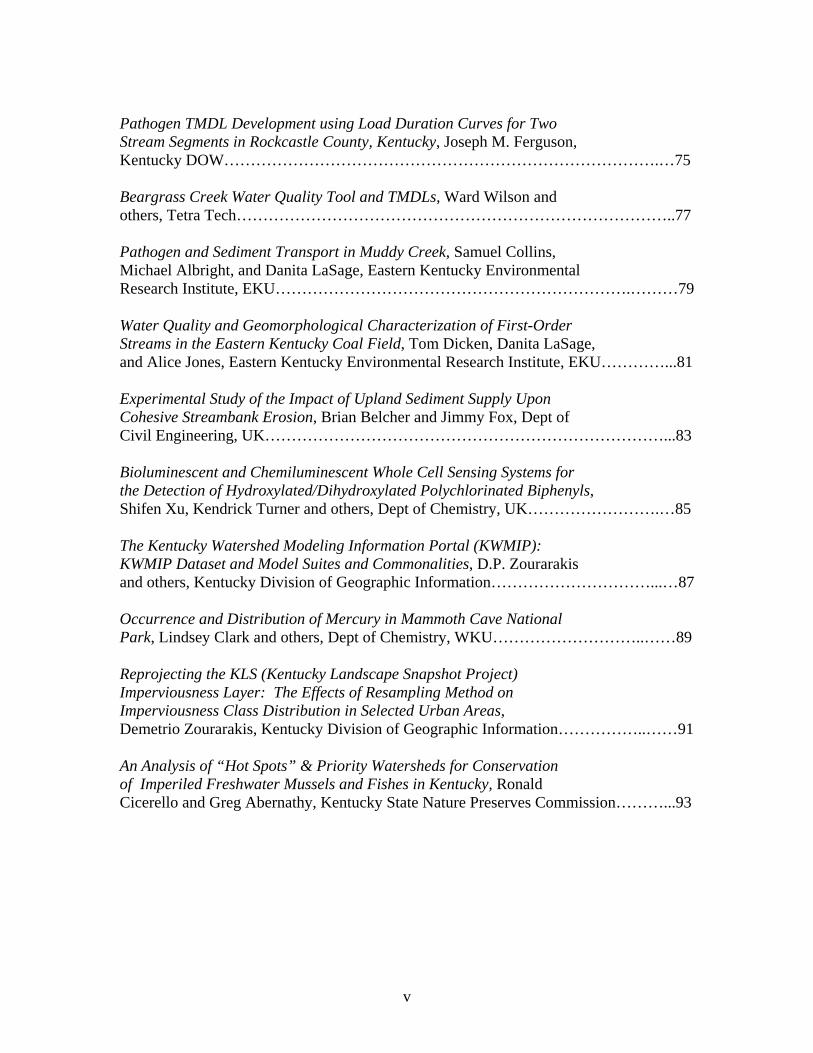
Pathogen TMDL Development using Load Duration Curves for Two Stream Segments in Rockcastle County, Kentucky, Joseph M. Ferguson, Kentucky DOW……………………………………………………………………….…75 Beargrass Creek Water Quality Tool and TMDLs, Ward Wilson and others, Tetra Tech………………………………………………………………………..77 Pathogen and Sediment Transport in Muddy Creek, Samuel Collins, Michael Albright, and Danita LaSage, Eastern Kentucky Environmental Research Institute, EKU………………………………………………………….………79 Water Quality and Geomorphological Characterization of First-Order Streams in the Eastern Kentucky Coal Field, Tom Dicken, Danita LaSage, and Alice Jones, Eastern Kentucky Environmental Research Institute, EKU…………...81 Experimental Study of the Impact of Upland Sediment Supply Upon Cohesive Streambank Erosion, Brian Belcher and Jimmy Fox, Dept of Civil Engineering, UK…………………………………………………………………...83 Bioluminescent and Chemiluminescent Whole Cell Sensing Systems for the Detection of Hydroxylated/Dihydroxylated Polychlorinated Biphenyls, Shifen Xu, Kendrick Turner and others, Dept of Chemistry, UK…………………….…85 The Kentucky Watershed Modeling Information Portal (KWMIP): KWMIP Dataset and Model Suites and Commonalities, D.P. Zourarakis and others, Kentucky Division of Geographic Information…………………………...…87 Occurrence and Distribution of Mercury in Mammoth Cave National Park, Lindsey Clark and others, Dept of Chemistry, WKU………………………..……89 Reprojecting the KLS (Kentucky Landscape Snapshot Project) Imperviousness Layer: The Effects of Resampling Method on Imperviousness Class Distribution in Selected Urban Areas, Demetrio Zourarakis, Kentucky Division of Geographic Information……………..……91 An Analysis of “Hot Spots” & Priority Watersheds for Conservation of Imperiled Freshwater Mussels and Fishes in Kentucky, Ronald Cicerello and Greg Abernathy, Kentucky State Nature Preserves Commission………...93
vi
This symposium was funded in part by the U.S. Environmental Protection Agency, with Clean Water Act, Section 319(h) grant money through the Kentucky Division of Water and the Kentucky Waterways Alliance, #C9994861-00. Planning for this conference was conducted as part of the state water resources research annual program with the support and collaboration of the Department of Interior, U.S. Geological Survey and the University of Kentucky Research Foundation, under Grant Agreement No. 01HQGR0133. The views and conclusions contained in this document are those of the abstract authors and should not be interpreted as necessarily representing the official policies, either expressed or implied, of the U.S. Government or other symposium organizers and sponsors.

1
USE OF SUNFISH AND STONEROLLER MINNOWS AS SENTINEL MONITORS OF PCB CONTAMINATION IN FRESHWATER STREAMS IN KENTUCKY
David J. Price and Wesley J. Birge
101 T.H. Morgan Bldg. Department of Biology University of Kentucky
Lexington, Kentucky, 40506-0225 (859) 257-5800
A PCB monitoring study was conducted on two moderate gradient freshwater streams in western Kentucky, Big and Little Bayou creeks. Stream water, sediment, floodplain soils, and fish were analyzed for PCBs during 1988-2005. A total of 263 water samples were analyzed with only 8 samples showing detectable PCBs. The lack of PCB detections in stream water indicated that PCBs were transitory in the water column and rapidly mobilized into biotic and sediment compartments. A total of 211 and 99 stream sediment samples were analyzed from Big and Little Bayou creeks, respectively. In Big Bayou creek, Aroclor concentrations (Mean ± SEM, µg/g) were 80.23 ± 26.14, 22.75 ± 7.00, and 16.26 ± 6.12 for Aroclor 1248, 1254, and 1260, respectively. Aroclor 1248, 1254, and 1260 concentrations for Little Bayou creek were 120.96 ± 33.00, 49.54 ± 11.66, and 30.83 ± 9.13 µg/g. PCB concentrations were approximately two times higher in Little Bayou creek as compared to Big Bayou creek. One component of this study focused on species-specific patterns of PCB residues in fish, especially the green sunfish (Lepomis cyanellus), longear sunfish (L. megalotis), bluegill (L. macrochirus), stoneroller minnow (Campostoma anomalum), largemouth bass (Micropterus salmoides), and yellow bullhead catfish (Ameiurus natalis). A total of 1248 fish were analyzed for Aroclor 1248, 1254, and 1260. The fish from Big Bayou Creek consisted of 251 stoneroller minnows (SR), 196 green sunfish (GS), 285 longear sunfish (LS), 80 bluegill (BG), 29 largemouth bass (LMB), and 55 yellow bullhead catfish (YBH). Fish collected from Little Bayou creek consisted of 74 SR, 113 GS, 103 LS, 35 BG, 7 LMB, and 20 YBH. PCB levels for stoneroller minnows from Big Bayou creek were higher and significantly different from levels found in sport fish. Aroclor 1248 and 1260 were not significantly different among the sport fish. Based on frequency of detection, Aroclor 1248 was detected 80% of the time in stoneroller minnows from Big Bayou creek, whereas it was only detected 25-39% in sport fish. In comparison, Aroclor 1254 and 1260 in sport fish were detected 49-69% of the time. These results indicate that higher chlorinated PCBs, such as Aroclor 1254 and 1260, were not readily metabolized and excreted by sunfish. No relationships were found between sunfish age and Aroclor concentrations. These results demonstrated that sunfish exposed to low PCB contamination can effectively regulate PCBs, regardless of age. In addition, at low PCB levels (<0.50 µg/g), green sunfish body burden did not correlate with lipid content. Body burden and fish lipid became more significant with increased PCB concentrations, as observed in fish from Little Bayou creek. A threshold concentration, 0.50 - 1.00 µg/g, had to be exceeded for PCB body burden to correlate with lipid content.
2
Most sunfish have low lipid content and relative short biological half-life for PCBs, particularly the green sunfish. This makes this organism a good real-time indicator of PCB pollution. Studies by Hutzinger et al.(1975) and Sanborn et al. (1975; 1977) found this species to be particularly adept at metabolizing organochlorine compounds (DDT, DDE) and PCBs. This field study supports their laboratory findings. Results from this study indicate that sunfish have a unique system of dealing with PCB contamination. A PCB threshold concentration, perhaps 0.50 to 1.00 µg/g, must be achieved for the activation of metabolic pathways and the eventual elimination/excretion of PCBs. The green sunfish either has an enhanced P450 system, or due to low lipid, more rapidly shunts PCBs into metabolic pathways that detoxify this compound. As sentinels the sunfish have restricted home ranges; are easily colonized; and provides an effective way for assessing effectiveness of PCB remediations. Literature Cited: Hutzinger, O., D. M. Nash, S. Safe, A. S. W. DeFreitas, R. J. Norstrom, D. J. Wildish, and V. Zitko. 1975. Polychlorinated Biphenyls: Metabolic Behavior of Pure Isomers in Pigeons, Rats, and Brook Trout. Science, 178(4058): 312-314. Sanborn, J. R., W. F. Childers, and R. L. Metcalf. 1975. Uptake of Three Polychlorinated Biphenyls, DDT and DDE by the Green Sunfish, Lepomis cyanellus Raf. Bull. Environ. Contam. Toxicol., 13: 209-217. Sanborn, J. R., W. F. Childers, and L. G. Hansen. 1977. Uptake and Elimination of [14C]Hexachlorobenzene (HCB) by the Green Sunfish, Lepomis cyanellus Raf., after Feeding Contaminated Food. J. Agric. Food Chem., 25(3): 551-553.

3
INFERRING CAUSES OF BIOLOGICAL IMPAIRMENT IN APPALACHIAN STREAMS: WATERSHED-BASED PROBLEM FORMULATION AND
INTEGRATION OF MULTIPLE LINES OF EVIDENCE
Jon Ludwig and Sam Wilkes Tetra Tech, Inc.
405 Capitol Street Charleston, WV 25301
[email protected] [email protected]
Jeff Bailey, Ben Lowman, John Wirts,
West Virginia Department of Environmental Protection Division of Water and Waste Management
601-57th Street, Charleston, WV 25304-2345 [email protected]
Jeroen Gerritsen and Lei Zheng
Tetra Tech, Inc. 400 Red Brook Blvd., Suite 200
Owings Mills, MD 21117
Clint Boschen and June Burton Tetra Tech, Inc.
10306 Eaton Place, Suite 340, Fairfax, VA 22030
ABSTRACT Human activities such as mining, logging, agriculture and residential development have caused significant biological degradation to many streams of West Virginia, USA. Employing benthic macroinvertebrates as biological indicators of stream health, the West Virginia Department of Environmental Protection (WVDEP) has identified streams across the state that do not meet aquatic life use designations. Therefore, these streams are considered biologically impaired. The development of Total Maximum Daily Loads (TMDLs) is required for all biologically-impaired streams within the state and mandates the identification of stressors to the biological community, so that pollutants can be controlled in each watershed. EPA’s Stressor Identification guidance was used to identify and rank physical, chemical, and biological stressors that may have caused impairments to the aquatic community. This process involved the analysis of all available water quality, habitat, physical, biological, historical, anecdotal, and observational data to infer the likely causes of impairment for each stream. A comprehensive conceptual model was developed that provides the linkage between potential impairment causes, their sources, and the pathway by which each stressor can impact the benthic macroinvertebrate community. Data were analyzed using established
4
water quality standards and stressor-response threshold values were developed based on statistical analysis and reference population data. Quantitative data were plotted and analyzed spatially using a “geo-order” format of assigning relative positions to sampling locations from downstream to upstream for each impaired stream and its tributaries within a subwatershed. Watershed characteristics (e.g. land use and soils), point source inventories, site observations, and other lines of evidence were included in the analysis to identify sources of the stressors. Stressor Identification required the integration of watershed-based conceptual models of impairment, field biological and chemical monitoring databases, empirical models of biological impairment, and ecotoxicological principles in a strength-of-evidence approach to infer causes of impairment. Candidate causes included known toxic contaminants (metals), conventional pollutants (organic and nutrient enrichment), sedimentation, habitat degradation, and ionic concentration (conductivity). Analysis of some candidate causes was modified by the measures available that documented them. Candidate causes were screened to eliminate those shown not to co-occur with effects. Remaining candidate causes were ranked according to considerations of evidence within each watershed, as well as from statewide empirical models and from other published sources. Strongest inferences were obtained where the independent predictive model agreed with within-watershed observations of stressor measures. Final stressor determinations for each watershed will be used for the development of management plans (TMDL implementation). KEY WORDS Stressor identification, bioassessment, streams, TMDL

5
RELATIVE IMPORTANCE OF WATER AND DIETARY CADMIUM: TOXICITY TO CERIODAPHNIA DUBIA
Agus Sofyan and Wesley J. Birge University of Kentucky Department of Biology 101 Morgan Building Lexington, KY 40506
T 859-257-5800 F 859-257-1717 [email protected]
Key Words: Metals, Cadmium, Ceriodaphnia dubia, Trophic Transfer, Dietary Exposure This study was designed to compare relative importance of water and dietary cadmium on Ceriodaphnia dubia reproduction, survival, and feeding rates. Results showed that uptake from water were more rapid than from diet. Both uptakes occurred significantly independent and body burdens were additive from both sources in combined exposure. Furthermore, cadmium trophic transfer between primary producers (i.e., Pseudokirchneriella subcapitata) and primary consumers (i.e., C. dubia) were observed. Cadmium accumulation increased progressively until organisms stopped feeding. Thereafter, cadmium body burden decreased indicating that cadmium metabolism and excretion were active. However, cadmium biomagnification from algae to C. dubia was observed to be minimal. Results also showed that both water and dietary cadmium were chronically toxic for all three endpoints. For example, the LOECs were 5µg/L, 0.60µg/g DW, and 2µg/L+0.26µg/g DW for water, dietary, and combined exposures, respectively. These results suggested that the response was independent of exposure avenues, and the effects in combined exposures were additive. This study demonstrates that dietary cadmium is toxicologically relevant and should be carefully interpreted and considered as part of regulatory assessment of cadmium.

6
NOTES
______________________________________________________________ ______________________________________________________________ ______________________________________________________________ ______________________________________________________________ ______________________________________________________________ ______________________________________________________________ ______________________________________________________________ ______________________________________________________________ ______________________________________________________________ ______________________________________________________________ ______________________________________________________________ ______________________________________________________________ ______________________________________________________________ ______________________________________________________________ ______________________________________________________________ ______________________________________________________________ ______________________________________________________________
7
THE GRAYWATER STORY AT CURTIS PIKE
Jack Kieffer, D.Sc., Deborah Bledsoe, Margie Stelzer, John Hanson Appalachia--Science in the Public Interest
50 Lair St. Mt. Vernon, KY 40456-9806
(606) 453 3211 [email protected]
Some members of the Curtis Pike community including Margie Stelzer visited the ASPI demonstration site on the Rockcastle River some years ago. They saw our dry toilets and our constructed wetlands for graywater and were interested in this way of protecting water quality. As they were developing their plans for their community at Curtis Pike they decided that they wanted to have their homes off the grid and use dry toilets and a graywater system to water the garden. They wanted a system that would be acceptable to the county and Commonwealth Health Departments, the environmental divisions of them which oversee the certifying of onsite wastewater systems. Margie Stelzer searched the web and found the NutriCycle Graywater Root Zone System developed by John Hanson in Jefferson, Maryland. His NutriCycle system is accepted in the State of Maryland and he has over a dozen systems installed and working successfully in Maryland. This gave our Commonwealth people a precedent to allow the installation of two Graywater Root Zone Systems (RZS) at the Curtis Pike on an experimental basis and to certify them. A plot plan of the Curtis Pike Community with topographical contours, the location of the homes, and the soil conditions were sent to John Hanson. With this information and water usage information, John designed a Root Zone System (RZS) with a dosing system. Because the system waters crops for human consumption, this requires a dry toilet so that the graywater comes only from the bathroom, kitchen sinks and the showers. An in-ground tank is located a little distance from the houses. This tank collects the graywater and, in their case, when it reaches 60 gallons, a dose of graywater is sent through pipe to the RZS, which is downhill from the tank. The Root Zone System is a set of 4 parallel, level, covered troughs about 6 inches deep and 48 feet long for the Curtis Pike gardens which receive the graywater. The length of the troughs varies with water quantity. A garden of vegetables, fruit trees and fruit bushes is planted on either side of the troughs to make use of the water and the nutrients in the water. The soil bacteria and fungi convert the food particles, fats, soaps and any other contents of the graywater into materials that the plants can use. Obviously, toxic and hazardous chemicals and cleaners must not be put down the house drains since the garden is a living system. The graywater collecting tank has two dosing siphons which will intermittently send graywater to the top two or lower two troughs in the garden. The dosing siphons
8
were chosen over electric pumps because the community wanted to conserve electricity since they were off the grid and were producing their own electricity from photovoltaic panels. The dosing siphons work somewhat like the flush toilet. When the water rises high enough in the bowl of a toilet, the wastewater flows through the trap below the toilet bowl into the sewerage line. The siphons in the tank are inverted siphons and have a bell on top of them that holds air which is pressurized by the graywater rising in the bell. When the pressure is sufficient it will trip the siphon and send a 60 gallon dose to two of the troughs. The bells and siphons are designed so that they will be alternately triggered, thus feeding one set of troughs and then the other set. When another 60 gallons has reached the tank, the other siphon will trip and send the graywater to the other two troughs. Battery operated dosing counters record the number of doses that are sent to the garden. This indicates the proper operation of the dosing siphons and the number of gallons of graywater sent to the garden. The system was approved and put into use in the Spring of 2005. The results in this RZS garden are tomato "bushes" over three feet in diameter and four feet high, corn seven feet high with big full ears, and good-sized butternut squash with excellent flavor. These plants grew well in a season when most peoples' gardens withered because of the drought. And this is the water that we "throw out!"
The author oversaw the installation of the system and gave a workshop in April, 2005 on the NutriCycle Root Zone system to the personnel of the Commonwealth and Madison county Health Departments at the Curtis Pike site.
9
A Brief History and Current State of Groundwater Protection in Kentucky
by
James Webb, Beverly Oliver, Peter Goodmann Kentucky Division of Water, Groundwater Branch
14 Reilly Road Frankfort, KY 40601, (502) 564-3410 [email protected], [email protected], [email protected]
Groundwater is an essential resource that provides water for drinking, industry and agriculture. Although some degradation has occurred, ambient groundwater quality is generally of high quality, and in many areas of the Commonwealth, it is the most inexpensive and readily available source of water. The importance of this resource was recognized by then Governor Martha Layne Collins who created the Groundwater Advisory Council and a program to address previously neglected groundwater issues as part of the 1984 Kentucky Water Management Plan. The Council was comprised of representatives from various agencies responsible for the protection and management of groundwater, including the Kentucky Division of Water, the Kentucky Geological Survey (KGS) and the United States Geological Survey (USGS).
The Groundwater Advisory Council concluded that most of the problems encountered with protecting the Commonwealth’s groundwater were the result of nonexistent or fragmented and uncoordinated programs. The council therefore identified the need for a comprehensive groundwater protection strategy to address present and future needs.
The 1987 Kentucky Groundwater Protection Strategy, developed by the Groundwater Advisory Council, identified Kentucky’s Groundwater Protection Goal: to maintain or restore the resource for its highest and best use, and to minimize or prevent waste and degradation. To accomplish this, the council recommended the following:
1. Address groundwater concerns in statewide planning and programming through coordinating the efforts of all state, local and federal agencies, which manage, research, protect or promote groundwater resources.
2. Establish appropriate statutory and regulatory authority to accomplish the groundwater protection management goal.
3. Develop and implement an integrated and comprehensive information system for the collection, management and dissemination of groundwater data.
4. Establish a centralized archival repository for groundwater data. 5. Obtain a comprehensive understanding of Kentucky’s groundwater resources,
including present and potential threats. 6. Encourage local initiatives to safeguard groundwater resources.
In recognition of the important of this resource, the Groundwater Section was
elevated to branch status in the Division of Water in 1985. As its highest priority, the newly formed Groundwater Branch was assigned to implement the above recommendations. In cooperation with other agencies, the Groundwater Branch has

10
played an important role in coordinating groundwater protection efforts throughout the Commonwealth for the last 20 years. Although most, but not all of these goals, have been accomplished, on-going efforts are inherently necessary to maintain those in existence and additional efforts will be required to implement the others. The objectives enumerated above that have been addressed are:
1. The formation in 1998 of the Inter-agency Technical Advisory Committee
(ITAC), an advisory group formed to coordinate state groundwater concerns. 2. Statutory and regulatory authority to regulate and protect groundwater was
partially implemented through the Water Well Drillers Certification statute (1985) and resultant regulations, and the Groundwater Protection Plan Regulation (1994). The Agriculture Water Quality Act (1994) established the Agricultural Water Quality Authority and required agriculture producers to develop Agricultural Water Quality plans to protect groundwater and surface water. Other regulations have protected groundwater by strengthening the solid waste program (1991) and underground storage tank program (1994), and promoted the remediation of brownfields and other contaminated sites through the Voluntary Environmental Remediation Program (2003).
3. Information management was accomplished through the creation of the Department for Environmental Protection Consolidated Groundwater Database in 1986 and the establishment of KGS Groundwater Data Repository in 1990.
4. Understanding of the state’s groundwater resources was greatly expanded by the creation and implementation of the Ambient Groundwater Monitoring Network in 1995 and increasing other groundwater quality research projects including karst studies, groundwater assessment projects funded through nonpoint source grants, additional groundwater monitoring for pesticides through an MOA with the Division of Pesticides, and expanded sampling in response to complaints and spills.
5. Local initiatives to protect groundwater have been implemented primarily through the Wellhead Protection Program, approved by the USEPA in 1991.
The systematic and comprehensive collection, maintenance and distribution of
statewide ambient groundwater quality data over the last ten years, and the detailed analysis of these data, have dramatically expanded our knowledge of the resource. The protection of this resource has been expanded through the creation and administration of appropriate regulations and programs.
Managing and protecting groundwater, educating the public, and providing sound
science for policy decisions will remain challenging issues as Kentucky’s population expands and the demand for groundwater resources increases. Most obviously, the advances made over the last two decades need to be maintained, expanded, and certainly improved upon. Among the many emerging issues that should be addressed are the interrelationships, both in quantity and quality, between surface and groundwater systems. Pathogens continue to be an important parameter for which quality data are lacking, and the occurrence, fate, and significance in groundwater of emerging contaminants such as pharmaceutically active compounds, estrogen mimickers, and endocrine interrupters will undoubtedly challenge us as scientists and regulators.

11
SUMMARY OF GROUNDWATER-QUALITY DATA IN THE JACKSON PURCHASE REGION, KENTUCKY
E. Glynn Beck*, James S. Dinger, and Paul C. Inkenbrandt
*Kentucky Geological Survey Western Kentucky Office
1401 Corporate Court Henderson, KY 42420 270-827-3414 ext. 23
Over the past 7 years, Kentucky Geological Survey personnel have sampled 509 domestic water wells throughout the Jackson Purchase Region, Kentucky to assess how land use and well construction influence local groundwater quality. Of the 509 wells sampled, 286 are 4-inch diameter wells (drilled wells) and 223 are 24-inch diameter wells (bored wells). All of the 509 wells have been sampled for nitrate-N, chloride, and field parameters (pH, Temperature, Eh, and Electrical Conductivity). A number of wells were also sampled for herbicides (424 wells), total coliform and E. coli (328), caffeine (125), and nitrogen isotopes (96). The following significant findings have been made with respect to groundwater-quality data and land use, well construction, hydrogeology and human health. Of the 509 wells sampled for nitrate-N, 32 wells (6 percent) contained nitrate-N above the MCL of 10 mg/L. One of these wells is a domestic well in Ballard County located on an abandoned dairy farm operation. The nitrate-N and chloride concentrations are 18.6 mg/L and 129mg/L, respectively. The nitrate-N concentration for this well is two times that of surrounding wells and the chloride concentration is four times that of surrounding wells. The nitrogen isotope ratio is 10.3 per mil, which points to organic waste associated with an animal feeding lot as the source of elevated nitrate-N.
To better determine the role of well construction on local groundwater quality, a bromide
trace was performed on 62 (28 drilled and 34 bored) of the 509 wells sampled. Four of the drilled wells and 18 of the bored wells exhibited a breakthrough of bromide, which indicates that surface water moves practically unimpeded into the well. Because surface water or possibly shallow groundwater is able to move unimpeded into the well, these wells are considered to be constructed improperly. Improperly constructed water wells are an important human health concern because bacteria and other contaminates can enter the well by moving directly down the borehole bypassing the natural flow and filtering system.
Total coliform bacteria develop everywhere (soil, water, and in the gut of animals and humans). Generally, these bacteria are harmless, with the exception of a specific group called fecal coliforms. E. coli is a fecal coliform that naturally develops only in the gut of animals and humans. If ingested, E. coli may cause abdominal cramps, nausea, diarrhea, and bloody diarrhea. Even though total coliforms are generally harmless, apart from fecal coliforms, their presence is an indication that other harmful organisms and contaminants carried by animals and humans may also be present in drinking water. Therefore, the Environmental Protection Agency
12
has set a drinking water standard of zero for both E. coli and total coliforms. Of all the wells sampled (328), 66 percent contained total coliforms and 12 percent contained E. coli. Eighty-eight percent and 22 percent of the bored wells contained total coliforms and E. coli, respectively. Only 3 of the drilled wells contained E. coli, but 40 percent contained total coliforms. One such case of how improper well construction can adversely affect human health was identified when sampling a bored well in Calloway County for total coliform and E. coli. The initial bacteria results showed that total coliform and E. coli counts were >200.5 and 3.1, respectively. The home owner was contacted to discuss shock chlorinating the well. It was discovered that the well had not been used for over two years, the present family having recently moved from New Mexico to Kentucky. They were unfamiliar with well maintenance procedures and began using the well without disinfecting with the result that each member of the family was experiencing abdominal cramps and diarrhea. It was recommended that the well water not be used for drinking and that the well be shock chlorinated. Three shock chlorination treatments were required before the bacteria test was negative (no colonies). It was also discovered that within 30 seconds of pouring water around the well head, water entered the well. Additional bacteria samples will be collected to determine how long the shock chlorination treatment lasts.
To better determine the source of elevated nitrate-N in the groundwater, 96 wells were sampled for nitrogen isotopes, and 125 wells were sampled for caffeine. Isotope values for the 96 wells sampled indicate that possible sources of nitrate-N range from chemical fertilizer to animal/septic waste. Caffeine was detected in 19 of the 125 wells sampled for caffeine. Isotope and caffeine results strongly indicate that there are multiple sources of nitrate-N to the shallow groundwater system in the region.
One hundred thirty eight wells were resampled to determine if nitrate-N or herbicide
concentrations decrease or increase seasonally. Results show that there is generally very little change between the two sampling events. This indicates that at locations where nitrate-N or herbicides are elevated, the shallow groundwater system is contaminated.
13
GROUNDWATER-QUALITY ASSESMENT AND SHALLOW AQUIFER MODEL OF CALLOWAY COUNTY, KENTUCKY
Paul C. Inkenbrandt, E. Glynn Beck*, and James S. Dinger
*Kentucky Geological Survey Western Kentucky Office
1401 Corporate Court Henderson, KY 42420
[email protected] Calloway County is located in the southeastern portion of the Jackson Purchase Region
(JPR), just west of Kentucky Lake. The residents of Calloway County rely heavily on the more than 6,000 privately owned water wells for domestic, livestock, and irrigation use (Carey and Stickney, 2005). There are a number of potential factors that can influence groundwater quality, including well depth and construction, proximity to contaminating sources (row crop fields, septic systems, etc), and geology.
Water-quality results of 134 wells sampled from May of 2003 to October of 2005 by the
Kentucky Geological Survey in the six eastern-most quadrangles of Calloway County have led to useful conclusions and inferences. Nitrate-N, chloride, total coliform and E. coli, and herbicide results were analyzed statistically in relation to well depth, well diameter, and well age. Using data from the 134 wells, we calculated the average nitrate-N concentration in Calloway County to be 3.7 mg/L, and the average chloride concentration to be 21.3 mg/L. These average concentrations are slightly higher than the average nitrate-N and chloride seen throughout the JPR. Six percent of bored wells, as opposed to none of the drilled wells, have nitrate-N concentrations above the MCL of 10 mg/L. Sixteen percent of the bored wells contained E. coli, whereas none of the drilled wells contained E. coli.
Oil and water well driller logs, groundwater availability maps, geologic quadrangles, and
ArcGIS software were used to create an approximate, three dimensional, conceptional hydrostratigraphic model of shallow (<200ft) aquifers in Calloway County. Surface elevation was determined using a georeferenced topographic map, whereas static water level was estimated using measured quantities taken from different locations over a period of several years.
The model presents shallow (<200ft) hydrostratigraphic units that produce enough water
for a domestic water supply. The four main shallow producing hydrostratigraphic units in Calloway County are alluvium, continental gravel deposits, the Claiborne Formation (sands/clay), and the McNairy Formation (sand/clay). The model shows that the McNairy Formation is the dominant producing unit in the eastern third of the county. In the middle third of the county, the McNairy is overlain by the Porters Creek Clay aquitard. However, the overlying continental gravels in this area are more continuous than in other areas of the county and are closer to the surface than the McNairy, which makes them the dominant producing units in this portion of the county. The Claiborne Formation is the shallowest hydrostratigraphic unit in the western third of the county and overlies the Porters Creek Clay aquitard.
14
The proposed goal of this model is to estimate the drilling depth necessary for high-quality domestic water supplies for any geographical location in the county. The current model only presents inferred spatial relationships between hydrostratigraphic units and the wells that penetrate them. Future research can incorporate groundwater-quality data (metals, anions, etc) into the model to make it a hydrogeochemical stratigraphic model, which will allow for a more accurate and useful interpretation of local groundwater-quality trends. Reference Cited: Carey, D.I. and Stickney, J.F., 2005, Groundwater Resources of Calloway County, Kentucky: Kentucky Geological Survey County Report 18, Series XII http://www.uky.edu/KGS/water/library/gwatlas/Calloway/Calloway.htm

15
SUSPENDED SEDIMENT AND PATHOGEN TRANSPORT IN TWO INNER BLUEGRASS KARST GROUND-WATER BASINS
A.E. Fryar1, T.M. Reed1,2, G.M. Brion3, M.S. Coyne4, J.L. Taraba5, and A.W. Fogle6
1Earth & Environmental Sciences, Univ. of Kentucky, Lexington, KY 40506-0053 2AMEC, 108 Esplanade Ave., Suite 310, Lexington, KY 40507
3Civil Engineering, Univ. of Kentucky, Lexington, KY 40506-0281 4Plant & Soil Sciences, Univ. of Kentucky, Lexington, KY 40546-0091
5Biosystems & Agricultural Engineering, Univ. of Kentucky, Lexington, KY 40546-0276 6Kentucky Geological Survey, Univ. of Kentucky, Lexington, KY 40506-0107
1(859) 257-4392, 2(859) 231-0070, 3(859) 257-4467, 4(859) 257-4202 [email protected], [email protected], [email protected], [email protected]
Almost 40% of Kentucky is underlain by limestone, which is prone to dissolution
(karstification). Because karstification results in the development of preferential flow paths through sinkholes and subsurface conduits, karst aquifers are especially vulnerable to nonpoint-source pollution from urban and agricultural runoff. Suspended sediment, which can be carried into the subsurface or remobilized within karst conduits following storms, can adsorb pathogens and other pollutants. However, there have been few studies of the association between pathogens and sediment in karst aquifers in Kentucky, and none in the Inner Bluegrass region.
The objectives of this study were to characterize the relationship between
suspended sediment and pathogen indicators at two springs draining karst basins with contrasting land uses (urban and agricultural) in Woodford County, Kentucky. Blue Hole Spring is located in Versailles; spring SP-2 is at the University of Kentucky (UK) Animal Research Center (ARC). At each site, specific conductance (SC), pH, and temperature (T) were manually measured weekly from fall 2002 to spring 2004. Concentrations of fecal coliform bacteria (FC), total coliforms (TC), atypical coliforms (AC), male-specific coliphage (MSP, an indicator of viruses in waste water), and major ions were measured biweekly. Discharge at SP-2, stream stage at Blue Hole (which has been correlated to discharge), SC, pH, T, and turbidity were monitored continuously by sensors linked to digital data loggers. Bed sediments at SP-2 and the sinkhole feeding it were analyzed for mineralogy, petrology, particle size, total organic carbon (TOC), and total inorganic carbon (TIC). During two storms, SC, T, FC, TC, AC, MSP, and total suspended solids (TSS) were measured at both springs, and suspended sediment samples were collected at SP-2 for the same analyses previously performed on bed sediments.
Results of weekly to biweekly measurements indicate relatively consistent
differences in several water-quality parameters between the two springs, as well as possible temporal effects. Except for one date, weekly SC values were greater at Blue Hole than at SP-2, and SC ranges were broader at Blue Hole than at SP-2. SC spikes in winter at Blue Hole may reflect road-salt runoff. Ranges of weekly T values for the two springs overlapped, but spring T at Blue Hole was typically higher than at SP-2. Temperatures at both springs tracked air T measured at the ARC, but fluctuated over a
16
narrower range than air T did, as expected for ground water. Weekly pH values at both springs fluctuated around 7.1; near-neutral pH values are characteristic of limestone dissolution. Biweekly FC and TC concentrations tended to be higher at Blue Hole than at SP-2. The fact that FC and TC values tended to be highest from April through October at Blue Hole and from April through November at SP-2 may reflect seasonal variations in T or soil-water content. Biweekly AC/TC ratios were greater at Blue Hole than at SP-2 for 29 of 31 sampling rounds. The range of biweekly AC/TC ratios was much broader at Blue Hole than at SP-2, and the range at SP-2 was similar to values reported for runoff from farm fields in Fayette County. At both sites, average FC and TC concentrations were higher, and average AC/TC ratios were lower, for samples collected during relatively wet periods than for samples collected at other times. Differences in MSP concentrations (detected in 23 of 31 biweekly samples at Blue Hole, but none at SP-2) appear to reflect differences in land use between the two basins.
Monitoring of storm pulses at both springs in September 2003 and March 2004
confirmed previous findings from other sites that storm flow causes temporary increases in suspended sediment and pathogen concentrations. Discharge rose sharply following periods of intense rainfall, then receded. Ranges of discharge were similar for both sites for the September storm, but for the March storm, peak discharge at SP-2 was nearly three times the peak value at Blue Hole. SC, T, and turbidity all responded to changes in discharge at both sites and times. SC and T tended to decrease following peak discharge, which is consistent with movement of cooler, more dilute storm flow through the subsurface. Peak turbidity tended to coincide with peak discharge for both sites and times, but the turbidity response was relatively noisy. TSS values were uniformly lower at Blue Hole than at SP-2 in September, and maximum TSS values were lower at Blue Hole than SP-2 in March. Differences in TSS values may have in part reflected the choice of sampling locations at each site. Maximum FC and TC concentrations for both storms exceeded maximum values for biweekly samples at each site. For storm-flow samples, FC concentrations tended to be higher and TC concentrations tended to be lower at Blue Hole than at SP-2. FC and TC concentrations tended to decrease as the storm pulses receded at Blue Hole, but did not track discharge as closely at SP-2. Ranges of AC/TC ratios for storm flow samples overlapped biweekly-sample ranges at Blue Hole and fell within biweekly-sample ranges at SP-2. Maximum MSP values in both sets of storm-flow samples from Blue Hole exceeded biweekly maximum values. MSP was not detected in storm-flow samples from SP-2.
Sediment mineralogy and grain-size distributions determined for SP-2 and a
contributing sinkhole were similar to those previously observed in the Blue Hole basin. Bed sediment from SP-2 and the sinkhole consisted mainly of quartz and calcite, with at least 90% of grains being very fine sand or larger. Suspended sediment sampled at SP-2 during the September 2003 and March 2004 storms was also dominated by quartz and calcite. On average, silt and larger grains at SP-2 comprised 92% of the suspended sediment for the September storm and 99% of the suspended sediment for the March storm. The lack of phyllosilicate minerals and clay-sized particles probably limits the surface area available for sorption of pathogens and other pollutants.

17
LOCATING AND MAPPING DOMESTIC WATER WELLS IN MARSHALL COUNTY, KENTUCKY
Wendy D. Langhi, MS, RS PO Box 40, Hardin, KY 42048
(270) 437-4800 [email protected]
The Marshall County Board of Health became interested in the water quality of local water wells after Board members attended a seminar where awareness was raised regarding this issue. Upon returning, several Board members began questioning the quality of water the citizens in Marshall County are receiving from domestic water wells. The Health Department had some historical data pertaining to bacterial contamination in residential wells and it was evident that some wells in the county had elevated levels of bacterial contamination. The Health Department was directed by the Board of Health to conduct a study of the location and bacterial contamination of water wells in the county. The ‘Well Mapping’ project had two primary objectives. The first was to identify, map and sample water supplies for residents without current access to publicly supplied drinking water. The second objective, as requested by the Department for Public Health, was to help establish a method where other local health departments could conduct similar studies. It was determined that field personnel would be trained to visually assess wells for Assembled Kentucky Groundwater database (AKGWA) numbers and KY Division of Water specified characteristics. If no AKGWA number was noted and the well did not appear in an on-line database search, health department personnel would assign a number to that well. A target area of the county was then defined and informational letters were sent to the affected residences. In this letter, the owner was asked to provide specific information regarding any well on the property that might not be obtainable during field work. Once field work commenced, Marshall County Health Department personnel traveled to the residences which had responded to the initial informational letter. The well was ‘mapped’ using hand-held Global Positioning Satellite (GPS) devices, pertinent well information was recorded and a water sample was collected from an outside spigot. During field work, residences were visited which did not respond to the initial mailing. If no one was home an informational door hanger was left. The plan is to attempt to reach the non-responsive parties via telephone to ensure all available data is collected. Collected water samples were analyzed by the Western Kentucky Regional Laboratory for the presence of total coliform and E. coli. Once the sample results were completed, a
18
packet of information regarding well maintenance, groundwater protection and the assigned AKGWA number, if applicable, was sent to the homeowner. If a sample was ‘positive’ for total coliform and/or E. coli, a sheet outlining disinfection procedures was also included. As the project continues, the Marshall County Health Department is providing the Department for Public Health GPS coordinates of the located wells and KY Division of Water with well inspection forms and sample results. All involved personnel are hopeful that this will help generate an up-to-date database of the well locations in Marshall County. The response rate to the initial mailing was approximately 30%. To date, the Health Department has located water wells at over half of the residences, which responded to the mailing. 78% of the sampled wells tested positive for total coliform contamination and approximately 1% tested positive for E. coli. AKGWA numbers were assigned to 81% of the located wells. Undertaking this project has been very time-consuming and has not progressed as rapidly as hoped, due, in part, to the limited amount of personnel available for field work. It has been determined that this project will be on-going. During the summer months, more personnel may become available, in the form of interns, to assist with the data collection aspect of this project.

19
THE UNIVERSITY OF KENTUCKY SUPERFUND BASIC RESEACH PROGRAM: OVERVIEW AND EXAMPLES OF RESEARCH PROJECTS
Bernhard Hennig, Leonidas Bachas and Lindell Ormsbee
University of Kentucky, Lexington, KY 40536-0200
Kentucky has some of the worst health statistics in the US, with a high incidence of age-related diseases (e.g., atherosclerosis, cancer, obesity, hypertension, diabetes, etc.) and poor dietary habits (high intake of processed foods rich in fat and low in fruits and vegetables). Kentucky also has numerous Superfund sites, including sites contaminated with persistent organic pollutants such as polychlorinated biphenyls (PCBs), which could markedly contribute to the pathology of age-related diseases. PCBs are polyhalogenated aromatic hydrocarbons that are persistent and widely dispersed in the environment. The toxicity of PCBs and other chlorinated organics may be mediated by signal transduction following receptor binding, and the myriad effects that follow as part of the overall disease development.
The diet is a major route of exposure to PCBs and other persistent organic pollutants. Since these compounds are fat soluble, fatty foods usually contain higher levels of persistent organics, such as PCBs, than vegetable matter. Once absorbed, PCBs distribute themselves to tissues, especially adipose, where they are in dynamic equilibrium with the blood. Furthermore, nutrition also can dictate the cellular lipid milieu, oxidative stress and antioxidant status, and thus modulate mechanisms of cytotoxicity mediated by Superfund pollutants.
PCBs have broad adverse effects and may contribute to the pathology of age-related diseases, such as atherosclerosis, cancer, obesity, hypertension, diabetes, and neurological disorders and dementias. Many of these diseases also can be classified as inflammatory diseases. Evidence is increasing that PCBs and related pollutants exhibit toxicity and disease potential via oxidative stress-related mechanisms. This is of particular interest since many common vascular diseases are believed to be initiated through imbalances of the body’s oxidative stress/antioxidant status. The contribution of environmental toxins in these processes and the possibility that their initiation and/or progression of these could be manipulated by appropriate dietary interventions is of great public health potential. In studies with cells in culture and with animals, PCBs have been shown to alter oxidative stress via multiple mechanisms, and biologic and toxic consequences of these changes are diminished antioxidant capacity, resulting in lipid peroxidation, modified proteins and DNA, and changes in cell signaling pathways. These changes could be the cause for the adverse health effects of PCBs, including its potential in exacerbating age-related diseases. The paradigm of nutrition being able to modify Superfund chemical (e.g., PCB) toxicity is of interest to populations at risk, i.e., populations residing near Superfund sites or areas of contamination and populations with poor dietary habits. In addition to novel environmental remediation technologies associated with nanoparticles, biosensors, etc., nutrition could be considered part of “biological remediation” by modulating the cytotoxiciy of Superfund toxicants and thus affecting related issues of health and disease. Proper nutrition counseling should be considered by health officials and the medical

20
community to reduce the overall risk for Superfund chemical toxicity and disease development. Very little is known about the interaction of diets and cytotoxicity of environmental contaminants like PCBs. Our data clearly show that nutrition can modulate PCB toxicity. For example, specific dietary fatty acids can amplify PCB toxicity in vascular endothelial cells, an event which can be blocked by bioactive compounds with antioxidant activity, such as vitamin E and flavonoids. More research is needed to confirm our observed interactions of PCB toxicity with nutritional interventions. In addition to health-related concerns of Superfund toxins such as PCBs and other chlorinated organics, issues of remediation and detoxification are a major concern. The presence of chloro-organics (chloroethylenes to chloroaromatics) in various Superfund sites is well documented in the literature. The problems range from groundwater to soil contamination. Many chlorinated organics are toxic even at low concentrations, and exert a cumulative, deleterious effect on the environment. Thus, a major overall objective of the UK-SBRP is to develop particle (nanoparticles and nano-aggregates) immobilized oxidative and reductive platforms suitable for highly effective remediation strategies for selected chloro-organic detoxification. The fundamental understanding of these reactive systems is critical for sustainable use involving remediation. Another major goal is to design and develop whole cell sensing systems for the determination of chlorocatechols and PCBs in the environment. Optical and electrochemical biosensing systems will be developed for the detection of PCBs and their breakdown products found in hazardous waste sites. These biosensing systems are based on the use of recombinant bacteria that incorporate the catabolic pathways of PCBs along with the expression of reporter genes. In summary, the currently funded UK-SBRP integrates three biomedical projects that focus on critical age-related diseases, such as cardiovascular disease, brain cancer metastasis, and obesity/hypertension. The biomedical projects are integrated with two non-biomedical projects which involve novel environmental biosensors, as well as remediation technologies associated with nanoparticles and free radical-based oxidative techniques. All research projects are supported by five Cores: Administration, Research Support, Research Translation, Community Outreach, and Training. The Research Translation Core is a critical centerpiece of the overall UK-SBRP, and this Core will integrate all projects as part of the overall SBRP by advancing academic and public knowledge on environmental risk factors and development and application of new technologies. (Supported by grants from NIEHS/NIH (P42ES07380) and the University of Kentucky AES)

21
REDUCTIVE DECHLORINATION OF TOXIC ORGANICS BY BIMETALLIC NANOPARTICLES IN POLYACRYLIC ACID (PAA)
FUNCTIONALIZED MF MEMBRANES Jian Xu and Dibakar Bhattacharyya
Department of Chemical & Materials Engineering University of Kentucky, Lexington, KY 40506 Phone: 859-323-2976 Email: [email protected]
Chlorinated solvents such as trichloroethylene (TCE) and polychlorinated biphenyls (PCBs) are a group of high toxic organics in waste and underground water because of its past extensive use by industry and its resistance to biodegradation under natural subsurface conditions. The applications of zero-valent metals such as Zn or Fe in reductive degradation of chlorinated organics have been extensively studied. In this case, one Cl group is replaced by one hydrogen via transfer of the electron released from electrochemical corrosion of the zero-valent metal. Higher dechlorination rate can be obtained by using nanoscale metal particles due to the high surface area, high level of stepped surface and high surface energy. This dehalogenation process has been further enhanced by using nanoscale bimetallic particles (Fe/Ni or Fe/Pd). In the bimetallic system, Fe or Zn was considered as the reductant for water to generate hydrogen and the secondary metal Ni or Pd acts as a catalyst. In the presence of the secondary metal, contaminants were dehalogenated by catalytic hydrodechlorination rather than electron transfer, which can greatly increase the transformation rate as well as inhibit toxic intermediate products formation. Synthesis of bimetallic nanoparticles (Fe/Ni, Fe/Pd) in aqueous phase for dechlorination study has been reported in many literatures. However, in the absence of polymers or surfactants particle can easily aggregate into large particles with wide size distribution.
In this study, nanosized Fe/Ni and Fe/Pd particles were synthesized in polyacrylic acid (PAA) functionalized polyvinylidene fluoride (PVDF) MF membranes. The advantage of using PAA functionalized membranes to immobilize nanoparticles is the reduction of particles loss, prevention of particles agglomeration, application of convective flow, and potential recapture of dissolved metal ions from solution. The PAA/PVDF membranes were prepared by a dip-coating process. The carboxylic groups in PAA layer bind ferrous ions from aqueous solution by ion exchange at controlled pH (5~6). Subsequent reduction with sodium borohydride forms metallic Fe nanoparticles. The core-shell Fe/Pd nanoparticles can be achieved by a partial displacement reaction on Fe surface. The membranes and Fe/Pd nanoparticles were characterized by several electron microscopy techniques: scanning electron microscopy (SEM), transmission electron microscopy (TEM), scanning transmission electron microscopy (STEM), energy-dispersive X-ray spectroscopy (EDS), and high-resolution transmission electron microscopy (HRTEM). The reactive properties are dependent on the bimetallic nanoparticle structure and distribution of Fe and Pd at nano domain. A specimen-drift-free EDS mapping system was performed in STEM to determine the two-dimensional element distribution inside the membrane matrix at nano scale. The interfacial structure of Fe core and Pd shell are studied in detail using HRTEM. The reactive properties of Fe/Pd bimetallic nanoparticles in PAA/PVDF membrane were investigated toward the reductive dechlorination of 2,3,2’,5’-tetrachlorobiphenyl (TeCB) at room temperature.
22
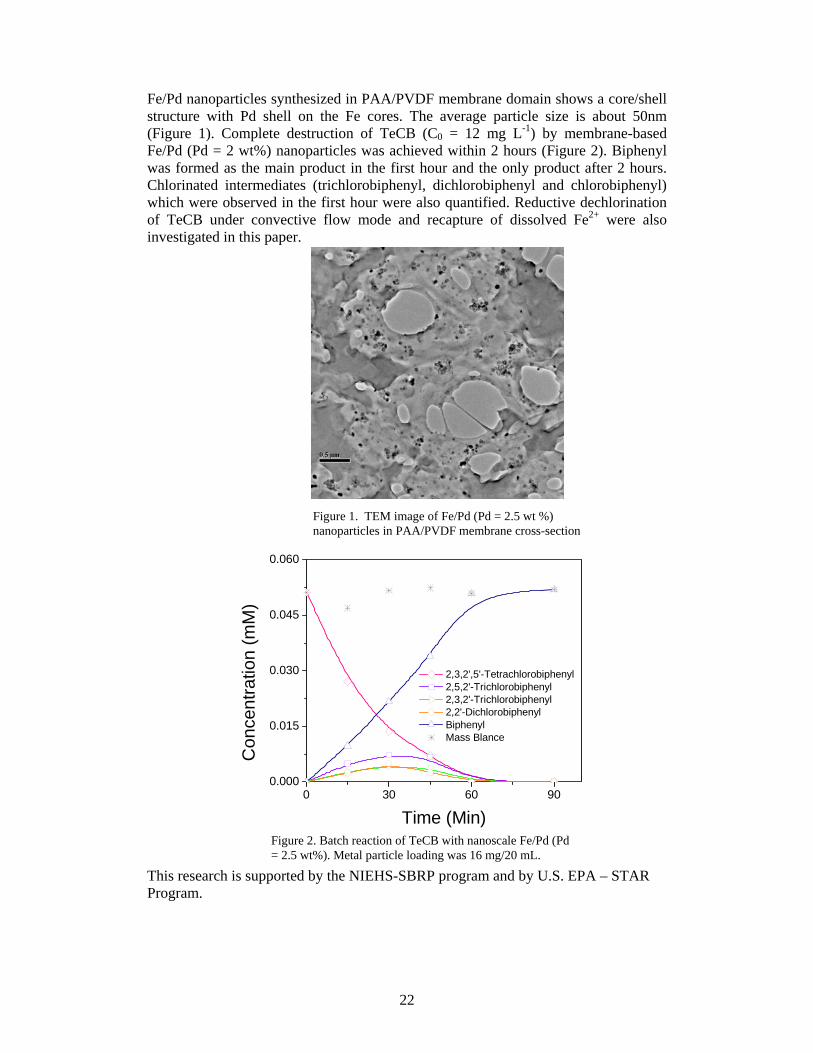
Fe/Pd nanoparticles synthesized in PAA/PVDF membrane domain shows a core/shell structure with Pd shell on the Fe cores. The average particle size is about 50nm (Figure 1). Complete destruction of TeCB (C0 = 12 mg L-1) by membrane-based Fe/Pd (Pd = 2 wt%) nanoparticles was achieved within 2 hours (Figure 2). Biphenyl was formed as the main product in the first hour and the only product after 2 hours. Chlorinated intermediates (trichlorobiphenyl, dichlorobiphenyl and chlorobiphenyl) which were observed in the first hour were also quantified. Reductive dechlorination of TeCB under convective flow mode and recapture of dissolved Fe2+ were also investigated in this paper. This research is supported by the NIEHS-SBRP program and by U.S. EPA – STAR Program.
0 30 60 900.000
0.015
0.030
0.045
0.060
Con
cent
ratio
n (m
M)
Time (Min)
2,3,2',5'-Tetrachlorobiphenyl 2,5,2'-Trichlorobiphenyl 2,3,2'-Trichlorobiphenyl 2,2'-Dichlorobiphenyl Biphenyl Mass Blance
Figure 2. Batch reaction of TeCB with nanoscale Fe/Pd (Pd = 2.5 wt%). Metal particle loading was 16 mg/20 mL.
Figure 1. TEM image of Fe/Pd (Pd = 2.5 wt %) nanoparticles in PAA/PVDF membrane cross-section

23
CHLORINATED ORGANIC COMPOUNDS DESTRUCTION BY MODIFIED FENTON REACTION INVOLVING IMMBOLIZED IRON-CHELATE
YongChao Li1, Leonidas G. Bachas2 and Dibakar Bhattacharyya1.
Department of Chemical & Materials Engineering1, and Department of Chemistry2, University of Kentucky, Lexington KY 40506-0046.
Phone: 859-323-2976 Email: [email protected]
Poly-chlorinated Biphenyls (PCB), and Trichlorophenol (TCP) present a big challenge for researchers in the area of environment and health because they are highly toxic for human being and animals and refractory for biodegradation. Reduction and oxidation are two effective techniques to destroy chlorinated organic contaminants in the wastewater and groundwater contamination. Fenton reaction, which produces free hydroxyl radicals by iron and H2O2, is an effective way to destroy organic pollutant and has been studied extensively. However, the low pH environment requirement and low H2O2 utilization limit its application for water remediation. Our research goals are: 1) to modify Fenton reaction by adding chelating agent into the reaction system to make it suitable for near neutral pH environment. 2) to understand the kinetic and mechanism of the chelate-based modified Fenton reaction. 3) to find out the role of the mono-chelate (such as citrate) and poly-chelate (such as poly acrylic acid, PAA) in the free radical reaction. 4) to immobilize the iron to prevent iron precipitation and control hydroxyl radical formation. Our experiments prove chelate-based modified Fenton reaction can prevent precipitation even in alkaline condition. Chelating agent can strongly combine with Fe2+ or Fe3+ to form stable metal-chelate complexes in solution. This decreases the concentration of Fe2+ in the solution so that reactions can be carried for longer contact times. Experimental results (citrate was chelating agent) for 2,4,6-Trichlorophenol (TCP) showed that the TCP degradations were great than 99% after 4-hour and 24-hour reaction times at fixed pH 5 and 6 respectively. At the same time, the normalized chloride formations were 85% and 88%. Comparing to the mono-ligand, such as citric acid, a poly-ligand (PAA-polyacrylic acid) can be used to immobilize the iron reactant within a suitable support to suppress the unwanted reactions in order to promote the catalytic nature of iron reaction. Polyvinylidene fluoride (PVDF) membrane was chosen as the support material because of its stability and easy handling. After acrylic acid polymerization inside the PVDF membrane, carboxylic groups of PAA can sequester iron (Fe2+/Fe3+) through ion exchange at neutral pH environment. In our experiments, 75.8% of Biphenyl (0.02 mM) was destroyed after 10 hr reaction time in the modified Fenton reaction (Fe: 2.8 mg; H2O2: 0.5 mM). The authors would like to acknowledge NIEHS-SBRP for support of this research. Various analytical supports were provided by ERTL at the University of Kentucky.

24
Figure 1. TCP Destruction by modified Fenton Reaction at pH 5, 6, and 7
0.00
0.20
0.40
0.60
0.80
1.00
0 5000 10000 15000 20000 25000 30000 35000 40000
Time, s
[Bip
heny
l]/[B
iphe
nyl] 0
Biphenyl analyzed byGC/MSControl run
including both aqueousphase and membraneextraction
0.000
0.200
0.400
0.600
0.800
1.000
0 500 1000 1500 2000
Time, s
[H2O
2]/[H
2O2]
0
Fe loading = 2.8 mg[H2O2]0 = 0.5 mM[Biphenyl]0 = 0.02 mMpH = 7
Figure 2. Biphenyl Destruction by Modified Fenton Reaction Involving Immobilized Iron-Chelate
-8.00
-7.00
-6.00
-5.00
-4.00
-3.00
-2.00
-1.00
0.00
0 200 400 600 800 1000 1200 1400 1600
Time, minutes
ln([T
CP]
/[TC
P]0)
TCP (fixed pH 5) analyzed by GC/MSKinetic Model for TCP (fixed pH 5)TCP (fixed pH 6) analyzed by GC/MSKinetic Model for TCP (fixed pH 6)TCP (fixed pH 7) analyzed by GC/MSKinetic Model for TCP (fixed pH 7)
[TCP]0=1.5 mM [L]:[Fe]=1:1 [Fe]=10 mM [H2O2]0=50 mM
pH 5 pH 6
pH 7
25
AN OUTREACH PROGRAM TRANSLATES BASIC RESEARCH FOR SUPERFUND COMMUNITIES TO IMPROVE HEALTH THROUGH
NUTRITION
Lisa Gaetke and Sandra Bastin Department of Nutrition and Food Science
University of Kentucky 218 Funkhouser Bldg
Lexington, KY 40506-0054 859-257-1031
Since 2000, the University of Kentucky’s (UK’s) Community Outreach Program, now entitled Superfund Community Action through Nutrition (SCAN), has offered support and guidance to those affected by environmental contaminants by providing critical information on relevant nutrition and health-related issues. In support of UK’s Superfund Basic Research Program’s (SBRP’s) overall hypothesis that nutrition can modulate the toxicity of Superfund pollutants, this model demonstrates how a Nutrition Outreach Program facilitates two-way interactions between affected communities and UK’s SBRP, while controlling the quality of nutrition information provided to communities. SCAN works with community groups to establish trust by attending group meetings and listening to health concerns. Through SCAN, Superfund community groups at sites in both western and eastern Kentucky share concerns with UK’s SBRP to inform research efforts. Ongoing SBRP research progresses from cellular and animal studies through clinical trials to establish dietary recommendations. At this stage, SCAN provides nutrition information limited to established guidelines of government and medical programs. Caution is exercised to avoid using preliminary findings of SBRP before clinical trials have established their efficacy and safety. Further quality control requires nutrition counseling to affected individuals and community groups be done only by SCAN’s Registered Dietitians, exclusively licensed in Kentucky to educate and counsel people on nutrition. SCAN also includes UK’s Cooperative Extension Service, the ongoing mission of which is to translate University research to the public. The model encourages Outreach in full partnership with affected communities to identify areas of research for SBRP inquiry and to translate safe, effective nutrition information to support the needs of Superfund communities. Supported by NIEHS/NIH (ES 07380)

26
NOTES
_____________________________________________________________ _____________________________________________________________ _____________________________________________________________ _____________________________________________________________ _____________________________________________________________ _____________________________________________________________ _____________________________________________________________ _____________________________________________________________ _____________________________________________________________ _____________________________________________________________ _____________________________________________________________ _____________________________________________________________ _____________________________________________________________ _____________________________________________________________ _____________________________________________________________ _____________________________________________________________ _____________________________________________________________ _____________________________________________________________ _____________________________________________________________
27
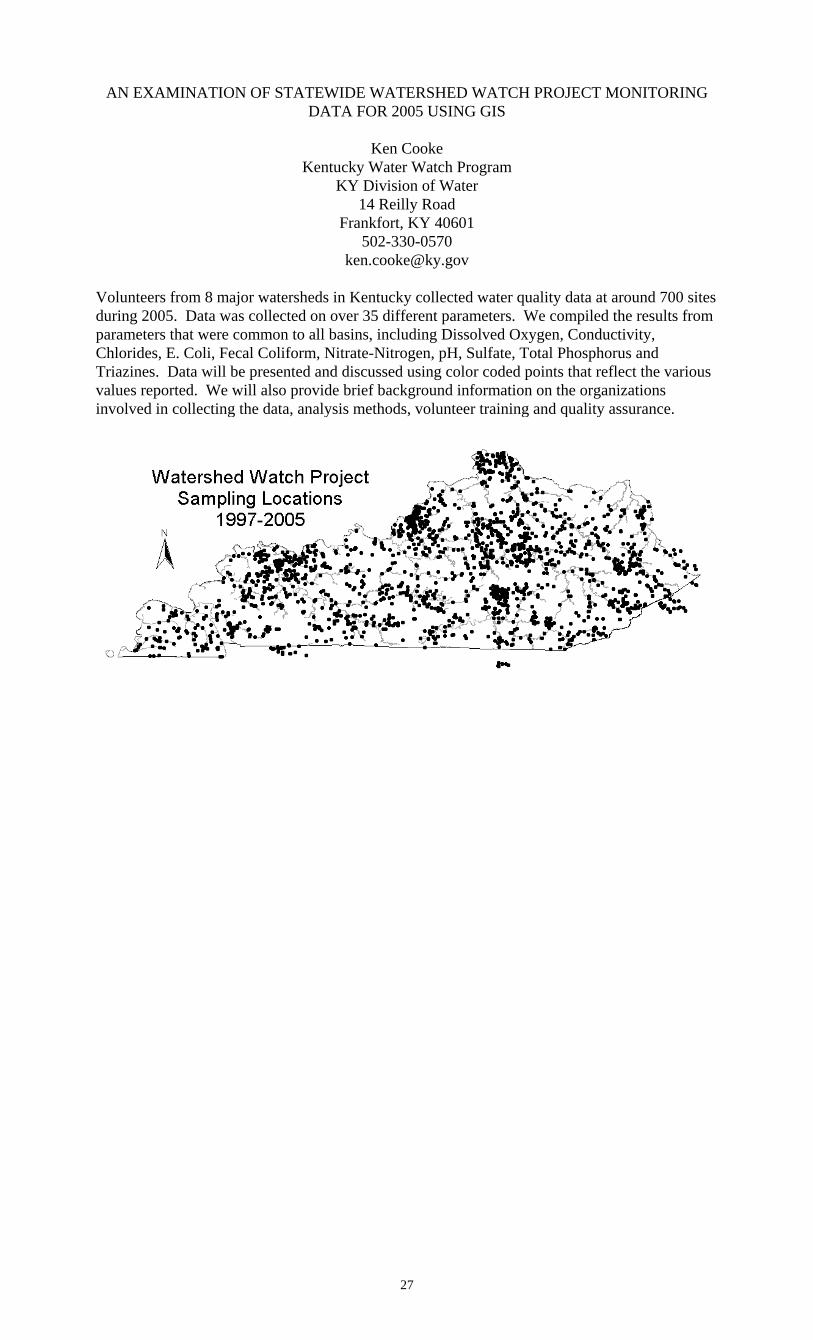
AN EXAMINATION OF STATEWIDE WATERSHED WATCH PROJECT MONITORING DATA FOR 2005 USING GIS
Ken Cooke
Kentucky Water Watch Program KY Division of Water
14 Reilly Road Frankfort, KY 40601
502-330-0570 [email protected]
Volunteers from 8 major watersheds in Kentucky collected water quality data at around 700 sites during 2005. Data was collected on over 35 different parameters. We compiled the results from parameters that were common to all basins, including Dissolved Oxygen, Conductivity, Chlorides, E. Coli, Fecal Coliform, Nitrate-Nitrogen, pH, Sulfate, Total Phosphorus and Triazines. Data will be presented and discussed using color coded points that reflect the various values reported. We will also provide brief background information on the organizations involved in collecting the data, analysis methods, volunteer training and quality assurance.

28
NOTES
________________________________________________________________ ________________________________________________________________ ________________________________________________________________ ________________________________________________________________ ________________________________________________________________ ________________________________________________________________ ________________________________________________________________ ________________________________________________________________ ________________________________________________________________ ________________________________________________________________ ________________________________________________________________ ________________________________________________________________ ________________________________________________________________ ________________________________________________________________ ________________________________________________________________ ________________________________________________________________ ________________________________________________________________ ________________________________________________________________ ________________________________________________________________

29
TAKING WATERSHED WATCH TO THE NEXT LEVEL: GRABBING THE ATTENTION OF LOCAL ELECTED OFFICIALS
Ken Cooke
Kentucky Water Watch Coordinator Kentucky Division of Water
14 Reilly Road Frankfort, Kentucky 40601
800.928.0045 ext. 473 [email protected]
And
H. David Gabbard
KDPES Stormwater Permit Administrator Division of Engineering
Lexington Fayette Urban County Government 101 East Vine Street
Lexington, Kentucky 40507 859.258.3410 office 859.983.4751 mobile [email protected]
In a world of ever increasing demands on public resources and a tightening fiscal “belt,” many watershed protection measures continue to go unfunded. For the city of Lexington, Kentucky, these issues continue to hamper efforts to create a stormwater utility and stormwater management fee which would fund the necessary programs and projects to address water quality impairments in the streams of Fayette County. Lexington is located on a hill and most of the major watersheds of the county drain away from the downtown area. Most headwater streams are buried and there is no river to protect, no bay to preserve, no endangered species to save. Therefore, the biggest stormwater concern is flooding. And with most homes that used to flood now torn down and converted into park land, support for a stormwater utility seems to be decreasing. Since the inception of the stormwater pollution prevention programs of the Lexington Fayette Urban County Government (LFUCG) in 1993, data has shown that Lexington has the same sorts of problems with urban stormwater runoff as other cities – fecal coliforms; illicit discharges; heavy metals; nutrients; sediment; and floatables. Furthermore, since 1997, the Kentucky River Watershed Watch (KRWW) has had citizen volunteer samplers at various locations throughout Fayette County. Their sampling efforts have shown the same information as the sampling efforts of the LFUCG and its stormwater consultant, Tetra Tech, Inc.

30
But since the data coming in showed the same thing as previously collected data, there was a collective “ho-hum,” nothing new attitude. Government sampling says there’s a problem…and a few citizens say there is a problem. Furthermore, because of the complex nature of comprehensive watershed planning and management, these concepts do not readily lend themselves to public discourse and easy solutions. So while the concerns about flooding may be decreasing and data showing polluted waters is not, there has been little momentum to push this discussion to the next level…until now… In May 2005, Mr. Ken Cooke, et. al., obtained a $2,000.00 grant from the Kentucky Water Resources Research Institute via monies provided by the Kentucky River Authority to start the first citizen-based advocacy stream protection group in Fayette County: The Friends of Wolf Run. Water samples were collected at numerous sites simultaneously with the assistance of enthusiastic voters in the fall of 2005. While the data showed the same results as before, the message was much more powerful – the collaborative effort at coordination and funding among the LFUCG, the KRWW, and the Kentucky Division of Water resulted in a presentation before the LFUCG Stormwater Oversight Committee in November 2005. The presentation that was given was more than the usual presentation of impaired streams, sample locations, and boring engineering diagrams and data plots – it was an aerial map with the location of the sampling points shown overlaid on parks, neighborhoods, shopping centers, etc. It grabbed the attention of the audience – the local elected officials – and showed the extent of urban watershed pollution and gave a spatial indication of the impacts to the communities along the Wolf Run corridor. At the end of the presentation, the final attention “grabbing” item was a comparison of a “normal” day in Lexington’s creeks was equivalent to the dangerously polluted waters of New Orleans after the hurricane. And at the end of the meeting, Councilmember Kevin Stinnett called for a citizen advisory committee to be reconvened to further examine the stormwater utility. While 40 people may not seem like a big number, because these people are willing to sit through 3 hours of watershed training and then when the time came, put their boots on, get up early in the morning and collect simultaneous water samples from 16 stations across a small urban watershed, that grabs the attention of local elected officials – these are committed citizens who are committed to improving their communities and protecting their children. The Friends of Wolf Run, Inc. has set an example for every community that is faced with the dilemma of limited budgets and unlimited public demands – how to “grab” the attention of the local officials to put the necessary resources behind efforts to protect and preserve our precious water resources and enhance our communities.
31
WATER QUALITY DATA FROM CITIZEN MONITORING IN THE LICKING RIVER REGION KENTUCKY 1998-2005: TRENDS AND ISSUES
Marc F. Hult 1 and Brian C. Reeder 2
1 Daniel Carter Beard Environmental Center 2 Center for Environmental Education 322 E. 3rd Street 327C Lappin Hall Covington KY 41011 Morehead, KY 40351 859-261-3882 606-783-2957 [email protected] [email protected]
Results of sampling in the Licking River Region of Kentucky during 1998-2005 by Licking River Watershed Watch (LRWW) volunteers are presented. LRWW is an independent 501(c)(3) non-profit organization affiliated with other Watershed Watch groups in Kentucky. Training, quality assurance and sampling strategies are coordinated statewide to provide compatible and consistent results. Over the past eight years, more than 400 LRWW volunteers have been trained to assess habitat, use qualitative macroinvertebrate surveys as an indicator of stream health , measure stream flow, dissolved oxygen, pH, and water temperature, and to collect water samples for laboratory analysis. Three times each year, basin-wide (“synoptic”) samples were collected synchronously. 305 sampling sites have been established and sampled at least once. As many as 110 samples have been collected during a single sampling event. Typically more than 90% of the samples are collected within a 4-hour period. The synoptic sampling events were typically on the second Saturday in May, July and September. Funding permitting, samples were collected for analysis of indicators of pathogens (fecal coliform, and at times fecal streptococcus or E.coli ). During the May sampling, samples for analysis of pesticides (typically atrazine) were collected. The July sampling period was chosen as a period when primary contact recreation (swimming) is prevalent. The sampling in September is during a period when historical stream-flow records indicate the greatest probability of low-flow conditions. This maximizes the likelihood that samples collected reflect base-flow water quality, namely ground-water and locally, discharge from straight pipes and septic, package and municipal sewage systems. Samples were collected on pre-determined dates, so actual flow conditions ranged from significant drought (September 1999) to wet-weather conditions. “Low-flow” samples were typically analyzed for major cations and anions, ammonia, nitrate, total phosphorus, total organic carbon, suspended-sediment concentration, and selected minor and trace metals as well as bacteria. All values reported, other than field parameters, were analyzed by qualified laboratories -- typically Morehead University Water Testing Lab (bacteria) and the Kentucky Geological Survey (all other parameters). Localized water quality investigations (“focused studies”) were conducted where basin-wide sampling identified issues and local interest warranted. Specific analytes varied depending on the problem and available funding.

32
Although significant efforts have been made in the watershed to improve water quality (for example sewage upgrades by eastern Kentucky PRIDE in the upper part of the basin), we found no discernable trend of improving water quality over time. The greatest concern for human and ecosystem health is the high concentration of fecal coliform bacteria. Sediment deposition in stream channels and attendant decrease in the quality of habitat has been identified nationally and by the Commonwealth as a major reason for impairment of streams. Although we did not collect quantitative data on sediment loads, qualitative habitat assessments suggest this is a prevalent problem. Pesticides and herbicides were not found in high concentrations in the Licking basin. Unlike in the western parts of the Commonwealth, row-crop runoff does not appear to be a major water quality concern. DO and pH problems were also not universally a problem; however, there were sometimes local problems during some years. The results of these 24 basin-wide sampling events demonstrate the importance of meteorological events in controlling bacteria concentrations in water bodies. The lowest fecal coliform concentrations occurred during the drought of 1999; the highest during the wettest year of 1998. The results have application to regulatory and management decisions. The data suggests that maximum concentrations of pathogens occurs after sufficient time for pollutant build-up and their subsequent discharge to water bodies owing to a major precipitation event.. This may not occur during a 30-day period if precipitation events are too frequent (so contaminant mass does not accumulate in the watershed) or too infrequent (so that a major surface water runoff event does not occur). However the method specified by Kentucky Revised Regulations (401 KAR 5:031) to legally define impairment by pathogens requires that samples be collected within a 30-day period regardless of meteorological conditions. Consequently, where and when the causes of pollution have not changed significantly with time, this method -- although giving the appearance of rigor -- may be less indicative of actual conditions than even data collected infrequently over several years. A significant example was the summer sampling period of 1999 which coincided with both a regional drought and the once-every-five-year sampling of the Kentucky Watershed Framework monitoring cycle. Based on summer 1999 data, the Commonwealth twice proposed to reduce from First to Second Priority, in both the draft 2002 and 2004 303(d) list of impaired water bodies in Kentucky, the main stem of the Licking River from its confluence with the Ohio River (Mile Post 0) to the confluence of Banklick Creek (Mile Post 4.7).This is the most important river reach wholly in Kentucky in the Commonwealth’s largest metropolitan area (Greater Cincinnati-Northern Kentucky). Formal comments to both the proposed 2002 and 2004 downgrading cited widespread effect of the drought in lowering measured bacteria. This resulted in the reach remaining First Priority in both 2002 ad 2004 lists. The conclusion that meteorological conditions, not a decrease in pollutant loading, were responsible for lower observed concentrations is consistent with documents filed in 2005 as part of the Consent Decree reached by US Department of Justice, the Commonwealth and Sanitation District #1 that indicate that no combined sewer overflows and few, if any, sanitary sewer overflows were eliminated in this reach during 1998-2005.

33
WATER QUALITY IN THE UPPER LICKING RIVER BASIN 2003-2005
Brian C. Reeder, Geoffery Gearner, Jason W. Marion, Todd A. Leonard, Phillip W. Whitley, Lee Crum, Joshua Hunt, Christopher C. Shields, and Jennifer Thompson
Morehead State University, Institute for Regional Analysis and Public Policy and
Department of Biological and Environmental Sciences, Morehead, KY 40351, (606)783-2957, [email protected]
Eastern Kentucky’s lushly forested hillsides and low population density would suggest the area should have above-average environmental quality. However, past analysis of water quality in the region suggested problems with fecal contamination and high sediment loading. Although human population density is low in the upper watershed counties (Magoffin, Morgan, Rowan, Bath, and part of Elliot and Menifee), there is little to no sewage treatment in many areas, and riparian degradation is common. We sought to identify any spatial relationships in Licking River water quality from the headwaters to the Cave Run Lake outflow, and to assess potential environmental hazards. We sampled water from the Licking River and some tributaries monthly from July 2003 until February 2005. Five sites were located upstream of Cave Run Lake (Magoffin and Morgan counties), and one below the dam (Rowan-Bath county line). We measured conductivity, temperature, pH, alkalinity, dissolved oxygen, total iron, nitrate, and total suspended solids, fecal coliform bacteria, and fecal streptococcus bacteria. The pH was usually between 7.2 and 7.5, with only one incident where pH fell below 6.5. Several of the samples had pH> 7.8, which is relatively high given the regional geology--suggesting high primary productivity, or contamination. Median dissolved oxygen concentrations were > 7 mg/L at all sites--well within the range of maintaining a healthy watershed. Dissolved oxygen concentrations did not correlate very well with temperature, suggesting biological activity may sometimes be more important than temperature in determining concentrations. There was no significant relationship between iron and conductivity, despite the potential in an extractive resource region, and given the local geology. Conductivity and alkalinity were negative correlated to flow (the reverse of what would be expected in this watershed). This is partially because the furthest upstream site appears to be impacted directly by an unknown pollutant (mean conductivity = 464 uS/cm; mean alkalinity = 70 mg CaCO3/l), which was diluted as it flowed down the river. The pollutant does not appear to be alkalinity, suspended solid, or iron related. The conductivity at this site increased almost an order of magnitude a few months into this study. There are a number of interacting factors compounding water quality degradation in the upper portion of the Licking River. Multiple pollutants are reducing water quality and creating water quality conditions that do not fit with expected biogeochemical relationships. Almost 75% of the samples had fecal coliform CFUs > 200. Five percent of samples suggested bacterial contamination from human sources; animals were the main contributor to 30%; the remainder were a mixture of human and animal contamination. With increases in sewage treatment, in the future, it may be possible to identify the

34
factors determining the physical and chemical components of the river. We are currently pursuing DNA fingerprinting and antibiotic resistance in the microbial community to determine potential sources. This would allow managers and decisions makers to put funding where it will have the greatest benefit to the people of the United States.

35
LITTLE RIVER WATERSHED DELINEATION AND "MISBEHAVED" KARST DRAINAGE
Joseph A. Ray and Robert J. Blair
Kentucky Division of Water 14 Reilly Road, Frankfort, Kentucky 40601
(502) 564-3410 [email protected] / [email protected]
Abstract: Groundwater hydrology of the southwestern two thirds of the Little River basin, in southwestern Kentucky, is dominated by well-developed karst in a sinkhole-plain. Previous groundwater-tracer investigations (1987 and 1994) documented karst underflow of topographic watershed boundaries of the Little River (Figure A). This Nonpoint Source (NPS) project expanded on these earlier dye tests and a previous NPS groundwater investigation by Ray and others (2005).
Accurate karst watershed information is vital for effective emergency response to spills and for reliable monitoring of waste and industrial sites. Likewise, karst groundwater data are important for assessment and abatement of NPS pollution from agriculture, transportation, and urban settings, and for evaluation of Total Maximum Daily Loadings (TMDL's) of pollution for regional streams. Hydrologic Unit Code (HUC) watershed delineations mapped by the U.S. Geological Survey (USGS)
comprise the existing watershed-boundary data-set to be tested by additional groundwater tracing. These digital HUC boundaries were mapped entirely from topographic divides, which often vary significantly from actual groundwater divides in karst regions. Forty-nine tracer tests were conducted to map spring basins and test the established HUC boundaries. Forty dye injections were successfully detected in 17 spring basins and two sub-basins, for an 82% test-recovery rate. Interpreted groundwater flow paths averaged 5.3 km, but extended up to 15 km. Groundwater velocities averaged greater than 30 m per hour. The highest documented velocity exceeded 130 m per hour. Rapid velocities within these lengthy groundwater flow paths demonstrate the sensitivity of karst terrane to spills and ambient pollution and highlight the importance of their identification. The minimum annual discharge of study-area springs ranges from 1.7-169.9 L/s. Groundwater basin and sub-basin areas, based on tracer tests and topographic divides, range from 2.0-186.6 km2. Unit base flow (UBF), or the ratio of discharge to basin area,
Figure A

36
ranges from 0.44-14.54 L/s/km2. Most spring basins in the well-developed karst of the sinkhole plain yield a UBF of 2.0-2.75 L/s/km2. UBF deficits at some springs suggest unmeasured sub-fluvial springs. Bordering the sinkhole plain to the northeast, a moderately-developed shallow karst setting has been identified that yields about half the UBF of the sinkhole plain. In contrast, Murphy Spring yields 7 times the typical UBF because of unaccounted cutoff diversions from Montgomery Creek. Karst groundwater drainage that is incongruous with topographic basins is termed "misbehaved". For the purposes of this study, misbehaved karst drainage is defined as verified conduit flow passing beneath a delineated 14-digit or lower HUC boundary. As shown by successful tracer tests, 39% of 17 karst basins contain misbehaved drainage, ranging from 10-99% of individual basin areas. Of the entire 638 km2 of karst-basin area in which tracer tests were conducted, 48% exhibited misbehaved drainage. These data demonstrate that identified karst drainage basins, rather than HUC delineations alone, comprise the most accurate and appropriate watershed research and management units in
karst areas. This study supported previous work and concluded that Little River basin enlargement occurs in the southeast, with watershed gains from West Fork Red River of about 23 km2. Equivalent basin reduction occurs in the northwest with watershed losses to Muddy Fork (Figure B). Unusual karst drainage documented in the region includes intermittent karst windows and lakes, seasonal overflow distributaries up to 5.6 km
wide, a 2.2 km-wide perennial distributary, audible subterranean waterfalls, conduit flow beneath a perched aquifer, and conduit underflow of the bedrock channels of West Fork Red River, Montgomery Creek, and Little River. Karst groundwater basins and conduit flow routes mapped during this NPS study will contribute significantly to a future issue of the Kentucky Geological Survey's Map and Chart Series entitled Mapped Karst Groundwater Basins in the Hopkinsville 30 x 60 Minute Quadrangle. Acquisition of these karst data is an efficient use of 319h Nonpoint Source funding and provides vital information for future studies and response to environmental emergencies. Crawford, N.C., 1987, Groundwater flow in the vicinity of a gasoline spill near Gracey, Trigg County, Kentucky, Consultant's Report. Ewers, R.O., and Idstein, P.J., 1994, Quarles Spring groundwater basin analysis, Fort Campbell, Kentucky: EWC Final Report. Ray, J.A., O'dell, P.W., Moody, J.R., Blanset, J.M., and Blair, R.J., 2005, Identification and prioritization of karst groundwater basins
in Kentucky for targeting resources for nonpoint source pollution prevention and abatement: Kentucky Division of Water, 136 p.
Figure B
37
COMPREHENSIVE COMMONWEALTH WATER EDUCATION PROJECT Principal Investigators: Dr. David Howarth and Dr. Keith Mountain
Project Coordinator: Kristen Dunaway [email protected]
Department of Geography and Geosciences University of Louisville
Louisville, Kentucky 40292 502-852-6153
This presentation will focus on the products, progress, difficulties, and successes
of the Comprehensive Commonwealth Water Education Project. The Comprehensive Commonwealth Water Education Project (“CWEP”) is a statewide, federally funded project designed to educate adult Kentuckians about the impact of nonpoint source water pollution. Through surveys of Kentucky citizens, water pollution was identified as the number one environmental problem in the state. However, few Kentuckians understand the sources of water pollution or how to prevent the impact of water pollution. The goal of CWEP is to use the talents, resources, and knowledge of the project partners to provide Kentuckians with the knowledge of the cause and effects of water pollution. To achieve this goal there are several components to CWEP including professional development for educators; a Kentucky State Standards aligned curriculum for grades K-8 based on the "Living Stream" at the Salato Wildlife Education Center; a documentary and virtual field trip produced by Kentucky Educational Television; the Kentucky Growth Readiness Project; and a media campaign produced by Western Kentucky University, WKYU-PBS. The Kentucky Environmental Education Council will assess all products, including the educator professional development workshops. The educator professional development project is designed to educate formal and non-formal teachers about the impacts of nonpoint source water pollution. The project is a standards-based program wherein the regional universities will implement the program in their basins and will serve as the project basin contact to assist with disseminating information to citizens of the universities’ basins. The Salato Wildlife Education Center and the participating universities are each developing a Kentucky standards aligned curriculum. Kentucky Educational Television created a water documentary explaining sources of nonpoint water pollution and the ways to address the problems. The documentary is divided into segments so that it can be used in a classroom setting. The virtual field trip will also be a tool that teachers can use in the classroom. The Kentucky Growth Readiness Project curriculum is based on the University of Connecticut Nonpoint Source Education for Municipal Officials (NEMO) curriculum that has been adapted for use in other states. With the assistance of the Tennessee Valley Authority, the Kentucky Division of Water developed the program to educate public officials, developers, farmers, builders, and consumers. There are presentations directed to specific audiences that the trainers can adjust depending on their audience. The

38
trainers are able to communicate through the internet and the tools for the project are available through the CWEP website and the Kentucky Growth Readiness Handbook. The media campaign includes television, radio, and print public service announcements. In addition, there is a website that incorporates all elements of CWEP, including the water documentary, the virtual field trip, public service announcements, the Kentucky Growth Readiness Project, and the Educator Professional Development Project. These tools will be made available to the public through the grant partners and CWEP basin contacts.
The Kentucky Environmental Education Council is developing assessment tools to measure the accomplishments of CWEP. This will include pre- and post- test scores for the participants of the workshops and the professional development programs. Furthermore, the Kentucky Environmental Education Council will include several nonpoint source questions in the environmental literacy survey it commissions every five years. KEEC will also conduct focus groups with citizens and then assess impact of CWEP within Kentucky communities. Project partners will continue to improve the project through the continuing assessment of CWEP.
The CWEP partnership includes: Kentucky Educational Television Foundation, Inc.; Western Kentucky University, Center for Water Resource Studies; Kentucky Division of Water, Watershed Management Branch; Kentucky Waterways Alliance; Kentucky Department for Fish and Wildlife Resources; University of Kentucky, Tracy Farmer Center; Kentucky Geographic Alliance; Kentucky Environmental Education Council; Kentucky Division of Conservation; University of Kentucky Cooperative Extension; Northern Kentucky University, College of Education; University of Louisville, Center for Environmental Education; University of Louisville, Department of Geography and Geosciences; Western Kentucky University, Center for Math, Science, and Environmental Education; and Murray State University, Center for Environmental Education; University of Kentucky Water Resource Institute; Kentucky Association of Counties; Kentucky League of Cities; and Western Kentucky University WKYU-PBS. The wealth of expertise that these partners bring to the project will make it possible to deliver to Kentuckians effective and accurate information regarding nonpoint source water pollution.

39
ASSESSMENT OF WATER QUALITY TRENDS IN THE UPPER CUMBERLAND RIVER BASIN: FOCUS ON PATHOGEN IMPAIRMENT
Lindell Ormsbee and Ramesh Teegavarapu Kentucky Water Resources Research Institute 233 Mining and Mineral Resources Building
University of Kentucky Lexington, Kentucky 40506-0107
859-257-1299 [email protected]
The upper Cumberland River Basin (8-digit HUC 05030101) has continued to be
significantly impacted by pathogen problems for several years. These impacts are due to
various causes including the improper operation of wastewater treatment plants, straight
pipes and failing onsite treatment systems, and other non-point sources. The Kentucky
Division of Water began an extensive sampling effort in 1993 that has continued up to
the present. In 1998, a formal TMDL (Total Maximum Daily Load) for the entire region
was developed that focused on eliminating point sources primarily associated with
improperly operated wastewater treatment plants within the basin. Subsequent to the
development of the TMDL, several million dollars of wastewater projects have been
implemented in the region as a result of funding provided through EPA, Eastern
Kentucky PRIDE, and the Army Corps of Engineers.
In order to assess the potential impacts of these projects, a 319 project was implemented
for the purposes of collecting and assessing water quality data in the region for the last 10
years. The analyzed data were obtained from the Kentucky Division of Water (both
ambient and focused sampling) and from PRIDE (both synoptic and focused sampling).
The data were evaluated using both deterministic and statistical measures at four different
levels: regional, county, station, and project sites. In general, the analyses indicated
measurable improvements in the majority of data sets, however several sites in Harlan
County still appear to exhibit problems associated with high fecal coliform
concentrations.

40
NOTES
_____________________________________________________________ _____________________________________________________________ _____________________________________________________________ _____________________________________________________________ _____________________________________________________________ _____________________________________________________________ _____________________________________________________________ _____________________________________________________________ _____________________________________________________________ _____________________________________________________________ _____________________________________________________________ _____________________________________________________________ _____________________________________________________________ _____________________________________________________________ _____________________________________________________________ _____________________________________________________________ _____________________________________________________________ _____________________________________________________________ _____________________________________________________________

41
WATERSHED & LAND USE PLANNING: A BMP TECHNOLOGY TRANSFER PROJECT
A Case Study of the Dry Run Watershed Basin
Rachel Phillips – Georgetown/Scott County Planning Commission
Brad Frazier – Georgetown City Engineer Sandy Camargo – CDP Engineers, Inc.
Georgetown/Scott County Planning Commission
230 East Main Street Georgetown, KY 40324 Phone: (502) 867-3701
Email: [email protected] The Georgetown-Scott County Planning Commission, working with CDP Engineers, Inc., is conducting a pilot project for watershed planning that will encompass properties within the City of Georgetown and Scott County. The plan was submitted and approved by the Kentucky Division of Water – Non-Point Source Section, as a Section 319(h) grant for FFY 2004. The study area is defined as the “Dry Run Watershed Basin” that incorporates approximately 8000 acres (12.5 sq.mi.). The basin is generally located north of downtown Georgetown at the confluence of Dry Run Creek and N. Elkhorn Creek (i.e., Moss Park and Bi-Water Farm), extending north towards and including approximately one-half of the Toyota Motor Manufacturing of Kentucky (TMMK) property, Anne Mason School, Derby Estates, Scott County Fire Station #1 and Harbor Village. Approximately one-third of the proposed study area is currently located within the current Urban Service Boundary (USB) with the potential growth area per the Comprehensive Plan process to increase to over one-half of the study area within a minimum of ten years. Based on development projections, the Dry Run Basin is the area identified for future growth and urban development within the community. There are several factors that will guide growth into this basin including the construction (completion) of Champion Way, construction of Anne Mason Elementary School, installation of a sanitary sewer trunk line and related infrastructure, construction of the proposed northwest bypass connecting U.S 460 at Western Elementary/Canewood to Cherry Blossom Way/Delaplain Road at I-75 (exit 129). This area was also identified as a growth corridor during the 1991 Comprehensive Plan review. Once completed, the watershed plan would provide a long range plan for development within this area. The Watershed Plan will be a proactive measure to guide development, storm water and establishing water quality features (BMP’s) including open space,
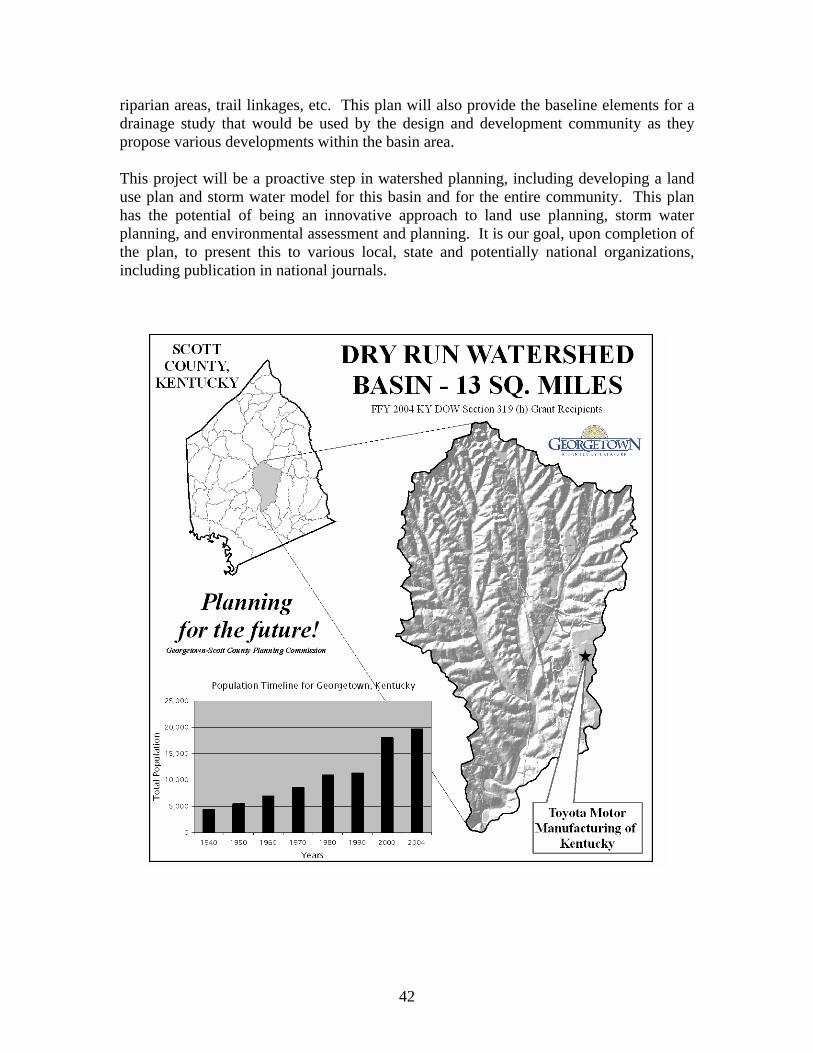
42
riparian areas, trail linkages, etc. This plan will also provide the baseline elements for a drainage study that would be used by the design and development community as they propose various developments within the basin area. This project will be a proactive step in watershed planning, including developing a land use plan and storm water model for this basin and for the entire community. This plan has the potential of being an innovative approach to land use planning, storm water planning, and environmental assessment and planning. It is our goal, upon completion of the plan, to present this to various local, state and potentially national organizations, including publication in national journals.

43
THE NEW CONTRACTOR EPSC CERTIFICATION PROGRAM DEVELOPED BY THE CITY OF BOWLING GREEN KENTUCKY:
EDUCATING AND INVOLVING CONTRACTORS IN NPDES PHASE II COMPLIANCE
Authors: *Jeff Lashlee, PE, City of Bowling Green1
*Beth Chesson, CPESC, CPSWQ, CEC, Inc.2 April Barker, CPESC, AMEC Earth & Environmental3
*indicates the speaker presenting the paper The City of Bowling Green, Kentucky is a designated NPDES Phase II community and is therefore required to adopt and implement a construction site runoff control program. In December of 2004, the City adopted a stormwater ordinance that required “certified contractors” on development sites. The certified contractor requirement was included in the stormwater ordinance in an effort to educate contractors on the importance of Erosion Prevention and Sediment Control (EPSC) and to more actively involve site contractors with stormwater compliance initiatives. In the summer of 2005, the City contracted with AMEC Earth & Environmental and Civil & Environmental Consultants, Inc. to help them develop the Contractor EPSC Certification Program. This presentation will discuss the following:
• The City has involved homebuilders and contractors throughout the certification program development process to keep them informed about upcoming changes. Comments from the homebuilders and developers have been incorporated into the program where appropriate.
• The City has developed training modules for contractors, the first of which will be delivered in October and November. Attendees must pass a test on information presented in the training in order to obtain certification.
• Re-certification will be required every three years and will involve training by the City and attendance at one City-sponsored EPSC field day.
• The City will be requiring most new single family residential sites to have an EPSC plan for the site and to identify a Certified Contractor prior to issuing a building permit. This requirement reflects a movement away from holding a residential subdivision developer responsible for all land-disturbing activities and EPSC requirements within a subdivision when individual lots have been sold.
• In an effort to make certification program tracking simpler, a tracking system has been developed for the City to track certified contractor activities.
The City will begin requiring Certified Contractors for new developments and building permits beginning April 1, 2006. 1 Jeff Lashlee, PE, City Engineer, City of Bowling Green, 1011 College St, Bowling Green, KY 42102, [email protected] 2 Beth Chesson, Senior Project Manager, Civil & Environmental Consultants, Inc. 624 Grassmere Park Dr., Suite 21, Nashville, TN 37211, [email protected] 3 April Barker Project Manager, AMEC Earth & Environmental, 3600 Ezell Rd, suite 100, Nashville, TN 37211, [email protected]

44
NOTES
_____________________________________________________________ _____________________________________________________________ _____________________________________________________________ _____________________________________________________________ _____________________________________________________________ _____________________________________________________________ _____________________________________________________________ _____________________________________________________________ _____________________________________________________________ _____________________________________________________________ _____________________________________________________________ _____________________________________________________________ _____________________________________________________________ _____________________________________________________________ _____________________________________________________________ _____________________________________________________________ _____________________________________________________________ _____________________________________________________________ _____________________________________________________________

45
KENTUCKY BEST MANAGEMENT PRACTICES FOR CONTROLLING EROSION, SEDIMENT, AND POLLUTANT RUNOFF
FROM CONSTRUCTION SITES: PLANNING AND TECHNICAL SPECIFICATIONS MANUAL
Richard Walker and Barry Tonning
Tetra Tech, 800 Corporate Drive, Lexington KY 40503 859.223.8000
[email protected], [email protected] The Kentucky Division of Conservation and Division of Water supported development of the “Construction Site BMP Planning and Technical Specifications Manual” to provide information to municipalities, agency staff, developers, engineers, and contractors on appropriate controls for construction site runoff. Poorly managed construction sites can become sources of sediment, nutrients, and wastes from concrete, painting, landscaping, and fueling operations, all of which may impact water quality. The BMP Manual builds on the successful release of the “Kentucky Erosion Protection and Sediment Control Field Guide,” a 100-page full-color laminated document for construction site workers released in 2003. Where the Field Guide provides summary information, BMP illustrations, and photo examples of BMP installations, the BMP Manual provides details on design requirements, construction/installation specifications, and inspection/maintenance needs. The manual stresses that BMPs must be selected, installed, and maintained in a manner appropriate for both the BMP and the unique conditions of the site. It also notes that while BMP plans identify the primary controls needed during each phase of construction, field personnel should be aware of how to select, adapt, operate, and maintain BMPs cited on plans or installed as a result of corrective actions stemming from field observations. The manual addresses both planning technical specifications for runoff pollutant controls. The series of BMP Technical Specifications Fact Sheets in the manual are organized according to the following categories. A table citing each BMP and the pollutant(s) it targets appears on the next page:
Site Preparation: Initial clearing and grading Soil Stabilization: Seeding, mulching, and sodding Slope Protection: Silt fences, blankets, mats, gabions Drainage System Controls: Inlet and outlet protection, ditches Sediment Traps/Basins: Small and large settling “ponds” Stream and Wetland Protection: Preserving and restoring waterways Good Housekeeping: Prevention of other types of polluted runoff

46
● BMP is very effective in treating, removing, or immobilizing the target pollutant. ◐ BMP is somewhat effective in treating, removing, or immobilizing the target pollutant. ○ BMP is not effective in treating, removing, or immobilizing the target pollutant; not applicable BMP Effectiveness for Various Construction Site Runoff Pollutants Section BMP Categories and Practices Sediment Oil/Grease Nutrients Toxics Waste
4.2.0 Site Preparation 4.2.1 Land Grading ● ○ ● ○ ○ 4.2.2 Construction Exit ● ○ ○ ○ ○ 4.2.3 Temporary Diversion (Berm or Ditch) ● ○ ◐ ○ ○ 4.2.4 Topsoil Stockpiling ● ○ ● ○ ○ 4.2.5 Surface Roughening ● ○ ● ○ ○ 4.3.0 Soil Stabilization 4.3.1 Temporary Seeding ● ○ ● ○ ○ 4.3.2 Permanent Seeding ● ○ ● ○ ○ 4.3.3 Mulching ● ○ ● ○ ○ 4.3.4 Sodding ● ○ ● ○ ○ 4.3.5 Polyacrylamides ◐ ○ ◐ ○ ○ 4.3.6 Dust Control ◐ ○ ○ ○ ○ 4.4.0 Slope Protection 4.4.1 Silt Fences ◐ ○ ◐ ○ ○ 4.4.2 Brush, Rock, and Other Sediment Barriers ◐ ○ ◐ ○ ○ 4.4.3 Erosion Blankets and Turf Reinforce. Mats ● ○ ● ○ ○ 4.4.4 Temporary Slope Drains ◐ ○ ○ ○ ○ 4.4.5 Gabion Baskets and Mattresses ◐ ○ ○ ○ ○ 4.4.6 Cellular Confinement Systems ● ○ ◐ ○ ○ 4.5.0 Drainage System Controls 4.5.1 Curb Inlet Sediment Barrier ◐ ○ ◐ ◐ ○ 4.5.2 Drop Inlet Sediment Barrier ◐ ○ ◐ ◐ ○ 4.5.3 Culvert Inlet Sediment Barrier ◐ ○ ◐ ◐ ○ 4.5.4 Culvert Outlet Energy Dissipator ● ○ ◐ ○ ○ 4.5.5 Rock Lined Ditches and Channels ● ○ ◐ ○ ○ 4.5.6 Grass Lined Ditches and Channels ● ○ ◐ ○ ○ 4.5.7 Check Dams for Ditches and Channels ◐ ○ ◐ ○ ○ 4.6.0 Sediment Traps and Basins 4.6.1 Temporary Sediment (Silt) Traps ◐ ○ ◐ ○ ○ 4.6.2 Sediment (Detention) Basins ◐ ◐ ◐ ○ ○ 4.63 Dewatering Devices ◐ ○ ○ ○ ○ 4.7.0 Stream and Wetland Protection 4.7.1 Buffer Zones ● ○ ● ◐ ○ 4.7.2 Filter Strips ● ○ ● ◐ ○ 4.7.3 Temporary Stream Crossing ● ○ ○ ○ ○ 4.7.4 Bioengineering: Live Staking ● ○ ◐ ○ ○ 4.7.5 Bioengineering: Wattles (Live Fascines) ● ○ ◐ ○ ○ 4.7.6 Bioengineering: Brushlayering ● ○ ◐ ○ ○ 4.8.0 Good Housekeeping / Other Controls 4.8.1 Materials Delivery, Storage, and Use ○ ● ● ● ● 4.8.2 Spill Prevention and Control ○ ● ● ● ◐ 4.8.3 Vehicle and Equipment Maintenance ◐ ● ○ ● ◐ 4.8.4 Debris and Trash Management ○ ○ ○ ○ ● 4.8.5 Hazardous Waste Management ○ ◐ ○ ● ● 4.8.6 Concrete Waste Management ◐ ○ ○ ◐ ● 4.8.7 Sanitary Facilities ○ ○ ◐ ○ ● 4.8.8 Employee Training ● ● ● ● ●

47
SEDIMENT MONITORING EFFORTS IN THE UPPER GREEN RIVER BASIN IN SUPPORT OF THE KENTUCKY CONSERVATION RESERVE ENHANCEMENT
PROGRAM
Stephen T. Kenworthy Department of Geography and Geology
Western Kentucky University 270-745-8777
The USDA Kentucky Conservation Reserve Enhancement Program (KY CREP) aims to promote soil conservation, improve water quality, and enhance riparian habitat in the Upper Green River basin. To assess progress toward achieving CREP goals for reduction of sediment delivery to aquatic systems, a set of related fluvial sediment monitoring activities has been initiated by KY CREP partners. These activities include efforts to identify sediment source areas and spatial patterns of sediment loading to stream channels, as well as field monitoring of suspended sediment fluxes.
Catchment areas contributing fine sediment to stream channels were assessed by estimating soil erosion and fine sediment delivery with a stream power based erosion model. Results of the modeling give a semi-quantitative assessment of the likely spatial variation of sediment production and delivery based on topographic, edaphic, and land use data. Field sampling of streambed material, particularly the proportion of fine sand, provided an additional index of spatial patterns of fine sediment delivery and in-channel storage.
Sediment flux monitoring efforts include collection of suspended sediment samples and continuous measurement of turbidity in cooperation with the US Geological Survey, KY Water Science Center. Monitoring sites include the Green River at Greensburg, Munfordville, and at Mammoth Cave National Park, as well as a site near the mouth of Pitman Creek. In addition to these surface stream monitoring sites, fluxes of water and sediment are measured at Logsdon River, a cave stream tributary to the Turnhole Basin in Mammoth Cave National Park. Although data collection at these sites is in an early stage, these data will complement the source area modeling and field sampling and will eventually provide insight into the hydrologic and geomorphic controls on patterns of fine sediment export from the Upper Green River Basin.

48
NOTES
_____________________________________________________________ _____________________________________________________________ _____________________________________________________________ _____________________________________________________________ _____________________________________________________________ _____________________________________________________________ _____________________________________________________________ _____________________________________________________________ _____________________________________________________________ _____________________________________________________________ _____________________________________________________________ _____________________________________________________________ _____________________________________________________________ _____________________________________________________________ _____________________________________________________________ _____________________________________________________________ _____________________________________________________________ _____________________________________________________________

49
LAND-USE FINGERPRINTING TO MEASURE THE SOURCE OF FINE SEDIMENTS IN CENTRAL KENTUCKY
J. F. Fox1
A.N. Papanicolaou
B. Belcher
N. Thompson
C. Davis
1 Assistant Professor
Civil Engineering, UK 161 O. H. Raymond Bldg.
Lexington, KY 40506-0281 Phone: 859-257-8668
Email: [email protected]
Excess fine sediments within streams and rivers are a pollutant recognized to cause un-fishable and un-swimable waters. In the Inner Bluegrass Region of Central Kentucky, fine sediments (silts and clays) are supplied to streams from upland land-uses including: tillage and livestock production in agriculture areas, logging and recreation in forests, and construction in urban areas. Watershed conservation of land-uses is needed to decrease the fine sediment problem; however, conservation is hindered due to a lack of knowledge regarding loading of fine sediments from the multiple sources. Land-use fingerprinting offers a technique to better understand fine sediment supply in Central Kentucky. Land-use fingerprinting refers to a field-based measurement technique that apportions fine sediments to their land-use sources. The technique uses biogeochemical tracers—here nitrogen and carbon isotope ratios, δ15N and δ13C, and the carbon to nitrogen atomic ratio, C/N—to identify sediment origin. The objective of this presentation is to: (1) demonstrate the land-use fingerprinting technique by presenting methods and results of a land-use fingerprinting application in Northwestern Idaho; and (2) describe the on-going research in the Inner Bluegrass Region of Central Kentucky to apply land-use fingerprinting. Land-use fingerprinting was applied in the Jerome Creek Watershed located in the Palouse Region of Northwestern Idaho. δ15N, δ13C, and C/N tracers were used to discriminate between forest and agriculture soil erosion sources during a high precipitation event in March 2003. In the forest, erosion was caused due to logging; in the agriculture, erosion was caused by seasonal tillage for winter wheat. Jerome Creek Watershed was chosen as a controlled setting to assess the usefulness of land-use fingerprinting due to well defined homogeneous land-uses and the predominance of fine sediment erosion over steep hillslopes to high gradient streams. Steps of the land-use fingerprinting methods included: sampling forest and agriculture erodible ‘source-soils’; sampling suspended ‘eroded-soils’ captured from the watershed outlet; analyzing the source- and eroded-soils for δ15N, δ13C, and C/N signatures using isotope ratio mass

50
spectrometry; and applying an unmixing model to quantify the fraction of eroded-soils from each source-soil. Results predicted approximately 90% of the eroded-soil (0.23 t/ha) was derived from the agriculture soil and 10% (0.003 t/ha) was from the forest soil. Results of land-use fingerprinting agreed well with a comparative study that used measured erosion rates from the forest and model predictions for the agriculture soil erosion rates. On-going research is assessing the applicability of land-use fingerprinting to the Inner Bluegrass Region of Central Kentucky. Key efforts currently under investigation in Central Kentucky include: (1) Field sampling and analysis of forest, agriculture, and urban source-soils to assess the discriminating capability of δ15N, δ13C, and C/N as ‘fingerprints’; (2) Sampling of suspended sediments from streams draining a range of watershed sizes and at different times of the year to assess the input of in-stream sediments (e.g., algae, bank sediments), which may mask the upland origins; and (3) Predict the transit times for aggregates of fine sediments in order that potential biogeochemical processing (e.g., in-stream decomposition, denitrification) may be accounted. Output from the current research will provide values of δ15N, δ13C, and C/N for land-use source-soils in Central Kentucky and additional methods and results (e.g., biomarkers, microscopy techniques) to successfully implement land-use fingerprinting in Central Kentucky.
51
Multi-Scalar Geomorphological Characterization of the Muddy Creek Watershed
Michael Albright Eastern Kentucky Environmental Research Institute
201 Roark Building Richmond, KY 40475
859-622-6914 [email protected]
Supervising Faculty:
Dr. Danita LaSage, Eastern Kentucky University, Senior Researcher, Eastern Kentucky Environmental Research Institute
Dr. Alice Jones, Eastern Kentucky University, Director, Eastern Kentucky Environmental Research Institute
This interdisciplinary undergraduate research project incorporates aspects of geology, geography, and geotechniques to create baseline geomorphologic data for the Muddy Creek watershed in Madison County, Kentucky. The Muddy Creek, a Kentucky River tributary, is on the 2002 Kentucky Division of Water 303(d) “List of Impaired Waters" as well as the draft 2004 303(d) List. A major identified pollutant in the river is sedimentation, and its suspected source is livestock operations. To better understand the sources of sediment in the stream system, it is important to understand the geomorphological characteristics of the stream so that sedimentation associated with natural dynamics can be distinguished from those associated with livestock management. Three elements of geotechniques and geographic information systems (GIS) were used in completing this project. First, a watershed-scale triangulated irregular network (TIN) surface model was built using 10-meter digital elevation model (DEM) maps created by the US Geological Survey, and the Kentucky GAP land cover dataset developed for the Kentucky Department of Fish & Wildlife Resources. Both coverages were accessed through the Kentucky Office of Geographic Information (OGI). The resulting three-dimensional land cover model was used to visualize and characterize the general geomorphology and land cover of the Muddy Creek watershed. The watershed’s prevalent geology is loosely divided into three geologic time periods: Devonian, Ordovician, and Silurian. A field sampling location was identified in each of the three major geologic zones, and then the three sites were geolocated on the 3-D surface model using global positioning systems (GPS) in the field. ArcGIS 3D Analyst was then used to create a site-specific geomorphological model at each field site. Finally, streambed materials at each site were collected and classified using the Udden-Wentworth grain-size classification scale; and a one-foot-interval cross-sectional survey of streambed elevations was conducted across the predominant drainage channel at each site.

52
The analysis indicates that there are both watershed-scale and local site-specific factors affecting observed geomorphology at each site. At the watershed scale, the upstream site is characterized by a dense tributary network and high sediment loads; at the site-specific scale, its most notable feature is the significant amount of sediment being trapped between the fence on the boundary of the Bluegrass Army Depot and a bridge immediately downstream at the road crossing. The midstream site is characterized at the watershed scale as having tight meanders in erosion-resistant dolomites. At the site-specific scale, it is characterized by a series of terraces and small waterfalls. The third most downstream site is characterized at the watershed scale by being deeply entrenched as it travels through less-resistant limestone. The local field site exhibits deep pools and scouring around bridge footings where hydraulic flow is locally altered. These baseline observations and the resulting geotechnical models will make it possible to track future geomorphological changes over time, and perhaps better understand to what degree these changes are influenced by natural dynamic stream fluctuations at the watershed scale, and to what degree these changes are associated with localized conditions including livestock management and other human-influenced factors.
53
US EPA’s NEW GUIDANCE ON WATERSHED-BASED PLANS FOR RESTORATION AND PROTECTION
Barry Tonning, Associate Director
Tetra Tech Water Resources Division 343 North Maysville Street
Mount Sterling, Kentucky 40353 Over the past 15 years, organizations and agencies have moved toward managing water quality by using a watershed approach. A watershed approach is a flexible framework for managing water resource quality and quantity within specified drainage areas, or watersheds. This approach includes stakeholder involvement and management actions supported by sound science and appropriate technology. The watershed planning process works within this framework by using a series of cooperative, iterative steps to characterize existing conditions, identify and prioritize problems, define management objectives, develop protection or remediation strategies, and implement and adapt selected actions as necessary. The outcomes of this process are documented or referenced in a watershed plan, which provides assessment and management information for a geographically defined watershed, including the analyses, actions, participants, and resources related to development and implementation of the plan. EPA is working with states, tribes, and watershed groups to realign agency programs and strengthen support for watershed-based environmental protection programs, which feature local stakeholders joining forces to develop and implement watershed-based plans that make sense for the conditions found in local communities. In the initial stages of the national nonpoint source program, some states and EPA regions focused their nonpoint source programs narrowly on demonstrations of particular technologies supported by section 319 grants. In upgrading their nonpoint source programs, many states have incorporated watershed-based approaches as a significant and sometimes central organizing theme of their programs. As a result, state nonpoint source programs have improved their ability to solve nonpoint source pollution problems at the watershed level. Although each watershed plan will emphasize different issues and reflect unique goals and management strategies, some common features are included in every watershed planning process. By definition, the watershed planning process is iterative, holistic, geographically defined, integrated, and collaborative. EPA recognizes that the processes involved in watershed assessment, planning, and management are iterative and that targeted actions might not result in complete success during the first or second cycle. It is expected, however, that through adjustments and adaptations made during the management cycles, water quality improvements can be documented and continuous progress toward attainment of water quality standards can be achieved. Watershed plans should address all the sources and causes of waterbody impairments and threats; that is, plans should address not only the sources of the immediate water quality impairment but also any pollutants and sources of pollutants that need to be addressed to ensure the long-term health of the watershed. EPA recognizes the difficulty in obtaining watershed-related information with precision and acknowledges that a balanced approach is needed to address this concern. Preliminary information and loading estimates might need to be modified over time, accompanied by midcourse corrections in the watershed plan and the projects it promotes. In many cases, several years of implementation will be required for a project to achieve its goals.
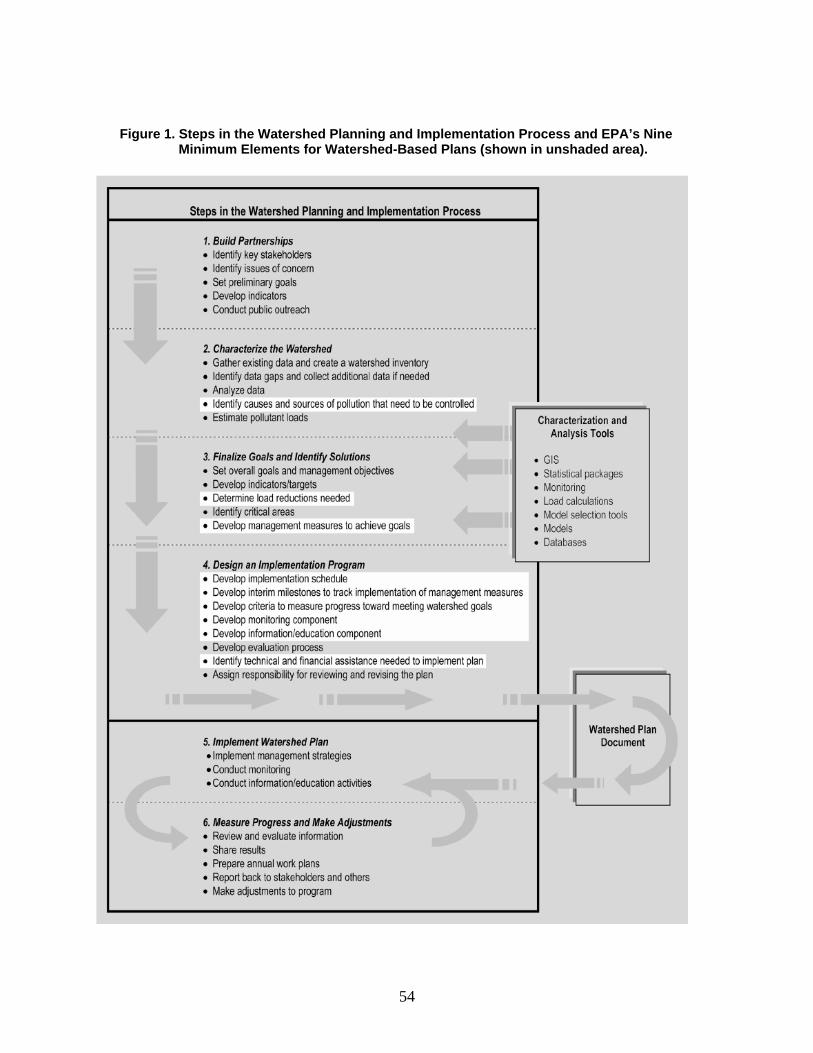
54
Figure 1. Steps in the Watershed Planning and Implementation Process and EPA’s Nine
Minimum Elements for Watershed-Based Plans (shown in unshaded area).

55
LOUISVILLE WATER COMPANY – WELLHEAD PROTECTION PLAN Marsha L. Taylor Meyer, Wellhead Protection Coordinator
550 South 3rd Street Louisville, KY 40202
Phone: (502) 569-3600, ext. 1809 [email protected]
The Louisville Water Company, (LWC), has provided high quality drinking water to the residents of the city since the 1879, when the Crescent Hill Reservoir was built as a sedimentation basin for water withdrawn from the Ohio River. By 1908, the water company had installed a ‘rapid sand filter’, which combined filtration with the use of chlorine. The company has participated in research performed by the USGS along the Ohio River valley since the 1940s, and was a leader in the use of fluoride to prevent tooth decay in the 1950s.
Along with other improvements to the water system, LWC began a program to use river bank filtration wells as an alternative means of supply in the 1980s. This natural pre-treatment program has enabled LWC to more easily meet current water quality standards. At present, LWC serves over a million customers per day, in three counties.
LWC has one riverbank infiltration well located at the B. E. Payne Plant next to the Ohio River in northeastern Jefferson County. The well was constructed in 1999, and was designed as a collector well: it contains a primary caisson, with lateral, horizontal screens extending outward from the central caisson in all directions. While several laterals extend into the aquifer within the valley, other laterals extend under the Ohio River, to induce surface water infiltration from the Ohio River into the well. Water produced from the well, (approximately 18 MGD), is considered a groundwater source, the majority of which is directly influenced by surface water. Therefore, the well falls under the Wellhead Protection Regulation for the State of Kentucky.
In accordance with Kentucky’s Wellhead Protection Program, LWC has completed a comprehensive and highly detailed Wellhead Protection Plan. A Wellhead Protection Plan, (WHPP), is comprised of five steps. The Phase I portion of the plan involves forming a Local Planning Team to develop the plan, and completing a delineation of the Wellhead Protection Areas, (WHPAs), to determine the area that must be protected. This portion of the plan was approved by the KY DOW on June 20, 2003. The Phase II portion of the plan involved locating and listing all potential contaminant sources within the WHPAs, developing management strategies to control potential sources of contamination, and developing a plan for the future. Phase II was accepted on November 23, 2004. Currently, LWC is working to implement the plan.
Local Planning Team Members of the local planning team included representatives of highly diverse interests within the community. Local government officials represented both the City of Louisville and Jefferson County government agencies, which has since merged into Metro Government. City of Prospect personnel represented the local government in the area immediately within the WHPA. Additional members included local business owners

56
and residents of the area, (those with a vested interest in the WHPA), as well as local environmental watchdog groups. State Department of Transportation and Division of Water personnel were also members of the LPT.
Delineation of the WHPA Delineation of the Wellhead Protection Areas was completed by an outside consultant retained by LWC, to determine the relative times of travel for potential contaminants moving into the area.
Inventory of Potential Contaminants A comprehensive inventory of potential contaminants has been completed and is constantly updated within the WHPAs. First, available data bases were searched for information detailing specific contaminants, and practices located within the WHPA. Local, state and federal data bases were searched for information about the WHPA. Next, a windshield or ‘drive-by’ survey was completed on all properties found within the WHPAs. Local Planning Team members drove by individual homes, businesses, and government properties to determine specific potential contaminants or practices that may adversely affect the groundwater that is a source of supply for the riverbank infiltration well. Over 1,000 properties are currently listed within the inventory, with over fifty, (50) different types of point source and nonpoint source potential pollutants.
Site interviews were conducted with selected businesses to determine specific contaminants on site, practices that may affect the groundwater, and to provide educational material about risks, modes of contamination, and Best Management Practices, (BMPs). This information is updated constantly by mailed surveys, additional drive-by surveys, reports from the Local Planning Team members, direct communication with property owners, and communications with local, state, and federal agencies. A susceptibility analysis was completed on the potential contaminants found within the area, in order to prioritize the potential contaminants for management purposes.
Management Plan The management plan focuses on compliance with existing laws, and education to encourage understanding of the risks and modes of contamination, voluntary compliance with regulations, and the use of BMPs. Specific potential contaminants were addressed, as well as general groups of potential contaminants. Both point and nonpoint sources were also addressed. For example, heating oil tank owners, distributors of heating oil, and realtors have been contacted, provided with educational materials, (voluntary use of BMPs), and a Groundwater Protection Plans have been requested, (compliance). LWC is also working closely with the Metropolitan Sewer District and the Metro Health Department to replace existing septic systems with sewers, or to update existing systems to current building codes.
Plan for the Future Existing emergency operation plans developed by the Louisville Metro Government and LWC were used to develop a contingency plan, should contamination occur. Emergency personnel including local HazMat teams, firefighters, and LWC personnel, contributed to the plan. These plans will be updated and enhanced as the WHPP is developed through implementation.
57
LESSONS LEARNED REFORESTING THE BLUEGRASS
H. David Gabbard KDPES Stormwater Permit Administrator
Division of Engineering Lexington Fayette Urban County Government
Suite 400 101 East Vine Street
Lexington, Kentucky 40507 859.258.3410 office 859.983.4751 mobile [email protected]
The Federal Clean Water Act (CWA) requires a municipality with a population greater than 10,000 to have a permit that creates and maintains programs and projects to address stormwater pollution reduction and prevention in urban stormwater discharges. These programs are to identify and reduce or eliminate stormwater pollution using best management practices to the maximum extent practicable. The streams of Fayette County (560 miles) suffer from two major causes of impairment: (1) abnormally high background concentrations of phosphorus and (2) the “Bluegrass Aesthetic.” One is a problem of natural origins and the other is a problem associated with the perceptions of man. Phosphorus – the streams in central Kentucky are limestone based streams. Only 7% of the streams in the United States are of this type. In Fayette County, the Tanglewood Member of the Lexington Limestone series is the most abundant and contributes greatly to the phosphatic nature of the soils (Ormsbee, et. al, 2003, 12). It has long been held that a concentration of 0.10 mg/L of phosphorus will result in unwanted algal growth that can impair a stream ecosystem. Testing information has shown that the background levels for phosphorus in Lexington are between 0.20 and 0.38 mg/L (Ibid, 18). From a qualitative analysis, a “stroll” along a stream in Fayette County will reveal that once shade is removed from a stream, algal growth is problematic – resulting in thick algal mats that alter aquatic habitat and deplete oxygen concentrations leading to numerous fish kills. Where there is shade, there is a viable aquatic community. The Bluegrass Aesthetic – for the past two hundred years, it has been the goal of every land owner to have a floodplain free of forests. Trees are “nice” when they line driveways and fencerows but they seldom line streams – “You can’t see the stream that way and being able to see the pretty creek is what sells the property.” The solution was the Reforest the Bluegrass program. Its purpose is to put back native forests along denuded stream corridors and involve the public to the maximum extent practicable. The project is seen more as a public outreach and education event than it is a
58
BMP to the MEP for erosion control; habitat improvement; and urban forestry. If the mindset of the citizens does not change, then no program will succeed. During the eight (8) years of the program, over 150,000 tree seedlings have been planted in over 150 floodplain acres. Over 5,000 regional citizens have been trained to plant these trees. First year survival rates have been phenomenal – over 85%! But there have been many valuable lessons learned – lessons that transcend this program and can apply to numerous watershed management programs:
1) “Health Forests, Healthy Streams.” Teaching the principles of urban stormwater management and urban forestry to a varied audience. It has been important to get all interested parties to see the value of healthy urban forests and how that translates into healthy streams and healthy communities. Also, it has been challenging to help people understand the fundamental goals and objectives of the CWA and how the simple act of planting a tree can accomplish those goals.
2) Citizen Input. There are many willing citizens who stand ready to participate in making their watersheds a healthier place to live. But many times government officials are “concerned” about all of that citizen input – “You can’t control it.” Most people want to do the right thing most of the time. Most people know that something is wrong – they used to be able to go to the park and play in and around the creek – they used to see dragonflies and butterflies all over the place. Reforest the Bluegrass has provided a successful venue for people to learn and be empowered to do things that will have a lasting impact on their communities.
3) “Keep ‘em happy.” Many things have been tried – some are successful and some fail. But many lessons have been learned about how to take care of our volunteers and make them glad they came and looking forward to the next opportunity to improve their communities.
4) Maintenance Coordination. When you plant tens of thousands of small “twigs” in areas of park property that have been mowed for decades, sometimes you loose a few trees to miscommunication.
5) Being too successful. Sometimes, by doing so much for so long with so little, you find it difficult to get additional funding to expand your efforts.
Reforest the Bluegrass has been an outstanding success. It has spawned similar efforts from Richmond, Kentucky to Galveston, Texas. And the lessons learned will continue to ensure its success into the future. References 1. Ormsbee, et. al., 2003, Draft Total Maximum Daily Load (TMDL) Development for Nutrients (Phosphorus) for Town Branch, Fayette County, Kentucky. Draft TMDL document created for the Kentucky Division of Water, Frankfort, Kentucky.
59
LOW-FLOW CHARACTERISTICS OF STREAMS IN KENTUCKY
Gary R. Martin, Daniel W. Evans, and Kenneth R. Odom U.S. Geological Survey 9818 Bluegrass Parkway
Louisville, KY 40299 502-493-1914 / 502-493-1930 / 502-493-1933
[email protected] / [email protected] / [email protected]
ABSTRACT
A new 2-year investigation of low-flow characteristics of streams in Kentucky has been initiated by the U.S. Geological Survey, Kentucky Water Science Center. This investigation is a component of the Water Budget Approach for Managing Water Supply Resources in Kentucky, a statewide hydrologic model currently (2006) under development. Detailed analyses using enhanced statistical techniques and additional periods of low-flow data collected in additional stream reaches distributed statewide will improve the reliability of water-supply assessments that can be developed from the Water Budget Approach. Information on low-flow characteristics of streams is used in water-resource modeling, planning, and management to assess a stream’s (1) adequacy for use as a water supply, (2) capacity for assimilation of liquid wastes, and (3) suitability as habitat for aquatic life (Riggs, 1972). Kentucky’s surface waters are the primary source for drinking-water supplies and the primary sink for wastewater-effluent disposal. Therefore, reliable, up-to-date estimates of low-flow characteristics are needed for making critical decisions concerning the location, design, and operation of water- and wastewater-treatment facilities.
The previous statewide low-flow investigation for Kentucky (Ruhl and Martin, 1991) was based on data collected through March 1987 at 136 long-term continuous-record streamflow-gaging stations and 212 short-term low-flow partial-record stations. Up to 18 years of additional low-flow data, some collected during severe drought periods, are available for many of the long-term continuous-record stations used in the previous investigation. In addition, several new long-term continuous-record stations have been established since 1987, which now have sufficient data for analysis. During the 2005 and 2006 low-flow seasons, data are being collected at a low-flow network that includes approximately 80 new partial-record stations distributed across the Commonwealth where data collection was first begun in the severe drought of 1987-88. This low-flow network currently (2006) includes over 40 percent more unregulated streamflow-gaging stations than were available for the previous low-flow investigation.
The investigation is designed to increase the current knowledge and understanding of hydrologic processes that control the low-flow characteristics of streams in Kentucky, a critical component of the streamflow regime for the water-budget model. Streamflow data from long-term continuous-record streamflow-gaging stations with 10 or more complete years of homogeneous daily streamflow record through 2005 will be analyzed
60
to determine low-flow characteristics, and low-flow characteristics for short-term low-flow partial-record stations will be estimated by correlative methods from low-flow characteristics determined for the continuous-record gaging stations.
Regional regression equations can be used by water-resource engineers, planners, and managers to estimate pertinent low-flow characteristics, such as the 7-day, 10-year low flow, at stream sites where little or no hydrologic data are available. Regional estimating equations define a relation between the streamflow characteristic of interest and one or more basin characteristics, such as drainage area. In certain settings, low-flow characteristics are difficult to estimate accurately by use of regression equations because of the difficulty in quantitatively representing the effects on low flows of various localized geologic features. The accuracy of the regional estimating equations generally is improved by collecting additional data at partial record sites to obtain a data set that is representative of a wider variety of basin types and characteristics.
Relevant basin characteristics will be determined by use of a geographic information system with the best available digital coverages for the new and historical gaging stations, and these basin characteristics will be tested as explanatory variables in the regression analyses. Drainage area and streamflow-variability index were used as explanatory variables in the most recent regional regression equations for estimating low-flow characteristics (Ruhl and Martin, 1991). The streamflow-recession and streamflow-variability indexes will be updated to include the daily mean discharge data collected since 1987 at the continuous-record stations. The indexes, if appropriate, will be regionalized as a function of geology and evaluation of residuals from the regression analysis. Maps delineating areas of similar indexes and lithology will be reviewed, and if appropriate, updated in the case of streamflow-variability index and incorporated into revised regional regression equations for estimating low-flow characteristics at ungaged, unregulated, rural stream sites in Kentucky. This investigation will be completed in June 2007.
REFERENCES CITED
Riggs, H.C., 1972, Low-flow investigations: U.S. Geological Survey Techniques of Water-Resources Investigations, book 4, chap. B1, 18 p.
Ruhl, K.J., and Martin, G.R., 1991, Low-flow characteristics of Kentucky streams: U.S. Geological Survey Water-Resources Investigations Report 91-4097, 50 p.
61
SIMPLIFICATION OF ACCESS TO HYDROLOGIC DATA FOR KENTUCKY THROUGH AN ONLINE, INTERACTIVE GIS TOOL
Kenneth R. Odom and Mark A. Ayers U. S. Geological Survey 9818 Bluegrass Parkway
Louisville, Kentucky 40299 502-493-1933 / 502-493-1910
[email protected] / [email protected]
Minimizing the effects of land-use practices and water use (including water-supply withdrawals and wastewater disposal) on water resources often involves the process of planning, design, permitting, implementation, and assessment of best-management practices (BMPs) that control runoff quantity and quality. This process depends upon reliable, accurate, and reproducible estimates of basin characteristics (watershed area, mean slope, mean elevation, soil properties, and land cover), runoff quality (nutrient loads), and runoff quantity (7-day low flows with 2- and 10-year recurrence interval, mean annual flow, and peak-flow statistics). In most cases, these data are needed for locations where no measured data are available. In addition, accessing this information is frequently a rigorous task.
The U.S. Geological Survey (USGS), in cooperation with the Kentucky Division of Water, has developed an interactive tool that allows users the ability to easily obtain hydrologic information. The overall goal of the project was to provide those involved in watershed planning, assessment, hydrologic-design, and permit review with reliable and reproducible hydrologic information at user-selected stream sites in Kentucky, but without requiring users to invest heavily in computer technology, GIS skills, or hydrologic analyses. This has been accomplished by linking hydrologic data to an existing ArcIMS mapping interface at the Kentucky Division of Geographic Information. Users can access the interactive, online tool on the Internet at (http://kygeonet.ky.gov/kyhydro/viewer.htm) and request hydrologic information by zooming and clicking on selected features. For example, a permit reviewer may be interested in the low-flow statistics at a point on a stream where a new wastewater-discharge point is proposed. The reviewer has the option of manually entering the coordinates of the discharge point and having the map go directly to that point, or the reviewer can zoom from a statewide view to the point of discharge. After the discharge point and the STREAM DATA layer are visible, the reviewer can use the IDENTIFY tool to click on the stream at the discharge point and view the flow statistics. Similarly, an engineer wanting to size a culvert for a 25-year peak flow could access peak-flow statistics for a selected stream in the same manner. The LAYER list gives the user the ability to select other features: USGS GAGING STATIONS, a GENERALIZED SOILS map, a SINKHOLES layer, and a STREAM REACH DRAINAGE AREAS layer. Selection of a USGS streamflow gage provides the user with a link to the USGS database to download streamflow records. The STREAM REACH DRAINAGE AREAS layer

62
provides information such as basin slope, percent impervious, and basin area for a watershed upstream of a selected stream reach.
Currently (January 2006), the data-population work is approximately 75 percent complete. Upon completion of the SPARROW model, estimates of loads for total nitrogen and total phosphorus will be available. Additional streamflow statistics that are currently in the process of being compiled also will be made available through the online tool above.

63
THE KENTUCKY WATERSHED MODELING INFORMATION PORTAL'S USER NEEDS ASSESSMENT, DATA MATRIX AND USE CASE
Karen L. Schaffer1 ∗, Kenneth R. Odom2 ∗,
Sam Bacharach3, and Gary R. Harp4,5 1 Senior Environmental Scientist, (FMSM Engineers, Inc.) 2 PhD, PE, Surface Water Specialist, (USGS Kentucky Water Science Center) 3 Exec. Director, Outreach/Community Adoption, (Open Geospatial Consortium, Inc., OGC) 4 Director, (Kentucky Division of Geographic Information, DGI) ∗ Presenting authors
1025 Capital Center Drive – Suite 101 Frankfort, KY 40601
502-573-1450 [email protected]
In September, 2004, The Kentucky Commonwealth Office of Technology (COT) was awarded $750,000 from the US Environmental Protection Agency (USEPA)’s Environmental Information Exchange Network (EIEN) to develop the Kentucky Watershed Modeling Information Portal (KWMIP). This 2-year project will develop a web-based portal to quickly and accurately deliver current, and appropriately formatted, watershed model input data for selected models. In order to design KWMIP to address the needs of future portal users, a Technical Advisory Group (TAG), consisting of future portal users and experts from agencies, academia, non-profits and consultants, are advising the Project Partners regarding model selection and key model input datasets, identifying portal functions and training needs. Over 80 individuals were invited to participate on the TAG, which to-date has delivered the following products in concert with other project partners: 1. User Needs Analysis (UNA): During the TAG meetings important models were
discussed and a conceptual overview of key portal functions was arrived at. Key findings by 38 TAG participants in UNA Meetings (August, 2005) include:
• Significant enthusiasm for the KWMIP Project, including the KY Climate Model. • Of 24 models used by UNA participants, 10 models and 2 tools were selected for
further consideration in KWMIP, with emphasis on models in the USEPA’s Region IV Modeling Toolbox to support development of Total Maximum Daily Loads.
• Emphasis on quality assurance, metadata, temporal and spatial resolution and a data catalog, which would provide information on other potentially useful datasets.
• Karst geology covers a significant portion of Kentucky and a clear discussion of data considerations in karst regions will be very important.
5 With KWMIP Project Partners: Demetrio P. Zourarakis, Ph.D. (DGI), Bill Caldwell, Lee Colten, Ann Fredenburg, Eric Liebenauer, Kay Harker, Peter Goodmann (KDOW), and Mark Ayers (USGS, KY Water Science Center).
64
• Training needs include technical (i.e., how to use KWMIP), and managerial (i.e., how to use model results to make decisions).
2. Data Matrix (DM): A TAG Subcommittee, the DM Working Group, summarized data needs for the short listed models (QUAL2K, EFDC, HEC, HSPF, Load Duration Curves, LSPC, ModFlow, SWMM, WASP) and explored the capabilities of two tools (BASINS, WCS). Approximately 70 datasets, including 27 spatial (i.e., geographic), and 42 tabular datasets identified. Over 80 sources of data have been identified thus far. Many spatial data layers are anticipated to be previewed and served through enhancements to the DGI’s existing web services. The DM is being used to prioritize data layers for access through KWMIP.
3. Use Case (UC): The UC describes the functional requirements of the portal based on the UNA. Key functions include: user registration and log-in, option to select a KWMIP supported model or to simply use KWMIP for browsing and downloading data, and data preview. As currently envisioned, the user will have four options to define study area boundaries that KWMIP will use to clip their selected data. Automated geographic data transformations are anticipated to include merge, clip, and project. Compressed files will be sent to an FTP site for user retrieval. KWMIP User Community Support functions under discussion include a searchable Data Registry to facilitate user contacts to obtain data that are not served by KWMIP and Data Standards to encourage standard formatting of registry data. Training materials and Help functions will be available. KWMIP users will interact through the Listserv and Feedback pages. The draft UC was discussed with the TAG in December, 2005 and finalized in January, 2006.
4. Kentucky Climate Model: The US Geological Service (USGS) has been continuing work on development of the KY Climate Model for temperature and precipitation. The model applies and enhances a spatial regression approach that has been applied in New Jersey and Colorado. The spatial regression model equations have been established and work on the user interfaces is ongoing. The KY Climate Model will be accessed through KWMIP to provide daily temperature and precipitation model results in model-ready format. A brief demonstration of the model will be provided during the presentation. The TAG will have the opportunity to evaluate Climate Model features and beta-test the portal. The portal is anticipated to be operational in September, 2006. Technical training on the use of the portal and managerial training on the uses of modeling to support decision-making will be provided to interested participants.
KWMIP’s next steps include: 1. Portal Build and Test: The OGC anticipates that a request for proposals, to build
the portal using open interface specifications will be issued in January, 2006, with responses due in February, 2006, and portal build anticipated to begin in April, 2006.
2. Beyond the Grant: A Long Term Operations and Maintenance Plan will be developed and implemented to ensure portal viability beyond the grant term. This will include updating data sharing agreements. The KWMIP Listserv and Feedback pages will be used to continually optimize services. Additional funding will be sought to enhance KWMIP functions and data services.

65
A Comparison of Manually and DEM Delineated Watersheds
Andrew C. Kellie Jane Benson Mike Kemp
Murray State University Murray, KY 42071
The purpose of this research is to compare watershed area and main stem length calculations for watersheds delineated both manually and by use of digital elevation models (DEMs). Watershed delineation provides basic data for watershed and runoff modeling as well as for geomorphic description for the watershed. Errors or mistakes in such delineation will result in erroneous results for all dependent calculations. Use of DEM-based watershed delineation algorithms, such as TOPAZ, ostensibly provide a repeatable (precise), non-biased method for watershed delineation. However, DEM-based delineation correctness (accuracy) must be dependent on not only the algorithm involved, but on DEM resolution as well. This research compares the results of manual and DEM-based watershed and main stem delineation on six watersheds located in three physiographic regions of Kentucky. Manual delineation employed 1:24,000 USGS topographic quads. Automated delineation used both BASINS and WMS software and employed both 10 meter and 30 meter resolution DEMs. The results of this work show DEM-based watershed and main stem delineation to be both precise and accurate. Results for automated delineation approximate those obtained by manual methods. However, experience with DEM-based delineation techniques also shows the benefit of being able to edit the results of the automated delineation to ensure accurate location in those isolated instances where data noise, DEM resolution, or other factors result in an apparently erroneous divide or stream location.

66
NOTES
_____________________________________________________________ _____________________________________________________________ _____________________________________________________________ _____________________________________________________________ _____________________________________________________________ _____________________________________________________________ _____________________________________________________________ _____________________________________________________________ _____________________________________________________________ _____________________________________________________________ _____________________________________________________________ _____________________________________________________________ _____________________________________________________________ _____________________________________________________________ _____________________________________________________________ _____________________________________________________________ _____________________________________________________________ _____________________________________________________________
OF FARM PONDS AND SINKHOLES: AUTOMATED FEATURE EXTRACTION FROM KENTUCKY’S NAIP IMAGERY USING ERDAS IMAGINE® 8.7, AND
FEATURE ANALYSTTM 4.0 FOR ESRI TM’s ArcGIS TM 9.1
Demetrio P. Zourarakis1*
1PhD, Remote Sensing and GIS Analyst – COT – DGI *Presenting author
Commonwealth Office of Technology (COT)
Kentucky Division of Geographic Information (DGI) 1025 Capital Center Dr. – Suite 101
Frankfort, KY 40601 (502) 573-1450 ext. 3452 – fax: (502) 573-6549
Digital imagery presents the opportunity for applications of interest to environmental and natural resource information specialists, such as the extraction of GIS (vector – or feature) layers from remotely sensed data. The extraction of features from digital imagery using manual photo-interpretation and heads-up digitization is laborious, time consuming and hence costly, and requires trained labor which is a scarce resource. As a viable alternative, automated feature extraction with machine-learning software is becoming commonplace. Kentucky recently purchased current, state-wide high resolution digital orthophotography from the National Agricultural Imagery Program (NAIP). The imagery was acquired during the 2004 growing season or leaf-on (late spring/early summer), at a 1-m ground resolution, in 3 bands (visible, RGB), and 8 pixels per band. Following the re-projection of the original data, this imagery was used by the Kentucky Division of Geographic Information (DGI) to update the state’s base map, served by DGI’s various Web mapping services - or “portals” (e.g. the Commonwealth Map at: http://kygeonet.ky.gov/tcm/viewer.htm). The imagery is also available for downloading, adding to the state’s significant data holdings, collectively known as the KY Geonet: (http://kygeonet.ky.gov). Farm ponds, with varying degrees of turbidity, and developing sinkholes are common feature elements in Kentucky’s changing landscape, and are subject to temporal changes depending on climactic/meteorological regimes and management variables. There are strong indications that in addition to observable, mapped or unmapped sinkholes, the beginning stages of formation of these features may be observable by their seasonal effects on vegetative cover stress (Dinger and Currens, 2006). Locations with known karst processes were selected in the Cadiz and Guston quadrangles, in Trigg and Meade Cos., respectively to test proposed image processing methodologies. The original NAIP imagery was enhanced spectrally by utilizing ERDAS® Imagine 8.7. The Feature AnalystTM 4.0 extension for ArcGISTM 9.1 was trained and used to extract feature layers 67
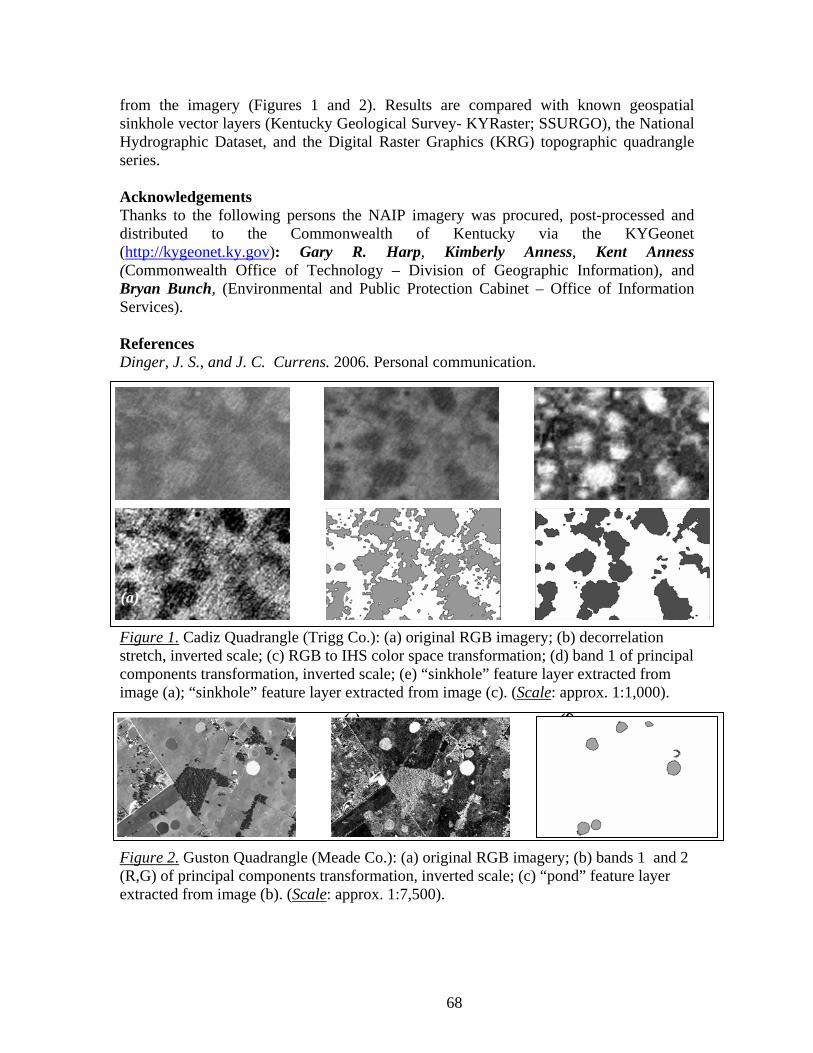
from the imagery (Figures 1 and 2). Results are compared with known geospatial sinkhole vector layers (Kentucky Geological Survey- KYRaster; SSURGO), the National Hydrographic Dataset, and the Digital Raster Graphics (KRG) topographic quadrangle series. Acknowledgements Thanks to the following persons the NAIP imagery was procured, post-processed and distributed to the Commonwealth of Kentucky via the KYGeonet (http://kygeonet.ky.gov): Gary R. Harp, Kimberly Anness, Kent Anness (Commonwealth Office of Technology – Division of Geographic Information), and Bryan Bunch, (Environmental and Public Protection Cabinet – Office of Information Services). References Dinger, J. S., and J. C. Currens. 2006. Personal communication.
Figure 1. Cadiz Quadrangle (Trigg Co.): (a) original RGB imagery; (b) decorrelation stretch, inverted scale; (c) RGB to IHS color space transformation; (d) band 1 of principal components transformation, inverted scale; (e) “sinkhole” feature layer extracted from image (a); “sinkhole” feature layer extracted from image (c). (Scale: approx. 1:1,000). Figure 2. Guston Quadrangle (Meade Co.): (a) original RGB imagery; (b) bands 1 and 2 (R,G) of principal components transformation, inverted scale; (c) “pond” feature layer extracted from image (b). (Scale: approx. 1:7,500). 68
(a) (b) (c)
(d) (e) (f)
(a) (b)
69
LIMESTONE-BASED MATERIAL FOR ARSENIC REMOVAL FROM DRINKING WATER
Chelsea Campbell*, Dr. Cathleen Webb, Lindsey Clark, and Ashley Dockery Department of Chemistry
Western Kentucky University 1906 College Heights Blvd Bowling Green, KY 42101
270-745-3786 [email protected]
Arsenic in surface water and ground water is of great concern because of potential
toxic effects in drinking water supplies. The EPA recommended drinking water standard for arsenic, currently set at 50 parts per billion (ppb), will be lowered to 10 ppb by the year 2006. Current remediation technologies are quite expensive and are designed for large water treatment facilities. Many rural water supplies will be out of compliance when the new lower standards are put into effect. This will place increased socio-economic pressure on rural America, primarily because of the lack of inexpensive point-of-source treatment technology.
Arsenic is readily soluble and transports easily through ground water. Observations of arsenic contamination from mining areas in the Black Hills of South Dakota indicate arsenic is retained by native limestone. Batch tests conducted as a function of time show that over 70% of the arsenic was removed within 2 hrs. Analyses clearly indicate that limestone reduced arsenic concentrations from > 100 ppb to less than 5 ppb. The arsenic removal efficiency of a novel, small scale device with a continuous, fresh exposure of limestone was tested. Arsenic test strips were evaluated for ease of use and for quality Analysis and Quality Control (QA/QC) studies. Water samples with various concentrations were tested before and after the batch experiments in order to evaluate the accuracy of the test strips. These inexpensive tests strips can detect arsenic levels on the spot from 1 ppb to 100 ppb.

70
NOTES
_____________________________________________________________ _____________________________________________________________ _____________________________________________________________ _____________________________________________________________ _____________________________________________________________ _____________________________________________________________ _____________________________________________________________ _____________________________________________________________ _____________________________________________________________ _____________________________________________________________ _____________________________________________________________ _____________________________________________________________ _____________________________________________________________ _____________________________________________________________ _____________________________________________________________ _____________________________________________________________ _____________________________________________________________ _____________________________________________________________

71
OPPORTUNISTIC WATER EDUCATION
Amanda Abnee Gumbert N-122C Ag Science North, Lexington, KY 40546-0091
859-257-6094 [email protected]
Many natural resource and water educators follow the idea that there is a need for more and more new and unique educational events, when, in reality, there is a need to become more opportunistic. Over the past four years, the University of Kentucky Cooperative Extension Service sought out existing events or programs to integrate water education. The Kentucky Forest Leadership Program now has a major water component in its five-day summer program for high school students. Two, three-day water camps were conducted with KY and TN 4-Hers. A three-hour water curriculum was integrated into all 4-H summer camps in 2005. Water education became a major focus of a summer program for minority youth. Water-related topics lead the way in two, week-long teacher workshops that explored land use in central Kentucky. Integration into existing programs has depended on building strong partnerships with other agencies and groups. This team-building has strengthened water education programs, reached new audiences with water education, and kept all partners from being stretched too thin.

72
NOTES
_____________________________________________________________ _____________________________________________________________ _____________________________________________________________ _____________________________________________________________ _____________________________________________________________ _____________________________________________________________ _____________________________________________________________ _____________________________________________________________ _____________________________________________________________ _____________________________________________________________ _____________________________________________________________ _____________________________________________________________ _____________________________________________________________ _____________________________________________________________ _____________________________________________________________ _____________________________________________________________ _____________________________________________________________ _____________________________________________________________
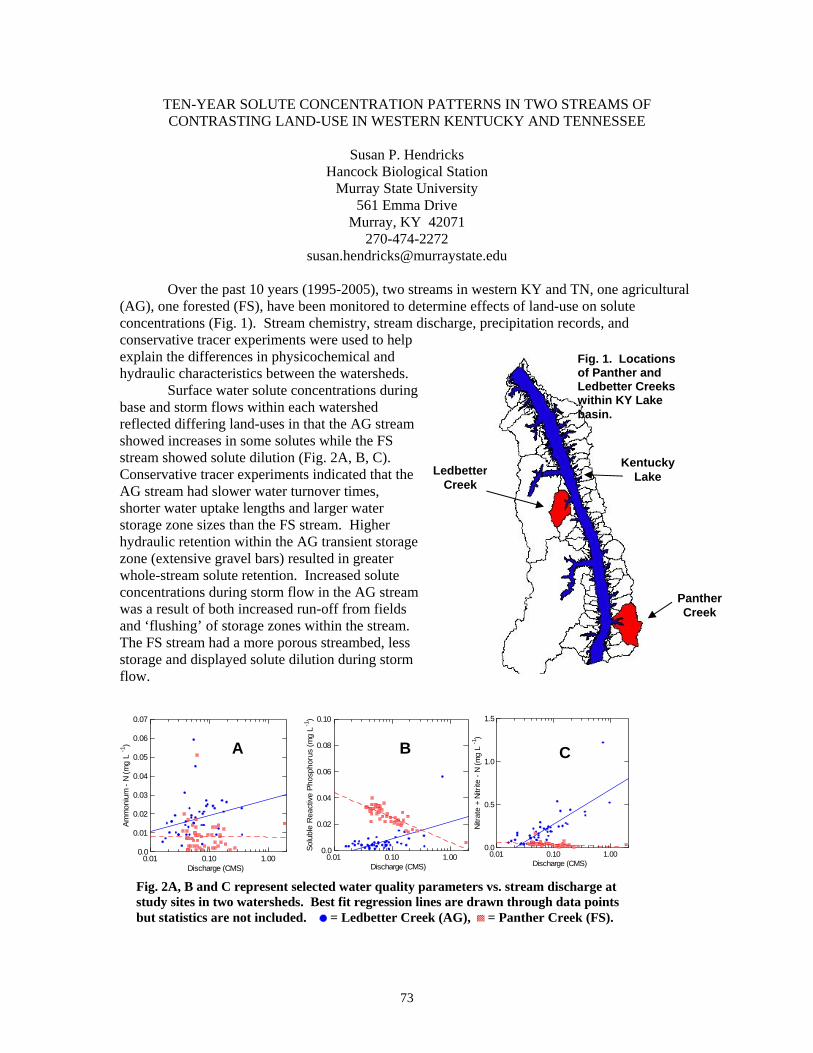
73
TEN-YEAR SOLUTE CONCENTRATION PATTERNS IN TWO STREAMS OF CONTRASTING LAND-USE IN WESTERN KENTUCKY AND TENNESSEE
Susan P. Hendricks
Hancock Biological Station Murray State University
561 Emma Drive Murray, KY 42071
270-474-2272 [email protected]
Over the past 10 years (1995-2005), two streams in western KY and TN, one agricultural (AG), one forested (FS), have been monitored to determine effects of land-use on solute concentrations (Fig. 1). Stream chemistry, stream discharge, precipitation records, and conservative tracer experiments were used to help explain the differences in physicochemical and hydraulic characteristics between the watersheds.
Surface water solute concentrations during base and storm flows within each watershed reflected differing land-uses in that the AG stream showed increases in some solutes while the FS stream showed solute dilution (Fig. 2A, B, C). Conservative tracer experiments indicated that the AG stream had slower water turnover times, shorter water uptake lengths and larger water storage zone sizes than the FS stream. Higher hydraulic retention within the AG transient storage zone (extensive gravel bars) resulted in greater whole-stream solute retention. Increased solute concentrations during storm flow in the AG stream was a result of both increased run-off from fields and ‘flushing’ of storage zones within the stream. The FS stream had a more porous streambed, less storage and displayed solute dilution during storm flow.
0.01 0.10 1.00Discharge (CMS)
0.0
0.5
1.0
1.5
Nitra
te +
Nitr
ite -
N ( m
g L
-1)
0.01 0.10 1.00Discharge (CMS)
0.0
0.02
0.04
0.06
0.08
0.10
Solu
ble
Rea
ctiv
e Ph
o sph
orus
(mg
L-1)
0.01 0.10 1.00Discharge (CMS)
0.0
0.01
0.02
0.03
0.04
0.05
0.06
0.07
Amm
oniu
m -
N (m
g L
-1)
A B C
Fig. 2A, B and C represent selected water quality parameters vs. stream discharge at study sites in two watersheds. Best fit regression lines are drawn through data points but statistics are not included. = Ledbetter Creek (AG), = Panther Creek (FS).
LedbetterCreek
Panther Creek
Kentucky Lake
Fig. 1. Locations of Panther and Ledbetter Creeks within KY Lake basin.

74
NOTES
_____________________________________________________________ _____________________________________________________________ _____________________________________________________________ _____________________________________________________________ _____________________________________________________________ _____________________________________________________________ _____________________________________________________________ _____________________________________________________________ _____________________________________________________________ _____________________________________________________________ _____________________________________________________________ _____________________________________________________________ _____________________________________________________________ _____________________________________________________________ _____________________________________________________________ _____________________________________________________________ _____________________________________________________________ _____________________________________________________________

75
Pathogen TMDL Development using Load Duration Curves for Two Stream Segments in Rockcastle County, Kentucky
Joseph M. Ferguson
Kentucky Division of Water 14 Reilly Road
Frankfort, KY 40601 (502) 564-3410 x 526
[email protected] Section 303(d) of the Clean Water Act requires states to identify waters within their boundaries that have been assessed and are not currently meeting water quality standards for their designated uses. Brush Creek and Crooked Creek, in Rockcastle County Kentucky, were placed on the 1998 303(d) List of Waters for Kentucky for violations of the Primary Contact Recreation standard (KDOW 1998). The suspected sources of pollution in both watersheds are agriculture and onsite wastewater systems (septic tanks and/or straight pipes). The water quality standard for E. coli concentrations in recreational waters as stated in 401 KAR 5:031 is 130 colonies per 100 ml as a geometric mean based on not less than five (5) samples taken during a thirty (30) day period or not to exceed 240 colonies per 100 ml in twenty (20) percent or more samples taken in a thirty day period. Listed waters are prioritized for Total Maximum Daily Load (TMDL) development. A TMDL calculation is performed as follows:
TMDL = WLA + LA + MOS Where: TMDL = the TMDL target, which is defined as the loading that is equivalent to a concentration of 240 colonies/100 ml at a given discharge, in units of billions of colonies per day. WLA = the Wasteload Allocation, including point sources and Municipal Separate Storm Sewer Systems (MS4s). No point sources exist in these watersheds. LA = the Load Allocation, including nonpoint sources and natural background. MOS = the Margin Of Safety, which can be an implicit or explicit additional reduction applied to the WLA, LA or both types of sources that accounts for uncertainties in the data or TMDL calculations. E. coli results were analyzed using the Load Duration Curve (LDC) method. The LDC is a data analysis tool that plots the load of E. coli observed at a particular sampling station (by multiplying an E.coli concentration with discharge and converting the units to billions of colonies per day {BoC/day}to generate an observed load) versus a curve which represents the maximum allowable load that would be permitted in the creek in similar discharge conditions (by multiplying the Water Quality Criterion of 240 counts/100 ml with a daily average stream discharge value, also converted to BoC/Day). This allows a graphical interpretation of the difference between the existing load and the Water Quality Criterion (Figure 1).

76
Load duration curves were developed for two sites in Brush Creek and five sites in Crooked Creek using E. coli data collected from May – October 2005. The load duration curve was divided into five flow zones (Figure 1). Each flow zone was assigned a load reduction based on either the 90th percentile of data exceeding the water quality standard, if three or more violations occurred in the given flow zone, or the highest point of exceedance if only one or two data points exceed. Load reductions ranged from 23 – 92 percent of the calculated existing load (Table 1).
0.01
0.10
1.00
10.00
100.00
1000.00
10000.00
0 10 20 30 40 50 60 70 80 90 100
Flow Duration Interval (%)
E. C
oli (
Bill
ions
of C
olon
ies/
day)
TMDL02BC
TMDL
HighFlows
MoistConditions
Mid-RangeFlows
Dry Conditions
LowFlows
Figure 1 Example TMDL Load Duration Curve.
Table 1 Range of Percent Load Reductions Required by Flow Duration Zones in Brush and Crooked Creek
High Flows Moist Conditions
Mid-Range Flows
Dry Conditions
Low Flows
Brush Creek No exceedance
83.86- 91.79%
87.10% 96.57% No exceedance
Crooked Creek
79.11% 90.40-93.35%
23.32-77.87%
23.39-50.47%
No exceedance

77
BEARGRASS CREEK WATER QUALITY TOOL AND TMDLs
Ward Wilson, Klaus Albertin (Tetra Tech) Elizabeth Coyle, (MSD)
Susan Bahng (O’Brien & Gere Engineers)
Tetra Tech, Inc. 2000 Warrington Way, Louisville, KY 40222
(502) 569-9028 [email protected]
Problem Statement
Beargrass Creek’s three forks drain 61 square miles in the Louisville Metro area into the Ohio River. The Kentucky Department of Environmental Protection (KDEP) has determined that portions of Beargrass Creek do not support the Designated-Use Criteria for Primary Contact Recreation and Aquatic Life due to pathogens, organic enrichment/low dissolved oxygen, and habitat alteration. KDEP has cited a number of suspected sources for these impairments including industrial and municipal point sources, urban runoff, and combined and sanitary sewer overflows.
Beargrass Creek is drained by an extensive system of natural stream segments, open concrete channels, and combined sanitary and storm sewers. The complex hydrology and combination of point and nonpoint sources pose significant technical obstacles for the prediction of water quality.
Development of the Tool
Since 2000, Louisville’s Metropolitan Sewer District (MSD) and its consultants have been developing an integrated model system that simulates sewer overflows, non-point source runoff, and stream water quality. This system is called the Beargrass Creek Water Quality Tool. Initially, the Tool was to be used to evaluate CSO abatement measures. Later, Tool objectives were expanded to include the water quality studies needed to support Total Maximum Daily Load (TMDL) allocations in Beargrass Creek. The Kentucky Water Resources Research Institute (KWRRI) joined the project team to oversee development of the Water Quality Tool and to develop pathogen and organic enrichment/low dissolved oxygen TMDLs in Beargrass Creek for the Kentucky Division of Water.
The Water Quality Tool is an integrated system of several computer models that continuously simulate the quality and quantity of runoff, sewer overflows, and stream flows for periods of a year or more. The model, representing 61 square miles, includes 31 subwatersheds, 111 CSO catchments, 39 CSO locations, and 54 SSO inputs.
• Hydrological Simulation Program - FORTRAN (HSPF) is used for simulation of watershed loads, in-stream transport, and water quality in Beargrass Creek.

78
Landuse was quantified based on eight landuse types intersected with three soil types, further divided into pervious and impervious fractions based on effective impervious area estimates.
• XP Software’s Storm Water Management Models (XP-SWMM) are used to predict CSO and SSO discharges.
• The CE-QUAL or EPD Riv1 model predicts receiving stream flow and water quality in the lower reaches of Beargrass Creek, near the Ohio River where flow dynamics are more complex.
• Bridge routines convert the formats of large amounts of data from the XP-SWMM and HSPF models to allow the Tool to be an integrated system.
Status Calibration of the Water Quality Tool is underway at this time. This process begins with the hydrologic and hydraulic simulations, then will extend to water quality load calibration. MSD is planning to collect additional wet-weather monitoring data at selected sewer overflow locations for use in final calibration of the Tool. TMDL load allocations will be developed in mid-2006 for use by KWRRI in developing the TMDLs for pathogens and organic enrichment/low dissolved oxygen for Beargrass Creek. The Tool will be used by MSD in the future for capital projects planning and prioritization.
Water Quality Tool
Combined Sewer SystemXP-SWMM Run
Runoff into combined sewer Runoff
to streams
HSPF Run 1 (watershed)
Bridge Routine 1
Bridge Routine 2Overflows
Receiving Water Models:HSPF Run 2
EPD Riv1
Simulation of stream water quality
Precipitation
Separate SewerSystem
XP-SWMM Runs

79
Pathogen and Sediment Transport in Muddy Creek
Samuel T. Collins and Michael Albright Eastern Kentucky Environmental Research Institute
201 Roark Building Richmond, Kentucky 40475
Phone: 859-622-6914 [email protected]
Supervising Faculty:
Dr. Danita LaSage, Eastern Kentucky University, Senior Researcher, Eastern Kentucky Environmental Research Institute
Muddy Creek, a 4th-order tributary of the Kentucky River, lies within an area of
changing land use. The stream includes reaches characterized by poor instream habitat, poor channel morphology, poor bank stability, and poor riparian zone conditions. The stream also frequently contains undesirable levels of pathogens, sediment, and/or nutrients, three of the four water-quality concerns most common to streams in Kentucky. Data tracking trends in these parameters document the interactions among humans and land-water systems in the Muddy Creek Watershed, Madison County, Kentucky. The data span four years and are intended to supplement understanding of spatial and temporal trends in Kentucky streams.
From February 2005 to February 2006, water samples from seven sites in the watershed were collected and analyzed by student researchers under faculty supervision. Data were incorporated into a pre-existing database and tied to land-use analyses. Water quality in the stream at times exceeds EPA-recommended limits for total nitrogen and/or total orthophosphate levels, indicating anthropogenic contamination. In addition, stream samples may exceed the reference turbidity level suggested by EPA for Ecoregion 71 streams. Levels of dissolved oxygen are at times lower than the minimum acceptable for warm-water aquatic habitat. Fecal coliform bacteria in Muddy Creek, indicative of fecal material input, have been collected annually since 2001. Fecal coliform counts ranged from 170 colonies per 100 mL to 18,000 colonies per mL. In Kentucky, water with more than 400 fecal coliform colonies per 100 mL may not be used for swimming; water with more than 1000 colonies per 100 mL may not be used for secondary contact. Higher than acceptable loads of pathogens as indicated by the presence of fecal coliform bacteria may be due to human sewage (failing septic systems or wastewater treatment plants), or local populations of warm-blooded animals. A number of non-point pollution sources exist in the watershed, particularly cattle pastures, which are present throughout the stream. Livestock density is substantially higher in Muddy Creek than in other areas of the Kentucky River basin. Therefore, in addition to annual fecal coliform analyses, monthly samples were collected during the past year and analyzed for total coliform (TC) and atypical coliform (AC). The AC/TC ratio is potentially useful in differentiating between

80
fecal material associated with animals and human sewage. For much of the period of interest, AC/TC ratios were high (up to 1700 or higher), suggesting predominantly aged material associated with agricultural sources. However, during periods of low flow, AC/TC ratios in Muddy Creek were lower, occasionally less than 2, and within the range associated with human sewage. This is contrary to previously reported findings of AC/TC ratios in the Kentucky River, in which ratios within the range of human sewage were associated with wet periods. The lowest AC/TC ratios measured in the watershed occurred during low flow months in the Central Kentucky Wildlife Management Area, the headwaters of Muddy Creek and an area expected to demonstrate little, if any, influence from man’s activities. Sediment load, a common problem in Kentucky streams, is of concern in Muddy Creek as well. Turbidity data are increasingly accepted as a surrogate for suspended sediment concentrations in a particular stream when a relationship between the two is shown to exist. During the past year, the stream was sampled during or shortly after rainfall events. Turbidity measurements taken during sampling were compared to measurements of suspended sediment concentration to determine the relationship. Rainfall events during the study period were infrequent and of short duration, and the data collected were not indicative of normal sediment transport; therefore, suspended sediment concentration data continue to be collected. Additionally, as part of this study, the EKU Environmental Research Institute contracted with USGS to install a monitoring station near the mouth of Muddy Creek. The continuously collected turbidity data from the station, coupled with continuing measures of suspended sediment, will ultimately allow turbidity data from the stream to be used as a surrogate for suspended sediment, and will lead to valuable tracking of sediment transport.

81
WATER QUALITY AND GEOMORPHOLOGICAL CHARACTERIZATION OF FIRST-ORDER STREAMS IN THE EASTERN KENTUCKY COAL FIELD
Tom Dicken
Eastern Kentucky Environmental Research Institute 201 Roark Building Roark Building
Richmond, KY 40475 859-622-6914
Supervising Faculty: Dr. Danita LaSage, Eastern Kentucky University, Senior Researcher
Dr. Alice Jones, Eastern Kentucky University, Director Eastern Kentucky Environmental Research Institute
The Eastern Kentucky Coal Field is characterized by steep mountainous terrain
and intense coal production. Rocks in the province, mostly sandstone, coal, shale, and thinly-interbedded limestone in this province, are of Pennsylvanian age and have a regional structural dip to the southeast. Over the past 200 years this region has produced almost 6 billion tons of coal, most of which was obtained by surface mining processes that have impacted local streams.
This study compared the water quality and geomorphology of a first-order stream
draining a watershed in eastern Kentucky that has been surface-mined, against a reference stream in an adjoining watershed covered by a nearly pristine deciduous forest. The reference stream also provided a baseline against which to compare the water quality of six streams impacted by Acid Mine Drainage (AMD) that exhibit similar geology, order, length, and load.
Methods used to determine geomorphological data included walking the streams
to note evidence of deposition, erosion, stream widening, and pooling. Discharge readings were also conducted along with stream channel surveys, which measure stream channel development, pebble counts, and bed load classifications.
Seven sites along the AMD-impacted streams were sampled monthly to determine
water quality, including measurements of pH, electrical conductivity, turbidity, dissolved oxygen, hardness, temperature, total acidity, and alkalinity. Funding for site visits and monthly sampling was provided by the Eastern Kentucky Environmental Research Institute.
Preliminary data demonstrate measurable differences between both water quality
and geomorphology of the reference stream and that of the comparison streams. The comparison streams exhibited lower pH, higher conductivity, lower alkalinity, and lower level of dissolved oxygen then the reference stream. Preliminary geomorphological data indicate that the reference stream is more stable, based on fewer meanders, fewer areas of erosion or deposition, and less evidence of stream widening.
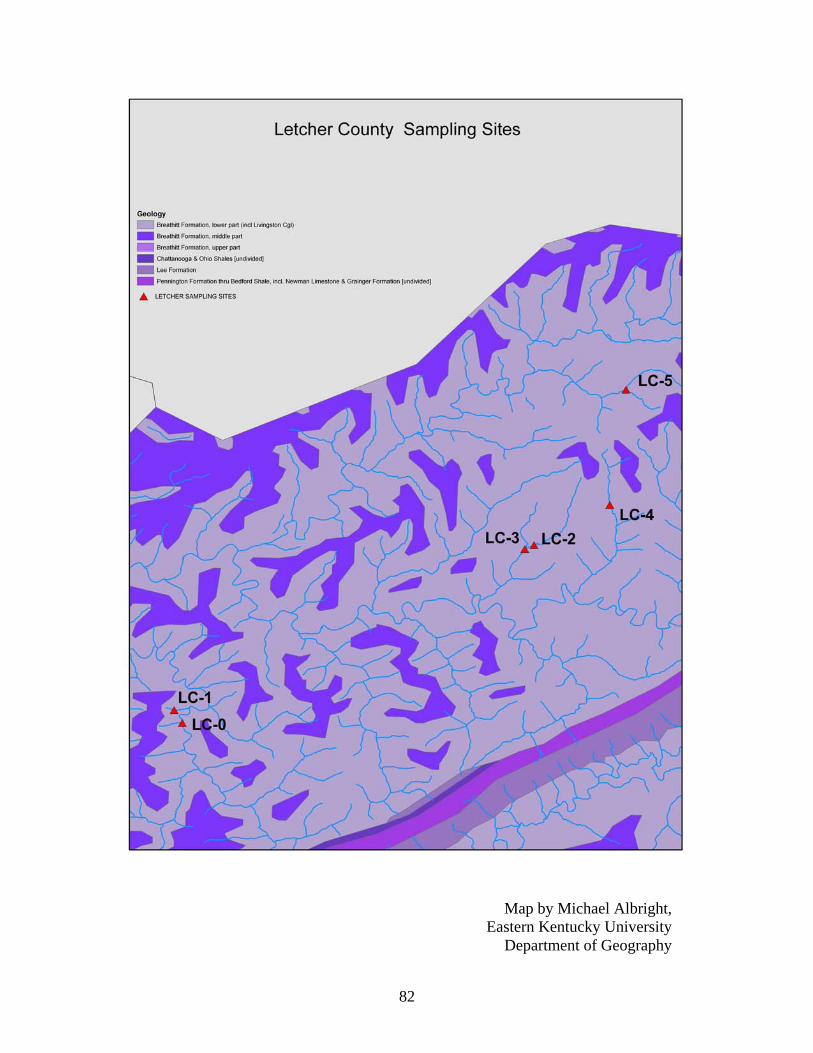
82
Map by Michael Albright, Eastern Kentucky University
Department of Geography

83
EXPERIMENTAL STUDY OF THE IMPACT OF UPLAND SEDIMENT SUPPLY UPON COHESIVE STREAMBANK EROSION
Brian Belcher, PE
Graduate Associate Department of Civil Engineering
University of Kentucky 161 O. H. Raymond Bldg.
Lexington, KY 40506-0281 Phone: (859) 257-4093
Email: [email protected]
Jimmy Fox Assistant Professor
Department of Civil Engineering University of Kentucky
161 O. H. Raymond Bldg. Lexington, KY 40506-0281
Phone: (859) 257-8668 Email: [email protected]
This research project is experimental in nature and studies the in-stream interaction of fluid turbulence, upland sediment supply, and cohesive streambank erosion. Experiments were designed for testing these complex interactions within the controlled setting of the 12 m recirculating flume in the Hydrosystems Laboratory located at the University of Kentucky, Civil Engineering (see Figure 1). This poster presentation illustrates: (1) the experimental design to study the fluid-sediment interactions; (2) the experimental setup, post-processing statistics and visualization, and preliminary results of the initial phase of this work; and (3) the experimental methods underway for the latter phase of this work. Currently, the presenters are in the initial phase of the project which involves quantifying the turbulent structure of the flow using highly sensitive velocimetry techniques. Instrumentation is setup and calibrated including instrumentation for intrusive measurements and non-intrusive measurements of instantaneous velocity. Thereafter, statistical and visualization techniques are used to assess fluid structure. The methods are able to capture the dominant eddy processes which act to dislodge sediments and transport the material downstream. Results are preliminary at this time, however, the results are expected to provide data regarding the fluid forces which may dislodge sediment particles. The presenters also discuss the latter phase of the project which involves introducing upland sediment supply at the entrance to the flume and monitoring the impacts upon fluid turbulence and cohesive bank material placed in the fully developed region within the flume. Sediment parameters in phase of the study are being designed based on field
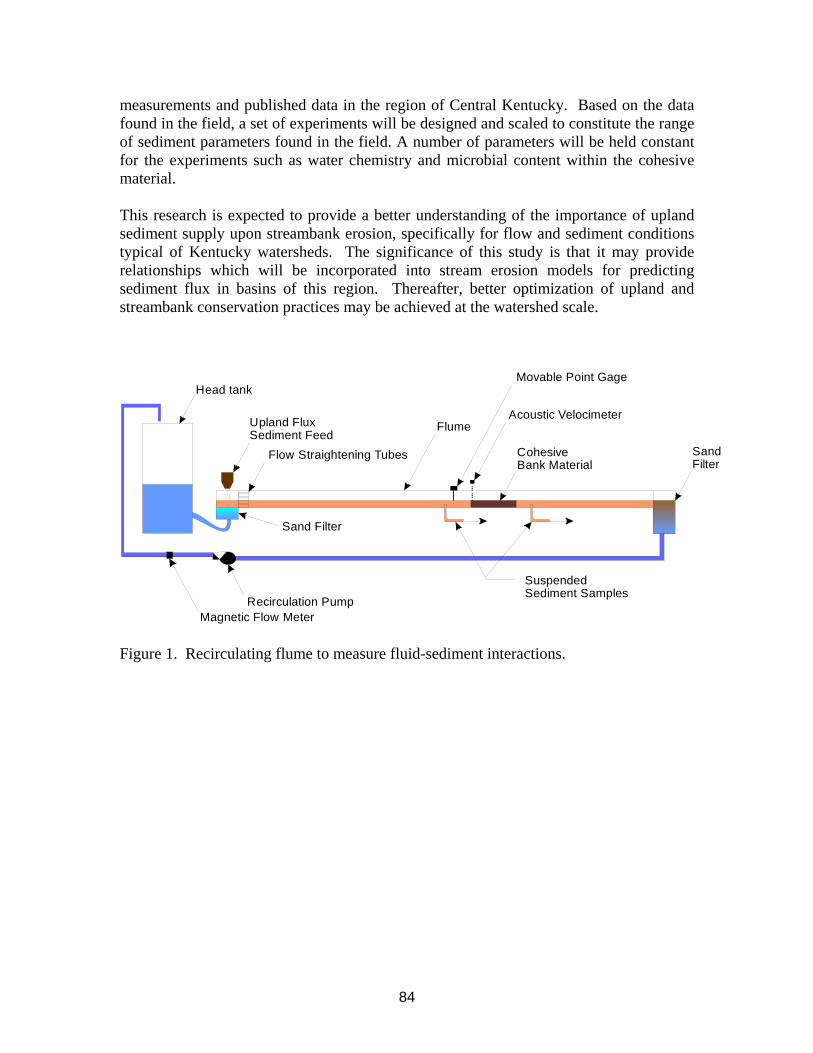
84
measurements and published data in the region of Central Kentucky. Based on the data found in the field, a set of experiments will be designed and scaled to constitute the range of sediment parameters found in the field. A number of parameters will be held constant for the experiments such as water chemistry and microbial content within the cohesive material. This research is expected to provide a better understanding of the importance of upland sediment supply upon streambank erosion, specifically for flow and sediment conditions typical of Kentucky watersheds. The significance of this study is that it may provide relationships which will be incorporated into stream erosion models for predicting sediment flux in basins of this region. Thereafter, better optimization of upland and streambank conservation practices may be achieved at the watershed scale.
Head tank
Recirculation PumpMagnetic Flow Meter
Flow Straightening Tubes SandFilter
Sand Filter
CohesiveBank Material
Upland FluxSediment Feed
FlumeAcoustic Velocimeter
Movable Point Gage
SuspendedSediment Samples
Figure 1. Recirculating flume to measure fluid-sediment interactions.
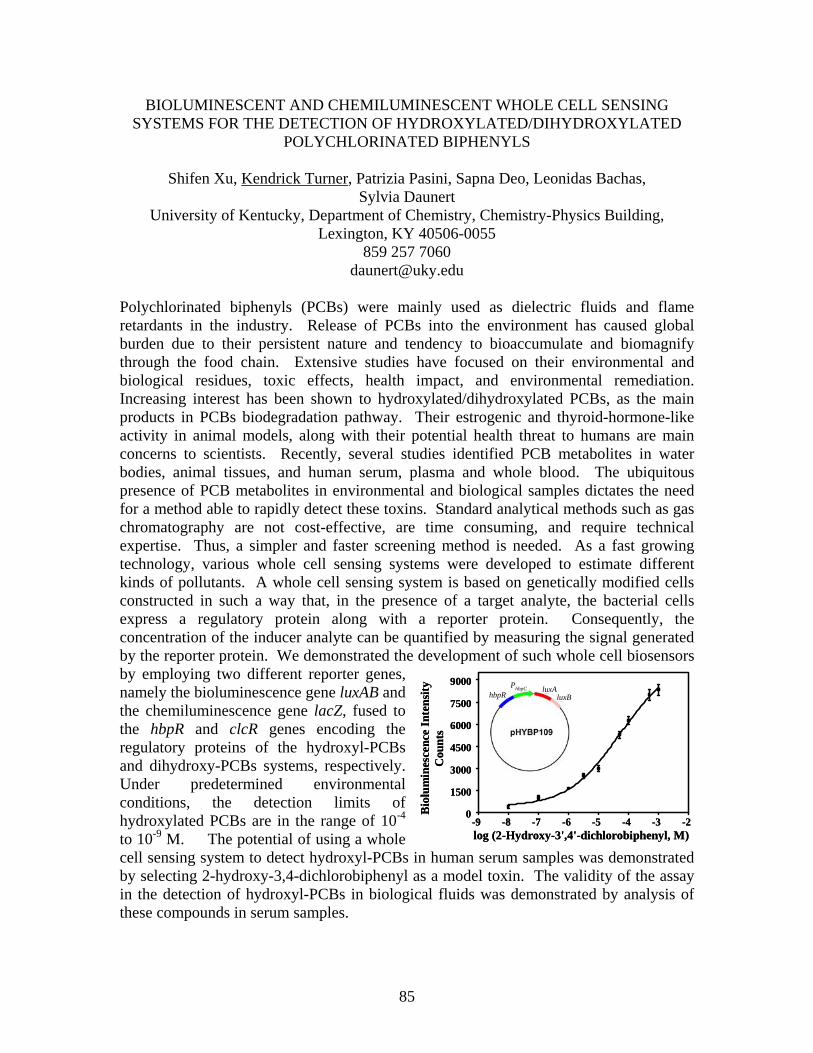
85
BIOLUMINESCENT AND CHEMILUMINESCENT WHOLE CELL SENSING SYSTEMS FOR THE DETECTION OF HYDROXYLATED/DIHYDROXYLATED
POLYCHLORINATED BIPHENYLS
Shifen Xu, Kendrick Turner, Patrizia Pasini, Sapna Deo, Leonidas Bachas, Sylvia Daunert
University of Kentucky, Department of Chemistry, Chemistry-Physics Building, Lexington, KY 40506-0055
859 257 7060 [email protected]
Polychlorinated biphenyls (PCBs) were mainly used as dielectric fluids and flame retardants in the industry. Release of PCBs into the environment has caused global burden due to their persistent nature and tendency to bioaccumulate and biomagnify through the food chain. Extensive studies have focused on their environmental and biological residues, toxic effects, health impact, and environmental remediation. Increasing interest has been shown to hydroxylated/dihydroxylated PCBs, as the main products in PCBs biodegradation pathway. Their estrogenic and thyroid-hormone-like activity in animal models, along with their potential health threat to humans are main concerns to scientists. Recently, several studies identified PCB metabolites in water bodies, animal tissues, and human serum, plasma and whole blood. The ubiquitous presence of PCB metabolites in environmental and biological samples dictates the need for a method able to rapidly detect these toxins. Standard analytical methods such as gas chromatography are not cost-effective, are time consuming, and require technical expertise. Thus, a simpler and faster screening method is needed. As a fast growing technology, various whole cell sensing systems were developed to estimate different kinds of pollutants. A whole cell sensing system is based on genetically modified cells constructed in such a way that, in the presence of a target analyte, the bacterial cells express a regulatory protein along with a reporter protein. Consequently, the concentration of the inducer analyte can be quantified by measuring the signal generated by the reporter protein. We demonstrated the development of such whole cell biosensors by employing two different reporter genes, namely the bioluminescence gene luxAB and the chemiluminescence gene lacZ, fused to the hbpR and clcR genes encoding the regulatory proteins of the hydroxyl-PCBs and dihydroxy-PCBs systems, respectively. Under predetermined environmental conditions, the detection limits of hydroxylated PCBs are in the range of 10-4 to 10-9 M. The potential of using a whole cell sensing system to detect hydroxyl-PCBs in human serum samples was demonstrated by selecting 2-hydroxy-3,4-dichlorobiphenyl as a model toxin. The validity of the assay in the detection of hydroxyl-PCBs in biological fluids was demonstrated by analysis of these compounds in serum samples.
-9 -8 -7 -6 -5 -4 -3 -20
1500
3000
4500
6000
7500
9000
log (2-Hydroxy-3',4'-dichlorobiphenyl, M)
Bio
lum
ines
cenc
eIn
tens
ityC
ount
s
hbpRluxA
luxBPhbpC
-9 -8 -7 -6 -5 -4 -3 -20
1500
3000
4500
6000
7500
9000
log (2-Hydroxy-3',4'-dichlorobiphenyl, M)
Bio
lum
ines
cenc
eIn
tens
ityC
ount
s
hbpRluxA
luxBPhbpC
hbpRluxA
luxBPhbpC

86
NOTES
_____________________________________________________________ _____________________________________________________________ _____________________________________________________________ _____________________________________________________________ _____________________________________________________________ _____________________________________________________________ _____________________________________________________________ _____________________________________________________________ _____________________________________________________________ _____________________________________________________________ _____________________________________________________________ _____________________________________________________________ _____________________________________________________________ _____________________________________________________________ _____________________________________________________________ _____________________________________________________________ _____________________________________________________________ _____________________________________________________________
87
THE KENTUCKY WATERSHED MODELING INFORMATION PORTAL (KWMIP): KWMIP DATASET AND MODEL SUITES AND COMMONALITIES
Demetrio P. Zourarakis1, Karen L. Schaffer 2, Kenneth R. Odom3,
Sam A. Bacharach4, and Gary R. Harp5,6 1 PhD, Remote Sensing and GIS Analyst, (Division of Geographic Information, DGI) 2 Senior Environmental Scientist, (FMSM Engineers, Inc.) 3 PhD, PE, Surface Water Specialist, (USGS Kentucky Water Science Center) 4 Exec. Director, Outreach/Community Adoption (Open Geospatial Consortium, Inc. OGC) 5 Director, (DGI)
1025 Capital Center Drive – Suite 101
Frankfort, KY 40601 502-573-1450
In September, 2004, The Kentucky Commonwealth Office of Technology (COT) was awarded $750,000 from the US Environmental Protection Agency (USEPA)’s Environmental Information Exchange Network (EIEN) to develop the Kentucky Watershed Modeling Information Portal (KWMIP). This 2-year project will develop a web-based portal to quickly and accurately deliver current and appropriately formatted watershed model input data for selected models (Schaffer et al., 2006). In order to design KWMIP to address the needs of future portal users, a Technical Advisory Group (TAG), consisting of future portal users and experts from agencies, academia, non-profits and consultants, is advising the Project Partners. The TAG will provide input regarding model selection and key model input datasets, identification of portal functions and training needs. Over 80 individuals were invited to participate on the TAG, which to-date has delivered the User Needs Analysis, the Data Matrix (DM), and the Use Case documents. A TAG Subcommittee, the DM Working Group, summarized data needs for a short list of nine models (LSPC, EFDC, QUAL2K, HEC, SWMM, Load Duration Curves (LDC), HSPF, ModFlow (MODFLOW), and WASP)) and explored the capabilities of two tools (BASINS and WCS). Over 80 sources of data have been identified thus far. The approximately 90 datasets identified were categorized in two ways. Depending on the existence of location (geographic) information, the datasets were classified into spatial (i.e. geographic) or tabular categories, identifying 27 and 42 datasets, respectively. Another set of categories was identified as thematic or disciplinary: Basemap (13 datasets), Climate (16 datasets), Geology (3 datasets), Hydrology (29 datasets), Source (16 datasets), and Water Quality (11 datasets). Many of the spatial data layers are 6 With KWMIP Project Partners: Bill Caldwell, Lee Colten, Ann Fredenburg, Eric Liebenauer, Kay Harker, Peter Goodmann (KDOW), and Mark Ayers (USGS, KY Water Science Center).
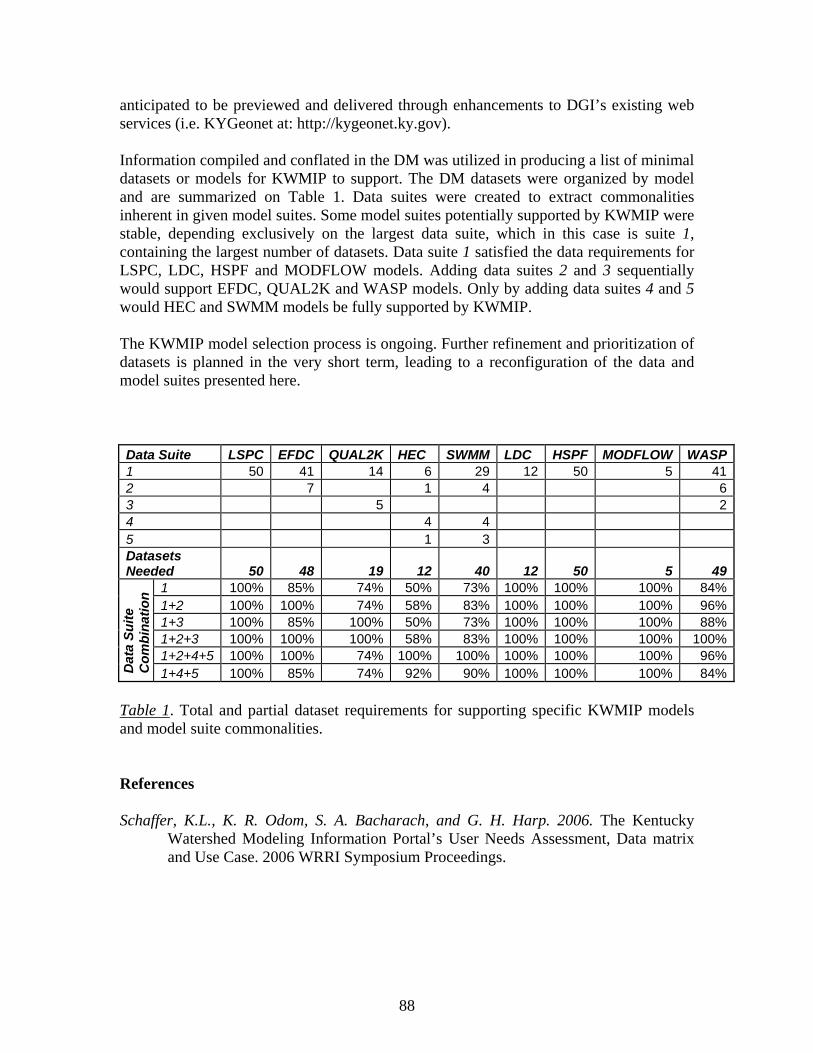
88
anticipated to be previewed and delivered through enhancements to DGI’s existing web services (i.e. KYGeonet at: http://kygeonet.ky.gov). Information compiled and conflated in the DM was utilized in producing a list of minimal datasets or models for KWMIP to support. The DM datasets were organized by model and are summarized on Table 1. Data suites were created to extract commonalities inherent in given model suites. Some model suites potentially supported by KWMIP were stable, depending exclusively on the largest data suite, which in this case is suite 1, containing the largest number of datasets. Data suite 1 satisfied the data requirements for LSPC, LDC, HSPF and MODFLOW models. Adding data suites 2 and 3 sequentially would support EFDC, QUAL2K and WASP models. Only by adding data suites 4 and 5 would HEC and SWMM models be fully supported by KWMIP. The KWMIP model selection process is ongoing. Further refinement and prioritization of datasets is planned in the very short term, leading to a reconfiguration of the data and model suites presented here. Data Suite LSPC EFDC QUAL2K HEC SWMM LDC HSPF MODFLOW WASP1 50 41 14 6 29 12 50 5 412 7 1 4 63 5 24 4 4 5 1 3 Datasets Needed 50 48 19 12 40 12 50 5 49
1 100% 85% 74% 50% 73% 100% 100% 100% 84%1+2 100% 100% 74% 58% 83% 100% 100% 100% 96%1+3 100% 85% 100% 50% 73% 100% 100% 100% 88%1+2+3 100% 100% 100% 58% 83% 100% 100% 100% 100%1+2+4+5 100% 100% 74% 100% 100% 100% 100% 100% 96%
Dat
a Su
ite
Com
bina
tion
1+4+5 100% 85% 74% 92% 90% 100% 100% 100% 84% Table 1. Total and partial dataset requirements for supporting specific KWMIP models and model suite commonalities. References Schaffer, K.L., K. R. Odom, S. A. Bacharach, and G. H. Harp. 2006. The Kentucky
Watershed Modeling Information Portal’s User Needs Assessment, Data matrix and Use Case. 2006 WRRI Symposium Proceedings.
89
Occurrence and Distribution of Mercury in Mammoth Cave National Park
Lindsey Clark, Chelsea Campbell, Dr. David Hartman
Dr. Sreedevi Dawadi and Dr. Cathleen Webb
Department of Chemistry, Western Kentucky University, 1 Big Red Way, Bowling Green, KY 42101
Phone: 270-745-3786 [email protected]
The fate and transport of mercury in Mammoth Cave National Park (MCNP) will be examined in order to determine mercury’s mobility in surface and ground water. Mercury (Hg) is a persistent neurotoxin that is easily transported through karst aquifer systems; for example, the South Central Kentucky Karst (SCKK) ecosystem, which includes the MCNP area. The largest source of mercury to MCNP is atmospheric deposition, largely produced by coal-fired power plants. Hg from the atmosphere deposits in rivers, sediments, and organisms through rain, wind, and bioaccumulation.
The current data shows a potential threat of Hg levels in the drinking water and
Hg bioaccumulation in a number of surface and subsurface organisms of MCNP. Background levels of mercury, 0-25 ppt in the water and 0-3000 ppb in the sediment have been observed. A number of surface and subsurface organisms are endangered or declining in MCNP due to bioaccumulation of mercury. Observed levels of mercury in fish and clam samples are comparable to values observed in other studies (0-0.50 ppm). Mercury levels in different bat species, including federally listed endangered species in the park have been examined which show 1-9 ppm. Quality analysis and quality control tests were done using a human hair reference material as a standard. Mercury concentrations in bats collected at various locations during summer 2004 and summer 2005 and hair from archival bats were analyzed and compared in order to investigate the potential for mercury bioaccumulation.

90
NOTES
_____________________________________________________________ _____________________________________________________________ _____________________________________________________________ _____________________________________________________________ _____________________________________________________________ _____________________________________________________________ _____________________________________________________________ _____________________________________________________________ _____________________________________________________________ _____________________________________________________________ _____________________________________________________________ _____________________________________________________________ _____________________________________________________________ _____________________________________________________________ _____________________________________________________________ _____________________________________________________________ _____________________________________________________________ _____________________________________________________________

91
REPROJECTING THE KLS (KENTUCKY LANDSCAPE SNAPSHOT PROJECT) IMPERVIOUSNESS LAYER: THE EFFECTS OF RESAMPLING METHOD ON
IMPERVIOUS CLASS DISTRIBUTION IN SELECTED URBAN AREAS
Demetrio P. Zourarakis1*
1PhD, Remote Sensing and GIS Analyst – COT – DGI *Presenting author
Commonwealth Office of Technology (COT)
Kentucky Division of Geographic Information (DGI) 1025 Capital Center Dr. – Suite 101
Frankfort, KY 40601 (502) 573-1450 ext. 3452 – fax: (502) 573-6549
The 2001 30-m imperviousness layer is published and originally available for downloading from both the USGS Seamless Data Distribution Center at: http://seamless.usgs.gov/website/seamless/viewer.php. Cubic convolution interpolation was used to re-project the data from USGS Albers Equal Area to Kentucky Single Zone projection (SPCS, FIPS 1600), which were then clipped to the buffered state boundary and then published also on the KY Geonet at: http://kygeonet.ky.gov). Imperviousness is an important hydrologic variable, which reflects multiple land cover and land use modifying processes and is utilized in several hydrologic models. Urban areas in Kentucky were “sampled”; the urban – corporate – boundaries for 8 urban cities were selected: Bowling Green, Maysville, Middlesboro, Owensboro, Paducah, Pikeville, and Williamstown-Dry Ridge were selected (Anness, 2006). The nearest neighbor interpolation method not being suitable for quantitative data, three different methods of interpolation were assessed: bilinear (BLI), cubic convolution (CC) and bicubic spline interpolation (BSI). These methods become more computationally intense, resulting – purportedly - in increasing quality as one progresses from BLI to BSI. The results are characterized in two different ways: spatial distribution of imperviousness values (Figure 1), and overall frequency distributions by imperviousness numerical class (Figure 2). As compared with the original data, contrast is lost by using BLI, while the CC and BSI methods preserve the general geometry and crispness of the impervious area distribution (Figs. 1 (a), 1(b)). The BSI method created artifact pixels with imperviousness>100% (Figs. 1(a), 1(c)), indicated in black on the figure. The frequency distribution for the 100 classes of imperviousness was better preserved by the CC method versus the BLI and BSI methods, with respect to the original data (Figs. 2(a), 2(b), 2(c)).

92
Bilinear Transformed vs. Original Data (Class-to-class Correlate)
05000
1000015000200002500030000
0 2000 4000 6000 8000 10000 12000 14000
Original Count
Bilin
ear
Tran
sf. C
ount
Cubic Convolution Transformed vs. Original Data(Class-to-class Correlate)
02000400060008000
100001200014000
0 2000 4000 6000 8000 10000 12000 14000
Original Count
Bilin
ear T
rans
f. Co
unt
Bicubic Spline Transformed vs. Original Data(Class-to-class Correlate)
0
2000
4000
6000
8000
10000
0 2000 4000 6000 8000 10000 12000 14000
Original Count
Bilin
ear T
rans
f. C
ount
References Anness, Kimberly. 2006. Corporate boundaries geodatabase maintained and filed with the Kentucky Secretary of State, and published to the KYGeonet (http://kygeonet.ky.gov).
Figure 1. Results from re-projection with different interpolation methods. (a) original imperviousness (USGS – Albers Equal Area); (b) bilinear interpolation (FIPS 1600- KY Single Zone); (c) cubic convolution (FIPS 1600); (d) bicubic spline (FIPS 1600) – pixels with over 100% imperviousness values indicated inside circles. (Scale: approx. 1:40,000; Owensboro vicinity).
(a) (b)
(c) (d)
(a)
(b)
(c)
Figure 2. Frequency distribution by class-to-class pairs; (a) BLI vs. original data; (b) CC vs. original data; (c) BSI vs. original data.

93
AN ASSESSMENT OF “HOT SPOTS” & PIRORITY WATERSHEDS FOR CONSERVATION OF IMPERILED FRESHWATER MUSSELS AND FISHES IN
KENTUCKY
Ronald R. Cicerello and Greg Abernathy Kentucky State Nature Preserves Commission
801 Schenkel Lane Frankfort, KY 40601-1403
502-573-2886 [email protected]
Kentucky’s native freshwater fish and mussel faunas are among the richest in North America, the center of worldwide freshwater mussel and temperate freshwater fish biodiversity. Mussels and fishes are among the most imperiled taxonomic groups nationally; their distribution in Kentucky is well documented. During the last century, habitat destruction and degradation (e.g., dams, pollution) caused the extirpation or extinction of 21% and 4% of Kentucky’s mussel and fish taxa, respectively. Of the extant taxa, 41% of mussels and 25% of fishes are imperiled because of significant declines in diversity, numbers and distribution. Although there are efforts to conserve imperiled aquatic taxa priority areas for conservation have not been assessed. Priority areas must be identified so limited conservation funds can be expended wisely. The objective of this analysis was to identify hot spots, watersheds with the highest species richness, and priority watersheds for conservation of extant imperiled freshwater mussels and fishes in Kentucky. Using Geographic Information Systems each of 616 Kentucky watersheds (11-digit U.S. Geological Survey hydrologic unit codes) were scored for post-1984 records of imperiled mussels (33 taxa) and fishes (50 taxa) in the KSNPC Natural Heritage Program database. Only 31% of the 616 11-digit watersheds in Kentucky had at least one imperiled taxon and only 1.9% were determined to be hot spot watersheds (a watershed that supports 8 or more imperiled taxa). Using a rarity-weighted richness index (RWRI) 53 watersheds were identified as priority watersheds, an area totaling ca. 1,490,896 hectares or 14% of Kentucky. This preliminary assessment focused on imperiled mussels and fishes. A future assessment will use data for all native mussel and fish taxa to determine priorities for biodiversity conservation of these groups.

94
NOTES
_____________________________________________________________ _____________________________________________________________ _____________________________________________________________ _____________________________________________________________ _____________________________________________________________ _____________________________________________________________ _____________________________________________________________ _____________________________________________________________ _____________________________________________________________ _____________________________________________________________ _____________________________________________________________ _____________________________________________________________ _____________________________________________________________ _____________________________________________________________ _____________________________________________________________ _____________________________________________________________ _____________________________________________________________ _____________________________________________________________
Related Documents


