2017 TECHNICAL REPORT PROJECT EXPLORATION UPDATE AND FARADAY INFERRED MINERAL RESOURCE ESTIMATE KENNADY NORTH PROJECT NORTHWEST TERRITORIES, CANADA 63° 26' 04" to 63° 33' 50" North 108° 59' 12" to 109° 23' 48" West N.T.S. 75N/6 and 11 prepared for: report prepared by:

Welcome message from author
This document is posted to help you gain knowledge. Please leave a comment to let me know what you think about it! Share it to your friends and learn new things together.
Transcript
2017 TECHNICAL REPORT
PROJECT EXPLORATION UPDATE AND FARADAY INFERRED MINERAL RESOURCE ESTIMATE
KENNADY NORTH PROJECT NORTHWEST TERRITORIES, CANADA
63° 26' 04" to 63° 33' 50" North
108° 59' 12" to 109° 23' 48" West
N.T.S. 75N/6 and 11
prepared for:
report prepared by:
2017 TECHNICAL REPORT
PROJECT EXPLORATION UPDATE AND FARADAY INFERRED RESOURCE ASSESSMENT
KENNADY NORTH PROJECT
NORTHWEST TERRITORIES, CANADA
Kennady Diamonds Inc.
Suite 2700 – 401 Bay Street
Toronto, ON M5H 2Y3
Tel: 416.361.3562
Aurora Geosciences Ltd.
3506 McDonald Drive
Yellowknife, NT
X1A 2H1
Tel: 867.920.2729 Fax: 867.920.2739
www. aurorageosciences.com
Effective date: November 16, 2017
Authors
Gary Vivian, M.Sc., P.Geol., QP
Aurora Geosciences Ltd.
Dr. Tom Nowicki, P.Geo., QP
Mineral Services Canada Inc.
Kennady Diamonds Inc. Aurora Geosciences Ltd.
KDI NI 43-101 Technical Report- Update 2017 i | P a g e
TABLE OF CONTENTS
1 EXECUTIVE SUMMARY ................................................................................................................................... 1
PROPERTY DESCRIPTION, LOCATION, ACCESS AND PHYSIOGRAPHY ............................................................. 1
HISTORY........................................................................................................................................................ 2
REGIONAL AND LOCAL GEOLOGICAL SETTING ............................................................................................... 2
DEPOSIT TYPES AND MINERALIZATION .......................................................................................................... 3
EXPLORATION AND DRILLING ........................................................................................................................ 3
SAMPLING METHOD, APPROACH AND ANALYSIS .......................................................................................... 4
DATA VERIFICATION ..................................................................................................................................... 4
MINERAL PROCESSING AND METALLURGICAL DATA COLLECTION ................................................................ 5
KENNADY NORTH MINERAL RESOURCE ESTIMATE....................................................................................... 5
2 INTRODUCTION ............................................................................................................................................. 7
3 RELIANCE ON OTHER EXPERTS ....................................................................................................................... 7
SOURCES OF INFORMATION AND DISCLOSURE ............................................................................................ 7
4 PROPERTY DESCRIPTION AND LOCATION ...................................................................................................... 8
5 ACCESSIBILITY, CLIMATE, LOCAL RESOURCES, INFRASTRUCTURE AND PHYSIOGRAPHY .............................. 14
ACCESS, INFRASTRUCTURE AND LOCAL RESOURCES ................................................................................... 14
CLIMATE ..................................................................................................................................................... 17
TOPOGRAPHY AND PHYSIOGRAPHY ............................................................................................................ 17
FLORA AND FAUNA ...................................................................................................................................... 17
6 HISTORY ...................................................................................................................................................... 18
7 GEOLOGICAL SETTING AND MINERALIZATION ............................................................................................. 19
SLAVE CRATON OVERVIEW ......................................................................................................................... 19
REGIONAL GEOLOGY .................................................................................................................................. 19
PROPERTY GEOLOGY .................................................................................................................................. 21
7.3.1 Kelvin-Faraday (KFC) Area Rock Types ................................................................................................... 22 7.3.1.1 Metasedimentary Rocks ............................................................................................................................... 22 7.3.1.2 Mafic to Ultramafic Rocks ............................................................................................................................. 24 7.3.1.3 Intermediate Intrusive Rocks ........................................................................................................................ 24 7.3.1.4 Granitoids ..................................................................................................................................................... 25 7.3.1.5 Proterozoic Diabase Dykes ............................................................................................................................ 26 7.3.1.6 Metamorphic and Structural Aspects ........................................................................................................... 27 7.3.1.7 Folding and Fabric Development .................................................................................................................. 27 7.3.1.8 Faults and Fractures ...................................................................................................................................... 27
7.3.2 MZ Lake Area Rock Types ...................................................................................................................... 28 7.3.2.1 Granitoids ..................................................................................................................................................... 28 7.3.2.2 Alkaline Intrusion .......................................................................................................................................... 30 7.3.2.3 Diabase Dykes ............................................................................................................................................... 31 7.3.2.4 Metamorphic and Structural Aspects ........................................................................................................... 31
7.3.3 Doyle Lake Area Rock Types ................................................................................................................... 31 7.3.3.1 Rock Types .................................................................................................................................................... 32 7.3.3.2 Structural Aspects ......................................................................................................................................... 32
Kennady Diamonds Inc. Aurora Geosciences Ltd.
KDI NI 43-101 Technical Report- Update 2017 ii | P a g e
7.3.4 Kelvin Kimberlite Detail Geology ............................................................................................................ 34 7.3.4.1 Introduction .................................................................................................................................................. 34 7.3.4.2 Kelvin kimberlite unit and sub-unit characteristics ....................................................................................... 35
KIMB1 ....................................................................................................................................................... 37 KIMB2 ....................................................................................................................................................... 38 KIMB3 ....................................................................................................................................................... 39 KIMB6 ....................................................................................................................................................... 40 KIMB4 ....................................................................................................................................................... 41 KIMB7 ....................................................................................................................................................... 41 KIMB8 ....................................................................................................................................................... 42
7.3.4.3 Kelvin kimberlite 3-D geological model ......................................................................................................... 43 External pipe shell model ......................................................................................................................... 43 Internal geology model ............................................................................................................................ 45 Drill data constraining Kelvin model ........................................................................................................ 46
7.3.5 Faraday 2 Kimberlite Geology ................................................................................................................ 47 7.3.5.1 Faraday 2 kimberlite units ............................................................................................................................ 47
KIMB1A..................................................................................................................................................... 48 KIMB1B ..................................................................................................................................................... 49 KIMB2 ....................................................................................................................................................... 49 KIMB3 ....................................................................................................................................................... 49 KIMB4 ....................................................................................................................................................... 49 KIMB5 ....................................................................................................................................................... 49 Coherent/Hypabyssal Kimberlite (KDyke) ................................................................................................ 49
7.3.5.2 Faraday 2 kimberlite 3-D geological model ................................................................................................... 50 External pipe shell model ......................................................................................................................... 50 Internal geology model ............................................................................................................................ 51 Drill data constraining Faraday 2 model................................................................................................... 52
7.3.6 Faraday 3 Kimberlite Geology ................................................................................................................ 53 7.3.6.1 Faraday 3 kimberlite units ............................................................................................................................ 53
KIMB1 ....................................................................................................................................................... 55 KIMB2 ....................................................................................................................................................... 55 KIMB3 ....................................................................................................................................................... 55 KIMB4 ....................................................................................................................................................... 56 Minor units within or peripheral to Faraday 3 ......................................................................................... 57
7.3.6.2 Faraday 3 kimberlite 3-D geological model ................................................................................................... 58 External pipe shell model ......................................................................................................................... 58 Internal geology model ............................................................................................................................ 59 Drill data constraining Faraday 3 model................................................................................................... 60
7.3.7 Faraday 1 Kimberlite Geology ................................................................................................................ 61 7.3.7.1 Faraday 1 kimberlite units ............................................................................................................................ 61 7.3.7.2 Faraday 1 3-D Geological Model ................................................................................................................... 65
Faraday 1 Model Kimberlite Domains ...................................................................................................... 65 7.3.8 Quaternary ............................................................................................................................................. 66
7.3.9 Metamorphic and Structural Geology ................................................................................................... 66
MINERALIZATION ....................................................................................................................................... 68
8 DEPOSIT TYPES ............................................................................................................................................ 68
9 EXPLORATION ............................................................................................................................................. 72
EXPLORATION 2017 .................................................................................................................................... 72
Kennady Diamonds Inc. Aurora Geosciences Ltd.
KDI NI 43-101 Technical Report- Update 2017 iii | P a g e
9.1.1 Introduction ........................................................................................................................................... 72
GRAVITY SURVEY............................................................................................................................................. 72
9.2.1 Introduction ........................................................................................................................................... 72
9.2.2 Gravity Results ....................................................................................................................................... 72 9.2.2.1 Blob Lake – Target 1 ...................................................................................................................................... 73 9.2.2.2 Blob Lake Gravity – Target 2 ......................................................................................................................... 78 9.2.2.3 Blob Lake Gravity – Target 3 ......................................................................................................................... 78 9.2.2.4 Blob Lake Gravity – Target 4 ......................................................................................................................... 78
BATHYMETRIC SURVEY ..................................................................................................................................... 78
9.3.1 Introduction ........................................................................................................................................... 78 9.3.1.1 Bathymetric Results ...................................................................................................................................... 78
OHMMAPPER© SURVEY .................................................................................................................................. 82
9.4.1 Introduction ........................................................................................................................................... 82
9.4.2 OhmMapper© Results ........................................................................................................................... 82
TOTAL FIELD MAGNETIC SURVEY ........................................................................................................................ 85
9.5.1 Introduction ........................................................................................................................................... 85
9.5.2 Ground Magnetic Survey Results ........................................................................................................... 85
GEOPHYSICAL COMPILATION ............................................................................................................................. 85
10 DRILLING ..................................................................................................................................................... 88
INTRODUCTION .......................................................................................................................................... 88
DIAMOND DRILLING AT THE KELVIN KIMBERLITE ..................................................................................................... 88
DIAMOND DRILLING AT THE FARADAY 2 KIMBERLITE ............................................................................................... 89
DIAMOND DRILLING AT THE FARADAY 3 AND 1 KIMBERLITE ...................................................................................... 89
LARGE DIAMETER REVERSE CIRCULATION (RC) BULK SAMPLE 2017 ......................................................................... 95
10.5.1 Introduction ....................................................................................................................................... 95
10.5.2 Geology of the Faraday 2 Kimberlite ................................................................................................. 95
10.5.3 Geology of the Faraday 3 Kimberlite ................................................................................................. 96
10.5.4 Geology of the Faraday 1 Kimberlite ................................................................................................. 96
10.5.5 Bulk Sample Drilling ........................................................................................................................... 97 10.5.5.1 Drilling Method ............................................................................................................................................. 97 10.5.5.2 Drillhole Planning and Preparation ............................................................................................................... 98 10.5.5.3 Caliper Survey ............................................................................................................................................... 98 10.5.5.4 Gamma Survey .............................................................................................................................................. 98 10.5.5.5 Drill Monitoring System ................................................................................................................................ 99 10.5.5.6 Drillhole Closure ............................................................................................................................................ 99 10.5.5.7 SUMMARY OF REVERSE CIRCULATION DRILLING RESULTS - 2017 ................................................................ 99
Faraday 2 Kimberlite ............................................................................................................................... 99 Faraday 3 Kimberlite ............................................................................................................................... 99 Faraday 1 Kimberlite ............................................................................................................................. 102
10.5.5.8 Bulk Sample Results from the 2017 RC Program on the Faraday Kimberlites............................................. 102
11 SAMPLE PREPRATION, ANALYSES AND SECURITY ...................................................................................... 104
DIAMOND DRILL CORE SAMPLING AND SECURITY ..................................................................................... 104
11.1.1 Diamond Drill Core Sampling for Microdiamond Analyses or Dense Media Separation ................. 104
11.1.2 Drill Core Sample Shipments and Security ....................................................................................... 105
11.1.3 Caustic Fusion Analysis of Diamond Drill Core................................................................................. 105
LARGE DIAMETER REVERSE CIRCULATION DRILLING, SAMPLING AND SECURITY ...................................... 107
Kennady Diamonds Inc. Aurora Geosciences Ltd.
KDI NI 43-101 Technical Report- Update 2017 iv | P a g e
11.2.1 Data Records ................................................................................................................................... 107
11.2.2 Representative Chip Samples .......................................................................................................... 107
11.2.3 Rig Logs ........................................................................................................................................... 107
11.2.4 Chip Logs.......................................................................................................................................... 108
11.2.5 Bulk Samples .................................................................................................................................... 108
11.2.6 Underflow Samples .......................................................................................................................... 109
11.2.7 Granulometry Samples .................................................................................................................... 110
11.2.8 Onsite Security ................................................................................................................................. 110
11.2.9 Sample Shipment and Security ........................................................................................................ 111
12 DATA VERIFICATION .................................................................................................................................. 111
MICRODIAMOND SAMPLES – DRILL CORE ................................................................................................ 111
MACRODIAMOND SAMPLES – DRILL CORE AND RC CHIPS ......................................................................... 112
DRILL DATA ............................................................................................................................................... 112
DENSITY DATA .......................................................................................................................................... 113
13 MINERAL PROCESSING AND METALLUGICAL DATA COLLECTION ............................................................... 114
INTRODUCTION ........................................................................................................................................ 114
DENSE MEDIA SEPARATION FOR MACRODIAMOND SAMPLES .................................................................. 114
X-RAY AND GREASE TABLE RECOVERY ....................................................................................................... 117
13.3.1 Diamond Sorting .............................................................................................................................. 118
13.3.2 Reporting ......................................................................................................................................... 118
14 MINERAL RESOURCE ESTIMATES ............................................................................................................... 119
14.1 KELVIN MINERAL RESOURCE ESTIMATE .............................................................................................................. 119
14.1.1 Resource domains and volumes ...................................................................................................... 120
14.1.2 Bulk density and tonnages............................................................................................................... 120
14.1.3 Grade ............................................................................................................................................... 121
14.1.4 Diamond value ................................................................................................................................. 122
14.1.5 Confidence and resource classification ............................................................................................ 123
14.1.6 Kelvin Mineral Resource statement ................................................................................................. 123
14.2 FARADAY MINERAL RESOURCE ESTIMATE ........................................................................................................... 124
14.2.1 Resource estimation approach ........................................................................................................ 125
14.2.2 Resource domains and volumes ...................................................................................................... 127
14.2.3 Bulk density and tonnages............................................................................................................... 128
14.2.4 Grade ............................................................................................................................................... 130 14.2.4.1 Supporting data – macrodiamonds ............................................................................................................. 130 14.2.4.2 Supporting data - microdiamonds .............................................................................................................. 132 14.2.4.3 Macrodiamond stone frequency and SFD characteristics ........................................................................... 134 14.2.4.4 Microdiamond stone frequency and SFD characteristics ............................................................................ 137 14.2.4.5 Total diamond content size frequency distributions .................................................................................. 139 14.2.4.6 Adjustment for recoverable grade and final SFD models ........................................................................... 141 14.2.4.7 Grade estimates .......................................................................................................................................... 142
14.2.5 Diamond value ................................................................................................................................. 146 14.2.5.1 Diamond valuation results .......................................................................................................................... 146 14.2.5.2 Value distribution ($/ct per size class) models............................................................................................ 148 14.2.5.3 Average diamond value .............................................................................................................................. 149
Kennady Diamonds Inc. Aurora Geosciences Ltd.
KDI NI 43-101 Technical Report- Update 2017 v | P a g e
14.2.6 Diamond breakage .......................................................................................................................... 150
14.2.7 Confidence and resource classification ............................................................................................ 150 14.2.7.1 Confidence in resource volumes ................................................................................................................. 150 14.2.7.2 Confidence in bulk density and tonnage estimates .................................................................................... 150 14.2.7.3 Confidence in grade estimates .................................................................................................................... 151 14.2.7.4 Confidence in diamond value estimates ..................................................................................................... 152
14.2.8 Reasonable prospects for eventual economic extraction ................................................................ 153
14.2.9 Faraday Mineral Resource Statement ............................................................................................. 153
14.3 KENNADY NORTH PROJECT MINERAL RESOURCE STATEMENT ................................................................................ 154
14.4 TFFE ESTIMATES FOR FARADAY 1 AND 2 ........................................................................................................... 155
14.4.1 Supporting data ............................................................................................................................... 155
14.4.2 TFFE domains, volume and tonnage range estimates ..................................................................... 157
14.4.3 SFD and grade characteristics ......................................................................................................... 158
14.4.4 TFFE grade range estimates ............................................................................................................ 160
14.4.5 Faraday 1 diamond values .............................................................................................................. 161
14.4.6 Summary of TFFE estimates ............................................................................................................ 161
15 ADJACENT PROPERTIES ............................................................................................................................. 161
GAHCHO KUÉ ............................................................................................................................................ 161
16 OTHER RELEVANT DATA AND INFORMATION ............................................................................................ 162
17 INTERPRETATION AND CONCLUSIONS ....................................................................................................... 162
18 RECOMMENDATIONS ................................................................................................................................ 164
19 DATE AND SIGNATURE PAGE ..................................................................................................................... 167
20 REFERENCES .............................................................................................................................................. 168
UNPUBLISHED COMPANY REPORTS ................................................................................................................... 168
20.2 GENERAL REFERENCES ......................................................................................................................................... 171
Kennady Diamonds Inc. Aurora Geosciences Ltd.
KDI NI 43-101 Technical Report- Update 2017 vi | P a g e
LIST OF FIGURES
FIGURE 4-1. LOCATION MAP OF THE KENNADY NORTH PROJECT ................................................................................................. 9
FIGURE 4-2. CLAIM LOCATION MAP OF THE KENNADY NORTH PROPERTY .................................................................................... 10
FIGURE 5-1. LOCATION MAP SHOWING WINTER ROAD ACCESS TO THE KENNADY NORTH PROJECT ................................................... 16
FIGURE 7-1. GEOLOGY MAP OF THE SLAVE CRATON (AFTER STUBLEY, 2005; HELMSTAEDT AND PEHRSSON, 2012) ........................... 20
FIGURE 7-2. KIMBERLITE BODIES OF THE SOUTHEASTERN SLAVE CRATON .................................................................................... 21
FIGURE 7-3. SIMPLIFIED GEOLOGY OF THE KFC (STUBLEY, 2015) .............................................................................................. 23
FIGURE 7-4. PHOTOGRAPHS SHOWING TEXTURAL VARIATIONS IN METATURBIDITES (A-D) ............................................................... 24
FIGURE 7-5. PHOTOGRAPHS SHOWING TEXTURAL VARIATIONS OF THE GRANITOID ROCKS (A-D) ....................................................... 26
FIGURE 7-6. SIMPLIFIED GEOLOGY MAP OF THE MZ LAKE AREA SHOWING KIMBERLITE SHEET AS KNOWN PRIOR TO 2015 ..................... 29
FIGURE 7-7. PHOTOGRAPHS OF GRANITOIDS IN THE MZ LAKE AREA ........................................................................................... 30
FIGURE 7-8. SIMPLIFIED GEOLOGY MAP OF THE DOYLE LAKE AREA WITH OUTLINE OF THE DOYLE KIMBERLITE AS KNOWN PRE-2015 ....... 33
FIGURE 7-9. DRILL CORE PHOTOGRAPHS OF THE KELVIN KIMBERLITE UNITS IN THE SOUTH (LEFT) AND NORTH (RIGHT) LIMBS ................ 37
FIGURE 7-10. PLAN VIEW OF EXTERNAL PIPE SHELL MODEL OF THE KELVIN KIMBERLITE (DECEMBER 2016) ........................................ 44
FIGURE 7-11. KELVIN 3-D MODEL SHOWING THE INTERNAL GEOLOGICAL DOMAINS (CRX DOMAIN NOT SHOWN) ............................... 46
FIGURE 7-12. IDEALIZED SCHEMATIC CROSS-SECTION OF KIMBERLITE UNITS IN FARADAY 2 .............................................................. 47
FIGURE 7-13. CONCEPTUAL SCHEMATIC OF POTENTIAL SPATIAL AND TEMPORAL RELATIONSHIPS OF HK TO THE FARADAY 2 PIPE ............ 50
FIGURE 7-14. INCLINED VIEW (LOOKING NE) OF THE EXTERNAL PIPE SHELL MODEL OF THE FARADAY 2 KIMBERLITE ............................. 51
FIGURE 7-15. FARADAY 2 3-D MODEL (LOOKING NE) SHOWING INTERNAL GEOLOGICAL DOMAINS .................................................. 52
FIGURE 7-16. INCLINED VIEW (LOOKING SE) OF THE EXTERNAL PIPE SHELL MODEL OF THE FARADAY 3 KIMBERLITE (NOV 2016) ............ 59
FIGURE 7-17. FARADAY 3, 3-D MODEL (LOOKING SE) SHOWING THE INTERNAL GEOLOGICAL DOMAINS (JUNE 2017) ......................... 60
FIGURE 7-18. 3-D GEOLOGICAL MODEL OF THE FARADAY 1 KIMBERLITE .................................................................................... 66
FIGURE 8.1A SCHEMATIC REPRESENTATION OF CLASS 1 KIMBERLITE PIPE (INFILLED WITH TK OR NOW KPK) VERSUS KELVIN (HETMAN,
2008) ................................................................................................................................................................... 70
FIGURE 8.1B CONCEPTUAL FORMATION OF THE KELVIN KIMBERLITE ........................................................................................... 71
FIGURE 9-1. LOCATION OF 2017 EXPLORATION PROGRAM ...................................................................................................... 73
FIGURE 9-2. BLOB LAKE GRAVITY - TREND REMOVED WITH HISTORICAL GGL DRILLHOLES ............................................................... 74
FIGURE 9-3. BLOB LAKE GRAVITY - AREA 1 ........................................................................................................................... 75
FIGURE 9-4. AREA 1 - BLOB LAKE GRAVITY ........................................................................................................................... 76
FIGURE 9-5. TARGET AREA 1 - BLOB LAKE GRAVITY ................................................................................................................ 77
FIGURE 9-6. TARGET AREA 2 - BLOB LAKE GRAVITY ................................................................................................................ 79
FIGURE 9-7. TARGET AREA 3 - BLOB LAKE GRAVITY ................................................................................................................ 80
FIGURE 9-8. TARGET AREA 4 - BLOB LAKE GRAVITY ................................................................................................................ 81
FIGURE 9-9. BATHYMETRIC SURVEY LOCATION....................................................................................................................... 82
FIGURE 9-10. RESISTIVITY CONTOURED DATA AT 410 MASL. .................................................................................................... 83
FIGURE 9-11. RESISTIVITY DATA CONTOURED - 360 MASL ....................................................................................................... 84
FIGURE 9-12. BLOB LAKE TOTAL FIELD MAGNETIC SURVEY WITH LINEAMENTS - 2017 .................................................................. 86
FIGURE 10-1. PLAN MAP OF KELVIN DRILLING - 2017 ............................................................................................................ 90
FIGURE 10-2. CROSS-SECTION OF KDI 17-001 ...................................................................................................................... 91
FIGURE 10-3. PLAN MAP OF THE FARADAY 2 DRILLING - 2017 ................................................................................................ 92
FIGURE 10-4. LONG SECTION OF FARADAY 2 DRILLING – 2017 ................................................................................................ 93
FIGURE 10-5 . PLAN VIEW OF FARADAY 1-3 DRILLING - 2017 .................................................................................................. 94
FIGURE 10-6. RC DRILLHOLE LOCATION MAP - FARADAY 2 .................................................................................................... 100
FIGURE 10-7. RC DRILL HOLE LOCATION MAP - FARADAY 3 .................................................................................................. 101
FIGURE 10-8. RC DRILL HOLE LOCATION PLAN FOR FARADAY 1 IN 2017 .................................................................................. 103
Kennady Diamonds Inc. Aurora Geosciences Ltd.
KDI NI 43-101 Technical Report- Update 2017 vii | P a g e
FIGURE 11-1. CAUSTIC FUSION ANALYSIS FLOW SHEET ......................................................................................................... 106
FIGURE 13-1. SRC - DMS PROCESS FLOW CHART - 2017 ................................................................................................... 115
FIGURE 13-2. X-RAY AND GREASE TABLE SORTER - SRC RECOVERY PROCESS FLOW SHEET .......................................................... 117
FIGURE 14-1. INCLINED VIEW OF THE FARADAY 1, 2 AND 3 PIPE SHELLS .................................................................................... 125
FIGURE 14-2. BULK DENSITY VARIATION WITH DEPTH IN THE VOLUMETRICALLY DOMINANT DOMAINS OF FARADAY 2 (KIMB1) AND
FARADAY 3 (KIMB4B) ........................................................................................................................................... 129
FIGURE 14-3. INCLINED VIEW (LOOKING SW) OF THE FARADAY 2 AND 3 GEOLOGICAL MODELS SHOWING ALL LDD DRILL HOLE TRACES IN
GREEN ................................................................................................................................................................. 132
FIGURE 14-4. INCLINED VIEW (LOOKING SW) OF THE FARADAY 2 AND 3 PIPE SHELL MODELS SHOWING ALL MICRODIAMOND SAMPLE
COVERAGE. ........................................................................................................................................................... 134
FIGURE 14-5. VARIATION IN MACRODIAMOND STONE FREQUENCY (+1.18MM ST/T) IN FARADAY 2 BY DOMAIN AND DRILL CLUSTER. ... 135
FIGURE 14-6. MACRODIAMOND SFD CHARACTERISTICS OF THE VOLUMETRICALLY DOMINANT DOMAINS OF FARADAY 2 (KIMB1) AND
FARADAY 3 (KIMB4B). .......................................................................................................................................... 136
FIGURE 14-7. PLUS 212 µM MICRODIAMOND STONE FREQUENCIES FROM DRILL CORE SAMPLES GROUPED BY DOMAIN INTO BROAD ZONES
WITH DISTANCE ALONG STRIKE .................................................................................................................................. 137
FIGURE 14-8. COMPARISON OF +106 µM MICRODIAMOND SFD CHARACTERISTICS OF (A) FARADAY 2 KIMB1 AND (B) FARADAY 3
KIMB4B WITH DISTANCE ALONG STRIKE. ................................................................................................................... 138
FIGURE 14-9. TOTAL +212 µM DIAMOND CONTENT SFD MODEL FOR FARADAY 2 KIMB1 ........................................................... 141
FIGURE 14-10. GRADE-SIZE PLOT ILLUSTRATING CORRECTIONS MADE TO FARADAY 2 KIMB1 LDD RECOVERIES FOR UNDER-RECOVERY OF
SMALL DIAMONDS. ................................................................................................................................................. 143
FIGURE 14-11. COMPARISON OF MACRODIAMOND SFD CHARACTERISTICS OF (A) ALL FARADAY 2 DOMAINS AND (B) FARADAY 3 KIMB1,
KIMB2 AND KIMB3. ............................................................................................................................................. 145
FIGURE 14-12. FARADAY 2 AND 3 DIAMOND VALUATION RESULTS BY GEOLOGICAL DOMAIN. ........................................................ 147
FIGURE 14-13. DIAMOND VALUE DISTRIBUTION MODELS, FROM WWW (2017) ....................................................................... 149
FIGURE 14-14. INCLINED VIEW (LOOKING NE) OF THE FARADAY 1 PIPE AND ASSOCIATED SHEET SHOWING MICRODIAMOND SAMPLE
COVERAGE AND LDD HOLE TRACES. ........................................................................................................................... 157
FIGURE 14-15. PLUS 212 µM MICRODIAMOND STONE FREQUENCIES BY DOMAIN FROM DRILL CORE SAMPLES OF FARADAY 1 .............. 159
FIGURE 14-16. COMPARISON OF +105 µM MICRODIAMOND SFD CHARACTERISTICS OF GROUPED RECOVERIES FROM FARADAY 1, 2, 3
AND KELVIN .......................................................................................................................................................... 159
FIGURE 14-17. GROUPED +0.85 MM MACRODIAMOND SFD CHARACTERISTICS FROM FARADAY 1 IN COMPARISON WITH FARADAY 3 AND
KELVIN ................................................................................................................................................................. 160
LIST OF TABLES
TABLE 1-1. MINERAL REOSURCE STATEMENT FOR THE KENNADY NORTH PROJECT. .......................................................................... 6
TABLE 1-2. TFFE ESTIMATES OF THE RANGES OF VOLUME, TONNES AND GRADE WITHIN FARADAY 1 AND MINOR UNITS WITHIN FARADAY 2
.............................................................................................................................................................................. 6
TABLE 4-1. MINERAL CLAIM STATISTICS FOR THE KENNADY NORTH PROPERTY .............................................................................. 11
TABLE 6-1. EXPLORATION SUMMARY ON THE KENNADY NORTH PROPERTY PRIOR TO 2017 ............................................................ 18
TABLE 7-1. KELVIN KIMBERLITE UNITS AND SUB-UNITS ............................................................................................................. 35
TABLE 7-2. SUMMARY OF THE MACROSCOPIC CHARACTERISTICS OF THE KELVIN KIMBERLITE UNITS AND SUB-UNITS ESTABLISHED BY END OF
2015 .................................................................................................................................................................... 36
TABLE 7-3. SUMMARY OF KEY PETROGRAPHIC FEATURES OF THE KELVIN KIMBERLITE UNITS (DECEMBER 2016) .................................. 42
TABLE 7-4. RELATIONSHIP BETWEEN KIMBERLTIE UNTIS AND 3-D GEOLOGICAL DOMAINS AT KELVIN ................................................. 45
TABLE 7-5. SUMMARY OF DRILL DATA USED TO CONSTRUCT THE KELVIN PIPE SHELL AND INTERNAL GEOLOGY MODEL ........................... 46
Kennady Diamonds Inc. Aurora Geosciences Ltd.
KDI NI 43-101 Technical Report- Update 2017 viii | P a g e
TABLE 7-6. SUMMARY OF KEY PETROGRAPHIC FEATURES OF THE FARADAY 2 KIMBERLITE UNITS ....................................................... 48
TABLE 7-7. RELATIONSHIP BETWEEN KIMBERLITE UNITS AND 3-D GEOLOGICAL DOMAINS AT FARADAY 2 ........................................... 51
TABLE 7-8. SUMMARY OF DRILL DATA TO CONSTRUCT THE FARADAY 2 PIPE SHELL AND INTERNAL GEOLOGY MODELS ............................ 52
TABLE 7-9. SUMMARY OF KEY PETROGRAPHIC FEATURES OF THE FARADAY 3 KIMBERLITE UNITS ....................................................... 54
TABLE 7-10. SUMMARY OF MINOR KIMBERLITE UNITS WITHIN OR EXTERNAL TO THE FARADAY 3 PIPE ................................................ 54
TABLE 7-11. RELATIONSHIP BETWEEN KIMBERLITE UNITS AND 3-D GEOLOGICAL DOMAINS AT FARADAY 3 ......................................... 60
TABLE 7-12. SUMMARY OF DRILL DATA TO CONSTRUCT FARADAY 3 PIPE SHELL AND INTERNAL GEOLOGICAL MODEL ............................. 61
TABLE 7-13. SUMMARY OF KIMBERLITE UNITS AT FARADAY 1 ................................................................................................... 62
TABLE 7-14. SUMMARY OF DRILL DATA USED TO DEFINE THE FARADAY 1 PIPE SHELL AND INTERNAL DOMAINS .................................... 65
TABLE 10-1. DIAMOND DRILLING SUMMARY FOR 2017 .......................................................................................................... 88
TABLE 10-2. LARGE DIAMETER REVERSE CIRCULATION DRILL SUMMARY - 2017 .......................................................................... 88
TABLE 10-3. FARADAY 2 DOMAIN MODEL FOR BULK SAMPLE RETRIEVAL DURING 2017 ............................................................... 96
TABLE 10-4. FARADAY 3 DOMAIN MODEL FOR BULK SAMPLE RETRIEVAL IN 2017 ....................................................................... 96
TABLE 10-5. FARADAY 1 DOMAIN MODEL FOR BULK SAMPLE RETRIEVAL IN 2017 ....................................................................... 97
TABLE 14-1. VOLUMES OF THE KELVIN GEOLOGICAL DOMAINS THAT FORM THE BASIS OF THE MINERAL RESOURCE ESTIMATE .............. 120
TABLE 14-2. INTERPOLATED BULK DENSITIES AND TOTAL TONNAGE FOR KELVIN BY DOMAIN .......................................................... 121
TABLE 14-3. ESTIMATES OF RECOVERABLE (+1MM) GRADE FOR EACH KELVIN DOMAIN ................................................................ 122
TABLE 14-4. KELVIN AVERAGE DIAMOND VALUE ESTIMATES (US$/CARAT) ................................................................................ 122
TABLE 14-5. KELVIN MINERAL RESOURCE ........................................................................................................................... 124
TABLE 14-6. VOLUMES OF THE FARADAY 2 AND 3 DOMAINS. ................................................................................................. 127
TABLE 14-7. SUMMARY STATISTICS OF THE FARADAY 2 AND 3 BULK DENSITY DATASETS USED TO DEFINE BULK DENSITY FOR KIMBERLITE
DOMAINS ............................................................................................................................................................. 128
TABLE 14-8. AVERAGE BULK DENSITIES AND TOTAL TONNAGE BY DOMAIN OF FARADAY 2 AND 3.................................................... 130
TABLE 14-9. LDD SAMPLE TONNES AND DIAMOND RECOVERIES (+0.85MM) BY GEOLOGICAL DOMAIN - FARADAY 2 AND 3 ................ 131
TABLE 14-10. SUMMARY OF MICRODIAMOND DATA USED TO SUPPORT GRADE ESTIMATION FOR FARADAY 2 AND 3 .......................... 133
TABLE 14-11. LDD DIAMOND RECOVERIES BY DOMAIN - FARADAY 2 AND 3 .............................................................................. 135
TABLE 14-12. SPATIALLY ASSOCIATED MICRO-/MACRODIMAOND PARCELS USED TO EVALUATE THE DEGREE OF VARIATION IN THE RATIO
BETWEEN MICRO- AND MACRODIAMOND STONE FREQUENCY AT FARADAY 2 ...................................................................... 139
TABLE 14-13. MICRODIAMOND AND MACRODIAMOND STONE COUNTS AND WEIGHTS BY SIZE CLASS FOR PARCELS SELECTED TO ESTABLISH
TOTAL DIAMOND CONTENT SFD CURVES ..................................................................................................................... 140
TABLE 14-14. FINAL MODELS OF TOTAL AND RECOVERABLE SFD ............................................................................................. 142
TABLE 14-15. ORIGINAL AND CORRECTED FARADAY 2 LDD RESULTS. ....................................................................................... 143
TABLE 14-16. ESTIMATES OF RECOVERABLE (+1MM) GRADE FOR EACH GEOLOGICAL DOMAIN OF FARADAY 2 AND 3 ......................... 144
TABLE 14-17. DIAMOND VALUE ESTIMATES (WWW, 2017) BY SIZE CLASS FOR DIAMOND PARCELS REPRESENTING GROUPINGS OF
DOMAINS. ............................................................................................................................................................ 147
TABLE 14-18. BEST-FIT, LOW AND HIGH VALUE DISTRIBUTION MODELS ..................................................................................... 148
TABLE 14-19. AVERAGE DIAMOND VALUE ESTIMATES (US$/CARAT) FOR EACH DOMAIN .............................................................. 149
TABLE 14-20. RESOURCE STATEMENT FOR THE FARADAY 2 AND FARADAY 3 KIMBERLITES ............................................................ 154
TABLE 14-21. MINERAL RESOURCE STATEMENT FOR THE KENNADY NORTH PROJECT. .................................................................. 154
TABLE 14-22. MICRODIAMOND DATASETS USED TO EVALUATE GRADE AND SFD CHARACTERISTICS AND TO SUPPORT GRADE RANGE
ESTIMATION IN THE FARADAY 1 KIMBERLITE ................................................................................................................ 156
TABLE 14-23. FARADAY 1 LDD SAMPLE MACRODIAMOND RECOVERIES BY DOMAIN. ................................................................... 156
TABLE 14-24. FARADAY 1 AND 2 TFFE VOLUME, TONNES AND GRADE RANGE ESTIMATES. ........................................................... 161
TABLE 15-1. INDICATED AND INFERRED MINERAL RESOURCE SUMMARY FOR GAHCHO KUÉ MINE ................................................. 162
TABLE 15-2. GEOLOGICIAL RESERVE SUMMARY FOR GAHCHO KUÉ MINE.................................................................................. 162
TABLE 17-1. MINERAL RESOURCES STATEMENT FOR THE KENNADY NORTH PROJECT ................................................................... 163
Kennady Diamonds Inc. Aurora Geosciences Ltd.
KDI NI 43-101 Technical Report- Update 2017 ix | P a g e
TABLE 17-2. FARADAY 1 AND 2 TFFE VOLUME, TONNES AND GRADE RANGE ESTIMATES. ............................................................. 163
TABLE 18-1. PROPOSED BUDGET FOR Q1 AND Q2 ............................................................................................................... 164
TABLE 18-2. PROPOSED BUDGET FOR Q3 AND Q4. .............................................................................................................. 165
ABBREVIATIONS and TERMINOLOGY
Abbre via tion De finition Abbre via tion De finition
OLV olivine CD chrome diopside
OLVp olivine phenocryst MUS muscovite
OLVm olivine macrocryst MB marginal breccia
CR country rock Xeno xenolith
CRX country rock xenolith KIMB kimberlite
CRXb basalt country rock xenolith CKt CK transitional
CRXs sedimentary country rock xenolith HKt HK transitional
MC magmaclast KPKt KPK transitional
SPN spinel TKB tuffisitic kimberlite breccia
PER perovskite FOV field of view
CPX clinopyroxene PPL plane polar light
PHL phlogopite XPL cross polar light
PHLp phlogopite phenocryst PLAG plagioclase
CAR carbonate f fine-grained
GNT garnet m medium-graind
ILM ilmenite c coarse-grained
BIO biotite f-m fine- to medium-grained
FEL feldspar f-m+c fine to medium + coarse-grained
CHL chlorite f-c fine to coarse grianed
SER serpentine f-c+vc fine to coarse+verycoarse grained
MONT monticellite Ga billion years
RFW requires further work Ma million years
RVK resedimented volcaniclastic kimberlite mm millimetre
KPK kimberley-type pyroclastic cm centimetre
VK volcaniclastic kimberlite m metre
VKSE volcaniclastic kimberlite km kilometre
CK coherent kimberlite l litre
HK hypabyssal kimberlite ct carat
f fine cpt carats per tonne
m medium Mt million tonnes
c coarse st/t stones per tonne
SFD size frequency distribution
Kennady Diamonds Inc. Aurora Geosciences Ltd.
KDI NI 43-101 Technical Report – Update 2017 1 | P a g e
1 EXECUTIVE SUMMARY
Aurora Geosciences Ltd. (AGL) was commissioned by Kennady Diamonds Inc. (KDI) to prepare an updated
independent, Canadian National Instrument 43-101 Resource Assessment, for the Kennady North
Property, located in the Northwest Territories, Canada.
The Kennady North Property is wholly owned (100%) by KDI. The property was originally acquired through
Mountain Province Inc’s (MPV) joint venture with De Beers Canada Ltd. The ground which became the
Kennady North property was removed from the joint venture ground under an agreement with DeBeers.
MPV then transferred the ground and related data to the Kennady North project into a subsidiary
company called Kennady Diamonds Inc. (KDI). This would allow DeBeers Canada Inc (51%) and MPV (49%)
to concentrate on the development of the Gahcho Kué Mine.
KDI filed a maiden resource statement included in a report filed to Sedar on January 23, 2017 - “2016
Technical Report -Project Exploration Update and Maiden Mineral Resource Estimate, Kennady Lake
North – Northwest Territories, Canada”.
This report will provide details of the 2017 exploration work and an updated compliant NI-43-101 Inferred
Resource for the Faraday kimberlites.
PROPERTY DESCRIPTION, LOCATION, ACCESS and PHYSIOGRAPHY
The Kennady North property is 100% owned by KDI. The land package comprises twenty-two (22) mineral
leases and fifty-eight (58) mineral claims, totaling 160,997.16 acres or 65,154.66 hectares. The property
covers an area roughly 30 kilometres long and up to 30 kilometres wide. The project area is located 290
kilometres east-northeast of Yellowknife, NT and centered geographically at approximately 63°29’ North
latitude and 109°11’ West longitude.
Yellowknife, NT, provides the closest business and commercial centre for the project. Access to the
property is via a winter road, float- and/or ski-equipped aircraft year-round or via larger Dash 7 aircraft
landing on an ice strip in the winter. The KDI project also has a license agreement to use the airstrip at
Gachcho Kué.
The property area is part of the Barrenlands on the edge of the zone of Continuous Permafrost. The area
is characterized by heath and tundra (low shrubs and alpine-type vegetation) with occasional knolls,
surface outcrops and localized surface depressions, interspersed with lakes.
The Kennady North project features low to moderate relief, ranging from 400 metres to 550 metres ASL
(above sea level). Elongate north-northeast trending outcrop expressions vary in height from a few
metres up to 20 metres.
Kennady Diamonds Inc. Aurora Geosciences Ltd.
KDI NI 43-101 Technical Report – Update 2017 2 | P a g e
HISTORY
Numerous exploration programs have been completed on the Kennady North property since 1992 by
multiple operators including GGL Diamond Corp, Winspear Resources Ltd., SouthernEra Resources Ltd.,
Canamera Geological Ltd. and the joint venture comprising Mountain Province Inc. A joint venture
agreement was signed with Monopros Ltd. (now DeBeers Canada Exploration Inc. – DCEI) MPV and
Camphor Ventures Inc. in 1997 turning over operatorship of the large ground package to DCEI.
Subsequent to forming the joint venture with DCEI, all activity on the MPV ground was either undertaken
by DCEI directly, or by sub-contractors under the supervision of DCEI personnel. The commissioned writer
was involved in field operations during the time DCEI was operator on the current KDI property.
KDI has completed extensive programs of till sampling, ground geophysics, diamond drilling and large
diameter reverse circulation drilling (LDD) since obtaining 100% ownership in 2012. A maiden resource
for the Kelvin kimberlite was established in January of 2017 and stands at 8.5 million tonnes, grading 1.6
carats per tonne for a total of 13.62 million carats.
REGIONAL and LOCAL GEOLOGICAL SETTING
The Kennady North property covers a portion of the southeastern Slave Geological Province, an Archean
terrane ranging in age from 4.03 Ga to 2.55 Ga (Bleeker et al., 1999). The area consists of granodiorite
intrusions, high-grade gneisses and migmatites, along with volcanic and sedimentary supracrustal rocks
typical of many greenstone belts in the Slave Province.
The emplacement of kimberlite bodies in the Kennady Lake (Gahcho Kué) area occurred between 531-
542 Ma +/- 2.5 to 11.0 Ma during the Cambrian Period (Heaman et al., 2003). 87Rb-87Sr geochronology
indicates that the age of the 5034 pipe is 538.6 +/- 2.51 Ma (Heaman et al., 2003). Age dating for two
samples of groundmass phlogopite (87Rb-87Sr geochronology) obtained from the Kelvin kimberlite has
returned dates ranging between 536-551 Ma and 531-546 Ma both +/- 8 Ma (Bezzola, M. et al, 2017).
These emplacement ages are coincident with the Gahcho Kué kimberlites. Erosional processes since
emplacement may have been significant, stripping the kimberlites almost to their root zones but still
preserving the hypabyssal and diatreme facies. This significant erosion has allowed KDI to document an
unconventional style of kimberlite which approximates an ideal kimberlite pipe-like body, but inclined.
The Kelvin kimberlite has been documented to show excellent geological continuity along its length of
greater than 700 metres, with respect to the distribution of the main pipe infills. The external morphology
of the pipe is variable with increasing depth; it turns twice and becomes wider at depth. The kimberlite is
comprised of a “north” and “south” limb. Detailed geological logging, petrographic work and diamond
grade investigations have identified seven individual kimberlite units. Volcaniclastic kimberlite, classified
as Kimberley-type pyroclastic kimberlite (KPK), and lesser amounts of coherent kimberlite (CK) are the
two end member kimberlite types present. Lesser amounts of texturally transitional kimberlite occurs as
well.
Kennady Diamonds Inc. Aurora Geosciences Ltd.
KDI NI 43-101 Technical Report – Update 2017 3 | P a g e
DEPOSIT TYPES and MINERALIZATION
Although kimberlite sheets are apparent at all locations, a new model for kimberlites has been identified
at Kelvin and Faraday. Originally thought to be very small idealized kimberlite pipes, KDI has documented
four (4) unconventional, irregular shaped, subhorizontal and inclined pipe-like bodies. These kimberlites
(Kelvin, Faraday 2, Faraday 3 and Faraday 1) are composed primarily of volcaniclastic kimberlite classified
as Kimberley-type pyroclastic kimberlite (KPK) and lesser volumes of coherent kimberlite (CK) and
texturally transitional kimberlite between these two end members. A total of six kimberlite units have
been identified at the Kelvin kimberlite.
The Kelvin kimberlite has been delineated over 700 m in strike length and varies in thickness from 30 m
at the south end, to over 70 m at the north end. The kimberlite varies in height from 60 m at the south
end, up to 200 m at the north end. The Kelvin has an indicated resource of 8.5 million tonnes at a grade
of 1.6 carats per tonne for a total of 13.62 million carats. The deposit is open at depth.
The Faraday 2 kimberlite comprises seven (7) kimberlite units dominated by volcaniclastic Kimberley-type
pyroclastic kimberlite (KPK), with lesser coherent hypabyssal kimberlite (CK-HK). Much like Kelvin, Faraday
2 also hosts a significant amount of texturally transitional kimberlite. Faraday 2 kimberlite has been
delineated over 600 m in length and varies in thickness from 20 m to 90 m and in height from 20 m up to
60 m. The Faraday 2 kimberlite remains open to the northwest.
The Faraday 1 kimberlite was first identified in the spring of 2015 and is the smallest of the known
unconventional kimberlite bodies. Faraday 1 is infilled with volcaniclastic kimberlite (KPK) but is associated
with significant amounts of hypabyssal kimberlite. The proportion of marginal breccia versus other
kimberlite material is also higher than that documented in the other kimberlites. During the 2017 drilling
of Faraday 1 and 3 bodies, it has been determined that Faraday 1 and Faraday 3 coalesce to form one
body at around the lakeshore of Faraday Lake. Faraday 1 has been delineated over 200 m in length, varies
in width between 30-60 m and in height between 10-30 m.
Faraday 3 was the last of the unconventional kimberlite bodies discovered in early 2016 at Faraday Lake.
The Faraday 3 body has been delineated over 400 m, varies in width between 40-150 m and in height from
20-50 m. A significant amount of detailed geology, both macroscopic and petrographic work, has been
undertaken to help establish four kimberlite units. The primary texture, like the other kimberlites in the
area, is dominated by volcaniclastic kimberlite (Kimberley-type pyroclastic kimberlite – KPK) with lesser
amounts of hypabyssal kimberlite (HK). There is also texturally transitional kimberlite between these two
end members dominated by volcaniclastic-type material. Of particular importance, was the discovery in
2017 that Faraday 1 and Faraday 3 coalesce to form one complex kimberlite body, around the lakeshore
of Faraday lake. This kimberlite body is now referred to as the Faraday 1-3 kimberlite.
EXPLORATION and DRILLING
The focus of KDI’S work on the property, during 2017, was to establish an Inferred Resource for the
Faraday kimberlites, as well as initiating ground geophysical coverage at Blob Lake. Blob Lake occurs
southwest of the Gahcho Kué mine and underlies two of the four mineral leases that KDI acquired from
Kennady Diamonds Inc. Aurora Geosciences Ltd.
KDI NI 43-101 Technical Report – Update 2017 4 | P a g e
GGL Resources Corp. in 2016. A small diamond drill program comprising 2766 metres was completed at
the Faraday 2 body and extended the kimberlite an additional 150 m to the west-northwest and also
documented that the Faraday 1 and Faraday 3 kimberlites coalesce to form one body.
The large diameter reverse circulation drill program produced over 8000 metres of drilling and 580 tonnes
of kimberlite material. Faraday 2 returned 275 tonnes of kimberlite, Faraday 3 returned 280 tonnes of
kimberlite and Faraday 1 returned 25 tonnes of kimberlite material for processing at the Saskatchewan
Research Council (SRC) in Saskatoon, Saskatchewan, for macrodiamond analysis.
At Blob Lake, ground gravity surveying (over 12,000 readings), OhmMapper© surveying (over 401 line
kms) and total field magnetic surveying (over 450 line kms) has delineated at least four priority drill
targets.
SAMPLING METHOD, APPROACH and ANALYSIS
Aurora Geosciences Ltd. (with assistance from SRK Consulting), on behalf of KDI, have established a best
practices protocol using standard operating procedures (SOPs) for all diamond and large diameter RC
drilling including: core/chip logging, sampling for caustic fusion and dense media separation (DMS),
downhole surveying, collar surveying, shipping, sample descriptions of kimberlite and database
management.
SRC has completed all of the caustic fusion and dense media separation analyses since the program was
initiated in 2012. SRC is an ISO/IEC 17025 accredited laboratory for caustic fusion analyses. The bulk
sample retrieved during 2017 was under the supervision of Howard Coopersmith (“QP”) and Mike
Waldegger (“QP”). The processing and recovery of the diamonds was under the supervision of Howard
Coopersmith.
The shipment of the bulk sample from site to SRC was under the supervision of Gary Vivian (“QP”). He
visited the SRC lab on the 20th of June 2017, to verify the dense media separation process.
DATA VERIFICATION
Density measurements have been acquired by evaluating drill core in Yellowknife using a SOP designed
by both SRK Consulting and Aurora Geosciences Ltd. incorporating industry best practices. Verification of
densities measured has been completed by ALS Labs in Vancouver, BC. There is excellent correlation
between Aurora’s density measurements and those acquired by the independent laboratory.
The drillhole database continues to undergo significant scrutiny by field geologists, the site geologist, the
Project Manager and the database manager all under the supervision of Mr. Vivian (“QP”). The drill
database continues to be scrutinized by SRK Consulting as they support the geological database and the
establishment of the 3-D internal and external models for the kimberlite bodies.
Microdiamond and macrodiamond results listed in the Aurora Geosciences Ltd. database have been
compared to the Kennady Diamonds database. There are no inconsistencies.
Kennady Diamonds Inc. Aurora Geosciences Ltd.
KDI NI 43-101 Technical Report – Update 2017 5 | P a g e
The Faraday kimberlites bulk sample weights, moisture contents, diamond weights and size data were
verified by an independent QP, Howard Coopersmith. Mr. Coopersmith was onsite at SRC to verify the
full bulk sample process including confirmation of diamond sieve data. Mr. Coopersmith continues to
refine the bulk sample process to efficiently handle the processing of any KDI kimberlite.
MINERAL PROCESSING and METALLURGICAL DATA COLLECTION
The SRC facility uses a 5 tonne per hour DMS plant, and processed the Faraday bulk sample from 2017 in
June and July of 2017. SRC completed all processing for diamond recovery. Diamond recovery was
completed at a bottom cut-off of +0.85 mm.
KENNADY NORTH MINERAL RESOURCE ESTIMATE
The Kelvin, Faraday 2 and Faraday 3 geological model domains have been adopted as the resource
domains for the estimation of Mineral Resources. The volumes of these domains were combined with
estimates of bulk density to derive tonnage estimates.
The micro-1 and macrodiamond2 grade and size frequency distribution (SFD) characteristics of each
kimberlite were assessed and were found to indicate limited local variation and no evidence for large scale
trends or changes in grade or SFD along strike within any of the volumetrically significant domains.
Continuity is considered to be well established on this basis and is further supported by geological logging
and petrographic studies. The use of average (global) grade estimates is therefore considered to be
appropriate.
Grade estimates in Kelvin are based on drill core microdiamond results from each domain applied to a
calibration of microdiamond stone frequency (stones per kilogram, st/kg) to recoverable (+1 mm)
macrodiamond grade (micro-grade ratio). Microdiamond and macrodiamond data from corresponding
kimberlite sample material in each domain of Kelvin were selected, allowing for definition of total content
diamond SFD models to which appropriate recovery correction factors were applied, hence defining the
micro-grade ratio. Grade estimates in Faraday 2 and 3 are based on average LDD sample grades converted
to +1 mm recoverable grades using the same recovery parameters as used for Kelvin.
Diamond values are based on the valuation of two parcels of 2,262.43 ct from Kelvin and 1,183.12 ct from
Faraday 2 and 3. Average values were derived by applying Kelvin and Faraday best estimate value
distribution models to models of recoverable diamond size frequency distribution (SFD) by domain. These
represent estimated average values of +1 mm recoverable diamonds and correlate with the +1 mm
recoverable grades reported. Modifications to process plant efficiency (and hence degree of liberation
1 The term microdiamond is used throughout this report to refer to diamonds recovered through caustic fusion of kimberlite at a bottom screen size cut off of 105 μm (~0.00002 ct). Rare larger diamonds that would be recovered by a commercial production plant are also recovered through this process and are evaluated as part of the microdiamond population. 2 The term macrodiamond is used throughout this report to refer to diamonds recovered by commercial diamond production plants, which typically only recover diamonds in and larger than the Diamond Trading Company sieve category 1 (~0.01 ct).
Kennady Diamonds Inc. Aurora Geosciences Ltd.
KDI NI 43-101 Technical Report – Update 2017 6 | P a g e
and recovery of diamonds in the smaller size ranges), relative to that assumed for this estimate, will
require an adjustment to these values.
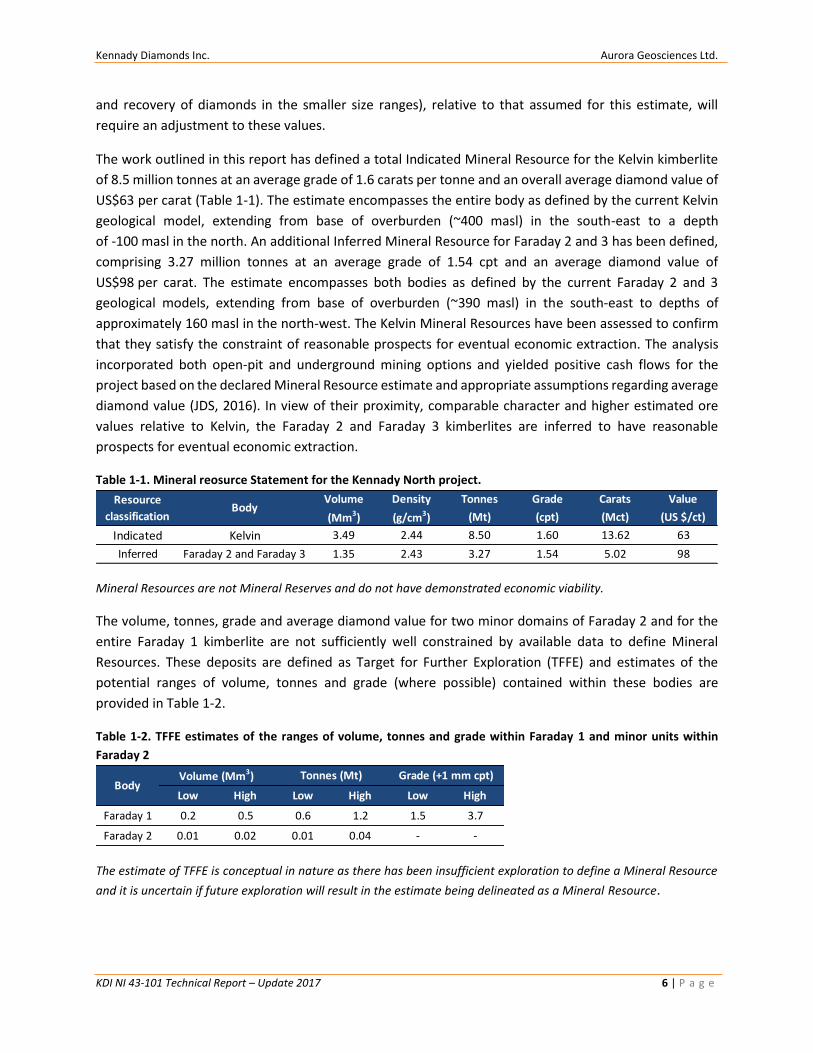
The work outlined in this report has defined a total Indicated Mineral Resource for the Kelvin kimberlite
of 8.5 million tonnes at an average grade of 1.6 carats per tonne and an overall average diamond value of
US$63 per carat (Table 1-1). The estimate encompasses the entire body as defined by the current Kelvin
geological model, extending from base of overburden (~400 masl) in the south-east to a depth
of -100 masl in the north. An additional Inferred Mineral Resource for Faraday 2 and 3 has been defined,
comprising 3.27 million tonnes at an average grade of 1.54 cpt and an average diamond value of
US$98 per carat. The estimate encompasses both bodies as defined by the current Faraday 2 and 3
geological models, extending from base of overburden (~390 masl) in the south-east to depths of
approximately 160 masl in the north-west. The Kelvin Mineral Resources have been assessed to confirm
that they satisfy the constraint of reasonable prospects for eventual economic extraction. The analysis
incorporated both open-pit and underground mining options and yielded positive cash flows for the
project based on the declared Mineral Resource estimate and appropriate assumptions regarding average
diamond value (JDS, 2016). In view of their proximity, comparable character and higher estimated ore
values relative to Kelvin, the Faraday 2 and Faraday 3 kimberlites are inferred to have reasonable
prospects for eventual economic extraction.
Table 1-1. Mineral reosurce Statement for the Kennady North project.
Mineral Resources are not Mineral Reserves and do not have demonstrated economic viability.
The volume, tonnes, grade and average diamond value for two minor domains of Faraday 2 and for the
entire Faraday 1 kimberlite are not sufficiently well constrained by available data to define Mineral
Resources. These deposits are defined as Target for Further Exploration (TFFE) and estimates of the
potential ranges of volume, tonnes and grade (where possible) contained within these bodies are
provided in Table 1-2.
Table 1-2. TFFE estimates of the ranges of volume, tonnes and grade within Faraday 1 and minor units within
Faraday 2
The estimate of TFFE is conceptual in nature as there has been insufficient exploration to define a Mineral Resource
and it is uncertain if future exploration will result in the estimate being delineated as a Mineral Resource.
Volume Density Tonnes Grade Carats Value
(Mm3) (g/cm3) (Mt) (cpt) (Mct) (US $/ct)
Indicated Kelvin 3.49 2.44 8.50 1.60 13.62 63
Inferred Faraday 2 and Faraday 3 1.35 2.43 3.27 1.54 5.02 98
Resource
classificationBody
Low High Low High Low High
Faraday 1 0.2 0.5 0.6 1.2 1.5 3.7
Faraday 2 0.01 0.02 0.01 0.04 - -
BodyVolume (Mm3) Tonnes (Mt) Grade (+1 mm cpt)
Kennady Diamonds Inc. Aurora Geosciences Ltd.
KDI NI 43-101 Technical Report – Update 2017 7 | P a g e
2 INTRODUCTION
The Kennady North project is 100% owned by Kennady Diamonds Inc. (KDI) and is located 290 km east-
northeast of the City of Yellowknife, NT.
KDI commissioned Aurora Geosciences Ltd. (AGL) to provide an update to the technical report submitted
on January 23, 2017 titled, “2016 Technical Report - Project Exploration Update and Maiden Mineral
Resource Estimate, Kennady Lake North – Northwest Territories, Canada”. The update will include all
exploration work which has been completed on the property since January of 2017 as well as providing
an inferred mineral resource for the Faraday kimberlites. Although all aspects of this report have been
under the supervision of AGL, both SRK Consulting and Mineral Services Canada Inc. (MSC) have
contributed significantly to this report. This submission is an update to the above-noted technical report
submitted to Sedar on January 23, 2017. This report will be filed by KDI in accordance with applicable
securities commissions following the guidelines of the Canadian Securities Administrators National
Instrument 43-101 and Form 43-101F1, and in conformity with generally accepted CIM “Estimation of
Mineral Resources and Mineral Reserves Best Practice Guidelines”.
The information contained in this report was collected by AGL for KDI. All information has been reviewed
by third parties such as SRK Consulting and MSC. Detailed geological modeling and descriptions have been
under the supervision of Casey Hetman, M.Sc., P.Geo. (SRK) and the grade valuation and mineral resource
estimate has been carried out by MSC under the supervision of Tom Nowicki, Ph.D., P.Geo. Mr. Hetman
has been to the Kennady North property on numerous occasions over the past five years.
This report is prepared by Gary Vivian M.Sc., P.Geol., a principal of Aurora Geosciences Ltd. of Yellowknife
and Dr. Tom Nowicki, P.Geo., Technical Director of Mineral Services Canada Inc. (MSC), Vancouver, BC.
Mr. Vivian has 41 years of exploration experience, over 34 years as a geologist and 29 years as a P.Geol.
His disciplines include gold, base metal and magmatic sulphides, uranium-rare earth related and diamond
projects within Canada and Alaska. He is a member in good standing with the NWT and Nunavut
Association of Professional Engineers and Geoscientists (NAPEG Member # 1301). Dr. Nowicki has over
23 years of experience in mineral exploration and mining. His role includes oversight and supervision of
technical work undertaken by MSC particularly in the evaluation of diamond potential, geological and
resource modeling of kimberlites.
Mr. Vivian and Dr. Nowicki are Qualified Persons (QPs) as defined by the Canadian Securities
Administrators National Instrument 43-101.
3 RELIANCE ON OTHER EXPERTS
SOURCES OF INFORMATION AND DISCLOSURE
This report is based upon all information which has been gathered by Aurora Geosciences Ltd. (AGL) as
the exploration management contractor to KDI. AGL has relied on some experienced subcontractors to
help with field programs, but all under the standard operating procedures administered by AGL. Internal
Kennady Diamonds Inc. Aurora Geosciences Ltd.
KDI NI 43-101 Technical Report – Update 2017 8 | P a g e
reports written for AGL or KDI and public releases used for the purposes of information in this submission
have all been referenced correctly.
Diamond valuation and value distribution modelling results have been incorporated as provided by WWW
International Diamond Consultants Ltd. (WWW) and are used in Section 14.1.4 and 14.2.5 in the modelling
of average diamond values for Faraday and Kelvin. WWW are recognized international leaders in the field
of diamond valuation and the QP’s for this report believe it is reasonable to rely on the diamond values
and value distribution models provided.
4 PROPERTY DESCRIPTION AND LOCATION
The Kennady North property is located in Canada’s Northwest Territories, approximately 290 kilometres
east-northeast of Yellowknife, NT (Figure 4-1) and geographically centered at 63°29’ North latitude and
109°11’ West longitude. The property is comprised of 22 mining leases and 58 mineral claims, totaling
160,997.16 acres or 65,154.66 hectares (Table 4-1 and Figure 4-2). The claims cover an area roughly 30
kilometres long by 30 kilometres wide and are located on NTS map sheets 75N/06 and 75N/11. Table 4.1
summarizes the mineral claim and mining lease details current as at December 31, 2016. The property is
100% owned by Kennady Diamonds Inc.
The Kennady North property is part of a once larger group of original claims known as the AK property.
The AK Property was staked by Inukshuk Capital Corp. in 1992, comprising 520,000 ha, and optioned to
Mountain Province Mining Inc. later that same year. Only nine (9) mining leases remain of this original
claim group.
Additional partners in the original AK Property included Camphor Ventures Inc. (Camphor Ventures), and
444965 BC Ltd., a subsidiary of Glenmore Highlands Inc. (Glenmore Highlands). At the time, Glenmore
Highlands was a controlling shareholder of Mountain Province Mining Inc. as defined under the Securities
Act of British Columbia. 444965 BC Ltd. amalgamated with Mountain Province Mining Inc. in 1997, to form
Mountain Province Diamonds Inc. (MPV), and Camphor Ventures’ interest in the property was acquired
by MPV in 2007.
During 2013, KDI completed an agreement with GGL Resources Corp. to buy their Bob Lake camp and
acquire 12 mineral leases. A total of 52 mineral claims were added in late 2013. Two of these claims have
been allowed to lapse. KDI then completed an agreement in 2016 to purchase 6 leases along the southern
boundary of the GK mine site from GGL Resources Corp. The current land package comprises 22 mining
leases and 58 mineral claims.
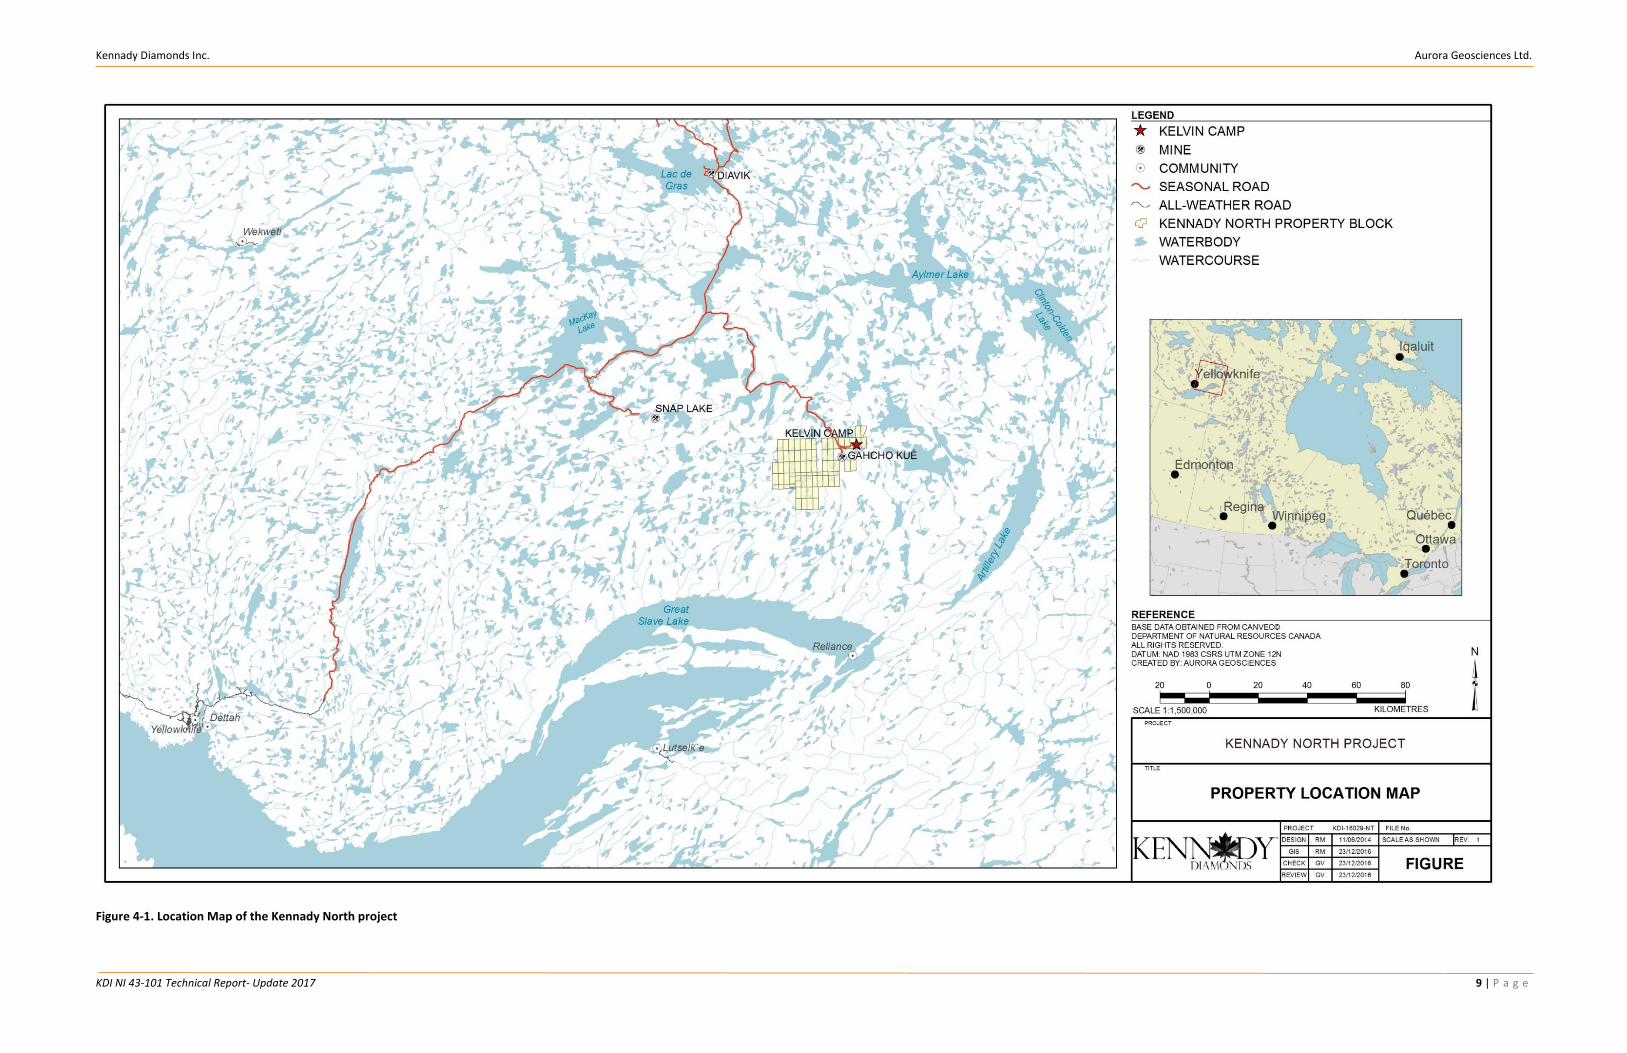
Kennady Diamonds Inc. Aurora Geosciences Ltd.
KDI NI 43-101 Technical Report- Update 2017 9 | P a g e
Figure 4-1. Location Map of the Kennady North project
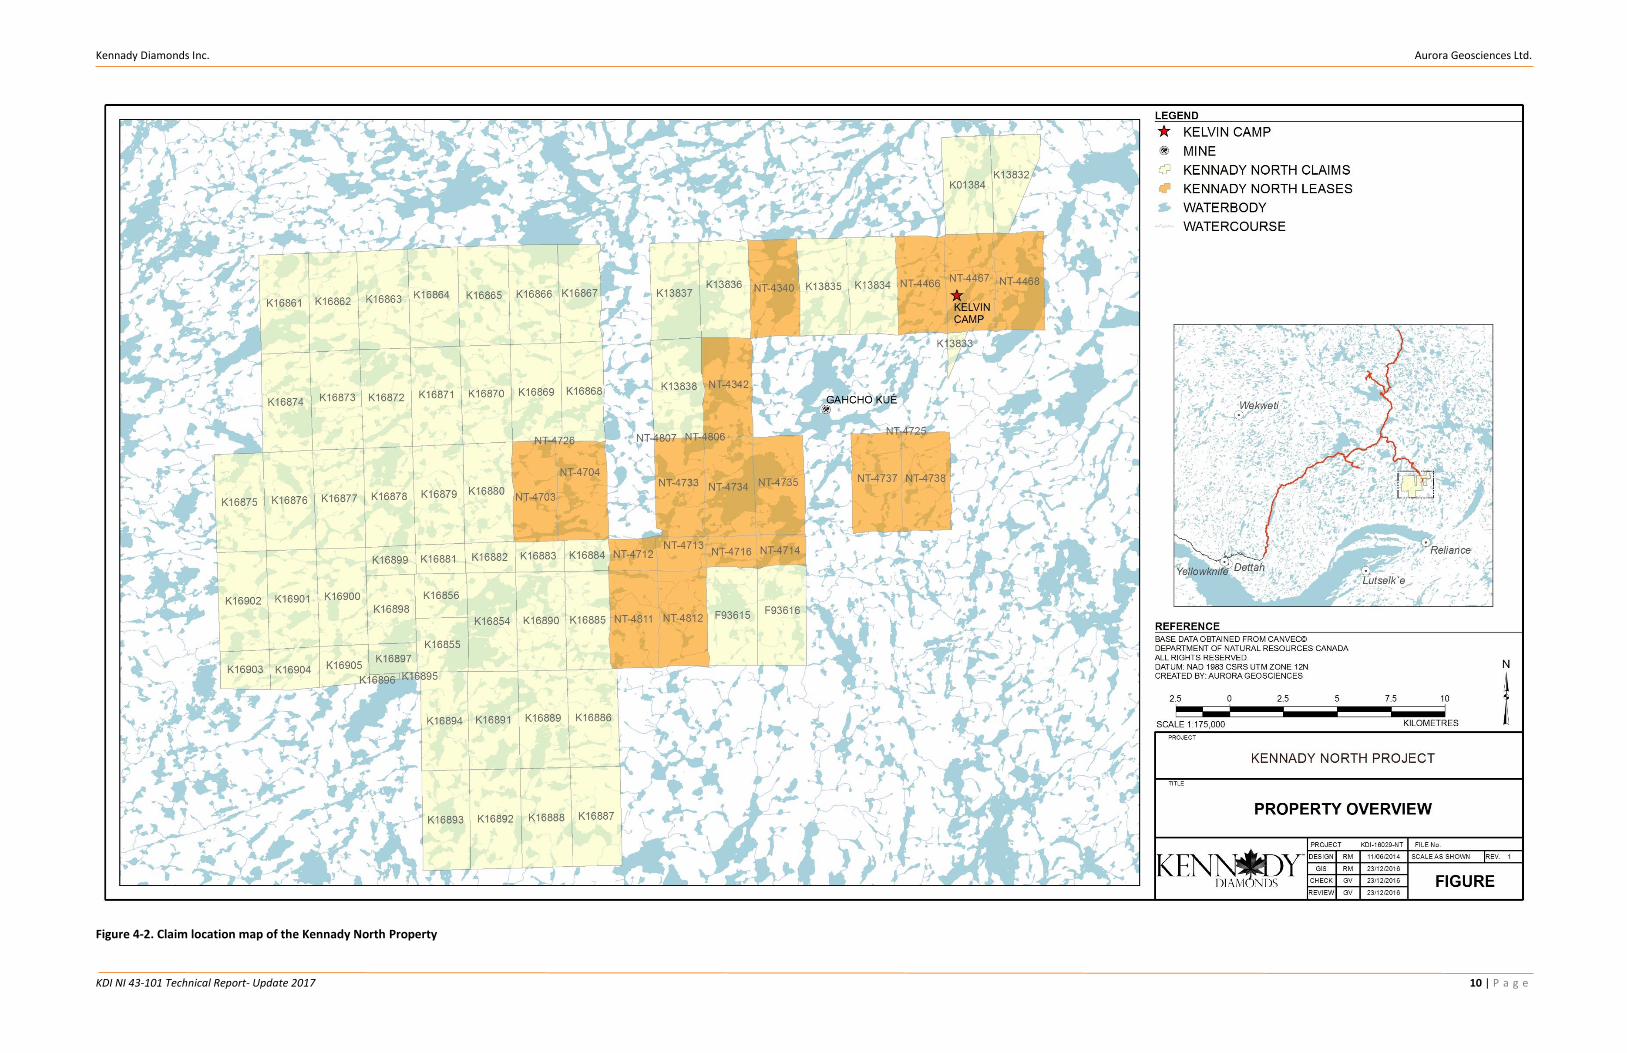
Kennady Diamonds Inc. Aurora Geosciences Ltd.
KDI NI 43-101 Technical Report- Update 2017 10 | P a g e
Figure 4-2. Claim location map of the Kennady North Property
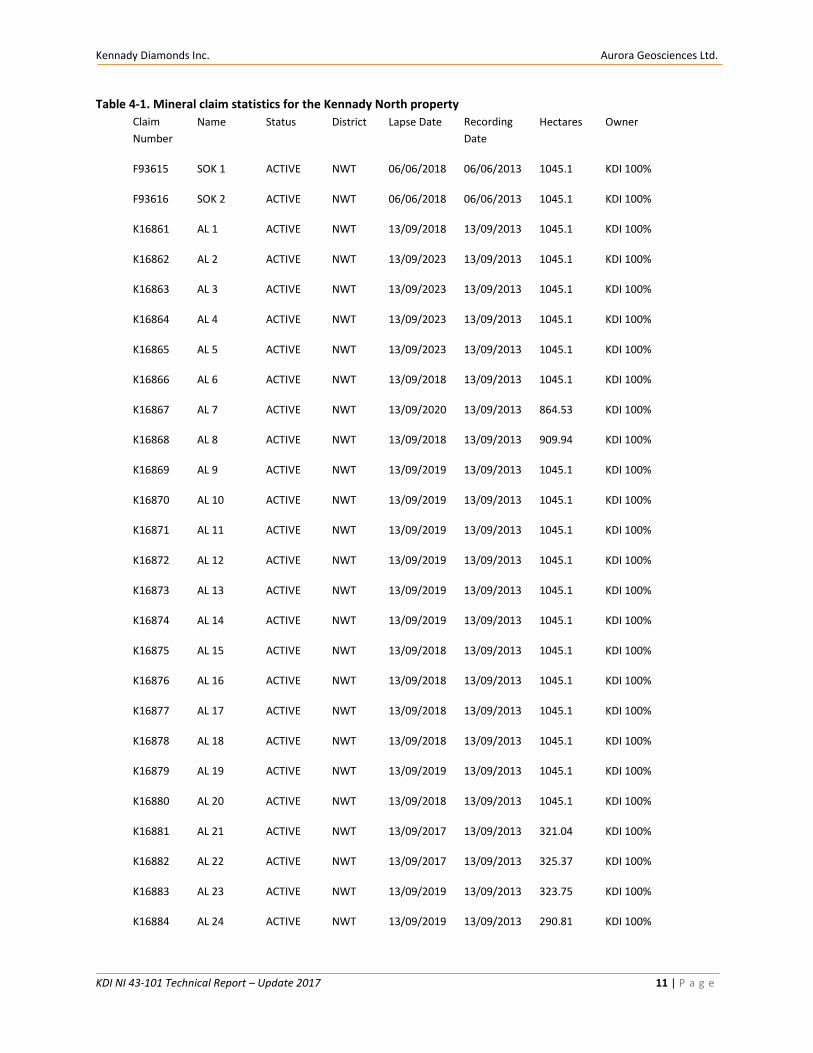
Kennady Diamonds Inc. Aurora Geosciences Ltd.
KDI NI 43-101 Technical Report – Update 2017 11 | P a g e
Table 4-1. Mineral claim statistics for the Kennady North property
Claim
Number
Name Status District Lapse Date Recording
Date
Hectares Owner
F93615 SOK 1 ACTIVE NWT 06/06/2018 06/06/2013 1045.1 KDI 100%
F93616 SOK 2 ACTIVE NWT 06/06/2018 06/06/2013 1045.1 KDI 100%
K16861 AL 1 ACTIVE NWT 13/09/2018 13/09/2013 1045.1 KDI 100%
K16862 AL 2 ACTIVE NWT 13/09/2023 13/09/2013 1045.1 KDI 100%
K16863 AL 3 ACTIVE NWT 13/09/2023 13/09/2013 1045.1 KDI 100%
K16864 AL 4 ACTIVE NWT 13/09/2023 13/09/2013 1045.1 KDI 100%
K16865 AL 5 ACTIVE NWT 13/09/2023 13/09/2013 1045.1 KDI 100%
K16866 AL 6 ACTIVE NWT 13/09/2018 13/09/2013 1045.1 KDI 100%
K16867 AL 7 ACTIVE NWT 13/09/2020 13/09/2013 864.53 KDI 100%
K16868 AL 8 ACTIVE NWT 13/09/2018 13/09/2013 909.94 KDI 100%
K16869 AL 9 ACTIVE NWT 13/09/2019 13/09/2013 1045.1 KDI 100%
K16870 AL 10 ACTIVE NWT 13/09/2019 13/09/2013 1045.1 KDI 100%
K16871 AL 11 ACTIVE NWT 13/09/2019 13/09/2013 1045.1 KDI 100%
K16872 AL 12 ACTIVE NWT 13/09/2019 13/09/2013 1045.1 KDI 100%
K16873 AL 13 ACTIVE NWT 13/09/2019 13/09/2013 1045.1 KDI 100%
K16874 AL 14 ACTIVE NWT 13/09/2019 13/09/2013 1045.1 KDI 100%
K16875 AL 15 ACTIVE NWT 13/09/2018 13/09/2013 1045.1 KDI 100%
K16876 AL 16 ACTIVE NWT 13/09/2018 13/09/2013 1045.1 KDI 100%
K16877 AL 17 ACTIVE NWT 13/09/2018 13/09/2013 1045.1 KDI 100%
K16878 AL 18 ACTIVE NWT 13/09/2018 13/09/2013 1045.1 KDI 100%
K16879 AL 19 ACTIVE NWT 13/09/2019 13/09/2013 1045.1 KDI 100%
K16880 AL 20 ACTIVE NWT 13/09/2018 13/09/2013 1045.1 KDI 100%
K16881 AL 21 ACTIVE NWT 13/09/2017 13/09/2013 321.04 KDI 100%
K16882 AL 22 ACTIVE NWT 13/09/2017 13/09/2013 325.37 KDI 100%
K16883 AL 23 ACTIVE NWT 13/09/2019 13/09/2013 323.75 KDI 100%
K16884 AL 24 ACTIVE NWT 13/09/2019 13/09/2013 290.81 KDI 100%
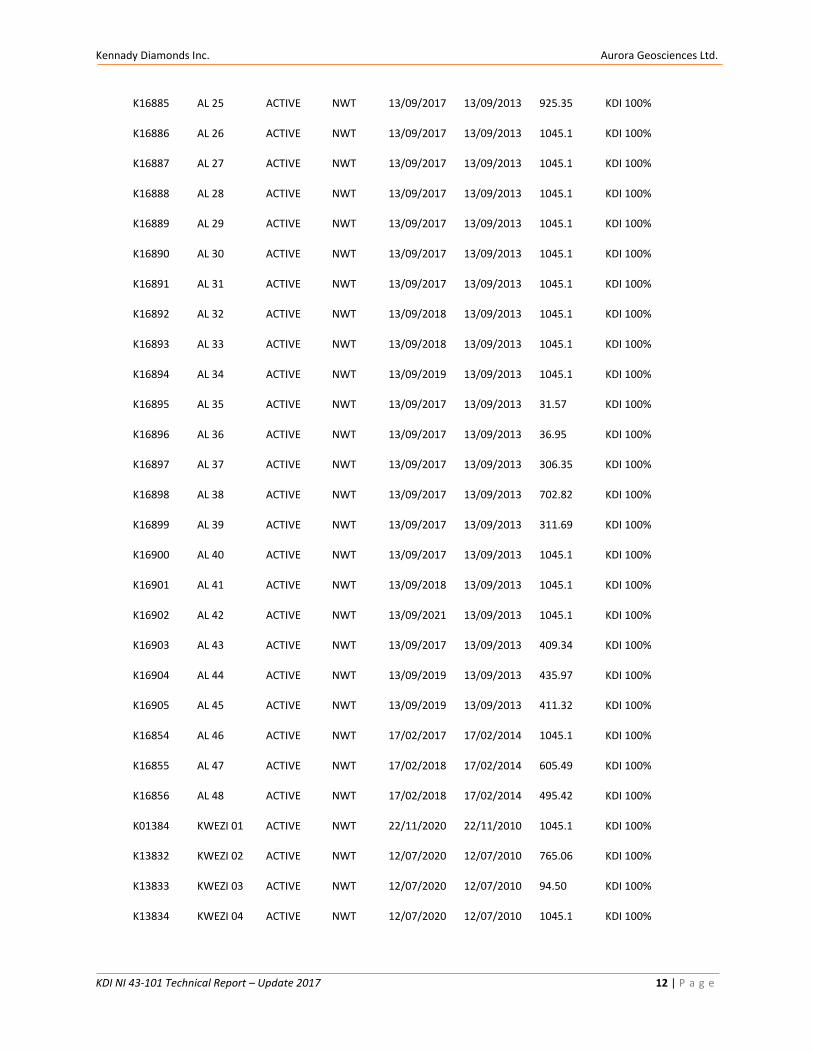
Kennady Diamonds Inc. Aurora Geosciences Ltd.
KDI NI 43-101 Technical Report – Update 2017 12 | P a g e
K16885 AL 25 ACTIVE NWT 13/09/2017 13/09/2013 925.35 KDI 100%
K16886 AL 26 ACTIVE NWT 13/09/2017 13/09/2013 1045.1 KDI 100%
K16887 AL 27 ACTIVE NWT 13/09/2017 13/09/2013 1045.1 KDI 100%
K16888 AL 28 ACTIVE NWT 13/09/2017 13/09/2013 1045.1 KDI 100%
K16889 AL 29 ACTIVE NWT 13/09/2017 13/09/2013 1045.1 KDI 100%
K16890 AL 30 ACTIVE NWT 13/09/2017 13/09/2013 1045.1 KDI 100%
K16891 AL 31 ACTIVE NWT 13/09/2017 13/09/2013 1045.1 KDI 100%
K16892 AL 32 ACTIVE NWT 13/09/2018 13/09/2013 1045.1 KDI 100%
K16893 AL 33 ACTIVE NWT 13/09/2018 13/09/2013 1045.1 KDI 100%
K16894 AL 34 ACTIVE NWT 13/09/2019 13/09/2013 1045.1 KDI 100%
K16895 AL 35 ACTIVE NWT 13/09/2017 13/09/2013 31.57 KDI 100%
K16896 AL 36 ACTIVE NWT 13/09/2017 13/09/2013 36.95 KDI 100%
K16897 AL 37 ACTIVE NWT 13/09/2017 13/09/2013 306.35 KDI 100%
K16898 AL 38 ACTIVE NWT 13/09/2017 13/09/2013 702.82 KDI 100%
K16899 AL 39 ACTIVE NWT 13/09/2017 13/09/2013 311.69 KDI 100%
K16900 AL 40 ACTIVE NWT 13/09/2017 13/09/2013 1045.1 KDI 100%
K16901 AL 41 ACTIVE NWT 13/09/2018 13/09/2013 1045.1 KDI 100%
K16902 AL 42 ACTIVE NWT 13/09/2021 13/09/2013 1045.1 KDI 100%
K16903 AL 43 ACTIVE NWT 13/09/2017 13/09/2013 409.34 KDI 100%
K16904 AL 44 ACTIVE NWT 13/09/2019 13/09/2013 435.97 KDI 100%
K16905 AL 45 ACTIVE NWT 13/09/2019 13/09/2013 411.32 KDI 100%
K16854 AL 46 ACTIVE NWT 17/02/2017 17/02/2014 1045.1 KDI 100%
K16855 AL 47 ACTIVE NWT 17/02/2018 17/02/2014 605.49 KDI 100%
K16856 AL 48 ACTIVE NWT 17/02/2018 17/02/2014 495.42 KDI 100%
K01384 KWEZI 01 ACTIVE NWT 22/11/2020 22/11/2010 1045.1 KDI 100%
K13832 KWEZI 02 ACTIVE NWT 12/07/2020 12/07/2010 765.06 KDI 100%
K13833 KWEZI 03 ACTIVE NWT 12/07/2020 12/07/2010 94.50 KDI 100%
K13834 KWEZI 04 ACTIVE NWT 12/07/2020 12/07/2010 1045.1 KDI 100%
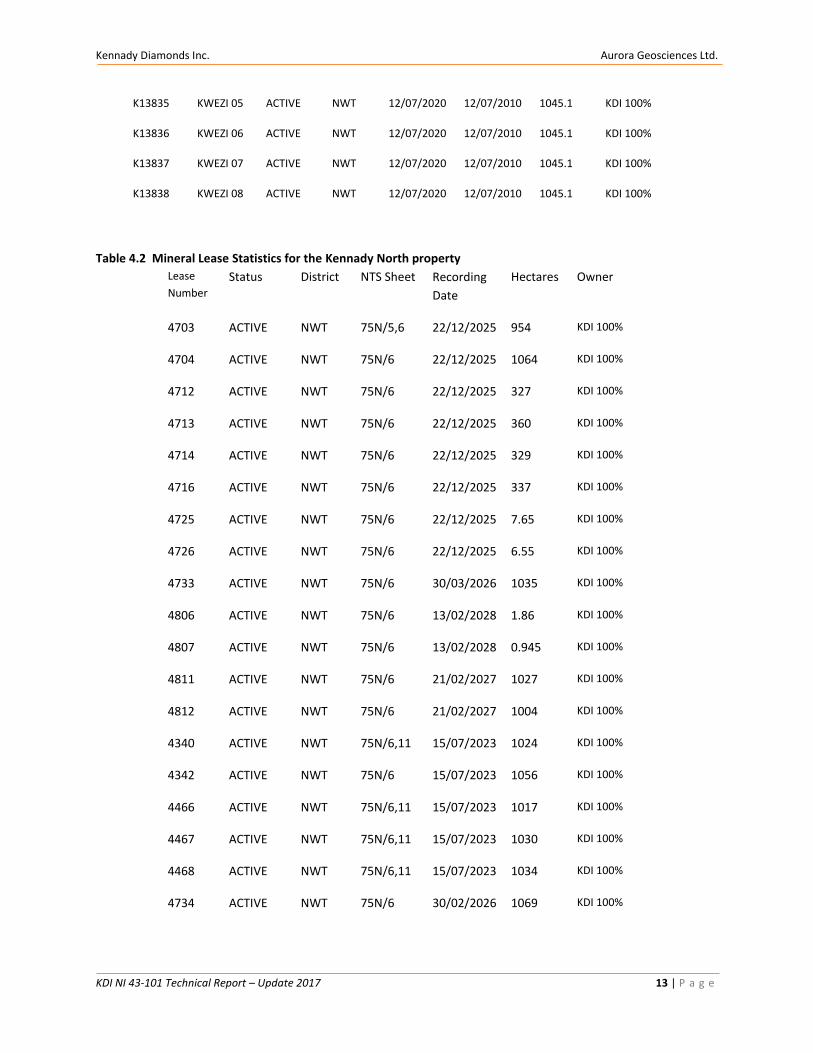
Kennady Diamonds Inc. Aurora Geosciences Ltd.
KDI NI 43-101 Technical Report – Update 2017 13 | P a g e
K13835 KWEZI 05 ACTIVE NWT 12/07/2020 12/07/2010 1045.1 KDI 100%
K13836 KWEZI 06 ACTIVE NWT 12/07/2020 12/07/2010 1045.1 KDI 100%
K13837 KWEZI 07 ACTIVE NWT 12/07/2020 12/07/2010 1045.1 KDI 100%
K13838 KWEZI 08 ACTIVE NWT 12/07/2020 12/07/2010 1045.1 KDI 100%
Table 4.2 Mineral Lease Statistics for the Kennady North property
Lease
Number
Status District NTS Sheet Recording
Date
Hectares Owner
4703 ACTIVE NWT 75N/5,6 22/12/2025 954 KDI 100%
4704 ACTIVE NWT 75N/6 22/12/2025 1064 KDI 100%
4712 ACTIVE NWT 75N/6 22/12/2025 327 KDI 100%
4713 ACTIVE NWT 75N/6 22/12/2025 360 KDI 100%
4714 ACTIVE NWT 75N/6 22/12/2025 329 KDI 100%
4716 ACTIVE NWT 75N/6 22/12/2025 337 KDI 100%
4725 ACTIVE NWT 75N/6 22/12/2025 7.65 KDI 100%
4726 ACTIVE NWT 75N/6 22/12/2025 6.55 KDI 100%
4733 ACTIVE NWT 75N/6 30/03/2026 1035 KDI 100%
4806 ACTIVE NWT 75N/6 13/02/2028 1.86 KDI 100%
4807 ACTIVE NWT 75N/6 13/02/2028 0.945 KDI 100%
4811 ACTIVE NWT 75N/6 21/02/2027 1027 KDI 100%
4812 ACTIVE NWT 75N/6 21/02/2027 1004 KDI 100%
4340 ACTIVE NWT 75N/6,11 15/07/2023 1024 KDI 100%
4342 ACTIVE NWT 75N/6 15/07/2023 1056 KDI 100%
4466 ACTIVE NWT 75N/6,11 15/07/2023 1017 KDI 100%
4467 ACTIVE NWT 75N/6,11 15/07/2023 1030 KDI 100%
4468 ACTIVE NWT 75N/6,11 15/07/2023 1034 KDI 100%
4734 ACTIVE NWT 75N/6 30/02/2026 1069 KDI 100%
Kennady Diamonds Inc. Aurora Geosciences Ltd.
KDI NI 43-101 Technical Report – Update 2017 14 | P a g e
4735 ACTIVE NWT 75N/6 30/02/2026 1066 KDI 100%
4737 ACTIVE NWT 75N/6 30/02/2026 1059 KDI 100%
4738 ACTIVE NWT 75N/6 30/02/2026 1029 KDI 100%
15838.01
To the east of, and bordering on, some of the claims and leases, Parks Canada and the Łutsel K’e Dene
First Nations have withdrawn lands for the proposed Thaidene Nënė National Park Reserve. No staking or
mineral exploration is currently allowed in this area although there is a suggestion the reserve boundaries
could be moved and finalized by April 1, 2018. To the west, is the very large interim land withdrawal of
the Akaitcho First Nations. Land claims negotiations with the Canadian Federal government have stalled,
and as such this withdrawal represents one of the largest land packages removed from industry access in
history.
There are no environmental liabilities associated with the Kennady North property and there is a fully
accessible Class ‘A’ land use permit and Class ‘B’ water license covering this project. KDI received a new
land use permit and water license to accommodate an advanced stage exploration program.
5 ACCESSIBILITY, CLIMATE, LOCAL RESOURCES, INFRASTRUCTURE AND PHYSIOGRAPHY
ACCESS, INFRASTRUCTURE and LOCAL RESOURCES
The Kennady North project is located in the Northwest Territories approximately 290 kilometres east-
northeast of Yellowknife, 80 kilometres east-southeast of the Snap Lake Mine and 100 kilometres north
of the community of Łutsel K’e. The property is 25 km north of the tree line with no permanent road
access. Centered geographically at 63°29’ North latitude and 109°11’ West longitude, the property covers
an area roughly 30 km long and up to 30 km wide.
Access to the property is easiest via ski- and/or float-equipped fixed wing aircraft and helicopters. The
Gahcho Kué Mine Site, just seven kilometres to the south, has a 120 kilometre long winter spur road,
leading north to join the Tibbitt to Contwoyto Winter Road (TCWR) at MacKay Lake. KDI has an agreement
in place with the Gahco Kué (GK) joint venture (DeBeers Canada and MPV) to use the spur road to access
the Kennady North property. Annually, KDI builds a 10 km spur road from the Kelvin camp to access the
GK spur road (Figure 5-1).
The Tibbitt-Contwoyto Lake Winter Road operates from late January to the beginning of April in most
years to resupply the Ekati, Diavik, Gahco Kué and recently closed Snap Lake diamond mines. It connects
with the Ingraham Trail (NWT Highway 4), a paved highway that runs for approximately 70 kilometres east
of Yellowknife. Transportation within the Kennady North property is by helicopter, small ski- or float-
equipped fixed wing aircraft, boats, snowmachines or on foot. KDI builds an ice strip every year to allow

Kennady Diamonds Inc. Aurora Geosciences Ltd.
KDI NI 43-101 Technical Report – Update 2017 15 | P a g e
larger aircraft (Dash 7) to access the site. KDI also has an agreement with the GK joint venture to use the
permanent airstrip at the Gahcho Kué mine site to allow larger aircraft such as an Electra or C-130 Hercules
to move cargo as needed. Access encumbrances to the property are not considered significant.
The Akaitcho Interim Land Withdrawal (Figure 5-1) was instituted to put a halt to exploration in order to
provide time for culminating the final Akaitcho Territory Land Claim. This agreement in principle has still
not been finalized which creates uncertainty for exploration in the NWT. Figure 5-1 also shows the lands
held under an interim withdrawal for the proposed Thaidene Nënė National Park Reserve abutting up
against the GK mine site and the Kennady North property on the west.. It is proposed that some of the
proposed reserve would be turned over to the Government of the NWT to operate as territorial lands. It
is unclear how all of this will be represented on a final map, but parties have been working towards a final
plan for April 1, 2018. The park and the interim withdrawal do not directly affect the Kennady North
project but could certainly have a negative impact on streamlining costs.
Two camps exist on the Kennady North project, Kelvin and Bob, and provide all room and board at site.
The newly amended land use permit will allow for 150 people at site with significant on-site equipment
such as loaders, graders, trucks, etc.
Yellowknife is the largest supply centre in the area. This small city (pop. 19,000) has many amenities. It is
serviced by four airlines with daily flights connecting to the south. A paved highway also extends from
Yellowknife south to Alberta. All logistical support, labour and professional staff can be supplied from
Yellowknife, NT.
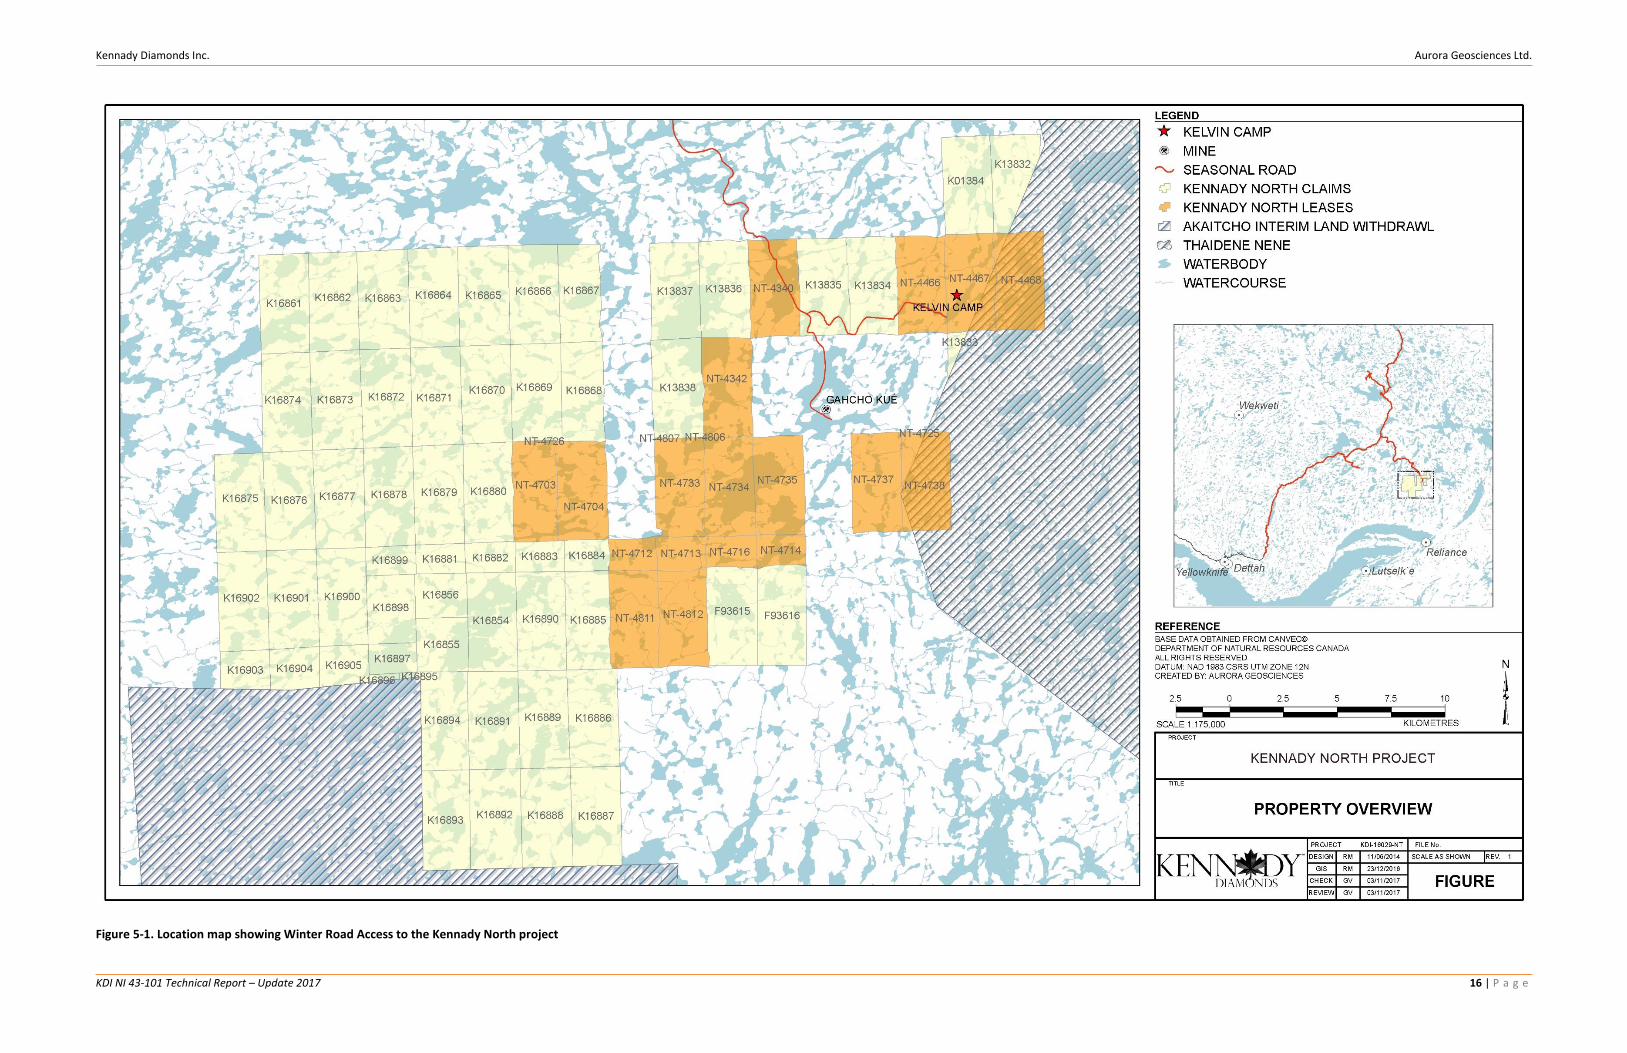
Kennady Diamonds Inc. Aurora Geosciences Ltd.
KDI NI 43-101 Technical Report – Update 2017 16 | P a g e
Figure 5-1. Location map showing Winter Road Access to the Kennady North project
Kennady Diamonds Inc. Aurora Geosciences Ltd.
KDI NI 43-101 Technical Report – Update 2017 17 | P a g e
CLIMATE
The Kennady North project is located 225 kilometres south of the Arctic Circle and experiences an extreme
and semi-arid polar climate typical of the Taiga Shield Ecozone of Canada (Ecological Stratification Working
Group, 1995). The area can further be classified as belonging to the Taiga Shield High Subarctic (HS)
Ecoregion (ibid.). The area is dominated by long and cold winters with cool, nice summers. The Northwest
Territories are classified as a polar semi-desert with limited precipitation, both in the winter as snow and
summer as rain.
Winter temperatures average -25°C to -30°C but extreme temperatures due to wind chill, dropping below
-50°C, are not uncommon. Freeze-up usually occurs around the first week of October and break-up is
usually finished by mid-June. Summers are commonly cool and short, with average temperatures around
+15°C but can reach +30°C for short durations. Exploration has occurred all 12 months of the year, but
the most feasible times (daylight hours, temperatures, etc.) extend from early March to late October.
Daylight hours range from 4-5 during the Winter Solstice to effectively 24 hours at the Summer Solstice.
The spring and fall (vernal and autumnal) equinoxes occur in March and September, respectively, at which
time the daylight hours equal night time hours.
TOPOGRAPHY and PHYSIOGRAPHY
The KDI property is part of the Barrenlands on the edge of the zone of Continuous Permafrost. The area
is characterized by heath and tundra (low shrubs and alpine-type vegetation) with occasional knolls,
surface outcrops and localized surface depressions, interspersed with lakes. Thin, discontinuous cover of
mineral soil, organic materials and glacial drift overlie shallowly buried bedrock.
The area is characterized by low to moderate relief, ranging from 400 metres to 550 metres ASL (above
sea level). Elongate north-northeast trending outcrop expressions vary in height from a few metres up to
20 metres. Local topographical relief can be up to 40-50 metres and as such, one can usually see tens of
kilometres in any direction. Outcrops are separated by numerous small ponds, lakes and marshy
depressions. In some places, overburden is very extensive and there may be as little as 5% outcrop in an
area, but this can vary widely across the property.
FLORA and FAUNA
The local habitat represents the transition from sub-Arctic taiga coniferous forest to treeless tundra. Year-
round fauna includes: red fox, Arctic fox, Arctic ground squirrel (sik-sik), Barrens grizzly, wolf, wolverine
and ptarmigan. Migratory species include Barrenlands caribou and many species of birds. During the
summer months (mid-June to mid-August), heavy concentrations of biting flies (mosquito and blackfly)
are present (NWT Department of Environment & Natural Resources web site).
Vegetation in the area is characteristic of Arctic tundra, with moss, sedges, lichens and dwarf species of
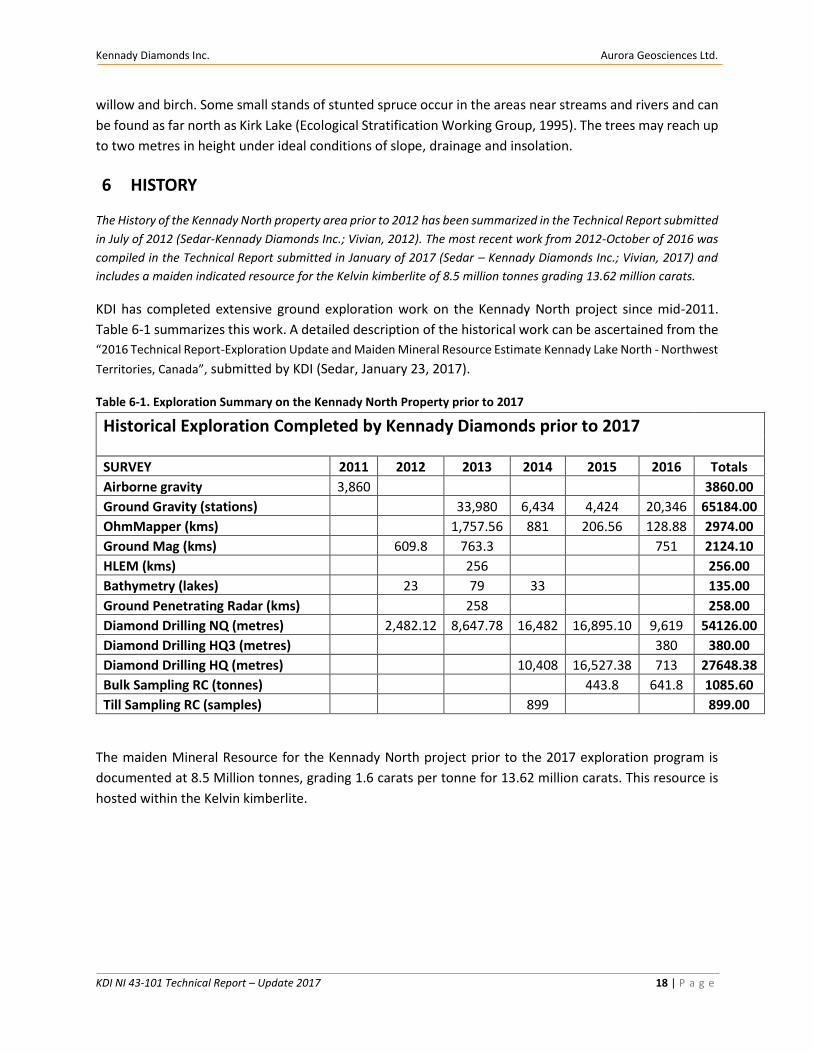
Kennady Diamonds Inc. Aurora Geosciences Ltd.
KDI NI 43-101 Technical Report – Update 2017 18 | P a g e
willow and birch. Some small stands of stunted spruce occur in the areas near streams and rivers and can
be found as far north as Kirk Lake (Ecological Stratification Working Group, 1995). The trees may reach up
to two metres in height under ideal conditions of slope, drainage and insolation.
6 HISTORY
The History of the Kennady North property area prior to 2012 has been summarized in the Technical Report submitted
in July of 2012 (Sedar-Kennady Diamonds Inc.; Vivian, 2012). The most recent work from 2012-October of 2016 was
compiled in the Technical Report submitted in January of 2017 (Sedar – Kennady Diamonds Inc.; Vivian, 2017) and
includes a maiden indicated resource for the Kelvin kimberlite of 8.5 million tonnes grading 13.62 million carats.
KDI has completed extensive ground exploration work on the Kennady North project since mid-2011.
Table 6-1 summarizes this work. A detailed description of the historical work can be ascertained from the
“2016 Technical Report-Exploration Update and Maiden Mineral Resource Estimate Kennady Lake North - Northwest
Territories, Canada”, submitted by KDI (Sedar, January 23, 2017).
Table 6-1. Exploration Summary on the Kennady North Property prior to 2017
Historical Exploration Completed by Kennady Diamonds prior to 2017
SURVEY 2011 2012 2013 2014 2015 2016 Totals
Airborne gravity 3,860 3860.00
Ground Gravity (stations) 33,980 6,434 4,424 20,346 65184.00
OhmMapper (kms) 1,757.56 881 206.56 128.88 2974.00
Ground Mag (kms) 609.8 763.3 751 2124.10
HLEM (kms) 256 256.00
Bathymetry (lakes) 23 79 33 135.00
Ground Penetrating Radar (kms) 258 258.00
Diamond Drilling NQ (metres) 2,482.12 8,647.78 16,482 16,895.10 9,619 54126.00
Diamond Drilling HQ3 (metres) 380 380.00
Diamond Drilling HQ (metres) 10,408 16,527.38 713 27648.38
Bulk Sampling RC (tonnes) 443.8 641.8 1085.60
Till Sampling RC (samples) 899 899.00
The maiden Mineral Resource for the Kennady North project prior to the 2017 exploration program is
documented at 8.5 Million tonnes, grading 1.6 carats per tonne for 13.62 million carats. This resource is
hosted within the Kelvin kimberlite.
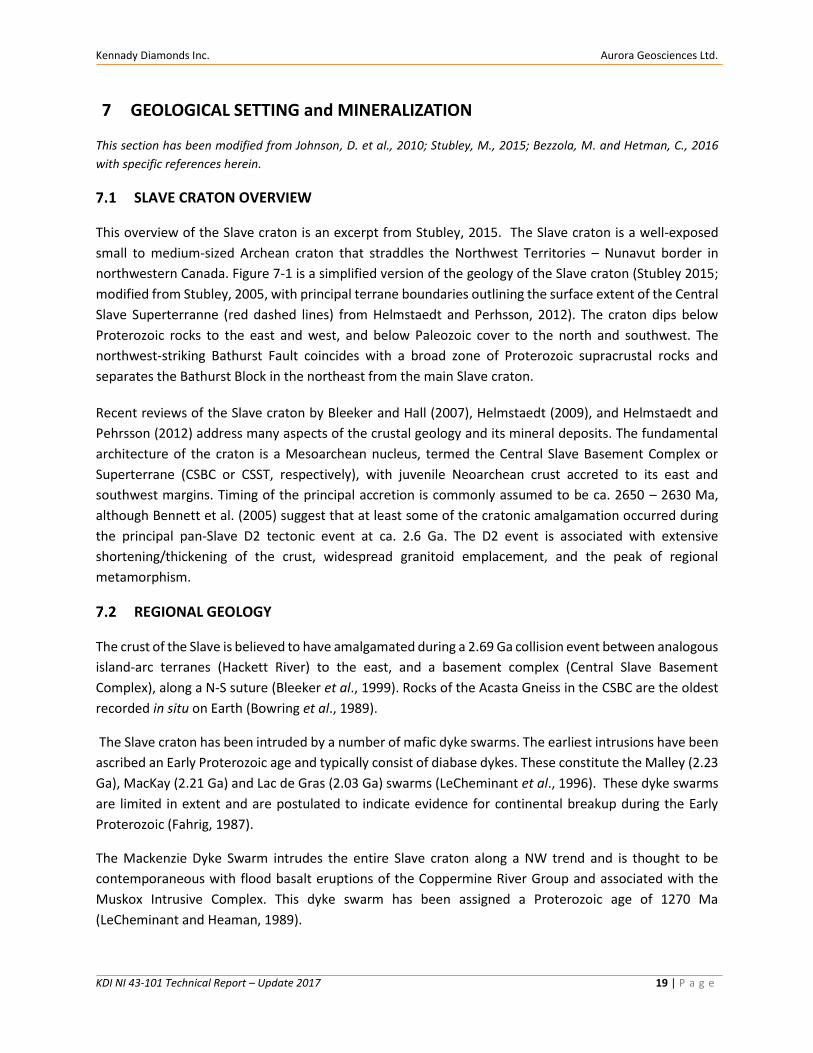
Kennady Diamonds Inc. Aurora Geosciences Ltd.
KDI NI 43-101 Technical Report – Update 2017 19 | P a g e
7 GEOLOGICAL SETTING and MINERALIZATION
This section has been modified from Johnson, D. et al., 2010; Stubley, M., 2015; Bezzola, M. and Hetman, C., 2016
with specific references herein.
SLAVE CRATON OVERVIEW
This overview of the Slave craton is an excerpt from Stubley, 2015. The Slave craton is a well-exposed
small to medium-sized Archean craton that straddles the Northwest Territories – Nunavut border in
northwestern Canada. Figure 7-1 is a simplified version of the geology of the Slave craton (Stubley 2015;
modified from Stubley, 2005, with principal terrane boundaries outlining the surface extent of the Central
Slave Superterranne (red dashed lines) from Helmstaedt and Perhsson, 2012). The craton dips below
Proterozoic rocks to the east and west, and below Paleozoic cover to the north and southwest. The
northwest-striking Bathurst Fault coincides with a broad zone of Proterozoic supracrustal rocks and
separates the Bathurst Block in the northeast from the main Slave craton.
Recent reviews of the Slave craton by Bleeker and Hall (2007), Helmstaedt (2009), and Helmstaedt and
Pehrsson (2012) address many aspects of the crustal geology and its mineral deposits. The fundamental
architecture of the craton is a Mesoarchean nucleus, termed the Central Slave Basement Complex or
Superterrane (CSBC or CSST, respectively), with juvenile Neoarchean crust accreted to its east and
southwest margins. Timing of the principal accretion is commonly assumed to be ca. 2650 – 2630 Ma,
although Bennett et al. (2005) suggest that at least some of the cratonic amalgamation occurred during
the principal pan-Slave D2 tectonic event at ca. 2.6 Ga. The D2 event is associated with extensive
shortening/thickening of the crust, widespread granitoid emplacement, and the peak of regional
metamorphism.
REGIONAL GEOLOGY
The crust of the Slave is believed to have amalgamated during a 2.69 Ga collision event between analogous
island-arc terranes (Hackett River) to the east, and a basement complex (Central Slave Basement
Complex), along a N-S suture (Bleeker et al., 1999). Rocks of the Acasta Gneiss in the CSBC are the oldest
recorded in situ on Earth (Bowring et al., 1989).
The Slave craton has been intruded by a number of mafic dyke swarms. The earliest intrusions have been
ascribed an Early Proterozoic age and typically consist of diabase dykes. These constitute the Malley (2.23
Ga), MacKay (2.21 Ga) and Lac de Gras (2.03 Ga) swarms (LeCheminant et al., 1996). These dyke swarms
are limited in extent and are postulated to indicate evidence for continental breakup during the Early
Proterozoic (Fahrig, 1987).
The Mackenzie Dyke Swarm intrudes the entire Slave craton along a NW trend and is thought to be
contemporaneous with flood basalt eruptions of the Coppermine River Group and associated with the
Muskox Intrusive Complex. This dyke swarm has been assigned a Proterozoic age of 1270 Ma
(LeCheminant and Heaman, 1989).
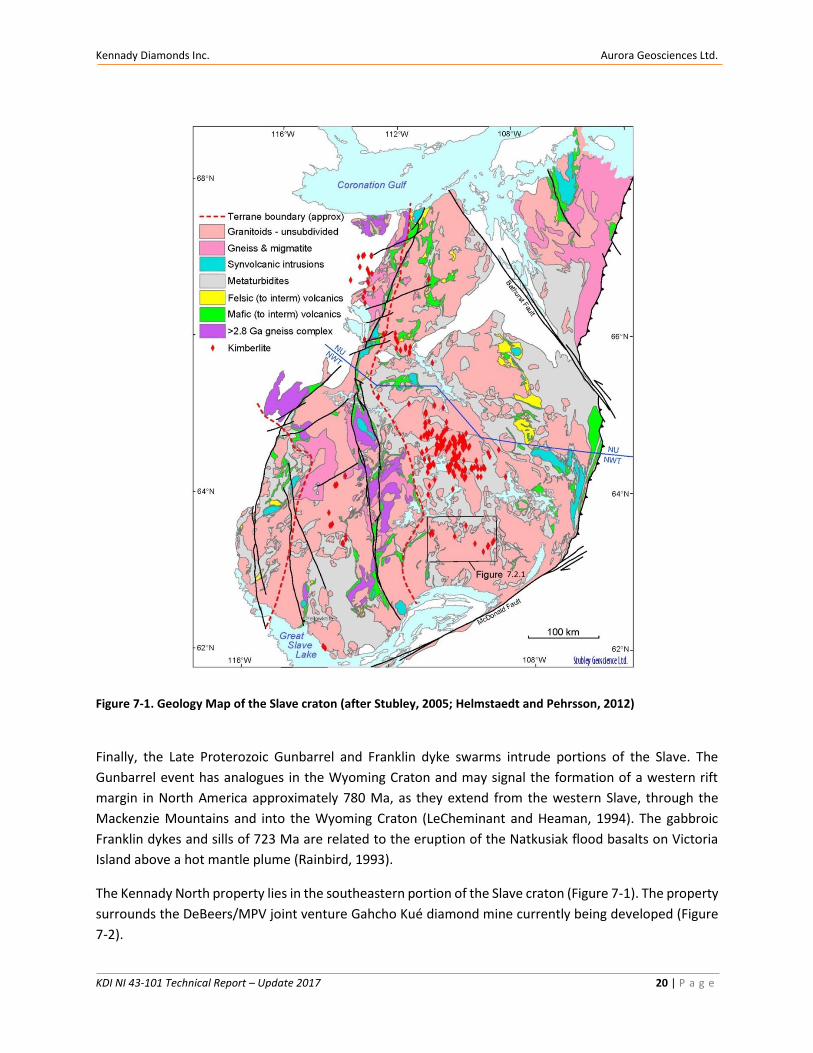
Kennady Diamonds Inc. Aurora Geosciences Ltd.
KDI NI 43-101 Technical Report – Update 2017 20 | P a g e
Figure 7-1. Geology Map of the Slave craton (after Stubley, 2005; Helmstaedt and Pehrsson, 2012)
Finally, the Late Proterozoic Gunbarrel and Franklin dyke swarms intrude portions of the Slave. The
Gunbarrel event has analogues in the Wyoming Craton and may signal the formation of a western rift
margin in North America approximately 780 Ma, as they extend from the western Slave, through the
Mackenzie Mountains and into the Wyoming Craton (LeCheminant and Heaman, 1994). The gabbroic
Franklin dykes and sills of 723 Ma are related to the eruption of the Natkusiak flood basalts on Victoria
Island above a hot mantle plume (Rainbird, 1993).
The Kennady North property lies in the southeastern portion of the Slave craton (Figure 7-1). The property
surrounds the DeBeers/MPV joint venture Gahcho Kué diamond mine currently being developed (Figure
7-2).
Kennady Diamonds Inc. Aurora Geosciences Ltd.
KDI NI 43-101 Technical Report – Update 2017 21 | P a g e
Figure 7-2. Kimberlite bodies of the southeastern Slave Craton
The only published bedrock maps in this region are from Folinsbee (1952) and Cairns et al., (2003) at a
scale of 1:250,000. The multidisciplinary study completed by Cairns et al., produced a number of
lithological, metamorphic, structural and geochronological publications (e.g., Maclachlan et al., 2002;
Cairns, 2003; and Cairns et al., 2005).
Multiple phases of kimberlite emplacement have occurred throughout the Phanerozoic Era in the
Cambrian, Siluro-Ordovician, Permian, Cretaceous, Jurassic and Eocene periods (Heaman et al., 2003).
Many of the kimberlites in the southeastern Slave craton form broad clusters with similar characteristics
from other areas of the craton (Stubley, 2004). All known “blind pipes” and most of the prominent
shallow-dipping dykes (“sheets”) are confined to this cluster. In classical terminology, kimberlite textures
studied in the Slave craton are characterized solely by tuffisitic (TK), hypabyssal (HK), and transitional (TK-
HK) components; crater and extra-crater components have not been recognized (e.g., Scott Smith, 2008).
Early Cambrian emplacement ages for the Snap Lake, Gahcho Kué and the first age dates for the Kelvin
kimberlites are essentially identical, and contrast with all other kimberlite ages within the craton. The
nature of the lithospheric mantle underlying the southeast craton also appears to be unique; a thicker
(>220 to ~300 km) and cooler lithosphere at the time of kimberlite emplacement is documented by
Kopylova and Caro (2004), Pokhilenko et al. (1998), and Agashev et al. (2008).
PROPERTY GEOLOGY
Aurora Geosciences Ltd. contracted Mike Stubley, Ph.D. (Stubley Geoscience Ltd.) to complete detailed
mapping and structural analysis of the Kelvin-Faraday Corridor as well as the MZ and Doyle Lake areas
Kennady Diamonds Inc. Aurora Geosciences Ltd.
KDI NI 43-101 Technical Report – Update 2017 22 | P a g e
(blue areas outlined in Figure 7-2). Upon completion of the 10 week mapping program an internal report
was produced for KDI. A summary of this report is used in this section.
7.3.1 Kelvin-Faraday (KFC) Area Rock Types
The following sections summarize the outcrop characteristics within the KFC and provide the most
detailed property geology to date (Figure 7-3). Inset in this figure shows poles to bedding and the
dominant foliation on a lower hemisphere equal-area stereonet; Gaussian contouring at multiples of
sigma above “expected” (Stubley, 2015). Historical airborne geophysical data have been used to help
define structure and lithological contacts.
7.3.1.1 Metasedimentary Rocks
The oldest rocks, and the host to all known kimberlite, comprise a turbiditic greywacke- mudstone
sequence (Unit Asm), as constitutes more than 25% of the exposed Slave craton (Stubley, 2005; Figure 7-
3). Upper-amphibolite metamorphic conditions have induced a mineral assemblage containing ubiquitous
biotite and sillimanite (with quartz and feldspars), variable muscovite, and local garnet. Variable melting
of the sedimentary sequence, particularly in the pelitic components (e.g., Fig. 7-4a), has produced
common segregation fabrics and complex migmatitic textures. Anatectic melt phases (“neosome” of
leucocratic granodioritic composition) are variably mobile. Planar bedding typically ranges from 10 to 150
cm thick, but locally ranges from <4 to about 300 cm. Graded bedding is locally evident, and is commonly
expressed by increased aluminosilicate porphyroblasts and/or migmatitic textures in the upper pelitic
(mudstone) zones (Fig. 7-4b). A spectacular zone of lichen-free well-bedded metaturbidites east of Mag
Lake lacks significant in situ melt phases and preserves many primary sedimentary features.
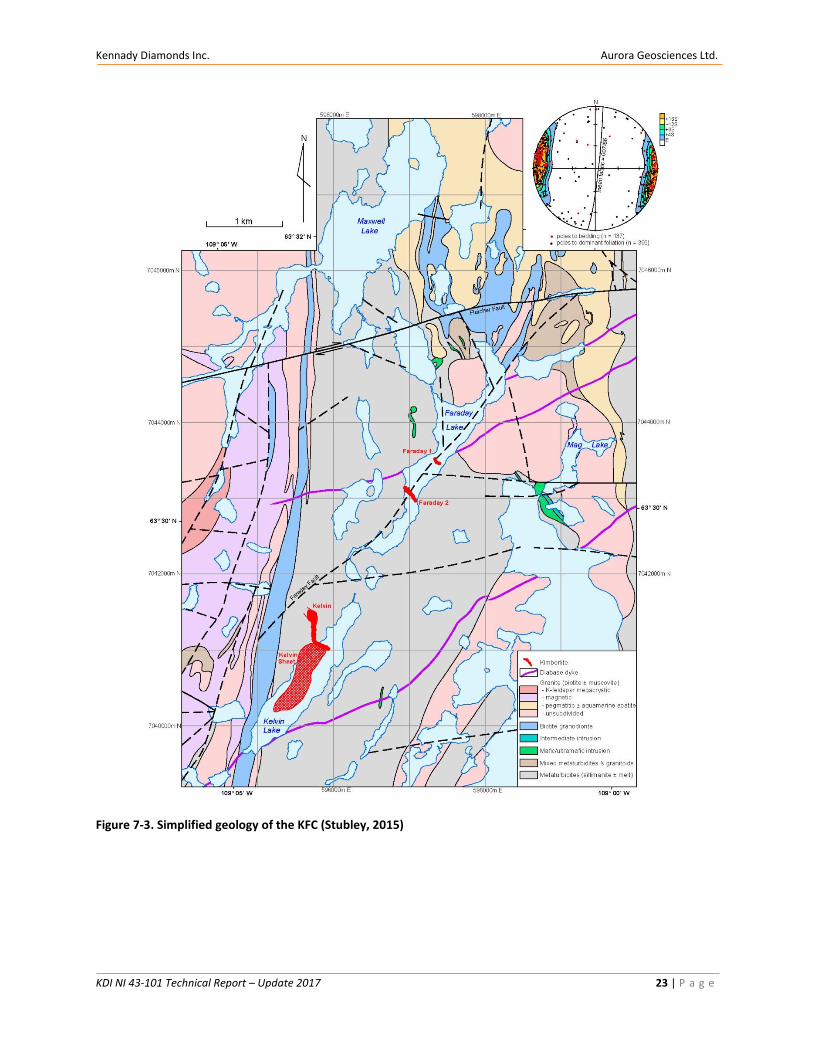
Kennady Diamonds Inc. Aurora Geosciences Ltd.
KDI NI 43-101 Technical Report – Update 2017 23 | P a g e
Figure 7-3. Simplified geology of the KFC (Stubley, 2015)
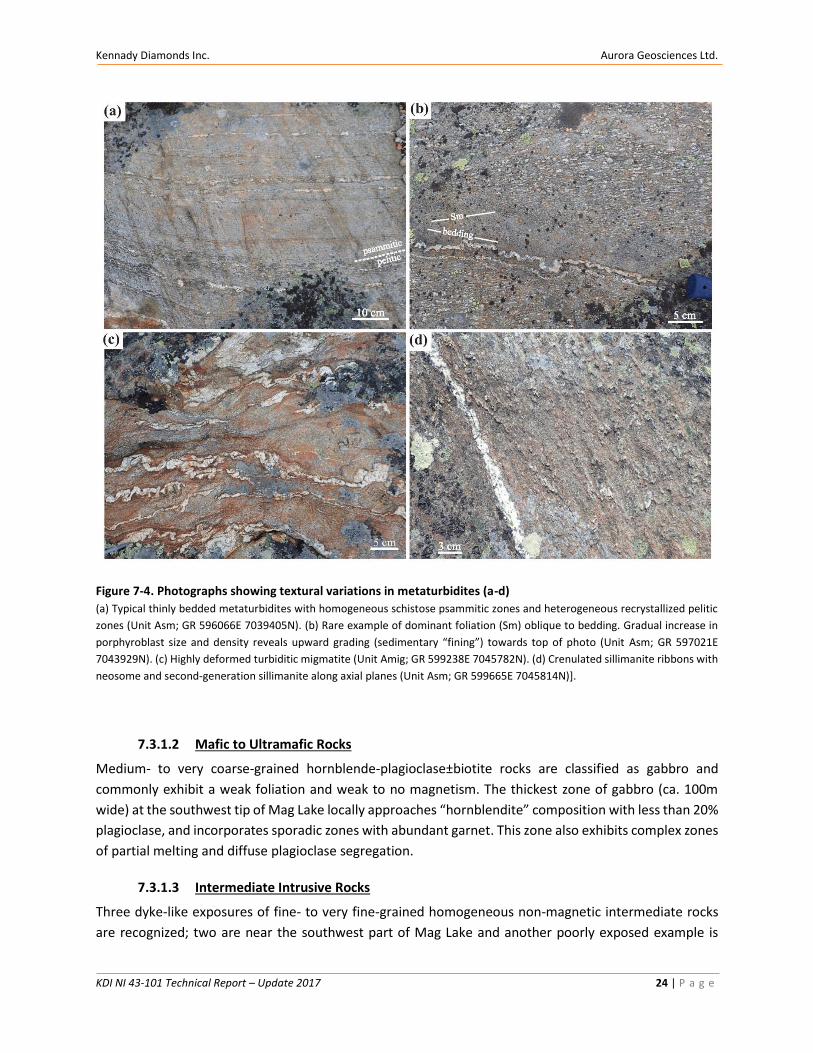
Kennady Diamonds Inc. Aurora Geosciences Ltd.
KDI NI 43-101 Technical Report – Update 2017 24 | P a g e
Figure 7-4. Photographs showing textural variations in metaturbidites (a-d)
(a) Typical thinly bedded metaturbidites with homogeneous schistose psammitic zones and heterogeneous recrystallized pelitic
zones (Unit Asm; GR 596066E 7039405N). (b) Rare example of dominant foliation (Sm) oblique to bedding. Gradual increase in
porphyroblast size and density reveals upward grading (sedimentary “fining”) towards top of photo (Unit Asm; GR 597021E
7043929N). (c) Highly deformed turbiditic migmatite (Unit Amig; GR 599238E 7045782N). (d) Crenulated sillimanite ribbons with
neosome and second-generation sillimanite along axial planes (Unit Asm; GR 599665E 7045814N)].
7.3.1.2 Mafic to Ultramafic Rocks
Medium- to very coarse-grained hornblende-plagioclase±biotite rocks are classified as gabbro and
commonly exhibit a weak foliation and weak to no magnetism. The thickest zone of gabbro (ca. 100m
wide) at the southwest tip of Mag Lake locally approaches “hornblendite” composition with less than 20%
plagioclase, and incorporates sporadic zones with abundant garnet. This zone also exhibits complex zones
of partial melting and diffuse plagioclase segregation.
7.3.1.3 Intermediate Intrusive Rocks
Three dyke-like exposures of fine- to very fine-grained homogeneous non-magnetic intermediate rocks
are recognized; two are near the southwest part of Mag Lake and another poorly exposed example is
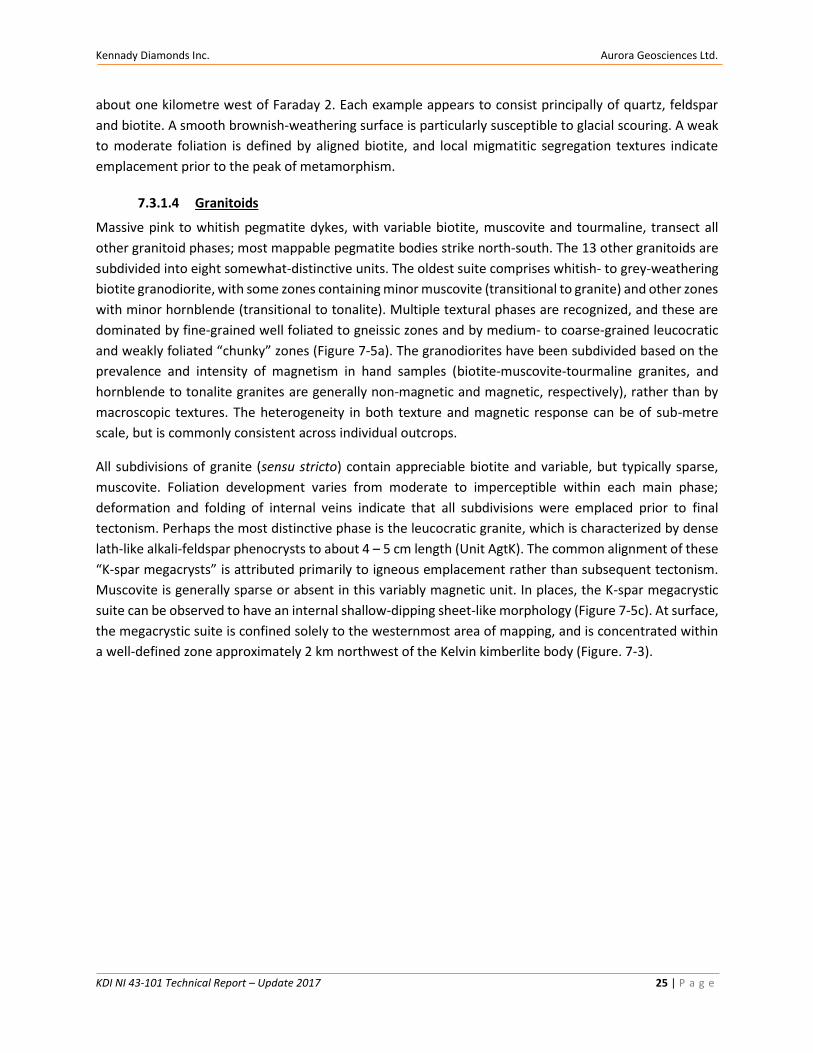
Kennady Diamonds Inc. Aurora Geosciences Ltd.
KDI NI 43-101 Technical Report – Update 2017 25 | P a g e
about one kilometre west of Faraday 2. Each example appears to consist principally of quartz, feldspar
and biotite. A smooth brownish-weathering surface is particularly susceptible to glacial scouring. A weak
to moderate foliation is defined by aligned biotite, and local migmatitic segregation textures indicate
emplacement prior to the peak of metamorphism.
7.3.1.4 Granitoids
Massive pink to whitish pegmatite dykes, with variable biotite, muscovite and tourmaline, transect all
other granitoid phases; most mappable pegmatite bodies strike north-south. The 13 other granitoids are
subdivided into eight somewhat-distinctive units. The oldest suite comprises whitish- to grey-weathering
biotite granodiorite, with some zones containing minor muscovite (transitional to granite) and other zones
with minor hornblende (transitional to tonalite). Multiple textural phases are recognized, and these are
dominated by fine-grained well foliated to gneissic zones and by medium- to coarse-grained leucocratic
and weakly foliated “chunky” zones (Figure 7-5a). The granodiorites have been subdivided based on the
prevalence and intensity of magnetism in hand samples (biotite-muscovite-tourmaline granites, and
hornblende to tonalite granites are generally non-magnetic and magnetic, respectively), rather than by
macroscopic textures. The heterogeneity in both texture and magnetic response can be of sub-metre
scale, but is commonly consistent across individual outcrops.
All subdivisions of granite (sensu stricto) contain appreciable biotite and variable, but typically sparse,
muscovite. Foliation development varies from moderate to imperceptible within each main phase;
deformation and folding of internal veins indicate that all subdivisions were emplaced prior to final
tectonism. Perhaps the most distinctive phase is the leucocratic granite, which is characterized by dense
lath-like alkali-feldspar phenocrysts to about 4 – 5 cm length (Unit AgtK). The common alignment of these
“K-spar megacrysts” is attributed primarily to igneous emplacement rather than subsequent tectonism.
Muscovite is generally sparse or absent in this variably magnetic unit. In places, the K-spar megacrystic
suite can be observed to have an internal shallow-dipping sheet-like morphology (Figure 7-5c). At surface,
the megacrystic suite is confined solely to the westernmost area of mapping, and is concentrated within
a well-defined zone approximately 2 km northwest of the Kelvin kimberlite body (Figure. 7-3).
Kennady Diamonds Inc. Aurora Geosciences Ltd.
KDI NI 43-101 Technical Report – Update 2017 26 | P a g e
Figure 7-5. Photographs showing textural variations of the granitoid rocks (a-d)
(a) Multiphase non-magnetic biotite granodiorite; well-foliated to gneissic fine-grained phase on left and “chunky” medium- to
coarse-grained leucocratic phase on right (Unit Agd; GR 594810E 7039626N). (b) Typical massive inequigranular magnetic granite
(Unit Agtm; GR 594066E 7041517N). (c) Oblique view of shallow westward-dipping granitic layering; leucocratic layers dominated
by aligned cm-scale feldspar laths (Unit AgtK; GR 594380E 7043134N). (d) Muscovite-rich phase of highly inequigranular to
pegmatitic leucogranite (Unit Agtp; GR 599820E 7043700N).]
Strongly foliated biotite-rich granitoid with local centimetre-scale feldspar phenocrysts is exposed near
the southwest extent of mapping. Its coarse segregation into quartz-feldspar- and biotite-rich seams, and
its apparent transition to typical granite along its west margin, suggest a tectonic influence; the kinematics
and lateral continuity of this zone are undetermined.
7.3.1.5 Proterozoic Diabase Dykes
Fine- to medium-grained massive diabase is poorly exposed in outcrop but can be traced by
aeromagnetics. All dykes within the map area strike east-northeast and, where exposed, are subvertical
and undeformed, with locally well-developed ophitic texture; moderate to strong magnetism is
characteristic. The dykes are correlated with the undated “Fletcher” swarm (Stubley, 2005) of presumed
Paleoproterozoic age (geochronology pending).
Kennady Diamonds Inc. Aurora Geosciences Ltd.
KDI NI 43-101 Technical Report – Update 2017 27 | P a g e
7.3.1.6 Metamorphic and Structural Aspects
The turbiditic greywacke-mudstone sequence is ideal for investigating metamorphism and its relationship
to deformational events. In the Kelvin – Faraday area, the metaturbidites record sillimanite-grade
metamorphism and partial melting, indicating upper amphibolite facies conditions and peak temperatures
exceeding 700ºC. Cairns et al. (2005) indicate pressures of about 7 kbar were associated with the high-
temperature assemblages at Walmsley Lake (about 30 km east of the current map area). Garnet is locally
evident; high-temperature cordierite (gem-type iolite) was not recognized but would likely be evident
petrographically. In places, two generations of sillimanite growth can be demonstrated.
7.3.1.7 Folding and Fabric Development
The tectonothermal history of the Kelvin – Faraday area is similar to many areas of the Slave craton, with
one major additional complication as discussed below. In most outcrops, a single penetrative foliation is
evident and this is termed “Sm” (main or dominant foliation). Elsewhere within the Slave craton, Sm can
be demonstrated to be related to the second regional deformation event, D2, that is constrained to about
2.6 Ga. The pan-Slave D2 event is associated with extensive shortening and thickening of crustal rocks,
the onset of peak metamorphism and S-type granitoid emplacement, and formation of the principal
orogenic gold deposits, among other features. Where recognized, features that predate Sm are ascribed
to a D1 event (S1, F1), and features that postdate Sm are ascribed to D3 (S3, F3) and D4 (S4, F4), etc. With
minor modifications, this model works reasonably well at Kelvin – Faraday.
Within sporadic zones of the northeast area of mapping, two episodes of sillimanite growth accompany
development of discrete fabrics. Early sillimanite ribbons defining the dominant foliation are crenulated
with the development of new sillimanite along the axial planes as a new crenulation cleavage (e.g., Fig. 7-
4d). Within metres, the intensity of the newer crenulation cleavage obliterates evidence of the earlier
foliation. As such, the sole “dominant foliation” (Sm) in the region is a S2-S3 transposition fabric with final
formation during D3. Similar observations and interpretations are presented by MacLachlan et al. (2002)
and Cairns et al. (2005) from regional-scale mapping. The timing of D3 in turbiditic migmatites is
constrained to about 2585 Ma whereas D2 in lower-grade rocks is inferred to be ≥2603 Ma (Cairns et al.,
2005), and this suggests that “Sm” is a product of two or more events spanning about 20 my.
A well-exposed transect across metaturbidites of the southernmost map area reveals numerous reversals
in top directions in subparallel beds; the sole foliation (Sm) is subparallel to bedding. The top reversals are
inferred to reflect the presence of F1 isoclinal folds formed during pre-2620 Ma D1, as is common
throughout the craton. A discrete macroscopic and penetrative foliation associated with the proposed
isoclinal folds, which would be termed S1, was not recognized in this study, and this relationship is also
common in most studies within the Slave.
7.3.1.8 Faults and Fractures
The most-significant fault in the area is the Paleoproterozoic Fletcher Fault (Figure 7-3.) that can be traced
regionally for almost 150 km (Stubley, 2005), and which also passes through the MZ Lake map area
(discussed in a later section). Along its length, the fault records about 40-50m subhorizontal dextral
displacement associated with quartz veining/flooding, hematization of feldspar, and local occurrences of
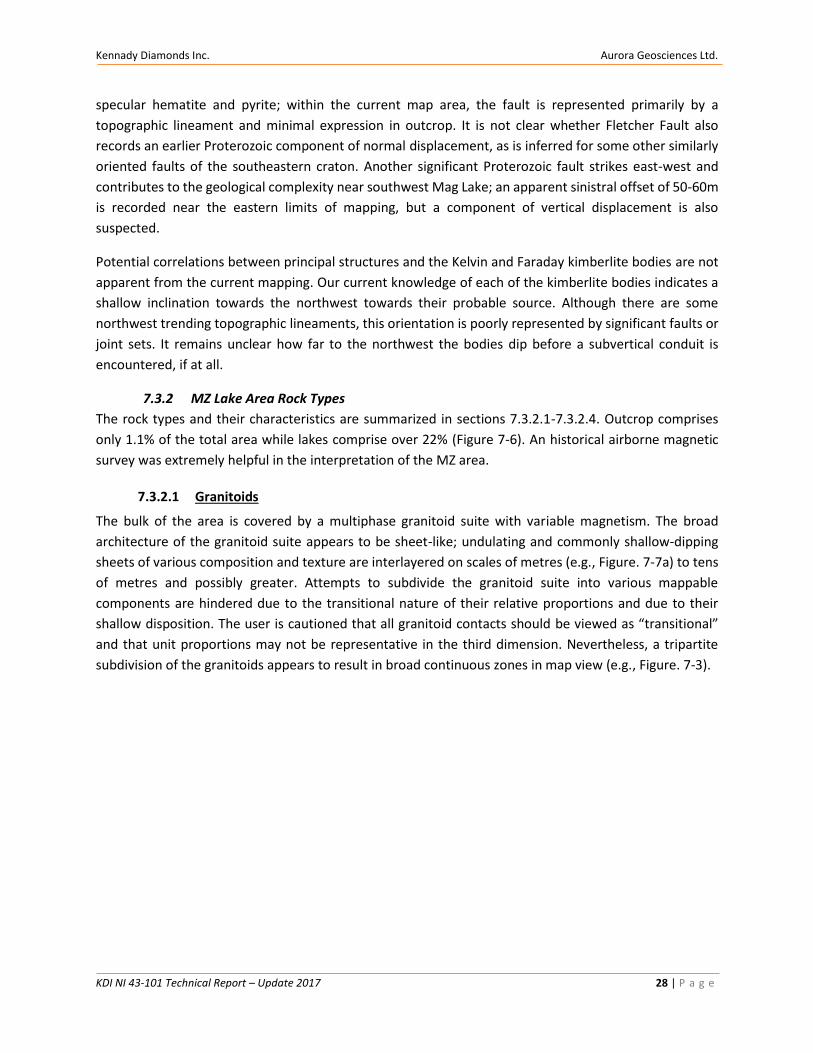
Kennady Diamonds Inc. Aurora Geosciences Ltd.
KDI NI 43-101 Technical Report – Update 2017 28 | P a g e
specular hematite and pyrite; within the current map area, the fault is represented primarily by a
topographic lineament and minimal expression in outcrop. It is not clear whether Fletcher Fault also
records an earlier Proterozoic component of normal displacement, as is inferred for some other similarly
oriented faults of the southeastern craton. Another significant Proterozoic fault strikes east-west and
contributes to the geological complexity near southwest Mag Lake; an apparent sinistral offset of 50-60m
is recorded near the eastern limits of mapping, but a component of vertical displacement is also
suspected.
Potential correlations between principal structures and the Kelvin and Faraday kimberlite bodies are not
apparent from the current mapping. Our current knowledge of each of the kimberlite bodies indicates a
shallow inclination towards the northwest towards their probable source. Although there are some
northwest trending topographic lineaments, this orientation is poorly represented by significant faults or
joint sets. It remains unclear how far to the northwest the bodies dip before a subvertical conduit is
encountered, if at all.
7.3.2 MZ Lake Area Rock Types
The rock types and their characteristics are summarized in sections 7.3.2.1-7.3.2.4. Outcrop comprises
only 1.1% of the total area while lakes comprise over 22% (Figure 7-6). An historical airborne magnetic
survey was extremely helpful in the interpretation of the MZ area.
7.3.2.1 Granitoids
The bulk of the area is covered by a multiphase granitoid suite with variable magnetism. The broad
architecture of the granitoid suite appears to be sheet-like; undulating and commonly shallow-dipping
sheets of various composition and texture are interlayered on scales of metres (e.g., Figure. 7-7a) to tens
of metres and possibly greater. Attempts to subdivide the granitoid suite into various mappable
components are hindered due to the transitional nature of their relative proportions and due to their
shallow disposition. The user is cautioned that all granitoid contacts should be viewed as “transitional”
and that unit proportions may not be representative in the third dimension. Nevertheless, a tripartite
subdivision of the granitoids appears to result in broad continuous zones in map view (e.g., Figure. 7-3).
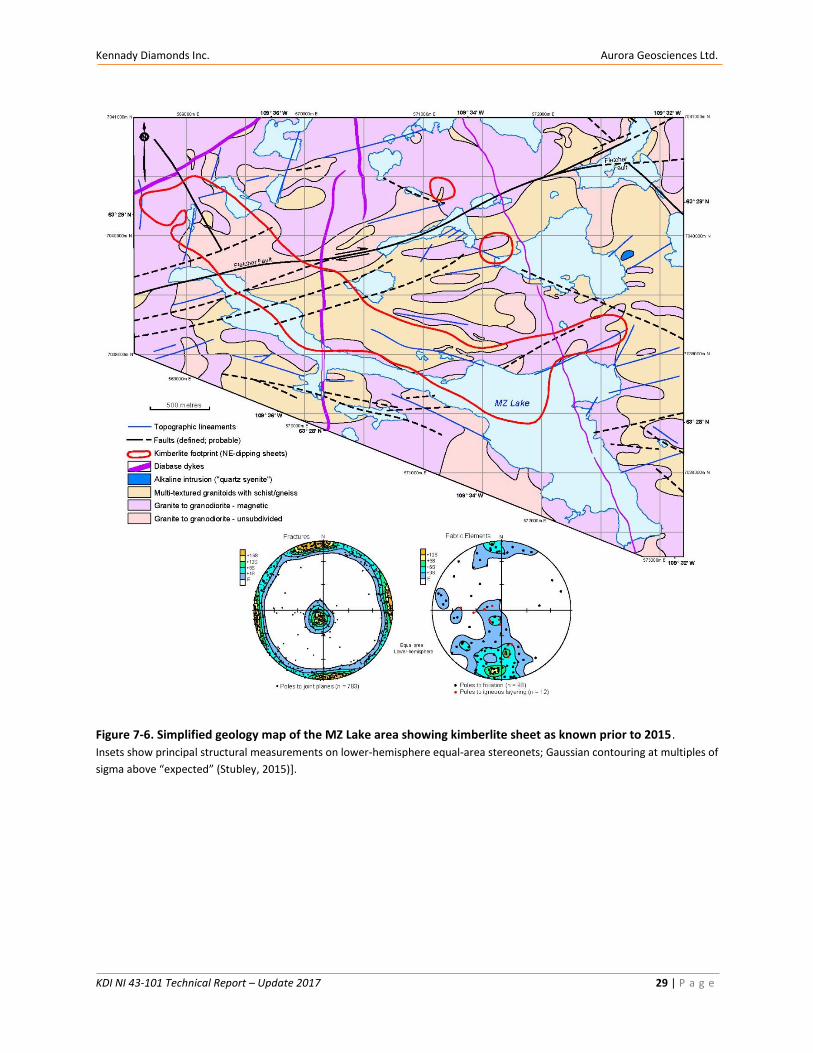
Kennady Diamonds Inc. Aurora Geosciences Ltd.
KDI NI 43-101 Technical Report – Update 2017 29 | P a g e
Figure 7-6. Simplified geology map of the MZ Lake area showing kimberlite sheet as known prior to 2015.
Insets show principal structural measurements on lower-hemisphere equal-area stereonets; Gaussian contouring at multiples of
sigma above “expected” (Stubley, 2015)].
Kennady Diamonds Inc. Aurora Geosciences Ltd.
KDI NI 43-101 Technical Report – Update 2017 30 | P a g e
Figure 7-7. Photographs of granitoids in the MZ Lake area
(a) View to the north of moderately east-dipping “igneous layering”; interlayered tonalitic gneiss, quartz-biotite schist and
massive granite (Unit Aggn; GR 570566E 7039731N). (b) Wayne Barnett examining fine-grained brick-red quartz-poor syenitic
frost-heave (Unit APsy; GR 572723E 7039830N). (c) Subhorizontal joints in multiphase granitoids impart a step-like outcrop
disposition (Unit Aggn; GR 571290E 7039073N). (d) Typical expression of Proterozoic fault activity; reddish hematitic feldspar,
quartz veining/flooding, trace sulphides, and local open-cavity quartz infilling (altered part of Unit Aggn; GR 569775E 7038695N)].
The granitoid suite is composed primarily of pink to grey medium-grained to moderately inequigranular,
and locally porphyritic, granite to granodiorite. This component is commonly massive, or rarely weakly
foliated, and contains biotite and local muscovite that typically comprise <10% of the rock combined.
7.3.2.2 Alkaline Intrusion
An unusual zone of fine-grained brick-red frost heave is exposed in the eastern map area (Figure. 7-7b).
An internal geochemical evaluation has determined rock-type classifications ranging from alkali-feldspar
quartz syenite to quartz monzonite; an average “quartz syenite” classification is deemed appropriate until
petrological examination is conducted.
Kennady Diamonds Inc. Aurora Geosciences Ltd.
KDI NI 43-101 Technical Report – Update 2017 31 | P a g e
7.3.2.3 Diabase Dykes
Three diabase dykes are recognized within the map area (Figure 7-7), and despite their poor preservation
in outcrop, can be traced by their pronounced aeromagnetic signature. A strongly magnetic north-
northwest striking dyke transects eastern MZ Lake and is presumed to be representative of the 1267 Ma
Mackenzie swarm. In two locations, the Mackenzie dyke can be constrained to <3 metres width. A
northeast-striking dyke, about 20m wide, in the northwest zone of mapping is correlated with the
“Fletcher” swarm of Stubley (2005), although most other authors (e.g., Buchan et al., 2010) have
attributed this to the MacKay swarm.
7.3.2.4 Metamorphic and Structural Aspects
Three prominent sets of joints are developed within the granitoid suites (Figure. 7-6 inset), and their
orientations are remarkably similar to those from the Kelvin – Faraday area. The most prevalent set is
subvertical and strikes east-northeast subparallel to Fletcher Fault. Another subvertical set is nearly
orthogonal, and predominantly strikes slightly west of north. Approximately 5% of measured steep joints
(of variable strike) had alteration haloes, quartz infilling, or some indication of probable displacement.
Subhorizontal joints, with a preferential tendency to dip slightly towards the northeast quadrant
(subparallel to kimberlite sheets), commonly impart step-like appearances to outcrops (Figure 7-7c).
Abundant evidence for Proterozoic brittle faulting is preserved in the MZ Lake area. The most prominent
feature is the dextral curviplanar Fletcher Fault and its associated splays; secondary faults appear to
nucleate on smooth bends in Fletcher Fault as accommodation features (Figure 7-6). Another prominent
set of faults of uncertain kinematics strikes to the northwest, and may underlie the long arm of MZ Lake.
All of the designated faults are marked by linear zones of reduced magnetic response, reddish hematitic
alteration of feldspars, and abundant quartz infiltration (Figure 7-7d); sporadic zones with moderate
epidote and/or minor pyrite are also noted.
Features of the host rocks that might have influenced emplacement of the thin shallow northeast-dipping
kimberlite sheets are unknown. The subparallel orientation of many shallow joints is intriguing, but
questions remain regarding the timing and vertical extent of the joints (discussed in a later section). The
variably oriented “igneous layering” is locally subparallel to the kimberlite sheets, but is deemed too
irregular to have influenced the semi-planar kimberlite location; cursory review of some drill core did not
reveal a correlation between kimberlite location and lithological layering. The only structure of the map
area that potentially has vertical extent more than about 10 kilometres is Fletcher Fault, but there seems
no obvious reason why kimberlite would have exploited this regional feature at MZ Lake. However, two
highly anomalous features of the small map area, both of which are assumed to reflect mantle-depth
activity, might warrant further consideration; these are the small alkaline intrusion and the MZ diabase
dyke.
7.3.3 Doyle Lake Area Rock Types
A total of four days was spent mapping in the Doyle lake area. Outcropping accounts for 2.5% (Figure 7-
8), while lakes comprise 5.4% of the map area. A majority of the outcrops are within 600 m of a major
esker and as such a historical airborne magnetic survey was used for geological interpretation.
Kennady Diamonds Inc. Aurora Geosciences Ltd.
KDI NI 43-101 Technical Report – Update 2017 32 | P a g e
7.3.3.1 Rock Types
Little mappable variation is noted in most outcrops of the Doyle area (Figure 7-8). The bulk is massive and
unfoliated multi-textured white- to pink-weathering granodiorite to granite (Unit Agt). Most is medium-
to coarse-grained, but some zones are markedly inequigranular with porphyritic to pegmatitic phases.
Biotite typically accounts for 5 – 12%; muscovite is absent (or rare). Magnetism is variable at sub-metre
scales, but is commonly moderate to strong (except adjacent to Proterozoic fault zones).
In places, the massive granitoid suite incorporates a subordinate component of foliated material (Unit
Aggn). In the eastern part of the map area, the foliated components are typically subtle or comprise
narrow panels of quartz-biotite schist, and commonly account for less than 5-10% of any outcrop; a field
term of “dirty granite” was employed during mapping. In the Half Moon Lake area (Figure 7-8), moderately
foliated granite-granodiorite, fine-grained quartz-biotite schist, and locally gneissic granitoids, contribute
to the heterogeneity of this unit.
A single small outcrop of fine-grained leucogabbro to diorite intrudes a prominent 3m-wide lineament
through granitoid outcrops, and is the only occurrence. The recessive dyke weathers white to medium
brown and its principal components (plagioclase > hornblende) impart a distinctive black-and-white
speckling. Moderate to strong magnetism is characteristic. The dyke appears massive and unfoliated, yet
it is transected by a hematitic granite vein and this may suggest an Archean age.
Proterozoic diabase is represented by at least two dykes. A north-northwest striking dyke, presumably of
the 1267 Ma Mackenzie swarm, fails to crop out within the map area, but is readily traceable by strong
magnetic signature; it appears to alter its trend (i.e., “jog”) to follow Doyle Fault for about 250 metres. All
outcrops, frost-heave, and drill intersections of diabase appear to belong to a different highly anomalous
dyke exhibiting a segmented and irregular trace through the map area. The magnetic response suggests
the single dyke “jogs” to follow parts of the Eagle, Doyle, and Mooseview faults (Figure 7-8), which is a
geometry uncharacteristic of any named swarm of the Slave craton. This moderately to strongly magnetic
diabase locally appears fractured and altered, and hosts quartz veins.
7.3.3.2 Structural Aspects
The massive nature of most outcrops hinders evaluation of the Archean structural history of the Doyle
area. Foliation and “layering” within Unit Aggn exhibit inconsistent orientations (Fig. 7-8 inset); their
general parallelism to contacts with adjacent Unit Agt may support an undulating sheet-like interface
between the two units.
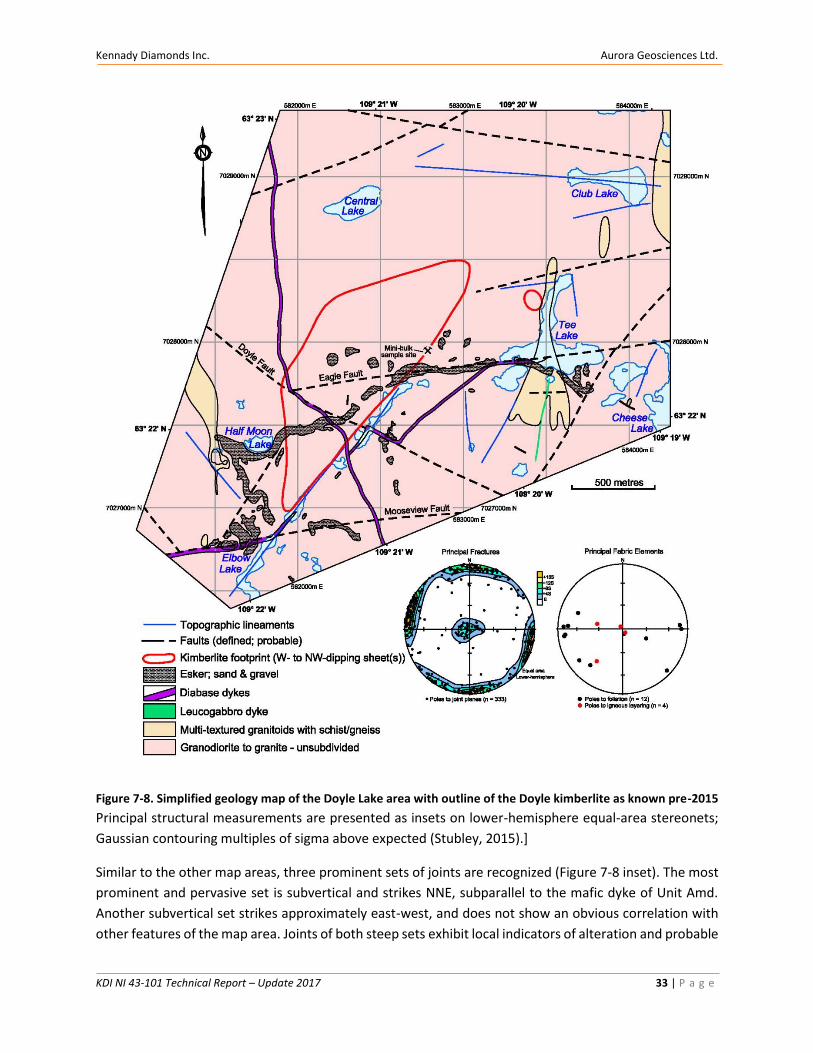
Kennady Diamonds Inc. Aurora Geosciences Ltd.
KDI NI 43-101 Technical Report – Update 2017 33 | P a g e
Figure 7-8. Simplified geology map of the Doyle Lake area with outline of the Doyle kimberlite as known pre-2015
Principal structural measurements are presented as insets on lower-hemisphere equal-area stereonets;
Gaussian contouring multiples of sigma above expected (Stubley, 2015).]
Similar to the other map areas, three prominent sets of joints are recognized (Figure 7-8 inset). The most
prominent and pervasive set is subvertical and strikes NNE, subparallel to the mafic dyke of Unit Amd.
Another subvertical set strikes approximately east-west, and does not show an obvious correlation with
other features of the map area. Joints of both steep sets exhibit local indicators of alteration and probable
Kennady Diamonds Inc. Aurora Geosciences Ltd.
KDI NI 43-101 Technical Report – Update 2017 34 | P a g e
displacement. Subhorizontal joints reveal a slight tendency to dip preferentially towards the northeast
quadrant; hematitic alteration is anomalously associated with shallow joints in one outcrop.
Aeromagnetic imagery reveals linear zones of reduced magnetic intensity that are interpreted to
represent Proterozoic brittle faults. Boulders and frost heave overlying Eagle Fault exhibit extensive
hematitic alteration and quartz infiltration, chloritization of biotite, and local specular hematite and pods
of massive pyrite. At least one outcrop adjacent to Doyle Fault exhibits similar hematitic and siliceous
alteration. Review of regional airborne geophysical imagery suggests Doyle Fault is through-going, with
many other faults (including Eagle and Mooseview) terminating on it (see Figure. 7-8). Two subvertical
metre-scale faults parallel to Doyle Fault are exposed in continuous outcrop and are characterized by
extensive hematitic alteration and quartz veining; kinematics was not determined. An anomalous area of
fault-related deformation and alteration is exposed near the intersection of Doyle and Eagle faults (see
accompanying map); prominent north-south layering and “flakey” fragmentation (with hematite and
quartz alteration) are of uncertain origin.
At present, the extent of shallow-dipping kimberlite is poorly constrained, and the source of magma and
its flow direction are unknown. Nevertheless, and despite the presence of several significant Proterozoic
faults, there appears to be no obvious structure that controls the kimberlite disposition. Outcrop-scale
joints do not, in general, reveal parallelism with the kimberlite sheet(s).
7.3.4 Kelvin Kimberlite Detail Geology
This section is modified from industry reports SRK (2016b, c, d, g). Kimberlite descriptions and classifications follow
the terminology from Scott Smith et al. (2013).
7.3.4.1 Introduction
All geological work at Kelvin has been completed by Aurora Geosciences Ltd (AGL) under the guidance
and supervision of Casey Hetman, P.Geo. of SRK Consulting (SRK). The core logging methods have evolved
over time with detailed logging, following strict standard operating procedures established by SRK and
AGL, and petrographic work on representative core samples having been undertaken since late 2013. In
2015, detailed logging and petrographic analysis of 11,402.83 m of kimberlite core led to the identification
and characterization of six kimberlite units infilling the Kelvin pipe as described in Section 7.3.4.2 below.
Logging and petrographic analysis of an additional 26 drill cores in 2016 served to confirm continuity of
the units between the South and North limbs of the body, and along strike in the North limb. The 3-D
geological model for Kelvin comprises a well constrained external pipe shell model and internal geology
model, both of which were constructed by Michael Diering of SRK as outlined in Section 7.3.4.3. The core
logging, petrography and geological model have been subject to independent review by Kimberley Webb,
P.Geo. of Mineral Services Canada (MSC15/025R, MSC16/004R, MSC16/014R, MSC16/017R).
Extensive drilling of the Kelvin kimberlite has defined it as an irregular, subhorizontal, L-shaped inclined
pipe infilled primarily by volcaniclastic kimberlite classified as Kimberley-type pyroclastic kimberlite (KPK),
as well as coherent kimberlite (CK) and minor kimberlite transitional in texture between KPK and CK. The
combined geometry of Kelvin and ‘layer cake’ stratigraphy of its internal units are unconventional relative
to other known kimberlite bodies (Section 8).
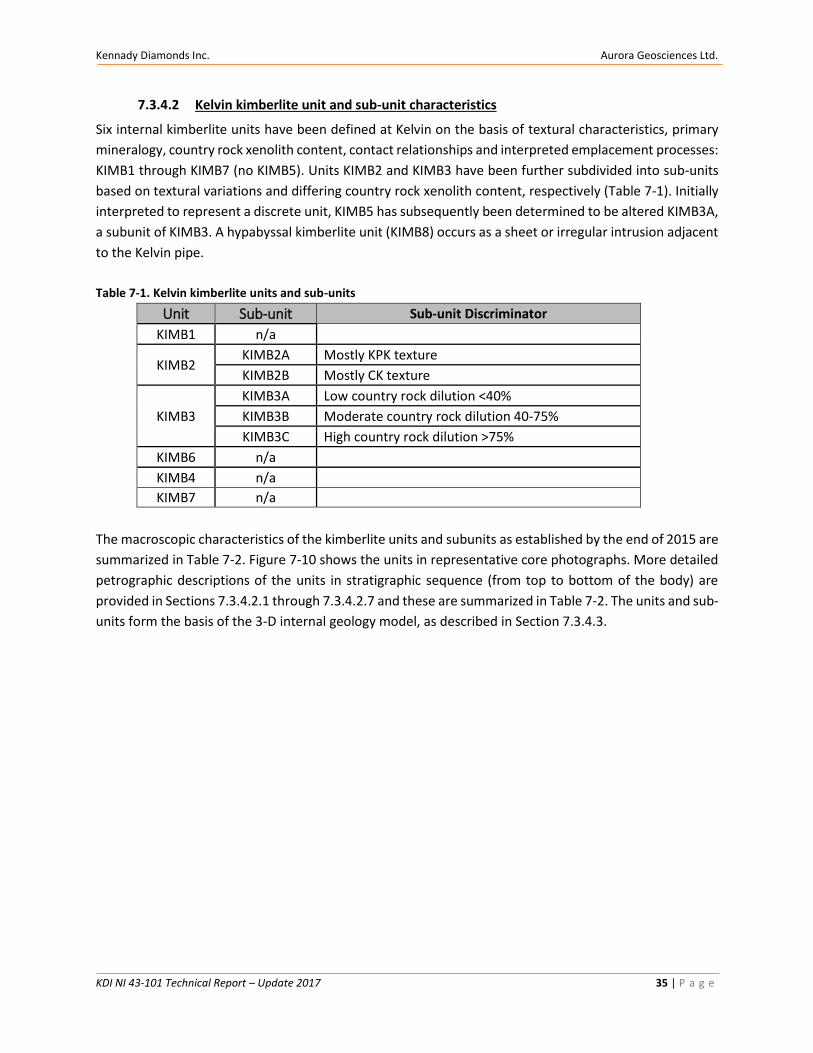
Kennady Diamonds Inc. Aurora Geosciences Ltd.
KDI NI 43-101 Technical Report – Update 2017 35 | P a g e
7.3.4.2 Kelvin kimberlite unit and sub-unit characteristics
Six internal kimberlite units have been defined at Kelvin on the basis of textural characteristics, primary
mineralogy, country rock xenolith content, contact relationships and interpreted emplacement processes:
KIMB1 through KIMB7 (no KIMB5). Units KIMB2 and KIMB3 have been further subdivided into sub-units
based on textural variations and differing country rock xenolith content, respectively (Table 7-1). Initially
interpreted to represent a discrete unit, KIMB5 has subsequently been determined to be altered KIMB3A,
a subunit of KIMB3. A hypabyssal kimberlite unit (KIMB8) occurs as a sheet or irregular intrusion adjacent
to the Kelvin pipe.
Table 7-1. Kelvin kimberlite units and sub-units
Unit Sub-unit Sub-unit Discriminator
KIMB1 n/a
KIMB2 KIMB2A Mostly KPK texture
KIMB2B Mostly CK texture KIMB3A Low country rock dilution <40%
KIMB3 KIMB3B Moderate country rock dilution 40-75% KIMB3C High country rock dilution >75%
KIMB6 n/a
KIMB4 n/a
KIMB7 n/a
The macroscopic characteristics of the kimberlite units and subunits as established by the end of 2015 are
summarized in Table 7-2. Figure 7-10 shows the units in representative core photographs. More detailed
petrographic descriptions of the units in stratigraphic sequence (from top to bottom of the body) are
provided in Sections 7.3.4.2.1 through 7.3.4.2.7 and these are summarized in Table 7-2. The units and sub-
units form the basis of the 3-D internal geology model, as described in Section 7.3.4.3.
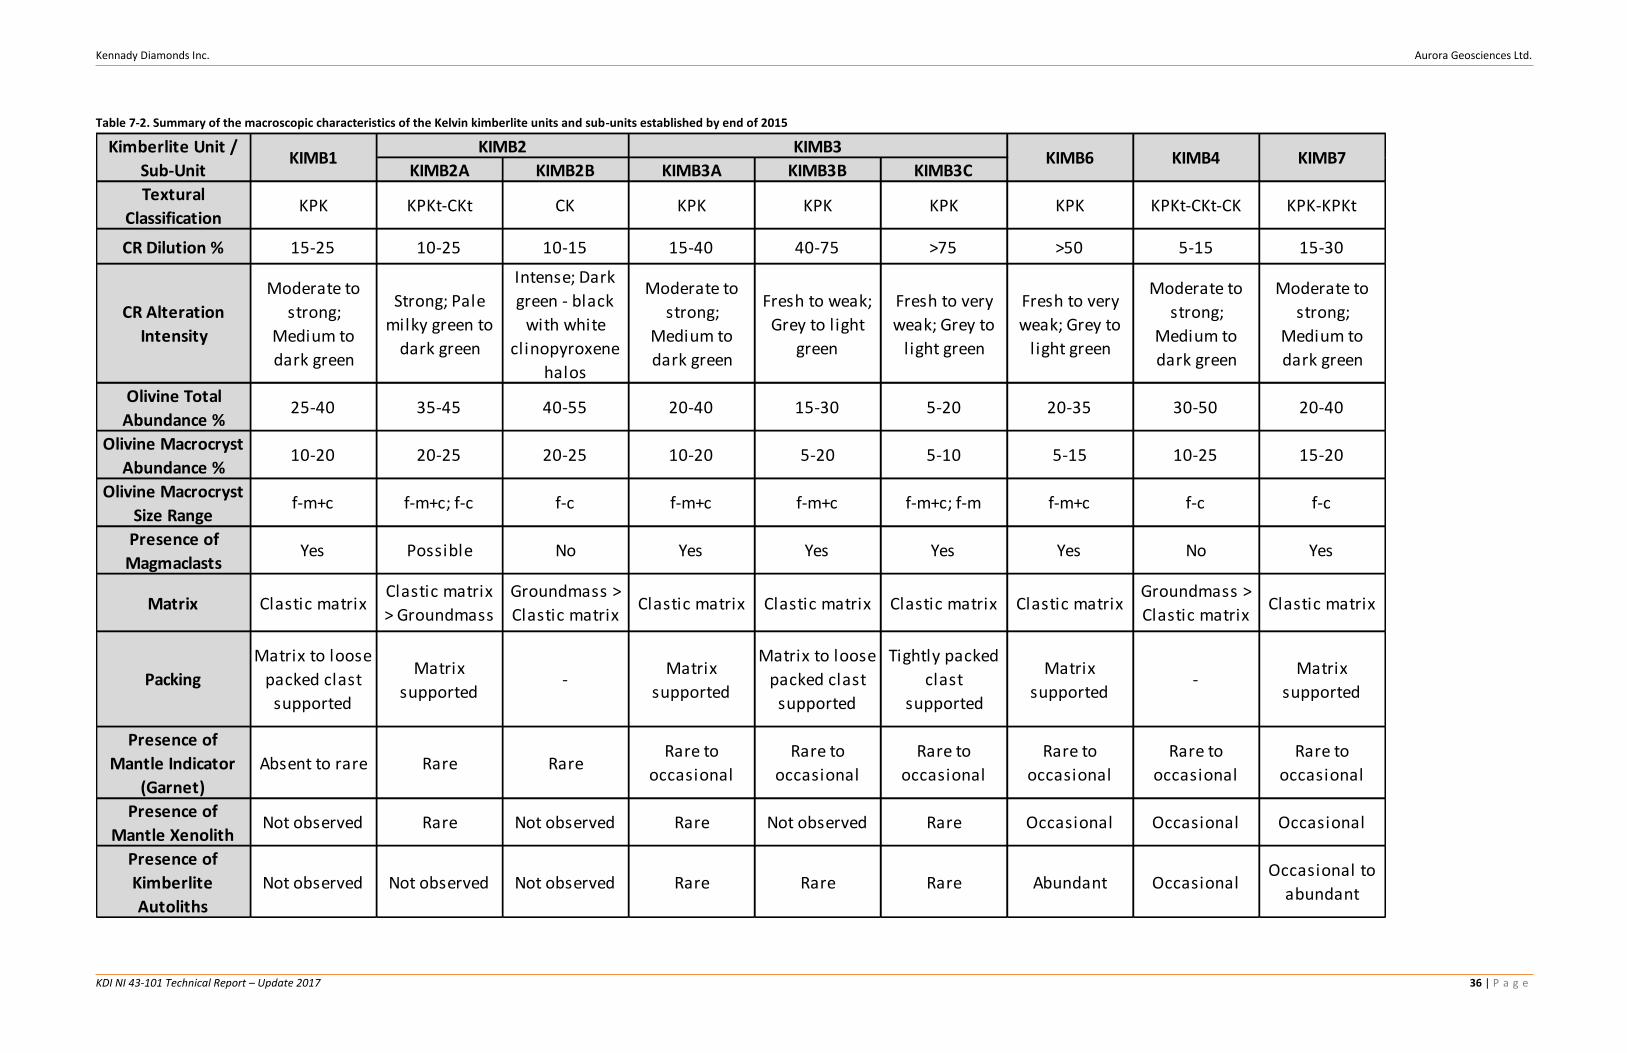
Kennady Diamonds Inc. Aurora Geosciences Ltd.
KDI NI 43-101 Technical Report – Update 2017 36 | P a g e
Table 7-2. Summary of the macroscopic characteristics of the Kelvin kimberlite units and sub-units established by end of 2015
KIMB2A KIMB2B KIMB3A KIMB3B KIMB3C
Textural
ClassificationKPK KPKt-CKt CK KPK KPK KPK KPK KPKt-CKt-CK KPK-KPKt
CR Dilution % 15-25 10-25 10-15 15-40 40-75 >75 >50 5-15 15-30
CR Alteration
Intensity
Moderate to
strong;
Medium to
dark green
Strong; Pale
milky green to
dark green
Intense; Dark
green - black
with white
clinopyroxene
halos
Moderate to
strong;
Medium to
dark green
Fresh to weak;
Grey to light
green
Fresh to very
weak; Grey to
light green
Fresh to very
weak; Grey to
light green
Moderate to
strong;
Medium to
dark green
Moderate to
strong;
Medium to
dark green
Olivine Total
Abundance %25-40 35-45 40-55 20-40 15-30 5-20 20-35 30-50 20-40
Olivine Macrocryst
Abundance %10-20 20-25 20-25 10-20 5-20 5-10 5-15 10-25 15-20
Olivine Macrocryst
Size Rangef-m+c f-m+c; f-c f-c f-m+c f-m+c f-m+c; f-m f-m+c f-c f-c
Presence of
MagmaclastsYes Possible No Yes Yes Yes Yes No Yes
Matrix Clastic matrixClastic matrix
> Groundmass
Groundmass >
Clastic matrixClastic matrix Clastic matrix Clastic matrix Clastic matrix
Groundmass >
Clastic matrixClastic matrix
Packing
Matrix to loose
packed clast
supported
Matrix
supported-
Matrix
supported
Matrix to loose
packed clast
supported
Tightly packed
clast
supported
Matrix
supported-
Matrix
supported
Presence of
Mantle Indicator
(Garnet)
Absent to rare Rare RareRare to
occasional
Rare to
occasional
Rare to
occasional
Rare to
occasional
Rare to
occasional
Rare to
occasional
Presence of
Mantle XenolithNot observed Rare Not observed Rare Not observed Rare Occasional Occasional Occasional
Presence of
Kimberlite
Autoliths
Not observed Not observed Not observed Rare Rare Rare Abundant OccasionalOccasional to
abundant
KIMB4 KIMB7KIMB6KIMB1KIMB2 KIMB3Kimberlite Unit /
Sub-Unit
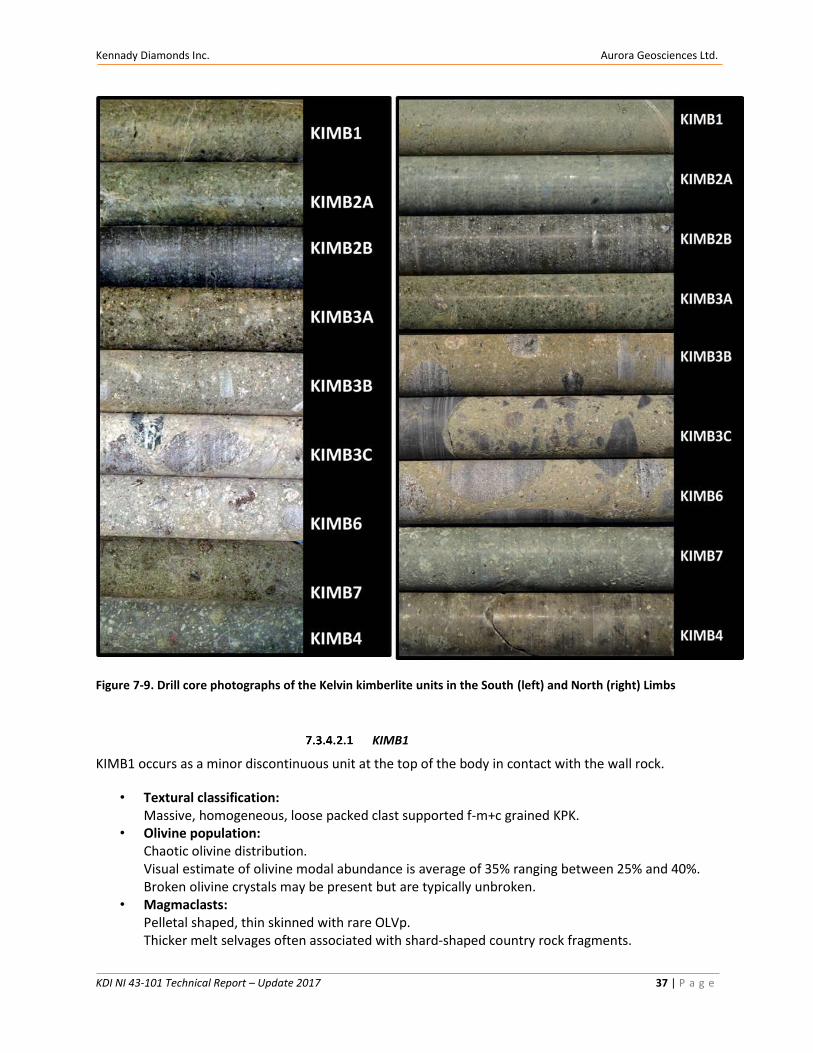
Kennady Diamonds Inc. Aurora Geosciences Ltd.
KDI NI 43-101 Technical Report – Update 2017 37 | P a g e
Figure 7-9. Drill core photographs of the Kelvin kimberlite units in the South (left) and North (right) Limbs
KIMB1
KIMB1 occurs as a minor discontinuous unit at the top of the body in contact with the wall rock.
• Textural classification: Massive, homogeneous, loose packed clast supported f-m+c grained KPK.
• Olivine population: Chaotic olivine distribution. Visual estimate of olivine modal abundance is average of 35% ranging between 25% and 40%. Broken olivine crystals may be present but are typically unbroken.
• Magmaclasts: Pelletal shaped, thin skinned with rare OLVp. Thicker melt selvages often associated with shard-shaped country rock fragments.
Kennady Diamonds Inc. Aurora Geosciences Ltd.
KDI NI 43-101 Technical Report – Update 2017 38 | P a g e
• Groundmass (within melt selvages): Phlogopite, spinel and perovskite.
• Matrix: Dominated by microlites and serpentine.
• Mantle derived indicator minerals: Generally absent; may include rare garnet.
• Country rock xenoliths: Mostly moderately altered with some fresh K-feldspar xenocrysts. Visual dilution estimate averages 22%, ranging between 15% and 40%.
KIMB2
KIMB2 is the second most abundant kimberlite unit at Kelvin and occurs above KIMB3, the dominant unit.
Subunits KIMB2A and KIMB2B are distinguished by differences in texture, KIMB2A being mainly KPK and
KIMB2B primarily CK. The textural classification of KIMB2B is complicated by the fact that despite having
uniform olivine distribution (as is typical of hypabyssal kimberlite), most intervals lack well crystallized
groundmass and contain conspicuous microlites surrounding olivine crystals and country rock xenoliths,
features more typical of KPK or transitional-textured rocks (KPKt, CKt).
KIMB2A
• Textural classification: Massive, homogeneous, loose packed clast supported, f-m+c grained KPK. May be transitional – KPKt or CKt.
• Olivine population: Uniformly distributed OLVm and OLVp. Visual estimate of olivine modal abundance is average of 38% ranging between 35% and 45%.
• Magmaclasts: Thin skinned pelletal shaped and symmetrical with poor groundmass development. Rare OLVp observed within melt selvages.
• Groundmass: Typically, phlogopite, spinel and perovskite. Matrix: Microlitic and abundant serpentine – generally lacks ash size particles typical of KIMB3.
• Mantle derived indicator minerals: Generally absent; may include rare garnet.
• Country rock xenoliths: Mostly highly altered and kimberlitized. Visual dilution estimate averages 14.5%, ranging between 7% and 20%.
KIMB2B
• Textural classification: Massive, homogeneous f-c grained CK May be transitional including KPKt.
• Olivine population: Fairly uniformly distributed OLVm and OLVp.
Kennady Diamonds Inc. Aurora Geosciences Ltd.
KDI NI 43-101 Technical Report – Update 2017 39 | P a g e
Mostly serpentinized, with rare fresh olivine within endmember CK Visual estimate of olivine modal abundance is average of 39% ranging between 25% and 50%.
• Groundmass: Clinopyroxene typically developed in groundmass patches.
• Phlogopite, spinel and perovskite. • Matrix:
Microlitic • Mantle derived indicator minerals:
Generally absent; may include rare garnet. • Country rock xenoliths:
Typically, extensively digested resulting in the development of distinctive clinopyroxene in the groundmass. Most xenoliths are kimberlitized. Visual dilution estimate averages 9.4%, ranging between 3% and 20%.
KIMB3
KIMB3 is volumetrically the most significant kimberlite unit in the Kelvin pipe. It is a massive volcaniclastic
rock containing variable amounts of locally derived gneissic and granitic xenoliths. The xenolith abundance
increases gradationally with depth through KIMB3 leading to its subdivision into KIMB3A, KIMB3B and
KIMB3C which are defined as having less than 40%, 40-75% and greater than 75% country rock dilution,
respectively. A juvenile kimberlite matrix is variably fine to coarse-grained in units KIMB3A and KIMB3B
while KIMB3C is characterized by a pulverized country rock matrix with little juvenile material present.
KIMB3A (low country rock dilution)
• Textural classification: Massive, homogeneous, loose packed clast supported f-m+c grained KPK.
• Olivine population: Non-uniform OLVm and OLVp distribution. Altered and serpentinized. Visual estimate of olivine modal abundance is average of 23% ranging between 15% and 30%.
• Magmaclasts: Thin skinned with poor groundmass development and thicker melt selvages associated with country rock clasts, particularly shard-shaped xenocrysts.
• Groundmass: Phlogopite, spinel and perovskite.
• Interclast matrix: Variable. Mostly microlitic with variable ash size particles and serpentine, may be clay altered.
• Mantle derived indicator minerals: Generally absent; may include rare garnet with kelyphite rims and spinel.
• Country rock xenoliths: Conspicuous biotite xenocrysts (brown and green varieties). Visual dilution estimate averages 41%, ranging between 20% and 50%.
Kennady Diamonds Inc. Aurora Geosciences Ltd.
KDI NI 43-101 Technical Report – Update 2017 40 | P a g e
KIMB3B (moderate country rock dilution)
• Textural classification: Massive, homogeneous, close packed clast supported f-m grained KPK.
• Olivine population: Chaotic olivine distribution. Common broken olivine crystals. Visual estimate of olivine modal abundance is average of 18% ranging between 10% and 30%.
• Magmaclasts: Thin skinned with poor groundmass development and thicker melt selvages associated with country rock clasts, particularly shard-shaped xenocrysts.
• Groundmass: Poorly defined and altered.
• Matrix: Mostly turbid with ash sized particles.
• Mantle derived indicator minerals: Generally absent; may include rare garnet.
• Country rock xenoliths: Mostly fresh locally derived unaltered xenoliths and xenocrysts (mostly K-feldspar). Conspicuous biotite xenocrysts (brown and green varieties). Visual dilution estimate averages 47%, ranging between 20% and 70%.
KIMB3C (high country rock dilution)
• Textural classification: Massive, homogeneous, close packed clast supported f-m grained KPK.
• Olivine population: Common broken olivine crystals. Chaotic olivine distribution. Visual estimate of olivine modal abundance is average of 8% ranging between 1% and 25%.
• Magmaclasts: Thin skinned with poor groundmass development and thicker melt selvages associated with country rock clasts, particularly shard-shaped xenocrysts.
• Groundmass: Highly altered and difficult to discern.
• Matix: Turbid and very ashy.
• Mantle derived indicator minerals: Generally absent; may include rare garnet.
• Country rock xenoliths: Typically fresh country rock xenoliths and xenocrysts (K-feldspar common). Biotite xenocrysts common (both brown and green varieties). Rare autoliths may also be present. Visual dilution estimate averages 78%, ranging between 45% and 90%.
KIMB6
Kennady Diamonds Inc. Aurora Geosciences Ltd.
KDI NI 43-101 Technical Report – Update 2017 41 | P a g e
KIMB6 is a minor unit that occurs discontinuously along the pipe below KIMB3. It is similar in appearance to KIMB3C and is distinguished primarily based on the presence of more conspicuous juvenile material, in particular olivine macrocrysts, and distinctive autoliths of CK.
• Textural classification: Massive, homogeneous, loose packed clast supported f-m+c grained KPK.
• Olivine population: Visual estimate of olivine modal abundance is average of 14% ranging between 2% and 10%.
• Magmaclasts: Thin skinned with poor groundmass development and thicker melt selvages associated with country rock clasts, particularly shard-shaped xenocrysts.
• Groundmass (within melt selvages): Altered and not determined with confidence.
• Matrix: Typically, turbid and ashy.
• Mantle derived indicator minerals: Generally absent; may include rare garnet.
• Country rock xenoliths: Visual dilution estimate averages 78%, ranging between 60% and 90%
KIMB4
KIMB4 is a minor discontinuous unit at the base of the pipe; it is closely associated spatially with KIMB7. The morphology and relationship of these two units is not as well constrained as the other units in Kelvin.
• Textural classification: Massive, homogeneous f-m+c grained CK, may include CKt.
• Olivine population: Two generations with OLVp fairly uniformly distributed. Visual estimate of olivine modal abundance is average of 35% ranging between 20% and 40%.
• Groundmass: Phlogopite, spinel and perovskite. Inhomogeneous in areas due to digested country rock xenoliths. Dominated by phlogopite which may be coarsely crystalline. Uniform size and distribution of groundmass spinel.
• Mantle derived indicator minerals: Occasional garnet.
• Country rock xenoliths: Mostly altered and digested country rock xenoliths. Visual dilution estimate averages 18%, ranging between 5% and 30%.
KIMB7
KIMB7 is a minor discontinuous unit at the base of the body; it is closely associated spatially with KIMB4. A distinctive feature of KIMB7 relative to the other volcaniclastic kimberlite units at Kelvin is the presence of more common thicker melt selvages on magmaclasts.
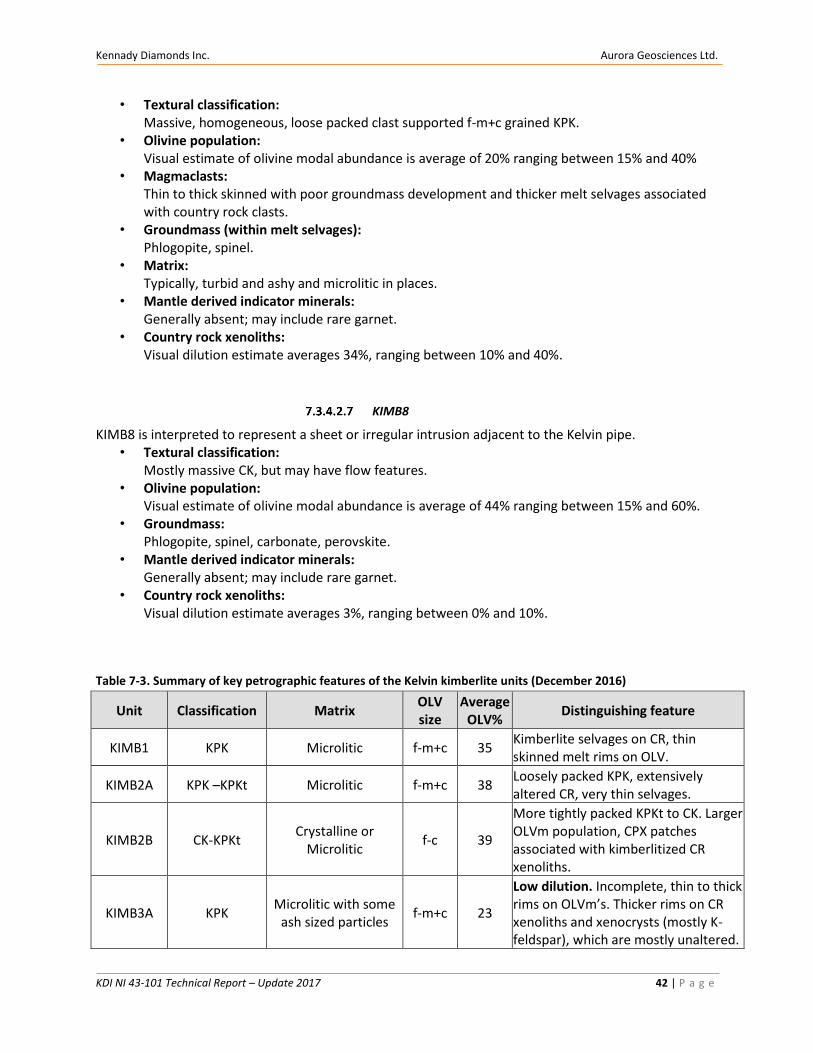
Kennady Diamonds Inc. Aurora Geosciences Ltd.
KDI NI 43-101 Technical Report – Update 2017 42 | P a g e
• Textural classification: Massive, homogeneous, loose packed clast supported f-m+c grained KPK.
• Olivine population: Visual estimate of olivine modal abundance is average of 20% ranging between 15% and 40%
• Magmaclasts: Thin to thick skinned with poor groundmass development and thicker melt selvages associated with country rock clasts.
• Groundmass (within melt selvages): Phlogopite, spinel.
• Matrix: Typically, turbid and ashy and microlitic in places.
• Mantle derived indicator minerals: Generally absent; may include rare garnet.
• Country rock xenoliths: Visual dilution estimate averages 34%, ranging between 10% and 40%.
KIMB8
KIMB8 is interpreted to represent a sheet or irregular intrusion adjacent to the Kelvin pipe. • Textural classification:
Mostly massive CK, but may have flow features. • Olivine population:
Visual estimate of olivine modal abundance is average of 44% ranging between 15% and 60%. • Groundmass:
Phlogopite, spinel, carbonate, perovskite. • Mantle derived indicator minerals:
Generally absent; may include rare garnet. • Country rock xenoliths:
Visual dilution estimate averages 3%, ranging between 0% and 10%.
Table 7-3. Summary of key petrographic features of the Kelvin kimberlite units (December 2016)
Unit Classification Matrix OLV size
Average OLV%
Distinguishing feature
KIMB1 KPK Microlitic f-m+c 35 Kimberlite selvages on CR, thin skinned melt rims on OLV.
KIMB2A KPK –KPKt Microlitic f-m+c 38 Loosely packed KPK, extensively altered CR, very thin selvages.
KIMB2B CK-KPKt Crystalline or
Microlitic f-c 39
More tightly packed KPKt to CK. Larger OLVm population, CPX patches associated with kimberlitized CR xenoliths.
KIMB3A KPK Microlitic with some
ash sized particles f-m+c 23
Low dilution. Incomplete, thin to thick rims on OLVm’s. Thicker rims on CR xenoliths and xenocrysts (mostly K-feldspar), which are mostly unaltered.
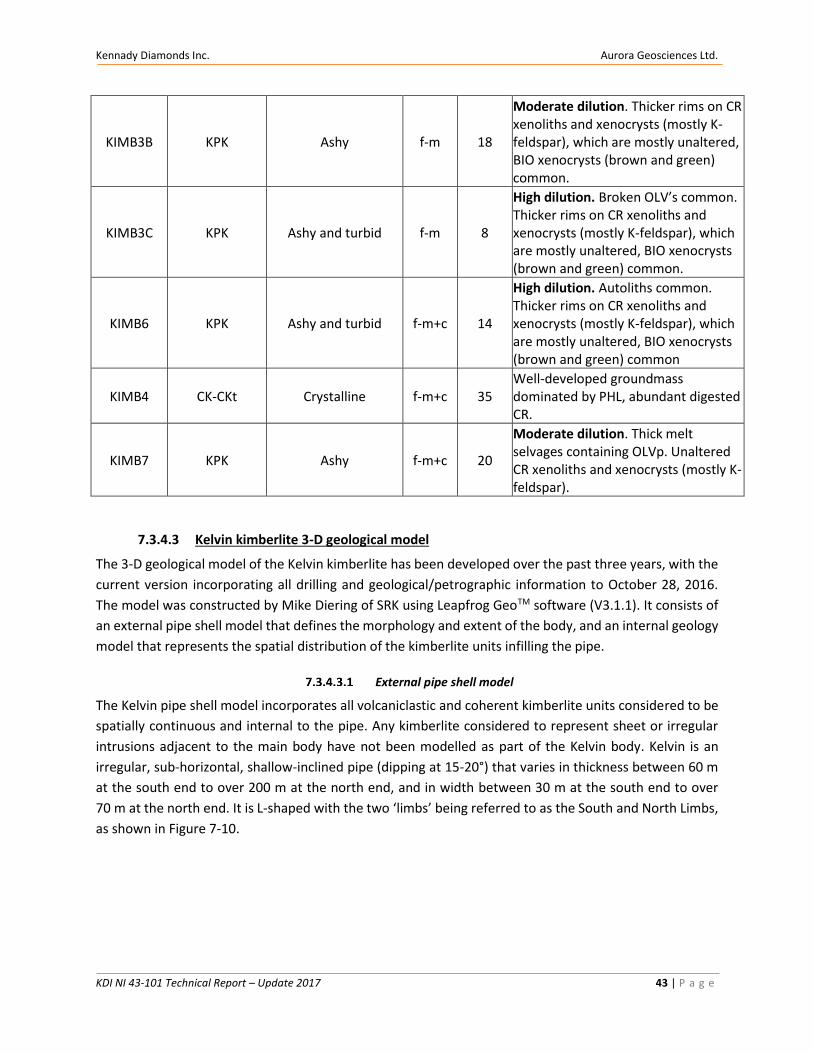
Kennady Diamonds Inc. Aurora Geosciences Ltd.
KDI NI 43-101 Technical Report – Update 2017 43 | P a g e
KIMB3B KPK Ashy f-m 18
Moderate dilution. Thicker rims on CR xenoliths and xenocrysts (mostly K-feldspar), which are mostly unaltered, BIO xenocrysts (brown and green) common.
KIMB3C KPK Ashy and turbid f-m 8
High dilution. Broken OLV’s common. Thicker rims on CR xenoliths and xenocrysts (mostly K-feldspar), which are mostly unaltered, BIO xenocrysts (brown and green) common.
KIMB6 KPK Ashy and turbid f-m+c 14
High dilution. Autoliths common. Thicker rims on CR xenoliths and xenocrysts (mostly K-feldspar), which are mostly unaltered, BIO xenocrysts (brown and green) common
KIMB4 CK-CKt Crystalline f-m+c 35
Well-developed groundmass dominated by PHL, abundant digested CR.
KIMB7 KPK Ashy f-m+c 20
Moderate dilution. Thick melt selvages containing OLVp. Unaltered CR xenoliths and xenocrysts (mostly K-feldspar).
7.3.4.3 Kelvin kimberlite 3-D geological model
The 3-D geological model of the Kelvin kimberlite has been developed over the past three years, with the
current version incorporating all drilling and geological/petrographic information to October 28, 2016.
The model was constructed by Mike Diering of SRK using Leapfrog GeoTM software (V3.1.1). It consists of
an external pipe shell model that defines the morphology and extent of the body, and an internal geology
model that represents the spatial distribution of the kimberlite units infilling the pipe.
External pipe shell model
The Kelvin pipe shell model incorporates all volcaniclastic and coherent kimberlite units considered to be
spatially continuous and internal to the pipe. Any kimberlite considered to represent sheet or irregular
intrusions adjacent to the main body have not been modelled as part of the Kelvin body. Kelvin is an
irregular, sub-horizontal, shallow-inclined pipe (dipping at 15-20°) that varies in thickness between 60 m
at the south end to over 200 m at the north end, and in width between 30 m at the south end to over
70 m at the north end. It is L-shaped with the two ‘limbs’ being referred to as the South and North Limbs,
as shown in Figure 7-10.
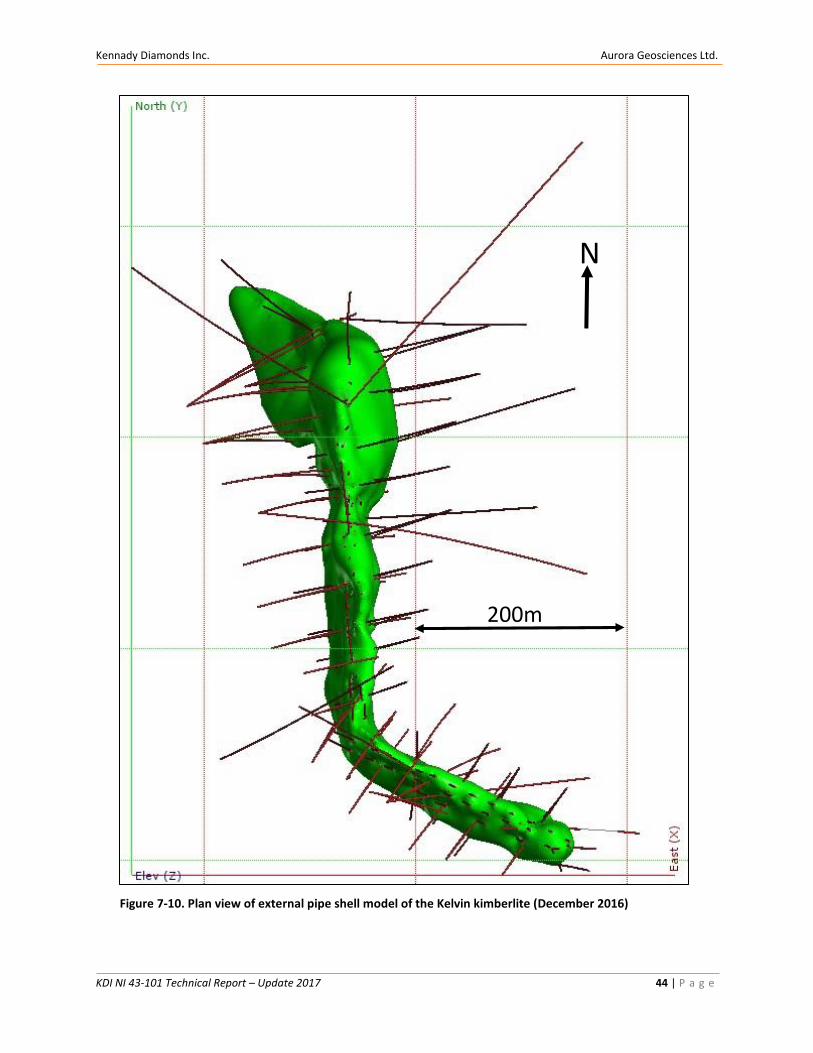
Kennady Diamonds Inc. Aurora Geosciences Ltd.
KDI NI 43-101 Technical Report – Update 2017 44 | P a g e
North Limb
South Limb
200 m
N
Figure 7-10. Plan view of external pipe shell model of the Kelvin kimberlite (December 2016)
Kennady Diamonds Inc. Aurora Geosciences Ltd.
KDI NI 43-101 Technical Report – Update 2017 45 | P a g e
Internal geology model
The kimberlite units and subunits described in Section 7.3.4.2 above form the basis of the internal geology
model which comprises nine geological domains, eight of which are kimberlite domains, as shown in
Table 7-4 and Figure 7-11. Some of the domains correspond to single kimberlite units whereas others
comprise groups or subdivisions of kimberlite units, in order to provide a more reliable basis for resource
estimation (Section 14). The subunits of KIMB2 (KIMB2A and KIMB2B) have been modelled as separate
domains due to their textural differences; the subunits of KIMB3 (KIMB3A, KIMB3B, KIMB3C) have also
been modelled individually due to differences in country rock dilution (and associated impact on grade).
In contrast, KIMB4 and KIMB7 have been combined into a single geological domain (KIMB4/7) as these
units are too small and morphologically complex to be reasonably modelled on an individual basis. The
internal model reveals that the geological domains vary significantly in morphology and along strike, but
broadly conform to a “layer cake” stratigraphy that is continuous along strike. The ninth domain (CRX)
represents internal waste rock and includes material interpreted as very large country rock xenoliths (drill
hole intercepts > 5 m) and possible wedges of in situ country rock within the pipe shell, where these could
be delineated based on available drilling.
In an earlier version of the internal geology model, when the distribution and character of the kimberlite
units were less well-constrained, the units were combined into four domains referred to as Zones A, B, Bx
and C; these have now been superseded by the domains in the current model.
Table 7-4. Relationship between kimberltie untis and 3-D geological domains at Kelvin
Kimberlite unit / subunit 3-D geological domain
KIMB1 KIMB1
KIMB2A KIMB2A
KIMB2B KIMB2B
KIMB3A KIMB3A
KIMB3B KIMB3B
KIMB3C KIMB3C
KIMB6 KIMB6
KIMB4 and KIMB7 KIMB4/7
Large country rock xenoliths / in situ wedges CRX
Kennady Diamonds Inc. Aurora Geosciences Ltd.
KDI NI 43-101 Technical Report – Update 2017 46 | P a g e
Figure 7-11. Kelvin 3-D model showing the internal geological domains (CRX domain not shown)
Drill data constraining Kelvin model
Extensive drilling, detailed core logging and petrographic work have been used to define the external pipe
shell and internal geology model of the Kelvin kimberlite. A total of 195 drill holes providing 384 contact
points define the pipe shell; the total number of contact points delineating the kimberlite domains ranges
from 164 to 312 (Table 7-5).
Table 7-5. Summary of drill data used to construct the Kelvin pipe shell and internal geology model
Number of drill holes Number of drill hole contact points
External pipe shell model 195 384
Geological domains
KIMB1 83 164
KIMB2A 109 214
N 50 m
KIMB3A
KIMB3B
KIMB3C
KIMB2A KIMB2B
KIMB1
KIMB4 + 7
KIMB6 KIMB3B
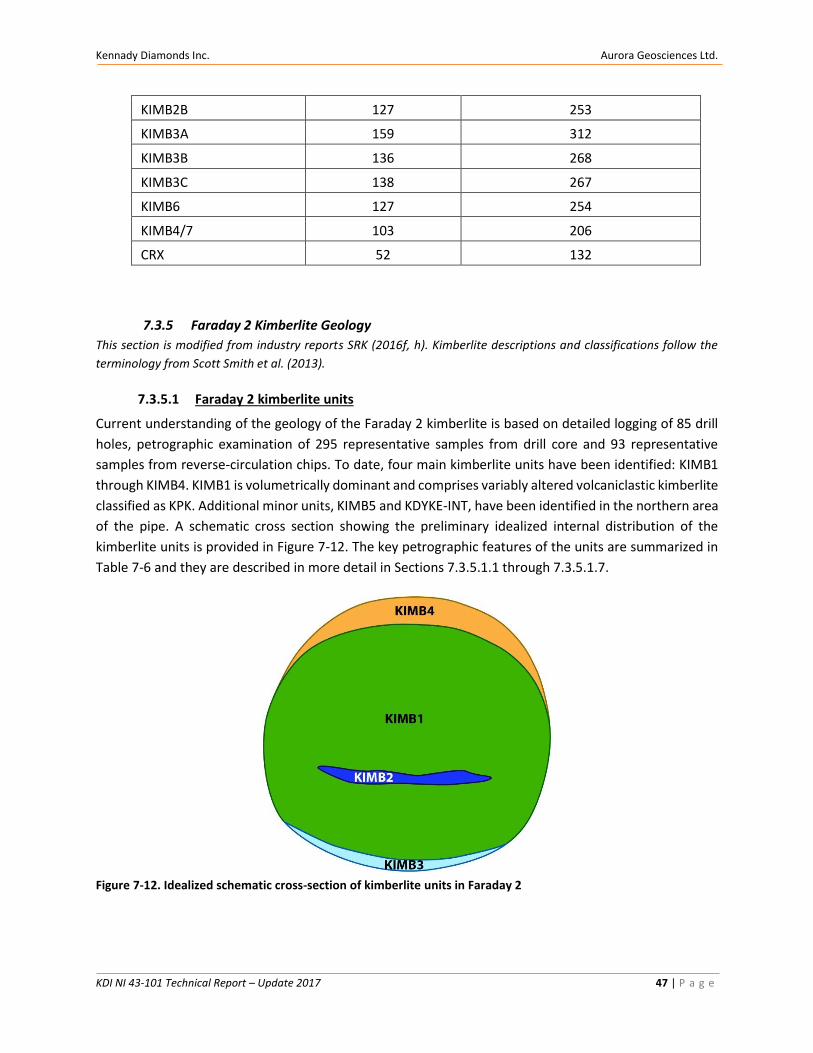
Kennady Diamonds Inc. Aurora Geosciences Ltd.
KDI NI 43-101 Technical Report – Update 2017 47 | P a g e
KIMB2B 127 253
KIMB3A 159 312
KIMB3B 136 268
KIMB3C 138 267
KIMB6 127 254
KIMB4/7 103 206
CRX 52 132
7.3.5 Faraday 2 Kimberlite Geology
This section is modified from industry reports SRK (2016f, h). Kimberlite descriptions and classifications follow the
terminology from Scott Smith et al. (2013).
7.3.5.1 Faraday 2 kimberlite units
Current understanding of the geology of the Faraday 2 kimberlite is based on detailed logging of 85 drill
holes, petrographic examination of 295 representative samples from drill core and 93 representative
samples from reverse-circulation chips. To date, four main kimberlite units have been identified: KIMB1
through KIMB4. KIMB1 is volumetrically dominant and comprises variably altered volcaniclastic kimberlite
classified as KPK. Additional minor units, KIMB5 and KDYKE-INT, have been identified in the northern area
of the pipe. A schematic cross section showing the preliminary idealized internal distribution of the
kimberlite units is provided in Figure 7-12. The key petrographic features of the units are summarized in
Table 7-6 and they are described in more detail in Sections 7.3.5.1.1 through 7.3.5.1.7.
Figure 7-12. Idealized schematic cross-section of kimberlite units in Faraday 2
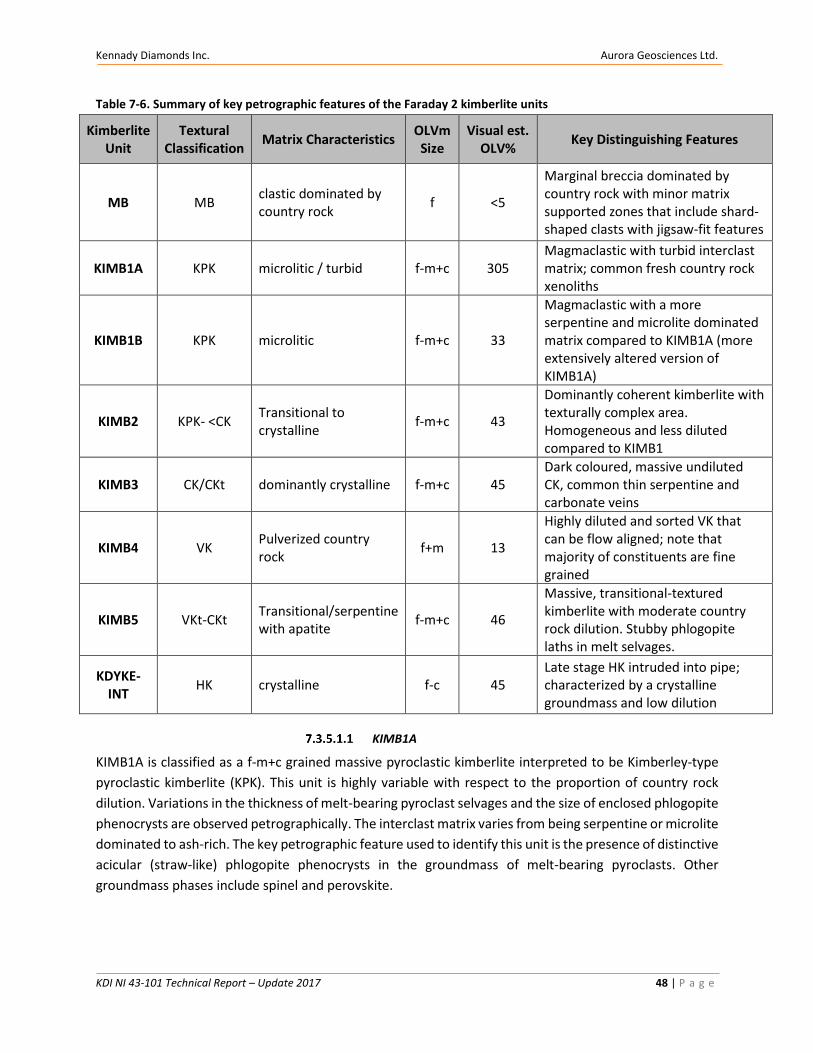
Kennady Diamonds Inc. Aurora Geosciences Ltd.
KDI NI 43-101 Technical Report – Update 2017 48 | P a g e
Table 7-6. Summary of key petrographic features of the Faraday 2 kimberlite units
Kimberlite Unit
Textural Classification
Matrix Characteristics OLVm Size
Visual est. OLV%
Key Distinguishing Features
MB MB clastic dominated by country rock
f <5
Marginal breccia dominated by country rock with minor matrix supported zones that include shard-shaped clasts with jigsaw-fit features
KIMB1A KPK microlitic / turbid f-m+c 305 Magmaclastic with turbid interclast matrix; common fresh country rock xenoliths
KIMB1B KPK microlitic f-m+c 33
Magmaclastic with a more serpentine and microlite dominated matrix compared to KIMB1A (more extensively altered version of KIMB1A)
KIMB2 KPK- <CK Transitional to crystalline
f-m+c 43
Dominantly coherent kimberlite with texturally complex area. Homogeneous and less diluted compared to KIMB1
KIMB3 CK/CKt dominantly crystalline f-m+c 45 Dark coloured, massive undiluted CK, common thin serpentine and carbonate veins
KIMB4 VK Pulverized country rock
f+m 13
Highly diluted and sorted VK that can be flow aligned; note that majority of constituents are fine grained
KIMB5 VKt-CKt Transitional/serpentine with apatite
f-m+c 46
Massive, transitional-textured kimberlite with moderate country rock dilution. Stubby phlogopite laths in melt selvages.
KDYKE-INT
HK crystalline f-c 45 Late stage HK intruded into pipe; characterized by a crystalline groundmass and low dilution
KIMB1A
KIMB1A is classified as a f-m+c grained massive pyroclastic kimberlite interpreted to be Kimberley-type
pyroclastic kimberlite (KPK). This unit is highly variable with respect to the proportion of country rock
dilution. Variations in the thickness of melt-bearing pyroclast selvages and the size of enclosed phlogopite
phenocrysts are observed petrographically. The interclast matrix varies from being serpentine or microlite
dominated to ash-rich. The key petrographic feature used to identify this unit is the presence of distinctive
acicular (straw-like) phlogopite phenocrysts in the groundmass of melt-bearing pyroclasts. Other
groundmass phases include spinel and perovskite.
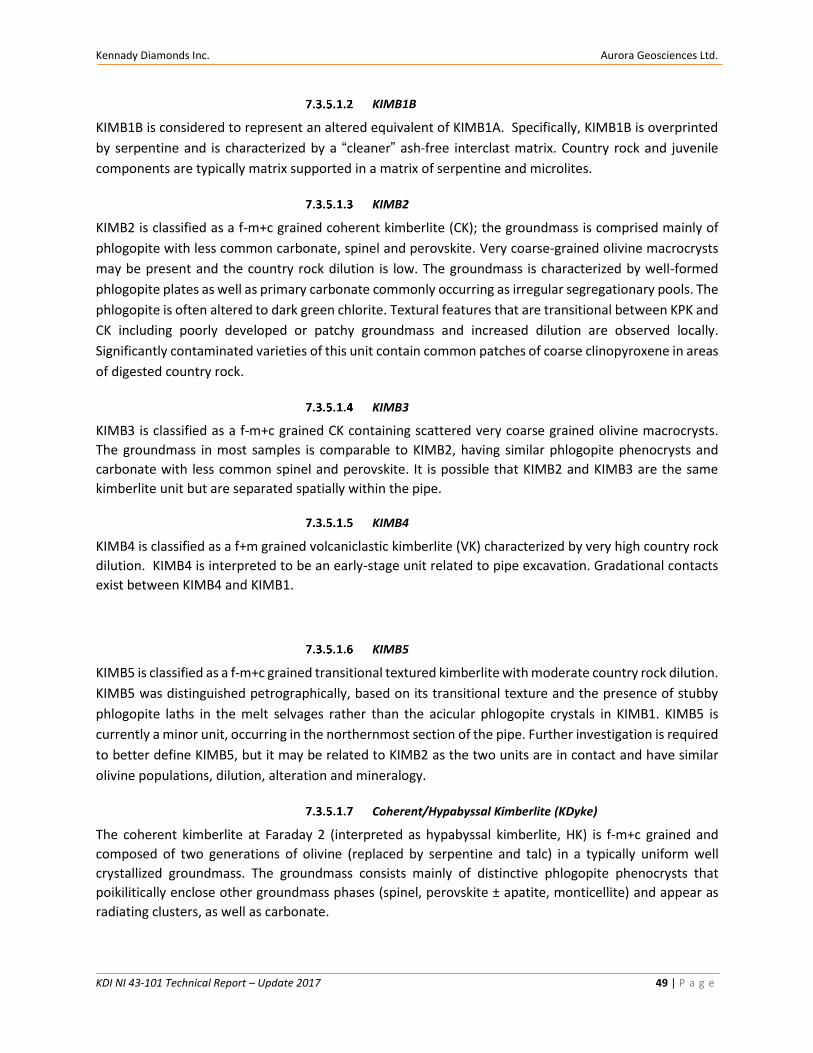
Kennady Diamonds Inc. Aurora Geosciences Ltd.
KDI NI 43-101 Technical Report – Update 2017 49 | P a g e
KIMB1B
KIMB1B is considered to represent an altered equivalent of KIMB1A. Specifically, KIMB1B is overprinted
by serpentine and is characterized by a “cleaner” ash-free interclast matrix. Country rock and juvenile
components are typically matrix supported in a matrix of serpentine and microlites.
KIMB2
KIMB2 is classified as a f-m+c grained coherent kimberlite (CK); the groundmass is comprised mainly of
phlogopite with less common carbonate, spinel and perovskite. Very coarse-grained olivine macrocrysts
may be present and the country rock dilution is low. The groundmass is characterized by well-formed
phlogopite plates as well as primary carbonate commonly occurring as irregular segregationary pools. The
phlogopite is often altered to dark green chlorite. Textural features that are transitional between KPK and
CK including poorly developed or patchy groundmass and increased dilution are observed locally.
Significantly contaminated varieties of this unit contain common patches of coarse clinopyroxene in areas
of digested country rock.
KIMB3
KIMB3 is classified as a f-m+c grained CK containing scattered very coarse grained olivine macrocrysts.
The groundmass in most samples is comparable to KIMB2, having similar phlogopite phenocrysts and
carbonate with less common spinel and perovskite. It is possible that KIMB2 and KIMB3 are the same
kimberlite unit but are separated spatially within the pipe.
KIMB4
KIMB4 is classified as a f+m grained volcaniclastic kimberlite (VK) characterized by very high country rock
dilution. KIMB4 is interpreted to be an early-stage unit related to pipe excavation. Gradational contacts
exist between KIMB4 and KIMB1.
KIMB5
KIMB5 is classified as a f-m+c grained transitional textured kimberlite with moderate country rock dilution.
KIMB5 was distinguished petrographically, based on its transitional texture and the presence of stubby
phlogopite laths in the melt selvages rather than the acicular phlogopite crystals in KIMB1. KIMB5 is
currently a minor unit, occurring in the northernmost section of the pipe. Further investigation is required
to better define KIMB5, but it may be related to KIMB2 as the two units are in contact and have similar
olivine populations, dilution, alteration and mineralogy.
Coherent/Hypabyssal Kimberlite (KDyke)
The coherent kimberlite at Faraday 2 (interpreted as hypabyssal kimberlite, HK) is f-m+c grained and
composed of two generations of olivine (replaced by serpentine and talc) in a typically uniform well
crystallized groundmass. The groundmass consists mainly of distinctive phlogopite phenocrysts that
poikilitically enclose other groundmass phases (spinel, perovskite ± apatite, monticellite) and appear as
radiating clusters, as well as carbonate.
Kennady Diamonds Inc. Aurora Geosciences Ltd.
KDI NI 43-101 Technical Report – Update 2017 50 | P a g e
Where the HK occurs within the pipe shell it has been modelled as part of the pipe infill (and not extended
away from the main body). Intervals identified as KDyke-INT have been modelled with KIMB2 and KIMB3
where they are spatially close. Minor KDyke-INT intervals that cannot be reasonably modeled with the
other CK units are grouped with KIMB1. The KDyke-INT unit at the base of the north end of the pipe was
modelled as a separate unit due to its size. The temporal relationship of the HK to the pipe has yet to be
confirmed; these intrusions may have been emplaced prior or subsequent to the main volcaniclastic
emplacement event. Figure 7-13 is a conceptual schematic showing a number of potential geological
scenarios.
Figure 7-13. Conceptual schematic of potential spatial and temporal relationships of HK to the Faraday 2 pipe
7.3.5.2 Faraday 2 kimberlite 3-D geological model
The 3-D geological model of the Faraday 2 kimberlite incorporates all drilling and geological/petrographic
information to June 2017. The model was constructed by Mike Diering of SRK using Leapfrog GeoTM
software (V3.1.1). It consists of an external pipe shell model that defines the morphology and extent of
the body, and an internal geology model that represents the spatial distribution of the kimberlite units
infilling the pipe. The current model does not include diamond drilling completed during the summer of
2017.
External pipe shell model
The Faraday 2 pipe shell model shown in Figure 7-14. incorporates all of the volcaniclastic kimberlite units
identified as well as any hypabyssal kimberlite present within the volcaniclastic pipe infill. Any hypabyssal
kimberlite considered to represent sheet or irregular intrusions adjacent to or outside the main body have
not been modelled. Faraday 2 is an irregular, variably trending (northwest, west) and variably inclined
pipe (dips range from less than 20 to 40°). It has been delineated over 600 m, ranging in width from 20 to
90 m and in height from 20 to 60 m.
(main pipe)
pipe)
HK intrusions
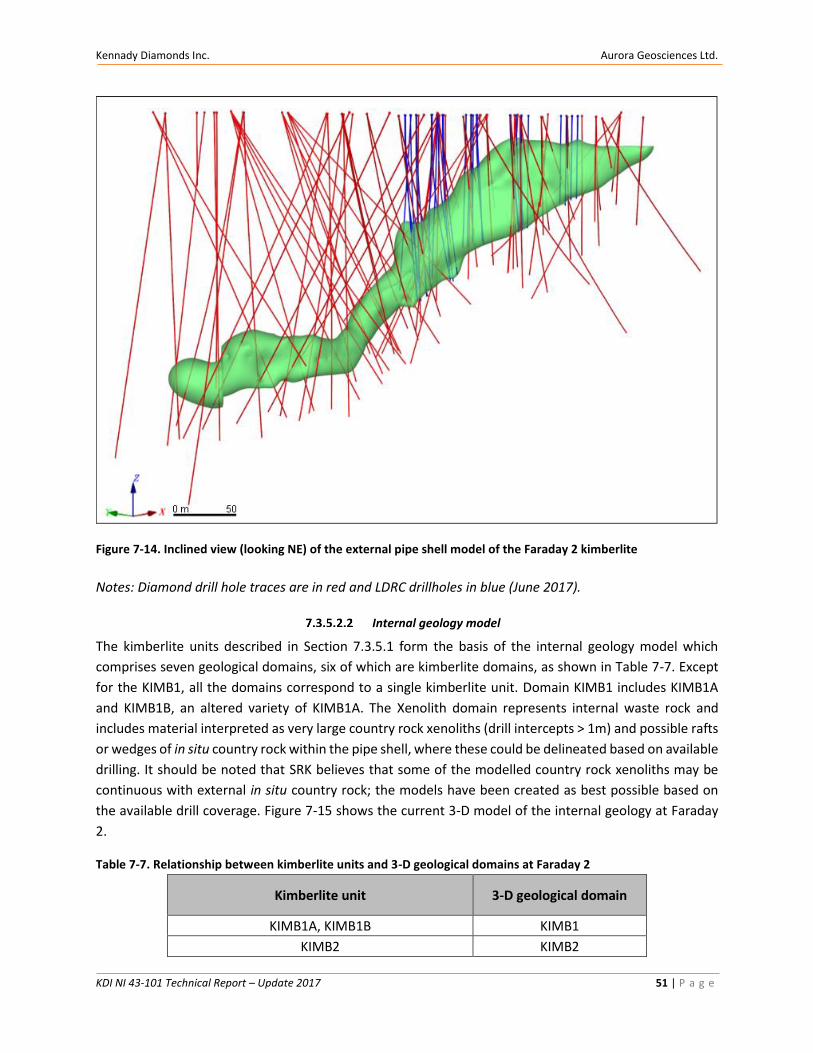
Kennady Diamonds Inc. Aurora Geosciences Ltd.
KDI NI 43-101 Technical Report – Update 2017 51 | P a g e
Figure 7-14. Inclined view (looking NE) of the external pipe shell model of the Faraday 2 kimberlite
Notes: Diamond drill hole traces are in red and LDRC drillholes in blue (June 2017).
Internal geology model
The kimberlite units described in Section 7.3.5.1 form the basis of the internal geology model which
comprises seven geological domains, six of which are kimberlite domains, as shown in Table 7-7. Except
for the KIMB1, all the domains correspond to a single kimberlite unit. Domain KIMB1 includes KIMB1A
and KIMB1B, an altered variety of KIMB1A. The Xenolith domain represents internal waste rock and
includes material interpreted as very large country rock xenoliths (drill intercepts > 1m) and possible rafts
or wedges of in situ country rock within the pipe shell, where these could be delineated based on available
drilling. It should be noted that SRK believes that some of the modelled country rock xenoliths may be
continuous with external in situ country rock; the models have been created as best possible based on
the available drill coverage. Figure 7-15 shows the current 3-D model of the internal geology at Faraday
2.
Table 7-7. Relationship between kimberlite units and 3-D geological domains at Faraday 2
Kimberlite unit 3-D geological domain
KIMB1A, KIMB1B KIMB1
KIMB2 KIMB2
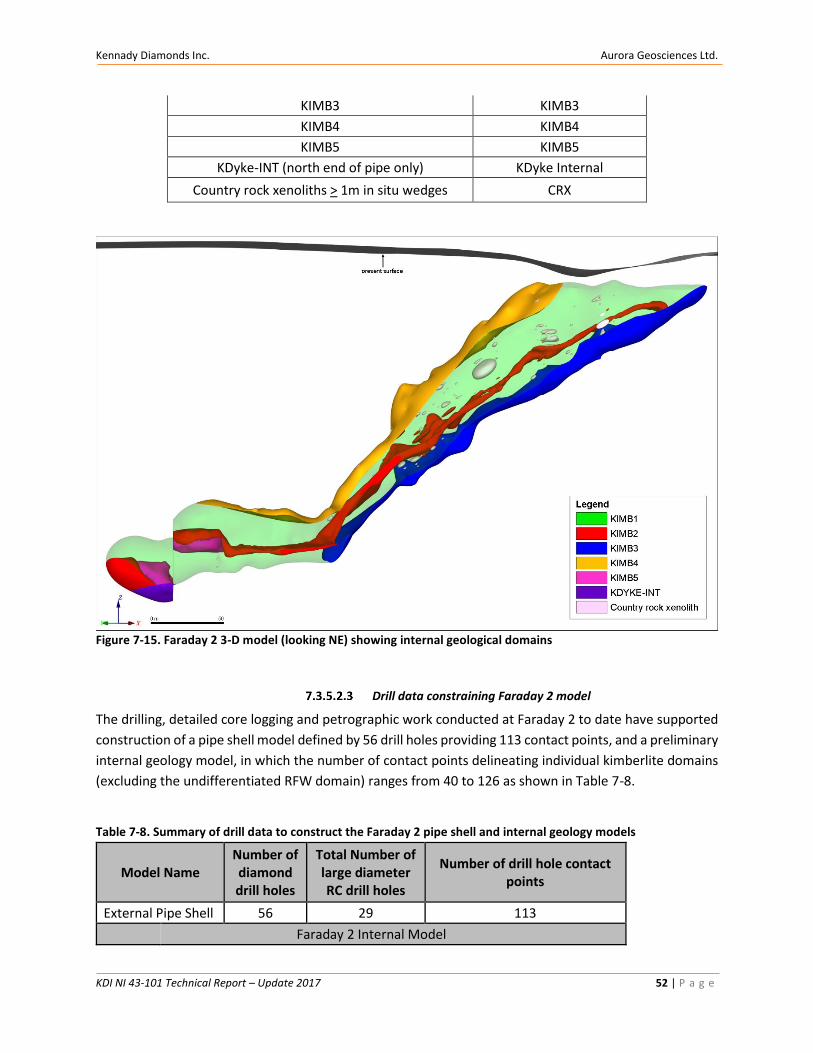
Kennady Diamonds Inc. Aurora Geosciences Ltd.
KDI NI 43-101 Technical Report – Update 2017 52 | P a g e
KIMB3 KIMB3
KIMB4 KIMB4
KIMB5 KIMB5
KDyke-INT (north end of pipe only) KDyke Internal
Country rock xenoliths > 1m in situ wedges CRX
Figure 7-15. Faraday 2 3-D model (looking NE) showing internal geological domains
Drill data constraining Faraday 2 model
The drilling, detailed core logging and petrographic work conducted at Faraday 2 to date have supported
construction of a pipe shell model defined by 56 drill holes providing 113 contact points, and a preliminary
internal geology model, in which the number of contact points delineating individual kimberlite domains
(excluding the undifferentiated RFW domain) ranges from 40 to 126 as shown in Table 7-8.
Table 7-8. Summary of drill data to construct the Faraday 2 pipe shell and internal geology models
Model Name Number of diamond drill holes
Total Number of large diameter RC drill holes
Number of drill hole contact points
External Pipe Shell 56 29 113
Faraday 2 Internal Model
Kennady Diamonds Inc. Aurora Geosciences Ltd.
KDI NI 43-101 Technical Report – Update 2017 53 | P a g e
KIMB1 40 29 126
KIMB2 27 27 54
KIMB3 20 28 40
KIMB4 23 22 46
KIMB5 4 0 8
Xenoliths 30 26 221
Kdyke Internal 2 0 4
7.3.6 Faraday 3 Kimberlite Geology
This section is modified from industry reports SRK (2016e). Kimberlite descriptions and classifications follow the
terminology from Scott Smith et al. (2013).
7.3.6.1 Faraday 3 kimberlite units
Current understanding of the geology of the Faraday 3 kimberlite is based on logging of 53 drill cores and
petrographic examination of 163 kimberlite thin sections from 16 of these drill cores, distributed in a
representative manner through the body. A total of four main kimberlite units have been identified to
date: KIMB1 through KIMB4, with KIMB4 subdivided into KIMB4B and KIMB4C based on differences in
country rock xenolith content. KIMB4B is the volumetrically dominant unit and comprises variably diluted
KPK. The key petrographic features of the kimberlite units infilling the Faraday 3 pipe and those either
considered to be minor or to occur external to the body are summarized in Tables 7-9 and 7-10,
respectively; the units are described in more detail in Sections 7.3.6.1.1 through 7.3.6.1.5.
Kennady Diamonds Inc. Aurora Geosciences Ltd.
KDI NI 43-101 Technical Report – Update 2017 54 | P a g e
Table 7-9. Summary of key petrographic features of the Faraday 3 kimberlite units
Kimberlite Unit
Textural Classification
Visually estimated dilution
Description
KIMB1 HK <10%
HK composed of at least two different kimberlites: a phlogopite kimberlite and a monticellite kimberlite. Located in the uppermost part of the body. Contains conspicuous kelphytized garnets. Further work is required to divide KIMB1 into two units.
KIMB2 KPK <25% PK with conspicuous olivine macrocrysts and magmaclasts with thin complete rims; cored and uncored magmaclasts. Loosely packed and matrix supported.
KIMB3 VK >50%
Often separated from KIMB2 by probable in situ country rock wedge. Highly diluted and sorted kimberlite that may display a fabric defined by the preferred orientation of elongated clasts.
KIMB4B KPK 25-75% Similar to KIMB2 with increased country rock dilution including conspicuous gneiss xenoliths larger than 5 cm and rare diabase. Loosely to closely packed and clast supported.
KIMB4C KPK >75%
Same as KIMB4B with a matrix comprised of pulverized country rock as well as large +10 cm gneiss xenoliths and minor (<20%) juvenile material. Closely packed and clast supported.
Table 7-10. Summary of minor kimberlite units within or external to the Faraday 3 pipe
Kimberlite Unit
Textural Classification
Visually estimated dilution
Description
KIMB5 VK >50% Isolated VK intervals peripheral to the pipe, may represent a range of kimberlite units
KIMB6 CK <10% Similar to KIMB1 and dominated by carbonate and serpentine melt segregations (one hole in pipe)
KIMB7 VK 30% VK unit with irregular shaped magmaclasts and matrix of carbonate and serpentine flood (exterior to pipe)
KDYKE-EXT CK <10% Similar CK to KIMB1, but identified spatially as outside of the pipe.
KDYKE-INT CK <10% Rare. Typically, <10 cm units with variable composition.
Kennady Diamonds Inc. Aurora Geosciences Ltd.
KDI NI 43-101 Technical Report – Update 2017 55 | P a g e
KIMB1
• HK comprised of at least two kimberlites: dominated by phlogopite kimberlite with minor
monticellite kimberlite identified in thin section but not discriminated in drill logs.
• Dark green colour with light to dark green olivine macrocrysts.
• Core is smooth and waxy to touch.
• Typically, massive with rare areas of weak flow alignment.
• 50-60% visual estimation of olivine abundance.
• f-m+c olivine macrocrysts, partially to completely serpentinized +/- carbonate replacement
and rare hematite replacement.
• <10% country rock xenoliths include gneiss that are extensively serpentinized +/- hematite
altered.
• Groundmass is poorly developed. Phlogopite>carbonate>spinel>perovskite.
• Globular white carbonate segregations common.
• Common mantle-derived garnets with thin to thick kelyphite rims or completely kelyphitized.
• Rare mantle xenoliths with kelyphitized garnets and other completely serpentinized phases.
• Widespread serpentine overprinting common, with oxide alteration rare.
KIMB2
• Texturally classified as massive, homogeneous KPK.
• Light to medium blue green colour with dark green olivine macrocrysts.
• Core is smooth to rough to touch.
• Massive, loosely packed, matrix supported.
• 30-40% visually estimated olivine abundance.
• f-m+c olivine macrocrysts, completely serpentinized. Broken crystals present.
• <25% fresh to completed altered country rock xenocrysts of feldspar, mica and quartz. Note
feldspars include common orange altered examples.
• Magmaclasts are pelletal-shaped with thin complete rims (most cases) typical of KPK, cored
and uncored, with well-developed groundmass of phlogopite>spinel>perovskite.
• CK autoliths are rare and up to 10mm in size and comprised of tightly packed f-m olivine in a
coarse phlogopite groundmass.
• Matrix is dominated by semi-transparent brown-green serpentine with ash sized particles.
Microlites are common, radiating from olivine and country rock xenoliths and sometimes
extending throughout matrix.
• Rare indicator minerals include garnet with thin to thick kelyphite rims.
KIMB3
• Classified as VK that displays better sorting than the rocks classified as KPK and is
characterized by finer grained olivine and country rock xenocryst populations.
• Light green-grey colour.
• Core is rough to touch and often broken or reduced to rubble.
• Juvenile material is difficult to estimate due to alteration but is estimated as less than 30%.
• A subtle fabric is defined by aligned biotite xenocrysts.
Kennady Diamonds Inc. Aurora Geosciences Ltd.
KDI NI 43-101 Technical Report – Update 2017 56 | P a g e
• f-m olivine crystals are completely pseudomorphed and can be difficult to distinguish from
altered country rock xenocrysts.
• Note the xenoliths are small, typically < 1 cm and the rock is dominated by pulverized
country rock xenocrysts and small olivine crystals less than 1 mm.
• Close packed and clast supported.
• This material is interpreted to represent a zone of flow associated with a contact against a
possible in situ wedge of country rock.
KIMB4
KIMB4 has been subdivided based on contrasting country rock xenolith contents into KIMB4B (25 - 75%)
and KIMB4C (> 75%). KIMB4B is the most voluminous kimberlite unit at Faraday 3.
KIMB4B
• Massive KPK with abundant fresh gneissic xenoliths.
• Total olivine abundance is visually estimated as 20-30%.
• f-m+c olivine macrocrysts are completely pseudomorphed by serpentine and may be broken.
• Magmaclasts consist of typically thin, complete selvages around olivine and some country
rock xenocrysts and xenoliths (not all), typical of KPK. May be cored or uncored, and selvage
thickness tends to increase with depth. Well-formed groundmass minerals of
phlogpite>spinel>perovskite.
• Country rock xenolith dilution ranges 25-75% and includes abundant fresh gneiss. Feldspar
xenocrysts are orange due to alteration and include common shards.
• Variable from loosely packed and clast supported to close packed and clast supported.
• This unit is not classified as “uniform” and “homogeneous” as there are fluctuations in the
proportions of country rock and juvenile material.
• Rare indicator minerals include garnet with thin to thick kelyphite rims; typically, peridotitic.
KIMB4C
• Similar to KIMB4B but contains a greater proportion of fine pulverized country rock within
the matrix as well as more common larger country rock xenoliths.
• Differentiated by light green core colour and lack of conspicuous olivine macrocryst
population in thin section and in core.
• Classified as a highly diluted, generally massive and homogeneous KPK.
• Total olivine abundance is visually estimated as 5-15%.
• f-m+c olivine macrocrysts are completely pseudomorphed by serpentine; broken crystals are
conspicuous.
• Magmaclasts may be difficult to discern and consist of thin selvages around olivine crystals
and some country rock xenoliths; rare uncored magmaclasts.
• Close packed and clast supported.
• Xenoliths >10cm common and may display a bleached appearance.
• Rare indicator minerals include garnet with thin to thick kelyphite rims; typically, peridotitic.

Kennady Diamonds Inc. Aurora Geosciences Ltd.
KDI NI 43-101 Technical Report – Update 2017 57 | P a g e
• Note sulfide is commonly encountered within xenoliths – these are potentially fragments of
pre-conditioned country rock.
Minor units within or peripheral to Faraday 3
There are five additional kimberlite units which have been identified as either insignificant volumes of
pipe infill material or as units external to the Faraday 3 pipe.
KIMB5
• Volcaniclastic kimberlite present in discrete 1 cm to 1 m intervals on the periphery of the
main pipe (i.e. bounded by country rock).
• Petrographically similar to but not considered part of the pipe due to spatial relationships;
further work is required to determine the relationship to the main pipe.
• Country rock xenolith dilution is >50%.
• Typically, poorly preserved in core, and not examined in thin section to date.
KIMB6
• Core is smooth and waxy to touch.
• Medium blue-green colour with conspicuous black olivine macrocrysts.
• Massive, matrix supported.
• 40-50% visually estimated olivine abundance.
• f-m+c olivine macrocrysts, completely serpentinized +/- hematite replacement.
• <10% country rock xenoliths include gneiss that are extensively serpentine and hematite
altered as well as rare diabase fragments.
• Groundmass is well developed and consists of phlogopite>carbonate>spinel>perovskite.
• Textually complex and dominated by melt segregations giving appearance of possible
magmaclasts in core.
• Widespread serpentine overprinting with minor hematite alteration.
• Phlogopite HK.
KIMB7
• Dark brown-green colour.
• Massive, loosely packed, clast supported.
• 30% visually estimated olivine abundance.
• f-c olivine macrocrysts, completely serpentinized with ‘blady’ phlogopite rims.
• 30% country rock xenoliths include angular, weakly serpentinized gneiss and rare diabase.
• Thick and irregular shaped magmaclasts of phlogopite-carbonate>spinel>perovskite
separated by a matrix of serpentine and carbonate.
• Rare peridotitic garnet with thin kelyphite rims.
• CK autoliths common; comprised of tightly packed fine to medium olivine in well-formed
phlogopite groundmass.
• Phlogopite-carbonate PK.
Kennady Diamonds Inc. Aurora Geosciences Ltd.
KDI NI 43-101 Technical Report – Update 2017 58 | P a g e
KDYKE-EXT
• Phlogopite HK.
• Same kimberlite as KIMB1 but spatially resolved as outside the pipe shell.
• May be continuous with KIMB1.
• All CK intervals (typically less than 1.5 m thick) exterior to pipe are classified as KDYKE-EXT.
KDYKE-INT
• Rare, typically <10cm units of CK with variable composition.
• Dark green grey colour.
• 50% visually estimated olivine abundance.
• f-c+vc olivine macrocrysts.
• Moderately well-formed groundmass of carbonate>phlogopite>spinel>perovskite.
• 5% country rock dilution.
• Strong carbonate overprinting with moderate to poor mineral preservation. Grain
boundaries are masked.
7.3.6.2 Faraday 3 kimberlite 3-D geological model
The 3-D geological model of the Faraday 3 kimberlite incorporates all drilling and geological/petrographic
information to October 28, 2016. The model was constructed by Mike Diering of SRK using Leapfrog GeoTM
software (V3.1.1). It consists of an external pipe shell model that defines the morphology and extent of
the body, and an internal geology model that represents the spatial distribution of the kimberlite units
infilling the pipe. The model is considered preliminary as further drilling, detailed logging and petrographic
work are required to increase confidence in the pipe morphology and the character and distribution of
internal units. The current model will be used to guide ongoing evaluation at Faraday 3 during 2017.
External pipe shell model
The Faraday 3 pipe shell model shown in Figure 7-16. incorporates all of the hypabyssal, pyroclastic and
volcaniclastic kimberlite units interpreted as pipe infills. Any kimberlite considered to occur external to
the pipe has not been modelled. Faraday 3 is an irregular inclined pipe that dips at 30° to the northwest.
It is flatter and wider than Faraday 2 and Kelvin, ranging in width from 40 to 150 m and in height from 20
to 50 m. It extends over approximately 350 m and is open at depth.
Figure 7-16 shows the diamond drillhole traces in red and the LDRC drillholes in blue. Internal geology and
external morphology of the Faraday 3 pipe has been determined from the intersection points from all
drillholes.
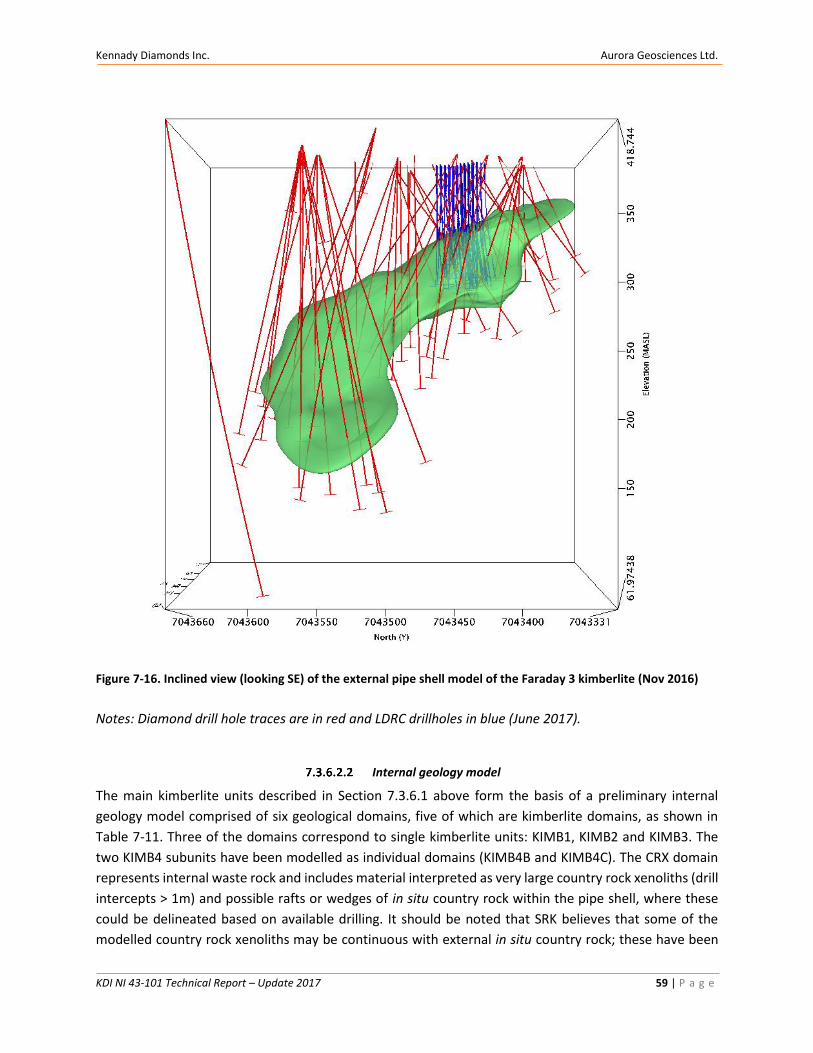
Kennady Diamonds Inc. Aurora Geosciences Ltd.
KDI NI 43-101 Technical Report – Update 2017 59 | P a g e
Figure 7-16. Inclined view (looking SE) of the external pipe shell model of the Faraday 3 kimberlite (Nov 2016)
Notes: Diamond drill hole traces are in red and LDRC drillholes in blue (June 2017).
Internal geology model
The main kimberlite units described in Section 7.3.6.1 above form the basis of a preliminary internal
geology model comprised of six geological domains, five of which are kimberlite domains, as shown in
Table 7-11. Three of the domains correspond to single kimberlite units: KIMB1, KIMB2 and KIMB3. The
two KIMB4 subunits have been modelled as individual domains (KIMB4B and KIMB4C). The CRX domain
represents internal waste rock and includes material interpreted as very large country rock xenoliths (drill
intercepts > 1m) and possible rafts or wedges of in situ country rock within the pipe shell, where these
could be delineated based on available drilling. It should be noted that SRK believes that some of the
modelled country rock xenoliths may be continuous with external in situ country rock; these have been
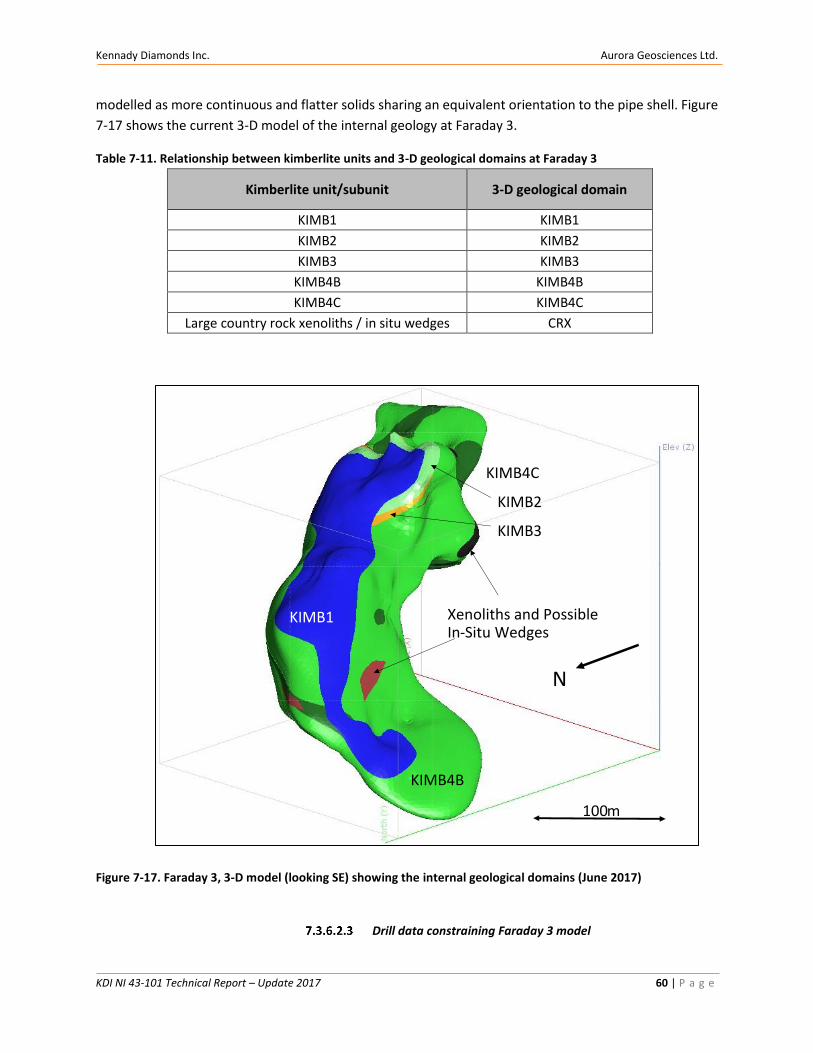
Kennady Diamonds Inc. Aurora Geosciences Ltd.
KDI NI 43-101 Technical Report – Update 2017 60 | P a g e
modelled as more continuous and flatter solids sharing an equivalent orientation to the pipe shell. Figure
7-17 shows the current 3-D model of the internal geology at Faraday 3.
Table 7-11. Relationship between kimberlite units and 3-D geological domains at Faraday 3
Kimberlite unit/subunit 3-D geological domain
KIMB1 KIMB1
KIMB2 KIMB2
KIMB3 KIMB3
KIMB4B KIMB4B
KIMB4C KIMB4C
Large country rock xenoliths / in situ wedges CRX
Figure 7-17. Faraday 3, 3-D model (looking SE) showing the internal geological domains (June 2017)
Drill data constraining Faraday 3 model
100 m
N
KIMB1
KIMB4B
KIMB4C
KIMB2
KIMB3
Xenoliths and Possible In - Situ Wedges
Kennady Diamonds Inc. Aurora Geosciences Ltd.
KDI NI 43-101 Technical Report – Update 2017 61 | P a g e
The drilling, core logging and petrographic work conducted at Faraday 3 to date have supported the
construction of a pipe shell model defined by 44 drill holes providing 90 contact points, and a preliminary
internal geology model, in which the number of contact points delineating individual kimberlite domains
ranges from 14 to 84 as shown in Table 7.3.6.2.2.
Table 7-12. Summary of drill data to construct Faraday 3 pipe shell and internal geological model
Number of drill holes Number of drill hole contact points
External Pipe Shell 44 90
Geological domains
KIMB1 16 32
KIMB2 10 20
KIMB3 7 14
KIMB4B 42 84
KIMB4C 24 48
CRX 27 82
7.3.7 Faraday 1 Kimberlite Geology
This section is summarized from industry report SRK (2016j). Kimberlite descriptions and classifications follow the
terminology from Scott Smith et al. (2013).
Faraday 1 is associated with a series of en-echelon kimberlite sheets of variable thicknesses. The general
geometry of Faraday 1 is similar to the Faraday 2, 3 and Kelvin kimberlites. It is an irregular, tube-shaped
body that dips 25-30° to the northwest and is currently defined as being much smaller than the other
kimberlites along the KFC trend, ranging 30 to 60 m in width and 10 to 20 m in height over approximately
200 m. Faraday 1 is infilled with volcaniclastic kimberlite (KPK) but is associated with significant amounts
of hypabyssal kimberlite. The proportion of marginal breccia versus other kimberlite material is also higher
than that documented in the other kimberlites. The small size of the volcaniclastic body, complex spatial
relationship between units and nature of the units suggest that Faraday 1 is a less mature volcanic system
than Faraday 2, 3 or Kelvin.
7.3.7.1 Faraday 1 kimberlite units
A preliminary geology model of Faraday 1 was produced in 2015 and updated in early 2017. The Faraday
1 geology and petrographic work completed to-date consists of the logging of 42 drill holes and
investigation of 137 kimberlite thin sections and 54 country rock and marginal breccia thin sections
collected from 20 drillholes across the length of the body. A summary of the kimberlite units is provided
in Table 7-13, followed by more detailed description of the units.
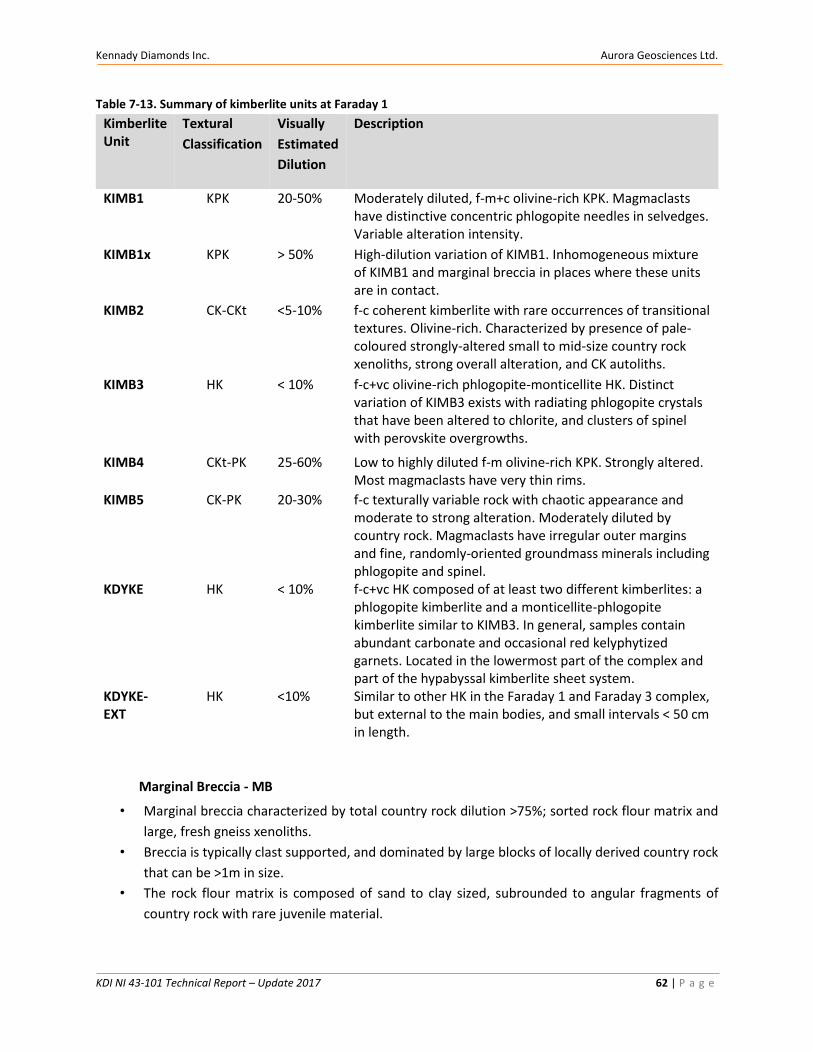
Kennady Diamonds Inc. Aurora Geosciences Ltd.
KDI NI 43-101 Technical Report – Update 2017 62 | P a g e
Table 7-13. Summary of kimberlite units at Faraday 1
Kimberlite Unit
Textural
Classification
Visually
Estimated
Dilution
Description
KIMB1 KPK 20-50% Moderately diluted, f-m+c olivine-rich KPK. Magmaclasts have distinctive concentric phlogopite needles in selvedges. Variable alteration intensity.
KIMB1x KPK > 50% High-dilution variation of KIMB1. Inhomogeneous mixture of KIMB1 and marginal breccia in places where these units are in contact.
KIMB2 CK-CKt <5-10% f-c coherent kimberlite with rare occurrences of transitional textures. Olivine-rich. Characterized by presence of pale-coloured strongly-altered small to mid-size country rock xenoliths, strong overall alteration, and CK autoliths.
KIMB3 HK < 10% f-c+vc olivine-rich phlogopite-monticellite HK. Distinct variation of KIMB3 exists with radiating phlogopite crystals that have been altered to chlorite, and clusters of spinel with perovskite overgrowths.
KIMB4 CKt-PK 25-60% Low to highly diluted f-m olivine-rich KPK. Strongly altered. Most magmaclasts have very thin rims.
KIMB5 CK-PK 20-30% f-c texturally variable rock with chaotic appearance and moderate to strong alteration. Moderately diluted by country rock. Magmaclasts have irregular outer margins and fine, randomly-oriented groundmass minerals including phlogopite and spinel.
KDYKE HK < 10% f-c+vc HK composed of at least two different kimberlites: a phlogopite kimberlite and a monticellite-phlogopite kimberlite similar to KIMB3. In general, samples contain abundant carbonate and occasional red kelyphytized garnets. Located in the lowermost part of the complex and part of the hypabyssal kimberlite sheet system.
KDYKE-EXT
HK <10% Similar to other HK in the Faraday 1 and Faraday 3 complex, but external to the main bodies, and small intervals < 50 cm in length.
Marginal Breccia - MB
• Marginal breccia characterized by total country rock dilution >75%; sorted rock flour matrix and
large, fresh gneiss xenoliths.
• Breccia is typically clast supported, and dominated by large blocks of locally derived country rock
that can be >1m in size.
• The rock flour matrix is composed of sand to clay sized, subrounded to angular fragments of
country rock with rare juvenile material.
Kennady Diamonds Inc. Aurora Geosciences Ltd.
KDI NI 43-101 Technical Report – Update 2017 63 | P a g e
• Trace amounts of kimberlitic material including olivine, magmaclasts, and very rare pink-red
garnet may occur within the matrix.
• Country rock xenoliths >1cm occasionally have irregular rims of fine material – clay to fine sand
sized particles of country rock.
• The proportion of juvenile material present in the marginal breccia is highly variable. Zones
containing 20-30 cm intervals of kimberlite similar to KIMB1 separated by blocks of country rock
>1m occur in some holes.
KIMB1
• KIMB1 is an olive green to grey-green coloured f-m+c phlogopite KPK with grey, white and pink
fresh to weakly-altered xenoliths. More intensely serpentine-altered versions are pale blue-green
with moderately altered green and red xenoliths.
• Slightly rough to smooth surface texture, core is moderately competent.
• Massive rock with a large range in clast size, homogeneous on a large scale, rock is matrix-
supported to clast-supported.
• Olivine-rich, with 15-35% total olivine.
• Fine to medium and coarse (2-6 mm) conspicuous olivine macrocrysts, completely serpentinized.
• Moderate to high dilution (30-60%), many sub-angular shards, large xenoliths are fresh to
moderately altered.
• Magmaclasts are abundant, morphology is diverse, both cored and uncored are present. Melt
selvedges contain needle-like phlogopite laths with a concentric orientation, olivine phenocrysts,
and rare country rock shards, particularly in more diluted examples.
• CK autoliths are present.
• Indicator-poor, rare red and pink garnets are the only mantle-derived indicator minerals
identified.
• Mantle xenoliths are absent.
• Serpentine-dominated matrix with microlites. Matrix is commonly turbid and ashy, the matrix in
more strongly altered examples is less-so due to serpentinization.
• Microlites in matrix and groundmass minerals in melt selvedges are relatively coarse.
KIMB4
• f-m+c olivine-rich volcaniclastic phlogopite kimberlite.
• Moderately to highly diluted by small and mid-sized country rock xenoliths. Xenoliths are
moderately to strongly altered by serpentine, clay, and carbonate. Country rock dilution
decreases with depth.
• Magmaclastic. Melt selvedges are generally thin with a uniform width and very fine groundmass
minerals. Magmaclasts with larger selvedges contain phlogopite laths with random orientations
and somewhat jagged-looking crystal shapes.
• Loosely-packed with a serpentine matrix. In some instances, the matrix appears to be flooded by
serpentine and carbonate, obscuring the primary texture of the rock.
• Mantle-derived indicator minerals are present in most intervals, but are not abundant, and
primarily consist of red garnets.
Kennady Diamonds Inc. Aurora Geosciences Ltd.
KDI NI 43-101 Technical Report – Update 2017 64 | P a g e
• Only one mantle xenolith has been observed.
• Possible small CK autoliths have been observed.
• KIMB4 has a more HK-like appearance with increasing depth within the unit. This is due to the
decrease in CR xenoliths and uniform olivine distribution.
• Minor unit at Faraday 1, occurring above KIMB3. The relationship between KIMB4 and KIMB3 has
not been defined. A sharp contact does not exist between the two units.
KIMB5
• Medium grey-green to brown-green f-m+c olivine-rich phlogopite kimberlite with CK autoliths.
• Texturally variable, full spectrum of textures from CK-PK. Can have chaotic appearance.
• Pervasive serpentine alteration and white carbonate veining through core. Alteration is
commonly strong.
• The rock is massive and unsorted.
• f-c olivine macrocrysts, completely replaced by serpentine with minor carbonate and oxides. Pale
green colour.
• Olivine-rich – total olivine abundance ranges from 30-50%
• Country rock dilution is variable, ranging from 5-40%. More pyroclastic examples of KIMB2 tend
to have a higher proportion of xenoliths. Xenoliths are moderately to strongly altered by
serpentine.
• The matrix contains serpentine segregations and can be microlitic. Groundmass minerals are
commonly altered, but they include fine phlogopite and spinel.
• Where present, magmaclasts have irregular margins and abundant small olivine phenocrysts in
melt selvedges.
• Rare red and pink garnets are the only mantle-derived indicator mineral identified.
• No mantle xenoliths have been identified in this unit.
KDYKE
• Medium-dark green hypabyssal kimberlite with pale-dark green olivine.
• Alteration type and intensity is variable. White-pale green carbonate ± serpentine veining occurs
in all samples.
• Smooth, waxy texture to core surface, core is fairly competent.
• Structure varies from massive to flow-aligned, rock is homogeneous.
• Very olivine-rich: total olivine ranges from ~50-60%
• f-c+vc olivine macrocrysts. Olivine is completely altered. Serpentine is the dominant alteration
mineral, with minor carbonate and oxides.
• Country rock dilution is low, generally <10%. Xenoliths are strongly altered.
• Carbonate, phlogopite and spinel in groundmass, some serpentine.
• Rare CK autoliths.
• Indicator mineral-poor, red garnet with thin/thick kelyphite rims are the most common indicator
mineral; one chrome diopside observed.
• Mantle xenoliths are rare.
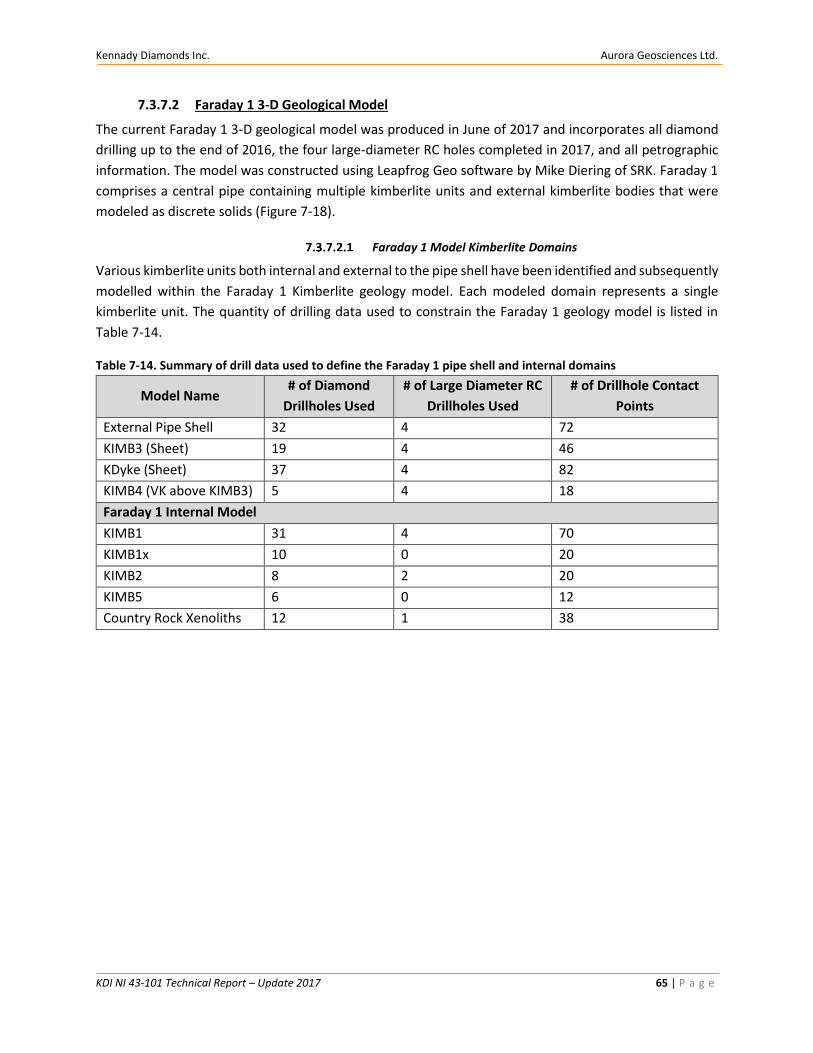
Kennady Diamonds Inc. Aurora Geosciences Ltd.
KDI NI 43-101 Technical Report – Update 2017 65 | P a g e
7.3.7.2 Faraday 1 3-D Geological Model
The current Faraday 1 3-D geological model was produced in June of 2017 and incorporates all diamond
drilling up to the end of 2016, the four large-diameter RC holes completed in 2017, and all petrographic
information. The model was constructed using Leapfrog Geo software by Mike Diering of SRK. Faraday 1
comprises a central pipe containing multiple kimberlite units and external kimberlite bodies that were
modeled as discrete solids (Figure 7-18).
Faraday 1 Model Kimberlite Domains
Various kimberlite units both internal and external to the pipe shell have been identified and subsequently
modelled within the Faraday 1 Kimberlite geology model. Each modeled domain represents a single
kimberlite unit. The quantity of drilling data used to constrain the Faraday 1 geology model is listed in
Table 7-14.
Table 7-14. Summary of drill data used to define the Faraday 1 pipe shell and internal domains
Model Name # of Diamond
Drillholes Used
# of Large Diameter RC
Drillholes Used
# of Drillhole Contact
Points
External Pipe Shell 32 4 72
KIMB3 (Sheet) 19 4 46
KDyke (Sheet) 37 4 82
KIMB4 (VK above KIMB3) 5 4 18
Faraday 1 Internal Model
KIMB1 31 4 70
KIMB1x 10 0 20
KIMB2 8 2 20
KIMB5 6 0 12
Country Rock Xenoliths 12 1 38
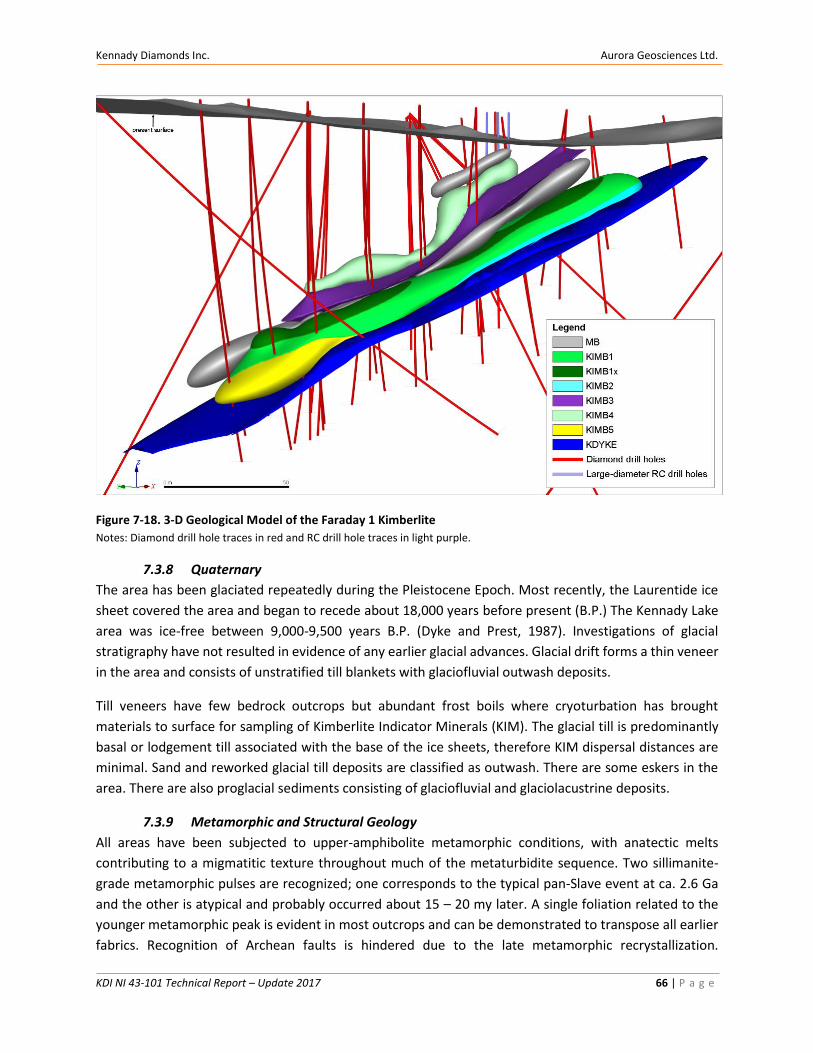
Kennady Diamonds Inc. Aurora Geosciences Ltd.
KDI NI 43-101 Technical Report – Update 2017 66 | P a g e
Figure 7-18. 3-D Geological Model of the Faraday 1 Kimberlite
Notes: Diamond drill hole traces in red and RC drill hole traces in light purple.
7.3.8 Quaternary
The area has been glaciated repeatedly during the Pleistocene Epoch. Most recently, the Laurentide ice
sheet covered the area and began to recede about 18,000 years before present (B.P.) The Kennady Lake
area was ice-free between 9,000-9,500 years B.P. (Dyke and Prest, 1987). Investigations of glacial
stratigraphy have not resulted in evidence of any earlier glacial advances. Glacial drift forms a thin veneer
in the area and consists of unstratified till blankets with glaciofluvial outwash deposits.
Till veneers have few bedrock outcrops but abundant frost boils where cryoturbation has brought
materials to surface for sampling of Kimberlite Indicator Minerals (KIM). The glacial till is predominantly
basal or lodgement till associated with the base of the ice sheets, therefore KIM dispersal distances are
minimal. Sand and reworked glacial till deposits are classified as outwash. There are some eskers in the
area. There are also proglacial sediments consisting of glaciofluvial and glaciolacustrine deposits.
7.3.9 Metamorphic and Structural Geology
All areas have been subjected to upper-amphibolite metamorphic conditions, with anatectic melts
contributing to a migmatitic texture throughout much of the metaturbidite sequence. Two sillimanite-
grade metamorphic pulses are recognized; one corresponds to the typical pan-Slave event at ca. 2.6 Ga
and the other is atypical and probably occurred about 15 – 20 my later. A single foliation related to the
younger metamorphic peak is evident in most outcrops and can be demonstrated to transpose all earlier
fabrics. Recognition of Archean faults is hindered due to the late metamorphic recrystallization.

Kennady Diamonds Inc. Aurora Geosciences Ltd.
KDI NI 43-101 Technical Report – Update 2017 67 | P a g e
Proterozoic dykes of the Fletcher and Mackenzie swarms and of two other anomalous events are
recognized. A small-volume alkaline intrusion of uncertain age was discovered in the MZ area.
Brittle Paleoproterozoic faulting is particularly evident in the granitoid terrains due to introduction of
hematite and quartz and destruction of magnetite. The regional-scale east-northeast striking Fletcher
Fault transects two of the mapped areas and is interpreted to be a ca. 2.2 Ga extensional feature
reactivated at ca. 1.8 Ga as a dextral fault. Three regional sets of joints are recognized; subvertical joints
are interpreted to primarily reflect the ca. 2.2 Ga event whereas a subhorizontal set is ascribed to recent
glacial retreat and unloading. Potential correlations between principal structures and kimberlite
occurrences were not identified.
The granite-gneiss terrane of the area has been intruded by diabase dykes. Granite intrusions tend to be
bordered by gneisses that have been metamorphosed by the intrusions. In the eastern portion of the area
granitoid-gneiss terrane gives way to metasediments typical of the turbidite sequences observed
elsewhere in the Slave (Yellowknife Supergroup). Complex, tight folding and shearing has affected these
mudstones and greywackes. Minor volcaniclastic lithologies are also present (Thurston, 2003).
There are several groups of “demagnetized” lineaments with weak to negative magnetic responses. They
could be either dykes or country rock that has been demagnetized along fault or shear zones. They are
classified as: i) regular, pervasive northeast-trending set, ii) regular, pervasive northwest-trending set, and
iii) east-west trending set.
The northeast-trending structures lie parallel to the orientation of the ca. 2.0-1.8 Ga Great Slave Lake
Shear Zone (Hoffman, 1987) to the south. Younger, second-order structures trend primarily northwest
and may be related to the rifting event that emplaced the Mackenzie dyke swarm (1270 Ma) (LeCheminant
and Heaman, 1989).
Kennady Diamonds Inc. Aurora Geosciences Ltd.
KDI NI 43-101 Technical Report – Update 2017 68 | P a g e
MINERALIZATION
Substantial work has been undertaken on the Kennady North property since 2012. Prior to 2012, five (5)
diamond-bearing kimberlites had been identified. These five kimberlites in chronological order of
identification are: Doyle in 1996, Faraday in 1999, Kelvin and Hobbes in 2000 and the MZ in 2001. Although
the primary mode of emplacement was considered to be sheets (dykes), volcaniclastic (pyroclastic)
kimberlite had been identified (Hetman, 2000) which resulted in the interpretation of potential blows or
small kimberlite pipes occurring along the kimberlite sheets. This identification of pyroclastic kimberlite
material without a full explanation of the airborne and ground geophysical survey results enticed KDI to
engage in more detailed exploration along the Kelvin-Faraday Corridor (KFC).
The kimberlites in the KFC area are portions of the deep roots of an intrusive kimberlitic complex,
consisting of volcaniclastic kimberlite and less common hypabyssal kimberlite as well as transitional
kimberlite (Bezzola, M. and Hetman, C., 2015). There are numerous interconnecting dykes. The geometry
of the intrusive bodies is complex.
The complex structure and geometry is a reflection of a combination of their Cambrian age (Heaman et
al., 2003) and the extent of the erosional processes on the Slave craton over the past 500 Ma since
emplacement, thereby exposing the deeper subsurface roots of these volcanic systems. This has produced
a deep cross-section of the original kimberlite intrusions, which are now further masked by lake basins
and glacial sediments.
Over the past 5 years, much diamond drilling has been undertaken for caustic fusion analyses for
microdiamonds to delineate the Kelvin, Faraday 2, Faraday 3, Faraday 1 and Hobbes kimberlites within
the KFC. Over 2,100 tonnes of kimberlite has been removed via bulk sampling using large diameter reverse
circulation drilling. This extensive exploration has delineated the kimberlite bodies that host diamond
mineralization, and has provided sufficient constraints on their volumes and bulk density, as well as the
grade and value of diamonds present, to support the declaration of Mineral Resources (see Section 14)
for the Kelvin, Faraday 2 and Faraday 3 bodies.
8 DEPOSIT TYPES
The Kelvin, Faraday 2 and 1-3 kimberlites are unconventional, irregular shaped, subhorizontal kimberlites.
This model type has yet to be recognized anywhere else in the world. These kimberlites are similar with
respect to textures, primary mineralogy, grade and age, but not in external morphology, to the Gahcho
Kué kimberlite cluster at Kennady Lake. These kimberlites in the southeast Slave craton differ from many
other Canadian kimberlites (Field and Scott-Smith, 1999).
The Fort à la Corne kimberlites preserve the volcanic craters with associated pyroclastic aprons that
erupted in an intertidal environment, which subsequently modified the aprons. These kimberlite crater
facies have relatively large surface areas.
The Lac de Gras pipes are preserved as diatreme zones which lie below the craters and above the
hypabyssal root-zone.
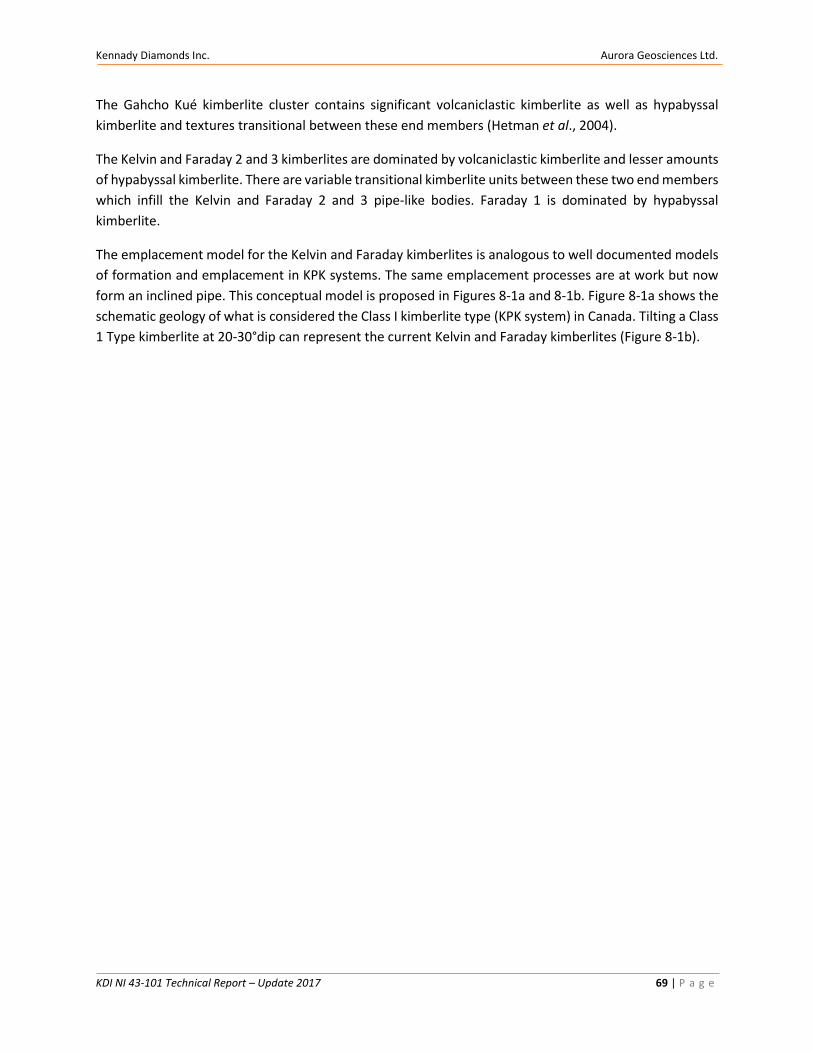
Kennady Diamonds Inc. Aurora Geosciences Ltd.
KDI NI 43-101 Technical Report – Update 2017 69 | P a g e
The Gahcho Kué kimberlite cluster contains significant volcaniclastic kimberlite as well as hypabyssal
kimberlite and textures transitional between these end members (Hetman et al., 2004).
The Kelvin and Faraday 2 and 3 kimberlites are dominated by volcaniclastic kimberlite and lesser amounts
of hypabyssal kimberlite. There are variable transitional kimberlite units between these two end members
which infill the Kelvin and Faraday 2 and 3 pipe-like bodies. Faraday 1 is dominated by hypabyssal
kimberlite.
The emplacement model for the Kelvin and Faraday kimberlites is analogous to well documented models
of formation and emplacement in KPK systems. The same emplacement processes are at work but now
form an inclined pipe. This conceptual model is proposed in Figures 8-1a and 8-1b. Figure 8-1a shows the
schematic geology of what is considered the Class I kimberlite type (KPK system) in Canada. Tilting a Class
1 Type kimberlite at 20-30°dip can represent the current Kelvin and Faraday kimberlites (Figure 8-1b).
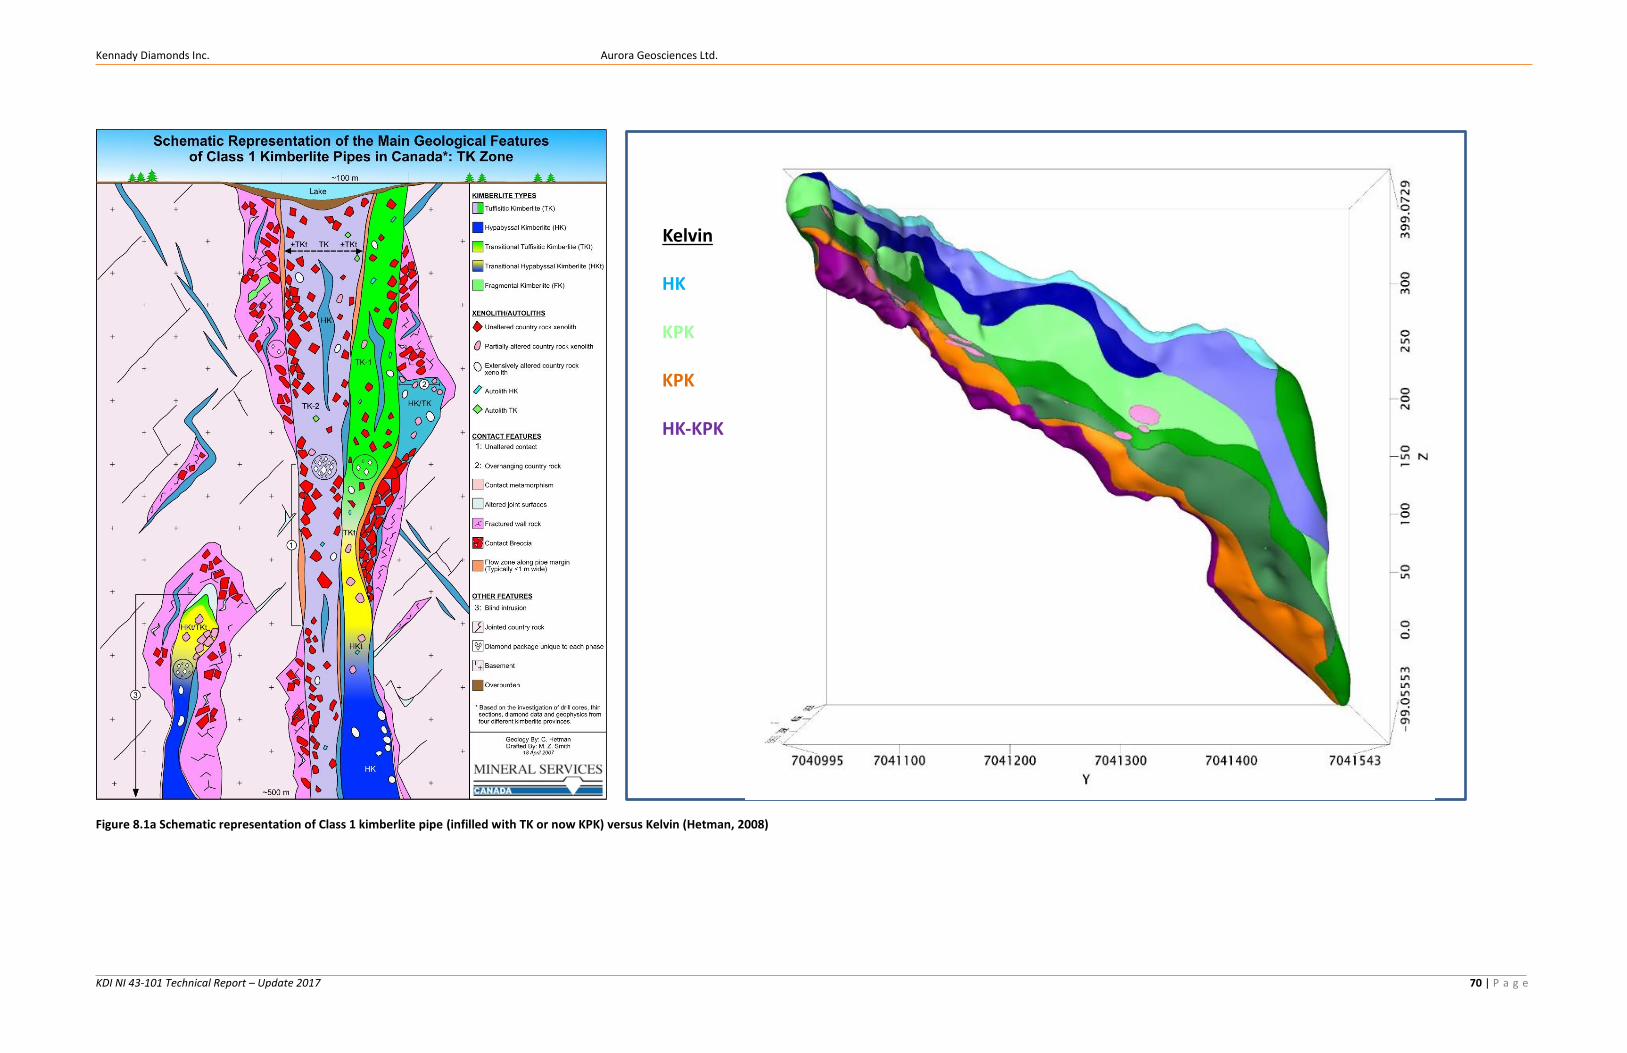
Kennady Diamonds Inc. Aurora Geosciences Ltd.
KDI NI 43-101 Technical Report – Update 2017 70 | P a g e
Figure 8.1a Schematic representation of Class 1 kimberlite pipe (infilled with TK or now KPK) versus Kelvin (Hetman, 2008)
HK
KPK
KPK
HK-KPK
Kelvin
Kennady Diamonds Inc. Aurora Geosciences Ltd.
KDI NI 43-101 Technical Report – Update 2017 71 | P a g e
N 50 m
KIMB3A
KIMB3B
KIMB3C
KIMB2A KIMB2B
KIMB1
KIMB4 + 7
KIMB6 KIMB3B
Kelvin Kimberlite – December 2016 Tilted Class 1 Kimberlite
Figure 8.1b Conceptual Formation of the Kelvin kimberlite
Kennady Diamonds Inc. Aurora Geosciences Ltd.
KDI NI 43-101 Technical Report – Update 2017 72 | P a g e
There is not a clear understanding yet of how these kimberlites force their way to surface. One suggestion
from Wayne Barnett (Ph.D., SRK) is that the primary structural system of the kimberlite dykes is oriented
at 20° dip and trending 320° Az. The dyke segments may or may not connect, but may step up or down,
and do have a coincidental correlation in dip with shallower segments and irregularities of the Kelvin
kimberlite. Mike Stubley (Ph.D., Stubley Geoscience) has suggested that these types of kimberlite
formations could occur through changing pressures from compressional to extensional environments
which allow the kimberlite to carve its way to the surface without pre-existing structures. Neither
emplacement model has been proven and further work is required.
9 EXPLORATION
EXPLORATION 2017
9.1.1 Introduction
Significant exploration has been completed by KDI on the Kennady North project since 2011. This information is
documented within the NI 43-101 document titled “2016 Technical Report – Project Exploration Update and Maiden
Mineral Resource Estimate, Kennady North Project, Northwest Territories, Canada, and filed on Sedar (January 23,
2017).
In mid-2016, KDI acquired four mineral leases from GGL which lie just south of the Gahcho Kué mine site.
The exploration ground work completed during the 2017 field season was focused at Blob Lake (Figure 9-
1), underlying the western leases (light pink in colour). All four leases will become part of the important
exploration ground package moving forward.
Between January 26th and August 24th, 2017, geophysical surveying at Blob Lake comprised ground gravity
(12,160 stations), OhmMapper© (401.78 kms), total field magnetic (451.38 line kms) and boat-borne
bathymetric (186.53 kms) surveying.
Gravity Survey
9.2.1 Introduction
Ground gravity was completed over Blob Lake and surrounding area in an attempt to outline trends in
density contrast that might lead to the identification of conventional kimberlite bodies (like the GK mine
site or Doyle and MZ sills) or unconventional kimberlite sources, like the Kelvin and Faraday kimberlites.
A total of 12,160 gravity stations were read between the dates of March 4th and May 3rd, and July 13th to
August 14th, 2017. Measurements were commonly at 40 m spaced stations but are 20 m spaced stations
within the northeast quadrant of Blob Lake.
9.2.2 Gravity Results
There are commonly significant regional effects from gravity surveying and to lessen these regional
effects, a 1st order trend removal filter has been applied to the full dataset (Figure 9-2). A narrow, high
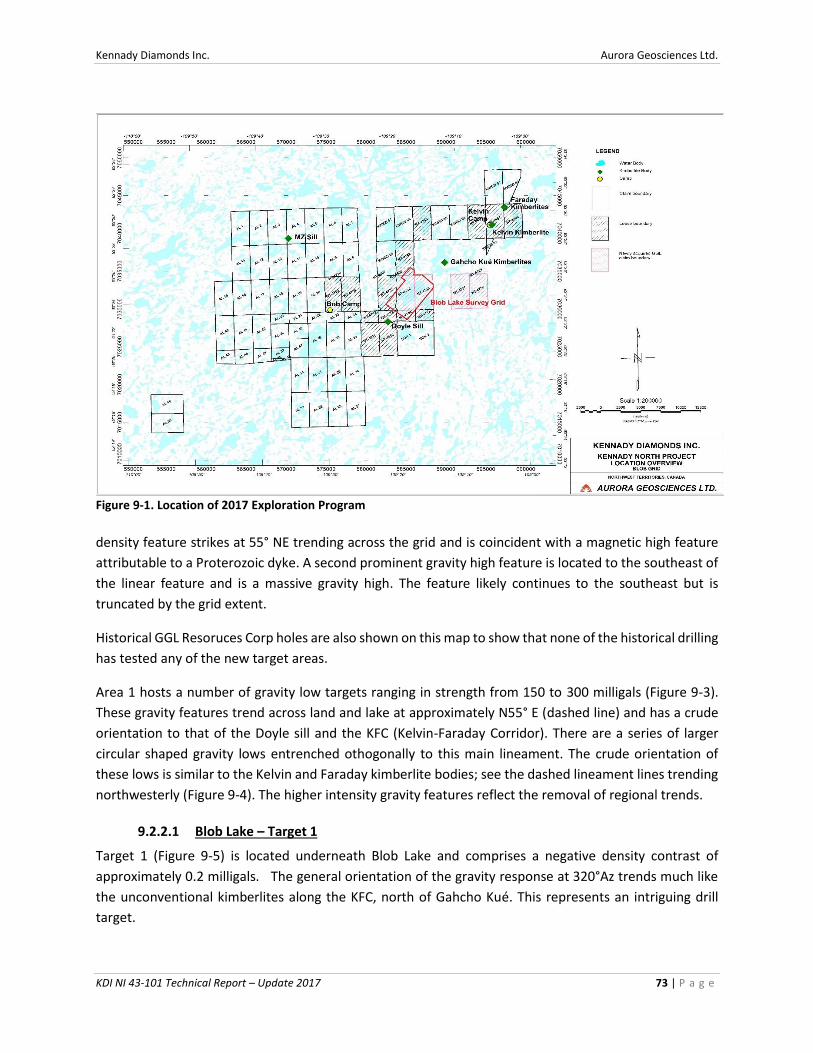
Kennady Diamonds Inc. Aurora Geosciences Ltd.
KDI NI 43-101 Technical Report – Update 2017 73 | P a g e
Figure 9-1. Location of 2017 Exploration Program
density feature strikes at 55° NE trending across the grid and is coincident with a magnetic high feature
attributable to a Proterozoic dyke. A second prominent gravity high feature is located to the southeast of
the linear feature and is a massive gravity high. The feature likely continues to the southeast but is
truncated by the grid extent.
Historical GGL Resoruces Corp holes are also shown on this map to show that none of the historical drilling
has tested any of the new target areas.
Area 1 hosts a number of gravity low targets ranging in strength from 150 to 300 milligals (Figure 9-3).
These gravity features trend across land and lake at approximately N55° E (dashed line) and has a crude
orientation to that of the Doyle sill and the KFC (Kelvin-Faraday Corridor). There are a series of larger
circular shaped gravity lows entrenched othogonally to this main lineament. The crude orientation of
these lows is similar to the Kelvin and Faraday kimberlite bodies; see the dashed lineament lines trending
northwesterly (Figure 9-4). The higher intensity gravity features reflect the removal of regional trends.
9.2.2.1 Blob Lake – Target 1
Target 1 (Figure 9-5) is located underneath Blob Lake and comprises a negative density contrast of
approximately 0.2 milligals. The general orientation of the gravity response at 320°Az trends much like
the unconventional kimberlites along the KFC, north of Gahcho Kué. This represents an intriguing drill
target.
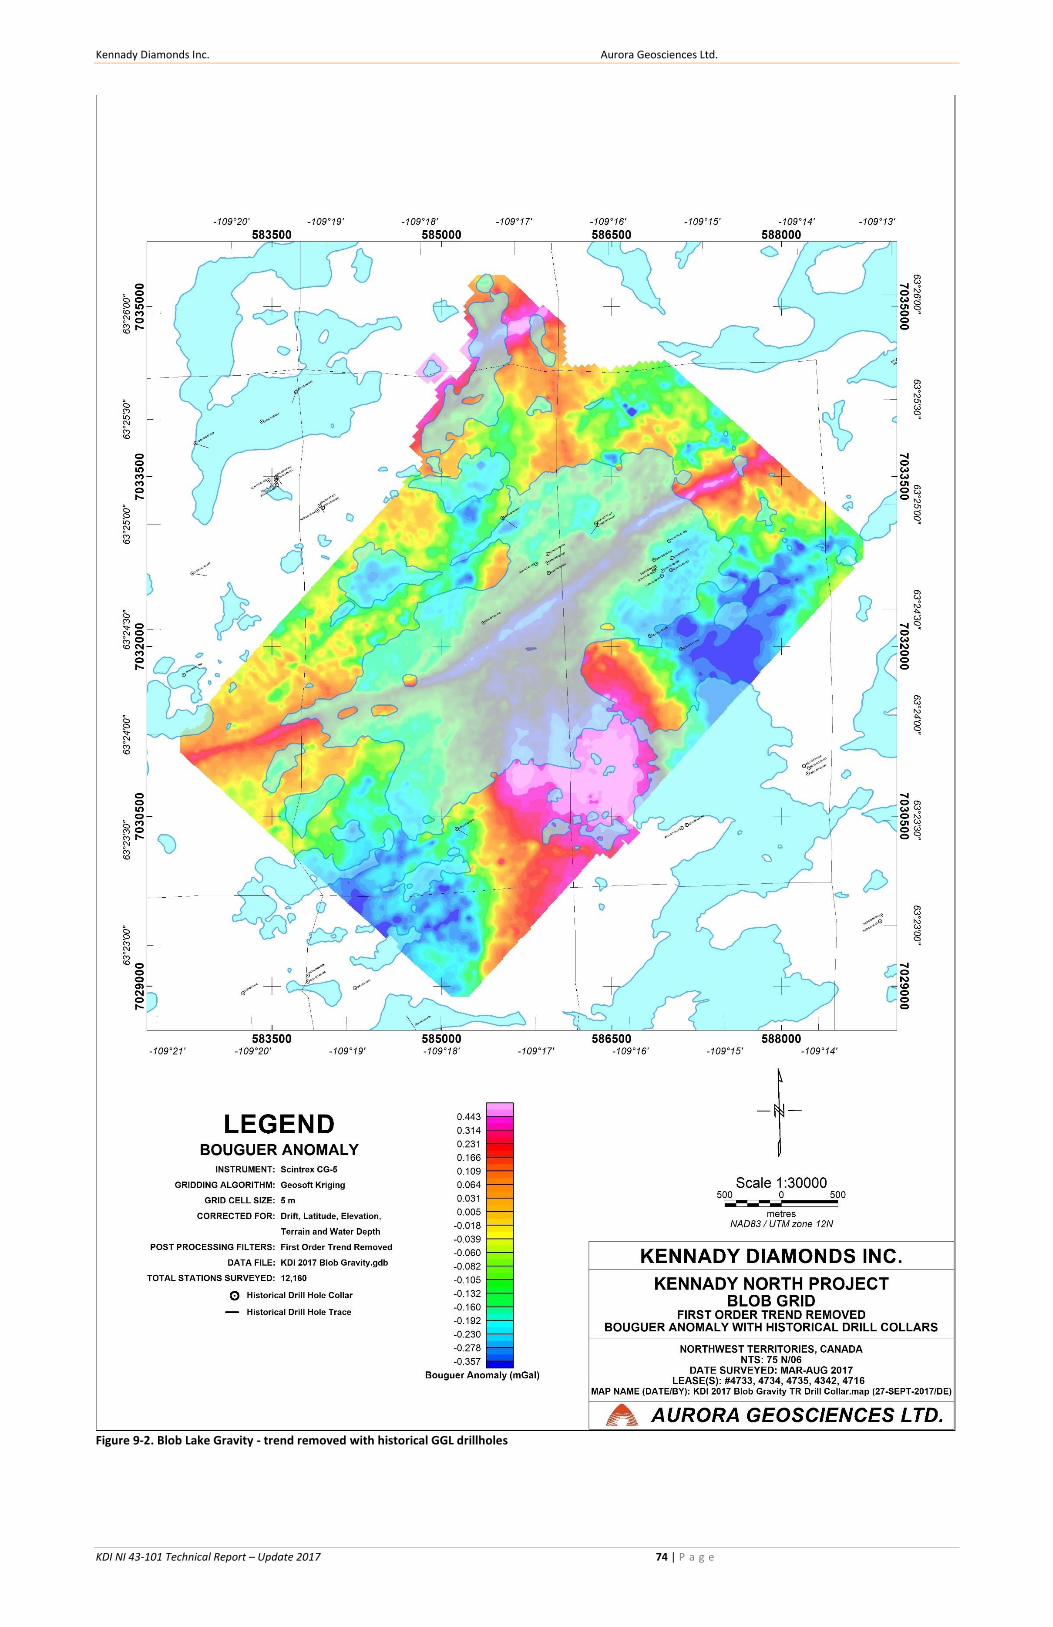
Kennady Diamonds Inc. Aurora Geosciences Ltd.
KDI NI 43-101 Technical Report – Update 2017 74 | P a g e
Figure 9-2. Blob Lake Gravity - trend removed with historical GGL drillholes
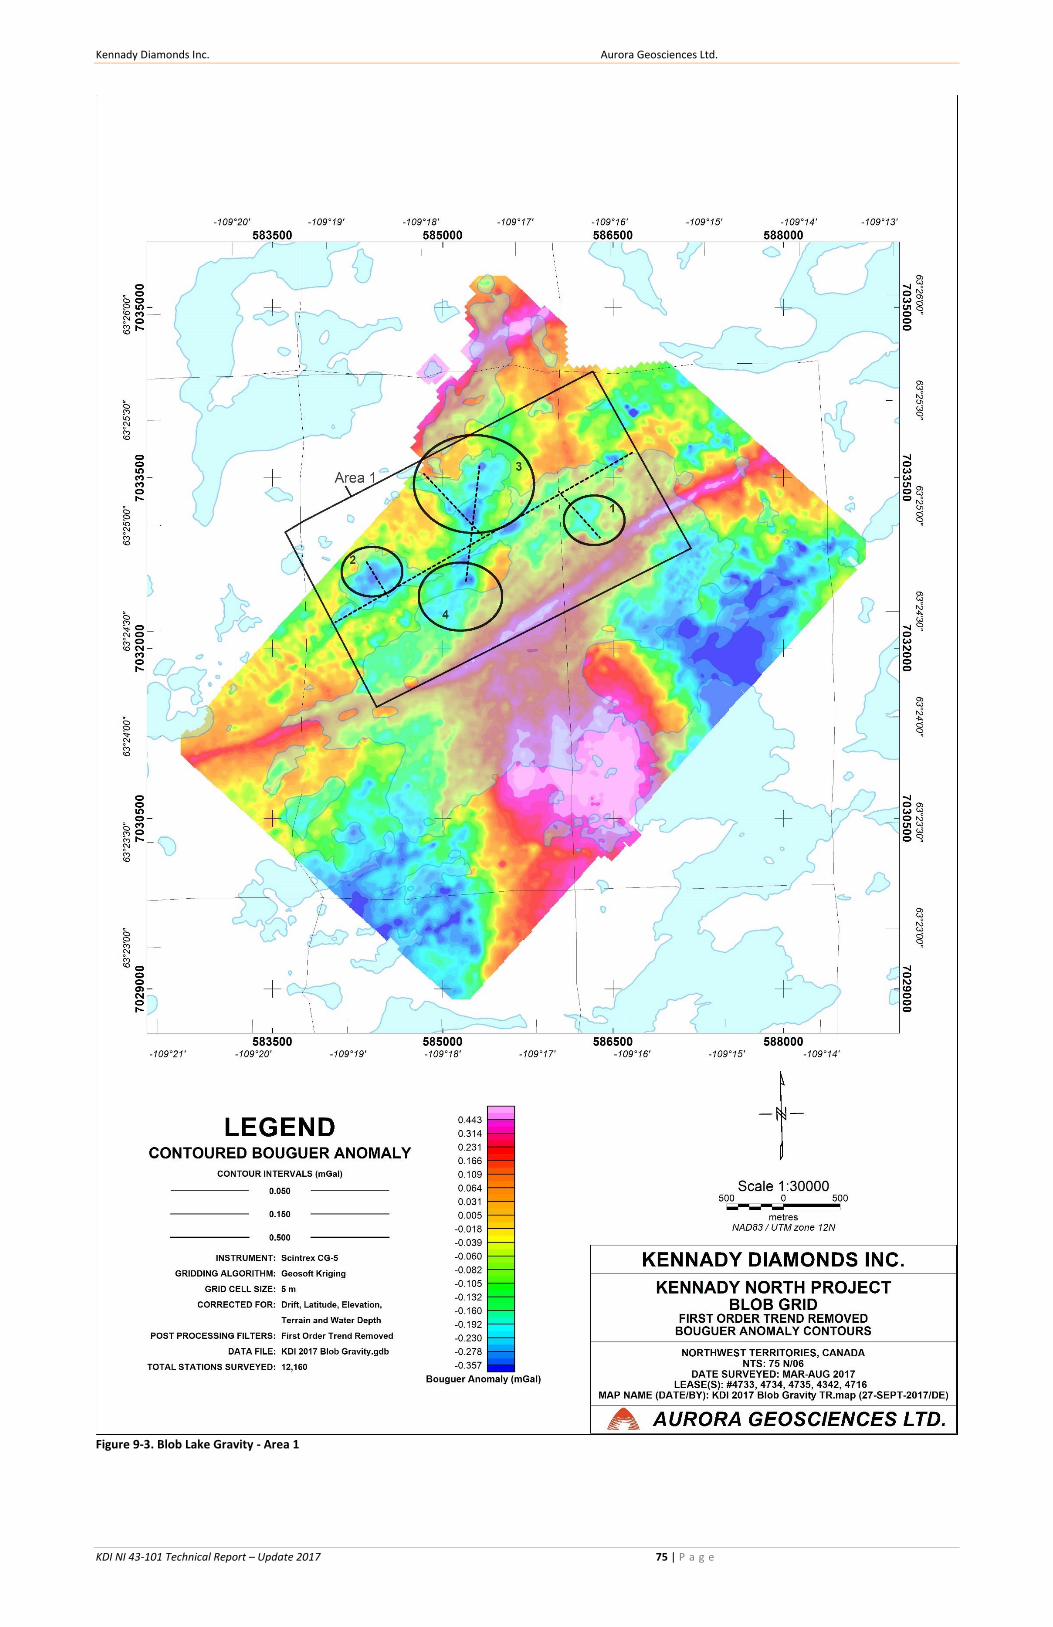
Kennady Diamonds Inc. Aurora Geosciences Ltd.
KDI NI 43-101 Technical Report – Update 2017 75 | P a g e
Figure 9-3. Blob Lake Gravity - Area 1
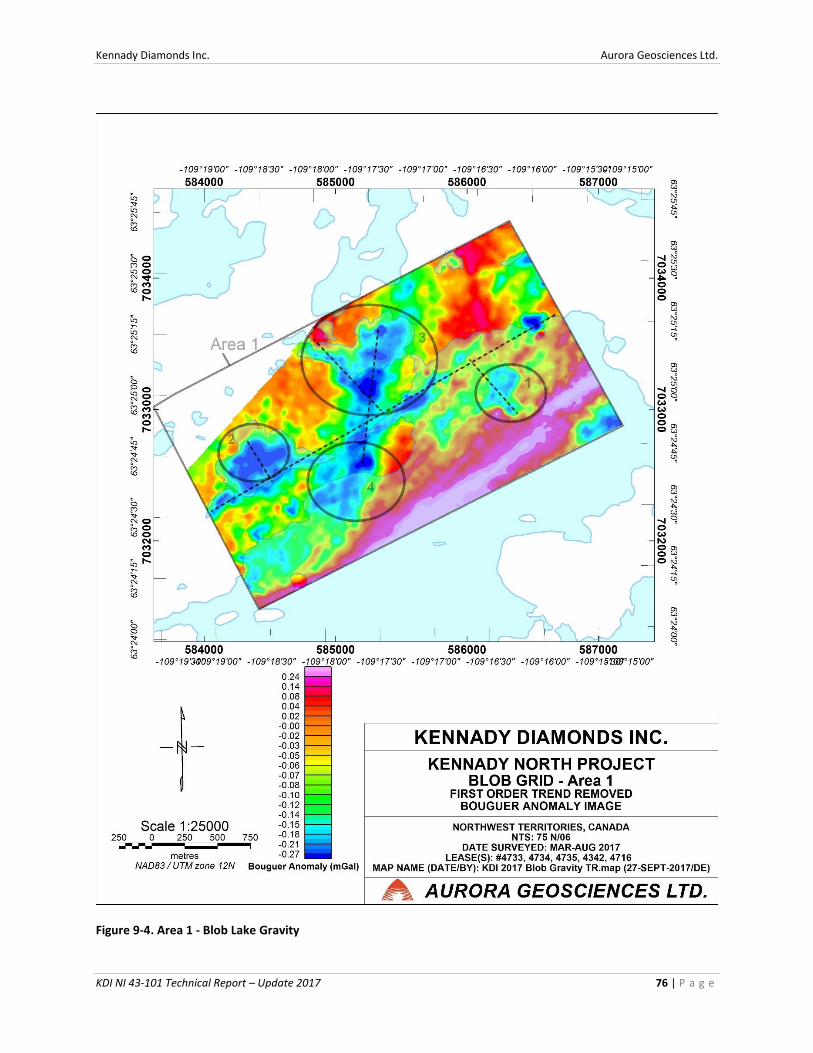
Kennady Diamonds Inc. Aurora Geosciences Ltd.
KDI NI 43-101 Technical Report – Update 2017 76 | P a g e
Figure 9-4. Area 1 - Blob Lake Gravity
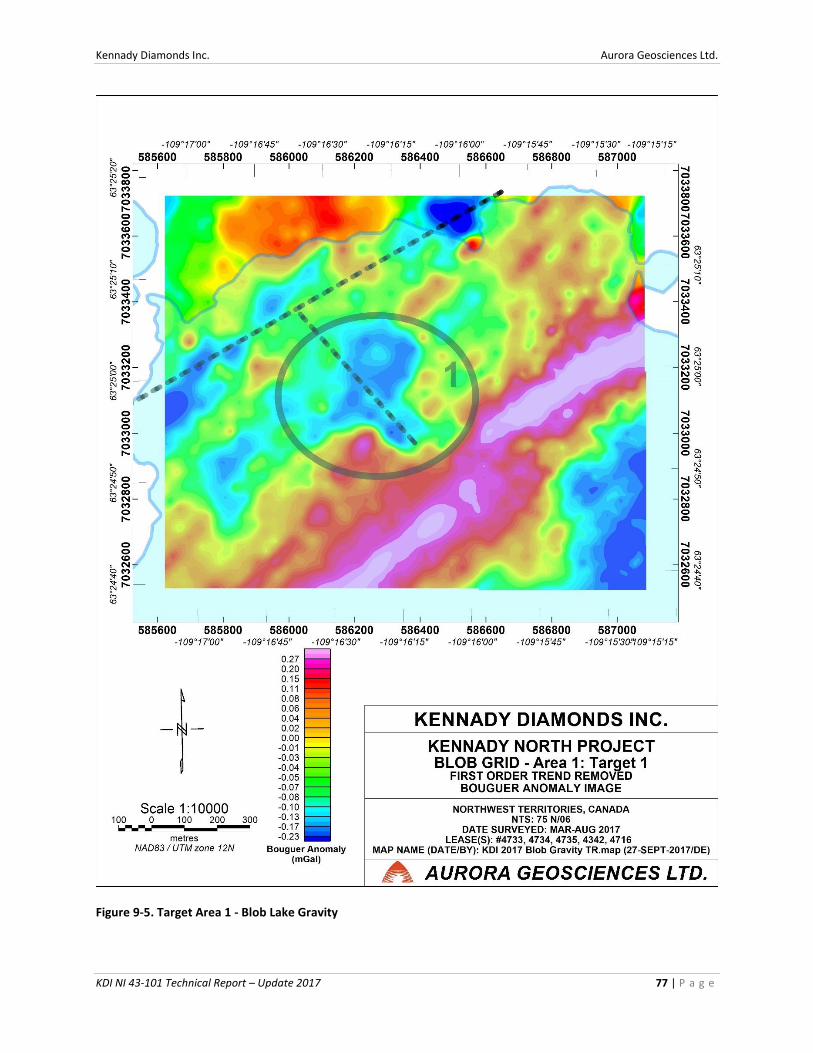
Kennady Diamonds Inc. Aurora Geosciences Ltd.
KDI NI 43-101 Technical Report – Update 2017 77 | P a g e
Figure 9-5. Target Area 1 - Blob Lake Gravity
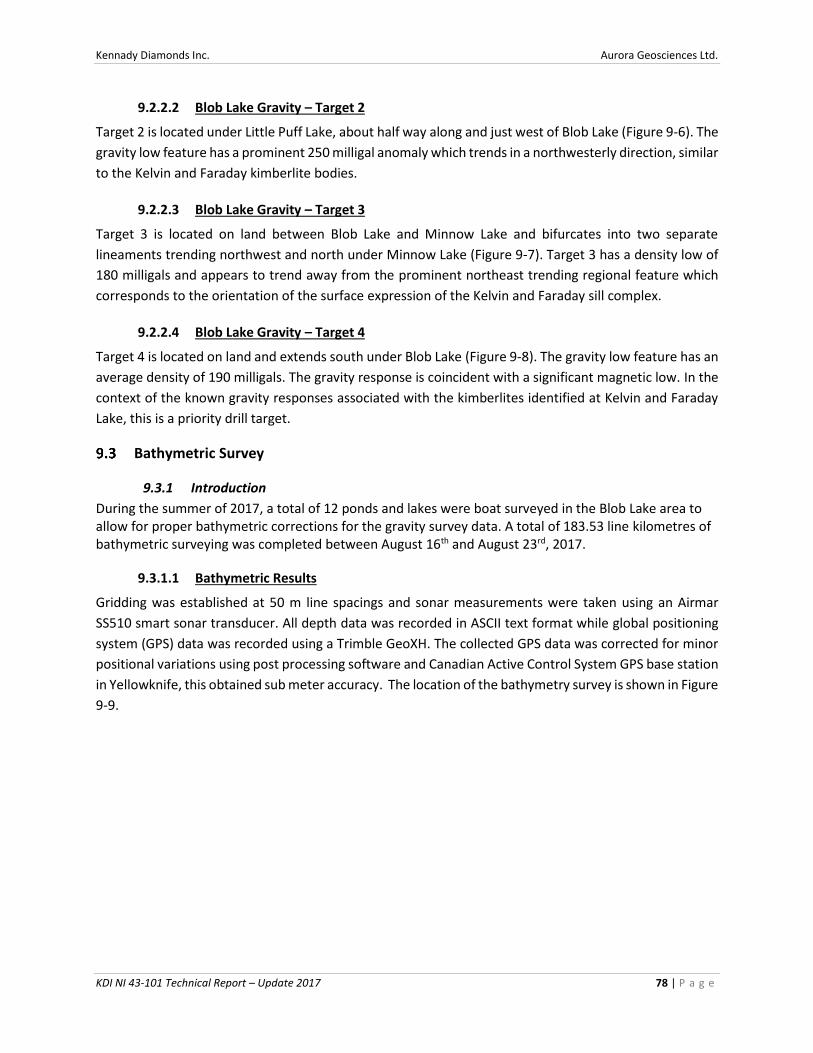
Kennady Diamonds Inc. Aurora Geosciences Ltd.
KDI NI 43-101 Technical Report – Update 2017 78 | P a g e
9.2.2.2 Blob Lake Gravity – Target 2
Target 2 is located under Little Puff Lake, about half way along and just west of Blob Lake (Figure 9-6). The
gravity low feature has a prominent 250 milligal anomaly which trends in a northwesterly direction, similar
to the Kelvin and Faraday kimberlite bodies.
9.2.2.3 Blob Lake Gravity – Target 3
Target 3 is located on land between Blob Lake and Minnow Lake and bifurcates into two separate
lineaments trending northwest and north under Minnow Lake (Figure 9-7). Target 3 has a density low of
180 milligals and appears to trend away from the prominent northeast trending regional feature which
corresponds to the orientation of the surface expression of the Kelvin and Faraday sill complex.
9.2.2.4 Blob Lake Gravity – Target 4
Target 4 is located on land and extends south under Blob Lake (Figure 9-8). The gravity low feature has an
average density of 190 milligals. The gravity response is coincident with a significant magnetic low. In the
context of the known gravity responses associated with the kimberlites identified at Kelvin and Faraday
Lake, this is a priority drill target.
Bathymetric Survey
9.3.1 Introduction
During the summer of 2017, a total of 12 ponds and lakes were boat surveyed in the Blob Lake area to allow for proper bathymetric corrections for the gravity survey data. A total of 183.53 line kilometres of bathymetric surveying was completed between August 16th and August 23rd, 2017.
9.3.1.1 Bathymetric Results
Gridding was established at 50 m line spacings and sonar measurements were taken using an Airmar
SS510 smart sonar transducer. All depth data was recorded in ASCII text format while global positioning
system (GPS) data was recorded using a Trimble GeoXH. The collected GPS data was corrected for minor
positional variations using post processing software and Canadian Active Control System GPS base station
in Yellowknife, this obtained sub meter accuracy. The location of the bathymetry survey is shown in Figure
9-9.
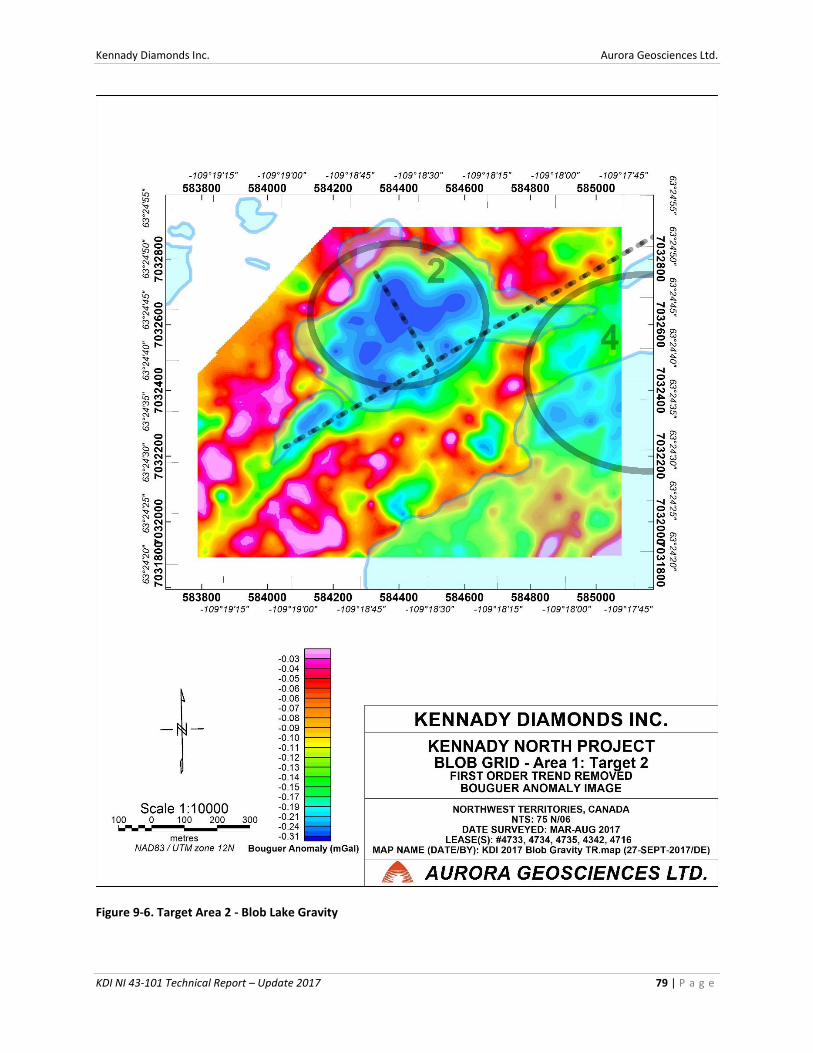
Kennady Diamonds Inc. Aurora Geosciences Ltd.
KDI NI 43-101 Technical Report – Update 2017 79 | P a g e
Figure 9-6. Target Area 2 - Blob Lake Gravity
Kennady Diamonds Inc. Aurora Geosciences Ltd.
KDI NI 43-101 Technical Report – Update 2017 80 | P a g e
Figure 9-7. Target Area 3 - Blob Lake Gravity
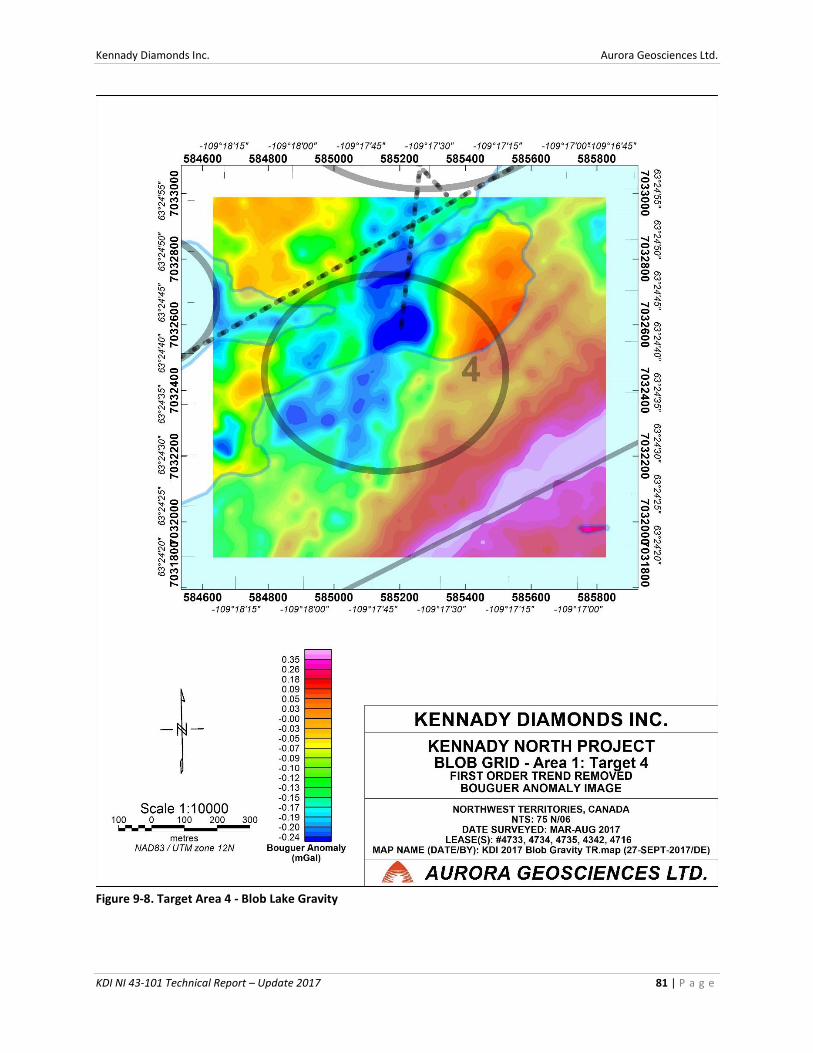
Kennady Diamonds Inc. Aurora Geosciences Ltd.
KDI NI 43-101 Technical Report – Update 2017 81 | P a g e
Figure 9-8. Target Area 4 - Blob Lake Gravity
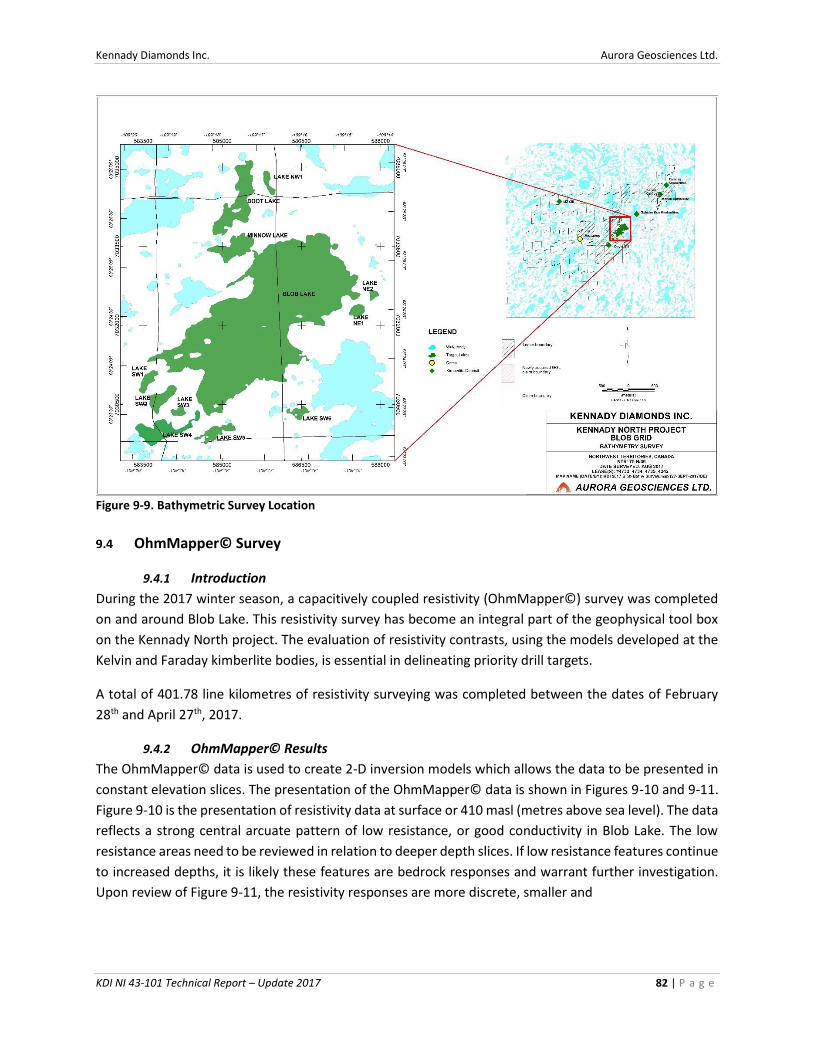
Kennady Diamonds Inc. Aurora Geosciences Ltd.
KDI NI 43-101 Technical Report – Update 2017 82 | P a g e
Figure 9-9. Bathymetric Survey Location
OhmMapper© Survey
9.4.1 Introduction
During the 2017 winter season, a capacitively coupled resistivity (OhmMapper©) survey was completed
on and around Blob Lake. This resistivity survey has become an integral part of the geophysical tool box
on the Kennady North project. The evaluation of resistivity contrasts, using the models developed at the
Kelvin and Faraday kimberlite bodies, is essential in delineating priority drill targets.
A total of 401.78 line kilometres of resistivity surveying was completed between the dates of February
28th and April 27th, 2017.
9.4.2 OhmMapper© Results
The OhmMapper© data is used to create 2-D inversion models which allows the data to be presented in
constant elevation slices. The presentation of the OhmMapper© data is shown in Figures 9-10 and 9-11.
Figure 9-10 is the presentation of resistivity data at surface or 410 masl (metres above sea level). The data
reflects a strong central arcuate pattern of low resistance, or good conductivity in Blob Lake. The low
resistance areas need to be reviewed in relation to deeper depth slices. If low resistance features continue
to increased depths, it is likely these features are bedrock responses and warrant further investigation.
Upon review of Figure 9-11, the resistivity responses are more discrete, smaller and
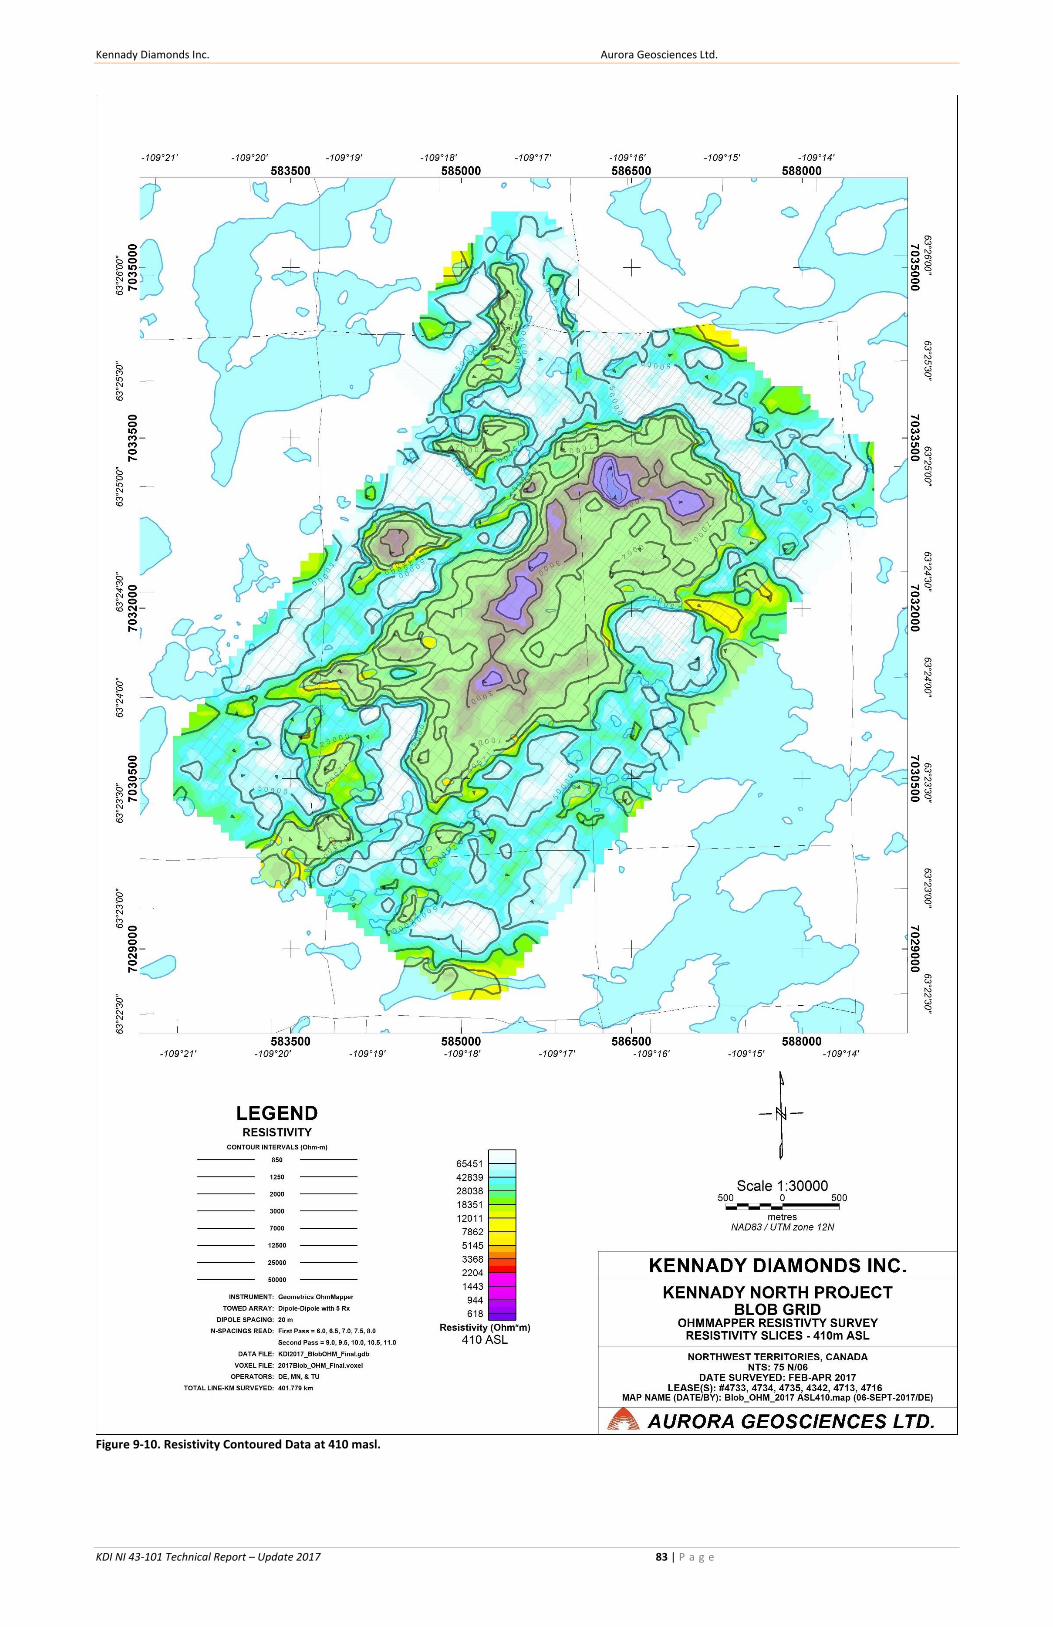
Kennady Diamonds Inc. Aurora Geosciences Ltd.
KDI NI 43-101 Technical Report – Update 2017 83 | P a g e
Figure 9-10. Resistivity Contoured Data at 410 masl.
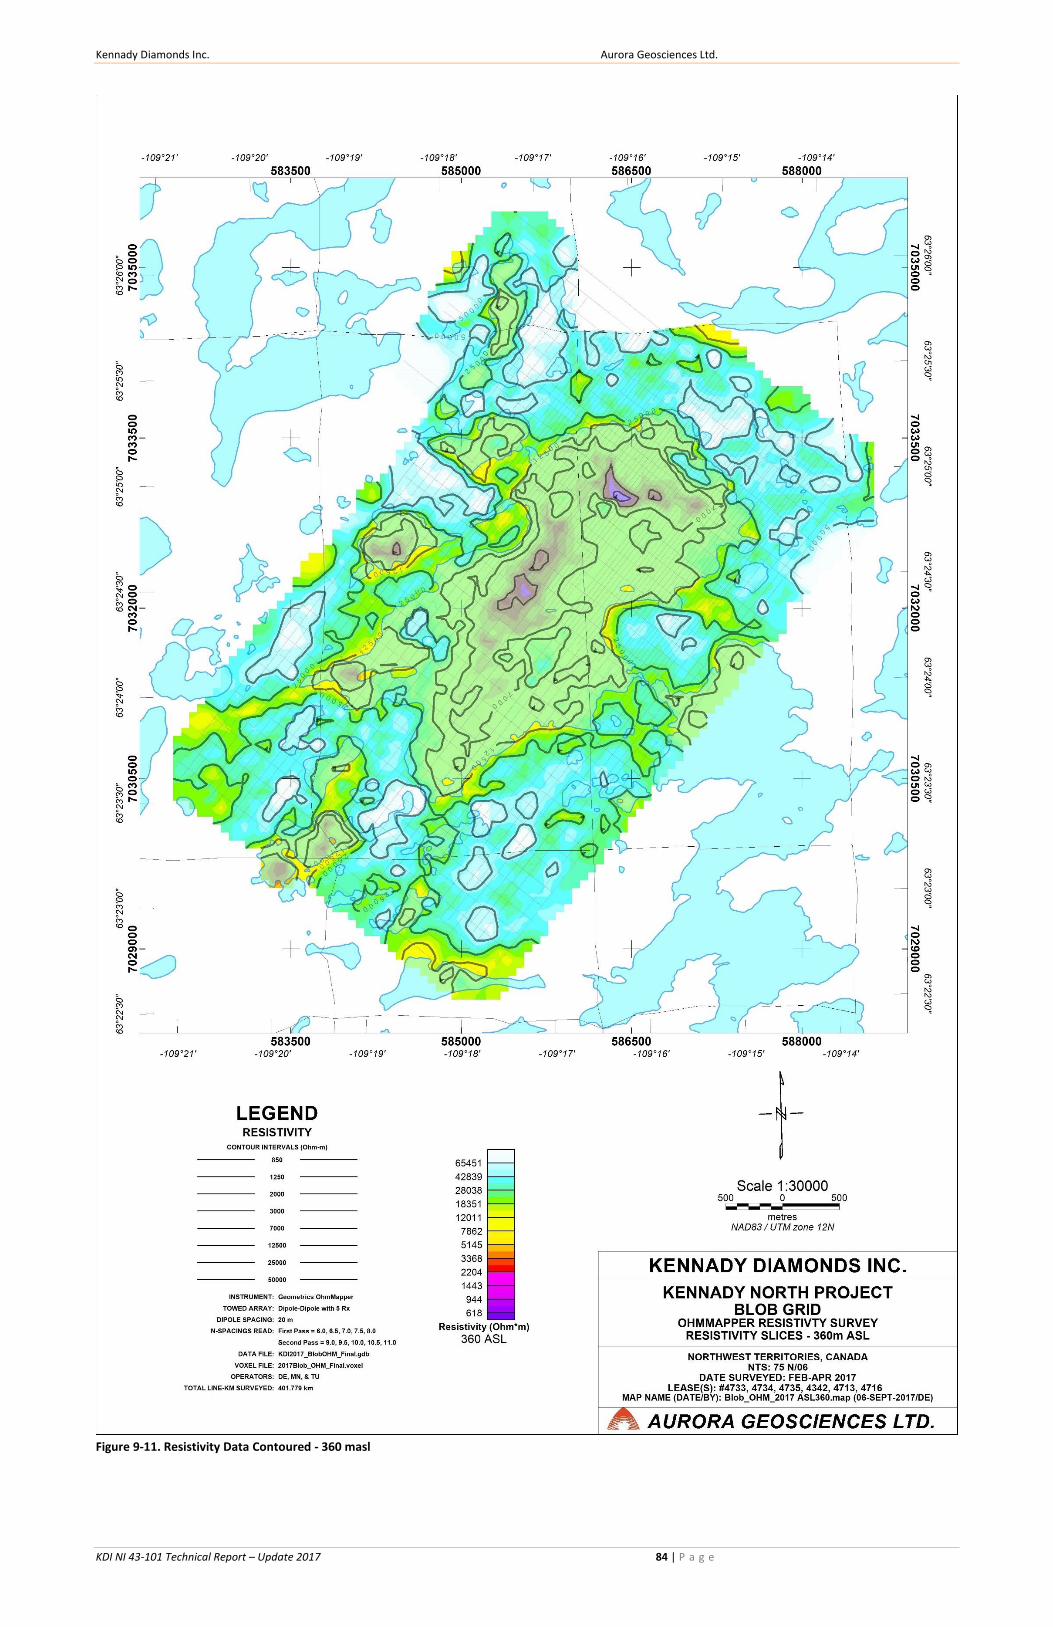
Kennady Diamonds Inc. Aurora Geosciences Ltd.
KDI NI 43-101 Technical Report – Update 2017 84 | P a g e
Figure 9-11. Resistivity Data Contoured - 360 masl
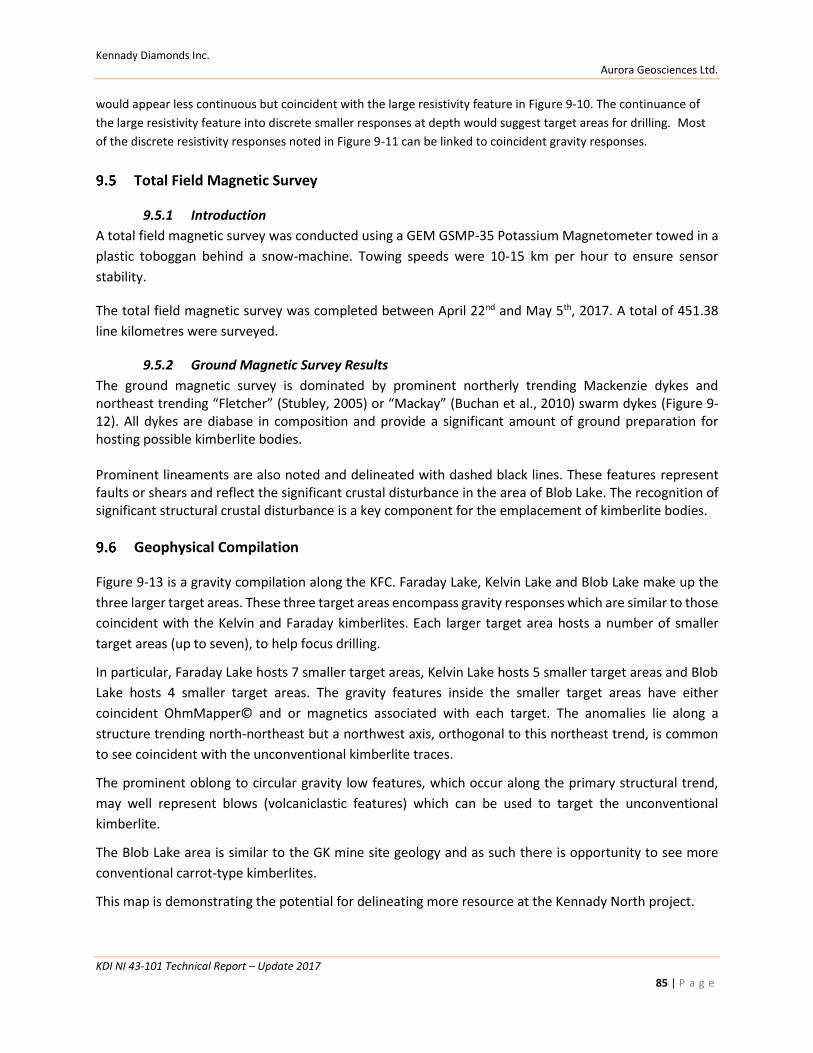
Kennady Diamonds Inc. Aurora Geosciences Ltd.
KDI NI 43-101 Technical Report – Update 2017
85 | P a g e
would appear less continuous but coincident with the large resistivity feature in Figure 9-10. The continuance of
the large resistivity feature into discrete smaller responses at depth would suggest target areas for drilling. Most
of the discrete resistivity responses noted in Figure 9-11 can be linked to coincident gravity responses.
Total Field Magnetic Survey
9.5.1 Introduction
A total field magnetic survey was conducted using a GEM GSMP-35 Potassium Magnetometer towed in a
plastic toboggan behind a snow-machine. Towing speeds were 10-15 km per hour to ensure sensor
stability.
The total field magnetic survey was completed between April 22nd and May 5th, 2017. A total of 451.38
line kilometres were surveyed.
9.5.2 Ground Magnetic Survey Results
The ground magnetic survey is dominated by prominent northerly trending Mackenzie dykes and northeast trending “Fletcher” (Stubley, 2005) or “Mackay” (Buchan et al., 2010) swarm dykes (Figure 9-12). All dykes are diabase in composition and provide a significant amount of ground preparation for hosting possible kimberlite bodies. Prominent lineaments are also noted and delineated with dashed black lines. These features represent faults or shears and reflect the significant crustal disturbance in the area of Blob Lake. The recognition of significant structural crustal disturbance is a key component for the emplacement of kimberlite bodies.
Geophysical Compilation
Figure 9-13 is a gravity compilation along the KFC. Faraday Lake, Kelvin Lake and Blob Lake make up the
three larger target areas. These three target areas encompass gravity responses which are similar to those
coincident with the Kelvin and Faraday kimberlites. Each larger target area hosts a number of smaller
target areas (up to seven), to help focus drilling.
In particular, Faraday Lake hosts 7 smaller target areas, Kelvin Lake hosts 5 smaller target areas and Blob
Lake hosts 4 smaller target areas. The gravity features inside the smaller target areas have either
coincident OhmMapper© and or magnetics associated with each target. The anomalies lie along a
structure trending north-northeast but a northwest axis, orthogonal to this northeast trend, is common
to see coincident with the unconventional kimberlite traces.
The prominent oblong to circular gravity low features, which occur along the primary structural trend,
may well represent blows (volcaniclastic features) which can be used to target the unconventional
kimberlite.
The Blob Lake area is similar to the GK mine site geology and as such there is opportunity to see more
conventional carrot-type kimberlites.
This map is demonstrating the potential for delineating more resource at the Kennady North project.
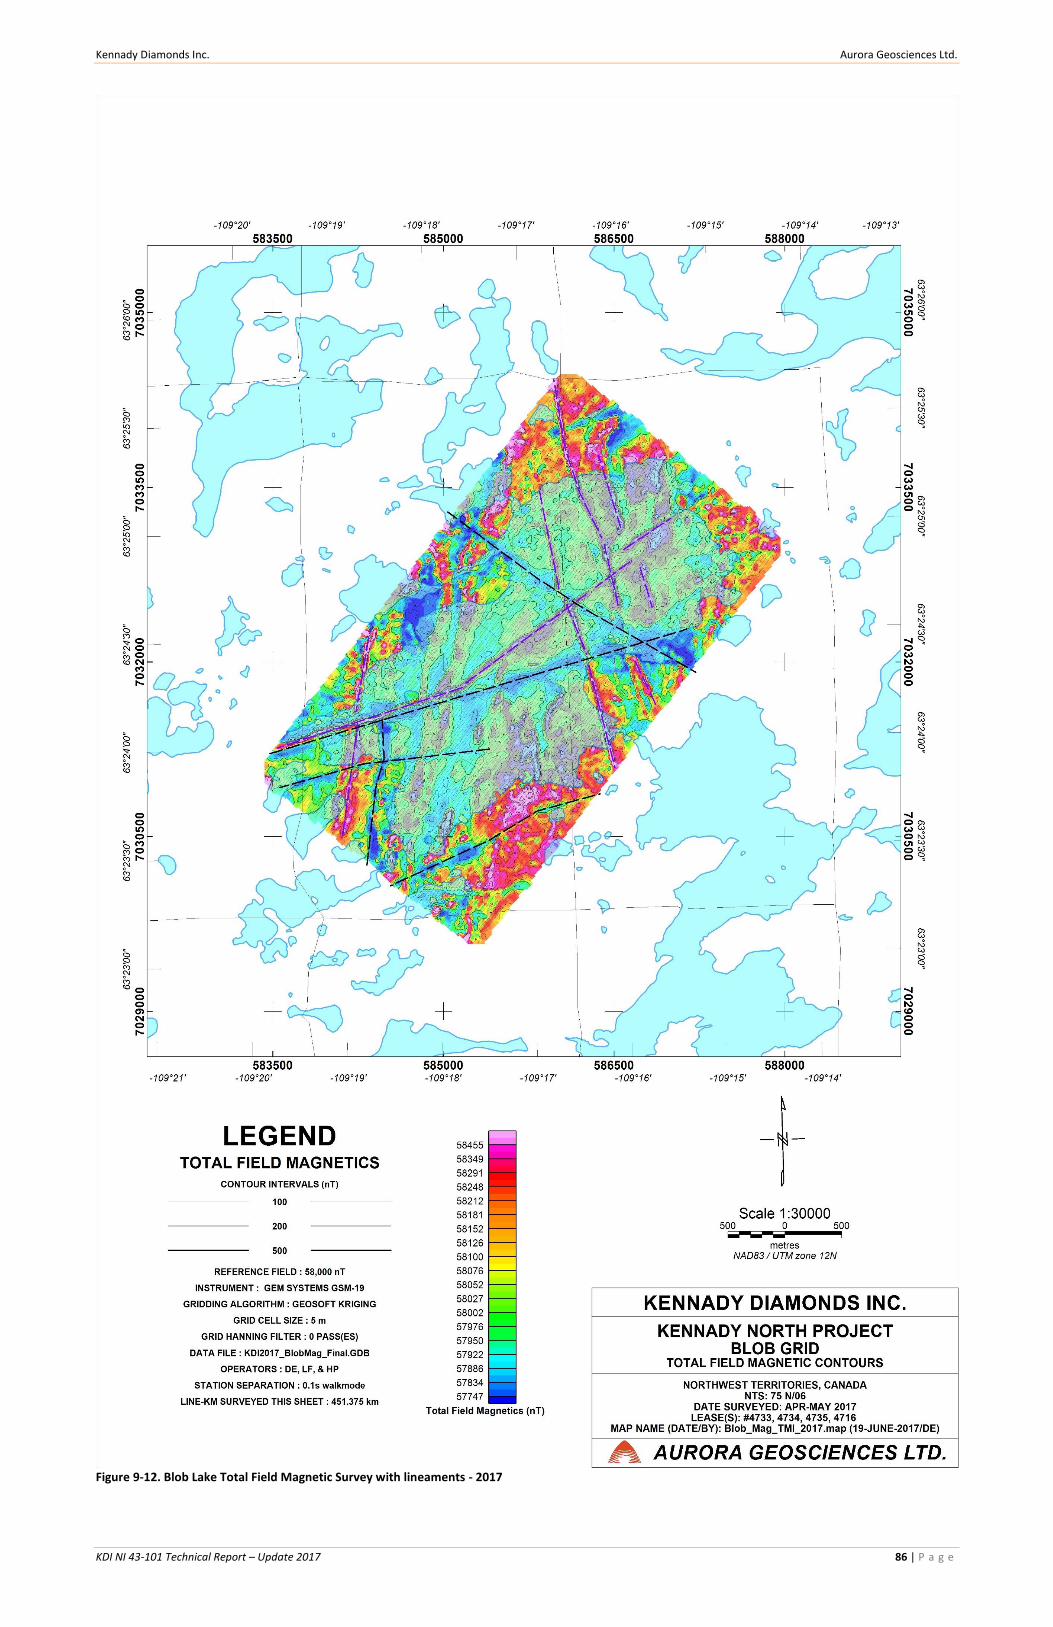
Kennady Diamonds Inc. Aurora Geosciences Ltd.
KDI NI 43-101 Technical Report – Update 2017 86 | P a g e
Figure 9-12. Blob Lake Total Field Magnetic Survey with lineaments - 2017
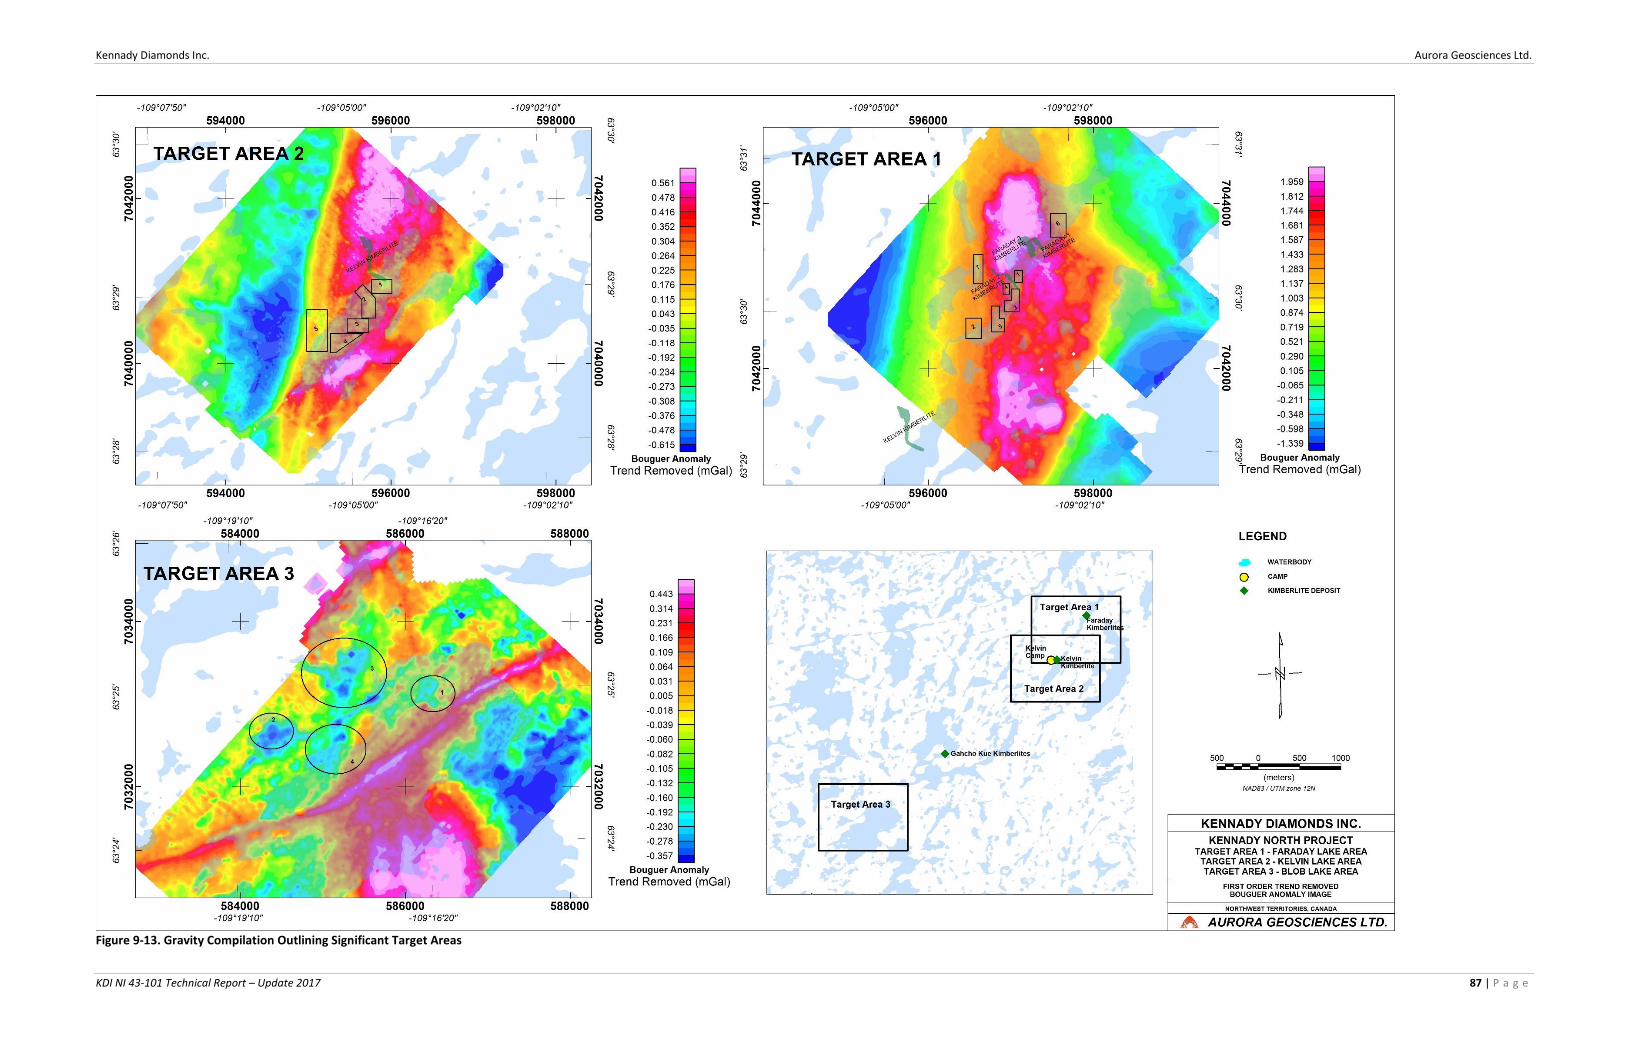
Kennady Diamonds Inc. Aurora Geosciences Ltd.
KDI NI 43-101 Technical Report – Update 2017 87 | P a g e
Figure 9-13. Gravity Compilation Outlining Significant Target Areas
Kennady Diamonds Inc. Aurora Geosciences Ltd.
KDI NI 43-101 Technical Report – Update 2017
88 | P a g e
10 DRILLING
This section provides information relating to drilling (core and large diameter RC) recently carried out
during 2017. Details of all drilling carried out prior to this were included in the previous Kennady North
Technical Report (Vivian and Nowicki, 2017)
INTRODUCTION
Kennady Diamonds Inc. continued exploration drilling at the Faraday pipes during 2017. One drillhole was
completed at the Kelvin kimberlite as the final geotechnical hole needed to complete the pre-feasibility
study (PFS). Significant drilling was completed and filed at the end of 2016 in a technical report on the
Kennady North project (Sedar filing, January 23, 2017). Diamond and LDDH (large diameter drill hole)
reverse circulation drilling during 2017 is summarized herein with detailed drill summary statistics, strip
logs, plans and sections in the appendices.
A total of 2,766 m of HQ drilling was completed with kimberlite intersections totaling 334.29 m of the
total drilling, or 12.1% (Table 10-1).
Table 10-1. Diamond Drilling Summary for 2017
Drill Summary for 2017
Kimberlite Metres Drilled Metres of kimberlite
Kelvin 295 23.45
Faraday 2 1917 287.7
Faraday 1-3 554 23.14
2766 334.29
A total of 76 LDRC holes were completed into Faraday 2, 3 and 1. The LDRC drilling comprises 8,008 m of
drilling, 579.22 tonnes of kimberlite material and is summarized in Table 10-2. Tonnage estimates are
based on caliper survey measurement of drill hole diameters and estimates of kimberlite bulk density.
Table 10-2. Large Diameter Reverse Circulation Drill Summary - 2017
Large Diameter RC Drill Summary for 2017
Kimberlite Metres Tonnes
Faraday 2 3,471 275.38
Faraday 3 4,234 279.42
Faraday 1 303 24.42
8008 579.22
Diamond drilling at the Kelvin kimberlite
The 2017 drill program at Kelvin comprised one geotechnical hole which was completed across the
knuckle area of the Kelvin kimberlite where the kimberlite turns from trending westerly to trending
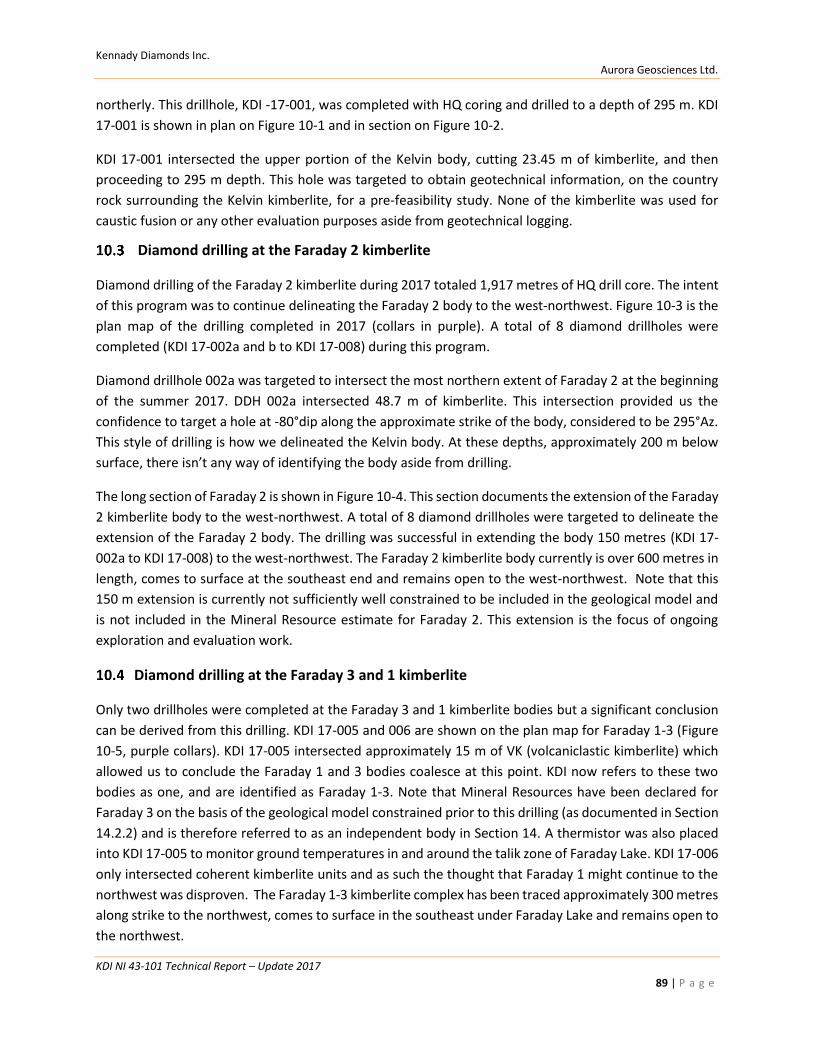
Kennady Diamonds Inc. Aurora Geosciences Ltd.
KDI NI 43-101 Technical Report – Update 2017
89 | P a g e
northerly. This drillhole, KDI -17-001, was completed with HQ coring and drilled to a depth of 295 m. KDI
17-001 is shown in plan on Figure 10-1 and in section on Figure 10-2.
KDI 17-001 intersected the upper portion of the Kelvin body, cutting 23.45 m of kimberlite, and then
proceeding to 295 m depth. This hole was targeted to obtain geotechnical information, on the country
rock surrounding the Kelvin kimberlite, for a pre-feasibility study. None of the kimberlite was used for
caustic fusion or any other evaluation purposes aside from geotechnical logging.
Diamond drilling at the Faraday 2 kimberlite
Diamond drilling of the Faraday 2 kimberlite during 2017 totaled 1,917 metres of HQ drill core. The intent
of this program was to continue delineating the Faraday 2 body to the west-northwest. Figure 10-3 is the
plan map of the drilling completed in 2017 (collars in purple). A total of 8 diamond drillholes were
completed (KDI 17-002a and b to KDI 17-008) during this program.
Diamond drillhole 002a was targeted to intersect the most northern extent of Faraday 2 at the beginning
of the summer 2017. DDH 002a intersected 48.7 m of kimberlite. This intersection provided us the
confidence to target a hole at -80°dip along the approximate strike of the body, considered to be 295°Az.
This style of drilling is how we delineated the Kelvin body. At these depths, approximately 200 m below
surface, there isn’t any way of identifying the body aside from drilling.
The long section of Faraday 2 is shown in Figure 10-4. This section documents the extension of the Faraday
2 kimberlite body to the west-northwest. A total of 8 diamond drillholes were targeted to delineate the
extension of the Faraday 2 body. The drilling was successful in extending the body 150 metres (KDI 17-
002a to KDI 17-008) to the west-northwest. The Faraday 2 kimberlite body currently is over 600 metres in
length, comes to surface at the southeast end and remains open to the west-northwest. Note that this
150 m extension is currently not sufficiently well constrained to be included in the geological model and
is not included in the Mineral Resource estimate for Faraday 2. This extension is the focus of ongoing
exploration and evaluation work.
Diamond drilling at the Faraday 3 and 1 kimberlite
Only two drillholes were completed at the Faraday 3 and 1 kimberlite bodies but a significant conclusion
can be derived from this drilling. KDI 17-005 and 006 are shown on the plan map for Faraday 1-3 (Figure
10-5, purple collars). KDI 17-005 intersected approximately 15 m of VK (volcaniclastic kimberlite) which
allowed us to conclude the Faraday 1 and 3 bodies coalesce at this point. KDI now refers to these two
bodies as one, and are identified as Faraday 1-3. Note that Mineral Resources have been declared for
Faraday 3 on the basis of the geological model constrained prior to this drilling (as documented in Section
14.2.2) and is therefore referred to as an independent body in Section 14. A thermistor was also placed
into KDI 17-005 to monitor ground temperatures in and around the talik zone of Faraday Lake. KDI 17-006
only intersected coherent kimberlite units and as such the thought that Faraday 1 might continue to the
northwest was disproven. The Faraday 1-3 kimberlite complex has been traced approximately 300 metres
along strike to the northwest, comes to surface in the southeast under Faraday Lake and remains open to
the northwest.
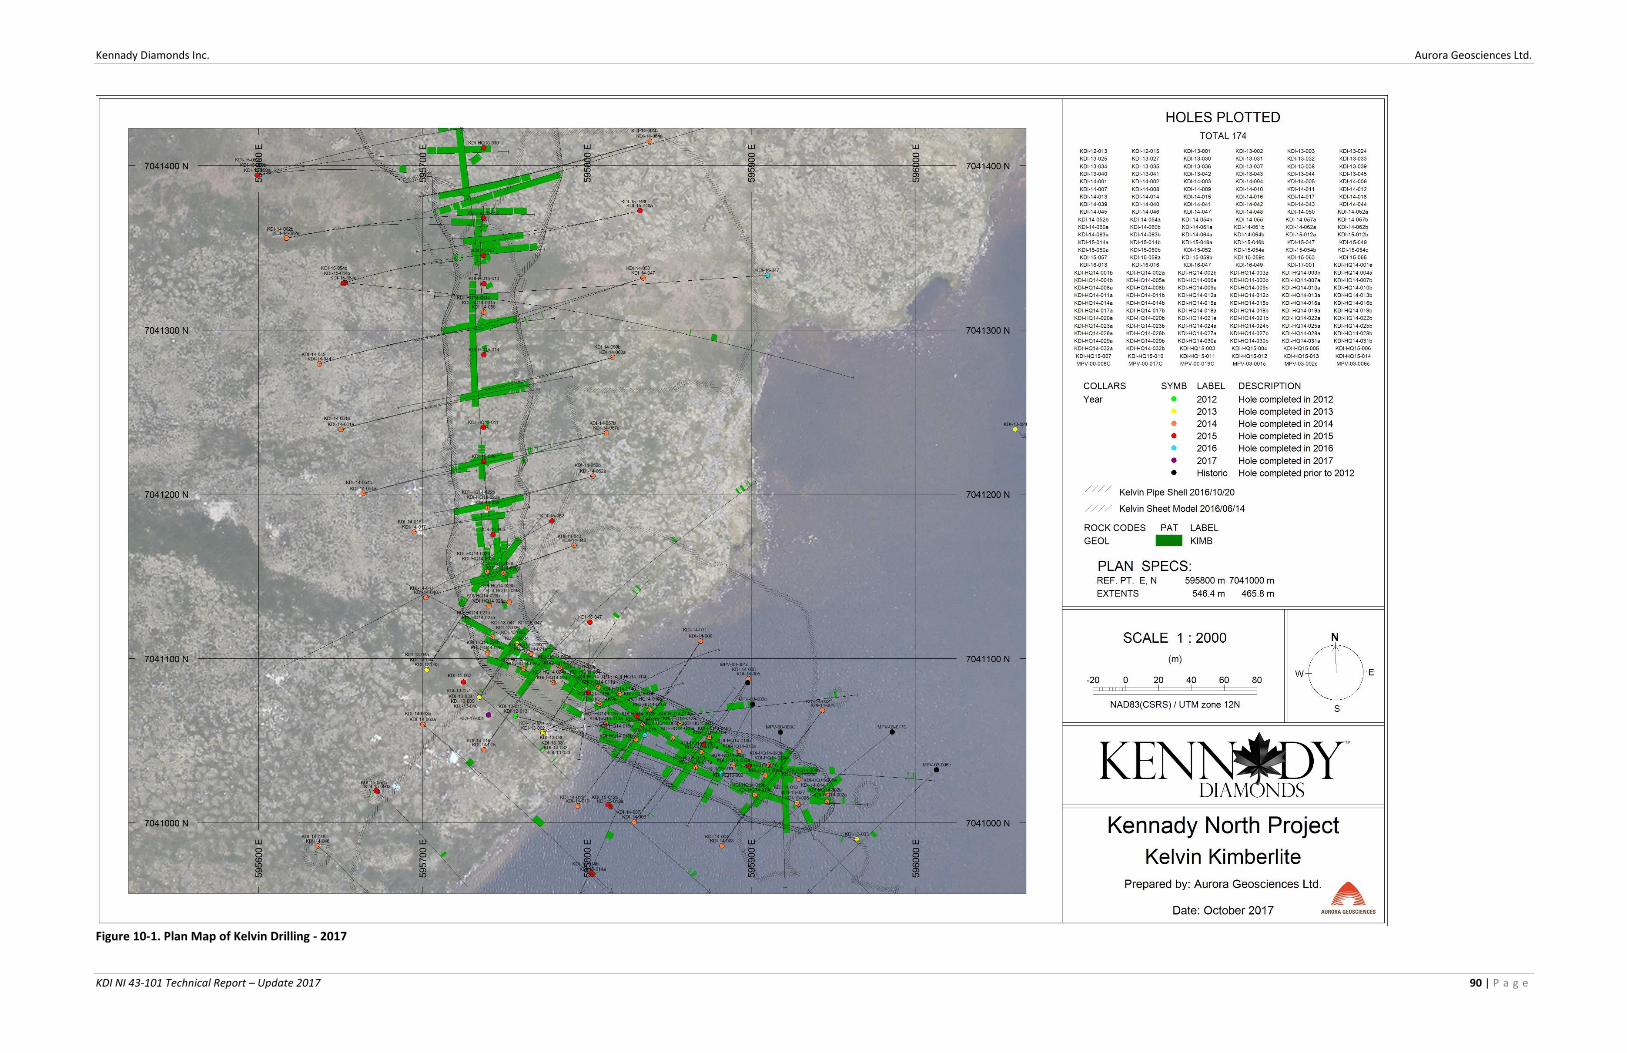
Kennady Diamonds Inc. Aurora Geosciences Ltd.
KDI NI 43-101 Technical Report – Update 2017 90 | P a g e
Figure 10-1. Plan Map of Kelvin Drilling - 2017
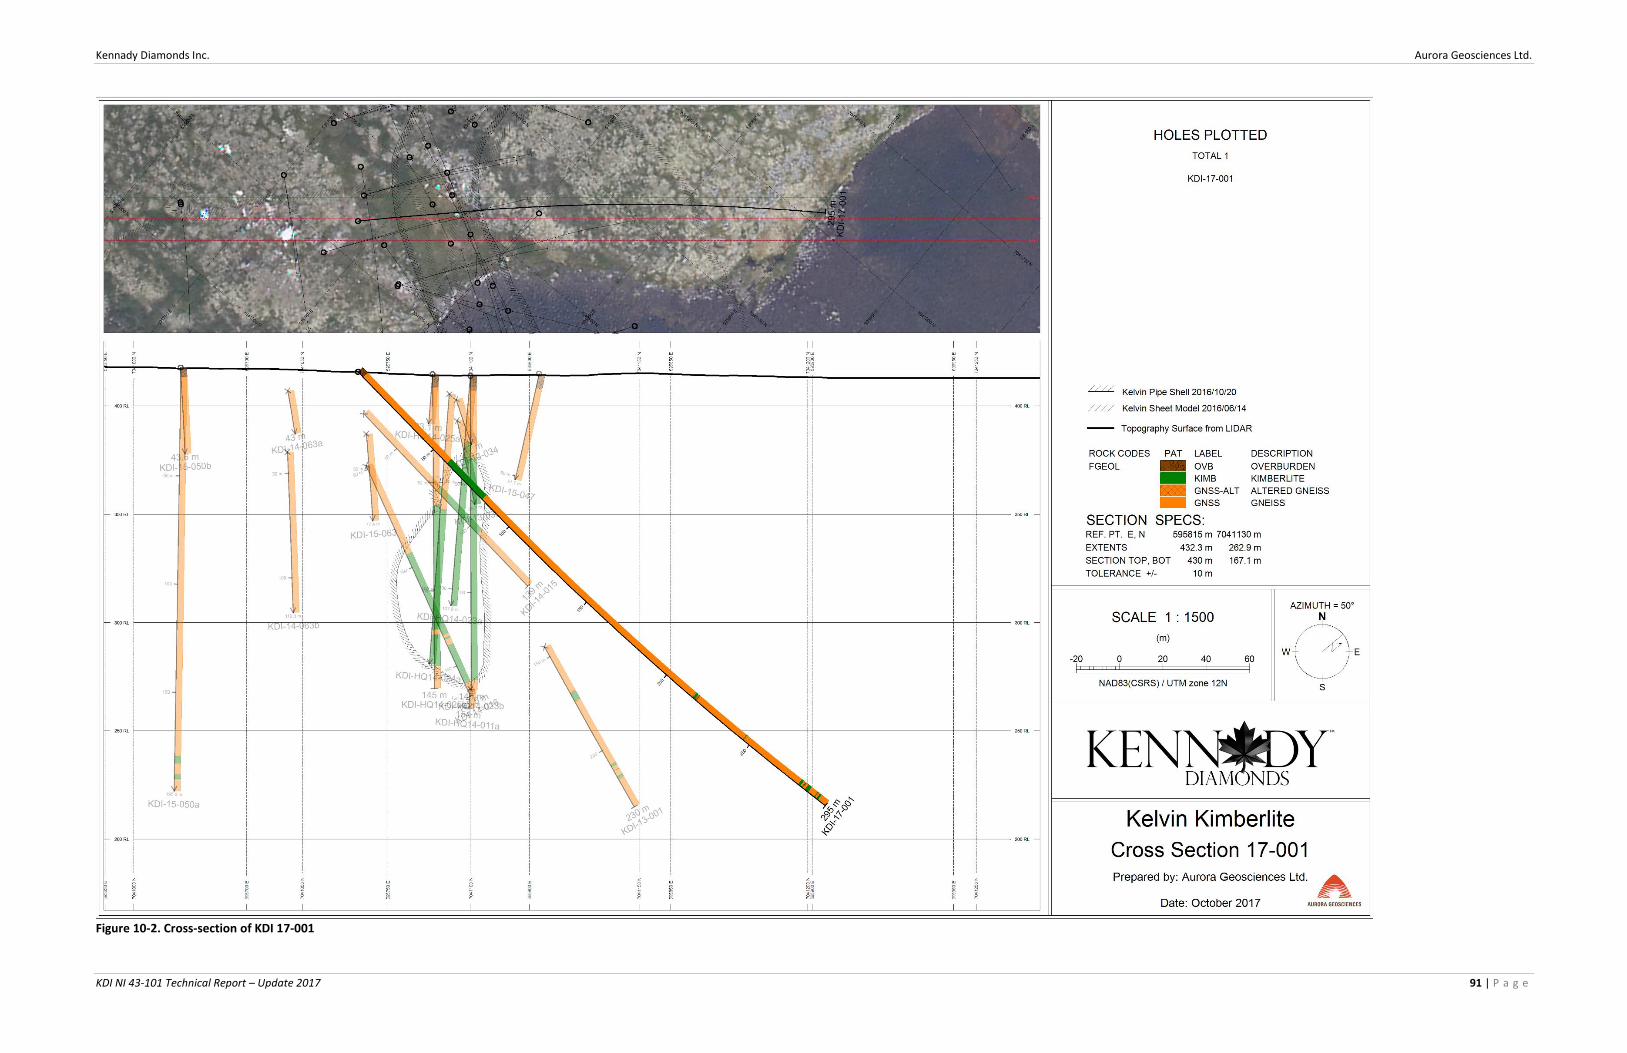
Kennady Diamonds Inc. Aurora Geosciences Ltd.
KDI NI 43-101 Technical Report – Update 2017 91 | P a g e
Figure 10-2. Cross-section of KDI 17-001
Kennady Diamonds Inc. Aurora Geosciences Ltd.
KDI NI 43-101 Technical Report – Update 2017 92 | P a g e
Figure 10-3. Plan Map of the Faraday 2 Drilling - 2017
Kennady Diamonds Inc. Aurora Geosciences Ltd.
KDI NI 43-101 Technical Report – Update 2017 93 | P a g e
Figure 10-4. Long Section of Faraday 2 Drilling – 2017
Kennady Diamonds Inc. Aurora Geosciences Ltd.
KDI NI 43-101 Technical Report – Update 2017 94 | P a g e
Figure 10-5 . Plan View of Faraday 1-3 Drilling - 2017
Kennady Diamonds Inc. Aurora Geosciences Ltd.
KDI NI 43-101 Technical Report – Update 2017 95 | P a g e
Large Diameter Reverse Circulation (RC) Bulk Sample 2017
10.5.1 Introduction
The large diameter reverse circulation (LDRC) program was initiated on January 19th, 2017 and culminated
April 10th, 2017. The bulk of the drilling was completed with one RC drill although a second unit was
deployed between the dates of February 13th and April 1st, 2017 to guarantee all goals were met. The
goals of the 2017 were as follows:
i) Bulk sample the Faraday 2 kimberlite using sample divisions established from the detailed petrographic
descriptions and domain model created (November 2016) to determine macrodiamond grade and
carat value within each domain to establish an inferred resource.
ii) Bulk sample the Faraday 3 kimberlite using sample divisions established from the detailed petrographic
descriptions and domain model created (November 2016) to determine macrodiamond grade and
carat value within each domain to establish an inferred resource.
iii) Obtain a small bulk sample from the Faraday 1 kimberlite using sample divisions established from the
detailed petrographic descriptions and domain model created (March 2017) to obtain a basic
assessment of macrodiamond grade and carat value within each domain to establish a Target For
Further Exploration (TFFE) and to inform planning work for forward evaluation.
The two reverse circulation drills cut primarily with 11” diameter pipe. There was a total of 29 holes drilled
into Faraday 2, 43 holes drilled into Faraday 3 and 4 holes drilled into Faraday 1.
This program was under the supervision of Gary Vivian, M.Sc., P.Geol., Chris Hrkac, B.Sc. and Duncan
McBean, P.Geo all of Aurora Geosciences Ltd., and Casey Hetman, M.Sc., P.Geo. of SRK Consulting. The
program was managed by Mike Waldegger, B.Sc., P.Geo.
Howard Coopersmith was an external QP for the drill program, and monitored the full processing of the
2017 bulk samples at the SRC in Saskatoon.
10.5.2 Geology of the Faraday 2 Kimberlite
A detailed description of the Faraday 2 kimberlite can be found in Section 7.3.5. The geology of the
Faraday 2 kimberlite has been established using macroscopic and microscopic investigations by Casey
Hetman. Hetman then provided instruction and guidance on identifying and sampling the known
lithological units to the RC geology team.
The Faraday 2 kimberlite is an irregular shaped and inclined pipe-like body that has been delineated over
600 m and remains open to the northwest. The body varies in width between 30-50 m and the vertical
thickness ranges between 10-100 m, outcropping (at lake bottom) at the southeast end and is about 50
m thick at the furthest delineated northwest end. The kimberlite dips at almost 40° to the northwest.
Bulk sampling of the Faraday 2 kimberlite during 2017 used the geological model outlined in Table 10-3.
The reader is reminded that detailed descriptions of each unit occur in Section 7.3.5.
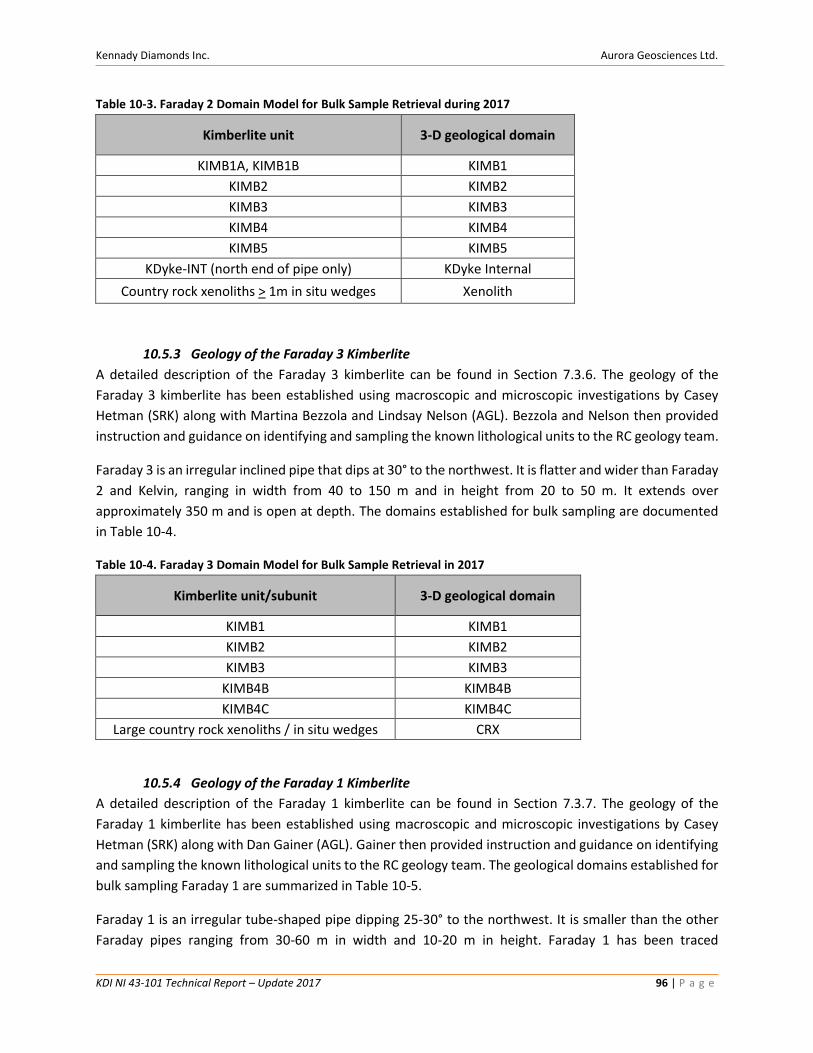
Kennady Diamonds Inc. Aurora Geosciences Ltd.
KDI NI 43-101 Technical Report – Update 2017 96 | P a g e
Table 10-3. Faraday 2 Domain Model for Bulk Sample Retrieval during 2017
Kimberlite unit 3-D geological domain
KIMB1A, KIMB1B KIMB1
KIMB2 KIMB2
KIMB3 KIMB3
KIMB4 KIMB4
KIMB5 KIMB5
KDyke-INT (north end of pipe only) KDyke Internal
Country rock xenoliths > 1m in situ wedges Xenolith
10.5.3 Geology of the Faraday 3 Kimberlite
A detailed description of the Faraday 3 kimberlite can be found in Section 7.3.6. The geology of the
Faraday 3 kimberlite has been established using macroscopic and microscopic investigations by Casey
Hetman (SRK) along with Martina Bezzola and Lindsay Nelson (AGL). Bezzola and Nelson then provided
instruction and guidance on identifying and sampling the known lithological units to the RC geology team.
Faraday 3 is an irregular inclined pipe that dips at 30° to the northwest. It is flatter and wider than Faraday
2 and Kelvin, ranging in width from 40 to 150 m and in height from 20 to 50 m. It extends over
approximately 350 m and is open at depth. The domains established for bulk sampling are documented
in Table 10-4.
Table 10-4. Faraday 3 Domain Model for Bulk Sample Retrieval in 2017
Kimberlite unit/subunit 3-D geological domain
KIMB1 KIMB1
KIMB2 KIMB2
KIMB3 KIMB3
KIMB4B KIMB4B
KIMB4C KIMB4C
Large country rock xenoliths / in situ wedges CRX
10.5.4 Geology of the Faraday 1 Kimberlite
A detailed description of the Faraday 1 kimberlite can be found in Section 7.3.7. The geology of the
Faraday 1 kimberlite has been established using macroscopic and microscopic investigations by Casey
Hetman (SRK) along with Dan Gainer (AGL). Gainer then provided instruction and guidance on identifying
and sampling the known lithological units to the RC geology team. The geological domains established for
bulk sampling Faraday 1 are summarized in Table 10-5.
Faraday 1 is an irregular tube-shaped pipe dipping 25-30° to the northwest. It is smaller than the other
Faraday pipes ranging from 30-60 m in width and 10-20 m in height. Faraday 1 has been traced
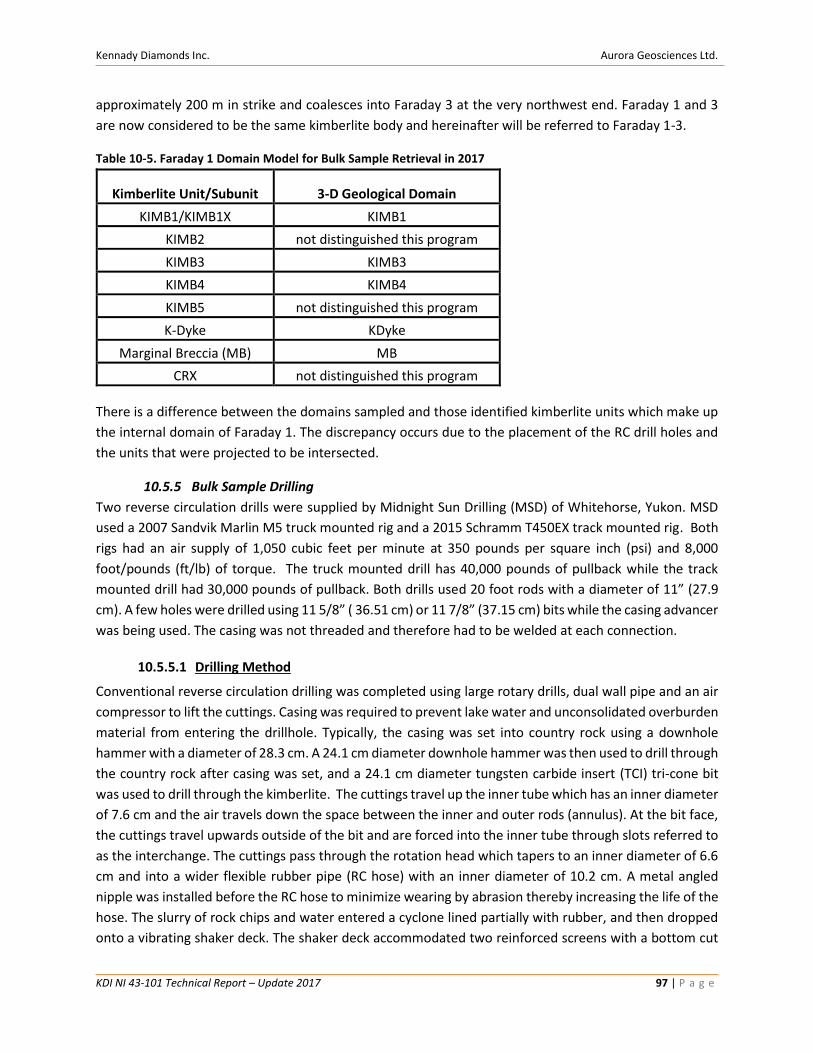
Kennady Diamonds Inc. Aurora Geosciences Ltd.
KDI NI 43-101 Technical Report – Update 2017 97 | P a g e
approximately 200 m in strike and coalesces into Faraday 3 at the very northwest end. Faraday 1 and 3
are now considered to be the same kimberlite body and hereinafter will be referred to Faraday 1-3.
Table 10-5. Faraday 1 Domain Model for Bulk Sample Retrieval in 2017
Kimberlite Unit/Subunit 3-D Geological Domain
KIMB1/KIMB1X KIMB1
KIMB2 not distinguished this program
KIMB3 KIMB3
KIMB4 KIMB4
KIMB5 not distinguished this program
K-Dyke KDyke
Marginal Breccia (MB) MB
CRX not distinguished this program
There is a difference between the domains sampled and those identified kimberlite units which make up
the internal domain of Faraday 1. The discrepancy occurs due to the placement of the RC drill holes and
the units that were projected to be intersected.
10.5.5 Bulk Sample Drilling
Two reverse circulation drills were supplied by Midnight Sun Drilling (MSD) of Whitehorse, Yukon. MSD
used a 2007 Sandvik Marlin M5 truck mounted rig and a 2015 Schramm T450EX track mounted rig. Both
rigs had an air supply of 1,050 cubic feet per minute at 350 pounds per square inch (psi) and 8,000
foot/pounds (ft/lb) of torque. The truck mounted drill has 40,000 pounds of pullback while the track
mounted drill had 30,000 pounds of pullback. Both drills used 20 foot rods with a diameter of 11” (27.9
cm). A few holes were drilled using 11 5/8” ( 36.51 cm) or 11 7/8” (37.15 cm) bits while the casing advancer
was being used. The casing was not threaded and therefore had to be welded at each connection.
10.5.5.1 Drilling Method
Conventional reverse circulation drilling was completed using large rotary drills, dual wall pipe and an air
compressor to lift the cuttings. Casing was required to prevent lake water and unconsolidated overburden
material from entering the drillhole. Typically, the casing was set into country rock using a downhole
hammer with a diameter of 28.3 cm. A 24.1 cm diameter downhole hammer was then used to drill through
the country rock after casing was set, and a 24.1 cm diameter tungsten carbide insert (TCI) tri-cone bit
was used to drill through the kimberlite. The cuttings travel up the inner tube which has an inner diameter
of 7.6 cm and the air travels down the space between the inner and outer rods (annulus). At the bit face,
the cuttings travel upwards outside of the bit and are forced into the inner tube through slots referred to
as the interchange. The cuttings pass through the rotation head which tapers to an inner diameter of 6.6
cm and into a wider flexible rubber pipe (RC hose) with an inner diameter of 10.2 cm. A metal angled
nipple was installed before the RC hose to minimize wearing by abrasion thereby increasing the life of the
hose. The slurry of rock chips and water entered a cyclone lined partially with rubber, and then dropped
onto a vibrating shaker deck. The shaker deck accommodated two reinforced screens with a bottom cut
Kennady Diamonds Inc. Aurora Geosciences Ltd.
KDI NI 43-101 Technical Report – Update 2017 98 | P a g e
of 0.85 mm. Material less than 0.85 mm in size reported to the slimes tank under the shaker deck. A
vacuum truck was required to remove the cuttings in the slimes tank many times per shift and the material
was deposited into a land-based sump.
10.5.5.2 Drillhole Planning and Preparation
On January 4th, 2017, a drill hole planning session included Rory Moore and Tom McCandless from KDI,
Gary Vivian and Chris Hrkac from AGL, Mike Diering and Casey Hetman from SRK and Mike Waldegger
form MFW. A total of 76 holes were targeted for the Spring drilling program with 29 holes to be completed
on Faraday 2 and 43 holes on Faraday 3. The plan was to retrieve a total of approximately 250 tonnes
each from Faraday 2 and Faraday 3 planning for a NI 43-101 compliant Inferred Resource. A total of 4
holes were targeted for Faraday 1 to provide diamond evaluation data and determine a TFFE (Target for
Further Exploration).
All drill collars were located with a Leica Viva GS15/CS15 RTK Global Positioning System (GPS). The
coordinates with an accuracy of 8 mm in the horizontal plane and 15 mm in the vertical plane were
downloaded into the database During the drill program, the collars were marked with flagging and the
hole number was written on the flagging. The flagging was held in place on the ice with a screw drilled
into the ice at the collar. All collars were covered with a bright orange traffic cone to eliminate driving
over the marked collar locations.
10.5.5.3 Caliper Survey
The caliper survey had two purposes: i) to determine the volume of material sampled in each hole, and ii)
to determine the volume of cement required to cement each hole.
Each hole was surveyed by DGI Geoscience Inc. (DGI) of Toronto, ON, using a three-arm caliper instrument.
A secondary unit was on site for back-up. A second survey was run on holes KDI LD15-003 and 006 to
ensure both units were functioning properly.
The caliper information was reported in 5 m intervals down the hole and compared to a theoretical
volume based on a cylinder with a diameter of 24.1 cm, in 2015 drill holes, and 27.9 cm, in 2016. Final
manipulations included depth corrections and the incorporation of the inner diameter of the casing as a
calibration point. Theoretical volumes were always about 3% less than calculated volumes, due to the
inhomogeneities within the rocks. Some holes, like KDI-LD17-096, 107 and 130, had the volumes
estimated due to hole collapse and there was no interest in losing the tool.
10.5.5.4 Gamma Survey
Gamma surveys were run to aid in the interpretation of geology and as density checks. The gamma probe
is effective in detecting radiation from elements such as potassium which can be a common element in
granitoid or gneissic host rocks. The survey was an add-on to the caliper survey as they could be run in
sequence. The gamma probe was effective in delineating cap rock and host rock dilution within the
kimberlite bodies. Commonly the radiation increased down hole in the kimberlite due to the increase in
host rock dilution of the kimberlite. The gamma survey was not completed on every hole.
Kennady Diamonds Inc. Aurora Geosciences Ltd.
KDI NI 43-101 Technical Report – Update 2017 99 | P a g e
10.5.5.5 Drill Monitoring System
Digital monitoring systems were provided by Pason Systems of Calgary, AB. Sensors were installed on the
both drill rigs to monitor and record depth in imperial and metric, rate of penetration (ROP), air pressure,
RPM, down-feed pressure and torque. The information was transmitted to Pason via on-site satellite and
made available graphically through a web based application almost in real time, to those persons assigned
access. The information was exported at the end of the program and presented in strip logs for each hole
and in long sections. The downhole trends of some parameters provided support to the geological logs.
For example, typically changes in ROP down feed pressure and torque were indicators of change in
geology, and compared well to observations in the chip logs.
10.5.5.6 Drillhole Closure
During 2017, the cementing of all holes was completed by CR Enterprises out of Yellowknife, NT. All holes
were back-filled with cement to the casing. A sample of the cement was gathered by the rig geologist for
strength testing at camp using a point load tester. Some samples were also sent for testing to Queen’s
University.
Casing was removed from all holes. If the casing could not be freed easily by pulling back on it, a casing
cutter was used to cut casing at lake bottom and the remainder of the casing was removed.
Minor amounts of cuttings were deposited on the ice pads during drilling and these cuttings were
removed either by machine scraping or hand scraping. The cuttings were placed in either an approved
land-based sump or environmental containment drums to be removed from site.
10.5.5.7 SUMMARY OF REVERSE CIRCULATION DRILLING RESULTS - 2017
Faraday 2 Kimberlite
The 2017 LDRC program at Faraday 2 comprised 29 holes totaling 3,471 m of drilling. There was a total of
1,794 m of kimberlite and 1,311 m of country rock intersected during this drill program. Drill holes were
spaced 5-10 m apart in clusters of 5-7 holes. The clusters were 25-50 m apart along the trace of Faraday
2. The drill plan is shown in Figure 10-6.
The total volume of kimberlite removed by drilling was measured using a three-arm caliper to be 116.2
m3 which is estimated (based on average estimates of bulk density by domain, see Section 14.2.3) to be
275.38 tonnes. Approximately 40% of this material reported to the undersize tank and the final collected
sample sent to the laboratory was 169.9 tonnes. Final bag masses will be less than field calculated masses
for the bags due to thawing and water loss through the bags.
Faraday 3 Kimberlite
The 2017 LDRC program at Faraday 3 comprised 43 holes totaling 4,234 m of drilling. A total of 1,747 m
of kimberlite and 1,963 m of country rock was intersected during this program. The drill holes were spaced
5 m apart along 4 grid lines and in four clusters. A fifth grid line had two holes completed. The drill plan is
shown in Figure 10-7.
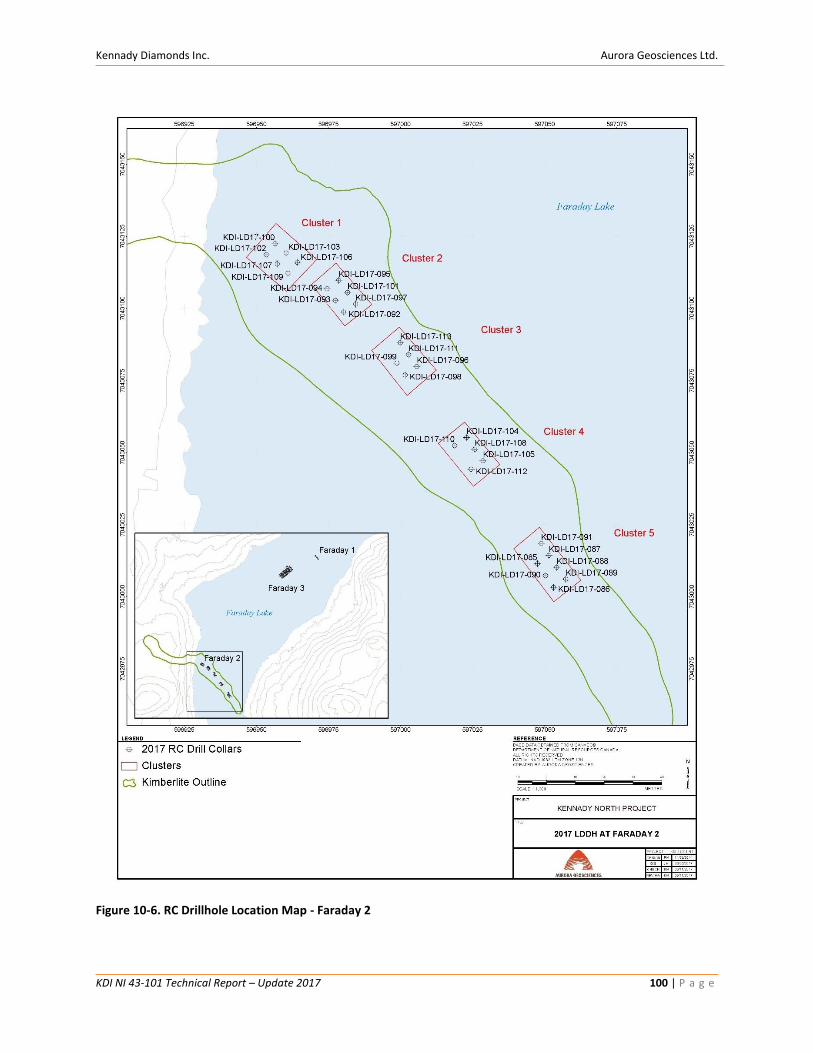
Kennady Diamonds Inc. Aurora Geosciences Ltd.
KDI NI 43-101 Technical Report – Update 2017 100 | P a g e
Figure 10-6. RC Drillhole Location Map - Faraday 2
Kennady Diamonds Inc. Aurora Geosciences Ltd.
KDI NI 43-101 Technical Report – Update 2017 101 | P a g e
Figure 10-7. RC Drill Hole Location Map - Faraday 3
Kennady Diamonds Inc. Aurora Geosciences Ltd.
KDI NI 43-101 Technical Report – Update 2017 102 | P a g e
The total volume of kimberlite removed was estimated by a three-arm caliper survey to be 114.4 m3 and
is estimated (based on average estimates of bulk density by domain, see Section 14.2.3) to be 279.42
tonnes. Approximately 40% of this material reported to the undersize tank and the final collected sample
was 175.3 tonnes. The final mass of the sample by the time it gets to the lab will be less than the field
mass due to thawing and water loss through the bags.
SRK provided the block model densities based upon density measurements from drill core samples.
Faraday 1 Kimberlite
The 2017 large diameter reverse circulation program completed at Faraday 3 comprised a total of 4 drill
holes comprising 303 m of drilling. This drilling intersected 162 m of kimberlite and 78.6m of country rock.
The drill plan is shown in Figure 10-8.
The total volume of kimberlite removed was measured by a three-arm caliper and determined to be 10.1
m3 and is estimated (based on average estimates of bulk density by domain, see Section 14.2.3) to be
24.42 tonnes. Approximately 40% of this material reported to the undersize tank, with the final collected
sample weighing 20.8 tonnes. It is assumed the final mass will be less once the sample reaches the
laboratory due to thaw and water loss through the bags.
SRK provided the block model densities based upon density measurements from drill core samples.
10.5.5.8 Bulk Sample Results from the 2017 RC Program on the Faraday Kimberlites
The 2017 RC drill program completed a total of 76 drill holes from which a calculated mass (based on
caliper volume measurements and average estimates of bulk density) of 579.22 tonnes of kimberlite were
recovered. Sampled material was trucked in secured ore bags to the SRC in Saskatoon, SK. Sample
preparation and analyses are detailed in Section 11.2. The sample processing was supervised by Howard
Coopersmith, under contract to KDI. The results from the 2017 bulk sampling program are summarized
below in Table 10.2.5.8.1.1. All kimberlite was processed with a bottom cut-off of 0.85 mm.
Table 10.5.5.7.3.1. Bulk sample results from large diameter drilling of the Faraday kimberlites in 2017
Body Holes Metres Kimberlite
intersection (m) Sample mass (t)
Diamonds (+0.85 mm)
Carats (+0.85 mm)
Faraday 1 4 303 162 24.42 1,184 76.84
Faraday 2 29 3,471 1,794 275.38 14,310 737.58
Faraday 3 43 4,234 1,747 279.42 7,519 460.54
Total 2017 76 8,008 3,703 579.22 23,013 1,274.96
Kennady Diamonds Inc. Aurora Geosciences Ltd.
KDI NI 43-101 Technical Report – Update 2017 103 | P a g e
Figure 10-8. RC Drill Hole Location Plan for Faraday 1 in 2017
Kennady Diamonds Inc. Aurora Geosciences Ltd.
KDI NI 43-101 Technical Report – Update 2017 104 | P a g e
11 SAMPLE PREPRATION, ANALYSES AND SECURITY
DIAMOND DRILL CORE SAMPLING and SECURITY
Logging of diamond drill core was completed using a standard operating procedure (SOP) for each
program.
All core was moved from drill shack to camp via helicopter or snowmachine. The core was arranged in the
core shack. A geotech would then ensure core was in order, broken pieces reassembled, core boxes were
marked properly with meterage markers and labels, Total Core Recovery (TCR) in metres, Rock Quality
Designation (RQD) in metres, magnetic susceptibility readings were collected, and the information was
stored in the core database for each drillhole. The core was then quick logged by the geologist using simple
designations such as overburden, country rock and kimberlite. This information was passed on nightly to
the Project Manager in Yellowknife.
The logging geologist would then log the core; recording lithology (accurate to 0.01 m), structure,
alteration; and within kimberlite intersections estimated macrocrysts and xenoliths and marked sample
designations for representative samples.
Photos of dry core are taken before and after logging. The core is not wet for the photos to prevent
kimberlite from deteriorating. Close-up photos may also be taken to record notable features in greater
detail.
Downhole surveys were run upon completion of the drilling and prior to pulling rods. During 2012-2013,
an Icefields Gyro tool was used; replaced by a Reflex gyro tool for 2014 - 2016 and then this past season,
a Champ Navigator Tool from Axis Mining Technology was used.
The field geologist would send the full kimberlite intersection into town with at least two core boxes of
country rock core above and below the kimberlite intersection. Core was transported via aircraft from
camp to a secure warehouse at the Yellowknife Airport. The airport warehouse facilities are owned by
Great Slave Helicopters.
At the Yellowknife warehouse, detailed logging was initiated using hand written descriptions of rock type
code, core colour, mineralogy, grain size, foliation or texture with variability noted by percentage over
core length, alteration plus any other observations. A graphic log was produced by hand with rock codes.
All data was then entered into a digital entry form.
11.1.1 Diamond Drill Core Sampling for Microdiamond Analyses or Dense Media Separation
The geologist ensured lithological breaks were clearly marked with red flagging tape and samples are
collected consecutively from top to bottom respecting lithological breaks. Country rock (CR) fragments
less than 1 m are included in the kimberlite sampling, whereas CR intersections between 1-3 m are
considered separate units and CR samples greater than 3 m are left in the box and stored.
Kennady Diamonds Inc. Aurora Geosciences Ltd.
KDI NI 43-101 Technical Report – Update 2017 105 | P a g e
Each sample is generally between 8-8.5 kg but smaller samples occur in order to respect lithological
boundaries. Samples are identified with sequential sample numbers and contain depth interval, texture,
3D model code designation, comments and sample weight, with all data recorded on a sample sheet. Hole
number and sample interval are recorded in sample booklet.
Samples are placed in plastic sample bags and closed with zip ties and placed into a 20 litre bucket with 1
or 2 other samples. Sample buckets are marked with hole number, sample numbers and bucket # and
secured with three metal security tags. All pail weights and security tag numbers are recorded, and pails
are stacked on pallets two high. All sample data is entered into a Microsoft Access digital database.
The difference in sampling for dense media separation (DMS) is that any sample designated as a specific
domain (domain KIMB1, KIMB2 or KIMB3) gets placed into large Mega bags capable of holding
approximately 1 tonne of sample. Holes can be inter-mixed but the critical concern is that the samples
are separated on the basis of domain type. As such the following steps differentiate the sampling for
DMS:
Mega bags are labeled with Domain name (Domain KIMB1, KIMB2 or KIMB3) and bag # and placed on
pallets. The geologist reviews geology contacts to ensure samples will be placed into the proper mega
bag. All xenoliths are included in their respective sample domains. Marginal breccia is not included, nor is
country rock that is considered to be in-situ.
The geologist removes all marking blocks and flagging from core boxes and samples one domain at a time
down hole ensuring that all core material, even fine sand, makes it into the mega bag. Once mega bag is
full, a heavy-duty metal security tag is placed around the top to close the bag and security tag number is
recorded in the detailed logging table.
Once all kimberlite intercepts have been dumped into mega bags, a summary table is compiled with
number of bags in each zone with corresponding security tag numbers.
11.1.2 Drill Core Sample Shipments and Security
Chain of custody paperwork is filled out which is submitted with sample shipment, in a closed and locked
trucking van. More detailed standard operating procedures (SOPs) for lithological and geotechnical
logging, sampling for microdiamond and macrodiamond analyses (using caustic fusion and dense media
separation) have been designed by SRK Consulting.
Samples are shipped to Saskatchewan Research Council’s Geoanalytical Lab in Saskatoon, SK.
11.1.3 Caustic Fusion Analysis of Diamond Drill Core
Processing information in this section was provided by the Saskatchewan Research Council (SRC)
Geoanalytical Laboratory and is documented in Figure 11-1. The caustic fusion process begins with 75 kg
of virgin caustic (NaOH) in a 40 litre furnace pot. An 8 kg sample is then loaded on top of the caustic,
followed by bright yellow synthetic diamonds, 150 to 212 μm (micrometres) which are used as a spike.
The furnace pot is heated in a kiln to 550°C for 40 hours then removed and allowed to cool. The molten
sample is poured through a 106 μm screen, which is then discarded after use. Micro-diamonds and other
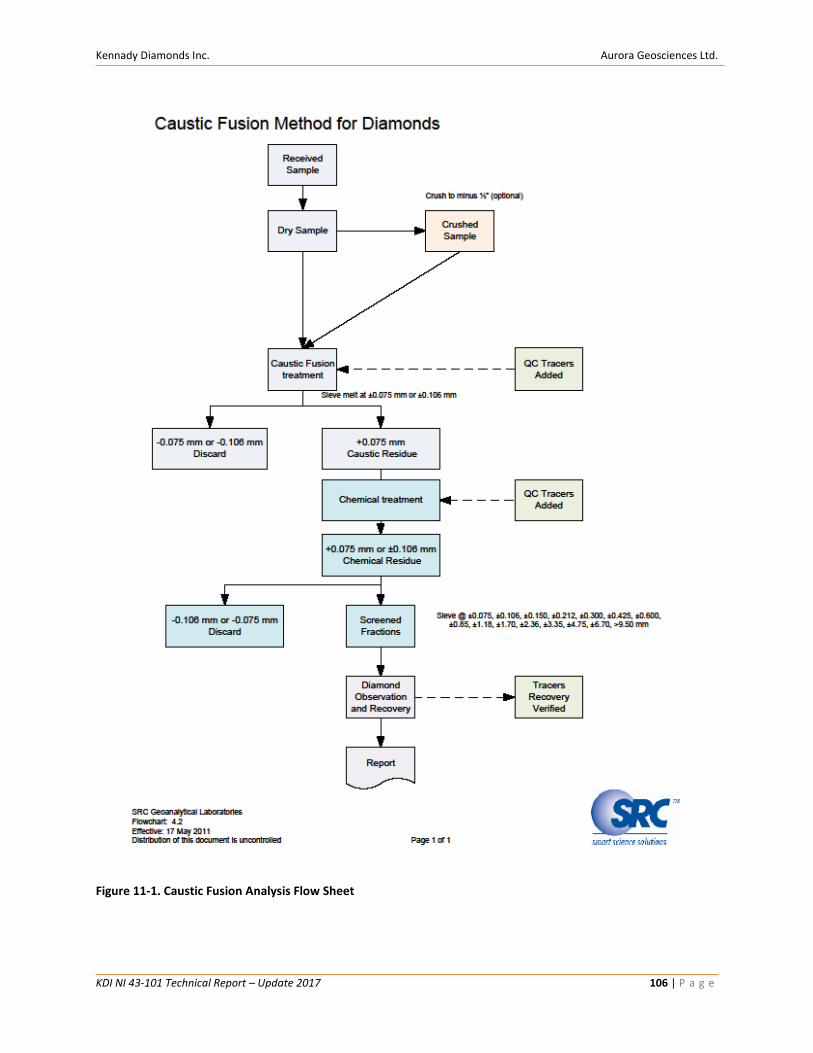
Kennady Diamonds Inc. Aurora Geosciences Ltd.
KDI NI 43-101 Technical Report – Update 2017 106 | P a g e
Figure 11-1. Caustic Fusion Analysis Flow Sheet
Kennady Diamonds Inc. Aurora Geosciences Ltd.
KDI NI 43-101 Technical Report – Update 2017 107 | P a g e
insoluble minerals (typically ilmenite and chromite) remain on the screen. The furnace pot is then soaked
with water to remove any remaining caustic and micro-diamonds. The water is poured through the same
screen.
Additional steps are required to remove ilmenite, chromite and other materials from the concentrate. The
samples are sent to the “wet” lab where acid is used to neutralize the caustic solution. The residue is then
rinsed and treated with acid to dissolve readily soluble materials.
Samples are then transferred to a zirconium crucible along with bright yellow synthetic diamonds as a
spike and fused with sodium peroxide to remove any remaining minerals other than diamond from the
sample. The sample is allowed to cool and then decanted through wet screens to divide and classify the
recovered diamonds. Stones are stored in plastic vials filled with methanol.
LARGE DIAMETER REVERSE CIRCULATION DRILLING, SAMPLING and SECURITY
The purpose of the security measures established for the bulk sampling program was to ensure that
macrodiamonds were not removed or added to the kimberlite sampled.
11.2.1 Data Records
Observations at the rig were recorded onto paper forms and all depths were measured in imperial units
to match the drilling procedures. The hand-written records were transcribed to multiple spreadsheets in
a single digital workbook. At the end of each shift, the workbooks were date stamped and transferred to
the server in camp using a USB memory stick. Each shift’s date stamped file was retained on the server,
and a final completed file was saved and appended to a master file. The original hand-written logs were
organized into 3-ring binders.
All data records were checked line by line by several personnel directly involved in the sampling, and the
entire database was checked by Mr. Waldegger, P.Geo., “QP”, through a detailed review, and presented
in strip logs and in long sections. All observed errors were corrected in the final data tables and the original
data sheets were scanned to PDF files and stored in Yellowknife.
11.2.2 Representative Chip Samples
Representative samples were collected into 235 ml clear plastic containers supplied by Uline Canada Corp.
and logged at the drill rig by the rig sampler. The representative sample was collected every 3.1 m in the
country rock and every 0.9 m close to the contact with, and within, the kimberlite. The depth and time
that the sample was collected was recorded on the lid of the sample container and on the hard copy log.
Representative samples were stored in the rig sampler’s shack and transported to the core shack in camp
at the end of each shift. Samples were transported to Yellowknife after being logged in detail in the camp,
and stored in the warehouse. All samples were organized by hole, opened for drying and photographed
and are available for re-examination if required.
11.2.3 Rig Logs
The purpose of logging the representative chip samples at the rig was to aid in the subdivision of bulk
sample bags by domain.
Kennady Diamonds Inc. Aurora Geosciences Ltd.
KDI NI 43-101 Technical Report – Update 2017 108 | P a g e
The following observations were recorded by the rig sampler: percent kimberlite, percent country rock,
percent clay, time of collection and sample colour. Comments on drilling conditions and minerals
observed were also recorded when relevant. Predicted domain subdivisions that were based on the
current 3D geological model were available to the rig sampler as a guide to help classify the chips by
domain. Overall the rig logs were very similar to the predicted model.
Rig logs were plotted in the GEMS program to confirm consistency with the 3D geological model being
monitored in Leapfrog.
11.2.4 Chip Logs
The purpose of logging the representative chip samples in detail was to confirm the geology of the bulk
bag intervals.
The representative chip samples collected by the rig samplers were logged in camp with the aid of two
Nikon SZM1000 binocular microscopes with a halogen lighting system. Logging was performed by Martina
Bezzola and Dan Gainer (AGL) who were trained on kimberlite rock types by Casey Hetman (SRK). The
following observations were recorded for each representative sample: depth, percent chips above 5, 10,
20, and 30 mm, hardness, percent clay, country rock and kimberlite, colour, percent olivine, garnet,
magmaclasts and texture. Based on these observations the samples were classified by domain where
possible. In most cases the boundaries logged were similar to the rig based logs and the 3D model.
Exceptions were mostly due to difficulties in accurately estimating in-situ country rock dilution, likely
because a higher proportion of the kimberlite reported to the undersize preferentially over the country
rock, resulting in an apparent increase in country rock dilution. Distinguishing KIMB4B from KIMB4C at
Faraday 3 was extremely challenging using the chip samples.
Chip log domain codes were reviewed in Leapfrog to confirm consistency with the 3-D geological model.
Differences in chip log geology and core hole geology do exist and need to be investigated further. A
selection of chips from Faraday 2 were submitted for further petrographic study.
11.2.5 Bulk Samples
The purpose of collecting the bulk sample was to determine the grade of the various internal geological
domains identified, as well as to estimate the dollar per carat value of the macrodiamonds recovered.
Due to the inclined nature of the kimberlite and the orientation of the internal domains, sampling based
on elevation, which is standard procedure in many kimberlite bulk sampling programs, was not
implemented. Bags were changed at domain contacts established in the current 3D geological model,
based on core logs, and supplemented by observations in the chips. In most cases the bag changes were
within a few metres of the predicted contacts.
Bulk samples were collected into 1 m3 poly woven “rice” bags immediately after the material passed over
the shaker table. Bags were changed based on a maximum target weight of 800 kg and domain contacts.
Typically, bags were changed at the first sign of kimberlite on the screen and the bag just before the
contact was included in the shipment to the laboratory. These bags contained mostly country rock with
trace kimberlite; however, in a few cases the bags were not changed at the upper contact and therefore
Kennady Diamonds Inc. Aurora Geosciences Ltd.
KDI NI 43-101 Technical Report – Update 2017 109 | P a g e
these contain a mix of country rock and kimberlite. In other cases, the rig geologist was able to switch the
bag before any kimberlite went into the overburden bag, and that bag was removed to the sump with the
other bags containing only overburden and country rock. Bags were labelled with a unique alphabetic
sequential sample ID, incorporating the hole number as a prefix; e.g., hole KDI-LD17-085 had four country
rock bags labelled 085OVBA to 085OVBD and eight kimberlite bags labelled 085A to 085F. No sample
labels or tags were inserted into the bags.
To facilitate bag changes, the drilling was temporarily stopped and bags were removed from the drill
enclosure using a loader. A new bag was positioned and drilling continued. The bag was weighed using a
digital scale and sealed using a metal cable lock with a unique number engraved on the coupler. Bags were
set onto covered pallets and transported to the bulk sample laydown area and organized by hole.
All bags were checked prior to shipping for errors in documentation, adequate sealing and damage.
Compromised bags were documented and double bagged.
The following information was recorded for each bulk sample bag: sample ID, depth interval in feet, mass
in kilograms, unique security seal number, sampler’s name, date sampled and comments. The data was
checked line by line in the spreadsheet for typos in seal numbers, and errors in depth intervals. Bag
weights and security seals recorded in the field were cross-checked with those recorded by the laboratory.
A total of 582 bulk bags containing kimberlite were collected and shipped to the Saskatchewan Research
Council in Saskatoon, SK. Six bags were set aside not to be processed as they were logged as not containing
any kimberlite.
11.2.6 Underflow Samples
The purpose of collecting underflow samples was to determine diamond breakage and ensure that no
diamonds larger than the shaker table screen size were reporting to the undersize.
Samples of the material <0.85 mm falling through the screen were collected by kimberlite domain. Two
troughs made from 3 inch angle iron were installed under the shaker table and were oriented
perpendicular to the material flow. Material falling into the troughs flowed into buckets suspended by a
hook at the end of each trough. Buckets were switched at domain contacts coincident with other sample
change overs. Water was drained from the buckets before sealing with lids and the buckets were
transported to the core shack at the end of each shift. Part way through the program the procedure
changed, to collecting material into only one five litre pail from the trough closest to the back of the shaker
table where most of the de-sliming occurred. If a drilled domain was particularly thick, it was therefore
possible that only the top portion of the domain was sampled for underflow material. Buckets were
labelled using permanent marker on the lid and the side of the bucket with “Underflow”, the hole ID and
the domain name (e.g. UF 085KIMB1). The following data were recorded for each underflow sample:
depth interval in metres, domain, mass in kilograms, comments, sampler’s name, date sampled.
The underflow samples were shipped to Yellowknife for storage. An analysis of these samples will be
undertaken should there be indication there is significant diamond breakage.
Kennady Diamonds Inc. Aurora Geosciences Ltd.
KDI NI 43-101 Technical Report – Update 2017 110 | P a g e
11.2.7 Granulometry Samples
The purpose of collecting granulometry samples was to determine the particle size distribution (PSD) of
the drilled material making up the bulk samples.
A half-filled 135 ml sample jar was collected every metre, approximately at the same time as the
representative sample was collected, and was placed into a small poly woven rice bag set inside a 20 litre
PVC pail. Samples were prevented from freezing and were transported at the end of each shift to the core
shack in camp for drying. Multiple samples were placed into 20 litre PVC buckets and labelled using
permanent marker on the lid and the side of the bucket with “Granulometry”, the hole ID and the domain
names (e.g., Granulometry, KDI-LD17-085, KIMB1). The following data were recorded for each
granulometry sample: depth interval in feet, domain, mass in kilograms, comments, sampler’s name, date
sampled.
While drilling at Faraday 2, samples were collected into intervals corresponding to the bulk sample
megabag intervals and assigned a sample-ID which included the bulk sample-ID (eg. Gran085B). This is
different from last year and provided a PSD which includes the same input sample material of the bulk
sample domains.
While drilling at Faraday 3 and 1, samples were collected over each entire kimberlite domain per drill hole
as identified at the rig. In some cases, the detailed logging identified a contact Above or below where the
rig sampler identified the same contact. In these cases, the PSD reflects the bulk sample domain with a
minor amount of cross contamination from material from a contacting domain.
Samples were shipped to SRC for processing. Individual samples were grouped into their corresponding
bulk sample domain, combined, and a split of approximately 2 kg was analyzed. Upon completion of
analysis, the material was processed through the DMS plant along with their respective process groups.
This is different from the previous year when all the granulometry material was processed as one sample
and the diamonds could not be allocated to their specific domains.
11.2.8 Onsite Security
Security measures included the setup and off-site monitoring of digital video surveillance, access control,
and cable seals for samples. One camera which broadly covered the drilling vicinity and one camera at
each drill rig, providing coverage of the shaker table, were setup at the beginning of the program. The
video was archived onto disks. Access to the sample recovery area (shaker table to sample bag) was
limited to rig geologists working on shift as well as relevant drilling staff, and the area had posted
restricted access signs. Bulk sample bags were sealed using a metal cable lock with a unique number
engraved on the coupler. Bags were temporarily stored at the bulk sample laydown area organized by
hole and all bags were checked prior to shipping for adequate sealing by the senior site geologist. Howard
Coopersmith, P.Geo., “QP”, made a site visit, February 20-25th, 2015, to inspect security measures in place.
No diamond pick-ups were reported during the collection of the bulk samples and no diamonds were
observed while working on the rigs or handling the samples. All video footage was reviewed by an
independent third-party contract through AGL.
Kennady Diamonds Inc. Aurora Geosciences Ltd.
KDI NI 43-101 Technical Report – Update 2017 111 | P a g e
11.2.9 Sample Shipment and Security
The purpose of establishing chain of custody procedures for the bulk samples was to ensure that bags
arrived at the SRC without incident and to provide documentation supporting this.
Chain of custody began with the collection of the sample and recording the sample bag number, seal
number, and bag weight. These data were compared by the senior site geologist to the records
documented by receipt at the SRC in Saskatoon. Minor discrepancies occurred with typos and these were
resolved.
Sean Marshall of Marshall Solutions, Yellowknife, NT managed the transfers of the samples from Kelvin
camp to the SRC. A spreadsheet of details on sample bags ready for shipment was sent to Mr. Marshall
from site and he organized the bags into shipments by truck. Supervision of on-site truck loading was
completed by an available senior site geologist. Variances to the manifests were documented by Mr.
Marshall as part of the sample chain of custody. Chain of custody documents and a spreadsheet of transfer
details were saved to the server.
Bulk samples were shipped to Yellowknife on open flat decks. The trucking company was Aurora Telecom
Systems Ltd. (ATS). In total, 24 truck shipments transported the samples from Kelvin camp to Yellowknife.
There were also 5 airborne shipments using Air Tindi’s Dash 7 aircraft. On arrival in Yellowknife, a bag was
either added directly to a highway transfer to Saskatoon or to a storage transfer area, monitored 24 hours
by a security camera, in Yellowknife awaiting the arrival of additional bags to complete a load. The truck
drivers or pilot was responsible for the samples until they were handed over to Mr. Marshall. One load
was transferred at ATS and the rest at Grimshaw Trucking L.P. Each bag was transferred between two and
four times and at each transfer the bag seals were checked.
The transportation of samples to the SRC was in closed vans and the final step in the chain of custody for
this portion of the program was the receipt of samples by the SRC laboratory in Saskatoon, SK.
All samples were transported in locked and secured panel trucks to SRC in Saskatchewan. SRC confirmed
the secured samples upon arrival and stored them in locked and secured storage areas at their facilities.
12 DATA VERIFICATION
MICRODIAMOND SAMPLES – DRILL CORE
All drill core sent for caustic fusion diamond analysis to the SRC is subjected to the process outlined in
Figure 11-3. The fusion residues are held at SRC while the recovered diamonds are sent to KDI for storage
and reference. The SRC spikes the samples for quality control and has a recovery rate of these spikes of
over 99%, for the KDI samples. This efficiency is extremely high and as such the microdiamond recoveries
are considered reliable. The SRC Diamond Services Lab is ISO 17025 accredited for caustic fusion.
Every sample is picked by a trained technician and the residue is re-picked by a senior technician to ensure
that all diamonds have been recovered. The senior technician then signs off on the sample. All technicians
are required to take annual retraining. New technicians are trained by picking spikes, first under
supervision, for up to four months.
Kennady Diamonds Inc. Aurora Geosciences Ltd.
KDI NI 43-101 Technical Report – Update 2017 112 | P a g e
There are seven container transfers and two screenings during the caustic fusion procedure. This increases
the risk of losing diamonds. The QC procedures are in place to minimize any potential loss of stones. A
designated QC Manager is in charge of all QC documentation at SRC.
MACRODIAMOND SAMPLES – DRILL CORE and RC CHIPS
All macrodiamond samples received at the SRC lab are placed in secured storage to ensure the integrity
of the samples.
Prior to sample processing, all equipment functions are checked. A quality control test is performed daily
or upon startup (prior to sample processing) to ensure that the density of the separation media meets the
operational and customer requirements. A check sample from the sample introduction mix box is taken
and the density (specific gravity) is checked using a Marcy scale. The Marcy scale is checked for accuracy
prior to each media test. The automated dense media controller is calibrated against the Marcy scale
when the density reaches the operating density.
A selection of dense media separation (DMS) synthetic tracers were added to the mix box. The recovery
on the concentrate side is plotted on a graph to determine the d50, or cut point, of the separation media.
This is the cut point at which the plant will separate the sample into concentrate and tailings material
based on the sample density.
The diamond recovery circuit is in a restricted area and all samples, concentrates, diamonds and data are
locked in safes, cabinets, drying ovens or secure rooms when not being handled. Bulk samples were
entirely consumed during treatment, and therefore check samples processed at the same or different
facility are not possible. The coarse tails DMS product consists of 1 mm to 6 mm DMS floats, and the
remaining sample represents approximately one-half of the original head weight. This material could be
audited or reprocessed to check for additional diamonds. The recovery tails of DMS concentrate minus
concentrate removed by x-ray and grease recovery is stored. This could also be audited or re-processed
to check for additional diamonds. The hand sorted recovery concentrates are also available. Audits or re-
processing of these concentrates would not seek to duplicate original sample results, but to check
diamond recovery efficiency.
Assessment of QA/QC data during processing of Faraday 2 bulk sample material in 2017 highlighted an
issue with recovery efficiency - it was noted that fine diamonds were being lost due to compromised
screen panels on process plant de-grit circuit. All discarded (undersize) de-grit material is collected, and
the relevant material was reprocessed subsequent to replacement of the compromised panels such that
lost diamonds could be recovered. This issue was identified and remedied, and has not compromised the
validity of these samples for use in grade estimation (see Section 14.2.4 for details on how this was
resolved).
DRILL DATA
Drill collars were located in 2012 and 2013 using a Trimble GeoXT DGPS with sub-metre accuracy, and
using a Trimble GeoHT DGPS with sub-30 cm accuracy in 2014. In 2015 and 2016, a Leica GS15 RTK GPS
was used with horizontal accuracy of +/- 2 cm and a vertical accuracy of < 5 cm. Drill collars were located
Kennady Diamonds Inc. Aurora Geosciences Ltd.
KDI NI 43-101 Technical Report – Update 2017 113 | P a g e
in 2017 with a Leica GS15 RTK GPS with a horizontal accuracy of +/- 2 cm and a vertical accuracy of < 5
cm.
Downhole surveying during 2012 was a problem as the Icefields gyro tool arrived late and the first four
holes were completed using just acid tests. The dip of these holes would be considered to be low
confidence estimates. Once the Icefields tool arrived onsite, the final drilling of 2012 and all of 2013 was
completed using this tool. The Icefields tool was not equipped to handle vertical surveys so the confidence
level for vertical holes is not high. We had significant technical issues with the Icefield tool during 2013
and as such we switched to the Reflex Gyro tool in 2014.
All drilling in 2014, 2015 and 2016 was surveyed using the Reflex gyro tool with essentially no issues and
a high confidence in accuracy. Drill holes in 2017 have been surveyed using the Champ Navigator Tool
from Axis Mining Technology.
The drill survey data, both collar and down-hole, are considered to be of high confidence.
Drill hole data which was used for volume and tonnage estimates was verified by both Aurora Geosciences
Ltd. and SRK Consulting in the following manner:
i) Verification of collar data was confirmed against the printed data from the DGPS survey tool and the
original data and reports from our survey technician.
ii) Downhole data was checked against original data and print-outs from the downhole survey tools and
bad data points were removed.
iii) The end of hole points were checked with original drill log data, driller’s time sheets, printed detailed
core logs and core photos showing the end of every hole.
iv) Downhole meterage was confirmed with photos, detailed drill logs and geotechnical logs. There were
no discrepancies identified.
All drill hole data is compiled in a Microsoft Access database which is stored on server at site, in
Yellowknife and a copy with KDI in Toronto.
DENSITY DATA
The majority of the bulk density data for Kelvin and the Faraday kimberlites were collected on-rig and
tested immediately after being recovered (with lag-times of less than 12 hours). These samples were
measured in-field using a water displacement balance-method and are considered to be near in situ
measurements. Additional independent testing of bulk density has included:
1. Field sampling for strength testing of rock (uniaxial and triaxial) was completed at
Queens University Laboratory and resulted in precision measurement of cylinders of
rock (n = 10) which included the sample densities.
2. To determine the density of air-dried kimberlite, a mass/volume method was
implemented for Kelvin using large pieces of typically 0.6 m length, with more than 4
months of air-drying using right-angle sawn kimberlite (n = 70, approximately 200 kg).
Kennady Diamonds Inc. Aurora Geosciences Ltd.
KDI NI 43-101 Technical Report – Update 2017 114 | P a g e
These different approaches have produced data that are extremely similar for equivalent material,
suggesting that bulk density is well constrained. Two approaches were used to verify that moisture
content is not an issue in bulk density for samples measured using approach (1) above. This included oven-
drying (105°C for 24 hours) 20 samples from Kelvin and measuring bulk density on an additional 90
samples from Kelvin that had been dry stored for 2 years. Results of this testing confirm that the bulk
density results generated by method (1) above can be adopted as dry bulk density as moisture is not a
significant component. In conjunction with the very large and spatially representative datasets available,
the QA/QC measures adopted have verified that the bulk density data are reliable.
13 MINERAL PROCESSING AND METALLUGICAL DATA COLLECTION
INTRODUCTION
Dense media separation (DMS) has been used to extract commercial sized (+1.00 mm) diamonds from the
samples of the Faraday kimberlites. During processing of Faraday 2 samples during 2017 there was a feed
preparation screen failure (identified by red arrow on DMS flow chart) allowing +0.85mm diamonds to
pass to the grit audit which should only have seen diamonds of -0.85mm. This may cause minor issues
with a loss of diamonds for SFD which could under-estimate recoverable grade. Lost diamonds have
essentially been accounted for during grade estimation. Section 14.2.4.1 describes how this accounting
was achieved. Sample processing and diamond recovery methods employed for the 2017 RC chip samples
are outlined in the sections below. They are consistent with the methods used in processing of sample
material from the 2015 and 2016 RC drill programs (Kelvin evaluation), as detailed in Vivian and Nowicki
(2017).
DENSE MEDIA SEPARATION for MACRODIAMOND SAMPLES
Howard Coopersmith (Coopersmith, 2017) was contracted to oversee the sample processing of RC chips
using DMS in 2017. Kennady Diamonds and SRC completed agreements for sample processing, which
included standard terms and describe the scope of work in some detail for sample processing and
deliverables. The agreements called for a crushing and DMS treatment, with secondary crushing and a re-
crush circuit utilizing the SRC 5 tonne per hour (“tph”) DMS plant, and peripherals including a High
Pressure Grinding Roll (HPGR) re-crush. DMS concentration would be of a +0.85 mm -12 mm feed material.
Heavy mineral concentrate from the DMS would be treated in the SRC two stage Flow Sort X-ray sorter
and vibrating grease table recovery circuit. Recovery concentrates would be hand sorted in the secure
SRC Macro Room utilizing glove boxes. The final recovered diamonds would be sieved, weighed and
described as warranted. SRC has standard operating procedures in place for the operation of the above
circuits and includes a comprehensive security regime.
The SRC 5 tph DMS Plant is routinely used for the treatment of bulk exploration samples for the recovery
of diamonds. Each stage of treatment of the Faraday bulk samples is described below as outlined in the
SOPs, and modifications and special circumstances are noted. The equipment was operated by, and the
process performed by trained SRC staff. Actual sample treatment and sorting occurred during April to
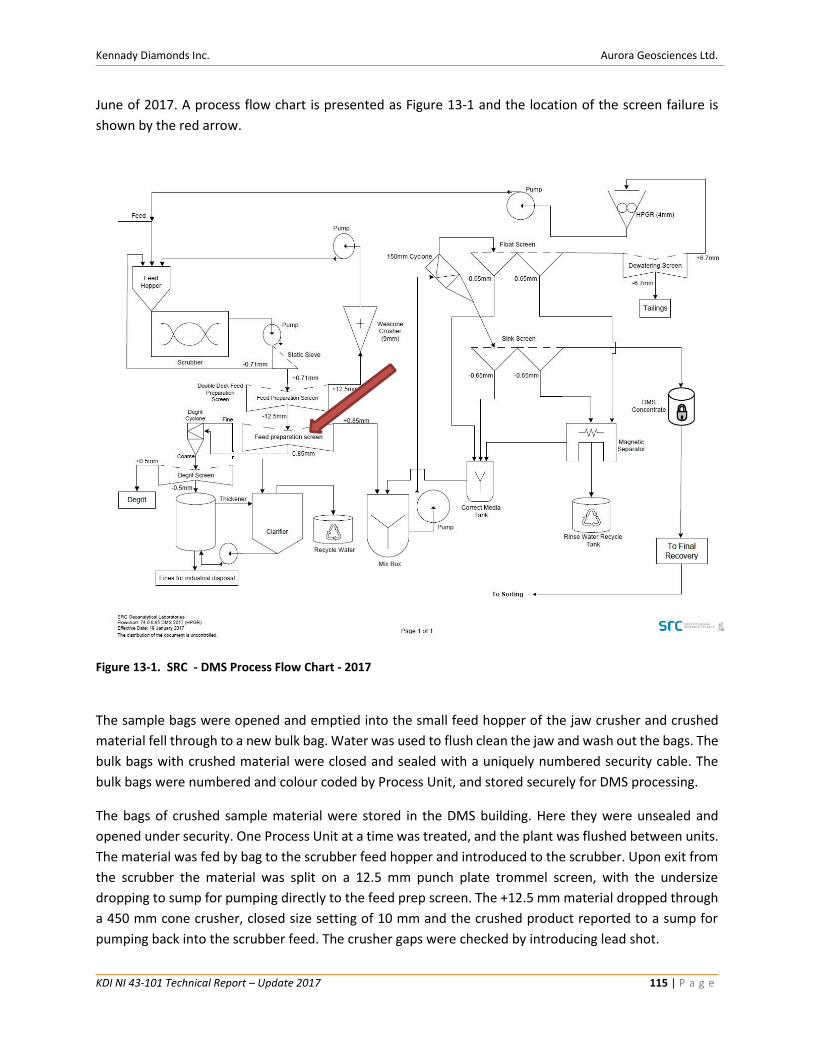
Kennady Diamonds Inc. Aurora Geosciences Ltd.
KDI NI 43-101 Technical Report – Update 2017 115 | P a g e
June of 2017. A process flow chart is presented as Figure 13-1 and the location of the screen failure is
shown by the red arrow.
Figure 13-1. SRC - DMS Process Flow Chart - 2017
The sample bags were opened and emptied into the small feed hopper of the jaw crusher and crushed
material fell through to a new bulk bag. Water was used to flush clean the jaw and wash out the bags. The
bulk bags with crushed material were closed and sealed with a uniquely numbered security cable. The
bulk bags were numbered and colour coded by Process Unit, and stored securely for DMS processing.
The bags of crushed sample material were stored in the DMS building. Here they were unsealed and
opened under security. One Process Unit at a time was treated, and the plant was flushed between units.
The material was fed by bag to the scrubber feed hopper and introduced to the scrubber. Upon exit from
the scrubber the material was split on a 12.5 mm punch plate trommel screen, with the undersize
dropping to sump for pumping directly to the feed prep screen. The +12.5 mm material dropped through
a 450 mm cone crusher, closed size setting of 10 mm and the crushed product reported to a sump for
pumping back into the scrubber feed. The crusher gaps were checked by introducing lead shot.
Kennady Diamonds Inc. Aurora Geosciences Ltd.
KDI NI 43-101 Technical Report – Update 2017 116 | P a g e
Sized (+0.85 mm -12 mm) and scrubbed material presented to the prep screen was washed clean of -
0.85mm fines and vibratory fed to the mixing box, where it was mixed with ferrosilicon (270F FeSi) and
water. This mixed product is pump fed to a 150mm cyclone producing a float (light) product and a sink
(heavy) product. Cyclone settings are determined by daily density bead testing and are generally held
around 60-70 Kpa and density of 2.2 g/cm3, producing an average d50 cut point of 3.1 g/cc (see QA/QC
below). These products are discharged over separate 0.6 mm wedgewire screens to recover the FeSi and
wash the respective products. The sinks product gravity feeds through a sealed and closed tube to a can
inside a sealed and double locked concentrate cage.
The float product drops to a tails screen where -6 mm material (6.7 mm slotted screen) drops into a bulk
bag of coarse plant tails, sealed and numbered and weighed for storage. Plus 6 mm floats drop into a
feed bin for re-crush via a HPGR with a setting of 4 mm at 65 bars. This setting was determined through
kimberlite crushing tests using cylindrical breakage simulants in 4mm, 6mm, and 8mm sizes. This testing
concluded little or no simulant breakage of 6 mm beads at 85 bars. The gap was checked by use of lead
shot. The 65 bars setting was selected to effect good kimberlite disaggregation and avoid particle
breakage. The re-crushed HPGR product was pumped back to the scrubber mouth for re-processing.
At the end of Process Unit feed the bags were washed clean into the scrubber to recover all sample
material. The plant then continued to treat and was flushed through, including scrubber emptying and
screen de-pegging until no more feed was exiting each stage.
All undersized (-0.85 mm) material is pumped to a settling tank with agitation where reagent and
flocculent are introduced to produce a pump-able slimes waste. All spills and loose material are fed back
into the sample, with any remnants collected as a clean-up sample and treated by caustic fusion, and any
diamonds are reported.
When the concentrate can is full, the carousel cage is spun to fill another can. When the cans are full or
at the end of the day the cans are closed with can rings and security sealed within the cage through gloved
openings. There is no contact with the concentrate can until it is secured and sealed. Concentrate cans
are then moved by operators and security personnel to the Secure Recovery section at SRC.
The 2017 bulk samples retrieved from the Faraday 2, 3 and 1 kimberlites were taken by large diameter RC
drills. These drills produced a drill screened (+0.85 mm) cuttings product. Primary jaw crushing was not
necessary, and the material was fed directly to the scrubber. Approximately 28 to 47% of the head feed
(including HPGR product) reported to slimes, leaving over one-half of the material for DMS treatment.
Much of the sample treated well, but weathered or clay zones were encountered. This produced feeding
issues and clay (saponite, identified by XRD) balls were formed in the scrubber. In addition, process water
was not being sufficiently clarified by the thickener and flocculent reagents, resulting in frequent clean
outs to provide cleaner process water. The clay balls were continuously re-fed to the scrubber and cone
crusher until they broke down. Only small (2-3 mm) clay balls were occasionally seen in the cyclone feed
and coarse tails. It is not believed that these issues materially affected diamond recovery.
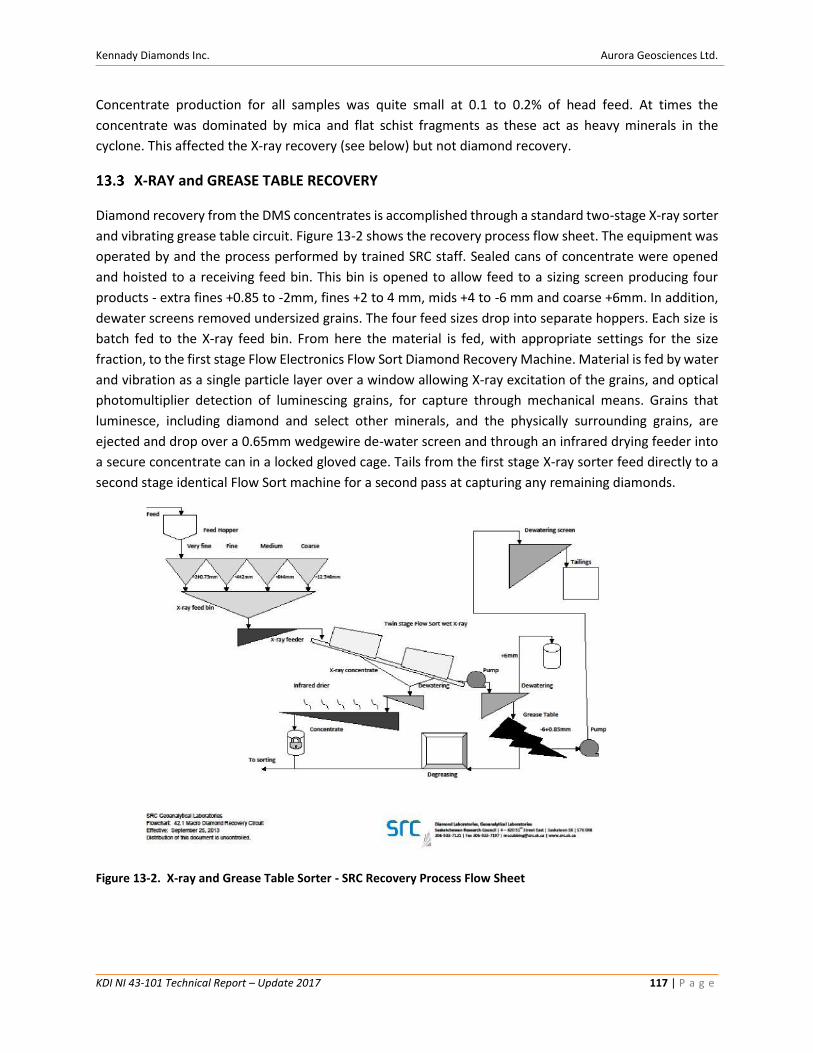
Kennady Diamonds Inc. Aurora Geosciences Ltd.
KDI NI 43-101 Technical Report – Update 2017 117 | P a g e
Concentrate production for all samples was quite small at 0.1 to 0.2% of head feed. At times the
concentrate was dominated by mica and flat schist fragments as these act as heavy minerals in the
cyclone. This affected the X-ray recovery (see below) but not diamond recovery.
X-RAY and GREASE TABLE RECOVERY
Diamond recovery from the DMS concentrates is accomplished through a standard two-stage X-ray sorter
and vibrating grease table circuit. Figure 13-2 shows the recovery process flow sheet. The equipment was
operated by and the process performed by trained SRC staff. Sealed cans of concentrate were opened
and hoisted to a receiving feed bin. This bin is opened to allow feed to a sizing screen producing four
products - extra fines +0.85 to -2mm, fines +2 to 4 mm, mids +4 to -6 mm and coarse +6mm. In addition,
dewater screens removed undersized grains. The four feed sizes drop into separate hoppers. Each size is
batch fed to the X-ray feed bin. From here the material is fed, with appropriate settings for the size
fraction, to the first stage Flow Electronics Flow Sort Diamond Recovery Machine. Material is fed by water
and vibration as a single particle layer over a window allowing X-ray excitation of the grains, and optical
photomultiplier detection of luminescing grains, for capture through mechanical means. Grains that
luminesce, including diamond and select other minerals, and the physically surrounding grains, are
ejected and drop over a 0.65mm wedgewire de-water screen and through an infrared drying feeder into
a secure concentrate can in a locked gloved cage. Tails from the first stage X-ray sorter feed directly to a
second stage identical Flow Sort machine for a second pass at capturing any remaining diamonds.
Figure 13-2. X-ray and Grease Table Sorter - SRC Recovery Process Flow Sheet
Kennady Diamonds Inc. Aurora Geosciences Ltd.
KDI NI 43-101 Technical Report – Update 2017 118 | P a g e
Tails from the two stage X-ray sorting are screened. Plus 6mm X-ray tails drop into a can for collection and
later hand sort for any remaining diamond. Minus 6mm tails are fed with temperature controlled water
(26oC) over a stepped vibrating table coated with diamond collector grease (Engen DB Collector).
Diamonds, being hydrophobic, adhere to the grease surface. The grease is scraped off at the end of the
sample or as required during the run, including the adhering grains, which are later cleaned of grease for
hand sort. De-greasing is accomplished by melting off of the majority of the grease, a hot water bath for
removal of the remainder of the grease, and a hot water detergent wash to clean the grains. This product
is then dried and weighed and sealed and taken to the secure Macro Room. Grease table tails are de-
watered and drop into a can for sealing, weighing and storage.
X-ray concentrate cans are clamped and sealed within the locked concentrate cage. They are then
removed by operators and security to the secure Macro Room. All spills and loose material are collected
as a clean-up sample and treated by caustic fusion, and any diamonds are reported.
13.3.1 Diamond Sorting
Diamond sorting of X-ray and grease concentrates was accomplished by hand by trained SRC staff in the
secure Macro Room. Concentrate and diamond handling was performed inside locked and sealed glove
boxes. The concentrate pail was placed in the glove box, which was re-locked and sealed. All concentrate
is weighed into the glove box and weighed out of the glove box upon completion. All fractions are
accounted for and a detailed weight reconciliation is kept. Reconciliation weights must match within 0.2%
before a sample is re-sealed and removed. Hand sorting of the +6mm X-ray tails is accomplished on a table
outside of the glove box, as is sorting of the grease table concentrate.
The concentrate is sieved into convenient size fractions for sorting, for feed to the Polus-M as required
and for granulometry data. Each size fraction is sorted at least twice by two different sorters. A microscope
is used for all but the coarsest fractions. All diamonds and QC materials such as diamond spikes and
density tracers are removed and recorded.
13.3.2 Reporting
SRC provided final result reports on May 23 and June 19, 2017 (KDI public releases on these dates for
Faraday 2 and Faraday 3 and 1, respectively) corresponding to the bulk samples retrieved during the
winter of 2017. A process data compilation from DMS processing and recovery processing, sorting results,
quality control and security were also received.
Diamond results are reported by number of stones and carat weight per square mesh sieve class. All
reported diamonds were reviewed to confirm that they originated from the Faraday samples, and had no
contamination from natural diamond tracers used for quality control. Individual stones greater than
3.35mm sieve class are described and weighed.
Howard Coopersmith, P.Geo., QP, reviewed security at SRC for the Faraday samples and noted no concern
with security issues, incidents or discrepancies.
Kennady Diamonds Inc. Aurora Geosciences Ltd.
KDI NI 43-101 Technical Report – Update 2017 119 | P a g e
14 MINERAL RESOURCE ESTIMATES
A Mineral Resource estimate for the Kelvin kimberlite was documented in the previous independent
technical report for the Kennady North Project dated 24 January 2017 (Vivian and Nowicki, 2017). This
estimate is summarised here in Section 14.1. The Kelvin Mineral Resource estimate is restated with no
modification. Ongoing evaluation work on the Kennady North Project now supports declaration of
additional Mineral Resources in the Faraday 2 and Faraday 3 kimberlites, as described in Section 14.2. An
additional kimberlite (Faraday 1) as well as kimberlite dyke sheet complexes surrounding the Faraday
kimberlites, are present. The available data do not permit declaration of Mineral Resources for these
bodies. Volume, tonnes and grade range estimates under the classification of Targets for Further
Exploration (TFFE) are provided for these where possible in Section 14.4.
14.1 Kelvin Mineral Resource estimate
The Mineral Resource estimate for Kelvin is restated from the independent technical report for the
Kennady North Project dated 24 January 2017 (Vivian and Nowicki, 2017). Each component of the
resource estimate (volume, tonnage, grade and value) is summarized in the sections below; for more
comprehensive explanations of the methodologies and details of supporting datasets the reader is
referred to Vivian and Nowicki (2017). The Mineral Resource estimate for Kelvin is based on:
1. A geological model that defines the boundaries of the deposit (external pipe shell) as well as the
geologically distinct domains of which it is comprised.
2. A spatial (block) model representing the variation in bulk density within the deposit and, in
combination with volumes derived from the geological model, providing estimates of the tonnes
of kimberlite present.
3. Estimates of average grade (carats per tonne) for each domain derived based on distributed
microdiamond3 stone frequency (st/kg) data calibrated to recoverable macrodiamond4 grade
using LDD macrodiamond results.
4. Estimates of the average value of diamonds within each domain, based on a single estimated
diamond value distribution (dollar per carat per sieve size class) combined with diamond size
frequency distributions (SFDs) defined for each of the domains.
3 The term microdiamond is used throughout this report to refer to diamonds recovered through caustic fusion of kimberlite at a bottom screen size cut off of 106 μm (~0.00002 ct). Rare larger diamonds that would be recovered by a commercial production plant are also recovered through this process and are evaluated as part of the microdiamond population. 4 The term macrodiamond is used throughout this report to refer to diamonds recovered by commercial diamond production plants, which typically only recover diamonds in and larger than the Diamond Trading Company sieve category 1 (~0.01 ct).
Kennady Diamonds Inc. Aurora Geosciences Ltd.
KDI NI 43-101 Technical Report – Update 2017 120 | P a g e
14.1.1 Resource domains and volumes
The Kelvin kimberlite comprises a number of kimberlite units that are each considered to be internally
consistent but present differing bulk density, grade and SFD characteristics. These kimberlite units form
the basis for a geological model of the Kelvin body that comprises 9 geological domains. The geological
domains have been created to represent portions of the body that correspond with the kimberlite units,
but that are also relevant from a resource estimation perspective. More information on the nature of the
kimberlite units and their subdivision or grouping into geological domains is provided in Section 7.3.4. The
geological domains have been adopted as the basis for the resource estimate (Table 14-1).
Table 14-1. Volumes of the Kelvin geological domains that form the basis of the Mineral Resource estimate
14.1.2 Bulk density and tonnages
Bulk density estimates for all kimberlite material is based on local interpolation within each domain of
sample bulk density data (3,652 measurements) into a block model using the inverse distance squared
method. For the country rock xenolith (CRX) and external country rock (CR) domains, estimates were
based on the sample averages. Resulting average densities and corresponding tonnage by domain,
extracted through volumetric reporting in Dassault Systemes Geovia GEMSTM (GEMS), are provided in
Table 14-2. No reliable measurements are available for overburden material, which was assigned an
assumed value of 2.00 g/cm3.
Kimberlite unit DomainVolume
(Million m3)
KIMB1 KIMB1 0.09
KIMB2 KIMB2A 0.57
KIMB2 KIMB2B 0.26
KIMB3 KIMB3A 0.77
KIMB3 KIMB3B 0.74
KIMB3 KIMB3C 0.57
KIMB6 KIMB6 0.30
KIMB4 / KIMB7 KIMB4/7 0.17
N/a CRX 0.01
Total 3.49
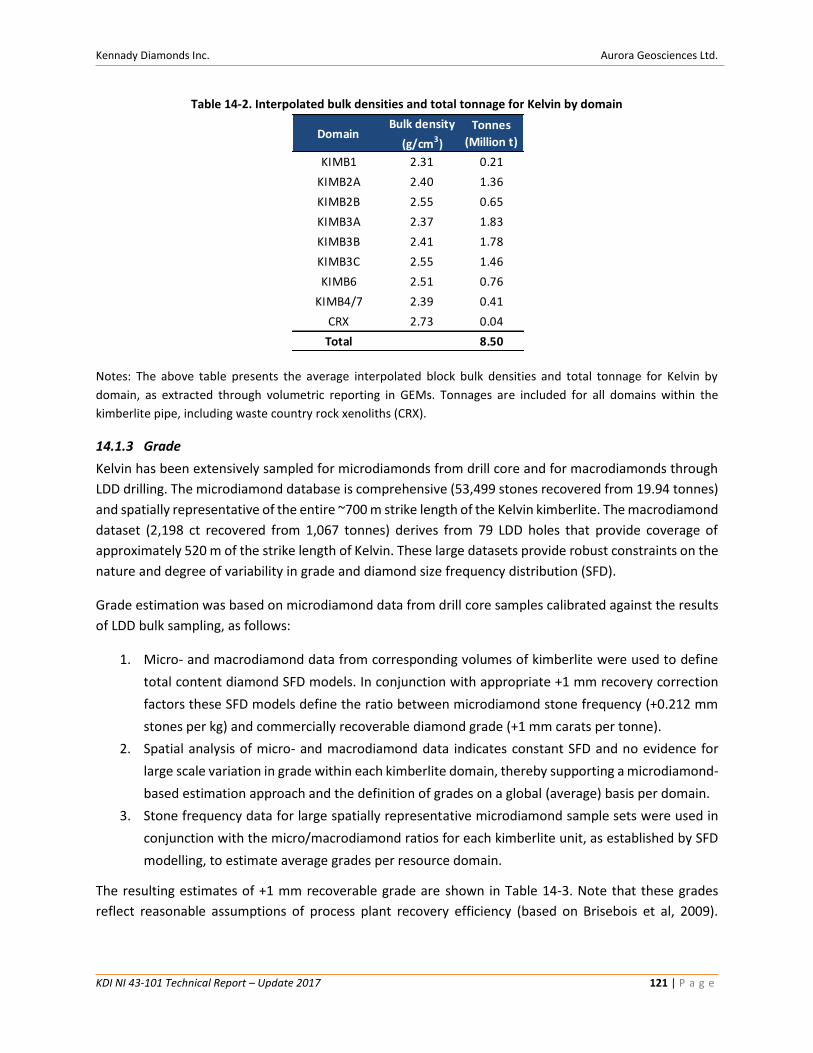
Kennady Diamonds Inc. Aurora Geosciences Ltd.
KDI NI 43-101 Technical Report – Update 2017 121 | P a g e
Table 14-2. Interpolated bulk densities and total tonnage for Kelvin by domain
Notes: The above table presents the average interpolated block bulk densities and total tonnage for Kelvin by
domain, as extracted through volumetric reporting in GEMs. Tonnages are included for all domains within the
kimberlite pipe, including waste country rock xenoliths (CRX).
14.1.3 Grade
Kelvin has been extensively sampled for microdiamonds from drill core and for macrodiamonds through
LDD drilling. The microdiamond database is comprehensive (53,499 stones recovered from 19.94 tonnes)
and spatially representative of the entire ~700 m strike length of the Kelvin kimberlite. The macrodiamond
dataset (2,198 ct recovered from 1,067 tonnes) derives from 79 LDD holes that provide coverage of
approximately 520 m of the strike length of Kelvin. These large datasets provide robust constraints on the
nature and degree of variability in grade and diamond size frequency distribution (SFD).
Grade estimation was based on microdiamond data from drill core samples calibrated against the results
of LDD bulk sampling, as follows:
1. Micro- and macrodiamond data from corresponding volumes of kimberlite were used to define
total content diamond SFD models. In conjunction with appropriate +1 mm recovery correction
factors these SFD models define the ratio between microdiamond stone frequency (+0.212 mm
stones per kg) and commercially recoverable diamond grade (+1 mm carats per tonne).
2. Spatial analysis of micro- and macrodiamond data indicates constant SFD and no evidence for
large scale variation in grade within each kimberlite domain, thereby supporting a microdiamond-
based estimation approach and the definition of grades on a global (average) basis per domain.
3. Stone frequency data for large spatially representative microdiamond sample sets were used in
conjunction with the micro/macrodiamond ratios for each kimberlite unit, as established by SFD
modelling, to estimate average grades per resource domain.
The resulting estimates of +1 mm recoverable grade are shown in Table 14-3. Note that these grades
reflect reasonable assumptions of process plant recovery efficiency (based on Brisebois et al, 2009).
DomainBulk density
(g/cm3)
Tonnes
(Million t)
KIMB1 2.31 0.21
KIMB2A 2.40 1.36
KIMB2B 2.55 0.65
KIMB3A 2.37 1.83
KIMB3B 2.41 1.78
KIMB3C 2.55 1.46
KIMB6 2.51 0.76
KIMB4/7 2.39 0.41
CRX 2.73 0.04
Total 8.50
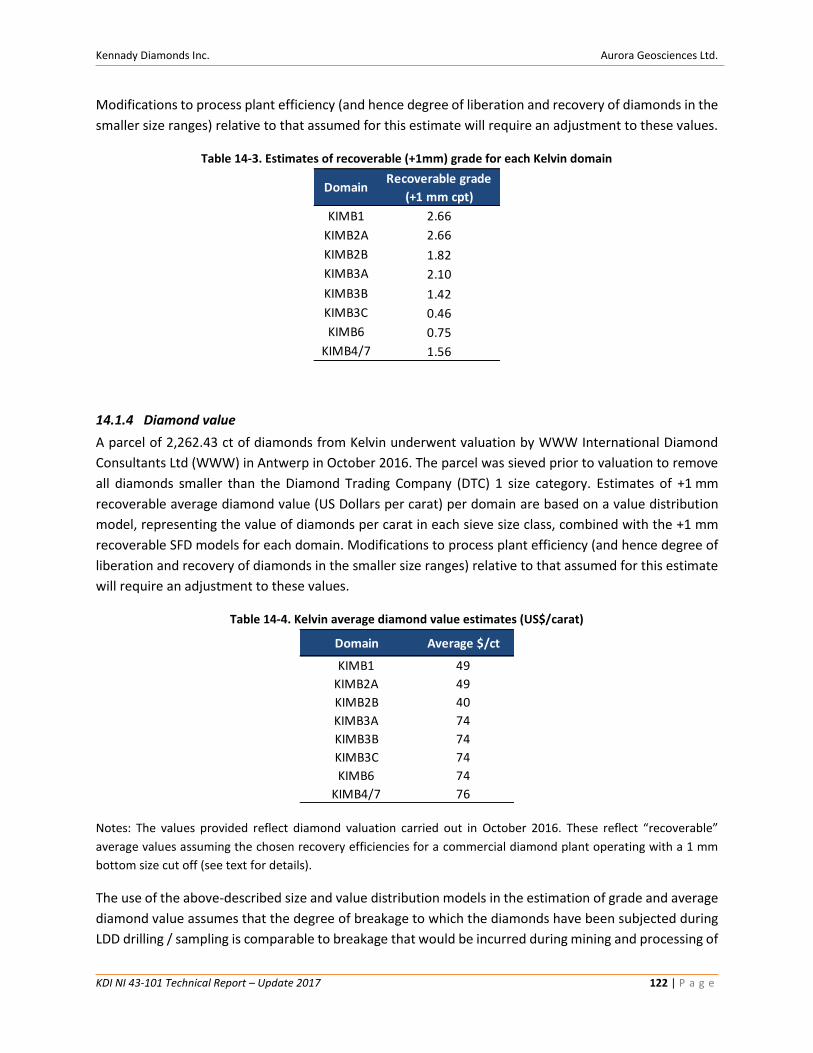
Kennady Diamonds Inc. Aurora Geosciences Ltd.
KDI NI 43-101 Technical Report – Update 2017 122 | P a g e
Modifications to process plant efficiency (and hence degree of liberation and recovery of diamonds in the
smaller size ranges) relative to that assumed for this estimate will require an adjustment to these values.
Table 14-3. Estimates of recoverable (+1mm) grade for each Kelvin domain
14.1.4 Diamond value
A parcel of 2,262.43 ct of diamonds from Kelvin underwent valuation by WWW International Diamond
Consultants Ltd (WWW) in Antwerp in October 2016. The parcel was sieved prior to valuation to remove
all diamonds smaller than the Diamond Trading Company (DTC) 1 size category. Estimates of +1 mm
recoverable average diamond value (US Dollars per carat) per domain are based on a value distribution
model, representing the value of diamonds per carat in each sieve size class, combined with the +1 mm
recoverable SFD models for each domain. Modifications to process plant efficiency (and hence degree of
liberation and recovery of diamonds in the smaller size ranges) relative to that assumed for this estimate
will require an adjustment to these values.
Table 14-4. Kelvin average diamond value estimates (US$/carat)
Notes: The values provided reflect diamond valuation carried out in October 2016. These reflect “recoverable”
average values assuming the chosen recovery efficiencies for a commercial diamond plant operating with a 1 mm
bottom size cut off (see text for details).
The use of the above-described size and value distribution models in the estimation of grade and average
diamond value assumes that the degree of breakage to which the diamonds have been subjected during
LDD drilling / sampling is comparable to breakage that would be incurred during mining and processing of
DomainRecoverable grade
(+1 mm cpt)
KIMB1 2.66
KIMB2A 2.66
KIMB2B 1.82
KIMB3A 2.10
KIMB3B 1.42
KIMB3C 0.46
KIMB6 0.75
KIMB4/7 1.56
Domain Average $/ct
KIMB1 49
KIMB2A 49
KIMB2B 40
KIMB3A 74
KIMB3B 74
KIMB3C 74
KIMB6 74
KIMB4/7 76
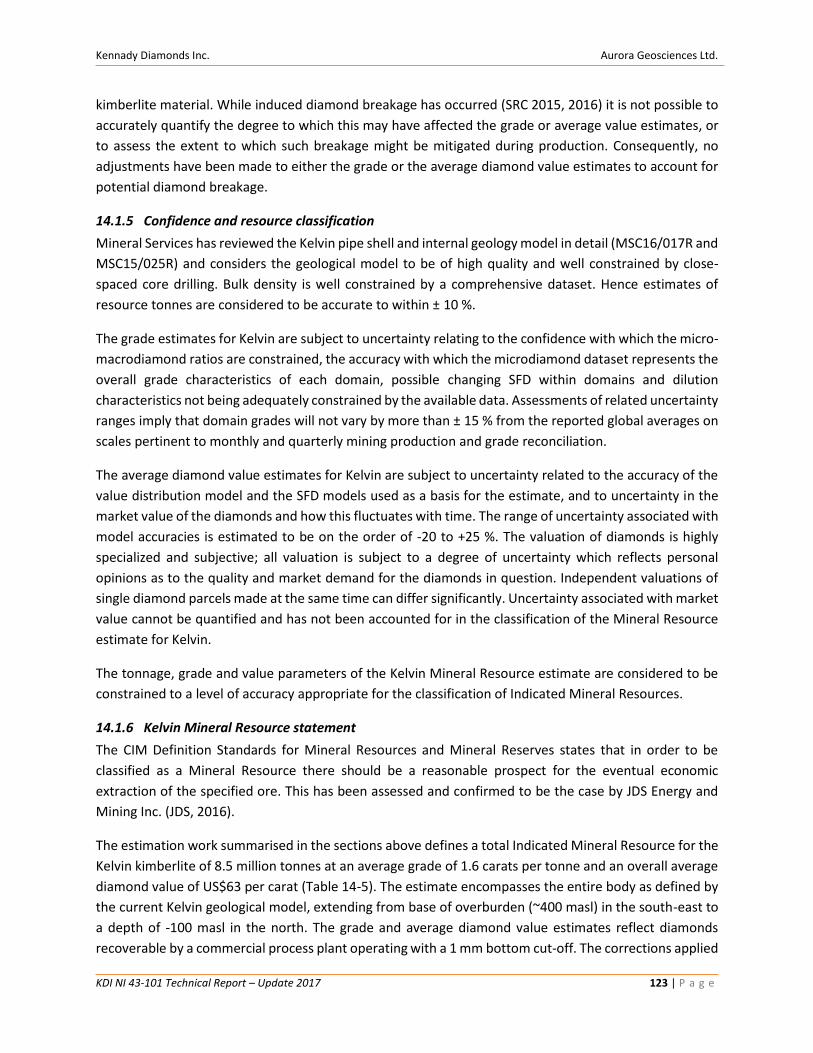
Kennady Diamonds Inc. Aurora Geosciences Ltd.
KDI NI 43-101 Technical Report – Update 2017 123 | P a g e
kimberlite material. While induced diamond breakage has occurred (SRC 2015, 2016) it is not possible to
accurately quantify the degree to which this may have affected the grade or average value estimates, or
to assess the extent to which such breakage might be mitigated during production. Consequently, no
adjustments have been made to either the grade or the average diamond value estimates to account for
potential diamond breakage.
14.1.5 Confidence and resource classification
Mineral Services has reviewed the Kelvin pipe shell and internal geology model in detail (MSC16/017R and
MSC15/025R) and considers the geological model to be of high quality and well constrained by close-
spaced core drilling. Bulk density is well constrained by a comprehensive dataset. Hence estimates of
resource tonnes are considered to be accurate to within ± 10 %.
The grade estimates for Kelvin are subject to uncertainty relating to the confidence with which the micro-
macrodiamond ratios are constrained, the accuracy with which the microdiamond dataset represents the
overall grade characteristics of each domain, possible changing SFD within domains and dilution
characteristics not being adequately constrained by the available data. Assessments of related uncertainty
ranges imply that domain grades will not vary by more than ± 15 % from the reported global averages on
scales pertinent to monthly and quarterly mining production and grade reconciliation.
The average diamond value estimates for Kelvin are subject to uncertainty related to the accuracy of the
value distribution model and the SFD models used as a basis for the estimate, and to uncertainty in the
market value of the diamonds and how this fluctuates with time. The range of uncertainty associated with
model accuracies is estimated to be on the order of -20 to +25 %. The valuation of diamonds is highly
specialized and subjective; all valuation is subject to a degree of uncertainty which reflects personal
opinions as to the quality and market demand for the diamonds in question. Independent valuations of
single diamond parcels made at the same time can differ significantly. Uncertainty associated with market
value cannot be quantified and has not been accounted for in the classification of the Mineral Resource
estimate for Kelvin.
The tonnage, grade and value parameters of the Kelvin Mineral Resource estimate are considered to be
constrained to a level of accuracy appropriate for the classification of Indicated Mineral Resources.
14.1.6 Kelvin Mineral Resource statement
The CIM Definition Standards for Mineral Resources and Mineral Reserves states that in order to be
classified as a Mineral Resource there should be a reasonable prospect for the eventual economic
extraction of the specified ore. This has been assessed and confirmed to be the case by JDS Energy and
Mining Inc. (JDS, 2016).
The estimation work summarised in the sections above defines a total Indicated Mineral Resource for the
Kelvin kimberlite of 8.5 million tonnes at an average grade of 1.6 carats per tonne and an overall average
diamond value of US$63 per carat (Table 14-5). The estimate encompasses the entire body as defined by
the current Kelvin geological model, extending from base of overburden (~400 masl) in the south-east to
a depth of -100 masl in the north. The grade and average diamond value estimates reflect diamonds
recoverable by a commercial process plant operating with a 1 mm bottom cut-off. The corrections applied
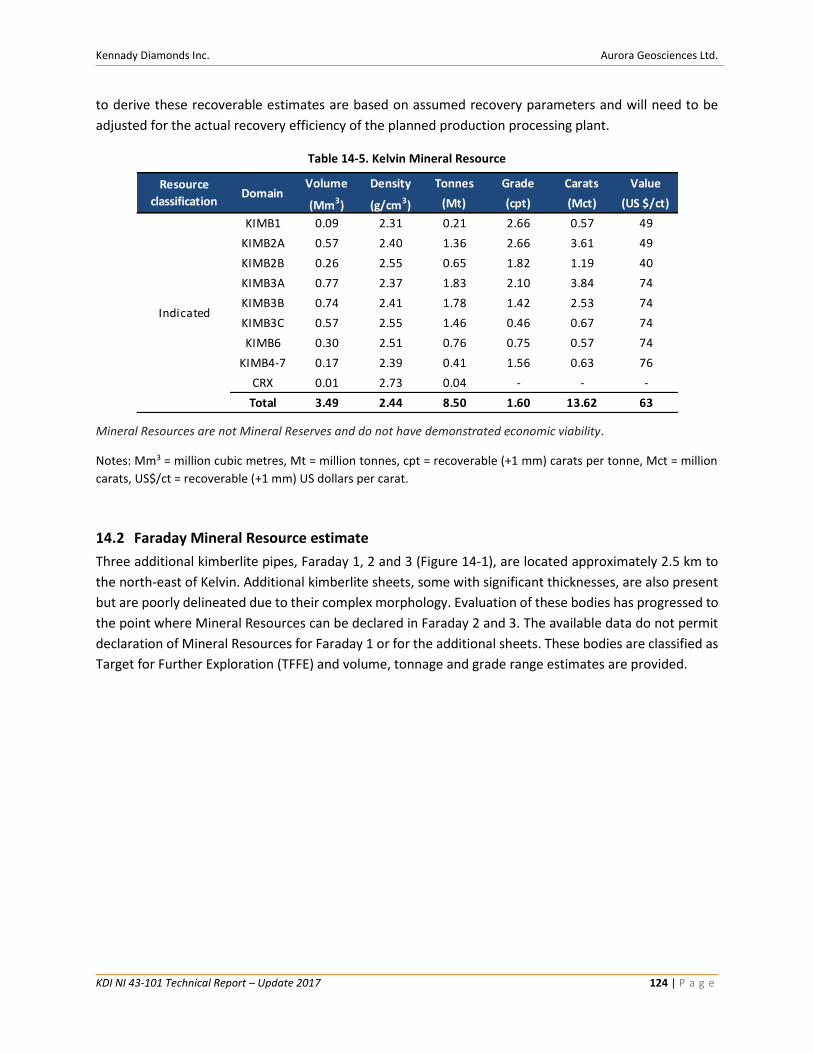
Kennady Diamonds Inc. Aurora Geosciences Ltd.
KDI NI 43-101 Technical Report – Update 2017 124 | P a g e
to derive these recoverable estimates are based on assumed recovery parameters and will need to be
adjusted for the actual recovery efficiency of the planned production processing plant.
Table 14-5. Kelvin Mineral Resource
Mineral Resources are not Mineral Reserves and do not have demonstrated economic viability.
Notes: Mm3 = million cubic metres, Mt = million tonnes, cpt = recoverable (+1 mm) carats per tonne, Mct = million
carats, US$/ct = recoverable (+1 mm) US dollars per carat.
14.2 Faraday Mineral Resource estimate
Three additional kimberlite pipes, Faraday 1, 2 and 3 (Figure 14-1), are located approximately 2.5 km to
the north-east of Kelvin. Additional kimberlite sheets, some with significant thicknesses, are also present
but are poorly delineated due to their complex morphology. Evaluation of these bodies has progressed to
the point where Mineral Resources can be declared in Faraday 2 and 3. The available data do not permit
declaration of Mineral Resources for Faraday 1 or for the additional sheets. These bodies are classified as
Target for Further Exploration (TFFE) and volume, tonnage and grade range estimates are provided.
Volume Density Tonnes Grade Carats Value
(Mm3) (g/cm3) (Mt) (cpt) (Mct) (US $/ct)
KIMB1 0.09 2.31 0.21 2.66 0.57 49
KIMB2A 0.57 2.40 1.36 2.66 3.61 49
KIMB2B 0.26 2.55 0.65 1.82 1.19 40
KIMB3A 0.77 2.37 1.83 2.10 3.84 74
KIMB3B 0.74 2.41 1.78 1.42 2.53 74
KIMB3C 0.57 2.55 1.46 0.46 0.67 74
KIMB6 0.30 2.51 0.76 0.75 0.57 74
KIMB4-7 0.17 2.39 0.41 1.56 0.63 76
CRX 0.01 2.73 0.04 - - -
Total 3.49 2.44 8.50 1.60 13.62 63
Resource
classificationDomain
Indicated
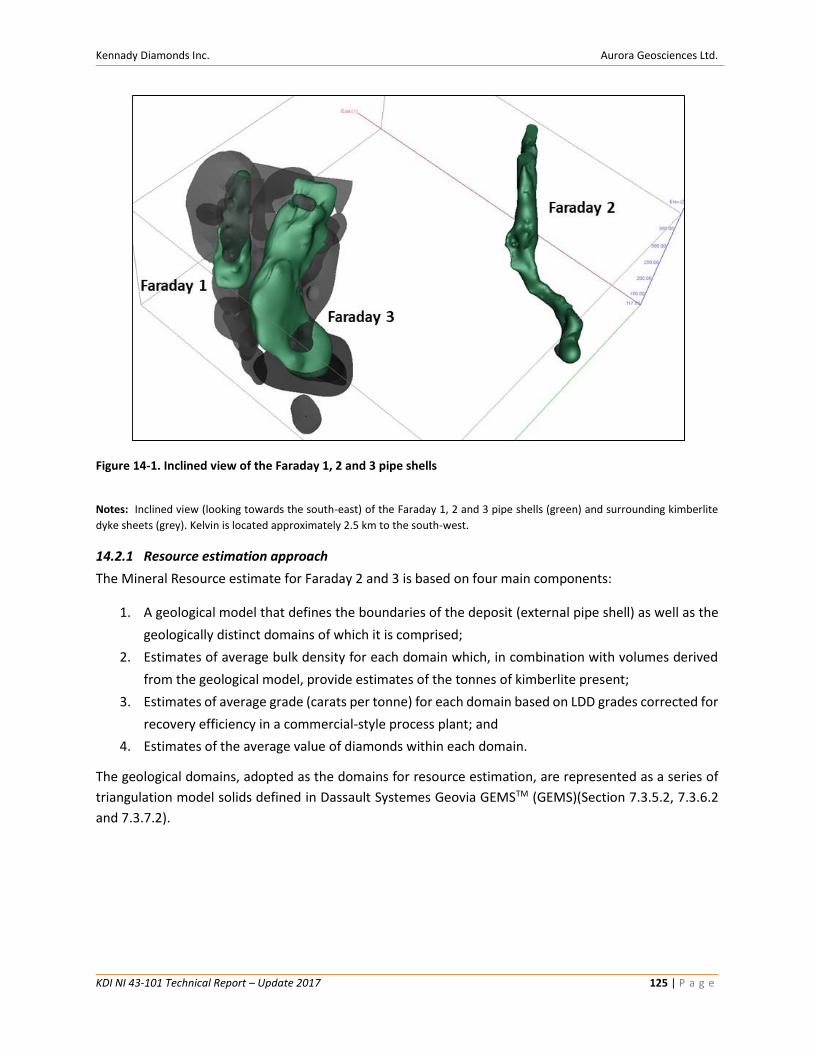
Kennady Diamonds Inc. Aurora Geosciences Ltd.
KDI NI 43-101 Technical Report – Update 2017 125 | P a g e
Figure 14-1. Inclined view of the Faraday 1, 2 and 3 pipe shells
Notes: Inclined view (looking towards the south-east) of the Faraday 1, 2 and 3 pipe shells (green) and surrounding kimberlite
dyke sheets (grey). Kelvin is located approximately 2.5 km to the south-west.
14.2.1 Resource estimation approach
The Mineral Resource estimate for Faraday 2 and 3 is based on four main components:
1. A geological model that defines the boundaries of the deposit (external pipe shell) as well as the
geologically distinct domains of which it is comprised;
2. Estimates of average bulk density for each domain which, in combination with volumes derived
from the geological model, provide estimates of the tonnes of kimberlite present;
3. Estimates of average grade (carats per tonne) for each domain based on LDD grades corrected for
recovery efficiency in a commercial-style process plant; and
4. Estimates of the average value of diamonds within each domain.
The geological domains, adopted as the domains for resource estimation, are represented as a series of
triangulation model solids defined in Dassault Systemes Geovia GEMSTM (GEMS)(Section 7.3.5.2, 7.3.6.2
and 7.3.7.2).
Kennady Diamonds Inc. Aurora Geosciences Ltd.
KDI NI 43-101 Technical Report – Update 2017 126 | P a g e
Microdiamond5 and macrodiamond6 grade and SFD characteristics provide reasonable support for an
assumption of SFD and grade constancy within the volumetrically significant domains of Faraday 2 and 3.
Average grade estimates by domain have therefore been generated. Total content diamond size
frequency distributions (SFDs) were modelled to define the total in-situ (not necessarily recoverable)
diamond content across the full diamond size range. The same +1 mm recovery correction factors used
for Kelvin (Section 14.1.3) were applied to these models, thereby converting +0.85 mm LDD grade into
recoverable +1 mm grade.
The estimates of average diamond value per domain are derived by combining a single estimated diamond
value distribution (dollar per carat per sieve size class) with recoverable diamond size frequency
distributions (SFDs) defined for each of the domains.
Details of the data and methods used to generate each component of the Faraday 2 and 3 Mineral
Resource estimate are provided in the sections below. Estimates were populated into a GEMS percent
block model with the following parameters:
• Block model origin (X, Y, Z): 597046, 7042794, 450 (coordinates defined in the Universal
Transverse Mercator (UTM) coordinate system in the NAD83 datum for Zone 12N).
• Block model rotation of 45o counter-clockwise.
• Block model comprised of 170 columns, 134 rows, 67 levels.
• Block size 5 m by 5 m by 5 m, total of 1,526,260 blocks.
5 The term microdiamond is used throughout this report to refer to diamonds recovered through caustic fusion of kimberlite at a bottom screen size cut off of 105 μm (~0.00002 ct). Rare larger diamonds that would be recovered by a commercial production plant are also recovered through this process and are evaluated as part of the microdiamond population. 6 The term macrodiamond is used throughout this report to refer to diamonds recovered by commercial diamond production plants, which typically only recover diamonds in and larger than the Diamond Trading Company sieve category 1 (~0.01 ct).
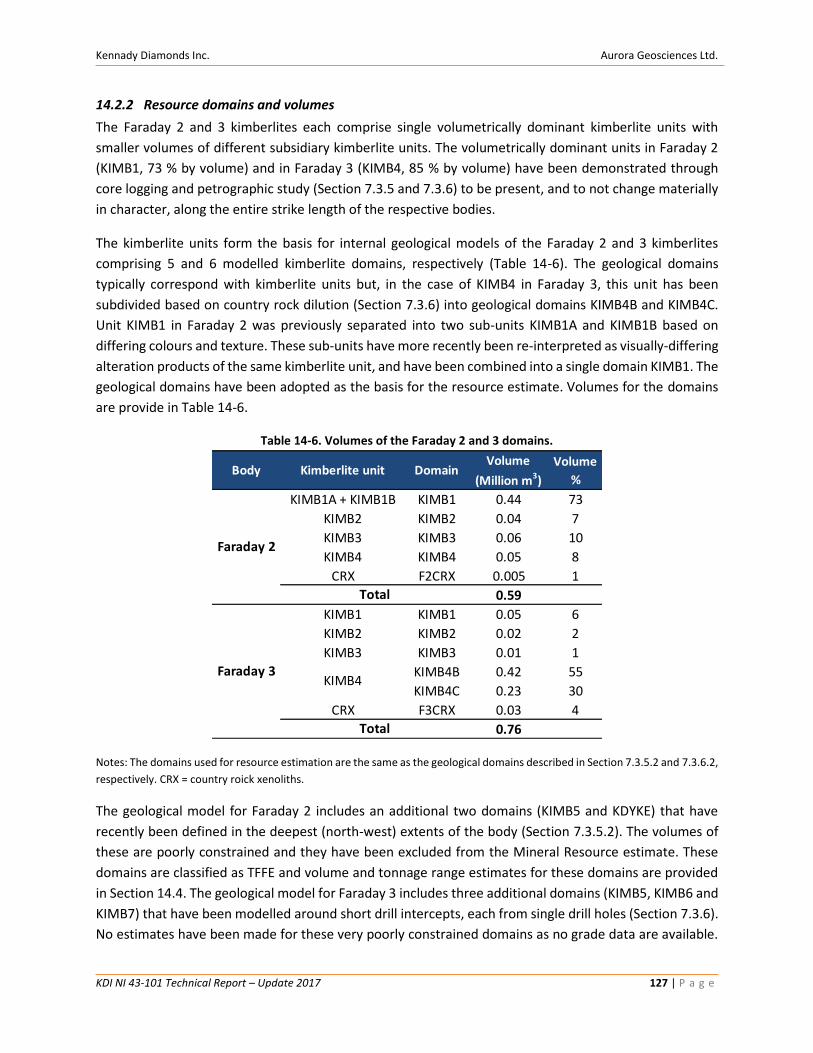
Kennady Diamonds Inc. Aurora Geosciences Ltd.
KDI NI 43-101 Technical Report – Update 2017 127 | P a g e
14.2.2 Resource domains and volumes
The Faraday 2 and 3 kimberlites each comprise single volumetrically dominant kimberlite units with
smaller volumes of different subsidiary kimberlite units. The volumetrically dominant units in Faraday 2
(KIMB1, 73 % by volume) and in Faraday 3 (KIMB4, 85 % by volume) have been demonstrated through
core logging and petrographic study (Section 7.3.5 and 7.3.6) to be present, and to not change materially
in character, along the entire strike length of the respective bodies.
The kimberlite units form the basis for internal geological models of the Faraday 2 and 3 kimberlites
comprising 5 and 6 modelled kimberlite domains, respectively (Table 14-6). The geological domains
typically correspond with kimberlite units but, in the case of KIMB4 in Faraday 3, this unit has been
subdivided based on country rock dilution (Section 7.3.6) into geological domains KIMB4B and KIMB4C.
Unit KIMB1 in Faraday 2 was previously separated into two sub-units KIMB1A and KIMB1B based on
differing colours and texture. These sub-units have more recently been re-interpreted as visually-differing
alteration products of the same kimberlite unit, and have been combined into a single domain KIMB1. The
geological domains have been adopted as the basis for the resource estimate. Volumes for the domains
are provide in Table 14-6.
Table 14-6. Volumes of the Faraday 2 and 3 domains.
Notes: The domains used for resource estimation are the same as the geological domains described in Section 7.3.5.2 and 7.3.6.2,
respectively. CRX = country roick xenoliths.
The geological model for Faraday 2 includes an additional two domains (KIMB5 and KDYKE) that have
recently been defined in the deepest (north-west) extents of the body (Section 7.3.5.2). The volumes of
these are poorly constrained and they have been excluded from the Mineral Resource estimate. These
domains are classified as TFFE and volume and tonnage range estimates for these domains are provided
in Section 14.4. The geological model for Faraday 3 includes three additional domains (KIMB5, KIMB6 and
KIMB7) that have been modelled around short drill intercepts, each from single drill holes (Section 7.3.6).
No estimates have been made for these very poorly constrained domains as no grade data are available.
Body Kimberlite unit DomainVolume
(Million m3)
Volume
%
KIMB1A + KIMB1B KIMB1 0.44 73
KIMB2 KIMB2 0.04 7
KIMB3 KIMB3 0.06 10
KIMB4 KIMB4 0.05 8
CRX F2CRX 0.005 1
0.59
KIMB1 KIMB1 0.05 6
KIMB2 KIMB2 0.02 2
KIMB3 KIMB3 0.01 1
KIMB4B 0.42 55
KIMB4C 0.23 30
CRX F3CRX 0.03 4
0.76
Faraday 2
KIMB4
Total
Total
Faraday 3
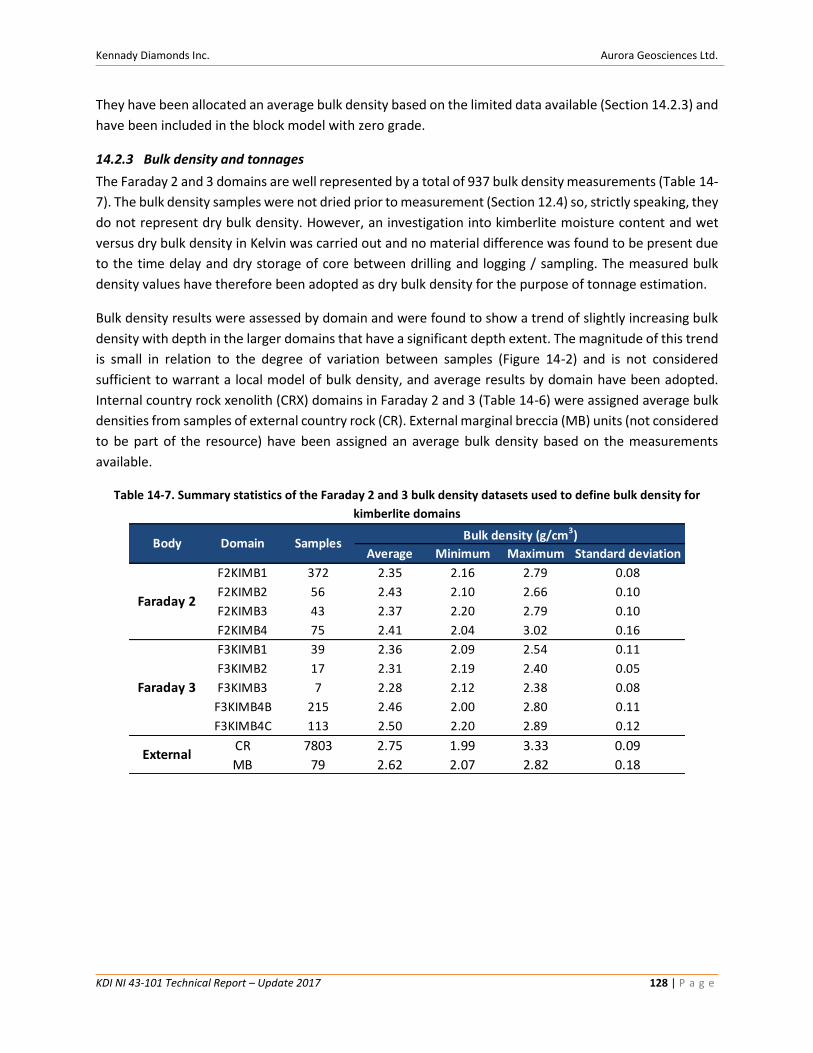
Kennady Diamonds Inc. Aurora Geosciences Ltd.
KDI NI 43-101 Technical Report – Update 2017 128 | P a g e
They have been allocated an average bulk density based on the limited data available (Section 14.2.3) and
have been included in the block model with zero grade.
14.2.3 Bulk density and tonnages
The Faraday 2 and 3 domains are well represented by a total of 937 bulk density measurements (Table 14-
7). The bulk density samples were not dried prior to measurement (Section 12.4) so, strictly speaking, they
do not represent dry bulk density. However, an investigation into kimberlite moisture content and wet
versus dry bulk density in Kelvin was carried out and no material difference was found to be present due
to the time delay and dry storage of core between drilling and logging / sampling. The measured bulk
density values have therefore been adopted as dry bulk density for the purpose of tonnage estimation.
Bulk density results were assessed by domain and were found to show a trend of slightly increasing bulk
density with depth in the larger domains that have a significant depth extent. The magnitude of this trend
is small in relation to the degree of variation between samples (Figure 14-2) and is not considered
sufficient to warrant a local model of bulk density, and average results by domain have been adopted.
Internal country rock xenolith (CRX) domains in Faraday 2 and 3 (Table 14-6) were assigned average bulk
densities from samples of external country rock (CR). External marginal breccia (MB) units (not considered
to be part of the resource) have been assigned an average bulk density based on the measurements
available.
Table 14-7. Summary statistics of the Faraday 2 and 3 bulk density datasets used to define bulk density for
kimberlite domains
Average Minimum Maximum Standard deviation
F2KIMB1 372 2.35 2.16 2.79 0.08
F2KIMB2 56 2.43 2.10 2.66 0.10
F2KIMB3 43 2.37 2.20 2.79 0.10
F2KIMB4 75 2.41 2.04 3.02 0.16
F3KIMB1 39 2.36 2.09 2.54 0.11
F3KIMB2 17 2.31 2.19 2.40 0.05
F3KIMB3 7 2.28 2.12 2.38 0.08
F3KIMB4B 215 2.46 2.00 2.80 0.11
F3KIMB4C 113 2.50 2.20 2.89 0.12
CR 7803 2.75 1.99 3.33 0.09
MB 79 2.62 2.07 2.82 0.18External
Domain SamplesBulk density (g/cm3)
Body
Faraday 2
Faraday 3
Kennady Diamonds Inc. Aurora Geosciences Ltd.
KDI NI 43-101 Technical Report – Update 2017 129 | P a g e
Figure 14-2. Bulk density variation with depth in the volumetrically dominant domains of Faraday 2 (KIMB1) and
Faraday 3 (KIMB4B)
Tonnage estimates by domain, extracted from the block model by applying the average bulk density values
provided in Table 14-7 are provided in Table 14-8. No reliable measurements are available for overburden
material, which was assigned an assumed value of 2.00 g/cm3 in the block model. Three domains in
Faraday 3 with no supporting grade data (KIMB5, KIMB6 and KIMB7) have been allocated an average bulk
density of 2.35 g/cm3 based on the very limited data available and have been incorporated into the block
model as waste with zero grade.
Kennady Diamonds Inc. Aurora Geosciences Ltd.
KDI NI 43-101 Technical Report – Update 2017 130 | P a g e
Table 14-8. Average bulk densities and total tonnage by domain of Faraday 2 and 3
Notes: Reported tonnages were extracted through volumetric reporting in GEMs. Tonnages are included for all resource
domains within the kimberlite pipe, including waste country rock xenoliths (CRX).
14.2.4 Grade
14.2.4.1 Supporting data – macrodiamonds
Large diameter drill (LDD) sampling programs were undertaken at Faraday 2 and 3 in 2016 and 2017.
Samples were processed at the Saskatchewan Research Council (SRC) Geoanalytical Laboratories with a
conventional DMS recovery plant operating at a 0.85 mm bottom cut-off size (Section 13.2). Recovery
parameters are however not internally consistent. Process plant sizing panels (on de-grit screens) were
replaced subsequent to processing the majority of the Faraday 2 sample, following observations that
recovery efficiency of finer diamonds was compromised. All material passing through the de-grit screens
was collected during processing, and audit of this material for samples processed prior to replacement of
the panels confirmed the presence of a significant number of +0.85 mm diamonds. Assessment of SFD
characteristics implies that the audit has however substantially over-recovered fine diamonds relative to
typical process efficiency with new panels. The audit results can therefore not simply be added to the
production results for Faraday 2 as they will significantly fine-skew the SFD and will overestimate
recoverable grade relative to conventionally processed samples. Faraday 2 LDD results have therefore not
been corrected on a sample by sample basis, but lost diamonds have been accounted for during grade
estimation (Sections 14.2.4.5 to 14.2.4.7).
Sample masses (total of 571 dry tonnes of kimberlite) are derived based on sample volumes (determined
from sample length and caliper measurements of hole diameter; Section 10.5.5.3) multiplied by average
bulk density (Table 14-8) for the domain being sampled. More information on the sample collection and
processing methods is provided in Section 11 and 12. Results are summarised by domain in Table 14-9.
Body DomainBulk density
(g/cm3)
Tonnes
(Million t)
F2KIMB1 2.35 1.03
F2KIMB2 2.43 0.11
F2KIMB3 2.37 0.14
F2KIMB4 2.41 0.11
F2CRX 2.75 0.01
Total 1.39
F3KIMB1 2.36 0.11
F3KIMB2 2.31 0.04
F3KIMB3 2.28 0.02
F3KIMB4B 2.46 1.03
F3KIMB4C 2.50 0.58
F3CRX 2.75 0.09
Total 1.87
Faraday 2
Faraday 3
Kennady Diamonds Inc. Aurora Geosciences Ltd.
KDI NI 43-101 Technical Report – Update 2017 131 | P a g e
Table 14-9. LDD sample tonnes and diamond recoveries (+0.85mm) by geological domain - Faraday 2 and 3
Notes: In 2016 a very limited LDD program sampled Faraday 2 domains KIMB1, KIMB2 and KIMB3 in combination. Domains were
sampled discretely in 2017. Sample tonnages are based on measured (calliper) hole volumes in combination with estimates of
dry bulk density. Note that the reported tonnages may differ slightly from those previously disclosed due to the updates to bulk
density estimates. Only results from kimberlite are included – additional diamonds recovered from overburden, marginal breccia
and during audit of Faraday 2 results in 2017 have not been used to support grade estimates.
The sample distribution achieved by the 31 completed and sampled LDD holes in 5 clusters at Faraday 2
provides a spatially representative coverage of approximately 200 m of the total 450 m strike length of
the body. A single very large cluster (43 holes) was drilled at Faraday 3; due to significant time and
operational constraints it was decided to maximise productivity in a near-surface portion of the pipe
characterised by the presence of higher grade units, in order to obtain as large a diamond parcel as
possible for valuation. LDD hole distribution in Faraday 2 and 3 is shown in Figure 14-3. While the lateral
extents (across strike) of both bodies are not well represented by this coverage, the domains are well
represented at each location due to their relatively narrow width, “layer cake” stratigraphy and lack of
internal variability across or along strike (Section 7.3.5.2 and 7.3.6.2, respectively).
Year Body Domain Dry mass (t) St Ct
KIMB4 4.53 104 9.27
KIMB1/2/3 16.56 751 47.34
KIMB1 154.41 4,535 361.64
KIMB2 22.82 822 68.37
KIMB3 56.07 2,620 167.10
KIMB4 39.18 745 52.63
KIMB1 32.10 2,107 144.43
KIMB2 36.53 1,565 96.93
KIMB3 36.32 491 26.73
KIMB4B 137.80 2,882 162.26
KIMB4C 34.56 404 27.42
Total 570.87 17,026 1,164.10
2017
2016 Faraday 2
Faraday 2
Faraday 3
Kennady Diamonds Inc. Aurora Geosciences Ltd.
KDI NI 43-101 Technical Report – Update 2017 132 | P a g e
Figure 14-3. Inclined view (looking SW) of the Faraday 2 and 3 geological models showing all LDD drill hole traces
in green
The allocation of LDD drill intervals to domains was carried out in the field based on visual assessment of
the LDD drill cuttings at the time of drilling. Sample increments were defined to represent the targeted
intervals with the minimum possible cross-contamination between domains. Discrete LDD sample
intervals were grouped by domain in 2017 into process batches for diamond recovery. Process batches
each contain material from several LDD holes; the grouping of material by domain into process batches
was carried out to obtain the best possible along-strike resolution of sample results (by cluster in
Faraday 2, by quadrant within a single large cluster in Faraday 3) while obtaining reasonable sample sizes
for processing. The degree to which the process batches represent the geological domains to which they
were allocated has been assessed by comparing LDD drill chip logs with intercepts of the equivalent
modelled geological domains. The samples obtained were found to represent the targeted domains well;
the proportion of the samples falling within their respective domains varies from a minimum of 79 % to a
maximum of 96 % for Faraday 2 KIMB2 and KIMB3, respectively.
14.2.4.2 Supporting data - microdiamonds
Microdiamond results were generated by processing of drill core samples at the Saskatchewan Research
Council Geoanalytical Laboratories as documented in Section 11. Results for Faraday 2 and 3 were
allocated to kimberlite units based on drill logs supplied by SRK and to domains by intersecting the mid-
point of microdiamond sample intervals with the current geological domain model. Outlier samples
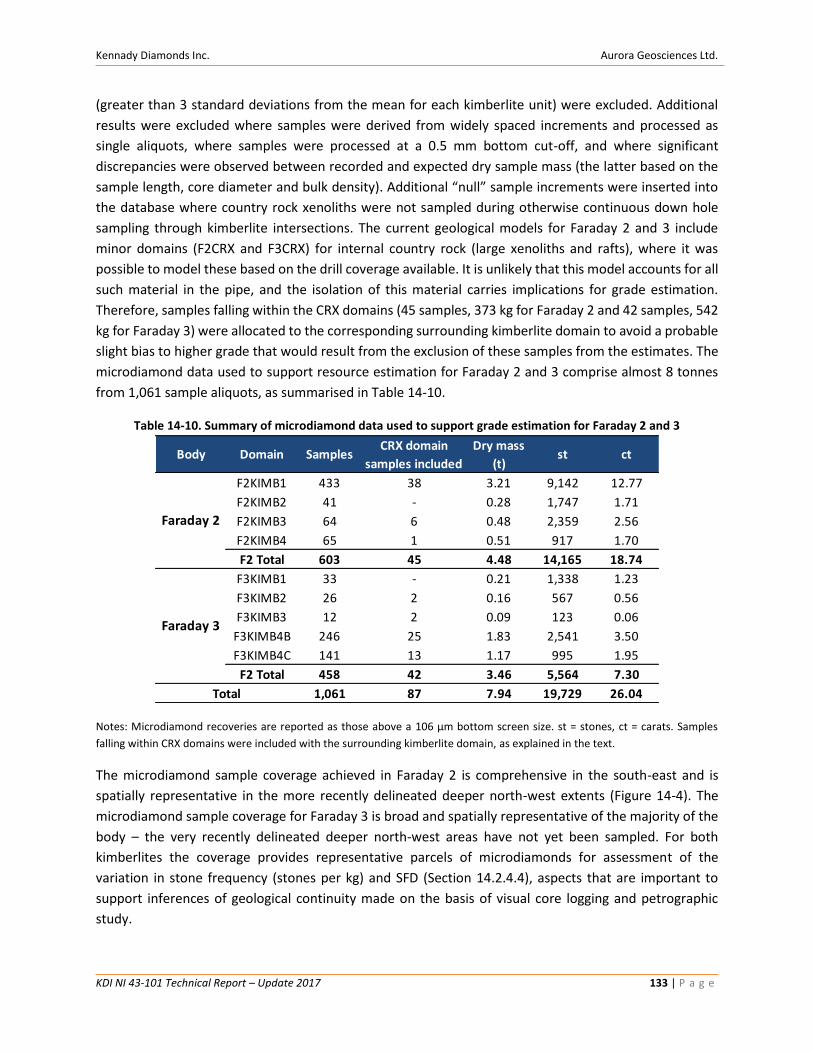
Kennady Diamonds Inc. Aurora Geosciences Ltd.
KDI NI 43-101 Technical Report – Update 2017 133 | P a g e
(greater than 3 standard deviations from the mean for each kimberlite unit) were excluded. Additional
results were excluded where samples were derived from widely spaced increments and processed as
single aliquots, where samples were processed at a 0.5 mm bottom cut-off, and where significant
discrepancies were observed between recorded and expected dry sample mass (the latter based on the
sample length, core diameter and bulk density). Additional “null” sample increments were inserted into
the database where country rock xenoliths were not sampled during otherwise continuous down hole
sampling through kimberlite intersections. The current geological models for Faraday 2 and 3 include
minor domains (F2CRX and F3CRX) for internal country rock (large xenoliths and rafts), where it was
possible to model these based on the drill coverage available. It is unlikely that this model accounts for all
such material in the pipe, and the isolation of this material carries implications for grade estimation.
Therefore, samples falling within the CRX domains (45 samples, 373 kg for Faraday 2 and 42 samples, 542
kg for Faraday 3) were allocated to the corresponding surrounding kimberlite domain to avoid a probable
slight bias to higher grade that would result from the exclusion of these samples from the estimates. The
microdiamond data used to support resource estimation for Faraday 2 and 3 comprise almost 8 tonnes
from 1,061 sample aliquots, as summarised in Table 14-10.
Table 14-10. Summary of microdiamond data used to support grade estimation for Faraday 2 and 3
Notes: Microdiamond recoveries are reported as those above a 106 μm bottom screen size. st = stones, ct = carats. Samples
falling within CRX domains were included with the surrounding kimberlite domain, as explained in the text.
The microdiamond sample coverage achieved in Faraday 2 is comprehensive in the south-east and is
spatially representative in the more recently delineated deeper north-west extents (Figure 14-4). The
microdiamond sample coverage for Faraday 3 is broad and spatially representative of the majority of the
body – the very recently delineated deeper north-west areas have not yet been sampled. For both
kimberlites the coverage provides representative parcels of microdiamonds for assessment of the
variation in stone frequency (stones per kg) and SFD (Section 14.2.4.4), aspects that are important to
support inferences of geological continuity made on the basis of visual core logging and petrographic
study.
Body Domain SamplesCRX domain
samples included
Dry mass
(t)st ct
F2KIMB1 433 38 3.21 9,142 12.77
F2KIMB2 41 - 0.28 1,747 1.71
F2KIMB3 64 6 0.48 2,359 2.56
F2KIMB4 65 1 0.51 917 1.70
F2 Total 603 45 4.48 14,165 18.74
F3KIMB1 33 - 0.21 1,338 1.23
F3KIMB2 26 2 0.16 567 0.56
F3KIMB3 12 2 0.09 123 0.06
F3KIMB4B 246 25 1.83 2,541 3.50
F3KIMB4C 141 13 1.17 995 1.95
F2 Total 458 42 3.46 5,564 7.30
1,061 87 7.94 19,729 26.04
Faraday 2
Faraday 3
Total
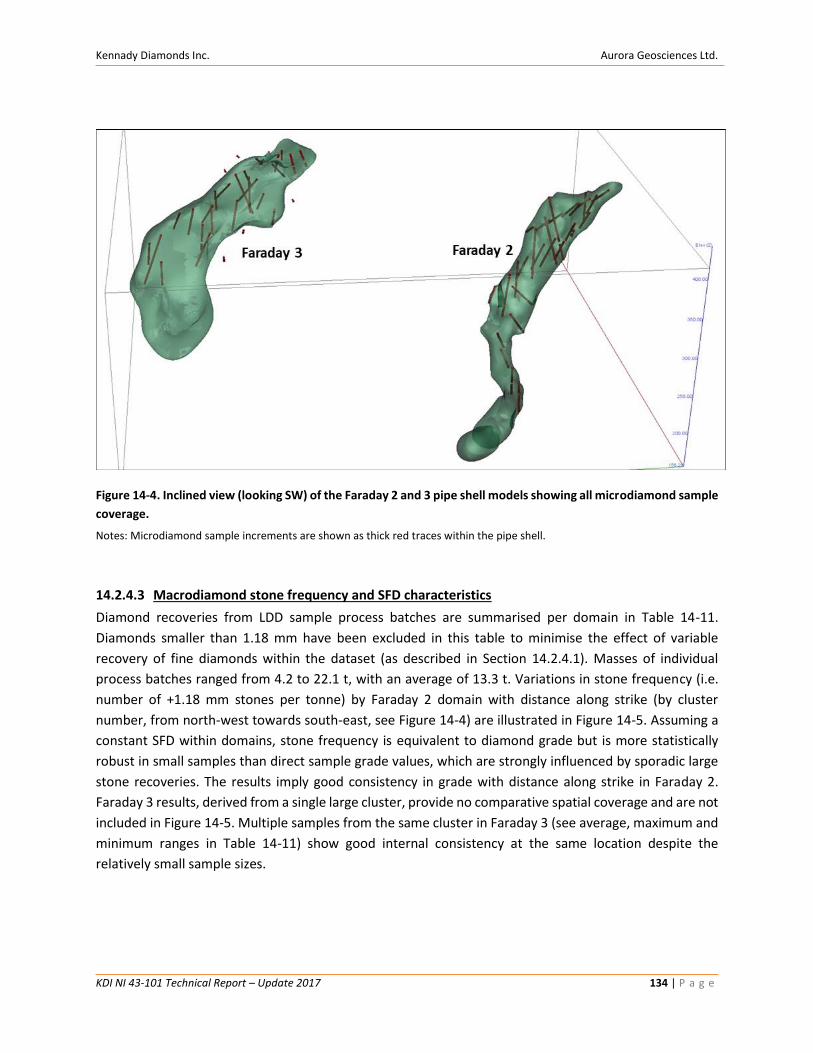
Kennady Diamonds Inc. Aurora Geosciences Ltd.
KDI NI 43-101 Technical Report – Update 2017 134 | P a g e
Figure 14-4. Inclined view (looking SW) of the Faraday 2 and 3 pipe shell models showing all microdiamond sample
coverage.
Notes: Microdiamond sample increments are shown as thick red traces within the pipe shell.
14.2.4.3 Macrodiamond stone frequency and SFD characteristics
Diamond recoveries from LDD sample process batches are summarised per domain in Table 14-11.
Diamonds smaller than 1.18 mm have been excluded in this table to minimise the effect of variable
recovery of fine diamonds within the dataset (as described in Section 14.2.4.1). Masses of individual
process batches ranged from 4.2 to 22.1 t, with an average of 13.3 t. Variations in stone frequency (i.e.
number of +1.18 mm stones per tonne) by Faraday 2 domain with distance along strike (by cluster
number, from north-west towards south-east, see Figure 14-4) are illustrated in Figure 14-5. Assuming a
constant SFD within domains, stone frequency is equivalent to diamond grade but is more statistically
robust in small samples than direct sample grade values, which are strongly influenced by sporadic large
stone recoveries. The results imply good consistency in grade with distance along strike in Faraday 2.
Faraday 3 results, derived from a single large cluster, provide no comparative spatial coverage and are not
included in Figure 14-5. Multiple samples from the same cluster in Faraday 3 (see average, maximum and
minimum ranges in Table 14-11) show good internal consistency at the same location despite the
relatively small sample sizes.
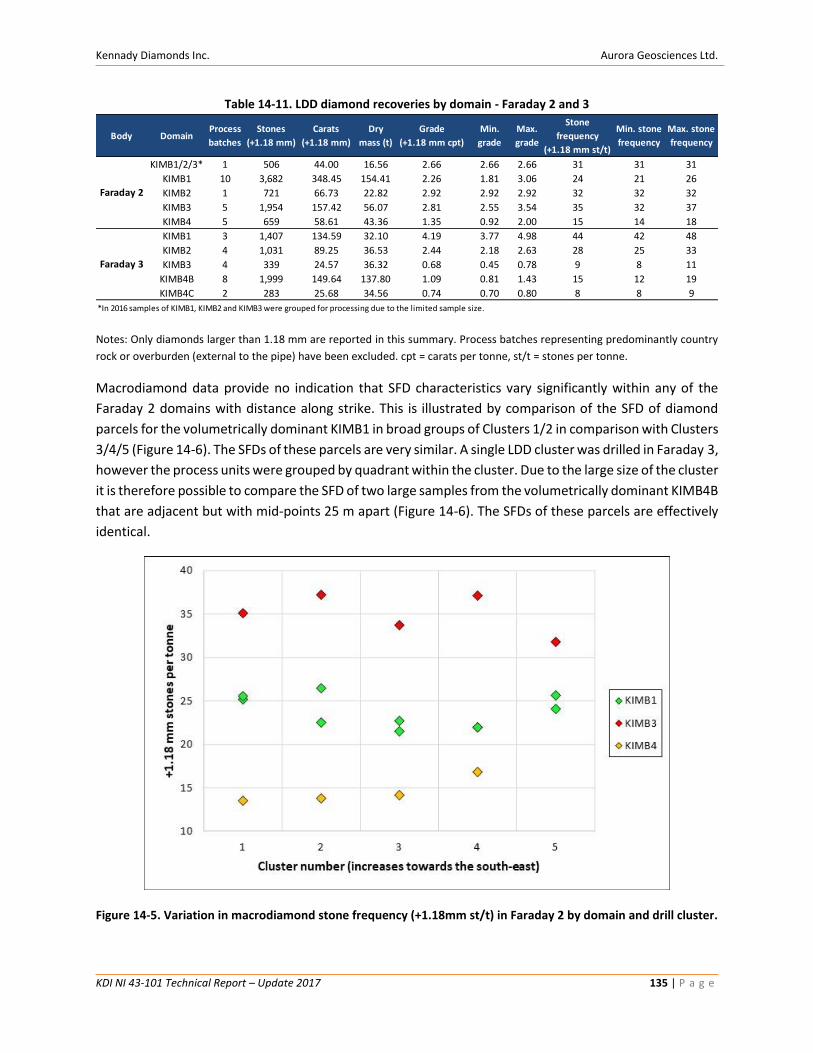
Kennady Diamonds Inc. Aurora Geosciences Ltd.
KDI NI 43-101 Technical Report – Update 2017 135 | P a g e
Table 14-11. LDD diamond recoveries by domain - Faraday 2 and 3
Notes: Only diamonds larger than 1.18 mm are reported in this summary. Process batches representing predominantly country
rock or overburden (external to the pipe) have been excluded. cpt = carats per tonne, st/t = stones per tonne.
Macrodiamond data provide no indication that SFD characteristics vary significantly within any of the
Faraday 2 domains with distance along strike. This is illustrated by comparison of the SFD of diamond
parcels for the volumetrically dominant KIMB1 in broad groups of Clusters 1/2 in comparison with Clusters
3/4/5 (Figure 14-6). The SFDs of these parcels are very similar. A single LDD cluster was drilled in Faraday 3,
however the process units were grouped by quadrant within the cluster. Due to the large size of the cluster
it is therefore possible to compare the SFD of two large samples from the volumetrically dominant KIMB4B
that are adjacent but with mid-points 25 m apart (Figure 14-6). The SFDs of these parcels are effectively
identical.
Figure 14-5. Variation in macrodiamond stone frequency (+1.18mm st/t) in Faraday 2 by domain and drill cluster.
Body DomainProcess
batches
Stones
(+1.18 mm)
Carats
(+1.18 mm)
Dry
mass (t)
Grade
(+1.18 mm cpt)
Min.
grade
Max.
grade
Stone
frequency
(+1.18 mm st/t)
Min. stone
frequency
Max. stone
frequency
KIMB1/2/3* 1 506 44.00 16.56 2.66 2.66 2.66 31 31 31
KIMB1 10 3,682 348.45 154.41 2.26 1.81 3.06 24 21 26
KIMB2 1 721 66.73 22.82 2.92 2.92 2.92 32 32 32
KIMB3 5 1,954 157.42 56.07 2.81 2.55 3.54 35 32 37
KIMB4 5 659 58.61 43.36 1.35 0.92 2.00 15 14 18
KIMB1 3 1,407 134.59 32.10 4.19 3.77 4.98 44 42 48
KIMB2 4 1,031 89.25 36.53 2.44 2.18 2.63 28 25 33
KIMB3 4 339 24.57 36.32 0.68 0.45 0.78 9 8 11
KIMB4B 8 1,999 149.64 137.80 1.09 0.81 1.43 15 12 19
KIMB4C 2 283 25.68 34.56 0.74 0.70 0.80 8 8 9
*In 2016 samples of KIMB1, KIMB2 and KIMB3 were grouped for processing due to the limited sample size.
Faraday 2
Faraday 3
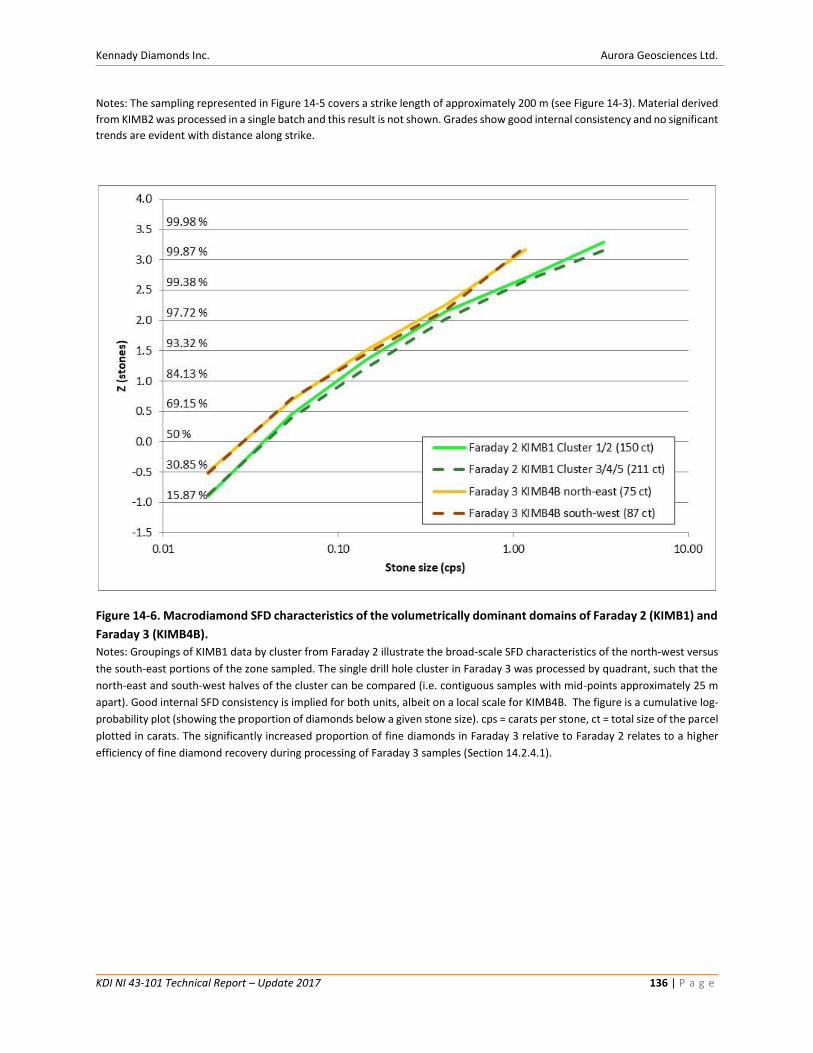
Kennady Diamonds Inc. Aurora Geosciences Ltd.
KDI NI 43-101 Technical Report – Update 2017 136 | P a g e
Notes: The sampling represented in Figure 14-5 covers a strike length of approximately 200 m (see Figure 14-3). Material derived
from KIMB2 was processed in a single batch and this result is not shown. Grades show good internal consistency and no significant
trends are evident with distance along strike.
Figure 14-6. Macrodiamond SFD characteristics of the volumetrically dominant domains of Faraday 2 (KIMB1) and
Faraday 3 (KIMB4B).
Notes: Groupings of KIMB1 data by cluster from Faraday 2 illustrate the broad-scale SFD characteristics of the north-west versus
the south-east portions of the zone sampled. The single drill hole cluster in Faraday 3 was processed by quadrant, such that the
north-east and south-west halves of the cluster can be compared (i.e. contiguous samples with mid-points approximately 25 m
apart). Good internal SFD consistency is implied for both units, albeit on a local scale for KIMB4B. The figure is a cumulative log-
probability plot (showing the proportion of diamonds below a given stone size). cps = carats per stone, ct = total size of the parcel
plotted in carats. The significantly increased proportion of fine diamonds in Faraday 3 relative to Faraday 2 relates to a higher
efficiency of fine diamond recovery during processing of Faraday 3 samples (Section 14.2.4.1).
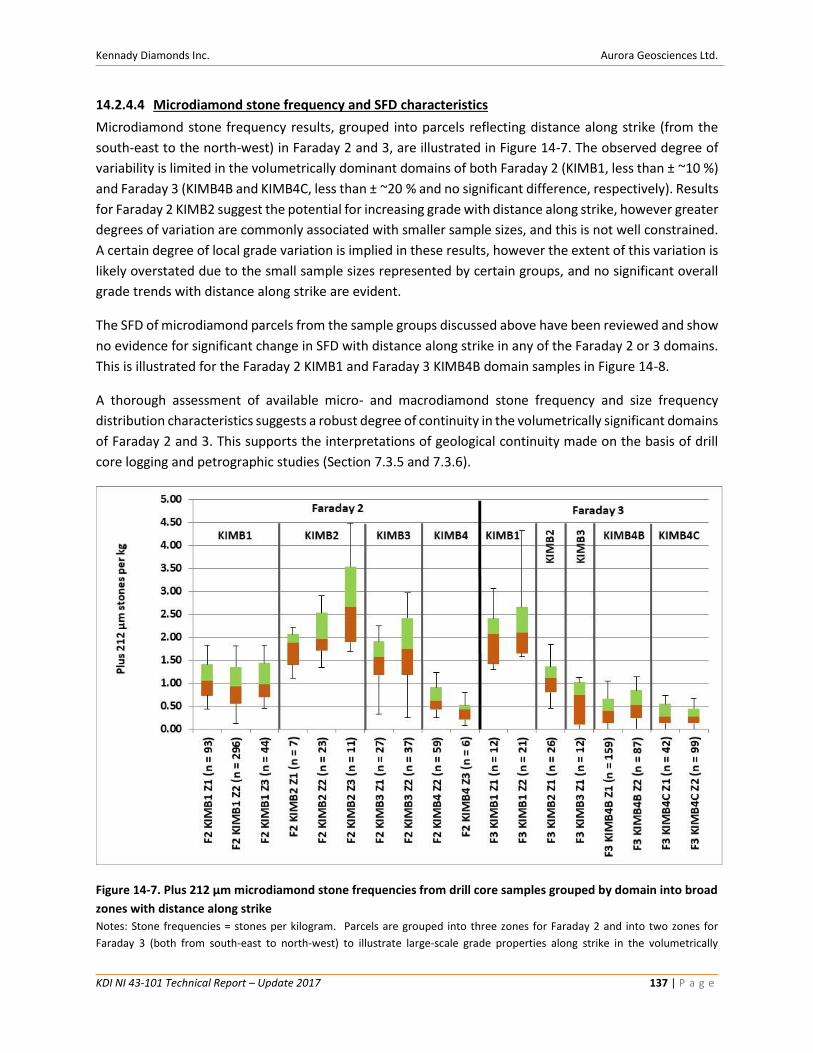
Kennady Diamonds Inc. Aurora Geosciences Ltd.
KDI NI 43-101 Technical Report – Update 2017 137 | P a g e
14.2.4.4 Microdiamond stone frequency and SFD characteristics
Microdiamond stone frequency results, grouped into parcels reflecting distance along strike (from the
south-east to the north-west) in Faraday 2 and 3, are illustrated in Figure 14-7. The observed degree of
variability is limited in the volumetrically dominant domains of both Faraday 2 (KIMB1, less than ± ~10 %)
and Faraday 3 (KIMB4B and KIMB4C, less than ± ~20 % and no significant difference, respectively). Results
for Faraday 2 KIMB2 suggest the potential for increasing grade with distance along strike, however greater
degrees of variation are commonly associated with smaller sample sizes, and this is not well constrained.
A certain degree of local grade variation is implied in these results, however the extent of this variation is
likely overstated due to the small sample sizes represented by certain groups, and no significant overall
grade trends with distance along strike are evident.
The SFD of microdiamond parcels from the sample groups discussed above have been reviewed and show
no evidence for significant change in SFD with distance along strike in any of the Faraday 2 or 3 domains.
This is illustrated for the Faraday 2 KIMB1 and Faraday 3 KIMB4B domain samples in Figure 14-8.
A thorough assessment of available micro- and macrodiamond stone frequency and size frequency
distribution characteristics suggests a robust degree of continuity in the volumetrically significant domains
of Faraday 2 and 3. This supports the interpretations of geological continuity made on the basis of drill
core logging and petrographic studies (Section 7.3.5 and 7.3.6).
Figure 14-7. Plus 212 µm microdiamond stone frequencies from drill core samples grouped by domain into broad
zones with distance along strike
Notes: Stone frequencies = stones per kilogram. Parcels are grouped into three zones for Faraday 2 and into two zones for
Faraday 3 (both from south-east to north-west) to illustrate large-scale grade properties along strike in the volumetrically
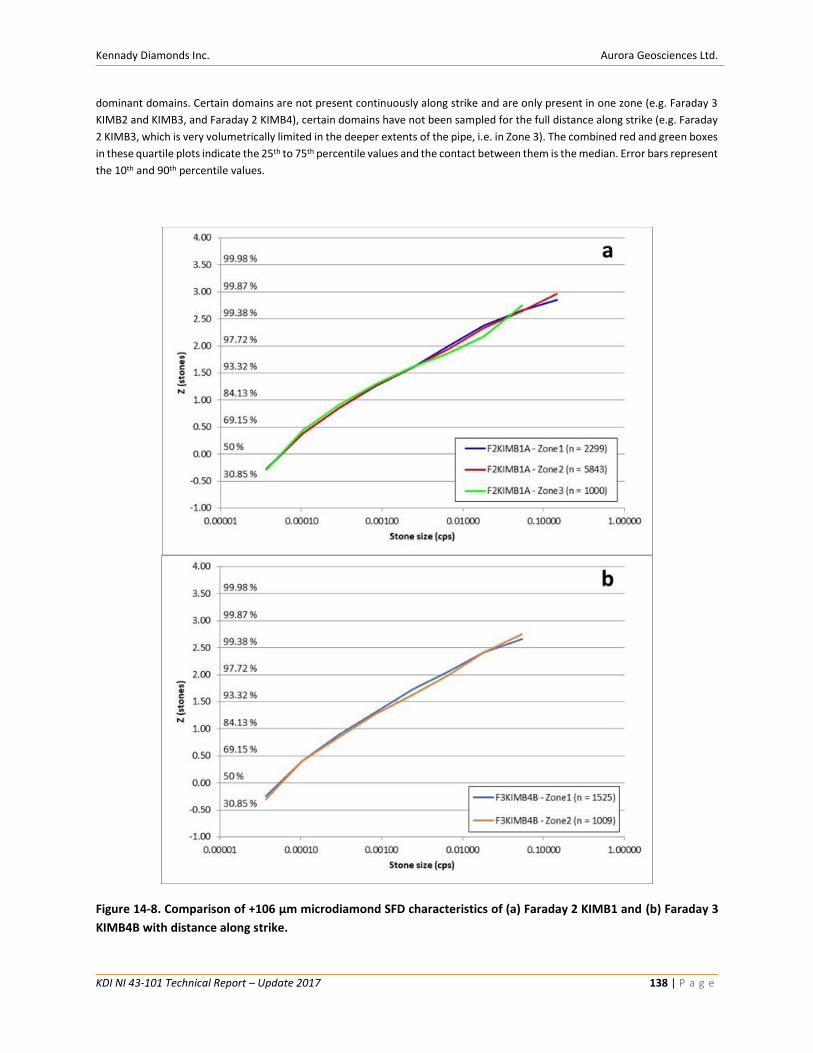
Kennady Diamonds Inc. Aurora Geosciences Ltd.
KDI NI 43-101 Technical Report – Update 2017 138 | P a g e
dominant domains. Certain domains are not present continuously along strike and are only present in one zone (e.g. Faraday 3
KIMB2 and KIMB3, and Faraday 2 KIMB4), certain domains have not been sampled for the full distance along strike (e.g. Faraday
2 KIMB3, which is very volumetrically limited in the deeper extents of the pipe, i.e. in Zone 3). The combined red and green boxes
in these quartile plots indicate the 25th to 75th percentile values and the contact between them is the median. Error bars represent
the 10th and 90th percentile values.
Figure 14-8. Comparison of +106 µm microdiamond SFD characteristics of (a) Faraday 2 KIMB1 and (b) Faraday 3
KIMB4B with distance along strike.
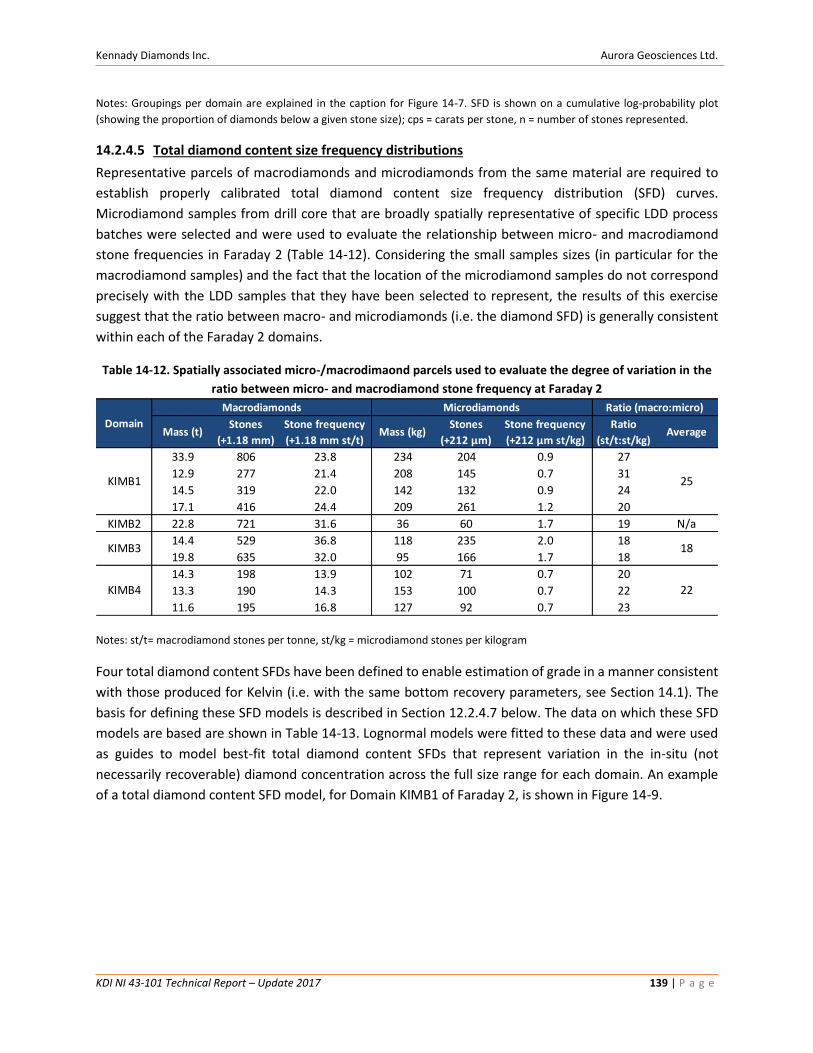
Kennady Diamonds Inc. Aurora Geosciences Ltd.
KDI NI 43-101 Technical Report – Update 2017 139 | P a g e
Notes: Groupings per domain are explained in the caption for Figure 14-7. SFD is shown on a cumulative log-probability plot
(showing the proportion of diamonds below a given stone size); cps = carats per stone, n = number of stones represented.
14.2.4.5 Total diamond content size frequency distributions
Representative parcels of macrodiamonds and microdiamonds from the same material are required to
establish properly calibrated total diamond content size frequency distribution (SFD) curves.
Microdiamond samples from drill core that are broadly spatially representative of specific LDD process
batches were selected and were used to evaluate the relationship between micro- and macrodiamond
stone frequencies in Faraday 2 (Table 14-12). Considering the small samples sizes (in particular for the
macrodiamond samples) and the fact that the location of the microdiamond samples do not correspond
precisely with the LDD samples that they have been selected to represent, the results of this exercise
suggest that the ratio between macro- and microdiamonds (i.e. the diamond SFD) is generally consistent
within each of the Faraday 2 domains.
Table 14-12. Spatially associated micro-/macrodimaond parcels used to evaluate the degree of variation in the
ratio between micro- and macrodiamond stone frequency at Faraday 2
Notes: st/t= macrodiamond stones per tonne, st/kg = microdiamond stones per kilogram
Four total diamond content SFDs have been defined to enable estimation of grade in a manner consistent
with those produced for Kelvin (i.e. with the same bottom recovery parameters, see Section 14.1). The
basis for defining these SFD models is described in Section 12.2.4.7 below. The data on which these SFD
models are based are shown in Table 14-13. Lognormal models were fitted to these data and were used
as guides to model best-fit total diamond content SFDs that represent variation in the in-situ (not
necessarily recoverable) diamond concentration across the full size range for each domain. An example
of a total diamond content SFD model, for Domain KIMB1 of Faraday 2, is shown in Figure 14-9.
Mass (t)Stones
(+1.18 mm)
Stone frequency
(+1.18 mm st/t)Mass (kg)
Stones
(+212 μm)
Stone frequency
(+212 μm st/kg)
Ratio
(st/t:st/kg)Average
33.9 806 23.8 234 204 0.9 27
12.9 277 21.4 208 145 0.7 31
14.5 319 22.0 142 132 0.9 24
17.1 416 24.4 209 261 1.2 20
KIMB2 22.8 721 31.6 36 60 1.7 19 N/a
14.4 529 36.8 118 235 2.0 18
19.8 635 32.0 95 166 1.7 18
14.3 198 13.9 102 71 0.7 20
13.3 190 14.3 153 100 0.7 22
11.6 195 16.8 127 92 0.7 23
KIMB3 18
KIMB4 22
Domain
Macrodiamonds Microdiamonds Ratio (macro:micro)
KIMB1 25
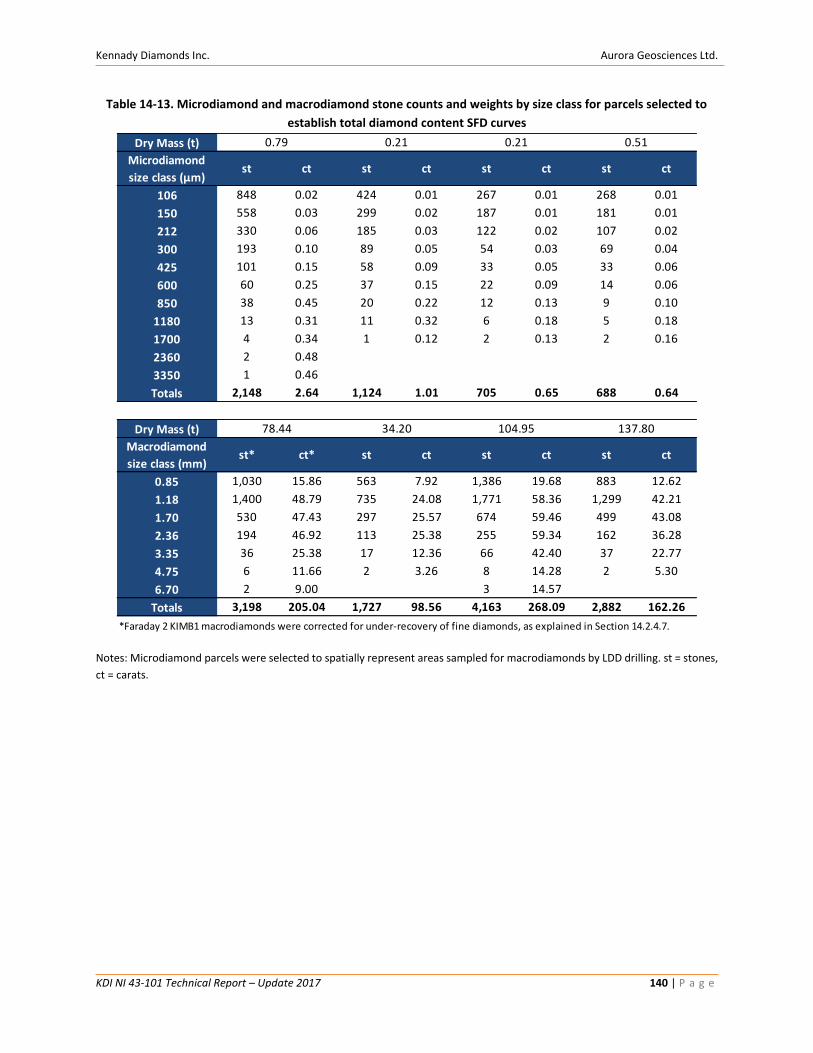
Kennady Diamonds Inc. Aurora Geosciences Ltd.
KDI NI 43-101 Technical Report – Update 2017 140 | P a g e
Table 14-13. Microdiamond and macrodiamond stone counts and weights by size class for parcels selected to
establish total diamond content SFD curves
Notes: Microdiamond parcels were selected to spatially represent areas sampled for macrodiamonds by LDD drilling. st = stones,
ct = carats.
Dry Mass (t)
Microdiamond
size class (μm)st ct st ct st ct st ct
106 848 0.02 424 0.01 267 0.01 268 0.01
150 558 0.03 299 0.02 187 0.01 181 0.01
212 330 0.06 185 0.03 122 0.02 107 0.02
300 193 0.10 89 0.05 54 0.03 69 0.04
425 101 0.15 58 0.09 33 0.05 33 0.06
600 60 0.25 37 0.15 22 0.09 14 0.06
850 38 0.45 20 0.22 12 0.13 9 0.10
1180 13 0.31 11 0.32 6 0.18 5 0.18
1700 4 0.34 1 0.12 2 0.13 2 0.16
2360 2 0.48
3350 1 0.46
Totals 2,148 2.64 1,124 1.01 705 0.65 688 0.64
Dry Mass (t)
Macrodiamond
size class (mm)st* ct* st ct st ct st ct
0.85 1,030 15.86 563 7.92 1,386 19.68 883 12.62
1.18 1,400 48.79 735 24.08 1,771 58.36 1,299 42.21
1.70 530 47.43 297 25.57 674 59.46 499 43.08
2.36 194 46.92 113 25.38 255 59.34 162 36.28
3.35 36 25.38 17 12.36 66 42.40 37 22.77
4.75 6 11.66 2 3.26 8 14.28 2 5.30
6.70 2 9.00 3 14.57
Totals 3,198 205.04 1,727 98.56 4,163 268.09 2,882 162.26
*Faraday 2 KIMB1 macrodiamonds were corrected for under-recovery of fine diamonds, as explained in Section 14.2.4.7.
78.44 34.20 104.95 137.80
0.79 0.21 0.21 0.51
Kennady Diamonds Inc. Aurora Geosciences Ltd.
KDI NI 43-101 Technical Report – Update 2017 141 | P a g e
Figure 14-9. Total +212 µm diamond content SFD model for Faraday 2 KIMB1
Notes: The SFD model is shown in a grade-size plot (log of stones per tonne per unit interval against the log of average size of
diamonds in each sieve class). This model was used as a basis for grade estimates in Faraday 2 KIMB1 and KIMB4. cps = carats
per stone, UI= unit interval (The unit interval factors are applied to diamond size data to correct for non-systematic size divisions
(Nowicki, 2016).
14.2.4.6 Adjustment for recoverable grade and final SFD models
The total content SFD models used for grade estimation were corrected based on assumed recovery
parameters (the same as those used for the Kelvin Mineral Resource estimate, Section 14.1.3) in a
commercial processing plant operating with a 1 mm bottom size cut-off. Recovery corrections were
estimated based on those reported in the Brisebois et al. (2009) technical report for the Gahcho Kué
Kimberlite Project. Due to general similarities in the nature of the kimberlite and size distribution of
diamonds these are a reasonable benchmark for processing of Faraday 2 and 3 kimberlites. The final
recovery corrected macrodiamond SFD models are included in Table 14-14. These recoverable SFD models
and the grade estimates derived therefrom may need to be adjusted based on the specific bottom cut-off
and plant configuration chosen for processing of Faraday ore.
Kennady Diamonds Inc. Aurora Geosciences Ltd.
KDI NI 43-101 Technical Report – Update 2017 142 | P a g e
Table 14-14. Final models of total and recoverable SFD
Notes: Total and recoverable SFD is reported as % ct in each size class, DTC = Diamond Trading Company.
14.2.4.7 Grade estimates
Five LDD drill clusters along 200 m of strike length in Faraday 2 provide good spatial coverage of domains
KIMB1, KIMB3 and KIMB4. Results have confirmed that no significant overall variations in grade or SFD
are present. Microdiamond data support this interpretation, and indicate that no significant change in
grade or SFD is likely to be present along strike in the areas not sampled by LDD. Extensive LDD drilling
has now shown that no significant changes in grade or SFD are present within well constrained geological
domains in both Kelvin (Vivian and Nowicki, 2017) and Faraday 2 (Section 14.2.4.3). While a spatial
coverage of LDD samples is not available for the geologically similar Faraday 3, microdiamond data provide
strong support for an assumption of similar grade and SFD constancy.
In diamond deposits of this nature, where the volumetrically dominant domains comprise massive
volcaniclastic kimberlite, dilution is likely to be the most significant driver of grade variability. Quantitative
measurement of all internal dilution larger than 0.5 cm has been carried out on ~1,800 and 1,300 m of
drill core internal to the Faraday 2 and 3 pipes, respectively. These data show no evidence for systematic
trends or for significant deviation from the average in the volumetrically dominant domains that are well
represented by dilution data.
The dilution data therefore support evidence from direct diamond sampling in suggesting suggest limited
scope for significant variation in grade on scales relevant to mining. Average grades have therefore been
adopted for all domains. Grades are based on the recovered LDD grade (with corrections applied where
necessary for variable efficiency in fine diamond recovery), adjusted for anticipated recovery efficiency in
a commercial process plant, as described below.
F2 KIMB1 F2 KIMB3 F3 KIMB1/2/3 F3 KIMB4 F2 KIMB1 F2 KIMB3 F3 KIMB1/2/3 F3 KIMB4
212 μm 1.64 2.56 2.24 1.64 0
300 μm 3.39 5.03 4.16 3.64 0
425 μm 6.19 8.35 7.09 6.72 0
600 μm 9.41 12.64 11.00 11.25 0
850 μm 5.20 6.76 5.58 6.40 0
1180 μm 12.58 14.79 12.64 14.72 15 3.16 4.59 3.40 4.11
DTC3 10.63 10.72 9.93 11.57 65 11.57 14.42 11.59 13.98
DTC5 12.89 12.00 11.62 13.43 100 21.58 24.83 20.86 24.97
DTC7 7.23 6.15 6.49 7.02 100 12.10 12.73 11.65 13.05
DTC9 8.72 7.51 7.99 8.31 100 14.59 15.55 14.34 15.46
DTC11 9.54 6.99 9.39 8.53 100 15.96 14.46 16.86 15.86
DTC13 4.33 2.98 4.54 3.49 100 7.25 6.17 8.15 6.48
DTC15 1.15 0.71 1.23 0.77 100 1.92 1.46 2.20 1.42
DTC17 1.63 0.96 1.70 0.96 100 2.72 1.98 3.05 1.78
DTC19 2.54 1.16 2.41 1.07 100 4.26 2.41 4.33 1.98
DTC21 1.70 0.51 1.35 0.38 100 2.84 1.05 2.41 0.71
DTC23 0.48 0.09 0.31 0.06 100 0.81 0.19 0.55 0.12
+10.8 ct 0.33 0.04 0.17 0.03 100 0.55 0.09 0.31 0.05
+15 ct 0.21 0.02 0.09 0.01 100 0.35 0.04 0.17 0.02
+20 ct 0.21 0.01 0.08 0.01 100 0.34 0.02 0.14 0.01
Size classTotal +212 μm content models (% ct)
Recovery %Recovery corrected domain SFD models (% ct)
Kennady Diamonds Inc. Aurora Geosciences Ltd.
KDI NI 43-101 Technical Report – Update 2017 143 | P a g e
Faraday 2 LDD grades were corrected for under-recovery of fine diamonds relative to Faraday 3 and Kelvin.
Process plant degrit screening panels were replaced during processing of Faraday 2 KIMB3, significantly
increasing the efficiency with which small diamonds were recovered. All other Faraday 2 material (KIMB1,
KIMB2 and KIMB4) was processed prior to this, and all Faraday 3 material was processed subsequently.
Corrections were made by adding diamonds to the fine size classes of the parcels until the bottom
recovery SFD characteristics matched those of comparative reference datasets (from 2016 Faraday 2 and
all Faraday 3). Original and corrected datasets are shown in Table 14-15 and an example of an original and
corrected diamond SFD (Faraday 2 KIMB1) is shown in Figure 14-10.
Table 14-15. Original and corrected Faraday 2 LDD results.
Notes: Corrections noted above were partially applied to KIMB3, as de-grit panels were replaced mid-way through processing of
this material, all other domains were processed prior to this.
Figure 14-10. Grade-size plot illustrating corrections made to Faraday 2 KIMB1 LDD recoveries for under-recovery
of small diamonds.
St Ct St Ct St Ct St Ct St Ct St Ct St Ct St Ct
850 853 13.19 2,130 32.94 101 1.64 440 7.16 666 9.68 1,003 15.44 162 2.41 300 4.45
1180 2,146 75.28 2,870 100.67 400 14.55 600 21.83 1,201 41.24 1,345 46.55 363 12.09 420 13.98
1700 1,078 98.08 1,088 98.99 222 20.39 228 20.94 530 45.85 535 46.28 149 12.53 150 12.61
2360 372 91.84 372 91.84 83 19.01 83 19.01 186 41.62 186 41.62 62 14.81 62 14.81
3350 69 47.51 69 47.51 15 10.40 15 10.40 32 21.05 32 21.05 7 6.94 7 6.94
4750 14 23.29 14 23.29 1 2.37 1 2.37 5 7.66 5 7.66 2 3.86 2 3.86
6700 3 12.45 3 12.45
Totals 4,535 361.64 6,546 407.69 822 68.37 1,367 81.71 2,620 167.10 3,106 178.60 745 52.63 941 56.66
Mass (t)
Grade (+0.85
mm cpt)2.98
KIMB1 LDD KIMB2 LDD KIMB3 LDD KIMB4 LDDKIMB2 corr. KIMB3 corr.
22.8 56.1 39.2
KIMB1 corr.
1.34 1.45
KIMB4 corr
3.19
154.4
Size
2.34 2.64 3.00 3.58
Kennady Diamonds Inc. Aurora Geosciences Ltd.
KDI NI 43-101 Technical Report – Update 2017 144 | P a g e
Notes: Figure 14-10 uses a “Faraday reference” dataset, comprising recoveries from Faraday 2 in 2016 and all 2017 Faraday 3
recoveries was used, with its grade adjusted to overlap the SFD of KIMB1, as a baseline of expected recovery efficiency. Diamonds
were added to the fine size classes to make the KIMB1 SFD overlap with the fine size classes of the reference dataset. The grade
size plot shows the log of stones per tonne per unit interval against the log of average size of diamonds in each sieve class. cps =
carats per stone.
Grade determined by LDD drilling and sample processing at a 0.85 mm bottom cut off is overstated
relative to that recoverable by a commercial processing plant. The models of total diamond content SFD
(Section 14.2.4.5) and application of process plant recovery correction factors thereto (Section 14.2.4.6)
effectively converts LDD-recovered grade into a commercially-recoverable grade at a 1 mm bottom cut-
off reflecting standardized recovery efficiencies for all estimates (including Kelvin).
Due to the relatively small microdiamond parcels available for correlation with macrodiamond parcels in
the volumetrically limited domains of both bodies it was only possible to define total diamond content
SFD models at a reasonable level of confidence for Faraday 2 KIMB1 and KIMB3, and for Faraday 3 KIMB4.
In Faraday 2 the macrodiamond SFD of KIMB4 is most similar to KIMB1, and KIMB2 is most similar to
KIMB3 (Figure 14-11). These SFD models have been adopted for KIMB4 and KIMB2 accordingly. In
Faraday 3, KIMB1, KIMB2 and KIMB3 all show very similar macrodiamond SFD characteristics
(Figure 14-11) and the combined micro- and macrodiamond datasets (Table 14-13) for all of these
domains were therefore used to define a single total diamond content SFD model (Table 14-14) for
Faraday 3 KIMB1/2/3. The macrodiamond parcel for Faraday 3 KIMB4C is very limited due to its low grade.
KIMB4C is however a more highly-diluted sub-unit of KIMB4, and the SFD model for KIMB4 (Table 14-14),
based on the data for KIMB4B (Table 14-13), has been adopted for both KIMB4B and KIMB4C.
The percentage difference between LDD grade and +1 mm grade, as defined by the four SFD models
(Section 14.2.4.5), has been used to correct the LDD grades from all domains, which have been adopted
as the final average grade estimates in this report (Table 14-16).
Table 14-16. Estimates of recoverable (+1mm) grade for each geological domain of Faraday 2 and 3
Notes: Grades, as recovered by LDD sampling are shown for comparison. In Faraday 2 these were adjusted upwards to correct
for under-recovery of small diamonds for the majority of sample processing (this only partially affected KIMB3, de-grit panels
were replaced mid-way through processing of KIMB3 material, all other domains were processed prior to this). The difference
between LDD grade and +1 mm grade, as defined by SFD models, was applied to the LDD grades to derive final grade estimates.
Body Domain SFD modelLDD grade
(+0.85 mm cpt)
Corrected LDD grade
(+0.85 mm cpt)
Final grade
(+1 mm cpt)
KIMB1 F2 KIMB1 2.34 2.64 2.23
KIMB2 F2 KIMB2/3 3.00 3.58 3.07
KIMB3 F2 KIMB2/3 2.98 3.19 2.73
KIMB4 F2 KIMB1 1.34 1.45 1.22
KIMB1 F3 KIMB1/2/3 4.50 N/a 3.74
KIMB2 F3 KIMB1/2/3 2.65 N/a 2.20
KIMB3 F3 KIMB1/2/3 0.74 N/a 0.61
KIMB4B F3 KIMB4 1.18 N/a 0.97
KIMB4C F3 KIMB4 0.79 N/a 0.65
Faraday 2
Faraday 3
Kennady Diamonds Inc. Aurora Geosciences Ltd.
KDI NI 43-101 Technical Report – Update 2017 145 | P a g e
Recovery corrections are based on a conventional commercial process plant operating at a 1 mm bottom recovery cut off (Section
14.2.4.6).
Figure 14-11. Comparison of macrodiamond SFD characteristics of (a) all Faraday 2 domains and (b) Faraday 3
KIMB1, KIMB2 and KIMB3.
Notes: Only diamonds recovered prior to replacement of degrit panels are shown for Faraday 2 KIMB3 to allow for a valid
comparison. SFD is shown on a cumulative log-probability plot (showing the proportion of diamonds below a given stone size);
cps = carats per stone, ct = size in carats of the parcel represented.
Kennady Diamonds Inc. Aurora Geosciences Ltd.
KDI NI 43-101 Technical Report – Update 2017 146 | P a g e
14.2.5 Diamond value
14.2.5.1 Diamond valuation results
A parcel of 1,183 ct of diamonds from Faraday 2 and Faraday 3 underwent valuation by WWW
International Diamond Consultants Ltd (WWW) in Antwerp in July 2017. The parcel, derived from LDD
drilling, was valued subsequent to cleaning and was sieved prior to valuation to remove all diamonds
smaller than the Diamond Trading Company (DTC) 1 size category. Valuation results and comments on
value characteristics have been extracted from the WWW diamond valuation report (WWW, 2017).
Diamonds have been valued in four parcels, as follows:
• Faraday 2 KIMB1 and KIMB4 (456.76 ct) – grouped based on textural similarities, the KIMB4 parcel
is too small to value separately.
• Faraday 2 KIMB2 and KIMB3 (269.71 ct) – grouped based on textural similarities, neither parcel
of sufficient size for valuation.
• Faraday 3 KIMB4 (188.20 ct) - includes results from KIMB4B and KIMB4C, considered to be sub-
units of the same kimberlite unit, distinguished by increased dilution in KIMB4C relative to
KIMB4B.
• Faraday 3 KIMB1, KIMB2 and KIMB3 (268.45 ct) - diamonds derived from volumetrically minor
domains above KIMB4B and KIMB4C in Faraday 3.
Diamond value estimates per size class for diamonds grouped on this basis are presented in Table 14-17
and shown graphically in Figure 14-12. All values are reported in US dollars and estimates are based on
the WWW price book as of 31 July 2017. The five highest value diamonds on a dollar per carat basis from
the Faraday bulk samples include:
• 7.78 carat sawable octahedron from Faraday 3 valued at US$2,967 per carat
• 4.02 carat sawable octahedron from Faraday 3 valued at US$2,526 per carat
• 3.08 carat sawable octahedron from Faraday 3 valued at US$1,966 per carat
• 4.72 carat sawable octahedron from Faraday 2 valued at US$1,667 per carat
• 2.37 carat sawable diamond from Faraday 2 valued at US$1,502 per carat
Images of select diamonds are available on the Company’s website at www.kennadydiamonds.com.
Kennady Diamonds Inc. Aurora Geosciences Ltd.
KDI NI 43-101 Technical Report – Update 2017 147 | P a g e
Table 14-17. Diamond value estimates (WWW, 2017) by size class for diamond parcels representing groupings of
domains.
Notes: Parcels were sieved prior to valuation to remove diamonds smaller than DTC 1. ct = carats, st = stones, gr = grainer, DTC
= Diamond Trading Company. Values are reported in US dollars based on the WWW price book as of 31 July 2017. The number
of diamonds valued in size classes DTC 9 and below are based on the carat weight divided by an assumed average stone size.
Figure 14-12. Faraday 2 and 3 diamond valuation results by geological domain.
Notes: Valuation results extracted from WWW (2017). Values per size class are presented in US dollars, based on the WWW price
book as of 31 July 2017. Ct = total size of the parcel valued in carats.
Domain
Size class ct st $/ct ct st $/ct ct st $/ct ct st $/ct ct st $/ct
7 ct 7.78 1 2,967 7.78 1 2,967
4 ct 8.99 2 1,442 4.02 1 2,526 13.01 3 1,777
3 ct 3.43 1 22 9.87 3 1,313 2.87 1 1,375 16.17 5 1,050
10 gr 5.23 2 380 2.37 1 1,502 7.60 3 730
8 gr 9.00 4 77 3.90 2 83 4.29 2 161 17.19 8 99
6 gr 6.09 4 287 1.46 1 117 6.15 4 98 13.70 9 184
5 gr 7.61 6 276 3.73 3 166 1.38 1 40 3.94 3 852 16.66 13 368
4 gr 17.22 16 245 11.00 11 302 10.51 10 248 4.00 4 22 42.73 41 239
3 gr 17.50 22 101 7.27 10 116 9.14 12 75 5.02 7 134 38.93 51 102
+11 DTC 74.69 196 71 36.73 101 66 46.93 125 90 33.61 90 58 191.96 512 73
+9 DTC 53.30 299 43 33.00 169 43 30.85 166 51 22.61 127 42 139.76 761 45
+7 DTC 53.66 474 27 34.03 292 39 30.00 249 36 24.93 230 33 142.62 1,245 33
+5 DTC 97.79 1,499 25 65.25 1,150 22 57.46 906 22 43.75 708 20 264.25 4,263 23
+3 DTC 55.28 1,882 11 41.48 1,694 13 32.92 1,122 12 27.24 956 16 156.92 5,654 13
+1 DTC 46.97 3,837 5 29.49 1,919 7 21.17 1,294 6 16.21 1,076 5 113.84 8,126 6
Total 456.76 8,244 83 269.71 5,353 60 268.45 3,895 184 188.20 3,203 124 1,183.12 20,695 107
Faraday 2 K1/K4 Faraday 2 K2/K3 Faraday 3 K4 (B and C)Faraday 3 K1/K2/K3 Total
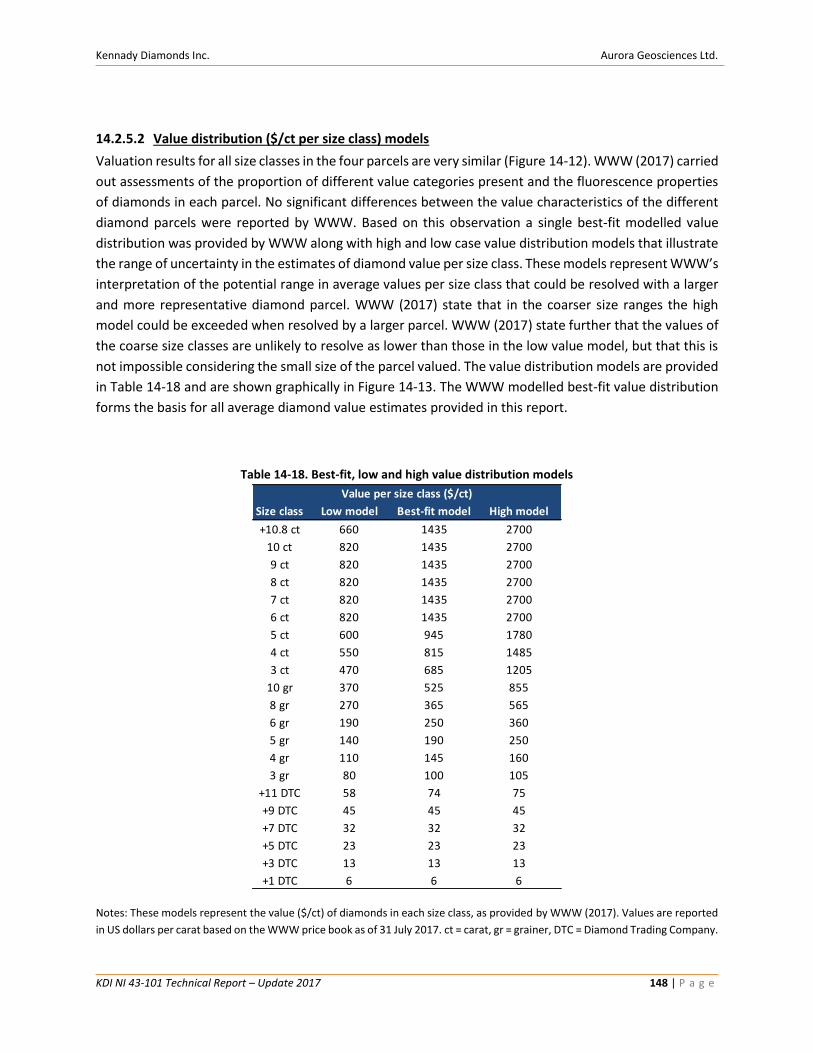
Kennady Diamonds Inc. Aurora Geosciences Ltd.
KDI NI 43-101 Technical Report – Update 2017 148 | P a g e
14.2.5.2 Value distribution ($/ct per size class) models
Valuation results for all size classes in the four parcels are very similar (Figure 14-12). WWW (2017) carried
out assessments of the proportion of different value categories present and the fluorescence properties
of diamonds in each parcel. No significant differences between the value characteristics of the different
diamond parcels were reported by WWW. Based on this observation a single best-fit modelled value
distribution was provided by WWW along with high and low case value distribution models that illustrate
the range of uncertainty in the estimates of diamond value per size class. These models represent WWW’s
interpretation of the potential range in average values per size class that could be resolved with a larger
and more representative diamond parcel. WWW (2017) state that in the coarser size ranges the high
model could be exceeded when resolved by a larger parcel. WWW (2017) state further that the values of
the coarse size classes are unlikely to resolve as lower than those in the low value model, but that this is
not impossible considering the small size of the parcel valued. The value distribution models are provided
in Table 14-18 and are shown graphically in Figure 14-13. The WWW modelled best-fit value distribution
forms the basis for all average diamond value estimates provided in this report.
Table 14-18. Best-fit, low and high value distribution models
Notes: These models represent the value ($/ct) of diamonds in each size class, as provided by WWW (2017). Values are reported
in US dollars per carat based on the WWW price book as of 31 July 2017. ct = carat, gr = grainer, DTC = Diamond Trading Company.
Size class Low model Best-fit model High model
+10.8 ct 660 1435 2700
10 ct 820 1435 2700
9 ct 820 1435 2700
8 ct 820 1435 2700
7 ct 820 1435 2700
6 ct 820 1435 2700
5 ct 600 945 1780
4 ct 550 815 1485
3 ct 470 685 1205
10 gr 370 525 855
8 gr 270 365 565
6 gr 190 250 360
5 gr 140 190 250
4 gr 110 145 160
3 gr 80 100 105
+11 DTC 58 74 75
+9 DTC 45 45 45
+7 DTC 32 32 32
+5 DTC 23 23 23
+3 DTC 13 13 13
+1 DTC 6 6 6
Value per size class ($/ct)
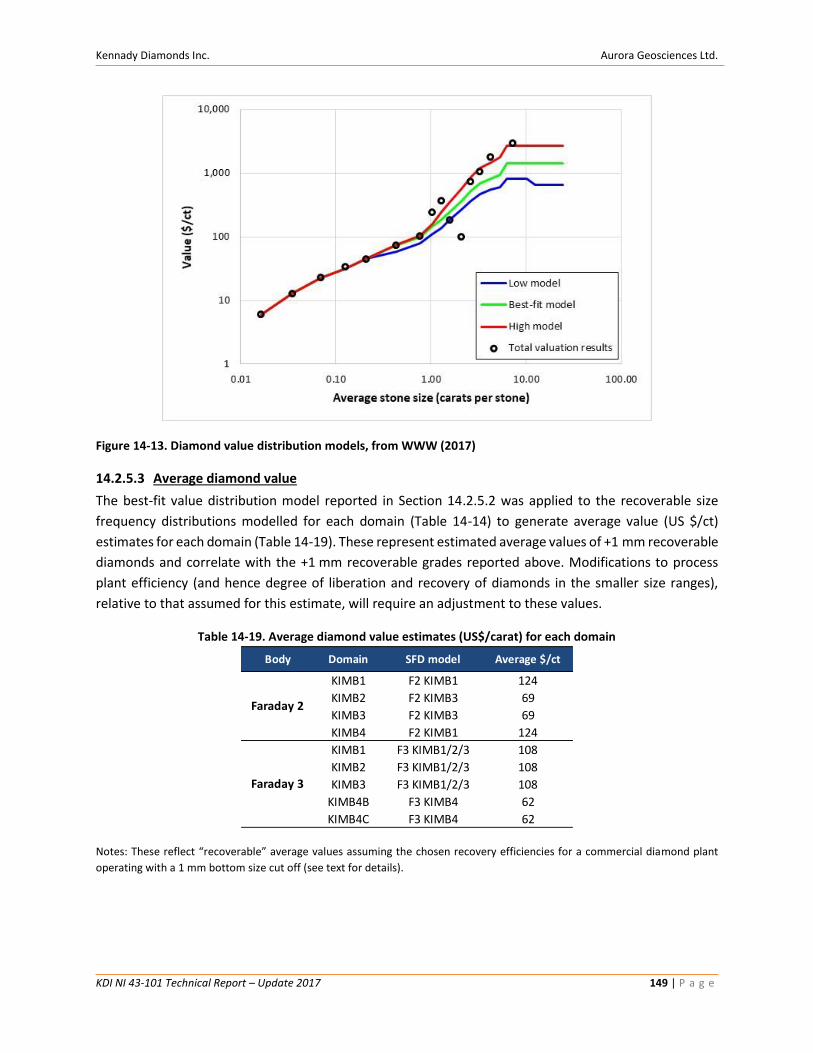
Kennady Diamonds Inc. Aurora Geosciences Ltd.
KDI NI 43-101 Technical Report – Update 2017 149 | P a g e
Figure 14-13. Diamond value distribution models, from WWW (2017)
14.2.5.3 Average diamond value
The best-fit value distribution model reported in Section 14.2.5.2 was applied to the recoverable size
frequency distributions modelled for each domain (Table 14-14) to generate average value (US $/ct)
estimates for each domain (Table 14-19). These represent estimated average values of +1 mm recoverable
diamonds and correlate with the +1 mm recoverable grades reported above. Modifications to process
plant efficiency (and hence degree of liberation and recovery of diamonds in the smaller size ranges),
relative to that assumed for this estimate, will require an adjustment to these values.
Table 14-19. Average diamond value estimates (US$/carat) for each domain
Notes: These reflect “recoverable” average values assuming the chosen recovery efficiencies for a commercial diamond plant
operating with a 1 mm bottom size cut off (see text for details).
Body Domain SFD model Average $/ct
KIMB1 F2 KIMB1 124
KIMB2 F2 KIMB3 69
KIMB3 F2 KIMB3 69
KIMB4 F2 KIMB1 124
KIMB1 F3 KIMB1/2/3 108
KIMB2 F3 KIMB1/2/3 108
KIMB3 F3 KIMB1/2/3 108
KIMB4B F3 KIMB4 62
KIMB4C F3 KIMB4 62
Faraday 2
Faraday 3
Kennady Diamonds Inc. Aurora Geosciences Ltd.
KDI NI 43-101 Technical Report – Update 2017 150 | P a g e
14.2.6 Diamond breakage
The use of the above-described size and value distribution models in the estimation of grade and average
diamond value assumes that the degree of breakage to which the diamonds have been subjected during
LDD drilling / sampling is comparable to breakage that would be incurred during mining and processing of
kimberlite material. If the degree of breakage incurred during sampling is higher than that achievable
during production, then the value and potentially the grade of an LDD-derived parcel would under-
represent the production diamond grade and value; i.e. additional breakage in the LDD parcel would
reduce the frequency of large diamonds and potentially increase the proportion diamonds that are
smaller than the bottom cut-off, resulting in net diamond loss.
Observations by the SRC on diamond parcels for Faraday 2 and Faraday 3 provide an indication of the
proportions of stones larger than 3350 μm considered to have been subjected to significant induced
breakage, here classified as a loss in mass of more than 5 % resulting from breakage that is not of natural
causes. Faraday 2 and Faraday 3 diamonds show 15 and 20 % such breakage, respectively. This is
consistent with breakage levels in the 2015 and 2016 Kelvin diamond parcels, which were recorded as 14
to 18 % and 4 to 18 %, respectively.
While induced diamond breakage has occurred it is not possible to accurately quantify the degree to which
this may have affected the grade or average value estimates, or to assess the extent to which such
breakage might be mitigated during production. Consequently, no adjustments have been made to either
the grade or the average diamond value estimates to account for potential diamond breakage.
14.2.7 Confidence and resource classification
The nature and degree of uncertainty relating to each component (volume, tonnage, grade and value) of
the Faraday 2 and 3 Mineral Resource estimate is discussed in the sections below. The estimate is
considered to be constrained to a level of confidence suitable for the declaration of Inferred Mineral
Resources.
14.2.7.1 Confidence in resource volumes
Mineral Services has reviewed the Faraday 2 and 3 pipe shell and internal geology models (MSC17/018R)
in detail and considers the geological models to be well defined. The external shells are constrained by 85
and 61 drill holes, respectively, and there is no scope for substantial (more than ~15 %) loss or addition of
pipe volume within the area currently delineated (the pipe extents and volume may increase with depth
with additional drilling). The volumes of individual internal domains are also well constrained, however
due to the horizontally-layered nature of the deposit and the very thin extents of several smaller domains
these are subject to a higher relative degree of uncertainty. However, the bulk densities of all internal
kimberlite domains are very similar (Section 14.2.3) and hence uncertainty in the internal domain model
volumes has very limited implication for tonnage uncertainty.
14.2.7.2 Confidence in bulk density and tonnage estimates
The bulk density estimates for Faraday 2 and 3 are based on large, representative datasets of 546 and 391
measurements, respectively. In view of the large number of bulk density measurements and the limited
degree of variability in bulk density of the kimberlite domains comprising the resource, uncertainty in the
Kennady Diamonds Inc. Aurora Geosciences Ltd.
KDI NI 43-101 Technical Report – Update 2017 151 | P a g e
estimates of bulk density is estimated to be lower than ±5 % and is not a significant source of uncertainty
for tonnage estimates. Due to the use of average bulk densities it is possible that bulk density is slightly
underestimated at depth and slightly overestimated (<5 % local variation from the average) in the
shallower portions of both pipes. This variation is not considered sufficiently large to justify the use of a
local bulk density model.
14.2.7.3 Confidence in grade estimates
The grade estimates for Faraday 2 are based on average LDD grades per domain. These grades have been
corrected where necessary for compromised efficiency in the recovery of small diamonds (Faraday 2,
Section 14.2.4.7) and have been converted to +1 mm recoverable grade through the use of total diamond
content SFD models to which standardized recovery correction factors have been applied.
Potential error associated with this approach derives from four key factors: (1) possible error in the
corrections to Faraday 2 results for under-recovery of small diamonds; (2) error in the modelling of the
total content SFD models to which recovery correction factors have been applied; (3) error in the use of
an assumed SFD for domains in which a confident SFD model could not be defined and; (4) potential
variation in grade along strike, i.e. if the sample grade is not representative of the entire domain. These
areas of uncertainty are discussed below.
1. The potential scope of error associated with the correction in Faraday 2 grades for under-
recovery of small diamonds has been assessed by gauging the relative degree of variation in fine
diamond recovery for various process parcels in Faraday 3 (used as a basis for the correction of
Faraday 2 LDD grades) and assessing the impact that this degree of variation could have on
sample grade. The results suggest a maximum potential error of ±10 % associated with this
aspect of the estimate. This is likely overstated, as the recovery parameters for larger parcels are
generally more consistent than for smaller process batches.
2. If the micro- and macrodiamond datasets used to define a total diamond content SFD model are
derived from material with differing grade this would result in an inaccurate model. The
implications for this are however limited; while the relationship between microdiamond and
macrodiamond stone frequency would be incorrect, the +1 mm recovery corrected grades would
be subject to substantially less error. This was assessed by changing the grade of the
microdiamond parcel used to define the Faraday 2 KIMB1 model to quantify the impact on
recoverable +1 mm grade. A modification to the microdiamond grade of 50 % translates to a
change in +1 mm recoverable grade of < 5 %.
3. The use of assumed SFD models for grade corrections (Section 14.2.4.7) has limited implication
for grade error. The range of % correction from LDD to +1 mm recoverable grade, as defined by
the 4 different SFD models, is between 14 and 18 %. Based on the macrodiamond parcels
available and the degree of similarity between the recovered and assumed SFDs, it is considered
highly unlikely that a domain SFD would vary from the assumed model to the extend where a
grade uncertainty in excess of 5 % would apply.
Kennady Diamonds Inc. Aurora Geosciences Ltd.
KDI NI 43-101 Technical Report – Update 2017 152 | P a g e
4. The potential for grade variation along strike and the amount of error potentially associated with
the LDD grade not being representative of the overall domain grade can be assessed through
observations of macrodiamond stone frequency variation along strike in Faraday 2 (-10 to
+15 %), variation in microdiamond stone frequency along strike in both bodies (-15 to +30 %,
even for grouped parcels of limited size), and in variation in dilution (likely to be a major control
on grade) along strike. The average dilution of broad zones within Faraday 2 and Faraday 3 do
not vary by more than 15 % from the respective domain average. The dilution characteristics of
the area sampled by LDD was compared with the average dilution characteristics of each domain.
No significant differences are evident.
14.2.7.4 Confidence in diamond value estimates
There are three sources of uncertainty relevant to the average diamond value estimates for Faraday 2 and
3. Two of these relate to the key components of the value estimation approach used, i.e. uncertainty in
the extent to which value distribution model and the SFD models used as a basis for the estimate
accurately reflect those of the underlying diamond populations in each of the domains. The third relates
to uncertainty in the market value of the diamonds and how this fluctuates with time.
Confidence in value distribution models
Estimates of average values in size classes DTC 1 to DTC 11 are well constrained by the diamond parcels
on which they are based (e.g. 512 stones valued in the DTC 11 size class; see Table 14-17). Average values
in the coarser size ranges are represented by significantly fewer diamonds (< 100 in each size class; see
Table 14-17) and are hence far less reliably constrained (as indicated by the range between low- and high-
case value models, Figure 14-13). However, due to the relatively fine-grained nature of the Faraday 2 and
3 SFDs, the impact of this uncertainty on estimates of average diamond value is relatively small; the low
frequency of coarse diamonds limits the overall impact of uncertainty related to their value. The high and
low case value distribution models (WWW, 2017), when applied to the recoverable domain SFD curves,
imply a maximum possible error range on the domain average values of -30 to +50 %.
The average value estimates by domain have been produced on the assumption that the value
distributions (i.e. $/ct per sieve size class) of all domains are the same. It is possible that individual domains
may resolve differing value distribution characteristics with a larger sample. However, based on the
valuation data and observations available, the extent of these differences is expected to be limited and
their impact on average diamond value is very unlikely to exceed the uncertainty associated with the
overall value distribution model, as outlined above.
Confidence in diamond size frequency distribution
Diamond SFDs that are coarser or finer grained than the current models (i.e. that reflect uncertainty in
the coarse end of the size distribution) will have limited impact on grade but will have significant
implications for average diamond value. The degree of uncertainty associated with error in the models,
Kennady Diamonds Inc. Aurora Geosciences Ltd.
KDI NI 43-101 Technical Report – Update 2017 153 | P a g e
and with the assumption of SFD models from certain domains for the estimation of value in other
domains, has been modelled by fitting high-case (coarse) and low-case (fine) model SFDs for each domain
and applying the best-fit value distribution model to these. The range of uncertainty in average value
implied by these models is approximately -25 to +50 %.
Market fluctuation in diamond price
The value estimates for Faraday 2 and 3 are based on valuations and model estimates of diamond value
per sieve size class made by WWW. These estimates are based on the WWW price book for 31 July 2017
and will be subject to market fluctuations with time. The valuation of diamonds is highly specialized and
subjective; all valuation is subject to a degree of uncertainty which reflects personal opinions as to the
quality and market demand for the diamonds in question. Independent valuations of single diamond
parcels made at the same time can differ significantly. Quantification of the uncertainty in average value
associated with market fluctuation in diamond prices is beyond the scope of this study and has not been
accounted for in the classification of the Mineral Resource estimate for Faraday 2 and 3.
14.2.8 Reasonable prospects for eventual economic extraction
The CIM Definition Standards for Mineral Resources and Mineral Reserves states that in order to be
classified as a Mineral Resource there should be a reasonable prospect for the eventual economic
extraction of the specified ore. The Mineral Resource estimate for Kelvin has been found to satisfy this
criterion independently of the Faraday kimberlites (JDS, 2016, Section 14.1.6). Considering the close
proximity of the Faraday kimberlites to Kelvin a precedent for reasonable prospects of eventual economic
extraction is considered to be established for near-surface deposits of similar character and with similar
grade and value.
14.2.9 Faraday Mineral Resource Statement
The estimation work described in the sections above defines a total Inferred Mineral Resource for the
Faraday 2 and 3 kimberlites of 1.35 million tonnes at an average grade of 1.54 carats per tonne and an
overall average diamond value of US$98 per carat (Table 14-20). The estimates encompass the entire
bodies as defined by the current geological models, extending from base of overburden (~390 masl) in the
south-east to similar depths of approximately 160 masl. The grade and average diamond value estimates
reflect diamonds recoverable by a commercial process plant operating with a 1 mm bottom cut-off. The
corrections applied to derive these recoverable estimates are based on assumed recovery parameters and
will need to be adjusted for the actual recovery efficiency of the planned production processing plant.
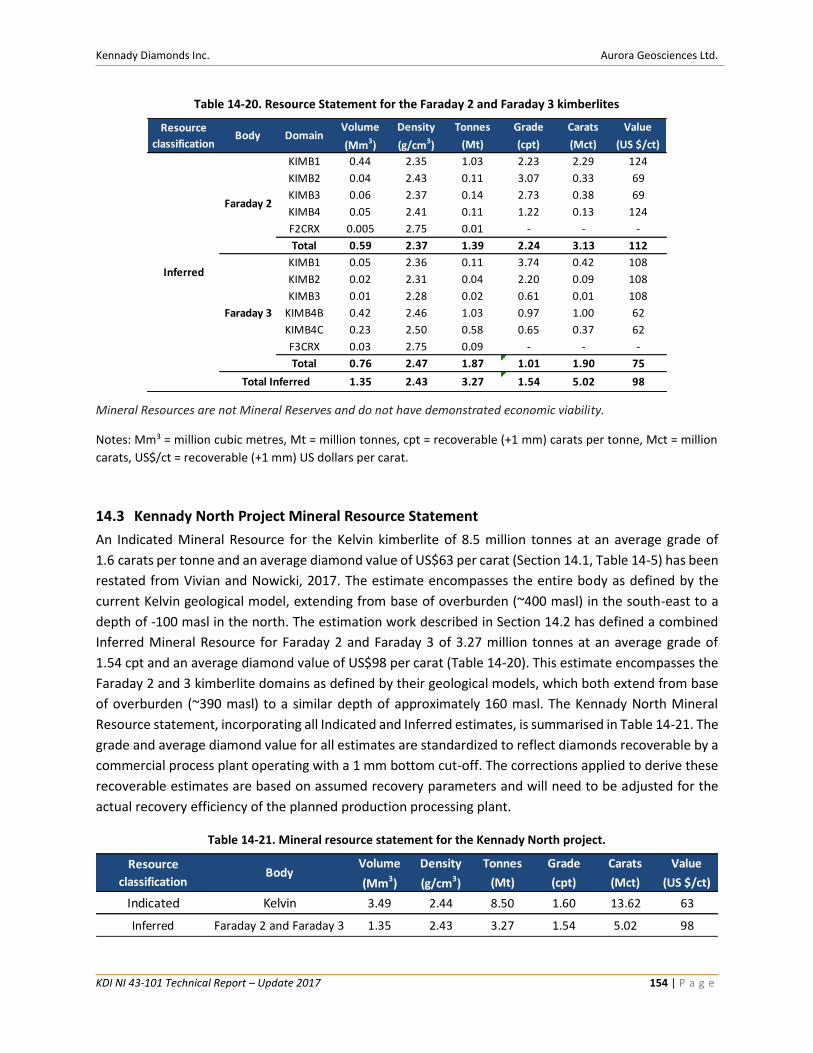
Kennady Diamonds Inc. Aurora Geosciences Ltd.
KDI NI 43-101 Technical Report – Update 2017 154 | P a g e
Table 14-20. Resource Statement for the Faraday 2 and Faraday 3 kimberlites
Mineral Resources are not Mineral Reserves and do not have demonstrated economic viability.
Notes: Mm3 = million cubic metres, Mt = million tonnes, cpt = recoverable (+1 mm) carats per tonne, Mct = million
carats, US$/ct = recoverable (+1 mm) US dollars per carat.
14.3 Kennady North Project Mineral Resource Statement
An Indicated Mineral Resource for the Kelvin kimberlite of 8.5 million tonnes at an average grade of
1.6 carats per tonne and an average diamond value of US$63 per carat (Section 14.1, Table 14-5) has been
restated from Vivian and Nowicki, 2017. The estimate encompasses the entire body as defined by the
current Kelvin geological model, extending from base of overburden (~400 masl) in the south-east to a
depth of -100 masl in the north. The estimation work described in Section 14.2 has defined a combined
Inferred Mineral Resource for Faraday 2 and Faraday 3 of 3.27 million tonnes at an average grade of
1.54 cpt and an average diamond value of US$98 per carat (Table 14-20). This estimate encompasses the
Faraday 2 and 3 kimberlite domains as defined by their geological models, which both extend from base
of overburden (~390 masl) to a similar depth of approximately 160 masl. The Kennady North Mineral
Resource statement, incorporating all Indicated and Inferred estimates, is summarised in Table 14-21. The
grade and average diamond value for all estimates are standardized to reflect diamonds recoverable by a
commercial process plant operating with a 1 mm bottom cut-off. The corrections applied to derive these
recoverable estimates are based on assumed recovery parameters and will need to be adjusted for the
actual recovery efficiency of the planned production processing plant.
Table 14-21. Mineral resource statement for the Kennady North project.
Volume Density Tonnes Grade Carats Value
(Mm3) (g/cm3) (Mt) (cpt) (Mct) (US $/ct)
KIMB1 0.44 2.35 1.03 2.23 2.29 124
KIMB2 0.04 2.43 0.11 3.07 0.33 69
KIMB3 0.06 2.37 0.14 2.73 0.38 69
KIMB4 0.05 2.41 0.11 1.22 0.13 124
F2CRX 0.005 2.75 0.01 - - -
Total 0.59 2.37 1.39 2.24 3.13 112
KIMB1 0.05 2.36 0.11 3.74 0.42 108
KIMB2 0.02 2.31 0.04 2.20 0.09 108
KIMB3 0.01 2.28 0.02 0.61 0.01 108
KIMB4B 0.42 2.46 1.03 0.97 1.00 62
KIMB4C 0.23 2.50 0.58 0.65 0.37 62
F3CRX 0.03 2.75 0.09 - - -
Total 0.76 2.47 1.87 1.01 1.90 75
1.35 2.43 3.27 1.54 5.02 98Total Inferred
Resource
classificationBody
Inferred
Domain
Faraday 2
Faraday 3
Volume Density Tonnes Grade Carats Value
(Mm3) (g/cm3) (Mt) (cpt) (Mct) (US $/ct)
Indicated Kelvin 3.49 2.44 8.50 1.60 13.62 63
Inferred Faraday 2 and Faraday 3 1.35 2.43 3.27 1.54 5.02 98
Resource
classificationBody
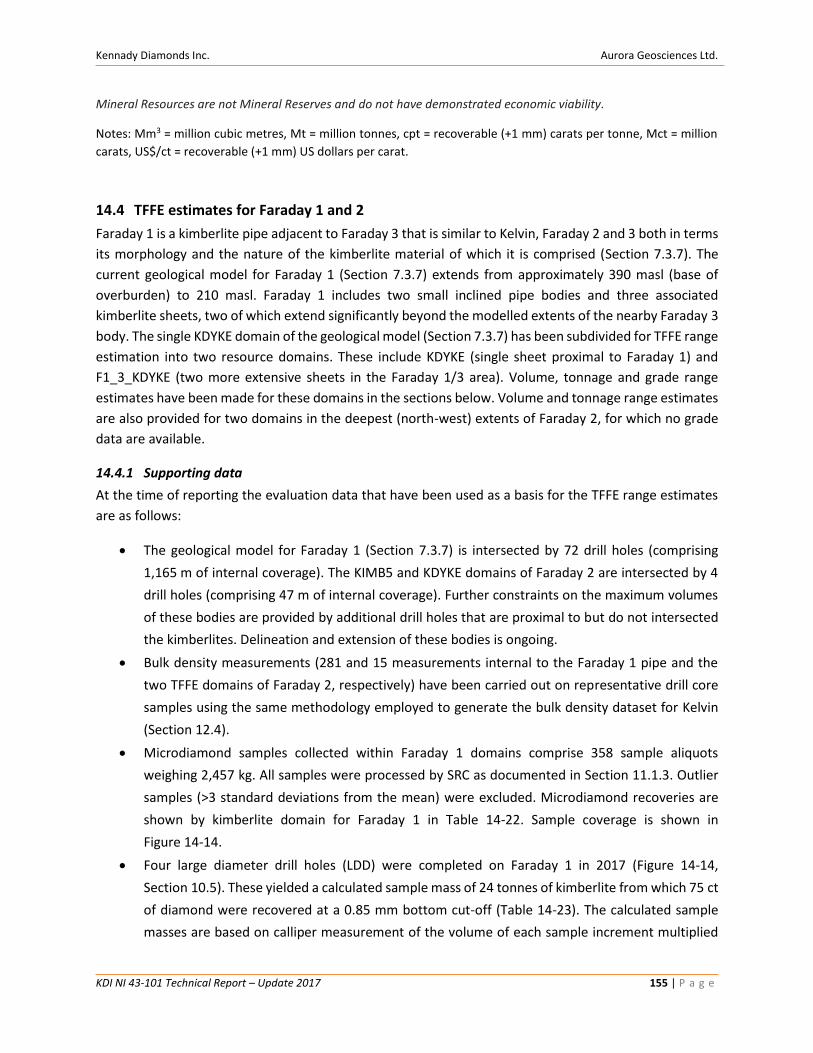
Kennady Diamonds Inc. Aurora Geosciences Ltd.
KDI NI 43-101 Technical Report – Update 2017 155 | P a g e
Mineral Resources are not Mineral Reserves and do not have demonstrated economic viability.
Notes: Mm3 = million cubic metres, Mt = million tonnes, cpt = recoverable (+1 mm) carats per tonne, Mct = million
carats, US$/ct = recoverable (+1 mm) US dollars per carat.
14.4 TFFE estimates for Faraday 1 and 2
Faraday 1 is a kimberlite pipe adjacent to Faraday 3 that is similar to Kelvin, Faraday 2 and 3 both in terms
its morphology and the nature of the kimberlite material of which it is comprised (Section 7.3.7). The
current geological model for Faraday 1 (Section 7.3.7) extends from approximately 390 masl (base of
overburden) to 210 masl. Faraday 1 includes two small inclined pipe bodies and three associated
kimberlite sheets, two of which extend significantly beyond the modelled extents of the nearby Faraday 3
body. The single KDYKE domain of the geological model (Section 7.3.7) has been subdivided for TFFE range
estimation into two resource domains. These include KDYKE (single sheet proximal to Faraday 1) and
F1_3_KDYKE (two more extensive sheets in the Faraday 1/3 area). Volume, tonnage and grade range
estimates have been made for these domains in the sections below. Volume and tonnage range estimates
are also provided for two domains in the deepest (north-west) extents of Faraday 2, for which no grade
data are available.
14.4.1 Supporting data
At the time of reporting the evaluation data that have been used as a basis for the TFFE range estimates
are as follows:
• The geological model for Faraday 1 (Section 7.3.7) is intersected by 72 drill holes (comprising
1,165 m of internal coverage). The KIMB5 and KDYKE domains of Faraday 2 are intersected by 4
drill holes (comprising 47 m of internal coverage). Further constraints on the maximum volumes
of these bodies are provided by additional drill holes that are proximal to but do not intersected
the kimberlites. Delineation and extension of these bodies is ongoing.
• Bulk density measurements (281 and 15 measurements internal to the Faraday 1 pipe and the
two TFFE domains of Faraday 2, respectively) have been carried out on representative drill core
samples using the same methodology employed to generate the bulk density dataset for Kelvin
(Section 12.4).
• Microdiamond samples collected within Faraday 1 domains comprise 358 sample aliquots
weighing 2,457 kg. All samples were processed by SRC as documented in Section 11.1.3. Outlier
samples (>3 standard deviations from the mean) were excluded. Microdiamond recoveries are
shown by kimberlite domain for Faraday 1 in Table 14-22. Sample coverage is shown in
Figure 14-14.
• Four large diameter drill holes (LDD) were completed on Faraday 1 in 2017 (Figure 14-14,
Section 10.5). These yielded a calculated sample mass of 24 tonnes of kimberlite from which 75 ct
of diamond were recovered at a 0.85 mm bottom cut-off (Table 14-23). The calculated sample
masses are based on calliper measurement of the volume of each sample increment multiplied
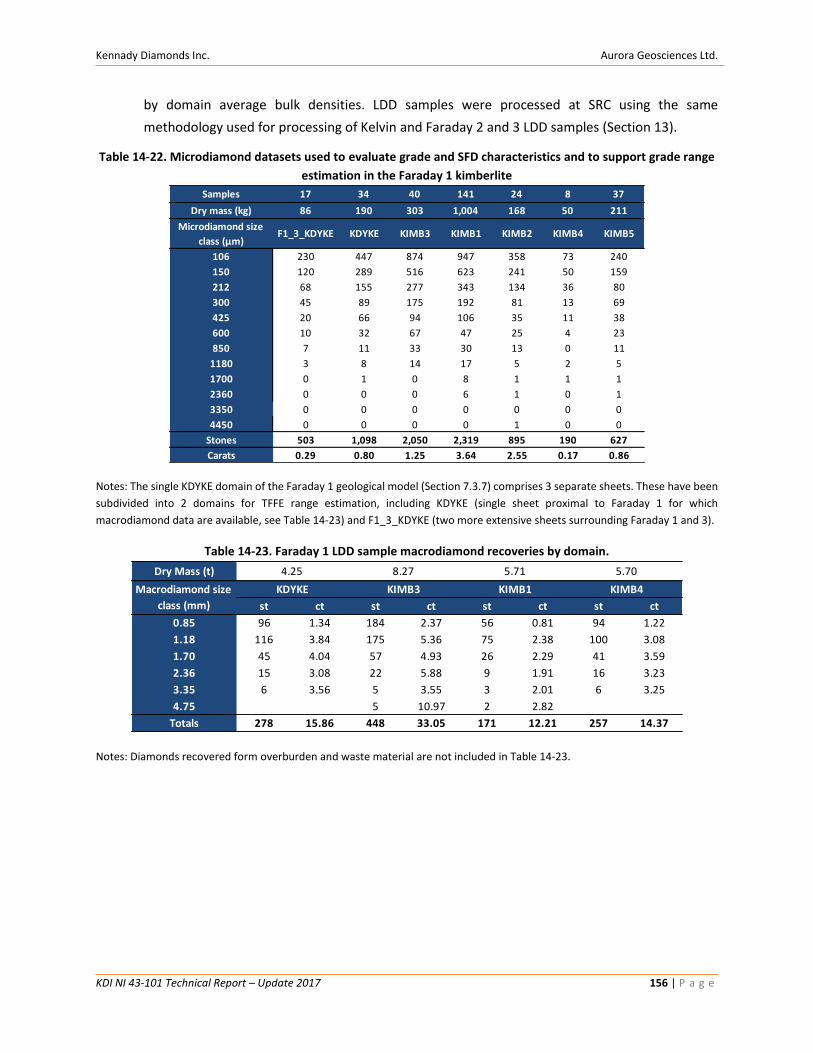
Kennady Diamonds Inc. Aurora Geosciences Ltd.
KDI NI 43-101 Technical Report – Update 2017 156 | P a g e
by domain average bulk densities. LDD samples were processed at SRC using the same
methodology used for processing of Kelvin and Faraday 2 and 3 LDD samples (Section 13).
Table 14-22. Microdiamond datasets used to evaluate grade and SFD characteristics and to support grade range
estimation in the Faraday 1 kimberlite
Notes: The single KDYKE domain of the Faraday 1 geological model (Section 7.3.7) comprises 3 separate sheets. These have been
subdivided into 2 domains for TFFE range estimation, including KDYKE (single sheet proximal to Faraday 1 for which
macrodiamond data are available, see Table 14-23) and F1_3_KDYKE (two more extensive sheets surrounding Faraday 1 and 3).
Table 14-23. Faraday 1 LDD sample macrodiamond recoveries by domain.
Notes: Diamonds recovered form overburden and waste material are not included in Table 14-23.
Samples 17 34 40 141 24 8 37
Dry mass (kg) 86 190 303 1,004 168 50 211
Microdiamond size
class (μm)F1_3_KDYKE KDYKE KIMB3 KIMB1 KIMB2 KIMB4 KIMB5
106 230 447 874 947 358 73 240
150 120 289 516 623 241 50 159
212 68 155 277 343 134 36 80
300 45 89 175 192 81 13 69
425 20 66 94 106 35 11 38
600 10 32 67 47 25 4 23
850 7 11 33 30 13 0 11
1180 3 8 14 17 5 2 5
1700 0 1 0 8 1 1 1
2360 0 0 0 6 1 0 1
3350 0 0 0 0 0 0 0
4450 0 0 0 0 1 0 0
Stones 503 1,098 2,050 2,319 895 190 627
Carats 0.29 0.80 1.25 3.64 2.55 0.17 0.86
Dry Mass (t)
st ct st ct st ct st ct
0.85 96 1.34 184 2.37 56 0.81 94 1.22
1.18 116 3.84 175 5.36 75 2.38 100 3.08
1.70 45 4.04 57 4.93 26 2.29 41 3.59
2.36 15 3.08 22 5.88 9 1.91 16 3.23
3.35 6 3.56 5 3.55 3 2.01 6 3.25
4.75 5 10.97 2 2.82
Totals 278 15.86 448 33.05 171 12.21 257 14.37
5.70
KIMB4
4.25
Macrodiamond size
class (mm)
KDYKE
8.27
KIMB3
5.71
KIMB1
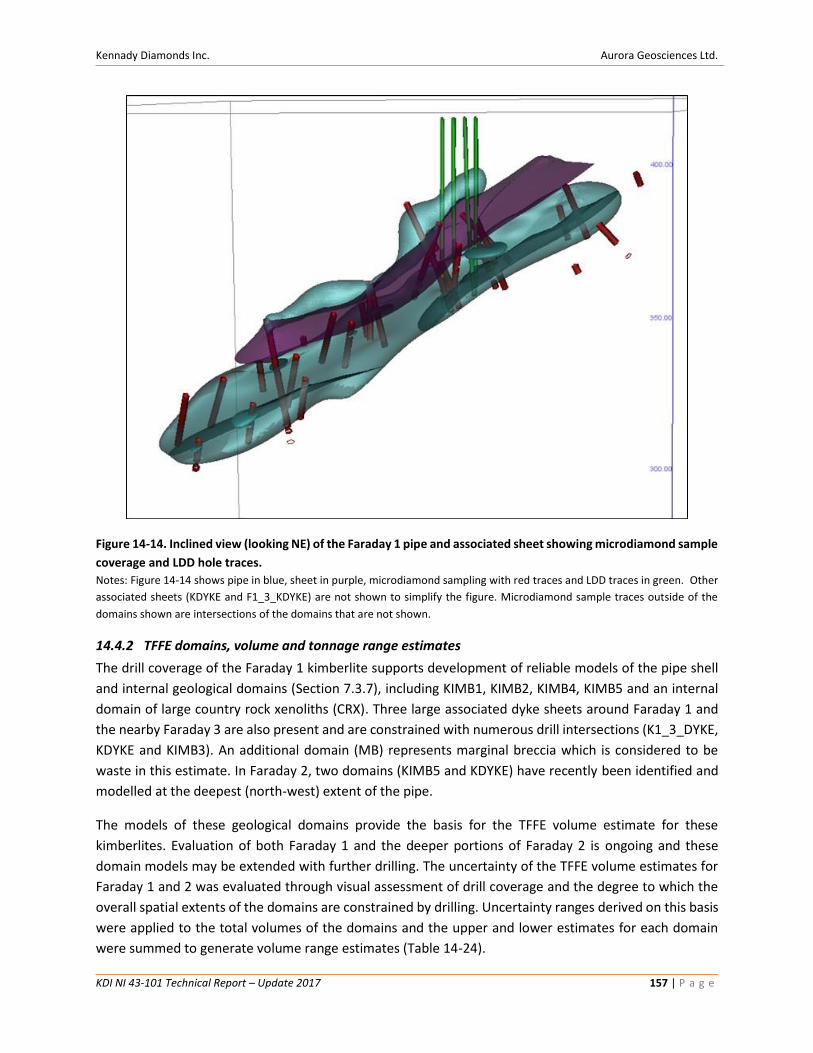
Kennady Diamonds Inc. Aurora Geosciences Ltd.
KDI NI 43-101 Technical Report – Update 2017 157 | P a g e
Figure 14-14. Inclined view (looking NE) of the Faraday 1 pipe and associated sheet showing microdiamond sample
coverage and LDD hole traces.
Notes: Figure 14-14 shows pipe in blue, sheet in purple, microdiamond sampling with red traces and LDD traces in green. Other
associated sheets (KDYKE and F1_3_KDYKE) are not shown to simplify the figure. Microdiamond sample traces outside of the
domains shown are intersections of the domains that are not shown.
14.4.2 TFFE domains, volume and tonnage range estimates
The drill coverage of the Faraday 1 kimberlite supports development of reliable models of the pipe shell
and internal geological domains (Section 7.3.7), including KIMB1, KIMB2, KIMB4, KIMB5 and an internal
domain of large country rock xenoliths (CRX). Three large associated dyke sheets around Faraday 1 and
the nearby Faraday 3 are also present and are constrained with numerous drill intersections (K1_3_DYKE,
KDYKE and KIMB3). An additional domain (MB) represents marginal breccia which is considered to be
waste in this estimate. In Faraday 2, two domains (KIMB5 and KDYKE) have recently been identified and
modelled at the deepest (north-west) extent of the pipe.
The models of these geological domains provide the basis for the TFFE volume estimate for these
kimberlites. Evaluation of both Faraday 1 and the deeper portions of Faraday 2 is ongoing and these
domain models may be extended with further drilling. The uncertainty of the TFFE volume estimates for
Faraday 1 and 2 was evaluated through visual assessment of drill coverage and the degree to which the
overall spatial extents of the domains are constrained by drilling. Uncertainty ranges derived on this basis
were applied to the total volumes of the domains and the upper and lower estimates for each domain
were summed to generate volume range estimates (Table 14-24).
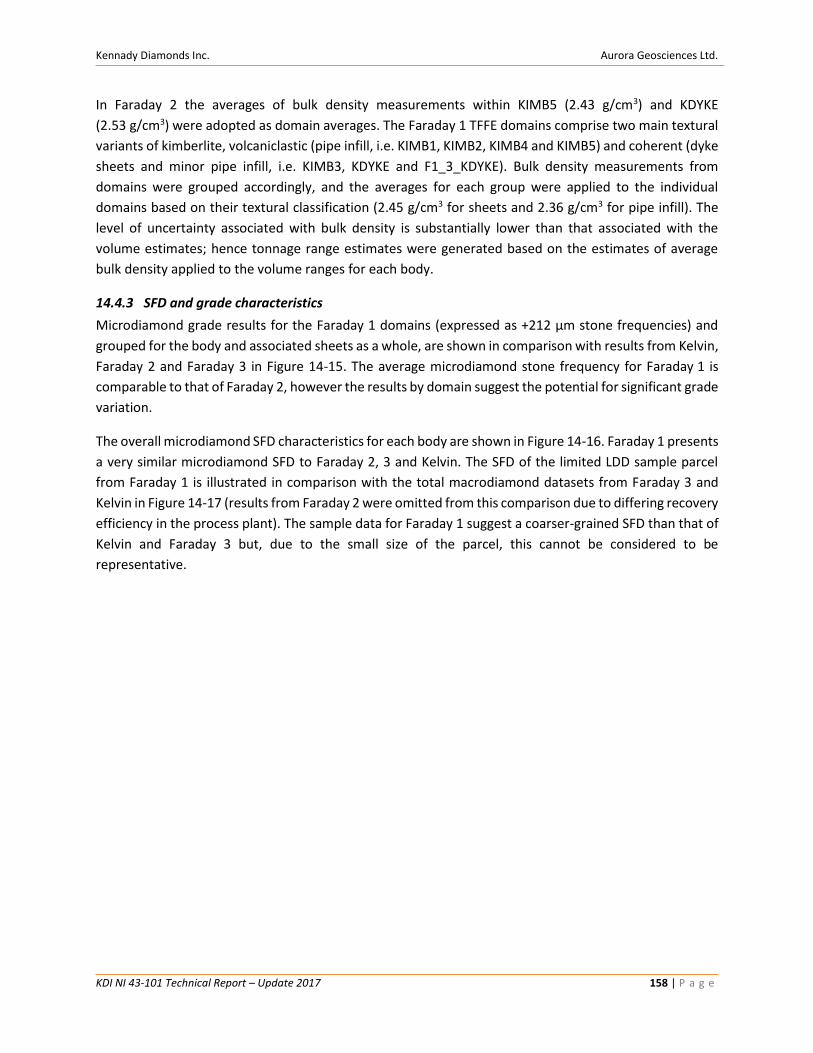
Kennady Diamonds Inc. Aurora Geosciences Ltd.
KDI NI 43-101 Technical Report – Update 2017 158 | P a g e
In Faraday 2 the averages of bulk density measurements within KIMB5 (2.43 g/cm3) and KDYKE
(2.53 g/cm3) were adopted as domain averages. The Faraday 1 TFFE domains comprise two main textural
variants of kimberlite, volcaniclastic (pipe infill, i.e. KIMB1, KIMB2, KIMB4 and KIMB5) and coherent (dyke
sheets and minor pipe infill, i.e. KIMB3, KDYKE and F1_3_KDYKE). Bulk density measurements from
domains were grouped accordingly, and the averages for each group were applied to the individual
domains based on their textural classification (2.45 g/cm3 for sheets and 2.36 g/cm3 for pipe infill). The
level of uncertainty associated with bulk density is substantially lower than that associated with the
volume estimates; hence tonnage range estimates were generated based on the estimates of average
bulk density applied to the volume ranges for each body.
14.4.3 SFD and grade characteristics
Microdiamond grade results for the Faraday 1 domains (expressed as +212 μm stone frequencies) and
grouped for the body and associated sheets as a whole, are shown in comparison with results from Kelvin,
Faraday 2 and Faraday 3 in Figure 14-15. The average microdiamond stone frequency for Faraday 1 is
comparable to that of Faraday 2, however the results by domain suggest the potential for significant grade
variation.
The overall microdiamond SFD characteristics for each body are shown in Figure 14-16. Faraday 1 presents
a very similar microdiamond SFD to Faraday 2, 3 and Kelvin. The SFD of the limited LDD sample parcel
from Faraday 1 is illustrated in comparison with the total macrodiamond datasets from Faraday 3 and
Kelvin in Figure 14-17 (results from Faraday 2 were omitted from this comparison due to differing recovery
efficiency in the process plant). The sample data for Faraday 1 suggest a coarser-grained SFD than that of
Kelvin and Faraday 3 but, due to the small size of the parcel, this cannot be considered to be
representative.
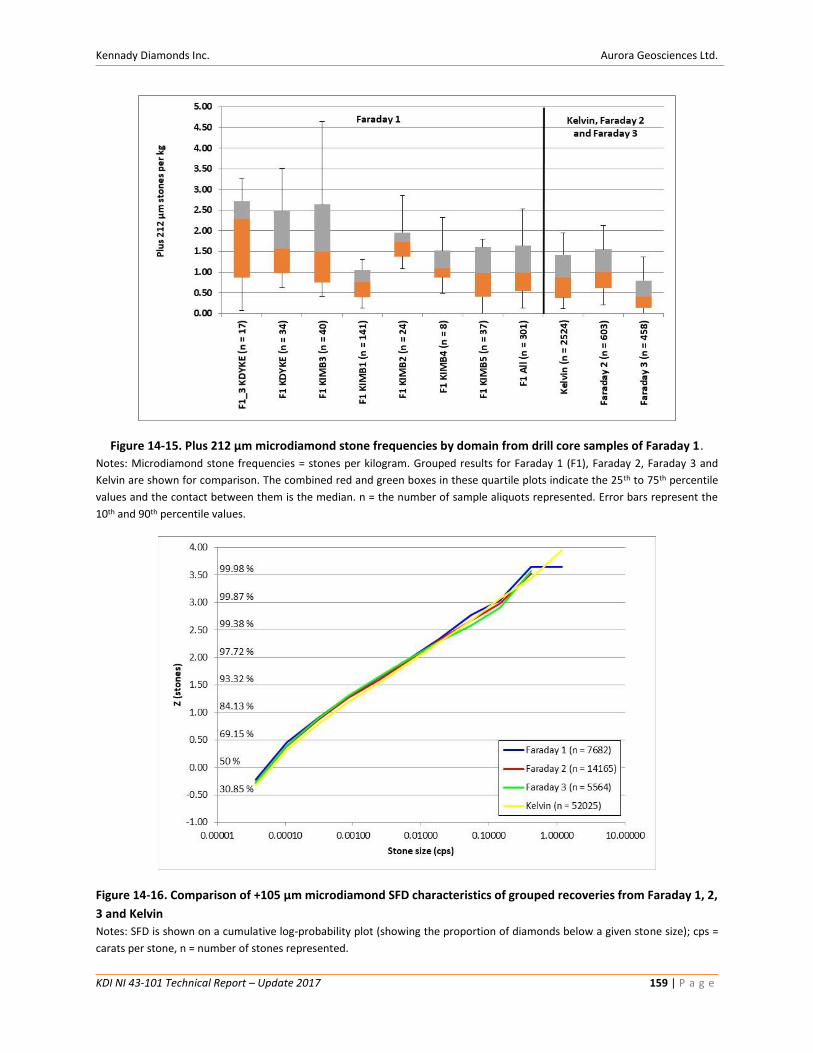
Kennady Diamonds Inc. Aurora Geosciences Ltd.
KDI NI 43-101 Technical Report – Update 2017 159 | P a g e
Figure 14-15. Plus 212 µm microdiamond stone frequencies by domain from drill core samples of Faraday 1.
Notes: Microdiamond stone frequencies = stones per kilogram. Grouped results for Faraday 1 (F1), Faraday 2, Faraday 3 and
Kelvin are shown for comparison. The combined red and green boxes in these quartile plots indicate the 25th to 75th percentile
values and the contact between them is the median. n = the number of sample aliquots represented. Error bars represent the
10th and 90th percentile values.
Figure 14-16. Comparison of +105 µm microdiamond SFD characteristics of grouped recoveries from Faraday 1, 2,
3 and Kelvin
Notes: SFD is shown on a cumulative log-probability plot (showing the proportion of diamonds below a given stone size); cps =
carats per stone, n = number of stones represented.
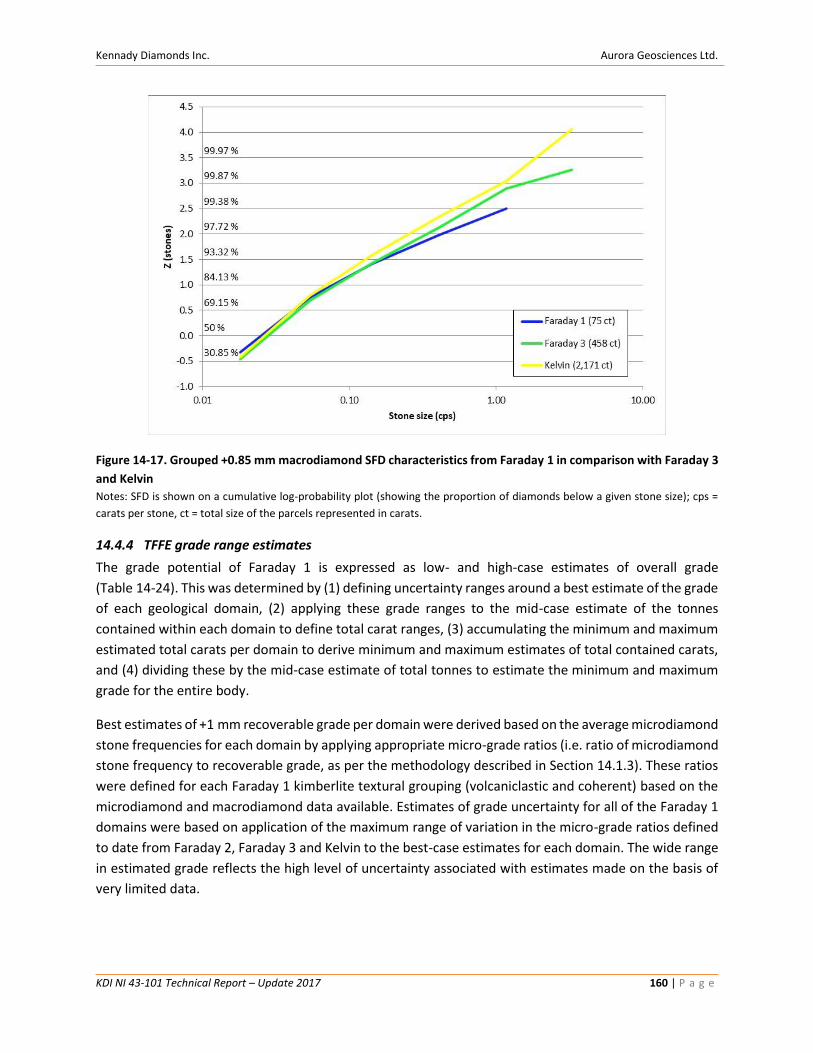
Kennady Diamonds Inc. Aurora Geosciences Ltd.
KDI NI 43-101 Technical Report – Update 2017 160 | P a g e
Figure 14-17. Grouped +0.85 mm macrodiamond SFD characteristics from Faraday 1 in comparison with Faraday 3
and Kelvin
Notes: SFD is shown on a cumulative log-probability plot (showing the proportion of diamonds below a given stone size); cps =
carats per stone, ct = total size of the parcels represented in carats.
14.4.4 TFFE grade range estimates
The grade potential of Faraday 1 is expressed as low- and high-case estimates of overall grade
(Table 14-24). This was determined by (1) defining uncertainty ranges around a best estimate of the grade
of each geological domain, (2) applying these grade ranges to the mid-case estimate of the tonnes
contained within each domain to define total carat ranges, (3) accumulating the minimum and maximum
estimated total carats per domain to derive minimum and maximum estimates of total contained carats,
and (4) dividing these by the mid-case estimate of total tonnes to estimate the minimum and maximum
grade for the entire body.
Best estimates of +1 mm recoverable grade per domain were derived based on the average microdiamond
stone frequencies for each domain by applying appropriate micro-grade ratios (i.e. ratio of microdiamond
stone frequency to recoverable grade, as per the methodology described in Section 14.1.3). These ratios
were defined for each Faraday 1 kimberlite textural grouping (volcaniclastic and coherent) based on the
microdiamond and macrodiamond data available. Estimates of grade uncertainty for all of the Faraday 1
domains were based on application of the maximum range of variation in the micro-grade ratios defined
to date from Faraday 2, Faraday 3 and Kelvin to the best-case estimates for each domain. The wide range
in estimated grade reflects the high level of uncertainty associated with estimates made on the basis of
very limited data.
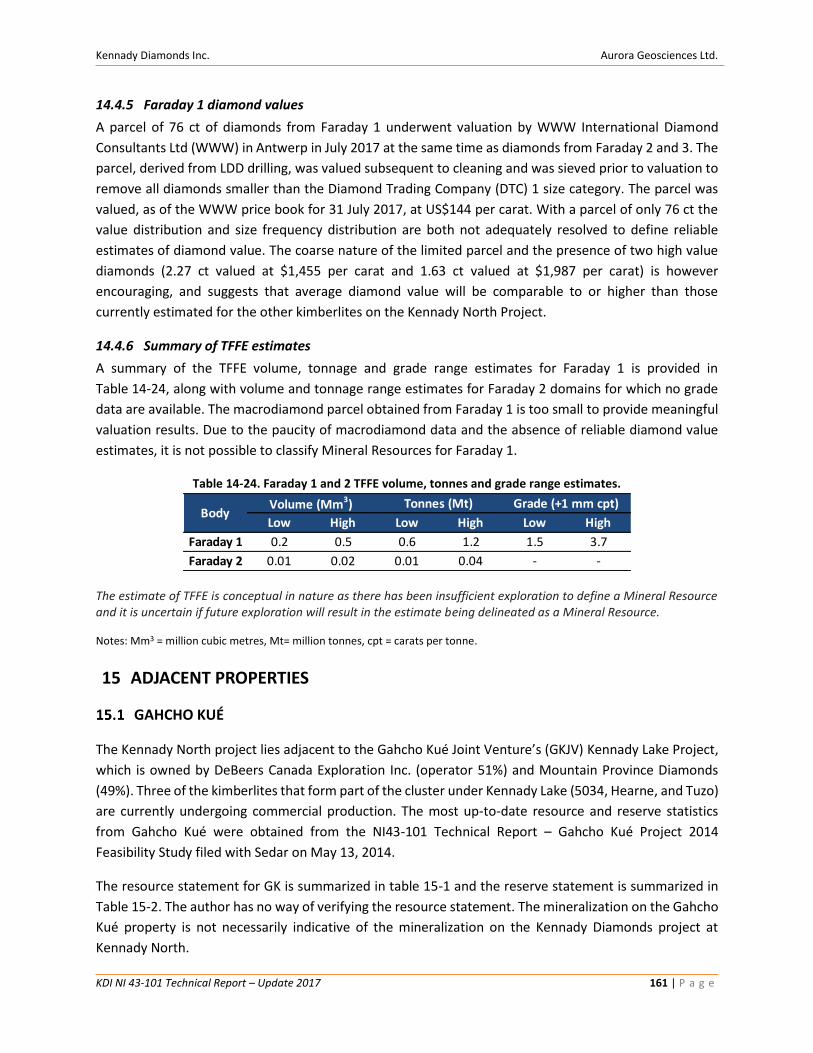
Kennady Diamonds Inc. Aurora Geosciences Ltd.
KDI NI 43-101 Technical Report – Update 2017 161 | P a g e
14.4.5 Faraday 1 diamond values
A parcel of 76 ct of diamonds from Faraday 1 underwent valuation by WWW International Diamond
Consultants Ltd (WWW) in Antwerp in July 2017 at the same time as diamonds from Faraday 2 and 3. The
parcel, derived from LDD drilling, was valued subsequent to cleaning and was sieved prior to valuation to
remove all diamonds smaller than the Diamond Trading Company (DTC) 1 size category. The parcel was
valued, as of the WWW price book for 31 July 2017, at US$144 per carat. With a parcel of only 76 ct the
value distribution and size frequency distribution are both not adequately resolved to define reliable
estimates of diamond value. The coarse nature of the limited parcel and the presence of two high value
diamonds (2.27 ct valued at $1,455 per carat and 1.63 ct valued at $1,987 per carat) is however
encouraging, and suggests that average diamond value will be comparable to or higher than those
currently estimated for the other kimberlites on the Kennady North Project.
14.4.6 Summary of TFFE estimates
A summary of the TFFE volume, tonnage and grade range estimates for Faraday 1 is provided in
Table 14-24, along with volume and tonnage range estimates for Faraday 2 domains for which no grade
data are available. The macrodiamond parcel obtained from Faraday 1 is too small to provide meaningful
valuation results. Due to the paucity of macrodiamond data and the absence of reliable diamond value
estimates, it is not possible to classify Mineral Resources for Faraday 1.
Table 14-24. Faraday 1 and 2 TFFE volume, tonnes and grade range estimates.
The estimate of TFFE is conceptual in nature as there has been insufficient exploration to define a Mineral Resource and it is uncertain if future exploration will result in the estimate being delineated as a Mineral Resource.
Notes: Mm3 = million cubic metres, Mt= million tonnes, cpt = carats per tonne.
15 ADJACENT PROPERTIES
GAHCHO KUÉ
The Kennady North project lies adjacent to the Gahcho Kué Joint Venture’s (GKJV) Kennady Lake Project,
which is owned by DeBeers Canada Exploration Inc. (operator 51%) and Mountain Province Diamonds
(49%). Three of the kimberlites that form part of the cluster under Kennady Lake (5034, Hearne, and Tuzo)
are currently undergoing commercial production. The most up-to-date resource and reserve statistics
from Gahcho Kué were obtained from the NI43-101 Technical Report – Gahcho Kué Project 2014
Feasibility Study filed with Sedar on May 13, 2014.
The resource statement for GK is summarized in table 15-1 and the reserve statement is summarized in
Table 15-2. The author has no way of verifying the resource statement. The mineralization on the Gahcho
Kué property is not necessarily indicative of the mineralization on the Kennady Diamonds project at
Kennady North.
Low High Low High Low High
Faraday 1 0.2 0.5 0.6 1.2 1.5 3.7
Faraday 2 0.01 0.02 0.01 0.04 - -
BodyVolume (Mm3) Tonnes (Mt) Grade (+1 mm cpt)
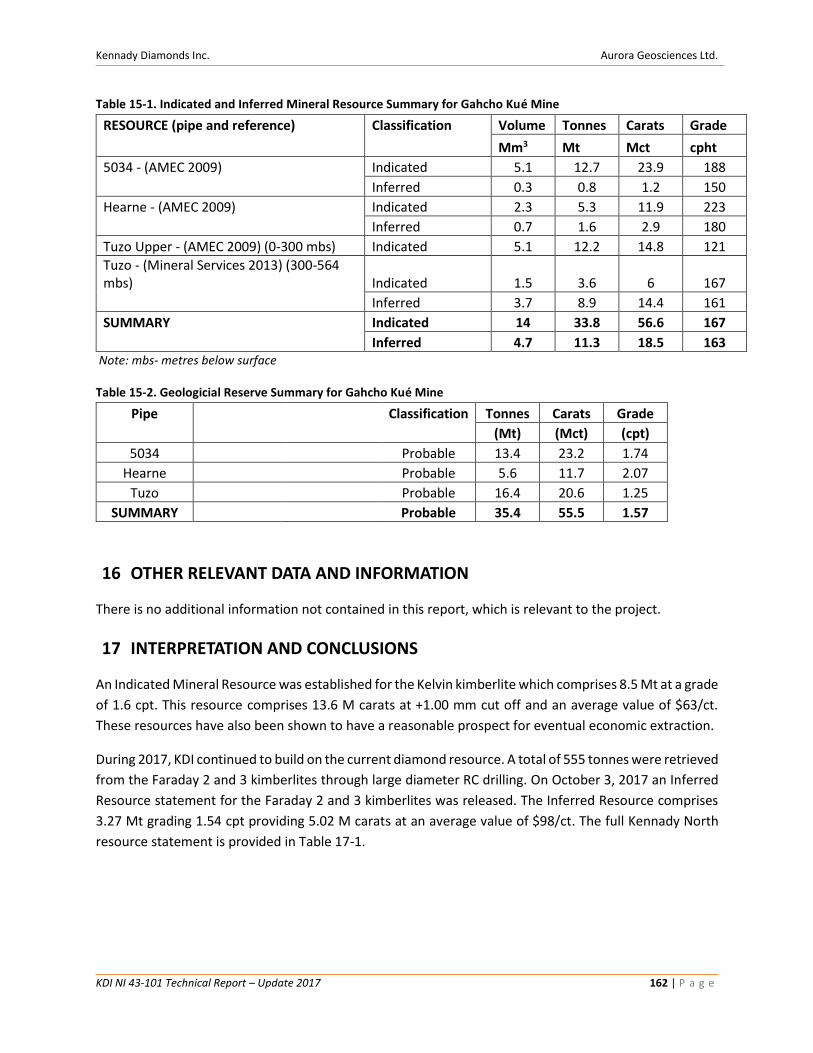
Kennady Diamonds Inc. Aurora Geosciences Ltd.
KDI NI 43-101 Technical Report – Update 2017 162 | P a g e
Table 15-1. Indicated and Inferred Mineral Resource Summary for Gahcho Kué Mine
RESOURCE (pipe and reference) Classification Volume Tonnes Carats Grade
Mm3 Mt Mct cpht
5034 - (AMEC 2009) Indicated 5.1 12.7 23.9 188
Inferred 0.3 0.8 1.2 150
Hearne - (AMEC 2009) Indicated 2.3 5.3 11.9 223
Inferred 0.7 1.6 2.9 180
Tuzo Upper - (AMEC 2009) (0-300 mbs) Indicated 5.1 12.2 14.8 121
Tuzo - (Mineral Services 2013) (300-564 mbs) Indicated 1.5 3.6 6 167
Inferred 3.7 8.9 14.4 161
SUMMARY Indicated 14 33.8 56.6 167
Inferred 4.7 11.3 18.5 163 Note: mbs- metres below surface
Table 15-2. Geologicial Reserve Summary for Gahcho Kué Mine
Pipe Classification Tonnes Carats Grade
(Mt) (Mct) (cpt)
5034 Probable 13.4 23.2 1.74
Hearne Probable 5.6 11.7 2.07
Tuzo Probable 16.4 20.6 1.25
SUMMARY Probable 35.4 55.5 1.57
16 OTHER RELEVANT DATA AND INFORMATION
There is no additional information not contained in this report, which is relevant to the project.
17 INTERPRETATION AND CONCLUSIONS
An Indicated Mineral Resource was established for the Kelvin kimberlite which comprises 8.5 Mt at a grade
of 1.6 cpt. This resource comprises 13.6 M carats at +1.00 mm cut off and an average value of $63/ct.
These resources have also been shown to have a reasonable prospect for eventual economic extraction.
During 2017, KDI continued to build on the current diamond resource. A total of 555 tonnes were retrieved
from the Faraday 2 and 3 kimberlites through large diameter RC drilling. On October 3, 2017 an Inferred
Resource statement for the Faraday 2 and 3 kimberlites was released. The Inferred Resource comprises
3.27 Mt grading 1.54 cpt providing 5.02 M carats at an average value of $98/ct. The full Kennady North
resource statement is provided in Table 17-1.
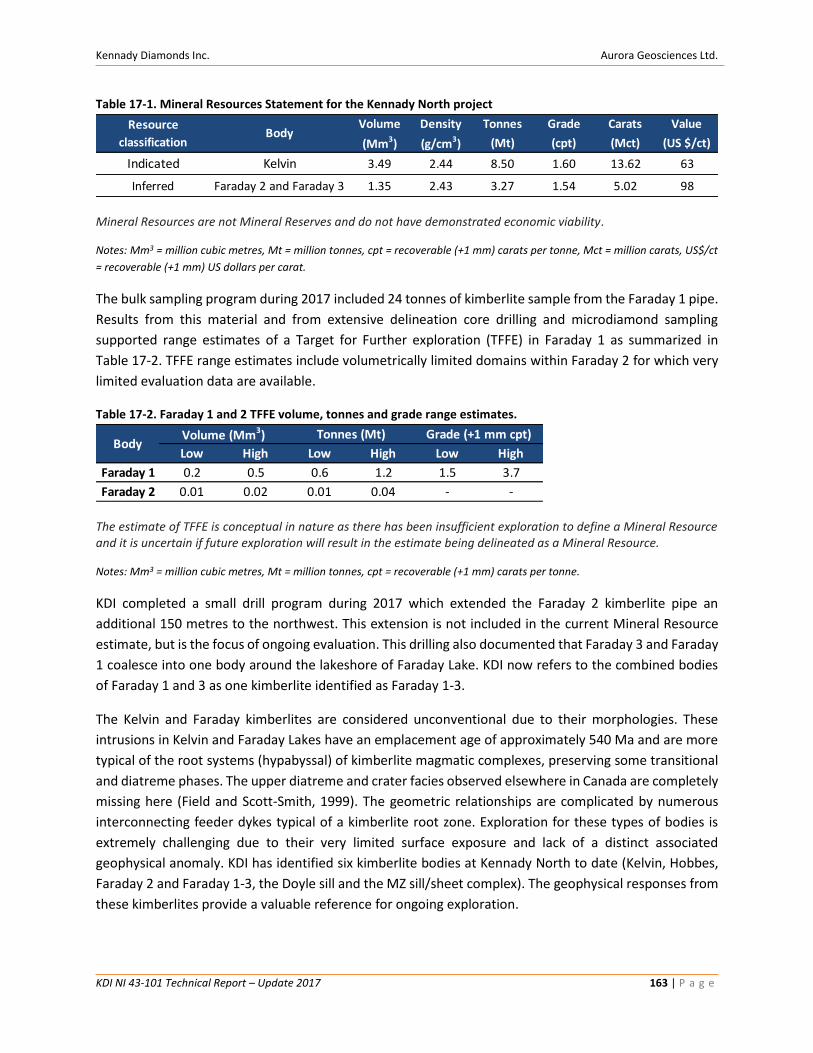
Kennady Diamonds Inc. Aurora Geosciences Ltd.
KDI NI 43-101 Technical Report – Update 2017 163 | P a g e
Table 17-1. Mineral Resources Statement for the Kennady North project
Mineral Resources are not Mineral Reserves and do not have demonstrated economic viability.
Notes: Mm3 = million cubic metres, Mt = million tonnes, cpt = recoverable (+1 mm) carats per tonne, Mct = million carats, US$/ct
= recoverable (+1 mm) US dollars per carat.
The bulk sampling program during 2017 included 24 tonnes of kimberlite sample from the Faraday 1 pipe.
Results from this material and from extensive delineation core drilling and microdiamond sampling
supported range estimates of a Target for Further exploration (TFFE) in Faraday 1 as summarized in
Table 17-2. TFFE range estimates include volumetrically limited domains within Faraday 2 for which very
limited evaluation data are available.
Table 17-2. Faraday 1 and 2 TFFE volume, tonnes and grade range estimates.
The estimate of TFFE is conceptual in nature as there has been insufficient exploration to define a Mineral Resource and it is uncertain if future exploration will result in the estimate being delineated as a Mineral Resource.
Notes: Mm3 = million cubic metres, Mt = million tonnes, cpt = recoverable (+1 mm) carats per tonne.
KDI completed a small drill program during 2017 which extended the Faraday 2 kimberlite pipe an
additional 150 metres to the northwest. This extension is not included in the current Mineral Resource
estimate, but is the focus of ongoing evaluation. This drilling also documented that Faraday 3 and Faraday
1 coalesce into one body around the lakeshore of Faraday Lake. KDI now refers to the combined bodies
of Faraday 1 and 3 as one kimberlite identified as Faraday 1-3.
The Kelvin and Faraday kimberlites are considered unconventional due to their morphologies. These
intrusions in Kelvin and Faraday Lakes have an emplacement age of approximately 540 Ma and are more
typical of the root systems (hypabyssal) of kimberlite magmatic complexes, preserving some transitional
and diatreme phases. The upper diatreme and crater facies observed elsewhere in Canada are completely
missing here (Field and Scott-Smith, 1999). The geometric relationships are complicated by numerous
interconnecting feeder dykes typical of a kimberlite root zone. Exploration for these types of bodies is
extremely challenging due to their very limited surface exposure and lack of a distinct associated
geophysical anomaly. KDI has identified six kimberlite bodies at Kennady North to date (Kelvin, Hobbes,
Faraday 2 and Faraday 1-3, the Doyle sill and the MZ sill/sheet complex). The geophysical responses from
these kimberlites provide a valuable reference for ongoing exploration.
Volume Density Tonnes Grade Carats Value
(Mm3) (g/cm3) (Mt) (cpt) (Mct) (US $/ct)
Indicated Kelvin 3.49 2.44 8.50 1.60 13.62 63
Inferred Faraday 2 and Faraday 3 1.35 2.43 3.27 1.54 5.02 98
Resource
classificationBody
Low High Low High Low High
Faraday 1 0.2 0.5 0.6 1.2 1.5 3.7
Faraday 2 0.01 0.02 0.01 0.04 - -
BodyVolume (Mm3) Tonnes (Mt) Grade (+1 mm cpt)
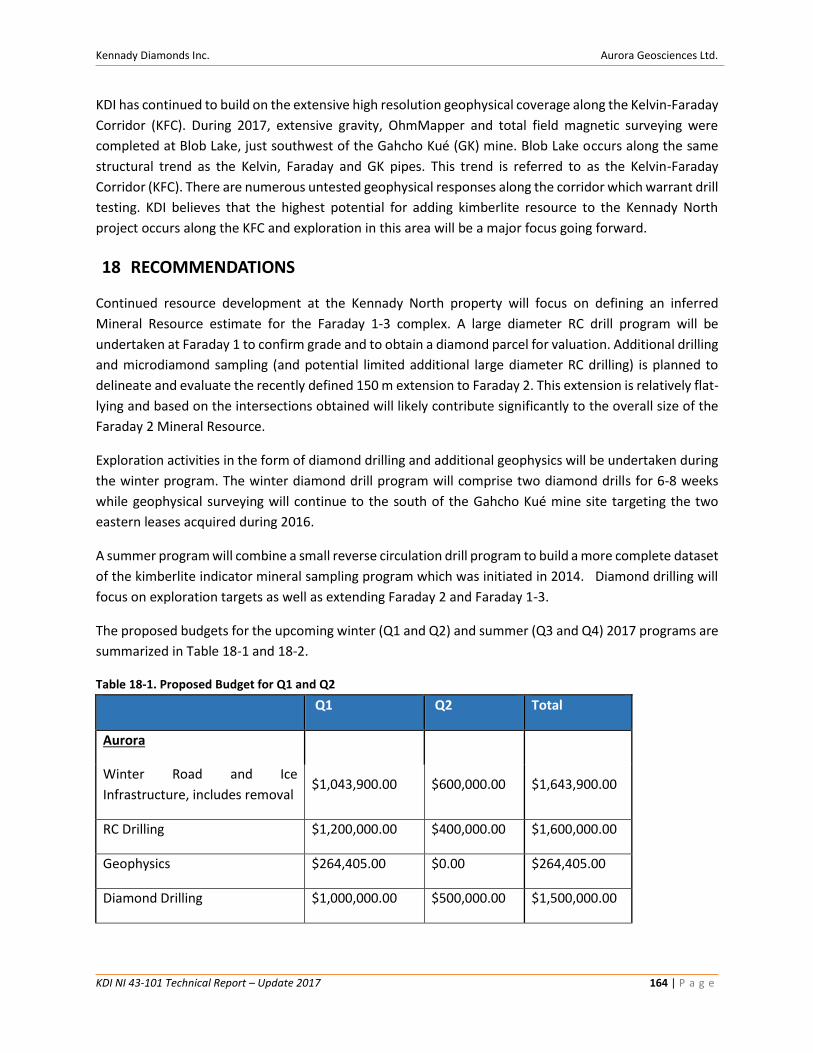
Kennady Diamonds Inc. Aurora Geosciences Ltd.
KDI NI 43-101 Technical Report – Update 2017 164 | P a g e
KDI has continued to build on the extensive high resolution geophysical coverage along the Kelvin-Faraday
Corridor (KFC). During 2017, extensive gravity, OhmMapper and total field magnetic surveying were
completed at Blob Lake, just southwest of the Gahcho Kué (GK) mine. Blob Lake occurs along the same
structural trend as the Kelvin, Faraday and GK pipes. This trend is referred to as the Kelvin-Faraday
Corridor (KFC). There are numerous untested geophysical responses along the corridor which warrant drill
testing. KDI believes that the highest potential for adding kimberlite resource to the Kennady North
project occurs along the KFC and exploration in this area will be a major focus going forward.
18 RECOMMENDATIONS
Continued resource development at the Kennady North property will focus on defining an inferred
Mineral Resource estimate for the Faraday 1-3 complex. A large diameter RC drill program will be
undertaken at Faraday 1 to confirm grade and to obtain a diamond parcel for valuation. Additional drilling
and microdiamond sampling (and potential limited additional large diameter RC drilling) is planned to
delineate and evaluate the recently defined 150 m extension to Faraday 2. This extension is relatively flat-
lying and based on the intersections obtained will likely contribute significantly to the overall size of the
Faraday 2 Mineral Resource.
Exploration activities in the form of diamond drilling and additional geophysics will be undertaken during
the winter program. The winter diamond drill program will comprise two diamond drills for 6-8 weeks
while geophysical surveying will continue to the south of the Gahcho Kué mine site targeting the two
eastern leases acquired during 2016.
A summer program will combine a small reverse circulation drill program to build a more complete dataset
of the kimberlite indicator mineral sampling program which was initiated in 2014. Diamond drilling will
focus on exploration targets as well as extending Faraday 2 and Faraday 1-3.
The proposed budgets for the upcoming winter (Q1 and Q2) and summer (Q3 and Q4) 2017 programs are
summarized in Table 18-1 and 18-2.
Table 18-1. Proposed Budget for Q1 and Q2
Q1 Q2 Total
Aurora
Winter Road and Ice
Infrastructure, includes removal $1,043,900.00 $600,000.00 $1,643,900.00
RC Drilling $1,200,000.00 $400,000.00 $1,600,000.00
Geophysics $264,405.00 $0.00 $264,405.00
Diamond Drilling $1,000,000.00 $500,000.00 $1,500,000.00
Kennady Diamonds Inc. Aurora Geosciences Ltd.
KDI NI 43-101 Technical Report – Update 2017 165 | P a g e
Subtotal $3,508,305.00 $1,500,000.00 $4,008,305.00
5% Contingency $175,000.00 $75,000.00 $225,000.00
Total Q1 + Q2 Budget $3,683,305.00 $1,575,000.00 $5,258,305.00
KDI
Preliminary Economic Assessment $0.00 $0.00 $0.00
Diamond Valuation $50,000.00 $50,000.00
First Nations consultation $6,500.00 $6,500.00 $13,000.00
Miscellaneous Consulting $25,000.00 $25,000.00 $50,000.00
General and Administration $287,500.00 $287,500.00 $575,000.00
Total Q1 + Q2 Budget $319,000.00 $319,000.00 $638,000.00
Total – Q1 and Q2 Budget $8,456,196.75 $4,519,007.50 $12,975,204.25
Table 18-2. Proposed Budget for Q3 and Q4.
Q3 Q4 Total
Aurora
Geophysics – summer $150,000.00 $150,000.00
Diamond Drilling - summer/fall $2,000,000.00
$2,000,000.00
Report Writing- Compilation $50,000.00 $50,000.00
Subtotal $2,150,000.00
$2,200,000.00
5% Contingency $107,500.00 $2,500.00 $110,000.00
Total Q3 + Q4 Budget $2,257,500.00 $52,500.00 $2,310,000.00
KDI
PEA
Diamond Valuation $50,000.00 $50,000.00
First Nations Consultation $20,000.00 $20,000.00 $40,000.00

Kennady Diamonds Inc. Aurora Geosciences Ltd.
KDI NI 43-101 Technical Report – Update 2017 166 | P a g e
Miscellaneous Consulting $25,000.00 $25,000.00 $50,000.00
General and Administration $287,500.00 $287,500.00 $575,000.00
Total Q3 + Q4 Budget $557,500.00 $657,500.00 $1,215,000.00
Total $7,120,000.00 $4,306,250.00 $11,426,250.00
Kennady Diamonds Inc. Aurora Geosciences Ltd.
KDI NI 43-101 Technical Report – Update 2017 167 | P a g e
19 DATE AND SIGNATURE PAGE
This report titled “2017 Technical Report - Project Exploration Update and Faraday Inferred Resource
Estimate, Kennady Lake North – Northwest Territories, Canada” and dated November 16, 2017 was
prepared by and signed by the following authors:
(original signed and sealed) “Gary Vivian, P.Geol.”
_______________________________
Gary Vivian, M.Sc., P.Geol.
Chairman, Aurora Geosciences Ltd.
Dated at Yellowknife, Northwest Territories on November 16, 2017
(original signed and sealed) “Tom E. Nowicki, P.Geo.”
_______________________________
Dr. Tom E. Nowicki, P.Geo.
Technical Director, Mineral Services Canada Inc.
Dated at Vancouver, British Columbia on November 16, 2017.
Kennady Diamonds Inc. Aurora Geosciences Ltd.
KDI NI 43-101 Technical Report – Update 2017 168 | P a g e
20 REFERENCES
Unpublished Company Reports
AGL (2016): Belcourt, G., Dziuba, F., Brown, N. and Hrkac, C.; Kennady North Geophysics Report 2013-
2015, 159 p. Unpublished industry report for KDI, April 2016.
AGL (2016): Belcourt, G.; Kennady North Winter 2016 Geophysical Field Report. 163 p. Unpublished
industry report for KDI, June 2016.
AGL (2016): Belcourt, G.; Kennady North Summer 2016 Geophysical Field Report. 103 p. Unpublished
industry report for KDI, August 2016.
AGL (2012): Bezzola, M.: Kennady North Drill Program – 2012 Field Report. 106 p. Unpublished industry
report for KDI, October 2012.
AGL (2013): Bezzola, M.: Kennady North Drill Program – Winter and Spring 2013. 276 p. Unpublished
industry report for KDI, June 2013.
AGL (2013): Bezzola, M.: Kennady North Drill Program – Summer 2013. 246 p. Unpublished industry report
for KDI, November 2013.
AGL (2014): Nelson, L.: Kennady North Drill program – Summer and Fall 2014. 204 p. Unpublished industry
report for KDI, January 2015.
AGL (2016): Nelson, L.: Kennady North Drill Program 2015. 627 p. Unpublished industry report for KDI,
July 2016.
AGL (2016): Nelson, L.: Kennady North Drill Program 2016. 456 p. Unpublished industry report for KDI,
December 2016.
AGL (2016): Bezzola, M., Hetman, C., Vivian, G. and White, D.: Preliminary Geology of the Kelvin
Kimberlite. 49 p. Unpublished industry report for KDI, June 2016.
Coopersmith, H. G. (2015): Observations on recovered diamonds from the 2015 Kelvin LDD Bulk Sample.
Unpublished industry report prepared by H. G. Coopersmith for Kennady Diamonds Inc., 24 August 2015.
Coopersmith, H. G. (2016): Notes on the KS (Kelvin South) and KN (Kelvin North) 2016 Drill Samples.
Unpublished industry memo prepared by H. G. Coopersmith for Kennady Diamonds Inc., 16 September
2016.
Creaser, R. (2016): Age dating of two samples of groundmass phlogopite obtained from the Kelvin
kimberlite. Internal report for KDI.
DeBeers (1996) Clement, C.R., Fowler, F.A., Williamson, P.A., Kong, J. and Williams, A.C: Mountain
Province Mining Inc. Due Diligence Study: An investigation of Pipe 5034 and the AK and CJ Claims.
Unpublished internal DeBeers report for Mountain Province Mining.
Kennady Diamonds Inc. Aurora Geosciences Ltd.
KDI NI 43-101 Technical Report – Update 2017 169 | P a g e
Fugro Airborne Surveys Corp., (2011):. Kennady North / Gahcho Kué JV Northwest Territories,
HeliFALCONTM Airborne Gravity Gradiometer Survey for Mountain Province Diamonds Inc. AGG Logistics
and Processing Report. Internal report for Mountain Province Diamonds.
Hunt, L., PhD., 2015: Diamond Breakage Study: Results and Interpretation of a dimond breakage study
from the Kennady Diamond Project, NWT. Internal report for KDI. SRC Publication N0. 12361-4C 15. 45
pp.
JDS (2016): Technical Memorandum: Reasonable Prospects for Eventual Economic Extraction for Kelvin
Geological Units, Kennady Diamonds, Kennady North Project. Unpublished industry memo prepared by
JDS Energy and Mining Inc. for Kennady Diamonds Inc., 9 December 2016.
MSC15/025R: Kelvin kimberlite geology review: summary and recommendations. Unpublished industry
memo prepared by Mineral Services Canada Inc. for Aurora Geosciences Ltd., 23 November 2015.
MSC16/003R: Grade and value estimates for the Kelvin kimberlite, Kennady North Project, February 9,
2016. Unpublished internal report for AGL. 50 pp.
MSC16/004R: Kelvin kimberlite geology review: north-southeast continuity. Unpublished internal report
for AGL, February 3, 2016. 3 pp.
MSC16/014R: Kelvin kimberlite geology review: drill core. Unpublished internal report for AGL, May19,
2016. 5 pp.
MSC16/015R: Kennady North project: Preliminary assessment of the resource potential of the Faraday 1,
2 and 3 kimberlites. Unpublished internal report for AGL, July, 2016. 24 pp.
MSC16/017R: Kelvin kimberlite geology review: updated 3D model and north limb continuity.
Unpublished industry memo prepared by Mineral Services Canada Inc. for Aurora Geosciences Ltd., 7
October 2016.
MSC16/021R: Kennady North Resource estimate. Unpublished report for AGL to incorporate into the NI
43-101, December 2016. 54 pp.
MSC17/018R: Faraday 2 and Faraday 3 geology review. Unpublished industry memo prepared by Mineral
Services Canada Inc. for Aurora Geosciences Ltd, 28 August 2017.
SRC (2015): Diamond Breakage Study: Results and interpretation of a diamond breakage study from the
Kennady Diamond Project, NWT. Unpublished industry report prepared by Saskatchewan Research
Council Mining and Minerals Division for Kennady Diamonds Inc., August 2015. SRC Publication No. 12361-
4C15.
SRC (2016): Diamond Breakage Study: Results and interpretation of a diamond breakage study from the
Kennady Diamond Project, NWT. Unpublished industry report prepared by Saskatchewan Research
Council Mining and Minerals Division for Kennady Diamonds Inc., October 2016. SRC Publication No.
10646-1C16.
Kennady Diamonds Inc. Aurora Geosciences Ltd.
KDI NI 43-101 Technical Report – Update 2017 170 | P a g e
SRC (2017): SRC Mini Bulk Sample Plant Feed Prep Screen Failure. Unpublished industry report prepared
by Saskatchewan Research Council Mining and mineral sDivision for kennady Diamonds Inc., May 2017.
SRC Publication No. 12361-5C17, 13 pp.
SRC (2017a): Diamond Breakage Study: Results and interpretation of a diamond breakage study from the
Kennady Diamond Project, NWT, Group D-17-022. Unpublished industry report prepared by
Saskatchewan Research Council Mining and Minerals Division for Kennady Diamonds Inc., May 2017. SRC
Publication No. 12361-1C17.
SRC (2017b): Diamond Breakage Study: Results and interpretation of a diamond breakage study from the
Kennady Diamond Project, NWT, Group D-17-028. Unpublished industry report prepared by
Saskatchewan Research Council Mining and Minerals Division for Kennady Diamonds Inc., June 2017. SRC
Publication No. 12361-3C17.
SRK (2016a): Updated Specific Gravity Block Model, Kennady North Project, Aurora Geoscience.
Unpublished industry report prepared by SRK Consulting (Canada) Inc. for Aurora Geosciences Ltd.;
Project Number 2CA039.000.
SRK (2016b): Hetman, C.: Kelvin North vs Kelvin South Petrographic Analysis. 10 p. Unpublished industry
report for KDI, February 2016.
SRK (2016c): Diering, M.: Kelvin Kimberlite - Internal Dilution within Modeled Geology Zones. 7 p. Internal
industry report for KDI, January 2016.
SRK (2016d): Diering, M., Bezzola, M. and Hetman, C.: Modelling update for Kelvin kimberlite pipe model.
48 p. Internal industry report for KDI, October 2016.
SRK (2016e): Dieirng, M., Gainer, D. and Hetman, C.: Modelling update for the Faraday 3 kimberlite pipe
model. 29 p. Internal industry report for KDI, December 2016.
SRK (2016f) Diering, M., Bezzola, M. and Hetman, C.: Modelling update for the Faraday 2 kimberlite pipe
model. 22 p. Internal industry report for KDI, December 2016.
SRK (2016g) Uden, R. and Hetman, C.: Kelvin – North Limb Petrography – Summary of Findings. 305 p.
Internal industry report for KDI, August 2016.
SRK (2016h) Hetman, C. and Dubman, R.: Faraday 2 Petrography. 109 p. Internal industry Report for KDI,
December 2016.
SRK (2016i) Gainer, D. and Hetman, C.: Kennady North – Faraday 3 Geology Update. 81 p. Internal industry
Report for KDI, November 2016.
SRK (2016j) Nelson, L. and Hetman, C.: Kennady North – Faraday 1 Rock Types. 49 p. Internal industry
report for KDI, December 2015.
Stubley, M.P., 2015: Bedrock Hosts to the Kelvin-Faraday, MZ and Doyle Kimberlite Bodies, Southeastern
Slave Craton. Accompnaies three bedrock geological maps by M. Stubley and R. Gibson. Internal Report
Kennady Diamonds Inc. Aurora Geosciences Ltd.
KDI NI 43-101 Technical Report – Update 2017 171 | P a g e
WWW (2015): Valuation and modelling of the average price for the Kelvin Kimberlite, September 2015.
Unpublished industry report prepared by WWW International Diamond Consultants Ltd. for Kennady
Diamonds Inc., 9 December 2015.
WWW (2016): Valuation, Re-Pricing & Modelling of the Average Price for the Kelvin Kimberlite, October
2016. Unpublished industry report prepared by WWW International Diamond Consultants Ltd. for
Kennady Diamonds Inc., 18 October 2016.
WWW (2017): Valuation & Modelling of the Average Price for the Faraday Kimberlites, July 2017.
Unpublished industry report prepared by WWW International Diamond Consultants Ltd for Kennady
Diamonds Inc., 4 August 2017.
20.2 General References
Agashev, A.M., Pokhilenko, N.P., Takazawa, E., McDonald, J.A., Vavilov, M.A., Watanabe, T., and Sobolev,
N.V., 2008: Primary melting sequence of a deep (>250 km) lithospheric mantle as recorded in the
geochemistry of kimberlite-carbonatite assemblages, Snap Lake dyke system, Canada: Chemical Geology,
v. 225, p. 317-328.
Barnett, W. 2015: Kelvin Dyke System Interpretation. Internal report for AGL and KDI. 13 pp.
Bennett, V., Jackson, V.A., Rivers, T., Relf, C., Horan, P., and Tubret, M., 2005: Geology and U-Pb
geochronology of the Neoarchean Snare River terrane: tracking evolving tectonic regimes and crustal
growth mechanisms; Canadian Journal of Earth Sciences; v. 42, p. 895934.
Bezzola, M., Hetman, C., Garlick, G., Creaser, R., Hrkac, C., Vivian, G., Diering, M. and Nowicki, T., 2017.
Geology and Resource Development of the Kelvin Kimberlite Pipe in the Northwest Territories of Canada;
presented as a poster at the 11th International Kimberlite Conference, Gabarone, Botswana.
Bleeker, W., Ketchum, J.W.F., and Davis, W.J., 1999. The Central Slave Basement Complex, Part I: Its
structural topology and autochthonous cover: Canadian Journal of Earth Sciences, v. 36, p. 1083-1109.
Bleeker, W. and Hall, B., 2007: The Slave Craton: Geology and metallogenic evolution; in Goodfellow, W.D.,
ed., Mineral Deposits of Canada: A Synthesis of Major Deposit-Types, District Metallogeny, the Evolution
of Geological Provinces, and Exploration Methods; Geological Association of Canada, Mineral Deposits
Division, Special Publication No. 5, p. 849-879
Bowring, S.A., Williams, I.S. and Compston, W., 1989: 3.96 Ga gneisses from the Slave Province, NWT,
Canada: Geology v. 17, p. 971-975.
Brisebois, K., Eggleston, T. and Kozak, A., 2009: Gahcho Kué Kimberlite Project NI 43-101 Technical Report,
Northwest Territories, Canada. SEDAR 43-101 Compliant Technical Report, 186 pp.
Cairns, S.R., 2003: Bedrock mapping in the Walmsley Lake area, southeastern Slave Province, Northwest
Territories; Geological Survey of Canada, Current Research 2003-C9, 9 p.
Kennady Diamonds Inc. Aurora Geosciences Ltd.
KDI NI 43-101 Technical Report – Update 2017 172 | P a g e
Cairns, S.R., MacLachlan, K., Relf, C., Renaud, J., and Davis, W., 2003: Geology of the Walmsley Lake area,
NTS 75N; Northwest Territories Geological Survey, Open File 2003-04 (1:250,000 scale map, digital
database, and extended marginal notes).
Cairns, S., Relf, C., MacLachlan, K., and Davis, W.J., 2005: Neoarchean decoupling of upper-and mid-crustal
tectonothermal domains in the southeast Slave Province: evidence from the Walmsley Lake area;
Canadian Journal of Earth Sciences, v. 42, p. 869-894.
Canadian Institute of Mining, Metallurgy & Petroleum (CIM), 2003: Guidelines for the Reporting of
Diamond Exploration Results – Final: CIM Standing Committee, Canadian Institute of Mining, Metallurgy
& Petroleum, posted to http://www.cim.org/committees/diamond_exploration_final.pdf, 6 pp.
Dyke, A.S. and Prest, V.K., 1987: Paleogeography of Northern North America, 18,000 – 5,000 years ago:
Geological Survey of Canada, Map 1703A, scale 1:12,500,000.
Ecosystem Classification Group, 2008: Ecological Regions of the Northwest Territories - Taiga Shield.
Department of Environment and Natural Resources, Government of the Northwest Territories,
Yellowknife, NT, Canada. 146 pp. plus insert map.
Ecological Stratification Working Group, 1995: A National Ecological Framework for Canada. Agriculture
and Agri-Food Canada, Research Branch, Centre for Land and Biological Resources Research and
Environment Canada, State of the Environment Directorate, Ecozone Analysis Branch, Ottawa/Hull.
Report and national map at 1:7,500,000 scale.
Fahrig, W.F., 1987: The Tectonic Setting of Continental Mafic Dyke Swarms: Failed arm and early passive
margins: in Halls, H.C. and Fahrig, W.F. (eds.) Mafic Dyke Swarms. GAC Special Paper 34, p. 331-348.
Field, M. and Scott-Smith, B., 1999: Contrasting geology and near-surface emplacement of kimberlite
pipes in Southern Africa and Canada: in Proc. Seventh Int. Kimberlite Conf. (J.J. Gurney et al., eds.). Red
Roof Designs, Cape Town, South Africa, p. 214-237.
Folinsbee, R.E., 1952: Walmsley Lake, District of Mackenzie, Northwest Territories; Geological Survey of
Canada, Map 1013A; scale 1:253,440.
Griffin, W.L., Doyle, B.J., Ryan, C.C., Pearson, N.J., O’Reilly, S.Y., Natapov, L., Kivi, K., Kretschmar, U., and
Ward, J., 1999: Lithospheric Structure and Mantle Terranes: Slave Craton, Canada. in Proc. Seventh Int.
Kimberlite Conf. (J.J. Gurney et al., eds.). Red Roof Designs, Cape Town, South Africa, p. 299-306.
Heaman, L.M., Kjarsgaard, B., and Creaser, R.A., 2003: The timing of kimberlite magmatism in North
America: Implications for global kimberlite genesis and diamond exploration: Lithos, v. 71, p. 153-184.
Helmstaedt, H.H., 2009: Crust-mantle coupling revisited: The Archean Slave craton, NWT, Canada; Lithos
112S, Part 2, p. 1055-1068.
Kennady Diamonds Inc. Aurora Geosciences Ltd.
KDI NI 43-101 Technical Report – Update 2017 173 | P a g e
Helmstaedt, H.H. and Pehrsson, S.J., 2012: Geology and tectonic evolution of the Slave Province – a post-
LITHOPROBE perspective; in Percival, J.A., Cook, F.A. and Clowes, R.M., eds., Tectonic Styles in Canada:
The LITHOPROBE Perspective; Geological Association of Canada, Special Paper 49, p. 379-466.
Hetman, C.M., Scott-Smith, B.H., Paul, J.L., and Winter, F., 2004: Geology of the Gahcho Kué kimberlite
pipes, NWT, Canada: root to diatreme magmatic transition zones: Lithos, v. 76, p. 51-74.
Hetman, C., 2008: Tuffisitic Kimberlite (TK): A Canadian perspective on a distinctive textural variety of
kimberlite. Journal of Volcanology and Geothermal Research 174, p. 57-67.
Hoffman, P.F., 1987: Continental transform tectonics: Great Slave Lake Shear Zone (ca. 1.9 Ga), northwest
Canada: Geology, v. 15, p. 785-788.
Isachsen, C.E., Bowring, S.A. and Padgham, W.A., 1991: U-Pb Geochronology of the Yellowknife
Supergroup at Yellowknife, NWT, Canada: Constraints on its evolution. GAC/MAC Annual Meeting
Program with Abstracts, vol. 16, p. A59.
Johnson, D., Makarenko, M., Meikle, K., Prince-Wright, B, Jakubec, J. and Jones, K., 2010: Gahcho Kué
Project, Definitive Feasibility Study, NI 43-101 Technical Report, NWT, Canada, 299 pp.
Johnson, D., Meikle, K. and Pilotto, D., 2014: Gahcho Kué Project, 2014 Feasibility Study Report – NI 43-
101 Technical Report, 294 pp.
Kopylova, M.G. and Caro, G., 2004: The Hypabyssal 5034 Kimberlite of the Gahcho Kué Cluster, South-
Eastern Slave Craton, Northwest Territories, Canada: A Granite-Contaminated Group-1 Kimberlite: The
Canadian Mineralogist, v. 42, p. 183-207.
Kurszlaukis, S. and Lorenz, V., 2008: Formation of “Tuffisitic Kimberlites” by Phreatomagmatic Processes.
Journal of Volcanology and Geothermal Research, v. 174, p. 68-80.
Kusky, T.M., 1989: Accretion of the Archean Slave Province. Geology, v. 17, p. 63-67.
LeCheminant, A.N. and Heaman, L.M., 1989: MacKenzie Igneous Events, Canada: Middle Proterozoic
Hotspot Magmatism Associated with Ocean Opening. Earth & Planetary Sci. Letters, v. 96, 9. 38-48.
LeCheminant, A.N. and Heaman, L.M., 1994: 779 Ma mafic magmatism in the northwestern Canadian
Shield and northern Cordillera: a new regional time-marker. In Proceedings of the 8th International
Conference, Geochronology, Cosmochronology and Isotope Geology, Program with Abstracts, US
Geological Survey Circular 1107, Berkley, CA, p. 197.
LeCheminant, A.N., Van Breemen, O., and Buchan, K.L., 1995: Proterozoic dyke swarms, Lac de Gras –
Aylmer Lake area, NWT: Regional distribution, ages and paleomagnetism: GAC/MAC Annual Meeting,
Program with Abstracts, 27 pp.
LeCheminant, A.N., Heaman, L.M., van Breemen, O., Ernst, R.E., Baragar, W.R.A., and Buchan, K.L., 1996:
Mafic magmatism, mantle roots, and kimberlites in the Slave craton. in Searching for Diamonds in Canada,
Kennady Diamonds Inc. Aurora Geosciences Ltd.
KDI NI 43-101 Technical Report – Update 2017 174 | P a g e
A.N. LeCheminant, D.G. Richardson, R.N.W. DiLabio and K.A. Richardson (eds.), Geological Survey of
Canada, Open File 3228, p. 161-169.
Lorenz, V. and Kurszlaukis, S., 2007: Root Zone Processes in the Phreatomagmatic Pipe Emplacement
Model and Consequences for the Evolution of Maar-Diatreme Volcanoes. Journal of Volcanology and
Geothermal Research, v. 159, p. 4-32.
MacLachlan, K., Relf, C., Cairns, S., Renaud, J., and Mills, A., 2002: New bedrock mapping and preliminary
U/Pb geochronology in the Walmsley Lake area, southeastern Slave Province, Northwest Territories;
Geological Survey of Canada, Current Research 2002-C1, 10 p
Nowicki, T., 2016. Diamond size frequency distribution exercise – Paractical 2. in Microdiamonds: origin,
relationship to Macrodiamonds and Use in Kimberlite Evaluation. MDRU Affiliate Shortcourse 88. Mineral
Desposits Research Unit, University of British Columbia. (unpaginated).
Pokhilenko, N.P., McDonald, J.A., Melnyk, W., Hall, A.E., Shimizu, N., Vavilov, M.A., Afanasiev, V.P.,
Reimers, L.F., Irvin, L.N., Pokhilenko, L.N., Vasilenko, V.B., Kuligin, S.S., and Sobolev,N.V., 1998: Kimberlites
of Camsell Lake field and some features of construction, and composition of lithosphere roots of
southeastern part of Slave Craton, Canada; Extended Abstracts, 7th International Kimberlite Conference,
Cape Town, pp. 699– 700.
Rainbird, R.H., 1993: The Sedimentary Record of Mantle Plume Uplift Preceding Eruption of the
Neoproterozoic Natkusiak Flood Basalt. Geology, v. 101, n. 3, p. 305-318.
Rikhotso, C.T., Poniatowski, B.T., and Hetman, C.M., 2003: Overview of the Exploration, Evaluation and
Geology of the Gahcho Kué Kimberlites, Northwest Territories. in Kjarsgaard, B.B. (ed.) Eighth
International Kimberlite Conference, Slave Province and Northern Alberta Field Trip Guidebook.
Geological Survey of Canada, p. 79-86.
Scott-Smith, B.H., 2008: Canadian kimberlites: Geological characteristics relevant to emplacement;
Journal of Volcanology and Geothermal Research, v. 174, p. 9-19.
Scott-Smith, B.H., Nowicki, T.E., Russell, J.K., Webb, K.J., Mithcell, R.H., Hetman, C.M., Harder, M., Skinner,
E.M.W., and Robey, Jv.A., 2013: Kimberlite Terminology and Classification. in D.G. Pearson et al. (eds.),
Proceedings of 10th International Kimberlite Conference, Volume 2, Special Issue of the Journal of the
Geological Society of India, DOI: 10.1007/978-81-322-1173-0_1. ©Springer India. 17 pp.
Stasiuk and Nassichuk, 1996: Thermal data from petrographic analysis of organic matter in kimberlite
pipes, Lac de Gras, NWT. in Searching for Diamonds in Canada, A.N. LeCheminant, D.G. Richardson, R.N.W.
DiLabio and K.A. Richardson (eds.), Geological Survey of Canada, Open File 3228, p. 147-149.
Stubley, M.P., 2004: Spatial distribution of kimberlite in the Slave craton, Canada: a geometrical approach;
Lithos, v. 77, p. 683-693
Kennady Diamonds Inc. Aurora Geosciences Ltd.
KDI NI 43-101 Technical Report – Update 2017 175 | P a g e
Stubley, M.P., 2005: Slave Craton: Interpretive bedrock compilation; Northwest Territories Geoscience
Office, NWT-NU Open File 2005-01. Digital files and 2 maps.
Stubley, M.P., 2014: The rise and stall of kimberlite magma; in D. Irwin and P.X. Normandeau (compilers),
42nd Annual Yellowknife Geoscience Forum Abstracts Volume, Northwest Territories Geoscience Office,
Yellowknife, p. 74-75
Thurston, M.L., 2003: Gahcho Kué, Northwest Territories, Canada – Independent Qualified Person’s
Review and Technical Report, NI 43-101 Technical Report, 109 pp.
Vivian, G. and Nowicki, T.E., 2017: 2016 Technical Report -Project Exploration Update and Maiden Mineral
Resource Estimate, Kennady Lake North – Northwest Territories, Canada, 289 pp.
Kennady Diamonds Inc. Aurora Geosciences Ltd.
KDI NI 43-101 Technical Report – Update 2017 176 | P a g e
CERTIFICATE OF QUALIFIED PERSON
I, Gary Vivian, of the City of Yellowknife, in the Northwest Territories, Canada,
HEREBY CERTIFY:
1. That my business address is 3506 McDonald Drive, Yellowknife, NT, X1A 2H1
2. This certificate applies to the report titled “2017 Technical Report, Project – Project Exploration Update and
Faraday Inferred Mineral Resource Estimate - Kennady North Project - Northwest Territories, Canada” and
dated November 16, 2017.
3. That I am a graduate of Sir Sandford Fleming College as a Geophysical Technologist, 1976.
4. That I am a graduate of the University of Alberta in Geology:
a. B.Sc. – Specialization Geology, 1983.
b. M.Sc. – Geology, 1987, U of A – Thesis title: The Geology of Blackdome Ag-Au Deposit, BC
5. That I have been practicing Geology since 1983:
a) May 1983 – November 1986 Noranda Exploration Co. Ltd., Bathurst, NB
b) December 1986 – May 1988 Noranda Exploration Co. Ltd., Timmins, ON
c) May 1988 – Present Covello, Bryan and Associates Ltd.
and currently Aurora Geosciences Ltd.,
Yellowknife, NT
6. That I am a registered Professional Geologist in the Northwest Territories. I have professional designation
in Manitoba, Saskatchewan, Alberta and BC. I am also registered with AIPG (American Institute of Professional
Geologists). I have over 40 years of exploration experience, 29 years as a P.Geol., with 26 years in kimberlite
exploration (till sampling, geophysics, geology, mapping, core logging and program management). These programs
were completed for companies such as Diavik Diamond Mines, Aber Resources, SouthernEra Resources, De Beers
Canada Exploration Inc., GGL Resources Corp. and many other junior mining companies. As such I am a Qualified
Person for the purposes of National Instrument 43-101.
7. As a principal of Aurora, I have written this report and managed a number of the historical programs on the
Kennady North project. I have visited the property on a monthly basis since April 1, 2012. I am responsible for all
sections, except for Section 1.9 and 14, in this report titled – “2017 Technical Report-Project Exploration Update and
Faraday Inferred Mineral Resource Estimate, Kennady Lake North - Northwest Territories, Canada”.
8. That I am independent of the issuer as defined by the tests set out in Section 1.5, “Standards of Disclosure
for Mineral Projects”, National Instrument 43-101.
9. That I have read “Standards of Disclosure for Mineral Projects”, National Instrument 43-101 and read Form
43-101F1. This report has been prepared in compliance with this Instrument and Form 43-101F1.
10. That, as of November 16, 2017, to the best of my knowledge, information and belief, the Technical Report
contains all scientific and technical information that is required to be disclosed to make the Technical Report not
misleading.
Dated November 16, 2017 at Yellowknife, Northwest Territories.
(original signed and sealed) “Gary Vivian, P.Geol.”
______________________________
Gary Vivian, M.Sc., P.Geol.
Kennady Diamonds Inc. Aurora Geosciences Ltd.
KDI NI 43-101 Technical Report – Update 2017
CERTIFICATE OF AUTHOR
I, Tom E. Nowicki, P.Geo., do hereby certify that:
1. I am currently employed as a Senior Principal Geoscientist with Mineral Services Canada Inc. with an office at 501 – 88 Lonsdale Avenue, North Vancouver, BC, V7M 2E6, Canada.
2. This certificate applies to the technical report titled “2017 Technical Report, Project Exploration Update and Faraday Inferred Mineral Resource Estimate, Kennady North Project, Northwest Territories, Canada”, with an effective date of November 16, 2017, (the “Technical Report”) prepared for Kennady Diamonds Inc. (“the Issuer”).
3. I am a Professional Geoscientist (P.Geo. #30747) registered with the Association of Professional Engineers, Geologists of British Columbia.
I am a graduate of the University of Cape Town having obtained the degree of Bachelor of Science (Honours) in Geology in 1986 and Ph.D. Degree in geochemistry in 1998. I am a graduate of Rhodes University (Grahamstown, South Africa) having obtained the degree of Masters of Science in Economic Geology in 1990. I have been employed as a full-time geoscientist in the mineral exploration and mining fields in 1987 and 1988, from 1990 to 1993 and from 1998 to present.
I have read the definition of "qualified person" set out in National Instrument 43-101 (“NI 43-101”) and certify that by reason of my education, affiliation with a professional association (as defined in NI 43-101) and past relevant work experience, I fulfill the requirements to be a "qualified person" for the purposes of NI 43-101.
4. I am responsible for Section 1.9 and Section 14 of the Technical Report.
5. I am independent of the Issuer and related companies as independence is described in Section 1.5 of NI 43-101;
6. My prior involvement with the property is limited to contributions to the previous Kennady North Project Technical Report (Vivian and Nowicki, 2017);
7. I have read NI 43-101, and the Technical Report has been prepared in compliance with NI 43-101 and Form 43-101F1.
8. As of the effective date of the Technical Report, to the best of my knowledge, information and
belief, the Technical Report contains all scientific and technical information that is required to be disclosed to make the Technical Report not misleading.
Effective Date: November 16, 2017
Signing Date: November 16, 2017
(original signed and sealed) “Tom E. Nowicki, P.Geo.”
_____________________ Dr. Tom E. Nowicki, P.Geo.
Kennady Diamonds Inc. Aurora Geosciences Ltd.
KDI NI 43-101 Technical Report – Update 2017
CONSENT To : The Toronto Stock Exchange, P.O. Box 450, 3rd Floor, 130 King Street West, Toronto, ON M5X 1J2
British Columbia Securities Commission – 701 West Georgia St, P.O. Box 10142, Pacific Centre,
Vancouver, BC V7Y 1L2
Alberta Securities Commission – Suite 600, 250-5th Street SW, Calgary, AB T2P 0R4
Saskatchewan Securities Commission – Financial and Consumer Affairs Authority – Suite 601, 1919
Saskatchewan Drive, Regina, SK S4P 4H2
Manitoba Securities Commission – 500, 400 ST, Mary Avenue, Winnipeg, MB R3C 4K5
Ontario Securities Commission – 20 Queen St W, 20th Floor, Toronto, ON M5N 3S8
New Brunswick Securities Commission – Financial and Consumer Services Commission – 85 Charlotte
Street, Suite 300, Saint John, NB E2L 2J2
Nova Scotia Securities Commission – P.O. Box 458, Halifax, NS B3J 2P8
Prince Edward Island Securities Commission – P.O. Box 2000, Charlottetown, PEI C1A 7N8
Newfoundland Securities Commission– 100 Prince Phillip Drive, P.O. Box 8700, St. John’s, NL A1B 4J6
The authors consent to the public filing of the Technical Report and to extracts from, or a summary of, the
Technical Report in the written disclosure being filed. The authors confirm they have read the written
disclosure being filed and that it fairly and accurately represents the information in the Technical Report
that supports the disclosure.
This consent is dated at Vancouver, British Columbia on November 16, 2017.
(original signed and sealed) “Gary Vivian, P.Geol.”
________________________
Gary Vivian, M.Sc., P.Geol.
Aurora Geosciences Ltd.
(original signed and sealed) “Tom E. Nowicki, P.Geo.”
_________________________
Dr. Tom Nowicki, P.Geo.
Mineral Services Canada Inc.
Related Documents