Indonesia Initiating Coverage See important disclosures at the end of this report 1 14 October 2019 Alternative Energy | Energy Kencana Energi Lestari (KEEN IJ) Buy Initiate BUY: Renewables For a Better Future Target Price (Return) IDR780 (+30%) Price: IDR600 Market Cap: USD156m Avg Daily Turnover (IDR/USD) (IDR/USD) 11,300m/0.8m Initiate BUY, IDR780 TP derived from 1.3x FY20F P/BV, 30% upside. KEEN’s share price has skyrocketed after its IPO, thereby justifying its fundamentals. We believe its valuation is still attractive vs peers. This power plant operat or’s business is also in line with the global trend of battling pollution. Cash flow is stable, marked by the recent increase in raised cash (from IPO proceeds), which enables it to expand into more renewable energy projects. It deserves to trade at a premium, on its environment-based operation. Renewable energy specialist. Kencana Energi Lestari aims to be Indonesia’s leading renewable power producer. It built its first hydropower plant in 2010, and currently operates three hydropower plants totalling 49MW in output. As concerns on greenhouse gas emissions are growing globally, countries are racing to adopt renewable energy – which should help secure KEEN’s project pipeline ahead. Key beneficiary of the Government’s move to boost renewable energy. KEEN’s speciality lies in constructing run-of-river (RoR) hydropower facilities. Despite surging significantly in the past five years, Indonesia’s electricity consumption was still lower than that of other countries in the region, in 2018. Also, Indonesia has one of the lowest rates of renewable energy consumption per capita in Asia. The country’s current renewable power plants account for a mere 12% of the nation’s total installed capacity vs the regional peer average of 17-18%. We believe Indonesia should further promote the construction of hydropower plant projects, to fulfil the Government’s target of having renewable energy take up a 23% portion of energy consumption by 2025. Stable cash flow. KEEN’s stable cash flow is due to its build-own-operate- transfer (BOOT) contract with state-owned power company Perusahaan Listrik Negara (PLN), as mandated by the Ministry of Energy and Mineral Resources (ESDM). Under a power purchase agreement (PPA), KEEN is required to supply a certain amount of electricity, which is subject to set tariffs. IPO proceeds to enable it to expand into more renewable energy projects. Its recent IPO raised IDR290.4bn (c.USD20.5m). The proceeds should enable KEEN to expand into more renewable energy projects, and finance working capital. Management said 55% of total IPO proceeds will be used for expansion, 25% for working capital, and 20% for capex. Analysts Fauzan Luthfi Djamal +6221 5093 9853 [email protected] Andrey Wijaya +6221 5093 9846 [email protected] Share Performance (%) YTD 1m 3m 6m 12m Absolute 51.52 (11.76) - - - Relative 48.00 (8.14) - - - 52-wk Price low/high (IDR) 396 – 720 Table of Contents Financial Exhibits 2 Investment Summary 3 Company Background 5 Financial Performance 12 Valuation 18 Industry Overview 20 Appendix 28 Forecasts and Valuation Dec-17 Dec-18 Dec-19F Dec-20F Dec-21F Total turnover (USDm) 35.0 26.4 32.8 35.7 33.5 Reported net profit (USDm) 2.6 6.0 10.1 12.1 11.4 Reported net profit growth (%) (51.4) 134.7 67.8 19.3 (5.3) EPS (IDR) 10.0 23.4 39.2 46.8 44.3 P/E (x) 63.3 27.0 16.1 13.5 14.2 P/B (x) 1.6 1.5 1.1 1.0 1.0 Dividend Yield (%) - - - 2.2 2.1 EV/EBITDA (x) 8.8 15.4 9.9 8.8 9.3 Return on average equity (%) 2.5 5.5 6.9 7.8 7.0 Source: Company data, RHB

Welcome message from author
This document is posted to help you gain knowledge. Please leave a comment to let me know what you think about it! Share it to your friends and learn new things together.
Transcript
Indonesia Initiating Coverage
See important disclosures at the end of this report 1
14 October 2019 Alternative Energy | Energy
Kencana Energi Lestari (KEEN IJ) Buy
Initiate BUY: Renewables For a Better Future Target Price (Return) IDR780 (+30%)
Price: IDR600
Market Cap: USD156m
Avg Daily Turnover (IDR/USD)
(IDR/USD)
11,300m/0.8m
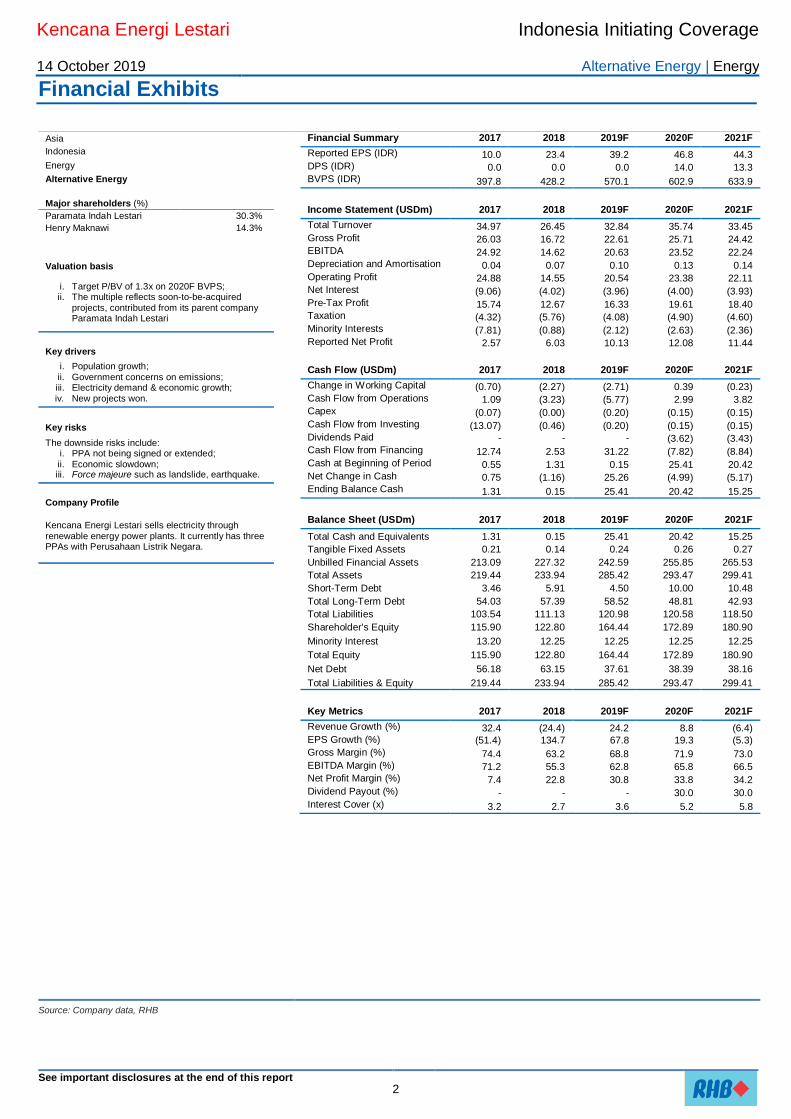
Initiate BUY, IDR780 TP derived from 1.3x FY20F P/BV, 30% upside. KEEN’s share price has skyrocketed after its IPO, thereby justifying its fundamentals. We believe its valuation is still attractive vs peers. This power plant operator’s business is also in line with the global trend of battling pollution. Cash flow is stable, marked by the recent increase in raised cash (from IPO proceeds), which enables it to expand into more renewable energy projects. It deserves to trade at a premium, on its environment-based operation.
Renewable energy specialist. Kencana Energi Lestari aims to be Indonesia’s leading renewable power producer. It built its first hydropower plant in 2010, and currently operates three hydropower plants totalling 49MW in output. As concerns on greenhouse gas emissions are growing globally, countries are racing to adopt renewable energy – which should help secure KEEN’s project pipeline ahead.
Key beneficiary of the Government’s move to boost renewable energy. KEEN’s speciality lies in constructing run-of-river (RoR) hydropower facilities. Despite surging significantly in the past five years, Indonesia’s electricity consumption was still lower than that of other countries in the region, in 2018. Also, Indonesia has one of the lowest rates of renewable energy consumption per capita in Asia. The country’s current renewable power plants account for a mere 12% of the nation’s total installed capacity vs the regional peer average of 17-18%. We believe Indonesia should further promote the construction of hydropower plant projects, to fulfil the Government’s target of having renewable energy take up a 23% portion of energy consumption by 2025.
Stable cash flow. KEEN’s stable cash flow is due to its build-own-operate-transfer (BOOT) contract with state-owned power company Perusahaan Listrik Negara (PLN), as mandated by the Ministry of Energy and Mineral Resources (ESDM). Under a power purchase agreement (PPA), KEEN is required to supply a certain amount of electricity, which is subject to set tariffs.
IPO proceeds to enable it to expand into more renewable energy projects. Its recent IPO raised IDR290.4bn (c.USD20.5m). The proceeds should enable KEEN to expand into more renewable energy projects, and finance working capital. Management said 55% of total IPO proceeds will be used for expansion, 25% for working capital, and 20% for capex.
Analysts Fauzan Luthfi Djamal
+6221 5093 9853 [email protected]
Andrey Wijaya
+6221 5093 9846 [email protected]
Share Performance (%)
YTD 1m 3m 6m 12m
Absolute 51.52 (11.76) - - -
Relative 48.00 (8.14) - - -
52-wk Price low/high (IDR) 396 – 720
Table of Contents Financial Exhibits 2 Investment Summary 3 Company Background 5 Financial Performance 12 Valuation 18 Industry Overview 20 Appendix 28
Forecasts and Valuation Dec-17 Dec-18 Dec-19F Dec-20F Dec-21F
Total turnover (USDm) 35.0 26.4 32.8 35.7 33.5
Reported net profit (USDm) 2.6 6.0 10.1 12.1 11.4
Reported net profit growth (%) (51.4) 134.7 67.8 19.3 (5.3)
EPS (IDR) 10.0 23.4 39.2 46.8 44.3
P/E (x) 63.3 27.0 16.1 13.5 14.2
P/B (x) 1.6 1.5 1.1 1.0 1.0
Dividend Yield (%) - - - 2.2 2.1
EV/EBITDA (x) 8.8 15.4 9.9 8.8 9.3
Return on average equity (%) 2.5 5.5 6.9 7.8 7.0
Source: Company data, RHB
Kencana Energi Lestari Indonesia Initiating Coverage
14 October 2019 Alternative Energy | Energy
See important disclosures at the end of this report 2
Financial Exhibits
Asia
Indonesia
Energy
Alternative Energy
Major shareholders (%)
Paramata Indah Lestari 30.3%
Henry Maknawi 14.3%
Valuation basis
i. Target P/BV of 1.3x on 2020F BVPS; ii. The multiple reflects soon-to-be-acquired
projects, contributed from its parent company Paramata Indah Lestari
Key drivers
i. Population growth;
ii. Government concerns on emissions; iii. Electricity demand & economic growth; iv. New projects won.
Key risks
The downside risks include: i. PPA not being signed or extended; ii. Economic slowdown; iii. Force majeure such as landslide, earthquake.
Company Profile
Kencana Energi Lestari sells electricity through renewable energy power plants. It currently has three PPAs with Perusahaan Listrik Negara.
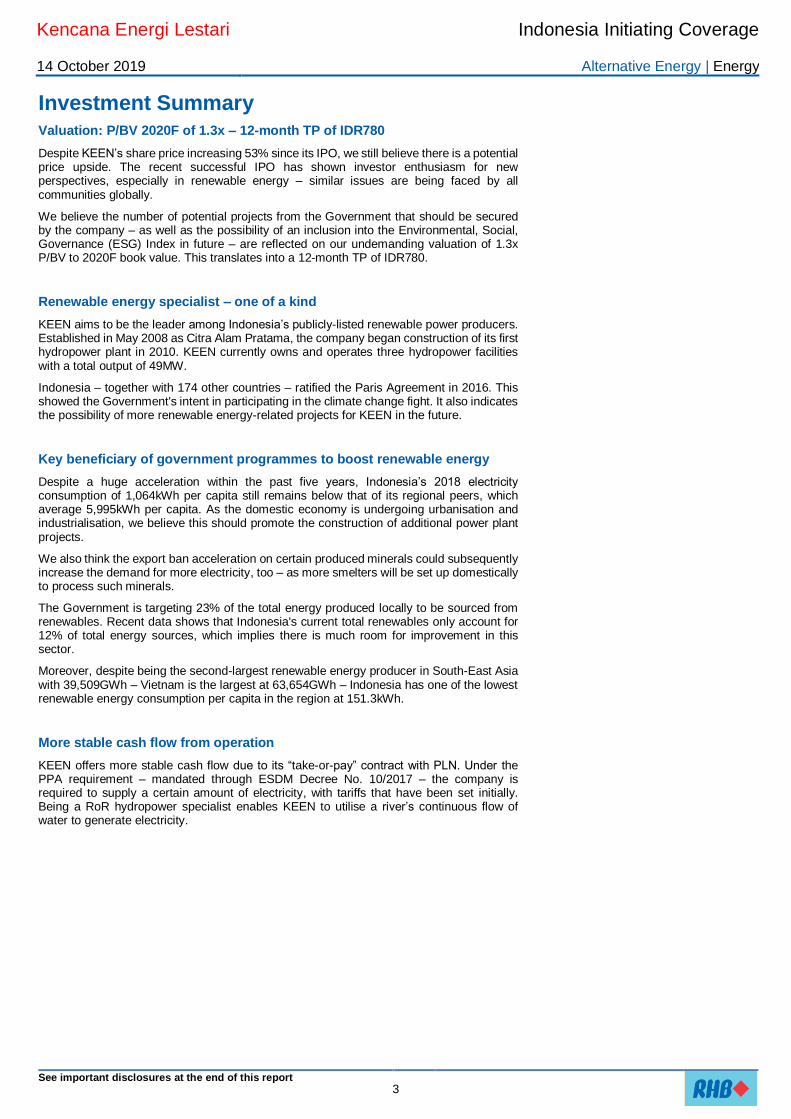
Financial Summary 2017 2018 2019F 2020F 2021F
Reported EPS (IDR) 10.0 23.4 39.2 46.8 44.3 DPS (IDR) 0.0 0.0 0.0 14.0 13.3 BVPS (IDR) 397.8 428.2 570.1 602.9 633.9
Income Statement (USDm) 2017 2018 2019F 2020F 2021F
Total Turnover 34.97 26.45 32.84 35.74 33.45 Gross Profit 26.03 16.72 22.61 25.71 24.42 EBITDA 24.92 14.62 20.63 23.52 22.24 Depreciation and Amortisation 0.04 0.07 0.10 0.13 0.14 Operating Profit 24.88 14.55 20.54 23.38 22.11 Net Interest (9.06) (4.02) (3.96) (4.00) (3.93) Pre-Tax Profit 15.74 12.67 16.33 19.61 18.40 Taxation (4.32) (5.76) (4.08) (4.90) (4.60) Minority Interests (7.81) (0.88) (2.12) (2.63) (2.36) Reported Net Profit 2.57 6.03 10.13 12.08 11.44
Cash Flow (USDm) 2017 2018 2019F 2020F 2021F
Change in Working Capital (0.70) (2.27) (2.71) 0.39 (0.23) Cash Flow from Operations 1.09 (3.23) (5.77) 2.99 3.82 Capex (0.07) (0.00) (0.20) (0.15) (0.15) Cash Flow from Investing (13.07) (0.46) (0.20) (0.15) (0.15) Dividends Paid - - - (3.62) (3.43) Cash Flow from Financing 12.74 2.53 31.22 (7.82) (8.84) Cash at Beginning of Period 0.55 1.31 0.15 25.41 20.42 Net Change in Cash 0.75 (1.16) 25.26 (4.99) (5.17) Ending Balance Cash 1.31 0.15 25.41 20.42 15.25
Balance Sheet (USDm) 2017 2018 2019F 2020F 2021F
Total Cash and Equivalents 1.31 0.15 25.41 20.42 15.25
Tangible Fixed Assets 0.21 0.14 0.24 0.26 0.27
Unbilled Financial Assets 213.09 227.32 242.59 255.85 265.53
Total Assets 219.44 233.94 285.42 293.47 299.41
Short-Term Debt 3.46 5.91 4.50 10.00 10.48
Total Long-Term Debt 54.03 57.39 58.52 48.81 42.93
Total Liabilities 103.54 111.13 120.98 120.58 118.50
Shareholder's Equity 115.90 122.80 164.44 172.89 180.90
Minority Interest 13.20 12.25 12.25 12.25 12.25
Total Equity 115.90 122.80 164.44 172.89 180.90
Net Debt 56.18 63.15 37.61 38.39 38.16
Total Liabilities & Equity 219.44 233.94 285.42 293.47 299.41
Key Metrics 2017 2018 2019F 2020F 2021F
Revenue Growth (%) 32.4 (24.4) 24.2 8.8 (6.4) EPS Growth (%) (51.4) 134.7 67.8 19.3 (5.3)
Gross Margin (%) 74.4 63.2 68.8 71.9 73.0 EBITDA Margin (%) 71.2 55.3 62.8 65.8 66.5 Net Profit Margin (%) 7.4 22.8 30.8 33.8 34.2 Dividend Payout (%) - - - 30.0 30.0 Interest Cover (x) 3.2 2.7 3.6 5.2 5.8
Source: Company data, RHB
Kencana Energi Lestari Indonesia Initiating Coverage
14 October 2019 Alternative Energy | Energy
See important disclosures at the end of this report 3
Investment Summary Valuation: P/BV 2020F of 1.3x – 12-month TP of IDR780
Despite KEEN’s share price increasing 53% since its IPO, we still believe there is a potential price upside. The recent successful IPO has shown investor enthusiasm for new perspectives, especially in renewable energy – similar issues are being faced by all communities globally.
We believe the number of potential projects from the Government that should be secured by the company – as well as the possibility of an inclusion into the Environmental, Social, Governance (ESG) Index in future – are reflected on our undemanding valuation of 1.3x P/BV to 2020F book value. This translates into a 12-month TP of IDR780.
Renewable energy specialist – one of a kind
KEEN aims to be the leader among Indonesia’s publicly-listed renewable power producers. Established in May 2008 as Citra Alam Pratama, the company began construction of its first hydropower plant in 2010. KEEN currently owns and operates three hydropower facilities with a total output of 49MW.
Indonesia – together with 174 other countries – ratified the Paris Agreement in 2016. This showed the Government's intent in participating in the climate change fight. It also indicates the possibility of more renewable energy-related projects for KEEN in the future.
Key beneficiary of government programmes to boost renewable energy
Despite a huge acceleration within the past five years, Indonesia’s 2018 electricity consumption of 1,064kWh per capita still remains below that of its regional peers, which average 5,995kWh per capita. As the domestic economy is undergoing urbanisation and industrialisation, we believe this should promote the construction of additional power plant projects.
We also think the export ban acceleration on certain produced minerals could subsequently increase the demand for more electricity, too – as more smelters will be set up domestically to process such minerals.
The Government is targeting 23% of the total energy produced locally to be sourced from renewables. Recent data shows that Indonesia's current total renewables only account for 12% of total energy sources, which implies there is much room for improvement in this sector.
Moreover, despite being the second-largest renewable energy producer in South-East Asia with 39,509GWh – Vietnam is the largest at 63,654GWh – Indonesia has one of the lowest renewable energy consumption per capita in the region at 151.3kWh.
More stable cash flow from operation
KEEN offers more stable cash flow due to its “take-or-pay” contract with PLN. Under the PPA requirement – mandated through ESDM Decree No. 10/2017 – the company is required to supply a certain amount of electricity, with tariffs that have been set initially. Being a RoR hydropower specialist enables KEEN to utilise a river’s continuous flow of water to generate electricity.
Kencana Energi Lestari Indonesia Initiating Coverage
14 October 2019 Alternative Energy | Energy
See important disclosures at the end of this report 4
Ready to expand into more renewable energy segments
To keep growing, the company needs to expand its renewables portfolio. On 2 Sep 2019, KEEN succeeded in raising USD20.5m via its IPO. The proceeds will ensure that it has enough funding to expand its renewables portfolio and finance working capital – to meet the Government’s goal of having 23% of total energy produced locally from renewable sources.
Around 55% of KEEN’s total IPO proceeds will be used by the company to develop new renewable projects. Of the remaining balance, 25% is slated for working capital and 20% has been set aside for capex. KEEN plans use the 55% portion of the proceeds to expand its renewable energy projects portfolio.
As a near-term catalyst, in Jun 2019, KEEN made an initial investor agreement with parent Paramata Indah Lestari (PIL), which owns a 28.4% stake in the company. The agreement allows KEEN to acquire shares in PIL’s renewable projects with a minimum 70% stake. This agreement will secure the company’s construction project revenue for the next 4-5 years and more operating cash flow going forward.
Kencana Energi Lestari Indonesia Initiating Coverage
14 October 2019 Alternative Energy | Energy
See important disclosures at the end of this report 5
Company Background KEEN was established in 2008 with a focus on building and operating renewable energy facilities in Indonesia. The company started constructing its first hydropower plant in 2010 after obtaining a PPA with PLN in 2009. KEEN currently owns and operates three hydropower plants with a total capacity of 49MW.
The company aims to become the leading renewables player in Indonesia by acquiring more renewable projects. These include:
i. Biomass;
ii. Biogas;
iii. Solar photovoltaics;
iv. Wind farms.
KEEN’s medium-term plan is to have a renewables capacity total of 200MW.
The company acts as a holding entity for three operating subsidiaries:
i. Energy Sakti Sentosa (ESS);
ii. Bangun Tirta Lestari (BTL);
iii. Nagata Dinamika Hidro Madong (NDHM).
Each unit constructs and operates an alternative energy power plant and sells the electricity produced solely to PLN. ESS and BTL are located in Indonesia’s second-biggest contributing region in terms of economic output GDP, Sumatera (21.54%). The other contributing regions are Java, Kalimantan, Sulawesi, and others, at 59.11%, 8.01%, 6.34%, and 5.23% as at 2Q19. BTL is also situated in Sulawesi’s nickel reserves region – most nickel smelters are currently developed on the island’s southern and eastern parts.
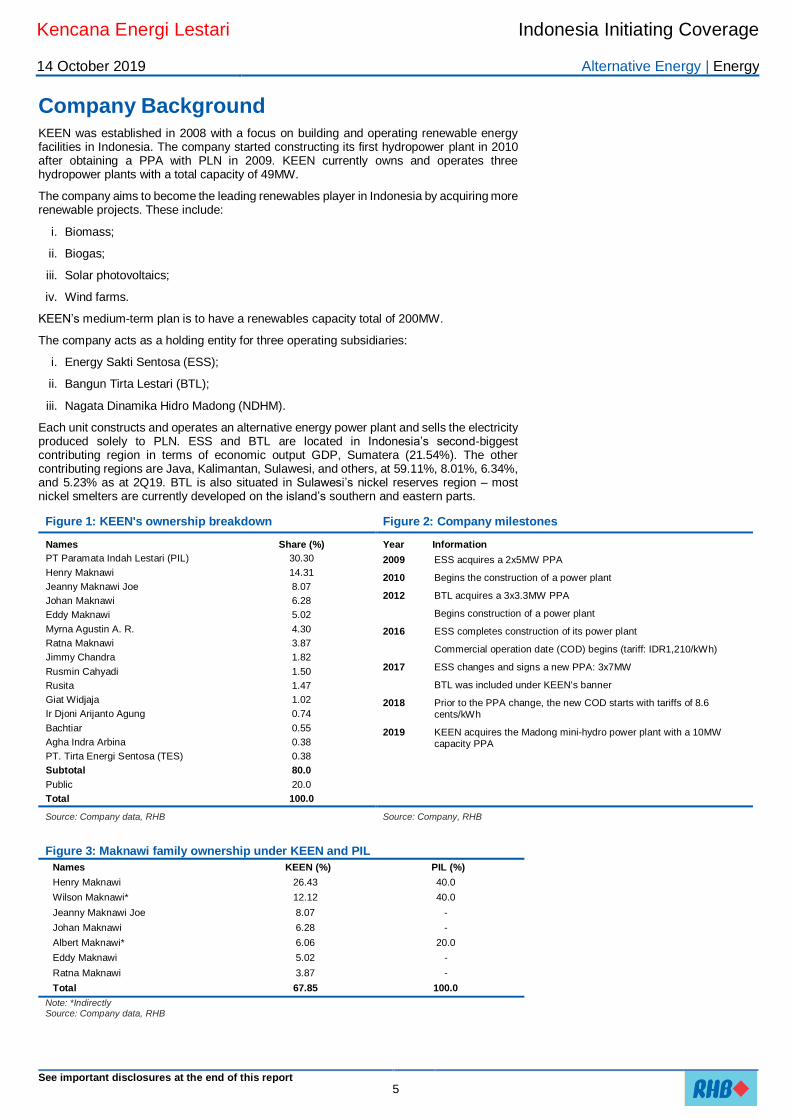
Figure 1: KEEN's ownership breakdown Figure 2: Company milestones
Names Share (%)
PT Paramata Indah Lestari (PIL) 30.30
Henry Maknawi 14.31
Jeanny Maknawi Joe 8.07
Johan Maknawi 6.28
Eddy Maknawi 5.02
Myrna Agustin A. R. 4.30
Ratna Maknawi 3.87
Jimmy Chandra 1.82
Rusmin Cahyadi 1.50
Rusita 1.47
Giat Widjaja 1.02
Ir Djoni Arijanto Agung 0.74
Bachtiar 0.55
Agha Indra Arbina 0.38
PT. Tirta Energi Sentosa (TES) 0.38
Subtotal 80.0
Public 20.0
Total 100.0
Year Information
2009 ESS acquires a 2x5MW PPA
2010 Begins the construction of a power plant
2012 BTL acquires a 3x3.3MW PPA
Begins construction of a power plant
2016 ESS completes construction of its power plant
Commercial operation date (COD) begins (tariff: IDR1,210/kWh)
2017 ESS changes and signs a new PPA: 3x7MW
BTL was included under KEEN's banner
2018 Prior to the PPA change, the new COD starts with tariffs of 8.6 cents/kWh
2019 KEEN acquires the Madong mini-hydro power plant with a 10MW capacity PPA
Source: Company data, RHB Source: Company, RHB
Figure 3: Maknawi family ownership under KEEN and PIL
Names KEEN (%) PIL (%)
Henry Maknawi 26.43 40.0
Wilson Maknawi* 12.12 40.0
Jeanny Maknawi Joe 8.07 -
Johan Maknawi 6.28 -
Albert Maknawi* 6.06 20.0
Eddy Maknawi 5.02 -
Ratna Maknawi 3.87 -
Total 67.85 100.0
Note: *Indirectly Source: Company data, RHB
Kencana Energi Lestari Indonesia Initiating Coverage
14 October 2019 Alternative Energy | Energy
See important disclosures at the end of this report 6
Subsidiaries’ profiles
ESS
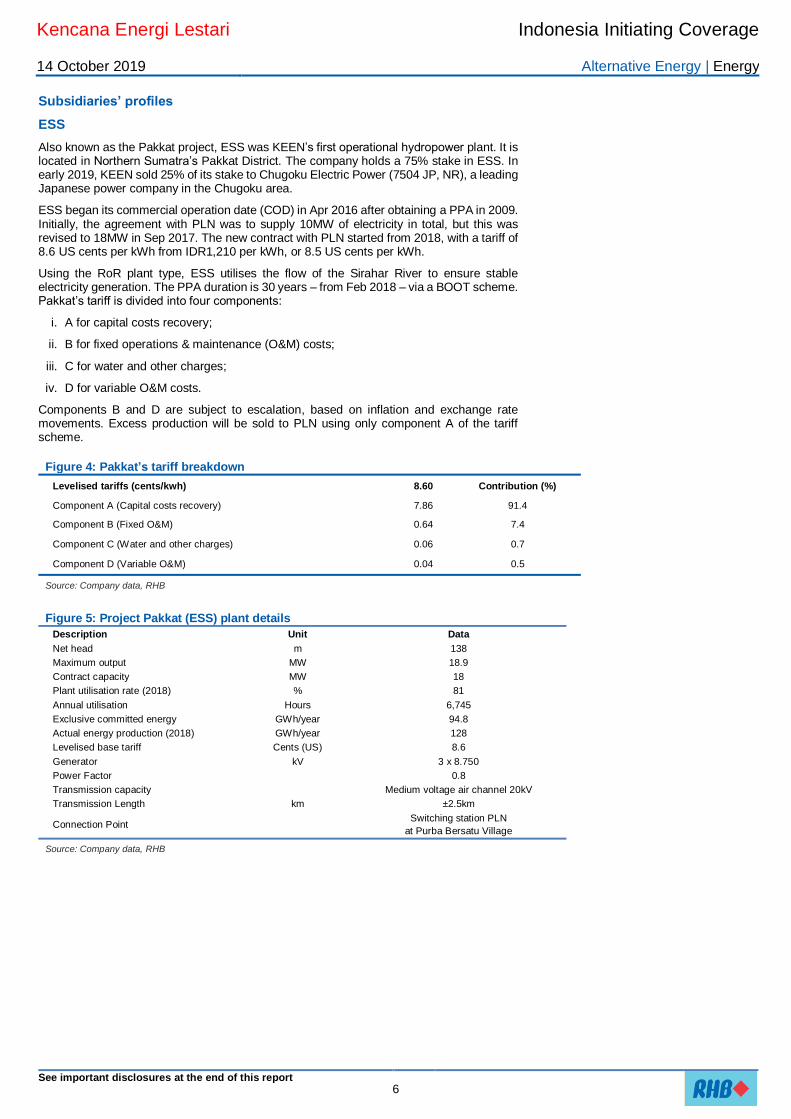
Also known as the Pakkat project, ESS was KEEN’s first operational hydropower plant. It is located in Northern Sumatra’s Pakkat District. The company holds a 75% stake in ESS. In early 2019, KEEN sold 25% of its stake to Chugoku Electric Power (7504 JP, NR), a leading Japanese power company in the Chugoku area.
ESS began its commercial operation date (COD) in Apr 2016 after obtaining a PPA in 2009. Initially, the agreement with PLN was to supply 10MW of electricity in total, but this was revised to 18MW in Sep 2017. The new contract with PLN started from 2018, with a tariff of 8.6 US cents per kWh from IDR1,210 per kWh, or 8.5 US cents per kWh.
Using the RoR plant type, ESS utilises the flow of the Sirahar River to ensure stable electricity generation. The PPA duration is 30 years – from Feb 2018 – via a BOOT scheme. Pakkat’s tariff is divided into four components:
i. A for capital costs recovery;
ii. B for fixed operations & maintenance (O&M) costs;
iii. C for water and other charges;
iv. D for variable O&M costs.
Components B and D are subject to escalation, based on inflation and exchange rate movements. Excess production will be sold to PLN using only component A of the tariff scheme.
Figure 4: Pakkat’s tariff breakdown
Levelised tariffs (cents/kwh) 8.60 Contribution (%)
Component A (Capital costs recovery) 7.86 91.4
Component B (Fixed O&M) 0.64 7.4
Component C (Water and other charges) 0.06 0.7
Component D (Variable O&M) 0.04 0.5
Source: Company data, RHB
Figure 5: Project Pakkat (ESS) plant details
Description Unit Data
Net head m 138
Maximum output MW 18.9
Contract capacity MW 18
Plant utilisation rate (2018) % 81
Annual utilisation Hours 6,745
Exclusive committed energy GWh/year 94.8
Actual energy production (2018) GWh/year 128
Levelised base tariff Cents (US) 8.6
Generator kV 3 x 8.750
Power Factor 0.8
Transmission capacity Medium voltage air channel 20kV
Transmission Length km ±2.5km
Connection Point Switching station PLN
at Purba Bersatu Village
Source: Company data, RHB
Kencana Energi Lestari Indonesia Initiating Coverage
14 October 2019 Alternative Energy | Energy
See important disclosures at the end of this report 7
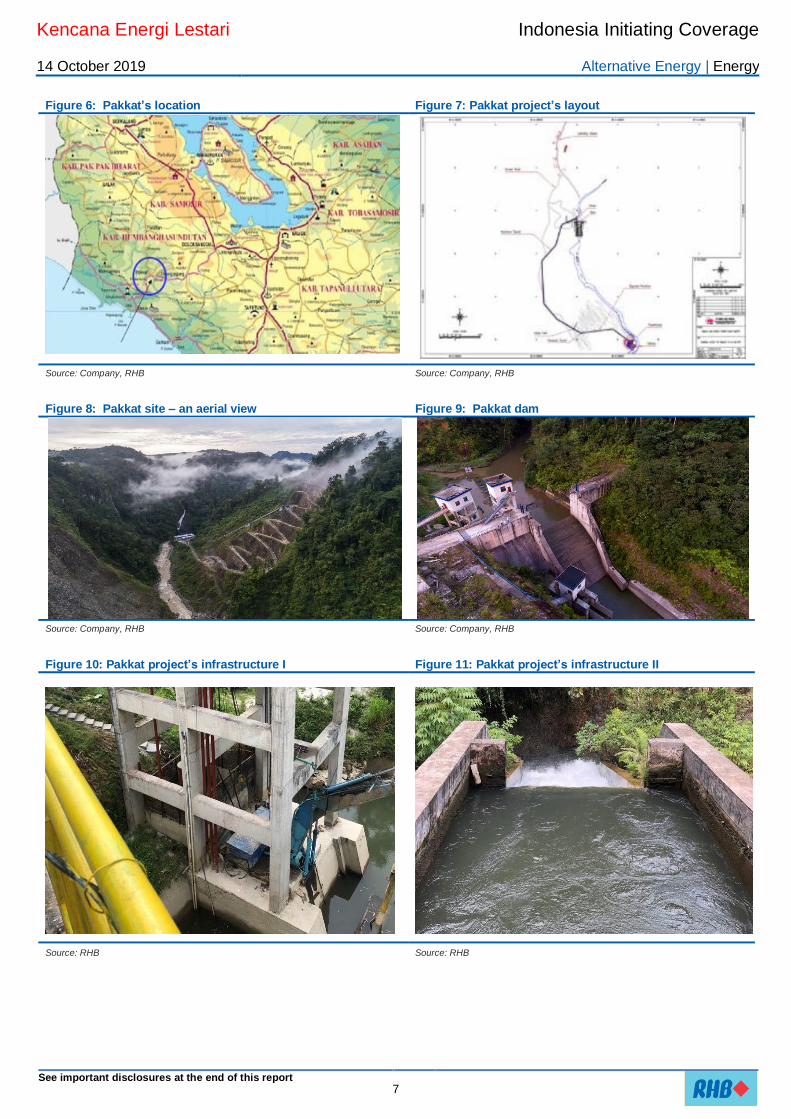
Figure 6: Pakkat’s location Figure 7: Pakkat project’s layout
Source: Company, RHB Source: Company, RHB
Figure 8: Pakkat site – an aerial view Figure 9: Pakkat dam
Source: Company, RHB Source: Company, RHB
Figure 10: Pakkat project’s infrastructure I Figure 11: Pakkat project’s infrastructure II
Source: RHB Source: RHB
Kencana Energi Lestari Indonesia Initiating Coverage
14 October 2019 Alternative Energy | Energy
See important disclosures at the end of this report 8
Figure 12: Pakkat project’s infrastructure III Figure 13: Project Pakkat turbine
Source: RHB Source: RHB
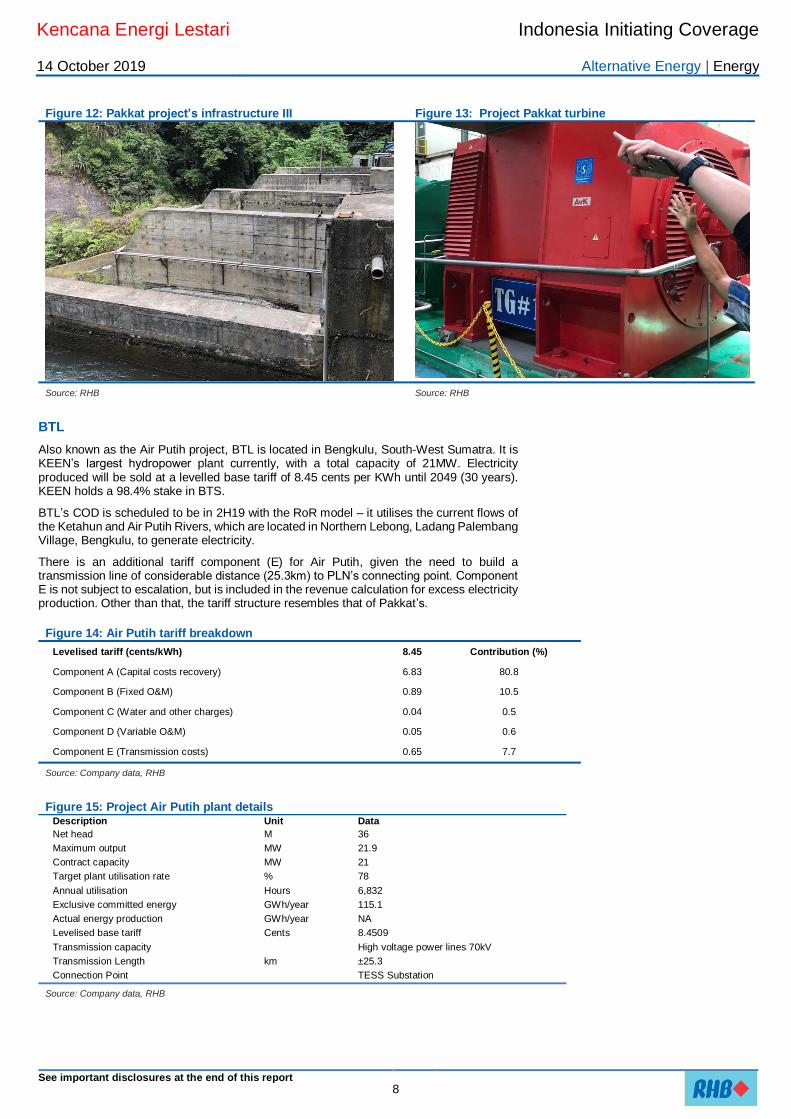
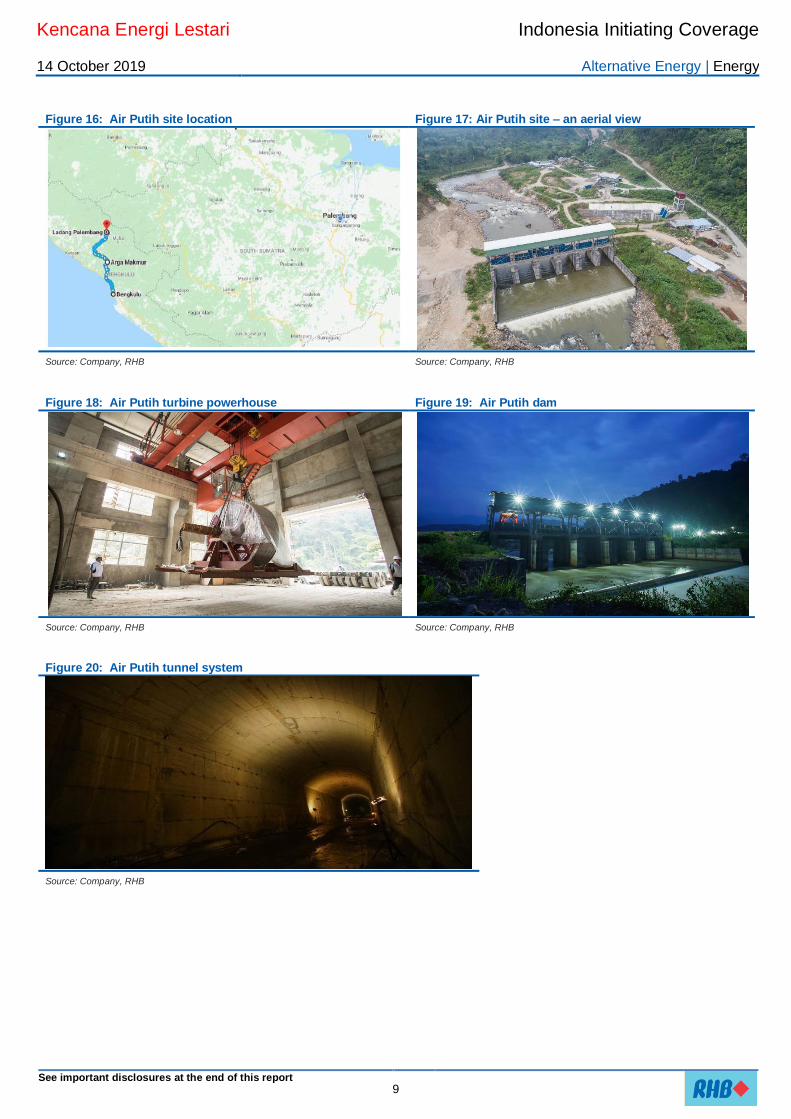
BTL
Also known as the Air Putih project, BTL is located in Bengkulu, South-West Sumatra. It is KEEN’s largest hydropower plant currently, with a total capacity of 21MW. Electricity produced will be sold at a levelled base tariff of 8.45 cents per KWh until 2049 (30 years). KEEN holds a 98.4% stake in BTS.
BTL’s COD is scheduled to be in 2H19 with the RoR model – it utilises the current flows of the Ketahun and Air Putih Rivers, which are located in Northern Lebong, Ladang Palembang Village, Bengkulu, to generate electricity.
There is an additional tariff component (E) for Air Putih, given the need to build a transmission line of considerable distance (25.3km) to PLN’s connecting point. Component E is not subject to escalation, but is included in the revenue calculation for excess electricity production. Other than that, the tariff structure resembles that of Pakkat’s.
Figure 14: Air Putih tariff breakdown
Levelised tariff (cents/kWh) 8.45 Contribution (%)
Component A (Capital costs recovery) 6.83 80.8
Component B (Fixed O&M) 0.89 10.5
Component C (Water and other charges) 0.04 0.5
Component D (Variable O&M) 0.05 0.6
Component E (Transmission costs) 0.65 7.7
Source: Company data, RHB
Figure 15: Project Air Putih plant details Description Unit Data
Net head M 36
Maximum output MW 21.9
Contract capacity MW 21
Target plant utilisation rate % 78
Annual utilisation Hours 6,832
Exclusive committed energy GWh/year 115.1
Actual energy production GWh/year NA
Levelised base tariff Cents 8.4509
Transmission capacity High voltage power lines 70kV
Transmission Length km ±25.3
Connection Point TESS Substation
Source: Company data, RHB
Kencana Energi Lestari Indonesia Initiating Coverage
14 October 2019 Alternative Energy | Energy
See important disclosures at the end of this report 9
Figure 16: Air Putih site location Figure 17: Air Putih site – an aerial view
Source: Company, RHB Source: Company, RHB
Figure 18: Air Putih turbine powerhouse Figure 19: Air Putih dam
Source: Company, RHB Source: Company, RHB
Figure 20: Air Putih tunnel system
Source: Company, RHB
Kencana Energi Lestari Indonesia Initiating Coverage
14 October 2019 Alternative Energy | Energy
See important disclosures at the end of this report 10
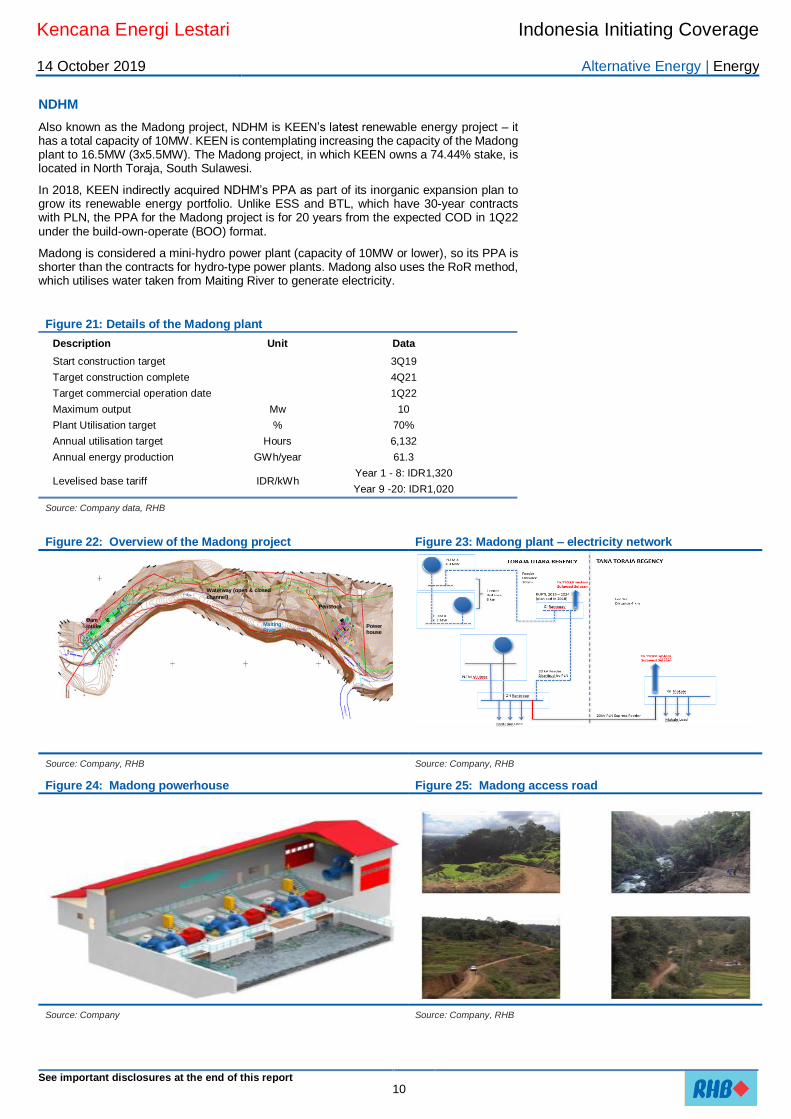
NDHM
Also known as the Madong project, NDHM is KEEN’s latest renewable energy project – it has a total capacity of 10MW. KEEN is contemplating increasing the capacity of the Madong plant to 16.5MW (3x5.5MW). The Madong project, in which KEEN owns a 74.44% stake, is located in North Toraja, South Sulawesi.
In 2018, KEEN indirectly acquired NDHM’s PPA as part of its inorganic expansion plan to grow its renewable energy portfolio. Unlike ESS and BTL, which have 30-year contracts with PLN, the PPA for the Madong project is for 20 years from the expected COD in 1Q22 under the build-own-operate (BOO) format.
Madong is considered a mini-hydro power plant (capacity of 10MW or lower), so its PPA is shorter than the contracts for hydro-type power plants. Madong also uses the RoR method, which utilises water taken from Maiting River to generate electricity.
Figure 21: Details of the Madong plant
Description Unit Data
Start construction target 3Q19
Target construction complete 4Q21
Target commercial operation date 1Q22
Maximum output Mw 10
Plant Utilisation target % 70%
Annual utilisation target Hours 6,132
Annual energy production GWh/year 61.3
Levelised base tariff IDR/kWh Year 1 - 8: IDR1,320
Year 9 -20: IDR1,020
Source: Company data, RHB
Figure 22: Overview of the Madong project Figure 23: Madong plant – electricity network
Source: Company, RHB Source: Company, RHB
Figure 24: Madong powerhouse Figure 25: Madong access road
Source: Company Source: Company, RHB
Waterway (open & closed
channel)
Dam &
Intake
Penstock
Powerhouse
Maiting River
Kencana Energi Lestari Indonesia Initiating Coverage
14 October 2019 Alternative Energy | Energy
See important disclosures at the end of this report 11
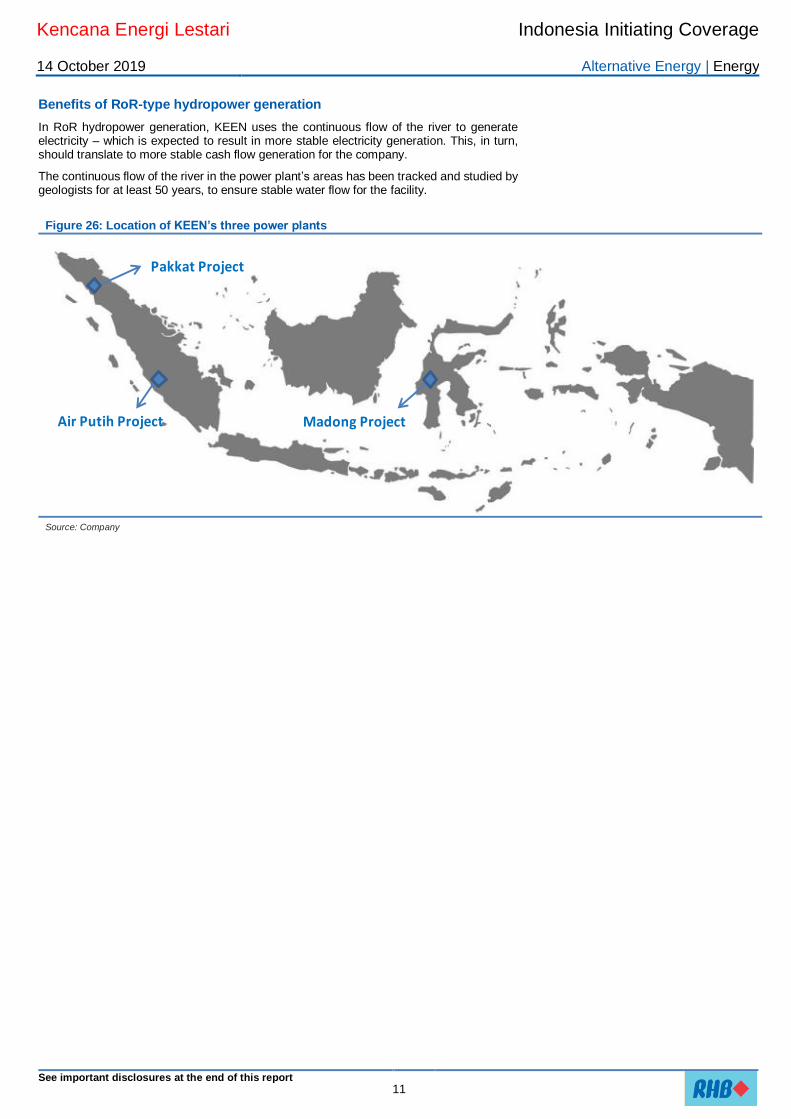
Benefits of RoR-type hydropower generation
In RoR hydropower generation, KEEN uses the continuous flow of the river to generate electricity – which is expected to result in more stable electricity generation. This, in turn, should translate to more stable cash flow generation for the company.
The continuous flow of the river in the power plant’s areas has been tracked and studied by geologists for at least 50 years, to ensure stable water flow for the facility.
Figure 26: Location of KEEN’s three power plants
Source: Company
Pakkat Project
Air Putih Project Madong Project
Kencana Energi Lestari Indonesia Research Note
14 October 2019 Alternative Energy | Energy
See important disclosures at the end of this report 12
Financial Performance Three sources of revenue
KEEN’s revenue sources comprise:
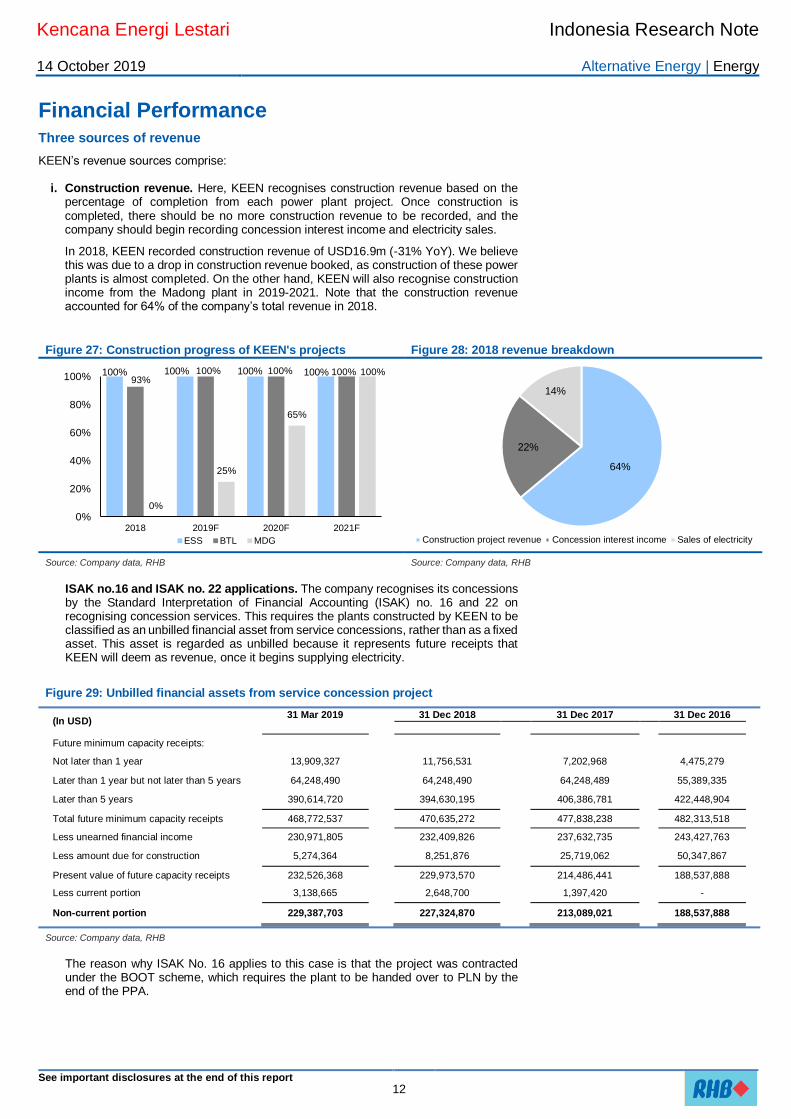
i. Construction revenue. Here, KEEN recognises construction revenue based on the percentage of completion from each power plant project. Once construction is completed, there should be no more construction revenue to be recorded, and the company should begin recording concession interest income and electricity sales.
In 2018, KEEN recorded construction revenue of USD16.9m (-31% YoY). We believe this was due to a drop in construction revenue booked, as construction of these power plants is almost completed. On the other hand, KEEN will also recognise construction income from the Madong plant in 2019-2021. Note that the construction revenue accounted for 64% of the company’s total revenue in 2018.
Figure 27: Construction progress of KEEN's projects Figure 28: 2018 revenue breakdown
Source: Company data, RHB Source: Company data, RHB
ISAK no.16 and ISAK no. 22 applications. The company recognises its concessions by the Standard Interpretation of Financial Accounting (ISAK) no. 16 and 22 on recognising concession services. This requires the plants constructed by KEEN to be classified as an unbilled financial asset from service concessions, rather than as a fixed asset. This asset is regarded as unbilled because it represents future receipts that KEEN will deem as revenue, once it begins supplying electricity.
Figure 29: Unbilled financial assets from service concession project
(In USD) 31 Mar 2019 31 Dec 2018 31 Dec 2017 31 Dec 2016
Future minimum capacity receipts:
Not later than 1 year 13,909,327 11,756,531 7,202,968 4,475,279
Later than 1 year but not later than 5 years 64,248,490 64,248,490 64,248,489 55,389,335
Later than 5 years 390,614,720 394,630,195 406,386,781 422,448,904
Total future minimum capacity receipts 468,772,537 470,635,272 477,838,238 482,313,518
Less unearned financial income 230,971,805 232,409,826 237,632,735 243,427,763
Less amount due for construction 5,274,364 8,251,876 25,719,062 50,347,867
Present value of future capacity receipts 232,526,368 229,973,570 214,486,441 188,537,888
Less current portion 3,138,665 2,648,700 1,397,420 -
Non-current portion 229,387,703 227,324,870 213,089,021 188,537,888
Source: Company data, RHB
The reason why ISAK No. 16 applies to this case is that the project was contracted under the BOOT scheme, which requires the plant to be handed over to PLN by the end of the PPA.
100% 100% 100% 100%93%
100% 100% 100%
0%
25%
65%
100%
0%
20%
40%
60%
80%
100%
2018 2019F 2020F 2021F
ESS BTL MDG
64%
22%
14%
Construction project revenue Concession interest income Sales of electricity
Kencana Energi Lestari Indonesia Research Note
14 October 2019 Alternative Energy | Energy
See important disclosures at the end of this report 13
Figure 30: International Standard of Financial Accounting no 16 Article Key Points
2 The Government introduced service contracts to attract the private sector to
construct, finance, operate and maintain public infrastructure
3 Operators are obliged to submit the infrastructure to the concession granter by the
end of the contract
4 The interpretation of the accounting standard is directed to service concession
contracts from a state-owned company to a private company
11 The infrastructure shall be recognised not as a fixed asset
15 Operators that execute construction services will receive receivables accounted for
as financial assets or intangible assets, which are accounted from the projects’ fair values
13 Operators shall acknowledge revenue from the unbilled financial asset's fair value
Source: Indonesian Government, RHB
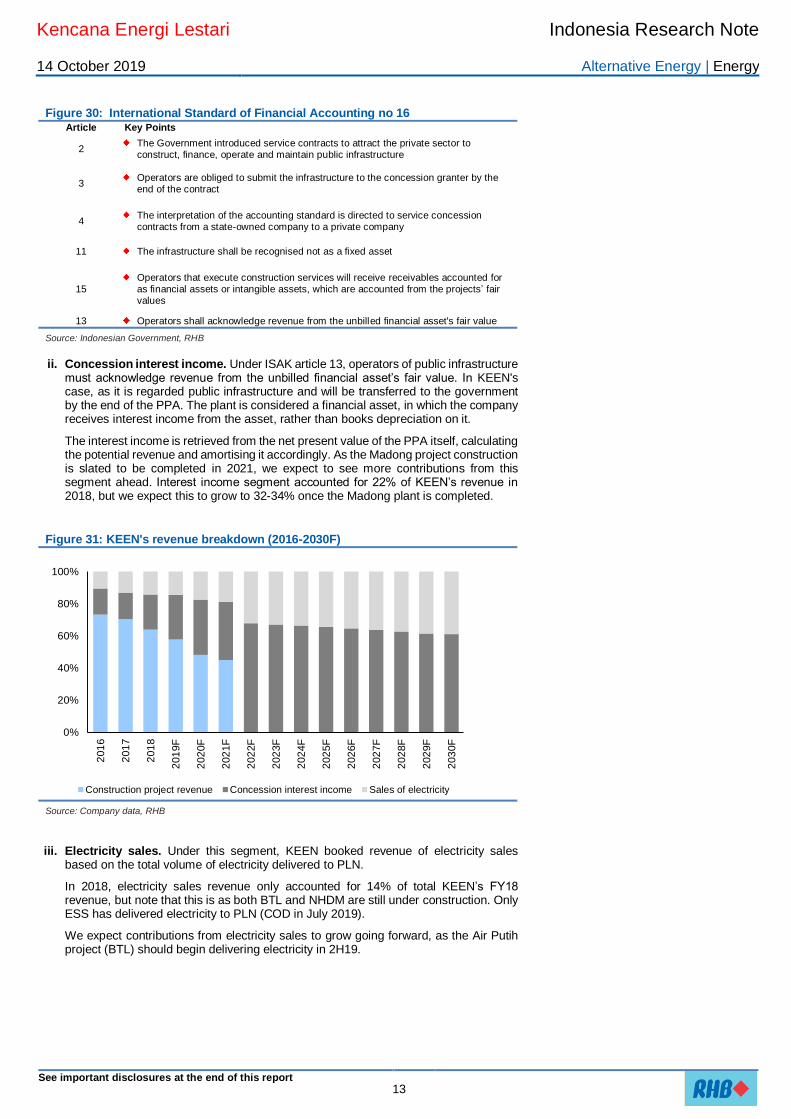
ii. Concession interest income. Under ISAK article 13, operators of public infrastructure must acknowledge revenue from the unbilled financial asset’s fair value. In KEEN's case, as it is regarded public infrastructure and will be transferred to the government by the end of the PPA. The plant is considered a financial asset, in which the company receives interest income from the asset, rather than books depreciation on it.
The interest income is retrieved from the net present value of the PPA itself, calculating the potential revenue and amortising it accordingly. As the Madong project construction is slated to be completed in 2021, we expect to see more contributions from this segment ahead. Interest income segment accounted for 22% of KEEN’s revenue in 2018, but we expect this to grow to 32-34% once the Madong plant is completed.
Figure 31: KEEN's revenue breakdown (2016-2030F)
Source: Company data, RHB iii. Electricity sales. Under this segment, KEEN booked revenue of electricity sales
based on the total volume of electricity delivered to PLN.
In 2018, electricity sales revenue only accounted for 14% of total KEEN’s FY18 revenue, but note that this is as both BTL and NHDM are still under construction. Only ESS has delivered electricity to PLN (COD in July 2019).
We expect contributions from electricity sales to grow going forward, as the Air Putih project (BTL) should begin delivering electricity in 2H19.
0%
20%
40%
60%
80%
100%
201
6
201
7
201
8
201
9F
202
0F
202
1F
202
2F
202
3F
202
4F
202
5F
202
6F
202
7F
202
8F
202
9F
203
0F
Construction project revenue Concession interest income Sales of electricity
Kencana Energi Lestari Indonesia Research Note
14 October 2019 Alternative Energy | Energy
See important disclosures at the end of this report 14
Figure 32: KEEN’s electricity revenue vs YoY growth Figure 33: KEEN’s electricity revenue breakdown
Source: Company data, RHB Source: Company data, RHB
Are there seasonal factors?
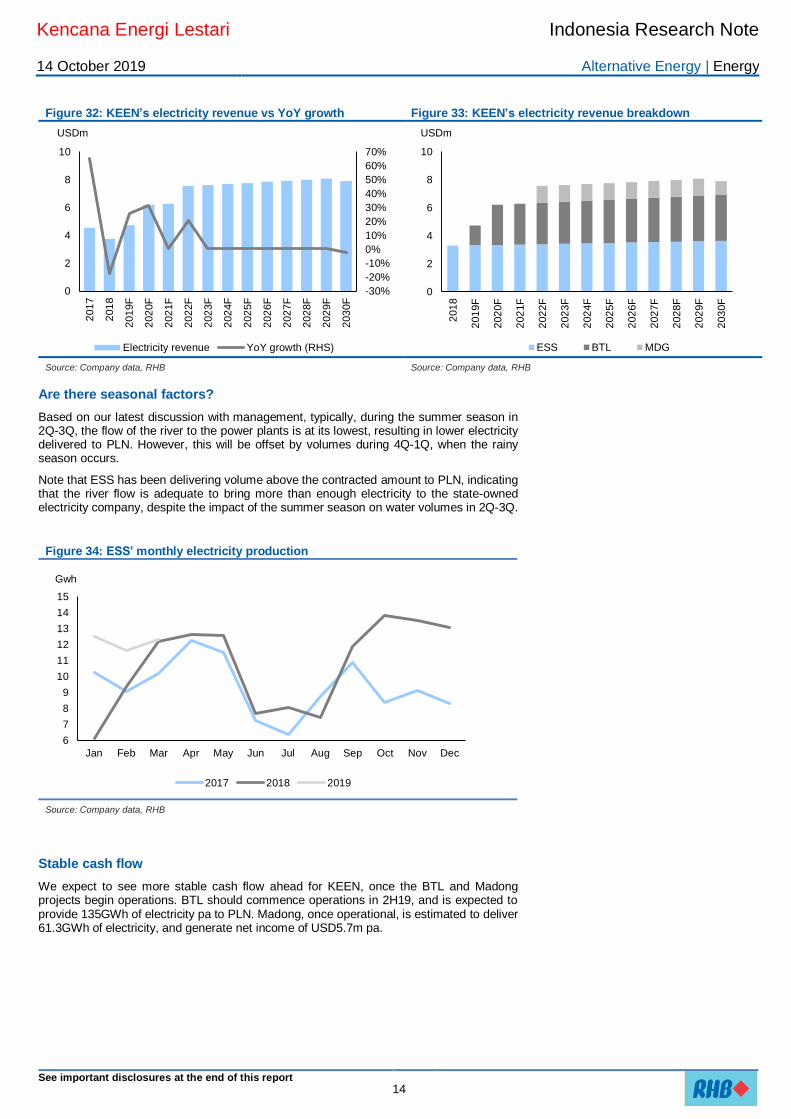
Based on our latest discussion with management, typically, during the summer season in 2Q-3Q, the flow of the river to the power plants is at its lowest, resulting in lower electricity delivered to PLN. However, this will be offset by volumes during 4Q-1Q, when the rainy season occurs.
Note that ESS has been delivering volume above the contracted amount to PLN, indicating that the river flow is adequate to bring more than enough electricity to the state-owned electricity company, despite the impact of the summer season on water volumes in 2Q-3Q.
Figure 34: ESS’ monthly electricity production
Source: Company data, RHB
Stable cash flow
We expect to see more stable cash flow ahead for KEEN, once the BTL and Madong projects begin operations. BTL should commence operations in 2H19, and is expected to provide 135GWh of electricity pa to PLN. Madong, once operational, is estimated to deliver 61.3GWh of electricity, and generate net income of USD5.7m pa.
-30%
-20%
-10%
0%
10%
20%
30%
40%
50%
60%
70%
0
2
4
6
8
10
201
7
201
8
201
9F
202
0F
202
1F
202
2F
202
3F
202
4F
202
5F
202
6F
202
7F
202
8F
202
9F
203
0F
Electricity revenue YoY growth (RHS)
USDm
0
2
4
6
8
10
201
8
201
9F
202
0F
202
1F
202
2F
202
3F
202
4F
202
5F
202
6F
202
7F
202
8F
202
9F
203
0F
ESS BTL MDG
USDm
6
7
8
9
10
11
12
13
14
15
Jan Feb Mar Apr May Jun Jul Aug Sep Oct Nov Dec
2017 2018 2019
Gwh
Kencana Energi Lestari Indonesia Research Note
14 October 2019 Alternative Energy | Energy
See important disclosures at the end of this report 15
Figure 35: KEEN’s revenue contributions Figure 36: KEEN NPAT vs YoY growth
Source:Company, RHB Source:Company, RHB
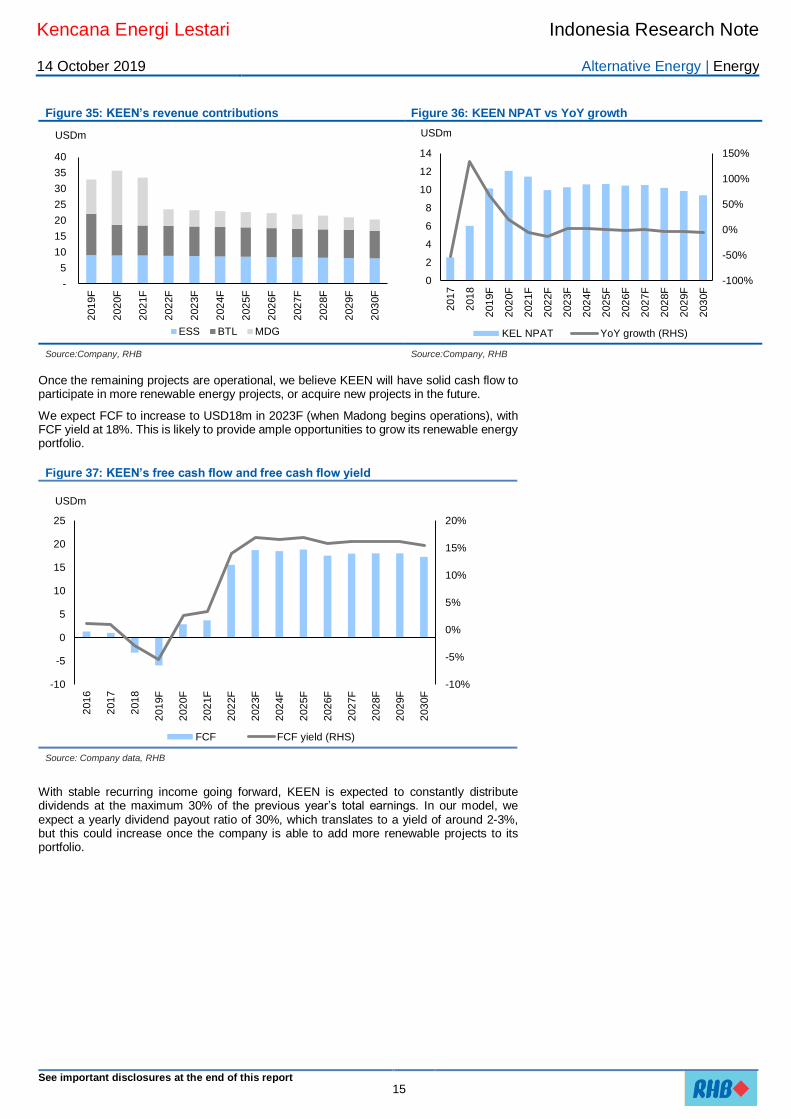
Once the remaining projects are operational, we believe KEEN will have solid cash flow to participate in more renewable energy projects, or acquire new projects in the future.
We expect FCF to increase to USD18m in 2023F (when Madong begins operations), with FCF yield at 18%. This is likely to provide ample opportunities to grow its renewable energy portfolio.
Figure 37: KEEN’s free cash flow and free cash flow yield
Source: Company data, RHB
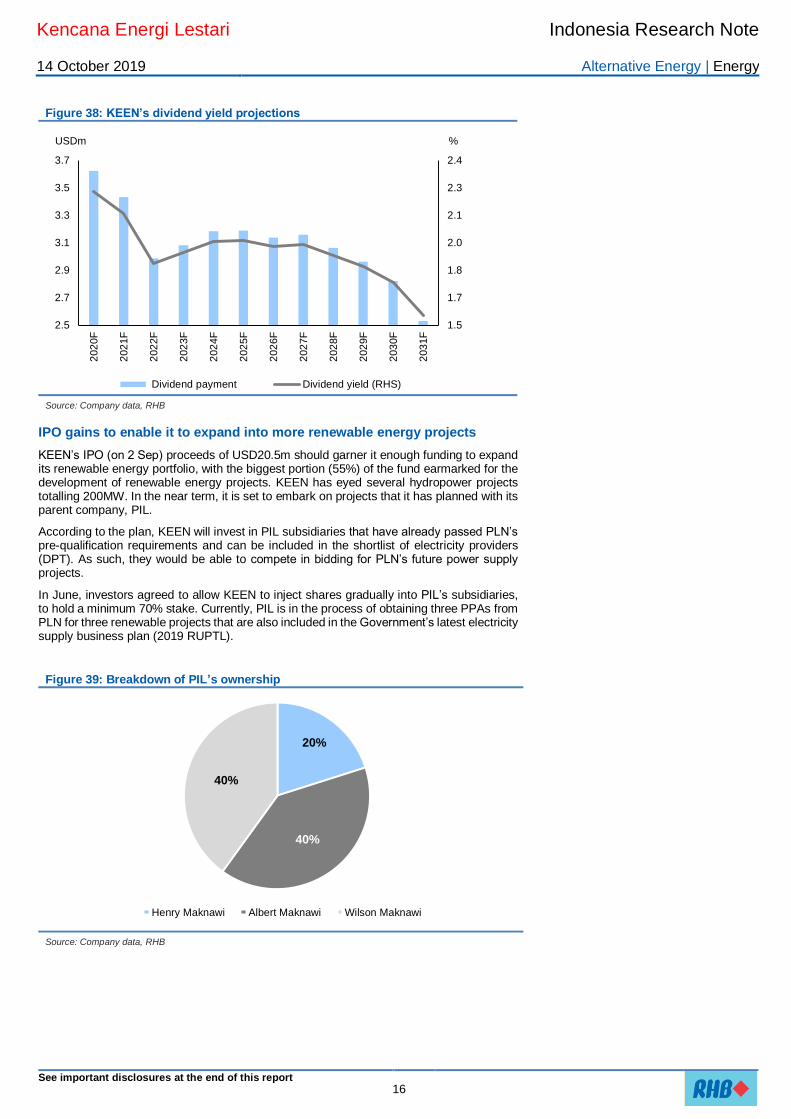
With stable recurring income going forward, KEEN is expected to constantly distribute dividends at the maximum 30% of the previous year’s total earnings. In our model, we expect a yearly dividend payout ratio of 30%, which translates to a yield of around 2-3%, but this could increase once the company is able to add more renewable projects to its portfolio.
-
5
10
15
20
25
30
35
40
201
9F
202
0F
202
1F
202
2F
202
3F
202
4F
202
5F
202
6F
202
7F
202
8F
202
9F
203
0F
ESS BTL MDG
USDm
-100%
-50%
0%
50%
100%
150%
0
2
4
6
8
10
12
14
201
7
201
8
201
9F
202
0F
202
1F
202
2F
202
3F
202
4F
202
5F
202
6F
202
7F
202
8F
202
9F
203
0F
KEL NPAT YoY growth (RHS)
USDm
-10%
-5%
0%
5%
10%
15%
20%
-10
-5
0
5
10
15
20
25
201
6
201
7
201
8
201
9F
202
0F
202
1F
202
2F
202
3F
202
4F
202
5F
202
6F
202
7F
202
8F
202
9F
203
0F
FCF FCF yield (RHS)
USDm
Kencana Energi Lestari Indonesia Research Note
14 October 2019 Alternative Energy | Energy
See important disclosures at the end of this report 16
Figure 38: KEEN’s dividend yield projections
Source: Company data, RHB
IPO gains to enable it to expand into more renewable energy projects
KEEN’s IPO (on 2 Sep) proceeds of USD20.5m should garner it enough funding to expand its renewable energy portfolio, with the biggest portion (55%) of the fund earmarked for the development of renewable energy projects. KEEN has eyed several hydropower projects totalling 200MW. In the near term, it is set to embark on projects that it has planned with its parent company, PIL.
According to the plan, KEEN will invest in PIL subsidiaries that have already passed PLN’s pre-qualification requirements and can be included in the shortlist of electricity providers (DPT). As such, they would be able to compete in bidding for PLN’s future power supply projects.
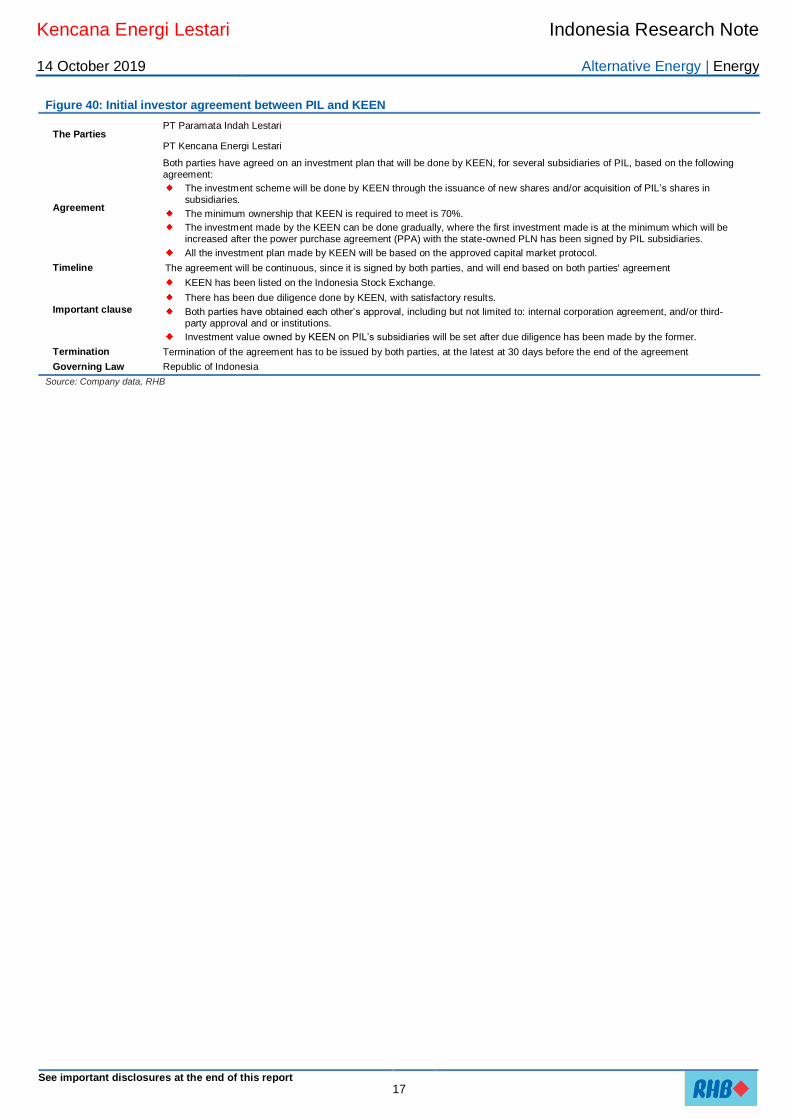
In June, investors agreed to allow KEEN to inject shares gradually into PIL’s subsidiaries, to hold a minimum 70% stake. Currently, PIL is in the process of obtaining three PPAs from PLN for three renewable projects that are also included in the Government’s latest electricity supply business plan (2019 RUPTL).
Figure 39: Breakdown of PIL’s ownership
Source: Company data, RHB
1.5
1.7
1.8
2.0
2.1
2.3
2.4
2.5
2.7
2.9
3.1
3.3
3.5
3.7
202
0F
202
1F
202
2F
202
3F
202
4F
202
5F
202
6F
202
7F
202
8F
202
9F
203
0F
203
1F
Dividend payment Dividend yield (RHS)
USDm %
20%
40%
40%
Henry Maknawi Albert Maknawi Wilson Maknawi
Kencana Energi Lestari Indonesia Research Note
14 October 2019 Alternative Energy | Energy
See important disclosures at the end of this report 17
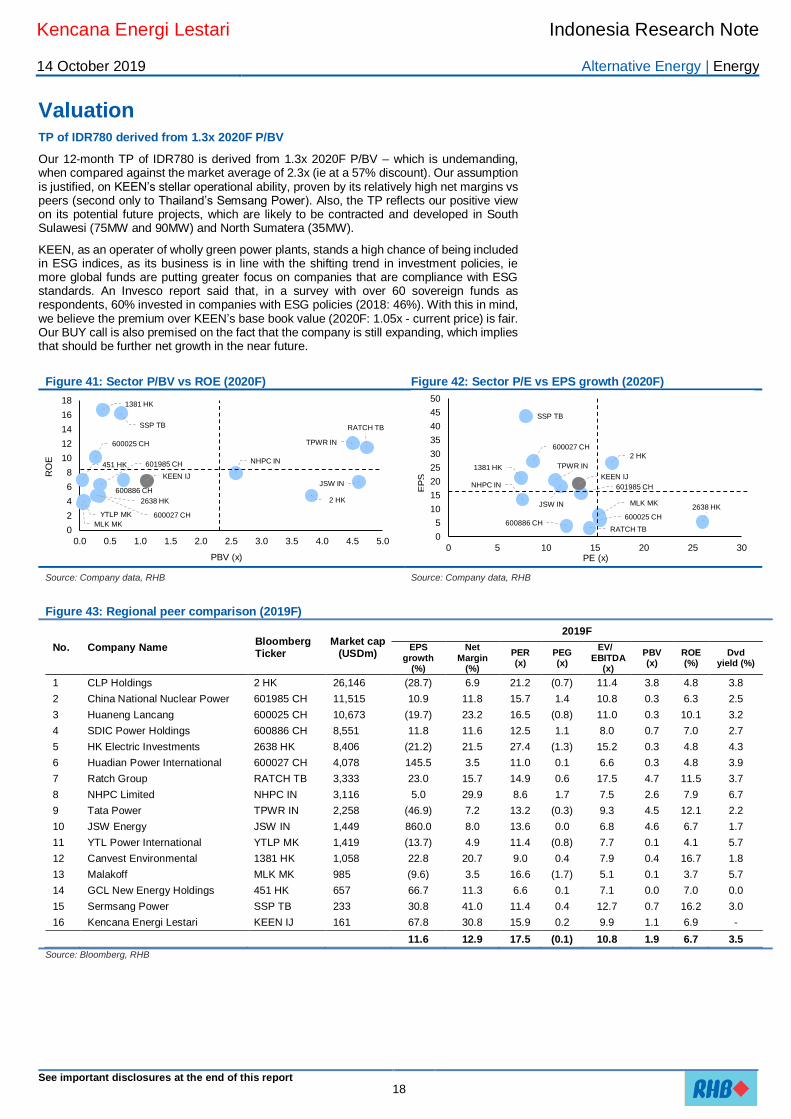
Figure 40: Initial investor agreement between PIL and KEEN
The Parties PT Paramata Indah Lestari
PT Kencana Energi Lestari
Agreement
Both parties have agreed on an investment plan that will be done by KEEN, for several subsidiaries of PIL, based on the following agreement:
The investment scheme will be done by KEEN through the issuance of new shares and/or acquisition of PIL’s shares in subsidiaries.
The minimum ownership that KEEN is required to meet is 70%.
The investment made by the KEEN can be done gradually, where the first investment made is at the minimum which will be increased after the power purchase agreement (PPA) with the state-owned PLN has been signed by PIL subsidiaries.
All the investment plan made by KEEN will be based on the approved capital market protocol.
Timeline The agreement will be continuous, since it is signed by both parties, and will end based on both parties' agreement
Important clause
KEEN has been listed on the Indonesia Stock Exchange.
There has been due diligence done by KEEN, with satisfactory results.
Both parties have obtained each other’s approval, including but not limited to: internal corporation agreement, and/or third-party approval and or institutions.
Investment value owned by KEEN on PIL’s subsidiaries will be set after due diligence has been made by the former.
Termination Termination of the agreement has to be issued by both parties, at the latest at 30 days before the end of the agreement
Governing Law Republic of Indonesia
Source: Company data, RHB
Kencana Energi Lestari Indonesia Research Note
14 October 2019 Alternative Energy | Energy
See important disclosures at the end of this report 18
Valuation TP of IDR780 derived from 1.3x 2020F P/BV
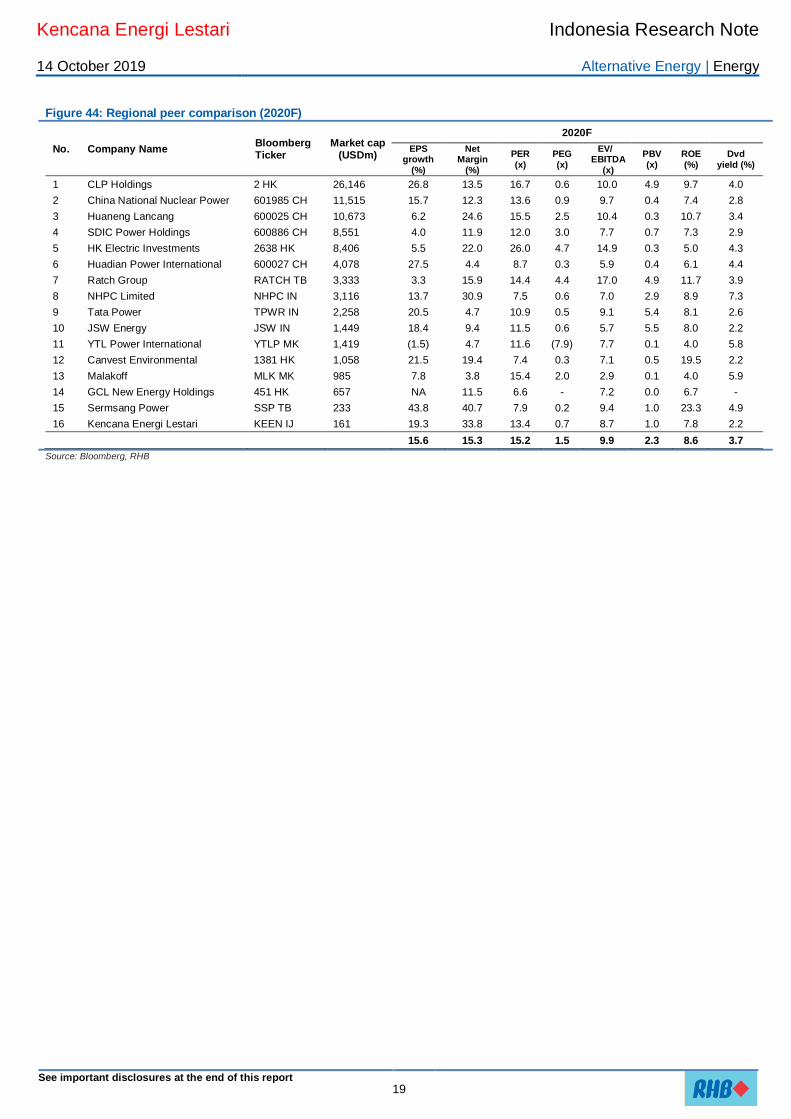
Our 12-month TP of IDR780 is derived from 1.3x 2020F P/BV – which is undemanding, when compared against the market average of 2.3x (ie at a 57% discount). Our assumption is justified, on KEEN’s stellar operational ability, proven by its relatively high net margins vs peers (second only to Thailand’s Semsang Power). Also, the TP reflects our positive view on its potential future projects, which are likely to be contracted and developed in South Sulawesi (75MW and 90MW) and North Sumatera (35MW).
KEEN, as an operater of wholly green power plants, stands a high chance of being included in ESG indices, as its business is in line with the shifting trend in investment policies, ie more global funds are putting greater focus on companies that are compliance with ESG standards. An Invesco report said that, in a survey with over 60 sovereign funds as respondents, 60% invested in companies with ESG policies (2018: 46%). With this in mind, we believe the premium over KEEN’s base book value (2020F: 1.05x - current price) is fair. Our BUY call is also premised on the fact that the company is still expanding, which implies that should be further net growth in the near future.
Figure 41: Sector P/BV vs ROE (2020F) Figure 42: Sector P/E vs EPS growth (2020F)
Source: Company data, RHB Source: Company data, RHB
Figure 43: Regional peer comparison (2019F)
No. Company Name Bloomberg Ticker
Market cap (USDm)
2019F
EPS growth
(%)
Net Margin
(%)
PER (x)
PEG (x)
EV/ EBITDA
(x)
PBV (x)
ROE (%)
Dvd yield (%)
1 CLP Holdings 2 HK 26,146 (28.7) 6.9 21.2 (0.7) 11.4 3.8 4.8 3.8
2 China National Nuclear Power 601985 CH 11,515 10.9 11.8 15.7 1.4 10.8 0.3 6.3 2.5
3 Huaneng Lancang 600025 CH 10,673 (19.7) 23.2 16.5 (0.8) 11.0 0.3 10.1 3.2
4 SDIC Power Holdings 600886 CH 8,551 11.8 11.6 12.5 1.1 8.0 0.7 7.0 2.7
5 HK Electric Investments 2638 HK 8,406 (21.2) 21.5 27.4 (1.3) 15.2 0.3 4.8 4.3
6 Huadian Power International 600027 CH 4,078 145.5 3.5 11.0 0.1 6.6 0.3 4.8 3.9
7 Ratch Group RATCH TB 3,333 23.0 15.7 14.9 0.6 17.5 4.7 11.5 3.7
8 NHPC Limited NHPC IN 3,116 5.0 29.9 8.6 1.7 7.5 2.6 7.9 6.7
9 Tata Power TPWR IN 2,258 (46.9) 7.2 13.2 (0.3) 9.3 4.5 12.1 2.2
10 JSW Energy JSW IN 1,449 860.0 8.0 13.6 0.0 6.8 4.6 6.7 1.7
11 YTL Power International YTLP MK 1,419 (13.7) 4.9 11.4 (0.8) 7.7 0.1 4.1 5.7
12 Canvest Environmental 1381 HK 1,058 22.8 20.7 9.0 0.4 7.9 0.4 16.7 1.8
13 Malakoff MLK MK 985 (9.6) 3.5 16.6 (1.7) 5.1 0.1 3.7 5.7
14 GCL New Energy Holdings 451 HK 657 66.7 11.3 6.6 0.1 7.1 0.0 7.0 0.0
15 Sermsang Power SSP TB 233 30.8 41.0 11.4 0.4 12.7 0.7 16.2 3.0
16 Kencana Energi Lestari KEEN IJ 161 67.8 30.8 15.9 0.2 9.9 1.1 6.9 -
11.6 12.9 17.5 (0.1) 10.8 1.9 6.7 3.5
Source: Bloomberg, RHB
2 HK
601985 CH
600025 CH
600886 CH
2638 HK
600027 CH
RATCH TB
NHPC IN
TPWR IN
JSW IN
YTLP MK
1381 HK
MLK MK
451 HK
SSP TB
KEEN IJ
0
2
4
6
8
10
12
14
16
18
0.0 0.5 1.0 1.5 2.0 2.5 3.0 3.5 4.0 4.5 5.0
RO
E
PBV (x)
2 HK
601985 CH
600025 CH600886 CH
2638 HK
600027 CH
RATCH TB
NHPC IN
TPWR IN
JSW IN
1381 HK
MLK MK
SSP TB
KEEN IJ
0
5
10
15
20
25
30
35
40
45
50
0 5 10 15 20 25 30
EP
S
PE (x)
Kencana Energi Lestari Indonesia Research Note
14 October 2019 Alternative Energy | Energy
See important disclosures at the end of this report 19
Figure 44: Regional peer comparison (2020F)
No. Company Name Bloomberg Ticker
Market cap (USDm)
2020F
EPS growth
(%)
Net Margin
(%)
PER
(x)
PEG
(x)
EV/ EBITDA
(x)
PBV
(x)
ROE
(%)
Dvd
yield (%)
1 CLP Holdings 2 HK 26,146 26.8 13.5 16.7 0.6 10.0 4.9 9.7 4.0
2 China National Nuclear Power 601985 CH 11,515 15.7 12.3 13.6 0.9 9.7 0.4 7.4 2.8
3 Huaneng Lancang 600025 CH 10,673 6.2 24.6 15.5 2.5 10.4 0.3 10.7 3.4
4 SDIC Power Holdings 600886 CH 8,551 4.0 11.9 12.0 3.0 7.7 0.7 7.3 2.9
5 HK Electric Investments 2638 HK 8,406 5.5 22.0 26.0 4.7 14.9 0.3 5.0 4.3
6 Huadian Power International 600027 CH 4,078 27.5 4.4 8.7 0.3 5.9 0.4 6.1 4.4
7 Ratch Group RATCH TB 3,333 3.3 15.9 14.4 4.4 17.0 4.9 11.7 3.9
8 NHPC Limited NHPC IN 3,116 13.7 30.9 7.5 0.6 7.0 2.9 8.9 7.3
9 Tata Power TPWR IN 2,258 20.5 4.7 10.9 0.5 9.1 5.4 8.1 2.6
10 JSW Energy JSW IN 1,449 18.4 9.4 11.5 0.6 5.7 5.5 8.0 2.2
11 YTL Power International YTLP MK 1,419 (1.5) 4.7 11.6 (7.9) 7.7 0.1 4.0 5.8
12 Canvest Environmental 1381 HK 1,058 21.5 19.4 7.4 0.3 7.1 0.5 19.5 2.2
13 Malakoff MLK MK 985 7.8 3.8 15.4 2.0 2.9 0.1 4.0 5.9
14 GCL New Energy Holdings 451 HK 657 NA 11.5 6.6 - 7.2 0.0 6.7 -
15 Sermsang Power SSP TB 233 43.8 40.7 7.9 0.2 9.4 1.0 23.3 4.9
16 Kencana Energi Lestari KEEN IJ 161 19.3 33.8 13.4 0.7 8.7 1.0 7.8 2.2
15.6 15.3 15.2 1.5 9.9 2.3 8.6 3.7
Source: Bloomberg, RHB
Kencana Energi Lestari Indonesia Research Note
14 October 2019 Alternative Energy | Energy
See important disclosures at the end of this report 20
Industry Overview Key beneficiary of Indonesia’s growing electricity consumption
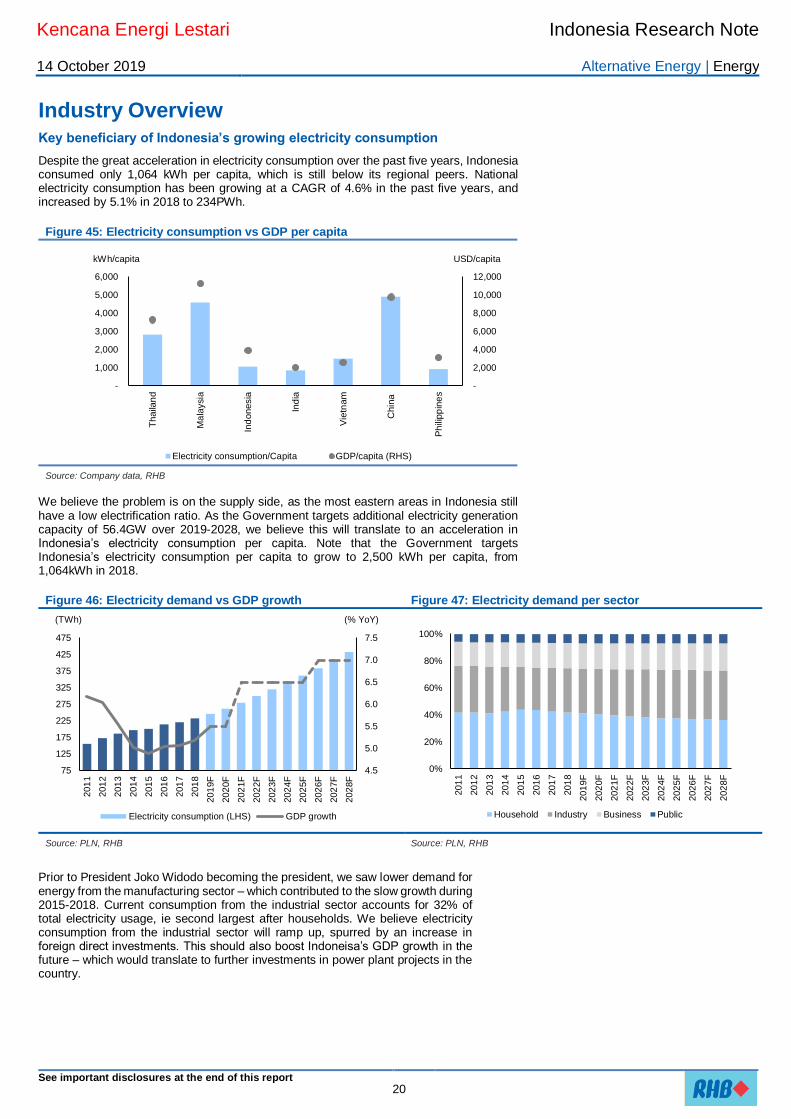
Despite the great acceleration in electricity consumption over the past five years, Indonesia consumed only 1,064 kWh per capita, which is still below its regional peers. National electricity consumption has been growing at a CAGR of 4.6% in the past five years, and increased by 5.1% in 2018 to 234PWh.
Figure 45: Electricity consumption vs GDP per capita
Source: Company data, RHB We believe the problem is on the supply side, as the most eastern areas in Indonesia still have a low electrification ratio. As the Government targets additional electricity generation capacity of 56.4GW over 2019-2028, we believe this will translate to an acceleration in Indonesia’s electricity consumption per capita. Note that the Government targets Indonesia’s electricity consumption per capita to grow to 2,500 kWh per capita, from 1,064kWh in 2018.
Figure 46: Electricity demand vs GDP growth Figure 47: Electricity demand per sector
Source: PLN, RHB Source: PLN, RHB
Prior to President Joko Widodo becoming the president, we saw lower demand for energy from the manufacturing sector – which contributed to the slow growth during 2015-2018. Current consumption from the industrial sector accounts for 32% of total electricity usage, ie second largest after households. We believe electricity consumption from the industrial sector will ramp up, spurred by an increase in foreign direct investments. This should also boost Indoneisa’s GDP growth in the future – which would translate to further investments in power plant projects in the country.
-
2,000
4,000
6,000
8,000
10,000
12,000
-
1,000
2,000
3,000
4,000
5,000
6,000
Thaila
nd
Ma
laysia
Ind
onesia
Ind
ia
Vie
tnam
Chin
a
Ph
ilipp
ine
s
Electricity consumption/Capita GDP/capita (RHS)
USD/capitakWh/capita
4.5
5.0
5.5
6.0
6.5
7.0
7.5
75
125
175
225
275
325
375
425
475
201
1
201
2
201
3
201
4
201
5
201
6
201
7
201
8
201
9F
202
0F
202
1F
202
2F
202
3F
202
4F
202
5F
202
6F
202
7F
202
8F
Electricity consumption (LHS) GDP growth
(TWh) (% YoY)
0%
20%
40%
60%
80%
100%
201
1
201
2
201
3
201
4
201
5
201
6
201
7
201
8
201
9F
202
0F
202
1F
202
2F
202
3F
202
4F
202
5F
202
6F
202
7F
202
8F
Household Industry Business Public
Kencana Energi Lestari Indonesia Research Note
14 October 2019 Alternative Energy | Energy
See important disclosures at the end of this report 21
Figure 48: Indonesia’s FDI trend
Source: Bloomberg, RHB
Renewable energy – how far behind are we?
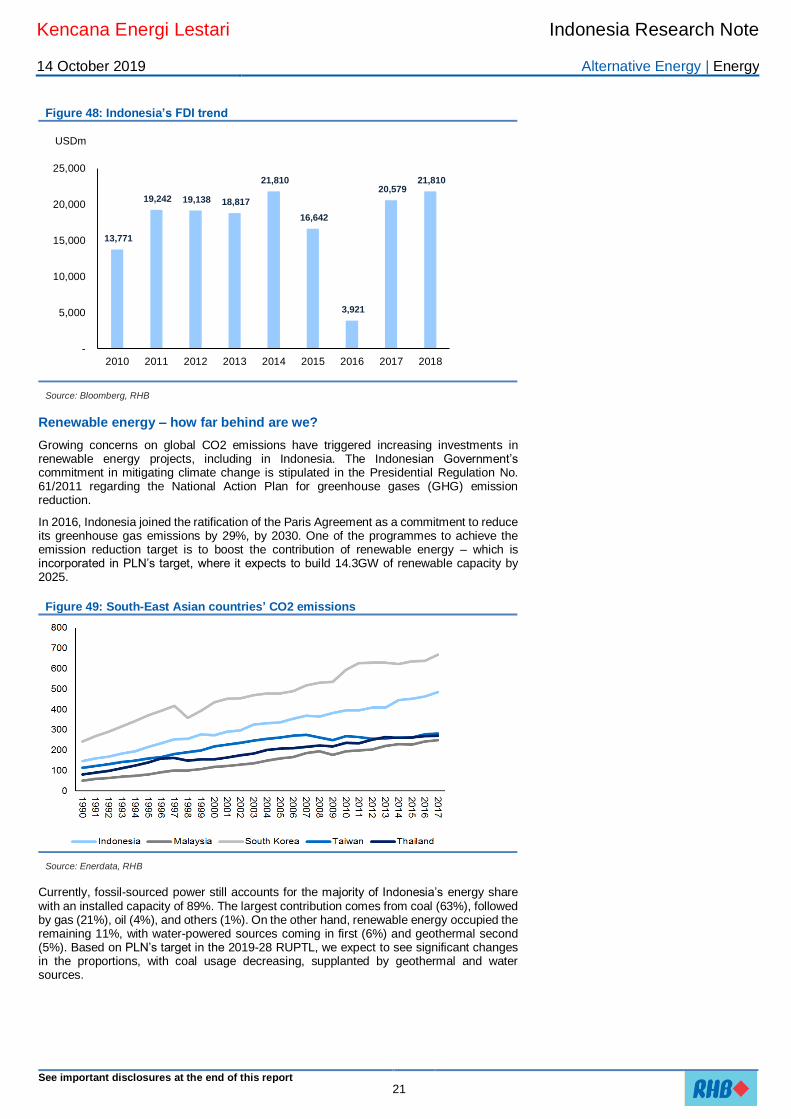
Growing concerns on global CO2 emissions have triggered increasing investments in renewable energy projects, including in Indonesia. The Indonesian Government’s commitment in mitigating climate change is stipulated in the Presidential Regulation No. 61/2011 regarding the National Action Plan for greenhouse gases (GHG) emission reduction.
In 2016, Indonesia joined the ratification of the Paris Agreement as a commitment to reduce its greenhouse gas emissions by 29%, by 2030. One of the programmes to achieve the emission reduction target is to boost the contribution of renewable energy – which is incorporated in PLN’s target, where it expects to build 14.3GW of renewable capacity by 2025.
Figure 49: South-East Asian countries’ CO2 emissions
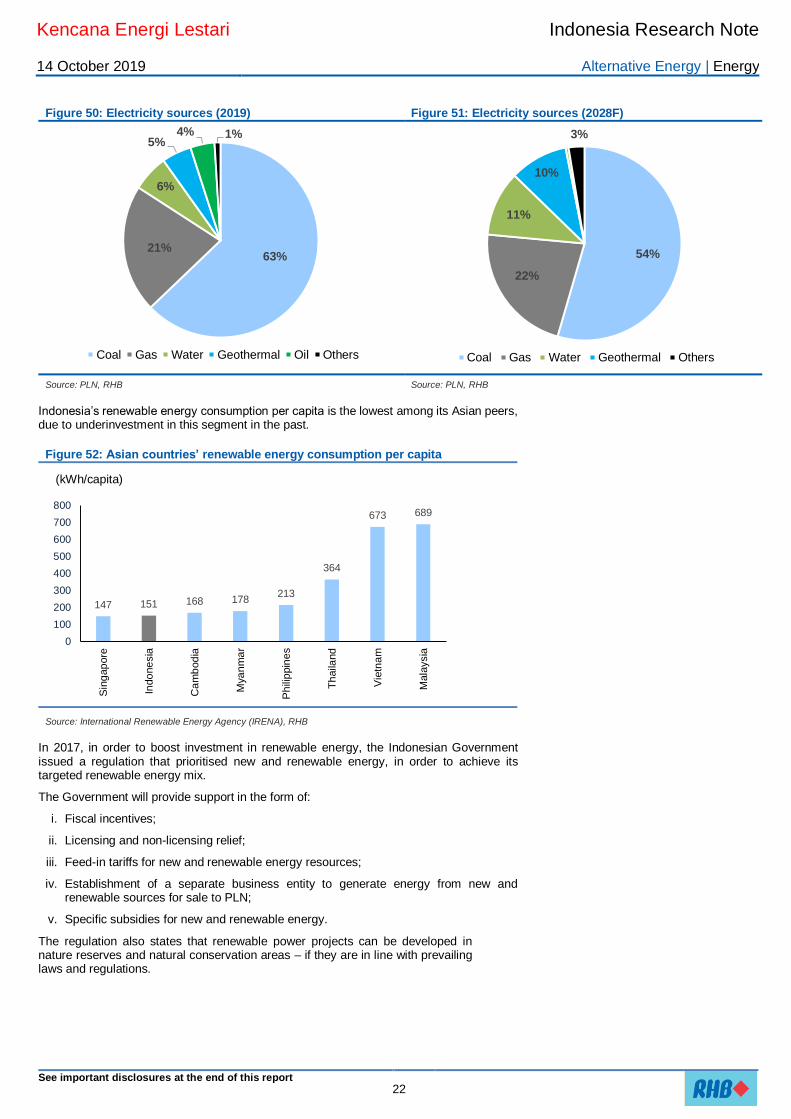
Source: Enerdata, RHB Currently, fossil-sourced power still accounts for the majority of Indonesia’s energy share with an installed capacity of 89%. The largest contribution comes from coal (63%), followed by gas (21%), oil (4%), and others (1%). On the other hand, renewable energy occupied the remaining 11%, with water-powered sources coming in first (6%) and geothermal second (5%). Based on PLN’s target in the 2019-28 RUPTL, we expect to see significant changes in the proportions, with coal usage decreasing, supplanted by geothermal and water sources.
13,771
19,242 19,138 18,817
21,810
16,642
3,921
20,579 21,810
-
5,000
10,000
15,000
20,000
25,000
2010 2011 2012 2013 2014 2015 2016 2017 2018
USDm
Kencana Energi Lestari Indonesia Research Note
14 October 2019 Alternative Energy | Energy
See important disclosures at the end of this report 22
Figure 50: Electricity sources (2019) Figure 51: Electricity sources (2028F)
Source: PLN, RHB Source: PLN, RHB
Indonesia’s renewable energy consumption per capita is the lowest among its Asian peers, due to underinvestment in this segment in the past.
Figure 52: Asian countries’ renewable energy consumption per capita
Source: International Renewable Energy Agency (IRENA), RHB In 2017, in order to boost investment in renewable energy, the Indonesian Government issued a regulation that prioritised new and renewable energy, in order to achieve its targeted renewable energy mix.
The Government will provide support in the form of:
i. Fiscal incentives;
ii. Licensing and non-licensing relief;
iii. Feed-in tariffs for new and renewable energy resources;
iv. Establishment of a separate business entity to generate energy from new and renewable sources for sale to PLN;
v. Specific subsidies for new and renewable energy.
The regulation also states that renewable power projects can be developed in nature reserves and natural conservation areas – if they are in line with prevailing laws and regulations.
63%21%
6%
5%4% 1%
Coal Gas Water Geothermal Oil Others
54%
22%
11%
10%
3%
Coal Gas Water Geothermal Others
147 151 168 178213
364
673 689
0
100
200
300
400
500
600
700
800
Sin
gap
ore
Indo
ne
sia
Ca
mb
od
ia
Mya
nm
ar
Ph
ilip
pin
es
Th
aila
nd
Vie
tna
m
Mala
ysia
(kWh/capita)
Kencana Energi Lestari Indonesia Research Note
14 October 2019 Alternative Energy | Energy
See important disclosures at the end of this report 23
Figure 53: PLN’s purchase prices for renewable energy
Power Type Condition Tarrif Range
Solar (PLTS Fotovoltaik) Local BPP > National BPP ≤ 85% from local BPP
Local BPP ≤ National BPP according to agreement
Wind (PLTB) Local BPP > National BPP ≤ 85% from local BPP
Local BPP ≤ National BPP according to agreement
Hydro (PLTA) Local BPP > National BPP ≤ Local BPP
Local BPP ≤ National BPP according to agreement
Biomass (PLTBm) Local BPP > National BPP ≤ 85% from local BPP
Local BPP ≤ National BPP according to agreement
Biogas (PLTBg) Local BPP > National BPP ≤ 85% from local BPP
Local BPP ≤ National BPP according to agreement
Waste (PLTSa) Local BPP > National BPP ≤ Local BPP
Local BPP ≤ National BPP according to agreement
Geothermal (PLTP) Local BPP > National BPP ≤ Local BPP
Local BPP ≤ National BPP according to agreement
Marine (PLTA) Local BPP > National BPP ≤ 85% from local BPP
Local BPP ≤ National BPP according to agreement
Note: BPP = reference benchmark prices
Source: Ministry of Natural Resources and Minerals, RHB
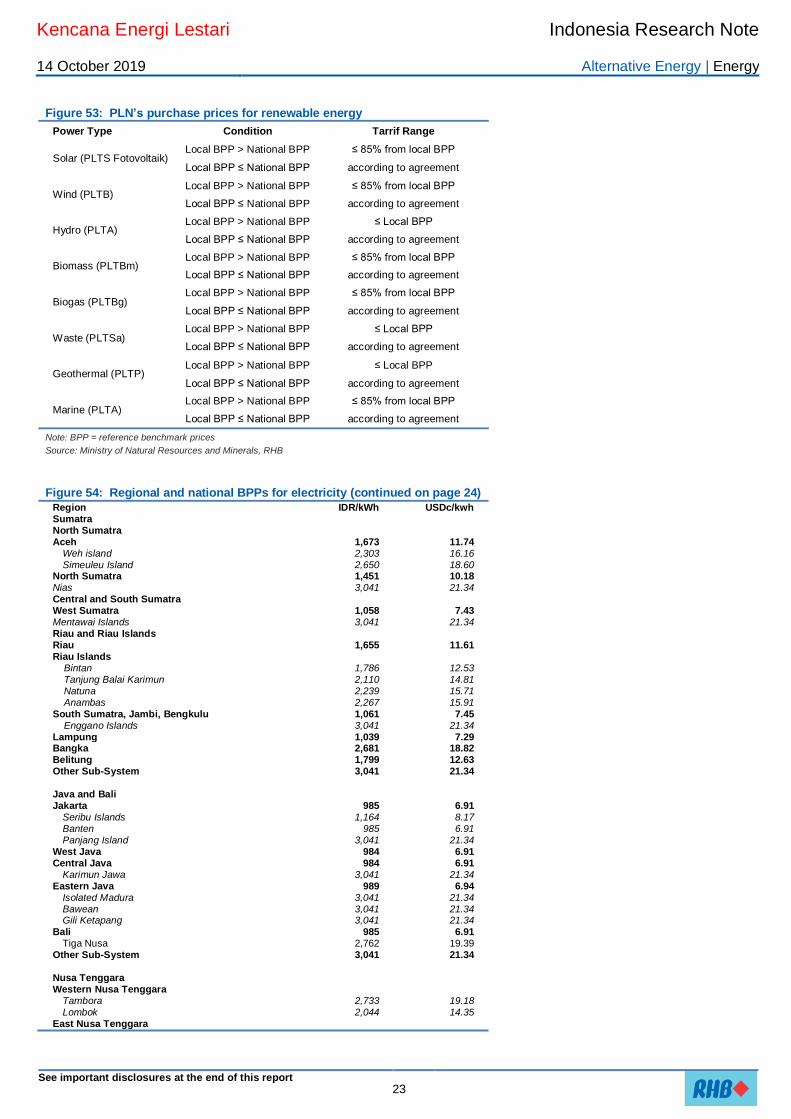
Figure 54: Regional and national BPPs for electricity (continued on page 24) Region IDR/kWh USDc/kwh Sumatra
North Sumatra
Aceh 1,673 11.74 Weh island 2,303 16.16 Simeuleu Island 2,650 18.60
North Sumatra 1,451 10.18 Nias 3,041 21.34 Central and South Sumatra
West Sumatra 1,058 7.43 Mentawai Islands 3,041 21.34 Riau and Riau Islands
Riau 1,655 11.61 Riau Islands
Bintan 1,786 12.53 Tanjung Balai Karimun 2,110 14.81 Natuna 2,239 15.71 Anambas 2,267 15.91
South Sumatra, Jambi, Bengkulu 1,061 7.45 Enggano Islands 3,041 21.34
Lampung 1,039 7.29 Bangka 2,681 18.82 Belitung 1,799 12.63 Other Sub-System 3,041 21.34
Java and Bali
Jakarta 985 6.91 Seribu Islands 1,164 8.17 Banten 985 6.91 Panjang Island 3,041 21.34
West Java 984 6.91 Central Java 984 6.91
Karimun Jawa 3,041 21.34 Eastern Java 989 6.94
Isolated Madura 3,041 21.34 Bawean 3,041 21.34 Gili Ketapang 3,041 21.34
Bali 985 6.91 Tiga Nusa 2,762 19.39
Other Sub-System 3,041 21.34
Nusa Tenggara
Western Nusa Tenggara
Tambora 2,733 19.18 Lombok 2,044 14.35
East Nusa Tenggara
Kencana Energi Lestari Indonesia Research Note
14 October 2019 Alternative Energy | Energy
See important disclosures at the end of this report 24
Sumba 2,964 20.81 Timor 2,588 18.17 Western Flores 2,504 17.58 Eastern Flores 3,031 21.28
Other Sub-System 3,041 21.34
Kalimantan
Western Kalimantan 1,525 10.70 South and Central Kalimantan 1,682 11.80 East and North Kalimantan 1,507 10.58 Other Sub-System 3,041 21.34
Sulawesi
North and Central Sulawesi and Gorontalo
North Sulawesi (Manado, Gorontalo, Kotamobagu) 1,918 13.46 Toli - Toli 2,894 20.32 Tahuna 2,929 20.56 Palu, Poso 1,171 8.22 Luwuk 2,403 16.87
South, South-East and West Sulawesi South Sulawesi 1,175 8.25 Kendari 2,321 16.29 Bau - Bau 2,369 16.63 Selayar 2,445 17.16
Other Sub-System 2,994 21.02
Maluku and Papua
Ambon 3,010 21.13 Seram 2,971 20.85 Saparua 2,993 21.01 Buru 3,019 21.19 Ternate - Tidore 2,299 16.13 Sanana 2,486 17.45 Bacan 2,674 18.77 Halmahera 2,963 20.80 Daruba 3,041 21.34 Tual 3,041 21.34 Dobo 3,041 21.34 Saumlaki 2,384 16.74
Papua and West Papua
Jayapura 2,162 15.17 Sarmi 3,041 21.34 Biak 2,389 16.77 Serui 2,882 20.23 Nabire 2,191 15.38 Wamena 3,041 21.34 Timika 2,736 19.21 Marauke 2,593 18.20 Tanah Merah 3,041 21.34 Manokwari 2,018 14.17 Sorong 1,465 10.28 Teminabuan 2,783 19.53 Fak Fak 2,483 17.43 Kaimana 3,041 21.34 Bintuni 1,812 12.72 Raja Ampat 3,041 21.34
Other Sub-System 3,041 21.34
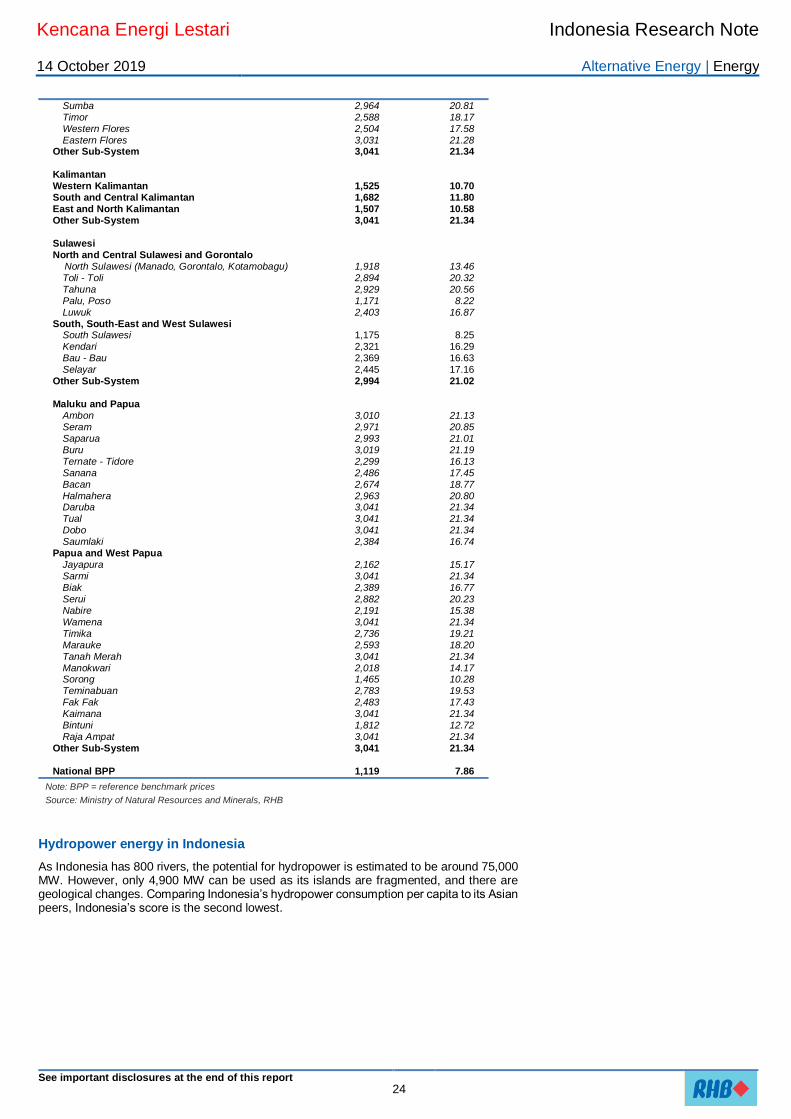
National BPP 1,119 7.86
Note: BPP = reference benchmark prices
Source: Ministry of Natural Resources and Minerals, RHB
Hydropower energy in Indonesia
As Indonesia has 800 rivers, the potential for hydropower is estimated to be around 75,000 MW. However, only 4,900 MW can be used as its islands are fragmented, and there are geological changes. Comparing Indonesia’s hydropower consumption per capita to its Asian peers, Indonesia’s score is the second lowest.
Kencana Energi Lestari Indonesia Research Note
14 October 2019 Alternative Energy | Energy
See important disclosures at the end of this report 25
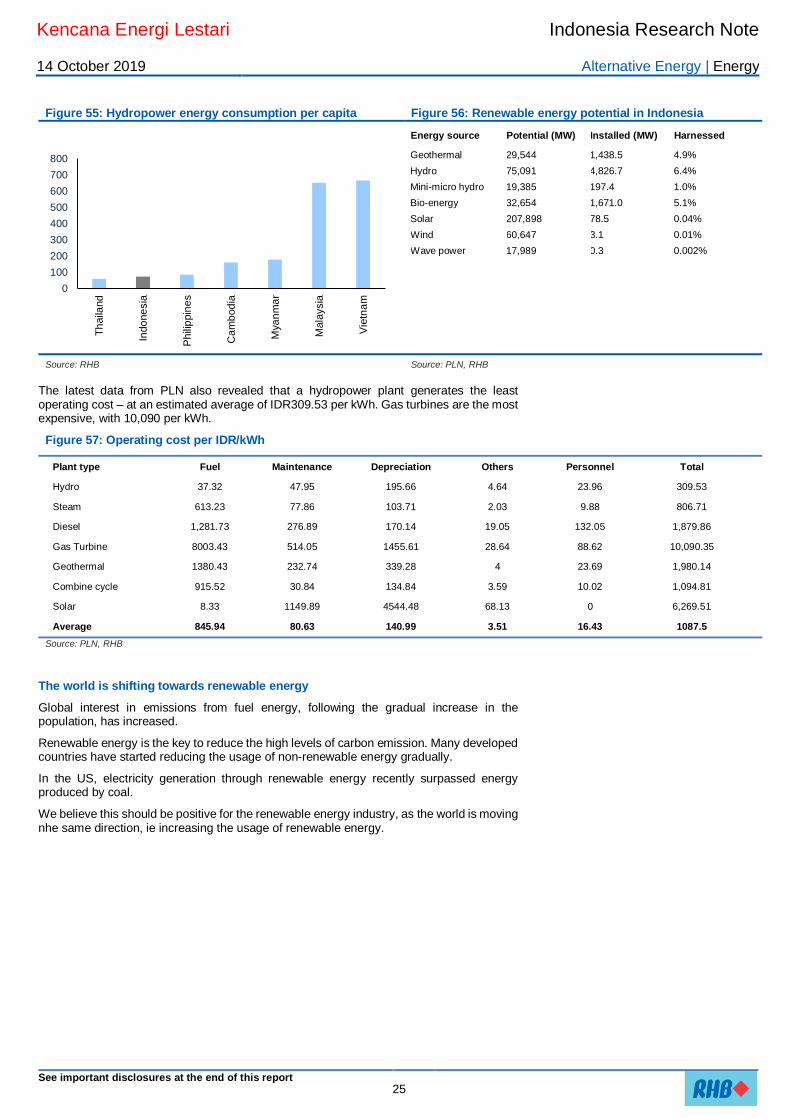
Figure 55: Hydropower energy consumption per capita Figure 56: Renewable energy potential in Indonesia
Energy source Potential (MW) Installed (MW) Harnessed
Geothermal 29,544 1,438.5 4.9%
Hydro 75,091 4,826.7 6.4%
Mini-micro hydro 19,385 197.4 1.0%
Bio-energy 32,654 1,671.0 5.1%
Solar 207,898 78.5 0.04%
Wind 60,647 3.1 0.01%
Wave power 17,989 0.3 0.002%
Source: RHB Source: PLN, RHB
The latest data from PLN also revealed that a hydropower plant generates the least operating cost – at an estimated average of IDR309.53 per kWh. Gas turbines are the most expensive, with 10,090 per kWh.
Figure 57: Operating cost per IDR/kWh
Plant type Fuel Maintenance Depreciation Others Personnel Total
Hydro 37.32 47.95 195.66 4.64 23.96 309.53
Steam 613.23 77.86 103.71 2.03 9.88 806.71
Diesel 1,281.73 276.89 170.14 19.05 132.05 1,879.86
Gas Turbine 8003.43 514.05 1455.61 28.64 88.62 10,090.35
Geothermal 1380.43 232.74 339.28 4 23.69 1,980.14
Combine cycle 915.52 30.84 134.84 3.59 10.02 1,094.81
Solar 8.33 1149.89 4544.48 68.13 0 6,269.51
Average 845.94 80.63 140.99 3.51 16.43 1087.5
Source: PLN, RHB
The world is shifting towards renewable energy
Global interest in emissions from fuel energy, following the gradual increase in the population, has increased.
Renewable energy is the key to reduce the high levels of carbon emission. Many developed countries have started reducing the usage of non-renewable energy gradually.
In the US, electricity generation through renewable energy recently surpassed energy produced by coal.
We believe this should be positive for the renewable energy industry, as the world is moving nhe same direction, ie increasing the usage of renewable energy.
0
100
200
300
400
500
600
700
800
Th
aila
nd
Indo
ne
sia
Ph
ilip
pin
es
Ca
mb
od
ia
Mya
nm
ar
Mala
ysia
Vie
tna
m
Kencana Energi Lestari Indonesia Research Note
14 October 2019 Alternative Energy | Energy
See important disclosures at the end of this report 26
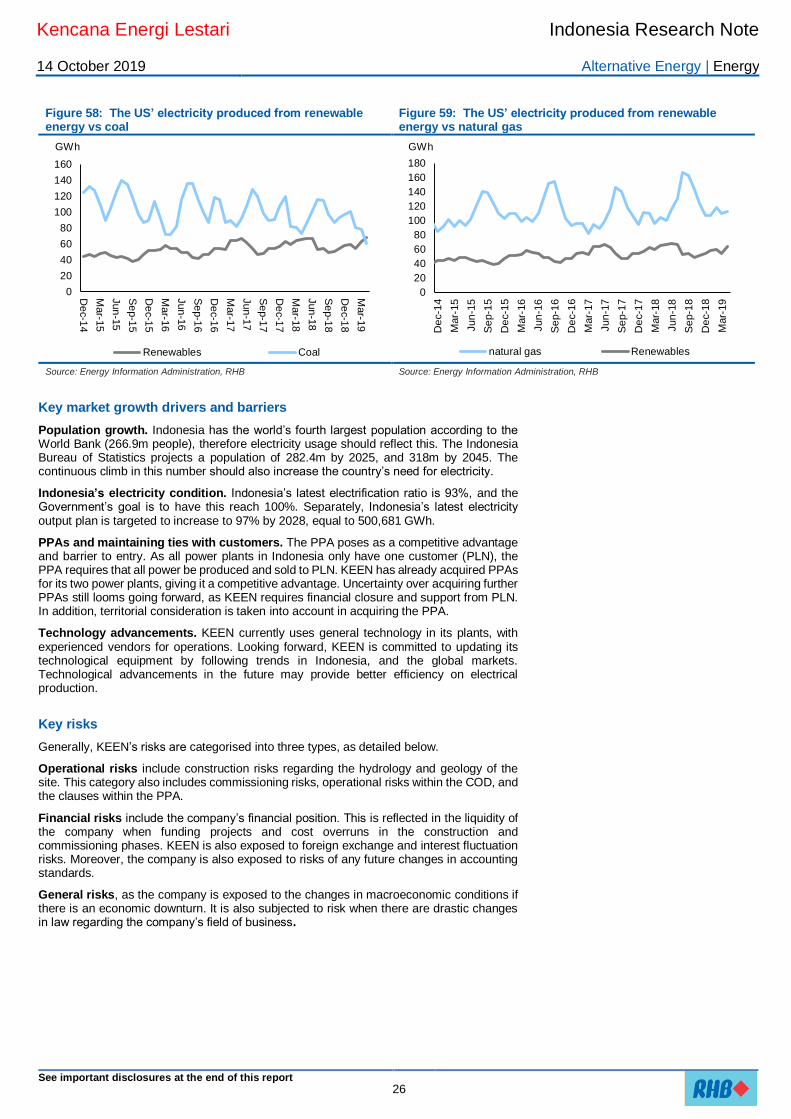
Figure 58: The US’ electricity produced from renewable energy vs coal
Figure 59: The US’ electricity produced from renewable energy vs natural gas
Source: Energy Information Administration, RHB Source: Energy Information Administration, RHB
Key market growth drivers and barriers
Population growth. Indonesia has the world’s fourth largest population according to the World Bank (266.9m people), therefore electricity usage should reflect this. The Indonesia Bureau of Statistics projects a population of 282.4m by 2025, and 318m by 2045. The continuous climb in this number should also increase the country’s need for electricity.
Indonesia’s electricity condition. Indonesia’s latest electrification ratio is 93%, and the Government’s goal is to have this reach 100%. Separately, Indonesia’s latest electricity output plan is targeted to increase to 97% by 2028, equal to 500,681 GWh.
PPAs and maintaining ties with customers. The PPA poses as a competitive advantage and barrier to entry. As all power plants in Indonesia only have one customer (PLN), the PPA requires that all power be produced and sold to PLN. KEEN has already acquired PPAs for its two power plants, giving it a competitive advantage. Uncertainty over acquiring further PPAs still looms going forward, as KEEN requires financial closure and support from PLN. In addition, territorial consideration is taken into account in acquiring the PPA.
Technology advancements. KEEN currently uses general technology in its plants, with experienced vendors for operations. Looking forward, KEEN is committed to updating its technological equipment by following trends in Indonesia, and the global markets. Technological advancements in the future may provide better efficiency on electrical production.
Key risks
Generally, KEEN’s risks are categorised into three types, as detailed below.
Operational risks include construction risks regarding the hydrology and geology of the site. This category also includes commissioning risks, operational risks within the COD, and the clauses within the PPA.
Financial risks include the company’s financial position. This is reflected in the liquidity of the company when funding projects and cost overruns in the construction and commissioning phases. KEEN is also exposed to foreign exchange and interest fluctuation risks. Moreover, the company is also exposed to risks of any future changes in accounting standards.
General risks, as the company is exposed to the changes in macroeconomic conditions if there is an economic downturn. It is also subjected to risk when there are drastic changes in law regarding the company’s field of business.
0
20
40
60
80
100
120
140
160
De
c-1
4
Mar-1
5
Jun
-15
Se
p-1
5
De
c-1
5
Mar-1
6
Jun
-16
Se
p-1
6
De
c-1
6
Mar-1
7
Jun
-17
Se
p-1
7
De
c-1
7
Mar-1
8
Jun
-18
Se
p-1
8
De
c-1
8
Mar-1
9
Renewables Coal
GWh
0
20
40
60
80
100
120
140
160
180
De
c-1
4
Mar-
15
Jun
-15
Se
p-1
5
De
c-1
5
Mar-
16
Jun
-16
Se
p-1
6
De
c-1
6
Mar-
17
Jun
-17
Se
p-1
7
De
c-1
7
Mar-
18
Jun
-18
Se
p-1
8
De
c-1
8
Mar-
19
natural gas Renewables
GWh
Kencana Energi Lestari Indonesia Research Note
3 October 2019 Alternative Energy | Energy
See important disclosures at the end of this report 27
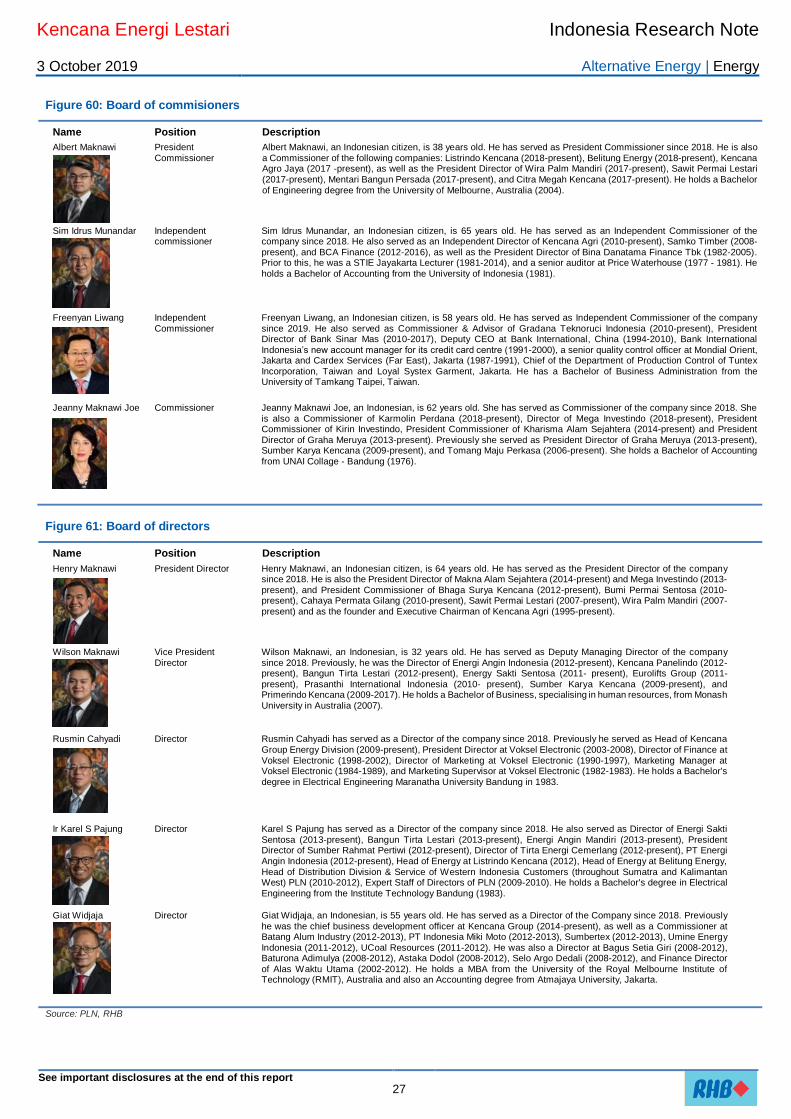
Figure 60: Board of commisioners
Name Position Description
Albert Maknawi
President
Commissioner
Albert Maknawi, an Indonesian citizen, is 38 years old. He has served as President Commissioner since 2018. He is also
a Commissioner of the following companies: Listrindo Kencana (2018-present), Belitung Energy (2018-present), Kencana Agro Jaya (2017 -present), as well as the President Director of Wira Palm Mandiri (2017-present), Sawit Permai Lestari (2017-present), Mentari Bangun Persada (2017-present), and Citra Megah Kencana (2017-present). He holds a Bachelor of Engineering degree from the University of Melbourne, Australia (2004).
Sim Idrus Munandar Independent commissioner
Sim Idrus Munandar, an Indonesian citizen, is 65 years old. He has served as an Independent Commissioner of the company since 2018. He also served as an Independent Director of Kencana Agri (2010-present), Samko Timber (2008- present), and BCA Finance (2012-2016), as well as the President Director of Bina Danatama Finance Tbk (1982-2005). Prior to this, he was a STIE Jayakarta Lecturer (1981-2014), and a senior auditor at Price Waterhouse (1977 - 1981). He
holds a Bachelor of Accounting from the University of Indonesia (1981).
Freenyan Liwang Independent Commissioner
Freenyan Liwang, an Indonesian citizen, is 58 years old. He has served as Independent Commissioner of the company since 2019. He also served as Commissioner & Advisor of Gradana Teknoruci Indonesia (2010-present), President Director of Bank Sinar Mas (2010-2017), Deputy CEO at Bank International, China (1994-2010), Bank International Indonesia’s new account manager for its credit card centre (1991-2000), a senior quality control officer at Mondial Orient, Jakarta and Cardex Services (Far East), Jakarta (1987-1991), Chief of the Department of Production Control of Tuntex Incorporation, Taiwan and Loyal Systex Garment, Jakarta. He has a Bachelor of Business Administration from the University of Tamkang Taipei, Taiwan.
Jeanny Maknawi Joe Commissioner Jeanny Maknawi Joe, an Indonesian, is 62 years old. She has served as Commissioner of the company since 2018. She is also a Commissioner of Karmolin Perdana (2018-present), Director of Mega Investindo (2018-present), President Commissioner of Kirin Investindo, President Commissioner of Kharisma Alam Sejahtera (2014-present) and President Director of Graha Meruya (2013-present). Previously she served as President Director of Graha Meruya (2013-present), Sumber Karya Kencana (2009-present), and Tomang Maju Perkasa (2006-present). She holds a Bachelor of Accounting from UNAI Collage - Bandung (1976).
Figure 61: Board of directors
Name Position Description
Henry Maknawi
President Director Henry Maknawi, an Indonesian citizen, is 64 years old. He has served as the President Director of the company since 2018. He is also the President Director of Makna Alam Sejahtera (2014-present) and Mega Investindo (2013-present), and President Commissioner of Bhaga Surya Kencana (2012-present), Bumi Permai Sentosa (2010-present), Cahaya Permata Gilang (2010-present), Sawit Permai Lestari (2007-present), Wira Palm Mandiri (2007-present) and as the founder and Executive Chairman of Kencana Agri (1995-present).
Wilson Maknawi Vice President Director
Wilson Maknawi, an Indonesian, is 32 years old. He has served as Deputy Managing Director of the company since 2018. Previously, he was the Director of Energi Angin Indonesia (2012-present), Kencana Panelindo (2012- present), Bangun Tirta Lestari (2012-present), Energy Sakti Sentosa (2011- present), Eurolifts Group (2011-present), Prasanthi International Indonesia (2010- present), Sumber Karya Kencana (2009-present), and Primerindo Kencana (2009-2017). He holds a Bachelor of Business, specialising in human resources, from Monash University in Australia (2007).
Rusmin Cahyadi
Director Rusmin Cahyadi has served as a Director of the company since 2018. Previously he served as Head of Kencana Group Energy Division (2009-present), President Director at Voksel Electronic (2003-2008), Director of Finance at Voksel Electronic (1998-2002), Director of Marketing at Voksel Electronic (1990-1997), Marketing Manager at Voksel Electronic (1984-1989), and Marketing Supervisor at Voksel Electronic (1982-1983). He holds a Bachelor's degree in Electrical Engineering Maranatha University Bandung in 1983.
Ir Karel S Pajung
Director Karel S Pajung has served as a Director of the company since 2018. He also served as Director of Energi Sakti Sentosa (2013-present), Bangun Tirta Lestari (2013-present), Energi Angin Mandiri (2013-present), President Director of Sumber Rahmat Pertiwi (2012-present), Director of Tirta Energi Cemerlang (2012-present), PT Energi Angin Indonesia (2012-present), Head of Energy at Listrindo Kencana (2012), Head of Energy at Belitung Energy, Head of Distribution Division & Service of Western Indonesia Customers (throughout Sumatra and Kalimantan West) PLN (2010-2012), Expert Staff of Directors of PLN (2009-2010). He holds a Bachelor's degree in Electrical Engineering from the Institute Technology Bandung (1983).
Giat Widjaja
Director Giat Widjaja, an Indonesian, is 55 years old. He has served as a Director of the Company since 2018. Previously
he was the chief business development officer at Kencana Group (2014-present), as well as a Commissioner at Batang Alum Industry (2012-2013), PT Indonesia Miki Moto (2012-2013), Sumbertex (2012-2013), Umine Energy Indonesia (2011-2012), UCoal Resources (2011-2012). He was also a Director at Bagus Setia Giri (2008-2012), Baturona Adimulya (2008-2012), Astaka Dodol (2008-2012), Selo Argo Dedali (2008-2012), and Finance Director of Alas Waktu Utama (2002-2012). He holds a MBA from the University of the Royal Melbourne Institute of Technology (RMIT), Australia and also an Accounting degree from Atmajaya University, Jakarta.
Source: PLN, RHB
Kencana Energi Lestari Indonesia Research Note
3 October 2019 Alternative Energy | Energy
See important disclosures at the end of this report 28
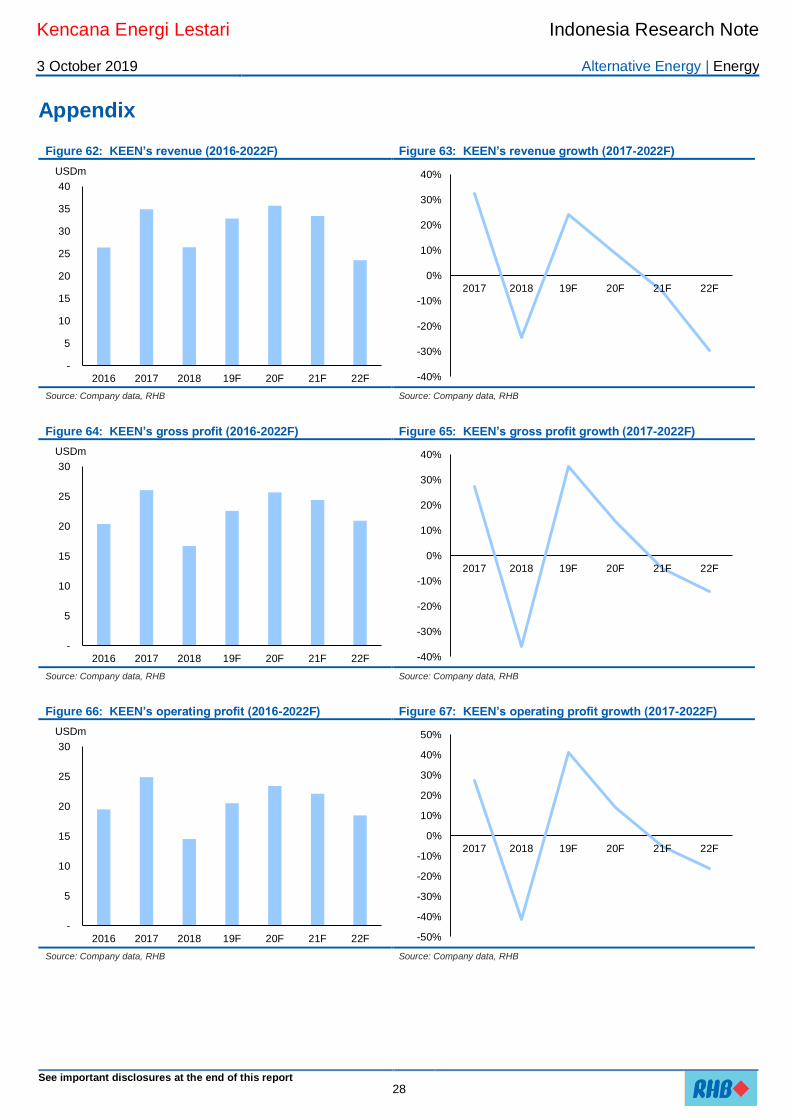
Appendix
Figure 62: KEEN’s revenue (2016-2022F) Figure 63: KEEN’s revenue growth (2017-2022F)
Source: Company data, RHB Source: Company data, RHB
Figure 64: KEEN’s gross profit (2016-2022F) Figure 65: KEEN’s gross profit growth (2017-2022F)
Source: Company data, RHB Source: Company data, RHB
Figure 66: KEEN’s operating profit (2016-2022F) Figure 67: KEEN’s operating profit growth (2017-2022F)
Source: Company data, RHB Source: Company data, RHB
-
5
10
15
20
25
30
35
40
2016 2017 2018 19F 20F 21F 22F
USDm
-40%
-30%
-20%
-10%
0%
10%
20%
30%
40%
2017 2018 19F 20F 21F 22F
-
5
10
15
20
25
30
2016 2017 2018 19F 20F 21F 22F
USDm
-40%
-30%
-20%
-10%
0%
10%
20%
30%
40%
2017 2018 19F 20F 21F 22F
-
5
10
15
20
25
30
2016 2017 2018 19F 20F 21F 22F
USDm
-50%
-40%
-30%
-20%
-10%
0%
10%
20%
30%
40%
50%
2017 2018 19F 20F 21F 22F
Kencana Energi Lestari Indonesia Research Note
3 October 2019 Alternative Energy | Energy
See important disclosures at the end of this report 29
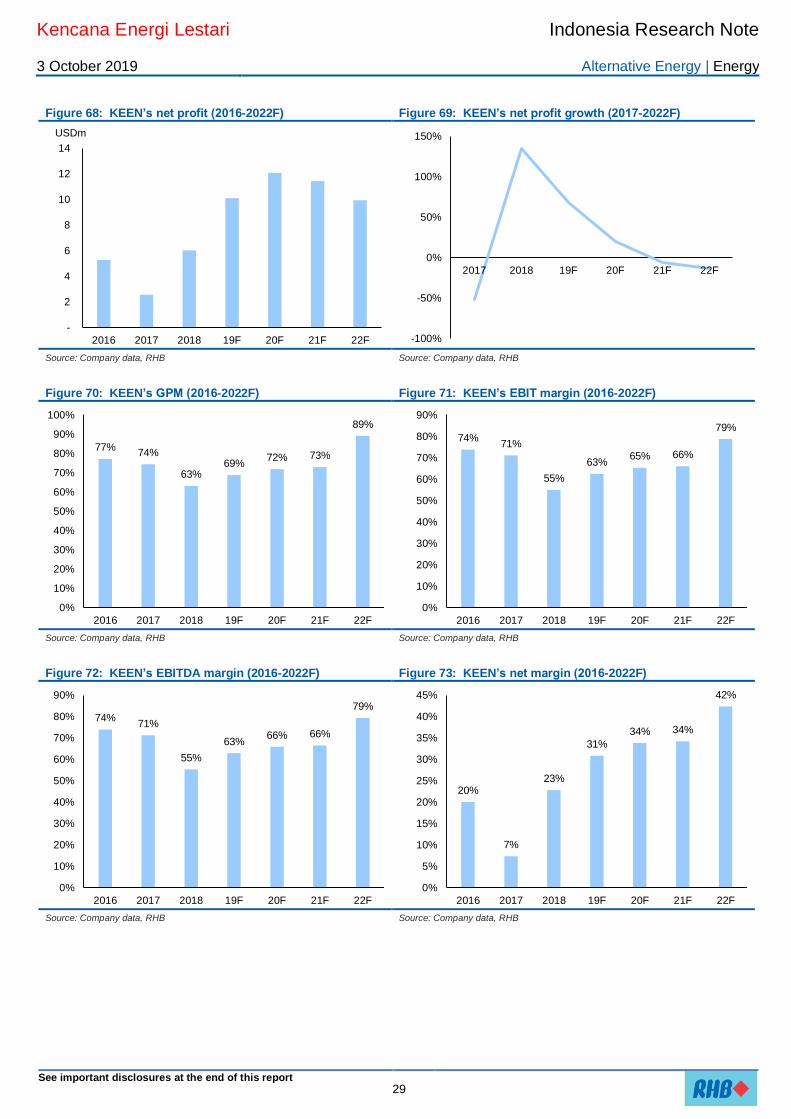
Figure 68: KEEN’s net profit (2016-2022F) Figure 69: KEEN’s net profit growth (2017-2022F)
Source: Company data, RHB Source: Company data, RHB
Figure 70: KEEN’s GPM (2016-2022F) Figure 71: KEEN’s EBIT margin (2016-2022F)
Source: Company data, RHB Source: Company data, RHB
Figure 72: KEEN’s EBITDA margin (2016-2022F) Figure 73: KEEN’s net margin (2016-2022F)
Source: Company data, RHB Source: Company data, RHB
-
2
4
6
8
10
12
14
2016 2017 2018 19F 20F 21F 22F
USDm
-100%
-50%
0%
50%
100%
150%
2017 2018 19F 20F 21F 22F
77%74%
63%69%
72% 73%
89%
0%
10%
20%
30%
40%
50%
60%
70%
80%
90%
100%
2016 2017 2018 19F 20F 21F 22F
74%71%
55%
63%65% 66%
79%
0%
10%
20%
30%
40%
50%
60%
70%
80%
90%
2016 2017 2018 19F 20F 21F 22F
74%71%
55%
63%66% 66%
79%
0%
10%
20%
30%
40%
50%
60%
70%
80%
90%
2016 2017 2018 19F 20F 21F 22F
20%
7%
23%
31%
34% 34%
42%
0%
5%
10%
15%
20%
25%
30%
35%
40%
45%
2016 2017 2018 19F 20F 21F 22F
Kencana Energi Lestari Indonesia Research Note
3 October 2019 Alternative Energy | Energy
See important disclosures at the end of this report 30
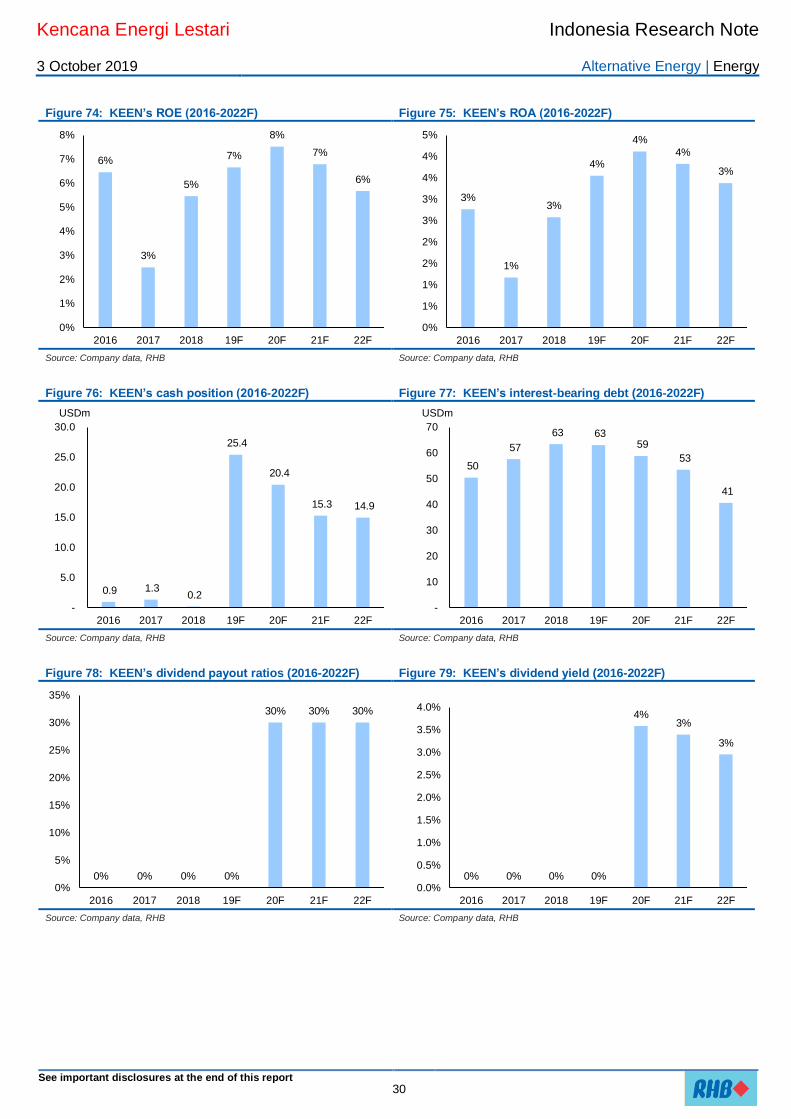
Figure 74: KEEN’s ROE (2016-2022F) Figure 75: KEEN’s ROA (2016-2022F)
Source: Company data, RHB Source: Company data, RHB
Figure 76: KEEN’s cash position (2016-2022F) Figure 77: KEEN’s interest-bearing debt (2016-2022F)
Source: Company data, RHB Source: Company data, RHB
Figure 78: KEEN’s dividend payout ratios (2016-2022F) Figure 79: KEEN’s dividend yield (2016-2022F)
Source: Company data, RHB Source: Company data, RHB
6%
3%
5%
7%
8%
7%
6%
0%
1%
2%
3%
4%
5%
6%
7%
8%
2016 2017 2018 19F 20F 21F 22F
3%
1%
3%
4%
4%
4%
3%
0%
1%
1%
2%
2%
3%
3%
4%
4%
5%
2016 2017 2018 19F 20F 21F 22F
0.9 1.3 0.2
25.4
20.4
15.3 14.9
-
5.0
10.0
15.0
20.0
25.0
30.0
2016 2017 2018 19F 20F 21F 22F
USDm
50
57
63 63 59
53
41
-
10
20
30
40
50
60
70
2016 2017 2018 19F 20F 21F 22F
USDm
0% 0% 0% 0%
30% 30% 30%
0%
5%
10%
15%
20%
25%
30%
35%
2016 2017 2018 19F 20F 21F 22F
0% 0% 0% 0%
4%3%
3%
0.0%
0.5%
1.0%
1.5%
2.0%
2.5%
3.0%
3.5%
4.0%
2016 2017 2018 19F 20F 21F 22F
Kencana Energi Lestari Indonesia Research Note
3 October 2019 Alternative Energy | Energy
See important disclosures at the end of this report 31
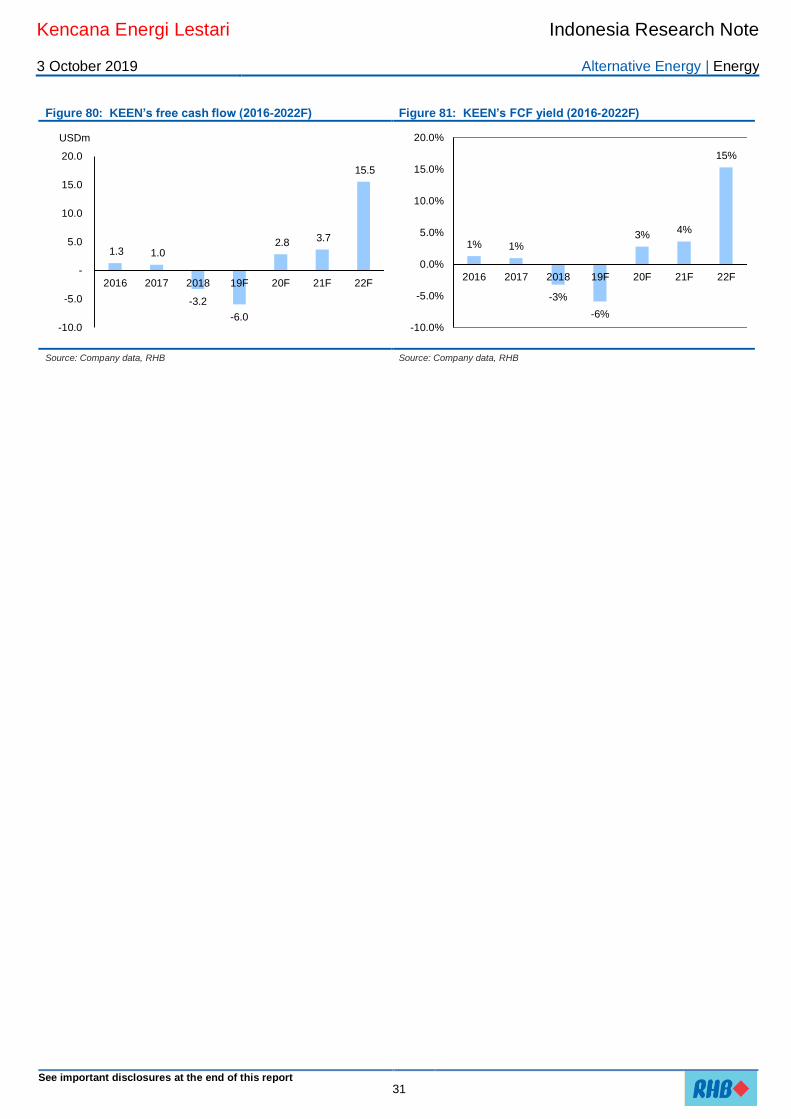
Figure 80: KEEN’s free cash flow (2016-2022F) Figure 81: KEEN’s FCF yield (2016-2022F)
Source: Company data, RHB Source: Company data, RHB
1.3 1.0
-3.2
-6.0
2.8 3.7
15.5
-10.0
-5.0
-
5.0
10.0
15.0
20.0
2016 2017 2018 19F 20F 21F 22F
USDm
1% 1%
-3%
-6%
3%4%
15%
-10.0%
-5.0%
0.0%
5.0%
10.0%
15.0%
20.0%
2016 2017 2018 19F 20F 21F 22F
32
RHB Guide to Investment Ratings
Buy: Share price may exceed 10% over the next 12 months Trading Buy: Share price may exceed 15% over the next 3 months, however longer-
term outlook remains uncertain Neutral: Share price may fall within the range of +/- 10% over the next
12 months Take Profit: Target price has been attained. Look to accumulate at lower levels Sell: Share price may fall by more than 10% over the next 12 months Not Rated: Stock is not within regular research coverage
Investment Research Disclaimers RHB has issued this report for information purposes only. This report is intended for circulation amongst RHB and its affiliates’ clients generally or such persons as may be deemed eligible by RHB to receive this report and does not have regard to the specific investment objectives, financial situation and the particular needs of any specific person who may receive this report. This report is not intended, and should not under any circumstances be construed as, an offer or a solicitation of an offer to buy or sell the securities referred to herein or any related financial instruments. This report may further consist of, whether in whole or in part, summaries, research, compilations, extracts or analysis that has been prepared by RHB’s strategic, joint venture and/or business partners. No representation or warranty (express or implied) is given as to the accuracy or completeness of such information and accordingly investors should make their own informed decisions before relying on the same. This report is not directed to, or intended for distribution to or use by, any person or entity who is a citizen or resident of or located in any locality, state, country or other jurisdiction where such distribution, publication, availability or use would be contrary to the applicable laws or regulations. By accepting this report, the recipient hereof (i) represents and warrants that it is lawfully able to receive this document under the laws and regulations of the jurisdiction in which it is located or other applicable laws and (ii) acknowledges and agrees to be bound by the limitations contained herein. Any failure to comply with these limitations may constitute a violation of applicable laws. All the information contained herein is based upon publicly available information and has been obtained from sources that RHB believes to be reliable and correct at the
time of issue of this report. However, such sources have not been independently verified by RHB and/or its affiliates and this report does not purport to contain all information that a prospective investor may require. The opinions expressed herein are RHB’s present opinions only and are subject to change without prior notice. RHB is not under any obligation to update or keep current the information and opinions expressed herein or to provide the recipient with access to any additional information. Consequently, RHB does not guarantee, represent or warrant, expressly or impliedly, as to the adequacy, accuracy, reliability, fairness or completeness of the information and opinion contained in this report. Neither RHB (including its officers, directors, associates, connected parties, and/or employees) nor does any of its agents accept
any liability for any direct, indirect or consequential losses, loss of profits and/or damages that may arise from the use or reliance of this research report and/or further communications given in relation to this report. Any such responsibility or liability is hereby expressly disclaimed. Whilst every effort is made to ensure that statement of facts made in this report are accurate, all estimates, projections, forecasts, expressions of opinion and other subjective judgments contained in this report are based on assumptions considered to be reasonable and must not be construed as a representation that the matters referred to therein will occur. Different assumptions by RHB or any other source may yield substantially different results and recommendations contained on one type of research product may differ from recommendations contained in other types of research. The performance of currencies may affect the value of, or income from, the securities or any other financial instruments referenced in this report. Holders of depositary receipts backed by the securities discussed in this report assume currency risk. Past performance is not a guide to future performance. Income from investments may fluctuate. The price or value of the investments to which this report relates, either directly or indirectly, may fall or rise against the interest of investors. This report does not purport to be comprehensive or to contain all the information that a prospective investor may need in order to make an investment decision. The recipient of this report is making its own independent assessment and decisions regarding any securities or financial instruments referenced herein. Any investment discussed or recommended in this report may be unsuitable for an investor depending on the investor’s specific investment objectives and financial position. The material in this report is general information intended for recipients who understand the risks of investing in financial instruments. This report does not take into account whether an investment or course of action and any associated risks are suitable for the recipient. Any recommendations contained in this report must therefore not be relied upon as investment advice based on the recipient's personal circumstances. Investors should make their own independent evaluation of the information contained herein, consider their own investment objective,
financial situation and particular needs and seek their own financial, business, legal, tax and other advice regarding the appropriateness of investing in any securities or the investment strategies discussed or recommended in this report. This report may contain forward-looking statements which are often but not always identified by the use of words such as “believe”, “estimate”, “intend” and “expect” and statements that an event or result “may”, “will” or “might” occur or be achieved and other similar expressions. Such forward-looking statements are based on assumptions made and information currently available to RHB and are subject to known and unknown risks, uncertainties and other factors which may cause the actual results,
performance or achievement to be materially different from any future results,
performance or achievement, expressed or implied by such forward-looking statements. Caution should be taken with respect to such statements and recipients of this report should not place undue reliance on any such forward-looking statements. RHB expressly disclaims any obligation to update or revise any forward-looking statements, whether as a result of new information, future events or circumstances after the date of this publication or to reflect the occurrence of unanticipated events. The use of any website to access this report electronically is done at the recipient’s own risk, and it is the recipient’s sole responsibility to take precautions to ensure that it is free from viruses or other items of a destructive nature. This report may also provide the addresses of, or contain hyperlinks to, websites. RHB takes no responsibility for the content contained therein. Such addresses or hyperlinks (including addresses or hyperlinks to RHB own website material) are provided solely for the recipient’s convenience. The information and the content of the linked site do not in any way form part of this report. Accessing such website or following such link through the report or RHB website shall be at the recipient’s own risk.
This report may contain information obtained from third parties. Third party content providers do not guarantee the accuracy, completeness, timeliness or availability of any information and are not responsible for any errors or omissions (negligent or otherwise), regardless of the cause, or for the results obtained from the use of such content. Third party content providers give no express or implied warranties, including, but not limited to, any warranties of merchantability or fitness for a particular purpose or use. Third party content providers shall not be liable for any direct, indirect, incidental, exemplary, compensatory, punitive, special or consequential damages, costs, expenses, legal fees, or losses (including lost income or profits and opportunity costs) in connection with any use of their content.
The research analysts responsible for the production of this report hereby certifies that the views expressed herein accurately and exclusively reflect his or her personal views and opinions about any and all of the issuers or securities analysed in this report and were prepared independently and autonomously. The research analysts that authored this report are precluded by RHB in all circumstances from trading in the securities or other financial instruments referenced in the report, or from having an interest in the company(ies) that they cover. The contents of this report is strictly confidential and may not be copied, reproduced, published, distributed, transmitted or passed, in whole or in part, to any other person without the prior express written consent of RHB and/or its affiliates. This report has been delivered to RHB and its affiliates’ clients for information purposes only and upon the express understanding that such parties will use it only for the purposes set forth above. By electing to view or accepting a copy of this report, the recipients have agreed that they will not print, copy, videotape, record, hyperlink, download, or otherwise attempt to reproduce or re-transmit (in any form including hard copy or electronic distribution format) the contents of this report. RHB and/or its affiliates accepts no liability whatsoever for the actions of third parties in this respect. The contents of this report are subject to copyright. Please refer to Restrictions on Distribution below for information regarding the distributors of this report. Recipients must not reproduce or disseminate any content or findings of this report without the express permission of RHB and the distributors. The securities mentioned in this publication may not be eligible for sale in some states or countries or certain categories of investors. The recipient of this report should have regard to the laws of the recipient’s place of domicile when contemplating transactions in the securities or other financial instruments referred to herein. The securities discussed in this report may not have been registered in such jurisdiction. Without prejudice to the foregoing, the recipient is to note that additional disclaimers, warnings
or qualifications may apply based on geographical location of the person or entity receiving this report. The term “RHB” shall denote, where appropriate, the relevant entity distributing or disseminating the report in the particular jurisdiction referenced below, or, in every other case, RHB Investment Bank Berhad and its affiliates, subsidiaries and related companies. RESTRICTIONS ON DISTRIBUTION Malaysia This report is issued and distributed in Malaysia by RHB Investment Bank Berhad (“RHBIB”). The views and opinions in this report are our own as of the date hereof and is subject to change. If the Financial Services and Markets Act of the United Kingdom or the rules of the Financial Conduct Authority apply to a recipient, our obligations owed to such recipient therein are unaffected. RHBIB has no obligation to update its opinion or the information in this report. Thailand This report is issued and distributed in the Kingdom of Thailand by RHB Securities
(Thailand) PCL, a licensed securities company that is authorised by the Ministry of Finance, regulated by the Securities and Exchange Commission of Thailand and is a member of the Stock Exchange of Thailand. The Thai Institute of Directors Association has disclosed the Corporate Governance Report of Thai Listed Companies made pursuant to the policy of the Securities and Exchange Commission of Thailand. RHB Securities (Thailand) PCL does not endorse, confirm nor certify the result of the Corporate Governance Report of Thai Listed Companies. Indonesia
This report is issued and distributed in Indonesia by PT RHB Sekuritas Indonesia. This research does not constitute an offering document and it should not be construed as
33
an offer of securities in Indonesia. Any securities offered or sold, directly or indirectly, in Indonesia or to any Indonesian citizen or corporation (wherever located) or to any Indonesian resident in a manner which constitutes a public offering under Indonesian laws and regulations must comply with the prevailing Indonesian laws and regulations. Singapore
This report is issued and distributed in Singapore by RHB Securities Singapore Pte Ltd which is a holder of a capital markets services licence and an exempt financial adviser regulated by the Monetary Authority of Singapore. RHB Securities Singapore Pte Ltd may distribute reports produced by its respective foreign entities, affiliates or other foreign research houses pursuant to an arrangement under Regulation 32C of the Financial Advisers Regulations. Where the report is distributed in Singapore to a person who is not an Accredited Investor, Expert Investor or an Institutional Investor, RHB Securities Singapore Pte Ltd accepts legal responsibility for the contents of the report to such persons only to the extent required by law. Singapore recipients should contact RHB Securities Singapore Pte Ltd in respect of any matter arising from or in connection with the report.
Hong Kong
This report is issued and distributed in Hong Kong by RHB Securities Hong Kong
Limited (興業僑豐證券有限公司) (CE No.: ADU220) (“RHBSHK”) which is licensed in
Hong Kong by the Securities and Futures Commission for Type 1 (dealing in securities) and Type 4 (advising on securities) regulated activities. Any investors wishing to purchase or otherwise deal in the securities covered in this report should contact RHBSHK. RHBSHK is a wholly owned subsidiary of RHB Hong Kong Limited; for the purposes of disclosure under the Hong Kong jurisdiction herein, please note that RHB Hong Kong Limited with its affiliates (including but not limited to RHBSHK) will collectively be referred to as “RHBHK.” RHBHK conducts a full-service, integrated investment banking, asset management, and brokerage business. RHBHK does and seeks to do business with companies covered in its research reports. As a result, investors should be aware that the firm may have a conflict of interest that could affect the objectivity of this research report. Investors should consider this report as only a single factor in making their investment decision. Importantly, please see the company-specific regulatory disclosures below for compliance with specific rules and regulations under the Hong Kong jurisdiction. Other than company-specific disclosures relating to RHBHK, this research report is based on current public information that we consider reliable, but we do not represent it is accurate or complete, and it should not
be relied on as such. United States This report was prepared by RHB and is being distributed solely and directly to “major” U.S. institutional investors as defined under, and pursuant to, the requirements of Rule 15a-6 under the U.S. Securities and Exchange Act of 1934, as amended (the “Exchange Act”). Accordingly, access to this report via Bursa Marketplace or any other Electronic Services Provider is not intended for any party other than “major” US institutional investors, nor shall be deemed as solicitation by RHB in any manner. RHB is not registered as a broker-dealer in the United States and does not offer brokerage
services to U.S. persons. Any order for the purchase or sale of the securities discussed herein that are listed on Bursa Malaysia Securities Berhad must be placed with and through Auerbach Grayson (“AG”). Any order for the purchase or sale of all other securities discussed herein must be placed with and through such other registered U.S. broker-dealer as appointed by RHB from time to time as required by the Exchange Act Rule 15a-6. This report is confidential and not intended for distribution to, or use by, persons other than the recipient and its employees, agents and advisors, as applicable. Additionally, where research is distributed via Electronic Service Provider, the analysts whose names appear in this report are not registered or qualified as research analysts in the United States and are not associated persons of Auerbach Grayson AG or such other registered U.S. broker-dealer as appointed by RHB from time to time and therefore may not be subject to any applicable restrictions under Financial Industry Regulatory Authority (“FINRA”) rules on communications with a subject company, public appearances and personal trading. Investing in any non-U.S. securities or related financial instruments discussed in this research report may present certain risks. The securities of non-U.S. issuers may not be registered with, or be subject to the regulations of, the U.S. Securities and Exchange Commission. Information on non-U.S. securities or related financial instruments may be limited. Foreign companies may not be subject to audit and reporting standards and regulatory requirements comparable to those in the United States. The financial instruments discussed in this report may not be suitable for all investors. Transactions in foreign markets may be subject to regulations that differ from or offer less protection than those in the United States. DISCLOSURE OF CONFLICTS OF INTEREST
RHB Investment Bank Berhad, its subsidiaries (including its regional offices) and associated companies, (“RHBIB Group”) form a diversified financial group, undertaking various investment banking activities which include, amongst others, underwriting, securities trading, market making and corporate finance advisory.
As a result of the same, in the ordinary course of its business, any member of the RHBIB Group, may, from time to time, have business relationships with or hold positions in the securities (including capital market products) or perform and/or solicit investment, advisory or other services from any of the subject company(ies) covered in this research report. While the RHBIB Group will ensure that there are sufficient information barriers and internal controls in place where necessary, to prevent/manage any conflicts of interest to ensure the independence of this report, investors should also be aware that such conflict of interest may exist in view of the investment banking activities undertaken by
the RHBIB Group as mentioned above and should exercise their own judgement before making any investment decisions.
Malaysia
Save as disclosed in the following link (RHB Research conflict disclosures – Oct 2019) and to the best of our knowledge, RHBIB hereby declares that: 1. RHBIB does not have a financial interest in the securities or other capital market
products of the subject company(ies) covered in this report. 2. RHBIB is not a market maker in the securities or capital market products of the
subject company(ies) covered in this report. 3. None of RHBIB’s staff or associated person serve as a director or board
member* of the subject company(ies) covered in this report *For the avoidance of doubt, the confirmation is only limited to the staff of
research department
4. Save as disclosed below, RHBIB did not receive compensation for investment banking or corporate finance services from the subject company in the past 12 months.
5. RHBIB did not receive compensation or benefit (including gift and special cost arrangement e.g. company/issuer-sponsored and paid trip) in relation to the production of this report.
Thailand
RHB Securities (Thailand) PCL and/or its directors, officers, associates, connected parties and/or employees, may have, or have had, interests and/or commitments in the securities in subject company(ies) mentioned in this report or any securities related thereto. Further, RHB Securities (Thailand) PCL may have, or have had, business relationships with the subject company(ies) mentioned in this report. As a result, investors should exercise their own judgment carefully before making any investment decisions. Indonesia PT RHB Sekuritas Indonesia is not affiliated with the subject company(ies) covered in this report both directly or indirectly as per the definitions of affiliation above. Pursuant to the Capital Market Law (Law Number 8 Year 1995) and the supporting regulations thereof, what constitutes as affiliated parties are as follows: 1. Familial relationship due to marriage or blood up to the second degree, both
horizontally or vertically;
2. Affiliation between parties to the employees, Directors or Commissioners of the parties concerned;
3. Affiliation between 2 companies whereby one or more member of the Board of Directors or the Commissioners are the same;
4. Affiliation between the Company and the parties, both directly or indirectly, controlling or being controlled by the Company;
5. Affiliation between 2 companies which are controlled, directly or indirectly, by the same party; or
6. Affiliation between the Company and the main Shareholders. PT RHB Sekuritas Indonesia is not an insider as defined in the Capital Market Law and the information contained in this report is not considered as insider information prohibited by law. Insider means: a. a commissioner, director or employee of an Issuer or Public Company; b. a substantial shareholder of an Issuer or Public Company; c. an individual, who because of his position or profession, or because of a
business relationship with an Issuer or Public Company, has access to inside information; and
d. an individual who within the last six months was a Person defined in letters a, b or c, above.
Singapore
Save as disclosed in the following link (RHB Research conflict disclosures – Oct 2019) and to the best of our knowledge, RHB Securities Singapore Pte Ltd hereby declares that: 1. RHB Securities Singapore Pte Ltd, its subsidiaries and/or associated companies
do not make a market in any issuer covered in this report. 2. RHB Securities Singapore Pte Ltd, its subsidiaries and/or its associated
companies and its analysts do not have a financial interest (including a shareholding of 1% or more) in the issuer covered in this report.
3. RHB Securities, its staff or connected persons do not serve on the board or trustee positions of the issuer covered in this report.
4. RHB Securities Singapore Pte Ltd, its subsidiaries and/or its associated companies do not have and have not within the last 12 months had any corporate finance advisory relationship with the issuer covered in this report or any other relationship that may create a potential conflict of interest.
5. RHB Securities Singapore Pte Ltd, or person associated or connected to it do not have any interest in the acquisition or disposal of, the securities, specified securities based derivatives contracts or units in a collective investment scheme covered in this report.
6. RHB Securities Singapore Pte Ltd and its analysts do not receive any
compensation or benefit in connection with the production of this research report or recommendation.
Hong Kong
The following disclosures relate to relationships between RHBHK and companies covered by Research Department of RHBSHK and referred to in this research report:
34
RHBSHK hereby certifies that no part of RHBSHK analyst compensation was, is or will be, directly or indirectly, related to the specific recommendations or views expressed in this research report. RHBHK had an investment banking services client relationships during the past 12 months with: -. RHBHK has received compensation for investment banking services, during the past 12 months from: -. RHBHK managed/co-managed public offerings, in the past 12 months for: -. On a principal basis. RHBHK has a position of over 1% market capitalization of: -. Additionally, please note the following:
Ownership and material conflicts of interest: RHBSHK policy prohibits its analysts and associates reporting to analysts from owning securities of any company covered by the analyst. Analyst as officer or director: RHBSHK policy prohibits its analysts, and associates reporting to analysts from serving as an officer, director, advisory board member or employee of any company covered by the analyst. RHBHK salespeople, traders, and other non-research professionals may provide oral or written market commentary or trading strategies to RHB clients that reflect opinions
that are contrary to the opinions expressed in this research report.
KUALA LUMPUR
RHB Investment Bank Bhd Level 3A, Tower One, RHB Centre
Jalan Tun Razak Kuala Lumpur 50400 Malaysia
Tel : +603 9280 8888 Fax : +603 9200 2216
JAKARTA
PT RHB Sekuritas Indonesia Revenue Tower, 11th Floor, District 8 - SCBD
Jl. Jendral Sudirman Kav 52-53 Jakarta 12190 Indonesia
Tel : +6221 509 39 888 Fax :+6221 509 39 777
HONG KONG
RHB Securities Hong Kong Ltd.
12th Floor, World-Wide House 19 Des Voeux Road Central
Hong Kong Tel : +852 2525 1118 Fax : +852 2810 0908
BANGKOK
RHB Securities (Thailand) PCL
10th Floor, Sathorn Square Office Tower 98, North Sathorn Road, Silom Bangrak, Bangkok 10500
Thailand Tel: +66 2088 9999 Fax :+66 2088 9799
SINGAPORE
RHB Securities Singapore Pte Ltd. 10 Collyer Quay #09-08 Ocean Financial Centre
Singapore 049315 Tel : +65 6533 1818 Fax : +65 6532 6211
Related Documents