1 For immediate release 30 July 2018 Keller Group plc Results for the six months ended 30 June 2018 Keller Group plc (“Keller” or “the group”), the world’s largest geotechnical contractor, announces its results for the six months ended 30 June 2018. H1 2018 £m H1 2017 £m % change Constant currency % change Revenue 1,075.1 991.1 +8% +15% Underlying EBITDA 1 83.5 78.1 +7% +15% Underlying operating profit 1 49.1 44.0 +12% +22% Underlying profit before tax 1 42.2 39.3 +7% +18% Underlying earnings per share 1 41.0p 35.0p +17% +29% Interim dividend per share 12.0p 9.7p +24% +24% Statutory operating profit 42.8 60.4 (29)% (25)% Statutory profit before tax 35.9 55.2 (35)% (31)% Statutory earnings per share 33.9p 57.0p (41)% (37)% 1 Before pre-tax non-underlying costs of £6.3m (H1 2017: credit of £15.9m). The H1 2017 statutory profit included a £21.0m credit from an exceptional contract dispute. Details of the non-underlying items are set out in note 6 of the consolidated financial information. H1 2018 summary: Record first half revenue of £1,075m driven by constant currency growth of 15% Strong underlying constant currency operating profit growth of 22% Divisional performance North America: strong growth in both revenue and profit, despite poor weather in the first quarter EMEA: solid performance with profits maintained despite less revenue from large projects and a harsh winter APAC: losses substantially reduced; profitable second quarter and an encouraging order book Tendering activity remains positive and the order book remains healthy – up 1% excluding the Caspian project, giving confidence for the full year Net debt increased to £367m, representing 1.9x annualised EBITDA, due to the Moretrench acquisition, strong organic growth and normal seasonal working capital outflows – currently expected to be around 1.5x at year end Underlying earnings per share increased 17% to 41.0p Interim dividend per share of 12.0p, up 24%, following the upward rebasing of the 2017 full year dividend Alain Michaelis, Chief Executive, said: “We remain encouraged by the group’s progress. Despite a harsh northern hemisphere winter, we are reporting a strong financial performance for the first half of the year. Broadly healthy markets, consistent operational delivery and business improvement projects have all contributed to this performance. We remain well positioned to benefit from the global trends of urbanisation and infrastructure growth and we continue to advance our strategic objectives. We are confident of making further progress in the second half.”

Welcome message from author
This document is posted to help you gain knowledge. Please leave a comment to let me know what you think about it! Share it to your friends and learn new things together.
Transcript
1
For immediate release 30 July 2018
Keller Group plc Results for the six months ended 30 June 2018
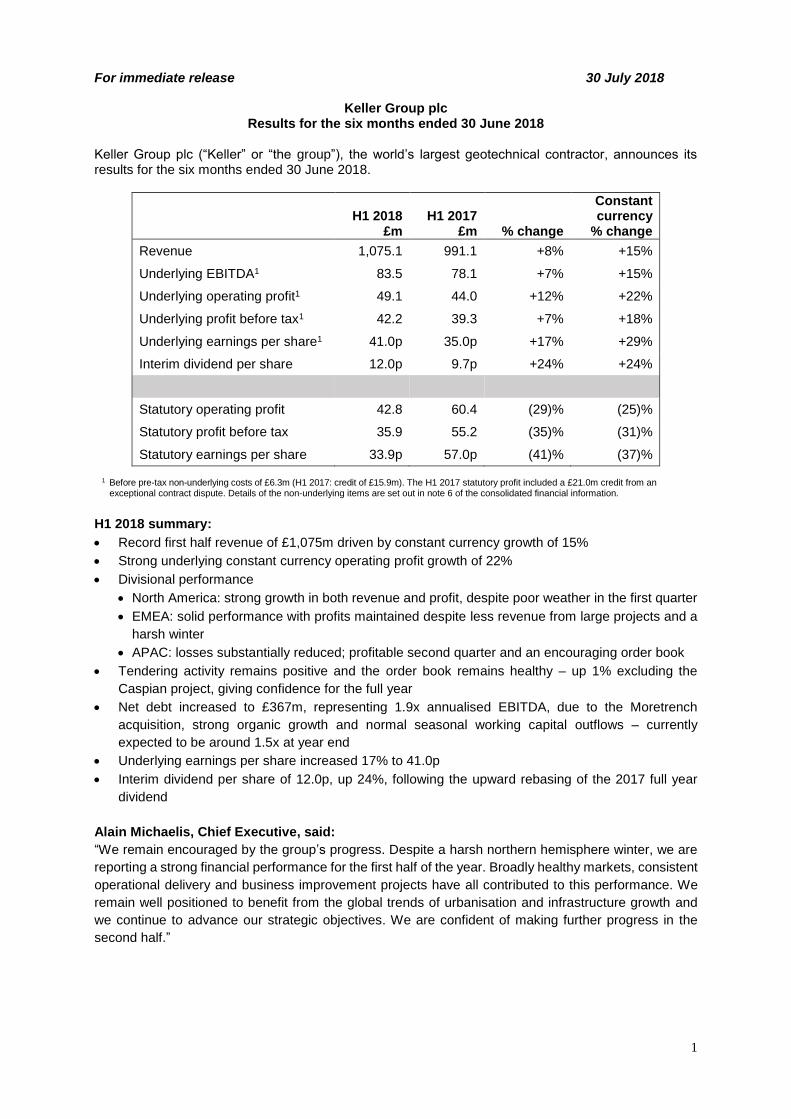
Keller Group plc (“Keller” or “the group”), the world’s largest geotechnical contractor, announces its results for the six months ended 30 June 2018.
H1 2018
£m
H1 2017
£m
% change
Constant currency
% change
Revenue 1,075.1 991.1 +8% +15%
Underlying EBITDA1 83.5 78.1 +7% +15%
Underlying operating profit1 49.1 44.0 +12% +22%
Underlying profit before tax1 42.2 39.3 +7% +18%
Underlying earnings per share1 41.0p 35.0p +17% +29%
Interim dividend per share 12.0p 9.7p +24% +24%
Statutory operating profit 42.8 60.4 (29)% (25)%
Statutory profit before tax 35.9 55.2 (35)% (31)%
Statutory earnings per share 33.9p 57.0p (41)% (37)%
1 Before pre-tax non-underlying costs of £6.3m (H1 2017: credit of £15.9m). The H1 2017 statutory profit included a £21.0m credit from an exceptional contract dispute. Details of the non-underlying items are set out in note 6 of the consolidated financial information.
H1 2018 summary:
Record first half revenue of £1,075m driven by constant currency growth of 15%
Strong underlying constant currency operating profit growth of 22%
Divisional performance
North America: strong growth in both revenue and profit, despite poor weather in the first quarter
EMEA: solid performance with profits maintained despite less revenue from large projects and a
harsh winter
APAC: losses substantially reduced; profitable second quarter and an encouraging order book
Tendering activity remains positive and the order book remains healthy – up 1% excluding the
Caspian project, giving confidence for the full year
Net debt increased to £367m, representing 1.9x annualised EBITDA, due to the Moretrench
acquisition, strong organic growth and normal seasonal working capital outflows – currently
expected to be around 1.5x at year end
Underlying earnings per share increased 17% to 41.0p
Interim dividend per share of 12.0p, up 24%, following the upward rebasing of the 2017 full year
dividend
Alain Michaelis, Chief Executive, said:
“We remain encouraged by the group’s progress. Despite a harsh northern hemisphere winter, we are
reporting a strong financial performance for the first half of the year. Broadly healthy markets, consistent
operational delivery and business improvement projects have all contributed to this performance. We
remain well positioned to benefit from the global trends of urbanisation and infrastructure growth and
we continue to advance our strategic objectives. We are confident of making further progress in the
second half.”
2
Basis of preparation
The group’s results as reported under International Financial Reporting Standards (IFRS) and presented
in the financial statements (the “statutory results”) are significantly impacted by movements in exchange
rates relative to sterling, as well as by exceptional items and non-trading amounts relating to
acquisitions.
As a result, adjusted performance measures have been used throughout this report to describe the
group's underlying performance. The Board and Executive Committee use these adjusted measures to
assess the performance of the business because they consider them more representative of the
underlying ongoing trading result and allow more meaningful comparison to prior year. Where not
presented on the face of the consolidated income statement, balance sheet or cash flow statement, the
adjusted measures are defined and reconciled to the amounts reported under IFRS in the adjusted
performance measures section at the end of this statement.
The constant currency basis (“constant currency”) adjusts the comparative to exclude the impact of
movements in exchange rates relative to sterling on the translation of the results of overseas operations.
Retranslating at 2018 average exchange rates decreases the first half 2017 revenue and underlying
operating profit by £56.4m and £3.6m respectively.
The term ‘underlying’ excludes the impact of exceptional items, amortisation of acquired intangible
assets and other non-trading amounts relating to acquisitions (collectively ‘non-underlying items’), net
of any associated tax. Pre-tax non-underlying items of £6.3m mainly comprise £5.8m of amortisation of
acquired intangible assets.
Group overview
Financial results
Group revenue for the period was £1,075.1m, up 8% on the first half of 2017. On a constant currency
basis and excluding acquisitions revenue was up 13%, primarily as a result of strong organic growth in
North America and APAC. Constant currency revenue in EMEA was down 4% year on year due to the
completion of the two large projects early in 2018.
Underlying operating profit was £49.1m, an increase of 12% on the £44.0m generated in the first half of
2017. On a constant currency basis underlying operating profit was up 22%, despite the first quarter’s
trading being impacted by poor weather conditions in both North America and Europe. This increase in
profitability reflects an improved underlying performance in North America and a much improved result
in APAC. The group underlying operating margin increased from 4.4% to 4.6%, mainly reflecting the
better performance in APAC.
After taking account of £5.8m of amortisation of acquired intangible assets and a £0.5m charge relating
to other non-underlying items, the statutory operating profit was £42.8m (H1 2017: £60.4m). The
decrease in statutory operating profit is mainly due to a credit of £21.0m in the first half of 2017 relating
to an exceptional contract dispute.
On an underlying basis, after net finance costs of £6.9m (H1 2017: £4.7m), the profit before tax was
£42.2m, up 7% compared to the first half of 2017. Tax has been provided on the underlying profits at
the expected 2018 full year rate of 28%, above the full year 2017 rate of 25% as the latter benefitted
from a large credit for the revaluation of US deferred tax liabilities following the recent US tax reforms.
Underlying earnings per share for the period were 41.0p (H1 2017: 35.0p), an increase of 17%. On a
constant currency basis, underlying earnings per share were up 29%.
3
The statutory profit before tax was down to £35.9m (H1 2017: £55.2m). After the statutory tax charge of
£10.6m (H1 2017: £13.5m), statutory profit after tax was £25.3m (H1 2017: £41.7m) and statutory
earnings per share were 33.9p, compared with 57.0p in 2017.
Cash generated from operations before non-underlying items was £7.4m (H1 2017: £3.7m outflow). Net
debt at the end of June was £367.0m (30 June 2017: £297.3m), representing 1.9x annualised underlying
EBITDA. The financial position of the group remains strong with undrawn committed borrowing facilities
totalling £110m. The group continues to operate well within all of its financial covenants and, given the
seasonally much stronger cash flow in the second half of the year, the net debt to EBITDA ratio is
currently expected to be around 1.5x at the year end.
The group continues to invest in growing and upgrading its equipment capability, with net capital
expenditure of £38.9m in the first half of 2018, representing 1.2x depreciation.
We continue to see tangible benefits coming from the group’s business improvement initiatives. We
remain confident that these initiatives will produce the targeted £50m of gross benefits by 2020, of which
we continue to expect about half will be reflected in improved profitability.
Interim dividend
At the time of the group’s 2017 preliminary results, we announced that the Board had decided to rebase
the dividend, in part due to ongoing benefits expected from the US tax reforms announced in December.
We therefore announced an increase of 20% in the total 2017 dividend to 34.2p.
The Board has therefore decided to recommend an interim dividend for 2018 of 12.0p (H1 2017: 9.7p).
This is consistent with the group’s usual approach of paying an interim dividend representing about a
third of the total year’s expected dividend payments, and it is currently expected that the full year
dividend will therefore represent a 5% increase on the full year 2017. The dividend will be paid on 3
September 2018 to shareholders on the register as at the close of business on 10 August 2018. As
previously stated, the group intends to maintain a progressive dividend policy in the future.
Outlook
Customer orders have been healthy in the first half of the year and the group order book remains over
£1bn. There are increases in North America and APAC, largely offset by a decrease in EMEA.
The majority of our markets remain robust; bidding activity is at a healthy level and Keller is well
positioned to address the continuing global market trends of urbanisation and infrastructure growth.
There is good momentum in most of our business units and we continue to expect APAC to record a full
year profit in 2018. EMEA’s underlying business performance remains healthy, and our North America
business has returned to growth. As a result, the Board expects further progress during the second half,
and remains confident that the group’s full year results will be in line with its expectations.
Board changes
As announced on 18 July 2018, James Hind, currently the group’s Finance Director, is appointed
President of Keller’s North America division, remaining an Executive Director, and Michael Speakman
joins Keller as Chief Financial Officer and an Executive Director, both effective from 20 August 2018.
Keller has today separately announced that Chris Girling, independent Non-executive Director and
Chairman of the Audit Committee, has decided to retire from the Board at the conclusion of the
Company’s Annual General Meeting to be held in May 2019, having served on the Board for 8 years.
Chris will step down as Chairman of the Audit Committee with effect from 1 January 2019.
Paula Bell will join the Board as an independent Non-executive Director with effect from 1 September
2018, and succeed Chris Girling as Audit Committee Chairman on 1 January 2019. Baroness Kate Rock
also joins the Board on 1 September 2018 as an independent Non-executive Director.
4
Divisional results - underlying
North America
H1 2018 H1 2017 Constant
currency £m £m
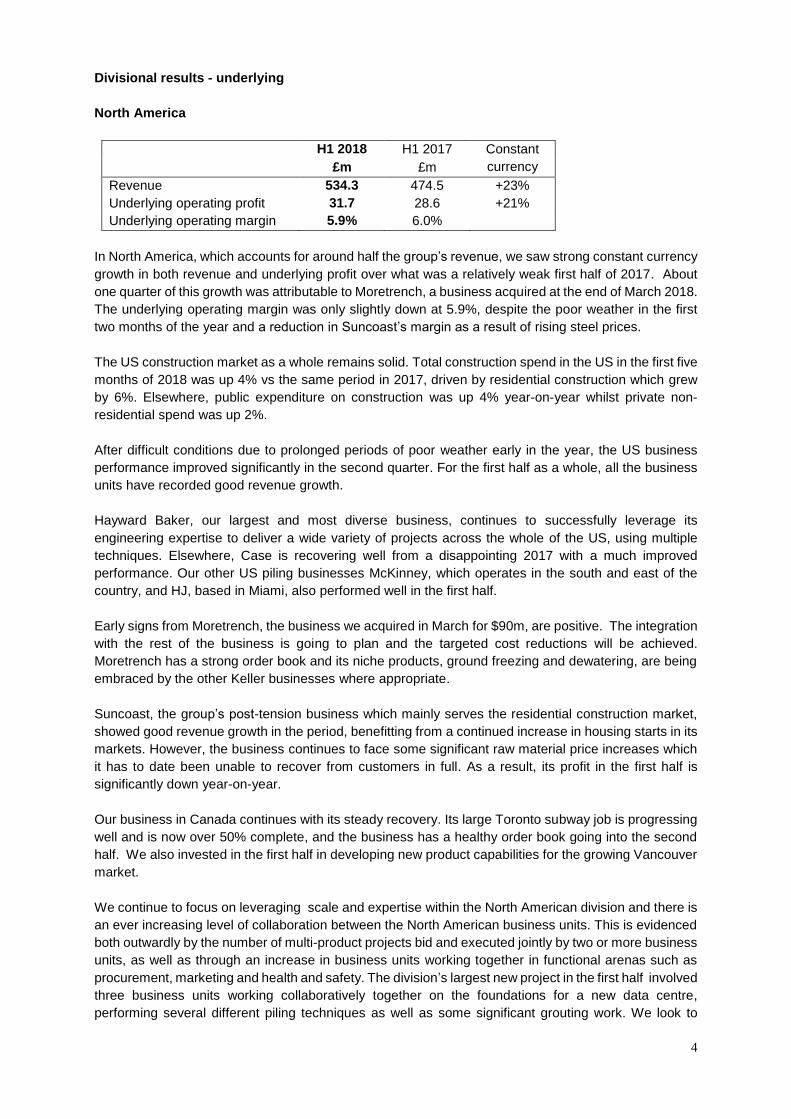
Revenue 534.3 474.5 +23%
Underlying operating profit 31.7 28.6 +21%
Underlying operating margin 5.9% 6.0%
In North America, which accounts for around half the group’s revenue, we saw strong constant currency
growth in both revenue and underlying profit over what was a relatively weak first half of 2017. About
one quarter of this growth was attributable to Moretrench, a business acquired at the end of March 2018.
The underlying operating margin was only slightly down at 5.9%, despite the poor weather in the first
two months of the year and a reduction in Suncoast’s margin as a result of rising steel prices.
The US construction market as a whole remains solid. Total construction spend in the US in the first five
months of 2018 was up 4% vs the same period in 2017, driven by residential construction which grew
by 6%. Elsewhere, public expenditure on construction was up 4% year-on-year whilst private non-
residential spend was up 2%.
After difficult conditions due to prolonged periods of poor weather early in the year, the US business
performance improved significantly in the second quarter. For the first half as a whole, all the business
units have recorded good revenue growth.
Hayward Baker, our largest and most diverse business, continues to successfully leverage its
engineering expertise to deliver a wide variety of projects across the whole of the US, using multiple
techniques. Elsewhere, Case is recovering well from a disappointing 2017 with a much improved
performance. Our other US piling businesses McKinney, which operates in the south and east of the
country, and HJ, based in Miami, also performed well in the first half.
Early signs from Moretrench, the business we acquired in March for $90m, are positive. The integration
with the rest of the business is going to plan and the targeted cost reductions will be achieved.
Moretrench has a strong order book and its niche products, ground freezing and dewatering, are being
embraced by the other Keller businesses where appropriate.
Suncoast, the group’s post-tension business which mainly serves the residential construction market,
showed good revenue growth in the period, benefitting from a continued increase in housing starts in its
markets. However, the business continues to face some significant raw material price increases which
it has to date been unable to recover from customers in full. As a result, its profit in the first half is
significantly down year-on-year.
Our business in Canada continues with its steady recovery. Its large Toronto subway job is progressing
well and is now over 50% complete, and the business has a healthy order book going into the second
half. We also invested in the first half in developing new product capabilities for the growing Vancouver
market.
We continue to focus on leveraging scale and expertise within the North American division and there is
an ever increasing level of collaboration between the North American business units. This is evidenced
both outwardly by the number of multi-product projects bid and executed jointly by two or more business
units, as well as through an increase in business units working together in functional arenas such as
procurement, marketing and health and safety. The division’s largest new project in the first half involved
three business units working collaboratively together on the foundations for a new data centre,
performing several different piling techniques as well as some significant grouting work. We look to
5
further develop these opportunities following the organisational changes that we announced on 18 July
– appointing James Hind to lead the division and Eric Drooff as Chief Operating Officer, North America.
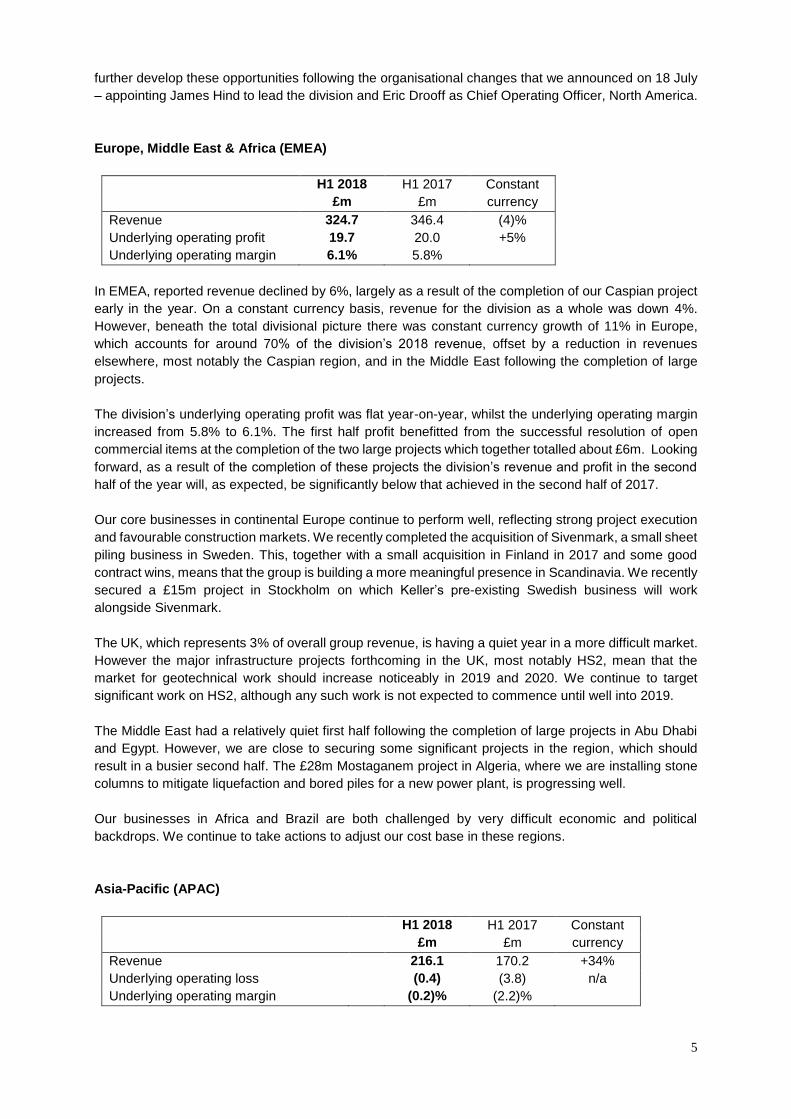
Europe, Middle East & Africa (EMEA)
H1 2018 H1 2017 Constant
currency £m £m
Revenue 324.7 346.4 (4)%
Underlying operating profit 19.7 20.0 +5%
Underlying operating margin 6.1% 5.8%
In EMEA, reported revenue declined by 6%, largely as a result of the completion of our Caspian project
early in the year. On a constant currency basis, revenue for the division as a whole was down 4%.
However, beneath the total divisional picture there was constant currency growth of 11% in Europe,
which accounts for around 70% of the division’s 2018 revenue, offset by a reduction in revenues
elsewhere, most notably the Caspian region, and in the Middle East following the completion of large
projects.
The division’s underlying operating profit was flat year-on-year, whilst the underlying operating margin
increased from 5.8% to 6.1%. The first half profit benefitted from the successful resolution of open
commercial items at the completion of the two large projects which together totalled about £6m. Looking
forward, as a result of the completion of these projects the division’s revenue and profit in the second
half of the year will, as expected, be significantly below that achieved in the second half of 2017.
Our core businesses in continental Europe continue to perform well, reflecting strong project execution
and favourable construction markets. We recently completed the acquisition of Sivenmark, a small sheet
piling business in Sweden. This, together with a small acquisition in Finland in 2017 and some good
contract wins, means that the group is building a more meaningful presence in Scandinavia. We recently
secured a £15m project in Stockholm on which Keller’s pre-existing Swedish business will work
alongside Sivenmark.
The UK, which represents 3% of overall group revenue, is having a quiet year in a more difficult market.
However the major infrastructure projects forthcoming in the UK, most notably HS2, mean that the
market for geotechnical work should increase noticeably in 2019 and 2020. We continue to target
significant work on HS2, although any such work is not expected to commence until well into 2019.
The Middle East had a relatively quiet first half following the completion of large projects in Abu Dhabi
and Egypt. However, we are close to securing some significant projects in the region, which should
result in a busier second half. The £28m Mostaganem project in Algeria, where we are installing stone
columns to mitigate liquefaction and bored piles for a new power plant, is progressing well.
Our businesses in Africa and Brazil are both challenged by very difficult economic and political
backdrops. We continue to take actions to adjust our cost base in these regions.
Asia-Pacific (APAC)
H1 2018 H1 2017 Constant
currency £m £m
Revenue 216.1 170.2 +34%
Underlying operating loss (0.4) (3.8) n/a
Underlying operating margin (0.2)% (2.2)%
6
In APAC, constant currency revenue was up 34% with significant increases in both Asia and Australia.
Following two years of material losses, the division was broadly break even in the first half, recording a
loss of £0.4m, demonstrating the positive effects of the significant restructuring and rebuilding actions
we have undertaken in the region. The division was profitable in the second quarter and we are confident
that APAC will be profitable for the year as a whole, and that its performance will continue to improve.
In general, our markets in APAC continue to show signs of recovery, in particular in the Australian mining
and infrastructure sectors. The surprise election result in Malaysia however means that the major
infrastructure projects planned in the country have been put on hold.
Australia
The group’s geotechnical business in Australia had an improved first half, with revenue significantly up
on 2017. Pricing in some sectors remains challenging, but investment in infrastructure in Australia is
now robust, and the order book for this business is encouraging. We were pleased to announce in May
that our 50:50 joint venture with Intrafor had been awarded a £113m contract for work on the Metro
Tunnel Project in Melbourne. The contract is to construct the sub-structure retention walls and
foundation piling for five new underground stations. Keller and Intrafor provided a significant amount of
early technical advice to optimise design and buildability. Work is already underway. The majority of
the project will finish in mid-2019, although some work will continue through to 2020.
Our near shore marine businesses have had a mixed start to the year. Waterway has struggled with low
volumes, but Austral, which does most of its work for the resources industry, grew its revenue and profits
substantially and has a strong order book going into the second half.
Asia
Our business in Singapore and Malaysia continues to improve in what remains a challenging market.
We have recently introduced new management and continue to build capability in the region. Whilst
consistently realising good contract margins remains a challenge, it is encouraging that the business
made a small profit in the second quarter.
Keller India has again shown strong revenue and profit growth. Demonstrating strong collaboration
between business units, we won our first near shore marine contract in Kattupalli, with expertise drawn
from colleagues in Australia.
Other financial items
Non-underlying items
Non-underlying items before taxation totalled £6.3m before tax in the first half of 2018. These comprise
£5.8m of amortisation of acquired intangible assets and £0.5m of other items relating to acquisitions.
Interest
Underlying net finance costs were £6.9m (2017: £4.7m), due to both a higher level of average net debt
and higher rates. Statutory net finance costs increased from £5.2m in the first half of 2017 to £6.9m in
the first half of 2018.
Tax
The group’s underlying effective tax rate for the period was 28.0%, a significant reduction on the 2017
first half effective rate of 34.0%. This is mainly attributable to the benefit from the US tax reforms
announced in December 2017.
A non-underlying tax credit of £1.2m has been recognised, representing the net tax impact of the 2018
non-underlying items.
7
Cash flow and financing
Cash generated from operations before non-underlying items was £7.4m (H1 2017: £3.7m outflow).
After taking account of net capital expenditure of £38.9m in the first half (H1 2017: £31.5m) and interest
and tax payments, there was a free cash outflow of £44.1m (H1 2017: outflow of £49.8m). On a constant
currency basis and excluding acquisitions, working capital increased by £73.1m (H1 2017: an increase
of £84.4m), reflecting the strong organic growth as well as the usual seasonal movement.
Net underlying capital expenditure in the period totalled £38.9m (H1 2017: £31.5m), compared to
depreciation and amortisation of £34.4m. The group continues to invest in transferring technologies into
new geographies and to expand and upgrade the equipment fleet.
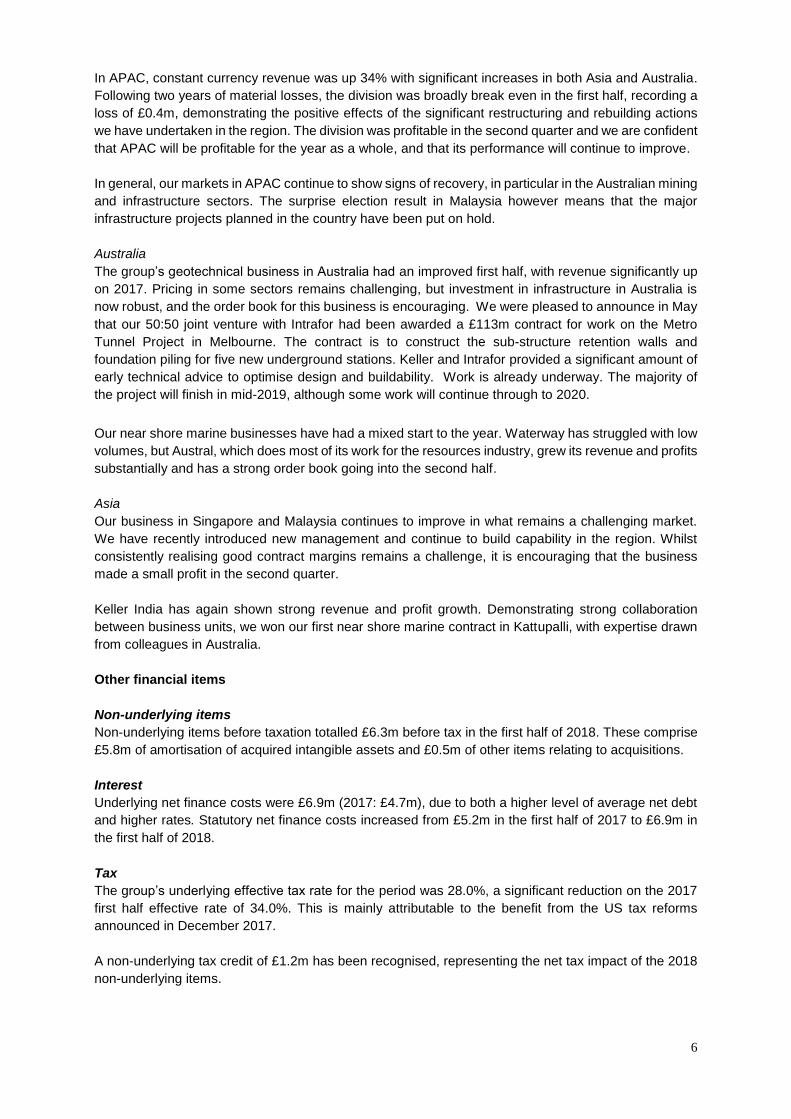
At 30 June 2018, net debt amounted to £367.0m (30 June 2017: £297.3m, 31 December 2017:
£229.5m). The increase in net debt is explained as follows:
£m
Net debt at 1 January 2018 (229.5)
Free cash outflow (44.1)
Dividends (17.6)
Foreign exchange movements (3.9)
Non-underlying items (0.5)
Acquisitions (71.4)
Net debt at 30 June 2018 (367.0)
Net debt represents 1.9x underlying annualised EBITDA on a headline basis or 2.1x calculated on a
covenant basis, well within the covenant limit of 3.0x. Given the seasonally much stronger cash flow in
the second half of the year, the headline net debt to EBITDA ratio is expected to be around 1.5x at the
year end.
Principal risks and uncertainties
The principal risks and uncertainties faced by Keller in the remaining six months of the year remain
largely unchanged from those reported in the 2017 annual report and can be found, together with the
mitigating actions in place, in pages 39 to 41 of the report. In summary, these are:
Market risk: A rapid downturn in our markets
Strategic risk:
- Failure to procure new contracts
- Losing our market share
- Non-compliance with our Code of Business Conduct
Financial risk: Inability to finance our business
Operational risk:
- Product and/or solution failure
- Ineffective management of our contracts
- Causing a serious injury or fatality to an employee or member of the public
- Not having the right skills to deliver
8
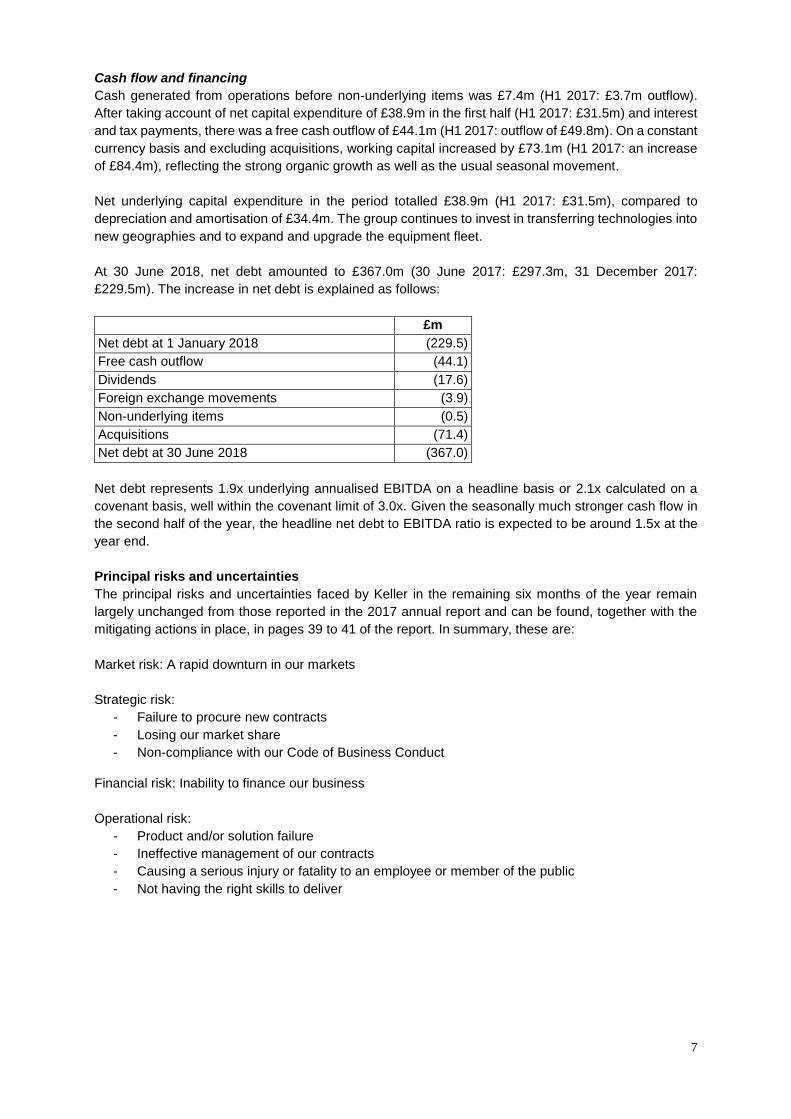
Consolidated income statement For the half year ended 30 June 2018
Half year to 30 June 2018 Half year to 30 June 2017 Year to 31 December 2017
Note
Before non-underlying
items £m
Non-underlying
items (Note 6)
£m
Statutory £m
Before non-
underlying items
£m
Non-underlying
items (Note 6)
£m
Statutory £m
Before non-
underlying items
£m
Non-underlying
items (Note 6)
£m
Statutory £m
Revenue 3 1,075.1 - 1,075.1 991.1 – 991.1 2,070.6 – 2,070.6
Operating costs (1,026.0) (0.5) (1,026.5) (947.1) (0.1) (947.2) (1,961.9) (1.6) (1,963.5)
Amortisation of acquired intangible assets
- (5.8) (5.8)
–
(4.5)
(4.5)
–
(9.0)
(9.0)
Other operating income - - - – 21.0 21.0 – 23.2 23.2
Operating profit 3 49.1 (6.3) 42.8 44.0 16.4 60.4 108.7 12.6 121.3
Finance income 0.7 - 0.7 1.8 – 1.8 3.8 – 3.8
Finance costs (7.6) - (7.6) (6.5) (0.5) (7.0) (13.8) (0.7) (14.5)
Profit before taxation 42.2 (6.3) 35.9 39.3 15.9 55.2 98.7 11.9 110.6
Taxation 7 (11.8) 1.2 (10.6) (13.4) (0.1) (13.5) (24.7) 1.6 (23.1)
Profit for the period 30.4 (5.1) 25.3 25.9 15.8 41.7 74.0 13.5 87.5
Attributable to:
Equity holders of the parent 29.5 (5.1) 24.4 25.2 15.8 41.0 73.6 13.5 87.1
Non-controlling interests 0.9 - 0.9 0.7 – 0.7 0.4 – 0.4
30.4 (5.1) 25.3 25.9 15.8 41.7 74.0 13.5 87.5
Earnings per share
Basic (pence) 9 41.0 33.9 35.0 57.0 102.2 121.0
Diluted (pence) 9 40.7 33.7 34.4 56.0 101.8 120.5
Consolidated statement of comprehensive income For the half year ended 30 June 2018
Half year to 30 June
2018
Half year to 30 June
2017
Year to 31 December
2017
£m £m £m
Profit for the period 25.3 41.7 87.5
Other comprehensive income Items that may be reclassified subsequently to profit or loss: Exchange differences on translation of foreign operations (3.4) (14.0) (27.0) Net investment hedge gains/(losses) 0.2 (0.6) (0.7) Cash flow hedge gains/(losses) taken to equity 1.3 (1.8) (3.3) Cash flow hedge transfers to income statement (1.0) 1.8 3.4 Items that will not be reclassified subsequently to profit or loss: Remeasurements of defined benefit pension schemes 3.9 2.0 1.4 Tax on remeasurements of defined benefit pension schemes (0.5) (0.2) (0.3)
Other comprehensive income for the period, net of tax 0.5 (12.8) (26.5)
Total comprehensive income for the period 25.8 28.9 61.0
Attributable to: Equity holders of the parent 25.0 28.3 61.0 Non-controlling interests 0.8 0.6 -
25.8 28.9 61.0
9
Consolidated balance sheet As at 30 June 2018
As at 30 June
2018
As at 30 June
2017
As at 31 December
2017
Note £m £m £m
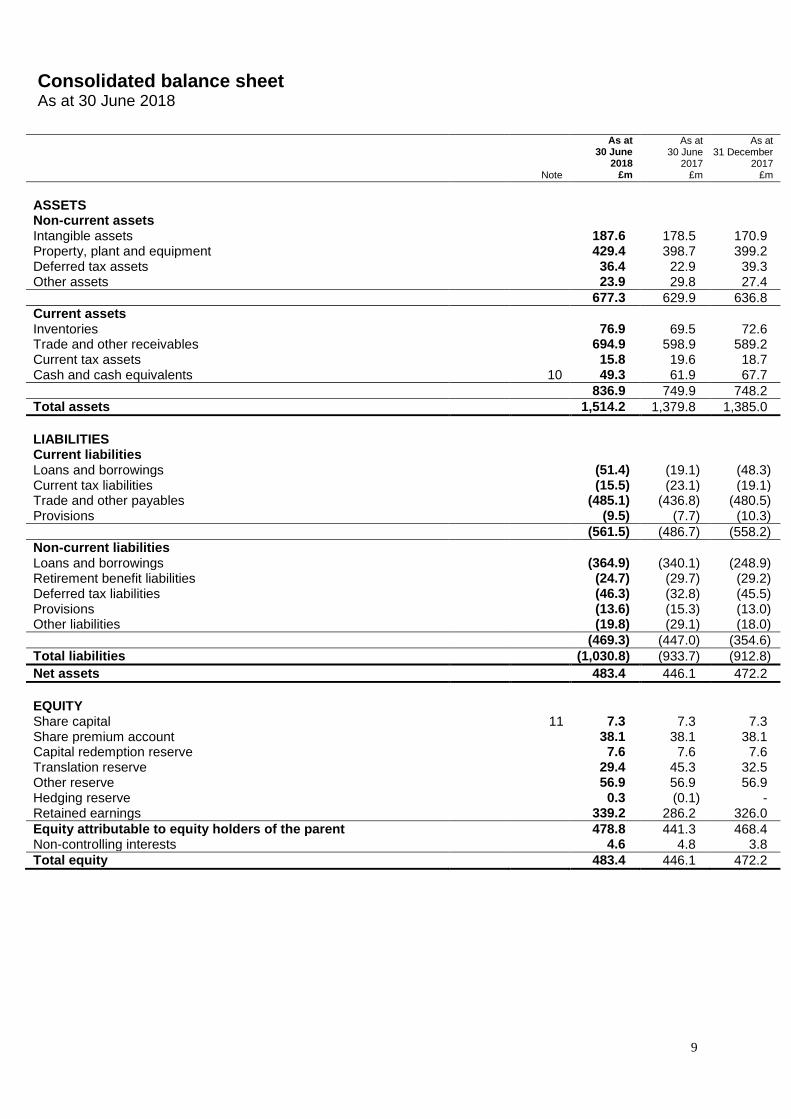
ASSETS Non-current assets Intangible assets 187.6 178.5 170.9 Property, plant and equipment 429.4 398.7 399.2 Deferred tax assets 36.4 22.9 39.3 Other assets 23.9 29.8 27.4
677.3 629.9 636.8
Current assets Inventories 76.9 69.5 72.6 Trade and other receivables 694.9 598.9 589.2 Current tax assets 15.8 19.6 18.7 Cash and cash equivalents 10 49.3 61.9 67.7
836.9 749.9 748.2
Total assets 1,514.2 1,379.8 1,385.0
LIABILITIES Current liabilities Loans and borrowings (51.4) (19.1) (48.3) Current tax liabilities (15.5) (23.1) (19.1) Trade and other payables (485.1) (436.8) (480.5) Provisions (9.5) (7.7) (10.3)
(561.5) (486.7) (558.2)
Non-current liabilities Loans and borrowings (364.9) (340.1) (248.9) Retirement benefit liabilities (24.7) (29.7) (29.2) Deferred tax liabilities (46.3) (32.8) (45.5) Provisions (13.6) (15.3) (13.0) Other liabilities (19.8) (29.1) (18.0)
(469.3) (447.0) (354.6)
Total liabilities (1,030.8) (933.7) (912.8)
Net assets 483.4 446.1 472.2
EQUITY Share capital 11 7.3 7.3 7.3 Share premium account 38.1 38.1 38.1 Capital redemption reserve 7.6 7.6 7.6 Translation reserve 29.4 45.3 32.5 Other reserve 56.9 56.9 56.9 Hedging reserve 0.3 (0.1) - Retained earnings 339.2 286.2 326.0
Equity attributable to equity holders of the parent 478.8 441.3 468.4 Non-controlling interests 4.6 4.8 3.8
Total equity 483.4 446.1 472.2
10
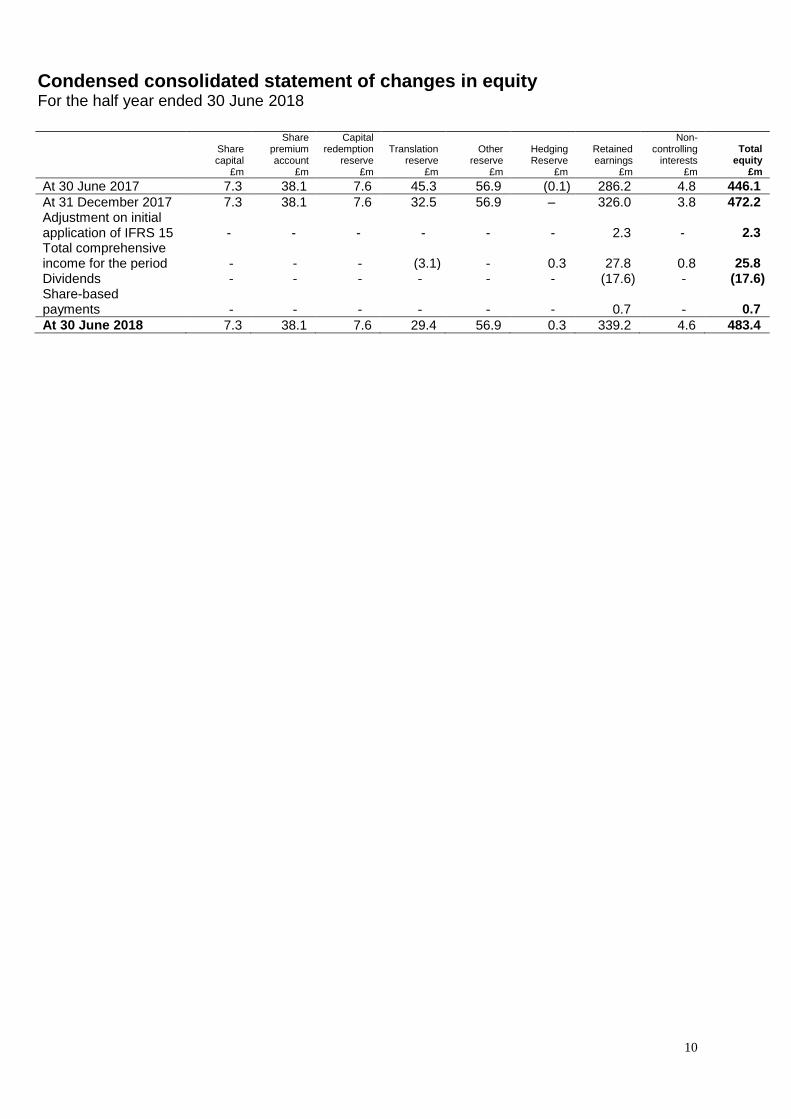
Condensed consolidated statement of changes in equity For the half year ended 30 June 2018
Share capital
Share premium account
Capital redemption
reserve
Translation
reserve
Other
reserve
Hedging Reserve
Retained earnings
Non-controlling
interests
Total
equity £m £m £m £m £m £m £m £m £m
At 30 June 2017 7.3 38.1 7.6 45.3 56.9 (0.1) 286.2 4.8 446.1
At 31 December 2017 7.3 38.1 7.6 32.5 56.9 – 326.0 3.8 472.2 Adjustment on initial application of IFRS 15 - - - - - - 2.3 - 2.3 Total comprehensive income for the period
-
-
- (3.1)
-
0.3 27.8 0.8 25.8 Dividends - - - - - - (17.6) - (17.6) Share-based payments
-
-
-
-
-
- 0.7
- 0.7
At 30 June 2018 7.3 38.1 7.6 29.4 56.9 0.3 339.2 4.6 483.4
11
Consolidated cash flow statement For the half year ended 30 June 2018
Half year to
30 June 2018
Half year to 30 June
2017
Year to 31 December
2017 Note £m £m £m
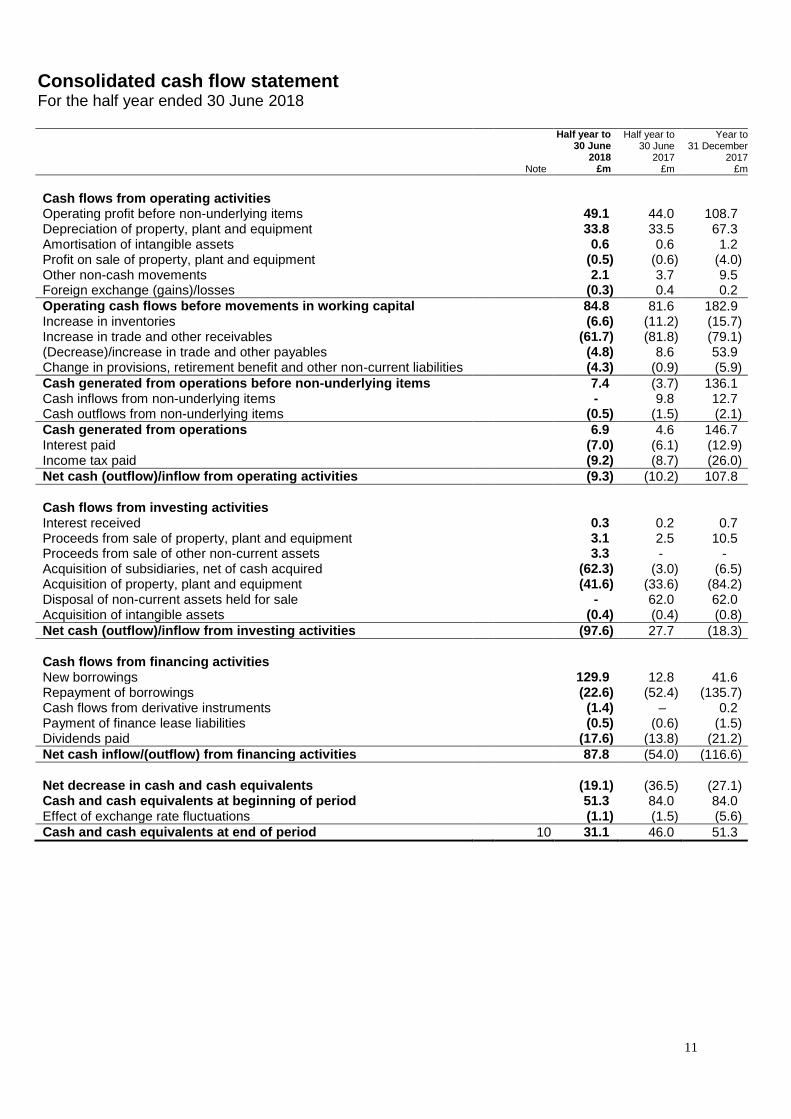
Cash flows from operating activities Operating profit before non-underlying items 49.1 44.0 108.7 Depreciation of property, plant and equipment 33.8 33.5 67.3 Amortisation of intangible assets 0.6 0.6 1.2 Profit on sale of property, plant and equipment (0.5) (0.6) (4.0) Other non-cash movements 2.1 3.7 9.5 Foreign exchange (gains)/losses (0.3) 0.4 0.2
Operating cash flows before movements in working capital 84.8 81.6 182.9 Increase in inventories (6.6) (11.2) (15.7) Increase in trade and other receivables (61.7) (81.8) (79.1) (Decrease)/increase in trade and other payables (4.8) 8.6 53.9 Change in provisions, retirement benefit and other non-current liabilities (4.3) (0.9) (5.9)
Cash generated from operations before non-underlying items 7.4 (3.7) 136.1 Cash inflows from non-underlying items - 9.8 12.7 Cash outflows from non-underlying items (0.5) (1.5) (2.1)
Cash generated from operations 6.9 4.6 146.7 Interest paid (7.0) (6.1) (12.9) Income tax paid (9.2) (8.7) (26.0)
Net cash (outflow)/inflow from operating activities (9.3) (10.2) 107.8
Cash flows from investing activities Interest received 0.3 0.2 0.7 Proceeds from sale of property, plant and equipment 3.1 2.5 10.5 Proceeds from sale of other non-current assets 3.3 - - Acquisition of subsidiaries, net of cash acquired (62.3) (3.0) (6.5) Acquisition of property, plant and equipment (41.6) (33.6) (84.2) Disposal of non-current assets held for sale - 62.0 62.0 Acquisition of intangible assets (0.4) (0.4) (0.8)
Net cash (outflow)/inflow from investing activities (97.6) 27.7 (18.3)
Cash flows from financing activities New borrowings 129.9 12.8 41.6 Repayment of borrowings (22.6) (52.4) (135.7) Cash flows from derivative instruments (1.4) – 0.2 Payment of finance lease liabilities (0.5) (0.6) (1.5) Dividends paid (17.6) (13.8) (21.2)
Net cash inflow/(outflow) from financing activities 87.8 (54.0) (116.6)
Net decrease in cash and cash equivalents (19.1) (36.5) (27.1) Cash and cash equivalents at beginning of period 51.3 84.0 84.0 Effect of exchange rate fluctuations (1.1) (1.5) (5.6)
Cash and cash equivalents at end of period 10 31.1 46.0 51.3
12
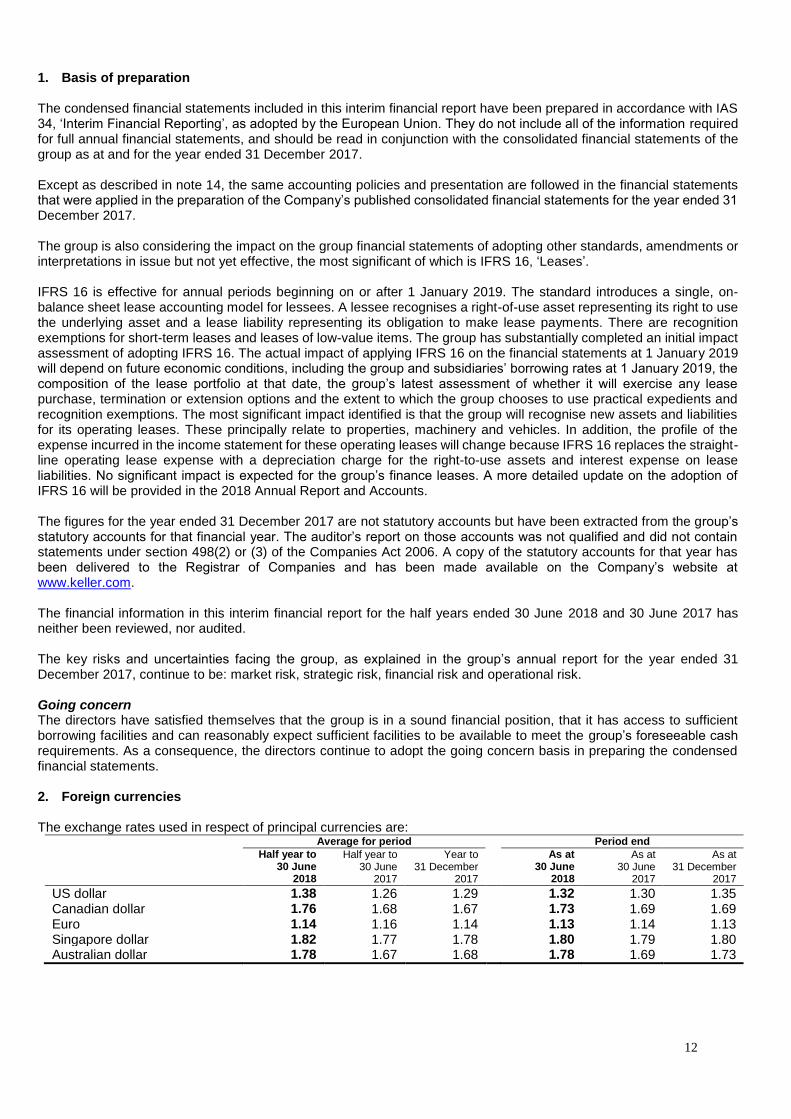
1. Basis of preparation The condensed financial statements included in this interim financial report have been prepared in accordance with IAS 34, ‘Interim Financial Reporting’, as adopted by the European Union. They do not include all of the information required for full annual financial statements, and should be read in conjunction with the consolidated financial statements of the group as at and for the year ended 31 December 2017. Except as described in note 14, the same accounting policies and presentation are followed in the financial statements that were applied in the preparation of the Company’s published consolidated financial statements for the year ended 31 December 2017.
The group is also considering the impact on the group financial statements of adopting other standards, amendments or interpretations in issue but not yet effective, the most significant of which is IFRS 16, ‘Leases’. IFRS 16 is effective for annual periods beginning on or after 1 January 2019. The standard introduces a single, on-balance sheet lease accounting model for lessees. A lessee recognises a right-of-use asset representing its right to use the underlying asset and a lease liability representing its obligation to make lease payments. There are recognition exemptions for short-term leases and leases of low-value items. The group has substantially completed an initial impact assessment of adopting IFRS 16. The actual impact of applying IFRS 16 on the financial statements at 1 January 2019 will depend on future economic conditions, including the group and subsidiaries’ borrowing rates at 1 January 2019, the composition of the lease portfolio at that date, the group’s latest assessment of whether it will exercise any lease purchase, termination or extension options and the extent to which the group chooses to use practical expedients and recognition exemptions. The most significant impact identified is that the group will recognise new assets and liabilities for its operating leases. These principally relate to properties, machinery and vehicles. In addition, the profile of the expense incurred in the income statement for these operating leases will change because IFRS 16 replaces the straight-line operating lease expense with a depreciation charge for the right-to-use assets and interest expense on lease liabilities. No significant impact is expected for the group’s finance leases. A more detailed update on the adoption of IFRS 16 will be provided in the 2018 Annual Report and Accounts. The figures for the year ended 31 December 2017 are not statutory accounts but have been extracted from the group’s statutory accounts for that financial year. The auditor’s report on those accounts was not qualified and did not contain statements under section 498(2) or (3) of the Companies Act 2006. A copy of the statutory accounts for that year has been delivered to the Registrar of Companies and has been made available on the Company’s website at www.keller.com. The financial information in this interim financial report for the half years ended 30 June 2018 and 30 June 2017 has neither been reviewed, nor audited. The key risks and uncertainties facing the group, as explained in the group’s annual report for the year ended 31 December 2017, continue to be: market risk, strategic risk, financial risk and operational risk. Going concern The directors have satisfied themselves that the group is in a sound financial position, that it has access to sufficient borrowing facilities and can reasonably expect sufficient facilities to be available to meet the group’s foreseeable cash requirements. As a consequence, the directors continue to adopt the going concern basis in preparing the condensed financial statements. 2. Foreign currencies The exchange rates used in respect of principal currencies are:
Average for period Period end
Half year to 30 June
2018
Half year to 30 June
2017
Year to 31 December
2017
As at 30 June
2018
As at 30 June
2017
As at 31 December
2017
US dollar 1.38 1.26 1.29 1.32 1.30 1.35 Canadian dollar 1.76 1.68 1.67 1.73 1.69 1.69 Euro 1.14 1.16 1.14 1.13 1.14 1.13 Singapore dollar 1.82 1.77 1.78 1.80 1.79 1.80 Australian dollar 1.78 1.67 1.68 1.78 1.69 1.73
13
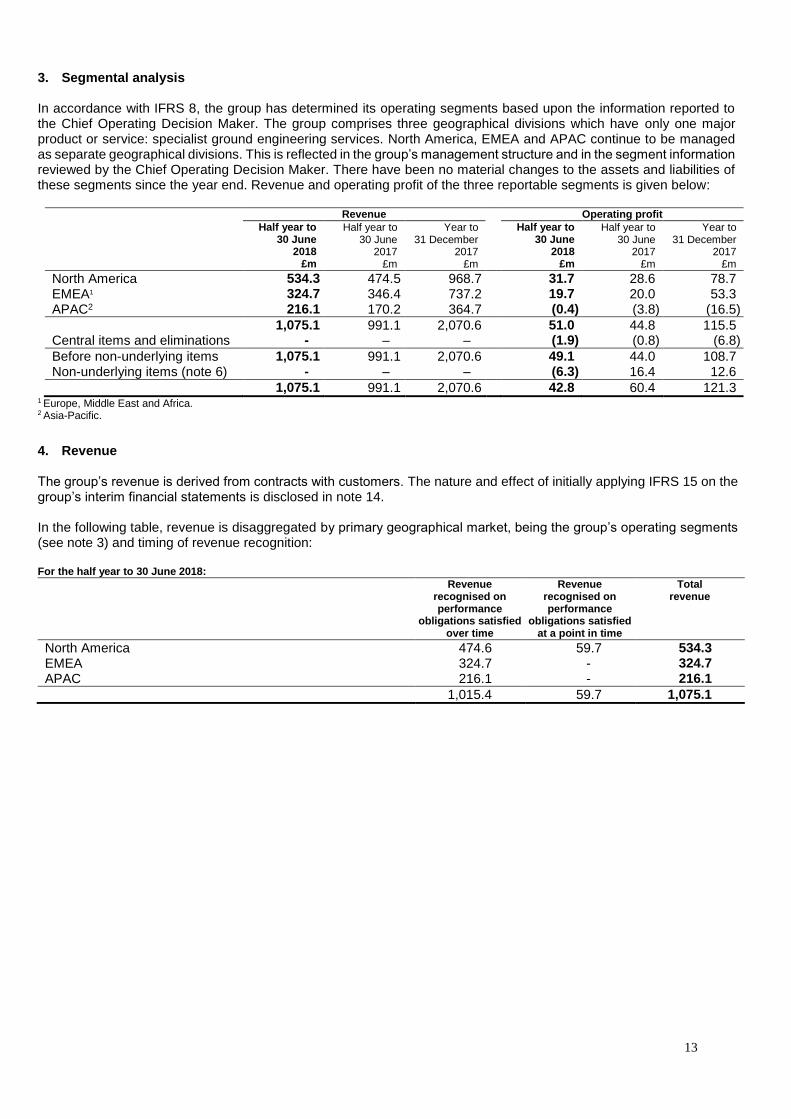
3. Segmental analysis In accordance with IFRS 8, the group has determined its operating segments based upon the information reported to the Chief Operating Decision Maker. The group comprises three geographical divisions which have only one major product or service: specialist ground engineering services. North America, EMEA and APAC continue to be managed as separate geographical divisions. This is reflected in the group’s management structure and in the segment information reviewed by the Chief Operating Decision Maker. There have been no material changes to the assets and liabilities of these segments since the year end. Revenue and operating profit of the three reportable segments is given below:
Revenue Operating profit Half year to
30 June 2018
£m
Half year to 30 June
2017 £m
Year to 31 December
2017 £m
Half year to 30 June
2018 £m
Half year to 30 June
2017 £m
Year to 31 December
2017 £m
North America 534.3 474.5 968.7 31.7 28.6 78.7 EMEA1 324.7 346.4 737.2 19.7 20.0 53.3 APAC2 216.1 170.2 364.7 (0.4) (3.8) (16.5)
1,075.1 991.1 2,070.6 51.0 44.8 115.5 Central items and eliminations - – – (1.9) (0.8) (6.8)
Before non-underlying items 1,075.1 991.1 2,070.6 49.1 44.0 108.7 Non-underlying items (note 6) - – – (6.3) 16.4 12.6
1,075.1 991.1 2,070.6 42.8 60.4 121.3 1 Europe, Middle East and Africa.
2 Asia-Pacific.
4. Revenue
The group’s revenue is derived from contracts with customers. The nature and effect of initially applying IFRS 15 on the group’s interim financial statements is disclosed in note 14. In the following table, revenue is disaggregated by primary geographical market, being the group’s operating segments (see note 3) and timing of revenue recognition: For the half year to 30 June 2018:
Revenue recognised on performance
obligations satisfied over time
Revenue recognised on performance
obligations satisfied at a point in time
Total revenue
North America 474.6 59.7 534.3 EMEA 324.7 - 324.7 APAC 216.1 - 216.1
1,015.4 59.7 1,075.1

14
5. Acquisitions 2018 acquisitions
Moretrench
Carrying amount
Fair value adjustment
Fair value
£m £m £m
Net assets acquired Intangible assets – 10.1 10.1 Property, plant and equipment 21.4 2.8 24.2 Cash and cash equivalents 8.5 – 8.5 Receivables 30.1 – 30.1 Other assets 10.4 – 10.4 Loans and borrowings (8.8) – (8.8) Deferred tax 0.1 – 0.1 Other liabilities (20.9) – (20.9)
40.8 12.9 53.7 Goodwill 11.5
Total consideration 65.2
Satisfied by Initial cash consideration 65.2 Contingent consideration –
65.2
On 29 March 2018, the group acquired 100% of the issued share capital of Moretrench America Corporation, a geotechnical contracting company operating predominantly along the east coast of the US for cash consideration of £65.2m ($90m). The fair value of the intangible assets acquired represents the fair value of customer contracts at the date of acquisition, customer relationships and the trade name. Goodwill arising on acquisition is attributable to the knowledge and expertise of the assembled workforce, the expectation of future contracts and customer relationships and the operating synergies that arise from the group’s strengthened market position. The amount of goodwill that is expected to be deductible for tax purposes totals £21.6m. On 13 June 2018, the group acquired 100% of the issued share capital of Sivenmark Maskintjanst AB, a sheet piling specialist based in Sweden for cash consideration of £2.1m (SEK 24.6m). The purchase price is a premium of £0.8m (SEK 9.4m) to the fair value of the net assets acquired. This goodwill is attributable to the knowledge and expertise of the assembled workforce, the expectation of future contracts and customer relationships and the operating synergies that arise from the group’s strengthened market position. For both acquisitions the fair value of the total trade receivables is not materially different from the gross contractual amounts receivable and is expected to be recovered in full. In the period to 30 June 2018, the acquisitions contributed £19.5m to revenue and a net profit of £1.3m. Had the acquisitions taken place on 1 January 2018, total group revenue would have been £1,106.0m and total net profit before non-underlying items would have been £31.3m. Any adjustments made in respect of acquisitions in the period to 30 June 2018 are provisional and will be finalised within 12 months of the acquisition date. 2017 acquisitions
On 6 March 2017, the group acquired the assets and liabilities of Geo Instruments, an instrumentation and monitoring company based in North America, for cash consideration of £2.8m ($3.6m). The purchase price is a premium of £0.5m ($0.7m) to the fair value of the net assets acquired. This goodwill is attributable to the knowledge and expertise of the assembled workforce, the expectation of future contracts and customer relationships and the operating synergies that arise from the group’s strengthened market position.
15
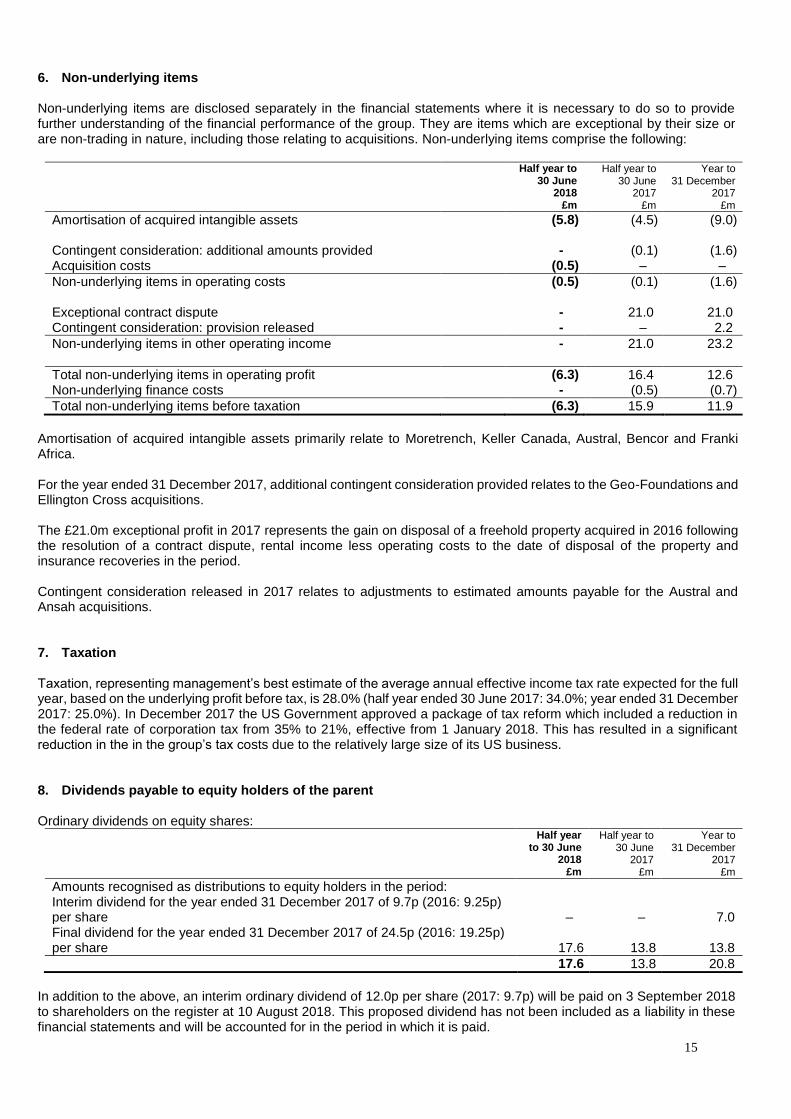
6. Non-underlying items Non-underlying items are disclosed separately in the financial statements where it is necessary to do so to provide further understanding of the financial performance of the group. They are items which are exceptional by their size or are non-trading in nature, including those relating to acquisitions. Non-underlying items comprise the following:
Half year to 30 June
2018 £m
Half year to 30 June
2017 £m
Year to 31 December
2017 £m
Amortisation of acquired intangible assets (5.8) (4.5) (9.0) Contingent consideration: additional amounts provided - (0.1) (1.6) Acquisition costs (0.5) – –
Non-underlying items in operating costs (0.5) (0.1) (1.6) Exceptional contract dispute - 21.0 21.0 Contingent consideration: provision released - – 2.2
Non-underlying items in other operating income - 21.0 23.2
Total non-underlying items in operating profit (6.3) 16.4 12.6 Non-underlying finance costs - (0.5) (0.7)
Total non-underlying items before taxation (6.3) 15.9 11.9
Amortisation of acquired intangible assets primarily relate to Moretrench, Keller Canada, Austral, Bencor and Franki Africa. For the year ended 31 December 2017, additional contingent consideration provided relates to the Geo-Foundations and Ellington Cross acquisitions. The £21.0m exceptional profit in 2017 represents the gain on disposal of a freehold property acquired in 2016 following the resolution of a contract dispute, rental income less operating costs to the date of disposal of the property and insurance recoveries in the period. Contingent consideration released in 2017 relates to adjustments to estimated amounts payable for the Austral and Ansah acquisitions.
7. Taxation Taxation, representing management’s best estimate of the average annual effective income tax rate expected for the full year, based on the underlying profit before tax, is 28.0% (half year ended 30 June 2017: 34.0%; year ended 31 December 2017: 25.0%). In December 2017 the US Government approved a package of tax reform which included a reduction in the federal rate of corporation tax from 35% to 21%, effective from 1 January 2018. This has resulted in a significant reduction in the in the group’s tax costs due to the relatively large size of its US business.
8. Dividends payable to equity holders of the parent Ordinary dividends on equity shares:
Half year to 30 June
2018 £m
Half year to 30 June
2017 £m
Year to 31 December
2017 £m
Amounts recognised as distributions to equity holders in the period: Interim dividend for the year ended 31 December 2017 of 9.7p (2016: 9.25p) per share
–
–
7.0
Final dividend for the year ended 31 December 2017 of 24.5p (2016: 19.25p) per share
17.6
13.8
13.8
17.6 13.8 20.8
In addition to the above, an interim ordinary dividend of 12.0p per share (2017: 9.7p) will be paid on 3 September 2018 to shareholders on the register at 10 August 2018. This proposed dividend has not been included as a liability in these financial statements and will be accounted for in the period in which it is paid.
16
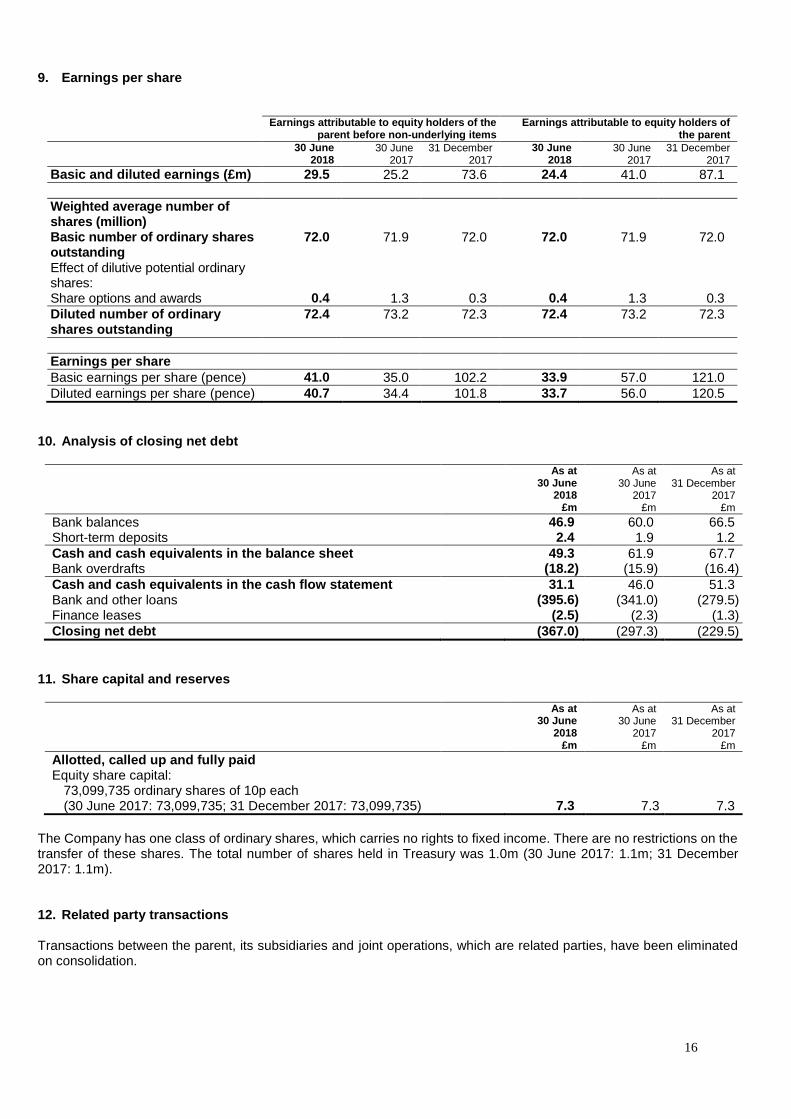
9. Earnings per share
Earnings attributable to equity holders of the parent before non-underlying items
Earnings attributable to equity holders of the parent
30 June 2018
30 June 2017
31 December 2017
30 June 2018
30 June 2017
31 December 2017
Basic and diluted earnings (£m) 29.5 25.2 73.6 24.4 41.0 87.1
Weighted average number of shares (million)
Basic number of ordinary shares outstanding
72.0 71.9 72.0 72.0 71.9 72.0
Effect of dilutive potential ordinary shares:
Share options and awards 0.4 1.3 0.3 0.4 1.3 0.3
Diluted number of ordinary shares outstanding
72.4 73.2 72.3 72.4 73.2 72.3
Earnings per share
Basic earnings per share (pence) 41.0 35.0 102.2 33.9 57.0 121.0
Diluted earnings per share (pence) 40.7 34.4 101.8 33.7 56.0 120.5
10. Analysis of closing net debt
As at 30 June
2018 £m
As at 30 June
2017 £m
As at 31 December
2017 £m
Bank balances 46.9 60.0 66.5 Short-term deposits 2.4 1.9 1.2
Cash and cash equivalents in the balance sheet 49.3 61.9 67.7 Bank overdrafts (18.2) (15.9) (16.4)
Cash and cash equivalents in the cash flow statement 31.1 46.0 51.3 Bank and other loans (395.6) (341.0) (279.5) Finance leases (2.5) (2.3) (1.3)
Closing net debt (367.0) (297.3) (229.5)
11. Share capital and reserves
As at 30 June
2018 £m
As at 30 June
2017 £m
As at 31 December
2017 £m
Allotted, called up and fully paid Equity share capital:
73,099,735 ordinary shares of 10p each (30 June 2017: 73,099,735; 31 December 2017: 73,099,735)
7.3
7.3
7.3
The Company has one class of ordinary shares, which carries no rights to fixed income. There are no restrictions on the transfer of these shares. The total number of shares held in Treasury was 1.0m (30 June 2017: 1.1m; 31 December 2017: 1.1m). 12. Related party transactions Transactions between the parent, its subsidiaries and joint operations, which are related parties, have been eliminated on consolidation.
17
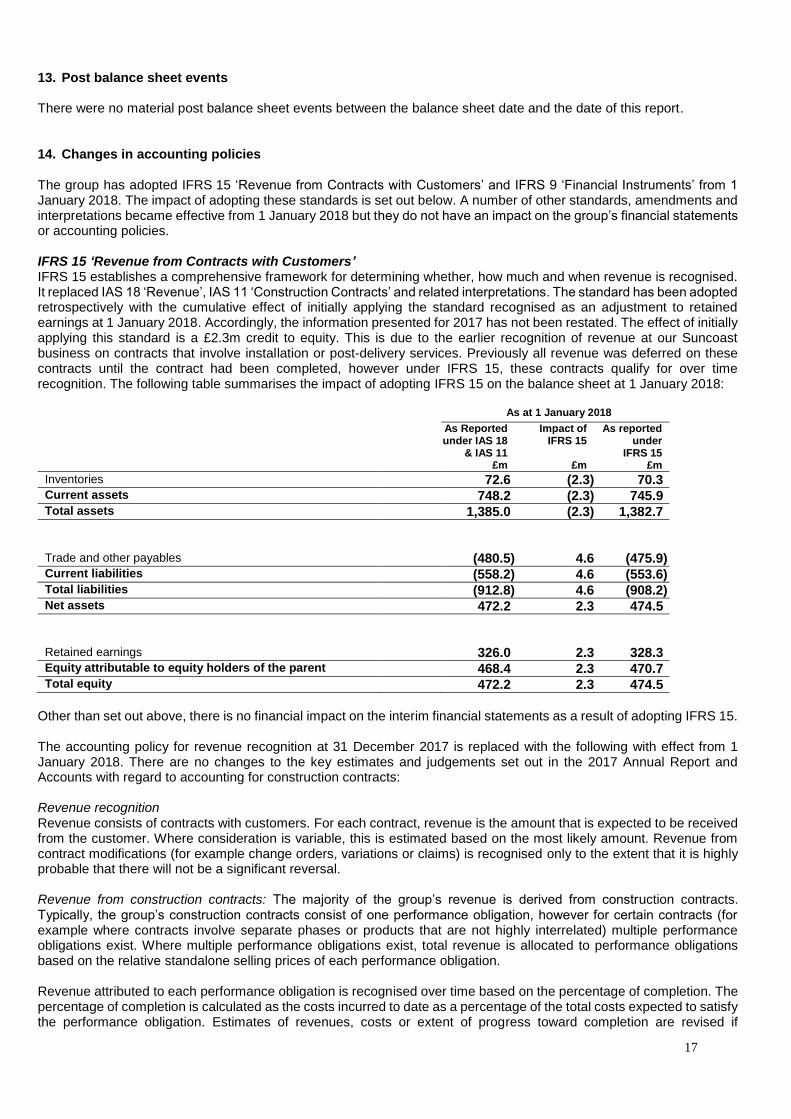
13. Post balance sheet events There were no material post balance sheet events between the balance sheet date and the date of this report.
14. Changes in accounting policies
The group has adopted IFRS 15 ‘Revenue from Contracts with Customers’ and IFRS 9 ‘Financial Instruments’ from 1 January 2018. The impact of adopting these standards is set out below. A number of other standards, amendments and interpretations became effective from 1 January 2018 but they do not have an impact on the group’s financial statements or accounting policies. IFRS 15 ‘Revenue from Contracts with Customers’ IFRS 15 establishes a comprehensive framework for determining whether, how much and when revenue is recognised. It replaced IAS 18 ‘Revenue’, IAS 11 ‘Construction Contracts’ and related interpretations. The standard has been adopted retrospectively with the cumulative effect of initially applying the standard recognised as an adjustment to retained earnings at 1 January 2018. Accordingly, the information presented for 2017 has not been restated. The effect of initially applying this standard is a £2.3m credit to equity. This is due to the earlier recognition of revenue at our Suncoast business on contracts that involve installation or post-delivery services. Previously all revenue was deferred on these contracts until the contract had been completed, however under IFRS 15, these contracts qualify for over time recognition. The following table summarises the impact of adopting IFRS 15 on the balance sheet at 1 January 2018:
As at 1 January 2018
As Reported
under IAS 18 & IAS 11
£m
Impact of IFRS 15
£m
As reported under
IFRS 15 £m
Inventories 72.6 (2.3) 70.3 Current assets 748.2 (2.3) 745.9 Total assets 1,385.0 (2.3) 1,382.7 Trade and other payables (480.5) 4.6 (475.9) Current liabilities (558.2) 4.6 (553.6) Total liabilities (912.8) 4.6 (908.2) Net assets 472.2 2.3 474.5 Retained earnings 326.0 2.3 328.3 Equity attributable to equity holders of the parent 468.4 2.3 470.7 Total equity 472.2 2.3 474.5
Other than set out above, there is no financial impact on the interim financial statements as a result of adopting IFRS 15. The accounting policy for revenue recognition at 31 December 2017 is replaced with the following with effect from 1 January 2018. There are no changes to the key estimates and judgements set out in the 2017 Annual Report and Accounts with regard to accounting for construction contracts: Revenue recognition Revenue consists of contracts with customers. For each contract, revenue is the amount that is expected to be received from the customer. Where consideration is variable, this is estimated based on the most likely amount. Revenue from contract modifications (for example change orders, variations or claims) is recognised only to the extent that it is highly probable that there will not be a significant reversal. Revenue from construction contracts: The majority of the group’s revenue is derived from construction contracts. Typically, the group’s construction contracts consist of one performance obligation, however for certain contracts (for example where contracts involve separate phases or products that are not highly interrelated) multiple performance obligations exist. Where multiple performance obligations exist, total revenue is allocated to performance obligations based on the relative standalone selling prices of each performance obligation. Revenue attributed to each performance obligation is recognised over time based on the percentage of completion. The percentage of completion is calculated as the costs incurred to date as a percentage of the total costs expected to satisfy the performance obligation. Estimates of revenues, costs or extent of progress toward completion are revised if
18
circumstances change. Any resulting increases or decreases in estimated revenues or costs are reflected in the percentage of completion calculation in the period in which the circumstances that give rise to the revision become known. Where it is probable that a loss will arise on the total contract, full provision for this loss is made when the group becomes aware that a loss may arise. Incremental bid/tender costs and fulfilment costs are not material to the overall contract and are expensed as incurred. Any revenues recognised in excess of billings are recognised as contract assets within trade and other receivables. Any payments received in excess of revenue recognised are recognised as contract liabilities within trade and other payables. Revenue from the sale of goods and services: The group’s revenue recognised from the sale of goods and services primarily relates to the Suncoast business. These contracts all have a single performance obligation, or a series of distinct performance obligations that are substantially the same. There are typically two types of contract:
a. Delivery of goods: revenue for these contracts is recognised at a point in time, on delivery of the goods to the
customer.
b. Delivery of goods with installation and/or post-delivery services: revenue for these contracts is recognised over
time by reference to the percentage of completion. The percentage of completion is calculated as the costs
incurred to date as a percentage of the total costs expected to satisfy the contract, however this results in most
of the revenue being recognised on delivery of the materials as this forms the majority of the cost to Keller.
IFRS 9 ‘Financial Instruments’ IFRS 9 sets out requirements for recognising and measuring financial assets, financial liabilities and some contracts to buy or sell non-financial items. This standard replaces IAS 39 ‘Financial Instruments: Recognition and Measurement’. The classification and measurement of financial liabilities and derivative instruments remains unchanged from IAS 39. Under IFRS 9, a financial asset is now classified on initial recognition as measured at: amortised cost; fair value through other comprehensive income (FVOCI) – debt investment; FVOCI – equity investment; or fair value through profit or loss (FVTPL). Applying this classification to the group’s financial assets does not result in changes to the accounting: trade receivables and cash and cash equivalents continue to be recognised at amortised cost and certain other non-current financial assets continue to be recognised at FVTPL. With regard to impairment of financial assets, IFRS 9 replaces the ‘incurred loss’ model in IAS 39 with an ‘expected credit loss’ (ECL) model. The group’s bad debts typically arise due to invoices being unpaid for commercial reasons rather than credit default and therefore the group’s expected initial credit loss on initial recognition was not material and there has been no change in the overall bad debt provision at 1 January 2018. As a result of adopting IFRS 9, the accounting policy for trade receivables at 31 December 2017 is replaced with the following with effect from 1 January 2018: Trade receivables Trade receivables are initially recognised at their transaction price, unless there is a significant financing component, and are carried subsequently at amortised cost. Loss allowances for expected credit losses are deducted on initial recognition from the gross carrying amount of trade receivables and recognised in full when there is a significant increase in credit risk.
19
Responsibility Statement
The interim financial report is the responsibility of the directors who confirm that to the best of their knowledge: (a) the condensed set of financial statements has been prepared in accordance with IAS 34 Interim Financial
Reporting as adopted by the EU;
(b) the interim management report includes a fair review of the information required by:
DTR 4.2.7R of the Disclosure Guidance and Transparency Rules, being an indication of important
events that have occurred during the first six months of the financial year and their impact on the
condensed set of financial statements; and a description of the principal risks and uncertainties for
the remaining six months of the year; and
DTR 4.2.8R of the Disclosure Guidance and Transparency Rules, being related party transactions
that have taken place in the first six months of the current financial year and that have materially
affected the financial position or performance of the entity during that period; and any changes in
the related party transactions described in the last annual report that could do so.
The directors of Keller Group plc are listed in the 2017 Annual Report and Accounts. Approved by the Board of Keller Group plc and signed on its behalf by: Alain Michaelis Chief Executive James Hind Finance Director 30 July 2018
20
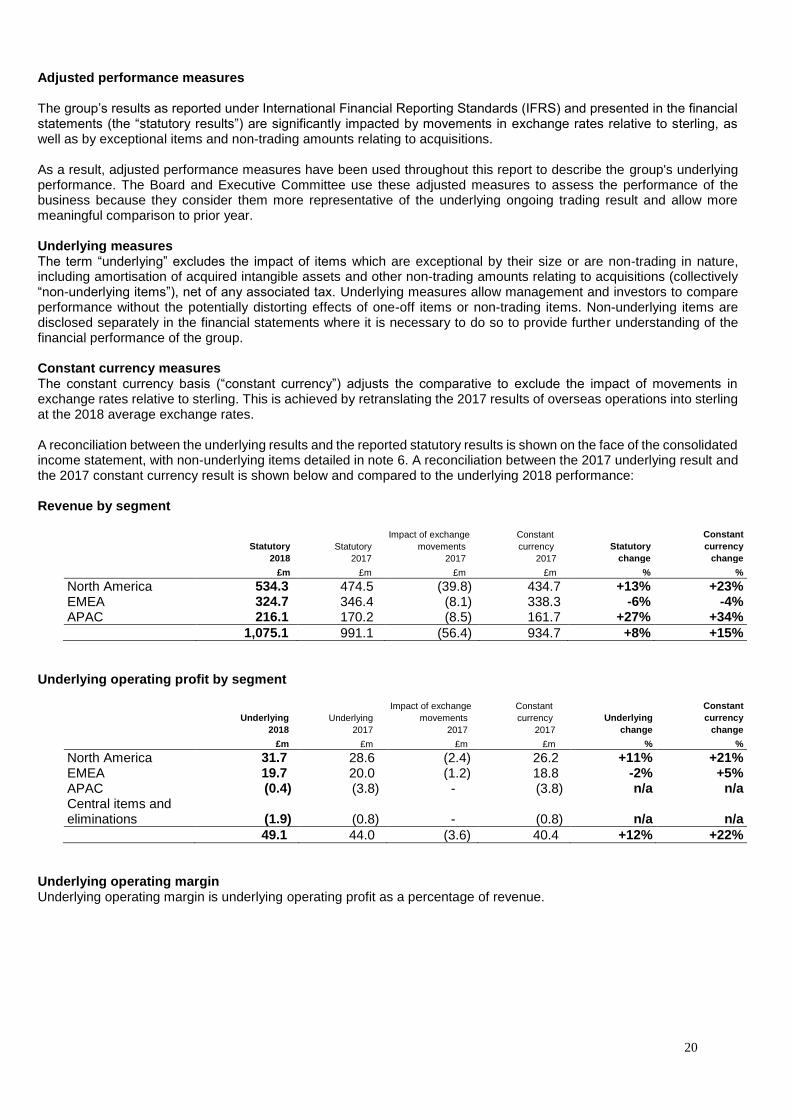
Adjusted performance measures The group’s results as reported under International Financial Reporting Standards (IFRS) and presented in the financial statements (the “statutory results”) are significantly impacted by movements in exchange rates relative to sterling, as well as by exceptional items and non-trading amounts relating to acquisitions. As a result, adjusted performance measures have been used throughout this report to describe the group's underlying performance. The Board and Executive Committee use these adjusted measures to assess the performance of the business because they consider them more representative of the underlying ongoing trading result and allow more meaningful comparison to prior year. Underlying measures The term “underlying” excludes the impact of items which are exceptional by their size or are non-trading in nature, including amortisation of acquired intangible assets and other non-trading amounts relating to acquisitions (collectively “non-underlying items”), net of any associated tax. Underlying measures allow management and investors to compare performance without the potentially distorting effects of one-off items or non-trading items. Non-underlying items are disclosed separately in the financial statements where it is necessary to do so to provide further understanding of the financial performance of the group. Constant currency measures The constant currency basis (“constant currency”) adjusts the comparative to exclude the impact of movements in exchange rates relative to sterling. This is achieved by retranslating the 2017 results of overseas operations into sterling at the 2018 average exchange rates. A reconciliation between the underlying results and the reported statutory results is shown on the face of the consolidated income statement, with non-underlying items detailed in note 6. A reconciliation between the 2017 underlying result and the 2017 constant currency result is shown below and compared to the underlying 2018 performance: Revenue by segment
Statutory
2018
Statutory
2017
Impact of exchange
movements
2017
Constant
currency
2017
Statutory
change
Constant
currency
change
£m £m £m £m % %
North America 534.3 474.5 (39.8) 434.7 +13% +23% EMEA 324.7 346.4 (8.1) 338.3 -6% -4% APAC 216.1 170.2 (8.5) 161.7 +27% +34%
1,075.1 991.1 (56.4) 934.7 +8% +15%
Underlying operating profit by segment
Underlying
2018
Underlying
2017
Impact of exchange
movements
2017
Constant
currency
2017
Underlying
change
Constant
currency
change
£m £m £m £m % %
North America 31.7 28.6 (2.4) 26.2 +11% +21% EMEA 19.7 20.0 (1.2) 18.8 -2% +5% APAC (0.4) (3.8) - (3.8) n/a n/a Central items and eliminations (1.9) (0.8) - (0.8) n/a n/a
49.1 44.0 (3.6) 40.4 +12% +22%
Underlying operating margin Underlying operating margin is underlying operating profit as a percentage of revenue.
21
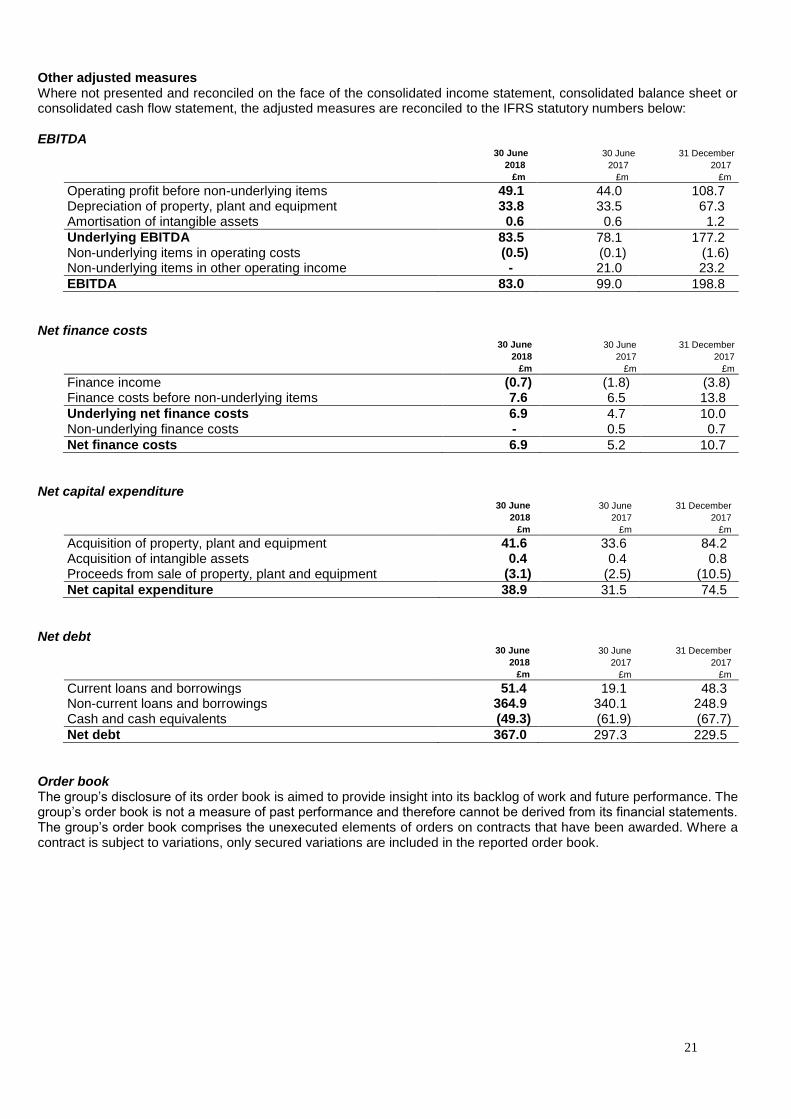
Other adjusted measures Where not presented and reconciled on the face of the consolidated income statement, consolidated balance sheet or consolidated cash flow statement, the adjusted measures are reconciled to the IFRS statutory numbers below: EBITDA
30 June 30 June 31 December
2018 2017 2017
£m £m £m
Operating profit before non-underlying items 49.1 44.0 108.7 Depreciation of property, plant and equipment 33.8 33.5 67.3 Amortisation of intangible assets 0.6 0.6 1.2
Underlying EBITDA 83.5 78.1 177.2 Non-underlying items in operating costs (0.5) (0.1) (1.6) Non-underlying items in other operating income - 21.0 23.2
EBITDA 83.0 99.0 198.8
Net finance costs 30 June 30 June 31 December
2018 2017 2017
£m £m £m
Finance income (0.7) (1.8) (3.8) Finance costs before non-underlying items 7.6 6.5 13.8
Underlying net finance costs 6.9 4.7 10.0 Non-underlying finance costs - 0.5 0.7
Net finance costs 6.9 5.2 10.7
Net capital expenditure
30 June 30 June 31 December
2018 2017 2017
£m £m £m
Acquisition of property, plant and equipment 41.6 33.6 84.2 Acquisition of intangible assets 0.4 0.4 0.8 Proceeds from sale of property, plant and equipment (3.1) (2.5) (10.5)
Net capital expenditure 38.9 31.5 74.5
Net debt
30 June 30 June 31 December
2018 2017 2017
£m £m £m
Current loans and borrowings 51.4 19.1 48.3 Non-current loans and borrowings 364.9 340.1 248.9 Cash and cash equivalents (49.3) (61.9) (67.7)
Net debt 367.0 297.3 229.5
Order book The group’s disclosure of its order book is aimed to provide insight into its backlog of work and future performance. The group’s order book is not a measure of past performance and therefore cannot be derived from its financial statements. The group’s order book comprises the unexecuted elements of orders on contracts that have been awarded. Where a contract is subject to variations, only secured variations are included in the reported order book.
22
For further information, please contact:
Keller Group plc
www.keller.com
James Hind, Finance Director Victoria Huxster, Head of Investor Relations
020 7616 7575
Finsbury Gordon Simpson James Kavanagh
020 7251 3801
A presentation for analysts will be held at 10.00am at
One Moorgate Place - Chartered Accountants Hall, 1 Moorgate Place, London EC2R 6EA
A live webcast will be available from 10.00am and, on demand, from 2.00pm at
https://www.investis-live.com/keller/5b2cd5d64b7b0d10007b75d4/omaa Notes to editors: Keller is the world’s largest geotechnical contractor, providing technically advanced geotechnical solutions to the construction industry. With annual revenue of more than £2.0bn, Keller has approximately 11,000 staff world-wide. Keller is the clear market leader in the US, Canada, Australia and South Africa; it has prime positions in most established European markets and a strong profile in many developing markets. Cautionary statements: This document contains certain 'forward looking statements' with respect to Keller’s financial condition, results of operations and business and certain of Keller’s plans and objectives with respect to these items. Forward looking statements are sometimes, but not always, identified by their use of a date in the future or such words as 'anticipates', 'aims', 'due', 'could', 'may', 'should', 'expects', 'believes', 'intends', 'plans', 'potential', 'reasonably possible', 'targets', 'goal' or 'estimates'. By their very nature forward-looking statements are inherently unpredictable, speculative and involve risk and uncertainty because they relate to events and depend on circumstances that will occur in the future. There are a number of factors that could cause actual results and developments to differ materially from those expressed or implied by these forward-looking statements. These factors include, but are not limited to, changes in the economies and markets in which the group operates; changes in the regulatory and competition frameworks in which the group operates; the impact of legal or other proceedings against or which affect the group; and changes in interest and exchange rates. All written or verbal forward looking statements, made in this document or made subsequently, which are attributable to Keller or any other member of the group or persons acting on their behalf are expressly qualified in their entirety by the factors referred to above. Keller does not intend to update these forward looking statements. Nothing in this document should be regarded as a profits forecast. This document is not an offer to sell, exchange or transfer any securities of Keller Group plc or any of its subsidiaries and is not soliciting an offer to purchase, exchange or transfer such securities in any jurisdiction. Securities may not be offered, sold or transferred in the United States absent registration or an applicable exemption from the registration requirements of the US Securities Act of 1933 (as amended). LEI number: 549300QO4MBL43UHSN10
Classification: 1.2 (Half yearly financial reports)
The person responsible for making this announcement is Kerry Porritt, Group Company Secretary
Related Documents


