Envision CaChE v allEy Final REpoRt & t oolkit Keep the city, city Keep the country, country

Welcome message from author
This document is posted to help you gain knowledge. Please leave a comment to let me know what you think about it! Share it to your friends and learn new things together.
Transcript
Envision CaChE vallEy Final REpoRt & toolkit
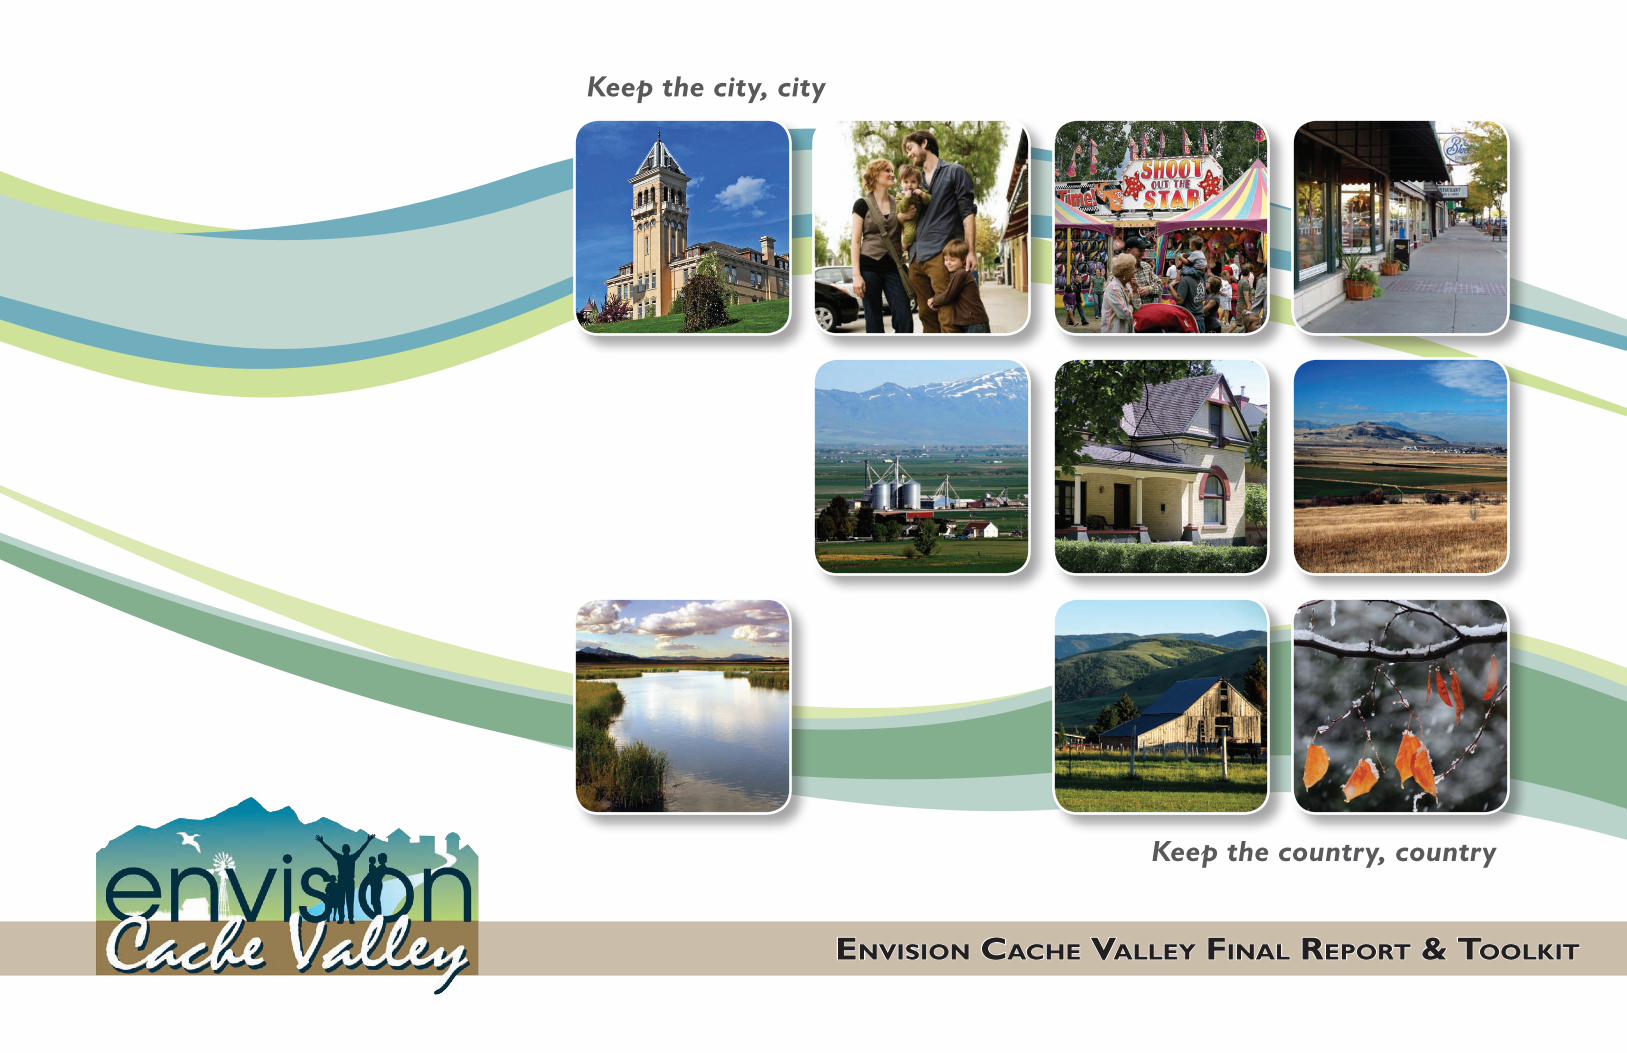
Keep the city, city
Keep the country, country


Envision CaChE vallEy Final REpoRt & toolkit
iv Envision CaChE vallEy
Envision Cache valley Project PartnersCache Valley Regional Council
Cache County, Utah
Franklin County, Idaho
Envision Cache valley Funding sponsorsArchitectural Nexus, In-Kind
Bank of Utah, Providence & Logan Branches
Bear River Association of Governments
BIO-WEST, Inc.
Cache County
Cache Valley Chamber of Commerce, In-Kind
Cache Valley Electric
Cache Valley Metropolitan Planning Organization
Cache Valley Transit Authority
Campbell Scientific, Inc.
The Church of Jesus Christ of Latter-day Saints Foundation
Franklin County
George S. and Dolores Doré Eccles Foundation
Gossner Foods
L.W. Miller Companies
Lewiston State Bank
Logan City
Logan Regional Hospital
Marriner S. Eccles Foundation
Merit Medical
The Nature Conservancy
Pepperidge Farm, In-Kind
Rocky Mountain Power
Utah State University
Wescor, Inc.
Envision Cache valley Executive CommitteeDirk Bowles, Co-Chair, Envision Cache Valley, Commissioner, Franklin County, Idaho
Tom Jensen, Co-Chair, Envision Cache Valley, Principal, Architectural Nexus
Gary Anderson, Chair, Cache Valley Regional Council
Lynn Lemon, Cache County Executive
Alan Matheson, Executive Director, Envision Utah
Envision Cache valley steering CommitteeRuss Akina, Parks and Recreation Director, Logan City
Gary Anderson, Cache Valley Regional Council
DalVon Atkinson, Commissioner, Franklin County
Jay Baker, Countywide Planner, Cache County
Wayne Barlow, President and CEO, Wescor, Inc.
Scott Beckstead, Realtor, Franklin County
L. J. Bolton, Assistant Strategic Ventures and Economic Development, Utah State University (USU)
Dirk Bowles, Co-Chair, Envision Cache Valley, Commissioner, Franklin County, Idaho
Larry Bradford, Idaho State House of Representatives
John Burg, Planning and Zoning Administrator, Franklin County
Brian Carver, Community and Economic Development Director, Bear River Association of Governments
Dee Virile Christensen, Mayor, Dayton City
Justin Cooper, Cache Valley Home Builders Association
Leo Daley, Mayor, Weston
Joan Degiorgio, The Nature Conservancy
Curtis Dent, Cache County Planning Commission
Paul Dent, Board of Adjustment, Lewiston City
Jack Draxler, Utah State House of Representatives
Clair Ellis, Cache County Planning Commission
Kelly Field, Mayor, Lewiston City
Bob Fotheringham, Water Manager, Cache County
Nat Frazer, Dean, College of Natural Resources, USU
John T. Gaily, Mayor, Clifton
Marshal Garrett, Superintendent, Logan City School District
Jim Gass, City Manager, Smithfield City
Marc Gibbs, Idaho State House of Representatives
Lee Hendrickson, Mayor, Preston City
Russell Hirst, Mayor, Lewiston City
Julie Holist, Cache Valley Tourist Council
Dean Howard, Mayor, Hyrum City
George Humbert, Rocky Mountain Power
Clark Israelsen, Farm Bureau, USU Extension
Dennis Jackson, Economic Development Committee, Lewiston City
Tom Jensen, Envision Cache Valley Co-Chair, Architectural Nexus
Jeff Gilbert, Cache Valley Metropolitan Organization
Roger C. Jones, Executive Director, Bear River Association of Governments
Michael Kennedy, Assistant to the President, USU
Gerald Knight, Mayor, Nibley City
Dave Kooyman, Mayor, Hyde Park
Lynn Lemon, Cache County Executive
Mike Liechty, Deputy Superintendent, Cache County School District
Carlos Licon, Department of Landscape Architecture and Environmental Planning, USU
Vic Mahoney, Pepperidge Farm
Ruth Maughan, Mayor, Wellsville City
acknowledgements
Brandon McBride, Intermountain Health Care
Brent Miller, Vice President of Research, USU
Larry W. Miller, President and CEO, L.W. Miller Companies
Mark Nielsen, Public Works Director, Logan City
Jay Nielson, Community Development Director, Logan City
Steven C. Norton, Superintendent, Cache County School District
Blake Parker, Parker Real Estate
Craig Petersen, Chair, Cache County Council
Sydney Peterson, Chief of Staff, USU
Wayne Priestley, Mayor, Franklin City
Josh Runhaar, Director of Development Services, Cache County
Caroline Shugart, Wellness Coordinator, USU
Darrell Simmons, Cache Valley Home Builders Association
Max Steadman, Logan Resident
Laraine Swenson, Utah Quality Growth Commission, Logan City Council
Cary Watkins, Mayor, North Logan
Scott Watterson, Icon Health and Fitness
Randy Watts, Mayor, Logan City
Ned Weinshenker, Vice President, Strategic Ventures and Economic Development, USU
Richard Westerberg, Commissioner, Franklin County
Thanks to all partners, funders, steering committee members, and technical experts for valuable contributions to Envision Cache Valley! Thanks especially to community leaders and the public, who, through the Envision Cache Valley process, created a vision for Cache Valley’s future.
Project Facilitator
Christie Oostema, Project Manager, Envision UtahEnvision Cache valley Final Report & Toolkit
Design: Envision Utah
Cover Photos: www.flickr.com/photos/8430129@N06
TablE oF ConTEnTs v
Keep the city, cityInvest in our towns—our centers for living, industry and culture.
Keep the country, country Protect the agricultural and natural lands that sustain us.
Introduction11
• Background • Process • Population Projections
Public Process23
• Committees • Baseline Development • Workshops, Results & Analysis • Alternative Growth Scenario Maps & Analysis
The Cache Valley Vision313
• Vision Statement • Vision Principles • Vision Benef its • Vision Maps
Realizing Our Vision431
• Recommendations • Sample Municipal Strategy • Local Analysis & Innovation
Implementation Toolkit537
• Toolbox Matrix • Tools • Case Studies • Resources (On-line & Print)
Cache Valley is a remarkable place. Brigham Young said that no other valley in the Territory was its equal—it was and is a beautiful and abundant valley. Life was not easy for the first pioneers, but they were resilient, creating an incredible place to live and to pursue one’s dreams, whatever they may be: raising a family, developing businesses, pursuing higher education, making a living from the land’s abundance, or relaxing in its beautiful surroundings.
The quality of human settlement was important to Utah’s founders. In 1892, LDS Church President John Taylor wrote,
“In all cases in making new settlements, the Saints should be advised to gather together in villages, as has been our custom from the time of our earliest settlement on these mountain valleys. The advantages of this plan, instead of carelessly scattering out over a wide extent of country, are many and obvious. ..By this means the people can retain their ecclesiastical organizations…Cooperate for the good of all in financial and secular matters, in making ditches, fencing fields, building bridges, and other necessary improvements. Further than this they are a mutual protection and a source of strength… their compact organization gives them many advantages of a social and civic character which might be lost, misapplied or frittered away by spreading out so thinly that inter-communication is difficult, dangerous, inconvenient, and expensive.”
- Quoted in “Mormon Country” by Wallace Stegner
Times have changed. We don’t face the same challenges, but our task remains the same: to create the best place possible today and for generations to come. In that respect we, too, are pioneers—dreaming and innovating and collaborating to bring our dreams to fruition.
The Cache Valley Vision, illustrated in this document, captures a common dream, our collective hopes for the future. This hope is echoed by voices of the past—who also saw the value of investing in our towns and cities while protecting and enhancing resources in outlying areas. Let’s realize our dreams and keep Cache Valley beautiful, neighborly and prosperous - The Envision Cache Valley Executive Committee.
1 Envision CaChE vallEy
introduction
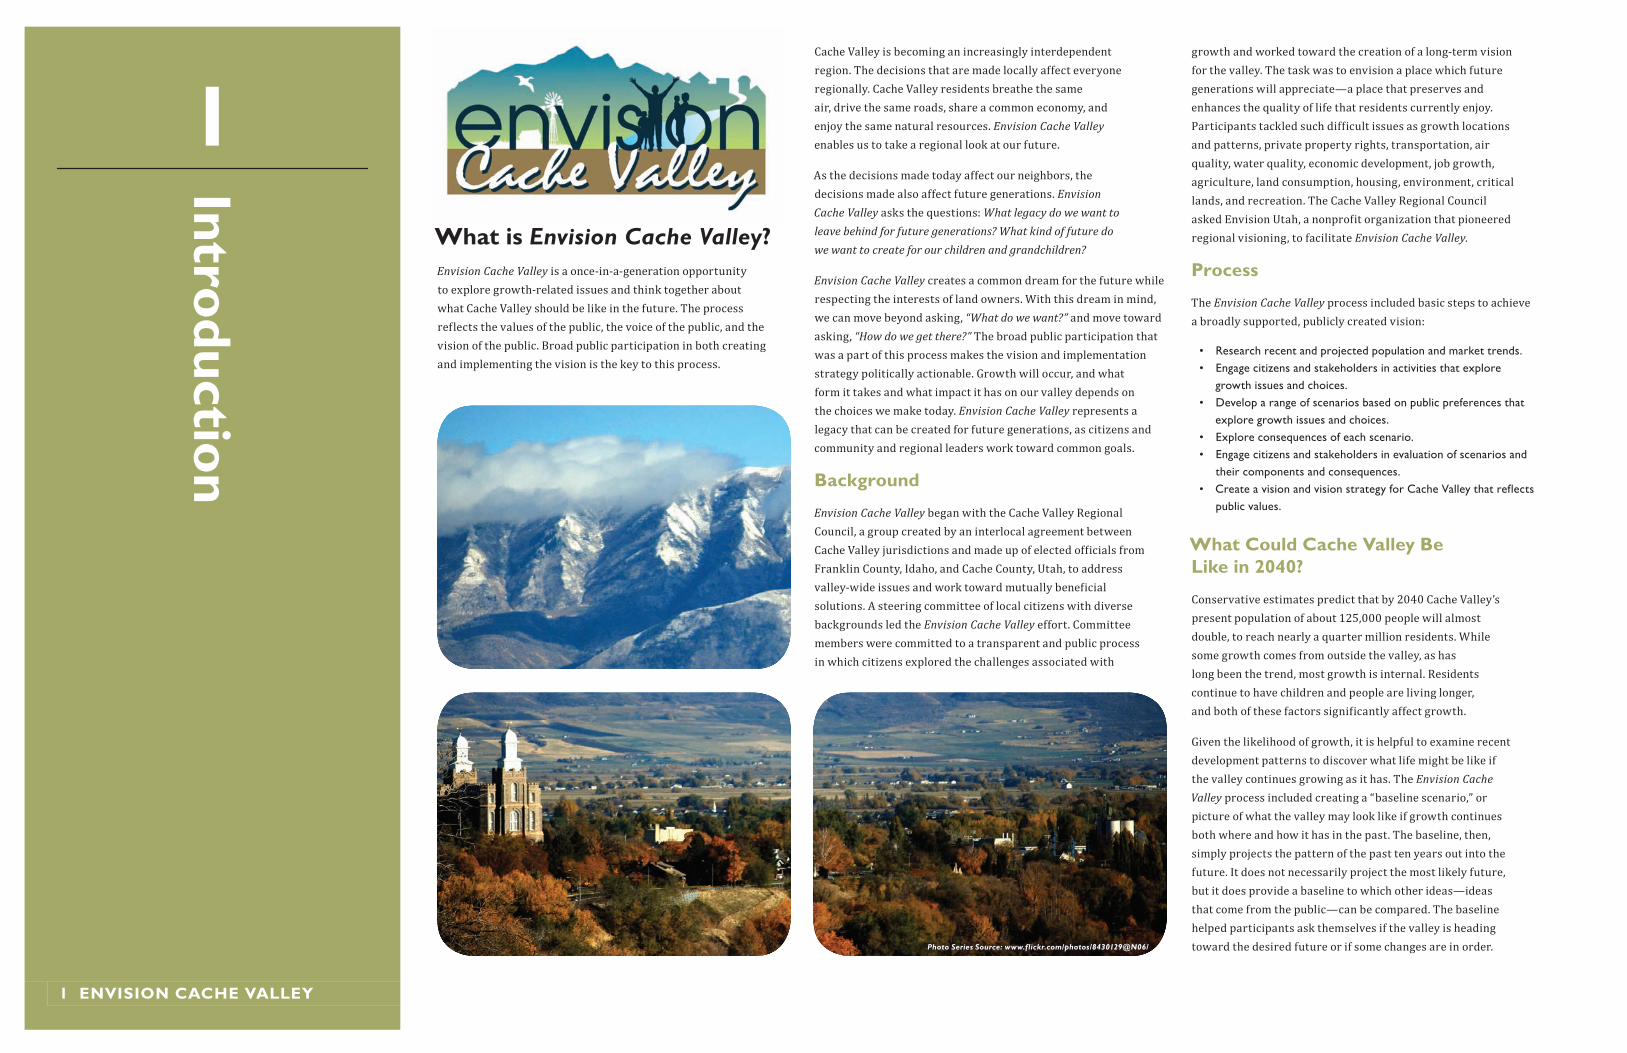
1What is Envision Cache Valley?Envision Cache Valley is a once-in-a-generation opportunity to explore growth-related issues and think together about what Cache Valley should be like in the future. The process reflects the values of the public, the voice of the public, and the vision of the public. Broad public participation in both creating and implementing the vision is the key to this process.
Cache Valley is becoming an increasingly interdependent region. The decisions that are made locally affect everyone regionally. Cache Valley residents breathe the same air, drive the same roads, share a common economy, and enjoy the same natural resources. Envision Cache Valley enables us to take a regional look at our future.
As the decisions made today affect our neighbors, the decisions made also affect future generations. Envision
Cache Valley asks the questions: What legacy do we want to
leave behind for future generations? What kind of future do
we want to create for our children and grandchildren?
Envision Cache Valley creates a common dream for the future while respecting the interests of land owners. With this dream in mind, we can move beyond asking, “What do we want?” and move toward asking, “How do we get there?” The broad public participation that was a part of this process makes the vision and implementation strategy politically actionable. Growth will occur, and what form it takes and what impact it has on our valley depends on the choices we make today. Envision Cache Valley represents a legacy that can be created for future generations, as citizens and community and regional leaders work toward common goals.
background
Envision Cache Valley began with the Cache Valley Regional Council, a group created by an interlocal agreement between Cache Valley jurisdictions and made up of elected officials from Franklin County, Idaho, and Cache County, Utah, to address valley-wide issues and work toward mutually beneficial solutions. A steering committee of local citizens with diverse backgrounds led the Envision Cache Valley effort. Committee members were committed to a transparent and public process in which citizens explored the challenges associated with
growth and worked toward the creation of a long-term vision for the valley. The task was to envision a place which future generations will appreciate—a place that preserves and enhances the quality of life that residents currently enjoy. Participants tackled such difficult issues as growth locations and patterns, private property rights, transportation, air quality, water quality, economic development, job growth, agriculture, land consumption, housing, environment, critical lands, and recreation. The Cache Valley Regional Council asked Envision Utah, a nonprofit organization that pioneered regional visioning, to facilitate Envision Cache Valley.
Process
The Envision Cache Valley process included basic steps to achieve a broadly supported, publicly created vision:
• Research recent and projected population and market trends.• Engage citizens and stakeholders in activities that explore
growth issues and choices.• Develop a range of scenarios based on public preferences that
explore growth issues and choices.• Explore consequences of each scenario.• Engage citizens and stakeholders in evaluation of scenarios and
their components and consequences.• Create a vision and vision strategy for Cache Valley that reflects
public values.
What Could Cache valley be like in 2040?
Conservative estimates predict that by 2040 Cache Valley’s present population of about 125,000 people will almost double, to reach nearly a quarter million residents. While some growth comes from outside the valley, as has long been the trend, most growth is internal. Residents continue to have children and people are living longer, and both of these factors significantly affect growth.
Given the likelihood of growth, it is helpful to examine recent development patterns to discover what life might be like if the valley continues growing as it has. The Envision Cache
Valley process included creating a “baseline scenario,” or picture of what the valley may look like if growth continues both where and how it has in the past. The baseline, then, simply projects the pattern of the past ten years out into the future. It does not necessarily project the most likely future, but it does provide a baseline to which other ideas—ideas that come from the public—can be compared. The baseline helped participants ask themselves if the valley is heading toward the desired future or if some changes are in order.Photo Series Source: www.flickr.com/photos/8430129@N06/
inTRoduCTion 2
developed lands
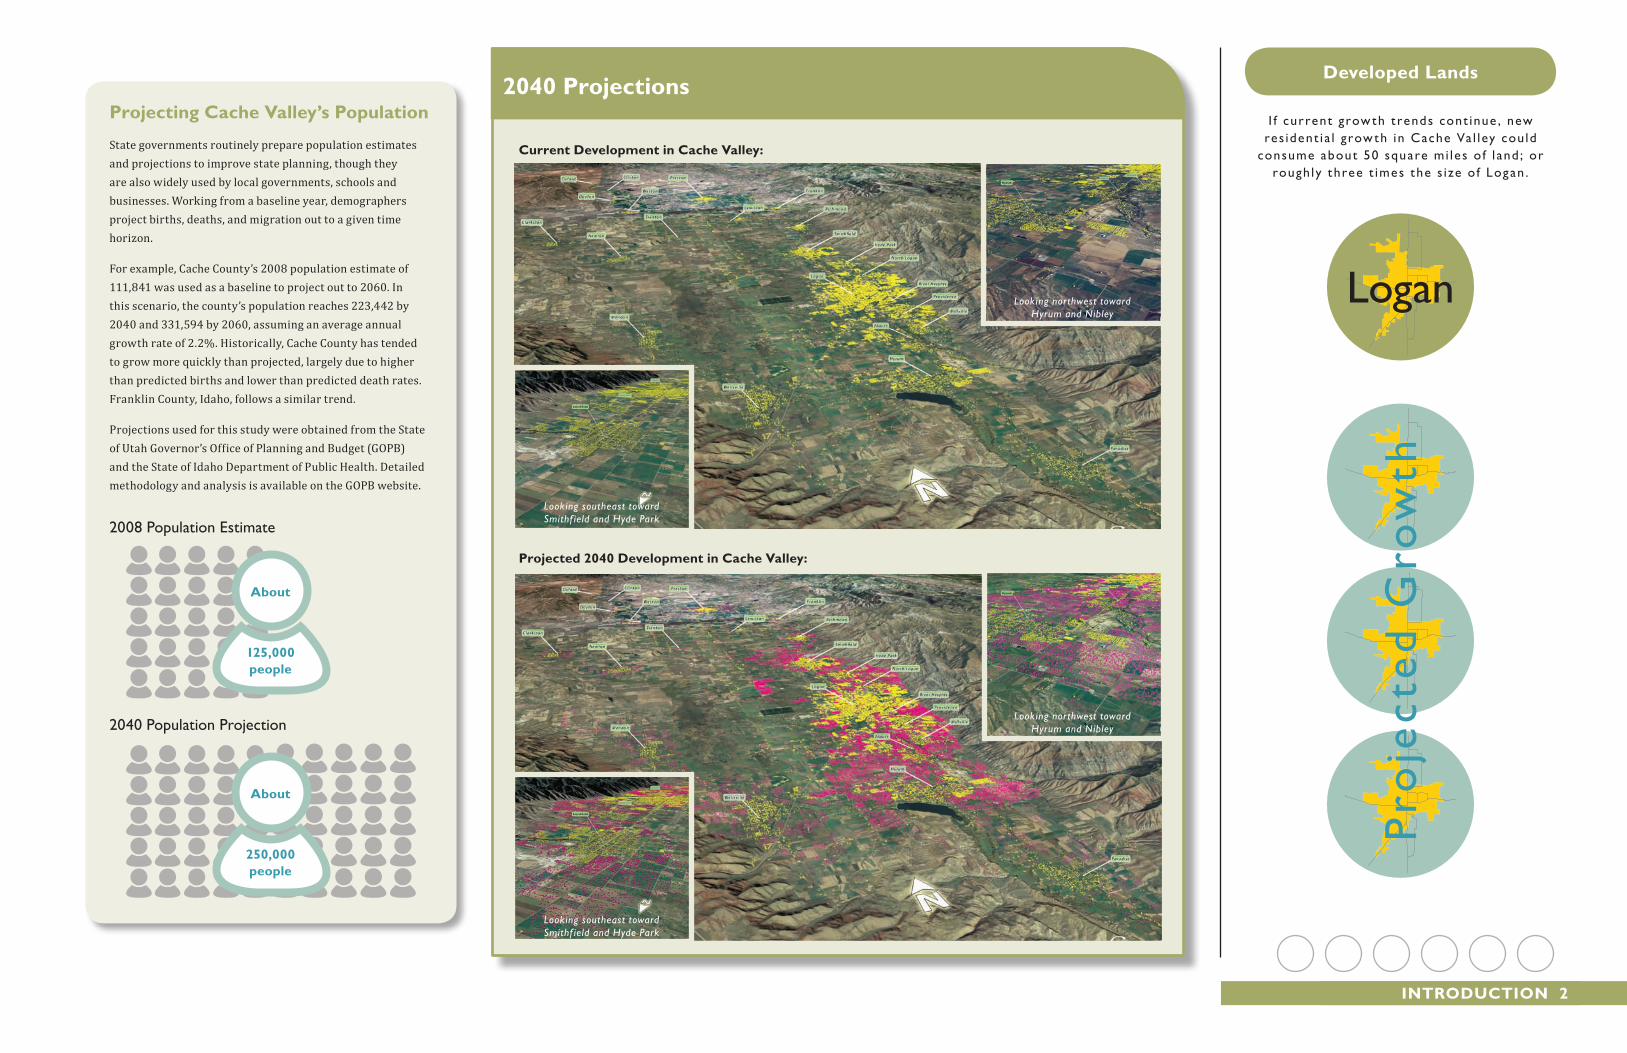
I f current growth t rends cont inue , new res ident i a l growth in Cache Va l ley cou ld
consume about 50 square mi les o f l and; or rough ly three t imes the s ize o f Logan .
Pro
ject
ed G
row
th
Logan
Projecting Cache valley’s Population
State governments routinely prepare population estimates and projections to improve state planning, though they are also widely used by local governments, schools and businesses. Working from a baseline year, demographers project births, deaths, and migration out to a given time horizon.
For example, Cache County’s 2008 population estimate of 111,841 was used as a baseline to project out to 2060. In this scenario, the county’s population reaches 223,442 by 2040 and 331,594 by 2060, assuming an average annual growth rate of 2.2%. Historically, Cache County has tended to grow more quickly than projected, largely due to higher than predicted births and lower than predicted death rates. Franklin County, Idaho, follows a similar trend.
Projections used for this study were obtained from the State of Utah Governor’s Office of Planning and Budget (GOPB) and the State of Idaho Department of Public Health. Detailed methodology and analysis is available on the GOPB website.
2008 Population Estimate
2040 Population Projection
about
250,000people
about
125,000people
Current development in Cache valley:
Projected 2040 development in Cache valley:
2040 Projections
Looking northwest toward Hyrum and Nibley
Looking southeast toward Smithf ield and Hyde Park
Looking northwest toward Hyrum and Nibley
Looking southeast toward Smithf ield and Hyde Park
3 Envision CaChE vallEy
Public P
rocess
2Public Processintroduction - a vision Created by the PublicHow is a regional vision created by the public? An active citizenry and committed stakeholders participate in the process. Public workshops provided opportunities for citizens to craft maps illustrating their ideal future, town hall meetings enabled residents to express preferences regarding ideas proposed by the public at prior events, and online questionnaires facilitated another means to provide feedback.
Envision Cache Valley engaged citizens from all 25 cities and towns as well as unincorporated areas within Franklin County, Idaho and Cache County, Utah. The process also included a survey conducted by an independent research firm, which polled 400 residents to achieve a representative sample of the population.
Cache valley Regional CouncilThe Cache Valley Regional Council is a group of elected officials and community leaders from across the valley that collaborates to address regional issues. This body, created by an interlocal agreement of Cache Valley jurisdictions, identified the need for a regional vision, and initiated the Envision Cache Valley process. The council was instrumental in forming the project’s executive and steering committees and will take on a leadership and empowerment role in vision implementation.
Envision Cache Valley steering CommitteeThe steering committee is composed of a large and diverse group of community leaders and citizens. Charged with directing Envision
Cache Valley, the steering committee ensured a transparent and public process in which citizens could explore the challenges associated with growth and express preferences leading to the creation of a publicly supported valley-wide vision. Under the direction of the steering committee, Envision Utah facilitated the process.
Envision Cache Valley Executive CommitteeThe executive committee is composed of a small group of steering committee members that oversees project administration, operations, and facilitators.
Envision Cache Valley Technical CommitteeThe technical committee includes local experts who convened at key points in the process to evaluate project issues, identify themes and ideas from public input, help create and improve pieces developed for public meetings, and ensure that information shared with the public was accurate and technically sound.
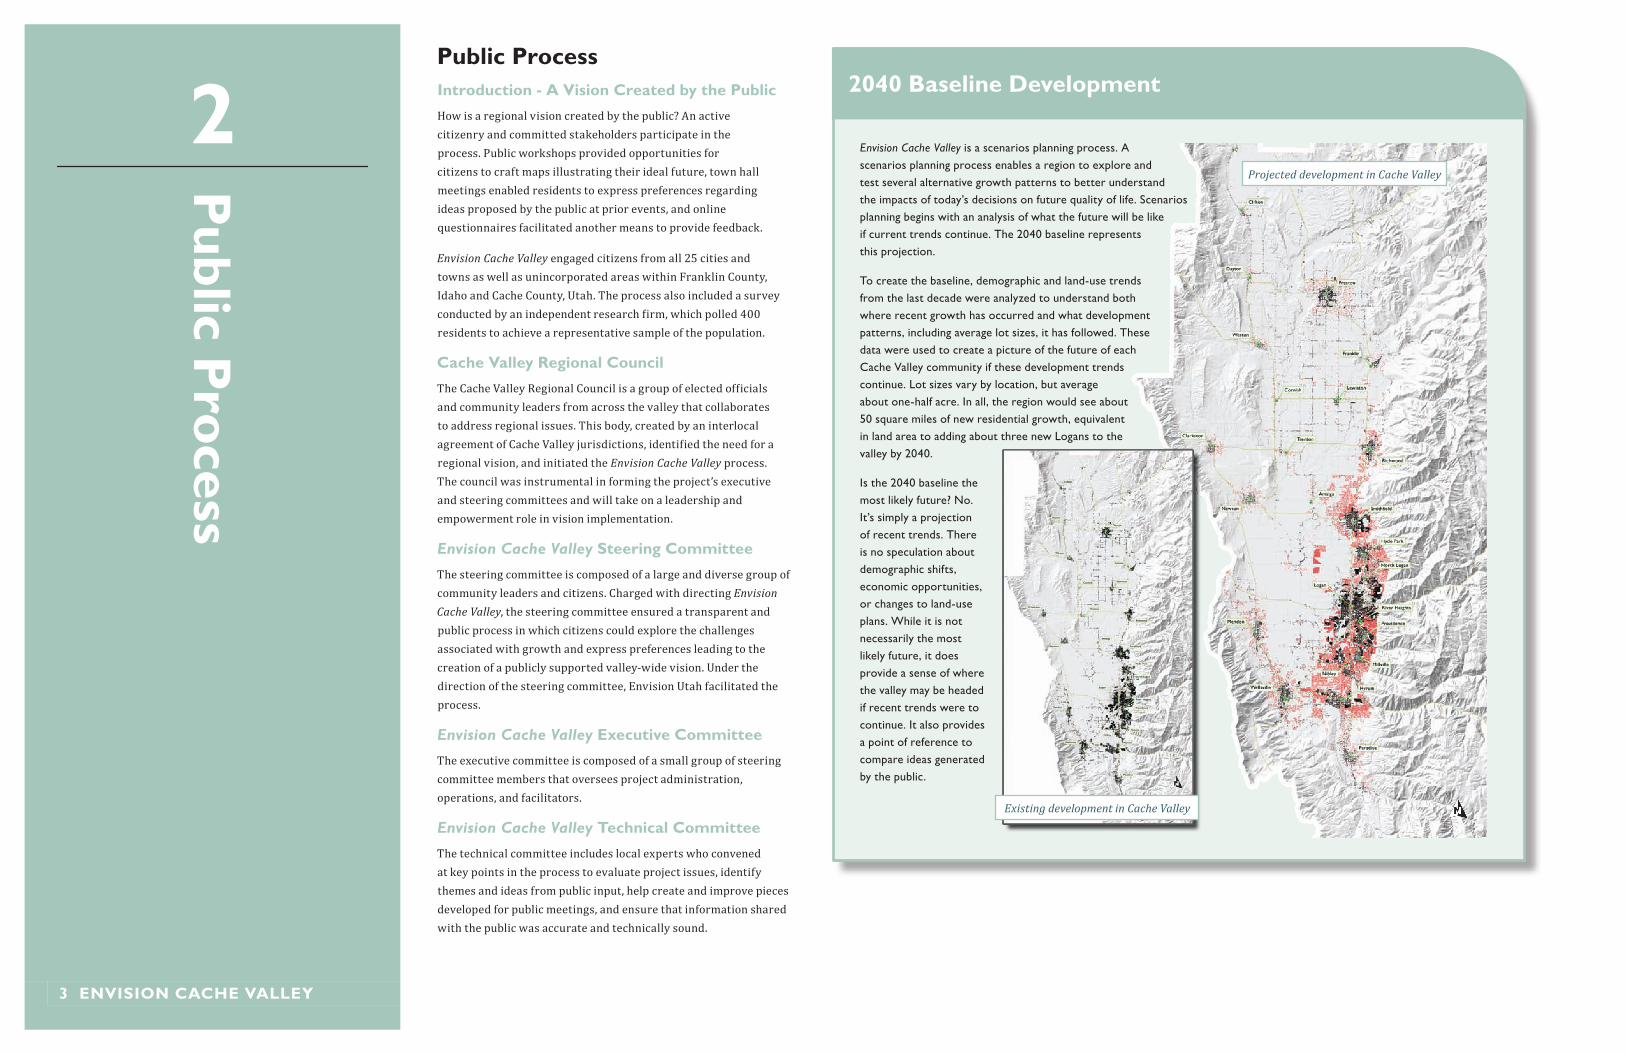
Envision Cache Valley is a scenarios planning process. A scenarios planning process enables a region to explore and test several alternative growth patterns to better understand the impacts of today’s decisions on future quality of life. Scenarios planning begins with an analysis of what the future will be like if current trends continue. The 2040 baseline represents this projection.
To create the baseline, demographic and land-use trends from the last decade were analyzed to understand both where recent growth has occurred and what development patterns, including average lot sizes, it has followed. These data were used to create a picture of the future of each Cache Valley community if these development trends continue. Lot sizes vary by location, but average about one-half acre. In all, the region would see about 50 square miles of new residential growth, equivalent in land area to adding about three new Logans to the valley by 2040.
Is the 2040 baseline the most likely future? No. It’s simply a projection of recent trends. There is no speculation about demographic shifts, economic opportunities, or changes to land-use plans. While it is not necessarily the most likely future, it does provide a sense of where the valley may be headed if recent trends were to continue. It also provides a point of reference to compare ideas generated by the public.
2040 baseline development
Projected development in Cache Valley
Existing development in Cache Valley
PubliC PRoCEss 4
Growth summit and stakeholder MeetingsNearly 250 residents met at the Logan Tabernacle to launch Envision Cache Valley on February 25, 2009. Participants contemplated the first 150 years of the valley’s settlement while looking toward the next few decades. While it took about 150 years for the valley to reach its current population of almost 125,000, the population is expected to double to about 250,000 in only a few decades. As they reviewed the 2040 baseline, participants were challenged to engage in a conversation about growth, to contemplate how to accommodate growth while creating a future that the next generations will appreciate. In conjunction with the Growth Summit, numerous meetings were held with stakeholder groups, including the Chamber of Commerce, Rotary, Kiwanis, local mayors, local planners, local city managers, conservation groups, and the media. About 200 people participated in these meetings.
Public Workshops and surveyMore than 1,150 citizens participated in an initial round of public input in February and March 2009, through ten public workshops or an online questionnaire. Participants brainstormed how growth should occur in coming decades, and those at the workshops created maps illustrating their preferences for conservation, housing, employment, and transportation. Participants worked collectively to create 53 maps, which, along with survey responses, presented ideas used to develop alternative growth scenarios. The workshops and other public events were the heart of the visioning process. The goal was to capture public values and preferences in order to create a publicly generated and supported long-term vision.
Among a wide range of possible goals, Envision Cache Valley participants identified the following as most important to the future:
• maintain/improve air quality• maintain/improve water quality; conserve water• retain viable agricultural land• preserve scenic beauty• keep housing reasonably priced• create high-quality jobs in Cache Valley• preserve wildlife habitat• focus on infill and redevelopment of underutilized parcels• provide access to outdoor recreation• reduce drive times/alleviate traffic congestion.
Some features related to the above goals are tied to land-use and can be measured across alternative growth scenarios. These measures enabled citizens to compare the growth scenarios against common values.
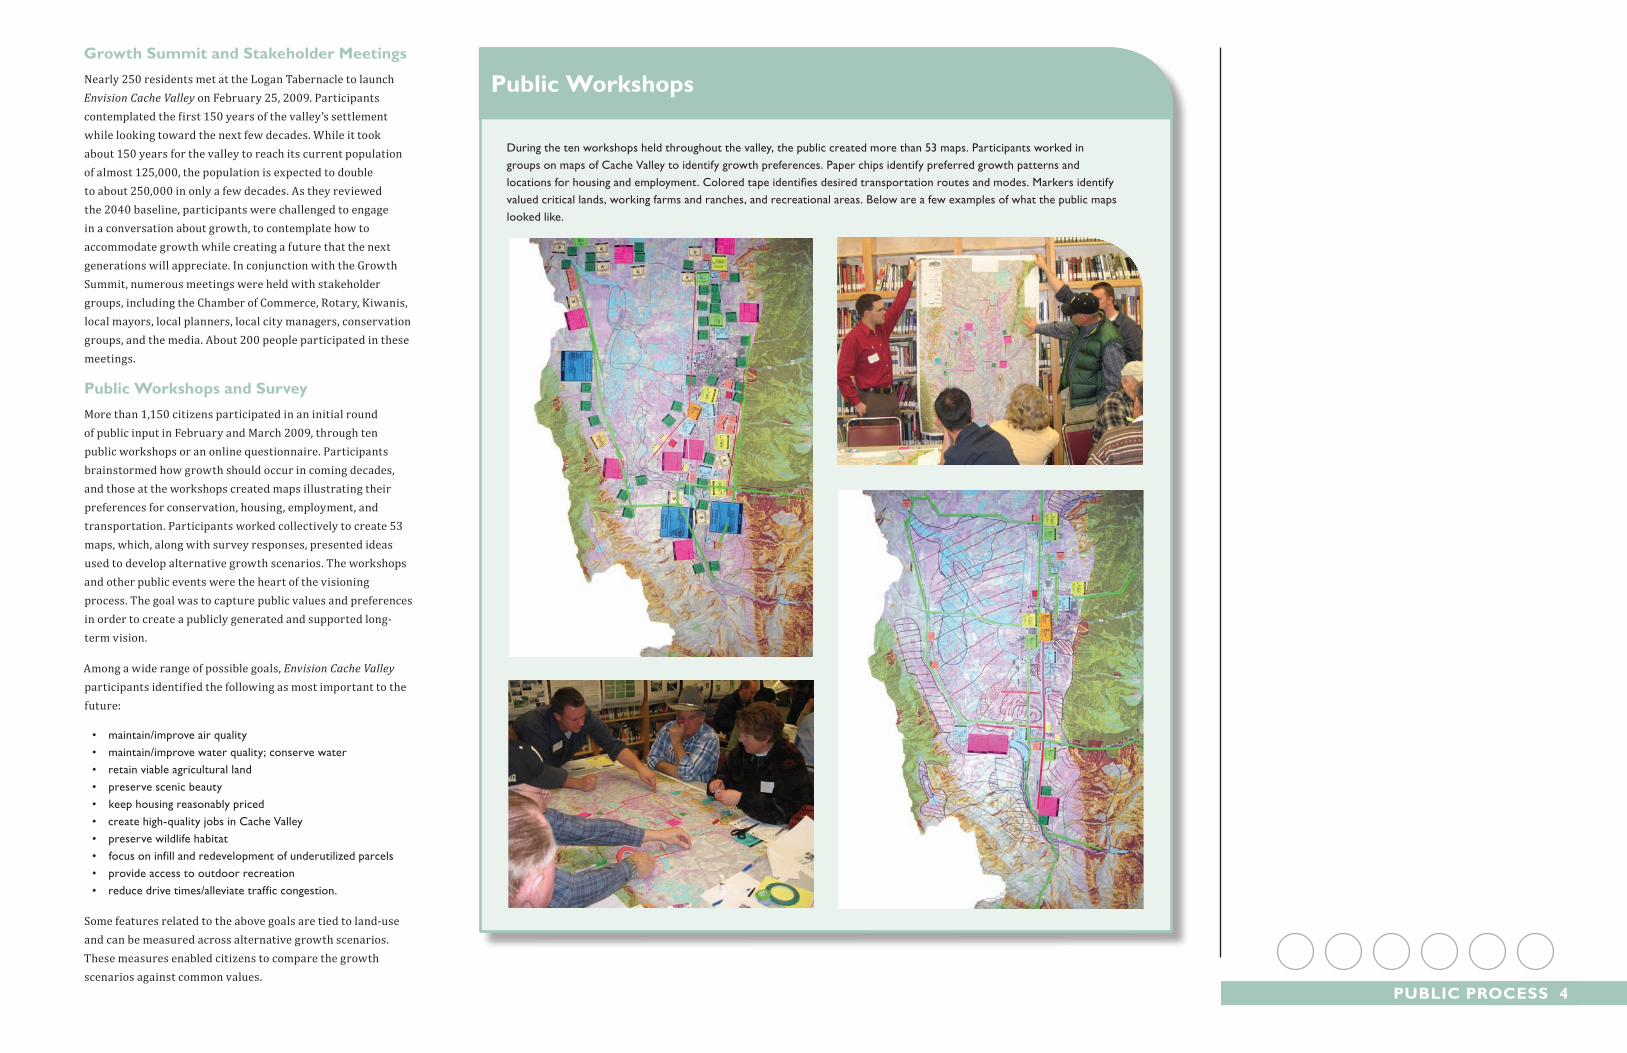
During the ten workshops held throughout the valley, the public created more than 53 maps. Participants worked in groups on maps of Cache Valley to identify growth preferences. Paper chips identify preferred growth patterns and locations for housing and employment. Colored tape identifies desired transportation routes and modes. Markers identify valued critical lands, working farms and ranches, and recreational areas. Below are a few examples of what the public maps looked like.
Public Workshops
5 Envision CaChE vallEy
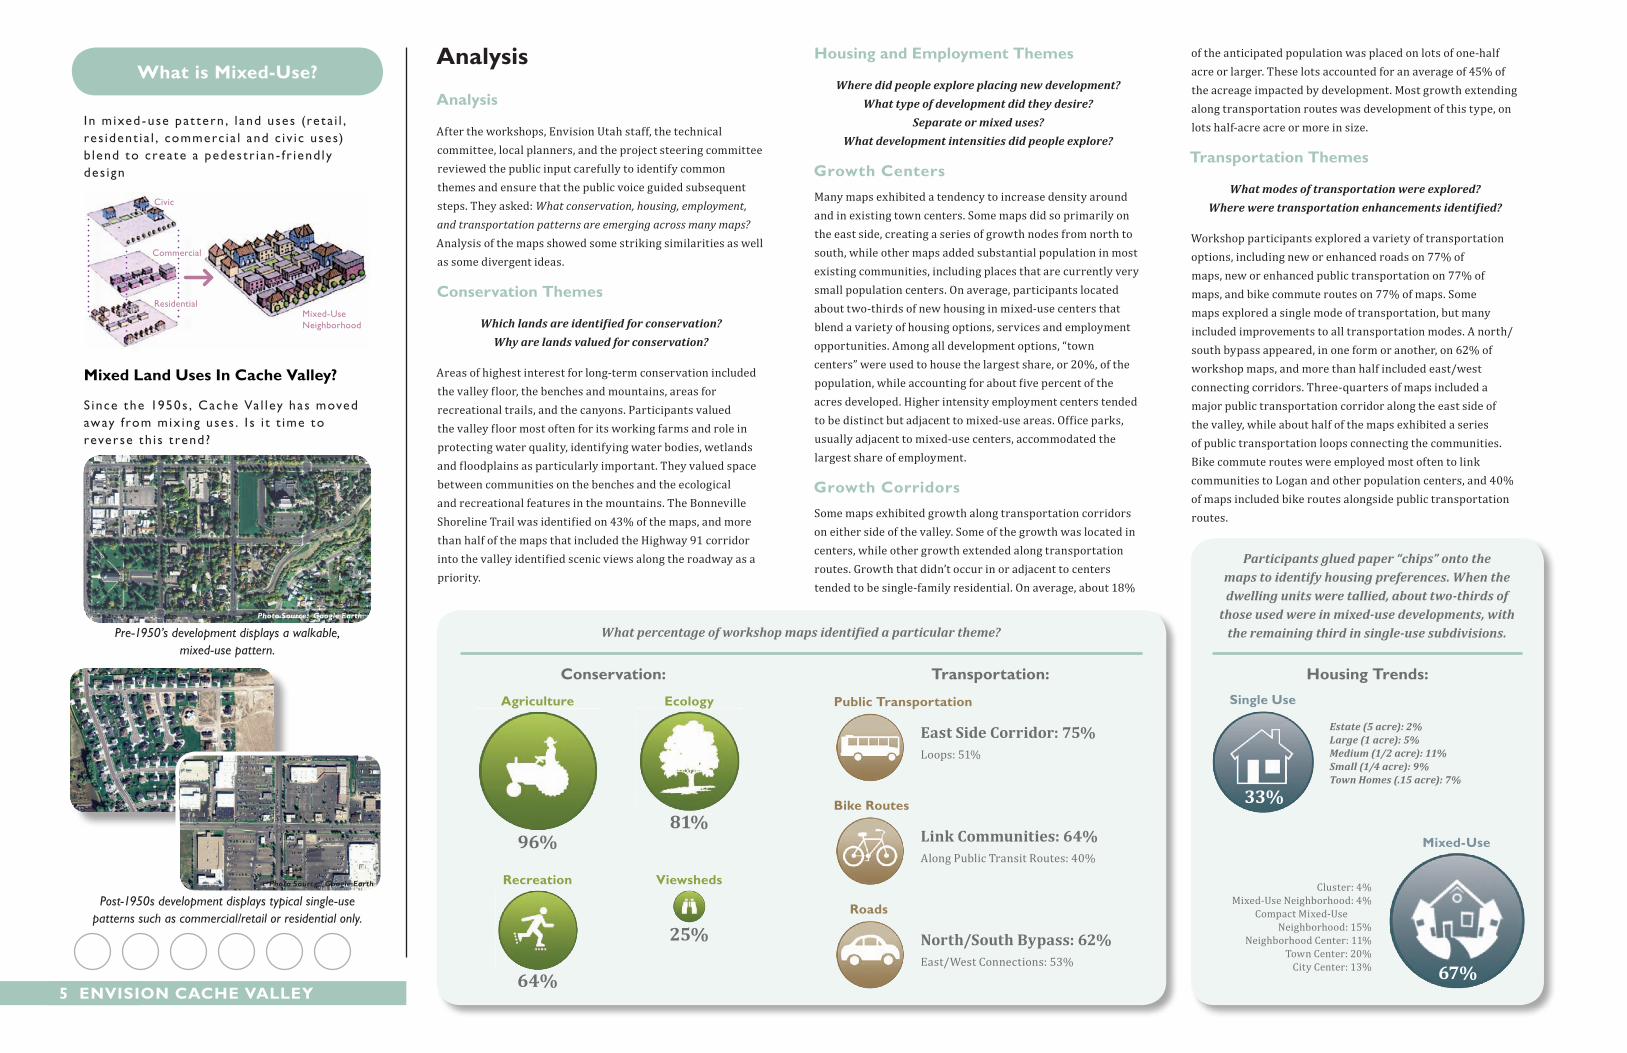
What is Mixed-use?
I n mixed -use pat tern , l and uses (re t a i l , res ident i a l , commerc i a l and c iv ic uses) b lend to create a pedestr i an - fr iend ly des ign
Mixed land uses in Cache valley?
S ince the 1950s , Cache Va l ley has moved away from mix ing uses . I s i t t ime to reverse th i s t rend?
Mixed-Use Neighborhood
Civic
Commercial
Residential
Pre-1950’s development displays a walkable,mixed-use pattern.
Photo Source: Google Earth
Post-1950s development displays typical single-use patterns such as commercial/retail or residential only.
Photo Source: Google Earth
analysis
analysis
After the workshops, Envision Utah staff, the technical committee, local planners, and the project steering committee reviewed the public input carefully to identify common themes and ensure that the public voice guided subsequent steps. They asked: What conservation, housing, employment,
and transportation patterns are emerging across many maps? Analysis of the maps showed some striking similarities as well as some divergent ideas.
Conservation Themes
Which lands are identified for conservation?
Why are lands valued for conservation?
Areas of highest interest for long-term conservation included the valley floor, the benches and mountains, areas for recreational trails, and the canyons. Participants valued the valley floor most often for its working farms and role in protecting water quality, identifying water bodies, wetlands and floodplains as particularly important. They valued space between communities on the benches and the ecological and recreational features in the mountains. The Bonneville Shoreline Trail was identified on 43% of the maps, and more than half of the maps that included the Highway 91 corridor into the valley identified scenic views along the roadway as a priority.
housing and Employment Themes
Where did people explore placing new development?
What type of development did they desire?
Separate or mixed uses?
What development intensities did people explore?
Growth CentersMany maps exhibited a tendency to increase density around and in existing town centers. Some maps did so primarily on the east side, creating a series of growth nodes from north to south, while other maps added substantial population in most existing communities, including places that are currently very small population centers. On average, participants located about two-thirds of new housing in mixed-use centers that blend a variety of housing options, services and employment opportunities. Among all development options, “town centers” were used to house the largest share, or 20%, of the population, while accounting for about five percent of the acres developed. Higher intensity employment centers tended to be distinct but adjacent to mixed-use areas. Office parks, usually adjacent to mixed-use centers, accommodated the largest share of employment.
Growth CorridorsSome maps exhibited growth along transportation corridors on either side of the valley. Some of the growth was located in centers, while other growth extended along transportation routes. Growth that didn’t occur in or adjacent to centers tended to be single-family residential. On average, about 18%
of the anticipated population was placed on lots of one-half acre or larger. These lots accounted for an average of 45% of the acreage impacted by development. Most growth extending along transportation routes was development of this type, on lots half-acre acre or more in size.
Transportation Themes
What modes of transportation were explored?
Where were transportation enhancements identified?
Workshop participants explored a variety of transportation options, including new or enhanced roads on 77% of maps, new or enhanced public transportation on 77% of maps, and bike commute routes on 77% of maps. Some maps explored a single mode of transportation, but many included improvements to all transportation modes. A north/south bypass appeared, in one form or another, on 62% of workshop maps, and more than half included east/west connecting corridors. Three-quarters of maps included a major public transportation corridor along the east side of the valley, while about half of the maps exhibited a series of public transportation loops connecting the communities. Bike commute routes were employed most often to link communities to Logan and other population centers, and 40% of maps included bike routes alongside public transportation routes.
What percentage of workshop maps identified a particular theme?
Transportation:
East Side Corridor: 75%Loops: 51%
Public Transportation
Link Communities: 64%Along Public Transit Routes: 40%
bike Routes
Roads
North/South Bypass: 62%East/West Connections: 53%
Conservation:
agriculture
96%
Recreation
64%
viewsheds
25%
Ecology
81%
Participants glued paper “chips” onto the maps to identify housing preferences. When the dwelling units were tallied, about two-thirds of
those used were in mixed-use developments, with the remaining third in single-use subdivisions.
housing Trends:single use
33%
Estate (5 acre): 2%Large (1 acre): 5%Medium (1/2 acre): 11%Small (1/4 acre): 9%Town Homes (.15 acre): 7%
Mixed-use
67%
Cluster: 4%Mixed-Use Neighborhood: 4%
Compact Mixed-Use Neighborhood: 15%
Neighborhood Center: 11%Town Center: 20%
City Center: 13%
PubliC PRoCEss 6
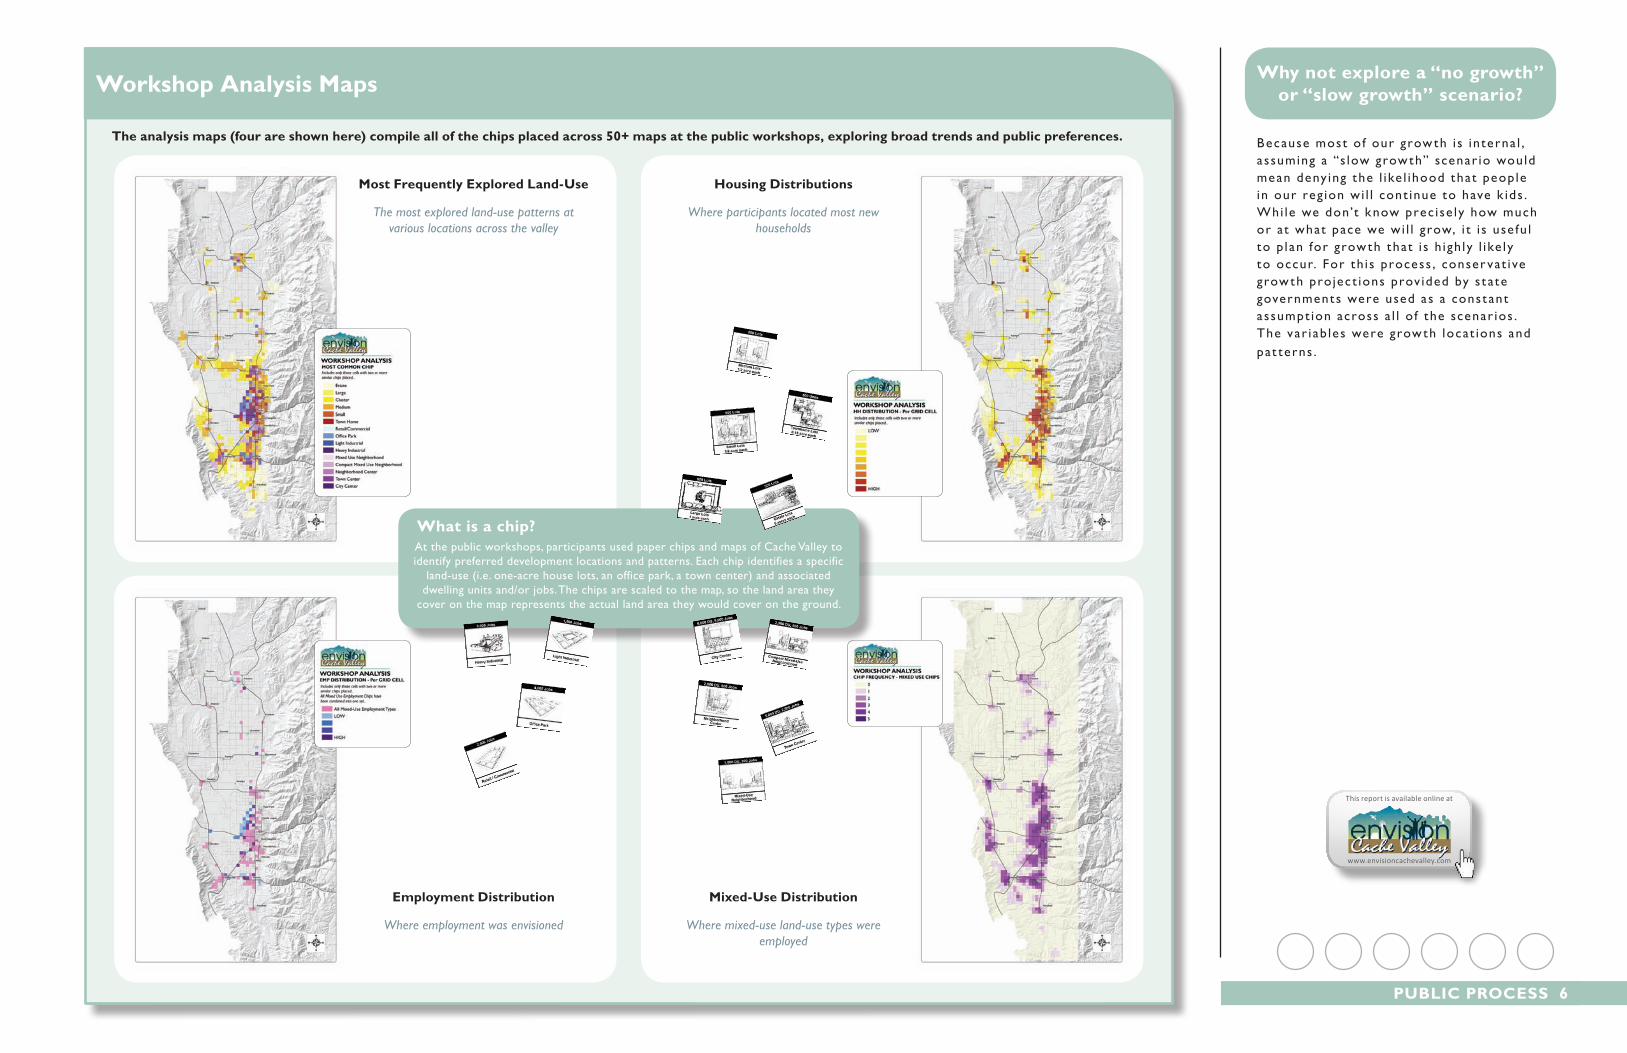
The analysis maps (four are shown here) compile all of the chips placed across 50+ maps at the public workshops, exploring broad trends and public preferences.
Workshop analysis Maps
Most Frequently Explored land-use
The most explored land-use patterns at various locations across the valley
housing distributions
Where participants located most new households
Employment distribution
Where employment was envisioned
Mixed-use distribution
Where mixed-use land-use types were employed
What is a chip?At the public workshops, participants used paper chips and maps of Cache Valley to identify preferred development locations and patterns. Each chip identifies a specific
land-use (i.e. one-acre house lots, an office park, a town center) and associated dwelling units and/or jobs. The chips are scaled to the map, so the land area they
cover on the map represents the actual land area they would cover on the ground.
Why not explore a “no growth” or “slow growth” scenario?
Because most o f our growth i s in terna l , a ssuming a “s low growth” scenar io would mean deny ing the l ike l ihood that peop le in our reg ion wi l l cont inue to have k ids . Whi le we don’t know prec i se ly how much or at what pace we wi l l grow, i t i s use fu l to p l an for growth that i s h igh ly l ike ly to occur. For th i s process , conser vat ive growth projec t ions prov ided by s t ate government s were used as a const ant a ssumpt ion across a l l o f the scenar ios . The var i ab les were growth locat ions and pat terns .
This report is available online at
www.envisioncachevalley.com
7 Envision CaChE vallEy
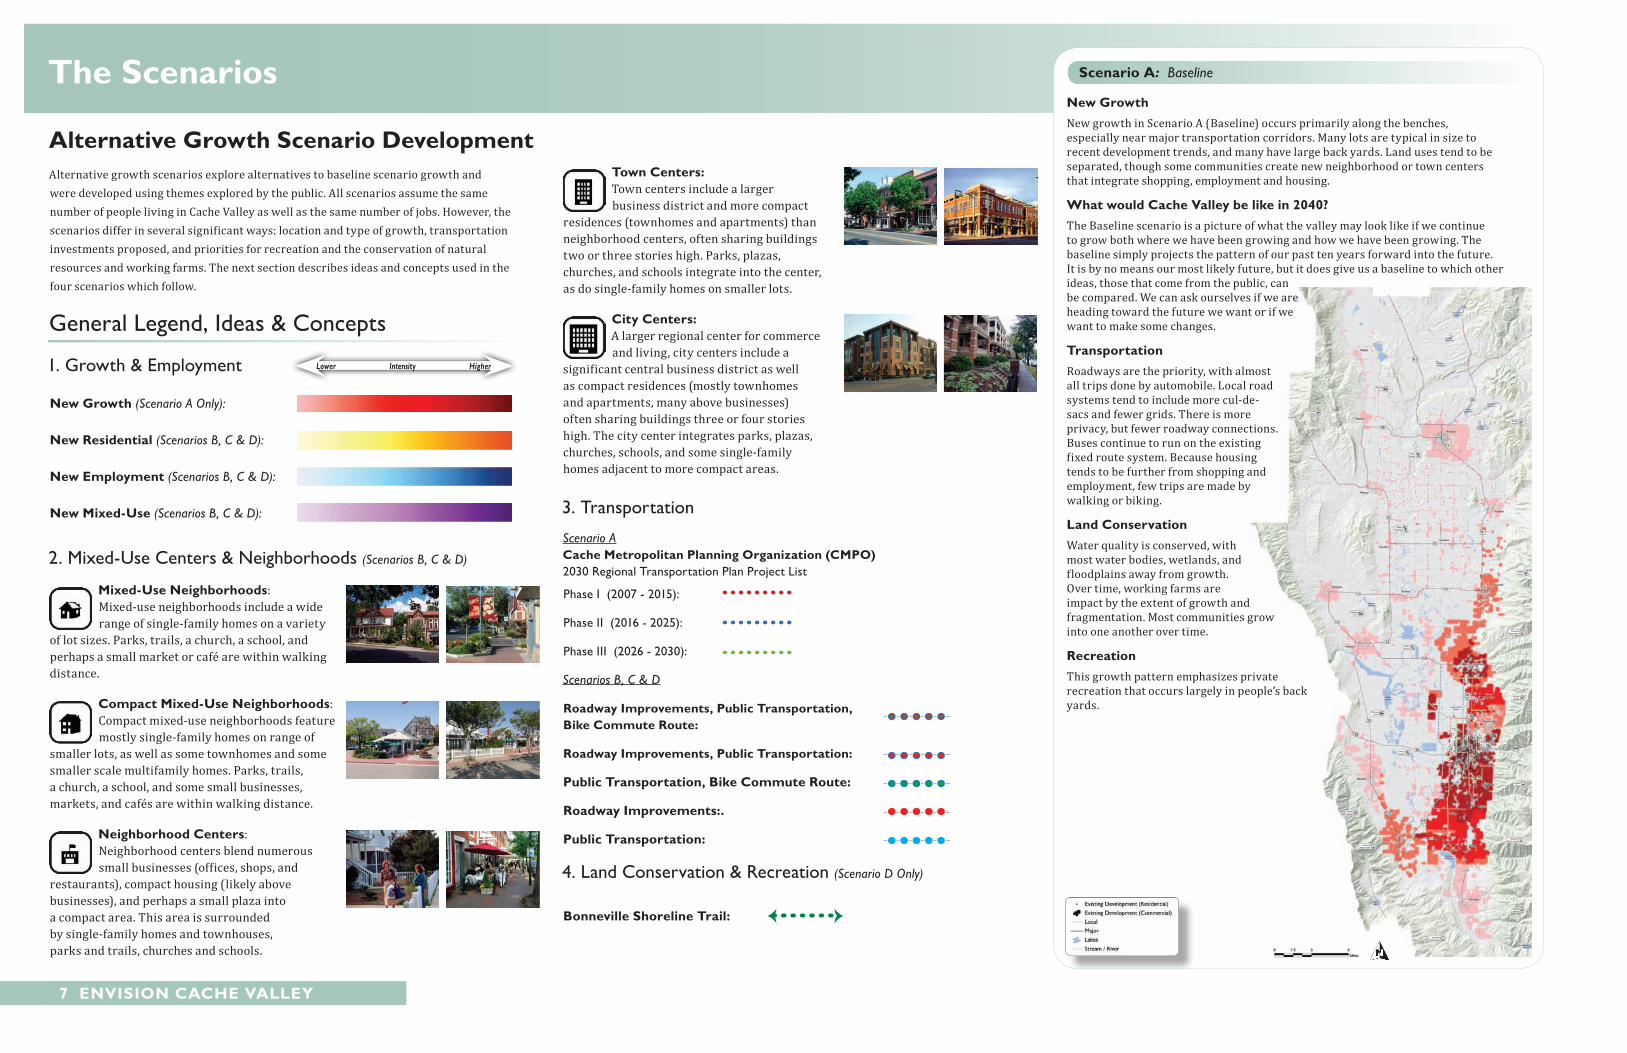
The scenarios scenario a: Baseline
alternative Growth scenario development Alternative growth scenarios explore alternatives to baseline scenario growth and were developed using themes explored by the public. All scenarios assume the same number of people living in Cache Valley as well as the same number of jobs. However, the scenarios differ in several significant ways: location and type of growth, transportation investments proposed, and priorities for recreation and the conservation of natural resources and working farms. The next section describes ideas and concepts used in the four scenarios which follow.
General Legend, Ideas & Concepts
1. Growth & Employment
new Growth (Scenario A Only):
new Residential (Scenarios B, C & D):
new Employment (Scenarios B, C & D):
new Mixed-use (Scenarios B, C & D):
2. Mixed-Use Centers & Neighborhoods (Scenarios B, C & D)
Mixed-use neighborhoods:Mixed-use neighborhoods include a wide range of single-family homes on a variety
of lot sizes. Parks, trails, a church, a school, and perhaps a small market or café are within walking distance.
Compact Mixed-use neighborhoods: Compact mixed-use neighborhoods feature mostly single-family homes on range of
smaller lots, as well as some townhomes and some smaller scale multifamily homes. Parks, trails, a church, a school, and some small businesses, markets, and cafés are within walking distance.
neighborhood Centers:Neighborhood centers blend numerous small businesses (offices, shops, and
restaurants), compact housing (likely above businesses), and perhaps a small plaza into a compact area. This area is surrounded by single-family homes and townhouses, parks and trails, churches and schools.
Lower Intensity Higher
Town Centers:Town centers include a larger business district and more compact
residences (townhomes and apartments) than neighborhood centers, often sharing buildings two or three stories high. Parks, plazas, churches, and schools integrate into the center, as do single-family homes on smaller lots.
City Centers:A larger regional center for commerce and living, city centers include a
significant central business district as well as compact residences (mostly townhomes and apartments, many above businesses) often sharing buildings three or four stories high. The city center integrates parks, plazas, churches, schools, and some single-family homes adjacent to more compact areas.
3. Transportation
Scenario ACache Metropolitan Planning organization (CMPo)2030 Regional Transportation Plan Project List
Phase I (2007 - 2015):
Phase II (2016 - 2025):
Phase III (2026 - 2030):
Scenarios B, C & D
Roadway improvements, Public Transportation, bike Commute Route:
Roadway improvements, Public Transportation:
Public Transportation, bike Commute Route:
Roadway improvements:.
Public Transportation:
4. Land Conservation & Recreation (Scenario D Only)
bonneville shoreline Trail:
new GrowthNew growth in Scenario A (Baseline) occurs primarily along the benches, especially near major transportation corridors. Many lots are typical in size to recent development trends, and many have large back yards. Land uses tend to be separated, though some communities create new neighborhood or town centers that integrate shopping, employment and housing.
What would Cache valley be like in 2040?The Baseline scenario is a picture of what the valley may look like if we continue to grow both where we have been growing and how we have been growing. The baseline simply projects the pattern of our past ten years forward into the future. It is by no means our most likely future, but it does give us a baseline to which other ideas, those that come from the public, can be compared. We can ask ourselves if we are heading toward the future we want or if we want to make some changes.
TransportationRoadways are the priority, with almost all trips done by automobile. Local road systems tend to include more cul-de-sacs and fewer grids. There is more privacy, but fewer roadway connections. Buses continue to run on the existing fixed route system. Because housing tends to be further from shopping and employment, few trips are made by walking or biking.
land ConservationWater quality is conserved, with most water bodies, wetlands, and floodplains away from growth. Over time, working farms are impact by the extent of growth and fragmentation. Most communities grow into one another over time.
RecreationThis growth pattern emphasizes private recreation that occurs largely in people’s back yards.
PubliC PRoCEss 8
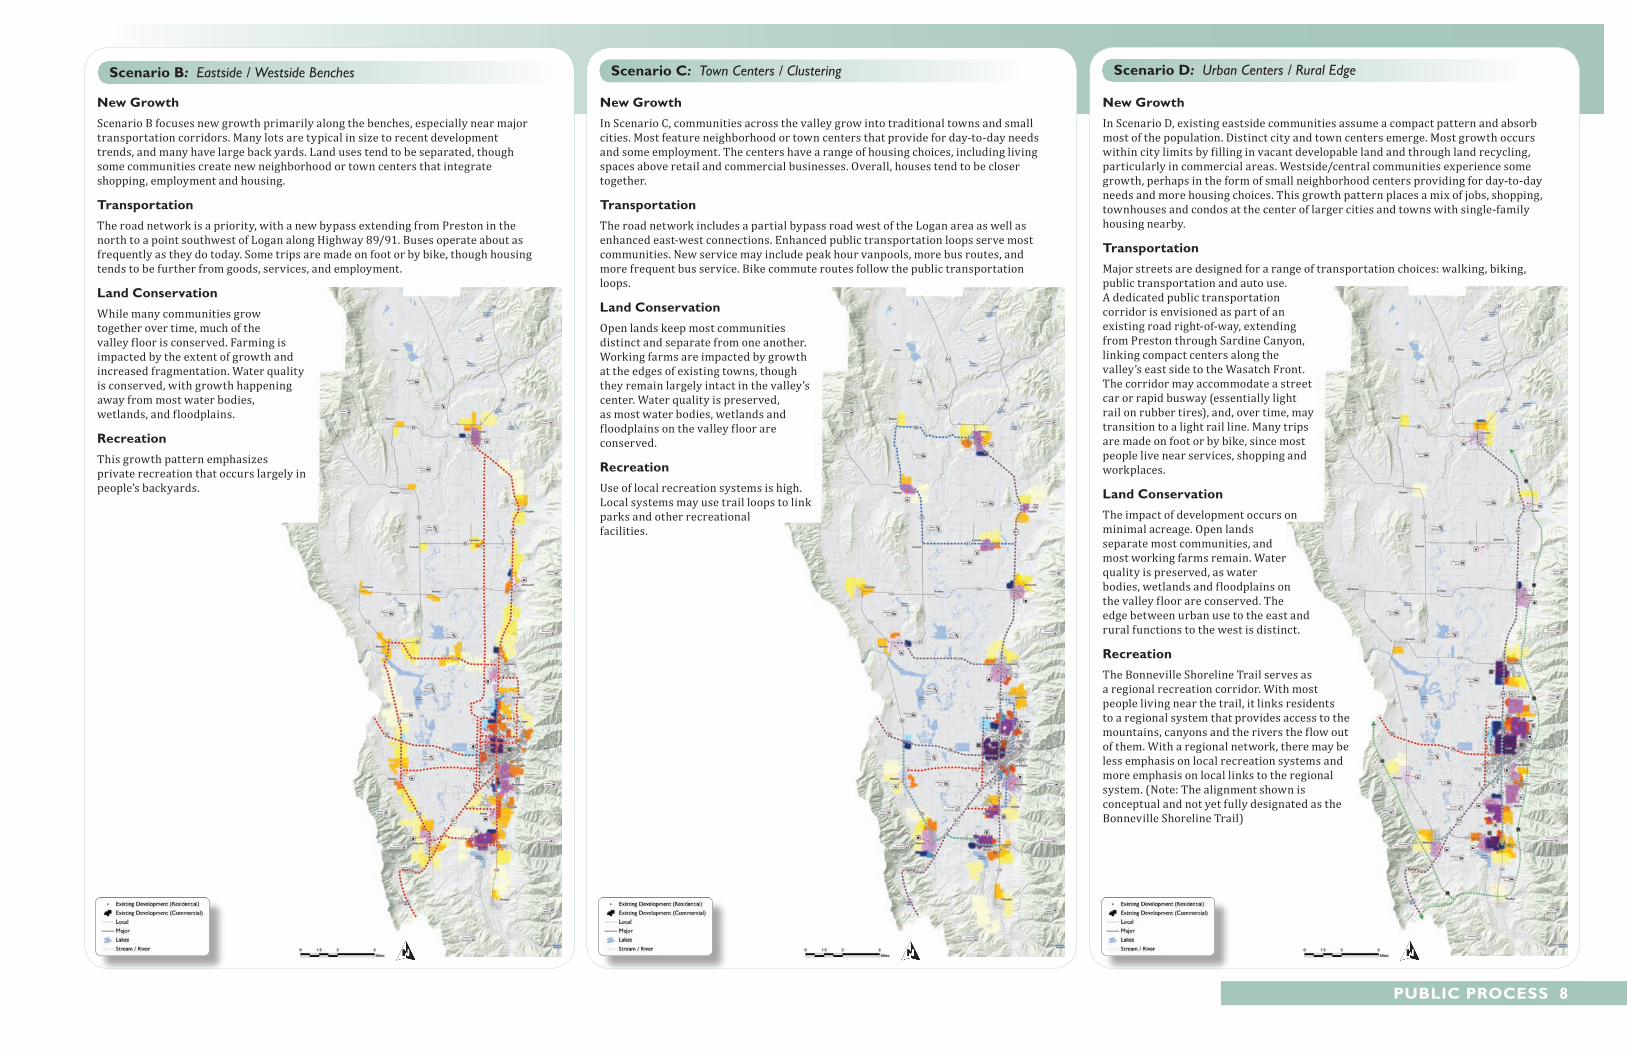
The scenariosscenario b: Eastside / Westside Benches scenario C: Town Centers / Clustering scenario d: Urban Centers / Rural Edge
new GrowthScenario B focuses new growth primarily along the benches, especially near major transportation corridors. Many lots are typical in size to recent development trends, and many have large back yards. Land uses tend to be separated, though some communities create new neighborhood or town centers that integrate shopping, employment and housing.
TransportationThe road network is a priority, with a new bypass extending from Preston in the north to a point southwest of Logan along Highway 89/91. Buses operate about as frequently as they do today. Some trips are made on foot or by bike, though housing tends to be further from goods, services, and employment.
land ConservationWhile many communities grow together over time, much of the valley floor is conserved. Farming is impacted by the extent of growth and increased fragmentation. Water quality is conserved, with growth happening away from most water bodies, wetlands, and floodplains.
RecreationThis growth pattern emphasizes private recreation that occurs largely in people’s backyards.
new GrowthIn Scenario C, communities across the valley grow into traditional towns and small cities. Most feature neighborhood or town centers that provide for day-to-day needs and some employment. The centers have a range of housing choices, including living spaces above retail and commercial businesses. Overall, houses tend to be closer together.
TransportationThe road network includes a partial bypass road west of the Logan area as well as enhanced east-west connections. Enhanced public transportation loops serve most communities. New service may include peak hour vanpools, more bus routes, and more frequent bus service. Bike commute routes follow the public transportation loops.
land ConservationOpen lands keep most communities distinct and separate from one another. Working farms are impacted by growth at the edges of existing towns, though they remain largely intact in the valley’s center. Water quality is preserved, as most water bodies, wetlands and floodplains on the valley floor are conserved.
RecreationUse of local recreation systems is high. Local systems may use trail loops to link parks and other recreational facilities.
new GrowthIn Scenario D, existing eastside communities assume a compact pattern and absorb most of the population. Distinct city and town centers emerge. Most growth occurs within city limits by filling in vacant developable land and through land recycling, particularly in commercial areas. Westside/central communities experience some growth, perhaps in the form of small neighborhood centers providing for day-to-day needs and more housing choices. This growth pattern places a mix of jobs, shopping, townhouses and condos at the center of larger cities and towns with single-family housing nearby.
TransportationMajor streets are designed for a range of transportation choices: walking, biking, public transportation and auto use. A dedicated public transportation corridor is envisioned as part of an existing road right-of-way, extending from Preston through Sardine Canyon, linking compact centers along the valley’s east side to the Wasatch Front. The corridor may accommodate a street car or rapid busway (essentially light rail on rubber tires), and, over time, may transition to a light rail line. Many trips are made on foot or by bike, since most people live near services, shopping and workplaces.
land ConservationThe impact of development occurs on minimal acreage. Open lands separate most communities, and most working farms remain. Water quality is preserved, as water bodies, wetlands and floodplains on the valley floor are conserved. The edge between urban use to the east and rural functions to the west is distinct.
RecreationThe Bonneville Shoreline Trail serves as a regional recreation corridor. With most people living near the trail, it links residents to a regional system that provides access to the mountains, canyons and the rivers the flow out of them. With a regional network, there may be less emphasis on local recreation systems and more emphasis on local links to the regional system. (Note: The alignment shown is conceptual and not yet fully designated as the Bonneville Shoreline Trail)
9 Envision CaChE vallEy
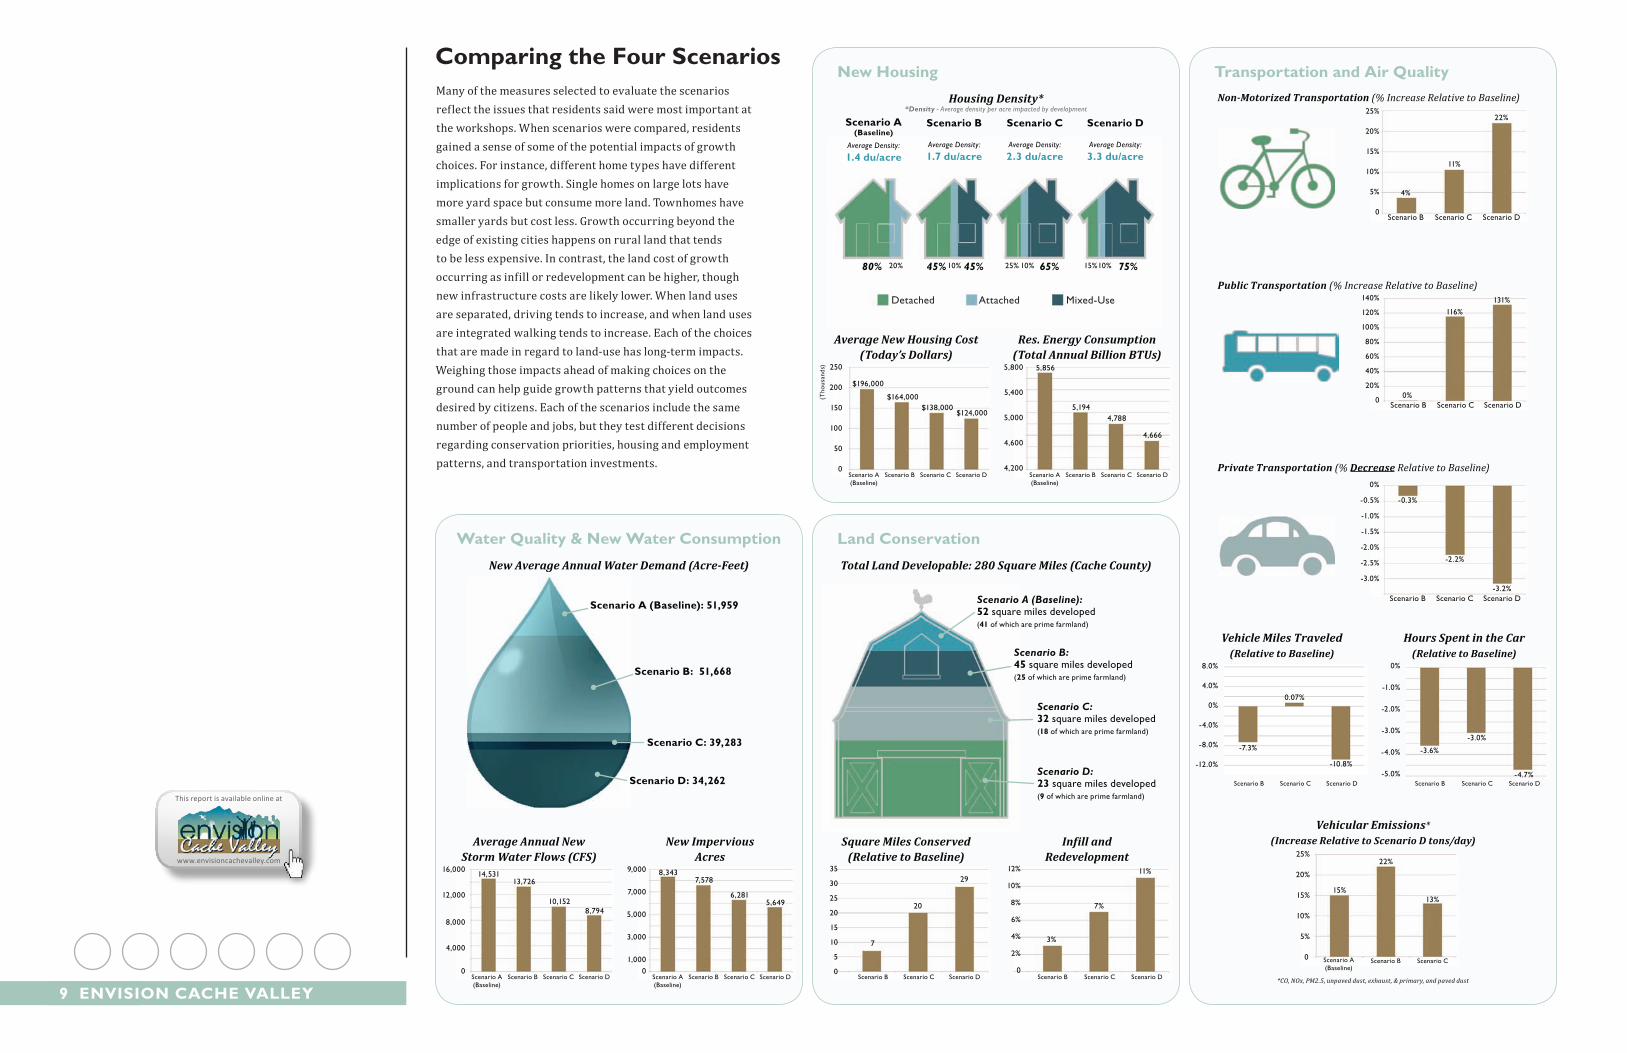
Comparing the Four scenariosMany of the measures selected to evaluate the scenarios reflect the issues that residents said were most important at the workshops. When scenarios were compared, residents gained a sense of some of the potential impacts of growth choices. For instance, different home types have different implications for growth. Single homes on large lots have more yard space but consume more land. Townhomes have smaller yards but cost less. Growth occurring beyond the edge of existing cities happens on rural land that tends to be less expensive. In contrast, the land cost of growth occurring as infill or redevelopment can be higher, though new infrastructure costs are likely lower. When land uses are separated, driving tends to increase, and when land uses are integrated walking tends to increase. Each of the choices that are made in regard to land-use has long-term impacts. Weighing those impacts ahead of making choices on the ground can help guide growth patterns that yield outcomes desired by citizens. Each of the scenarios include the same number of people and jobs, but they test different decisions regarding conservation priorities, housing and employment patterns, and transportation investments.
Transportation and air Quality
Hours Spent in the Car(Relative to Baseline)
Scenario B Scenario C Scenario D
-3.6%
-3.0%
-4.7%
-4.0%
-3.0%
-2.0%
-1.0%
0%
-5.0%
Vehicle Miles Traveled(Relative to Baseline)
-7.3%
0.07%
-10.8%
Scenario B Scenario C Scenario D
8.0%
4.0%
0%
-4.0%
-8.0%
-12.0%
Vehicular Emissions*(Increase Relative to Scenario D tons/day)
20%
15%
10%
5%
0
15%
22%
13%
25%
Scenario A (Baseline)
Scenario B Scenario C
*CO, NOx, PM2.5, unpaved dust, exhaust, & primary, and paved dust
Non-Motorized Transportation (% Increase Relative to Baseline)
Scenario B Scenario C Scenario D0
5% 4%
11%
22%
10%
15%
20%
25%
Public Transportation (% Increase Relative to Baseline)
Scenario B Scenario C Scenario D 0
20%0%
116%131%
40%
100%
80%
60%
120%
140%
Private Transportation (% Decrease Relative to Baseline)
Scenario B Scenario C Scenario D
-2.5%
-3.0%
-0.3%
-2.2%
-3.2%
-2.0%
-1.5%
-1.0%
-0.5%
0%
land Conservation
Total Land Developable: 280 Square Miles (Cache County)
Scenario A (Baseline):52 square miles developed(41 of which are prime farmland)
Scenario B:45 square miles developed(25 of which are prime farmland)
Scenario C:32 square miles developed(18 of which are prime farmland)
Scenario D:23 square miles developed(9 of which are prime farmland)
Scenario B Scenario C Scenario D
Infill and Redevelopment
3%
7%
11%
0
2%
4%
6%
8%
10%
12%
Square Miles Conserved(Relative to Baseline)
Scenario B Scenario C Scenario D
35
7
20
2930
25
20
15
10
5
0
new housing
Housing Density*
4,600
4,200
5,000
5,400
5,800 5,856
5,1944,788
4,666
Scenario A (Baseline)
Scenario B Scenario C Scenario D
Res. Energy Consumption(Total Annual Billion BTUs)
0
50
100
150
200
Average New Housing Cost(Today’s Dollars)
Scenario A (Baseline)
Scenario B Scenario C Scenario D
250
$196,000
$164,000 $138,000
$124,000
80% 20% 45% 65% 75%10% 10% 10%45% 25% 15%
Detached Attached Mixed-Use
scenario a(baseline)
Average Density:
1.4 du/acre
scenario b
Average Density:
1.7 du/acre
scenario C
Average Density:
2.3 du/acre
scenario d
Average Density:
3.3 du/acre
*Density - Average density per acre impacted by development
(Tho
usan
ds)
0
4,000
8,000
12,000
16,000
Average Annual New Storm Water Flows (CFS)
14,531 13,726
10,152 8,794
Scenario A (Baseline)
Scenario B Scenario C Scenario D 0
3,000
1,000
5,000
7,000
9,000
New Impervious Acres
8,343 7,578
6,281 5,649
Scenario A (Baseline)
Scenario B Scenario C Scenario D
New Average Annual Water Demand (Acre-Feet)
scenario d: 34,262
scenario C: 39,283
scenario a (baseline): 51,959
scenario b: 51,668
Water Quality & new Water Consumption
This report is available online at
www.envisioncachevalley.com

PubliC PRoCEss 10
Town hall Meetings and Feedback surveyIn May and June 2009, about 650 citizens engaged in the second major round of public events, participating in either one of 14 town hall meetings held throughout the valley or in an online feedback survey. In this round, the scenarios, including the baseline and the alternatives developed from public brainstorming, were presented and compared. Participants evaluated the scenarios, expressing their preferences regarding general growth patterns and the elements of the scenarios they most favored, ranging from housing and employment patterns to transportation priorities and conservation goals.
What did Cache valley Residents say?When asked to identify the most appropriate pattern for future growth, the growth scenario representing the development trends of the last ten years garnered 11% of the vote, while 89% opted for the alternative scenarios created with information from public brainstorming workshops. Scenarios that depicted most future growth occurring within existing towns and cities—without those cities growing together—received the most support. These scenarios were also preferred for the public transportation options that become possible with their respective land-use patterns and the natural resource conservation and farmland protection that is possible when less land is consumed for residential development.
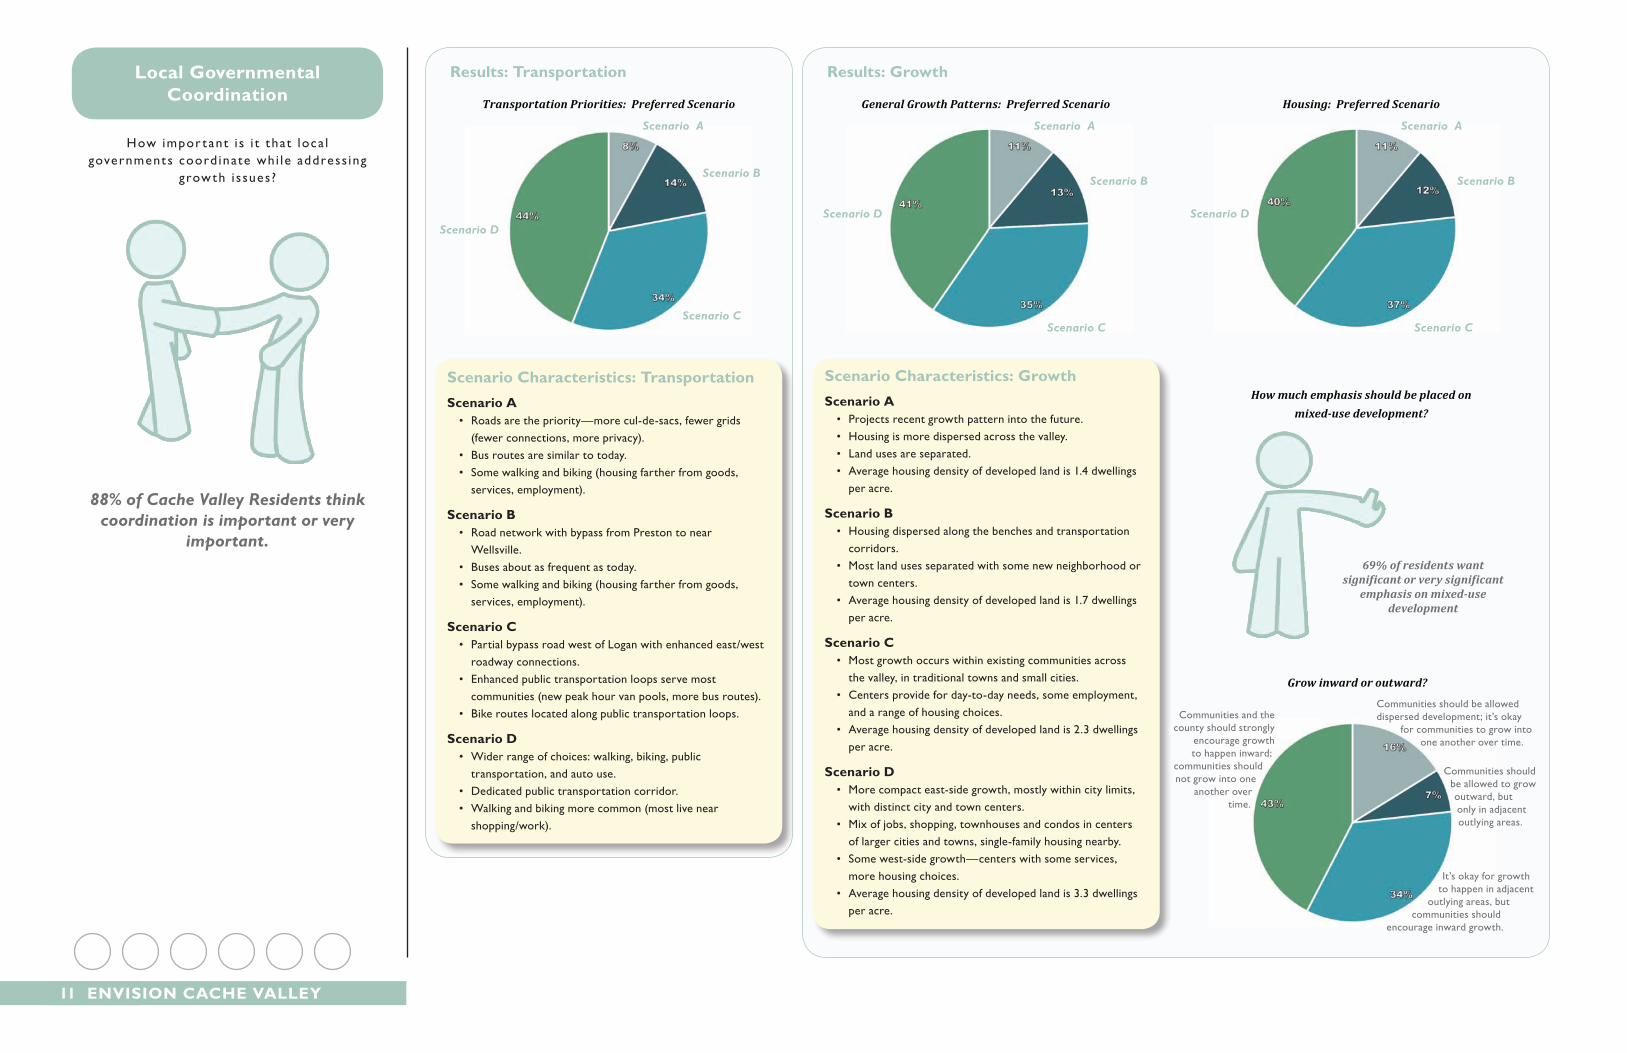
Overall, more participants envision more compact growth than what has been built in recent years, with only 16% of residents desirous of a dispersed pattern of growth in the valley. Rather, there is significant interest in growing within existing cities and towns, creating mixed-use neighborhoods and centers (places with a variety of housing options and the ability to walk to schools, shops, restaurants, and, perhaps, workplaces). More than 90% of residents preferred at least some emphasis on mixed-use—69% preferred a significant or very significant emphasis.
Participants preferred a balanced transportation system that includes improved roadway connections, more public transportation options, bike routes, and pedestrian access.
Conservation is a common goal, with 67% wanting to emphasize water quality, working farms and ranches, and protection of scenic vistas—including maintaining space between communities and preserving roadway corridors.
Further, residents want local jurisdictions to work together to address growth issues, with 88% finding coordination important or very important.
While most participants took the survey online or at a town hall meeting, an independent research firm also conducted a survey to obtain the responses of a random sample of the population. Responses were similar, though showing a preference for more limited changes than those of participants who received more information about demographics and market trends during Envision Cache Valley events.
Cost
Scenario A (Baseline)
Scenario B Scenario C Scenario D
Total New Local Infrastructure Cost, Today’s Dollars (local road construction and maintenance, culinary water, sewer, storm water
does not include cost of schools and other services)
$1,200,000,000 $1,174,537,623$1,027,915,005
$914,355,132$849,495,968
$1,000,000,000
$800,000,000
$600,000,000
$400,000,000
$200,000,000
$0
Scenario A (Baseline)
Scenario B Scenario C Scenario D
Annual Local Infrastructure Cost of Each New Household (local road construction and maintenance, culinary water, sewer, storm water
does not include cost of schools and other services)
$800
$700
$600
$500
$400
$300
$200
$100
$0
$900$789
$691$614 $571
Results: Conservation / Recreation
Conservation/Recreation Priorities: Preferred Scenario
Scenario D
Scenario B
Scenario C
Scenario A
scenario Characteristics: Conservation / Recreationscenario a
• Square miles developed: 52 (communities grow together)• Farmland developed: 26,091 acres • Recreation in backyards; trail loops/parks within brief
drive
scenario b• Square miles developed: 45 (most communities grow
together)• Farmland developed: 15,805 acres• Recreation in backyards; trail loops/parks within brief
drive
scenario C• Square miles developed: 32 (many communities remain
geographically distinct)• Farmland developed: 11,206 acres• Local recreation (trail loops link parks/other recreational
facilities)
scenario d• Square miles developed: 23 (most communities remain
geographically distinct)• Farmland developed: 5,746• Bonneville Shoreline Trail as a regional recreation corridor
(most live near trail)
11 Envision CaChE vallEy
Results: Transportation
Transportation Priorities: Preferred Scenario
Scenario D
Scenario B
Scenario C
Scenario A
scenario Characteristics: Transportationscenario a
• Roads are the priority—more cul-de-sacs, fewer grids (fewer connections, more privacy).
• Bus routes are similar to today.• Some walking and biking (housing farther from goods,
services, employment).
scenario b• Road network with bypass from Preston to near
Wellsville.• Buses about as frequent as today.• Some walking and biking (housing farther from goods,
services, employment).
scenario C• Partial bypass road west of Logan with enhanced east/west
roadway connections.• Enhanced public transportation loops serve most
communities (new peak hour van pools, more bus routes).• Bike routes located along public transportation loops.
scenario d• Wider range of choices: walking, biking, public
transportation, and auto use.• Dedicated public transportation corridor.• Walking and biking more common (most live near
shopping/work).
Results: Growth
General Growth Patterns: Preferred Scenario
Scenario D
Scenario B
Scenario C
Scenario A
Scenario D
Scenario B
Scenario C
Scenario A
Housing: Preferred Scenario
Grow inward or outward?
Communities should be allowed dispersed development; it’s okay
for communities to grow into one another over time.
It’s okay for growth to happen in adjacent
outlying areas, but communities should
encourage inward growth.
Communities and the county should strongly
encourage growth to happen inward;
communities should not grow into one
another over time.
Communities should be allowed to grow outward, but only in adjacent outlying areas.
69% of residents want significant or very significant
emphasis on mixed-use development
How much emphasis should be placed on
mixed-use development?
scenario Characteristics: Growthscenario a
• Projects recent growth pattern into the future.• Housing is more dispersed across the valley.• Land uses are separated.• Average housing density of developed land is 1.4 dwellings
per acre.
scenario b• Housing dispersed along the benches and transportation
corridors.• Most land uses separated with some new neighborhood or
town centers.• Average housing density of developed land is 1.7 dwellings
per acre.
scenario C• Most growth occurs within existing communities across
the valley, in traditional towns and small cities.• Centers provide for day-to-day needs, some employment,
and a range of housing choices.• Average housing density of developed land is 2.3 dwellings
per acre.
scenario d• More compact east-side growth, mostly within city limits,
with distinct city and town centers.• Mix of jobs, shopping, townhouses and condos in centers
of larger cities and towns, single-family housing nearby.• Some west-side growth—centers with some services,
more housing choices.• Average housing density of developed land is 3.3 dwellings
per acre.
local Governmental Coordination
How impor t ant i s i t that loca l government s coord inate whi le address ing
growth i s sues?
88% of Cache Valley Residents think coordination is important or very
important.
PubliC PRoCEss 12
draft vision developmentThe vision development process brought together the public preferences expressed at the town hall meetings and online. The Steering Committee identified themes that captured overall preferences, making sure that the themes accurately reflected public input. These themes were used to create the vision statement and vision principles. The preferred components of the growth scenarios formed the basis of a vision map representing one possible way that growth could occur if vision principles are implemented. The Steering Committee and Technical Committee reviewed and refined the vision, which was then presented to the Cache Valley Regional Council at a joint regional council and steering committee retreat. The vision is featured in chapter three.
Cache valley Regional Council and Envision Cache Valley steering Committee RetreatAfter the draft vision documents were created, the Cache Valley Regional Council and the Steering Committee participated in a retreat to review the process and the
vision developed through the process. The group affirmed the process, affirmed that the vision is a reflection of public preferences, and affirmed supporting efforts to implement vision principles. The group also began initial discussion about how to act on vision principles, both locally and as a partnership of jurisdictions, to address valley-wide issues
vision summitThe culmination of the public events surrounding Envision
Cache Valley, the Vision Summit held on October 13, 2009, enabled residents to review the Envision Cache Valley process and, most importantly, its results: the Cache Valley Vision. More than 200 people joined local officials as well as Utah Governor Gary Herbert and Idaho State Representative Marc Gibbs at this event.
Forum for local officials: Moving beyond visioningThe visioning process is really just the beginning—only a first step toward realizing the future that Cache Valley residents desire. On November 17, 2009, more than 100 local officials—primarily town mayors, council members, and planning commissioners—participated in a forum to begin the process of implementation. After reviewing the visioning process and the Cache Valley Vision, and hearing from other regions involved in vision implementation efforts, leaders engaged in community-specific small-group discussions, identifying local priorities and initial goals. Scheduled for February 2010, a follow-up meeting aims to continue the dialogue, fostering coordination among local governments to identify and address needs for education, policy updates, and intergovernmental cooperation.
Photo Series Source: www.cjpphoto.com
“Do you let [growth] happen haphazard, or do
you do something about it?
It’s important that we do it right,
to get ahead of the curve. Those who follow us will judge what we do today.”
–Utah Governor Gary Herbert
13 Envision CaChE vallEy
The Cache valley visionEnvision Cache Valley is an historic effort by leaders across the valley to listen to the preferences of citizens regarding future growth. The Cache Valley Vision is the product of this process, reflecting the ideas explored and preferred by a broad sample of the valley’s residents. The public expressed optimism and excitement for the future if growth unfolds in a thoughtful, efficient way. They foresee a future where there are more housing choices for people at different stages of life, more efficient transportation so they have more time for family and other priorities, active communities and cleaner air for a healthier lifestyle, good jobs to promote prosperity, more efficient development patterns that save taxpayer money, and continued opportunities to enjoy beautiful outdoor resources. The challenge will be to move beyond visioning, for the vision will only be realized as local governments and citizens translate the vision into specific actions.
The C
ache valley v
ision
3
Photo Source: www.flickr.com/people/8430129@N06/
ThE vision 14
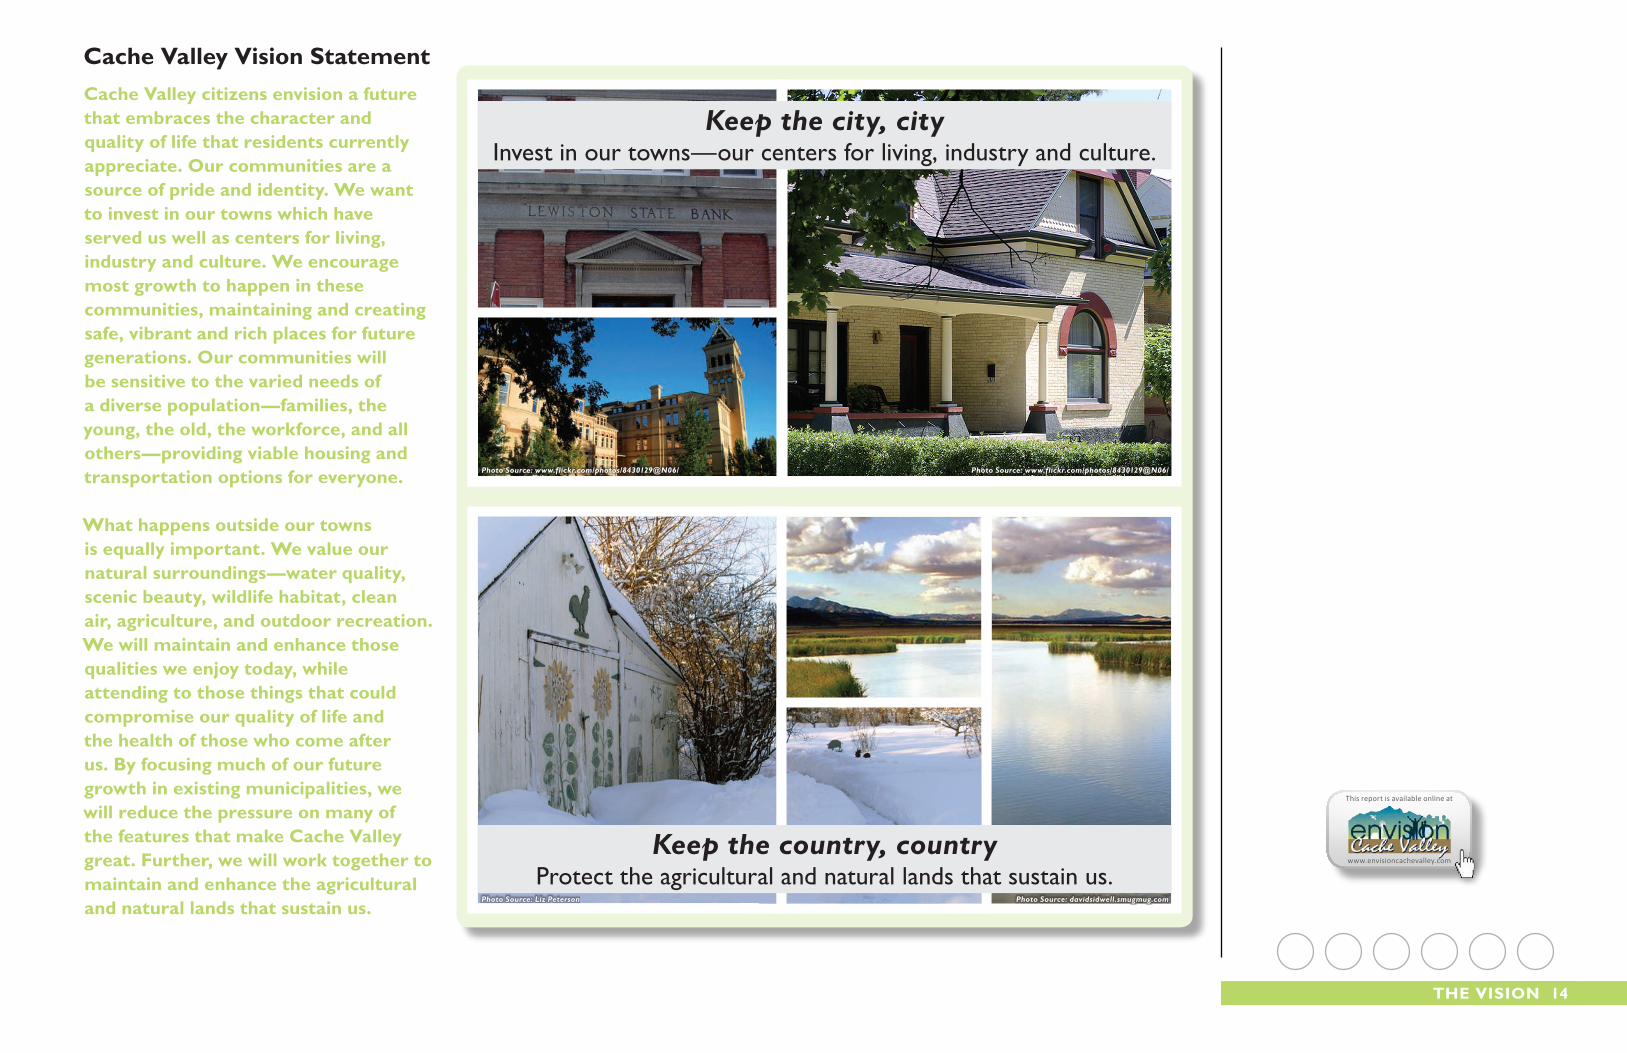
Cache valley vision statementCache valley citizens envision a future that embraces the character and quality of life that residents currently appreciate. our communities are a source of pride and identity. We want to invest in our towns which have served us well as centers for living, industry and culture. We encourage most growth to happen in these communities, maintaining and creating safe, vibrant and rich places for future generations. our communities will be sensitive to the varied needs of a diverse population—families, the young, the old, the workforce, and all others—providing viable housing and transportation options for everyone.
What happens outside our towns is equally important. We value our natural surroundings—water quality, scenic beauty, wildlife habitat, clean air, agriculture, and outdoor recreation. We will maintain and enhance those qualities we enjoy today, while attending to those things that could compromise our quality of life and the health of those who come after us. by focusing much of our future growth in existing municipalities, we will reduce the pressure on many of the features that make Cache valley great. Further, we will work together to maintain and enhance the agricultural and natural lands that sustain us.
Keep the country, countryProtect the agricultural and natural lands that sustain us.
Photo Source: davidsidwell.smugmug.comPhoto Source: Liz Peterson
Photo Source: library.loganutah.org/Photo Source: www.flickr.com/photos/8430129@N06/ Photo Source: www.flickr.com/photos/8430129@N06/
Keep the city, cityInvest in our towns—our centers for living, industry and culture.
This report is available online at
www.envisioncachevalley.com
15 Envision CaChE vallEy
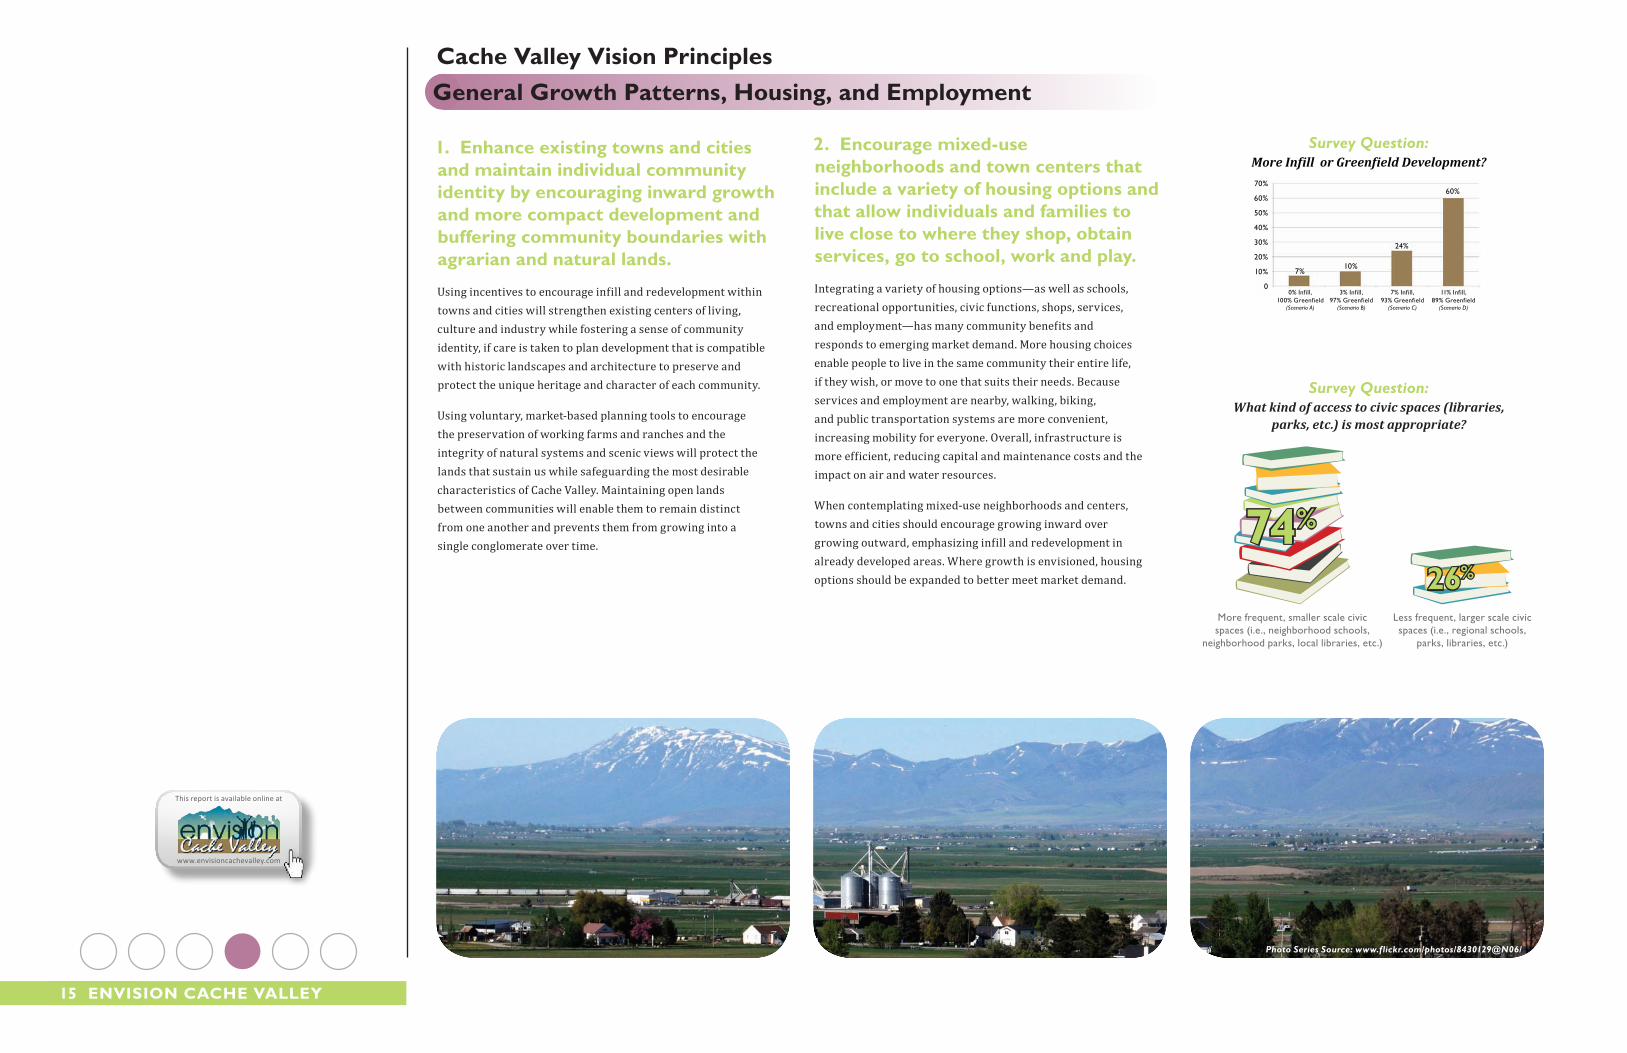
2. Encourage mixed-use neighborhoods and town centers that include a variety of housing options and that allow individuals and families to live close to where they shop, obtain services, go to school, work and play.
Integrating a variety of housing options—as well as schools, recreational opportunities, civic functions, shops, services, and employment—has many community benefits and responds to emerging market demand. More housing choices enable people to live in the same community their entire life, if they wish, or move to one that suits their needs. Because services and employment are nearby, walking, biking, and public transportation systems are more convenient, increasing mobility for everyone. Overall, infrastructure is more efficient, reducing capital and maintenance costs and the impact on air and water resources.
When contemplating mixed-use neighborhoods and centers, towns and cities should encourage growing inward over growing outward, emphasizing infill and redevelopment in already developed areas. Where growth is envisioned, housing options should be expanded to better meet market demand.
Cache valley vision Principles
1. Enhance existing towns and cities and maintain individual community identity by encouraging inward growth and more compact development and buffering community boundaries with agrarian and natural lands.
Using incentives to encourage infill and redevelopment within towns and cities will strengthen existing centers of living, culture and industry while fostering a sense of community identity, if care is taken to plan development that is compatible with historic landscapes and architecture to preserve and protect the unique heritage and character of each community.
Using voluntary, market-based planning tools to encourage the preservation of working farms and ranches and the integrity of natural systems and scenic views will protect the lands that sustain us while safeguarding the most desirable characteristics of Cache Valley. Maintaining open lands between communities will enable them to remain distinct from one another and prevents them from growing into a single conglomerate over time.
General Growth Patterns, housing, and Employment
Photo Series Source: www.flickr.com/photos/8430129@N06/
3% Infill, 97% Greenfield
(Scenario B)
0% Infill, 100% Greenfield
(Scenario A)
7% Infill, 93% Greenfield
(Scenario C)
11% Infill, 89% Greenfield
(Scenario D)
70%
7%10%
24%
60%60%
50%
40%
30%
20%
10%
0
Survey Question:More Infill or Greenfield Development?
Survey Question:What kind of access to civic spaces (libraries,
parks, etc.) is most appropriate?
More frequent, smaller scale civic spaces (i.e., neighborhood schools,
neighborhood parks, local libraries, etc.)
Less frequent, larger scale civic spaces (i.e., regional schools,
parks, libraries, etc.)
74%
26%
This report is available online at
www.envisioncachevalley.com

ThE vision 16
3. develop clean and sustainable industry and good-paying jobs close to home.
Specific areas for economic development should be designated and prepared, and where job sites are envisioned, towns and cities should build efficient, business-ready infrastructure, addressing transportation, energy, water, broadband, etc.
Underutilized or vacant land within existing towns and cities should be considered for compatible economic development, and a job center on the west side of the valley, perhaps near the State Route 30/23 junction, should be explored.
did you Know?
Not that we’re Colorado, but...
I n Colorado, d i sbursed rura l res ident i a l deve lopment cost s count ies and schools $1.65 in ser v ice expend i tures for ever y $1.00 o f t ax revenue generated .
In genera l , commerc i a l , industr i a l , and work ing l andscapes more than pay for themse lves . Genera l l y, res ident i a l growth cost s more for government s to ser v ice than i t contr ibutes in revenue . However, th i s changes when res ident i a l deve lopment assumes more compac t pat terns .
An Un s u s t ainable C ycle
Some loca l government s enter in to an unsust a inab le cyc le in which they approve d i sbursed deve lopment projec t s to generate new t ax revenue in order to pay the cost s o f o ld deve lopment .
Source: American Farmland Trust
Survey Question:How should shopping and employment relate
to other land uses?
Some compatible employment & shopping should
blend into where people live, play, and
go to school.
Most compatible employment & shopping
should be away from where people live, play, and
go to school.
Most compatible employment & shopping should blend into where people live, play, and go to school.
Average Cost of Service Per Dollar of Revenue Raised
$1.40
$1.20
Source: American Farmland Trust
Cost
of S
ervi
ces
Per
Dol
lar
of R
even
ue
Rai
sed
$1.00
$0.80
$0.60
$0.40
$0.20$0.29
Commercial & Industrial
Working & Open Land
Residential
$0.37
$0
$1.19
Mixed-use Town Center development• multiple land uses exist in close proximity to one another• small parking lots tucked behind buildings.
Conventional development• single-use areas are largely separated from each other• large parking lots.
What does “mixed-use” look like?
Imagine walking from the housing development in the upper right hand corner to the shopping
center. How would you do it?
Imagine walking from the housing development in the upper right hand corner to the shopping
center. How would you do it?
Photo Source: ©Regents of the University of Minnesota. Used with the permission of the Metropolitan Design Center.
Photo Source: ©Regents of the University of Minnesota. Used with the permission of the Metropolitan Design Center.
17 Envision CaChE vallEy
5. invest in efficient infrastructure systems to serve existing communities and future growth. These systems manage such services as water, sewer, waste disposal, and energy.
Transportation and the cost of other infrastructure are significant municipal and regional burdens. The cost of infrastructure should be reduced by maximizing existing infrastructure and building new development more compactly—in a fashion that requires fewer miles of roads, pipes, and wires.
Cache valley vision Principles
4. Provide a balanced transportation network with improved roadway connections, enhanced public transportation options, and streets that encourage bicyclist and pedestrian mobility.
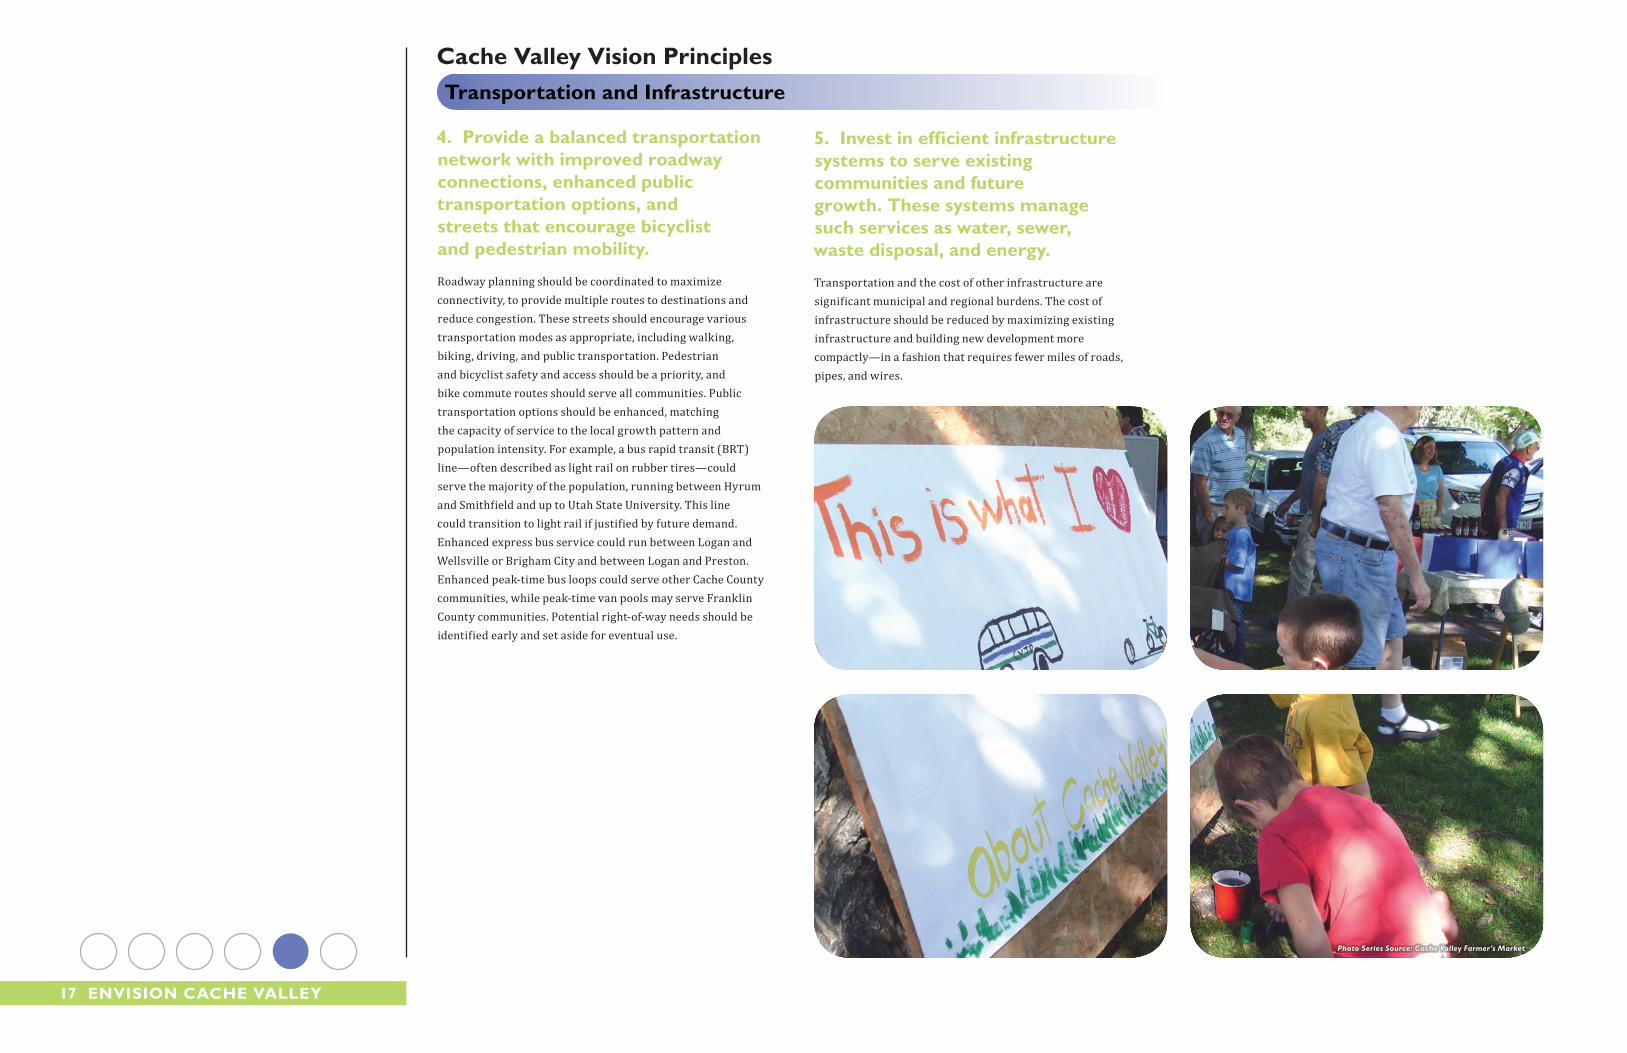
Roadway planning should be coordinated to maximize connectivity, to provide multiple routes to destinations and reduce congestion. These streets should encourage various transportation modes as appropriate, including walking, biking, driving, and public transportation. Pedestrian and bicyclist safety and access should be a priority, and bike commute routes should serve all communities. Public transportation options should be enhanced, matching the capacity of service to the local growth pattern and population intensity. For example, a bus rapid transit (BRT) line—often described as light rail on rubber tires—could serve the majority of the population, running between Hyrum and Smithfield and up to Utah State University. This line could transition to light rail if justified by future demand. Enhanced express bus service could run between Logan and Wellsville or Brigham City and between Logan and Preston. Enhanced peak-time bus loops could serve other Cache County communities, while peak-time van pools may serve Franklin County communities. Potential right-of-way needs should be identified early and set aside for eventual use.
Transportation and infrastructure
Photo Series Source: Cache Valley Farmer’s Market

ThE vision 18
Why is a balanced transportation network
important?
Improved Connections...
• Reduce auto congestion by providing multiple ways to get around.
• Reduce travel distances, especially important for walkers and bikers. Connected streets, for example, make it possible for kids to walk to school.
• Reductions in vehicle congestion and miles traveled can improve air quality and give us more time for the things we enjoy.
More Transportation Options...
• Provide mobility for more people, including children and the elderly. Kids can walk to school, for example, or an older person who no longer drives can take a bus to an appointment.
• Streets designed for more transportation options improve safety for everyone using the transportation system. Those in cars and buses have a space designed especially for their travel, as do cyclists and pedestrians. While connectivity makes it possible for kids to walk to school, streets designed for walking make it safe to do so.
• A transportation system that is conducive to walking and biking also encourages physical fitness and health.
• Shifting even a small share of vehicle trips from personal automobiles to other modes measurably improves air quality.
a balanCEd TRansPoRTaTion nETWoRK is ConnECTEd...
... and PRovidEs FoR a WidE RanGE oF TRansPoRTaTion oPTions.
What is a balanced Transportation network?
Poorly Connected NetworkImagine a child walking or riding their bike from a home in the lower left of this photo
to the school in the upper right. How would they do it?
Would a parent want them to?
Photo Source: ©Regents of the University of Minnesota. Used with the permission of the Metropolitan Design Center.
Photo Source: www.wfrc.org
Photo Source: www.pedbikeimages.org / Dan BurdenPhoto Source: www.blog.pps.org
Single-Mode SystemTransportation systems designed only for cars make other options
dangerous and less viable.
Multi-Mode System
Photo Source: www.pedbikeimages.org / Dan BurdenPhoto Source: www.pedbikeimages.org / Dan Burden
Photo Source: www.pedbikeimages.org / Dan Burden
Transportation systems that include a range of choices provide safety
and mobility for everyone.
Well-Connected Network
Photo Source: ©Regents of the University of Minnesota. Used with the permission of the Metropolitan Design Center.
Imagine a child walking or riding their bike from a home in the lower left of this photo
to the school in the upper right. How would they do it?
Would a parent want them to?
VS.
VS.
19 Envision CaChE vallEy
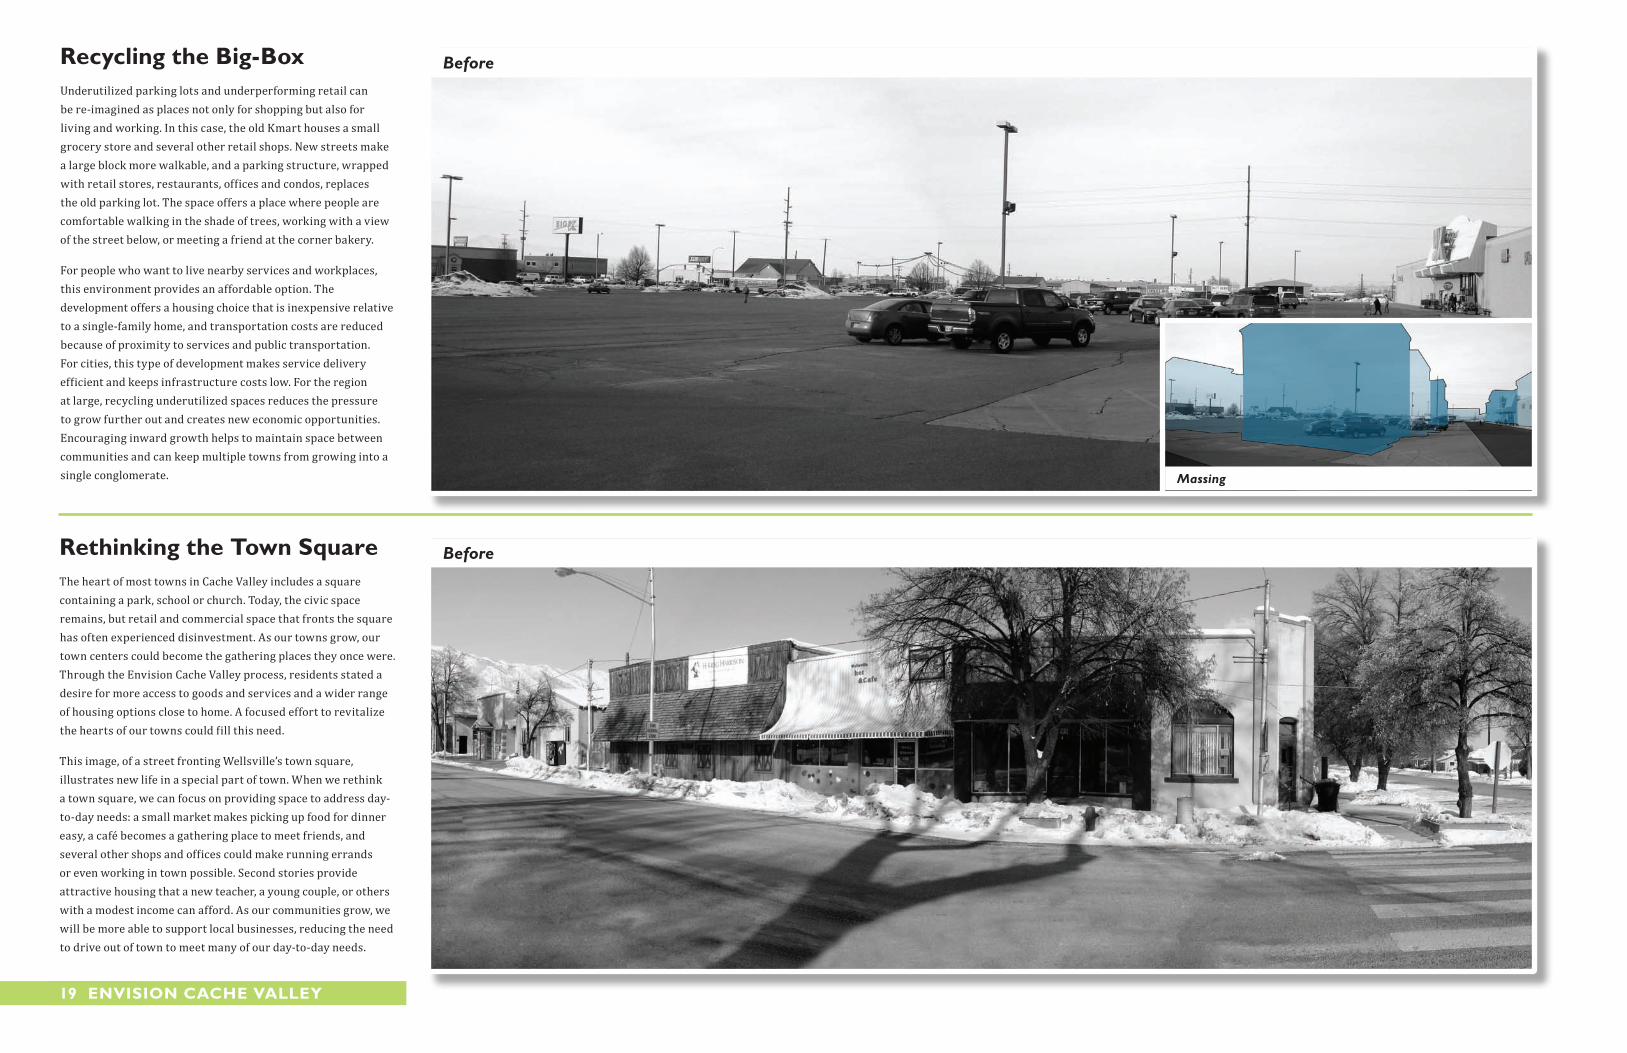
Recycling the big-boxUnderutilized parking lots and underperforming retail can be re-imagined as places not only for shopping but also for living and working. In this case, the old Kmart houses a small grocery store and several other retail shops. New streets make a large block more walkable, and a parking structure, wrapped with retail stores, restaurants, offices and condos, replaces the old parking lot. The space offers a place where people are comfortable walking in the shade of trees, working with a view of the street below, or meeting a friend at the corner bakery.
For people who want to live nearby services and workplaces, this environment provides an affordable option. The development offers a housing choice that is inexpensive relative to a single-family home, and transportation costs are reduced because of proximity to services and public transportation. For cities, this type of development makes service delivery efficient and keeps infrastructure costs low. For the region at large, recycling underutilized spaces reduces the pressure to grow further out and creates new economic opportunities. Encouraging inward growth helps to maintain space between communities and can keep multiple towns from growing into a single conglomerate.
Rethinking the Town squareThe heart of most towns in Cache Valley includes a square containing a park, school or church. Today, the civic space remains, but retail and commercial space that fronts the square has often experienced disinvestment. As our towns grow, our town centers could become the gathering places they once were. Through the Envision Cache Valley process, residents stated a desire for more access to goods and services and a wider range of housing options close to home. A focused effort to revitalize the hearts of our towns could fill this need.
This image, of a street fronting Wellsville’s town square, illustrates new life in a special part of town. When we rethink a town square, we can focus on providing space to address day-to-day needs: a small market makes picking up food for dinner easy, a café becomes a gathering place to meet friends, and several other shops and offices could make running errands or even working in town possible. Second stories provide attractive housing that a new teacher, a young couple, or others with a modest income can afford. As our communities grow, we will be more able to support local businesses, reducing the need to drive out of town to meet many of our day-to-day needs.
Before
Massing
Before

ThE vision 20
After
After
This report is available online at
www.envisioncachevalley.com
21 Envision CaChE vallEy
Cache valley vision Principles
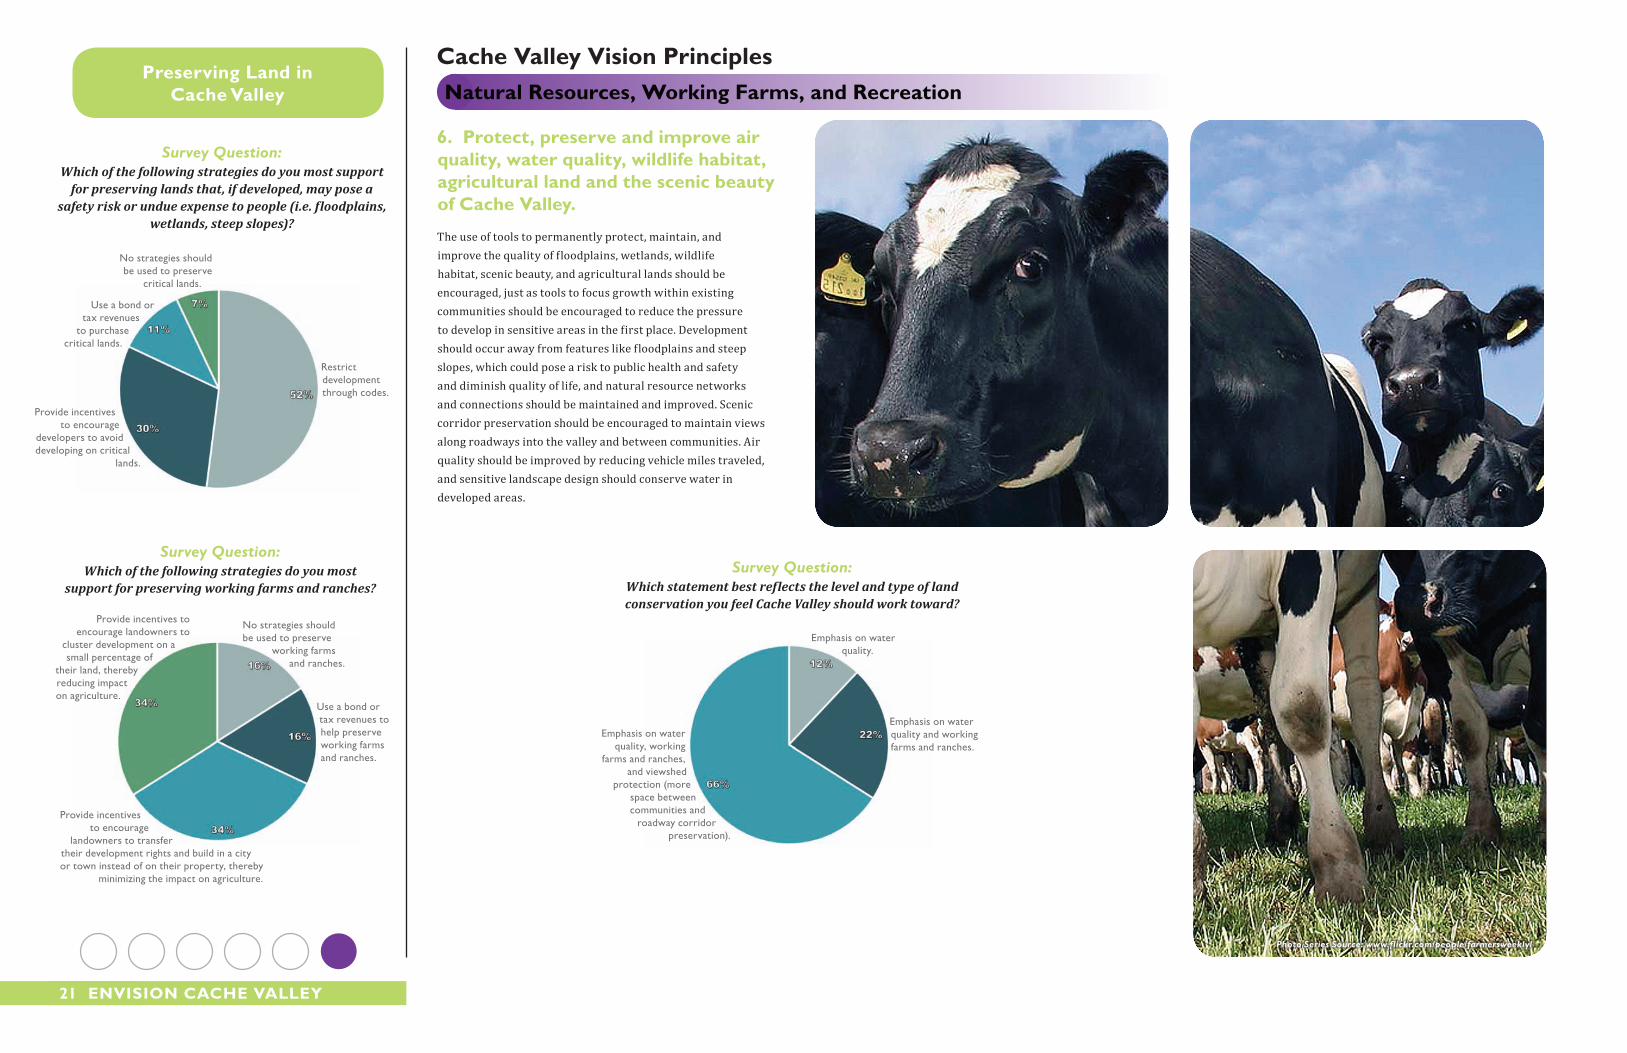
6. Protect, preserve and improve air quality, water quality, wildlife habitat, agricultural land and the scenic beauty of Cache valley.
The use of tools to permanently protect, maintain, and improve the quality of floodplains, wetlands, wildlife habitat, scenic beauty, and agricultural lands should be encouraged, just as tools to focus growth within existing communities should be encouraged to reduce the pressure to develop in sensitive areas in the first place. Development should occur away from features like floodplains and steep slopes, which could pose a risk to public health and safety and diminish quality of life, and natural resource networks and connections should be maintained and improved. Scenic corridor preservation should be encouraged to maintain views along roadways into the valley and between communities. Air quality should be improved by reducing vehicle miles traveled, and sensitive landscape design should conserve water in developed areas.
Preserving land in Cache valley natural Resources, Working Farms, and Recreation
Survey Question:Which statement best reflects the level and type of land conservation you feel Cache Valley should work toward?
Emphasis on water quality, working
farms and ranches, and viewshed
protection (more space between communities and
roadway corridor preservation).
Emphasis on water quality and working farms and ranches.
Emphasis on water quality.
Survey Question:Which of the following strategies do you most
support for preserving working farms and ranches?
Provide incentives to encourage
landowners to transfer their development rights and build in a city or town instead of on their property, thereby
minimizing the impact on agriculture.
Provide incentives to encourage landowners to
cluster development on a small percentage of
their land, thereby reducing impact on agriculture.
Use a bond or tax revenues to help preserve working farms and ranches.
No strategies should be used to preserve
working farms and ranches.
Survey Question:Which of the following strategies do you most support
for preserving lands that, if developed, may pose a safety risk or undue expense to people (i.e. floodplains,
wetlands, steep slopes)?
Use a bond or tax revenues
to purchase critical lands.
Restrict development through codes.
Provide incentives to encourage
developers to avoid developing on critical
lands.
No strategies should be used to preserve
critical lands.
Photo Series Source: www.flickr.com/people/farmersweekly/
ThE vision 22
7. Maintain and improve access to recreation by connecting local recreational amenities to a regional network.
The bicycle and pedestrian trail network should be improved and expanded, with the Bonneville Shoreline Trail providing access to other regional amenities, including regional recreation centers, but also recreation in more natural areas, like canyon trails and the mountains. New regional recreation areas, including parks, greenways, and blueways should be created, with local recreation systems linking to the Bonneville Shoreline Trail or otherwise providing access to the regional network.
8. Expand local recreational systems, providing small parks located near where people live and linked by trails for walking and biking.
As towns and cities grow, access to recreation should be provided close to home. Small parks can provide nearby multi-use space to accommodate a range of interests, from playing and picnicking to growing a garden. Trails and walkways should provide recreational opportunities for biking and walking as well as a means to get around without a car.
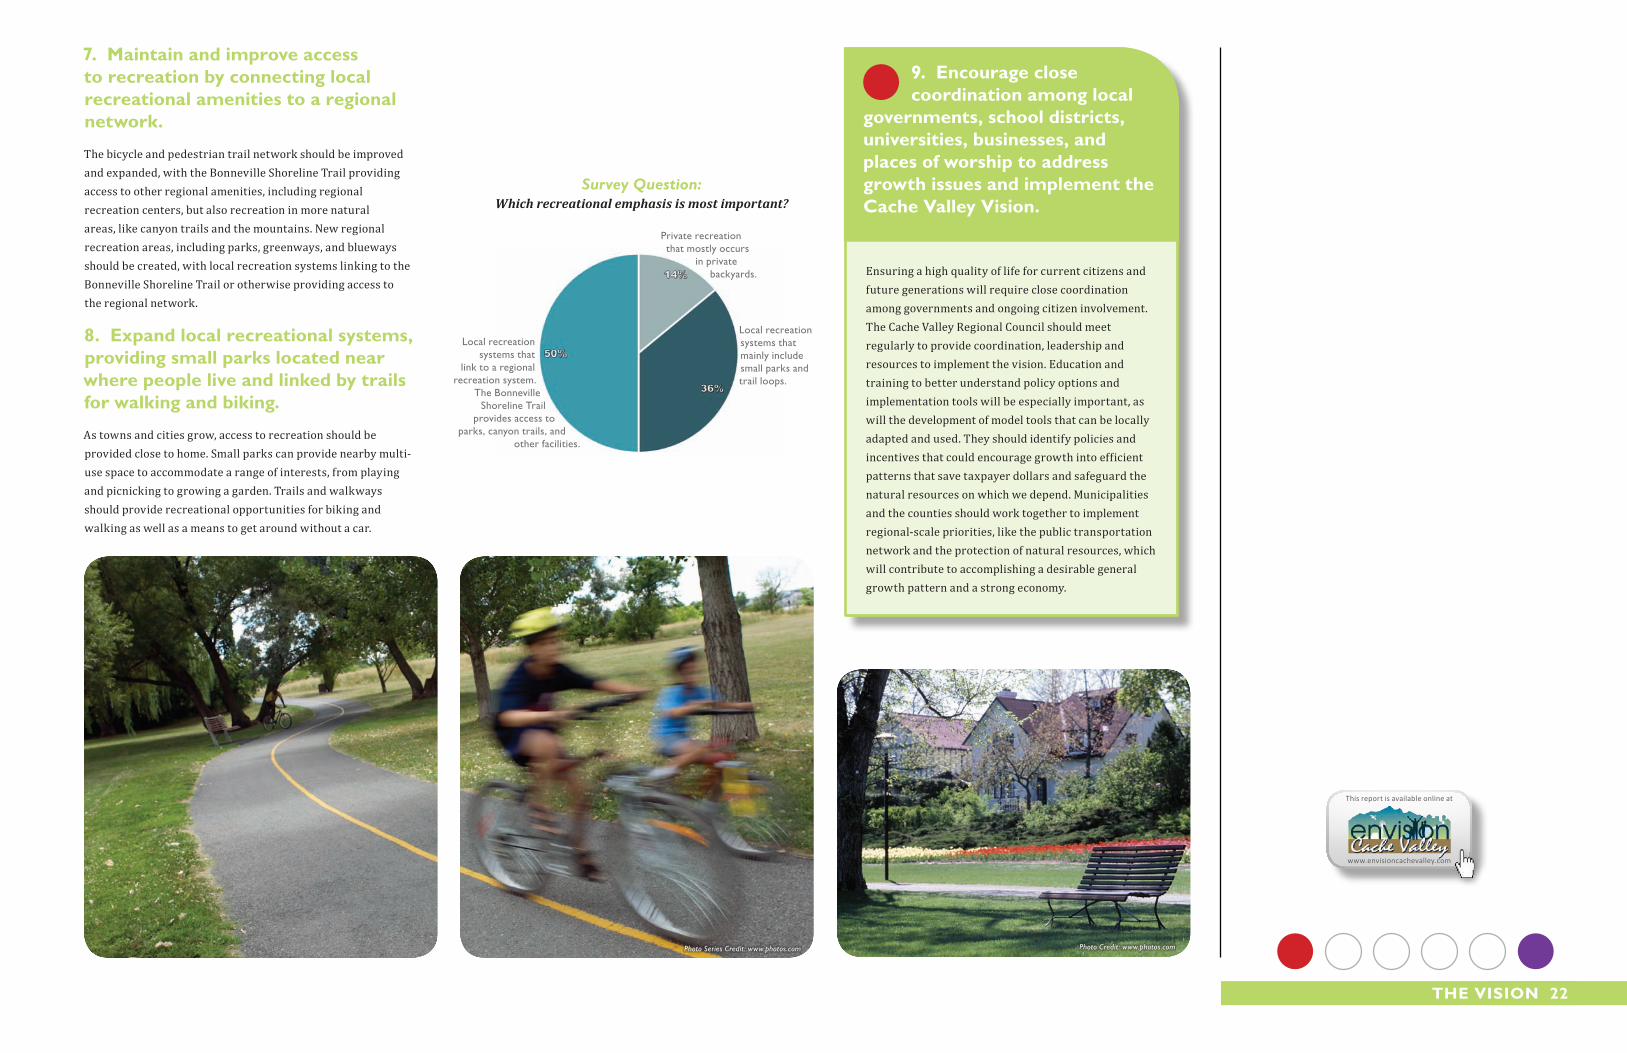
Survey Question:Which recreational emphasis is most important?
Local recreation systems that
link to a regional recreation system.
The Bonneville Shoreline Trail
provides access to parks, canyon trails, and
other facilities.
Local recreation systems that mainly include small parks and trail loops.
Private recreation that mostly occurs
in private backyards.
Photo Series Credit: www.photos.com Photo Credit: www.photos.com
Ensuring a high quality of life for current citizens and future generations will require close coordination among governments and ongoing citizen involvement. The Cache Valley Regional Council should meet regularly to provide coordination, leadership and resources to implement the vision. Education and training to better understand policy options and implementation tools will be especially important, as will the development of model tools that can be locally adapted and used. They should identify policies and incentives that could encourage growth into efficient patterns that save taxpayer dollars and safeguard the natural resources on which we depend. Municipalities and the counties should work together to implement regional-scale priorities, like the public transportation network and the protection of natural resources, which will contribute to accomplishing a desirable general growth pattern and a strong economy.
9. Encourage close coordination among local
governments, school districts, universities, businesses, and places of worship to address growth issues and implement the Cache valley vision.
This report is available online at
www.envisioncachevalley.com
23 Envision CaChE vallEy
vision scenarioThe vision scenario maps featured on pages 25-30 illustrate one of many plausible ways that growth could unfold as the vision principles are implemented. Best viewed as a story rather than a prediction, the purpose of the maps is to highlight ideas embodied in the vision principles—from growing inward and maintaining communities that are distinct from one another, to safeguarding our agricultural and natural lands. The maps are not intended to be prescriptive. Individual communities could implement the principles in many ways to have both local relevance and meaningful regional impact. The vision maps do, however, enable comparison with the baseline scenario, providing a snapshot of potential benefits if the vision is implemented. They show reduced infrastructure costs, fewer vehicular emissions, reduced impact on farmland, and lower housing costs.
benefits of the vision
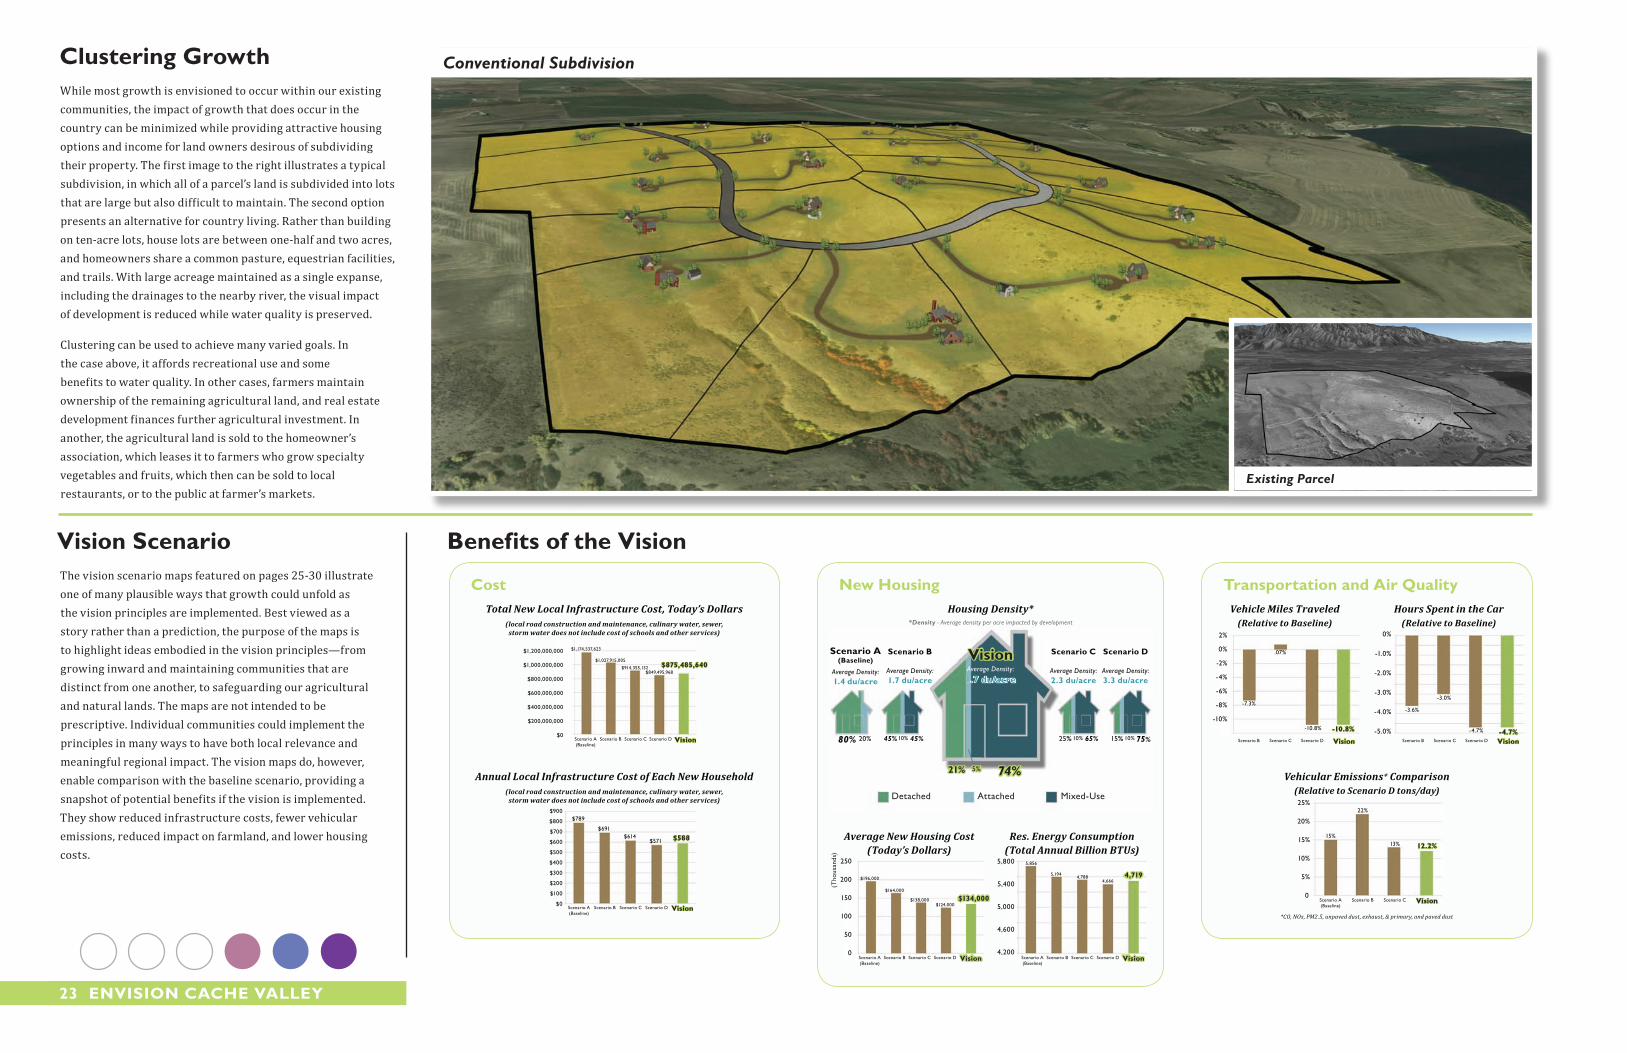
Clustering GrowthWhile most growth is envisioned to occur within our existing communities, the impact of growth that does occur in the country can be minimized while providing attractive housing options and income for land owners desirous of subdividing their property. The first image to the right illustrates a typical subdivision, in which all of a parcel’s land is subdivided into lots that are large but also difficult to maintain. The second option presents an alternative for country living. Rather than building on ten-acre lots, house lots are between one-half and two acres, and homeowners share a common pasture, equestrian facilities, and trails. With large acreage maintained as a single expanse, including the drainages to the nearby river, the visual impact of development is reduced while water quality is preserved.
Clustering can be used to achieve many varied goals. In the case above, it affords recreational use and some benefits to water quality. In other cases, farmers maintain ownership of the remaining agricultural land, and real estate development finances further agricultural investment. In another, the agricultural land is sold to the homeowner’s association, which leases it to farmers who grow specialty vegetables and fruits, which then can be sold to local restaurants, or to the public at farmer’s markets.
CostTotal New Local Infrastructure Cost, Today’s Dollars
(local road construction and maintenance, culinary water, sewer, storm water does not include cost of schools and other services)
$1,200,000,000 $1,174,537,623
$1,027,915,005
$914,355,132$849,495,968
$1,000,000,000
$800,000,000
$600,000,000
$400,000,000
$200,000,000
$0visionScenario D Scenario C Scenario B Scenario A
(Baseline)
$875,485,640
Annual Local Infrastructure Cost of Each New Household (local road construction and maintenance, culinary water, sewer,
storm water does not include cost of schools and other services)
$800
$700
$600
$500
$400
$300
$200
$100
$0
$900$789
$691$614
$571
visionScenario D Scenario C Scenario B Scenario A (Baseline)
$588
Transportation and air Quality
Vehicular Emissions* Comparison(Relative to Scenario D tons/day)
*CO, NOx, PM2.5, unpaved dust, exhaust, & primary, and paved dust
20%
15%
10%
5%
0
25%
visionScenario C Scenario B Scenario A (Baseline)
12.2%13%
22%
15%
Hours Spent in the Car(Relative to Baseline)
-4.0%
-3.0%
-2.0%
-1.0%
0%
-5.0% -4.7%-4.7%
-3.0%
visionScenario D Scenario C Scenario B
-3.6%
Vehicle Miles Traveled(Relative to Baseline)
2%
0%
-2%
-4%
-6%
-8%
-10.8%-10.8%
.07%
visionScenario D Scenario C Scenario B
-7.3%
-10%
Conventional Subdivision
Existing Parcel
new housing
0
50
100
150
200
Average New Housing Cost(Today’s Dollars)
250
vision
$134,000
Scenario D
$124,000
Scenario C
$138,000
Scenario B
$164,000
Scenario A (Baseline)
$196,000
4,600
4,200
5,000
5,400
5,800
Res. Energy Consumption(Total Annual Billion BTUs)
4,7194,666
4,7885,194
5,856
visionScenario D Scenario C Scenario B Scenario A (Baseline)
Housing Density*
80% 20% 45%10%45% 65%10%25%
74%5%21%
75%10%15%
Detached Attached Mixed-Use
scenario a (baseline)
Average Density:1.4 du/acre
scenario b
Average Density:1.7 du/acre
visionAverage Density:
1.7 du/acre
scenario C
Average Density:2.3 du/acre
scenario d
Average Density:3.3 du/acre
*Density - Average density per acre impacted by development
(Tho
usan
ds)
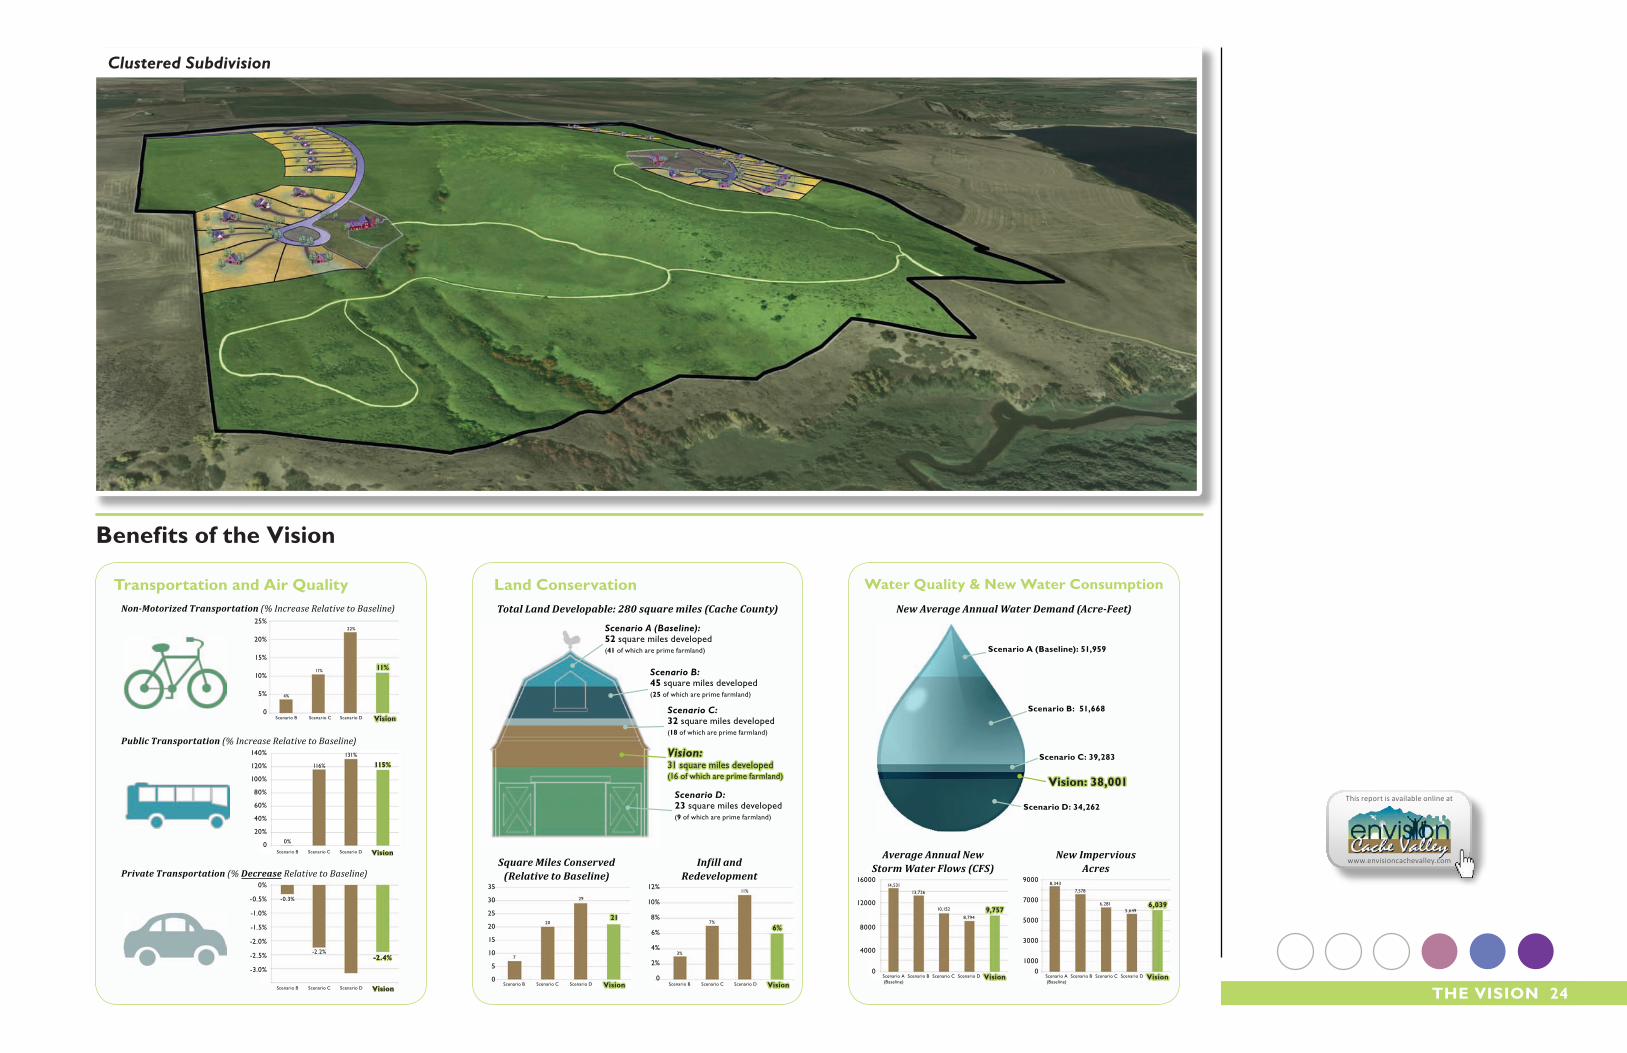
ThE vision 24
benefits of the vision
Water Quality & new Water Consumption
New Average Annual Water Demand (Acre-Feet)
scenario d: 34,262
vision: 38,001
scenario C: 39,283
scenario a (baseline): 51,959
scenario b: 51,668
0
4000
8000
12000
16000
Average Annual New Storm Water Flows (CFS)
9,7578,794
10,152
13,726
visionScenario D Scenario C Scenario B Scenario A (Baseline)
14,531
0
3000
1000
5000
7000
9000
New Impervious Acres
5,6496,281
7,578
visionScenario D Scenario C Scenario B Scenario A (Baseline)
8,343
6,039
land Conservation
Infill and Redevelopment
0
2%
4%
6%
8%
10%
12%
visionScenario D Scenario C Scenario B
6%
11%
7%
3%
Square Miles Conserved(Relative to Baseline)
35
30
25
20
15
10
5
0visionScenario D Scenario C Scenario B
21
29
20
7
Total Land Developable: 280 square miles (Cache County)
Scenario A (Baseline):52 square miles developed(41 of which are prime farmland)
Scenario B:45 square miles developed(25 of which are prime farmland)
Scenario C:32 square miles developed(18 of which are prime farmland)
Vision:31 square miles developed(16 of which are prime farmland)
Scenario D:23 square miles developed(9 of which are prime farmland)
Transportation and air QualityNon-Motorized Transportation (% Increase Relative to Baseline)
0
5%
10%
15%
20%
25%
vision
11%
Scenario D
22%
Scenario C
11%
Scenario B
4%
Public Transportation (% Increase Relative to Baseline)
0
20%
40%
100%
80%
60%
120%
140%
vision
115%
Scenario D
131%
Scenario C
116%
Scenario B
0%
-3.2%
Private Transportation (% Decrease Relative to Baseline)
-2.5%
-3.0%
-2.0%
-1.5%
-1.0%
-0.5%
0%
-2.4%-2.2%
-0.3%
visionScenario D Scenario C Scenario B
Clustered Subdivision
This report is available online at
www.envisioncachevalley.com
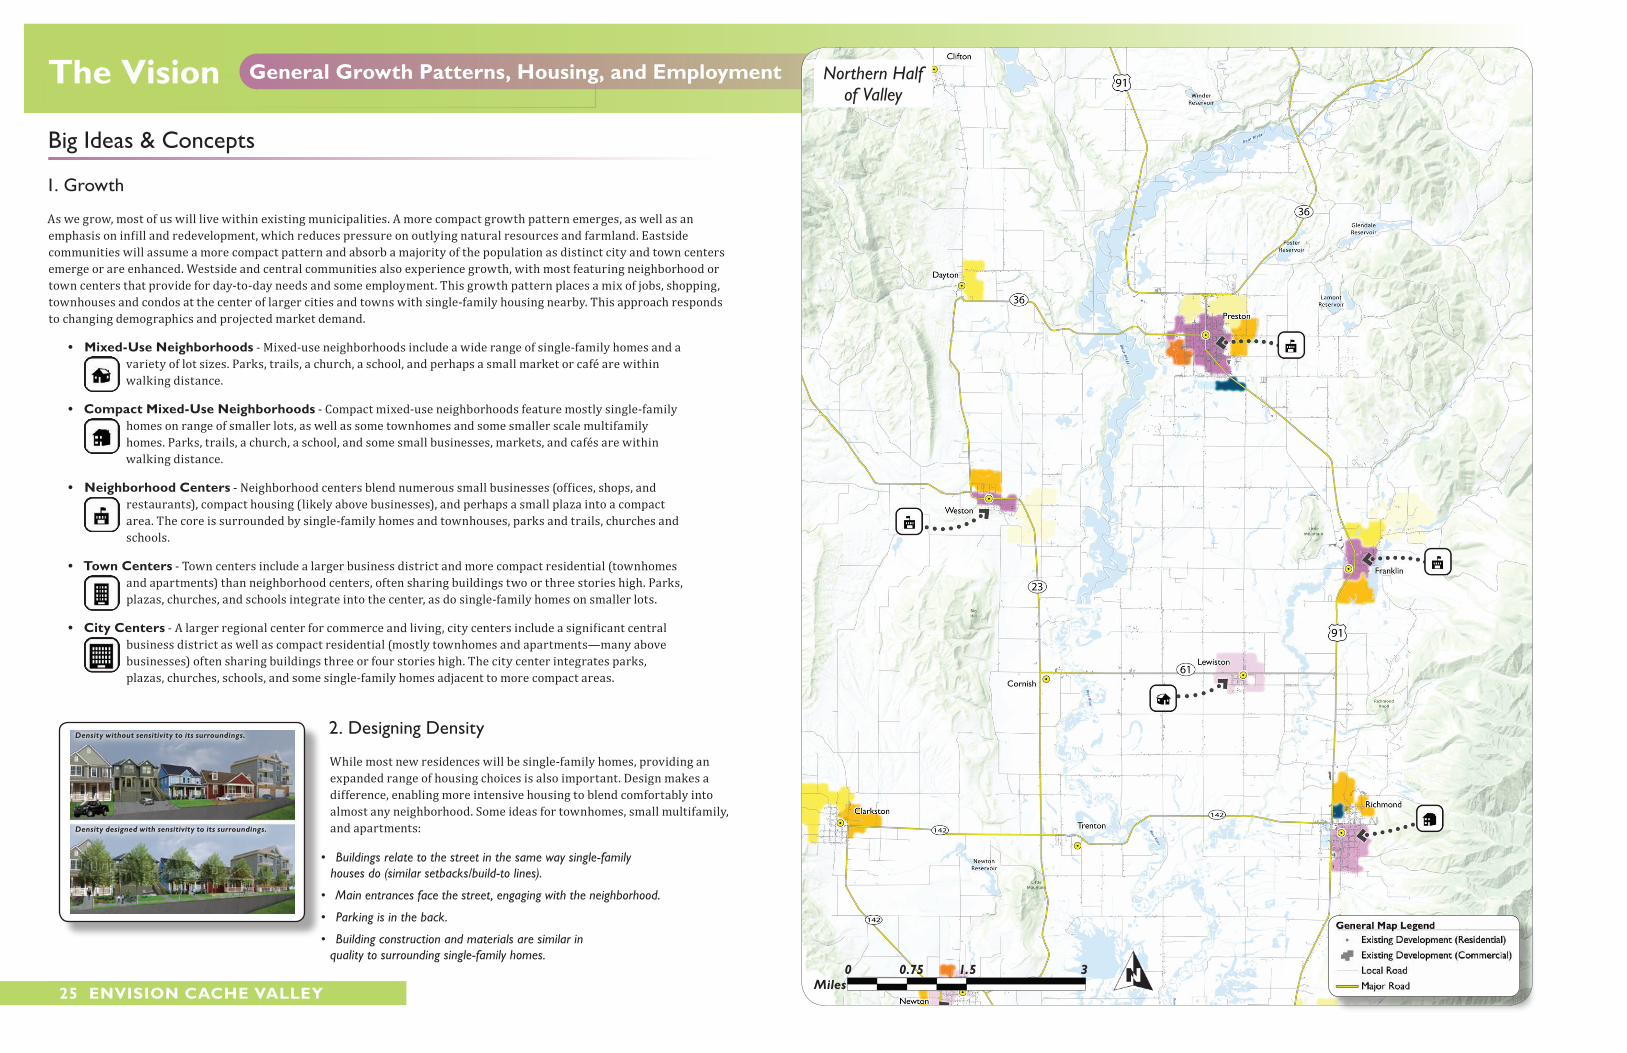
The vision General Growth Patterns, housing, and Employment Northern Halfof Valley
0 1.5 3Miles
0.75
25 Envision CaChE vallEy
Big Ideas & Concepts
1. Growth
As we grow, most of us will live within existing municipalities. A more compact growth pattern emerges, as well as an emphasis on infill and redevelopment, which reduces pressure on outlying natural resources and farmland. Eastside communities will assume a more compact pattern and absorb a majority of the population as distinct city and town centers emerge or are enhanced. Westside and central communities also experience growth, with most featuring neighborhood or town centers that provide for day-to-day needs and some employment. This growth pattern places a mix of jobs, shopping, townhouses and condos at the center of larger cities and towns with single-family housing nearby. This approach responds to changing demographics and projected market demand.
• Mixed-use neighborhoods - Mixed-use neighborhoods include a wide range of single-family homes and a variety of lot sizes. Parks, trails, a church, a school, and perhaps a small market or café are within walking distance.
• Compact Mixed-use neighborhoods - Compact mixed-use neighborhoods feature mostly single-family homes on range of smaller lots, as well as some townhomes and some smaller scale multifamily homes. Parks, trails, a church, a school, and some small businesses, markets, and cafés are within walking distance.
• neighborhood Centers - Neighborhood centers blend numerous small businesses (offices, shops, and restaurants), compact housing (likely above businesses), and perhaps a small plaza into a compact area. The core is surrounded by single-family homes and townhouses, parks and trails, churches and schools.
• Town Centers - Town centers include a larger business district and more compact residential (townhomes and apartments) than neighborhood centers, often sharing buildings two or three stories high. Parks, plazas, churches, and schools integrate into the center, as do single-family homes on smaller lots.
• City Centers - A larger regional center for commerce and living, city centers include a significant central business district as well as compact residential (mostly townhomes and apartments—many above businesses) often sharing buildings three or four stories high. The city center integrates parks, plazas, churches, schools, and some single-family homes adjacent to more compact areas.
2. Designing Density
While most new residences will be single-family homes, providing an expanded range of housing choices is also important. Design makes a difference, enabling more intensive housing to blend comfortably into almost any neighborhood. Some ideas for townhomes, small multifamily, and apartments:
• Buildings relate to the street in the same way single-family houses do (similar setbacks/build-to lines).
• Main entrances face the street, engaging with the neighborhood.
• Parking is in the back.
• Building construction and materials are similar in quality to surrounding single-family homes.
Density without sensitivity to its surroundings.
Density designed with sensitivity to its surroundings.
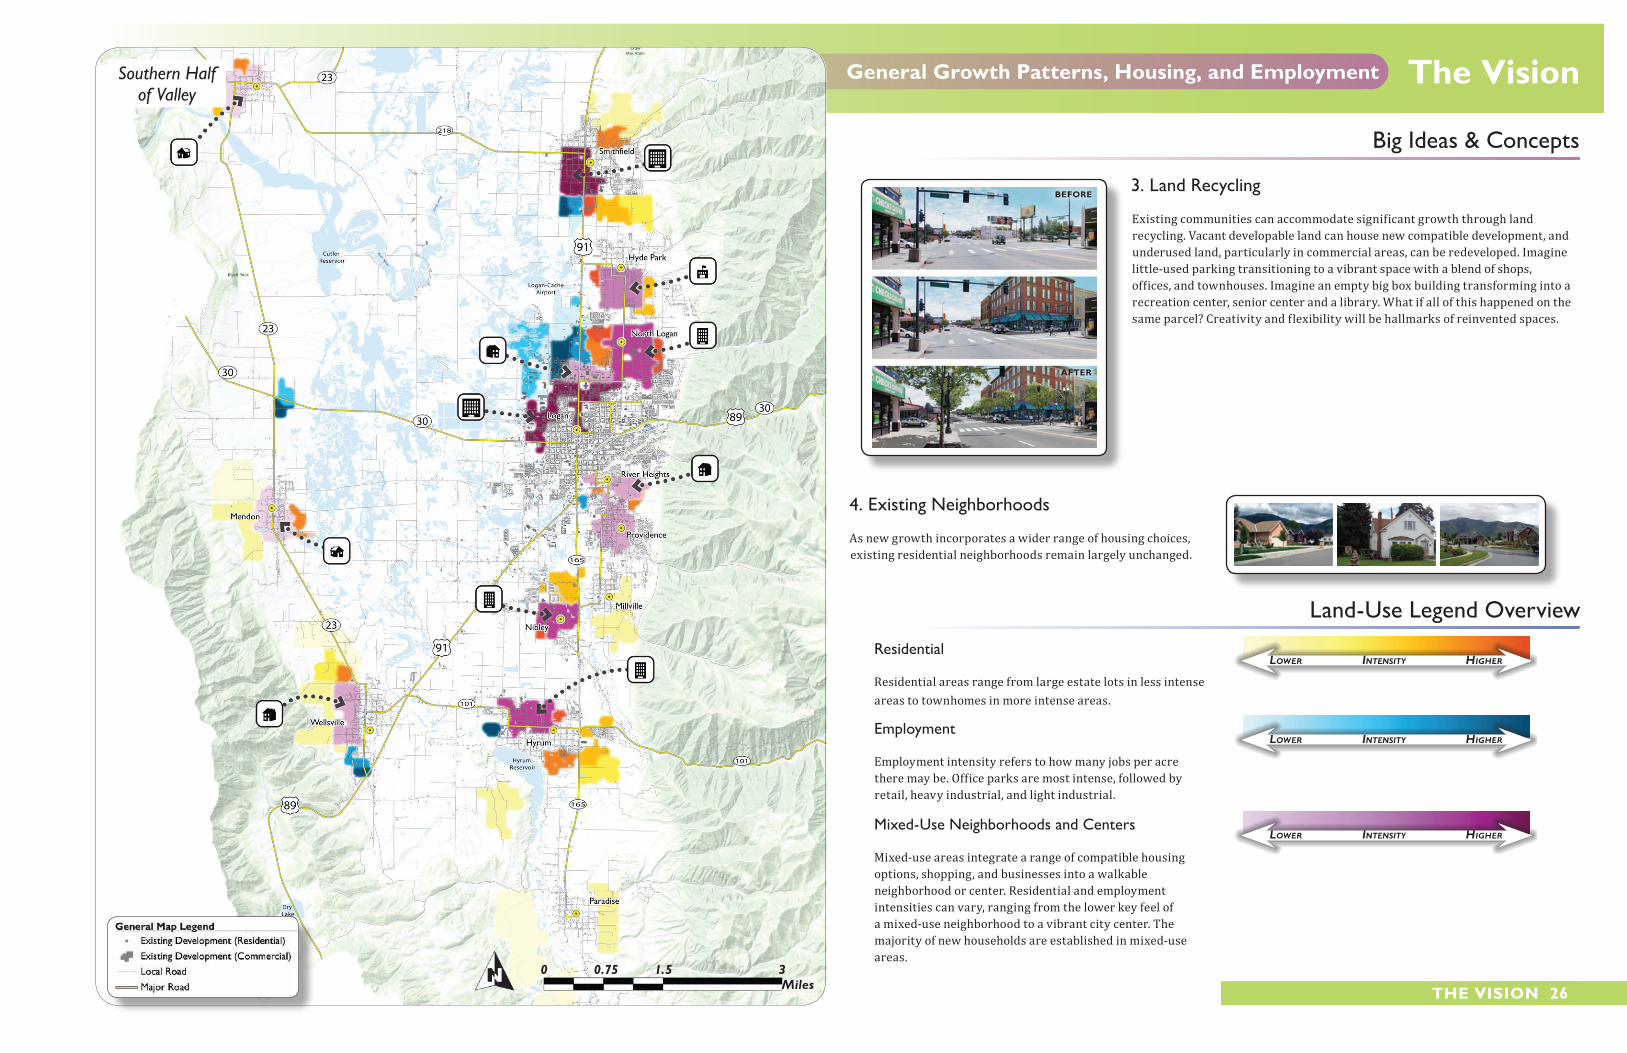
The visionGeneral Growth Patterns, housing, and EmploymentSouthern Halfof Valley
0 1.5 3Miles
0.75
ThE vision 26
3. Land Recycling
Existing communities can accommodate significant growth through land recycling. Vacant developable land can house new compatible development, and underused land, particularly in commercial areas, can be redeveloped. Imagine little-used parking transitioning to a vibrant space with a blend of shops, offices, and townhouses. Imagine an empty big box building transforming into a recreation center, senior center and a library. What if all of this happened on the same parcel? Creativity and flexibility will be hallmarks of reinvented spaces.
4. Existing Neighborhoods
As new growth incorporates a wider range of housing choices, existing residential neighborhoods remain largely unchanged.
Land-Use Legend Overview
Residential
Residential areas range from large estate lots in less intense areas to townhomes in more intense areas.
Employment
Employment intensity refers to how many jobs per acre there may be. Office parks are most intense, followed by retail, heavy industrial, and light industrial.
Mixed-Use Neighborhoods and Centers
Mixed-use areas integrate a range of compatible housing options, shopping, and businesses into a walkable neighborhood or center. Residential and employment intensities can vary, ranging from the lower key feel of a mixed-use neighborhood to a vibrant city center. The majority of new households are established in mixed-use areas.
Big Ideas & Concepts
bEFoRE
aFTER
Lower IntensIty HIgHer
Lower IntensIty HIgHer
Lower IntensIty HIgHer
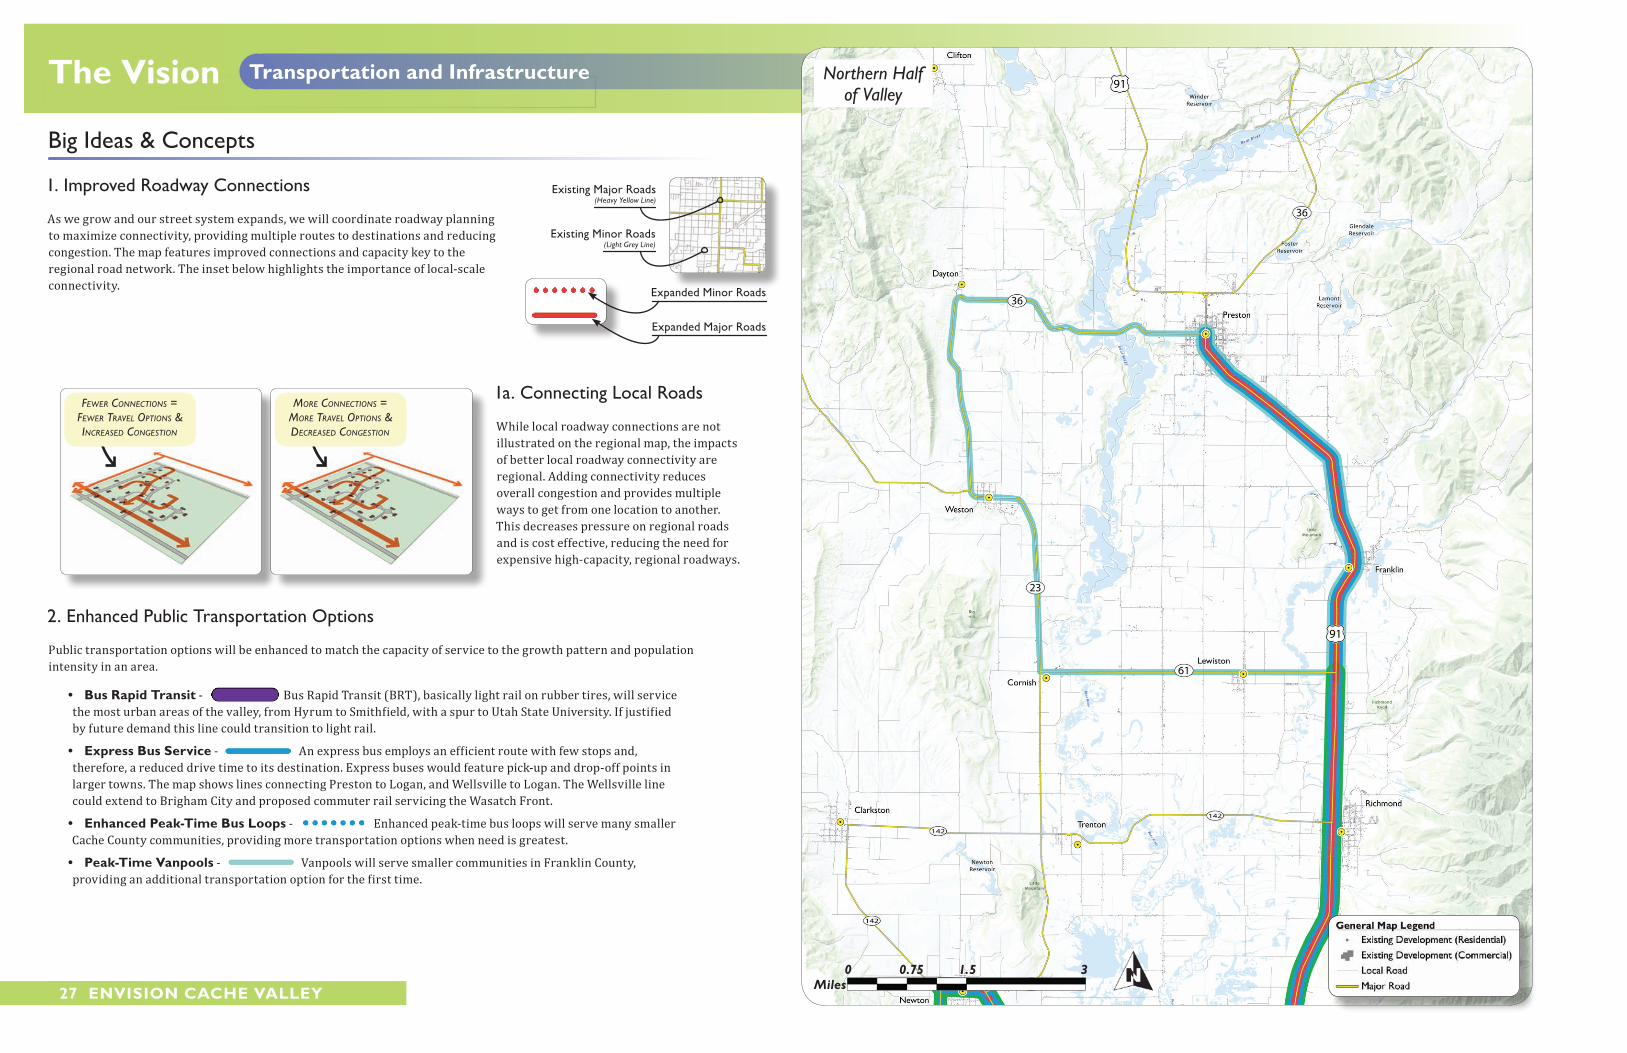
The vision Transportation and infrastructure Northern Halfof Valley
0 1.5 3Miles
0.75
27 Envision CaChE vallEy
Big Ideas & Concepts
1. Improved Roadway Connections
As we grow and our street system expands, we will coordinate roadway planning to maximize connectivity, providing multiple routes to destinations and reducing congestion. The map features improved connections and capacity key to the regional road network. The inset below highlights the importance of local-scale connectivity.
1a. Connecting Local Roads
While local roadway connections are not illustrated on the regional map, the impacts of better local roadway connectivity are regional. Adding connectivity reduces overall congestion and provides multiple ways to get from one location to another. This decreases pressure on regional roads and is cost effective, reducing the need for expensive high-capacity, regional roadways.
2. Enhanced Public Transportation Options
Public transportation options will be enhanced to match the capacity of service to the growth pattern and population intensity in an area.
• bus Rapid Transit - Bus Rapid Transit (BRT), basically light rail on rubber tires, will service the most urban areas of the valley, from Hyrum to Smithfield, with a spur to Utah State University. If justified by future demand this line could transition to light rail.
• Express bus service - An express bus employs an efficient route with few stops and, therefore, a reduced drive time to its destination. Express buses would feature pick-up and drop-off points in larger towns. The map shows lines connecting Preston to Logan, and Wellsville to Logan. The Wellsville line could extend to Brigham City and proposed commuter rail servicing the Wasatch Front.
• Enhanced Peak-Time bus loops - Enhanced peak-time bus loops will serve many smaller Cache County communities, providing more transportation options when need is greatest.
• Peak-Time vanpools - Vanpools will serve smaller communities in Franklin County, providing an additional transportation option for the first time.
Expanded Major Roads
Expanded Minor Roads
Existing Minor Roads(Light Grey Line)
Existing Major Roads(Heavy Yellow Line)
More ConneCtions = More travel options & DeCreaseD Congestion
Fewer ConneCtions = Fewer travel options & inCreaseD Congestion

The visionTransportation and infrastructureSouthern Halfof Valley
0 1.5 3Miles
0.75
ThE vision 28
2a. The Existing Public Transportation Network
Cache Valley is well served by its existing public transportation network, pictured at left. Key additions to existing service, as outlined on the large map and including bus rapid transit and the expansion of local and express bus service, signal more reliance on public transportation as a key long-term mobility strategy.
3. Bike Commute Routes
Bike commute routes provide a non-motorized, inexpensive and healthful transportation option, linking many communities in Cache Valley
4. Mobility for Everyone
The streets in our communities are important public spaces that can significantly enhance livability, safety, and mobility. When street design and operation are sensitive to context and to all of their users, including pedestrians, bicyclists, and those riding public transportation, we make the most of a valuable public resource.
5. Infrastructure Efficiency
When overall development patterns are more compact, infrastructure usually becomes more efficient. Fewer miles of water and sewer pipes mean lower maintenance costs. All else being equal, a smaller house uses less energy than a larger one. The road network is shorter, costs less to construct, and uses fewer resources.
Big Ideas & Concepts
Pictures Courtesy of Cache Valley Transit District
greater DistanCe to HouseHolD = inCreaseD inFrastruCture Costs
reDuCeD DistanCe to HouseHolD = DeCreaseD
inFrastruCture Costs
Map Courtesy of Cache Valley Transit District
auto
lanEs
10’ (EaCh)
BikE
lanE
5’
sidEwalk &paRkstRip
4’ (EaCh)
Before
auto
lanEs
10’ (EaCh)
BikE
lanE
5’
sidEwalk &paRkstRip
4’ (EaCh)
BRtlanE
10’
BeforeAfter After
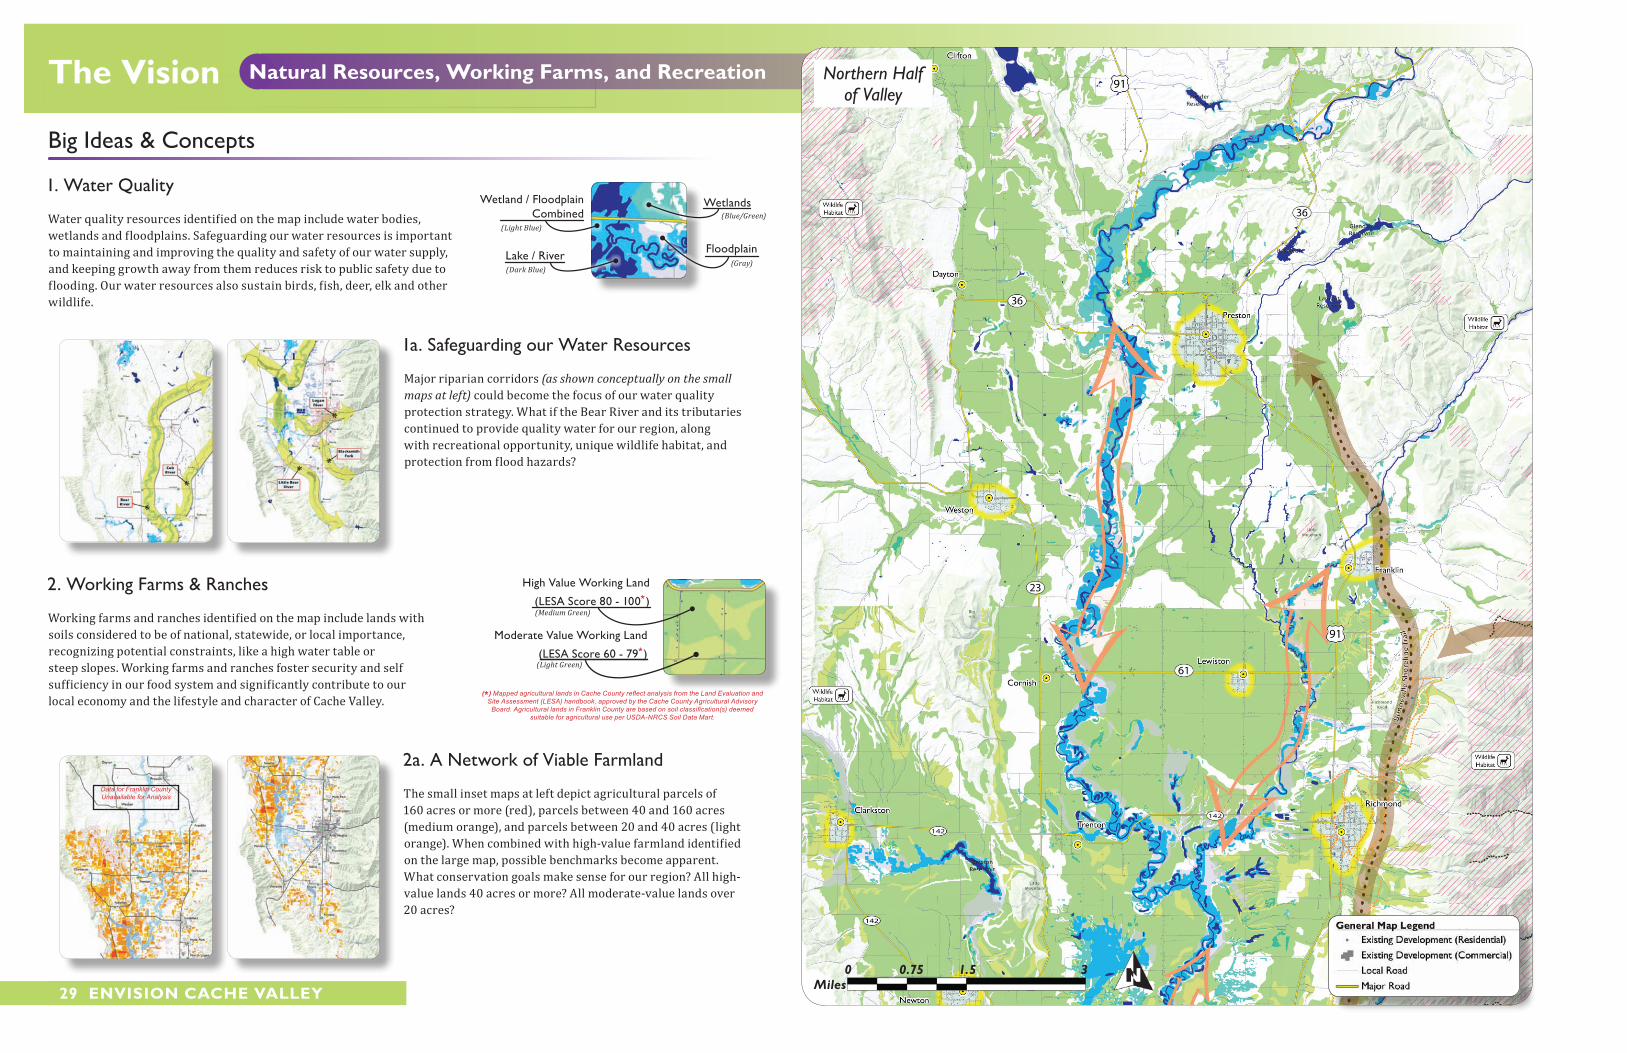
The vision natural Resources, Working Farms, and Recreation Northern Halfof Valley
0 1.5 3Miles
0.75
29 Envision CaChE vallEy
Big Ideas & Concepts
1. Water Quality
Water quality resources identified on the map include water bodies, wetlands and floodplains. Safeguarding our water resources is important to maintaining and improving the quality and safety of our water supply, and keeping growth away from them reduces risk to public safety due to flooding. Our water resources also sustain birds, fish, deer, elk and other wildlife.
1a. Safeguarding our Water Resources
Major riparian corridors (as shown conceptually on the small maps at left) could become the focus of our water quality protection strategy. What if the Bear River and its tributaries continued to provide quality water for our region, along with recreational opportunity, unique wildlife habitat, and protection from flood hazards?
2. Working Farms & Ranches
Working farms and ranches identified on the map include lands with soils considered to be of national, statewide, or local importance, recognizing potential constraints, like a high water table or steep slopes. Working farms and ranches foster security and self sufficiency in our food system and significantly contribute to our local economy and the lifestyle and character of Cache Valley.
2a. A Network of Viable Farmland
The small inset maps at left depict agricultural parcels of 160 acres or more (red), parcels between 40 and 160 acres (medium orange), and parcels between 20 and 40 acres (light orange). When combined with high-value farmland identified on the large map, possible benchmarks become apparent. What conservation goals make sense for our region? All high-value lands 40 acres or more? All moderate-value lands over 20 acres?
Wetland / Floodplain Combined
Lake / River
Wetlands
Floodplain
(Blue/Green)
(Gray)
(Light Blue)
(Dark Blue)
(*) Mapped agricultural lands in Cache County reflect analysis from the Land Evaluation and Site Assessment (LESA) handbook, approved by the Cache County Agricultural Advisory
Board. Agricultural lands in Franklin County are based on soil classification(s) deemed suitable for agricultural use per USDA-NRCS Soil Data Mart.
High Value Working Land
(LESA Score 80 - 100*)(Medium Green)
Moderate Value Working Land
(LESA Score 60 - 79*)(Light Green)
Data for Franklin CountyUnavailable for Analysis
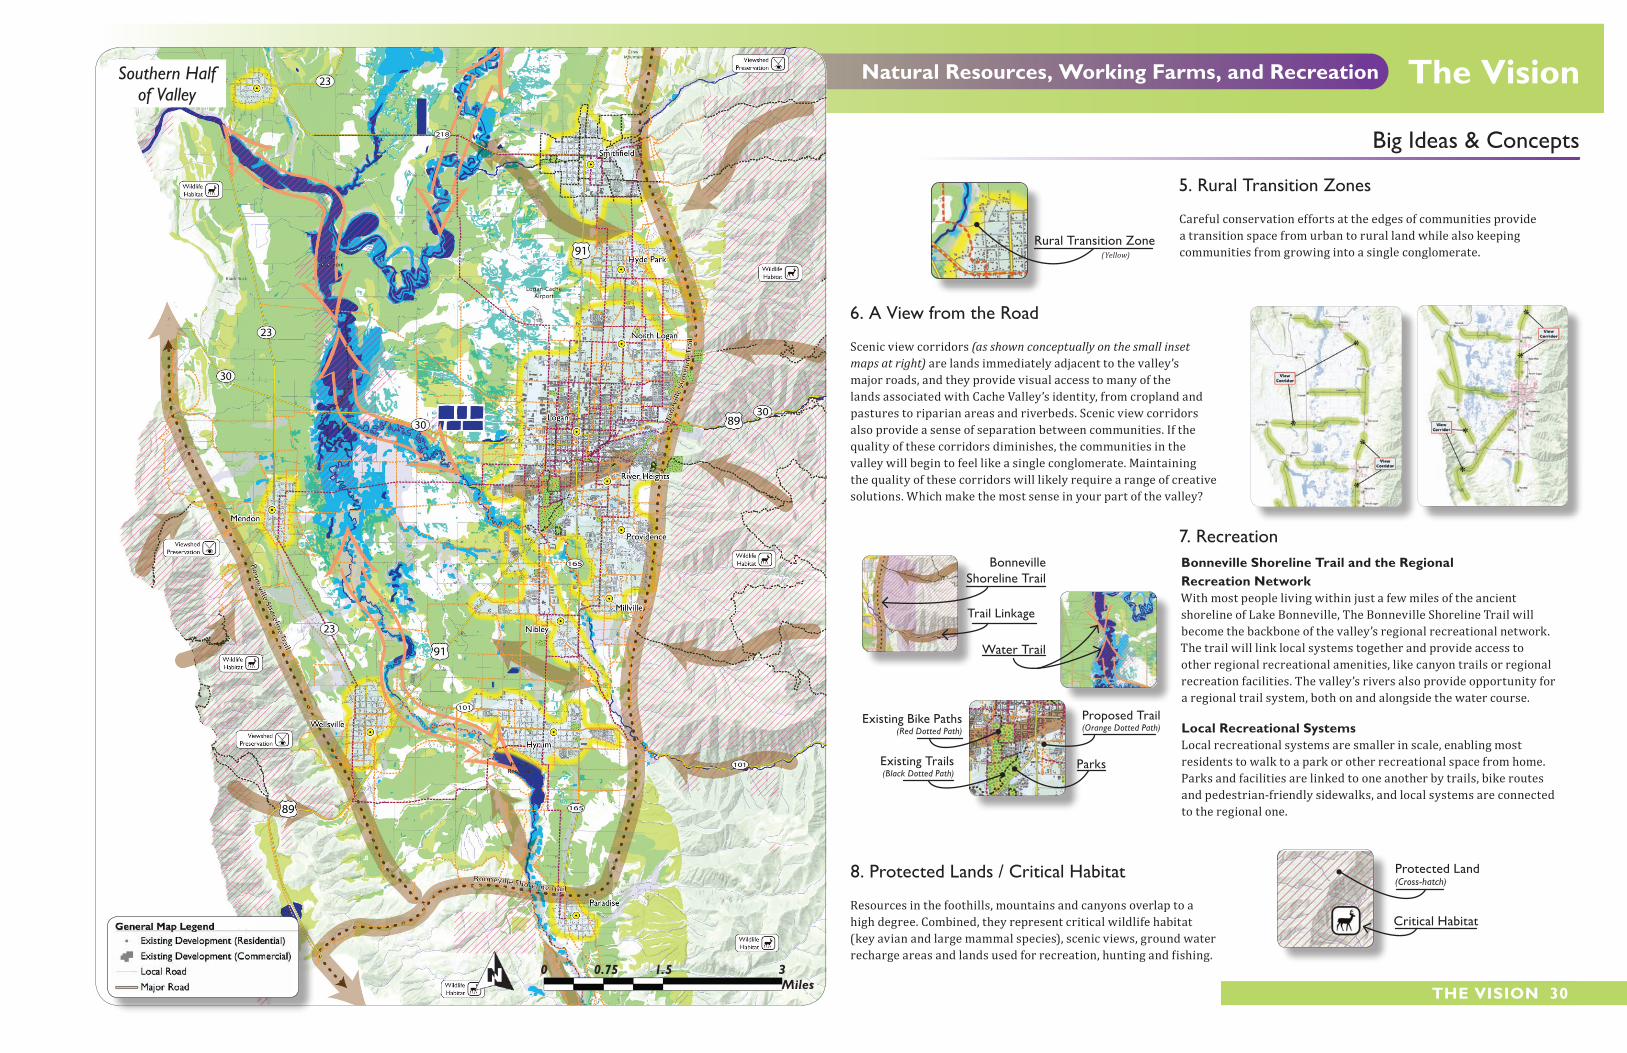
The visionnatural Resources, Working Farms, and RecreationSouthern Halfof Valley
0 1.5 3Miles
0.75
ThE vision 30
5. Rural Transition Zones
Careful conservation efforts at the edges of communities provide a transition space from urban to rural land while also keeping communities from growing into a single conglomerate.
6. A View from the Road
Scenic view corridors (as shown conceptually on the small inset maps at right) are lands immediately adjacent to the valley’s major roads, and they provide visual access to many of the lands associated with Cache Valley’s identity, from cropland and pastures to riparian areas and riverbeds. Scenic view corridors also provide a sense of separation between communities. If the quality of these corridors diminishes, the communities in the valley will begin to feel like a single conglomerate. Maintaining the quality of these corridors will likely require a range of creative solutions. Which make the most sense in your part of the valley?
7. Recreation bonneville shoreline Trail and the Regional Recreation networkWith most people living within just a few miles of the ancient shoreline of Lake Bonneville, The Bonneville Shoreline Trail will become the backbone of the valley’s regional recreational network. The trail will link local systems together and provide access to other regional recreational amenities, like canyon trails or regional recreation facilities. The valley’s rivers also provide opportunity for a regional trail system, both on and alongside the water course.
local Recreational systemsLocal recreational systems are smaller in scale, enabling most residents to walk to a park or other recreational space from home. Parks and facilities are linked to one another by trails, bike routes and pedestrian-friendly sidewalks, and local systems are connected to the regional one.
8. Protected Lands / Critical Habitat
Resources in the foothills, mountains and canyons overlap to a high degree. Combined, they represent critical wildlife habitat (key avian and large mammal species), scenic views, ground water recharge areas and lands used for recreation, hunting and fishing.
Critical Habitat
Protected Land(Cross-hatch)
Big Ideas & Concepts
Rural Transition Zone(Yellow)
Water Trail
Trail Linkage
Bonneville Shoreline Trail
Existing Bike Paths (Red Dotted Path)
Existing Trails (Black Dotted Path)
Parks
Proposed Trail (Orange Dotted Path)
31 Envision CaChE vallEy
introductionThe Envision Cache Valley process provides local leaders with a summary of public preferences in regard to future growth. These preferences are incorporated into the Cache Valley Vision Principles, which provide a bridge between the public visioning process and local action: each principle could be implemented locally in a variety of ways, to address both local challenges and valley-wide objectives. The Cache Valley Vision is realized to the extent that it is embraced locally.
The Envision Cache Valley process also enables leaders to gauge the impact of embracing the vision versus continuing current growth trends. The vision:
• Focuses most growth within existing towns.• Reduces the acres of farmland converted to urban use.• Keeps most communities from growing into one another.• Reduces the miles traveled and the time spent in the car.• Increases housing and transportation options.
• Reduces the cost of public services for taxpayers.
The valley and its municipalities can achieve these benefits as they implement priority strategies.
Because implementation strategies are voluntary, and each jurisdiction will have varied opportunities for realizing vision objectives, the suggestions in this chapter are intended more to generate conversation and the development of specific strategies by local leaders than to prescribe a specific set of implementation steps. Each jurisdiction will, in fact, need to create its own unique strategy.
This chapter highlights some options for valley-wide action and county-level initiatives, as well as a potential municipal approach. Actual strategies will, of course, vary among municipalities, depending on specific priorities, existing codes, policies that are working well, policies that need improvement, and resources available.
The recommendations that follow briefly reference many tools. For further description of these tools, see the toolkit in the following chapter.
General valley-wide Recommendations (Engaging all Jurisdictions)Increase awareness of the Cache Valley Vision and Envision
Cache Valley Process. Continued awareness efforts through presentations, newsletters and other media will keep the vision top of mind and remind the public and local officials what the process was and what the results were.
Provide toolkit education and training. Some tools are already being successfully used in Cache Valley. Those using these tools should provide training to others who want to explore them. Other tools are not in current use or have not been used successfully in Cache Valley. Plan training sessions with outside speakers or field trips to better understand unfamiliar tools. The toolkit is provided in the following chapter.
Meet regularly. All Cache Valley local officials should meet regularly to identify mutual goals and timelines; share ideas, solutions, and challenges; and set measurable indicators for successful vision implementation.
Develop valley-wide plans for systems that impact everyone.
Transportation Master Plan. To clean our air and save money and time for what matters most, we can: improve roadway connections and reduce congestion; expand multimodal transportation options; plan for needed capital improvements, right-of-way acquisitions, etc.; and tie in with EPA-driven air quality attainment plans.
Economic Development Plan. A plan to advance regional prosperity can: retain and attract high-quality jobs for valley-wide economic health; reduce municipal competition for sales tax revenue and encourage focus on providing needed services and higher-wage jobs; reduce economic development pressure on outlying lands; and create business-ready sites that build on existing synergy and strategic improvements to existing infrastructure.
Critical Lands Inventory and Protection Strategy. To use our valuable and limited land most appropriately, we can: amass critical lands data at a single, accessible source; identify specific valley-wide priorities for critical lands protection (i.e., farmland with high LESA values, 100-year FEMA floodplain, slopes with grades exceeding 25%, etc.); and work together to employ a combination of tools to meet critical lands protection goals.
Regional Recreation and Trails Plan. We can enjoy our beautiful valley by pursuing strategies to plan and fund: desired regional recreation facilities; a trail network that includes the Bonneville Shoreline Trail and, perhaps, a water trail; and connections between local networks and the regional system. The formation of a recreation district could be a part of this process.
Develop model tools. Identify needs for model policies and codes. Work from codes referenced in the toolkit (next chapter), from well-performing local policy, or other sources to create models that are widely adaptable to local municipalities.
County-level RecommendationsAdopt the vision principles. Principles could be adopted as an addendum to a county’s general plan, or as a checklist by which proposed developments are evaluated.
Update the general plan. The update ensures that the general plan and the Cache Valley Vision are in alignment.
Work with the cities and towns to explore and adopt
shared land-use agreements. The agreement should provide a framework that enables the county and a municipality to successfully work through development proposals for county lands that are within a city’s area of influence, keeping in mind the goal of keeping the city, city and the country, country. Such conversations may include agreement regarding infrastructure extensions, annexation lines, transportation network connectivity, or other issues that impact the county and one or more municipalities.
Adopt a clustering incentive or requirement. Clustering enables a landowner to realize the real estate development value of the land while preserving large tracts of it for existing uses, whether agricultural, recreational, or ecological. Clustering also reduces infrastructure costs.
Work with municipalities to adopt TDR sending areas. Transferring a limited number of development rights from county lands to a nearby city would permanently protect outlying working landscapes while encouraging vibrancy in town.
Use conservation easements. When land conservation strategies are employed, use conservation easements where possible to preserve land and associated uses in perpetuity.
4
Creating a Locally Relevant and Regionally
Significant Strategy
Realizing o
ur vision
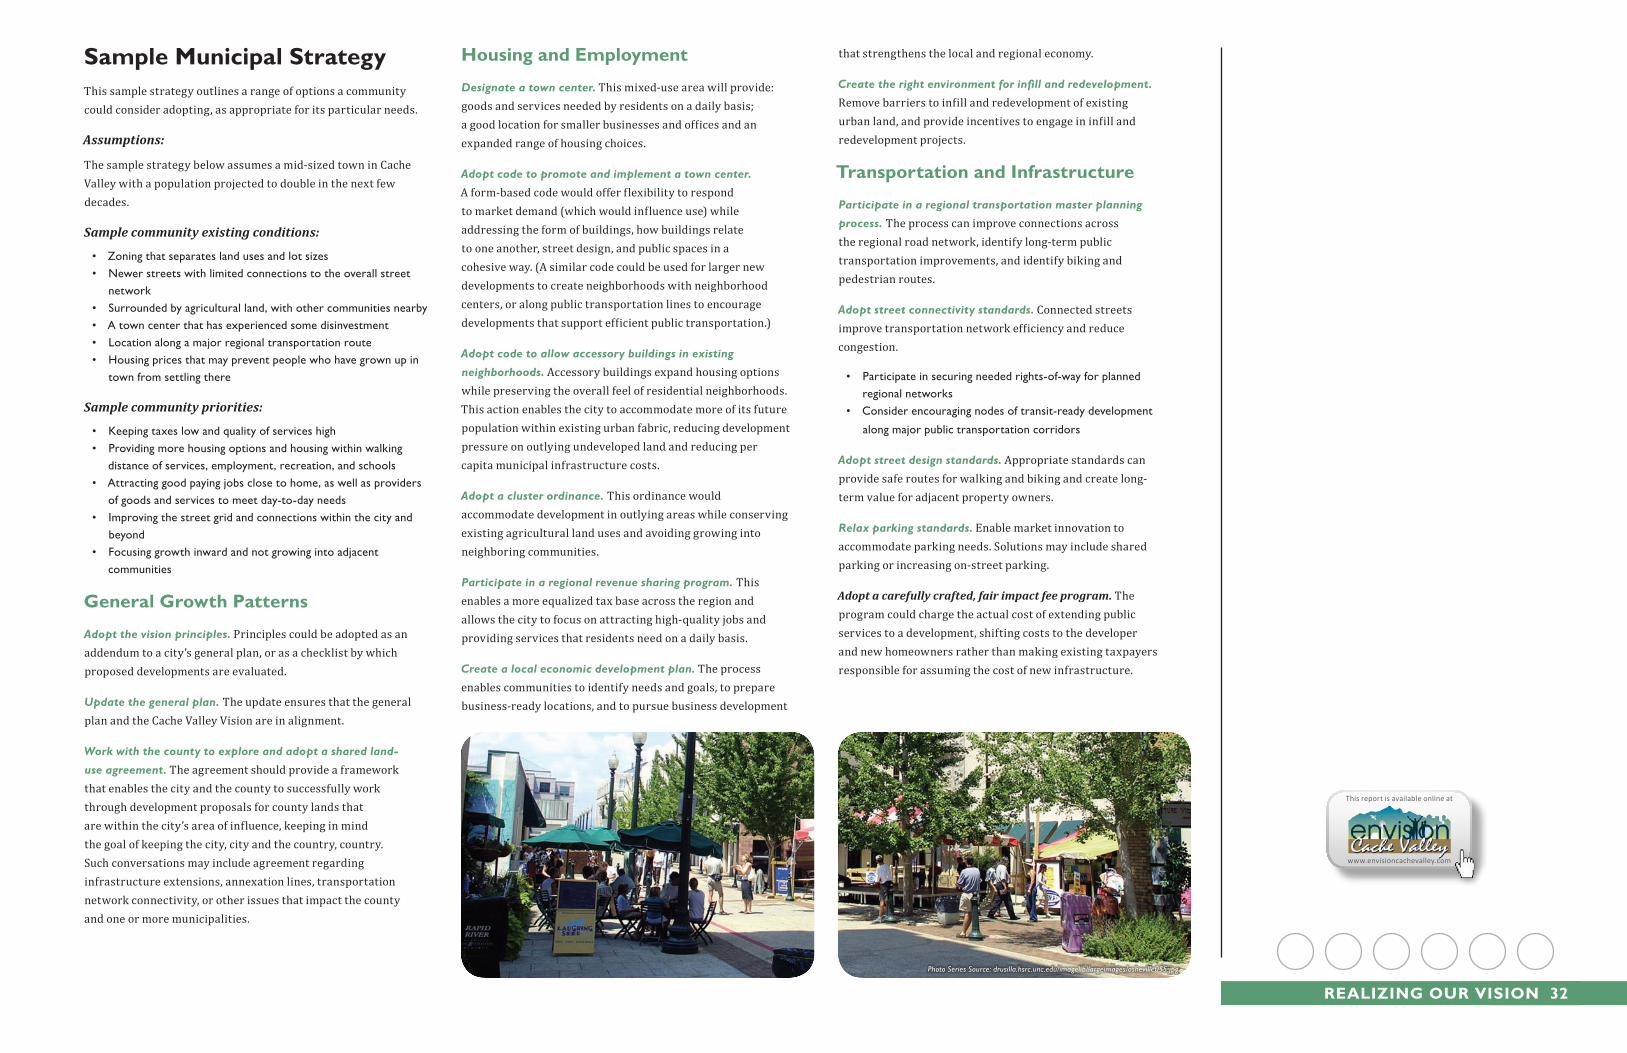
REalizinG ouR vision 32
sample Municipal strategyThis sample strategy outlines a range of options a community could consider adopting, as appropriate for its particular needs.
Assumptions:
The sample strategy below assumes a mid-sized town in Cache Valley with a population projected to double in the next few decades.
Sample community existing conditions:
• Zoning that separates land uses and lot sizes• Newer streets with limited connections to the overall street
network• Surrounded by agricultural land, with other communities nearby• A town center that has experienced some disinvestment• Location along a major regional transportation route• Housing prices that may prevent people who have grown up in
town from settling there
Sample community priorities:
• Keeping taxes low and quality of services high• Providing more housing options and housing within walking
distance of services, employment, recreation, and schools• Attracting good paying jobs close to home, as well as providers
of goods and services to meet day-to-day needs• Improving the street grid and connections within the city and
beyond• Focusing growth inward and not growing into adjacent
communities
General Growth Patterns
Adopt the vision principles. Principles could be adopted as an addendum to a city’s general plan, or as a checklist by which proposed developments are evaluated.
Update the general plan. The update ensures that the general plan and the Cache Valley Vision are in alignment.
Work with the county to explore and adopt a shared land-
use agreement. The agreement should provide a framework that enables the city and the county to successfully work through development proposals for county lands that are within the city’s area of influence, keeping in mind the goal of keeping the city, city and the country, country. Such conversations may include agreement regarding infrastructure extensions, annexation lines, transportation network connectivity, or other issues that impact the county and one or more municipalities.
housing and Employment
Designate a town center. This mixed-use area will provide: goods and services needed by residents on a daily basis; a good location for smaller businesses and offices and an expanded range of housing choices.
Adopt code to promote and implement a town center. A form-based code would offer flexibility to respond to market demand (which would influence use) while addressing the form of buildings, how buildings relate to one another, street design, and public spaces in a cohesive way. (A similar code could be used for larger new developments to create neighborhoods with neighborhood centers, or along public transportation lines to encourage developments that support efficient public transportation.)
Adopt code to allow accessory buildings in existing
neighborhoods. Accessory buildings expand housing options while preserving the overall feel of residential neighborhoods. This action enables the city to accommodate more of its future population within existing urban fabric, reducing development pressure on outlying undeveloped land and reducing per capita municipal infrastructure costs.
Adopt a cluster ordinance. This ordinance would accommodate development in outlying areas while conserving existing agricultural land uses and avoiding growing into neighboring communities.
Participate in a regional revenue sharing program. This enables a more equalized tax base across the region and allows the city to focus on attracting high-quality jobs and providing services that residents need on a daily basis.
Create a local economic development plan. The process enables communities to identify needs and goals, to prepare business-ready locations, and to pursue business development
that strengthens the local and regional economy.
Create the right environment for infill and redevelopment.
Remove barriers to infill and redevelopment of existing urban land, and provide incentives to engage in infill and redevelopment projects.
Transportation and infrastructure
Participate in a regional transportation master planning
process. The process can improve connections across the regional road network, identify long-term public transportation improvements, and identify biking and pedestrian routes.
Adopt street connectivity standards. Connected streets improve transportation network efficiency and reduce congestion.
• Participate in securing needed rights-of-way for planned regional networks
• Consider encouraging nodes of transit-ready development
along major public transportation corridors
Adopt street design standards. Appropriate standards can provide safe routes for walking and biking and create long-term value for adjacent property owners.
Relax parking standards. Enable market innovation to accommodate parking needs. Solutions may include shared parking or increasing on-street parking.
Adopt a carefully crafted, fair impact fee program. The program could charge the actual cost of extending public services to a development, shifting costs to the developer and new homeowners rather than making existing taxpayers responsible for assuming the cost of new infrastructure.
Photo Series Source: drusilla.hsrc.unc.edu/imagelib/largeimages/asheville055.jpg
This report is available online at
www.envisioncachevalley.com
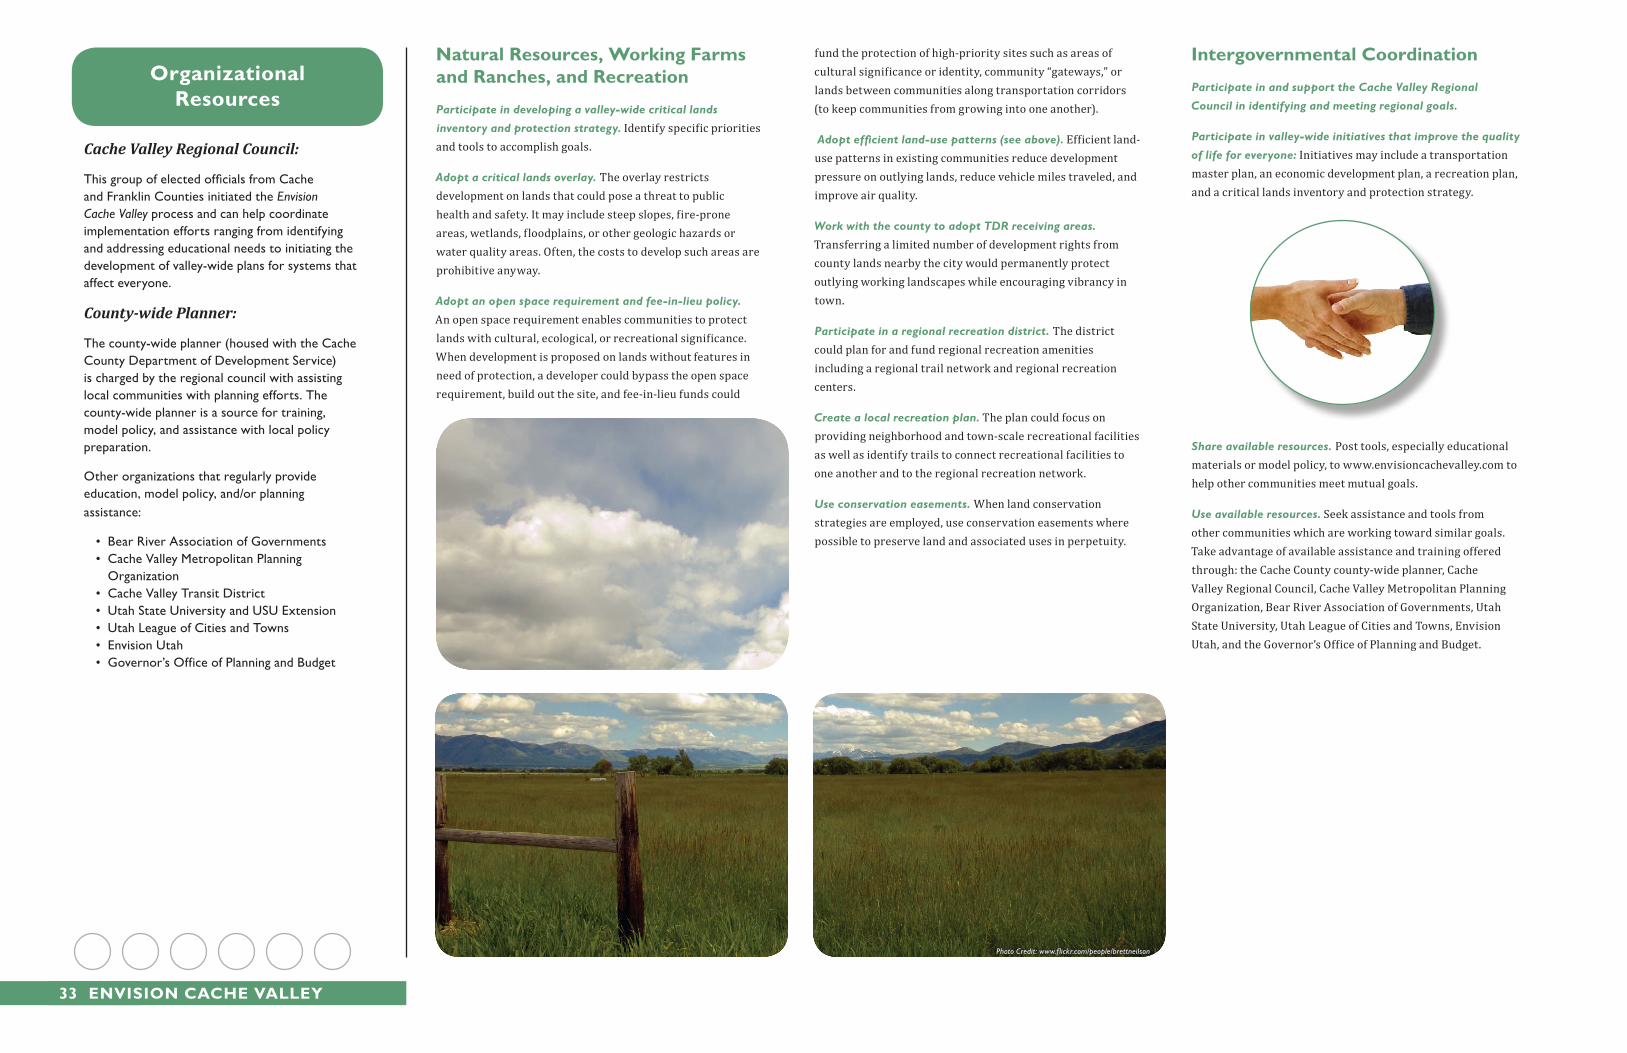
33 Envision CaChE vallEy
natural Resources, Working Farms and Ranches, and Recreation
Participate in developing a valley-wide critical lands
inventory and protection strategy. Identify specific priorities and tools to accomplish goals.
Adopt a critical lands overlay. The overlay restricts development on lands that could pose a threat to public health and safety. It may include steep slopes, fire-prone areas, wetlands, floodplains, or other geologic hazards or water quality areas. Often, the costs to develop such areas are prohibitive anyway.
Adopt an open space requirement and fee-in-lieu policy. An open space requirement enables communities to protect lands with cultural, ecological, or recreational significance. When development is proposed on lands without features in need of protection, a developer could bypass the open space requirement, build out the site, and fee-in-lieu funds could
fund the protection of high-priority sites such as areas of cultural significance or identity, community “gateways,” or lands between communities along transportation corridors (to keep communities from growing into one another).
Adopt efficient land-use patterns (see above). Efficient land-use patterns in existing communities reduce development pressure on outlying lands, reduce vehicle miles traveled, and improve air quality.
Work with the county to adopt TDR receiving areas.
Transferring a limited number of development rights from county lands nearby the city would permanently protect outlying working landscapes while encouraging vibrancy in town.
Participate in a regional recreation district. The district could plan for and fund regional recreation amenities including a regional trail network and regional recreation centers.
Create a local recreation plan. The plan could focus on providing neighborhood and town-scale recreational facilities as well as identify trails to connect recreational facilities to one another and to the regional recreation network.
Use conservation easements. When land conservation strategies are employed, use conservation easements where possible to preserve land and associated uses in perpetuity.
intergovernmental Coordination
Participate in and support the Cache Valley Regional
Council in identifying and meeting regional goals.
Participate in valley-wide initiatives that improve the quality
of life for everyone: Initiatives may include a transportation master plan, an economic development plan, a recreation plan, and a critical lands inventory and protection strategy.
Share available resources. Post tools, especially educational materials or model policy, to www.envisioncachevalley.com to help other communities meet mutual goals.
Use available resources. Seek assistance and tools from other communities which are working toward similar goals. Take advantage of available assistance and training offered through: the Cache County county-wide planner, Cache Valley Regional Council, Cache Valley Metropolitan Planning Organization, Bear River Association of Governments, Utah State University, Utah League of Cities and Towns, Envision Utah, and the Governor’s Office of Planning and Budget.
Photo Credit: www.f lickr.com/people/brettneilson
organizational Resources
Cache Valley Regional Council:
This group of elected officials from Cache and Franklin Counties initiated the Envision Cache Valley process and can help coordinate implementation efforts ranging from identifying and addressing educational needs to initiating the development of valley-wide plans for systems that affect everyone.
County-wide Planner:
The county-wide planner (housed with the Cache County Department of Development Service) is charged by the regional council with assisting local communities with planning efforts. The county-wide planner is a source for training, model policy, and assistance with local policy preparation.
Other organizations that regularly provide education, model policy, and/or planning assistance:
• Bear River Association of Governments• Cache Valley Metropolitan Planning
Organization• Cache Valley Transit District• Utah State University and USU Extension • Utah League of Cities and Towns• Envision Utah• Governor’s Office of Planning and Budget
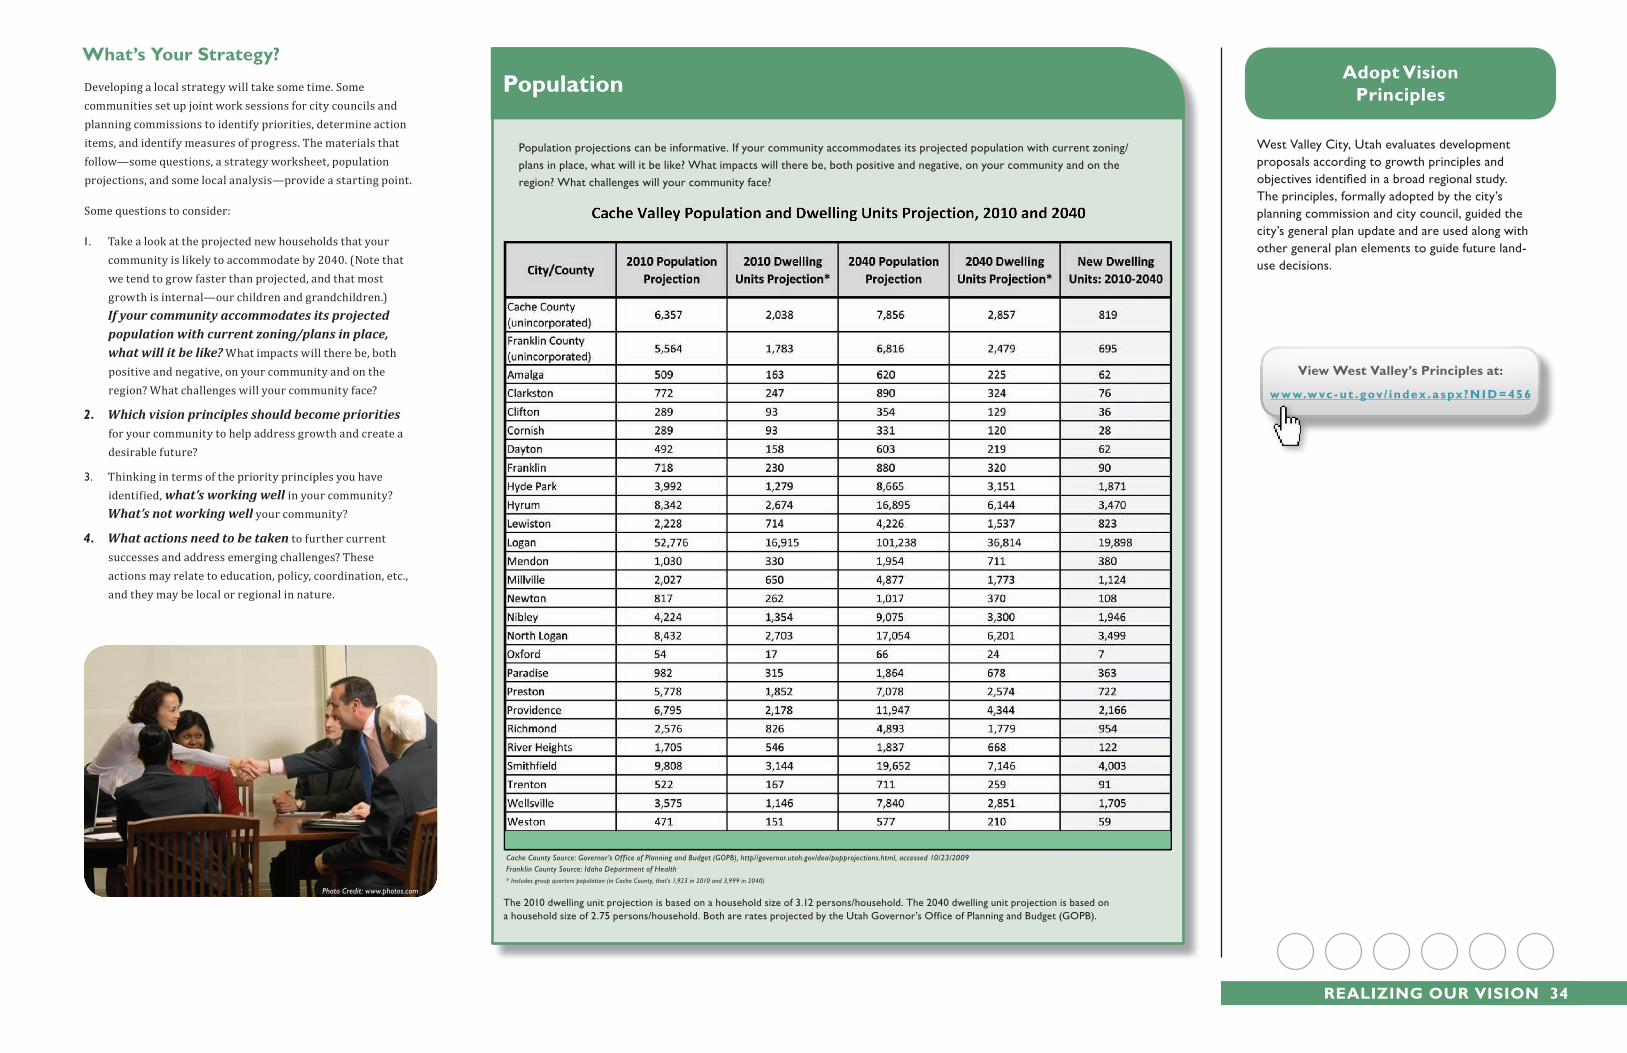
REalizinG ouR vision 34
What’s your strategy?
Developing a local strategy will take some time. Some communities set up joint work sessions for city councils and planning commissions to identify priorities, determine action items, and identify measures of progress. The materials that follow—some questions, a strategy worksheet, population projections, and some local analysis—provide a starting point.
Some questions to consider:
1. Take a look at the projected new households that your community is likely to accommodate by 2040. (Note that we tend to grow faster than projected, and that most growth is internal—our children and grandchildren.) If your community accommodates its projected population with current zoning/plans in place, what will it be like? What impacts will there be, both positive and negative, on your community and on the region? What challenges will your community face?
2. Which vision principles should become priorities
for your community to help address growth and create a desirable future?
3. Thinking in terms of the priority principles you have identified, what’s working well in your community? What’s not working well your community?
4. What actions need to be taken to further current successes and address emerging challenges? These actions may relate to education, policy, coordination, etc., and they may be local or regional in nature.
Photo Credit: www.photos.com
Population projections can be informative. If your community accommodates its projected population with current zoning/plans in place, what will it be like? What impacts will there be, both positive and negative, on your community and on the region? What challenges will your community face?
Population
The 2010 dwelling unit projection is based on a household size of 3.12 persons/household. The 2040 dwelling unit projection is based on a household size of 2.75 persons/household. Both are rates projected by the Utah Governor’s Office of Planning and Budget (GOPB).
Cache County Source: Governor’s Off ice of Planning and Budget (GOPB), http//governor.utah.gov/dea/popprojections.html, accessed 10/23/2009Franklin County Source: Idaho Department of Health* Includes group quarters population (in Cache County, that’s 1,923 in 2010 and 3,999 in 2040)
adopt vision Principles
West Valley City, Utah evaluates development proposals according to growth principles and objectives identified in a broad regional study. The principles, formally adopted by the city’s planning commission and city council, guided the city’s general plan update and are used along with other general plan elements to guide future land-use decisions.
view West valley’s Principles at:
w w w.w vc - ut .gov / index . a s px?n i d = 456
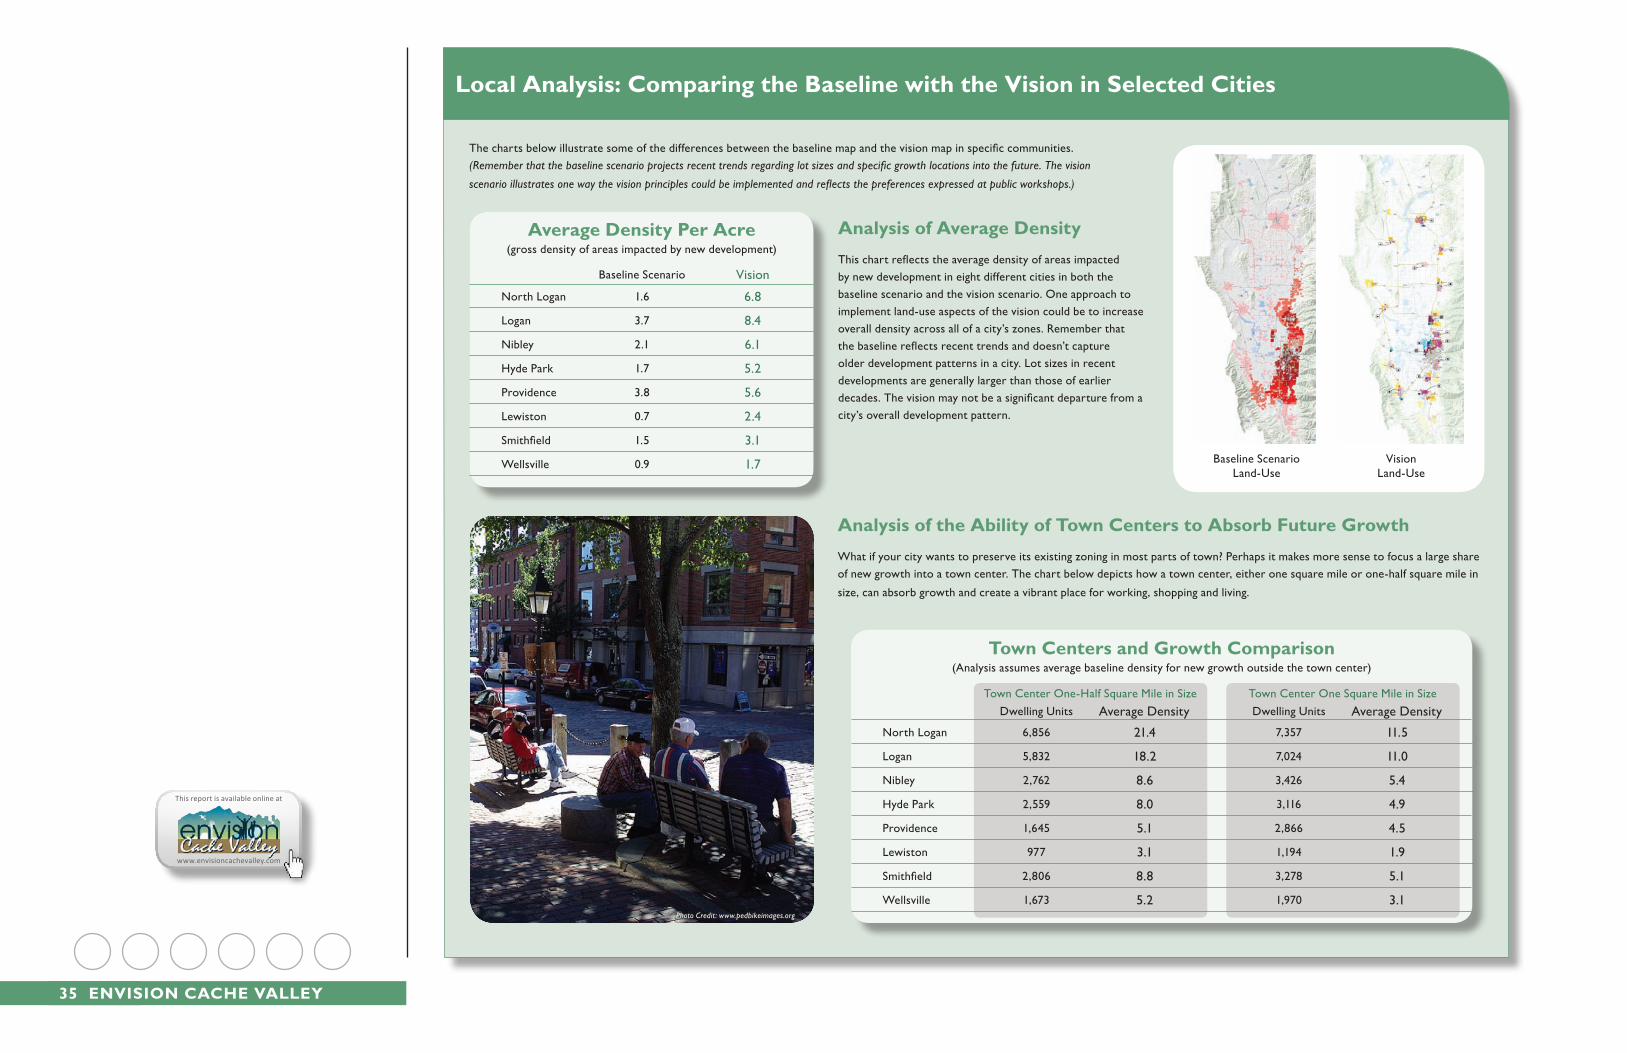
35 Envision CaChE vallEy
This report is available online at
www.envisioncachevalley.com
The charts below illustrate some of the differences between the baseline map and the vision map in specific communities. (Remember that the baseline scenario projects recent trends regarding lot sizes and specific growth locations into the future. The vision
scenario illustrates one way the vision principles could be implemented and reflects the preferences expressed at public workshops.)
analysis of average densityThis chart reflects the average density of areas impacted by new development in eight different cities in both the baseline scenario and the vision scenario. One approach to implement land-use aspects of the vision could be to increase overall density across all of a city’s zones. Remember that the baseline reflects recent trends and doesn’t capture older development patterns in a city. Lot sizes in recent developments are generally larger than those of earlier decades. The vision may not be a significant departure from a city’s overall development pattern.
analysis of the ability of Town Centers to absorb Future GrowthWhat if your city wants to preserve its existing zoning in most parts of town? Perhaps it makes more sense to focus a large share of new growth into a town center. The chart below depicts how a town center, either one square mile or one-half square mile in
size, can absorb growth and create a vibrant place for working, shopping and living.
local analysis: Comparing the baseline with the vision in selected Cities
Baseline Scenario Land-Use
Vision Land-Use
Photo Credit: www.pedbikeimages.org
average density Per acre (gross density of areas impacted by new development)
Vision
6.8
8.4
6.1
5.2
5.6
2.4
3.1
1.7
Baseline Scenario
1.6
3.7
2.1
1.7
3.8
0.7
1.5
0.9
North Logan
Logan
Nibley
Hyde Park
Providence
Lewiston
Smithfield
Wellsville
Town Centers and Growth Comparison(Analysis assumes average baseline density for new growth outside the town center)
North Logan
Logan
Nibley
Hyde Park
Providence
Lewiston
Smithfield
Wellsville
Town Center One-Half Square Mile in Size Town Center One Square Mile in Size
21.4
18.2
8.6
8.0
5.1
3.1
8.8
5.2
Average Density
6,856
5,832
2,762
2,559
1,645
977
2,806
1,673
Dwelling Units
11.5
11.0
5.4
4.9
4.5
1.9
5.1
3.1
Average Density
7,357
7,024
3,426
3,116
2,866
1,194
3,278
1,970
Dwelling Units
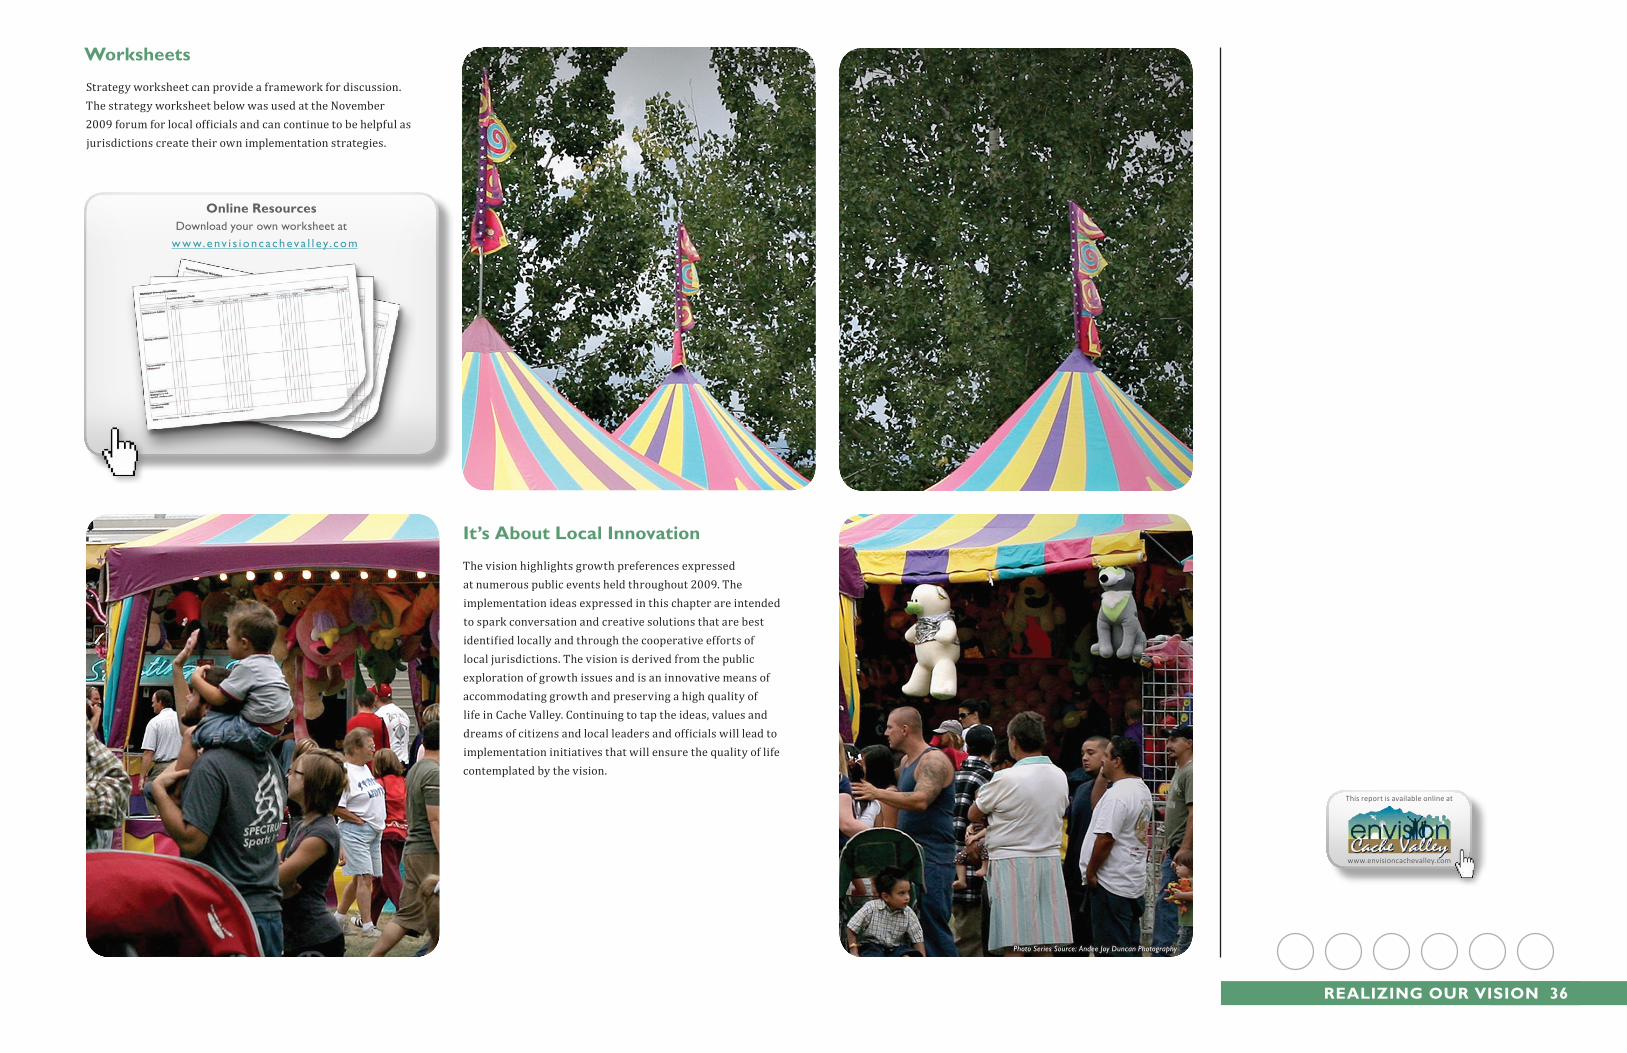
REalizinG ouR vision 36
Worksheets
Strategy worksheet can provide a framework for discussion. The strategy worksheet below was used at the November 2009 forum for local officials and can continue to be helpful as jurisdictions create their own implementation strategies.
it’s about local innovation
The vision highlights growth preferences expressed at numerous public events held throughout 2009. The implementation ideas expressed in this chapter are intended to spark conversation and creative solutions that are best identified locally and through the cooperative efforts of local jurisdictions. The vision is derived from the public exploration of growth issues and is an innovative means of accommodating growth and preserving a high quality of life in Cache Valley. Continuing to tap the ideas, values and dreams of citizens and local leaders and officials will lead to implementation initiatives that will ensure the quality of life contemplated by the vision.
Photo Series Source: Andee Joy Duncan Photography
online ResourcesDownload your own worksheet at
w w w.e nv i s i onc achev a l l ey. com
This report is available online at
www.envisioncachevalley.com
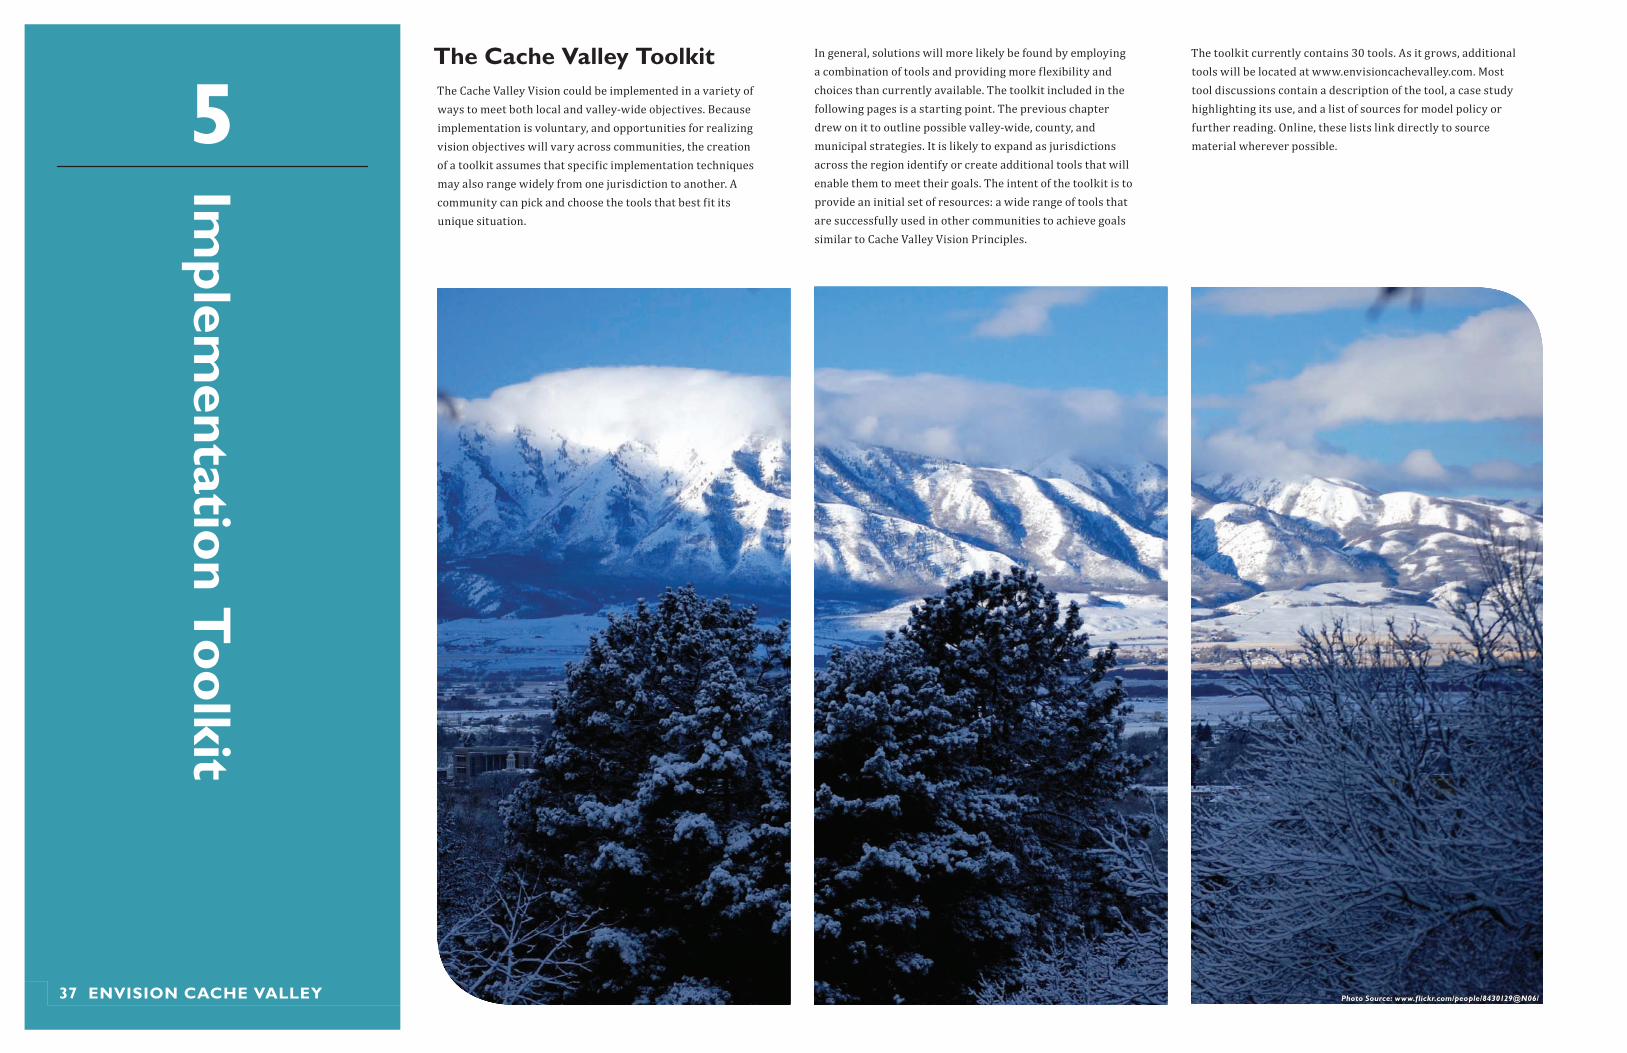
The Cache valley ToolkitThe Cache Valley Vision could be implemented in a variety of ways to meet both local and valley-wide objectives. Because implementation is voluntary, and opportunities for realizing vision objectives will vary across communities, the creation of a toolkit assumes that specific implementation techniques may also range widely from one jurisdiction to another. A community can pick and choose the tools that best fit its unique situation.
In general, solutions will more likely be found by employing a combination of tools and providing more flexibility and choices than currently available. The toolkit included in the following pages is a starting point. The previous chapter drew on it to outline possible valley-wide, county, and municipal strategies. It is likely to expand as jurisdictions across the region identify or create additional tools that will enable them to meet their goals. The intent of the toolkit is to provide an initial set of resources: a wide range of tools that are successfully used in other communities to achieve goals similar to Cache Valley Vision Principles.
The toolkit currently contains 30 tools. As it grows, additional tools will be located at www.envisioncachevalley.com. Most tool discussions contain a description of the tool, a case study highlighting its use, and a list of sources for model policy or further reading. Online, these lists link directly to source material wherever possible.
Photo Source: www.flickr.com/people/8430129@N06/37 Envision CaChE vallEy
implem
entation Toolkit
5
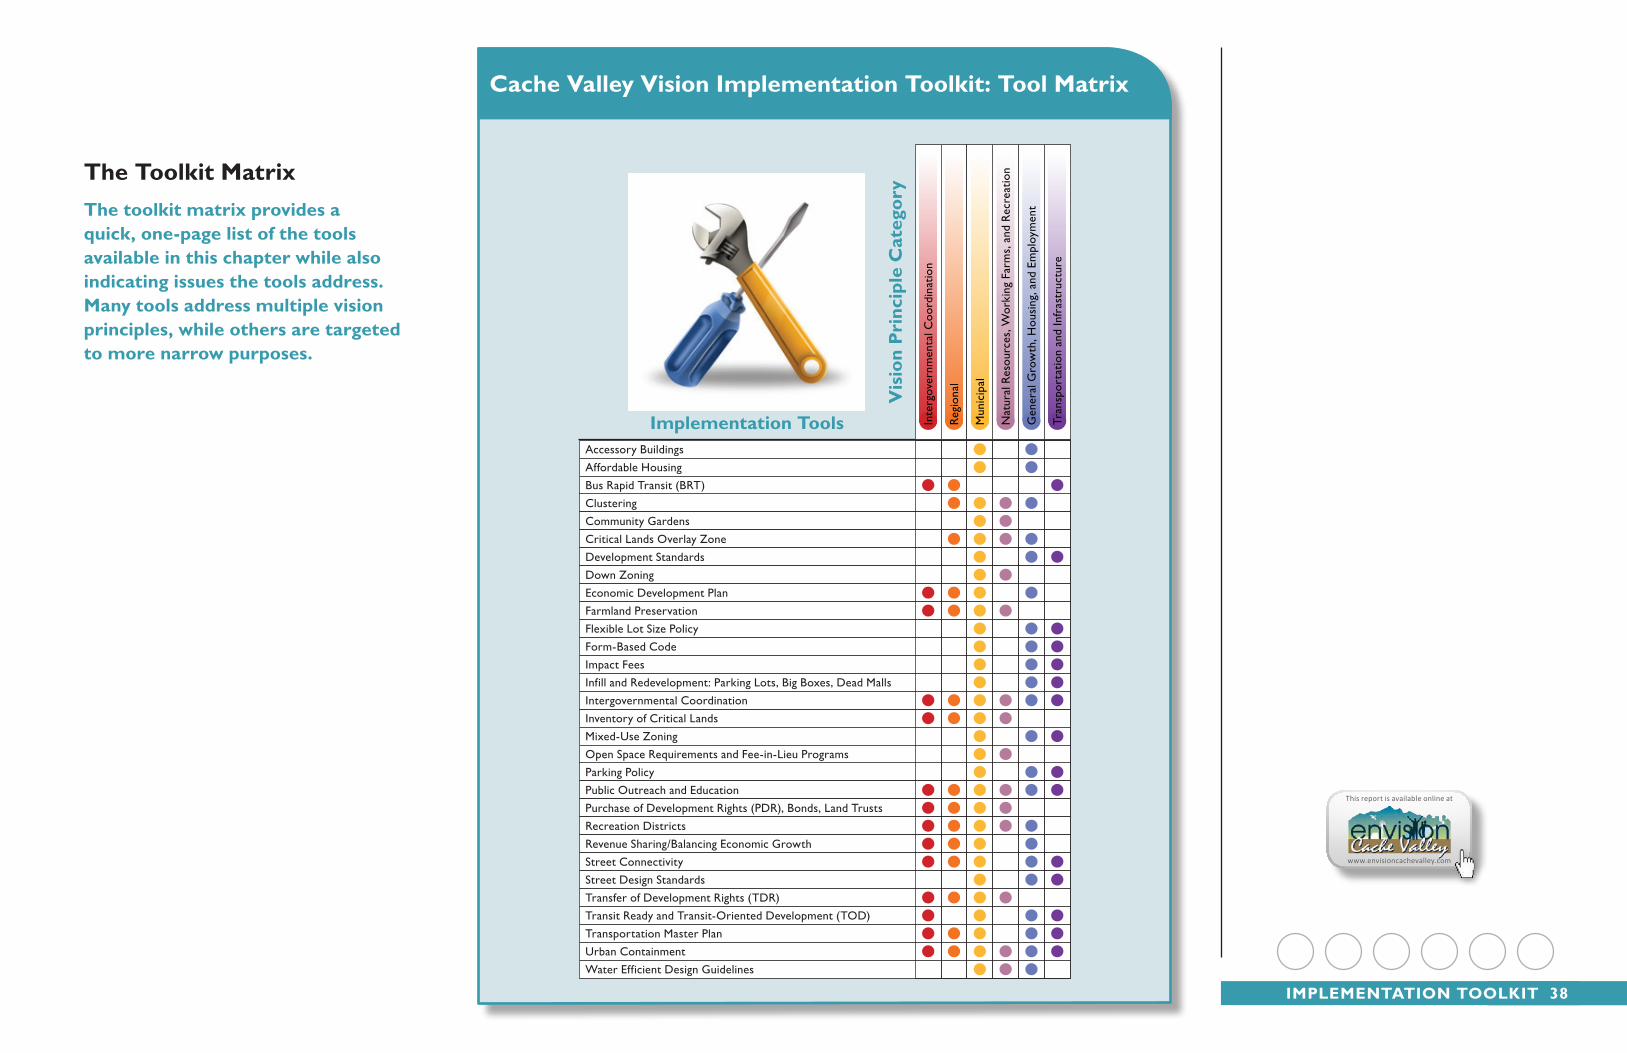
The Toolkit MatrixThe toolkit matrix provides a quick, one-page list of the tools available in this chapter while also indicating issues the tools address. Many tools address multiple vision principles, while others are targeted to more narrow purposes.
Cache valley vision implementation Toolkit: Tool Matrix
vis
ion
Pri
ncip
le C
ateg
ory
implementation Tools
Inventory of Critical Lands
Accessory BuildingsAffordable HousingBus Rapid Transit (BRT)ClusteringCommunity GardensCritical Lands Overlay ZoneDevelopment StandardsDown ZoningEconomic Development PlanFarmland PreservationFlexible Lot Size PolicyForm-Based CodeImpact FeesInfill and Redevelopment: Parking Lots, Big Boxes, Dead MallsIntergovernmental Coordination
Mixed-Use ZoningOpen Space Requirements and Fee-in-Lieu ProgramsParking PolicyPublic Outreach and EducationPurchase of Development Rights (PDR), Bonds, Land TrustsRecreation DistrictsRevenue Sharing/Balancing Economic GrowthStreet ConnectivityStreet Design StandardsTransfer of Development Rights (TDR)Transit Ready and Transit-Oriented Development (TOD)Transportation Master PlanUrban ContainmentWater Efficient Design Guidelines
Nat
ural
Res
ourc
es, W
orki
ng F
arm
s, a
nd R
ecre
atio
n
Inte
rgov
ernm
enta
l Coo
rdin
atio
n
Gen
eral
Gro
wth
, Hou
sing
, and
Em
ploy
men
t
Regi
onal
Tran
spor
tatio
n an
d In
fras
truc
ture
Mun
icip
al
This report is available online at
www.envisioncachevalley.com
iMPlEMEnTaTion ToolKiT 38
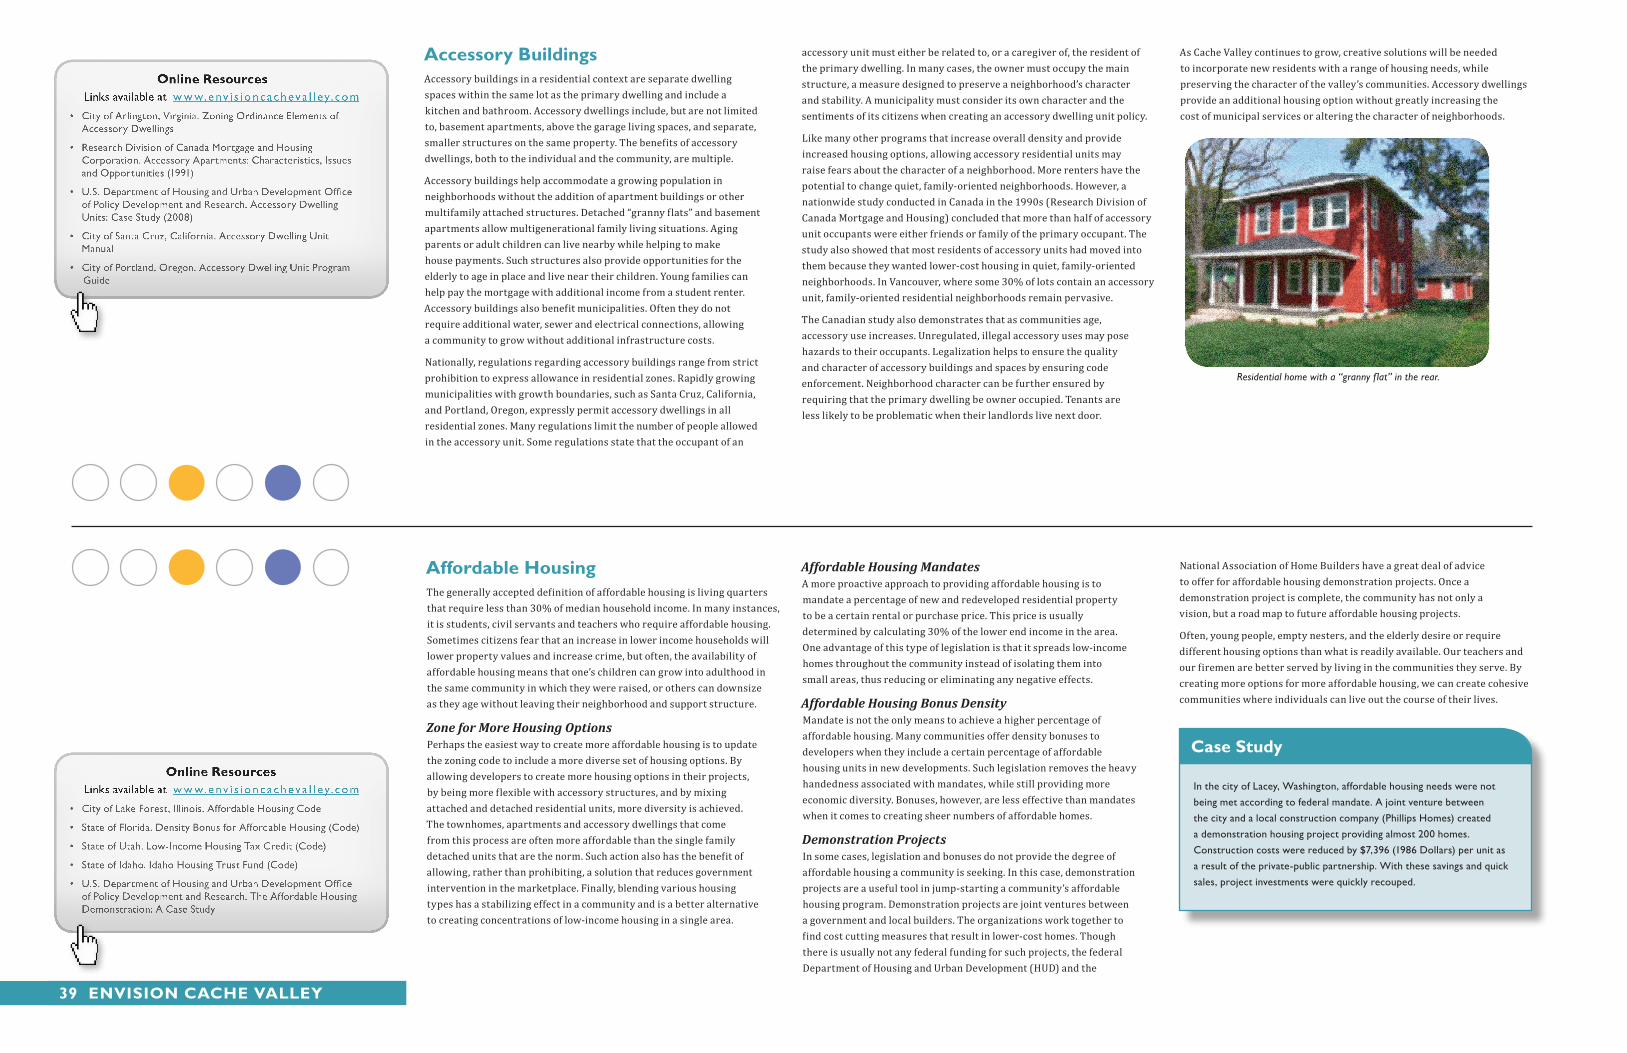
accessory buildingsAccessory buildings in a residential context are separate dwelling spaces within the same lot as the primary dwelling and include a kitchen and bathroom. Accessory dwellings include, but are not limited to, basement apartments, above the garage living spaces, and separate, smaller structures on the same property. The benefits of accessory dwellings, both to the individual and the community, are multiple.
Accessory buildings help accommodate a growing population in neighborhoods without the addition of apartment buildings or other multifamily attached structures. Detached “granny flats” and basement apartments allow multigenerational family living situations. Aging parents or adult children can live nearby while helping to make house payments. Such structures also provide opportunities for the elderly to age in place and live near their children. Young families can help pay the mortgage with additional income from a student renter. Accessory buildings also benefit municipalities. Often they do not require additional water, sewer and electrical connections, allowing a community to grow without additional infrastructure costs.
Nationally, regulations regarding accessory buildings range from strict prohibition to express allowance in residential zones. Rapidly growing municipalities with growth boundaries, such as Santa Cruz, California, and Portland, Oregon, expressly permit accessory dwellings in all residential zones. Many regulations limit the number of people allowed in the accessory unit. Some regulations state that the occupant of an
affordable housingThe generally accepted definition of affordable housing is living quarters that require less than 30% of median household income. In many instances, it is students, civil servants and teachers who require affordable housing. Sometimes citizens fear that an increase in lower income households will lower property values and increase crime, but often, the availability of affordable housing means that one’s children can grow into adulthood in the same community in which they were raised, or others can downsize as they age without leaving their neighborhood and support structure.
Zone for More Housing OptionsPerhaps the easiest way to create more affordable housing is to update the zoning code to include a more diverse set of housing options. By allowing developers to create more housing options in their projects, by being more flexible with accessory structures, and by mixing attached and detached residential units, more diversity is achieved. The townhomes, apartments and accessory dwellings that come from this process are often more affordable than the single family detached units that are the norm. Such action also has the benefit of allowing, rather than prohibiting, a solution that reduces government intervention in the marketplace. Finally, blending various housing types has a stabilizing effect in a community and is a better alternative to creating concentrations of low-income housing in a single area.
accessory unit must either be related to, or a caregiver of, the resident of the primary dwelling. In many cases, the owner must occupy the main structure, a measure designed to preserve a neighborhood’s character and stability. A municipality must consider its own character and the sentiments of its citizens when creating an accessory dwelling unit policy.
Like many other programs that increase overall density and provide increased housing options, allowing accessory residential units may raise fears about the character of a neighborhood. More renters have the potential to change quiet, family-oriented neighborhoods. However, a nationwide study conducted in Canada in the 1990s (Research Division of Canada Mortgage and Housing) concluded that more than half of accessory unit occupants were either friends or family of the primary occupant. The study also showed that most residents of accessory units had moved into them because they wanted lower-cost housing in quiet, family-oriented neighborhoods. In Vancouver, where some 30% of lots contain an accessory unit, family-oriented residential neighborhoods remain pervasive.
The Canadian study also demonstrates that as communities age, accessory use increases. Unregulated, illegal accessory uses may pose hazards to their occupants. Legalization helps to ensure the quality and character of accessory buildings and spaces by ensuring code enforcement. Neighborhood character can be further ensured by requiring that the primary dwelling be owner occupied. Tenants are less likely to be problematic when their landlords live next door.
Affordable Housing MandatesA more proactive approach to providing affordable housing is to mandate a percentage of new and redeveloped residential property to be a certain rental or purchase price. This price is usually determined by calculating 30% of the lower end income in the area. One advantage of this type of legislation is that it spreads low-income homes throughout the community instead of isolating them into small areas, thus reducing or eliminating any negative effects.
Affordable Housing Bonus DensityMandate is not the only means to achieve a higher percentage of affordable housing. Many communities offer density bonuses to developers when they include a certain percentage of affordable housing units in new developments. Such legislation removes the heavy handedness associated with mandates, while still providing more economic diversity. Bonuses, however, are less effective than mandates when it comes to creating sheer numbers of affordable homes.
Demonstration ProjectsIn some cases, legislation and bonuses do not provide the degree of affordable housing a community is seeking. In this case, demonstration projects are a useful tool in jump-starting a community’s affordable housing program. Demonstration projects are joint ventures between a government and local builders. The organizations work together to find cost cutting measures that result in lower-cost homes. Though there is usually not any federal funding for such projects, the federal Department of Housing and Urban Development (HUD) and the
As Cache Valley continues to grow, creative solutions will be needed to incorporate new residents with a range of housing needs, while preserving the character of the valley’s communities. Accessory dwellings provide an additional housing option without greatly increasing the cost of municipal services or altering the character of neighborhoods.
National Association of Home Builders have a great deal of advice to offer for affordable housing demonstration projects. Once a demonstration project is complete, the community has not only a vision, but a road map to future affordable housing projects.
Often, young people, empty nesters, and the elderly desire or require different housing options than what is readily available. Our teachers and our firemen are better served by living in the communities they serve. By creating more options for more affordable housing, we can create cohesive communities where individuals can live out the course of their lives.
Residential home with a “granny flat” in the rear.
In the city of Lacey, Washington, affordable housing needs were not being met according to federal mandate. A joint venture between the city and a local construction company (Phillips Homes) created a demonstration housing project providing almost 200 homes. Construction costs were reduced by $7,396 (1986 Dollars) per unit as a result of the private-public partnership. With these savings and quick sales, project investments were quickly recouped.
Case study
39 Envision CaChE vallEy
www.env i s i onc achev a l l ey. com
• CityofArlington,Virginia.ZoningOrdinanceElementsofAccessoryDwellings
• ResearchDivisionofCanadaMortgageandHousingCorporation.AccessoryApartments:Characteristics,IssuesandOpportunities(1991)
• U.S.DepartmentofHousingandUrbanDevelopmentOfficeofPolicyDevelopmentandResearch.AccessoryDwellingUnits:CaseStudy(2008)
• CityofSantaCruz,California.AccessoryDwellingUnitManual
• CityofPortland,Oregon.AccessoryDwellingUnitProgramGuide
www.env i s i onc achev a l l ey. com
• CityofLakeForest,Illinois.AffordableHousingCode
• StateofFlorida.DensityBonusforAffordableHousing(Code)
• StateofUtah.Low-IncomeHousingTaxCredit(Code)
• StateofIdaho.IdahoHousingTrustFund(Code)
• U.S.DepartmentofHousingandUrbanDevelopmentOfficeofPolicyDevelopmentandResearch.TheAffordableHousingDemonstration:ACaseStudy
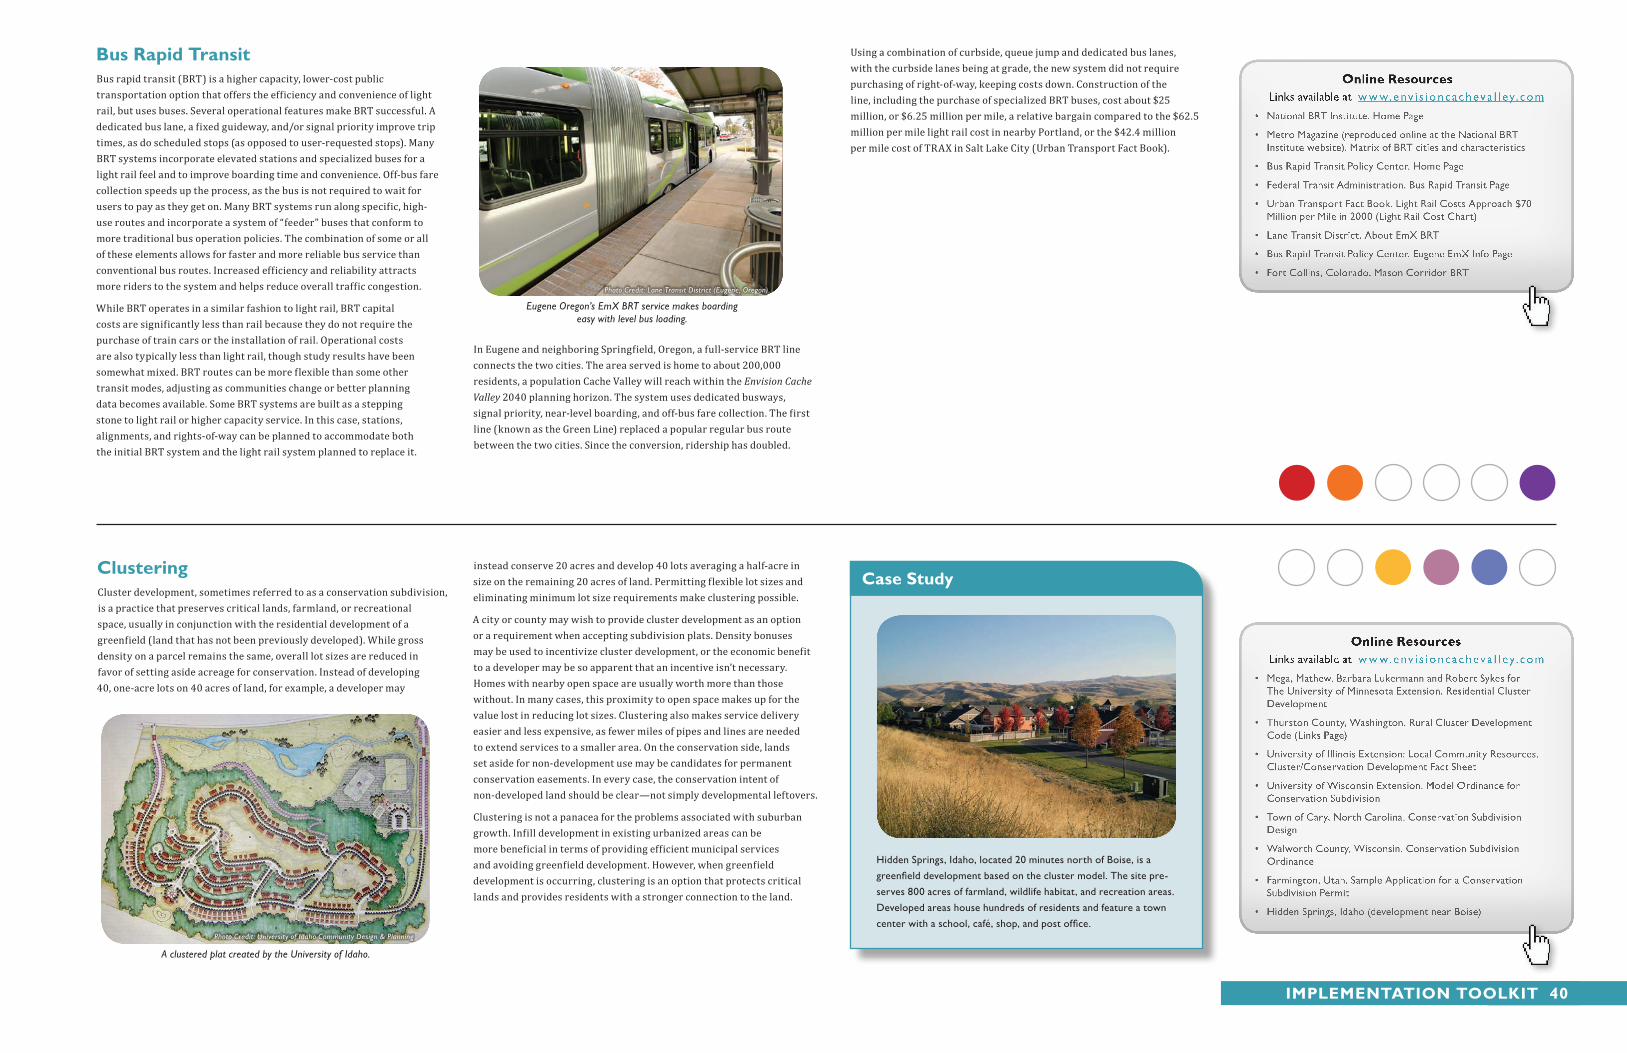
bus Rapid TransitBus rapid transit (BRT) is a higher capacity, lower-cost public transportation option that offers the efficiency and convenience of light rail, but uses buses. Several operational features make BRT successful. A dedicated bus lane, a fixed guideway, and/or signal priority improve trip times, as do scheduled stops (as opposed to user-requested stops). Many BRT systems incorporate elevated stations and specialized buses for a light rail feel and to improve boarding time and convenience. Off-bus fare collection speeds up the process, as the bus is not required to wait for users to pay as they get on. Many BRT systems run along specific, high-use routes and incorporate a system of “feeder” buses that conform to more traditional bus operation policies. The combination of some or all of these elements allows for faster and more reliable bus service than conventional bus routes. Increased efficiency and reliability attracts more riders to the system and helps reduce overall traffic congestion.
While BRT operates in a similar fashion to light rail, BRT capital costs are significantly less than rail because they do not require the purchase of train cars or the installation of rail. Operational costs are also typically less than light rail, though study results have been somewhat mixed. BRT routes can be more flexible than some other transit modes, adjusting as communities change or better planning data becomes available. Some BRT systems are built as a stepping stone to light rail or higher capacity service. In this case, stations, alignments, and rights-of-way can be planned to accommodate both the initial BRT system and the light rail system planned to replace it.
ClusteringCluster development, sometimes referred to as a conservation subdivision, is a practice that preserves critical lands, farmland, or recreational space, usually in conjunction with the residential development of a greenfield (land that has not been previously developed). While gross density on a parcel remains the same, overall lot sizes are reduced in favor of setting aside acreage for conservation. Instead of developing 40, one-acre lots on 40 acres of land, for example, a developer may
In Eugene and neighboring Springfield, Oregon, a full-service BRT line connects the two cities. The area served is home to about 200,000 residents, a population Cache Valley will reach within the Envision Cache
Valley 2040 planning horizon. The system uses dedicated busways, signal priority, near-level boarding, and off-bus fare collection. The first line (known as the Green Line) replaced a popular regular bus route between the two cities. Since the conversion, ridership has doubled.
instead conserve 20 acres and develop 40 lots averaging a half-acre in size on the remaining 20 acres of land. Permitting flexible lot sizes and eliminating minimum lot size requirements make clustering possible.
A city or county may wish to provide cluster development as an option or a requirement when accepting subdivision plats. Density bonuses may be used to incentivize cluster development, or the economic benefit to a developer may be so apparent that an incentive isn’t necessary. Homes with nearby open space are usually worth more than those without. In many cases, this proximity to open space makes up for the value lost in reducing lot sizes. Clustering also makes service delivery easier and less expensive, as fewer miles of pipes and lines are needed to extend services to a smaller area. On the conservation side, lands set aside for non-development use may be candidates for permanent conservation easements. In every case, the conservation intent of non-developed land should be clear—not simply developmental leftovers.
Clustering is not a panacea for the problems associated with suburban growth. Infill development in existing urbanized areas can be more beneficial in terms of providing efficient municipal services and avoiding greenfield development. However, when greenfield development is occurring, clustering is an option that protects critical lands and provides residents with a stronger connection to the land.
Using a combination of curbside, queue jump and dedicated bus lanes, with the curbside lanes being at grade, the new system did not require purchasing of right-of-way, keeping costs down. Construction of the line, including the purchase of specialized BRT buses, cost about $25 million, or $6.25 million per mile, a relative bargain compared to the $62.5 million per mile light rail cost in nearby Portland, or the $42.4 million per mile cost of TRAX in Salt Lake City (Urban Transport Fact Book).
Photo Credit: Lane Transit District (Eugene, Oregon)
Eugene Oregon’s EmX BRT service makes boarding easy with level bus loading.
A clustered plat created by the University of Idaho.
Photo Credit: University of Idaho Community Design & Planning
Hidden Springs, Idaho, located 20 minutes north of Boise, is a greenfield development based on the cluster model. The site pre-serves 800 acres of farmland, wildlife habitat, and recreation areas. Developed areas house hundreds of residents and feature a town center with a school, café, shop, and post office.
Case study
iMPlEMEnTaTion ToolKiT 40
www.env i s i onc achev a l l ey. com
• NationalBRTInstitute.HomePage
• MetroMagazine(reproducedonlineattheNationalBRTInstitutewebsite).MatrixofBRTcitiesandcharacteristics
• BusRapidTransitPolicyCenter.HomePage
• FederalTransitAdministration.BusRapidTransitPage
• UrbanTransportFactBook.LightRailCostsApproach$70MillionperMilein2000(LightRailCostChart)
• LaneTransitDistrict.AboutEmXBRT
• BusRapidTransitPolicyCenter.EugeneEmXInfoPage
• FortCollins,Colorado.MasonCorridorBRT
www.env i s i onc achev a l l ey. com
• Mega,Mathew,BarbaraLukermannandRobertSykesforTheUniversityofMinnesotaExtension.ResidentialClusterDevelopment
• ThurstonCounty,Washington.RuralClusterDevelopmentCode(LinksPage)
• UniversityofIllinoisExtension:LocalCommunityResources.Cluster/ConservationDevelopmentFactSheet
• UniversityofWisconsinExtension.ModelOrdinanceforConservationSubdivision
• TownofCary,NorthCarolina.ConservationSubdivisionDesign
• WalworthCounty,Wisconsin.ConservationSubdivisionOrdinance
• Farmington,Utah.SampleApplicationforaConservationSubdivisionPermit
• HiddenSprings,Idaho(developmentnearBoise)
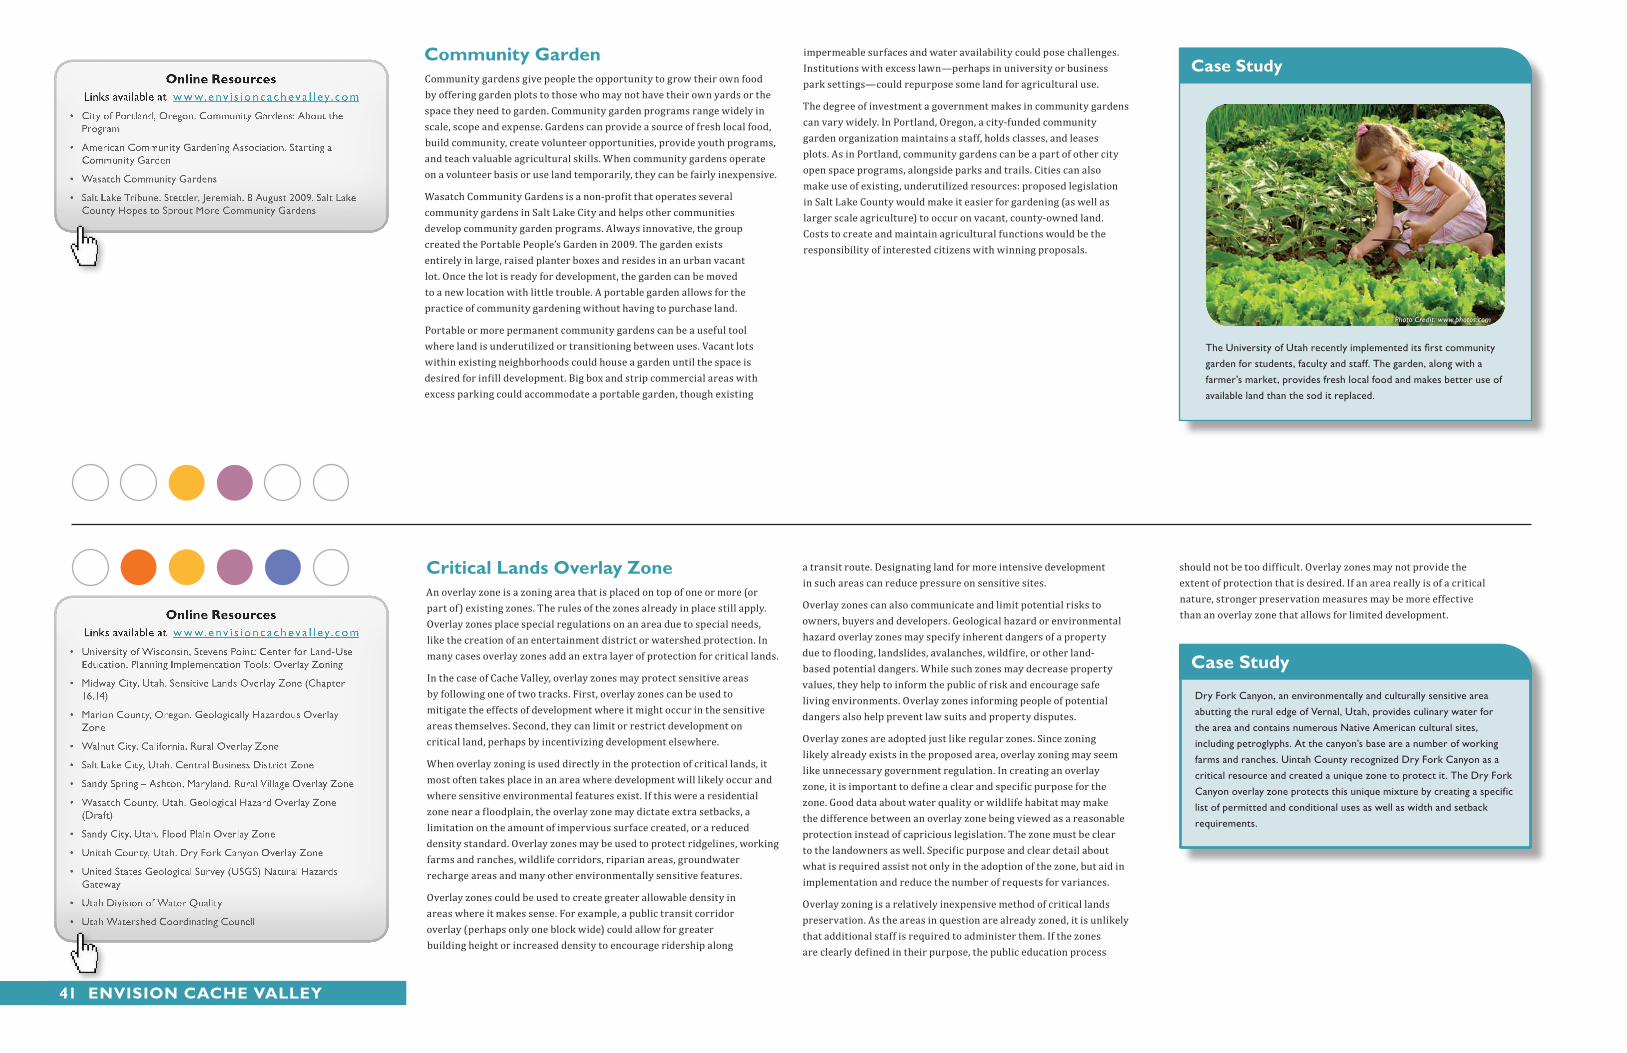
Community GardenCommunity gardens give people the opportunity to grow their own food by offering garden plots to those who may not have their own yards or the space they need to garden. Community garden programs range widely in scale, scope and expense. Gardens can provide a source of fresh local food, build community, create volunteer opportunities, provide youth programs, and teach valuable agricultural skills. When community gardens operate on a volunteer basis or use land temporarily, they can be fairly inexpensive.
Wasatch Community Gardens is a non-profit that operates several community gardens in Salt Lake City and helps other communities develop community garden programs. Always innovative, the group created the Portable People’s Garden in 2009. The garden exists entirely in large, raised planter boxes and resides in an urban vacant lot. Once the lot is ready for development, the garden can be moved to a new location with little trouble. A portable garden allows for the practice of community gardening without having to purchase land.
Portable or more permanent community gardens can be a useful tool where land is underutilized or transitioning between uses. Vacant lots within existing neighborhoods could house a garden until the space is desired for infill development. Big box and strip commercial areas with excess parking could accommodate a portable garden, though existing
impermeable surfaces and water availability could pose challenges. Institutions with excess lawn—perhaps in university or business park settings—could repurpose some land for agricultural use.
The degree of investment a government makes in community gardens can vary widely. In Portland, Oregon, a city-funded community garden organization maintains a staff, holds classes, and leases plots. As in Portland, community gardens can be a part of other city open space programs, alongside parks and trails. Cities can also make use of existing, underutilized resources: proposed legislation in Salt Lake County would make it easier for gardening (as well as larger scale agriculture) to occur on vacant, county-owned land. Costs to create and maintain agricultural functions would be the responsibility of interested citizens with winning proposals.
Critical lands overlay zoneAn overlay zone is a zoning area that is placed on top of one or more (or part of) existing zones. The rules of the zones already in place still apply. Overlay zones place special regulations on an area due to special needs, like the creation of an entertainment district or watershed protection. In many cases overlay zones add an extra layer of protection for critical lands.
In the case of Cache Valley, overlay zones may protect sensitive areas by following one of two tracks. First, overlay zones can be used to mitigate the effects of development where it might occur in the sensitive areas themselves. Second, they can limit or restrict development on critical land, perhaps by incentivizing development elsewhere.
When overlay zoning is used directly in the protection of critical lands, it most often takes place in an area where development will likely occur and where sensitive environmental features exist. If this were a residential zone near a floodplain, the overlay zone may dictate extra setbacks, a limitation on the amount of impervious surface created, or a reduced density standard. Overlay zones may be used to protect ridgelines, working farms and ranches, wildlife corridors, riparian areas, groundwater recharge areas and many other environmentally sensitive features.
Overlay zones could be used to create greater allowable density in areas where it makes sense. For example, a public transit corridor overlay (perhaps only one block wide) could allow for greater building height or increased density to encourage ridership along
a transit route. Designating land for more intensive development in such areas can reduce pressure on sensitive sites.
Overlay zones can also communicate and limit potential risks to owners, buyers and developers. Geological hazard or environmental hazard overlay zones may specify inherent dangers of a property due to flooding, landslides, avalanches, wildfire, or other land-based potential dangers. While such zones may decrease property values, they help to inform the public of risk and encourage safe living environments. Overlay zones informing people of potential dangers also help prevent law suits and property disputes.
Overlay zones are adopted just like regular zones. Since zoning likely already exists in the proposed area, overlay zoning may seem like unnecessary government regulation. In creating an overlay zone, it is important to define a clear and specific purpose for the zone. Good data about water quality or wildlife habitat may make the difference between an overlay zone being viewed as a reasonable protection instead of capricious legislation. The zone must be clear to the landowners as well. Specific purpose and clear detail about what is required assist not only in the adoption of the zone, but aid in implementation and reduce the number of requests for variances.
Overlay zoning is a relatively inexpensive method of critical lands preservation. As the areas in question are already zoned, it is unlikely that additional staff is required to administer them. If the zones are clearly defined in their purpose, the public education process
should not be too difficult. Overlay zones may not provide the extent of protection that is desired. If an area really is of a critical nature, stronger preservation measures may be more effective than an overlay zone that allows for limited development.
Dry Fork Canyon, an environmentally and culturally sensitive area abutting the rural edge of Vernal, Utah, provides culinary water for the area and contains numerous Native American cultural sites, including petroglyphs. At the canyon’s base are a number of working farms and ranches. Uintah County recognized Dry Fork Canyon as a critical resource and created a unique zone to protect it. The Dry Fork Canyon overlay zone protects this unique mixture by creating a specific list of permitted and conditional uses as well as width and setback requirements.
Case study
The University of Utah recently implemented its first community garden for students, faculty and staff. The garden, along with a farmer’s market, provides fresh local food and makes better use of available land than the sod it replaced.
Case study
Photo Credit: www.photos.com
41 Envision CaChE vallEy
www.env i s i onc achev a l l ey. com
• CityofPortland,Oregon.CommunityGardens:AbouttheProgram
• AmericanCommunityGardeningAssociation.StartingaCommunityGarden
• WasatchCommunityGardens
• SaltLakeTribune.Stettler,Jeremiah.8August2009.SaltLakeCountyHopestoSproutMoreCommunityGardens
www.env i s i onc achev a l l ey. com
• UniversityofWisconsin,StevensPoint:CenterforLand-UseEducation.PlanningImplementationTools:OverlayZoning
• MidwayCity,Utah.SensitiveLandsOverlayZone(Chapter16.14)
• MarionCounty,Oregon.GeologicallyHazardousOverlayZone
• WalnutCity,California,RuralOverlayZone
• SaltLakeCity,Utah.CentralBusinessDistrictZone
• SandySpring–Ashton,Maryland.RuralVillageOverlayZone
• WasatchCounty,Utah.GeologicalHazardOverlayZone(Draft)
• SandyCity,Utah.FloodPlainOverlayZone
• UnitahCounty,Utah.DryForkCanyonOverlayZone
• UnitedStatesGeologicalSurvey(USGS)NaturalHazardsGateway
• UtahDivisionofWaterQuality
• UtahWatershedCoordinatingCouncil
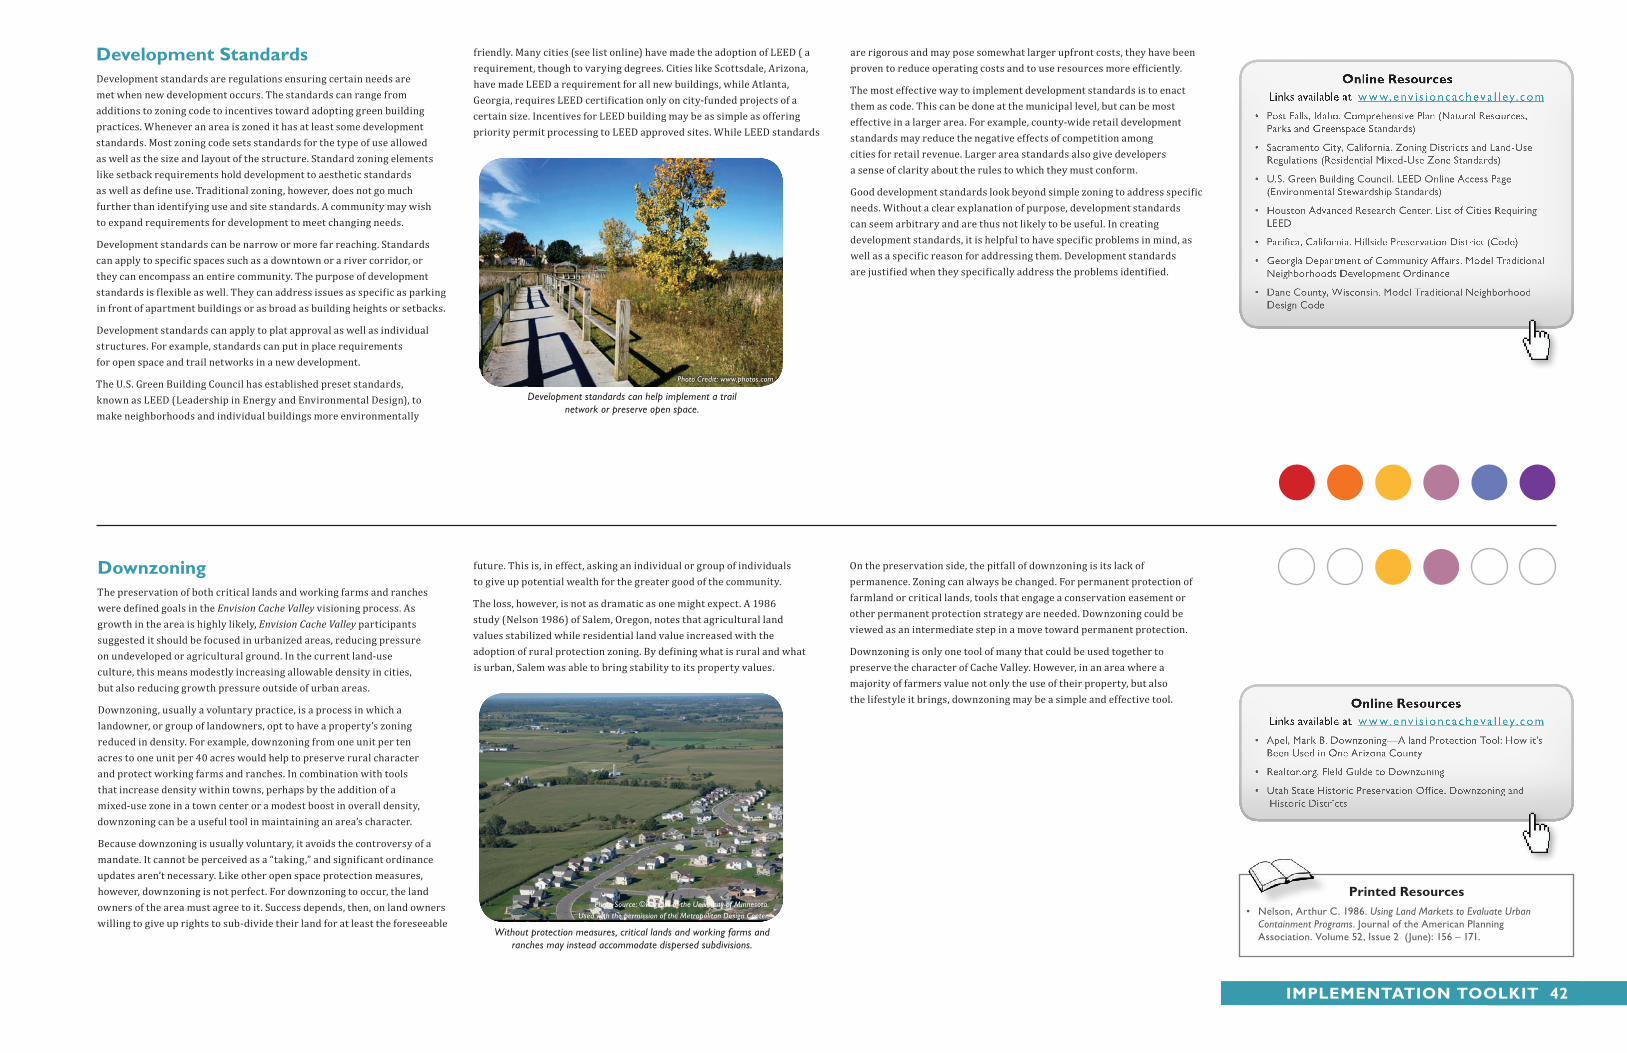
downzoningThe preservation of both critical lands and working farms and ranches were defined goals in the Envision Cache Valley visioning process. As growth in the area is highly likely, Envision Cache Valley participants suggested it should be focused in urbanized areas, reducing pressure on undeveloped or agricultural ground. In the current land-use culture, this means modestly increasing allowable density in cities, but also reducing growth pressure outside of urban areas.
Downzoning, usually a voluntary practice, is a process in which a landowner, or group of landowners, opt to have a property’s zoning reduced in density. For example, downzoning from one unit per ten acres to one unit per 40 acres would help to preserve rural character and protect working farms and ranches. In combination with tools that increase density within towns, perhaps by the addition of a mixed-use zone in a town center or a modest boost in overall density, downzoning can be a useful tool in maintaining an area’s character.
Because downzoning is usually voluntary, it avoids the controversy of a mandate. It cannot be perceived as a “taking,” and significant ordinance updates aren’t necessary. Like other open space protection measures, however, downzoning is not perfect. For downzoning to occur, the land owners of the area must agree to it. Success depends, then, on land owners willing to give up rights to sub-divide their land for at least the foreseeable
future. This is, in effect, asking an individual or group of individuals to give up potential wealth for the greater good of the community.
The loss, however, is not as dramatic as one might expect. A 1986 study (Nelson 1986) of Salem, Oregon, notes that agricultural land values stabilized while residential land value increased with the adoption of rural protection zoning. By defining what is rural and what is urban, Salem was able to bring stability to its property values.
On the preservation side, the pitfall of downzoning is its lack of permanence. Zoning can always be changed. For permanent protection of farmland or critical lands, tools that engage a conservation easement or other permanent protection strategy are needed. Downzoning could be viewed as an intermediate step in a move toward permanent protection.
Downzoning is only one tool of many that could be used together to preserve the character of Cache Valley. However, in an area where a majority of farmers value not only the use of their property, but also the lifestyle it brings, downzoning may be a simple and effective tool.
development standardsDevelopment standards are regulations ensuring certain needs are met when new development occurs. The standards can range from additions to zoning code to incentives toward adopting green building practices. Whenever an area is zoned it has at least some development standards. Most zoning code sets standards for the type of use allowed as well as the size and layout of the structure. Standard zoning elements like setback requirements hold development to aesthetic standards as well as define use. Traditional zoning, however, does not go much further than identifying use and site standards. A community may wish to expand requirements for development to meet changing needs.
Development standards can be narrow or more far reaching. Standards can apply to specific spaces such as a downtown or a river corridor, or they can encompass an entire community. The purpose of development standards is flexible as well. They can address issues as specific as parking in front of apartment buildings or as broad as building heights or setbacks.
Development standards can apply to plat approval as well as individual structures. For example, standards can put in place requirements for open space and trail networks in a new development.
The U.S. Green Building Council has established preset standards, known as LEED (Leadership in Energy and Environmental Design), to make neighborhoods and individual buildings more environmentally
friendly. Many cities (see list online) have made the adoption of LEED ( a requirement, though to varying degrees. Cities like Scottsdale, Arizona, have made LEED a requirement for all new buildings, while Atlanta, Georgia, requires LEED certification only on city-funded projects of a certain size. Incentives for LEED building may be as simple as offering priority permit processing to LEED approved sites. While LEED standards
are rigorous and may pose somewhat larger upfront costs, they have been proven to reduce operating costs and to use resources more efficiently.
The most effective way to implement development standards is to enact them as code. This can be done at the municipal level, but can be most effective in a larger area. For example, county-wide retail development standards may reduce the negative effects of competition among cities for retail revenue. Larger area standards also give developers a sense of clarity about the rules to which they must conform.
Good development standards look beyond simple zoning to address specific needs. Without a clear explanation of purpose, development standards can seem arbitrary and are thus not likely to be useful. In creating development standards, it is helpful to have specific problems in mind, as well as a specific reason for addressing them. Development standards are justified when they specifically address the problems identified.
Photo Credit: www.photos.com
Development standards can help implement a trail network or preserve open space.
Without protection measures, critical lands and working farms and ranches may instead accommodate dispersed subdivisions.
Photo Source: ©Regents of the University of Minnesota. Used with the permission of the Metropolitan Design Center.
iMPlEMEnTaTion ToolKiT 42
www.env i s i onc achev a l l ey. com
• PostFalls,Idaho.ComprehensivePlan(NaturalResources,ParksandGreenspaceStandards)
• SacramentoCity,California.ZoningDistrictsandLand-UseRegulations(ResidentialMixed-UseZoneStandards)
• U.S.GreenBuildingCouncil.LEEDOnlineAccessPage(EnvironmentalStewardshipStandards)
• HoustonAdvancedResearchCenter.ListofCitiesRequiringLEED
• Pacifica,California.HillsidePreservationDistrict(Code)
• GeorgiaDepartmentofCommunityAffairs.ModelTraditionalNeighborhoodsDevelopmentOrdinance
• DaneCounty,Wisconsin.ModelTraditionalNeighborhoodDesignCode
www.env i s i onc achev a l l ey. com
• Apel,MarkB.Downzoning—AlandProtectionTool:Howit’sBeenUsedinOneArizonaCounty
• Realtor.org.FieldGuidetoDownzoning
• UtahStateHistoricPreservationOffice.DownzoningandHistoricDistricts
Printed Resources• Nelson, Arthur C. 1986. Using Land Markets to Evaluate Urban
Containment Programs. Journal of the American Planning Association. Volume 52, Issue 2 (June): 156 – 171.

Economic development PlanA Regional PerspectiveWhen creating an economic development plan, it is important to think at a regional scale, as this scale increasingly reflects the way people live their lives: living in one municipality, working in another, running errands in a third, and meeting friends in a fourth. Businesses work at a regional scale as well, realizing the low-cost economies of scale, and utilizing regional networks that enable information sharing and innovation. Because of these trends and the diverse resources that a region can offer, it is the metropolitan or regional scale that attracts business interest.
Interestingly, there is a disconnect between the regional scale at which business interests compete and the local scale at which municipal governments operate. While existing businesses rely on a regional network and new businesses consider the region when making decisions about relocation, municipal governments compete with their neighbors when seeking to generate revenue.
Economic development plans in Cache Valley should focus first on making the valley as a whole more attractive. Regional coordination on quality-of-life issues, creation and maintenance of regional assets, and economic cooperation create an environment conducive to business interests. For example, the airline manufacturer, Boeing, was drawn to the City of Chicago in large part because of the regional cooperation created by the Chicago Metropolitan Mayor’s Conference (Flynn).
Regional cooperation not only makes an area more attractive to business, but it also helps to balance the regional economy. In Utah, the tax structure creates an incentive to attract retail businesses over
other industries. While retail sales provide important services and help support the municipal tax base, retail jobs are often low paying, and retail does little to enhance the economic capacity of the region. Rather, creating “high-skill, high-wage” (Flynn) employment is more beneficial to the region as a whole. Such jobs increase the spending capacity of those they employ and increase a region’s export capacity.
“High-skill, high-wage” jobs also create more skilled workers, helping to create a culture of educated and skilled people. Such a culture makes a region even more attractive to new business interests.
Creating an Economic Development PlanWhile it is important to think and act regionally in terms of overall business expansion and recruitment, it is also very important to think about how to prepare a municipality to be an attractive home for high-skill, high-wage companies. Thinking and Acting
Regionally in the Greater Wasatch Area: Implications for Local
Economic Development Practice, an Envision Utah tool prepared by Erin Flynn, defines a four-step process that enables a city to identify economic development goals and a strategy to implement them.
1. Establish an Economic Development Vision - This step centers on public involvement about the type of community residents want to become. Questions that need to be answered include: What type of businesses do you wish to attract? Where should they be located? Do we simply want to grow, or do we wish to maintain or create a specific business climate? Some cities may find they wish to remain primarily residential. In this case, economic development can be limited to requested services or property tax initiatives.
2. Conduct a Baseline Assessment - A baseline assessment focuses on the current economic development practices in a municipality, the infrastructure requirements of various industries, and municipal strengths and weaknesses in light of industry requirements. Quality of life issues apply generally, but specific industries have specific land, water, power and other requirements. Assets and weaknesses surveyed should include land and buildings, zoning and permitting practice, taxes and regulations, infrastructure and utilities, labor and workforce, education, housing, transportation and quality of life. An inventory across these areas will identify municipal strengths and weaknesses and will highlight areas in which a municipality must coordinate and work with other municipalities across the region to improve services and amenities.
3. Prioritize and Select Implementation Strategies - An implementation strategy should move a municipality from its baseline to its future vision. The strategy may focus on upgrading economic development practices, business development, the workforce, the preparation of land and buildings, and quality of life and community amenities. The strategy should reflect not only the needs of the targeted industries defined in the economic development vision, but also the assets and weaknesses defined in the baseline assessment. A viable implementation strategy will reflect what businesses want as well as what a city and its residents need.
4. Benchmark Progress - Finally, a municipality should follow up on its economic development work by establishing benchmark goals and ensuring they are met. Economic development should certainly praise its successes, but it must also examine and learn from instances where success does not occur.
Farmland PreservationIn the visioning process, the protection of working farms and ranches, as well as the preservation of Cache Valley’s scenic beauty, are stated goals. Without measures of protection it is very likely that thousands of acres of Cache Valley’s farmland will be developed to accommodate a rapidly growing population. This will not only change the valley’s character, but it will also limit future local food production, reduce water quality, and reduce wildlife habitat.
Techniques for preserving farmland are numerous and include protective zoning, transfer of development rights, conservation easements, right-to-farm legislation and agricultural districting (downzoning). Several of these tools are reviewed elsewhere in this toolkit, with a few more being discussed below. Successful methods have used both regulatory and incentive-based programs.
Master Planning By including farmland preservation in a master plan, the basis for farm protection zoning is codified. Including farmland in a master plan also grants the basis for growth management practices that include agriculture.
Mitigation OrdinanceA mitigation ordinance is usually used in conjunction with protective zoning, or some other regulated designation of farmland. A mitigation ordinance usually states that for any loss of designated farmland, a developer must create or protect that much land somewhere else. Mitigation ordinances are quite new, with the first adopted in 1995, in Davis, California. In Davis, developers
must protect one acre of farmland for every acre they convert (American Farmland Trust). A successful mitigation ordinance also exists in King County, Washington (American Farmland Trust).
Green BeltsWhen development encroaches on farmland and property taxes rise, property owners understandably begin to view their farm in a different light—as a future subdivision location instead of ground for food production. Green belt laws assess property tax based on agricultural use, not on potential developable use, thereby keeping taxes low. In addition to helping preserve the farm by creating a financial incentive to keep the ground in farm use, green belt makes general financial sense. Agricultural land uses fewer services than residential development, and a green belt reflects the expenditures by a municipality or county to provide services.
Conservation EasementsA conservation easement is a voluntary, permanent deed restriction placed on a parcel to protect its resources or functions—natural or man-made. An easement precludes future real estate development and identifies permitted and prohibited uses. An easement may protect or preserve environmental conditions like water quality or preserve an economic pursuit like farming or ranching.
Conservation easements are often used in tandem with other growth tools, such as the purchase of development rights or the transfer of development rights to another property. These programs enable a landowner to receive the economic benefit of the development rights associated with the land, while not building them on site. Further, the landowner can continue current use of the land—economically benefitting from farm operations.
Finally, with development rights permanently removed, the land is usually assessed at a lower tax rate, further enhancing the viability of farming.
Soil and Water GrantsBy recognizing the value of soil and water that are protected by continued farming, some areas have offered soil and water protection grants. These grants usually guarantee a certain time frame in which the farmer will keep farming, and thus continue to protect ground water and soil stability. While such grants are sometimes seen as an excessive municipal expenditure, they can be less costly than building and maintaining water treatment plants and initiating soil reclamation projects.
Government Measures to Increase Farm ProfitMunicipal and county governments often have means to disseminate information favorable to farmers. A county tourism organization may offer maps of pick-your-own farms and roadside stands. Many cities sponsor farmers markets, offering direct sales of agricultural products. “Buy local” campaigns highlight the products of specific farms and help to advertise local products. Local label regulations stipulate what must be contained in a product with a certain name. Individually, these small government measures may seem trivial, but they create needed connections between farmers, their representatives, and their customers. These connections have the most potential for creating successful farm protection measures.
Farmland is not simply a source of scenic beauty for Cache Valley. Farms mitigate air pollution, provide wildlife habitat and can ensure clean groundwater. They provide a stable local food source and a significant economic contribution to the local economy.
43 Envision CaChE vallEy
www.env i s i onc achev a l l ey. com
• Flynn,Erin.2005.ThinkingandActingRegionallyintheGreaterWasatchArea:ImplicationsforLocalEconomicDevelopmentPractice.EnvisionUtah
• U.S.FederalGovernment.EconomicDevelopmentandInfrastructureResourcesPage
• Theising,AndrewandDebraMoore.2007.EvolvingLocalGovernmentPurposethroughEconomicDevelopment
• AssociationofUniversityResearchParks.HomePage
• InternationalEconomicDevelopmentCouncil.HomePage
• NationalCongressforCommunityEconomicDevelopment.HomePage
Printed Resources• American Farmland Trust. 1997. Saving American Farmland: What
Works. Northampton, Massachusetts: American Farmland Trust.
www.env i s i onc achev a l l ey. com
• UtahAgriculturalCode(relevantstatutesinclude4-7,4-8,4-18,4-19,4-21,4-22)
• UtahCriminalCode(RighttoFarmLegislation,twolocationsinUtahCode)
• IdahoRighttoFarmLegislation
• AmericanFarmlandTrust.RockyMountainAgriculturalLandownersGuidetoConservationandSustainability
• NaturalResourcesConservationService.2003NationalRescoresInventory:Land-Use
• 2007CensusofAgriculture:CountyLevelData
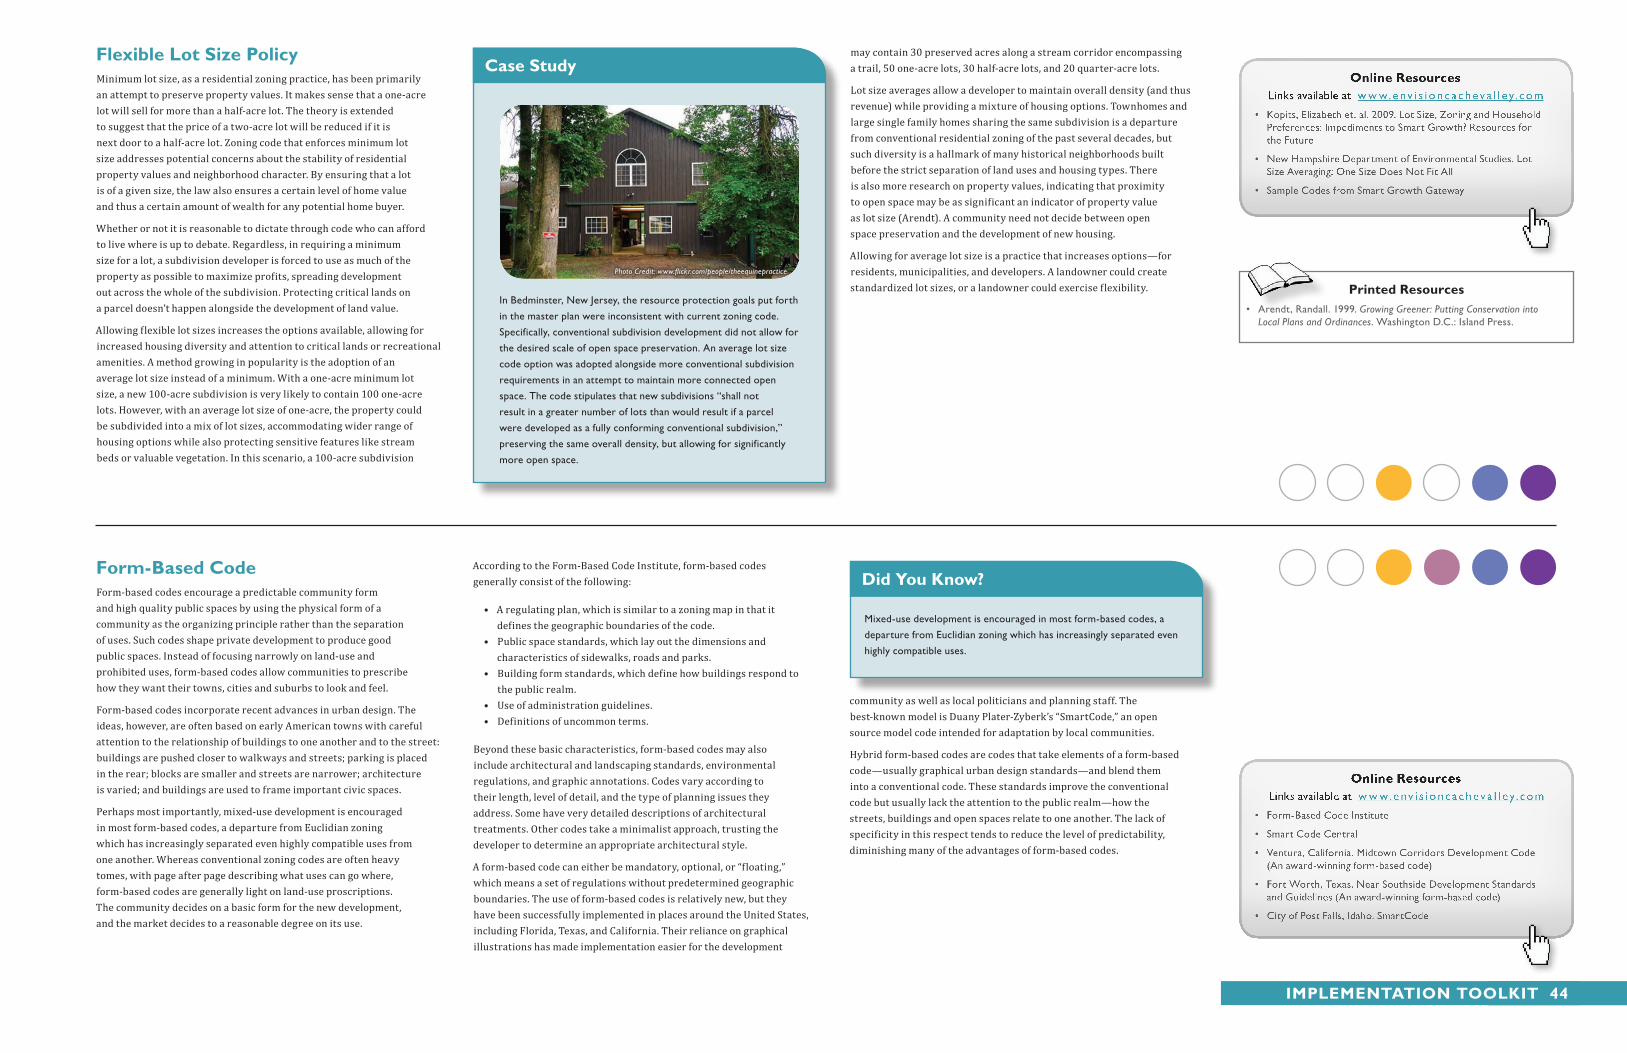
Form-based CodeForm-based codes encourage a predictable community form and high quality public spaces by using the physical form of a community as the organizing principle rather than the separation of uses. Such codes shape private development to produce good public spaces. Instead of focusing narrowly on land-use and prohibited uses, form-based codes allow communities to prescribe how they want their towns, cities and suburbs to look and feel.
Form-based codes incorporate recent advances in urban design. The ideas, however, are often based on early American towns with careful attention to the relationship of buildings to one another and to the street: buildings are pushed closer to walkways and streets; parking is placed in the rear; blocks are smaller and streets are narrower; architecture is varied; and buildings are used to frame important civic spaces.
Perhaps most importantly, mixed-use development is encouraged in most form-based codes, a departure from Euclidian zoning which has increasingly separated even highly compatible uses from one another. Whereas conventional zoning codes are often heavy tomes, with page after page describing what uses can go where, form-based codes are generally light on land-use proscriptions. The community decides on a basic form for the new development, and the market decides to a reasonable degree on its use.
According to the Form-Based Code Institute, form-based codes generally consist of the following:
• A regulating plan, which is similar to a zoning map in that it defines the geographic boundaries of the code.
• Public space standards, which lay out the dimensions and characteristics of sidewalks, roads and parks.
• Building form standards, which define how buildings respond to the public realm.
• Use of administration guidelines.• Definitions of uncommon terms.
Beyond these basic characteristics, form-based codes may also include architectural and landscaping standards, environmental regulations, and graphic annotations. Codes vary according to their length, level of detail, and the type of planning issues they address. Some have very detailed descriptions of architectural treatments. Other codes take a minimalist approach, trusting the developer to determine an appropriate architectural style.
A form-based code can either be mandatory, optional, or “floating,” which means a set of regulations without predetermined geographic boundaries. The use of form-based codes is relatively new, but they have been successfully implemented in places around the United States, including Florida, Texas, and California. Their reliance on graphical illustrations has made implementation easier for the development
community as well as local politicians and planning staff. The best-known model is Duany Plater-Zyberk’s “SmartCode,” an open source model code intended for adaptation by local communities.
Hybrid form-based codes are codes that take elements of a form-based code—usually graphical urban design standards—and blend them into a conventional code. These standards improve the conventional code but usually lack the attention to the public realm—how the streets, buildings and open spaces relate to one another. The lack of specificity in this respect tends to reduce the level of predictability, diminishing many of the advantages of form-based codes.
Flexible lot size PolicyMinimum lot size, as a residential zoning practice, has been primarily an attempt to preserve property values. It makes sense that a one-acre lot will sell for more than a half-acre lot. The theory is extended to suggest that the price of a two-acre lot will be reduced if it is next door to a half-acre lot. Zoning code that enforces minimum lot size addresses potential concerns about the stability of residential property values and neighborhood character. By ensuring that a lot is of a given size, the law also ensures a certain level of home value and thus a certain amount of wealth for any potential home buyer.
Whether or not it is reasonable to dictate through code who can afford to live where is up to debate. Regardless, in requiring a minimum size for a lot, a subdivision developer is forced to use as much of the property as possible to maximize profits, spreading development out across the whole of the subdivision. Protecting critical lands on a parcel doesn’t happen alongside the development of land value.
Allowing flexible lot sizes increases the options available, allowing for increased housing diversity and attention to critical lands or recreational amenities. A method growing in popularity is the adoption of an average lot size instead of a minimum. With a one-acre minimum lot size, a new 100-acre subdivision is very likely to contain 100 one-acre lots. However, with an average lot size of one-acre, the property could be subdivided into a mix of lot sizes, accommodating wider range of housing options while also protecting sensitive features like stream beds or valuable vegetation. In this scenario, a 100-acre subdivision
may contain 30 preserved acres along a stream corridor encompassing a trail, 50 one-acre lots, 30 half-acre lots, and 20 quarter-acre lots.
Lot size averages allow a developer to maintain overall density (and thus revenue) while providing a mixture of housing options. Townhomes and large single family homes sharing the same subdivision is a departure from conventional residential zoning of the past several decades, but such diversity is a hallmark of many historical neighborhoods built before the strict separation of land uses and housing types. There is also more research on property values, indicating that proximity to open space may be as significant an indicator of property value as lot size (Arendt). A community need not decide between open space preservation and the development of new housing.
Allowing for average lot size is a practice that increases options—for residents, municipalities, and developers. A landowner could create standardized lot sizes, or a landowner could exercise flexibility.
In Bedminster, New Jersey, the resource protection goals put forth in the master plan were inconsistent with current zoning code. Specifically, conventional subdivision development did not allow for the desired scale of open space preservation. An average lot size code option was adopted alongside more conventional subdivision requirements in an attempt to maintain more connected open space. The code stipulates that new subdivisions “shall not result in a greater number of lots than would result if a parcel were developed as a fully conforming conventional subdivision,” preserving the same overall density, but allowing for significantly more open space.
Case study
Mixed-use development is encouraged in most form-based codes, a departure from Euclidian zoning which has increasingly separated even highly compatible uses.
did you Know?
iMPlEMEnTaTion ToolKiT 44
www.env i s i onc achev a l l ey. com
• Form-BasedCodeInstitute
• SmartCodeCentral
• Ventura,California.MidtownCorridorsDevelopmentCode(Anaward-winningform-basedcode)
• FortWorth,Texas.NearSouthsideDevelopmentStandardsandGuidelines(Anaward-winningform-basedcode)
• CityofPostFalls,Idaho.SmartCode
Photo Credit: www.flickr.com/people/theequinepractice
www.env i s i onc achev a l l ey. com
• Kopits,Elizabethet.al.2009.LotSize,ZoningandHouseholdPreferences:ImpedimentstoSmartGrowth?ResourcesfortheFuture
• NewHampshireDepartmentofEnvironmentalStudies.LotSizeAveraging:OneSizeDoesNotFitAll
• SampleCodesfromSmartGrowthGateway
Printed Resources• Arendt, Randall. 1999. Growing Greener: Putting Conservation into
Local Plans and Ordinances. Washington D.C.: Island Press.
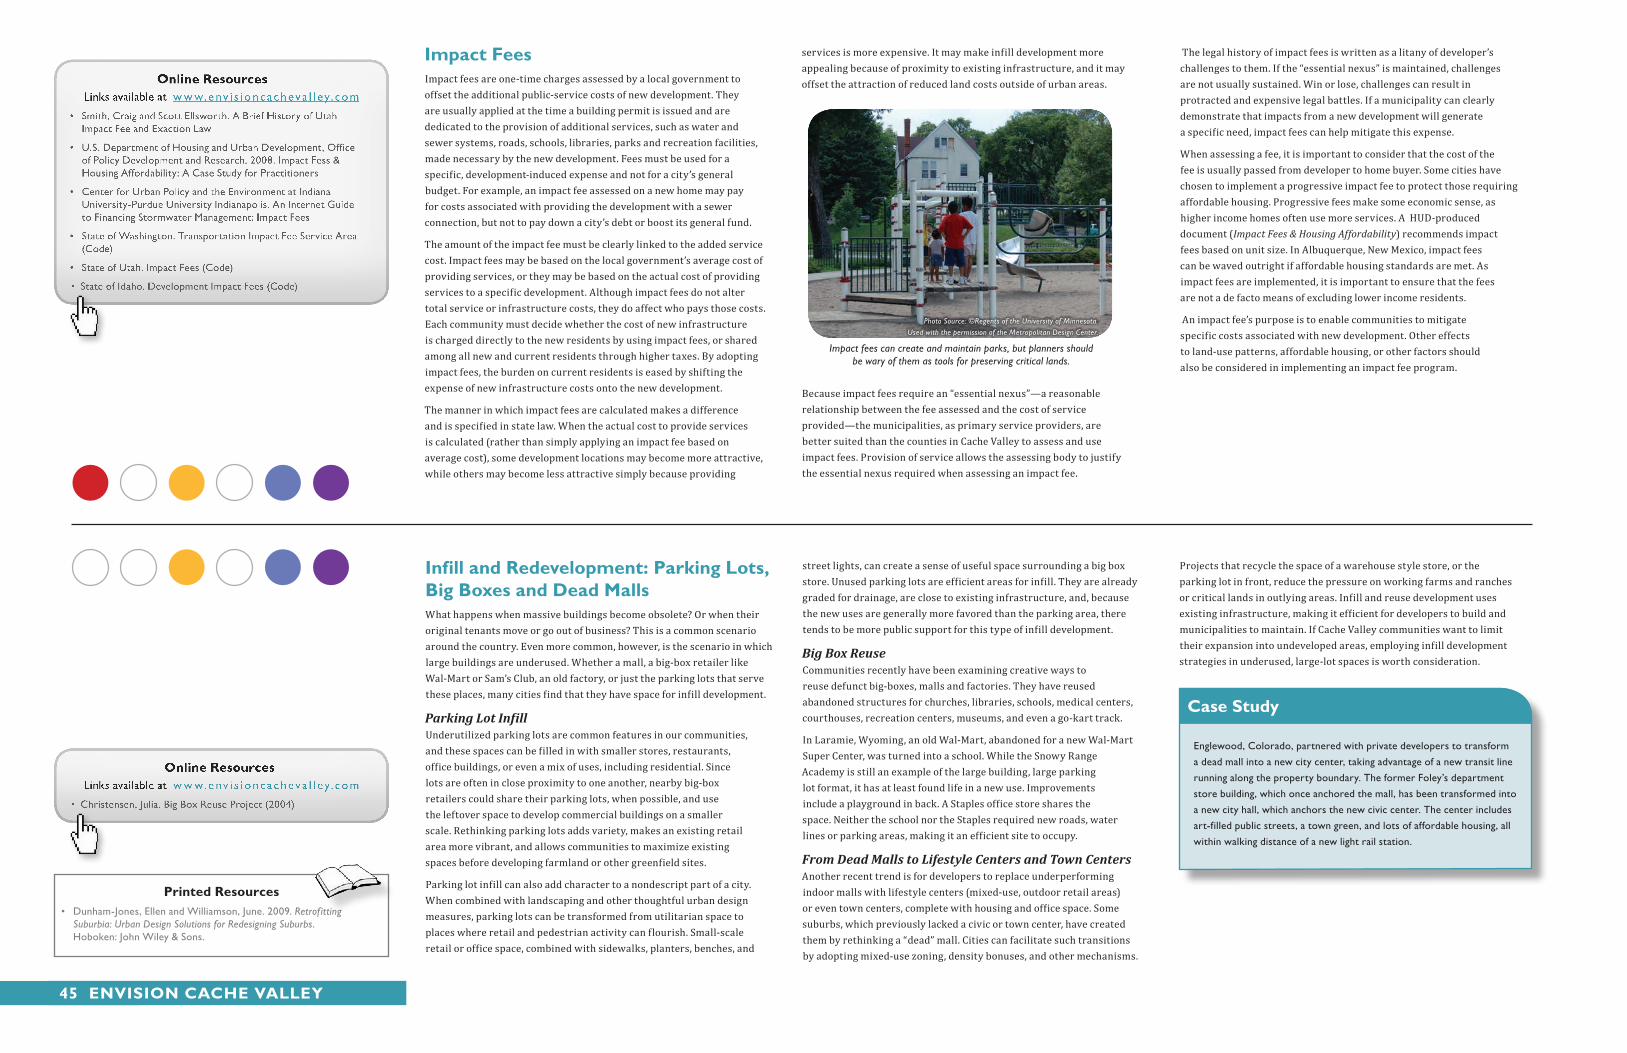
impact FeesImpact fees are one-time charges assessed by a local government to offset the additional public-service costs of new development. They are usually applied at the time a building permit is issued and are dedicated to the provision of additional services, such as water and sewer systems, roads, schools, libraries, parks and recreation facilities, made necessary by the new development. Fees must be used for a specific, development-induced expense and not for a city’s general budget. For example, an impact fee assessed on a new home may pay for costs associated with providing the development with a sewer connection, but not to pay down a city’s debt or boost its general fund.
The amount of the impact fee must be clearly linked to the added service cost. Impact fees may be based on the local government’s average cost of providing services, or they may be based on the actual cost of providing services to a specific development. Although impact fees do not alter total service or infrastructure costs, they do affect who pays those costs. Each community must decide whether the cost of new infrastructure is charged directly to the new residents by using impact fees, or shared among all new and current residents through higher taxes. By adopting impact fees, the burden on current residents is eased by shifting the expense of new infrastructure costs onto the new development.
The manner in which impact fees are calculated makes a difference and is specified in state law. When the actual cost to provide services is calculated (rather than simply applying an impact fee based on average cost), some development locations may become more attractive, while others may become less attractive simply because providing
services is more expensive. It may make infill development more appealing because of proximity to existing infrastructure, and it may offset the attraction of reduced land costs outside of urban areas.
Because impact fees require an “essential nexus”—a reasonable relationship between the fee assessed and the cost of service provided—the municipalities, as primary service providers, are better suited than the counties in Cache Valley to assess and use impact fees. Provision of service allows the assessing body to justify the essential nexus required when assessing an impact fee.
The legal history of impact fees is written as a litany of developer’s challenges to them. If the “essential nexus” is maintained, challenges are not usually sustained. Win or lose, challenges can result in protracted and expensive legal battles. If a municipality can clearly demonstrate that impacts from a new development will generate a specific need, impact fees can help mitigate this expense.
When assessing a fee, it is important to consider that the cost of the fee is usually passed from developer to home buyer. Some cities have chosen to implement a progressive impact fee to protect those requiring affordable housing. Progressive fees make some economic sense, as higher income homes often use more services. A HUD-produced document (Impact Fees & Housing Affordability) recommends impact fees based on unit size. In Albuquerque, New Mexico, impact fees can be waved outright if affordable housing standards are met. As impact fees are implemented, it is important to ensure that the fees are not a de facto means of excluding lower income residents.
An impact fee’s purpose is to enable communities to mitigate specific costs associated with new development. Other effects to land-use patterns, affordable housing, or other factors should also be considered in implementing an impact fee program.
infill and Redevelopment: Parking lots, big boxes and dead Malls What happens when massive buildings become obsolete? Or when their original tenants move or go out of business? This is a common scenario around the country. Even more common, however, is the scenario in which large buildings are underused. Whether a mall, a big-box retailer like Wal-Mart or Sam’s Club, an old factory, or just the parking lots that serve these places, many cities find that they have space for infill development.
Parking Lot InfillUnderutilized parking lots are common features in our communities, and these spaces can be filled in with smaller stores, restaurants, office buildings, or even a mix of uses, including residential. Since lots are often in close proximity to one another, nearby big-box retailers could share their parking lots, when possible, and use the leftover space to develop commercial buildings on a smaller scale. Rethinking parking lots adds variety, makes an existing retail area more vibrant, and allows communities to maximize existing spaces before developing farmland or other greenfield sites.
Parking lot infill can also add character to a nondescript part of a city. When combined with landscaping and other thoughtful urban design measures, parking lots can be transformed from utilitarian space to places where retail and pedestrian activity can flourish. Small-scale retail or office space, combined with sidewalks, planters, benches, and
street lights, can create a sense of useful space surrounding a big box store. Unused parking lots are efficient areas for infill. They are already graded for drainage, are close to existing infrastructure, and, because the new uses are generally more favored than the parking area, there tends to be more public support for this type of infill development.
Big Box ReuseCommunities recently have been examining creative ways to reuse defunct big-boxes, malls and factories. They have reused abandoned structures for churches, libraries, schools, medical centers, courthouses, recreation centers, museums, and even a go-kart track.
In Laramie, Wyoming, an old Wal-Mart, abandoned for a new Wal-Mart Super Center, was turned into a school. While the Snowy Range Academy is still an example of the large building, large parking lot format, it has at least found life in a new use. Improvements include a playground in back. A Staples office store shares the space. Neither the school nor the Staples required new roads, water lines or parking areas, making it an efficient site to occupy.
From Dead Malls to Lifestyle Centers and Town CentersAnother recent trend is for developers to replace underperforming indoor malls with lifestyle centers (mixed-use, outdoor retail areas) or even town centers, complete with housing and office space. Some suburbs, which previously lacked a civic or town center, have created them by rethinking a “dead” mall. Cities can facilitate such transitions by adopting mixed-use zoning, density bonuses, and other mechanisms.
Projects that recycle the space of a warehouse style store, or the parking lot in front, reduce the pressure on working farms and ranches or critical lands in outlying areas. Infill and reuse development uses existing infrastructure, making it efficient for developers to build and municipalities to maintain. If Cache Valley communities want to limit their expansion into undeveloped areas, employing infill development strategies in underused, large-lot spaces is worth consideration.
Impact fees can create and maintain parks, but planners should be wary of them as tools for preserving critical lands.
Photo Source: ©Regents of the University of Minnesota. Used with the permission of the Metropolitan Design Center.
Englewood, Colorado, partnered with private developers to transform a dead mall into a new city center, taking advantage of a new transit line running along the property boundary. The former Foley’s department store building, which once anchored the mall, has been transformed into a new city hall, which anchors the new civic center. The center includes art-filled public streets, a town green, and lots of affordable housing, all within walking distance of a new light rail station.
Case study
45 Envision CaChE vallEy
www.env i s i onc achev a l l ey. com
• Smith,CraigandScottEllsworth.ABriefHistoryofUtahImpactFeeandExactionLaw
• U.S.DepartmentofHousingandUrbanDevelopment,OfficeofPolicyDevelopmentandResearch.2008.ImpactFess&HousingAffordability:ACaseStudyforPractitioners
• CenterforUrbanPolicyandtheEnvironmentatIndianaUniversity-PurdueUniversityIndianapolis.AnInternetGuidetoFinancingStormwaterManagement:ImpactFees
• StateofWashington.TransportationImpactFeeServiceArea(Code)
• StateofUtah.ImpactFees(Code)
• StateofIdaho.DevelopmentImpactFees(Code)
Printed Resources• Dunham-Jones, Ellen and Williamson, June. 2009. Retrofitting
Suburbia: Urban Design Solutions for Redesigning Suburbs. Hoboken: John Wiley & Sons.
www.env i s i onc achev a l l ey. com
• Christensen,Julia.BigBoxReuseProject(2004)

intergovernmental CoordinationCache Valley includes 25 cities and towns and spans two counties and two states. Realizing a valley-wide vision will require cooperation between the various municipalities, the counties, the state governments, and other agencies that affect Cache Valley. There is little question that what one municipality does affects its neighbors, as the valley shares roads, water, air, critical lands, and an economy.
That said, what benefit does increased regional cooperation bring? The most obvious answer is a reduction in waste. Regionally planned transportation and sewer and water lines are better integrated and more efficient. Infrastructure often benefits from an economy of scale. Connection to sewer and waterlines are cheaper per household in a larger and better integrated system. The system as a whole is more efficient than an agglomeration of smaller, localized systems.
Aside from simply saving money, better regional cooperation can address the related issues of tax-base equality and property values. Property values in a connected region have been shown to rise and fall in relation to one another (Orfield). Economic disparities between cities in a given region can affect the cities’ respective property values. Depressed property values in one community can drive down home prices in a neighboring town. Tax-base sharing and other regional equity measures can ensure local market stability and thus greater regional economic stability.
A united region also has the benefit of greater leverage in state and national affairs. While a small Cache Valley town may not have enough influence to secure a state grant, Cache Valley as a whole presents a much more formidable force. The same is true for national funding in air quality attainment, transit, transportation and a host of other issues.
Regional cooperation is usually achieved by one of four methods:
1. Annexation - Affords cooperation at a small scale within a portion of a region. An existing government, usually a city, incorporates
outlying land into city boundaries. Annexation and annexation declarations can cause disagreements between communities whose boundaries are close together or whose annexation declarations overlap. Working through annexation issues with neighboring cities can bring unity of purpose and common understanding.
2. Consolidation - Occurs when a group of municipal governments band together to form a new, larger municipality. This more typically occurs in larger urbanized areas, where municipalities are no longer distinct from one another.
3. Metropolitan Planning Organization (MPO) - A local organization designated by the federal government to be responsible for street, highway and air quality planning for a metropolitan region. Federal transportation laws and regulations require the establishment
of an MPO in every urbanized area of the United States with a population over 50,000. MPOs sometimes coordinate other regional projects, from open space plans to affordable housing initiatives.
Strengthening the Cache Valley MPO may benefit regional cooperation. One strategy includes direct election of its members, with representatives apportioned by voting population. Going even further, the recommendations of an MPO can be made mandatory rather than advisory.
As Cache Valley moves toward common regional goals, such as a valley-wide bike or trail system, better street connectivity, or an intercity bus rapid transit system, a strong MPO may work well to coordinate planning and implementation. If desired, the MPO could assume other roles, becoming an arbiter of regional disputes, the instigator of a tax-base sharing agreement, or a facilitator of interlocal agreements.
4. Interlocal Agreements - The most common means of intergovernmental coordination, interlocal agreements enable two or more local governments to work together on shared goals or to provide services. Interlocal agreements can be extremely specific, providing fire, water, police or myriad other municipal services. Interlocal agreements across state lines are also somewhat common, though special consideration is required, as differing state codes can make arbitration difficult if the agreement is broken.
Regional cooperation is not a blanket solution. Greater regional cooperation must be balanced with recognizing local autonomy. Local elected officials have an understanding of the sentiments of those they represent. As regional cooperation is contemplated in future projects, these officials will play key roles.
Critical lands inventory and Protection strategyA critical lands inventory is a database of maps and narrative that identify different types of ecological, agricultural, recreational and/or cultural/historical resources that are important to a community or region. Typically, the purpose of the inventory is to compile data at a single source to increase accessibility, enable analysis, and identify critical lands protection priorities. While a critical lands inventory is an effective means of illustrating where priority resources are located, they can become outdated quickly if land uses are in flux. An inventory that is developed for use by multiple jurisdictions or for an extended period of time can help solidify common goals, but it may require significant commitment of staff. Often, significant data already exists, and the inventory simply brings it together, enabling detailed analysis. While a regional visioning process can identify broad critical lands conservation goals, an inventory and associated discussion can answer the following key questions with specificity: What lands do we
want to conserve? How much and where do we want to conserve land?
Washington County, Utah, created a critical lands resource guide shortly after its regional visioning process known as Vision Dixie to support vision principles. The guide identifies three priority categories to be considered for conservation and protection by local jurisdictions. The first includes critical lands tied to public health and safety: geologic hazards, FEMA floodplains, erosion prone soils, and areas of wildfire risk. The second includes areas of public interest or quality of life: agricultural land, viewsheds, ridgelines, riparian areas, and scenic byways. The third category includes habitat for threatened and endangered species and critical habitat for large mammals whose migratory range also includes habitat for many smaller plant and animal species. In addition to identifying critical lands priorities, the resource guide includes policy strategies for local municipalities. Mapped data is available on the county’s website.
Other communities in Utah have used the state’s Geographic Information Systems (GIS) Portal to obtain needed data, or the Governor’s Office of Planning and Budget’s Critical Lands Planning Toolkit. In Cache Valley, wetland/riparian/floodplain areas, agricultural land, scenic corridors, and wildlife habitat could comprise an inventory and form the basis
of a critical lands protection strategy. Envision Cache Valley began this process (see the natural resource, working farms, and recreation vision map and associated illustrations), overlaying information in these categories to identify areas with high critical land values and illustrating where they overlap. Percentage goals could be set for priority critical lands: What if 30%, 50% or even 70% of these spaces were protected? It may not be possible to protect them all, but it may be possible to protect enough. Several organizations, including Utah State University and The Nature Conservancy, have developed detailed data sets and associated priorities and strategies for Cache Valley.
An interlocal agreement between Madison County, Idaho, and the City of Rexburg recognizes the development of an ordinance defining the purpose and standards for the renegotiation of areas of city impact. It encourages mutual coordination of land-use and annexation in a planned and orderly manner and recognizes that (1) annexations and the area of city impact expansions can have extra-jurisdictional impacts, and that (2) intergovernmental cooperation is an effective means to deal with impacts and opportunities that transcend jurisdictional boundaries. The local governments agree not to change or modify the Area of City Impact Ordinance as adopted within their city or county code without formal discussion with and agreement of all other local governments. The local governments have formed a joint commission, which includes representation of all bodies engaged in the interlocal agreement, to review proposals for renegotiation.
an agreement To Watch
iMPlEMEnTaTion ToolKiT 46
www.env i s i onc achev a l l ey. com
• UtahCode.InterlocalAgreements
• BearRiverHeritageArea.(AninterlocalcrossingtheUtah/IdahoBoarder)
• CityofRexburg,Idaho.AreaofCityImpactInter-localAgreement:Chapter16.06ImpactZone:
• CityofRexburg,Idaho.AreaofCityImpactInter-localAgreementZoning:MapwithImpactArea:
• BoulderCounty,Colorado.TransferofDevelopmentRightsProgramandInterlocalAgreements
Printed Resources• Baker, J. B. (2006) Planning for the Bear River Corridor Through Cache
County. Logan, UT: College of Natural Resources, Utah State University.
• Noss, Wuerthner, Vance-Borland, Carroll. A Biological Conservation Assessment for the Utah-Wyoming Rocky Mountains Ecoregion. 2001.
• Toth, R.E., Braddy, K., Guth, J.D., Leydsman, E.I., Price, J.T., Slade, L.M., and Taro, B.S. (2006). Cache Valley 2030 - The Future Explored. Final Project Report No. 2006-1, College of Natural Resources, Utah State University, Logan, Utah 84322-5200.
www.env i s i onc achev a l l ey. com
• TheNatureConservancy.Eco-regionalAssessments(Note:AplanfortheBearRiverhasbeendeveloped.)
• StateofUtah.GeographicInformationSystems(GIS)Portal
• StateofUtah.CriticalLandsPlanningToolkit
EXAMPLE: Intergovernmental agreements between Boulder County, Colorado, and six cities in the county enable the transfer of development rights (TDRs) from the unincorporated portions of the county into the cities. The cities accept development rights from nearby county land because acceptance of TDRs achieves city goals for economic development, community separators, greenbelts, and farmland preservation.Photo Credit: University of Colorado
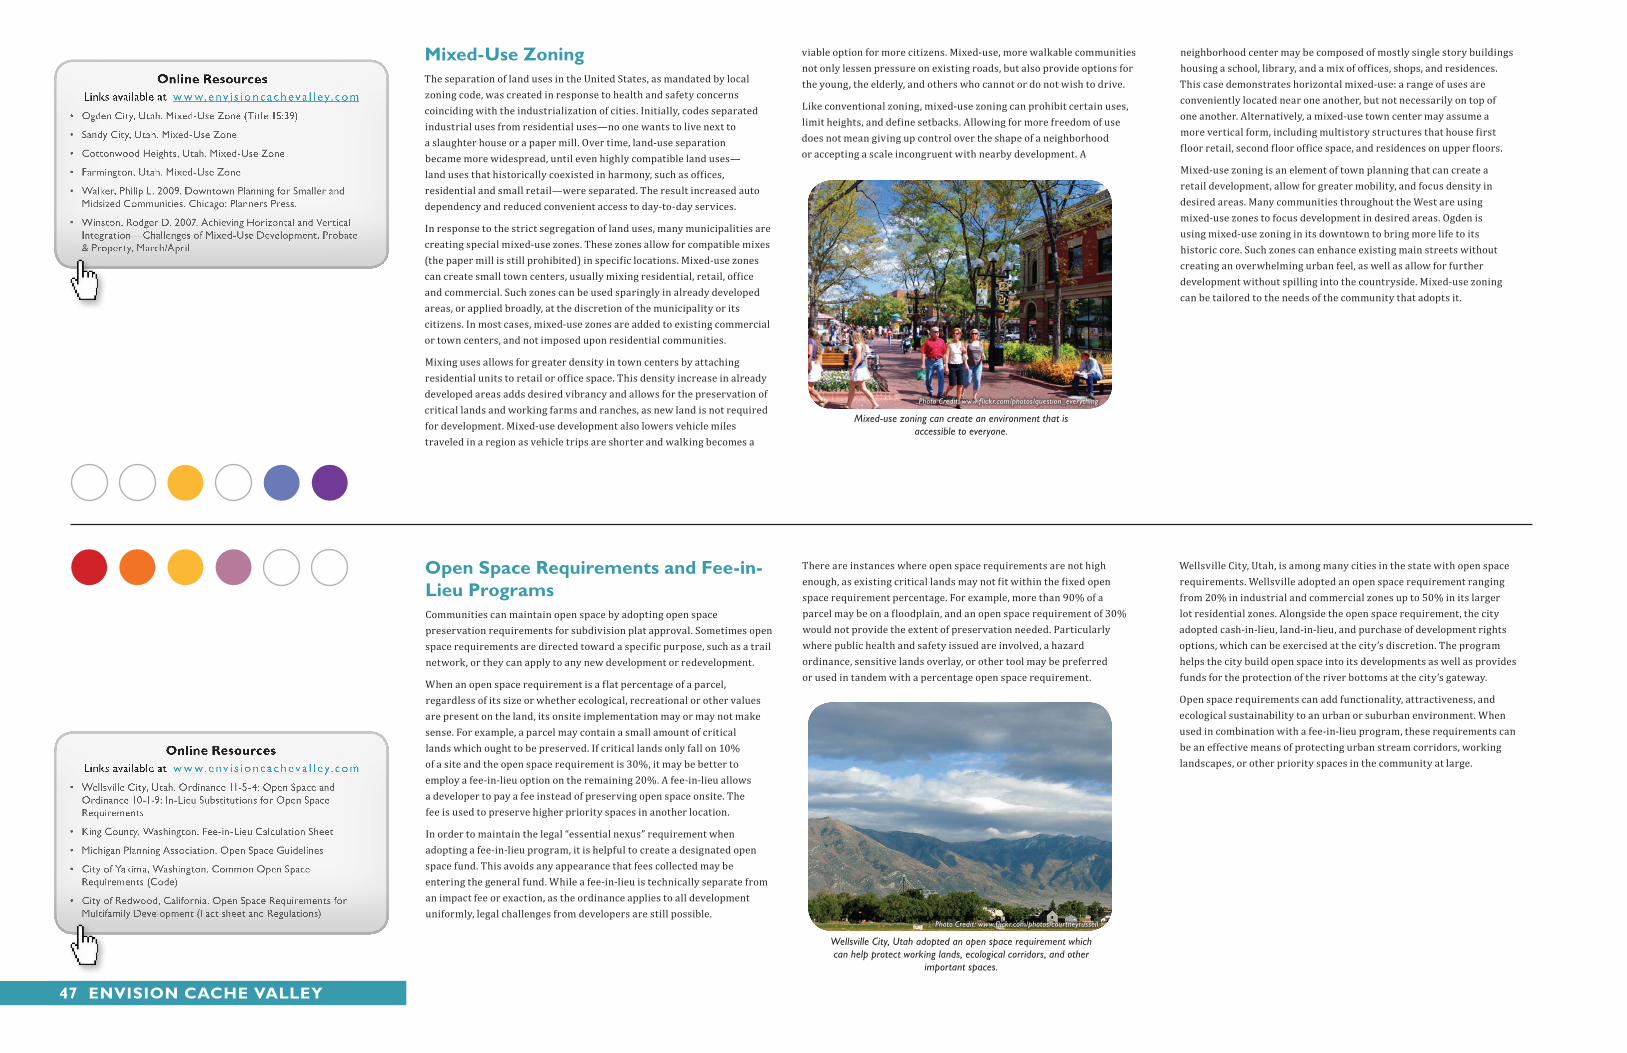
Mixed-use zoningThe separation of land uses in the United States, as mandated by local zoning code, was created in response to health and safety concerns coinciding with the industrialization of cities. Initially, codes separated industrial uses from residential uses—no one wants to live next to a slaughter house or a paper mill. Over time, land-use separation became more widespread, until even highly compatible land uses—land uses that historically coexisted in harmony, such as offices, residential and small retail—were separated. The result increased auto dependency and reduced convenient access to day-to-day services.
In response to the strict segregation of land uses, many municipalities are creating special mixed-use zones. These zones allow for compatible mixes (the paper mill is still prohibited) in specific locations. Mixed-use zones can create small town centers, usually mixing residential, retail, office and commercial. Such zones can be used sparingly in already developed areas, or applied broadly, at the discretion of the municipality or its citizens. In most cases, mixed-use zones are added to existing commercial or town centers, and not imposed upon residential communities.
Mixing uses allows for greater density in town centers by attaching residential units to retail or office space. This density increase in already developed areas adds desired vibrancy and allows for the preservation of critical lands and working farms and ranches, as new land is not required for development. Mixed-use development also lowers vehicle miles traveled in a region as vehicle trips are shorter and walking becomes a
viable option for more citizens. Mixed-use, more walkable communities not only lessen pressure on existing roads, but also provide options for the young, the elderly, and others who cannot or do not wish to drive.
Like conventional zoning, mixed-use zoning can prohibit certain uses, limit heights, and define setbacks. Allowing for more freedom of use does not mean giving up control over the shape of a neighborhood or accepting a scale incongruent with nearby development. A
neighborhood center may be composed of mostly single story buildings housing a school, library, and a mix of offices, shops, and residences. This case demonstrates horizontal mixed-use: a range of uses are conveniently located near one another, but not necessarily on top of one another. Alternatively, a mixed-use town center may assume a more vertical form, including multistory structures that house first floor retail, second floor office space, and residences on upper floors.
Mixed-use zoning is an element of town planning that can create a retail development, allow for greater mobility, and focus density in desired areas. Many communities throughout the West are using mixed-use zones to focus development in desired areas. Ogden is using mixed-use zoning in its downtown to bring more life to its historic core. Such zones can enhance existing main streets without creating an overwhelming urban feel, as well as allow for further development without spilling into the countryside. Mixed-use zoning can be tailored to the needs of the community that adopts it.
open space Requirements and Fee-in-lieu ProgramsCommunities can maintain open space by adopting open space preservation requirements for subdivision plat approval. Sometimes open space requirements are directed toward a specific purpose, such as a trail network, or they can apply to any new development or redevelopment.
When an open space requirement is a flat percentage of a parcel, regardless of its size or whether ecological, recreational or other values are present on the land, its onsite implementation may or may not make sense. For example, a parcel may contain a small amount of critical lands which ought to be preserved. If critical lands only fall on 10% of a site and the open space requirement is 30%, it may be better to employ a fee-in-lieu option on the remaining 20%. A fee-in-lieu allows a developer to pay a fee instead of preserving open space onsite. The fee is used to preserve higher priority spaces in another location.
In order to maintain the legal “essential nexus” requirement when adopting a fee-in-lieu program, it is helpful to create a designated open space fund. This avoids any appearance that fees collected may be entering the general fund. While a fee-in-lieu is technically separate from an impact fee or exaction, as the ordinance applies to all development uniformly, legal challenges from developers are still possible.
There are instances where open space requirements are not high enough, as existing critical lands may not fit within the fixed open space requirement percentage. For example, more than 90% of a parcel may be on a floodplain, and an open space requirement of 30% would not provide the extent of preservation needed. Particularly where public health and safety issued are involved, a hazard ordinance, sensitive lands overlay, or other tool may be preferred or used in tandem with a percentage open space requirement.
Wellsville City, Utah, is among many cities in the state with open space requirements. Wellsville adopted an open space requirement ranging from 20% in industrial and commercial zones up to 50% in its larger lot residential zones. Alongside the open space requirement, the city adopted cash-in-lieu, land-in-lieu, and purchase of development rights options, which can be exercised at the city’s discretion. The program helps the city build open space into its developments as well as provides funds for the protection of the river bottoms at the city’s gateway.
Open space requirements can add functionality, attractiveness, and ecological sustainability to an urban or suburban environment. When used in combination with a fee-in-lieu program, these requirements can be an effective means of protecting urban stream corridors, working landscapes, or other priority spaces in the community at large.
Mixed-use zoning can create an environment that is accessible to everyone.
Photo Credit: www.f lickr.com/photos/question_everything
Wellsville City, Utah adopted an open space requirement which can help protect working lands, ecological corridors, and other
important spaces.
Photo Credit: www.f lickr.com/photos/courtneyrussell
47 Envision CaChE vallEy
www.env i s i onc achev a l l ey. com
• OgdenCity,Utah.Mixed-UseZone(Title15:39)
• SandyCity,Utah.Mixed-UseZone
• CottonwoodHeights,Utah.Mixed-UseZone
• Farmington,Utah.Mixed-UseZone
• Walker,PhilipL.2009.DowntownPlanningforSmallerandMidsizedCommunities.Chicago:PlannersPress.
• Winston,RodgerD.2007.AchievingHorizontalandVerticalIntegration—ChallengesofMixed-UseDevelopment.Probate&Property,March/April
www.env i s i onc achev a l l ey. com
• WellsvilleCity,Utah.Ordinance11-5-4:OpenSpaceandOrdinance10-1-9:In-LieuSubstitutionsforOpenSpaceRequirements
• KingCounty,Washington.Fee-in-LieuCalculationSheet
• MichiganPlanningAssociation.OpenSpaceGuidelines
• CityofYakima,Washington.CommonOpenSpaceRequirements(Code)
• CityofRedwood,California.OpenSpaceRequirementsforMultifamilyDevelopment(FactsheetandRegulations)
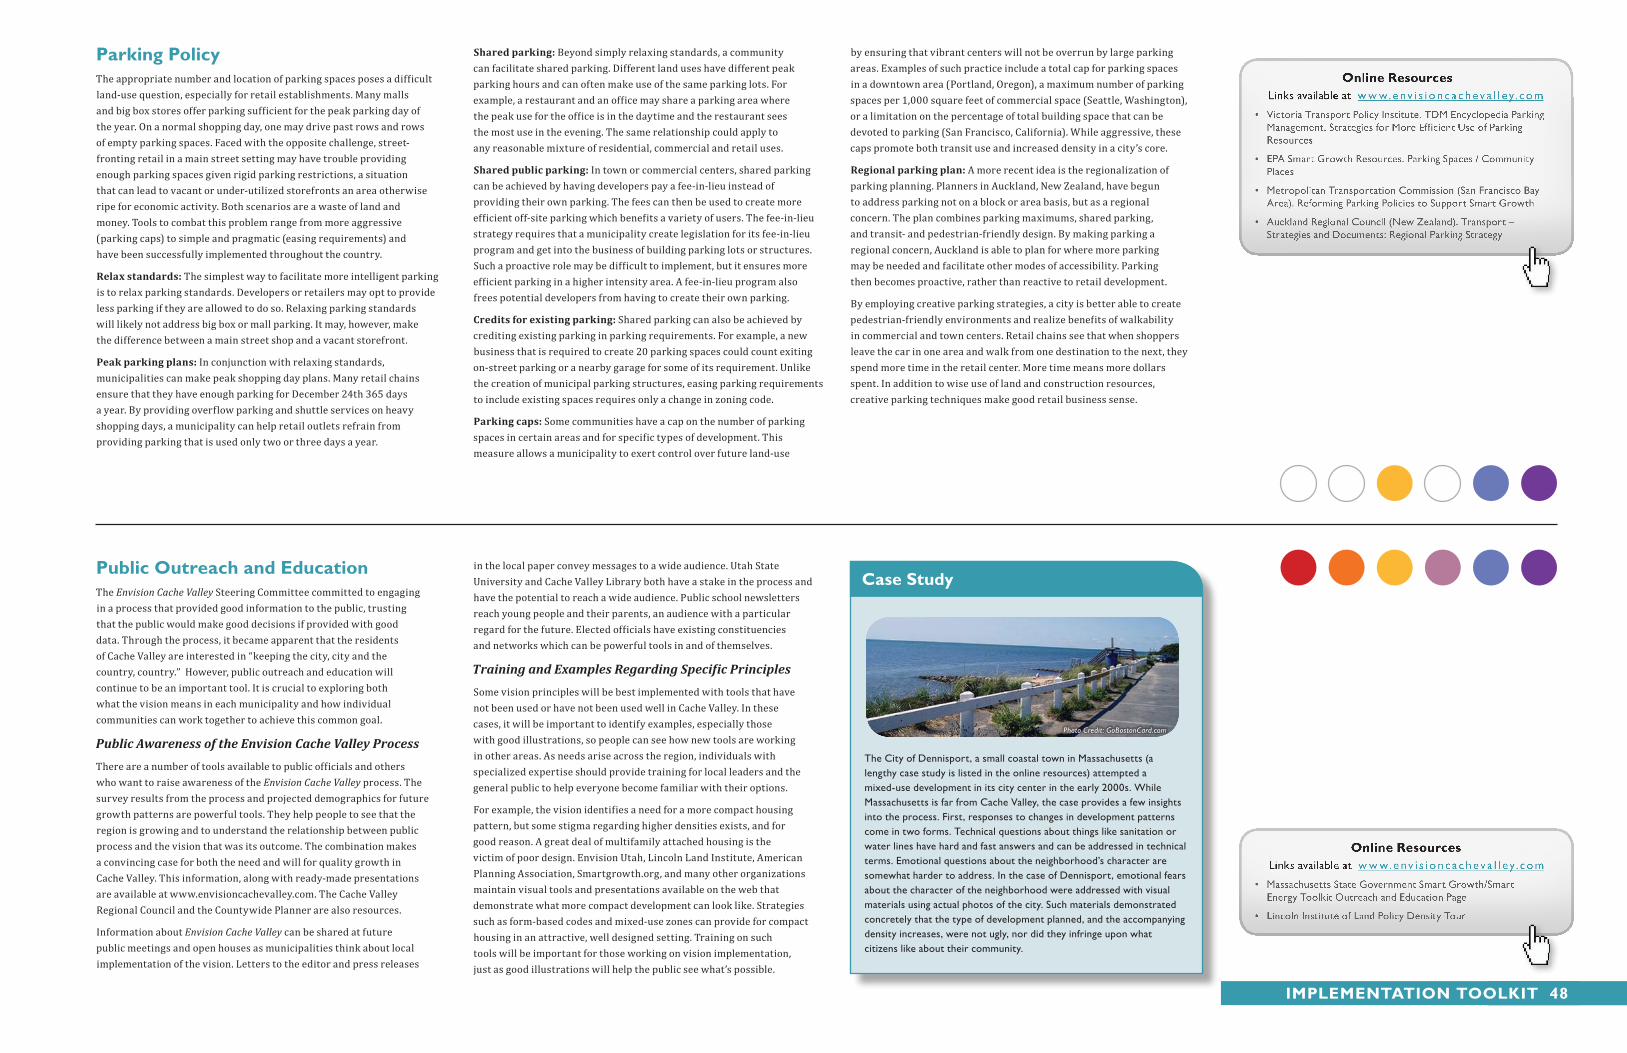
Public outreach and EducationThe Envision Cache Valley Steering Committee committed to engaging in a process that provided good information to the public, trusting that the public would make good decisions if provided with good data. Through the process, it became apparent that the residents of Cache Valley are interested in “keeping the city, city and the country, country.” However, public outreach and education will continue to be an important tool. It is crucial to exploring both what the vision means in each municipality and how individual communities can work together to achieve this common goal.
Public Awareness of the Envision Cache Valley Process
There are a number of tools available to public officials and others who want to raise awareness of the Envision Cache Valley process. The survey results from the process and projected demographics for future growth patterns are powerful tools. They help people to see that the region is growing and to understand the relationship between public process and the vision that was its outcome. The combination makes a convincing case for both the need and will for quality growth in Cache Valley. This information, along with ready-made presentations are available at www.envisioncachevalley.com. The Cache Valley Regional Council and the Countywide Planner are also resources.
Information about Envision Cache Valley can be shared at future public meetings and open houses as municipalities think about local implementation of the vision. Letters to the editor and press releases
in the local paper convey messages to a wide audience. Utah State University and Cache Valley Library both have a stake in the process and have the potential to reach a wide audience. Public school newsletters reach young people and their parents, an audience with a particular regard for the future. Elected officials have existing constituencies and networks which can be powerful tools in and of themselves.
Training and Examples Regarding Specific Principles
Some vision principles will be best implemented with tools that have not been used or have not been used well in Cache Valley. In these cases, it will be important to identify examples, especially those with good illustrations, so people can see how new tools are working in other areas. As needs arise across the region, individuals with specialized expertise should provide training for local leaders and the general public to help everyone become familiar with their options.
For example, the vision identifies a need for a more compact housing pattern, but some stigma regarding higher densities exists, and for good reason. A great deal of multifamily attached housing is the victim of poor design. Envision Utah, Lincoln Land Institute, American Planning Association, Smartgrowth.org, and many other organizations maintain visual tools and presentations available on the web that demonstrate what more compact development can look like. Strategies such as form-based codes and mixed-use zones can provide for compact housing in an attractive, well designed setting. Training on such tools will be important for those working on vision implementation, just as good illustrations will help the public see what’s possible.
The City of Dennisport, a small coastal town in Massachusetts (a lengthy case study is listed in the online resources) attempted a mixed-use development in its city center in the early 2000s. While Massachusetts is far from Cache Valley, the case provides a few insights into the process. First, responses to changes in development patterns come in two forms. Technical questions about things like sanitation or water lines have hard and fast answers and can be addressed in technical terms. Emotional questions about the neighborhood’s character are somewhat harder to address. In the case of Dennisport, emotional fears about the character of the neighborhood were addressed with visual materials using actual photos of the city. Such materials demonstrated concretely that the type of development planned, and the accompanying density increases, were not ugly, nor did they infringe upon what citizens like about their community.
Case study
Photo Credit: GoBostonCard.com
iMPlEMEnTaTion ToolKiT 48
Parking PolicyThe appropriate number and location of parking spaces poses a difficult land-use question, especially for retail establishments. Many malls and big box stores offer parking sufficient for the peak parking day of the year. On a normal shopping day, one may drive past rows and rows of empty parking spaces. Faced with the opposite challenge, street-fronting retail in a main street setting may have trouble providing enough parking spaces given rigid parking restrictions, a situation that can lead to vacant or under-utilized storefronts an area otherwise ripe for economic activity. Both scenarios are a waste of land and money. Tools to combat this problem range from more aggressive (parking caps) to simple and pragmatic (easing requirements) and have been successfully implemented throughout the country.
Relax standards: The simplest way to facilitate more intelligent parking is to relax parking standards. Developers or retailers may opt to provide less parking if they are allowed to do so. Relaxing parking standards will likely not address big box or mall parking. It may, however, make the difference between a main street shop and a vacant storefront.
Peak parking plans: In conjunction with relaxing standards, municipalities can make peak shopping day plans. Many retail chains ensure that they have enough parking for December 24th 365 days a year. By providing overflow parking and shuttle services on heavy shopping days, a municipality can help retail outlets refrain from providing parking that is used only two or three days a year.
Shared parking: Beyond simply relaxing standards, a community can facilitate shared parking. Different land uses have different peak parking hours and can often make use of the same parking lots. For example, a restaurant and an office may share a parking area where the peak use for the office is in the daytime and the restaurant sees the most use in the evening. The same relationship could apply to any reasonable mixture of residential, commercial and retail uses.
Shared public parking: In town or commercial centers, shared parking can be achieved by having developers pay a fee-in-lieu instead of providing their own parking. The fees can then be used to create more efficient off-site parking which benefits a variety of users. The fee-in-lieu strategy requires that a municipality create legislation for its fee-in-lieu program and get into the business of building parking lots or structures. Such a proactive role may be difficult to implement, but it ensures more efficient parking in a higher intensity area. A fee-in-lieu program also frees potential developers from having to create their own parking.
Credits for existing parking: Shared parking can also be achieved by crediting existing parking in parking requirements. For example, a new business that is required to create 20 parking spaces could count exiting on-street parking or a nearby garage for some of its requirement. Unlike the creation of municipal parking structures, easing parking requirements to include existing spaces requires only a change in zoning code.
Parking caps: Some communities have a cap on the number of parking spaces in certain areas and for specific types of development. This measure allows a municipality to exert control over future land-use
by ensuring that vibrant centers will not be overrun by large parking areas. Examples of such practice include a total cap for parking spaces in a downtown area (Portland, Oregon), a maximum number of parking spaces per 1,000 square feet of commercial space (Seattle, Washington), or a limitation on the percentage of total building space that can be devoted to parking (San Francisco, California). While aggressive, these caps promote both transit use and increased density in a city’s core.
Regional parking plan: A more recent idea is the regionalization of parking planning. Planners in Auckland, New Zealand, have begun to address parking not on a block or area basis, but as a regional concern. The plan combines parking maximums, shared parking, and transit- and pedestrian-friendly design. By making parking a regional concern, Auckland is able to plan for where more parking may be needed and facilitate other modes of accessibility. Parking then becomes proactive, rather than reactive to retail development.
By employing creative parking strategies, a city is better able to create pedestrian-friendly environments and realize benefits of walkability in commercial and town centers. Retail chains see that when shoppers leave the car in one area and walk from one destination to the next, they spend more time in the retail center. More time means more dollars spent. In addition to wise use of land and construction resources, creative parking techniques make good retail business sense.
www.env i s i onc achev a l l ey. com
• MassachusettsStateGovernmentSmartGrowth/SmartEnergyToolkitOutreachandEducationPage
• LincolnInstituteofLandPolicyDensityTour
www.env i s i onc achev a l l ey. com
• VictoriaTransportPolicyInstitute.TDMEncyclopediaParkingManagement,StrategiesforMoreEfficientUseofParkingResources
• EPASmartGrowthResources.ParkingSpaces/CommunityPlaces
• MetropolitanTransportationCommission(SanFranciscoBayArea).ReformingParkingPoliciestoSupportSmartGrowth
• AucklandRegionalCouncil(NewZealand).Transport–StrategiesandDocuments:RegionalParkingStrategy
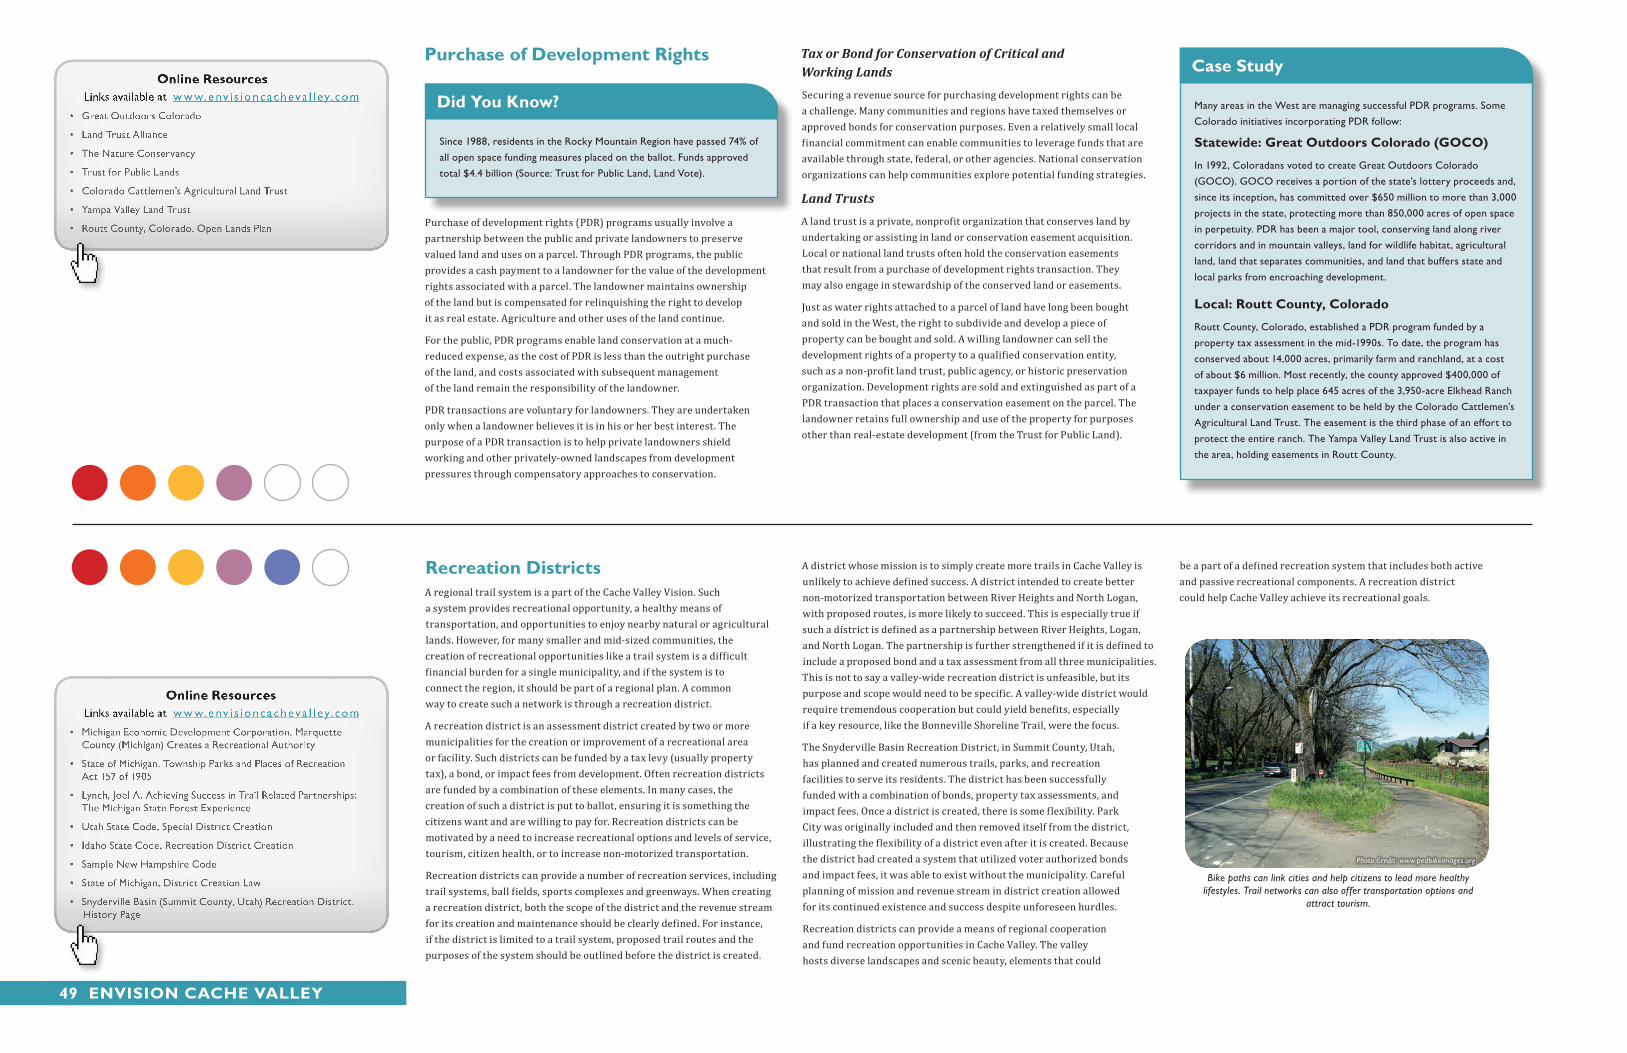
Purchase of development Rights
Purchase of development rights (PDR) programs usually involve a partnership between the public and private landowners to preserve valued land and uses on a parcel. Through PDR programs, the public provides a cash payment to a landowner for the value of the development rights associated with a parcel. The landowner maintains ownership of the land but is compensated for relinquishing the right to develop it as real estate. Agriculture and other uses of the land continue.
For the public, PDR programs enable land conservation at a much-reduced expense, as the cost of PDR is less than the outright purchase of the land, and costs associated with subsequent management of the land remain the responsibility of the landowner.
PDR transactions are voluntary for landowners. They are undertaken only when a landowner believes it is in his or her best interest. The purpose of a PDR transaction is to help private landowners shield working and other privately-owned landscapes from development pressures through compensatory approaches to conservation.
Tax or Bond for Conservation of Critical and Working Lands
Securing a revenue source for purchasing development rights can be a challenge. Many communities and regions have taxed themselves or approved bonds for conservation purposes. Even a relatively small local financial commitment can enable communities to leverage funds that are available through state, federal, or other agencies. National conservation organizations can help communities explore potential funding strategies.
Land Trusts
A land trust is a private, nonprofit organization that conserves land by undertaking or assisting in land or conservation easement acquisition. Local or national land trusts often hold the conservation easements that result from a purchase of development rights transaction. They may also engage in stewardship of the conserved land or easements.
Just as water rights attached to a parcel of land have long been bought and sold in the West, the right to subdivide and develop a piece of property can be bought and sold. A willing landowner can sell the development rights of a property to a qualified conservation entity, such as a non-profit land trust, public agency, or historic preservation organization. Development rights are sold and extinguished as part of a PDR transaction that places a conservation easement on the parcel. The landowner retains full ownership and use of the property for purposes other than real-estate development (from the Trust for Public Land).
Recreation districtsA regional trail system is a part of the Cache Valley Vision. Such a system provides recreational opportunity, a healthy means of transportation, and opportunities to enjoy nearby natural or agricultural lands. However, for many smaller and mid-sized communities, the creation of recreational opportunities like a trail system is a difficult financial burden for a single municipality, and if the system is to connect the region, it should be part of a regional plan. A common way to create such a network is through a recreation district.
A recreation district is an assessment district created by two or more municipalities for the creation or improvement of a recreational area or facility. Such districts can be funded by a tax levy (usually property tax), a bond, or impact fees from development. Often recreation districts are funded by a combination of these elements. In many cases, the creation of such a district is put to ballot, ensuring it is something the citizens want and are willing to pay for. Recreation districts can be motivated by a need to increase recreational options and levels of service, tourism, citizen health, or to increase non-motorized transportation.
Recreation districts can provide a number of recreation services, including trail systems, ball fields, sports complexes and greenways. When creating a recreation district, both the scope of the district and the revenue stream for its creation and maintenance should be clearly defined. For instance, if the district is limited to a trail system, proposed trail routes and the purposes of the system should be outlined before the district is created.
A district whose mission is to simply create more trails in Cache Valley is unlikely to achieve defined success. A district intended to create better non-motorized transportation between River Heights and North Logan, with proposed routes, is more likely to succeed. This is especially true if such a district is defined as a partnership between River Heights, Logan, and North Logan. The partnership is further strengthened if it is defined to include a proposed bond and a tax assessment from all three municipalities. This is not to say a valley-wide recreation district is unfeasible, but its purpose and scope would need to be specific. A valley-wide district would require tremendous cooperation but could yield benefits, especially if a key resource, like the Bonneville Shoreline Trail, were the focus.
The Snyderville Basin Recreation District, in Summit County, Utah, has planned and created numerous trails, parks, and recreation facilities to serve its residents. The district has been successfully funded with a combination of bonds, property tax assessments, and impact fees. Once a district is created, there is some flexibility. Park City was originally included and then removed itself from the district, illustrating the flexibility of a district even after it is created. Because the district had created a system that utilized voter authorized bonds and impact fees, it was able to exist without the municipality. Careful planning of mission and revenue stream in district creation allowed for its continued existence and success despite unforeseen hurdles.
Recreation districts can provide a means of regional cooperation and fund recreation opportunities in Cache Valley. The valley hosts diverse landscapes and scenic beauty, elements that could
be a part of a defined recreation system that includes both active and passive recreational components. A recreation district could help Cache Valley achieve its recreational goals.
Bike paths can link cities and help citizens to lead more healthy lifestyles. Trail networks can also offer transportation options and
attract tourism.
Photo Credit: www.pedbikeimages.org
Many areas in the West are managing successful PDR programs. Some Colorado initiatives incorporating PDR follow:
statewide: Great outdoors Colorado (GoCo)
In 1992, Coloradans voted to create Great Outdoors Colorado (GOCO). GOCO receives a portion of the state’s lottery proceeds and, since its inception, has committed over $650 million to more than 3,000 projects in the state, protecting more than 850,000 acres of open space in perpetuity. PDR has been a major tool, conserving land along river corridors and in mountain valleys, land for wildlife habitat, agricultural land, land that separates communities, and land that buffers state and local parks from encroaching development.
local: Routt County, Colorado
Routt County, Colorado, established a PDR program funded by a property tax assessment in the mid-1990s. To date, the program has conserved about 14,000 acres, primarily farm and ranchland, at a cost of about $6 million. Most recently, the county approved $400,000 of taxpayer funds to help place 645 acres of the 3,950-acre Elkhead Ranch under a conservation easement to be held by the Colorado Cattlemen’s Agricultural Land Trust. The easement is the third phase of an effort to protect the entire ranch. The Yampa Valley Land Trust is also active in the area, holding easements in Routt County.
Case study
Since 1988, residents in the Rocky Mountain Region have passed 74% of all open space funding measures placed on the ballot. Funds approved total $4.4 billion (Source: Trust for Public Land, Land Vote).
did you Know?
49 Envision CaChE vallEy
www.env i s i onc achev a l l ey. com
• GreatOutdoorsColorado
• LandTrustAlliance
• TheNatureConservancy
• TrustforPublicLands
• ColoradoCattlemen’sAgriculturalLandTrust
• YampaValleyLandTrust
• RouttCounty,Colorado.OpenLandsPlan
www.env i s i onc achev a l l ey. com
• MichiganEconomicDevelopmentCorporation.MarquetteCounty(Michigan)CreatesaRecreationalAuthority
• StateofMichigan.TownshipParksandPlacesofRecreationAct157of1905
• Lynch,JoelA.AchievingSuccessinTrailRelatedPartnerships:TheMichiganStateForestExperience
• UtahStateCode,SpecialDistrictCreation
• IdahoStateCode,RecreationDistrictCreation
• SampleNewHampshireCode
• StateofMichigan,DistrictCreationLaw
• SnydervilleBasin(SummitCounty,Utah)RecreationDistrict.HistoryPage
street ConnectivityIn the last half century, cul-de-sacs have dominated the design of residential developments. Traffic from cul-de-sacs typically feeds onto collector roads. While this street pattern offers some privacy and can be sensitive to existing land features, it has major drawbacks.
Hierarchical street development depends entirely on collector roads for transportation to and from individual cul-de-sac streets. Because there are few ways to get from one place to another, most trips require accessing a collector road, which can become congested at peak driving hours. Over time, former country lanes are converted to major arterials as more lanes, to accommodate increasing traffic loads, are added. Driving becomes increasingly unpleasant, and this pattern makes alternative modes of transportation, such as walking and cycling, much more difficult.
The lack of connection between the dead-end roads in a hierarchical street system can make destinations that are physically very close practically very far away. Unconnected streets may require children who live near a school to be driven. The inability to walk reduces exercise levels and adversely affects health. The collective miles driven negatively impacts air quality, which, in turn, impacts health.
Street connectivity, commonplace in traditional neighborhoods, solves these problems quite simply. If traffic on one street becomes too congested, there are other options. A diversity of routes to the same
destination reduces congestion and allows for pedestrian- and bicycle-friendly routes. Destinations around the block do not require a trip on a busy collector street. In addition, connectivity allows greater access for emergency service vehicles and makes waste collection more efficient.
Street connectivity is usually associated with a grid system, but a standard grid is not the only means to connect streets. A variety of options exist to create connectivity, including a modified grid system, a system of connected loops, or belts around a grid. Connectivity need not preclude taking the environment into account. Streets can curve to avoid streams or other natural features. Block sizes can change depending on the use.
The State of Virginia recently adopted street connectivity standards whereby new sub-division plats must meet a required “connectivity index.” Simply a ratio of roads to intersections, the index requires connectivity but allows for freedom of design.
It is important to remember that while buildings come and go in a relatively short time span, the layout of streets will likely exist for generations. An efficiently designed street network can facilitate land uses that create convenient, safe and accessible communities.
Revenue sharing/balancing Economic GrowthA stable tax base, either from property or sales tax, allows a municipality to provide needed services. Sometimes competition among neighboring municipal governments for these dollars can negatively impact an area’s overall land-use and economic development goals. To generate more tax revenue with a comparatively small burden on public services, a community might reject needed affordable housing in favor of expensive homes, or forego office buildings with high-paying jobs in favor of big box retail stores with low-wage jobs.
The tax structure creates incentive for municipalities to attract and recruit retail employers over other types of industry, and the desire to secure development that generates sales tax revenue can lead to bidding wars between communities as they compete for a limited share of an existing market. From a regional perspective, providing subsidies for businesses that have already decided to locate in an area is unnecessary and may be harmful. A big box store, for example, may draw sales from existing local businesses and shopping centers and, for the region as a whole, there will be no net gain in economic activity.
Zoning for sales tax revenues can foster undesirable development patterns. Newer communities with extensive new commercial development and relatively affluent homes may have high quality public services with a relatively low tax rate. A central city area may see its commercial center decline and the exodus of its more affluent residents. As it imposes a higher tax rate and delivers poorer quality services, disparities increase and can engender a cycle of disinvestment in a central city area and increasing investment in land even farther away. Alternatively, some new communities may be primarily bedroom communities, and are left with the costs of residential development
that doesn’t pay for itself and little sales tax revenue to offset the public service costs of housing.
Regional Tax-Base Sharing
Regional tax-base sharing offers one way to alleviate an unbalanced regional tax structure. Municipalities within an area agree to share tax proceeds from new development. This reduces interregional competition, facilitates other planning goals, such as preserving open space or maintaining a vibrant downtown, encourages communities to cooperate on regional economic development goals, and leads to a more equitable distribution of tax burdens and public services. Because of the level of cooperation required, this strategy can be hard to implement. For example, cities with a large share of retail business relative to others in the region may not want to give up sales tax dollars.
Tax-base sharing has been successfully implemented by the Twin Cities Metropolitan Area, in Minnesota, Hackensack Meadowlands, New Jersey, and other regions. The Twin Cities program, known as the Minnesota Fiscal Disparities Act (https://www.revisor.leg.state.mn.us/statutes/?id=473F), was established in 1971. Under the act every city in the metro area contributes 40% of its commercial-industrial taxes to a regional pool. This pool is then allocated under a formula with regard to the population and fiscal capacity of the various municipalities in the region. The act has withstood a constitutional test and an attempt at repeal.
Communities competing for tax base can miss out on achieving other goals, such as the creation of higher wage jobs.
Interlocal Revenue Sharing Agreements
The other, more common approach is an interlocal revenue sharing agreement. Such an agreement between municipalities or other local or regional governments allows for the sharing of revenue from
development in a manner agreed upon by the participating governments. According to the Utah Attorney General, a revenue agreement of this type is legal, even if not all residents paying into the system receive benefits, as long as the agreement was adopted under a general balloting process.
Such programs free an individual municipality from some of the burden of seeking revenue from retail sales or high-end housing at the expense of regional needs and goals, including the creation of high-quality jobs and a variety of housing options.
Twad
dell,
Han
nah
Mak
ing
the
Conn
ecti
on P
lann
ing
Com
mis
sion
ers
Jour
nal
No.
58
Spri
ng 2
005
repr
inti
ng L
ocal
str
eet c
onne
ctiv
ity
patt
erns
com
pare
d —
from
dia
gram
by
City
of S
alem
, Ore
gon
(bas
ed o
nTri
-Cou
nty
Met
ropo
litan
Tr
ansp
orta
tion
Dis
tric
t).
Connectivity need not preclude the benefits of the cul-de-sac.
An economic development plan should focus on balanced growth and a regional perspective. Revenue sharing enables a regional view, as communities can be less concerned with attracting retail development (a larger share of a fixed market) and more concerned with attracting high quality jobs that actually grow the market. Jobs in the retail sector tend to pay lower wages than jobs in knowledge-intensive industries, which strengthen the regional economy in several ways: they bring new wealth into a region by exporting goods and services to customers outside the region; they pay high wages relative to other sectors of the economy; they provide career advancement for employees; and they contribute to the development of a skilled workforce. The location and expansion of business in high-skill, high-wage industry sectors in a region is good for everyone because the job and wealth creation that these businesses bring to the region spills across municipal boundaries. Employees may work and earn their paychecks in one municipality, but they spend them across a region. Revenue sharing can further balance wealth and equalize services across communities.
balancing Economic Growth
iMPlEMEnTaTion ToolKiT 50
www.env i s i onc achev a l l ey. com
• AmericanPlanningAssociation.APAGrowingSmartGuidebook(Ch14:DevicesandTaxReliefPrograms)
• UtahAGOpinionNumber91-031.MillardCountyRevenueSharing
• MinnesotaCodeforTwinCitiesRevenueSharingProgram
• ProposedCodeforSacramento,California.TaxSharingLegislation
• StuartMeakTestimonytotheJointLegislativecommitteeNewJerseyLegislature
• CodeofVirginia.1994.RevenueSharingAgreements(CodeofVa.15-1-1167.1.2)
• EnvisionUtah.2005.ThinkingandActingRegionallyintheGreaterWasatchArea:ImplicationsforLocalEconomicDevelopmentPractice(availableatEnvisionUtah)
Printed Resources• Hall Kenneth B. and Gerald A. Porterfield. 2001. Community
by Design: New Urbanism for Suburbs and Small Communities. New York: McGraw-Hill.
• Twaddell, Hannah. 2005. Making the Connection. Planning Commissioners Journal, 58 (Spring).
• Girling, Cynthia and Ronald Kellett. 2005. Skinny Streets and Green Neighborhoods: Design for Environment and Community. Washington, D.C.: Island Press.
www.env i s i onc achev a l l ey. com
• VirginiaStateCode.SecondaryStreetAcceptanceRequirements
• OfficeoftheSecretaryofTransportation,StateofVirginia
• CompleteStreets.CompleteStreetsPolicyElements
• Colombia,Missouri.ModelStreetStandards–IllustratedCode
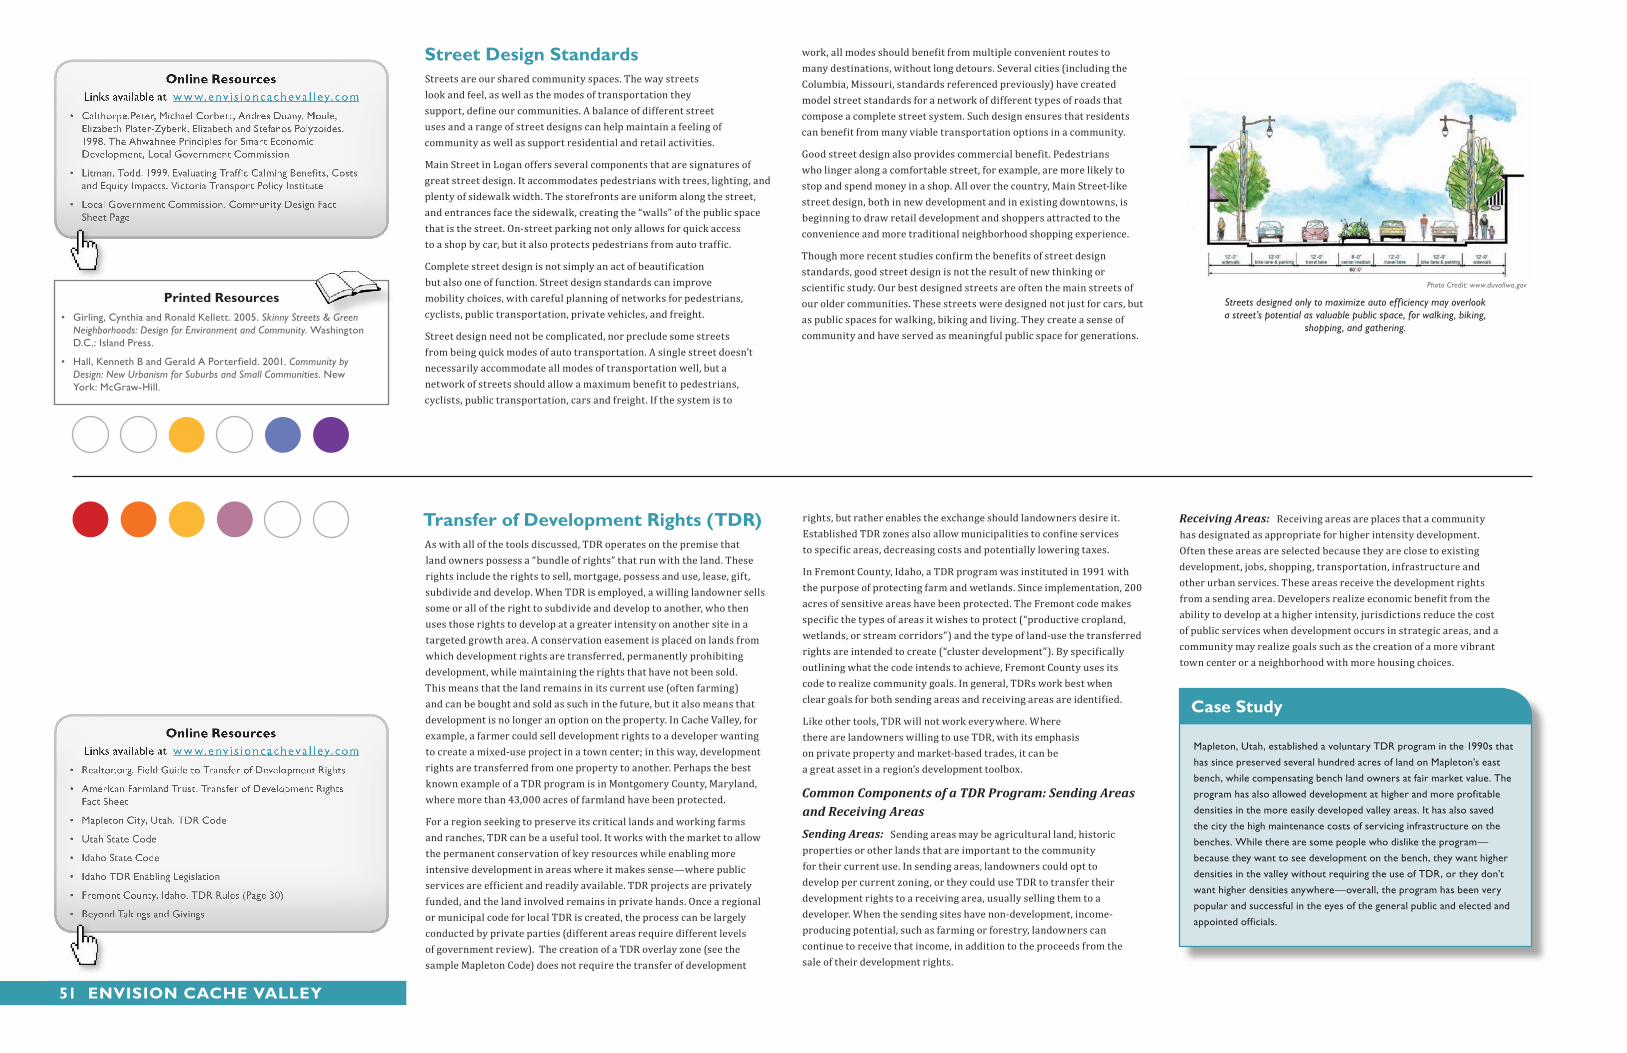
street design standardsStreets are our shared community spaces. The way streets look and feel, as well as the modes of transportation they support, define our communities. A balance of different street uses and a range of street designs can help maintain a feeling of community as well as support residential and retail activities.
Main Street in Logan offers several components that are signatures of great street design. It accommodates pedestrians with trees, lighting, and plenty of sidewalk width. The storefronts are uniform along the street, and entrances face the sidewalk, creating the “walls” of the public space that is the street. On-street parking not only allows for quick access to a shop by car, but it also protects pedestrians from auto traffic.
Complete street design is not simply an act of beautification but also one of function. Street design standards can improve mobility choices, with careful planning of networks for pedestrians, cyclists, public transportation, private vehicles, and freight.
Street design need not be complicated, nor preclude some streets from being quick modes of auto transportation. A single street doesn’t necessarily accommodate all modes of transportation well, but a network of streets should allow a maximum benefit to pedestrians, cyclists, public transportation, cars and freight. If the system is to
work, all modes should benefit from multiple convenient routes to many destinations, without long detours. Several cities (including the Columbia, Missouri, standards referenced previously) have created model street standards for a network of different types of roads that compose a complete street system. Such design ensures that residents can benefit from many viable transportation options in a community.
Good street design also provides commercial benefit. Pedestrians who linger along a comfortable street, for example, are more likely to stop and spend money in a shop. All over the country, Main Street-like street design, both in new development and in existing downtowns, is beginning to draw retail development and shoppers attracted to the convenience and more traditional neighborhood shopping experience.
Though more recent studies confirm the benefits of street design standards, good street design is not the result of new thinking or scientific study. Our best designed streets are often the main streets of our older communities. These streets were designed not just for cars, but as public spaces for walking, biking and living. They create a sense of community and have served as meaningful public space for generations.
Transfer of development Rights (TdR)As with all of the tools discussed, TDR operates on the premise that land owners possess a “bundle of rights” that run with the land. These rights include the rights to sell, mortgage, possess and use, lease, gift, subdivide and develop. When TDR is employed, a willing landowner sells some or all of the right to subdivide and develop to another, who then uses those rights to develop at a greater intensity on another site in a targeted growth area. A conservation easement is placed on lands from which development rights are transferred, permanently prohibiting development, while maintaining the rights that have not been sold. This means that the land remains in its current use (often farming) and can be bought and sold as such in the future, but it also means that development is no longer an option on the property. In Cache Valley, for example, a farmer could sell development rights to a developer wanting to create a mixed-use project in a town center; in this way, development rights are transferred from one property to another. Perhaps the best known example of a TDR program is in Montgomery County, Maryland, where more than 43,000 acres of farmland have been protected.
For a region seeking to preserve its critical lands and working farms and ranches, TDR can be a useful tool. It works with the market to allow the permanent conservation of key resources while enabling more intensive development in areas where it makes sense—where public services are efficient and readily available. TDR projects are privately funded, and the land involved remains in private hands. Once a regional or municipal code for local TDR is created, the process can be largely conducted by private parties (different areas require different levels of government review). The creation of a TDR overlay zone (see the sample Mapleton Code) does not require the transfer of development
rights, but rather enables the exchange should landowners desire it. Established TDR zones also allow municipalities to confine services to specific areas, decreasing costs and potentially lowering taxes.
In Fremont County, Idaho, a TDR program was instituted in 1991 with the purpose of protecting farm and wetlands. Since implementation, 200 acres of sensitive areas have been protected. The Fremont code makes specific the types of areas it wishes to protect (“productive cropland, wetlands, or stream corridors”) and the type of land-use the transferred rights are intended to create (“cluster development”). By specifically outlining what the code intends to achieve, Fremont County uses its code to realize community goals. In general, TDRs work best when clear goals for both sending areas and receiving areas are identified.
Like other tools, TDR will not work everywhere. Where there are landowners willing to use TDR, with its emphasis on private property and market-based trades, it can be a great asset in a region’s development toolbox.
Common Components of a TDR Program: Sending Areas and Receiving Areas
Sending Areas: Sending areas may be agricultural land, historic properties or other lands that are important to the community for their current use. In sending areas, landowners could opt to develop per current zoning, or they could use TDR to transfer their development rights to a receiving area, usually selling them to a developer. When the sending sites have non-development, income-producing potential, such as farming or forestry, landowners can continue to receive that income, in addition to the proceeds from the sale of their development rights.
Receiving Areas: Receiving areas are places that a community has designated as appropriate for higher intensity development. Often these areas are selected because they are close to existing development, jobs, shopping, transportation, infrastructure and other urban services. These areas receive the development rights from a sending area. Developers realize economic benefit from the ability to develop at a higher intensity, jurisdictions reduce the cost of public services when development occurs in strategic areas, and a community may realize goals such as the creation of a more vibrant town center or a neighborhood with more housing choices.
Photo Credit: www.duvallwa.gov
Streets designed only to maximize auto eff iciency may overlook a street’s potential as valuable public space, for walking, biking,
shopping, and gathering.
Mapleton, Utah, established a voluntary TDR program in the 1990s that has since preserved several hundred acres of land on Mapleton’s east bench, while compensating bench land owners at fair market value. The program has also allowed development at higher and more profitable densities in the more easily developed valley areas. It has also saved the city the high maintenance costs of servicing infrastructure on the benches. While there are some people who dislike the program—because they want to see development on the bench, they want higher densities in the valley without requiring the use of TDR, or they don’t want higher densities anywhere—overall, the program has been very popular and successful in the eyes of the general public and elected and appointed officials.
Case study
51 Envision CaChE vallEy
Printed Resources• Girling, Cynthia and Ronald Kellett. 2005. Skinny Streets & Green
Neighborhoods: Design for Environment and Community. Washington D.C.: Island Press.
• Hall, Kenneth B and Gerald A Porterfield. 2001. Community by Design: New Urbanism for Suburbs and Small Communities. New York: McGraw-Hill.
www.env i s i onc achev a l l ey. com
• Calthorpe,Peter,MichaelCorbett,AndresDuany,Moule,ElizabethPlater-Zyberk,ElizabethandStefanosPolyzoides.1998.TheAhwahneePrinciplesforSmartEconomicDevelopment,LocalGovernmentCommission
• Litman,Todd.1999.EvaluatingTrafficCalmingBenefits,CostsandEquityImpacts.VictoriaTransportPolicyInstitute
• LocalGovernmentCommission.CommunityDesignFactSheetPage
www.env i s i onc achev a l l ey. com
• Realtor.org.FieldGuidetoTransferofDevelopmentRights
• AmericanFarmlandTrust.TransferofDevelopmentRightsFactSheet
• MapletonCity,Utah.TDRCode
• UtahStateCode
• IdahoStateCode
• IdahoTDREnablingLegislation
• FremontCounty,Idaho.TDRRules(Page30)
• BeyondTakingsandGivings
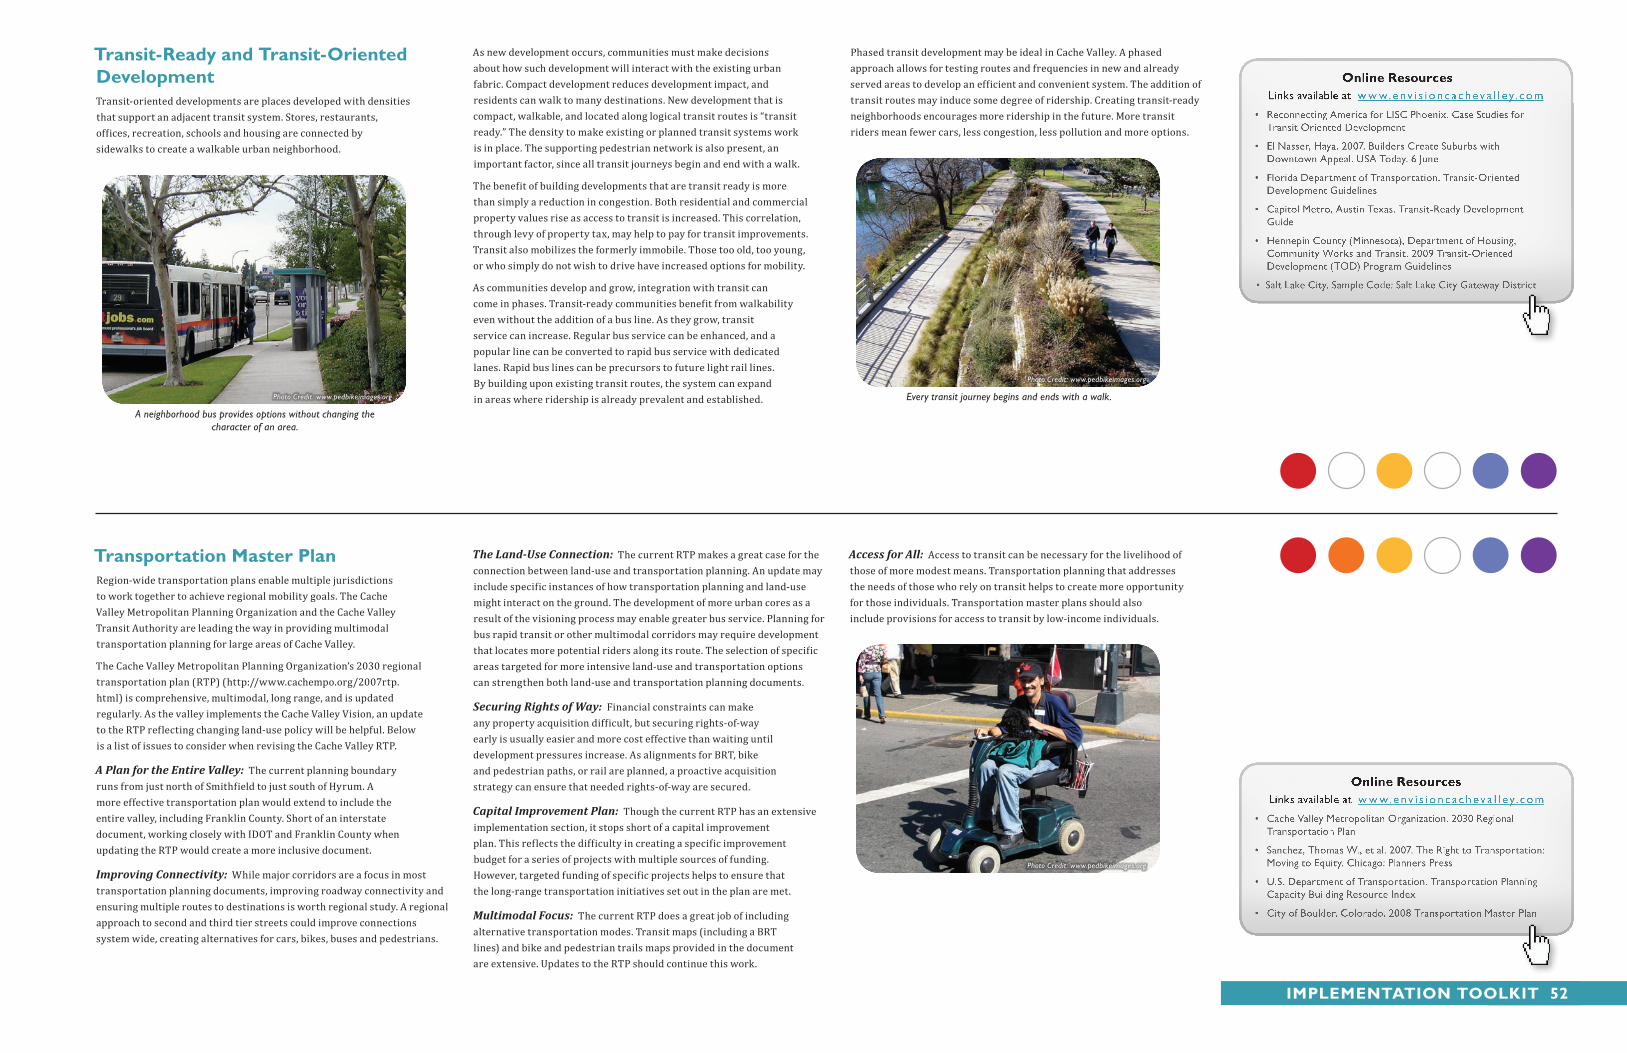
Transit-Ready and Transit-oriented developmentTransit-oriented developments are places developed with densities that support an adjacent transit system. Stores, restaurants, offices, recreation, schools and housing are connected by sidewalks to create a walkable urban neighborhood.
As new development occurs, communities must make decisions about how such development will interact with the existing urban fabric. Compact development reduces development impact, and residents can walk to many destinations. New development that is compact, walkable, and located along logical transit routes is “transit ready.” The density to make existing or planned transit systems work is in place. The supporting pedestrian network is also present, an important factor, since all transit journeys begin and end with a walk.
The benefit of building developments that are transit ready is more than simply a reduction in congestion. Both residential and commercial property values rise as access to transit is increased. This correlation, through levy of property tax, may help to pay for transit improvements. Transit also mobilizes the formerly immobile. Those too old, too young, or who simply do not wish to drive have increased options for mobility.
As communities develop and grow, integration with transit can come in phases. Transit-ready communities benefit from walkability even without the addition of a bus line. As they grow, transit service can increase. Regular bus service can be enhanced, and a popular line can be converted to rapid bus service with dedicated lanes. Rapid bus lines can be precursors to future light rail lines. By building upon existing transit routes, the system can expand in areas where ridership is already prevalent and established.
Phased transit development may be ideal in Cache Valley. A phased approach allows for testing routes and frequencies in new and already served areas to develop an efficient and convenient system. The addition of transit routes may induce some degree of ridership. Creating transit-ready neighborhoods encourages more ridership in the future. More transit riders mean fewer cars, less congestion, less pollution and more options.
Transportation Master PlanRegion-wide transportation plans enable multiple jurisdictions to work together to achieve regional mobility goals. The Cache Valley Metropolitan Planning Organization and the Cache Valley Transit Authority are leading the way in providing multimodal transportation planning for large areas of Cache Valley.
The Cache Valley Metropolitan Planning Organization’s 2030 regional transportation plan (RTP) (http://www.cachempo.org/2007rtp.html) is comprehensive, multimodal, long range, and is updated regularly. As the valley implements the Cache Valley Vision, an update to the RTP reflecting changing land-use policy will be helpful. Below is a list of issues to consider when revising the Cache Valley RTP.
A Plan for the Entire Valley: The current planning boundary runs from just north of Smithfield to just south of Hyrum. A more effective transportation plan would extend to include the entire valley, including Franklin County. Short of an interstate document, working closely with IDOT and Franklin County when updating the RTP would create a more inclusive document.
Improving Connectivity: While major corridors are a focus in most transportation planning documents, improving roadway connectivity and ensuring multiple routes to destinations is worth regional study. A regional approach to second and third tier streets could improve connections system wide, creating alternatives for cars, bikes, buses and pedestrians.
The Land-Use Connection: The current RTP makes a great case for the connection between land-use and transportation planning. An update may include specific instances of how transportation planning and land-use might interact on the ground. The development of more urban cores as a result of the visioning process may enable greater bus service. Planning for bus rapid transit or other multimodal corridors may require development that locates more potential riders along its route. The selection of specific areas targeted for more intensive land-use and transportation options can strengthen both land-use and transportation planning documents.
Securing Rights of Way: Financial constraints can make any property acquisition difficult, but securing rights-of-way early is usually easier and more cost effective than waiting until development pressures increase. As alignments for BRT, bike and pedestrian paths, or rail are planned, a proactive acquisition strategy can ensure that needed rights-of-way are secured.
Capital Improvement Plan: Though the current RTP has an extensive implementation section, it stops short of a capital improvement plan. This reflects the difficulty in creating a specific improvement budget for a series of projects with multiple sources of funding. However, targeted funding of specific projects helps to ensure that the long-range transportation initiatives set out in the plan are met.
Multimodal Focus: The current RTP does a great job of including alternative transportation modes. Transit maps (including a BRT lines) and bike and pedestrian trails maps provided in the document are extensive. Updates to the RTP should continue this work.
Access for All: Access to transit can be necessary for the livelihood of those of more modest means. Transportation planning that addresses the needs of those who rely on transit helps to create more opportunity for those individuals. Transportation master plans should also include provisions for access to transit by low-income individuals.
Every transit journey begins and ends with a walk.
Photo Credit: www.pedbikeimages.org
A neighborhood bus provides options without changing the character of an area.
Photo Credit: www.pedbikeimages.org
Photo Credit: www.pedbikeimages.org
iMPlEMEnTaTion ToolKiT 52
www.env i s i onc achev a l l ey. com
• CacheValleyMetropolitanOrganization.2030RegionalTransportationPlan
• Sanchez,ThomasW.,etal.2007.TheRighttoTransportation:MovingtoEquity.Chicago:PlannersPress
• U.S.DepartmentofTransportation.TransportationPlanningCapacityBuildingResourceIndex
• CityofBoulder,Colorado.2008TransportationMasterPlan
www.env i s i onc achev a l l ey. com
• ReconnectingAmericaforLISCPhoenix.CaseStudiesforTransitOrientedDevelopment
• ElNasser,Haya.2007.BuildersCreateSuburbswithDowntownAppeal.USAToday.6June
• FloridaDepartmentofTransportation.Transit-OrientedDevelopmentGuidelines
• CapitolMetro,AustinTexas.Transit-ReadyDevelopmentGuide
• HennepinCounty(Minnesota),DepartmentofHousing,CommunityWorksandTransit.2009Transit-OrientedDevelopment(TOD)ProgramGuidelines
• SaltLakeCity.SampleCode:SaltLakeCityGatewayDistrict
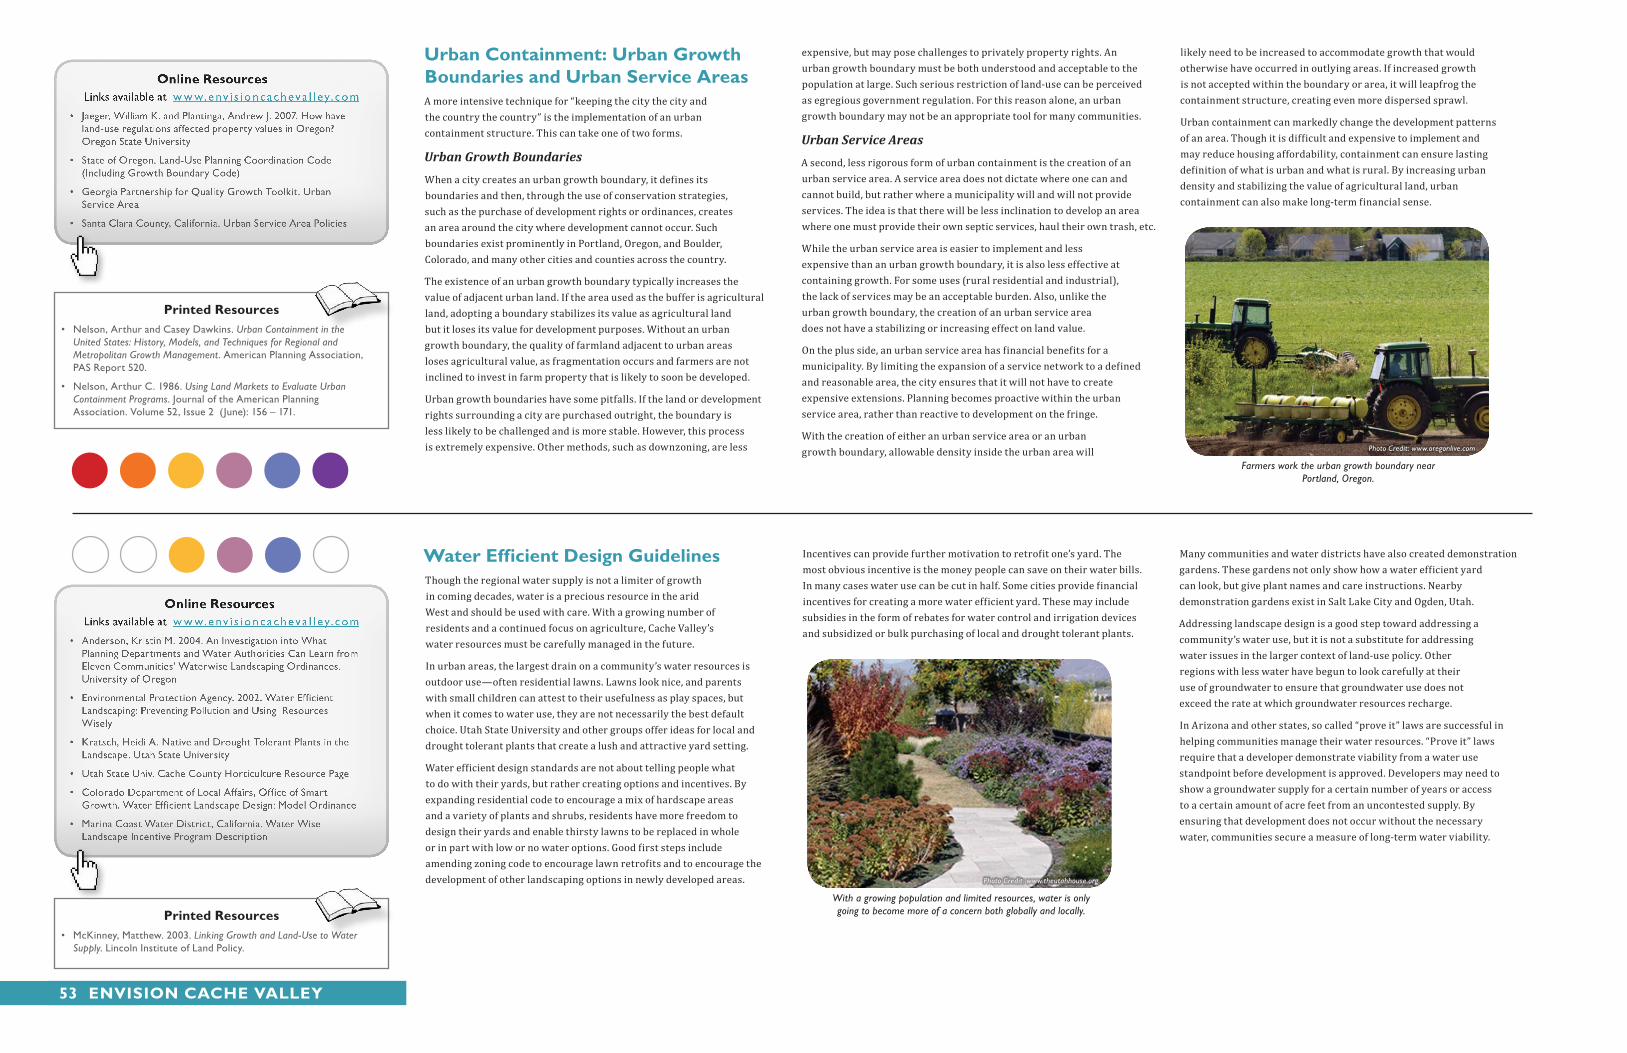
Water Efficient design GuidelinesThough the regional water supply is not a limiter of growth in coming decades, water is a precious resource in the arid West and should be used with care. With a growing number of residents and a continued focus on agriculture, Cache Valley’s water resources must be carefully managed in the future.
In urban areas, the largest drain on a community’s water resources is outdoor use—often residential lawns. Lawns look nice, and parents with small children can attest to their usefulness as play spaces, but when it comes to water use, they are not necessarily the best default choice. Utah State University and other groups offer ideas for local and drought tolerant plants that create a lush and attractive yard setting.
Water efficient design standards are not about telling people what to do with their yards, but rather creating options and incentives. By expanding residential code to encourage a mix of hardscape areas and a variety of plants and shrubs, residents have more freedom to design their yards and enable thirsty lawns to be replaced in whole or in part with low or no water options. Good first steps include amending zoning code to encourage lawn retrofits and to encourage the development of other landscaping options in newly developed areas.
Incentives can provide further motivation to retrofit one’s yard. The most obvious incentive is the money people can save on their water bills. In many cases water use can be cut in half. Some cities provide financial incentives for creating a more water efficient yard. These may include subsidies in the form of rebates for water control and irrigation devices and subsidized or bulk purchasing of local and drought tolerant plants.
Many communities and water districts have also created demonstration gardens. These gardens not only show how a water efficient yard can look, but give plant names and care instructions. Nearby demonstration gardens exist in Salt Lake City and Ogden, Utah.
Addressing landscape design is a good step toward addressing a community’s water use, but it is not a substitute for addressing water issues in the larger context of land-use policy. Other regions with less water have begun to look carefully at their use of groundwater to ensure that groundwater use does not exceed the rate at which groundwater resources recharge.
In Arizona and other states, so called “prove it” laws are successful in helping communities manage their water resources. “Prove it” laws require that a developer demonstrate viability from a water use standpoint before development is approved. Developers may need to show a groundwater supply for a certain number of years or access to a certain amount of acre feet from an uncontested supply. By ensuring that development does not occur without the necessary water, communities secure a measure of long-term water viability.
urban Containment: urban Growth boundaries and urban service areasA more intensive technique for “keeping the city the city and the country the country” is the implementation of an urban containment structure. This can take one of two forms.
Urban Growth Boundaries
When a city creates an urban growth boundary, it defines its boundaries and then, through the use of conservation strategies, such as the purchase of development rights or ordinances, creates an area around the city where development cannot occur. Such boundaries exist prominently in Portland, Oregon, and Boulder, Colorado, and many other cities and counties across the country.
The existence of an urban growth boundary typically increases the value of adjacent urban land. If the area used as the buffer is agricultural land, adopting a boundary stabilizes its value as agricultural land but it loses its value for development purposes. Without an urban growth boundary, the quality of farmland adjacent to urban areas loses agricultural value, as fragmentation occurs and farmers are not inclined to invest in farm property that is likely to soon be developed.
Urban growth boundaries have some pitfalls. If the land or development rights surrounding a city are purchased outright, the boundary is less likely to be challenged and is more stable. However, this process is extremely expensive. Other methods, such as downzoning, are less
expensive, but may pose challenges to privately property rights. An urban growth boundary must be both understood and acceptable to the population at large. Such serious restriction of land-use can be perceived as egregious government regulation. For this reason alone, an urban growth boundary may not be an appropriate tool for many communities.
Urban Service Areas
A second, less rigorous form of urban containment is the creation of an urban service area. A service area does not dictate where one can and cannot build, but rather where a municipality will and will not provide services. The idea is that there will be less inclination to develop an area where one must provide their own septic services, haul their own trash, etc.
While the urban service area is easier to implement and less expensive than an urban growth boundary, it is also less effective at containing growth. For some uses (rural residential and industrial), the lack of services may be an acceptable burden. Also, unlike the urban growth boundary, the creation of an urban service area does not have a stabilizing or increasing effect on land value.
On the plus side, an urban service area has financial benefits for a municipality. By limiting the expansion of a service network to a defined and reasonable area, the city ensures that it will not have to create expensive extensions. Planning becomes proactive within the urban service area, rather than reactive to development on the fringe.
With the creation of either an urban service area or an urban growth boundary, allowable density inside the urban area will
likely need to be increased to accommodate growth that would otherwise have occurred in outlying areas. If increased growth is not accepted within the boundary or area, it will leapfrog the containment structure, creating even more dispersed sprawl.
Urban containment can markedly change the development patterns of an area. Though it is difficult and expensive to implement and may reduce housing affordability, containment can ensure lasting definition of what is urban and what is rural. By increasing urban density and stabilizing the value of agricultural land, urban containment can also make long-term financial sense.
Farmers work the urban growth boundary near Portland, Oregon.
Photo Credit: www.oregonlive.com
With a growing population and limited resources, water is only going to become more of a concern both globally and locally.
Photo Credit: www.theutahhouse.org
53 Envision CaChE vallEy
Printed Resources• Nelson, Arthur and Casey Dawkins. Urban Containment in the
United States: History, Models, and Techniques for Regional and Metropolitan Growth Management. American Planning Association, PAS Report 520.
• Nelson, Arthur C. 1986. Using Land Markets to Evaluate Urban Containment Programs. Journal of the American Planning Association. Volume 52, Issue 2 (June): 156 – 171.
www.env i s i onc achev a l l ey. com
• Jaeger,WilliamK.andPlantinga,AndrewJ.2007.Howhaveland-useregulationsaffectedpropertyvaluesinOregon?OregonStateUniversity
• StateofOregon.Land-UsePlanningCoordinationCode(IncludingGrowthBoundaryCode)
• GeorgiaPartnershipforQualityGrowthToolkit.UrbanServiceArea
• SantaClaraCounty,California.UrbanServiceAreaPolicies
Printed Resources• McKinney, Matthew. 2003. Linking Growth and Land-Use to Water
Supply. Lincoln Institute of Land Policy.
www.env i s i onc achev a l l ey. com
• Anderson,KristinM.2004.AnInvestigationintoWhatPlanningDepartmentsandWaterAuthoritiesCanLearnfromElevenCommunities’WaterwiseLandscapingOrdinances.UniversityofOregon
• EnvironmentalProtectionAgency.2002.WaterEfficientLandscaping:PreventingPollutionandUsingResourcesWisely
• Kratsch,HeidiA.NativeandDroughtTolerantPlantsintheLandscape.UtahStateUniversity
• UtahStateUniv.CacheCountyHorticultureResourcePage
• ColoradoDepartmentofLocalAffairs,OfficeofSmartGrowth.WaterEfficientLandscapeDesign:ModelOrdinance
• MarinaCoastWaterDistrict,California.WaterWiseLandscapeIncentiveProgramDescription

This report is available online at
www.envisioncachevalley.com

Related Documents