113 &KDSWHU *OREDO $LG 7UHQGV %5,&6 5HSRUWV DQG 2(&' 5HSRUWV *OREDO $LG 7UHQGV $ *URZLQJ 'RQRU 3ULYDWH 6HFWRU 2ULHQWDWLRQ LQ D 0XOWLVWDNHKROGHU $LG $UFKLWHFWXUH %ULDQ 7RPOLQVRQ $LG:DWFK &DQDGD %5,&6 5HSRUWV 2(&' 5HSRUWV

Welcome message from author
This document is posted to help you gain knowledge. Please leave a comment to let me know what you think about it! Share it to your friends and learn new things together.
Transcript
113

115
Chapter 4 Global Aid Trends, BRICS Reports and OECD Reports
115 115 115
Meeting Aid Quantity Targets
1. Declining ODA in 2011 Of cial Development Assistance (ODA) provided by the 23 members of the OECD Development Assistance Committee (DAC), at US$133.5 billion, declined in 2011 for the rst time since 1997 by 2.7% when in ation and exchange rate changes are taken into account.
2. Two-thirds of DAC donors reduced their “Real ODA” in 2011 Reality of Aid’s calculation of 2011 “Real Aid” (ODA less debt cancellation, refugee and student costs in donor countries) was $115.4 billion (in 2010 dollars), down from $118.7 billion in 2010. The decline was across the board: more than two-thirds of donors (16 out of out of the 23 DAC donors), representing close to 80% of aid in 2010, reduced their “Real ODA” in 2011.
3. Donor promises abandoned Around the 2005 Gleneagles G8 Summit, donors made signi cant commitments to increase ODA and international assistance by 2010. Reality of Aid has calculated that if these commitments had been realized, 2011 “Real ODA” would have been US$156.9 billion, US$41.5 billion more than
the actual 2011 level. Among European Union members, Austria, France, Germany, Greece, Italy, Portugal and Spain were furthest from their commitments. Among other donors, Canada, Japan and Switzerland had signi cant gaps between their actual “Real Aid” in 2011 and aid projected by their 2005 commitment.
4. Citizens support meeting aid commitments despite economic crisis
According to the polls conducted by Eurobarometer, among 11 EU Member States that reduced aid in 2011, the majority of their citizens supported increasing their country’s aid budgets as promised, despite economic challenges. Political will, not an economic capacity to contribute, is a key driver for sustaining and growing aid ows. Even in the midst of down-sizing government programs, several donor countries such as the UK, Switzerland and Australia have explicitly committed to maintain increased aid ows and meet their 2005 targets.
Donor Aid Quality and Allocations
1. Foreign policy concerns continue to drive donor aid allocations Of new bilateral aid money disbursed in the past decade (i.e. money over and above the level of bilateral aid in 2000), Reality of Aid has calculated

Chapter 4 Global Aid Trends, BRICS Reports and OECD Reports
116116
that only 35.7%, or slightly more than a third, was even available for meeting MDG and other long-term development priorities for poor and marginalized people in developing countries. Between 2004 and 2010, on average close to 12% of bilateral aid was disbursed to Afghanistan, Pakistan and Iraq, based on donor foreign and security policy interests. Increased ODA allocations to debt cancellation, despite donor promises in 2002 that this be additional to their aid levels, as well as increased allocations to refugees and students expenditures in donor countries, took up signi cant new bilateral aid resources after 2000.
2. Very modest improvement in prioritizing MDGs A Reality of Aid proxy indicator for donor commitments to MDG-relevant sectors shows modest improvement from 2000 to 2010, but is still only slightly more than one third (37.7%) of “Real ODA” in 2010.
3. Increasing concern for growing debt burdens While most ODA is provided as non-repayable grants, ODA loans are still prevalent in Japanese, German and French aid. In 2010, developing countries paid back to donors US$11.9 billion in loan payments on outstanding ODA loans. Most highly indebted poor countries have bene ted from debt cancellation in the early part of the last decade. But debt campaigners are drawing attention to recent growth in private sector debt in these countries, which for some poor countries are now double the foreign debt payments owed by the pubic sector.
3. Growing importance of Development Finance Institutions as alternative to increasing ODA As donors abandon their ODA targets in the continuing wake of the 2008 nancial crisis, some
are focusing on non-ODA bilateral and multilateral nancial instruments. While largely untransparent,
these institutions claim to leverage additional private sector resources for development purposes with small amounts of ODA. Development
nance, delivered through International Finance Institutions grew dramatically between 2006 and 2010, reaching an estimated US$40 billion in 2010, with expectations that this nancing will grow to US$100 million by 2015.
4. ODA shifting towards private sector- oriented sectors and activities Most donors have also been placing greater emphasis on the private sector and “sustainable economic growth” in their aid policies in the past several years. Aid directed to sectors oriented to the private sector (economic services and production) increased from US$14.4 billion in 2005 to US$22.6 billion in 2010, or by 58.2%. Agriculture, sheries and forestry aid activities increased by 66.2% from US$4.5 billion to US$7.4 billion in the same period. Aid-for-trade activities are growing in scale and in importance in donor policies. A policy marker on aid reported to the DAC indicates that US$11.3 billion was directed to aid-for-trade in 2009.
5. How much ODA is available under the “ownership” of developing country partners?
Despite donor commitments and rhetoric for country ownership of the use of aid resources, donors have made only modest progress in improving country ownership and leadership in bilateral aid. As one indicator, Reality of Aid’s has made its own calculation of “Country Programmable Aid”, which in 2010 was only 40.7% of DAC “Real Bilateral Aid”, but an improvement from 32.5% in 2000. This is the total amount of aid that is even available, in theory, to be used by developing country partners
117
Chapter 4 Global Aid Trends, BRICS Reports and OECD Reports
117
for their priorities; as demonstrated in the 2011 pre-High Level Forum Survey by the DAC, much of this aid was still programmed in relation to donors’ priorities.
6. Gender equality programs continue to be invisible in DAC donor ODA At the 2011 High Level Forum in Busan, all stakeholders acknowledged the importance of gender equality and women’s empowerment for development outcomes. Nevertheless, donors continue to put only very minimal resources into activities where they consider gender equality to be the “principal objective”: US$3 billion in 2009/10 or a mere 3.2% of sector allocated aid.
7. Climate nance not additional to ODA If the US$22.9 billion for climate nance included by donors in their ODA were excluded, 2010 “Real ODA” would have been only US$95.8 billion, rather than US$118.7 billion, and the DAC ODA performance would have been 0.23% of GNI, rather than 0.30%. At the 2009 Copenhagen climate conference, donors committed to targets for climate nance additional to their targets for ODA.
Non-DAC Donors and Non-State Actors in Development Cooperation
1. Non-DAC Donors consolidate south-south cooperation
An estimate for 2008 of US$12.5 billion in total aid-like contributions through south-south cooperation by Non-DAC Donors has perhaps grown to US$15 billion by 2010, assuming a
growth in aid allocations by China, India and Saudi Arabia, the major donors. South-south cooperation in 2010 is therefore approximately 12.6% of “Real ODA” (US$118.7 billion) from DAC countries.
2. Civil society organizations have become major donors The DAC donors estimate that they channel US$18.5 billion of their ODA through civil society organizations (CSOs), which is 22.8% of their “Real Bilateral ODA”. This amount has more than doubled since 2007. The DAC members estimate that CSOs in donor countries raise at least an additional US$30.6 billion through private donations (other estimates are as high as US$56 billion). CSOs therefore provide close to US$50 billion in aid resources to developing country partners. More than two-thirds of these CSO-channeled resources go to priorities in social infrastructure and services and to humanitarian assistance.
3. The private sector increasingly recognized as an aid actor While the 2011 Busan High Level Forum recognized the “central role of the private sector” in development cooperation, this sector has long been substantially engaged in the aid regime. CSOs estimate that more than 50% of ODA, is spent on procuring goods and services for development projects, still largely from private sector suppliers in the donor country. The private sector is engaged through special donor Trust Funds and Challenge Funds set up at the World Bank and other International Financial Institutions, Development Finance Institutions noted above, and through the conversion of private wealth into large pools of capital for private foundations.

Chapter 4 Global Aid Trends, BRICS Reports and OECD Reports
118118
1. Abandoned ODA commitments ...
During the peak of the 2008 nancial crisis, Angel Gurría, Secretary-General for the Organization for Economic Co-operation and Development (OECD), and Eckhard Deutscher, Chair of the OECD’s Development Assistance Committee (DAC), issued a call to the world’s main aid donor countries to stand by their 2005 development pledges. In the face of the deepest economic crisis of the past forty years, accompanied by pressures of rising food and energy prices, the OECD urged donor countries to make an “Aid Pledge” that would con rm existing aid promises. The intent was to avert cuts in aid budgets, aware of the impact of such cuts on countries whose people were least able to accommodate compounding economic, food, energy and climate crises.1
Nevertheless, in 2012, donors’ 2005 aid pledges remain largely unmet. Most DAC donors have abandoned time-bound aid commitments, just three years before the 2015 MDG milestone year. European economies teeter on the brink of a deeper recession with no end in sight for the euro zone debt crisis; food prices may be again on the rise; while many parts of the world are experiencing more extreme climatic events, long predicted by scenarios of unchecked climate change. Meanwhile, DAC forward projections for aid are pointing to declines in core aid resources, particularly for Africa, for 2013 and 2014.2
This section considers a number of ongoing and emerging trends in Of cial Development Assistance (ODA).
ODA in 2011 declines
After increasing by more than 63% between 2000 and 2010, the DAC reported that ODA in 2011
fell by 2.7% in real terms, breaking 14 years of real growth in aid since 1997 (discounting years of unusually high debt relief). ODA in 2011 was US$133.5 billion, up from US$128.5 billion in 2010. However, when discounted for in ation and exchange rate changes, 2011 ODA in 2010 dollars declined to US$125.1 billion or by 2.7%.
Real ODA in 2011 declines
“Real Aid” in 2011 also declined by 2.8%, following steady increases since 2000. Reality of Aid calculates “Real Aid” as reported-ODA minus debt cancellation by donors, the cost of refugees in donor countries for their first year, and the cost of students from southern countries studying in donor countries. CSOs have strongly encouraged unconditional debt cancellation and donors in 2002 promised that such cancellation would be additional to ODA. Furthermore, while donors can write-off the full value of debt cancelled in the year that it is cancelled, in practice developing countries only reap a small benefit each year in foregone principal and interest payments.
In 2011 “Real Aid” (in 2010 dollars) was $115.4 billion, down from $118.7 billion in 2010 (Chart 1). The decline was across the board, with more than two-thirds of donors (16 out of out of 23 DAC donors), representing close to 80% of aid in 2010, reducing their “Real ODA” between 2010 and 2011. The largest declines, not unexpectedly, were reported by Greece (49.2%) and Spain (44.1%). In contrast, Sweden, Australia, Switzerland, New Zealand and Korea reported increases in “Real ODA”. Italy, while falling far short of its 2005 commitment to reach the UN target of 0.7% by 2015, also had a 24.5% increase in its “Real ODA” between 2010 and 2011 (but at 0.17% of Gross National Income (GNI) was only 23.8% above its 2004 level).

119
Chapter 4 Global Aid Trends, BRICS Reports and OECD Reports
119
Declining ODA to Gross National Income (GNI) Performance in 2011
With the exception of the United States, all donors have acknowledged the United Nations (UN) target for ODA of 0.07% of donors’ GNI, putting a mere 70 cents out of each $100 dollars in national income to reduce poverty in developing countries. Only ve donors have consistently achieved this target (Norway, Sweden, Denmark, the Netherlands and Luxembourg).
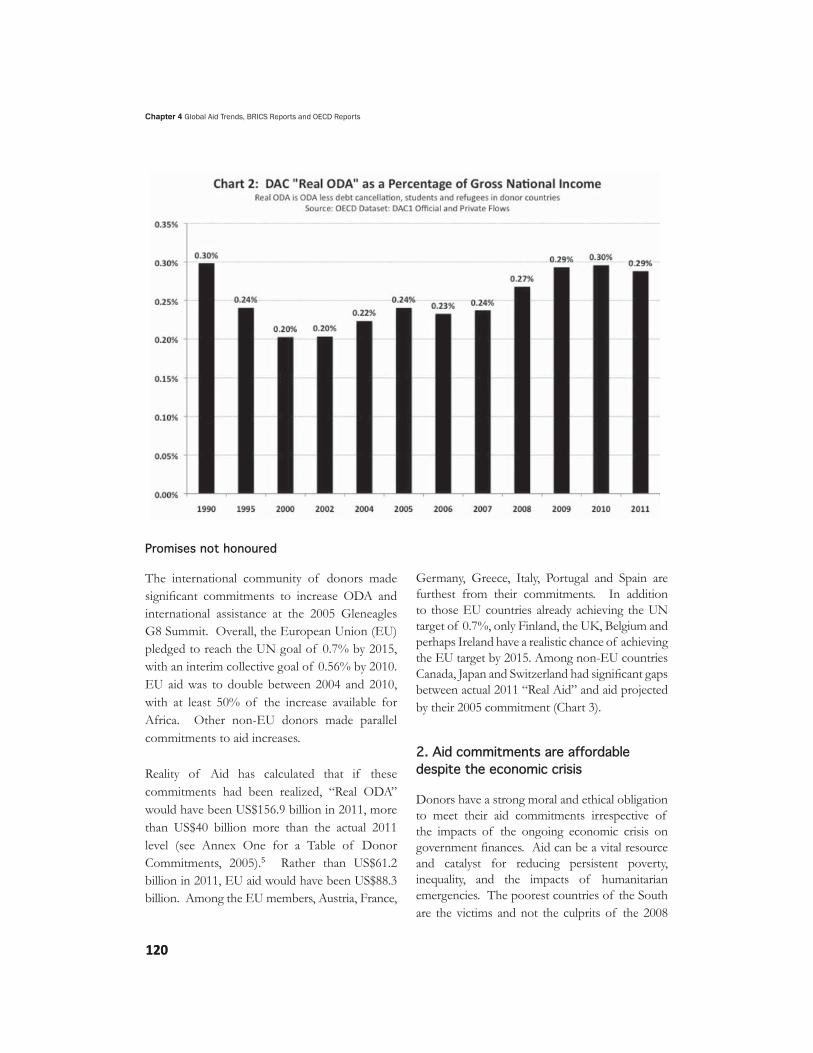
In 2011, the DAC donors contributed no more than 0.31% of their GNI to ODA, down from 0.32% in 2010. The performance of “Real ODA” demonstrated even less commitment, falling from 0.30% in 2010 to 0.29% in 2011. “Real ODA’s” performance has improved substantially since 2000, when donors provided only 0.20% of their GNI to ODA. But donors have failed to meet their commitment to Millennium Development
Goal (MDG) Eight to maximize ODA. With 1990 as the base year of comparison for all the MDGs, donors’ 2011 “Real ODA” performance remains below 1990’s performance of 0.30% (Chart 2).
If all donors had achieved the UN’s target of 0.7% in 2011, ODA would have been US$300.3 billion, resulting in an extra US$185 billion in resources for development cooperation (see Chart 1 above). To put this in context, $300 billion is equal to the total of private charitable giving in the United States alone in 2011. The current costs of maintaining the Afghan mission for the United States alone is slightly over $100 billion per year.3 The DAC has recently estimated the incremental cost of fully meeting the MDGs for poverty, education and health at $120 billion in additional resources4 – which would only require donors to collectively commit 0.55% of the GNI to ODA.
Chapter 4 Global Aid Trends, BRICS Reports and OECD Reports
120120
Promises not honoured
The international community of donors made signi cant commitments to increase ODA and international assistance at the 2005 Gleneagles G8 Summit. Overall, the European Union (EU) pledged to reach the UN goal of 0.7% by 2015, with an interim collective goal of 0.56% by 2010. EU aid was to double between 2004 and 2010, with at least 50% of the increase available for Africa. Other non-EU donors made parallel commitments to aid increases.
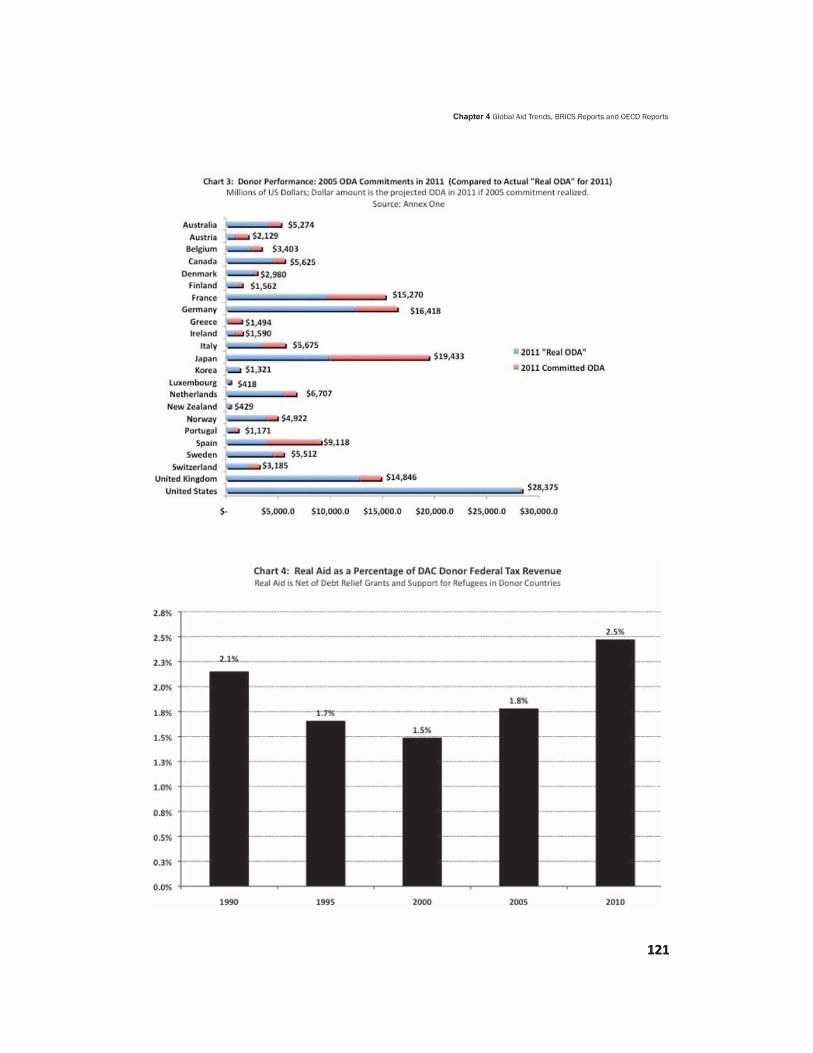
Reality of Aid has calculated that if these commitments had been realized, “Real ODA” would have been US$156.9 billion in 2011, more than US$40 billion more than the actual 2011 level (see Annex One for a Table of Donor Commitments, 2005).5 Rather than US$61.2 billion in 2011, EU aid would have been US$88.3 billion. Among the EU members, Austria, France,
Germany, Greece, Italy, Portugal and Spain are furthest from their commitments. In addition to those EU countries already achieving the UN target of 0.7%, only Finland, the UK, Belgium and perhaps Ireland have a realistic chance of achieving the EU target by 2015. Among non-EU countries Canada, Japan and Switzerland had signi cant gaps between actual 2011 “Real Aid” and aid projected by their 2005 commitment (Chart 3).
2. Aid commitments are affordable despite the economic crisis
Donors have a strong moral and ethical obligation to meet their aid commitments irrespective of the impacts of the ongoing economic crisis on government nances. Aid can be a vital resource and catalyst for reducing persistent poverty, inequality, and the impacts of humanitarian emergencies. The poorest countries of the South are the victims and not the culprits of the 2008
121
Chapter 4 Global Aid Trends, BRICS Reports and OECD Reports
121

Chapter 4 Global Aid Trends, BRICS Reports and OECD Reports
122122
nancial crisis. In 2008 and 2009, lower trade and investment volumes, falling remittances from migrant populations living in donor countries, and volatile commodity prices, affected many countries in the South. Those living in extreme poverty are also the populations most vulnerable to severe climatic events. On the threshold of 2015, this is not the moment for most donor countries to abandon a decade of progress in building aid volumes.
With falling donor government tax revenue, aid was 2.5% of government revenue in 2010, its highest level in the decade, but only marginally above the level of 2.1% in 1990 (Chart 4). Aid remains eminently affordable. There is no apparent and necessary linkage between reducing government de cits by reducing ODA. AidWatch Europe likens cutting aid to reduce government de cits to cutting hair to reduce body weight.6 Nor is there broad public support for such cuts. According to Eurobarometer, among 11 EU Member States that reduced aid in 2011, the majority of citizens supported increasing aid budgets as promised despite economic challenges.7 In Sweden, with ODA at 1% of its GNI, 60% of the population support Sweden maintaining or increasing its level of ODA, a level of support in that has been steady since 2005.
In both the US and the UK more than 80% of the population consistently say that developed countries have a moral obligation to work to reduce poverty in the poorest countries.8 A majority of Canadians believe that their country has a human rights obligation to reduce global poverty and compared to US and UK citizens, Canadians were more optimistic about the impact of poverty reduction measures on human rights obligations.9 Consequently political will, not an economic capacity to contribute, is a key driver for sustaining and growing aid ows, even in the midst of down-sizing government programs. Several donor countries such as the UK and Australia
have explicitly committed to maintain increased aid ows and meet their 2005 targets.
AidWatch Europe has pointed to positive commitments to aid increases in a number of EU Member States as evidence that, “EU Governments who claim that the challenges they face leave them no choice but to ignore their aid promises are absolving themselves of their responsibility to the world’s poorest people and exposing themselves as fair weather development partners”.10 At the same time, however, with tightening economic circumstances, increasing numbers of political constituencies in donor countries continue to question the impact and effectiveness of aid in delivering outcomes from increased aid resources.
on reducing their aid further in 2012, with
Aid at Euro e, Aid e an Invest ore in Global Develo ent, Re ort , on ord, a e , a essible at aidwat on ordeuro e or

123
Chapter 4 Global Aid Trends, BRICS Reports and OECD Reports
123
1. Foreign policy concerns continue to drive donor aid allocations, with only modest new resources for human development goals
Allocating new aid resources since 2000 Bilateral aid increased by more than 150% between 2000 and 2010, potentially bringing signi cant amounts of new aid resources to meet donor commitments to reduce poverty and achieve the MDGs. By 2010 donor governments had cumulatively disbursed US$314 billion additional bilateral aid dollars above what they had allocated in 2000 (Box 2). But how were these new resources allocated?
Donors had direct decision-making on the allocation of bilateral aid resources. Unfortunately,
of the additional resources of US$314 billion, only slightly more than a third (35.7%) were even available for meeting MDG and other long-term development priorities for poor and marginalized people in developing countries.
Direct foreign policy interests, closely related to the post-2001 security agenda, played a major role in determining the cumulative allocation of US$54 billion of new bilateral aid (above what was allocated in 2000) to Afghanistan, Pakistan and Iraq in this past decade. Total ODA to these three countries increased markedly after 2001, peaking at 13.5% of total “Real ODA”(excluding debt cancellation) and 17.2% of DAC “Real Bilateral ODA” in 2005. In 2010 these shares have declined to some extent to 8.6% and 10% respectively of “Real ODA” and “Real Bilateral ODA” (Chart 5). Nevertheless it is clear that strategic foreign policy considerations continue to drive DAC aid allocation decisions.
Chapter 4 Global Aid Trends, BRICS Reports and OECD Reports
124124
As a result of effective civil society campaigns on cancelling unfair and unpayable debt in the late 1990s and early 2000s, donors dramatically increased their commitment to debt cancellation for the poorest highly indebted countries. But this debt cancellation was not additional to ODA, as committed in the 2002 UN Monterrey Financing for Development Conference, but included by donors as bilateral aid. Consequently, US$69 billion of the new bilateral aid resources between 2000 and 2010 were allocated to debt cancellation. Debt cancellation is clearly a bene t to the treasury of the highly indebted low-income countries in the longer term. But in the short term very little bene t is realized on cancellation of loans that had very long amortization periods.
Beyond foreign policy considerations, increased DAC bilateral aid allocations for refugees in donor countries and students studying in donor countries took up US$18 billion in new bilateral money. Finally, additional allocations to humanitarian emergencies (by de nition not open to long term development priorities) and to donor administrative costs amounted to an additional US$61 billion over what was spent in 2000.
Aid alone is not the answer to complex socio-economic issues of poverty and inequality. But in light of these allocations of new aid money over this past decade and dramatic nominal increases in ODA, it is not surprising that major nancing gaps continued to plague efforts by the world community to achieve the MDGs in the poorest countries in Africa and elsewhere.
Achieving the MDGs
In July 2012, just three years before the deadline of 2015, the United Nations reported broad progress in achieving the MDGs.11 The UN’s annual report on the Millennium Development
Goals claims that the rst goal to halve the rate of poverty (proportion of people living on less than $1.25 per day, in comparison with the proportion in 1990) may already have been achieved in 2010, thanks in large part to signi cant reductions in poverty in China. When China is excluded, the decline in absolute poverty is still positive, but less dramatic, from 41% of the population in developing countries in 1990 to 28% in 2008. The report also highlights gains towards gender parity in primary education, a decline in levels of child mortality, a downward trend of tuberculosis and global malaria deaths, and an expansion of treatment for HIV.
These are important gains against debilitating diseases and in preventable deaths. Yet more than 1.4 billion people, according to the UN, will still be living in absolute poverty in 2015. Many people remain highly vulnerable to economic downturns with at least 2.6 billion people, equivalent to almost half the population of developing countries, living on less than $2.00 a day (in terms of Purchasing Power Parity). Nearly half the population in developing countries still lacks access to improved sanitation facilities. Under-nourished populations remain a critical issue, particularly in Sub-Saharan Africa, which is a region that was hit hard by the impact of the 2008 economic and nancial crisis.
Where are the poor?
Geo-economic shifts in the past twenty years have changed the patterns of persistent poverty and accentuated inequalities within many countries, with still large numbers of people living in poverty. As more countries move from “low income” status to “lower middle income” status due to strong economic growth, Ravi Kanbur and Andy Sumner have calculated that three quarters of the world’s poor now live in

125
Chapter 4 Global Aid Trends, BRICS Reports and OECD Reports
125
middle-income countries. They argue for a focus in development cooperation strategies on poor people rather than poor countries.12 This may imply different post-2015 targets and instruments for poverty reduction. They suggest that poor people in middle income countries will bene t from improved income distribution, better access to social services, productive and decent jobs, and the ability to exercise human rights.
As Jonathan Glennie notes, another way of looking at these same trends in poverty, in the context of the role of ODA, follows from his observation that 85% of poor people have for many years always lived in the same 10 countries (albeit now some of these countries have achieved middle-income status). Aid has always been a marginal nancial resource for most of these countries’ GNI: “aid to low-aid countries such as Chile, China and India doesn’t ll a gaping hole in the public nances, as it did in Korea and Botswana, but it has supported particular projects or initiatives within or outside government to catalyze larger change – the development of a civil society, crucial in countries where the problem is wealth inequality rather than an absolute lack of capital – and provided targeted support to the poorest.”13Three more years, but modest donor aid commitments to the MDGs
How dedicated have donors been in directing their aid towards sectors that would impact the achievement of the MDGs? While the UN has been following 60 indicators related to progress in results for the eight MDGs, there are no comparable benchmarks for donor contributions to their achievement. Reality of Aid in its global reports has created and followed a proxy indicator to track donor support for the MDGs based on key sectors for MDGs that donors report to the DAC.14
The Reality of Aid MDG Proxy (Chart 6 and 7) demonstrates modest improvement in focus on the MDG-relevant sectors for donor bilateral and multilateral ODA since 2000. Focus on these proxy sectors has steadily increased to 37.7% in 2010 as a proportion of total DAC “Real ODA” commitments (Chart 6). While the increase since 2000 is notable, the level of support for the proxy MDG sectors has leveled off since 2006 at slightly more than a third of “Real ODA”. The trend for Sub-Saharan Africa is somewhat stronger (Chart 7). These proxy sectors make up more than 42% of DAC “Real ODA” commitments to this sub-region in 2010, up from 36% in 2000. In the context of the international community’s Millennium Declaration commitment to “spare no effort” to reduce poverty and achieve the MDGs, it should be no surprise that MDGs remain elusive given this seemingly very modest improvements in donor aid commitments to MDG-relevant sectors.
2. International Humanitarian Assistance reaches highest level in 2010
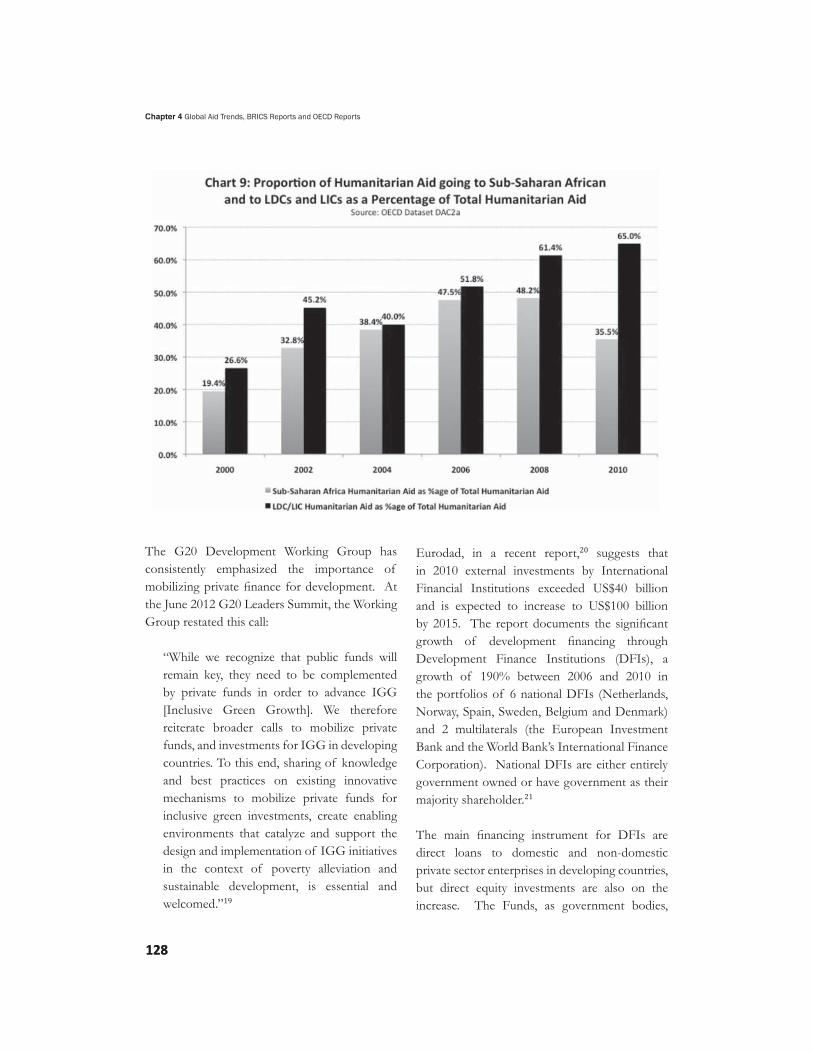
In 2010, total International Humanitarian Assistance (IHA) reached a peak of US$11.5 billion, due to a robust response by the international community to the devastation of the Haiti earthquake and oods in Pakistan. However, disbursements to humanitarian assistance have remained relatively constant at about 10% of “Real ODA” since its peak as a in 2004 and 2005 (12.3%) as a result of the Tsunami and Kashmir earthquake in those years (Chart 8).
The Global Humanitarian Assistance Report 2012 (GHA)15 points to a small decline in IHA in 2011, which corresponded to a decline in the total population requiring assistance. In 2010, the top three recipients of IHA – Haiti (25%), Pakistan (17%) and Sudan (7%) – accounted for about 50% of all IHA disbursements. On the other hand, the Report also drew attention to

Chapter 4 Global Aid Trends, BRICS Reports and OECD Reports
126126

127
Chapter 4 Global Aid Trends, BRICS Reports and OECD Reports
127
an alarming nancing gap for all UN emergency appeals in 2011, reaching the widest level, not seen in 10 years (US$3.4 billion or 38% of the consolidated appeal).16 The GHA reported that privately raised funding for humanitarian emergencies grew to US$5.8 billion in 2010 (see Section E below and the growing share of NGOs in humanitarian assistance disbursements). It also noted that between 2006 and 2010, US$1.38 billion in IHA was delivered by defense agencies from 13 donor countries, of which the United States accounted for 80% (with 21% directed to Afghanistan and 33% to Haiti).17 During the past decade IHA has been increasingly concentrated in least developed and low-income countries (65% in 2010), with Sub-Saharan Africa also taking an increasing proportion up to 2009 (46.8%). Distributions in 2010 were affected by Haiti and Pakistan emergencies. Not surprisingly, the GHA Report also noted that con ict-affected states received the over-whelming majority of
IHA between 2001 and 2010, averaging between 64% and 83%.18 (Chart 9)
3. Growing importance of Development Finance Institutions and leveraging private
ODA ows through and to the private sector have been increasing for several DAC donors (see below the sector distribution of ODA (B4) and the section E2 on private sector actors). The private sector is also engaged in ODA through procurement contracts for goods and services mainly in donor countries. But as donor commitments to ODA growth are abandoned in the continuing wake of the 2008 nancial crisis (see Section A), donors are increasingly focusing on non-ODA bilateral and multilateral nancial instruments that claim to leverage additional private sector resources for development purposes.
Chapter 4 Global Aid Trends, BRICS Reports and OECD Reports
128128
The G20 Development Working Group has consistently emphasized the importance of mobilizing private nance for development. At the June 2012 G20 Leaders Summit, the Working Group restated this call:
“While we recognize that public funds will remain key, they need to be complemented by private funds in order to advance IGG [Inclusive Green Growth]. We therefore reiterate broader calls to mobilize private funds, and investments for IGG in developing countries. To this end, sharing of knowledge and best practices on existing innovative mechanisms to mobilize private funds for inclusive green investments, create enabling environments that catalyze and support the design and implementation of IGG initiatives in the context of poverty alleviation and sustainable development, is essential and welcomed.”19
Eurodad, in a recent report,20 suggests that in 2010 external investments by International Financial Institutions exceeded US$40 billion and is expected to increase to US$100 billion by 2015. The report documents the signi cant growth of development nancing through Development Finance Institutions (DFIs), a growth of 190% between 2006 and 2010 in the portfolios of 6 national DFIs (Netherlands, Norway, Spain, Sweden, Belgium and Denmark) and 2 multilaterals (the European Investment Bank and the World Bank’s International Finance Corporation). National DFIs are either entirely government owned or have government as their majority shareholder.21 The main nancing instrument for DFIs are direct loans to domestic and non-domestic private sector enterprises in developing countries, but direct equity investments are also on the increase. The Funds, as government bodies,

129
Chapter 4 Global Aid Trends, BRICS Reports and OECD Reports
129
also provide sovereign guarantees and preferred creditor status to protect investments. The vast majority of these investments ow to middle-income countries that already have developed
nancing sectors. But DFIs have also expanded into low-income countries. The International Finance Corporation (IFC) has increased its portfolio in IDA low-income countries four-fold in the past decade.22 Only a small portion of this public nance to the private sector through DFIs is included as ODA expenditures by the donors (about 2% in the case of the DFIs for the Netherlands, Norway and Sweden). Most public nancing through DFIs fails to meet the DAC ODA criteria for concessional
nance, although it is important to note that several donors are advocating at the DAC for an expansion of the criteria for ODA to include new forms of development nance. Additional ODA also goes directly to the private sector through direct procurement of goods and services (most often in the donor country) and public private partnerships (PPPs) (see section E2 below).
DFI investments have focused largely on infrastructure and extractive sectors, with a very signi cant growth of the nancial sector since the 2008 global economic and nancial crisis. Both the Eurodad report and a report by the Breton Woods Project23 raise questions about both the claim that such large public investments create additionality – would the investment proceed without the DFI’s role – and about the measurement of development impact for poor and vulnerable populations.
Measuring development outcomes for DFI investment is dif cult, in part due to the nature of private sector investment and the lack of transparency and evaluation of these investments against development criteria. But according to a 2011 evaluation of the IFC’s portfolio by the
World Bank’s Independent Evaluation Group, “fewer than half the projects reviewed included evidence of poverty and distributional aspects in project objectives, targeting of interventions, characteristics of intended bene ciaries or tracking of impacts.” Only 3% of projects explicitly analyzed the project’s effects on women’s assets, capacities and decision-making.24The stated purpose for DFI investments is to strengthen the private sector in developing countries with nance that would not otherwise be available to meet development goals, create decent jobs and tax revenue for government. But according to Eurodad, their research demonstrated that most investments by the European Investment Bank and the IFC still go to rms based in donor countries (63% of IFC’s investments). For low-income countries, IFC investments are mainly with companies based in middle-income or OECD countries.254. ODA loans are becoming a growing
The vast majority of DAC donors provide ODA as grants to recipients. However, ODA in the form of loans remains a signi cant and increasing modality for aid delivery for four major donors (France, Germany, Japan and Korea). Such loans are often directed to middle-income countries in support of donor’s foreign economic interests in these countries. In 2010 ODA loans were US$19.9 billion or 14.1% of gross ODA disbursements for that year. This amount of ODA loans has grown (in constant 2010$) over the decade, from US$11.8 billion in 2000 and US$12.9 billion in 2005. These four donors account for more than 90% of all bilateral aid loans in 2010. For Japan, US$10.4 billion in loans amounts to more than 55% of gross ODA disbursements for Japan in that year.
Chapter 4 Global Aid Trends, BRICS Reports and OECD Reports
130130
Looking ahead, even more ODA is expected to be allocated through loans. For example, the European Commission has recently proposed to shift 19 upper middle-income recipient countries to non-grant cooperation instruments. These countries include Colombia, India, Peru and Indonesia, where still a large proportion of the world’s poorest people live. As the EU CSO Platform, Concord, notes, excluding these countries from grants by using the level of growth as the sole criteria, may take the focus away from the needs of millions of the poorest people. These populations have bene ted little from a highly unequal distribution of growth in middle-income countries.26A decade of concerted debt cancellation for heavily indebted poor countries (HIPC) has had meaningful impact. For the 32 HIPC countries that have quali ed for International Monetary Fund (IMF) and World Bank debt relief, payments on foreign debt has fallen from 20% of government revenue in 1998 to less than 5% in 2010. While successful in nancing terms, the conditions attached to debt cancellation also led to externally directed privatization of many public services, with reduced access for poor and vulnerable populations. In the context of the ongoing nancial crisis in the North, the sustainability of these reduced debt loads are being questioned by CSO debt campaigners.27Despite these measures, many indebted countries were never eligible for the HIPC Initiative. According to a recent report by the UK Jubilee Campaign, several middle-income countries, such as El Salvador, the Philippines and Sri Lanka, continue to spend a quarter of their government revenue on debt servicing. This report predicts that many low and middle-income countries could see a return of the debt trap, as they remain vulnerable to the impacts of the continued economic crisis on their export earnings and
income from migrant workers. They are increasingly dependent on foreign nancing, from both the IMF/World Bank (accounting for 45% of new loans over the past ve years) and from the private sector.28The Jubilee report points out that debt owed by the private sector in low-income countries (which collect these statistics) has increased dramatically from 4% of export earnings in 2000 to 10% in 2010, now double the foreign debt payments owed by the public sector. In 2007, for example, it is reported that privately owed debt made up 75% of Zambia’s external debt, 50% of Ghana’s and 40% of Uganda’s. In total, private external debt was 20% or more of GDP in Zambia, Cameroon and Ghana.29DAC statistics on ODA loans LAO point to a continued heavy burden for indebted aid recipients of interest and principal payments from previous ODA loans. In 2010, developing countries reimbursed donors US$11.9 billion in loan payments on outstanding ODA loans (OECD Dataset DAC2a). These payments came mainly from Peru, China, Indonesia, the Philippines, India and Egypt.
A portion of DAC donors’ multilateral grants (US$8.1 billion in 2010) are directed to the World Bank’s International Development Association (IDA), the Bank’s concessional lending window for the poorest developing countries. In turn, IDA is another source of loans for developing countries governments, with these loans amounting to US$12.1 billion in 2010. The 16th IDA replenishment, covering the period July 2011 to June 2014, grew by an estimated 12%, with total pledges and income increasing to US$49.3 billion from US$41.6 billion in the previous round. Most of this increase, however, came from the Bank’s own resources, while donor levels of pledges at US$26.4 billion remained at.

131
Chapter 4 Global Aid Trends, BRICS Reports and OECD Reports
131
CSOs continue to raise serious concerns about conditionality attached to IDA loans affecting developing country ownership of their policy space for nancing their own development options. These concerns also relate to the policy orientation of IDA indicators of expected results, such as the “reduction of regulatory obstacles to private sector development.”305. Sector allocation of DAC bilateral ODA shows modest shift towards private sector- oriented sectors
investments
DAC bilateral aid directed toward the social sectors declined slightly as a share of sector-allocated aid between 2005 and 2010, but these sectors still received close to 50% of bilateral aid in 2010
(Chart 10). Aid directed to economic services and to production, which would tend to be oriented towards the private sector, increased from 32.2% to 34.2% as a share of sector-allocated aid.
However, the value of this aid (in constant 2010 dollars) registered sharper increases for private sector-oriented activities between 2005 and 2010 than comparable increases for the social sectors. Aid directed to the social sectors increased from US$33.8 billion to US$47.8 billion (in constant 2010 dollars) or by 29.5%, while aid directed to sectors oriented to the private sector (excluding agriculture) increased from US$14.4 billion to US$22.6 billion or by 58.2%. Agriculture,
sheries and forestry aid activities increased by 66.2% from US$4.5 billion to US$7.4 billion.
Bilateral aid for basic health and reproductive services amounted to US$10.9 billion in 2010, but this amount is only 27.4% greater than the

Chapter 4 Global Aid Trends, BRICS Reports and OECD Reports
132132
value of this aid in 2005. On the other hand, basic education at a modest US$3.6 billion in 2010 was lower than 2008, but signi cantly above 2005 levels by US$2.5 billion.
Aid-for-trade growing in scale and in donor policies
The Busan Partnership for Effective Development Cooperation (BPd) called for strengthening diverse sources of development nance for development, including ramping up “aid-for-trade”. With the failure of the Doha Round of trade negotiations, which were intended to bring a development focus to trade liberalization, the WTO alongside donors has increasingly pushed more aid resources to support trade objectives. A WTO Task Team on Aid for Trade has established several core objectives for these initiatives:
• Enable developing countries, particularly the least-developed countries (LDCs), to use trade more effectively to promote growth, development and poverty reduction and to achieve their development objectives, including the MDGs;
• Help developing countries, particularly LDCs, to build supply-side capacity and trade-related infrastructure in order to facilitate their access to markets and to export more;
• Help facilitate, implement and adjust to trade reform and liberalisation;
• Assist regional integration;• Assist countries’ smooth integration into the
world trading system; and• Assist in the implementation of trade
agreements.31Trade, as part of country-owned economic policies, can indeed contribute to development goals and improve the lives of people. In aid-for-trade programs, the assumption is made
that increased trade liberalization necessarily contributes to growth and therefore to poverty reduction. However, in doing so, donors often ignore evidence of signi cant negative impacts of externally imposed trade regimes on the conditions of rural populations, on women’s rights and empowerment, or decent work.
In the words of the South Centre, LDCs in particular face structural disadvantages in a WTO liberalized aid regime: unlike current donor prescriptions, these countries “must be allowed and assisted to grow their own food and expand manufacturing, including through processing and manufacturing based on natural resources.”32 BetterAid has also called for aid-for-trade to follow aid and development effectiveness principles, that is, to “respect democratic ownership, human rights, policy space and freedom for developing countries to choose their own trade strategies in accordance with local needs and priorities and sustainable development”.33A review by the WTO and OECD reveals that more than half the donors surveyed had changed and enhanced their aid-for-trade strategies since 2008, for many this was the result of placing greater emphasis on the private sector and growth in their aid policies. This same study suggests that ODA directed to aid-for-trade amounted to US$40.1 billion in 2009, a 60% increase on the base period of 2002-2005.34 However, DAC aid-for-trade gures must be disaggregated to enable a more accurate picture of aid-for-trade investments. The DAC includes for example all aid investments in economic infrastructure (including banking and services for micro- nance) and in production (including all investments in agriculture). The DAC
gure of US$40 billion is consequently a gross exaggeration as many of these aid investments target producers in the informal sector (micro credit) and small-scale producers (agriculture) producing for the local markets.

133
Chapter 4 Global Aid Trends, BRICS Reports and OECD Reports
133
While much more modest, donors report to the DAC Creditor Reporting System (CRS) their aid for “trade policy and regulation”. These amounts have also grown signi cantly from US$462.1 million in 2005 to US$861.5 million in 2010 (a growth in value of 86% in constant 2010 dollars).
It is not possible to completely disaggregate other trade-related investments in economic infrastructure and production in the DAC CRS. However, the WTO/OECD study noted above does report a donor “marker” for aid-for-trade. Of US$18.2 billion in 2009 for aid investments for building productive capacity (all of which is included in the US$40 billion gure), donors marked US$1.9 billion (10.4%) as investments where aid-for-trade was a “principal objective”. A further US$2.9 billion (15.9%) in investments had aid-for-trade as a more unde ned “signi cant objective”. Using this marker as an indicator suggests that in 2009 aid-for-trade accounted for a total of US$11.3 billion in ODA for 2009,35 still not an insigni cant amount and one that is growing in relation to donor trade interests in developing countries.
Agriculture and greater emphasis on the private sector
The continuing global economic crisis in Europe, alongside extreme weather patterns in food producing regions of the world, have brought renewed fears of food price spikes in 2012. As pointed out in the 2010 Reality of Aid Report three-quarters of the world’s hungry are the rural poor, and many of these people are highly vulnerable to climate change impacts on their food production.
At US$8.1 billion in 2010, the value of bilateral and multilateral aid commitments to agriculture has increased by 111% since 2000 and 82% since
2005. Between 2009 and 2010, aid for agriculture increased by 3.2%, perhaps re ecting G8 leaders’ commitments to stress agriculture and food security in their aid strategies at the Italian 2009 Summit, where they launched a three-year US$22 billion L’Aquila Food Security Initiative. Total commitments to agriculture and food security amounted to US$16.8 billion in 2010, an increase in value (in 2010 dollars) of 80% from 2000 and 55% from 2005.
The L’Aquila Initiative ends in December 2012. By May 2012, the fund had attracted only 44% of donor commitments that were to be targeted to meet country generated plans. Perhaps as a result of this shortfall, at the 2012 G8 Summit, the United States launched the next initiative, but this time with much less donor funding commitments expected. Rather the “New Alliance to Increase Food and Nutrition Security”, will rely on partnerships with the private sector to focus their non-aid resources on strengthening smallholder producers, and particularly women producers.
President Obama announced the participation of 45 companies in the Alliance, including agribusiness companies such as Cargill, DuPont and Monsanto, with a total pledged commitment of US$3 billion.36 A coalition of African civil society organizations, supporting smallholder producers, questioned the evidence that the private sector can deliver for small-scale producers. Nor did they see the US initiative as an “Alliance”, given that women small-scale producers, youth, and pastoralists were never consulted in the drafting of the plan and African governments were simply asked by the G8 to “rubber-stamp” the initiative.37 In these global initiatives, seldom is there any analysis or commitment to addressing the kinds of return that host governments and communities might want to insist upon to ensure long-term sustainable outcomes.
Chapter 4 Global Aid Trends, BRICS Reports and OECD Reports
134134
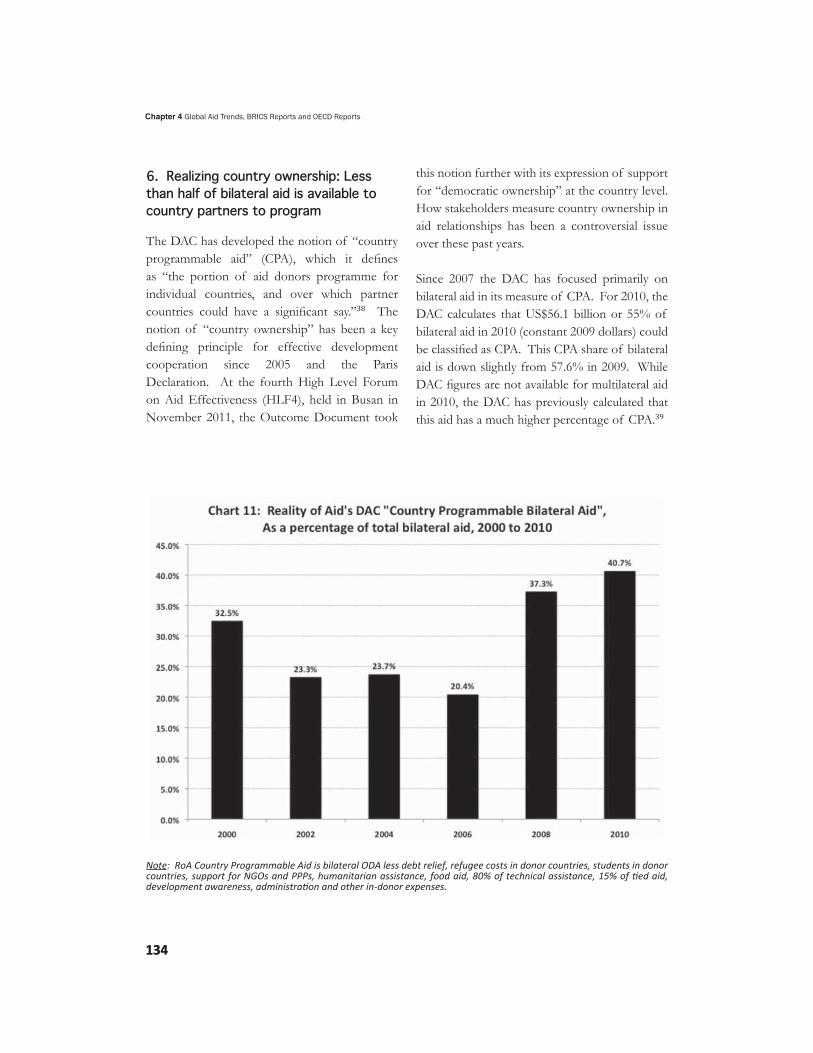
6. Realizing country ownership: Less than half of bilateral aid is available to country partners to program
The DAC has developed the notion of “country programmable aid” (CPA), which it de nes as “the portion of aid donors programme for individual countries, and over which partner countries could have a signi cant say.”38 The notion of “country ownership” has been a key de ning principle for effective development cooperation since 2005 and the Paris Declaration. At the fourth High Level Forum on Aid Effectiveness (HLF4), held in Busan in November 2011, the Outcome Document took
this notion further with its expression of support for “democratic ownership” at the country level. How stakeholders measure country ownership in aid relationships has been a controversial issue over these past years.
Since 2007 the DAC has focused primarily on bilateral aid in its measure of CPA. For 2010, the DAC calculates that US$56.1 billion or 55% of bilateral aid in 2010 (constant 2009 dollars) could be classi ed as CPA. This CPA share of bilateral aid is down slightly from 57.6% in 2009. While DAC gures are not available for multilateral aid in 2010, the DAC has previously calculated that this aid has a much higher percentage of CPA.39
Note RoA ountr Pro ra able Aid is bilateral ODA less debt relie , re u ee osts in donor ountries, students in donor ountries, su ort or NGOs and PPPs, u anitarian assistan e, ood aid, o te ni al assistan e, o ed aid,
develo ent awareness, ad inistra on and ot er in donor e enses

135
Chapter 4 Global Aid Trends, BRICS Reports and OECD Reports
135
Reality of Aid (RoA) considers that the DAC systematically over-estimates country programmable aid, particularly with respect to free-standing technical assistance. Studies repeatedly demonstrate that technical assistance remains tied to donor country consultants and donor personnel. Reality of Aid therefore does not include 80% of technical assistance in its calculations of CPA. As a result, Reality of Aid’s calculation of CPA in 2010 was only 40.7% of DAC bilateral aid (Chart 11). While much less than the DAC estimate of 55% for that year, Reality of Aid’s calculations still show that CPA has increased substantially since the mid-2000s, due in large part to less debt cancellation in the later part of the decade.
7. ODA directed to gender equality shows modest improvement
It is widely acknowledged that the economic empowerment of women in development, in the context of women’s equality and access to rights, is essential for the achievement of development goals for health, education, environmental sustainability, economic and human development.40 Women’s economic empowerment is about rights and equitable societies as well as a holistic approach to achieving development outcomes that are fully inclusive of women. In Busan at HLF4 gender equality was highlighted in the Outcome Document (BPd):
“We must accelerate our efforts to achieve gender equality and the empowerment of women through development programmes grounded in country priorities, recognizing that gender equality and women’s empowerment are critical to achieving development results. Reducing gender inequality is both an end in its own right and a prerequisite for sustainable and inclusive growth.” [§20]
While welcoming this progress in Busan, women’s organizations and CSOs in BetterAid were concerned that donors and governments could go no further to give concrete commitments to strengthening the central role of women’s empowerment, grounded in a rights-based approach to implementing ODA programs.41DAC statistics on donor commitment to gender programming in ODA re ects this tension between words and action. The DAC has been tracking gender-oriented programming through a gender marker that identi es activities where gender is either a principal objective or a signi cant objective. In total, ODA identi ed with this marker increased signi cantly from US$15 billion in 2007/08 to US$24.9 billion in 2009/10, representing a 66% increase. However, activities marked as “principal objective” only increased from US$2.1 billion to US$3 billion. In 2009/10, these latter activities were a mere 3.2% of sector allocated aid for these years.42 Activities that were marked “signi cant objective” were 23.1% of sector allocated aid, but this indicator is subject to differing interpretations among donors, and therefore less reliable.
In terms of the US$24.9 billion marked as gender equality, a very small and declining percentage (from 14% in 2007/08 to 12% in 2009/10) is going to projects with gender equality as a primary focus. Even more worrying, the DAC tracks funds dedicated for women’s equality organizations. These resources declined from US$515 million in 2007/08 to only US$331 million in 2009/10, a decline of just under 36%. The Association for Women’s Rights in Development (AWID) has conducted their own survey of women’s organizations. Thirty-
ve percent (35%) of responding organizations reported shortfalls in meeting their budgets in 2010 and of these 15% experienced catastrophic shortfalls (of 80% – 100% shortfalls).43

Chapter 4 Global Aid Trends, BRICS Reports and OECD Reports
136136
In a review of nancing for gender equality and women’s rights, AWID does point to a number of positive initiatives. At the UN they saw a continuance of the UN Trust Fund to End Violence Against Women and the creation of the UN Fund for Gender Equality, both within UN Women, as positive. However, at the same time, UN Women received less than half of the Secretary General’s suggested starting budget of US$500 million. At the country level, Sweden’s Global Gender Equality Program increased 3.5 times from 2008 to 2011. The Dutch government re-launched its gender equality funding window as Funding Leadership Opportunities for Women with an investment of 70 million between 2012 and 2015.44AWID’s commentary also noted increased involvement of private sector-based foundations, including Nike and Nova Foundation (Girl Effect), Exxon Mobil (Women’s Economic Opportunities Initiative) and Goldman Sachs (10,000 Women Initiative for business and management skills). On this trend, Lydia Duran, Executive Director of AWID, has commented that, “it seems apparent that in some cases corporations are using this heightened interest in women and girls as part of their broader marketing efforts, without meaningfully transforming harmful corporate practices for women in their communities (violation of labour rights, land grabbing etc.).”45AWID is calling for a minimum investment of 20% of ODA in gender equality and women’s rights programming by donors. They propose a three dimensional approach 1) gender equality as a sectoral thematic area; 2) mainstreaming gender equality; and 3) supporting, promoting, and ensuring women’s participation in government,
women’s rights and women’s organizations in all aspect of development cooperation.466. Allocations of ODA to regions and income groups: Donors fail to meet their 2005 target for Africa
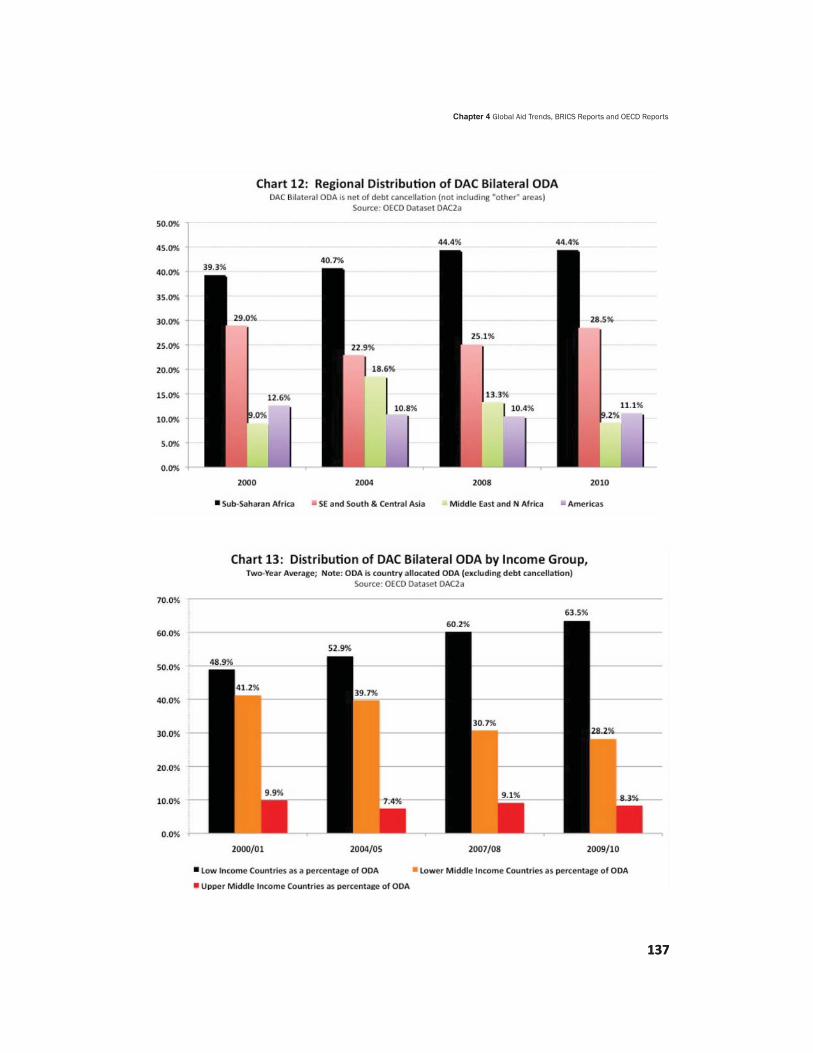
At 2005 Gleneagles G8 Summit donors committed to increase aid to Sub-Saharan Africa by at least US$25 billion by 2010. They were short by more than US$15 billion (or 60%) of this commitment. According to the 2012 G8 Accountability Report, bilateral ODA to Sub-Saharan Africa increased from US$19.4 billion to US$24.9 billion (in constant 2004 dollars), an increase of only US$5.5 billion.47Overall trends in the distribution of DAC bilateral ODA by regions suggests that regional distribution has changed only slightly over the decade 2000 to 2010 (Chart 12). Bilateral aid to Sub-Saharan Africa increased from 39.4% to 44.4%, while other regions saw difference in their share of bilateral aid.
Bilateral ODA distribution by income group (Chart 13) does show a signi cant improvement towards low-income countries over the past decade (including the least developed countries) from 48.9% to 63.5% of country allocated aid. There has been a corresponding decline for lower middle-income countries from 41.2% to 28.2%.Chart 14 represents aid to least developed countries (LDCs) only. This chart indicates that a substantial part of the increase for these countries was the result of dramatic increases in aid to Afghanistan during the decade. When Afghanistan is excluded ODA for LDCs rose only slightly from 24% to 29% as a share of total DAC ODA from 2000 to 2010.
137
Chapter 4 Global Aid Trends, BRICS Reports and OECD Reports
137

Chapter 4 Global Aid Trends, BRICS Reports and OECD Reports
138138
At the meeting of the Conference of the Parties to the UN Framework Convention on Climate Change (COP-15) in Copenhagen in 2009 developed countries agreed to provide “new and additional resources” for climate change adaptation and mitigation pledging US$30 billion in fast-track nancing for the period, 2010 to 2012, with a view towards mobilizing US$100 billion of these purposes by 2020.48 After several years of discussion following the Copenhagen meeting, the Green Climate Fund mechanism, which is intended to channel this US$100 billion, was proposed at Cancun in 2010 and is expected to become operational in 2013.49 So far, three countries have agreed to cover the start up costs of the Fund – Germany, Denmark and the U.K.50
CSOs have consistently called on governments to prioritize the impact of climate change on the billions of poorest and most vulnerable people who bear no responsibility for the climate crisis.51 The Africa Development Bank, for example, has estimated that 50% of Africa’s population live in countries that are most exposed to the impacts of climate change. They also suggest that the cost for adaptation alone in Africa could be in the order of US$20 billion to US$30 billion per year.52 Many CSOs are calling for a Green Climate Fund that exempli es the principles of development effectiveness, piloting a new approach to international cooperation nance based on equality, interdependence, common interest, cooperation and accountability to stakeholders. For example, CSOs are also highly supportive of a recent call by the UN Independent Expert

139
Chapter 4 Global Aid Trends, BRICS Reports and OECD Reports
139
on foreign debt and human rights that “ nance under the proposed Green Climate Fund does not exacerbate the external debt burdens of recipient countries”.53A joint study by the OECD and the International Energy Agency (IEA) on tracking climate
nance underscored the fact that, despite years of international dialogue, there is still no agreed de nition of “climate nance”, particularly for “private ows”, and no centralized comprehensive system for tracking all the relevant public and private climate ows. Moreover, there is also no agreement on methodologies for measuring the need for climate nance.54 The OECD/IEA study called for greater transparency and agreement on clear de nitions in order to accurately track ows for relevant climate mitigation and adaptation activities.55 This OECD/IEA study also reported a wide margin in the estimates of public and private climate nance ows at between US$70 billion and US$120 billion in 2009/10. Climate-related
ows from private investments were estimated to be between US$37 billion and US$72 billion. It remains to be seen what role is contemplated for private sector nance in the nancing of the Green Climate Fund, in particular given the scal pressures on many of the donor countries. Without signi cant public sector nance, the unregulated and untransparent pro t-oriented interests of the private sector could subvert the public purposes and goals of the Green Climate Fund. On this point, CSOs raised grave concerns about proposals at the June 2012 Rio+20 conference that aim to “commodify the environment” in the interests of tackling climate change.56 Recently the DAC CRS made available comprehensive data on public nancing for
climate change mitigation and adaptation by DAC donors, with the addition of an “adaptation marker” for reporting aid in 2010.57 In May 2012, the multilateral banks have also now agreed to jointly track their climate change nancing, consistent with this DAC methodology.
Based on the mitigation and adaptation markers, the DAC put total bilateral climate change activities from ODA in 2010 at US$22.9 billion, with adaptation nance at US$9.3 billion and mitigation nance at US$17.6 billion.58 The DAC also provided a preliminary estimate of US$718 million for multilateral climate change aid. The markers for bilateral aid were allocated by principal and signi cant objectives as set out in Box Three.
Total Bilateral Mi ga on and Adapta on Finance: US 22 9 billion
Sour e Realit o Aid al ula ons ro DA , irst Ever o re ensive Data on Aid or li ate an e Ada ta on ,
www oe d or dataoe d d

Chapter 4 Global Aid Trends, BRICS Reports and OECD Reports
140140
Clearly mitigation activities have been the predominant priority for DAC bilateral ODA, accounting for more than 70% of all DAC identi ed climate change activities. But DAC climate nance was also highly concentrated among ve (out of 23) DAC donors. Based on mitigation activities that were marked principal objective, almost 92% were accounted for by Japan (47%), France (20%), Germany (13%), Norway (6%) and the United States (5.5%). Five donors contributed 73% of all activities marked adaptation principal objective: United Kingdom (25.6%), France (23%), the United States (14.4%), Japan (6.1%), and Korea (5.1%).
The DAC does not comment or adjust its ODA gures to take account of the Copenhagen
commitment that climate nance be additional to ODA. While several donors have consciously added resources for climate change (such as Canada and Norway), all DAC donors have included climate nance in the ODA they report to the DAC, if the activities meet the criteria for ODA grans or concessional loans. If the DAC total of US$22.9 billion for climate
nance were to be excluded from ODA for 2010, “Real ODA” for that year would have been only US$95.8 billion rather than US$118.7 billion. Excluding climate nance, DAC donor ODA performance would have been signi cantly lower at 0.23% of GNI, rather than 0.30%.
The DAC data also allows for a breakdown of the allocation of climate nance among developing country income groups as set out in Box Four.
DAC bilateral investments in mitigation are overwhelmingly concentrated in lower middle-income countries and in a few countries: India (US$2.8 billion), Algeria (US$1.8 billion), Indonesia (US$870 million) and China (US$560 million). Adaptation investments are more
Least Developed and Low Income: 13.6%Lower Middle Income: 75.5%
Least Developed and Low Income: 58.1%Lower Middle Income: 38.3%
Sour e Realit o Aid al ula ons ro DA , irst Ever o re ensive Data on Aid or li ate an e Ada ta on ,
www.oecd.org/dataoecd/54/43/49187939.pdf . Per enta es are o ountr allo ated li ate nan e.
evenly distributed among countries, with a high concentration in least developed and low-income countries. Some of the largest investments are Kenya (US$338 million), Vietnam (US$321 million), Ethiopia (US$288 million), Indonesia (US$485 million) and Peru (US$175 million). Sub-Saharan Africa received 31.1% of all DAC investments in adaptation in 2010.
CSOs were the implementing channel for 18.5% of adaptation projects, while they accounted for only 4.7% of the mitigation projects. The DAC registered a low level of public private partnerships (PPPs) for DAC climate investments – only US$3.4 million for mitigation and only US$2 million for adaptation. Government and multilateral organizations were the primary implementing channels.
Special climate change funds are an important channel for donor climate change nancing. Climate Fund Update, a database maintained by the UK Overseas Development Institute and the Heinrich Boll Stiftung Foundation (North America), tracks multi-year pledges made to 26 national and multilateral climate change funds.59 As of July 2012, there was a total of US$32 billion in public resources pledged by all donors to all funds (both national and multilateral).

141
Chapter 4 Global Aid Trends, BRICS Reports and OECD Reports
141
Japan alone makes up close to 40% of these pledges. Of the total pledged to funds, 73% are for bilateral funds under the direct control of the donor (with the largest being US$15 billion for Japan’s Fast Start Finance Fund and US$4.6 billion for the UK’s International Climate Fund).
Most of the remaining pledges, or more than 31%, has been allocated to funds under various World Bank windows, including the Global Environment Fund (GEF).60 CSOs have been highly critical of the approach and investment decisions of the Bank’s Climate Investment Funds.61 Recently CSOs have written to the government funders of these Funds, asking them to adhere to the sunset agreement made at their creation, conduct a full independent review of their programs, projects and overall performance, and redirect their donor climate nancing to the newly created Green Climate Fund noted above.62Recalling the concern of the UN Independent Expert on foreign debt noted above, Climate Fund Update reports that 37.7% of current pledges are for loans or concessional loans (out of US$7.9 billion pledges that are allocated by nancial instrument). The disbursements for the 26 funds tracked targeted mainly lower and upper middle-income countries (81.7% of total disbursements recorded), with only 18% directed to low-income countries. However, consistent with the DAC data, Sub-Saharan Africa received close to 38% of the disbursements from funds dedicated to adaptation, with countries in Asia/Paci c receiving 23% of these disbursements.63
South-South Cooperation (SSC) received considerable attention in the lead-up to the November 2011 HLF4 in Busan. In early 2010, a High Level Event on South-South Cooperation and Capacity Development was held in Bogota,
Colombia. This High Level Event aimed at pro ling the experience of development actors in SSC as “contributions to a more effective and inclusive cooperation architecture.”64 In Busan, the Outcome Document (PBd) recognized that “South-South and triangular co-operation have the potential to transform developing countries’ policies and approaches to service delivery by bringing effective, locally owned solutions that are appropriate to country contexts.” [§30]
At the previous High Level Forum in Accra in 2008 donors and partner countries acknowledged that the principles guiding South-South Cooperation were distinct from those agreed by donors in the Paris Declaration: “South-South co-operation on development aims to observe the principle of non-interference in internal affairs, equality among developing partners and respect for their independence, national sovereignty, cultural diversity and identity and local content.” [AAA§19] Several countries engaged in SSC, such as Brazil and China, have subsequently af rmed these goals in policy statements.65China
An accurate measure of the total nancial commitments and trends in SSC are affected by both a lack of transparency and published data and by confusion among some analysts about what to include in SSC as aid. This has been particularly true for the many instruments that China has used to extend economic relationships in its global diplomacy. But now for the rst time, in a 2011 Policy on Foreign Aid, China clari ed that Chinese “aid” includes only grants, interest-free loans and concessional loans. The policy paper stated that by the end of 2009, China had disbursed a total of 256 billion yuan or US$37.7 billion through these three modalities of assistance. It also revealed that this aid had grown by close to 30% between 2004 and 2009.66
Chapter 4 Global Aid Trends, BRICS Reports and OECD Reports
142142
With the exception of concessional loans, Chinese aid is managed centrally through the Department of Aid to Foreign Countries in the Ministry of Commerce. Concessional loans are handled as a small part of the portfolio of the China Development Bank.
However, beyond the 2011 policy paper, there is no regularly published of cial Chinese data for aid. Kang-Ho Park at the Brookings Institute has recently estimated Chinese aid in 2008 at US$3.8 billion, and Deborah Brautigam puts Chinese aid to Africa at US$1.2 billion in that year.67 Clearly these resources make up only a small share of rapidly growing Chinese nancial relationships with developing countries and with Africa in particular. China trade with Africa has expanded rapidly in the last decade to well over US$130 billion. In January 2011, for example, the Financial Times reported that China had loaned more money to developing countries governments and companies in 2009 and 2010 through the China Development Bank and the China Export-Import Bank (US$110 billion) than World Bank loans for these years (US$100.3 billion).68 For the most part, these were non-concessional loans and were not included in China’s policy on foreign aid.
Brazil
Brazil, through a study conducted by ABC, the Brazilian Cooperation Agency, has similarly de ned its concept of international development cooperation:
“The total funds invested by the Brazilian federal government, entirely as non-repayable grants, in governments of other countries, in nationals of other countries in Brazilian territory or in international organizations with the purpose of contributing to international development, understood as the strengthening of the capacities of
international organizations and groups or populations of other countries to improve their socioeconomic conditions.”69
According to this de nition, Brazilian total cooperation for international development in 2009 was estimated to be US$362.2 million, made up of the following components: humanitarian assistance: US$43.5 million; scholarships for foreign students: US$22.2 million; technical cooperation: US$48.9 million; and contributions to international organizations: US$247.6 million.70 Between 2005 and 2009 these forms of cooperation grew by more than 46% in real value. A high percentage of this cooperation is directed to Brazil’s immediate neighbours in the Americas and to Africa (particularly the Portuguese speaking countries). Brazilian cooperation (technical cooperation and humanitarian assistance) is often provided “in-kind” and nancial contributions are made through triangular cooperation with a multilateral or bilateral donor partner. The latter is due in part to an unfavourable legal regime in Brazil for the transfer of resources for development to other countries.
India
Since the 1960s, India’s Technical and Economic Cooperation programs have aimed at sharing India’s development experience primarily through technical cooperation. In July 2012, the Indian government announced the establishment of the Development Partnership Administration (DPA), which will oversee Indian development projects around the world. It will have a US$15 billion budget over the next ve years (which would be a substantial increase over the estimate of US$1 billion in 2008 by Kang-Ho Park).71 The sectoral emphasis of India’s cooperation in the past has been in the areas of education, healthcare, energy and Internet technology. The programs are currently taking place in more than 60 countries, but with strong emphasis on regional partners and Africa.

143
Chapter 4 Global Aid Trends, BRICS Reports and OECD Reports
143
Similar to China, these resources for development cooperation are only a small part of India’s growing economic relationships with Africa. This relationship has been rooted in a series of India-Africa Summits, the most recent being held in Addis Ababa in May 2011. At that Summit India’s pledged to meet the goals of boosting trade from $45 billion in 2011 to $70 billion by 2015, providing an additional $500 million of aid to the $5.4 billion already promised, and building capacity.72South Africa
Since the end of apartheid, an important emphasis in South Africa’s foreign policy has been the promotion of development and stability in Africa. This policy has been implemented since 2001 through the Africa Renaissance and International Cooperation Fund (ARF) administered by the government’s International Relations and Cooperation Department. The focus for this Fund has been democracy and good governance, con ict prevention, social and economic development and humanitarian assistance. In 2010, ARF contributed 45 million, a signi cant increase from 9.3 million in 2006.
In April 2012 the government established the South African Development Partnership Agency (SADPA). This new body is intended to coordinate both South Africa’s out-bound international partnership programs as well as its development assistance from other donors. It replaces the ARF and brings together other programs currently dispersed among many departments. It is expected to have an annual budget of approximately US$70 million to $US90 million.
Other non-DAC Donors
Twenty non-DAC donors report their aid to the DAC under the DAC de nition for ODA. These include OECD members such as Turkey and Eastern European countries as well as non-
OECD countries such as Saudi Arabia, UAE, Kuwait, Thailand, and Liechtenstein. In 2010, these 20 countries contributed US$7.2 billion in ODA. However, this was down from a peak of US$9.0 billion in 2008. Saudi Arabia, at US$3.5 billion in 2010, is by far the largest donor among the 20. A decline in its ODA from 2008 accounted for close to 80% of the overall decline for non-DAC donors reporting to the DAC. Approximately 15%, or US$1.1 billion, of the US$7.2 billion were loans.73
Saudi Arabia has been a signi cant donor since 1974 when it established the Saudi Fund for Development, through which it has provided both grants and technical assistance, mainly to Islamic developing countries. It was a major contributor to alleviation of the Sahel drought in the 1980s. By 2010, the Fund was supporting 12 major projects in Africa and 11 projects in Asia.74
In summary, an estimate for 2008 of US$12.5 billion in total aid contributions through SSC has perhaps grown to US$15 billion by 2010, assuming growth in aid allocations by both China and India. SSC would therefore be approximately 12.6% of “Real ODA” (US$118.7 billion) from DAC countries for 2010.75
1. Civil Society Actors play a growing role in development cooperation
Civil Society Organizations (CSOs) are playing a signi cant role in both long-term development and humanitarian assistance. They do so in their own right, raising funds from private donations, and as implementers of programs on behalf of of cial donor agencies. Because of the great diversity in sources of funding and the independence

Chapter 4 Global Aid Trends, BRICS Reports and OECD Reports
144144
of CSOs, exact measurement of the nancial scope for their role in resourcing development is incomplete. But some statistics are available that begin to provide a picture of the scale of CSOs in aid and development cooperation.
Overall Trends
The members of the OECD DAC submit annual statistics on the amount of ODA that is channeled through CSOs and NGOs.76• In 2010, DAC donors channeled a total of
US$18.5 billion in aid through CSOs. This amount represents 15.6% of “Real ODA” from DAC members in that year (US$118.7 billion).
• In 2010, DAC donors channeled close to a quarter of their “Real Bilateral ODA” (22.8%) through CSOs (bilateral aid net of debt cancellation, refugees and students).
• ODA channeled by DAC members through CSOs has more than doubled in value since 2007 (from US$7.8 billion to US$18.5 billion in 2010 dollars).
• Nevertheless, in 2010 there was considerable variance in the priority given to this channel by different donors for their bilateral aid (share of total bilateral aid):
Ireland 39.0% Netherlands 38.9%Switzerland 37.1% Sweden 32.4%United States 26.5% Canada 22.5%United Kingdom 14.9% Australia 12.9%Japan 6.4% France 3.1%
• Non-DAC donors that report to the DAC allocated less than 4% of their bilateral aid through CSOs (mainly the United Arab Emirates). The Republic of Korea, a new DAC member, channeled only 2% of its
bilateral aid through CSOs in 2010.
The DAC also provide an estimate of the amount of funds raised privately for aid activities by CSOs in the donor country independent of government resources. In 2010, this estimate totaled US$30.6 billion for the DAC members. This amount is up from US$20.5 billion in 2007 (although some of the increase may be due to improved reporting on the part of some donors). Several members of the DAC do not report private ows and other DAC members are said to under-estimate private CSO aid ows. At US$30.6 billion, privately raised funds by CSOs were more than 25% of “Real ODA” for 2010.
According to these DAC statistics, the United States represents the largest share of private funds raised by CSOs. In 2010 the United States reported to the DAC that its CSOs raised US$22.8 billion (or 75% of these private ows). The next largest was Canada at US$2 billion and Germany at US$1.5 billion.
There are no reliable statistics on total aid ows, including privately raised funds, through CSOs to developing countries, particularly for countries outside of the United States. As noted above, the DAC estimate of private ows in 2010 was US$30.6 billion. The US-based Centre for Global Prosperity, however, puts the estimate at US$56 billion for 2010, of which the United States accounted for US$39 billion).77 If the DAC estimates are taken as the minimum amount of privately raised aid channeled by CSOs, then in 2010 civil society organizations disbursed more than US$49 billion, when ODA
ows and private ows are combined.
Some DAC donors not only channel funds through CSOs in their own country, they also channel resources directly to CSOs in developing
145
Chapter 4 Global Aid Trends, BRICS Reports and OECD Reports
145
countries, most often from funds established for this purpose in the Embassies. In a survey conducted by the Development Cooperation Directorate (DCD) at the OECD, 20 of the 26 responding donors reported that they allocate between 1% and 30% of their ODA directly to CSOs in developing countries.78
The DAC Creditor Reporting System provides a sector breakdown for all DAC ODA channeled through CSOs.79 This provides a good understanding of the sector priorities for donor funds channeled through these organizations, and a reasonable proxy for privately raised aid delivered by CSOs. Some highlights include the following: • More than half (52.4%) of CSO aid from DAC
countries is allocated to “social infrastructure and services” (human development priorities in education, health, reproductive services etc.). This is more than the 43.1% for this sector in DAC members’ ODA as a whole.
• Humanitarian assistance for emergencies is a strong priority for CSOs (16.9% of their aid) compared to 10.1% for DAC donors’ ODA as a whole. Donors are also reported to channel 7% of their IHA aid to the Red Cross. A number of large CSOs raise considerable private funds at the time of major humanitarian emergencies. The 2012 Global Humanitarian Assistance Report calculated that the proportion of total IHA responses from private funds increased from 17% in 2006 to 31% in 2010.80 This modality of aid is therefore likely a larger share of CSO total aid ows than indicated by the DAC statistics.
• On the other hand, “economic infrastructure and services” (banking, transportation, etc.) and “production sectors” (agriculture, mining, forestry etc.) is relatively weak for CSOs (at 10.5% of their aid). These sectors
are a stronger priority for DAC donors (23.5% of their ODA). NGOs/CSOs mainly contribute to micro- nance banking and agriculture in these sectoral areas.
While “social infrastructure and services” is a strong priority for NGOs/CSOs across all donor countries, it is important to note considerable variations among the donor countries. CSOs from the United States, Sweden and Canada, for example, all have a very high allocation to the social infrastructure and humanitarian sectors, while Dutch CSOs work in multi-sector programs (52.6% of all CSO aid from that country).
2. New attention to the role of the private sector in development
Special recognition was given to the role of the private sector in development cooperation at the Busan HLF4 : “We recognize the central role of the private sector in advancing innovation, creating wealth, income and jobs, mobilizing domestic resources and in turn contributing to poverty reduction.” [BPd §32]Engagement of the private sector takes a variety of forms in development cooperation, through aid-for-trade programs (already described above in section B5), substantial procurement contracts, direct local private sector development, and through public private partnerships (PPPs). The role of private foundations in development cooperation, and in particular the Gates Foundation, is built around the conversion of substantial wealth generated by the private sector for wealthy individuals. In addition, some analysts point to the potential impact for development of the considerable transfers of resources through remittances of migrant populations.
The Centre for Global Prosperity claims that the “new nancing mechanisms ... are blurring

Chapter 4 Global Aid Trends, BRICS Reports and OECD Reports
146146
the line among philanthropy, remittances, investment, and pro t/not-for-pro t socially aware organizations”.81 In an era of declining of cial aid resources, former World Bank President, Robert Zoellick proclaimed in 2011 that “the time has come to ‘move beyond aid’ to a system in which assistance would be integrated with – and connected to – global growth strategies, fundamentally driven by private investment and entrepreneurship”.82 This is the vision that informed the emphasis on private sector engagement at Busan. The private sector is already substantially engaged in the aid regime.
Foundations and the private sector
The Centre for Global Prosperity provides an annual overview of philanthropy and remittances for developing countries. In the United States, the Centre calculated that US$12.2 billion were contributed to development cooperation from foundations and corporations. The Gates Foundation, for example, has a private endowment of approximately US$37 billion, and makes annual disbursements in the order of US$4 billion (exceeding the ODA disbursements for 11 DAC donor countries). Corporate philanthropy in the US provides an estimated US$7.6 billion, but the Centre points out that 90% of this corporate giving to developing countries was in-kind contributions from pharmaceutical companies.83Multi-Donor Trust Funds
Multi-Donor Trust Funds, whether at the World Bank or in regional institutions, have become an increasingly important channel for donor concession nance to the private sector. Examples include the several Climate Funds at the Bank noted above, the Global Agriculture and Food Security Program managed by the Bank, the G20 Small and Medium Enterprise Finance Challenge, the Advanced Market Commitment
for vaccine, and the Caribbean Catastrophic Risk Insurance Facility, among many others.
The World Bank’s Independent Evaluation Group (IEG) reviewed US$57.5 billion that donors contributed to Bank-administered Trust Funds between 2002 and 2010, an amount greater than what donors gave to the Bank’s low income country window, the International Development Association in the same period. The IEG concluded that such funds fail to foster coordination on the group, with little or no recipient participation in their initiation or design, despite some broad contributions to global public goods (in response to country emergencies or global health issues).84Public private partnerships
Within the aid regime, there has been growing interest in public-private partnerships. These partnerships are said to augment limited of cial aid resources, through the investment of private sector funds in public purpose projects. In recent years the DAC has systematically tracked PPPs as a channel for aid delivery. In 2010, DAC members channeled US$903 million in this aid modality (unfortunately there is no corresponding estimate of the private sector contributions). This amount has grown dramatically since 2007 when PPP’s accounted for only US$234 million of DAC ODA, which could be in part the result of under-reporting in 2007.
The sector allocation of ODA for PPPs in 2010 emphasized projects in the health sector, including population and reproductive health (40.9%), in economic infrastructure (31.8%), agriculture (15.2%), and environmental protection (6.0%). More than half of PPPs (58.7%) were implemented in Least Developed Countries (however, this percentage is based on

147
Chapter 4 Global Aid Trends, BRICS Reports and OECD Reports
147
US$216 million that were allocated by the DAC to country income groups).
ODA Procurement and the private sector
Eurodad has undertaken substantial research on public procurement and its impact on development outcomes.85 Their summary report, based on six case studies, points out that
“Development projects are administered by ministries and aid agencies but they rely on inputs from the private sector, for example to contract construction rms to deliver infrastructure works, buy drugs for health programmes, or purchase textbooks for education projects. The exact amount is not of cially disclosed, but our calculations suggest that US$69 billion annually, more than 50% of total of cial development assistance, is spent on procuring goods and services for development projects from external providers.”86
The development impact of procurement policies and practices can be profound. Where developing country governments are permitted to give priority to domestic rms, these practices can strengthen local economic spin-offs from the implementation of aid projects and/or budget support. The degree to which procurement practices respect international norms and rules, including ILO core labour standards and human rights frameworks will also in uence the nature of their development impacts.87Procurement practices in aid are therefore closely aligned with both the degree to which donors have untied their aid and the extent to which developing country governments are permitted to use domestic government systems for aid procurements. In both cases, there is cause for concern. While formal untying status for DAC ODA has declined substantially (to about 16.3%
of bilateral aid commitments in 2010), DAC rules do not include substantial investments in technical assistance and in food aid, much of which remain tied, in their consideration of tied aid. Furthermore, research undertaken by the OECD DAC on the implementation of untying policies suggests that in fact “informal tying” remains very high. This OECD DAC study estimated that two-thirds of ODA contracts are still awarded to rms in OECD countries and up to 60% are in the donor country that provided the aid resource.88 With respect to the use of country systems, the survey of the 2005 Paris Declaration commitments prepared for the Busan HLF4 indicated only limited progress, with “less than half of all aid reported in the Survey uses countries’ PFM [public nancial management] and procurement systems.”89 Remittances
Remittances from migrant populations living in DAC donor countries to developing countries recovered quickly from the 2008 nancial crisis. These ows were estimated to be US$190 billion in 2010, 60% more than total “Real ODA” and up from US$174 billion in 2009. Almost half of the remittances were directed to Asia (48%), with China and India accounting for 50% of Asian
ows. Sub-Saharan Africa accounted for only 7% of total remittances and half of these ows were directed to Nigeria.90While not considered remittances, a recent report pointed out that in the Muslim world an estimated US$200 billion to US$1 trillion are raised and spent annually in mandatory alms (2.5% of wealth and assets) and voluntary contributions. While a quarter of the population of Muslims lives in absolute poverty, there is no strategic disbursement of these funds for poverty reduction and many in the Muslim world do not trust to give these resources to government.91
Chapter 4 Global Aid Trends, BRICS Reports and OECD Reports
148148
In summary, not including remittances, there was an estimated total of $180 billion in aid-related ows to developing countries in 2010 (see Chart 15). Of these ows, CSOs accounted
T ese are es ates based on US ures ro t e re ort o t e entre or Global Pros erit . T is a ount a in lude so e SOs ows w ere SOs ro ure oods and servi es or donors.
for 26% of total ows and the private sector for 41.8%. Non-DAC donors provided 7.9% of the total public and private ows that can be identi ed as development cooperation (broadly using the DAC ODA de nition).
149
Chapter 4 Global Aid Trends, BRICS Reports and OECD Reports
149
€
€€
Real D erformance of D Donors ainst ro ected D ommitments
Sour es or o it ents G Re ort DA Develo ent oo era on Re ort , a e , and DA Develo ent oo era on Re ort, Real ODA is Total ODA, less debt an ela on, re u ees in donor ountries, and students in donor ountries.
OE D Dataset, DA , A essed Jul

Chapter 4 Global Aid Trends, BRICS Reports and OECD Reports
150150
Endnotes
1 OECD, “OECD Calls for Aid Pledge from Donor Countries”, October 30, 2008, accessed August 2012, http://www.oecd.org/dac/oecdcallsforaidpledgefromdonorcountries.htm
2 OECD DAC, “2011 OECD Report on Aid Predictability: Survey on Donors’ Forward Spending Plans, 2011 – 2013”, November 2011, accessed August 2012 at http://www.oecd.org/document/30/0, 3746,en_2649_3236398_46010014_1_1_1_1,00.html
3 “Afghan war cost $300 million per day: Pentagon”, AFP,
February 14, 2011, accessed August 2012 at http://www.google.com/hostednews/afp/article/A eqM5gNQ3JbWwd6t-Pz uEC RJvsAlN A
4 OECD Development Centre, “Can we still achieve the Millennium Development Goals: From costs to policies” Development Centre Studies, July 2012, accessed August 2012 at http://www. eepee .com/Digital-Asset-Management/oecd/development/can-we-still-achieve-the-millennium-development-goals_9789264173248-en
5 The Reality of Aid calculation of donor committed ODA in 2011 is based on the 2005 commitment and the current GNI for 2011. If the commitment is an ODA/GNI ratio for a year beyond 2011, the gap between 2010 and that year is evenly distributed to meet the goal in the stated year (GNI is also projected forward based on OECD projections for economic growth). If the 2005 commitment is a dollar amount, then this dollar amount is assumed to continue to 2015. If the 2005 commitment is a percentage increase up to a year prior to 2011, then this percentage increase is assumed to continue in the years beyond the last year of the increase.
6 AidWatch Europe, “Aid We Can – Invest More in Global Development, 2012 Report”, Concord, page 10, accessible at http://aidwatch.concordeurope.org/.
7 Eurobarometer Survey, quoted in AidWatch Europe, op. cit., page 10.
8 Charles Kenny, “ ies, Damn ies and surveys about Foreign Aid”, Rethin ing US Foreign Assistance Blog, August 30, 2011, accessed August 2012 at http://blogs.cgdev.org/mca-monitor/2011/08/lies-damn-lies-and-surveys-about-foreign-aid.php.
9 Inter-Council Networ , “Canadian Engagement on Global Poverty Issues: Report of Results”, Opinion Survey, March 2012, accessible at www.icnpoll.ca/
10 AidWatch Europe, op. cit., 12.
11 United Nations, illennium Development Goals Report 2012 Department of Economic and Social Affairs, New
or , July 2012, accessed July 2012 at http://www.un.org/en/development/desa/publications/mdg-report-2012.html.
12 Kanbur, R. Sumner, A. “Poor Countries or Poor People? Development assistance and the new geography of global poverty”, Wor ing Paper 8, February 2011, Charles . Dyson School of Applied Economics and Management, Cornell University, Ithaca, New or , accessed July 2012 at http://www.ids.ac.u /index.cfm?objectid=38BC8645-EF50-2765-67E11936F9DDE35C.
13 Glennie, J. “Aid still matters once growth begins”, Guardian Development Blog, May 30, 2012, accessed July 2012 at http://www.guardian.co.u /global-development/poverty-matters/2012/may/30/aid-matters-growth.
14 This proxy includes bilateral ODA commitments related to the DAC CRS sector codes for basic education, basic health, population and reproductive health, water supply and sanitation, agriculture, development food aid and food security, and general environmental protection. Bilateral sector-allocated aid is bilateral ODA commitments less debt cancellation, support for refugees, support for NGOs, administration, and aid unallocated to sectors (such a humanitarian assistance) in the DAC sector codes.
15 Development Initiatives, Global Humanitarian ssistance Report 2012 July 2012, accessed July 2012 at http://www.globalhumanitarianassistance.org/reports.
16 Ibid., 62.
17 bid., 50 and 51.
18 bid., 7
19 Development Wor ing Group, “2012 Progress Report”, os Cabos Summit, June 18-19, 2012, accessed August 2012 at http://www.g20.utoronto.ca/2012/2012-0619-dwg.pdf.
20 Kwa enbos, J., Private Pro t or Public Good Can investing in private companies deliver or the poor Eurodad, May 2012, accessed July 2012 at http://eurodad.org/1543000/. A summary of this report is included among the thematic chapters of this Reality of Aid Report.
21 bid., 9.
22 bid. 1
23 Bretton Woods Project, “’ everaging’ private sector nance: ow does it wor and what are the ris s?”, April 2012,
accessed August 2012 at www.brettonwoodsproject.org/art-570165.
24 bid., 5. See also Ellmers, B., Molina, N. Tuominen, V. Development Diverted How the nternational inance Corporation ails to reach the poor. Eurodad, December 2010. Accessed August 2012 at http://eurodad.org/4304/.
25 Kwa enbos, op. cit., 18-19.
26 bid. 1 .
27 Tim Jones, The State o Debt, UK Jubilee Debt Campaign, May 2012, accessed August 2012 at www.jubileedebtcampaign.org.u .
28 bid.
29 bid., 35.
30 Bretton Woods Project, “Donor IDA Pledges Fall Flat”, Update #74, February 17, 2011, accessed August 2012 at http://www.brettonwoodsproject.org/art-567572.
31 WTO/OECD, id or Trade at a Glance 2011 Showing Results July 2011, accessed July 2012 at http://dx.doi.org/10.1787/9789264117471-en.

151
Chapter 4 Global Aid Trends, BRICS Reports and OECD Reports
151
32 Martin Khor, “What DCs Need on Trade”, a statement at the DC-IV conference in Istanbul on 10 May 2011, South Bulletin, #55, July 2011, South Centre, accessed August 2012 at http://www.southcentre.org/index.php?option=com_content view=art icle id=1595%3Asb55 catid=156%3Asouth-bulletin-reflections-and-foresights Itemid=370 lang=en.
33 BetterAid, “Aid for Trade: False Assumptions”, Statement, November 2011, accessed August 2012 at http://www.betteraid.org/en/betteraid-policy/betteraid-publications/statements/514-false-assumptions-the-betteraid-position-paper-on-aid-for-trade-for-the-hlf4.html.
34 WTO/OECD, op. cit., 359.
35 Estimate is based on the gures set out in a table in WTO/OECD, op. cit., 359. The estimate includes the mar er amounts for “building productive capacity”, 25% of “economic infrastructure” (based on the mar er proportion of building productive capacity) and support for trade policy and regulation.
36 Carey . Biron, “G8 Turns to Private Sector for Food Crisis Solutions”, IPS, May 18, 2012.
37 “Stic to African Plans: Open letter to the G8 from African civil society”, May 4, 2012, accessed August 2012 at http://africasplansforg8.org/. See also Oxfam International, “G8 food security alliance answers question hungry people have not as ed”, Media Release, May 18, 2012 accessed August 2012 at http://www.oxfam.org/en/pressroom/pressreleases.
38 See DAC web site, http://www.oecd.org/dac/aidarchitecture/countryprogrammableaidcpa.htm.
39 OECD DAC, 2009 DAC Report on Aid Predictability: Survey of Donor Spending Plans, 2009-2011, 2009, pages 10-11. The 2011 Report estimates total CPA at US$90.3 billion for 2010, but does not give a brea down between bilateral and multilateral CPA. See http://www.oecd.org/dac/aidarchitecture/aidpredictability.htm.
40 Anne Marie Golla, Anju Malhotra, Priya Nanda, and Re ha Mehra, nderstanding and easuring omen’s conomic
mpowerment International Centre for Research on Women, 2011, accessed August 2012 at www.icrw.org/node/971. See also D C Gender et omen’s conomic mpowerment
CD D C 2012 accessible at http://www.oecd.org/dac/povertyreduction/50157530.pdf.
41 AWID, “Position On The Proposed Busan Joint Action Plan On Gender Equality And Development”, December 1, 2011, accessed August 2012 at http://awid.org/ ibrary/Position-on-the-proposed-Busan-Joint-Action-Plan-on-Gender-Equality-and-Development
42 DAC, “Aid in Support of Gender Equality and Women’s Empowerment, 2009/2010”, February 2012, accessed July 2012 at www.oecd.org/dataoecd/57/38/49732892.pdf.
43 AWID Survey of members 2011, reported in ydia Alpizar Duran, “Strengthening Finances for Gender Equality and Women’s Organizations”, AWID, Interactive Plan 4, UN Commission on the Status of Women, February 27, 2012, http://www.awid.org/ ibrary/56th-session-of-CSW-Panel-4-Progress-in-financing-for-gender-equality-from-the-perspective-of-international-organizations-and-multilatera-l-development-partners.
44 bid.
45 bid., 9.
46 bid.
47 ODA for Sub-Saharan Africa was US$19.4 billion in current dollars in 2004 and should have increased to US$44.4 billion by 2010. ODA for Sub-Saharan Africa in current dollars in 2010 was US$29.4 billion or US$15 billion sort. See Camp David ccountabilit Report ctions pproaches and Results 2012 G8, pp 73-74, accessed July 2012 at www.state.gov/documents/organization/189889.pdf.
48 The $100 billion was from all sources both public and private.
49 UN Climate Change Secretariat, “Bonn UN Climate Change meeting delivers progress on ey issues”, Press Release, May 25, 2012, accessed August 2012 at http://unfccc.int/ les/press/press_releases_advisories/application/pdf/20120525_pr_sb6_close.pdf.
50 AidWatch Europe, op. cit., 29.
51 See Reality of Aid Africa Networ , “Climate Finance and Development Effectiveness in Africa”, Realit Chec , November 2011, accessible at http://www.realityofaid.org/content/publicationsitem/name/Reality-Chec /sec/393/title/Reality-Chec -November-2011#title.
52 Africa Development Ban Group, “Cost for vulnerable’ Africa to handle climate change could reach $30 billion”, December 2, 2011, accessed August 2012 at http://www.afdb.org/en/news-and-events/article/cost-for-vulnerable-africa-to-handle-climate-change-could-reach-usd-30-billion-8648/.
53 Of ce of the igh Commission for uman Rights, “Climate nance should not add to the external debt burdens of poor recipient countries, says UN expert”, December 8, 2011, accessed August 2012 at http://www.ohchr.org/en/NewsEvents/Pages/DisplayNews.aspx?NewsID=11697 angID=E.
54 See the outcome of the July 2012 meeting of UNFCCC at http://unfccc.int/ les/cooperation_support/ nancial_mechanism/long-term_finance/application/pdf/montes_9_july_2012.pdf.
55 Christa Clapp, Jane Ellis, Julia Benn, Jan Corfee-Morlot (OECD), Trac ing Climate inance hat and How OECD International Energy Agency, 2012, OECD COM/ENV/EPOC/IEA/S T(2012)1, accessed at www.oecd.org/dataoecd/16/50/50293494.pdf.
56 See the “Final Declaration of the Peoples’ Summit at Rio 20” accessed at http://cupuladospovos.org.br/en/.
57 See the dedicated web page on the DAC website at http://www.oecd.org/dac/aidstatist ics/focusonaidtargeting theobjectivesoftherioconventions.htm.
58 DAC, “First-Even Comprehensive Data on Aid for Climate Change Adaptation”, November 2011, accessed July 2012 at www.oecd.org/dataoecd/54/43/49187939.pdf.
59 See the database at Climate Funds Update, http://www.climatefundsupdate.org/.
60 Reality of Aid calculations from the Climate Funds Update, op. cit., accessed July 2012.

Chapter 4 Global Aid Trends, BRICS Reports and OECD Reports
152152
61 alifax Initiative, ssues pdate, Volume VII, Number 9, June 2012 accessible at www.halifaxinitiative.org and Bretton Woods Project, “A faulty model? What the Green Climate Fund can learn from the Climate Investment Funds”, June 2011, accessed August 2012 at http://www.brettonwoodsproject.org/art-568686.
62 Bretton Woods Project, “Calls for halt of World Ban climate initiatives”, pdate, #81, July 3, 2012, accessed August 2012 at http://www.brettonwoodsproject.org/art-570788.
63 Climate Fund Update, op. cit. accessed July 2012.
64 See the web site for the igh evel Event at http://www.impactalliance.org/ev_en.php?ID=48980_201 ID2=DO_COMMUNIT and the Tas Team on South South Cooperation that has been meeting under the umbrella of the Wor ing Party on Aid Effectiveness at http://www.oecd.org/dac/aideffectiveness/tas teamonsouth-southco-operation.htm
65 While Brazil has not made an of cial policy statement on its international cooperation, ABC, the Brazilian Cooperation Agency, documented its cooperation between 2005 and 2009, which sets out a framewor for this cooperation. See Cintra, M. (organizer) 2011, ra ilian Cooperation or nternational Development 200 200 , Brasília : Ipea : ABC, accessible at http://www.southsouth.info/pro les/blogs/brazilian-cooperation-for-international-development-2005-2009. In April of 2011 China published a State Council, China’s oreign
id, Information Of ce of the State Council, which can be found at http://news.xinhuanet.com/english2010/china/2011-04/21/c_13839683.htm.
66 State Council, 2011, op.cit, and Deborah Brautigam, “Chinese Development Aid in Africa: What, where, why, and how much?”, In Rising China Global Challenges and pportunities, Jane Golley and igang Song, eds, Canberra: Australia National University Press, 2011, pp. 203-223., accessed at http://www.american.edu/sis/faculty/upload/Brautigam-Chinese-Aid-in-Africa.pdf. See also Brautigam’s excellent summary paper on Chinese aid, “Aid with Chinese characteristics’: Chinese foreign aid and development nance meet the OECD-DAC aid regime”, ournal o nternational Development, Vol. 23, #5, 2011.
67 See Kang- o, Par . “New Development Partners and a Global Development Partnership.” n Catal ing Development ew
ision or id, edited by omi Kharas, Koji Ma ino andWoojin Jung, 38-60. Washington, DC: Broo ings Institution, 2011 and Brautigam, “Chinese Development Aid in Africa”, op. cit.
68 Geoff Dyer, Jamil Anderlini and enry Sender, “China lending hits new eights”, Financial Times, January 17, 2011.
69 Cintra, “Brazilian Cooperation for International Development”, op. cit., 17.
70 bid., 20
71 Kabir Taneja, “India sets up global aid agency”, Sunday Guardian (India), August 19, 2012, accessed August 2012 at http://www.sunday-guardian.com/news/india-sets-up-global-aid-agency and Kang- o, op. cit.
72 Sumit Roy, “”China and India, the Emerging Giants’, and African Economic Prospects”, Global Policy, July 2012, accessed August 2012 at http://www.globalpolicyjournal.com/articles/world-economy-trade-and-finance/china-and-india-%E2%80%98emerging-giants%E2%80%99-and-african-economic-pros and Kristen Palitza, “China Keen to Reverse Negative Image in Africa”, IPS, May 24, 2012, http://www.ipsnews.net/2012/05/china- een-to-reverse-negative-image-in-africa/.
73 OECD Dataset, DAC1, accessed August 2012.
74 See Correa, G., 2012. anual de Cooperaci n nternacional, RACI, Argentina, pages 144-145, accessible at http://www.raci.org.ar/recursos-para-ong/manual-de-cooperacion-internacional/ [in Spanish].
75 Estimates of SSC are often in ated with the inclusion of non-concessionary loans and export credits, particularly from China. Under the DAC aid regime these state nancial transfers of resources are considered “Other Of cial Flows” (OOF). In 2010 Gross OOF for DAC countries was US$21.8 billion. Including private sector ows, DAC countries net transfers to developing countries was US$390.5 or more than three times the level of “Real ODA”.
76 OECD Dataset DAC1.
77 Center for Global Prosperity, The Index of Global Philanthropy and Remittances, 2012, udson Institute, Washington, page 3. Accessed July 2012 at http://gpr.hudson.org/.
78 Development Cooperation Directorate (OECD), Partnering with CS s Twelve Lessons rom D C Peer Reviews Draft Version, February 15, 2012 draft, forthcoming, page 11.
79 OECD DAC Creditor Reporting System, accessed July 2012.
80 Development Initiatives, op. cit. p. 25.
81 Center for Global Prosperity, op. cit. 3.
82 Zoellic , Speech, September 14, 2011, Washington University, quoted in Center for Global Prosperity, op. cit. 7.
83 bid., 12.
84 Bretton Woods Project, IEG Slams World Ban Trust Funds, Update #77, September 2011, accessed August 2012 at http://www.brettonwoodsproject.org/art-568900.
85 Bodo Ellmers, How to spend it Smart procurement or more e ective aid, Eurodad, September 2011, accessed August 2012 at www.eurodad.org/4639/. llmers published a summar o the outcomes o the case studies conducted or this research in the 2010 Realit o id Report Re orming Public Procurement S stems or Development ectiveness .
86 Ellmers, op cit., [Eurodad], p. 4.
87 Ellmers sets out a framewor for development effective procurement practices in the 2010 Reality of Aid Report article, op.cit.
88 Ellmers, op. cit. [Eurodad], page 15 and Clay, Edward J., Matthew Geddes and uisa Natali (2009) Untying Aid: Is it wor ing? An Evaluation of the Implementation of the Paris Declaration and of the 2001 DAC Recommendation of Untying ODA to the DCs. Copenhagen, December 2009, accessed August 2012 at www.oecd.org/dataoecd/5/22/41537529.pdf.
89 OECD, id ectiveness 200 to 2010 Progress in mplementing the Paris Declaration on id ectiveness, Part 1, OECD DAC, 2011, page 49, accessed August 2012 at http://www.aideffectiveness.org/busanhlf4/en/topics/evidence-for-busan/448.html
90 Center for Prosperity, op. cit., 19.
91 IRIN, “A Faith-Based Aid Revolution in the Muslim World”, UN Of ce for the Coordination of umanitarian Affairs, June 1, 2012, accessed August 2012 at http://www.irinnews.org/Report/95564/Analysis-A-faith-based-aid-revolution-in-the-Muslim-world.

153
Chapter 4 Global Aid Trends, BRICS Reports and OECD Reports
153
In the last decade Brazil has been pursuing a more ambitious international agenda in order to leverage its economic growth and strengthen its position in multilateral forums of global governance. Regional integration in South America, the promotion of commercial and political relations with African countries, and deeper engagement with other emerging countries are key goals for its foreign policy. Based on this framework and taking advantage of Brazil’s economic signi cance, its social and natural resources, the country has taken a proactive role in the recon guration of power dynamics at the global level, with the view to making it more multi-polar, with a better balance between Northern and Southern nations.
It is within this context that Brazil emerges as a new actor in the eld of international cooperation, recognized among the so-called “new donors”, protagonists of a new modality of intervention, South-South cooperation. Great expectations are growing in relation to these new actors, in an environment which increasingly recognizes the quantitative and qualitative limits of the traditional model of aid as it has been practiced by countries of the Development Assistance Committee of the Organization for Economic Cooperation and Development (OECD/DAC). However, besides positive expectations, there are also signi cant questions that should be addressed: Are these “new donors” in fact promoting a qualitative and quantitative change in the policies of international cooperation? Or are they simply reproducing the same standards of
traditional cooperation and, even worse, without the mechanisms of transparency and social control that have been built into the trajectory of North-South cooperation?
Brazilian international cooperation con rms this ambivalence: there are reasons for hope, but also apprehension about whether governmental and non-governmental diplomacy will adhere to the principles of solidarity and justice, and the worldwide defense of human rights and common public goods.
Brazil’s implementation of its national development project is itself ambivalent. The country is the 6th largest world economy and, at the same time, a country of extreme inequalities where 36 million people live in poverty. Innovative policies for income distribution and social inclusion, support of family agriculture and cooperative enterprises coexist with the promotion of mega projects for commodity production, energy and infrastructure, whose social and environmental bene ts are rather controversial. The country has developed solid democratic institutions, with channels of social participation in the design and monitoring of various social policies. Yet, some areas continue to remain impervious to social accountability, especially economic and foreign policies. In recent years, the government has created a hostile environment for civil society organizations and social movements, making access to public and private resources more dif cult, due to the lack of clear policy and legal frameworks needed to promote the autonomous organization of society.

Chapter 4 Global Aid Trends, BRICS Reports and OECD Reports
154154
Despite Brazil’s expansion of its international cooperation programs, there is little data available. This is partly due to the absence of an integrated accounting system for the various institutions involved and the lack of consensus on what is understood as international cooperation for development, (Usher, 2011; Cabral and Weinstock, 2010). In addition, there are few independent impact evaluations and also little analysis of approaches used, and of existing barriers to cooperation. (Bava, 2011; Souza, 2012)
Brazil has been traditionally regarded as a recipient country in international cooperation. Despite its recent economic growth, the OECD-DAC data on nancial ows does not indicate a decline in received resources in recent years, reaching US$664 million in 2010. But few studies about the characteristics and trajectory of this aid have been produced, maybe because the amount was never very relevant in relation to the country’s GDP. A plausible assumption, which would require a more thorough investigation, is that these funds are currently changing focus, migrating from traditional areas of assistance to new strategic areas such as power generation and protection of forests. (Beghin, 2012)
Information on Brazil as a donor is even scarcer, since it involves a multiplicity of actors such as ministries, secretariats, municipalities, foundations, universities, companies and NGOs. A pioneering effort of documentation has recently been produced by the Brazilian Cooperation Agency (Agência Brasileira de Cooperação, ABC), linked to the Ministry of Foreign Affairs, and the Institute of Applied Economic Research (Instituto de Pesquisa Econômica Aplicada, IPEA). They examined the resources invested
in international cooperation for more than 100 federal Brazilian agencies between the years 2005 to 2009. (Cintra, 2010)
The aspect that most stands out is the increase in Brazilian investment in international cooperation, growing from US$24.9 million in 2005 to more than US$362.2 million in 2009 (constant values). Three quarters of this cooperation is accounted for by Brazil’s contributions to international organizations and regional banks, while 9.9% is directed to scholarships, 8.5% to technical cooperation and 5.0% to humanitarian aid. Technical cooperation and humanitarian aid were the fastest growing modalities, which together accounted for 7.5% of the total in 2005 and represented 25.5% in 2009. In both areas, the country has sought innovative approaches, sharing experiences of participation and social inclusion but, as noted above, still lacks independent studies on their impacts.
Financial and commercial cooperation between Brazil and other developing countries can be considered the largest information gap about the Brazilian cooperation (Schlager, 2007), and unfortunately the study by ABC/IPEA does not provide comprehensive data on this cooperation. However, when nancial and commercial cooperation data is included, it is clear that concessional lending to support Brazilian exports is quite relevant. According to Cabral (2011), the values of loans from 2005 to 2009 exports correspond to US$1,776 million, debt cancellation $474 million, and food nancing $349 million. If considered along with the other modalities of cooperation, export loans would represent 43% of the total, as illustrated in the chart below:
It is in the eld of concessional loans that the private sector is more visible, since these are Brazilian companies that receive loans to facilitate

155
Chapter 4 Global Aid Trends, BRICS Reports and OECD Reports
155
the internationalization of their business or, when resources are provided to partner countries, they are under the condition that purchases must be made from Brazilian companies. As it will be further explored in the next section, it is likely that technical cooperation linked to the private sector also follows the same pattern, as this modality is integrated into nancial and commercial cooperation.
The Brazilian presence in Africa is particularly relevant to demonstrate the potential risks and contributions of Brazilian South-South cooperation, linked to the participation of the private sector, for development effectiveness. In the rst place, half the resources for technical cooperation invested by Brazil are directed to Africa and a majority of the partner countries are highly dependent on ODA. In addition,
many African countries do not have a robust and organized civil society, with the autonomy to demand and ensure government and private sector accountability for their actions. As a result there is greater risk that social and environmental impacts of projects are not taken into consideration. In the case of countries with an incipient national private sector, the possibility of large Brazilian companies creating unfair competition is also signi cant.
Africa is not only the main focus of Brazilian cooperation during the Lula Government (2003-2010), but the continent is also an important frontier for the expansion of Brazil’s trade and political alliances. The Brazilian diplomatic network in Africa grew signi cantly during the Lula period, resulting in the establishment of 37 embassies and two general consulates. Between 2003 and 2008, trade
ows between Brazil and Africa increased from US$6 million to US$30 million, and the presence of Brazilian companies in Africa has been growing signi cantly (see map below).

Chapter 4 Global Aid Trends, BRICS Reports and OECD Reports
156156
Investments in infrastructure projects by Brazilian companies on the continent are not new; they have been investing at least since the 1970s. However, since the Lula government there has been more intense and concerted support for the promotion of trade with Africa, alongside greater engagement by Brazilian foreign policy of cials in encouraging the involvement of Brazilian companies in projects of national reconstruction. Support for the execution of projects in Africa have developed around three axes: encouraging
the participation of Brazilian companies; funding and granting credit for national reconstruction projects; and bilateral technical cooperation, by sending missions to support urban development. (MFA, 2011)
The National Bank for Economic and Social Development (Banco Nacional de Desenvolvimento Econômico e Social, BNDES) has, in recent years, implemented signi cant reforms to support the new role of the state
157
Chapter 4 Global Aid Trends, BRICS Reports and OECD Reports
157
within Brazil and abroad. This Bank’s importance in terms of investment resources is growing, not only for the Brazilian economy: since 2005 the volume of loans increased by 391% reaching US$96.32 billion in 2010, approximately 3.3 times more than the World Bank. The role of the BNDES has been essential for investments in infrastructure in Africa. The large conglomerates of engineering and construction rms are the main bene ciaries of public credits directed for these projects. (Garcia, 2011) For instance, funding was targeted to the following countries, (BNDES, 2011 and MRE, 2011):
• Mozambique: approval of funding of US$80 million in 2009 for the construction of the Nacala airport;
• Ghana: funding for the construction of the Eastern road corridor in 2010, to be undertaken by Brazilian construction
rms Oderbrecht and Andrade Gutierrez, budgeted at more than US$200 million; and
• Angola: approval of a credit line of US$3.5 billion, aimed at national reconstruction projects, undertaken by four major Brazilian construction companies operating in Angola.
This increase in funding by BNDES for Brazilian companies carrying out infrastructure projects in Africa coincides with growing governmental technical cooperation projects in these countries. The relationship between these two kinds of activities on the part of Brazil in Africa is still unclear. There is little data available to analyze the public-private relationship in countries where governmental cooperation co-exists with private investments. Nonetheless, there is an urgent need for assessing how far there is alignment of cooperation practices with support to Brazilian private investment. If so, what are the positive and negative impacts? Can these different initiatives nd synergies in ways that promote greater transparency and effectiveness of social
development projects, especially when the various partners are relating to the same sectors and territories?
Since the terms and conditions of loans are not made public, there is no information about the social and environmental criteria guiding the internationalization of Brazilian companies, even though their investments involve the nancing of infrastructure projects, with considerable social and environmental risks and costs. Bearing in mind that BNDES resources are public, the lack of transparency is of deep concern. To what extent do the activities involved in private sector investment in infrastructure and development cooperation as a whole, take into account the right of African countries and their populations to fair and sustainable development? (Beghin, 2012)
A particularly interesting example regarding the integration of technical, nancial and commercial cooperation is the program More Food Africa (Mais Alimentos África). This program adopts a cross-sectoral approach in order to increase the productivity of smallholder agriculture in a sustainable manner and strengthen national strategies for food security (Leite, in press). The program, led by the Ministry of Agrarian Development, (MDA), is inspired by the Brazilian program More Food (Mais Alimentos).
More Food Africa has three lines of action. First, a technical cooperation project is signed with authorities from each country, with the objective of facilitating the exchange of technical assistance and extension activities for rural areas. The Brazilian Government offers credit through concessional lending to the country to import Brazilian agricultural machinery and
Chapter 4 Global Aid Trends, BRICS Reports and OECD Reports
158158
equipment, considered by the partner country as necessary to implement its national strategy for the development of family farming. Finally, an agreement with the Brazilian industrial sector is made, in which African country partners formulate a list of machinery needed, while MDA negotiates prices with the relevant trade unions in Brazil with predetermined conditions. (Patriot and Pierre, in press)
The program is considered innovative for trying to reconcile different goals and interests: supporting family agriculture in the partner country as well as Brazil’s industrial sector. However, such approaches have been common in North-South cooperation in agriculture. It is necessary, therefore, to explore what really differentiates the Brazilian program and how to ensure that it will not replicate past mistakes. An important factor to be considered is the role that the mobilization and involvement of civil society and social movements in Brazil have had, to make such programs successful in Brazil. To what extent can this experience be replicated without the participation of these actors?
The More Food Africa also includes practices highly criticized by global civil society. (Reality of Aid, 2010) The requirement to buy Brazilian machinery can be characterized as “tied aid”, and the need to submit a national strategy for agricultural development to have access to nance, can be seen as conditionality. The Brazilian Government itself has taken positions against such practices in multilateral debates on aid and development effectiveness.
Brazil-Africa relations in recent decades illustrate the integration between Brazilian international cooperation, intensi cation of imports and
exports, and direct investment by the Brazilian private sector in the continent. (World Bank and IPEA, 2011; Schlager, 2007) If, on the one hand, private sector participation in infrastructure projects can contribute positively to the socio-economic development of African countries – assuming a growing volume of resources invested will bring gains in terms of innovation, scale and technology transfer – on the other hand, such investments also represent risks and concerns of various kinds. (Beghin, 2012)
Government funding for the internationalization of Brazilian private companies in Africa raises a series of questions about the legitimacy of this arrangement, and of the motivations for Brazilian cooperation: What are the criteria for the selection of companies and projects to be subsidized? Do they include environmental impact concerns and the participation of civil society in partner countries? In which way do activities of Brazilian subsidized companies correspond with projects and international technical cooperation programs carried out in the same countries? Are they aligned with principles defended by the of cial discourse on South-South cooperation? Above all how does such a cooperation modality combine the principle of non-conditionality with the search for mutual interests?
These are dif cult issues, but unavoidable for the maturation of Brazilian international cooperation policy. There is an urgent need to promote research, technical studies and evaluations that can support and build local knowledge about these forms of cooperation. It is also crucial to support civil society engagement to conduct independent studies, to develop common positions regarding Brazilian and multilateral organizations’ policies and practices, to participate in the design, implementation and execution of projects, and to encourage mobilization of civil society in the partner countries and their integration into global citizenship movements.

159
Chapter 4 Global Aid Trends, BRICS Reports and OECD Reports
159
Some important initiatives of civil society organizations in this regard are underway: the BNDES Platform, for example, brought together several Brazilian civil society organizations to monitor and in uence development policies of the Bank, at both the national and international levels. The Brazilian Network for the Integration of Peoples (REBRIP) has also been bringing together organizations engaged in the monitoring and impact of Brazilian foreign policy since 2001. On the occasion of the Fourth High-Level Forum, held in Busan, 2011, the NGO platform, ABONG (Associação Brasileira de ONGs), with other partner organizations, organized a meeting to exchange knowledge and facilitate interaction among representatives of the Brazilian civil society that would be present in Busan. It resulted in a declaration by Brazilian civil society organizations on international cooperation and development effectiveness.
Finally, we must bear in mind that horizontal cooperation, or South-South Cooperation, as a broader concept than the traditional concept of Of cial Development Assistance (ODA), requires new analysis and parameters for evaluation. The Brazilian case suggests that the analysis of the United Nations Economic and Social Council (ECOSOC) is correct, according to which South-South Cooperation should include the country’s provision of commercial loans for exports, granted at concessional terms, since such ows are important to the economic development of the partner countries and to the promotion of mutual interests. (Cabral, 2011) For researchers and civil society, there is a pressing need to understand cooperation as part of foreign policy, an arena that encompasses state actors, private companies and organized civil society, in a struggle that can either promote or compromise fair and sustainable development, human rights and common goods.
i lio raphy
97 – 98, (April 2012). Barcelona; CIDOB, 2012.
Sub-Saharan Africa: South-South Partnership for Growth. Brasilia: World Bank; IPEA, 2011.
Role of Ecumenical Agencies. INESC,2012.
November 2011, available at midia/documentos/luizantoniodantas.pdf (accessed on 5/25/2012)
November 2011.
Brief Counts 59. Rio de Janeiro: CINDES, 2011.
future prospects. London: ODI, 2010.
CAMPOS, Rodrigo Pires de; LIMA,; João Brígido Bezerra
2011). Brasília, IPEA/DINTE: 2011.

Chapter 4 Global Aid Trends, BRICS Reports and OECD Reports
160160
Development 2005-2009. Brasília: Ipea/ABC, 2010.
Expansion of Companies located in Brazil. Published in October 2011 on the site org.br/site/index.php/biblioteca/category/11-analises-do-desenvolvimento (in 5/25/2012)
LEITE, Iara Costa. Solidarity, Interests and
de Relações Internacionais, 2005.
externa-2003-2010 (accessed on 5/25/2012).
in Africa. Zed Books.
Reports, 2010.
America 2010. Studies SEGIB In 5. Madrid: SEGIB, 2010.
IPEA/DINTE: 2012.

161
Chapter 4 Global Aid Trends, BRICS Reports and OECD Reports
161
The international aid system has undergone a lot of changes in recent years. Initially dependent on Of cial Development Assistance (ODA) by DAC countries, it has moved on and become more complex. Under pressure to prune budgets in the wake of nancial crises, the traditional donors are
nding it dif cult to meet their commitment to allocate 0.7% of their GNI to ODA. ODA has also come under criticism for being an inappropriate mechanism through which to assist development in poor countries. An OECD report, The Tying of Aid1 found that donors continue to be driven by economic and political motivations in tying their aid. Donor countries aim at increasing their exports through aid. Tied aid also in uences the policy options for the recipient country as they are tied to the decisions made at the behest of the donor countries.
At the international level new and competing paradigms for development are emerging. A consensus is growing for both the decentralisation of resources and, more equitable access to make development more inclusive. The June 2012 UN Rio +20 Outcome advocates for democratic access and control by smallholders, women, indigenous people, youth and other marginalised groups over resources; committing adequate public nancing for poverty eradication, social equity and sustainable development; establishing a strong regulatory framework for
the private sector; and establishing participatory accountability mechanisms.
Over the years increasing concerns have been raised that aid has not been able to achieve its goals. Against such background, a movement towards international aid effectiveness began to take shape in the late 1990s, acknowledging that money alone is not enough. Aid had to be seen as a partnership, rather than a one-way relationship between donor and recipient. This agenda for aid effectiveness has been expressed through a series of High Level Forums since 2003.2
The dominance of the G8 and the hegemony of OECD donor countries, including the leadership of the United States, are being challenged by several players on the world stage. The BRICS is one such formation of growing upper middle-income countries. It is estimated that the BRICS economies will overtake the G7 economies by 2027. Four countries (Brazil, Russia, China and India), combined, currently account for more than a quarter of the world’s land area and more than 40% of the world’s population. Goldman Sachs predicts that China and India, respectively, will become the dominant global suppliers of manufactured goods and services, while Brazil and Russia will become similarly dominant as suppliers of raw materials.3
The ten largest economies in the world in 2050, measured in GDP (billions of 2006 USD), according to Goldman Sachs.4
Sa a i a o a i a in in a n o a o So ia a a a ni i o a a a n a an a i a a o ia n o an o n i ni Sin
i S a n a o So ian o o So ia i a o n S S i

Chapter 4 Global Aid Trends, BRICS Reports and OECD Reports
162162
The international aid system is also no longer dependent on OECD Development Assistance Committee (DAC) members alone. In recent years non-DAC countries, and particularly the BRICS, have started exing their muscles in the international aid system. Global Humanitarian Assistance published a report in July 20105 ranking BRICS countries on the total amount of humanitarian aid channelled through United Nations (83.6%), elected governments (7.3%), NGOs (3.3%) and others (5.8%).
• Saudi Arabia- US$51.8 million• United Arab Emirates- US$35.3 million• Kuwait- US$34.2 million• Russia- US$32.5 million• India- US$14.6 million• South Korea- US$13.2 million• Qatar- US$12.9 million
The international aid system is also witnessing increasing levels of public private partnerships. The role of the private sector is growing in the aid system. International donors have been associating the private sector, sometimes through non-governmental organizations (NGOs), in the implementation of the projects funded by the donors. In recent years, WHO’s work has
involved more collaboration with NGOs and the pharmaceutical industry, as well as with foundations such as the Bill and Melinda Gates Foundation and the Rockfeller Foundation. Some of these collaborations may be considered global public-private partnerships (GPPPs). Half of the WHO budget is nanced by private foundations.
India is an interesting case in this evolving international aid scenario. From being one of the world’s largest recipients of foreign aid in the mid-1980s, India has become a net donor. In 2008 it allocated about US$547 million to aid- related activities, while approving US$2.96 billion in Lines of Credits (LoCs) mostly to Sub-Saharan Africa (SSA).
In 2003, India became a net creditor to the IMF and the World Food Program after having been a borrower from these organisations for years. India laid out its new policy towards aid in June 2003.6 It would no longer accept tied aid. Bilateral aid would be accepted only from ve countries, namely the United Kingdom (UK), the USA, Russia, Germany and Japan, in addition to the
163
Chapter 4 Global Aid Trends, BRICS Reports and OECD Reports
163
European Union (EU). Bilateral cooperation with other donors would not be renewed after completion of existing projects, although these donors may still channel their assistance through NGOs and multilateral agencies. In many respects, this decision was a political one in order to secure a permanent seat in the reform of the UN Security Council, and not based on any nancial consideration. It is important also to note that many innovative schemes were initiated and implemented successfully by these bilateral donors, which have become models for development.
Government of India has established its own overseas development aid agency named Development Partnership Administration under the Economic Relations Division of the Ministry of External Affairs. Major traditional donor countries usually have an autonomous agency to administer their aid, such as USAID and the UK’s Department for International Development (DFID). Development Partnership Administraion is GOI’s effort along that direction.7
India focuses its development assistance in two geographical regions: its immediate neighbourhood, particularly Bhutan, Nepal, and Afghanistan and the developing countries of Africa.
India has pledged US$5 billion in aid to Africa, an amount almost equivalent to its own annual healthcare budget- around US$5.9 billion.8 Africa is one of the weakest links in the realisation of the Millennium Development Goals (MDGs). Apart from development aid, India will also US$700m to build institutions and establish training programmes and US$300m to develop the Ethio-Djibouti Railway. Plans for an India-Africa virtual university and more than 22,000 higher education scholarships for African students are also in pipeline. Apart from these initiatives, India will
contribute US$2m to the African Union Mission in Somalia (AMISOM).9 Similarly, India’s largest public-sector oil company, ONGC, has invested US$10m to build a railroad in Nigeria.
Afghanistan has also become a signi cant recipient of Indian development assistance. If current trends continue, Afghanistan will shortly overtake Bhutan as the single-largest recipient of Indian development assistance. Since 2002, India has pledged US$750m under the assistance programme for Afghanistan.
India’s of cial development assistance (ODA) is a mix of project assistance, purchase subsidies, lines of credit, travel costs, and technical training costs incurred by the Indian government.
One new idea that holds signi cant potential is contained in a government report currently under review. The report recommends that Indian non-governmental organisations be permitted to use their funds in other countries. This move will open the door for Indian non-governmental organisations to serve as the ‘soft’ arm of the MEA. Although this policy is being debated under the aegis of the Planning Commission of India, most signals point to a policy that will also enable public-private partnerships in Indian development assistance. When it happens, this change will be assisted by the establishment of large voluntary organisations by India’s biggest corporations, including Reliance, Tata, Bharti Airtel, Mittal etc.10
While India’s assistance to Bhutan, Afghanistan, and Nepal is devoted mainly to infrastructure and project assistance, aid to other countries (especially in Africa) is focussed on training civil servants, engineers, and public-sector managers in recipient nations. Aid goes to providing loans to enable foreign governments to purchase Indian equipment and services and for project-related

Chapter 4 Global Aid Trends, BRICS Reports and OECD Reports
164164
activities such as feasibility studies and sending technical experts from India. The country provides very little development assistance in the form of cash grants.
While CSOs criticize the conditionalities of traditional donors, countries like India and China have their own tied conditionalities attached to their aid. These latter policies ignore the fact that traditional ODA have come under attack mainly on the grounds of the tied nature of their aid. China and India are implicated in many cases in human rights violations in the countries of Asia and Africa through their support to dictatorships that supress human rights. Civil society organisations in India should not remain a mute spectator. They should take a de nite and ethical stand on these issues with their own government.
A strong underlying motivating factor for India’s aid priorities is the India-China rivalry for regional supremacy and the quest for natural resources. This competition focuses on three major issues: diplomatic in uence, oil reserves, and markets for goods.
India’s rivalry with China is most evident in the two countries’ quest for African energy resources, with both countries trying to secure ‘equity oil’.11 Africa enjoys some eight percent of the world’s known oil reserves, an attractive prospect for China ( the world’s second largest importer of energy) and India (the fth). Africa is also a growing market for exports. Indian rms have begun to invest in Africa in signi cant volumes, with almost US$400 million in the last two years alone. In Africa, Indian products in light engineering, consumer goods, and intermediate products can compete on price and are well adapted to local conditions. For instance, trucks
made by the India corporate giant Tata sell well in Africa.
Given its quest for regional power status and membership in the UN Security Council, India is increasingly eager to portray itself as a provider of development assistance. In fact, in a major development, at the 2012 G20 summit, held at Los Cabos, Mexico, Prime Minister Manmohan Singh announced that India would contribute $10billion to the International Monetary Fund’s additional
rewall of $430 billion meant for the eurozone, in a stark reversal of roles!12 At one point in the mid-1980s, the country was the world’s largest recipient of foreign aid. Now foreign aid constitutes less than 0.3 percent of the country’s national GDP and is marginal at best in India’s economic development. On the other hand India’s development assistance is well behind China’s development assistance. (Estimated to be about seven times that of India’s!).
Indian NGOs’ response to aid is divided into two main perspectives. One perspective says that Indian NGOs should focus on generating resources from the people in the country itself, from a growing and af uent middle class. This will ensure that they become more politically rooted as well as more accountable to the people they claim to represent. This way they can also overcome the conditionalities that come with their reliance on foreign funds. The donors dictate strategies for implementing projects, which are often completely out of tune with social and political realities and most of the time do more harm than good. More reliance on domestic resources would check this aid dependency.
On the other hand, the advocates for aid argue that all Indians deserve entitlements to food

165
Chapter 4 Global Aid Trends, BRICS Reports and OECD Reports
165
security, safe drinking water, healthcare, sanitation and education at affordable prices. These are areas where well-targeted aid has the potential to reshape India in a more inclusive, participatory, and egalitarian direction. In absolute dollars, aid may not deliver much to India’s social spending programmes. But its contribution must not be trivialized so long as the Indian state fails in public services provision for all Indians.
Sectoral priorities for public investment
The focus of the Eleventh Five year Plan (2007-12) has been on infrastructure. It envisaged an increase in investment in physical infrastructure from the level of about 5% of GDP during the Tenth Plan (2002-07) to about 9% of GDP by 2011-12 ( nal year of the Eleventh Plan). This was estimated to require an investment of Rs 20,56,150 crore13 (US$514 billion) during the Eleventh Plan period as compared to an estimated investment of Rs 8,71,445 crore (US$218 billion) during the Tenth Plan. Further, it was estimated that the contribution of the private sector in this investment would increase from about 20% in the Tenth Plan to about 30% in the Eleventh Plan.14 The contribution of the private sector in total investment in infrastructure in the rst two years of the Eleventh Plan was 34.3% and 33.7% respectively, which is higher than the Plan’s target of 30% of investment by the private sector.
The focus of Twelfth Five Year Plan (2012-17) has been on social sector. But investment is well below its targets. The Approach document for this Plan notes that resource limitations imply the need to prioritize carefully and that some priority areas, e.g., health, education and infrastructure, will receive more funds than other
areas. Although the country targeted 6% share of GDP to the education sector, performance has fallen short of expectations. During the Financial Year 2011-12, the Central Government of India has allocated Rs 38,957 crore for the Department of School Education and Literacy. Within this allocation, a major share of Rs 21,000 crore is for the agship programme ‘Sarva Siksha Abhiyan’. However, a budgetary allocation of Rs 21,000 crore is considered very low in view of the of cially appointed Anil Boradia Committee’s recommendation of Rs 35,659 crore for the year 2011-12. This higher allocation was required to implement the recent legislation, ‘Right to Children to Free and Compulsory Education Act’, 2009.
Similarly, India’s total expenditure on health amounts to 5.1% of the GDP, while its per capita total expenditure on health is $ 80 compared to an average of over $220 spent by many other developing countries. These trends have resulted in shift in demand towards private providers, which are prohibitively expensive for most of the population.
Strengthening Public-Private Partnerships (PPPs)
A Public-Private Partnership is not the panacea for all development ills; however, at its best, it represents the convergence of private sector capabilities and the government’s priorities. A large number of PPP projects have been taken up in various infrastructure sectors, including roads, ports, airports, and urban infrastructure. A total of 937 projects, involving an investment of Rs 7,16,439 crore are currently at various stages of awards and implementation.
Some illustrative PPP projects include the following:15

Chapter 4 Global Aid Trends, BRICS Reports and OECD Reports
166166
• Bangalore International Airport, Karnataka• Rajiv Gandhi International Airport,
Hyderabad• Chhatrapati Shivaji International Airport,
Mumbai• 6 Laning of Jaipur- Kishangarh National
Highway• Hyderabad Metro Rail Project, Hyderabad• Bridge across River Godavari between
Yanam-Edurulanka, Andhra Pradesh, etc.
As a major policy decision, Government of India noti ed the Viability Gap Fund (VGF) Scheme16 in 2006 to enhance the nancial liability of competitively bid infrastructure projects.
Public-Private Partnerships extend to other areas
This public-private partnership framework, however, is not limited to the area of infrastructure alone.
As a matter of fact, several of India’s agship programmes are running under the PPP framework, (though not in the traditional sense of PPP) with signi cant external funding. For example, Sarva Siksha Abhiyan (SSA)17 was partially funded to the tune of Rs 4700 crore from 2003-04 to 2006-07 by the World Bank, the European Commission and DFID.18 SSA involves a Public-Private Partnership; not at the stage of construction of physical infrastructure, but at the monitoring stage. The monitoring mechanism includes apart from government representatives, representatives of civil society (i.e. two NGOs working on elementary education). The Government of India is also commissioning several independent assessments to assess the implementation of SSA and the elementary education situation in the country.
Similarly under ‘Rajiv Gandhi Grameen Vidyutikaran Yojana’19, a franchisee can be an
NGO, a Self Help Group, User Associations, Cooperatives or individual entrepreneurs. This is also an excellent example of PPP.
The Mid-day Meal Scheme20 in the state of Karnataka has successfully involved private sector participation in the programme.21 In the mid-day meal scheme, the weekly menu is decided by the local authorities (i.e. village Panchayats, VEC, Self-Help Groups, etc). Representatives of Gram Panchayats/Gram Sabhas, members of VECs, PTAs, SDMCs as well as Mothers’ Committees can monitor the quality of the food cooked.
The Bharat Livelihood Foundation of India22 is an acknowledgement of the resourcefulness and initiative of the private sector. The Foundation attempts to link leading corporate houses with the Government initiatives in a public-private partnership framework to counter naxal insurgency through development work. For 2012, the Government has allocated Rs 200 crore to the Bharat Livelihood Foundation of India, which will work to improve livelihoods and the habitat of tribal communities in 170 districts. It plans to provide a total of Rs 500 crore to the Foundation over three years.
Draft National Public-Private Partnership Policy
The considerable growth in Public-Private Partnerships in the last 15 years has led the Government to envisage a substantive role for PPPs as a means for harnessing private sector investment and operational ef ciencies in the provision of public infrastructure and services. The Government has set up a Public-Private Partnership Appraisal Committee to streamline appraisal and approval of projects. PPPs are now seen as the preferred implementation mode for Government initiatives in many sectors such as highways, ports and airports. Increasingly PPPs are being adopted in the urban sector and in social sectors. 23

167
Chapter 4 Global Aid Trends, BRICS Reports and OECD Reports
167
In September 2011, the Ministry of Finance promulgated a “Draft of PPP Policy 2011” and solicited views and suggestions from all stakeholders over a month.
The Draft National PPP Policy seeks to facilitate this expansion of PPPs, where appropriate, in a consistent and effective manner, through measures:
1. Setting out the broad principles for pursuing a project through PPP;
2. Providing a framework for identifying, structuring, awarding and managing PPP projects;
3. Delineating the cross-sectoral institutional architecture and mechanisms for facilitating and implementing PPPs;
4. Standardizing some of the vital interpretations and processes of PPPs so that a clear and consistent common position is adopted for key issues; and
5. Identifying the ‘next generation issues’
harat i elihood Fo ndation of India
to mainstream, upscale, broaden and expedite PPPs.
The implementing agency for a PPP project must establish appropriate mechanisms for project monitoring such as Project Monitoring Unit (PMU) as well as appropriate inter-department committees. The latter would oversee project implementation, facilitate coordination between departments and render assistance during dispute resolution or arbitration.
In order to continuously monitor the performance of the PPP projects over the project life cycle, the Government is establishing a Management Information System for PPP projects.24
The Government has created a progressive nancial support system for PPP projects. It has
put in place a number of nancing mechanisms to support PPPs, either for project development or for gap nancing of capital and life cycle investments. These mechanisms include the
Chapter 4 Global Aid Trends, BRICS Reports and OECD Reports
168168
India Infrastructure Project Development Fund (IIPDF), the Viability Gap Funding (VGF), resources for annuities/availability based payments, long term lending, a re nancing facility, infrastructure debt funds, among others.
The implementing agencies are to encourage leveraging funding for PPPs available from schemes such as JNNURM25, Bharat Nirman26 etc, as well as alternate sources of nance such as Municipal Bonds, Pooled Finance Structures or Pension Funds. The Draft Policy states that monopolistic tendencies inherent in basic services projects will be controlled so as to protect the interests of both the consumers as well as private investors.
Government agencies sponsoring a PPP project retain full responsibility for making available unencumbered land for the project and obtaining clearances from relevant regulatory authorities. The agency must also ensure that the interests of land owners are fully protected under the extant laws.
A number of capacity building interventions have also been initiated by the Government to develop organizational and individual capacities for identi cation, procurement and managing PPPs. A National Capacity Building Programme provide training on PPPs in a phased manner for State Governments, Urban Local Bodies and Central Government departments.
Implementing Corporate Social Responsibility
While the Draft Policy on PPPs is welcome, Corporate Social Responsibility (CSR) is another mechanism whereby the government is managing the utilization of private sector expertise in the social sector. However, CSR raises certain challenges.
The Indian Government would like to make it mandatory for companies to spend at least 2% of their net pro ts on CSR. Industry has strongly resisted a mandatory requirement for CSR. Facing strong criticism, it gave up the effort in mid-July 2011 and made CSR spending mandatory only for public sector companies and for rest it remains voluntary. Instead of de ning CSR, the Indian Government recast it as “responsible business” in a set of voluntary guidelines for
rms.27 In the latest round of recommendations, the Government asks that companies keep tab on CSR spending and disclose it to their principal stakeholders.
Recently, the Government also sought to include vocational training for employees as part of CSR. But vocational training was also dif cult to delimit. The rst Government paper on CSR, released by the Ministry of Corporate Affairs in 2009, also raises health, cultural and social welfare, and education under the purview of CSR.28
In the Indian experience of CSR, corporate houses establish their own not-for-pro t arms. In majority of the cases, Indian companies are working through their own foundations, using their not-for-pro t extensions as tax breaks.
The Azim Premji Foundation, for example, has committed to train ve lakh teachers through distance education in the next ve years under its ‘Wipro Applying Thought in Schools’ programme. Indian Oil has set up the Indian Oil Foundation (IOF) as a non-pro t trust to protect, preserve and promote national heritage monuments.
A survey conducted by TNS India on behalf of the Times Foundation of Bennett, Coleman & Co has brought out several stark realities about CSR.

169
Chapter 4 Global Aid Trends, BRICS Reports and OECD Reports
169
It demonstrates that
• Most of the companies implement CSR projects through their own CSR project management divisions, with just about 29 percent involving voluntary organisations and over one-tenth of the companies giving
nancial support directly to the community or to community-based organisations.
• Education, health and environment are three of the most popular areas of intervention for companies as part of their CSR initiatives.
• Companies continue to decide their own projects depending on a number of parameters. These efforts are driven purely by the company’s operational perspectives and the ease of implementation for their CSR projects.
• Many CSR initiatives and programmes are taken up in urban localities. As a result, the impact of most projects does not reach the poor and marginalised in the rural areas.
• Only medium and large corporate houses are involved in CSR activities, and only in selected geographical areas. To address the issue of reaching out to wider geographical areas, the involvement of small and medium enterprises (SMEs) in the CSR domain will be essential.
• Companies end up duplicating each others’ efforts on similar projects in the same geographical locations. This creates problems and induces a competitive spirit amongst companies. It is recommended that companies involved in CSR activities urgently consider pooling their efforts into building a national alliance for corporate social responsibility.
But as corporate social responsibility is not compulsion under law, corporate initiatives under
CSR are erratic, unplanned and have elements of spontaneity. The Indian companies are clearly not utilising 2% of their earning as CSR. This percentage would have been a very large outlay by any measure and if utilised in proper way, it could have given a huge boost to the PPP model. It is a major failure on the part of Indian Government, especially considering that companies take many bene ts from the state such as tax breaks, special economic zones, purchase and lease of land at highly concessional rates. For these reasons, the Government should not have given way under corporate pressure, but rather should come back to make CSR spending by Indian companies compulsory.
The nancial regulatory system in India is well developed. Recently the Government has taken an initiative to check corruption in the private sector (including the social sector). A Transparency International India Report29 says that the private sector is no longer a victim of government corruption; instead, they are instrumental to corruption and work hand-in-glove with public of cials. As such the Government must bring a strong deterrent tool to curb corruption in the private sector. In this regard, the Government has proposed to amend the Indian penal code to make bribes exchanged between private persons a criminal offence.
National Policy on voluntary sector
NGOs were intended to ll gaps in government services. In countries like India, NGOs are also gaining powerful strongholds in policy decision-making. In the interest of sustainability, most donors require NGOs to demonstrate a relationship with governments.

Chapter 4 Global Aid Trends, BRICS Reports and OECD Reports
170170
The scale and variety of activities in which NGOs participate in Indian development has grown rapidly since the 1980s, witnessing a particular expansion in the 1990s. Foreign funding has played a signi cant role in this expansion, as Indian NGOs/CSOs have been getting substantial nancial help from foreign donor agencies. In the period from 2001 to 2010, Indian CSOs received more than Rs 70,000 crore. In one particular nancial year 2009-10 the foreign contribution was Rs 10,338 crore, as reported under FCRA (Foreign contribution regulation Act).30
A breakdown of this nancial assistance shows that the highest amount of foreign contributions was allocated (rather utilised) for Establishment Expenses (Rs 1482.58 crore), followed by- Rural Development (Rs 944.30 crore), Welfare of Children (Rs 742.42 crore), Construction and Maintenance of school/college (Rs 630.78 crore), and the Grant of Stipend/Scholarship/Assistance in cash and kind to poor/deserving children (Rs 454.70 crore).
Realising the signi cant role of the voluntary sector in the national life, as well as their growing international stature, the Government’s efforts to establish a new and de ned policy with respect to NGOs/CSOs is a breath of fresh air. It recognises that the voluntary sector has contributed signi cantly to innovative solutions to poverty, deprivation, discrimination and exclusion, through means such as awareness raising, social mobilisation, service delivery, training, research, and advocacy. The voluntary sector has been an effective non-political bridge between the people and the Government. This af rms the growing need for collaboration with the voluntary sector by the Government, as well as by the private sector, at the local, provincial and national levels.
The policy addresses issues of critical importance to Voluntary Sector:
• The Government will encourage the evolution of, and subsequently accord recognition to, an independent, national level, self-regulatory agency for the Voluntary Sector.
• At the same time, there is need to bolster public con dence in the Voluntary Sector by opening it up to greater public scrutiny. The Government will simplify and streamline the system for granting income tax exemption status to charitable projects under the Income Tax Act.
• The Government will review the FCRA (Foreign Contribution Regulation Act) and simplify its provisions that apply to Voluntary Organisations (VOs).
• The Government will encourage all relevant Central and State Government agencies to introduce pre-service and in-service training modules on constructive relations with the Voluntary Sector.
• It is essential that the Government and the Voluntary Sector work together, as Voluntary Organisations have alternative perspectives, capacity to conduct a meaningful dialogue with communities. Where feasible, such partnership may also include other entities such as Panchayati Raj Institutions, municipalities, academic institutions, and private sector organisations.
• The expertise of the Voluntary Sector will also be utilised, by including experts from Voluntary Organisations in the committees, task forces, and advisory panels constituted by the Government from time to time to help address important issues.
• The Government will identify national collaborative programmes to be implemented in partnership with Voluntary Organisations

171
Chapter 4 Global Aid Trends, BRICS Reports and OECD Reports
171
in areas like poverty alleviation, skill promotion, entrepreneurship development, empowerment of women, population stabilization, combating HIV/AIDS, managing water resources, elementary education and forest management.
• Concerned Government agencies will be encouraged to ensure proper accountability and monitoring of public funds distributed to Voluntary Organisations.
• The Government will encourage various agencies, including those in the Voluntary Sector, to develop alternative accreditation methodologies for Voluntary Organisations, which will lead to better funding decisions and make the funding processes more transparent. Accreditation may provide incentives for better governance, management and performance of Voluntary Organisations.
• The Government will support and encourage existing, as well new, independent philanthropic institutions and private foundations to provide nancial assistance to deserving Voluntary Organisations.
• The Voluntary Sector is expected to set its own benchmarks in the areas of transparency and accountability. The Government will recognize excellence in governance among Voluntary Organisations by publicizing best practices.
• The Government will commission suitable agencies to prepare and update databases on Voluntary Organisations.
• The websites of various Government agencies will be re-designed to provide links to key documents and databases, including those related to project funding schemes.
• The Government will encourage involvement of volunteers in public services, such as in family welfare centres, primary health centres, hospitals, schools, vocational training centres, sanitation campaigns, etc.
The relationship between Indian government and the Voluntary Sector has generally been one characterized by a lack of trust and hostility. Voluntary Organisations have been viewed as greedy recipients of foreign aid and dictated by the foreign funders. This attitude is exempli ed in a statement of Prime Minister Manmohan Singh wherein he pointed to the foreign funded NGOs behind opposition to Kudankulam Atomic Project.31 Indian NGOs/CSOs have hope that this Voluntary Sector policy opens a new chapter in the relationship between the Government and NGOs/CSOs.
But it seems to a be wishful thinking, at least for the time being. At present, the Government’s Voluntary Sector Policy is still only “on paper” and has not been implemented since its acceptance by the Union Cabinet in 2010. All Ministries and Departments are not following the spirit of the Policy. Even the Ministry of Home Affairs recently made major amendments to the FCRA (Foreign Contribution Regulation Act), which has made it even more stringent to receive funds from foreign funding agencies.
To sum up, the aid and international cooperation are undergoing major paradigm shift. In the wake of emergence of new private players, Government is being forced to make changes in its perspectives and policies towards private players and aid system. PPPs are emerging as new implementing mechanisms. And unlike the traditional de nition of PPPs, they are not limited to infrastructure projects, but are extending to social areas, where not-for-pro t organisations have increasingly been playing a bigger role. As such, PPPs have emerged as a signi cant avenue for the aid mechanism. Foreign aid has only scaled up and become more complex, with the

Chapter 4 Global Aid Trends, BRICS Reports and OECD Reports
172172
involvement of private sector actors and the foundations in this increasingly globalised world. Bill and Melinda Gates Foundation being one of the illustrious examples. Government has been doing a lot to make adjustments in this changed scenario. And this is not smooth sailing for the government. On one hand, it recognises the role
of the private sector, and plans to use them as a ‘soft arm’ of government; on the other hand, the government tries to clip their wings by making stringent provisions in the FCRA. As a matter of fact, a lot of the challenges owes to the problem that the bureaucracy has, with its old mindset, in sharing space with other stakeholders.
Endnotes
1 OECD Development Centre Studies: The Tying of Aid
2 igh evel Forum on armonization at Rome (2003), Paris Declaration on Aid Effectiveness (2005), Accra Agenda of Action (2008), Fourth igh evel Forum on Aid Effectiveness, Busan (2011).
3 “ BRICS AND BE OND”-Goldman Sachs Study of BRIC and N11 nations, November 23, 2007
4 Ibid
5 http://www.globalhumanitarianassistance.org/report/gha-report-2010
6 w w w . r e a l i t y o f a i d . o r g / u s e r f i l e s / r o a r e p o r t s /roareport_3ce2522270.pdf
7 h t tp : / /www.mea.gov. in /deve lopment -par tnersh ip -administration.htm
8 h t t p : / / w w w . i n d i a a f r i c a c o n n e c t . i n / u p l o a d /p u b l i c a t i o n / A Q _ M a y - J u l y 2 0 1 1 . p d f . The Second Africa India Forum Summit was held in Addis Ababa, Ethiopia, from May 24 to 25, 2011. The theme for the second summit was Enhancing Partnership and Shared Vision’. The Prime Minister of India Manmohan Singh announced that India would provide US$5 billion in credits to support infrastructure and other development in Africa.
9 http://www.guardian.co.u /global-development/poverty-matters/2011
10 http://www.idrc.ca/EN/Documents/Case-of-India-pdf
11 Equity oil’ is oil obtained as part of ownership (in part or whole) of an oil-production facility. It is generally much cheaper than oil purchased on the open mar et and thought to be of great strategic value in unpredictable mar et conditions.
12 The indu, June 19, 2012
13 Crore is equivalent to ten million.
14 http://planningcommission.nic.in/plans/mta/11th_mta/chapterwise/chap14_invest.pdf
15 planningcommission.nic.in/plans/planrel/ veyr/11th/.../11th_
vol1.pd.
16 Government of India has established a iabilit Gap und to aid the PPP infrastructure projects which face the viability gap due to inherent nature of the project. The Viability Gap Funding Scheme provides nancial support in the form of grants to infrastructure projects in PPP mode to ma e them commercially viable. The Scheme is administered by the Ministry of Finance. Provision has been made to provide upto 20% of total project cost as capital grant to meet the funding gap. Also in such project sponsoring agency/department/state can give additional 20% of the project cost VGF support. The criteria is that the PPP project should be implemented, i.e. developed, nanced, constructed, maintained and operated for the Project term by a Private Sector Company; selected through a transparent and open competitive bidding process.
17 Sarva Si sha bhi an SS is Government of India’s agship programme for achievement of Universalization of
Elementary Education (UEE) in a time bound manner, as mandated by 86th amendment to the Constitution of India, which ma es free and compulsory Education to the Children of 6-14 years age group, a Fundamental Right. Opening new schools in those habitations which do not have schooling facilities and strengthening existing school infrastructure through provision of additional class rooms, toilets, drin ing water, maintenance grant and school improvement grants.
18 http://pib.nic.in/archieve/ agship/ssa_faq.pdf
19 aunched in April 2005, Rajiv Gandhi Grameen Vidyuti aran ojana (RGGV ) aims at providing access to electricity to
all rural households and providing electricity Connection to Below Poverty ine (BP ) families free of charge. abitations above population of 100 are being covered under the scheme.
Under the RGGV scheme, deployment of franchisees is mandatory in the areas for the management of rural distribution in the areas, where projects have been nanced under the scheme. These franchisees will be the authorized representatives of the state power utilities. They may be given the responsibilities of operation and maintenance of the distribution system, issuance of electricity connections, attending of minor faults, meter reading, issuance of electricity bills, collection of bill payment etc. They will wor under the supervision of the state utility, which will have the overall responsibility of providing proper services to its consumers.
20 The Mid Day Meal is the world’s largest school feeding programme reaching out to about 12 crore children in over 12.65 la h schools/EGS centres across the country. Purpose- to enhance enrolment, retention and attendance and simultaneously improving nutritional levels among

173
Chapter 4 Global Aid Trends, BRICS Reports and OECD Reports
173
children.
21 A shaya Patra Foundation is a not-for-pro t organization providing freshly coo ed, hot and nutritious coo ed classroom lunches for nearly 1.3 million underprivileged children in India. It runs the world’s largest NGO midday meal program for underprivileged school children in India. A public-private partnership project, A shaya Patra delivers school lunch at a fraction of the cost of similar programs in other parts of the world. The Board of Trustees comprise missionaries of ISKCON Bangalore, corporate professionals, and entrepreneurs.
Voluntary organizations such as A shaya Patra are encouraged to set up operations wherever possible. They act as the implementing arm of the government. Karnata a
uman Development Report 2005 explains the policy of involving NGOs in development programs, “ nvolvement o the G s in multilateral bilateral programs raises the level o co-operations to another level. The G s become not onl implementers the also nd a place in designing and managing programs together with government at all levels.
22 “I have written to the Tatas, Reliance, Infosys, Wipro. It will be a public-private-partnership model. The Foundation will be an independent body with a full-time professional CEO. On [April] 27 we have called a meeting of non-government organisations, donors and State governments. We are hoping to get a good response from the private sector,” Mr. Ramesh told reporter. Foundation “will wor with civil society organisations” directly in 170 Adivasi (tribal) districts. “Its function will be to build institutions and capacity of NGOs wor ing in livelihood areas, such as dairy, watershed management, women’s empowerment, in these dif cult districts.”
The Foundation will raise an initial corpus of Rs. 1,000 crore, of which Rs. 500 crore will come from the Centre and the remaining from the private sector. This news appeared in the
indu, April 15, 2012 http://www.thehindu.com/news/national/article3315406.ece
23 “Draft of PPP Policy 2011” www.pppinindia.com accessed on ctober 2012
24 The evaluation of the PPP projects would also be tabulated and summarized so as to utilize the same for improving the quality of service delivery levels and sustainability of PPPs in the future. The database of the projects would not only contain information on the ongoing projects but also set out framewor s for monitoring them during various stages of the project cycle. The database would be so developed so as to generate information for underta ing VfM (Value for Money) analysis. PPP Cells would be responsible to set up
MIS systems and disseminate information to Government agencies from time to time so as to effectuate suitable policy changes based on the previous experience of managing PPP projects.
25 Jawaharlal Nehru National Urban Renewal Mission (JNNURM) is a massive city-modernisation scheme launched by the Government of India under Ministry of Urban Development. It envisages a total investment of over $20 billion over seven years i.e. the duration of the Mission is seven years beginning from December 2005-06. During this period, the Mission see s to ensure sustainable development of select cities. Currently, ten projects are being covered by JNNURM funds pertaining to road networ , storm water drains, bus rapid transit system, water supply, solid waste management, sewage treatment, river and la e improvement, slum improvement and rehabilitation. It supports public-private partnerships and cost recovery to ma e service providers nancially self-sustaining.
26 Bharat Nirman is an ambitious plan for creating basic rural infrastructure, launched by Government of India in 2005. It comprises projects in six areas: irrigation, roads, housing, water supply, electri cation and telecommunication connectivity with an eye on overall development of the infrastructural facilities of the country.
27 http://www.mca.gov.in/Ministry/latestnews/National_Voluntary_Guidelines_2011_12jul2011.pdf
28 http://www.mca.gov.in/Ministry/latestnews/CSR_Voluntary_Guidelines_24dec2009.pdf
29 http://transparencyindia.org/resource/survey_study/Assessment%20of%20Integrity%20Pact%20in%20IP%20compliant%20PSUs.pdf
30 FCRA (Foreign Contribution Regulation Act), 1976, amended in 2010. The prime objective of the Act is to regulate the acceptance and utilization of foreign contribution and foreign hospitality by persons and associations wor ing in the important areas of national life. The Act also see s to regulate ow of foreign funds to voluntary organizations with the objective of preventing any possible diversion of such funds towards activities detrimental to the national interest and to ensure that individuals and organizations may function in a manner consistent with the values of the sovereign democratic republic.
31 American NGOs fund the protests that hold India bac from building the nuclear reactors it needs to meet fast-growing energy needs, Mr Manmohan Singh said in an interview published in Science magazine on February 24.

Chapter 4 Global Aid Trends, BRICS Reports and OECD Reports
174174
• Total ODA in 2012-2013 is budgeted at AUS$5.2 billion or 0.35% of GNI. This represented an increase in real terms of AUS$315 million;
• Australia has delayed its commitment to achieving 0.5% GNI for its ODA until 2016-2017, missing the target year for the Millennium Development Goals;
• Australia undertook a comprehensive review of aid effectiveness in 2011 resulting in a new policy framework outlining spending priorities for the next 5 years;
• Economic development is a core priority of the aid program and received the highest level of funding of all strategic goals in the 2012-2013 budget; and
• The Government has committed to increase spending through multilateral institutions and NGOs.
The Independent Review of Aid Effectiveness undertaken in 2010/2011 aimed to assess the overall effectiveness of the Australian aid program and give advice on the strategic direction of Australian Overseas Development Assistance for the next ve years and beyond. 1 The Government accepted 38 of the 39 recommendations from the review and have used this process to produce an overarching policy framework for Australian ODA. This is the rst
substantial review of the aid program in 15 years, and replaces the previous government’s 2006 White Paper on Australia’s Overseas Aid.
The new policy framework (“Framework”) recon rms Australia’s commitment to the Millennium Development Goals and sets out Australia’s ODA as being guided by ve core strategic goals. (See Figure 1)
These core strategic goals are reinforced by 10 individual development objectives that includes the development of “sustainable mining” industries as a means of achieving economic development.2
The new Framework for Australia’s aid program also proposes some changes to the way the aid program operates as it expands due to expected increases in funding. Despite lip-service to “aid effectiveness”, many NGOs were disappointed that the Framework did not incorporate the international aid effectiveness agenda to which Australia is a signatory, such as the 2008 Accra Agenda for Action. It also lacks a human rights framework or approach to development.
This chapter examines ve aid program highlights:
• Commitment to aid spending • The purpose of the aid program• Delivery of aid program• Regional focus• Improvements to transparency

175
Chapter 4 Global Aid Trends, BRICS Reports and OECD Reports
175
Although the Australian Government had previously committed to reaching aid expenditure of 0.5% of Gross National Income (GNI) by 2015, the 2012 budget delayed this target under domestic pressure to return the budget to surplus. Aid spending in 2012/2013 increased in real terms from AUS$4.9 billion to AUS$5.2 billion but remained at 0.35% of GNI.3 This delay has affected initiatives in the new Framework, with most announcements in the budget expected to commence in 2014-2015.4
The 0.5% target is now scheduled for 2016-2017, missing the deadline for the Millennium Development Goals. To reach the delayed target, the aid budget for 2012/2013 expects to increase Australian aid to 0.37% of GNI in 2013/2014, 0.41% in 2014/2015 and 0.45% in 2015/2016.5 In real terms this means an increase of approximately AUS$1 billion per year from 2013 onwards, an amount never before seen in the history of the aid program. These amounts have led some analysts to cast doubt on the achievability of this goal.6
Although the commitment to reaching 0.5% at some stage retains bipartisan support, the opposition Liberal Party have been vocal in their criticism of Australia’s aid agency7, and there is
some concern that if in power after the 2013 elections, they will abandon the 0.5% target.
NGOs have been strongly critical of the delay, especially given Australia’s economic growth and record of being the only OECD nation not to have experienced a recession over the past 5 years. The retention of an aid budget at 0.35% of GNI means that Australia’s contribution to overseas aid and development remains much lower than the average OECD contribution for 2011 of 0.46 percent.8
Although the Australian Government has tweaked the language describing the aim of its aid program to focus more on poverty reduction and less on the national interest, there has been an abject failure to completely remove the national interest from the aims of the Australian aid program. The latter continues to be viewed in terms of strategic, economic and security bene ts to Australia.
Australian aid allocations to countries, regions and sectors, incorporate the national interest as one of four criteria that determine these allocations. The other criteria include poverty-related need, effectiveness and the capacity to make a difference.9 Like the new Framework, aid allocation criteria do not include measuring

Chapter 4 Global Aid Trends, BRICS Reports and OECD Reports
176176
a particular program or area against international aid and development instruments to which Australia is a current signatory.
Funding streams in the 2012-2013 budget are assigned according to each of the new ve priority areas. ‘Sustainable economic development’ (SED) is a agship sector for Australian ODA under this new Framework, expected to account for 27% of ODA expenditure in 2012-2013, representing the highest amount of expenditure for any area. This spending is articulated by AusAID as a link between economic growth and poverty reduction, with an expectation that countries will become less reliant on aid as their economies expand.
SED encompasses food security, with AusAID committing to increase spending on agricultural productivity and work towards the ‘opening of markets’. Mining has also taken a dominant role in AusAID’s economic development strategy with a focus on providing expertise and regulatory advice to other nations. Funding for climate change mitigation and adaptation programs will continue to be supported through the aid budget. This is despite ongoing criticism that such funding should be additional to aid funding as per international agreements such as the United Nations Framework Convention on Climate Change, the Kyoto Protocol, the Bali Action Plan and the Copenhagen Accord.10
‘Promoting opportunities for all’ encompasses education, gender and disability and represents AUS$1.04 billion or 21% of ODA in 2012-2013. Spending on this component, and education in particular, is expected to increase up to 2015-2016 when it will become the largest sector (closely followed by economic development) for Australia’s ODA. Scholarships remain a major part of the education aid budget, with spending
on scholarships expected to be AUS$350 million in 2012-2013, 7% of total ODA and 56% of all education spending. Funding for scholarships is expected to expand despite increasing international consensus on the limited impact of scholarships on development objectives11 and the clear relationship to Australia’s economic interests, where the provision of education services is one of our largest exports.
Other areas of expansion include health, with a particular focus on increased funding to water and sanitation (WASH) to help meet MDG targets. Funding in this area is expected to be AUS$1 billion between 2012-2016. As the last of the ve core pillars, humanitarian and emergency response has also received greater funding, with AUS$493 million earmarked in 2012-2013, around 10% of total ODA. This funding is largely to be channelled through multilateral partners, which has disappointed many NGOs that work on in-country disaster relief programs.12 (See Figure 2)
Given Australia’s strategic and trade interests, near neighbours in the Paci c and East Asia will continue to receive the highest levels of ODA, expected to be around 75% of aid allocations for 2015-2016. PNG and Indonesia will remain the two largest recipient countries, and an additional 10 of the largest bilateral aid recipients are located in the Asia Paci c region.13
Aid spending to Africa and South Asia is increasing as Australia seeks to boost its image as a “growing middle power with global interests” whilst bilateral aid to China and India will be phased out. 14
In keeping with earlier commitments to articulate engagement strategies in each country where development assistance is provided, and also to

177
Chapter 4 Global Aid Trends, BRICS Reports and OECD Reports
177
achieve Accra Agenda for Action aims of greater recipient input into program design, AusAID has developed country strategies. Country strategies now cover most of AusAID’s major country programs.15
In keeping with the Independent Review on Aid Effectiveness, the Australian Government has committed to increase core funding to multilateral organisations, including United Nations agencies,
global funds and the multilateral development banks. In 2010–2011, total funding to the 42 multilateral organisations was AUS$1.6 billion, or almost 40 % of ODA.16
A review of the 42 multilateral institutions receiving funding from Australian ODA was undertaken in 2012 to rank institutions based on effectiveness and value for money, including how their mandate aligned with AusAID priorities and the national interest. Priority for additional funding was given to organisations that ranked a ‘high degree of con dence’.
Figure 2: Share of total ODA expenditure in 2011-2012 and 2015-2016 by strategic goal
Sour e i ure re rodu ed ro Hel in t e orld s Poor T rou E e ve Aid Australia s o re ensive Aid Poli ra ework to , AusAID,

Chapter 4 Global Aid Trends, BRICS Reports and OECD Reports
178178
The 2012-2013 budget announced that the World Bank, Asian Development Bank (ADB), World Food Program and UNICEF will be Australia’s main multilateral partners, receiving 30% of the total aid budget. An additional AUS$154.3 million will be provided over four years to United Nations Organisations.17 As the only G20 country not currently a member of the African Development Bank and Fund, the Australian Government has started consultations on joining this institution.18 Extra funding provided to the ADB in 2012-2013 means Australia is now its second largest donor.19
Funding for Civil Society Organisations is also set to increase from AUS$500 million in 2011-2012 to between AUS$700 – AUS$800 million by 2015-2016. In June 2012, the Government produced a framework outlining how they intend to engage with civil society organisations. Like the Multilateral Assessment, increases in funding to CSOs will be linked to their effectiveness, capacity to make an impact and relevance to the strategic goals of the Australian aid program.20
The predominance of aid spending on technical assistance (TA) will continue to decrease with a commitment to reduce the number of technical advisers by 25% over the next two years.21 In 2009 spending on TA had peaked, representing 46% of AusAID’s budget expenditure, a level twice the average of other OECD countries.22 A process to reduce unreasonable levels of remuneration is currently underway to also address criticisms over the level of spending on Australian advisors labelled ‘boomerang aid’.
In November 2011, the Australian Government released a charter on aid transparency, in time
for the Busan meeting on aid effectiveness. This Charter commits the Australian Government to publishing detailed information on AusAID programs including policies, plans and internal audits.23
Then Foreign Minister Kevin Rudd stated, “the Government intends to be upfront with the Australian public as to what has gone right, what might have gone wrong and what needs to be improved. We are committed to ensuring that the bene ciaries of Australia’s aid know that the money is being spent effectively”.24
In the past, assessments of Australian aid transparency have been mixed, with a report by the Of ce of Development Effectiveness ranking Australia highly in 2011, but NGO Publish What You Fund (PWYF) ranking Australian aid transparency as ‘poor’. PWYF awarded a score of 26% (on a scale of 100) and ranked Australia 36th out of 58 countries and agencies assessed.25
AusAID has slowly started publishing country program documents on its website. Whilst this is clearly a welcome and positive reform, there are concerns that the commitment to transparency is being hindered by both the process time for uploading documents and a continuation of old dogmas within the agency. In July 2012 AID/WATCH complained that key documents concerning resettlement in an AusAID funded project in Cambodia were blocked on the grounds that release of the documents would threaten Australia’s relationship with the Cambodian Government.26
Australia is a signatory to the International Aid Transparency Initiative (IATI) but is yet to give a due date for full implementation of IATI principles.

179
Chapter 4 Global Aid Trends, BRICS Reports and OECD Reports
179
Whilst there have been some positive reforms implemented in the Australian aid program with the new policy Framework, it also presents a missed opportunity to integrate initiatives from international agreements on effectiveness to which Australia is a signatory. A particular disappointment is the lack of commitment to a human rights approach to development.
Of continuing concern is the link between Australia’s aid program with the Australian national interest and the prominence this is given in deciding aid allocations. Programmatically, this has the potential to skew funding towards
programs that have stronger links with the strategic, security and economic interests of Australia, and weaker links in terms of effective poverty reduction strategies. This is witnessed in the continuing support of the scholarship program and preference towards supporting mining-related activities.
Nevertheless there are some areas that are cause for celebration such as increased spending towards education, health, higher funding for NGOs and the move towards greater transparency. Given the election in 2013 and continued scrutiny of the domestic budget situated against a global economic downturn, the delivery of current aid program commitments will continue to be challenged.
Endnotes
1 Commonwealth of Australia, April 2011, ndependent Review o id ectiveness
2 These connections are elaborated in the chapter on the Australian Mining for Development Initiative in this Report.
3 C ews 9/5/2012, Foreign aid delay to save $2.9b’, [accessed 24/7/2012] at < http://www.abc.net.au/news/2012-05-08/foreign-aid-delays/3998968>
4 ACFID, 2012, ederal udget nal sis 2012-201
5 Commonwealth Government, 2012, udget ustralia’s nternational Development ssistance Program 2012-201
Helping the orld’s Poor mplementing ective id p 13
6 owes, S. 2012, Wea on quantity, strong on quality: the 2012 Australian aid budget’ Development Polic log [accessed 24/7/2012] at < http://devpolicy.org/wea -on-quantity-strong-on-quality-the-australian-2012-13-aid-budget/>
7 all, B. 11/5/2012, Coalition won’t eep aid commitment’, S dne orning Herald [accessed 25/7/2012] at < http://www.smh.com.au/business/federal-budget/coalition-wont-eep-aid-commitment-20120510-1yfni.html>
8 OECD, 2012, et Development ssistance rom D C and ther CD embers in 2011 [accessed 24/7/2012] at
<http://www.oecd.org/dataoecd/44/13/50060310.pdf>
9 Commonwealth of Australia, July 2011, n ective id Program or ustralia. a ing a Di erence Delivering Real Results p 27 and AusAID, 2012, Helping the orld’s Poor Through ective id ustralia’s Comprehensive id
ramewor to 201 -1 p8
10 Ballesteros, A. 2010, dditionalit o Climate inance, World Resources Institute. http://www.un-ngls.org/IMG/pdf/WRI_-_Additionality_of_Climate_Finance.pdf [accessed 31 July 2012]
11 OECD, 2009, D C Peer Review o ustralia
12 ACFID, 2012, ederal udget nal sis 2012-1 8 May, p 13
13 AusAID, 2012, Helping the orld’s Poor Through ective id ustralia’s Comprehensive id ramewor to 201 -1 p8
14 Commonwealth of Australia, June 2012, n ective id Program or ustralia. a ing a Di erence Delivering Real Results update p41
15 Australian National Audit Of ce, 2011, us D’s anagement o Tertiar Training ssistance [accessed 26/7/2012] at <http://www.anao.gov.au/Publications/Audit-Reports/2010-2011/AusAIDs-Management-of-Tertiary-Training-Assistance/Audit-brochure>
16 AusAID, 2012, ustralian ultilateral ssessment March, p xi
17 AusAID, 2011, ustralia’s nternational Development ssistance Program 2012-1 . Helping the orld’s Poor
mplementing ective id p 96
Chapter 4 Global Aid Trends, BRICS Reports and OECD Reports
180180
18 Carr, B. Swan, W. 2012, ustralia to Pursue embership o the rican Development an to Help vercome Povert Media release, 17 July
19 ACFID, 2012, ederal udget nal sis 2012-201 p5
20 AusAID, 2012, us D Civil Societ ngagement ramewor or ing with Civil Societ rganisations to Help People vercome Povert June
21 Commonwealth of Australia, June 2012, n ective id Program or ustralia. a ing a Di erence Delivering Real Results update p2
22 ACFID Analysis: Aid budget 2010, p14 http://www.ac d.asn.au/resources/docs_resources/docs_papers/ACFID%20Bud...
23 AusAID, November 2011, Transparenc Charter ustralian id Program
24 AusAID, 2011, Transparenc in the ustralian id ndustr Media Release, 23 November, [accessed 24/7/2012] at < http://www.foreignminister.gov.au/releases/2011/ r_mr_111123b.html>
25 Publish What ou Fund, 2011, Pilot id Transparenc nde [accessed 24/7/2012] at < http://www.publishwhatyoufund.org/ les/2011-Pilot-Aid-Transparency-Index.pdf>
26 AID/WATC , 2012, us D Dodging Transparenc Media Release, 17 July, [accessed 24/7/2012] at < http://www.aidwatch.org.au/news/aidwatch-media-release-ausaid-dodging-transparency>

181
Chapter 4 Global Aid Trends, BRICS Reports and OECD Reports
181
• In 2011, Belgian ODA was 2,011 million or 0.53% of GNI. This represents an 11.4% decline compared to 2010 when ODA amounted to 2,269 million or 0.64% of GNI.
• Without debt cancellation and spending on refugees and students, ‘real’ ODA between 2010 and 2011 remained constant at 0.48% GNI, despite Belgium’s commitment in 2002 to reach the 0.7% ODA/GNI target by 2010.
• Belgium will continue to move away from this 0.7% target as budgets for Development Co-operation are being frozen.
• The amount of ODA spent by the Development Co-operation Department was 67% in 2011, considerably higher than in 2010 (58%), but similar to 2009 (67%)
• Budgets for 2012 plan Belgian ODA to get close to 0.56%, but it is unlikely this percentage will be reached.
• ODA to the private sector nearly trebled between 2008 and 2009 (from 44 million in 2008 to 142 million in 2009), uctuating between 8% and 6% of total ODA between 2009 and 2011
• Budgets for 2012 plan a signi cant decrease of private sector support from 124 million in 2011 to 100 million in 2012
Belgian aid levels have uctuated since 2002, when the Belgian parliament passed a law committing the government to reach the 0.7% ODA/GNI target from 2010 onwards. Between 2008 and 2010, the Belgian government has made real efforts to systematically increase ODA levels. The 2010 ODA/GNI ratio was 0.64%, up signi cantly from the 2007 gure of 0.43% and an all time record. In 2011 the ODA/GNI ratio was 0.53%. The sharp decrease is mainly due to less debt cancellations in 2011 in comparison with 2010.
However, Belgium’s genuine or “real” aid – total ODA after deducting spending on debt cancellation, refugees and students – was 1.79 billion in 2011, up from 1.74 billion in 2010. As a percentage of GNI, real aid remained constant at 0.48% between 2010 and 2011, but down from 0.50% in 2009. (See Table 1) In the 2012 budget, the government reaf rmed its commitment to the 0.7% goal, but says it has to delay this commitment due to the economic crisis and budgetary constraints. The budget of the Department of Development Cooperation will be frozen at the 2011 level for 2012 and 2013. Given the impact of in ation and (limited) economic growth, the ODA/GNI ratio will most likely decline further in the near future.

Chapter 4 Global Aid Trends, BRICS Reports and OECD Reports
182182
Belgian NGOs congratulated the government on its effort to increase the budget between 2008 and 2010, but regret the fact that no additional money is being provided in the coming years, thus leading Belgium away from its ODA commitment to spend at the 0.7% target.
Belgium continues to include debt cancellations, refugee costs and costs for foreign students in its ODA gures, as most donors do. In 2010 a large debt cancellation of 416 million (mainly for the DR Congo) was included in ODA. In 2011 only 95.5 million in cancellation of commercial debt
was counted. For 2012 a debt cancellation of 154 million (for Ivory Coast) is being included
in the ODA projections.
The real challenge for the Belgian government will be to sustain an increasing ODA/GNI ratio in 2012 and in following years, let alone reach the 0.7% target, when all major debt cancellation packages will have been implemented. A new and large increase in the budget of the Department of Development Cooperation would have been needed for 2012 for Belgium to successfully attain the legislated target of 0.7%..
From July 2010 until December 2011, Belgium was facing a major political crisis. For 541 days the different political parties failed to come to an agreement to form a new government after the parliamentary elections of June 2010. The country was in a state of “current affaires”, meaning that no new policies and initiatives could be elaborated. As a consequence Belgium lacked credibility on the international scene. The Rwandese president cynically commented: “Imagine being taught good governance by somebody who is not even able to form a government in his own country”.
In December 2011, a new government was formed. The new government’s statement of priorities and policy initiatives identi ed the major coming challenges. The chapter dedicated to international cooperation was titled “For a respectful, ef cient and coherent cooperation”. The statement promised the installment of an inter-ministerial conference on policy coherence for development. At the end of December, that promise was repeated in a policy statement by the Minister for Development Cooperation, a socialist after more than a decade of center of right politicians leading the department. For the
€

183
Chapter 4 Global Aid Trends, BRICS Reports and OECD Reports
183
new Minister, policy coherence for development is clearly a priority, which has created an important momentum for advancing the debate in Belgium.
While the future may be promising, 2010 and 2011 were mainly characterized by political stagnation, including regarding development cooperation policy. Some examples:
The Belgian law on development cooperation
Belgium is one of the few donor countries with a law on international cooperation. In December 2007, the Minister of Development Cooperation announced that the law needed to be revised, to ll gaps (e.g. regarding humanitarian aid) and to adapt the law to the Paris Declaration aid effectiveness framework. But this process was put on hold since the fall of the government in 2010. The new Minister has reopened the debate within the majority. In July 2012 the Federal Council of Ministers approved a draft bill. This draft will be debated and voted in the Belgian Parliament in the last trimester of 2012. The main new aspects are the incorporation of concepts such as a human rights-based approach and policy coherence for development.
Policy coherence for Development
For many years, NGOs are saying that the technocratic focus on aid effectiveness in Belgian development cooperation must not distract from policy coherence for development (PCD). Ensuring coherence between decisions in policy areas with a clear international impact and development goals remains a major challenge.
So far there has been too little progress towards PCD in Belgium as repeatedly argued by the OECD-DAC peer reviews.1 The December
2011 coalition agreement makes clear reference to PCD, but it could be interpreted in different ways. Nevertheless, the new Minister stressed the need for a ‘development re ex’ in all international policy areas, which seems to indicate a new trend towards greater coherence. However, the main challenge remains to re ect the Minister’s political commitment in measures on the part of the whole of government (in the Belgian federal context – whole of governments). A working institutional mechanism is required to deliberately align policies and their implementation with PCD, including a reference to the PCD-principle in a legal framework or in a revised law on international co-operation. The Belgian government should strengthen inter-ministerial information and coordination mechanisms and between different levels of government to ensure greater ef ciency and effectiveness in efforts to promote positive development results. Climate change
The annual pledged fast-start nance for Belgium for the years 2010 to 2012 is 50 million, 150 million in total. But in 2010 Belgium disbursed only 42 million. Of this amount, 40 million were disbursed through the development budget and registered as ODA. The remaining amount was disbursed by the Walloon region. The regions of Flanders and Brussels were asked to join this engagement but refused to contribute. In 2011 the federal government disbursed only 20 million and the Wallonia region 4.1 million. For 2012 the federal government promises 20 million. For the rst time, the Flemish region contributed as well: a little over 1.5 million. These amounts are far below the pledged 150 million.
Although The Copenhagen Agreement promised new and additional resources, this is not the case for Belgium. Not only did the government fail to meet its pledge, most of the actual amount
Chapter 4 Global Aid Trends, BRICS Reports and OECD Reports
184184
disbursed and promised has not been additional. Moreover, there is no indication that new sources of nance will be found to meet short (fast start) and long term needs for climate nance. Belgium was in favour of the creation of the new Climate Fund, apart from the existing bilateral, multilateral and other UNFCCC-funds. But at this point it is not clear whether any funding will be pledged to this new Climate Fund.
Fourth High Level Forum on Aid Effectiveness, 2011, Busan
At the Fourth High Level Forum in Busan, Republic of Korea, Belgium was not represented at the ministerial level. While this allowed the administration to play a progressive role, the lack of political backing have undermined its commitments. Belgium has been very committed to the Paris Aid Effectiveness Agenda in the past years, particularly concerning the differentiated approach in fragile states and division of labour. Notwithstanding, Belgium missed a political opportunity at the HLF4 to be more proactive, including encouraging more ambitious European involvement in Busan.
In 2010 the Belgian Peer Review was published by the OECD DAC covering Belgium’s efforts and performance in the area of development co-operation over the previous four years. The DAC main conclusions were positive: “Belgium improved the quality and volume of its aid”. The main recommendation was the need for a shared vision and a clear understanding of policy guidance and aid management among the many development actors involved in improving the ef ciency and effectiveness of Belgium’s aid.
The Coalitions of the Flemish and French speaking North-South Movement agree that improvements were made by the Belgian government. Given the strong criticisms in the previous 2005 Peer Review, progress was not too dif cult to accomplish. But Belgian NGOs suggest that it is too early to applaud this progress on the part of the Belgian government. So far there have been a lot of intentions expressed by the new government, but real implementation is falling behind. In that respect, the 2010 Peer Review urged Belgium to develop an explicit policy statement on policy coherence for development and to promote a better understanding of this concept amongst government entities and the general public. The peer review team also encouraged the NGO coalitions to continue lobbying for a better understanding of the concept.
The Peer Review stresses the importance of “fragility” as a key framework for Belgian development co-operation. As a consequence of its strong involvement in Africa’s Great Lakes Region, one-third of Belgium’s partner countries are fragile states. A 2009 Policy Note put fragility high on the political agenda for 2010, and declared it a priority for Belgium’s presidency of the European Union.2 However, Belgium is still struggling to translate this political priority into its operations.
Since 2008, private sector development (PSD) has seen the strongest growth in Belgium’s aid budget. In 2008 44.6 million was disbursed for PSD, rising dramatically in the following years (see table 2). Starting from a base of 2% in earlier years, PSD now represents nearly 5% of total ODA, peaking brie y at 8% in 2009. This
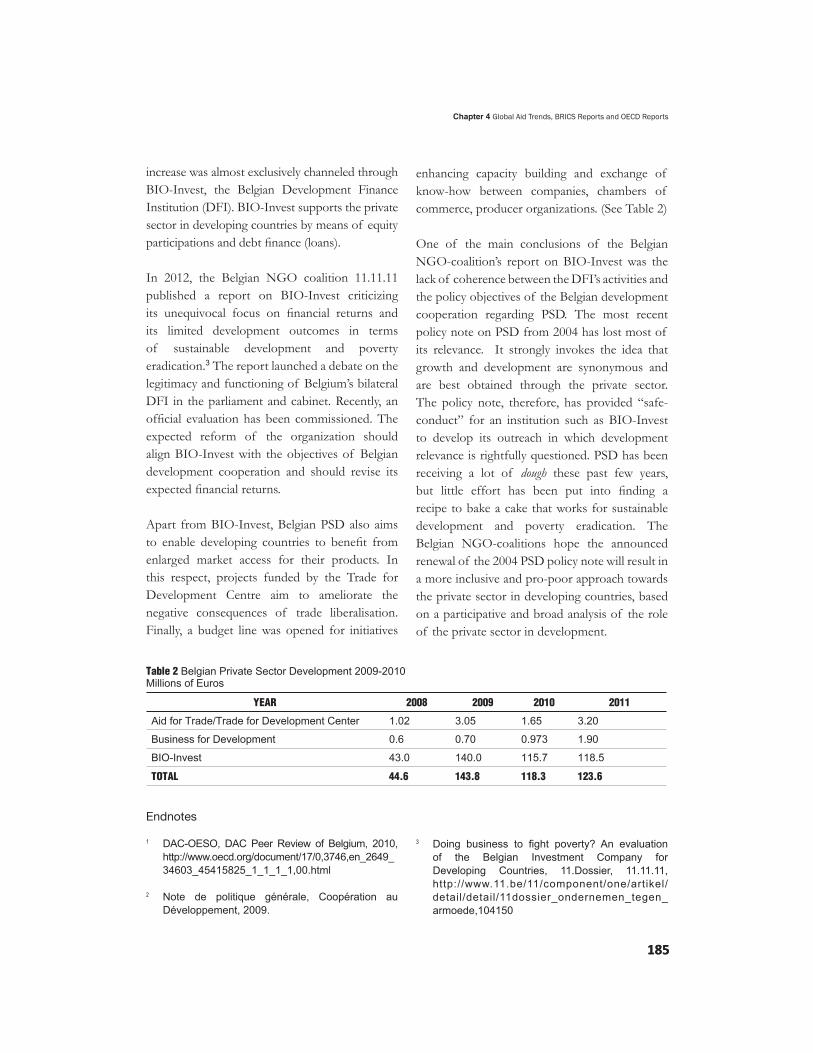
185
Chapter 4 Global Aid Trends, BRICS Reports and OECD Reports
185
increase was almost exclusively channeled through BIO-Invest, the Belgian Development Finance Institution (DFI). BIO-Invest supports the private sector in developing countries by means of equity participations and debt nance (loans).
In 2012, the Belgian NGO coalition 11.11.11 published a report on BIO-Invest criticizing its unequivocal focus on nancial returns and its limited development outcomes in terms of sustainable development and poverty eradication.3 The report launched a debate on the legitimacy and functioning of Belgium’s bilateral DFI in the parliament and cabinet. Recently, an of cial evaluation has been commissioned. The expected reform of the organization should align BIO-Invest with the objectives of Belgian development cooperation and should revise its expected nancial returns.
Apart from BIO-Invest, Belgian PSD also aims to enable developing countries to bene t from enlarged market access for their products. In this respect, projects funded by the Trade for Development Centre aim to ameliorate the negative consequences of trade liberalisation. Finally, a budget line was opened for initiatives
enhancing capacity building and exchange of know-how between companies, chambers of commerce, producer organizations. (See Table 2)
One of the main conclusions of the Belgian NGO-coalition’s report on BIO-Invest was the lack of coherence between the DFI’s activities and the policy objectives of the Belgian development cooperation regarding PSD. The most recent policy note on PSD from 2004 has lost most of its relevance. It strongly invokes the idea that growth and development are synonymous and are best obtained through the private sector. The policy note, therefore, has provided “safe-conduct” for an institution such as BIO-Invest to develop its outreach in which development relevance is rightfully questioned. PSD has been receiving a lot of dough these past few years, but little effort has been put into nding a recipe to bake a cake that works for sustainable development and poverty eradication. The Belgian NGO-coalitions hope the announced renewal of the 2004 PSD policy note will result in a more inclusive and pro-poor approach towards the private sector in developing countries, based on a participative and broad analysis of the role of the private sector in development.
Endnotes
1 DAC-OESO, DAC Peer Review of Belgium, 2010, http://www.oecd.org/document/17/0,3746,en_2649_
34603_45415825_1_1_1_1,00.html
2 Note de politique générale, Coopération au Développement, 2009.
3 Doing bu ine to ght povert An evaluation of the Belgian nve tment Compan for Developing Countries, 11.Dossier, 11.11.11, http://www.11.be/11/component/one/artikel/detail/detail/11dossier_ondernemen_tegen_armoede,104150

Chapter 4 Global Aid Trends, BRICS Reports and OECD Reports
186186
• Canadian of cial development assistance (ODA) for 2012 is estimated by the Canadian Council for International Co-operation (CCIC) to be Cdn$5.17 billion or 0.29% of Gross National Income (GNI), assuming no supplementary estimates and GNI growth remains consistent with current levels.
• Canada ranked 14th in 2011 among the 23 donors in the Organization for Economic Co-operation and Development (OECD) Development Assistance Committee (DAC) with respect to percentage of GNI for ODA.
• The international assistance envelope (IAE) for Canadian aid is set to decrease by 7.6% over the next three years, from Cdn$5 billion in 2011 to Cdn$4.66 billion in 2014/15. These cuts are projected by CCIC to move Canada to 0.26% of GNI by 2015.
• Canada has increased funding to Latin America and multilateral organizations. Aid to Sub-Saharan Africa has remained steady at 2008 levels (which met Canada’s 2005 Group of Seven commitment), while Asia is seeing a slight decline. In 2012, the government made further reductions and cuts to 13 country programs, including eight in Africa.
• Support has also declined to governments by 12.2% and to civil society organizations by 17.9% between FY2008/09 and FY 2010/11.
2012 will be a landmark year for the Canadian International Development Agency (CIDA) in many ways. Canada’s Aid Effectiveness Action Plan (AEAP) is up for renewal and the new plan should highlight how Canada expects to implement commitments made at the 2011 Fourth High Level Forum on Aid Effectiveness (HLF-4). This will be particularly important following an OECD Peer Review critical of Canadian aid. This year, 2012, will also see the government translate its transparency pledge to the International Aid Transparency Initiative (IATI) into concrete deliverables. It may see further clarity around CIDA’s long-term approach to Canadian civil society organizations (CSOs). Finally, it will see CIDA release a new Private Sector strategy, including how it will promote the role of the Canadian private sector in development. And all of this comes in the context of major cuts over the next three years to Canada’s aid program and countries of operation. Canadian aid may never be the same again.
Since 2009, when CIDA launched its Aid Effectiveness Action Plan (AEAP), the Agency has been all about being “focused, effective, transparent and accountable”. CIDA has advanced on commitments to transparency and untying aid. But its interpretation of “aid effectiveness” is a very loose one. As the 2012 OECD DAC Peer Review notes, this Plan “combines domestic accountability and internal ef ciency with
187
Chapter 4 Global Aid Trends, BRICS Reports and OECD Reports
187
implementing the Paris Declaration principles themselves”, consequently lessening the emphasis CIDA places on the actual principles.
The 2012 Peer Review makes a number of further important observations:
While the ODA Accountability Act has improved accountability and established criteria to guide development cooperation,
CIDA still needs a clear and consistent vision for its development work, with commensurate and measurable objectives. In terms of ways forward, the Review makes a constructive recommendation: Canada should update its AEAP “and ensure it is fully aligned with the Paris Declaration principles and the objectives agreed at Busan”.
Similarly, in the absence of a humanitarian assistance strategy – something noted in the 2007 Peer Review
– the DAC also recommended Canada establish a cross-government humanitarian strategy with transparent measurable objectives and expected results. CIDA has been nalizing this strategy for more than a year now, but has not yet made it public. While positive on the overall directions of Canada’s humanitarian assistance and its strong track record, the DAC identi ed the need for clearer funding criteria for humanitarian interventions and more transparent processes to address concerns that funding decisions are based more on politics than humanitarianism.
Recognizing Canada’s interest in disaster risk reduction, the DAC also suggested CIDA establish clearer links between its humanitarian and development interventions and better integrate resilience-building and post-crisis recovery into both programs.
The OECD Report notes that the AEAP only tackles the portion of aid delivered through
CIDA and not other government departments. A renewed Plan should mobilize all government departments to make all Canadian aid fully effective, in particular in terms of addressing aid predictability and aligning with countries’ systems. In fact, “aid predictability” – and the delegation and decentralization of decision-making – is a major theme of the Peer Review Report and a central challenge for CIDA looking ahead.
In 2011, Canadian NGOs welcomed Canada’s decision to join 13 other bilateral donors as signatories to IATI.
Improved transparency has been a focus of the Canadian government in the past few years. CIDA now produces regular substantive and statistical reports and short current country reports, and launched its new open-data project browser in 2011.
CCIC looks forward to CIDA releasing its Implementation Schedule for IATI by December 2012. This schedule must include other Canadian government bodies, in particular Finance Canada and Foreign Affairs Canada. The Schedule must also greatly enhance access to qualitative and quantitative data, with information on projects, programs, policies, priorities, and forward-planning data.
In July 2010, CIDA launched its “Partnership Modernization and Effectiveness Framework”, introducing new policy guidance on civil society funding and programming. Despite the promise that the new call-for-proposal mechanism would “streamline the application process,”

Chapter 4 Global Aid Trends, BRICS Reports and OECD Reports
188188
it has instead been characterized by a lack of transparency, unacceptable delays, and what seems to be a lack of adequate resources to manage the process ef ciently within CIDA.
In a detailed study of the impacts of the new mechanism on Canadian CSOs, CCIC found that it is profoundly destabilizing the sector and its programs in developing countries. CCIC has made a number of technical recommendations for improving the mechanism and has asked for it to be reviewed in light of its impacts.
This situation has been further aggravated by the lack of public guidelines for policy consultation – something the OECD Peer Review highlighted – and a worsening political climate in Canada that has decreased CSO space for holding the government to account.
Beyond funding, CIDA’s 2010 framework also lacks a clear strategy for civil society within the agency’s broader development agenda, in particular in the context of the new Istanbul Principles on CSO Development Effectiveness,
endorsed at HLF-4. In response, the OECD Peer Review suggested CIDA develop a CSO effectiveness strategy with clear aims and strategic objectives. Such a policy, the review said, should balance respect for CSOs as independent development actors in their own right with CIDA’s own desire to steer CSO work in a way that helps CIDA achieve its own development objectives.
In 2011, the Conservative government froze the International Assistance Envelope (IAE), which
nances Canadian ODA, at Cdn$5 billion, ending the 8% annual increases to the IAE from 2003 to 2010. A year later, in the context of austerity cuts, the government announced reductions to the IAE between FY2011/12 and FY2014/15 of
7.6%. Between FY2012/2013 and FY2015/16, Canada will have reduced cumulative spending on aid by close to Cdn$1.2 billion. Perhaps more astonishingly, Canada’s aid relative to its GNI is expected to tumble nine points from 0.34% to 0.25%, between 2010 and 2015. This will put Canada among the lowest ODA performers.
In the context of cuts to the aid budget, and in particular to Low Income Countries, the DAC Peer Review urges Canada to continue to prioritize the advances made in previous years in Canadian aid for Africa. To do so, it suggests maintaining ODA levels at 0.31% of GNI in the short term and returning to higher levels when the economy improves.
Canada’s focus on the private sector is not a new one. CIDA has had a private sector policy in place since 2003. But in the past ve years, the private sector has become more important as a de ning force behind CIDA’s (and other government departments’) overall approach to development cooperation. This emphasis is beginning to blur the lines between responding to poverty-focused country-led development priorities and promoting Canada’s own economic self-interests.
CIDA, Growth and the Private Sector
In October 2010, CIDA released its Sustainable Economic Growth Strategy (SEG).1 The intent of the SEG is to make growth more inclusive of the majority of the world’s population, generate revenue, create employment and establish a strong role for the private sector in ful lling this mandate.2
CIDA’s Strategy, however, makes a one-to-one relationship between increased growth and poverty reduction, without giving due consideration to

189
Chapter 4 Global Aid Trends, BRICS Reports and OECD Reports
189
where and how growth is occurring and whether it is having a positive effect on the livelihoods, assets and capacities of the poor. Consequently, it assumes that the key to poverty reduction lies in improving legal and regulatory frameworks and creating enabling conditions for business that will in turn generate growth and create jobs. While important, in the end it is not about creating the conditions for the private sector to develop, but the conditions for how the private sector can contribute to development.3
So how does CIDA’s SEG strategy play out in practice? CIDA, and increasingly Finance Canada, seem to be making four different broad categories of investment through ODA.
1. Private sector trust funds currently make up a core component of the government’s ap-proach to the Private Sector. Such trust
funds, often administered by the World Bank, generally provide large pools of fund-ing from Canada and other bilateral donors to encourage greater private sector or pub-lic-private initiatives on a development issue. These donor resources ll a nancing gap often with a concessional component that provides the incentive for the private sector to get more engaged. For example, through the International Finance Corporation of the World Bank, CIDA and Finance have in-vested in private sector lending to help small and medium–sized agribusiness and farmers integrate into global markets and distribu-tion chains, and to encourage private-sector led investments in clean energy.
2. Challenge funds provide funding to generate innovative solutions to very speci c global
Sour e Table o iled b I ro various Sta s al Re ort on Interna onal Assistan e, IDA and Jobs, Growt and Lon Ter Pros erit E ono i A on Plan , Anne , Govern ent o anada, , . .

Chapter 4 Global Aid Trends, BRICS Reports and OECD Reports
190190
development challenges. The intent of the funding is to promote innovation and cre-ate a market that would not otherwise exist without such support. In the past six years, Canada has launched three principal initia-tives: a) Advance Market Commitments in health, agricultural production and nutrition; b) the Caribbean Catastrophic Risk Insur-ance Facility, which provides a rapid and guaranteed payment to participating Carib-bean countries when a natural catastrophe strikes; and c) the SME Finance Challenge to nd innovative ways of supporting SMEs and scale up the best ideas. Assessments of each have been mixed.4
3. CIDA also makes direct investments in Mi-cro, Small and Medium-sized Enterprises, small-holder farmers and women entrepreneurs, all with a view to creating jobs, increasing incomes, and better integrating these actors into lo-cal, national and regional markets and value. Women’s economic empowerment is gaining increasing prominence in CIDA’s strategies.5
4. Corporate social responsibility in the extractive sec-tor is an increasing focus of the government with Canada promoting a new International Institute for Extractive Industries and Devel-opment to support and build natural resource management capacity in developing countries,6 alongside a number of pilot projects between Canadian CSOs and Canadian mining compa-nies.7 Further announcements from CIDA of additional pilot projects are expected in 2012, along with a possible Corporate Social Responsibil-ity Framework for the Extractive Sector.
Towards a new Private Sector?
CIDA’s 2003 Private Sector Development (PSD) policy clearly focused CIDA interventions
around “more, better, and decent jobs and sustainable livelihoods and […] stimulating the growth of the local private sector in developing countries and countries in transition”. 8 In contrast, new and current initiatives for the private sector are increasingly and more explicitly promoting Canada’s national economic interests and Canada’s domestic private sector. Former CIDA Minister, Beverly Oda, in fact, has publicly commented that she saw no difference between Canada’s trade and foreign policy interests and Canadian development goals.9 In fact, CIDA is currently developing a strategy that is expected to determine how to promote the Canadian private sector in international development – a strategy that will purportedly replace its 2003 (local) Private Sector Development policy.
Cognizant of the thin line that Canada is now treading, the 2012 DAC Peer Review noted that Canada should ensure that development objectives and partner country ownership are paramount in the activities and programmes Canada supports. “There should be no confusion between development objectives and the promotion of commercial interests.”10 It noted that any private sector strategy should provide a clear rationale for Canada’s engagement, including well-de ned aims, strategic objectives and transparent procedures for partnerships with private sector enterprises.
In this regard, the Strategy could bene t from applying the original approach of CIDA’s 2003 Policy on Private Sector Development to pursue “pro-poor equitable economic growth”.11 Unlike that Policy, the SEG Strategy is missing references to clear standards that its private sector investments are expected to meet, including the Canadian Environmental Assessment Act, ILO core labour standards, OECD Guidelines for Multinational Enterprises, and the Beijing Platform of Action.

191
Chapter 4 Global Aid Trends, BRICS Reports and OECD Reports
191
The challenge for Canada looking forward will be how it deepens and strengthen its unmet commitments to Paris and Accra, while addressing its new commitments from Busan. In an environment that has seen aid resources declining, decisions about their use becoming increasingly political, and CIDA’s agenda becoming more short-term and directive, how will CIDA reconcile these challenges with an
emphasis and approach that is meant to respond to the priority needs as determined by developing countries? And how will CIDA include all development actors in shaping that process, in particular civil society?
2013 will demonstrate whether Canada’s role in the Busan Partnership for Global Development Cooperation will spell out a new era for development cooperation and development effectiveness that engages all development actors, or whether it will be just business (and the private sector) as usual.
Endnotes
1 The International Assistance Envelope or IAE, a Canadian peculiarity, contains the budgetary allocations by the federal government to programs for international cooperation. This includes allocations to CIDA, Foreign Affairs Canada, the Department of Finance and other departments. owever, not all of the allocations in the Envelope are eligible to be counted as Canadian aid or ODA. This includes some disbursements for peace and security (decommissioning of nuclear warheads in the former USSR, security programs in non-ODA eligible countries). Nor does the Envelope include all items that can be included when calculating Canadian ODA since they are allocated through other government expenditures ( rst year of supporting refugees from developing countries in Canada), are non-budgetary (bilateral debt forgiveness) or are imputed values (developing country students studying in Canada). Total Canadian Of cial Development Assistance is therefore made up of: ODA-eligible line items in the International Assistance Envelope less IAE items not eligible for Canadian ODA plus non-budgetary items that can be included as ODA.
2 Organization for Economic Co-operation and Development (OECD), Canada - Development ssistance Committee D C P R R 2012, p. 17, on-line: http://www.
oecd.org/development/peerreviewsofdacmembers/canadapeerreview2012.pdf.
3 See Brian Tomlinson, “Canada’s ODA Accountability Act”, in the Reality of Aid 2010 Report. The 2008 Canadian ODA Accountability Act states that the responsible Minister must be of the opinion that ODA disbursements meet three criteria: reduce poverty, ta e account of the perspectives of the poor, and be consistent with international human rights standards. Despite this, in the third Report to Parliament on implementation of the Act, CCIC has noted that only two of the 13 Departments that report even reference these criteria, and none mention how the respective Ministers came to the opinion that the activities pro led re ect the criteria of the Act. CIDA was not among them. See CCIC’s report on the implications of the Act, Time to ct mplementing the Canadian D ccountabilit ct, April 2010, on-line: http://www.ccic.ca/what_we_do/aid_liability_act_e.php),and ongoing analysis of the implementation of the Act and of the government’s Annual Reports to Parliament on the Act
available on-line: http://www.ccic.ca/what_we_do/aid_oda_accountability_act_e.php.
4 OECD, op. cit., 2012, p.18.
5 OECD, Canada - Development ssistance Committee D C P R R 2007, p. 101, on-line: http://www.oecd.org/development/peerreviewsofdacmembers/39515510.pdf
6 CCIC, Canadian international development plat orm congratulates C D or stride orward on transparenc , Press Release, November 29, 2011, on-line: http://www.ccic.ca/_ les/en/media/2011_11_Press_Release_CIDA_stride_forward_on_transparency.e.pdf
7 The Project Browser is on-line: http://les.acdi-cida.gc.ca/servlet/JKMSearchController?desTemplateFile=cpoSearchEn.htm desClient ocale=enUS AppID=cpoEn
8 CIDA, inister da announces ne t step to C D ’s aid e ectiveness, Press Release, July 22, 2010, on-line: http://www.acdi-cida.gc.ca/acdi-cida/acdi-cida.nsf/eng/cec-722111726- xg
9 For more details see CCIC and the Inter-Council Networ , Putting Partnership bac at the Heart o Development Canadian Civil Societ perience with C D ’s Call- or-Proposal echanism Partnerships with Canadians ranch -
n nal sis o Surve Results, March 2012, online: http://www.ccic.ca/_ les/en/what_we_do/2012_03_Survey_Report_e.pdf
10 “Voices” has begun to document the worsening environment in Canada for civil society and other actors, on-line: http://www.voices-voix.ca
11 Open Forum for CSO Development Effectiveness, Istanbul Principles for CSO Development Effectiveness, September 2010, on-line: http://www.cso-effectiveness.org/IMG/pdf/nal_istanbul_cso_development_effectiveness_principles_
footnote_december_2010-2.pdf
12 For more speci c details relating to different dimensions of the cuts, see “CCIC Analysis of Budget 2012”, Canadian Council for International Co-operation, July 2012, on-line at http://www.ccic.ca/_files/en/what_we_do/2012_08_CCIC_Initial_Analysis_Budget_2012.pdf

Chapter 4 Global Aid Trends, BRICS Reports and OECD Reports
192192
• The European Commission made total aid disbursements of 9.1 billion in 2011, which represents a decrease of almost 0.5 billion from 2010.
• The recent re-organizations of EU system of development cooperation may further politicize aid decisions and de-prioritize development compared to other foreign affairs policies.
• The EU is only weakly delivering on its responsibility to promote policy coherence for development, a legal obligation under the Lisbon Treaty. Here, the reform processes of its trade, agriculture, sheries and energy policies need to be urgently addressed.
• An EU 15-month structured dialogue with civil society organizations resulted in broad multi-stakeholder agreement reaf rming important principles, in particular the rights-based approach, democratic ownership and the right of initiative of civil society, and the Open Forum’s Istanbul Principles.
The European Union (EU) institutions are unique in the way that they provide direct development assistance to developing countries and play a “federating role” vis-à-vis the 27 Member States (MS) - coordinating them for better development impact, and preparing common positions to
strengthen the EU voice in global debates. They are a major trading and investment actor, maintaining a political and policy dialogue with a wide range of partner countries.
The European Commission (EC) is the world’s third largest provider of development assistance with aid disbursements in 2011 of 9.081 billion. The European institutions are committed to poverty reduction and to realizing the MDGs and have an obligation to achieve Policy Coherence for Development. Their size, their weight and the presence of 136 EU delegations around the world allow the EU to implement development programmes on a scale many MS alone cannot match, and in places they do not prioritise. This is part of the real value added of the EC.
The development policy of the EU was made both explicit and legally binding with the enactment of the Lisbon Treaty. According to the Treaty, development policy is an area of EU policy in its own right, with the eradication of poverty as the primary objective. Equally, development objectives need to be considered when setting all other policies with repercussions for developing countries. This complements the already existing European Consensus on Development as signed off by the EU in 2005 and the Cotonou Agreement of 2000.
This chapter is reproduced with the generous permission of CONCORD AidWatch from its 2012 Report, Aid We Can – Invest More in Global Development, pages 33 – 38, accessible at http://aidwatch.concordeurope.org/ CONCORD is the European NGO Confederation for Relief and Development. Its 27 national associations, 18 international networks and 2 associate members represent 1,800 European NGOs. AidWatch is a pan-European project of development NGOs, monitoring aid quantity and quality across the EU 27.

193
Chapter 4 Global Aid Trends, BRICS Reports and OECD Reports
193
The Commissioner for Development, A. Piebalgs, is in charge of development policy and its implementation. The High Representative (HR), C. Ashton, is responsible for the EU’s external affairs and security policies. Besides being the HR based in the Council, she is the Vice-President of the Commission, Chair of the Foreign Affairs Council (FAC) and the Development FAC and head of the European External Action Service (EEAS). This latter service includes all 136 EU Delegations, is in charge of the political dialogue with third countries and has a responsibility to defend development objectives in the EU’s external activities. The EEAS was introduced by the Treaty to help conduct the EU’s foreign affairs and security policy. The EEAS has put an end to the geographical division between the Commission’s DG Development for ACP countries and DG Relex for all other non-European countries. In the meantime the EC has undergone major changes, bringing its policy and implementing services together in the Directorate General for Development and Cooperation – EuropeAid (DEVCO) - led by the Development Commissioner.
In practice a compromise was agreed on development cooperation: strategic programming of funds (country and regional and sector spending) went to the EEAS, under close collaboration with DG DEVCO. Development policy and implementation remain squarely with the EC, but with a stronger role by the EU delegations. This makes development programming more complex and runs the risk of aid being politicised and development being de-prioritised compared to other foreign affairs policies. However, the EEAS also provides an opportunity to improve the coherence and consistency of the EU external relation agenda in promoting development objectives.
In April 2012, the OECD published the ndings of its peer review on the European Union. It commended the European institutions for signi cant efforts made to increase their ef ciency and impact on development over the past ve years. The review highlighted the strong impact of the European Commission’s provision of humanitarian assistance linked to its strong eld presence and good understanding of operational realities. This nding is pleasant. These are encouraging ndings given that about 40% ( 1.2 billion) of the EU 15 countries’ funding of 3.1 billion is channelled via the EC´s Directorate for Humanitarian Aid and Civil Protection.
Nevertheless, it has been identi ed that EU development programmes are suffering from poor institutional coordination – mainly as a consequence of the formation of the new EEAS (see above). The division of labour between the EEAS and the EC still needs to be better operationalised. The EEAS has a long way to go before it is effectively coordinating its activities with the EC, fully integrating its poverty focused development policy work into its service and maximising its support to policy coherence for development.
AidWatch members welcome the improvements the EC has made in its aid management, in particular by developing closer relations with partner countries and common principles across the EU 27. However, we deeply regret that the EU is only weakly delivering on its responsibility to promote policy coherence for development, a legal obligation under the Lisbon Treaty. Here, the reform processes of its trade, agriculture,
sheries and energy policies need to be urgently addressed. Without developing more equitable and just relationships between developing partners and the EU in these thematic areas,
Chapter 4 Global Aid Trends, BRICS Reports and OECD Reports
194194
the successes of development policy are being seriously undermined. One way that PCD could be better addressed is to ensure that impact assessments are – as a rule – undertaken before any external policy is approved.
In addition to the launch of the Agenda for Change for EU Development Policy in October 2011, the EC released its Communication on “the future approach to EU budget support to third countries” at the same time1. CONCORD is encouraged to see that the Communication puts a strong emphasis on contractual partnership and mutual commitment to fundamental values of human rights, democracy and rule of law, as essential components for the establishment of any partnership between the EU and third countries.
To take forward the objective of improving the EC’s preferred aid modality, the communication distinguishes between three types of budget support for the future:
• Good governance contracts (formerly general budget support) with the objective to strengthen core government systems, such as public nance management and public administration;
• Sector reform contracts (formerly sector budget support) aiming at promoting service delivery or reforms in a speci c sector; and
• State building contracts, budget support for fragile contexts to ensure vital state functions, support the transition towards development and to deliver basic services to the populations.
In addition to the three existing eligibility criteria (stable macro-economic framework, national/
sector policies and reforms and public nancial management) CONCORD welcomes the creation of a fourth criterion on transparency and oversight of the budget, to grant budget support to countries disclosing their budgetary information (or making rapid progress to do so).
However, despite some welcome wording on the importance of more participatory approaches and strengthening support to oversight bodies and CSOs, the Communication does not emphasise the importance of concrete actions to promote inclusive processes around budget support through involving actors such as Parliamentarians, local governments, CSOs, audit institutions and media. It is important that the EC takes such action by earmarking a xed percentage of budget support envelopes to
nance capacity-building of all stakeholders. It is only with this kind of nancial commitment to ensuring proper oversight that we will see the necessary improvements in the record of budget support as an aid modality.
Following the Council conclusions in May 2012 endorsing this Communication, CONCORD expects EU Member States and the Commission to increase the use of this aid modality when deciding the EU’s development priorities for the next EU budget (2014-2020).
In 2005, the EU and its MSs made a commitment to increase their Trade Related Assistance (TRA) to 2 billion annually by 2013 and a joint ‘EU Aid for Trade strategy’2 was adopted in October 2007.
Aid for Trade (AfT) - which has a broader focus than TRA - represents about a fth of total EU ODA since 2005 and reached 22% in 2009

195
Chapter 4 Global Aid Trends, BRICS Reports and OECD Reports
195
( 7.15 billion from EU MSs and 3.35 billion from the European Commission).
Despite the apparent trade-related needs of LDCs, the EU and its MSs allocate only about 22% of their total AfT to LDCs, while 7 of the top 10 recipients of EU AfT are Middle Income Countries, including China and India. This seems to be in contradiction with the EC´s proposal adopted in 2011 for the new General System of Preferences (GSP). One of the key elements of the proposal that will enter into force in 2014 is to apply a drastic cut in the number of countries eligible for the GSP, which will in turn lead to an increase in EU tariffs on all imports from UMICs that do not have a free trade agreement with the EU and on some imports from certain LMICs and LICs.
We fear that the graduation formula applied will mainly bene t richer states and populations that already have the capacity to make the best use of AfT while having an adverse effect on poor and small producers in UMICs. CONCORD is concerned that AfT will have little impact on
ghting poverty and inequality in developing countries as long as incoherence between EU trade and development objectives are not seriously addressed.
The year 2011 saw the culmination of a 15 month process of dialogue and consensus building between the EU institutions, CSOs and local authorities through the Structured Dialogue (SD) on the involvement of CSOs and local authorities in EC development cooperation.
Through the SD process, important principles have been reaf rmed by all stakeholders; in particular the rights-based approach, democratic
ownership and the right of initiative of civil society and the Open Forum Istanbul Principles. The Final Statement of the Structured Dialogue3 constitutes a rm multi-stakeholder commitment to cooperate for an effective partnership in development, in full respect of each actor’s prerogatives, roles and mandates.
Some concrete outcomes of the SD process are:
• The EC will produce a new Civil Society Communication re ecting the consensus reached during the SD. Clear support and commitment by EU institutions in favour of an enabling environment for civil society’s multiple roles in line with a rights-based approach to development.
• Establishment of a multi-stakeholder institutionalized dialogue in Brussels and most importantly at country and regional level, involving local civil society actors.
• The EC intends to use a broader range of delivery mechanisms for supporting civil society and is committed to increasing the share of its geographic programmes allocated to and delivered through civil society.
In 2011, the European institutions disbursed 9.081 billion which represents a decrease of 491 million compared to 2010 aid levels. The
budget of the European institutions is counted towards ODA through the bilateral contributions of its member states. The amount of 9.081 billion covers both disbursements through the EU budget and the EDF (the nancial instrument

Chapter 4 Global Aid Trends, BRICS Reports and OECD Reports
196196
dedicated to the African, Caribbean and Paci c countries).
In 2011, out of the 53 billion of total ODA from EU Member States 54% was delivered through their own bilateral channels and 46% was delivered through multilateral channels, of which 19.7% ( 10.4 billion) was received by the EU institutions.
The 27 EU Member States had agreed to contribute about 1.91 billion to the EDF in 20114. This included the rst contribution by the EU12 to the European Development Fund, amounting to a total of 45 million. While it is not yet clear what the actual level of disbursements was for 2011, we assume that a similar level of payments was executed as in 2009 and 2010: about 3.23 billion.
The share of in ated aid of the European institutions is minimal. Elements which Member States include in their reports, such as refugee costs or imputed student costs are not relevant. The gures reported by the OECD for the European institutions do not contain any loan payments; therefore repayments for interest on loans do not apply. Only the 12.14 million it provided in debt relief is relevant in 2011.5
The majority of European institution funding is formally untied and efforts have been taken to use country systems. However, aid delivered through the EU budget and, in particular under the EDF, is partially tied. Procurement under the EDF is open to all DAC members and to the group of ACP countries, but not to other developing countries. The Development Cooperation Instrument provides access to more countries: it is open to all Member States, all candidate
countries, members of the EEA, DAC members for co-operation in LDCs and 47 bene ciary countries (145 bene ciary countries for thematic programmes).6 The EU is advancing efforts to open up its external funds to further countries, based on the principle of reciprocity
We regret however that in practice a high share of EU aid is still informally tied. The vast majority of contracts are won by donor countries’ companies. ACP country providers still nd it dif cult to compete with EU providers in this set up, which means there is a real endemic power imbalance in competition for aid contracts. If we look at some of the main recipient countries of EC aid contracts in 2010 we can see that a minor share were won by companies from countries such as Afghanistan (6 contracts), Democratic Republic of Congo (28 contracts), Haiti (13 contracts), Mozambique (3 contracts). In comparison, the number of contracts won by European countries was substantially higher: Belgium (864 contracts), UK (415 contracts), France (331 contracts) and Germany (186 contracts).
The EC committed to provide 150 million in Fast Start Climate Finance over the period 2010-2012. 19 regional and national programmes (in Benin, Bhutan, Ethiopia, Lao PDR, Nepal, Samoa and the Gambia) have bene tted so far from such funding from the EC. This funding has been grant payments, 50% of which has been focused on building climate resilience in LDCs and small island developing states, in many cases through the Global Climate Change Alliance (GCCA). It is positive to note that the share of the EC’s climate funding that goes to adaptation is higher than the average across all donors (32%) and that all of this funding is provided in the form of grants.

197
Chapter 4 Global Aid Trends, BRICS Reports and OECD Reports
197
Some doubt remains however as to whether international organisations, such as the World Bank and UNDP who are also bene ting from this funds, are capable of responding swiftly to the immediate needs of vulnerable populations. Moreover, we wonder whether the resources provided are additional to the Commission’s development nance. If existing interventions have been simply labelled as “Fast Start Climate Finance” then this funding could not be judged to be additional. However, if climate nance commitments have led to additional contributions through the EU budget, e.g., through the budget of DG Climate Action, then this funding could be considered additional.
Disaggregated data on countries and sectors receiving EU aid in 2011 was not yet available at the time of writing this report. This section therefore explores trends in the allocations of EU aid for 2010. In 2010, LDCs, LMICs and Other Low Income Countries (68%) were the main recipients of aid of the EU institutions. Sub-Saharan Africa was the main targeted region, receiving 33% of disbursements. The top 3 recipient countries were however the Occupied Palestinian Territory ( 333 million), the Democratic Republic of Congo ( 275 million) and Turkey ( 223 million). We are encouraged to see that amongst the top 6 recipients there were 4 LDCs (Afghanistan, DRC, Haiti and Sudan). However, Turkey which is an Upper Middle Income Country takes a large share of the EU’s development nance.7
In terms of the sectoral focus of EC aid, we note that there was a slight increase in 2010 in ODA disbursements for health, education and
population and reproductive health to 12.1 percent. Nevertheless, it is still far less than the 20% benchmark which the Commission committed to achieve during the current nancial perspective. Regrettably, the EC is proposing that in the next nancial perspectives (covering the period 2013-2020) it will count contributions to social protection towards efforts to achieve this 20% target. Concord believes that the EU institutions need to stick to their existing commitments and reach this target through increases in funding for health and basic education.
During 2010 sectors such as agriculture, forestry and shing received a mere 4.7% or 446.6 million of the EC’s the allocated resources. We look forward to seeing stronger support to these areas in the future, particularly to smallholder farmers, as set out in the EU Food Security Framework.
Concord recommends:
1. The EC must urgently implement its devel-opment effectiveness commitments and be more transparent. It should allocate more re-sources through budget support and to the joint monitoring and evaluation of policies and programmes, involving partner coun-tries and other donors, to improve sharing and learning processes.
2. The EU should take action to further im-prove the accessibility of its external funds to partner country providers of goods and services, as well as grants applicants from partner countries.
3. The EEAS and DEVCO should complete and make public the Memorandum of Un-derstanding on how they will divide tasks and responsibilities for development. The MoU should cover both the approach to
Chapter 4 Global Aid Trends, BRICS Reports and OECD Reports
198198
the programming of funds, as well as PCD, cooperation in-country, joint programming and in-country consultation processes.
4. The positive outcome of the Structured Dia-logue needs to be translated into tangible im-provements in the enabling environment for civil society, including through responsive and exible funding mechanisms and in the way non-state actors are involved in political
and policy dialogue and resource manage-ment at country level and with the EU insti-tutions, including the EEAS.
5. The European Commission should honour its commitment to dedicate 20% of its exter-nal funds to health and basic education.8 This 20% benchmark should be applied across geo-graphic, intra-ACP and thematic programmes, in line with its international commitments.
Endnotes
1 European Commission (2011), The future approach to EU budget support to third countries. Available at http://eur-lex.europa.eu/ exUriServ/ exUriServ.do?uri=COM:2011:0638:FIN:EN:PDF
2 The EU Strategy embraces the full AfT agenda, which can be divided into six categories: (1) trade policy and regulations; (2) trade development; (3) trade-related infrastructure; (4) building productive capacity; (5) trade-related adjustment; and (6) other trade-related needs, notably regional trade integration. Categories 1, 2 and 6 correspond to more narrowly focused Trade-Related Assistance’ (TRA). TRA plus the remaining categories are referred to as the wider Aid for Trade agenda’, designed to bene t trade in a broader sense. Council of the European Union (2007), Adoption of an EU Strategy on Aid for Trade: Enhancing EU support for trade-related needs in developing countries. Available at http://register.consilium.europa.eu/pdf/en/07/st13/st13070.en07.pdf
3 Final Statement of the Structured Dialogue, Budapest, 19th of May 2011. Available at https://webgate.ec.europa.eu/fp s/mwi is/aidco/images/f/fb/Joint_Final_Statement_May_2011.pdf
4 European Commission (2010), Proposal for a Council Decision on the nancial contributions to be paid by the Member States to nance the European Development Fund in 2011 and 2012, including the rst instalment for 2011. Available at: http://eur-lex.europa.eu/ exUriServ/ exUriServ.do?uri=COM:2010:0556:FIN:EN:PDF
5 It can be expected that the further analysis of data will reveal a higher amount. According to EuropeAid´s Annual Report, in 2010, actions related to debt amounted to 119,2 million.
6 http://www.hipc-cbp.org/files/en/open/Guide_to_Donors/EC_11_09_2009.pdf
7 European Commission (2011), Annual report on the European Union´s development and external assistance policies and their implementation in 2010.
European Commission: http://ec.europa.eu/europeaid/how/ensure-aid-
8 ealth should be de ned according to the OECD DAC codes and basic education should encompass primary and lower secondary education
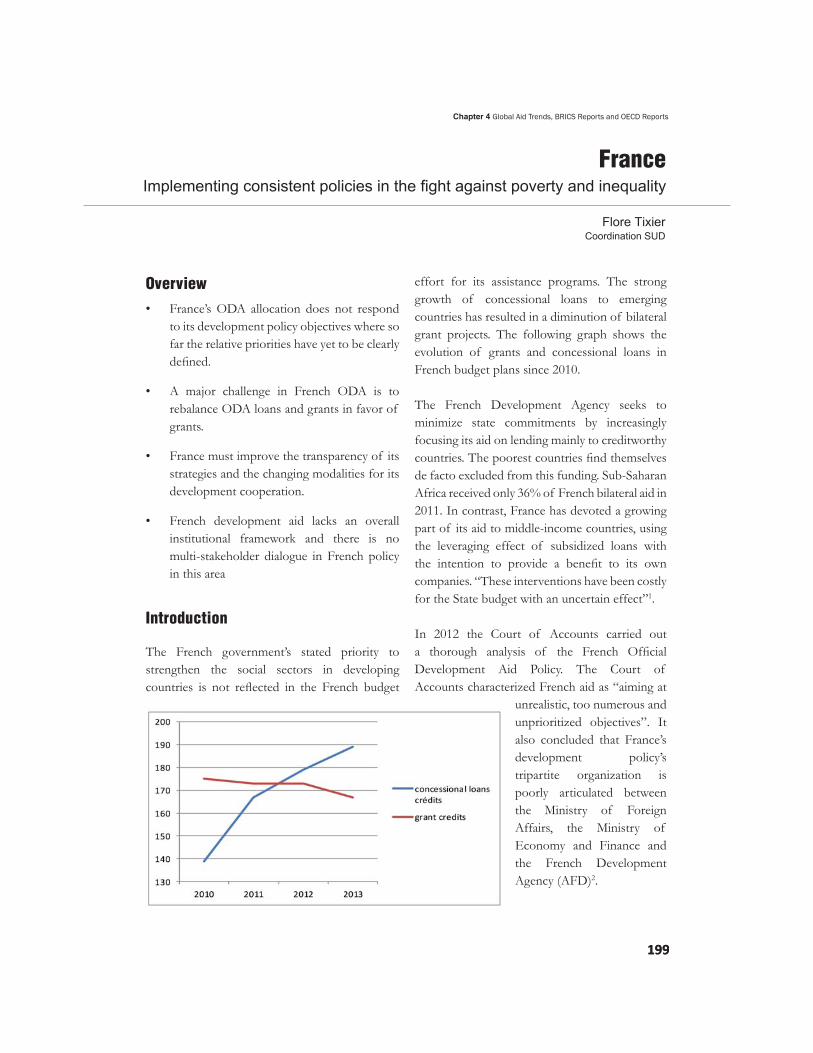
199
Chapter 4 Global Aid Trends, BRICS Reports and OECD Reports
199
• France’s ODA allocation does not respond to its development policy objectives where so far the relative priorities have yet to be clearly de ned.
• A major challenge in French ODA is to rebalance ODA loans and grants in favor of grants.
• France must improve the transparency of its strategies and the changing modalities for its development cooperation.
• French development aid lacks an overall institutional framework and there is no multi-stakeholder dialogue in French policy in this area
The French government’s stated priority to strengthen the social sectors in developing countries is not re ected in the French budget
effort for its assistance programs. The strong growth of concessional loans to emerging countries has resulted in a diminution of bilateral grant projects. The following graph shows the evolution of grants and concessional loans in French budget plans since 2010.
The French Development Agency seeks to minimize state commitments by increasingly focusing its aid on lending mainly to creditworthy countries. The poorest countries nd themselves de facto excluded from this funding. Sub-Saharan Africa received only 36% of French bilateral aid in 2011. In contrast, France has devoted a growing part of its aid to middle-income countries, using the leveraging effect of subsidized loans with the intention to provide a bene t to its own companies. “These interventions have been costly for the State budget with an uncertain effect”1.
In 2012 the Court of Accounts carried out a thorough analysis of the French Of cial Development Aid Policy. The Court of Accounts characterized French aid as “aiming at
unrealistic, too numerous and unprioritized objectives”. It also concluded that France’s development policy’s tripartite organization is poorly articulated between the Ministry of Foreign Affairs, the Ministry of Economy and Finance and the French Development Agency (AFD)2.
Chapter 4 Global Aid Trends, BRICS Reports and OECD Reports
200200
The ndings of the Court of Auditors are categorical. They converge with recurrent interpellations from French NGOs, who now call on the government to show political courage, not to sacri ce the least developed countries on the altar of the crisis and to meet its other commitments. In October 2012, the new French government announced that it would engage in a reform process (“Assises du développement et de la solidarité internationale”) for its development cooperation policy. It is hoped that this process will clearly address paramount challenges of France’s development policy and include all actors of international cooperation. This chapter aims at presenting some of the main characteristics and challenges that should be included in this reform process.
The French State has experienced dif culties in de ning its role in the sharing of responsibilities between ministries and AFD, the French Development Agency, and in the positioning of the Agency as an implementor of French ODA. It is only since late 2011 that the Agency can rely on a single objective and resource contract with the State. “The control of French aid policy is shared mainly between two ministries, the Ministry of Foreign Affairs and the Ministry of the Economy, Finance and Industry. The way their roles are shared out depends less on the type of aid involved than on a historical compromise, which has led to some dif culties”. The Ministry of Foreign and European Affairs (MAEE) is responsible for France’s diplomatic and development initiatives, and for developing sectorial strategies. It managed 12.2% of bilateral ODA in 2010, all of which was disbursed as grants. The Ministry of the Economy, Finance and Industry (MINEFI) managed 30.2% of
bilateral ODA 2010, of which 62% was debt relief.
Both ministries can have diverging views on the nature and amount of French ODA. While the MAEE is in favor of an increase in its overseas presence and a reinforcement of its in-country services making its assistance more visible, the MINEFI would prefer a freeze or decrease of assistance. While the MAEE and MINEFI are key players in managing ODA, the French Inter-ministerial Committee for International Cooperation and Development (Comité Interministériel de la Coopération Internationale et du Développement, CICID) is the body that broadly de nes the strategic and geographic priorities for France’s development policy and coordinates all ministries. The Prime Minister chairs the CICID, which is supposed to meet once every year. However, the Committee did not meet between 2006 and 2009, and has not met since, thus further accentuating the lack of coordination in French aid policy.
In 2010, the French Development Agency (AFD) was responsible for 35.9% of the bilateral assistance budget in French ODA. In 2011, it accounted for over 30 percent of aid documented and managed two-thirds of programmable bilateral aid. The AFD has a dual status as a public agency and a development bank. The Agency is wholly owned by the French government and is overseen by the CICID. Despite the development cooperation strategy, the AFD and the MAEE continue to have separate sector strategies. The Agency’s involvement is mainly in the form of loans, which accounted for 84% of its activity in 2011. The Agency’s funds come principally from the
nancial markets, with favorable nancial terms: more than half of AFD’s funding comes from bonds issued on international capital markets and through private investments.
201
Chapter 4 Global Aid Trends, BRICS Reports and OECD Reports
201
In 2011, the government nalized a development cooperation strategy, which provides a ten-year outlook on the strategic objectives and modes of intervention of French development assistance. The strategy focuses on four overarching objectives: fostering sustainable and equitable growth for the poorest populations; combatting poverty and inequality; preserving global public goods; and ensuring global stability and the rule of law. The strategy also includes health and agriculture as two key priority areas. CSOs generally welcomed the adoption of this Comprehensive Framework for France’s development cooperation strategy, which also highlights the right-based approach and the recognition of the role civil society.
Nevertheless, France’s ODA does not appear to respond to these objectives whose relative priority has not been de ned. French ODA is still too oriented by security interests, as well as foreign policy and instrumental approaches. The Budget Plan for 2012 re ects the tension between the budget for ODA (modest) and French ambitions (grand). “France has the ambitions of the United States with the budget of Denmark,” say the senators themselves.3
Changing priorities in the French Budget for International Assistance
The Development Goals of the 2011 Framework are far from being translated into French budget allocations. French of cial development assistance should help to fund local and national public policies that contribute to the ght against poverty and inequalities. Only the consistent deployment of grant nancing in social sectors ensures the relevance of French ODA
instruments with this ght against inequality in the Least Development Countries (LDCs). French ODA should target countries with the greatest need (the 14 countries and LDCs as stated by the Inter-ministerial Committee for International Cooperation and Development) and with evidence of improving effectiveness.
The major challenges in French ODA for the years leading up to 2015 and its contribution to the achievement of the MDGs is to rebalance ODA loans and grants in favor of grants, like its European counterparts, and as recommended by the OECD Development Assistance Committee (DAC).
The strong growth of loans to emerging countries with low concessional conditions has resulted in a diminution of funding projects on bilateral grants. An increasing share of ODA is allocated to middle-income countries through loans, following a logic that moves away from development cooperation. Representing 84% of the French Development Agency disbursements in 2011, loans have become its main instrument of intervention. Without signi cant new budget resources for grants, ODA will follow an instrumental logic, which leads to an increased use of loans at near-market conditions, and therefore at low cost to the State. These loans are still considered as concessional in relation to the OECD criteria and counted as ODA.
With an objective to minimize the cost for the State, i.e. to minimize the concessionality, the AFD searches for creditworthy borrowers. The Agency seeks to minimize the cost of state commitments and focuses on lending to creditworthy countries.
Being a nancial institution as well as an agency supporting French foreign policy, the Agency’s
nancial programs have more than tripled in six years, amounting to 5.13 billion in 2011, with the share for Sub-Saharan Africa being 45% of its loans.

Chapter 4 Global Aid Trends, BRICS Reports and OECD Reports
202202
The bilateral grants, used to nance projects in social sectors, mainly in Sub-Saharan Africa, have plummeted since 2006 (by close to 30% according to the OECD DAC). In 2011, the envelope used to nance new projects amounts to 170 million, down 46% from 2006. This declining commitment to grants strongly constrains the capacity to review and undertake new projects in the social sectors. The steady decline of this envelope since 2006, if con rmed in the coming years, will no longer allow France to be present in the nancing of the social sectors in many priority countries.
Thus, in spite of repeated assertions to the contrary, development aid is having dif culty in concentrating on countries and sectors most in need: mainly in Sub-Saharan Africa. France allocated 70% of its aid to this region over the past decade, but only devoted 36% of its bilateral aid to the region in 2011. This means that the 2011 Framework’s objective of allocating 60% of the French aid to Sub-Saharan Africa, set for the three years from 2011 to 2013, seems ambitious.
The French Development Agency has committed to go “beyond the DAC recommendation by fully untying its aid projects, regardless of the contract amount, and to LDCs as well as to all partners”. However, after the November 2011 Busan High Level Forum, France declared that it would not go beyond untying 85% of its aid due to domestic economic issues. France wants reciprocity in untying aid, i.e. getting the BRICS “donors” to untie their aid as well.
According to the OECD DAC, France cancelled US$1.2 billion in debt in 2011, which made up more than 14% of its bilateral ODA in this year. Much of the canceled debts were generated by
an active policy of support to French exporting companies, via the state guarantee for exports managed by Coface. This type of debt resulting from public policy to promote French exports is based on a logic that is clearly distinct from sustainable development goals.
The Ministry of Economy publishes the table of outstanding claims of France on foreign states.4 This table includes claims held either by the State / AFD directly, or by Coface and Natixis on behalf of the State. There are two categories of claims – for ODA loans and for trade receivables. In presenting outstanding claims as of December 2011, the Ministry reported that “outstanding signi cant countries such as China, Indonesia, Morocco and Pakistan corresponds mainly to
nance projects involving French companies in these emerging countries”. These four countries account for 17% of total outstanding debt owed to France by foreign states. However, the information provided notes that 79% of receivables on loans from these four countries can be included as ODA.
Despite their multiple roles in international cooperation as humanitarian and development actors, technical experts and advocates, French CSOs received only a very modest share (1%) of French ODA. Non-governmental cooperation remains the “poor relation” of French cooperation. According to a recent survey published by the OECD, at 1%, France ranks last among DAC donors for the share of ODA channeled through NGOs, while the OECD average is 13%. It is essential that France signi cantly improves in this area to respect NGOs as development actors creating conditions for cooperation based on partnership.

203
Chapter 4 Global Aid Trends, BRICS Reports and OECD Reports
203
French CSOs have important programs in the eld of international solidarity and development
education, working closely with their partners in the South and in the East. France provides
nancial support for French CSOs primarily through AFD, through a competitive bidding process to select CSO implementing partners. Civil society dialogue between the government and international solidarity associations has been characterized by dashed hopes, discontinuities and dissonances. Beyond the need to strengthen
nancial support, French CSOs insist upon a formal framework for strategic dialogue with the government on French policies for development cooperation.
Dissemination of information on government policies to parliament is a democratic imperative. A public policy is legitimate only if it is transparent, if responsibilities are clearly assumed, and if the democratic debate about its objectives, its implementation and its results is facilitated. In this sense, the goal must be to maximize the predictability and transparency of French ODA, at the governmental and parliamentary levels, to enable responsible partnership with developing country governments and civil societies. Parliament must be involved in setting priorities and be able to evaluate government policies. French parliamentarians also expressed their wish to be more consistently involved in the
development and evaluation of the effectiveness of development cooperation policies. A debate on appropriate policy guidelines for development cooperation should be held in a Parliament that is regularly informed on French ODA expenditures and practices by the government.
France must improve the transparency of its strategies and the changing modalities for its development cooperation (information and quality of information provided, accountability for its positions in multilateral bodies, etc.). France should sign IATI, develop an implementation schedule and begin publication of information against the IATI Standard through the IATI Registry. AFD could publish to the Registry by improving its online project database and ensuring that it is compatible to the IATI Standard. France should support and deliver on an ambitious and comprehensive EU Transparency Guarantee.
The government should anticipate that the level of debt forgiveness will decline in French ODA. If the government wants to translate its commitments to increase ODA with new budget resources, it should undertake a programming review to accurately determine the allocation of new appropriations for ODA over the period 2012-2017. Considering the signi cance of the amounts involved and the current weight of constraints on the state budget, this should be done quickly and lead to a substantial parliamentary debate to propose a multi-annual programming law for French ODA.

Chapter 4 Global Aid Trends, BRICS Reports and OECD Reports
204204
Endnotes
1 http://www.ccomptes.fr/Publications/Publications/ a-politique-francaise-d-aide-au-developpement
2 http://www.ccomptes.fr/Publications/Publications/ a-politique-francaise-d-aide-au-developpement
3 Cambon, Christian, Vantomme, André, Rapport d’information, ’AFD, fer de lance de la coopération française», mai 2011,
p 97.
4 http://www.tresor.economie.gouv.fr/5597_encours-des-creances-de-la-france-sur-les-etats-etrangers-au-31-decembre-2011. Outstanding claims as of December 2011 is available from the Ministry’s web site.

205
Chapter 4 Global Aid Trends, BRICS Reports and OECD Reports
205
• The ODA budget will be frozen to the euro level of 2012 for the next two years.
• Previous government aligned Finnish development projects more with sectors important for Finnish exports and introduced new private sector aid modalities.
• The present government emphasises more traditional Finnish values in its development cooperation, such as human rights, but will not withdraw from the increased focus on private sector development.
The election of a new government in March 2011 brought major changes to Finnish development policies – again. The previous administration had de-prioritised the traditional focus on education, health and other social sectors. It had expanded work in areas such as agriculture, forestry, infrastructure, and even innovation policies, with a constant search for “Finnish added value” in development projects. Aid priorities were to be aligned with sectors important for Finnish exports.
The new government approved its Development Policy Programme in February 2012.1 It reaf rmed Finnish commitments to the Millennium Development Goals (MDGs), aid effectiveness and to human rights, which had received less attention in the previous government’s policy. The new development minister Heidi Hautala also promised a new culture of transparency in Finnish development cooperation, which was a
fresh start after the often-secretive procedures of the previous development administration.
The changes in Finland’s development policy coincided with the global economic crisis, which has brought an end to years of steady growth of Finnish Of cial Development Aid (ODA), with Finnish ODA performance likely peaking at 0.52% of Gross National Income (GNI) in 2011.2 The ODA budget will be frozen to the euro level of 2012 for 2013-2014 and cut by 30 million in 2015, the only exception being the addition of possible pro ts from the EU emissions auction. However, as the timing and amounts of possible additional income arising from this trade are highly uncertain, it is dif cult to estimate their amount or plan their use. It looks like the UN target of 0.7 % GNI for ODA by 2015 is fading from view.
With the ODA budget frozen and the planned cut, the big question is whether the government can bring the human rights-based approach and other new priorities of the Development Policy Programme to the current implementation plans for ongoing projects in forestry, agriculture and other elds inherited from the previous government. Active debates on this have been held in the Ministry for Foreign Affairs (MFA) in 2012, centred on the concept of green economy (another new opening of the current government), but the results remain to be seen. The previous government’s four-year long neglect of social inclusion has made these efforts more dif cult.

Chapter 4 Global Aid Trends, BRICS Reports and OECD Reports
206206
Regarding private sector development, the single biggest change brought by the new government is the phasing out of the concessional credit programme. Between 2002 and 2009 there were a total of 47 projects corresponding to 156 million in the concessional credit programme.3
The deadline for the last new projects was June 2012. After that date no new concessional credits have been granted and the programme will phase out after the current projects reach their completion.
The concessional credit programme has so far survived despite the outspoken criticism by several OECD Development Assistance Committee (DAC) peer reviews and by civil society organisations. The programme has focused on a small number of large projects in sectors such as agriculture, energy, water and health services, conducted usually by major Finnish multinational companies, with a history of several controversial projects. The latest evaluation looked at project relevance, effectiveness, impact and sustainability, ef ciency, complementarity, coherence and coordination, and Finnish value-added of the programme. The main conclusion rated the scheme poorly on most the above criteria (D.C.F. SAU 2012). Finnish CSOs have also been criticising the programme along similar lines and discontinuation of the programme is thus a welcomed development.
Overall, it seems likely that the current government will build upon the paradigm change in private sector cooperation initiated by its predecessor rather than overhaul it. The Development Policy Programme notes that “today, development is based increasingly on the rapidly growing private investments, both
from domestic and foreign sources”.4 However, principles such as decent work, human rights and green economy are supposed to be emphasised in the implementation of private sector activities in global South. This private sector emphasis is not just a result of the freeze in the ODA budget but a conscious policy decision by the government. A moderate shift is already visible in the new alignments in Finland’s policies on export credits (see below).
The previous government had decreased programme aid (especially direct budget support) and initiated a number of smaller projects in various countries. This bene ted especially Finnish consulting rms, as international agencies such as the World Bank or UN organisations are less likely participants in smaller projects. The result has been an increase in aid fragmentation and also the spreading of Finnish ODA across a wider geographical span, with many new regional and country-level programmes e.g. in West Africa where Finland has traditionally not had much presence.
The previous government placed an increasing focus on Aid for Trade (AfT). The new projects shifted focus from education and social development to infrastructure, forestry, agriculture and other new areas. According to the MFA, currently some 3% of Finnish ODA goes to nancing private sector related activities. While this is not a substantial proportion as such, there has been a clear trend in scaling up private sector
nancing.
The MFA evaluation of Finnish Aid for Trade (2011), for example, demonstrates that Finnish AfT commitments increased between 2006 and 2009 by 29.1% per year, while disbursements

207
Chapter 4 Global Aid Trends, BRICS Reports and OECD Reports
207
increased by 8.9% on average. Total AfT commitments have increased by 377% since 2006, while disbursements have increased by 238%. In 2009, total AfT commitments accounted for 38.5% of total sector-allocable aid, while AfT disbursements were 23.4%. Commitments and disbursements have increased from 20.5% and 14.1% respectively in 2006, therefore achieving the former government’s aim of increasing broad AfT as a share of aid. The largest AfT category is building productive capacity (approximately 72% of disbursements), which covers two of Finland’s focus sectors, forestry and agriculture.5
The MFA’s programme for Aid for Trade cooperation expired in 2011, and the next programme will be published in late 2012. The principles outlined in this programme will guide the funding decisions of AfT related projects. In addition to private sector instruments covered in this chapter, Finnish AfT cooperation centres around public sector projects aimed at fostering an enabling environment for private sector activities. Finding relevant statistical information on sector development of this aspect of ODA is dif cult.
Finnish CSOs have criticised the Finnish approach towards Aid for Trade for its lack of focus on the impacts of trade agreements on long-term development in partner countries6 and for not taking into account “numerous pieces of UN and independent research [showing] that international trade offers little help to the poorest countries”.7 CSOs have proposed that all Aid for Trade cooperation should promote only companies that operate sustainably under international standards and guidelines for responsible corporate investment. It will be crucial for the new government to enhance policy coherence between Aid for Trade co-operation,
international and national work against illicit capital ight, and better trade policies.8
Some existing Finnish aid instruments were modi ed to better support the private sector. Funding criteria of the Local Cooperation Fund (LCF), an instrument traditionally used for
nancing civil society organisations in the South, was broadened in 2009 to include Chambers of Commerce and other business organisations. The projects supported under the LCF often span several years, and until now very few private sector related projects have been initiated under it. The LCF disbursements represent slightly more than 1% of the Finnish ODA.
The 2008 evaluation criticised the fragmentation of LCF funding into a large number of too small projects.9 Decisions on the use of the LCF are made in the Finnish embassies. The 2008 evaluation recommended clarifying and explicitly de ning the role of the LCF as a capacity building instrument. It suggested more focussed LCF support for fewer partners and systematically in line with the country mission plan of action.10
In addition to widening the scope of the LCF, the previous government initiated a new aid modality labelled the Institutional Cooperation Instrument (ICI). The ICI is intended to strengthen collaboration and capacity-building efforts between institutions such as universities and research centres. Although the ICI is tailored for cooperation between public institutions, it is also used in sectors related to the Aid for Trade. In that context, it is employed particularly in aid programming in the mining and forestry sectors.11

Chapter 4 Global Aid Trends, BRICS Reports and OECD Reports
208208
The Finnish civil society has emphasized the need for clear and transparent guidelines for allocations made through the LCF, as well as robust and transparent mechanisms for evaluating the effectiveness of the work.12 The ICI instrument, on the other hand, is still a relatively new tool, and Finnish NGOs have not yet been voicing any recommendations. However, from the viewpoint of the quality of aid, it is important to ensure that its use genuinely bene ts the Southern organisations involved.
Finnfund, the Finnish development nance company, has expanded its operations with annual capital contributions by the government of 10 to 15 million over several consecutive years.13 While the contributions have been small related to Finnish total ODA ( 879 million in 2012), they have been substantial relative to the total capital of Finnfund, reaching 162 million in 2010.14 The capital contributions as such are not ODA-eligible, but the discounted proportion of Finnfund’s investments and loans is included in ODA. Finnfund’s six executive directors are responsible for funding decisions. Two of directors always come from the MFA, one from Ministry of Finance, and one from Finnvera, the Export Credit Agency of Finland.
The Finnfund’s strategy requires that the nanced projects create developmental impacts. The independent National Audit Of ce conducted an evaluation of Finnfund in 2010, criticising it for fragmentation of its funding and “hands-off ” governance of its activities by the Ministry for Foreign Affairs. As a result, the MFA issued a Guidance Note for Finnfund in 2011. The updated Note of the new government requires Finnfund to concentrate 75% of the value of its new funding
on low income and least developed countries.15
Finnfund refrained from tying its aid to Finnish companies in 2001,16 but the investments need to align with “Finnish interests”. De ning this interest has often created confusion, since it can be interpreted either in terms of commercial interests or emphasising Finnish development policy priorities. In practice the “Finnish interest” refers mainly to commercial bene ts17, and there have been very few projects (excluding private equity funds) that do not have any linkages to Finnish business.18
The current Guidance Note calls on Finnfund to evaluate its investments for direct and indirect jobs creation, net tax income, and net export revenues, as well as environmental and gender effects of its operations. However, the evaluations are often based only on questionnaires completed by companies themselves, and not on independent audits. Only a few large projects are being evaluated annually by outside consultants or the Finnfund staff.19 Finnish CSOs have argued that all Finnfund lending should be based on the highest corporate responsibility standards.20
Finnfund channels part of its funding through several private equity funds. An evaluation noted that decisions on private equity investments include analysis of the risks and an environmental assessment. However, private equity funds are often registered in tax havens such as Cayman Islands, and those funds that Finnfund invests are no exception. Obtaining detailed information on private equity investments is therefore dif cult due to corporate and banking secrecies. Private equity investments represent currently a signi cant 30% of Finnfund’s total investments.21

209
Chapter 4 Global Aid Trends, BRICS Reports and OECD Reports
209
Negotiations are now underway to expand Finnfund’s operations with a new lending instrument tailored for nancing high-risk projects. The new instrument will be modelled in a way that distributes the risk for Finnfund to the state of Finland, which would cover part of potential losses for a high-risk project. A survey conducted for a background report for the high-risk instrument identi ed middle-income countries as the primary targets for this instrument. However, the MFA’s guidance note for Finnfund, with its goal of delivering 75% of the nancing to low and least developed countries, will also bind the use of the new instrument. In addition, the instrument will not be earmarked for projects involving Finnish companies.
Finnfund administers Finnpartnership, a programme started in 2006 to help Finnish companies invest in the South. The programme is supported by Finnish ODA with approximately 7 million per year.22 The number of supported
projects in the programme has risen steadily from 22 in 2006 to 110 in 2010. However, there has been a signi cant discrepancy between the commitments and actual disbursements. In 2008, for example, the disbursements were less than half of the pre-approved amounts.23
Some country-level programmes include similar nancing windows for local companies in the
South, for example, for conducting feasibility studies on planned investments.
Finnish NGOs have expressed their concerns over Finnfund’s private equity investments channelled via tax havens. The governments of Norway and Sweden have recognised the problems that tax haven based private equity funds create for policy coherence. These governments have started to look for ways to refrain from using tax havens in the future. In Finland, the CSOs argue, this discussion has not yet begun.
Increasing dialogue with Finnish companies has been a priority for two consequent governments. The previous government initiated working groups (“clusters”) around the sectors where Finnish export industries interests overlapped with potential development cooperation projects. Work of the clusters, however, did not gain momentum and their meetings were discontinued. The present government initiated a broader-level corporate forum for similar purposes. But the focus of these forums has been more on listening to the needs of Finnish exporters, and much less on discussing corporate responsibility issues.
A potentially very interesting theme in the connection between private sector and development policies is the work on illicit nancial
ows and tax havens. Both the Government Programme, which is the highest level document for government’s commitments, and Development Policy Programme, which complements it, have strong wordings on taking Finland to the forefront of international work against illicit capital ight from the South. The new government has given support for an international dialogue on tax issues and the topic will also be included in the 2013 Ownership Guidance Note to Finnfund. There is less clarity on how these commitments will be included in bilateral cooperation.
Despite ambitious commitments, it is also worth pointing out that Finland was one of the few countries in the EU opposing wide-range country and project level transparency of tax payments in EU extractive industry companies present in the South. The main responsibility for this decision was in the Ministry for Trade and Employment. It represents the continued challenges for development policy coherence within a broad coalition government.

Chapter 4 Global Aid Trends, BRICS Reports and OECD Reports
210210
Endnotes
1 Ministry for Foreign Affairs 2012a2 Ministry for Foreign Affairs 2012b3 D.C.F. SAU 20124 Ministry for Foreign Affairs 2012a, p. 65 Saana Consulting td. 2011, p. 426 appalainen 20107 Kepa 20108 Kepa 20129 Impact Consulting Oy td. 200810 Impact Consulting Oy td. 2008, p. 511 Saana Consulting td. 2011 s. 52
12 Kepa 200813 Ministry of Finance 201214 Finnfund 201215 Ministry for Foreign Affairs 201116 National Audit Of ce of Finland 2010, p. 13 17 National Audit Of ce of Finland 2010, p. 1918 National Audit Of ce of Finland 2010, p. 3219 National Audit Of ce of Finland 2010, p. 5220 Kepa 201221 Finnfund 2011, p. 2522 Ministry for Foreing Affairs 2012c23 Finnpartnership 2010
References
Evalua on innis on essional Aid Instru ent
vsk_2011
Tunnusluvut a viisivuo skatsaus
inn artners i o el an toi intara or . . . .
Lo al oo era on unds Role in Ins tu on Buildin o ivil So iet Or aniza ons
Ltd.
Ke it s olii sen instru en valikoi an ke i inen ksit issektorin toi innan ke i isen n k kul asta. Tarkiste u lo ura or
Ke an lin aus ke it s teist n laadusta
kepan-linjaus-kehitysyhteistyon-laadusta.pdf
ualit o Develo ent oo era on
rit svastuuta vai vastuu o ia rit ksi
Aid and E ono i Rela ons S ll La in Be ind Peo les el arev
inn undin ke it s olii nen erit iste t v sek o ista a a ke it s olii set tavoi eet vuodelle
Suo en ke it s olii nen toi en ideo el a Val oneuvoston
eriaate t s . .
A ro ria ons and their use
inn artnershi o ers new business oo era on o ortuni es
Teollisen hteist n rahasto O n inn und toi intatarkastusviraston tuloksellisuustarkastuskertomus
Evalua on innish Aid for Trade

211
Chapter 4 Global Aid Trends, BRICS Reports and OECD Reports
211
Overview
• The German government continues to reaf rm the 0.7 percent target by 2015, although it has started to communicate the quali cation that the target “cannot be reached only by funds coming from the general budget. Instead innovative nancing instruments should make a signi cant contribution.”1
• Despite this public con rmation, Germany is not on track meeting the target. In 2011, Germany’s aid increased only by 5.6 percent to US$14.53 billion.
• While Germany is now the second largest donor in absolute numbers, its ODA performance reaches only 0.40% of gross national income (GNI) and increased by only 0.01 percentage points compared to 2010. Germany ranks twelfth among the 23 OECD/DAC member states. This is – compared to its relative economic power – remarkable low.
• Among the existing “innovative nancing instruments” there are two mechanisms with a considerable potential impact: One is the auctioning of carbon emissions certi cates that led to the establishment of a national special fund for energy and climate nancing. The second are revenues from a nancial transaction tax that is very much welcomed by the German public.
• According to the ministry, Germany plans to channel nearly 50% of its bilateral assistance to Africa2 and 37% to the Least Developed
Countries (LDCs) in 2012. In 2010, US$3.2 billion was directed to Africa, and US$2.8 billion to the LDCs.3
• Sectoral priorities of German development policies demonstrate continuity: democracy and public administration, energy and environmental issues are among the top priorities, while education and food security still lack suf cient nancial resources.
• Aid in ation continues to be an issue, especially related to imputed student costs, which made up US$886 million (6.8% of ODA) in 2010. Debt relief has been insigni cant since 2008, declining from a peak of almost 40% of ODA in 2005 to a little more than 3% in 2010. Refugee costs amount to only 0.6% of ODA in 2010.
• Germany still has a way to go in untying its aid: The latest numbers say that Germany has untied 73% of its ODA in 20094. But what is especially problematic is that only 48% of freestanding technical cooperation (TC) was channeled through local procurement, and more than 50% of TC is still tied. The German government has suggested that it has achieved “nearly 80 percent of untied aid” in 2011.
• Climate nance is an integral component of the German ODA. According to “of cial information”5 the government has made the commitment to give 433 million as Fast Start Finance (FSF) for 2011. Actual of cial information regarding FSF-disbursement is not available.
Chapter 4 Global Aid Trends, BRICS Reports and OECD Reports
212212
One of the major changes concerning development politics in Germany has been the creation of the Deutsche Gesellschaft für Internationale Zusammenarbeit (German Organization for International Cooperation (GIZ) GmbH in 2011, a company of which the Federal Ministry for Economic Cooperation and Development (BMZ) is the sole shareholder. It emerged from the three former implementing organizations GTZ, DED, InWEnt. The GIZ mandate is to implement German governmental technical and regional projects and to present German development work “with one face to the customer”. At the beginning of 2012 another new implementing agency was founded. This new agency is called “Engagement Global – Services for development initiatives” and is responsible for development education and cooperation with civil society organizations.
Besides these institutional changes, the Federal ministry (BMZ) has developed more than 12 new strategy papers for different development sectors, among them for education, HIV-control and Aid-for-Trade. The ministry has also created an overreaching political strategy paper entitled, “Minds for Change – Enhancing Opportunities”.6 The paper was drafted by a small group of political of cials working with the minister and then released for public comments. However, the results of this consultation were never made public, and according to civil society, the resulting paper is more of a collection of keywords than a real strategy document.
Since assuming of ce (2009) the Development Minister, coming from a liberal party, has been strongly pushing for cooperation with the private sector in Germany’s development initiatives.
The election of the conservative-liberal government in 2009 resulted in a strategic shift with regard to the directions for German development cooperation. As noted above, Development Minister Niebel strongly pushed for an increased cooperation with the private sector and its involvement in development cooperation. In its coalition agreement, the coalition de nes economic cooperation as one of the key sectors within the eld of development cooperation. In this sector, the government aims to expand and protect the private sector, e.g. through Public-Private Partnerships (PPPs), micro-
nance systems and infrastructure support.7 Furthermore, in order to create win-win impacts, German development cooperation should not only contribute to development, but also take into account German external trade interests:
“Foreign trade and development co-operation must build upon each other and be integrated in a seamless fashion. Development policy decisions must take suf cient account of the interests of the German economy, particularly the needs of small and medium-sized companies. Foreign trade chambers should be informed in good time about development organisations’ commissions when contracts are awarded.”8
With regard to this approach, German Civil Society Organizations (CSOs) are concerned that development cooperation may now be used to promote external trade interests, rather than focus on poverty reduction. Furthermore, they are skeptical about the logic behind the approach: Growth alone does not automatically lead to poverty reduction, and the role of private sectors in the development process has not been carefully analyzed. In their view, the government is following a one dimensional approach, one which emphasizes coherent action by state and

213
Chapter 4 Global Aid Trends, BRICS Reports and OECD Reports
213
private stakeholders, but without taking into account possible trade-offs affecting poor and vulnerable populations (e.g. private pro ts versus poverty reduction).
From 2010 onwards, concrete action was taken by the development ministry to foster cooperation with the private sector. A new service unit in the development ministry was established in order to advise small and medium enterprises with regard to possible engagements in development policies.
Funding for public-private partnerships increased signi cantly. Already introduced in the 1990s, PPPs are not a completely new tool in German development cooperation. An evaluation conducted in 2002 revealed that PPP contributed to increased funding from the private sector on the one hand, but also warned to be cautious about possible windfall gains and crowding-out of local competitors in partner countries’ markets.9
Since 2002, a detailed evaluation of the impact of PPPs on development is missing. Therefore, it is dif cult to assess the concrete impacts of PPPs for poverty reduction. However, taking a look at the regional and sectoral concentration of PPP projects in German development cooperation, it is doubtful that the poorest people really bene t from this instrument. The focus of PPP cooperation projects is mainly in Asia. Since 2000, only one-fourth of all PPP projects have been implemented in Africa. Cooperation projects have been concentrated where German companies can expect to make pro ts. The resources are so far going to investments in sustainable economic development and the environmental sector. Sectors that are important
for meeting the MDGs have received only a small share, especially sectors like education (4.4% share in PPP projects), health (5.6%) and water (4.8%). 10 Therefore, the regional and sectoral concentration of PPPs seem to re ect more the interests of German companies rather than a distribution in line with the needs of the poorest populations.
At the same time, CSOs would nd a private sector shift towards the social sectors rather problematic. Strengthening public education and public health and social protection systems are essential for achieving the MDGs. Abolishing school fees or out of pocket payments in the health sector have been proven to be successful tools in poverty reduction, as well as social cash transfers for poor populations. But this has to be done by public nancing, for example through additional donor budget support. For the private sector, these areas are also uninteresting, since investments do not automatically lead to pro ts, and, if so, might not lead to poverty reduction. Furthermore, investments in building private schools, hospitals or water and sanitation systems take place where people can afford private services. Therefore, the potential of PPPs in making a substantial contribution to achieving the MDGs might be rather limited.
In a broader picture, since the 2009 change of government, there has been a trend to increase the use of concessional loans eligible as Of cial Development Assistance (ODA) in order to
nance market-related development. The amount of this interest-subsidized mixed-credit nancing has increased from 332 million in 2008 to 1,155 million in 2010. This kind of nancing is mainly

Chapter 4 Global Aid Trends, BRICS Reports and OECD Reports
214214
to support projects in the eld of infrastructure – for example, transportation, energy, telecommunication, and water and sanitation.
With these concessional loans, it is mainly the economically stronger developing countries that are supported, and poorer countries only to a small extent. 11
At European level, the German government is also pushing for a broader use of mixed
nancing, in the context of the so-called blending of EU budget grants with loans from international and European bilateral
nancial institutions. In order to increase blending, a number of regional facilities in Latin America and other regions have been created. It seems that these new instruments have improved EU donor coordination, increased the leverage of EU development nance, and enhanced effectiveness and ef ciency of the operations. However, a recent study on behalf of the European Parliament’s Committee on Development concludes with the concern “that [these] instruments do not t well the needs of the poorest.”12 CSOs are particularly concerned that blending could lead to unsustainable debt levels in partner countries, since loans have to be paid back, which could be a serious burden especially for Low-Income Countries (LICs). Furthermore, due to scal constraints in budgets of donor countries, they fear that grant assistance, which is necessary to support the poorest countries, could be reduced since loans can be used to increase aid at lower budgetary costs for the donor. Finally, the poverty focus of blending is often not clear: “Quite often, no direct links between blending and poverty deduction can be observed. Blending facilities are focusing on growth incentives through investments in infrastructure, energy and transport. Impacts on poverty cannot be taken for granted, which is why transmission channels need to be identi ed for stakeholders to directly or indirectly pursue the MDGs and other goals.”13
So far the implications of the strategic shift in German development cooperation towards a stronger cooperation with private actors are not fully clear, and it is too early to draw nal conclusions. However, several risks have to be taken into account when cooperating with the private sector, as the DAC Peer review on German development cooperation in 2010 stated: “Germany should carefully manage the risks posed by combining the emphasis on private sector development in the Coalition Agreement and other policy documents (which is a positive response to the growth agenda) with the promotion of Germany’s own commercial interest. This risks using the development programme for purposes which would not qualify as ODA.” 14
In general, cooperation between Germany’s development program and the private sector has limits. Experience shows that these development partnerships cannot be a substitute for increases in traditional ODA, especially in order to support essential public systems and programs in sectors such as education, health, and basic social care.
From a German CSO perspective, there are some key principles that have to be taken into account in the cooperation with the private sector:
• Development cooperation must support those countries most in need of external assistance, and those sectors that are relevant for achieving the MDGs and realizing universal human rights, not those countries and sectors that are most attractive for the private sector.
• All cooperation projects with private partners have to be fully integrated into bilateral development cooperation policies and in the national development strategies of partner countries.
215
Chapter 4 Global Aid Trends, BRICS Reports and OECD Reports
215
• Projects with private partners in German development cooperation should undergo a Human Rights Impact Assessment to ensure that projects are in line with international human rights standards.
• All instruments for cooperation with the private sector should be open for local companies in the partner countries.
• All projects need to be evaluated ex-post to ensure that they really provide win-
win impacts, particularly for development outcomes for poor and marginalized populations.15
For civil society, it remains an open question whether the bene ts of poor people in the South or the interests of German external trade are the decisive driver for future German government cooperation with the private sector in development.
(Endnotes)
1 German budget draft for 2013, 27th of July 2012, not published.
2 GERMAN at a glance – OECD DAC information: http://ec.europa.eu/europeaid/what/development-policies/financing_for_development/documents/germany-donor-pro le.pdf
3 BMZ website: http://www.bmz.de/de/ministerium/zahlen_fa ten/Bi_und_multilaterale_Netto_ODA_an_
DC_2006_2010.pdf
4 OECD/DAC 2001: IMP EMENTING T E 2001 DAC RECOMMENDATION ON UNT NG AID: 2010-2011 REVIEW: http://www.oecd.org/of cialdocuments/publicdisplaydocumentpdf/?cote=DCD/DAC(2011)4/REV1 doc anguage=En
5 Fast start nancing: Germany’s lessons learnt from the rst year of implementation: http://www.bmu- limaschutzinitiative.de/ les/BMU-BMZ-fast_start-lessons_learnt_2010_770.pdf
6 BMZ: Minds for change – enhancing opportunities: http://www.bmz.de/en/publications/type_of_publication/special_publications/Minds_for_Change.pdf
7 Growth. Education. Unity. The Coalition Agreement between the CDU, CSU and FDP. 2009, p.182.http://www.cdu.de/doc/pdfc/091215- oalitionsvertrag-2009-2013-englisch.pdf
8 Ibid. p.75-76
9 Altenburg, Tilman / Chahoud, Tatjana 2003: Synthesebericht über die Evaluierung Public-Private Partnership in der deutschen Entwic lungszusammenarbeit. Bonn.
10 Terre des ommes / Deutsche Welthungerhilfe 2010:The Reality of Aid 2010, long version in German, p.36, http://www.tdh.de/fileadmin/user_upload/inhalte/10_Material/Wir lich eit_der_Entwic lungshilfe/Wir lich eit_der_Entwic lungshilfe_2010_18.pdf
11 Terre des hommes / Deutsche Welthungerhilfe 2012: The Reality of Aid. A critical analysis of the German Federal Government’s development policy. Where is development policy heading? The search for new concepts and alliances. Summary, p. 4, http://www.tdh.de/ leadmin/user_upload/ inhal te/10_Mater ia l /Wir l ich ei t_der_Entwic lungshilfe/2012-20-1/WdEP-Engl- urz_2012-20-1.pdf
12 European Union (Directorate-General for External Policies, Policy Department) 2012: Blending Grants And oans In The ight Of The New DCI. Authors: Núnez Ferrer, Jorge / Moraz n, Pedro / Sch fer, Tobias / Behrens, Arno, p. 8, http://www.fors.cz/user_ les/ep_study_blending_loans_and_grants_in_light_of_dci.pdf
13 Ibid. P. 9.
14 OECD / DAC 2010: Germany Peer Review 2010, Paris, p. 37, http://www.oecd.org/development/peerreviewsofdacmembers/46439355.pdf
15 Terre des ommes / Deutsche Welthungerhilfe 2010, p. 42

Chapter 4 Global Aid Trends, BRICS Reports and OECD Reports
216216
• The Italian government remains of cially committed to the international agreed aid targets. On the other hand, the Development Minister publicly referred in January 2012 to the fact that Italy will not be able to reach the 0.7% UN target by 2015.
• ODA allocations to the grant budget managed by the Ministry of Foreign Affairs (MFA) decreased from 179 million in 2011 to only 86 million in 2012 (a decline of 51%), which is an 88% reduction compared to 2008 levels. It is the third 50% decrease of the MFA budget over the past 4 years, since the beginning of the current legislature.
• In 2011, Italy was the fourth worst performer on aid quantity among the DAC members, providing a mere 0.19% of its gross national income in ODA. In 2010, Italy’s ODA was 0.15% of GNI, the second from bottom in the DAC ranking.
• Italy has increased since 2010 the share of ODA allocated to debt relief, from 170 million to 400 million in 2011. Over the past four years, however, debt relief as a share of ODA has decreased from 18% in 2008 to 14% in 2011.
• In 2010, Italy provided a 58% share of bilateral assistance (excluding debt relief) as tied aid, with a 55% increase from 2009; and more than 20% from 2008. In 2010, Italy was the second largest provider of tied aid
among the European countries.
• In 2011, Italy provided 60% of its total disbursements as multilateral aid, compared to the 40% European average and 30% for G8 countries.
In May 2008, Silvio Berlusconi was sworn in as Prime Mister. His party’s electoral manifesto included no references to development cooperation, which was and still is ruled by Law 49/87 and managed by the Ministry of Foreign Affairs. The ODA grant component managed by the MFA decreased from 179 million in 2011 to only 86 million in 2012 (a decline of 51%), with an overall 88% reduction compared to 2008 levels. It is the third 50% decrease in the total available resources through Law 49/87 over the past 4 years, since the beginning of this legislature.
In 2010, total Italian aid ows were 0.15% of GNI ( 2.3 billion), which was signi cantly lower than the agreed European target of 0.51% by 2010, and accounted for one of the largest pledging gaps among European Union member states. According to the preliminary OECD/DAC data of April 2012, Italy’s ODA performance recorded an improvement on the previous year: from 0.15% to 0.19% ODA/GNI in 2011. Italy and Greece, members of the EU-15, delivered less ODA than some EU-12 new member states; Italy is currently the fourth worst performer among OECD/DAC donors. Moreover, the

217
Chapter 4 Global Aid Trends, BRICS Reports and OECD Reports
217
2011 gures are controversial in the light of the fact that 30% of its 2011 bilateral aid is not “real aid”; a large share of aid resources was in fact made up of funds to support refugees at the time of the Arab Spring. In addition, approximately 36% of Italian aid comes from debt conversion and cancellation. By leaving out the contributions to the European institutions and the remission of Italian ODA credits, it is possible to identify the amount of ODA that is directly managed by the Italian politicians in government and of cials, which is a clear measure of the country’s commitment to development cooperation. This aid which is subject to direct decision-making by the Italian government, decreased from 46% to 40% of total Italian ODA between 2008 and 2011. Since the beginning of the sixteenth Italian legislature, such aid has never exceeded 0.10% of GNI; in 2011, it was a mere 0.08% against an of cial ODA/GNI ratio of 0.19%.
According to the 2012 AidWatch Report,1 Italian “genuine aid” in 2011 - which leaves out the costs for refugees, foreign students, debt relief, tied aid and interest derived from loans of donor countries to recipient countries - was 0.13% ODA/GNI.
Against a backdrop of economic and political turmoil, in November 2011, a new government was installed. For the rst time ever, a Minister for International Development and Integration was appointed and included in the Cabinet. The new Minister promised to “turn over the negative picture of Italian cooperation”. Even though the Minister’s mandate also includes the integration/migration agenda, the focus on development cooperation marks a turning point that all Italian CSOs would like to amplify and preserve.
The new Government led by Mr. Mario Monti appointed the Development Minister. This was a remarkable change in many ways: it was a largely unexpected move because of the dire economic situation; the Development Minister, Andrea Riccardi, is a leading gure from the CSO community; one of his rst initiative was to appoint experts from NGOs to his team. Despite this positive charge, one should bear in mind that this is a Minister without portfolio and has not been permanently established, which makes his position weaker than the other Cabinet posts.
According to DAC data, a Minister for development cooperation goes hand in hand with a positive trend in the ODA budget. All countries that have achieved (and in some cases exceeded) the 2010 European goal of 0.51% ODA/GNI have had a Minister for international cooperation. By contrast, out of the seven countries that have not reached 0.51% (Italy, Greece, Portugal, Austria, Germany, Spain, France), six do not have a development Minister, with Germany the exception. In addition, ODA performance is higher when the Minister for cooperation is part of the Cabinet: 0.63% ODA/GNI on average compared to 0.23% for the “no Minister” group (2000-2011). In terms of aid quality, based on the indicators set by the Paris Declaration and Accra Agenda for Action,2 DAC analysis con rmed that donors having a development Minister better performed on development policy compared to the others.
2011 might be seen as the beginning of a period of transition in Italy. As mentioned earlier, the Development cabinet post is a without-portfolio Minister, which means that human and nancial resources are still in the hands of the usual players: the Ministry of Foreign Affairs and the Ministry of Finance. The latter plays a pivotal role in many key areas including Italy’s participation in the multilateral development banks. Considering
Chapter 4 Global Aid Trends, BRICS Reports and OECD Reports
218218
that the budget of the MFA can be submitted to periodic reviews throughout the year to accommodate spending adjustments required by the Treasury, clearly Italy is still far from having an autonomous development policy. It may well happen that agreed expenditures are withheld even in the face of international commitments.
In 2011, the share of multilateral aid in total ODA disbursements is 60%, compared to the 40% European average, and 30% for G8 countries. Italian multilateral aid is mostly made up of contributions to the European Development Fund and the EC budget; such expenditures over the last four years accounted for about half of Italy’s ODA, making up 6% of total aid in 2011 and for 52% in the previous year. Compared to other DAC European countries, Italy is second only to Greece, which in 2011 allocated 78% of ODA resources through the EU; the EU average is 19%.
In 2011, bilateral aid accounts for 27% of the total ODA (debt relief excluded). Although the bilateral aid ows grew by almost 9% from the previous year, in 2011 Italy comes nearly at the bottom of the DAC donor list, again second only to Greece (18%).
The top ten Italian aid-recipient countries in 2010 were Albania, Afghanistan, Mozambique, Palestinian territories, Lebanon, Ethiopia, Sudan, Pakistan, India and Uganda. Among the top twenty recipient countries, eight are not on the priority list of the MFA. This is the case of Brazil, India, Uruguay and China, which received about US$10 million each. Between 2008 and 2010, Italy increased its aid to some of these countries; the most striking case was Uruguay, which moved from almost US$2 million in 2008 to over US$10 million in 2010. Allocations to Burundi and the
Democratic Republic of the Congo, which are not priority countries, increased by 25% between 2008 and 2010. The average share of ODA to Sub-Saharan Africa is higher than that of the G8 countries and even the European Union (around 28% for both groups). Although it marks a slight decrease compared to the 2009 levels (34%), in 2010 Italy allocated 32% of total ODA (debt relief excluded) to the 51 countries in the region.
In 2009, the OECD/DAC recommended that Italy address the gap in terms of political commitment to pursuing external policy coherence with the objectives of international cooperation for development. In particular, OECD/DAC called for the reduction of tied aid. In 2010, Italy provided 58% of its bilateral assistance (debt relief excluded) as tied aid, with a 55% increase over 2009; and more than 20% over 2008. Italy in 2010 was the second among European countries in tying its aid, second only to Portugal.
Ethiopia provides a good example of tied aid generated through loans. In accordance with the Italian National Guidelines for Development Cooperation, Ethiopia is a priority country. In 2005, out of total aid disbursements of US$100 million (debt relief excluded), around US$87 million were in the form of a loan for the Gibe II dam project; in 2006, loans totaled US$90 million out of US$120 million (debt relief excluded). The percentage of total aid (debt relief excluded) as loans was 87% in 2005, 75% in 2006 and 80% in 2007. In 2008, loans were 77% of total aid, with respectively US$61 million and US$47 million reported by the DAC database (Creditor Reporting System - CRS) as “Hydro-electric power plants”. According to Salini Costruzioni SpA - a top Italian construction contractor - the
219
Chapter 4 Global Aid Trends, BRICS Reports and OECD Reports
219
Gibe II dam cost 365 million, of which 220 million have been nanced through loans from the of cial Italian development cooperation, “the largest ever loan” of this kind. Italian NGOs have questioned the role of Salini as the ultimate bene ciary of the Italian loans.
• As stated in the 2012 “Documento di Economia e Finanza” (the government’s three-year nancial paper), the Italian government should implement commitments to aligning Italy’s performance with “the international standards for development cooperation”.
• The Italian government should mobilize fresh resources to match the most urgent outstanding ODA pledges; this is the case for the Global Fund to ght AIDS, Tuberculosis and Malaria (a gap of 260 million in Italy’s
funding commitment) as well as for Food Aid (a 300 million gap). In the short term, these resources can be drawn from anti- tax-evasion norms as well as from a careful assessment of military spending.
• The Italian Parliament should make the recently established Cabinet post of Minister for Development Cooperation permanent starting with the 2013 general elections for the new Parliamentary bodies.
• All political parties, in their programs for the 2013 general elections, should include clear commitments to increasing aid quantity and quality in accordance with global standards. They should support the introduction of a Minister for Development Cooperation as well as the comprehensive reform of the Italian ODA system.
• The Italian Government should put an end to tied aid grants and loans.
Endnotes
1 AidWatch, id we can. nvest more in global development, 2012.
2 A. Prizon, Does a inister or nternational Cooperation atter Political leadership or development cooperation
polic mplications or aid uantit and ualit , ActionAid Italy and ODI, may 2012.

Chapter 4 Global Aid Trends, BRICS Reports and OECD Reports
220220
• According to the OECD Development Assistance Committee (DAC), Japan’s ODA for 2011 (net disbursement) was US$10,604 million, or 0.18% of GNI (Gross National Income). Compared to 2010, this was 10.8% decline.
• The government’s ODA budget in the General Account Budget for Fiscal Year (FY) 2012 is 561.2 billion Japanese Yen, 2.0% reduction compared to FY 2011. However, as Japan’s ODA has other nancial sources like Fiscal Investment and Loan Program (FILP)1, it doesn’t automatically mean that ODA would be cut by 2 percent.
• For a decade until 2000, Japan was the largest bilateral aid donor. But after the government’s decision to cut ODA as one of the measures to cope with government’s huge de cit, aid volume has continuously decreased; Japan is now only fth largest donor in terms of volume, and third from the last among 23 DAC members in terms of ODA/GNI performance ratio.
In the afternoon of the 11th of March 2011, the eastern part of Japan, especially the prefectures of Iwate, Miyagi and Fukushima in the Tohoku region, was hit by the Great East Japan
Earthquake, the world’s fourth-largest earthquake since modern record-keeping began in early 20th century, followed by the tsunami and the accident at the nuclear power plant in Fukushima Prefecture. As of the summer of 2012, more than 15,000 people are con rmed dead, and nearly 3,000 still missing. There has been global
nancial, personnel and technical support for the victims of the earthquake and tsunami.
The rst part of the Japanese Ministry of Foreign Affairs (MoFA) 2011 annual report on ODA was titled “Overcoming the Earthquake: ODA and our Kizuna with the World”. Kizuna is a Japanese word meaning bond or ties. The global support for the regions and the people affected by the earthquake and tsunami, according to MoFA, is the result of Japan’s contribution to solving global issues including provision of ODA. MoFA went on to say that in order to respond to the worldwide kizuna, it is rmly required that Japan continue to actively work on global issues through ODA and other means.2
But if we analyze the recent trends in Japan’s aid, it is hard to say it would truly promote kizuna in the global community through reducing poverty and tackling other global issues.
Japan was the largest bilateral donor in 1989, and from 1991 to 2000. Historically, Japan’s aid volume was the largest in 1995, with US$14,489

221
Chapter 4 Global Aid Trends, BRICS Reports and OECD Reports
221
million (net disbursement). The ODA/GNI ratio was the highest in 1999 with 0.34 percent.
Since 2001, when the government announced that it would cut the aid budget by 10% as a measure to tackle its huge budget de cit, aid volume has been on a downward trend, although on some occasions (emergencies such as the Sumatran Earthquake, the tsunami in late 2004, and debt relief) there have been temporary increases.
In the 2010 OECD-DAC peer review, it was recommended that Japan should “set a timeline for increasing volumes to regain ground lost over the previous decade and make progress towards meeting the UN target of 0.7% ODA/GNI and other existing commitments.”3
About three weeks after the earthquake, in early April 2011, the ruling Democratic Party proposed a 20% cut for the original FY 2011 aid budget, reallocating the money for reconstruction of the regions in Japan damaged by the earthquake and tsunami. After facing opposition from CSOs such
as JANIC and GCAP Japan and some members of the parliament,4 later in the same month, the Cabinet decided to reduce the cut to the aid budget to 10 percent.
Behind the downward trend for Japan’s ODA is declining public support. In the early 1990s when Japan became the largest donor, opinion polls had around 35% of the Japanese public in support of increase of aid, 45% for maintaining the existing aid volume, and a little more than 10% favouring a reduction. By the early 2000s, public support had rapidly declined; only about 20% supported an increase, while about 25% asked for reduction. After 2005, public support for aid has slowly recovered. Comparing the 2010 and 2011 polls, support for increased aid declined slightly, but people asking for a reduction did not increase. The earthquake and tsunami is thought to be one reason for the 2011 decline in support for increased aid.
Sour e o A, Ja an s O ial Develo ent Assistan e hite Pa er and OE D ress release.
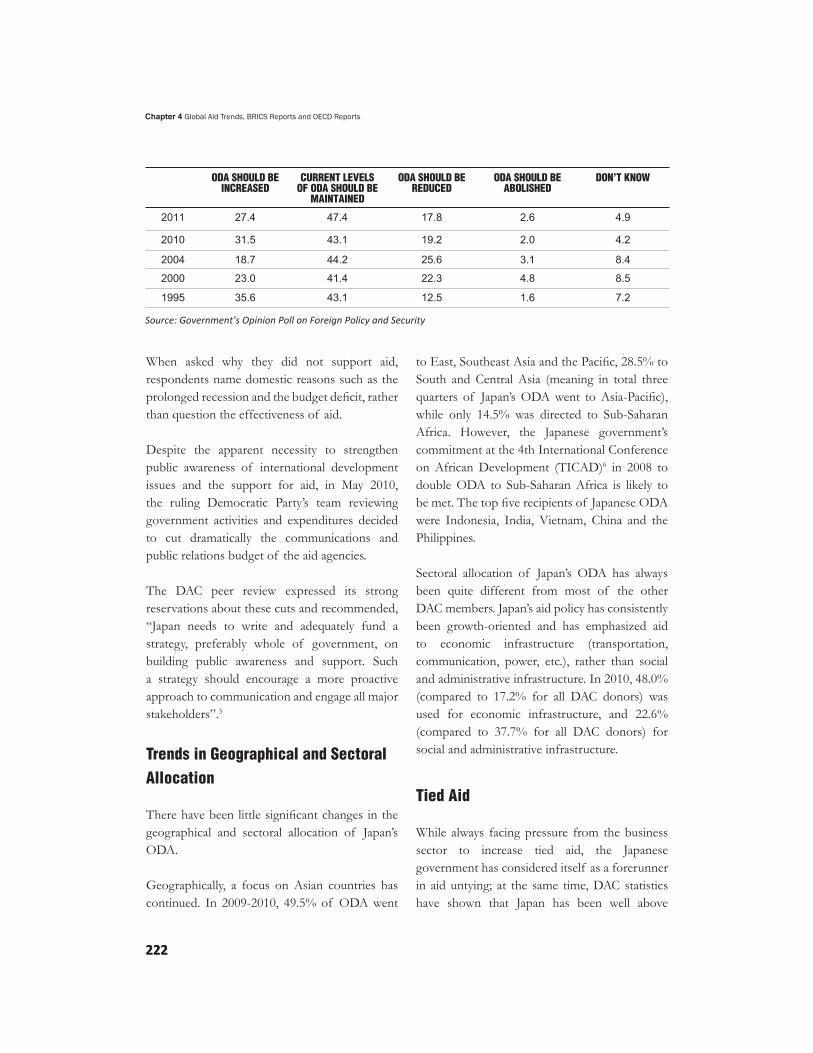
Chapter 4 Global Aid Trends, BRICS Reports and OECD Reports
222222
When asked why they did not support aid, respondents name domestic reasons such as the prolonged recession and the budget de cit, rather than question the effectiveness of aid.
Despite the apparent necessity to strengthen public awareness of international development issues and the support for aid, in May 2010, the ruling Democratic Party’s team reviewing government activities and expenditures decided to cut dramatically the communications and public relations budget of the aid agencies.
The DAC peer review expressed its strong reservations about these cuts and recommended, “Japan needs to write and adequately fund a strategy, preferably whole of government, on building public awareness and support. Such a strategy should encourage a more proactive approach to communication and engage all major stakeholders”.5
There have been little signi cant changes in the geographical and sectoral allocation of Japan’s ODA.
Geographically, a focus on Asian countries has continued. In 2009-2010, 49.5% of ODA went
Sour e Govern ent s O inion Poll on orei n Poli and Se urit
to East, Southeast Asia and the Paci c, 28.5% to South and Central Asia (meaning in total three quarters of Japan’s ODA went to Asia-Paci c), while only 14.5% was directed to Sub-Saharan Africa. However, the Japanese government’s commitment at the 4th International Conference on African Development (TICAD)6 in 2008 to double ODA to Sub-Saharan Africa is likely to be met. The top ve recipients of Japanese ODA were Indonesia, India, Vietnam, China and the Philippines.
Sectoral allocation of Japan’s ODA has always been quite different from most of the other DAC members. Japan’s aid policy has consistently been growth-oriented and has emphasized aid to economic infrastructure (transportation, communication, power, etc.), rather than social and administrative infrastructure. In 2010, 48.0% (compared to 17.2% for all DAC donors) was used for economic infrastructure, and 22.6% (compared to 37.7% for all DAC donors) for social and administrative infrastructure.
While always facing pressure from the business sector to increase tied aid, the Japanese government has considered itself as a forerunner in aid untying; at the same time, DAC statistics have shown that Japan has been well above
223
Chapter 4 Global Aid Trends, BRICS Reports and OECD Reports
223
average in tying status of aid among the 23 DAC donors. The 2010 DAC peer review identi ed a problem with the Japanese government’s de nition of tied/untied aid: Japan considers a project to be untied even if it requires the primary contractor to be Japanese. It justi es this on the grounds that the primary contractor is the project manager and is able to sub-contract freely. However, where primary contractors have to be Japanese and can act as both agents and suppliers of goods or services (including management) Japan should report such aid as tied.7
Up to the time of writing this chapter, there has been no indication from the government to change its practices regarding its reporting on the tying status of Japanese aid.
In June 2011, the government announced its plan to provide goods produced by manufacturers in the areas affected by the earthquake and tsunami as in-kind commodity grants to developing countries. Although reconstruction of industries in these areas is vital, CSOs criticized this plan as an example of tied and supply-driven aid, undermining the developmental needs and ownership of partner countries.
In the past, Japan’s ODA was often criticized for its strong ties to the commercial interests of Japanese businesses. In the early days of Japan’s aid program (the 1960s and early 1970s), the government did not hesitate to write that its major objective was to promote its own economic interests through its ODA.
Public-Private Partnerships (PPPs) have recently been emphasized in Japan’s aid policy. The
government de nes a PPP as:
A new method of cooperation between the public and private sectors, in which governmental and private organizations collaborate in the undertaking of a project. Input from private businesses is incorporated in the formation of the project, and the basic infrastructure is prepared with ODA, with investment, operation, and maintenance management conducted by the private sector. In this manner, roles are divided between the public and private sectors, with the technologies, knowledge, experiences, and funds of the private sector used in an effort to implement activities that are more ef cient and effective. (Examples of preparatory survey: Water and sewer systems, airport construction, motorways, railways, etc.)8
In 2008, the government announced a new policy regarding PPPs titled “Public-Private Cooperation for Accelerated Growth”. Speci c measures in this policy were: (1) to implement private sector proposals on public-private cooperation; (2) to hold regular policy consultations between aid agencies and business communities; and (3) to promote public-private cooperation in developing countries.9
Several new PPP schemes and programs were introduced in FY 2010.
• A “Preparatory Survey for PPP Infrastructure Projects”, in which the government calls for proposals from the private sector for a preparatory survey of infrastructure projects.
• Another new call for proposals from the private sector was for a preparatory survey on BOP (base of the pyramid) business projects.

Chapter 4 Global Aid Trends, BRICS Reports and OECD Reports
224224
• JICA Private Sector Investment Finance, which is a scheme to provide loans to “private development business implemented by private Japanese companies in developing countries,”10 was re-launched. (This program had been abolished in 2001.)
In June 2011, the MoFA launched the “MDGs Public-Private Partnership Network” to promote public-private partnerships towards achieving the Millennium Development Goals (MDGs). JICA initiatives to support business activities of Japanese medium and small-sized corporations in developing countries were also started in FY2011 and FY2012.
Although some of the above-mentioned developments in Japan’s PPP could potentially have positive impacts in reducing poverty, from a CSOs perspective, several concerns should be raised. First, it goes without saying, these initiatives would continue to promote the commercial interests of Japan, which are in many cases incompatible with developmental objectives. Second, the initiatives also may promote supply-driven aid, undermining developmental needs and ownership of partner countries. Third, the call for proposals for private sector in infrastructure projects could further accelerate Japan’s overconcentration of its ODA in economic infrastructure, which is growth-oriented but has little direct impact on poverty reduction.
Conclusion
The Japanese government has emphasized that in order to respond to the worldwide kizuna for those affected by the earthquake and tsunami, Japan should actively work on global issues through its ODA and other means. But from a CSO perspective, a real kizuna should aim to
bring about sustainable changes that address the causes, as well as symptoms, of poverty, inequality and marginalization, and to respect, protect and ful ll the human rights of all people. If we look at the reality of what has happened under the name of kizuna, it is hard to say that Japan’s aid has been promoting a real kizuna. In reality, after the earthquake and tsunami, CSOs saw in Japan an increased tendency to consider aid as a means of pursuing its own interests. The declining trend in aid volume has continued, and there was an additional aid cut, reallocating the money for reconstruction of the earthquake and tsunami-affected regions. There was also a special commodity aid program, purchasing goods of manufacturers of the affected regions and granting them to developing countries, which is an example of tied and supply-driven aid. The government’s call for kizuna has not resulted in increased public support for aid.
Many international development CSOs in Japan have also worked on the emergency relief and reconstruction efforts in the regions damaged by the earthquake and tsunami. However, CSOs consider that Japan’s ODA program should not be used as a means to promote reconstruction of the earthquake and tsunami-affected regions.
After the turn of the century, Japan’s aid volume has been on a downward trend. Public support for aid has been declining, and there have been calls, especially from businesses, but to some extent from the public, to align aid policy to Japan’s own foreign policy and commercial interests rather than global and developmental objectives. Behind these pressures are domestic issues such as the prolonged recession, an increasing income gap between the rich and the poor, increased unemployment, and an aging population (meaning increased government’s spending for welfare and social security programs).

225
Chapter 4 Global Aid Trends, BRICS Reports and OECD Reports
225
But if Japan is to be really serious about kizuna, it must regain its performance on aid volume, making progress towards meeting international commitments, including the UN target of 0.7% ODA/GNI, and qualitatively, reconsider
its current aid allocations and enhance its aid effectiveness. Concrete measures for building public awareness on global issues and support for international cooperation as the DAC Peer Review recommends are also vital.
Endnotes
1 According to the Japanese Ministry of Finance, FI P is “long term low interest loans and investments by the government to achieve policy objectives of nancial support for small and medium enterprises, construction and improvement of hospitals and welfare facilities, and to obtain natural resources. Procuring the capital through issuing FI P bonds, a type of Japanese Government Bond, FI P provides long-term and low-interest funds that are dif cult for the private sector to deal with and enables the execution of large-scale and long-term public projects.” Ministry of Finance, LP Report 2011 (http://www.mof.go.jp/english/ lp/ lp_report/zaito2011/index.html: accessed 28 Sept. 2012)
2 Ministry of Foreign Affairs, apan’s cial Development ssistance hite Paper 2011 apan’s nternational
Cooperation, Chapter 1.
3 OECD, apan Development ssistance Committee Peer Review, 2010, p.18.
4 JANIC’s statement as ing to maintain the aid budget can be accessed at: http://www.janic.org/Emergency%20Statement%20on%20ODA%202011.4.pdf
5 bid., p.35.
6 TICAD has been held every ve years since 1993, hosted by the Japanese government and co-sponsored by UNDP, the World Ban , etc. The 5th TICAD is scheduled to be held in
o ohama in Metro-To yo Area in June 2013.
7 OECD, apan Development ssistance Committee Peer Review, 2010, p.21.
8 Ministry of Foreign Affairs, apan’s cial Development ssistance hite Paper 2011 apan’s nternational
Cooperation, p.29.
9 Ministry of Foreign Affairs, apan’s cial Development ssistance hite Paper 2008 apan’s nternational
Cooperation, p.62.
10 Ministry of Foreign Affairs, apan’s cial Development ssistance hite Paper 2011 apan’s nternational
Cooperation, p.43.

Chapter 4 Global Aid Trends, BRICS Reports and OECD Reports
226226
The Korean government has played a leading role in making substantive progress in the implementation of the Seoul Development Consensus, which was adopted at the G20 Seoul Summit in 2010. The government is working for concrete results as co-chair of the G20 High-Level Development Working Group (DWG). In late 2011, the Fourth High-Level Forum on Aid Effectiveness (HLF4) was also successfully hosted with the Korean government’s active role and contribution.
Korea’s recent efforts and performance contributing to poverty reduction and sustainable development has heightened not only the international community’s interest, but also Korean people’s support.
The volume of Korean aid has been increasing steadily. In 2011, Korea’s net Of cial Development Assistance (ODA) recorded its highest level (US$1.32 billion). However, Korea’s ODA to Gross National Income (GNI) performance ratio has not increased for two consecutive years since 2010, remaining at 0.12%.
There has been some progress nevertheless in some other areas that affected the quality of Korea’s ODA. The government has reaf rmed that the loan to grant ratio for its aid would be
maintained at 4 to 6 in favour of grants. In the early 2000s, the volume of loans was twice as high as grants. Since then grants have rapidly increased. In 2007 there was a marked decrease in loans. However, the proportion of loans has actually been increasing again. While not returning to the levels of loans in the early 2000s, in 2011, the level of grants continued to decline relative to loans. The loan ratio increased by 26.2%, showing a ratio of 42 (loans) to 58 (grants).
Consistent with the emphasis by other donors of the private sector’s role and participation in development cooperation to extend development
nance, the private sector is also emerging as a prominent agent of development cooperation in Korea. The government has been eagerly promoting the private sector’s participation in its infrastructure projects in developing countries.
In June 2012, Korea underwent its rst Peer Review since it became a member of OECD DAC. This Peer Review is important for Korea to demonstrate its efforts to improve its aid policy and institutional management system. Civil society organizations (CSOs) also took this opportunity to examine the progress made by government departments and agencies toward meeting the commitments made by the Korean administration. They urged the government to increase the pace of reforms and improvements in the quality and practices of its aid.

227
Chapter 4 Global Aid Trends, BRICS Reports and OECD Reports
227
It is encouraging that the volume of Korean aid has been increasing steadily since 2006. However, the amount of Korean ODA remains insuf cient compared to that of other DAC members. In 2010, Korea ranked as the 13th largest economy and 9th largest by trade volume, while its aid performance remains at the bottom among DAC donors. As a country enjoying a favorable economic situation, Korea needs to sustain the political will to take concrete measures to implement its commitments to increase its aid volume and ensure its accountability to the international community.
The Korean government has continued to reaf rm its promise to annual increases to its ODA. This commitment is made in national strategies and plans such as the Mid-Term ODA Strategy (2008) and the Public Financial Management Plans (2009, 2010, 2011). But actual increases in 2010 and 2011 were insuf cient to meet the target performance (ODA to GNI) in both years, which points to the signi cant challenges in achieving the 0.25% ODA/GNI target by 2015 without stronger measures and political will.
In 2010, loans represented 39% of the total bilateral aid disbursements, which is a high ratio compared to that of other DAC donors. Most DAC members’ bilateral aid consists almost 100% of grants, with the exception of three countries: Germany, France and Japan.
Despite a recommendation to correct this bias towards loans, the ratio of loans has actually been increasing since 2008. The grant ratio in 2011 declined by 2.8% compared to that of the previous year (US$560 million), while the loan ratio increased by 26.2% (US$410 million).
According to the Strategic Plan for International Development Cooperation, the government has vowed to keep the loan ratio around 40% of total bilateral aid, which means that Korean ODA will involve more volume of loans than at present, as the total volume of aid increases.
The Korean aid architecture consists of two pillars. Under the current system, the Ministry of Foreign Affairs and Trade (MOFAT) manages Korea’s grant aid through the Korea International Co-operation Agency (KOICA). The Ministry of Strategy and Finance (MOSF) works through the Korea EximBank and its loan institution, the Economic Development and Co-operation Fund (EDCF), to implement concessional loan programs. The Special Review of Korea’s international development cooperation in 2008, which was conducted by OECD DAC at the request of Korea, suggested that the shortcomings of the dual system of development cooperation had been solved, but in reality this duality still exerts a negative in uence on aid effectiveness.
In 2010, the Framework Act on International Development Cooperation (hereafter the ‘Framework Act’) and its Presidential Decree came into effect, serving as a legal basis for Korean development aid. According to Article 7 of the Framework Act, the Committee for International Development Cooperation (CIDC) and the ODA Policy Bureau were established under the Prime Minister’s Of ce. The Strategic Plan for International Development Cooperation and the Sectoral Basic Plans for 2011-2015 were created to lay the legal groundwork for a development policy that is structured, integrated, and policy consistent.

Chapter 4 Global Aid Trends, BRICS Reports and OECD Reports
228228
Despite these legal and policy improvements, integrated aid policy and strategy has not been achieved due mostly to the weak coordinating function of the CIDC under the Prime Minister’s Of ce, which only works as a negotiating channel between agencies.
Institutional fragmentation is a crucial issue. Besides the Ministry of Strategy and Finance and its EDCF in charge of loans, and the Ministry of Foreign Affairs and Trade and its KOICA in charge of grants, there are over 30 ministries, central government organizations, and local municipalities providing aid. The problem is that a number of these actors are providing aid in the absence of coherent guidelines or principles from the central government, whereas their actions may sometimes result in duplication and eventually impede aid effectiveness.
As a basic strategy paper, the Strategic Plan for International Development Cooperation is not premised on a strategy to streamline aid policy with a partner country’s demands and local needs. Rather, it highlights the importance of learning from Korea’s economic development experience and sets out a “Korean ODA Model”. Therefore, this paper has been criticized by CSOs in Korea as an aid strategy that is highly donor-centric.
The government has announced a plan to select 26 priority partner countries. It intends to complete a uni ed Country Partnership Strategy (CPS) for each of these 26 priority partner countries by 2012. Among the 26 countries are 11 Asian, 8 African, 4 Central-South American, 2 Central Asia and CIS, and 1 Oceanic. The list of 26 countries and the criteria for their selection were not made public, allegedly to avoid a deterioration of diplomatic relations with
countries not selected as priority countries. This secrecy and limited access to information have been criticized as a problem of transparency in relation to Korean ODA.
The Outcome Document of HLF4 refers to “Private Sector and Development” (paragraph 32), highlighting expectations for the role of the private sector as a development actor. The Korean government, which has been actively involved in developing the Post-Busan Partnership Framework, has been emphasizing the role of the private sector with a strong interest in corporations’ participation in development projects.
In its Strategic Plan for International Development Cooperation, the government has stressed private-public partnerships (PPPs) as an important modality in its development cooperation policy. KOICA is responsible for grants in a newly adopted Global Social Responsibility Partnership program (2010). KOICA formulated a Mid-term ODA Policy for 2011-2015 to support various types of projects implemented by both NGOs and corporations. In 2010, the rst year of the Global Social Responsibility Partnership Program, KOICA channeled US$1.06 million (KRW1.2 billion) to
ve projects from ve organizations, which was funded from corporations. In the following two years, 2011-2012, 22 projects by 19 organizations were provided with US$4.4 million (KRW5 billion). Considering the plans for a growing budget for KOICA’s NGO support program, which are expected to amount to US$80 million (KRW90 billion) by 2015, the ODA volume channeled through NGOs and the private sector will steadily increase.

229
Chapter 4 Global Aid Trends, BRICS Reports and OECD Reports
229
The EximBank had announced (but did not publish) an Invigorating Plan for Private Public Partnership in 2011 to support and encourage through its loans program private corporations to get more involved in development cooperation projects. Even though the plan has not been established yet as of 2012, the Bank now provides loans to PPP projects. The Laos Sapien-Senamnoi hydropower project was announced in 2011 as the rst PPP project supported through the EximBank EDCF fund. It demonstrates a PPP scheme under which corporations’ investments cover part of the project’s cost and the partner country received a loan from the Korean government to make up the rest of the project budget. In this scheme, the EximBank provided project nancing with cooperation from Multinational Development Banks (MDBs) and private nancial institutions. A high-level of cial from the Ministry of Strategy and Finance reaf rmed that it would promote and encourage more corporations to participate in PPP projects, saying that “because PPP projects allow for big projects even where only a small amount of development aid is provided, we plan to increase EDCF loans to PPP projects”.1 Many Korean corporations have been competing to invest in the Asian and African regions and win contracts for large-scale infrastructure projects such as resource exploitation, mining, industrial plants, and urban development. This rush for overseas development investments is the consequence of not only the intensifying competition for resources across the world, but also the enduring recession in the domestic construction sector. To ensure Korean engagement in this global trend, the government has provided Korean investment funds with US$60 billion as well as regional investment
information to help Korean corporations make inroads overseas.
Due to insuf cient investment capital and lack of technological know-how, donors’ assistance and foreign corporations’ participation in large-scale infrastructure projects are necessary for many developing countries. Recently, more Korean corporations have invested directly in infrastructure projects in developing countries with the Build-Operate-Transfer (BOT) approach. For developing countries struggling to attract foreign investment, it may be good news. However, most of the PPP projects are involved in large-scale public infrastructure construction projects, which may create public goods, but may also burden local people with the impacts of these projects, in order to create pro ts for external corporations.
Through the private sector’s participation in development cooperation projects, governments can access funding and expertise from the private sector and project ef ciency can increase. However, when the private sector is driven by the pursuit of their own bene t, with little consideration of social responsibility and business ethics, these engagements by the private sector may be in contradiction with the objectives of ODA to reduce poverty and contribute to the partner countries’ development. They may also dramatically harm or even destroy local communities, their environment and peoples’ livelihoods. Although the private sector may also endure unexpected business conditions and poor environments in which to invest in developing countries, corporate involvement in projects that are supported through ODA should be guided by their contribution to poverty reduction and to the partner country’s development strategy.
There have been many cases of Korean corporations doing harm to local communities

Chapter 4 Global Aid Trends, BRICS Reports and OECD Reports
230230
and people while implementing development projects in developing countries. Daewoo International Corp.’s commuter train project in southern Philippines is known as one of the worst cases. This project caused strong local resistance against Korean ODA because of a large number of people being forced out of their homes. The Karian Dam project in Indonesia was funded with a Korean concessional loan. It faced criticism for its forced evictions and environmental degradation, which resulted in its suspension and the demand for an environment and social impact assessment.
Besides the ODA supported cases, there have been many allegations of human rights violations relating to other development projects managed by Korean corporations. POSCO’s steel project in Orissa, India, provoked a storm of protests by local communities because of environmental impacts and forced evictions. Local NGOs and the media have also criticized the inadequacies of working conditions at the Subic Shipbuilding Company in the Philippines, which was bought out by the Korean corporation, Hanjin Heavy Industries and Construction Co. In the case of Daewoo International’s Burma gas pipeline project, the dismissal of workers who protested against overdue wages and inadequate land compensation was reported.
In this context of a rapid and widespread trend of investment by the private sector in overseas development projects, corporations have not taken suf cient consideration of the rights of local people who reside close to the project sites and become affected by these projects. Despite the fact that many Korean corporations have committed to respect human rights through the
UN Global Compact, their awareness or attitude concerning human rights remains at a low level.
According to a 2008 study report by the National Human Rights Commission of Korea, only 16.7% of companies said that they carry out a human rights impact assessment when a new domestic project is launched and 15.6% of companies when a new overseas project is started.2 Although many companies said human rights issues would stand as an important risk factor in a long-term perspective, they did not see human rights as an important operational principle in their day-to-day practices.
The scramble for resource is not exceptional to Korean corporations. As more Korean companies participate in resource exploitation and investment projects, more impacts are apparent and are reported. In fact, the provision of ODA to a country in return for access to that country’s resources is often in tension with the goal of poverty reduction, a development cooperation objective that is widely agreed upon by the international community.
In early 2012, the corrupt practices of a Korean mining company, CNK Global Co., which invested in a diamond-mining project in Cameroon, were uncovered. It was a typical corruption scandal involving incumbent high-level government of cials. However, the other side of the scandal clearly revealed the problem with the Korean government’s ODA policy. In the process of CNK’s obtaining the mining concessions in Cameroon, the Prime Minister’s of ce selected Cameroon as a priority partner country under the name of ‘Resource Diplomacy’. This scandal disclosed the government’s hidden agenda to
231
Chapter 4 Global Aid Trends, BRICS Reports and OECD Reports
231
utilize ODA as a means of resource diplomacy to secure Korea’s political and economic interest.
The lack of transparency about priority countries and PPP projects may be hiding more scandals in the privatizing of ODA for the interests of an individual company or its utilizing as an incentive in resource negotiation. The Korean government has of cially announced that its ODA is aimed at reducing poverty, but in reality it often uses ODA as a means to further Korea’s resource diplomacy or economic bene t.
Although harmful consequences from Korean corporations’ participation in overseas development projects have increased as more corporations rush into developing countries, government initiatives to regulate the activities of these corporations seem a long way off. The Eximbank is preparing Safeguards for Environmental and Social Impact Assessments for their Operating Manual. Based on these Safeguards, further efforts must be made to provide binding power to the recommendations from Environmental and Social Impact Assessments and to ensure access to ODA information and consultation with civil society in the affected communities.
Here are some recommendations from CSOs concerned about the private sector’s unrestricted development activities and its support by the Korean government and corporations.
• Korean corporations, which invest in developing countries, should elaborate a code of conduct for their engagement in development projects and follow these standards of conduct irrespective of the laws of the country concerned.
• Korean corporations, which invest in developing countries, should carry out a fair and transparent Environmental and Social Impact Assessment before the development project is launched.
• Korean corporations, which invest in developing countries, should respect and abide by international standards and guidelines such as the OECD Guidelines for Multinational Enterprises and ILO Standards.
• Korean corporations, which invest in developing countries, should not collude in human rights violations by the partner country government, such as forced evictions or forced labour.
• The Korean government should prepare corporate regulations to prevent Korean corporations from perpetrating human rights abuses and environmental destruction.
• The Korean government should issue human rights and environmental guidelines for corporations and monitor their compliance.
• The Korean government should make it compulsory for corporations to prepare a Preparatory Investigation, a Project Progress Assessment and Post-Project Assessment and guarantee active participation for civil society, especially from the partner country, in the process of assessment.
Since Korea became a member of the OECD DAC, Korean ODA has been considerably improved through the creation of new legislation, strategies and policies to guide Korea’s international development cooperation. Like many other donors, in the context of shrinking global aid budgets due to the economic crisis,
Chapter 4 Global Aid Trends, BRICS Reports and OECD Reports
232232
Korea has been encouraging the private sector to participate in development cooperation projects. However, there have been few discussions in Korea to put in place guidelines and standards for the private sector to preserve the environment and respect human rights in developing countries, while involvement in large-scale infrastructure projects might have a profound social and economic impact on the country.
The government should issue human rights and environmental guidelines for corporations and
monitor their compliance, so that corporations are not the only ones bene tting without any improvement in the lives of local people. Also, in the process of assessment, active participation of the civil society, especially from the partner country, should be guaranteed. Only when Korean ODA policy is implemented, based on respect for the partner country’s people and their rights, will Korea meet the international community’s expectations for a country that used to receive aid, but now provides aid, and avoid the criticisms of using ODA as a means to pursue its own interests.
Endnotes
1 Press release by the Ministry of Strategy and Finance, December 7th 2011
2 Center for Corporate Social Responsibility, “An Analysis of uman Rights Policies and Management Practices of Major
Korean Corporations and a Study of Korean-style Business uman Rights Guideline”, 2008, National uman Rights
Commission of Korea.

233
Chapter 4 Global Aid Trends, BRICS Reports and OECD Reports
233
• In 2011, Luxembourg slightly missed the of cial development assistance (ODA) target of 1% of gross national income (GNI), spending 0.97% of GNI on ODA (or 294.3 million) – a decrease from 1.05% of GNI in 2010 ( 303.6 million).1
• In 2011, Luxembourg ranks third among the European member states in terms of its ODA performance (ODA to GNI ratio): after Norway (1.02% of GNI) and Sweden (1% of GNI), and ahead of Denmark (0.86%) and the Netherlands (0.75%).
• The Ministry of Foreign Affairs is responsible for 84.4% of this ODA ( 248.5 million) and 9.1% is spent by the Ministry of Finance. The remaining amount is spread among several other ministries (0.1%) and concerns the Luxembourg contribution to the overall EU budget.
• Luxembourg remains committed to providing 1% of GNI for ODA (con rmed in the government declaration 2009-2014) and consequently plans to increase ODA again in order to maintain the level of 1% at least until 2014.
• Apart from some positive trends in the quality of Luxembourg’s aid, Luxembourg has room for improvements - mainly in climate nancing, policy coherence for development and in nancing development education and awareness-raising.
Since 2001, Luxembourg has been reporting of cial development assistance (ODA) levels exceeding the United Nations (UN) target of 0.7% of GNI, and has been steadily improving this performance in ODA to GNI ratio over the past decade. In 2009, Luxembourg committed to allocate 1% of GNI to aid, at least until 2014 (reaching 1.1% in 2009, 1.05% in 2010). 2 This impressive target has been achieved since 2009 (except in 2011 when it was 0.97%, see above) and remains a commitment for the current government.
There is continued strong support for the 1% target among the Luxembourg population according to recent surveys. However, this ODA level and the untying of aid to national economical interests have recently been questioned by the minority right-wing party.
In Luxembourg, debt cancellation, refugee and student costs are not included in the calculation of ODA.
3Luxembourg’s development cooperation is focused on ten “partner countries” with which the Luxembourgish government has signed country programmes. These are mainly from West Africa (6), Asia (2) and Latin America (2). Luxembourgish NGOs, however, are not bound to this country “restriction”. Apart from these

Chapter 4 Global Aid Trends, BRICS Reports and OECD Reports
234234
partner countries, Luxembourg provides aid to three Balkan countries (Kosovo, Serbia and Montenegro), Rwanda and Mongolia.
The selection of sectors has been inspired by the MDGs. Luxembourg focuses mainly on health, education and local development. The latter supports the water and sanitation sectors, decentralization and micro nance.
In 2010, the Ministry of development cooperation and humanitarian action launched a reform of the law governing development cooperation that had been in place since 1996. Consultations on revisions to the law were held with the Parliament, but NGOs were less pleased with the process. The latter regretted not having been involved actively in the drafting process from the outset and they were concerned that the proposed changes lacked ambition. The new law came into force in May 2012.
Luxembourg is proud that its aid is untied and that there are no instrumental interactions between Luxembourg development cooperation on one hand and other ministries and national interests on the other.
In 2011, a public private partnership (PPP) called “emergency.lu”5 was launched. This is a satellite based telecommunication platform providing a rapid telecommunication solution for disaster relief and humanitarian operations. This PPP involves three Luxembourg-based companies - HITEC Luxembourg, SES and Luxembourg
Air Ambulance, the operational partners - and the technical partners Ericsson and Skype, which provide their technical expertise to the undertaking. One might consider that this PPP is a form of tied aid because the initiative exclusively relies on Luxembourg telecommunication and air rescue companies.
Another sector of development cooperation in which the Luxembourg private sector is increasingly involved in is micro nance. The Ministry responsible for development cooperation encourages collaborations with Luxembourg’s nancial services providers, for instance in the area of management and transfer of nancial data, emphasizing the added value for Luxembourg economy and reputation.
In May 2012, the OECD Development Assistance Committee undertook a peer review of Luxembourg’s development cooperation. The report of this peer review, which included peers from Spain and Greece, is expected to be made public in November 2012.
Despite the fact that Luxembourg is not including its climate nance within its ODA and is one of the strongest advocates within the EU for its additionality, climate nance is one of the major challenges for Luxembourg’s ODA. Based on the lack of EU leadership to contribute to mitigation and adaptation for global climate change, Luxembourg committed only 9 million toward the Copenhagen Fast Start Financing for the period 2010-2012. Luxembourg has also had delays in its disbursement as a result of
235
Chapter 4 Global Aid Trends, BRICS Reports and OECD Reports
235
administration hurdles. Until now Luxembourg has not shown any signs that it would increase this amount for climate change before 2020.
NGOs have recommended the government apply the Greenhouse Development Rights Framework in order to estimate Luxembourg’s fair share of climate nance and calculate amounts of funding that correspond to Luxembourg’s real climate obligations.
NGOs are also urging the government to improve its contributions towards development education and awareness-raising by increasing the share of ODA allocated to education and advocacy programming from currently 0.63% of ODA (0.55% in 2010) to 2%.
Endnotes
1 Annual report 2011 of the uxembourg development cooperation http://www.cooperation.lu/2011/
2 A new government will be elected in 2014.
3 http://cooperation.mae.lu/fr/Politique-de-Cooperation-et-d-Action-humanitaire/Programmes-indicatifs-de-cooperation
4 http://cooperation.mae.lu/fr/content/download/32928/251138/version/1/file/M%C3%A9morial A - n%C2%B0 111 -
1er juin 2012.pdf
5 http://emergency.lu/

Chapter 4 Global Aid Trends, BRICS Reports and OECD Reports
236236
• In 2010, Dutch government spending on of cial development assistance (ODA) was 4.7 billion (net). This equalled 0.81% of Dutch gross national income (GNI). The nancial crisis and the resulting lower GNI, negatively affected the budget by approximately 0.5 billion (gross).
• In 2011, the Dutch government spent 4.5 billion (net) on ODA or 0.75% of Dutch GNI.
• In 2012, Dutch government spending on ODA is projected to be 4.3 billion (net). The government that came to power in 2010, agreed to lower ODA to 0.7% of GNI. Additionally, an amount of 200 million for climate spending that was originally allocated in addition to of cial aid, will now be included in the 0.7 percent. Altogether, the total cut for 2012 will amount to 958 million. This represents a decrease of 17.8 percent.
Since the late 1990s the Dutch government has been allocating the equivalent of 0.8% of gross national product (GNP) to aid—more commonly referred to as “development cooperation” in the Netherlands. In 2010, the then newly-elected government decided to lower this target to 0.75% in 2011 and structurally to 0.7% in 2012.
A large share of Dutch ODA is channelled bilaterally, multilaterally and to civil society
organisations (CSOs). In 2010, about one-third of Dutch aid consisted of bilateral aid (through embassies), a quarter went to multilateral organisations, and 23% to civil society. Part of spending on civil society is directly channelled to southern CSOs by the Dutch government (via bilateral aid budgets) and part is channelled through Dutch CSOs. The budget that was historically allocated to the so-called Dutch co- nancing NGOs has been cut signi cantly by one-third in 2011 as compared to the years before. Risks of further budget cuts remain.
The current Dutch government has also implemented a major change in focus on recipient countries. This new policy is premised on the idea that Dutch ODA will be more effective if the Dutch efforts are more focused. The focus countries have been reduced from 33 to only 15. These
fteen are Benin, Ethiopia, Mali, Mozambique, Uganda, Rwanda, Afghanistan, Burundi, Yemen, Palestinian Territories, South Sudan, Bangladesh, Ghana, Indonesia, and Kenya. Additionally, Dutch ODA will be organized around four themes within these countries: water, food security, sexual health, and security and the rule of law.
The current Dutch government led by Prime Minister Rutte—“Cabinet Rutte”—has been a “care-taker” cabinet since the defeat of the government in April 2012. This means that it has signi cantly fewer powers than a conventional government, with its main aim being the
237
Chapter 4 Global Aid Trends, BRICS Reports and OECD Reports
237
organisation of elections. Cabinet Rutte is a minority government formed by VVD (the conservative liberal party) and CDA (Christian Democrats) and supported by PVV (populist party led by Geert Wilders).
Elections were held in September 2012. As expected, they resulted in a close tie between the Labour Party (PvdA) and the Conservative Liberals (VVD), with 39 seats for PvdA and 41 for VVD (out of a 150-seat total). The Netherlands has a multi-party system that makes it near-to-impossible for one party to win an outright majority. Therefore, there are several combinations of parties that may form the ruling coalition. At the time of writing, two formateurs had just been appointed to attempt to form a new government—initially one of just VVD and PvdA.
The current Dutch government has decreased 2012 spending on ODA to 0.7% of GNI, lowering ODA spending by 840 million from the previous year. An additional 200 million allocated to climate spending, which was originally budgeted on top of of cial development aid over several years, has now become part of the ODA target. This means that the total ODA budget has been decreased by 958 million in 2012. Across all government departments, cuts to aid represents the largest budget cut in both absolute and relative terms, for both 2011 and 2012. The aid budget has made by far the largest contribution to resolving the Dutch budget de cit in these two years.
Another major political debate pushing for deeper cuts to the development budget took place in 2011. Luckily, a major cut was avoided, in part due to a large-scale campaign by Dutch civil society organisations. What’s more, the
government eventually fell in April 2012 as a result of fundamental disagreements over a series of budget cuts that were to take place in order to accommodate the consequences of the economic crisis—development aid was among one of the themes taking centre stage.
The results of the recent elections and the new government that will ensue will greatly in uence the direction in which Dutch development assistance will be taken. In terms of their points of view related to international policy and development aid in particular, it is fair to say that there is quite a gap between the two biggest parties—the Conservative Liberals (VVD) and Labour (PvdA). Leading up to the elections, major budget cuts on development aid gured prominently in the VVD’s campaign: wanting to cut aid by 3 billion out of a 4 billion total budget. Alternatively, PvdA has a progressive stance on development aid, with a platform to stick to the 0.7% international norm, and even wanting to raise it to 0.8% as soon as the economic situation allows for it. Hence, the topic will be one of several on which one or both parties will have to compromise signi cantly during the coalition negotiations that have started after the election.
A signi cant share of Dutch ODA is channelled to and through the private sector. In 2010, this aid through the private sector was 5% of ODA, growing to 7% of ODA in 2011. In 2012, this channel is projected to be approximately 9% of the total ODA budget. In addition to the budget that is allocated directly to the private sector, part of the ODA budget is allocated to Excess Crude Account (ECA) debt cancellation that bene ts Dutch companies. In 2010 this Account represents 7% of the total ODA budget, in 2011 it is 2%, and in 2012 it is projected to be 2 percent.

Chapter 4 Global Aid Trends, BRICS Reports and OECD Reports
238238
In recent years, private sector involvement in development has become an increasingly hot topic in the Dutch development debate. In January 2010, the Dutch Scienti c Council to the Government (WRR)1 produced a report on development cooperation that is having a large impact on the future design of Dutch development policies. While the report includes many valuable insights and recommendations, in some areas CSOs consider the recommendations less well-founded. A key recommendation of the report is for Dutch development aid to focus on economic growth and development instead of investing in health and education, arguing that this is the way to make people and countries self-reliant.
Granted, economic growth is a key factor in development and investing in economic development – and in particular livelihoods for small-scale producers – is vital. But, rst of all, growth will not help to reduce poverty unless it goes hand-in-hand with policies that strengthen equality, which is where a strong civil society can make a difference. And, secondly, economic growth requires healthy and educated citizens: investing in health and education therefore remains crucial.
In September of 2011, the Dutch Social-Economic Council (SER)2 published an advisory report to the government that was titled “Development through sustainable entrepreneurship” (Ontwikkeling door duurzaam ondernemen). This report explicitly builds on the report by the 2010 Dutch Scienti c Council. It emphasizes the importance of a strong private sector in developing countries to promote sustainable and inclusive growth. The report emphasizes the importance of developing countries’ increasing economic independence. According to the SER report, sustainable growth and economic independence requires a proper “enabling environment” for the private sector, referring to the conditions that need to be in place in order to ensure local private sector development. Among these conditions are good governance,
macro-economic stability, appropriate physical and technological infrastructure, legal security and an effective tax system, labour law, presence of quali ed personnel, access to social security, independent trade unions and employers’ organisations, and a strong civil society. It states that the Netherlands can contribute to private sector development by utilizing the power of its private sector, knowledge and expert centres, as well as societal organisations in a series of speci c elds in which Dutch experience offers a comparative advantage.
Self-evidently, private sector development is closely related to the overall encouragement of economic growth worldwide, and it has the potential to positively impact people’s livelihoods. Nonetheless, it is more equal distribution of this growth that will be key for private sector development to actually lead to poverty reduction. The focus therefore should remain on inclusive sustainable growth and the overall enabling environment for equitable development.
The private sector could be in an excellent position to encourage sustainable development. Dutch companies are able to contribute positively to the overall purposes of development aid by building partnerships with civil society organisations and by ensuring that their business positively impacts global interests related to climate change, sustainability, and poverty reduction. Key here is encouraging and monitoring the sustainability of the private sector’s investments in relation to these purposes. Positively, there are a multitude of Dutch companies that are moving in this direction, particularly from an environmental point of view, inspired by a deeper understanding of what it means to live in an era where scarcity is
239
Chapter 4 Global Aid Trends, BRICS Reports and OECD Reports
239
becoming an ever bigger concern. Unfortunately, many businesses still pay too little attention to the impact of their operations on people and their environment. It is here that strategic ODA investments and Dutch civil society may play a major role in encouraging change.
There is much debate about the effectiveness of channelling ODA via the private sector. Focusing on sustainable economic growth in developing countries is essential and Dutch CSOs welcome companies’ increasing awareness of this orientation in their investments. But nonetheless, when it comes to channelling aid through the private sector, there are signi cant obstacles to effectiveness.
Firstly, channelling ODA via the private sector sometimes appears to be a goal in and of itself, which is mostly inspired by the desire to contribute to the success of Dutch companies abroad, rather than giving priority to the goal of effective ODA spending for poverty reduction. Actual experience in the past has demonstrated that channelling aid through Dutch enterprise insuf ciently contributes to the general objectives of development aid. Moreover, if ODA should be directed to the private sector, it should focus on strengthening the private sector in developing countries. Spending ODA via Dutch companies’ activities abroad does not automatically contribute to this objective.
A recent Dutch private sector investment evaluation demonstrated that investments in the private sector hardly bene ted the local economy, since 55% of projects focused on exports of goods while relying on imported inputs. This is an orientation that severely limits positive local economic spinoff.3 These types of projects should not be eligible for ODA funding.
Additionally, local private sector development in developing countries, as noted above, requires
a proper enabling environment, entailing solid governance, rule of law, an effective taxation system, quali ed and healthy personnel, access to social security, and a strong civil society. These should be stimulated through allocations of Dutch ODA. Last but not least, many companies have expressed that they do not require additional subsidies in order to successfully establish themselves in developing countries.4 That is why it is essential to properly evaluate and adapt rules and regulations in private sector policies for ODA accordingly.
There is increasing willingness among companies to adhere to the OECD Guidelines5 and the Dutch government has made the Guidelines mandatory for every company receiving ODA funding. This has been an excellent step and the government is now looking into the practical ways of implementing this policy. Dutch civil society believes the OECD Guidelines should not only be evaluated at the company level, but should also apply to all the company’s activities abroad. Furthermore, accountability requires appropriate and independent checks and balances, which are lacking at this stage. More action is needed in these areas.
Apart from the Guidelines, strong criteria should be put in place in order to ensure a positive impact of Dutch private sector investments in developing countries on poverty reduction. The current criteria in Dutch ODA for this purpose are too weak to have a meaningful impact. So far, there has been too little willingness by the government to ne-tune criteria for poverty reduction — in spite of pressure from parliament to improve the development criteria.

Chapter 4 Global Aid Trends, BRICS Reports and OECD Reports
240240
Endnotes
1 The Scienti c Council for Government Policy (in Dutch: etenschappeli e Raad voor het Regeringsbeleid, WRR)
is an independent thin tan of the Dutch government. The Council has the objective to supply the government with scienti c information on long-term social developments. The Council falls under the responsibility of the Ministry of General Affairs.
2 The Sociaal-Economische Raad (Social and Economic Council, SER) is a major economic advisory council of the Dutch government. Formally it heads a system of sector-based regulatory organisations. It represents the social partners’ trade unions and employers’ organisations. It forms the core organisation of the corporatist and social mar et
economy nown as the “polder model” and the main platform for social dialogue.
3 Private sector investment, “EVA UATION PSOM/PSI 1999-2009 AND MMF,” commissioned by the Dutch Ministry of Foreign Affairs: http://www.minbuza.nl/binaries/content/assets/minbuza/nl/import/nl/producten_en_diensten/evaluatie/afgeronde_onderzoe en/2010/07/evaluatie_psom_psi_1999_2009_en_mmf/rapport
4 At a Dutch conference titled “Enterprising Development Cooperation” (Con erentie ntwi elingssamenwer ing in
edri ), 78% of companies present stated this.
5 OECD Guidelines for Multinational Enterprises, 2011 edition: http://www.oecd.org/daf/internationalinvestment/guidelinesformultinationalenterprises/48004323.pdf

241
Chapter 4 Global Aid Trends, BRICS Reports and OECD Reports
241
• Continued divergence of the New Zealand Aid Programme from the path of poverty elimination into the realm of economic development over the past two years.
• New Zealand’s of cial development assistance (ODA) was 0.28% of gross national income (GNI) in 2011.
• Spending in 2011 represents a 10.7% increase from 2010 in real terms.
• In 2015, the proportion of ODA to GNI is projected to fall to 0.24% - its lowest level ever in NewZealand.1
• The funding mechanism for NGOs has undergone major changes, becoming more competitive and less transparent.
• Focus on the Paci c is increasing, with over 50% of ODA and more than 80% of bilateral funding going to the region.
Government policies calling for and implementing changes in the New Zealand Aid Programme have been in uenced by the impacts of the economic and environmental crises both globally and locally in New Zealand.
Since the conservative National Party formed the new government in 2008 and was re-elected in late-2011, the New Zealand Aid Programme
has continued to undergo radical change. The re-integration of the NZAID into the Ministry of Foreign Affairs and Trade (MFAT) in 2009 marked the beginning of a shift to more closely align the programme with government foreign policies. With the move away from a poverty reduction mandate, the government has maintained its directive that there should be a focus on fewer and larger, economic-oriented projects in the Paci c region. ODA is increasingly channelled to this region, while projects related to New Zealand’s areas of comparative advantage are favoured.
Earthquakes in the Canterbury region have resulted in a massive economic cost to the nation, with rebuilding estimates equivalent to around 10% of GDP (in comparison, the 2011 earthquake and tsunami in Japan is estimated at damage of around 3-4% GDP). Combined with the lingering effects of the global nancial crisis, New Zealand’s economic outlook is therefore weak. The combined impact has translated into cost cutting across most government programmes, including aid.
NZAID was formed as a semi-autonomous agency within MFAT in 2002. In 2009 the agency was re-integrated with the Ministry as the International Development Group (IDG). The government’s rationale for this reform was primarily increased accountability, reduced management overheads and better alignment with foreign policy objectives. This alignment has come at the expense of the New Zealand Aid

Chapter 4 Global Aid Trends, BRICS Reports and OECD Reports
242242
Programme’s semi-autonomous status, and there is concern that this integration in the Ministry is a less appropriate mechanism for providing the assistance to developing nations. Further issues and concerns will be discussed below. Fortunately, the importance of keeping the ODA budgetary vote separate is still recognised.
During this period, the New Zealand Aid Programmes’ main policy outcome has morphed from “poverty eliminated through development partnerships”, to “sustainable development in partner countries”, to “sustainable development in developing countries, in order to reduce poverty and to contribute to a more secure, equitable and prosperous world”. These alterations are based upon National’s perspective that NZAID’s initial mandate was “too lazy and incoherent”.2
Further change has been oriented around “fewer, deeper and longer relationships tightly focused on sustainable economic development”, in accordance with a more business-like ethos and stronger Paci c orientation.3 Consequently, the number of programmes has been reduced from 33 (2009) to 24 (2011).
With a core focus on the Paci c Island countries, more than 50% of total ODA is currently directed to the region, including around 80% of all bilateral funding.
The rationale for this focus is sound as the Paci c is second only to sub-Saharan Africa in being off-track in achieving the Millennium Development Goals and some of the countries are amongst the most vulnerable to climate change. Further,
Pasi ka peoples4 currently comprise 6.9% of the New Zealand population – a gure that is projected to rise to close to 10% by 2026. As a Paci c nation itself, New Zealand is in a unique position to deliver aid to the region, especially given its close cultural and historical ties.5
With each successive year since the government’s greater emphasis on the Paci c region, NGO members of the Council for International Development (CID)6 have also reported a trend in their aid with less spending directed to Africa and Asia and more to the Paci c. In 2010, CID members spent 50% more on the Paci c, and this trend continued in 2011, with an additional $10 million prioritised for Oceania.7 It re ects changes in government funding to NGOs that favour projects in the region. While NGOs have expressed concern with the absorptive capacity of the region, and how this Paci c focus is enacted through funding mechanisms, this change is generally well received.
Sustainable Economic Development
Proponents of the recent changes have argued in economic terms that the goal of poverty elimination is a ‘de cit model’, which tries to ll gaps. In contrast, the aim of sustainable economic development is regarded as an “opportunity model,” creating added value.8
In a DAC peer review of New Zealand’s aid in 2010, it is recommended that “economic activities are viable, sustainable and include positive environmental impact”.9 Beyond this, however, NGOs,10 religious groups11 and opposition political parties12 have expressed concern that the goal of poverty reduction will become secondary to economic growth. This could mean that projects that contribute to sustainable development through the empowerment of people living in poverty, but lack a tangible impact on economic growth, may be overlooked.

243
Chapter 4 Global Aid Trends, BRICS Reports and OECD Reports
243
Complementary to this approach, the New Zealand Aid Programme has been directed to make use of New Zealand’s comparative advantage to “add the most value to addressing our partner’s needs”. Areas of advantage have been identi ed as sheries, tourism, agriculture and renewable energy. The government’s decision regarding the choice of areas where New Zealand was seen to have comparative advantage was based upon what was “largely obvious” at the time.13
CSOs in New Zealand have also experienced a tough and tumultuous period of change particularly in relation to the processes for government funding that is channelled through them to overseas partners.
The previous funding scheme for CSOs, KOHA-PICD (Kaihono hei Oranga Hapori o te Ao - Partnerships for International Community Development) was initially replaced with the Sustainable Development Fund (SDF) in 2010. The Programme Management Committee, which oversaw KOHA-PICD (comprising of representatives from NZAID and NGOs), received no warning of the changes and CID received written notice only after the decision had been made. There was no consultation with affected CSOs and no evaluation of the performance of the KOHA-PICD fund. The new Fund has been criticised as “a step backwards from good development practice,”14 and much less transparent.
The criteria for KOHA funding covered promotion of self-reliance, addressing poverty and injustice, community development and participation, human rights, gender equality and more. However, the SDF criterion merely states that activities should be “consistent with the New
Zealand Government’s aid policy and priorities.”15 SDF saw the introduction of a competitive funding mechanism and, most regrettably, the early, unplanned and forced termination of some projects.
Despite the disruption caused by this shift to the SDF, the funding programme is set to change once again in late 2012. The ‘New Zealand Partnerships for International Development’ (NZPFID) scheme will replace SDF, but will be similar in many ways. Still there has been no published review of the effectiveness of the KOHA or the short-lived SDF. The new scheme will seek proposals that will “deliver sustainable development outcomes and value for money,”16 and harness New Zealand’s expertise in primary, service and manufacturing industries. In contrast, activities based around social services will be considered “where they can be linked to enabling economic development”.17 Further, projects must be able to articulate how tangible (short-term) results will be delivered – exacerbating the possibility of activities which provide sustained developmental, but non-economic bene ts, being overlooked.
The competitive modality to access funds continues, but worryingly NZPFID aggregates other funds, and will be open to state and private sector organisations as well as the traditional CSOs. While competitive funding has in some ways led to greater cooperation between NGOs (through coordination to avoid similar proposals and information sharing), the incorporation of other actors is concerning, and may destroy the delicate CSO unity presently achieved. Potentially, this could mean a decrease in funding channelled via development NGOs.18
Consultation concerning this newest fund has allowed reasonable opportunities for CSO engagement, but it is feared this process will have limited impact on the nal outcome.
Chapter 4 Global Aid Trends, BRICS Reports and OECD Reports
244244
• New Zealand provided net ODA of NZ$586 million in 2011, thereby having a ratio of ODA to GNI of 0.28%. This gure is far below the internationally agreed 0.7% of ODA to GNI target. While nominal funding is expected to increase to NZ$620 million in 2014/2015, there are presently no commitments regarding the ratio of ODA to GNI.
• Based upon current projections, the proportion of ODA to GNI will fall to 0.24% in 2015 - its lowest level ever in New Zealand.19
Over the past 20 years, New Zealand’s ODA performance has barely changed, with ODA being 0.26% of GNI in 1992 to the current level of 0.28%. Despite continuing calls from the OECD Development Assistance Committee to implement a clear and strategic forward spending plan in order to reach ODA of 0.7% of GNI, New Zealand has repeatedly failed to comply.20 With New Zealand’s highest proportion of ODA to GNI being 0.52% back in 1976, it is highly unlikely New Zealand will reach the target of 0.7% by 2015. This is re ected in New Zealand’s ranking at 17th out of 23 DAC donors in terms of ODA to GNI.
The New Zealand Aid Programme encompasses many efforts to make aid more effective. New Zealand is a signatory and remains committed to the Busan Partnership for Effective Development Cooperation.
Several reforms have worked to make New Zealand aid more effective. Such changes include a greater utilisation of Joint Commitments for Development (which establish a shared vision for
achieving development outcomes between the New Zealand Government and partner countries), encouraging ‘value for money’ throughout the life of an activity and the introduction of SWAps (sector-wide approaches). These aim in different ways to increase the harmonisation, ownership, alignment and effectiveness of projects.
The implementation of New Zealand’s commitment to the International Aid Transparency Initiative (IATI) reporting standard for aid activities, and more efforts by New Zealand to build capacity with Paci c partners, re ects a commitment to the Busan Outcome Document. With respect to IATI implementation, New Zealand ranked poorly in the 2011 Pilot Aid Transparency Index21 (30 out of 58), in large part due to the absence of reporting on activities. Recent changes, however, have seen IATI reporting of activities being made available on the MFAT website, which is commendable, but more detail should be provided consistent with the IATI Standard.
There are many areas in the Busan Partnership for Effective Development Cooperation that require signi cant new commitments by New Zealand. Among the 23 OECD DAC donors, New Zealand aid currently scores as one of the least predictable. This should be recti ed, as unpredictability has been shown to reduce the value of aid by 15% to 20%.22 In the Commitment to Development Index, New Zealand was ranked 16th out of 23 nations in 2011 for aid.23 Further, the many changes to the New Zealand Aid Programme have been counter-productive to an enabling environment for civil society, despite the commitments made in Accra and repeated in Busan to work with CSOs for an enabling environment as development actors “in their own right.” The recent reforms in funding modalities are unsettling for actors both within New Zealand and in recipient nations. More transparency and dialogue with civil society organisations, especially during policy development, are vital.

245
Chapter 4 Global Aid Trends, BRICS Reports and OECD Reports
245
Endnotes
1 Based on current projections: http://nzadds. les.wordpress.com/2012/07/nzadds-aid-trends-analysis-charts-july-2012.pdf
2 Murray McCully (2009) http://ips.ac.nz/publications/les/9a837c22669.pdf
3 MFAT Annual Report 2011: http://www.mfat.govt.nz/Media-and-publications/Publications/Annual-report/0-Overview.php
4 Pasi a peoples’ is a term which describes people living in New Zealand who have migrated from the Paci c Islands or who identify with the Paci c Islands because of ancestry or heritage.
5 International Development Policy Statement, NZ Aid Programme: http://www.aid.govt.nz/webfm_send/3
6 The Council for International Development is the umbrella body for international development NGOs in New Zealand.
7 Please note these gures are drawn from the CID Annual Report 2010 2011, and are based upon the nancial year prior to the publication of the report. http://www.cid.org.nz/assets/About/2010annual-report.pdf
8 DAC Peer-Review 2010: http://www.oecd.org/dataoecd/16/22/47468242.pdf
9 http://www.oecd.org/dataoecd/16/22/47468242.pdf
10 http://nzadds.files.wordpress.com/2011/04/economic-development-and-aid-agencies-wor ing-paper-wood-t-v2.pdf
11 http://www.presbyterian.org.nz/spea ing-out/ecumenical-and-inter-church/change-to-nz%E2%80%99s-aid
12 abour Party: http://www.labour.org.nz/news/minister-moves-silence-nzaid
Greens Party: http://www.greens.org.nz/press-releases/mccully-s-bac room-aid-meddling-could-hurt-frontline-efforts
13 NZADDS OIA: http://nzadds. les.wordpress.com/2011/01/oia-1-comparative-advantage.pdf
14 CWS, 2010, http://www.cws.org.nz/the-issues/aid
15 SDF guidelines: http://www.aid.govt.nz/webfm_send/127
16 IDG de nes value for money as “achieving the best possible development outcomes over the life of an activity relative to the total cost of managing and resourcing that activity and ensuring that resources are used effectively, economically, and without waste.” http://www.aid.govt.nz/sites/default/ les/Value%20for%20Money%20Guideline.pdf
17 http://www.aid.govt.nz/webfm_send/223
18 Please note that all descriptions of NZPFID may be subject to change as the scheme is currently undergoing consultation.
19 Based on current projections: http://nzadds. les.wordpress.com/2012/07/nzadds-aid-trends-analysis-charts-july-2012.pdf
20 DAC Peer-Review 2010: http://www.oecd.org/dataoecd/16/22/47468242.pdf
21 This Pilot Index ran ed implementation of and achievement under the IATI reporting standard.
22 http://www.oecd.org/document/54/0,3746,en_ 2649_3236 398_46010014_1_1_1_1,00.html
23 http://www.cgdev.org/section/initiatives/_active/cdi/
Chapter 4 Global Aid Trends, BRICS Reports and OECD Reports
246246
• In 2011, Sweden reached the of cial development assistance target of 1%, spending 4 billion or 1.02% of GNI on ODA.
• Climate and development is together with democracy and human rights and gender equality the three priority areas for Sweden’s aid. However, climate change nance is not additional to the ODA target.
• There has been a lot of criticism on the quality of Swedish development cooperation in the media during the last two years, including from the Minister of Development Cooperation. Public support for the ODA level however remains high, with 7 out of 10 Swedes believing that the current ODA level should remain or increase.
• Sweden´s three priorities for the aid effectiveness agenda at HLF4 and the Global Partnership have been transparency, results and the private sector. A positive outcome has been the Open Aid initiative that was launched in 2011.
• The private sector is playing a larger role in Swedish aid delivery compared to previous years. Aid to private sector cooperation has increased signi cantly.
• The proportion of development aid directed to the state venture capital rm, Swedfund, has also increased substantially, despite criticism of its ability to demonstrate development results for poor and marginalized populations.
• According to “Sweden’s policy for global development” all government policy areas should act coherently to contribute to equitable and sustainable global development. However, there is a lack of results-oriented indicators and independent monitoring, and some policy areas show serious incoherencies. For example over half of Swedish arms export during 2011 went to non-democratic countries.
In 2011, Sweden reached its target of 1% of its GNI, spending 4 billion or 1.02% on ODA. This is an increase compared to 2010, when Sweden spent 0.98% of GNI on ODA. Sweden has committed to maintain the 1% target in the future.
Sweden continues, however, to in ate its development cooperation budget with expenditures that have limited or no impact on development results, or that are part of other international commitments. In 2011, 9% of the ODA budget was spent on refugee costs, which is an increase from previous years. Despite a decreasing number of refugees, ODA allocated for this purpose has increased by more than 100% during the last ve years. The government further in ates the ODA budget by including cost of embassies, many of them located in OECD countries. The method used

247
Chapter 4 Global Aid Trends, BRICS Reports and OECD Reports
247
for the allocation of aid money to embassies does not specify to what development outcomes they will contribute. The OECD DAC has pointed out that this method of calculating is not ODA eligible. ODA-funded foreign service administration costs have increased by more than 100% since 2005, with more than 3 million allocated in 20111. The Swedish Ministry of Foreign Affairs has now developed more strict guidelines for ODA funding of embassies, which is said to be used from 2013 and onwards.
Sweden s top ve partner countries (gross ODA) are Tanzania, Mozambique, Afghanistan, Democratic Republic of Congo and est Bank aza. Democrac and increased respect for human rights is one of Sweden s three long-term priorit areas and constitutes the largest thematic sector within Swedish bilateral development cooperation. ender equalit and women s role in development is another priorit area.
A third long term priority for development cooperation is climate change. For the period of 2010-2012, Sweden is allocating 870 million to the Fast Start climate nance commitment that was announced at the Copenhagen Climate Summit in 2009. Since Sweden nances this commitment through the development cooperation budget, it is not respecting the internationally agreed commitment to provide new and additional
nance for climate change. This also means that in practice Sweden is not ful lling its 1% target. The government argues that it is respecting the principle of new and additional funding since
Sweden is well above the UN ODA target of 0.7% of GNI. Further, the government nds the question of additionality somewhat arti cial since it regards climate change adaptation and mitigation as an integral aspect of development assistance.
In total, Sweden in ates its development cooperation budget with unspeci ed costs of embassies and refugee costs by more that 12%, which is equivalent to around 0.5 billion. Added to this amount is the annual allocation of 290 million to the Fast Track climate nancing.2
During the past few years, Swedish development cooperation has been subject to signi cant public debate. The Minister of Development Cooperation, journalists and aid skeptics, have painted a picture of Swedish ODA and aid in general as inef cient and marked by corruption. Mutual discontent and lack of con dence between the development minister and the Swedish development agency, Sida, has been publically exposed.
CSOs and their activities have also been criticized. In 2009 the government cut funding for CSOs’ information activities by approximately half. Further, it has since then increasingly restricted CSOs’ possibilities to use information grants for advocacy activities. These actions contradict Sweden’s Policy for Global Development, which states that funding CSO information and advocacy activities is central to create a broad and dynamic debate in Sweden, building on the experiences of civil society in the North and South.
Nevertheless, public support for Sweden’s ODA level remains high according to the 2011 annual

Chapter 4 Global Aid Trends, BRICS Reports and OECD Reports
248248
opinion survey, with 7 out of 10 Swedes believing that the current ODA level should remain or increase.
The Swedish Policy for Global Development (PGD) dates from 2003 when Sweden – through the national parliament´s adoption of a government bill - became the rst country to have an of cial coherence policy for development.3 The PGD states that all government policy areas should act coherently to contribute to equitable and sustainable global development. The policy is characterized by two guiding perspectives: a human rights perspective and a poor people’s perspective on development.
In June 2012 the Swedish government presented its fth and most recent report to parliament on the implementation of the PGD. Four years ago, the government identi ed six global challenges, and has presented examples of results for each one of the six global challenges: oppression,4 economic exclusion, climate change and environmental impact, migration ows, communicable diseases and other health threats, con ict and fragile situations. In the 2012 report, the government focuses on economic exclusion, and for the rst time is trying to tackle the main con icts of interest or incoherencies in this thematic area.
Compared to other OECD DAC countries, Sweden has come far in adopting a coherence policy for development, but some important challenges remain. As the DAC points out in its 2011 peer mid-term review of Sweden5 the government has not yet identi ed indicators for monitoring the PGD. And, so far there have not been any external evaluations of the PGD.
But in its 2012 report, the government says that an external evaluation of work methods and governance of the policy for coherence will be undertaken.
The PGD stresses the importance of identifying con icting objectives or interests in order to make well-informed and well-considered strategic choices. Yet Swedish CSOs have criticized the government for placing too much emphasis on promoting synergies between policy areas and less on handling incoherencies. For example, Sweden is the largest arms exporter per capita, and during 2011 over half of these exports went to non-democratic countries. The most recent report, however, does deal with some of these incoherencies (for instance tax ight is identi ed as a development issue), but it remains to be seen how the words translate into action.
The government is in the process of developing a new comprehensive development cooperation policy, which is expected to provide political direction for future aid priorities. The objective, according to the government, is to have a joint strategy for all activities, simplify governance procedures, and be more results oriented. The initiative is partly a response to criticism on how Sweden’s development cooperation is governed, in the Swedish Agency for Public Management’s evaluation from 20116 and in the OECD/DAC 2011 mid-term review.7 The government will present the new policy in the autumn of 2012. CSOs have been invited to submit their view on future Swedish development cooperation to the Ministry of Foreign Affairs. It remains unclear to what extent the platform will change current development objectives and criteria for aid allocation.

249
Chapter 4 Global Aid Trends, BRICS Reports and OECD Reports
249
Sweden is actively involved in the international efforts to improve aid effectiveness. Improving transparency is one of three priorities for the government. In 2011, Sweden launched Open Aid, an initiative that includes a transparency guarantee, anti-corruption activities, and support for increased accountability in partner countries. Data is published on the Open Aid website according to the International Aid Transparency Initiative (IATI) Standard. Swedish CSOs welcomed the initiative, and encourage the government to broaden the reporting in accordance with the full IATI Standard. In 2012, Sweden also joined the Open Government Partnership, a global initiative to make governments more transparent, effective and accountable.
Sweden’s other two aid effectiveness priorities are results and value for money, and the role of the private sector in development. According to the government, the new approach towards results will ensure that Swedish policy decisions, interventions and approaches are based on evidence of what works and of what represents value for money in terms of poverty reduction. The government argues that broad public support for development cooperation will continue only if Sweden focuses more on results in the future when deciding how to allocate taxpayers´ money. Results in development cooperation raise complex issues. Swedish CSOs emphasize that decisions on aid modalities and aid allocation should be based on rigorous research and evaluations, including drawing on lessons from aid effectiveness evaluations. They are advocating for an approach that recognizes the complex and unique realities of donor support for development processes. The approach to results must therefore be “ t for purpose”. Often, impacts that are of importance
for development are not easily apparent or quanti able. CSOs think that the pursuit of such impacts must not be neglected, and these results are likely to emerge over more extended periods of support. Therefore, there is a need to focus on long-term results at the same time as trying to achieve short-term goals. Further, CSOs have highlighted the need to have a human rights perspective, to work from country results frameworks as the point of departure, and to strengthen democratic ownership.
Funding and strategies
The Swedish government has initiated a process to strengthen the role of the private sector in development cooperation and to draw on the knowledge and resources of the Swedish private sector. In 2004, Sweden published Policy Guidelines for Sida’s Support to Private Sector Development.8 Since then, the government has signi cantly increased development aid through various forms of private sector cooperation. Most of the support to private sector initiatives is channeled either through Sida or through the state venture capital fund, Swedfund.
In 2012 the government is allocating 70 million, or approximately 2% of the development assistance budget, to support for private actors or initiatives that involve private actors in poverty reduction. The aim is to help developing countries create a large number of enterprises, to provide employment for people living in these countries. Of this amount, the government is allocating approximately 28 million to support innovative approaches and capacity development in the areas of business for development and information and communication technology for development.
Chapter 4 Global Aid Trends, BRICS Reports and OECD Reports
250250
The government has increased the proportion of development aid allocated by the state venture capital rm, Swedfund. Since Swedfund was created in 1979, the government has contributed around 270 million to the fund. More than half of this amount, 160 million, was provided after 2007. The government wants to encourage the growth of robust small and medium-sized enterprises in countries where it is dif cult to mobilize private capital for these ends. Therefore, it has provided a long-term capital contribution to Swedfund, which is additional to other forms of support to the private sector, amounting to at least 130 million over the next three-year period.
Sida´s Program Business for Development (B4D) is part of the support to entrepreneurship for poverty reduction mentioned above. In both 2011 and 2012 the government granted project support of approximately 22 million to B4D. Embassies and other departments within Sida can choose to allocate additional funds to B4D projects beyond this budget.
The B4D program has several instruments through which Swedish aid supports private sector engagement in development:
Private-Public Partnerships (PPP): Supports initiatives where private and public actors identify a possible solution to a development problem and join forces to address it.
Challenge funds: Invites companies and entrepreneurs to apply for catalytic funds in competition with others, in accordance with a number of pre-de ned selection criteria. An example is Sida’s DemoEnvironment programme, where companies can apply for small grants for feasibility studies.
Drivers of Change: Supports organizations whose activities can contribute to the goals
of B4D. Examples include organizations that enhance corporate social responsibility, social entrepreneurship and building of relations between NGOs and the business community.
Innovative nance: A pilot program is under development, aiming at mobilizing capital resources in the private sector.
Challenges ahead
The private sector plays an important role in advancing development as provider of resources, jobs, and innovations. Cooperating with the private sector in aid can therefore provide opportunities to advance development goals. However, there are also a number of challenges and risks with this “private turn of aid” that should be addressed and discussed.
• Weak evaluation of development impact: Swedish business has been involved in aid for many years. Compared to earlier decades the framework around private sector actors are now more in line with aid effectiveness principles.9 Still, civil society organizations have identi ed some risks and negative outcomes from business’ involvement in development aid. In 2011, Swedish CSOs carried out a mapping of independent evaluations of Swedish aid channeled through the private sector. The report revealed that several activities and projects lack clear development objectives or the ability to demonstrate development results.10 The information necessary to assess and draw general conclusions about development impacts has not been collected according to independent evaluations.
Norwegian Church Aid assessed the development impact evaluation systems in

251
Chapter 4 Global Aid Trends, BRICS Reports and OECD Reports
251
European Development Finance Institutions (DFIs), including Swedfund. This study revealed that although improvements had been made, several challenges remain. A key
nding is that the Swedfund and other DFIs rarely do development impact assessments before deciding on where, with whom, and how to make investments. Furthermore, Swedfund and other DFIs seem to rely on an honor code. The DFIs accept on good faith the assurances of the companies that sign a code of conduct with them, especially with regard to ESG performance (environmental, social and governance areas). Companies
nanced through portfolio rms are not even required to report to Swedfund. Finally, external auditing is rarely performed.
Another concern relates to tax issues. In 2009, the government issued a general ban to prevent Swedfund from making new investments in funds based in tax havens. In April 2012, the government replaced the ban with new Guidelines. The new Guidelines rely on the OECD Global Forum on Transparency and Exchange of Information on Tax Purposes and its peer review process. As the Tax Justice Network11 has pointed out, the Global Forum’s peer review process is questionable and the new Guidelines actually open the possibility for Swedfund to channel funds through well-known tax havens such as Cayman Islands and Jersey.
• Lack of transparency: The government has applied less stringent transparency requirements on the private sector compared to other actors working in development cooperation. One argument for not requiring full transparency is that companies must be able to protect their commercial secrets. It
is however dif cult to assess whether the argument for commercial secrecy is valid or not. Less stringent requirements also apply to activities of state-owned companies and the International Council of Swedish Industry.
However, recently the government has taken steps to strengthen transparency requirements for some aspects of private sector engagement in development. According to the revised government Guidelines, Swedfund must abide by the new transparency guarantee in Swedish aid and report to IATI Standard, to the OECD/DAC and to the Swedish OpenAid initiative. Further, during the Forth High Level Forum in Busan, Sweden was one of the actors pushing for an ambitious paragraph on transparency and the private sector.
• Risk of tied aid: Swedish ODA is formally 100 % untied according to Sweden’s reports to the OECD/DAC’s Creditor Reporting System. At the same time, research by Swedish CSOs shows that a part of the aid allocated to cooperation with the private sector is primarily directed towards Swedish companies.12 Examples include projects within Swedpartnership, aid nanced activities of the Swedish Trade Council, and parts of Swedfund´s investments. It is even stated in Swedfund’s annual report that “in its activities, for the purpose of developing the Swedish business sector´s involvement in development cooperation, the Company should strive to collaborate with Swedish companies”. There is a concern that the strengthened role of the Swedish private sector could result in increased informal tying of aid, as is the case in many other donor countries.
Chapter 4 Global Aid Trends, BRICS Reports and OECD Reports
252252
Swedish CSOs recognize the private sector as an important actor in promoting development. They welcome private sector involvement provided that it undergoes the same scrutiny as other actors and aligns with the objectives of Sweden´s development policies. In other words, the private sector must meet more stringent transparency requirements and demonstrate how it contributes to development results.
This is especially important as of cial evaluations have shown that there is currently a lack of transparency and weak results measurement standards in private sector aid in terms of its impact on development. Sweden must also clarify how it will avoid the risk of informally tying Swedish aid to large-scale non-domestic private sector, rather than supporting the private sector in partner countries.
Endnotes
1 h t t p : / / s v e r i g e s r a d i o . s e / s i d a / a r t i e l .aspx?programid=83 arti el=4502395
2 h t t p : / / a i d w a t c h . c o n c o r d e u r o p e . o r g / s t a t i c / f i l e s /assets/3f200cc4/report.pdf
3 Sweden’s policy for global development: http://www.sweden.gov.se/sb/d/14232
4 Which includes: Freedom of expression, sexual and reproductive health and rights and organised crime with special focus on human traf c ing
5 OECD/DAC (2011). DAC mid-term review of Sweden: http://www.regeringen.se/content/1/c6/17/30/04/40322a14.pdf
6 http://www.stats ontoret.se/in-english/publications/2011/management-of-swedish-aid-policy-an-evaluation-201125/
7 Ibid
8 http://www.sida.se/Global/About%20Sida/S%C3%A5%20arbetar%20vi /pol icy%20guidel ines%20provate%20sector%20development.pdf
9 The private sector as a provider of Swedish development cooperation: http://www.dia onia.se/documents/public/A B O U T _ D I A K O N I A / R e p o r t s / 111 2 1 4 _ R E P O R T _P r i v a t e A c t o r s . p d f ? u t m _ s o u r c e = w e b s i t e u t m _medium=PDF utm_campaign=PRIVATEACTORS2011
10 Ibid
11 The Creeping utilit o the Global orum’s Peer Reviews, Tax Justice Networ , brie ng march 2012. http://www.taxjustice.net/cms/upload/GlobalForum2012-TJN-Brie ng.pdf
12 Ibid

253
Chapter 4 Global Aid Trends, BRICS Reports and OECD Reports
253
• In February 2011 Parliament decided to increase Swiss ODA to 0.5% of gross national income (GNI) by 2015 and approved an increase of the current 2011/2012 global credit lines by CHF640 million (approx. US$660 million). Of this increase, 60% will be allocated for the implementation of the Millennium Development Goals, in particular poverty reduction, water supplies and climate change adaptation measures. The remaining 40% will cover gaps in Switzerland’s multinational commitments.
• In 2012 for the rst time, Parliament decided simultaneously on all four-year credit lines for international cooperation (humanitarian aid; technical cooperation; trade and economic measures; and cooperation with CIS countries) and their shared development strategy for the period 2013-2016. Thereby the House of Representatives and the Senate con rmed the previous year’s decision for a 9% annual increase in the development budget up to 2015. For years Alliance Sud and its partners had fought for this increase with their petition “0.7% - Together against poverty”. In 2008 a group of parliamentarians from nearly all parties agreed on the compromise of a 0.5% increase that now
nally has been con rmed by the Parliament in the strategy of Switzerland’s international development cooperation 2013-2016.
• Swiss ODA was CHF2.7 billion or 0.46% of GNI in 2011. But again the share of the non-aid component was considerable.
At CHF489.3 million, spending on asylum seekers reached a new high in 2011, accounting for almost 18% of overall ODA.
The petition launched in 2008 for an increase in Of cial Development Assistance (ODA) to 0.7% of gross national income (GNI) is nally bearing fruit. In February 2011, the parliamentary majority agreed on a compromise to increase ODA gradually to 0.5% of GNI by 2015. The new four-year credit lines had to be decided in 2012. For the rst time, humanitarian, technical and economic cooperation were combined in a single Message under a common strategy. In line with the provisions of law and the Constitution, and with the UN Millennium Declaration, Switzerland’s top priority remains poverty reduction in developing and transition countries.
Besides its engagement in ten Least Developed Countries (LDCs), the Swiss Agency for Development and Cooperation (SDC) wants to be more involved in “fragile contexts“. The agency has accordingly designated a further ten priority crisis regions (including the Great Lakes, Horn of Africa, Hindu Kush). An external assessment identi ed SDC shortcomings, particularly in staff recruitment and training, and with respect to security and the lack of direct involvement of those in power. Nevertheless SDC argues that as a neutral country with no colonial past and with decades of experience in humanitarian aid, Switzerland is well positioned to work effectively in fragile states.

Chapter 4 Global Aid Trends, BRICS Reports and OECD Reports
254254
In 2011, in the context of the “Arabellion” (Arab spring), SDC and the State Secretariat for Economic Affairs (Seco) launched a ve-year North Africa programme with a new focus in Tunisia. Besides income support, democratization and institution building by Seco, SDC is involved in humanitarian aid and in a recently-agreed migration partnership for the reintegration of asylum seekers rejected by Switzerland.
In the run-up to the new Message a vociferous debate erupted about linking development assistance to the readmission of asylum seekers turned down in Switzerland. By a small majority, Parliament rejected any strict linkage. But for the rst time, migration-related self-interest
gured prominently in the Message. To combat irregular migration, the Federal Council and the development agencies are directed to seek concrete quid pro quos or agreements with partner countries.
Four years ago, SDC launched four global programmes on climate change, water, food security and migration. SDC’s objectives were to build expertise in these elds and in uence international organizations and agreements, promote pilot projects, demonstrate groundbreaking solutions and generate know-how for practical work in priority countries. The 2013-2016 Message adds a new “Health” programme. A sixth global programme “Finance and Trade” groups existing Seco development programmes. For SDC and Seco priority countries, the objectives and expertise of the global programmes will feed into existing country programmes.
Moreover, SDC is launching programmes to tackle international energy and environmental
issues in high-growth emerging countries like China and India. As Switzerland lacks a speci c budget to enter “strategic partnerships” with these countries, one wonders whether development funds might not be diverted towards foreign policy goals.
As recommended by the 2009 DAC Peer Review, the 2013-2016 Message devotes an entire chapter to foreign policy coherence for sustainable global development. It promises that con icts between development policy and other Confederation foreign policy goals will be resolved less at the expense of developing countries than hitherto. It remains to be seen whether future consultations within the Administration will bring greater coherence with SDC positions than previously.
However, little has changed in practice. Swiss arms exports reached a new high in 2011. Switzerland still supplies military goods to developing countries embroiled in con icts. But distinct progress has been made regarding stolen assets. In 2011 the Federal Cabinet arranged to block unlawful assets from Côte d’Ivoire, Egypt, Libya and Tunisia. These assets are to be returned as soon as possible. In contrast, there are still no effective measures to end tax ight from developing countries. In April 2012 the Swiss Government nonetheless stated its readiness, in principle, to negotiate Tax Information Exchange Agreements (TIEAs) with selected developing countries. Countries with which Switzerland already has double taxation agreements (DTAs) are not covered by this decision. These countries will bene t from tax information sharing only by renegotiating existing DTAs. In return for introducing information exchange, Switzerland wants to further reduce current withholding taxes on the revenues of Swiss investors.

255
Chapter 4 Global Aid Trends, BRICS Reports and OECD Reports
255
Thanks to parliamentary initiatives, Switzerland is slowly accepting the consideration of social and environmental rights when negotiating bilateral free trade agreements. It has thus begun offering its negotiating partners the possibility to include the European Free Trade Association (EFTA) voluntary provisions on environmental and labour rights. There has been less progress however on investment protection agreements. Under pressure from Parliament and as requested by a number of countries, Switzerland now includes principles of sustainable development in the preamble of agreements, but still lags far behind the European Union in the anchoring of human rights.
In late 2011, fty Swiss civil society organizations (CSOs) launched the “Corporate Justice” campaign. These CSOs call on the Government and Parliament to create the necessary legal basis to compel companies headquartered in Switzerland to respect human rights and environmental standards worldwide. In the summer of 2012 this CSO alliance delivered a petition on the issue to the Federal Parliament with over 130,000 signatures.
Switzerland has longstanding experience and recurrent budgets in the eld of private sector development. While a modest share of ODA, partnerships with pro t-oriented Swiss enterprises are most dominant in trade and infrastructure projects of the Swiss economic development programme. Regulation and assessment of these partnerships are project-speci c, and there are neither universally applicable rules nor an accreditation procedure for corporations.
Alongside the SDC, which reports to the Foreign Ministry, another governmental development agency, Seco, accounts for some 10% of the overall development budget and manages economic and trade programmes. It forms part of the State Secretariat for Economic Affairs and falls under the Department of Economic Affairs.
Seco’s primary emphasis is private sector development in middle-income countries (MICs). Along with SIFEM, a quasi-commercial corporate
nancing fund (see below), Seco provides approximately CHF35 million annually for multilateral initiatives by the World Bank Group and other development banks to improve general conditions for the private sector (40%), to develop new corporate funding instruments (40%), and for business skills training programmes such as corporate governance (20%). For the years 2013-2016, Seco is assigning an indicative amount of 15% of its funds or CHF30 million annually to these initiatives. Seco further states that the local private sector also bene ts from infrastructure, tax and nancial reforms, which help stabilize the investment climate.
SDC spends CHF30 million for private sector development in LDCs, or less than 2% of the SDC budget of CHF1.7 billion. The focus is mainly micro-enterprises and value chains in the agricultural sector. A further CHF10 million is spent on nancial services for poor households and farmers, plus CHF18 million for vocational training.1 In addition to direct funding for job creation, SDC also supports the elimination of obstacles to economic initiatives in the formal sector, the establishment of a nancial

Chapter 4 Global Aid Trends, BRICS Reports and OECD Reports
256256
sector geared to the needs of small and micro-enterprises, as well as capacity building in public administration.
One of Seco’s important tools for promoting the private sector is the quasi-commercial Swiss Investment Fund for Emerging Markets, SIFEM. For seven years, its total assets (currently CHF530 million) was replenished largely from Seco’s ODA budget. The last tranche, worth CHF30 million, falls due in 2012. The government envisages no further contributions from ODA funds.
SIFEM is a limited company under private law, owned since 2011 by the Swiss Confederation. Its of cial mandate is to “assist the private sector in developing countries and transitional economies either by investing in nancial intermediaries that provide long-term capital and know-how to local small and medium-sized companies (SMEs) or by directly co- nancing sustainable private businesses.”2 All of SIFEM’s direct investments and at least 60% of its indirect investments are to be made in of cial priority countries for both SDC and Seco. According to SIFEM’s latest Annual Report, the Internal Rate of Return of 11% in 2011 was just below the average for the preceding years.3
SIFEM made investments worth some CHF52 million (US$55.6 million) in 2011. This included, for example, investments in the Maghreb Private Equity Fund III and the Cambodia-Laos Development Fund. Under its long-term business plan the Fund’s target is to invest at least CHF60 million annually. These investments, as well as the administrative costs, are to be funded exclusively from the returns on current investments.
According to the Board of SIFEM, this level of investment would require assets of CHF620-650 million in funding. It is therefore likely to request additional contributions from Seco.
In early 2011, just before restructuring, SIFEM found itself in the media spotlight. Journalists from the Swiss weekly Handelszeitung revealed that through the investment company Tuninvest, SIFEM had invested in several companies closely linked to overthrown Tunisian President Ben Ali.4 One of these companies, the Tunisian airline Nouvelair, had been chaired directly by the brother of the President’s wife, Leila Trabelsi. This illustrates one of the dangers constantly confronting indirect investments by international
nancial institutions, as there is no direct control over the use made of the investments. There are no guarantees that the nancial intermediaries concerned will properly observe terms of reference of the donors, however stringent these may be.
As stated above, Seco supports trade and infrastructure-related Private-Public Partnerships (PPPs). Over the past ve years it has invested CHF55 million in the donor consortium Private Infrastructure Development Group (PIDG).5 In close cooperation with the Swiss private sector, Seco has also launched value chains for commodities costing CHF25 million annually. The priorities are to develop and implement certi cation standards as well as quality assurance for exports from developing countries and measures to promote imports into Europe.
These partnerships aim to leverage funds and invite business groups to co-sponsor the development of standards and value chains in

257
Chapter 4 Global Aid Trends, BRICS Reports and OECD Reports
257
trade in the areas of sustainability, fair trade and organic trade. According to Seco, there are no regulatory frameworks for such partnerships, nor are they needed. The necessary conditions are agreed at the project level. Private partners are expected to display corporate social responsibility and a high degree of initiative. Free riders are not accepted. For example, Seco has been involved in the sustainability assessment of coffee and cocoa certi cations by the Committee on Sustainability Assessment (COSA) since 2008.6 In a comparative study of 8 countries and 5,000 sample farms, the Committee gauges the social, economic and environmental impacts of various agricultural initiatives on yield and income, as well as on food security, education, health, etc. To be able to document the degree of poverty reduction more accurately, further indicators such as local governance and school attendance are to be added to the survey in the years ahead. Still, Seco does not envisage a comprehensive monitoring of poverty and human rights for all its commodity initiatives or for its collaboration with for-pro t enterprises in general.
Under the 2013-2016 Strategy, SDC will also expand its partnerships with the pro t-oriented private sector. For the past ten years, SDC has maintained a small, relatively unstructured number of partnerships (20 to 25) with Swiss multinationals under the Public-Private Development Partnership (PPDP) program. These initiatives are scattered throughout the world and are extremely diverse. They range from vocational training, small farmer education, the development of medicines, the sale of micro-insurance, water supply and irrigation programmes, to the recycling of refrigerators. SDC has no speci c budget line for PPDPs. These partnerships are designed and funded within the country programmes. According to SDC, some CHF40 million have been allocated over the past ten years for PPDP implementation. Annual
spending on PPDPs is therefore far below 1% of ODA and is expected to increase only modestly in the coming years.
According to SDC, roughly half of all new PPDP initiatives are developed by the heads of Swiss coordination of ces in priority countries in direct contact with Swiss enterprises that are present locally. The current project cycle management tools for Swiss development cooperation are used for planning and assessment of these initiatives. SDC does not plan to introduce speci c human rights or poverty reduction assessments. The other PPDPs are multi-stakeholder programmes with world-leading Swiss pharmaceutical, agricultural and insurance companies and often involve other of cial donors.
It’s doubtful whether “the principle of ownership” has been respected, as there is no information available to what extent local governments and/or the civil society have been considered in the planning and design of PPDPs. Project monitoring is undertaken by the enterprises. The donors coordinate only the overall programme. All assessments to date have been withheld from public access and review. Only programme content information is available to the press, but no assessment or budget information. SDC reports that it has so far not compiled any systematic data that would allow for comparative analyses of programmes. That should now change.
In the spring of 2012, SDC created the position of PPDP Policy Advisor. This position has no budget and will initiate no PPDPs, but will revise and operationalize the guidelines. The aim is to come to grips with the dangers and con icting challenges posed by PPDPs. SDC aims to deal with the lack of ownership or the possible implementation of projects in isolation from the development context. It will do so

Chapter 4 Global Aid Trends, BRICS Reports and OECD Reports
258258
by integrating PPDPs in the respective country programmes. A mandatory consultation with local CSOs or with the government in the planning and assessment of PPDPs, however, is not being considered. SDC’s new Policy Advisor has promised to develop, by the autumn of 2012, indicators with which to measure the impact of the policy principles and guidelines. These indicators include pro-poor development, additionality, the avoidance of any local market distortion, bene cial effects on public governance and local structures, and the potential for scaling up and sustainability. Insights from completed programmes will be harnessed for future partnerships. But SDC is still reluctant to commit to making such assessments publicly available.
For now SDC is considering private sector partnerships only with globally active Swiss corporations. SDC is not striving for minimum standards or an accreditation procedure similar to the one currently in place for cooperation
with NGOs. To minimize reputational risk, SDC recommends that its partner companies should join the Global Compact and take (voluntary) corporate social responsibility seriously. The development agency reports that it would rather not exclude companies whose subsidiaries or branches are publicly accused of human rights violations or environmental damage, so long as they do not refuse to engage in con ict management. Instead, SDC intends, through partnership, to invite multinational corporations to participate actively in development dialogues and to develop sensitivity to social and environmental issues.
It remains to be seen whether these corporations will voluntarily abide by the high aspirational principles. Alliance Sud will be monitoring the evolution of cooperation with pro t-making multinationals. Owing to the prevailing lack of transparency and poor standards, civil society organizations have to date not been able to recognize PPDPs as legitimate contributions to development outcomes.
Endnotes
1 Switzerland’s contribution, The achievements of SDC in 2006-2010,http://www.ddc.admin.ch/de/ ome/Do umentation/Publi ationen
2 See: http://www.sifem.ch/med/205-strategic-objectives-of-the-federal-council.pdf.
3 Further information: www.sifem.ch (in particular the 2011 annual report: http://www.sifem.ch/about/annual-reports/)
4 http://www.handelszeitung.ch/unternehmen/im-dunst reis-des-di tators, Jan 27, 2011 (in German).
5 http://www.pidg.org
6 http://sustainablecommodities.org/cosa

259
Chapter 4 Global Aid Trends, BRICS Reports and OECD Reports
259
in new initiatives such as the Partnership for Growth and the New Alliance for Food Security and Nutrition, and in USAID’s focus on public private partnerships (PPPs).
• Unfortunately, in many of these initiatives, the planning and design process has not included meaningful consultation with local and international civil society groups, and it remains to be seen if the Partnership for Growth and New Alliance will be effective at fostering broad-based and inclusive development.
• The way in which certain USAID reforms and private sector initiatives are being implemented risks undermining the principles of effectiveness, impact, and ownership that the Agency has rightly identi ed as key priorities.
• U.S. aid officials should improve consultations and engagement with civil society groups in the early stages of policy development. These consultations should critically evaluate the extent to which the new private sector initiatives align with local priorities, will likely result in significant poverty reduction, and can achieve broad-based and inclusive development outcomes.
• In 2011, U.S. of cial development assistance (ODA) totaled US$30.7 billion, making the U.S. the largest donor in the world. This amounts to 0.20 percent of Gross National Income (GNI) and is a decrease of 0.9% in real terms from 2010.2 The future outlook for U.S. foreign assistance funding is uncertain, with mild to severe cuts expected in the coming year.
• At a time of severe budget pressure, the U.S. Agency for International Development (USAID) is seeking to reform the agency and leverage aid dollars through private sector partnerships. USAID is increasingly favoring new, “non-traditional actors” such as corporations over “traditional actors” such as NGOs in its partnerships and consultations.
• U.S. aid of cials have embraced the principles of aid effectiveness and country ownership, and the Agency is attempting consequential reforms through USAID FORWARD. However, the lack of meaningful consultation with civil society groups jeopardizes the effectiveness of these reforms.
• Policymakers view economic growth as central to development, and see the private sector as a key partner in achieving development outcomes. This is re ected

Chapter 4 Global Aid Trends, BRICS Reports and OECD Reports
260260
The State of U.S. Foreign Assistance
As President, I have made it clear that the United States will do our part. My national security strategy recognizes development as not only a moral imperative, but a strategic and economic imperative. Secretary of State Clinton is leading a review to strengthen and better coordinate our diplomacy and development efforts. We’ve re-engaged with multilateral development institutions. And we’re rebuilding the United States Agency for International Development as the world’s premier development agency. In short, we’re making sure that the United States will be a global leader in international development in the 21st century.3
President Barack ObamaSeptember 22, 2010
Upon assuming of ce, President Barack Obama made foreign assistance a priority, pledging to double the budget for foreign aid and make development a central tenet of U.S. foreign policy. The administration issued the Presidential Policy Directive on Global Development (PPD) and commissioned the State Department’s Quadrennial Diplomacy and Development Review (QDDR). These were both signi cant steps that established a new vision for U.S. foreign assistance and its role in U.S. foreign policy. The PPD emphasized sustainable outcomes, economic growth, increased effectiveness, and coordination of development agencies,4 while the QDDR aimed to modernize U.S. foreign assistance and elevate “civilian power”, identifying development as a national security tool to be used alongside U.S. diplomatic capabilities.5
What legacy will the Obama administration leave for U.S. foreign assistance? The administration’s largest initiatives are Feed the Future, the Global Health Initiative, and the Global Climate Change Initiative, focusing on key Millennium Development Goals. The administration has also placed a strong emphasis on economic growth and the private sector, rolling out the private sector-based Partnership for Growth and New Alliance for Food Security and Nutrition, while continuing to use the Global Development Alliance model.6 The past four years have also seen a greater focus on fragile and con ict-affected states and renewed and enhanced gender integration in development programs as well as a new agency-wide gender policy. In its rhetoric and new initiatives, the administration has embraced principles of aid effectiveness, including country ownership (the principle that recipient countries – governments and their people – should have ownership over development initiatives).
Overall, U.S. development policy appears to be shaped by four central tenets:
• The Millennium Development Goals are key components for effective development outcomes and should be prioritized;
• The U.S. should strive to ensure aid effectiveness by adhering to principles of results, accountability, and country ownership;
• Aid is a key tool to advance the national security of the United States, with large amounts of assistance going to countries of strategic interest; and
• Economic growth and the private sector have a central role to play in reducing poverty.

261
Chapter 4 Global Aid Trends, BRICS Reports and OECD Reports
261
Recently, one of the greatest challenges to U.S. foreign assistance has been the U.S. political environment. In 2011, U.S. ODA stood at US$30.7 billion, a signi cant increase from the 2008 level of US$26 billion, although cuts are expected in the near future.7 While President Obama pledged to double U.S. foreign assistance, Congress ultimately determines the budgets of USAID and other poverty-focused ODA programs, and in 2011 concerns over government spending resulted in cuts to many areas of the aid budget. While calls for deeper cuts have come largely from the Republican Party, several prominent Republicans have supported more robust funding for foreign assistance. Based on the current state of budget negotiations, we can expect Congress to enact mild to severe cuts to the foreign assistance budget in the coming year.
On a positive note, 2011 saw the release of a discussion draft of the Global Partnerships Act by Representative Howard Berman (D-CA), outlining much-needed reforms to modernize and strengthen U.S. foreign assistance. Most importantly, the bill lays out a vision for U.S. global engagement that emphasizes partnerships and aid effectiveness. Although it will not become law in the near future, parts of the bill are being moved forward separately such as the Foreign Aid Transparency and Accountability Act introduced by Representative Ted Poe (R-TX).8
Ultimately, U.S. foreign assistance survived negotiations on the 2011 and 2012 budgets mostly intact, due largely to strong leadership and advocacy by NGOs and other allies. But it is clear that the era of growth and relatively broad support that the aid budget enjoyed over the past several years is over for the foreseeable
future. This transition from a period of growth to a period of stagnation or decline is one of the more consequential shifts for U.S. foreign assistance in the past few years.
An overview of the years since President Obama’s election highlights a number of additional trends that will have large implications for the future directions of U.S. ODA:
• USAID’s decreasing independence from the State Department, for example through the integrated planning and budgeting outlined in the QDDR;
• The continued alignment of USAID priorities with U.S. national security objectives, carried over from the Bush Administration (a large portion of U.S. aid dollars are devoted to countries of strategic interest to the United States, such as Afghanistan and Pakistan, which received more than 15% of U.S. bilateral aid in 2010 according to the OECD DAC9);
• An “out with the old, in with the new” mentality toward development approaches, with increasing bias toward new, technical innovations and private sector solutions, predicated on the belief that these solutions can achieve rapid, large-scale results; and
• An increasing emphasis on principles of aid effectiveness, including country ownership.
From building sustainable capacity to restoring performance monitoring and impact evaluation to promoting science, technology and innovation, we are

Chapter 4 Global Aid Trends, BRICS Reports and OECD Reports
262262
transforming our capabilities … USAID is poised and ready to reclaim our place as the world’s premiere development agency.
USAID Administrator Rajiv ShahSeptember 22, 2010
Considerable energy has been devoted to reforming USAID, primarily through the USAID FORWARD initiative. USAID FORWARD comprises seven areas of reform: Implementation and Procurement Reform, Talent Management, Rebuilding Policy Capacity, Strengthening Monitoring and Evaluation, Rebuilding Budget Management, Science and Technology, and Innovation.10 American civil society organizations (CSOs) generally welcomed the launch of these reform efforts, which demonstrate a serious commitment on the part of USAID leadership to transforming USAID into an effective, modern development agency.
Subsequently, serious questions have been raised about the way in which some reforms are being carried out, particularly those in the “Implementation and Procurement Reform” area, which affect the Agency’s partnerships with NGOs, for-pro t contractors, and other third parties. USAID intends to work more directly with local actors, with the stated target of channeling 30% of Agency resources directly to local partners by 2015. However, the reasoning behind the 30% target is unclear, and making these changes too quickly and without adequate planning may jeopardize their effectiveness. Moreover, USAID is limited by its staff capacity, and many of the newly-hired staff may lack the experience and knowledge required to select, guide and advise local organizations who become new recipients of direct funding.
Most troubling, however, is the lack of meaningful consultation with U.S.-based international NGOs
and other civil society groups in the design of these reforms. This is a serious concern given that these NGOs have decades of experience working directly with local partners. USAID should consult with all stakeholders in frequent, in-depth discussions to help shape both the design and implementation of these direct-funding reforms to ensure they are consistent with the Agency’s stated intentions. The intention and energy behind USAID’s reform effort are commendable, but without thorough and meaningful consultation, some reforms may work against the Agency’s important goals of increased effectiveness and local ownership.
In 2011, the U.S. government took strides to advance aid effectiveness through its participation in the Fourth High Level Forum on Aid Effectiveness (HLF-4) in Busan, South Korea. HLF-4 brought delegates from governments, civil society, parliamentarians and the private sector to nd agreement on principles and commitments to guide change in the practices of of cial development assistance. Notably, the U.S. government agreed to join the International Aid Transparency Initiative (IATI) and was a strong advocate for new donors such as the BRICS to agree to principles of aid effectiveness. In addition, the consultations with NGOs and other civil society groups leading up to HLF-4 were productive, providing a clear blueprint for how consultation between the U.S. government and civil society should be conducted.
To unleash transformational change, we’re putting a new emphasis on the most powerful force the world has ever known for eradicating poverty and creating opportunity. It’s the force that turned South Korea from a recipient of aid to a donor of aid. It’s the force that has

263
Chapter 4 Global Aid Trends, BRICS Reports and OECD Reports
263
raised living standards from Brazil to India … The force I’m speaking of is broad-based economic growth.11
President Barack ObamaSeptember 22, 2010
If we are going to encourage truly sustainable, broad-based economic growth in developing countries, we have to do a far better job of working with private rms—be they domestic or foreign, established or entrepreneurial … We must partner with the private sector much more deeply from the start, instead of treating companies as just another funding source for our development work … In short, we must embrace a new wave of creative, enlightened capitalism.12
USAID Administrator Rajiv ShahOctober 20, 2011
In 2001, USAID under Administrator Andrew Natsios rolled out the Global Development Alliance, a model where government and private sector actors identify development outcomes of common interest and each contribute resources and skill sets to achieve those outcomes.13 Since then, USAID has engaged in over 1,000 private sector partnerships with over 3,000 partners, with Administrator Rajiv Shah reinforcing this focus through increased partnerships and dialogue with business leaders.14 Simultaneously, the Obama administration has established the Partnership for Growth and the New Alliance for Food Security and Nutrition, two large initiatives that leverage private sector investment.
U.S. aid of cials view the private sector—including businesses ranging from multinational corporations to local small enterprises—as a partner that can provide signi cant new resources, achieve unparalleled scale and reach, and generate
economic growth that can lift millions out of poverty. Additionally, the private sector provides new dollars at a time of declining aid budgets; allows the Obama administration to create new initiatives despite Congressional inaction; and generally wins more political support from skeptical members of Congress.
The private sector can be a powerful engine for poverty reduction if engaged effectively, and USAID and the administration should be seeking to achieve greater impact through partnerships. In practice, however, the engagement of the private sector thus far has raised a number of concerns:
• “Private sector” and “public private partnership” have been used as catch-all terms that include a multitude of forces and actors that interact with human development in very different ways. Involving a private sector actor sounds innovative but does not guarantee that a private sector partnership is the most effective way to achieve the desired results for poor and marginalized populations.
• Private sector partnerships should be prioritized based on the extent to which they are likely to produce development outcomes. Engagement of the private sector has been somewhat opportunistic and ad hoc, rather than strategically determined based on an analysis of what is most effective at reducing poverty. Engagement of local businesses and entrepreneurs is particularly important.
• Private sector partners should be held accountable to appropriate standards in development practice, and the U.S. government should advocate for standards such as respect for workers, good governance, anti-corruption measures, environmental

Chapter 4 Global Aid Trends, BRICS Reports and OECD Reports
264264
stewardship, and respectful engagement of communities.
• Thus far, the lack of outreach to U.S. NGOs to be meaningfully involved in new public-private partnerships is troubling. In previous public-private partnerships, NGOs have helped to ensure a focus on poverty reduction and positive development outcomes through employment, capacity strengthening and positive ripple effects for local small businesses.
One of the U.S. government’s signature private sector-focused initiatives is the Partnership for Growth (PFG), announced in late 2011. The PFG is described as a new approach, not a new allocation of resources – a “framework for engagement” by multiple U.S. government agencies with four pilot recipient countries: El Salvador, Ghana, the Philippines, and Tanzania. The aim is to “accelerate and sustain broad-based economic growth” by enacting the principles contained in the September 2010 Presidential Policy Directive.15 The PFG is a framework for engagement in which Joint Country Action Plans are formulated and agreed upon by the U.S. and each partner country. Multiple U.S. government agencies as well as the recipient country government coordinate to facilitate and support economic growth in each recipient country. Priority areas of intervention are determined through an analysis of the country’s primary constraints to growth.
The initiative is still in its infancy, and so it remains to be seen if this type of engagement
will indeed be successful in contributing to the reduction of poverty in these four countries. In determining priority areas of intervention, the PFG’s primary consideration should be what interventions are most likely to produce growth that is broad-based and inclusive, and bene ts the poor and marginalized in each recipient country. Additionally, one open question is how much input the host country’s civil society has to ensure that PFG programs actually meet local needs and re ect local interests.
At the May 2012 G-8 summit, President Obama announced the New Alliance for Food Security and Nutrition. The White House describes the New Alliance as “a commitment by G8 nations, African countries and private sector partners to lift 50 million people out of poverty over the next 10 years through inclusive and sustained agricultural growth,” although few details have been released. This will supposedly be achieved through agricultural investments, with US$3 billion worth of investments over ten years identi ed thus far. The New Alliance will begin in Ghana, Ethiopia, and Tanzania, and eventually expand to other African countries.16 The private sector, broadly de ned, certainly has a critical role to play in increasing food security and improving nutrition, and the U.S. and other G-8 countries are right to try to leverage private dollars to achieve these ends. However, many CSOs have raised serious questions about the New Alliance.
To begin with, the extent to which private investment in agriculture actually reduces poverty depends on the nature of the investment.

265
Chapter 4 Global Aid Trends, BRICS Reports and OECD Reports
265
Effective investment should focus on smallholder farmers, who account for over 70 percent of agricultural production and 75 percent of labor in Africa.17 The White House’s fact sheet on the New Alliance recognizes “the critical role played by smallholder farmers,” but it is not clear to what extent they will actually bene t from the New Alliance investments. Overall, the speci c pathways toward poverty reduction and food security, engaging smallholder farmers themselves, should be explained in more detail.
The stated goals of the initiative are to increase responsible private investment, take productivity innovations to scale, and reduce and manage risk.18 Priority outcomes should go beyond productivity and risk to include gender equity, nutrition, environmental sustainability, and climate resilience. In addition, it is unclear how private sector actors are held accountable to standards beyond nancial commitments.
Unfortunately, the New Alliance appears to be driven by donor priorities, particularly corporate investment priorities. The initiative should consult with African civil society groups, particularly those representing smallholder agriculturalists and farm laborers, to ensure that investments align with the interests of smallholder agriculture and do not compromise host country-led food security initiatives. One strong criticism of the New Alliance came from a group of African civil society leaders: “For the initiative to truly be an alliance, women small-scale producers, youth, and pastoralists should have been consulted in the drafting of the plan. Instead, G8 leaders are
merely asking African governments for a rubber stamp.”19
Finally, private sector investment cannot be a substitute for continued public investment. The U.S. and other donor countries should ful ll their 2009 L’Aquila commitments and sustain robust ODA funding of country-led agriculture and nutrition investment plans over the coming years.
The U.S. government has taken a strategic lens to the administration of U.S. aid dollars by focusing on effectiveness, impact, and ownership. However, the implementation of some reforms and initiatives currently underway must be improved if they are to be effective, locally owned and have real impact on the lives of the poor. U.S. aid of cials should undertake meaningful consultations with civil society, including international NGOs and local groups, and should take a critical look at whether the new efforts to engage the private sector can actually achieve broad-based and inclusive development outcomes for poor and marginalized populations. The U.S. government should engage in co-planning with all stakeholders to ensure these initiatives match local priorities, are equitable, and make a real difference in the lives of the poor. Initiatives focused on economic growth and the private sector can and should be a part of U.S. foreign assistance. But if not implemented strategically, these initiatives can undermine the principles of effectiveness, impact, and ownership that the U.S. government has worked hard to elevate.

Chapter 4 Global Aid Trends, BRICS Reports and OECD Reports
266266
Endnotes
1 This paper was nalized on August 13, 2012, and does not re ect changes or advances made between its nalization and the date of publication. InterAction staff who contributed include: Stephanie Cappa, Brian Greenberg, aia Grino, Filmona ailemichael, Carolyn ong, Mar otwis, and John Ruthrauff.
2 OECD Newsroom. “Development: Aid to developing countries falls because of recession.” http://www.oecd.org/newsroom
developmentaidtodevelopingcountriesfallsbecauseofglobal recession.htm
3 Remar s of President Barac Obama – As Prepared for Delivery. Millennium Development Goals Summit, UN
eadquarters, N , N . 2010.
4 White ouse Factsheet: U.S. Global Development Policy. 2010.
5 U.S. State Department: “The Quadrennial Diplomacy and Development Review.” http://www.state.gov/documents/organization/153109.pdf.
6 According to the USAID website, “The Global Development Alliance (GDA) is a mar et-based business model for partnerships between the public and private sectors to address jointly de ned business and development objectives… A well-constructed GDA furthers the objectives of the USAID mission while bene ting the business interests of the resource partner.” yperlin : http://idea.usaid.gov/gp/about-gda-model. See the section “The Private Sector: A New Emphasis” below for more elaboration.
7 OECD Newsroom. “Development aid at its highest level ever in 2008.” http://www.oecd.org/development/developmentaidatitshighestleveleverin2008.htm
8 Modernizing Foreign Assistance Networ Newsletter, October 24th 2011.
9 OECD DAC Creditor Reporting System and OECD DAC Dataset2, accessed July 2012
10 USAID R RD. http://forward.usaid.gov/about/overview.
11 Remar s of President Barac Obama – As Prepared for Delivery. Millennium Development Goals Summit, UN
eadquarters, N , N . 2010.
12 Remar s by USAID Administrator Dr. Rajiv Shah at the USAID Public-Private Partnership Forum. 2011.
13 USAID. “Partnering for Impact: PPPs and USAID’s Global Development Alliance Approach.” http://idea.usaid.gov/sites/default/ les/attachments/PPPs_vs_GDAs.pdf.
14 “USAID’s 2012 Global Development Alliance Annual Program Statement.” 2012. http://idea.usaid.gov/sites/default/ les/attachments/Private_Sector_Partnership_Invitation_2012.pdf.
15 U.S. State Department Fact Sheet: Partnership for Growth. 2011.
16 White ouse Blog. “New Alliance for Food Security and Nutrition.” 2012.
17 African Development Ban . “Smallholder agriculture in Africa’s changing economy.” 2009.
18 White ouse Fact Sheet: G-8 Action on Food Security and Nutrition. 2012.
19 etter signed by ROPPA, POSCAO-AC, REPAOC, WASCOF, CAOSAD, OSCAF, WANEJ, AFAO, REPAD, WAITAD, WABA, RECAO, NANTS, PASCiB and S TO.
Related Documents