126 Copyright © 2016 Pearson Education, Inc. Chapter 2 Trigonometric Functions Section 2.1 1. 2 C r π = ; 2 A r π = 2. 1 2 (2) 2 2 A π π = = 3. standard position 4. central angle 5. d 6. r θ ; 2 1 2 r θ 7. b 8. s t ; t θ 9. True 10. False; r υ ω = 11. 12. 13. 14. _ 15. 16. 17. 18. 19. 20. 21. 22. 23. º 1 1 1 40º10'25" 40 10 25 60 60 60 (40 0.1667 0.00694)º 40.17º = + ⋅ + ⋅ ⋅ ≈ + + ≈ 24. º 1 1 1 61º 42 ' 21" 61 42 21 60 60 60 (61 0.7000 0.00583)º 61.71º = + ⋅ + ⋅ ⋅ ≈ + + ≈ Full file at https://testbankuniv.eu/Trigonometry-A-Unit-Circle-Approach-10th-Edition-Sullivan-Solutions-Manual Full file at https://testbankuniv.eu/Trigonometry-A-Unit-Circle-Approach-10th-Edition-Sullivan-Solutions-Manual

Welcome message from author
This document is posted to help you gain knowledge. Please leave a comment to let me know what you think about it! Share it to your friends and learn new things together.
Transcript

126 Copyright © 2016 Pearson Education, Inc.
Chapter 2 Trigonometric Functions
Section 2.1
1. 2C rπ= ; 2A rπ=
2. 1 2 (2) 22
A π π = =
3. standard position
4. central angle
5. d
6. rθ ; 212
r θ
7. b
8. st
; tθ
9. True
10. False; rυ ω=
11.
12.
13.
14. _
15.
16.
17.
18.
19.
20.
21.
22.
23. º1 1 140º10 '25" 40 10 25
60 60 60(40 0.1667 0.00694)º40.17º
= + ⋅ + ⋅ ⋅
≈ + +≈
24. º1 1 161º 42 '21" 61 42 21
60 60 60(61 0.7000 0.00583)º61.71º
= + ⋅ + ⋅ ⋅
≈ + +≈
Full file at https://testbankuniv.eu/Trigonometry-A-Unit-Circle-Approach-10th-Edition-Sullivan-Solutions-Manual
Full file at https://testbankuniv.eu/Trigonometry-A-Unit-Circle-Approach-10th-Edition-Sullivan-Solutions-Manual
Section 2.1: Angles and Their Measure
127 Copyright © 2016 Pearson Education, Inc.
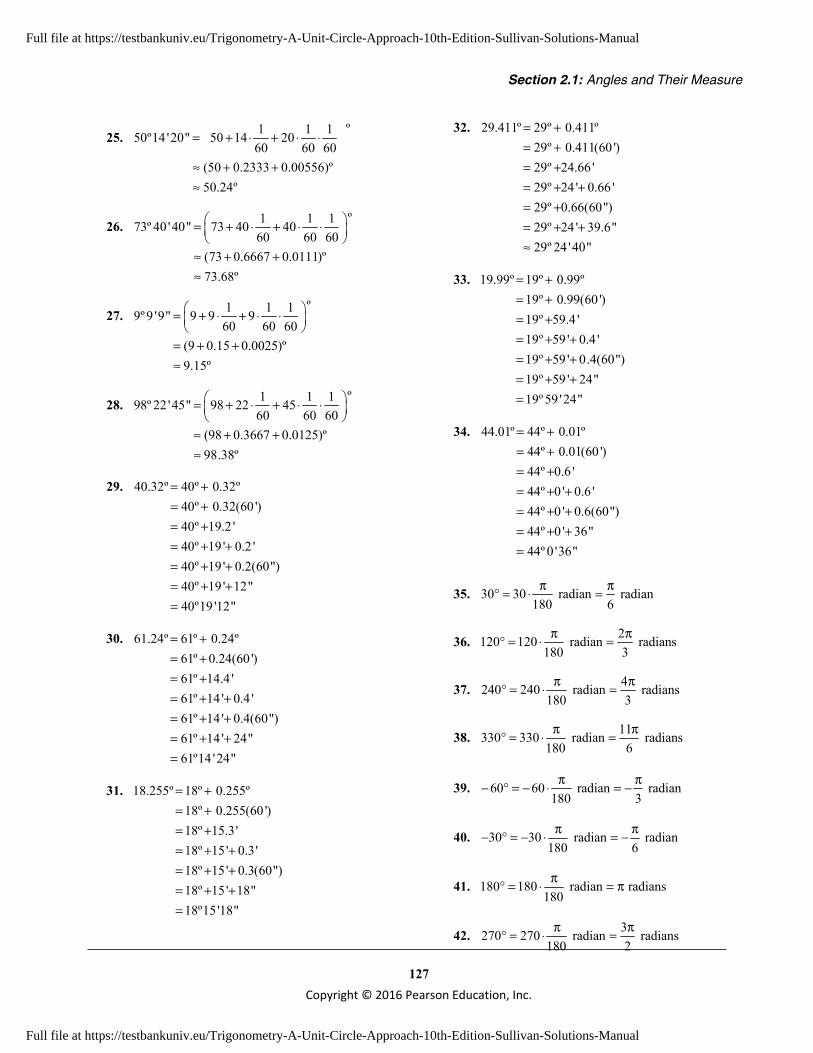
25. º1 1 150º14 '20" 50 14 20
60 60 60(50 0.2333 0.00556)º50.24º
= + ⋅ + ⋅ ⋅ ≈ + +≈
26. º1 1 173º 40 '40" 73 40 40
60 60 60(73 0.6667 0.0111)º73.68º
= + ⋅ + ⋅ ⋅
≈ + +≈
27. º1 1 19º 9 '9" 9 9 9
60 60 60(9 0.15 0.0025)º9.15º
= + ⋅ + ⋅ ⋅
= + +≈
28. º1 1 198º 22 '45" 98 22 45
60 60 60(98 0.3667 0.0125)º98.38º
= + ⋅ + ⋅ ⋅
≈ + +≈
29. 40.32º 40º 0.32º40º 0.32(60 ')40º 19.2 '40º 19 ' 0.2 '40º 19 ' 0.2(60")40º 19 ' 12"40º19 '12"
= += += += + += + += + +=
30. 61.24º 61º 0.24º61º 0.24(60 ')61º 14.4 '61º 14 ' 0.4 '61º 14 ' 0.4(60")61º 14 ' 24"61º14 '24"
= += += += + += + += + +=
31. 18.255º 18º 0.255º18º 0.255(60 ')18º 15.3'18º 15' 0.3'18º 15' 0.3(60")18º 15' 18"18º15'18"
= += += += + += + += + +=
32. 29.411º 29º 0.411º29º 0.411(60 ')29º 24.66 '29º 24 ' 0.66 '29º 0.66(60")29º 24 ' 39.6"29º 24 '40"
= += += += + += += + +≈
33. 19.99º 19º 0.99º19º 0.99(60 ')19º 59.4 '19º 59 ' 0.4 '19º 59 ' 0.4(60")19º 59 ' 24"19º 59 '24"
= += += += + += + += + +=
34. 44.01º 44º 0.01º44º 0.01(60 ')44º 0.6 '44º 0 ' 0.6 '44º 0 ' 0.6(60")44º 0 ' 36"44º 0 '36"
= += += += + += + += + +=
35. 30 30 radian radian180 6
π π° = ⋅ =
36. 2120 120 radian radians180 3
π π° = ⋅ =
37. 4240 240 radian radians180 3
π π° = ⋅ =
38. 11330 330 radian radians180 6
π π° = ⋅ =
39. 60 60 radian radian180 3
π π− ° = − ⋅ = −
40. 30 30 radian radian180 6
π π− ° = − ⋅ = −
41. 180 180 radian radians180
π° = ⋅ = π
42. 3270 270 radian radians180 2
π π° = ⋅ =
Full file at https://testbankuniv.eu/Trigonometry-A-Unit-Circle-Approach-10th-Edition-Sullivan-Solutions-Manual
Full file at https://testbankuniv.eu/Trigonometry-A-Unit-Circle-Approach-10th-Edition-Sullivan-Solutions-Manual

Chapter 2: Trigonometric Functions
128
Copyright © 2016 Pearson Education, Inc.
43. 3135 135 radian radians180 4
π π− ° = − ⋅ = −
44. 5225 225 radian radians180 4
π π− ° = − ⋅ = −
45. 90 90 radian radians180 2
π π− ° = − ⋅ = −
46. 180 180 radian radians180
π− ° = − ⋅ = −π
47. 180 degrees 603 3π π= ⋅ = °
π
48. 5 5 180 degrees 1506 6π π= ⋅ = °
π
49. 5 5 180 degrees 2254 4π π− = − ⋅ = − °
π
50. 2 2 180 degrees 1203 3π π− = − ⋅ = − °
π
51. 180 degrees 902 2π π= ⋅ = °
π
52. 1804 4 degrees 720π = π⋅ = °π
53. 180 degrees 1512 12π π= ⋅ = °
π
54. 5 5 180 degrees 7512 12
π π= ⋅ = °π
55. 180 degrees 902 2π π− = − ⋅ = − °
π
56. 180 degrees 180−π = −π⋅ = − °π
57. 180 degrees 306 6π π− = − ⋅ = − °
π
58. 3 3 180 degrees 1354 4π π− = − ⋅ = − °
π
59. 1717 17 radian radian 0.30 radian180 180
π π° = ⋅ = ≈
60. 73 73 radian180
73 radians1801.27 radians
π° = ⋅
π=
≈
61. 40 40 radian180
2 radian9
0.70 radian
π− ° = − ⋅
π= −
≈ −
62. 51 51 radian180
17 radian60
0.89 radian
π− ° = − ⋅
π= −
≈ −
63. 125 125 radian180
25 radians36
2.18 radians
π° = ⋅
π=
≈
64. 350 350 radian180
35 radians18
6.11 radians
π° = ⋅
π=
≈
65. 1803.14 radians 3.14 degrees 179.91º= ⋅ ≈π
66. 1800.75 radian 0.75 degrees 42.97º= ⋅ ≈π
67. 1802 radians 2 degrees 114.59º= ⋅ ≈π
68. 1803 radians 3 degrees 171.89º= ⋅ ≈π
69. 1806.32 radians 6.32 degrees 362.11º= ⋅ ≈π
70. 1802 radians 2 degrees 81.03º= ⋅ ≈π
Full file at https://testbankuniv.eu/Trigonometry-A-Unit-Circle-Approach-10th-Edition-Sullivan-Solutions-Manual
Full file at https://testbankuniv.eu/Trigonometry-A-Unit-Circle-Approach-10th-Edition-Sullivan-Solutions-Manual
Section 2.1: Angles and Their Measure
129 Copyright © 2016 Pearson Education, Inc.
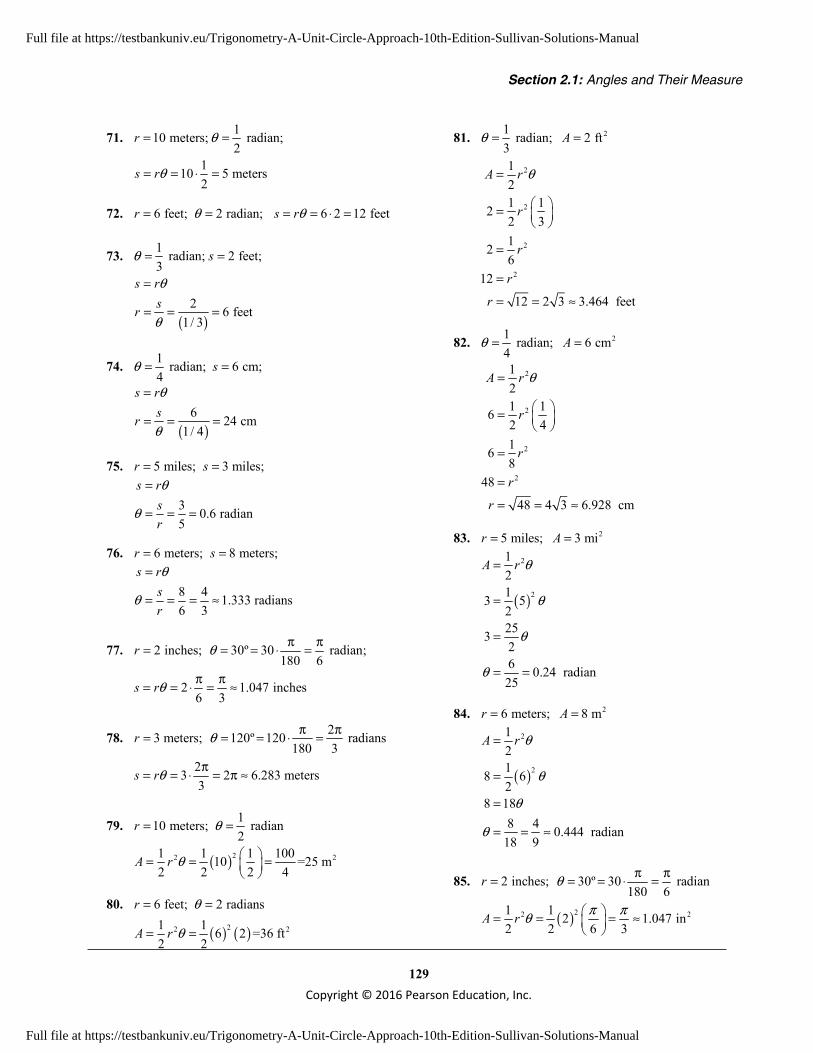
71. 110 meters; radian;2
r θ= =
110 5 meters2
s rθ= = ⋅ =
72. 6 feet; 2 radian; 6 2 12 feetr s rθ θ= = = = ⋅ =
73. 1 radian; 2 feet;3
sθ = =
( )2 6 feet
1/ 3
s rsr
θ
θ
=
= = =
74. 1 radian; 6 cm;4
sθ = =
( )6 24 cm
1/ 4
s rsr
θ
θ
=
= = =
75. 5 miles; 3 miles;r s= =
3 0.6 radian5
s rsr
θ
θ
=
= = =
76. 6 meters; 8 meters;r s= =
8 4 1.333 radians6 3
s rsr
θ
θ
=
= = = ≈
77. 2 inches; 30º 30 radian;180 6
r θ π π= = = ⋅ =
2 1.047 inches6 3
s rθ π π= = ⋅ = ≈
78. 23 meters; 120º 120 radians180 3
r θ π π= = = ⋅ =
23 2 6.283 meters3
s rθ π= = ⋅ = π ≈
79. 110 meters; radian2
r θ= =
( )22 21 1 1 10010 =25 m2 2 2 4
A r θ = = =
80. 6 feet; 2 radiansr θ= =
( ) ( )22 21 1 6 2 =36 ft2 2
A r θ= =
81. 21 radian; 2 ft3
Aθ = =
2
2
2
2
121 122 3126
12
12 2 3 3.464 feet
A r
r
r
r
r
θ=
=
=
=
= = ≈
82. 21 radian; 6 cm4
Aθ = =
2
2
2
2
121 162 4168
48
48 4 3 6.928 cm
A r
r
r
r
r
θ=
=
=
=
= = ≈
83. 25 miles; 3 mir A= =
( )
2
2
1213 5225326 0.24 radian25
A r θ
θ
θ
θ
=
=
=
= =
84. 26 meters; 8 mr A= =
( )
2
2
1218 62
8 188 4 0.444 radian
18 9
A r θ
θ
θ
θ
=
=
=
= = ≈
85. 2 inches; 30º 30 radian180 6
r θ π π= = = ⋅ =
( )22 21 1 2 1.047 in2 2 6 3
A r π πθ = = = ≈
Full file at https://testbankuniv.eu/Trigonometry-A-Unit-Circle-Approach-10th-Edition-Sullivan-Solutions-Manual
Full file at https://testbankuniv.eu/Trigonometry-A-Unit-Circle-Approach-10th-Edition-Sullivan-Solutions-Manual
Chapter 2: Trigonometric Functions
130
Copyright © 2016 Pearson Education, Inc.
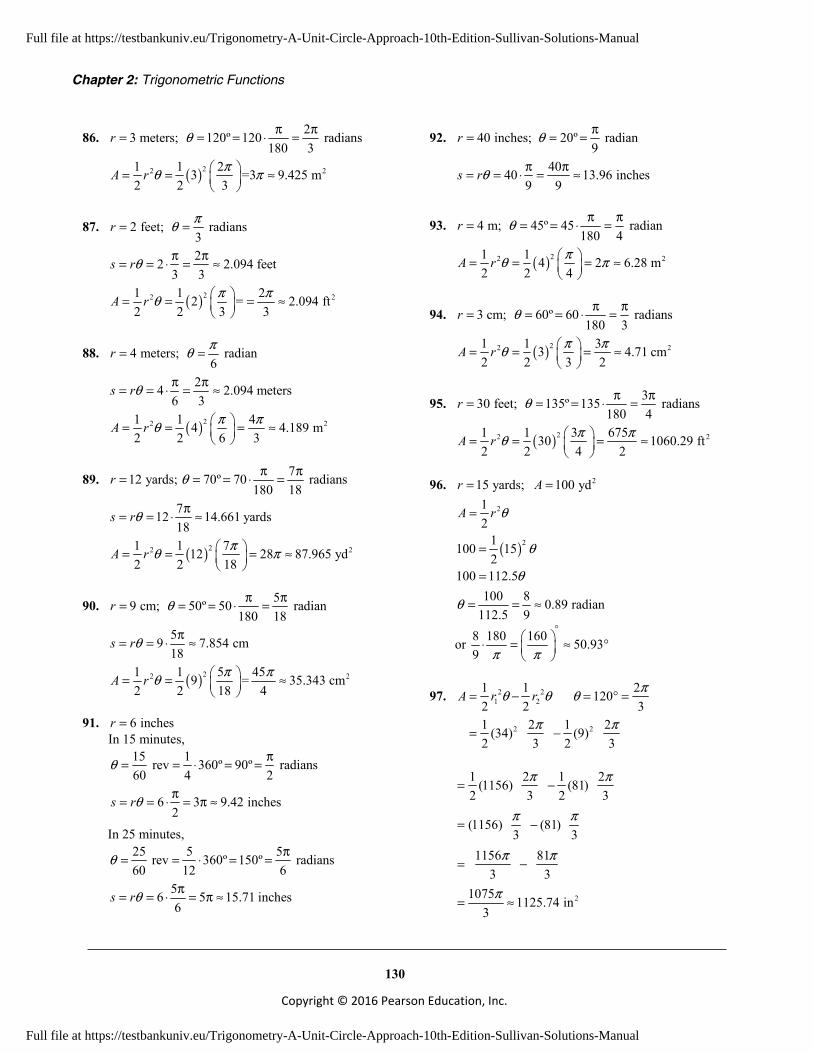
86. 23 meters; 120º 120 radians180 3
r θ π π= = = ⋅ =
( )22 21 1 23 =3 9.425 m2 2 3
A r πθ π = = ≈
87. 2 feet; radians3
r πθ= =
22 2.094 feet3 3
s rθ π π= = ⋅ = ≈
( )22 21 1 22 = 2.094 ft2 2 3 3
A r π πθ = = = ≈
88. 4 meters; radian6
r πθ= =
24 2.094 meters6 3
s rθ π π= = ⋅ = ≈
( )22 21 1 44 4.189 m2 2 6 3
A r π πθ = = = ≈
89. 712 yards; 70º 70 radians180 18
r θ π π= = = ⋅ =
712 14.661 yards18
s rθ π= = ⋅ ≈
( )22 21 1 712 28 87.965 yd2 2 18
A r πθ π = = = ≈
90. 59 cm; 50º 50 radian180 18
r θ π π= = = ⋅ =
59 7.854 cm18
s rθ π= = ⋅ ≈
( )22 21 1 5 459 = 35.343 cm2 2 18 4
A r π πθ = = ≈
91. 6 inchesr = In 15 minutes,
15 1 rev 360º 90º radians60 4 2
θ π= = ⋅ = =
6 3 9.42 inches2
s rθ π= = ⋅ = π ≈
In 25 minutes, 25 5 5 rev 360º 150º radians60 12 6
θ π= = ⋅ = =
56 5 15.71 inches6
s rθ π= = ⋅ = π ≈
92. 40 inches; 20º radian9
r θ π= = =
4040 13.96 inches9 9
s rθ π π= = ⋅ = ≈
93. 4 m; 45º 45 radian180 4
r θ π π= = = ⋅ =
( )22 21 1 4 2 6.28 m2 2 4
A r πθ π = = = ≈
94. 3 cm; 60º 60 radians180 3
r θ π π= = = ⋅ =
( )22 21 1 33 4.71 cm2 2 3 2
A r π πθ = = = ≈
95. 330 feet; 135º 135 radians180 4
r θ π π= = = ⋅ =
( )22 21 1 3 67530 1060.29 ft2 2 4 2
A r π πθ = = = ≈
96. 215 yards; 100 ydr A= =
( )
2
2
12
1100 152
100 112.5100 8 0.89 radian
112.5 9
A r θ
θ
θ
θ
=
=
=
= = ≈
or 8 180 160 50.939 π π
° ⋅ = ≈ °
97. 2 21 2
2 2
1 1 2 1202 2 31 2 1 2(34) (9)2 3 2 3
A r r πθ θ θ
π π
= − = ° =
= −
2
1 2 1 2(1156) (81)2 3 2 3
(1156) (81)3 3
1156 813 3
1075 1125.74 in3
π π
π π
π π
π
= −
= −
= −
= ≈
Full file at https://testbankuniv.eu/Trigonometry-A-Unit-Circle-Approach-10th-Edition-Sullivan-Solutions-Manual
Full file at https://testbankuniv.eu/Trigonometry-A-Unit-Circle-Approach-10th-Edition-Sullivan-Solutions-Manual
Section 2.1: Angles and Their Measure
131 Copyright © 2016 Pearson Education, Inc.
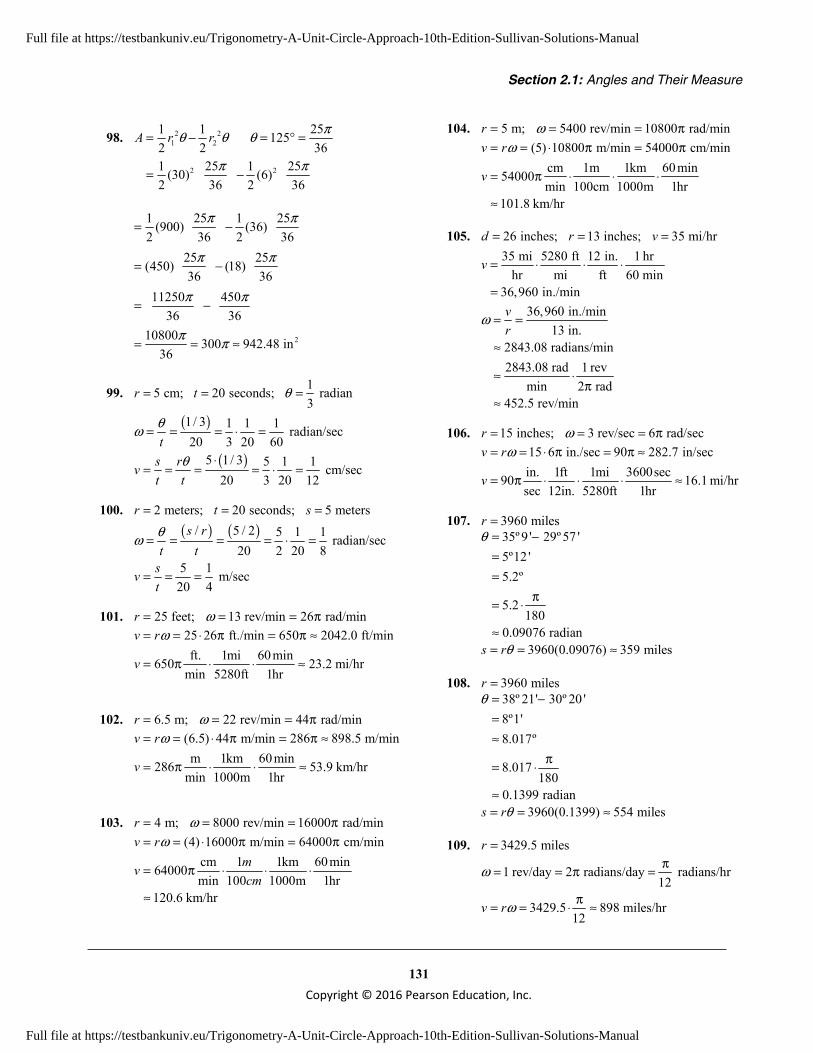
98. 2 21 2
2 2
1 1 25 1252 2 361 25 1 25(30) (6)2 36 2 36
A r r πθ θ θ
π π
= − = ° =
= −
2
1 25 1 25(900) (36)2 36 2 36
25 25(450) (18)36 36
11250 45036 36
10800 300 942.48 in36
π π
π π
π π
π π
= −
= −
= −
= = ≈
99. 15 cm; 20 seconds; radian3
r t θ= = =
( )
( )
1/ 3 1 1 1 radian/sec20 3 20 60
5 1/ 3 5 1 1 cm/sec20 3 20 12
ts rvt t
θω
θ
= = = ⋅ =
⋅= = = = ⋅ =
100. 2 meters; 20 seconds; 5 metersr t s= = = ( ) ( )/ 5 / 2 5 1 1 radian/sec
20 2 20 85 1 m/sec20 4
s rt t
svt
θω = = = = ⋅ =
= = =
101. 25 feet; 13 rev/min 26 rad/minr ω= = = π 25 26 ft./min 650 2042.0 ft/minft. 1mi 60min650 23.2 mi/hr
min 5280ft 1hr
v r
v
ω= = ⋅ π = π ≈
= π ⋅ ⋅ ≈
102. 6.5 m; 22 rev/min 44 rad/minr ω= = = π (6.5) 44 m/min 286 898.5 m/minm 1km 60min286 53.9 km/hr
min 1000m 1hr
v r
v
ω= = ⋅ π = π ≈
= π ⋅ ⋅ ≈
103. 4 m; 8000 rev/min 16000 rad/minr ω= = = π (4) 16000 m/min 64000 cm/min
cm 1 1km 60min64000min 100 1000m 1hr
120.6 km/hr
v rmvcm
ω= = ⋅ π = π
= π ⋅ ⋅ ⋅
≈
104. 5 m; 5400 rev/min 10800 rad/minr ω= = = π (5) 10800 m/min 54000 cm/min
cm 1m 1km 60min54000min 100cm 1000m 1hr
101.8 km/hr
v r
v
ω= = ⋅ π = π
= π ⋅ ⋅ ⋅
≈
105. 26 inches; 13 inches; 35 mi/hrd r v= = = 35 mi 5280 ft 12 in. 1 hr
hr mi ft 60 min36,960 in./min
v = ⋅ ⋅ ⋅
=
36,960 in./min13 in.
2843.08 radians/min2843.08 rad 1 rev
min 2 rad452.5 rev/min
vr
ω = =
≈
≈ ⋅π
≈
106. 15 inches; 3 rev/sec 6 rad/secr ω= = = π 15 6 in./sec 90 282.7 in/secin. 1ft 1mi 3600sec90 16.1 mi/hrsec 12in. 5280ft 1hr
v r
v
ω= = ⋅ π = π ≈
= π ⋅ ⋅ ⋅ ≈
107. 3960 milesr = 35º 9 ' 29º 57 '5º12 '5.2º
5.2180
0.09076 radian
θ = −==
π= ⋅
≈
3960(0.09076) 359 miless rθ= = ≈
108. 3960 milesr = 38º 21' 30º 20 '8º1'8.017º
8.017180
0.1399 radian
θ = −=≈
π= ⋅
≈
3960(0.1399) 554 miless rθ= = ≈
109. 3429.5 milesr =
1 rev/day 2 radians/day radians/hr12
ω π= = π =
3429.5 898 miles/hr12
v rω π= = ⋅ ≈
Full file at https://testbankuniv.eu/Trigonometry-A-Unit-Circle-Approach-10th-Edition-Sullivan-Solutions-Manual
Full file at https://testbankuniv.eu/Trigonometry-A-Unit-Circle-Approach-10th-Edition-Sullivan-Solutions-Manual

Chapter 2: Trigonometric Functions
132
Copyright © 2016 Pearson Education, Inc.
110. 3033.5 milesr =
1 rev/day 2 radians/day radians/hr12
ω π= = π =
3033.5 794 miles/hr12
v rω π= = ⋅ ≈
111. 52.39 10 milesr = ×
( )5
1 rev/27.3 days2 radians/27.3 days
radians/hr12 27.3
2.39 10 2292 miles/hr327.6
v r
ω
ω
== π
π=⋅
π= = × ⋅ ≈
112. 79.29 10 milesr = ×
( )7
1 rev/365 days2 radians/365 days
radians/hr12 365
9.29 10 66,633 miles/hr4380
v r
ω
ω
== π
π=⋅
π= = × ⋅ ≈
113. 1 22 inches; 8 inches;r r= =
1 3 rev/min 6 radians/minω π= = Find 2ω :
1 2
1 1 2 2
2
2
2(6 ) 812
81.5 radians/min1.5 rev/min2
3 rev/min4
v vr rω ω
ω
ω
==
π =π=
= ππ=
π
=
114. 30 feetr = 1 rev 2 0.09 radian/sec70 sec 70 sec 35
ω π π= = = ≈
rad 6 ft30 feet 2.69 feet/sec35 sec 7 sec
v rω π π= = ⋅ = ≈
115. 4 feet; 10 rev/min 20 radians/minr ω= = = π
4 20ft80
min80 ft 1 mi 60 minmin 5280 ft hr
2.86 mi/hr
v rω== ⋅ π
= π
π= ⋅ ⋅
≈
116. 26 inches; 13 inches;d r= = 480 rev/min 960 radians/minω = = π
13 960in12480
min12480 in 1 ft 1 mi 60 min
min 12 in 5280 ft hr37.13 mi/hr
v rω== ⋅ π
= π
π= ⋅ ⋅ ⋅
≈
80 mi/hr 12 in 5280 ft 1 hr 1 rev13 in 1 ft 1 mi 60 min 2 rad
1034.26 rev/min
vr
ω =
= ⋅ ⋅ ⋅ ⋅π
≈
117. 8.5 feet; 4.25 feet; 9.55 mi/hrd r v= = = 9.55 mi/hr
4.25 ft9.55 mi 1 5280 ft 1 hr 1 rev
hr 4.25 ft mi 60 min 231.47 rev/min
vr
ω = =
= ⋅ ⋅ ⋅ ⋅π
≈
118. Let t represent the time for the earth to rotate 90 miles.
2490 2 (3559)
90(24) 0.0966 hours 5.8 minutes2 (3559)
t
t
=π
= ≈ ≈π
Full file at https://testbankuniv.eu/Trigonometry-A-Unit-Circle-Approach-10th-Edition-Sullivan-Solutions-Manual
Full file at https://testbankuniv.eu/Trigonometry-A-Unit-Circle-Approach-10th-Edition-Sullivan-Solutions-Manual

Section 2.1: Angles and Their Measure
133 Copyright © 2016 Pearson Education, Inc.
119. 2
2(9)81
A rππ
π
===
We need ¾ of this area. 3 243814 4
π π = . Now
we calculate the small area.
2
2(3)9
A rπππ
=
==
We need ¼ of the small area. 1 994 4
π π =
So the total area is: 243 9 252 634 4 4
π π π π+ = =
square feet.
120. First we find the radius of the circle.
2
8 24
C rr
r
ππ π
==
=
The area of the circle is 2 2(4) 16A rπ π π= = = . The area of the sector of the circle is 4π . Now we calculate the area of the rectangle.
(4)(4 7)44
A lwAA
== +=
So the area of the rectangle that is outside of the circle is 244 4 uπ− .
121. The earth makes one full rotation in 24 hours. The distance traveled in 24 hours is the circumference of the earth. At the equator the circumference is 2 (3960)π miles. Therefore, the linear velocity a person must travel to keep up with the sun is:
2 (3960) 1037 miles/hr24
svt
π= = ≈
122. Find , when 3960 miles and 1'.s r θ= = 1 degree radians1' 0.00029 radian60 min 180 degrees
3960(0.00029) 1.15 miless r
θ
θ
π= ⋅ ⋅ ≈
= = ≈
Thus, 1 nautical mile is approximately 1.15 statute miles.
123. We know that the distance between Alexandria and Syene to be 500s = miles. Since the measure of the Sun’s rays in Alexandria is 7.2° , the central angle formed at the center of Earth between Alexandria and Syene must also be 7.2° . Converting to radians, we have
7.2 7.2 radian180 25
π π° = ° ⋅ =°
. Therefore,
50025
25 12,500500 3979 miles
s r
r
r
θπ
π π
=
= ⋅
= ⋅ = ≈
12,5002 2 25,000C rπ ππ
= = ⋅ = miles.
The radius of Earth is approximately 3979 miles, and the circumference is approximately 25,000 miles.
124. a. The length of the outfield fence is the arc length subtended by a central angle 96θ = ° with 200r = feet.
200 96 335.10 feet180
s r πθ= ⋅ = ⋅ ° ⋅ ≈°
The outfield fence is approximately 335.1 feet long.
b. The area of the warning track is the difference between the areas of two sectors with central angle 96θ = ° . One sector with
200r = feet and the other with 190r = feet.
( )
( )
( )
2 2 2 2
2 2
1 12 2 296 200 1902 180
4 3900 3267.2615
A R r R rθθ θ
π
π
= − = −
°= ⋅ −°
= ≈
The area of the warning track is about 3267.26 square feet.
Full file at https://testbankuniv.eu/Trigonometry-A-Unit-Circle-Approach-10th-Edition-Sullivan-Solutions-Manual
Full file at https://testbankuniv.eu/Trigonometry-A-Unit-Circle-Approach-10th-Edition-Sullivan-Solutions-Manual
Chapter 2: Trigonometric Functions
134
Copyright © 2016 Pearson Education, Inc.
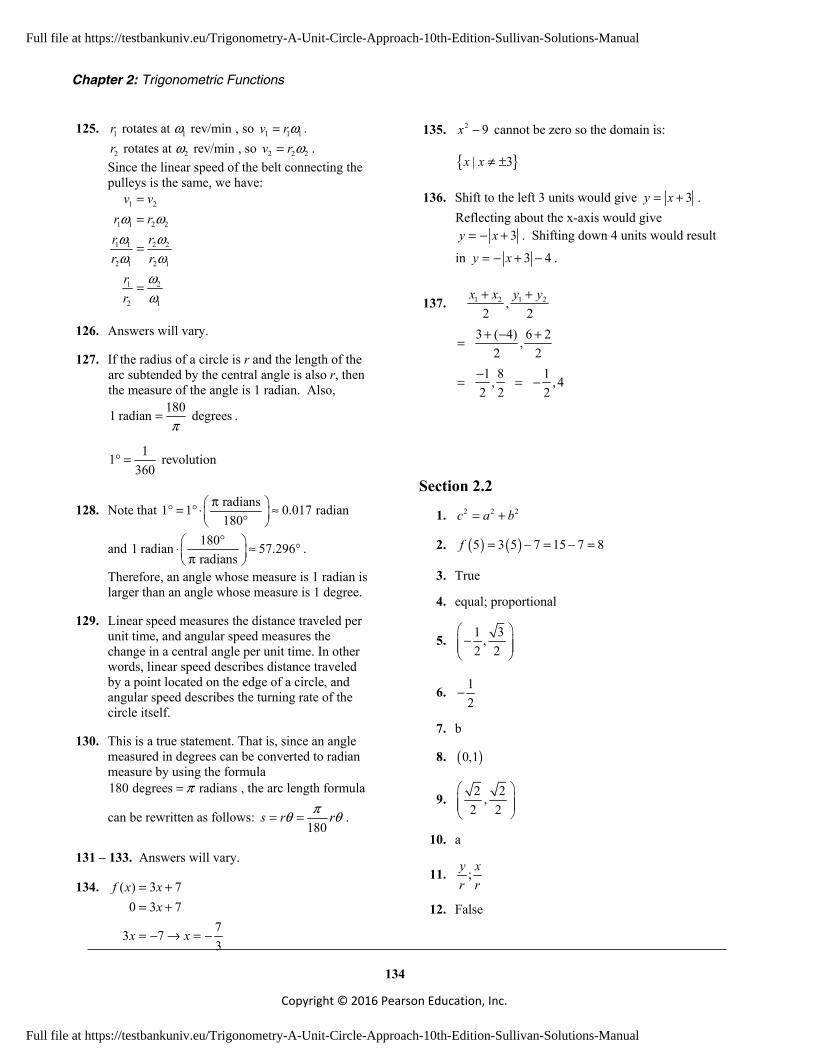
125. 1 1 rotates at rev/minr ω , so 1 1 1v rω= .
2 2 rotates at rev/minr ω , so 2 2 2v r ω= . Since the linear speed of the belt connecting the pulleys is the same, we have:
1 2
1 1 2 2
1 1 2 2
2 1 2 1
1 2
2 1
v vr rr rr r
rr
ω ωω ωω ω
ωω
==
=
=
126. Answers will vary.
127. If the radius of a circle is r and the length of the arc subtended by the central angle is also r, then the measure of the angle is 1 radian. Also,
1801 radian degreesπ
= .
11360
° = revolution
128. Note that radians1 1 0.017 radian180
π ° = ° ⋅ ≈ °
and 1801 radian 57.296 radians
° ⋅ ≈ ° π .
Therefore, an angle whose measure is 1 radian is larger than an angle whose measure is 1 degree.
129. Linear speed measures the distance traveled per unit time, and angular speed measures the change in a central angle per unit time. In other words, linear speed describes distance traveled by a point located on the edge of a circle, and angular speed describes the turning rate of the circle itself.
130. This is a true statement. That is, since an angle measured in degrees can be converted to radian measure by using the formula 180 degrees radiansπ= , the arc length formula
can be rewritten as follows: 180
s r rπθ θ= = .
131 – 133. Answers will vary.
134. ( ) 3 70 3 7
73 73
f x xx
x x
= += +
= − → = −
135. 2 9x − cannot be zero so the domain is:
{ }| 3x x ≠ ±
136. Shift to the left 3 units would give 3y x= + . Reflecting about the x-axis would give
3y x= − + . Shifting down 4 units would result
in 3 4y x= − + − .
137. 1 2 1 2,2 2
3 ( 4) 6 2,2 2
1 8 1, , 42 2 2
x x y y+ +
+ − + =
− = = −
Section 2.2
1. 2 2 2c a b= +
2. ( ) ( )5 3 5 7 15 7 8f = − = − =
3. True
4. equal; proportional
5. 1 3,2 2
−
6. 12
−
7. b
8. ( )0,1
9. 2 2,2 2
10. a
11. ;y xr r
12. False
Full file at https://testbankuniv.eu/Trigonometry-A-Unit-Circle-Approach-10th-Edition-Sullivan-Solutions-Manual
Full file at https://testbankuniv.eu/Trigonometry-A-Unit-Circle-Approach-10th-Edition-Sullivan-Solutions-Manual

Section 2.2: Trigonometric Functions: Unit Circle Approach
135 Copyright © 2016 Pearson Education, Inc.
13. 3 1 3 1, , 2 2 2 2
P x y
= = =
1sin2
t y= =
3cos2
t x= =
11 2 1 3 32tan2 33 3 33
2
ytx
= = = ⋅ = ⋅ =
1 1 2csc 1 21 12
ty
= = = ⋅ =
1 1 2 2 3 2 3sec 133 3 33
2
tx
= = = ⋅ = ⋅ =
32 3 2cot 31 2 12
xty
= = = ⋅ =
14. 1 3 1 3, , 2 2 2 2
P x y
= − = = −
3sin2
t y= = −
1cos2
t x= =
33 22tan = 3
1 2 12
ytx
− = = = − ⋅ −
1 1 2 2 3 2 3csc33 3 33
2
ty
= = = − = − ⋅ = −
−
1 1 2sec 1 21 12
tx
= = = ⋅ =
11 2 1 3 32cot2 33 3 33
2
xty
= = = − ⋅ = − ⋅ = −
−
15. 2 21 2 21, , 5 5 5 5
P x y
= − = − =
21sin5
t y= =
2cos5
t x= = −
2121 5 215tan =
2 5 2 25
ytx
= = = − −
−
1 1 5 5 21 5 21csc 12121 21 2121
5
ty
= = = ⋅ = ⋅ =
1 1 5 5sec 12 2 25
tx
= = = − = − −
22 55cot5 2121
52 21 2 21
2121 21
xty
− = = = − ⋅
= − ⋅ = −
16. 1 2 6 1 2 6, , 5 5 5 5
P x y
= − = − =
2 6sin5
t y= =
1cos5
t x= = −
2 62 6 55tan = 2 6
1 5 15
ytx
= = = − −
−
1 1 5 5 6 5 6csc 1122 6 2 6 62 6
5
ty
= = = ⋅ = ⋅ =
Full file at https://testbankuniv.eu/Trigonometry-A-Unit-Circle-Approach-10th-Edition-Sullivan-Solutions-Manual
Full file at https://testbankuniv.eu/Trigonometry-A-Unit-Circle-Approach-10th-Edition-Sullivan-Solutions-Manual

Chapter 2: Trigonometric Functions
136
Copyright © 2016 Pearson Education, Inc.
1 1 5sec 1 51 15
tx
= = = − = − −
11 55cot5 2 62 6
51 6 6
122 6 6
xty
− = = = −
= − ⋅ = −
17. 2 2 2 2, , 2 2 2 2
P x y
= − = − =
2sin2
t =
2cos2
t x= = −
22tan 1
22
ytx
= = = −
−
1 1 2 2 2csc 1 22 2 22
2
ty
= = = ⋅ = ⋅ =
1 1 2 2 2sec 1 22 2 22
2
tx
= = = − = − ⋅ = − −
22cot 12
2
xty
− = = = −
18. 2 2 2 2, , 2 2 2 2
P x y
= = =
2sin2
t y= =
2cos2
t x= =
22
tan 12
2
ytx
= = =
1 1 2 2 2csc 1 22 2 22
2
ty
= = = ⋅ = ⋅ =
1 1 2 2 2sec 1 22 2 22
2
tx
= = = ⋅ = ⋅ =
22
cot 12
2
xty
= = =
19. 2 2 1 2 2 1, , 3 3 3 3
P x y
= − = = −
1sin3
t y= = −
2 2cos3
t x= =
11 33tan3 2 22 2
31 2 2= =
42 2 2
ytx
− = = = − ⋅
− ⋅ −
1 1 3csc 1 31 13
ty
= = = − = − −
1 1 3 3 2 3 2sec 142 2 2 2 22 2
3
tx
= = = = ⋅ =
2 22 2 33cot 2 2
1 3 13
xty
= = = − = −
−
20. 5 2 5 2, , 3 3 3 3
P x y
= − − = − = −
2sin3
t y= = −
5cos3
t x= = −
Full file at https://testbankuniv.eu/Trigonometry-A-Unit-Circle-Approach-10th-Edition-Sullivan-Solutions-Manual
Full file at https://testbankuniv.eu/Trigonometry-A-Unit-Circle-Approach-10th-Edition-Sullivan-Solutions-Manual
Section 2.2: Trigonometric Functions: Unit Circle Approach
137 Copyright © 2016 Pearson Education, Inc.
22 33tan3 55
3
2 5 2 5= =55 5
ytx
− = = = − − −
⋅
1 1 3 3csc 12 2 23
ty
= = = − = − −
1 1 3sec 155
3
3 5 3 555 5
tx
= = = − −
= − ⋅ = −
53 5 3 5cot2 3 2 23
xty
− = = = − − = −
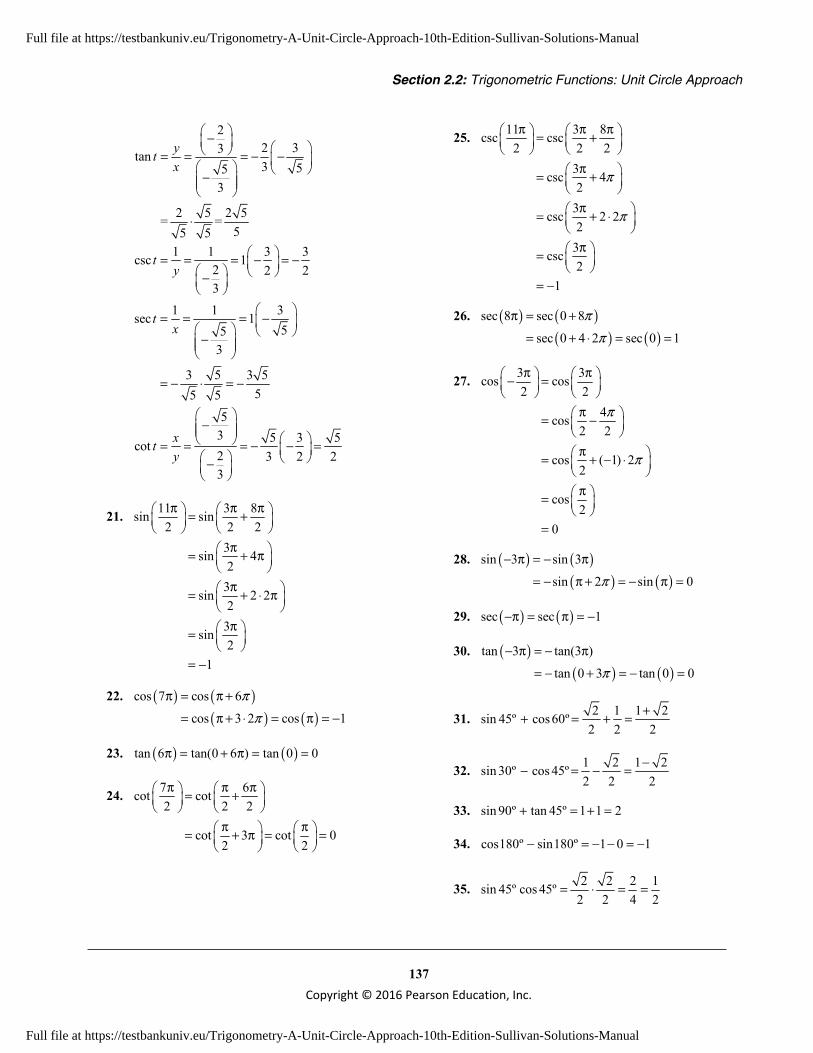
21. 11 3 8sin sin2 2 2
3sin 42
3sin 2 22
3sin2
1
π π π = +
π = + π
π = + ⋅ π
π =
= −
22. ( ) ( )( ) ( )
cos 7 cos 6cos 3 2 cos 1
ππ
π = π +
= π + ⋅ = π = −
23. ( ) ( )tan 6 tan(0 6 ) tan 0 0π = + π = =
24. 7 6cot cot2 2 2
cot 3 cot 02 2
π π π = +
π π = + π = =
25. 11 3 8csc csc2 2 2
3csc 42
3csc 2 22
3csc2
1
π
π
π π π = +
π = +
π = + ⋅
π =
= −
26. ( ) ( )( ) ( )
sec 8 sec 0 8sec 0 4 2 sec 0 1
ππ
π = +
= + ⋅ = =
27. 3 3cos cos2 2
4cos2 2
cos ( 1) 22
cos2
0
π
π
π π − =
π = −
π = + − ⋅
π =
=
28. ( ) ( )( ) ( )
sin 3 sin 3sin 2 sin 0π
− π = − π
= − π + = − π =
29. ( ) ( )sec sec 1−π = π = −
30. ( )( ) ( )
tan 3 tan(3 )tan 0 3 tan 0 0π
− π = − π
= − + = − =
31. 2 1 1 2sin 45º cos60º2 2 2
++ = + =
32. 1 2 1 2sin 30º cos 45º2 2 2
−− = − =
33. sin 90º tan 45º 1 1 2+ = + =
34. cos180º sin180º 1 0 1− = − − = −
35. 2 2 2 1sin 45º cos 45º2 2 4 2
= ⋅ = =
Full file at https://testbankuniv.eu/Trigonometry-A-Unit-Circle-Approach-10th-Edition-Sullivan-Solutions-Manual
Full file at https://testbankuniv.eu/Trigonometry-A-Unit-Circle-Approach-10th-Edition-Sullivan-Solutions-Manual
Chapter 2: Trigonometric Functions
138
Copyright © 2016 Pearson Education, Inc.
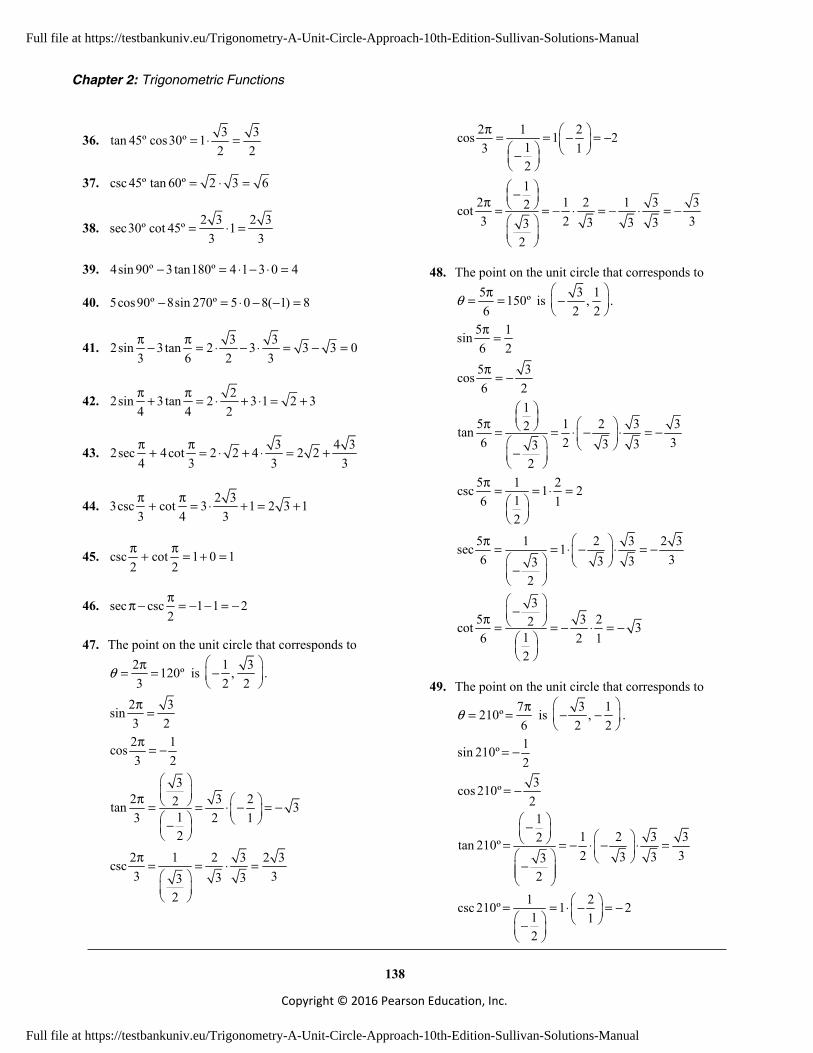
36. 3 3tan 45º cos30º 12 2
= ⋅ =
37. csc 45º tan 60º 2 3 6= ⋅ =
38. 2 3 2 3sec30º cot 45º 13 3
= ⋅ =
39. 4sin 90º 3 tan180º 4 1 3 0 4− = ⋅ − ⋅ =
40. 5cos90º 8sin 270º 5 0 8( 1) 8− = ⋅ − − =
41. 3 32sin 3tan 2 3 3 3 03 6 2 3π π− = ⋅ − ⋅ = − =
42. 22sin 3 tan 2 3 1 2 34 4 2π π+ = ⋅ + ⋅ = +
43. 3 4 32sec 4cot 2 2 4 2 24 3 3 3π π+ = ⋅ + ⋅ = +
44. 2 33csc cot 3 1 2 3 13 4 3π π+ = ⋅ + = +
45. csc cot 1 0 12 2π π+ = + =
46. sec csc 1 1 22ππ − = − − = −
47. The point on the unit circle that corresponds to 2 120º3
θ π= = is 1 3,2 2
−
.
2 3sin3 2π =
2 1cos3 2π = −
32 3 22tan 3
13 2 12
π = = ⋅ − = − −
2 1 2 3 2 3csc3 33 33
2
π = = ⋅ =
2 1 2cos 1 213 12
π = = − = − −
12 1 2 1 3 32cot3 2 33 3 33
2
− π = = − ⋅ = − ⋅ = −
48. The point on the unit circle that corresponds to 5 150º6
θ π= = is 3 1,2 2
−
.
5 1sin6 2π =
5 3cos6 2π = −
15 1 2 3 32tan6 2 33 33
2
π = = ⋅ − ⋅ = − −
5 1 2csc 1 216 12
π = = ⋅ =
5 1 2 3 2 3sec 16 33 33
2
π = = ⋅ − ⋅ = − −
35 3 22cot 3
16 2 12
− π = = − ⋅ = −
49. The point on the unit circle that corresponds to 7210º6
θ π= = is 3 1,2 2
− −
.
1sin 210º2
= −
3cos 210º2
= −
11 2 3 32tan 210º2 33 33
2
− = = − ⋅ − ⋅ = −
1 2csc 210º 1 21 12
= = ⋅ − = − −
Full file at https://testbankuniv.eu/Trigonometry-A-Unit-Circle-Approach-10th-Edition-Sullivan-Solutions-Manual
Full file at https://testbankuniv.eu/Trigonometry-A-Unit-Circle-Approach-10th-Edition-Sullivan-Solutions-Manual
Section 2.2: Trigonometric Functions: Unit Circle Approach
139 Copyright © 2016 Pearson Education, Inc.
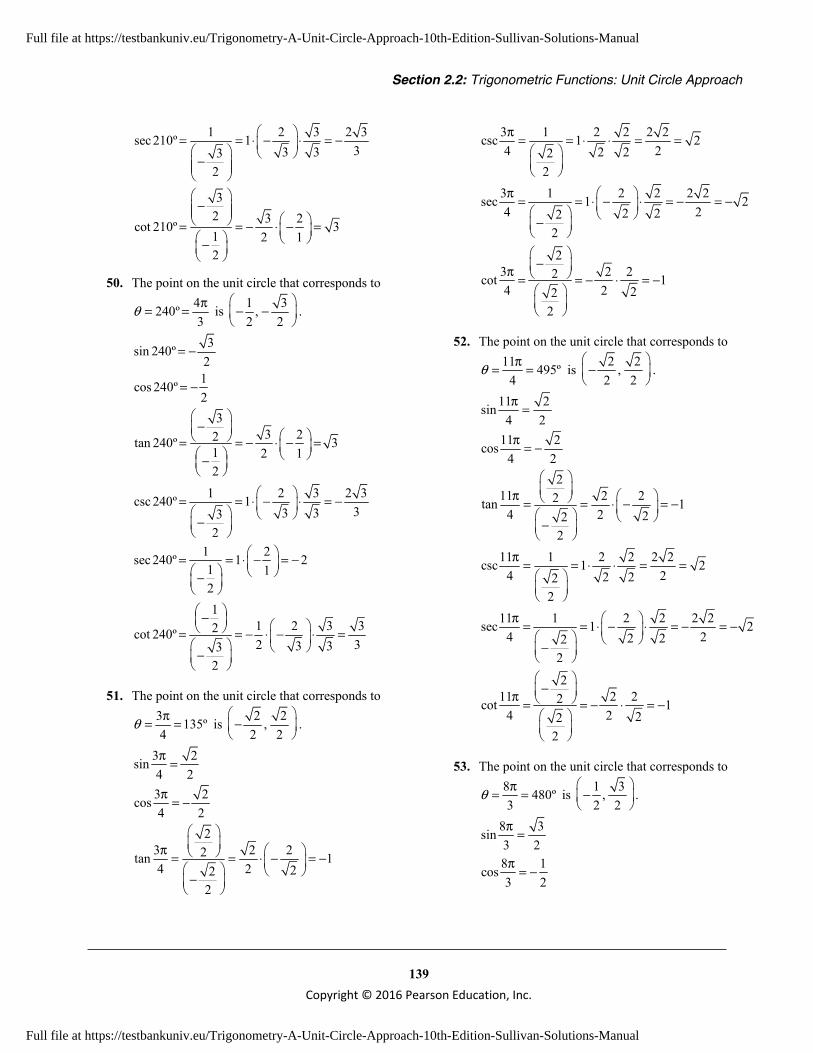
1 2 3 2 3sec 210º 133 33
2
= = ⋅ − ⋅ = − −
32 3 2cot 210º 31 2 12
− = = − ⋅ − = −
50. The point on the unit circle that corresponds to 4240º3
θ π= = is 1 3,2 2
− −
.
3sin 240º2
= −
1cos 240º2
= −
33 22tan 240º 3
1 2 12
− = = − ⋅ − = −
1 2 3 2 3csc 240º 133 33
2
= = ⋅ − ⋅ = − −
1 2sec 240º 1 21 12
= = ⋅ − = − −
11 2 3 32cot 240º2 33 33
2
− = = − ⋅ − ⋅ = −
51. The point on the unit circle that corresponds to 3 135º4
θ π= = is 2 2,2 2
−
.
3 2sin4 2π =
3 2cos4 2π = −
23 2 22tan 14 2 22
2
π = = ⋅ − = − −
3 1 2 2 2 2csc 1 24 22 22
2
π = = ⋅ ⋅ = =
3 1 2 2 2 2sec 1 24 22 22
2
π = = ⋅ − ⋅ = − = − −
23 2 22cot 14 2 22
2
− π = = − ⋅ = −
52. The point on the unit circle that corresponds to 11 495º
4θ π= = is 2 2,
2 2
−
.
11 2sin4 2π =
11 2cos4 2π = −
211 2 22tan 1
4 2 222
π = = ⋅ − = − −
11 1 2 2 2 2csc 1 24 22 22
2
π = = ⋅ ⋅ = =
11 1 2 2 2 2sec 1 24 22 22
2
π = = ⋅ − ⋅ = − = − −
211 2 22cot 1
4 2 222
− π = = − ⋅ = −
53. The point on the unit circle that corresponds to 8 480º3
θ π= = is 1 3,2 2
−
.
8 3sin3 2π =
8 1cos3 2π = −
Full file at https://testbankuniv.eu/Trigonometry-A-Unit-Circle-Approach-10th-Edition-Sullivan-Solutions-Manual
Full file at https://testbankuniv.eu/Trigonometry-A-Unit-Circle-Approach-10th-Edition-Sullivan-Solutions-Manual

Chapter 2: Trigonometric Functions
140
Copyright © 2016 Pearson Education, Inc.
38 3 22tan 3
13 2 12
π = = ⋅ − = − −
8 1 2 3 2 3csc 13 33 33
2
π = = ⋅ ⋅ =
8 1 2sec 1 213 12
π = = ⋅ − = − −
18 1 2 3 32cot3 2 33 33
2
− π = = − ⋅ ⋅ = −
54. The point on the unit circle that corresponds to 13 390º
6θ π= = is 3 1,
2 2
.
13 1sin6 2π =
13 3cos6 2π =
113 1 2 3 32tan
6 2 33 332
π = = ⋅ ⋅ =
13 1 2csc 1 216 12
π = = ⋅ =
13 1 2 3 2 3sec 16 33 33
2
π = = ⋅ ⋅ =
3213 3 2cot 316 2 12
π = = ⋅ =
55. The point on the unit circle that corresponds to 9405º4
θ π= = is 2 2,2 2
.
2sin 405º2
=
2cos 405º2
=
22 22tan 405º 1
2 222
= = ⋅ =
1 2 2csc 405º 1 22 22
2
= = ⋅ ⋅ =
1 2 2sec 405º 1 22 22
2
= = ⋅ ⋅ =
22cot 405º 12
2
= =
56. The point on the unit circle that corresponds to 13390º
6θ π= = is 3 1,
2 2
.
1sin 390º2
=
3cos390º2
=
11 2 3 32tan 390º2 33 33
2
= = ⋅ ⋅ =
1 2csc390º 1 21 12
= = ⋅ =
1 2 3 2 3sec390º 133 33
2
= = ⋅ ⋅ =
33 22cot 390º 3
1 2 12
= = ⋅ =
Full file at https://testbankuniv.eu/Trigonometry-A-Unit-Circle-Approach-10th-Edition-Sullivan-Solutions-Manual
Full file at https://testbankuniv.eu/Trigonometry-A-Unit-Circle-Approach-10th-Edition-Sullivan-Solutions-Manual

Section 2.2: Trigonometric Functions: Unit Circle Approach
141 Copyright © 2016 Pearson Education, Inc.
57. The point on the unit circle that corresponds to
= 30º6
θ π= − − is 3 1,2 2
−
.
1sin6 2π − = −
3cos6 2π − =
11 2 3 32tan
6 2 33 332
− π − = = − ⋅ ⋅ = −
1csc = 2162
π − − −
1 2 3 2 3sec6 33 33
2
π − = = ⋅ =
33 22cot 3
16 2 12
π − = = ⋅ − = − −
58. The point on the unit circle that corresponds to
60º3
θ π= − = − is 1 3,2 2
−
.
3sin3 2π − = −
1cos3 2π − =
33 22tan 3
13 2 12
− π − = = − ⋅ = −
1 2 3 2 3csc 13 33 33
2
π − = = ⋅ − ⋅ = − −
1 2sec 1 213 12
π − = = ⋅ =
11 2 3 32cot
3 2 33 332
π − = = ⋅ − ⋅ = − −
59. The point on the unit circle that corresponds to 3135º4
θ π= − = − is 2 2,2 2
− −
.
( ) 2sin 135º2
− = −
( ) 2cos 135º2
− = −
( )2
2 22tan 135º 12 22
2
− − = = − ⋅ − = −
( ) 1 2 2csc 135º 1 22 22
2
− = = ⋅ − ⋅ = − −
( ) 1 2 2sec 135º 1 22 22
2
− = = ⋅ − ⋅ = −
( )2
2cot 135º 12
2
− − = =
−
60. The point on the unit circle that corresponds to 4240º3πθ = − = − is 1 3,
2 2
−
.
( ) 3sin 240º2
− =
( ) 1cos 240º2
− = −
( )3
3 22tan 240º 31 2 12
− = = ⋅ − = − −
( ) 1 2 3 2 3csc 240º 133 33
2
− = = ⋅ ⋅ =
( ) 1 2sec 240º 1 21 12
− = = ⋅ − = − −
( )1
1 2 3 32cot 240º2 33 33
2
− − = = − ⋅ ⋅ = −
Full file at https://testbankuniv.eu/Trigonometry-A-Unit-Circle-Approach-10th-Edition-Sullivan-Solutions-Manual
Full file at https://testbankuniv.eu/Trigonometry-A-Unit-Circle-Approach-10th-Edition-Sullivan-Solutions-Manual

Chapter 2: Trigonometric Functions
142
Copyright © 2016 Pearson Education, Inc.
61. The point on the unit circle that corresponds to 5 450º2πθ = = is ( )0, 1 .
5sin 12π = 5 1csc 1
2 1π = =
5cos 02π = 5 1sec undefined
2 0π = =
5 1tan undefined2 0π = = 5 0cot 0
2 1π = =
62. The point on the unit circle that corresponds to 5 900ºθ π= = is ( )1, 0− .
sin 5 0π = 1csc5 undefined0
π = =
cos5 1π = − 1sec5 11
π = = −−
0tan 5 01
π = =−
1cot 5 undefined0
π −= =
63. The point on the unit circle that corresponds to 14 840
3πθ = − = − ° is 1 3,
2 2
− −
.
14 3 14 1sin cos3 2 3 2π π − = − − = −
314 3 22tan 3
13 2 12
π
− − = = − ⋅ − = −
14 1 2 3 2 3csc 13 33 33
2
π − = = ⋅ − ⋅ = − −
14 1 2sec 1 213 12
π − = = ⋅ − = − −
114 1 2 3 32cot
3 2 33 332
π − − = − ⋅ − ⋅ = −
64. The point on the unit circle that corresponds to 13 390
6πθ = − = − ° is 3 1,
2 2
−
.
13 1 13 3sin cos6 2 6 2π π − = − − =
113 1 2 3 32tan
6 2 33 332
− π − = = − ⋅ ⋅ = −
13 1csc = 2162
π − − −
13 1 2 3 2 3sec6 33 33
2
π − = = ⋅ =
313 3 22cot 3
16 2 12
π − = = ⋅ − = − −
65. Set the calculator to degree mode: sin 28º 0.47≈ .
66. Set the calculator to degree mode: cos14º 0.97≈ .
67. Set the calculator to degree mode: 1sec 21º 1.07
cos 21= ≈
°.
Full file at https://testbankuniv.eu/Trigonometry-A-Unit-Circle-Approach-10th-Edition-Sullivan-Solutions-Manual
Full file at https://testbankuniv.eu/Trigonometry-A-Unit-Circle-Approach-10th-Edition-Sullivan-Solutions-Manual

Section 2.2: Trigonometric Functions: Unit Circle Approach
143 Copyright © 2016 Pearson Education, Inc.
68. Set the calculator to degree mode: 1cot 70º 0.36
tan 70º= ≈ .
69. Set the calculator to radian mode: tan 0.3210π ≈ .
70. Set the calculator to radian mode: sin 0.388π ≈ .
71. Set the calculator to radian mode:
1cot 3.7312 tan
12
π = ≈π
.
72. Set the calculator to radian mode: 5 1csc 1.07513 sin
13
π = ≈π
.
73. Set the calculator to radian mode: sin 1 0.84≈ .
74. Set the calculator to radian mode: tan 1 1.56≈ .
75. Set the calculator to degree mode: sin1º 0.02≈ .
76. Set the calculator to degree mode: tan1º 0.02≈ .
77. For the point ( 3, 4)− , 3x = − , 4y = , 2 2 9 16 25 5r x y= + = + = = 4 5sin csc5 4
3 5cos sec5 34 3tan cot3 4
θ θ
θ θ
θ θ
= =
= − = −
= − = −
78. For the point (5, 12)− , 5x = , 12y = − , 2 2 25 144 169 13r x y= + = + = =
12 13sin csc13 12
5 13cos sec13 5
12 5tan cot5 12
θ θ
θ θ
θ θ
= − = −
= =
= − = −
79. For the point (2, 3)− , 2x = , 3y = − , 2 2 4 9 13r x y= + = + =
3 13 3 13 13sin csc13 313 13
2 13 2 13 13cos sec13 213 13
3 2tan cot2 3
θ θ
θ θ
θ θ
−= ⋅ = − = −
= ⋅ = =
= − = −
Full file at https://testbankuniv.eu/Trigonometry-A-Unit-Circle-Approach-10th-Edition-Sullivan-Solutions-Manual
Full file at https://testbankuniv.eu/Trigonometry-A-Unit-Circle-Approach-10th-Edition-Sullivan-Solutions-Manual

Chapter 2: Trigonometric Functions
144
Copyright © 2016 Pearson Education, Inc.
80. For the point ( 1, 2)− − , 1x = − , 2y = − , 2 2 1 4 5r x y= + = + =
2 5 2 5 5 5sin csc5 2 25 5
1 5 5 5cos sec 55 15 5
2 1 1tan 2 cot1 2 2
θ θ
θ θ
θ θ
−= ⋅ = − = = −−
−= ⋅ = − = = −−
− −= = = =− −
81. For the point ( 2, 2)− − , 2x = − , 2y = − , 2 2 4 4 8 2 2r x y= + = + = =
2 2 2 2 2sin csc 2
2 22 2 2
2 2 2 2 2cos sec 2
2 22 2 22 2
tan 1 cot 12 2
θ θ
θ θ
θ θ
−= ⋅ = − = = −
−
−= ⋅ = − = = −
−
− −= = = =
− −
82. For the point ( 1, 1)− , 1x = − , 1y = , 2 2 1 1 2r x y= + = + =
1 2 2 2sin csc 22 12 2
1 2 2 2cos sec 22 12 2
1 1tan 1 cot 11 1
θ θ
θ θ
θ θ
= ⋅ = = =
−= ⋅ = − = = −−−= = − = = −
−
83. For the point 1 1,3 4
, 13
x = , 14
y = ,
2 2 1 1 25 59 16 144 12
r x y= + = + = =
11 12 34sin 5 4 5 5
12
θ = = ⋅ =
55 4 512csc 1 12 1 3
4
θ = = ⋅ =
11 12 43cos 5 3 5 5
12
θ = = ⋅ =
55 3 512sec 1 12 1 4
3
θ = = ⋅ =
11 3 34tan 1 4 1 4
3
θ = = ⋅ =
11 4 43cot 1 3 1 3
4
θ = = ⋅ =
84. For the point (0.3, 0.4) , 0.3x = , 0.4y = , 2 2 0.09 0.16 0.25 0.5r x y= + = + = = 0.4 4 0.5 5sin csc0.5 5 0.4 40.3 3 0.5 5cos sec0.5 5 0.3 30.4 4 0.3 3tan cot0.3 3 0.4 4
θ θ
θ θ
θ θ
= = = =
= = = =
= = = =
85. sin 45º sin135º sin 225º sin 315º
2 2 2 22 2 2 2
0
+ + +
= + + − + −
=
86. 3tan 60º tan150º 33
3 3 3 2 33 3
+ = + −
−= =
87. ( )
( )
sin 40º sin130º sin 220º sin 310ºsin 40º sin130º sin 40º 180º
sin 130º 180ºsin 40º sin130º sin 40º sin130º0
+ + += + + + +
+= + − −=
88. ( )tan 40º tan140º tan 40º tan 180º 40ºtan 40º tan 40º0
+ = + −= −=
89. If ( ) sin 0.1f θ θ= = , then
( ) sin( ) 0.1f θ π θ+ = + π = − .
90. If ( ) cos 0.3f θ θ= = , then
( ) cos( ) 0.3f θ π θ+ = + π = − .
91. If ( ) tan 3f θ θ= = , then
( ) tan( ) 3f θ π θ+ = + π = .
92. If ( ) cot 2f θ θ= = − , then
( ) cot( ) 2f θ π θ+ = + π = − .
Full file at https://testbankuniv.eu/Trigonometry-A-Unit-Circle-Approach-10th-Edition-Sullivan-Solutions-Manual
Full file at https://testbankuniv.eu/Trigonometry-A-Unit-Circle-Approach-10th-Edition-Sullivan-Solutions-Manual
Section 2.2: Trigonometric Functions: Unit Circle Approach
145 Copyright © 2016 Pearson Education, Inc.
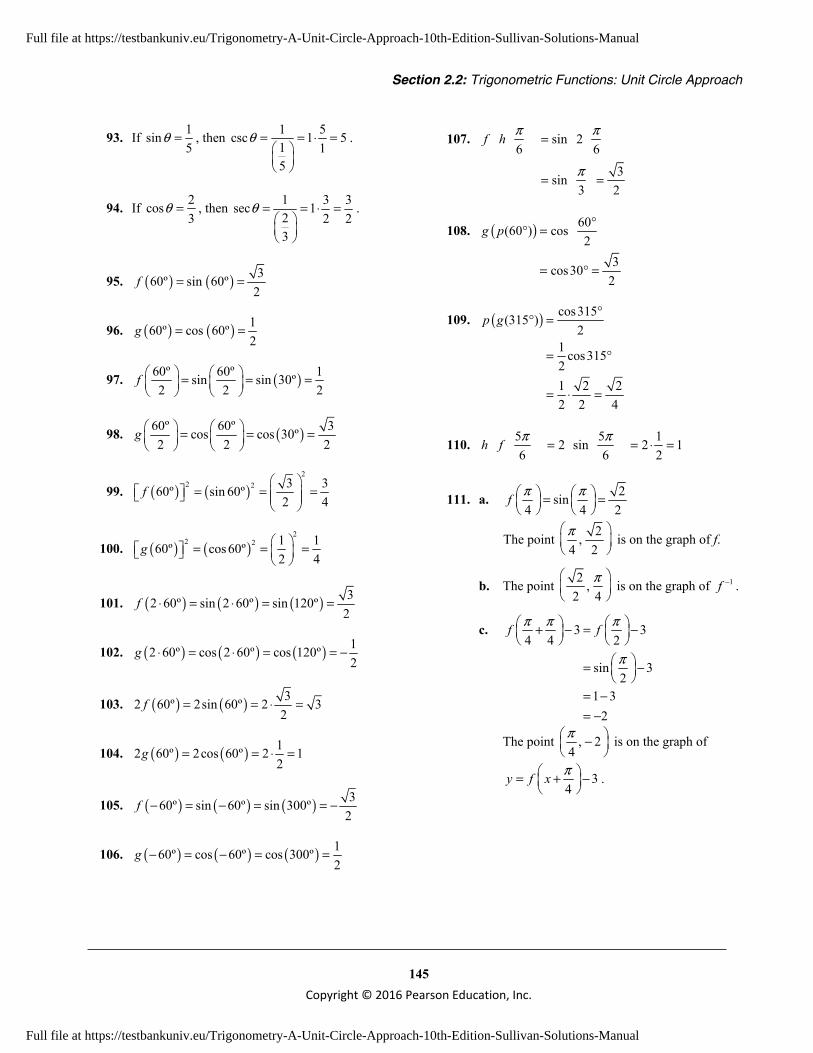
93. If 1sin5
θ = , then 1 5csc 1 51 15
θ = = ⋅ =
.
94. If 2cos3
θ = , then 1 3 3sec 12 2 23
θ = = ⋅ =
.
95. ( ) ( ) 360º sin 60º2
f = =
96. ( ) ( ) 160º cos 60º2
g = =
97. ( )60º 60º 1sin sin 30º2 2 2
f = = =
98. ( )60º 60º 3cos cos 30º2 2 2
g = = =
99. ( ) ( )2
2 2 3 360º sin 60º2 4
f
= = =
100. ( ) ( )2
2 2 1 160º cos60º2 4
g = = =
101. ( ) ( ) ( ) 32 60º sin 2 60º sin 120º2
f ⋅ = ⋅ = =
102. ( ) ( ) ( ) 12 60º cos 2 60º cos 120º2
g ⋅ = ⋅ = = −
103. ( ) ( ) 32 60º 2sin 60º 2 32
f = = ⋅ =
104. ( ) ( ) 12 60º 2cos 60º 2 12
g = = ⋅ =
105. ( ) ( ) ( ) 360º sin 60º sin 300º2
f − = − = = −
106. ( ) ( ) ( ) 160º cos 60º cos 300º2
g − = − = =
107. sin 26 6
3sin3 2
f h π π
π
=
= =
108. ( ) 60(60 ) cos2
3cos302
g p ° ° =
= ° =
109. ( ) cos315(315 )2
1 cos31521 2 22 2 4
p g °° =
= °
= ⋅ =
110. 5 5 12 sin 2 16 6 2
h f π π = = ⋅ =
111. a. 2sin4 4 2
f π π = =
The point 2,4 2π
is on the graph of f.
b. The point 2 ,2 4
π
is on the graph of 1f − .
c. 3 34 4 2
sin 32
1 32
f fπ π π
π
+ − = −
= −
= −= −
The point , 24π −
is on the graph of
34
y f x π = + −
.
Full file at https://testbankuniv.eu/Trigonometry-A-Unit-Circle-Approach-10th-Edition-Sullivan-Solutions-Manual
Full file at https://testbankuniv.eu/Trigonometry-A-Unit-Circle-Approach-10th-Edition-Sullivan-Solutions-Manual

Chapter 2: Trigonometric Functions
146
Copyright © 2016 Pearson Education, Inc.
112. a. 3cos6 6 2
g π π = =
The point 3,6 2π
is on the graph of g.
b. The point 3 ,2 6
π
is on the graph of 1g − .
c. 2 2 (0)6 6
2cos(0)2 12
g gπ π − =
== ⋅=
Thus, the point , 26π
is on the graph of
26
y g x π = −
.
113. Answers will vary. One set of possible answers
is 11 5 7 13, , , ,3 3 3 3 3π π π π π− − .
114. Answers will vary. One ser of possible answers
is 13 5 3 11 19, , , ,4 4 4 4 4π π π π π− −
115.
sinsin
0.5 0.4794 0.95890.4 0.3894 0.97350.2 0.1987 0.99330.1 0.0998 0.9983
0.01 0.0100 1.00000.001 0.0010 1.0000
0.0001 0.0001 1.00000.00001 0.00001 1.0000
θθ θθ
( ) sinf θθθ
= approaches 1 as θ approaches 0.
116.
cos 1cos 1
0.5 0.1224 0.24480.4 0.0789 0.19730.2 0.0199 0.09970.1 0.0050 0.00500.01 0.00005 0.0050
0.001 0.0000 0.00050.0001 0.0000 0.000050.00001 0.0000 0.000005
θθ θθ
−−
− −− −− −− −− −
−−
−
( ) cos 1g θθθ
−= approaches 0 as θ
approaches 0.
117. Use the formula ( ) ( )20 sin 2v
Rg
θθ = with
232.2ft/secg = ; 45ºθ = ; 0 100 ft/secv = :
( )2(100) sin(2 45º )45º 310.56 feet32.2
R ⋅= ≈
Use the formula ( ) ( )220 sin
2v
Hg
θθ = with
232.2ft/secg = ; 45ºθ = ; 0 100 ft/secv = :
( )2 2100 (sin 45º )45º 77.64 feet2(32.2)
H = ≈
118. Use the formula ( ) ( )20 sin 2v
Rg
θθ = with
29.8 m/secg = ; 30ºθ = ; 0 150 m/secv = :
( )2150 sin(2 30º )30º 1988.32 m
9.8R ⋅= ≈
Use the formula ( ) ( )220 sin
2v
Hg
θθ = with
29.8 m/secg = ; 30ºθ = ; 0 150 m/secv = :
( )2 2150 (sin 30º )30º 286.99 m2(9.8)
H = ≈
119. Use the formula ( ) ( )20 sin 2v
Rg
θθ = with
29.8 m/secg = ; 25ºθ = ; 0 500 m/secv = :
( )2
19,541.95500 sin(2 25º )25º m
9.8R ⋅= ≈
Full file at https://testbankuniv.eu/Trigonometry-A-Unit-Circle-Approach-10th-Edition-Sullivan-Solutions-Manual
Full file at https://testbankuniv.eu/Trigonometry-A-Unit-Circle-Approach-10th-Edition-Sullivan-Solutions-Manual
Section 2.2: Trigonometric Functions: Unit Circle Approach
147 Copyright © 2016 Pearson Education, Inc.
Use the formula ( ) ( )220 sin
2v
Hg
θθ = with
29.8 m/secg = ; 25ºθ = ; 0 500 m/secv = :
( )2 2500 (sin 25º )25º 2278.14 m2(9.8)
H = ≈
120. Use the formula ( ) ( )20 sin 2v
Rg
θθ = with
232.2ft/secg = ; 50ºθ = ; 0 200 ft/secv = :
( )2200 sin(2 50º )50º 1223.36 ft
32.2R ⋅= ≈
Use the formula ( ) ( )220 sin
2v
Hg
θθ = with
232.2ft/secg = ; 50ºθ = ; 0 200 ft/secv = :
( )2 2200 (sin 50º )50º 364.49 ft2(32.2)
H = ≈
121. Use the formula ( ) 2sin cos
atg
θθ θ
= with
232 ft/secg = and 10 feeta = :
a. ( ) ( )2 1030 1.20 seconds
32sin 30º cos30ºt = ≈
⋅
b. ( ) ( )2 1045 1.12 seconds
32sin 45º cos 45ºt = ≈
⋅
c. ( ) ( )2 1060 1.20 seconds
32sin 60º cos60ºt = ≈
⋅
122. Use the formula ( ) cos 16 0.5cos(2 )x θ θ θ= + + .
( ) ( )( ) ( )
30 cos 30º 16 0.5cos(2 30º )
cos 30º 16 0.5cos 60º4.90 cm
x = + + ⋅
= + +
≈
( ) ( )( ) ( )
45 cos 45º 16 0.5cos(2 45º )
cos 45º 16 0.5cos 90º4.71 cm
x = + + ⋅
= + +
≈
123. Note: distance on roadtime on roadrate on road
=
8 28
14
1tan1
411
4 tan
x
x
θ
θ
−=
= −
= −
= −
a. 2 1(30º ) 13sin 30º 4 tan 30º
2 11 1 13 42 3
4 31 1.9 hr3 4
T = + −
= + −⋅ ⋅
= + − ≈
Sally is on the paved road for 11 0.57 hr
4 tan 30º− ≈ .
b. 2 1(45º ) 13sin 45º 4 tan 45º
2 11 1 4 132
2 2 11 1.69 hr3 4
T = + −
= + −⋅⋅
= + − ≈
Sally is on the paved road for
o
11 0.75 hr4 tan 45
− = .
c. o o
2 1(60º ) 13sin 60 4 tan 60
2 113 4 33
24 11
3 3 4 31.63 hr
T = + −
= + −⋅⋅
= + −
≈
Sally is on the paved road for
o
11 0.86 hr4 tan 60
− ≈ .
Full file at https://testbankuniv.eu/Trigonometry-A-Unit-Circle-Approach-10th-Edition-Sullivan-Solutions-Manual
Full file at https://testbankuniv.eu/Trigonometry-A-Unit-Circle-Approach-10th-Edition-Sullivan-Solutions-Manual
Chapter 2: Trigonometric Functions
148
Copyright © 2016 Pearson Education, Inc.
d. 2 1(90º ) 13sin 90º 4 tan 90º
T = + − .
But tan 90º is undefined, so we cannot use the function formula for this path. However, the distance would be 2 miles in the sand and 8 miles on the road. The total
time would be: 2 51 1.673 3
+ = ≈ hours. The
path would be to leave the first house walking 1 mile in the sand straight to the road. Then turn and walk 8 miles on the road. Finally, turn and walk 1 mile in the sand to the second house.
124. When 30ºθ = :
( ) ( )( )
33 3
2
1 sec30º130º (2) 251.42 cm3 tan 30º
V π+
= ≈
When 45ºθ = :
( ) ( )( )
33 3
2
1 sec 45º145º (2) 117.88 cm3 tan 45º
V π+
= ≈
When 60ºθ = :
( ) ( )( )
33 3
2
1 sec60º160º (2) 75.40 cm3 tan 60º
V π+
= ≈
125. tan2 2
22 6tan2 2
2 tan11 63 15.4
tan11
HD
DD
D
θ =
°=
° =
= =°
Arletha is 15.4 feet from the car.
126. tan2 2
8 555tan2 2
2 tan 4 555555 3968
2 tan 4
HD
DD
D
θ =
°=
° =
= =°
The tourist is 3968 feet from the monument.
127. tan2 2
20tan2 2(200)
400 tan1071
HDH
HH
θ =
°=
= °≈
The tree is approximately 71 feet tall.
128. tan2 2
0.52tan2 2(384400)
768800 tan 0.263488
HD
H
HH
θ =
°=
= °=
The moon has a radius of 1744 km.
129. 2 2 241cos sin ;cos sin 149
θ θ θ θ+ = + =
Substitute cos ; sinx yθ θ= = and solve these simultaneous equations for y.
2 2 2
2 2
2
2
41 ; 149
141(1 )49
8 049
x y x y
y x
x x
x x
+ = + =
= −
+ − =
− − =
Using the quadratic formula:
2 8
49
32 81 949 49 7
81, 1,49
( 1) ( 1) 4(1)( )2
1 1 1 1 8 1 2 2 2 7 7
a b c
x
or
= = − = −
− − ± − − −=
± + ± ±= = = = −
Since the point is in quadrant III then 17
x = −
and 2
2 1 1 481 17 49 49
48 4 349 7
y
y
= − − = − =
= − = −
Full file at https://testbankuniv.eu/Trigonometry-A-Unit-Circle-Approach-10th-Edition-Sullivan-Solutions-Manual
Full file at https://testbankuniv.eu/Trigonometry-A-Unit-Circle-Approach-10th-Edition-Sullivan-Solutions-Manual
Section 2.2: Trigonometric Functions: Unit Circle Approach
149 Copyright © 2016 Pearson Education, Inc.
130. 2 2 21cos sin ;cos sin 19
θ θ θ θ− = − + =
Substitute cos ; sinx yθ θ= = and solve these simultaneous equations for y.
2 2 2
2 2
2
2
2
1 ; 19
11(1 )9
10 09
9 9 10 0
x y x y
x y
y y
y y
y y
− = − + =
= −
− − = −
+ − =
+ − =
Using the quadratic formula:
2
9, 9, 10
(9) (9) 4(9)( 10)18
9 81 360 9 441 9 2118 18 18
a b c
y
= = = −
− ± − −=
− ± + − ± − ±= = =
Since the point is in quadrant II then 3 21 12 218 18 3
y − += = = and
2
2 2 4 51 13 9 9
5 59 3
x
x
= − = − =
= − = −
131. a. ( ) ( ) ( )[ ]
( ) ( )[ ]
2
2
32 260 sin 2 60º cos 2 60º 1
3232 2
sin 120º cos 120º 132
32 2 1
16.56 ft
3 12 2
R = ⋅ − ⋅ −
= − −
≈ − −
≈
−
b. Let ( ) ( )2
132 2 sin 2 cos 2 1
32Y x x= − −
0
20
45° 90°
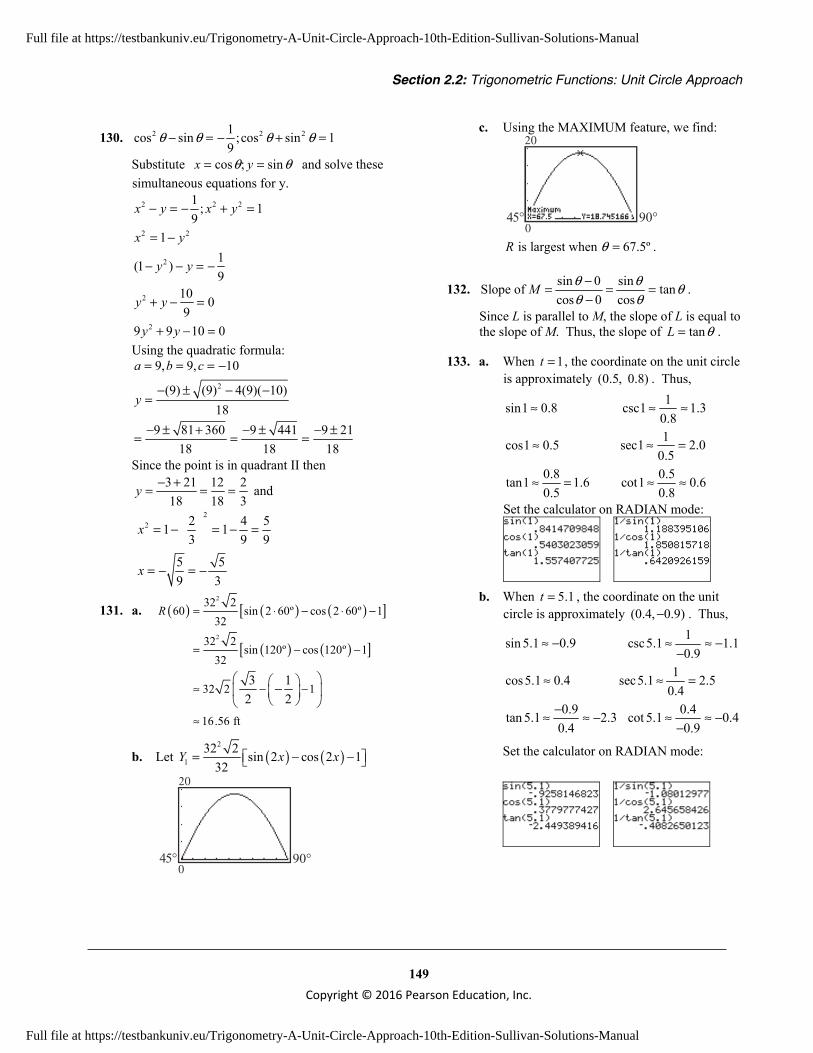
c. Using the MAXIMUM feature, we find:
0
20
90°45°
is largest when 67.5ºR θ = .
132. sin 0 sinSlope of tancos 0 cos
M θ θ θθ θ
−= = =−
.
Since L is parallel to M, the slope of L is equal to the slope of M. Thus, the slope of tanL θ= .
133. a. When 1t = , the coordinate on the unit circle is approximately (0.5, 0.8) . Thus,
sin1 0.8≈ 1csc1 1.30.8
≈ ≈
cos1 0.5≈ 1sec1 2.00.5
≈ =
0.8tan1 1.60.5
≈ = 0.5cot1 0.60.8
≈ ≈
Set the calculator on RADIAN mode:
b. When 5.1t = , the coordinate on the unit
circle is approximately (0.4, 0.9)− . Thus,
sin 5.1 0.9≈ − 1csc5.1 1.10.9
≈ ≈ −−
cos5.1 0.4≈ 1sec5.1 2.50.4
≈ =
0.9tan 5.1 2.30.4
−≈ ≈ − 0.4cot 5.1 0.40.9
≈ ≈ −−
Set the calculator on RADIAN mode:
Full file at https://testbankuniv.eu/Trigonometry-A-Unit-Circle-Approach-10th-Edition-Sullivan-Solutions-Manual
Full file at https://testbankuniv.eu/Trigonometry-A-Unit-Circle-Approach-10th-Edition-Sullivan-Solutions-Manual
Chapter 2: Trigonometric Functions
150
Copyright © 2016 Pearson Education, Inc.
134. a. When 2t = , the coordinate on the unit circle is approximately ( 0.4, 0.9)− . Thus,
sin 2 0.9≈ 1csc 2 1.10.9
≈ ≈
cos 2 0.4≈ − 1sec 2 2.50.4
≈ = −−
0.9tan 2 2.30.4
≈ = −−
0.4cot 2 0.40.9
−≈ ≈ −
Set the calculator on RADIAN mode:
b. When 4t = , the coordinate on the unit
circle is approximately ( 0.7, 0.8)− − . Thus,
sin 4 0.8≈ − 1csc 4 1.30.8
≈ ≈ −−
cos 4 0.7≈ − 1sec 4 1.40.7
≈ ≈ −−
0.8tan 4 1.10.7
−≈ ≈−
0.7cot 4 0.90.8
−≈ ≈−
Set the calculator on RADIAN mode:
135 – 137. Answers will vary.
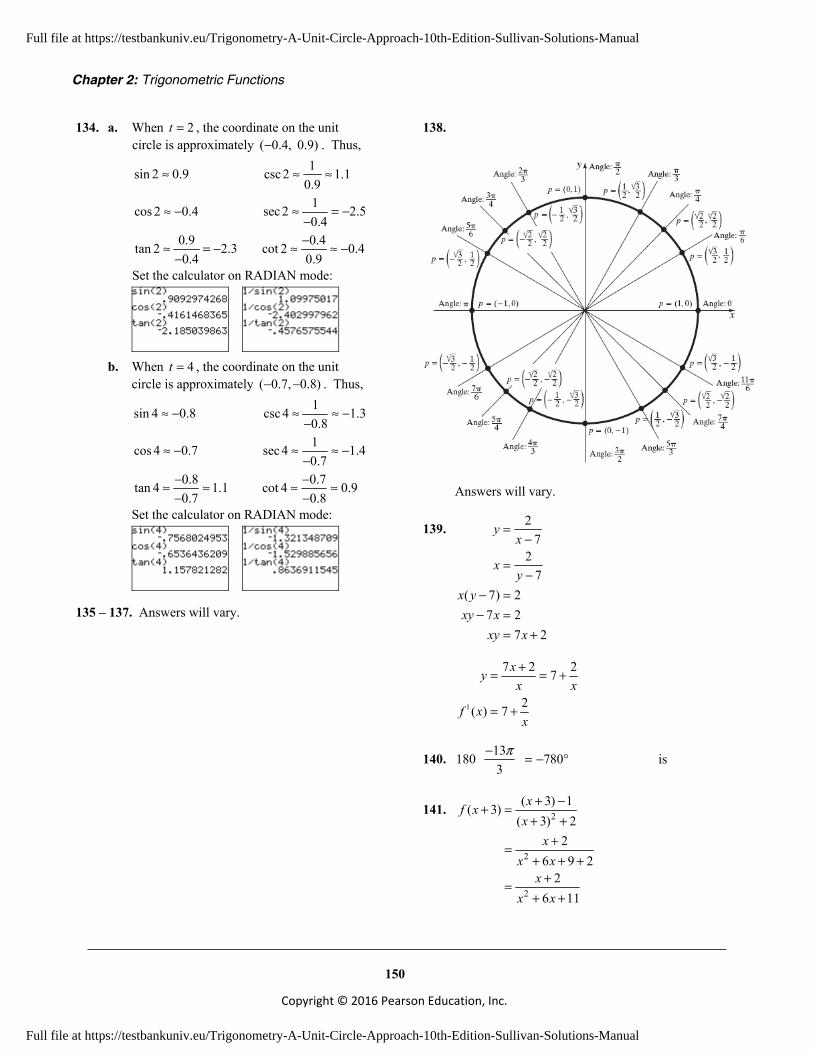
138.
Answers will vary.
139. 27
27
( 7) 27 2
7 2
yx
xy
x yxy x
xy x
=−
=−
− =− =
= +
1
7 2 27
2( ) 7
xyx x
f xx
+= = +
= +
140. 13180 7803
π− = − ° is
141. 2
2
2
( 3) 1( 3)( 3) 2
26 9 2
26 11
xf xx
xx x
xx x
+ −+ =
+ ++
=+ + +
+=+ +
Full file at https://testbankuniv.eu/Trigonometry-A-Unit-Circle-Approach-10th-Edition-Sullivan-Solutions-Manual
Full file at https://testbankuniv.eu/Trigonometry-A-Unit-Circle-Approach-10th-Edition-Sullivan-Solutions-Manual
Section 2.3: Properties of the Trigonometric Functions
151 Copyright © 2016 Pearson Education, Inc.
142. 2 2
2 2
(1 3) (0 ( 6))
( 2) (6)
4 36 40 2 10
d = − + − −
= − +
= + = =
Section 2.3
1. All real numbers except 12
− ; 1|2
x x ≠ −
2. even
3. False
4. True
5. 2π , π
6. All real number, except odd multiples of 2π
7. b.
8. a
9. 1
10. False; 1seccos
θθ
=
11. 2sin 405º sin(360º 45º ) sin 45º2
= + = =
12. 1cos 420º cos(360º 60º ) cos 60º2
= + = =
13. tan 405º tan(180º 180º 45º ) tan 45º 1= + + = =
14. 1sin 390º sin(360º 30º ) sin 30º2
= + = =
15. csc 450º csc(360º 90º ) csc90º 1= + = =
16. sec540º sec(360º 180º ) sec180º 1= + = = −
17. cot 390º cot(180º 180º 30º ) cot 30º 3= + + = =
18. sec 420º sec(360º 60º ) sec60º 2= + = =
19. 33cos cos 84 4π π = + π
cos 4 2
4
cos4
22
π = + ⋅ π π=
=
20. 9 2sin sin 2 sin4 4 4 2π π π = + π = =
21. ( ) ( )tan 21 tan(0 21 ) tan 0 0π = + π = =
22. 9csc csc 42 2π π = + π
csc 2 2
2
csc2
1
π = + ⋅ π π=
=
23. 17sec sec 44 4π π = + π
sec 2 2
4
sec4
2
π = + ⋅ π π=
=
24. 17cot cot 44 4π π = + π
cot 2 2
4
cot4
1
π = + ⋅ π π=
=
25. 19 3tan tan 3 tan6 6 6 3π π π = + π = =
26. 25sec sec 46 6π π = + π
sec 2 2
6
sec6
2 33
π = + ⋅ π π=
=
27. Since sin 0θ > for points in quadrants I and II, and cos 0θ < for points in quadrants II and III, the angle θ lies in quadrant II.
28. Since sin 0θ < for points in quadrants III and IV, and cos 0θ > for points in quadrants I and IV, the angle θ lies in quadrant IV.
Full file at https://testbankuniv.eu/Trigonometry-A-Unit-Circle-Approach-10th-Edition-Sullivan-Solutions-Manual
Full file at https://testbankuniv.eu/Trigonometry-A-Unit-Circle-Approach-10th-Edition-Sullivan-Solutions-Manual
Chapter 2: Trigonometric Functions
152
Copyright © 2016 Pearson Education, Inc.
29. Since sin 0θ < for points in quadrants III and IV, and tan 0θ < for points in quadrants II and IV, the angle θ lies in quadrant IV.
30. Since cos 0θ > for points in quadrants I and IV, and tan 0θ > for points in quadrants I and III, the angle θ lies in quadrant I.
31. Since cos 0θ > for points in quadrants I and IV, and tan 0θ < for points in quadrants II and IV, the angle θ lies in quadrant IV.
32. Since cos 0θ < for points in quadrants II and III, and tan 0θ > for points in quadrants I and III, the angle θ lies in quadrant III.
33. Since sec 0θ < for points in quadrants II and III, and sin 0θ > for points in quadrants I and II, the angle θ lies in quadrant II.
34. Since csc 0θ > for points in quadrants I and II, and cos 0θ < for points in quadrants II and III, the angle θ lies in quadrant II.
35. 3 4sin , cos5 5
θ θ= − =
3sin 3 5 35tan
4cos 5 4 45
θθθ
− = = = − ⋅ = −
1 1 5csc3sin 35
θθ
= = = − −
1 1 5sec4cos 45
θθ
= = =
1 4cottan 3
θθ
= = −
36. 4 3sin , cos5 5
θ θ= = −
4sin 4 5 45tan
3cos 5 3 35
θθθ
= = = ⋅ − = − −
1 1 5csc4sin 45
θθ
= = =
1 1 5sec3cos 35
θθ
= = = − −
1 3cottan 4
θθ
= = −
37. 2 5 5sin , cos5 5
θ θ= =
2 55sin 2 5 5tan 2
cos 5 555
θθθ
= = = ⋅ =
1 1 5 5 5csc 1sin 22 5 52 5
5
θθ
= = = ⋅ ⋅ =
1 1 5 5sec 5cos 5 55
5
θθ
= = = ⋅ =
1 1cottan 2
θθ
= =
38. 5 2 5sin , cos5 5
θ θ= − = −
55 5 5 1
5 22 52 55
sintancos
θθθ
−
= − ⋅ − =
−
= =
1 1 5 5csc 1 5sin 5 55
5
θθ
= = = ⋅ − ⋅ = − −
1 1 5 5 5seccos 22 5 52 5
5
θθ
= = = − ⋅ = − −
1 1 2cot 1 21tan 12
θθ
= = = ⋅ =
Full file at https://testbankuniv.eu/Trigonometry-A-Unit-Circle-Approach-10th-Edition-Sullivan-Solutions-Manual
Full file at https://testbankuniv.eu/Trigonometry-A-Unit-Circle-Approach-10th-Edition-Sullivan-Solutions-Manual
Section 2.3: Properties of the Trigonometric Functions
153 Copyright © 2016 Pearson Education, Inc.
39. 1 3sin , cos2 2
θ θ= =
1sin 1 2 3 32tancos 2 33 33
2
θθθ
= = = ⋅ ⋅ =
1 1 2csc 1 21sin 12
θθ
= = = ⋅ =
1 1 2 3 2 3seccos 33 33
2
θθ
= = = ⋅ =
1 1 3 3cot 3tan 3 33
3
θθ
= = = ⋅ =
40. 3 1sin , cos2 2
θ θ= =
32sin 3 2tan 31cos 2 12
θθθ
= = = ⋅ =
1 1 2 3 2 3csc 1sin 33 33
2
θθ
= = = ⋅ ⋅ =
1 1 2sec 1 21cos 12
θθ
= = = ⋅ =
1 1 1 3 3cottan 33 3 3
θθ
= = = ⋅ =
41. 1 2 2sin , cos3 3
θ θ= − =
1sin 1 3 2 23tancos 3 42 2 22 2
3
θθθ
− = = = − ⋅ ⋅ = −
1 1 3csc 1 31sin 13
θθ
= = = ⋅ − = − −
1 1 3 2 3 2seccos 42 2 22 2
3
θθ
= = = ⋅ =
1 1 4 2cot 2 2tan 2 22
4
θθ
= = = − ⋅ = −
−
42. 2 2 1sin , cos3 3
θ θ= = −
2 23sin 2 2 3tan 2 21cos 3 13
θθθ
= = = ⋅ − = − −
1 1 3 2 3 2csc 1sin 42 2 22 2
3
θθ
= = = ⋅ ⋅ =
1 1 3sec 1 31cos 13
θθ
= = = ⋅ − = − −
1 1 1 2 2cottan 42 2 2 2 2
θθ
= = = − ⋅ = −−
43. 12sin , in quadrant II13
θ θ=
Solve for cosθ : 2 2
2 2
2
sin cos 1cos 1 sin
cos 1 sin
θ θθ θ
θ θ
+ == −
= ± −
Since is in quadrant II, cos 0θ θ < . 2
2
cos 1 sin
12 144 25 51 113 169 169 13
θ θ= − −
= − − = − − = − = −
12sin 12 13 1213tan
5cos 13 5 513
θθθ
= = = ⋅ − = − −
1 1 13csc12sin 1213
θθ
= = =
Full file at https://testbankuniv.eu/Trigonometry-A-Unit-Circle-Approach-10th-Edition-Sullivan-Solutions-Manual
Full file at https://testbankuniv.eu/Trigonometry-A-Unit-Circle-Approach-10th-Edition-Sullivan-Solutions-Manual
Chapter 2: Trigonometric Functions
154
Copyright © 2016 Pearson Education, Inc.
1 1 13sec5cos 5
13
θθ
= = = − −
1 1 5cot12tan 125
θθ
= = = − −
44. 3cos , in quadrant IV5
θ θ=
Solve for sinθ : 2 2
2 2
2
sin cos 1sin 1 cos
sin 1 cos
θ θθ θ
θ θ
+ == −
= ± −
Since is in quadrant IV, sin 0θ θ < . 2
2 3 16 4sin 1 cos 15 25 5
θ θ = − − = − − = − = −
4
sin 4 5 45tan3cos 5 3 35
θθθ
− = = = − ⋅ = −
1 1 5csc4sin 45
θθ
= = = − −
1 1 5sec3cos 35
θθ
= = =
1 1 3cot4tan 43
θθ
= = = − −
45. 4cos , in quadrant III5
θ θ= −
Solve for sinθ : 2 2
2 2
2
sin cos 1sin 1 cos
sin 1 cos
θ θθ θ
θ θ
+ == −
= ± −
Since is in quadrant III, sin 0θ θ < . 2
2
sin 1 cos
4 16 9 31 15 25 25 5
θ θ= − −
= − − − = − − = − = −
3sin 3 5 35tan
4cos 5 4 45
θθθ
− = = = − ⋅ − = −
1 1 5csc3sin 35
θθ
= = = − −
1 1 5sec4cos 45
θθ
= = = − −
1 1 4cot3tan 34
θθ
= = =
46. 5sin , in quadrant III13
θ θ= −
Solve for cosθ : 2 2
2 2
2
sin cos 1cos 1 sin
cos 1 sin
θ θθ θ
θ θ
+ == −
= ± −
Since is in quadrant III, cos 0θ θ < . 2
2 5cos 1 sin 113
144 12169 13
θ θ = − − = − − −
= − = −
5sin 5 13 513tan
12cos 13 12 1213
θθθ
− = = = − ⋅ − = −
1 1 13csc5sin 5
13
θθ
= = = − −
1 1 13sec12cos 1213
θθ
= = = − −
1 1 12cot5tan 5
12
θθ
= = =
47. 5sin , 90º 180º , in quadrant II13
θ θ θ= < <
Solve for cosθ : 2 2
2 2
2
sin cos 1cos 1 sin
cos 1 sin
θ θθ θ
θ θ
+ == −
= ± −
Since is in quadrant II, cos 0θ θ < . 2
2 5cos 1 sin 113
25 144 121169 169 13
θ θ = − − = − −
= − − = − = −
Full file at https://testbankuniv.eu/Trigonometry-A-Unit-Circle-Approach-10th-Edition-Sullivan-Solutions-Manual
Full file at https://testbankuniv.eu/Trigonometry-A-Unit-Circle-Approach-10th-Edition-Sullivan-Solutions-Manual

Section 2.3: Properties of the Trigonometric Functions
155 Copyright © 2016 Pearson Education, Inc.
5sin 5 13 513tan
12cos 13 12 1213
θθθ
= = = ⋅ − = − −
1 1 13csc5sin 5
13
θθ
= = =
1 1 13sec12cos 1213
θθ
= = = − −
1 1 12cot5tan 5
12
θθ
= = = − −
48. 4cos , 270º 360º ; in quadrant IV5
θ θ θ= < <
Solve for sinθ : 2 2
2
sin cos 1
sin 1 cos
θ θ
θ θ
+ =
= ± −
Since is in quadrant IV, sin 0θ θ < . 2
2 4 9 31
5 25 5sin 1 cosθ θ = − − = − = − = − −
3sin 3 5 35tan
4cos 5 4 45
θθθ
− = = = − ⋅ = −
1 1 5csc3sin 35
θθ
= = = − −
1 1 5sec4cos 45
θθ
= = =
1 1 4cot3tan 34
θθ
= = = − −
49. 1cos , , in quadrant II3 2
πθ θ θ= − < < π
Solve for sinθ : 2 2
2 2
2
sin cos 1sin 1 cos
sin 1 cos
θ θθ θ
θ θ
+ == −
= ± −
Since is in quadrant II, sin 0θ θ > .
2
2
sin 1 cos
1 1 8 2 21 13 9 9 3
θ θ= −
= − − = − = =
2 23sin 2 2 3tan 2 21cos 3 13
1 1 3 2 3 2cscsin 42 2 22 2
3
θθθ
θθ
= = = ⋅ − = − −
= = = ⋅ =
1 1sec 31cos3
1 1 2 2cottan 42 2 2
θθ
θθ
= = = − −
= = ⋅ = −−
50. 2 3sin , , in quadrant III3 2
πθ θ θ= − π < <
Solve for cosθ : 2 2
2
sin cos 1
cos 1 sin
θ θ
θ θ
+ =
= ± −
Since is in quadrant III, cos 0θ θ < . 2
2 2cos 1 sin 13
5 59 3
θ θ = − − = − − −
= − = −
2sin 3tancos 5
3
2 3 5 2 53 55 5
θθθ
− = =
−
= − ⋅ − ⋅ =
1cscsin
θθ
= 1 32 23
= = − −
1seccos
θθ
= 1 3 5 3 555 55
3
= = − ⋅ = −
−
1cottan
θθ
= = 1 5 5 522 5 52 5
5
= ⋅ =
Full file at https://testbankuniv.eu/Trigonometry-A-Unit-Circle-Approach-10th-Edition-Sullivan-Solutions-Manual
Full file at https://testbankuniv.eu/Trigonometry-A-Unit-Circle-Approach-10th-Edition-Sullivan-Solutions-Manual
Chapter 2: Trigonometric Functions
156
Copyright © 2016 Pearson Education, Inc.
51. 2sin , tan 0, so is in quadrant II3
θ θ θ= <
Solve for cosθ : 2 2
2 2
2
sin cos 1cos 1 sin
cos 1 sin
θ θθ θ
θ θ
+ == −
= ± −
Since is in quadrant II, cos 0θ θ < . 2
2
cos 1 sin
2 4 5 51 13 9 9 3
θ θ= − −
= − − = − − = − = −
2sin 2 3 2 53tancos 3 555
31 1 3csc
2sin 23
θθθ
θθ
= = = ⋅ − = − −
= = =
1 1 3 3 5seccos 555
31 1 5 5cot
tan 22 52 55
θθ
θθ
= = = − = −
−
= = = − = − −
52. 1cos , tan 04
θ θ= − >
Since sintan 0cos
θθθ
= > and cos 0θ < , sin 0θ < .
Solve for sinθ : 2 2
2
sin cos 1
sin 1 cos
θ θ
θ θ
+ =
= ± −
2
2
sin 1 cos
1 11 14 16
15 1516 4
θ θ= − −
= − − − = − −
= − = −
sintancos
θθθ
= =
154 15 41 4 14
− = − ⋅ − −
15=
1 1 4 15 4 15cscsin 1515 1515
4
θθ
= = = − ⋅ = −
−
1seccos
θθ
= = 114
−
4 41
= − = −
1 1 15 15cottan 1515 15
θθ
= = ⋅ =
53. sec 2, sin 0, so is in quadrant IVθ θ θ= <
Solve for cosθ : 1 1cossec 2
θθ
= =
Solve for sinθ : 2 2
2 2
2
sin cos 1sin 1 cos
sin 1 cos
θ θθ θ
θ θ
+ == −
= ± −
Since is in quadrant IV, sin 0θ θ < . 2
2
sin 1 cos
1 1 3 31 12 4 4 2
θ θ= − −
= − − = − − = − = −
3sin 3 22tan 3
1cos 2 12
1 1 2 2 3cscsin 333
2
θθθ
θθ
− = = = − ⋅ = −
= = = − = −
−
1 1 3cottan 33
θθ
= = = −−
54. csc 3, cot 0, so is in quadrant IIθ θ θ= <
Solve for sinθ : 1 1sincsc 3
θθ
= =
Solve for cosθ : 2 2
2
sin cos 1
cos 1 sin
θ θ
θ θ
+ =
= ± −
Since is in quadrant II, cos 0θ θ < . 2
2
cos 1 sin
1 1 8 2 21 13 9 9 3
θ θ= − −
= − − = − − = − = −
1sin 3tancos 2 2
31 3 2 23 42 2 2
θθθ
= =
−
= ⋅ − ⋅ = −
Full file at https://testbankuniv.eu/Trigonometry-A-Unit-Circle-Approach-10th-Edition-Sullivan-Solutions-Manual
Full file at https://testbankuniv.eu/Trigonometry-A-Unit-Circle-Approach-10th-Edition-Sullivan-Solutions-Manual
Section 2.3: Properties of the Trigonometric Functions
157 Copyright © 2016 Pearson Education, Inc.
1 1 3 32 2seccos 42 2 22 2
3
θθ
⋅= = = − = −
−
1 1 4 2cot 2 2tan 2 22
4
θθ
= = = − ⋅ = −
−
55. 3tan , sin 0, so is in quadrant III4
θ θ θ= <
Solve for secθ : 2 2
2
sec 1 tan
sec 1 tan
θ θ
θ θ
= +
= ± +
Since is in quadrant III, sec 0θ θ < . 2
2
sec 1 tan
3 9 25 51 14 16 16 4
θ θ= − +
= − + = − + = − = −
1 4cossec 5
θθ
= = −
2
2
sin 1 cos
4 16 9 31 15 25 25 5
θ θ= − −
= − − − = − − = − = −
1 1 5csc3sin 35
θθ
= = = − −
1 1 4cot3tan 34
θθ
= = =
56. 4cot , cos 0, so is in quadrant III3
θ θ θ= <
1 1 3tan4cot 43
θθ
= = =
Solve for secθ : 2 2
2
sec 1 tan
sec 1 tan
θ θ
θ θ
= +
= ± +
Since is in quadrant III, sec 0θ θ < . 2
2
sec 1 tan
3 9 25 51 14 16 16 4
θ θ= − +
= − + = − + = − = −
1 4cossec 5
θθ
= = −
2
2
sin 1 cos
4 16 9 31 15 25 25 5
θ θ= − −
= − − − = − − = − = −
1 1 5csc3sin 35
θθ
= = = − −
57. 1tan , sin 0, so is in quadrant II3
θ θ θ= − >
Solve for secθ : 2 2
2
sec 1 tan
sec 1 tan
θ θ
θ θ
= +
= ± +
Since is in quadrant II, sec 0θ θ < . 2
2
sec 1 tan
1 1 10 101 13 9 9 3
θ θ= − +
= − + − = − + = − = −
1 1 3 3 10cossec 101010
3
θθ
= = = − = −
−
2
2
sin 1 cos
3 10 901 110 100
10 10100 10
θ θ= −
= − − = −
= =
1 1csc 10sin 10
10
θθ
= = =
1 1cot 31tan3
θθ
= = = − −
58. sec 2, tan 0, so is in quadrant IIIθ θ θ= − > Solve for tanθ : 2 2
2
sec 1 tan
tan sec 1
θ θ
θ θ
= +
= ± −
2 2tan sec 1 ( 2) 1 4 1 3θ θ= − = − − = − = 1 1cos
sec 2θ
θ= = −
1 1 3 3cottan 33 3
θθ
= = ⋅ =
Full file at https://testbankuniv.eu/Trigonometry-A-Unit-Circle-Approach-10th-Edition-Sullivan-Solutions-Manual
Full file at https://testbankuniv.eu/Trigonometry-A-Unit-Circle-Approach-10th-Edition-Sullivan-Solutions-Manual
Chapter 2: Trigonometric Functions
158
Copyright © 2016 Pearson Education, Inc.
2
2
sin 1 cos
1 1 3 31 12 4 4 2
θ θ= − −
= − − − = − − = − = −
1 1 2 3 2 3cscsin 33 33
2
θθ
= = = − ⋅ = −
−
59. 3sin( 60º ) sin 60º2
− = − = −
60. 3cos( 30º ) cos30º2
− = =
61. 3tan( 30º ) tan 30º3
− = − = −
62. 2sin( 135º ) sin135º2
− = − = −
63. sec( 60º ) sec60º 2− = =
64. csc( 30º ) csc30º 2− = − = −
65. sin( 90º ) sin 90º 1− = − = −
66. cos( 270º ) cos 270º 0− = =
67. tan tan 14 4π π − = − = −
68. sin( ) sin 0−π = − π =
69. 2cos cos4 4 2π π − = =
70. 3sin sin3 3 2π π − = − = −
71. tan( ) tan 0−π = − π =
72. 3 3sin sin ( 1) 12 2π π − = − = − − =
73. csc csc 24 4π π − = − = −
74. ( )sec sec 1−π = π = −
75. 2 3sec sec6 6 3π π − = =
76. 2 3csc csc3 3 3π π − = − = −
77. ( ) ( )2 2sin 40º cos 40º 1+ =
78. ( ) ( )2 2sec 18º tan 18º 1− =
79. ( ) ( ) ( ) ( )1sin 80º csc 80º sin 80º 1
sin 80º= ⋅ =
80. ( ) ( ) ( ) ( )1tan 10º cot 10º tan 10º 1
tan 10º= ⋅ =
81. ( ) ( )( ) ( ) ( )sin 40º
tan 40º tan 40º tan 40º 0cos 40º
− = − =
82. ( ) ( )( ) ( ) ( )cos 20º
cot 20º cot 20º cot 20º 0sin 20º
− = − =
83. ( ) ( ) ( ) ( )( ) ( )
( ) ( )
cos 400º sec 40º cos 40º 360º sec 40ºcos 40º sec 40º
1cos 40º 1cos 40º
⋅ = + ⋅
= ⋅
= ⋅ =
84. ( ) ( ) ( ) ( )( ) ( )
( ) ( )
tan 200º cot 20º tan 20º 180º cot 20ºtan 20º cot 20º
1tan 20º 1tan 20º
⋅ = + ⋅
= ⋅
= ⋅ =
85. 25 25sin csc sin csc12 12 12 12π π π π − = −
24sin csc12 12 12
sin csc 212 12
sin csc12 12
1sin 112 sin
12
π π π
π π π
π π
ππ
= − + = − + = − = − ⋅ = −
Full file at https://testbankuniv.eu/Trigonometry-A-Unit-Circle-Approach-10th-Edition-Sullivan-Solutions-Manual
Full file at https://testbankuniv.eu/Trigonometry-A-Unit-Circle-Approach-10th-Edition-Sullivan-Solutions-Manual
Section 2.3: Properties of the Trigonometric Functions
159 Copyright © 2016 Pearson Education, Inc.
86. 37 37sec cos sec cos18 18 18 18π π π π − =
36sec cos18 18 18
sec cos 218 18
sec cos18 18
1sec 118 sec
18
π π π
π π π
π π
ππ
= + = + = = ⋅ =
87. ( )( ) ( )
( )( ) ( )
( )( ) ( )
( ) ( )
sin 20ºtan 200º
cos 380ºsin 20º
tan 20º 180ºcos 20º 360º
sin 20ºtan 20º
cos 20ºtan 20º tan 20º 0
−+
−= + +
+
−= +
= − + =
88. ( )( ) ( )
( )( ) ( )
sin 70ºtan 70º
cos 430ºsin 70º
tan 70ºcos 430º
+ −−
= −
( )( ) ( )
( )( ) ( )
( ) ( )
sin 70ºtan 70º
cos 70º 360ºsin 70º
tan 70ºcos 70ºtan 70º tan 70º 0
= −+
= −
= − =
89. If sin 0.3θ = , then ( ) ( )sin sin 2 sin 4
0.3 0.3 0.3 0.9θ θ θ+ + π + + π
= + + =
90. If cos 0.2θ = , then ( ) ( )cos cos 2 cos 4
0.2 0.2 0.2 0.6θ θ θ+ + π + + π
= − + + =
91. If tan 3θ = , then ( ) ( )tan tan tan 2
3 3 3 9θ θ θ+ + π + + π
= + + =
92. If cot 2θ = − , then ( ) ( )
( ) ( )cot cot cot 2
2 2 2 6θ θ θ+ − π + − π
= − + − + − = −
93. sin1º sin 2º sin 3º ... sin 357º sin 358º sin 359º
sin1º sin 2º sin 3º sin(360º 3º ) sin(360º 2º ) sin(360º 1º )
sin1º sin 2º sin 3º sin( 3
+ + + ++ +
= + + + ⋅⋅⋅ + −+ − + −
= + + + ⋅⋅⋅ + −
( )
º ) sin( 2º ) sin( 1º )
sin1º sin 2º sin 3º sin 3º sin 2º sin1ºsin 180º 0
+ − + −= + + + ⋅⋅⋅ − − −= =
94. cos1º cos 2º cos3º cos357º cos358º cos359º
+ + + ⋅⋅⋅ ++ +
cos1º cos 2º cos3º ... cos(360º 3º ) cos(360º 2º ) cos(360º 1º )
cos1º cos 2º cos3º ... cos( 3º ) cos( 2º ) cos( 1º )
cos1º cos 2º cos3º ... cos3º
= + + + + −+ − + −
= + + + + −+ − + −
= + + + + cos 2º cos1º
2cos1º 2cos 2º 2cos3º ... 2cos178º 2cos179º cos180º
2cos1º 2cos 2º 2cos3º ... 2cos(180º 2º )
+ += + + + +
+ += + + + + −
( ) 2cos(180º 1º ) cos 180º2cos1º 2cos 2º 2cos3º ... 2cos 2º
2cos1º cos180ºcos180º 1
+ − += + + + −
− += = −
95. The domain of the sine function is the set of all real numbers.
96. The domain of the cosine function is the set of all real numbers.
97. ( ) tanf θ θ= is not defined for numbers that are
odd multiples of 2π .
98. ( ) cotf θ θ= is not defined for numbers that are multiples of π .
99. ( ) secf θ θ= is not defined for numbers that are
odd multiples of 2π .
Full file at https://testbankuniv.eu/Trigonometry-A-Unit-Circle-Approach-10th-Edition-Sullivan-Solutions-Manual
Full file at https://testbankuniv.eu/Trigonometry-A-Unit-Circle-Approach-10th-Edition-Sullivan-Solutions-Manual

Chapter 2: Trigonometric Functions
160
Copyright © 2016 Pearson Education, Inc.
100. ( ) cscf θ θ= is not defined for numbers that are multiples of π .
101. The range of the sine function is the set of all real numbers between 1− and 1, inclusive.
102. The range of the cosine function is the set of all real numbers between 1− and 1, inclusive.
103. The range of the tangent function is the set of all real numbers.
104. The range of the cotangent function is the set of all real numbers.
105. The range of the secant function is the set of all real numbers greater than or equal to 1 and all real numbers less than or equal to 1− .
106. The range of the cosecant function is the set of all real number greater than or equal to 1 and all real numbers less than or equal to 1− .
107. The sine function is odd because sin( ) sinθ θ− = − . Its graph is symmetric with respect to the origin.
108. The cosine function is even because cos( ) cosθ θ− = . Its graph is symmetric with respect to the y-axis.
109. The tangent function is odd because tan( ) tanθ θ− = − . Its graph is symmetric with respect to the origin.
110. The cotangent function is odd because cot( ) cotθ θ− = − . Its graph is symmetric with respect to the origin.
111. The secant function is even because sec( ) secθ θ− = . Its graph is symmetric with respect to the y-axis.
112. The cosecant function is odd because csc( ) cscθ θ− = − . Its graph is symmetric with respect to the origin.
113. a. 1( ) ( )3
f a f a− = − = −
b. ( ) ( 2 ) ( 4 )( ) ( ) ( )
1 1 1 13 3 3
f a f a f af a f a f a
+ + π + + π= + +
= + + =
114. a. 1( ) ( )4
f a f a− = =
b. ( ) ( 2 ) ( 2 )( ) ( ) ( )
1 1 14 4 434
f a f a f af a f a f a
+ + π + − π= + +
= + +
=
115. a. ( ) ( ) 2f a f a− = − = −
b. ( ) ( ) ( 2 )( ) ( ) ( )
2 2 2 6
f a f a f af a f a f a
+ + π + + π= + += + + =
116. a. ( ) ( ) ( 3) 3f a f a− = − = − − =
b. ( ) ( ) ( 4 )( ) ( ) ( )3 ( 3) ( 3)9
f a f a f af a f a f a
+ + π + + π= + += − + − + −= −
117. a. ( ) ( ) 4f a f a− = = −
b. ( ) ( 2 ) ( 4 )( ) ( ) ( )4 ( 4) ( 4)12
f a f a f af a f a f a
+ + π + + π= + += − + − + −= −
118. a. ( ) ( ) 2f a f a− = − = −
b. ( ) ( 2 ) ( 4 )( ) ( ) ( )
2 2 26
f a f a f af a f a f a
+ + π + + π= + += + +=
119. Since 500 1tan1500 3
yx
θ = = = , then
2 2 2 9 1 10
10
r x y
r
= + = + =
=
1 1sin1 9 10
θ = =+
.
5 551 133 10
5 5 5 10
5 10 15.8 minutes
T = − + ⋅
= − +
= ≈
Full file at https://testbankuniv.eu/Trigonometry-A-Unit-Circle-Approach-10th-Edition-Sullivan-Solutions-Manual
Full file at https://testbankuniv.eu/Trigonometry-A-Unit-Circle-Approach-10th-Edition-Sullivan-Solutions-Manual
Section 2.3: Properties of the Trigonometric Functions
161 Copyright © 2016 Pearson Education, Inc.
120. a. 1tan4
yx
θ = = for 02
θ π< < .
2 2 2 16 1 17
17
r x y
r
= + = + =
=
Thus, 1sin17
θ = .
2 1( ) 111 43417
2 17 2 171 1 2.75 hours3 3
T θ = + − ⋅⋅
= + − = ≈
b. Since 1tan4
θ = , 4x = . Sally heads
directly across the sand to the bridge, crosses the bridge, and heads directly across the sand to the other house.
c. θ must be larger than 14º , or the road will not be reached and she cannot get across the river.
121. Let ( , )P x y= be the point on the unit circle that corresponds to an angle t. Consider the equation
tan yt ax
= = . Then y ax= . Now 2 2 1x y+ = ,
so 2 2 2 1x a x+ = . Thus, 2
11
xa
= ±+
and
21ay
a= ±
+. That is, for any real number a ,
there is a point ( , )P x y= on the unit circle for which tan t a= . In other words,
tan t−∞ < < ∞ , and the range of the tangent function is the set of all real numbers.
122. Let ( , )P x y= be the point on the unit circle that corresponds to an angle t. Consider the equation
cot xt ay
= = . Then x ay= . Now 2 2 1x y+ = ,
so 2 2 2 1a y y+ = . Thus, 2
11
ya
= ±+
and
21ax
a= ±
+. That is, for any real number a ,
there is a point ( , )P x y= on the unit circle for which cot t a= . In other words, cot t−∞ < < ∞ , and the range of the tangent function is the set of all real numbers.
123. Suppose there is a number p, 0 2p< < π for which sin( ) sinpθ θ+ = for all θ . If 0θ = , then ( )sin 0 sin sin 0 0p p+ = = = ; so that
p = π . If 2πθ = then sin sin
2 2pπ π + =
.
But p = π . Thus, 3sin 1 sin 12 2π π = − = =
,
or 1 1− = . This is impossible. The smallest positive number p for which sin( ) sinpθ θ+ = for all θ must then be 2p = π .
124. Suppose there is a number p, 0 2p< < π , for
which cos( ) cospθ θ+ = for all θ . If 2
θ π= ,
then cos cos 02 2
pπ π + = =
; so that p = π .
If 0θ = , then ( ) ( )cos 0 cos 0p+ = . But
p = π . Thus ( ) ( )cos 1 cos 0 1π = − = = , or 1 1− = . This is impossible. The smallest
positive number p for which cos( ) cospθ θ+ = for all θ must then be 2p = π .
125. 1seccos
θθ
= : Since cosθ has period 2π , so
does sec .θ
126. 1cscsin
θθ
= : Since sinθ has period 2π , so
does csc .θ
127. If ( , )P a b= is the point on the unit circle corresponding to θ , then ( , )Q a b= − − is the point on the unit circle corresponding to θ + π .
Thus, tan( ) tanb ba a
θ θ−+ π = = =−
. If there
exists a number , 0 ,p p π< < for which tan( ) tanpθ θ+ = for all θ , then if 0θ = ,
( ) ( )tan tan 0 0.p = = But this means that p is a multiple of π . Since no multiple of π exists in the interval ( )0, π , this is impossible. Therefore,
the fundamental period of ( ) tanf θ θ= is π .
Full file at https://testbankuniv.eu/Trigonometry-A-Unit-Circle-Approach-10th-Edition-Sullivan-Solutions-Manual
Full file at https://testbankuniv.eu/Trigonometry-A-Unit-Circle-Approach-10th-Edition-Sullivan-Solutions-Manual
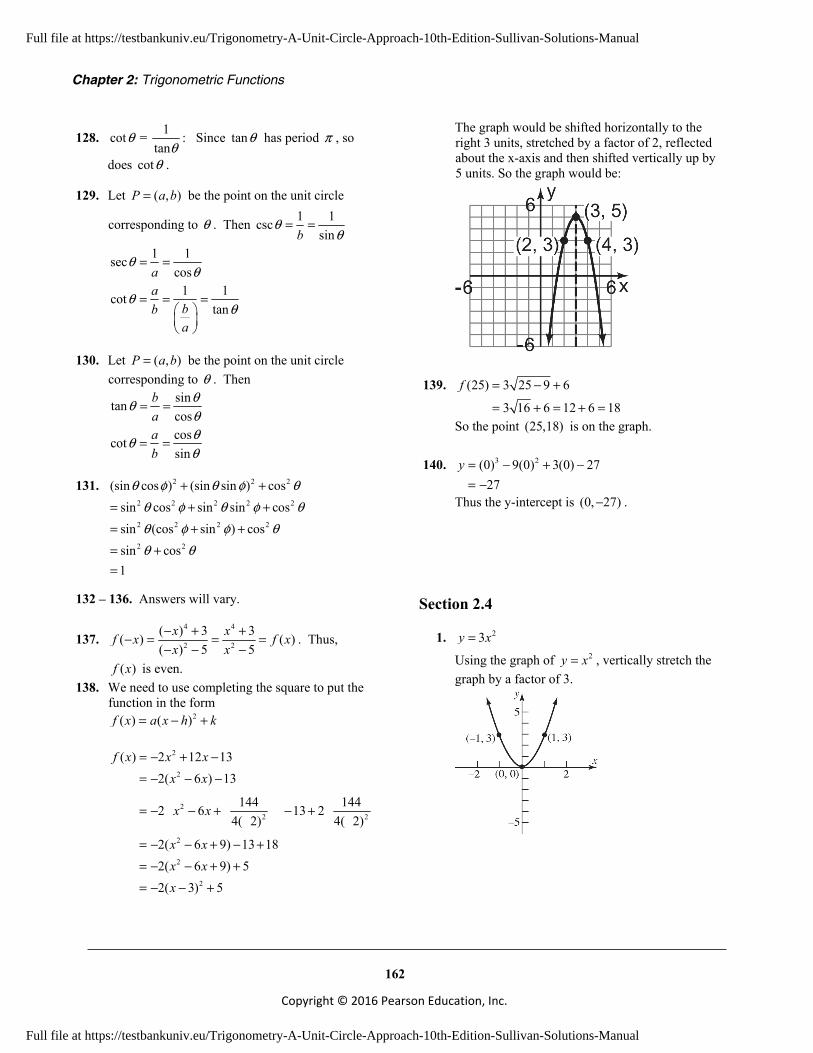
Chapter 2: Trigonometric Functions
162
Copyright © 2016 Pearson Education, Inc.
128. 1cot = tan
θθ
: Since tanθ has period π , so
does cotθ .
129. Let ( , )P a b= be the point on the unit circle
corresponding to θ . Then 1 1cscsinb
θθ
= =
1 1seccosa
θθ
= =
1 1cottan
abba
θθ
= = =
130. Let ( , )P a b= be the point on the unit circle corresponding to θ . Then
sintancos
ba
θθθ
= =
coscotsin
ab
θθθ
= =
131. 2 2 2
2 2 2 2 2
2 2 2 2
2 2
(sin cos ) (sin sin ) cossin cos sin sin cossin (cos sin ) cossin cos1
θ φ θ φ θθ φ θ φ θθ φ φ θθ θ
+ += + += + += +=
132 – 136. Answers will vary.
137. 4 4
2 2
( ) 3 3( ) ( )( ) 5 5
x xf x f xx x
− + +− = = =
− − −. Thus,
( )f x is even. 138. We need to use completing the square to put the
function in the form 2( ) ( )f x a x h k= − +
2
2
22 2
2
2
2
( ) 2 12 132( 6 ) 13
144 1442 6 13 24( 2) 4( 2)
2( 6 9) 13 182( 6 9) 52( 3) 5
f x x xx x
x x
x xx xx
= − + −= − − −
= − − + − +
= − − + − += − − + += − − +
The graph would be shifted horizontally to the right 3 units, stretched by a factor of 2, reflected about the x-axis and then shifted vertically up by 5 units. So the graph would be:
139. (25) 3 25 9 6
3 16 6 12 6 18
f = − +
= + = + =
So the point (25,18) is on the graph.
140. 3 2(0) 9(0) 3(0) 2727
y = − + −= −
Thus the y-intercept is (0, 27)− .
Section 2.4
1. 23y x=
Using the graph of 2y x= , vertically stretch the graph by a factor of 3.
Full file at https://testbankuniv.eu/Trigonometry-A-Unit-Circle-Approach-10th-Edition-Sullivan-Solutions-Manual
Full file at https://testbankuniv.eu/Trigonometry-A-Unit-Circle-Approach-10th-Edition-Sullivan-Solutions-Manual
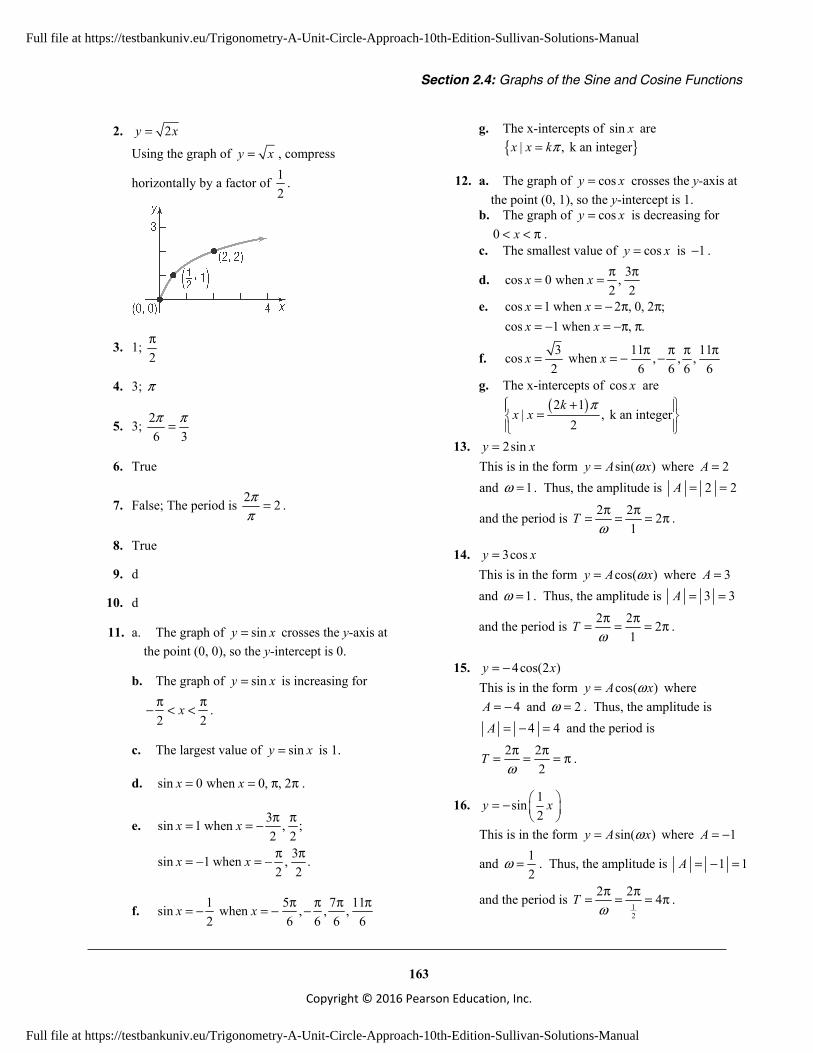
Section 2.4: Graphs of the Sine and Cosine Functions
163
Copyright © 2016 Pearson Education, Inc.
2. 2y x=
Using the graph of y x= , compress
horizontally by a factor of 12
.
3. 1; 2π
4. 3; π
5. 3; 26 3π π=
6. True
7. False; The period is 2 2ππ
= .
8. True
9. d
10. d
11. a. The graph of siny x= crosses the y-axis at the point (0, 0), so the y-intercept is 0.
b. The graph of siny x= is increasing for
2 2xπ π− < < .
c. The largest value of siny x= is 1.
d. sin 0 when 0, , 2x x= = π π .
e. 3sin 1 when , ;2 2
3sin 1 when , .2 2
x x
x x
π π= = −
π π= − = −
f. 1 5 7 11sin when , , ,2 6 6 6 6
x x π π π π= − = − −
g. The x-intercepts of sin x are { }| , k an integerx x kπ=
12. a. The graph of cosy x= crosses the y-axis at the point (0, 1), so the y-intercept is 1.
b. The graph of cosy x= is decreasing for 0 x< < π .
c. The smallest value of cosy x= is 1− .
d. 3cos 0 when ,2 2
x x π π= =
e. cos 1 when 2 , 0, 2 ;cos 1 when , .
x xx x
= = − π π= − = −π π
f. 3 11 11cos when , , ,2 6 6 6 6
x x π π π π= = − −
g. The x-intercepts of cos x are ( )2 1
| , k an integer2
kx x
π+ =
13. 2siny x= This is in the form sin( )y A xω= where 2A = and 1ω = . Thus, the amplitude is 2 2A = =
and the period is 2 2 21
Tωπ π= = = π .
14. 3cosy x= This is in the form cos( )y A xω= where 3A = and 1ω = . Thus, the amplitude is 3 3A = =
and the period is 2 2 21
Tωπ π= = = π .
15. 4cos(2 )y x= − This is in the form cos( )y A xω= where
4A = − and 2ω = . Thus, the amplitude is 4 4A = − = and the period is
2 22
Tωπ π= = = π .
16. 1sin2
y x = −
This is in the form sin( )y A xω= where 1A = −
and 12
ω = . Thus, the amplitude is 1 1A = − =
and the period is 12
2 2 4Tωπ π= = = π .
Full file at https://testbankuniv.eu/Trigonometry-A-Unit-Circle-Approach-10th-Edition-Sullivan-Solutions-Manual
Full file at https://testbankuniv.eu/Trigonometry-A-Unit-Circle-Approach-10th-Edition-Sullivan-Solutions-Manual
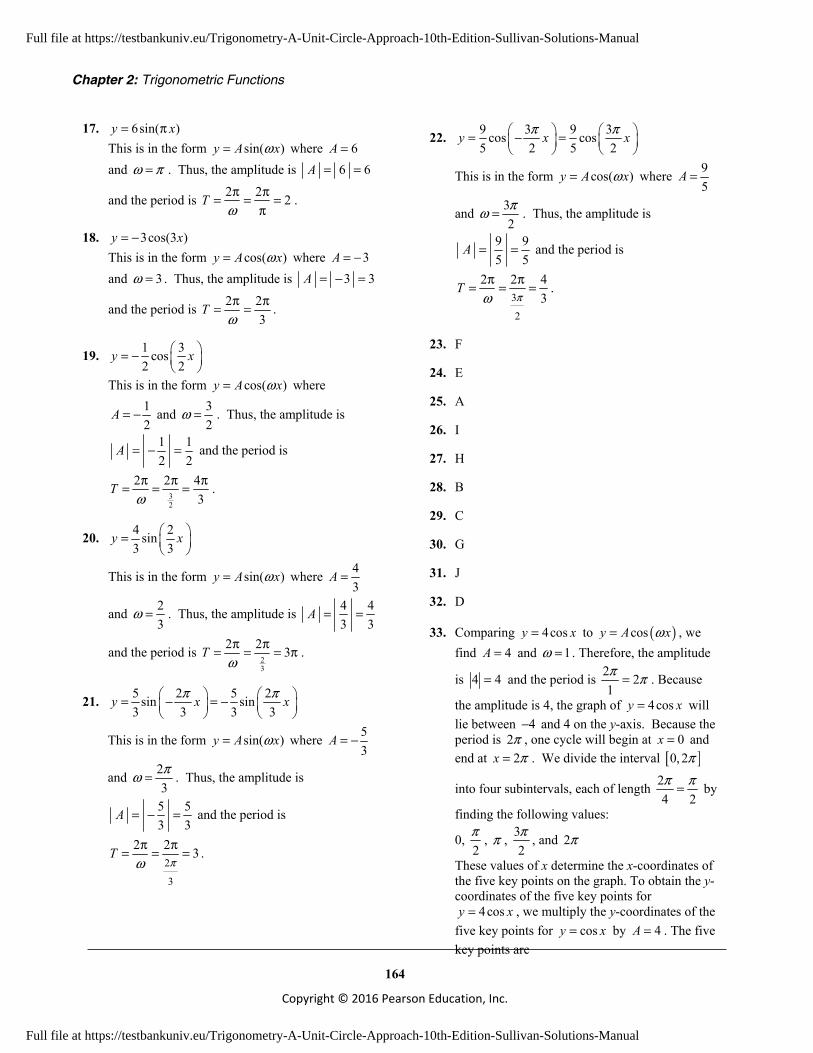
Chapter 2: Trigonometric Functions
164
Copyright © 2016 Pearson Education, Inc.
17. 6sin( )y x= π This is in the form sin( )y A xω= where 6A = and ω π= . Thus, the amplitude is 6 6A = =
and the period is 2 2 2Tωπ π= = =
π.
18. 3cos(3 )y x= − This is in the form cos( )y A xω= where 3A = − and 3ω = . Thus, the amplitude is 3 3A = − =
and the period is 2 23
Tωπ π= = .
19. 1 3cos2 2
y x = −
This is in the form cos( )y A xω= where 12
A = − and 32
ω = . Thus, the amplitude is
1 12 2
A = − = and the period is
32
2 2 43
Tωπ π π= = = .
20. 4 2sin3 3
y x =
This is in the form sin( )y A xω= where 43
A =
and 23
ω = . Thus, the amplitude is 4 43 3
A = =
and the period is 23
2 2 3Tωπ π= = = π .
21. 5 2 5 2sin sin3 3 3 3
y x xπ π = − = −
This is in the form sin( )y A xω= where 53
A = −
and 23πω = . Thus, the amplitude is
5 53 3
A = − = and the period is
2
3
2 2 3Tπω
π π= = = .
22. 9 3 9 3cos cos5 2 5 2
y x xπ π = − =
This is in the form cos( )y A xω= where 95
A =
and 32πω = . Thus, the amplitude is
9 95 5
A = = and the period is
3
2
2 2 43
Tπω
π π= = = .
23. F
24. E
25. A
26. I
27. H
28. B
29. C
30. G
31. J
32. D
33. Comparing 4cosy x= to ( )cosy A xω= , we find 4A = and 1ω = . Therefore, the amplitude
is 4 4= and the period is 2 21π π= . Because
the amplitude is 4, the graph of 4cosy x= will lie between 4− and 4 on the y-axis. Because the period is 2π , one cycle will begin at 0x = and end at 2x π= . We divide the interval [ ]0, 2π
into four subintervals, each of length 24 2π π= by
finding the following values:
0, 2π , π , 3
2π , and 2π
These values of x determine the x-coordinates of the five key points on the graph. To obtain the y-coordinates of the five key points for
4cosy x= , we multiply the y-coordinates of the five key points for cosy x= by 4A = . The five key points are
Full file at https://testbankuniv.eu/Trigonometry-A-Unit-Circle-Approach-10th-Edition-Sullivan-Solutions-Manual
Full file at https://testbankuniv.eu/Trigonometry-A-Unit-Circle-Approach-10th-Edition-Sullivan-Solutions-Manual

Section 2.4: Graphs of the Sine and Cosine Functions
165
Copyright © 2016 Pearson Education, Inc.
( )0, 4 , ,02π
, ( ), 4π − , 3 ,02π
, ( )2 ,4π
We plot these five points and fill in the graph of the curve. We then extend the graph in either direction to obtain the graph shown below.
From the graph we can determine that the domain is all real numbers, ( ),−∞ ∞ and the
range is [ ]4,4− .
34. Comparing 3siny x= to ( )siny A xω= , we find 3A = and 1ω = . Therefore, the amplitude
is 3 3= and the period is 2 21π π= . Because
the amplitude is 3, the graph of 3siny x= will lie between 3− and 3 on the y-axis. Because the period is 2π , one cycle will begin at 0x = and end at 2x π= . We divide the interval [ ]0, 2π
into four subintervals, each of length 24 2π π= by
finding the following values:
0, 2π , π , 3
2π , and 2π
These values of x determine the x-coordinates of the five key points on the graph. To obtain the y-coordinates of the five key points for 3siny x= , we multiply the y-coordinates of the five key points for siny x= by 3A = . The five key
points are ( )0,0 , ,32π
, ( ),0π , 3 , 32π −
,
( )2 ,0π We plot these five points and fill in the graph of the curve. We then extend the graph in either
direction to obtain the graph shown below.
From the graph we can determine that the domain is all real numbers, ( ),−∞ ∞ and the
range is [ ]3,3− .
35. Comparing 4siny x= − to ( )siny A xω= , we find 4A = − and 1ω = . Therefore, the amplitude
is 4 4− = and the period is 2 21π π= . Because
the amplitude is 4, the graph of 4siny x= − will lie between 4− and 4 on the y-axis. Because the period is 2π , one cycle will begin at 0x = and end at 2x π= . We divide the interval [ ]0, 2π
into four subintervals, each of length 24 2π π= by
finding the following values: 0, 2π , π , 3
2π , 2π
These values of x determine the x-coordinates of the five key points on the graph. To obtain the y-coordinates of the five key points for
4siny x= − , we multiply the y-coordinates of the five key points for siny x= by 4A = − . The five key points are
( )0,0 , , 42π −
, ( ),0π , 3 , 42π
, ( )2 ,0π
We plot these five points and fill in the graph of the curve. We then extend the graph in either direction to obtain the graph shown below.
Full file at https://testbankuniv.eu/Trigonometry-A-Unit-Circle-Approach-10th-Edition-Sullivan-Solutions-Manual
Full file at https://testbankuniv.eu/Trigonometry-A-Unit-Circle-Approach-10th-Edition-Sullivan-Solutions-Manual

Chapter 2: Trigonometric Functions
166
Copyright © 2016 Pearson Education, Inc.
From the graph we can determine that the domain is all real numbers, ( ),−∞ ∞ and the
range is [ ]4,4− .
36. Comparing 3cosy x= − to ( )cosy A xω= , we find 3A = − and 1ω = . Therefore, the amplitude
is 3 3− = and the period is 2 21π π= . Because
the amplitude is 3, the graph of 3cosy x= − will lie between 3− and 3 on the y-axis. Because the period is 2π , one cycle will begin at 0x = and end at 2x π= . We divide the interval [ ]0, 2π
into four subintervals, each of length 24 2π π= by
finding the following values:
0, 2π , π , 3
2π , and 2π
These values of x determine the x-coordinates of the five key points on the graph. To obtain the y-coordinates of the five key points for
3cosy x= − , we multiply the y-coordinates of the five key points for cosy x= by 3A = − . The five key points are
( )0, 3− , ,02π
, ( ),3π , 3 ,02π
, ( )2 , 3π −
We plot these five points and fill in the graph of the curve. We then extend the graph in either direction to obtain the graph shown below.
�� ��2� 2�
5(�, 3)(��, 3)
(0, �3)
�5
y
x
(2�, �3)
3�–––2(
, 0)
, 0)
�––2(
From the graph we can determine that the domain is all real numbers, ( ),−∞ ∞ and the
range is [ ]3,3− .
37. Comparing ( )cos 4y x= to ( )cosy A xω= , we find 1A = and 4ω = . Therefore, the amplitude
is 1 1= and the period is 24 2π π= . Because the
amplitude is 1, the graph of ( )cos 4y x= will lie between 1− and 1 on the y-axis. Because the
period is2π , one cycle will begin at 0x = and
end at 2
x π= . We divide the interval 0,2π
into four subintervals, each of length / 24 8
π π=
by finding the following values:
0, 8π ,
4π , 3
8π , and
2π
These values of x determine the x-coordinates of the five key points on the graph. The five key points are
( )0,1 , ,08π
, , 14π −
, 3 ,08π
, ,12π
We plot these five points and fill in the graph of the curve. We then extend the graph in either direction to obtain the graph shown below.
From the graph we can determine that the domain is all real numbers, ( ),−∞ ∞ and the
range is [ ]1,1− .
Full file at https://testbankuniv.eu/Trigonometry-A-Unit-Circle-Approach-10th-Edition-Sullivan-Solutions-Manual
Full file at https://testbankuniv.eu/Trigonometry-A-Unit-Circle-Approach-10th-Edition-Sullivan-Solutions-Manual

Section 2.4: Graphs of the Sine and Cosine Functions
167
Copyright © 2016 Pearson Education, Inc.
38. Comparing ( )sin 3y x= to ( )siny A xω= , we find 1A = and 3ω = . Therefore, the amplitude
is 1 1= and the period is 23π . Because the
amplitude is 1, the graph of ( )sin 3y x= will lie between 1− and 1 on the y-axis. Because the
period is 23π , one cycle will begin at 0x = and
end at 23
x π= . We divide the interval 20,3π
into four subintervals, each of length 2 / 34 6
π π=
by finding the following values:
0, 6π ,
3π ,
2π , and 2
3π
These values of x determine the x-coordinates of the five key points on the graph. The five key points are
( )0,0 , ,16π
, ,03π
, , 12π −
, 2 ,03π
We plot these five points and fill in the graph of the curve. We then extend the graph in either direction to obtain the graph shown below.
From the graph we can determine that the
domain is all real numbers, ( ),−∞ ∞ and the
range is [ ]1,1− .
39. Since sine is an odd function, we can plot the equivalent form ( )sin 2y x= − .
Comparing ( )sin 2y x= − to ( )siny A xω= , we find 1A = − and 2ω = . Therefore, the
amplitude is 1 1− = and the period is 22π π= .
Because the amplitude is 1, the graph of ( )sin 2y x= − will lie between 1− and 1 on the
y-axis. Because the period isπ , one cycle will begin at 0x = and end at x π= . We divide the interval [ ]0,π into four subintervals, each of
length 4π by finding the following values:
0, 4π ,
2π , 3
4π , and π
These values of x determine the x-coordinates of the five key points on the graph. To obtain the y-coordinates of the five key points for
( )sin 2y x= − , we multiply the y-coordinates of the five key points for siny x= by 1A = − .The five key points are
( )0,0 , , 14π −
, ,02π
, 3 ,14π
, ( ),0π
We plot these five points and fill in the graph of the curve. We then extend the graph in either direction to obtain the graph shown below.
y
x
2
�2
2��2�
(�, 0)
��
3�–––4( , 1)��–––
4( , 1)
�––4( , �1)
�––2( , 0)(0, 0)
From the graph we can determine that the domain is all real numbers, ( ),−∞ ∞ and the
range is [ ]1,1− .
40. Since cosine is an even function, we can plot the equivalent form ( )cos 2y x= .
Comparing ( )cos 2y x= to ( )cosy A xω= , we find 1A = and 2ω = . Therefore, the amplitude
is 1 1= and the period is 22π π= . Because the
amplitude is 1, the graph of ( )cos 2y x= will lie between 1− and 1 on the y-axis. Because the period isπ , one cycle will begin at 0x = and end at x π= . We divide the interval [ ]0,π into
four subintervals, each of length 4π by finding
the following values:
0, 4π ,
2π , 3
4π , and π
Full file at https://testbankuniv.eu/Trigonometry-A-Unit-Circle-Approach-10th-Edition-Sullivan-Solutions-Manual
Full file at https://testbankuniv.eu/Trigonometry-A-Unit-Circle-Approach-10th-Edition-Sullivan-Solutions-Manual

Chapter 2: Trigonometric Functions
168
Copyright © 2016 Pearson Education, Inc.
These values of x determine the x-coordinates of the five key points on the graph. To obtain the y-coordinates of the five key points for
( )cos 2y x= , we multiply the y-coordinates of the five key points for cosy x= by 1A = .The five key points are
( )0,1 , ,04π
, , 12π −
, 3 ,04π
, ( ),1π
We plot these five points and fill in the graph of the curve. We then extend the graph in either direction to obtain the graph shown below.
From the graph we can determine that the domain is all real numbers, ( ),−∞ ∞ and the
range is [ ]1,1− .
41. Comparing 12sin2
y x =
to ( )siny A xω= ,
we find 2A = and 12
ω = . Therefore, the
amplitude is 2 2= and the period is 2 41/ 2
π π= .
Because the amplitude is 2, the graph of 12sin2
y x =
will lie between 2− and 2 on the
y-axis. Because the period is 4π , one cycle will begin at 0x = and end at 4x π= . We divide the interval [ ]0, 4π into four subintervals, each
of length 44π π= by finding the following
values: 0, π , 2π , 3π , and 4π These values of x determine the x-coordinates of the five key points on the graph. To obtain the y-coordinates of the five key points for
12sin2
y x =
, we multiply the y-coordinates of
the five key points for siny x= by 2A = . The five key points are ( )0,0 , ( ), 2π , ( )2 ,0π , ( )3 , 2π − , ( )4 ,0π We plot these five points and fill in the graph of the curve. We then extend the graph in either direction to obtain the graph shown below.
From the graph we can determine that the domain is all real numbers, ( ),−∞ ∞ and the
range is [ ]2,2− .
42. Comparing 12cos4
y x =
to ( )cosy A xω= ,
we find 2A = and 14
ω = . Therefore, the
amplitude is 2 2= and the period is 2 81/ 4
π π= .
Because the amplitude is 2, the graph of 12cos4
y x =
will lie between 2− and 2 on
the y-axis. Because the period is 8π , one cycle will begin at 0x = and end at 8x π= . We divide the interval [ ]0,8π into four subintervals,
each of length 8 24π π= by finding the following
values: 0, 2π , 4π , 6π , and 8π These values of x determine the x-coordinates of the five key points on the graph. To obtain the y-coordinates of the five key points for
12cos4
y x =
, we multiply the y-coordinates
of the five key points for cosy x= by 2A = .The five key points are
( )0, 2 , ( )2 ,0π , ( )4 , 2π − , ( )6 ,0π , ( )8 , 2π We plot these five points and fill in the graph of the curve. We then extend the graph in either
Full file at https://testbankuniv.eu/Trigonometry-A-Unit-Circle-Approach-10th-Edition-Sullivan-Solutions-Manual
Full file at https://testbankuniv.eu/Trigonometry-A-Unit-Circle-Approach-10th-Edition-Sullivan-Solutions-Manual
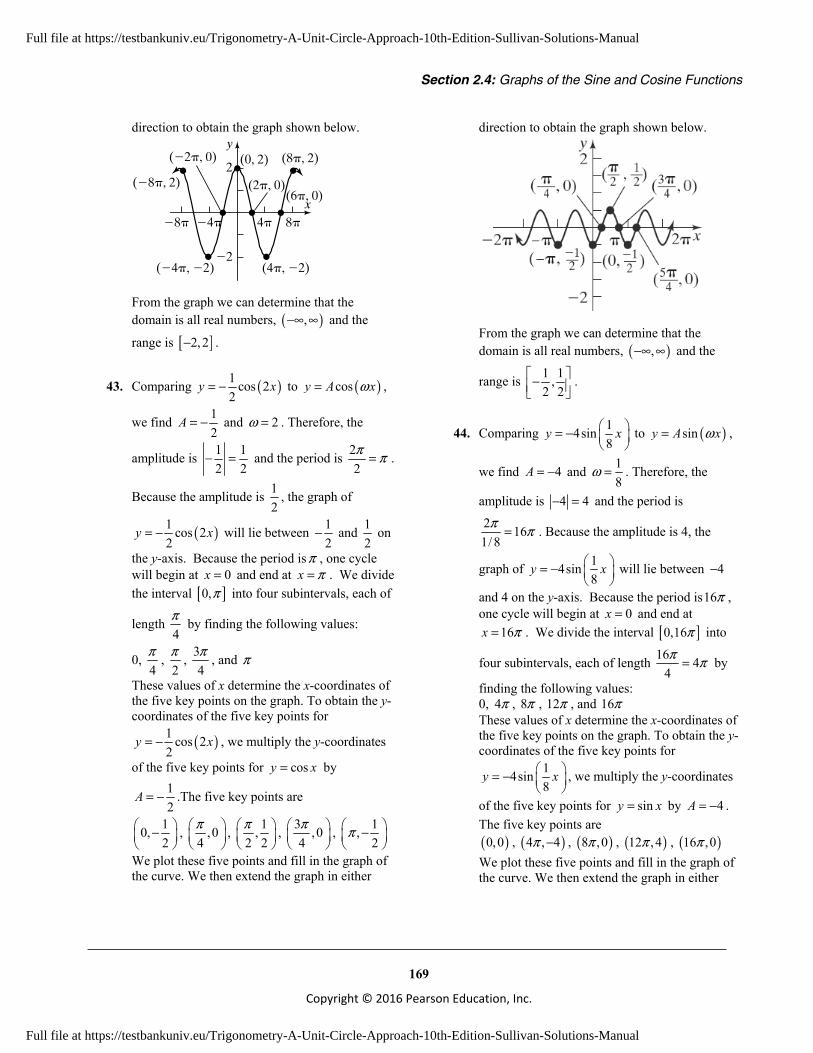
Section 2.4: Graphs of the Sine and Cosine Functions
169
Copyright © 2016 Pearson Education, Inc.
direction to obtain the graph shown below.
2
�2
�8� �4� 8�4�
y
x
(0, 2)
(2�, 0)(6�, 0)
(8�, 2)
(�8�, 2)
(�2�, 0)
(�4�, �2) (4�, �2)
From the graph we can determine that the domain is all real numbers, ( ),−∞ ∞ and the
range is [ ]2,2− .
43. Comparing ( )1 cos 22
y x= − to ( )cosy A xω= ,
we find 12
A = − and 2ω = . Therefore, the
amplitude is 1 12 2
− = and the period is 22π π= .
Because the amplitude is 12
, the graph of
( )1 cos 22
y x= − will lie between 12
− and 12
on
the y-axis. Because the period isπ , one cycle will begin at 0x = and end at x π= . We divide the interval [ ]0,π into four subintervals, each of
length 4π by finding the following values:
0, 4π ,
2π , 3
4π , and π
These values of x determine the x-coordinates of the five key points on the graph. To obtain the y-coordinates of the five key points for
( )1 cos 22
y x= − , we multiply the y-coordinates
of the five key points for cosy x= by 12
A = − .The five key points are
10,2
−
, ,04π
, 1,2 2π
, 3 ,04π
, 1,2
π −
We plot these five points and fill in the graph of the curve. We then extend the graph in either
direction to obtain the graph shown below.
From the graph we can determine that the domain is all real numbers, ( ),−∞ ∞ and the
range is 1 1,2 2
− .
44. Comparing 14sin8
y x = −
to ( )siny A xω= ,
we find 4A = − and 18
ω = . Therefore, the
amplitude is 4 4− = and the period is 2 161/ 8
π π= . Because the amplitude is 4, the
graph of 14sin8
y x = −
will lie between 4−
and 4 on the y-axis. Because the period is16π , one cycle will begin at 0x = and end at
16x π= . We divide the interval [ ]0,16π into
four subintervals, each of length 16 44π π= by
finding the following values: 0, 4π , 8π , 12π , and 16π These values of x determine the x-coordinates of the five key points on the graph. To obtain the y-coordinates of the five key points for
14sin8
y x = −
, we multiply the y-coordinates
of the five key points for siny x= by 4A = − . The five key points are ( )0,0 , ( )4 , 4π − , ( )8 ,0π , ( )12 ,4π , ( )16 ,0π We plot these five points and fill in the graph of the curve. We then extend the graph in either
Full file at https://testbankuniv.eu/Trigonometry-A-Unit-Circle-Approach-10th-Edition-Sullivan-Solutions-Manual
Full file at https://testbankuniv.eu/Trigonometry-A-Unit-Circle-Approach-10th-Edition-Sullivan-Solutions-Manual

Chapter 2: Trigonometric Functions
170
Copyright © 2016 Pearson Education, Inc.
direction to obtain the graph shown below.
�8��16�
5 (12�, 4)
(4�, �4)
(16�, 0)
(8�, 0)
(0, 0)
�5
y
x
From the graph we can determine that the domain is all real numbers, ( ),−∞ ∞ and the
range is [ ]4,4− .
45. We begin by considering 2siny x= . Comparing 2siny x= to ( )siny A xω= , we find 2A =
and 1ω = . Therefore, the amplitude is 2 2=
and the period is 2 21π π= . Because the
amplitude is 2, the graph of 2siny x= will lie between 2− and 2 on the y-axis. Because the period is 2π , one cycle will begin at 0x = and end at 2x π= . We divide the interval [ ]0, 2π
into four subintervals, each of length 24 2π π= by
finding the following values:
0, 2π , π , 3
2π , and 2π
These values of x determine the x-coordinates of the five key points on the graph. To obtain the y-coordinates of the five key points for
2sin 3y x= + , we multiply the y-coordinates of the five key points for siny x= by 2A = and then add 3 units. Thus, the graph of
2sin 3y x= + will lie between 1 and 5 on the y-axis. The five key points are
( )0,3 , ,52π
, ( ),3π , 3 ,12π
, ( )2 ,3π
We plot these five points and fill in the graph of the curve. We then extend the graph in either
direction to obtain the graph shown below.
From the graph we can determine that the domain is all real numbers, ( ),−∞ ∞ and the
range is [ ]1,5 .
46. We begin by considering 3cosy x= . Comparing 3cosy x= to ( )cosy A xω= , we find 3A =
and 1ω = . Therefore, the amplitude is 3 3=
and the period is 2 21π π= . Because the
amplitude is 3, the graph of 3cosy x= will lie between 3− and 3 on the y-axis. Because the period is 2π , one cycle will begin at 0x = and end at 2x π= . We divide the interval [ ]0, 2π
into four subintervals, each of length 24 2π π= by
finding the following values:
0, 2π , π , 3
2π , and 2π
These values of x determine the x-coordinates of the five key points on the graph. To obtain the y-coordinates of the five key points for
3cos 2y x= + , we multiply the y-coordinates of the five key points for cosy x= by 3A = and then add 2 units. Thus, the graph of
3cos 2y x= + will lie between 1− and 5 on the y-axis. The five key points are
( )0,5 , , 22π
, ( ), 1π − , 3 , 22π
, ( )2 ,5π
We plot these five points and fill in the graph of the curve. We then extend the graph in either
Full file at https://testbankuniv.eu/Trigonometry-A-Unit-Circle-Approach-10th-Edition-Sullivan-Solutions-Manual
Full file at https://testbankuniv.eu/Trigonometry-A-Unit-Circle-Approach-10th-Edition-Sullivan-Solutions-Manual
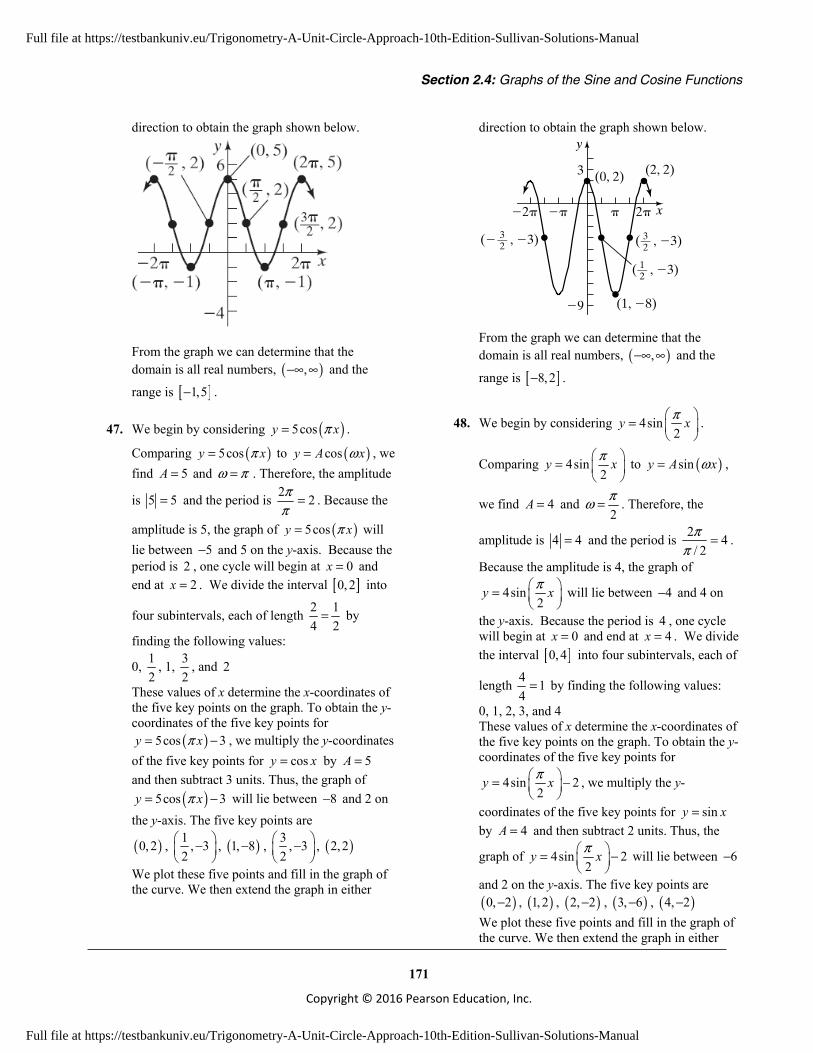
Section 2.4: Graphs of the Sine and Cosine Functions
171
Copyright © 2016 Pearson Education, Inc.
direction to obtain the graph shown below.
From the graph we can determine that the domain is all real numbers, ( ),−∞ ∞ and the
range is [ ]1,5− .
47. We begin by considering ( )5cosy xπ= .
Comparing ( )5cosy xπ= to ( )cosy A xω= , we find 5A = and ω π= . Therefore, the amplitude
is 5 5= and the period is 2 2ππ
= . Because the
amplitude is 5, the graph of ( )5cosy xπ= will lie between 5− and 5 on the y-axis. Because the period is 2 , one cycle will begin at 0x = and end at 2x = . We divide the interval [ ]0, 2 into
four subintervals, each of length 2 14 2
= by
finding the following values:
0, 12
, 1, 32
, and 2
These values of x determine the x-coordinates of the five key points on the graph. To obtain the y-coordinates of the five key points for
( )5cos 3y xπ= − , we multiply the y-coordinates of the five key points for cosy x= by 5A = and then subtract 3 units. Thus, the graph of
( )5cos 3y xπ= − will lie between 8− and 2 on the y-axis. The five key points are
( )0, 2 , 1 , 32
−
, ( )1, 8− , 3 , 32
−
, ( )2,2
We plot these five points and fill in the graph of the curve. We then extend the graph in either
direction to obtain the graph shown below.
�� � 2��2�
3
�9
y
x
3––2( , �3)
1––2( , �3)
3––2(� , �3)
(0, 2) (2, 2)
(1, �8)
From the graph we can determine that the domain is all real numbers, ( ),−∞ ∞ and the
range is [ ]8,2− .
48. We begin by considering 4sin2
y xπ =
.
Comparing 4sin2
y xπ =
to ( )siny A xω= ,
we find 4A = and 2πω = . Therefore, the
amplitude is 4 4= and the period is 2 4/ 2π
π= .
Because the amplitude is 4, the graph of
4sin2
y xπ =
will lie between 4− and 4 on
the y-axis. Because the period is 4 , one cycle will begin at 0x = and end at 4x = . We divide the interval [ ]0, 4 into four subintervals, each of
length 4 14
= by finding the following values:
0, 1, 2, 3, and 4 These values of x determine the x-coordinates of the five key points on the graph. To obtain the y-coordinates of the five key points for
4sin 22
y xπ = −
, we multiply the y-
coordinates of the five key points for siny x= by 4A = and then subtract 2 units. Thus, the
graph of 4sin 22
y xπ = −
will lie between 6−
and 2 on the y-axis. The five key points are ( )0, 2− , ( )1, 2 , ( )2, 2− , ( )3, 6− , ( )4, 2− We plot these five points and fill in the graph of the curve. We then extend the graph in either
Full file at https://testbankuniv.eu/Trigonometry-A-Unit-Circle-Approach-10th-Edition-Sullivan-Solutions-Manual
Full file at https://testbankuniv.eu/Trigonometry-A-Unit-Circle-Approach-10th-Edition-Sullivan-Solutions-Manual

Chapter 2: Trigonometric Functions
172
Copyright © 2016 Pearson Education, Inc.
direction to obtain the graph shown below.
From the graph we can determine that the domain is all real numbers, ( ),−∞ ∞ and the
range is [ ]6,2− .
49. We begin by considering 6sin3
y xπ = −
.
Comparing 6sin3
y xπ = −
to ( )siny A xω= ,
we find 6A = − and 3πω = . Therefore, the
amplitude is 6 6− = and the period is 2 6/ 3π
π= .
Because the amplitude is 6, the graph of
6sin3
y xπ =
will lie between 6− and 6 on the
y-axis. Because the period is 6, one cycle will begin at 0x = and end at 6x = . We divide the interval [ ]0,6 into four subintervals, each of
length 6 34 2
= by finding the following values:
0, 32
, 3, 92
, and 6
These values of x determine the x-coordinates of the five key points on the graph. To obtain the y-coordinates of the five key points for
6sin 43
y xπ = − +
, we multiply the y-
coordinates of the five key points for siny x= by 6A = − and then add 4 units. Thus, the graph
of 6sin 43
y xπ = − +
will lie between 2− and
10 on the y-axis. The five key points are
( )0, 4 , 3 , 22
−
, ( )3,4 , 9 ,102
, ( )6, 4
We plot these five points and fill in the graph of the curve. We then extend the graph in either direction to obtain the graph shown below.
From the graph we can determine that the domain is all real numbers, ( ),−∞ ∞ and the
range is [ ]2,10− .
50. We begin by considering 3cos4
y xπ = −
.
Comparing 3cos4
y xπ = −
to ( )cosy A xω= ,
we find 3A = − and 4πω = . Therefore, the
amplitude is 3 3− = and the period is 2 8/ 4π
π= .
Because the amplitude is 3, the graph of
3cos4
y xπ = −
will lie between 3− and 3 on
the y-axis. Because the period is 8, one cycle will begin at 0x = and end at 8x = . We divide the interval [ ]0,8 into four subintervals, each of
length 8 24
= by finding the following values:
0, 2, 4, 6, and 8 These values of x determine the x-coordinates of the five key points on the graph. To obtain the y-coordinates of the five key points for
3cos 24
y xπ = − +
, we multiply the y-
coordinates of the five key points for cosy x= by 3A = − and then add 2 units. Thus, the graph
Full file at https://testbankuniv.eu/Trigonometry-A-Unit-Circle-Approach-10th-Edition-Sullivan-Solutions-Manual
Full file at https://testbankuniv.eu/Trigonometry-A-Unit-Circle-Approach-10th-Edition-Sullivan-Solutions-Manual

Section 2.4: Graphs of the Sine and Cosine Functions
173
Copyright © 2016 Pearson Education, Inc.
of 3cos 24
y xπ = − +
will lie between 1− and
5 on the y-axis. The five key points are ( )0, 1− , ( )2,2 , ( )4,5 , ( )6,2 , ( )8, 1− We plot these five points and fill in the graph of the curve. We then extend the graph in either direction to obtain the graph shown below.
From the graph we can determine that the domain is all real numbers, ( ),−∞ ∞ and the
range is [ ]1,5− .
51. ( ) ( )5 3sin 2 3sin 2 5y x x= − = − +
We begin by considering ( )3sin 2y x= − .
Comparing ( )3sin 2y x= − to ( )siny A xω= , we find 3A = − and 2ω = . Therefore, the
amplitude is 3 3− = and the period is 22π π= .
Because the amplitude is 3, the graph of ( )3sin 2y x= − will lie between 3− and 3 on the
y-axis. Because the period is π , one cycle will begin at 0x = and end at x π= . We divide the interval [ ]0,π into four subintervals, each of
length 4π by finding the following values:
0, 4π ,
2π , 3
4π , and π
These values of x determine the x-coordinates of the five key points on the graph. To obtain the y-coordinates of the five key points for
( )3sin 2 5y x= − + , we multiply the y-coordinates of the five key points for siny x= by 3A = − and then add 5 units. Thus, the graph of ( )3sin 2 5y x= − + will lie between 2 and 8
on the y-axis. The five key points are
( )0,5 , , 24π
, ,52π
, 3 ,84π
, ( ),5π
We plot these five points and fill in the graph of the curve. We then extend the graph in either direction to obtain the graph shown below.
y10
π−π
( ),5π( )0,5
,24π
3 ,84π
,52π
From the graph we can determine that the
domain is all real numbers, ( ),−∞ ∞ and the
range is [ ]2,8 .
52. ( ) ( )2 4cos 3 4cos 3 2y x x= − = − +
We begin by considering ( )4cos 3y x= − .
Comparing ( )4cos 3y x= − to ( )cosy A xω= , we find 4A = − and 3ω = . Therefore, the
amplitude is 4 4− = and the period is 23π .
Because the amplitude is 4, the graph of ( )4cos 3y x= − will lie between 4− and 4 on
the y-axis. Because the period is 23π , one cycle
will begin at 0x = and end at 23
x π= . We
divide the interval 20,3π
into four
subintervals, each of length 2 / 34 6
π π= by
finding the following values:
0, 6π ,
3π ,
2π , and 2
3π
These values of x determine the x-coordinates of the five key points on the graph. To obtain the y-coordinates of the five key points for
( )4cos 3 2y x= − + , we multiply the y-
Full file at https://testbankuniv.eu/Trigonometry-A-Unit-Circle-Approach-10th-Edition-Sullivan-Solutions-Manual
Full file at https://testbankuniv.eu/Trigonometry-A-Unit-Circle-Approach-10th-Edition-Sullivan-Solutions-Manual

Chapter 2: Trigonometric Functions
174
Copyright © 2016 Pearson Education, Inc.
coordinates of the five key points for cosy x= by 4A = − and then adding 2 units. Thus, the graph of ( )4cos 3 2y x= − + will lie between 2− and 6 on the y-axis. The five key points are
( )0, 2− , , 26π
, ,63π
, , 22π
, 2 , 23π −
We plot these five points and fill in the graph of the curve. We then extend the graph in either direction to obtain the graph shown below.
33
From the graph we can determine that the
domain is all real numbers, ( ),−∞ ∞ and the
range is [ ]2,6− .
53. Since sine is an odd function, we can plot the
equivalent form 5 2sin3 3
y xπ = −
.
Comparing 5 2sin3 3
y xπ = −
to
( )siny A xω= , we find 53
A = − and 23πω = .
Therefore, the amplitude is 5 53 3
− = and the
period is 2 32 / 3
ππ
= . Because the amplitude is
53
, the graph of 5 2sin3 3
y xπ = −
will lie
between 53
− and 53
on the y-axis. Because the
period is 3 , one cycle will begin at 0x = and end at 3x = . We divide the interval [ ]0,3 into
four subintervals, each of length 34
by finding
the following values:
0, 34
, 32
, 94
, and 3
These values of x determine the x-coordinates of the five key points on the graph. To obtain the y-coordinates of the five key points for
5 2sin3 3
y xπ = −
, we multiply the y-
coordinates of the five key points for siny x=
by 53
A = − .The five key points are
( )0,0 , 3 5,4 3
−
, 3 ,02
, 9 5,4 3
, ( )3,0
We plot these five points and fill in the graph of the curve. We then extend the graph in either direction to obtain the graph shown below.
From the graph we can determine that the domain is all real numbers, ( ),−∞ ∞ and the
range is 5 5,3 3
− .
54. Since cosine is an even function, we consider the
equivalent form 9 3cos5 2
y xπ =
. Comparing
9 3cos5 2
y xπ =
to ( )cosy A xω= , we find
95
A = and 32πω = . Therefore, the amplitude is
9 95 5
= and the period is 2 43 / 2 3
ππ
= . Because
the amplitude is 95
, the graph of
9 3cos5 2
y xπ =
will lie between 95
− and 95
Full file at https://testbankuniv.eu/Trigonometry-A-Unit-Circle-Approach-10th-Edition-Sullivan-Solutions-Manual
Full file at https://testbankuniv.eu/Trigonometry-A-Unit-Circle-Approach-10th-Edition-Sullivan-Solutions-Manual

Section 2.4: Graphs of the Sine and Cosine Functions
175
Copyright © 2016 Pearson Education, Inc.
on the y-axis. Because the period is 43
, one
cycle will begin at 0x = and end at 43
x = . We
divide the interval 40,3
into four subintervals,
each of length 4 / 3 14 3
= by finding the following
values:
0, 13
, 23
, 1 , and 43
These values of x determine the x-coordinates of the five key points on the graph. To obtain the y-coordinates of the five key points for
9 3cos5 2
y xπ =
, we multiply the y-coordinates
of the five key points for cosy x= by 95
A = .
Thus, the graph of 9 3cos5 2
y xπ = −
will lie
between 95
− and 95
on the y-axis. The five key
points are 90,5
, 1 ,03
, 2 9,3 5
−
, ( )1,0 , 4 9,3 5
We plot these five points and fill in the graph of the curve. We then extend the graph in either direction to obtain the graph shown below.
From the graph we can determine that the domain is all real numbers, ( ),−∞ ∞ and the
range is 9 9,5 5
− .
55. We begin by considering 3 cos2 4
y xπ = −
.
Comparing 3 cos2 4
y xπ = −
to
( )cosy A xω= , we find 32
A = − and 4πω = .
Therefore, the amplitude is 3 32 2
− = and the
period is 2 8/ 4π
π= . Because the amplitude is 3
2,
the graph of 3 cos2 4
y xπ = −
will lie between
32
− and 32
on the y-axis. Because the period is
8, one cycle will begin at 0x = and end at 8x = . We divide the interval [ ]0,8 into four
subintervals, each of length 8 24
= by finding the
following values: 0, 2, 4, 6, and 8 These values of x determine the x-coordinates of the five key points on the graph. To obtain the y-coordinates of the five key points for
3 1cos2 4 2
y xπ = − +
, we multiply the y-
coordinates of the five key points for cosy x=
by 32
A = − and then add 12
unit. Thus, the
graph of 3 1cos2 4 2
y xπ = − +
will lie between
1− and 2 on the y-axis. The five key points are
( )0, 1− , 12,2
, ( )4,2 , 16,2
, ( )8, 1−
We plot these five points and fill in the graph of the curve. We then extend the graph in either direction to obtain the graph shown below.
2
�2
�8 �4 84
y
x
(0, �1) (8, �1)(�8, �1)
(6, )
(4, 2)(�4, 2)
1––2
(2, )1––2
Full file at https://testbankuniv.eu/Trigonometry-A-Unit-Circle-Approach-10th-Edition-Sullivan-Solutions-Manual
Full file at https://testbankuniv.eu/Trigonometry-A-Unit-Circle-Approach-10th-Edition-Sullivan-Solutions-Manual
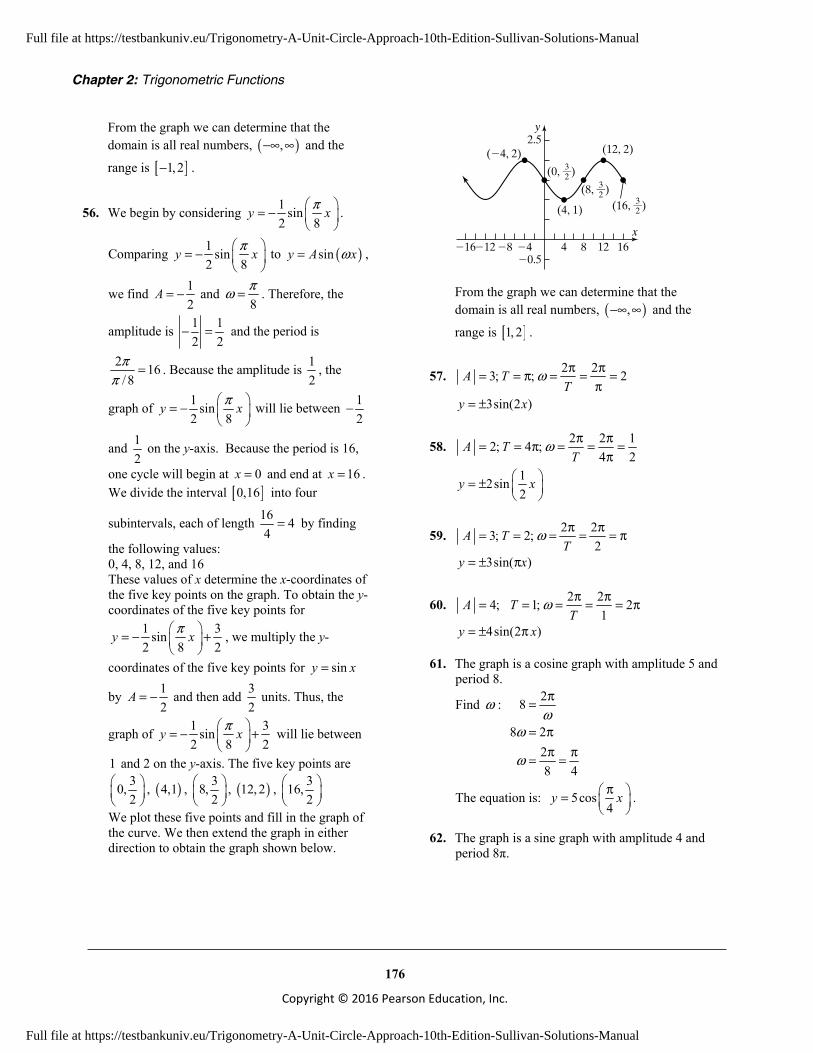
Chapter 2: Trigonometric Functions
176
Copyright © 2016 Pearson Education, Inc.
From the graph we can determine that the domain is all real numbers, ( ),−∞ ∞ and the
range is [ ]1,2− .
56. We begin by considering 1 sin2 8
y xπ = −
.
Comparing 1 sin2 8
y xπ = −
to ( )siny A xω= ,
we find 12
A = − and 8πω = . Therefore, the
amplitude is 1 12 2
− = and the period is
2 16/ 8π
π= . Because the amplitude is 1
2, the
graph of 1 sin2 8
y xπ = −
will lie between 12
−
and 12
on the y-axis. Because the period is 16,
one cycle will begin at 0x = and end at 16x = . We divide the interval [ ]0,16 into four
subintervals, each of length 16 44
= by finding
the following values: 0, 4, 8, 12, and 16 These values of x determine the x-coordinates of the five key points on the graph. To obtain the y-coordinates of the five key points for
1 3sin2 8 2
y xπ = − +
, we multiply the y-
coordinates of the five key points for siny x=
by 12
A = − and then add 32
units. Thus, the
graph of 1 3sin2 8 2
y xπ = − +
will lie between
1 and 2 on the y-axis. The five key points are 30,2
, ( )4,1 , 38,2
, ( )12, 2 , 316,2
We plot these five points and fill in the graph of the curve. We then extend the graph in either direction to obtain the graph shown below.
�4�8�12�16 4 8 12 16�0.5
2.5y
x
(16, )
(12, 2)(�4, 2)
(4, 1)3––2
(8, )3––2
(0, )3––2
From the graph we can determine that the domain is all real numbers, ( ),−∞ ∞ and the
range is [ ]1, 2 .
57. 2 23; ; 2A TT
ω π π= = π = = =π
3sin(2 )y x= ±
58. 2 2 12; 4 ;4 2
A TT
ω π π= = π = = =π
12sin2
y x = ±
59. 2 23; 2;2
A TT
ω π π= = = = = π
3sin( )y x= ± π
60. 2 24; 1; 21
A TT
ω π π= = = = = π
4sin(2 )y x= ± π
61. The graph is a cosine graph with amplitude 5 and period 8.
Find ω : 28
8 228 4
ωω
ω
π=
= ππ π= =
The equation is: 5cos4
y xπ =
.
62. The graph is a sine graph with amplitude 4 and period 8π.
Full file at https://testbankuniv.eu/Trigonometry-A-Unit-Circle-Approach-10th-Edition-Sullivan-Solutions-Manual
Full file at https://testbankuniv.eu/Trigonometry-A-Unit-Circle-Approach-10th-Edition-Sullivan-Solutions-Manual
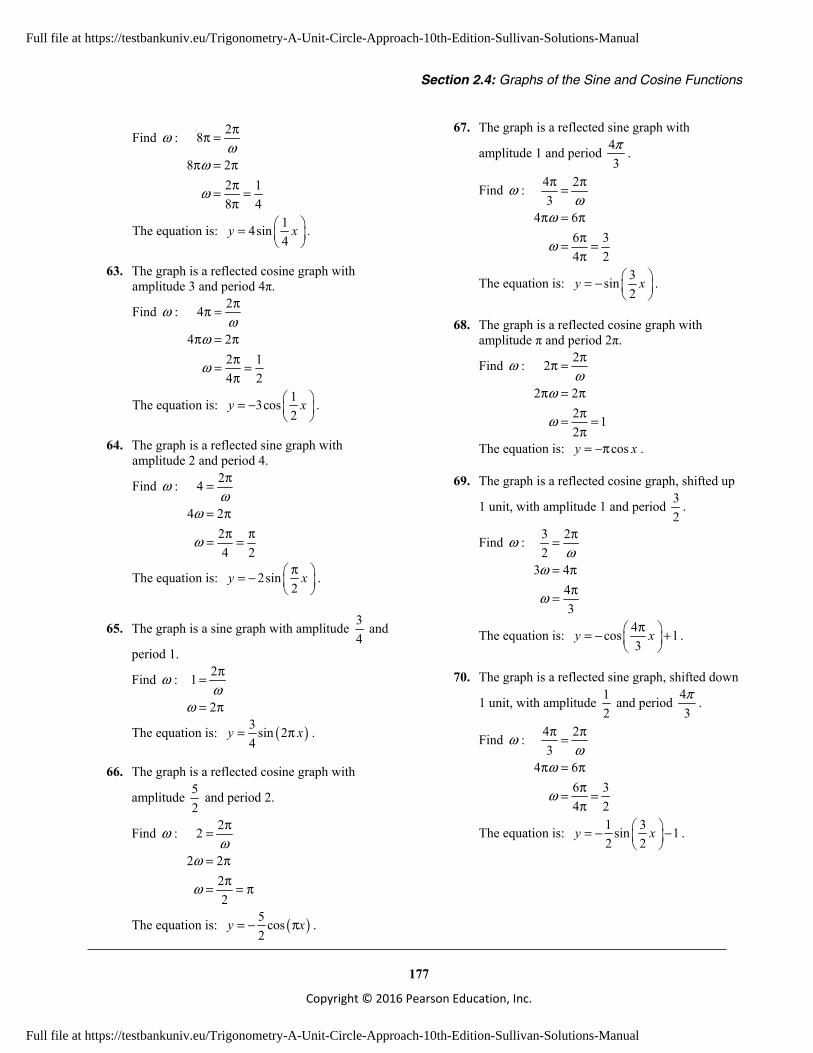
Section 2.4: Graphs of the Sine and Cosine Functions
177
Copyright © 2016 Pearson Education, Inc.
Find ω : 28
8 22 18 4
ωω
ω
ππ =
π = ππ= =π
The equation is: 14sin4
y x =
.
63. The graph is a reflected cosine graph with amplitude 3 and period 4π.
Find ω : 24
4 22 14 2
ωω
ω
ππ =
π = ππ= =π
The equation is: 13cos2
y x = −
.
64. The graph is a reflected sine graph with amplitude 2 and period 4.
Find ω : 24
4 224 2
ωω
ω
π=
= ππ π= =
The equation is: 2sin2
y xπ = −
.
65. The graph is a sine graph with amplitude 34
and
period 1.
Find ω : 21
2ω
ω
π=
= π
The equation is: ( )3 sin 24
y x= π .
66. The graph is a reflected cosine graph with
amplitude 52
and period 2.
Find ω : 22
2 222
ωω
ω
π=
= ππ= = π
The equation is: ( )5 cos2
y x= − π .
67. The graph is a reflected sine graph with
amplitude 1 and period 43π .
Find ω : 4 23
4 66 34 2
ωω
ω
π π=
π = ππ= =π
The equation is: 3sin2
y x = −
.
68. The graph is a reflected cosine graph with amplitude π and period 2π.
Find ω : 22
2 22 12
ωω
ω
ππ =
π = ππ= =π
The equation is: cosy x= −π .
69. The graph is a reflected cosine graph, shifted up
1 unit, with amplitude 1 and period 32
.
Find ω : 3 22
3 443
ωω
ω
π=
= ππ=
The equation is: 4cos 13
y xπ = − +
.
70. The graph is a reflected sine graph, shifted down
1 unit, with amplitude 12
and period 43π .
Find ω : 4 23
4 66 34 2
ωω
ω
π π=
π = ππ= =π
The equation is: 1 3sin 12 2
y x = − −
.
Full file at https://testbankuniv.eu/Trigonometry-A-Unit-Circle-Approach-10th-Edition-Sullivan-Solutions-Manual
Full file at https://testbankuniv.eu/Trigonometry-A-Unit-Circle-Approach-10th-Edition-Sullivan-Solutions-Manual
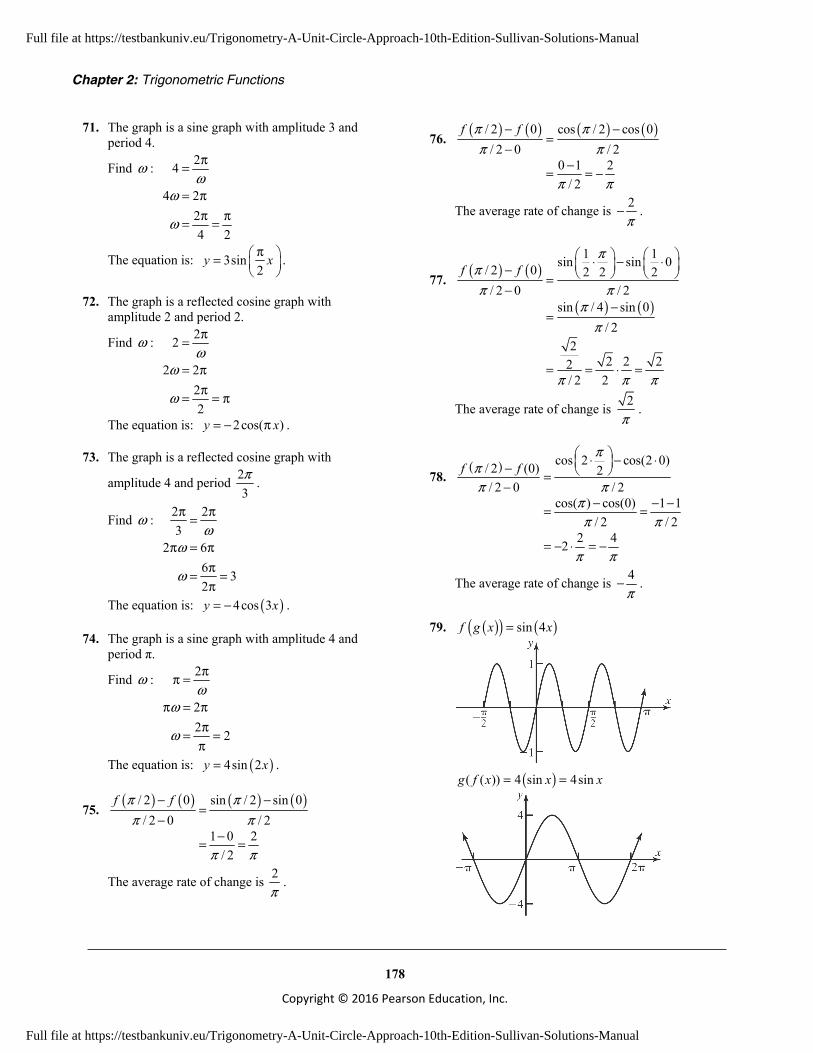
Chapter 2: Trigonometric Functions
178
Copyright © 2016 Pearson Education, Inc.
71. The graph is a sine graph with amplitude 3 and period 4.
Find ω : 24
4 224 2
ωω
ω
π=
= ππ π= =
The equation is: 3sin2
y xπ =
.
72. The graph is a reflected cosine graph with amplitude 2 and period 2.
Find ω : 22
2 222
ωω
ω
π=
= ππ= = π
The equation is: 2cos( )y x= − π .
73. The graph is a reflected cosine graph with
amplitude 4 and period 23π .
Find ω : 2 23
2 66 32
ωω
ω
π π=
π = ππ= =π
The equation is: ( )4cos 3y x= − .
74. The graph is a sine graph with amplitude 4 and period π.
Find ω : 2
22 2
ωω
ω
ππ =
π = ππ= =
π
The equation is: ( )4sin 2y x= .
75. ( ) ( ) ( ) ( )/ 2 0 sin / 2 sin 0/ 2 0 / 2
1 0 2/ 2
f fπ ππ π
π π
− −=
−−= =
The average rate of change is 2π
.
76. ( ) ( ) ( ) ( )/ 2 0 cos / 2 cos 0/ 2 0 / 2
0 1 2/ 2
f fπ ππ π
π π
− −=
−−= = −
The average rate of change is 2π
− .
77. ( ) ( )
( ) ( )
1 1sin sin 0/ 2 0 2 2 2/ 2 0 / 2
sin / 4 sin 0/ 2
22 2 22
/ 2 2
f fπ
ππ π
ππ
π π π
⋅ − ⋅ − =−
−=
= = ⋅ =
The average rate of change is 2π
.
78. ( ) cos 2 cos(2 0)/ 2 (0) 2
/ 2 0 / 2cos( ) cos(0) 1 1
/ 2 / 22 42
f fπ
ππ π
ππ π
π π
⋅ − ⋅ − =−
− − −= =
= − ⋅ = −
The average rate of change is 4π
− .
79. ( )( ) ( )sin 4f g x x=
( )( ( )) 4 sin 4sing f x x x= =
Full file at https://testbankuniv.eu/Trigonometry-A-Unit-Circle-Approach-10th-Edition-Sullivan-Solutions-Manual
Full file at https://testbankuniv.eu/Trigonometry-A-Unit-Circle-Approach-10th-Edition-Sullivan-Solutions-Manual
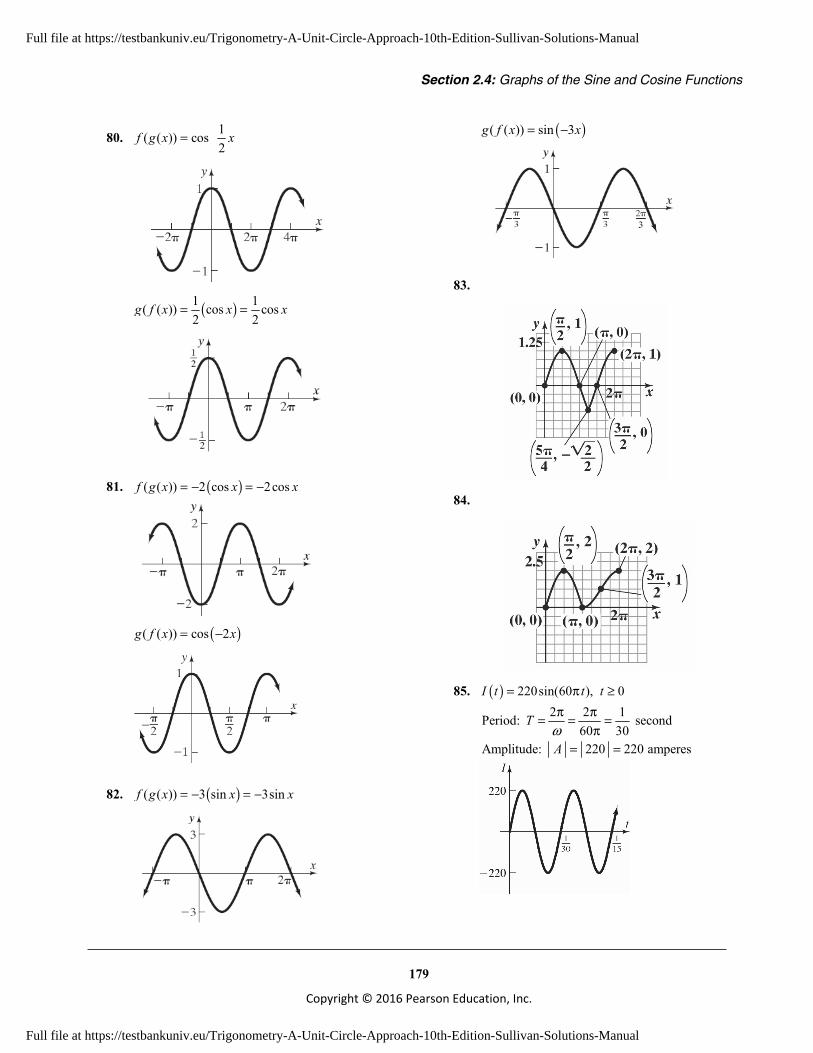
Section 2.4: Graphs of the Sine and Cosine Functions
179
Copyright © 2016 Pearson Education, Inc.
80. 1( ( )) cos2
f g x x =
( )1 1( ( )) cos cos
2 2g f x x x= =
81. ( )( ( )) 2 cos 2cosf g x x x= − = −
( )( ( )) cos 2g f x x= −
82. ( )( ( )) 3 sin 3sinf g x x x= − = −
( )( ( )) sin 3g f x x= −
83.
84.
85. ( ) 220sin(60 ), 0I t t t= π ≥ 2 2 1Period: second
60 30Amplitude: 220 220 amperes
T
Aωπ π= = =
π= =
Full file at https://testbankuniv.eu/Trigonometry-A-Unit-Circle-Approach-10th-Edition-Sullivan-Solutions-Manual
Full file at https://testbankuniv.eu/Trigonometry-A-Unit-Circle-Approach-10th-Edition-Sullivan-Solutions-Manual

Chapter 2: Trigonometric Functions
180
Copyright © 2016 Pearson Education, Inc.
86. ( ) 120sin(30 ), 0I t t t= π ≥ 2 2 1Period: second
30 15Amplitude: 120 120 amperes
T
Aωπ π= = =
π= =
87. ( ) 220sin(120 )V t t= π a. Amplitude: 220 220 volts
2 2 1Period: second120 60
A
Tω
= =π π= = =
π
b, e.
c. V IR=
220sin(120 ) 1022sin(120 )
( ) 22sin(120 )
t It I
I t t
ππ
π
===
d. Amplitude: 22 22 amperesA = =
2 2 1Period: second120 60
Tωπ π= = =
π
88. ( ) 120sin(120 )V t t= π a. Amplitude: 120 120 volts
2 2 1Period: second120 60
A
Tω
= =π π= = =
π
b, e.
c. V IR=
120sin(120 ) 20
6sin(120 )( ) 6sin(120 )
t It I
I t t
π =π =
= π
d. Amplitude: 6 6 amperesA = =
2 2 1Period: second120 60
Tωπ π= = =
π
89. a. [ ]
( )
( )
( )
2
20
2 20
220
( )( )
sin 2
sin 2
sin 2
V tP t
RV ft
RV ft
RV
ftR
=
π =
π=
= π
b. The graph is the reflected cosine graph translated up a distance equivalent to the
amplitude. The period is 12 f
, so 4 fω = π .
The amplitude is 2 2
0 012 2
V VR R
⋅ = .
The equation is:
( ) ( )
( )
2 20 0
20
cos 42 2
1 cos 42
V VP t ft
R RV
ftR
= − π +
= − π
c. Comparing the formulas:
( ) ( )( )2 1sin 2 1 cos 42
ft ftπ = − π
90. a. Since the tunnel is in the shape of one-half a sine cycle, the width of the tunnel at its base is one-half the period. Thus,
2 2(28) 56T πω
= = = or 28πω = .
The tunnel has a maximum height of 15 feet so we have 15A = . Using the form
sin( )y A xω= , the equation for the sine curve that fits the opening is
15sin28
xy π =
.
b. Since the shoulders are 7 feet wide and the road is 14 feet wide, the edges of the road correspond to 7x = and 21x = .
Full file at https://testbankuniv.eu/Trigonometry-A-Unit-Circle-Approach-10th-Edition-Sullivan-Solutions-Manual
Full file at https://testbankuniv.eu/Trigonometry-A-Unit-Circle-Approach-10th-Edition-Sullivan-Solutions-Manual
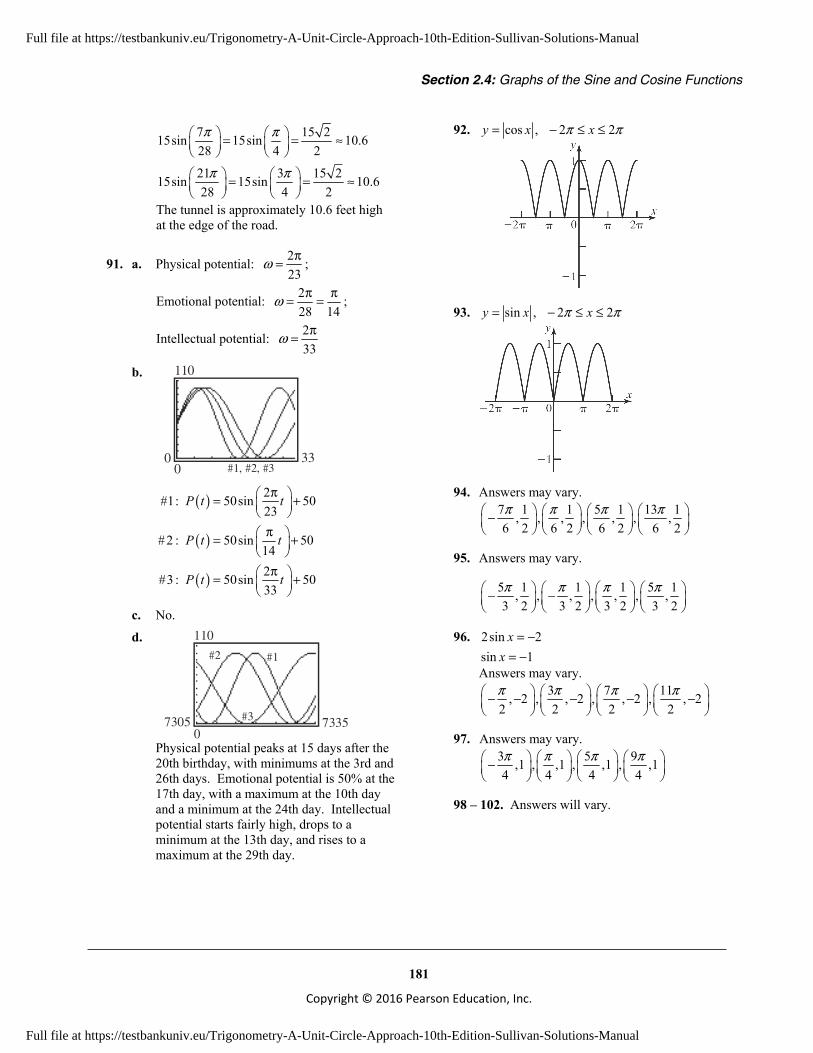
Section 2.4: Graphs of the Sine and Cosine Functions
181
Copyright © 2016 Pearson Education, Inc.
7 15 215sin 15sin 10.628 4 2π π = = ≈
21 3 15 215sin 15sin 10.628 4 2
π π = = ≈
The tunnel is approximately 10.6 feet high at the edge of the road.
91. a. Physical potential: 223
ω π= ;
Emotional potential: 228 14
ω π π= = ;
Intellectual potential: 233
ω π=
b.
00
110
33#1, #2, #3
( )
( )
( )
2#1: 50sin 5023
#2 : 50sin 50142#3 : 50sin 5033
P t t
P t t
P t t
π = +
π = +
π = +
c. No. d.
07305
110
7335
#1
#3
#2
Physical potential peaks at 15 days after the 20th birthday, with minimums at the 3rd and 26th days. Emotional potential is 50% at the 17th day, with a maximum at the 10th day and a minimum at the 24th day. Intellectual potential starts fairly high, drops to a minimum at the 13th day, and rises to a maximum at the 29th day.
92. cos , 2 2y x xπ π= − ≤ ≤
93. sin , 2 2y x xπ π= − ≤ ≤
94. Answers may vary.
7 1 1 5 1 13 1, , , , , , ,6 2 6 2 6 2 6 2π π π π −
95. Answers may vary.
5 1 1 1 5 1, , , , , , ,3 2 3 2 3 2 3 2π π π π − −
96. 2sin 2sin 1
xx
= −= −
Answers may vary.
3 7 11, 2 , , 2 , , 2 , , 22 2 2 2π π π π − − − − −
97. Answers may vary.
3 5 9,1 , ,1 , ,1 , ,14 4 4 4π π π π −
98 – 102. Answers will vary.
Full file at https://testbankuniv.eu/Trigonometry-A-Unit-Circle-Approach-10th-Edition-Sullivan-Solutions-Manual
Full file at https://testbankuniv.eu/Trigonometry-A-Unit-Circle-Approach-10th-Edition-Sullivan-Solutions-Manual
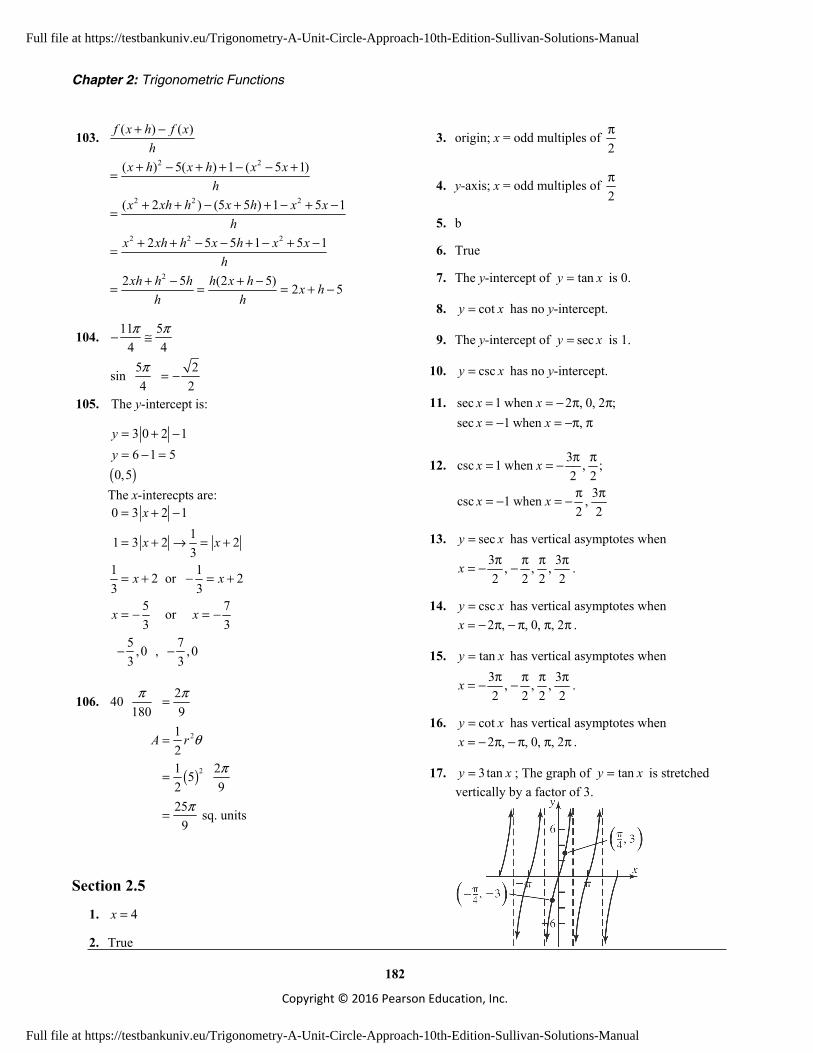
Chapter 2: Trigonometric Functions
182
Copyright © 2016 Pearson Education, Inc.
103.
2 2
2 2 2
2 2 2
2
( ) ( )
( ) 5( ) 1 ( 5 1)
( 2 ) (5 5 ) 1 5 1
2 5 5 1 5 1
2 5 (2 5) 2 5
f x h f xh
x h x h x xh
x xh h x h x xh
x xh h x h x xh
xh h h h x h x hh h
+ −
+ − + + − − +=
+ + − + + − + −=
+ + − − + − + −=
+ − + −= = = + −
104. 11 54 4
5 2sin4 2
π π
π
− ≅
= −
105. The y-intercept is:
3 0 2 16 1 5
yy
= + −= − =
( )0,5 The x-interecpts are: 0 3 2 1
11 3 2 23
1 12 or 23 3
5 7 or 3 3
x
x x
x x
x x
= + −
= + → = +
= + − = +
= − = −
5 7,0 , ,03 3
− −
106.
( )
2
2
240180 9
121 252 925 sq. units
9
A r
π π
θ
π
π
=
=
=
=
Section 2.5
1. 4x =
2. True
3. origin; x = odd multiples of 2π
4. y-axis; x = odd multiples of 2π
5. b
6. True
7. The y-intercept of tany x= is 0.
8. coty x= has no y-intercept.
9. The y-intercept of secy x= is 1.
10. cscy x= has no y-intercept.
11. sec 1 when 2 , 0, 2 ;sec 1 when ,
x xx x
= = − π π= − = −π π
12. 3csc 1 when , ;2 2
3csc 1 when ,2 2
x x
x x
π π= = −
π π= − = −
13. secy x= has vertical asymptotes when 3 3, , ,2 2 2 2
x π π π π= − − .
14. cscy x= has vertical asymptotes when 2 , , 0, , 2x = − π − π π π .
15. tany x= has vertical asymptotes when 3 3, , ,2 2 2 2
x π π π π= − − .
16. coty x= has vertical asymptotes when 2 , , 0, , 2x = − π − π π π .
17. 3 tany x= ; The graph of tany x= is stretched vertically by a factor of 3.
Full file at https://testbankuniv.eu/Trigonometry-A-Unit-Circle-Approach-10th-Edition-Sullivan-Solutions-Manual
Full file at https://testbankuniv.eu/Trigonometry-A-Unit-Circle-Approach-10th-Edition-Sullivan-Solutions-Manual
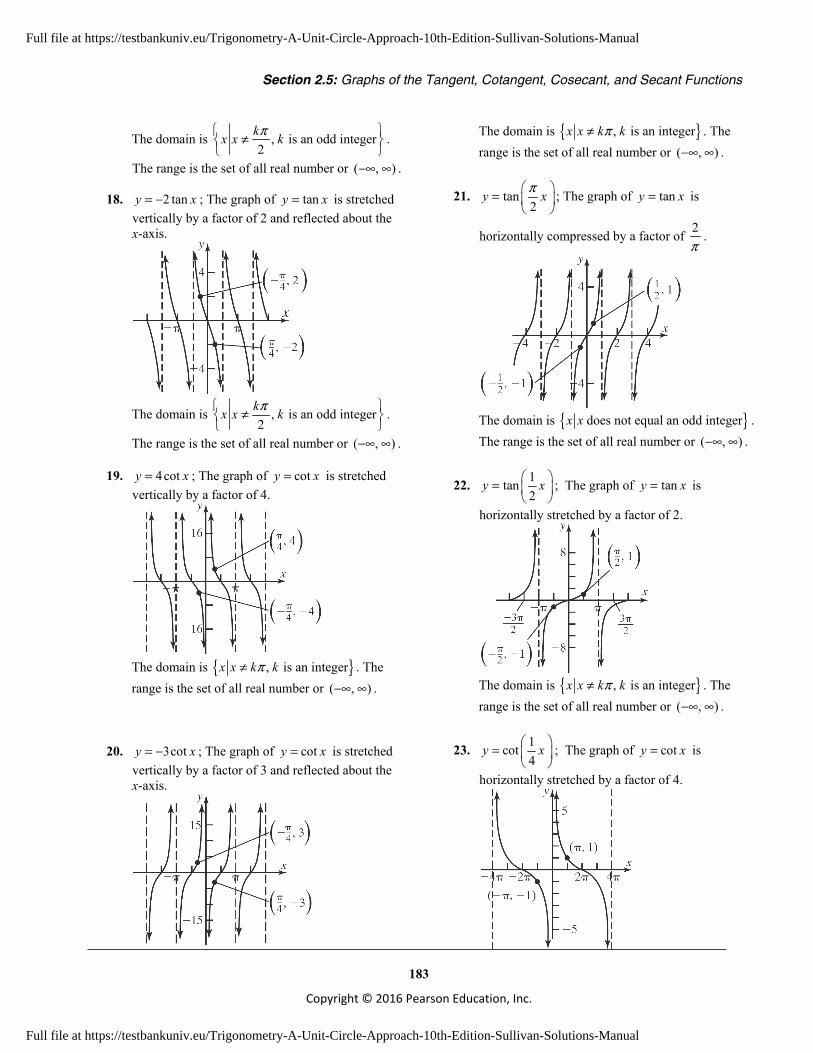
Section 2.5: Graphs of the Tangent, Cotangent, Cosecant, and Secant Functions
183
Copyright © 2016 Pearson Education, Inc.
The domain is , is an odd integer2
kx x kπ ≠
.
The range is the set of all real number or ( , )−∞ ∞ .
18. 2 tany x= − ; The graph of tany x= is stretched vertically by a factor of 2 and reflected about the x-axis.
The domain is , is an odd integer2
kx x kπ ≠
.
The range is the set of all real number or ( , )−∞ ∞ .
19. 4coty x= ; The graph of coty x= is stretched vertically by a factor of 4.
The domain is { }, is an integerx x k kπ≠ . The
range is the set of all real number or ( , )−∞ ∞ .
20. 3coty x= − ; The graph of coty x= is stretched
vertically by a factor of 3 and reflected about the x-axis.
The domain is { }, is an integerx x k kπ≠ . The range is the set of all real number or ( , )−∞ ∞ .
21. tan2
y xπ =
; The graph of tany x= is
horizontally compressed by a factor of 2π
.
The domain is { }does not equal an odd integerx x .
The range is the set of all real number or ( , )−∞ ∞ .
22. 1tan2
y x =
; The graph of tany x= is
horizontally stretched by a factor of 2.
The domain is { }, is an integerx x k kπ≠ . The
range is the set of all real number or ( , )−∞ ∞ .
23. 1cot4
y x =
; The graph of coty x= is
horizontally stretched by a factor of 4.
Full file at https://testbankuniv.eu/Trigonometry-A-Unit-Circle-Approach-10th-Edition-Sullivan-Solutions-Manual
Full file at https://testbankuniv.eu/Trigonometry-A-Unit-Circle-Approach-10th-Edition-Sullivan-Solutions-Manual
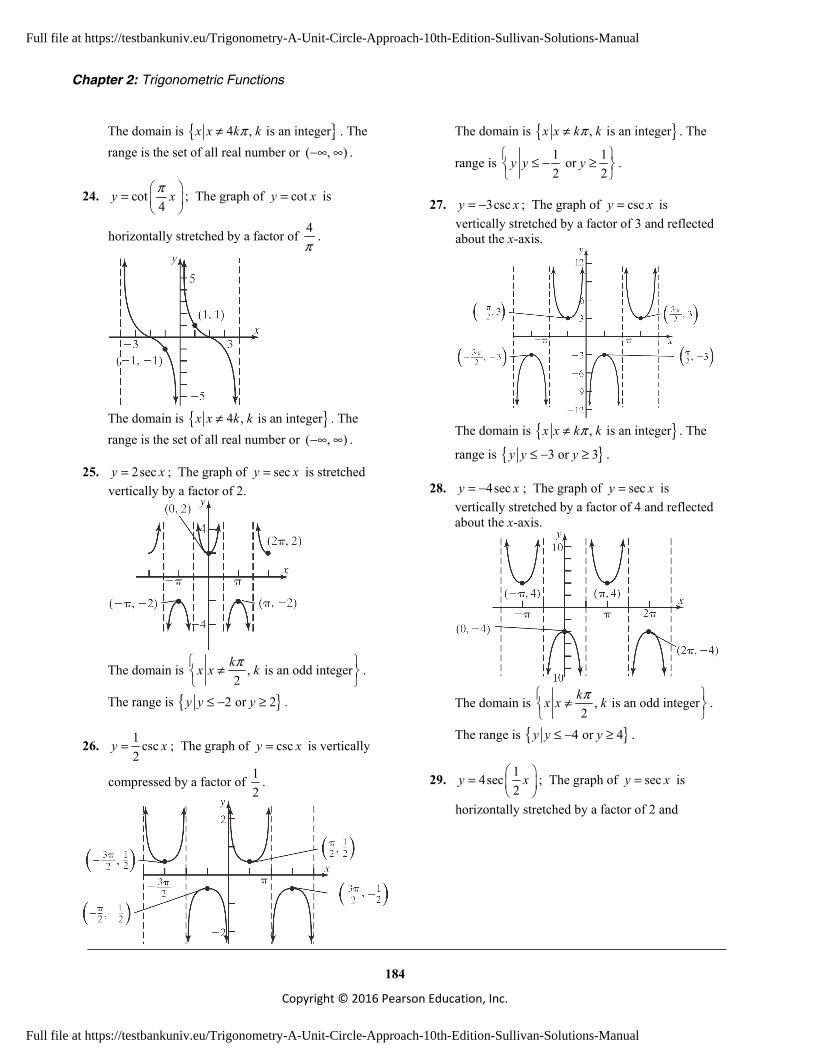
Chapter 2: Trigonometric Functions
184
Copyright © 2016 Pearson Education, Inc.
The domain is { }4 , is an integerx x k kπ≠ . The range is the set of all real number or ( , )−∞ ∞ .
24. cot4
y xπ =
; The graph of coty x= is
horizontally stretched by a factor of 4π
.
The domain is { }4 , is an integerx x k k≠ . The
range is the set of all real number or ( , )−∞ ∞ .
25. 2secy x= ; The graph of secy x= is stretched vertically by a factor of 2.
The domain is , is an odd integer2
kx x kπ ≠
.
The range is { }2 or 2y y y≤ − ≥ .
26. 1 csc2
y x= ; The graph of cscy x= is vertically
compressed by a factor of 12
.
The domain is { }, is an integerx x k kπ≠ . The
range is 1 1 or 2 2
y y y ≤ − ≥
.
27. 3cscy x= − ; The graph of cscy x= is vertically stretched by a factor of 3 and reflected about the x-axis.
The domain is { }, is an integerx x k kπ≠ . The
range is { }3 or 3y y y≤ − ≥ .
28. 4secy x= − ; The graph of secy x= is vertically stretched by a factor of 4 and reflected about the x-axis.
The domain is , is an odd integer2
kx x kπ ≠
.
The range is { }4 or 4y y y≤ − ≥ .
29. 14sec2
y x =
; The graph of secy x= is
horizontally stretched by a factor of 2 and
Full file at https://testbankuniv.eu/Trigonometry-A-Unit-Circle-Approach-10th-Edition-Sullivan-Solutions-Manual
Full file at https://testbankuniv.eu/Trigonometry-A-Unit-Circle-Approach-10th-Edition-Sullivan-Solutions-Manual
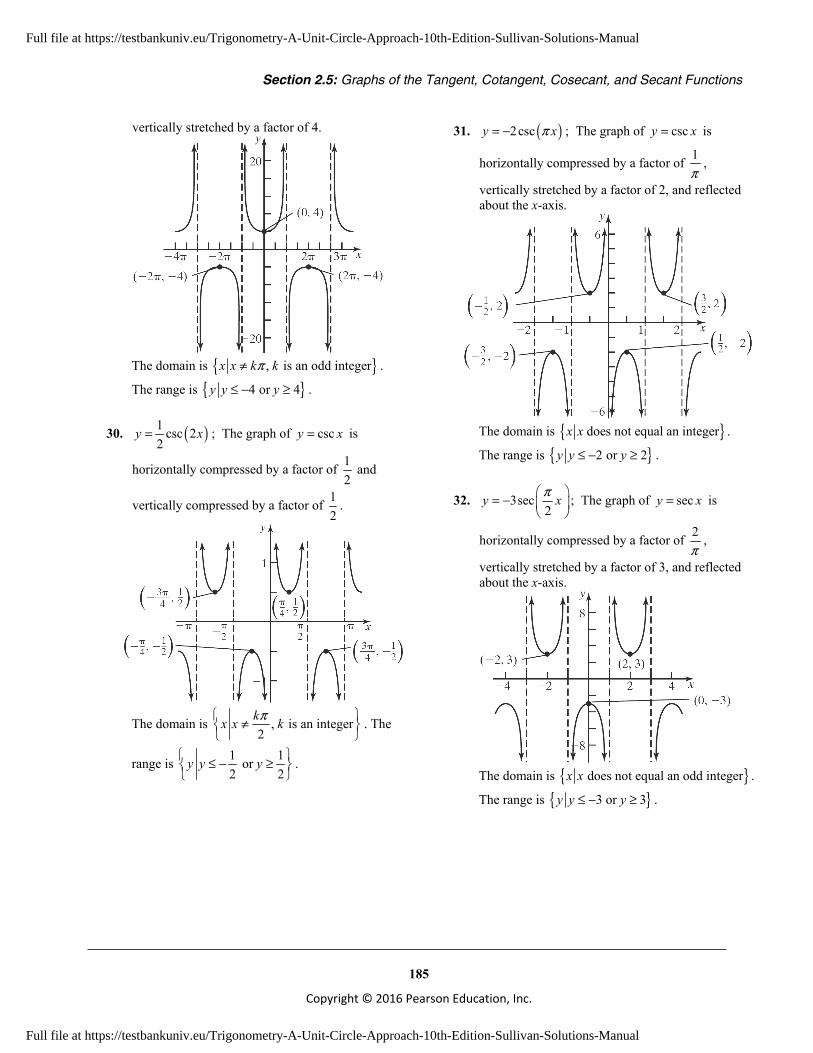
Section 2.5: Graphs of the Tangent, Cotangent, Cosecant, and Secant Functions
185
Copyright © 2016 Pearson Education, Inc.
vertically stretched by a factor of 4.
The domain is { }, is an odd integerx x k kπ≠ .
The range is { }4 or 4y y y≤ − ≥ .
30. ( )1 csc 22
y x= ; The graph of cscy x= is
horizontally compressed by a factor of 12
and
vertically compressed by a factor of 12
.
The domain is , is an integer2
kx x kπ ≠
. The
range is 1 1 or 2 2
y y y ≤ − ≥
.
31. ( )2cscy xπ= − ; The graph of cscy x= is
horizontally compressed by a factor of 1π
,
vertically stretched by a factor of 2, and reflected about the x-axis.
The domain is { }does not equal an integerx x .
The range is { }2 or 2y y y≤ − ≥ .
32. 3sec2
y xπ = −
; The graph of secy x= is
horizontally compressed by a factor of 2π
,
vertically stretched by a factor of 3, and reflected about the x-axis.
The domain is { } does not equal an odd integerx x .
The range is { }3 or 3y y y≤ − ≥ .
Full file at https://testbankuniv.eu/Trigonometry-A-Unit-Circle-Approach-10th-Edition-Sullivan-Solutions-Manual
Full file at https://testbankuniv.eu/Trigonometry-A-Unit-Circle-Approach-10th-Edition-Sullivan-Solutions-Manual

Chapter 2: Trigonometric Functions
186
Copyright © 2016 Pearson Education, Inc.
33. 1tan 14
y x = +
; The graph of tany x= is
horizontally stretched by a factor of 4 and shifted up 1 unit.
The domain is { }2 , is an odd integerx x k kπ≠ .
The range is the set of all real number or ( , )−∞ ∞ .
34. 2cot 1y x= − ; The graph of coty x= is vertically stretched by a factor of 2 and shifted down 1 unit.
The domain is { }, is an integerx x k kπ≠ . The
range is the set of all real number or ( , )−∞ ∞ .
35. 2sec 23
y xπ = +
; The graph of secy x= is
horizontally compressed by a factor of 32π
and
shifted up 2 units.
The domain is 3 , is an odd integer4
x x k k ≠
.
The range is { }1 or 3y y y≤ ≥ .
36. 3csc2
y xπ =
; The graph of cscy x= is
horizontally compressed by a factor of 23π
.
The domain is 2 , is an integer3
x x k k ≠
. The
range is { }1 or 1y y y≤ − ≥ .
Full file at https://testbankuniv.eu/Trigonometry-A-Unit-Circle-Approach-10th-Edition-Sullivan-Solutions-Manual
Full file at https://testbankuniv.eu/Trigonometry-A-Unit-Circle-Approach-10th-Edition-Sullivan-Solutions-Manual

Section 2.5: Graphs of the Tangent, Cotangent, Cosecant, and Secant Functions
187
Copyright © 2016 Pearson Education, Inc.
37. 1 1tan 22 4
y x = −
; The graph of tany x= is
horizontally stretched by a factor of 4, vertically
compressed by a factor of 12
, and shifted down 2
units.
The domain is { }2 , is an odd integerx x k kπ≠ .
The range is the set of all real number or ( , )−∞ ∞ .
38. 13cot 22
y x = −
; The graph of coty x= is
horizontally stretched by a factor of 2, vertically stretched by a factor of 3, and shifted down 2 units.
The domain is { }2 , is an integerx x k kπ≠ . The
range is the set of all real number or ( , )−∞ ∞ .
39. 12csc 13
y x = −
; The graph of cscy x= is
horizontally stretched by a factor of 3, vertically stretched by a factor of 2, and shifted down 1 unit.
The domain is { }3 , is an integerx x k kπ≠ .
The range is { }3 or 1y y y≤ − ≥ .
40. 13sec 14
y x = +
; The graph of secy x= is
horizontally stretched by a factor of 4, vertically stretched by a factor of 3, and shifted up 1 unit.
The domain is { }2 , is an odd integerx x k kπ≠ .
The range is { }2 or 4y y y≤ − ≥ .
41. ( ) ( ) ( )
30 0tan / 6 tan 06 3/ 6 / 60
63 6 2 3
3
f fππ
π π π
π π
− − − = =−
= ⋅ =
The average rate of change is 2 3π
.
Full file at https://testbankuniv.eu/Trigonometry-A-Unit-Circle-Approach-10th-Edition-Sullivan-Solutions-Manual
Full file at https://testbankuniv.eu/Trigonometry-A-Unit-Circle-Approach-10th-Edition-Sullivan-Solutions-Manual
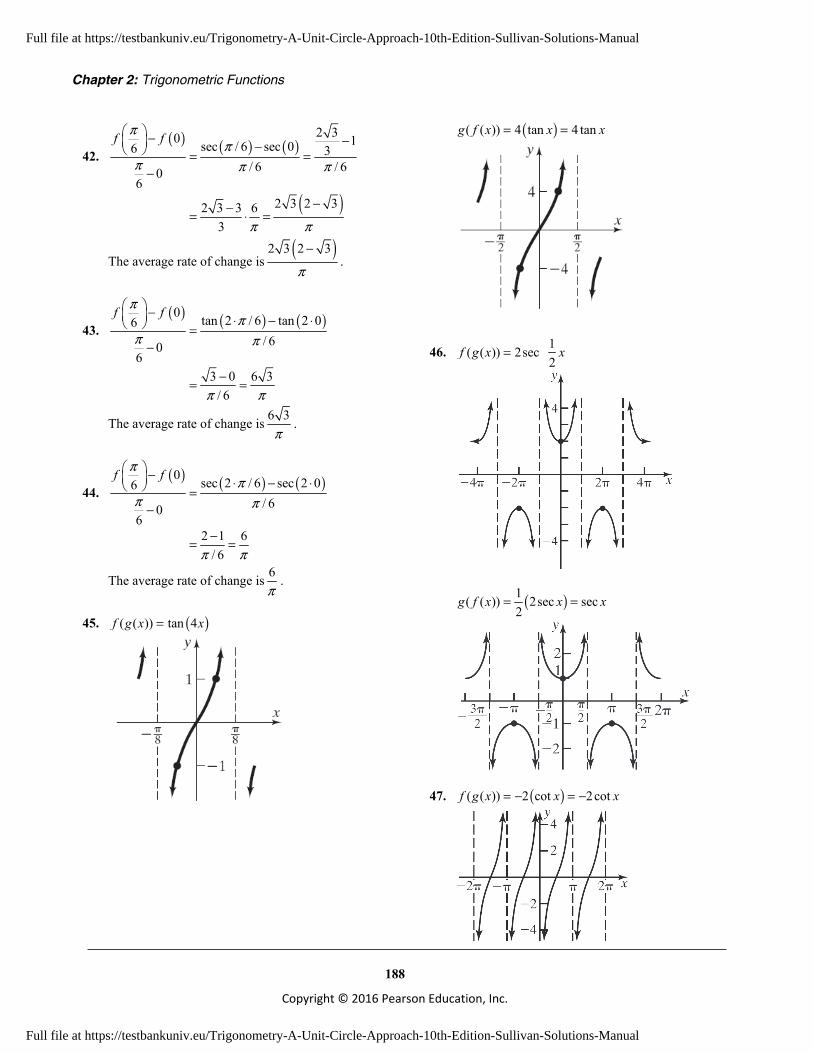
Chapter 2: Trigonometric Functions
188
Copyright © 2016 Pearson Education, Inc.
42. ( ) ( ) ( )
( )
2 30 1sec / 6 sec 06 3/ 6 / 60
62 3 2 32 3 3 6
3
f fππ
π π π
π π
− − − = =−
−−= ⋅ =
The average rate of change is( )2 3 2 3
π
−.
43. ( ) ( ) ( )0 tan 2 / 6 tan 2 06
/ 606
3 0 6 3/ 6
f fππ
π π
π π
− ⋅ − ⋅ =−
−= =
The average rate of change is 6 3π
.
44. ( ) ( ) ( )0 sec 2 / 6 sec 2 06
/ 606
2 1 6/ 6
f fππ
π π
π π
− ⋅ − ⋅ =−
−= =
The average rate of change is 6π
.
45. ( )( ( )) tan 4f g x x=
( )( ( )) 4 tan 4 tang f x x x= =
46. 1( ( )) 2sec2
f g x x =
( )1( ( )) 2sec sec2
g f x x x= =
47. ( )( ( )) 2 cot 2cotf g x x x= − = −
Full file at https://testbankuniv.eu/Trigonometry-A-Unit-Circle-Approach-10th-Edition-Sullivan-Solutions-Manual
Full file at https://testbankuniv.eu/Trigonometry-A-Unit-Circle-Approach-10th-Edition-Sullivan-Solutions-Manual

Section 2.5: Graphs of the Tangent, Cotangent, Cosecant, and Secant Functions
189
Copyright © 2016 Pearson Education, Inc.
( )( ( )) cot 2g f x x= −
48. ( )1( ( )) 2csc csc2
f g x x x= =
1( ( )) 2csc2
g f x x =
49.
50.
51. a. Consider the length of the line segment in
two sections, x, the portion across the hall that is 3 feet wide and y, the portion across that hall that is 4 feet wide. Then,
3cos
3cos
x
x
θ
θ
=
=
and 4sin
4sin
y
y
θ
θ
=
=
Thus, 3 4 3sec 4csc
cos sinL x y θ θ
θ θ= + = + = + .
b. Let 13 4
cos sinY
x x= + .
00
25
2π_
c. Use MINIMUM to find the least value:
00
25
2π_
L is least when 0.83θ ≈ .
d. ( ) ( )3 4 9.86 feet
cos 0.83 sin 0.83L ≈ + ≈ .
Note that rounding up will result in a ladder that won’t fit around the corner. Answers will vary.
Full file at https://testbankuniv.eu/Trigonometry-A-Unit-Circle-Approach-10th-Edition-Sullivan-Solutions-Manual
Full file at https://testbankuniv.eu/Trigonometry-A-Unit-Circle-Approach-10th-Edition-Sullivan-Solutions-Manual
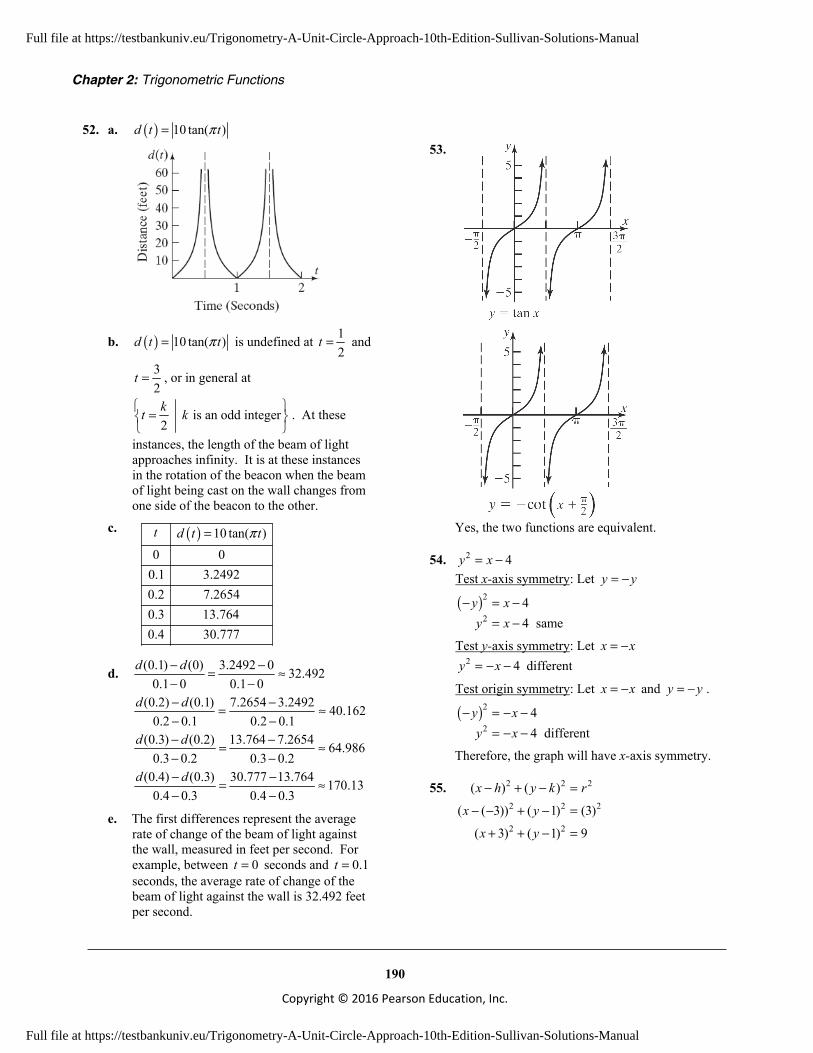
Chapter 2: Trigonometric Functions
190
Copyright © 2016 Pearson Education, Inc.
52. a. ( ) 10 tan( )d t tπ=
b. ( ) 10 tan( )d t tπ= is undefined at 12
t = and
32
t = , or in general at
is an odd integer2kt k =
. At these
instances, the length of the beam of light approaches infinity. It is at these instances in the rotation of the beacon when the beam of light being cast on the wall changes from one side of the beacon to the other.
c. ( ) 10 tan( )0 0
0.1 3.24920.2 7.26540.3 13.7640.4 30.777
t d t tπ=
d. (0.1) (0) 3.2492 0 32.4920.1 0 0.1 0
d d− −= ≈− −
(0.2) (0.1) 7.2654 3.2492 40.1620.2 0.1 0.2 0.1
d d− −= ≈− −
(0.3) (0.2) 13.764 7.2654 64.9860.3 0.2 0.3 0.2
d d− −= ≈− −
(0.4) (0.3) 30.777 13.764 170.130.4 0.3 0.4 0.3
d d− −= ≈− −
e. The first differences represent the average rate of change of the beam of light against the wall, measured in feet per second. For example, between 0t = seconds and 0.1t = seconds, the average rate of change of the beam of light against the wall is 32.492 feet per second.
53.
Yes, the two functions are equivalent.
54. 2 4y x= − Test x-axis symmetry: Let y y= −
( )2
244 same
y xy x
− = −= −
Test y-axis symmetry: Let x x= − 2 4y x= − − different
Test origin symmetry: Let x x= − and y y= − .
( )2
244 different
y xy x
− = − −= − −
Therefore, the graph will have x-axis symmetry.
55. 2 2 2
2 2 2
2 2
( ) ( )
( ( 3)) ( 1) (3)
( 3) ( 1) 9
x h y k r
x y
x y
− + − =
− − + − =
+ + − =
Full file at https://testbankuniv.eu/Trigonometry-A-Unit-Circle-Approach-10th-Edition-Sullivan-Solutions-Manual
Full file at https://testbankuniv.eu/Trigonometry-A-Unit-Circle-Approach-10th-Edition-Sullivan-Solutions-Manual
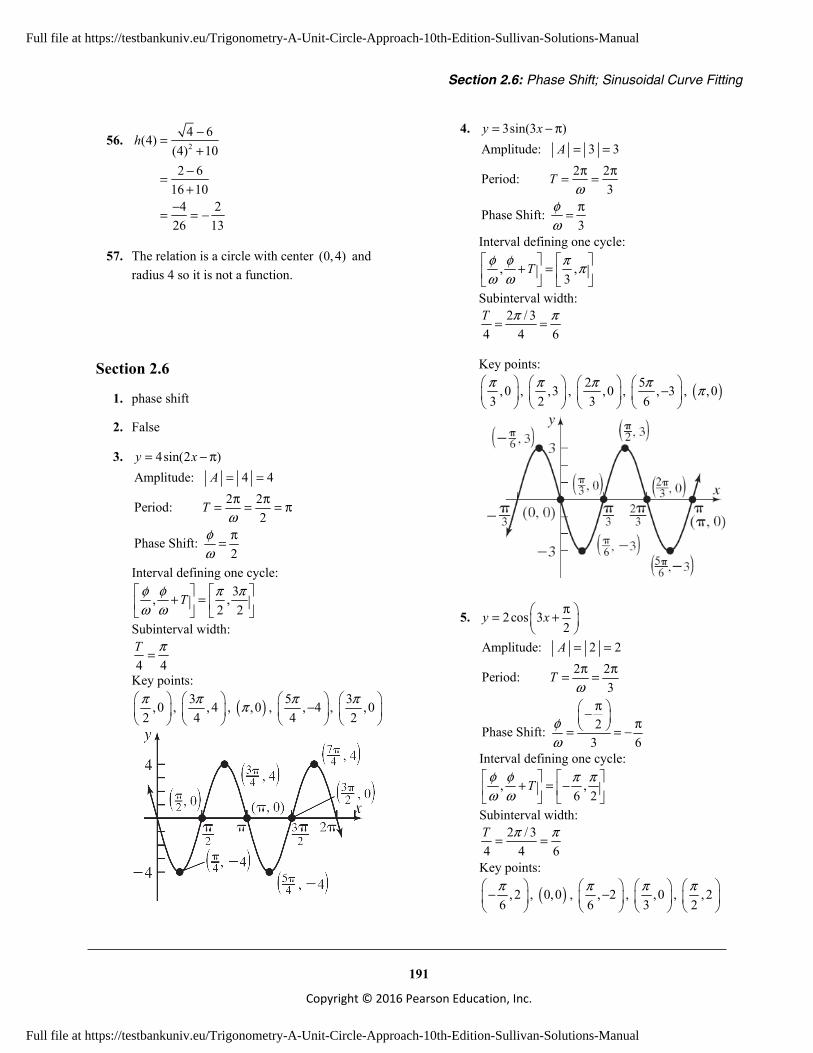
Section 2.6: Phase Shift; Sinusoidal Curve Fitting
191
Copyright © 2016 Pearson Education, Inc.
56. 24 6(4)
(4) 102 6
16 104 2
26 13
h −=+
−=+
−= = −
57. The relation is a circle with center (0, 4) and radius 4 so it is not a function.
Section 2.6
1. phase shift
2. False
3. 4sin(2 )y x= − π Amplitude: 4 4
2 2Period:2
Phase Shift:2
A
Tω
φω
= =π π= = = π
π=
Interval defining one cycle: 3, ,
2 2Tφ φ π π
ω ω + =
Subinterval width:
4 4T π=
Key points:
,02π
, 3 , 44π
, ( ),0π , 5 , 44π −
, 3 ,0
2π
4. 3sin(3 )y x= − π Amplitude: 3 3
2 2Period:3
Phase Shift:3
A
Tω
φω
= =π π= =
π=
Interval defining one cycle:
, ,3
Tφ φ π πω ω + =
Subinterval width: 2 / 3
4 4 6T π π= =
Key points:
,03π
, ,32π
, 2 ,03π
, 5 , 36π −
, ( ),0π
5. 2cos 32
y x π = +
Amplitude: 2 22 2Period:
3
2Phase Shift:3 6
A
Tω
φω
= =π π= =
π − π = = −
Interval defining one cycle:
, ,6 2
Tφ φ π πω ω + = −
Subinterval width: 2 / 3
4 4 6T π π= =
Key points:
, 26π −
, ( )0,0 , , 2
6π −
, ,03π
, , 22π
Full file at https://testbankuniv.eu/Trigonometry-A-Unit-Circle-Approach-10th-Edition-Sullivan-Solutions-Manual
Full file at https://testbankuniv.eu/Trigonometry-A-Unit-Circle-Approach-10th-Edition-Sullivan-Solutions-Manual
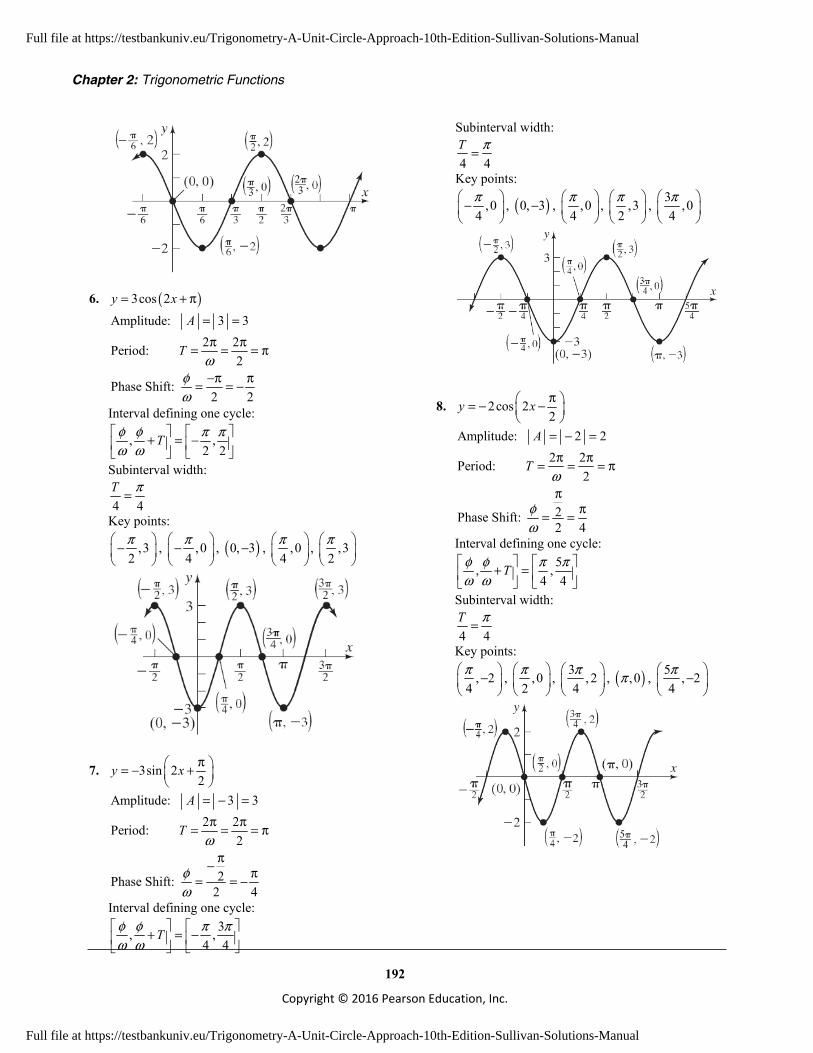
Chapter 2: Trigonometric Functions
192
Copyright © 2016 Pearson Education, Inc.
6. ( )3cos 2y x= + π Amplitude: 3 3
2 2Period:2
Phase Shift:2 2
A
Tω
φω
= =π π= = = π
−π π= = −
Interval defining one cycle:
, ,2 2
Tφ φ π πω ω + = −
Subinterval width:
4 4T π=
Key points:
,32π −
, ,0
4π −
, ( )0, 3− , ,0
4π
, ,32π
7. 3sin 22
y x π = − +
Amplitude: 3 32 2Period:
2
2Phase Shift:2 4
A
Tω
φω
= − =π π= = = π
π− π= = −
Interval defining one cycle: 3, ,
4 4Tφ φ π π
ω ω + = −
Subinterval width:
4 4T π=
Key points:
,04π −
, ( )0, 3− , ,0
4π
, ,32π
, 3 ,04π
8. 2cos 22
y x π = − −
Amplitude: 2 22 2Period:
2
2Phase Shift:2 4
A
Tω
φω
= − =π π= = = π
ππ= =
Interval defining one cycle: 5, ,
4 4Tφ φ π π
ω ω + =
Subinterval width:
4 4T π=
Key points:
, 24π −
, ,02π
, 3 , 24π
, ( ),0π , 5 , 24π −
Full file at https://testbankuniv.eu/Trigonometry-A-Unit-Circle-Approach-10th-Edition-Sullivan-Solutions-Manual
Full file at https://testbankuniv.eu/Trigonometry-A-Unit-Circle-Approach-10th-Edition-Sullivan-Solutions-Manual

Section 2.6: Phase Shift; Sinusoidal Curve Fitting
193
Copyright © 2016 Pearson Education, Inc.
9. 4sin( 2) 5y x= π + − Amplitude: 4 4
2 2Period: 2
2 2Phase Shift:
A
Tω
φω
= =π π= = =
π−= = −π π
Interval defining one cycle: 2 2, , 2Tφ φ
ω ω π π + = − −
Subinterval width: 2 1
4 4 2T = =
Key points: 2 , 5π
− −
, 1 2 , 12 π
− −
, 21 , 5π
− −
,
3 2 , 92 π
− −
, 22 , 5π
− −
10. 2cos(2 4) 4y x= π + + Amplitude: 2 2
2 2Period: 12
4 2Phase Shift:2
A
Tω
φω
= =π π= = =
π−= = −
π π
Interval defining one cycle: 2 2, ,1Tφ φ
ω ω π π + = − −
Subinterval width: 14 4T =
Key points: 2 ,6π
−
, 1 2 , 44 π
−
, 1 2 , 22 π
−
, 3 2 , 44 π
−
,
21 ,6π
−
11. 3cos( 2) 5y x= π − +
Amplitude: 3 32 2Period: 2
2Phase Shift:
A
Tω
φω
= =π π= = =
π
=π
Interval defining one cycle: 2 2, , 2Tφ φ
ω ω π π + = +
Subinterval width: 2 1
4 4 2T = =
Key points: 2 ,8π
, 1 2 ,52 π
+
, 21 ,2π
+
, 3 2 ,52 π
+
,
22 ,8π
+
Full file at https://testbankuniv.eu/Trigonometry-A-Unit-Circle-Approach-10th-Edition-Sullivan-Solutions-Manual
Full file at https://testbankuniv.eu/Trigonometry-A-Unit-Circle-Approach-10th-Edition-Sullivan-Solutions-Manual
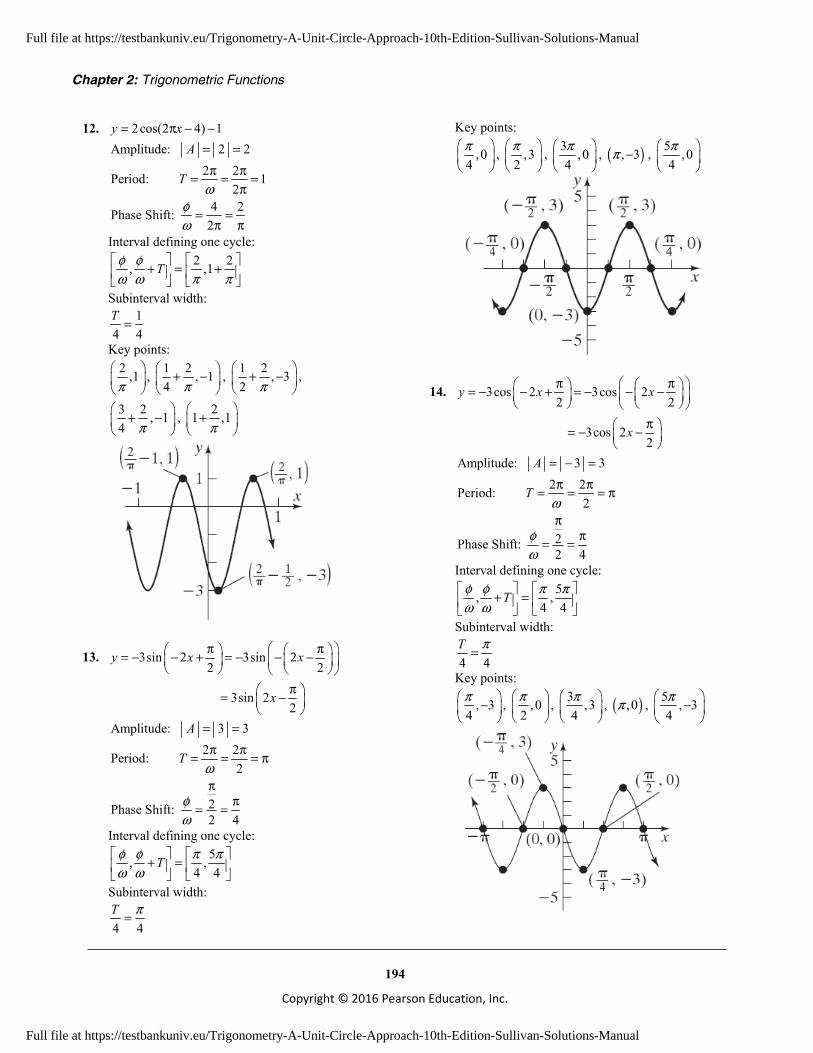
Chapter 2: Trigonometric Functions
194
Copyright © 2016 Pearson Education, Inc.
12. 2cos(2 4) 1y x= π − − Amplitude: 2 2
2 2Period: 12
4 2Phase Shift:2
A
Tω
φω
= =π π= = =
π
= =π π
Interval defining one cycle: 2 2, ,1Tφ φ
ω ω π π + = +
Subinterval width: 1
4 4T =
Key points: 2 ,1π
, 1 2 , 14 π
+ −
, 1 2 , 32 π
+ −
,
3 2 , 14 π
+ −
, 21 ,1π
+
13. 3sin 2 3sin 22 2
3sin 22
y x x
x
π π = − − + = − − −
π = −
Amplitude: 3 32 2Period:
2
2Phase Shift:2 4
A
Tω
φω
= =π π= = = π
ππ= =
Interval defining one cycle: 5, ,
4 4Tφ φ π π
ω ω + =
Subinterval width:
4 4T π=
Key points:
,04π
, ,32π
, 3 ,04π
, ( ), 3π − , 5 ,04π
14. 3cos 2 3cos 22 2
3cos 22
y x x
x
π π = − − + = − − −
π = − −
Amplitude: 3 32 2Period:
2
2Phase Shift:2 4
A
Tω
φω
= − =π π= = = π
ππ= =
Interval defining one cycle: 5, ,
4 4Tφ φ π π
ω ω + =
Subinterval width:
4 4T π=
Key points:
, 34π −
, ,02π
, 3 ,34π
, ( ),0π , 5 , 34π −
Full file at https://testbankuniv.eu/Trigonometry-A-Unit-Circle-Approach-10th-Edition-Sullivan-Solutions-Manual
Full file at https://testbankuniv.eu/Trigonometry-A-Unit-Circle-Approach-10th-Edition-Sullivan-Solutions-Manual

Section 2.6: Phase Shift; Sinusoidal Curve Fitting
195
Copyright © 2016 Pearson Education, Inc.
15. 12; ;2
A T φω
= = π =
2 2 2T
ω π π= = =π
12 2
1
φ φω
φ
= =
=
Assuming A is positive, we have that sin( ) 2sin(2 1)
1 2sin 22
y A x x
x
ω φ= − = −
= −
16. 3; ; 22
A T φω
π= = =
2 2 4
2T
ω π π= = =π
24
8
φ φω
φ
= =
=
Assuming A is positive, we have that
( )sin( ) 3sin(4 8)
3sin 4 2y A x x
xω φ= − = −
= −
17. 13; 3 ;3
A T φω
= = π = −
2 2 23 3T
ω π π= = =π
12 33
1 2 23 3 9
φ φω
φ
= = −
= − ⋅ = −
Assuming A is positive, we have that 2 2sin( ) 3sin3 92 1 3sin3 3
y A x x
x
ω φ = − = + = +
18. 2; ; 2A T φω
= = π = −
2 2 2T
ω π π= = =π
22
4
φ φω
φ
= = −
= −
Assuming A is positive, we have that
( )sin( ) 2sin(2 4)
2sin 2 2y A x x
xω φ= − = +
= +
19. ( )2 tan 4y x π= − Begin with the graph of tany x= and apply the following transformations:
1) Shift right π units ( )tany x π = −
2) Horizontally compress by a factor of 14
( )tan 4y x π = −
3) Vertically stretch by a factor of 2 ( )2 tan 4y x π = −
20. ( )1 cot 22
y x π= −
Begin with the graph of coty x= and apply the following transformations:
1) Shift right π units ( )coty x π = −
2) Horizontally compress by a factor of 12
( )cot 2y x π = −
3) Vertically compress by a factor of 12
( )1 cot 22
y x π = −
Full file at https://testbankuniv.eu/Trigonometry-A-Unit-Circle-Approach-10th-Edition-Sullivan-Solutions-Manual
Full file at https://testbankuniv.eu/Trigonometry-A-Unit-Circle-Approach-10th-Edition-Sullivan-Solutions-Manual

Chapter 2: Trigonometric Functions
196
Copyright © 2016 Pearson Education, Inc.
21. 3csc 24
y x π = −
Begin with the graph of cscy x= and apply the following transformations:
1) Shift right 4π units csc
4y x π = −
2) Horizontally compress by a factor of 12
csc 24
y x π = −
3) Vertically stretch by a factor of 3
3csc 24
y x π = −
22. ( )1 sec 32
y x π= −
Begin with the graph of secy x= and apply the following transformations:
1) Shift right π units ( )secy x π = −
2) Horizontally compress by a factor of 13
( )sec 3y x π = −
3) Vertically compress by a factor of 12
( )1 sec 32
y x π = −
23. cot 22
y x π = − +
Begin with the graph of coty x= and apply the following transformations:
1) Shift left 2π units cot
2y x π = +
2) Horizontally compress by a factor of 12
cot 22
y x π = +
3) Reflect about the x-axis
cot 22
y x π = − +
Full file at https://testbankuniv.eu/Trigonometry-A-Unit-Circle-Approach-10th-Edition-Sullivan-Solutions-Manual
Full file at https://testbankuniv.eu/Trigonometry-A-Unit-Circle-Approach-10th-Edition-Sullivan-Solutions-Manual
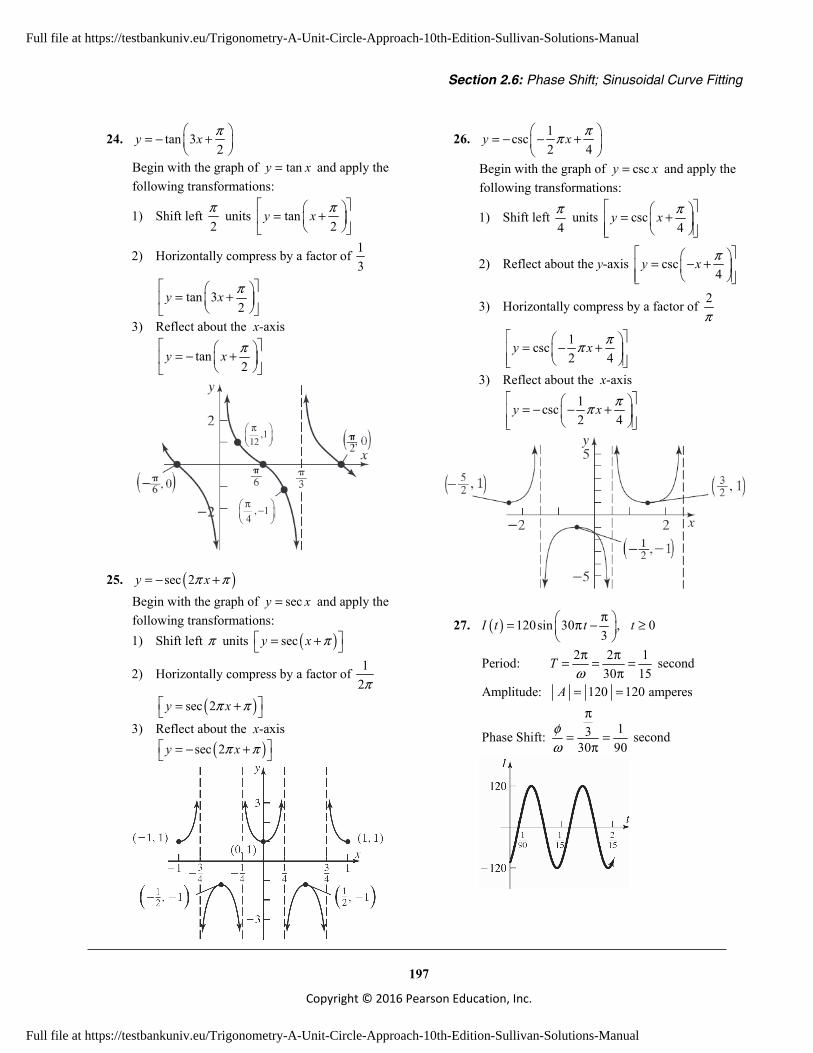
Section 2.6: Phase Shift; Sinusoidal Curve Fitting
197
Copyright © 2016 Pearson Education, Inc.
24. tan 32
y x π = − +
Begin with the graph of tany x= and apply the following transformations:
1) Shift left 2π units tan
2y x π = +
2) Horizontally compress by a factor of 13
tan 32
y x π = +
3) Reflect about the x-axis
tan2
y x π = − +
,112π
, 14π −
25. ( )sec 2y xπ π= − + Begin with the graph of secy x= and apply the following transformations:
1) Shift left π units ( )secy x π = +
2) Horizontally compress by a factor of 12π
( )sec 2y xπ π = +
3) Reflect about the x-axis ( )sec 2y xπ π = − +
26. 1csc2 4
y x ππ = − − +
Begin with the graph of cscy x= and apply the following transformations:
1) Shift left 4π units csc
4y x π = +
2) Reflect about the y-axis csc4
y x π = − +
3) Horizontally compress by a factor of 2π
1csc2 4
y x ππ = − +
3) Reflect about the x-axis 1csc2 4
y x ππ = − − +
27. ( ) 120sin 30 , 03
I t t tπ = π − ≥
2 2 1Period: second30 15
Amplitude: 120 120 amperes
13Phase Shift: second30 90
T
Aω
φω
π π= = =π
= =π
= =π
Full file at https://testbankuniv.eu/Trigonometry-A-Unit-Circle-Approach-10th-Edition-Sullivan-Solutions-Manual
Full file at https://testbankuniv.eu/Trigonometry-A-Unit-Circle-Approach-10th-Edition-Sullivan-Solutions-Manual

Chapter 2: Trigonometric Functions
198
Copyright © 2016 Pearson Education, Inc.
28. ( ) 220sin 60 , 06
I t t tπ = π − ≥
2 2 1Period: second60 30
Amplitude: 220 220 amperes
16Phase Shift: second60 360
T
Aω
φω
π π= = =π
= =π
= =π
29. a.
b. 33 16 17Amplitude: 8.52 2
A −= = =
33+16 49Vertical Shift: 24.52 2
2 25 5
Phase Shift (use 16, 6):y x
ω
= =
π π= =
= =
216 8.5sin 6 24.55
128.5 8.5sin5
121 sin5
122 5
2910
φ
φ
φ
φ
φ
π = ⋅ − +
π − = − π − = −
π π− = −
π=
Thus, 2 118.5sin 24.55 10
y xπ π = − +
or
2 118.5sin 24.55 4
y x π = − + .
c.
d. ( )9.46sin 1.247 2.906 24.088y x= + +
e.
30. a.
b. 79.8 36.0 43.8Amplitude: 21.92 2
A −= = =
79.8+36.0 115.8Vertical Shift: 57.92 2
212 6
ω
= =
π π= =
Phase Shift (use 36.0, 1):y x= =
36.0 21.9sin 1 57.96
21.9 21.9sin6
1 sin6
2 623
φ
φ
φ
φ
φ
π = ⋅ − +
π − = −
π − = − π π
− = −
π=
Thus, 221.9sin 57.96 3
y xπ π = − + or
( )21.9sin 4 57.96
y xπ = − + .
Full file at https://testbankuniv.eu/Trigonometry-A-Unit-Circle-Approach-10th-Edition-Sullivan-Solutions-Manual
Full file at https://testbankuniv.eu/Trigonometry-A-Unit-Circle-Approach-10th-Edition-Sullivan-Solutions-Manual
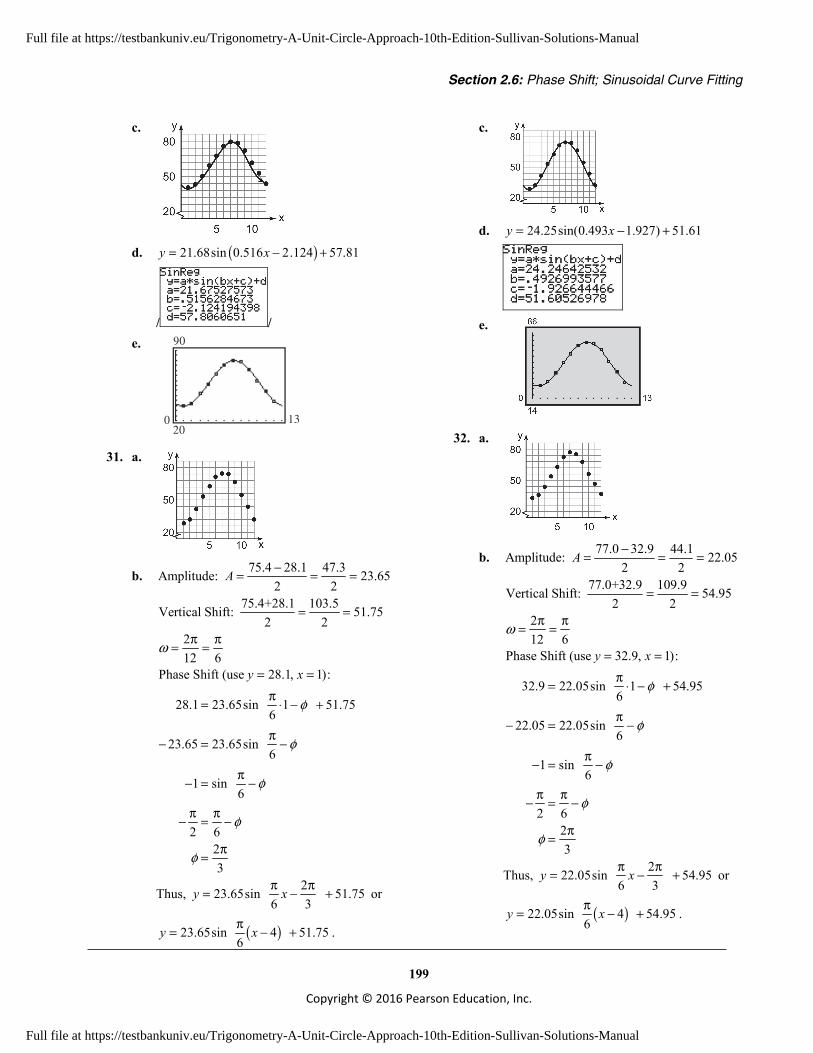
Section 2.6: Phase Shift; Sinusoidal Curve Fitting
199
Copyright © 2016 Pearson Education, Inc.
c.
d. ( )21.68sin 0.516 2.124 57.81y x= − +
/ / e.
200
90
13
31. a.
b. 75.4 28.1 47.3Amplitude: 23.652 2
A −= = =
75.4+28.1 103.5Vertical Shift: 51.752 2
212 6
ω
= =
π π= =
Phase Shift (use 28.1, 1):y x= =
28.1 23.65sin 1 51.756
23.65 23.65sin6
1 sin6
2 623
φ
φ
φ
φ
φ
π = ⋅ − +
π − = −
π − = − π π
− = −
π=
Thus, 223.65sin 51.756 3
y xπ π = − + or
( )23.65sin 4 51.756
y xπ = − + .
c.
d. 24.25sin(0.493 1.927) 51.61y x= − +
e.
32. a.
b. 77.0 32.9 44.1Amplitude: 22.052 2
A −= = =
77.0+32.9 109.9Vertical Shift: 54.952 2
212 6
ω
= =
π π= =
Phase Shift (use 32.9, 1):y x= =
32.9 22.05sin 1 54.956
22.05 22.05sin6
1 sin6
2 623
φ
φ
φ
φ
φ
π = ⋅ − +
π − = −
π − = − π π
− = −
π=
Thus, 222.05sin 54.956 3
y xπ π = − + or
( )22.05sin 4 54.956
y xπ = − + .
Full file at https://testbankuniv.eu/Trigonometry-A-Unit-Circle-Approach-10th-Edition-Sullivan-Solutions-Manual
Full file at https://testbankuniv.eu/Trigonometry-A-Unit-Circle-Approach-10th-Edition-Sullivan-Solutions-Manual
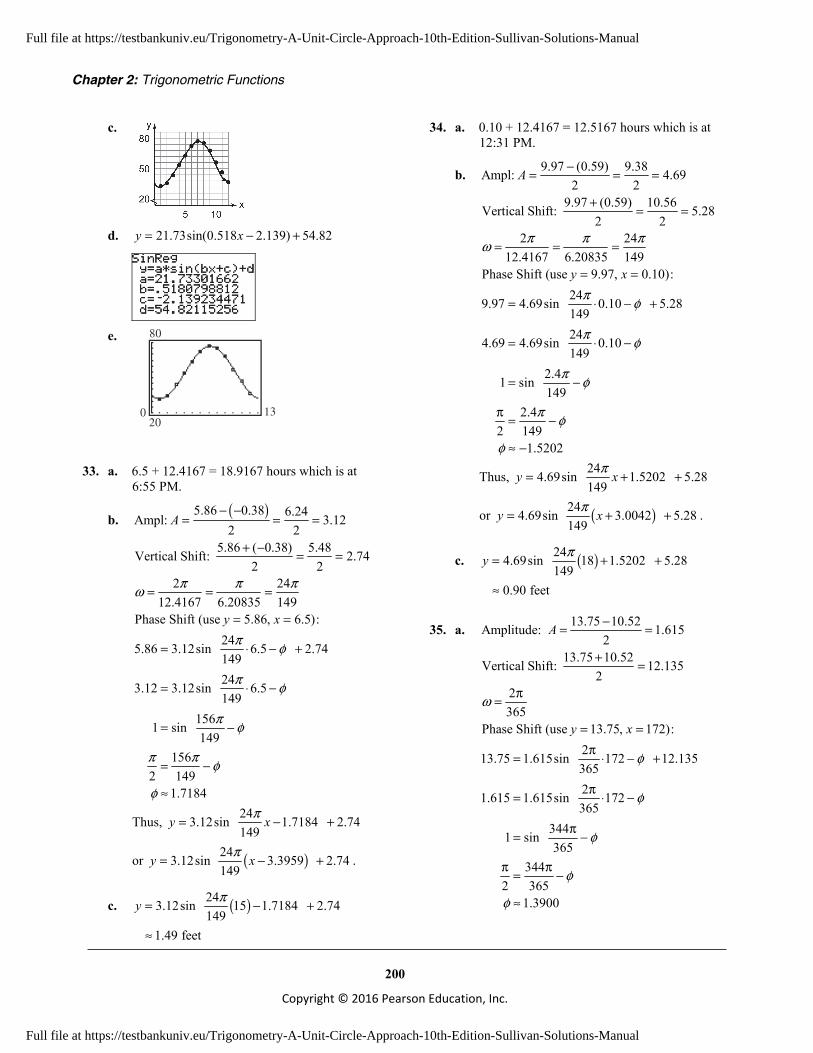
Chapter 2: Trigonometric Functions
200
Copyright © 2016 Pearson Education, Inc.
c.
d. 21.73sin(0.518 2.139) 54.82y x= − +
e.
200
80
13
33. a. 6.5 + 12.4167 = 18.9167 hours which is at
6:55 PM.
b. ( )5.86 0.38 6.24Ampl: 3.122 2
A− −
= = =
5.86 ( 0.38) 5.48Vertical Shift: 2.742 2
2 2412.4167 6.20835 149
Phase Shift (use 5.86, 6.5):y x
π π πω
+ −= =
= = =
= =245.86 3.12sin 6.5 2.74149243.12 3.12sin 6.5149
1561 sin149
1562 149
1.7184
π φ
π φ
π φ
π π φ
φ
= ⋅ − +
= ⋅ −
= −
= −
≈
Thus, 243.12sin 1.7184 2.74149
y xπ = − +
or ( )243.12sin 3.3959 2.74149
y xπ = − + .
c. ( )243.12sin 15 1.7184 2.74149
1.49 feet
y π = − + ≈
34. a. 0.10 + 12.4167 = 12.5167 hours which is at 12:31 PM.
b. 9.97 (0.59) 9.38Ampl: 4.692 2
A −= = =
9.97 (0.59) 10.56Vertical Shift: 5.282 2
2 2412.4167 6.20835 149
Phase Shift (use 9.97, 0.10):y x
π π πω
+= =
= = =
= =
249.97 4.69sin 0.10 5.28149244.69 4.69sin 0.10149
2.41 sin149
2.42 149
1.5202
π φ
π φ
π φ
π φ
φ
= ⋅ − +
= ⋅ −
= − π
= −
≈ −
Thus, 244.69sin 1.5202 5.28149
y xπ = + +
or ( )244.69sin 3.0042 5.28149
y xπ = + + .
c. ( )244.69sin 18 1.5202 5.28149
0.90 feet
y π = + + ≈
35. a. 13.75 10.52Amplitude: 1.6152
A −= =
13.75 10.52Vertical Shift: 12.1352
2365
Phase Shift (use 13.75, 172):y x
ω
+=
π=
= =
213.75 1.615sin 172 12.13536521.615 1.615sin 172365
3441 sin365
3442 365
1.3900
φ
φ
φ
φ
φ
π = ⋅ − +
π = ⋅ −
π = − π π
= −
≈
Full file at https://testbankuniv.eu/Trigonometry-A-Unit-Circle-Approach-10th-Edition-Sullivan-Solutions-Manual
Full file at https://testbankuniv.eu/Trigonometry-A-Unit-Circle-Approach-10th-Edition-Sullivan-Solutions-Manual

Section 2.6: Phase Shift; Sinusoidal Curve Fitting
201
Copyright © 2016 Pearson Education, Inc.
Thus, 21.615sin 1.39 12.135365
y xπ = − + or
( )21.615sin 80.75 12.135365
y xπ = − + .
b. ( )21.615sin 91 80.75 12.135365
12.42 hours
y π = − + ≈
c.
d. The actual hours of sunlight on April 1,
2014 were 12.43 hours. This is very close to the predicted amount of 12.42 hours.
36. a. 15.27 9.07Amplitude: 3.12
A −= =
15.27 9.07Vertical Shift: 12.172
2365
Phase Shift (use 15.27, 172):y x
ω
+=
π=
= =
215.27 3.1sin 172 12.1736523.1 3.1sin 172365
3441 sin365
3442 365
1.39
φ
φ
φ
φ
φ
π = ⋅ − +
π = ⋅ −
π = − π π
= −
≈
Thus, 23.1sin 1.39 12.17365
y xπ = − + or
( )23.1sin 80.75 12.17365
y xπ = − + .
b. ( )23.1sin 91 1.39 12.17365
12.71 hours
y π = − + ≈
c.
d. The actual hours of sunlight on April 1,
2014 were 12.75 hours. This is very close to the predicted amount of 12.71 hours.
37. a. 19.37 5.45Amplitude: 6.962
A −= =
19.37 5.45Vertical Shift: 12.412
2365
Phase Shift (use 19.37, 172):y x
ω
+=
π=
= =
219.37 6.96sin 172 12.4136526.96 6.96sin 172365
3441 sin365
3442 365
1.39
φ
φ
φ
φ
φ
π = ⋅ − +
π = ⋅ −
π = − π π
= −
≈
Thus, 26.96sin 1.39 12.41365
y xπ = − + or
( )26.96sin 80.75 12.41365
y xπ = − + .
b. ( )26.96sin 91 1.39 12.41365
13.63 hours
y π = − + ≈
Full file at https://testbankuniv.eu/Trigonometry-A-Unit-Circle-Approach-10th-Edition-Sullivan-Solutions-Manual
Full file at https://testbankuniv.eu/Trigonometry-A-Unit-Circle-Approach-10th-Edition-Sullivan-Solutions-Manual
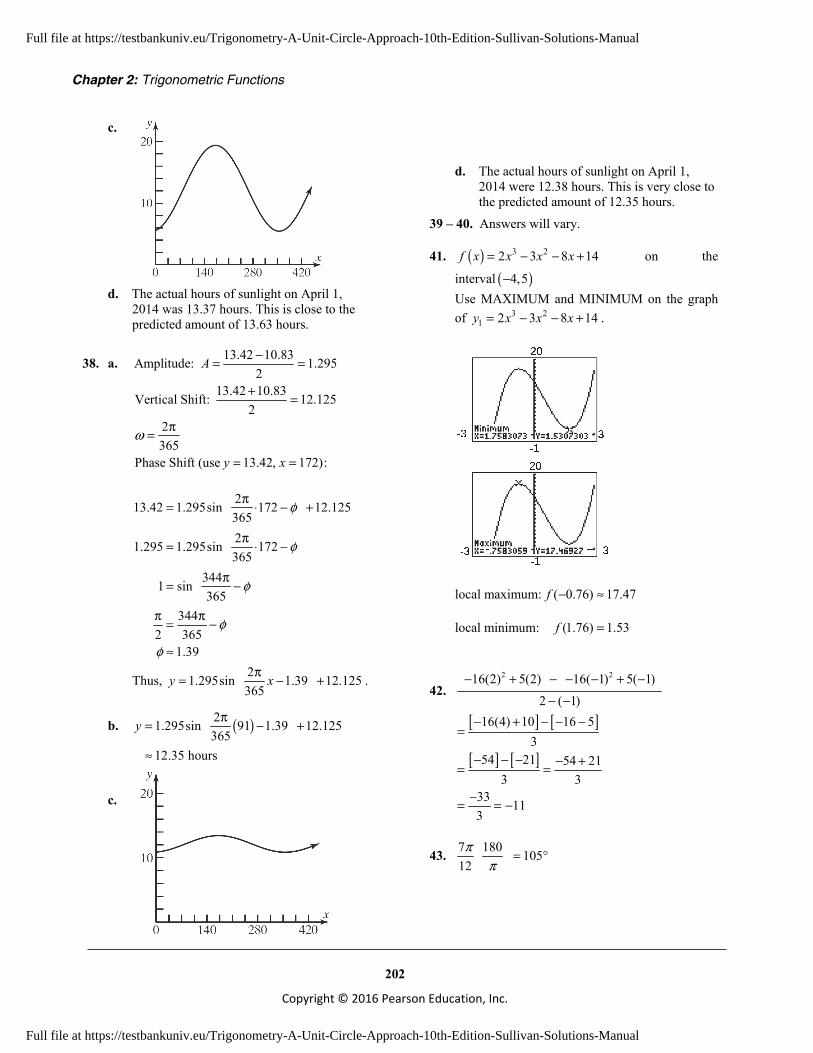
Chapter 2: Trigonometric Functions
202
Copyright © 2016 Pearson Education, Inc.
c.
d. The actual hours of sunlight on April 1,
2014 was 13.37 hours. This is close to the predicted amount of 13.63 hours.
38. a. 13.42 10.83Amplitude: 1.2952
A −= =
13.42 10.83Vertical Shift: 12.1252
2365
Phase Shift (use 13.42, 172):y x
ω
+=
π=
= =
213.42 1.295sin 172 12.12536521.295 1.295sin 172365
3441 sin365
3442 365
1.39
φ
φ
φ
φ
φ
π = ⋅ − +
π = ⋅ −
π = − π π
= −
≈
Thus, 21.295sin 1.39 12.125365
y xπ = − + .
b. ( )21.295sin 91 1.39 12.125365
12.35 hours
y π = − + ≈
c.
d. The actual hours of sunlight on April 1, 2014 were 12.38 hours. This is very close to the predicted amount of 12.35 hours.
39 – 40. Answers will vary.
41. ( ) 3 22 3 8 14f x x x x= − − + on the
interval ( )4,5− Use MAXIMUM and MINIMUM on the graph of 3 2
1 2 3 8 14y x x x= − − + .
local maximum: ( 0.76) 17.47f − ≈
local minimum: (1.76) 1.53f =
42.
[ ] [ ]
[ ] [ ]
2 216(2) 5(2) 16( 1) 5( 1)2 ( 1)
16(4) 10 16 53
54 21 54 213 3
33 113
− + − − − + − − −
− + − − −=
− − − − += =
−= = −
43. 7 180 10512π
π = °
Full file at https://testbankuniv.eu/Trigonometry-A-Unit-Circle-Approach-10th-Edition-Sullivan-Solutions-Manual
Full file at https://testbankuniv.eu/Trigonometry-A-Unit-Circle-Approach-10th-Edition-Sullivan-Solutions-Manual

Chapter 2 Review Exercises
203
Copyright © 2016 Pearson Education, Inc.
44. 2
2
9 54
2
xxx
− = −== ±
But only the 2− is in the domain of the part of the piecewise function.
3 7 53 12
4
xxx
− + = −− = −
=
Thus the values are { }2, 4− .
Chapter 2 Review Exercises
1. 3135 135 radian radians180 4
π π° = ⋅ =
2. 18 18 radian radian180 10
π π° = ⋅ =
3. 3 3 180 degrees 1354 4π π= ⋅ = °
π
4. 5 5 180 degrees 4502 2π π− = − ⋅ = − °
π
5. 1 1tan sin 14 6 2 2π π− = − =
6. 2 3 3 2 4 33sin 45º 4 tan 3 46 2 3 2 3π− = ⋅ − ⋅ = −
7. ( )3 26cos 2 tan 6 2 34 3 2
3 2 2 3
π π + − = − + −
= − −
8. 5 5sec cot sec cot 2 1 33 4 3 4π π π π − − − = + = + =
9. tan sin 0 0 0π + π = + =
10. cos540º tan( 405º ) 1 ( 1)1 1 0
− − = − − −= − + =
11. 2 2 221sin 20º sin 20º cos 20º 1
sec 20º+ = + =
12. 1sec50º cos50º cos50º 1cos50º
⋅ = ⋅ =
13. cos( 40º ) cos 40º 1cos 40º cos 40º
− = =
14. sin( 40º ) sin 40º 1sin 40º sin 40º
− −= = −
15. ( )
( )
sin 400º sec 50º sin 400º sec50º1sin 40º 360º
cos50ºsin 40º sin 40ºcos50º sin(90º 50º )sin 40º 1sin 40º
⋅ − = ⋅
= + ⋅
= =−
= =
16. 4sin5
θ = and 02πθ< < , so θ lies in quadrant I.
Using the Pythagorean Identities: 2 2
22
cos 1 sin
4 16 9cos 1 15 25 259 3cos25 5
θ θ
θ
θ
= −
= − = − =
= ± = ±
Note that cosθ must be positive since θ lies in
quadrant I. Thus, 3cos5
θ = .
4535
sin 4 5 4tancos 5 3 3
θθθ
== = ⋅ =
45
1 1 5 5csc 1sin 4 4
θθ
== = ⋅ =
35
1 1 5 5sec 1cos 3 3
θθ
== = ⋅ =
43
11 1 3 3cot
tan 4 4θ
θ== = ⋅ =
17. 12tan5
θ = and sin 0θ < , so θ lies in quadrant III.
Using the Pythagorean Identities:
Full file at https://testbankuniv.eu/Trigonometry-A-Unit-Circle-Approach-10th-Edition-Sullivan-Solutions-Manual
Full file at https://testbankuniv.eu/Trigonometry-A-Unit-Circle-Approach-10th-Edition-Sullivan-Solutions-Manual
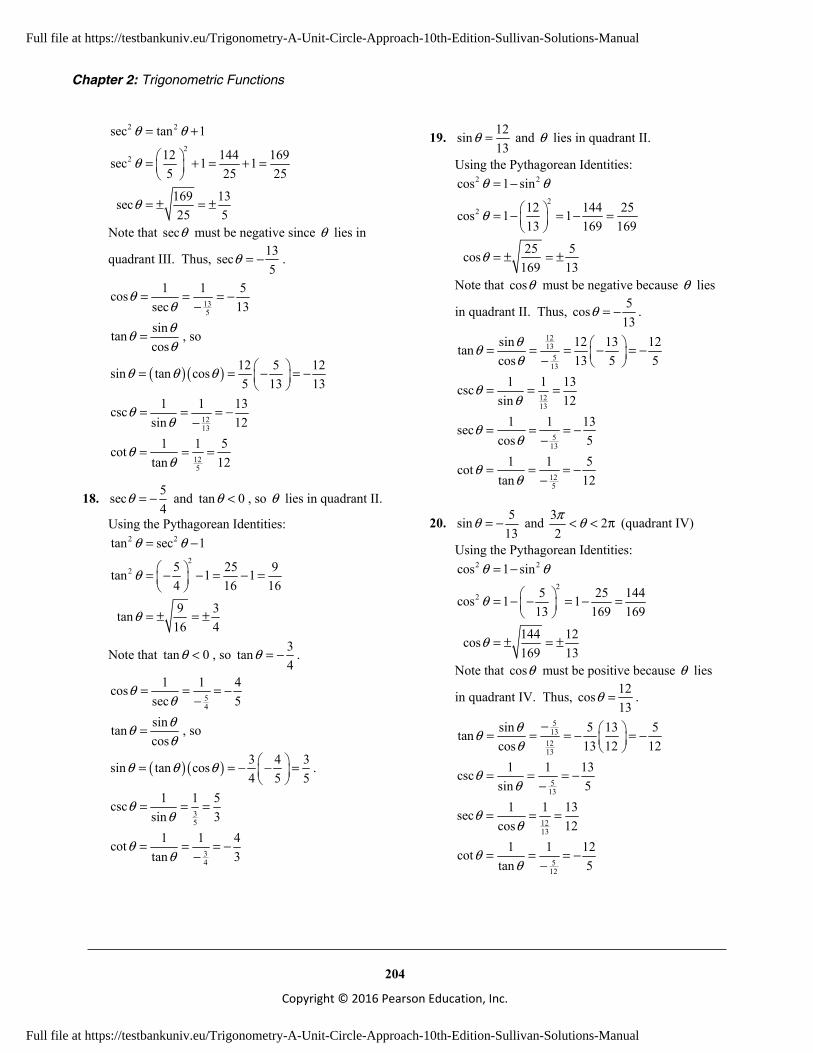
Chapter 2: Trigonometric Functions
204
Copyright © 2016 Pearson Education, Inc.
2 2
22
sec tan 1
12 144 169sec 1 15 25 25169 13sec25 5
θ θ
θ
θ
= +
= + = + =
= ± = ±
Note that secθ must be negative since θ lies in
quadrant III. Thus, 13sec5
θ = − .
135
1 1 5cossec 13
θθ
= = = −−
sintancos
θθθ
= , so
( )( ) 12 5 12sin tan cos5 13 13
θ θ θ = = − = −
1213
1 1 13cscsin 12
θθ
= = = −−
125
1 1 5cottan 12
θθ
= = =
18. 5sec4
θ = − and tan 0θ < , so θ lies in quadrant II.
Using the Pythagorean Identities: 2 2
22
tan sec 1
5 25 9tan 1 14 16 169 3tan
16 4
θ θ
θ
θ
= −
= − − = − =
= ± = ±
Note that tan 0θ < , so 3tan4
θ = − .
54
1 1 4cossec 5
θθ
= = = −−
sintancos
θθθ
= , so
( )( ) 3 4 3sin tan cos4 5 5
θ θ θ = = − − =
.
35
1 1 5cscsin 3
θθ
= = =
34
1 1 4cottan 3
θθ
= = = −−
19. 12sin13
θ = and θ lies in quadrant II.
Using the Pythagorean Identities: 2 2
22
cos 1 sin
12 144 25cos 1 113 169 16925 5cos
169 13
θ θ
θ
θ
= −
= − = − =
= ± = ±
Note that cosθ must be negative because θ lies
in quadrant II. Thus, 5cos13
θ = − .
1213
513
sin 12 13 12tancos 13 5 5
θθθ
= = = − = − −
1213
1 1 13cscsin 12
θθ
= = =
513
1 1 13seccos 5
θθ
= = = −−
125
1 1 5cottan 12
θθ
= = = −−
20. 5sin13
θ = − and 3 22π θ< < π (quadrant IV)
Using the Pythagorean Identities: 2 2
22
cos 1 sin
5 25 144cos 1 113 169 169
144 12cos169 13
θ θ
θ
θ
= −
= − − = − =
= ± = ±
Note that cosθ must be positive because θ lies
in quadrant IV. Thus, 12cos13
θ = .
513
1213
sin 5 13 5tancos 13 12 12
θθθ
− = = = − = −
513
1 1 13cscsin 5
θθ
= = = −−
1213
1 1 13seccos 12
θθ
= = =
512
1 1 12cottan 5
θθ
= = = −−
Full file at https://testbankuniv.eu/Trigonometry-A-Unit-Circle-Approach-10th-Edition-Sullivan-Solutions-Manual
Full file at https://testbankuniv.eu/Trigonometry-A-Unit-Circle-Approach-10th-Edition-Sullivan-Solutions-Manual

Chapter 2 Review Exercises
205 Copyright © 2016 Pearson Education, Inc.
21. 1tan3
θ = and 180º 270ºθ< < (quadrant III)
Using the Pythagorean Identities: 2 2
22
sec tan 1
1 1 10sec 1 13 9 9
10 10sec9 3
θ θ
θ
θ
= +
= + = + =
= ± = ±
Note that secθ must be negative since θ lies in
quadrant III. Thus, 10sec3
θ = − .
1 1 3 10 3 10cossec 1010 10 10
3
θθ
= = = − ⋅ = −−
sintancos
θθθ
= , so
( )( ) 1 3 10 10sin tan cos3 10 10
θ θ θ
= = − = −
1 1 10csc 10sin 10 10
10
θθ
= = = − = −−
13
1 1cot 3tan
θθ
= = =
22. sec 3θ = and 3 22π θ< < π (quadrant IV)
Using the Pythagorean Identities: 2 2
2 2
tan sec 1tan 3 1 9 1 8
tan 8 2 2
θ θθθ
= −
= − = − =
= ± = ±
Note that tanθ must be negative since θ lies in quadrant IV. Thus,. tan 2 2θ = − .
1 1cossec 3
θθ
= =
sintancos
θθθ
= , so
( )( ) 1 2 2sin tan cos 2 23 3
θ θ θ = = − = −
.
2 23
1 1 3 2 3 2cscsin 2 42 2
θθ
= = = − ⋅ = −−
1 1 2 2cottan 42 2 2
θθ
= = ⋅ = −−
23. cot 2θ = − and 2π θ< < π (quadrant II)
Using the Pythagorean Identities:
( )
2 2
22
csc 1 cot
csc 1 2 1 4 5
csc 5
θ θ
θ
θ
= +
= + − = + =
= ±
Note that cscθ must be positive because θ lies in quadrant II. Thus, csc 5θ = .
1 1 5 5sincsc 55 5
θθ
= = ⋅ =
coscotsin
θθθ
= , so
( )( ) 5 2 5cos cot sin 25 5
θ θ θ
= = − = −
.
1 1 1tancot 2 2
θθ
= = = −−
2 55
1 1 5 5seccos 22 5
θθ
= = = − = −−
24. 2sin(4 )y x= The graph of siny x= is stretched vertically by a factor of 2 and compressed horizontally by a
factor of 14
.
Domain: ( ),−∞ ∞
Range: [ ]2,2−
Full file at https://testbankuniv.eu/Trigonometry-A-Unit-Circle-Approach-10th-Edition-Sullivan-Solutions-Manual
Full file at https://testbankuniv.eu/Trigonometry-A-Unit-Circle-Approach-10th-Edition-Sullivan-Solutions-Manual

Chapter 2: Trigonometric Functions
206
Copyright © 2016 Pearson Education, Inc.
25. 3cos(2 )y x= − The graph of cosy x= is stretched vertically by a factor of 3, reflected across the x-axis, and
compressed horizontally by a factor of 12
.
Domain: ( ),−∞ ∞
Range: [ ]3,3−
26. tan( )y x= + π The graph of tany x= is shifted π units to the left.
Domain: | , k is an odd integer2
kx x π ≠
Range: ( ),−∞ ∞
27. 2 tan(3 )y x= − The graph of tany x= is stretched vertically by a factor of 2, reflected across the x-axis, and
compressed horizontally by a factor of 13
.
Domain: | , k is an integer6 3
x x kπ π ≠ + ⋅
Range: ( ),−∞ ∞
28. cot4
y x π = +
The graph of coty x= is shifted 4π units to the
left.
Domain: | , k is an integer4
x x kπ π ≠ − +
Range: ( ),−∞ ∞
Full file at https://testbankuniv.eu/Trigonometry-A-Unit-Circle-Approach-10th-Edition-Sullivan-Solutions-Manual
Full file at https://testbankuniv.eu/Trigonometry-A-Unit-Circle-Approach-10th-Edition-Sullivan-Solutions-Manual

Chapter 2 Review Exercises
207 Copyright © 2016 Pearson Education, Inc.
29. ( )4sec 2y x= The graph of secy x= is stretched vertically by a factor of 4 and compressed horizontally by a
factor of 12
.
4321
�2�3�4�5
x
y
�( , �4)�––2
( , �4)�––2
(0, 4) (�, 4)(��, 4)
�––4
3�–––4
�––4�
3�–––4�
Domain: | , k is an odd integer4
kx x π ≠
Range: { }| 4 or 4y y y≤ − ≥
30. csc4
y x π = +
The graph of cscy x= is shifted 4π units to the
left.
Domain: | , k is an integer4
x x kπ π ≠ − +
Range: { }| 1 or 1y y y≤ − ≥
31. ( )4sin 2 4 2y x= + − The graph of siny x= is shifted left 4 units,
compressed horizontally by a factor of 12
,
stretched vertically by a factor of 4, and shifted down 2 units.
Domain: ( ),−∞ ∞
Range: [ ]6,2−
32. 5cot3 4xy π = −
The graph of coty x= is shifted right 4π units,
stretched horizontally by a factor of 3, and stretched vertically by a factor of 5.
Domain: 3| 3 , k is an integer4
x x kπ π ≠ + ⋅
Range: ( ),−∞ ∞
33. sin(2 )y x=
Amplitude = 1 1= ; Period = 22π π=
34. 2cos(3 )y x= − π
Amplitude = 2 2− = ; Period = 2 23 3ππ
=
Full file at https://testbankuniv.eu/Trigonometry-A-Unit-Circle-Approach-10th-Edition-Sullivan-Solutions-Manual
Full file at https://testbankuniv.eu/Trigonometry-A-Unit-Circle-Approach-10th-Edition-Sullivan-Solutions-Manual
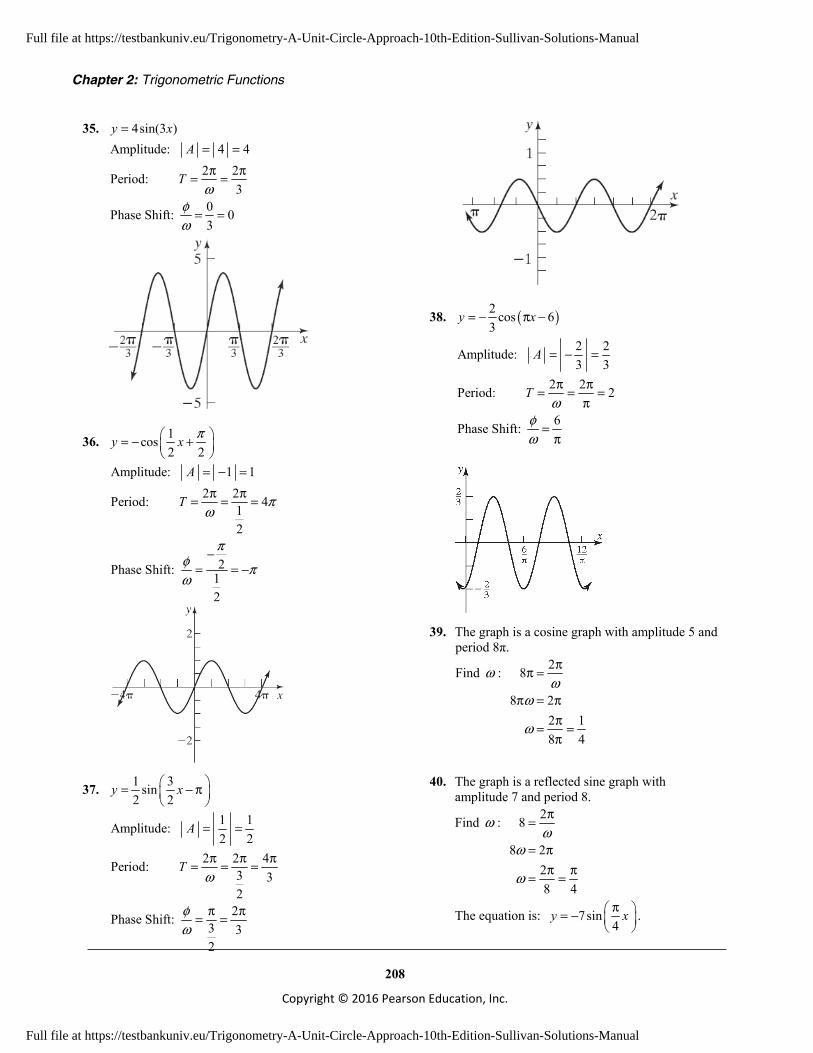
Chapter 2: Trigonometric Functions
208
Copyright © 2016 Pearson Education, Inc.
35. 4sin(3 )y x= Amplitude: 4 4
2 2Period:3
0Phase Shift: 03
A
Tω
φω
= =π π= =
= =
36. 1cos2 2
y x π = − +
Amplitude: 1 12 2Period: 41
2
2Phase Shift: 12
A
T πω
πφ πω
= − =π π= = =
−= = −
37. 1 3sin2 2
y x = − π
1 1Amplitude:2 2
2 2 4Period: 3 32
2Phase Shift: 3 32
A
Tω
φω
= =
π π π= = =
π π= =
38. ( )2 cos 63
y x= − π −
2 2Amplitude:3 3
2 2Period: 2
6Phase Shift:
A
Tω
φω
= − =
π π= = =π
=π
39. The graph is a cosine graph with amplitude 5 and period 8π.
Find ω : 28
8 22 18 4
ωω
ω
ππ =
π = ππ= =π
40. The graph is a reflected sine graph with amplitude 7 and period 8.
Find ω : 28
8 228 4
ωω
ω
π=
= ππ π= =
The equation is: 7sin4
y xπ = −
.
Full file at https://testbankuniv.eu/Trigonometry-A-Unit-Circle-Approach-10th-Edition-Sullivan-Solutions-Manual
Full file at https://testbankuniv.eu/Trigonometry-A-Unit-Circle-Approach-10th-Edition-Sullivan-Solutions-Manual

Chapter 2 Review Exercises
209 Copyright © 2016 Pearson Education, Inc.
41. Set the calculator to radian mode: sin 0.388π ≈ .
42. Set the calculator to degree mode: o
o1sec10 1.02
cos10= ≈ .
43. Terminal side of θ in quadrant III implies sin 0 csc 0cos 0 sec 0tan 0 cot 0
θ θθ θθ θ
< << <> >
44. cos 0, tan 0θ θ> < ; θ lies in quadrant IV.
45. 1 2 2,3 3
P
= −
2 2sin3
t = ; 1 3 2 3 2csc42 2 22 2
3
t = = ⋅ =
1cos3
t = − ; 1sec 313
t = = − −
2 22 2 33tan 2 2
3 113
t
= = ⋅ − = − −
;
1 2 2cot42 2 2
t = ⋅ = −−
46. The point ( 2, 5)P = − is on a circle of radius 2 2( 2) 5 4 25 29r = − + = + = with the center
at the origin. So, we have 2x = − , 5y = , and
29r = . Thus, 5 5 29sin2929
ytr
= = = ;
2 2 29cos2929
xtr
−= = = − ; 5tan2
ytx
= = − .
47. The domain of secy x= is
odd multiple of 2
x x π ≠
.
The range of secy x= is { }1 or 1 .y y y≤ − ≥ The period is 2π .
48. a. o o20 3532 20 '35" 32 32.3460 3600
= + + ≈
b. o63.18 o0.18 (0.18)(60 ') 10.8 '
0.8 ' (0.8)(60") 48"= =
= =
Thus, o o63.18 63 10 '48"=
49. 2 feet, 30º or 6
r θ θ π= = =
( )22
2 1.047 feet6 3
1 1 2 1.047 square feet2 2 6 3
s r
A r
θ
θ
π π= = ⋅ = ≈
π π= ⋅ = ⋅ ⋅ = ≈
50. In 30 minutes: 8 inches, 180º or r θ θ= = = π 8 8 25.13 inchess rθ= = ⋅ π = π ≈
In 20 minutes: 28 inches, 120º or 3
r θ θ π= = =
2 168 16.76 inches3 3
s rθ π π= = ⋅ = ≈
51. 180 mi/hrv = ; 1 mile21 0.25 mile4
d
r
=
= =
180 mi/hr0.25 mi
720 rad/hr720 rad 1 rev
hr 2 rad360 rev
hr114.6 rev/hr
vr
ω = =
=
= ⋅π
=π
≈
52. Since there are two lights on opposite sides and the light is seen every 5 seconds, the beacon makes 1 revolution every 10 seconds:
1 rev 2 radians radians/second10 sec 1 rev 5
ω π π= ⋅ =
Full file at https://testbankuniv.eu/Trigonometry-A-Unit-Circle-Approach-10th-Edition-Sullivan-Solutions-Manual
Full file at https://testbankuniv.eu/Trigonometry-A-Unit-Circle-Approach-10th-Edition-Sullivan-Solutions-Manual

Chapter 2: Trigonometric Functions
210
Copyright © 2016 Pearson Education, Inc.
53. ( ) 220sin 30 , 06
I t t tπ = π + ≥
a. 2 1Period30 15
π= =π
b. The amplitude is 220. c. The phase shift is:
1 1630 6 30 180
φω
π− π= = − ⋅ = −π π
d.
54. a.
b. 95 55 40Amplitude: 202 2
A −= = =
95+55 150Vertical Shift: 752 2
212 6
ω
= =
π π= =
Phase shift (use 55, 1):y x= =
55 20sin 1 756
20 20sin6
1 sin6
2 623
φ
φ
φ
φ
φ
π = ⋅ − +
π − = −
π − = − π π
− = −
π=
Thus, 220sin 756 3
y xπ π = − + , or
( )20sin 4 756
y xπ = − + .
c.
d. ( )19.81sin 0.543 2.296 75.66y x= − +
e.
55.
Full file at https://testbankuniv.eu/Trigonometry-A-Unit-Circle-Approach-10th-Edition-Sullivan-Solutions-Manual
Full file at https://testbankuniv.eu/Trigonometry-A-Unit-Circle-Approach-10th-Edition-Sullivan-Solutions-Manual
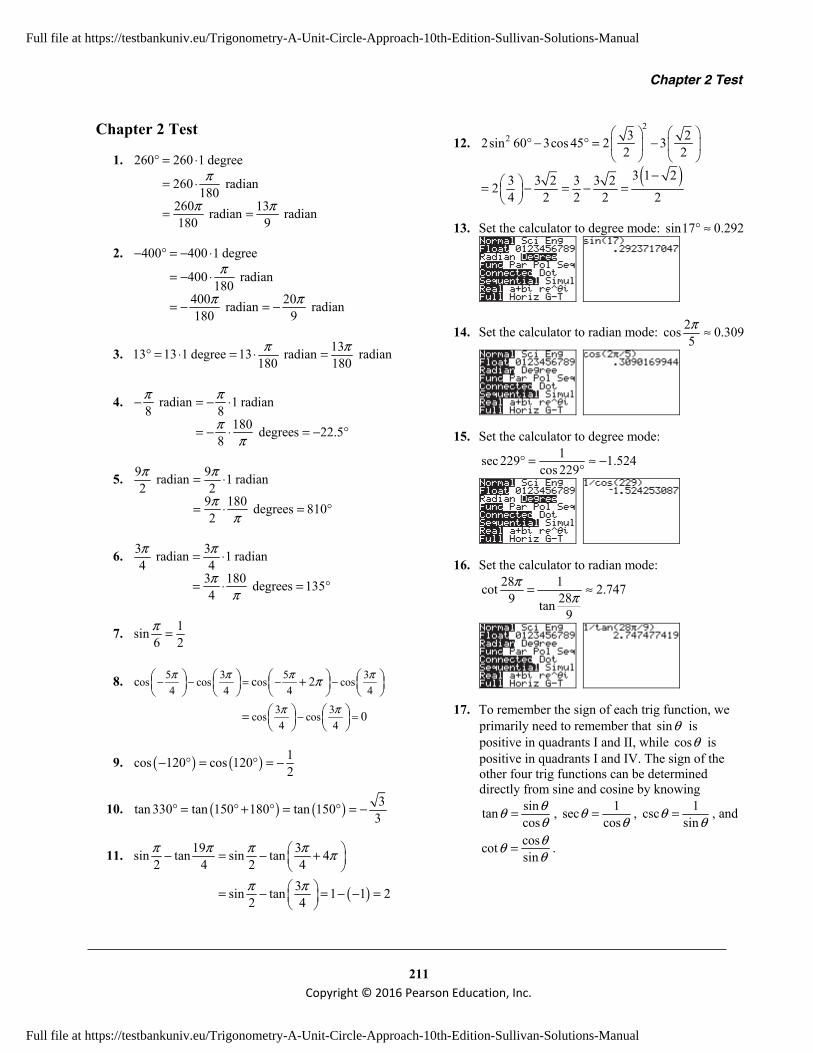
Chapter 2 Test
211 Copyright © 2016 Pearson Education, Inc.
Chapter 2 Test
1. 260 260 1 degree
260 radian180
260 13 radian radian180 9
π
π π
° = ⋅
= ⋅
= =
2. 400 400 1 degree
400 radian180
400 20 radian radian180 9
π
π π
− ° = − ⋅
= − ⋅
= − = −
3. 1313 13 1 degree 13 radian radian180 180π π° = ⋅ = ⋅ =
4. radian 1 radian8 8
180 degrees 22.58
π π
ππ
− = − ⋅
= − ⋅ = − °
5. 9 9 radian 1 radian2 2
9 180 degrees 8102
π π
ππ
= ⋅
= ⋅ = °
6. 3 3 radian 1 radian4 4
3 180 degrees 1354
π π
ππ
= ⋅
= ⋅ = °
7. 1sin6 2π =
8. 5 3 5 3os cos os cos4 4 4 4
3 3cos cos4 4
c c 2
0
π π π π
π π
π− − = − −
− =
+
=
9. ( ) ( ) 1cos 120 cos 1202
− ° = ° = −
10. ( ) ( ) 3tan 330 tan 150 180 tan 1503
° = ° + ° = ° = −
11.
( )
19 3sin tan sin tan 42 4 2 4
3sin tan 1 1 22 4
π π π π π
π π
− = − + = − = − − =
12.
( )
22 3 22sin 60 3cos 45 2 3
2 2
3 1 23 3 2 3 3 224 2 2 2 2
° − ° = −
− = − = − =
13. Set the calculator to degree mode: sin17 0.292° ≈
14. Set the calculator to radian mode: 2cos 0.3095π ≈
15. Set the calculator to degree mode: 1sec 229 1.524
cos 229° = ≈ −
°
16. Set the calculator to radian mode: 28 1cot 2.747289 tan 9
ππ= ≈
17. To remember the sign of each trig function, we primarily need to remember that sinθ is positive in quadrants I and II, while cosθ is positive in quadrants I and IV. The sign of the other four trig functions can be determined directly from sine and cosine by knowing
sintancos
θθθ
= , 1seccos
θθ
= , 1cscsin
θθ
= , and
coscotsin
θθ θ= .
Full file at https://testbankuniv.eu/Trigonometry-A-Unit-Circle-Approach-10th-Edition-Sullivan-Solutions-Manual
Full file at https://testbankuniv.eu/Trigonometry-A-Unit-Circle-Approach-10th-Edition-Sullivan-Solutions-Manual
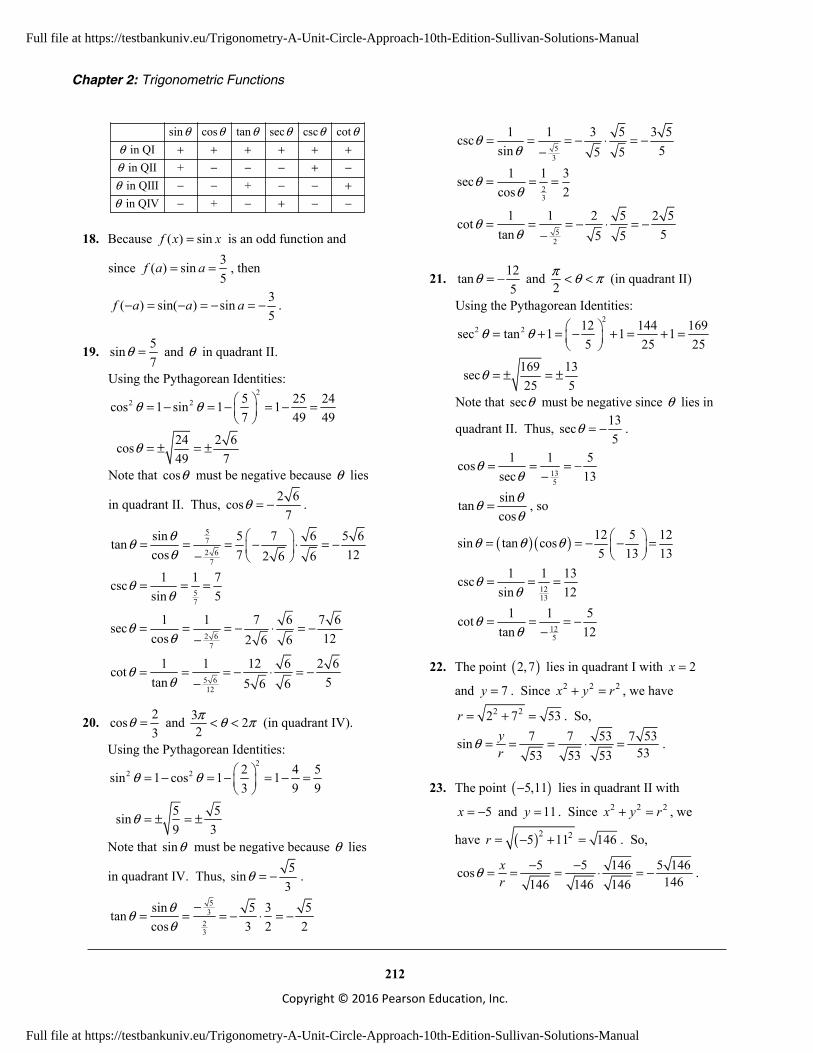
Chapter 2: Trigonometric Functions
212
Copyright © 2016 Pearson Education, Inc.
sin cos tan sec csc cot in QI in QII + in QIII + in QIV +
θ θ θ θ θ θθθθθ
+ + + + + +− − − + −
− − − − +− − + − −
18. Because ( ) sinf x x= is an odd function and
since 3( ) sin5
f a a= = , then
3( ) sin( ) sin5
f a a a− = − = − = − .
19. 5sin7
θ = and θ in quadrant II.
Using the Pythagorean Identities: 2
2 2 5 25 24cos 1 sin 1 17 49 49
24 2 6cos49 7
θ θ
θ
= − = − = − =
= ± = ±
Note that cosθ must be negative because θ lies
in quadrant II. Thus, 2 6cos7
θ = − .
572 6
7
sin 5 7 6 5 6tancos 7 122 6 6
θθθ
= = = − ⋅ = − −
57
1 1 7cscsin 5
θθ
= = =
2 67
1 1 7 6 7 6seccos 122 6 6
θθ
= = = − ⋅ = −−
5 612
1 1 12 6 2 6cottan 55 6 6
θθ
= = = − ⋅ = −−
20. 2cos3
θ = and 3 22π θ π< < (in quadrant IV).
Using the Pythagorean Identities: 2
2 2 2 4 5sin 1 cos 1 13 9 9
5 5sin9 3
θ θ
θ
= − = − = − =
= ± = ±
Note that sinθ must be negative because θ lies
in quadrant IV. Thus, 5sin3
θ = − .
53
23
sin 5 3 5tancos 3 2 2
θθθ
−= = = − ⋅ = −
53
1 1 3 5 3 5cscsin 55 5
θθ
= = = − ⋅ = −−
23
1 1 3seccos 2
θθ
= = =
52
1 1 2 5 2 5cottan 55 5
θθ
= = = − ⋅ = −−
21. 12tan5
θ = − and 2π θ π< < (in quadrant II)
Using the Pythagorean Identities: 2
2 2 12 144 169sec tan 1 1 15 25 25
169 13sec25 5
θ θ
θ
= + = − + = + =
= ± = ±
Note that secθ must be negative since θ lies in
quadrant II. Thus, 13sec5
θ = − .
135
1 1 5cossec 13
θθ
= = = −−
sintancos
θθθ
= , so
( )( ) 12 5 12sin tan cos5 13 13
θ θ θ = = − − =
1213
1 1 13cscsin 12
θθ
= = =
125
1 1 5cottan 12
θθ
= = = −−
22. The point ( )2,7 lies in quadrant I with 2x =
and 7y = . Since 2 2 2x y r+ = , we have 2 22 7 53r = + = . So,
7 7 53 7 53sin5353 53 53
yr
θ = = = ⋅ = .
23. The point ( )5,11− lies in quadrant II with
5x = − and 11y = . Since 2 2 2x y r+ = , we
have ( )2 25 11 146r = − + = . So,
5 5 146 5 146cos146146 146 146
xr
θ − −= = = ⋅ = − .
Full file at https://testbankuniv.eu/Trigonometry-A-Unit-Circle-Approach-10th-Edition-Sullivan-Solutions-Manual
Full file at https://testbankuniv.eu/Trigonometry-A-Unit-Circle-Approach-10th-Edition-Sullivan-Solutions-Manual
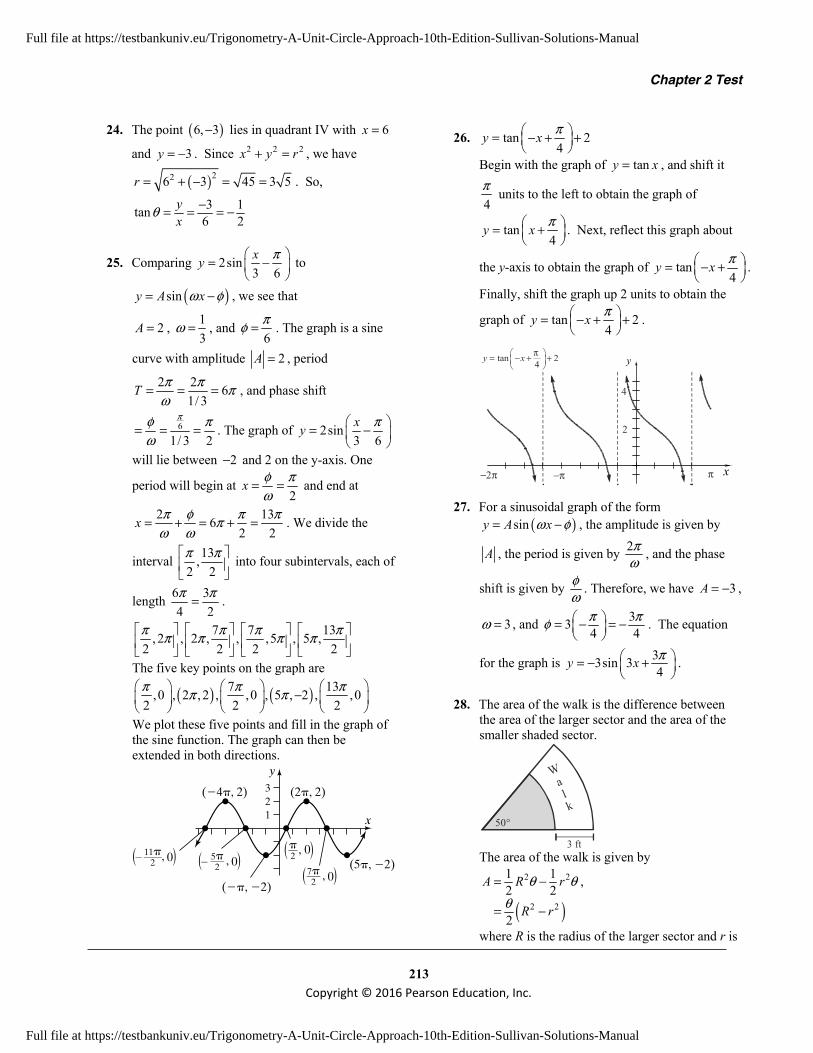
Chapter 2 Test
213 Copyright © 2016 Pearson Education, Inc.
24. The point ( )6, 3− lies in quadrant IV with 6x =
and 3y = − . Since 2 2 2x y r+ = , we have
( )226 3 45 3 5r = + − = = . So,
3 1tan6 2
yx
θ −= = = −
25. Comparing 2sin3 6xy π = −
to
( )siny A xω φ= − , we see that
2A = , 13
ω = , and 6πφ = . The graph is a sine
curve with amplitude 2A = , period
2 2 61/ 3
T π π πω
= = = , and phase shift
6
1/ 3 2
πφ πω
= = = . The graph of 2sin3 6xy π = −
will lie between 2− and 2 on the y-axis. One
period will begin at 2
x φ πω
= = and end at
2 1362 2
x π φ π ππω ω
= + = + = . We divide the
interval 13,2 2π π
into four subintervals, each of
length 6 34 2π π= .
7 7 13, 2 , 2 , , ,5 , 5 ,2 2 2 2π π π ππ π π π
The five key points on the graph are
( ) ( )7 13,0 , 2 ,2 , ,0 , 5 , 2 , ,02 2 2π π ππ π −
We plot these five points and fill in the graph of the sine function. The graph can then be extended in both directions.
321 x
y
(2�, 2)(�4�, 2)
(��, �2)
(5�, �2)0�5�–––2 (( ,0�
11�––––2 (( ,
07�–––2 (( ,
�––2 (( , 0
26. tan 24
y x π = − + +
Begin with the graph of tany x= , and shift it
4π units to the left to obtain the graph of
tan4
y x π = +
. Next, reflect this graph about
the y-axis to obtain the graph of tan4
y x π = − +
.
Finally, shift the graph up 2 units to obtain the
graph of tan 24
y x π = − + +
.
y
x−π
2
π− π2
tan 24
y x π = − + +
4
27. For a sinusoidal graph of the form ( )siny A xω φ= − , the amplitude is given by
A , the period is given by 2πω
, and the phase
shift is given by φω . Therefore, we have 3A = − ,
3ω = , and 334 4π πφ = − = −
. The equation
for the graph is 33sin 34
y x π = − +
.
28. The area of the walk is the difference between the area of the larger sector and the area of the smaller shaded sector.
Wa
lk
50°
3 ft The area of the walk is given by
( )
2 2
2 2
1 12 2
2
A R r
R r
θ θθ
= −
= −
,
where R is the radius of the larger sector and r is
Full file at https://testbankuniv.eu/Trigonometry-A-Unit-Circle-Approach-10th-Edition-Sullivan-Solutions-Manual
Full file at https://testbankuniv.eu/Trigonometry-A-Unit-Circle-Approach-10th-Edition-Sullivan-Solutions-Manual
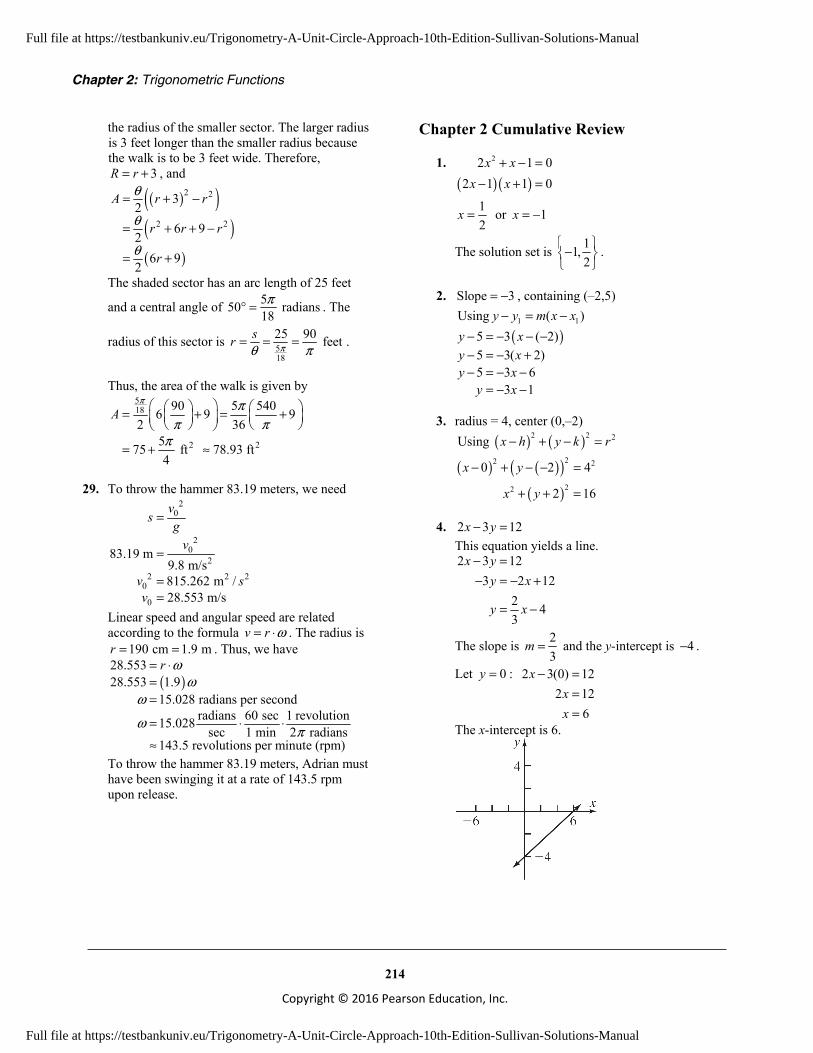
Chapter 2: Trigonometric Functions
214
Copyright © 2016 Pearson Education, Inc.
the radius of the smaller sector. The larger radius is 3 feet longer than the smaller radius because the walk is to be 3 feet wide. Therefore,
3R r= + , and
( )( )( )( )
2 2
2 2
32
6 92
6 92
A r r
r r r
r
θ
θ
θ
= + −
= + + −
= +
The shaded sector has an arc length of 25 feet
and a central angle of 550 radians18π° = . The
radius of this sector is 518
25 90 feetsr πθ π= = = .
Thus, the area of the walk is given by 518
2 2
90 5 5406 9 92 36
575 ft 78.93 ft4
Aπ π
π ππ
= + = +
= + ≈
29. To throw the hammer 83.19 meters, we need 2
0
20
2
2 2 20
0
83.19 m9.8 m/s815.262 m /28.553 m/s
vs
gv
v sv
=
=
==
Linear speed and angular speed are related according to the formula v r ω= ⋅ . The radius is
190 cm 1.9 mr = = . Thus, we have
( )28.55328.553 1.9
15.028 radians per secondradians 60 sec 1 revolution15.028
sec 1 min 2 radians143.5 revolutions per minute (rpm)
r ωω
ω
ωπ
= ⋅==
= ⋅ ⋅
≈
To throw the hammer 83.19 meters, Adrian must have been swinging it at a rate of 143.5 rpm upon release.
Chapter 2 Cumulative Review
1. ( )( )
22 1 02 1 1 0
x xx x
+ − =− + =
1 or 12
x x= = −
The solution set is 11,2
−
.
2. Slope 3= − , containing (–2,5)
1 1Using ( )y y m x x− = − ( )5 3 ( 2)
5 3( 2)5 3 6
3 1
y xy xy x
y x
− = − − −− = − +− = − −
= − −
3. radius = 4, center (0,–2) ( ) ( )2 2 2Using x h y k r− + − =
( ) ( )( )( )
22 2
22
0 2 4
2 16
x y
x y
− + − − =
+ + =
4. 2 3 12x y− = This equation yields a line. 2 3 12
3 2 122 43
x yy x
y x
− =− = − +
= −
The slope is 23
m = and the y-intercept is 4− .
Let 0y = : 2 3(0) 122 12
6
xxx
− ===
The x-intercept is 6.
Full file at https://testbankuniv.eu/Trigonometry-A-Unit-Circle-Approach-10th-Edition-Sullivan-Solutions-Manual
Full file at https://testbankuniv.eu/Trigonometry-A-Unit-Circle-Approach-10th-Edition-Sullivan-Solutions-Manual
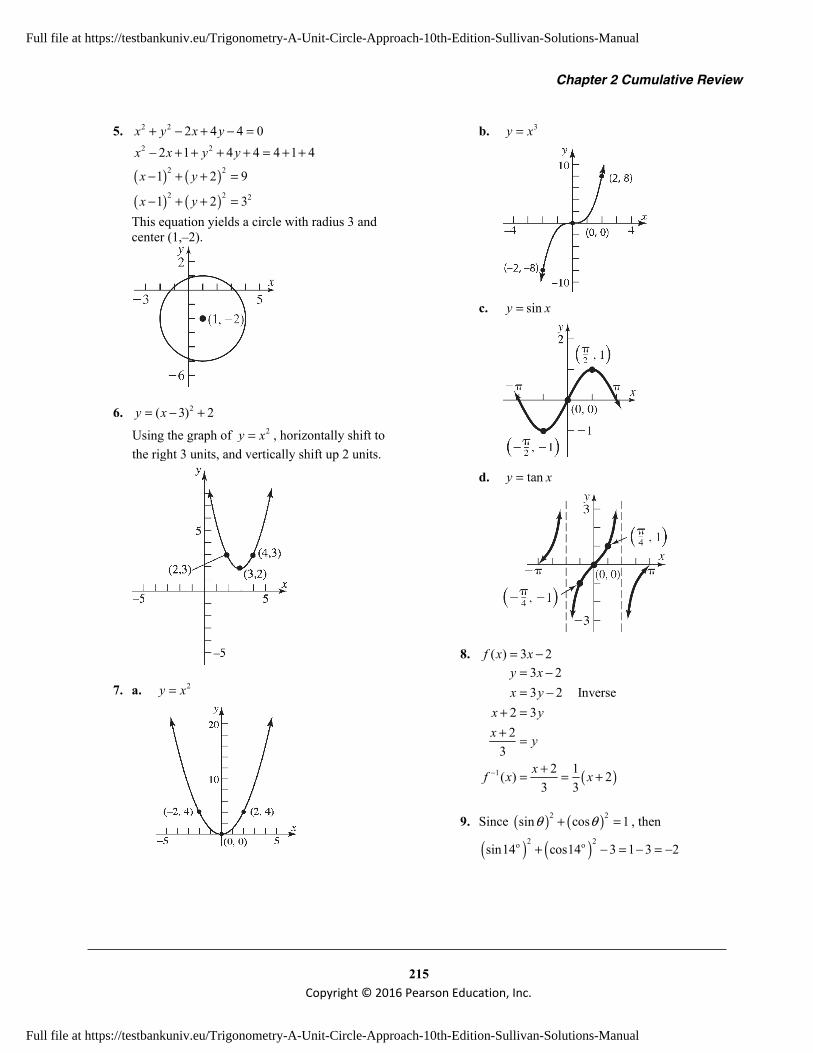
Chapter 2 Cumulative Review
215 Copyright © 2016 Pearson Education, Inc.
5. 2 2 2 4 4 0x y x y+ − + − =
( ) ( )( ) ( )
2 2
2 2
2 2 2
2 1 4 4 4 1 4
1 2 9
1 2 3
x x y y
x y
x y
− + + + + = + +
− + + =
− + + =
This equation yields a circle with radius 3 and center (1,–2).
6. 2( 3) 2y x= − +
Using the graph of 2y x= , horizontally shift to the right 3 units, and vertically shift up 2 units.
7. a. 2y x=
b. 3y x=
c. siny x=
d. tany x=
8. ( ) 3 2f x x= −
( )1
3 23 2 Inverse
2 32
32 1( ) 2
3 3
y xx y
x yx y
xf x x−
= −= −
+ =+ =
+= = +
9. Since ( ) ( )2 2sin cos 1θ θ+ = , then
( ) ( )2 2o osin14 cos14 3 1 3 2+ − = − = −
Full file at https://testbankuniv.eu/Trigonometry-A-Unit-Circle-Approach-10th-Edition-Sullivan-Solutions-Manual
Full file at https://testbankuniv.eu/Trigonometry-A-Unit-Circle-Approach-10th-Edition-Sullivan-Solutions-Manual

Chapter 2: Trigonometric Functions
216
Copyright © 2016 Pearson Education, Inc.
10. 3sin(2 )y x= Amplitude: 3 3
2Period:20Phase Shift: 02
A
T
φω
= =π= = π
= =
11. 3tan 3cos csc 1 3 24 6 6 2
3 332
6 3 32
π π π − + = − +
= −
−=
12. The graph is a cosine graph with amplitude 3 and period 12.
Find ω : 212
12 2212 6
ωω
πω
π=
= ππ= =
The equation is: 3cos6
y xπ =
.
Chapter 2 Projects Project I – Internet Based Project
Project II
1. November 15: High tide: 11:18 am and 11:15 pm November 19: low tide: 7:17 am and 8:38 pm
2. The low tide was below sea level. It is measured against calm water at sea level.
3. Nov Low Tide Low Tide High Tide High Tide Time Ht (ft) t Time Ht (ft) t Time Ht (ft) t Time Ht (ft) t 14
0-24 6:26a 2.0 6.43 4:38p 1.4 16.63 9:29a 2.2 9.48 11:14p 2.8 23.23
15 24-48 6:22a 1.6 30.37 5:34p 1.8 41.57 11:18a 2.4 35.3 11:15p 2.6 47.25
16 48-72 6:28a 1.2 54.47 6:25p 2.0 66.42 12:37p 2.6 60.62 11:16p 2.6 71.27
17 72-96 6:40a 0.8 78.67 7:12p 2.4 91.2 1:38p 2.8 85.63 11:16p 2.6 95.27
18 96-120 6:56a 0.4 102.93 7:57p 2.6 115.95 2:27p 3.0 110.45 11:14p 2.8 119.23
19 120-144 7:17a 0.0 127.28 8:38p 2.6 140.63 3:10p 3.2 135.17 11:05p 2.8 143.08
20 144-168 7:43a -0.2 151.72 3:52p 3.4 159.87
Full file at https://testbankuniv.eu/Trigonometry-A-Unit-Circle-Approach-10th-Edition-Sullivan-Solutions-Manual
Full file at https://testbankuniv.eu/Trigonometry-A-Unit-Circle-Approach-10th-Edition-Sullivan-Solutions-Manual
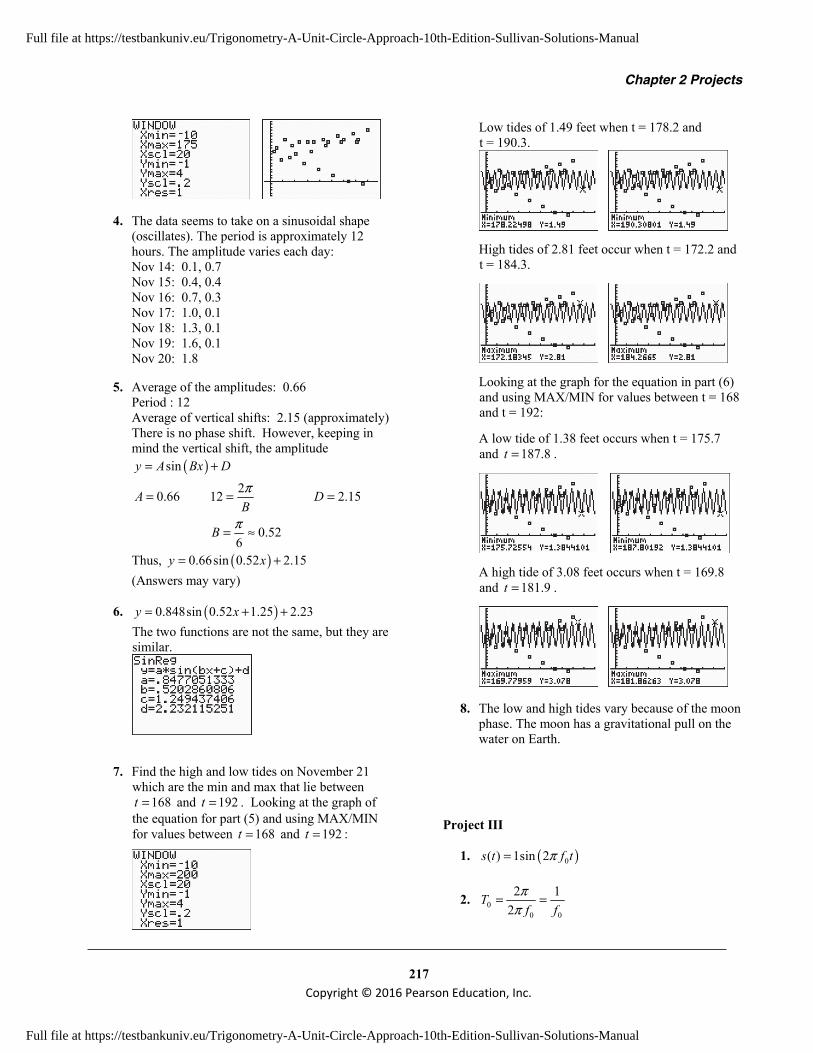
Chapter 2 Projects
217 Copyright © 2016 Pearson Education, Inc.
4. The data seems to take on a sinusoidal shape
(oscillates). The period is approximately 12 hours. The amplitude varies each day: Nov 14: 0.1, 0.7 Nov 15: 0.4, 0.4 Nov 16: 0.7, 0.3 Nov 17: 1.0, 0.1 Nov 18: 1.3, 0.1 Nov 19: 1.6, 0.1 Nov 20: 1.8
5. Average of the amplitudes: 0.66 Period : 12 Average of vertical shifts: 2.15 (approximately) There is no phase shift. However, keeping in mind the vertical shift, the amplitude
( )siny A Bx D= +
0.66A = 212
0.526
B
B
π
π
=
= ≈
2.15D =
Thus, ( )0.66sin 0.52 2.15y x= + (Answers may vary)
6. ( )0.848sin 0.52 1.25 2.23y x= + + The two functions are not the same, but they are similar.
7. Find the high and low tides on November 21
which are the min and max that lie between 168t = and 192t = . Looking at the graph of
the equation for part (5) and using MAX/MIN for values between 168t = and 192t = :
Low tides of 1.49 feet when t = 178.2 and t = 190.3.
High tides of 2.81 feet occur when t = 172.2 and t = 184.3.
Looking at the graph for the equation in part (6) and using MAX/MIN for values between t = 168 and t = 192:
A low tide of 1.38 feet occurs when t = 175.7 and 187.8t = .
A high tide of 3.08 feet occurs when t = 169.8
and 181.9t = .
8. The low and high tides vary because of the moon phase. The moon has a gravitational pull on the water on Earth.
Project III
1. ( )0( ) 1sin 2s t f tπ=
2. 00 0
2 12
Tf f
ππ
= =
Full file at https://testbankuniv.eu/Trigonometry-A-Unit-Circle-Approach-10th-Edition-Sullivan-Solutions-Manual
Full file at https://testbankuniv.eu/Trigonometry-A-Unit-Circle-Approach-10th-Edition-Sullivan-Solutions-Manual
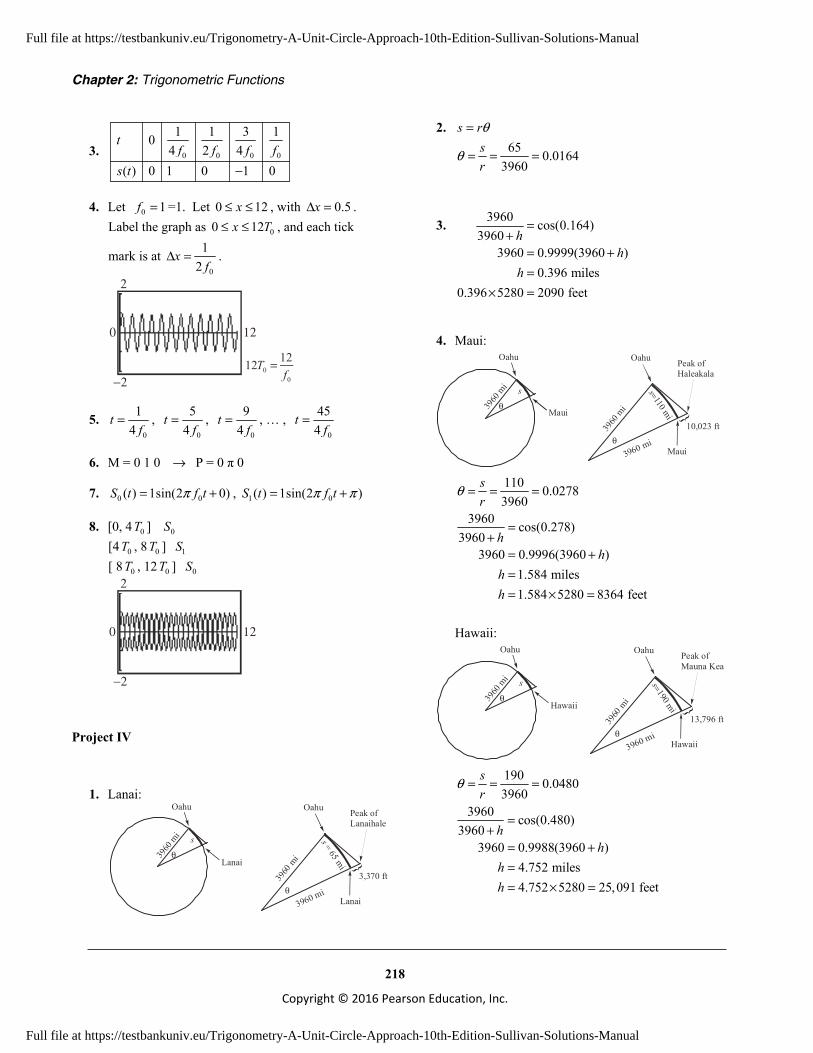
Chapter 2: Trigonometric Functions
218
Copyright © 2016 Pearson Education, Inc.
3. 0 0 0 0
1 1 3 104 2 4
( ) 0 1 0 1 0
tf f f f
s t −
4. Let 0 1f = =1. Let 0 12x≤ ≤ , with 0.5xΔ = . Label the graph as 00 12x T≤ ≤ , and each tick
mark is at 0
12
xf
Δ = .
−2
0
2
12
00
1212Tf
= __
5. 0
14
tf
= , 0
54
tf
= , 0
94
tf
= , … , 0
454
tf
=
6. M = 0 1 0 → P = 0 π 0
7. 0 0( ) 1sin(2 0)S t f tπ= + , 1 0( ) 1sin(2 )S t f tπ π= +
8. [0, 4 0T ] 0S [4 0T , 8 0T ] 1S [ 8 0T , 12 0T ] 0S
−2
0
2
12
Project IV
1. Lanai:
3960
mi
θ
s
Oahu
Lanai
3960
mi
θ
s = 65 mi
Oahu
Lanai
3,370 ft
3960 mi
}}
Peak of Lanaihale
2. 65 0.0164
3960
s rsr
θ
θ
=
= = =
3. 3960 cos(0.164)3960
3960 0.9999(3960 )0.396 miles
0.396 5280 2090 feet
hh
h
=+
= +=
× =
4. Maui:
Oahu
Maui
3960
mi
θ
s=110 mi
Oahu
Maui
10,023 ft
3960 mi
}}
Peak of Haleakala
3960
mi
θ
s
110 0.02783960
sr
θ = = =
3960 cos(0.278)3960
3960 0.9996(3960 )1.584 miles1.584 5280 8364 feet
hh
hh
=+
= +== × =
Hawaii:
Oahu
Hawaii
3960
mi
θ
s=190 mi
Oahu
Hawaii
13,796 ft
3960 mi
}}
Peak of Mauna Kea
3960
mi
θ
s
190 0.04803960
sr
θ = = =
3960 cos(0.480)3960
3960 0.9988(3960 )4.752 miles4.752 5280 25,091 feet
hh
hh
=+
= +== × =
Full file at https://testbankuniv.eu/Trigonometry-A-Unit-Circle-Approach-10th-Edition-Sullivan-Solutions-Manual
Full file at https://testbankuniv.eu/Trigonometry-A-Unit-Circle-Approach-10th-Edition-Sullivan-Solutions-Manual
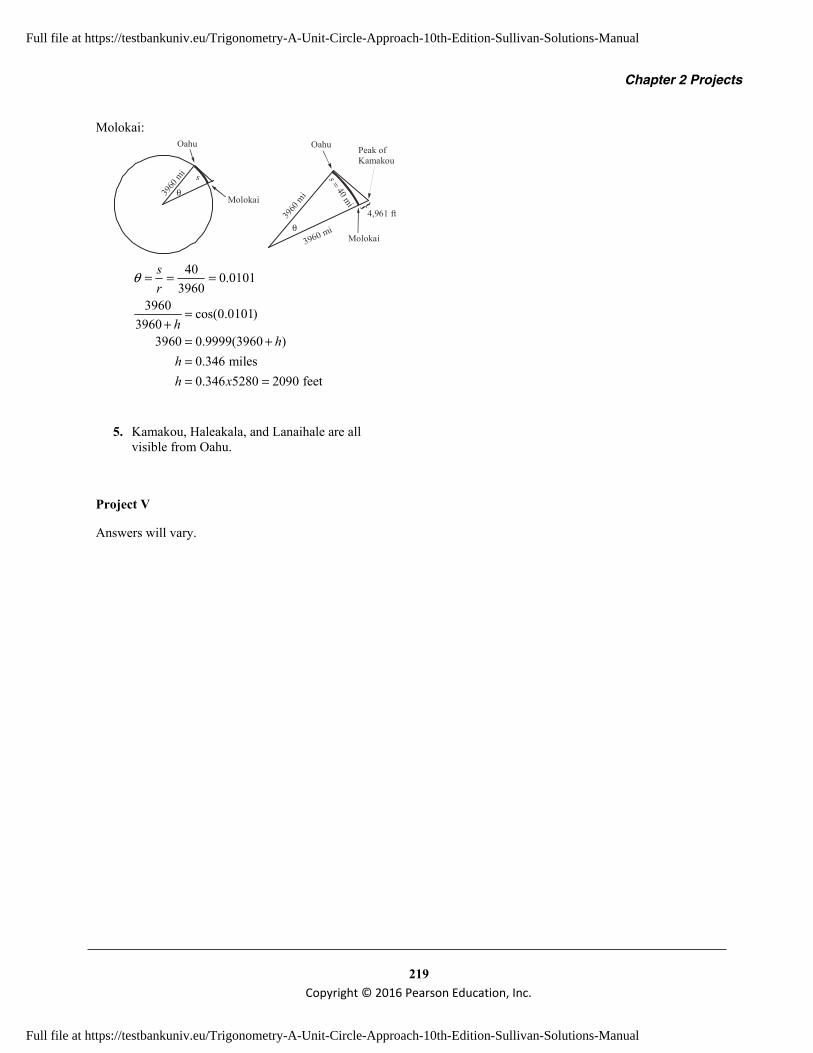
Chapter 2 Projects
219 Copyright © 2016 Pearson Education, Inc.
Molokai:
Oahu
Molokai
3960
mi
θ
s = 40 mi
Oahu
Molokai
4,961 ft
3960 mi
}}
Peak of Kamakou
3960
mi
θ
s
40 0.01013960
sr
θ = = =
3960 cos(0.0101)3960
3960 0.9999(3960 )0.346 miles0.346 5280 2090 feet
hh
hh x
=+
= +== =
5. Kamakou, Haleakala, and Lanaihale are all visible from Oahu.
Project V
Answers will vary.
Full file at https://testbankuniv.eu/Trigonometry-A-Unit-Circle-Approach-10th-Edition-Sullivan-Solutions-Manual
Full file at https://testbankuniv.eu/Trigonometry-A-Unit-Circle-Approach-10th-Edition-Sullivan-Solutions-Manual

Copyright © 2013 Pearson Education, Inc.
Full file at https://testbankuniv.eu/Trigonometry-A-Unit-Circle-Approach-10th-Edition-Sullivan-Solutions-Manual
Full file at https://testbankuniv.eu/Trigonometry-A-Unit-Circle-Approach-10th-Edition-Sullivan-Solutions-Manual
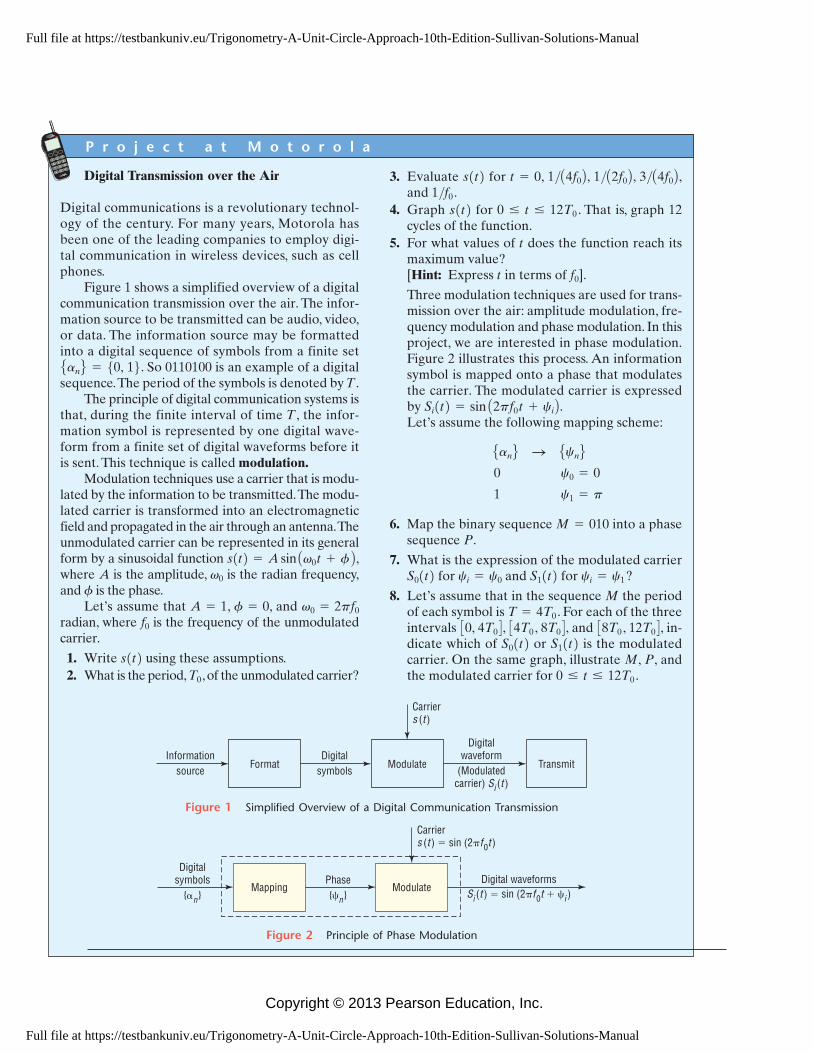
Digital Transmission over the Air
Digital communications is a revolutionary technol-ogy of the century. For many years, Motorola hasbeen one of the leading companies to employ digi-tal communication in wireless devices, such as cellphones.
Figure 1 shows a simplified overview of a digitalcommunication transmission over the air. The infor-mation source to be transmitted can be audio, video,or data. The information source may be formattedinto a digital sequence of symbols from a finite setEanF={0, 1}. So 0110100 is an example of a digitalsequence.The period of the symbols is denoted by T.
The principle of digital communication systems isthat, during the finite interval of time T, the infor-mation symbol is represented by one digital wave-form from a finite set of digital waveforms before itis sent. This technique is called modulation.
Modulation techniques use a carrier that is modu-lated by the information to be transmitted.The modu-lated carrier is transformed into an electromagneticfield and propagated in the air through an antenna.Theunmodulated carrier can be represented in its generalform by a sinusoidal function s(t)=A sin Av0t+f B ,where A is the amplitude, v0 is the radian frequency,and f is the phase.
Let’s assume that A=1, f=0, and v0=2pf0
radian, where f0 is the frequency of the unmodulatedcarrier.
1. Write s(t) using these assumptions.2. What is the period,T0,of the unmodulated carrier?
P r o j e c t a t M o t o r o l a
3. Evaluate s(t) for t=0, 1/ A4f0 B , 1/ A2f0 B , 3/ A4f0 B ,and 1/f0 .
4. Graph s(t) for 0 � t � 12T0 . That is, graph 12cycles of the function.
5. For what values of t does the function reach itsmaximum value? [Hint: Express t in terms of f0].
Three modulation techniques are used for trans-mission over the air: amplitude modulation, fre-quency modulation and phase modulation. In thisproject, we are interested in phase modulation.Figure 2 illustrates this process. An informationsymbol is mapped onto a phase that modulatesthe carrier. The modulated carrier is expressedby Si(t)=sin A2pf0t+ci B .Let’s assume the following mapping scheme:
EanF S EcnF
0
1
6. Map the binary sequence M=010 into a phasesequence P.
7. What is the expression of the modulated carrierS0(t) for ci=c0 and S1(t) for ci=c1?
8. Let’s assume that in the sequence M the periodof each symbol is T=4T0 . For each of the threeintervals C0, 4T0 D , C4T0 , 8T0 D , and C8T0 , 12T0 D , in-dicate which of S0(t) or S1(t) is the modulatedcarrier. On the same graph, illustrate M, P, andthe modulated carrier for 0 � t � 12T0 .
c1 = p c0 = 0
Figure 1 Simplified Overview of a Digital Communication Transmission
Figure 2 Principle of Phase Modulation
Digitalsymbols
{�n}Phase{�n}
Digital waveformsSi (t ) � sin (2�f0t � �i )
Carriers (t ) � sin (2�f0t )
Mapping Modulate
Informationsource
Digitalsymbols
Digitalwaveform
(Modulatedcarrier) Si (t )
Carriers (t )
Format Modulate Transmit
Copyright © 2013 Pearson Education, Inc.
Full file at https://testbankuniv.eu/Trigonometry-A-Unit-Circle-Approach-10th-Edition-Sullivan-Solutions-Manual
Full file at https://testbankuniv.eu/Trigonometry-A-Unit-Circle-Approach-10th-Edition-Sullivan-Solutions-Manual

Distance HeightIsland (miles) Mountain (feet)
Lanai 65 Lanaihale 3,370
Maui 110 Haleakala 10,023
Hawaii 190 Mauna Kea 13,796
Molokai 40 Kamakou 4,961
2. Identifying Mountain Peaks in HawaiiSuppose that you are standing on the southeastern shoreof Oahu and you see three mountain peaks on the hori-zon. You want to determine which mountains are visiblefrom Oahu.The possible mountain peaks that can be seenfrom Oahu and the height (above sea level) of their peaksare given in the table.
Copyright © 2013 Pearson Education, Inc.
Full file at https://testbankuniv.eu/Trigonometry-A-Unit-Circle-Approach-10th-Edition-Sullivan-Solutions-Manual
Full file at https://testbankuniv.eu/Trigonometry-A-Unit-Circle-Approach-10th-Edition-Sullivan-Solutions-Manual

(a) To determine which of these mountain peaks wouldbe visible from Oahu, consider that you are standingon the shore and looking “straight out” so that yourline of sight is tangent to the surface of Earth at thepoint where you are standing. Make a sketch of theright triangle formed by your sight line, the radiusfrom the center of Earth to the point where you arestanding, and the line from the center of Earththrough Lanai.
(b) Assuming that the radius of Earth is 3960 miles,determine the angle formed at the center of Earth.
(c) Determine the length of the hypotenuse of the trian-gle. Is Lanaihale visible from Oahu?
(d) Repeat parts (a)–(c) for the other three islands.(e) Which three mountains are visible from Oahu?
Copyright © 2013 Pearson Education, Inc.
Full file at https://testbankuniv.eu/Trigonometry-A-Unit-Circle-Approach-10th-Edition-Sullivan-Solutions-Manual
Full file at https://testbankuniv.eu/Trigonometry-A-Unit-Circle-Approach-10th-Edition-Sullivan-Solutions-Manual
4. CBL Experiment Using a CBL, the microphoneprobe, and a tuning fork, record the amplitude, frequen-cy, and period of the sound from the graph of the soundcreated by the tuning fork over time. Repeat the experi-ment for different tuning forks.
Copyright © 2013 Pearson Education, Inc
.
Full file at https://testbankuniv.eu/Trigonometry-A-Unit-Circle-Approach-10th-Edition-Sullivan-Solutions-Manual
Full file at https://testbankuniv.eu/Trigonometry-A-Unit-Circle-Approach-10th-Edition-Sullivan-Solutions-Manual
Related Documents


![&KDSWHU *UDSKV · 2018-03-15 · } Ç ]pz îìíòw }v µ ]}vu/v x &kdswhu *udskv 6hfwlrq ŠŠ = =() 6lqfhwkhvxpriwkhvtxduhvr iwzrriwkhvlghv riwkhwuldqjohhtxdo vwkhvtxduhriwkhwklugvlgh](https://static.cupdf.com/doc/110x72/5ec050b1a31ad72fa04e7c22/kdswhu-udskv-2018-03-15-pz-w-v-vuv-x-kdswhu-udskv.jpg)
![E-MANUALstatic.highspeedbackbone.net/pdf/Samsung UN32EH5300... · &kdqqho 0hqx 0dqdjlqj &kdqqhov dqg &kdqqho )xqfwlrqv 0hprul]lqj &kdqqhov 2wkhu )hdwxuhv %dvlf )hdwxuh &kdqjlqj wkh](https://static.cupdf.com/doc/110x72/5ec8b340d5c764388150bb72/e-un32eh5300-kdqqho-0hqx-0dqdjlqj-kdqqhov-dqg-kdqqho-xqfwlrqv.jpg)