KCOL Surface Water Supply Availability Study Summary of “With Project” Base Conditions – Technical Memorandum Deliverable B-2.3.1 (Contract No. 4600000933-WO01) South Florida Water Management District 3301 Gun Club Road West Palm Beach, FL 33406 (561) 686-8800 Prepared by: March 2009 http://www. aecom.com 3750 NW 87 th Avenue, Suite 300 Doral, FL 33178

Welcome message from author
This document is posted to help you gain knowledge. Please leave a comment to let me know what you think about it! Share it to your friends and learn new things together.
Transcript

KCOL Surface Water Supply Availability Study
Summary of “With Project” Base
Conditions – Technical Memorandum Deliverable B-2.3.1
(Contract No. 4600000933-WO01)
South Florida Water Management District
3301 Gun Club Road West Palm Beach, FL 33406
(561) 686-8800
Prepared by:
March 2009
http://www. aecom.com
3750 NW 87th Avenue, Suite 300
Doral, FL 33178
Evaluation of the Surface Water Withdrawals from the Kissimmee Chain of Lakes
Summary of “With Project” Base Conditions – Technical Memorandum
Page i
TABLE OF CONTENTS
1 INTRODUCTION .............................................................................................................. 1-1 1.1 Report Structure ........................................................................................................... 1-1 1.2 Background.................................................................................................................. 1-1
1.2.1 AFET and AFET-W............................................................................................. 1-1 1.2.2 What are Base Conditions?.................................................................................. 1-1
2 CALIBRATION EFFORTS .............................................................................................. 2-1 2.1 Overview of AFET Model Calibration ........................................................................ 2-1
2.1.1 AFET-W Calibration ........................................................................................... 2-5 3 DESCRIPTION OF THE “WITH PROJECT” BASE CONDITIONS ........................ 3-1
3.1 Selection of Model Version to be Used ....................................................................... 3-1 3.2 “With Project” Base Conditions .................................................................................. 3-1
3.2.1 Model Setup ......................................................................................................... 3-1 3.2.1.1 Downstream Boundary Conditions (S-65E-TW)............................................. 3-2 3.2.1.2 Groundwater Boundary Conditions ................................................................. 3-2
3.2.2 Model Drivers ...................................................................................................... 3-5 3.2.2.1 Historic Rainfall (1965 – 2005) ....................................................................... 3-5 3.2.2.2 Reference Evapotranspiration RET ................................................................. 3-6
3.2.3 Watershed Description......................................................................................... 3-9 3.2.3.1 Current Land Use (2000) ................................................................................. 3-9 3.2.3.2 Status of the KRR Infrastructure.................................................................... 3-10 3.2.3.3 Water Use (Existing Legal Users) ................................................................. 3-11 3.2.3.4 Operations ...................................................................................................... 3-15
4 REFERENCES ................................................................................................................... 4-1
LIST OF FIGURES
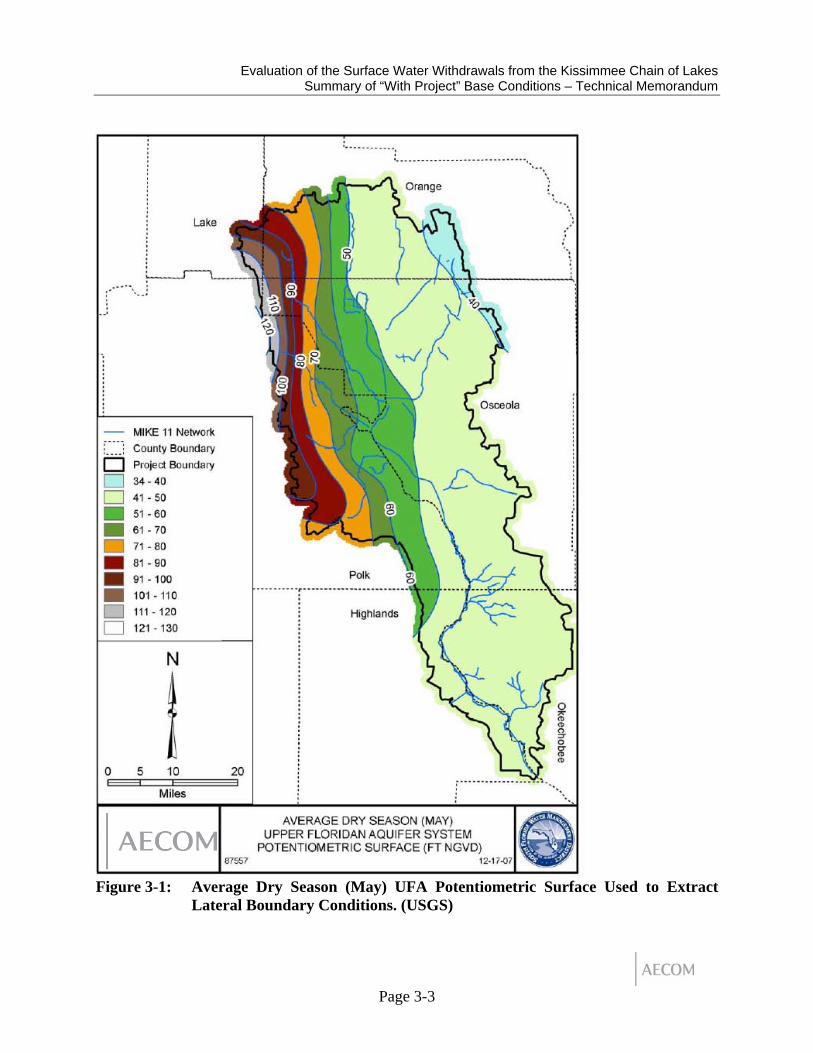
Figure 3-1: Average Dry Season (May) UFA Potentiometric Surface Used to Extract Lateral Boundary Conditions. (USGS) ............................................................................ 3-3
Figure 3-2: Average Wet Season (September) UFA Potentiometric Surface Used to Extract Lateral Boundary Conditions. (USGS) ................................................................ 3-4
Figure 3-3: Annual Rainfall during the “with project” base conditions ................................. 3-5 Figure 3-4: Frequency of Normalized Annual Rainfall Kissimmee Basin 1965-2005 .......... 3-6 Figure 3-5: Reference Evapotranspiration in inches/ year - annual average for the Kissimmee
Basin .................................................................................................................... 3-7 Figure 3-6: Spatially-Distributed Maximum RET in the Kissimmee Basin from 1965 through
2005...................................................................................................................... 3-8 Figure 3-7: Spatially-Distributed Average RET in the Kissimmee Basin from 1965 through
2005...................................................................................................................... 3-9 Figure 3-8: Operating Criteria for S-65 Structure “with project” base condition ................ 3-15 Figure 3-9: Operating Criteria for S-65D Structure “with project” base condition.............. 3-16 Figure 3-10: Operating Criteria for S-61 Structure “with project” base condition ................ 3-17
Evaluation of the Surface Water Withdrawals from the Kissimmee Chain of Lakes
Summary of “With Project” Base Conditions – Technical Memorandum
Page ii
Figure 3-11: Operating Criteria for S-59 Structure “with project” base condition ................ 3-18 Figure 3-12: Operating Criteria for S-62 Structure “with project” base condition ................ 3-18 Figure 3-13 : Operating Criteria for S-57 Structure “with project” base condition ................ 3-19 Figure 3-14: Operating Criteria for S-60 Structure “with project” base condition ................ 3-19 Figure 3-15: Operating Criteria for S-63 (S-63A) Structure “with project” base condition .3-20
LIST OF TABLES
Table 2-1: Stage statistics for the calibration period. Shading is used to indicate locations that do not meet specified criteria – AFET................................................................. 2-3
Table 2-2: Flow statistics for the calibration period. Shading is used to indicate locations that do not meet specified criteria - AFET.................................................................. 2-4
Table 2-3: Groundwater statistics for the calibration period. Shading is used to indicate locations that do not meet specified criteria – AFET .......................................... 2-5
Table 2-4: Stage statistics for the calibration period ............................................................. 2-8 Table 2-5: Flow statistics for the calibration period. Shading is used to indicate locations that
do not meet specified criteria............................................................................... 2-9 Table 2-6: Cumulative Error for the 10-year run at S-65 and S-65E Structures................... 2-9 Table 3-1: Summary of Year 2000 (Current) Kissimmee Basin Land Use to be used in the
“With Project” Base Conditions ........................................................................ 3-10 Table 3-2: Breakdown of Water Permits Usage between Irrigation and Non-Irrigation .... 3-14
LIST OF APPENDICES
Appendix A: Base Condition Runs Previously used in KBMOS

Evaluation of the Surface Water Withdrawals from the Kissimmee Chain of Lakes
Summary of “With Project” Base Conditions – Technical Memorandum
Page 1-1
1 INTRODUCTION This document describes the “with project” base conditions run to be used in the Kissimmee Chain of Lakes (KCOL) Surface Water Supply Availability Study, the Kissimmee Basin Modeling and Operations Study (KBMOS), and the development of the Kissimmee Basin Water Reservation. As part of this project, the Kissimmee Basin Modeling and Operations Study (KBMOS) Alternative Formulation and Evaluation Tool (AFET) will be recalibrated using a new Reference Evapotranspiration dataset. The recalibrated model is referred to as AFET-W. The “with project” base condition run will be executed after the AFET-W model recalibration update is complete.
1.1 Report Structure The purpose of the Summary of the “With Project “ Base Conditions Report is to present the information that will be used to run the aforementioned base conditions and the justification for its selection. The following summarizes the content of this report:
• Section 1 Introduction and Background – Provides an introduction to the report, summarizes the basic differences between the available modeling tools and describes the base conditions
• Section 2 Calibration Efforts – Summarizes the AFET and AFET-W calibration efforts
• Section 3 Description of the “with project” base conditions - Summarizes the information that will be use to define the “with project” base conditions
1.2 Background
1.2.1 AFET and AFET-W The AFET is a fully integrated model that couples the formulation tool (MIKE 11) with a watershed model that includes overland and groundwater flow (MIKE SHE) that was developed for application as part of the KBMOS. The development and calibration of AFET is documented in the “Alternative Formulation Evaluation Model Documentation and Calibration Report” (Earth Tech 2007a). Peer Review of the development and proposed application of AFET was completed in June 2008. The Peer Review Panel recommended that new RET be used to calibrate the model. This work is being completed under the present work order contract. The main differences between AFET-W and AFET are that AFET-W is being calibrated with an improved set of RET data (differences between RET data sets will be detailed later in the document) and AFET-W is also being calibrated to match the behavior of observation wells in the Floridan Aquifer, while AFET used a qualitative approach based on seasonal potentiometric maps.
1.2.2 What are Base Conditions? Once the calibrated hydrology and hydraulics of the basin are obtained through model calibration, the calibrated parameters of the basin are applied under a fixed set of conditions, or

Evaluation of the Surface Water Withdrawals from the Kissimmee Chain of Lakes
Summary of “With Project” Base Conditions – Technical Memorandum
Page 1-2
model drivers, to predict the basin response. This set of fixed conditions is called base conditions.
The base conditions defined in this document are the “with project” base conditions. These base conditions combine the existing hydrologic conditions of the watershed (land use, water use) with the future hydraulic conditions (infrastructure, operations, etc). These two components are augmented by climate drivers and other boundary conditions that will be held constant throughout the study. The following sections describe the information that will be part of the “with project” base condition definition in detail, along with the following:
• Definition of the period of simulation (1965 to 2005)
• Climate drivers (RET and rainfall)
• Boundary conditions
Tailwater time series for the S-65E Structure
Lateral and horizontal groundwater boundary conditions
• Hydrologic conditions of the basin (land use, water use)
Year 2000 Land Use/Cover
Existing Legal Uses of Water
• Hydraulic conditions of the basin (operations, infrastructure, etc)
Complete restoration of the Kissimmee River including Kissimmee River Headwaters Revitalization Project
Evaluation of the Surface Water Withdrawals from the Kissimmee Chain of Lakes
Summary of “With Project” Base Conditions – Technical Memorandum
Page 2-1
2 CALIBRATION EFFORTS
2.1 Overview of AFET Model Calibration
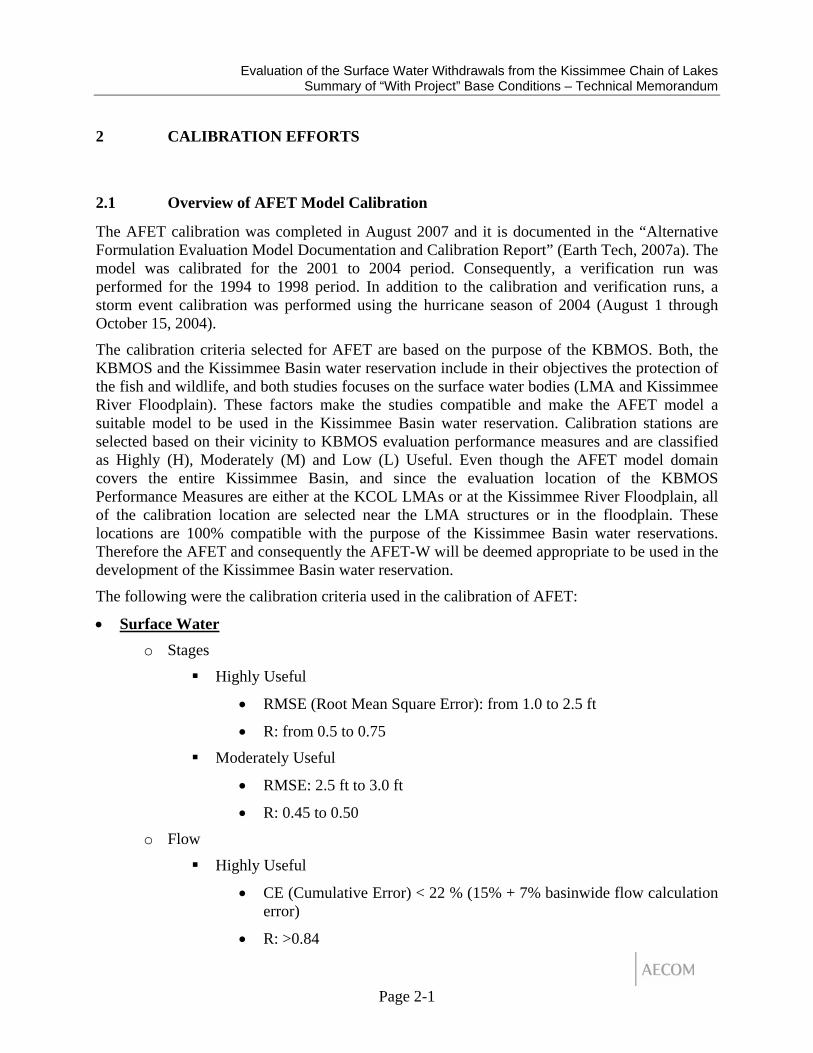
The AFET calibration was completed in August 2007 and it is documented in the “Alternative Formulation Evaluation Model Documentation and Calibration Report” (Earth Tech, 2007a). The model was calibrated for the 2001 to 2004 period. Consequently, a verification run was performed for the 1994 to 1998 period. In addition to the calibration and verification runs, a storm event calibration was performed using the hurricane season of 2004 (August 1 through October 15, 2004).
The calibration criteria selected for AFET are based on the purpose of the KBMOS. Both, the KBMOS and the Kissimmee Basin water reservation include in their objectives the protection of the fish and wildlife, and both studies focuses on the surface water bodies (LMA and Kissimmee River Floodplain). These factors make the studies compatible and make the AFET model a suitable model to be used in the Kissimmee Basin water reservation. Calibration stations are selected based on their vicinity to KBMOS evaluation performance measures and are classified as Highly (H), Moderately (M) and Low (L) Useful. Even though the AFET model domain covers the entire Kissimmee Basin, and since the evaluation location of the KBMOS Performance Measures are either at the KCOL LMAs or at the Kissimmee River Floodplain, all of the calibration location are selected near the LMA structures or in the floodplain. These locations are 100% compatible with the purpose of the Kissimmee Basin water reservations. Therefore the AFET and consequently the AFET-W will be deemed appropriate to be used in the development of the Kissimmee Basin water reservation.
The following were the calibration criteria used in the calibration of AFET:
• Surface Water o Stages
Highly Useful
• RMSE (Root Mean Square Error): from 1.0 to 2.5 ft
• R: from 0.5 to 0.75
Moderately Useful
• RMSE: 2.5 ft to 3.0 ft
• R: 0.45 to 0.50
o Flow
Highly Useful
• CE (Cumulative Error) < 22 % (15% + 7% basinwide flow calculation error)
• R: >0.84
Evaluation of the Surface Water Withdrawals from the Kissimmee Chain of Lakes
Summary of “With Project” Base Conditions – Technical Memorandum
Page 2-2
Moderately Useful
• CE (Cumulative Error) < 32 % (25% + 7% basinwide flow calculation error)
• R > 0.64
•
• Groundwater o Heads
Highly Useful
• RMSE (Root Mean Square Error): from 2.5 to 3.0 ft
• R: from 0.50 to 0.75
Moderately Useful
• RMSE: 3.0 ft to 3.5 ft
• R: 0.45 to 0.50
Table 2-1, Table 2-2 and Table 2-3 below summarize the calibration statistics obtained with the calibration run that was finally accepted as the calibrated AFET (Run 99).
Evaluation of the Surface Water Withdrawals from the Kissimmee Chain of Lakes
Summary of “With Project” Base Conditions – Technical Memorandum
Page 2-3
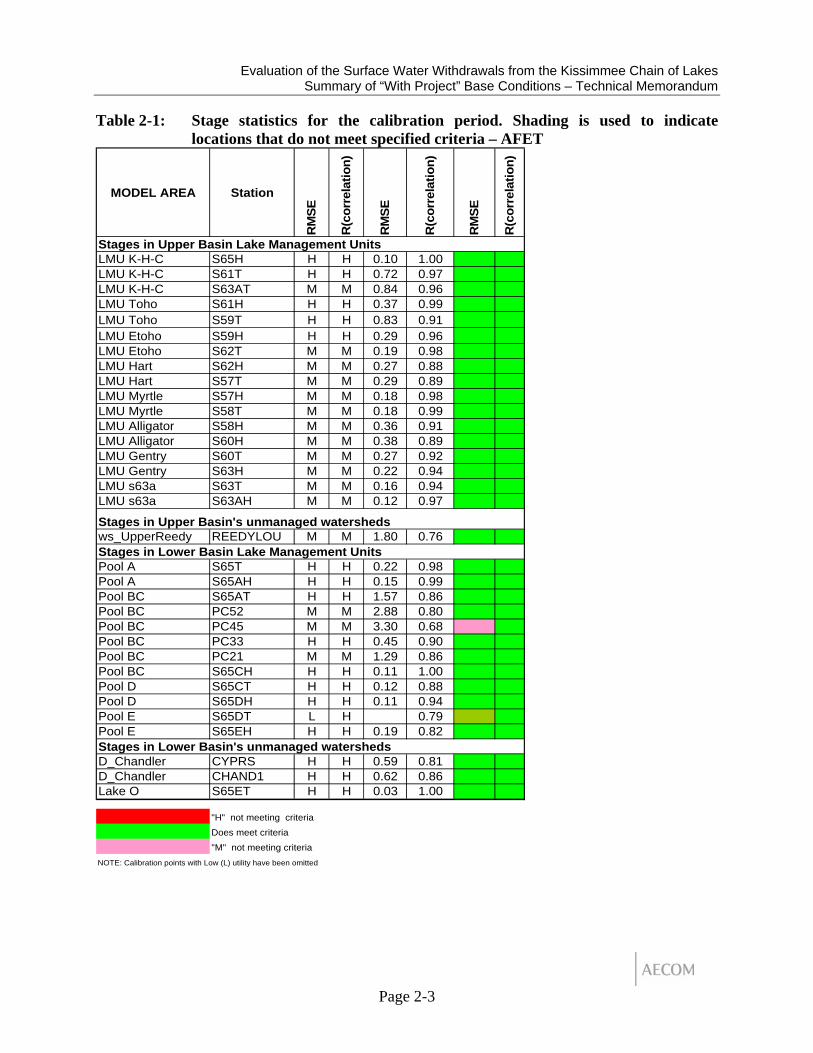
Table 2-1: Stage statistics for the calibration period. Shading is used to indicate locations that do not meet specified criteria – AFET
MODEL AREA Station
RM
SE
R(c
orre
latio
n)
RM
SE
R(c
orre
latio
n)
RM
SE
R(c
orre
latio
n)
Stages in Upper Basin Lake Management UnitsLMU K-H-C S65H H H 0.10 1.00 0 0LMU K-H-C S61T H H 0.72 0.97 0 0LMU K-H-C S63AT M M 0.84 0.96 0 0LMU Toho S61H H H 0.37 0.99 0 0LMU Toho S59T H H 0.83 0.91 0 0LMU Etoho S59H H H 0.29 0.96 0 0LMU Etoho S62T M M 0.19 0.98 0 0LMU Hart S62H M M 0.27 0.88 0 0LMU Hart S57T M M 0.29 0.89 0 0LMU Myrtle S57H M M 0.18 0.98 0 0LMU Myrtle S58T M M 0.18 0.99 0 0LMU Alligator S58H M M 0.36 0.91 0 0LMU Alligator S60H M M 0.38 0.89 0 0LMU Gentry S60T M M 0.27 0.92 0 0LMU Gentry S63H M M 0.22 0.94 0 0LMU s63a S63T M M 0.16 0.94 0 0LMU s63a S63AH M M 0.12 0.97 0 0
Stages in Upper Basin's unmanaged watershedsws_UpperReedy REEDYLOU M M 1.80 0.76 0 0Stages in Lower Basin Lake Management UnitsPool A S65T H H 0.22 0.98 0 0Pool A S65AH H H 0.15 0.99 0 0Pool BC S65AT H H 1.57 0.86 0 0Pool BC PC52 M M 2.88 0.80 0 0Pool BC PC45 M M 3.30 0.68 1 0Pool BC PC33 H H 0.45 0.90 0 0Pool BC PC21 M M 1.29 0.86 0 0Pool BC S65CH H H 0.11 1.00 0 0Pool D S65CT H H 0.12 0.88 0 0Pool D S65DH H H 0.11 0.94 0 0Pool E S65DT L H 0.79 2 0Pool E S65EH H H 0.19 0.82 0 0Stages in Lower Basin's unmanaged watershedsD_Chandler CYPRS H H 0.59 0.81 0 0D_Chandler CHAND1 H H 0.62 0.86 0 0Lake O S65ET H H 0.03 1.00 0 0
"H" not meeting criteriaDoes meet criteria"M" not meeting criteria
NOTE: Calibration points with Low (L) utility have been omitted
Evaluation of the Surface Water Withdrawals from the Kissimmee Chain of Lakes
Summary of “With Project” Base Conditions – Technical Memorandum
Page 2-4
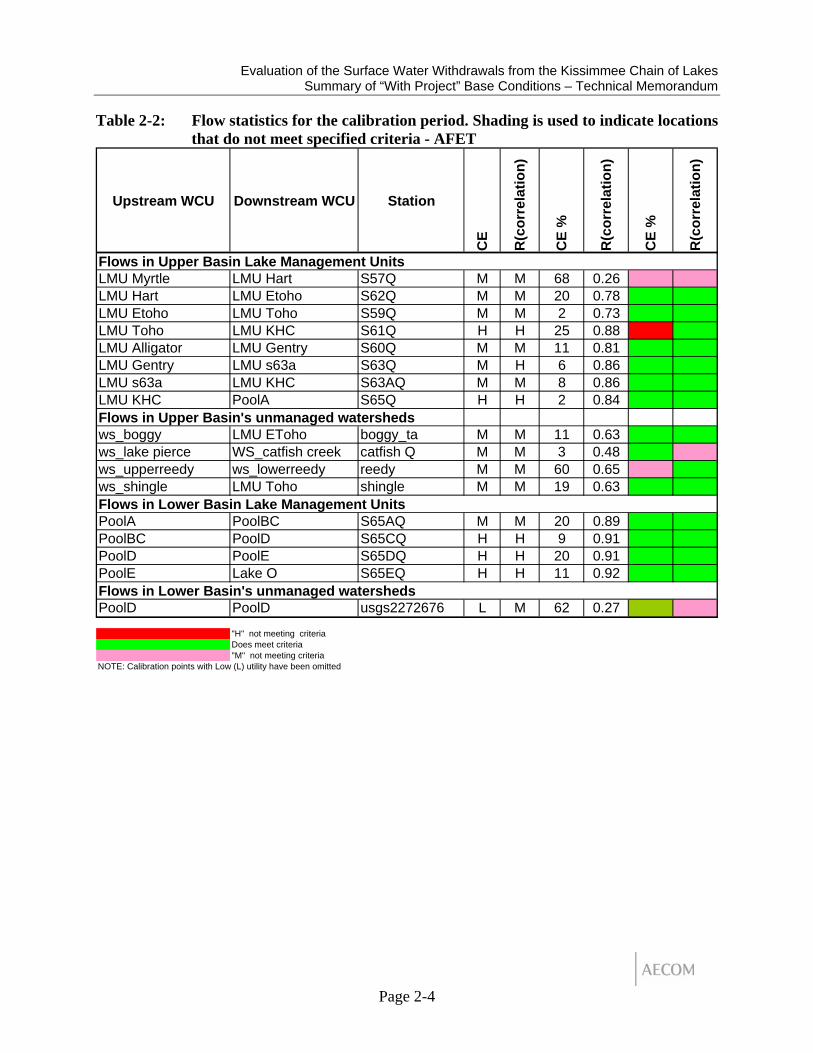
Table 2-2: Flow statistics for the calibration period. Shading is used to indicate locations that do not meet specified criteria - AFET
Upstream WCU Downstream WCU Station
CE
R(c
orre
latio
n)
CE
%
R(c
orre
latio
n)
CE
%
R(c
orre
latio
n)
Flows in Upper Basin Lake Management UnitsLMU Myrtle LMU Hart S57Q M M 68 0.26 1 1LMU Hart LMU Etoho S62Q M M 20 0.78 0 0LMU Etoho LMU Toho S59Q M M 2 0.73 0 0LMU Toho LMU KHC S61Q H H 25 0.88 1 0LMU Alligator LMU Gentry S60Q M M 11 0.81 0 0LMU Gentry LMU s63a S63Q M H 6 0.86 0 0LMU s63a LMU KHC S63AQ M M 8 0.86 0 0LMU KHC PoolA S65Q H H 2 0.84 0 0Flows in Upper Basin's unmanaged watershedsws_boggy LMU EToho boggy_ta M M 11 0.63 0 0ws_lake pierce WS_catfish creek catfish Q M M 3 0.48 0 1ws_upperreedy ws_lowerreedy reedy M M 60 0.65 1 0ws_shingle LMU Toho shingle M M 19 0.63 0 0Flows in Lower Basin Lake Management UnitsPoolA PoolBC S65AQ M M 20 0.89 0 0PoolBC PoolD S65CQ H H 9 0.91 0 0PoolD PoolE S65DQ H H 20 0.91 0 0PoolE Lake O S65EQ H H 11 0.92 0 0Flows in Lower Basin's unmanaged watershedsPoolD PoolD usgs2272676 L M 62 0.27
"H" not meeting criteriaDoes meet criteria"M" not meeting criteria
NOTE: Calibration points with Low (L) utility have been omitted
Evaluation of the Surface Water Withdrawals from the Kissimmee Chain of Lakes
Summary of “With Project” Base Conditions – Technical Memorandum
Page 2-5
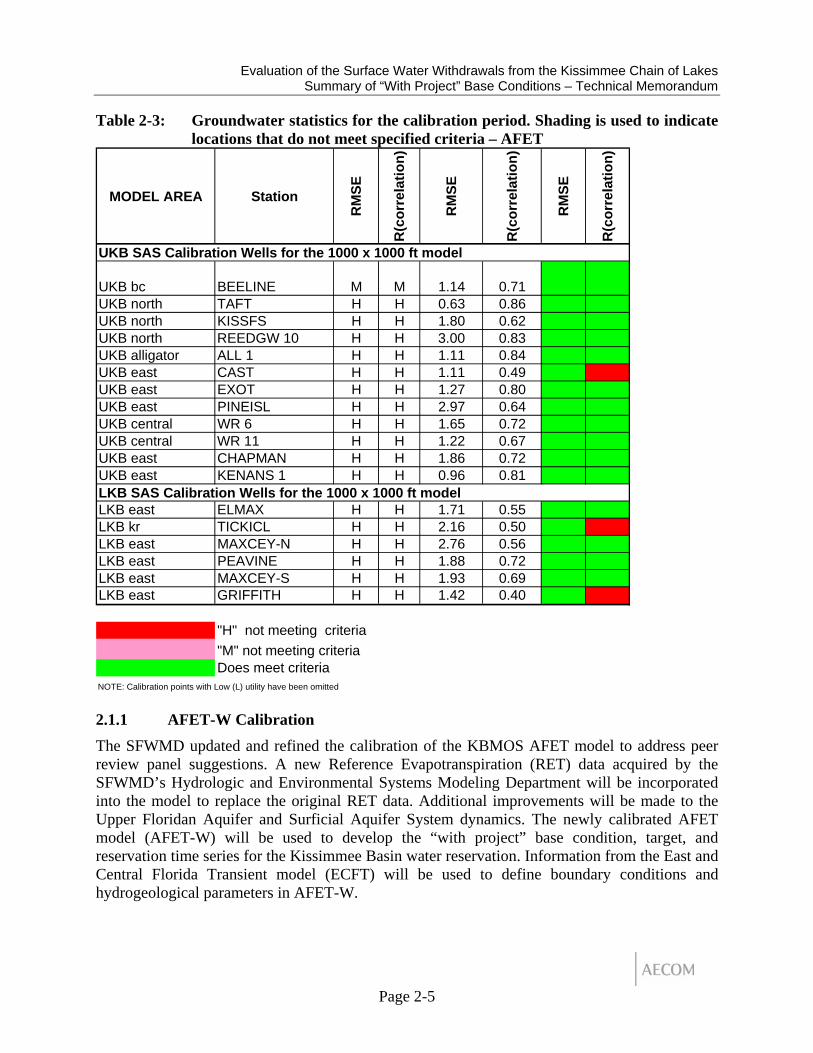
Table 2-3: Groundwater statistics for the calibration period. Shading is used to indicate locations that do not meet specified criteria – AFET
MODEL AREA Station
RM
SE
R(c
orre
latio
n)
RM
SE
R(c
orre
latio
n)
RM
SE
R(c
orre
latio
n)
UKB SAS Calibration Wells for the 1000 x 1000 ft model
UKB bc BEELINE M M 1.14 0.71 0 0UKB north TAFT H H 0.63 0.86 0 0UKB north KISSFS H H 1.80 0.62 0 0UKB north REEDGW 10 H H 3.00 0.83 0 0UKB alligator ALL 1 H H 1.11 0.84 0 0UKB east CAST H H 1.11 0.49 0 1UKB east EXOT H H 1.27 0.80 0 0UKB east PINEISL H H 2.97 0.64 0 0UKB central WR 6 H H 1.65 0.72 0 0UKB central WR 11 H H 1.22 0.67 0 0UKB east CHAPMAN H H 1.86 0.72 0 0UKB east KENANS 1 H H 0.96 0.81 0 0LKB SAS Calibration Wells for the 1000 x 1000 ft modelLKB east ELMAX H H 1.71 0.55 0 0LKB kr TICKICL H H 2.16 0.50 0 1LKB east MAXCEY-N H H 2.76 0.56 0 0LKB east PEAVINE H H 1.88 0.72 0 0LKB east MAXCEY-S H H 1.93 0.69 0 0LKB east GRIFFITH H H 1.42 0.40 0 1
"H" not meeting criteria"M" not meeting criteriaDoes meet criteria
NOTE: Calibration points with Low (L) utility have been omitted
2.1.1 AFET-W Calibration The SFWMD updated and refined the calibration of the KBMOS AFET model to address peer review panel suggestions. A new Reference Evapotranspiration (RET) data acquired by the SFWMD’s Hydrologic and Environmental Systems Modeling Department will be incorporated into the model to replace the original RET data. Additional improvements will be made to the Upper Floridan Aquifer and Surficial Aquifer System dynamics. The newly calibrated AFET model (AFET-W) will be used to develop the “with project” base condition, target, and reservation time series for the Kissimmee Basin water reservation. Information from the East and Central Florida Transient model (ECFT) will be used to define boundary conditions and hydrogeological parameters in AFET-W.
Evaluation of the Surface Water Withdrawals from the Kissimmee Chain of Lakes
Summary of “With Project” Base Conditions – Technical Memorandum
Page 2-6
An AFET-W Calibration Report (Earth Tech, 2008a) was prepared to document the re-calibration process. That report is considered a supplement to the AFET Model Documentation and Calibration Report (Earth Tech, 2007a).
During the AFET-W calibration, additional emphasis was put on the calibration of the Upper Floridan Aquifer (UFA). While AFET had used a qualitative approach to calibrate the UFA heads based on the comparison with seasonal potentiometric maps published by the USGS, AFET-W incorporated new calibration wells and used a quantitative approach. Out of the available wells, the study team selected a set of wells (a.k.a. primary wells) to be used for the calibration. Wells that were not selected (a.k.a. secondary wells) were used for qualitative comparisons. The criteria used to decide if a well was primary of secondary were the amount of points in the data sets (enough to compute the calibration statistics or not) and their proximity to the model domain boundary. Most of the new calibration wells coincide with the calibration wells being used by the SFWMD in their effort to calibrate the East Central Florida Transient (ECFT) model. The calibration criteria selected for the groundwater portion of AFET-W was taken from the calibration criteria being used by the ECFT.
In regards to the surface water network, AFET-W kept the same calibration points originally included in AFET. However AFET was calibrated for the 2001 to 2004 period and verified for the 1994 to 1998 period. Since the UFA wells added to the calibration set did not have data in the recent years, the calibration period of AFET-W was selected from 1995-1998. The AFET-W calibration runs were started in 1994 to allow enough time to “warm up” the model and avoid discrepancies due to differences in the antecedent or initial conditions selected to run the calibration.
The following calibration criteria was established and used in the AFET-W calibration effort:
Calibration Period:
• Model Calibration: 1995-1998 (coinciding with the ECFT calibration) Calibration Criteria
• Surface Network o Stages*
Root mean squared error (RMSE) ≤ 2.5
R ≥0.5
o Flow*
CE ≤15 percent
R ≥ 0.84
• Groundwater (both SAS and UFA) o Heads
For primary wells, the mean error (ME) and the mean absolute error (MAE) should be less than or equal to ± 2.5 feet for 50 percent of the wells.
Evaluation of the Surface Water Withdrawals from the Kissimmee Chain of Lakes
Summary of “With Project” Base Conditions – Technical Memorandum
Page 2-7
For primary wells, the ME and MAE should be less than or equal to ± 5.0 feet for 80 percent of the wells.
For primary wells, the RMSE should be less than or equal to ± 5.0 feet for 80 percent of the wells.
The overall ME should be within ± 1.0 feet and should approach zero.
R ≥ 0.5
*: For surface water calibration, only stations listed in the AFET documentation as “H” highly useful will be used in the calibration refinement – (Earth Tech, 2008a). This classification is still valid in the Kissimmee Basin water reservation, since it refers to the proximity to the bigger lakes and the floodplain.
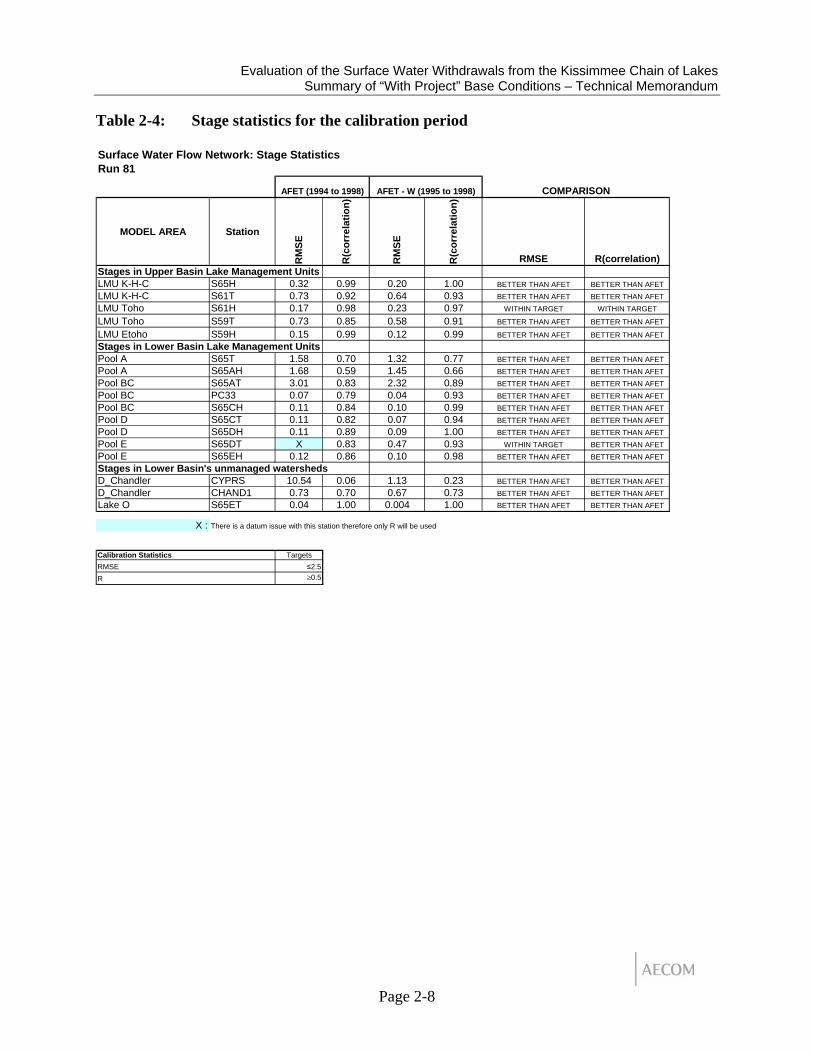
Table 2-4, Table 2-5 and Table 2-6 show the results of the AFET-W calibration. Stage hydrographs and cumulative plots are included in the aforementioned report.
Evaluation of the Surface Water Withdrawals from the Kissimmee Chain of Lakes
Summary of “With Project” Base Conditions – Technical Memorandum
Page 2-8
Table 2-4: Stage statistics for the calibration period
Surface Water Flow Network: Stage StatisticsRun 81
MODEL AREA Station
RM
SE
R(c
orre
latio
n)
RM
SE
R(c
orre
latio
n)
RMSE R(correlation)Stages in Upper Basin Lake Management UnitsLMU K-H-C S65H 0.32 0.99 0.20 1.00 BETTER THAN AFET BETTER THAN AFETLMU K-H-C S61T 0.73 0.92 0.64 0.93 BETTER THAN AFET BETTER THAN AFETLMU Toho S61H 0.17 0.98 0.23 0.97 WITHIN TARGET WITHIN TARGET
LMU Toho S59T 0.73 0.85 0.58 0.91 BETTER THAN AFET BETTER THAN AFET
LMU Etoho S59H 0.15 0.99 0.12 0.99 BETTER THAN AFET BETTER THAN AFETStages in Lower Basin Lake Management UnitsPool A S65T 1.58 0.70 1.32 0.77 BETTER THAN AFET BETTER THAN AFETPool A S65AH 1.68 0.59 1.45 0.66 BETTER THAN AFET BETTER THAN AFETPool BC S65AT 3.01 0.83 2.32 0.89 BETTER THAN AFET BETTER THAN AFETPool BC PC33 0.07 0.79 0.04 0.93 BETTER THAN AFET BETTER THAN AFETPool BC S65CH 0.11 0.84 0.10 0.99 BETTER THAN AFET BETTER THAN AFETPool D S65CT 0.11 0.82 0.07 0.94 BETTER THAN AFET BETTER THAN AFETPool D S65DH 0.11 0.89 0.09 1.00 BETTER THAN AFET BETTER THAN AFETPool E S65DT X 0.83 0.47 0.93 WITHIN TARGET BETTER THAN AFETPool E S65EH 0.12 0.86 0.10 0.98 BETTER THAN AFET BETTER THAN AFETStages in Lower Basin's unmanaged watershedsD_Chandler CYPRS 10.54 0.06 1.13 0.23 BETTER THAN AFET BETTER THAN AFETD_Chandler CHAND1 0.73 0.70 0.67 0.73 BETTER THAN AFET BETTER THAN AFETLake O S65ET 0.04 1.00 0.004 1.00 BETTER THAN AFET BETTER THAN AFET
X : There is a datum issue with this station therefore only R will be used
Targets≤2.5≥0.5
COMPARISON
Calibration StatisticsRMSE R
AFET (1994 to 1998) AFET - W (1995 to 1998)

Evaluation of the Surface Water Withdrawals from the Kissimmee Chain of Lakes
Summary of “With Project” Base Conditions – Technical Memorandum
Page 2-9
Table 2-5: Flow statistics for the calibration period. Shading is used to indicate locations that do not meet specified criteria
Surface Water Flow Network: Flow StatisticsRun 81
Upstream WCU Downstream WCU Station
CE
%
R(c
orre
latio
n)
CE
%
R(c
orre
latio
n)
CE% R(correlation)Flows in Upper Basin Lake Management UnitsLMU Toho LMU KHC S61 9% 0.86 23% 0.88 BETTER THAN AFETLMU KHC PoolA S65 10% 0.82 10% 0.88 WITHIN TARGET BETTER THAN AFETFlows in Lower Basin Lake Management UnitsPoolB PoolC S65B -6% 0.92 BETTER THAN AFET BETTER THAN AFETPoolC PoolD S65C 20% 0.86 -13% 0.92 BETTER THAN AFET BETTER THAN AFETPoolD PoolE S65D 18% 0.87 -11% 0.92 BETTER THAN AFET BETTER THAN AFETPoolE Lake O S65E 28% 0.86 -3% 0.92 BETTER THAN AFET BETTER THAN AFET
≥0.84
Calibration StatisticsCER
≤15%
COMPARISONAFET AFET - W
Targets for non-shaded cells
Table 2-6: Cumulative Error for the 10-year run at S-65 and S-65E Structures Structure S65
Run Cumulative Modeled (cfs) Cumulative Observed (cfs)* Cumulative Error Run 81 10 year run (94-04) 5,072,582.42 5,367,838.72 6%* Uses the Preferred DBKEY HO289
Structure S65ERun Cumulative Modeled (cfs) Cumulative Observed (cfs) Cumulative Error
Run 81 10 year run (94-04) 7,859,587.17 7,562,106.57 -4% * Uses DBKEYs 8066 (01/01/1994-6/20/2000), KO585 (6/21/2000 -12/31/2004)
Evaluation of the Surface Water Withdrawals from the Kissimmee Chain of Lakes
Summary of “With Project” Base Conditions – Technical Memorandum
Page 3-1
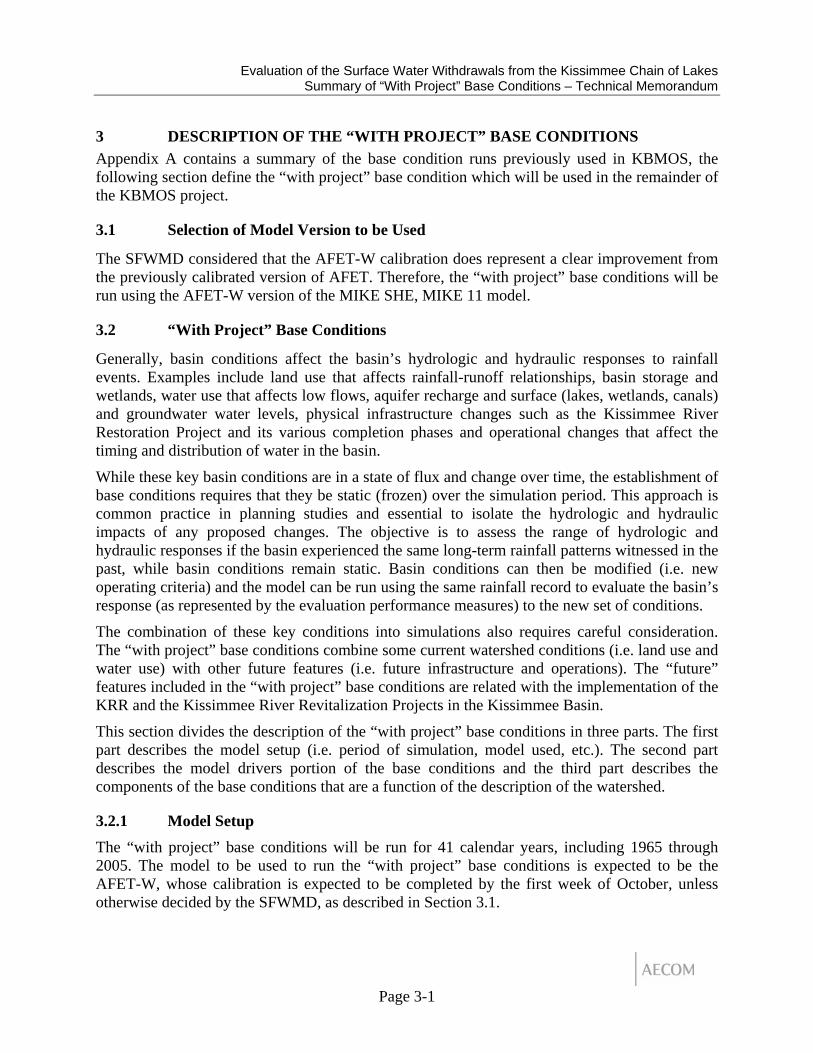
3 DESCRIPTION OF THE “WITH PROJECT” BASE CONDITIONS Appendix A contains a summary of the base condition runs previously used in KBMOS, the following section define the “with project” base condition which will be used in the remainder of the KBMOS project.
3.1 Selection of Model Version to be Used
The SFWMD considered that the AFET-W calibration does represent a clear improvement from the previously calibrated version of AFET. Therefore, the “with project” base conditions will be run using the AFET-W version of the MIKE SHE, MIKE 11 model.
3.2 “With Project” Base Conditions
Generally, basin conditions affect the basin’s hydrologic and hydraulic responses to rainfall events. Examples include land use that affects rainfall-runoff relationships, basin storage and wetlands, water use that affects low flows, aquifer recharge and surface (lakes, wetlands, canals) and groundwater water levels, physical infrastructure changes such as the Kissimmee River Restoration Project and its various completion phases and operational changes that affect the timing and distribution of water in the basin.
While these key basin conditions are in a state of flux and change over time, the establishment of base conditions requires that they be static (frozen) over the simulation period. This approach is common practice in planning studies and essential to isolate the hydrologic and hydraulic impacts of any proposed changes. The objective is to assess the range of hydrologic and hydraulic responses if the basin experienced the same long-term rainfall patterns witnessed in the past, while basin conditions remain static. Basin conditions can then be modified (i.e. new operating criteria) and the model can be run using the same rainfall record to evaluate the basin’s response (as represented by the evaluation performance measures) to the new set of conditions.
The combination of these key conditions into simulations also requires careful consideration. The “with project” base conditions combine some current watershed conditions (i.e. land use and water use) with other future features (i.e. future infrastructure and operations). The “future” features included in the “with project” base conditions are related with the implementation of the KRR and the Kissimmee River Revitalization Projects in the Kissimmee Basin.
This section divides the description of the “with project” base conditions in three parts. The first part describes the model setup (i.e. period of simulation, model used, etc.). The second part describes the model drivers portion of the base conditions and the third part describes the components of the base conditions that are a function of the description of the watershed.
3.2.1 Model Setup
The “with project” base conditions will be run for 41 calendar years, including 1965 through 2005. The model to be used to run the “with project” base conditions is expected to be the AFET-W, whose calibration is expected to be completed by the first week of October, unless otherwise decided by the SFWMD, as described in Section 3.1.

Evaluation of the Surface Water Withdrawals from the Kissimmee Chain of Lakes
Summary of “With Project” Base Conditions – Technical Memorandum
Page 3-2
3.2.1.1 Downstream Boundary Conditions (S-65E-TW) The modeling tools use a time series of tailwater stages at the S-65E Structure as downstream boundary conditions. During the entire alternative plan selection process, a single time series will be used. The USACE Lake Okeechobee Regulation Schedule Study was selected to be used as boundary conditions in the KBMOS. The criteria used for this selection is presented in Earth Tech 2007b.
3.2.1.2 Groundwater Boundary Conditions The “with project” base conditions will be run in two stages. The first stage will be the 3-layer, 3,000 foot grid size model (a.k.a. the 3K model). This model will use lateral boundary conditions obtained from United States Geological Survey (USGS) seasonal potentiometric maps for the UFA (Included in Figure 3-1 and Figure 3-2) and no flow boundaries for the SAS. The second stage, the 1-layer, 1,000 foot grid size, will use boundary conditions extracted from the 3K model and no boundary flows for the SAS.
There will be four sets of boundary conditions, including the lateral flow boundary conditions along the SAS, the lateral flow boundary conditions for the UFAS, the vertical flow boundary conditions at the bottom of the UFAS for the 3-layered configuration of the AFET-W and the vertical flow boundary conditions of the SAS for the 1-layered configuration of the AFET-W. These sets were defined as follows:
• Lateral flow for the SAS - A no flux boundary will be used in the “with project” base conditions as it was the case during the calibration of the AFET-W. The base condition evaluation should not use a set of boundary conditions that is different from the one used in the calibration.
• Lateral flow in the UFAS - A variable-head boundary condition will be used in the “with project” base conditions. This variable head was obtained from the USGS available potentiometric maps similar to the maps shown in Figure 3-1 and Figure 3-2. Since these maps were seasonal, linear interpolation will be used to obtain daily values.
• Vertical flow boundary conditions at the bottom of the SAS throughout the model domain are needed for the 1-layered configuration of the AFET-W. These boundary conditions will be extracted from the 3-layer results. Extracted values corresponded to daily heads at each cell grid (3,000 foot grid cell).
• Vertical flow boundary conditions at the bottom of the UFAS throughout the model domain are needed for the 3-layered configuration of the AFET-W. A no flux condition will be assumed for both the calibration and the “with project” base condition simulation.
Evaluation of the Surface Water Withdrawals from the Kissimmee Chain of Lakes
Summary of “With Project” Base Conditions – Technical Memorandum
Page 3-3
Figure 3-1: Average Dry Season (May) UFA Potentiometric Surface Used to Extract
Lateral Boundary Conditions. (USGS)

Evaluation of the Surface Water Withdrawals from the Kissimmee Chain of Lakes
Summary of “With Project” Base Conditions – Technical Memorandum
Page 3-4
Figure 3-2: Average Wet Season (September) UFA Potentiometric Surface Used to
Extract Lateral Boundary Conditions. (USGS)

Evaluation of the Surface Water Withdrawals from the Kissimmee Chain of Lakes
Summary of “With Project” Base Conditions – Technical Memorandum
Page 3-5
3.2.2 Model Drivers
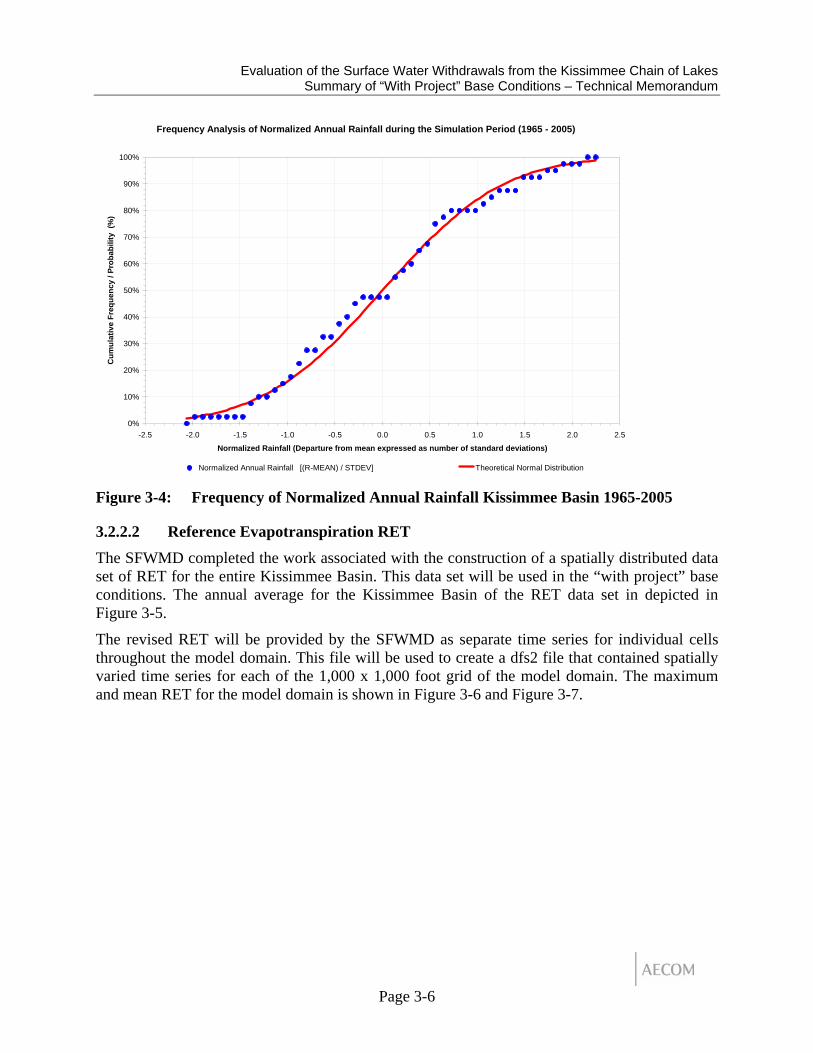
3.2.2.1 Historic Rainfall (1965 – 2005) The model will use spatially varied rainfall data obtained from a 2-mile square grid matrix provided by HESM – SFWMD for the 1965 to 2005 period. This period includes a wide variety of wet and dry years (Figure 3-3), as well as years where extreme conditions were observed (1994 and 2000). Figure 3-4 shows a frequency analysis of the rainfall being used to drive the study modeling tools. This figure shows that the annual rainfall during the simulation period is evenly distributed around the mean. This distribution is similar to the normal distribution, also included in the figure. This indicates that the selected period of simulation encompasses the range of climatic conditions required to achieve a fair evaluation of alternatives.
KBMOS Period of Simulation Average Annual Rainfall KUB
32
34
36
38
40
42
44
46
48
50
52
54
56
58
60
62
64
66
68
1965
1966
1967
1968
1969
1970
1971
1972
1973
1974
1975
1976
1977
1978
1979
1980
1981
1982
1983
1984
1985
1986
1987
1988
1989
1990
1991
1992
1993
1994
1995
1996
1997
1998
1999
2000
2001
2002
2003
2004
2005
Year
Rai
nfal
l (in
)
Figure 3-3: Annual Rainfall during the “with project” base conditions
Evaluation of the Surface Water Withdrawals from the Kissimmee Chain of Lakes
Summary of “With Project” Base Conditions – Technical Memorandum
Page 3-6
Frequency Analysis of Normalized Annual Rainfall during the Simulation Period (1965 - 2005)
0%
10%
20%
30%
40%
50%
60%
70%
80%
90%
100%
-2.5 -2.0 -1.5 -1.0 -0.5 0.0 0.5 1.0 1.5 2.0 2.5
Normalized Rainfall (Departure from mean expressed as number of standard deviations)
Cum
ulat
ive
Freq
uenc
y / P
roba
bilit
y (%
)
Normalized Annual Rainfall [(R-MEAN) / STDEV] Theoretical Normal Distribution Figure 3-4: Frequency of Normalized Annual Rainfall Kissimmee Basin 1965-2005
3.2.2.2 Reference Evapotranspiration RET The SFWMD completed the work associated with the construction of a spatially distributed data set of RET for the entire Kissimmee Basin. This data set will be used in the “with project” base conditions. The annual average for the Kissimmee Basin of the RET data set in depicted in Figure 3-5.
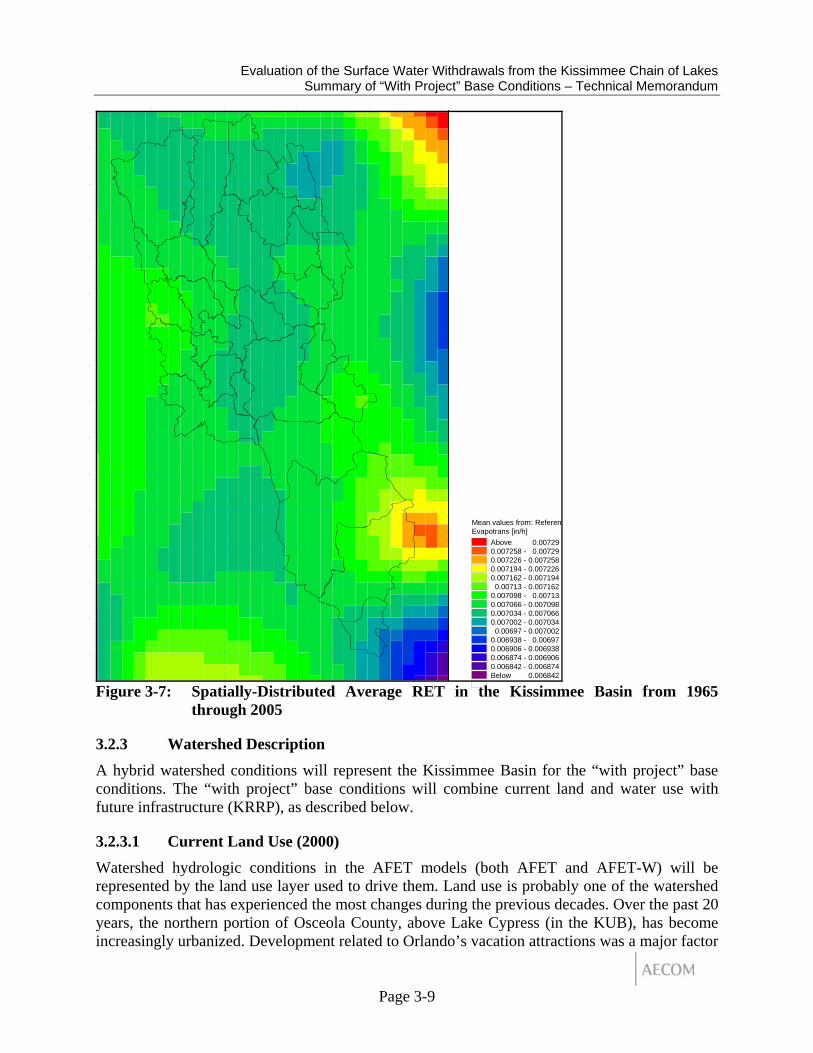
The revised RET will be provided by the SFWMD as separate time series for individual cells throughout the model domain. This file will be used to create a dfs2 file that contained spatially varied time series for each of the 1,000 x 1,000 foot grid of the model domain. The maximum and mean RET for the model domain is shown in Figure 3-6 and Figure 3-7.

Evaluation of the Surface Water Withdrawals from the Kissimmee Chain of Lakes
Summary of “With Project” Base Conditions – Technical Memorandum
Page 3-7
REFERENCE EVAPOTRANSPIRATION USED AFET-WANNUAL AVERAGE FOR THE KISSIMMEE BASIN
50.0
52.0
54.0
56.0
58.0
60.0
62.0
64.0
1965 1967 1969 1971 1973 1975 1977 1979 1981 1983 1985 1987 1989 1991 1993 1995 1997 1999 2001 2003 2005
Date
Ref
eren
ce E
avpo
tran
spira
tion
(inch
es/y
ear)
Figure 3-5: Reference Evapotranspiration in inches/ year - annual average for the
Kissimmee Basin

Evaluation of the Surface Water Withdrawals from the Kissimmee Chain of Lakes
Summary of “With Project” Base Conditions – Technical Memorandum
Page 3-8
Maximum values from:Reference Evapotrans[in/h]
Above 0.01660.0164 - 0.01660.0162 - 0.01640.016 - 0.0162
0.0158 - 0.0160.0156 - 0.01580.0154 - 0.01560.0152 - 0.01540.015 - 0.0152
0.0148 - 0.0150.0146 - 0.01480.0144 - 0.01460.0142 - 0.01440.014 - 0.0142
0.0138 - 0.014Below 0.0138
Figure 3-6: Spatially-Distributed Maximum RET in the Kissimmee Basin from 1965 through 2005
Evaluation of the Surface Water Withdrawals from the Kissimmee Chain of Lakes
Summary of “With Project” Base Conditions – Technical Memorandum
Page 3-9
Mean values from: ReferenEvapotrans [in/h]
Above 0.007290.007258 - 0.007290.007226 - 0.0072580.007194 - 0.0072260.007162 - 0.007194
0.00713 - 0.0071620.007098 - 0.007130.007066 - 0.0070980.007034 - 0.0070660.007002 - 0.007034
0.00697 - 0.0070020.006938 - 0.006970.006906 - 0.0069380.006874 - 0.0069060.006842 - 0.006874Below 0.006842
Figure 3-7: Spatially-Distributed Average RET in the Kissimmee Basin from 1965 through 2005
3.2.3 Watershed Description A hybrid watershed conditions will represent the Kissimmee Basin for the “with project” base conditions. The “with project” base conditions will combine current land and water use with future infrastructure (KRRP), as described below.
3.2.3.1 Current Land Use (2000) Watershed hydrologic conditions in the AFET models (both AFET and AFET-W) will be represented by the land use layer used to drive them. Land use is probably one of the watershed components that has experienced the most changes during the previous decades. Over the past 20 years, the northern portion of Osceola County, above Lake Cypress (in the KUB), has become increasingly urbanized. Development related to Orlando’s vacation attractions was a major factor

Evaluation of the Surface Water Withdrawals from the Kissimmee Chain of Lakes
Summary of “With Project” Base Conditions – Technical Memorandum
Page 3-10
in the over 60 percent population increase in Osceola County from 1990 to 2000 (Earth Tech, 2005). Citrus in the KUB, located mainly north of Lake Cypress, is the primary existing and projected water user in the Kissimmee Basin. Agriculture remains a significant land use in the Kissimmee Basin and is the primary land use activity in the LKB, being dominated by extensive beef cattle production and dairy activities. Yet, the citrus industry is shifting southward due to a series of severe freezes that occurred in the 1980s and sugar cane is becoming a significant crop in Highlands County (Earth Tech, 2005: Section 1.3). The land use spatial distribution presented during 1999 was captured by the SFWMD 2000 Kissimmee Basin Land Use Layer. This layer will be used to describe the watershed hydrologic conditions for the “with project” base conditions. The “with project” base conditions will use the current land use, which is the same land use used for the calibration of AFET and AFET-w. This land use coverage is consistent with current Kissimmee Basin water supply planning efforts. A summary of the current land use is presented in Table 3-1.
Table 3-1: Summary of Year 2000 (Current) Kissimmee Basin Land Use to be used in
the “With Project” Base Conditions
Land Use Category * Land Use
Code Range Number
of Parcels Acres Percentage
of Total Parcels Residential 1009 – 1390 11,112 612,873 4.80 Commercial 1400 – 1490 3,394 66,636 1.47 Industrial 1500 – 1660 1,182 236,461 0.51 Institutional 1700 – 1760 1,556 32,989 0.67 Recreational 1800 – 1890 1,144 43,134 0.49 Open Land 1900 – 1940 726 65,122 0.31 Agricultural 2100 – 2610 15,711 2,389,817 6.79 Upland Non-Forested 3100 – 3300 14,489 618,967 6.26 Upland Forests 4100 – 4430 22,571 1,056,544 9.76 Water 5000 – 5600 23,767 1,139,389 10.28 Wetlands 6100 – 6530 132,178 1,842,261 57.15 Barren Land 7100 – 7430 1,775 53,047 0.77 Transportation 8100 – 8191 473 63,837 0.20 Communication and Utilities 8200 – 8390 1,194 24,463 0.52 Other 9000 1 43 0.00
3.2.3.2 Status of the KRR Infrastructure Completed KRR or Future Infrastructure. In addition to the features of the KRR already in places, this includes the following:
o Demolition of the S-65C Structure
o U-shaped weir and downstream berm
Evaluation of the Surface Water Withdrawals from the Kissimmee Chain of Lakes
Summary of “With Project” Base Conditions – Technical Memorandum
Page 3-11
o Phase II and IV
o Future Conditions DEM (berms, removal of levees, etc.)
3.2.3.3 Water Use (Existing Legal Users) Irrigation uses and potable water use in the Kissimmee Basin to be used in the “with project” base conditions will reflect the existing legal users. Within the “with project” base condition the existing legal users will be divided in two broad categories for modeling purposes. These categories were:
• Public Water Supply (PWS). Each permit will be modeled as an individual point of withdrawals (wells).
• Irrigation uses. Modeled using the Irrigation Command Module (ICM) as coded in MIKE SHE/MIKE 11. To do that each permit was converted to Irrigation Command Areas as described below.
The inclusion of the PWS in the model is a straight forward process where each well in the permit will represent a well in the model. The ICM, used for irrigation uses, calculates the water demanded from the permitted wells based on the actual water deficit. In the ICM, the irrigation withdrawals are meant to cope with the “deficit in evapotranspiration”. Evapotranspiration from irrigated lands is first met by the moisture of the soil in the unsaturated zone. This is done by modifying the RET based on leaf area index and crop coefficients, which are defined in the land use layer identified in the model setup. The leaf area index represents the interception storage capacity of the vegetation, which must be filled before stem flow to the ground surface takes place. The leaf area index characterizes the vegetation type and its stage of development. The tables, based on land use, for the leaf area index and crop coefficients used are specified in the AFET-W Calibration Report (Earth Tech, 2008a). Once the required ET is calculated, it is compared with the amount of water available in the unsaturated zone and the ability of the plants to extract water from the soil as a function of the soil moisture content. The quantity of irrigation withdrawals or the “deficit in evapotranspiration” is based on the difference between the required ET levels and the water available in the unsaturated zone. However, the amount of water that is irrigated will be capped by the maximum permitted pumping capacity obtained from the SFWMD permit database described below.
Information to be included in the model was extracted from two sources. The SFWMD permit database that provided information regarding users within the jurisdiction of the SFWMD and, as a supplement of the SFWMD data, information included in previous versions of the model was used to represent the water uses outside of the SFWMD jurisdiction but inside the model domain. The process followed to query the SFWMD permit database to extract the information that will finally be used in the model was documented in a technical memorandum, dated November 26, 2008, titled “Technical Approach to Create the Existing Legal Users Database Included in the “With Project” Base Condition Model” (Earth Tech, 2008b). The referenced memorandum describes the steps followed to process and screen the information obtained from the SFWMD database. The results of the documented screening process were subject to a secondary screening since the SFWMD permit database also included permits that were located outside of the model domain. These permits had to be removed of the database.
Evaluation of the Surface Water Withdrawals from the Kissimmee Chain of Lakes
Summary of “With Project” Base Conditions – Technical Memorandum
Page 3-12
Since most of the reviewed permits listed as “source” the UFA and the ICU, the existing legal users will be included in the 3K version of AFET-W. Once the 3K model is run, the boundary condition extracted from the 3K transfers to the 1K model the effect of the withdrawals in the potentiometric surface of the groundwater system. The withdrawals in the 1K model will then be modeled assuming they are tapping an external source.
The following paragraphs describe the process followed to screen the SFWMD database in order to obtain the basic information input in the “with project” base condition model.
3.2.3.3.1 Public Water Supply (PWS) The SFWMD compiled existing legal consumptive use allocation information for the “with project” base conditions modeling being performed as part of Kissimmee Basin Water Reservation rule. These data were compiled for areas within the legal boundaries of the SFWMD and include permitted allocations through August 31, 2008. Data for areas outside the legal boundaries of the SFWMD but within the “with project” base condition model domain were obtained from the future base condition model developed for the Kissimmee Basin Modeling and Operations Study and documented in the Peer Review Evaluation of Base Conditions Report, May, 2008 (Earth Tech, 2008c). SFWMD existing legal user data were acquired from the SFWMD’s Regulatory Database and the pumpage files from the SFWMD’s ECFT Model, whose boundaries incorporate a portion of the SFWMD’s Kissimmee Basin. Data from both sources were compiled in a spreadsheet (A copy of this spreadsheet was included in Attachment A of the Technical Approach to Create the Existing Legal Users Database Included in the “With Project” Base Condition Model” - Earth Tech, 2008b) and included details such as permit number, use classification, source, location and annual allocation. It was determined that a monthly distribution of that allocation needed to be estimated based on historical usage. Monthly distribution percentages were calculated from actual pumpage from the most current available data for each permit number for public water supply, where actual data were available (A copy of this spreadsheet was included in Attachment B of the aforementioned memorandum – Earth Tech, 2008b) and percentage distribution averages for each county were developed to be used where there were gaps in the data (Attachment C of Earth Tech, 2008b).
• Screening / Processing Approach A database was developed for existing legal consumptive use allocation information compiled by SFWMD for the area within the jurisdiction of the SFWMD. This information was completed with information extracted from the KBMOS Future Base Conditions Model to account for the water uses in the small area within the Kissimmee Basin that fall outside of the SFWMD jurisdiction. This database includes such detail as: Well Identification Number, Location, Water Allocation (monthly and daily), Permit Number, Water Usage, Well Screen Elevation, and Water Source for 2149 permitted withdrawal facilities. This number includes data from the two sources, SFWMD database (1878 permits) and information from KBMOS models (271 wells), out of which only 37 fell outside of the SFWMD jurisdiction. Separate screening and processing procedures were used for the SFWMD data and the KBMOS data as documented below
The process of reviewing and screening the SFWMD data involved the following steps and procedures:
Evaluation of the Surface Water Withdrawals from the Kissimmee Chain of Lakes
Summary of “With Project” Base Conditions – Technical Memorandum
Page 3-13
1. The facilities database included 1878 facilities of both “withdrawal” and “non-withdrawal” structures. 273 facilities were identified as being “non-withdrawal” structures such as pumps and/or culverts and were deleted from the database since they refer to transmission infrastructure and were not necessarily related to any “withdrawal”. The other 1605 “withdrawal” structures, which were essentially wells, were maintained in the database for future analysis.
2. The 1605 withdrawal structures were placed in groups with identical permit identification numbers. A total of 352 groups (by permit ID) were identified. Although from the SFWMD permit database, a list of 417 water use permits had been originally compiled but only facility information for approximately 84 percent of those permits was available. As such, there was no available well information for 65 permits. Out of those 65 permits, only 22 fell within the model domain. It is important to note that despite the missing data, all withdrawal facilities within the available database were accounted for during the first screening.
3. The maximum water allocation for each of the water use permits was divided equally between the total number of withdrawal structure served under that permit. This facilitated the determination of the maximum annual water allocation per structure (MG/Yr/Well). For example, a water use permit that had an annual maximum allocation of 100 MG/Yr and served ten wells was given per well assignment of 10 MG/yr/well.
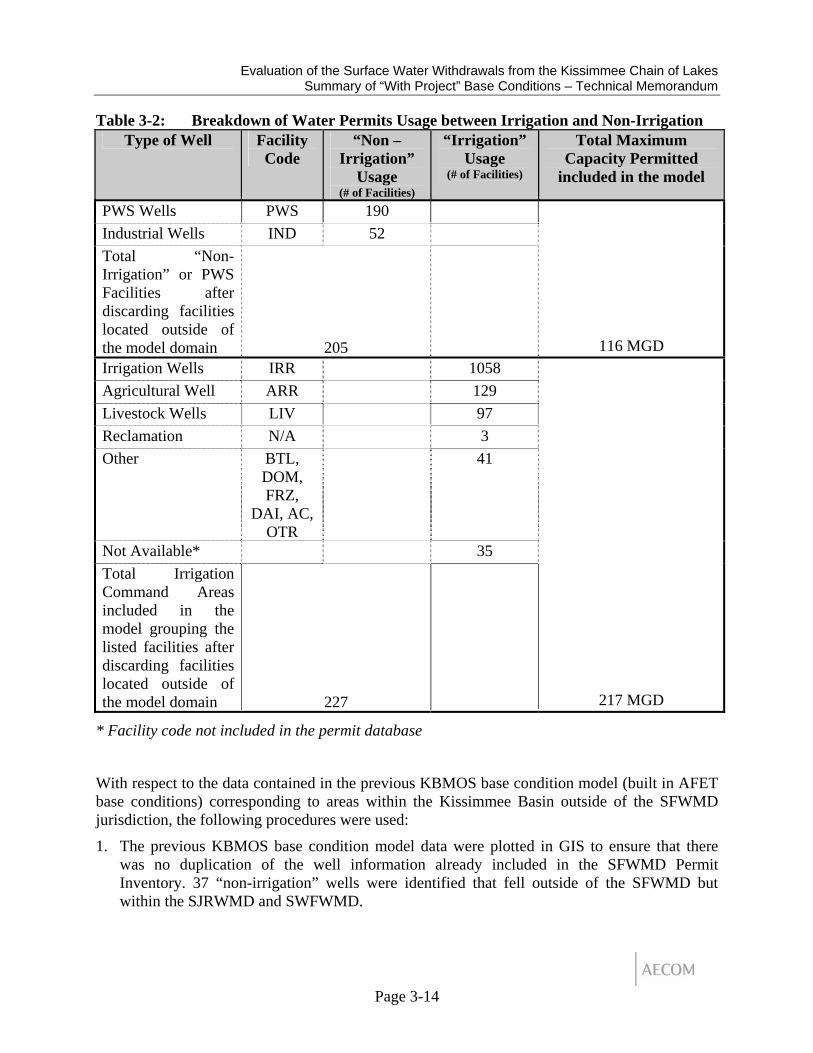
4. The withdrawal structures were then placed into two broad categories of “irrigation” and “non-irrigation” wells. The “non irrigation” designation was applied to PWS users and industrial users (IND) and the “irrigation” designation for agriculture (AGR), golf courses (GOL), landscaping (LAN), livestock (LIV) and reclamation usage. This categorization produced 242 “non irrigation” (See Attachment D of Earth Tech 2008b) and 1363 “irrigation” structures (See Attachment E of Earth Tech 2008b). Table 3-2 summarizes the breakdown of usage within each category of the entire database, thus including facilities that are located outside of the model domain. In the aforementioned table, the row indicating to “Non Available” corresponds to database entries where no facility coded information. Permits in this row were assigned to the “Irrigation” category. The same applies to the row indicating “Other” which correspond to other usages as listed in the table.
5. With the annual water allocations for the well determined, the monthly demand for the non-irrigation wells were calculated using the monthly multiplier prescribed specifically for each water use permit. In cases where this information was lacking, the average county monthly demand multiplier was used.
6. Finally, a second screening process was performed where the 1605 facilities contained in the SFWMD Permit Inventory were reviewed and plotted on Geographic Information System (GIS) maps to verify whether they were located within the limits of the Kissimmee Basin. Facilities outside of the basin boundary were eliminated.
Evaluation of the Surface Water Withdrawals from the Kissimmee Chain of Lakes
Summary of “With Project” Base Conditions – Technical Memorandum
Page 3-14
Table 3-2: Breakdown of Water Permits Usage between Irrigation and Non-Irrigation Type of Well Facility
Code “Non –
Irrigation” Usage
(# of Facilities)
“Irrigation” Usage
(# of Facilities)
Total Maximum Capacity Permitted
included in the model
PWS Wells PWS 190 Industrial Wells IND 52 Total “Non-Irrigation” or PWS Facilities after discarding facilities located outside of the model domain 205 116 MGD Irrigation Wells IRR 1058 Agricultural Well ARR 129 Livestock Wells LIV 97 Reclamation N/A 3 Other BTL,
DOM, FRZ,
DAI, AC, OTR
41
Not Available* 35 Total Irrigation Command Areas included in the model grouping the listed facilities after discarding facilities located outside of the model domain 227
217 MGD
* Facility code not included in the permit database
With respect to the data contained in the previous KBMOS base condition model (built in AFET base conditions) corresponding to areas within the Kissimmee Basin outside of the SFWMD jurisdiction, the following procedures were used:
1. The previous KBMOS base condition model data were plotted in GIS to ensure that there was no duplication of the well information already included in the SFWMD Permit Inventory. 37 “non-irrigation” wells were identified that fell outside of the SFWMD but within the SJRWMD and SWFWMD.
Evaluation of the Surface Water Withdrawals from the Kissimmee Chain of Lakes
Summary of “With Project” Base Conditions – Technical Memorandum
Page 3-15
2. The model files also provided current well user information and daily water demand/ withdrawal for the years 1965 through to 2005. They were incorporated into the database with the SFWMD information. The PWS wells were explicitly included in the “with project” base condition model at their permitted allocation using the information obtained in the previously described process.
3.2.3.4 Operations Operations of C&SF Structures will include:
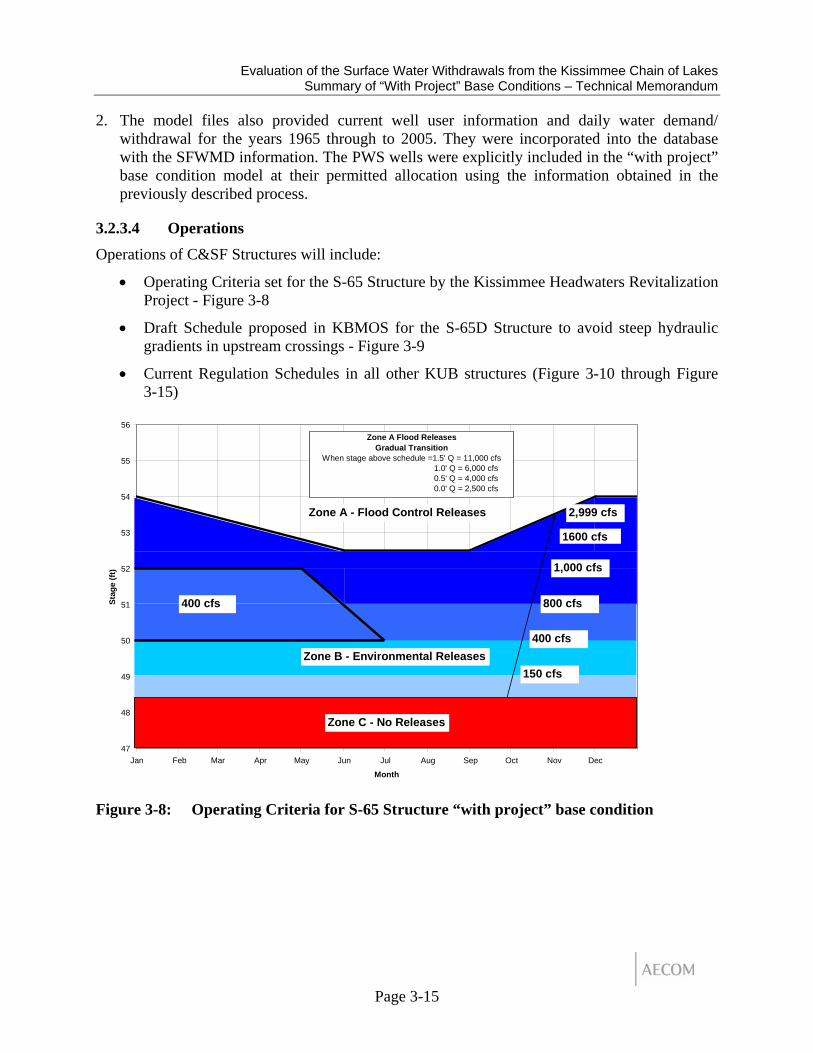
• Operating Criteria set for the S-65 Structure by the Kissimmee Headwaters Revitalization Project - Figure 3-8
• Draft Schedule proposed in KBMOS for the S-65D Structure to avoid steep hydraulic gradients in upstream crossings - Figure 3-9
• Current Regulation Schedules in all other KUB structures (Figure 3-10 through Figure 3-15)
47
48
49
50
51
52
53
54
55
56
Jan Feb Mar Apr May Jun Jul Aug Sep Oct Nov Dec
Month
Stag
e (ft
)
Zone C - No Releases
Zone A - Flood Control Releases
Zone B - Environmental Releases
2,999 cfs
150 cfs
400 cfs
800 cfs
1,000 cfs
400 cfs
Zone A Flood Releases Gradual Transition
When stage above schedule =1.5' Q = 11,000 cfs 1.0' Q = 6,000 cfs 0.5' Q = 4,000 cfs 0.0' Q = 2,500 cfs
1600 cfs
Figure 3-8: Operating Criteria for S-65 Structure “with project” base condition
Evaluation of the Surface Water Withdrawals from the Kissimmee Chain of Lakes
Summary of “With Project” Base Conditions – Technical Memorandum
Page 3-16
S-65 D and S-65D-X Proposed Operating Criteria
20.0
21.0
22.0
23.0
24.0
25.0
26.0
27.0
28.0
29.0
30.0
31.0
32.0
33.0
34.0
0 3000 6000 9000 12000 15000 18000 21000 24000 27000
Flow thorugh S-65D and S-65DX (cfs)
Targ
et H
eadw
ater
Sta
ge (f
t NG
VD)
Target HW = 28.8' NGVD during operations of S-65D-X (Q<1000 cfs)
Target HW = 30'0 NGVD when Q= 3000
Maximum HW = 32'4 NGVD for SPF (23,500 cfs)
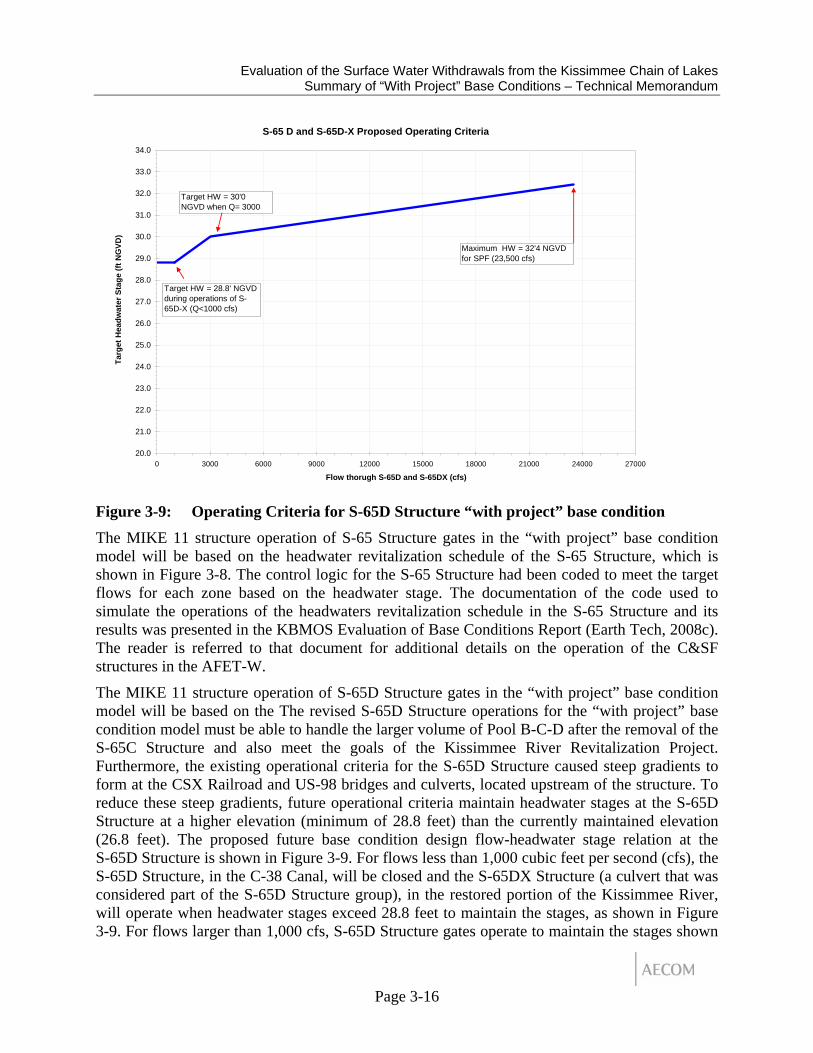
Figure 3-9: Operating Criteria for S-65D Structure “with project” base condition The MIKE 11 structure operation of S-65 Structure gates in the “with project” base condition model will be based on the headwater revitalization schedule of the S-65 Structure, which is shown in Figure 3-8. The control logic for the S-65 Structure had been coded to meet the target flows for each zone based on the headwater stage. The documentation of the code used to simulate the operations of the headwaters revitalization schedule in the S-65 Structure and its results was presented in the KBMOS Evaluation of Base Conditions Report (Earth Tech, 2008c). The reader is referred to that document for additional details on the operation of the C&SF structures in the AFET-W.
The MIKE 11 structure operation of S-65D Structure gates in the “with project” base condition model will be based on the The revised S-65D Structure operations for the “with project” base condition model must be able to handle the larger volume of Pool B-C-D after the removal of the S-65C Structure and also meet the goals of the Kissimmee River Revitalization Project. Furthermore, the existing operational criteria for the S-65D Structure caused steep gradients to form at the CSX Railroad and US-98 bridges and culverts, located upstream of the structure. To reduce these steep gradients, future operational criteria maintain headwater stages at the S-65D Structure at a higher elevation (minimum of 28.8 feet) than the currently maintained elevation (26.8 feet). The proposed future base condition design flow-headwater stage relation at the S-65D Structure is shown in Figure 3-9. For flows less than 1,000 cubic feet per second (cfs), the S-65D Structure, in the C-38 Canal, will be closed and the S-65DX Structure (a culvert that was considered part of the S-65D Structure group), in the restored portion of the Kissimmee River, will operate when headwater stages exceed 28.8 feet to maintain the stages, as shown in Figure 3-9. For flows larger than 1,000 cfs, S-65D Structure gates operate to maintain the stages shown

Evaluation of the Surface Water Withdrawals from the Kissimmee Chain of Lakes
Summary of “With Project” Base Conditions – Technical Memorandum
Page 3-17
in Figure 3-9. In the case of severe flooding, when the S-65D Structure was fully opened and headwater stages still exceeded 28.8 feet, the S-65DX2 Structure could be operated to allow additional flow from the restored portion of the river to the C-38 Canal. The documentation of the code used to simulate the operations of the proposed interim operating criteria of the S-65D Structure and its results was presented in the KBMOS Evaluation of Base Conditions Report (Earth Tech, 2008c). The reader is referred to that document for additional details on the operation of the C&SF structures in the AFET-W.
Figure 3-10: Operating Criteria for S-61 Structure “with project” base condition
Evaluation of the Surface Water Withdrawals from the Kissimmee Chain of Lakes
Summary of “With Project” Base Conditions – Technical Memorandum
Page 3-18
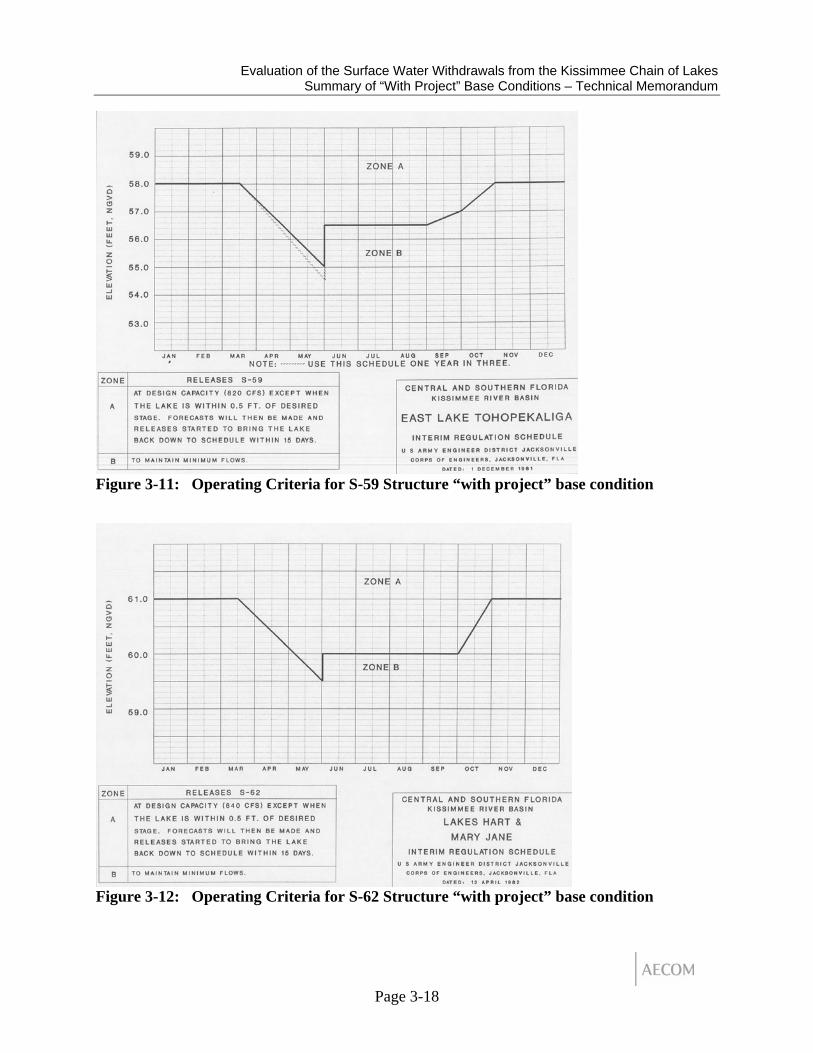
Figure 3-11: Operating Criteria for S-59 Structure “with project” base condition
Figure 3-12: Operating Criteria for S-62 Structure “with project” base condition
Evaluation of the Surface Water Withdrawals from the Kissimmee Chain of Lakes
Summary of “With Project” Base Conditions – Technical Memorandum
Page 3-19
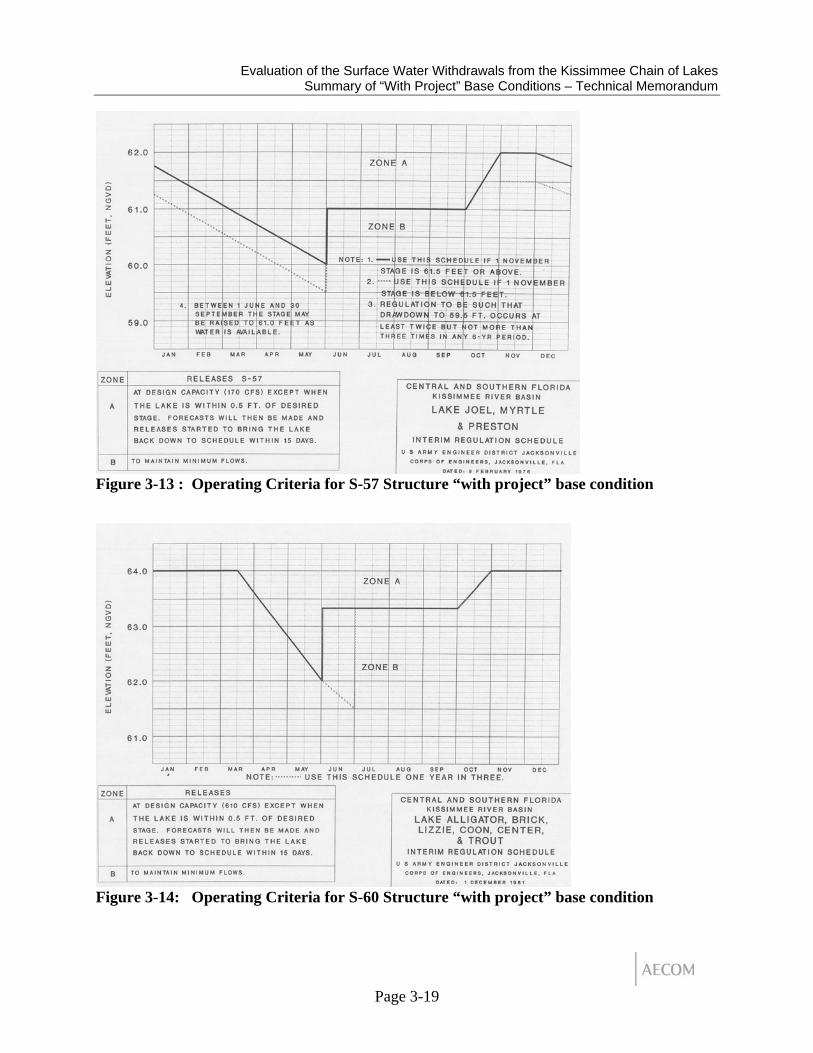
Figure 3-13 : Operating Criteria for S-57 Structure “with project” base condition
Figure 3-14: Operating Criteria for S-60 Structure “with project” base condition

Evaluation of the Surface Water Withdrawals from the Kissimmee Chain of Lakes
Summary of “With Project” Base Conditions – Technical Memorandum
Page 3-20
Figure 3-15: Operating Criteria for S-63 (S-63A) Structure “with project” base condition

Evaluation of the Surface Water Withdrawals from the Kissimmee Chain of Lakes
Summary of “With Project” Base Conditions – Technical Memorandum
Page 4-1
4 REFERENCES
Earth Tech, 2005. Kissimmee Basin Assessment Report, Kissimmee Basin Hydrologic Assessment, Modeling and Operations Planning Project.
Earth Tech, 2007a. KBMOS AFET Model Documentation / Calibration Report.
Earth Tech, 2007b. KBMOS Draft Operating Criteria for Modeling S-65D Future Conditions Memorandum.
Earth Tech, 2008a. Evaluation of Surface Water Withdrawals from the KCOL, AFET-W Calibration Report.
Earth Tech, 2008b. Technical Approach to Create the Existing Legal Users Database Included in the “With Project” Base Condition Model.
Earth Tech, 2008c. KBMOS Evaluation of Base Conditions Report, May, 2008 - Peer Review Copy.
Evaluation of the Surface Water Withdrawals from the Kissimmee Chain of Lakes
Summary of “With Project” Base Conditions – Technical Memorandum
APPENDIX A
BASE CONDITION RUNS PREVIOUSLY USED IN KBMOS
Evaluation of the Surface Water Withdrawals from the Kissimmee Chain of Lakes
Summary of “With Project” Base Conditions – Technical Memorandum
A-1
BASE CONDITION RUNS PREVIOUSLY USED IN KBMOS KBMOS future and current base conditions are described in the Evaluation of Base Conditions Report (Earth Tech, 2008c). This section analyzes the results obtained in terms of total basin runoff as compared to the available information.
Future Base Conditions A future base condition run was defined within KBMOS. These base conditions corresponded to the fully restored Kissimmee River under a future land use scenario. The first model results obtained from these base conditions indicated a large difference in basin runoff, as compared to the total basin runoff obtained with the model run corresponding to the current base conditions. Since the rest of the model drivers are kept constant in the base conditions, these differences in basin runoff were all due to changes in land use. These results raised concerns over the assumptions made to generate the “future” land use coverage. Therefore, base conditions used for ongoing KB planning efforts will only use the current land use.
Current Base Conditions The basic description of the KBMOS current base conditions is included below:
• Current Land Use (2000):
o Consistent with Current Kissimmee Basin Water Supply Planning Efforts
• Historic Rainfall (1965 to 2005)
o Data derived from the 2-mile square grid data (HESM Standard)
• RET
o Single data point RET (composite time series)
• Completed Kissimmee River Restoration (KRR)
o United States Army Corp of Engineers (USACE) Infrastructure
• Existing Permitted Surface Water and Groundwater Uses as of August 31, 2008
o SFWMD Permit Database
• Operations
o Headwater Revitalization Schedule at the S-65 Structure
o Current Regulation Schedules all other structures
Prior to the development of the “with project” base conditions, the KBMOS team ran two versions or revisions of the current base condition (Revision Zero and Revision One), as described below.

Evaluation of the Surface Water Withdrawals from the Kissimmee Chain of Lakes
Summary of “With Project” Base Conditions – Technical Memorandum
A-2
KBMOS - Current Base Conditions Revision Zero The initial current base condition run included a set of RET data that consisted of a single time series for the entire basin (not spatially distributed) and was compiled from multiple data sources:
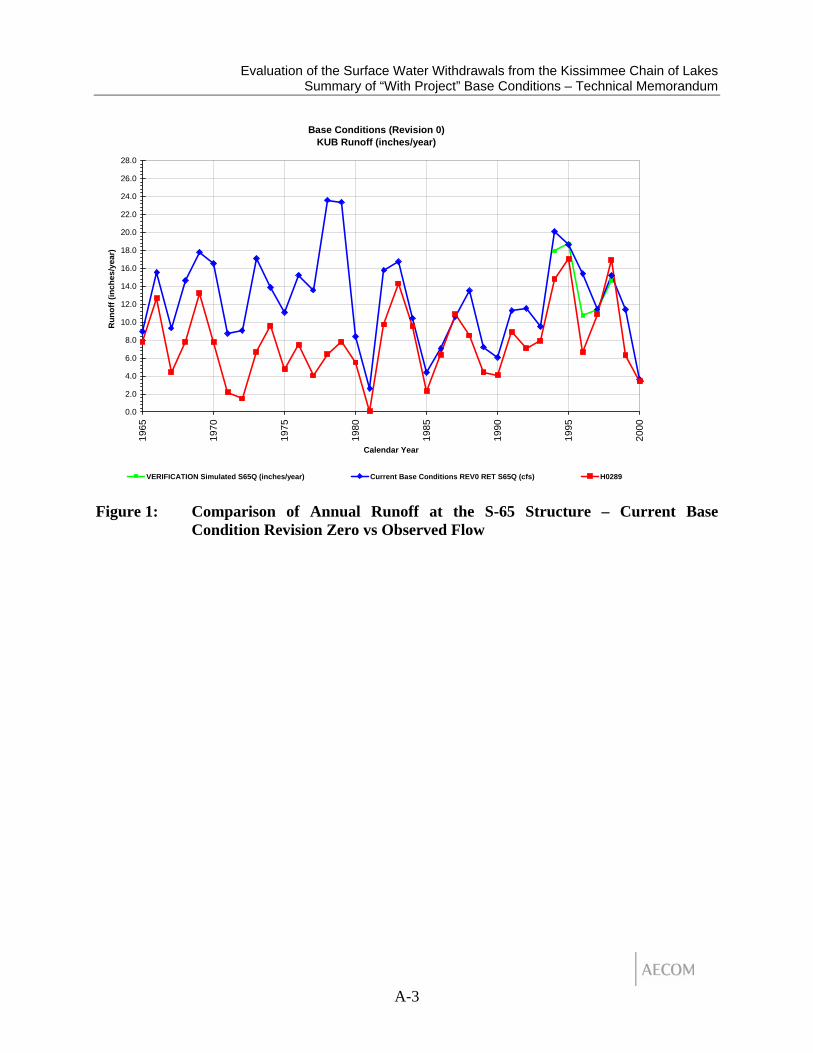
Figure 1 and Figure 2 show comparisons of runoff and cumulative flow at the S-65 Structure for the current base condition Revision Zero. As seen in these figures, the current base condition Revision Zero is over-predicting basin runoff.
However, it is important to emphasize that data collection and management is a very complex and challenging task within the SFWMD. The SFWMD is constantly updating the time series of recorded flows and stages. Flow recording is particularly challenging. Flow is calculated by the SFWMD using an equation that represents the flow through the type of structures where the flow is being computed (mostly gated spillways and gated culverts). Therefore, the time series of flows is affected by errors associated with the data used by those equations (stages and gate openings) and by errors associated with the equations. The SFWMD has been updating the equations used to compute the flows and identifying datum issues that could be affecting the calculation of flows. As a result of these efforts, there are several time series or “DBKEYS” with available information. In addition to the QA/QC efforts carried out by the SFWMD, there have been several changes in the methodologies used to collect the stage information used to compute flows. Stages are currently recorded using digital devices, but in the past they have been recorded with graphical devices. Gate openings were collected manually in the past. For the main structures representing total runoff from the upper and lower basins (S-65 and S-65E, respectively) the SFWMD has been responsible for the data collection activities only after 1996. Therefore, the study team believes that recent data (1996 to present) may have the level of accuracy sufficiently reliable to be compared to the results of the base condition simulations.
Evaluation of the Surface Water Withdrawals from the Kissimmee Chain of Lakes
Summary of “With Project” Base Conditions – Technical Memorandum
A-3
Base Conditions (Revision 0)KUB Runoff (inches/year)
0.0
2.0
4.0
6.0
8.0
10.0
12.0
14.0
16.0
18.0
20.0
22.0
24.0
26.0
28.0
1965
1970
1975
1980
1985
1990
1995
2000
Calendar Year
Run
off (
inch
es/y
ear)
VERIFICATION Simulated S65Q (inches/year) Current Base Conditions REV0 RET S65Q (cfs) H0289
Figure 1: Comparison of Annual Runoff at the S-65 Structure – Current Base
Condition Revision Zero vs Observed Flow

Evaluation of the Surface Water Withdrawals from the Kissimmee Chain of Lakes
Summary of “With Project” Base Conditions – Technical Memorandum
A-4
Base Conditions Revision 0
-
5,000,000
10,000,000
15,000,000
20,000,000
25,000,000
1965 1970 1975 1980 1985 1990 1995 2000 2005
Date
Cum
ulat
ive
Dai
ly F
low
(CFS
)
Observed Flow Modeled Flow (Rev 0) Verification Flow (Sim) Calibration Flow (Sim) Figure 2: Comparison of Cumulative Flow through the S-65 Structure – Current Base
Condition Revision Zero vs. Observed Flow
Reference Evapotranspiration - Rev 0
40.0
42.5
45.0
47.5
50.0
52.5
55.0
57.5
60.0
62.5
65.0
67.5
70.0
1965 1967 1968 1970 1972 1974 1976 1978 1980 1982 1984 1986 1988 1990 1992 1994 1996 1998 2000 2002 2004
Date
Ref
eren
ce E
avpo
tran
spira
tion
(inch
es/y
ear)
Old Data Set (2005)
Figure 3: Annual Summary of RET Data used in Revision Zero

Evaluation of the Surface Water Withdrawals from the Kissimmee Chain of Lakes
Summary of “With Project” Base Conditions – Technical Memorandum
A-5
The differences between modeled results and observed data cannot be explained by the lack of accuracy in the observed data. The plot included in Figure 3 shows that the RET values used to drive Revision Zero had a shift in their average after 1980. This shift is not explained by any climatologic phenomenon and it may be an artifact of the methodology used to calculate the RET time series. This shift in RET is also evident in the simulated runoff for the same time period shown in Figure 1. Based in these data, the RET was identified as a potential source of a portion of the cumulative error evident in Figure 3.
Since at the time Revision Zero was run there was no other data source available, it was decided to manually adjust the RET data set and re-run the current base conditions. This adjustment process created what is called “Revision One”.
KBMOS - Current Base Conditions Revision One As mentioned in the previous section, the RET values used in the KBMOS Current Base Conditions Revision Zero had annual values that were, on average, five inches per year lower in the period from 1965 to 1980 than in the period from 1980 through 2005. As is the case with the flow records, it is believed that the most recent data is more accurate than older information due to the advances in the methodologies to collect, process, transmit and store the information. For those reasons and given the lack of a better source of data, a manual adjustment was introduced to the RET data. The RET data set was adjusted with monthly multipliers that were applied to the RET time series (1965 to 1980). Table 1 summarizes the adjustment factors applied to the original RET time series . In addition to the adjustments done to the pre-1980 data, evident outliers were removed in January and February of 2000. The annual summary of the resulting RET time series is depicted in Figure 4.
Table 1: Adjustment Factor Applied to the RET Data (1965 to 1980) Revision Zero Month Multiplier
JAN 1.16 FEB 1.18 MAR 1.08 APR 1.09 MAY 1.11 JUN 1.14 JUL 1.12 AUG 1.12 SEP 1.08 OCT 1.12 NOV 1.14 DEC 1.17

Evaluation of the Surface Water Withdrawals from the Kissimmee Chain of Lakes
Summary of “With Project” Base Conditions – Technical Memorandum
A-6
Reference Evapotranspiration - Revision One
40.0
42.5
45.0
47.5
50.0
52.5
55.0
57.5
60.0
62.5
65.0
67.5
70.0
1965 1967 1968 1970 1972 1974 1976 1978 1980 1982 1984 1986 1988 1990 1992 1994 1996 1998 2000 2002 2004
Date
Ref
eren
ce E
avpo
tran
spira
tion
(inch
es/y
ear)
Data set used in Revision Zero (2005) Adjusted RET used in Revision One
Figure 4 : Annual Summary of RET Data used in Revisions One and Zero
This time series was still not the desired data set since it was a unique time series for the entire basin, meaning that it was not spatially distributed. The same data was being applied in the vicinity of the S-65E Structure as was being applied near Orlando. Additionally, as seen in Figure 4, the adjusted time series still had some oddities or peaks that needed to be resolved or explained.
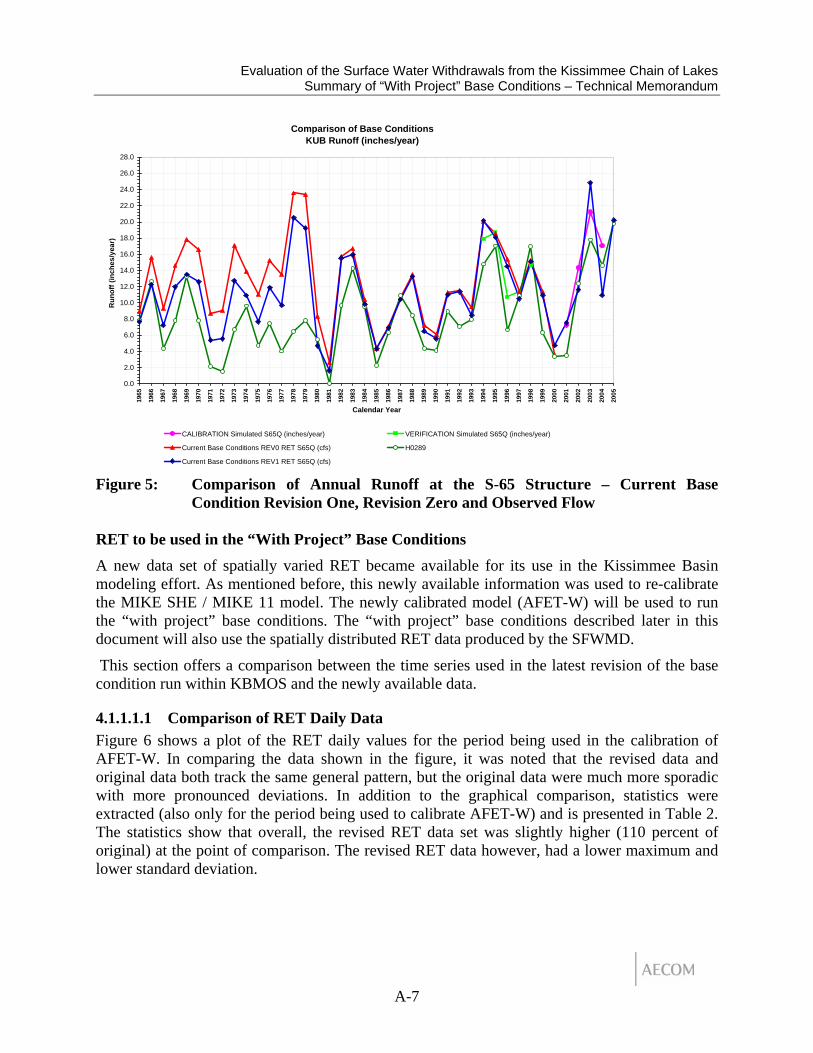
Figure 5 shows the results of Revision One in terms of the Kissimmee Upper Basin (KUB) total runoff (inches/year) measured at the S-65 Structure. This figure shows an improvement from Revision Zero (red line). It is also evident in this figure, as pointed out before, that almost all series coincide after 1996, which is the time period with more confidence in the observed flow data. Perhaps the largest discrepancy observed in the plot is the peak discharge seen in 1978. This coincides with the “oddity” mentioned in the previous paragraph. The RET time series show an unusual dip in that year, when the average annual RET is almost ten inches lower than the average in the entire period.
In June 2008, the SFWMD completed the work associated with the construction of a spatially distributed data set of RET for the entire Kissimmee Basin. This newly available data set generated the need to run Revision Two, described in the following sections.
Evaluation of the Surface Water Withdrawals from the Kissimmee Chain of Lakes
Summary of “With Project” Base Conditions – Technical Memorandum
A-7
Comparison of Base Conditions KUB Runoff (inches/year)
0.0
2.0
4.0
6.0
8.0
10.0
12.0
14.0
16.0
18.0
20.0
22.0
24.0
26.0
28.0
1965
1966
1967
1968
1969
1970
1971
1972
1973
1974
1975
1976
1977
1978
1979
1980
1981
1982
1983
1984
1985
1986
1987
1988
1989
1990
1991
1992
1993
1994
1995
1996
1997
1998
1999
2000
2001
2002
2003
2004
2005
Calendar Year
Run
off (
inch
es/y
ear)
CALIBRATION Simulated S65Q (inches/year) VERIFICATION Simulated S65Q (inches/year)
Current Base Conditions REV0 RET S65Q (cfs) H0289
Current Base Conditions REV1 RET S65Q (cfs)
Figure 5: Comparison of Annual Runoff at the S-65 Structure – Current Base Condition Revision One, Revision Zero and Observed Flow
RET to be used in the “With Project” Base Conditions A new data set of spatially varied RET became available for its use in the Kissimmee Basin modeling effort. As mentioned before, this newly available information was used to re-calibrate the MIKE SHE / MIKE 11 model. The newly calibrated model (AFET-W) will be used to run the “with project” base conditions. The “with project” base conditions described later in this document will also use the spatially distributed RET data produced by the SFWMD.
This section offers a comparison between the time series used in the latest revision of the base condition run within KBMOS and the newly available data.
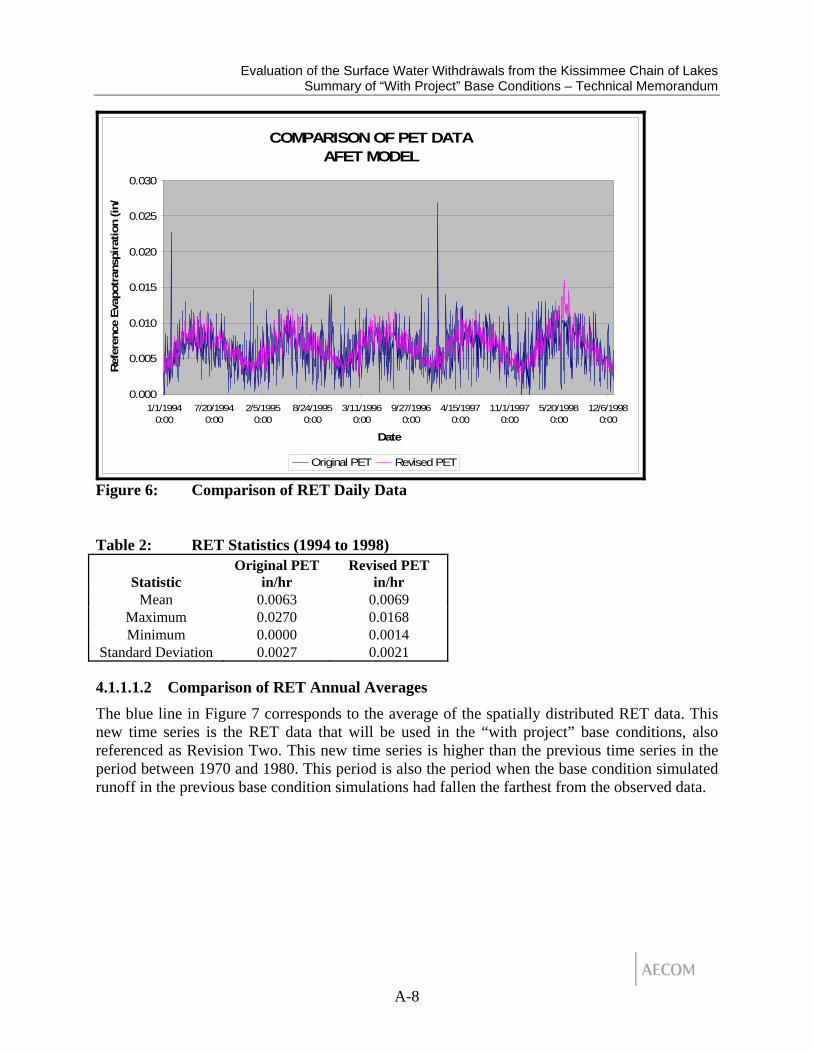
4.1.1.1.1 Comparison of RET Daily Data Figure 6 shows a plot of the RET daily values for the period being used in the calibration of AFET-W. In comparing the data shown in the figure, it was noted that the revised data and original data both track the same general pattern, but the original data were much more sporadic with more pronounced deviations. In addition to the graphical comparison, statistics were extracted (also only for the period being used to calibrate AFET-W) and is presented in Table 2. The statistics show that overall, the revised RET data set was slightly higher (110 percent of original) at the point of comparison. The revised RET data however, had a lower maximum and lower standard deviation.
Evaluation of the Surface Water Withdrawals from the Kissimmee Chain of Lakes
Summary of “With Project” Base Conditions – Technical Memorandum
A-8
COMPARISON OF PET DATAAFET MODEL
0.000
0.005
0.010
0.015
0.020
0.025
0.030
1/1/19940:00
7/20/19940:00
2/5/19950:00
8/24/19950:00
3/11/19960:00
9/27/19960:00
4/15/19970:00
11/1/19970:00
5/20/19980:00
12/6/19980:00
Date
Ref
eren
ce E
vapo
tran
spir
atio
n (in
/
Original PET Revised PET
Figure 6: Comparison of RET Daily Data Table 2: RET Statistics (1994 to 1998)
Statistic Original PET
in/hr Revised PET
in/hr Mean 0.0063 0.0069
Maximum 0.0270 0.0168 Minimum 0.0000 0.0014
Standard Deviation 0.0027 0.0021
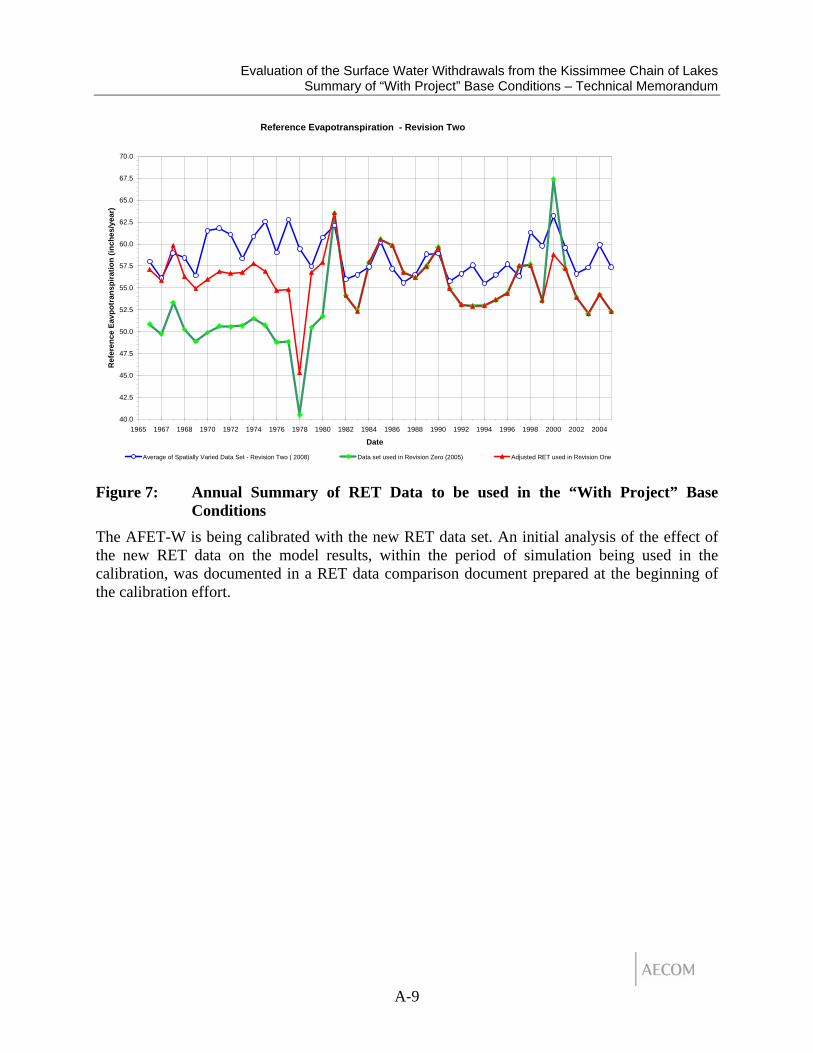
4.1.1.1.2 Comparison of RET Annual Averages The blue line in Figure 7 corresponds to the average of the spatially distributed RET data. This new time series is the RET data that will be used in the “with project” base conditions, also referenced as Revision Two. This new time series is higher than the previous time series in the period between 1970 and 1980. This period is also the period when the base condition simulated runoff in the previous base condition simulations had fallen the farthest from the observed data.
Evaluation of the Surface Water Withdrawals from the Kissimmee Chain of Lakes
Summary of “With Project” Base Conditions – Technical Memorandum
A-9
Reference Evapotranspiration - Revision Two
40.0
42.5
45.0
47.5
50.0
52.5
55.0
57.5
60.0
62.5
65.0
67.5
70.0
1965 1967 1968 1970 1972 1974 1976 1978 1980 1982 1984 1986 1988 1990 1992 1994 1996 1998 2000 2002 2004
Date
Ref
eren
ce E
avpo
tran
spira
tion
(inch
es/y
ear)
Average of Spatially Varied Data Set - Revision Two ( 2008) Data set used in Revision Zero (2005) Adjusted RET used in Revision One
Figure 7: Annual Summary of RET Data to be used in the “With Project” Base
Conditions The AFET-W is being calibrated with the new RET data set. An initial analysis of the effect of the new RET data on the model results, within the period of simulation being used in the calibration, was documented in a RET data comparison document prepared at the beginning of the calibration effort.
Related Documents