Thèse de doctorat de L'UNIVERSITE DE NANTES Comue Université Bretagne Loire ECOLE DOCTORALE N° 605 Biologie Santé Spécialité : « Cancérologie » « Exploring the Role of Intercellular and Intracellular Signaling in the Sustenance of Glioblastoma Stem-like Cells » Thèse présentée et soutenue à Nantes, le 21 février 2020. Unité de recherche : UMR1232 Thèse N° : Par Kathryn Jacobs Rapporteurs avant soutenance : Pr. Marja Jäättelä Professeur d’Université, Université de Copenhagen Dr. Servane Tauszig-Delamasure Directrice de Recherche, Université de Lyon 1 Composition du Jury : Président : Dr. Eric Chevet Directeur de Recherche, Université de Rennes Examinateurs : Dr. Stéphane Manenti Directeur de Recherche, Université Toulouse III Pr. Margot Thome-Miazza Professeur d’Université, Université de Lausanne Dir. de thèse : Dr. Julie Gavard Directrice de Recherche, Université de Nantes

Welcome message from author
This document is posted to help you gain knowledge. Please leave a comment to let me know what you think about it! Share it to your friends and learn new things together.
Transcript

Thèse de doctorat de L'UNIVERSITE DE NANTES Comue Université Bretagne Loire ECOLE DOCTORALE N° 605 Biologie Santé Spécialité : « Cancérologie »
« Exploring the Role of Intercellular and Intracellular Signaling in the Sustenance of Glioblastoma Stem-like Cells » Thèse présentée et soutenue à Nantes, le 21 février 2020. Unité de recherche : UMR1232 Thèse N° :
Par
Kathryn Jacobs
Rapporteurs avant soutenance : Pr. Marja Jäättelä Professeur d’Université, Université de Copenhagen Dr. Servane Tauszig-Delamasure Directrice de Recherche, Université de Lyon 1
Composition du Jury : Président : Dr. Eric Chevet Directeur de Recherche, Université de Rennes Examinateurs : Dr. Stéphane Manenti Directeur de Recherche, Université Toulouse III
Pr. Margot Thome-Miazza Professeur d’Université, Université de Lausanne Dir. de thèse : Dr. Julie Gavard Directrice de Recherche, Université de Nantes

2

4
TABLEOFCONTENTS
INTRODUCTION............................................................................................................................141. BRAIN TUMORS ............................................................................................................... 15
1.1Glioblastoma.....................................................................................................................151.2MolecularSubtypes...........................................................................................................171.3Treatments........................................................................................................................191.3.1 Standard of Care ............................................................................................................................ 19 1.3.2 Anti-angiogenic Therapy ................................................................................................................. 21 1.3.3 Immunotherapy ............................................................................................................................... 23 1.3.4 Other Alternatives ........................................................................................................................... 25 1.4BloodBrainBarrier............................................................................................................261.5ExperimentalModels.........................................................................................................281.5.1 In Vitro ............................................................................................................................................ 28 1.5.2 In Vivo ............................................................................................................................................. 30 1.6GlioblastomaStem-likeCells..............................................................................................331.7CellofOrigin......................................................................................................................361.8StemCellNiche..................................................................................................................381.9AVascularNicheforGSCs..................................................................................................391.9.1 Endothelial Secretome .................................................................................................................... 39 1.9.2 Cytokines and Growth Factors ....................................................................................................... 42 1.9.3 Extacellular Vesicle Communication ............................................................................................... 43 1.10Hypoxia............................................................................................................................431.11Mechanismstoresisthypoxiaandhostileenvironment..................................................45
2. LYSOSOMES .................................................................................................................... 48 2.1DiscoveryandOverview.....................................................................................................482.2LysosomalCompositionandBiogenesis............................................................................492.2.1 Formation of Lysosomes ................................................................................................................ 51 2.3LysosomalPositioning........................................................................................................552.4LysosomalFusion...............................................................................................................572.4.1 Endocytosis .................................................................................................................................... 57 2.4.2 Lysosomal Exocytosis .................................................................................................................... 58 2.4.3 Autophagy ....................................................................................................................................... 59
2.4.3iAutophagosomeCompositionandInduction............................................................................................592.4.3iiPhagophoreExpansionandMaturation...................................................................................................612.4.3iiiLysosomalFusion.....................................................................................................................................622.4.3ivOtherAutophagyRegulators...................................................................................................................63
2.5LysosomalCellDeath.........................................................................................................642.6LysosomesandCancer.......................................................................................................67
3. MTOR ............................................................................................................................. 71 3.1HistoricalOverview............................................................................................................713.2ComplexComposition........................................................................................................713.3UpstreamActivation..........................................................................................................723.3.1 Growth Factors ............................................................................................................................... 74 3.3.2 Environmental Stress ...................................................................................................................... 75 3.3.3 Amino Acid Sensing ........................................................................................................................ 76 3.3.4 mTORC2 Activation ........................................................................................................................ 79 3.4DownstreamSignaling.......................................................................................................793.4.1 Protein Synthesis ............................................................................................................................ 80 3.4.2 Lipid and Glucose Metabolism ....................................................................................................... 80 3.4.3 Protein Turnover ............................................................................................................................. 81 3.4.5 mTORC2 Downstream Signaling .................................................................................................... 82 3.5mTORandBrainFunction..................................................................................................833.6mTORandCancer..............................................................................................................83
PROJECT GOALS………………………………………………………………………………….87 1. Paracrine Signaling between GSCs and Endothelial Cells ................................................................. 87 2. Non-oncogenic Addiction via Intrinsic Signaling .................................................................................. 88
RESULTS.......................................................................................................................................89

5
FIRST ARTICLE .................................................................................................................... 91 Neutralizinggp130interfereswithEndothelial-mediatedEffectsonGlioblastomaStem-likeCells.........................................................................................................................................94
SECOND ARTICLE ................................................................................................................ 96 ParacaspaseMALT1regulatesGliomaCellSurvivalbyControllingEndo-lysosomalHomeostasis..........................................................................................................................104
DISCUSSION................................................................................................................................1311INTERCELLULARSIGNALING…………………………………………………………………………………………...1321.1DefiningtheRoleofgp130inDownstreamGSCSignaling...............................................1321.2Isgp130ActiononStemnesslinkedtoApelinSignaling?................................................1342INTRACELLULARSIGNALING………………………………………………………………………………….………..1382.1MALT1inSolidTumors....................................................................................................1382.2HowdoesMALT1affectmTOR?......................................................................................1392.3TFEB-IndependentRegulationofLysosomalBiogenesis..................................................1422.4DoesMALT1inhibitioninduceLMP?...............................................................................1442.5.LysosomesandStemCellFate........................................................................................147
ANNEXES....................................................................................................................................151ANNEX 1 ......................................................................................................................... 152
Mini CV .................................................................................................................................................. 153 ANNEX 2 ......................................................................................................................... 154
Pharmalogical Targeting of Apelin impairs Glioblastoma Growth ......................................................... 155 ANNEX 3 ......................................................................................................................... 171
3D Endothelial Cell Migration ................................................................................................................ 172 ANNEX 4 ......................................................................................................................... 180
Scientific Communications ..................................................................................................................... 180 ANNEX 5………………………………………………………………………………………...186 Supplemental methods for discussion………………………………………………………………………...187

6
LIST OF FIGURES
FIGURE 1: IMAGING OF GBM…………………………………………………....……………..15 FIGURE 2: TIMELINE OF STANDARD OF CARE ............................................................... 21 FIGURE 3: SCHEMATIC OF BLOOD BRAIN BARRIER CELLULAR ORGANIZATION. .. 26 FIGURE 4: COMPARISON OF ESTABLISHED CELL LINES AND PATIENT DERIVED CELLS. .................................................................................................................................. 28 FIGURE 5: ADVANTAGES AND DISADVANTAGES OF COMMON MOUSE MODELS OF GBM. ..................................................................................................................................... 32 FIGURE 6: GRAPHICAL REPRESENTATION OF GSC PROPERTIES. ............................ 35 FIGURE 7: GRAPHICAL REPRESENTATION OF NEURAL STEM CELL DIFFERENTIATION. MARKERS OF CELL TYPES ARE INCLUDED. ................................ 37 FIGURE 8: GRAPHICAL DEPICTION OF NSC NICHE. ...................................................... 38 FIGURE 9: GSCS AND EC RECIPROCITY. ........................................................................ 39 FIGURE 10: OVERVIEW OF NOTCH PATHWAY SIGNALING. ......................................... 41 FIGURE 11: VASCULAR AND HYPOXIC NICHE OF GSCS. GSCS CAN RESIDE AND SELF-RENEW IN BOTH VASCULAR AND HYPOXIC NICHES. ........................................ 44 FIGURE 12: THE ROLE OF QKI IN GSC BIOLOGY ........................................................... 46 FIGURE 13: FIRST ELECTRON MICROSCOPY OF LYSOSOMES ……………………….48 FIGURE 14: LYSOSOMAL MEMBRANE PROTEINS. ........................................................ 49 FIGURE 15: OVERVIEW OF TFEB ACTION. ...................................................................... 50 FIGURE 16: SUMMARY OF LYSOSOMAL PROTEIN TRANSPORT. ................................ 53 FIGURE 17: LYSOSOMAL POSITIONING .......................................................................... 55 FIGURE 18: SIMPLIFIED OVERVIEW OF AUTOPHAGY. .................................................. 60 FIGURE 19: OVERVIEW OF AUTOPHAGOSOME-LYSOSOME FUSION. ........................ 62 FIGURE 20: LYSOSOMAL CELL DEATH. .......................................................................... 64 FIGURE 21: POTENTIAL LYSOSOMAL VULERABILITIES IN CANCER THERAPY. ....... 69 FIGURE 22: COMPOSITION OF MTORC1……………………………………………………...72 FIGURE 23: COMPOSITION OF THE MTORC2 COMPLEX………………………………….73 FIGURE 24: SCHEMATIC OF GROWTH FACTOR (GF) RECEPTOR TYROSINE KINASE (RTK) SIGNALING. ............................................................................................................... 74 FIGURE 25: MTORC1 LYSOSOMAL DOCKING AND AMINO ACID SENSING. ............... 77 FIGURE 26: SUMMARY OF MTORC1 DOWNSTREAM SIGNALING. ............................... 81 FIGURE 27: OVERVIEW OF GP130 ACTION ..................................................................... 93 FIGURE 28: MALT1 CONSTRUCT MAP. ............................................................................ 97 FIGURE 29: MALT1 IS A PROTEASE. ................................................................................ 98 FIGURE 30: OVERVIEW OF MALT1 ACTION IN GSCS .................................................. 102 FIGURE 31: DOWNSTREAM SIGNALING UPON GP130 KNOCKOUT…………………..132 FIGURE 32: INHIBITION OF GP130 ALTERS APELIN SIGNALING………………………134

7
FIGURE 33: APELIN RECEPTOR INTERACTS WITH GP130 IN GSCS………………….135 FIGURE 34: GP130 REGULATES APLNR AVAILABILITY AT THE MEMBRANE………136 FIGURE 35: EFFECTS OF GP130 INHIBITION OR DELETION IN GSCS ....................... 137 FIGURE 36: MALT1 ACTION ON MTOR ACTIVATION .................................................... 140 FIGURE 37: BRD4 BLOCKADE INCREASES LYSOSOMES AND REDUCES GSC VIABILITY …………….…………………………………………………………………………...141 FIGURE 38: POTENTIAL QKI CLEAVAGE IN GSCS…………………..…………….……..144 FIGURE 39: DOES MALT1 INDUCE LMP? ....................................................................... 146 Figure 40: LYSOSMAL INVOLVEMENT IN NSC DIFFERENTIATION…………..…….….147
LIST OF TABLES
TABLE 1: SUMMARY OF GBM SUBTYPE CHARACTERISTICS. ..................................... 18 TABLE 2: MALT1 SUBSTRATES, CLEAVAGE SITES AND CELLULAR FUNCTIONS ... 99

8

9
Abbreviations ALG2 : Apoptosis-linked Gene 2 AMBRA : activating molecule in Beclin-1 regulated autophagy protein 1 AMP ; adenosine monophosphate AMPK : AMP-activated Protein Kinase APLNR : Apelin receptor AP1 : Activator Protein 1 ASM : Acid Sphingomyelinase ATCC : American Type Culture Collection ATG : Autophagy Related Protein BBB : Blood Brain Barrier BCL-2 : B- cell Lymphoma 2 BCL-10 : B-cell CLL/lymphoma 10 BDNF : brain-derived neurotrophic factor βGC : β-glucocerebrosidase BMP : Bone Morphogenetic Protein BORC : BLOC-1 related complex BRD4 : Bromodomain Containing Protein 4 BRUCE : Baculovirus IAP repeat repeat-containing ubiquitin-conjugating enzyme CAD : Cationic Amphiphilic Drugs CARD11: caspase recruitment domain family member 11 CAR-T-Cell : Chimeric Anfigen Receptor T-Cell CASTOR : cellular arginine sensor for mTORC1 CHO : Chinese hamster ovary cells CIMP : CpG Island Methylator Phenotype CLEAR : Coordinated Lysosomal Expression and Regulation Co-IP : Co-immunoprecipitation CSF-1R : Colony Stimulating Growth Factor-1 Receptor CTS : Cathepsin DEPTOR : DEP Domain Containing mTOR Interacting Protein DFCP1 : Double FYVE-containing protein1 DLBCL : Diffuse Large B- cell Lymphoma DRAM-1 : DNA damage regulated autophagy modulator 1
DYRK3 : dual specificity tyrosine- phosphorylation-regulated kinase 3 EC : Endothelial Cells EGFR : Epidermal Growth Factor Receptor ER : Endoplasmic Reticulum ESCRT : endosomal sorting complex required for transport EV : Extracellular Vesicle FAT : FRAP, ATM, and TRRAP FDA : Food and Drug Association FIP200 : FAK family kinase-interacting protein of 200kDa FKBP12 : FK506-binding protein 12 FYCO1 : FYVE and coiled-coil domain-containing protein 1 GABARAP : γ-aminobutyric Acid Receptor-associated Proteins GAP : GTPase Activating Protein GBM : Glioblastoma GEF : Guanine Exchange Factor GEMM : Genetic Engineered Mouse Model GF : Growth Factor GGA : Goligi-localized γ-ear-containing ADP ribosylation factor binding proteins gp130 : Glycoprotein 130 GPCR: G-protein coupled receptor GSC : Glioblastoma Stem-like Cells GSEA : Gene Set Enrichment Analysis HCAM : Homing Cell Adhesion Molecule HEAT : Huntington, elongation factor 3, protein phosphatase 2A, and TOR1 HeLa : Human Leukemia-60 cells HIF-1 : Hypoxia inducible Factor 1 HOPs : Homotypic fusion and protein sorting HUVEC : Human Umbilical Vein Endothelial Cells IDH : Isocitrate Dehydrogenase IGF-1R : Insulin Growth Factor Receptor IL6 : Interleukin 6 JAK : Janus Kinase KO : Knock Out

10
LAMP : Lysosomal Associated Membrane Proteins LAPTM5 : lysosomal-associated protein transmembrane 5 LARP1 : La-related protein 1 LCD : Lysosomal Cell Death LC3 : Light Chain 3 LDA : Limited dilution assay LIF : Leukemia Inhibitory Factor LIMP2 : Lysosomal Integral Membrane Protein 2 LIR : LC3 Interacting Region LMP : Lysosomal Membrane Permeabilization LPS: Lipopolysaccharides MALT1 : Mucosa-associated Lymphoid tissue 1 MCOLN1 : Mucolipin 1 MEF: Mouse Embryonic Fibroblasts MGMT : Methylguanine Methyltransferase mLST8 :mammalian Lethal with SEC13 protein MPZ : Mepazine mTOR : Mechanistic Target of Rapamycin mTORC : Mechanistic Target of Rapamycin Complex M6PR : Mannose-6-phosphate Receptor NICD : Notch Intracellular Domain NOD-SCID : Non-obese Diabetic Severe Combined Immunodeficient NOS : Not Otherwise Specified NSC : Neural Stem Cells ORP1L : Oxysterol Binding Protein Related Protein 1 PAS : Phagophore Assembly Site PDCD4 : Programmed cell death protein 4 PDGF : Platelet Derived Growth Factor PD-L1 : Programmed Cell Death Ligand 1 PDOX : Patient Derived Orthotopic Xenograft PE : Phosphatidylethanolamine PFK : Phospho-fructo Kinase PKC : Protein Kinase C PLA : Proximity ligation assay
PLEKHM1 : Pleckstrin homology domain containing protein family member 1 PM : Plasma Membrane PRAS40 : Proline-rich AKT Substrate of 40 kDa PTEN : Phosphatase and Tensin Homologue QKI : Quaking RAPTOR : Regulatory Protein Associated with mTOR RCAS-TVA : Replication-competent Avian Sarcoma-leukosis Virus-Tumor Virus A REDD1 : regulated in DNA damage and development 1 Rheb : Ras homolog enriched in brain RICTOR : Rapamycin Insensitive Companion of mTOR RILP : Rab7-interacting Lysosomal Protein ROS : Reactive Oxygen Species RTK : Receptor Tyrosine Kinase SCID : Severe Combined Immunodeficient SGK1 : serine/threonine-protein kinase 1 SHH : Sonic Hedgehog SNAP29 : Synaptosomal-associated Protein 29 SNARE : sensitive factor attachment protein SOX: Sry-related HMG box SQSTM1 : Sequestosome 1 SREBPs : sterol responsive element binding protein STAT3 : signal transducer and activator of transcription 3 STK11 : serine threonine kinase 11 STX17 : syntaxin-17 SVZ : Subventricular Zone S1P : Sphingosine 1-phosphate S1P1 :Sphingosine1-phosphate receptor 1 TCGA : The Cancer Genome Atlas TGF : Transforming Growth Factor TGN : Trans-Golgi Network TMZ : Temolzolomide TOP : Terminal Oligopyrimidine TOS : TOR signaling motif

11
TSC : Tuberous Sclerosis Complex TTF : Tumor Treating Fields ULK1 : Unc-51-like Kinase 1 UVRAG : UV-radiation resistance-associated gene VASN : Vasorin VAMP7 : vesicle-associated membrane protein 7 v-ATPase : Vacuolar H+ ATPase VEGF : Vascular Endothelial Growth Factor VHL : von Hippel-Lindau VPS : vacuolar protein sorting VTI1B : Vps10 tail interactor-1B WAC : WW-domain containing adaptor with coiled coil WIPI : WD-repeat-domain phosphoinositide-interacting WT : Wildtype

12
Abstract Glioblastoma multiforme, GBM, is the deadliest adult primary brain tumor
with a median survival time of approximately 12 to 15 months. Within these
heterogeneous tumors exists a subpopulation of cells with stem-like properties
termed glioblastoma stem-like cells, GSCs. As they are suspected to be involved in
initiation, expansion, and relapse, they represent a promising strategy for treating
these tumors. In situ, GSCs reside in part in a protective vascular niche in close
interaction with endothelial cells, however these cells have also been found in more
hostile areas of the tumor, away from their privileged microenvironment. Therefore,
uncovering intrinsic cell signaling regulating autocrine and paracrine survival
mechanisms can produce novel targets for therapy.
Here, we approach the analysis of signaling mechanisms employed by GSCs
in their survival, in order to identify potential targets for therapy. On one hand, we
report that the glycoprotein gp130 has an important role in endothelial cell
communication with GSCs. In fact, the endothelial secretome is able to sustain GSC
stemness in the absence of other mitogens. However, pharmacological blockade of
gp130 abrogates this effect. On the other hand, in the absence of signals emanating
from endothelial cells, we uncover that the paracaspase MALT1 is important to
maintain GSC survival and expansion, as knockdown or inhibition of this protease is
lethal to these cells. From a molecular standpoint, we found that inhibition of MALT1
disrupts endo-lysosomal homeostasis, resulting in a lysosomal cell death
concomitant with mTOR inactivation. Therefore, we identified two signaling axes
within GSCs with the potential for therapeutic targeting.

13
Résumé
Le Glioblastome Multiforme, GBM, est une tumeur cérébrale parmi les plus
agressives de l’adulte, avec une médiane de survie s’échelonnant autour de 12 à
15 mois. Au sein de ces tumeurs hétérogènes réside une sous-population de
cellules aux propriétés souches appelées GSC pour cellules de type souche du
glioblastome, Une stratégie potentielle pour le traitement de ces tumeurs
consisterait à cibler ces GSCs, suspectées d’être impliquées dans l’initiation,
l’expansion et la récurrence des tumeurs. Au sein des tumeurs, ces GSCs résident
à la fois dans une niche vasculaire protectrice en interaction étroite avec les cellules
endothéliales et dans des zones non vascularisées, plus hostiles. Dans ce contexte,
il est crucial de mieux caractériser la signalisation cellulaire intrinsèque régulant les
mécanismes de survie autocrine et paracrine des GSCs.
Ma thèse s’est concentrée sur l'analyse des mécanismes de signalisation
régissant les décisions de vie/mort des GSCs, dans le but d’offrir de nouvelles
perspectives thérapeutiques. D’une part, mes résultats montrent que la
glycoprotéine gp130 joue un rôle important dans la communication entre les GSCs
et les cellules endothéliales. Le sécrétome endothélial est en effet capable de
maintenir le caractère souche des GSCs, en l'absence d'autres mitogènes externes.
Le blocage pharmacologique de gp130 annule cet effet. Par ailleurs, en l’absence
de signaux émanant des cellules endothéliales, j’ai mis en évidence le rôle
instrumental de la paracaspase MALT1 dans la survie et l’expansion des GSCs. La
suppression ou l'inhibition de cette protéase s’avère toxique pour ces cellules. D’un
point de vue mécanistique, j’ai trouvé que l'inhibition de MALT1 perturbe
l'homéostasie endo-lysosomale, entraînant une mort cellulaire lysosomale
concomitante à l'inactivation de mTOR. J’ai donc identifié deux axes de
signalisation au sein des GSCs avec un potentiel de ciblage thérapeutique.

14
Introduction

Chapter 1
15
1. Brain Tumors
1.1 Glioblastoma Gliomas represent approximately 80% of all diagnosed adult malignant brain
tumors. They are classified in three types depending on the cell of origin: astrocytes,
oligodendrocytes, and ependymal cells; and spread into four grades (I, II, III, IV).
Grade II tumors have the characteristics of being well differentiated with an increased
cell concentration amid some abnormalities, but mostly resembling noncancerous
cells. Higher-grade gliomas (Grade III) show exacerbated vessel concentration,
increased cell density and cellular anomalies. Cells can become anaplastic with
excessive mitosis. Common histo-pathological features of Grade IV include elevated
cell frequency and atypia, extensive, but abnormal vascularization and areas of
necrosis (Westphal and Lamszus, 2011). Grade IV can permeate the normal
parenchyma through varied growth patterns. Although uncommon, some may spread
to the ventricles. This infiltrative capacity leads to incomplete tumor removal, causing
new masses to form at the border of the original lesion (Gaspar et al., 1992).
The 2016 world health organization (WHO) classification of tumors of the
central nervous system allocates Grade IV astrocytoma for glioblastoma multiform
(GBM). GBM is the most frequently occurring type of glioma (about 50%) with an
incidence of 3.3/100,000 in North America (Baldi et al., 2010; Ostrom et al., 2014). In
France, about 3000 new cases of GBM are diagnosed each year (Zouaoui et al.,
2012). Median survival ranges from 12 to 15 months following diagnosis, with a 5
(left) MRI with contrast; (center) Map of microvessel size; (right) Map of blood brain barrier permeability (Batchelor et al., 2007).
Figure 1: Clinical Imaging of GBM.

Chapter 1
16
year-survival of only 5% (Ostrom et al., 2014; Yan et al., 2013). GBM subdivides into
three categories. The first type, IDH1-wild-type, represents nearly 90% of these
tumors which are clinically defined as primary GBM and mostly occur in patients over
the age of 55 (Louis et al., 2016; Ohgaki and Kleihues, 2013). The second type,
termed IDH-mutant, represent the other 10% of cases, arising primarily in younger
patients, and are classified as secondary GBM, as these patients often have
previously developed lower grade diffuse gliomas (Louis et al., 2016; Ohgaki and
Kleihues, 2013). The third category, NOS (not otherwise specified), is reserved for
tumors where the IDH status cannot be evaluated. These tumors still maintain
astrocytic features, vascular proliferation and necrosis. Most of these tumors are
likely IDH wild-type, however, due to unavailable IDH status they are given a
separate denotation (Louis et al., 2016). Other common changes in Grade IV tumors
include amplifications in the EGFR2 gene in 57% of primary GBM, as compared to
8% of secondary GBM (Brennan et al., 2013). Moreover, the tumor suppressor
PTEN3 is frequently altered in GBM, with mutations in up to 40% of patients, in
addition to a loss of heterozygosity in 60 to 80% of all GBM (Kwon et al., 2008).
GBM are most frequently localized into cerebral hemispheres; 95% of tumors
are found in the supratentorial region, while, in contrast, very few tumors arise in
brainstem, spinal cord or cerebellum (Nakada et al., 2011). The only established risk
factor for developing a GBM is exposure of the central nervous system to ionizing
radiation (Elsamadicy et al., 2015; Taylor et al., 2010), although GBM incidence may
change between ethnicity, gender, age, and exposure to specific xenobiotics. Clinical
presentation includes neural deficit, which vary depending on tumor localization, in
40-60% of patients. These can range from hearing and vision impairment in temporal
lobe tumors, to personality changes in some patients who present with frontal lobe
tumors. Hemiparesis can also occur. Other symptoms include unilaterally localized
headaches in 30-50% of clinical cases, and seizures in 20-40% of them (Hanif et al.,
2017).
1 Isocitrate Dehydrogenase 2 Epidermal Growth Factor Receptor 3 Phosphatase and Tensin Homologue

Chapter 1
17
1.2 Molecular Subtypes
In 2010, seminal work by Verhaak and colleagues identified four molecular
subtypes of GBM: Classical, Mesynchymal, Proneural, and Neural (Verhaak et al.,
2010). Proneural subtype has an oligodendrocytic signature, while Classical tumors
express an astrocytic gene repertoire. Mesenchymal tumors are highly correlated
with a cultured astroglial profile and the Neural molecular category is associated with
oligodendrocytic and astrocytic differentiation, in addition to encompassing genes
expressed in neurons (Verhaak et al., 2010). Those molecular subtypes are
canonically characterized as follows:
- Proneural: The major features of Proneural GBM include IDH1 mutations and
PDGFRA alterations. Frequent loss or mutation of TP53, and expression of
oligodendrocytic markers OLIG2 and NKX2-2 similarly occur (Verhaak et al., 2010).
Conversely, protein abundance of the tumor supressor p21 is reduced and negatively
correlated with OLIG2 levels (Ligon et al., 2007). Proneural tumors are also
characterized with higher expression of proneural development genes encoding
transcription factors, such as SOX (Sry-related HMG box), DCX, ASCL1, and TCF4
genes. More recent analysis further subdivides the Proneural subtype by CpG island
methylation status. CpG island methylator phenotype (CIMP+) Proneural subtype
represents the tumors resulting from secondary GBM, they have IDH mutations and
ensure the best prognosis of any GBM subtype. By contrast, CIMP- Proneural tumors
contain PDGFRA amplification, and have a worse prognosis than CIMP+
counterparts (Nakano, 2015).
- Classical: Classical GBM retain a chromosome 7 amplification accompanied by a
chromosome 10 loss. Most Classical tumors (ie 97%) also acquire an EGFR
amplification, but lack TP53 mutation. Neural precursor and stem cell marker NES, in
addition to NOTCH and Sonic hedgehog, SHH, signaling pathways are highly
expressed (Verhaak et al., 2010).
- Mesenchymal: The majority of Mesenchymal tumors possess a low NF1
expression. NF1 is a tumor supressor gene which primarily regulates RAS. Loss of
this gene leads to increased MAP kinase activity, a pro-tumorigenic pathway (Carroll,
2012). Mesenchymal tumors also present with frequent co-mutation of NF1 and
Chapter 1
18
PTEN. They display mesenchymal markers such as CHI3L1 and MET, as well as
CD44 and MERTK, genes well-known to associate with the epithelial-to-
mesenchymal transition. They likewise exhibit higher levels of tumor necrosis factor
(TNF) and NF-κB pathways including TRADD, RELB, and TNFRSF1A (Verhaak et
al.,2010).
- Neural: The Neural subtype is defined by the expression of neuron markers such as
NEFL, GABRA1, SYT1 and SLC12A5 (Verhaak et al., 2010).
The most relevant clinical associations with subtype in this study was age, with
younger patients predominantly falling in the Proneural category and having a
significant survival advantage. A more recent study by Verhaak’s group determined
that the Neural phenotype may not hold tumor specific features as these samples
came from tumor margins where more non-tumoral neural tissue is likely to be
detectable. Therefore the Neural subtype may actually correspond to a normal neural
lineage contamination in the original study (Gill et al., 2014; Wang et al., 2017b), as
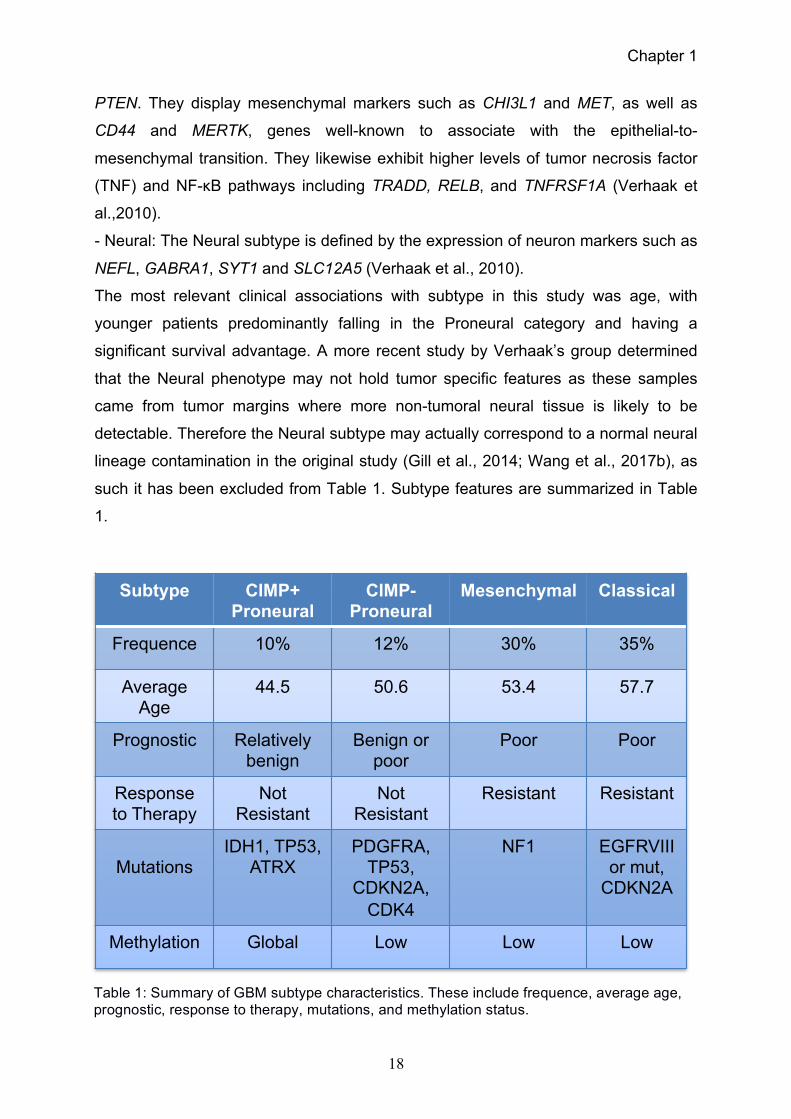
such it has been excluded from Table 1. Subtype features are summarized in Table
1.
Table 1: Summary of GBM subtype characteristics. These include frequence, average age, prognostic, response to therapy, mutations, and methylation status.
Subtype CIMP+ Proneural
CIMP-Proneural
Mesenchymal Classical
Frequence 10% 12% 30% 35%
Average Age
44.5 50.6 53.4 57.7
Prognostic Relatively benign
Benign or poor
Poor Poor
Response to Therapy
Not Resistant
Not Resistant
Resistant Resistant
Mutations
IDH1, TP53, ATRX
PDGFRA, TP53,
CDKN2A, CDK4
NF1 EGFRVIII or mut,
CDKN2A
Methylation Global Low Low Low

Chapter 1
19
Characterization of molecular subtype implicates associations with the tumor
microenvironment. Analysis of Mesenchymal alterations showed that increased
macrophage/microglia infiltration was due to aberrations in NF1. Further, the poor
prognosis correlated with the Mesenchymal subtype and with a higher frequency of
macrophages/microglia, which might contribute to a sub-optimal response to
radiotherapy (Wang et al., 2017).
More recent studies have emphasized that tumors contain cells with differing
subtype specific gene expression. Indeed, single cell analysis of five patient tumors
showed that all tumors contain a heterogeneous mixture of cells belonging to
different GBM subtypes (Patel et al., 2014). One way this can occur is a Proneural to
Mesenchymal transition after radiation treatment (Halliday et al., 2014). However,
tumor cells grown ex vivo under stem cell conditions maintain features of the
dominant subtype of the tumor from which they were derived, implying that changes
in environment are the key drivers for subtype variations. Correspondingly,
transcriptomic analysis from multi-region sampling of several patient biopsies
unmasked that tumor cells from the enhancing region had a Proneural signature;
tumor cells from the necrotic region a Mesenchymal signature, and cells from an
intermediate region (enhanced margin) contain features of both Classical and
Proneural subtypes (Jin et al., 2017). Therefore, developing subtype specific
therapies may be less effective than previously thought.
1.3 Treatments
1.3.1 Standard of Care
When possible, the most effective treatment in GBM involves surgical
resection of the primary tumor. This can provide patients with immediate relief from
tumor mass related effects and symptoms. Brown et al. showed that more extensive
resection of the tumor resulted in increased 1 and 2 year survival rates in addition to
an improvement in progression free survival (Brown et al., 2016). The use of
fluorescent dyes to identify tumor tissue has further enhanced the accuracy of this
process. A phase III clinical trial, using 5-aminolevulinic acid to visualize tumor tissue
as compared to conventional microsurgery, showed a better rate of complete tumor

Chapter 1
20
resection (65% versus 36%) and superior 6 month progression free survival (41%
versus 21%), however there was no impact on overall survival (Stummer et al.,
2006). Additionally, it has recently been established that subcortical electro-
stimulation mapping during an awake craniotomy can improve resection margins and
patient quality of life in low-grade gliomas (Ghinda and Duffau, 2017), thus this
protocol might be applied to higher grade tumors as well.
Post-surgery, patients undergo radiation therapy, which focally targets MRI-
evident tumor and surrounding margins to a cumulative dose of 60 Gy. Daily doses of
1.8 to 2.0 Gy fractions for approximately 6 weeks is usually applied, three to four
weeks postoperative procedure (Han et al., 2015a, 2015b). Increased radiation
dosage up to 76 Gy did not appear to extend patient survival (Kirkpatrick et al.,
2017). Moreover, shorter courses of augmented doses of radiotherapy, known as
hypofractionation, have been evaluated in elderly patients. In a randomized trial
comparing 6 weeks (30 fractions of 60 Gy) to 3 weeks (15 fractions of 40 Gy) in
patients over 60 years-old, there was neither a difference in median patient survival,
nor in quality of life. However, patients in the hypofractionation group required less
post-treatment corticosteroids. Therefore, it was concluded that hypofractionation
was a viable treatment option for elderly patients (Roa et al., 2004). Proton therapy
uses particles rather than photons to deliver radiation, allowing for enhanced
focalization of the treatment. This lessens the radiation exposure of non-target
tissues, reducing patient fatigue and neurocognitive dysfunction associated with brain
irradiation. In addition, proton therapy offers a dosimetric advantage over
conventional radiotherapy in glioma. A retroactive study comparing photon and
proton therapy illustrated an improved overall survival for proton-treated patients.
Randomized trials still need to be performed to confirm these findings (Harrabi et al.,
2016; Jhaveri et al., 2018).
Temozolomide (TMZ) is a DNA-alkylating agent for chemotherapy, which
efficiently crosses the blood brain barrier (please see section 1.4) to deliver relevant
concentrations in the brain. TMZ is, in fact, a prodrug with aqueous chemistry typical
of imidazotetrazine compounds with bicyclic aromatic heterocycles. Under neutral or
alkaline conditions, structural changes allow the hydrolytic ring to open and dispense
an intermediate active compound. Thus, the acidic pH of the GBM tumor

Chapter 1
21
microenvironment stabilizes the prodrug form of TMZ. Once inside cells,
intermediates then release methyl diazonium ions to interact with nucleophilic sites in
DNA and methylate it (Moody and Wheelhouse, 2014). TMZ acts by supplying a
methyl group to purines in DNA to form O6-methylguanine which causes DNA
changes and leads to cell cycle arrest at G2/M phase, during consequent replication
cycles (Nanegrungsunk et al., 2015). However, methylguanine methyltransferase
(MGMT) can remove this methylation, and therefore tumors with wild-type MGMT are
most likely resistant to TMZ treatment. Plus, DNA mismatch repair may fail in GBM
and cause the O6-methylguanine to be ineffective (Zhang et al., 2012). Therefore,
knowing a patient’s MGMT status and capacity to mismatch repair can inform their
response to TMZ.
A 2005 phase III trial showed that daily TMZ given in parallel to radiotherapy
(75 mg/m2) for 40-49 days and followed by 6 maintenance cycles of TMZ (150-200
mg/m2), 5 times over a 28 day period, prolonged patient survival (Stupp et al., 2005,
2009, 2015). Based on these results, this became the standard of care procedure,
named the Stupp protocol for newly diagnosed GBM: combined radiation and TMZ
followed by a continuation of TMZ (Figure 2). Different dosing schedules of TMZ
have been investigated; an intensified maintenance dose of TMZ (75 mg/m2), 21
times over a 28 day-period, was compared to the standard dose, doubling the
cumulative administration of TMZ. There was no noted outcome difference, however
patients had higher incidence of grade 3 and 4 toxicities (Gilbert et al., 2013).
1.3.2 Anti-angiogenic Therapy Angiogenesis is the process by which new blood vessels grow from existing
ones. In tumors, angiogenesis is hijacked to provide nutrients and oxygen to the
Figure 2: Timeline of standard of care. Following surgical resection patients receive both radiotherapy and TMZ for 6 weeks followed by a maintenance dose of TMZ (5 times in 28 days) for 6 months after.
0 6 10 14 18 22 26 30 Weeks
Surgical Resection
Radiation/ TMZ Maintenance TMZ
Chapter 1
22
rapidly expanding cancer cells. Vascular Endothelial Growth Factor (VEGF) is the
prototype of angiogenic factors and belongs to the family of heparin binding proteins,
operating through tyrosine kinase receptors (VEGFRs). Upon receptor binding,
VEGF promotes angiogenesis and stimulates endothelial cell proliferation and
migration. VEGF expression can be induced by growth factors like epidermal growth
factor (EGF), transforming growth factor (TGFα/β), fibroblast growth factor (FGF) and
platelet derived growth factor (PDGF) (Yadav et al., 2015).
Bevacizumab is an antibody that targets the pro-angiogenic factor VEGF. It
was developed by Genentech and approved by the food and drug administration
(FDA) in 2009 (Cohen et al., 2009). Bevacizumab is a specific antibody, which binds
to all isoforms of human VEGF-A. Tyrosine kinase inhibitors sunitinib, sorafenib, and
pazopanib, in contrast, inactivate VEGF signaling by targeting VEGFRs, with off-
target inhibition of PDGFR and c-KIT (Meadows and Hurwitz, 2012). The group of
Jeremy Rich demonstrated that bevacizumab abolished the GSC-driven pro-
angiogenic effects, including tube formation and vessel migration, on human
umbilical vein endothelial cells (HUVEC). This antibody-based treatment also
reduced the growth of ectopic and orthotopic xenografts from primary tumor cells
(Bao et al., 2006a; Calabrese et al., 2007). Combining bevacizumab with TMZ and
radiation was explored in 3 phase III randomized trials with two focused on newly
diagnosed GBM and the third one devoted to recurrent GBM. All three clinical studies
showed increased progression free survival and baseline quality of life; however, this
was accompanied by an augmentation in grade 3 or higher toxicities. Moreover, there
was no improvement in overall survival, though it was expected based on imaging
analysis (Chinot et al., 2014; Gilbert et al., 2014; Wick et al., 2017). In contrast, some
studies claim that bevacizumab and other VEGF pathway inhibitors do benefit
patients by reducing peritumoral edema, which lessens the need for corticosteroid
prescription and can in turn significantly improve patient quality of life (Batchelor et
al., 2007; Nagpal et al., 2011). However, as all three phase-III clinical trials report
amplification of severe toxicities for bevacizumab-treated patients, its uses for such
purposes should be cautioned.
Why do anti-angiogenic therapies fail? John de Groot’s group showed that
xenografts resistant to anti-VEGF treatment contained an invasive mesenchymal

Chapter 1
23
signature, as illustrated by the expression of STAT3, c-MET, and TGFβ (Piao et al.,
2013). Moreover, it has also been demonstrated that one potential mechanism of
resistance in GBM involves the recruitment of pro-angiogenic inflammatory cells, as a
source of angiogenic chemokines and cytokines, to restore tumor vascularization
(Gabrusiewicz et al., 2014; Piao et al., 2013; Rivera et al., 2015). A recent study by
Gabriele Bergers’s laboratory suggests a role for the tumor immune
microenvironment in resistance to anti-angiogenic therapy. Their work elucidated that
tumor cells resistant to anti-angiogenic therapy had increased programmed cell death
ligand 1, PD-L1, expression, allowing them to escape immune detection (Allen et al.,
2017).
1.3.3 Immunotherapy
Immunotherapy has vastly improved patient outcome in clinical trials of
metastatic melanoma (Albertini, 2018). As such, it may represent a viable option for
the treatment of other cancers with poor prognosis. Indeed, in the recent issue of
Nature reviews cancer, focusing on brain tumors, an Peter Fecci and colleagues
devoted their review to the prospect of immunotherapy for the treatment of brain
tumors (Sampson et al., 2020).
The programmed cell death receptor, PD-1, is expressed on the surface of
activated T-cells, and acts as an immune checkpoint to prevent autoimmunity. Cells
expressing a ligand for the receptor, such as PD-L1, can inactivate these T-cells via
PD-1/PD-L1 interaction. Many cancer cells overexpress PD-L1 to escape immune
responses. Therefore this immune checkpoint is an attractive target for anti-cancer
therapy (Chen et al., 2012b). In fact, a phase I clinical trial of pembrolizumab, in
patients with recurrent, but resectable tumors, showed a statistically significant
survival rate for those receiving immunotherapy. Pembrolizumab is a monoclonal
antibody that binds the PD-1 receptor in lymphocytes to prevent PD-L1 interaction.
This was combined with bevacizumab, as a second line therapy, for most of the
patients in the trial after immunotherapy was removed. Overall survival improved
from 7.5 months to 13.7 months in the pembrolizumab treated group (Cloughesy et
al., 2019). Therefore, combining immunotherapy with anti-angiogenic therapy
remains an open axis to explore for the treatment of GBM.

Chapter 1
24
Another promising immunotherapy for GBM includes the formation of chimeric
antigen receptor T-cells, CAR-T-cells. Several clinical trials explore the efficacy of
targeting the EGFRvIII receptor, a common mutation of EGFR in GBM, using
rindopepimut (Del Vecchio et al., 2012; Swartz et al., 2014). Phase I and II trials have
shown significant improvement in overall survival for vaccinated patients, however
some drawbacks to this approach exist. Not all GBM express EGFRvIII, and its
expression has been shown to fluctuate throughout disease progression (van den
Bent et al., 2015). Further, CAR-T therapy can promote immunosuppressive
response including up-regulation of PD-L1. Hence, a current trial, seeks to
ameliorate patient outcome by combining pembrolizumab with EGFRvIII-CAR-T
therapy to reduce immunosuppressive side effects (Akhavan et al., 2019). Together,
this evidence shows that there are many hurdles to overcome in developing novel
and effective treatments.
Moreover, a recent study by Peter Fecci’s group demonstrated that naïve T-
cells accumulate in the bone marrow in preclinical models of GBM, as well as in GBM
patients, prior to treatment. Circulating lymphocyte rate, in GBM patients, borders on
the ones found in immunosuppressed patients, such as AIDS (Chongsathidkiet et al.,
2018). This sequestering was occurring due to loss of S1P1 (sphingosine 1-
phosphate receptor 1) on the surface of these T-cells (Chongsathidkiet et al., 2018).
Sphingosine 1-phosphate (S1P) is a bioactive lipid that acts as the ligand for several
G protein coupled S1P receptors. This signaling axis also promotes the development
of type 1 helper T-cells (Blaho et al., 2015). When Fecci’s group prevented S1P1
internalization, T-cell sequestration was abolished and enhances the efficacy of
immune checkpoint-based therapy in animal models (Chongsathidkiet et al., 2018).
Additionally, in order to target tumor-associated macrophages, colony stimulating
growth factor-1 receptor (CSF-1R) inhibitors have been employed. These inhibitors
were shown to block gliomagenesis and debulk the tumor by a glioma-cell
independent mechanism. Instead, they alter macrophage polarization to promote
phagocytosis of tumor cells (Pyonteck et al., 2013; Quail et al., 2016). Therefore,
enhancing the immune response may improve patient outcome.
Chapter 1
25
1.3.4 Other Alternatives
One alternative method of treating GBM, proposes the use of virotherapy, ie
live attenuated virus, to target the tumor cells. As early as 1991, Martuza and
colleagues showed that the herpes simplex virus mutant could kill GBM immortalized
cells in vitro and in vivo (Martuza et al., 1991). Moreover, it was later revealed that an
attenuated adenovirus could exert similar effects, and that cell death in this case was
likely due to autophagy (Alonso et al., 2008, 2012; Fueyo et al., 2000; Ito et al.,
2006). With recent outbreaks bringing the Zika virus to the global health
conversation, Zhu and colleagues showed that this oncolytic virus effectively targets
Glioblastoma Stem-like Cells, GSCs (please see section 1.6). Furthermore, the virus
was found selective for these cells, as it infected them at a much higher rate than
normal neural stem cells. Attenuated Zika virus maintained its efficacy against GSCs,
and had an additive effect when combined with TMZ treatment (Zhu et al., 2017). A
study by Chen-Feng Qin’s laboratory confirmed this effect using intracranial injection
of the Zika-LAV vaccine, which is currently undergoing testing as a potential vaccine
against the Zika virus (Chen et al., 2018). Similarly, a trial of inactivated poliovirus in
patients with recurrent GBM demonstrated an increased overall survival in virus
treated group (Desjardins et al., 2018).
Carmustine, or Gliadel, wafers are biodegradable polymers, which contain
3.85% carmustine, an alkylating agent. They are implanted upon surgical resection of
the tumor and deliver a controlled release of 7.7 mg carmustine for approximately 5
days. The efficacy of these wafers in clinical trials remains inconclusive. While some
trials report survival benefits, they are not statistically significant (Affronti et al., 2009;
Brem et al., 1995; Westphal et al., 2003). Also, at least one study shows no
significant improvement and drastically higher toxicity in patients who received
carmustine (De Bonis et al., 2012).
Other studies have introduced the idea of a cancer cell trap for GBM therapy.
These traps are designed with both chemoattractant, to target the tumor cells to the
cage, and chemotherapy to kill the sequestered cells (Van Der Sanden et al., 2013).
A recent report demonstrated that bacterial cellulose could be used as the polymer
for such a trap in rats (Autier et al., 2019). However, much research remains to be
done on these therapies before determining their true efficacy in patients.

Chapter 1
26
Tumor treating fields (TTF), which involves low intensity (100-300 kHz)
alternating electric fields delivered via insulated electrodes, operate as antimitotic
physical treatment (Kirson et al., 2004). The first phase III trial compared TTF alone
to chemotherapy alone in recurrent GBM. GBM patients undergoing this treatment
wear transducers, placed on the shaved scalp, for more than 18 hours a day. Due to
this inconvenience, not all patients in the trial complied with the guidelines of therapy.
When analyzing patients that followed the therapy at least 75% of the time, an overall
improvement in patient survival and no significant adverse effects was observed
(Stupp et al., 2012). In 2009, Roger Stupp initiated a phase III trial for newly
diagnosed GBM. Patients either received TTF in addition to maintenance TMZ or
maintenance TMZ alone following standard of care surgery and chemo/radiotherapy.
In 2015, preliminary findings detailed progression free survival of 7.1 months in
patients treated with TTFs compared to 4 months for those treated with TMZ alone
(Fabian et al., 2019). The final study, published in 2017, revealed that treatment with
TTFs leads to a superior median overall survival of 20.9 months compared to 16. Of
note, half the patients undergoing TTF therapy experienced mild to moderate skin
toxicity (Stupp et al., 2017). The FDA approved TTFs for use on newly diagnosed
GBM in 2015, representing a
rare therapy to pass clinical
trials for GBM. Subsequent
trials combining TTF with
other therapies are currently
underway.
1.4 Blood Brain Barrier
The vasculature of the
brain delivers blood through
bilateral sets of arteries,
namely, internal carotid
arteries and vertebral
arteries, which branch to
reach all areas of the brain.
The cerebral vasculature
Astrocyte
Pericyte Endothelial
Cell
Tight Junction
Basal Lamina
Capillary
Figure 3: Schematic of Blood Brain Barrier (BBB) cellular organization. At the BBB, endothelial cells are covered with pericytes and surrounded by astrocyte end-feet.

Chapter 1
27
serves several functions including supplying the brain with nutrients, ridding the brain
of waste products, restricting ion and fluidic movement, and aiding in overall brain
homeostasis. The restriction of ions and fluids allows for optimal neuronal functions,
as fluctuations in ions which can occur after eating or exercising would disrupt
synaptic and axonal signaling (Abbott et al., 2006).
The blood brain barrier (BBB) acts as a discriminatory hurdle to molecules,
infectious agents and toxins seeking to enter the brain through the bloodstream. The
BBB relies on endothelial cells, which form tight junctions with each other along
cerebral microvessels, in order to shield the brain from infection and regulate its
microenvironment. Astrocytes and pericytes also participate in the organization of the
BBB; pericytes and microglia support the rigidity by associating with the basal lamina
of endothelial cells. Astrocytes line the perivascular space to form endfeet (Abbott et
al., 2006; Obermeier et al., 2013). Pericytes cover about 20% of endothelial cells in
the BBB, and can regulate blood flow through the brain capillaries via contracting and
relaxing (Armulik et al., 2005; Jespersen and Østergaard, 2012) (Figure 3).
Meanwhile, astrocytes connect the brain capillaries to neurons providing them with
nutrients and preventing oxidative stress (Hirrlinger and Dringen, 2010). In addition,
the extracellular matrix of the basal lamina contains laminin, collagen, proteoglycans
and other extracellular matrix proteins. Alterations of these protein compositions can
increase BBB permeability (Aumailley and Smyth, 1998; Tanjore and Kalluri, 2006;
Zhou et al., 2018). Gases, like oxygen and carbon dioxide passively diffuse through
the endothelial barrier, as do lipophilic agents like barbiturates and ethanol, however
hydrophilic molecules are excluded (Abbott et al., 2006). In order to prevent transport
of molecules across the BBB, endothelial cells express efflux pumps like p-
glycoproteins to expulse molecules back to the bloodstream. Because many drugs,
including anti-cancer therapies, have a high brain efflux index, attaining relevant
concentrations for clinical efficacy in the brain is challenging (Kakee et al., 1996).
While many vessels within tumors are leaky and disorganized, the invasive
region of the tumor maintains an intact BBB in GBM. One would expect the abnormal
vessels of the tumor core to allow for increased passage route to drugs; however, the
migrating and invasive cells of the tumor margin are surrounded by a normal brain
vasculature, preventing such treatments from reaching them (van Tellingen et al.,

Chapter 1
28
2015). Also, permeability increase usually led to uncontrolled fluid movement,
elevated interstitial fluid pressure (IFP), and edema, which collectively oppose the
crossing of vascular walls.
Various strategies have been adopted to deliver drugs to the brain including
modification of drugs and prodrugs, disruption of tight junctions, local delivery
through neurosurgery, and nanoparticles. These methods exhibit these main
drawbacks: i) disturbing junctions increases the risk of toxins entering with the drugs,
ii) altering chemical structure of drugs can be costly and long to develop, and iii)
neurosurgery should be avoided when possible to increase the patient’s quality of
life. However, nanoparticles are non-invasive, cost efficient, and easy to synthesize,
therefore, they represent a potential solution to distributing anticancer drugs across
the BBB (Zhou et al., 2018). Moreover, a recent clinical trial suggests that low
intensity pulsed ultrasound can safely disrupt the BBB for chemotherapy delivery
(Carpentier et al., 2016; Idbaih et al., 2019). In order to develop and deliver novel
therapies to GBM patients, delivery strategies must be adopted to account for and
overcome the BBB.
1.5 Experimental Models
1.5.1 In Vitro
The most widely
used established cell lines
to study GBM, including
U87 (established from a
44 year old female patient
with highly malignant
astrocytoma), U251
(derived from a male
patient with malignant
grade IV astrocytoma) and
T98G (originated from
human glioblastoma
multiforme tumor of a 61
Vs.
-Adherent -Different Transcription -Astrocytic Differentiation -Do Not Recapitulate Tumors
-Spheres -Maintain Transcription -Stem Character -Recapitulate Tumors
Established Cell Lines
Patient Derived Cells
Figure 4: Comparison of established cell lines and patient derived cells.

Chapter 1
29
year old male), are grown in milieu containing serum, which promotes astrocytic
differentiation (Pontén and Macintyre, 1968; Stein, 1979; Westermark et al., 1973).
Therefore transcriptional and epigenetic programs in these cells do not reflect the
neural stem cell pathways, which are activated in Glioblastoma Stem-like Cells (Lee
et al., 2006). Further, xenografts resulting from these established cell lines do not
resemble human GBM histopathological characteristics (Lee et al., 2006). Analysis of
U87 from the American Type Culture Collection (ATCC) suggests that it was likely
switched with another cell line as it does not match original Uppsala stocks (Allen et
al., 2016). This calls into question the results of numerous GBM studies performed
using U87, and together, this information cautions the use of established cell lines, as
they do not recapitulate human disease.
In order to long-term culture mouse neural stem cells, a protocol was
established by which these cells were grown in suspension as neurospheres. To
achieve this, their milieu lacked serum but rather contained defined composition and
concentration of growth factors, such as EGF, FGF and insulin, to sustain stemness
self-renewal (Reynolds and Weiss, 1992; Robertson et al., 2019). Patient-derived
primary GBM cells can also be maintained under similar settings (Galli et al., 2004;
Singh et al., 2003). Under spheroid culture conditions, they uphold transcriptional
status of parental tumors and can reiterate features of the primary tumor upon
xenotransplantation (Robertson et al., 2019). These cells are well characterized and
easily shared between laboratories. However, upon extended culture, tumor
heterogeneity is lost and subclone populations emerge, which often lose IDH status
of the original tumor. Still, the use of patient-derived cells as an in vitro model better
recapitulates the primary tumor than classical cell models (Figure 4).
Recently, Lancaster et al developed a method to establish neural tissue with
similar organization to a developing cortex from human pluripotent stem cells
(Lancaster et al., 2013). These developed tissues are termed organoids as they have
features of the original organ. This procedure has been adapted to grow primary
GBM samples (Hubert et al., 2016). Recent work by Howard Fine’s laboratory
demonstrated a novel 3D co-culture system using brain organoids and GSCs. They
established organoids, or “mini-brains” from human embryonic stem cells. Upon
creation of organoids, co-culture experiments with GSCs obtained a 100% tumor

Chapter 1
30
formation rate. These “tumors” carry the infiltrative behavior and resistance to
standard of care therapies, launching a system to study classic characteristics of
GBM under highly controlled and readily alterable conditions (Linkous et al., 2019).
One benefit of both types of organoid models is that they allow for the study of
hypoxic and necrotic tumor features. Major drawbacks include high variability in both
the shape of the organoid and the cell type produced, as well as time consuming
formation (Robertson et al., 2019). Additionally, they lack tumor vasculature and
immunological landscape, so they do not fully recapitulate in vivo tumor organization.
Therefore, while organoids present many advantages, factors such as time
limitations and availability of patient material presently limit their widespread use in
GBM studies.
1.5.2 In Vivo
Mice are the most cost effective and accessible model organism to study
GBM. Models include genetically engineered disease models or transplanted tumor
cells. Both allografts and xenografts are implanted either orthotopically in the brain or
subcutaneously. Additionally, growing evidence points to the potential use of canine
glioma to model human disease. In dogs, gliomas occur spontaneously, and
therefore there is a coevolution of the tumor and its microenvironment, as well as
relevant tumor heterogeneity, and an intact immune system (Koehler et al., 2018). A
potential drawback is that their use would require coordination with veterinarians and
owner consent, which can make cohorts difficult to establish.
Allograft transplantation allows tumors to develop in immune-competent mice.
This permits investigators to study the role of the immune system in the tumor’s
initiation, progression, and response to therapy. The most common model of this
uses the GL261 cell line established from carcinogen-induced glioma (Robertson et
al., 2019). GL261 has nonetheless developed genetic drift by accumulating
mutations, such as KRAS, which are not associated with GBM. This has led to in vivo
models that do not accurately reflect a GBM tumor (Szatmári et al., 2006). CRISPR
technology offers a solution to this problem; models are being created altering genes
in mouse NSCs to promote tumorigenicity. This should favor the study of GBM in an
intact immune system, should greatly improve modeling of the disease, and may
allow access to early steps of gliomagenesis (Robertson et al., 2019).

Chapter 1
31
Subcutaneous models are technically simple and can be adopted for pilot
studies to verify a molecule’s efficacy on tumor cells in vivo. Additionally, these
systems endorse the study of a cell tumor initiating capacities through visible tracking
of tumor growth over time. This serves a purpose for newly isolated GSCs or cells
undergoing gene silencing. These models are also useful for testing molecules that
do not efficiently cross the blood brain barrier, before setting up costly experiments,
which involve, for instance the implantation of mini-pumps directly to the brain or
pharmaco-kinetic manipulation of the lead compound to improve its delivery to the
brain. Subcutaneous tumors occur in a different environment that lacked central
nervous system specificity. Indeed, these models lack the infiltrative behavior of GBM
in the brain, the signs of neurological defects, and the tumor microenvironment, all of
which are important factors in selecting therapies (Liu et al., 2015a). Therefore,
whenever possible, subcutaneous studies should be supplemented using orthotopic
models.
Xenograft models of GBM involve the transplantation of either established
human cell lines, such as U87, or patient-derived primary cells in immune
compromised mice. The disadvantage of established cell lines remains the same as
in vitro; they do not precisely recapitulate human disease, and especially the early
stage of tumor development. Often, the patient-derived cells used for xenografts are
GSCs, which have been expanded by in vitro cell culture prior to implantation. These
GSCs are fully able to recreate tumors, and have the advantage of being
characterized, archived and distributed by researchers (Robertson et al., 2019).
However, these cells lose tumor heterogeneity, and these models cannot evaluate
the influence of the immune system. Patient-derived orthotopic xenografts (PDOX)
involve the direct implantation of tumor tissue from patients without an intermediate
cell culture step. These systems more fully capture genetic diversity and maintain
some of the tumor microenvironment, such as vessels, extracellular matrix, and
some immune regulators. Nevertheless, PDOX are costly, labor intensive, and
involve close partnership with surgeons and thus are not readily available to all
researchers (Robertson et al., 2019). Unfortunately, selection also inevitably occurs
in these models, through in vivo passage. Work by Ben-David et al. showed high
rates of copy number alteration in PDOX (Ben-David et al., 2017). Therefore, with the
exception of first implantations, fresh from patients, in vivo culture of tumor cells
Chapter 1
32
through PDOX may actually be no better than in vitro expanded GSC models
(deCarvalho et al., 2018).
Introducing defined genetic alterations in oncogenes and tumor suppressor
genes to generate spontaneous tumors creates genetic engineered mouse models,
GEMMs. A common model, used in GBM, and developed by Luis Parada’s group,
combines loss of Trp53 and conditional knockout of Nf1 (Zhu et al., 2005). For the
formation of IDH mutant tumors, IDH1R132H is conditionally expressed in the
subventricular zone (SVZ) of adult mice, which nicely models the early events in
gliomagenesis (Bardella et al., 2016). Viral delivery through a replication-competent
avian sarcoma-leukosis virus-tumor virus A, RCAS-TVA, system can also be used to
deliver oncogenes in vivo. Expression of TVA, the receptor of subgroup A avian
leucosis viruses, renders cells vulnerable to infection with RCAS viruses (Robertson
et al., 2019). HRAS and AKT overexpression through viral delivery is able to
transform NSCs to tumorigenic cells (Marumoto et al., 2009). Eric Holland’s work
also used this technology to establish Nes-TVA Cdkn2A-/- mice, very susceptible to
tumor formation (Holland et al., 2000). A limitation of this system is the need to breed
TVA-expressing mouse strains. Likewise, the viral cargo cannot contain large genes
like EGFRvIII, which constrains possible genetic mutations. GEMMs have the
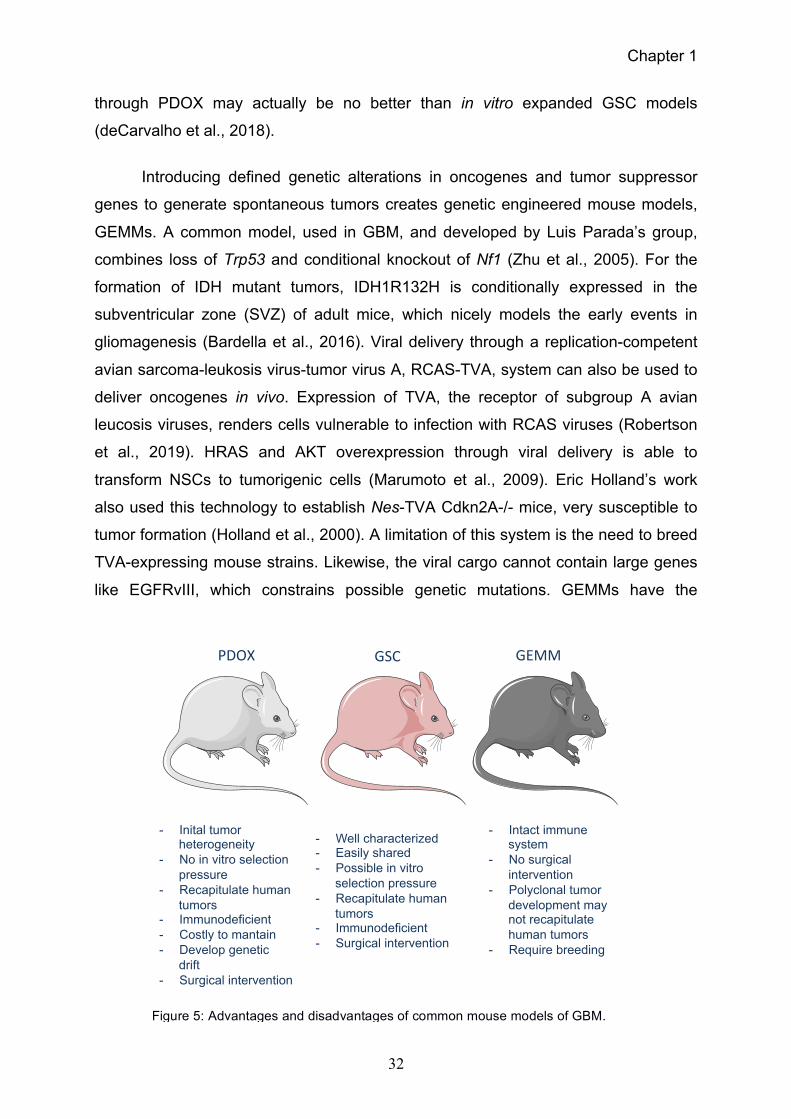
PDOX GSC GEMM
- Inital tumor heterogeneity
- No in vitro selection pressure
- Recapitulate human tumors
- Immunodeficient - Costly to mantain - Develop genetic
drift - Surgical intervention
- Well characterized - Easily shared - Possible in vitro
selection pressure - Recapitulate human
tumors - Immunodeficient - Surgical intervention
- Intact immune system
- No surgical intervention
- Polyclonal tumor development may not recapitulate human tumors
- Require breeding
Figure 5: Advantages and disadvantages of common mouse models of GBM.

Chapter 1
33
advantage of not requiring surgery to achieve orthotopic models. These mice also
have intact immune systems, so its effect on potential therapies can be evaluated.
However, GEMMs undergo a polyclonal tumor initiation, which does not reflect
human disease. CRISPR-based approaches that do not require cargo limited viral
delivery or mouse breeding may likely replace in the future currently used GEMMs
(Robertson et al., 2019).
There are advantages and disadvantages to all established mouse models of
GBM, and none of them fully recapitulate human disease (Figure 5). This may
account for the large number of proposed treatments, which work in pre-clinical
models but fail to prolong patient survival in clinics. With the advent of CRISPR
technology and an improved understanding of GBM, there will hopefully soon be
better models to study the tumor and its microenvironment in vivo.
Recently, other model organisms have been used to study various aspects of
GBM. Zebrafish represent an attractive model for the use in high-throughput drug
screening as they are small, inexpensive to maintain, and do not develop an immune
system until embryonic day 21, making xenotransplantation possible. Several groups
have reported the use of orthotopic xenograft models in zebrafish, demonstrating
their ability to recapitulate human disease (Lal et al., 2012; Pudelko et al., 2018;
Welker et al., 2016). Drosophila models of GBM can be useful in genetic screening
for those genes important to the cancer phenotype, as it is rather handy to generate
tissue specific genetic alterations in this system. One such model uses
overexpression of tyrosine kinase receptors (EGFR or PI3K) in the glia of Drosophila
(Witte et al., 2009). Hence, alternative model organisms can be useful in identifying
novel treatments and targets to be confirmed with cellular and mouse systems.
1.6 Glioblastoma Stem-like Cells
Cancer stem cells were first identified in acute myeloid leukemia in 1994, with
the discovery of a proportion of cells able to initiate human leukemia in severe
combined immunodeficient mice (SCID) (Lapidot et al., 1994), and later
characterized for their capacity to differentiate and self-renew in a similar manner to
that of hematopoietic stem cells (Bonnet and Dick, 1997). This led to the
Chapter 1
34
establishment of the cancer stem cell hypothesis whereby it was proposed that tumor
heterogeneity emanated from a subpopulation of cancer cells that possess
tumorigenic properties (Pardal et al., 2003; Reya et al., 2001). A decade after initial
observations in leukemia, this concept was expanded to solid tumors with the
identification of a subpopulation of tumorigenic cells in breast cancer (Al-Hajj et al.,
2003).
In 1992, Brent Reynolds and Samuel Weiss published their discovery that
certain brain-derived cells held self-renewal and multipotency properties in vitro
(Reynolds and Weiss, 1992). Around the same time, it was uncovered that new
neurons continually develop throughout adulthood, with the discovery that brain-
derived cells from the SVZ of adult mice could differentiate into new neurons in vitro
(Lois and Alvarez-Buylla, 1993). However, direct evidence of cells with these stem
properties in vivo did not emerge until 2007 with the pivotal findings of Fred Gage’s
laboratory conclusively elucidating the existence of SOX2+ adult neural stem cells
(NSCs) in the hippocampus (Suh et al., 2007). Following the breakthrough of adult
NSCs came the hypothesis that cancer stem cells could also be present in brain
cancers. In line with this, Peter Dirks’s laboratory determined that a proportion of
brain tumor cells were positive for CD133 (Prominin) and able to self-renew. These
cells could also initiate tumors in immunodeficient mice (NOD-SCID4), which
resembled original patient tumors (Singh et al., 2003, 2004). This was also
concurrently confirmed by Angelo Vescovi’s group (Galli et al., 2004). These cells
have been termed Glioblastoma Stem-like Cells or GSCs. Jeremy Rich’s team then
showed that these cells could promote tumor angiogenesis in xenografts due to an
elevated expression of VEGF (Bao et al., 2006a). This discovery was followed by
influential findings from the same laboratory claiming that the CD133+ tumor cells
were enriched in cell cultures and xenografts following ionized radiation, and that this
resistance was accompanied by increased activation of the DNA damage checkpoint
CHK1/CHK2 (Bao et al., 2006b). Likewise, Liu et al. demonstrated that CD133+
tumor cells had higher expression of MGMT mRNA and were resistant to
chemotherapy (Liu et al., 2006).
4 Non-obese diabetic severe combined immunodeficient mice

Chapter 1
35
Eric Holland’s group
later reported that
GSCs also overexpress
ATP-binding cassette
transporter ABCG2,
which allows GSCs to
export TMZ via a
PTEN/PI3K/AKT
dependent mechanism
(Bleau et al., 2009). It
was subsequently
confirmed that TMZ
targets the proliferative,
but not quiescent GSC
population of tumors
and that these GSCs
are responsible for tumor recurrence (Chen et al., 2012c). Together these data
demonstrated that GBM contain cancer stem cells with the properties of self-renewal,
tumor initiation, and radio and chemo-resistance, and that GSCs are responsible for
tumor recurrence (Chen et al., 2012d; Yan et al., 2013) (Figure 6).
Several cell surface markers, including CD15, CD44, and CD133, which
mediate interactions with the microenvironment have been proposed (Lathia et al.,
2015). CD133, also known as prominin-1 (PROM1), as already mentioned, was used
to distinguish cells with higher self-renewal and differentiation capacity in the initial
identification of GSCs (Singh et al., 2003, 2004). However, this marker is not
universally informative and can lead to false-negative identification of cancer stem
cells (Beier et al., 2007). Further, CD133 is less expressed in cells that are in G0/G1,
which is often the case for relatively quiescent GSCs (Sun et al., 2009). CD15, or
Lewis x, and CD44, also referred to as homing cell adhesion molecule (HCAM) have
also been suggested as potential GSC markers with subtype specific association,
Proneural and Mesenchymal, respectively (Bhat et al., 2013). However, they may
also have large false-positive rates (Lathia et al., 2015). Many other cancer stem cell
markers in GSCs have been identified through their characteristic as markers of
Figure 6: Graphical representation of GSC properties. These include self renewal, multipotency, radio and chemo resistance, and the capacity for serial transplantation.
GSCs
Self- Renewal
Multipotency
Serial transplantation
Radio/ Chemo Resistant
Chapter 1
36
normal stem cells, including SOX2 (Hemmati et al., 2003), NESTIN (Tunici et al.,
2004), NANOG (Ben-Porath et al., 2008), and OLIG2 (Ligon et al., 2007). However,
these markers are intracellular and therefore have little utility in cell sorting isolation
methods, but are largely employed for in situ identification. Therefore, there are no
universal markers of GSCs; rather GSCs are defined by the expression of multiple
stem markers, in addition to their properties of self-renewal, therapeutic resistance,
ability to differentiate, and tumor initiation.
1.7 Cell of Origin
Before the conclusive proof of adult neural stem cells, it was believed that
astrocytes were the cell of origin for GBM initiation (Chen et al., 2012d). For this
process to occur, it would require cells to undergo de-differentiation to recapture
immature glia and progenitor aspects, as was done to create induced pluripotent
stem cells (Takahashi and Yamanaka, 2006). Supporting this hypothesis, work done
by Bachoo et al. showed that in vitro neonatal cortical astrocytes could regain neural
progenitor properties after prolonged culture with growth factors, and that they could
generate gliomas via transformation of these astrocytes (Bachoo et al., 2002).
However, there is a lack of evidence to support that mature astrocytes can undergo
this process.

Chapter 1
37
With the discovery of adult NSCs, the hypothesis shifted away from astrocyte
de-differentiation. As NSCs feature self-renewal capabilities, they were natural
candidate for the glioma cell of origin. Indeed, abnormalities occur in cells of the NSC
niche of GEMMs (Kwon et al., 2008; Zhu et al., 2005). Further, inducible deletion of
Tp53, Nf1 and Pten specifically in mouse NSCs produced gliomas in 100% of the
mice (Alcantara Llaguno et al., 2009). IDH mutation or HRAS and AKT
overexpression in NSCs also leads to the development of GBM in GEMMs (Bardella
et al., 2016; Holland et al., 2000). In 2018, Lee and colleagues used a method of
deep sequencing to provide evidence that astrocyte-like NSCs, in the SVZ of GBM
patients, contain driver mutations of GBM, and thus are likely the cell of origin (Lee et
al., 2018) (Figure 7). Recent data from Luis Parada’s group showed that mutations in
NSCs and neural progenitor cells, but not differentiated neurons induce
gliomagenesis in mice (Llaguno et al., 2019). Therefore, mutations in neural
progenitor cells may also initiate GBM, independent of NSCs. Certainly; GBM
Figure 7: Graphical representation of neural stem cell differentiation. Markers of cell types are included.
Neural Stem Cell
Neural Progenitor Cell
Glial Progenitor Cell
Neuron Astrocyte Oligodendrocyte
Cancer Stem Cell
GFAP, SOX2, NES, PDGFRA
OLIG2, SOX2, NES, NG2, PDGFRA, S100B, ASCL1
MBP, S100B GFAP, S100B
OLIG2, NES, NG2, ASCL1, DLX, DCX
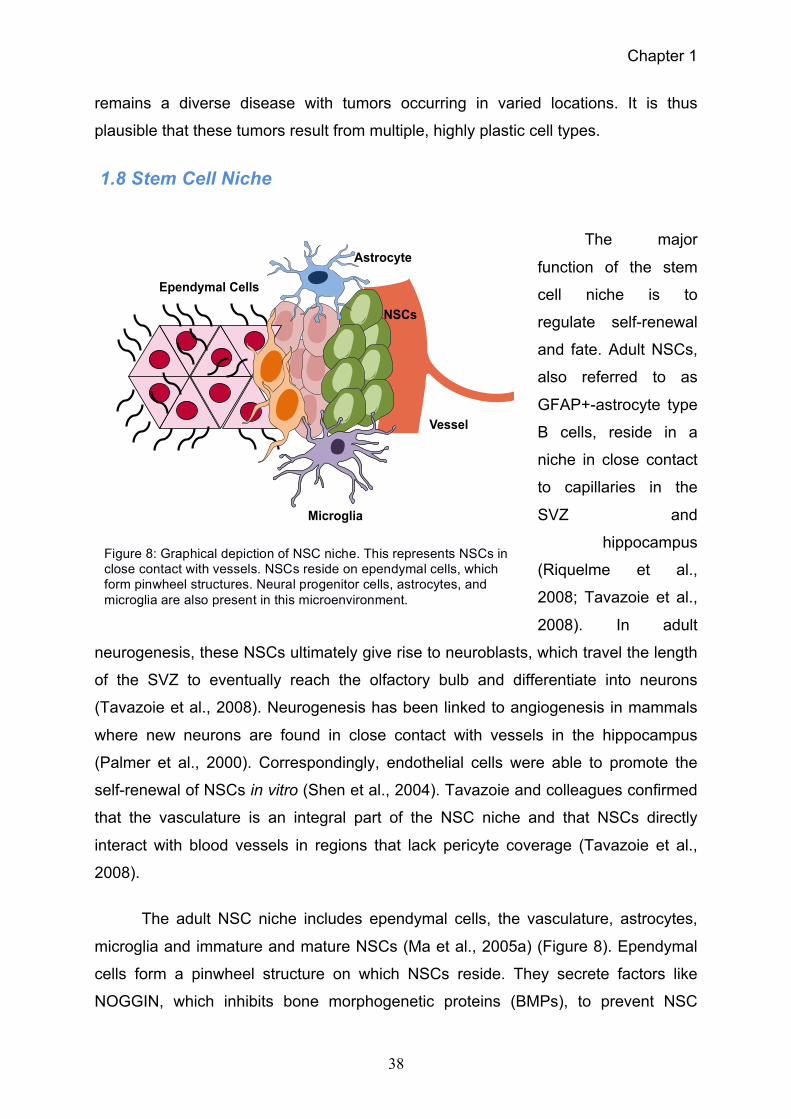
Chapter 1
38
remains a diverse disease with tumors occurring in varied locations. It is thus
plausible that these tumors result from multiple, highly plastic cell types.
1.8 Stem Cell Niche
The major
function of the stem
cell niche is to
regulate self-renewal
and fate. Adult NSCs,
also referred to as
GFAP+-astrocyte type
B cells, reside in a
niche in close contact
to capillaries in the
SVZ and
hippocampus
(Riquelme et al.,
2008; Tavazoie et al.,
2008). In adult
neurogenesis, these NSCs ultimately give rise to neuroblasts, which travel the length
of the SVZ to eventually reach the olfactory bulb and differentiate into neurons
(Tavazoie et al., 2008). Neurogenesis has been linked to angiogenesis in mammals
where new neurons are found in close contact with vessels in the hippocampus
(Palmer et al., 2000). Correspondingly, endothelial cells were able to promote the
self-renewal of NSCs in vitro (Shen et al., 2004). Tavazoie and colleagues confirmed
that the vasculature is an integral part of the NSC niche and that NSCs directly
interact with blood vessels in regions that lack pericyte coverage (Tavazoie et al.,
2008).
The adult NSC niche includes ependymal cells, the vasculature, astrocytes,
microglia and immature and mature NSCs (Ma et al., 2005a) (Figure 8). Ependymal
cells form a pinwheel structure on which NSCs reside. They secrete factors like
NOGGIN, which inhibits bone morphogenetic proteins (BMPs), to prevent NSC
Ependymal Cells
NSCs
Microglia
Astrocyte
Vessel
Figure 8: Graphical depiction of NSC niche. This represents NSCs in close contact with vessels. NSCs reside on ependymal cells, which form pinwheel structures. Neural progenitor cells, astrocytes, and microglia are also present in this microenvironment.

Chapter 1
39
differentiation (Mirzadeh et al., 2008). The ECs secrete VEGF to promote self-
renewal of NSCs, in addition to NEUROTROPHIN-3 which induces quiescence
(Bond et al., 2015; Delgado et al., 2014). NSCs themselves also supply factors for
both paracrine and autocrine signaling. Neurotransmitter GABA and NOTCH ligand
DELTA-LIKE 1 (DLL1) released by neural progenitor cells also regulate quiescence
in NSCs through feedback mechanisms (Bond et al., 2015).
Likewise, GSCs reside, at least in part, in a perivascular niche in close contact
with endothelial cells (Calabrese et al., 2007; Lathia et al., 2015). Further supporting
the existence of a similar niche for NSCs and GSCs, Piccirillo et al demonstrated that
BMPs have a similar effect on GSCs as they do on NSCs. In normal adult stem cells,
the introduction of BMP4 causes cells to differentiate towards an astroglial fate
(Bonaguidi et al., 2005). Likewise, the addition of BMP4 to GBM culture reduced
proliferation and promoted
differentiation (Piccirillo et al., 2006).
1.9 A Vascular Niche for GSCs
1.9.1 Endothelial Secretome
The vasculature of GBM is
characterized by irregular
angiogenesis, producing leaky and
dysfunctional blood vessels. Bao and
colleagues showed that GSCs can
affect tumor angiogenesis through the
secretion of VEGF (Bao et al., 2006a)
Seminal work by Calabrese and
colleagues showed that NESTIN
positive cells in brain tumors are found
near ECs. They further showed that
CD133+ brain tumor cells can
specifically interact with ECs and that ECs can maintain these cancer stem cells in
an undifferentiated state by secreting soluble factors (Calabrese et al., 2007).
Confirming this study, Ricci-Vitiani and colleagues further showed that GSCs
Figure 9: GSCs and ECs reciprocity. Endothelial cells and GSCs both secrete factors into the microenvironment, which affect self-renewal, angiogenesis, differentiation etc.
ECs
GSC
Secreted Factors (EVs, peptides, ligands etc)

Chapter 1
40
themselves can differentiate into endothelial cells in vitro and possibly in vivo (Ricci-
Vitiani et al., 2010), therefore adding another axis by which GSCs contribute to tumor
angiogenesis. Also, GSCs can transdifferentiate into pericytes to support vessel
integrity and promote tumor growth, highlighting a reciprocal interaction between
GSCs and the vasculature (Cheng et al., 2013).
Krusche and colleagues identified that GSCs up-regulate expression of the
Ephrin-B2 ligand to desensitize cells from vascular confinement and promote
invasion. Ephrin-B2 is expressed by ECs; it is a receptor tyrosine kinase of the Eph
family known to effect migration, proliferation, and stemness. The augmentation of
Ephrin-B2 ligand in GSCs saturated signaling with its receptor on ECs to prevent EC
sequestering of GSCs. Also, overexpression of Ephrin-B2 in NSCs leads to
gliomagenesis. Conversely, knockdown of Ephrin-B2 in GSCs delayed tumorigenesis
(Krusche et al., 2016). Moreover, WNT7a/b expression in tumor cells was necessary
for single cell vessel co-option, the process by which tumor cells employ preexisting
blood vessels for growth and survival. WNT7a/b levels were also correlated with
oligodendrocyte precursor-like (OPC) markers in glioma. Inhibition of WNT signaling
improved response to TMZ, while anti-VEGF therapy increased expression of WNT7
and OPC marker OLIG2 (Griveau et al., 2018). These studies emphasize the
coordinated signaling between GSCs and ECs (Figure 9).
Moreover, endothelial cell-secreted factors promote mechanistic (formerly
mammalian) target of rapamycin (mTOR), a central regulator of cellular growth and
metabolism, activation in GSCs. Previous work by our laboratory demonstrated that
the endothelial secretome can maintain mTOR signaling in GSCs in vitro in the
absence of other mitogens (Galan-Moya et al., 2011). In fact, conditioned medium
from endothelial cells prevents apoptosis and autophagy induced by mitogen
deprivation (Galan-Moya et al., 2014). Eric Holland’s group showed that the mTOR
pathway is activated in radio-resistant medulloblastoma, which allows them to bypass
cell cycle arrest (Bleau et al., 2009). Together, these data illustrate the importance of
the endothelial secretome on GSC maintenance.

Chapter 1
41
Endothelial cells
contribute to GSC
maintenance by secreting a
variety of factors, including
Notch ligands. They can
also secrete nitric oxide to
activate the Notch pathway
in GSCs (Charles et al.,
2010; Fan et al., 2010).
Notch signaling occurs when
ligands bind Notch receptors
causing gamma secretase
to process the receptor and
release the Notch
intracellular domain (NICD).
Consequently, NICD
translocates to the nucleus
with co-factors to activate
target genes of the pathway
(Figure 10). There is an
observed reduction in
CD133+ glioma cells in the absence of Notch ligands (Zhu et al., 2011). Notch
signaling has also been shown to be important in the development of normal brain
cells including glia and neurons (Morrison et al., 2000). Activation of the Notch
pathway in GSCs by ECs maintains the GSC stem state.
Comparatively, ECs secrete Sonic hedgehog (SHH) into the perivascular
niche, which can also sustain GSC self-renewal (Clement et al., 2007). Moreover,
EC-derived Angiopoietin1, a ligand involved in angiogenic remodeling, activates its
tyrosine-kinase receptor Tie2 in GSCs to promote expression of adhesion molecules,
N-cadherin and integrin β1, which expedites invasion (Liu et al., 2010).
Self-renewal Differentiation Angiogenesis
NICD
Notch Receptor
Γ-secretase
Ligand Stimulation
Nuclear Translocation
Gene Transcription
Delta/Jagged
Figure 10: Overview of Notch pathway signaling. Upon binding of the notch ligand, gamma secretase cleaves the intracellular portion (NICD) of the Notch receptor, freeing it to translocate to the nucleus and bind its targets.

Chapter 1
42
1.9.2 Cytokines and Growth Factors
The interleukin 6 (IL6) cytokine is highly expressed in GBM and has been
linked to poor patient prognosis (Choi et al., 2002; Tchirkov et al., 2007). Work by
Jeremy Rich’s laboratory demonstrated that GSCs express the IL6 receptor, and
targeting either the receptor or ligand reduces cell viability in vitro and tumor growth
in orthotopic xenografts. IL6 promotes survival in these cells by activating the
JAK/STAT3 signaling pathway (Wang et al., 2009). One study suggests that IL6 in
the niche is produced, at least in part, by Glioma-associated Mesenchymal Stem
Cells, a component of the stroma (Hossain et al., 2015). More recent analysis by the
same group established that CD9 stabilizes the IL6 receptor and its co-receptor
glycoprotein130 (gp130) to prevent receptor recycling by the lysosome, and maintain
STAT3 signaling in GSCs (Shi et al., 2017). Accordingly, blocking STAT3 signaling
downstream of IL6 stimulation reduced tumor growth in mice (Shi et al., 2018).
Recent mass spectrometry analysis of the brain endothelial secretome by our
laboratory identified the vasoactive peptide, apelin, as critical for GSC maintenance
and growth (Harford-Wright et al., 2017). Apelin is expressed in endothelial cells, and
has been shown to induce proliferation and vessel sprouting in ECs (Kidoya et al.,
2008). Our findings demonstrate that apelin could sustain GSC expansion in the
absence of all other mitogens. Also, pharmacological blockade of the apelin receptor
drastically reduced tumor growth in preclinical models of GBM and sensitized GSCs
to TMZ treatment in vitro (Harford-Wright et al., 2017). The importance of apelin in
the glioblastoma niche was later confirmed in a study by Ronald Kalin’s group where
it as found that apelin can effect both vessel formation and tumor cell invasion, and
that its blockade enhances anti-angiogenic therapy (Mastrella et al., 2019a). A recent
study in hematopoietic stem cells emphasizes the significance of both these aspects
of apelin signaling. In mouse models of radiation, EC-derived apelin maintained the
hematopoietic stem cells which in turn supported vessel integrity (Chen et al.,
2019a).

Chapter 1
43
1.9.3 Extracellular Vesicle Communication
There is now a large body of evidence that GSCs can influence the
vasculature through the secretion of small extracellular vesicles (EVs). Small EVs are
membrane bound vesicles, which are derived from endosomes, and released by cells
for intercellular communication. Small EVs can contain varying molecules including
proteins, lipids, and nucleic acids (André-Grégoire and Gavard, 2016). GBM-
originating EVs were shown to promote tumor angiogenesis by affecting
tubulogenesis and permeability (Giusti et al., 2016; Ricklefs et al., 2016; Treps et al.,
2017). In fact, the pivotal findings of Skog et al. first demonstrated that GSC-
originated EVs could transfer mRNAs to endothelial cells (Skog et al., 2008).
Correspondingly, one study illustrated that GSC-derived EVs delivered microRNA-1
to stromal cells to alter endothelial tube formation and glioma cell invasion (Bronisz et
al., 2014). In keeping with this, our group has discovered that semaphorin 3A, a
molecule that promotes permeability, released in EVs by GSCs, enhanced vascular
permeability in GBM xenografts, and therefore corrupts brain vasculature (Treps et
al., 2016). Indeed, our laboratory later clarified that EVs from GSCs also contain pro-
angiogenic VEGF-A (Treps et al., 2017). Further, upon treatment with TMZ, there
was increased release of GSC-derived EVs, which contained more cell adhesion-
related proteins than EVs derived from vehicle treated cells (André-Grégoire et al.,
2018). GSC-derived EVs can also affect other cells of the niche, including
microglia/macrophages (van der Vos et al., 2016). GSCs are not the only cells of the
tumor microenvironment to release exosomes. Recently, it was reported that stromal-
derived exosomes enhance tumorigenicity of GSCs in xenografts (Figueroa et al.,
2017).
Therefore, reciprocal signaling cues from ECs and GSCs affect tumor cell
response to therapies, which highlights the importance of the tumor
microenvironment in the development of novel therapies.
1.10 Hypoxia
While GBM are highly vascularized, these tumors also contain hypoxic zones.
Hypoxia is defined as the decrease in oxygen availability in cells, and can affect cell
proliferation, viability and differentiation (Hamanaka and Chandel, 2009). This

Chapter 1
44
process can be associated
with inflammation,
ischemia, and most notably
cancer. The importance of
this concept was
highlighted in 2019 with the
awarding of the Nobel
Prize in physiology or
medicine to William Kaelin,
Peter Ratcliffe, and Gregg
Semenza for their work on
how oxygen rate affects
cellular functions. Most
solid tumors contain
hypoxic zones with low
oxygen. This is exemplified
in GBM, in which the
altered vasculature leads to
inconsistent oxygen
delivery. Local regions of hypoxia can create necrotic zones within the tumor. Cancer
cells adapt to these unfavorable conditions by promoting tumor angiogenesis and
switching from oxidative respiration to glycolysis to fulfill metabolic requirements.
Hypoxia-Inducible Factors, HIF-1 and HIF-2, are transcription factors which have
been identified to regulate this process (Nakayama, 2009; Semenza, 2010). HIFs can
activate pro-survival genes and counteract apoptosis induction under hypoxia. Under
normoxia, HIF-1α subunit is ubiquitinated by von Hippel-Lindau (VHL) and further
degraded by the proteasome (Tanimoto et al., 2000). By contrast, HIF-1α is
stabilized under low oxygen, and subsequently translocated to the nucleus, where it
can complex with the HIF-1β subunit to form an active transcription complex, able to
bind target genes (Loor and Schumacker, 2008).
Microscopic analysis of GBM biopsies shows multiple hypoxic zones, due to
irregular tumor neo-vascularization (Monteiro et al., 2017). GBM vessels are
disorganized and extremely permeable with abnormal endothelial walls partially due
Figure 11: Vascular and hypoxic niche of GSCs. GSCs can reside and self-renew in both vascular and hypoxic niches.
GSC
Vascular Niche
Hypoxic Niche
GSC
Proliferation
Infiltration
O2
Differentiation to EC

Chapter 1
45
to lack of pericyte coverage (Monteiro et al., 2017; Plate and Mennel, 1995; Yuan et
al., 1994). HIF-1α can be upregulated in GBM due to EGFR mutation/amplification
and/or PTEN deletion. These mutations are responsible for constitutive activation of
PI3K/AKT/mTOR signaling, that in turn increases HIF-1α expression (Clarke et al.,
2001; Sansal and Sellers, 2004). Additionally, TRP53 deletion can augment HIF-1α
expression by preventing MDM2-mediated ubiquitination for proteosomal degradation
(Ravi et al., 2000).
Hypoxia is a known regulator of the so called “angiogenic switch” in addition to
being an orchestrator of stem cell fate (Li et al., 2009). Under low oxygen conditions,
embryonic stem cells maintain pluripotent state and block differentiation (Ezashi et
al., 2005) (Figure 11). In line with this, in in vitro cultures of glioma cells, a higher
proportion of cells express stem cell marker, CD133, under hypoxia (Platet et al.,
2007). Therefore, hypoxia appears as an essential factor in the cancer stem cell
niche (Gilbertson and Rich, 2007). Accordingly, work by the laboratory of Jeremy
Rich demonstrates that while all GBM cells up-regulate HIF-1α under hypoxia, GSCs
specifically express HIF-2α, which is required for VEGF expression, as well as known
HIF-2 target genes like OCT4 and GLUT1. They also show that expression of HIFs in
these cells promotes survival and prevents apoptosis (Li et al., 2009).
In order for tumor cells to propagate, they need access to oxygen and
nutrients, and they adapt their metabolism to their rapid expansion, thus hypoxia
might be deleterious to their growth. GSCs circumvent this by lengthening growth
factor signaling to survive under hostile conditions.
1.11 Mechanisms to resist hypoxia and hostile environment
In normal cells, upon ligand stimulation, receptor-ligand complexes are
internalized and degraded by the lysosome to prevent saturation of signaling
pathways (Mellman, 1996). Mutations in cancer cells have been shown to pervert this
pathway either by mutating receptors to no longer require ligand stimulus (such as an
EGFRvIII mutation) or to prevent downstream endocytosis. GSCs have adapted to
reduce receptor recycling in an unfavorable tumor environment such as hypoxia
(Shingu et al., 2016).

Chapter 1
46
Recent findings by Man and colleagues demonstrate that under hypoxic
conditions, GSCs maintain Notch signaling by preventing endo-lysosomal
degradation of receptors through Vasorin (VASN)-mediated stabilization (Man et al.,
2018). Previous findings demonstrated that VASN expression is induced under
hypoxic conditions and that it is overexpressed in human GBM (Choksi et al., 2011).
VASN is an inhibitor of TGFβ signaling, with a role in angiogenesis, as well as the
capacity to block TNF-mediated apoptosis (Choksi et al., 2011; Ikeda et al., 2004). It
was lately confirmed
to promote tumor
angiogenesis in GBM
(Liang et al., 2019). In
the context of Notch
signaling, VASN acts
as a competitive
inhibitor of Numb, the
Notch receptor
inhibitor, stabilizing
Notch1 at the plasma
membrane and
preventing recycling.
This increases Notch
signaling and allows
GSC survival under
harsh hypoxic
conditions (Man et al.,
2018).
In parallel,
Quaking (QKI) is an
RNA binding protein
critical for
oligodendrocyte
differentiation and
myelin formation as
QKI
Stabalized Lysosomal RNAs
Lysosomal Biogenesis
Receptor Recycling
Figure 12: The role of QKI in GSC biology. QKI binds directly to mRNA of lysosomal genes to stabilize them in GSCs. This promotes lysosomal biogenesis and can ultimately affect receptor recycling.

Chapter 1
47
well as the development of monocytes, endothelial cells, and smooth muscle
(Darbelli and Richard, 2016). It regulates RNA homeostasis by influencing stability,
splicing, and translation. QKI has also been established as a tumor suppressor in
gastric, colon, and prostate cancers (Darbelli and Richard, 2016). In GBM, analysis
of the cancer genome atlas, TCGA, showed methylation of the QKI locus in 20% of
GBM samples (Chen et al., 2012a). Pivotal work by Shingu and colleagues
demonstrated that GSCs survive in suboptimal tumor environment by downregulating
endo-lysosomes. Deletion of QKI in transformed NSC maintained stemness outside
the SVZ in mice. QKI binds directly to lysosomal RNAs in transformed NSCs and
acts as a regulator of lysosomal biogenesis. Indeed, when Qki was deleted, there
were lower levels of endo-lysosomes resulting in reduced receptor recycling. Further,
QKI expression was inversely correlated with self-renewal receptor (EGFR, Notch1,
Frizzled, SOX2) protein levels. The proposed mechanism of GSC survival in harsh
tumor environments was to decreasing endo-lysosomes and thus prolonging receptor
signaling (Figure 12)(Shingu et al., 2016). Altering receptor recycling, by limiting
endo-lysosomal degradation, is therefore one mechanism by which GSCs survive in
the hostile tumor microenvironment. Hence, modifying the endo-lysosomal
architecture of GSCs may represent a novel way to target them.

Chapter 2
48
2. Lysosomes
2.1 Discovery and Overview
Christian de Duve was awarded with the Nobel Prize in 1974 for having
discovered lysosomes. They were named so as it means “digestive body” in Greek.
While performing centrifugal tissue fractionations to study glucose 6-phosphatase in
the function of insulin, the group unveiled that acid phosphatase, another liver
phosphatase, was inactive in their
homogenate in 1955. This
phosphatase resides in a sac-like
particle separated from the rest of
the cell (de Duve, 2005).
Subsequently, they uncovered
other enzymes residing in the
same particles: cathepsin (now
cathepsin D), ribonuclease,
deoxyribonuclease, and β-
glucuronidase (de Duve, 2005; de
Duve et al., 1955). The presence
of these hydrolases in the same
compartment leads to the
hypothesis that these particles
exerted collective digestive
function, which resulted in the
naming “lysosome”. The structure
of this organelle was confirmed
with morphological studies using
electron microscopy in 1956, in
collaboration with Alex Novikoff (Figure 13)(de Duve, 2005; Novikoff et al., 1956).
One of the most notable characteristics of the lysosome is its acidic pH
(between 4.5-5.5), established by the vacuolar H+ ATPase (v-ATPase) which sits on
the lysosomal membrane and pumps protons across the membrane, in addition to
THE JOURNAL OF BIOPI-IYSICAL AND BIOCHEMICAL
CYTOLOGY
PLATE 60 VOL. 2
(Novikoff et al.: Lysosome-rich fractions from rat liver) Figure 13: First electron microscopy of lysosomes. Arrows denote dense bodies (lysosomes). From Novikoff et al., 1956.

Chapter 2
49
the counterflux of ions (K+, Na+, and Cl-) (Forgac, 2007; Perera and Zoncu, 2016).
This low pH is optimal for the functioning of hydrolases in the degradation of the
lysosomal cargos (Perera and Zoncu, 2016). Lysosomes receive their substrates
through a variety of trafficking functions including endocytosis, phagocytosis, and
autophagy (please see the following sections). Physiological involvement comprises
cholesterol homeostasis, plasma membrane repair, pathogen defense, bone and
tissue remodeling, cell signaling, and cell death (Saftig and Klumperman, 2009).
Therefore, lysosomes are diverse, dynamic organelles with complex functions that
are still being uncovered.
2.2 Lysosomal Composition and Biogenesis
The lysosome is composed of an outer membrane comprising a single
phospholipid bilayer of approximately 10 nanometers thickness, which contains
many transmembrane proteins. In fact, there exist two major classes of proteins,
which constitute this compartment: lysosomal membrane proteins and hydrolases.
Lysosomal membrane
proteins, as the name
suggests, reside on the
limiting lipid bilayer of the
lysosome. They harbor varied
functions including:
acidification, protein import
and export, and membrane
fusion (Eskelinen et al., 2003).
The most abundant lysosomal
membrane proteins are the
lysosomal associated
membrane proteins LAMP1
and LAMP2, the lysosomal
integral membrane protein 2
(LIMP2), and the tetraspanin
CD63 (Gonzalez et al., 2014;
Figure 14: Lysosomal membrane proteins. From Gonzalez et al 2014

Chapter 2
50
Saftig and Klumperman, 2009). These proteins are heavily glycosylated to prevent
auto-digestion within the lysosome (Kornfeld and Mellman, 1989; Saftig and
Klumperman, 2009). Hydrolases each have a specific set of cargos, which they
target for degradation and are the principle proteins responsible for the lysosome’s
capacity for catabolism. These proteases also process antigens and pro-proteins,
degrade the extracellular matrix, and can initiate apoptosis (Conus and Simon,
2008).
Pivotal findings by Andrea Ballabio’s group identified a consensus sequence,
GTCACGTGAC, in the promoter of many lysosomal genes which became known as
the coordinated lysosomal expression and regulation, or CLEAR, element (Sardiello
et al., 2009). This constitutes a type of E-box that is recognized by basic helix-loop-
helix MiTF/TFE family transcription factors, namely: TFEB, TFE3, MITF, and TFEC.
Of these transcription factors, TFE3 and TFEB have both been shown to regulate
lysosomal biogenesis. In fact, TFEB is considered a master regulator of lysosomal
biogenesis. Overexpression of TFEB provoked the transcription of numerous
lysosomal protein encoding genes in HeLa cells (Sardiello et al., 2009). TFEB was
also shown to bind to the promoters of genes involved in autophagy, underlining a
Figure 15: overview of TFEB action. Under nutrient rich conditions, mTORC1 phosphorylates TFEB to promote recruitment of the chaperone 14-3-3. This causes TFEB to remain cytosolic and inactive. Upon nutrient depletion, TFEB translocates to the nucleus to bind targets.
TFEB
TFEB P
Lysosome
Nucleus
inactive
CLEAR
CLEAR Genes active
TFEB
active
MTORC1
14-3-3

Chapter 2
51
clear co-regulation between lysosome and autophagosome formation (Settembre
and Ballabio, 2011). TFEB is regulated via post-translational modification, namely by
phosphorylation at serine 142 and 211. When TFEB is phosphorylated at both of
these residues, it remains cytosolic and inactive. However, under conditions of
lysosomal dysfunction or starvation, TFEB is dephosphorylated and translocates to
the nucleus to activate target genes (Napolitano and Ballabio, 2016a).
Phosphorylation at serine 211 recruits the chaperone 14-3-3 to dock on TFEB and
mask nuclear localization signal, therefore preventing it from nuclear shuttling
(Figure 15). Both ERK2 and the mTORC1 complex have been shown to
phosphorylate TFEB under nutrient rich conditions (Martina et al., 2012; Roczniak-
Ferguson et al., 2012). As mTORC1 has also been implicated in autophagy
regulation, its action on TFEB serves as another layer of control on these
interconnected processes.
In addition to this established ‘canonical’ TFEB action, a recent report
implicated bromodomain containing protein 4 (BRD4) as a transcriptional repressor
of the CLEAR network, acting independently of TFEB (Sakamaki et al., 2017).
Likewise, in glioma, the RNA binding protein QKI was shown to interact specifically
with lysosomal RNAs regulating their stability, again in a TFEB-independent fashion
(Shingu et al., 2016). Therefore, there may be other TFEB-independent processes
regulating lysosome biogenesis yet to be uncovered.
2.2.1 Formation of Lysosomes
During lysosomal biogenesis, many newly synthesized lysosomal proteins are
trafficked through the trans-golgi network (TGN) to the endosomal system. For
hydrolases, this occurs via the mannose-6-phosphate receptor (M6PR) mediated
transport system. In the golgi, lysosomal enzyme precursors acquire 6-
phosphomannosyl moieties, which act as M6P recognition markers (Reitman and
Kornfeld, 1981a, 1981b; Waheed et al., 1981). There are two types of M6PR: cation-
independent (300 kDa) or cation-dependent (46 kDa). These two receptors are type I
transmembrane glycoproteins, and compose the p-type lectin family. In the TGN,
M6PRs bind AP5 or GGA6 proteins. This causes clathrin-coated vesicles to form and
5 Activator Protein 1 6 Goligi-localized γ-ear-containing ADP ribosylation factor binding proteins

Chapter 2
52
traffic to early endosomes. M6PRs orient with the lysosomal enzyme binding site
toward the vesicle lumen, and the C-terminus toward the vesicle exterior (Sahagian
and Steer, 1985). Deficiencies in this pathway can lead to the secretion of lysosomal
enzymes, altering its function and resulting in lysosomal storage disorders (Ludwig et
al., 1995). Lysosomal storage disorders arise from an inability of lysosomes to
degrade one or more substrate due to genetic mutations. This results in
accumulation of lysosomal substrates and cell death. Symptoms and severity of
lysosomal storage disorders depend on the tissues affected and the extent of
mutations. In fact, a potential treatment for this kind of malfunctions involves enzyme
replacement therapy for M6P derivatives (Gary-Bobo et al., 2007; Solomon and
Muro, 2017; Zhu et al., 2004).
Vesicles containing lysosomal hydrolases bud from the TGN and arrive at the
endosome. Endosome maturation causes the formation of the late endosome, which
has a pH around 6. Lysosomal enzymes bind M6PR at a pH of about 6.5, so
acidification of the “pre-lysosomal compartment” leads to their release from M6PRs,
which can then recycle back to the golgi. In addition to its localization at the golgi, the
cation-independent M6PR is also found at cell surface, allowing it to shuttle
extracellular content to the lysosome (Dahms, 1996; Gary-Bobo et al., 2007;
Kornfeld, 1992; Munier-Lehmann et al., 1996). Therefore, lysosomal components
can be transferred after both de novo synthesis and endocytosis via the M6PR
sorting pathway.
The vacuolar protein sorting (VPS10) domain containing family of proteins is
involved in direct transport of hydrolases to the lysosome. In mammalian cells, these
proteins include Sortilin, SorLA, SORC1, SORC2 and SORC3. Sortilin is responsible
for direct lysosomal shuttling of acid sphingomyelinase (Ni and Morales, 2006;
Petersen et al., 1997). Cathepsin D and Cathepsin H, two other lysosomal
hydrolases can co-immunoprecipitate with Sortilin (Canuel et al., 2008). Additionally,
electron microscopy analysis reveals that Sortilin colocalizes with cation-independent
M6PR in the TGN. Thus, although unrelated to M6PRs, Sortilin likely targets
hydrolases to the lysosome by the same clathrin-mediated pathway (Saftig and
Klumperman, 2009). Unlike M6PR, Sortilin associates with ligands through binding at
its β-propeller domain, and therefore does not require glycosylation (Quistgaard et
al., 2009).

Chapter 2
53
β-glucocerebrosidase
(βGC) is a lysosomal
enzyme that lacks the
M6P tag, and therefore is
trafficked to the lysosome
in a M6PR-independent
manner. Mutations in this
enzyme produce the most
common lysosomal
storage disorder, Type I
Gaucher disease. So how
is it targeted to the
lysosome? Strikingly, βGC
was found to interact
directly with the lysosomal
membrane protein LIMP2
(Reczek et al., 2007).
LIMP2 is heavily
glycosylated, and contains
sorting signals at the C-
terminus. The binding of
these two proteins is dependent of the cellular pH; in the endoplasmic reticulum,
βGC and LIMP2 associate, and traffic together to the lysosome. At acidic lysosomal
pH, they dissociate and can perform their independent functions. Of note, βGC is no
longer sorted to the lysosome in LIMP2 knock-out mice (Gamp et al., 2003).
However, deletion of LIMP2 C-terminus does not affect its lysosomal placement
(Kuronita et al., 2005). LIMP2-βGC association represents a noteworthy lysosomal
targeting method, whereby the transport of lysosomal membrane proteins and
hydrolases converge.
Two major routes have been proposed for the transport of lysosomal
membrane proteins to their destination. The “direct” pathway refers to passage from
the TGN to the early and late endosomes without an intermediate step. By contrast,
in the “indirect” pathway, these proteins are first delivered to the plasma membrane
Endocytosis
MVB(Late endosome
intermediate)
Lysosome
TGN
Endosome
M6PR Transport
Figure 16: Summary of lysosomal protein transport. After translation, lysosomal proteins are sorted from the golgi either by M6PR dependant translocation to the endosome, or directly to the MVB or lysosome. Lysosomal proteins can also be endocytosed.

Chapter 2
54
before internalization and sequestering in the early endosome, late endosome, or
lysosome. TGN vesicle transport is summarized in figure 16. Work by Juan
Bonifacino’s group demonstrated that elimination of clathrin or AP complexes caused
LAMP proteins to accumulate at the plasma membrane of HeLa cells, suggesting
that the “indirect” pathway is likely a major trafficking route for LAMPs to the
lysosome (Janvier and Bonifacino, 2005). However, earlier pulse chase studies of
LAMP1 in HL-607 cells revealed the majority of LAMP1 shuttled via the direct
pathway (Carlsson and Fukuda, 1992). Moreover, in CHO8 cells LAMP1 transport
was largely dependent on protein abundance, where LAMP1 was enriched at the
plasma membrane alongside increased expression (Harter and Mellman, 1992).
Also, particular lysosomal membrane proteins can have sorting motifs for divergent
trafficking pathways. Mucolipin 1 (MCOLN1) for example contains two di-leucine type
motifs, which promote separate transport events. The N-terminal motif promotes
direct TGN to lysosome passage, while the C-terminal signal guides MCOLN1
movement to the plasma membrane where it is thereafter endocytosed
(Vergarajauregui and Puertollano, 2006). Hence, the contribution of each pathway
may differ between cell type, expression level, and cellular conditions.
Experimental evidence suggests multiple methods of TGN exit for lysosomal
membrane proteins. The lysosomal-associated protein transmembrane 5 (LAPTM5),
for example, requires GGA3, suggesting a trafficking similar to the M6PR pathway
used for hydrolase transport (Pak et al., 2006). Conversely, in vitro analysis of
vesicles containing LAMP1 and LAMP2 implies that they sort distinctly from the
M6PR transport system (Karlsson and Carlsson, 1998). Indeed, knockdown of AP1
in HeLa cells or its depletion in mice did not impede LAMP1 transport to the
lysosome (Janvier and Bonifacino, 2005; Meyer et al., 2000). The same was true
when clathrin was silenced in HeLa cells (Janvier and Bonifacino, 2005; Meyer et al.,
2000).
Together, these data indicate a complex and diverse mechanism by which different
proteins reach the lysosome.
7 Human Leukemia-60 cells 8 Chinese hamster ovary cells

Chapter 2
55
2.3 Lysosomal Positioning
While it was previously thought that lysosomes were static structures with
either perinuclear or uniform cytosolic distribution, recent findings have shown their
dynamic, calcium-dependent movement including: exocytosis, fusing with each other
and with other organelles (endosome, phagosome, and autophagosome), as well as
reformation from hybrid organelles (Lawrence and Zoncu, 2019). This shuttling is
dependent on the BLOC-1 related complex (BORC), localized on the lysosomal
membrane, which associates with ARL8, a small GTPase, and kinesin-5, to travel
along microtubules. Lysosomes traverse microtubules and change direction by
switching between plus-end directed kinesin motors and minus-end directed dynein-
dynactin motor complexes. Cells lacking BORC do not display lysosomal localization
to the cell periphery (Pu et al., 2015). Lysosomal movement is not continuous, rather
it appears to stop and start depending on and adaptating to cellular conditions.
Acidification of the cytosol disperses perinuclear lysosomes, whereas starvation,
aggresome formation or lysosomal storage disorders result in the opposite
phenotype (Heuser, 1989; Korolchuk et al., 2011; Li et al., 2016; Zaarur et al., 2014).
Starvation Nutrient-Rich
Perinuclear lysosomes
Cytosolic dispersion Of lysosomes
Figure 17: Lysosomal positioning. (Left) Under starvation, lysosomes cluster in a perinuclear fashion. (Right) In nutrient rich conditions, lysosomes can be found dispersed throughout the cytosol.
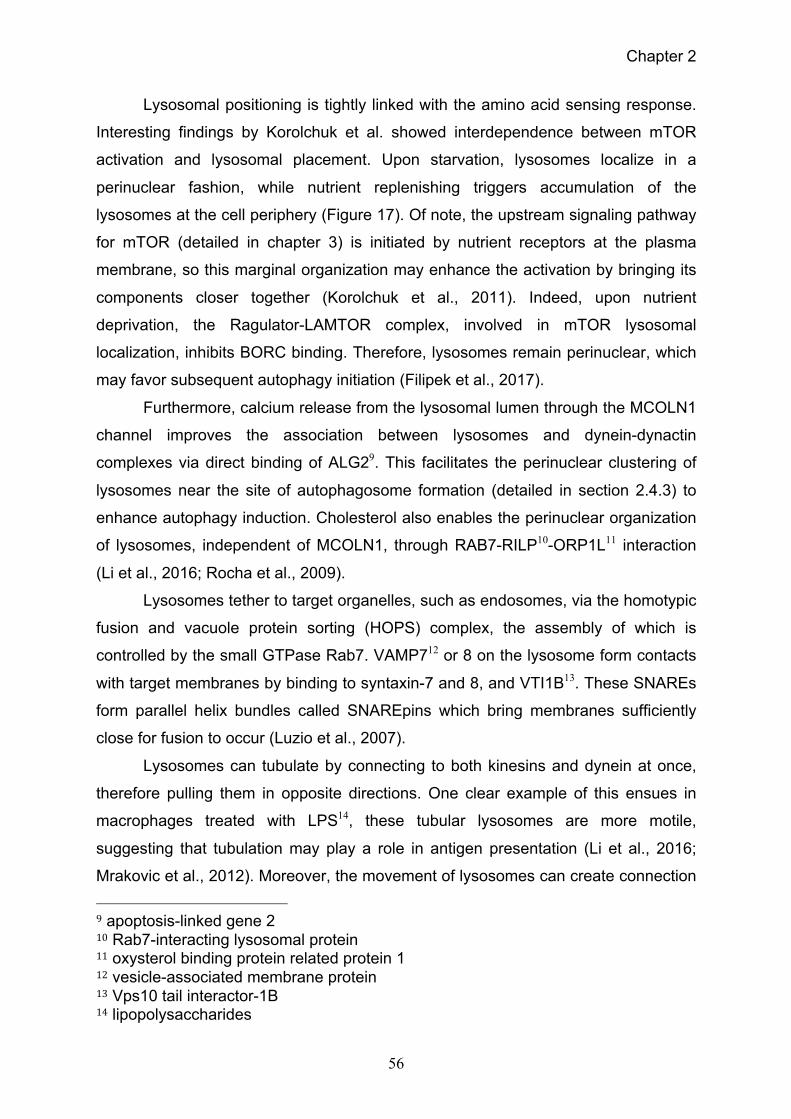
Chapter 2
56
Lysosomal positioning is tightly linked with the amino acid sensing response.
Interesting findings by Korolchuk et al. showed interdependence between mTOR
activation and lysosomal placement. Upon starvation, lysosomes localize in a
perinuclear fashion, while nutrient replenishing triggers accumulation of the
lysosomes at the cell periphery (Figure 17). Of note, the upstream signaling pathway
for mTOR (detailed in chapter 3) is initiated by nutrient receptors at the plasma
membrane, so this marginal organization may enhance the activation by bringing its
components closer together (Korolchuk et al., 2011). Indeed, upon nutrient
deprivation, the Ragulator-LAMTOR complex, involved in mTOR lysosomal
localization, inhibits BORC binding. Therefore, lysosomes remain perinuclear, which
may favor subsequent autophagy initiation (Filipek et al., 2017).
Furthermore, calcium release from the lysosomal lumen through the MCOLN1
channel improves the association between lysosomes and dynein-dynactin
complexes via direct binding of ALG29. This facilitates the perinuclear clustering of
lysosomes near the site of autophagosome formation (detailed in section 2.4.3) to
enhance autophagy induction. Cholesterol also enables the perinuclear organization
of lysosomes, independent of MCOLN1, through RAB7-RILP10-ORP1L11 interaction
(Li et al., 2016; Rocha et al., 2009).
Lysosomes tether to target organelles, such as endosomes, via the homotypic
fusion and vacuole protein sorting (HOPS) complex, the assembly of which is
controlled by the small GTPase Rab7. VAMP712 or 8 on the lysosome form contacts
with target membranes by binding to syntaxin-7 and 8, and VTI1B13. These SNAREs
form parallel helix bundles called SNAREpins which bring membranes sufficiently
close for fusion to occur (Luzio et al., 2007).
Lysosomes can tubulate by connecting to both kinesins and dynein at once,
therefore pulling them in opposite directions. One clear example of this ensues in
macrophages treated with LPS14, these tubular lysosomes are more motile,
suggesting that tubulation may play a role in antigen presentation (Li et al., 2016;
Mrakovic et al., 2012). Moreover, the movement of lysosomes can create connection 9 apoptosis-linked gene 2 10 Rab7-interacting lysosomal protein 11 oxysterol binding protein related protein 1 12 vesicle-associated membrane protein 13 Vps10 tail interactor-1B 14 lipopolysaccharides

Chapter 2
57
sites with other organelles including ER, TG and peroxisomes. In the TGN, the
interaction controls the spatial distribution of the lysosomes (Wang and Hong, 2002).
In peroxisomes, these contacts regulate cholesterol transport (Chu et al., 2015).
Similarly, ER-lysosome connections have recently been linked to cholesterol sensing
and homeostasis (Höglinger et al., 2019; Lim et al., 2019). Furthermore, ER-late
endosome contacts also have been implicated in neurite growth and cellular
protrusions (Raiborg et al., 2015). Therefore, lysosomal repositioning enables
movement in response to specific stimuli and communication with other organelles in
order to carry out their varied functions.
2.4 Lysosomal Fusion
Lysosomes act as the terminal delivery site for several degradative processes
including endocytosis and autophagy. Moreover, lysosomes can remove unwanted
cargos from the cell through exocytosis. These processes involve the fusion of
lysosomes with different membranes of the cell including endosomes, the plasma
membrane, and autophagosomes.
2.4.1 Endocytosis
Lysosomes act as the endpoint for many molecular cargos that the cell
internalizes. During endocytosis, extracellular and membrane components are
coopted into vesicles, pass through the endosome, and often are delivered to the
lysosome for degradation and recycling. Some cargos, such as transferrin, deliver
essential components, eg iron, for lysosomal function (Inpanathan and Botelho,
2019).
Another function of the lysosome is recycling of cell receptors and ligands. For
low-density lipoprotein ligands, they dissociate from their receptors in the acidic
compartment after endocytosis and are subsequently degraded in the lysosomal
lumen by hydrolases. Disengaged receptors can meanwhile be recycled to the cell
surface for further signaling. In contrast, EGF remains bound to its cognate receptor
as it travels through the late endosome to the lysosome (Kirchhausen et al., 2014).
By this method, the lysosome can regulate the length of signaling cascades, upon
ligand triggering. Indeed, one mechanism cancer stem cells use to increase the
duration of growth factor signaling is to down-regulate their endo-lysosomal
Chapter 2
58
degradation (Man et al., 2018; Shingu et al., 2016). Moreover, endocytosis can
remodel the plasma membrane by removing transporters and adhesion molecules in
response to stimuli (Ross et al., 2015).
Upon endocytosis, cargos are sorted in the early endosome, a compartment
defined by Rab5 and EEA1 expression. Those components marked for degradation
are retained in the late endosome. Rab7 and LAMP1 expression, components also
present in the lysosome, label late endosomes. These late endosomes then fuse
either terminally, or transiently with lysosomes to form endo-lysosomes where they
deliver their cargo for degradation (Bissig et al., 2017; Bright et al., 2016).
2.4.2 Lysosomal Exocytosis Lysosomes can join with the plasma membrane upon increase in cytosolic
calcium levels. This process has long been understood to occur in hematopoietic
cells, in order to destroy targets through the release of specialized secretory
lysosomes (Stinchcombe and Griffiths, 1999). In 2001, a study in fibroblasts revealed
that conventional lysosomes can also undergo this shuttling (Reddy et al., 2001).
This process is referred to as lysosomal exocytosis, where lysosomes dock at the
plasma membrane and release their content into the extracellular space.
As in lysosomal-endosomal merging, SNAREs are essential to this type of
fusion. LAMP1 is a major player in the docking step, and is negatively regulated by
Neu-115 through processing of sialic acids, 9 carbon monosaccharides, in the
glycosylated region of LAMP1. Correspondingly, expression of over-sialylated
LAMP1 enhances lysosomal exocytosis (Yogalingam et al., 2008). Additionally,
TFEB has been implicated in this process, as its overexpression can provoke
lysosomal exocytosis in vitro and in vivo (Spampanato et al., 2013).
Lysosomal exocytosis has emerged as important for the reparation of the
plasma membrane and the removal of pathogenic bacteria and viruses from the cell
(Huynh et al., 2004; Jaiswal et al., 2002; Reddy et al., 2001; Roy et al., 2004).
Moreover, cancer cells can pirate this route to degrade the extracellular matrix and
facilitate invasion (Machado et al., 2015).
15 Neuraminidase-1
Chapter 2
59
2.4.3 Autophagy
Macroautophagy, hereafter referred to as autophagy, is a process for bulk
degradation in the cell in response to stress, nutrient or growth factor deprivation, or
hypoxia. Upon initiation, autophagy-related proteins, ATGs, are engaged at the
phagophore assembly site, PAS, to form a C-shaped structure, or phagophore. This
phagophore elongates to engulf the portion of cytosolic material for degradation,
eventually sealing into a double membrane vesicle, termed autophagosome. Fully
formed autophagosomes travel along microtubules to reach and fuse with the
lysosome, allowing for the destruction of cargos (Dikic and Elazar, 2018).
2.4.3i Autophagosome Composition and Induction
There are five complexes of ATGs essential for a functional autophagy
pathway. The first is the ULK116 complex, or the initiation complex, which consists of
ULK1, FIP20017, ATG13, and ATG101. ULK1 was first identified in HEK293 cells
where its knockdown was sufficient to inhibit autophagy. This effect was confirmed in
starvation-induced autophagy with ULK1/2 knockout MEFs (Chan et al., 2007;
Cheong et al., 2011). Autophagy is ignited thanks to the serine/threonine kinase
action of ULK1. Accordingly, autophagic flux is blocked by the expression of the
kinase dead version of ULK1 or its chemical inhibition (Chan et al., 2009; Egan et al.,
2015; Petherick et al., 2015). Conversely, interaction of ULK1 with ATG13 or FIP200
increases its enzymatic activity (Ganley et al., 2009; Hosokawa et al., 2009; Jung et
al., 2009). Additionally, autophosphorylation at threonine 180 in the activation loop of
ULK1 may be important for its kinase action (Bach et al., 2011; Lazarus et al., 2015).
After stimulation, ULK1 phosphorylates other components within the initiation
complex, ATG13 and FIP200 (Hosokawa et al., 2009; Jung et al., 2009). The
complex forms puncta under amino acid starvation that colocalize with omegasomes,
ie ER structures that support autophagosome biogenesis (Karanasios et al., 2013).
ULK1 complex activity is also regulated by mTOR and AMPK. Upon nutrient
detection, mTOR phosphorylates ULK1 at serine 637 and 757 to inactivate it (Ganley
et al., 2009; Hosokawa et al., 2009; Jung et al., 2009). mTOR additionally
16 Unc-51-like Kinase 1 17 FAK family kinase-interacting protein of 200kDa.

Chapter 2
60
phosphorylates ATG13 to block its translocation to autophagy initiation site (Puente
et al., 2016). In contrast, under energy deprivation, there is an increase in cellular
adenosine monophosphate, AMP, which activates AMPK18. AMPK can inactivate in
turn the mTORC1 complex (please see chapter 3 for details), which prevents the
inhibitory effects on ULK1. Notably, AMPK can also directly phosphorylate ULK1 at
multiple sites to activate it (Egan et al., 2011; Kim et al., 2011).
The second complex contains ATG9 bound phospholipid vesicles. ATG9 is
the sole transmembrane ATG; it delivers a lipid membrane source for phagophore
formation, and associates with the initiation complex at the PAS (Karanasios et al.,
2013; Nishimura et al., 2017). In mammals, ATG9 is not incorporated into
18 AMP-activated protein kinase
Figure 18: Simplified overview of autophagy. Briefly, upon activation, ULK1 complex and PI3KC3 complex come together with ATG9 vesicles to form the isolation membrane at the PAS. This leads to formation of the phagophore, which matures with association of ATG8s (here LC3). Upon phagophore closure autophagosomes mature and ATGs dissociate from outermembrane. Autophagosomes tether to lysosome for fusion and degradation of internal cargo.
Autolysosome
Lysosome
Fusion with lysosome
Autophagosome
Cargo sequestering
Isolation Membrane
Omegasome
Initiation Phagophore nucleation
Nutrient recycling
LC3
ATG
5 AT
G12
AT
G3
ATG
16L1
WIP
I2
DFCP1 ULK1
Complex
ULK1 Complex
PI3KC3 Complex I
PI3KC3 Complex I
PI3P
ATG9 Vesicles

Chapter 2
61
autophagosomes, but transiently associates with omegosome (Orsi et al., 2012).
Live cell imaging suggests that autophagosome formation occurs when ATG9
coalesces with the ER (Karanasios et al., 2016). Correspondingly, ATG9 deficient
mutants in yeast or mammals fail to form autophagosomes (Orsi et al., 2012;
Yamamoto et al., 2012).
The class III PI3K complex, PI3KC3, contains VPS3419, Beclin1, p115, and
ATG14 or UVRAG20 depending on the context. AMPK can also directly
phosphorylate VPS34 and Beclin1 (Kim et al., 2011). The fourth class composes
WIPI21 proteins and ATG2 proteins. Finally, the fifth complex consists of the
ubiquitin-like proteins ATG12 and ATG5, which interact with ATG16L and members
of the ATG8 protein family. The ATG8 protein family has two subfamilies: light chain
3 (LC3) A, B, and C and γ-aminobutyric acid receptor-associated proteins
(GABARAPs), which conjugate with membrane phosphatidylethanolamine (PE)
(Dikic and Elazar, 2018).
Phagophore formation occurs at the omegasome, which are enriched in PI3Ps
and are marked with PI3P binding protein DFCP22. ULK1 and PI3KC3-C1 complexes
are activated and recruited to the PAS along with ATG9 vesicles. The mechanism of
ULK1 recruitment is still being uncovered. One study found that the positive regulator
of autophagy, WAC23, translocates GABARAP to the centrosome, which can then be
transferred to the phagophore. GABARAP could recruit and activate ULK1 (Joachim
et al., 2015; McKnight et al., 2012). More is known about PI3KC3-C1. ULK1
phosphorylates ATG14, which interacts with ATG13 under amino acid starvation.
This stimulates the kinase activity of PI3KC3 and initiates phagophore formation
(Park et al., 2016). ATG9 is regulated in part by ULK1 phosphorylation (Karanasios
et al., 2016; Papinski et al., 2014).
2.4.3ii Phagophore Expansion and Maturation
ATG8s are the most important proteins for phagophore expansion. ATG4
processes pro-ATG8s exposing a glycine residue in the C-terminus, which is 19 Vacuolar protein sorting 34 20 UV-radiation resistance-associated gene 21 WD repeat domain phosphoinositide-interacting 22 Double FYVE-containing protein1 23 WW-domain containing adaptor with coiled coil

Chapter 2
62
essential for PE conjugation. Processed ATG8s are then activated by ATG7 which is
an E1-like enzyme. Consequently, ATG3 fuses ATG8s to PE, converting from the
freely diffuse form (for LC3 this is LC3-I) to the lipidated form (LC3-II) (Hamasaki et
al., 2013; Slobodkin and Elazar, 2013). For PE attachment to occur, it requires ATG3
to be stimulated by ATG12-ATG5 E3 activity. WIPI2 recruits ATG12-ATG5-ATG16L
to the PAS through its interaction with ATG16L (Dooley et al., 2014; Fujioka et al.,
2010; Kuma et al., 2002). The lipidation of ATG8s promotes phagophore expansion
and can facilitate cargo recruitment in selective autophagy as cargo receptors, like
SQSTM1/p6224, contain an LC3 interacting region (LIR), where ATG8s directly bind
(Slobodkin and Elazar, 2013). Of note, recent studies demonstrate that
autophagosomes can form without the conjugation machinery or ATG8s (Nguyen et
al., 2016; Tsuboyama et al., 2016).
Following the closure of the phagophore, autophagosomes undergo a
maturation phase where ATGs dissociate from the outermembrane, and the fusion
proteins, syntaxin-17 (STX17), and SNAP2925, are recruited (Diao et al., 2015;
Itakura et al., 2012). ATG8s link autophagosomes to kinesins through the autophagy
specific adaptors, including FYCO126. They also drive fusion by recruiting the HOPS
complex (McEwan et al., 2015; Olsvik et al., 2015). Interestingly, ATG14 has also
been implicated in the maturation of the autophagosome via interaction with STX17
to foster membrane
tethering (Itakura et al.,
2012).
2.4.3iii Lysosomal Fusion Similar to
lysosomal fusion with
other organelles,
autophagosomes require
the formation of the
24 Sequestosome 1 25 Synaptosomal-associated protein 29 26 FYVE and coiled-coil domain-containing protein 1
Tether Rab
SNARE
Autophagosome Lysosome
Figure 19: Overview of autophagosome-lysosome fusion. The SNAREpin forms when lysosomal VAMP8 associates with Stx17 and SNAP29 on the autophagosome.

Chapter 2
63
SNAREpin via VAMP8 on the lysosomal side and SNAP29 and syntaxin-17 (Stx17)
on the autophagosome. These SNAREs are translocated from the ER to the
autophagosome after formation of the double membrane structure. Knockdown of
Stx17 causes accumulation of autophagosomes (Itakura et al., 2012).
ATG14 has a role in tethering and fusion as it was demonstrated to stabilize
Stx17 and SNAP29 on autophagosomes (Diao et al., 2015). Likewise, the subfamily
of ATG8s, known as GABARAPs, drive fusion of autophagosomes with lysosomes
by recruiting PLEKHM127, which in turn interacts with the HOPS complex (McEwan
et al., 2015; Nguyen et al., 2016). Recently, Fumiyo Ikeda’s group identified the
inhibitor of apoptosis protein BRUCE28 as an important factor in autolysosome
formation. They found that BRUCE resides on the surface of the lysosome. Upon
fusion with the autophagosome, BRUCE interacts with Stx17 and
GABARAP/GABARAPL1 to facilitate merging (Ebner et al., 2018).
2.4.3iv Other Autophagy Regulators Autophagy can also be regulated transcriptionally. In addition to its regulator
effects on ATGs, mTOR negatively regulates TFEB, a transcription factor for many
autophagy genes. Upon mTOR inhibition, TFEB translocates to the nucleus and
promotes the transcription of its target genes (please see also section 2.2).
Therefore, TFEB enhances autophagy by inducing the expression of essential
components of this metabolic pathway (Settembre et al., 2013). Moreover, TFEB
regulates mTOR activity through the expression of RagD (please see chapter 3).
Increased RagD facilitates mTORC1 lysosomal localization upon nutrient sensing,
hence TFEB action fine tunes mTORC1 signaling (Di Malta et al., 2017). Regulation
of autophagy by the transcription factor FOXO3 has been reported in
cardiomyocytes (Mammucari et al., 2007; Zhao et al., 2007). Furthermore, Kevin
Ryan’s group recently demonstrated that BRD4 and methyl-transferase G9A repress
CLEAR network transcription, independently of TFEB, therefore regulating
autophagy at the transcriptional level (Sakamaki et al., 2017).
Autophagy is further controlled through post-translational modifications of
regulators involved in the modification of pathway components. As previously 27 Pleckstrin homology domain containing protein family member1 28 Baculovirus IAP repeat repeat-containing ubiquitin-conjugating enzyme

Chapter 2
64
described, mTOR and AMPK modulate autophagy through inhibitory or activating
phosphorylation. In addition, BCL-229, AKT, and EGFR are all negative regulators of
Beclin-1 (Dikic and Elazar, 2018; Pattingre et al., 2005). Also, histone acetyl-
transferase p300 acetylates VPS34 to prevent complex formation (Su et al., 2017).
In contrast, the PI3KC3 complex1 binds to AMBRA130 to promote autophagy through
Beclin1 interaction (Fimia et al., 2007). Therefore, the autophagic pathway is tightly
regulated by a variety of factors in response to cellular cues, as such, dysfunction of
these regulators can lead to defects in autophagic clearance.
2.5 Lysosomal Cell Death The idea that lysosomes can drive cell death was proposed in the 1970s
(Firestone et al., 1979). Indeed,
Christian de Duve described
lysosomes as “suicide bags,”
able to rupture cells and tissue
upon their lysis. However, it was
not extensively explored until
recently, potentially due in part to
the fact that lysosomal
ultrastructure is not always
changed during this process
(Brunk and Ericsson, 1972).
Lysosomal dysfunction includes
changes in expression of
hydrolases in addition to
alterations in their size, number,
pH and positioning. Deterioration
of these organelles can likewise
cause blockade of processes like
autophagy, leading to an
29 B- cell Lymphoma 230 activating molecule in Beclin-1 regulated autophagy protein 1
Cell Death
CathepsinRelease
LMP
ROS
Ca2+SphingosineLysomotrophic
drugs
p53
Figure 20: Lysosomal cell death. Different signals can induce lysosomal cell death including lysomotrophic drugs, p53, Ca2+, sphingosine, and ROS. This induces permeabilization of the lysosomal membrane, leading to release of lysosomal cathepsins, and cell death.

Chapter 2
65
accumulation of lysosomal substrates (Aits and Jäättelä, 2013).
Lysosomal membrane permeabilization (LMP) is defined as any perturbation
in the lysosomal membrane, which leads to lysosomal materials to leak out into the
cytosol (Figure 20). This can range from total lysosomal lysis, which lowers the pH of
the cytosol and causes cell death by necrosis, to selective cathepsin release, which
can induce cell death through signaling cascades. Among cathepsins, the major
players in LMP are cathepsins B and D, as well as chromotrypsin B and proteinase 3
(Aits and Jäättelä, 2013; Loison et al., 2014; Zhao et al., 2010). LMP is often
accompanied by lysosomal enlargement, however it is unclear whether it is essential
for the process to occur. Indeed, Repnik and colleagues suggested that enlargement
is not sufficient to trigger membrane dismantlement, while others believe large
lysosomes are more prone to breach (Ono et al., 2003; Repnik et al., 2014).
LMP can be induced by a variety of triggers. Lysomotrophic detergents
damage the membrane, as they are weak bases, which easily cross the lipid bilayer
and can be subsequently trapped to accumulate in the acidic lysosomal lumen.
Some known lysomotrophic agents include amines with hydrophobic side chains,
such as imidazole and morpholine, cisprofloxacin, sphingosine and siramesine (Boya
et al., 2003; Firestone et al., 1979; Kågedal et al., 2001; Ostenfeld et al., 2008). In
addition to lysomotrophic drugs, studies have demonstrated that nanoparticles can
stimulate LMP, and lead to deleterious accumulation of lysosomes with an
autophagic flux defect (Wang et al., 2013, 2018). Moreover, microtubule poisons, like
vincristine and paclitaxel, alter lysosomal stability (Castino et al., 2009; Groth-
Pedersen et al., 2007).
Reactive oxygen species (ROS) can trigger LMP, as ROS often accumulate in
response to certain drugs and ionizing radiation (Kurz et al., 2008a). Oxidative stress
causes hydrogen peroxide to diffuse into the lysosome, where it creates hydroxyl
radicals by reacting with iron (Kurz et al., 2008b). These radicals can destabilize the
lysosomal membrane through lipid peroxidation and damage integral proteins. ROS
can also contribute to LMP by activating lysosomal calcium channels (Sumoza-
Toledo and Penner, 2011). Accordingly, antioxidants and redox regulators can
rescue cells from ROS-induced LMP (Kurz et al., 2008a, 2008b).
Cathepsins mediate the downstream effects of lysosomal cell death, but they
can also initiate LMP. Increased cysteine cathepsin activity drives sensitization to
LMP in cancer cells (Fehrenbacher et al., 2004, 2008; Groth-Pedersen et al., 2007,

Chapter 2
66
2012; Kreuzaler et al., 2011). Minor lysosomal leakage in these cells could induce
LMP through cleavage of cytosolic substrates such as sphingosine kinase 1, which
maintains the stability of lysosomes (Mora et al., 2010; Taha et al., 2005).
Accordingly, cathepsin inhibitors can partially rescue cells from LCD. Moreover, the
calcium activated lysosomal enzymes, calpains, promote LMP by cleaving HSP70
and LAMP2a. HSP70 protects the lysosomal membrane from oxidative stress by
recycling damaged proteins (Arnandis et al., 2012; Sahara and Yamashima, 2010).
Alternatively, the integrity of the lysosomal membrane can be altered by
changes in sphingolipids. Inactivating mutations of acid sphingomyelinase (ASM) are
associated with lysosomal storage disorders, like Niemann-Pick disease. HSP70
supports ASM interaction with its docking lipid BMP31 (Gabandé-Rodríguez et al.,
2014; Kirkegaard et al., 2010). Drugs that target ASM therefore can induce LMP.
These range from antidepressants to antihistamines and are collectively known as
cationic amphiphilic drugs (CAD). These compounds freely diffuse across the
lysosomal membrane and displace ASM from BMP, which leads to the degradation
of ASM and an accrual of sphingomyelin (Gulbins and Kolesnick, 2013; Kirkegaard
et al., 2010; Petersen et al., 2013).
The most studied CAD is siramesine. The group of Marja Jäättelä
demonstrated that this drug is a lysomotrophic detergent, which leads to
autophagosome accumulation (Ostenfeld et al., 2008). Moreover, siramesine
selectively targets cancer cells and can resensitize these cells to chemotherapy
(Groth-Pedersen et al., 2007; Petersen et al., 2013). Likewise, in a study with
leukemic cells, siramesine and desipramine, another CAD, preferentially targeted
cancer cells compared to B-cells (Dielschneider et al., 2016). In keeping with this,
inhibition of HSP70 also disrupts ASM activity and prompts LMP, therefore making it
another attractive target in cancer therapy (Granato et al., 2013; Kirkegaard et al.,
2010; Nylandsted et al., 2002).
Increased sphingosine in the lysosomal membrane causes LMP. Ceramide is
degraded by acid ceramidase to sphingosine, which diffuses out of the lysosome to
convert to sphingosine-1 phosphate (S1P) by sphingosine kinase. S1P promotes cell
survival, while sphingosine and ceramide encourage cell growth arrest (Shida et al.,
2008). Inhibition of sphingosine kinase thus provokes cell death (Mora et al., 2010;
31 bis monoacylglycerophosphate

Chapter 2
67
Noack et al., 2014; Taha et al., 2005). The sphingosine kinase 2 inhibitor opaganib
also shows a potent anti-tumor activity and is being evaluated in clinical trials for liver
cancer and multiple myeloma (Britten et al., 2017; Ding et al., 2016; Lewis et al.,
2016).
Upon LMP, several endo-lysosomal damage response mechanisms are
employed by the cell to escape death. This includes TFEB-induced lysosomal
biogenesis, selective autophagy of lysosomes known as lysophagy, repair by the
ESCRT32 machinery, and lysosomal exocytosis. Cells activate the transcription of
lysosomal genes via TFEB to compensate for dysfunctional lysosomes (Raben and
Puertollano, 2016). Galectins act as lysosomal damage sensors by binding to β-
galactosides on damaged lysosomes and recruiting the autophagic machinery for
clearance (Chauhan et al., 2016; Hung et al., 2013; Papadopoulos and Meyer, 2017;
Thurston et al., 2012). For minor loss of lysosomal membrane integrity, the ESCRT
machinery is recruited to the lysosomal membrane to facilitate its healing (Radulovic
et al., 2018; Skowyra et al., 2018). Finally, in response to anti-cancer agents,
damaged lysosomes may relocate to the plasma membrane and release their cargo
into the extracellular space, though this response mechanism is poorly understood
(Zhitomirsky and Assaraf, 2017).
Lysosomal dysfunction leads to potent cell death. This can be highly
deleterious for patients with lysosomal storage disorders; however, it represents an
intriguing axis for anti-cancer therapy.
2.6 Lysosomes and Cancer
Lysosomal recycling is essential for the growth and survival of cancer cells, as
these cells require constant nutrient supply and clearance of damaged organelles for
their continued propagation. Targeting the lysosome can affect proteostasis and
cellular homeostasis on multiple levels, as they play a role in metabolism, protein
aggregate clearance, reactive oxygen species and cell death. During oncogenesis,
cells exhibit alterations in lysosomal volume and cellular localization (Figure 21).
Cancer cells can feature larger lysosomes making them more fragile and susceptible
to LMP. In addition, the higher metabolic activity causes iron accumulation in the 32 endosomal sorting complex required for transport
Chapter 2
68
lysosome, sensitizing them to ROS production. For instance, salinomycin causes
iron accumulation in the lysosomes of breast cancer stem cells leading to lysosomal
ROS accumulation and cell death (Gyrd-Hansen et al., 2004; Mai et al., 2017; Ono et
al., 2003).
Lysosomal hydrolases are involved in tumor growth, invasion, and even
angiogenesis. Various studies have demonstrated changes to the trafficking and
localization of cathepsins B, D, and L (CTS) (Démoz et al., 1999; Donatien et al.,
1996; Joyce and Hanahan, 2004; Nishimura et al., 1998; Rochefort et al., 2000;
Sloane et al., 1994). There is a positive correlation between CTSD expression and
tumor size, grade and prognosis (Benes et al., 2008; Leto et al., 2004). CTSB
expression is also increased in most cancer types, as well as in tumor-associated
macrophages (TAM) and cancer-associated fibroblasts (CAF). CTSB is implicated in
tumor invasion and can be found on the surface of tumor cells. Accordingly, CTSB
deficiency in pancreatic islet tumors and mammary tumors reduced tumor growth
(Joyce and Hanahan, 2004; Vasiljeva et al., 2006). In line with this, CTSB inhibitor
CA-074 has proven effective at treating preclinical models of breast cancer (Withana
et al., 2012). Conversely, increased CTSB activity in lysosomes can cause cleavage
of LAMP1 and 2, destabilizing the lysosome and promoting cell death. Therefore
CTSB may be a useful biomarker for determining whether or not to use LMP-
inducing drugs as a treatment strategy (Fehrenbacher et al., 2008; Ostenfeld et al.,
2005).
As demonstrated in the previous section, CADs like siramine and desipramine
have potent anti-tumor properties (Dielschneider et al., 2016; Petersen et al., 2013).
Additionally, in non-small cell lung cancer, other CADs including loratadine and
astemizole were successful (Ellegaard et al., 2016). Likewise, terfenadine induced
cell death in prostate cancer cells and astemizole showed efficacy in breast cancer
and leukemia cells (Wang et al., 2014). CADs may also be applicable at resensitizing
resistant cancer cells to therapy (Ellegaard et al., 2016; Hait et al., 1993; Jaffrézou et
al., 1995; Petersen et al., 2013). The usefulness of this class of molecules
emphasizes the promise of targeting lysosomes in cancer.

Chapter 2
69
In glioma, several groups have explored induction of lysosomal cell death as a
tumor cell elimination strategy. Loss of HSP70 expression eradicated orthotopic
xenografts of GBM (Nylandsted et al., 2002). Moreover, Mora et al. showed that in
glioma, there is a difference in sphingolipid metabolism, as compared to astrocytes,
making them more sensitive to lysosomal cell death upon sphingosine kinase
blockade (Mora et al., 2010). Sphingosine kinase inhibitors were additionally shown
to be successful in combination with the standard-of-care chemotherapy agent TMZ
(Noack et al., 2014). More recently, Le Joncour and colleagues used the
lysomotrophic compound clemastine to prompt LMP in in vitro and in vivo models of
GBM. The use of this drug induced cell death in vitro and reduced tumor growth in
vivo emphasizing the potential of targeting the lysosome in GBM (Le Joncour et al.,
2019).
As mentioned earlier, mTORC1 docks at the lysosome in order to perform its
signaling functions. mTOR signaling is up-regulated in approximately 30% of human
LYSOSOME
Exocytosis
Extracellular Cathepsins
Autophagy
LMP Apoptosis
Necrosis
mTORC1
ASM CADs
Chloroquine
Bafilomycin
Rapalogs, Torin1 etc (ch.3)
Figure 21: Potential lysosomal vulnerabilities in cancer therapy. These targets include autophagy (via chloroquine), mTORC signaling (via rapalogs and Torin1), lysosomal acidification (via bafilomycin), and LMP induction (which can occur via CAD drugs targeting acid sphingomylenase).

Chapter 2
70
tumors, including GBM (Fine et al., 2009; Saxton and Sabatini, 2017). Therefore, the
next chapter explores mTOR activation and its implications in cancer in greater
detail.

Chapter 3
71
3. mTOR
3.1 Historical Overview
The mechanistic target of rapamycin, mTOR, gene regulates growth and
metabolism in a cell, and was identified decades after the drug rapamycin for which it
gets its name. Rapamycin was isolated in 1975 from the Streptomyces hygroscopius
and originally proposed as an anti-fungal agent (Baker et al., 1978; Vézina et al.,
1975). Later, this drug was shown to have immunosuppressive and anti-tumor
properties. Indeed, clinical trials using rapamycin after organ transplantation
demonstrated its potent immunosuppressive functions (Douros and Suffness, 1981;
Eng et al., 1984). However, first mechanistic insight into rapamycin’s molecular
action did not occur until the 1990s with the identification of its complex formation
with the immunophilin FKBP1233, a protein known to interact with the
immunosuppressant drug, tacrolimus, and inhibit cell growth and proliferation. These
drugs act competitively to associate with FKBP12 and bind their respective target
proteins (Dumont et al., 1990; Schreiber, 1991).
Target genes, TOR1/2, and DRR1/2, of rapamycin were first uncovered in
yeast based on their ability to confer resistance to the drug upon their mutation
(Cafferkey et al., 1993; Heitman et al., 1991; Kunz et al., 1993). Michael Hall, whose
work idenfied TOR genes, received the Lasker prize for this discovery in 2017. The
mammalian homologue was identified using screens of FKBP12-rapamycin
interactors, and differently named by three groups as rapamycin and FKBP12 target
1 (RAFT1) (Sabatini et al., 1994), FKBP12-rapamycin associated protein (FRAP)
(Brown et al., 1994), or rapamycin target 1 (RAPT1) (Chiu et al., 1994). After
sequence homology with TOR proteins was confirmed, the gene became known as
mTOR (Sabers et al., 1995). In yeast, purification of TOR1 and TOR2 led to the
discovery of two separate complexes with distinct functions: TORC1 which is
rapamycin sensitive, and TORC2 which is not (Loewith et al., 2002). In Eukaryotes,
there is only one mTOR gene, however, this gene product partitions in between
distinct mTORC1 and mTORC2 complexes (Saxton and Sabatini, 2017).
33 FK506-binding protein 12

Chapter 3
72
3.2 Complex Composition
mTOR is a protein kinase of the PI3K-related kinase family. It contains several
protein-protein interacting domains in the N-terminus including 20 HEAT (Huntington,
elongation factor 3, protein phosphatase 2A, and TOR1) repeats and a FAT (FRAP,
ATM, and TRRAP) domain. Each HEAT repeat forms two alpha helices of
approximately 40 amino acids. The C-terminus domain comprises the protein kinase
domain, with sequence homology to that of PI3K, and a FAT domain at the C-
terminus (FATC), which is essential for kinase function (Hay and Sonenberg, 2004;
Takahashi et al., 2000). Pivotal findings by David Sabatini’s team and Kazuyoshi
Yonezawa’s group discovered the members of the mTORC1 complex. The mTORC1
consists of three main components: mTOR, RAPTOR (regulatory protein associated
with mTOR), and mLST8 (mammalian lethal with Sec13 protein 8) (Hara et al., 2002;
Kim et al., 2002, 2003). RAPTOR was simultaneously detected by both groups using
crosslinking autoradiography or high salt immunoprecipitation followed by mass
spectrometry analysis (Hara et al., 2002; Kim et al., 2002). RAPTOR is responsible
for the recruitment of mTOR substrates. It does so by binding a TOR signaling motif,
TOS, on mTOR substrates (Nojima et al., 2003; Schalm et al., 2003). RAPTOR also
HEAT HEAT FATC Kinase Domain FRB FAT
mTOR
RAPTOR mLST8
DEPTOR PRAS40
FKBP12-rapa
mTORC1
Figure 22: Composition of mTORC1 composed of mTOR, Raptor, and mLST8. Inhibitors include : FKBP12-rapamyycin complex, PRAS40, and DEPTOR HEAT= Huntington, elongation factor 3, protein phosphatase 2A, and TOR1, FAT= FRAP, ATM, and TRRAP.

Chapter 3
73
participates in the subcellular localization of the mTORC1 complex. By deploying
mass spectrometry in HEK293T cells, Sabatini’s group then identified mLST8 using
the mTOR/RAPTOR immunocomplex as a bait (Kim et al., 2003). mLST8 binds at
the kinase activation loop and is believed to play a role in its stabilization. However
its presence is not essential for a functional mTORC1 complex (Guertin et al., 2006;
Yang et al., 2013). In addition to the core components, the mTORC1 complex has
two negative regulators PRAS40 (proline-rich AKT substrate of 40 kDa) (Sancak et
al., 2007; Vander Haar et al., 2007; Wang et al., 2007) and DEPTOR (DEP domain
containing mTOR interacting protein) (Peterson et al., 2009). Cryo-electron
microscopy reveals that RAPTOR binds at the heat repeats. Crystal structure of
mTOR bound to mLST8 has also uncovered that FKBP12-rapamycin associates with
the FRB domain of mTOR to block substrates from the active site (Saxton and
Sabatini, 2017) (Figure 22).
mTORC2 similarly contains mTOR and mLST8, but the third component,
RICTOR (rapamycin insensitive companion of mTOR) replaces RAPTOR with
analogous functions. Inhibitory subunits of mTORC2 include DEPTOR, mSin1 and
PROTOR1/2 (Frias et al., 2006; Jacinto et al., 2006; Pearce et al., 2007; Yang et al.,
2006) (Figure 23). While FKBP12-rapamycin does not directly bind this complex,
mTORC2 signaling is diminished by extended rapamycin treatment, likely due to a
lack of free mTOR to incorporate into complexes (Sarbassov et al., 2006).
HEAT HEAT FATC Kinase Domain FRB FAT
mTOR
RICTOR mLST8
DEPTOR Protor1/2
mTORC2
mSin1
Figure 23: Composition of mTORC2 composed of mTOR, RICTOR, and mLST8. Inhibitors include : mSin1, Proctor1/2, and DEPTOR HEAT= Huntington, elongation factor 3, protein phosphatase 2A, and TOR1, FAT= FRAP, ATM, and TRRAP.

Chapter 3
74
3.3 Upstream Activation
3.3.1 Growth Factors
Various growth factors and mitogens activate the mTORC1 complex (Figure
24). Interestingly, these diverse pathways converge by inhibiting the negative
regulator of mTORC1 tuberous sclerosis complex, TSC. This complex includes
TSC1, TSC2, and TBC1D7 to form a hetero-trimer. It acts as a GAP34 for the small
GTPase Rheb35, which directly associates with mTORC1, and is necessary for
mTORC1 activation (Garami et al., 2003; Inoki et al., 2003a; Tee et al., 2003). Upon
AKT activation, the TSC is disabled, and Rheb, anchored to the lysosomal
membrane, becomes loaded with GTP and able to recruit mTORC1 to the lysosomal
surface (Long et al., 2005; Sancak et al., 2007, 2008).
The implicated growth factor pathways include the insulin growth factor
34GAPs inactivate GTPases by stimulating GTP hydrolysis35 Ras homolog enriched in brain
Figure 24: Schematic of growth factor (GF) receptor tyrosine kinase (RTK) signaling. Upon growth factor sensing, PI3K action is incited by RTKs. In turn it stimulates AKT, which will trigger both the mTORC1 and 2 complexes. mTORC2 then further phosphorylates AKT to fully activate it.
MTORC1 MTORC2
AKT
IRS1
p85
P110
RTK
GF
PTEN PI3K

Chapter 3
75
receptor 1 (IGF-1R), which triggers PI3K, eventually resulting in AKT restricting
TSC2 (Figure 24)(Inoki et al., 2002; Manning et al., 2002). Once inhibited, the TSC
dissociates from the lysosome membrane, liberating Rheb (Menon et al., 2014).
Likewise, Ras signaling, downstream of receptor tyrosine kinases, can redundantly
initiate mTORC1 via ERK (Ma et al., 2005b; Roux et al., 2004). Other pathways able
to trigger downstream mTOR include, but are not limited to: EGF, VEGF, BDNF36,
Wnt pathway, and TNFα. Both Wnt and TNFα pathways inhibit TSC1 to stimulate
mTORC1 (Inoki et al., 2006; Lee et al., 2007; Saxton and Sabatini, 2017; Takei et
al., 2004). Thus, growth factors and mitogens act as the inciting signal of the
mTORC1 cascade.
3.3.2 Environmental Stress
Environmental stress is incompatible with growth functions of mTOR;
therefore, there are a variety of mechanisms to shut down signaling under these
conditions. Upon cellular starvation, when glucose becomes scarce, the stress response
regulator AMP-activated protein kinase (AMPK) can oppose mTOR signaling at two
levels. Not only does its kinase function activate TSC2, but it also inhibitorily
phosphorylates RAPTOR (Gwinn et al., 2008; Inoki et al., 2003b; Shaw et al., 2004).
Markedly, cells that lack AMPK can still inactivate mTORC1 through a Rag GTPase
dependent mechanism, signifying that the glucose sensing function of mTOR has not
fully been elucidated (Kalender et al., 2010).
Hypoxia, as discussed in chapter 1, refers to a state of low oxygen availability.
Like under glucose deprivation, the stress of hypoxia drives AMPK, which inactivates
mTOR. In addition, regulated in DNA damage and development 1 (REDD1), a
protein induced in response to stresses like hypoxia and DNA damage, can also
hinder mTORC1 via activation of the TSC (Brugarolas et al., 2004). In addition, in
response to DNA damage stimuli, mTORC1 activity may be blocked via several p53
target genes, including the regulatory subunit of AMPK (AMPKβ), PTEN, and TSC2
(Feng et al., 2007). Moreover, it has been reported that mTORC1 is sequestered in
stress granules, cytosolic aggregates of proteins and RNA, through interaction with
36brain-derived neurotrophic factor

Chapter 3
76
DYRK337 under unfavorable cellular conditions (Wippich et al., 2013). Thedieck et al.
then illustrated that the protein Astrin interacts specifically with RAPTOR under
oxidative stress to recruit mTORC1 to the stress granules (Thedieck et al., 2013).
Together, these findings highlight the impact of cellular stress on mTORC1.
3.3.3 Amino Acid Sensing
mTORC1 activation on a global level can occur in response to feeding. Not
only due to increased glucose availability, but also due to digestion of dietary
proteins, which liberate amino acids for protein synthesis and metabolism.
Simultaneous discoveries in Drosophila by the Guan laboratory (Kim et al., 2008)
and mammalian cells by Sabatini’s group (Sancak et al., 2008) placed Rag GTPases
as members of the mTORC1 cascade. Four Rags (A, B, C, D) form heterodimers of
Rag A or B with Rag C or D, and cluster at the membrane of the lysosome via
binding to the Ragulator complex. This Ragulator complex, again discovered by
Sabatini’s laboratory, is composed of LAMTOR proteins 1-5 (also known as MP1,
p14, p18, HPXIP, and C7ORF59), and acts as a guanine exchange factor (GEF) for
the Rag GTPases (Bar-Peled et al., 2012; Sancak et al., 2010). The Ragulator binds
Rag A or B more strongly in the absence of amino acids, preventing GDP-GTP
exchange. Amino acid signaling serves to weaken this interaction and thus,
increases GTP-Rag A/B loading.
At the same time, the Sabatini group also implicated the lysosomal v-ATPase
in mTORC1-amino acid pathway. The v-ATPase senses amino acid accumulation in
the lysosomal lumen and transmits this to the Ragulator via an “inside-out” signaling
method. Accordingly, blockade of the v-ATPase induces the Ragulator to bind
RagA/B more strongly, regardless of available amino acids (Bar-Peled et al., 2012;
Zoncu et al., 2011). Therefore, the v-ATPase communicates the amino acid stimulus
to the Ragulator. This promotes GTP loading on Rag A or B, which links directly to
RAPTOR and docks mTORC1 at the lysosomal surface, where it also associates
with Rheb (Figure 24). The localization of Rheb at the lysosomal membrane
converges amino acid sensing with growth factor stimulus, as mTORC1 is only “on”
when both Rags and Rheb are active.
37dual specificity tyrosine- phosphorylation-regulated kinase 3

Chapter 3
77
How exactly does mTORC1 detect amino acids? This occurs through two
methods, via intra-lysosomal detection, and upstream due to cytosolic complexes.
1- In terms of lysosomal sensing, following the discovery of v-ATPase’s role,
the amino acid transporter, SLC38A9 was shown to interact with the v-ATPase-
Ragulator complex (Jung et al., 2015; Rebsamen et al., 2015; Wang et al., 2015).
Wang et al. illustrated that SLC38A9 is required for arginine-specific mTORC1
signaling, as knock-out of SLC38A9 blunted arginine but not leucine dependent
activation of the complex (Wang et al., 2015). More recently, a role of SLC38A9 in
the outpouring of amino acids from the lysosome to facilitate mTORC1 activation
was described (detailed below) (Wyant et al., 2017). Consequently, Kevin Ryan’s
Figure 25: mTORC1 lysosomal docking and amino acid sensing. mTORC1 docks at the lysosome via association with Rags (here shown RagA and RagC), which bind the regulator. For this to occur, Rheb must be in an active (GTP) bound state. GATOR 1/2 complexes sense amino acid levels to fine tune this action.
Ragulator
SLC38A9
RagA RagC
GTP GDP mTORC1
GTP Rheb
KICSTOR v-ATPase
Sestrin2 CASTOR1
GATOR2
GATOR1
Leucine Arginine
Lysosome
SAMTOR

Chapter 3
78
group uncovered that DRAM-138, a protein previously implicated in autophagy,
recruits other amino acid transporters SLC1A5 and SLC7A5 to the lysosomal
membrane to invoke a similar amino acid efflux (Beaumatin et al., 2019). In terms of
amino acid influx at the lysosome, SLC7A5 is recruited to the lysosome by
LAPTM4b39. The influx of amino acids via SLC7A5 stimulates mTORC1 through the
poorly defined v-ATPase-dependent mechanism (Milkereit et al., 2015). It is
important to note that most research regarding amino acid sensing has been done in
vitro with the withdrawal and refeeding of a mixture of amino acids. Hence, the full
list of strategies by which mTORC1 recognizes intra-lysosomal amino acids remains
to be elucidated.
2- Cytosolic amino acid recognition occurs via the GATOR1 (DEPDC5, Nprl2,
and Nprl3) and GATOR2 (Mios, WDR24, WDR59, Seh1L and Sec13) complexes.
GATOR1 acts a GAP for Rag A or B, to inhibit the mTORC1 cascade (Bar-Peled et
al., 2013). GATOR1 is recruited to the lysosome by another complex, KICSTOR
(Kaptin, ITFG2, C12orf66, and SZT2), upstream of Rags in the activation process.
KICSTOR functions as a scaffold to modulate the amino acid sensing response
(Peng et al., 2017; Wolfson et al., 2017). Conversely, GATOR2 positively regulates
mTORC1 by interacting with GATOR1 at the lysosomal membrane, checking its
GAP action through an unknown mechanism (Bar-Peled et al., 2013). Sestrin2, a
leucine sensor, associates with GATOR2 in the absence of amino acids. It disperses
upon leucine binding, freeing GATOR2 to act (Chantranupong et al., 2014;
Parmigiani et al., 2014; Wolfson et al., 2016). Intriguingly, Sestrin2 transcription is
up-regulated upon prolonged amino acid starvation (Ye et al., 2015), indicating that it
functions in both the acute and prolonged perception of amino acids. Similarly,
arginine sensor CASTOR140, abolishes GATOR2 activity when amino acids are
scarce, and dissociates upon arginine detection (Chantranupong et al., 2016; Saxton
et al., 2016). Recently, another negative regulator of mTORC1, SAMTOR41 (or
C7orf60), was uncovered. Unlike CASTOR1 and Sestrin2, which regulate GATOR2,
SAMTOR interacts with GATOR1 and KICSTOR in the absence of methionine.
Upon, s-adenosylmethionine binding, SAMTOR dissociates. The exact mechanism
38 DNA damage regulated autophagy modulator 1 39 Lysosomal protein transmembrane 4 beta 40cellular arginine sensor for mTORC141S-adenosylmethionine sensor upstream of mTORC1

Chapter 3
79
by which SAMTOR enhances GATOR1 function remains to be uncovered (Gu et al.,
2017). These mechanisms of amino acid sensing are summarized in Figure 25.
Several other means of activating mTORC1 via amino acids have been
reported. The Folliculin-FNIP2 complex acts as a GAP for Rag C or D in response to
amino acids, thus driving mTORC1 (Petit et al., 2013; Tsun et al., 2013). Glutamine
can also stimulate mTORC1 independent of Rags through Arf GTPases (Jewell et
al., 2015). Therefore, the full extent of mTORC1 sensing amino acids remains to be
seen.
3.3.4 mTORC2 Activation
mTORC2 is largely initiated by insulin-PI3K signaling (Figure 24). mSin1
contains a domain which obstructs the mTOR catalytic function in the absence of
insulin. Upon insulin stimulation, PI3K downstream signaling alleviates inhibition of
mSin1, to allow activation of the complex. AKT can also phosphorylate mSin1,
implying a positive feedback mechanism where AKT fosters the mTORC2 cascade,
which in turn phosphorylates and fully activates AKT (Liu et al., 2015b; Yang et al.,
2015). Unlike mTORC1, which docks at the lysosome, mTORC2 localizes in distinct
cellular compartments. These include the plasma membrane, the mitochondria, and
a portion of endosomal vesicles (Ebner et al., 2017). Further, mTORC2 undergoes a
negative feedback loop with mTORC1. Insulin activates mTORC1/2; mTORC1 then
phosphorylates GRB10, a negative regulator of IGF-1 signaling (Hsu et al., 2011; Yu
et al., 2011). mTORC1 and S6K can also directly inhibitorily phosphorylate the IRS
proteins at multiple sites. This prevents downstream, PI3K/AKT signaling and
therefore inhibits mTORC2 activation (Harrington et al., 2004; Tanti and Jager, 2009;
Tremblay and Marette, 2001).
3.4 Downstream Signaling mTOR signaling regulates a variety of downstream actions, including protein
synthesis and turnover, metabolism, proliferation, and cell survival, detailed as
followed.

Chapter 3
80
3.4.1 Protein Synthesis Once activated, mTORC1 stimulates protein synthesis through the
phosphorylation of two downstream effectors, p70S6 kinase 1 (S6K1) and 4EBP, the
eIF4E binding protein.
mTOR phosphorylates S6K1 at threonine 389. This activates the kinase and
allows it to in turn stimulate PDK1. It also drives substrates that promote mRNA
translation such as eIF4B, which is a regulator of the 5’cap binding eIF4F complex
(Holz et al., 2005). Furthermore, S6K1 phosphorylates PDCD442, an inhibitor of
eIF4B, to promote its degradation (Dorrello et al., 2006).
4EBP acts independently of S6K1. It is an inhibitor of translation, which
segregates eIF4E from assembling the eIF4F translation complex. When active,
mTORC1 phosphorylates to disable 4EBP1 on multiple sites, causing it to dissociate
from eIF4E, and initiating 5’ cap–dependent mRNA translation (Brunn et al., 1997;
Gingras et al., 1998). mTOR inhibition quashes general mRNA translation. However,
work by Thoreen and colleagues showed it more severely suppresses mRNAs
containing 5’ TOP43 motifs (Thoreen et al., 2012). Recent studies have also
implicated the protein LARP144 in this process. LARP1 binds directly to the 5’ cap of
TOP mRNAs and represses their transcription, preventing the recruitment of eIF4F,
in an mTOR-dependent manner (Fonseca et al., 2015; Lahr et al., 2017; Philippe et
al., 2018). Thus, mTOR inhibition represses translation from multiple axes (figure
26).
3.4.2 Lipid and Glucose Metabolism In order for cells to grow, they require enough lipids to form and expand their
membranes. The mTORC1 complex affects de novo lipid synthesis via SREBPs
(sterol responsive element binding protein). SREBPs are transcription factors, which
regulate the expression of genes involved in the biogenesis of fatty acids and
cholesterol (Porstmann et al., 2008). mTORC1 affects SREBP through S6K1-
42Programmed cell death protein 4 43 terminal oligopyrimidine 44 La-related protein 1

Chapter 3
81
dependent activation and through inactivation of Lipin1, an SREBP inhibitor (Düvel et
al., 2010; Peterson et al., 2011). Likewise, mTORC1 has been implicated in nucleic
acid synthesis. S6K1 triggers carbamoyl-phosphate synthetase phosphorylation.
carbamoyl-phosphate synthetase is an important component of de novo pyrimidine
synthesis (Ben-Sahra et al., 2013).
Further, mTORC1 plays an essential role in glucose metabolism, by enabling
a switch from oxidative phosphorylation to glycolysis. It does so by increasing the
expression of HIF1-α, which in turn promotes the expression of glycolytic enzymes
including phospho-fructo kinase, PFK. SREBP similarly augments the activity of the
oxidative pentose phosphate pathway, to generate NADPH and other metabolites
(Düvel et al., 2010).
3.4.3 Protein Turnover
Moreover, mTORC1 can control cell growth by suppressing the catabolism of
proteins, particularly via the suppression of autophagy. The ULK1 kinase is
activated, early in the initiation of autophagy, to drive autophagosome formation
(detailed in chapter 2). Under nutrient rich conditions, mTORC1 facilitates inhibitory
Figure 26: Summary of mTORC1 downstream signaling. (Left) mTORC1 effects translation by two independent methods, activating phosphorylation of S6K and by inhibitory phosphorylation of 4EBP1. (Center) mTORC1 alters metabolism via stimulation of S6K and HIF1α and blockade of Lipin1. (Right) mTORC1 can hinder protein turnover by affecting autophagy (via ATG14/UVRAG and ULK1 inhibition), lysosomal biogenesis (TFEB blockade), or through the less well-understood effect on proteasome assembly (ERK5 inhibition).
mTORC1 mTORC1 mTORC1
mRNA Translation Metabolism
Protein Turnover
S6K
eIF4B
PDCD4 4EBP
eIF4E
5’ cap- dependent translation
S6K
CAD
Nucleotide synthesis
SREBP
HIF1α
Glucose synthesis
Lipid synthesis
Lipin1 ERK5
Proteosome assembly
TFEB ULK1 UVRAG/ ATG14L
Autophagy Lysosome Biogenesis

Chapter 3
82
phosphorylation at serine 757, which prevents ULK1 stimulation by AMPK, a crucial
autophagy initiator (Kim et al., 2011). mTOR also negatively phosphorylates other
proteins involved in autophagosome formation, including ATG14L (Yuan et al., 2013)
and serine 498 of UVRAG (Kim et al., 2015). mTORC1 can further regulate
autophagy by inhibiting the nuclear translocation of TFEB (detailed in chapter 2) and
therefore preventing the transcription of autophagy and lysosomal genes (Martina et
al., 2012; Settembre et al., 2012).
In addition to autophagy, the ubiquitin proteasome system is another major
pathway involved in protein turnover. In this system, proteins are tagged with
ubiquitin, which targets them to the 20S proteasome for degradation. Recently,
mTORC1 activity has been linked to this process. Two studies illustrated that mTOR
blockade led to elevated proteolysis by the proteasome through amplified protein
ubiquitination. Inhibition of ERK5 in these conditions lead to increased quantity of
proteasomal chaperones (Rousseau and Bertolotti, 2016; Zhao et al., 2015).
However, how exactly mTORC1 regulates this activity is still an open conundrum.
mTORC1 downstream functions are summarized in Figure 26.
3.4.5 mTORC2 Downstream Signaling The major function of the mTORC2 complex is to control cell survival and
proliferation. It does this by phosphorylating various members of the AGC family of
protein kinases, namely different protein kinase Cs (PKCs). The earliest identified
substrate of mTORC2 is PKCα, a protein known to regulate the actin cytoskeleton
(Jacinto et al., 2004; Sarbassov et al., 2004). mTORC2 also phosphorylates PKCδ,
PKCζ, PKCγ, and PKCε, which too are involved in cytoskeleton remodeling and
cellular migration (Gan et al., 2012; Li and Gao, 2014; Thomanetz et al., 2013).
Most notably, mTORC2 activates AKT (Sarbassov et al., 2005), the
downstream effector of PI3K, to promote proliferation, growth, and survival. This is
achieved through inhibition of: the mTORC1 inhibitor TSC2, the metabolic regulator
GSK3β, and the FoxO1 and FoxO3a transcription factors. Intriguingly, mTORC2 was
required for the phosphorylation of FoxO1/3a in vivo, but, was dispensable for TSC2
phosphorylation (Guertin et al., 2006; Jacinto et al., 2006). Furthermore, mTORC2
regulates survival through the phosphorylation of another AGC family member,

Chapter 3
83
serine/threonine-protein kinase 1, SGK1, a kinase also involved in ion transport
(García-Martínez and Alessi, 2008).
3.5 mTOR and Brain Function mTOR plays a role in various neurological processes. Mice with inactivating
mutations in mTOR lack the telencephalon, the anterior region of the forebrain,
highlighting a crucial role in neural development (Hentges et al., 2001). Also, early
embryonic activation of mTOR produced microcephaly, and over-activation in post-
mitotic neurons created problems in cortical lamination and neurodegeneration
(Kassai et al., 2014). Notably, loss of TSC components vastly altered neuronal
architecture. TSC deficiency in neurons leads to multiple axon formation. In addition,
mice lacking TSC1 in either neurons or astrocytes developed large neurons and
dysplastic glial cells (Choi et al., 2008; Meikle et al., 2007; Tavazoie et al., 2005).
These studies underline the importance of balanced mTOR signaling in the
developing brain.
Tuberous sclerosis complex (TSC) is a rare multisystem genetic disorder due
to loss of TSC1 or TSC2, which affects multiple organs including brain, skin, eyes,
kidney, heart, and lungs. mTORC1 hyper-activation in TSC leads to epileptic
seizures in 90% of patients (Lipton and Sahin, 2014). Mice with loss of neural TSC1
or TSC2 had severe epileptic episodes, which rapamycin could alleviate (Zeng et al.,
2008). Further, GATOR1 and KICSTOR mutations have been linked to epilepsy in
patients (Basel-Vanagaite et al., 2013; Ricos et al., 2016). In neurodegenerative
diseases, such as Alzheimer’s disease and Huntington’s disease, where autophagy
dysfunction has been implicated, there is a corresponding increase in mTOR
activation (Li et al., 2005; Ravikumar et al., 2004). As such mTOR inhibitors are
among the autophagy stimulatory drugs currently under evaluation to treat these
disorders (Nixon, 2013). Hence, over-activation of mTOR can lead to pathological
conditions in the brain.
3.6 mTOR and Cancer
As the mTOR pathway regulates cell size, metabolism, proliferation, and
survival, it is unsurprising that many cancer cells pirate this signaling cascade.

Chapter 3
84
Several of the upstream activators involved in mTOR activation are commonly
mutated in cancer. This results in the hyper-activation of the cascade across
approximately 30% of human tumors. There are three major routes to alter mTOR in
cancer: through upstream regulators, through its binding partners, or through mTOR
itself (Saxton and Sabatini, 2017).
1- Upstream. The most common method that cancer cells alter mTOR
signaling is through upstream oncogenes and tumor suppressors. The PI3K pathway
converges on mTORC1 and mTORC2, and can be mutated in a variety of ways,
including amplification of AKT, PIK3CA, EGFR or IGFR (insulin growth factor
receptor). As Ras acts in parallel to PI3K, amplification upstream of either signal can
result in aberrant activation of both mTORCs (Tian et al., 2019). Moreover, silencing
mutations in tumor suppressors PTEN, p53, TSC1/2, and serine threonine kinase 11
(STK11) contribute to undisciplined mTOR activation in cancer. One example of this
is that PTEN-loss induces prostate tumor formation via mTORC2 complex signaling
(Guertin et al., 2009).
2- Binding Partners. Genetic abnormality of mTORC components can also
trigger the pathway. The mTORC2 component, RICTOR, is genetically amplified in
breast cancer, non-small cell lung cancer, and glioma (Tian et al., 2019). In glioma,
the overexpression of RICTOR was associated with hyper-activation of AKT and
tumor aggressiveness (Masri et al., 2007). Another mTORC complex component
susceptible to mutation is Rheb. One study showed that mutations in Rheb (Y35N or
E139K) increased phosphorylation of the S6 Kinase 1 compared to wild-type Rheb
(Grabiner et al., 2014). Indeed, in a large scale genomic analysis study, Rheb Y35N
was identified as a novel cancer-associated mutation (Lawrence et al., 2014). Thus,
defects in mTOR binding partners can also be utilized by cancer cells to stimulate
the pathway.
3- mTOR itself. There are 33 known mutations in the mTOR protein that can
lead to aberrant mTOR signaling in various cancers (Grabiner et al., 2014). This was
discovered through public database analysis by David Sabatini’s laboratory. They
found that these mutations cluster in 6 different regions of the mTOR gene, the most
highly recurrent mutations included the following encoding amino acid substitutions
C1483, E1799, T1977, S2215, L2427, and R2505. Cancers with the largest changes
in mTOR were found to be colorectal, endometrial and lung. However, this might be
a bias as these cancers have the highest general mutation rates and are the most

Chapter 3
85
represented in public databases. Mutated mTOR associates less with DEPTOR, the
mTOR inhibitor, which may partially explain how it is overactivated. Interestingly,
mTOR alteration had no effect on pathway sensitivity to rapamycin (Grabiner et al.,
2014). In fact multiple studies demonstrate increased rapamycin sensitivity upon
PTEN deletion (Meric-Bernstam et al., 2012; Neshat et al., 2001).
Most GBM have atypical stimulation of mTOR signaling, with 90% showing
hyper-activation of PI3K signaling. This is due to common PTEN deletion and EGFR
amplification or mutation (constitutively active EGFRvIII) (Cancer Genome Atlas
Research Network, 2008; Fine et al., 2009). Confirming genetic analyses, a study by
Chakravarti and colleagues tested 92 glioma samples and found increased
phosphorylation of PI3K, AKT and S6K proteins in GBM as compared to non-GBM
tumors. They further correlated activation of the pathway with radio-resistance in
GBM patients (Chakravarti et al., 2004). Along these lines, work by Tanaka et al.
showed that EGFRvIII promotes mTORC2 activation in GBM and this activation
conferred resistance to chemotherapy (Tanaka et al., 2011). The direct involvement
of mTORC2 in GBM biology was elucidated through a Drosophila model of GBM,
which overexpresses EGFR, RAS, and PI3K. In this model, knockdown of RICTOR
or mSIN1, components of the mTORC2 complex, prevented tumor growth (Read et
al., 2009). Further, mice overexpressing RICTOR in astroglial cells develop
oligodendroglial tumors in the SVZ (Bashir et al., 2012). Moreover, subunits of the
GATOR complex are mutated at a low frequency in GBM (Bar-Peled et al., 2013),
which may also contribute to aberrant mTOR activation in these tumors.
In spite of a potential role for mTOR in GBM biology, first generation inhibitors
(rapalogs) failed in clinical trials. It is believed that one major reason they were
unsuccessful is their inability to block mTORC2 (Mecca et al., 2018a). Several
studies confirmed the efficacy of ATP-competitive mTOR kinase inhibitors at
targeting GBM in preclinical models (Gini et al., 2013; Lin et al., 2017; Mecca et al.,
2018b). Unlike rapalogs, these compounds inhibit mTOR’s catalytic activity and can
therefore suppress both complexes. Consequently, a phase I clinical trial of one such
inhibitor, AZD8055 (NCT01316809) in recurrent GBM is ongoing.
mTOR activation thus represents an interesting axis to explore in the context
of GSC biology. As demonstrated in the above chapters, the identification of novel
targets within GSCs may improve treatment response in GBM. My thesis aims to

Chapter 3
86
evaluate both internal and external signaling cues in GSCs, as detailed in the
following section.

Project Goals
87
Project Goals
GBM is the most commonly occurring adult primary brain tumor with a 5 year
survival rate of only 5% (Ostrom et al., 2014; Yan et al., 2013). Standard of care
therapy comprises a surgical resection of the tumor, when possible, followed by
chemotherapy (TMZ) and radiation, known as the Stupp protocol (Stupp et al., 2005,
2009, 2015). While these therapies may provide patients with some benefit, it is
essentially for pain and symptoms relief, as tumors habitually recur and fatal.
Growing evidence points to this relapse being due to a subpopulation of tumor cells,
GSCs, with the stem properties of self-renewal and multipotency, and transformed
features such as tumor initiating capabilities and resistance to therapies (Lathia et al,
2015). Therefore, new targets within the GSCs must be identified to eliminate these
cells and improve patient outcome.
The interaction between GSCs and their environment is essential for their
survival. GSCs are present in both perivascular and hypoxic tumor regions. In the
perivascular region, these cells receive positive signals from endothelial cells and
pericytes, which allow them to retain their undifferentiated state. By contrast, under
unfavorable conditions, they resist deleterious effects of hypoxia and nutrient
deprivation by down-regulating endo-lysosomes to decrease recycling and enhance
receptor signaling (Man et al, 2017; Shingu et al, 2016). Hence, to target GSCs one
must consider their diverse microenvironments.
The primary goal of this PhD project was to identify novel therapeutic targets
within the signaling pathways involved in sustaining GSCs. This was achieved by
studying two separate axes of signaling.
1. Paracrine Signaling between GSCs and Endothelial Cells
Previous work by our lab exemplified that the endothelial secretome was able to
maintain stemness properties in patient-derived GSCs in vitro. I further evaluated the
importance of the transmembrane glycoprotein 130 (gp130) in GSCs, known to be

Project Goals
88
essential in signal transduction following cytokine stimulation, here assessed in
response to endothelial cues.
2. Non-oncogenic Addiction via Intrinsic Signaling
The NF-κB transcription factor marshalls cell proliferation and viability, as well as
the paracrine action of cytokines. As this pathway is implicated in many cancers, we
evaluated the TCGA for mediators of NF-κB signaling and identified that the
paracaspase MALT1 was highly correlated with patient probability of survival. We
thus explored the role of MALT1 activity in GSC maintenance.

Project Goals
89
Results

90

91
First Article
First Publication Context
92
Neutralizing gp130 interferes with Endothelial-mediated Effects on Glioblastoma Stem-like Cells
The tumorigenic nature of GSCs is dependent on their interaction with the
tumor microenvironment. Within GBM there exist both vascularized and hypoxic
zones fostering tumor heterogeneity. As such, GSCs can confront a variety of
different extracellular signaling cues, which affect their maintenance. Numerous
studies report a privileged interaction between a portion of GSCs and endothelial
cells within the tumor (Calabrese et al., 2007; Galan-Moya et al., 2011; Harford-
Wright et al., 2017). This close contact favors reciprocal communication between the
tumor vasculature and GSCs. Previous work by our lab demonstrated that
endothelial secreted factors were able to sustain GSC self-renewal in the absence of
other exogenous mitogens (Galan-Moya et al., 2011, 2014). Therefore, elucidating
the composition of the endothelial secretome could produce novel therapeutic targets
to interrupt paracrine signaling.
In order to achieve this goal, our group employed mass spectrometry analysis
of the brain endothelial cell secretome to identify factors that may be important in
GSC signaling. The vasoactive peptide apelin was identified. Exogenous apelin was
able to maintain GSC stemness properties in vitro and recapitulated endothelial
secretome action. Moreover, pharmacological blockade with the MM54 inhibitor of
the apelin receptor, APLNR, obliterated self-renewal of GSCs in vitro and tumor
growth in ectopic and orthotopic xenograft models of GBM. Likewise, MM54 had a
synergistic effect with TMZ at suboptimal doses in vitro. Hence, targeting factors of
the endothelial secretome is a potentially attractive strategy for the treatment of GBM
(Annex 2) (Harford-Wright et al., 2017).
With this in mind, we revisited other receptors on GSCs that might be involved
in endothelial communication. Among the pathway reported to operate in non-
oncogene addiction, the IL6-mediated activation of the JAK/STAT pathway is of
importance in GSCs (Shi et al., 2017, 2018). IL6 family cytokines trigger a JAK
phosphorylation cascade ultimately activating the transcription factor STAT3, which
regulates pathways involved in survival, stemness and angiogenesis (Kim et al.,
2014). Moreover, IL6 is a cytokine abundantly present in the tumor microenvironment
of GSCs (Hossain et al., 2015). The glycoprotein gp130 acts as a co-receptor in

First Publication Context
93
several signal transduction pathways including IL6, and has the potential for
pharmacological inhibition. A recent report suggests a potent effect of gp130
knockdown on GSC viability. In contrast to these findings, our data demonstrate that
the use of a blocking antibody against gp130 has no impact on cell viability, but
rather it abrogates the protective effect of endothelial-secreted factors on GSC
expansion. This suggests a more complex role for gp130 in GSCs requiring further
investigation.
• Endothelial secreted factors maintain GSCs in vitro.
• Pharmacological blockade of gp130 abolishes this effect.
• gp130 inhibition has no effect on overall viability.
Self- Renewal
ECs GSCs
Secreted Factors
Anti-gp130
Figure 27: overview of gp130 action. Blocking gp130 reduces EC induced self-renewal in GSCs.

First Publication
94
Correspondence
Neutralizing gp130 interferes with endothelial-mediatedeffects on glioblastoma stem-like cells
Cell Death and Differentiation (2017) 24, 384; doi:10.1038/cdd.2016.163; published online 6 January 2017
Dear Editor,
Glioblastoma (GBM) is the most common and lethal primarybrain tumor in adults. The aggressiveness of the diseasepartly relies on a subpopulation of tumor cells, termed asglioblastoma stem-like cells (GSCs) with a phenotype similarto that of normal neural stem cells such as multipotency andthe ability to self-renewal.1,2 GSCs have been implicated intumor initiation and growth, resistance to therapies, andrecurrence.1–3 Additionally, it has been reported that GSCsreside in vascular niches in close contact with brainendothelial cells. These niches may regulate GSC self-renewal, determine cell fate, and protect these cells fromchemo- and radiation therapies.3,4 Accordingly, the localiza-tion of GSCs in close proximity to endothelial cells facilitatesreciprocal communication, allowing notably the vascular nicheto provide paracrine factors essential to maintain GSCs.4,5
We read with interest the article by Shi et al6 published inCellDeath and Differentiation online on 14 October 2016. In thisarticle, the authors implicate the glycoprotein gp130 and thetetraspanin CD9 as vital to maintaining the stem-like character-istics of GSCs.6 Employing RNA interference techniques, theyobserved a reduction in the stem-like properties of GSCs in theabsence of gp130 when cultured in complete media.6 Ourlaboratory has also explored the role of gp130 in GSCs, usingneutralizing antibodies (B-K5 clone) to pharmacologically alterits functions. To better reflect the in vivo endothelial microenvir-onment, our study was performed in human brain endothelialcell-conditioned serum-free mitogen-free media (EC-CM).5 Wetoo observed a drastic reduction in the stem-like properties inGSCs treatedwith the anti-gp130 blocking antibodies, assessedby both tumorsphere formation (Supplementary Figure S1a)and limiting dilution assays (Supplementary Figure S1b), aspreviously described.7,8 However, and in contrast to the Shi et alwork, no significant impact of anti-gp130 blocking antibodieswas observed when GSCs were grown in complete media(Supplementary Figure S1a-b). Moreover, blocking gp130had no overt impact on cell viability in any of the fourGSCs tested (data for GSC4 and GSC9 not shown) in eitherEC-CM (Supplementary Figure S1c) or complete media(Supplementary Figure S1c).9 Although our findings confirmthe involvement of gp130 in stem maintenance, our data alsosuggest that the gp130 function in GSCs might vary along withcytokine and growth factor availability in the milieu.The main differences in the two studies reside in the means
employed in order to interfere with gp130 function: silencing
versus blocking antibodies. Indeed, while Shi et al6 reporteddecreased stem characteristics and cell viability with gp130silencing in complete medium, our study using antibody-directed targeting of gp130 did not recapitulate these findings.From these results, it is tempting to speculate that gp130scaffolds a ligand-independent biased intracellular signaling incomplete medium that could be affected by gp130 silencing butnot by antibodies. Conversely, the gp130 extracellular domain-ignited signaling action may be unmasked in EC-CM byneutralizing antibodies, while growth factor overload in com-pletemediummight circumvent the need for gp130 extracellulardomain-based signaling. Consequently, gp130 silencing orneutralization could target different signaling functions.Taken together, our data reiterate the importance of gp130
in GSC maintenance, although therapeutic targeting of thegp130 complex alone might not lead to a full annihilation of itssignaling functions as obtained through a genetic approach.Therefore, this indicates that we should remain cautious in ourinterpretations of such results as they may differ greatly whencoming to the pre-clinical stage.
Conflict of InterestThe authors declare no conflict of interest.
Acknowledgements. The authors wish to thank Nicolas Bidère (SOAP team,Nantes, France) for careful reading of the manuscript. This research was funded by a grantfrom Région Pays-de-la-Loire and Nantes Métropole (Connect Talent), Ligue Nationalecontre le Cancer (comité Loire-Atlantique, Maine-et-Loire, Morbihan, Sarthe, Vendée),Institut National du Cancer (INCA), Fondation ARC pour la Recherche contre le Cancer.
Kathryn A Jacobs1, Elizabeth Harford-Wright1 andJulie Gavard*,1
1 CRCINA, Team SOAP, Inserm, CNRS, Universite de Nantes, 8 quai Moncousu,Nantes, France
* Corresponding authors: J Gavard, Team SOAP, Signaling in Oncogenesis,Angiogenesis and Permeability, IRS-UN blg, Room 416, 8 quai Moncousu,Nantes 44000, France. Tel: +33 2 2808 0327E-mail: [email protected]
1. Chen J et al. Nature 2012; 488(7412): 522–526.2. Singh SK et al. Nature 2004; 432(7015): 396–401.3. Bao S et al. Nature 2006; 444(7120): 756–760.4. Calabrese C et al. Cancer Cell 2007; 11(1): 69–82.5. Galan-Moya EM et al. EMBO Rep 2011; 12(5): 470–476.6. Shi Y et al. Cell Death Differ 2017; 24: 167–180.7. Tropepe V et al. Dev Biol 1999; 208(1): 166–188.8. Harford-Wright E et al. Oncotarget; e-pub ahead of print 1 September 2016, 10.18632/oncotarget.11784.9. Galan-Moya EM et al. PLoS One 2014; 9(3): e93505.
Supplementary Information accompanies this paper on Cell Death and Differentiation website (http://www.nature.com/cdd)
Cell Death and Differentiation (2017) 24, 384& 2017 Macmillan Publishers Limited, part of Springer Nature. All rights reserved 1350-9047/17
www.nature.com/cdd

First Publication
95
0
5
10
15
GSC1 GSC2 GSC4 GSC9
Tum
orsp
here
s/FO
V
a
*** ***
*
b
-1.5
Log
frac
tion
nega
tive
wel
ls
0
20
40
60
80
100
120
GSC1 GSC2
% v
iabl
e ce
lls
DMSO
0 500 1000 1500 2000−2
.5−2
.0−1
.5−1
.0−0
.50.
0
dose (number of cells)
log
fract
ion
nonr
espo
ndin
g
●
●
●
●●
●
●
●
●
●
●
●
●●●
Group abGroup igg
# cells/well
0.0
-0.5
-1.0
-2.0
-2.5
0 500 1000 1500 2000
ccontrol ab anti-GP130 ab EC-CM
control ab anti-GP130 ab EC-CM
control ab anti-GP130 ab EC-CM
***
Tum
orsp
here
s/FO
V
0
5
10
15
20
GSC1 GSC2 GSC4 GSC9 0 500 1000 1500 2000 0 500 1000 1500 2000
−2.5
−2.0
−1.5
−1.0
−0.5
0.0
dose (number of cells)
log
fract
ion
nonr
espo
ndin
g
●
●●
●
●
●
Group AbGroup IgG
#cells/well
0.0
-0.5
-1.0
-2.0
-2.5
Log
frac
tion
nega
tive
wel
ls
0
20
40
60
80
100
120
GSC1 GSC2
% v
iabl
e ce
lls DMSO
-1.5
control ab anti-GP130 ab NS34
control ab anti-GP130 ab NS34
control ab anti-GP130 ab NS34
Figure S1. anti-gp130 blocking antibodies reduce GSC expansion in EC-CM.
(A) Tumorsphere formation per field of view (FOV) in mesenchymal (#1, #2 and #4) and classical (#9) glioblastoma stem-like cell (GSC)8 subtypes in response to anti-gp130 (2 µmol.l-1, B-K5 clone, Abcam) or control (swap70, 2 µmol.l-1, Abcam) antibodies in endothelial cell-conditioned serum-free mitogen-free media, prepared as previously described5,9 (EC-CM, top panel) and in mitogen-defined complete medium (NS34, bottom panel). n=3, mean±SEM, ns p>0.05 *p<0.05, ***p<0.001. (B) Linear regression plot of in vitro limiting dilution assay (LDA) for GSC#2 in EC-CM (top) and NS34 (bottom), in the presence of anti-gp130 or control antibodies. Data were analyzed as described by Tropepe et al. 7 n=2 (C) Cell viability using the UptiBlue reagent (Interchim), a fluorometric/colormetric growth indicator in response to treatment with anti-gp130 or control antibodies in EC-CM top) and NS34 (bottom). n=3, mean±SEM, ns p>0.05.

Second Publication Context
96
Second Article

Second Publication Context
97
Paracaspase MALT1 regulates Glioma Cell Survival by Controlling Endo-lysosomal Homeostasis
GBM are heterogeneous tumors with a characteristically abnormal
vasculature, which allows for hypoxic and necrotic zones to develop within the tumor.
In addition to their protective vascular niche, GSCs have been shown to survive in
these harsh regions of the tumor. In the absence of oxygen and nutrients, they
reduce receptor recycling to sustain signaling for longer and overcome
microenvironmental stress (Man et al., 2018; Shingu et al., 2016). Therefore, there
may be other autocrine signaling pathways employed by GSCs to maintain
themselves outside the protective vascular niche.
To address this question, we decided to explore signaling involved in non-
oncogene addiction in cancer, a process by which cancer cells exploit non-mutated
cellular functions for their propagation and survival. While there are numerous
pathways that fall into this category, NF-κB signaling converges on cytokine release,
in addition to cell proliferation and survival. As NF-κB impacts both tumor cells and
the microenvironment, we analyzed the TCGA for known mediators of the NF-κB
pathway, and identified the paracaspase mucosa-associated lymphoid tissue l
(MALT1) as the gene most significantly correlated with probability of survival in GBM
patients.
MALT1 is
a unique
protease with a
scaffold
function, linked
to immune
responses, and aggressive lymphoma but whose role is underestimated in CNS
cancer. Upon antigen receptor engagement in lymphocytes, a multiprotein complex
named the CARMA1/BCL10/MALT1 complex or CBM forms. This signalosome is
composed of a scaffold protein caspase recruitment domain family member 11
(CARD11 or CARMA1), an adaptor protein B Cell CLL/lymphoma-10 (BCL-10), and
MALT1. CARMA1 has an autoinhibitory linker region which masks the CARD domain
in unstimulated cells. Antigen receptor activation in T/B lymphocytes allows protein
kinase Cθ/β (PKC θ/β) to phosphorylate CARMA1, changing its conformation (Ruland
Death Domain
Ig1 Ig2 Ig3 Caspase Domain
39 126 201 212 305 348 566 584 718
MALT1
Figure 28: MALT1 construct map, featuring N-terminal death domain, 3 Ig domains, and a paracaspase domain

Second Publication Context
98
and Hartjes, 2019). Now in an open conformation, CARMA1 associates with BCL10
via the CARD domain of BCL10 to form a CARD/CARD interaction. BCL10 forms a
constitutive heterodimer with MALT1 via its C-terminal serine/threonine rich domain,
which interacts with the Ig domains for MALT1 (Figure 28). Once formed, the CBM
complex organizes in a filamentous structure, which then allows the NF-κB activating
machinery to dock (Qiao et al., 2013). The transcription factor NF-κB can
subsequently translocate to the nucleus and bind its targets, enabling their
expression (Bonizzi and Karin, 2004).
Caspases represent a family of cysteine
proteases essential in the regulation of cell
death. Paracaspases maintain their conserved
catalytic cysteine and histidine combination, but
unlike caspases have a specificity towards
uncharged residues in the P1 position of
substrates (Uren et al., 2000). In 2008, it was
confirmed that the caspase-like domain in the C-
terminus of MALT1 was indeed functional through pivotal findings of Margot Thome’s
and Rudi Beyaert’s groups (Coornaert et al., 2008a; Rebeaud et al., 2008). Beyaert’s
laboratory established that A20, also known as TNFAIP3, a negative regulator of NF-
κB was cleaved and inactivated by MALT1 (Coornaert et al., 2008a). Thome’s group
identified the MALT1 binding partner BCL10 as a substrate of MALT1 after T cell
activation, and showed that this proteolysis was critical for integrin-mediated
adhesion of T cells (Rebeaud et al., 2008). Both groups showed that MALT1
trimming of substrates was arginine specific and cysteine dependent (Coornaert et
al., 2008a; Rebeaud et al., 2008). Later, structural analysis studies were performed
to determine that MALT1 proteolytic activity occurs within the S/P-R↓G/A consensus
motif (Table 2)(Wiesmann et al., 2012).
MALT1 knockout mice develop normally and have functional immune systems
(Brüstle et al., 2017; Ruefli-Brasse et al., 2003; Ruland et al., 2003). With the
creation of mice expressing a catalytically inactivated MALT1, it was discovered that
the proteolytic activity of MALT1 specifically plays a crucial part in immune cell
maturation as these mice did not properly develop regulatory T cells (Bornancin et
al., 2015; Gewies et al., 2014; Jaworski et al., 2014; Yu et al., 2015). Catalytically
dead MALT1 mice develop a lethal multi-organ inflammatory syndrome due to
Ntl
MALT1
Ctl Substrate
Figure 29: MALT1 is a protease. MALT1 cleaves substrates with a S/P-RêG/A consensus motif

Second Publication Context
99
abnormal secretion of interferon gamma, in addition to the tissue specific problems of
neurodegeneration, and gastric inflammation (Gewies et al., 2014). Lung immune
infiltration and eye inflammation were also reported (Bornancin et al., 2015; Yu et al.,
2015). These mice also develop autoimmune gastritis (Jaworski et al., 2014). In
contrast, the MALT1 knockout mice do not have any obvious phenotypes (Ruland et
al., 2003), underlining an importance of each of the MALT1 protein functions: as a
scaffold and as a protease.
Of the already
identified MALT1
substrates, half of them
(A20, RELB, HOIL-1,
MALT1, and NIK) play a
role in NF-κB signaling. In
addition to A20, HOIL-1,
a component of the linear
ubiquitination complex
(LUBAC) involved in IKK
activation, was identified
as a MALT1 substrate by
three independent
groups, including our own
(Douanne et al., 2016;
Elton et al., 2016; Klein et
al., 2015). Klein et al.
suggest that the
processing of HOIL-1 affects NF-κB signaling by destabilizing the LUBAC and
therefore reducing its capacity for linear ubiquitination. Conversely, our laboratory
showed that HOIL-1 cleavage inactivates it and therefore limits its function as a
repressor of NF-κB.
Similarly, RELB, a component of the NF-κB pathway, was also identified as a
MALT1 substrate by Margot Thome’s laboratory (Hailfinger et al., 2011). RELB
belongs to the NF-κB transcription family, which is composed of five members
(RELA, RELB, c-Rel, p105/p50, p100/p52) all sharing a REL homology domain which
Substrate Cleavage Site Function A20 GASR439GEA NF-κB
RELB LVSR85GAA NF-κB
HOIL1 LQPR165GPL NF-κB
MALT1 LCCR149ATG…HCSR781TPD
NF-κB
NIK CLSR325GAH NF-κB
LIMA1 PDSR206ASS…FKSK269GNY
B-cell Growth, Adhesion
CYLD FMSR324GVG JNK/ AP1
ROQUIN 1 LIPR510GTD…MVPR579GSQ
mRNA Stability
ROQUIN 2 LISR509TDS mRNA Stability
REGNASE 1 LVPR111GGS mRNA Stability
BCL10 LRSR228TVS Adhesion
Table 2: MALT1 substrates, cleavage sites and cellular functions

Second Publication Context
100
is responsible for DNA binding and oligomerization. It negatively regulates the
canonical pathway in two ways, first by competing for DNA binding sites and second
by forming inactive heterodimers with canonical REL family members RELA and c-
REL (Hailfinger et al., 2011). This group showed that processed RELB is rapidly
degraded by the proteasome. Further, when an uncleavable RELB mutant was
expressed in Jurkat T cells, NF-κB signaling was reduced (Hailfinger et al., 2011).
Therefore, among the NF-κB related substrates of MALT1, there exists a subgroup of
negative regulators, whose processing permits their disabling.
From another axis, MALT1 protease activity can affect NF-κB activation by
auto-cleavage at arginine 149 and arginine 781 (Baens et al., 2014, 2018; Wu et al.,
2018). Baens et al illustrated that uncleavable mutants of this paracaspase reduced
the MALT1 dependent production of interleukin-2, without affecting processing of
other substrates or MALT1 scaffold function. Instead, this auto-processing appears to
be essential for the expression of NF-κB target genes upon activation of T cells
(Baens et al., 2014). Also, Wu et al. further extended the role of auto-processing to
be important in regulatory T cell activation (Wu et al., 2018). These findings add
another layer to MALT1’s proteolytic activity in NF-κB signaling; not only does it
inactivate negative regulators but also it self-regulates.
Additionally, Staal et al showed that MALT1 processes the deubiqutinating
enzyme CYLD to inactivate it (Staal et al., 2011). CYLD is a negative regulator of the
JNK and AP-1 pathways. Indeed, previously it was shown that MALT1 deficient T
cells had impaired JNK activation upon T cell receptor stimulation (Ruland et al.,
2003). Accordingly, uncleavable CYLD expression leads to decrease in JNK and AP-
1 targets interleukin 2, interleukin-8 and c-Jun (Staal et al., 2011). Interestingly, the
mice expressing catalytically inactive MALT1 did not show striking defects in JNK
and AP-1 (Bornancin et al., 2015) which may signify other roles of CYLD processing
outside of this signaling context.
As already described, Thome’s group first identified MALT1 proteolytic activity
in the context of BCL10 processing. Not only did they show that MALT1 was indeed a
protease, but they also demonstrated that BCL10 processing is important for cell
adhesion, though the mechanism of action remains poorly understood (Rebeaud et
al., 2008). Moreover, Nakaya et al. showed that MALT1 proteolytic activity is
necessary for glutamine uptake and mTOR activation upon antigen receptor
engagement. Inhibition of MALT1 paracaspase activity with the competitive inhibitor

Second Publication Context
101
zVRPR led to decreased mTOR signaling, as evaluated through phosphorylation of
S6 kinase and S6 (Nakaya et al., 2014). Concurrently, Hamilton et al. showed similar
effects, and demonstrated that MALT1 protease activity is necessary for metabolic
switch upon T cell activation (Hamilton et al., 2014). However, to date no specific
substrates of MALT1 within the mTOR signaling pathway have been identified, so the
exact molecular mechanism by which MALT1 controls mTOR signaling upon TCR
engagement remains to be explored.
A rather surprising role for MALT1 in regulating RNA binding proteins emerged
with the discovery of Regnase-1, also known as ZC3H12A or MCPIP-1, as a bona
fide MALT1 substrate (Uehata et al., 2013). The RNA binding protein Regnase-1
contains a zinc finger domain, which tethers directly to mRNAs, as well as a PilT N-
terminus like domain which has an RNase catalytic center activated upon interaction
with N-terminus of the protein (Xu et al., 2012a, 2012b). It facilitates the mRNA
stability of different genes including c-REL, OX40, and IL2 and prevents the
generation of aberrant CD4+ T cells (Uehata et al., 2013). Indeed, Regnase-1
deficient mice have systematic inflammation due to hyperactive B and T cells
(Iwasaki et al., 2011). In this vein, Uehata and colleagues showed that MALT1
inhibition led to destabilization of mRNAs and deregulated T cell activation (Uehata et
al., 2013). Additionally, Heissmeyer’s group linked Regnase-1 to Roquin 1 and
Roquin 2, two other RNA binding proteins, in the production of IL17. They also
demonstrated that Roquins 1/2 are MALT1 substrates upon antigen receptor
engagement (Jeltsch et al., 2014). In addition to the zinc finger RNA binding domain,
Roquins have a RING (Really Interesting New Gene) finger domain known to be
present in E3 ubiquitin ligases (Schaefer and Klein, 2016). To date Roquin 1 has not
been demonstrated to have any E3 ligase activity, while Roquin 2 has been shown to
promote ubiquitination of MAP3K5, a protein involved in reactive oxygen species
(ROS)-induced cell death (Maruyama et al., 2014). The role of MALT1 in regulating
RNA binding proteins demonstrates a multi-level function of the protease in gene
expression. Not only does it modify gene transcription through its role in NF-κB,
MALT1 also regulates the stability and therefore translation of mRNA.
MALT1 has been shown to be constitutively active and involved in disease
progression in a subset of diffuse large B-cell lymphoma (DLBCL) known as
Activated B Cell diffuse large B cell lymphoma, or ABC DLBCL (Ferch et al., 2009;
Hailfinger et al., 2009). Concurrently, Margot Thome’s and Jurgen Ruland’s

Second Publication Context
102
laboratories demonstrated that the competitive inhibitor of MALT1, zVRPR, as well as
overexpression of a catalytically dead MALT1 could reduce growth and survival of
ABC DLBCL (Ferch et al., 2009; Hailfinger et al., 2009). This work was expanded
upon by studies with the small compound MI2 or phenothiazines, especially
mepazine, which were shown to bind specifically to MALT1 and were selectively toxic
to ABC DLBCL in vitro and in vivo without displaying toxicity in mice (Fontan et al.,
2012; Nagel et al., 2012a; Schlauderer et al., 2013). However, the role of MALT1 in
solid tumors has not been extensively explored.
Confirming my in silico TCGA analysis, knockdown or pharmacological
inhibition of MALT1 in a panel of patient-derived GSCs abolished cell viability in vitro.
MALT1 blockade also reduced tumor growth in vivo. In addition, these cells observed
an increase in their endo-lysosomal compartment accompanied by a defect in
autophagic flux. Moreover, inhibition or silencing of MALT1 reduced mTOR activation
and lysosomal localization. We also demonstrated that MALT1 interacts with the
lysosomal regulator QKI. This interaction was disturbed in response to
pharmacological intervention. Consequently, QKI knockdown rescued MALT1-
induced phenotype. Thus, targeting MALT1 is a potential strategy for the treatment of
GBM.
• Expression and catalytic activity of MALT1 are required for GSC expansion.
• Pharmacological targeting of MALT1 is lethal to GSCs and reduces the
expansion of established tumors in mice.
• MALT1 depletion results in an increased endo-lysosomal compartment and
decreased mTOR signaling.
MALT1
mTOR
LAMP2
Endo-lysosome Homeostasis
Expansion of Glioblastoma Stem-like Cells
Figure 30: Overview of MALT1 action in GSCs. MALT1 activity regulates lysosomal homeostasis and mTOR signaling to promote GSC expansion.

Second Publication Context
103
• MALT1 expression negatively correlates to that of RNA-binding protein
Quaking to control endo-lysosomal biogenesis.

Second Publication
104

Second Publication
105
Article
Paracaspase MALT1 regulates glioma cell survivalby controlling endo-lysosome homeostasisKathryn A Jacobs1, Gwennan André-Grégoire1,2, Clément Maghe1, An Thys1 , Ying Li3, Elizabeth
Harford-Wright1, Kilian Trillet1, Tiphaine Douanne1, Carolina Alves Nicolau1, Jean-Sébastien Frénel2,
Nicolas Bidère1 & Julie Gavard1,2,*
Abstract
Glioblastoma is one of the most lethal forms of adult cancer with amedian survival of around 15 months. A potential treatment strategyinvolves targeting glioblastoma stem-like cells (GSC), which consti-tute a cell autonomous reservoir of aberrant cells able to initiate,maintain, and repopulate the tumor mass. Here, we report that theexpression of the paracaspase mucosa-associated lymphoid tissue l(MALT1), a protease previously linked to antigen receptor-mediatedNF-jB activation and B-cell lymphoma survival, inversely correlateswith patient probability of survival. The knockdown of MALT1 largelyimpaired the expansion of patient-derived stem-like cells in vitro,and this could be recapitulated with pharmacological inhibitors,in vitro and in vivo. Blocking MALT1 protease activity increases theendo-lysosome abundance, impairs autophagic flux, and culminatesin lysosomal-mediated cell death, concomitantly with mTOR inactiva-tion and dispersion from endo-lysosomes. These findings placeMALT1 as a new druggable target involved in glioblastoma and unveilways to modulate the homeostasis of endo-lysosomes.
Keywords glioma; lysosome; MALT1; mTOR; protease
Subject Categories Cancer; Autophagy & Cell Death; Membranes & Traf-
ficking
DOI 10.15252/embj.2019102030 | Received 18 March 2019 | Revised 16
October 2019 | Accepted 25 October 2019
The EMBO Journal (2019) e102030
Introduction
Glioblastoma multiforme (GBM) represents the most lethal adult
primary brain tumors, with a median survival time of 15 months
following diagnosis (Stupp et al, 2009, 2015). The current standard-
of-care for the treatment of GBM includes a surgical resection of the
tumor followed by treatment with alkylating agent temozolomide
and radiation. While these standardized strategies have proved
beneficial, they remain essentially palliative (Stupp et al, 2009;
Chinot et al, 2014; Brown et al, 2016). Within these highly
heterogeneous tumors exists a subpopulation of tumor cells named
glioblastoma stem-like cells (GSCs). Although the molecular and
functional definition of GSCs is still a matter of debate, there is
compelling evidence that these cells can promote resistance to
conventional therapies, invasion into normal brain, and angiogene-
sis (Singh et al, 2004; Bao et al, 2006; Chen et al, 2012; Yan et al,
2013; Lathia et al, 2015). As such, they are suspected to play a role
in tumor initiation and progression, as well as recurrence and thera-
peutic resistance. Owing to their quiescent nature, GSCs resist to
both chemotherapy and radiation, which target highly proliferative
cancer cells (Bao et al, 2006; Chen et al, 2012). Hence, there is a
clear need to identify novel therapeutic targets, designed to eradi-
cate GSCs, in order to improve patient outcome.
GSCs constantly integrate external maintenance cues from their
microenvironment and as such represent the most adaptive and resi-
lient proportion of cells within the tumor mass (Lathia et al, 2015).
Niches provide exclusive habitat where stem cells propagate continu-
ously in an undifferentiated state through self-renewal (Lathia et al,
2015). GSCs are dispersed within tumors and methodically enriched in
perivascular and hypoxic zones (Calabrese et al, 2007; Jin et al, 2017;
Man et al, 2017). GSCs essentially received positive signals from
endothelial cells and pericytes, such as ligand/receptor triggers of
stemness pathways and adhesion components of the extracellular
matrix (Calabrese et al, 2007; Galan-Moya et al, 2011; Pietras et al,
2014; Harford-Wright et al, 2017; Jacobs et al, 2017). GSCs are also
protected in rather unfavorable conditions where they resist hypoxic
stress, acidification, and nutrient deprivation (Shingu et al, 2016; Jin
et al, 2017; Man et al, 2017). Recently, it has been suggested that this
latter capacity is linked to the function of the RNA-binding protein
Quaking (QKI), in the down-regulation of endocytosis, receptor traf-
ficking, and endo-lysosome-mediated degradation. GSCs therefore
down-regulate lysosomes as one adaptive mechanism to cope with the
hostile tumor environment (Shingu et al, 2016).
Lysosomes operate as central hubs for macromolecule traf-
ficking, degradation, and metabolism (Aits & Jaattela, 2013). Cancer
cells usually show significant changes in lysosome morphology and
composition, with reported enhancement in volume, protease activ-
ity, and membrane leakiness (Fennelly & Amaravadi, 2017). These
1 Team SOAP, CRCINA, Inserm, CNRS, Université de Nantes, Université d’Angers, Nantes, France2 Integrated Center for Oncology, ICO, St. Herblain, France3 Tsinghua University-Peking University Joint Center for Life Sciences, Technology Center for Protein Sciences, School of Life Sciences, Tsinghua University, Beijing, China
*Corresponding author. Tel: +33 2808 0327; E-mail: [email protected]
ª 2019 The Authors The EMBO Journal e102030 | 2019 1 of 21

Second Publication
106
modifications can paradoxically serve tumor progression and drug
resistance, while providing an opportunity for cancer therapies. The
destabilization of the integrity of these organelles might indeed
ignite a less common form of cell death, known as lysosomal
membrane permeabilization (LMP). LMP occurs when lysosomal
proteases leak into the cytosol and induce features of necrosis or
apoptosis, depending on the degree of permeabilization (Aits & Jaat-
tela, 2013). Recent reports also highlighted that lysosomal home-
ostasis is essential in cancer stem cell survival (Shingu et al, 2016;
Mai et al, 2017; Le Joncour et al, 2019). Additionally, it has been
shown that targeting the autophagic machinery is an effective treat-
ment against apoptosis-resistant GBM (Shchors et al, 2015; Zielke
et al, 2018). The autophagic flux inhibitor chloroquine can decrease
cell viability and acts as an adjuvant for TMZ treatment in GBM.
However, this treatment might cause neural degeneration at the
high doses required for GBM treatment (Weyerhauser et al, 2018).
Therefore, it is preferable to find alternative drugs that elicit anti-
tumor responses without harmful effects on healthy brain cells.
A growing body of literature supports the concept of non-onco-
gene addiction (NOA) in cancer. Although neither mutated nor
involved in the initiation of tumorigenesis, NOA genes are essential
for the propagation of the transformed phenotype (Luo et al, 2009).
Because NOA gene products are pirated for the benefit of tumor
cells’ own survival, their targeting therefore constitutes an Achilles’
heel. Among reported NOA genes and pathways (Staudt, 2010), the
paracaspase mucosa-associated lymphoid tissue l (MALT1) might be
of particular interest in GBM (please see Fig 1). This arginine-
specific protease plays a key role in NF-jB signaling upon antigen
receptor engagement in lymphocytes, via the assembly of the
CARMA-BCL10-MALT1 (CBM) complex. In addition to this scaffold
role in NF-jB activation, MALT1 regulates NF-jB activation, cell
adhesion, mRNA stability, and mTOR signaling through its prote-
olytic activity (Rebeaud et al, 2008; Staal et al, 2011; Uehata et al,
2013; Hamilton et al, 2014; Jeltsch et al, 2014; Nakaya et al, 2014).
MALT1 has been shown to be constitutively active in activated B-
cell-like diffuse large B-cell lymphoma (ABC DLBCL), and its inhibi-
tion is lethal (Ngo et al, 2006; Hailfinger et al, 2009; Nagel et al,
2012). MALT1 was also recently reported to exert pro-metastatic
effects in solid tumors (McAuley et al, 2019). However, the role of
MALT1 in solid tumors has not been extensively investigated.
Here, we provide evidence of the role of MALT1 in disrupting
GSC lysosomal homeostasis, which is associated with autophagic
features. We found that targeting MALT1, notably through the
phenothiazine family of drugs, including mepazine (MPZ), is lethal
to GBM cells. We further established that MALT1 sequesters QKI
and maintains low levels of lysosomes, while its inhibition
unleashes QKI and hazardously increases endo-lysosomes, which
subsequently impairs autophagic flux. This leads to cell death
concomitant with mTOR inhibition and dispersion from lysosomes.
Disrupting lysosomal homeostasis therefore represents an interesting
therapeutic strategy against GSCs.
Results
MALT1 expression sustains glioblastoma cell growth
Glioblastoma stem-like cells (GSCs) are suspected to be able to
survive outside the protective vascular niche, in non-favorable
environments, under limited access to growth factors and nutrients
(Calabrese et al, 2007; Shingu et al, 2016; Jin et al, 2017). While
many signaling pathways can influence this process, the transcrip-
tion factor NF-jB has been demonstrated to be instrumental in
many cancers as it centralizes the paracrine action of cytokines, in
addition to playing a major role in cell proliferation and survival of
tumor cells and surrounding cells (Bargou et al, 1996; Davis et al,
2001; Karin & Greten, 2005; Li et al, 2009; McAuley et al, 2019).
Because of this dual influence on both tumor cells and their
microenvironment, we revisited The Cancer Genome Atlas (TCGA)
for known mediators of the NF-jB pathway (Fig 1A). We found that
MALT1 expression was more significantly correlated with survival
than other tested genes of the pathway (Fig 1B). This arginine-
specific protease is crucial for antigen receptor-mediated NF-jB acti-
vation and B-cell lymphoma survival (Ngo et al, 2006). In addition,
when GBM patients were grouped between low and high MALT1
expression levels, there was a significant survival advantage for
patients with lower MALT1 expression (Fig 1C). Moreover, levels of
MALT1 mRNA are elevated in GBM (Grade IV) when compared with
lower grade brain tumors (grades II and III) or non-tumor samples
(Fig 1D and E).
Although this increased MALT1 expression may be due to tumor-
infiltrating immune cells, we first explored whether MALT1 was
engaged in patient-derived GSCs, as these cells recapitulated ex vivo
features of the tumor of origin (Lathia et al, 2015). The functional
impact of MALT1 knockdown was thus evaluated by their viability
and expansion in vitro (Fig 1F–J). Two individual short hairpin
RNA sequences targeting MALT1 (shMALT1) cloned in a lentiviral
bi-cistronic GFP-expressing plasmid were delivered into GSC#1
(mesenchymal) and GSC#9 (classical) cells. We observed a reduced
fraction of GFP-positive cells over time, while cells expressing non-
silencing RNA plasmids (shc) maintained a steady proportion of
GFP-positive cells, indicating that MALT1 silencing was detrimental
to GSCs (Fig 1F). Likewise, cells transfected with siMALT1 had a
lower percentage of EdU-positive cells as compared to non-silenced
control cells (Fig 1G) and a higher incorporation of propidium
iodide (PI) (Fig 1H). Additionally, GSCs either expressing shMALT1
or transfected with siMALT1 had less stem traits, as evaluated by
limited dilution assay and tumorsphere formation (Fig 1I and J).
Taken together, these results indicate that MALT1 expression may
be important for glioblastoma cell ex vivo expansion.
Pharmacological inhibition of MALT1 is lethal toglioblastoma cells
Next, to evaluate the potential of targeting MALT1 pharmacologi-
cally, we treated GSC #1 (mesenchymal), #4 (mesenchymal), #9
(classical), and #12 (neural) with the MALT1 allosteric inhibitor
mepazine (MPZ) at a dose of 20 lM, as initially described (Nagel
et al, 2012). All four GSCs showed a significant reduction in stem-
ness by both limited dilution and tumorsphere assays (Fig 2A–C).Additionally, the competitive inhibitor Z-VRPR-FMK induced similar
decrease in tumorsphere formation (Fig 2C). This was accompanied
by a marked reduction in the abundance of SOX2 and NESTIN stem-
ness markers (Fig 2D). Alongside the in vitro self-renewal impair-
ment, GSC viability was largely annihilated by MPZ treatment,
including reduction in EdU staining and increase in PI incorporation
(Fig 2E–G). In contrast, MPZ had no significant effect on viability of
2 of 21 The EMBO Journal e102030 | 2019 ª 2019 The Authors
The EMBO Journal Kathryn A Jacobs et al

Second Publication
107
0 20 40 60 80 100 0
50
100
- High MALT1
- Low MALT1
** Logrank pvalue= 0.0017 ** Wilcoxon pvalue=0.0038
Prob
abilit
yof
Sur
viva
l (%
)
Time (Months)
0 2 6
8
10
12
II III IV
****
TCGA_GBMLGG
mR
NA
Expr
essi
on (l
og2)
E
0
6
7
8
10
Non-Tumor GBM
TCGA_GBM m
RN
A Ex
pres
sion
(log
2) ***
MALT1 GAPDH
-100 -37
0
5
10
15
20
25 sic siMALT1
GSC#1 GSC#4 GSC#9
* **
RELB CARD14
CARD10
BCL10
CARD11 REL
SHARPIN
NFKB1 NFKB2
RELA
MYD88 IKBKB
IKBKG IKBKA
RNF31
RBCK1
MALT1
B
4 6 8 11
sic
siM
ALT1
MALT1 GAPDH -37
-100
Cellular component (GO) NF- B/I- B complex CBM complex LUBAC complex I- B kinase complex
20 - 40 - 60 - 80 -
100 -
% o
f Max
GSC#1
MALT1 GAPDH -37
-100
GSC#9
0.001
0.01
0.1
1
NFK
B1
NFK
B2
REL
R
ELA
REL
B IK
BKB
IKBK
G
IKBK
A R
BCK1
R
NF3
1 SH
ARPI
N
BCL1
0 C
ARD
11
CAR
D10
C
ARD
14
MAL
T1
MYD
88
MAP
K3K1
4 IK
BKG
IK
BKA
Log-
rank
p-v
alue
A TCGA_GBM: Probability of Survival
C
F
D
- shc- shMALT1 seq#1 - shMALT1 seq#2 0
50
100
150
Frac
tion
of S
urvi
ving
C
ells
(Dx/
D4)
GSC#1
Time Post-Infection (Days)
4 6 8 11 0
50
100
150 GSC#9
- shc- shMALT1 seq#1 - shMALT1 seq#2
G
sic siMALT1 0
10
20
30
EdU
Posi
tive
Cel
ls (%
)
*
9
1
J
*
Tum
orsp
here
s/FO
V
H I
Log
Frac
tion
Neg
ativ
e W
ells
Number of GSC#9 per Well0 500 1000 1500 2000
-0.5 - -1.0 -
-1.5 - -2.0 -
0.0 -
-2.5 -
- shc- shMALT1 seq#1 - shMALT1 seq#2
102 103
104
100
PI
101 102
104
102
101
103
100
103
100
104
101
104
102
101
103
100
SSC
sic siMALT1
GSC#9
EdU/DAPI
- sic - siMALT1
0-
EdU100 101 102 103 104
GSC#1
Figure 1.
ª 2019 The Authors The EMBO Journal e102030 | 2019 3 of 21
Kathryn A Jacobs et al The EMBO Journal

Second Publication
108
brain-originated human cells (endothelial cells, astrocytes, and
neurons), ruling out a non-selectively toxic effect (Fig 2E). Differen-
tiated sister GSCs (DGCs) also showed reduced viability in response
to MPZ, indicating that targeting MALT1 may have a pervasive
effect on differentiated GBM tumor cells (Fig 2H).
MPZ is a drug, belonging to the phenothiazine family, and was
formerly used in the treatment of schizophrenia (Lomas, 1957).
Several anti-psychotic phenothiazines have been shown to potentially
reduce glioma growth (Tan et al, 2018). We therefore evaluated
whether clinically relevant phenothiazines could affect GSC viability
(Fig EV1A–E). The effect on MALT1 inhibition was reflected in cell
viability, with chlorpromazine (Oliva et al, 2017) and fluphenazine
having robust effects on cell viability (Fig 2I). In addition to its effect
on MALT1 protease activity (Fig EV1B and C) (Nagel et al, 2012;
Schlauderer et al, 2013), MPZ may also exert off-target biological
effects (Meloni et al, 2018). We took advantage of the well-character-
ized MPZ-resistant E397A MALT1 mutant (Schlauderer et al, 2013) to
challenge the toxic action of phenothiazines in GSCs (Fig EV1F).
E397A MALT1 expression in GSCs partially restored cell viability in
phenothiazine-treated cells, suggesting that the main target of
phenothiazine-mediated death involves MALT1 inhibition (Fig EV1F).
Because MPZ has been shown to efficiently and safely obliterate
MALT1 activity in experimental models (Nagel et al, 2012; McGuire
et al, 2014; Kip et al, 2018; Di Pilato et al, 2019; Rosenbaum et al,
2019), ectopically implanted GSC#9 mice were challenged with MPZ.
Daily MPZ administration reduced tumor volume in established xeno-
grafts, as well as NESTIN-positive staining (Fig 2J and K). This effect
was prolonged for the week of measurement following treatment with-
drawal (Fig 2J). Together, these data demonstrate that targeting
MALT1 pharmacologically is toxic to GBM cells in vitro and in vivo.
GSCs maintain basal protease activity of MALT1
In addition to its scaffold function in the modulation of the NF-jBpathway, MALT1 also acts as a protease for a limited number of
substrates (Juilland & Thome, 2018; Thys et al, 2018). No hallmarks
of NF-jB activation such as phosphorylation and degradation of IjBa,or p65 and cREL nuclear translocation were observed, unless GSCs
were treated with TNFa (Fig 3A and B). Nevertheless, the deubiquiti-
nating enzyme CYLD (Staal et al, 2011) and the RNA-binding proteins
ROQUIN 1 and 2 (Jeltsch et al, 2014), two known MALT1 substrates,
were constitutively cleaved in GSCs (Fig 3C–F). This was, however,
not the case of the MALT1 target HOIL1 (Douanne et al, 2016),
suggesting that only a subset of MALT1 substrates is cleaved in GSCs
(Fig 3C). Of note, CYLD proteolysis was not further increased upon
stimulation with PMA plus ionomycin, in contrast to Jurkat lympho-
cytes, most likely due to a failure to co-opt this signaling route in
GSCs (Fig 3C). However, CYLD processing was reduced in cells
treated with MPZ or upon siRNA-mediated MALT1 knockdown
(Fig 3D and E). The same was true when MALT1 competitive inhi-
bitor Z-VRPR-FMK was used (Fig 3F). Further supporting a role for
MALT1 enzyme in GSCs, the expression of a protease-dead version of
MALT1 (C464A) weakened CYLD trimming (Fig 3G and H). Interest-
ingly, we found that refreshing medium also reduced CYLD cleavage,
suggesting that MALT1 basal activity may rely on outside-in signals
rather than cell autonomous misactivation (Fig 3I).
The activation of MALT1 habitually occurs within the microenvi-
ronment of the CBM complex (Thys et al, 2018). Accordingly, the
knocking down of the CBM components BCL10 or CARD10 (i.e.,
CARMA3) also decreased CYLD processing (Fig 3J and K). In keep-
ing with this, BCL10-silenced GSC#9 cells showed a reduction in cell
viability (Fig 3K), therefore recapitulating the effect of knocking
down MALT1. These data reinforce the hypothesis that a fraction of
MALT1 is most likely active in growing GSCs, outside its canonical
role in antigen receptor signaling and immune cancer cells.
MALT1 inhibition alters endo-lysosome homeostasis
To evaluate cell death modality triggered by MALT1 inhibition,
transmission electron microscopy (TEM) was deployed to visualize
◀ Figure 1. MALT1 expression sustains glioblastoma cell growth.
A STRING diagram representation of the network of proteins involved in NF-jB pathway.B The Cancer Genome Atlas (TCGA RNAseq dataset) was used on the GlioVis platform (Bowman et al, 2007) to analyze the probability of survival (log-rank P-value) of
155 GBM patients, for each gene encoding for the mediators of the NF-jB pathway.C Kaplan–Meier curve of the probability of survival for 155 GBM patients with low or high MALT1 RNA level, using median cutoff, based on the TCGA RNAseq dataset.D, E Box and whisker plot of MALT1 mRNA expression in low-grade glioma (LGG, grades II and III) or in GBM (grade IV) (TCGA GBMLGG, RNAseq dataset) (D). Horizontal
line marks the median, box limits are the upper and lower quartiles, and error bars show the highest and lowest values. Alternatively, MALT1 mRNA expression wasplotted in non-tumor samples versus GBM samples (TCGA RNAseq dataset) (E). Each dot represents one clinical sample.
F Fraction of surviving cells over time in GSC#1 and GSC#9, transduced with control (shc) or bi-cistronic GFP plasmids using two different short hairpin RNA(shMALT1 sequences, seq #1 and #2). Data are plotted as the percentage of GFP-positive cells at the day of the analysis (Dx), normalized to the starting point (day4 post-infection, D4).
G EdU incorporation (green, 2 h) was visualized by confocal imagery in GSC#1 or by FACS in GSC#9 transfected with sic or siMALT1. In GSC#1, the percentage ofEdU-positive cells was quantified. Nuclei (DAPI) are shown in blue. n > 240 cells per replicate. Scale bar: 10 lm. Data are presented as the mean ! SEM on threeindependent experiments.
H FACS analysis of propidium iodide (PI) incorporation in GSC #1 and #9 transfected with non-silencing duplexes (sic) or MALT1 siRNA duplexes (siMALT1) andanalyzed 72 h later.
I Linear regression plot of in vitro limiting dilution assay (LDA) for control (shc) or shMALT1 seq#1 and seq#2 transduced GSC#9. Data are representative of n = 2.Knockdown efficiency was verified at day 3 by Western blot using anti-MALT1 antibodies. GAPDH served as a loading control.
J Tumorspheres per field of view (fov) were manually counted in sic or siMALT1 transfected GSC#1, #4, and #9. Data are presented as the mean ! SEM on threeindependent experiments.
Data information: All data are representative of n = 3, unless specified. Statistics were performed using pairwise comparisons (Tukey’s honest significant difference (HSD)with a 95% confidence interval for panels C–E), and a two-tailed t-test with a 95% confidence interval for panels (G and J), *P < 0.05, **P < 0.01, ***P < 0.001, and****P < 0.0001.
Source data are available online for this figure.
4 of 21 The EMBO Journal e102030 | 2019 ª 2019 The Authors
The EMBO Journal Kathryn A Jacobs et al

Second Publication
109
FLU CYAM
PIPO ALI
PROM DOXY
MPZ
I Phenothiazine (µM)
0
30
40
50
20
10
EdU
Pos
itive
Cel
ls (%
)
GSC#1
*
DMSO MPZ
DMSO MPZ GSC#9: DAPI/NESTIN/SOX2
DMSO MPZ
(x102) SSC
Daily Treatment
0 100 200 300 400 500 600 700
1 4 7 10 13 16 19 22
0 500 1000 1500 2000 Log
Frac
tion
Neg
ativ
e W
ells
-0.5- -1.0- -1.5- -2.0-
0.0-
Number of GSC#9 per Well
-2.5-
DMSO MPZ
B C
#1 #4 #12 0.00
0.01
0.02
0.03
Stem
Cel
lFre
quen
cy
Veh
MPZ
Vehicle
MPZ
*p<0.03
0
500
2000
1500
1000
J
Tum
or V
olum
e (m
m3 )
*p<0.0019
*** *** *** ** Tum
orsp
here
s/FO
V
0
5
10
15
20
K
GAPDH -35
SOX2 NESTIN
-35
-250 - + - +
Tum
or V
olum
e (m
m3 )
GSC#9 Xenografts
MPZ
0
10
20
30 GSC#9
*
DMSO MPZ
DMSO VRPR
A B C D E
1
2
3
4
5
6
7
8
F
G
0 2 4 6 8 10
MPZ 100 101
102
103
104 DMSO
100
101
102
103
104
PI
DGC
***
0
0.5
1.0
1.5
Viab
le C
ells
(%)
DGC #1 #4 #9
DMSO MPZ
*** **
A
D E
DMSO MPZ
DAP
I/NES
TIN
/PEC
AM1
#1 #4 #9 #12 GSC GSC
H
* * *
EXPT. #2 DAY 21 EXPT. #1
0
50
100
150
GSC#1 GSC#4 GSC#9 GSC#12
Viab
le C
ells
(%)
*** *** *** ***
endo astro neuron
DMSO MPZ ns
ns ns
-20
-40
-60
-80 -100
CHLO
GSC
#9
#
4
#
1
DMSO MPZ
0 5 10 20 40
Figure 2.
ª 2019 The Authors The EMBO Journal e102030 | 2019 5 of 21
Kathryn A Jacobs et al The EMBO Journal
Second Publication
110
morphological changes upon MPZ treatment. TEM images showed
increased vacuoles and lysosomes compared to control cells
(Fig 4A). The augmentation was also visible in siMALT1-transfected
cells (Fig EV2A). In fact, the abundance of the endo-lysosome
protein LAMP2 was amplified upon MALT1 inhibition with MPZ, in
a time-dependent manner (Figs 4B and EV2B). Additionally, treat-
ment with the MALT1 competitive inhibitor Z-VRPR-FMK, other
phenothiazines, or MALT1 knockdown resulted in similar LAMP2
increase (Figs 4C–E and EV1D), therefore militating against putative
drug-related action or deleterious accumulation in lysosomes. More-
over, the ectopic expression of a protease-dead MALT1 mutant
(C464A) mimicked MPZ effect on lysosome staining, using the lyso-
tracker probe (Fig 4D). In addition, CTSD and Rab7 endo-lysosomal
protein levels were up-regulated as well upon MALT1 blockade
(Figs 4C and EV2C). Conversely, other cellular organelles (early
endosomes, mitochondria, Golgi, and peroxisomes) remained
unchanged upon MPZ treatment (Fig EV2B and D). Furthermore,
ectopic tumors, excised from mice challenged with a MPZ 2-week
regime, showed a marked gain in LAMP2 staining intensity and
protein amount, as compared to vehicle-treated tumors (Fig 4F).
Finally, the treatment with MPZ of the ABC DLBCL lymphoma cell
line HBL1, which displays constitutive MALT1 activity, also led to
an increase in LAMP2 protein amount (Fig EV2E), indicating that
MALT1’s effect on lysosomal homeostasis might not be limited to
GSCs.
The newly formed endo-lysosomes in GSCs appeared to be at
least partially functional, as evidenced by pH-based Lysotracker
staining, DQ-ovalbumin, and transferrin uptake (Figs 4G and EV2F).
Of note, at a later time point (16 h) in MPZ-treated cells, DQ-
ovalbumin staining was dimmer as compared to early time points
(4 h), which might signify lysosomal membrane permeabilization
(Fig EV2F). Our data demonstrated that MALT1 knockdown and
pharmacological inhibition provoke a meaningful endo-lysosomal
increase.
MALT1 inhibition induces autophagic features in GBM cells
Because autophagy is fueled by endo-lysosomal activity, the impact
of MALT1 inhibition on autophagy in GSCs was explored and esti-
mated by LC3B modifications. The turnover of LC3B and the degra-
dation of the autophagy substrate P62 also reflect autophagic flux
(Loos et al, 2014). Treatment with MPZ led to a significant increase
in LC3B puncta at later time points (16 h), subsequent to lysosomal
increase (4 h) (Fig 5A, left panel). Super-resolution microscopy
using structured illumination microscopy (SIM) further revealed
that these LC3 structures were covered with LAMP2-positive stain-
ing (Fig 5A, right panel). Upon MPZ treatment, there was also an
accumulation of lipidated LC3B (LC3B-II) and P62 protein amount
over time, suggesting impaired autophagic flux (Fig 5B). Likewise,
there was an increase in lipidated LC3B protein amount in cells that
received phenothiazines or were knocked down for MALT1
(Figs EV1D and 5C). Of note, chloroquine treatment did not further
augment LC3 lipidation (Fig 5C and D). The effect of MPZ was
concomitant with a reduced LC3B turnover, as evaluated via luci-
ferase assay (Fig 5E), and P62 puncta accumulation in cells treated
with MPZ and Z-VRPR-FMK, or knocked down for MALT1 (Fig 5F).
Taken together, this suggests that MALT1 inhibition impairs autop-
hagic flux in GSCs.
◀ Figure 2. MALT1 pharmacological inhibition is lethal to glioblastoma cells.
A Linear regression plot of in vitro limiting dilution assay (LDA) for GSC#9 treated with MALT1 inhibitor, mepazine (MPZ, 20 lM, 14 days). DMSO vehicle was used as acontrol. Data are representative of n = 2.
B Stem cell frequency was calculated from LDA in GSCs #1, #4, and #12 treated with MPZ treatment (20 lM, 14 days). Data are presented as the mean ! SEM ontwo independent experiments.
C Tumorspheres per field of view (fov) were manually counted in GSCs #1, #4, #9, and #12 in response to MPZ (20 lM) and vehicle (DMSO), and in GSC#9 treatedwith Z-VRPR-FMK (75 lM) and vehicle (H2O) for 4 days. Data are presented as the mean ! SEM on 4 independent experiments for MPZ and three independentexperiments for Z-VRPR-FMK.
D The expression of the stemness markers SOX2 and NESTIN was evaluated by Western blot and immunofluorescence (SOX2 in red NESTIN in green) in MPZ (+, 20 lM,16 h) and vehicle (", DMSO, 16 h) treated GSC#9. GAPDH served as a loading control. Scale bar: 10 lm.
E Cell viability was measured using Cell TiterGlo luminescent assay in GSCs #1, #4, #9, and #12, human brain endothelial cells (endo), human astrocytes (astro), andhuman neuron-like cells (neuron) treated for 48 h with DMSO or MPZ (20 lM). Data were normalized to their respective DMSO-treated controls and are presented asthe mean ! SEM of three independent experiments in triplicate.
F FACS analysis of EdU staining was performed on GSC#1 treated overnight with MPZ (10 lM). Data are presented as the mean ! SEM on three independentexperiments.
G FACS analysis of propidium iodide (PI) incorporation in GSC#9 treated for 48 h with vehicle (DMSO) or MPZ (20 lM).H Cell viability was measured using Cell TiterGlo luminescent assay in differentiated GSC#1 #4, and #9 (DGCs) treated for 48 h with vehicle (DMSO) or MPZ (20 lM).
Data were normalized to their respective DMSO-treated controls and are presented as the mean ! SEM of three independent experiments. Morphology of GSCs #1,#4, #9, and DGCs #1, #4, #9 was shown using brightfield images.
I Heatmap of cell viability of GSC#9 using increasing doses (0, 5, 10, 20, 40 lM) of phenothiazines: mepazine (MPZ), fluphenazine (FLU), cyamemazine (CYAM),chlorpromazine (CHLO), pipotiazine (PIPO), alimemazine (ALI), promethazine (PRO), and doxylamine (DOXY). Data were normalized to their respective DMSO-treatedcontrols.
J Nude mice were implanted with GSC#9 (106 cells) in each flank, and randomized cages were treated with either vehicle (DMSO) or MPZ (8 mg/kg) daily i.p., for 14consecutive days, once tumors were palpable. Tumor volume was measured from the start of treatment until 1 week after treatment was removed. Graph of tumorvolume on day 21 post-treatment is presented. Data are presented as the mean ! SEM n = 10/group.
K Cryosections from GSC-xenografted tumors were stained for the endothelial marker PECAM1 (red) and tumor marker NESTIN (green). Nuclei (DAPI) are shown in blue.Scale bar: 20 lm.
Data information: All data are representative of n = 3, unless specified. Statistics were performed using a two-tailed t-test with a 95% confidence interval for panels (B,C, E, F, H), a two-way ANOVA with Bonferroni post-test at 95% confidence interval for panel (J), a Wilcoxon–Mann–Whitney test for Expt #2 with P-values stated forpanel (J). *P < 0.05 **P < 0.01, ***P < 0.001.
Source data are available online for this figure.
6 of 21 The EMBO Journal e102030 | 2019 ª 2019 The Authors
The EMBO Journal Kathryn A Jacobs et al

Second Publication
111
Lysosomes are the cornerstone of MPZ-induced cell death
To evaluate precisely the mechanism of cell death by MPZ, caspases
were simultaneously blocked with Q-VD-OPh (QVD) (Fig 5G and
H). However, this did not thwart MPZ-mediated cell death, suggest-
ing another mechanism than apoptosis. Meanwhile, chloroquine
treatment did not impact GSC#9 viability (Fig EV3A). Further, cells,
in which autophagy was inhibited via knockdown of BECN1 (i.e.,
A
TNF (min) GSC#1 GSC#9
p-I BI B
-37-37
GAPDH -37
p-JNKJNK -50
-50
PMA/Iono - + - + - +CYLDfl -100
-75
MALT1
p-I BI B
BCL10
-37-37-100
-37
HOIL1fl
HOIL
CYLD
C
E
CYLDfl
MALT1GAPDH
-100
-100-75
-37sic siMALT1
/FL
CYL
D
(Int.
AU)
*
B
F
/FL
(In
t. AU
)
D
CYLDfl
PMA/Iono - + + - - - -
MALT1
MPZ - - + - + - +-100-75
-100CYLD
G
ROQUIN1/2FL
ROQUIN1/2
CYLDFL
CYLD
MALT1
VRPR - +
GAPDH
-100
-37
-37
-100
-75
-150
-50
0
0.5
1.0
1.5
ROQUIN CYLD
GSC#1
-100-75
GSC#9
CYLD
siMALT1 - +
BCL10
** ***
0
0.5
1.0
1.5
cREL75 50
p65
RELB 75 50
GSC#1 GSC#9
150100 PARP 50 TUBULIN
0 15
30
0 15
30
15
0 30
0 15
30 TNF (min)
nuc cyt nuc cyt
H2O VRPR
/FL
CYL
D
(Int.
AU)
CYLDfl
GAPDH
-100-75-37
CYLD
GSC#9
Refresh + -
0 0.5 1.0 1.5 2.0
Refresh + -
*
0
50
100
150
Viab
le C
ells
(%)
sic siBCL10
***
CYLDfl
BCL10
-100-75CYLD-37
-37 GAPDHGSC#9
J K
-100-75
CYLDfl
CYLD
-37 GAPDH
siCARD10 - #1 - #2 - #3
GSC#9
siCARD10 - #1 #2 #3
Rel
ativ
e C
ARD
10Ex
pres
sion
0 0.2 0.4
0.8 0.6
1.0
*** ** ***
siBCL10 - #1 #2H
Protease-dead MALT1 (C464A)
0 15
30
0 15
30
GSC#9
GAPDH
FLAG -100
-37
WT
C46
4A
moc
k
CYLDfl -100-75CYLD
I
DD Ig1 Ig2 Ig3 C-like D
C464A
Figure 3.
ª 2019 The Authors The EMBO Journal e102030 | 2019 7 of 21
Kathryn A Jacobs et al The EMBO Journal
Second Publication
112
BECLIN1), were not protected either, suggesting that autophagy
might be secondary to MPZ-induced cell death (Fig EV3B). Nonethe-
less, there was increased CTSD release by GSCs treated with MPZ or
silenced for MALT1, which could signify either lysosomal
membrane permeabilization or increased secretion of lysosomal
enzymes (Fig 5I). Accordingly, treatment with lysosomal enzyme
inhibitors partially rescued cells from MPZ-induced cell death
(Fig 5J). Thus, lysosomes participate in MPZ-induced cell death,
while MALT1 appears to be required to maintain innocuous level of
endo-lysosomes in GSCs.
MALT1 modulates the lysosomal mTOR signaling pathway
In order to further characterize the mode of action of MALT1 inhi-
bition in GSCs, we performed RNA-sequencing analysis on GSCs
treated with MPZ for 4 h, prior to any functional sign of death. Our
results identified 7474 differentially expressed genes, among which
9/10 randomly chosen top candidates were validated in both MPZ-
treated and MALT1-silenced cells (Figs 6A and EV3C, Table EV1).
No obvious endo-lysosomal protein encoding genes were found,
which was further confirmed by qPCR (Fig 6A–E, Table EV1). Of
note, VGF, recently shown to promote GSC/DGC survival, was
down-regulated upon MPZ treatment (Wang et al, 2018a) (Figs 6E
and EV3C, Table EV1). In line with a non-transcriptional regulation
of lysosome biogenesis, knockdown of the master regulator of lyso-
somal transcription TFEB (Sardiello et al, 2009) failed to reduce
autophagy signature and CTSD protein up-regulation upon MPZ
treatment (Fig 6F). We thus hypothesized that the observed endo-
lysosomal increase was due to modulation in their translation and/
or RNA metabolism. When translation was blocked with cyclohex-
imide, MPZ failed to increase endo-lysosomal protein amounts
(Fig EV3D). Likewise, RNAseq analysis unveiled putative changes
in translation (peptide chain elongation, ribosome, co-translational
protein targeting, 30-UTR mediated translational regulation), RNA
biology (influenza viral RNA, nonsense mediated decay), metabo-
lism (respiratory electron transport, ATP synthesis, oxidative
phosphorylation, respiratory electron transport), and an mTOR
signature (referred as Bilanges serum and rapamycin-sensitive
genes) (Fig 6C and D). Because mTOR sustains GSC expansion and
its activation is linked to lysosomal biogenesis (Yu et al, 2010;
Galan-Moya et al, 2011; Settembre et al, 2012), we further explored
this possibility. Notably, MALT1 activity has been shown to partici-
pate in mTOR activation upon antigen receptor engagement,
although the mechanism of action remains poorly understood
(Hamilton et al, 2014; Nakaya et al, 2014). In fact, MPZ and
phenothiazine pharmacological challenge, as well as MALT1 siRNA
blunted mTOR activation in GSCs, as evaluated through the phos-
phorylation of AKT, p70S6K, and S6 ribosomal protein (Figs 6G–Iand EV3E). MPZ treatment also reduced inhibitory phosphorylation
of autophagy regulator ULK1 at serine 757 (Fig 6G), which may
partially account for increased autophagic features upon MPZ treat-
ment. In addition, the enforced expression of protease-dead MALT1
(C464A) reduced S6 phosphorylation levels, reiterating the impor-
tance of MALT1 catalytic activity in the observed phenotype
(Fig 6J). Furthermore, as phosphorylation of 4EBP1 increases
protein translation by releasing it from EIF4E (Gingras et al, 1998),
and as it can be resistant to mTOR inhibition (Qin et al, 2016), we
evaluated 4EBP1 phosphorylation levels over time in response to
MPZ (Fig EV3F). Although reduced shortly upon MPZ addition,
phosphorylation returned at later time points, which may allow for
the observed translational effect despite mTOR inhibition. As
mTOR signaling is intimately linked to lysosomes (Korolchuk et al,
◀ Figure 3. MALT1 is active in GSCs.
A Total protein lysates from GSCs #1 and #9 challenged with TNFa (10 ng/ml, for the indicated times) were analyzed by Western blot for p-IjBa, IjBa, and p-JNK.Total JNK and GAPDH served as loading controls.
B Western blot analysis of p65, cREL, and RELB in cytosolic (cyt) and nuclear (nuc) cell fractionation from GSC#1 and GSC#9 stimulated with TNFa (10 ng/ml, for theindicated times). TUBULIN and PARP served as controls for each fraction.
C Jurkat T cells, GSC#1, and GSC#9 were stimulated with PMA (20 ng/ml) and ionomycin (Iono, 300 ng/ml) for 30 min. Total protein lysates were analyzed by Westernblot for CYLD (full length, FL, and cleaved, c’d), HOIL1 (full length, FL, and cleaved, c’d), p-IjBa and IjBa. MALT1 and BCL10 served as loading controls.
D Jurkat T cells, GSC#1, and GSC#9 were treated with vehicle (DMSO) and mepazine (MPZ, 20 lM) for 4 h. PMA/ionomycin mixture was also administered to Jurkatcells for the last 30 min. Total protein lysates were analyzed by Western blot for CYLD (full length, FL, and cleaved, c’d). MALT1 served as a loading control.
E Western blot analysis of CYLD (full length, FL, and cleaved, c’d) and MALT1 in total protein lysates from GSC#9 transfected with non-silencing RNA duplexes (sic) orMALT1 targeting duplexes (siMALT1). GAPDH served as a loading control. Densitometric analysis of c’d CYLD/FL CYLD was performed (right). Data are presented as themean ! SEM on five independent experiments.
F (Left) Western blot analysis of CYLD, ROQUIN1/2, MALT1, and BCL10 in total protein lysates from GSC#9 treated for 4 h with vehicle (H2O) or Z-VRPR-FMK (75 lM).GAPDH served as a loading control. (Right) Densitometric analysis of c’d/FL was performed for ROQUIN1/2 and CYLD. Data are presented as the mean ! SEM onthree independent experiments.
G Schematic drawing of MALT1 structures highlighting the C464A substitution in the protease-dead version. DD: death domain, C-like D: caspase-like domain,Ig: immunoglobulin domain.
H Western blot analysis of CYLD and FLAG in total protein lysates from GSC#9 transfected with WT or C464A MALT1-FLAG. GAPDH served as a loading control.I Western blot of CYLD (full length, FL, and cleaved, c’d) in total protein lysates from GSC#9 after refreshing the medium (+), as compared to 3-day-old culture (").
GAPDH served as a loading control. Densitometric analysis of c’d/FL CYLD was performed. Data are presented as the mean ! SEM on five independent experiments.J Western blot analysis of CYLD (full length, FL, and cleaved, c’d) in total protein lysates from GSC#9 transfected with non-silencing RNA duplexes (sic) or CARD10
targeting duplexes (siCARD10 seq#1, seq#2, and seq#3). GAPDH served as a loading control. qPCR analysis confirmed the knockdown of CARD10 in GSC#9. Data arepresented as the mean ! SEM on three independent experiments.
K Western blot analysis of CYLD and BCL10 in total protein lysates from GSC#9 transfected with non-silencing RNA duplexes (sic) or BCL10 targeting duplexes (siBCL10,seq#1, and seq#3). GAPDH served as a loading control. Cell viability was measured using Cell TiterGlo luminescent assay in sic and seq#1 siBCL10-transfected cells.Data were normalized to their respective sic-treated controls and are presented as the mean ! SEM of three independent experiments, in triplicate.
Data information: All data are representative of n = 3, unless specified. Statistics were performed using a two-tailed t-test with a 95% confidence interval. *P < 0.05,**P < 0.01, ***P < 0.001.
Source data are available online for this figure.
8 of 21 The EMBO Journal e102030 | 2019 ª 2019 The Authors
The EMBO Journal Kathryn A Jacobs et al

Second Publication
113
2011), we explored the impact of MPZ treatment on mTOR
positioning. Confocal microscopy analysis revealed that mTOR
staining no longer colocalized with LAMP2-positive structures upon
treatment with MPZ (Figs 6K and EV3G). Interestingly, TFEB
silencing did not influence mTOR recruitment at endo-lysosomes
(Fig EV3H). Conversely, mTOR staining appears dispersed from
LAMP2 puncta upon Z-VRPR-FMK, phenothiazines treatment, or
knockdown of MALT1 (Fig 6K). These results suggest that MALT1
affects lysosomal homeostasis post-transcriptionally, and that the
increase in endo-lysosomes coincides with weakening of the mTOR
signaling, which may be due to displacement of mTOR from its
lysosomal signaling hub.
A B LAMP2/DAPI
Golgi
lysososome
mit
MVB
MPZ
nuc
Golgi
mit
clathrin pit glycogen
granules lysosome
MVB
DMSO
ER C
LAMP2CTSD
MALT1
siMALT1 - +
-25 -100 -120
-35
-100
GAPDH
0 1h 2h 4h 6h
-100
LAMP2CTSD
MALT1 GAPDH
-25 -100
-35
0 20 40 60
LAM
P2 In
t. (A
U)
80
LAM
P2 In
t. (A
U)
F
LAM
P2/D
API
vehicle
MPZ
LAMP2 GAPDH -35
-100 -120
GSC#9 Xenografts
MPZ
DMSO MPZ
Lyso
track
erD
API
0 10 20
30
DMSO MPZ Lyso
som
e/C
ell
***
20 0
40 60 80
DMSO
Int.
(AU
) ***
MPZ
G H2O VRPR
Lyso
track
erD
API
sic siMALT1
Lyso
track
erD
API
Int.
(AU
)
siMALT1sic0
50
100
150 ***
Int.
(AU
)
VRPRH2O0
10 20 30
*** 40
***
0 50
100 150 200
H20 VRPR0
20 40 60 80 ***
DMSO MPZ
D
E
sic siMALT1
LAM
P2 In
t. (A
U)
GSC#9
VRPR
H
2O
sic
siM
ALT1
GSC#9
GSC
#9
GSC#9:
GSC#9
***
GSC#9
GSC#9
GSC#1 GSC#4 GSC#12
MPZ
D
MSO
GSC#9
sic
siBC
L10
* *
* *
* * *
vacuole *
LAMP2 GAPDH -35
-100 -120
LAM
P2/D
API
GSC#9 WT
C464A
Lyso
track
er/F
LAG
/DAP
I
Figure 4.
ª 2019 The Authors The EMBO Journal e102030 | 2019 9 of 21
Kathryn A Jacobs et al The EMBO Journal

Second Publication
114
MALT1 is negatively linked to the endo-lysosomal regulator QKI
Shinghu et al recently demonstrated that the RNA-binding protein
Quaking (QKI) regulates endo-lysosomal levels in GBM. They
showed that GBM-initiating cells maintain low levels of endo-lyso-
somal trafficking in order to reduce receptor recycling (Shingu et al,
2016). QKI was suggested to regulate RNA homeostasis of endo-
lysosome elements, independently of the TFEB-driven endo-lyso-
some biogenesis. TCGA analysis confirmed the prognosis value of
QKI expression in GBM, as patients with higher expression of QKI
had a slight survival advantage (Fig 7A). As our data suggest a
counterbalancing role of MALT1 in lysosomal biogenesis, we revis-
ited the TCGA and compared the expression of MALT1 with that of
QKI in GBM patients. Interestingly, there was a negative correlation
between the levels of expression of the two genes (Fig 7A). In addi-
tion, QKI and MALT1 were both linked to the expression of 7
common lysosomal lumen genes (Fig 7A). This prompted us to
examine QKI pattern in GBM. First, QKI was indeed expressed in a
panel of GSCs, as well as in ectopic xenografts (Fig EV4A). Simi-
larly, human GBM samples from two patients showed pervasive
QKI staining (Fig EV4B). As expected (Wu et al, 1999), QKI
displayed cytosolic and nuclear forms, as evidenced by cellular frac-
tionation and immunofluorescence (Fig EV4C and D). Given these
findings, we decided to explore the possible link between MALT1
and QKI in GSCs. Co-immunoprecipitation experiments were thus
deployed using QKI and the MALT1 binding partner BCL10 as baits.
This showed that MALT1 was pulled down with QKI in GSC#1 and
GSC#9, and vice versa (Fig 7B). Because MALT1 appeared excluded
from nuclear fractions, the QKI/MALT1 interaction most likely
occurs in the cytosol (Fig EV4C). Binding was, however, reduced in
cells exposed to MPZ or Z-VRPR-FMK (Fig 7C). This suggests that
active MALT1 tethered QKI in GSCs, while blocking MALT1
unleashed a fraction of QKI from the BCL10/MALT1 complex. Of
note, QKI and MALT1 readily interacted in HBL1 ABC DLBCL
lymphoma cells with constitutive MALT1 activation (Fig EV4E).
To next challenge the function of this putative neutralizing inter-
action of MALT1 and QKI, QKI expression was manipulated to alter
QKI/MALT1 stoichiometry in GSCs. Strikingly, transient
overexpression of QKI phenocopied the effect of MALT1 inhibition
on endo-lysosomes. Reinforcing pioneer findings of QKI action on
endo-lysosome components in transformed neural progenitors
(Shingu et al, 2016), ectopically expressed QKI was sufficient to
increase Lysotracker staining, LAMP2 protein amount and lipidated
LC3B (Fig 7D–F). Accordingly, the augmented endo-lysosome stain-
ing synchronized with mTOR dispersion from a focalized organiza-
tion, together with a decrease in the level of S6 phosphorylation
(Fig 7G and H). Corroborating the surge of endo-lysosomes, the
fraction of cells overexpressing QKI was drastically reduced over
time, while the fraction of cells expressing an empty vector
remained stable, suggesting that exacerbated QKI expression
hampered cell viability (Fig 7I). Conversely, cells knocked down for
QKI did not show the same MPZ-driven increase in LAMP2, CTSD,
and lipidated LC3B (LC3B-II), suggesting that QKI knockdown can
partially rescue cells from endo-lysosomal increase (Fig 7J and K).
Reinforcing this idea, the dissipation of mTOR staining from endo-
lysosomes and the reduction of S6 protein phosphorylation both
provoked upon MPZ treatment were no longer observed without
QKI (Fig 7K and L). Finally, double knockdown of QKI and MALT1
rescued cells from decreased proliferation and increased cell death
triggered by MALT1 depletion (Figs 7M and N, and EV4F). Thus,
QKI silencing rescued phenotype upon MALT1 inhibition or knock-
down, further indicating that MALT1 is negatively linked to the
endo-lysosomal regulator QKI.
Discussion
Here, we provide evidence that the activity of the paracaspase
MALT1 is decisive for growth and survival of GBM cells. Our data
indicate that MALT1 inhibition causes indiscipline of endo-lyso-
somal and autophagic proteins, which appears to occur in conjunc-
tion with a deficit in mTOR signaling. In addition to the known
MALT1 inhibitor mepazine (Nagel et al, 2012), we show that
several other clinically relevant phenothiazines can potently
suppress MALT1 enzymatic activity and have similar effects to MPZ
on endo-lysosomes and cell death in GSCs. Our data with MALT1
◀ Figure 4. MALT1 pharmacological inhibition alters endo-lysosome homeostasis.
A Transmission electron microscopy of GSC#9 treated with vehicle (DMSO) or MPZ (20 lM) for 16 h. ER: endoplasmic reticulum; MVB: multivesicular bodies; lys:lysosome; mit: mitochondria; nuc: nucleus. Red stars denote lysosomes; blue stars vacuoles.
B Confocal analysis of LAMP2 staining (red) at 0, 1, 2, 4, and 6 h post-MPZ (20 lM) treatment. Nuclei (DAPI) are shown in blue. Scale bar: 10 lm.C Western blot analysis was performed in total protein lysates from GSC#9 transfected with non-silencing duplexes (sic) or MALT1 targeting siRNA duplexes (siMALT1).
Alternatively, Western blot analysis of LAMP2, CTSD, and MALT1 was done in total protein lysates from GSC#9 treated for 16 h with MPZ (20 lM) or Z-VRPR-FMK(75 lM). DMSO was used as vehicle. GAPDH served as a loading control.
D Confocal analysis of LAMP2 staining (red) in GSCs #1, #4, #12 treated for 16 h with vehicle (DMSO) or MPZ (20 lM). Alternatively, GSC#9 were either treated for16 h with H2O or Z-VRPR-FMK (75 lM). Additionally, cells were transfected with non-silencing duplexes (sic) or MALT1 and BCL10 targeting siRNA duplexes (siMALT1and siBCL10). Alternatively, lysotracker staining (red) was used to track for lysosomes in either GSC#9 expressing either wild-type (WT) or C464A FLAG-MALT1 (green).Scale bar: 10 lm.
E Quantification of LAMP2 staining pixel intensity on GSC#9 treated as described in panel (D). Data are presented as the mean ! SEM on three independentexperiments. Each dot represents one cell. n > 30.
F Cryosections from GSC#9-xenografted tumors in vehicle and MPZ-challenged animals (as described in Fig 2J) and assessed for LAMP2 staining (green). Nuclei (DAPI)are shown in blue. Scale bar: 10 lm. Western blot analysis of LAMP2 was performed in tumor lysates. GAPDH served as a loading control.
G Confocal analysis of lysotracker staining (red) in GSC#9 treated for 16 h with vehicle (DMSO) or MPZ (20 lM). Alternatively, GSC#9 were either treated for 16 h withH2O or Z-VRPR-FMK (75 lM) (upper panel) or transfected with sic and siMALT1 (bottom panel). As indicated, number of lysotracker-positive puncta and lysotrackerpixel intensity (arbitrary unit, AU) were quantified per cell. Data are presented as the mean ! SEM on three independent experiments. Each dot represents one cell.n > 30. Nuclei (DAPI) are shown in blue. Scale bars: 10 lm.
Data information: All data are representative of n = 3, unless specified. Statistics were performed using a two-tailed t-test with a 95% confidence interval. ***P < 0.001.
Source data are available online for this figure.
10 of 21 The EMBO Journal e102030 | 2019 ª 2019 The Authors
The EMBO Journal Kathryn A Jacobs et al

Second Publication
115
% o
f Max
6080
100
0
4020
6080
0
4020
100
0
50
100
Viab
leC
ells
(%)
DM
SO Baf
Pep
Cts
i
Baf+
Pep
Baf+
Cts
i
Pep+
Cts
i
**
*** *** ***
*** ***
150
A
H
BDMSO MPZDMSO 4H
MPZ 4H
GSC#9: LAMP2/LC3/DAPI
DMSO 16H
MPZ 16H
GAPDH -35
-20-10
MPZ 0 2 4 6 16 (h)
P62GAPDH -35
-55
0
2
4
6
8
DMSO MPZ
(DST
Cng
/mL) **
F G
D
DMSOMPZ
0
50
100
150
Viab
le C
ells
(%)
0 5 10 20 40MPZ (µM)
DMSOQVD
GSC#1
DMSOQVD
GSC#9
ns ns
ns
ns
nsns ns ns ns
ns
sic siMALT1
**
0
2
4
6
8
LC3
(WT/
mut
ant)
0204060
100
DMSOMPZ
80**
GSC#9
GSC#9 GSC#9GSC#9
-37
-100-15-10
LC3B-ILC3B-IIGAPDH
MALT1CQ
siMALT1
GSC#1 GSC#9
LAM
P2
GSC#9: super-resolution 3D view
LC3
mer
gezo
om
Int.
(AU
)
siMALT1sic0
50100150200250 ***
DMSO MPZ
sic siMALT1
GSC#9: P62
Int.
(AU
)
VRPRH200
50100150200250 * H2O VRPR
Int.
(AU
)
050
100150200250
MPZDMSO
***
I J
C
E
GSC#9: LC3B/DAPID
MSO
MPZ
DMSO CQ
PI P
ositi
ve C
ells
(nor
mal
ized
to D
MSO
)
0123
54
MPZ
DMSOQVD
GSC#9
ns
ns
DM
SO Baf
Baf+
Pep
Baf+
Cts
i
PI P
ositi
ve C
ells
(nor
mal
ized
to D
MSO
)
0123
54
6
*ns
ns
***
PI
DMSO MPZ
+DMSO
+QVD
104
102
101
103
100
LC3B-ILC3B-II
- - + + - - + +- + - + - + - +
- +- +
Figure 5.
ª 2019 The Authors The EMBO Journal e102030 | 2019 11 of 21
Kathryn A Jacobs et al The EMBO Journal

Second Publication
116
and BCL10 silencing, as well as the expression of catalytically dead
MALT1, clearly support a role for MALT1 in maintaining the endo-
lysosomal homeostasis in GSCs. Although pharmacological inhibi-
tors largely recapitulated the phenotype obtained with molecular
interference, nonselective action of drugs remains of concern when
it comes to clinics. Indeed, because some of the less potent MALT1
inhibitors, such as promethazine (Nagel et al, 2012; Schlauderer
et al, 2013), also provoke changes LAMP2 and LC3B-II increase, we
cannot exclude that some of the lysosomal effects of phenothiazine
derivatives result from potential off-target accumulation in the lyso-
some. Likewise, it has been shown that Z-VRPR-FMK can efficiently
inhibit cathepsin B (Eitelhuber et al, 2015). Nevertheless, since
these drugs efficiently cross the blood–brain barrier in humans
(Korth et al, 2001) and since they are currently used in the clinic,
they represent an exciting opportunity for drug repurposing.
The disruption of endo-lysosomal homeostasis appears to be the
main cause of death upon MALT1 inhibition in GSCs. This is aligned
with recent findings that define lysosomes as an Achilles’ heel of
GBM cells (Shingu et al, 2016; Le Joncour et al, 2019). As CTSD
release is accelerated upon MALT1 blockade, and as inhibitors of
lysosomal cathepsins (cathepsin inhibitor 1 and pepstatin A), but
not pan-caspase blockade (QVD), can partially rescue cell viability,
we hypothesize that cells may be dying from a form of caspase-inde-
pendent lysosomal cell death (LCD) (Aits & Jaattela, 2013). During
this form of death, which may also be initiated by cathepsins, lyso-
somal membrane permeabilization (LMP) allows cathepsins to act
as downstream mediators of cell death upon leakage into the cytosol
(Aits & Jaattela, 2013). Additional studies will determine how
exactly MALT1 inhibition drives lysosomal death in GSCs.
Nevertheless, we found that inhibition of cathepsins provides only
partial protection to cells treated with MPZ (Fig 4K). Autophagic
features may also play a part in cell death. Induction of autophagy
likely occurs due to reduced inhibition of ULK1 (Fig 6G) as a conse-
quence of mTOR dispersion from endo-lysosomes (Yu et al, 2010;
Settembre et al, 2012) (Fig 6K). Whether inducing or blocking
autophagy is preferable therapeutic strategy in treating GBM
remains up for debate, with some groups reporting beneficial effects
of blocking autophagy, and others preferring its activation as a ther-
apeutic strategy (Shchors et al, 2015; Rahim et al, 2017). Here, we
show that the observed increased autophagic features are associated
with reduced autophagic flux. Impairment in autophagic flux
reduces a cell’s ability for bulk degradation (Loos et al, 2014).
Others have shown that lysosomal dysfunction, such as LMP, can
impede upon autophagic flux and eventually lead to cell death
(Elrick & Lieberman, 2013; Wang et al, 2018b). Because of this, we
infer that reduced autophagic flux is a downstream consequence of
LMP and ultimately contributes to LCD in our cells.
MALT1 has previously been linked to mTOR activity (Hamilton
et al, 2014; Nakaya et al, 2014). For instance, MALT1 was reported
to be necessary for glutamine uptake and mTOR activation after T-
cell receptor engagement (Nakaya et al, 2014). Subsequently, the
inhibition of MALT1 with Z-VRPR-FMK causes a reduction in the
phosphorylation of S6 and p70S6K (Hamilton et al, 2014). Our data
now extend these findings to GSCs, although the exact mechanism
by which mTORC1 inhibition occurs remains to be explored in both
cellular backgrounds. Immunofluorescence analysis of mTOR posi-
tioning after MPZ treatment suggests that inhibition of mTOR is
linked to its dispersion from the endo-lysosomes, concurrent with
◀ Figure 5. MALT1 inhibition induces autophagic features in GSCs.
A (Left) Confocal analysis of LAMP2 (red) and LC3B (green) in GSC#9 treated for 4 and 16 h with vehicle (DMSO) and MPZ (20 lM). Nuclei (DAPI) are shown in blue.Scale bars: 10 lm. (Right) Super-resolution imaging (SIM, Structured Illumination Microscopy) of LAMP2 (red) and LC3B (green) staining in GSC#9 treated for 16 hwith vehicle (DMSO) or MPZ (20 lM).
B Western blot analysis of LC3B and P62 in total protein lysates from GSC#9 at 0, 2, 4, 6, and 16 h post-MPZ treatment (20 lM). GAPDH served as a loading control.C Western blot analysis of LC3B in total protein lysates from GSCs #1 and #9 at 72 h post-transfection with sic or siMALT1 and subsequently treated 4 h with vehicle
(DMSO) or chloroquine (CQ, 20 lM). Knockdown was verified by MALT1 blotting and GAPDH served as a loading control.D Confocal analysis of LC3B (green) in GSC#9 treated for 16 h with vehicle (DMSO) and MPZ (20 lM) with or without chloroquine (CQ, 20 lM). Nuclei (DAPI) are shown
in blue. Scale bars: 10 lm.E GSC#9 were transfected with LC3B reporters (wild-type WT or G120A mutant, which cannot be lipidated), treated 24 h later with vehicle (DMSO) or MPZ (20 lM) for
6 more hours. Ratios of WT/mutant luciferase signals are presented as the mean ! SEM of three independent experiments.F Confocal analysis of P62 staining (red) in GSC#9 treated for 16 h with vehicle (DMSO) or MPZ (20 lM). Alternatively, GSC#9 was either transfected with sic or
siMALT1 (middle) or treated for 16 h with H2O or Z-VRPR-FMK (75 lM) (bottom). Quantification of P62 staining pixel intensity on GSC#9 treated for 16 h with vehicle(DMSO or H2O), MPZ (20 lM) or Z-VRPR-FMK (75 lM) or sic and siMALT1. Data are presented as the mean ! SEM on three independent experiments. Each dotrepresents one cell. n > 30.
G Cell viability was measuring using Cell TiterGlo in GSCs #1 and #9 pre-treated for 1 h with vehicle (DMSO) or QVD (20 lM) and treated for 72 h more with theindicated doses of MPZ. Data were normalized to the vehicle-treated controls and are presented as the mean ! SEM of 4 independent experiments.
H FACS analysis of propidium iodide (PI) incorporation in GSC#9 treated for 48 h with vehicle (DMSO) or MPZ (15 lM) in combination with QVD (20 lM). (Left)Percentage of PI-positive cells, normalized to vehicle-treated controls are presented as the mean ! SEM on three independent experiments. (Right) Histogram plotsfor representative experiment (DMSO in red and MPZ in blue).
I CTSD ELISA was performed on culture media from GSC#9 treated for 8 h with vehicle (DMSO) or MPZ (20 lM). Alternatively, cells were transfected with sic orsiMALT1 and analyzed 72 h later. Data are presented as the mean ! SEM of three independent experiments.
J (Left) Cell viability was measured using Cell TiterGlo luminescent assay in GSC#9 treated for 48 h with vehicle (DMSO) or MPZ (10 lM), following a 30-min pre-treatment with the following drugs: Bafilomycin A1 (Baf, 100 nM), pepstatin A (Pep, 1 lg/ml), or CTS inhibitor 1 (Ctsi, 1 lM). Data were normalized to the vehicle-treated controls and are presented as the mean ! SEM of three independent experiments in triplicate, stars refer to comparison to vehicle + MPZ group (bluesquares). (Right) FACS analysis of propidium iodide (PI) incorporation in GSC#9 treated for 48 h with vehicle (DMSO) or MPZ (15 lM) in combination with Baf, Pep,and Ctsi. Percentage of PI-positive cells normalized to vehicle-treated controls are presented as the mean ! SEM on three independent experiments.
Data Information: All data are representative of n = 3, unless specified. Statistics were performed using a two-tailed t-test with a 95% confidence interval for allexperiments with P-values stated, except panel (G, H, J), which used a two-way ANOVA with Bonferroni post-test at 95% confidence interval. *P < 0.05, **P < 0.01,***P < 0.001.
Source data are available online for this figure.
12 of 21 The EMBO Journal e102030 | 2019 ª 2019 The Authors
The EMBO Journal Kathryn A Jacobs et al
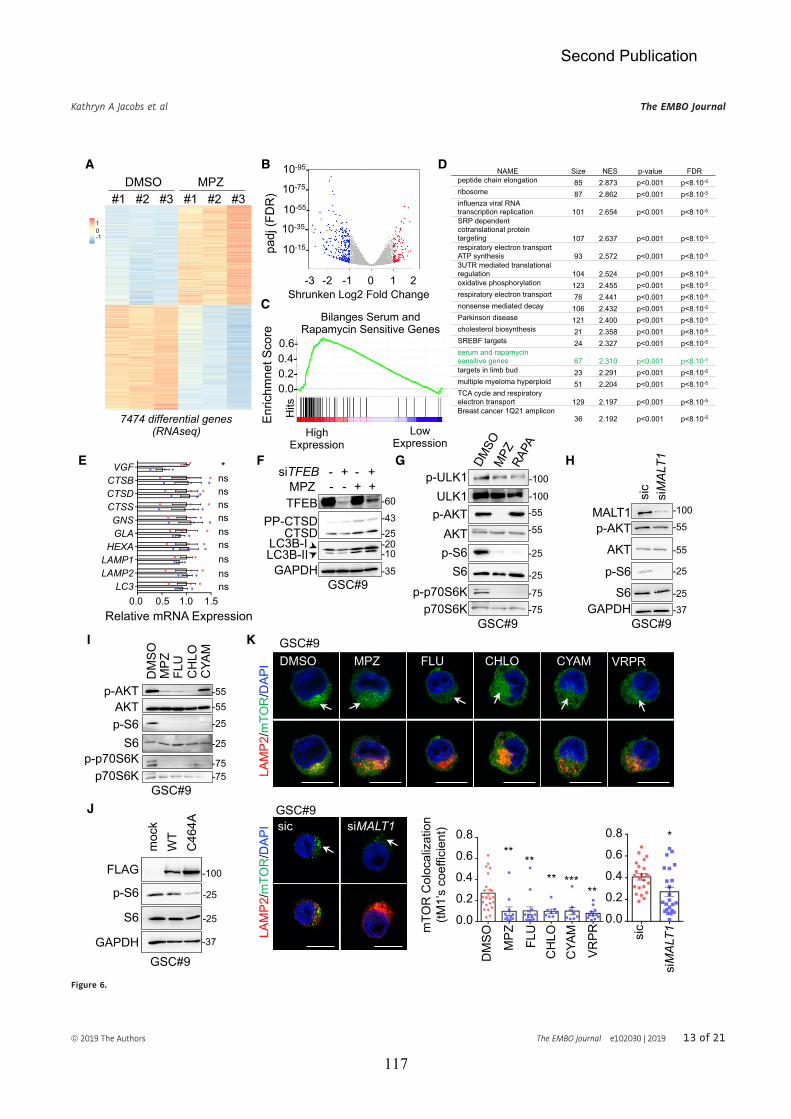
Second Publication
117
A
#1 #2 #3 #1 #2 #3DMSO MPZ
7474 differential genes (RNAseq)
B
C
10-1
Shrunken Log2 Fold Change
padj
(FD
R)
10-15-
-3 -2 -1 0 1 2
0.6-0.4-0.2-0.0-
Enric
hmne
t Sco
re
Hits
High Expression
Low Expression
DNAME Size NES p-value FDR
peptide chain elongation 85 2.873 p<0.001 p<8.10-5
ribosome 87 2.862 p<0.001 p<8.10-5
influenza viral RNA transcription replication 101 2.654 p<0.001 p<8.10-5
SRP dependent cotranslational protein targeting 107 2.637 p<0.001 p<8.10-5
respiratory electron transport ATP synthesis 93 2.572 p<0.001 p<8.10-5
3UTR mediated translational regulation 104 2.524 p<0.001 p<8.10-5
oxidative phosphorylation 123 2.455 p<0.001 p<8.10-5
respiratory electron transport 76 2.441 p<0.001 p<8.10-5
nonsense mediated decay 106 2.432 p<0.001 p<8.10-5
Parkinson disease 121 2.400 p<0.001 p<8.10-5
cholesterol biosynthesis 21 2.358 p<0.001 p<8.10-5
SREBF targets 24 2.327 p<0.001 p<8.10-5
serum and rapamycin sensitive genes 67 2.310 p<0.001 p<8.10-5
targets in limb bud 23 2.291 p<0.001 p<8.10-5
multiple myeloma hyperploid 51 2.204 p<0.001 p<8.10-5
TCA cycle and respiratory electron transport 129 2.197 p<0.001 p<8.10-5
Breast cancer 1Q21 amplicon 36 2.192 p<0.001 p<8.10-5
Bilanges Serum and Rapamycin Sensitive Genes
HF G
p-p70S6K
p-S6 -25
p-AKT -55
DM
SO
MPZ
FL
U
CH
LO
CYA
M
S6 -25
AKT -55
p70S6K -75 -75
K I
p-ULK1
p-AKT -55
p-S6 -25
AKT -55
S6 -25
p-p70S6K p70S6K
-75 -75
ECTSB CTSD CTSS GNS GLA
HEXA LAMP1 LAMP2
LC3 0.5 0.0 1.0 1.5
Relative mRNA Expression
ns ns ns ns ns ns ns ns ns
VGF *
PP-CTSD
MPZ siTFEB -100
-100
sic
siM
ALT1
p-S6
AKT
S6
p-AKT
GAPDH
-55
-55
-25
-25 -37
MALT1
J
GSC#9 GSC#9
GAPDH
TFEB
-20 -10
-60
CTSD -25
-35
-43
GSC#9
GSC#9
VRPR
LAM
P2/m
TOR
/DAP
I DMSO MPZ FLU CHLO CYAMGSC#9
0.0 0.2 0.4 0.6 0.8
DM
SO
MPZ
FLU
C
HLO
C
YAM
VRPR
mTO
RC
oloc
aliz
atio
n
** **
** *** **
0.0 0.2 0.4 0.6 0.8
sic
siM
ALT1
*
LAM
P2/m
TOR
/DAP
I
GSC#9 sic siMALT1
10-55-
10-75-
10-35-
10-95-
LC3B-I LC3B-II
-100 ULK1
GSC#9
p-S6
S6
GAPDH
FLAG
-25
-25
-100
-37
WT
C46
4A
moc
k
- + - + - - + +
Figure 6.
ª 2019 The Authors The EMBO Journal e102030 | 2019 13 of 21
Kathryn A Jacobs et al The EMBO Journal

Second Publication
118
◀ Figure 6. MALT1 modulates the lysosomal mTOR signaling pathway.
A Heatmap of differentially expressed genes obtained from RNAseq analysis of GSC#9 treated for 4 h with vehicle (DMSO) or MPZ (20 lM), from three biologicalreplicates.
B Volcano plot of differentially expressed genes in RNAseq analysis of GSC#9, expressed as fold changes between vehicle (DMSO) and MPZ-treated cells.C GSEA (gene set enrichment analysis) plot showing enrichment of “Bilanges serum and rapamycin sensitive genes” signature in vehicle (DMSO) versus MPZ-treated
triplicates.D Table of top differential pathways in DMSO versus MPZ-treated triplicates. Size of each pathway, normalized enrichment scores (NES), P-value, and false discovery
rate q value (FDR) were indicated.E qRT–PCR was performed on total RNA from GSC#9 treated for 4 h with vehicle (DMSO) or MPZ (20 lM). Histograms showed changes in RNA expression of indicated
targets. Data were normalized to two housekeeping genes (ACTB, HPRT1) and are presented as the mean ! SEM of technical triplicates.F Western blot analysis of LC3B, CTSD, and TFEB in total protein lysates from GSC#9 transfected with non-silencing duplexes (sic) or siRNA duplexes targeting TFEB
(siTFEB) and treated with vehicle (DMSO) or MPZ (20 lM) for 16 h. GAPDH served as a loading control.G Western blot analysis of p-ULK1, p-AKT, p-S6, and p-p70S6K in GSC#9 treated for 1 h with MPZ (20 lM) or rapamycin (RAPA, 50 nM). Total ULK, AKT, S6, and p70S6K
served as loading controls. DMSO was used as a vehicle.H Western blot analysis of MALT1, p-AKT, and p-S6 in total protein lysates from GSC#9 transfected with non-silencing duplexes (sic) or MALT1 targeting siRNA duplexes
(siMALT1). Total AKT and S6, as well as GAPDH served as loading controls.I Western blot analysis of p-AKT, p-S6, and p-p70S6K in total protein lysates from GSC#9 treated for 1 h with vehicle (DMSO) or 20 lM of phenothiazine compounds
(MPZ, FLU, CHLO, and CYAM). Total AKT, total S6, and total p70S6K served as loading controls.J Western blot analysis of p-S6 and FLAG in GSC#9 expressing WT or C464A MALT-FLAG. Total S6 and GAPDH served as loading controls.K Confocal analysis of LAMP2 (red) and mTOR (green) staining in GSC#9 treated with vehicle (DMSO) or MPZ (20 lM), Z-VRPR-FMK (75 lM), FLU (20 lM), CHLO
(20 lM), and CYAM (20 lM). Alternatively, cells were transfected with sic or siMALT1. Nuclei (DAPI) are shown in blue. Arrows point to LAMP2-positive area. Scalebars: 10 lm. Quantification of mTOR colocalization score with LAMP2 is shown. The Coloc2 plug-in from ImageJ was used to measure Mander’s tM1 correlationfactor in LAMP2-positive ROI, using Costes threshold regression. Data are presented as the mean ! SEM on three independent experiments. Each dot represents onecell. n > 10.
Data information: All data are representative of n = 3, unless specified. Statistics were performed using a two-tailed t-test with a 95% confidence interval for allexperiments with P-values stated. *P < 0.05, **P < 0.01, ***P < 0.001.
Source data are available online for this figure.
▸Figure 7. MALT1 is negatively linked to the endo-lysosomal regulator QKI.
A (Left) Kaplan–Meier curve of the probability of survival for 155 GBM patients with low or high QKI RNA level, using median cutoff, based on the TCGA RNAseq dataset.(Right) Differential expression analysis related to either MALT1 or QKI expression highlighted a lysosomal lumen GO function. Venn diagram of overlapping lysosomalenriched protein encoding genes from this comparison showed 7 shared genes, together with 9 and 10 specific genes for MALT1 and QKI expression, respectively.(Bottom) Correlation between MALT1 and QKI expression was analyzed using The Cancer Genome Atlas (TCGA, HG-U133A dataset) on the GlioVis platform (Bowmanet al, 2007). Pearson correlation factor = "0.21, P-value = 0.03.
B GSCs #1 and #9 protein lysates (input) were processed for immunoprecipitation (IP) using control immunoglobulins (Ig), anti-QKI, or anti-BCL10 antibodies. Inputand IP fractions were separated on SDS–PAGE and Western blots for MALT1, QKI, and BCL10 antibodies were performed as specified.
C Total protein lysates (input) from GSC#9 treated with vehicle (-, DMSO) or MPZ (+, 20 lM, 1 h) or with vehicle (-, H2O) or Z-VRPR-FMK (+, 75 lM, 4 h), wereprocessed for control immunoglobulins (Ig) or anti-QKI antibodies immunoprecipitation (IP). Western blots were performed with indicated antibodies. Western blotswere performed with indicated antibodies.
D Confocal analysis of Lysotracker (green) or FLAG (red) in GSC#9 overexpressing either empty vector (mock) or FLAG-QKI. Scale bars: 10 lm. Nuclei (DAPI) are shown inblue.
E Confocal analysis of LAMP2 (green) or FLAG (red) in GSC#9 transfected with either empty vector (mock) or FLAG-QKI. Scale bars: 10 lm. Nuclei (DAPI) are shown inblue. Quantification of LAMP2 staining pixel intensity on GSC#9 transfected with mock and FLAG-QKI. Data are presented as the mean ! SEM on three independentexperiments. Each dot represents one cell. n > 15.
F Western blot analysis of QKI, LAMP2, and LC3B in GSC#9 overexpressing either empty vector (mock) or FLAG-QKI. GAPDH served as a loading control.G Confocal analysis of mTOR (green) or FLAG (red) in GSC#9 transfected with either empty vector (mock) or Flag-QKI. Nuclei (DAPI) are shown in blue. Scale bars:
10 lm.H GSC#1 were transfected with either empty vector (mock) or FLAG-QKI. Total protein lysates were processed for Western blots against p-S6 and FLAG. Total S6 served
as a loading control.I Fraction of surviving cells over time in GSCs #1 and #9, transduced with empty vector (mock) or FLAG-QKI bi-cistronic GFP plasmids. Data are plotted as the
percentage of GFP-positive cells at the day of the analysis (Dx), normalized to the starting point (Day 4 post-infection, D4). Data are representative of n = 3.J GSC#9 transfected with non-silencing RNA duplexes (sic) or QKI targeting siRNA duplexes (siQKI) were treated for 16 h with vehicle (DMSO) or MPZ (10 lM). Total
protein lysates were processed for Western blots against LAMP2, CTSD, QKI, and LC3B expression, as indicated. GAPDH served as a loading control.K Confocal analysis of mTOR (green) and LAMP2 (red) in GSC#9 transfected with sic or siQKI and treated for 16 h with vehicle (DMSO) or MPZ (20 lM). Nuclei (DAPI)
are shown in blue. Scale bars: 10 lm. Quantification of mTOR colocalization score with LAMP2 is shown. The Coloc2 plug-in from ImageJ was used to measureMander’s tM1 correlation factor in LAMP2-positive ROI, using Costes threshold regression. Data are presented as the mean ! SEM on three independentexperiments. Each dot represents one cell. n > 10.
L GSC#9 transfected with non-silencing RNA duplexes (sic) or QKI targeting siRNA duplexes (siQKI) were treated for 1 h with vehicle (DMSO) or MPZ (20 lM). Totalprotein lysates were processed for Western blots against QKI and p-S6. TUBULIN and total S6 served as loading controls.
M FACS analysis of EdU staining was performed on GSC#9 cells transfected with non-silencing RNA duplexes (sic, pink), QKI targeting siRNA duplexes (siQKI, lightpurple), MALT1 targeting siRNA duplexes (siMALT1, blue), or double-transfected with siQKI and siMALT1 (purple).
N FACS analysis of propidium iodide (PI) incorporation in GSC#9 transfected with non-silencing RNA duplexes (sic), QKI targeting siRNA duplexes (siQKI), MALT1targeting siRNA duplexes (siMALT1) or double-transfected with siQKI and siMALT1 and analyzed 72 h later. Percentage of PI-positive cells normalized to vehicle-treated controls are presented as the mean ! SEM on three independent experiments.
Data information: All data are representative of n = 3, unless specified. Statistics were performed using a two-tailed t-test with a 95% confidence interval for allexperiments with P-values stated. *P < 0.05.
Source data are available online for this figure.
14 of 21 The EMBO Journal e102030 | 2019 ª 2019 The Authors
The EMBO Journal Kathryn A Jacobs et al

Second Publication
119
0 50 100 150 0
50
100 - High QKI - Low QKI
Prob
abilit
y of
Su
rviv
al (%
)
Time (Months) MALT1
QKI 10 7
CSPG5 NCAN LUM SDC1, 2, 3 BCAN
9
Lysosomal Lumen GO Function
AM
ALT1
4
6
8
6 8 10
Den
sity
0.0 0.2 0.4 0.6DensityQKI
0.000.250.500.75 TCGA, HG-U133A
Pearson correlation factor =-0.21
Pearson pvlaue= 0.03
B
C
BCL1
0
QKI MALT1
BCL10
Ig inpu
t
-35 -100
-35
GSC#9
GSC#1 QKI
MALT1
Ig QKI
in
put
GSC#9
IP
-35 -100
QKI MALT1
-35
-100
D
GSC#9
LAM
P2 In
t. (A
U)
0
40
80
120
mock QKIG
GSC#9: FLAG/Lysotracker/DAPI mock FLAG-QKI
FE
I
MPZ - - + - + -100 -35
IP input
MALT1
Ig QKI
QKI GSC#9
GSC#9: FLAG/mTOR/DAPI mock FLAG-QKI
GSC#9: FLAG/LAMP2/DAPI mock FLAG-QKI
J
0.0 0.2 0.4
0.6
0.8
mTO
RC
oloc
aliz
atio
n
*
MPZ - + - + siQKI - - + +
ns ns
QKI
p-S6
S6
TUBULIN
-37
-25
-25
-55
K
% o
f Max
sic siMALT1 siQKIsiMALT1/QKI
0 -
20 -
40 -
60 -
80 -
100 -
EdU100 101 103 104 102
GSC#9
M N
DMSO MPZ
DMSO MPZ
sic
siQ
KI
GSC#9: LAMP2/mTOR/DAPI
0.0
0.5
1.5
1.0
2.0
Nor
mal
ized
PI
Posi
tive
Cel
ls
*
ns
siMALT1siQKI
L
siQKI - + - +
LAMP2
QKI
GAPDH
-120
-35
-37 -20 -10
-100
LC3B-I LC3B-II
CTSD PP-CTSD
-25 -43
DMSO MPZ
GSC#9
siQKI - + - + DMSO MPZ
H
GSC#1
FLAG p-S6
S6
-37
-25 -25
F-QKI - +
QKI LAMP2 -100
-120 -35
-20 -10
GAPDH -35
LC3B-I LC3B-II
GSC#9
input VRPR - - + - +
MALT1 QKI -35
-100
Ig QKI
GSC#9
IP
- + - + - - + +
IP
* Logrank = 0.0279 + Wilcoxon 0.0862
0
50
100
150
1 2 3 4 Time Post-Infection (days)
- mock- FLAG-QKI Fr
actio
n of
Su
rviv
ing
Cel
ls(D
x/D
4)
4 6 8 10
Figure 7.
ª 2019 The Authors The EMBO Journal e102030 | 2019 15 of 21
Kathryn A Jacobs et al The EMBO Journal

Second Publication
120
lysosomal increase. In addition to a reduction in mTORC1 signaling,
AKT phosphorylation was also impaired upon MALT1 inhibition in
GSCs. It is thus possible that perturbed lysosome positioning might
also influence specific pools of mTORC2 and AKT, as recently
demonstrated (Jia & Bonifacino, 2019). Accordingly, AKT activity
modulated the lysosomal membrane dynamics during autophagy
(Arias et al, 2015). We and others speculate that there may exist
unidentified substrates of MALT1, which link its protease activity
directly to mTOR activation (Juilland & Thome, 2018; Thys et al,
2018). This may also rationalize the need for constitutive MALT1
activity in GSCs, as mTOR is constantly functioning in these cells
(Galan-Moya et al, 2011). Moreover, it was suggested that down-
regulation of lysosomes reduces recycling of receptors, including
EGFR, which allows signaling to continue even in unfavorable niche
where GSCs often reside and/or travel (Shingu et al, 2016). Less
turnover of EGFR may also explain increased mTOR activation
despite lysosomal down-regulation (Li et al, 2016). In addition, AKT
can be central to balance between proliferation and apoptosis, by
integrating multiple signaling networks besides mTOR in GBM. One
hypothesis is that mTOR inhibition and/or dissociation from endo-
lysosomes originate from lack of processing of unknown MALT1
substrates and is then exacerbated once homeostasis is disrupted.
How is QKI involved? Based on our data, we hypothesize that
MALT1 sequesters QKI to prevent it from carrying out its RNA-
binding function. Interestingly, MALT1 is already known to regulate
other RNA-binding proteins Regnase-1/ZC3H12A, Roquin-1/RC3H1,
and Roquin-2/RC3H2 (Uehata et al, 2013; Jeltsch et al, 2014). We
propose that upon MALT1 inhibition QKI is released and free to
bind its RNA-binding partners. QKI has already been shown to bind
directly to lysosomal RNAs in progenitor cells (Shingu et al, 2016).
It is thus tempting to speculate that QKI-dependent stabilization of
lysosomal RNAs would preference the system toward more transla-
tion of these genes upon MALT1 inhibition, leading in turn to
dysregulated endo-lysosomal protein expression and LMP. Indeed,
our RNA-sequencing data suggest changes in translation and RNA
biology upon MPZ treatment; however, further study is needed to
validate whether there is increased QKI binding to lysosomal RNAs
upon MALT1 inhibition. Notably, QKI-dependent lysosomal increase
appears to be a post-transcriptional effect, independent of TFEB. As
such, we propose a method of dual lysosomal control in GSCs
whereby transcriptional biogenesis is tightly checked by known
mTOR/TFEB pathway, and MALT1 acts on post-transcriptional
regulation by isolating QKI from RNAs.
These findings place MALT1 as a new druggable target operating
in non-immune cancer cells and involved in endo-lysosome home-
ostasis. Lysosomal homeostasis appears vital for glioblastoma cell
survival and thus presents an intriguing axis for new therapeutic
strategies in GBM.
Materials and Methods
Ethics statement
Informed consent was obtained from all patients prior to sample
collection for diagnostic purposes. This study was reviewed and
approved by the institutional review boards of Sainte Anne Hospital,
Paris, France, and Laennec Hospital, Nantes, France, and performed
in accordance with the Helsinki Protocol. Animal procedures were
conducted as outlined by the European Convention for the Protec-
tion of Vertebrate Animals used for Experimental and other Scien-
tific Purposes (ETS 123) and approved by the French Government
(APAFIS#2016-2015092917067009).
The Cancer Genome Atlas (TCGA) analysis
The Cancer Genome Atlas (TCGA) was explored via the Gliovis plat-
form (http://gliovis.bioinfo.cnio.es/) (Bowman et al, 2007). RNAseq
databases (155 patients) were used to interrogate data related to
MALT1 and QKI expression (levels of RNA, probability of survival,
correlation with QKI expression). Optimal cutoffs were set. All
subtypes were included and histology was the only selective criteria.
Cell culture, siRNA and DNA transfection, andlentiviral transduction
GBM patient-derived cells with stem-like properties (GSCs) were
isolated as previously described (Treps et al, 2016; Harford-Wright
et al, 2017). GSC#1 (mesenchymal, 68-year-old male), GSC#4 (mes-
enchymal, 76-year-old female), GSC#9 (classical, 68-year-old
female), and GSC#12 (neural, 59-year-old male) were cultured as
spheroids in NS34 medium (DMEM-F12, with N2, G5, and B27
supplements, glutamax, and antibiotics). In order to induce differen-
tiation, GSCs were grown in DMEM with 10% fetal bovine serum
(FBS), glutamax, and antibiotics, for at least 2 weeks. Differentia-
tion of sister cells (DGC) was monitored through their morphology
and NESTIN and/or SOX2 loss of expression. Human brain
microvascular endothelial cells (hCMEC/D3, a gift from PO
Couraud, Institut Cochin, Paris, France) and HEK-293T cells (ATCC)
were cultured as previously described (Treps et al, 2016). Human
fetal astrocytes SVG-p12 (ATCC) and human neuronal-like cells SK-
N-SH (ATCC) were cultured in MEM with 10% fetal bovine serum
(FBS), and antibiotics.
Stealth non-silencing control duplexes (low-GC 12935200, Life
Technologies), and small interfering RNA duplexes (Stealth RNAi,
Life Technologies) were transfected using RNAiMAX lipofectamine
(Life Technologies). The following duplexes targeting the respective
human genes were as follows: CAGCAUUCUGGAUUGGCAAAUGG
AA (MALT1), CCTTGAGTATCCTATTGAACCTAGT (QKI), UCAGAU
GAGAGUAAUUUCUCUGAAA and GGGCUCCUCCUUUGCCACCAGA
UCU (BCL10), CCCUUUGCGUGAAAGCCCAAGAGAU, ACAUCAC
AGGGAGUGUGACACUUAA, and GACAAGGGACCAGAUGGACUG
UCGU (CARD10), AGACGAAGGUUCAACAUCA (TFEB), CCACTCT
GTGAGGAATGCACAGATA (BECN1).
pFRT/FLAG/HA-DEST QKI was purchased from Addgene and
was subsequently cloned into a pCDH1-MSCV-EF1a-GreenPurovector (SBI). pMSCV-MALT1A-WT and pMSCV-MALT1A-E397A
were a gift from Daniel Krappmann (German Research Center for
Environmental Health, Neuherberg, Germany). pMSCV-MALT1A-
WT was subsequently mutated to C464A. Lentiviral GFP-expressing
GIPZ shMALT1 (V2LHS_84221 TATAATAACCCATATACTC and
V3LHS378343 TCTTCTGCAACTTCATCCA) or non-silencing short
hairpin control (shc) was purchased from Open Biosystems. Lentivi-
ral particles were obtained from psPAX2 and pVSVg co-transfected
HEK-293T cells and infected as previously described (Dubois et al,
2014). pFRT/FLAG/HA-DEST QKI was a gift from Thomas Tuschl
16 of 21 The EMBO Journal e102030 | 2019 ª 2019 The Authors
The EMBO Journal Kathryn A Jacobs et al

Second Publication
121
(Landthaler et al, 2008); pRluc-LC3wt and pRluc-LC3BG120A were
a gift from Marja Jaattela (Farkas & Jaattela, 2017). They were intro-
duced in GSCs using Neon electroporation system according to
manufacturer’s instructions (Life technologies).
Antibodies and reagents
Cathepsin inhibitor 1 was purchased from SelleckChem, rapamycin
from Tocris Bioscience, and mepazine from Chembridge. Bafilo-
mycin A1, cycloheximide, chloroquine, phorbol myristate acetate
(PMA), pepstatin A, fluphenazine, cyamemazine, chlorpromazine,
pipotiazine, alimemazine, promethazine, and doxylamine were all
from Sigma-Aldrich. Z-VRPR-FMK was purchased from Enzo Life
Sciences. Q-VD-OPh and tumor necrosis factor-alpha (TNFa) were
obtained from R&D Systems. Ionomycin was purchased from Calbio-
chem. The following primary antibodies were used: NESTIN (Milli-
pore MAB5326), SOX2 (Millipore AB5603), GAPDH (Santa Cruz SC-
25778 and SC-32233), TUBULIN (Santa Cruz SC-8035), MALT1
(Santa Cruz SC-46677), LAMP2 (Santa Cruz SC-18822), BCL10
(Santa Cruz SC-13153), BCL10 (Santa Cruz SC-5273), CYLD (Santa
Cruz SC-137139), HOIL1 (Santa Cruz SC-393754), QKI (Santa Cruz
SC-517305), PARP (Santa Cruz SC-8007), IjBa (CST 9242), p-S32/
S36-IjBa (CST 9246), P62 (CST 5114), P62 (CST 88588), mTOR
(CST 2983), p-S473-AKT (CST 4060), AKT (CST 9272), p-S235/
S236-S6 (CST 2211), p-T183/Y185-JNK (CST 9255), JNK (CST
9258), p-S757-ULK1 (CST 6888), LC3B (CST 3868), p-T37/T46-4E-
BP1 (CST 2855), p-T70-4E-BP1 (CST 9455), p-S65-4E-BP1 (CST
9451), 4E-BP1 (CST 9644), eIF4E (CST 2067), TOM20 (CST 42406),
p-T421/S424-p70S6K (CST 9204), p70S6K (CST 14130), EEA1 (BD
Bioscience 610456), CTSD (BD Bioscience 610800), PEX1 (BD
Bioscience 611719), PECAM (BD Bioscience 557355), TFEB (Bethyl
A303-673A), PDI (Abcam ab2792), GM130 (Abcam ab52649), QKI
(Atlas HPA019123), CTSD (Atlas HPA063001), ULK1 (Sigma
A7481), and FLAG (Sigma F1804). HRP-conjugated secondary anti-
bodies (anti-rabbit, mouse Ig, mouse IgG1, mouse IgG2a, and mouse
IgG2b) were purchased from Southern Biotech. Alexa-conjugated
secondary antibodies were from Life Technologies.
Tumorsphere formation
To analyze tumorsphere formation, GSCs (100/ll) were seeded in
triplicate in NS34 media as previously described (Harford-Wright
et al, 2017). Cells were dissociated manually each day to reduce
aggregation influence and maintained at 37°C 5% CO2 until day 5
(day 4 for siRNA). Tumorspheres per field of view (fov) were calcu-
lated by counting the total number of tumorspheres in 5 random fov
for each well. The mean of each condition was obtained from the
triplicates of three independent experiments.
Limiting dilution assays
In order to evaluate the self-renewal of GSCs, limited dilution assays
(LDA) were performed as previously described (Tropepe et al,
1999). GSCs were plated in a 96-well plate using serial dilution rang-
ing from 2,000 to 1 cell/well with 8 replicates per dilution and
treated as indicated. After 14 days, each well was binarily evaluated
for tumorsphere formation. Stemness frequency was then calculated
using ELDA software (Hu & Smyth, 2009). The mean stemness
frequency for each treatment was calculated by averaging across
two independent experiments.
Cell viability
Cell viability was measured using Cell TiterGlo luminescent cell
viability assay, according to the manufacturers’ protocol. Briefly,
cells were seeded at 5,000 cells per well in triplicate per indicated
treatment. Two days later, 100 ll of Cell TiterGlo reagent was added
to each condition, cells were shaken vigorously, using an orbital
shaker, to aid in their lysis, and then, luminescence was measured
on a FluStar Optima plate reader (BMG).
ELISA
10 × 106 GSCs were cultured with 20 lM MPZ or DMSO and culture
media was collected at 8 h, centrifuged, and filtered. Alternatively,
cells were transfected with sic or siMALT1 and supernatants were
collected on day 3 post-transfection, centrifuged, and filtered.
Human CTSD ELISA (Sigma) was performed on the culture media
according to the manufacturer’s instructions.
Animal procedures
Tumor inoculation was performed on female Balb/C nude mice aged
6–7 weeks, as described previously (Harford-Wright et al, 2017).
Animals were randomly assigned to each group and group-housed
in specific pathogen-free (SPF) conditions at 24°C on a 12-h day–night cycle. At all times, animals were allowed access to standard
rodent pellets and water ad libitum. Mice were subcutaneously
injected in each flank with 106 GSC#9 in 100 ll of PBS and growth
factor-free Matrigel. Once tumors were palpable, mice were injected
intraperitoneally daily with MPZ (8 mg/kg) or vehicle (DMSO) for
two consecutive weeks, based on previous reports (Nagel et al,
2012; McGuire et al, 2014). Tumor size was measured daily during
treatment and for 1 week following treatment withdrawal, with cali-
pers and tumor volume calculated using the following equa-
tion (width2 × length)/2.
Luciferase assays
Rluc-LC3B luciferase assay was performed as previously described
(Farkas & Jaattela, 2017). Briefly, GSC#9 was transfected with 1 lgplasmid using a Neon Transfection System. 24 h later, cells were
treated for 4 h with DMSO or MPZ and then assayed using Dual-Glo
Luciferase assay system according to the manufacturers’ guidelines.
Luminescence was measured on a FluStarOptima plate reader.
Flow cytometry
For EdU analysis, cells we incubated with EdU (10 lM) for 2 h
followed by fixation and Click-it reaction according to the manufac-
turers’ protocol. For propidium iodide (PI) staining, cells were incu-
bated for 15 min at room temperature with PI (100 lg/ml)
following treatment according to manufacturer’s protocol. Flow
cytometry analyses were performed on FACSCalibur (BD Bios-
ciences, Cytocell, SFR Francois Bonamy, Nantes, France) and
processed using FlowJo software.
ª 2019 The Authors The EMBO Journal e102030 | 2019 17 of 21
Kathryn A Jacobs et al The EMBO Journal
Second Publication
122
Immunostaining
After treatment, cells were seeded onto poly-lysine slides, fixed for
10 min with 4% PFA diluted in PBS, permeabilized in 0.04% Triton
X-100, and blocked with PBS–BSA 4% prior to 1 h primary antibody
incubation. After PBS washes, cells were incubated with AlexaFlu-
or-conjugated secondary antibodies for 30 min. Next, cells were
incubated with DAPI for 10 min and mounted with prolong gold
anti-fade mounting medium. For Lysotracker Red DND-99 staining,
cells were incubated with 50 nM Lysotracker during the last 30 min
of treatment, and cells were fixed for 10 min in 4% PFA. To monitor
changes in lysosomal enzyme activity, DQ-ovalbumin assay was
performed, as previously described (Ebner et al, 2018). Cells were
incubated with 10 lg/ml DQ-ovalbumin for 1 h at the end of treat-
ment. Cells were then fixed for 10 min in 4% PFA. For transferrin
uptake assay, following treatment, cells were washed in medium
and incubated with Alexa596-conjugated transferrin (25 lg/ml) for
30 min at 37°C. Cells were then acid-washed for 40 s and fixed for
10 min in 4% PFA. Mouse tissue sections, 7 lm thickness, were
obtained after cryosectioning of xenograft tumor embedded in OCT
(Leica cryostat, SC3M facility, SFR Francois Bonamy, Nantes,
France). Mouse tissue sections and human GBM samples from
patients (IRCNA tumor library IRCNA, CHU Nantes, Integrated
Center for Oncology, ICO, St. Herblain, France) were stained as
followed. Sections were fixed 20 min in 4% PFA, permeabilized
10 min with PBS–Triton 0.2%, and blocked with 4% PBS–BSA 2 h
prior to staining. Primary antibodies were incubated overnight at
4°C. All images were acquired on confocal Nikon A1 Rsi, using a
60× oil-immersion lens (Nikon Excellence Center, MicroPicell, SFR
Francois Bonamy, Nantes, France). Structure illumination micro-
scopy (SIM) images were acquired with a Nikon N-SIM microscope.
Z-stacks of 0.12 lm were performed using a 100× oil-immersion
lens with a 1.49 aperture and reconstructed in 3D using the NIS-
Element Software. All images were analyzed and quantified using
the ImageJ software.
Immunoblotting and immunoprecipitation
Cells were harvested with cold PBS followed by cellular lysis in TNT
lysis buffer (50 mM Tris pH 7.4, 150 mM NaCl, 1% Triton X-100,
1% Igepal, 2 mM EDTA, supplemented with protease inhibitor) for
30 min on ice. Samples were centrifuged at 8,000 g to remove insol-
uble fraction. Tissue samples were lysed in RIPA lysis buffer for 2 h
under agitation, following homogenization with mortar and pestle.
Lysates were cleared in centrifuge at max speed for 30 min. Cytosol
and nuclei separation were performed as previously described
(Dubois et al, 2014). Briefly, cells were lysed in Buffer A (HEPES
10 mM, KCl 10 mM, EDTA 0.1 mM, EGTA 0.1 mM, DTT 1 mM,
Na3VO4 1 mM, plus protease inhibitor) on ice for 5 min and then
Buffer A + 10% Igepal was added for 5 min. Samples were centri-
fuged at 1,000 g for 3 min. Soluble fraction was cleared at 8,000 g.
Immunoprecipitation was performed as previously described
(Dubois et al, 2014). Briefly, cells were lysed in TNT lysis buffer for
30 min and cleared by centrifugation at 8,000 g. Samples were
precleared by a 30-min incubation with Protein G agarose and then
incubated for 2 h at 4°C with Protein G agarose and 5 lg of indi-
cated antibodies. Protein concentrations were determined by BCA.
Equal amount of 5–10 lg proteins were resolved by SDS–PAGE and
transferred to nitrocellulose membranes. Membranes were revealed
using a chemiluminescent HRP substrate and visualized using the
Fusion imaging system.
Electron microscopy
After treatment, 1 volume of warm 2.5% glutaraldehyde (0.1M PB
buffer, pH 7.2, 37°C) was added to 1 volume of cell suspension for
5 min, RT. Fixative was removed by centrifugation, and cells were
treated 2.5% glutaraldehyde for 2 h, RT. Samples were then stored
at 4°C in 1% paraformaldehyde until processed. After washes
(10 min × 3), cells are post-fixed by 1% OsO4/1.5% K3[Fe(CN)6]
for 30 min following washed by ddH2O 10 min × 3, then dehy-
drated by 50, 70, 80, 90, 100% ethanol, 100% ethanol/100%
acetone (1:1) for 5 min, 100% acetone for 3 min. Cells were infil-
trated by 100% acetone/pure resin 1:1, 1:2, 1:3 for 1 h, pure resin
overnight, pure resin for 1 h, then cells were embedded in the pure
resin and polymerized at 60°C for 48 h. 70-nm sections were stained
by uranyl acetate and lead citrate then observed under TEM at
80 kV (Technology Center for Protein Sciences, School of Life
Sciences, Tsinghua University, Beijing, China).
RNAseq analysis
5 × 10⁶ GSC#9 were treated with vehicle (DMSO) and MPZ (20 lM)
for 4 h, in three biological replicates and snap-frozen on dry ice.
RNA extraction (all RIN > 9.0), library preparation, RNAseq, and
bioinformatics analysis were performed at Active Motif (Carlsbad,
California, USA). Briefly, 2 lg of total RNA was isolated using the
Qiagen RNeasy Mini Kit and further processed in Illumina’s TruSeq
Stranded mRNA Library kit. Libraries are sequenced on Illumina
NextSeq 500 as paired-end 42-nt reads. Sequence reads are analyzed
with the STAR alignment—DESeq2 software pipeline described in
the Data Explanation document. The list of differentially expressed
genes from DESeq2 output was selected based on 10% adjusted P-
value level and FDR of 0.1 (please see Fig 6A and D, Table EV1).
Gene ontology and KEGG pathway enrichment analysis were done
using DAVID bioinformatics resources portal.
qPCR
3 × 10⁶ GSC#9 were treated with vehicle (DMSO) and MPZ (20 lM)
for 4 h, in three biological replicates and were snap-frozen. RNA
extraction was done using Qiagen RNeasy kit. Equal amounts of
RNA were reverse-transcribed using the Maxima Reverse Transcrip-
tase kit, and 30 ng of the resulting cDNA was amplified by qPCR
using PerfeCTa SYBR Green SuperMix Low ROX. Data were
analyzed using the 2-DDCt methods and normalized by the house-
keeping genes ACTB and HPRT1.
The following primers were used: VGF forward GACCCTCCTCTC
CACCTCTC, VGF reverse ACCGGCTCTTTATGCTCAGA, GNS
forward CCCATTTTGAGAGGTGCCAGT, GNS reverse TGACGT
TACGGCCTTCTCCTT, HEXA forward CAACCAACACATTCTTCTC
CA, HEXA reverse CGCTATCGTGACCTGCTTTT, GLA forward
AGCCAGATTCCTGCATCAGTG, GLA reverse ATAACCTGCATCCTT
CCAGCC, CTSD forward CAACAGCGACAAGTCCAGC, CTSD reverse
CTGAATCAGCGGCACGGC, LAMP2 forward CGTTCTGGTCTGCC
TAGTC, LAMP2 reverse CAGTGCCATGGTCTGAAATG, LAMP1
18 of 21 The EMBO Journal e102030 | 2019 ª 2019 The Authors
The EMBO Journal Kathryn A Jacobs et al

Second Publication
123
forward ACCTGTCGAGTGGCAACTTCA, LAMP1 reverse GGGCA
CAAGTGGTGGTGAG, CSTB forward AGTGGAGAATGGCACACC
CTA, CSTB reverse AAGAAGCCATTGTCACCCCA, CTSS forward
GCCTGATTCTGTGGACTGG, CTSS reverse GATGTACTGGAAAGCC
GTTG, LC3B forward GCTCATCAAGATAATTAGAAGGCG, LC3B
reverse CTGGGAGGCATAGACCATGT, ACTB forward GGACTTC
GAGCAAGAGATGG, ACTB reverse AGCACTGTGTTGGCGTACAG,
HPRT1 forward TGACACTGGCAAAACAA TGCA, HPRT1 reverse
GGTCCTTTTCACCAGCAAGCT, CAV1 forward CGTAGACTCG
GAGGGACATC, CAV1 reverse GCCTTCCAAATGCCGTCAAA, CTGF
forward CATCTTCGGTGGTACGGTGT, CTGF reverse TTCCAGT
CGGTAAGCCGC, EGR3 forward GTGCTATGACCGGCAAACTC,
EGR3 reverse TGTCCATTACATTCTCTGTAGCCA, GLIPR1 forward
TACACTCAGGTTGTTTGGGCA, GLIPR1 reverse ACGTTTGAC
TTGGTCTCGCT, IL7R forward ACGATGTAGCTTACCGCCAG, IL7R
reverse TAGGATCCATCTCCCCTGAGC, CXCL10 forward TGGCATT
CAAGGAGTACCTCTC, CXCL10 reverse TGATGGCCTTCGATT
CTGGA, DRP2 forward CCGTGTGAGTGGCTATCGTA, DRP2 reverse
AGCTCTAACCTGAGGGTGGG, ITGAM forward CGATATCAG
CACATCGGCCT, ITGAM reverse AGCCCTCTGCCCCCTG, MSLN
forward ACTCCCGTCTGCTGTGACG, MSLN reverse AAGAGCAGG
AACAGGAGGCT, CARD10 forward GGACCTGAGCCTCACAACTC,
CARD10 reverse CCACCCTTTGCTCTCTTGGT.
Statistics
Data are representative of at least three independent experiments,
unless otherwise stated. Statistical analysis was performed with
GraphPad Prism5 using one-way analysis of variance (ANOVA),
two-way ANOVA, or an unpaired two-tailed t-test (Student’s t-test).
For each statistical test, P-value of < 0.05 was considered signifi-
cant.
Data availability
The datasets produced in this study are available in the following
databases:
RNA-seq data: Gene Expression Omnibus GSE139018 (https://
www.ncbi.nlm.nih.gov/geo/query/acc.cgi?acc=GSE139018).
Expanded View for this article is available online.
AcknowledgementsWe thank SOAP team members (Nantes, France). We thank Steven Nedellec
from MicroPicell, as well as Cytocell, and UTE facilities (SFR Santé François
Bonamy, Nantes, France). We are also grateful to Daniel Krappmann (German
Research Center for Environmental Health, Neuherberg, Germany), Rudi
Beyaert (VIB, Ghent, Belgium), and Li Yu (Tsinghua University, Beijing, China)
for reagents and helpful discussion. This research was funded by Fondation
pour la Recherche Medicale (Equipe labellisée DEQ20180339184), Fondation
ARC contre le Cancer (JG PJA20171206146), Ligue nationale contre le cancer
comités de Loire-Atlantique, Maine et Loire, Vendée, Ille-et-Vilaine (JG, NB),
Région Pays de la Loire et Nantes Métropole under Connect Talent Grant (JG),
and SIRIC ILIAD INCa-DGOS-Inserm_12558. KAJ received PhD fellowships from
Nantes Métropole and Fondation ARC; TD received PhD fellowship from
Nantes Métropole; GAG and AT hold postdoctoral fellowships from Fondation
de France and Fondation ARC, respectively.
Author contributionsKAJ, JG, NB: conception and design, acquisition of data, analysis and interpreta-
tion of data, drafting or revising the article; GA-G, CM, AT, YL, EH-W, KT, TD,
CAN: acquisition of data, analysis and interpretation of data; J-SF: conception
and interpretation of data. All authors approved the manuscript. All data
needed to evaluate the conclusions in the paper are present in the paper and/
or the Supplementary Materials. Additional data related to this paper may be
requested from the authors.
Conflict of interestThe authors declare that they have no conflict of interest.
References
Aits S, Jaattela M (2013) Lysosomal cell death at a glance. J Cell Sci 126:
1905 – 1912
Arias E, Koga H, Diaz A, Mocholi E, Patel B, Cuervo AM (2015) Lysosomal
mTORC2/PHLPP1/Akt regulate chaperone-mediated autophagy. Mol Cell 59:
270 – 284
Bao S, Wu Q, McLendon RE, Hao Y, Shi Q, Hjelmeland AB, Dewhirst MW,
Bigner DD, Rich JN (2006) Glioma stem cells promote radioresistance by
preferential activation of the DNA damage response. Nature 444: 756 – 760
Bargou RC, Leng C, Krappmann D, Emmerich F, Mapara MY, Bommert K,
Royer HD, Scheidereit C, Dörken B (1996) High-level nuclear NF-kappa B
and Oct-2 is a common feature of cultured Hodgkin/Reed-Sternberg cells.
Blood 87: 4340 – 4347
Bowman RL, Wang Q, Carro A, Verhaak RGW, Squatrito M (2007) GlioVis data
portal for visualization and analysis of brain tumor expression datasets.
Neuro Oncol 19: 139 – 141
Brown CE, Alizadeh D, Starr R, Weng L, Wagner JR, Naranjo A, Ostberg JR,
Blanchard MS, Kilpatrick J, Simpson J et al (2016) Regression of
glioblastoma after chimeric antigen receptor T-cell therapy. N Engl J Med
375: 2561 – 2569
Calabrese C, Poppleton H, Kocak M, Hogg TL, Fuller C, Hamner B, Oh EY,
Gaber MW, Finklestein D, Allen M et al (2007) A perivascular niche for
brain tumor stem cells. Cancer Cell 11: 69 – 82
Chen J, Li Y, Yu TS, McKay RM, Burns DK, Kernie SG, Parada LF (2012) A
restricted cell population propagates glioblastoma growth after
chemotherapy. Nature 488: 522 – 526
Chinot OL, Wick W, Mason W, Henriksson R, Saran F, Nishikawa R, Carpentier
AF, Hoang-Xuan K, Kavan P, Cernea D et al (2014) Bevacizumab plus
radiotherapy-temozolomide for newly diagnosed glioblastoma. N Engl J
Med 370: 709 – 722
Davis RE, Brown KD, Siebenlist U, Staudt LM (2001) Constitutive nuclear
factor kappaB activity is required for survival of activated B cell-like
diffuse large B cell lymphoma cells. J Exp Med 194: 1861 – 1874
Di Pilato M, Kim EY, Cadilha BL, Prüßmann JN, Nasrallah MN, Seruggia D,
Usmani SM, Misale S, Zappulli V, Carrizosa E et al (2019) Targeting the
CBM complex causes Treg cells to prime tumours for immune checkpoint
therapy. Nature 570: 112 – 116
Douanne T, Gavard J, Bidere N (2016) The paracaspase MALT1 cleaves the
LUBAC subunit HOIL1 during antigen receptor signaling. J Cell Sci 129:
1775 – 1780
Dubois SM, Alexia C, Wu Y, Leclair HM, Leveau C, Schol E, Fest T, Tarte K,
Chen ZJ, Gavard J et al (2014) A catalytic-independent role for the LUBAC
in NF-kappaB activation upon antigen receptor engagement and in
lymphoma cells. Blood 123: 2199 – 2203
ª 2019 The Authors The EMBO Journal e102030 | 2019 19 of 21
Kathryn A Jacobs et al The EMBO Journal

Second Publication
124
Ebner P, Poetsch I, Deszcz L, Hoffman T, Zuber J, Fumiyo I (2018) The IAP
family member BRUCE regulates autophagosome-lysosome fusion. Nat
Commun 9: 599
Eitelhuber AC, Vosyka O, Nagel D, Bognar M, Lenze D, Lammens K,
Schlauderer F, Hlahla D, Hopfner KP, Lenz G et al (2015) Activity-based
probes for detection of active MALT1 paracaspase in immune cells and
lymphomas. Chem Biol 22: 129 – 138
Elrick MJ, Lieberman AP (2013) Autophagic dysfunction in a lysosomal storage
disorder due to impaired proteolysis. Autophagy 9: 234 – 235
Farkas T, Jaattela M (2017) Chapter one - renilla luciferase-LC3B based
reporter assay for measuring autophagic flux. Methods Enzymol 588: 1 – 13
Fennelly C, Amaravadi RK (2017) Lysosomal biology in cancer. Methods Mol
Biol 1594: 293 – 308
Galan-Moya EM, Le Guelte A, Lima Fernandes E, Thirant C, Dwyer J, Bidere N,
Couraud PO, Scott MG, Junier MP, Chneiweiss H et al (2011) Secreted
factors from brain endothelial cells maintain glioblastoma stem-like cell
expansion through the mTOR pathway. EMBO Rep 12: 470 – 476
Gingras AC, Kennedy SG, O’Leary MA, Sonenberg N, Hay N (1998) 4EBP1, a
repressor of mRNA translation, is phosphorylated and inactivated by the
AKT (PKB) signaling pathway. Genes Dev 12: 502 – 513
Hamilton KS, Phong B, Corey C, Cheng J, Gorentla B, Zhong X, Shiva S,
Kane LP (2014) T cell receptor-dependent activation of mTOR signaling
in T cells is mediated by Carma1 and MALT1, but not Bcl10. Sci Signal
7: ra55
Hailfinger S, Lenz G, Ngo V, Posvitz-Fejfar A, Rebeaud F, Guzzardi M, Penas
EMM, Dierlamm J, Chan WC, Staudt LM et al (2009) Essential role of
MALT1 protease activity in activated B cell-like diffuse large B-cell
lymphoma. Proc Natl Acad Sci USA 106: 19946 – 19951
Harford-Wright E, Andre-Gregoire G, Jacobs KA, Treps L, Le Gonidec S, Leclair
HM, Gonzalez-Diest S, Roux Q, Guillonneau F, Loussouarn D et al (2017)
Pharmacological targeting of apelin impairs glioblastoma growth. Brain
140: 2939 – 2954
Hu Y, Smyth GK (2009) ELDA: extreme limiting dilution analysis for
comparing depleted and enriched populations in stem cell and other
assays. J Immunol Methods 347: 70 – 78
Jacobs KA, Harford-Wright E, Gavard J (2017) Neutralizing gp130 interferes
with endothelial-mediated effects on glioblastoma stem-like cells. Cell
Death Differ 24: 384
Jeltsch KM, Hu D, Brenner S, Zöller J, Heinz GA, Nagel D, Vogel KU, Rehage N,
Warth SC, Edelmann SL et al (2014) Cleavage of roquin and regnase-1 by
the paracaspase MALT1 releases their cooperatively repressed targets to
promote TH17 differentiation. Nat Immunol 15: 1079 – 1089
Jia R, Bonifacino JS (2019) Lysosome positioning influences mTORC2 and AKT
signaling. Mol Cell 75: 26 – 38
Jin X, Kim LJY, Wu Q, Wallace LC, Prager BC, Sanvoranart T, Gimple RC, Wang
X, Mack SC, Miller TE et al (2017) Targeting glioma stem cells through
combined BMI1 and EZH2 inhibition. Nat Med 23: 1352 – 1361
Juilland M, Thome M (2018) Holding all the CARDs: how MALT1 controls
CARMA/CARD-dependent signaling. Front Immunol 9: 1927
Karin M, Greten FR (2005) NF-kappaB: linking inflammation and immunity to
cancer development and progression. Nat Rev Immunol 5: 749 – 759
Kip E, Staal J, Verstrepen L, Tima HG, Terryn S, Romano M, Lemeire K, Suin V,
Hamouda A, Kalai M et al (2018) MALT1 controls attenuated rabies virus
by inducing early inflammation and T cell activation in the brain. J Virol
92: e02029 – 17
Korolchuk VI, Saiki S, Lichtenberg M, Siddiqi FH, Roberts EA, Imarisio S, Jahreiss
L, Sarkar S, Futter M, Menzies FM et al (2011) Lysosomal positioning
coordinates cellular nutrient responses. Nat Cell Biol 13: 453 – 460
Korth C, May BC, Cohen FE, Prusiner SB (2001) Acridine and phenothiazine
derivatives as pharmacotherapeutics for prion disease. Proc Natl Acad Sci
USA 98: 9836 – 9841
Landthaler M, Gaidatzis D, Rothballer A, Chen PY, Soll SJ, Dinic L, Ojo T,
Hafner M, Zavolan M, Tuschl T (2008) Molecular characterization of
human Argonaute-containing ribonucleoprotein complexes and their
bound target mRNAs. RNA 14: 2580 – 2596
Lathia JD, Mack SC, Mulkearns-Hubert EE, Valentim CL, Rich JN (2015) Cancer
stem cells in glioblastoma. Genes Dev 29: 1203 – 1217
Le Joncour V, Filppu P, Hyvonen M, Holopainen M, Turunen SP, Sihto H,
Burghardt I, Joensuu H, Tynninen O, Jaaskelainen J et al (2019)
Vulnerability of invasive glioblastoma cells to lysosomal membrane
destabilization. EMBO Mol Med 11: e9034
Li J, Jia H, Xie L, Wang X, Wang X, He H, Lin Y, Hu L (2009) Association of
constitutive nuclear factor-kappaB activation with aggressive aspects and
poor prognosis in cervical cancer. Int J Gynecol Cancer 19: 1421 – 1426
Li W, Wu C, Chen N, Gu H, Yen A, Cao L, Wang E, Wang L (2016) PI3K/Akt/
mTOR signaling pathway and targeted therapy for glioblastoma.
Oncotarget 7: 33440 – 33450
Lomas JL (1957) Treatment of schizophrenia. Br Med J 2: 78 – 80
Loos B, du Toit A, Hofmeyr JHS (2014) Defining and measuring
autophagosome flux-concept and reality. Autophagy 10: 2087 – 2096
Luo J, Solimini NL, Elledge SJ (2009) Principles of cancer therapy: oncogene
and non-oncogene addiction. Cell 138: 807
Mai TT, Hamai A, Hienzsch A, Caneque T, Müller S, Wicinski J, Cabaud O,
Leroy C, David A, Acevedo V et al (2017) Salinomycin kills cancer stem
cells by sequestering iron in lysosomes. Nat Chem 10: 1025 – 1033
Man J, Yu X, Huang H, Zhou W, Xiang C, Huang H, Miele L, Liu Z, Bebek G,
Bao S et al (2017) Hypoxic induction of vasorin regulates Notch1
turnover to maintain glioma stem-like cells. Cell Stem Cell 22:
104 – 118
McAuley JR, Bailey KM, Ekambaram P, Klei LR, Kang H, Hu D, Freeman TJ,
Concel VJ, Hubel NE, Lee JL et al (2019) MALT1 is a critical mediator of
PAR1-driven NF-jB activation and metastasis in multiple tumor types.
Oncogene. https://doi.org/10.1038/s41388-019-0958-4
McGuire C, Elton L, Wieghofer P, Staal J, Voet S, Demeyer A, Nagel D,
Krappmann D, Prinz M, Beyaert R et al (2014) Pharmacological inhibition
of MALT1 protease activity protects mice in a mouse model of multiple
sclerosis. J Neuroinflammation 11: 124
Meloni L, Verstrepen L, Kreike M, Staal J, Driege Y, Afonina IS, Beyaert R
(2018) Mepazine inhibits RANK-induced osteoclastogenesis independent of
its MALT1 inhibitory function. Molecules 23: 3144
Nagel D, Spranger S, Vincendeau M, Grau M, Raffegerst S, Kloo B, Hlahla D,
Neuenschwander M, Peter von Kries J, Hadian K et al (2012)
Pharmacologic inhibition of MALT1 protease by phenothiazines as a
therapeutic approach for the treatment of aggressive ABC-DLBCL. Cancer
Cell 22: 825 – 837
Nakaya M, Xiao Y, Zhou X, Chang JH, Chang M, Cheng X, Blonska M, Lin X,
Sun SC (2014) Inflammatory T cell responses rely on amino acid
transporter ASCT2 facilitation of glutamine uptake and mTORC1 kinase
activation. Immunity 40: 692 – 705
Ngo VN, Davis RE, Lamy L, Yu X, Zhao H, Lenz G, Lam LT, Dave S, Yang L,
Powell J et al (2006) A loss-of-function RNA interference screen for
molecular targets in cancer. Nature 441: 106 – 110
Oliva CR, Zhang W, Langford C, Suto MJ, Griguer CE (2017) Repositioning
chlorpromazine for treating chemoresistant glioma through the inhibition
of cytochrome c oxidase bearing the COX4-1 regulatory subunit.
Oncotarget 8: 37568 – 37583
20 of 21 The EMBO Journal e102030 | 2019 ª 2019 The Authors
The EMBO Journal Kathryn A Jacobs et al

Second Publication
125
Pietras A, Katz AM, Ekström EJ, Wee B, Halliday JJ, Pitter KL, Werbeck JL,
Amankulor NM, Huse JT, Holland EC (2014) Osteopontin-CD44 signaling in
the glioma perivascular niche enhances cancer stem cell phenotypes and
promotes aggressive tumor growth. Cell Stem Cell 14: 357 – 369
Qin X, Jiang B, Zhang Y (2016) 4E-BP1, a multifactor regulated
multifunctional protein. Cell Cycle 15: 781 – 786
Rahim SAA, Dirkse A, Oudin A, Schuster A, Bohler J, Barthelemy V, Muller A,
Vallar L, Janji B, Golebiewska A et al (2017) Regulation of hypoxia –
induced autophagy in glioblastoma involves ATG9A. Br J Cancer 117:
813 – 825
Rebeaud F, Hailfinger S, Posevitz-Fejfar A, Tapernoux M, Moser R, Rueda D,
Gaide O, Guzzardi M, Lancu EM, Rufer N et al (2008) The proteolytic
activity of the paracaspase MALT1 is key in T cell activation. Nat Immunol
9: 272 – 281
Rosenbaum M, Gewies A, Pechloff K, Heuser C, Engleitner T, Gehring T,
Hartjes L, Krebs S, Krappmann D, Kriegsmann M et al (2019) Bcl10-
controlled Malt1 paracaspase activity is key for the immune suppressive
function of regulatory T cells. Nat Commun 10: 2352
Sardiello M, Palmieri M, di Ronza A, Medina DL, Valenza M, Gennarino VA, Di
Malta C, Donaudy F, Embrione V, Polishchuk RS et al (2009) A gene
network regulating lysosomal biogenesis and function. Science 325:
473 – 477
Schlauderer F, Lammens K, Nagel D, Vincendeau M, Eitelhuber AC, Verhelst
SH, Kling D, Chrusciel A, Ruland J, Krappman D et al (2013) Structural
analysis of phenothiazine derivatives as allosteric inhibitors of the MALT1
paracaspase. Angew Chem Int Ed Engl 52: 10384 – 10387
Settembre C, Zoncu R, Medina DL, Vetrini F, Erdin S, Erdin S, Huynh T, Ferron
M, Karsenty G, Vellard MC et al (2012) A lysosome-to-nucleus signalling
mechanism senses and regulates the lysosome via mTOR and TFEB. EMBO
J 31: 1095 – 1108
Shchors K, Massaras A, Hanahan D (2015) Dual targeting of autophagic
regulatory circuitry in gliomas with repurposed drugs elicits cell-lethal
autophagy and therapeutic benefit. Cancer Cell 28: 456 – 471
Shingu T, Ho AL, Yuan L, Zhou X, Dai C, Zheng S, Wang Q, Zhong Y, Chang Q,
Horner JW et al (2016) Qki deficiency maintains stemness of glioma stem
cells in suboptimal environment by downregulating endolysosomal
degradation. Nat Genet 49: 75 – 86
Singh SK, Hawkins C, Clarke ID, Squire JA, Bayani J, Hide T, Henkelman RM,
Cusimano MD, Dirks PB (2004) Identification of human brain tumour
initiating cells. Nature 432: 396 – 401
Staal J, Driege Y, Bekaert T, Demeyer A, Muyllaert D, Van Damme P, Gevaert
K, Beyaert R (2011) T-cell receptor-induced JNK activation requires
proteolytic inactivation of CYLD by MALT1: CYLD is cleaved by MALT1.
EMBO J 30: 1742 – 1752
Staudt LM (2010) Oncogenic activation of NF-kappaB. Cold Spring Harb
Perspect Biol 2: a000109
Stupp R, Hegi ME, Mason WP, van den Bent MJ, Taphoorn MJ, Janzer RC,
Ludwin SK, Allgeier A, Fisher B, Belanger K et al (2009) Effects of
radiotherapy with concomitant and adjuvant temozolomide versus
radiotherapy alone on survival in glioblastoma in a randomised phase III
study: 5-year analysis of the EORTC-NCIC trial. Lancet Oncol 10:
459 – 466
Stupp R, Taillibert S, Kanner AA, Kesari S, Steinberg DM, Toms SA, Taylor LP,
Lieberman F, Silvani A, Fink KL et al (2015) Maintenance therapy with
tumor-treating fields plus temozolomide vs temozolomide alone for
glioblastoma: a randomized clinical trial. JAMA 314: 2535 – 2543
Tan SK, Jermakowicz A, Mookhtiar Adnan K, Nemeroff CB, Schurer SC, Ayad
NG (2018) Drug repositioning in glioblastoma: a pathway perspective.
Front Pharmacol 9: 218
Thys A, Douanne T, Bidere N (2018) Post-translational modifications
of the CARMA1-BCL10-MALT1 complex in lymphocytes and activated
B-cell like subtype of diffuse large B-cell lymphoma. Front Oncol
8: 498
Treps L, Edmond S, Harford-Wright E, Galan-Moya EM, Schmitt A, Azzi S,
Citerne A, Bidere N, Ricard D, Gavard J (2016) Extracellular vesicle-
transported Semaphorin3A promotes vascular permeability in
glioblastoma. Oncogene 35: 2615 – 2623
Tropepe V, Sibilia M, Ciruna BG, Rossant J, Wagner EF, van der Kooy D (1999)
Distinct neural stem cells proliferate in response to EGF and FGF in the
developing mouse telencephalon. Dev Biol 208: 166 – 188
Uehata T, Iwasaki H, Vandenbon A, Matsushita K, Hernandez-Cuellar E,
Kuniyoshi K, Satoh T, Mino T, Suzuki Y, Standley DM et al (2013) Malt1-
induced cleavage of Regnase-1 in CD4+ helper T cells regulates immune
activation. Cell 153: 1036 – 1049
Wang F, Salvati A, Boya P (2018a) Lysosome-dependent cell death and
deregulated autophagy induced by amine-modified polystyrene
nanoparticles. Open Biol 8: 170271
Wang X, Prager BC, Wu Q, Kim LJY, Gimple RC, Shi Y, Yang K, Morton AR,
Zhou W, Zhu Z et al (2018b) Reciprocal signaling between glioblastoma
stem cells and differentiated tumor cells promotes malignant progression.
Cell Stem Cell 22: 514 – 528
Weyerhäuser P, Kantelhardt SR, Kim EL (2018) Re-purposing chloroquine for
glioblastoma: potential merits and confounding variables. Front Oncol 8:
335
Wu J, Zhou L, Tonissen K, Tee R, Artzt K (1999) The quaking 1-5 protein (QKI-
5) has a novel nuclear localization signal and shuttles between the
nucleus and the cytoplasm. J Biol Chem 274: 29202 – 29210
Yan K, Yang K, Rich JN (2013) The evolving landscape of glioblastoma stem
cells. Curr Opin Neurol 26: 701 – 707
Yu L, McPhee CK, Zheng L, Mardones GA, Rong Y, Peng J, Mi N, Zhao Y, Liu Z,
Wan F et al (2010) Termination of autophagy and reformation of
lysosomes regulated by mTOR. Nature 465: 942 – 946
Zielke S, Meyer N, Mari M, Abou-El-Ardat K, Reggiori F, van Wijk SJL,
Kögel D, Fulda S (2018) Loperamide, pimozide, and STF-62247 trigger
autophagy-dependent cell death in glioblastoma cells. Cell Death Dis
9: 994
ª 2019 The Authors The EMBO Journal e102030 | 2019 21 of 21
Kathryn A Jacobs et al The EMBO Journal
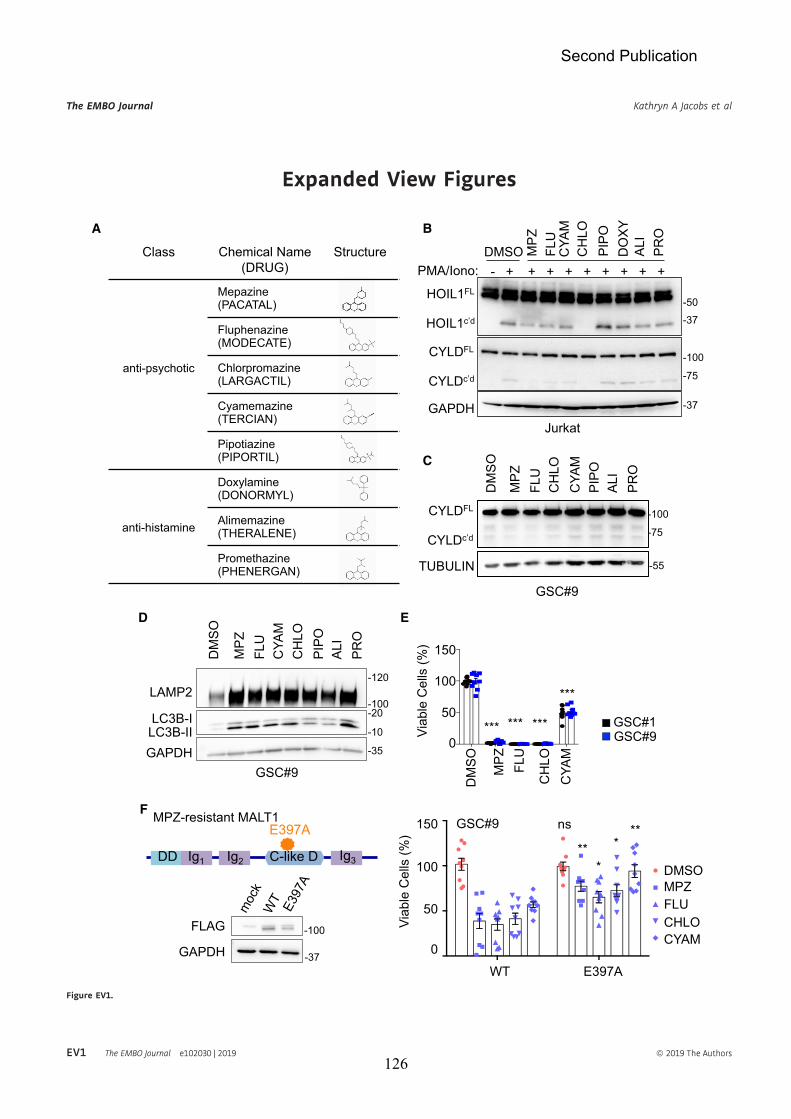
Second Publication
126
Expanded View Figures
Class Chemical Name (DRUG)
Structure
anti-psychotic
Mepazine(PACATAL)
Fluphenazine (MODECATE)
Chlorpromazine (LARGACTIL)
Cyamemazine(TERCIAN)
Pipotiazine (PIPORTIL)
anti-histamine
Doxylamine (DONORMYL)
Alimemazine (THERALENE)
Promethazine (PHENERGAN)
B
HOIL1FL
CYLDFL
GAPDH
- + + + + + + + + + DMSO M
PZ
-50-37
-37
-100
-75
FLU
CH
LOC
YAM
PIPO
DO
XY
ALI
PRO
PMA/Iono:
HOIL1
CYLD
C
Jurkat
DM
SO
MPZ
FL
U
CYA
M
CH
LO
PIPO
AL
I PR
O
-100
-75
CYLDFL
CYLD
GSC#9
TUBULIN -55
D
A
0
50
100
150
Viab
le C
ells
(%)
DM
SO
MPZ
FL
U
CH
LO
CYA
M
GSC#1 GSC#9
*** *** ***
***
DM
SO
CH
LO
LAMP2
LC3B-I -100
-120
-10
-20
GAPDH -35
MPZ
FL
U
CYA
M
PIPO
AL
I PR
O
LC3B-II
GSC#9
E
F
DD Ig1 Ig2 Ig3 C-like D
E397AMPZ-resistant MALT1
GAPDH
FLAG -100
-37
DMSO MPZ FLU CHLO CYAM
GSC#9
0
50
100
150
Viab
le C
ells
(%)
**
ns
*
* **
WT E397A Figure EV1.
The EMBO Journal Kathryn A Jacobs et al
EV1 The EMBO Journal e102030 | 2019 ª 2019 The Authors

Second Publication
127
Figure EV1. Impact of phenothiazines on MALT1 protease activity and lysosomes.
A Table summarizing eight phenothiazines used in clinics as either anti-psychotic or anti-histaminic, along with their generic and brand names (cap letters), andchemical structures.
B Western blot analysis of two MALT1 substrates, HOIL1 and CYLD, either full length (FL) or cleaved (c’d) in Jurkat T cells treated with vehicle (DMSO) or phenothiazines,as follows: 20 lM CYAM (cyamemazine), CHLO (chlorpromazine), PIPO (pipotiazine), DOXY (doxylamine), ALI (alimemazine), and PRO (promethazine), and 10 lM MPZ(mepazine) and FLU (fluphenazine) for 30 min and stimulated for 30 min more with PMA (20 ng/ml) and Ionomycin (Iono, 300 ng/ml). TUBULIN served as a loadingcontrol.
C Western blot analysis of CYLD processing in GSC#9 treated with vehicle (DMSO) or phenothiazines (20 lM CYAM, CHLO, PIPO, DOXY, ALI, and PRO, 10 lM MPZ andFLU) for 60 min. GAPDH served as a loading control.
D Western blot analysis of LAMP2 and LC3B in equal amount of total protein lysates from GSC#9 treated for 6 h with vehicle (DMSO) or 20 lM phenothiazines (MPZ,FLU, CYAM, CHLO, ALI, PRO). GAPDH served as a loading control.
E Cell viability of GSC#1 and GSC#9 using 20 lM of MPZ, FLU, CHLO, and CYAM, using Cell TiterGlo assays. Data were normalized to their respective DMSO-treatedcontrols and are presented as the mean ! SEM of three independent experiments in triplicate.
F Schematic drawing of MALT1 structures highlighting the E397A substitution in the mepazine-resistant version. DD: death domain, C-like D: caspase-like domain, Ig:immunoglobulin domain. Western blot analysis of FLAG in equal amount of total protein lysates from HEK-293T cells transfected with empty vector (mock), MALT-WT, or MALT1-E397A. GAPDH serves as a loading control. GSC#9 were transduced with MALT-WT or MALT1-E397A and treated with phenothiazines (10 lM of MPZ,FLU, CYAM, CHLO) for 24 h. Cell Viability was analyzed using Cell TiterGlo assay. Data were normalized to their respective DMSO-treated controls and are presentedas the mean ! SEM of three independent experiments in triplicate.
Data information: All data were repeated in three independent experiments. Statistics were performed using a one-way ANOVA with a 95% confidence interval for allexperiments with P-values stated. *P < 0.05, **P < 0.01, ***P < 0.001.
Source data are available online for this figure.
◀
Kathryn A Jacobs et al The EMBO Journal
ª 2019 The Authors The EMBO Journal e102030 | 2019 EV2

Second Publication
128
C D
E
MPZ 0 2 4 6 16 (h)
TOM20
LAMP2
GAPDH
PDI
-35
-100 -120
-55
-20
DM
SO
GSC#9: 4H GSC#9: 16H
dq-OVA + DAPI
MPZ
Transferrin + DAPI
GSC#9 GSC#4
A
Tom20 GM130 EEA1 PEX1
DM
SO
MPZ
B
F
RAB7 -25
GAPDH -35
MALT1 RAB7
GAPDH
siMALT1 - +
-25
-35
-100
LAMP2 + DAPI
HBL1
DMSO
MPZ
GSC#9
GSC#9
GSC#9
siMALT1 sic
nuc
Iyso
Golgi
nuc
mit
Golgi
siMALT1
* *
* *
*
* mit
mit
* vacuole
GSC
#9
-100
-120
-100
-75
-100
LAMP2
CYLDFL
CYLD
MALT1
HBL1
MPZ - +
GAPDH -35
*
Figure EV2. Impact of MALT1 inhibition on intracellular organelles.
A Transmission electron microscopy images from GSC#9 transfected with non-silencing duplexes (sic) or siRNA duplexes targeting MALT1 (siMALT1). Multiple imagesand sections from one experiment were analyzed. Red stars denote lysosomes; blue stars vacuoles.
B Western blot analysis of PDI, TOM20, and LAMP2 in total protein lysates from GSC#9 treated vehicle (DMSO) or MPZ (20 lM) for the indicated times. GAPDH servesas a loading control.
C Western blot analysis of RAB7 and MALT1 in GSC#9 in total protein lysates from GSC#9 transfected with non-silencing duplexes (sic) or siRNA duplexes targetingMALT1 (siMALT1). Alternatively, GSC#9 received Z-VRPR-FMK (VRPR, 75 lM, 16 h) and mepazine (MPZ, 20 lM, 16 h). GAPDH serves as a loading control.
D Confocal analysis of TOM20, GM130, EEA1, and PEX1 immunostaining (green) in GSC#9 treated with vehicle (DMSO) or MPZ (20 lM) for 4 h. Nuclei (DAPI) are shownin blue. Scale bars: 10 lm.
E ABC DLBCL lymphoma cells HBL1 treated with vehicle (DMSO) or MPZ (20 lM) for 4 h. (Left) Western blot analysis of LAMP2 and CYLD (full length, FL, or cleaved, c’d)in total protein lysates. MALT1 and GAPDH serve as loading controls. (Right) Confocal analysis of LAMP2 (red). Nuclei (DAPI) are shown in blue. Scale bars: 10 lm.
F Confocal analysis of dq-ovalbumin (dq-OVA, red) in GSC#9 treated with vehicle (DMSO) or MPZ (20 lM) for 4 or 16 h. Nuclei (DAPI) are shown in blue. Alternatively,confocal analysis of transferrin uptake (green) in GSC#9 and GSC#4 treated with vehicle (DMSO) or MPZ (20 lM) for 4 h. Nuclei (DAPI) are shown in blue. Scale bars:10 lm.
Data information: All data were repeated in three independent experiments, unless specified.
Source data are available online for this figure.
The EMBO Journal Kathryn A Jacobs et al
EV3 The EMBO Journal e102030 | 2019 ª 2019 The Authors

Second Publication
129
B C
E
A
-20
LAMP2
TUBULIN
LC3B-I
MPZ CHX
-100 -120
-55
-10 LC3B-II
GSC#9: LAMP2/mTOR/DAPIDMSO MPZ 1h MPZ 2h MPZ 4h MPZ 6h
MPZ - + - + - +
GSC#1 GSC#12 GSC#4
p-AKT -55
-55 AKT
-25
-25
p-S6 S6
sic siTFEB
LAM
P2/m
TOR
/DAP
I
DMSO MPZ DMSO MPZ
G
4E-BP1
pT37/46-4E-BP1
pS65-4E-BP1
pT70-4E-BP1
MPZ 0 1 2 4 6 (h)
EIF4E
GAPDH
-20 -10
-20 -10
-20 -10
-20 -10
-25
-37
F
H
Viab
le C
ells
(%)
0
50
100
CQ - +
ns
MPZ 0 10 20 0
50
100
150
ns
ns
ns
sic
siBE
CN
1
BECN1 GAPDH
Viab
le C
ells
(%)
D
DMSO
MPZ
sic
siMALT1
CAV
1 C
TGF
EGR
3 G
LIP1
IL
7R
VGF
CXC
L10
DR
P2
ITG
AM
MSL
N
-2 -1
Normalized RNA Expression (qRT-PCR)
GSC#9 GSC#9
GSC#9
GSC#9 GSC#9
GSC
#9:
- - + + - + - +
Figure EV3. Impact of MALT1 inhibition on cell death and mTOR signaling.
A Cell viability was measured using Cell TiterGlo luminescent assay in GSC#9 treated for 72 h with vehicle (DMSO) or chloroquine (CQ, 20 lM). Data were normalizedto the vehicle-treated controls and are presented as the mean ! SEM of three independent experiments in triplicate.
B Cell viability was measured using Cell TiterGlo luminescent assay in GSC#9 transfected with non-silencing duplexes (sic, red) or siRNA duplexes targeting BECLIN1(siBECN1, blue) and further treated with vehicle (DMSO) and MPZ (10 and 20 lM) for 72 h. Data were normalized to the vehicle-treated controls and are presentedas the mean ! SEM of two independent experiments in triplicate. Knockdown efficiency was checked at the end point by Western blot. GAPDH serves as a loadingcontrol.
C GSC#9 were treated with vehicle (DMSO) and mepazine (MPZ, 20 lM) for 16 h. Alternatively, GSC#9 were transfected with non-silencing duplexes (sic) or siRNAduplexes targeting MALT1 (siMALT1). RNAs were processed for qRT–PCR on 10 gene candidates from RNAseq data (Table EV1). Data are represented as heatmaprepresentation of RNA expression, normalized to two housekeeping genes (HPRT1 and ACTB).
D Western blot analysis of LAMP2 and LC3B in total protein lysates from GSC#9 treated with vehicle (DMSO) and mepazine (MPZ, 20 lM) in the presence ofcycloheximide (CHX, 50 lg/ml) for 16 h. TUBULIN served as a loading control.
E Western blot analysis of indicated antibodies in total protein lysates from GSC#1, GSC#12, and GSC#4 that received vehicle (DMSO, ") or mepazine (MPZ, 20 lM,1 h).
F Western blot analysis of indicated antibodies in total protein lysates from GSC#9 treated vehicle (DMSO) or mepazine (MPZ, 20 lM) for the indicated times. GAPDHserves as a loading control.
G Confocal analysis of LAMP2 (red) and mTOR (green) staining in GSC#9 treated vehicle (DMSO) or MPZ (20 lM) for the indicated times. Arrows point to LAMP2-positive area. Nuclei (DAPI) are shown in blue. Scale bars: 10 lm.
H GSC#9 were transfected with sic or siTFEB and treated with vehicle (DMSO) or MPZ (20 lM) for 16 h. Samples were analyzed as described in (G). Arrows point toLAMP2-positive area. Nuclei (DAPI) are shown in blue. Scale bars: 10 lm.
Data information: All data were repeated in three independent experiments, unless specified.
Source data are available online for this figure.
Kathryn A Jacobs et al The EMBO Journal
ª 2019 The Authors The EMBO Journal e102030 | 2019 EV4

Second Publication
130
TUBULINQKI -35
GSC #1 #4 #9 #12
-55
A
C B
D Flag-QKI GSC#9:
QKI
+ D
API
patient#1 patient#2MPZ - + - + - + - +
nuc
-37 QKI -100 MALT1
nuc cytGSC#1 GSC#9
-50 PARP -100
cyt
TUBULIN
GSC#9TUBULIN
QKI -35
-55
QKI siRNA seq#
1 se
q#2
seq#
3
sic
E
-100 MALT1
QKI
GAPDH
-37
-37
siMALT1siQKI
F
Ig
MALT1
QKI
HBL1 GSC#1
-35
-100
QKI
Ig
Q
KI
GSC#9
QKI -35 TUBULIN -55
Xenografts 1 2 3
- + - + - - + +
Figure EV4. Characterization of the RNA-binding protein QKI in glioblastoma cells.
A Western blot analysis of QKI in total protein lysates from GSC #1, #4, #9, #12, and from GSC-xenografted tumors. Alternatively, GSC#9 were transfected with sic orsiQKI using three different duplexes. TUBULIN served as a loading control.
B Confocal analysis of QKI immunostaining (red) in glioblastoma tissue sections from two patients. Nuclei (DAPI) are shown in blue. Scale bars: 10 lm.C Western blot analysis of QKI in cytosolic (cyt.) and nuclear (nuc.) cell fractionation from GSC#1 and GSC#9, treated with vehicle (!) and mepazine (MPZ, 20 mM,
1 h). TUBULIN and PARP served as loading controls for each fraction. Each panel was replicated at least twice.D Confocal analysis of FLAG-QKI (green) localization in transfected GSC#9. Scale bars: 10 lm.E GSC#1 and HBL1 protein lysates were processed for immunoprecipitation using control immunoglobulins (Ig) and anti-QKI antibodies. Western blots were performed
using anti-MALT1 and anti-QKI, as specified.F GSC#9 were transfected with non-silencing RNA duplexes (sic), QKI targeting siRNA duplexes (siQKI), MALT1 targeting siRNA duplexes (siMALT1), or double-transfected
with siQKI and siMALT1 and analyzed 72 h later. Knockdown efficiency was checked by Western blot analysis using the indicated antibodies.
Source data are available online for this figure.
The EMBO Journal Kathryn A Jacobs et al
EV5 The EMBO Journal e102030 | 2019 ª 2019 The Authors

Discussion
131
Discussion

Discussion
132
Discussion
1. Intercellular Signaling The first goal of this study was to identify novel targets involved in intercellular
signaling between GSCs and endothelial cells. We identified that the transmembrane
glycoprotein gp130 is important for stemness maintenance in response to endothelial
cues, as blocking antibodies against gp130 abolish functional properties of GSCs
cultured in a medium enriched with endothelial cell-secreted factors. However, how
gp130 affects self-renewal in GSCs, and the nature of the downstream signaling
pathways altered upon its inhibition have not been fully defined.
1.1 Defining the Role of gp130 in Downstream GSC Signaling
In order to better understand its role in the pathways regulating stemness of
GSCs, we generated two gp130 KO clones in one patient-derived GSC from a
Mesenchymal tumor origin, via CRISPR/Cas9 editing. In both clones, we detected a
marked decrease in STAT3 phosphorylation at Y705, as compared to wildtype (WT)
cells analyzed by western-blot (Figure 31A). Moreover, transcriptome data from RNA
sequencing highlight a “LIF signaling” signature between KO and WT cells (Figure
Figure 31: Downstream Signaling upon gp130 Knockout. (A) Briefly, wildtype and KO clones #2 and #7 were lysed in TNT lysis buffer and blotted for gp130 and p-STAT3 (Y705 and S727). Total STAT3 and Tubulin serve as loading controls. (B) RNA sequencing was performed on wildtype versus KO clones #2 and #7. GSEA (gene set enrichment analysis) plot showing enrichment of “LIF signaling” signature in wildtype versus KO #2 and #7 triplicates. Data are representative of 3 independent experiments in A and 3 Biological replicates in B. Detailed methods can be found in Annex 5.
gp130 -130 KD
pSTAT3 Y705
pSTAT3 S727
STAT3
GAPDH
-75 KD
-75 KD-75 KD
-37 KD
WT #2 #7
A. B.

Discussion
133
31B). In contrast, there was no obvious repertoire switch, which may occur due to
subpopulation selection from cloning pressure.
The leukemia inhibitory factor (LIF) is a member of the IL-6 family of
cytokines. The LIF receptor is a co-receptor of gp130 and activates downstream
JAK45/ STAT346 signaling upon its triggering (Gearing et al., 1991). After dimerization
of the LIF receptor and gp130, the kinase cascade of JAKs leads to the activating
Y705 phosphorylation of the transcription factor STAT3, which subsequently
promotes the expression of its target genes. These include classical stemness
markers, such as SOX2, angiogenic modifiers like VEGF, as well as gene products
involved in survival pathways, including AKT (Niu et al., 2002, 2002; Wang et al.,
2017a).
In glioma, several studies have implicated STAT3 as a marker of poor
prognosis (Abou-Ghazal et al., 2008; Ganguly et al., 2018; Tu et al., 2011).
Additionally, the therapeutic potential of blocking STAT3 action was explored by
multiple groups (Ashizawa et al., 2013; Fuh et al., 2009; Gao et al., 2010; Li et al.,
2010; Shi et al., 2018). Likewise, the upstream activator of STAT3, IL-6 was linked to
worse survival in GBM and targeting either the receptor or ligand reduces tumor
growth (Choi et al., 2002; Tchirkov et al., 2007; Wang et al., 2009). Moreover, the
gp130-IL6 receptor complex is stabilized by the tetraspanin CD9 and this increases
STAT3 signaling in GSCs (Shi et al., 2017). Therefore, one remaining question in our
experimental models is whether IL-6 secretion is altered in KO cells. This can be
answered with ELISAs of the WT vs KO secretome.
Combination studies inhibiting STAT3 have also been performed. Indirect
blockade of STAT3 signaling using resveratrol enhanced the effects of radiotherapy
(Yang et al., 2012). Furthermore, STAT3 inhibitors resensitized TMZ-resistant cell
lines to TMZ-induced cell death by downregulating the MGMT (Kohsaka et al.,
2012). Therefore, targeting gp130 in combination with standard of care therapy could
prove effective in the treatment of GBM.
45 Janus Kinase 46 Signal Transducer and Activator of Transcription 3

Discussion
134
1.2 Is gp130 Action on Stemness linked to Apelin Signaling?
As we also reported a potent effect of the endothelial-released peptide,
Apelin, in stemness maintenance (Annex 2), we revisited gp130 in the context of
Apelin signaling. Under cell culture with Apelin factor alone, pharmacological
blockade of gp130 with either blocking antibodies or the drug LMT-28 abrogated the
effect of Apelin on GSC expansion. Furthermore, this phenotype was recapitulated in
gp130 KO clones (Figure 32).
0 500 1000 1500 2000
−2.5
−2.0
−1.5
−1.0
−0.5
0.0
dose (number of cells)
log
fract
ion
nonr
espo
ndin
g
●
●
●
●
●
●
●
●
●
●
●
●●
●
Group APGroup GPGroup MFGroup SW
MF APLN
APLN+Ig
APLN+anti-GP130
0 500 1000 1500 2000
−1.4
−1.2
−1.0
−0.8
−0.6
−0.4
−0.2
0.0
dose (number of cells)
log
fract
ion
nonr
espo
ndin
g
●
●
●
●●
●
●
●
●
●
●
●Group APGroup APLMTGroup LMTGroup MF
MF
APLN Lo
g Fr
actio
n N
egat
ive
Wel
ls
-0.5-
-1.0-
-1.5-
-2.0-
-2.5-
0.0- MF+LMT-28
APLN+ LMT-28
0 500 1000 1500 2000 Number of GSC#1 per well
-3.0-
0 500 1000 1500 2000 Number of GSC#1 per well
Log
Frac
tion
Neg
ativ
e W
ells
-0.5-
-1.0-
-1.5-
-2.0-
-2.5-
0.0-
-3.0-
A. B.
0 500 1000 1500 2000
−1.4
−1.2
−1.0
−0.8
−0.6
−0.4
−0.2
0.0
dose (number of cells)
log
fract
ion
nonr
espo
ndin
g
●
●
●
●
●
●
●●
●
●
●●
Group GSC1Group GSC1KO#2Group GSC1KO#7
0 500 1000 1500 2000
Log
Frac
tion
Neg
ativ
e W
ells
-0.2-
-0.4-
-0.6-
-0.8-
0.0-
Number of GSC#1 per well
-1.0-
-1.2-
-1.4-
APLN+ #7 APLN+ WT
APLN+ #2
C.
Figure 32: Inhibition of gp130 alters Apelin Signaling. (A) Limited Dilution Assay (LDA) of GSC#1 +/- Apelin and +/- anti-gp130 blocking antibody. The more stem the cells, the closer the slope is to a vertical line. (B) LDA of GSC#1 +/- Apelin +/- LMT28. (C) LDA of GSC#1 in Apelin-containing media. WT= wildtype cells, #2= clone #2 KO gp130, #7 = clone #7 KO gp130. N= 2 independent experiments for each panel. Detailed methods can be found in Annex 5.

Discussion
135
Additionally, gp130 is a co-receptor for multiple membrane receptors,
including IL-6R, LIF, IL-11R, CTNF-R47, and WSX-1 (IL-27) (White and Stephens,
2011). We therefore investigated the possibility that a portion of gp130 could be
interacting with the Apelin receptor (APLNR), a GPCR48, in GSCs. In order to explore
this possibility, we performed co-immunoprecipitation (Co-IP) experiments in
endogenous and ectopic systems. In the over-expression system, APLNR falls into
the gp130 immunocomplex and vice versa. The same was true endogenously in
GSC#1 (Figure 33A). Moreover, immunofluorescence analysis of APLNR and gp130
showed polarized co-staining of the receptors in GSC#1 (Figure 33B). Using
proximity ligation assay (PLA), we confirmed the close contact (less than 40 nm)
between gp130 and APLNR. Therefore, we concluded that gp130 interacts with the
Apelin receptor in GSCs.
GPCRs are maintained at the plasma membrane through association with
eachother or with scaffold proteins. For example, GABA receptors form heterodimers
to anchor them at the cell surface (White et al., 1998). Additionally, the GPCR
mGluR5, involved in synaptic signaling in neurons, is maintained at the plasma
membrane by the scaffold Homer (Ango et al., 2000). Moreover, a previous report 47Ciliary neurotrophic factor 48G protein-coupled receptor
AP
LNR
/GP
130
AP
LNR
PLA + DAPI PLA
GP130
APLNR
GP130 + + - + APLNR - + + +
IP APLNR
IP GP130
293T
Inpu
t
IgG
AP
LNR
APLNR
GP130
GSC1
Merge GP130 APLNR
A. B. C.
Figure 33: Apelin Receptor interacts with gp130 in GSCs. (A) gp130 co-immunoprecipitates with APLNR in endogenous GSC#1 (Top) and in a HEK-293T overexpression system. (B) Costaining of gp130 (red) and APLNR (purple) in GSC#1. (C) Proximity ligation assay (PLA) in GSC#1 of APLNR and gp130. Data are representative of 3 independent experiments. Detailed information on methods can be found in Annex 5.

Discussion
136
demonstrated that gp130 is stabilized by the tetraspanin CD9 to prevent its recycling
and extend STAT3 signaling (Shi et al., 2017). With this in mind, we hypothesized
that gp130 and the APLNR might secure eachother at the membrane. Our data
suggest that gp130 associates with the APLNR, and blockade or KO of gp130
abolishes the effects of Apelin on stemness. Indeed, in cells KO for gp130, there was
less APLNR on the surface as compared to WT (Figure 34A). Importantly, the overall
level of APLNR expression, as tested by qRT-PCR, was similar between WT and
gp130 KO cells (data not shown). Moreover, re-expression of ectopic gp130 restored
APLNR to the membrane (Figure 34B).
In GSCs, gp130 acts as a novel co-receptor of APLNR, stabilizing this protein at the
membrane to enhance signaling. Hence, our recent data point to a scaffold role for
gp130 in stemness maintenance (Figure 35).
Recent papers have emphasized an important role of Apelin signaling in
cancer. Following our study about the role of Apelin in GSCs, work by Roland Kälin’s
group emphasized the pro-angiogenic nature of Apelin action in GBM. They found
that blockade of VEGF/VEGFR triggering diminishes Apelin expression and that
reducing Apelin signaling reduced tumor angiogenesis. Additionally, their in vivo data
confirms the importance of Apelin in tumor growth as syngenic grafts were smaller
when implanted in Apln KO background mice, as compared to WT animals
(Mastrella et al., 2019b). These data emphasize the potential of Apelin blockade in
Figure 34: gp130 regulates APLNR availability at the membrane. (A) FACS analysis of surface expression of gp130 and APLNR in WT or KO gp130 cells. (B) FACS analysis of gp130 and APLNR surface expression in WT, KO clone #2 and KO clone #7 +/- gp130 reexpression. Detailed information on methods can be found in Annex 5.
100 101 102 103 104FL1-H
100 101 102 103 104FL4-H
GP130 APLNR
WT
KOGP130
isoWT
#02#02+pGP130
#07
#07+pGP130
GP130 APLNR
A. B.

Discussion
137
GBM therapy, as it targets tumor growth from two axes: both by reducing both the
stem-like properties of GSCs and by reducing tumor angiogenesis.
Moreover, the role of Apelin signaling can now be expanded to other cancers.
Josef Penninger’s laboratory recently demonstrated that targeting Apelin improves
vessel function and prevents resistance to receptor-tyrosine kinase (RTK) therapy in
lung and breast cancer models. Metastases were also reduced. Moreover, high
Apelin expression was correlated with poor prognosis in these cancers (Uribesalgo
et al., 2019). Therefore, Apelin may be a ubiquitous marker of poor prognosis across
a variety of cancers.
In a recent study by Patel and colleagues, the APLNR was identified as an
important gene for cancer
immunotherapy, as loss of this
gene or point mutation
identified in melanoma
reduced the efficacy of these
treatments. Interestingly,
APLNR could co-
immunoprecipitate with JAK1
in such tumor cells (Patel et
al., 2014). As JAK1 can bind
to gp130, this converges with
our findings that gp130 is a
novel co-receptor of the
APLNR. Further study will
unveil whether or not JAK1 is
a component of the APLNR-
gp130 signaling complex in
GSCs.
Additionally, Ralf Adam’s group, in the context of bone marrow
transplantation, explored the role Apelin in vascular regeneration after irradiation.
Radiation therapy induced vessel permeability and morphological changes. Apelin
positive EC’s are necessary for the restoration of vessel integrity in this context, as
they are critical for the maintenance of hematopoietic stem cells in the niche (Chen
et al., 2019b). These results can be extrapolated, to form hypotheses about the
GSC
EC Secreted factors (including
Apelin) Self- Renewal
anti-gp130 therapy/KO
STAT3 signaling
APLNR at PM
Figure 35: Effects of gp130 inhibition or deletion in GSCs.

Discussion
138
therapeutic potential of this mechanism in tumors. If radiotherapy induces similar
changes in the tumor vasculature, one can hypothesize that anti-apelin/APLNR
therapy may enhance the effectiveness of this treatment. Indeed, preliminary data
from our lab suggest an increased expression of apelin in irradiated brain ECs (data
not shown). Moreover, our in vitro results show a synergism between TMZ and anti-
APLNR therapy. Therefore, further study combining anti-APLNR therapy with
standard of care treatment could prove effective against GBM growth.
Based on our data and the work of others, Apelin appears to play a reciprocal
role in maintaining the integrity of the vascular niche. Not only does it promote
angiogenesis, but also it is critical for maintaining stem properties in GSCs.
Targeting the apelin/APLNR signaling axis could prove more effective than current
anti-angiogenic therapy, as it targets multiple actors within the niche.
2. Intracellular signaling The second goal of this research was to identify novel mechanisms governing
non-oncogene addiction, ie pathways not necessarily involved in the initiation of the
transformed phenotype of tumor cells but rather in their persistence. Through
analysis of the TCGA, we identified that the protease MALT1 is correlated with GBM
patient probability of survival. Accordingly, knockdown or pharmacological blockade
of MALT1 reduced patient-derived cell viability in vitro. This was accompanied by
decreased mTOR activation and an increase in the abundance of endo-lysosomes.
However, how MALT1 acts on mTOR activation, and how this lysosomal increase
leads to cell death remain undefined.
2.1 MALT1 in Solid Tumors The importance of MALT1 in ABC DLBCL has been extensively investigated,
due to its constitutive activity in these lymphoma cells (Ferch et al., 2009; Hailfinger
et al., 2009). Inhibitors of MALT1, including zVRPR, phenothiazines (especially MPZ)
and MI2, were selectively toxic to these cancer cells in vitro and in vivo (Fontan et
al., 2012; Hailfinger et al., 2009; Nagel et al., 2012b; Schlauderer et al., 2013). As
such, a MALT1 inhibitor, JNJ-67856633 is currently in phase I clinical trials
(NCT03900598) for the treatment of this disease.
Discussion
139
In addition to our study of MALT1 in GSCs, the paracaspase was also
explored in several solid tumors including non-small cell lung cancer (NSCLC), GBM,
pancreatic cancer, osteosarcoma, and breast cancer (Konczalla et al.; McAuley et
al., 2019; Pan et al., 2016; Yang et al., 2017). In NSCLC and GBM, the scaffold role
of MALT1 in NF-κB activation, but not its protease activity, was shown to be
important for cell growth and migration (Pan et al., 2016; Yang et al., 2017).
However, the study in GBM was primarily done in established cell lines, U87, in
which NF-κB status may differ from patient-derived cells, which more accurately
represent human tumors (Galan-Moya et al., 2011; Harford-Wright et al., 2017;
Lathia et al., 2015). Indeed, our results did not demonstrate obvious CBM-dependent
activation of NF-κB in GSCs. Also, a recent study by Konczalla et al. demonstrated
that MALT1 was highly expressed and active in pancreatic ductal adenocarcinomas
and that inhibition reduced growth both in vitro and in vivo (Konczalla et al., 2019).
Concurrently, McAuley and colleagues showed that protease-activated receptor 1
(PAR1) induced CBM-dependent NF-κB activation and MALT1 protease activity in
both breast cancer and osteosarcoma cells (McAuley et al., 2019). Hence, the role of
MALT1 in CBM-dependent NF-κB activation may be more pervasive across different
cancers. One drawback to these studies is that they did not fully delve into the
protease function of MALT1, and the effects of its processed substrates. Therefore,
more extensive investigation to understand all of MALT1’s functions in solid tumors
will help to inform its use as a target in cancer therapy.
2.2 How does MALT1 affect mTOR?
Our experimental results clearly demonstrate a potent effect of MALT1
inhibition on mTORC1 activation in GSCs. Moreover, we show that mTOR is less
associated with LAMP2 staining upon MALT1 silencing or blockade, indicating that
lack of downstream signaling may be due to displacement of mTORC1 at the
lysosomes. However, our current data cannot not discriminate between the
possibility that either mTOR is re-localized from the lysosome or whether signaling is
dampened due to expansion of the endo-lysosomal compartment. Co-IP for Raptor
and the lysosomal Rags, or lysosomal IPs (Abu-Remaileh et al., 2017) may serve to
answer this question.

Discussion
140
The decrease in downstream mTOR signaling upon MALT1 inhibition in GSCs
confirms two previous studies in lymphocytes. These studies showed that MALT1
inhibition abrogates antigen receptor-dependent activation of the mTOR pathway
(Hamilton et al., 2014; Nakaya et al., 2014). However, to date no MALT1 substrates
involved in the mTOR cascade have been identified.
In order to be considered as a MALT1 substrate, proteins must contain an
S/P-R↓G/A consensus motif. Upon MALT1 activation, protein levels of the full-length
substrate should be reduced, while restored upon inhibition of the protease.
Additionally, mutation of the arginine in the consensus motif should protect against
MALT1-driven cleavage. We and others speculate that there do exist MALT1
substrates within mTOR pathway. As MALT1 inhibition blocks mTOR signaling, the
most likely candidates are negative regulators of mTOR activity, which would prevent
mTORC1 docking at the lysosome. Likewise, MALT1 proteolytic action has been
shown to inactivate negative regulators of the NF-κB pathway, in order to amplify the
downstream action of the transcription factor (Coornaert et al., 2008b; Douanne et
al., 2016; Hailfinger et al., 2011). So it is feasible that MALT1 exerts a similar role in
fine-tuning mTOR signaling nexus. Of note, overexpression of catalytically dead
MALT1 reduced mTOR activation in GSCs, signifying that the protease activity is
MALT1
Phenothiazines, zVRPR, siRNA
mTORC1 Dissociation
from Lysosome
mTORC1
mTORC1
mTORC1
mTORC1
?
?
? ?
?
? Substrate Accumulation
promotes mTOR Dissociation
Accumulation of MALT1 Substrate
From mTOR Pathway
?
mTORC1 Downstream
Signaling
Figure 36: MALT1 action on mTOR activation.

Discussion
141
important for mTOR triggering in these cells. With this in mind, we plan to perform in
silico analysis of the mTOR pathway components to uncover putative MALT1
substrates. While we cannot exclude that MALT1 inhibition indirectly affects the
mTOR pathway, our data points to a mechanistic link between MALT1 and mTOR in
GSCs, which prompts further investigation.
In brief, most GBM tumors display aberrant mTOR activation likely due to
PTEN deletion and EGFR amplification or mutation. However, rapalogs failed in
clinical trials, probably owing to continued mTORC2 activation (Cancer Genome
Atlas Research Network, 2008; Fine et al., 2009). Therefore, novel therapies, which
Figure 37: BRD4 blockade increases lysosomes and reduces GSC viability. (A and B) Cell titer Glo assay of GSCs treated 48 hrs with BRD4 inhibitors, JQ1 and AZD5153 (A) or 72 hrs after knocked-down for BRD4 using siRNA (B). % viable cells refers to the % viable/DMSO. BRD4 expression was controled by Western-blot where GAPDH served as a loading control. (C and D) Western-blot of lysosomal protein amount LAMP2 and cathepsin D (CTSD) in response to mepazine (MPZ) or JQ1 (C) or BRD4 KD (D). GAPDH served as a loading control. All data are representative of 3 independent experiments. *p<0.05 **p<0.01
SiC
SiBRD4
0
50
100
150
*
0
50
100
150
% V
iabl
e C
ells
SiC
SiB
RD
4
GAPDH
BRD4
DMSOJQ
1AZD
0
50
100
150GSC1GSC9
% V
iabl
e C
ells
-25
-100
-120
-35
-20 -10
Pre-pro CTSD
LAMP2
CTSD
GAPDH
LC3B
MPZ - + - JQ1 - - +
-43
-25
-100 -120
-35
Pre-pro CTSD
LAMP2
CTSD
GAPDH
-43
BRD4 -200
sic
siB
RD
4
A. B.
C. D.
**
**
**
**

Discussion
142
potently inhibit mTORC signaling could prove effective in the treatment of this
disease.
2.3. TFEB-Independent Regulation of Lysosomal Biogenesis
The MITF family transcription factor TFEB is an established master regulator
of lysosomal biogenesis. Upon mTOR inhibition, TFEB is translocated to the nucleus
to bind to the CLEAR element in the promoter of many lysosomal and autophagy
genes which enhances both the formation of new lysosomes and the induction of the
autophagy pathway (Napolitano and Ballabio, 2016b).
Recent studies have identified the existence of TFEB-independent control of
lysosomal biogenesis. The first, reported by Kevin Ryan’s laboratory, identified that
BRD4 is a transcriptional repressor of CLEAR network genes independent of TFEB.
BRD4 inhibition enhanced the induction of autophagy under several signaling cues
including starvation, hypoxia, rapamycin treatment, and oncogenic Ras expression,
however it had no effect on mitophagy, the organelle specific degradation of
mitochondria. Moreover, BRD4 inactivation occurs in response to AMPK stimulation,
suggesting that its repression of the CLEAR network has a function in the cellular
nutrient sensing response (Sakamaki et al., 2017). Our preliminary data using BRD4
knockdown or inhibition with the BET bromodomain pharmacological inhibitor JQ1
confirms that this protein regulates lysosomal biogenesis in GSCs (Figure 37 C-D).
In conjunction with this, an interesting report demonstrated a role of AMPK in
TFEB-dependent transcription via its regulation of CARM149, a co-activator of the
CLEAR network (Shin et al., 2016). AMPK senses changes in cellular energy
through the detection of AMP levels. Upon activation, AMPK inhibits mTOR and
activates autophagy through its kinase activity. When mTOR is stimulated, it
phosphorylates TFEB to prevent nuclear shuttling. As AMPK promotes TFEB action
(via mTOR inactivation and CARM1 stimulation), while also inactivating BRD4, this
metabolic enzyme seems to act as a key link between both pathways that converge
on lysosome formation. Hence, one can envision a model of lysosomal regulation
where AMPK rather than TFEB may be the “master” regulator of lysosomal
biogenesis.
49 Co-activator-associated arginine methyltransferase 1

Discussion
143
Similarly, lysosomal biogenesis can be regulated post-transcriptionally.
Shingu et al. identified that the RNA binding protein QKI associates directly to
stabilize lysosomal RNAs in NSCs and GSCs, independently of TFEB. Moreover,
QKI expression is lower in GSCs as compared to NSCs resulting in fewer lysosomes
(Shingu et al., 2016). Our data implicates the paracaspase MALT1 in this process.
Rather than reducing QKI expression, our study indicates that in patient-derived
GSCs, MALT1 alters QKI availability to binding to its targets (including lysosomal
RNAs) resulting in turn in reduced number of lysosomes. Indeed, QKI co-
immunoprecipitates with the MALT1 binding partner BCL10, while MALT1 interacts
with QKI. Moreover, inhibition of MALT1 reduces this association.
This gives rise to two major hypotheses as to how MALT1 alters QKI
accessibility: either QKI is a substrate of MALT1, or MALT1 sequesters QKI to
prevent it from binding to target RNAs. In silico analysis of the QKI amino acid
sequence revealed a potential MALT1 cleavage site are R106 (on the human
sequence). QKI as a MALT1 substrate is an intriguing possibility because MALT1 is
already known to cleave other RNA binding proteins, namely Roquin1/2 and
Regnase-1 (Jeltsch et al., 2014; Uehata et al., 2013). Also, preliminary western-blots
for QKI in GSCs showed a specific band at ~25kDa that disappears upon QKI
silencing, consistent with the expected size of a C-terminus cleavage fragment
(Figure 38A). This band was present in a panel of four patient-derived GSCs (Figure
38B). However, there was no clear induction of the 25kDa fragment in Jurkat T cells
upon stimulation (data not shown), calling into question the possibility that QKI is a
substrate upon tonic activation of MALT1. More experiments need to be done with
MALT1 inhibitors, and catalytically dead MALT1, including introduction of an
“uncleavable” QKI mutant, in order to determine whether or not this RNA binding
protein is indeed a substrate of MALT1.
If QKI is not a direct MALT1 substrate, this favors the possibility that the RNA
binding protein is sequestered by MALT1 and is kept silent when in complex with
MALT1. In this scenario, MALT1 inhibition allows QKI to be liberated from MALT1
isolation and free to bind and stabilize its targets. Because the catalytic activity of
MALT1 is also engaged in this process, as per our data with zVRPR and protease
dead mutant, this likely excludes steric hindrance. Rather this would suggest that
MALT1 activity helps in maintaining QKI at the vicinity of the CBM complex, possibly
by processing an intermediate substrate involved in regulating this process. Further

Discussion
144
studies would be required to delineate how MALT1 modulate QKI localization and
acitivity in GSCs.
2.4 Does MALT1 inhibition induce LMP?
Our data clearly show that lysosomes play an important role in MALT1-
dependent cell death. Inhibition, with phenothiazines or zVRPR, induces an increase
in endo-lysosomes, and lysosomal drugs partially rescue these cells from death.
Additionally, MALT1 silencing or overexpression of catalytically dead MALT1
recapitulate the drug induced effects. Moreover, silencing of the lysosomal regulator
QKI (Shingu et al., 2016) assuages MALT1 inhibition phenotype. However, whether
or not these cells experience LMP remains to be determined.
LMP can be difficult to detect because the ultrastructure of lysosomes is not
always changed (Aits and Jäättelä, 2013). In terms of my results, DQ-Ovalbumin
data hints at phenothiazine-induced LMP. Staining is indeed dimmer at later time
points upon MPZ treatment, suggesting the lysosomal compartment is less acidic.
However, there was still a strong lysotracker staining of cells at 16 hours, and all
experiments with transferrin were performed in a shorter time frame (4 hrs), therefore
longer timer courses need to be performed in these settings to confirm this
observation. Moreover, MALT1 blockade or silencing, causes an impairment in
Figure 38: Potential QKI cleavage in GSCs. (A) Western-blot of GSC9 transfected with 2 siRNA sequences against QKI or non-silencing control (SiC) to evaluated QKI expression. (*) denotes potential C-termiunus cleavage fragment. Tubulin serves as a loading control. (B) Western-blot for QKI (37 KD) of 4 patient derived GSCs (*) denotes potential C-termiunus cleavage fragment.
Figure EV4A
QKI
Tubulin
QKI
Tubulin
Figure EV4D Figure EV4F
MALT1
QKI
PARP
αTubulin
MALT1
QKI
GAPDH
Figure EV4E
MALT1
QKI
αTubulin
QKISiC SiQKI1 SiQKI2
Figure EV4A
QKI
Tubulin
QKI
Tubulin
Figure EV4D Figure EV4F
MALT1
QKI
PARP
αTubulin
MALT1
QKI
GAPDH
Figure EV4E
MALT1
QKI
αTubulin
QKI
Tubulin
QKI
*
-37
-25
-60
A. B.
Figure EV4A
QKI
Tubulin
QKI
Tubulin
Figure EV4D Figure EV4F
MALT1
QKI
PARP
αTubulin
MALT1
QKI
GAPDH
Figure EV4E
MALT1
QKI
αTubulin
QKI
QKI
*
Figure EV4A
QKI
Tubulin
QKI
Tubulin
Figure EV4D Figure EV4F
MALT1
QKI
PARP
αTubulin
MALT1
QKI
GAPDH
Figure EV4E
MALT1
QKI
αTubulin
QKI
-37
-25
-60Tubulin
GSC1 GSC4 GSC9 GSC12

Discussion
145
autophagic flux in GSCs, as certified with a clear accumulation of lipidated LC3 and
P62. LMP is often accompanied by a reduction in autophagic flux due to “defective”
lysosomes (Elrick and Lieberman, 2013; Wang et al., 2018). Galectins (including
Gal3) are recruited to leaky lysosomes upon LMP; which can therefore be
experimentally visualized by the formation of galectin puncta at lysosomes (Aits et
al., 2015; Chauhan et al., 2016). In our settings, Galectin-3 and LAMP2 co-staining
will be analyzed upon MALT1 knockdown or inhibition to address this question.
Moreover, our data do not exclude the possibility that some deleterious effects
on the lysosomes are due to non-selective actions of the drugs used in this study, as
less potent MALT1 inhibitors, like promethazine, also expand the lysosomal
compartment (Nagel et al., 2012b; Schlauderer et al., 2013). Indeed, phenothiozines
have a cationic amphiphilic nature, due to their hydrophilic amine groups and a
hydrophobic aromatic ring structures. As previously mentioned CADs can freely
diffuse across the lysosomal membrane and disrupt ASM stability (Gulbins and
Kolesnick, 2013; Kirkegaard et al., 2010; Petersen et al., 2013). Therefore we cannot
discount that some of the effect of phenothiozines on the lysosomes is independent
of MALT1 action. Also other drugs, such as clemastine, induce LMP and lysosomal
compartment increase in GBM cells (Le Joncour et al., 2019). Indeed, though not of
the same drug family, zVRPR can also affect lysosomes by inhibiting Cathepsin B
(Eitelhuber et al., 2015). Off target actions do not eliminate the therapeutic potential
of phenothiazines. For example, despite the lysomotrophic properties of Sunitinib, it
is commonly used as an anti-angiogenic treatment in cancer therapy. The
lysomotropic nature of a molecule does not therefore preclude it from being an
effective anti-cancer agent. (Meadows and Hurwitz, 2012; Zhitomirsky and Assaraf,
2014). Thus, as phenothiazines efficiently cross the blood-brain barrier in humans
(Korth et al., 2001), and as these molecules are currently used in the clinic, they
represent an interesting possibility for drug repurposing.
Certainly, targeting lysosomes has emerged as a potent and effective strategy
in cancer therapy. Due to an altered lysosomal compartment, cancer cells are more
susceptible to death upon treatment with LMP-inducers than normal cells (Gyrd-
Hansen et al., 2004; Ono et al., 2003). In GBM, several studies have also illustrated
the potential at targeting lysosomal stability (Le Joncour et al., 2019; Mora et al.,
2010; Shingu et al., 2016). Mora and colleagues showed that altered sphingolipid
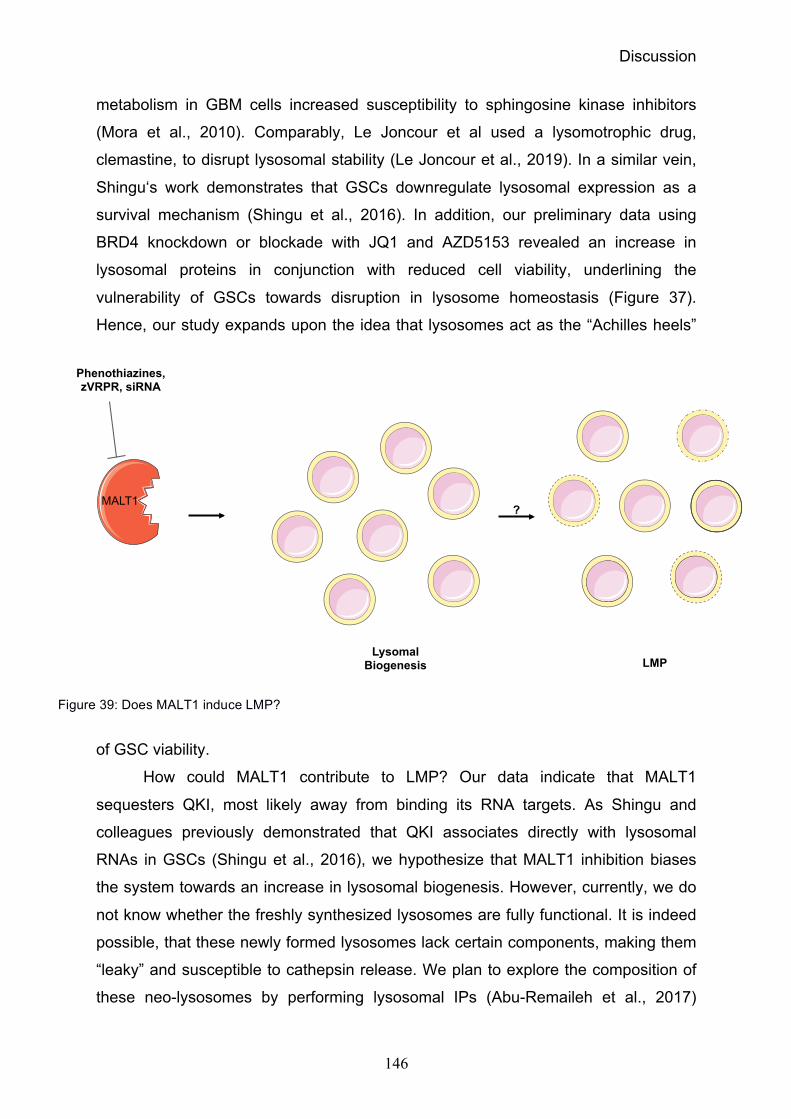
Discussion
146
metabolism in GBM cells increased susceptibility to sphingosine kinase inhibitors
(Mora et al., 2010). Comparably, Le Joncour et al used a lysomotrophic drug,
clemastine, to disrupt lysosomal stability (Le Joncour et al., 2019). In a similar vein,
Shingu‘s work demonstrates that GSCs downregulate lysosomal expression as a
survival mechanism (Shingu et al., 2016). In addition, our preliminary data using
BRD4 knockdown or blockade with JQ1 and AZD5153 revealed an increase in
lysosomal proteins in conjunction with reduced cell viability, underlining the
vulnerability of GSCs towards disruption in lysosome homeostasis (Figure 37).
Hence, our study expands upon the idea that lysosomes act as the “Achilles heels”
of GSC viability.
How could MALT1 contribute to LMP? Our data indicate that MALT1
sequesters QKI, most likely away from binding its RNA targets. As Shingu and
colleagues previously demonstrated that QKI associates directly with lysosomal
RNAs in GSCs (Shingu et al., 2016), we hypothesize that MALT1 inhibition biases
the system towards an increase in lysosomal biogenesis. However, currently, we do
not know whether the freshly synthesized lysosomes are fully functional. It is indeed
possible, that these newly formed lysosomes lack certain components, making them
“leaky” and susceptible to cathepsin release. We plan to explore the composition of
these neo-lysosomes by performing lysosomal IPs (Abu-Remaileh et al., 2017)
Figure 39: Does MALT1 induce LMP?
Lysomal Biogenesis LMP
? MALT1
Phenothiazines, zVRPR, siRNA

Discussion
147
followed by mass spectrometry, upon MALT1 inhibition or silencing, to determine the
presence of lysosomal alterations.
As MALT1 is a protease, and as the expression of a catalytically dead MALT1
leads to an increase in the lysosomal compartment, another possibility is that MALT1
directly cleaves a substrate involved in lysosomal stability, such as QKI itself (see
discussion 2.3). However, further study needs to be done to identify other potential
candidates.
2.5 Lysosomes and Stem Cell Fate
In addition to
the established
lysosomal
vulnerability of cancer
cells, emerging
evidence highlights a
potential role of
lysosomes in the
stem cell fate. A
recent study by
Villegas et al used a
CRISPR genome
wide screen to
identify regulators of
embryonic stem cell
(ESC) differentiation.
This classified TFE3
as a governor of ESC
pluripotency. In fact,
this study unveiled a
novel role for Rag C
and D outside their
canonical function in
Figure 40: Lysosomal involvement in NSC differentiation from Audesse and Webb 2018. (A) Quiescent NSCs have more lysosomes than activated NSCs. (B)In aged NSCs there are less functional lysosomes and more protein aggregates leading to reduction in NSC activation. (c) Lysosomal restoration could ameliorate the phenotype of aged NSCs.
Discussion
148
mTOR recruitment. Instead, in this context, these Rags retain TFE3 in the cytoplasm
to prevent nuclear translocation and cellular differentiation. As TFE3 directly binds to
CLEAR network targets, this implies that increased lysosomal protein expression
and degradation promotes differentiation. Likewise, this mechanism also occurs in
neural progenitor cells, suggesting that TFE3 may ubiquitously regulate the
differentiation process (Villegas et al., 2019). Therefore, this study highlights a
potential impact of lysosomes on stem cell fate.
Furthermore, damaged and misfolded proteins are cleared either by the
ubiquitin proteasome system or through the autophagy/lysosome degradation
pathway. Disruption of either system can lead to protein aggregate accumulation,
which can affect cellular functioning and viability. One area of the body especially
sensitive to protein aggregates is the central nervous system, as protein aggregates
play a key role in the development of neurodegenerative diseases (Balch et al.,
2008). With this in mind, a recently discovered characteristic of aging NSCs is the
development of defective lysosomes, which leads to the accumulation of protein
aggregates. A study by Anne Brunet’s group demonstrated that quiescent NSCs
(qNSCs) had more numerous and larger lysosomes than activated NSCs. However,
when older qNSCs were compared to younger qNSCs, there was a reduction in
lysosome expression and an accumulation of protein aggregates. Moreover, these
cells were less able to initiate differentiation than their younger counterparts. These
data suggest that restoration of lysosomal function in aging qNSCs could improve
their capacity to clear aggregates and activate in response to stimuli (Figure 40)
(Audesse and Webb, 2018; Leeman et al., 2018). Also, Kobayashi and colleagues
confirmed an important role of lysosomes in NSC quiescence. There was higher
lysosomal receptor recycling in qNSCs than in proliferating ones. Likewise, when
lysosomal degradation was blocked in qNSCs, these cells exited the quiescent state.
These results suggest that lysosomes play an important role in qNSC maintenance.
The RNA binding protein QKI is mostly expressed in the brain, and has
recently been reported as a lysosomal regulator in NSCs and GSCs (Shingu et al.,
2016). Interestingly, QKI has previously been implicated in Parkinson’s disease. QKI
null mice display dysmyelination in the central nervous system and a phenotype of
tonic seizures, as well as deletions in Parkin, a protein known to be altered in many
cases of Parkinson’s disease (Lorenzetti et al., 2004). Furthermore, QKI gene
expression was found to correlate with severity in Alzheimer’s disease, (Gómez

Discussion
149
Ravetti et al., 2010). Therefore, lysosomal dysfunction may be a common link in the
process of aging, culminating with neurodegenerative diseases and with GBM
development. Lysosomal integrity is of high importance for NSC maintenance, which
may explain the increased sensitivity of their GSC counterparts to disruptions in
lysosomal homeostasis.
In the course of this study, we identified two possible axes by which to target
GSCs. As GSCs are known to engage in close contacts with endothelial cells, we
first sought to disrupt their reciprocal communication. Interfering with the
gp130/APLNR signaling axis can perturb stemness maintenance within the
protective vascular niche. This molecular target has the potential to combine with
standard of care therapies. Not all GSCs are found in this nutrient rich environment.
We therefore explored at intrinsic survival mechanisms that could be exploited for
therapeutic purposes. MALT1 proved important in GSC viability due to its role in
lysosomal homeostasis. Our work and that of other groups point to the exciting
therapeutic potential of perturbing lysosomal stability in GSCs. Thus, MALT1
inhibitors and other LMP inducing drugs may prove to be an effective strategy in the
treatment of this lethal disease.

Discussion
150

Discussion
151
ANNEXES

Annex 1
152
ANNEX 1

Annex 1
153
Mini CV
Scientific Communication
Oral communications
• Oral Communication, ADELIH Meeting, Paris, March 2018. “Apelin Signaling in Glioblastoma Stem-like Cells”
Posters
• EMBO Autophagy, Creiff, Scotland, August 2019. ”The Paracaspase MALT1 regulates Endolysosome Levels in Glioblastoma Stem-Like Cells”
• Conference Cellular Proteolysis, SFBBM, Montpelier, France, October 2018. ”The Paracaspase MALT1 regulates Endolysosome Levels in Glioblastoma Stem-Like Cells” – Poster Prize winner
• EMBO Conference Lysosomes and Metabolism, Naples, Italy, May 2018. “Regulation of QKI by the Paracaspase MALT1 is required for Glioblastoma Stem Cell Survival”
• GDR MicroNIT Meeting, Marseille, France, January 2018. “Regulation of QKI by the Paracaspase MALT1 is required for Glioblastoma Stem Cell Survival”
• Brain Tumor Conference, Berlin, Germany, May 2017. “Neutralizing gp130 interferes with endothelial-mediated effects on glioblastoma stem-like cells”
Courses
• Course, Autophagy in the Healthy and Diseased Brain, Lake Como School for advanced studies, Lake Como, Italy, October 2018.

Annex 2
154
ANNEX 2 Pharmacological Targeting of Apelin impairs
Glioblastoma Growth

Annex 2
155
Pharmacological targeting of apelin impairsglioblastoma growthElizabeth Harford-Wright,1,2 Gwennan Andre-Gregoire,1,* Kathryn A. Jacobs,1,*Lucas Treps,2 Sophie Le Gonidec,3 Heloise M. Leclair,1,2 Sara Gonzalez-Diest,1,2
Quentin Roux,1 Francois Guillonneau,4 Delphine Loussouarn,5,6 Lisa Oliver,5,6
Francois M. Vallette,6,7 Fabienne Foufelle,8 Philippe Valet,3 Anthony P. Davenport,9
Robert C. Glen,10,11 Nicolas Bidere1,2 and Julie Gavard1,2
*These authors contributed equally to this work.
Glioblastoma are highly aggressive brain tumours that are associated with an extremely poor prognosis. Within these tumours
exists a subpopulation of highly plastic self-renewing cancer cells that retain the ability to expand ex vivo as tumourspheres, induce
tumour growth in mice, and have been implicated in radio- and chemo-resistance. Although their identity and fate are regulated by
external cues emanating from endothelial cells, the nature of such signals remains unknown. Here, we used a mass spectrometry
proteomic approach to characterize the factors released by brain endothelial cells. We report the identification of the vasoactive
peptide apelin as a central regulator for endothelial-mediated maintenance of glioblastoma patient-derived cells with stem-like
properties. Genetic and pharmacological targeting of apelin cognate receptor abrogates apelin- and endothelial-mediated expansion
of glioblastoma patient-derived cells with stem-like properties in vitro and suppresses tumour growth in vivo. Functionally,
selective competitive antagonists of apelin receptor were shown to be safe and effective in reducing tumour expansion and
lengthening the survival of intracranially xenografted mice. Therefore, the apelin/apelin receptor signalling nexus may operate
as a paracrine signal that sustains tumour cell expansion and progression, suggesting that apelin is a druggable factor in
glioblastoma.
1 CRCINA, Inserm, Team SOAP, CNRS, Universite de Nantes, Nantes, France2 Institut Cochin, Team SOAP, Inserm, CNRS, Universite Paris Descartes, Paris, France3 I2MC, Inserm, Universite Paul Sabatier, Toulouse, France4 3P5 Proteomics Facility of the Universite Paris Descartes, Paris, France5 Centre Hospitalier Universitaire (CHU) de Nantes, Nantes, France6 CRCINA, Inserm, Universite de Nantes, Nantes, France7 Institut de Cancerologie de l’Ouest, Rene Gauducheau, St Herblain, France8 Centre de Recherches des Cordeliers, Inserm, Universite Paris Descartes, Paris, France9 Experimental Medicine and Immunotherapeutics, University of Cambridge, Cambridge, UK
10 The Centre for Molecular Informatics, Department of Chemistry, University of Cambridge, Cambridge, UK11 Computational and Systems Medicine, Department of Surgery and Cancer, Faculty of Medicine, Imperial College London, UK
Correspondence to: Dr Julie Gavard,Team SOAP, Signaling in Oncogenesis, Angiogenesis and Permeability, IRS-UN blg, Room 416, 8 quai Moncousu, Nantes 44000,FranceE-mail: [email protected]: @LabSoap
Keywords: glioblastoma initiating cells; vascular niche; apelin; APJ; antagonist
doi:10.1093/brain/awx253 BRAIN 2017: 140; 2939–2954 | 2939
Received January 25, 2017. Revised July 27, 2017. Accepted August 5, 2017. Advance Access publication October 3, 2017! The Author (2017). Published by Oxford University Press on behalf of the Guarantors of Brain.
This is an Open Access article distributed under the terms of the Creative Commons Attribution License (http://creativecommons.org/licenses/by/4.0/), which permits unrestricted reuse,
distribution, and reproduction in any medium, provided the original work is properly cited.
Dow
nloaded from https://academ
ic.oup.com/brain/article-abstract/140/11/2939/4316093 by U
niversitary library of medicine user on 11 Septem
ber 2019

Annex 2
156
Abbreviations: EC-CM = endothelial cell conditioned media; GSC = glioblastoma stem-like cells; MF = mitogen-free;NS = mitogen-supplemented; TMZ = temozolomide
IntroductionGlioblastoma is the most common and lethal primary braintumour in adults. Although there has been notable progressin strategies to fight glioblastoma (Stupp et al., 2009;Chinot et al., 2014; Brown et al., 2016), the prognosisremains extremely poor with average survival reported tobe less than 15 months following diagnosis (Stupp et al.,2009, 2015). A subpopulation of tumorigenic cells termedglioblastoma stem-like cells (GSCs), also known as cancer-initiating cells (Lathia et al., 2015), has been implicated intumour initiation, resistance to current therapies and dis-ease recurrence (Singh et al., 2004; Bao et al., 2006; Chenet al., 2012; Yan et al., 2013). Similar to how normal stemand progenitor cells participate in tissue development andrepair, cancer stem-like cells pervert these processes to fa-cilitate the initiation and progression of tumours.Moreover, GSCs contribute to both radiation and chemo-resistance as these treatments target cycling, highly prolif-erative cancer cells, whereas GSCs are comparativelyquiescent, and thus survive to repopulate the tumourpost-treatment (Bao et al., 2006; Chen et al., 2012). Assuch, GSCs represent an important target for future thera-pies and a better understanding of how GSCs interact withtheir environment is required.
Studies have proposed that GSC tumorigenicity relies onthe surrounding tumour microenvironment, with braintumour-initiating cells reported to reside in close contactwith brain microvascular cells (Calabrese et al., 2007;Galan-Moya et al., 2011; Shingu et al., 2017). The local-ization of GSCs in proximity to endothelial cells facilitatescommunication between these cells (Calabrese et al., 2007)allowing the tumour vascular bed to provide factors essen-tial to maintain GSC resistance to therapies, identity andfate (Garcia-Barros et al., 2003; Folkins et al., 2007; Everset al., 2010; Galan-Moya et al., 2011, 2014). Among theputative candidates of this angiocrine signalling, solublegrowth factors emanating from the vascular niche havebeen reported in various physiological and pathologicalmodels (Andreu-Agullo et al., 2009; Beck et al., 2011;Cao et al., 2014, 2017). However, to date, the specificendothelial secreted factors involved in this processremain to be identified. Here, we used a mass spectrometryproteomic analysis of the endothelial cell secretome andidentified the vasoactive peptide apelin as a central regula-tor of the expansion of glioblastoma patient-derived cellswith stem-like properties. As such, targeting apelin mayrepresent an effective novel therapeutic approach to treatglioblastoma.
Materials and methods
Ethics statementInformed consent was obtained from all patients prior tosample collection for diagnostic purposes. Clinical tissue sam-ples were provided by the Regional Institute for Cancer inNantes Atlantique (IRCNA) tumour library (Nantes, France).This study was reviewed and approved by the institutionalreview boards of Sainte Anne Hospital, Paris, France, andLaennec Hospital, Nantes, France, and performed in accord-ance with the Declaration of Helsinki Protocol. Animal pro-cedures were conducted as outlined by the EuropeanConvention for the Protection of Vertebrate Animals usedfor Experimental and other Scientific Purposes (ETS 123)and approved by the French Government (APAFIS#2016-2015092917067009).
Analysis of human clinical databasesThe Cancer Genome Atlas (TCGA, HG-UG133A and Agilent-4502A data), Rembrandt and Gravendeel microarrays wereinterrogated through the Gliovis platform (http://gliovis.bioinfo.cnio.es/) (Bowman et al., 2017). Data were plottedbased on histology criteria only. For reverse protein phasearrays (RPPA), optimal cut-offs were set to define highversus low expression of APLNR, as indicated on the plots.Pairwise t-tests were run.
Cell culture, conditioned media pre-paration and mass spectrometryGlioblastoma patient-derived cells with stem-like properties(GSCs) were isolated as previously described (Treps et al.,2016). Briefly, tumours were dissociated using theMACsDissociator (Miltenyi) and each GSC characterized fortheir self-renewal capabilities, cell surface antigens, expressionof stemness markers, their ability to differentiate, and to initi-ate tumour formation (Supplementary Table 1). GSCs 1–16were maintained as spheres in NS medium (DMEM-F12,with N2, G5 and B27 supplements, GlutaMAXTM and antibi-otics, Life Technologies). To induce differentiation in GSCs,the three supplements were omitted and 10% foetal bovineserum added to the media.
Human brain microvascular endothelial cells (hCMEC/D3,PO Couraud), HEK-293T and SVEC4-10 mouse endothelialcells (ATCC) were cultured as previously described (Trepset al., 2016). Tumour-derived endothelial cells (tEC) were iso-lated from mechanically homogenized mice orthotopic braintumours using CD31 MicroBeads (Miltenyi).
Stealth non-silencing control (low-GC 12935111) and se-lected siRNA targeting human APLN (HSS113086), APLNR(HSS100325) and GSK3B (HSS104522) (Life Technologies,
2940 | BRAIN 2017: 140; 2939–2954 E. Harford-Wright et al.
Dow
nloaded from https://academ
ic.oup.com/brain/article-abstract/140/11/2939/4316093 by U
niversitary library of medicine user on 11 Septem
ber 2019

Annex 2
157
50 nM) were transfected using RNAiMAX Lipofectamine!
(Life Technologies). GIPZ lentiviral shRNAs against humanAPLNR sequences 1–3, with identification numbersV3LHS_307344, V3LHS_307345 and V3LHS_307346, re-spectively, were purchased from Thermo Fisher Scientific.Lentiviral particles were collected from pGIPZ, pSPAX2 andpVSVg co-transfected HEK-293T cells (Dubois et al., 2014).
Conditioned media (CM) from hCMEC/D3 (hEC-CM),tumour xenograft-derived endothelial cells (tEC-CM),SVEC4-10 (mEC) and HEK-293T (293T-CM) cells were ob-tained from 72-h-old monolayers in serum-free EBM2 (Lonza).Conditioned media from GSC#1 was obtained from 72-h-oldtumourspheres. For acidic stress simulation, EBM2 (Lonza, pH8.2) was adjusted to pH 6.8 using HCl before preparing hEC-CM. Apelin concentrations were quantified using the humanapelin-12 EIA kit according to the manufacturer’s instructions(cross-reactivity with apelin-12, apelin-13, and apelin-36,Phoenix Pharmaceuticals).
Protein and peptide identification was performed in theUniversity Paris Descartes Proteomics Facility (3P5, Paris,France), without trypsin proteolysis for peptidome analysis,as previously described in Luissint et al. (2012). Mass spectrawere measured with a 4800 MALDI-TOF-TOF mass spec-trometer (ABSciex) equipped with a Nd:YAG pulsed laser(355 nm wavelength, 5500 ps pulse and 200 Hz repetitionrate). Spectra acquisition and processing were performedusing the 4000 series explorer software (ABSciex).
DrugsMM54 (cyclo[1-6]CRPRLCKHcyclo[9-14]CRPRLC) andMM193 were prepared as previously described (Macalusoet al., 2011). Temozolomide (TMZ) and tideglusib were pur-chased from Sigma, and apelin peptides were from PhoenixPharmaceuticals (pyr1-apelin-13 pyr1-QRPRLSHKGPMPF,apelin-13 QRPRLSHKGPMPF, and apelin-36 LVQPRGSRNGPGPWQGGRRKFRRQRPRLSHKGPMPF).
Tumoursphere formationTo test the tumoursphere formation, GSCs (100 cells/ml) wereplated in triplicate in indicated media as previously described(Harford-Wright et al., 2016). Cells were manually dissociatedeach day and a single cell suspension maintained until Day 5.Tumourspheres were counted in five random fields of view,and the mean from the triplicate of each condition calculatedfrom three independent experiments.
Limiting dilution assaysTo test the clonal capacity of GSCs, a limiting dilution assaywas performed as previously described (Tropepe et al., 1999).GSCs were seeded in the tested media (NS, MF and EC-CM)in a 96-well plate with serial dilutions ranging from 4 to 2000cells/well, with eight wells per dilution for each plate and trea-ted as indicated. Two weeks later, each well was scored fortumoursphere formation and the frequency of stem cells calcu-lated using ELDA software (Hu and Smyth, 2009). The meanstem cell frequency for each condition was determined by aver-aging the stem cell frequencies of two independentexperiments.
Radioligand binding and calciummobilization assaysRadioligand binding and calcium mobilization assays to assessthe putative off-target effects of MM54 were performed byEurofins Cerep Panlabs, according to the manufacturer’sinstructions.
Cell viabilityCell viability in response to MM54 was tested using theUptiBlue reagent (Interchim), a fluorometric/colorimetricgrowth indicator based on the detection of metabolic activity.Briefly, cells were seeded at a density of 2 ! 103 per well,UptiBlue added at a concentration of 10% v/v and cells main-tained at 37"C 5% CO2 until analysis. Absorbance was mea-sured at Day 5 following treatment at 570 and 600 nm on aFLUOStar OPTIMA (BMG Labtech) plate reader, and the per-centage of cell viability calculated according to the manufac-turer’s instructions.
Cell survival in adherent cells was evaluated using the MTTassay [1-(4,5-dimethylthiazol-2-yl)-3,5-diphenylformazan, thia-zolyl blue formazan; Sigma], which is reduced to formazanbased on the mitochondrial activity of living cells. Cells wereseeded in a 96-well plate in triplicate at a density of 5 ! 103
per well and treatments administered 24 h after seeding.Absorbance values were read at 590 nm and expressed as apercentage of cell viability relative to basal conditions.
Animal proceduresTumour inoculation experiments were performed on femaleBalb/C nude mice (Janvier) aged 5–6 weeks. For toxicity ex-periments 6-week-old female C57/Bl6J (Janvier) mice wereused. Animals were randomly assigned to each group andgroup housed in specific pathogen-free conditions at 24"C ona 12-h day-night cycle. At all times, animals were allowedaccess to standard rodent pellets and water ad libitum.
To test potential toxic effects of MM54 and MM193in vivo, mice were administered 2 mg/kg of MM54, MM193or vehicle bi-weekly for 4 weeks. At sacrifice, blood was takenfor analysis and the heart, kidney, aorta and liver removed,weighed and fixed for histological analysis. For the glycaemicstudy, animals were starved for 6 h prior to sacrifice.
For the ectopic models, mice were subcutaneously injectedwith 5 ! 105 GSC#9 in 100ml of phosphate-buffered saline(PBS) and growth factor-free Matrigel! (Corning) in eachflank. Tumourspheres were dissociated prior to injection forall in vivo experiments to ensure implantation of a single cellsuspension. To analyse tumour initiation, mice were examinedweekly to monitor tumour growth and sacrificed between 6and 7 weeks following implantation. For pharmacological stu-dies, mice were treated twice per week once tumours werepalpable, with MM54 (2 mg/kg), MM193 (2 mg/kg) or vehicle(PBS) by intraperitoneal injection. Tumour size was measuredonce a week with callipers and tumour volume calculatedusing the following equation (width2 ! length)/2.
Intracranial injection of GSC#9 was performed using a freehand injection technique as described in detail elsewhere (Trepset al., 2016). Briefly, mice were anaesthetized with a mixture ofketamine (100 mg/kg) and xylazine (10 mg/kg) and a midline
Apelin signalling in glioma growth BRAIN 2017: 140; 2939–2954 | 2941
Dow
nloaded from https://academ
ic.oup.com/brain/article-abstract/140/11/2939/4316093 by U
niversitary library of medicine user on 11 Septem
ber 2019

Annex 2
158
incision performed. A small burr hole was made 2 mm to theright of bregma, 1 mm anterior and 3 mm ventral to the coronalsuture. A 5ml Hamilton syringe was inserted to a depth of 3 mmand 105 GSC#9 injected slowly. One minute after completion ofthe injection, the needle was retracted, surgical site closed andanimals allowed to recover. At 3 weeks following GSC#9 in-oculation, treatment with PBS or MM54 (2 mg/kg) was com-menced three times per week until death due to tumour burdenor the conclusion of the experiment at Day 70.
ImmunostainingBoth cellular and tissue analysis was performed using immunos-taining and haematoxylin and eosin standard protocols (Trepset al., 2016). The following primary antibodies were used:PECAM (BD), pS9-GSK3b (Cell Signaling), APLN andAPLNR (Abcam), and Ki67, SOX2 and NESTIN (Millipore).Cell death was estimated through the TUNEL assay kit(Trevigen). A minimum of three tumour sections per conditionwas used for analysis, with at least five different fields of view.For blood vessel surface analysis, PECAM pixel intensity wascalculated (ImageJ) in randomly chosen fields of view andmean ! standard error of the mean (SEM) of the total field ofview was represented. Cell proliferation was assessed throughthe percentage of Ki67-positive cells normalized to the totalnumber of nuclei. NESTIN-positive and pS9-GSK3b-positivecells were counted per field of view. Image acquisitions wereperformed on Spinning Disk Leica microscope (InstitutCochin) and confocal Nikon A1 RSi (Micropicell).
Flow cytometryFor cell surface expression analysis, cells were incubated withantibodies for 1 h and washed twice with cold PBS. For totalexpression, cells were fixed (4% paraformaldehyde-PBS,15 min) and permeabilized (iced-cold methanol, 10 min) priorincubation with antibodies. APC-APLNR, and isotype controlIg (R&D systems) antibodies were used.
Analysis of aldehyde dehydrogenase (ALDH) activity was per-formed using the ALDEFLUORTM assay kit (Stem CellTechnologies). Briefly, cells were incubated with ALDEFLUORalone or in combination with an ALDH activity inhibitor(DAEB) at 37"C for 45 min. This flow cytometry-based stainingallows monitoring ALDH activity in stem, progenitor andcancer precursor cells. The ALDH activity is considered positivein comparison to cells incubated with DEAB reagent.
Flow cytometry analyses were performed on Accuri C6 andFACsCalibur (BD Biosciences, Cytocell) and processed usingCFlow plus or FlowJo software (BD Biosciences).
Western blotsFollowing stimulation with the relevant treatment, cells werecollected and washed in PBS before lysis at 4"C with TNTbuffer (50 mM Tris pH 7.4, 150 mM NaCl, 2 mM EDTA,1% TritonTM X-100, 1% IGEPAL!) supplemented with prote-ase inhibitors (ThermoFisher Scientific). Equal amounts of pro-tein were loaded on tris-glycine gels and transferred ontonitrocellulose membranes (GE Healthcare). Antibodies againstpS9-GSK3b, GSK3b, KDM1A, pS473-AKT, AKT, pS235/S236-S6 and pT202/Y204-ERK1/2 (Cell Signaling, Ozyme),GAPDH (Santa Cruz Biotech) and APLNR (Abcam) were
incubated with the membrane overnight at 4"C and followedby incubation with the relevant secondary antibodies (SouthernBiotech) for 1 h at room temperature. Membranes were revealedusing a chemiluminescent HRP substrate (Millipore) and visua-lized using the Fusion imaging system (Vilber Lourmat).
RNA extraction and RT-PCRRNA was extracted using the Qiagen RNeasy! Mini Kit as perthe manufacturer’s directions. Equal amounts of RNA werereverse transcribed using the SuperScript! III RT kit (LifeTechnologies) and the resulting cDNA was used to amplifymRNA by PCR using gene-specific primer sets in the presenceof REDTaq! DNA polymerase (Sigma). ACTB and GAPDHwere also amplified as control for input. See SupplementaryTable 2 for primer details.
StatisticsData are representative of three independent experiments,unless otherwise stated. Statistical analysis was performedwith GraphPad Prism6 using two-way ANOVA and an un-paired two-tailed t-test (Student’s t-test). In Kaplan-Meier sur-vival curves, differences were compared by log-rank analysisand Gehan-Breslow-Wilcoxon. In all experiments a P-value of50.05 was considered significant.
Results
Endothelial cells produce thevasoactive peptide apelin
To identify endothelial-secreted factors potentially involved inthe maintenance of GSCs, we performed an unbiased tandemmass spectrometry proteomic analysis of the human brainendothelial secretome using human brain endothelial cell(hCMEC/D3)-conditioned media (EC-CM) and compared itto epithelial-like HEK-293T CM. Hits that were shared bythe two cell lines were discarded, and 22 peptides or proteinsspecific to the EC-CM identified (Fig. 1A, SupplementaryTable 3 and Supplementary Fig. 1A). Apelin peptides re-vealed the highest exponentially modified protein index andwere selected for further characterization (Fig. 1B,Supplementary Table 3 and Supplementary Fig. 1B and C).
Enzyme immunoassay analysis demonstrated that endo-thelial cells secreted significant amounts of apelin, as thepeptide was robustly detected in the conditioned mediaproduced by human, mouse and xenograft tumour-derivedendothelial cells, supporting endothelial cells as a source ofapelin (Fig. 1C and D). In contrast, apelin was not detectedin patient-derived GSC#1, #2, #9 and #12 RNA lysates,and concentrations were found lower than the limit ofELISA sensitivity (0.07 ng/ml) (Fig. 1C and D).Furthermore, to challenge apelin production in conditionsthat recapitulate the tumour microenvironment, we as-sessed apelin secretion from human brain endothelial cellsunder acidic stress (Fig. 1D). Interestingly, acidification ofthe milieu did not affect the overall production of apelin.
2942 | BRAIN 2017: 140; 2939–2954 E. Harford-Wright et al.
Dow
nloaded from https://academ
ic.oup.com/brain/article-abstract/140/11/2939/4316093 by U
niversitary library of medicine user on 11 Septem
ber 2019
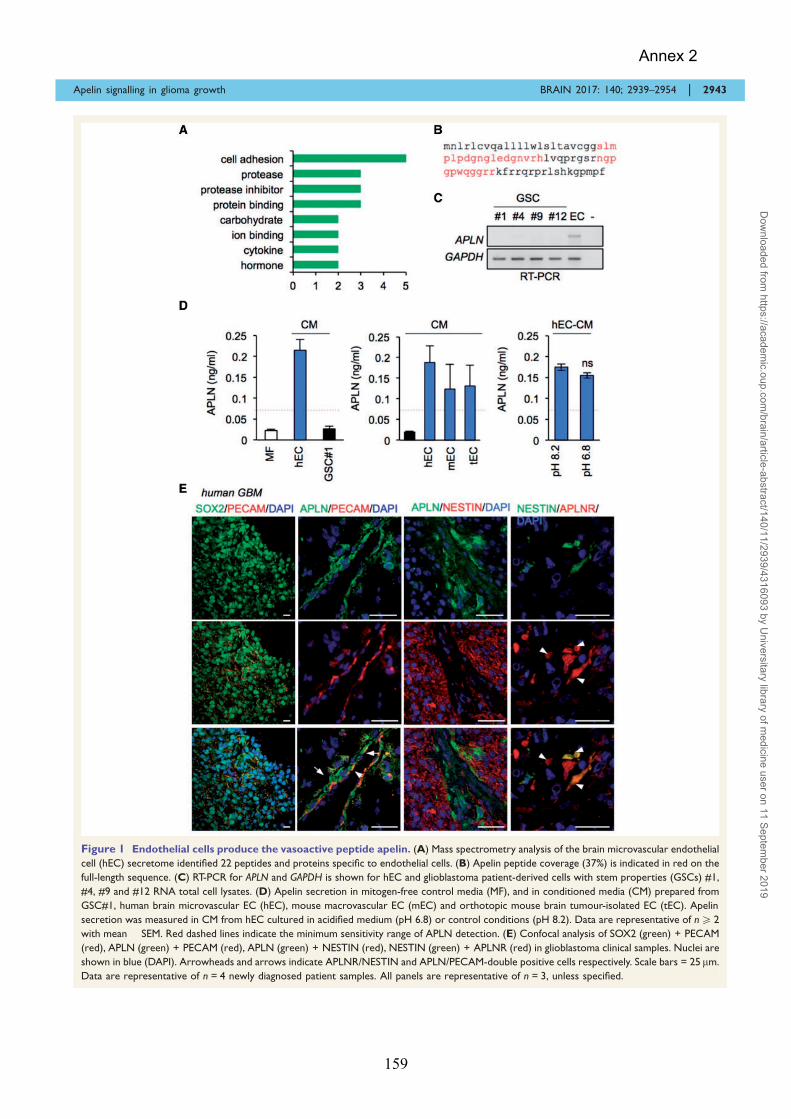
Annex 2
159
Figure 1 Endothelial cells produce the vasoactive peptide apelin. (A) Mass spectrometry analysis of the brain microvascular endothelial
cell (hEC) secretome identified 22 peptides and proteins specific to endothelial cells. (B) Apelin peptide coverage (37%) is indicated in red on the
full-length sequence. (C) RT-PCR for APLN and GAPDH is shown for hEC and glioblastoma patient-derived cells with stem properties (GSCs) #1,
#4, #9 and #12 RNA total cell lysates. (D) Apelin secretion in mitogen-free control media (MF), and in conditioned media (CM) prepared from
GSC#1, human brain microvascular EC (hEC), mouse macrovascular EC (mEC) and orthotopic mouse brain tumour-isolated EC (tEC). Apelin
secretion was measured in CM from hEC cultured in acidified medium (pH 6.8) or control conditions (pH 8.2). Data are representative of n5 2
with mean ! SEM. Red dashed lines indicate the minimum sensitivity range of APLN detection. (E) Confocal analysis of SOX2 (green) + PECAM
(red), APLN (green) + PECAM (red), APLN (green) + NESTIN (red), NESTIN (green) + APLNR (red) in glioblastoma clinical samples. Nuclei are
shown in blue (DAPI). Arrowheads and arrows indicate APLNR/NESTIN and APLN/PECAM-double positive cells respectively. Scale bars = 25 mm.
Data are representative of n = 4 newly diagnosed patient samples. All panels are representative of n = 3, unless specified.
Apelin signalling in glioma growth BRAIN 2017: 140; 2939–2954 | 2943
Dow
nloaded from https://academ
ic.oup.com/brain/article-abstract/140/11/2939/4316093 by U
niversitary library of medicine user on 11 Septem
ber 2019

Annex 2
160
Moreover, we detected apelin and its receptor, theG-protein coupled receptor APLNR (APJ), in clinical glio-blastoma samples in the vicinity of PECAM-labelled endothe-lial cells and cells positive for the stem cell markers NESTINand SOX2 (Fig. 1E), suggesting a potential role for apelin inthe tumour vascular niche (Calabrese et al., 2007). However,APLN staining did not coincide with NESTIN-positivetumour cells, but rather with vascular tracks (Fig. 1E), sup-porting endothelial cells as a potential source for apelin inglioblastoma, consistent with a recent report in colorectalcancer-derived endothelial cells (Zuurbier et al., 2017). Toexplore the clinical relevance of apelin further, we performeda retrospective analysis using The Cancer Genome Atlas(TCGA), Rembrandt and Gravendeel databases. Analysis ofall three databases revealed a significant increase in APLNmRNA in glioblastoma tissue, as compared to non-tumoursamples, which might be due to endothelial abundance inthese grade IV tumours (Supplementary Fig. 1D).
Apelin sustains GSC expansionin vitroWe next evaluated the response of patient-derived GSCs,which have been extensively characterized both in vitro andin vivo (Supplementary Table 1 and Supplementary Fig. 2Aand B) to the biologically active apelin fragments: apelin-13, pyr-apelin-13 and apelin-36 (see ‘Materials and meth-ods’ section for more information). Although all of theapelin peptides increased the number of tumourspherescompared to mitogen-free media (MF), apelin-13 was themost potent at sustaining GSCs (Fig. 2A). Subsequently, weassessed the effect of increasing concentrations of apelin-13(termed apelin hereafter) on GSC#1 and observed a potentand sustained increase in tumourspheres from the lowestconcentration (Fig. 2B). Consistent with our previouswork (Galan-Moya et al., 2011, 2014), both mitogen-sup-plemented medium (NS) and EC-CM maintained the ex-pression of stem markers NESTIN and SOX2 (Fig. 2C).Accordingly, mitogen withdrawal resulted in the loss ofexpression of these markers and the reduced ability toform tumourspheres, which was rescued by the additionof synthetic apelin to this MF media (Fig. 2C). To deter-mine whether apelin alone maintained GSC self-renewal, alimiting dilution assay was performed in GSC#1 (Fig. 2D).As expected, we observed the highest frequency of colony-forming cells in GSCs grown in NS and EC-CM.Nonetheless, compared to MF conditions, GSC#1 grownin apelin-supplemented MF demonstrated an increase inthe frequency of colony-forming cells. Moreover, weobserved in a panel of 16 patient-derived GSCs(Supplementary Table 1) that apelin-supplemented mediasignificantly increased the ability of GSCs to expand astumourspheres (Fig. 2E), and increased the frequency ofstem cells in a panel of five representative GSCs (Fig. 2F),indicating that in vitro apelin addition sustains GSC growthand substitutes, at least partially, to cell culture
supplements provided in the NS (Fig. 2D–F). Similar effectswere obtained with apelin-containing conditioned mediaderived from mouse brain tumour endothelial cells (tEC-CM) (Figs 1C and 2G), indicating that tumour-derivedendothelial cells may provide a source of bioactive apelinin situ, although the intratumoural concentration and theapelin forms are not experimentally available. Consistentwith these findings, EC-CM obtained from APLN-silencedendothelial cells was no longer able to maintain the stemproperties of GSCs, while the addition of exogenous apelininto the depleted EC-CM restored this effect (Fig. 2H–J).Furthermore, we did not observe any obvious effect ofapelin-supplemented mitogen-free media on the prolifer-ation of GSCs (Fig. 2K), indicating that apelin may main-tain GSCs by enhancing their self-renewal capabilities.
Apelin modulates GSCs via activationof the G-protein coupled receptorAPLNR
Apelin is known to signal through the G-protein coupledreceptor APLNR (also known as APJ), which is reportedto be highly expressed throughout the brain and act as para-crine and autocrine factor that supports embryonic andtumour angiogenesis (Kaelin et al., 2007). In the presentstudy, we observed a heterogeneous expression of APLNRin our panel of GSCs, at both a RNA and protein level (Fig.3A and B). In keeping with a role for apelin in the stem cellmaintenance, we found that differentiated GSCs were asso-ciated with a decrease in APLNR expression compared totumourspheres (Fig. 3C and D) and reduced tumour-initiat-ing ability (Supplementary Fig. 2C). Moreover, analysis ofthe stem marker PROM1 (CD133) revealed that expressionof APLNR was detected in the PROM1 (CD133)-positiveGSC population, further supporting a role for apelin andits receptor in the stem population (Fig. 3E). Consistentwith this, APLNR silencing in GSC#1 impaired the abilityof these cells to form SOX2-positive spheres cultured in bothEC-CM and apelin conditions (Fig. 3F and G). Of note, theoptimal concentration of exogenous mitogens in the NSmedium allows maintaining APLNR-knocked downGSC#1 expansion in vitro (Fig. 3F and G). Similar resultswere obtained in three additional GSCs with variableAPLNR expression level (Fig. 3A, B and H), highlightingthe potential importance of this receptor in GSC mainten-ance in response to APLN. Subsequently, GSC#9 was trans-duced with short hairpin (sh) RNA against APLNR andgrafted subcutaneously into the flanks of nude mice.Reducing APLNR levels in GSC#9 markedly decreasedtumour development, NESTIN overall staining and onlymildly affect tumour vascularization (Fig. 3I and J). To ob-serve the impact of APLNR signalling on tumour develop-ment in the brain microenvironment, shAPLNR GSC#9 wereorthotopically implanted into the striatum of nude mice andassessed for histological signs of tumour growth at Week 5,when tumours are largely developed but neurological signs
2944 | BRAIN 2017: 140; 2939–2954 E. Harford-Wright et al.
Dow
nloaded from https://academ
ic.oup.com/brain/article-abstract/140/11/2939/4316093 by U
niversitary library of medicine user on 11 Septem
ber 2019

Annex 2
161
were not yet evident. In these conditions, the number ofprogressing tumours was modestly reduced in APLNRshRNA (Supplementary Fig. 2D). Whether the reduction ofAPLNR expression also decreases tumour volume wouldrequire in-depth measurement over time. This slight decreasein tumour formation suggested that APLNR contributes totumour expansion, although compensatory mechanisms maytake place due to alternate signalling or an incompleteknockout of APLNR gene. Collectively, these results suggestthat endothelial-secreted apelin sustains GSCs both in vitroand in vivo via activation of the apelin receptor.
Pharmacological inhibition of APLNRimpairs the effects of the endothelialsecretome on GSCs by inhibition ofGSK3b signalling
To next evaluate the potential of targeting apelin/APLNR,we investigated the properties of a novel bi-cyclic peptide[cyclo(1–6)CRPRLC-KH-cyclo(9–14)CRPRLC], MM54,which acts as a competitive antagonist of APLNR (Fig.4A) (Macaluso et al., 2011; Brame et al., 2015). To identify
Figure 2 Apelin sustains GSC expansion in vitro. (A) Tumoursphere per field of view (fov) in GSCs #1, #9, #12 and #13 in response to
apelin 13 (APLN-13), pyr-apelin-13 (pyr-APLN-13) or apelin 36 (APLN-36) treatment (1mM, diluted in mitogen-free medium, MF). **P5 0.01,
*P5 0.05 compared to the MF condition. (B) Tumourspheres per field of view were counted in GSC#1 cultured in complete mitogen-supple-
mented medium (NS), MF and MF supplemented with the indicated APLN concentration. ***P5 0.001 compared to the MF condition.
(C) Confocal analysis of NESTIN (green), SOX2 (red) and nuclei (DAPI, blue) in GSC#1 grown in NS, MF, human brain endothelial cell-conditioned
medium (EC-CM) or MF + APLN (1mM). Scale bars = 20mm. (D) Linear regression plot of in vitro limiting dilution assay (LDA) for GSC#1 in NS, EC-
CM, MF, and MF + APLN (1mM). Data are representative of n = 2. (E) Tumourspheres per field of view were quantified in GSCs #1 to #16 cultured
in MF or with apelin. *P5 0.05; **P5 0.01; ***P5 0.001 compared to the MF condition. (F) Stem cell frequency in GSCs #1, #2, #4, #9 and #12 in
response to MF and APLN conditions. (G) Tumourspheres per field of view in GSC #1 in NS, MF and EC-CM derived from mouse tumour
endothelial cells (tEC-EM). **P5 0.01 compared to the MF condition. (H) EC received non-silencing RNA (sic) or siRNA targeting APLN (siAPLN)
and APLN knockdown efficiency assessed by RT-PCR and ELISA. (I and J) GSCs #1 were cultured with sic and siAPLN EC-CM, with or without
apelin (1mM). **P5 0.01 compared to the corresponding control condition for both tumoursphere and LDA assays. (K) FACS analysis of the
proliferation marker Ki67 in GSCs #4 and #9 in NS and MF + APLN conditions. All panels are representative of n = 3, unless otherwise specified.
Apelin signalling in glioma growth BRAIN 2017: 140; 2939–2954 | 2945
Dow
nloaded from https://academ
ic.oup.com/brain/article-abstract/140/11/2939/4316093 by U
niversitary library of medicine user on 11 Septem
ber 2019
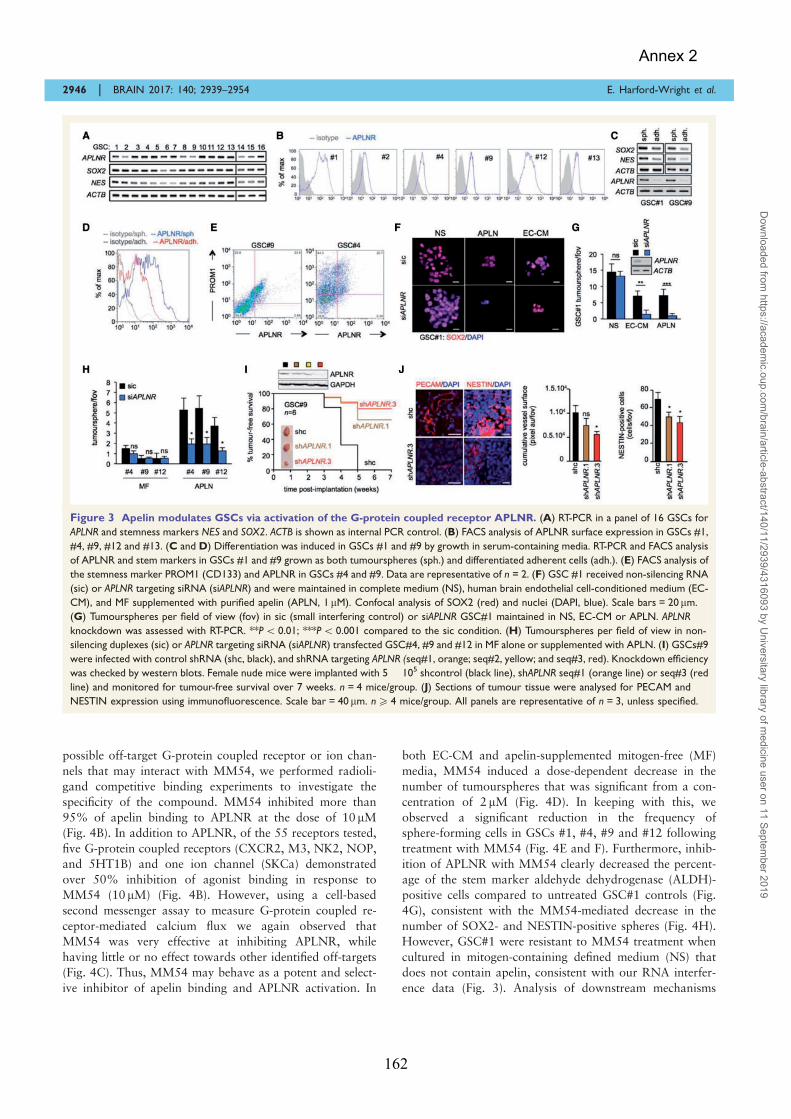
Annex 2
162
possible off-target G-protein coupled receptor or ion chan-nels that may interact with MM54, we performed radioli-gand competitive binding experiments to investigate thespecificity of the compound. MM54 inhibited more than95% of apelin binding to APLNR at the dose of 10 mM(Fig. 4B). In addition to APLNR, of the 55 receptors tested,five G-protein coupled receptors (CXCR2, M3, NK2, NOP,and 5HT1B) and one ion channel (SKCa) demonstratedover 50% inhibition of agonist binding in response toMM54 (10 mM) (Fig. 4B). However, using a cell-basedsecond messenger assay to measure G-protein coupled re-ceptor-mediated calcium flux we again observed thatMM54 was very effective at inhibiting APLNR, whilehaving little or no effect towards other identified off-targets(Fig. 4C). Thus, MM54 may behave as a potent and select-ive inhibitor of apelin binding and APLNR activation. In
both EC-CM and apelin-supplemented mitogen-free (MF)media, MM54 induced a dose-dependent decrease in thenumber of tumourspheres that was significant from a con-centration of 2 mM (Fig. 4D). In keeping with this, weobserved a significant reduction in the frequency ofsphere-forming cells in GSCs #1, #4, #9 and #12 followingtreatment with MM54 (Fig. 4E and F). Furthermore, inhib-ition of APLNR with MM54 clearly decreased the percent-age of the stem marker aldehyde dehydrogenase (ALDH)-positive cells compared to untreated GSC#1 controls (Fig.4G), consistent with the MM54-mediated decrease in thenumber of SOX2- and NESTIN-positive spheres (Fig. 4H).However, GSC#1 were resistant to MM54 treatment whencultured in mitogen-containing defined medium (NS) thatdoes not contain apelin, consistent with our RNA interfer-ence data (Fig. 3). Analysis of downstream mechanisms
Figure 3 Apelin modulates GSCs via activation of the G-protein coupled receptor APLNR. (A) RT-PCR in a panel of 16 GSCs for
APLNR and stemness markers NES and SOX2. ACTB is shown as internal PCR control. (B) FACS analysis of APLNR surface expression in GSCs #1,
#4, #9, #12 and #13. (C and D) Differentiation was induced in GSCs #1 and #9 by growth in serum-containing media. RT-PCR and FACS analysis
of APLNR and stem markers in GSCs #1 and #9 grown as both tumourspheres (sph.) and differentiated adherent cells (adh.). (E) FACS analysis of
the stemness marker PROM1 (CD133) and APLNR in GSCs #4 and #9. Data are representative of n = 2. (F) GSC #1 received non-silencing RNA
(sic) or APLNR targeting siRNA (siAPLNR) and were maintained in complete medium (NS), human brain endothelial cell-conditioned medium (EC-
CM), and MF supplemented with purified apelin (APLN, 1 mM). Confocal analysis of SOX2 (red) and nuclei (DAPI, blue). Scale bars = 20 mm.
(G) Tumourspheres per field of view (fov) in sic (small interfering control) or siAPLNR GSC#1 maintained in NS, EC-CM or APLN. APLNR
knockdown was assessed with RT-PCR. **P5 0.01; ***P5 0.001 compared to the sic condition. (H) Tumourspheres per field of view in non-
silencing duplexes (sic) or APLNR targeting siRNA (siAPLNR) transfected GSC#4, #9 and #12 in MF alone or supplemented with APLN. (I) GSCs#9
were infected with control shRNA (shc, black), and shRNA targeting APLNR (seq#1, orange; seq#2, yellow; and seq#3, red). Knockdown efficiency
was checked by western blots. Female nude mice were implanted with 5 ! 105 shcontrol (black line), shAPLNR seq#1 (orange line) or seq#3 (red
line) and monitored for tumour-free survival over 7 weeks. n = 4 mice/group. (J) Sections of tumour tissue were analysed for PECAM and
NESTIN expression using immunofluorescence. Scale bar = 40 mm. n5 4 mice/group. All panels are representative of n = 3, unless specified.
2946 | BRAIN 2017: 140; 2939–2954 E. Harford-Wright et al.
Dow
nloaded from https://academ
ic.oup.com/brain/article-abstract/140/11/2939/4316093 by U
niversitary library of medicine user on 11 Septem
ber 2019

Annex 2
163
Figure 4 Pharmacological inhibition of APLNR impairs the effects of the endothelial secretome on GSCs by inhibition of
GSK3b signalling. (A) Molecular structure and primary sequence of the competitive APLNR antagonist MM54. (B) A radioligand binding assay
of 55 G-protein coupled receptors and ion channels identified APLNR (indicated in red) and six putative off-targets (indicated in blue) that
demonstrated 450% inhibition of agonist binding following administration of APLNR antagonist MM54 (10 mM). (C) The percentage of calcium
flux inhibition following MM54 treatment (0.4–10 mM) in the G-protein coupled receptor hits. (D) Tumoursphere per field of view (fov) in
response to MM54 (0–4 mM) treatment in GSC#1 maintained in human brain endothelial cell-conditioned medium (EC-CM) and apelin-supple-
mented mitogen-free MF media (APLN, 1 mM) for 5 days. *P5 0.05 compared to EC-CM DMSO control, #P5 0.05 compared to apelin DMSO
control. (E) Linear regression plot of in vitro limiting dilution assay (LDA) for GSC#1 in EC-CM or EC-CM + MM54 (2 mM). (F) Stem cell
frequency in apelin supplemented media in response to MM54 (2 mM) in GSCs #1, #4, #9 and #12. *P5 0.05 compared to the vehicle condition.
Apelin signalling in glioma growth BRAIN 2017: 140; 2939–2954 | 2947
(continued)
Dow
nloaded from https://academ
ic.oup.com/brain/article-abstract/140/11/2939/4316093 by U
niversitary library of medicine user on 11 Septem
ber 2019

Annex 2
164
associated with apelin/APLNR activation revealed thatMM54 did not induce any changes to major componentsof the PI3K/AKT and ERK signalling pathways (Fig. 4I).To explore the APLNR downstream signalling further, weinterrogated the TCGA database for reverse phase proteinarray (RPPA) in glioblastoma patients with high and lowAPLNR expression (Fig. 4J). This analysis unmasks twosignificantly upregulated phospho-proteins, namely pYAPand pMET, and three downregulated (pRb, pPDK1, andpGSK3b) in high APLNR glioblastoma samples (Fig. 4J).Interestingly, glycogen synthase kinase 3b (GSK3b) activityhas recently been shown to participate in gliomagenesis viamaintenance of the stem population of cancer cells (Zhouet al., 2016). This process occurs through the GSK3b-de-pendent stabilization of KDM1A. Moreover, GSK3b inacti-vation by phosphorylation on serine 9 was associated witha loss of stemness traits in GSCs (Zhou et al., 2016). Inkeeping with this, incubation with MM54 (2mM, over-night) in apelin-supplemented MF media resulted in an in-crease in phosphorylation of GSK3b at serine 9 in bothGSCs #1 and #9 (Fig. 4K), consistent with an inhibitoryeffect on GSK3b signalling. Consequently, we treated pa-tient-derived GSCs with the GSK3b inhibitor tideglusib(2.5 mM) and observed that apelin was less potent atincreasing tumourspheres and self-renewal (Fig. 4L andM). Furthermore, silencing GSK3b in GSC#1 resulted ina significant decrease in apelin-mediated tumoursphere for-mation (Fig. 4N), suggesting that apelin may sustain GSCsvia activation of GSK3b signalling.
Pharmacological inhibition of APLNRby MM54 impairs the in vitro expan-sion of temozolomide-resistant GSCs
The chemotherapeutic agent TMZ is commonly used in thetreatment of glioblastoma, although it has been reportedthat GSCs are resistant to TMZ (Chen et al., 2012; Haleet al., 2013). To test the specificity of MM54 towardsGSCs, we treated a panel of normal human and primaryglioblastoma cell lines with increasing concentrations ofMM54, as compared to TMZ. MM54 demonstrated no
overtly toxic effects on any of the cell lines tested, whilstTMZ significantly reduced the viability of glioblastoma celllines (namely U87 and LN229) but not GSCs (Fig. 5A andB). Similarly to GSC#1, #4, #9 and #12, the in vitro via-bility of U87 glioblastoma cell line grown as spheroids wasnot modified upon high dose of TMZ (Fig. 5C).Conversely, TMZ reduces the viability of U87 glioblastomacell line and GSCs #1, #4 and #9, when grown as adherentdifferentiated cells (Fig. 5C).
Combined treatment of MM54 with TMZ did not sig-nificantly alter GSC#1 viability in NS or EC-CM even atthe highest concentrations of both compounds (Fig. 5D).Moreover, MM54 was significantly better at impairingGSC#1 tumoursphere formation and ALDH activity atlow doses compared to TMZ, which required muchhigher concentrations to achieve comparable results(Fig. 5E and F). Drugs were then combined at constantMM54:TMZ ratios (1:2.5, 1:5, and 1:10) and ALDH ac-tivity measured (Fig. 5E). At MM54 suboptimal dose, i.e.52 mM MM54 (Fig. 4), TMZ significantly potentiates theeffects of MM54. To further assess whether MM54 andTMZ do synergize, data were processed according to theChou combination index (CI) method (Chou, 2010)(Fig. 5G). In this representation, a CI value of 1 indicatesan additive effect, 51 synergism and 41 antagonism.TMZ and MM54 therefore displayed a striking synergism(Fig. 5H). In line with this, co-administration of low dosesof both MM54 (0.5 mM) and TMZ (1.25, 2.5, and 5 mM)decreased the percentage of ALDH activity in GSCs(Fig. 5I), indicating that APLNR antagonists may enhancethe therapeutic efficacy of TMZ.
Pharmacological inhibition of APLNRby MM54 reduces xenograftprogression
Pharmacodynamics studies revealed that MM54 demon-strated good solubility in the tested solutions, and was de-tected in the plasma and the brain in vivo followingintraperitoneal administration in healthy animals(Supplementary Table 4). Next, to determine the bio-
Figure 4 Continued(G) Flow cytometry analysis of the percentage of ALDH positive and negative GSC #1 in response to 2, 10 or 20 mM of MM54 at Day 5. ALDH
activity corresponds to the percentage of cells that contains ALDH activity (positive) or not (negative), normalized to the vehicle condition.
*P5 0.05; ***P5 0.001 compared to the vehicle condition. (H) Confocal analysis of GSC #1 treated with DMSO or MM54 (2 mM) for
SOX2 (red), NESTIN (green) and nuclei (DAPI, blue). Scale bars = 20 mm. (I) Western blot analysis of components of the mTOR and ERK
signalling pathways in GSC#1 with APLN in the presence or absence of MM54 (2 mM). (J) Reverse protein phase array (RPPA) from the TCGA
database were analysed in low and high APLNR expressing glioblastoma samples. *P5 0.05; **P5 0.01 compared to the low APLNR condition.
(K) Western blot analysis of pS9-GSK3b in GSCs #1 and #9 following MM54 treatment in APLN containing MF media. (L) Tumoursphere per field
of view in GSC#1 in response to APLN treatment (1mM) in the presence or absence of the GSK3b inhibitor (tideglusib, 2.5 mM). ***P5 0.001
compared to the MF condition. (M) Linear regression plot of limiting dilution assay (LDA) for GSC #1 in MF and APLN (1 mM) alone or with
tideglusib. (N) GSC #1 received sic (control) or GSK3B targeting siRNA (siGSK3B) and tumoursphere per field of view was quantified in MF
supplemented with purified apelin (APLN, 1 mM). *P5 0.05 compared to the sic MF condition. All panels are representative of n = 3, unless
otherwise specified.
2948 | BRAIN 2017: 140; 2939–2954 E. Harford-Wright et al.
Dow
nloaded from https://academ
ic.oup.com/brain/article-abstract/140/11/2939/4316093 by U
niversitary library of medicine user on 11 Septem
ber 2019

Annex 2
165
safety of MM54 in vivo, tumour-bearing mice were admin-istered 2 mg/kg of MM54 bi-weekly for 4 weeks. Due tothe known physiological roles of apelin on the cardiovas-cular system and glucose metabolism (Maguire et al., 2009;Scimia et al., 2012; Fournel et al., 2015), cardiac frequency,blood pressure and glycaemic index were measured. MM54did not induce alterations to these parameters, reflecting noobvious detrimental action of APLNR antagonism intumour-bearing animals (Fig. 6A and B). Complete bloodcount analysis revealed no significant differences between
mice treated with MM54 and vehicle in healthy animals(Supplementary Table 5). Similarly, histological and bio-chemical analysis of heart, kidney and liver revealed nodifferences between MM54-treated animals and vehiclecontrols (Supplementary Fig. 3), indicating that at the pre-sent dose following repeated administration, MM54 doesnot exert any overt adverse effects in vivo.
We next tested the effect of pharmacological inhibition ofAPLNR with MM54 in an ectopic xenograft tumourmodel. MM54 treatment dramatically reduced tumour
Figure 5 Pharmacological inhibition of APLNR by MM54 impairs the in vitro expansion of temozolomide-resistant GSCs.
(A) Cell viability following treatment with DMSO, MM54 (2, 20 and 100 mM) or temozolomide (TMZ, 50mM) was measured using UptiBlue in
different cell types for 3 days. Cardiomyocytes (mouse primary cardiomyocytes), keratinocytes (HaCAT), epithelial cells (CaCo2), endothelial
(hCMEC/D3), lymphocyte (Jurkat), neuronal (SH-SY5Y), glial (SVGp12). (B and C) Cell viability following treatment with DMSO or TMZ (100 mM)
was measured using UptiBlue in GSCs #1, #4, #9, and #12 for 3 days. Similar experiments were conducted U87 glioblastoma cell line and GSCs
#1, #4, and #9 grown as spheroids (sph.) in NS medium or as differentiated adherent cells (adh.) in serum-containing medium. (D) GSC#1 viability
was assessed following combined treatment with MM54 (0.2–20 mM) and TMZ (constant ratios TMZ:MM54 2.5:1, 5:1, and 10:1) in NS and human
brain endothelial cell-conditioned medium (EC-CM) conditions. (E and F) Tumoursphere per field of view (fov) and ALDH activity were assessed
in response to MM54 (0.2–100 mM) or TMZ (10–100 mM) treatment at Day 5. (G) Drugs were combined at a constant MM54:TMZ ratio (1:2.5,
1:5, and 1:10) and ALDH activity measured. *P5 0.05 compared to the TMZ 0 condition. (H) Combination index plot for TMZ with MM54.
Combination index (CI) was plotted against fractions affected (Fa) and analysed using COMPUSYN (http://www.combosyn.com/). A result
51 indicated an additive effect of the two compounds, while values closer to 0 suggest the drugs may behave synergistically. (I) Flow cytometry
analysis of ALDH activity in GSC #1 at Day 5 following combined treatment with MM54 (0.5 mM) and the indicated TMZ doses. ALDH activity
corresponds to the percentage of cells that contains ALDH activity (positive) or not (negative). ***P5 0.001 compared to the TMZ 0 condition.
All panels are representative of n = 3, unless otherwise specified.
Apelin signalling in glioma growth BRAIN 2017: 140; 2939–2954 | 2949
Dow
nloaded from https://academ
ic.oup.com/brain/article-abstract/140/11/2939/4316093 by U
niversitary library of medicine user on 11 Septem
ber 2019

Annex 2
166
growth over 11 weeks when compared to DMSO controlgroup (Fig. 6C). The decreased tumour volume was asso-ciated with a reduction in the staining of SOX2 andNESTIN-positive cells, overall proliferation and viabilitythat was accompanied by a diminution in tumour vascular-ization (Fig. 6D and E). Additionally, MM54 treatment ledto a significant increase in phospho-GSK3b positive cellswithin the tumour (Fig. 6F and G). In line with Zhouet al’s (2016) studies, this increased GSK3b phosphoryl-ation was correlated with a decrease in KDM1A levels
(Fig. 6G). To further validate our findings with MM54,we tested a second recently developed and structurally dif-ferent APLNR antagonist, MM193 (Glen and Davenport,unpublished observation). Increasing doses of MM193 inGSCs counteracted the effect of apelin on tumourspheresin vitro (Supplementary Fig. 4A). Moreover, administrationof MM193 (2 mg/kg) in GSC#9-inoculated mice resulted insignificant impairment of tumour growth compared to ve-hicle controls (Supplementary Fig. 4B). Likewise, blockadeof APLNR with MM193 did not induce any adverse
Figure 6 Pharmacological inhibition of APLNR by MM54 reduces xenograft progression. (A) Tumour-bearing mice were fasted for
6 h and the effect of either MM54 (2 mg/kg) or DMSO vehicle treatment on glycaemia measured via blood analysis. (B) Cardiac frequency and
blood pressure were measured in random-fed tumour-bearing animals. (C) Nude mice were implanted with GSC#9 (5 ! 105 cells) in each flank
and treated with either DMSO vehicle or the APLNR antagonist (MM54, 2 mg/kg) bi-weekly from Week 4. Tumour volume was measured weekly
until Week 11. n = 10/group. (D and E) Cryosections from GSC tumours were assessed for PECAM (red), Ki67 (green), NESTIN (green), SOX2
(green) and apoptosis (TUNEL). (F) Tumour sections were assessed for pS9-GSK3b staining in DMSO vehicle- and MM54-treated animals. Scale
bars = 40 mm. (G) Western blot analysis of KDM1A and pS9-GSK3b was performed on two independent tumours from each treatment group.
n = 6 mice/group. *P5 0.05; **P5 0.01; ***P5 0.001 compared to the DMSO vehicle control group. All panels are representative of n = 3, unless
specified.
2950 | BRAIN 2017: 140; 2939–2954 E. Harford-Wright et al.
Dow
nloaded from https://academ
ic.oup.com/brain/article-abstract/140/11/2939/4316093 by U
niversitary library of medicine user on 11 Septem
ber 2019

Annex 2
167
changes to cardiac frequency, blood pressure or glycaemiain healthy animals (Supplementary Fig. 4C). Together,these in vivo data indicate that pharmacological inhibitionof APLNR efficiently and safely reduces tumour growth inxenografted female animals.
Pharmacological blockade of APLNRby MM54 prolongs survival ofxenografted mice
To gain further insight into the therapeutic potential ofAPLNR antagonism in glioblastoma, nude mice wereorthotopically implanted with GSC#9 into the striatumand treated with MM54 (2 mg/kg) three times a week.Experimental models of brain tumours are commonly asso-ciated with the development of neurological symptoms aswell as cachexia as the tumour progresses. MM54 treat-ment was sufficient to impair the development of tumour-associated neurological symptoms and weight loss (Fig. 7Aand B), which was coupled with a marked reduction intumour size (Fig. 7C). Importantly, MM54 administrationsignificantly improved the overall survival of tumour-bear-ing mice compared to their vehicle-treated counterparts
(Fig. 7D). Additionally, blockade of APLNR was associatedwith a reduction in vascularization, proliferation, andSOX2 and NESTIN-positive cells (Fig. 7E). Collectively,these in vivo data provide a strong basis for the clinicalpotential of apelin/APLNR signalling as a therapeutic targetin glioblastoma.
DiscussionThe present study has identified the vasoactive peptideapelin as a critical factor involved in glioma growth. It isnow well accepted that GSCs reside in proximity to vascu-lar beds, into which endothelial cells secrete factors thatregulate their self-renewal and fate. With that view,apelin is highly expressed in endothelial cells and oncereleased has been proposed to act as a local mediator(Kleinz and Davenport, 2005; Kaelin et al., 2007). In keep-ing with this, a recent study reports the high expression ofapelin in colorectal cancer-isolated endothelial cells, whichfurther correlates with refractoriness to anti-angiogenictreatment (Zuurbier et al., 2017). Here, we demonstratethat apelin is released by human, mouse and tumour-derived endothelial cells in vitro, although this secretion
Figure 7 Pharmacological blockade of APLNR by MM54 prolongs survival of xenografted mice. (A–E) 105 GSC #9 were implanted
into the striatum of female nude mice and treated three times a week with DMSO or MM54 (2 mg/kg) from Week 3 and the appearance of
neurological symptoms monitored over time (A). The weight of mice at sacrifice was recorded for each treatment group (B). Haematoxylin and
eosin (H&E) staining of tumour-inoculated brains following MM54 (2 mg/kg) or DMSO vehicle treatment (C). Kaplan-Meier survival curve of GSC
#9 bearing mice in response to vehicle or MM54 treatment. n = 6/group. (D) Cryosections of brain tumour tissue stained for PECAM (red),
NESTIN (green), SOX2 (green), Ki67 (red), and DAPI (blue) and quantified. Scale bars = 40 mm. **P5 0.01; ***P5 0.001 compared to the DMSO
control group (E). All panels are representative of n = 3, unless otherwise specified.
Apelin signalling in glioma growth BRAIN 2017: 140; 2939–2954 | 2951
Dow
nloaded from https://academ
ic.oup.com/brain/article-abstract/140/11/2939/4316093 by U
niversitary library of medicine user on 11 Septem
ber 2019

Annex 2
168
was not overtly affected by the acidification of the milieu.Additionally, we show that apelin increases GSC self-re-newal in vitro in tumoursphere and limiting dilutionassays, and that this effect appears to be independent ofcell proliferation, consistent with the previously reportedaction on microvascular endothelial cells (Kaelin et al.,2007).
In both subcutaneous ectopic and intracranial orthotopicxenograft models, inhibition of APLNR was associatedwith a significant reduction in tumour volume togetherwith a reduction in vascularization, proliferation and anincrease in apoptosis. Moreover, animals implanted withAPLNR knocked down cells (shAPLNR GSC#9) were asso-ciated with a reduction in tumour burden compared tocontrol groups, indicating that APLNR may be intrinsicallyimportant for tumour development. Additionally, APLNRknockdown and MM54 treatment diminished the numberof NESTIN-positive cells within the xenografts againstrengthening our hypothesis that apelin is particularly es-sential for the maintenance of GSCs.
Moreover, apelin has been implicated in physiologicaland pathological angiogenesis (Kaelin et al., 2007).Apelin induces proliferation and vessel sprouting in endo-thelial cells, as well as stabilizing contacts between adjacentendothelial cells (Kleinz and Davenport, 2005). In keepingwith this, a recent study proposed apelin as a marker formonitoring tumour vessel normalization and response toanti-angiogenic therapy (Zhang et al., 2016; Zuurbieret al., 2017). Accordingly, pharmacological blockade ofapelin (Figs 6, 7 and Supplementary Fig. 3), but not thereduction of APLNR expression in GSCs (SupplementaryFig. 2D), may also contribute to the reduction of tumourvolume observed in this study in vivo, by blocking angio-genesis and depriving tumour cells of the nutrients theyrequire to survive. Although we cannot discount alternativesources of apelin peptides are involved in vivo, taken to-gether the results of this study indicate that endothelial-derived apelin is an important factor for glioma growth.
The poor response of glioblastoma to chemotherapies hasbeen in part attributed to the population of resistant initi-ating cells within the tumour. Therefore, identification ofagents that improve GSC sensitivity to TMZ, the currentstandard-of-care, is of great interest. It has been reportedthat vascular niche maintains GSCs in a quiescent statethereby protecting them from radiation and chemothera-pies. Our study demonstrates that the APLNR antagonistMM54 synergizes with TMZ in vitro. We further demon-strate that TMZ alone does not alter the activity of thestem marker ALDH, however when combined with sub-optimal dose of MM54, we observed profound alterationsin the percentage of ALDH-positive cells. High ALDH1A1expression has been associated with poor prognosis in glio-blastoma, and its overexpression in vitro a predictor ofTMZ resistance (Schafer et al., 2012). These alterationsto the stem identity of GSCs suggest that combined treat-ment with MM54 and TMZ may provide an interesting
opportunity to further target populations of cells currentlyresistant to chemotherapeutic drugs.
Although the precise molecular mechanisms that connectthe apelin/APLNR axis to GSC maintenance will requirefurther investigation, our data suggest that it may actthrough the GSK3b signalling pathway. GSK3b wasshown to be upregulated in glioblastoma cells, and assistin stem cell maintenance by phosphorylating and stabilizingKDM1A (Zhou et al., 2016). Paralleling the effect of theGSK3b inhibitor tideglusib (Zhou et al., 2016) (Fig. 4L),we found that the APLNR antagonist MM54 reduced GSCself-renewal and potentiated sensitivity to TMZ (Fig. 5).APLNR inhibition was accompanied by an increased phos-phorylation of GSK3b at S9, both in vitro and in vivofurther supporting an inhibitory effect of MM54 com-pound on GSK3b signalling.
Here, we provide evidence that both in vitro and in vivoinhibition of APLNR results in a significant reduction intumour growth. Given the concerns about the currenttherapeutic regime and the intrinsic resistance to TMZ, tar-geting apelin signalling presents a new opportunity for usein the treatment of glioblastoma.
AcknowledgementsThe authors wish to thank the present and past members ofSOAP laboratory at Institut Cochin, Paris and CRCINA,Nantes, France. We are grateful to Pierre-Olivier Couraudand Cecile Godard (Institut Cochin, Paris, France), HerveChneiweiss and Marie-Pierre Junier (Institut de BiologieParis-Seine/Neurosciences, Paris, France), Soumaya ElMoghrabi and Fawaz Alzaid (Centre de Recherches desCordeliers, Paris, France), Patrick Gizzi (TechMed,Strasbourg, France), and Lixin Zheng (NIAID, NIH,Bethesda, USA), for helpful discussions and reagents. Thefollowing core-facilities from SFR Francois Bonamy (FED4203/UMS Inserm 016/CNRS 3556, Nantes, France) areacknowledged: cellular and tissular imaging core facilityof Nantes University (MicroPICell), flow cytometry andcell sorting (Cytocell), functional exploration core facilityfor small animals (Therassay), SC3M/Histology, and UTEIRS-UN.
FundingThis research was funded by: Connect Talent award fromRegion Pays-de-la-Loire and Nantes Metropole (J.G),Fondation ARC Association pour la Recherche sur leCancer (J.G and N.B), Institut National du Cancer INCA(J.G), Ligue nationale contre le cancer comite Loire-Atlantique, Maine-et-Loire, Morbihan, Sarthe, Vendee(J.G and N.B), and SATT IDF Innov (J.G). R.C.G thanksUnilever for support of the Centre for MolecularInformatics. A.P.D thanks the Wellcome Trust(WT107715/Z/15/Z).
2952 | BRAIN 2017: 140; 2939–2954 E. Harford-Wright et al.
Dow
nloaded from https://academ
ic.oup.com/brain/article-abstract/140/11/2939/4316093 by U
niversitary library of medicine user on 11 Septem
ber 2019

Annex 2
169
Supplementary materialSupplementary material is available at Brain online.
ReferencesAndreu-Agullo C, Morante-Redolat JM, Delgado AC, Farinas I.
Vascular niche factor PEDF modulates Notch-dependent stemnessin the adult subependymal zone. Nat Neurosci 2009; 12: 1514–23.
Bao S, Wu Q, McLendon RE, Hao Y, Shi Q, Hjelmeland AB, et al.Glioma stem cells promote radioresistance by preferential activationof the DNA damage response. Nature 2006; 444: 756–60.
Beck B, Driessens G, Goossens S, Youssef KK, Kuchnio A, Caauwe A,et al. A vascular niche and a VEGF-Nrp1 loop regulate the initiationand stemness of skin tumours. Nature 2011; 478: 399–403.
Brame AL, Maguire JJ, Yang P, Dyson A, Torella R, Cheriyan J, et al.Design, characterization, and first-in-human study of the vascularactions of a novel biased apelin receptor agonist. Hypertension2015; 65: 834–40.
Bowman RL, Wang Q, Carro A, Verhaak RGW, Squatrito M. GlioVisdata portal for visualization and analysis of brain tumor expressiondatasets. Neuro Oncol 2017; 19: 139–41.
Brown CE, Alizadeh D, Starr R, Weng L, Wagner JR, Naranjo A,et al. Regression of glioblastoma after chimeric antigen receptor T-cell therapy. N Engl J Med 2016; 375: 2561–9.
Calabrese C, Poppleton H, Kocak M, Hogg TL, Fuller C, Hamner B,et al. A perivascular niche for brain tumor stem cells. Cancer Cell2007; 11: 69–82.
Cao Z, Ding BS, Guo P, Lee SB, Butler JM, Casey SC, et al.Angiocrine factors deployed by tumor vascular niche induce B celllymphoma invasiveness and chemoresistance. Cancer Cell 2014; 25:350–65.
Cao Z, Scandura JM, Inghirami GG, Shido K, Ding BS, Rafii S.Molecular checkpoint decisions made by subverted vascular nichetransform indolent tumor cells into chemoresistant cancer stem cells.Cancer Cell 2017; 31: 110–26.
Chen J, Li Y, Yu TS, McKay RM, Burns DK, Kernie SG, et al. Arestricted cell population propagates glioblastoma growth afterchemotherapy. Nature 2012; 488: 522–6.
Chinot OL, Wick W, Mason W, Henriksson R, Saran F, Nishikawa R,et al. Bevacizumab plus radiotherapy-temozolomide for newly diag-nosed glioblastoma. N Engl J Med 2014; 370: 709–22.
Chou TC. Drug combination studies and their synergy quantificationusing the Chou-Talalay method. Cancer Res 2010; 70: 440–6.
Dubois SM, Alexia C, Wu Y, Leclair HM, Leveau C, Schol E, et al. Acatalytic-independent role for the LUBAC in NF-kappaB activationupon antigen receptor engagement and in lymphoma cells. Blood2014; 123: 2199–203.
Evers P, Lee PP, DeMarco J, Agazaryan N, Sayre JW, Selch M, et al.Irradiation of the potential cancer stem cell niches in the adult brainimproves progression-free survival of patients with malignantglioma. BMC Cancer 2010; 10: 384.
Folkins C, Man S, Xu P, Shaked Y, Hicklin DJ, Kerbel RS. Anticancertherapies combining antiangiogenic and tumor cell cytotoxic effectsreduce the tumor stem-like cell fraction in glioma xenograft tumors.Cancer Res 2007; 67: 3560–4.
Fournel A, Drougard A, Duparc T, Marlin A, Brierley SM, Castro J,et al. Apelin targets gut contraction to control glucose metabolismvia the brain. Gut 2015; 66: 258–69.
Galan-Moya EM, Le Guelte A, Lima Fernandes E, Thirant C, DwyerJ, Bidere N, et al. Secreted factors from brain endothelial cells main-tain glioblastoma stem-like cell expansion through the mTOR path-way. EMBO Rep 2011; 12: 470–6.
Galan-Moya EM, Treps L, Oliver L, Chneiweiss H, Vallette FM,Bidere N, et al. Endothelial secreted factors suppress mitogen
deprivation-induced autophagy and apoptosis in glioblastomastem-like cells. PLoS One 2014; 9: e93505.
Garcia-Barros M, Paris F, Cordon-Cardo C, Lyden D, Rafii S,Haimovitz-Friedman A, et al. Tumor response to radiotherapy regu-lated by endothelial cell apoptosis. Science 2003; 300: 1155–9.
Hale JS, Sinyuk M, Rich JN, Lathia JD. Decoding the cancer stem cellhypothesis in glioblastoma. CNS Oncol 2013; 2: 319–30.
Harford-Wright E, Bidere N, Gavard J. b-escin selectively targets theglioblastoma-initiating cell population and reduces cell viability.Oncotarget 2016; 7: 66865–79.
Hu Y, Smyth GK. ELDA: extreme limiting dilution analysis for com-paring depleted and enriched populations in stem cell and otherassays. J Immunol Methods 2009; 347: 70–8.
Kaelin RE, Kretz MP, Meyer AM, Kispert A, Heppner FL, BrandliAW. Paracrine and autocrine mechanisms of apelin signalinggovern embryonic and tumor angiogenesis. Dev Biol 2007; 305:599–614.
Kleinz MJ, Davenport AP. Emerging roles of apelin in biology andmedicine. Pharmacol Ther 2005; 107: 198–211.
Lathia JD, Mack SC, Mulkearns-Hubert EE, Valentim CL, Rich JN.Cancer stem cells in glioblastoma. Genes Dev 2015; 29: 1203–17.
Luissint AC, Federici C, Guillonneau F, Chretien F, Camoin L, GlacialF, et al. Guanine nucleotide-binding protein Galphai2: a new partnerof claudin-5 that regulates tight junction integrity in human brainendothelial cells. J Cereb Blood Flow Metab 2012; 32: 860–73.
Macaluso NJ, Pitkin SL, Maguire JJ, Davenport AP, Glen RC.Discovery of a competitive apelin receptor (APJ) antagonist. ChemMed Chem 2011; 6: 1017–23.
Maguire JJ, Kleinz MJ, Pitkin SL, Davenport AP. [Pyr1]apelin-13 iden-tified as the predominant apelin isoform in the human heart: vaso-active mechanisms and inotropic action in disease. Hypertension2009; 54: 598–604.
Schafer A, Teufel J, Ringel F, Bettstetter M, Hoepner I, Rasper M,et al. Aldehyde dehydrogenase 1A1- a new mediator of resist-ance to temozolomide in glioblastoma. Neuro Oncol 2012; 14:1452–64.
Scimia MC, Hurtado C, Ray S, Metzler S, Wei K, Wang J, et al. APJacts as a dual receptor in cardiac hypertrophy. Nature 2012; 488:394–8.
Shingu T, Ho AL, Yuan L, Zhou X, Dai C, Zheng S, et al. Qkideficiency maintains stemness of glioma stem cells in suboptimalenvironment by downregulating endolysosomal degradation. NatGenet 2017; 49: 75–86.
Singh SK, Hawkins C, Clarke ID, Squire JA, Bayani J, Hide T, et al.Identification of human brain tumour initiating cells. Nature 2004;432: 396–401.
Stupp R, Hegi ME, Mason WP, van den Bent MJ, Taphoorn MJ,Janzer RC, et al. Effects of radiotherapy with concomitant and ad-juvant temozolomide versus radiotherapy alone on survival in glio-blastoma in a randomised phase III study: 5-year analysis of theEORTC-NCIC trial. Lancet Oncol 2009; 10: 459–66.
Stupp R, Taillibert S, Kanner AA, Kesari S, Steinberg DM, Toms SA,et al. Maintenance therapy with tumor-treating fields plus temozo-lomide vs temozolomide alone for glioblastoma: a randomized clin-ical trial. JAMA 2015; 314: 2535–43.
Treps L, Edmond S, Harford-Wright E, Galan-Moya EM, Schmitt A,Azzi S, et al. Extracellular vesicle-transported Semaphorin3A pro-motes vascular permeability in glioblastoma. Oncogene 2016; 35:2615–23.
Tropepe V, Sibilia M, Ciruna BG, Rossant J, Wagner EF, van derKooy D. Distinct neural stem cells proliferate in response to EGFand FGF in the developing mouse telencephalon. Dev Biol 1999;208: 166–88.
Yan K, Yang K, Rich JN. The evolving landscape of glioblastoma stemcells. Curr Opin Neurol 2013; 26: 701–7.
Zhang L, Takara K, Yamakawa D, Kidoya H, Takakura N. Apelin asa marker for monitoring the tumor vessel normalization windowduring antiangiogenic therapy. Cancer Sci 2016; 107: 36–44.
Apelin signalling in glioma growth BRAIN 2017: 140; 2939–2954 | 2953
Dow
nloaded from https://academ
ic.oup.com/brain/article-abstract/140/11/2939/4316093 by U
niversitary library of medicine user on 11 Septem
ber 2019

Annex 2
170
Zhou A, Lin K, Zhang S, Chen Y, Zhang N, Xue J, et al. NuclearGSK3beta promotes tumorigenesis by phosphorylating KDM1A andinducing its deubiquitylation by USP22. Nat Cell Biol 2016; 18:954–66.
Zuurbier L, Rahman A, Cordes M, Scheick J, Wong TJ, Rustenberg F,et al. Apelin: a putative novel predictive biomarker forbevacizumab response in colorectal cancer. Oncotarget 2017; 8:42949–61.
2954 | BRAIN 2017: 140; 2939–2954 E. Harford-Wright et al.
Dow
nloaded from https://academ
ic.oup.com/brain/article-abstract/140/11/2939/4316093 by U
niversitary library of medicine user on 11 Septem
ber 2019

Annex 3
171
ANNEX 3 3D Endothelial Cell Migration

Annex 3
172
51
Alexis Gautreau (ed.), Cell Migration: Methods and Protocols, Methods in Molecular Biology, vol. 1749,https://doi.org/10.1007/978-1-4939-7701-7_6, © Springer Science+Business Media, LLC 2018
Chapter 6
3D Endothelial Cell Migration
Kathryn A. Jacobs and Julie Gavard
Abstract
Endothelial cells have the capacity to shift between states of quiescence and angiogenesis. The early stage of angiogenesis, sprouting, occurs with the synchronized activities of tip cells, which lead the migration of the sprout, and stalk cells, which elongate this vessel sprout. Here, we describe a method to study in vitro this early and rapid stage of sprouting angiogenesis.
Key words Sprouting angiogenesis, Endothelial cell, VEGF, Tumor microenvironment, Fibrin matrix, Conditioned medium
1 Introduction
Blood vessels fuel organs and tissues throughout the body with oxygen, nutrients, hormones, and growth factors, while eliminat-ing metabolic by-products. They also allow for circulation of immune cells that patrol the blood stream [1].
Blood vessels form a hierarchized and stereotyped network of many branches, which are lined with endothelial cells. Angiogenesis is defined as the expansion of this predefined network. This occurs, in physiological and pathological conditions, in response to changes in metabolic demands, with nutrient deprivation and a reduction in oxygen tension as the primary provocations for angiogenesis [2–4].
Endothelial cells are mainly found quiescent with a slow turn-over in adult mature vessels. However, these differentiated cells remain highly plastic, with the ability to quickly switch between states of quiescence to rapid growth, i.e., vessel sprouting, when stimulated by growth factors or hypoxia. The most accepted model of vessel sprouting proposes a coordinated activity between endo-thelial cells in different states [4]. Schematically the leading cells—the first state—the so-called endothelial tip cells, navigate the vasculature and guide vessel elongation. The second one,

Annex 3
173
52
endothelial stalk cells, elongates the branch through rapid prolif-eration (Fig. 1) [4].
Tip and stalk differentiation is notably regulated by VEGF (vascular endothelial growth factor) and Notch signaling. VEGF signals tip cell induction and prompts expression of Notch ligand Delta-like 4 (dll4). This activates Notch signaling in neighboring endothelial cells, and suppresses VEGF receptor 2 expression, to prevent tip cell behavior [4]. This mechanism selects therefore VEGFR2-positive dll4-positive tip cells and VEGFR2-negative Notch-positive stalk cells. However, cell fates are not permanently defined, there is a dynamic switch between tip and stalk cell pheno-types depending on the fitness of the cells [5]. From a mechanistic standpoint, this sprouting angiogenesis requires orchestrated tridi-mensional migration of endothelial cells together with cell invasion within a defined matrix (Fig. 1).
Angiogenesis is important for maintaining homeostasis, but it also has implications in disease. Endothelial cell dysfunction is indeed a characteristic of diabetes as a consequence of elevated oxidative stress [2, 6]. In cancer, tumor-induced angiogenesis allows tumors to grow by providing them with nutrients and oxy-gen [1]. How the tumor microenvironment operates on endothe-lial cells to drive sprouting is crucial to design antiangiogenic- based anticancer strategies.
The method presented here allows for the in vitro study of the early stages of angiogenesis, by recapitulating the endothelial behavior during sprouting angiogenesis (Fig. 2). This model can
Filopodialprotrusions
Tip cell
Stalk cells
Pre-existing vessel
Migrating endothelial cell
Proliferating endothelial cell
Quiescent endothelial cell
Fig. 1 Sprouting angiogenesis. A schematic model of vessel sprouting where stalk cells proliferate to expand the sprout, and the tip cells guide the vessel migration
Kathryn A. Jacobs and Julie Gavard

Annex 3
174
53
have applications in a variety of disease studies, as conditions can be manipulated genetically or pharmacologically. For instance, recent studies from our lab had shown that conditioned media col-lected from patient-derived cancer cell cultures drive sprouting angiogenesis through secretion of growth factors [7]. In keeping with this idea, oncogenic transformation of endothelial cells also forces in vitro sprouting angiogenesis, a process that involves both the activation of intracellular aberrant signaling pathways and autocrine/paracrine cytokine action [8].
2 Materials
1. HUVEC (human umbilical vein endothelial cells, Ea.hy926, ATCC).
2. U87-MG (human astrocytoma malignant glioma cell line, ATCC).
3. DMEM 4.5 g/L glucose. 4. GlutaMAX.
2.1 Reagents
Microcarrier beadscoated with endothelial cells
Prepare fibrin matrix
3 days in culture
Conditioned media
Collectsupernatants
Tumor cells
Image acquisition and analysis- DAPI number outside the bead- Cumulative sprout length
Fig. 2 In vitro sprouting assay procedure. Human umbilical vein endothelial cells (HUVEC) are coated on microcarrier beads, and allowed to sprout into a fibrin matrix, under exposure to malignant tumor cell condi-tioned media
Endothelial Cell Migration

Annex 3
175
54
5. Fetal bovine serum (FBS). 6. Trypsin–EDTA (0.05%). 7. Cytodex-3 Beads (Sigma, C3275). 8. Rat tail collagen I. 9. Aprotinin. 10. Fibrinogen Type I. 11. bFGF solution (basic fibroblast growth factor solution, Sigma,
F5392) 2 μL bFGF stock (10,000×) in 200 μL DMEM. 12. Thrombin. 13. 8-well Ibidi plate. 14. Sterile filter 0.2 μm. 15. PBS. 16. Paraformaldehyde. 17. Prolong Diamond antifade mountant (Life Technologies). 18. Alexa 488-conjugated phalloidin (Life Technologies). 19. Deionized water.
1. Bench pipettes and small equipment (rocker, centrifuge). 2. Equipped cell culture room (37 °C/5%CO2 incubator, hood). 3. Conventional microscope to visualize DAPI and Alexa 488.
3 Methods
1. In order to prepare fibrinogen for use, first dissolve 2 mg/mL fibrinogen in DMEM-GlutaMAX medium. Make sure to note the clottable protein percentage and adjust accordingly. The solution should be heated in a 37 °C water bath to dissolve the fibrinogen. Filter solution through a sterile 0.2 μm filter (see Note 1).
2. To reconstitute aprotinin, dissolve lyophilized aprotinin in deionized water at 4 U/mL. Filter solution through a sterile 0.2 μm filter. Make aliquots of 1 mL each and store the solu-tion at −20 °C (see Note 2).
3. For thrombin preparation, reconstitute thrombin in sterile water at 50 U/mL. Make aliquots of 500 μL each and store at −20 °C (see Note 2).
4. For a 10 mL fibrinogen solution, dissolve 25 mg of fibrinogen in 10 mL of DMEM, as described in step 1. Then add 20 μL of aprotinin (10 mg/mL) to the solution. Filter the resulting solution sterilely through a 0.2 μm filter. Finally, add 100 μL of the bFGF solution.
5. In order to prepare Cytodex beads for use, hydrate 0.5 g of dry beads in PBS (pH 7.4) for at least 3 h at room temperature.
2.2 Equipment
3.1 Reagent Preparation
Kathryn A. Jacobs and Julie Gavard

Annex 3
176
55
This should be done in a 50 mL tube on a rocker, under gentle rotation. Next, let the beads settle down for approximately 15 min. Discard the supernatant and wash the beads for several minutes in 50 mL of fresh PBS. Then, discard the supernatant and replace again with fresh PBS. For 30,000 beads/mL (10 mg/mL), use 50 mL PBS.
6. Prepare all reagents for staining; paraformaldehyde (4% in PBS) for fixation, Triton X-100 (0.05% in PBS) for permeabi-lization. Prepare fresh solutions.
1. Grow HUVEC in DMEM-GlutaMAX +10% FBS in the days before beading. A concentration of 400 cells per bead is needed to perform the experiment. For 75 μL of bead solution, 106 HUVEC will be needed (see Notes 3 and 4).
2. Grow U87 in DMEM-GlutaMAX +10% FBS. To prepare U87-MG condition medium (CM), 250.000 cells are plated in 10 cm dish, grow for 2 days in DMEM-GlutaMAX, supple-mented with 10% FBS. Cells are washed thrice with PBS and incubated at 37 °C overnight in DMEM-GlutaMAX serum-free media [9]. Two days later, media are decanted and cleared by centrifugation (300 × g, 5 min), followed by filtration through a 0.2 μm filter. CM are then used immediately or stored at −20 °C until use (see Notes 2 and 5).
1. On day −1, coat beads with HUVEC. First, 4000 Cytodex microcarrier beads are incubated with collagen (1/50 dilution in PBS, 15 min, RT). Aspirate the supernatant and wash the beads in 1 mL of prewarmed DMEM. Trypsinize nonconflu-ent HUVEC and mix 75 μL of beads with 106 HUVEC in 1.5 mL of prewarmed DMEM in a 15 mL round tube. Make sure to place the tube vertically in the incubator (37 °C) (see Note 6).
2. Incubate the tube for 4 h at 37 °C, shaking the tube every 20 min. After 4 h, transfer the coated beads into a T75 flask, add 12 mL of DMEM and incubate overnight at 37 °C (see Note 7).
3. On day 0, coated beads should be embedded in fibrin gel. To do this, prepare the fibrinogen/aprotinin/bFGF solution (2.5 mg/mL) (see Subheading 3.1). Next, transfer the coated beads to a 15 mL conical tube. Let the beads settle. Wash the beads three times with 1 mL DMEM. Then, count the beads on a 10 μL coverslip and resuspend them in the fibrinogen solution at a concentration of approximately 500 beads per mL (see Note 8).
4. Add 0.625 U/mL of thrombin to each well of the IBIDI plate. Stock is at 100 U/mL, add 20 μL of the stock diluted 1–10 by adding 450 μL of DMEM to a 50 μL aliquot. Then add 400 μL
3.2 Cell Preparation
3.3 Sprouting Assay
Endothelial Cell Migration

Annex 3
177
56
of the fibrinogen/bead suspension to each well of the plate. Mix the thrombin and fibrinogen by pipetting up and down gently four or five times (see Notes 1, 9, and 10).
5. Leave the plate in the cell culture hood for 5 min. After, place plate in the incubator (37 °C) for 10 to 15 min in order to generate a clot. Once the clot is formed, add 1 mL of DMEM/bFGF dropwise to each well. Return the plate to the incubator (see Note 11).
6. On day 1, add the U87-CM on top of the fibrin gel. Return plate to incubator (37 °C) (see Notes 12 and 13).
1. By day 3, sprouting should have occurred. Check under bright field microscope and harvest the experiment. Fix in parafor-maldehyde 4% (15 min, RT) and permeabilized in Triton (5 min, RT). Wash once in PBS. Incubate with Alexa 488-con-jugated phalloidin (1/1000 in PBS, 45 min, RT). Wash three times in PBS. Mount in DAPI-containing mounting medium (see Note 14).
2. Proceed to image acquisition, with a minimum of 5 random fields of views (Fig. 3) (see Note 15).
3. From individual bead, quantify (1) number of sprouted cells by counting DAPI-positive nuclei away from the beads, and, (2) sprout extension by measuring cumulative sprout length and mean sprout length (Fig. 2) (see Note 16).
4 Notes
1. Tubes should never be vortexed, instead mix by inverting the tube.
2. Avoid freeze–thaw cycles.
3.4 Data Analysis
Fig. 3 Typical image of endothelial sprouting. Human endothelial cells were prepared for sprouting assays, as described and incubated for 3 days with conditioned media from malignant glioma cells. Nuclei are stained with DAPI (blue), actin cytoskeleton is visualized with Phalloidin (green)
Kathryn A. Jacobs and Julie Gavard

Annex 3
178
57
3. Antibiotics (penicillin/streptomycin) can be added to the medium.
4. Alternate endothelial cells could be used, such as from human, mouse, rat and porcine origin, as well as from any organs. Culture conditions vary and might need to be adapted.
5. Other tumor cell lines could be used. Cell density might need to be tested and adjusted. Usually 48 h is preferred to collect CM.
6. Allow the beads to settle, but do not centrifuge them. 7. Make sure to rinse the T75 flask with DMEM. 8. As a control of good coating, beads should look like golf balls. 9. Make sure to change the pipette tip each time. 10. Avoid creating large bubbles. 11. Tiny bubbles are usually formed in the fibrin gel. They should
disappear by the end of the experiment. 12. Media on plate should be changed every other day. Control for
evaporation, a humid chamber can be useful when CM volume is limited.
13. Do not forget negative control, such as DMEM-GlutaMAX media collected similarly to U87-CM from cell-free plates.
14. Experiment can be stopped after the fixation step and plate left in PBS, 4 °C overnight. Slowly aspirate medium by pipetting, avoid vacuum it.
15. Images can be acquired with any conventional large field microscope, equipped with DAPI and FITC filters, and autom-atized camera.
16. Image analysis can be performed with any image viewer soft-ware. We recommend Fiji software (Fiji is just Image J), free of use at https://fiji.sc/.
Acknowledgment
The authors are thankful to the present and past members of SOAP laboratory, in particular to Sandy Azzi and Lucas Treps who devel-oped the sprouting assays in the team. Research in SOAP team was funded by: Fondation ARC pour la recherche contre le Cancer, Ligue Nationale contre le Cancer comité Pays-de-la-Loire, comité Maine-et-Loire and comité Vendée, and Connect Talent grant from Région Pays-de-la-Loire and Nantes Métropole. KAJ received a doctoral fellowship from Nantes Métropole.
Endothelial Cell Migration

Annex 3
179
58
References
1. De Bock K, Georgiadou M, Carmeliet P (2013) Role of endothelial cell metabolism in vessel sprouting. Cell Metab 18:634–647
2. Adams RH, Alitalo K (2007) Molecular regula-tion of angiogenesis and lymphangiogenesis. Nat Rev Mol Cell Biol 8:464–478
3. Herbert SP, Stainier DY (2011) Molecular con-trol of endothelial cell behaviour during blood vessel morphogenesis. Nat Rev Mol Cell Biol 12:551–564
4. Potente M, Gerhardt H, Carmeliet P (2011) Basic and therapeutic aspects of angiogenesis. Cell 146:873–887
5. Jakobsson L, Franco CA, Bentley K, Collins RT, Ponsioen B, Aspalter IM, Rosewell I, Busse M, Thurston G, Medvinsky A et al (2010) Endothelial cells dynamically compete for the tip cell position during angiogenic sprouting. Nat Cell Biol 12:943–953
6. Yeh WL, Lin CJ, Fu WM (2008) Enhancement of glucose transporter expression of brain endo-thelial cells by vascular endothelial growth fac-tor derived from glioma exposed to hypoxia. Mol Pharmacol 73:170–177
7. Azzi S, Treps L, Leclair HM, Ngo H, Harford- Wright E, Gavard J (2015) Desert Hedgehog/Patch2 axis contributes to vascular permeability and angiogenesis in glioblastoma. Front Pharmacol 6:281
8. Dwyer J, Azzi S, Leclair HM, Georges S, Carlotti A, Treps L, Galan-Moya A, Alexia C, Dupin N, Bidere N, Gavard J (2015) The guanine exchange factor SWAP70 mediates vGPCR-induced endo-thelial plasticity. Cell Commun Signal 13:12
9. Dwyer J, Hebda JK, Le Guelte A, Galan- Moya EM, Smith SS, Azzi S, Bidere N, Gavard J (2012) Glioblastoma cell-secreted interleu-kin- 8 induces brain endothelial cell permeabil-ity via CXCR2. PLoS One 7:e45562
Kathryn A. Jacobs and Julie Gavard

Annex 4
180
ANNEX 4 Scientific Communications
Annex 4
181
idw - InformationsdienstWissenschaft
27.11.2019 12:34
Exploring drug repurposing to treatglioblastomaDr. Tilmann Kiessling EMBO CommunicationsEMBO - excellence in life sciences
MALT1 blockers have long been in clinical use for the treatment ofblood cancers. A study suggests that these drugs could potentially alsobe developed as a treatment option for glioblastoma, the most commonand lethal type of brain tumour.
Heidelberg, 27 November 2019 – For a long time, cancer research haslargely focused on so-called oncogenes – genes that can cause cancerwhen mutated. While targeting these genes has led to the successfuldevelopment of a number of valuable drugs, this approach is hamperedby the fact that tumours often become resistant to these treatments.
A study conducted by Julie Gavard at the Université de Nantes, CNRS,INSERM, France, and her team, published today in The EMBO Journal,is now based on a different concept, termed non-oncogene addiction.During disease progression, cancer cells become strongly dependenton normal genes and cell functions to survive. These genes could thusserve as potential targets to attack tumour growth more efficiently. Agene called mucosa-associated lymphoid tissue l (MALT1), for example,is highly active in lymphoma, a type of blood cancer, and blockingMALT1 causes lymphoma cells to die. MALT1 blockers have beenviewed as a promising new treatment for lymphomas.
The researchers now addressed the role of MALT1 in solid tumours,namely glioblastoma. Using data from The Cancer Genome Atlas, amolecular characterization of over 20,000 primary cancers, theyrevealed that MALT1 levels strongly correlate with patients’ survival inbrain cancer – patients with less MALT1 tend to live longer.
Gavard and colleagues then focused their attention on so-calledglioblastoma stem cells, a self-renewing subpopulation of cells withinthe tumour that are likely responsible for cancer recurrence aftertreatment. They uncovered that targeting MALT1 with MALT1 blockerscaused glioblastoma stem cells to undergo a rare form of cellularsuicide termed lysosomal cell death in human cell culture experiments.Lysosomes are organelles within the cell that serve as the cells’digestive system. MALT1 keeps lysosomes low in cancer cells, which iscrucial for their survival. Blocking MALT1 leads to an increase inlysosomes, which in turn impairs the cells’ waste disposal system,eventually killing them. This points to the possibility of further exploringMALT1 inhibitors as potential treatment of glioblastoma.
Originalpublikation:Control of the Homeostasis of Endo-lysosomes by the ParacaspaseMALT1 regulates Glioma Cell Survival
The EMBO Journal
Kathryn A. Jacobs, Gwennan André-Grégoire, Clément Maghe, AnThys, Ying Li, Elizabeth Harford-Wright1, Kilian Trillet, TiphaineDouanne, Carolina Alves Nicolau, Jean-Sébastien Frénel, NicolasBidère, and Julie Gavard
DOI: 10.15252/embj.2019102030
Weitere Informationen:http://Read the paper:www.embopress.org/doi/10.15252/embj.2019102030
Merkmale dieser Pressemitteilung: JournalistenBiologieüberregionalForschungsergebnisseEnglisch

Annex 4
182

Annex 4
183

Annex 4
184
02 décembre 2019 RÉSULTATS SCIENTIFIQUES PHYSIOLOGIE ETCANCER
Le glioblastome, une tumeur incurable du cerveau, est alimenté par un
réservoir de cellules souches capables d'initier, maintenir et renouveler la
tumeur. La cellule souche cancéreuse peut survivre en conditions hostiles
notamment en atténuant les processus de dégradation intracellulaire
médiée par les lysosomes. Cette étude publiée dans The EMBO Journalrévèle que la protéase MALT1 agit comme un point de contrôle vie/mort des
cellules souches cancéreuses en régulant la quantité de lysosomes.
Les glioblastomes multiformes (GBM) sont des tumeurs du cerveau parmi les plus dévastatrices
de l'adulte, avec une survie médiane de 15 mois après le diagnostic. Le traitement standard actuel
comprend une résection neurochirurgicale suivie de cycles répétés de chimiothérapie et
radiothérapie. Bien que ces stratégies standardisées se soient révélées bénéfiques, elles
demeurent essentiellement palliatives. Au sein de ces tumeurs hautement hétérogènes, existe
une sous-population de cellules tumorales appelées cellules de type souche du glioblastome
(GSC). Bien que la définition moléculaire des GSCs fasse encore l’objet de débat, ces cellules
jouent un rôle dans l'initiation et la progression de la tumeur, ainsi que dans les résistances
thérapeutiques et la récurrence.
Les GSCs sont dispersées dans la tumeur à la fois à proximité des vaisseaux sanguins et à distance
dans des zones moins oxygénées. Tandis que la vasculature cérébrale leur offre une "niche"
protectrice, enrichie en facteurs de croissance, les GSCs sont également capables de supporter
des conditions de privation extrême. Cette résilience est notamment liée à leur capacité à
prolonger et maintenir des voies de signalisation de survie cellulaire, en l’absence des activateurs
exogènes de la "niche". Cette caractéristique s’appuie sur la baisse du trafic d’endocytose des
récepteurs membranaires aux facteurs de croissance et de leur dégradation dans les lysosomes
qui sont des organites au pH acide fonctionnant comme des centres névralgiques pour le trafic et
le métabolisme des macromolécules. Les lysosomes sont notamment impliqués dans la voie de
signalisation multiple mTOR (mammalian Target of Rapamycin).
Afin d’identifier des régulateurs de cette voie intrinsèque d’autoprotection, les chercheurs ont
analysé les bases de données publiques de plusieurs centaines de patients atteints de
glioblastome. Parmi les gènes non déjà connus pour leur implication dans l’initiation de la
transformation tumorale, ils ont observé une corrélation entre la survie des patients et l'expression
du gène MALT1 (Mucosa-Associated lymphoid tissue Lymphoma Translocation protein 1). Ce gène
spécifie la paracaspase MALT1, une arginine-protéase qui orchestre la réponse immunitaire lors de
l’activation des lymphocytes, tandis qu’elle est constitutivement active dans certains lymphomes.
Son rôle dans le système nerveux central et en particulier dans les glioblastomes n’a cependant
pas été exploré en détail.
En utilisant des cellules isolées à partir des pièces opératoires de patients atteints de
glioblastome, les chercheurs ont constaté que le blocage moléculaire de l’expression de MALT1 est
toxique pour ces cellules. C’est aussi le cas lorsque MALT1 est inhibée pharmacologiquement par
le biais d’antipsychotiques de la famille des phénothiazines, dont la mépazine. Ce frein à
Accueil ! Actualités
MALT1 et Glioblastomes: Haro surles Lysosomes !

Annex 4
185
l’expansion tumorale est reproduit in vivo dans des souris greffées de tumeurs humaines.
Par des approches d’imagerie cellulaire, les chercheurs ont ensuite établi que l’activité
protéolytique de MALT1 permet de maintenir des quantités faibles en lysosomes dans les GSCs.
En revanche, le blocage de l’activité protéolytique de MALT1 ou la réduction de son expression
provoque dans les GSCs un déferlement fatal en lysosomes. Ceci conduit à la mort cellulaire des
GSCs, concomitante à une réduction de la voie de signalisation mTOR, normalement essentielle au
maintien de leur caractère "souche".
La perturbation de l'homéostasie lysosomale pourrait donc représenter une nouvelle stratégie
d’attaque contre les GSCs, faisant émerger MALT1 comme un "talon d’Achille" du glioblastome.
Pour en savoir plus :
Paracaspase MALT1 regulates glioma cell survival by controlling endo-lysosome homeostasis.
Jacobs KA, André-Grégoire G, Maghe C, Thys A, Li Y, Harford-Wright E, Trillet K, Douanne T, Alves
Nicolau C, Frénel JS, Bidère N, Gavard J.
EMBO J. 2019 Nov 27:e102030. doi: 10.15252/embj.2019102030 . [Epub ahead of print]
Chercheuse CNRS au Centre derecherche en cancérologie Nantes-Angers (CNRS / Inserm / Université deNantes / Université d'Angers)
© Julie Gavard
Figure : La forme sauvage (A) ou inactive (B) de l’arginine-protéase MALT1 a été introduite dans une cellule souchehumaine de glioblastome. L’analyse en microscopie confocale permet de révéler les noyaux en gris, les lysosomes enmagenta, et MALT1 en vert. Barre d’échelle : 10 mm.
Contact
Julie Gavard
0228080327

Annex 5
186
ANNEX 5 Supplemental methods for discussion
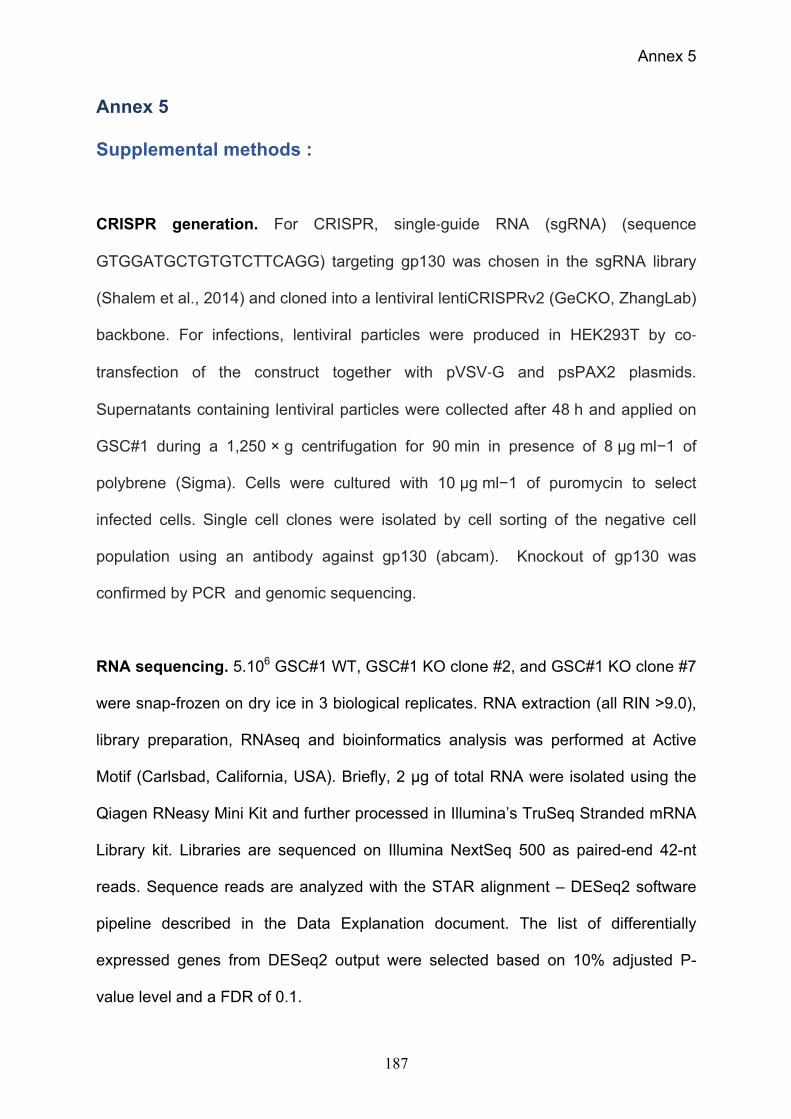
Annex 5
187
Annex 5 Supplemental methods :
CRISPR generation. For CRISPR, single‐guide RNA (sgRNA) (sequence
GTGGATGCTGTGTCTTCAGG) targeting gp130 was chosen in the sgRNA library
(Shalem et al., 2014) and cloned into a lentiviral lentiCRISPRv2 (GeCKO, ZhangLab)
backbone. For infections, lentiviral particles were produced in HEK293T by co‐
transfection of the construct together with pVSV‐G and psPAX2 plasmids.
Supernatants containing lentiviral particles were collected after 48 h and applied on
GSC#1 during a 1,250 × g centrifugation for 90 min in presence of 8 µg ml−1 of
polybrene (Sigma). Cells were cultured with 10 µg ml−1 of puromycin to select
infected cells. Single cell clones were isolated by cell sorting of the negative cell
population using an antibody against gp130 (abcam). Knockout of gp130 was
confirmed by PCR and genomic sequencing.
RNA sequencing. 5.106 GSC#1 WT, GSC#1 KO clone #2, and GSC#1 KO clone #7
were snap-frozen on dry ice in 3 biological replicates. RNA extraction (all RIN >9.0),
library preparation, RNAseq and bioinformatics analysis was performed at Active
Motif (Carlsbad, California, USA). Briefly, 2 µg of total RNA were isolated using the
Qiagen RNeasy Mini Kit and further processed in Illumina’s TruSeq Stranded mRNA
Library kit. Libraries are sequenced on Illumina NextSeq 500 as paired-end 42-nt
reads. Sequence reads are analyzed with the STAR alignment – DESeq2 software
pipeline described in the Data Explanation document. The list of differentially
expressed genes from DESeq2 output were selected based on 10% adjusted P-
value level and a FDR of 0.1.

Annex 5
188
Limiting Dilution Assays. In order to evaluate the self-renewal of GSCs, limited
dilution assays (LDA) were performed. GSCs were seeded in a 96-well plate via a
serial dilution ranging from 2000-1 cell/well. 8 replicates per dilution were performed
and treated as indicated. After 14 days, each well was assessed for tumoursphere
formation in a binary fashion. Stemness frequency was then calculated using ELDA
software. Data are representative of N=2 experiments.
Immunostaining. Cells were seeded onto slides, fixed for 10 min with 4% PFA
diluted in PBS, and blocked with PBS-BSA 4% prior to 1 hour primary antibody
incubation with gp130 (santa cruz) and APLNR (R&D). No permeabilization step was
performed. After PBS washes, cells were incubated with AlexaFluor-conjugated
secondary antibodies for 30 minutes. Next, cells were mounted with prolong
diamond anti-fade with DAPI mounting medium. All images were acquired on
confocal Nikon A1 Rsi, using a 60x oil-immersion lens (Nikon Excellence Center,
Micropicell, SFR Francois Bonamy, Nantes, France). All images were analyzed
using Image J software.
Proximity Ligation Assay. APLNR/GP130 interaction was visualized through the
Duolink in situ kit following manufacturer’s instructions (Sigma) on GSC#1 using
primary antibodies against ALPNR (R&D) and gp130 (Santa Cruz). All images were
acquired on confocal Nikon A1 Rsi, using a 60x oil-immersion lens (Nikon Excellence
Center, Micropicell, SFR Francois Bonamy, Nantes, France). All images were
analyzed using the Image J software.

Annex 5
189
Flow cytometry analysis. GSC#1 and GSC#1 KO cells were isolated, washed, and
incubated with antibodies against gp130 (abcam) and APLNR (R&D coupled APC)
for 1 hour at RT. Alternatively, ectopic gp130 or empty vector was introduced in KO
clones using a Neon transfection system and cells were analyzed 48 hrs later for
surface gp130 and APLNR. Flow Cytometry analyses were performed on
FACsCalibur (BD Biosciences, Cytocell, SFR Francois Bonamy, Nantes, France)
and processed using FlowJo software.
Cell viability. 5000 GSC#1 and GSC#9 were treated with JQ1 (Sigma) or AZD5153
(Selleckchem) in triplicate for 48 hrs. Alternatively, GSC#9 were transfected with
siRNA sic (Low GC duplex, Invitrogen) or siBRD4
(UUAGACUUGAUUGUGCUCATG) and analyzed 72 hrs later. Cell viability was
measured using Cell titer glo reagent (Promega) according to the manufacturers
protocol.
Immunoblotting and Immunoprecipitation. Cells were collected with cold PBS
and lysed in TNT lysis Buffer (50 mM TRIS pH7.4, 150 mM NaCl, 1% Triton X-100,
1% Igepal, 2 mM EDTA, supplemented with Protease Inhibitor) for 30 minutes on
ice. Samples were cleared at 8000g to remove insoluble fraction.
Immunoprecipitation was performed as previously described (Douanne et al. 2016).
Briefly, cell lysis was done in TNT lysis buffer for 30 minutes and samples were
centrifuged at 8000g. Samples were precleared via a 30 minute-incubation with
Protein G agarose, and then incubated for 2 hours at 4°C with Protein G agarose
and 5 µg of indicated antibodies. Protein concentrations were determined by BCA.
Equal amount of 5-10µg proteins were resolved by SDS-PAGE and transferred to

Annex 5
190
nitrocellulose membranes. Membranes were revealed using a chemiluminescent
HRP substrate and visualized using the Fusion imaging system.
Statistics. Statistical analysis was performed with GraphPad Prism5 using One-way
analysis of variance (ANOVA), or an unpaired two-tailed t-test (Student’s t test). For
each statistical test, p value of <0.05 was considered significant.
Bibliography
191
Abbott, N.J., Rönnbäck, L., and Hansson, E. (2006). Astrocyte-endothelial interactions at the blood-brain barrier. Nat. Rev. Neurosci. 7, 41–53.
Abou-Ghazal, M., Yang, D.S., Qiao, W., Reina-Ortiz, C., Wei, J., Kong, L.-Y., Fuller, G.N., Hiraoka, N., Priebe, W., Sawaya, R., et al. (2008). The incidence, correlation with tumor-infiltrating inflammation, and prognosis of phosphorylated STAT3 expression in human gliomas. Clin. Cancer Res. Off. J. Am. Assoc. Cancer Res. 14, 8228–8235.
Abu-Remaileh, M., Wyant, G.A., Kim, C., Laqtom, N.N., Abbasi, M., Chan, S.H., Freinkman, E., and Sabatini, D.M. (2017). Lysosomal metabolomics reveals V-ATPase and mTOR-dependent regulation of amino acid efflux from lysosomes. Science 358, 807–813.
Affronti, M.L., Heery, C.R., Herndon, J.E., Rich, J.N., Reardon, D.A., Desjardins, A., Vredenburgh, J.J., Friedman, A.H., Bigner, D.D., and Friedman, H.S. (2009). Overall survival of newly diagnosed glioblastoma patients receiving carmustine wafers followed by radiation and concurrent temozolomide plus rotational multiagent chemotherapy. Cancer 115, 3501–3511.
Aits, S., and Jäättelä, M. (2013). Lysosomal cell death at a glance. J. Cell Sci. 126, 1905–1912.
Aits, S., Kricker, J., Liu, B., Ellegaard, A.-M., Hämälistö, S., Tvingsholm, S., Corcelle-Termeau, E., Høgh, S., Farkas, T., Holm Jonassen, A., et al. (2015). Sensitive detection of lysosomal membrane permeabilization by lysosomal galectin puncta assay. Autophagy 11, 1408–1424.
Akhavan, D., Alizadeh, D., Wang, D., Weist, M.R., Shepphird, J.K., and Brown, C.E. (2019). CAR T cells for brain tumors: Lessons learned and road ahead. Immunol. Rev. 290, 60–84.
Albertini, M.R. (2018). The age of enlightenment in melanoma immunotherapy. J. Immunother. Cancer 6, 80.
Alcantara Llaguno, S., Chen, J., Kwon, C.-H., Jackson, E.L., Li, Y., Burns, D.K., Alvarez-Buylla, A., and Parada, L.F. (2009). Malignant astrocytomas originate from neural stem/progenitor cells in a somatic tumor suppressor mouse model. Cancer Cell 15, 45–56.
Al-Hajj, M., Wicha, M.S., Benito-Hernandez, A., Morrison, S.J., and Clarke, M.F. (2003). Prospective identification of tumorigenic breast cancer cells. Proc. Natl. Acad. Sci. U. S. A. 100, 3983–3988.
Allen, E., Jabouille, A., Rivera, L.B., Lodewijckx, I., Missiaen, R., Steri, V., Feyen, K., Tawney, J., Hanahan, D., Michael, I.P., et al. (2017). Combined antiangiogenic and anti–PD-L1 therapy stimulates tumor immunity through HEV formation. Sci. Transl. Med. 9.

Bibliography
192
Allen, M., Bjerke, M., Edlund, H., Nelander, S., and Westermark, B. (2016). Origin of the U87MG glioma cell line: Good news and bad news. Sci. Transl. Med. 8, 354re3-354re3.
Alonso, M.M., Jiang, H., Yokoyama, T., Xu, J., Bekele, N.B., Lang, F.F., Kondo, S., Gomez-Manzano, C., and Fueyo, J. (2008). Delta-24-RGD in Combination With RAD001 Induces Enhanced Anti-glioma Effect via Autophagic Cell Death. Mol. Ther. 16, 487–493.
Alonso, M.M., Jiang, H., Gomez-Manzano, C., and Fueyo, J. (2012). Targeting brain tumor stem cells with oncolytic adenoviruses. Methods Mol. Biol. Clifton NJ 797, 111–125.
André-Grégoire, G., and Gavard, J. (2016). Spitting out the demons: Extracellular vesicles in glioblastoma. Cell Adhes. Migr. 11, 164–172.
André-Grégoire, G., Bidère, N., and Gavard, J. (2018). Temozolomide affects Extracellular Vesicles Released by Glioblastoma Cells. Biochimie 155, 11–15.
Ango, F., Pin, J.P., Tu, J.C., Xiao, B., Worley, P.F., Bockaert, J., and Fagni, L. (2000). Dendritic and axonal targeting of type 5 metabotropic glutamate receptor is regulated by homer1 proteins and neuronal excitation. J. Neurosci. Off. J. Soc. Neurosci. 20, 8710–8716.
Armulik, A., Abramsson, A., and Betsholtz, C. (2005). Endothelial/pericyte interactions. Circ. Res. 97, 512–523.
Arnandis, T., Ferrer-Vicens, I., García-Trevijano, E.R., Miralles, V.J., García, C., Torres, L., Viña, J.R., and Zaragozá, R. (2012). Calpains mediate epithelial-cell death during mammary gland involution: mitochondria and lysosomal destabilization. Cell Death Differ. 19, 1536–1548.
Ashizawa, T., Miyata, H., Iizuka, A., Komiyama, M., Oshita, C., Kume, A., Nogami, M., Yagoto, M., Ito, I., Oishi, T., et al. (2013). Effect of the STAT3 inhibitor STX-0119 on the proliferation of cancer stem-like cells derived from recurrent glioblastoma. Int. J. Oncol. 43, 219–227.
Aumailley, M., and Smyth, N. (1998). The role of laminins in basement membrane function. J. Anat. 193 ( Pt 1), 1–21.
Autier, L., Clavreul, A., Cacicedo, M.L., Franconi, F., Sindji, L., Rousseau, A., Perrot, R., Montero-Menei, C.N., Castro, G.R., and Menei, P. (2019). A new glioblastoma cell trap for implantation after surgical resection. Acta Biomater. 84, 268–279.
Bach, M., Larance, M., James, D.E., and Ramm, G. (2011). The serine/threonine kinase ULK1 is a target of multiple phosphorylation events. Biochem. J. 440, 283–291.
Bachoo, R.M., Maher, E.A., Ligon, K.L., Sharpless, N.E., Chan, S.S., You, M.J., Tang, Y., DeFrances, J., Stover, E., Weissleder, R., et al. (2002). Epidermal growth

Bibliography
193
factor receptor and Ink4a/Arf: convergent mechanisms governing terminal differentiation and transformation along the neural stem cell to astrocyte axis. Cancer Cell 1, 269–277.
Baens, M., Bonsignore, L., Somers, R., Vanderheydt, C., Weeks, S.D., Gunnarsson, J., Nilsson, E., Roth, R.G., Thome, M., and Marynen, P. (2014). MALT1 auto-proteolysis is essential for NF-κB-dependent gene transcription in activated lymphocytes. PloS One 9, e103774.
Baens, M., Stirparo, R., Lampi, Y., Verbeke, D., Vandepoel, R., Cools, J., Marynen, P., de Bock, C.E., and Bornschein, S. (2018). Malt1 self-cleavage is critical for regulatory T cell homeostasis and anti-tumor immunity in mice. Eur. J. Immunol. 48, 1728–1738.
Baker, H., Sidorowicz, A., Sehgal, S.N., and Vézina, C. (1978). Rapamycin (AY-22,989), a new antifungal antibiotic. III. In vitro and in vivo evaluation. J. Antibiot. (Tokyo) 31, 539–545.
Balch, W.E., Morimoto, R.I., Dillin, A., and Kelly, J.W. (2008). Adapting Proteostasis for Disease Intervention. Science 319, 916–919.
Baldi, I., Huchet, A., Bauchet, L., and Loiseau, H. (2010). Épidémiologie des glioblastomes. Neurochirurgie 56, 433–440.
Bao, S., Wu, Q., Sathornsumetee, S., Hao, Y., Li, Z., Hjelmeland, A.B., Shi, Q., McLendon, R.E., Bigner, D.D., and Rich, J.N. (2006a). Stem cell-like glioma cells promote tumor angiogenesis through vascular endothelial growth factor. Cancer Res. 66, 7843–7848.
Bao, S., Wu, Q., McLendon, R.E., Hao, Y., Shi, Q., Hjelmeland, A.B., Dewhirst, M.W., Bigner, D.D., and Rich, J.N. (2006b). Glioma stem cells promote radioresistance by preferential activation of the DNA damage response. Nature 444, 756–760.
Bardella, C., Al-Dalahmah, O., Krell, D., Brazauskas, P., Al-Qahtani, K., Tomkova, M., Adam, J., Serres, S., Lockstone, H., Freeman-Mills, L., et al. (2016). Expression of Idh1R132H in the Murine Subventricular Zone Stem Cell Niche Recapitulates Features of Early Gliomagenesis. Cancer Cell 30, 578–594.
Bar-Peled, L., Schweitzer, L.D., Zoncu, R., and Sabatini, D.M. (2012). Ragulator Is a GEF for the Rag GTPases that Signal Amino Acid Levels to mTORC1. Cell 150, 1196–1208.
Bar-Peled, L., Chantranupong, L., Cherniack, A.D., Chen, W.W., Ottina, K.A., Grabiner, B.C., Spear, E.D., Carter, S.L., Meyerson, M., and Sabatini, D.M. (2013). A Tumor suppressor complex with GAP activity for the Rag GTPases that signal amino acid sufficiency to mTORC1. Science 340, 1100–1106.
Basel-Vanagaite, L., Hershkovitz, T., Heyman, E., Raspall-Chaure, M., Kakar, N., Smirin-Yosef, P., Vila-Pueyo, M., Kornreich, L., Thiele, H., Bode, H., et al. (2013).

Bibliography
194
Biallelic SZT2 Mutations Cause Infantile Encephalopathy with Epilepsy and Dysmorphic Corpus Callosum. Am. J. Hum. Genet. 93, 524–529.
Bashir, T., Cloninger, C., Artinian, N., Anderson, L., Bernath, A., Holmes, B., Benavides-Serrato, A., Sabha, N., Nishimura, R.N., Guha, A., et al. (2012). Conditional Astroglial Rictor Overexpression Induces Malignant Glioma in Mice. PLOS ONE 7, e47741.
Batchelor, T.T., Sorensen, A.G., di Tomaso, E., Zhang, W.-T., Duda, D.G., Cohen, K.S., Kozak, K.R., Cahill, D.P., Chen, P.-J., Zhu, M., et al. (2007). AZD2171, a Pan-VEGF Receptor Tyrosine Kinase Inhibitor, Normalizes Tumor Vasculature and Alleviates Edema in Glioblastoma Patients. Cancer Cell 11, 83–95.
Beaumatin, F., O’Prey, J., Barthet, V.J.A., Zunino, B., Parvy, J.-P., Bachmann, A.M., O’Prey, M., Kania, E., Gonzalez, P.S., Macintosh, R., et al. (2019). mTORC1 Activation Requires DRAM-1 by Facilitating Lysosomal Amino Acid Efflux. Mol. Cell 76, 163-176.e8.
Beier, D., Hau, P., Proescholdt, M., Lohmeier, A., Wischhusen, J., Oefner, P.J., Aigner, L., Brawanski, A., Bogdahn, U., and Beier, C.P. (2007). CD133(+) and CD133(-) glioblastoma-derived cancer stem cells show differential growth characteristics and molecular profiles. Cancer Res. 67, 4010–4015.
Ben-David, U., Ha, G., Tseng, Y.-Y., Greenwald, N.F., Oh, C., Shih, J., McFarland, J.M., Wong, B., Boehm, J.S., Beroukhim, R., et al. (2017). Patient-derived xenografts undergo mouse-specific tumor evolution. Nat. Genet. 49, 1567–1575.
Benes, P., Vetvicka, V., and Fusek, M. (2008). Cathepsin D--many functions of one aspartic protease. Crit. Rev. Oncol. Hematol. 68, 12–28.
Ben-Porath, I., Thomson, M.W., Carey, V.J., Ge, R., Bell, G.W., Regev, A., and Weinberg, R.A. (2008). An embryonic stem cell-like gene expression signature in poorly differentiated aggressive human tumors. Nat. Genet. 40, 499–507.
Ben-Sahra, I., Howell, J.J., Asara, J.M., and Manning, B.D. (2013). Stimulation of de novo pyrimidine synthesis by growth signaling through mTOR and S6K1. Science 339, 1323–1328.
van den Bent, M.J., Gao, Y., Kerkhof, M., Kros, J.M., Gorlia, T., van Zwieten, K., Prince, J., van Duinen, S., Sillevis Smitt, P.A., Taphoorn, M., et al. (2015). Changes in the EGFR amplification and EGFRvIII expression between paired primary and recurrent glioblastomas. Neuro-Oncol. 17, 935–941.
Bhat, K.P.L., Balasubramaniyan, V., Vaillant, B., Ezhilarasan, R., Hummelink, K., Hollingsworth, F., Wani, K., Heathcock, L., James, J.D., Goodman, L.D., et al. (2013). Mesenchymal Differentiation Mediated by NF-κB Promotes Radiation Resistance in Glioblastoma. Cancer Cell 24.
Bissig, C., Hurbain, I., Raposo, G., and van Niel, G. (2017). PIKfyve activity regulates reformation of terminal storage lysosomes from endolysosomes. Traffic

Bibliography
195
Cph. Den. 18, 747–757.
Blaho, V.A., Galvani, S., Engelbrecht, E., Liu, C., Swendeman, S.L., Kono, M., Proia, R.L., Steinman, L., Han, M.H., and Hla, T. (2015). HDL-bound sphingosine 1-phosphate restrains lymphopoiesis and neuroinflammation. Nature 523, 342–346.
Bleau, A.-M., Hambardzumyan, D., Ozawa, T., Fomchenko, E.I., Huse, J.T., Brennan, C.W., and Holland, E.C. (2009). PTEN/PI3K/Akt Pathway Regulates the Side Population Phenotype and ABCG2 Activity in Glioma Tumor Stem-like Cells. Cell Stem Cell 4, 226–235.
Bonaguidi, M.A., McGuire, T., Hu, M., Kan, L., Samanta, J., and Kessler, J.A. (2005). LIF and BMP signaling generate separate and discrete types of GFAP-expressing cells. Dev. Camb. Engl. 132, 5503–5514.
Bond, A.M., Ming, G.-L., and Song, H. (2015). Adult Mammalian Neural Stem Cells and Neurogenesis: Five Decades Later. Cell Stem Cell 17, 385–395.
Bonizzi, G., and Karin, M. (2004). The two NF-κB activation pathways and their role in innate and adaptive immunity. Trends Immunol. 25, 280–288.
Bonnet, D., and Dick, J.E. (1997). Human acute myeloid leukemia is organized as a hierarchy that originates from a primitive hematopoietic cell. Nat. Med. 3, 730–737.
Bornancin, F., Renner, F., Touil, R., Sic, H., Kolb, Y., Touil-Allaoui, I., Rush, J.S., Smith, P.A., Bigaud, M., Junker-Walker, U., et al. (2015). Deficiency of MALT1 paracaspase activity results in unbalanced regulatory and effector T and B cell responses leading to multiorgan inflammation. J. Immunol. Baltim. Md 1950 194, 3723–3734.
Boya, P., Andreau, K., Poncet, D., Zamzami, N., Perfettini, J.-L., Metivier, D., Ojcius, D.M., Jäättelä, M., and Kroemer, G. (2003). Lysosomal membrane permeabilization induces cell death in a mitochondrion-dependent fashion. J. Exp. Med. 197, 1323–1334.
Brem, H., Piantadosi, S., Burger, P.C., Walker, M., Selker, R., Vick, N.A., Black, K., Sisti, M., Brem, S., Mohr, G., et al. (1995). Placebo-controlled trial of safety and efficacy of intraoperative controlled delivery by biodegradable polymers of chemotherapy for recurrent gliomas. The Lancet 345, 1008–1012.
Brennan, C.W., Verhaak, R.G.W., McKenna, A., Campos, B., Noushmehr, H., Salama, S.R., Zheng, S., Chakravarty, D., Sanborn, J.Z., Berman, S.H., et al. (2013). The somatic genomic landscape of glioblastoma. Cell 155, 462–477.
Bright, N.A., Davis, L.J., and Luzio, J.P. (2016). Endolysosomes Are the Principal Intracellular Sites of Acid Hydrolase Activity. Curr. Biol. CB 26, 2233–2245.
Britten, C.D., Garrett-Mayer, E., Chin, S.H., Shirai, K., Ogretmen, B., Bentz, T.A., Brisendine, A., Anderton, K., Cusack, S.L., Maines, L.W., et al. (2017). A Phase I Study of ABC294640, a First-in-Class Sphingosine Kinase-2 Inhibitor, in Patients

Bibliography
196
with Advanced Solid Tumors. Clin. Cancer Res. Off. J. Am. Assoc. Cancer Res. 23, 4642–4650.
Bronisz, A., Wang, Y., Nowicki, M.O., Peruzzi, P., Ansari, K., Ogawa, D., Balaj, L., De Rienzo, G., Mineo, M., Nakano, I., et al. (2014). Extracellular vesicles modulate the glioblastoma microenvironment via a tumor suppression signaling network directed by miR-1. Cancer Res. 74, 738–750.
Brown, E.J., Albers, M.W., Shin, T.B., Ichikawa, K., Keith, C.T., Lane, W.S., and Schreiber, S.L. (1994). A mammalian protein targeted by G1-arresting rapamycin-receptor complex. Nature 369, 756–758.
Brown, T.J., Brennan, M.C., Li, M., Church, E.W., Brandmeir, N.J., Rakszawski, K.L., Patel, A.S., Rizk, E.B., Suki, D., Sawaya, R., et al. (2016). Association of the Extent of Resection With Survival in Glioblastoma: A Systematic Review and Meta-analysis. JAMA Oncol. 2, 1460–1469.
Brugarolas, J., Lei, K., Hurley, R.L., Manning, B.D., Reiling, J.H., Hafen, E., Witters, L.A., Ellisen, L.W., and Kaelin Jr., W.G. (2004). Regulation of mTOR function in response to hypoxia by REDD1 and the TSC1/TSC2 tumor suppressor complex. Genes Dev. 18, 2893–2904.
Brunk, U.T., and Ericsson, J.L. (1972). Cytochemical evidence for the leakage of acid phosphatase through ultrastructurally intact lysosomal membranes. Histochem. J. 4, 479–491.
Brunn, G.J., Hudson, C.C., Sekulić, A., Williams, J.M., Hosoi, H., Houghton, P.J., Lawrence, J.C., and Abraham, R.T. (1997). Phosphorylation of the translational repressor PHAS-I by the mammalian target of rapamycin. Science 277, 99–101.
Brüstle, A., Brenner, D., Knobbe-Thomsen, C.B., Cox, M., Lang, P.A., Lang, K.S., and Mak, T.W. (2017). MALT1 is an intrinsic regulator of regulatory T cells. Cell Death Differ. 24, 1214–1223.
Cafferkey, R., Young, P.R., McLaughlin, M.M., Bergsma, D.J., Koltin, Y., Sathe, G.M., Faucette, L., Eng, W.K., Johnson, R.K., and Livi, tia (1993). Dominant missense mutations in a novel yeast protein related to mammalian phosphatidylinositol 3-kinase and VPS34 abrogate rapamycin cytotoxicity. Mol. Cell. Biol. 13, 6012–6023.
Calabrese, C., Poppleton, H., Kocak, M., Hogg, T.L., Fuller, C., Hamner, B., Oh, E.Y., Gaber, M.W., Finklestein, D., Allen, M., et al. (2007). A perivascular niche for brain tumor stem cells. Cancer Cell 11, 69–82.
Cancer Genome Atlas Research Network (2008). Comprehensive genomic characterization defines human glioblastoma genes and core pathways. Nature 455, 1061–1068.
Canuel, M., Korkidakis, A., Konnyu, K., and Morales, C.R. (2008). Sortilin mediates the lysosomal targeting of cathepsins D and H. Biochem. Biophys. Res. Commun.

Bibliography
197
373, 292–297.
Carlsson, S.R., and Fukuda, M. (1992). The lysosomal membrane glycoprotein lamp-1 is transported to lysosomes by two alternative pathways. Arch. Biochem. Biophys. 296, 630–639.
Carpentier, A., Canney, M., Vignot, A., Reina, V., Beccaria, K., Horodyckid, C., Karachi, C., Leclercq, D., Lafon, C., Chapelon, J.-Y., et al. (2016). Clinical trial of blood-brain barrier disruption by pulsed ultrasound. Sci. Transl. Med. 8, 343re2.
Carroll, S.L. (2012). Molecular mechanisms promoting the pathogenesis of Schwann cell neoplasms. Acta Neuropathol. (Berl.) 123, 321–348.
Castino, R., Peracchio, C., Salini, A., Nicotra, G., Trincheri, N.F., Démoz, M., Valente, G., and Isidoro, C. (2009). Chemotherapy drug response in ovarian cancer cells strictly depends on a cathepsin D-Bax activation loop. J. Cell. Mol. Med. 13, 1096–1109.
Chakravarti, A., Zhai, G., Suzuki, Y., Sarkesh, S., Black, P.M., Muzikansky, A., and Loeffler, J.S. (2004). The Prognostic Significance of Phosphatidylinositol 3-Kinase Pathway Activation in Human Gliomas. J. Clin. Oncol. 22, 1926–1933.
Chan, E.Y.W., Kir, S., and Tooze, S.A. (2007). siRNA screening of the kinome identifies ULK1 as a multidomain modulator of autophagy. J. Biol. Chem. 282, 25464–25474.
Chan, E.Y.W., Longatti, A., McKnight, N.C., and Tooze, S.A. (2009). Kinase-Inactivated ULK Proteins Inhibit Autophagy via Their Conserved C-Terminal Domains Using an Atg13-Independent Mechanism. Mol. Cell. Biol. 29, 157–171.
Chantranupong, L., Wolfson, R.L., Orozco, J.M., Saxton, R.A., Scaria, S.M., Bar-Peled, L., Spooner, E., Isasa, M., Gygi, S.P., and Sabatini, D.M. (2014). The Sestrins Interact with GATOR2 to Negatively Regulate the Amino-Acid-Sensing Pathway Upstream of mTORC1. Cell Rep. 9, 1–8.
Chantranupong, L., Scaria, S.M., Saxton, R.A., Gygi, M.P., Shen, K., Wyant, G.A., Wang, T., Harper, J.W., Gygi, S.P., and Sabatini, D.M. (2016). The CASTOR Proteins Are Arginine Sensors for the mTORC1 Pathway. Cell 165, 153–164.
Charles, N., Ozawa, T., Squatrito, M., Bleau, A.-M., Brennan, C.W., Hambardzumyan, D., and Holland, E.C. (2010). Perivascular nitric oxide activates notch signaling and promotes stem-like character in PDGF-induced glioma cells. Cell Stem Cell 6, 141–152.
Chauhan, S., Kumar, S., Jain, A., Ponpuak, M., Mudd, M.H., Kimura, T., Choi, S.W., Peters, R., Mandell, M., Bruun, J.-A., et al. (2016). TRIMs and Galectins Globally Cooperate and TRIM16 and Galectin-3 Co-direct Autophagy in Endomembrane Damage Homeostasis. Dev. Cell 39, 13–27.
Chen, A.-J., Paik, J.-H., Zhang, H., Shukla, S.A., Mortensen, R., Hu, J., Ying, H., Hu,
Bibliography
198
B., Hurt, J., Farny, N., et al. (2012a). STAR RNA-binding protein Quaking suppresses cancer via stabilization of specific miRNA. Genes Dev. 26, 1459–1472.
Chen, D.S., Irving, B.A., and Hodi, F.S. (2012b). Molecular Pathways: Next-Generation Immunotherapy—Inhibiting Programmed Death-Ligand 1 and Programmed Death-1. Clin. Cancer Res. 18, 6580–6587.
Chen, J., Li, Y., Yu, T.-S., McKay, R.M., Burns, D.K., Kernie, S.G., and Parada, L.F. (2012c). A restricted cell population propagates glioblastoma growth after chemotherapy. Nature 488, 522–526.
Chen, J., McKay, R.M., and Parada, L.F. (2012d). Malignant Glioma: Lessons from Genomics, Mouse Models, and Stem Cells. Cell 149, 36–47.
Chen, Q., Wu, J., Ye, Q., Ma, F., Zhu, Q., Wu, Y., Shan, C., Xie, X., Li, D., Zhan, X., et al. (2018). Treatment of Human Glioblastoma with a Live Attenuated Zika Virus Vaccine Candidate. MBio 9.
Chen, Q., Liu, Y., Jeong, H.-W., Stehling, M., Dinh, V.V., Zhou, B., and Adams, R.H. (2019a). Apelin+ Endothelial Niche Cells Control Hematopoiesis and Mediate Vascular Regeneration after Myeloablative Injury. Cell Stem Cell 0.
Chen, Q., Liu, Y., Jeong, H.-W., Stehling, M., Dinh, V.V., Zhou, B., and Adams, R.H. (2019b). Apelin+ Endothelial Niche Cells Control Hematopoiesis and Mediate Vascular Regeneration after Myeloablative Injury. Cell Stem Cell 25, 768-783.e6.
Cheng, L., Huang, Z., Zhou, W., Wu, Q., Donnola, S., Liu, J.K., Fang, X., Sloan, A.E., Mao, Y., Lathia, J.D., et al. (2013). Glioblastoma Stem Cells Generate Vascular Pericytes to Support Vessel Function and Tumor Growth. Cell 153, 139–152.
Cheong, H., Lindsten, T., Wu, J., Lu, C., and Thompson, C.B. (2011). Ammonia-induced autophagy is independent of ULK1/ULK2 kinases. Proc. Natl. Acad. Sci. U. S. A. 108, 11121–11126.
Chinot, O.L., Wick, W., Mason, W., Henriksson, R., Saran, F., Nishikawa, R., Carpentier, A.F., Hoang-Xuan, K., Kavan, P., Cernea, D., et al. (2014). Bevacizumab plus radiotherapy-temozolomide for newly diagnosed glioblastoma. N. Engl. J. Med. 370, 709–722.
Chiu, M.I., Katz, H., and Berlin, V. (1994). RAPT1, a mammalian homolog of yeast Tor, interacts with the FKBP12/rapamycin complex. Proc. Natl. Acad. Sci. U. S. A. 91, 12574–12578.
Choi, C., Gillespie, G.Y., Van Wagoner, N.J., and Benveniste, E.N. (2002). Fas engagement increases expression of interleukin-6 in human glioma cells. J. Neurooncol. 56, 13–19.
Choi, Y.-J., Di Nardo, A., Kramvis, I., Meikle, L., Kwiatkowski, D.J., Sahin, M., and He, X. (2008). Tuberous sclerosis complex proteins control axon formation. Genes Dev. 22, 2485–2495.

Bibliography
199
Choksi, S., Lin, Y., Pobezinskaya, Y., Chen, L., Park, C., Morgan, M., Li, T., Jitkaew, S., Cao, X., Kim, Y.-S., et al. (2011). A HIF-1 target, ATIA, protects cells from apoptosis by modulating the mitochondrial thioredoxin, TRX2. Mol. Cell 42, 597–609.
Chongsathidkiet, P., Jackson, C., Koyama, S., Loebel, F., Cui, X., Farber, S.H., Woroniecka, K., Elsamadicy, A.A., Dechant, C.A., Kemeny, H.R., et al. (2018). Sequestration of T-cells in bone marrow in the setting of glioblastoma and other intracranial tumors. Nat. Med. 24, 1459–1468.
Chu, B.-B., Liao, Y.-C., Qi, W., Xie, C., Du, X., Wang, J., Yang, H., Miao, H.-H., Li, B.-L., and Song, B.-L. (2015). Cholesterol transport through lysosome-peroxisome membrane contacts. Cell 161, 291–306.
Clarke, K., Smith, K., Gullick, W.J., and Harris, A.L. (2001). Mutant epidermal growth factor receptor enhances induction of vascular endothelial growth factor by hypoxia and insulin-like growth factor-1 via a PI3 kinase dependent pathway. Br. J. Cancer 84, 1322–1329.
Clement, V., Sanchez, P., de Tribolet, N., Radovanovic, I., and Ruiz i Altaba, A. (2007). HEDGEHOG-GLI1 signaling regulates human glioma growth, cancer stem cell self-renewal, and tumorigenicity. Curr. Biol. CB 17, 165–172.
Cloughesy, T.F., Mochizuki, A.Y., Orpilla, J.R., Hugo, W., Lee, A.H., Davidson, T.B., Wang, A.C., Ellingson, B.M., Rytlewski, J.A., Sanders, C.M., et al. (2019). Neoadjuvant anti-PD-1 immunotherapy promotes a survival benefit with intratumoral and systemic immune responses in recurrent glioblastoma. Nat. Med. 25, 477–486.
Cohen, M.H., Shen, Y.L., Keegan, P., and Pazdur, R. (2009). FDA drug approval summary: bevacizumab (Avastin) as treatment of recurrent glioblastoma multiforme. The Oncologist 14, 1131–1138.
Conus, S., and Simon, H.-U. (2008). Cathepsins: key modulators of cell death and inflammatory responses. Biochem. Pharmacol. 76, 1374–1382.
Coornaert, B., Baens, M., Heyninck, K., Bekaert, T., Haegman, M., Staal, J., Sun, L., Chen, Z.J., Marynen, P., and Beyaert, R. (2008a). T cell antigen receptor stimulation induces MALT1 paracaspase-mediated cleavage of the NF-kappaB inhibitor A20. Nat. Immunol. 9, 263–271.
Coornaert, B., Baens, M., Heyninck, K., Bekaert, T., Haegman, M., Staal, J., Sun, L., Chen, Z.J., Marynen, P., and Beyaert, R. (2008b). T cell antigen receptor stimulation induces MALT1 paracaspase–mediated cleavage of the NF-κB inhibitor A20. Nat. Immunol. 9, 263–271.
Dahms, N.M. (1996). Insulin-like growth factor II/cation-independent mannose 6-phosphate receptor and lysosomal enzyme recognition. Biochem. Soc. Trans. 24, 136–141.
Darbelli, L., and Richard, S. (2016). Emerging functions of the Quaking RNA-binding proteins and link to human diseases. Wiley Interdiscip. Rev. RNA 7, 399–412.

Bibliography
200
De Bonis, P., Anile, C., Pompucci, A., Fiorentino, A., Balducci, M., Chiesa, S., Maira, G., and Mangiola, A. (2012). Safety and efficacy of Gliadel wafers for newly diagnosed and recurrent glioblastoma. Acta Neurochir. (Wien) 154, 1371–1378.
deCarvalho, A.C., Kim, H., Poisson, L.M., Winn, M.E., Mueller, C., Cherba, D., Koeman, J., Seth, S., Protopopov, A., Felicella, M., et al. (2018). Discordant inheritance of chromosomal and extrachromosomal DNA elements contributes to dynamic disease evolution in glioblastoma. Nat. Genet. 50, 708–717.
Del Vecchio, C.A., Li, G., and Wong, A.J. (2012). Targeting EGF receptor variant III: tumor-specific peptide vaccination for malignant gliomas. Expert Rev. Vaccines 11, 133–144.
Delgado, A.C., Ferrón, S.R., Vicente, D., Porlan, E., Perez-Villalba, A., Trujillo, C.M., D’Ocón, P., and Fariñas, I. (2014). Endothelial NT-3 delivered by vasculature and CSF promotes quiescence of subependymal neural stem cells through nitric oxide induction. Neuron 83, 572–585.
Démoz, M., Castino, R., Dragonetti, A., Raiteri, E., Baccino, F.M., and Isidoro, C. (1999). Transformation by oncogenic ras-p21 alters the processing and subcellular localization of the lysosomal protease cathepsin D. J. Cell. Biochem. 73, 370–378.
Desjardins, A., Gromeier, M., Herndon, J.E., Beaubier, N., Bolognesi, D.P., Friedman, A.H., Friedman, H.S., McSherry, F., Muscat, A.M., Nair, S., et al. (2018). Recurrent Glioblastoma Treated with Recombinant Poliovirus. N. Engl. J. Med. 379, 150–161.
Di Malta, C., Siciliano, D., Calcagni, A., Monfregola, J., Punzi, S., Pastore, N., Eastes, A.N., Davis, O., De Cegli, R., Zampelli, A., et al. (2017). Transcriptional activation of RagD GTPase controls mTORC1 and promotes cancer growth. Science 356, 1188–1192.
Diao, J., Liu, R., Rong, Y., Zhao, M., Zhang, J., Lai, Y., Zhou, Q., Wilz, L.M., Li, J., Vivona, S., et al. (2015). ATG14 promotes membrane tethering and fusion of autophagosomes to endolysosomes. Nature 520, 563–566.
Dielschneider, R.F., Eisenstat, H., Mi, S., Curtis, J.M., Xiao, W., Johnston, J.B., and Gibson, S.B. (2016). Lysosomotropic agents selectively target chronic lymphocytic leukemia cells due to altered sphingolipid metabolism. Leukemia 30, 1290–1300.
Dikic, I., and Elazar, Z. (2018). Mechanism and medical implications of mammalian autophagy. Nat. Rev. Mol. Cell Biol. 19, 349–364.
Ding, X., Chaiteerakij, R., Moser, C.D., Shaleh, H., Boakye, J., Chen, G., Ndzengue, A., Li, Y., Zhou, Y., Huang, S., et al. (2016). Antitumor effect of the novel sphingosine kinase 2 inhibitor ABC294640 is enhanced by inhibition of autophagy and by sorafenib in human cholangiocarcinoma cells. Oncotarget 7, 20080–20092.
Donatien, P.D., Diment, S.L., Boissy, R.E., and Orlow, S.J. (1996). Melanosomal and lysosomal alterations in murine melanocytes following transfection with the v-rasHa

Bibliography
201
oncogene. Int. J. Cancer 66, 557–563.
Dooley, H.C., Razi, M., Polson, H.E.J., Girardin, S.E., Wilson, M.I., and Tooze, S.A. (2014). WIPI2 links LC3 conjugation with PI3P, autophagosome formation, and pathogen clearance by recruiting Atg12-5-16L1. Mol. Cell 55, 238–252.
Dorrello, N.V., Peschiaroli, A., Guardavaccaro, D., Colburn, N.H., Sherman, N.E., and Pagano, M. (2006). S6K1- and betaTRCP-mediated degradation of PDCD4 promotes protein translation and cell growth. Science 314, 467–471.
Douanne, T., Gavard, J., and Bidère, N. (2016). The paracaspase MALT1 cleaves the LUBAC subunit HOIL1 during antigen receptor signaling. J. Cell Sci.
Douros, J., and Suffness, M. (1981). New antitumor substances of natural origin. Cancer Treat. Rev. 8, 63–87.
Dumont, F.J., Melino, M.R., Staruch, M.J., Koprak, S.L., Fischer, P.A., and Sigal, N.H. (1990). The immunosuppressive macrolides FK-506 and rapamycin act as reciprocal antagonists in murine T cells. J. Immunol. Baltim. Md 1950 144, 1418–1424.
de Duve, C. (2005). The lysosome turns fifty. Nat. Cell Biol. 7, 847–849.
de Duve, C., Pressman, B.C., Gianetto, R., Wattiaux, R., and Appelmans, F. (1955). Tissue fractionation studies. 6. Intracellular distribution patterns of enzymes in rat-liver tissue. Biochem. J. 60, 604–617.
Düvel, K., Yecies, J.L., Menon, S., Raman, P., Lipovsky, A.I., Souza, A.L., Triantafellow, E., Ma, Q., Gorski, R., Cleaver, S., et al. (2010). Activation of a metabolic gene regulatory network downstream of mTOR complex 1. Mol. Cell 39, 171–183.
Ebner, M., Sinkovics, B., Szczygieł, M., Ribeiro, D.W., and Yudushkin, I. (2017). Localization of mTORC2 activity inside cells. J. Cell Biol. 216, 343–353.
Ebner, P., Poetsch, I., Deszcz, L., Hoffmann, T., Zuber, J., and Ikeda, F. (2018). The IAP family member BRUCE regulates autophagosome–lysosome fusion. Nat. Commun. 9, 599.
Egan, D.F., Shackelford, D.B., Mihaylova, M.M., Gelino, S.R., Kohnz, R.A., Mair, W., Vasquez, D.S., Joshi, A., Gwinn, D.M., Taylor, R., et al. (2011). Phosphorylation of ULK1 (hATG1) by AMP-activated protein kinase connects energy sensing to mitophagy. Science 331, 456–461.
Egan, D.F., Chun, M.G.H., Vamos, M., Zou, H., Rong, J., Miller, C.J., Lou, H.J., Raveendra-Panickar, D., Yang, C.-C., Sheffler, D.J., et al. (2015). Small molecule inhibition of the autophagy kinase ULK1 and identification of ULK1 substrates. Mol. Cell 59, 285–297.
Eitelhuber, A.C., Vosyka, O., Nagel, D., Bognar, M., Lenze, D., Lammens, K.,

Bibliography
202
Schlauderer, F., Hlahla, D., Hopfner, K.-P., Lenz, G., et al. (2015). Activity-based probes for detection of active MALT1 paracaspase in immune cells and lymphomas. Chem. Biol. 22, 129–138.
Ellegaard, A.-M., Dehlendorff, C., Vind, A.C., Anand, A., Cederkvist, L., Petersen, N.H.T., Nylandsted, J., Stenvang, J., Mellemgaard, A., Østerlind, K., et al. (2016). Repurposing Cationic Amphiphilic Antihistamines for Cancer Treatment. EBioMedicine 9, 130–139.
Elrick, M.J., and Lieberman, A.P. (2013). Autophagic dysfunction in a lysosomal storage disorder due to impaired proteolysis. Autophagy 9, 234–235.
Elsamadicy, A.A., Babu, R., Kirkpatrick, J.P., and Adamson, D.C. (2015). Radiation-induced malignant gliomas: a current review. World Neurosurg. 83, 530–542.
Elton, L., Carpentier, I., Staal, J., Driege, Y., Haegman, M., and Beyaert, R. (2016). MALT1 cleaves the E3 ubiquitin ligase HOIL-1 in activated T cells, generating a dominant negative inhibitor of LUBAC-induced NF-κB signaling. FEBS J. 283, 403–412.
Eng, C.P., Sehgal, S.N., and Vézina, C. (1984). Activity of rapamycin (AY-22,989) against transplanted tumors. J. Antibiot. (Tokyo) 37, 1231–1237.
Eskelinen, E.-L., Tanaka, Y., and Saftig, P. (2003). At the acidic edge: emerging functions for lysosomal membrane proteins. Trends Cell Biol. 13, 137–145.
Ezashi, T., Das, P., and Roberts, R.M. (2005). Low O2 tensions and the prevention of differentiation of hES cells. Proc. Natl. Acad. Sci. U. S. A. 102, 4783–4788.
Fabian, D., Guillermo Prieto Eibl, M. del P., Alnahhas, I., Sebastian, N., Giglio, P., Puduvalli, V., Gonzalez, J., and Palmer, J.D. (2019). Treatment of Glioblastoma (GBM) with the Addition of Tumor-Treating Fields (TTF): A Review. Cancers 11, 174.
Fan, X., Khaki, L., Zhu, T.S., Soules, M.E., Talsma, C.E., Gul, N., Koh, C., Zhang, J., Li, Y.-M., Maciaczyk, J., et al. (2010). NOTCH pathway blockade depletes CD133-positive glioblastoma cells and inhibits growth of tumor neurospheres and xenografts. Stem Cells Dayt. Ohio 28, 5–16.
Fehrenbacher, N., Gyrd-Hansen, M., Poulsen, B., Felbor, U., Kallunki, T., Boes, M., Weber, E., Leist, M., and Jäättelä, M. (2004). Sensitization to the lysosomal cell death pathway upon immortalization and transformation. Cancer Res. 64, 5301–5310.
Fehrenbacher, N., Bastholm, L., Kirkegaard-Sørensen, T., Rafn, B., Bøttzauw, T., Nielsen, C., Weber, E., Shirasawa, S., Kallunki, T., and Jäättelä, M. (2008). Sensitization to the lysosomal cell death pathway by oncogene-induced down-regulation of lysosome-associated membrane proteins 1 and 2. Cancer Res. 68, 6623–6633.
Feng, Z., Hu, W., De Stanchina, E., Teresky, A.K., Jin, S., Lowe, S., and Levine, A.J.

Bibliography
203
(2007). The regulation of AMPK β1, TSC2, and PTEN expression by p53: Stress, cell and tissue specificity, and the role of these gene products in modulating the IGF-1-AKT-mTOR pathways. Cancer Res. 67, 3043–3053.
Ferch, U., Kloo, B., Gewies, A., Pfänder, V., Düwel, M., Peschel, C., Krappmann, D., and Ruland, J. (2009). Inhibition of MALT1 protease activity is selectively toxic for activated B cell-like diffuse large B cell lymphoma cells. J. Exp. Med. 206, 2313–2320.
Figueroa, J., Phillips, L.M., Shahar, T., Hossain, A., Gumin, J., Kim, H., Bean, A.J., Calin, G.A., Fueyo, J., Walters, E.T., et al. (2017). Exosomes from Glioma-Associated Mesenchymal Stem Cells Increase the Tumorigenicity of Glioma Stem-like Cells via Transfer of miR-1587. Cancer Res. 77, 5808–5819.
Filipek, P.A., de Araujo, M.E.G., Vogel, G.F., De Smet, C.H., Eberharter, D., Rebsamen, M., Rudashevskaya, E.L., Kremser, L., Yordanov, T., Tschaikner, P., et al. (2017). LAMTOR/Ragulator is a negative regulator of Arl8b- and BORC-dependent late endosomal positioning. J. Cell Biol. 216, 4199–4215.
Fimia, G.M., Stoykova, A., Romagnoli, A., Giunta, L., Di Bartolomeo, S., Nardacci, R., Corazzari, M., Fuoco, C., Ucar, A., Schwartz, P., et al. (2007). Ambra1 regulates autophagy and development of the nervous system. Nature 447, 1121–1125.
Fine, B., Hodakoski, C., Koujak, S., Su, T., Saal, L.H., Maurer, M., Hopkins, B., Keniry, M., Sulis, M.L., Mense, S., et al. (2009). Activation of the PI3K pathway in cancer through inhibition of PTEN by exchange factor P-REX2a. Science 325, 1261–1265.
Firestone, R.A., Pisano, J.M., and Bonney, R.J. (1979). Lysosomotropic agents. 1. Synthesis and cytotoxic action of lysosomotropic detergents. J. Med. Chem. 22, 1130–1133.
Fonseca, B.D., Zakaria, C., Jia, J.-J., Graber, T.E., Svitkin, Y., Tahmasebi, S., Healy, D., Hoang, H.-D., Jensen, J.M., Diao, I.T., et al. (2015). La-related Protein 1 (LARP1) Represses Terminal Oligopyrimidine (TOP) mRNA Translation Downstream of mTOR Complex 1 (mTORC1). J. Biol. Chem. 290, 15996–16020.
Fontan, L., Yang, C., Kabaleeswaran, V., Volpon, L., Osborne, M.J., Beltran, E., Garcia, M., Cerchietti, L., Shaknovich, R., Yang, S.N., et al. (2012). MALT1 small molecule inhibitors specifically suppress ABC-DLBCL in vitro and in vivo. Cancer Cell 22, 812–824.
Forgac, M. (2007). Vacuolar ATPases: rotary proton pumps in physiology and pathophysiology. Nat. Rev. Mol. Cell Biol. 8, 917–929.
Frias, M.A., Thoreen, C.C., Jaffe, J.D., Schroder, W., Sculley, T., Carr, S.A., and Sabatini, D.M. (2006). mSin1 is necessary for Akt/PKB phosphorylation, and its isoforms define three distinct mTORC2s. Curr. Biol. CB 16, 1865–1870.
Fueyo, J., Gomez-Manzano, C., Alemany, R., Lee, P.S., McDonnell, T.J., Mitlianga,

Bibliography
204
P., Shi, Y.-X., Levin, V.A., Yung, W.K.A., and Kyritsis, A.P. (2000). A mutant oncolytic adenovirus targeting the Rb pathway produces anti-glioma effect in vivo. Oncogene 19, 2–12.
Fuh, B., Sobo, M., Cen, L., Josiah, D., Hutzen, B., Cisek, K., Bhasin, D., Regan, N., Lin, L., Chan, C., et al. (2009). LLL-3 inhibits STAT3 activity, suppresses glioblastoma cell growth and prolongs survival in a mouse glioblastoma model. Br. J. Cancer 100, 106–112.
Fujioka, Y., Noda, N.N., Nakatogawa, H., Ohsumi, Y., and Inagaki, F. (2010). Dimeric coiled-coil structure of Saccharomyces cerevisiae Atg16 and its functional significance in autophagy. J. Biol. Chem. 285, 1508–1515.
Gabandé-Rodríguez, E., Boya, P., Labrador, V., Dotti, C.G., and Ledesma, M.D. (2014). High sphingomyelin levels induce lysosomal damage and autophagy dysfunction in Niemann Pick disease type A. Cell Death Differ. 21, 864–875.
Gabrusiewicz, K., Liu, D., Cortes-Santiago, N., Hossain, M.B., Conrad, C.A., Aldape, K.D., Fuller, G.N., Marini, F.C., Alonso, M.M., Idoate, M.A., et al. (2014). Anti-vascular endothelial growth factor therapy-induced glioma invasion is associated with accumulation of Tie2-expressing monocytes. Oncotarget 5, 2208–2220.
Galan-Moya, E.M., Le Guelte, A., Lima Fernandes, E., Thirant, C., Dwyer, J., Bidere, N., Couraud, P.-O., Scott, M.G.H., Junier, M.-P., Chneiweiss, H., et al. (2011). Secreted factors from brain endothelial cells maintain glioblastoma stem-like cell expansion through the mTOR pathway. EMBO Rep. 12, 470–476.
Galan-Moya, E.M., Treps, L., Oliver, L., Chneiweiss, H., Vallette, F.M., Bidère, N., and Gavard, J. (2014). Endothelial Secreted Factors Suppress Mitogen Deprivation-Induced Autophagy and Apoptosis in Glioblastoma Stem-Like Cells. PLOS ONE 9, e93505.
Galli, R., Binda, E., Orfanelli, U., Cipelletti, B., Gritti, A., Vitis, S.D., Fiocco, R., Foroni, C., Dimeco, F., and Vescovi, A. (2004). Isolation and Characterization of Tumorigenic, Stem-like Neural Precursors from Human Glioblastoma. Cancer Res. 64, 7011–7021.
Gamp, A.-C., Tanaka, Y., Lüllmann-Rauch, R., Wittke, D., D’Hooge, R., De Deyn, P.P., Moser, T., Maier, H., Hartmann, D., Reiss, K., et al. (2003). LIMP-2/LGP85 deficiency causes ureteric pelvic junction obstruction, deafness and peripheral neuropathy in mice. Hum. Mol. Genet. 12, 631–646.
Gan, X., Wang, J., Wang, C., Sommer, E., Kozasa, T., Srinivasula, S., Alessi, D., Offermanns, S., Simon, M.I., and Wu, D. (2012). PRR5L degradation promotes mTORC2-mediated PKC-δ phosphorylation and cell migration downstream of Gα12. Nat. Cell Biol. 14, 686–696.
Ganguly, D., Fan, M., Yang, C.H., Zbytek, B., Finkelstein, D., Roussel, M.F., and Pfeffer, L.M. (2018). The critical role that STAT3 plays in glioma-initiating cells: STAT3 addiction in glioma. Oncotarget 9, 22095–22112.
Bibliography
205
Ganley, I.G., Lam, D.H., Wang, J., Ding, X., Chen, S., and Jiang, X. (2009). ULK1·ATG13·FIP200 Complex Mediates mTOR Signaling and Is Essential for Autophagy. J. Biol. Chem. 284, 12297–12305.
Gao, L., Li, F., Dong, B., Zhang, J., Rao, Y., Cong, Y., Mao, B., and Chen, X. (2010). Inhibition of STAT3 and ErbB2 suppresses tumor growth, enhances radiosensitivity, and induces mitochondria-dependent apoptosis in glioma cells. Int. J. Radiat. Oncol. Biol. Phys. 77, 1223–1231.
Garami, A., Zwartkruis, F.J.T., Nobukuni, T., Joaquin, M., Roccio, M., Stocker, H., Kozma, S.C., Hafen, E., Bos, J.L., and Thomas, G. (2003). Insulin Activation of Rheb, a Mediator of mTOR/S6K/4E-BP Signaling, Is Inhibited by TSC1 and 2. Mol. Cell 11, 1457–1466.
García-Martínez, J.M., and Alessi, D.R. (2008). mTOR complex 2 (mTORC2) controls hydrophobic motif phosphorylation and activation of serum- and glucocorticoid-induced protein kinase 1 (SGK1). Biochem. J. 416, 375–385.
Gary-Bobo, M., Nirdé, P., Jeanjean, A., Morère, A., and Garcia, M. (2007). Mannose 6-phosphate receptor targeting and its applications in human diseases. Curr. Med. Chem. 14, 2945–2953.
Gaspar, L.E., Fisher, B.J., Macdonald, D.R., LeBer, D.V., Halperin, E.C., Schold, S.C., and Cairncross, J.G. (1992). Supratentorial malignant glioma: patterns of recurrence and implications for external beam local treatment. Int. J. Radiat. Oncol. Biol. Phys. 24, 55–57.
Gearing, D.P., Thut, C.J., VandeBos, T., Gimpel, S.D., Delaney, P.B., King, J., Price, V., Cosman, D., and Beckmann, M.P. (1991). Leukemia inhibitory factor receptor is structurally related to the IL-6 signal transducer, gp130. EMBO J. 10, 2839–2848.
Gewies, A., Gorka, O., Bergmann, H., Pechloff, K., Petermann, F., Jeltsch, K.M., Rudelius, M., Kriegsmann, M., Weichert, W., Horsch, M., et al. (2014). Uncoupling Malt1 threshold function from paracaspase activity results in destructive autoimmune inflammation. Cell Rep. 9, 1292–1305.
Ghinda, C.D., and Duffau, H. (2017). Network Plasticity and Intraoperative Mapping for Personalized Multimodal Management of Diffuse Low-Grade Gliomas. Front. Surg. 4.
Gilbert, M.R., Wang, M., Aldape, K.D., Stupp, R., Hegi, M.E., Jaeckle, K.A., Armstrong, T.S., Wefel, J.S., Won, M., Blumenthal, D.T., et al. (2013). Dose-dense temozolomide for newly diagnosed glioblastoma: a randomized phase III clinical trial. J. Clin. Oncol. Off. J. Am. Soc. Clin. Oncol. 31, 4085–4091.
Gilbert, M.R., Dignam, J.J., Armstrong, T.S., Wefel, J.S., Blumenthal, D.T., Vogelbaum, M.A., Colman, H., Chakravarti, A., Pugh, S., Won, M., et al. (2014). A randomized trial of bevacizumab for newly diagnosed glioblastoma. N. Engl. J. Med. 370, 699–708.

Bibliography
206
Gilbertson, R.J., and Rich, J.N. (2007). Making a tumour’s bed: glioblastoma stem cells and the vascular niche. Nat. Rev. Cancer 7, 733–736.
Gill, B.J., Pisapia, D.J., Malone, H.R., Goldstein, H., Lei, L., Sonabend, A., Yun, J., Samanamud, J., Sims, J.S., Banu, M., et al. (2014). MRI-localized biopsies reveal subtype-specific differences in molecular and cellular composition at the margins of glioblastoma. Proc. Natl. Acad. Sci. U. S. A. 111, 12550–12555.
Gingras, A.C., Kennedy, S.G., O’Leary, M.A., Sonenberg, N., and Hay, N. (1998). 4E-BP1, a repressor of mRNA translation, is phosphorylated and inactivated by the Akt(PKB) signaling pathway. Genes Dev. 12, 502–513.
Gini, B., Zanca, C., Guo, D., Matsutani, T., Masui, K., Ikegami, S., Yang, H., Nathanson, D., Villa, G.R., Shackelford, D., et al. (2013). The mTOR Kinase Inhibitors, CC214-1 and CC214-2, Preferentially Block the Growth of EGFRvIII-Activated Glioblastomas. Clin. Cancer Res. 19, 5722–5732.
Giusti, I., Delle Monache, S., Di Francesco, M., Sanità, P., D’Ascenzo, S., Gravina, G.L., Festuccia, C., and Dolo, V. (2016). From glioblastoma to endothelial cells through extracellular vesicles: messages for angiogenesis. Tumour Biol. J. Int. Soc. Oncodevelopmental Biol. Med. 37, 12743–12753.
Gómez Ravetti, M., Rosso, O.A., Berretta, R., and Moscato, P. (2010). Uncovering Molecular Biomarkers That Correlate Cognitive Decline with the Changes of Hippocampus’ Gene Expression Profiles in Alzheimer’s Disease. PLoS ONE 5, e10153.
Gonzalez, A., Valeiras, M., Sidransky, E., and Tayebi, N. (2014). Lysosomal integral membrane protein-2: A new player in lysosome-related pathology. Mol. Genet. Metab. 111, 84–91.
Grabiner, B.C., Nardi, V., Birsoy, K., Possemato, R., Shen, K., Sinha, S., Jordan, A., Beck, A.H., and Sabatini, D.M. (2014). A Diverse Array of Cancer-Associated MTOR Mutations Are Hyperactivating and Can Predict Rapamycin Sensitivity. Cancer Discov. 4, 554–563.
Granato, M., Lacconi, V., Peddis, M., Lotti, L.V., Renzo, L.D., Gonnella, R., Santarelli, R., Trivedi, P., Frati, L., D’Orazi, G., et al. (2013). HSP70 inhibition by 2-phenylethynesulfonamide induces lysosomal cathepsin D release and immunogenic cell death in primary effusion lymphoma. Cell Death Dis. 4, e730.
Griveau, A., Seano, G., Shelton, S.J., Kupp, R., Jahangiri, A., Obernier, K., Krishnan, S., Lindberg, O.R., Yuen, T.J., Tien, A.-C., et al. (2018). A Glial Signature and Wnt7 Signaling Regulate Glioma-Vascular Interactions and Tumor Microenvironment. Cancer Cell 33, 874-889.e7.
Groth-Pedersen, L., Ostenfeld, M.S., Høyer-Hansen, M., Nylandsted, J., and Jäättelä, M. (2007). Vincristine Induces Dramatic Lysosomal Changes and Sensitizes Cancer Cells to Lysosome-Destabilizing Siramesine. Cancer Res. 67, 2217–2225.
Bibliography
207
Groth-Pedersen, L., Aits, S., Corcelle-Termeau, E., Petersen, N.H.T., Nylandsted, J., and Jäättelä, M. (2012). Identification of Cytoskeleton-Associated Proteins Essential for Lysosomal Stability and Survival of Human Cancer Cells. PLOS ONE 7, e45381.
Gu, X., Orozco, J.M., Saxton, R.A., Condon, K.J., Liu, G.Y., Krawczyk, P.A., Scaria, S.M., Harper, J.W., Gygi, S.P., and Sabatini, D.M. (2017). SAMTOR is an S-adenosylmethionine sensor for the mTORC1 pathway. Science 358, 813–818.
Guertin, D.A., Stevens, D.M., Thoreen, C.C., Burds, A.A., Kalaany, N.Y., Moffat, J., Brown, M., Fitzgerald, K.J., and Sabatini, D.M. (2006). Ablation in mice of the mTORC components raptor, rictor, or mLST8 reveals that mTORC2 is required for signaling to Akt-FOXO and PKCalpha, but not S6K1. Dev. Cell 11, 859–871.
Guertin, D.A., Stevens, D.M., Saitoh, M., Kinkel, S., Crosby, K., Sheen, J.-H., Mullholland, D.J., Magnuson, M.A., Wu, H., and Sabatini, D.M. (2009). mTOR complex 2 is required for the development of prostate cancer induced by Pten loss in mice. Cancer Cell 15, 148–159.
Gulbins, E., and Kolesnick, R.N. (2013). It takes a CAD to kill a tumor cell with a LMP. Cancer Cell 24, 279–281.
Gwinn, D.M., Shackelford, D.B., Egan, D.F., Mihaylova, M.M., Mery, A., Vasquez, D.S., Turk, B.E., and Shaw, R.J. (2008). AMPK Phosphorylation of Raptor Mediates a Metabolic Checkpoint. Mol. Cell 30, 214–226.
Gyrd-Hansen, M., Nylandsted, J., and Jäättelä, M. (2004). Heat shock protein 70 promotes cancer cell viability by safeguarding lysosomal integrity. Cell Cycle Georget. Tex 3, 1484–1485.
Hailfinger, S., Lenz, G., Ngo, V., Posvitz-Fejfar, A., Rebeaud, F., Guzzardi, M., Penas, E.-M.M., Dierlamm, J., Chan, W.C., Staudt, L.M., et al. (2009). Essential role of MALT1 protease activity in activated B cell-like diffuse large B-cell lymphoma. Proc. Natl. Acad. Sci. U. S. A. 106, 19946–19951.
Hailfinger, S., Nogai, H., Pelzer, C., Jaworski, M., Cabalzar, K., Charton, J.-E., Guzzardi, M., Décaillet, C., Grau, M., Dörken, B., et al. (2011). Malt1-dependent RelB cleavage promotes canonical NF-kappaB activation in lymphocytes and lymphoma cell lines. Proc. Natl. Acad. Sci. U. S. A. 108, 14596–14601.
Hait, W.N., Gesmonde, J.F., Murren, J.R., Jin-Ming, Y., Hong-Xing, C., and Reiss, M. (1993). Terfenadine (seldane®): A new drug for restoring sensitivity to multidrug resistant cancer cells. Biochem. Pharmacol. 45, 401–406.
Halliday, J., Helmy, K., Pattwell, S.S., Pitter, K.L., LaPlant, Q., Ozawa, T., and Holland, E.C. (2014). In vivo radiation response of proneural glioma characterized by protective p53 transcriptional program and proneural-mesenchymal shift. Proc. Natl. Acad. Sci. U. S. A. 111, 5248–5253.
Hamanaka, R.B., and Chandel, N.S. (2009). Mitochondrial reactive oxygen species regulate hypoxic signaling. Curr. Opin. Cell Biol. 21, 894–899.

Bibliography
208
Hamasaki, M., Furuta, N., Matsuda, A., Nezu, A., Yamamoto, A., Fujita, N., Oomori, H., Noda, T., Haraguchi, T., Hiraoka, Y., et al. (2013). Autophagosomes form at ER-mitochondria contact sites. Nature 495, 389–393.
Hamilton, K.S., Phong, B., Corey, C., Cheng, J., Gorentla, B., Zhong, X., Shiva, S., and Kane, L.P. (2014). T cell receptor-dependent activation of mTOR signaling in T cells is mediated by Carma1 and MALT1, but not Bcl10. Sci. Signal. 7, ra55.
Han, S.J., Englot, D.J., Birk, H., Molinaro, A.M., Chang, S.M., Clarke, J.L., Prados, M.D., Taylor, J.W., Berger, M.S., and Butowski, N.A. (2015a). Impact of Timing of Concurrent Chemoradiation for Newly Diagnosed Glioblastoma: A Critical Review of Current Evidence. Neurosurgery 62 Suppl 1, 160–165.
Han, S.J., Rutledge, W.C., Molinaro, A.M., Chang, S.M., Clarke, J.L., Prados, M.D., Taylor, J.W., Berger, M.S., and Butowski, N.A. (2015b). The Effect of Timing of Concurrent Chemoradiation in Patients With Newly Diagnosed Glioblastoma. Neurosurgery 77, 248–253; discussion 253.
Hanif, F., Muzaffar, K., Perveen, K., Malhi, S.M., and Simjee, S.U. (2017). Glioblastoma Multiforme: A Review of its Epidemiology and Pathogenesis through Clinical Presentation and Treatment. Asian Pac. J. Cancer Prev. APJCP 18, 3–9.
Hara, K., Maruki, Y., Long, X., Yoshino, K., Oshiro, N., Hidayat, S., Tokunaga, C., Avruch, J., and Yonezawa, K. (2002). Raptor, a binding partner of target of rapamycin (TOR), mediates TOR action. Cell 110, 177–189.
Harford-Wright, E., Andre-Gregoire, G., Jacobs, K.A., Treps, L., Le Gonidec, S., Leclair, H.M., Gonzalez-Diest, S., Roux, Q., Guillonneau, F., Loussouarn, D., et al. (2017). Pharmacological targeting of apelin impairs glioblastoma growth. Brain J. Neurol. 140, 2939–2954.
Harrabi, S.B., Bougatf, N., Mohr, A., Haberer, T., Herfarth, K., Combs, S.E., Debus, J., and Adeberg, S. (2016). Dosimetric advantages of proton therapy over conventional radiotherapy with photons in young patients and adults with low-grade glioma. Strahlenther. Onkol. 192, 759–769.
Harrington, L.S., Findlay, G.M., Gray, A., Tolkacheva, T., Wigfield, S., Rebholz, H., Barnett, J., Leslie, N.R., Cheng, S., Shepherd, P.R., et al. (2004). The TSC1-2 tumor suppressor controls insulin-PI3K signaling via regulation of IRS proteins. J. Cell Biol. 166, 213–223.
Harter, C., and Mellman, I. (1992). Transport of the lysosomal membrane glycoprotein lgp120 (lgp-A) to lysosomes does not require appearance on the plasma membrane. J. Cell Biol. 117, 311–325.
Hay, N., and Sonenberg, N. (2004). Upstream and downstream of mTOR. Genes Dev. 18, 1926–1945.
Heitman, J., Movva, N.R., and Hall, M.N. (1991). Targets for cell cycle arrest by the immunosuppressant rapamycin in yeast. Science 253, 905–909.

Bibliography
209
Hemmati, H.D., Nakano, I., Lazareff, J.A., Masterman-Smith, M., Geschwind, D.H., Bronner-Fraser, M., and Kornblum, H.I. (2003). Cancerous stem cells can arise from pediatric brain tumors. Proc. Natl. Acad. Sci. U. S. A. 100, 15178–15183.
Hentges, K.E., Sirry, B., Gingeras, A.-C., Sarbassov, D., Sonenberg, N., Sabatini, D., and Peterson, A.S. (2001). FRAP/mTOR is required for proliferation and patterning during embryonic development in the mouse. Proc. Natl. Acad. Sci. 98, 13796–13801.
Heuser, J. (1989). Changes in lysosome shape and distribution correlated with changes in cytoplasmic pH. J. Cell Biol. 108, 855–864.
Hirrlinger, J., and Dringen, R. (2010). The cytosolic redox state of astrocytes: Maintenance, regulation and functional implications for metabolite trafficking. Brain Res. Rev. 63, 177–188.
Höglinger, D., Burgoyne, T., Sanchez-Heras, E., Hartwig, P., Colaco, A., Newton, J., Futter, C.E., Spiegel, S., Platt, F.M., and Eden, E.R. (2019). NPC1 regulates ER contacts with endocytic organelles to mediate cholesterol egress. Nat. Commun. 10, 1–14.
Holland, E.C., Celestino, J., Dai, C., Schaefer, L., Sawaya, R.E., and Fuller, G.N. (2000). Combined activation of Ras and Akt in neural progenitors induces glioblastoma formation in mice. Nat. Genet. 25, 55–57.
Holz, M.K., Ballif, B.A., Gygi, S.P., and Blenis, J. (2005). mTOR and S6K1 mediate assembly of the translation preinitiation complex through dynamic protein interchange and ordered phosphorylation events. Cell 123, 569–580.
Hosokawa, N., Hara, T., Kaizuka, T., Kishi, C., Takamura, A., Miura, Y., Iemura, S., Natsume, T., Takehana, K., Yamada, N., et al. (2009). Nutrient-dependent mTORC1 Association with the ULK1–Atg13–FIP200 Complex Required for Autophagy. Mol. Biol. Cell 20, 1981–1991.
Hossain, A., Gumin, J., Gao, F., Figueroa, J., Shinojima, N., Takezaki, T., Priebe, W., Villarreal, D., Kang, S.-G., Joyce, C., et al. (2015). Mesenchymal Stem Cells Isolated from Human Gliomas Increase Proliferation and Maintain Stemness of Glioma Stem Cells Through the IL-6/gp130/STAT3 pathway. Stem Cells Dayt. Ohio 33, 2400–2415.
Hsu, P.P., Kang, S.A., Rameseder, J., Zhang, Y., Ottina, K.A., Lim, D., Peterson, T.R., Choi, Y., Gray, N.S., Yaffe, M.B., et al. (2011). The mTOR-Regulated Phosphoproteome Reveals a Mechanism of mTORC1-Mediated Inhibition of Growth Factor Signaling. Science 332, 1317–1322.
Hubert, C.G., Rivera, M., Spangler, L.C., Wu, Q., Mack, S.C., Prager, B.C., Couce, M., McLendon, R.E., Sloan, A.E., and Rich, J.N. (2016). A Three-Dimensional Organoid Culture System Derived from Human Glioblastomas Recapitulates the Hypoxic Gradients and Cancer Stem Cell Heterogeneity of Tumors Found In Vivo. Cancer Res. 76, 2465–2477.

Bibliography
210
Hung, Y.-H., Chen, L.M.-W., Yang, J.-Y., and Yang, W.Y. (2013). Spatiotemporally controlled induction of autophagy-mediated lysosome turnover. Nat. Commun. 4, 2111.
Huynh, C., Roth, D., Ward, D.M., Kaplan, J., and Andrews, N.W. (2004). Defective lysosomal exocytosis and plasma membrane repair in Chediak-Higashi/beige cells. Proc. Natl. Acad. Sci. U. S. A. 101, 16795–16800.
Idbaih, A., Canney, M., Belin, L., Desseaux, C., Vignot, A., Bouchoux, G., Asquier, N., Law-Ye, B., Leclercq, D., Bissery, A., et al. (2019). Safety and Feasibility of Repeated and Transient Blood-Brain Barrier Disruption by Pulsed Ultrasound in Patients with Recurrent Glioblastoma. Clin. Cancer Res. Off. J. Am. Assoc. Cancer Res. 25, 3793–3801.
Ikeda, Y., Imai, Y., Kumagai, H., Nosaka, T., Morikawa, Y., Hisaoka, T., Manabe, I., Maemura, K., Nakaoka, T., Imamura, T., et al. (2004). Vasorin, a transforming growth factor beta-binding protein expressed in vascular smooth muscle cells, modulates the arterial response to injury in vivo. Proc. Natl. Acad. Sci. U. S. A. 101, 10732–10737.
Inoki, K., Li, Y., Zhu, T., Wu, J., and Guan, K.-L. (2002). TSC2 is phosphorylated and inhibited by Akt and suppresses mTOR signalling. Nat. Cell Biol. 4, 648–657.
Inoki, K., Li, Y., Xu, T., and Guan, K.-L. (2003a). Rheb GTPase is a direct target of TSC2 GAP activity and regulates mTOR signaling. Genes Dev. 17, 1829–1834.
Inoki, K., Zhu, T., and Guan, K.-L. (2003b). TSC2 Mediates Cellular Energy Response to Control Cell Growth and Survival. Cell 115, 577–590.
Inoki, K., Ouyang, H., Zhu, T., Lindvall, C., Wang, Y., Zhang, X., Yang, Q., Bennett, C., Harada, Y., Stankunas, K., et al. (2006). TSC2 Integrates Wnt and Energy Signals via a Coordinated Phosphorylation by AMPK and GSK3 to Regulate Cell Growth. Cell 126, 955–968.
Inpanathan, S., and Botelho, R.J. (2019). The Lysosome Signaling Platform: Adapting With the Times. Front. Cell Dev. Biol. 7.
Itakura, E., Kishi-Itakura, C., and Mizushima, N. (2012). The hairpin-type tail-anchored SNARE syntaxin 17 targets to autophagosomes for fusion with endosomes/lysosomes. Cell 151, 1256–1269.
Ito, H., Aoki, H., Kühnel, F., Kondo, Y., Kubicka, S., Wirth, T., Iwado, E., Iwamaru, A., Fujiwara, K., Hess, K.R., et al. (2006). Autophagic Cell Death of Malignant Glioma Cells Induced by a Conditionally Replicating Adenovirus. JNCI J. Natl. Cancer Inst. 98, 625–636.
Iwasaki, H., Takeuchi, O., Teraguchi, S., Matsushita, K., Uehata, T., Kuniyoshi, K., Satoh, T., Saitoh, T., Matsushita, M., Standley, D.M., et al. (2011). The IκB kinase complex regulates the stability of cytokine-encoding mRNA induced by TLR-IL-1R by controlling degradation of regnase-1. Nat. Immunol. 12, 1167–1175.

Bibliography
211
Jacinto, E., Loewith, R., Schmidt, A., Lin, S., Rüegg, M.A., Hall, A., and Hall, M.N. (2004). Mammalian TOR complex 2 controls the actin cytoskeleton and is rapamycin insensitive. Nat. Cell Biol. 6, 1122–1128.
Jacinto, E., Facchinetti, V., Liu, D., Soto, N., Wei, S., Jung, S.Y., Huang, Q., Qin, J., and Su, B. (2006). SIN1/MIP1 maintains rictor-mTOR complex integrity and regulates Akt phosphorylation and substrate specificity. Cell 127, 125–137.
Jaffrézou, J.-P., Chen, G., Durán, G.E., Muller, C., Bordier, C., Laurent, G., Sikic, B.I., and Levade, T. (1995). Inhibition of lysosomal acid sphingomyelinase by agents which reverse multidrug resistance. Biochim. Biophys. Acta BBA - Mol. Cell Res. 1266, 1–8.
Jaiswal, J.K., Andrews, N.W., and Simon, S.M. (2002). Membrane proximal lysosomes are the major vesicles responsible for calcium-dependent exocytosis in nonsecretory cells. J. Cell Biol. 159, 625–635.
Janvier, K., and Bonifacino, J.S. (2005). Role of the Endocytic Machinery in the Sorting of Lysosome-associated Membrane Proteins. Mol. Biol. Cell 16, 4231–4242.
Jaworski, M., Marsland, B.J., Gehrig, J., Held, W., Favre, S., Luther, S.A., Perroud, M., Golshayan, D., Gaide, O., and Thome, M. (2014). Malt1 protease inactivation efficiently dampens immune responses but causes spontaneous autoimmunity. EMBO J. 33, 2765–2781.
Jeltsch, K.M., Hu, D., Brenner, S., Zöller, J., Heinz, G.A., Nagel, D., Vogel, K.U., Rehage, N., Warth, S.C., Edelmann, S.L., et al. (2014). Cleavage of roquin and regnase-1 by the paracaspase MALT1 releases their cooperatively repressed targets to promote T(H)17 differentiation. Nat. Immunol. 15, 1079–1089.
Jespersen, S.N., and Østergaard, L. (2012). The roles of cerebral blood flow, capillary transit time heterogeneity, and oxygen tension in brain oxygenation and metabolism. J. Cereb. Blood Flow Metab. Off. J. Int. Soc. Cereb. Blood Flow Metab. 32, 264–277.
Jewell, J.L., Kim, Y.C., Russell, R.C., Yu, F.-X., Park, H.W., Plouffe, S.W., Tagliabracci, V.S., and Guan, K.-L. (2015). Differential regulation of mTORC1 by leucine and glutamine. Science 347, 194–198.
Jhaveri, J., Cheng, E., Tian, S., Buchwald, Z., Chowdhary, M., Liu, Y., Gillespie, T.W., Olson, J.J., Diaz, A.Z., Voloschin, A., et al. (2018). Proton vs. Photon Radiation Therapy for Primary Gliomas: An Analysis of the National Cancer Data Base. Front. Oncol. 8.
Jin, X., Kim, L.J.Y., Wu, Q., Wallace, L.C., Prager, B.C., Sanvoranart, T., Gimple, R.C., Wang, X., Mack, S.C., Miller, T.E., et al. (2017). Targeting glioma stem cells through combined BMI1 and EZH2 inhibition. Nat. Med. 23, 1352–1361.
Joachim, J., Jefferies, H.B.J., Razi, M., Frith, D., Snijders, A.P., Chakravarty, P., Judith, D., and Tooze, S.A. (2015). Activation of ULK Kinase and Autophagy by

Bibliography
212
GABARAP Trafficking from the Centrosome Is Regulated by WAC and GM130. Mol. Cell 60, 899–913.
Joyce, J.A., and Hanahan, D. (2004). Multiple Roles for Cysteine Cathepsins in Cancer. Cell Cycle 3, 1516–1519.
Jung, C.H., Jun, C.B., Ro, S.-H., Kim, Y.-M., Otto, N.M., Cao, J., Kundu, M., and Kim, D.-H. (2009). ULK-Atg13-FIP200 Complexes Mediate mTOR Signaling to the Autophagy Machinery. Mol. Biol. Cell 20, 1992–2003.
Jung, J., Genau, H.M., and Behrends, C. (2015). Amino Acid-Dependent mTORC1 Regulation by the Lysosomal Membrane Protein SLC38A9. Mol. Cell. Biol. 35, 2479–2494.
Kågedal, K., Zhao, M., Svensson, I., and Brunk, U.T. (2001). Sphingosine-induced apoptosis is dependent on lysosomal proteases. Biochem. J. 359, 335–343.
Kakee, A., Terasaki, T., and Sugiyama, Y. (1996). Brain efflux index as a novel method of analyzing efflux transport at the blood-brain barrier. J. Pharmacol. Exp. Ther. 277, 1550–1559.
Kalender, A., Selvaraj, A., Kim, S.Y., Gulati, P., Brûlé, S., Viollet, B., Kemp, B.E., Bardeesy, N., Dennis, P., Schlager, J.J., et al. (2010). Metformin, Independent of AMPK, Inhibits mTORC1 in a Rag GTPase-Dependent Manner. Cell Metab. 11, 390–401.
Karanasios, E., Stapleton, E., Manifava, M., Kaizuka, T., Mizushima, N., Walker, S.A., and Ktistakis, N.T. (2013). Dynamic association of the ULK1 complex with omegasomes during autophagy induction. J. Cell Sci. 126, 5224–5238.
Karanasios, E., Walker, S.A., Okkenhaug, H., Manifava, M., Hummel, E., Zimmermann, H., Ahmed, Q., Domart, M.-C., Collinson, L., and Ktistakis, N.T. (2016). Autophagy initiation by ULK complex assembly on ER tubulovesicular regions marked by ATG9 vesicles. Nat. Commun. 7, 1–17.
Karlsson, K., and Carlsson, S.R. (1998). Sorting of lysosomal membrane glycoproteins lamp-1 and lamp-2 into vesicles distinct from mannose 6-phosphate receptor/gamma-adaptin vesicles at the trans-Golgi network. J. Biol. Chem. 273, 18966–18973.
Kassai, H., Sugaya, Y., Noda, S., Nakao, K., Maeda, T., Kano, M., and Aiba, A. (2014). Selective Activation of mTORC1 Signaling Recapitulates Microcephaly, Tuberous Sclerosis, and Neurodegenerative Diseases. Cell Rep. 7, 1626–1639.
Kidoya, H., Ueno, M., Yamada, Y., Mochizuki, N., Nakata, M., Yano, T., Fujii, R., and Takakura, N. (2008). Spatial and temporal role of the apelin/APJ system in the caliber size regulation of blood vessels during angiogenesis. EMBO J. 27, 522–534.
Kim, D.-H., Sarbassov, D.D., Ali, S.M., King, J.E., Latek, R.R., Erdjument-Bromage, H., Tempst, P., and Sabatini, D.M. (2002). mTOR interacts with raptor to form a

Bibliography
213
nutrient-sensitive complex that signals to the cell growth machinery. Cell 110, 163–175.
Kim, D.-H., Sarbassov, D.D., Ali, S.M., Latek, R.R., Guntur, K.V.P., Erdjument-Bromage, H., Tempst, P., and Sabatini, D.M. (2003). GbetaL, a positive regulator of the rapamycin-sensitive pathway required for the nutrient-sensitive interaction between raptor and mTOR. Mol. Cell 11, 895–904.
Kim, E., Goraksha-Hicks, P., Li, L., Neufeld, T.P., and Guan, K.-L. (2008). Regulation of TORC1 by Rag GTPases in nutrient response. Nat. Cell Biol. 10, 935–945.
Kim, J., Kundu, M., Viollet, B., and Guan, K.-L. (2011). AMPK and mTOR regulate autophagy through direct phosphorylation of Ulk1. Nat. Cell Biol. 13, 132–141.
Kim, J.E., Patel, M., Ruzevick, J., Jackson, C.M., and Lim, M. (2014). STAT3 Activation in Glioblastoma: Biochemical and Therapeutic Implications. Cancers 6, 376–395.
Kim, Y.-M., Jung, C.H., Seo, M., Kim, E.K., Park, J.-M., Bae, S.S., and Kim, D.-H. (2015). mTORC1 Phosphorylates UVRAG to Negatively Regulate Autophagosome and Endosome Maturation. Mol. Cell 57, 207–218.
Kirchhausen, T., Owen, D., and Harrison, S.C. (2014). Molecular structure, function, and dynamics of clathrin-mediated membrane traffic. Cold Spring Harb. Perspect. Biol. 6, a016725.
Kirkegaard, T., Roth, A.G., Petersen, N.H.T., Mahalka, A.K., Olsen, O.D., Moilanen, I., Zylicz, A., Knudsen, J., Sandhoff, K., Arenz, C., et al. (2010). Hsp70 stabilizes lysosomes and reverts Niemann-Pick disease-associated lysosomal pathology. Nature 463, 549–553.
Kirkpatrick, J.P., Laack, N.N., Shih, H.A., and Gondi, V. (2017). Management of GBM: a problem of local recurrence. J. Neurooncol. 134, 487–493.
Kirson, E.D., Gurvich, Z., Schneiderman, R., Dekel, E., Itzhaki, A., Wasserman, Y., Schatzberger, R., and Palti, Y. (2004). Disruption of Cancer Cell Replication by Alternating Electric Fields. Cancer Res. 64, 3288–3295.
Klein, T., Fung, S.-Y., Renner, F., Blank, M.A., Dufour, A., Kang, S., Bolger-Munro, M., Scurll, J.M., Priatel, J.J., Schweigler, P., et al. (2015). The paracaspase MALT1 cleaves HOIL1 reducing linear ubiquitination by LUBAC to dampen lymphocyte NF-κB signalling. Nat. Commun. 6, 8777.
Koehler, J.W., Miller, A.D., Miller, C.R., Porter, B., Aldape, K., Beck, J., Brat, D., Cornax, I., Corps, K., Frank, C., et al. (2018). A Revised Diagnostic Classification of Canine Glioma: Towards Validation of the Canine Glioma Patient as a Naturally Occurring Preclinical Model for Human Glioma. J. Neuropathol. Exp. Neurol. 77, 1039–1054.

Bibliography
214
Kohsaka, S., Wang, L., Yachi, K., Mahabir, R., Narita, T., Itoh, T., Tanino, M., Kimura, T., Nishihara, H., and Tanaka, S. (2012). STAT3 inhibition overcomes temozolomide resistance in glioblastoma by downregulating MGMT expression. Mol. Cancer Ther. 11, 1289–1299.
Konczalla, L., Perez, D.R., Wenzel, N., Wolters‐Eisfeld, G., Klemp, C., Lüddeke, J., Wolski, A., Landschulze, D., Meier, C., Buchholz, A., et al. Biperiden and mepazine effectively inhibit MALT1 activity and tumor growth in pancreatic cancer. Int. J. Cancer 0.
Kornfeld, S. (1992). Structure and function of the mannose 6-phosphate/insulinlike growth factor II receptors. Annu. Rev. Biochem. 61, 307–330.
Kornfeld, S., and Mellman, I. (1989). The biogenesis of lysosomes. Annu. Rev. Cell Biol. 5, 483–525.
Korolchuk, V.I., Saiki, S., Lichtenberg, M., Siddiqi, F.H., Roberts, E.A., Imarisio, S., Jahreiss, L., Sarkar, S., Futter, M., Menzies, F.M., et al. (2011). Lysosomal positioning coordinates cellular nutrient responses. Nat. Cell Biol. 13, 453–460.
Korth, C., May, B.C., Cohen, F.E., and Prusiner, S.B. (2001). Acridine and phenothiazine derivatives as pharmacotherapeutics for prion disease. Proc. Natl. Acad. Sci. U. S. A. 98, 9836–9841.
Kreuzaler, P.A., Staniszewska, A.D., Li, W., Omidvar, N., Kedjouar, B., Turkson, J., Poli, V., Flavell, R.A., Clarkson, R.W.E., and Watson, C.J. (2011). Stat3 controls lysosomal-mediated cell death in vivo. Nat. Cell Biol. 13, 303–309.
Krusche, B., Ottone, C., Clements, M.P., Johnstone, E.R., Goetsch, K., Lieven, H., Mota, S.G., Singh, P., Khadayate, S., Ashraf, A., et al. (2016). EphrinB2 drives perivascular invasion and proliferation of glioblastoma stem-like cells. ELife 5, e14845.
Kuma, A., Mizushima, N., Ishihara, N., and Ohsumi, Y. (2002). Formation of the approximately 350-kDa Apg12-Apg5.Apg16 multimeric complex, mediated by Apg16 oligomerization, is essential for autophagy in yeast. J. Biol. Chem. 277, 18619–18625.
Kunz, J., Henriquez, R., Schneider, U., Deuter-Reinhard, M., Movva, N.R., and Hall, M.N. (1993). Target of rapamycin in yeast, TOR2, is an essential phosphatidylinositol kinase homolog required for G1 progression. Cell 73, 585–596.
Kuronita, T., Hatano, T., Furuyama, A., Hirota, Y., Masuyama, N., Saftig, P., Himeno, M., Fujita, H., and Tanaka, Y. (2005). The NH2-Terminal Transmembrane and Lumenal Domains of LGP85 are Needed for the Formation of Enlarged Endosomes/Lysosomes. Traffic 6, 895–906.
Kurz, T., Terman, A., Gustafsson, B., and Brunk, U.T. (2008a). Lysosomes and oxidative stress in aging and apoptosis. Biochim. Biophys. Acta 1780, 1291–1303.

Bibliography
215
Kurz, T., Terman, A., Gustafsson, B., and Brunk, U.T. (2008b). Lysosomes in iron metabolism, ageing and apoptosis. Histochem. Cell Biol. 129, 389–406.
Kwon, C.-H., Zhao, D., Chen, J., Alcantara, S., Li, Y., Burns, D.K., Mason, R.P., Lee, E.Y.-H.P., Wu, H., and Parada, L.F. (2008). Pten haploinsufficiency accelerates formation of high-grade astrocytomas. Cancer Res. 68, 3286–3294.
Lahr, R.M., Fonseca, B.D., Ciotti, G.E., Al-Ashtal, H.A., Jia, J.-J., Niklaus, M.R., Blagden, S.P., Alain, T., and Berman, A.J. (2017). La-related protein 1 (LARP1) binds the mRNA cap, blocking eIF4F assembly on TOP mRNAs. ELife 6.
Lal, S., La Du, J., Tanguay, R.L., and Greenwood, J.A. (2012). Calpain 2 is required for the invasion of glioblastoma cells in the zebrafish brain microenvironment. J. Neurosci. Res. 90, 769–781.
Lancaster, M.A., Renner, M., Martin, C.-A., Wenzel, D., Bicknell, L.S., Hurles, M.E., Homfray, T., Penninger, J.M., Jackson, A.P., and Knoblich, J.A. (2013). Cerebral organoids model human brain development and microcephaly. Nature 501, 373–379.
Lapidot, T., Sirard, C., Vormoor, J., Murdoch, B., Hoang, T., Caceres-Cortes, J., Minden, M., Paterson, B., Caligiuri, M.A., and Dick, J.E. (1994). A cell initiating human acute myeloid leukaemia after transplantation into SCID mice. Nature 367, 645–648.
Lathia, J.D., Mack, S.C., Mulkearns-Hubert, E.E., Valentim, C.L.L., and Rich, J.N. (2015). Cancer stem cells in glioblastoma. Genes Dev. 29, 1203–1217.
Lawrence, R.E., and Zoncu, R. (2019). The lysosome as a cellular centre for signalling, metabolism and quality control. Nat. Cell Biol. 21, 133–142.
Lawrence, M.S., Stojanov, P., Mermel, C.H., Robinson, J.T., Garraway, L.A., Golub, T.R., Meyerson, M., Gabriel, S.B., Lander, E.S., and Getz, G. (2014). Discovery and saturation analysis of cancer genes across 21 tumour types. Nature 505, 495–501.
Lazarus, M.B., Novotny, C.J., and Shokat, K.M. (2015). Structure of the human autophagy initiating kinase ULK1 in complex with potent inhibitors. ACS Chem. Biol. 10, 257–261.
Le Joncour, V., Filppu, P., Hyvönen, M., Holopainen, M., Turunen, S.P., Sihto, H., Burghardt, I., Joensuu, H., Tynninen, O., Jääskeläinen, J., et al. (2019). Vulnerability of invasive glioblastoma cells to lysosomal membrane destabilization. EMBO Mol. Med. 11.
Lee, D.-F., Kuo, H.-P., Chen, C.-T., Hsu, J.-M., Chou, C.-K., Wei, Y., Sun, H.-L., Li, L.-Y., Ping, B., Huang, W.-C., et al. (2007). IKKβ Suppression of TSC1 Links Inflammation and Tumor Angiogenesis via the mTOR Pathway. Cell 130, 440–455.
Lee, J., Kotliarova, S., Kotliarov, Y., Li, A., Su, Q., Donin, N.M., Pastorino, S., Purow, B.W., Christopher, N., Zhang, W., et al. (2006). Tumor stem cells derived from glioblastomas cultured in bFGF and EGF more closely mirror the phenotype and

Bibliography
216
genotype of primary tumors than do serum-cultured cell lines. Cancer Cell 9, 391–403.
Lee, J.H., Lee, J.E., Kahng, J.Y., Kim, S.H., Park, J.S., Yoon, S.J., Um, J.-Y., Kim, W.K., Lee, J.-K., Park, J., et al. (2018). Human glioblastoma arises from subventricular zone cells with low-level driver mutations. Nature 560, 243–247.
Leeman, D.S., Hebestreit, K., Ruetz, T., Webb, A.E., McKay, A., Pollina, E.A., Dulken, B.W., Zhao, X., Yeo, R.W., Ho, T.T., et al. (2018). Lysosome activation clears aggregates and enhances quiescent neural stem cell activation during aging. Science 359, 1277–1283.
Leto, G., Tumminello, F.M., Crescimanno, M., Flandina, C., and Gebbia, N. (2004). Cathepsin D expression levels in nongynecological solid tumors: clinical and therapeutic implications. Clin. Exp. Metastasis 21, 91–106.
Lewis, C.S., Voelkel-Johnson, C., and Smith, C.D. (2016). Suppression of c-Myc and RRM2 expression in pancreatic cancer cells by the sphingosine kinase-2 inhibitor ABC294640. Oncotarget 7, 60181–60192.
Li, X., and Gao, T. (2014). mTORC2 phosphorylates protein kinase Cζ to regulate its stability and activity. EMBO Rep. 15, 191–198.
Li, G.-H., Wei, H., Lv, S.-Q., Ji, H., and Wang, D.-L. (2010). Knockdown of STAT3 expression by RNAi suppresses growth and induces apoptosis and differentiation in glioblastoma stem cells. Int. J. Oncol. 37, 103–110.
Li, X., Alafuzoff, I., Soininen, H., Winblad, B., and Pei, J.-J. (2005). Levels of mTOR and its downstream targets 4E-BP1, eEF2, and eEF2 kinase in relationships with tau in Alzheimer’s disease brain. FEBS J. 272, 4211–4220.
Li, X., Rydzewski, N., Hider, A., Zhang, X., Yang, J., Wang, W., Gao, Q., Cheng, X., and Xu, H. (2016). A Molecular Mechanism to Regulate Lysosome Motility for Lysosome Positioning and Tubulation. Nat. Cell Biol. 18, 404–417.
Li, Z., Bao, S., Wu, Q., Wang, H., Eyler, C., Sathornsumetee, S., Shi, Q., Cao, Y., Lathia, J., McLendon, R.E., et al. (2009). Hypoxia-inducible factors regulate tumorigenic capacity of glioma stem cells. Cancer Cell 15, 501–513.
Liang, W., Guo, B., Ye, J., Liu, H., Deng, W., Lin, C., Zhong, X., and Wang, L. (2019). Vasorin stimulates malignant progression and angiogenesis in glioma. Cancer Sci. 110, 2558–2572.
Ligon, K.L., Huillard, E., Mehta, S., Kesari, S., Liu, H., Alberta, J.A., Bachoo, R.M., Kane, M., Louis, D.N., DePinho, R.A., et al. (2007). Olig2-Regulated Lineage-Restricted Pathway Controls Replication Competence in Neural Stem Cells and Malignant Glioma. Neuron 53, 503–517.
Lim, C.-Y., Davis, O.B., Shin, H.R., Zhang, J., Berdan, C.A., Jiang, X., Counihan, J.L., Ory, D.S., Nomura, D.K., and Zoncu, R. (2019). ER–lysosome contacts enable

Bibliography
217
cholesterol sensing by mTORC1 and drive aberrant growth signalling in Niemann–Pick type C. Nat. Cell Biol. 21, 1206–1218.
Lin, F., Gooijer, M.C. de, Hanekamp, D., Chandrasekaran, G., Buil, L.C.M., Thota, N., Sparidans, R.W., Beijnen, J.H., Würdinger, T., and Tellingen, O. van (2017). PI3K–mTOR Pathway Inhibition Exhibits Efficacy Against High-grade Glioma in Clinically Relevant Mouse Models. Clin. Cancer Res. 23, 1286–1298.
Linkous, A., Balamatsias, D., Snuderl, M., Edwards, L., Miyaguchi, K., Milner, T., Reich, B., Cohen-Gould, L., Storaska, A., Nakayama, Y., et al. (2019). Modeling Patient-Derived Glioblastoma with Cerebral Organoids. Cell Rep. 26, 3203-3211.e5.
Lipton, J.O., and Sahin, M. (2014). The neurology of mTOR. Neuron 84, 275–291.
Liu, D., Martin, V., Fueyo, J., Lee, O.-H., Xu, J., Cortes-Santiago, N., Alonso, M.M., Aldape, K., Colman, H., and Gomez-Manzano, C. (2010). Tie2/TEK modulates the interaction of glioma and brain tumor stem cells with endothelial cells and promotes an invasive phenotype. Oncotarget 1, 700–709.
Liu, F., Hon, G.C., Villa, G.R., Turner, K.M., Ikegami, S., Yang, H., Ye, Z., Li, B., Kuan, S., Lee, A.Y., et al. (2015a). EGFR Mutation Promotes Glioblastoma through Epigenome and Transcription Factor Network Remodeling. Mol. Cell 60, 307–318.
Liu, G., Yuan, X., Zeng, Z., Tunici, P., Ng, H., Abdulkadir, I.R., Lu, L., Irvin, D., Black, K.L., and Yu, J.S. (2006). Analysis of gene expression and chemoresistance of CD133+ cancer stem cells in glioblastoma. Mol. Cancer 5, 67.
Liu, P., Gan, W., Chin, Y.R., Ogura, K., Guo, J., Zhang, J., Wang, B., Blenis, J., Cantley, L.C., Toker, A., et al. (2015b). PtdIns(3,4,5)P3-Dependent Activation of the mTORC2 Kinase Complex. Cancer Discov. 5, 1194–1209.
Llaguno, S.A., Sun, D., Pedraza, A., Vera, E., Wang, Z., Burns, D.K., and Parada, L.F. (2019). Cell of Origin Susceptibility to Glioblastoma Formation Declines with Neural Lineage Restriction. Nat. Neurosci. 22, 545–555.
Loewith, R., Jacinto, E., Wullschleger, S., Lorberg, A., Crespo, J.L., Bonenfant, D., Oppliger, W., Jenoe, P., and Hall, M.N. (2002). Two TOR complexes, only one of which is rapamycin sensitive, have distinct roles in cell growth control. Mol. Cell 10, 457–468.
Lois, C., and Alvarez-Buylla, A. (1993). Proliferating subventricular zone cells in the adult mammalian forebrain can differentiate into neurons and glia. Proc. Natl. Acad. Sci. U. S. A. 90, 2074–2077.
Loison, F., Zhu, H., Karatepe, K., Kasorn, A., Liu, P., Ye, K., Zhou, J., Cao, S., Gong, H., Jenne, D.E., et al. (2014). Proteinase 3–dependent caspase-3 cleavage modulates neutrophil death and inflammation. J. Clin. Invest. 124, 4445–4458.
Long, X., Lin, Y., Ortiz-Vega, S., Yonezawa, K., and Avruch, J. (2005). Rheb binds and regulates the mTOR kinase. Curr. Biol. CB 15, 702–713.

Bibliography
218
Loor, G., and Schumacker, P.T. (2008). Role of hypoxia-inducible factor in cell survival during myocardial ischemia-reperfusion. Cell Death Differ. 15, 686–690.
Lorenzetti, D., Antalffy, B., Vogel, H., Noveroske, J., Armstrong, D., and Justice, M. (2004). The neurological mutant quaking(viable) is Parkin deficient. Mamm. Genome Off. J. Int. Mamm. Genome Soc. 15, 210–217.
Louis, D.N., Perry, A., Reifenberger, G., von Deimling, A., Figarella-Branger, D., Cavenee, W.K., Ohgaki, H., Wiestler, O.D., Kleihues, P., and Ellison, D.W. (2016). The 2016 World Health Organization Classification of Tumors of the Central Nervous System: a summary. Acta Neuropathol. (Berl.) 131, 803–820.
Ludwig, T., Le Borgne, R., and Hoflack, B. (1995). Roles for mannose-6-phosphate receptors in lysosomal enzyme sorting, IGF-II binding and clathrin-coat assembly. Trends Cell Biol. 5, 202–206.
Luzio, J.P., Pryor, P.R., and Bright, N.A. (2007). Lysosomes: fusion and function. Nat. Rev. Mol. Cell Biol. 8, 622–632.
Ma, D.K., Ming, G.-L., and Song, H. (2005a). Glial influences on neural stem cell development: cellular niches for adult neurogenesis. Curr. Opin. Neurobiol. 15, 514–520.
Ma, L., Chen, Z., Erdjument-Bromage, H., Tempst, P., and Pandolfi, P.P. (2005b). Phosphorylation and Functional Inactivation of TSC2 by Erk. Cell 121, 179–193.
Machado, E., White-Gilbertson, S., Vlekkert, D. van de, Janke, L., Moshiach, S., Campos, Y., Finkelstein, D., Gomero, E., Mosca, R., Qiu, X., et al. (2015). Regulated lysosomal exocytosis mediates cancer progression. Sci. Adv. 1, e1500603.
Mai, T.T., Hamaï, A., Hienzsch, A., Cañeque, T., Müller, S., Wicinski, J., Cabaud, O., Leroy, C., David, A., Acevedo, V., et al. (2017). Salinomycin kills cancer stem cells by sequestering iron in lysosomes. Nat. Chem. 9, 1025–1033.
Mammucari, C., Milan, G., Romanello, V., Masiero, E., Rudolf, R., Del Piccolo, P., Burden, S.J., Di Lisi, R., Sandri, C., Zhao, J., et al. (2007). FoxO3 controls autophagy in skeletal muscle in vivo. Cell Metab. 6, 458–471.
Man, J., Yu, X., Huang, H., Zhou, W., Xiang, C., Huang, H., Miele, L., Liu, Z., Bebek, G., Bao, S., et al. (2018). Hypoxic Induction of Vasorin Regulates Notch1 Turnover to Maintain Glioma Stem-like Cells. Cell Stem Cell 22, 104-118.e6.
Manning, B.D., Tee, A.R., Logsdon, M.N., Blenis, J., and Cantley, L.C. (2002). Identification of the tuberous sclerosis complex-2 tumor suppressor gene product tuberin as a target of the phosphoinositide 3-kinase/akt pathway. Mol. Cell 10, 151–162.
Martina, J.A., Chen, Y., Gucek, M., and Puertollano, R. (2012). MTORC1 functions as a transcriptional regulator of autophagy by preventing nuclear transport of TFEB. Autophagy 8, 903–914.

Bibliography
219
Martuza, R.L., Malick, A., Markert, J.M., Ruffner, K.L., and Coen, D.M. (1991). Experimental therapy of human glioma by means of a genetically engineered virus mutant. Science 252, 854–856.
Marumoto, T., Tashiro, A., Friedmann-Morvinski, D., Scadeng, M., Soda, Y., Gage, F.H., and Verma, I.M. (2009). Development of a novel mouse glioma model using lentiviral vectors. Nat. Med. 15, 110–116.
Maruyama, T., Araki, T., Kawarazaki, Y., Naguro, I., Heynen, S., Aza-Blanc, P., Ronai, Z., Matsuzawa, A., and Ichijo, H. (2014). Roquin-2 promotes ubiquitin-mediated degradation of ASK1 to regulate stress responses. Sci. Signal. 7, ra8.
Masri, J., Bernath, A., Martin, J., Jo, O.D., Vartanian, R., Funk, A., and Gera, J. (2007). mTORC2 activity is elevated in gliomas and promotes growth and cell motility via overexpression of rictor. Cancer Res. 67, 11712–11720.
Mastrella, G., Hou, M., Li, M., Stoecklein, V.M., Zdouc, N., Volmar, M.N.M., Miletic, H., Reinhard, S., Herold-Mende, C.C., Kleber, S., et al. (2019a). Targeting APLN/APLNR Improves Antiangiogenic Efficiency and Blunts Proinvasive Side Effects of VEGFA/VEGFR2 Blockade in Glioblastoma. Cancer Res. 79, 2298–2313.
Mastrella, G., Hou, M., Li, M., Stoecklein, V.M., Zdouc, N., Volmar, M.N.M., Miletic, H., Reinhard, S., Herold-Mende, C.C., Kleber, S., et al. (2019b). Targeting APLN/APLNR Improves Antiangiogenic Efficiency and Blunts Proinvasive Side Effects of VEGFA/VEGFR2 Blockade in Glioblastoma. Cancer Res. 79, 2298–2313.
McAuley, J.R., Bailey, K.M., Ekambaram, P., Klei, L.R., Kang, H., Hu, D., Freeman, T.J., Concel, V.J., Hubel, N.E., Lee, J.-Y. (Lloyd), et al. (2019). MALT1 is a critical mediator of PAR1-driven NF-κB activation and metastasis in multiple tumor types. Oncogene 1–15.
McEwan, D.G., Popovic, D., Gubas, A., Terawaki, S., Suzuki, H., Stadel, D., Coxon, F.P., Miranda de Stegmann, D., Bhogaraju, S., Maddi, K., et al. (2015). PLEKHM1 regulates autophagosome-lysosome fusion through HOPS complex and LC3/GABARAP proteins. Mol. Cell 57, 39–54.
McKnight, N.C., Jefferies, H.B.J., Alemu, E.A., Saunders, R.E., Howell, M., Johansen, T., and Tooze, S.A. (2012). Genome-wide siRNA screen reveals amino acid starvation-induced autophagy requires SCOC and WAC. EMBO J. 31, 1931–1946.
Meadows, K.L., and Hurwitz, H.I. (2012). Anti-VEGF Therapies in the Clinic. Cold Spring Harb. Perspect. Med. 2.
Mecca, C., Giambanco, I., Donato, R., and Arcuri, C. (2018a). Targeting mTOR in Glioblastoma: Rationale and Preclinical/Clinical Evidence.
Mecca, C., Giambanco, I., Bruscoli, S., Bereshchenko, O., Fioretti, B., Riccardi, C., Donato, R., and Arcuri, C. (2018b). PP242 Counteracts Glioblastoma Cell Proliferation, Migration, Invasiveness and Stemness Properties by Inhibiting

Bibliography
220
mTORC2/AKT. Front. Cell. Neurosci. 12.
Meikle, L., Talos, D.M., Onda, H., Pollizzi, K., Rotenberg, A., Sahin, M., Jensen, F.E., and Kwiatkowski, D.J. (2007). A mouse model of tuberous sclerosis: neuronal loss of Tsc1 causes dysplastic and ectopic neurons, reduced myelination, seizure activity, and limited survival. J. Neurosci. Off. J. Soc. Neurosci. 27, 5546–5558.
Mellman, I. (1996). Endocytosis and molecular sorting. Annu. Rev. Cell Dev. Biol. 12, 575–625.
Menon, S., Dibble, C.C., Talbott, G., Hoxhaj, G., Valvezan, A.J., Takahashi, H., Cantley, L.C., and Manning, B.D. (2014). Spatial control of the TSC complex integrates insulin and nutrient regulation of mTORC1 at the lysosome. Cell 156, 771–785.
Meric-Bernstam, F., Akcakanat, A., Chen, H., Do, K.-A., Sangai, T., Adkins, F., Gonzalez-Angulo, A.M., Rashid, A., Crosby, K., Dong, M., et al. (2012). PIK3CA/PTEN Mutations and Akt Activation as Markers of Sensitivity to Allosteric mTOR inhibitors. Clin. Cancer Res. 18, 1777–1789.
Meyer, C., Zizioli, D., Lausmann, S., Eskelinen, E.-L., Hamann, J., Saftig, P., von Figura, K., and Schu, P. (2000). µ1A-adaptin-deficient mice: lethality, loss of AP-1 binding and rerouting of mannose 6-phosphate receptors. EMBO J. 19, 2193–2203.
Milkereit, R., Persaud, A., Vanoaica, L., Guetg, A., Verrey, F., and Rotin, D. (2015). LAPTM4b recruits the LAT1-4F2hc Leu transporter to lysosomes and promotes mTORC1 activation. Nat. Commun. 6, 1–9.
Mirzadeh, Z., Merkle, F.T., Soriano-Navarro, M., Garcia-Verdugo, J.M., and Alvarez-Buylla, A. (2008). Neural stem cells confer unique pinwheel architecture to the ventricular surface in neurogenic regions of the adult brain. Cell Stem Cell 3, 265–278.
Monteiro, A.R., Hill, R., Pilkington, G.J., and Madureira, P.A. (2017). The Role of Hypoxia in Glioblastoma Invasion. Cells 6.
Moody, C.L., and Wheelhouse, R.T. (2014). The Medicinal Chemistry of Imidazotetrazine Prodrugs. Pharmaceuticals 7, 797–838.
Mora, R., Dokic, I., Kees, T., Hüber, C.M., Keitel, D., Geibig, R., Brügge, B., Zentgraf, H., Brady, N.R., and Régnier-Vigouroux, A. (2010). Sphingolipid rheostat alterations related to transformation can be exploited for specific induction of lysosomal cell death in murine and human glioma. Glia 58, 1364–1383.
Morrison, S.J., Perez, S.E., Qiao, Z., Verdi, J.M., Hicks, C., Weinmaster, G., and Anderson, D.J. (2000). Transient Notch activation initiates an irreversible switch from neurogenesis to gliogenesis by neural crest stem cells. Cell 101, 499–510.
Mrakovic, A., Kay, J.G., Furuya, W., Brumell, J.H., and Botelho, R.J. (2012). Rab7 and Arl8 GTPases are necessary for lysosome tubulation in macrophages. Traffic

Bibliography
221
Cph. Den. 13, 1667–1679.
Munier-Lehmann, H., Mauxion, F., and Hoflack, B. (1996). Function of the two mannose 6-phosphate receptors in lysosomal enzyme transport. Biochem. Soc. Trans. 24, 133–136.
Nagel, D., Spranger, S., Vincendeau, M., Grau, M., Raffegerst, S., Kloo, B., Hlahla, D., Neuenschwander, M., Peter von Kries, J., Hadian, K., et al. (2012a). Pharmacologic inhibition of MALT1 protease by phenothiazines as a therapeutic approach for the treatment of aggressive ABC-DLBCL. Cancer Cell 22, 825–837.
Nagel, D., Spranger, S., Vincendeau, M., Grau, M., Raffegerst, S., Kloo, B., Hlahla, D., Neuenschwander, M., Kries, J.P. von, Hadian, K., et al. (2012b). Pharmacologic Inhibition of MALT1 Protease by Phenothiazines as a Therapeutic Approach for the Treatment of Aggressive ABC-DLBCL. Cancer Cell 22, 825–837.
Nagpal, S., Harsh, G., and Recht, L. (2011). Bevacizumab Improves Quality of Life in Patients with Recurrent Glioblastoma. Chemother. Res. Pract. 2011.
Nakada, M., Kita, D., Watanabe, T., Hayashi, Y., Teng, L., Pyko, I.V., and Hamada, J.-I. (2011). Aberrant signaling pathways in glioma. Cancers 3, 3242–3278.
Nakano, I. (2015). Stem cell signature in glioblastoma: therapeutic development for a moving target. J. Neurosurg. 122, 324–330.
Nakaya, M., Xiao, Y., Zhou, X., Chang, J.-H., Chang, M., Cheng, X., Blonska, M., Lin, X., and Sun, S.-C. (2014). Inflammatory T cell responses rely on amino acid transporter ASCT2 facilitation of glutamine uptake and mTORC1 kinase activation. Immunity 40, 692–705.
Nakayama, K. (2009). Cellular signal transduction of the hypoxia response. J. Biochem. (Tokyo) 146, 757–765.
Nanegrungsunk, D., Onchan, W., Chattipakorn, N., and Chattipakorn, S.C. (2015). Current evidence of temozolomide and bevacizumab in treatment of gliomas. Neurol. Res. 37, 167–183.
Napolitano, G., and Ballabio, A. (2016a). TFEB at a glance. J. Cell Sci. 129, 2475–2481.
Napolitano, G., and Ballabio, A. (2016b). TFEB at a glance. J. Cell Sci. 129, 2475–2481.
Neshat, M.S., Mellinghoff, I.K., Tran, C., Stiles, B., Thomas, G., Petersen, R., Frost, P., Gibbons, J.J., Wu, H., and Sawyers, C.L. (2001). Enhanced sensitivity of PTEN-deficient tumors to inhibition of FRAP/mTOR. Proc. Natl. Acad. Sci. 98, 10314.
Nguyen, T.N., Padman, B.S., Usher, J., Oorschot, V., Ramm, G., and Lazarou, M. (2016). Atg8 family LC3/GABARAP proteins are crucial for autophagosome-lysosome fusion but not autophagosome formation during PINK1/Parkin mitophagy
Bibliography
222
and starvation. J. Cell Biol. 215, 857–874.
Ni, X., and Morales, C.R. (2006). The lysosomal trafficking of acid sphingomyelinase is mediated by sortilin and mannose 6-phosphate receptor. Traffic Cph. Den. 7, 889–902.
Nishimura, T., Tamura, N., Kono, N., Shimanaka, Y., Arai, H., Yamamoto, H., and Mizushima, N. (2017). Autophagosome formation is initiated at phosphatidylinositol synthase-enriched ER subdomains. EMBO J. 36, 1719–1735.
Nishimura, Y., Sameni, M., and Sloane, B.F. (1998). Malignant transformation alters intracellular trafficking of lysosomal cathepsin D in human breast epithelial cells. Pathol. Oncol. Res. 4, 283.
Niu, G., Wright, K.L., Huang, M., Song, L., Haura, E., Turkson, J., Zhang, S., Wang, T., Sinibaldi, D., Coppola, D., et al. (2002). Constitutive Stat3 activity up-regulates VEGF expression and tumor angiogenesis. Oncogene 21, 2000–2008.
Nixon, R.A. (2013). The role of autophagy in neurodegenerative disease. Nat. Med. 19, 983–997.
Noack, J., Choi, J., Richter, K., Kopp-Schneider, A., and Régnier-Vigouroux, A. (2014). A sphingosine kinase inhibitor combined with temozolomide induces glioblastoma cell death through accumulation of dihydrosphingosine and dihydroceramide, endoplasmic reticulum stress and autophagy. Cell Death Dis. 5, e1425.
Nojima, H., Tokunaga, C., Eguchi, S., Oshiro, N., Hidayat, S., Yoshino, K., Hara, K., Tanaka, N., Avruch, J., and Yonezawa, K. (2003). The mammalian target of rapamycin (mTOR) partner, raptor, binds the mTOR substrates p70 S6 kinase and 4E-BP1 through their TOR signaling (TOS) motif. J. Biol. Chem. 278, 15461–15464.
Novikoff, A.B., Beaufay, H., and de Duve, C. (1956). ELECTRON MICROSCOPY OF LYSOSOME-RICH FRACTIONS FROM RAT LIVER. J. Biophys. Biochem. Cytol. 2, 179–184.
Nylandsted, J., Wick, W., Hirt, U.A., Brand, K., Rohde, M., Leist, M., Weller, M., and Jäättelä, M. (2002). Eradication of glioblastoma, and breast and colon carcinoma xenografts by Hsp70 depletion. Cancer Res. 62, 7139–7142.
Obermeier, B., Daneman, R., and Ransohoff, R.M. (2013). Development, maintenance and disruption of the blood-brain barrier. Nat. Med. 19, 1584–1596.
Ohgaki, H., and Kleihues, P. (2013). The definition of primary and secondary glioblastoma. Clin. Cancer Res. Off. J. Am. Assoc. Cancer Res. 19, 764–772.
Olsvik, H.L., Lamark, T., Takagi, K., Larsen, K.B., Evjen, G., Øvervatn, A., Mizushima, T., and Johansen, T. (2015). FYCO1 Contains a C-terminally Extended, LC3A/B-preferring LC3-interacting Region (LIR) Motif Required for Efficient Maturation of Autophagosomes during Basal Autophagy. J. Biol. Chem. 290, 29361–

Bibliography
223
29374.
Ono, K., Kim, S.O., and Han, J. (2003). Susceptibility of lysosomes to rupture is a determinant for plasma membrane disruption in tumor necrosis factor alpha-induced cell death. Mol. Cell. Biol. 23, 665–676.
Orsi, A., Razi, M., Dooley, H.C., Robinson, D., Weston, A.E., Collinson, L.M., and Tooze, S.A. (2012). Dynamic and transient interactions of Atg9 with autophagosomes, but not membrane integration, are required for autophagy. Mol. Biol. Cell 23, 1860–1873.
Ostenfeld, M.S., Fehrenbacher, N., Høyer-Hansen, M., Thomsen, C., Farkas, T., and Jäättelä, M. (2005). Effective Tumor Cell Death by σ-2 Receptor Ligand Siramesine Involves Lysosomal Leakage and Oxidative Stress. Cancer Res. 65, 8975–8983.
Ostenfeld, M.S., Høyer-Hansen, M., Bastholm, L., Fehrenbacher, N., Olsen, O.D., Groth-Pedersen, L., Puustinen, P., Kirkegaard-Sørensen, T., Nylandsted, J., Farkas, T., et al. (2008). Anti-cancer agent siramesine is a lysosomotropic detergent that induces cytoprotective autophagosome accumulation. Autophagy 4, 487–499.
Ostrom, Q.T., Bauchet, L., Davis, F.G., Deltour, I., Fisher, J.L., Langer, C.E., Pekmezci, M., Schwartzbaum, J.A., Turner, M.C., Walsh, K.M., et al. (2014). The epidemiology of glioma in adults: a “state of the science” review. Neuro-Oncol. 16, 896–913.
Pak, Y., Glowacka, W.K., Bruce, M.C., Pham, N., and Rotin, D. (2006). Transport of LAPTM5 to lysosomes requires association with the ubiquitin ligase Nedd4, but not LAPTM5 ubiquitination. J. Cell Biol. 175, 631–645.
Palmer, T.D., Willhoite, A.R., and Gage, F.H. (2000). Vascular niche for adult hippocampal neurogenesis. J. Comp. Neurol. 425, 479–494.
Pan, D., Jiang, C., Ma, Z., Blonska, M., You, M.J., and Lin, X. (2016). MALT1 is required for EGFR-induced NF-κB activation and contributes to EGFR-driven lung cancer progression. Oncogene 35, 919–928.
Papadopoulos, C., and Meyer, H. (2017). Detection and Clearance of Damaged Lysosomes by the Endo-Lysosomal Damage Response and Lysophagy. Curr. Biol. CB 27, R1330–R1341.
Papinski, D., Schuschnig, M., Reiter, W., Wilhelm, L., Barnes, C.A., Maiolica, A., Hansmann, I., Pfaffenwimmer, T., Kijanska, M., Stoffel, I., et al. (2014). Early steps in autophagy depend on direct phosphorylation of Atg9 by the Atg1 kinase. Mol. Cell 53, 471–483.
Pardal, R., Clarke, M.F., and Morrison, S.J. (2003). Applying the principles of stem-cell biology to cancer. Nat. Rev. Cancer 3, 895–902.
Park, J.-M., Jung, C.H., Seo, M., Otto, N.M., Grunwald, D., Kim, K.H., Moriarity, B., Kim, Y.-M., Starker, C., Nho, R.S., et al. (2016). The ULK1 complex mediates
Bibliography
224
MTORC1 signaling to the autophagy initiation machinery via binding and phosphorylating ATG14. Autophagy 12, 547–564.
Parmigiani, A., Nourbakhsh, A., Ding, B., Wang, W., Kim, Y.C., Akopiants, K., Guan, K.-L., Karin, M., and Budanov, A.V. (2014). Sestrins Inhibit mTORC1 Kinase Activation through the GATOR Complex. Cell Rep. 9, 1281–1291.
Patel, A.P., Tirosh, I., Trombetta, J.J., Shalek, A.K., Gillespie, S.M., Wakimoto, H., Cahill, D.P., Nahed, B.V., Curry, W.T., Martuza, R.L., et al. (2014). Single-cell RNA-seq highlights intratumoral heterogeneity in primary glioblastoma. Science 344, 1396–1401.
Pattingre, S., Tassa, A., Qu, X., Garuti, R., Liang, X.H., Mizushima, N., Packer, M., Schneider, M.D., and Levine, B. (2005). Bcl-2 antiapoptotic proteins inhibit Beclin 1-dependent autophagy. Cell 122, 927–939.
Pearce, L.R., Huang, X., Boudeau, J., Pawłowski, R., Wullschleger, S., Deak, M., Ibrahim, A.F.M., Gourlay, R., Magnuson, M.A., and Alessi, D.R. (2007). Identification of Protor as a novel Rictor-binding component of mTOR complex-2. Biochem. J. 405, 513–522.
Peng, M., Yin, N., and Li, M.O. (2017). SZT2 dictates GATOR control of mTORC1 signalling. Nature 543, 433–437.
Perera, R.M., and Zoncu, R. (2016). The Lysosome as a Regulatory Hub. Annu. Rev. Cell Dev. Biol. 32, 223–253.
Petersen, C.M., Nielsen, M.S., Nykjaer, A., Jacobsen, L., Tommerup, N., Rasmussen, H.H., Roigaard, H., Gliemann, J., Madsen, P., and Moestrup, S.K. (1997). Molecular identification of a novel candidate sorting receptor purified from human brain by receptor-associated protein affinity chromatography. J. Biol. Chem. 272, 3599–3605.
Petersen, N.H.T., Olsen, O.D., Groth-Pedersen, L., Ellegaard, A.-M., Bilgin, M., Redmer, S., Ostenfeld, M.S., Ulanet, D., Dovmark, T.H., Lønborg, A., et al. (2013). Transformation-associated changes in sphingolipid metabolism sensitize cells to lysosomal cell death induced by inhibitors of acid sphingomyelinase. Cancer Cell 24, 379–393.
Peterson, T.R., Laplante, M., Thoreen, C.C., Sancak, Y., Kang, S.A., Kuehl, W.M., Gray, N.S., and Sabatini, D.M. (2009). DEPTOR is an mTOR inhibitor frequently overexpressed in multiple myeloma cells and required for their survival. Cell 137, 873–886.
Peterson, T.R., Sengupta, S.S., Harris, T.E., Carmack, A.E., Kang, S.A., Balderas, E., Guertin, D.A., Madden, K.L., Carpenter, A.E., Finck, B.N., et al. (2011). mTOR complex 1 regulates lipin 1 localization to control the SREBP pathway. Cell 146, 408–420.
Petherick, K.J., Conway, O.J.L., Mpamhanga, C., Osborne, S.A., Kamal, A., Saxty,

Bibliography
225
B., and Ganley, I.G. (2015). Pharmacological inhibition of ULK1 kinase blocks mammalian target of rapamycin (mTOR)-dependent autophagy. J. Biol. Chem. 290, 28726.
Petit, C.S., Roczniak-Ferguson, A., and Ferguson, S.M. (2013). Recruitment of folliculin to lysosomes supports the amino acid–dependent activation of Rag GTPases. J. Cell Biol. 202, 1107–1122.
Philippe, L., Vasseur, J.-J., Debart, F., and Thoreen, C.C. (2018). La-related protein 1 (LARP1) repression of TOP mRNA translation is mediated through its cap-binding domain and controlled by an adjacent regulatory region. Nucleic Acids Res. 46, 1457–1469.
Piao, Y., Liang, J., Holmes, L., Henry, V., Sulman, E., and de Groot, J.F. (2013). Acquired resistance to anti-VEGF therapy in glioblastoma is associated with a mesenchymal transition. Clin. Cancer Res. Off. J. Am. Assoc. Cancer Res. 19, 4392–4403.
Piccirillo, S.G.M., Reynolds, B.A., Zanetti, N., Lamorte, G., Binda, E., Broggi, G., Brem, H., Olivi, A., Dimeco, F., and Vescovi, A.L. (2006). Bone morphogenetic proteins inhibit the tumorigenic potential of human brain tumour-initiating cells. Nature 444, 761–765.
Plate, K.H., and Mennel, H.D. (1995). Vascular morphology and angiogenesis in glial tumors. Exp. Toxicol. Pathol. Off. J. Ges. Toxikol. Pathol. 47, 89–94.
Platet, N., Liu, S.Y., Atifi, M.E., Oliver, L., Vallette, F.M., Berger, F., and Wion, D. (2007). Influence of oxygen tension on CD133 phenotype in human glioma cell cultures. Cancer Lett. 258, 286–290.
Pontén, J., and Macintyre, E.H. (1968). Long Term Culture of Normal and Neoplastic Human Glia. Acta Pathol. Microbiol. Scand. 74, 465–486.
Porstmann, T., Santos, C.R., Griffiths, B., Cully, M., Wu, M., Leevers, S., Griffiths, J.R., Chung, Y.-L., and Schulze, A. (2008). SREBP activity is regulated by mTORC1 and contributes to Akt-dependent cell growth. Cell Metab. 8, 224–236.
Pu, J., Schindler, C., Jia, R., Jarnik, M., Backlund, P., and Bonifacino, J.S. (2015). BORC, a multisubunit complex that regulates lysosome positioning. Dev. Cell 33, 176–188.
Pudelko, L., Edwards, S., Balan, M., Nyqvist, D., Al-Saadi, J., Dittmer, J., Almlöf, I., Helleday, T., and Bräutigam, L. (2018). An orthotopic glioblastoma animal model suitable for high-throughput screenings. Neuro-Oncol. 20, 1475–1484.
Puente, C., Hendrickson, R.C., and Jiang, X. (2016). Nutrient-regulated Phosphorylation of ATG13 Inhibits Starvation-induced Autophagy. J. Biol. Chem. 291, 6026–6035.
Pyonteck, S.M., Akkari, L., Schuhmacher, A.J., Bowman, R.L., Sevenich, L., Quail,

Bibliography
226
D.F., Olson, O.C., Quick, M.L., Huse, J.T., Teijeiro, V., et al. (2013). CSF-1R inhibition alters macrophage polarization and blocks glioma progression. Nat. Med. 19, 1264–1272.
Qiao, Q., Yang, C., Zheng, C., Fontán, L., David, L., Yu, X., Bracken, C., Rosen, M., Melnick, A., Egelman, E.H., et al. (2013). Structural architecture of the CARMA1/Bcl10/MALT1 signalosome: nucleation-induced filamentous assembly. Mol. Cell 51, 766–779.
Quail, D.F., Bowman, R.L., Akkari, L., Quick, M.L., Schuhmacher, A.J., Huse, J.T., Holland, E.C., Sutton, J.C., and Joyce, J.A. (2016). The tumor microenvironment underlies acquired resistance to CSF1R inhibition in gliomas. Science 352, aad3018.
Quistgaard, E.M., Madsen, P., Grøftehauge, M.K., Nissen, P., Petersen, C.M., and Thirup, S.S. (2009). Ligands bind to Sortilin in the tunnel of a ten-bladed beta-propeller domain. Nat. Struct. Mol. Biol. 16, 96–98.
Raben, N., and Puertollano, R. (2016). TFEB and TFE3: Linking Lysosomes to Cellular Adaptation to Stress. Annu. Rev. Cell Dev. Biol. 32, 255–278.
Radulovic, M., Schink, K.O., Wenzel, E.M., Nähse, V., Bongiovanni, A., Lafont, F., and Stenmark, H. (2018). ESCRT-mediated lysosome repair precedes lysophagy and promotes cell survival. EMBO J. 37.
Raiborg, C., Wenzel, E.M., Pedersen, N.M., Olsvik, H., Schink, K.O., Schultz, S.W., Vietri, M., Nisi, V., Bucci, C., Brech, A., et al. (2015). Repeated ER-endosome contacts promote endosome translocation and neurite outgrowth. Nature 520, 234–238.
Ravi, R., Mookerjee, B., Bhujwalla, Z.M., Sutter, C.H., Artemov, D., Zeng, Q., Dillehay, L.E., Madan, A., Semenza, G.L., and Bedi, A. (2000). Regulation of tumor angiogenesis by p53-induced degradation of hypoxia-inducible factor 1α. Genes Dev. 14, 34–44.
Ravikumar, B., Vacher, C., Berger, Z., Davies, J.E., Luo, S., Oroz, L.G., Scaravilli, F., Easton, D.F., Duden, R., O’Kane, C.J., et al. (2004). Inhibition of mTOR induces autophagy and reduces toxicity of polyglutamine expansions in fly and mouse models of Huntington disease. Nat. Genet. 36, 585–595.
Read, R.D., Cavenee, W.K., Furnari, F.B., and Thomas, J.B. (2009). A Drosophila Model for EGFR-Ras and PI3K-Dependent Human Glioma. PLOS Genet. 5, e1000374.
Rebeaud, F., Hailfinger, S., Posevitz-Fejfar, A., Tapernoux, M., Moser, R., Rueda, D., Gaide, O., Guzzardi, M., Iancu, E.M., Rufer, N., et al. (2008). The proteolytic activity of the paracaspase MALT1 is key in T cell activation. Nat. Immunol. 9, 272–281.
Rebsamen, M., Pochini, L., Stasyk, T., de Araújo, M.E.G., Galluccio, M., Kandasamy, R.K., Snijder, B., Fauster, A., Rudashevskaya, E.L., Bruckner, M., et al.

Bibliography
227
(2015). SLC38A9 is a component of the lysosomal amino acid sensing machinery that controls mTORC1. Nature 519, 477–481.
Reczek, D., Schwake, M., Schröder, J., Hughes, H., Blanz, J., Jin, X., Brondyk, W., Van Patten, S., Edmunds, T., and Saftig, P. (2007). LIMP-2 is a receptor for lysosomal mannose-6-phosphate-independent targeting of beta-glucocerebrosidase. Cell 131, 770–783.
Reddy, A., Caler, E.V., and Andrews, N.W. (2001). Plasma membrane repair is mediated by Ca(2+)-regulated exocytosis of lysosomes. Cell 106, 157–169.
Reitman, M.L., and Kornfeld, S. (1981a). Lysosomal enzyme targeting. N-Acetylglucosaminylphosphotransferase selectively phosphorylates native lysosomal enzymes. J. Biol. Chem. 256, 11977–11980.
Reitman, M.L., and Kornfeld, S. (1981b). UDP-N-acetylglucosamine:glycoprotein N-acetylglucosamine-1-phosphotransferase. Proposed enzyme for the phosphorylation of the high mannose oligosaccharide units of lysosomal enzymes. J. Biol. Chem. 256, 4275–4281.
Repnik, U., Hafner Česen, M., and Turk, B. (2014). Lysosomal membrane permeabilization in cell death: concepts and challenges. Mitochondrion 19 Pt A, 49–57.
Reya, T., Morrison, S.J., Clarke, M.F., and Weissman, I.L. (2001). Stem cells, cancer, and cancer stem cells. Nature 414, 105–111.
Reynolds, B.A., and Weiss, S. (1992). Generation of neurons and astrocytes from isolated cells of the adult mammalian central nervous system. Science 255, 1707–1710.
Ricci-Vitiani, L., Pallini, R., Biffoni, M., Todaro, M., Invernici, G., Cenci, T., Maira, G., Parati, E.A., Stassi, G., Larocca, L.M., et al. (2010). Tumour vascularization via endothelial differentiation of glioblastoma stem-like cells. Nature 468, 824–828.
Ricklefs, F., Mineo, M., Rooj, A.K., Nakano, I., Charest, A., Weissleder, R., Breakefield, X.O., Chiocca, E.A., Godlewski, J., and Bronisz, A. (2016). Extracellular vesicles from high grade glioma exchange diverse pro-oncogenic signals that maintain intratumoral heterogeneity. Cancer Res. 76, 2876–2881.
Ricos, M.G., Hodgson, B.L., Pippucci, T., Saidin, A., Ong, Y.S., Heron, S.E., Licchetta, L., Bisulli, F., Bayly, M.A., Hughes, J., et al. (2016). Mutations in the mammalian target of rapamycin pathway regulators NPRL2 and NPRL3 cause focal epilepsy. Ann. Neurol. 79, 120–131.
Riquelme, P.A., Drapeau, E., and Doetsch, F. (2008). Brain micro-ecologies: neural stem cell niches in the adult mammalian brain. Philos. Trans. R. Soc. Lond. B. Biol. Sci. 363, 123–137.
Rivera, L.B., Meyronet, D., Hervieu, V., Frederick, M.J., Bergsland, E., and Bergers,

Bibliography
228
G. (2015). Intratumoral myeloid cells regulate responsiveness and resistance to antiangiogenic therapy. Cell Rep. 11, 577–591.
Roa, W., Brasher, P.M.A., Bauman, G., Anthes, M., Bruera, E., Chan, A., Fisher, B., Fulton, D., Gulavita, S., Hao, C., et al. (2004). Abbreviated course of radiation therapy in older patients with glioblastoma multiforme: a prospective randomized clinical trial. J. Clin. Oncol. Off. J. Am. Soc. Clin. Oncol. 22, 1583–1588.
Robertson, F.L., Marqués-Torrejón, M.-A., Morrison, G.M., and Pollard, S.M. (2019). Experimental models and tools to tackle glioblastoma. Dis. Model. Mech. 12, dmm040386.
Rocha, N., Kuijl, C., van der Kant, R., Janssen, L., Houben, D., Janssen, H., Zwart, W., and Neefjes, J. (2009). Cholesterol sensor ORP1L contacts the ER protein VAP to control Rab7-RILP-p150 Glued and late endosome positioning. J. Cell Biol. 185, 1209–1225.
Rochefort, H., Garcia, M., Glondu, M., Laurent, V., Liaudet, E., Rey, J.-M., and Roger, P. (2000). Cathepsin D in breast cancer: mechanisms and clinical applications, a 1999 overview. Clin. Chim. Acta 291, 157–170.
Roczniak-Ferguson, A., Petit, C.S., Froehlich, F., Qian, S., Ky, J., Angarola, B., Walther, T.C., and Ferguson, S.M. (2012). The Transcription Factor TFEB Links mTORC1 Signaling to Transcriptional Control of Lysosome Homeostasis. Sci. Signal. 5, ra42–ra42.
Ross, E., Ata, R., Thavarajah, T., Medvedev, S., Bowden, P., Marshall, J.G., and Antonescu, C.N. (2015). AMP-Activated Protein Kinase Regulates the Cell Surface Proteome and Integrin Membrane Traffic. PLOS ONE 10, e0128013.
Rousseau, A., and Bertolotti, A. (2016). An evolutionarily conserved pathway controls proteasome homeostasis. Nature 536, 184–189.
Roux, P.P., Ballif, B.A., Anjum, R., Gygi, S.P., and Blenis, J. (2004). Tumor-promoting phorbol esters and activated Ras inactivate the tuberous sclerosis tumor suppressor complex via p90 ribosomal S6 kinase. Proc. Natl. Acad. Sci. U. S. A. 101, 13489–13494.
Roy, D., Liston, D.R., Idone, V.J., Di, A., Nelson, D.J., Pujol, C., Bliska, J.B., Chakrabarti, S., and Andrews, N.W. (2004). A process for controlling intracellular bacterial infections induced by membrane injury. Science 304, 1515–1518.
Ruefli-Brasse, A.A., French, D.M., and Dixit, V.M. (2003). Regulation of NF-kappaB-dependent lymphocyte activation and development by paracaspase. Science 302, 1581–1584.
Ruland, J., and Hartjes, L. (2019). CARD–BCL-10–MALT1 signalling in protective and pathological immunity. Nat. Rev. Immunol. 19, 118–134.
Ruland, J., Duncan, G.S., Wakeham, A., and Mak, T.W. (2003). Differential

Bibliography
229
Requirement for Malt1 in T and B Cell Antigen Receptor Signaling. Immunity 19, 749–758.
Sabatini, D.M., Erdjument-Bromage, H., Lui, M., Tempst, P., and Snyder, S.H. (1994). RAFT1: a mammalian protein that binds to FKBP12 in a rapamycin-dependent fashion and is homologous to yeast TORs. Cell 78, 35–43.
Sabers, C.J., Martin, M.M., Brunn, G.J., Williams, J.M., Dumont, F.J., Wiederrecht, G., and Abraham, R.T. (1995). Isolation of a protein target of the FKBP12-rapamycin complex in mammalian cells. J. Biol. Chem. 270, 815–822.
Saftig, P., and Klumperman, J. (2009). Lysosome biogenesis and lysosomal membrane proteins: trafficking meets function. Nat. Rev. Mol. Cell Biol. 10, 623–635.
Sahagian, G.G., and Steer, C.J. (1985). Transmembrane orientation of the mannose 6-phosphate receptor in isolated clathrin-coated vesicles. J. Biol. Chem. 260, 9838–9842.
Sahara, S., and Yamashima, T. (2010). Calpain-mediated Hsp70.1 cleavage in hippocampal CA1 neuronal death. Biochem. Biophys. Res. Commun. 393, 806–811.
Sakamaki, J., Wilkinson, S., Hahn, M., Tasdemir, N., O’Prey, J., Clark, W., Hedley, A., Nixon, C., Long, J.S., New, M., et al. (2017). Bromodomain Protein BRD4 Is a Transcriptional Repressor of Autophagy and Lysosomal Function. Mol. Cell 66, 517-532.e9.
Sampson, J.H., Gunn, M.D., Fecci, P.E., and Ashley, D.M. (2020). Brain immunology and immunotherapy in brain tumours. Nat. Rev. Cancer 20, 12–25.
Sancak, Y., Thoreen, C.C., Peterson, T.R., Lindquist, R.A., Kang, S.A., Spooner, E., Carr, S.A., and Sabatini, D.M. (2007). PRAS40 is an insulin-regulated inhibitor of the mTORC1 protein kinase. Mol. Cell 25, 903–915.
Sancak, Y., Peterson, T.R., Shaul, Y.D., Lindquist, R.A., Thoreen, C.C., Bar-Peled, L., and Sabatini, D.M. (2008). The Rag GTPases bind raptor and mediate amino acid signaling to mTORC1. Science 320, 1496–1501.
Sancak, Y., Bar-Peled, L., Zoncu, R., Markhard, A.L., Nada, S., and Sabatini, D.M. (2010). Ragulator-Rag Complex Targets mTORC1 to the Lysosomal Surface and Is Necessary for Its Activation by Amino Acids. Cell 141, 290–303.
Sansal, I., and Sellers, W.R. (2004). The biology and clinical relevance of the PTEN tumor suppressor pathway. J. Clin. Oncol. Off. J. Am. Soc. Clin. Oncol. 22, 2954–2963.
Sarbassov, D.D., Ali, S.M., Kim, D.-H., Guertin, D.A., Latek, R.R., Erdjument-Bromage, H., Tempst, P., and Sabatini, D.M. (2004). Rictor, a novel binding partner of mTOR, defines a rapamycin-insensitive and raptor-independent pathway that regulates the cytoskeleton. Curr. Biol. CB 14, 1296–1302.

Bibliography
230
Sarbassov, D.D., Guertin, D.A., Ali, S.M., and Sabatini, D.M. (2005). Phosphorylation and regulation of Akt/PKB by the rictor-mTOR complex. Science 307, 1098–1101.
Sarbassov, D.D., Ali, S.M., Sengupta, S., Sheen, J.-H., Hsu, P.P., Bagley, A.F., Markhard, A.L., and Sabatini, D.M. (2006). Prolonged rapamycin treatment inhibits mTORC2 assembly and Akt/PKB. Mol. Cell 22, 159–168.
Sardiello, M., Palmieri, M., di Ronza, A., Medina, D.L., Valenza, M., Gennarino, V.A., Di Malta, C., Donaudy, F., Embrione, V., Polishchuk, R.S., et al. (2009). A gene network regulating lysosomal biogenesis and function. Science 325, 473–477.
Saxton, R.A., and Sabatini, D.M. (2017). mTOR Signaling in Growth, Metabolism, and Disease. Cell 168, 960–976.
Saxton, R.A., Chantranupong, L., Knockenhauer, K.E., Schwartz, T.U., and Sabatini, D.M. (2016). Mechanism of arginine sensing by CASTOR1 upstream of mTORC1. Nature 536, 229–233.
Schaefer, J.S., and Klein, J.R. (2016). Roquin – a multifunctional regulator of immune homeostasis. Genes Immun. 17, 79–84.
Schalm, S.S., Fingar, D.C., Sabatini, D.M., and Blenis, J. (2003). TOS motif-mediated raptor binding regulates 4E-BP1 multisite phosphorylation and function. Curr. Biol. CB 13, 797–806.
Schlauderer, F., Lammens, K., Nagel, D., Vincendeau, M., Eitelhuber, A.C., Verhelst, S.H.L., Kling, D., Chrusciel, A., Ruland, J., Krappmann, D., et al. (2013). Structural Analysis of Phenothiazine Derivatives as Allosteric Inhibitors of the MALT1 Paracaspase. Angew. Chem. Int. Ed. 52, 10384–10387.
Schreiber, S.L. (1991). Chemistry and biology of the immunophilins and their immunosuppressive ligands. Science 251, 283–287.
Semenza, G.L. (2010). HIF-1: upstream and downstream of cancer metabolism. Curr. Opin. Genet. Dev. 20, 51–56.
Settembre, C., and Ballabio, A. (2011). TFEB regulates autophagy: an integrated coordination of cellular degradation and recycling processes. Autophagy 7, 1379–1381.
Settembre, C., Zoncu, R., Medina, D.L., Vetrini, F., Erdin, S., Erdin, S., Huynh, T., Ferron, M., Karsenty, G., Vellard, M.C., et al. (2012). A lysosome-to-nucleus signalling mechanism senses and regulates the lysosome via mTOR and TFEB. EMBO J. 31, 1095–1108.
Settembre, C., Fraldi, A., Medina, D.L., and Ballabio, A. (2013). Signals from the lysosome: a control centre for cellular clearance and energy metabolism. Nat. Rev. Mol. Cell Biol. 14, 283–296.
Shalem, O., Sanjana, N.E., Hartenian, E., Shi, X., Scott, D.A., Mikkelson, T., Heckl,

Bibliography
231
D., Ebert, B.L., Root, D.E., Doench, J.G., et al. (2014). Genome-scale CRISPR-Cas9 knockout screening in human cells. Science 343, 84–87.
Shaw, R.J., Bardeesy, N., Manning, B.D., Lopez, L., Kosmatka, M., DePinho, R.A., and Cantley, L.C. (2004). The LKB1 tumor suppressor negatively regulates mTOR signaling. Cancer Cell 6, 91–99.
Shen, Q., Goderie, S.K., Jin, L., Karanth, N., Sun, Y., Abramova, N., Vincent, P., Pumiglia, K., and Temple, S. (2004). Endothelial cells stimulate self-renewal and expand neurogenesis of neural stem cells. Science 304, 1338–1340.
Shi, Y., Zhou, W., Cheng, L., Chen, C., Huang, Z., Fang, X., Wu, Q., He, Z., Xu, S., Lathia, J.D., et al. (2017). Tetraspanin CD9 stabilizes gp130 by preventing its ubiquitin-dependent lysosomal degradation to promote STAT3 activation in glioma stem cells. Cell Death Differ. 24, 167–180.
Shi, Y., Guryanova, O.A., Zhou, W., Liu, C., Huang, Z., Fang, X., Wang, X., Chen, C., Wu, Q., He, Z., et al. (2018). Ibrutinib inactivates BMX-STAT3 in glioma stem cells to impair malignant growth and radioresistance. Sci. Transl. Med. 10.
Shida, D., Takabe, K., Kapitonov, D., Milstien, S., and Spiegel, S. (2008). Targeting SphK1 as a new strategy against cancer. Curr. Drug Targets 9, 662–673.
Shin, H.-J.R., Kim, H., Oh, S., Lee, J.-G., Kee, M., Ko, H.-J., Kweon, M.-N., Won, K.-J., and Baek, S.H. (2016). AMPK–SKP2–CARM1 signalling cascade in transcriptional regulation of autophagy. Nature 534, 553–557.
Shingu, T., Ho, A.L., Yuan, L., Zhou, X., Dai, C., Zheng, S., Wang, Q., Zhong, Y., Chang, Q., Horner, J.W., et al. (2016). Qki deficiency maintains stemness of glioma stem cells in suboptimal environment by downregulating endolysosomal degradation. Nat. Genet. 49, 75.
Singh, S.K., Clarke, I.D., Terasaki, M., Bonn, V.E., Hawkins, C., Squire, J., and Dirks, P.B. (2003). Identification of a Cancer Stem Cell in Human Brain Tumors. Cancer Res. 63, 5821–5828.
Singh, S.K., Hawkins, C., Clarke, I.D., Squire, J.A., Bayani, J., Hide, T., Henkelman, R.M., Cusimano, M.D., and Dirks, P.B. (2004). Identification of human brain tumour initiating cells. Nature 432, 396–401.
Skog, J., Würdinger, T., van Rijn, S., Meijer, D.H., Gainche, L., Sena-Esteves, M., Curry, W.T., Carter, B.S., Krichevsky, A.M., and Breakefield, X.O. (2008). Glioblastoma microvesicles transport RNA and proteins that promote tumour growth and provide diagnostic biomarkers. Nat. Cell Biol. 10, 1470–1476.
Skowyra, M.L., Schlesinger, P.H., Naismith, T.V., and Hanson, P.I. (2018). Triggered recruitment of ESCRT machinery promotes endolysosomal repair. Science 360.
Sloane, B.F., Moin, K., Sameni, M., Tait, L.R., Rozhin, J., and Ziegler, G. (1994). Membrane association of cathepsin B can be induced by transfection of human

Bibliography
232
breast epithelial cells with c-Ha-ras oncogene. J. Cell Sci. 107, 373–384.
Slobodkin, M.R., and Elazar, Z. (2013). The Atg8 family: multifunctional ubiquitin-like key regulators of autophagy. Essays Biochem. 55, 51–64.
Solomon, M., and Muro, S. (2017). Lysosomal Enzyme Replacement Therapies: Historical Development, Clinical Outcomes, and Future Perspectives. Adv. Drug Deliv. Rev. 118, 109–134.
Spampanato, C., Feeney, E., Li, L., Cardone, M., Lim, J.-A., Annunziata, F., Zare, H., Polishchuk, R., Puertollano, R., Parenti, G., et al. (2013). Transcription factor EB (TFEB) is a new therapeutic target for Pompe disease. EMBO Mol. Med. 5, 691–706.
Staal, J., Driege, Y., Bekaert, T., Demeyer, A., Muyllaert, D., Van Damme, P., Gevaert, K., and Beyaert, R. (2011). T-cell receptor-induced JNK activation requires proteolytic inactivation of CYLD by MALT1. EMBO J. 30, 1742–1752.
Stein, G.H. (1979). T98G: An anchorage-independent human tumor cell line that exhibits stationary phase G1 arrest in vitro. J. Cell. Physiol. 99, 43–54.
Stinchcombe, J.C., and Griffiths, G.M. (1999). Regulated Secretion from Hemopoietic Cells. J. Cell Biol. 147, 1–5.
Stummer, W., Pichlmeier, U., Meinel, T., Wiestler, O.D., Zanella, F., Reulen, H.-J., and ALA-Glioma Study Group (2006). Fluorescence-guided surgery with 5-aminolevulinic acid for resection of malignant glioma: a randomised controlled multicentre phase III trial. Lancet Oncol. 7, 392–401.
Stupp, R., Mason, W.P., van den Bent, M.J., Weller, M., Fisher, B., Taphoorn, M.J.B., Belanger, K., Brandes, A.A., Marosi, C., Bogdahn, U., et al. (2005). Radiotherapy plus concomitant and adjuvant temozolomide for glioblastoma. N. Engl. J. Med. 352, 987–996.
Stupp, R., Hegi, M.E., Mason, W.P., van den Bent, M.J., Taphoorn, M.J.B., Janzer, R.C., Ludwin, S.K., Allgeier, A., Fisher, B., Belanger, K., et al. (2009). Effects of radiotherapy with concomitant and adjuvant temozolomide versus radiotherapy alone on survival in glioblastoma in a randomised phase III study: 5-year analysis of the EORTC-NCIC trial. Lancet Oncol. 10, 459–466.
Stupp, R., Wong, E.T., Kanner, A.A., Steinberg, D., Engelhard, H., Heidecke, V., Kirson, E.D., Taillibert, S., Liebermann, F., Dbalý, V., et al. (2012). NovoTTF-100A versus physician’s choice chemotherapy in recurrent glioblastoma: a randomised phase III trial of a novel treatment modality. Eur. J. Cancer Oxf. Engl. 1990 48, 2192–2202.
Stupp, R., Taillibert, S., Kanner, A.A., Kesari, S., Steinberg, D.M., Toms, S.A., Taylor, L.P., Lieberman, F., Silvani, A., Fink, K.L., et al. (2015). Maintenance Therapy With Tumor-Treating Fields Plus Temozolomide vs Temozolomide Alone for Glioblastoma: A Randomized Clinical Trial. JAMA 314, 2535–2543.

Bibliography
233
Stupp, R., Taillibert, S., Kanner, A., Read, W., Steinberg, D., Lhermitte, B., Toms, S., Idbaih, A., Ahluwalia, M.S., Fink, K., et al. (2017). Effect of Tumor-Treating Fields Plus Maintenance Temozolomide vs Maintenance Temozolomide Alone on Survival in Patients With Glioblastoma: A Randomized Clinical Trial. JAMA 318, 2306–2316.
Su, H., Yang, F., Wang, Q., Shen, Q., Huang, J., Peng, C., Zhang, Y., Wan, W., Wong, C.C.L., Sun, Q., et al. (2017). VPS34 Acetylation Controls Its Lipid Kinase Activity and the Initiation of Canonical and Non-canonical Autophagy. Mol. Cell 67, 907-921.e7.
Suh, H., Consiglio, A., Ray, J., Sawai, T., D’Amour, K.A., and Gage, F.H. (2007). In vivo fate analysis reveals the multipotent and self-renewal capacities of Sox2+ neural stem cells in the adult hippocampus. Cell Stem Cell 1, 515–528.
Sumoza-Toledo, A., and Penner, R. (2011). TRPM2: a multifunctional ion channel for calcium signalling. J. Physiol. 589, 1515–1525.
Sun, Y., Kong, W., Falk, A., Hu, J., Zhou, L., Pollard, S., and Smith, A. (2009). CD133 (Prominin) negative human neural stem cells are clonogenic and tripotent. PloS One 4, e5498.
Swartz, A., Li, Q., and Sampson, J. (2014). Rindopepimut®: A promising immunotherapeutic for the treatment of glioblastoma multiforme. Immunotherapy 6, 679–690.
Szatmári, T., Lumniczky, K., Désaknai, S., Trajcevski, S., Hídvégi, E.J., Hamada, H., and Sáfrány, G. (2006). Detailed characterization of the mouse glioma 261 tumor model for experimental glioblastoma therapy. Cancer Sci. 97, 546–553.
Taha, T.A., Kitatani, K., Bielawski, J., Cho, W., Hannun, Y.A., and Obeid, L.M. (2005). Tumor necrosis factor induces the loss of sphingosine kinase-1 by a cathepsin B-dependent mechanism. J. Biol. Chem. 280, 17196–17202.
Takahashi, K., and Yamanaka, S. (2006). Induction of pluripotent stem cells from mouse embryonic and adult fibroblast cultures by defined factors. Cell 126, 663–676.
Takahashi, T., Hara, K., Inoue, H., Kawa, Y., Tokunaga, C., Hidayat, S., Yoshino, K., Kuroda, Y., and Yonezawa, K. (2000). Carboxyl-terminal region conserved among phosphoinositide-kinase-related kinases is indispensable for mTOR function in vivo and in vitro. Genes Cells 5, 765–775.
Takei, N., Inamura, N., Kawamura, M., Namba, H., Hara, K., Yonezawa, K., and Nawa, H. (2004). Brain-Derived Neurotrophic Factor Induces Mammalian Target of Rapamycin-Dependent Local Activation of Translation Machinery and Protein Synthesis in Neuronal Dendrites. J. Neurosci. 24, 9760–9769.
Tanaka, K., Babic, I., Nathanson, D., Akhavan, D., Guo, D., Gini, B., Dang, J., Zhu, S., Yang, H., de Jesus, J., et al. (2011). Oncogenic EGFR signaling activates an mTORC2-NF-κB pathway that promotes chemotherapy resistance. Cancer Discov. 1, 524–538.

Bibliography
234
Tanimoto, K., Makino, Y., Pereira, T., and Poellinger, L. (2000). Mechanism of regulation of the hypoxia-inducible factor-1α by the von Hippel-Lindau tumor suppressor protein. EMBO J. 19, 4298–4309.
Tanjore, H., and Kalluri, R. (2006). The Role of Type IV Collagen and Basement Membranes in Cancer Progression and Metastasis. Am. J. Pathol. 168, 715–717.
Tanti, J.-F., and Jager, J. (2009). Cellular mechanisms of insulin resistance: role of stress-regulated serine kinases and insulin receptor substrates (IRS) serine phosphorylation. Curr. Opin. Pharmacol. 9, 753–762.
Tavazoie, M., Van der Veken, L., Silva-Vargas, V., Louissaint, M., Colonna, L., Zaidi, B., Garcia-Verdugo, J.M., and Doetsch, F. (2008). A Specialized Vascular Niche for Adult Neural Stem Cells. Cell Stem Cell 3, 279–288.
Tavazoie, S.F., Alvarez, V.A., Ridenour, D.A., Kwiatkowski, D.J., and Sabatini, B.L. (2005). Regulation of neuronal morphology and function by the tumor suppressors Tsc1 and Tsc2. Nat. Neurosci. 8, 1727–1734.
Taylor, A.J., Little, M.P., Winter, D.L., Sugden, E., Ellison, D.W., Stiller, C.A., Stovall, M., Frobisher, C., Lancashire, E.R., Reulen, R.C., et al. (2010). Population-based risks of CNS tumors in survivors of childhood cancer: the British Childhood Cancer Survivor Study. J. Clin. Oncol. Off. J. Am. Soc. Clin. Oncol. 28, 5287–5293.
Tchirkov, A., Khalil, T., Chautard, E., Mokhtari, K., Véronèse, L., Irthum, B., Vago, P., Kémény, J.-L., and Verrelle, P. (2007). Interleukin-6 gene amplification and shortened survival in glioblastoma patients. Br. J. Cancer 96, 474–476.
Tee, A.R., Manning, B.D., Roux, P.P., Cantley, L.C., and Blenis, J. (2003). Tuberous sclerosis complex gene products, Tuberin and Hamartin, control mTOR signaling by acting as a GTPase-activating protein complex toward Rheb. Curr. Biol. CB 13, 1259–1268.
van Tellingen, O., Yetkin-Arik, B., de Gooijer, M.C., Wesseling, P., Wurdinger, T., and de Vries, H.E. (2015). Overcoming the blood-brain tumor barrier for effective glioblastoma treatment. Drug Resist. Updat. Rev. Comment. Antimicrob. Anticancer Chemother. 19, 1–12.
Thedieck, K., Holzwarth, B., Prentzell, M.T., Boehlke, C., Kläsener, K., Ruf, S., Sonntag, A.G., Maerz, L., Grellscheid, S.-N., Kremmer, E., et al. (2013). Inhibition of mTORC1 by Astrin and Stress Granules Prevents Apoptosis in Cancer Cells. Cell 154, 859–874.
Thomanetz, V., Angliker, N., Cloëtta, D., Lustenberger, R.M., Schweighauser, M., Oliveri, F., Suzuki, N., and Rüegg, M.A. (2013). Ablation of the mTORC2 component rictor in brain or Purkinje cells affects size and neuron morphology. J. Cell Biol. 201, 293–308.
Thoreen, C.C., Chantranupong, L., Keys, H.R., Wang, T., Gray, N.S., and Sabatini, D.M. (2012). A unifying model for mTORC1-mediated regulation of mRNA
Bibliography
235
translation. Nature 485, 109–113.
Thurston, T.L.M., Wandel, M.P., von Muhlinen, N., Foeglein, A., and Randow, F. (2012). Galectin 8 targets damaged vesicles for autophagy to defend cells against bacterial invasion. Nature 482, 414–418.
Tian, T., Li, X., and Zhang, J. (2019). mTOR Signaling in Cancer and mTOR Inhibitors in Solid Tumor Targeting Therapy. Int. J. Mol. Sci. 20, 755.
Tremblay, F., and Marette, A. (2001). Amino acids and insulin signaling via the mTOR/p70 S6 kinase pathway: A negative feedback mechanism leading to insulin resistance in skeletal muscle cells. J. Biol. Chem.
Treps, L., Edmond, S., Harford-Wright, E., Galan-Moya, E.M., Schmitt, A., Azzi, S., Citerne, A., Bidère, N., Ricard, D., and Gavard, J. (2016). Extracellular vesicle-transported Semaphorin3A promotes vascular permeability in glioblastoma. Oncogene 35, 2615–2623.
Treps, L., Perret, R., Edmond, S., Ricard, D., and Gavard, J. (2017). Glioblastoma stem-like cells secrete the pro-angiogenic VEGF-A factor in extracellular vesicles. J. Extracell. Vesicles 6.
Tsuboyama, K., Koyama-Honda, I., Sakamaki, Y., Koike, M., Morishita, H., and Mizushima, N. (2016). The ATG conjugation systems are important for degradation of the inner autophagosomal membrane. Science 354, 1036–1041.
Tsun, Z.-Y., Bar-Peled, L., Chantranupong, L., Zoncu, R., Wang, T., Kim, C., Spooner, E., and Sabatini, D.M. (2013). The Folliculin Tumor Suppressor Is a GAP for the RagC/D GTPases That Signal Amino Acid Levels to mTORC1. Mol. Cell 52, 495–505.
Tu, Y., Zhong, Y., Fu, J., Cao, Y., Fu, G., Tian, X., and Wang, B. (2011). Activation of JAK/STAT signal pathway predicts poor prognosis of patients with gliomas. Med. Oncol. Northwood Lond. Engl. 28, 15–23.
Tunici, P., Bissola, L., Lualdi, E., Pollo, B., Cajola, L., Broggi, G., Sozzi, G., and Finocchiaro, G. (2004). Genetic alterations and in vivo tumorigenicity of neurospheres derived from an adult glioblastoma. Mol. Cancer 3, 25.
Uehata, T., Iwasaki, H., Vandenbon, A., Matsushita, K., Hernandez-Cuellar, E., Kuniyoshi, K., Satoh, T., Mino, T., Suzuki, Y., Standley, D.M., et al. (2013). Malt1-induced cleavage of regnase-1 in CD4(+) helper T cells regulates immune activation. Cell 153, 1036–1049.
Uren, A.G., O’Rourke, K., Aravind, L.A., Pisabarro, M.T., Seshagiri, S., Koonin, E.V., and Dixit, V.M. (2000). Identification of paracaspases and metacaspases: two ancient families of caspase-like proteins, one of which plays a key role in MALT lymphoma. Mol. Cell 6, 961–967.
Uribesalgo, I., Hoffmann, D., Zhang, Y., Kavirayani, A., Lazovic, J., Berta, J.,

Bibliography
236
Novatchkova, M., Pai, T.-P., Wimmer, R.A., László, V., et al. (2019). Apelin inhibition prevents resistance and metastasis associated with anti-angiogenic therapy. EMBO Mol. Med. 11, e9266.
Van Der Sanden, B., Appaix, F., Berger, F., Selek, L., Issartel, J.-P., and Wion, D. (2013). Translation of the ecological trap concept to glioma therapy: the cancer cell trap concept. Future Oncol. Lond. Engl. 817–824.
Vander Haar, E., Lee, S.-I., Bandhakavi, S., Griffin, T.J., and Kim, D.-H. (2007). Insulin signalling to mTOR mediated by the Akt/PKB substrate PRAS40. Nat. Cell Biol. 9, 316–323.
Vasiljeva, O., Papazoglou, A., Krüger, A., Brodoefel, H., Korovin, M., Deussing, J., Augustin, N., Nielsen, B.S., Almholt, K., Bogyo, M., et al. (2006). Tumor cell-derived and macrophage-derived cathepsin B promotes progression and lung metastasis of mammary cancer. Cancer Res. 66, 5242–5250.
Vergarajauregui, S., and Puertollano, R. (2006). Two di-leucine motifs regulate trafficking of mucolipin-1 to lysosomes. Traffic Cph. Den. 7, 337–353.
Verhaak, R.G.W., Hoadley, K.A., Purdom, E., Wang, V., Qi, Y., Wilkerson, M.D., Miller, C.R., Ding, L., Golub, T., Mesirov, J.P., et al. (2010). Integrated genomic analysis identifies clinically relevant subtypes of glioblastoma characterized by abnormalities in PDGFRA, IDH1, EGFR, and NF1. Cancer Cell 17, 98–110.
Vézina, C., Kudelski, A., and Sehgal, S.N. (1975). Rapamycin (AY-22,989), a new antifungal antibiotic. I. Taxonomy of the producing streptomycete and isolation of the active principle. J. Antibiot. (Tokyo) 28, 721–726.
Villegas, F., Lehalle, D., Mayer, D., Rittirsch, M., Stadler, M.B., Zinner, M., Olivieri, D., Vabres, P., Duplomb-Jego, L., Bont, E.S.J.M.D., et al. (2019). Lysosomal Signaling Licenses Embryonic Stem Cell Differentiation via Inactivation of Tfe3. Cell Stem Cell 24, 257-270.e8.
van der Vos, K.E., Abels, E.R., Zhang, X., Lai, C., Carrizosa, E., Oakley, D., Prabhakar, S., Mardini, O., Crommentuijn, M.H.W., Skog, J., et al. (2016). Directly visualized glioblastoma-derived extracellular vesicles transfer RNA to microglia/macrophages in the brain. Neuro-Oncol. 18, 58–69.
Waheed, A., Hasilik, A., and von Figura, K. (1981). Processing of the phosphorylated recognition marker in lysosomal enzymes. Characterization and partial purification of a microsomal alpha-N-acetylglucosaminyl phosphodiesterase. J. Biol. Chem. 256, 5717–5721.
Wang, T., and Hong, W. (2002). Interorganellar regulation of lysosome positioning by the Golgi apparatus through Rab34 interaction with Rab-interacting lysosomal protein. Mol. Biol. Cell 13, 4317–4332.
Wang, F., Yu, L., Monopoli, M.P., Sandin, P., Mahon, E., Salvati, A., and Dawson, K.A. (2013). The biomolecular corona is retained during nanoparticle uptake and
Bibliography
237
protects the cells from the damage induced by cationic nanoparticles until degraded in the lysosomes. Nanomedicine Nanotechnol. Biol. Med. 9, 1159–1168.
Wang, F., Salvati, A., and Boya, P. (2018). Lysosome-dependent cell death and deregulated autophagy induced by amine-modified polystyrene nanoparticles. Open Biol. 8.
Wang, H., Lathia, J.D., Wu, Q., Wang, J., Li, Z., Heddleston, J.M., Eyler, C.E., Elderbroom, J., Gallagher, J., Schuschu, J., et al. (2009). Targeting Interleukin 6 Signaling Suppresses Glioma Stem Cell Survival and Tumor Growth. Stem Cells Dayt. Ohio 27, 2393–2404.
Wang, H., Deng, J., Ren, H.-Y., Jia, P., Zhang, W., Li, M.-Q., Li, S.-W., and Zhou, Q.-H. (2017a). STAT3 influences the characteristics of stem cells in cervical carcinoma. Oncol. Lett. 14, 2131–2136.
Wang, L., Harris, T.E., Roth, R.A., and Lawrence, J.C. (2007). PRAS40 regulates mTORC1 kinase activity by functioning as a direct inhibitor of substrate binding. J. Biol. Chem. 282, 20036–20044.
Wang, Q., Hu, B., Hu, X., Kim, H., Squatrito, M., Scarpace, L., deCarvalho, A.C., Lyu, S., Li, P., Li, Y., et al. (2017b). Tumor evolution of glioma intrinsic gene expression subtype associates with immunological changes in the microenvironment. Cancer Cell 32, 42-56.e6.
Wang, S., Tsun, Z.-Y., Wolfson, R.L., Shen, K., Wyant, G.A., Plovanich, M.E., Yuan, E.D., Jones, T.D., Chantranupong, L., Comb, W., et al. (2015). Lysosomal amino acid transporter SLC38A9 signals arginine sufficiency to mTORC1. Science 347, 188–194.
Wang, W.-T., Chen, Y.-H., Hsu, J.-L., Leu, W.-J., Yu, C.-C., Chan, S.-H., Ho, Y.-F., Hsu, L.-C., and Guh, J.-H. (2014). Terfenadine induces anti-proliferative and apoptotic activities in human hormone-refractory prostate cancer through histamine receptor-independent Mcl-1 cleavage and Bak up-regulation. Naunyn. Schmiedebergs Arch. Pharmacol. 387, 33–45.
Welker, A.M., Jaros, B.D., Puduvalli, V.K., Imitola, J., Kaur, B., and Beattie, C.E. (2016). Standardized orthotopic xenografts in zebrafish reveal glioma cell-line-specific characteristics and tumor cell heterogeneity. Dis. Model. Mech. 9, 199–210.
Westermark, B., Pontén, J., and Hugosson, R. (1973). Determinants for the Establishment of Permanent Tissue Culture Lines from Human Gliomas. Acta Pathol. Microbiol. Scand. [A] 81A, 791–805.
Westphal, M., and Lamszus, K. (2011). The neurobiology of gliomas: from cell biology to the development of therapeutic approaches. Nat. Rev. Neurosci. 12, 495–508.
Westphal, M., Hilt, D.C., Bortey, E., Delavault, P., Olivares, R., Warnke, P.C., Whittle, I.R., Jääskeläinen, J., and Ram, Z. (2003). A phase 3 trial of local

Bibliography
238
chemotherapy with biodegradable carmustine (BCNU) wafers (Gliadel wafers) in patients with primary malignant glioma. Neuro-Oncol. 5, 79–88.
White, U.A., and Stephens, J.M. (2011). The gp130 Receptor Cytokine Family: Regulators of Adipocyte Development and Function. Curr. Pharm. Des. 17, 340–346.
White, J.H., Wise, A., Main, M.J., Green, A., Fraser, N.J., Disney, G.H., Barnes, A.A., Emson, P., Foord, S.M., and Marshall, F.H. (1998). Heterodimerization is required for the formation of a functional GABA(B) receptor. Nature 396, 679–682.
Wick, W., Gorlia, T., Bendszus, M., Taphoorn, M., Sahm, F., Harting, I., Brandes, A.A., Taal, W., Domont, J., Idbaih, A., et al. (2017). Lomustine and Bevacizumab in Progressive Glioblastoma. N. Engl. J. Med. 377, 1954–1963.
Wiesmann, C., Leder, L., Blank, J., Bernardi, A., Melkko, S., Decock, A., D’Arcy, A., Villard, F., Erbel, P., Hughes, N., et al. (2012). Structural determinants of MALT1 protease activity. J. Mol. Biol. 419, 4–21.
Wippich, F., Bodenmiller, B., Trajkovska, M.G., Wanka, S., Aebersold, R., and Pelkmans, L. (2013). Dual Specificity Kinase DYRK3 Couples Stress Granule Condensation/Dissolution to mTORC1 Signaling. Cell 152, 791–805.
Withana, N.P., Blum, G., Sameni, M., Slaney, C., Anbalagan, A., Olive, M.B., Bidwell, B.N., Edgington, L., Wang, L., Moin, K., et al. (2012). Cathepsin B inhibition limits bone metastasis in breast cancer. Cancer Res. 72, 1199–1209.
Witte, H.T., Jeibmann, A., Klämbt, C., and Paulus, W. (2009). Modeling Glioma Growth and Invasion in Drosophila melanogaster. Neoplasia N. Y. N 11, 882–888.
Wolfson, R.L., Chantranupong, L., Saxton, R.A., Shen, K., Scaria, S.M., Cantor, J.R., and Sabatini, D.M. (2016). Sestrin2 is a leucine sensor for the mTORC1 pathway. Science 351, 43–48.
Wolfson, R.L., Chantranupong, L., Wyant, G.A., Gu, X., Orozco, J.M., Shen, K., Condon, K.J., Petri, S., Kedir, J., Scaria, S.M., et al. (2017). KICSTOR recruits GATOR1 to the lysosome and is necessary for nutrients to regulate mTORC1. Nature 543, 438–442.
Wu, C.-H., Yang, Y.-H., Chen, M.-R., Tsai, C.-H., Cheng, A.-L., and Doong, S.-L. (2018). Autocleavage of the paracaspase MALT1 at Arg-781 attenuates NF-κB signaling and regulates the growth of activated B-cell like diffuse large B-cell lymphoma cells. PloS One 13, e0199779.
Wyant, G.A., Abu-Remaileh, M., Wolfson, R.L., Chen, W.W., Freinkman, E., Danai, L.V., Vander Heiden, M.G., and Sabatini, D.M. (2017). mTORC1 Activator SLC38A9 Is Required to Efflux Essential Amino Acids from Lysosomes and Use Protein as a Nutrient. Cell 171, 642-654.e12.
Xu, J., Fu, S., Peng, W., and Rao, Z. (2012a). MCP-1-induced protein-1, an immune regulator. Protein Cell 3, 903–910.

Bibliography
239
Xu, J., Peng, W., Sun, Y., Wang, X., Xu, Y., Li, X., Gao, G., and Rao, Z. (2012b). Structural study of MCPIP1 N-terminal conserved domain reveals a PIN-like RNase. Nucleic Acids Res. 40, 6957–6965.
Yadav, L., Puri, N., Rastogi, V., Satpute, P., and Sharma, V. (2015). Tumour Angiogenesis and Angiogenic Inhibitors: A Review. J. Clin. Diagn. Res. JCDR 9, XE01–XE05.
Yamamoto, H., Kakuta, S., Watanabe, T.M., Kitamura, A., Sekito, T., Kondo-Kakuta, C., Ichikawa, R., Kinjo, M., and Ohsumi, Y. (2012). Atg9 vesicles are an important membrane source during early steps of autophagosome formation. J. Cell Biol. 198, 219–233.
Yan, K., Yang, K., and Rich, J.N. (2013). The evolving landscape of glioblastoma stem cells. Curr. Opin. Neurol. 26, 701–707.
Yang, F., Liu, X., Liu, Y., Liu, Y., Zhang, C., Wang, Z., Jiang, T., and Wang, Y. (2017). miR-181d/MALT1 regulatory axis attenuates mesenchymal phenotype through NF-κB pathways in glioblastoma. Cancer Lett. 396, 1–9.
Yang, G., Murashige, D.S., Humphrey, S.J., and James, D.E. (2015). A Positive Feedback Loop between Akt and mTORC2 via SIN1 Phosphorylation. Cell Rep. 12, 937–943.
Yang, H., Rudge, D.G., Koos, J.D., Vaidialingam, B., Yang, H.J., and Pavletich, N.P. (2013). mTOR kinase structure, mechanism and regulation. Nature 497, 217–223.
Yang, Q., Inoki, K., Ikenoue, T., and Guan, K.-L. (2006). Identification of Sin1 as an essential TORC2 component required for complex formation and kinase activity. Genes Dev. 20, 2820–2832.
Yang, Y.-P., Chang, Y.-L., Huang, P.-I., Chiou, G.-Y., Tseng, L.-M., Chiou, S.-H., Chen, M.-H., Chen, M.-T., Shih, Y.-H., Chang, C.-H., et al. (2012). Resveratrol suppresses tumorigenicity and enhances radiosensitivity in primary glioblastoma tumor initiating cells by inhibiting the STAT3 axis. J. Cell. Physiol. 227, 976–993.
Ye, J., Palm, W., Peng, M., King, B., Lindsten, T., Li, M.O., Koumenis, C., and Thompson, C.B. (2015). GCN2 sustains mTORC1 suppression upon amino acid deprivation by inducing Sestrin2. Genes Dev. 29, 2331–2336.
Yogalingam, G., Bonten, E.J., van de Vlekkert, D., Hu, H., Moshiach, S., Connell, S.A., and d’Azzo, A. (2008). Neuraminidase 1 is a Negative Regulator of Lysosomal Exocytosis. Dev. Cell 15, 74–86.
Yu, J.W., Hoffman, S., Beal, A.M., Dykon, A., Ringenberg, M.A., Hughes, A.C., Dare, L., Anderson, A.D., Finger, J., Kasparcova, V., et al. (2015). MALT1 Protease Activity Is Required for Innate and Adaptive Immune Responses. PloS One 10, e0127083.
Yu, Y., Yoon, S.-O., Poulogiannis, G., Yang, Q., Ma, X.M., Villén, J., Kubica, N.,

Bibliography
240
Hoffman, G.R., Cantley, L.C., Gygi, S.P., et al. (2011). Phosphoproteomic Analysis Identifies Grb10 as an mTORC1 Substrate That Negatively Regulates Insulin Signaling. Science 332, 1322–1326.
Yuan, F., Salehi, H.A., Boucher, Y., Vasthare, U.S., Tuma, R.F., and Jain, R.K. (1994). Vascular permeability and microcirculation of gliomas and mammary carcinomas transplanted in rat and mouse cranial windows. Cancer Res. 54, 4564–4568.
Yuan, H.-X., Russell, R.C., and Guan, K.-L. (2013). Regulation of PIK3C3/VPS34 complexes by MTOR in nutrient stress-induced autophagy. Autophagy 9, 1983–1995.
Zaarur, N., Meriin, A.B., Bejarano, E., Xu, X., Gabai, V.L., Cuervo, A.M., and Sherman, M.Y. (2014). Proteasome Failure Promotes Positioning of Lysosomes around the Aggresome via Local Block of Microtubule-Dependent Transport. Mol. Cell. Biol. 34, 1336–1348.
Zeng, L.-H., Xu, L., Gutmann, D.H., and Wong, M. (2008). Rapamycin prevents epilepsy in a mouse model of tuberous sclerosis complex. Ann. Neurol. 63, 444–453.
Zhang, J., Stevens, M.F.G., and Bradshaw, T.D. (2012). Temozolomide: mechanisms of action, repair and resistance. Curr. Mol. Pharmacol. 5, 102–114.
Zhao, J., Brault, J.J., Schild, A., Cao, P., Sandri, M., Schiaffino, S., Lecker, S.H., and Goldberg, A.L. (2007). FoxO3 coordinately activates protein degradation by the autophagic/lysosomal and proteasomal pathways in atrophying muscle cells. Cell Metab. 6, 472–483.
Zhao, J., Zhai, B., Gygi, S.P., and Goldberg, A.L. (2015). mTOR inhibition activates overall protein degradation by the ubiquitin proteasome system as well as by autophagy. Proc. Natl. Acad. Sci. U. S. A. 112, 15790–15797.
Zhao, K., Zhao, X., Tu, Y., Miao, Q., Cao, D., Duan, W., Sun, Y., Wang, J., Wei, T., and Yang, F. (2010). Lysosomal chymotrypsin B potentiates apoptosis via cleavage of Bid. Cell. Mol. Life Sci. 67, 2665–2678.
Zhitomirsky, B., and Assaraf, Y.G. (2014). Lysosomal sequestration of hydrophobic weak base chemotherapeutics triggers lysosomal biogenesis and lysosome-dependent cancer multidrug resistance. Oncotarget 6, 1143–1156.
Zhitomirsky, B., and Assaraf, Y.G. (2017). Lysosomal accumulation of anticancer drugs triggers lysosomal exocytosis. Oncotarget 8, 45117–45132.
Zhou, Y., Peng, Z., Seven, E.S., and Leblanc, R.M. (2018). Crossing the blood-brain barrier with nanoparticles. J. Control. Release Off. J. Control. Release Soc. 270, 290–303.
Zhu, T.S., Costello, M.A., Talsma, C.E., Flack, C.G., Crowley, J.G., Hamm, L.L., He, X., Hervey-J umper, S.L., Heth, J.A., Muraszko, K.M., et al. (2011). Endothelial cells

Bibliography
241
create a stem cell niche in glioblastoma by providing Notch ligands that nurture self-renewal of cancer stem-like cells. Cancer Res. 71, 6061–6072.
Zhu, Y., Li, X., Kyazike, J., Zhou, Q., Thurberg, B.L., Raben, N., Mattaliano, R.J., and Cheng, S.H. (2004). Conjugation of mannose 6-phosphate-containing oligosaccharides to acid alpha-glucosidase improves the clearance of glycogen in pompe mice. J. Biol. Chem. 279, 50336–50341.
Zhu, Y., Guignard, F., Zhao, D., Liu, L., Burns, D.K., Mason, R.P., Messing, A., and Parada, L.F. (2005). Early inactivation of p53 tumor suppressor gene cooperating with NF1 loss induces malignant astrocytoma. Cancer Cell 8, 119–130.
Zhu, Z., Gorman, M.J., McKenzie, L.D., Chai, J.N., Hubert, C.G., Prager, B.C., Fernandez, E., Richner, J.M., Zhang, R., Shan, C., et al. (2017). Zika virus has oncolytic activity against glioblastoma stem cells. J. Exp. Med. 214, 2843–2857.
Zoncu, R., Bar-Peled, L., Efeyan, A., Wang, S., Sancak, Y., and Sabatini, D.M. (2011). mTORC1 senses lysosomal amino acids through an inside-out mechanism that requires the Vacuolar H+-ATPase. Science 334, 678–683.
Zouaoui, S., Rigau, V., Mathieu-Daudé, H., Darlix, A., Bessaoud, F., Fabbro-Peray, P., Bauchet, F., Kerr, C., Fabbro, M., Figarella-Branger, D., et al. (2012). [French brain tumor database: general results on 40,000 cases, main current applications and future prospects]. Neurochirurgie. 58, 4–13.

242

243

224
Title: Exploring the Role of Intercellular and Intracellular Signaling in the Sustenance of Glioblastoma Stem-like Cells
Keywords: Signaling, Cancer Stem-like Cells, GBM, Lysosome, mTOR, Niche
Abstract: Glioblastoma multiforme, GBM, is the deadliest adult primary brain tumor with a median survival time of approximately 12 to 15 months. Within these heterogeneous tumors exists a subpopulation of cells with stem-like properties termed glioblastoma stem-like cells, GSCs. As they are suspected to be involved in initiation, expansion, and relapse, they represent a promising strategy for treating these tumors. In situ, GSCs reside in part in a protective vascular niche in close interaction with endothelial cells, however these cells have also been found in more hostile areas of the tumor, away from their privileged microenvironment. Therefore, uncovering intrinsic cell signaling regulating autocrine and paracrine survival mechanisms can produce novel targets for therapy. Here, we approach the analysis of signaling mechanisms employed by GSCs in their survival, in order to identify potential targets for therapy.
On one hand, we report that the glycoprotein gp130 has an important role in endothelial cell communication with GSCs. In fact, the endothelial secretome is able to sustain GSC stemness in the absence of other mitogens. However, pharmacological blockade of gp130 abrogates this effect. On the other hand, in the absence of signals emanating from endothelial cells, we uncover that the paracaspase MALT1 is important to maintain GSC survival and expansion, as knockdown or inhibition of this protease is lethal to these cells. From a molecular standpoint, we found that inhibition of MALT1 disrupts endo-lysosomal homeostasis, resulting in a lysosomal cell death concomitant with mTOR inactivation. Therefore, we identified two signaling axes within GSCs with the potential for therapeutic targeting.
Titre : Exploration du rôle de la signalisation intercellulaire et intracellulaire dans le maintien des cellules de type souche de glioblastome
Mots clés : signalisation, cellules souches cancéreuses, GBM, lysosome, mTOR, niche
Résumé : Le Glioblastome Multiforme, GBM, est une tumeur cérébrale parmi les plus agressives de l’adulte, avec une médiane de survie s’échelonnant autour de 12 à 15 mois. Au sein de ces tumeurs hétérogènes réside une sous-population de cellules aux propriétés souches appelées GSC pour cellules de type souche du glioblastome, Une stratégie potentielle pour le traitement de ces tumeurs consisterait à cibler ces GSCs. Les GSCs résident à la fois dans une niche vasculaire protectrice en interaction étroite avec les cellules endothéliales et dans des zones non vascularisées, plus hostiles. Dans ce contexte, il est crucial de mieux caractériser la signalisation cellulaire intrinsèque régulant les mécanismes de survie autocrine et paracrine des GSCs. Ma thèse s’est concentrée sur l'analyse des mécanismes de signalisation régissant les décisions de vie/mort des GSCs, dans le but d’offrir de nouvelles perspectives thérapeutiques
D’une part, mes résultats montrent que la glycoprotéine gp130 joue un rôle important dans la communication entre les GSCs et les cellules endothéliales. Le sécrétome endothélial est en effet capable de maintenir le caractère souche des GSCs, en l'absence d'autres mitogènes externes. Le blocage pharmacologique de gp130 annule cet effet. Par ailleurs, en l’absence de signaux émanant des cellules endothéliales, j’ai mis en évidence le rôle instrumental de la paracaspase MALT1 dans la survie et l’expansion des GSCs. La suppression ou l'inhibition de cette protéase s’avère toxique pour ces cellules. D’un point de vue mécanistique, j’ai trouvé que l'inhibition de MALT1 perturbe l'homéostasie endo-lysosomale, entraînant une mort cellulaire lysosomale concomitante à l'inactivation de mTOR. J’ai donc identifié deux axes de signalisation au sein des GSCs avec un potentiel de ciblage thérapeutique.
Related Documents