KATANGA MINING LIMITED Management’s Discussion and Analysis For the three and six months ended June 30, 2015 and 2014 The following discussion and analysis is management’s assessment of the results of operations and financial condition of Katanga Mining Limited (“Katanga” or the “Company”) and should be read in conjunction with the unaudited interim condensed consolidated financial statements and the notes thereto of the Company for the three and six months ended June 30, 2015, and 2014, and the audited consolidated financial statements and the notes thereto of the Company for the years ended December 31, 2014, and 2013. The unaudited interim condensed consolidated financial statements have been prepared in accordance with IAS 34 “Interim Financial Reporting” (“IAS 34”) using accounting policies consistent with the International Financial Reporting Standards (“IFRS”) issued by the International Accounting Standards Board (“IASB”) and Interpretations of the International Financial Reporting Interpretations Committee (“IFRIC”). All dollar amounts are in United States dollars unless otherwise indicated. This information has been prepared as of August 12, 2015. Katanga’s common shares trade on the Toronto Stock Exchange (“TSX”) under the symbol “KAT”. Katanga’s most recent filings, including Katanga’s Annual Information Form for the year ended December 31, 2014, dated March 31, 2015, are available on the System for Electronic Document Analysis and Retrieval (“SEDAR”) and can be accessed through the internet at www.sedar.com. This Management’s Discussion and Analysis contains forward looking statements that are subject to risk factors as set out in items 13 and 18. Company Overview Katanga is a limited company whose common shares are listed on the TSX under the symbol “KAT”. The Company’s registered office address is Suite 300, 204 Black Street, Whitehorse, Yukon, Canada Y1A 2M9. Katanga's ultimate parent company is Glencore plc (“Glencore”) which owns 75.3% of Katanga's shares through its wholly-owned subsidiaries Glencore International AG and Glencore Finance (Bermuda) Limited. Katanga, through its 75% owned subsidiary Kamoto Copper Company SA (“KCC”), is engaged in copper and cobalt mining and related activities in the Democratic Republic of Congo (“DRC”). KCC is engaged in the exploration, mining, refurbishment, rehabilitation, development and operation of the Kamoto / Mashamba East mining complex (including “KTO Underground Mine” or “KTO”, “KTE Underground Mine” and “Etang South Underground Mine”), the Kamoto Oliveira Virgule copper and cobalt mine (“KOV Open Pit” or “KOV”), the T17 Mine consisting of “T17 Open Pit” and “T17 Underground Mine”, various oxide open pit resources, the Kamoto Concentrator (“KTC”) and the Luilu Metallurgical Plant (“Luilu”), (collectively, the “Project”), in the DRC.

Welcome message from author
This document is posted to help you gain knowledge. Please leave a comment to let me know what you think about it! Share it to your friends and learn new things together.
Transcript

KATANGA MINING LIMITED
Management’s Discussion and Analysis For the three and six months ended June 30, 2015 and 2014
The following discussion and analysis is management’s assessment of the results of operations and financial condition of Katanga
Mining Limited (“Katanga” or the “Company”) and should be read in conjunction with the unaudited interim condensed
consolidated financial statements and the notes thereto of the Company for the three and six months ended June 30, 2015, and 2014, and the audited consolidated financial statements and the notes thereto of the Company for the years ended December 31, 2014, and
2013. The unaudited interim condensed consolidated financial statements have been prepared in accordance with IAS 34 “Interim Financial Reporting” (“IAS 34”) using accounting policies consistent with the International Financial Reporting Standards (“IFRS”)
issued by the International Accounting Standards Board (“IASB”) and Interpretations of the International Financial Reporting
Interpretations Committee (“IFRIC”). All dollar amounts are in United States dollars unless otherwise indicated. This information has been prepared as of August 12, 2015. Katanga’s common shares trade on the Toronto Stock Exchange (“TSX”) under the symbol
“KAT”. Katanga’s most recent filings, including Katanga’s Annual Information Form for the year ended December 31, 2014, dated
March 31, 2015, are available on the System for Electronic Document Analysis and Retrieval (“SEDAR”) and can be accessed through the internet at www.sedar.com. This Management’s Discussion and Analysis contains forward looking statements that are
subject to risk factors as set out in items 13 and 18.
Company Overview
Katanga is a limited company whose common shares are listed on the TSX under the symbol “KAT”. The Company’s registered office address is Suite 300, 204 Black Street, Whitehorse, Yukon, Canada Y1A 2M9. Katanga's ultimate parent company is Glencore
plc (“Glencore”) which owns 75.3% of Katanga's shares through its wholly-owned subsidiaries Glencore International AG and
Glencore Finance (Bermuda) Limited.
Katanga, through its 75% owned subsidiary Kamoto Copper Company SA (“KCC”), is engaged in copper and cobalt mining and
related activities in the Democratic Republic of Congo (“DRC”). KCC is engaged in the exploration, mining, refurbishment, rehabilitation, development and operation of the Kamoto / Mashamba East mining complex (including “KTO Underground Mine” or
“KTO”, “KTE Underground Mine” and “Etang South Underground Mine”), the Kamoto Oliveira Virgule copper and cobalt mine
(“KOV Open Pit” or “KOV”), the T17 Mine consisting of “T17 Open Pit” and “T17 Underground Mine”, various oxide open pit resources, the Kamoto Concentrator (“KTC”) and the Luilu Metallurgical Plant (“Luilu”), (collectively, the “Project”), in the DRC.
MANAGEMENT’S DISCUSSION AND ANALYSIS OF FINANCIAL CONDITION AND RESULTS OF OPERATIONS
1
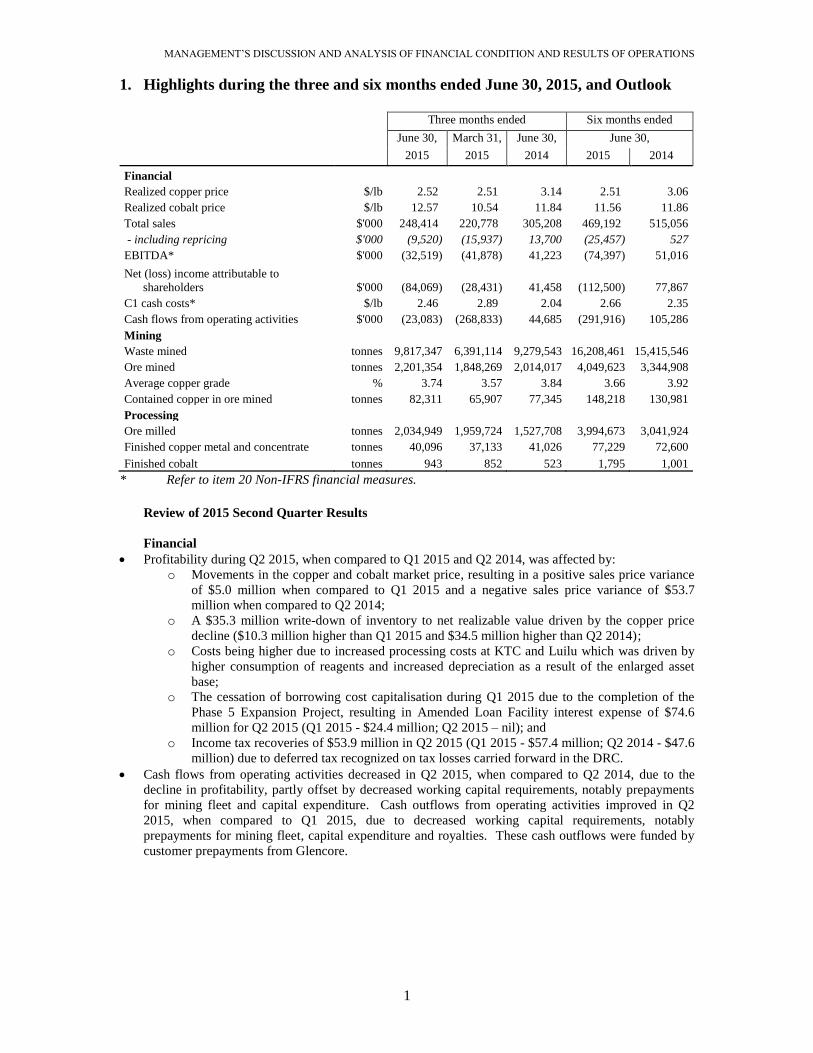
1. Highlights during the three and six months ended June 30, 2015, and Outlook
Three months ended Six months ended
June 30, March 31, June 30, June 30,
2015 2015 2014 2015 2014
Financial
Realized copper price $/lb 2.52) 2.51) 3.14 2.51) 3.06
Realized cobalt price $/lb 12.57) 10.54) 11.84 11.56) 11.86
Total sales $'000 248,414) 220,778) 305,208 469,192) 515,056
- including repricing $'000 (9,520) (15,937) 13,700 (25,457) 527
EBITDA* $'000 (32,519) (41,878) 41,223 (74,397) 51,016
Net (loss) income attributable to
shareholders $'000 (84,069) (28,431) 41,458 (112,500) 77,867
C1 cash costs* $/lb 2.46) 2.89) 2.04 2.66) 2.35
Cash flows from operating activities $'000 (23,083) (268,833) 44,685 (291,916) 105,286
Mining
Waste mined tonnes 9,817,347 6,391,114 9,279,543 16,208,461 15,415,546
Ore mined tonnes 2,201,354 1,848,269 2,014,017 4,049,623 3,344,908
Average copper grade % 3.74 3.57 3.84 3.66 3.92
Contained copper in ore mined tonnes 82,311 65,907 77,345 148,218 130,981
Processing
Ore milled tonnes 2,034,949 1,959,724 1,527,708 3,994,673 3,041,924
Finished copper metal and concentrate tonnes 40,096 37,133 41,026 77,229 72,600
Finished cobalt tonnes 943 852 523 1,795 1,001
* Refer to item 20 Non-IFRS financial measures.
Review of 2015 Second Quarter Results
Financial
Profitability during Q2 2015, when compared to Q1 2015 and Q2 2014, was affected by:
o Movements in the copper and cobalt market price, resulting in a positive sales price variance
of $5.0 million when compared to Q1 2015 and a negative sales price variance of $53.7
million when compared to Q2 2014;
o A $35.3 million write-down of inventory to net realizable value driven by the copper price
decline ($10.3 million higher than Q1 2015 and $34.5 million higher than Q2 2014);
o Costs being higher due to increased processing costs at KTC and Luilu which was driven by
higher consumption of reagents and increased depreciation as a result of the enlarged asset
base;
o The cessation of borrowing cost capitalisation during Q1 2015 due to the completion of the
Phase 5 Expansion Project, resulting in Amended Loan Facility interest expense of $74.6
million for Q2 2015 (Q1 2015 - $24.4 million; Q2 2015 – nil); and
o Income tax recoveries of $53.9 million in Q2 2015 (Q1 2015 - $57.4 million; Q2 2014 - $47.6
million) due to deferred tax recognized on tax losses carried forward in the DRC.
Cash flows from operating activities decreased in Q2 2015, when compared to Q2 2014, due to the
decline in profitability, partly offset by decreased working capital requirements, notably prepayments
for mining fleet and capital expenditure. Cash outflows from operating activities improved in Q2
2015, when compared to Q1 2015, due to decreased working capital requirements, notably
prepayments for mining fleet, capital expenditure and royalties. These cash outflows were funded by
customer prepayments from Glencore.

MANAGEMENT’S DISCUSSION AND ANALYSIS OF FINANCIAL CONDITION AND RESULTS OF OPERATIONS
2
Mining
During Q2 2015 the Company increased ore production by 9%, when compared to Q2 2014; this is
principally due to a record level of ore production at KOV Open Pit (an increase of 11% on Q2 2014)
where new mining fleet was commissioned in the intervening year. KTO also contributed with a
record level of ore production (a 4% increase compared to Q2 2014) due to higher stope availability
resulting from increased backfilling and development. Waste tonnes mined were 6% higher than Q2
2014.
Q2 2015 total ore tonnes mined were 19% higher than Q1 2015. Q1 2015 had lower volumes due to
dewatering issues at KOV during the DRC rainy season. Higher average copper mined grade was
achieved in Q2 as higher grade material at the pit bottom became more accessible.
In Q2 2015, the Company commissioned:
o Five new Caterpillar 793D haul trucks operating in KOV to increase ore and waste mining
capacity (increasing the fleet size to 19); and
o One Caterpillar AD45B haul truck operating in KTO to facilitate increased ore and waste
mining capacity (increasing the fleet size to 17).
Processing
Ore milled at KTC during Q2 2015 reached a record level driven by the increased volumes milled at
CM5 (commissioned as part of the Phase 5 Expansion Project). CM5 is currently milling at 99% of
design capacity.
Finished copper metal and concentrate produced decreased by 2% over Q2 2014 driven by the lower
mined grades and lower grade of concentrate feed to Luilu. Finished copper metal and concentrate
produced was an 8% increase over Q1 2015 driven by the increased contained copper in ore mined and
increased volumes of ore milled.
Cobalt metal produced totalled a record 943 tonnes for Q2 2015, an 80% increase from Q2 2014 and
an 11% increase from Q1 2015, due to the increased grades and volume fed together with improved
recoveries thereon.
During Q2, June 2015, the Company commenced with the Whole Ore Leach Project:
o Committed capital expenditure amounts to $10.5 million for site excavation and civil work.
o Concurrent with the construction of the Whole Ore Leach Plant and infrastructure, the current
Life of Mine Plan is being optimized to ensure that the appropriate ore blend will be supplied
to the Whole Ore Leach Process in order to maximize copper and cobalt recovery and to
minimize operating cost per unit.
In Q2 2015, the Company commissioned the following assets at KTC and Luilu in order to improve
throughputs and recoveries:
o Improvements to the froth skimmers in the KTC oxide flotation section which improved
mass-pull in the Wemco cells;
o Upgrade of cleaner bank cells in the oxide flotation section to improve oxide concentrate
grades;
o Upgrade of 20m3 tank cells in the old re-cleaner circuit with additional pre-floatation cells to
increase pre-float capacity;
o Installation of a second concentrate transfer line to increase concentrate transfer to Luilu; and
o A new pumping station at the Mupine tailings facility to increase water capacity to both KTC
and Luilu.

MANAGEMENT’S DISCUSSION AND ANALYSIS OF FINANCIAL CONDITION AND RESULTS OF OPERATIONS
3
Review of 2015 First Half Year Results
Financial
Profitability during H1 2015, when compared to H1 2014, was adversely affected by:
o The decline in the copper and cobalt market price, resulting in a sales price variance of $94.2
million when compared to H1 2014;
o A $60.2 million write-down of inventory to net realizable value driven by the copper price
decline (H1 2014 - $0.8 million);
o Costs being higher due to increased mining expenditure, increased processing costs at KTC
and Luilu as a result of higher reagent consumption, and increased depreciation as a result of
the enlarged asset base; and
o The cessation of borrowing cost capitalisation during H1 2015 due to the completion of the
Phase 5 Expansion Project, resulting in Amended Loan Facility interest expense of $99
million for the six month period.
Income tax recoveries were $111.3 million in H1 2015 (H1 2014 - $103.5 million) due to deferred tax
recognized on tax losses carried forward in the DRC.
Cash flows from operating activities decreased in H1 2015 due to the decline in profitability, in
addition to increased working capital requirements, notably increased inventories and decreased
payables. These cash outflows were funded by customer prepayments from Glencore.
Mining
During H1 2015 the Company increased the ore production by 21%, when compared to H1 2014; this
is principally due to an increase in ore production of 28% at KOV Open Pit where new mining fleet
was commissioned in the intervening year. KTO contributed with an 8% increase in ore production,
compared to H1 2014 due to higher stope availability resulting from increased backfilling and
development. Waste tonnes mined were 5% higher than H1 2014.
H1 2015 contained copper increased by 13%, when compared to H1 2014, as the increased volume
was partly offset by the lower average copper grade achieved.
In H1 2015, the Company commissioned:
o Two Caterpillar R2900G loaders in KTO to increase the ore and waste handling capacity;
o One lube truck for use underground;
o Two Caterpillar D11 dozers and one Caterpillar 834K dozer to optimize mined waste
management;
o Five new Caterpillar 793D haul trucks operating in KOV to increase ore and waste mining
capacity (increasing the fleet size to 19); and
o One Caterpillar AD45B haul truck operating in KTO to facilitate increased ore and waste
mining capacity (increasing the fleet size to 17).
MANAGEMENT’S DISCUSSION AND ANALYSIS OF FINANCIAL CONDITION AND RESULTS OF OPERATIONS
4
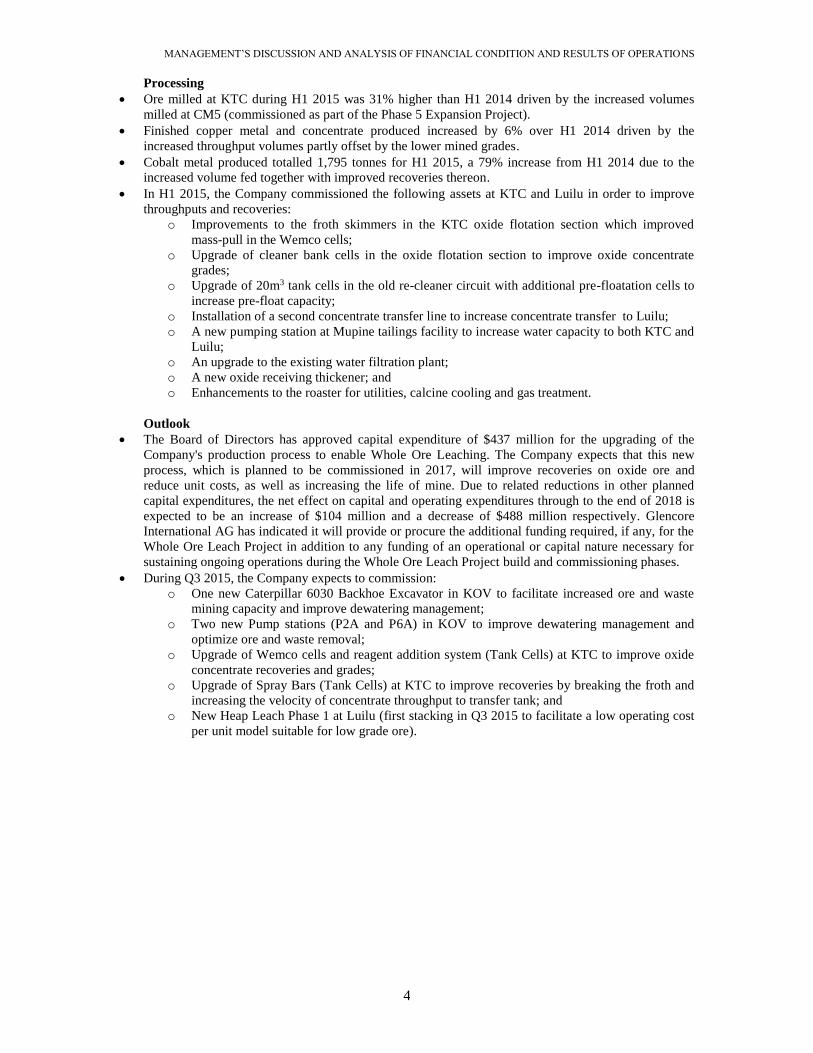
Processing
Ore milled at KTC during H1 2015 was 31% higher than H1 2014 driven by the increased volumes
milled at CM5 (commissioned as part of the Phase 5 Expansion Project).
Finished copper metal and concentrate produced increased by 6% over H1 2014 driven by the
increased throughput volumes partly offset by the lower mined grades.
Cobalt metal produced totalled 1,795 tonnes for H1 2015, a 79% increase from H1 2014 due to the
increased volume fed together with improved recoveries thereon.
In H1 2015, the Company commissioned the following assets at KTC and Luilu in order to improve
throughputs and recoveries:
o Improvements to the froth skimmers in the KTC oxide flotation section which improved
mass-pull in the Wemco cells;
o Upgrade of cleaner bank cells in the oxide flotation section to improve oxide concentrate
grades;
o Upgrade of 20m3 tank cells in the old re-cleaner circuit with additional pre-floatation cells to
increase pre-float capacity;
o Installation of a second concentrate transfer line to increase concentrate transfer to Luilu;
o A new pumping station at Mupine tailings facility to increase water capacity to both KTC and
Luilu;
o An upgrade to the existing water filtration plant;
o A new oxide receiving thickener; and
o Enhancements to the roaster for utilities, calcine cooling and gas treatment.
Outlook
The Board of Directors has approved capital expenditure of $437 million for the upgrading of the
Company's production process to enable Whole Ore Leaching. The Company expects that this new
process, which is planned to be commissioned in 2017, will improve recoveries on oxide ore and
reduce unit costs, as well as increasing the life of mine. Due to related reductions in other planned
capital expenditures, the net effect on capital and operating expenditures through to the end of 2018 is
expected to be an increase of $104 million and a decrease of $488 million respectively. Glencore
International AG has indicated it will provide or procure the additional funding required, if any, for the
Whole Ore Leach Project in addition to any funding of an operational or capital nature necessary for
sustaining ongoing operations during the Whole Ore Leach Project build and commissioning phases.
During Q3 2015, the Company expects to commission:
o One new Caterpillar 6030 Backhoe Excavator in KOV to facilitate increased ore and waste
mining capacity and improve dewatering management;
o Two new Pump stations (P2A and P6A) in KOV to improve dewatering management and
optimize ore and waste removal;
o Upgrade of Wemco cells and reagent addition system (Tank Cells) at KTC to improve oxide
concentrate recoveries and grades;
o Upgrade of Spray Bars (Tank Cells) at KTC to improve recoveries by breaking the froth and
increasing the velocity of concentrate throughput to transfer tank; and
o New Heap Leach Phase 1 at Luilu (first stacking in Q3 2015 to facilitate a low operating cost
per unit model suitable for low grade ore).
MANAGEMENT’S DISCUSSION AND ANALYSIS OF FINANCIAL CONDITION AND RESULTS OF OPERATIONS
5
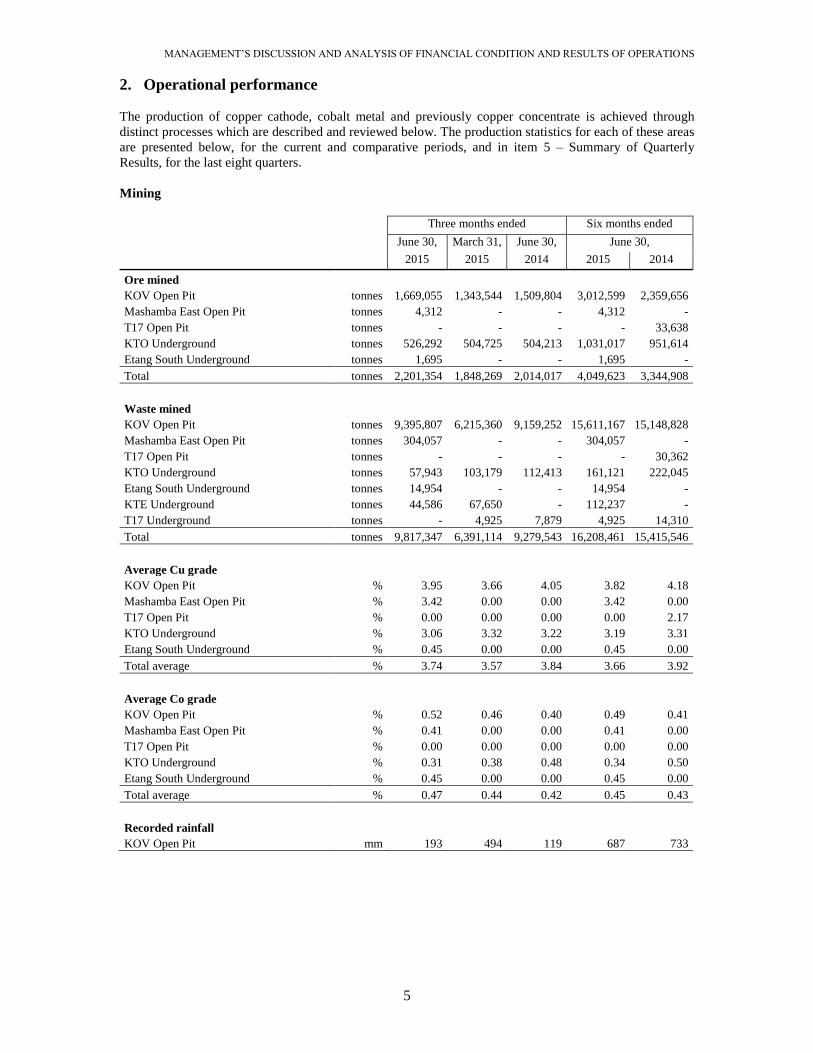
2. Operational performance
The production of copper cathode, cobalt metal and previously copper concentrate is achieved through
distinct processes which are described and reviewed below. The production statistics for each of these areas
are presented below, for the current and comparative periods, and in item 5 – Summary of Quarterly
Results, for the last eight quarters.
Mining
Three months ended Six months ended
June 30, March 31, June 30, June 30,
2015 2015 2014 2015 2014
Ore mined
KOV Open Pit tonnes 1,669,055 1,343,544 1,509,804 3,012,599 2,359,656
Mashamba East Open Pit tonnes 4,312 - - 4,312 -
T17 Open Pit tonnes - - - - 33,638
KTO Underground tonnes 526,292 504,725 504,213 1,031,017 951,614
Etang South Underground tonnes 1,695 - - 1,695 -
Total tonnes 2,201,354 1,848,269 2,014,017 4,049,623 3,344,908
Waste mined
KOV Open Pit tonnes 9,395,807 6,215,360 9,159,252 15,611,167 15,148,828
Mashamba East Open Pit tonnes 304,057 - - 304,057 -
T17 Open Pit tonnes - - - - 30,362
KTO Underground tonnes 57,943 103,179 112,413 161,121 222,045
Etang South Underground tonnes 14,954 - - 14,954 -
KTE Underground tonnes 44,586 67,650 - 112,237 -
T17 Underground tonnes - 4,925 7,879 4,925 14,310
Total tonnes 9,817,347 6,391,114 9,279,543 16,208,461 15,415,546
Average Cu grade
KOV Open Pit % 3.95 3.66 4.05 3.82 4.18
Mashamba East Open Pit % 3.42 0.00 0.00 3.42 0.00
T17 Open Pit % 0.00 0.00 0.00 0.00 2.17
KTO Underground % 3.06 3.32 3.22 3.19 3.31
Etang South Underground % 0.45 0.00 0.00 0.45 0.00
Total average % 3.74 3.57 3.84 3.66 3.92
Average Co grade
KOV Open Pit % 0.52 0.46 0.40 0.49 0.41
Mashamba East Open Pit % 0.41 0.00 0.00 0.41 0.00
T17 Open Pit % 0.00 0.00 0.00 0.00 0.00
KTO Underground % 0.31 0.38 0.48 0.34 0.50
Etang South Underground % 0.45 0.00 0.00 0.45 0.00
Total average % 0.47 0.44 0.42 0.45 0.43
Recorded rainfall
KOV Open Pit mm 193 494 119 687 733
MANAGEMENT’S DISCUSSION AND ANALYSIS OF FINANCIAL CONDITION AND RESULTS OF OPERATIONS
6
Review of 2015 Second Quarter Results
KOV Open Pit
The Q2 2015 increase in ore and waste mined, when compared to Q2 2014, is principally due to the
commissioning of new mining fleet during the intervening year. The Q2 2015 increase in ore and
waste mined, when compared to Q1 2015, is due to dewatering issues encountered during the DRC
rainy season during Q1 2015. This effect also resulted in the higher average copper grade achieved as
higher grade material at the pit bottom became more accessible.
In Q2 2015, the Company commissioned five new Caterpillar 793D haul trucks to increase ore and
waste mining capacity.
KTO Underground Mine
KTO mined 4% more ore in Q2 2015 than Q2 2014 and Q1 2015 due to higher stope availability
resulting from increased backfilling and development.
Additional mining fleet was also commissioned during 2014.
During Q2 2015, the Company commissioned one Caterpillar AD45B haul truck to facilitate increased
ore and waste mining capacity.
Other mines
Mashamba East Open Pit, commenced development during Q2 2015, with 304,057 tonnes of waste and
4,312 tonnes of ore mined. As at December 31, 2014, Mashamba East Open Pit had measured and
indicated mineral resources of 75 million tonnes of ore containing 1.8% copper and 0.38% cobalt. Etang South Underground Mine, an extension of KTO, mined 14,954 tonnes of waste and 4,312 tonnes
of ore during Q2 2015. KTE Underground Mine, an extension of KTO, continued development during Q2 2015, with 44,586
tonnes of waste mined and 539 metres of primary development achieved (Q1 2015 - 67,650 tonnes of
waste mined and 767 metres of primary development). T17 Underground Mine development continued during Q2 2015, with developmental ore extraction
still expected to commence in 2016.
Review of 2015 First Half Year Results
KOV Open Pit
The H1 2015 increase in ore and waste mined, when compared to H1 2014, is principally due to the
commissioning of new mining fleet during the intervening year.
In H1 2015, the Company commissioned:
o Two Caterpillar D11 dozers and one Caterpillar 834K dozer to optimize mined waste
management; and
o Five new Caterpillar 793D haul trucks to increase ore and waste mining capacity.
KTO Underground Mine
KTO mined 8% more ore in H1 2015 than H1 2014 due to higher stope availability resulting from
increased backfilling and development.
Additional mining fleet was also commissioned during H2 2014 and H1 2015.
During H1 2015, the Company commissioned:
o Two Caterpillar R2900G loaders to increase the ore and waste handling capacity;
o One lube truck for use underground; and
o One Caterpillar AD45B haul truck to facilitate increased ore and waste mining capacity.
MANAGEMENT’S DISCUSSION AND ANALYSIS OF FINANCIAL CONDITION AND RESULTS OF OPERATIONS
7
Other mines
KTE Underground Mine mined 112,237 tonnes of waste and 1,306 metres of primary development
were achieved. T17 Underground Mine mined 4,925 tonnes of waste during H1 2015 (H1 2014 – 14,310 tonnes).
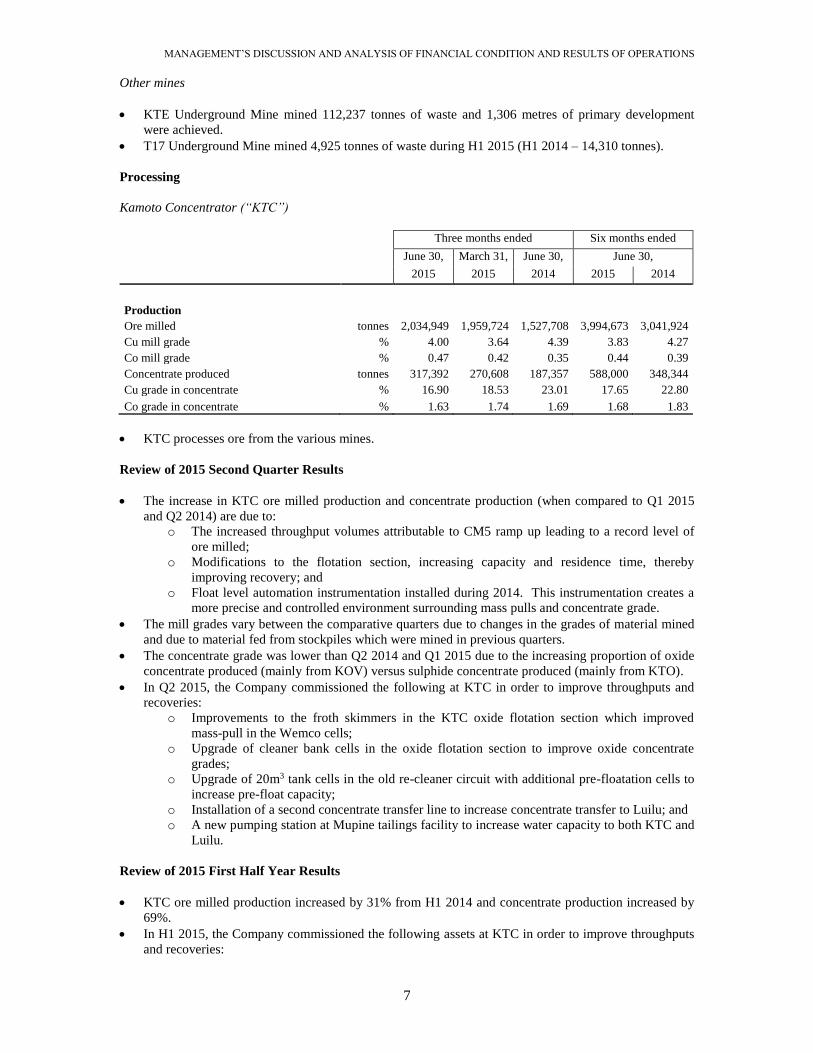
Processing
Kamoto Concentrator (“KTC”)
Three months ended Six months ended
June 30, March 31, June 30, June 30,
2015 2015 2014 2015 2014
Production
Ore milled tonnes 2,034,949 1,959,724 1,527,708 3,994,673 3,041,924
Cu mill grade % 4.00 3.64 4.39 3.83 4.27
Co mill grade % 0.47 0.42 0.35 0.44 0.39
Concentrate produced tonnes 317,392 270,608 187,357 588,000 348,344
Cu grade in concentrate % 16.90 18.53 23.01 17.65 22.80
Co grade in concentrate % 1.63 1.74 1.69 1.68 1.83
KTC processes ore from the various mines.
Review of 2015 Second Quarter Results
The increase in KTC ore milled production and concentrate production (when compared to Q1 2015
and Q2 2014) are due to:
o The increased throughput volumes attributable to CM5 ramp up leading to a record level of
ore milled;
o Modifications to the flotation section, increasing capacity and residence time, thereby
improving recovery; and
o Float level automation instrumentation installed during 2014. This instrumentation creates a
more precise and controlled environment surrounding mass pulls and concentrate grade.
The mill grades vary between the comparative quarters due to changes in the grades of material mined
and due to material fed from stockpiles which were mined in previous quarters.
The concentrate grade was lower than Q2 2014 and Q1 2015 due to the increasing proportion of oxide
concentrate produced (mainly from KOV) versus sulphide concentrate produced (mainly from KTO).
In Q2 2015, the Company commissioned the following at KTC in order to improve throughputs and
recoveries:
o Improvements to the froth skimmers in the KTC oxide flotation section which improved
mass-pull in the Wemco cells;
o Upgrade of cleaner bank cells in the oxide flotation section to improve oxide concentrate
grades;
o Upgrade of 20m3 tank cells in the old re-cleaner circuit with additional pre-floatation cells to
increase pre-float capacity;
o Installation of a second concentrate transfer line to increase concentrate transfer to Luilu; and
o A new pumping station at Mupine tailings facility to increase water capacity to both KTC and
Luilu.
Review of 2015 First Half Year Results
KTC ore milled production increased by 31% from H1 2014 and concentrate production increased by
69%.
In H1 2015, the Company commissioned the following assets at KTC in order to improve throughputs
and recoveries:

MANAGEMENT’S DISCUSSION AND ANALYSIS OF FINANCIAL CONDITION AND RESULTS OF OPERATIONS
8
o Improvements to the froth skimmers in the KTC oxide flotation section which improved
mass-pull in the Wemco cells;
o Upgrade of cleaner bank cells in the oxide flotation section to improve oxide concentrate
grades;
o Upgrade of 20m3 tank cells in the old re-cleaner circuit with additional pre-floatation cells to
increase pre-float capacity;
o Installation of a second concentrate transfer line to increase concentrate transfer to Luilu; and
o A new pumping station at Mupine tailings facility to increase water capacity to both KTC and
Luilu.
Luilu Metallurgical Plant
Three months ended Six months ended
June 30, March 31, June 30, June 30,
2015 2015 2014 2015 2014
Production
Concentrate fed tonnes 292,671 279,492 276,847 572,163 490,124
Cu concentrate grade % 17.50 18.31 21.29 17.90 21.19
Co concentrate grade % 1.72 1.73 1.66 1.72 1.76
Finished copper metal tonnes 35,974 37,133 40,016 73,107 71,590
Finished copper metal and concentrate tonnes 40,096 37,133 41,026 77,229 72,600
Cobalt produced tonnes 943 852 523 1,795 1,001
Electricity
Power consumption GWh 238 236 220 474 411
Power events number 119 44 94 163 178
Duration hours 192 6 101 198 205
The Luilu Metallurgical Plant processes sulphide and oxide concentrate from KTC through a modern
Solvent Extraction and Electro-Winning (“SX-EW”) circuit.
Review of 2015 Second Quarter Results
Q2 2015 copper metal produced was 10% lower than Q2 2014 and 3% lower than Q1 2015 due to the
lower grade of concentrate fed, in addition to less pond stockpile material being fed into the process.
The increased cobalt production, when compared to Q2 2014 and Q1 2015, is due to the increased
material fed together with efforts to increase bleed flow to Purification by Precipitation Selective
(“PPS”) and extension plants, and resolution of lime blockages and density control.
Copper production was achieved despite continuing power disruptions. During Q2 2015,
approximately 192 production hours were lost across the operation due to 119 separate events of power
disruption (Q2 2014 – 101 production hours and 94 events; Q1 2015 – 6 production hours and 44
events). This amounts to approximately 8 days of lost production (Q2 2014 – 4 days; Q1 2015 – 0.25
days) and includes the time from the power disruption until equipment is operating at pre-power
disruption capacity. The lost production time excludes the adverse impact on equipment availability
due to the unplanned abrupt shut downs and subsequent start up of the equipment due to the power
disruptions. In the short term, the diesel cogeneration plants, and in the medium to long term,
improvements in infrastructure as a result of the Power Project (see item 6) are expected to improve the
reliability and stability of electricity supply overall.
Review of 2015 First Half Year Results
H1 2015 copper metal produced was 2% higher than H1 2014 due to the increased SX-EW capacity
installed during the course of 2014, greater roaster efficiency and downtime improvements.
The 79% increase in cobalt production, when compared to H1 2014, is due to the increased material
fed together with efforts to increase bleed flow to PPS and extension plants, and resolution of lime
blockages and density control.

MANAGEMENT’S DISCUSSION AND ANALYSIS OF FINANCIAL CONDITION AND RESULTS OF OPERATIONS
9
In H1 2015, the Company commissioned the following at Luilu in order to improve throughputs and
recoveries:
o An upgrade to the existing water filtration plant;
o A new oxide receiving thickener; and
o Enhancements to the roaster for utilities, calcine cooling and gas treatment.
3. Financial Performance
Operating Results
Three months ended Six months ended
June 30, March 31, June 30, June 30,
2015 2015 2014 2015 2014
Sales* $'000 248,414) 220,778) 305,208) 469,192) 515,056)
Cost of sales* $'000 (253,935) (233,545) (222,532) (487,480) (386,359)
Royalties and transportation costs* $'000 (35,712) (29,055) (38,182) (64,767) (68,386)
Depreciation $'000 (62,454) (55,353) (57,751) (117,807) (99,081)
Gross loss $'000 (103,687) (97,175) (13,257) (200,862) (38,770)
Other expenses* $'000 8,714) (56) (3,271) 8,658) (9,295)
Net finance costs $'000 (77,929) (27,734) (2,135) (105,663) (5,432)
Income tax recovery $'000 53,945) 57,367) 47,567) 111,312) 103,461)
Net (loss) income $'000 (118,957) (67,598) 28,904) (186,555) 49,964)
Non-controlling interests $'000 (34,888) (39,167) (12,554) (74,055) (27,903)
Attributable to equity holders $'000 (84,069) (28,431) 41,458) (112,500) 77,867)
EBITDA* $'000 (32,519) (41,878) 41,223) (74,397) 51,016)
Basic and diluted (loss) income per
common share** $/share (0.04) (0.01) 0.02) (0.06) 0.04)
C1 cash cost*** $/pound 2.46) 2.89) 2.04) 2.66) 2.35)
* The aggregation of sales cost of sales, royalties and transportation costs, and other expenses
totals to EBITDA (Refer to item 20 Non-IFRS financial measures).
** Basic and diluted income per common share are the same for the periods presented since the
outstanding share options are anti-dilutive since their exercise prices exceeded the average market
value of the common shares at each period end.
*** Refer to item 20 Non-IFRS financial measures.
MANAGEMENT’S DISCUSSION AND ANALYSIS OF FINANCIAL CONDITION AND RESULTS OF OPERATIONS
10
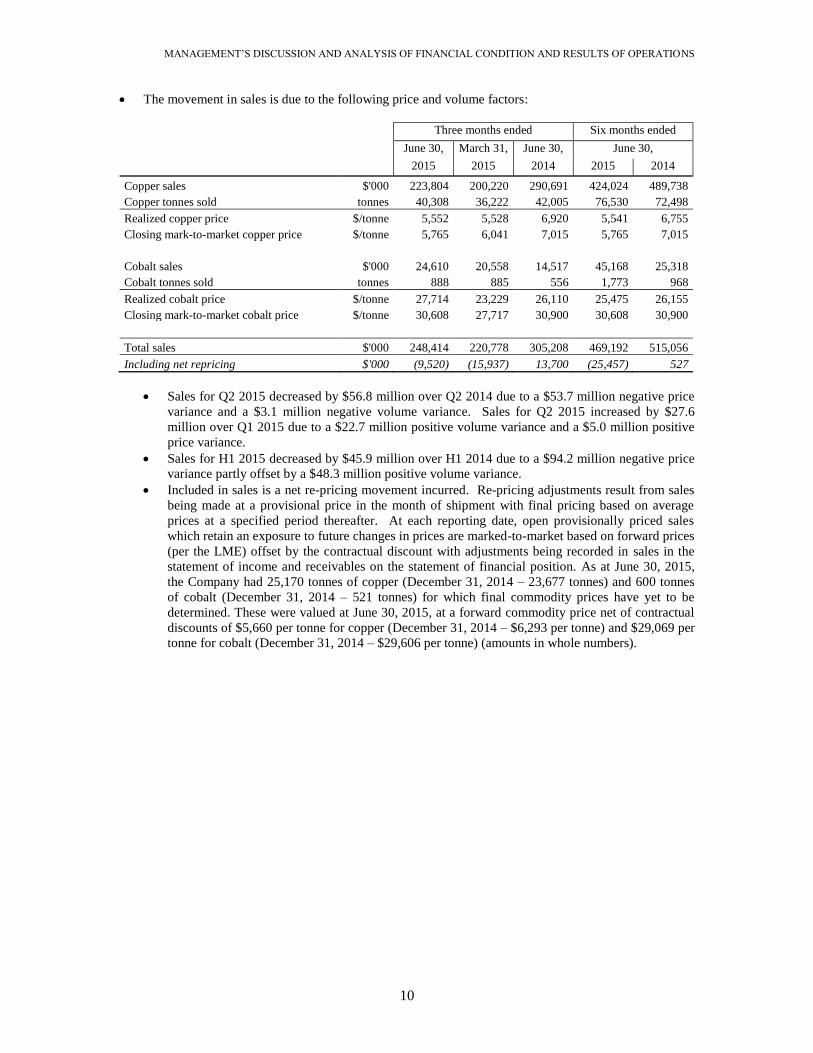
The movement in sales is due to the following price and volume factors:
Three months ended Six months ended
June 30, March 31, June 30, June 30,
2015 2015 2014 2015 2014
Copper sales $'000 223,804 200,220 290,691 424,024 489,738
Copper tonnes sold tonnes 40,308 36,222 42,005 76,530 72,498
Realized copper price $/tonne 5,552 5,528 6,920 5,541 6,755
Closing mark-to-market copper price $/tonne 5,765 6,041 7,015 5,765 7,015
Cobalt sales $'000 24,610 20,558 14,517 45,168 25,318
Cobalt tonnes sold tonnes 888 885 556 1,773 968
Realized cobalt price $/tonne 27,714 23,229 26,110 25,475 26,155
Closing mark-to-market cobalt price $/tonne 30,608 27,717 30,900 30,608 30,900
Total sales $'000 248,414 220,778 305,208 469,192 515,056
Including net repricing $'000 (9,520) (15,937) 13,700 (25,457) 527
Sales for Q2 2015 decreased by $56.8 million over Q2 2014 due to a $53.7 million negative price
variance and a $3.1 million negative volume variance. Sales for Q2 2015 increased by $27.6
million over Q1 2015 due to a $22.7 million positive volume variance and a $5.0 million positive
price variance.
Sales for H1 2015 decreased by $45.9 million over H1 2014 due to a $94.2 million negative price
variance partly offset by a $48.3 million positive volume variance.
Included in sales is a net re-pricing movement incurred. Re-pricing adjustments result from sales
being made at a provisional price in the month of shipment with final pricing based on average
prices at a specified period thereafter. At each reporting date, open provisionally priced sales
which retain an exposure to future changes in prices are marked-to-market based on forward prices
(per the LME) offset by the contractual discount with adjustments being recorded in sales in the
statement of income and receivables on the statement of financial position. As at June 30, 2015,
the Company had 25,170 tonnes of copper (December 31, 2014 – 23,677 tonnes) and 600 tonnes
of cobalt (December 31, 2014 – 521 tonnes) for which final commodity prices have yet to be
determined. These were valued at June 30, 2015, at a forward commodity price net of contractual
discounts of $5,660 per tonne for copper (December 31, 2014 – $6,293 per tonne) and $29,069 per
tonne for cobalt (December 31, 2014 – $29,606 per tonne) (amounts in whole numbers).
MANAGEMENT’S DISCUSSION AND ANALYSIS OF FINANCIAL CONDITION AND RESULTS OF OPERATIONS
11
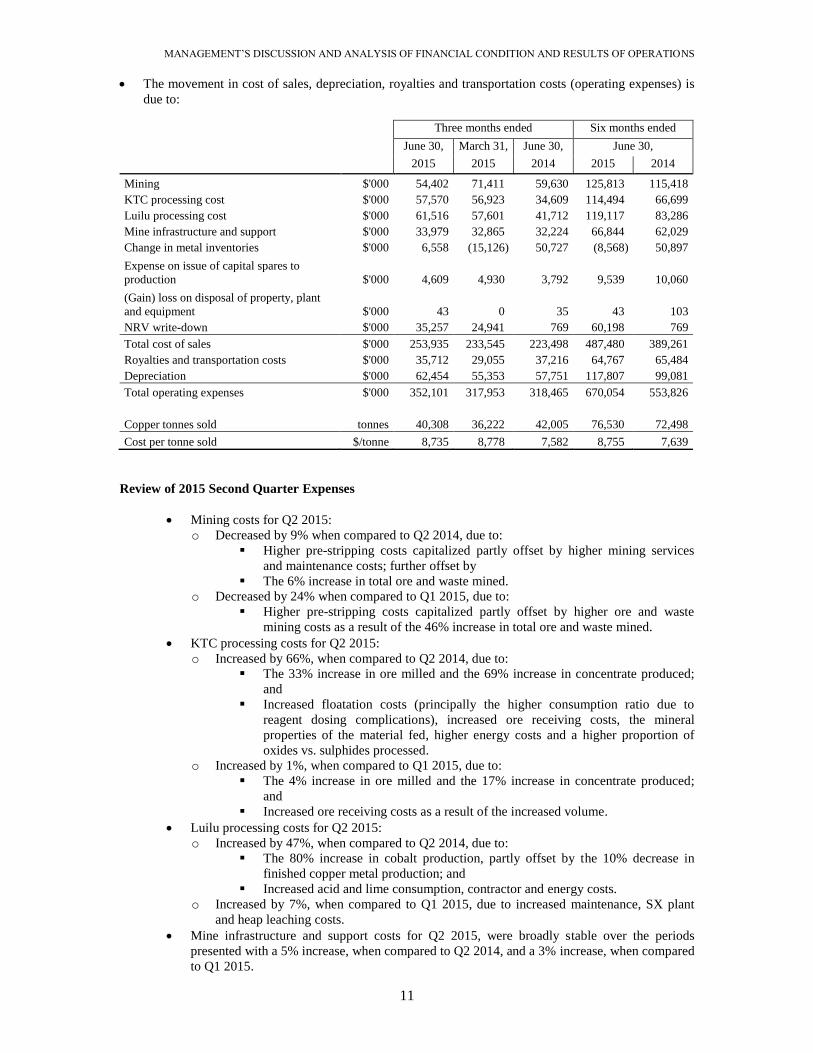
The movement in cost of sales, depreciation, royalties and transportation costs (operating expenses) is
due to:
Three months ended Six months ended
June 30, March 31, June 30, June 30,
2015 2015 2014 2015 2014
Mining $'000 54,402 71,411) 59,630 125,813) 115,418
KTC processing cost $'000 57,570 56,923) 34,609 114,494) 66,699
Luilu processing cost $'000 61,516 57,601) 41,712 119,117) 83,286
Mine infrastructure and support $'000 33,979 32,865) 32,224 66,844) 62,029
Change in metal inventories $'000 6,558 (15,126) 50,727 (8,568) 50,897
Expense on issue of capital spares to
production $'000 4,609 4,930) 3,792 9,539) 10,060
(Gain) loss on disposal of property, plant
and equipment $'000 43 0) 35 43) 103
NRV write-down $'000 35,257 24,941) 769 60,198) 769
Total cost of sales $'000 253,935 233,545) 223,498 487,480) 389,261
Royalties and transportation costs $'000 35,712 29,055) 37,216 64,767) 65,484
Depreciation $'000 62,454 55,353) 57,751 117,807) 99,081
Total operating expenses $'000 352,101 317,953) 318,465 670,054) 553,826
Copper tonnes sold tonnes 40,308 36,222) 42,005 76,530) 72,498
Cost per tonne sold $/tonne 8,735 8,778) 7,582 8,755) 7,639
Review of 2015 Second Quarter Expenses
Mining costs for Q2 2015:
o Decreased by 9% when compared to Q2 2014, due to:
Higher pre-stripping costs capitalized partly offset by higher mining services
and maintenance costs; further offset by
The 6% increase in total ore and waste mined.
o Decreased by 24% when compared to Q1 2015, due to:
Higher pre-stripping costs capitalized partly offset by higher ore and waste
mining costs as a result of the 46% increase in total ore and waste mined.
KTC processing costs for Q2 2015:
o Increased by 66%, when compared to Q2 2014, due to:
The 33% increase in ore milled and the 69% increase in concentrate produced;
and
Increased floatation costs (principally the higher consumption ratio due to
reagent dosing complications), increased ore receiving costs, the mineral
properties of the material fed, higher energy costs and a higher proportion of
oxides vs. sulphides processed.
o Increased by 1%, when compared to Q1 2015, due to:
The 4% increase in ore milled and the 17% increase in concentrate produced;
and
Increased ore receiving costs as a result of the increased volume.
Luilu processing costs for Q2 2015:
o Increased by 47%, when compared to Q2 2014, due to:
The 80% increase in cobalt production, partly offset by the 10% decrease in
finished copper metal production; and
Increased acid and lime consumption, contractor and energy costs.
o Increased by 7%, when compared to Q1 2015, due to increased maintenance, SX plant
and heap leaching costs.
Mine infrastructure and support costs for Q2 2015, were broadly stable over the periods
presented with a 5% increase, when compared to Q2 2014, and a 3% increase, when compared
to Q1 2015.

MANAGEMENT’S DISCUSSION AND ANALYSIS OF FINANCIAL CONDITION AND RESULTS OF OPERATIONS
12
Change in metal inventories expense increased due to the decreased level of work in progress
and finished goods not yet sold in Q2 2015.
Included in operating expenses for Q2 2015 is a $35.3 million write-down of inventory to net
realizable value as a result of the decline in the copper price (Q2 2014 - $0.8 million; Q1 2015
- $24.9 million).
Royalty payments and transportation costs for Q2 2015:
o Decreased by 4%, when compared to Q2 2014, due to the decreased copper tonnes sold
and the decrease in copper sales prices.
o Increased by 23%, when compared to Q1 2015, due to the increase in copper tonnes sold
and the increase in the cobalt sales prices.
Depreciation and amortization increased by 8% from Q2 2014 and 13% from Q1 2015 as a
result of the additional amortization of the pre-stripping costs at KOV as mining tonnes have
increased, additional depreciation on commissioned Updated Phase 4 Expansion Project and
Phase 5 Expansion Project assets, together with greater units-of-production (“UOP”)
amortization and depreciation as overall production has increased.
The decreased gross profit is due to the lower sales prices, the inventory write-down, the higher
processing costs, and the higher depreciation and amortization.
Other expenses were lower due to increased foreign exchange gains largely due to favourable
movements in the USD: ZAR exchange rate.
Net finance costs were higher due to:
o The cessation of borrowing cost capitalisation during Q1 2015 due to the completion of
the Phase 5 Expansion Project, resulting in Amended Loan Facility interest expense of
$74.6 million for Q2 2015 (Q1 2015 – $24.4 million; Q2 2014 – nil); and
o Changes in sales volumes upon which interest is charged for payments received in
advance.
Income tax recoveries vary based on the movements in tax losses carried forward in the DRC.
Review of 2015 First Half Year Expenses
Mining costs increased by 9% due to:
o The 8% increase in ore and waste mined; and
o Higher costs, notably increased mining services and dewatering costs, partly offset by
higher pre-stripping costs capitalized.
KTC processing costs increased by 72%, due to
o The 31% increase in ore milled and the 69% increase in concentrate produced; and
o Increased costs, notably floatation costs (principally the higher consumption ratio due to
reagent dosing complications), ore receiving costs, the mineral properties of the material
fed, higher energy costs and a higher proportion of oxides vs. sulphides processed.
Luilu processing costs increased by 43% due to:
o The 2% increase in finished copper metal production and 79% increase in cobalt
production; and
o Increased acid and lime consumption, tailings, maintenance and energy costs.
Mine infrastructure and support costs increased by 8% to support the higher levels of
operations.
Change in metal inventories expense decreased due to the increased level of work in progress
and finished goods not yet sold in H1 2015.
Included in operating expenses for H1 2015 is a $60.2 million write-down of inventory to net
realizable value as a result of the decline in the copper price (H1 2014 - $0.7 million).
Royalty payments and transportation costs decreased by 1% due to the decrease in sales prices
partly offset by the increased copper and cobalt tonnes sold.
Depreciation and amortization increased by 19% from H1 2014 as a result of the additional
amortization of the pre-stripping costs at KOV as mining tonnes have increased, additional
depreciation on commissioned Updated Phase 4 Expansion Project and Phase 5 Expansion
Project assets, together with greater units-of-production (“UOP”) amortization and
depreciation as overall production has increased.
The decreased gross profit is due to the lower sales prices, the inventory write-down, the higher
mining and processing costs, and the higher depreciation and amortization.

MANAGEMENT’S DISCUSSION AND ANALYSIS OF FINANCIAL CONDITION AND RESULTS OF OPERATIONS
13
Other expenses were lower due to increased foreign exchange gains largely due to favourable
movements in the USD: ZAR exchange rate and lower head office costs as a result of the reversal
of key management compensation accruals upon their resignation in Q1 2015.
Net finance costs were higher due to:
o The cessation of borrowing cost capitalisation during Q1 2015 due to the completion of
the Phase 5 Expansion Project, resulting in Amended Loan Facility interest expense of
$99 million for H1 2015; and
o Increased sales volumes upon which interest is charged for payments received in
advance.
Income tax recoveries were higher due to increases in tax losses carried forward in the DRC.
Further, in H1 2014, the recovery amount includes provision releases as a result of the finalization
of the tax audits for 2008 to 2012.
Cash Flows
Three months ended Six months ended
June 30, March 31, June 30, June 30,
2015 2015 2014 2015 2014
Cash flow from (used in):
Operating activities $'000 (23,083) (268,833) 44,685) (291,916) 105,286)
Investing activities $'000 (162,664) (98,345) (121,352) (261,009) (269,976)
Financing activities $'000 241,150) 354,000) 129,300) 595,150) 205,500)
Total cash flows $'000 55,403) (13,178) 52,633) 42,225) 40,810)
Cash, beginning of period* $'000 (23,784) (10,519) 13,929) (10,519) 25,745)
Effect of exchange rate changes on cash
held in foreign currencies $'000 67) (87) (94) (20) (87)
Cash, end of period* $'000 31,686) (23,784) 66,468) 31,686) 66,468)
* Consisting of cash on hand and bank overdrafts.
Review of 2015 Second Quarter Cash Flows
Cash outflows from operating activities were:
o $67.8 million higher in Q2 2015, when compared to Q2 2014, primarily due to:
The decrease in net income, net of non-cash items, of $72.8 million, as described
above; and
A working capital inflow of $8.7 million (Q2 2014, $3.7 million).
o $245.8 million lower, when compared to Q1 2015, primarily due to:
The increase in net income, net of non-cash items, $7.5 million, as described
above; and
A working capital inflow of $8.7 million (Q1 2015, $229.6 million outflow).
Investing activities in Q2 2015, increased by $41.3 million compared to Q2 2014 and by $64.3
million relative to Q1 2015, mainly due to additional mining fleet purchased at KOV and the
higher levels of pre-stripping expenditure incurred. The Q2 2015 additions to mineral interests and
property, plant and equipment relate mainly to the KOV pre-strip ($43.6 million), KOV mining
fleet ($22.5 million), processing expansionary capital ($40.0 million) and sustaining capital ($24.6
million).
Financing activities in Q2 2015, increased by $111.9 million, when compared to Q2 2014, and
decreased by $112.9 million, when compared to Q1 2015, due to draw-downs from customer
prepayments (in 2015). The Q2 2015 draw-downs were in the form of customer prepayments
from Glencore and were mainly utilized to fund additions to property, plant and equipment and
operating cash outflows.
MANAGEMENT’S DISCUSSION AND ANALYSIS OF FINANCIAL CONDITION AND RESULTS OF OPERATIONS
14
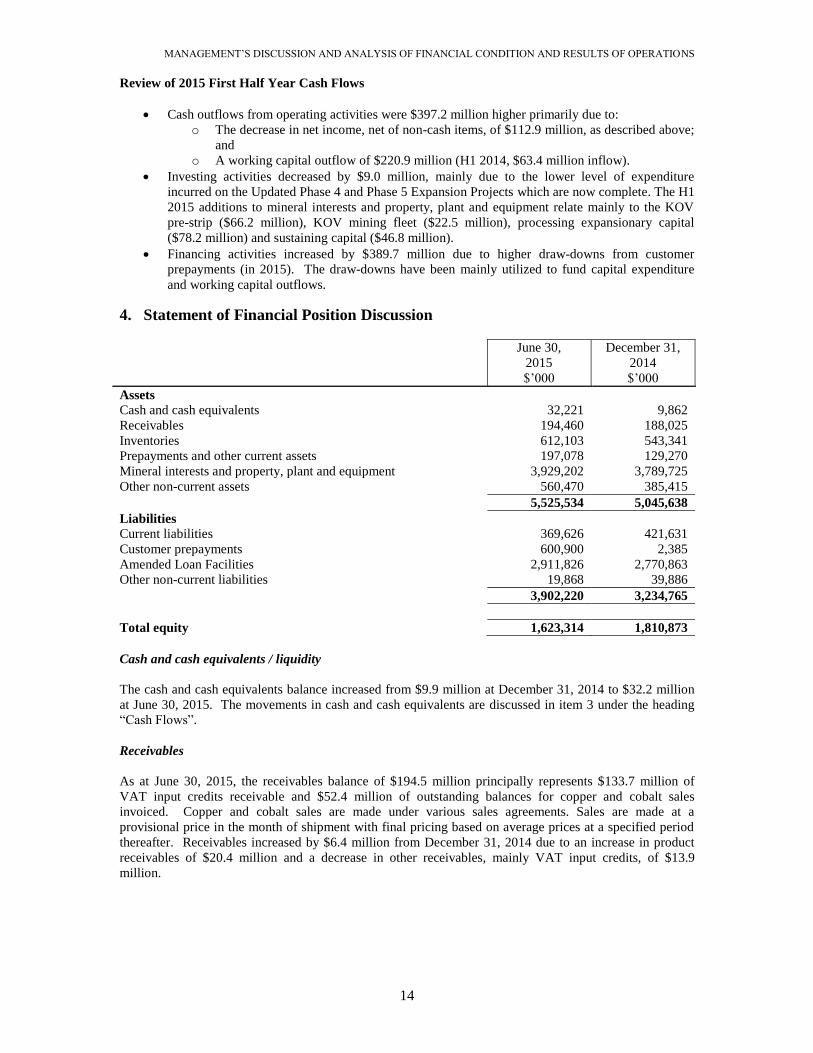
Review of 2015 First Half Year Cash Flows
Cash outflows from operating activities were $397.2 million higher primarily due to:
o The decrease in net income, net of non-cash items, of $112.9 million, as described above;
and
o A working capital outflow of $220.9 million (H1 2014, $63.4 million inflow).
Investing activities decreased by $9.0 million, mainly due to the lower level of expenditure
incurred on the Updated Phase 4 and Phase 5 Expansion Projects which are now complete. The H1
2015 additions to mineral interests and property, plant and equipment relate mainly to the KOV
pre-strip ($66.2 million), KOV mining fleet ($22.5 million), processing expansionary capital
($78.2 million) and sustaining capital ($46.8 million).
Financing activities increased by $389.7 million due to higher draw-downs from customer
prepayments (in 2015). The draw-downs have been mainly utilized to fund capital expenditure
and working capital outflows.
4. Statement of Financial Position Discussion
June 30,
2015
$’000
December 31,
2014
$’000
Assets
Cash and cash equivalents 32,221 9,862
Receivables 194,460 188,025
Inventories 612,103 543,341
Prepayments and other current assets 197,078 129,270
Mineral interests and property, plant and equipment 3,929,202 3,789,725
Other non-current assets 560,470 385,415
5,525,534 5,045,638
Liabilities
Current liabilities 369,626 421,631
Customer prepayments 600,900 2,385
Amended Loan Facilities 2,911,826 2,770,863
Other non-current liabilities 19,868 39,886
3,902,220 3,234,765
Total equity 1,623,314 1,810,873
Cash and cash equivalents / liquidity
The cash and cash equivalents balance increased from $9.9 million at December 31, 2014 to $32.2 million
at June 30, 2015. The movements in cash and cash equivalents are discussed in item 3 under the heading
“Cash Flows”.
Receivables
As at June 30, 2015, the receivables balance of $194.5 million principally represents $133.7 million of
VAT input credits receivable and $52.4 million of outstanding balances for copper and cobalt sales
invoiced. Copper and cobalt sales are made under various sales agreements. Sales are made at a
provisional price in the month of shipment with final pricing based on average prices at a specified period
thereafter. Receivables increased by $6.4 million from December 31, 2014 due to an increase in product
receivables of $20.4 million and a decrease in other receivables, mainly VAT input credits, of $13.9
million.

MANAGEMENT’S DISCUSSION AND ANALYSIS OF FINANCIAL CONDITION AND RESULTS OF OPERATIONS
15
Inventories
Inventories increased from $543.3 million at December 31, 2014 to $612.1 million at June 30, 2015,
primarily due to an increase in consumables inventories of $111.8 million and a decrease in current product
inventories of $43.0 million (including a $35.3 million write-down to net realizable value in Q2 2015).
Consumables inventory has increased to support the planned increase in production levels. As at June 30,
2015, $60.2 million of consumables inventory with a useful life of more than one year were included in
property, plant and equipment as capital spares (December 31, 2014 - $54.9 million).
Prepayments and other current assets
Prepayments and other current assets increased from $129.3 million at December 31, 2014 to $197.1
million at June 30, 2015, primarily due to an increase in prepayments for mining fleet, capital expenditure
and royalties.
Mineral interests and property, plant and equipment
Mineral interests and property, plant and equipment increased from $3,789.7 million at December 31, 2014
to $3,929.2 million at June 30, 2015, primarily due to sustaining capital expenditures of $46.8 million,
KOV pre-stripping expenditures of $66.2 million, project related capital expenditures of $88.5 million and
capitalized borrowing costs of $45.3 million offset by depreciation and amortization expense of $117.8
million. As at June 30, 2015, $60.2 million of consumables inventory with a useful life of more than one
year were included in property, plant and equipment (December 31, 2014 - $54.9 million).
Other non-current assets
Other non-current assets increased from $385.4 million at December 31, 2014 to $560.5 million at June 30,
2015, due to an increase in the net deferred income tax asset ($111.8 million) and a $63.2 million increase
in non-current prepayments mainly related to the Power Project (refer to item 6).
Current liabilities
Current liabilities decreased from $421.6 million at December 31, 2014 to $369.6 million at June 30, 2015.
This is primarily due to a decrease in trade payables, accruals and provisions of $25.7 million and a $19.8
million decrease in bank overdrafts.
Customer prepayments
Customer prepayments increased from $2.4 million at December 31, 2014 to $600.9 million at June 30,
2015. This is due to $593.4 million of advance payments received and $5.2 million of interest payable
accrued.
Amended Loan Facilities
Amended Loan Facilities (refer to item 8) increased from $2,770.9 million at December 31, 2014, to
$2,911.8 million at June 30, 2015, due to facility draw-downs of $1.8 million and the accrual of interest of
$139.2 million which is payable on maturity on January 1, 2021.
Other non-current liabilities
Other non-current liabilities consist of the Pas de Porte liability (an “entry premium” obligation payable to
Gécamines for access to the Project), the finance lease liability arising on the sale and leaseback of mining
equipment and the decommissioning and environmental provisions. Other non-current liabilities have
decreased from $39.9 million as at December 31, 2014, to $19.9 million as at June 30, 2015, due to the
non-current portion of the Pas de Porte obligation decreasing by $7.0 million and the non-current portion
of the finance lease liability decreasing by $0.7 million. Additionally, the decommissioning and
environmental provisions decreased by $12.3 million due to a decrease in the liability since the Company
reassessed its estimate regarding the expected closure costs and date of the mining properties.
MANAGEMENT’S DISCUSSION AND ANALYSIS OF FINANCIAL CONDITION AND RESULTS OF OPERATIONS
16
Off-Balance Sheet Arrangements
As at June 30, 2015, the Company had no off-balance sheet arrangements.
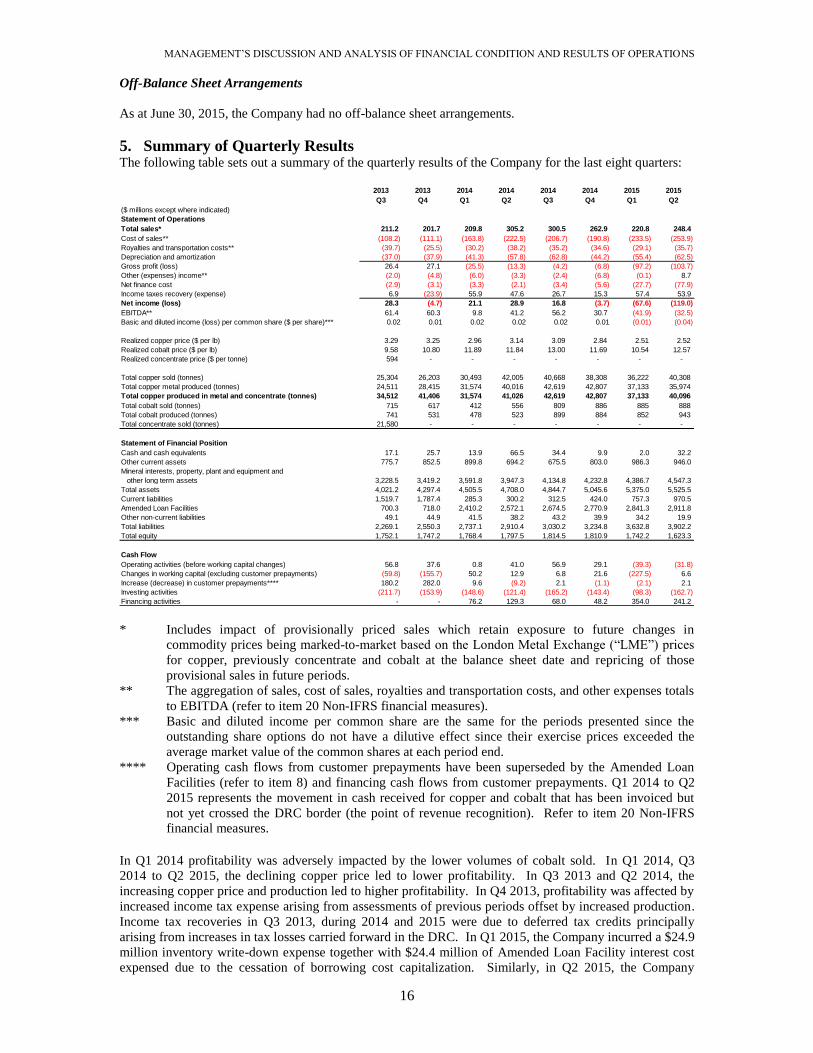
5. Summary of Quarterly Results The following table sets out a summary of the quarterly results of the Company for the last eight quarters:
* Includes impact of provisionally priced sales which retain exposure to future changes in
commodity prices being marked-to-market based on the London Metal Exchange (“LME”) prices
for copper, previously concentrate and cobalt at the balance sheet date and repricing of those
provisional sales in future periods.
** The aggregation of sales, cost of sales, royalties and transportation costs, and other expenses totals
to EBITDA (refer to item 20 Non-IFRS financial measures).
*** Basic and diluted income per common share are the same for the periods presented since the
outstanding share options do not have a dilutive effect since their exercise prices exceeded the
average market value of the common shares at each period end.
**** Operating cash flows from customer prepayments have been superseded by the Amended Loan
Facilities (refer to item 8) and financing cash flows from customer prepayments. Q1 2014 to Q2
2015 represents the movement in cash received for copper and cobalt that has been invoiced but
not yet crossed the DRC border (the point of revenue recognition). Refer to item 20 Non-IFRS
financial measures.
In Q1 2014 profitability was adversely impacted by the lower volumes of cobalt sold. In Q1 2014, Q3
2014 to Q2 2015, the declining copper price led to lower profitability. In Q3 2013 and Q2 2014, the
increasing copper price and production led to higher profitability. In Q4 2013, profitability was affected by
increased income tax expense arising from assessments of previous periods offset by increased production.
Income tax recoveries in Q3 2013, during 2014 and 2015 were due to deferred tax credits principally
arising from increases in tax losses carried forward in the DRC. In Q1 2015, the Company incurred a $24.9
million inventory write-down expense together with $24.4 million of Amended Loan Facility interest cost
expensed due to the cessation of borrowing cost capitalization. Similarly, in Q2 2015, the Company
2013 2013 2014 2014 2014 2014 2015 2015
Q3 Q4 Q1 Q2 Q3 Q4 Q1 Q2
($ millions except where indicated)
Statement of Operations
Total sales* 211.2 201.7 209.8 305.2 300.5 262.9 220.8 248.4
Cost of sales** (108.2) (111.1) (163.8) (222.5) (206.7) (190.8) (233.5) (253.9)
Royalties and transportation costs** (39.7) (25.5) (30.2) (38.2) (35.2) (34.6) (29.1) (35.7)
Depreciation and amortization (37.0) (37.9) (41.3) (57.8) (62.8) (44.2) (55.4) (62.5)
Gross profit (loss) 26.4 27.1 (25.5) (13.3) (4.2) (6.8) (97.2) (103.7)
Other (expenses) income** (2.0) (4.8) (6.0) (3.3) (2.4) (6.8) (0.1) 8.7
Net finance cost (2.9) (3.1) (3.3) (2.1) (3.4) (5.6) (27.7) (77.9)
Income taxes recovery (expense) 6.9 (23.9) 55.9 47.6 26.7 15.3 57.4 53.9
Net income (loss) 28.3 (4.7) 21.1 28.9 16.8 (3.7) (67.6) (119.0)
EBITDA** 61.4 60.3 9.8 41.2 56.2 30.7 (41.9) (32.5)
Basic and diluted income (loss) per common share ($ per share)*** 0.02 0.01 0.02 0.02 0.02 0.01 (0.01) (0.04)
Realized copper price ($ per lb) 3.29 3.25 2.96 3.14 3.09 2.84 2.51 2.52
Realized cobalt price ($ per lb) 9.58 10.80 11.89 11.84 13.00 11.69 10.54 12.57
Realized concentrate price ($ per tonne) 594 - - - - - - -
Total copper sold (tonnes) 25,304 26,203 30,493 42,005 40,668 38,308 36,222 40,308
Total copper metal produced (tonnes) 24,511 28,415 31,574 40,016 42,619 42,807 37,133 35,974
Total copper produced in metal and concentrate (tonnes) 34,512 41,406 31,574 41,026 42,619 42,807 37,133 40,096
Total cobalt sold (tonnes) 715 617 412 556 809 886 885 888
Total cobalt produced (tonnes) 741 531 478 523 899 884 852 943
Total concentrate sold (tonnes) 21,580 - - - - - - -
Statement of Financial Position
Cash and cash equivalents 17.1 25.7 13.9 66.5 34.4 9.9 2.0 32.2
Other current assets 775.7 852.5 899.8 694.2 675.5 803.0 986.3 946.0
Mineral interests, property, plant and equipment and
other long term assets 3,228.5 3,419.2 3,591.8 3,947.3 4,134.8 4,232.8 4,386.7 4,547.3
Total assets 4,021.2 4,297.4 4,505.5 4,708.0 4,844.7 5,045.6 5,375.0 5,525.5
Current liabilities 1,519.7 1,787.4 285.3 300.2 312.5 424.0 757.3 970.5
Amended Loan Facilities 700.3 718.0 2,410.2 2,572.1 2,674.5 2,770.9 2,841.3 2,911.8
Other non-current liabilities 49.1 44.9 41.5 38.2 43.2 39.9 34.2 19.9
Total liabilities 2,269.1 2,550.3 2,737.1 2,910.4 3,030.2 3,234.8 3,632.8 3,902.2
Total equity 1,752.1 1,747.2 1,768.4 1,797.5 1,814.5 1,810.9 1,742.2 1,623.3
Cash Flow
Operating activities (before working capital changes) 56.8 37.6 0.8 41.0 56.9 29.1 (39.3) (31.8)
Changes in working capital (excluding customer prepayments) (59.8) (155.7) 50.2 12.9 6.8 21.6 (227.5) 6.6
Increase (decrease) in customer prepayments**** 180.2 282.0 9.6 (9.2) 2.1 (1.1) (2.1) 2.1
Investing activities (211.7) (153.9) (148.6) (121.4) (165.2) (143.4) (98.3) (162.7)
Financing activities - - 76.2 129.3 68.0 48.2 354.0 241.2
MANAGEMENT’S DISCUSSION AND ANALYSIS OF FINANCIAL CONDITION AND RESULTS OF OPERATIONS
17
incurred a $35.3 million inventory write-down expense together with $74.6 million Amended Loan Facility
interest cost. These movements in the results are also reflected in the cash flows from operating activities
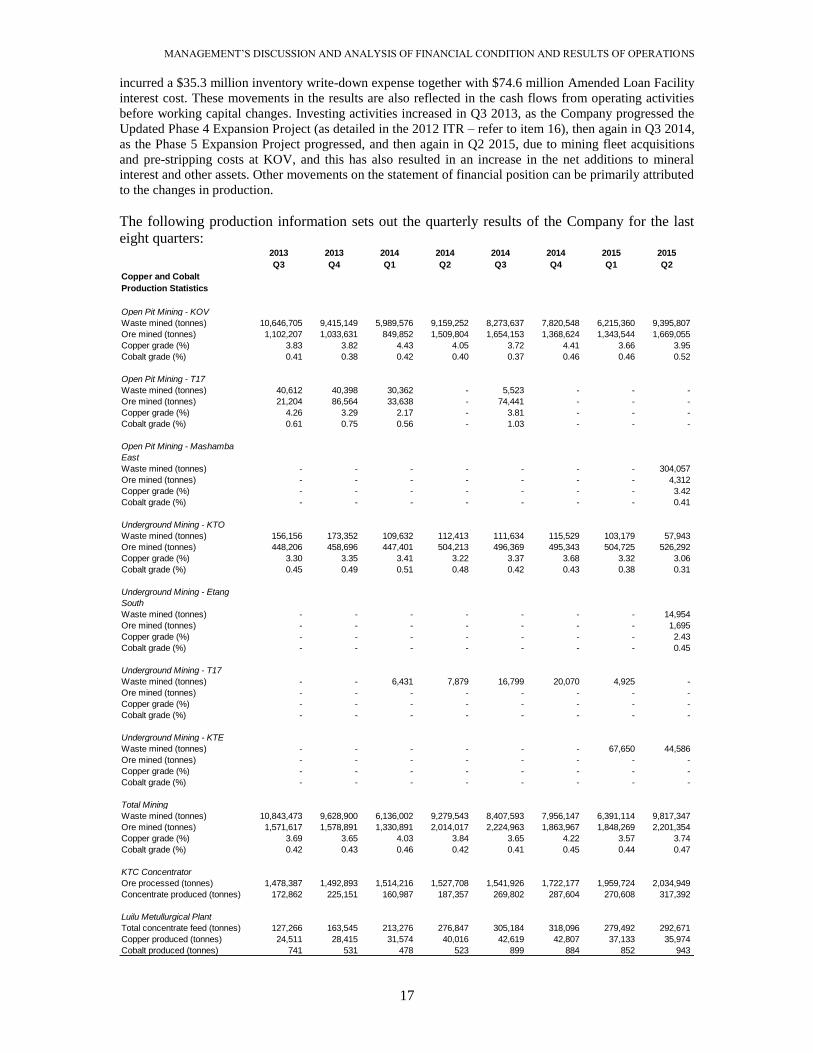
before working capital changes. Investing activities increased in Q3 2013, as the Company progressed the
Updated Phase 4 Expansion Project (as detailed in the 2012 ITR – refer to item 16), then again in Q3 2014,
as the Phase 5 Expansion Project progressed, and then again in Q2 2015, due to mining fleet acquisitions
and pre-stripping costs at KOV, and this has also resulted in an increase in the net additions to mineral
interest and other assets. Other movements on the statement of financial position can be primarily attributed
to the changes in production.
The following production information sets out the quarterly results of the Company for the last
eight quarters:
2013 2013 2014 2014 2014 2014 2015 2015
Q3 Q4 Q1 Q2 Q3 Q4 Q1 Q2
Copper and Cobalt
Production Statistics
Open Pit Mining - KOV
Waste mined (tonnes) 10,646,705 9,415,149 5,989,576 9,159,252 8,273,637 7,820,548 6,215,360 9,395,807
Ore mined (tonnes) 1,102,207 1,033,631 849,852 1,509,804 1,654,153 1,368,624 1,343,544 1,669,055
Copper grade (%) 3.83 3.82 4.43 4.05 3.72 4.41 3.66 3.95
Cobalt grade (%) 0.41 0.38 0.42 0.40 0.37 0.46 0.46 0.52
Open Pit Mining - T17
Waste mined (tonnes) 40,612 40,398 30,362 - 5,523 - - -
Ore mined (tonnes) 21,204 86,564 33,638 - 74,441 - - -
Copper grade (%) 4.26 3.29 2.17 - 3.81 - - -
Cobalt grade (%) 0.61 0.75 0.56 - 1.03 - - -
Open Pit Mining - Mashamba
East
Waste mined (tonnes) - - - - - - - 304,057
Ore mined (tonnes) - - - - - - - 4,312
Copper grade (%) - - - - - - - 3.42
Cobalt grade (%) - - - - - - - 0.41
Underground Mining - KTO
Waste mined (tonnes) 156,156 173,352 109,632 112,413 111,634 115,529 103,179 57,943
Ore mined (tonnes) 448,206 458,696 447,401 504,213 496,369 495,343 504,725 526,292
Copper grade (%) 3.30 3.35 3.41 3.22 3.37 3.68 3.32 3.06
Cobalt grade (%) 0.45 0.49 0.51 0.48 0.42 0.43 0.38 0.31
Underground Mining - Etang
South
Waste mined (tonnes) - - - - - - - 14,954
Ore mined (tonnes) - - - - - - - 1,695
Copper grade (%) - - - - - - - 2.43
Cobalt grade (%) - - - - - - - 0.45
Underground Mining - T17
Waste mined (tonnes) - - 6,431 7,879 16,799 20,070 4,925 -
Ore mined (tonnes) - - - - - - - -
Copper grade (%) - - - - - - - -
Cobalt grade (%) - - - - - - - -
Underground Mining - KTE
Waste mined (tonnes) - - - - - - 67,650 44,586
Ore mined (tonnes) - - - - - - - -
Copper grade (%) - - - - - - - -
Cobalt grade (%) - - - - - - - -
Total Mining
Waste mined (tonnes) 10,843,473 9,628,900 6,136,002 9,279,543 8,407,593 7,956,147 6,391,114 9,817,347
Ore mined (tonnes) 1,571,617 1,578,891 1,330,891 2,014,017 2,224,963 1,863,967 1,848,269 2,201,354
Copper grade (%) 3.69 3.65 4.03 3.84 3.65 4.22 3.57 3.74
Cobalt grade (%) 0.42 0.43 0.46 0.42 0.41 0.45 0.44 0.47
KTC Concentrator
Ore processed (tonnes) 1,478,387 1,492,893 1,514,216 1,527,708 1,541,926 1,722,177 1,959,724 2,034,949
Concentrate produced (tonnes) 172,862 225,151 160,987 187,357 269,802 287,604 270,608 317,392
Luilu Metullurgical Plant
Total concentrate feed (tonnes) 127,266 163,545 213,276 276,847 305,184 318,096 279,492 292,671
Copper produced (tonnes) 24,511 28,415 31,574 40,016 42,619 42,807 37,133 35,974
Cobalt produced (tonnes) 741 531 478 523 899 884 852 943
MANAGEMENT’S DISCUSSION AND ANALYSIS OF FINANCIAL CONDITION AND RESULTS OF OPERATIONS
18
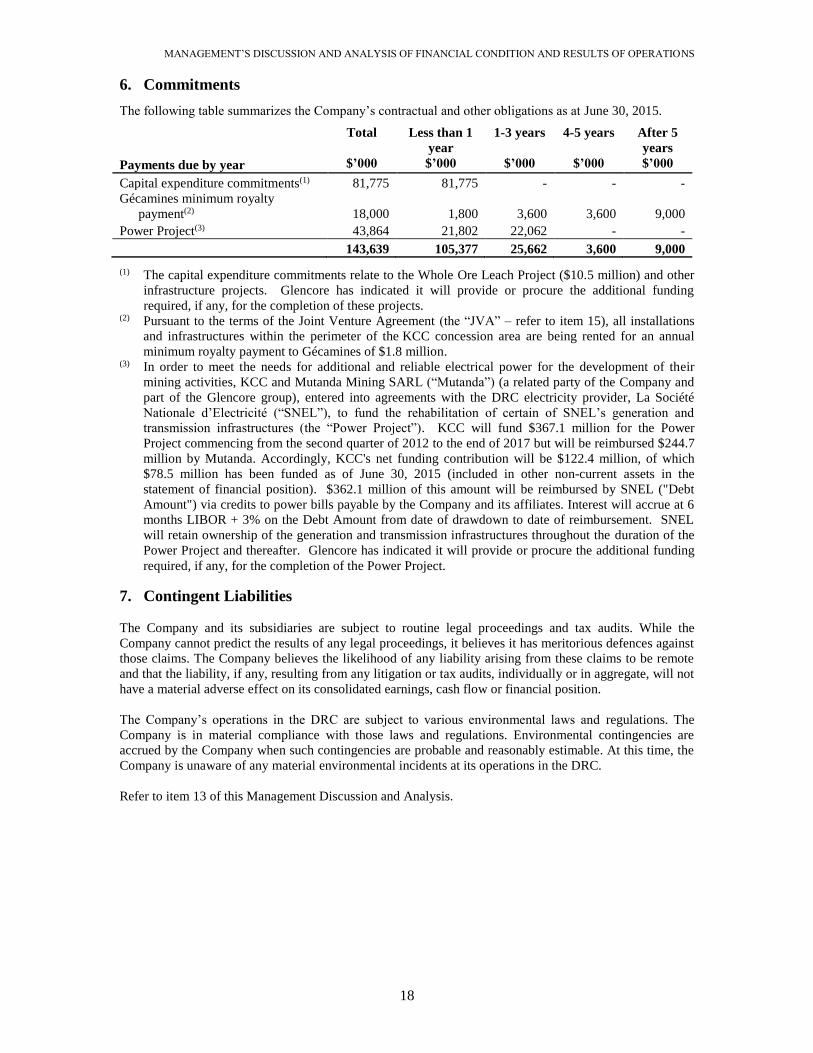
6. Commitments
The following table summarizes the Company’s contractual and other obligations as at June 30, 2015.
(1) The capital expenditure commitments relate to the Whole Ore Leach Project ($10.5 million) and other
infrastructure projects. Glencore has indicated it will provide or procure the additional funding
required, if any, for the completion of these projects. (2) Pursuant to the terms of the Joint Venture Agreement (the “JVA” – refer to item 15), all installations
and infrastructures within the perimeter of the KCC concession area are being rented for an annual
minimum royalty payment to Gécamines of $1.8 million. (3) In order to meet the needs for additional and reliable electrical power for the development of their
mining activities, KCC and Mutanda Mining SARL (“Mutanda”) (a related party of the Company and
part of the Glencore group), entered into agreements with the DRC electricity provider, La Société
Nationale d’Electricité (“SNEL”), to fund the rehabilitation of certain of SNEL’s generation and
transmission infrastructures (the “Power Project”). KCC will fund $367.1 million for the Power
Project commencing from the second quarter of 2012 to the end of 2017 but will be reimbursed $244.7
million by Mutanda. Accordingly, KCC's net funding contribution will be $122.4 million, of which
$78.5 million has been funded as of June 30, 2015 (included in other non-current assets in the
statement of financial position). $362.1 million of this amount will be reimbursed by SNEL ("Debt
Amount") via credits to power bills payable by the Company and its affiliates. Interest will accrue at 6
months LIBOR + 3% on the Debt Amount from date of drawdown to date of reimbursement. SNEL
will retain ownership of the generation and transmission infrastructures throughout the duration of the
Power Project and thereafter. Glencore has indicated it will provide or procure the additional funding
required, if any, for the completion of the Power Project.
7. Contingent Liabilities
The Company and its subsidiaries are subject to routine legal proceedings and tax audits. While the
Company cannot predict the results of any legal proceedings, it believes it has meritorious defences against
those claims. The Company believes the likelihood of any liability arising from these claims to be remote
and that the liability, if any, resulting from any litigation or tax audits, individually or in aggregate, will not
have a material adverse effect on its consolidated earnings, cash flow or financial position.
The Company’s operations in the DRC are subject to various environmental laws and regulations. The
Company is in material compliance with those laws and regulations. Environmental contingencies are
accrued by the Company when such contingencies are probable and reasonably estimable. At this time, the
Company is unaware of any material environmental incidents at its operations in the DRC.
Refer to item 13 of this Management Discussion and Analysis.
Total Less than 1
year
1-3 years 4-5 years After 5
years
Payments due by year $’000 $’000 $’000 $’000 $’000
Capital expenditure commitments(1) 81,775 81,775 - - -
Gécamines minimum royalty
payment(2) 18,000 1,800 3,600 3,600 9,000
Power Project(3) 43,864 21,802 22,062 - -
143,639 105,377 25,662 3,600 9,000

MANAGEMENT’S DISCUSSION AND ANALYSIS OF FINANCIAL CONDITION AND RESULTS OF OPERATIONS
19
8. Liquidity and Capital Resources
As at June 30, 2015, the Company had cash and cash equivalents of $32.2 million (December 31, 2014 –
$9.9 million), bank overdrafts of $0.5 million (December 31, 2014 – $20.4 million) and a working capital
surplus of $7.7 million (December 31, 2014 – $388.8 million).
In December 2011, the Company announced the execution of two loan facilities with Glencore Finance
(Bermuda) Limited, a subsidiary of Glencore, with total available borrowing of up to $635.5 million (the
“Loan Facilities”). $120.0 million was provided to the Company during the year ended December 31, 2011,
as a new term loan facility (the “Term Loan”) to fund in substantial part the redemption of the Company's
debentures. On December 13, 2012, the second facility (the “Senior Facility”), making up the balance of
the available borrowing and amounting to $515.5 million, was provided to a subsidiary of the Company and
together with other subsidiaries of the Company as guarantors, as a senior secured credit facility to fund a
portion of the Updated Phase 4 Expansion Project not covered by the Company's cash flows.
On November 26, 2014, the Company announced the execution of extended and increased loan facilities
with Glencore Finance (Bermuda) Limited. The amended facilities are comprised of the Senior Facility
and Term Loan, each as amended (the "Amended Loan Facilities") as follows:
The Senior Facility was increased to include the existing $515.5 million Senior Facility (plus accrued
interest thereon) and $1,815.8 million of customer prepayments provided by Glencore International AG to
KCC (plus accumulated interest thereon), which were converted into loans bearing interest at 10% per
annum and provided by Glencore Finance (Bermuda) Limited. Included in the total amount of the
amended Senior Facility was further funding of $50.0 million, which was subsequently fully drawn down,
made available according to the cash flow requirements of KCC based on the approved budgets for the
Phase 5 Expansion Project and the Power Project. The amount of the Term Loan remained unchanged at
$120.0 million plus accumulated interest. The maturity of the Senior Facility and the Term Loan was
extended to January 1, 2021. All other material terms of the Senior Facility and the Term Loan remained
the same.
The Company's 75% interest in KCC (which holds the copper and cobalt project assets) has been pledged
as security for the Senior Facility along with certain other assets of the Company and its subsidiaries. As
security for the Term Loan and additional security for the Senior Facility, the Company has agreed, if a
Loan Facility is in default, to complete a discounted rights offering with a Glencore subsidiary providing a
standby commitment, to repay the Loan Facility. In the case of the Senior Facility, a Glencore subsidiary
has agreed to exercise its right to compel the Company to complete the discounted rights offering prior to
realizing on the Glencore subsidiary's other security. The Loan Facilities contain undertakings which
restrict the Company’s and other Company subsidiaries’ ability to (i) make acquisitions, (ii) grant loans,
(iii) provide guarantees, (iv) pledge or dispose of their assets, as well as certain additional undertakings
which are customary for these type of transactions.
MANAGEMENT’S DISCUSSION AND ANALYSIS OF FINANCIAL CONDITION AND RESULTS OF OPERATIONS
20
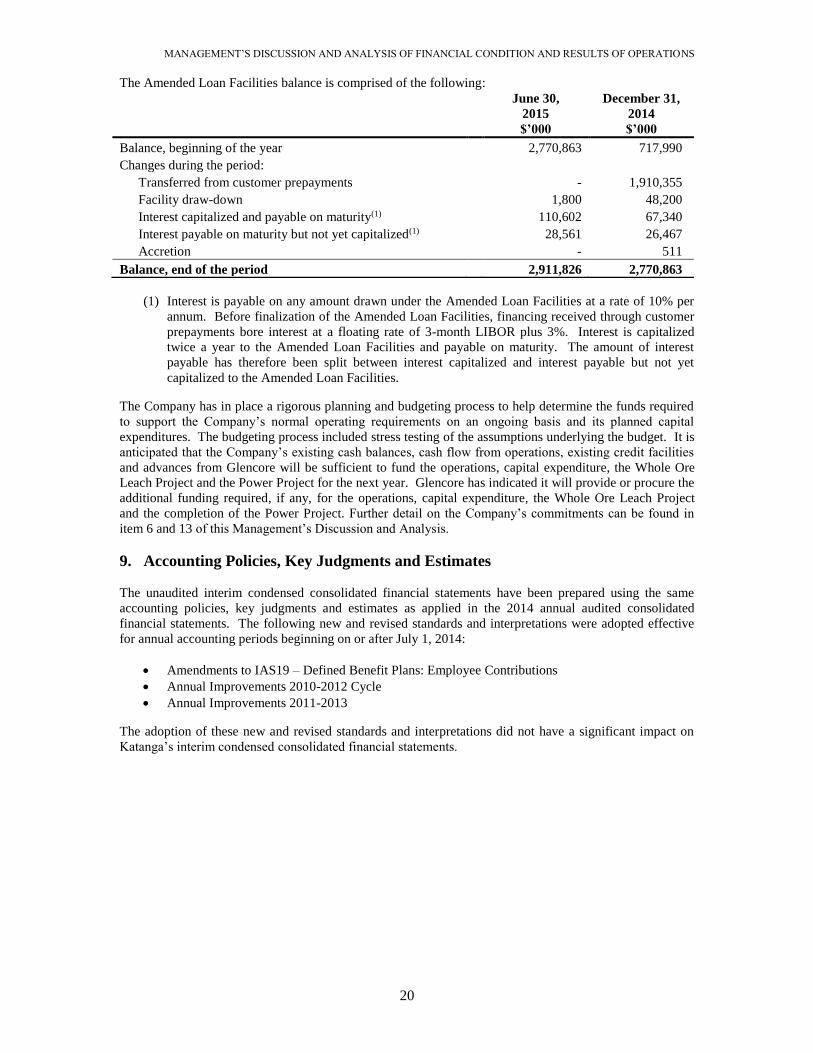
The Amended Loan Facilities balance is comprised of the following:
June 30,
2015
$’000
December 31,
2014
$’000
Balance, beginning of the year 2,770,863 717,990)
Changes during the period:
Transferred from customer prepayments - 1,910,355)
Facility draw-down 1,800 48,200)
Interest capitalized and payable on maturity(1) 110,602 67,340)
Interest payable on maturity but not yet capitalized(1) 28,561 26,467)
Accretion - 511)
Balance, end of the period 2,911,826 2,770,863)
(1) Interest is payable on any amount drawn under the Amended Loan Facilities at a rate of 10% per
annum. Before finalization of the Amended Loan Facilities, financing received through customer
prepayments bore interest at a floating rate of 3-month LIBOR plus 3%. Interest is capitalized
twice a year to the Amended Loan Facilities and payable on maturity. The amount of interest
payable has therefore been split between interest capitalized and interest payable but not yet
capitalized to the Amended Loan Facilities.
The Company has in place a rigorous planning and budgeting process to help determine the funds required
to support the Company’s normal operating requirements on an ongoing basis and its planned capital
expenditures. The budgeting process included stress testing of the assumptions underlying the budget. It is
anticipated that the Company’s existing cash balances, cash flow from operations, existing credit facilities
and advances from Glencore will be sufficient to fund the operations, capital expenditure, the Whole Ore
Leach Project and the Power Project for the next year. Glencore has indicated it will provide or procure the
additional funding required, if any, for the operations, capital expenditure, the Whole Ore Leach Project
and the completion of the Power Project. Further detail on the Company’s commitments can be found in
item 6 and 13 of this Management’s Discussion and Analysis.
9. Accounting Policies, Key Judgments and Estimates
The unaudited interim condensed consolidated financial statements have been prepared using the same
accounting policies, key judgments and estimates as applied in the 2014 annual audited consolidated
financial statements. The following new and revised standards and interpretations were adopted effective
for annual accounting periods beginning on or after July 1, 2014:
Amendments to IAS19 – Defined Benefit Plans: Employee Contributions
Annual Improvements 2010-2012 Cycle
Annual Improvements 2011-2013
The adoption of these new and revised standards and interpretations did not have a significant impact on
Katanga’s interim condensed consolidated financial statements.

MANAGEMENT’S DISCUSSION AND ANALYSIS OF FINANCIAL CONDITION AND RESULTS OF OPERATIONS
21
10. Outstanding Share Data
(a) AUTHORIZED
An unlimited number of common shares with no par value.
(b) ISSUED AT JUNE 30, 2015
1,907,380,413 common shares.
(c) SHARE OPTIONS
The following table reflects the continuity of share options during the periods presented:
Number of share
options
Weighted Exercise
Price per Share (1)
Outstanding at January 1, 2014 7,153,658) $2.85)
Unchanged during the year -) -)
Outstanding at December 31, 2014 7,153,658) $2.85)
Forfeited during the period (2,359,636) ($0.99)
Outstanding at June 30, 2015 4,794,022) $3.76)
(1) Denominated in Canadian dollars.
11. Related Party Transactions
Related parties and related party transactions not otherwise disclosed elsewhere in this Management’s
Discussion and Analysis include:
Galif Investments Limited (“Galif”), registered in Bermuda, is an aircraft management company whose
ultimate beneficial owner is Glencore. During 2015 and 2014, Galif provided aircraft maintenance and
auxiliary services to the Company in the normal course of business and on arm’s length commercial terms.
Glencore is the Company’s ultimate majority shareholder and is represented on the Board of Directors of
the Company. In November 2007, Glencore’s wholly owned subsidiary, Glencore International AG entered
into a 100% off-take agreement for concentrate sales with the Company and commencing January 1, 2009,
pursuant to additional off-take agreements, all copper and cobalt metal produced are sold to Glencore
International AG on market terms for the life of any mines and plants operated, acquired and / or developed
by the Company in the DRC. The off-take agreements were entered into before Glencore was a related
party of the Company. In December 2011, the Company entered into the Loan Facilities with total
available borrowing of up to $635.5 million, which was fully drawn down during 2011 and 2012. Such
Loan Facilities were amended in 2014 (refer to item 8).
Mutanda Mining SARL (“Mutanda”) is a copper and cobalt producer located in the DRC and is a 69%
owned subsidiary of Glencore. During the year ended December 31, 2012, the Company commenced the
Power Project with Mutanda and Kansuki SPRL (since merged with Mutanda) (refer to item 6).
Additionally, there is an agreement in place for employees of either Katanga or Mutanda to use charter
flights operated by either company with associated costs invoiced. In November 2014, the Company’s
Board of Directors, including its independent directors, unanimously approved entering into a contract for
the sale by Mutanda of copper concentrate to the Company, in the ordinary course of business and on arm’s
length commercial terms. Further, during 2015 and 2014, Mutanda supplied processing consumables and
medical services to the Company. These services were provided in the normal course of business and on
arm’s length commercial terms.
Mopani Copper Mines Plc (“Mopani”) is a copper and cobalt producer located in Zambia. Mopani is a
73.1% owned subsidiary of Glencore. During 2015 and 2014, Mopani supplied sulphuric acid and other
consumables to the Company in the normal course of business and on arm’s length commercial terms.
MANAGEMENT’S DISCUSSION AND ANALYSIS OF FINANCIAL CONDITION AND RESULTS OF OPERATIONS
22
Glencore Technology Proprietary Limited (“Glencore Technology”) is a provider of mining services and
is a 100% subsidiary of Glencore. During 2015 and 2014, Glencore Technology provided mining
equipment and services to the Company, in the normal course of business and on arm’s length commercial
terms.
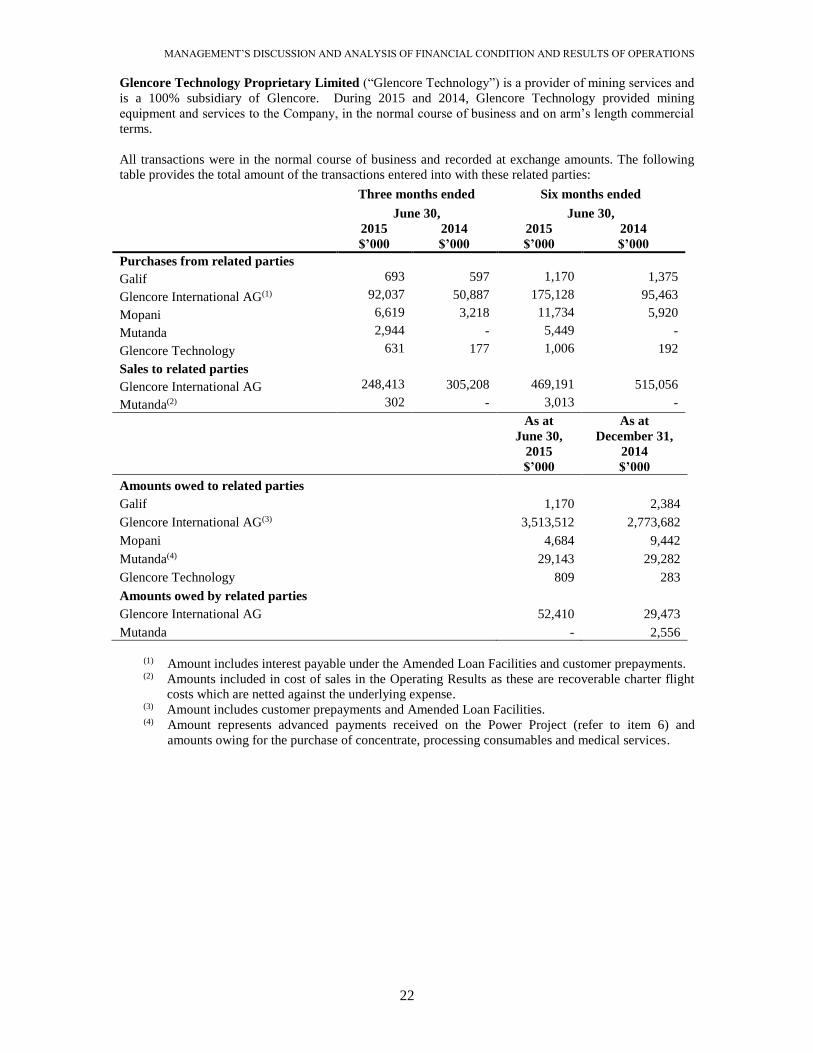
All transactions were in the normal course of business and recorded at exchange amounts. The following
table provides the total amount of the transactions entered into with these related parties:
Three months ended Six months ended
June 30, June 30,
2015
$’000
2014
$’000
2015
$’000
2014
$’000
Purchases from related parties
Galif 693 597 1,170 1,375
Glencore International AG(1) 92,037 50,887 175,128 95,463
Mopani 6,619 3,218 11,734 5,920
Mutanda 2,944 - 5,449 -
Glencore Technology 631 177 1,006 192
Sales to related parties
Glencore International AG 248,413 305,208 469,191 515,056
Mutanda(2) 302 - 3,013 -
As at
June 30,
2015
$’000
As at
December 31,
2014
$’000
Amounts owed to related parties
Galif 1,170 2,384
Glencore International AG(3) 3,513,512 2,773,682
Mopani 4,684 9,442
Mutanda(4) 29,143 29,282
Glencore Technology 809 283
Amounts owed by related parties
Glencore International AG 52,410 29,473
Mutanda - 2,556
(1) Amount includes interest payable under the Amended Loan Facilities and customer prepayments. (2) Amounts included in cost of sales in the Operating Results as these are recoverable charter flight
costs which are netted against the underlying expense. (3) Amount includes customer prepayments and Amended Loan Facilities. (4) Amount represents advanced payments received on the Power Project (refer to item 6) and
amounts owing for the purchase of concentrate, processing consumables and medical services.
MANAGEMENT’S DISCUSSION AND ANALYSIS OF FINANCIAL CONDITION AND RESULTS OF OPERATIONS
23
12. Financial Instruments
At June 30, 2015, and December 31, 2014, the Company’s financial instruments consisted of cash and cash
equivalents, receivables, accounts payable and accrued liabilities, bank overdrafts, customer prepayments,
other non-current liabilities and the Amended Loan Facilities. With respect to all of these financial
instruments, the Company estimates that the fair value of these financial instruments approximates the
carrying values at June 30, 2015 and December 31, 2014, respectively.
The Company values instruments carried at fair value using quoted market prices, where available. Quoted
market prices represent a Level 1 valuation. When quoted market prices are not available, the Company
maximizes the use of observable inputs within valuation models. When all significant inputs are
observable, the valuation is classified as Level 2. Valuations that require the significant use of unobservable
inputs are considered Level 3.
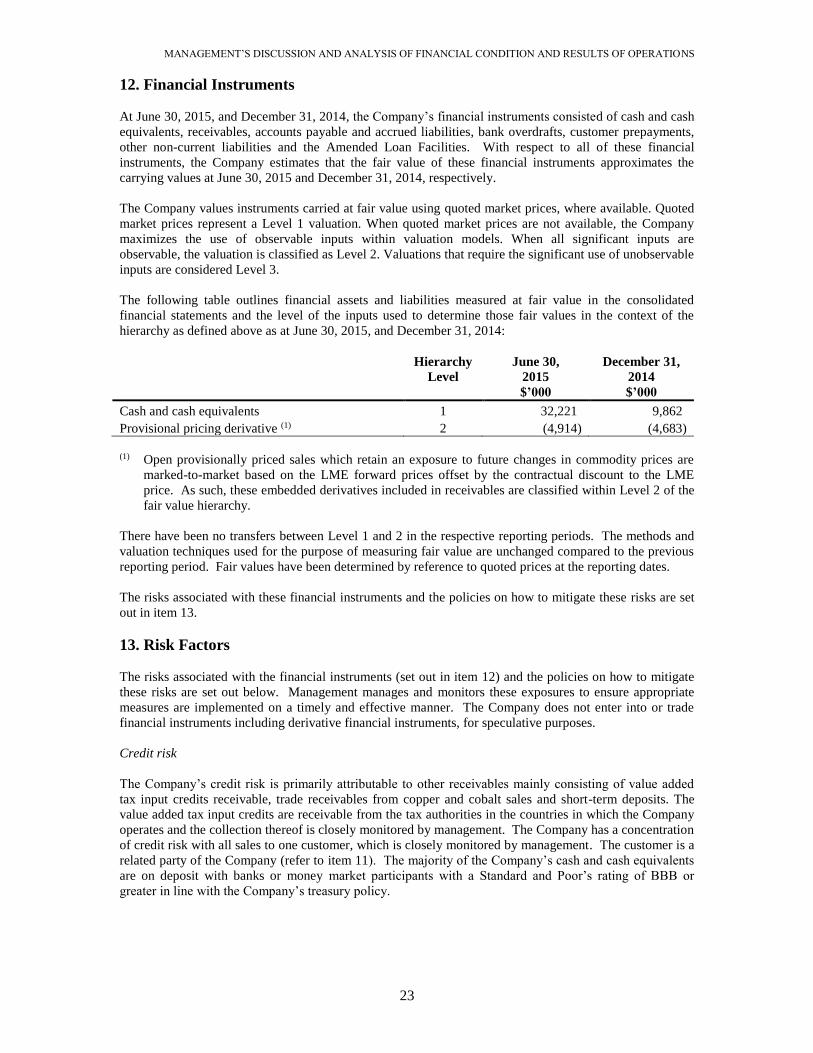
The following table outlines financial assets and liabilities measured at fair value in the consolidated
financial statements and the level of the inputs used to determine those fair values in the context of the
hierarchy as defined above as at June 30, 2015, and December 31, 2014:
Hierarchy
Level
June 30,
2015
$’000
December 31,
2014
$’000
Cash and cash equivalents 1 32,221) 9,862)
Provisional pricing derivative (1) 2 (4,914) (4,683)
(1) Open provisionally priced sales which retain an exposure to future changes in commodity prices are
marked-to-market based on the LME forward prices offset by the contractual discount to the LME
price. As such, these embedded derivatives included in receivables are classified within Level 2 of the
fair value hierarchy.
There have been no transfers between Level 1 and 2 in the respective reporting periods. The methods and
valuation techniques used for the purpose of measuring fair value are unchanged compared to the previous
reporting period. Fair values have been determined by reference to quoted prices at the reporting dates.
The risks associated with these financial instruments and the policies on how to mitigate these risks are set
out in item 13.
13. Risk Factors
The risks associated with the financial instruments (set out in item 12) and the policies on how to mitigate
these risks are set out below. Management manages and monitors these exposures to ensure appropriate
measures are implemented on a timely and effective manner. The Company does not enter into or trade
financial instruments including derivative financial instruments, for speculative purposes.
Credit risk
The Company’s credit risk is primarily attributable to other receivables mainly consisting of value added
tax input credits receivable, trade receivables from copper and cobalt sales and short-term deposits. The
value added tax input credits are receivable from the tax authorities in the countries in which the Company
operates and the collection thereof is closely monitored by management. The Company has a concentration
of credit risk with all sales to one customer, which is closely monitored by management. The customer is a
related party of the Company (refer to item 11). The majority of the Company’s cash and cash equivalents
are on deposit with banks or money market participants with a Standard and Poor’s rating of BBB or
greater in line with the Company’s treasury policy.
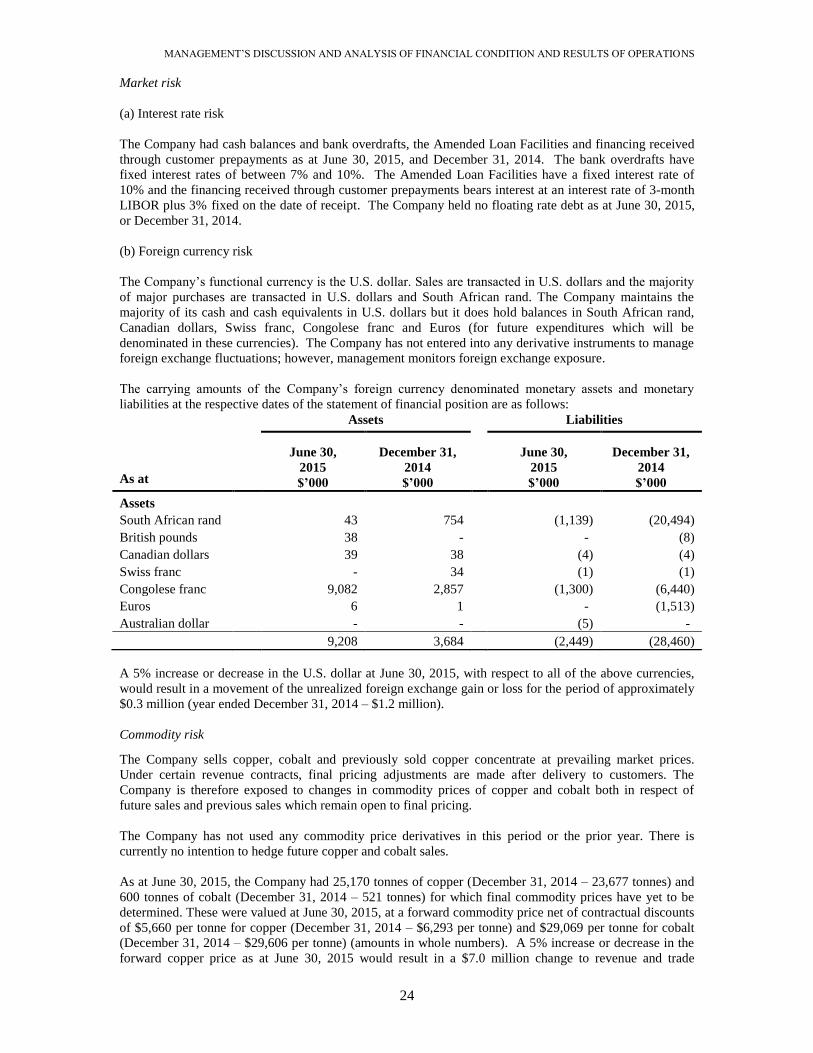
MANAGEMENT’S DISCUSSION AND ANALYSIS OF FINANCIAL CONDITION AND RESULTS OF OPERATIONS
24
Market risk
(a) Interest rate risk
The Company had cash balances and bank overdrafts, the Amended Loan Facilities and financing received
through customer prepayments as at June 30, 2015, and December 31, 2014. The bank overdrafts have
fixed interest rates of between 7% and 10%. The Amended Loan Facilities have a fixed interest rate of
10% and the financing received through customer prepayments bears interest at an interest rate of 3-month
LIBOR plus 3% fixed on the date of receipt. The Company held no floating rate debt as at June 30, 2015,
or December 31, 2014.
(b) Foreign currency risk
The Company’s functional currency is the U.S. dollar. Sales are transacted in U.S. dollars and the majority
of major purchases are transacted in U.S. dollars and South African rand. The Company maintains the
majority of its cash and cash equivalents in U.S. dollars but it does hold balances in South African rand,
Canadian dollars, Swiss franc, Congolese franc and Euros (for future expenditures which will be
denominated in these currencies). The Company has not entered into any derivative instruments to manage
foreign exchange fluctuations; however, management monitors foreign exchange exposure.
The carrying amounts of the Company’s foreign currency denominated monetary assets and monetary
liabilities at the respective dates of the statement of financial position are as follows:
Assets Liabilities
June 30, December 31, June 30, December 31,
As at
2015
$’000
2014
$’000
2015
$’000
2014
$’000
Assets
South African rand 43 754 (1,139) (20,494)
British pounds 38 - -) (8)
Canadian dollars 39 38 (4) (4)
Swiss franc - 34 (1) (1)
Congolese franc 9,082 2,857 (1,300) (6,440)
Euros 6 1 -) (1,513)
Australian dollar - - (5) -)
9,208 3,684 (2,449) (28,460)
A 5% increase or decrease in the U.S. dollar at June 30, 2015, with respect to all of the above currencies,
would result in a movement of the unrealized foreign exchange gain or loss for the period of approximately
$0.3 million (year ended December 31, 2014 – $1.2 million).
Commodity risk
The Company sells copper, cobalt and previously sold copper concentrate at prevailing market prices.
Under certain revenue contracts, final pricing adjustments are made after delivery to customers. The
Company is therefore exposed to changes in commodity prices of copper and cobalt both in respect of
future sales and previous sales which remain open to final pricing.
The Company has not used any commodity price derivatives in this period or the prior year. There is
currently no intention to hedge future copper and cobalt sales.
As at June 30, 2015, the Company had 25,170 tonnes of copper (December 31, 2014 – 23,677 tonnes) and
600 tonnes of cobalt (December 31, 2014 – 521 tonnes) for which final commodity prices have yet to be
determined. These were valued at June 30, 2015, at a forward commodity price net of contractual discounts
of $5,660 per tonne for copper (December 31, 2014 – $6,293 per tonne) and $29,069 per tonne for cobalt
(December 31, 2014 – $29,606 per tonne) (amounts in whole numbers). A 5% increase or decrease in the
forward copper price as at June 30, 2015 would result in a $7.0 million change to revenue and trade

MANAGEMENT’S DISCUSSION AND ANALYSIS OF FINANCIAL CONDITION AND RESULTS OF OPERATIONS
25
receivables (as at December 31, 2014 – $7.3 million). A 5% increase or decrease in the forward cobalt
price as at June 30, 2015 would result in a $0.9 million change to revenue and trade receivables (as at
December 31, 2014 – $0.8 million).
Liquidity risk
It is anticipated that the Company’s existing cash balances, cash flow from operations, existing credit
facilities and advances from Glencore (refer to item 8) will be sufficient to fund the operations, capital
expenditure, the Whole Ore Leach Project and the Power Project (refer to item 6), for the next twelve
months. Glencore has indicated it will provide or procure the additional funding required, if any, for the
operations, capital expenditure, the Whole Ore Leach Project and the completion of the Power Project.
During the year ended December 31, 2014, the existing Loan Facilities and customer prepayments received
up to November 26, 2014 were rolled into new long-term facilities with repayment terms extended to
January 1, 2021 (refer to item 8).
The following table details the Company’s expected remaining contractual maturities for its financial
liabilities at June 30, 2015. The table is based on the undiscounted cash flows of financial liabilities based
on the earliest date on which the Company can be required to satisfy the liabilities.
6 months
or less
6 to 12 1 to 2 Over
months years 2 years Total
As at June 30, 2015 $’000 $’000 $’000 $’000 $’000
Bank overdrafts 535 - - - 535
Accounts payable and accrued
liabilities 330,090 - - - 330,090
Customer prepayments 598,539 - - - 598,539
Amended Loan Facilities – related
parties - - - 4,676,567 4,676,567
Other non-current liabilities
Pas de Porte obligation - - 15,500 - 15,500
Finance lease liability - - 1,517 - 1,517
Current portion of finance lease
liability 2,834 1,517 - - 4,351
931,998 1,517 17,017 4,676,567 5,627,099
6 months
or less
6 to 12 1 to 2 Over
months years 2 years Total
As at December 31, 2014 $’000 $’000 $’000 $’000 $’000
Bank overdrafts 20,381 - - - 20,381
Accounts payable and accrued
liabilities 357,183 - - - 357,183
Customer prepayments 2,385 - - - 2,385
Amended Loan Facilities – related
parties - - - 4,624,724 4,624,724
Other non-current liabilities
Pas de Porte obligation - 15,000 15,500 - 30,500
Finance lease liability - - 1,409 - 1,409
Current portion of finance lease
liability 2,021 2,021 - - 4,042
381,970 17,021 16,909 4,624,724 5,040,624
Other risks
The Company is exposed to other risks during its course of business and these are discussed in detail in the
Company’s Annual Information Form which is available on SEDAR at www.sedar.com and should be
reviewed in conjunction with this document.

MANAGEMENT’S DISCUSSION AND ANALYSIS OF FINANCIAL CONDITION AND RESULTS OF OPERATIONS
26
The financial information in this Management’s Discussion and Analysis has been prepared using the same
accounting policies and methods of computation as applied in the Company’s 2014 annual audited
consolidated financial statements and no updates are required for the key accounting judgments and
estimates.
14. Health, Safety, Community and Environment
In terms of the health and safety policy, there is explicit recognition of the importance of a safe and healthy
work environment, created as a result of joint responsibility between the Company, its employees and
contracting companies involved in work on the operating site. The Company is fully committed to
continual improvement of its operational conditions and practices. The Company is actively developing
and implementing procedures, conducting training and auditing of protocols across its operation. The
Company has a well-established Emergency Response Team (“ERT”) and a mine rescue team trained to
international standards. Additionally, Katanga has an on-site hospital providing medical and occupational
health services to all employees, contractors and their dependents.
The prevention of fatalities is of utmost importance to the Company. As part of the Glencore “SafeWork”
program, the Company continues to develop and introduce Fatal Hazard Protocols and Life Saving
Behaviours that mandate the processes, conditions and behaviours needed to prevent fatalities. Each
individual employee has provided a commitment to this program. The Company also completed its
comprehensive baseline Health and Safety risk assessment for mining and processing areas in Q4 2014.
During H1 2015, no fatalities occurred. During 2014, regrettably, 3 fatalities occurred in the mining
operations. There were 2 lost time injury (LTI) recorded during Q2 2015 compared to 12 during the whole
of 2014. The H1 2015 LTI frequency rate based on one million man hours was 0.19 (0.40 during the whole
of 2014). There were 3 lost time injury (LTI) recorded during H1 2015..
The Company’s environmental practices are modelled after ISO 14000 and continual improvement is a
consistent theme with the Company’s environmental practices. In March 2008, the Company’s consultants
completed a draft Environmental & Social Impact Assessment (“ESIA”) which is supported by a series of
Environmental & Social Management Plans. This ESIA was carried out on a project description that
envisaged a full build-out to increase the production to in excess of 300,000 tonnes per annum of copper
production. Arrangements were subsequently made to review the draft ESIA based on the Accelerated
Development Plan, the 2012 ITR (refer to item 16) and in consideration of DRC legal requirements and to
re-draft an Environmental Impact Study (“EIS”). Public consultation was completed on April 15, 2010.
The EIS was submitted to the DRC authorities for approval in January 2011. Through the Department for
the Protection of Mining Environment, the DRC Ministry of Mines approved the EIS in March 2011 and as
a consequence, the Company has commenced all necessary steps required to comply with its environmental
commitments referenced in the EIS and its Environmental and Social Management Plans.
Under DRC law, Katanga is required to review its approved ESIA every five years and when any
significant changes to its operations occur. Katanga submitted an amended ESIA, including the Updated
Phase 4 Expansion Project, the Phase 5 Expansion Project and the development of T17 Underground Mine
in April 2014. The Company is also in the process of aligning its security practices with the United
Nation’s Voluntary Principles on Security and Human Rights.
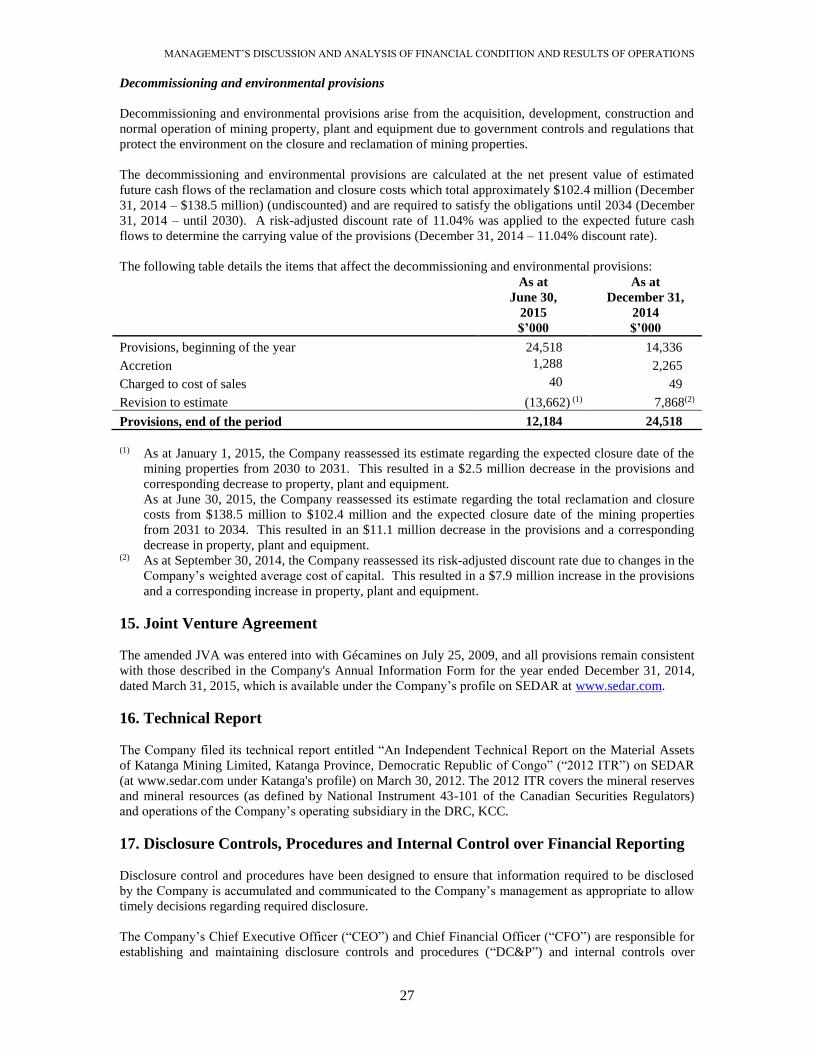
MANAGEMENT’S DISCUSSION AND ANALYSIS OF FINANCIAL CONDITION AND RESULTS OF OPERATIONS
27
Decommissioning and environmental provisions
Decommissioning and environmental provisions arise from the acquisition, development, construction and
normal operation of mining property, plant and equipment due to government controls and regulations that
protect the environment on the closure and reclamation of mining properties.
The decommissioning and environmental provisions are calculated at the net present value of estimated
future cash flows of the reclamation and closure costs which total approximately $102.4 million (December
31, 2014 – $138.5 million) (undiscounted) and are required to satisfy the obligations until 2034 (December
31, 2014 – until 2030). A risk-adjusted discount rate of 11.04% was applied to the expected future cash
flows to determine the carrying value of the provisions (December 31, 2014 – 11.04% discount rate).
The following table details the items that affect the decommissioning and environmental provisions:
As at
June 30,
2015
$’000
As at
December 31,
2014
$’000
Provisions, beginning of the year 24,518) ) ) 14,336) )
Accretion 1,288) ) ) 2,265) )
Charged to cost of sales 40) ) ) 49) )
Revision to estimate (13,662) (1) 7,868(2)
Provisions, end of the period 12,184) ) ) 24,518) )
(1) As at January 1, 2015, the Company reassessed its estimate regarding the expected closure date of the
mining properties from 2030 to 2031. This resulted in a $2.5 million decrease in the provisions and
corresponding decrease to property, plant and equipment.
As at June 30, 2015, the Company reassessed its estimate regarding the total reclamation and closure
costs from $138.5 million to $102.4 million and the expected closure date of the mining properties
from 2031 to 2034. This resulted in an $11.1 million decrease in the provisions and a corresponding
decrease in property, plant and equipment. (2) As at September 30, 2014, the Company reassessed its risk-adjusted discount rate due to changes in the
Company’s weighted average cost of capital. This resulted in a $7.9 million increase in the provisions
and a corresponding increase in property, plant and equipment.
15. Joint Venture Agreement
The amended JVA was entered into with Gécamines on July 25, 2009, and all provisions remain consistent
with those described in the Company's Annual Information Form for the year ended December 31, 2014,
dated March 31, 2015, which is available under the Company’s profile on SEDAR at www.sedar.com.
16. Technical Report
The Company filed its technical report entitled “An Independent Technical Report on the Material Assets
of Katanga Mining Limited, Katanga Province, Democratic Republic of Congo” (“2012 ITR”) on SEDAR
(at www.sedar.com under Katanga's profile) on March 30, 2012. The 2012 ITR covers the mineral reserves
and mineral resources (as defined by National Instrument 43-101 of the Canadian Securities Regulators)
and operations of the Company’s operating subsidiary in the DRC, KCC.
17. Disclosure Controls, Procedures and Internal Control over Financial Reporting
Disclosure control and procedures have been designed to ensure that information required to be disclosed
by the Company is accumulated and communicated to the Company’s management as appropriate to allow
timely decisions regarding required disclosure.
The Company’s Chief Executive Officer (“CEO”) and Chief Financial Officer (“CFO”) are responsible for
establishing and maintaining disclosure controls and procedures (“DC&P”) and internal controls over
MANAGEMENT’S DISCUSSION AND ANALYSIS OF FINANCIAL CONDITION AND RESULTS OF OPERATIONS
28
financial reporting (“ICFR”), as those terms are defined in National Instrument 52-109 Certification of
Disclosure in Issuers’ Annual and Interim Filings, for the Company.
The CEO and CFO have concluded that, as at June 30, 2015, the Company’s DC&P have been designed
effectively to provide reasonable assurance that (a) material information relating to the Company is made
known to them by others, particularly during the period in which the annual filings are being prepared; and
(b) information required to be disclosed by the Company in its annual filings, interim filings or other
reports filed or submitted by the Company under securities legislation is recorded, processed, summarized
and reported within the time periods specified in securities legislation. They have also concluded that the
Company’s ICFR have been designed effectively to provide reasonable assurance regarding the reliability
of the preparation and presentation of the financial statements for external purposes and were effective as at
June 30, 2015.
It should be noted that while the Company’s CEO and CFO believe that the Company’s disclosure controls
and procedures provide a reasonable level of assurance that they are effective, they do not expect that the
disclosure controls will prevent all errors and fraud. A control system, no matter how well conceived or
operated, can only provide reasonable, not absolute, assurance that the objectives of the control system are
met.
Internal controls over financial reporting are designed to provide reasonable assurance regarding the
reliability of financial reporting and the preparation of the financial statements for external reporting
purposes in line with IFRS. Management is responsible for establishing and maintaining adequate internal
controls over financial reporting appropriate to the nature and size of the Company. However, any system
of internal control over financial reporting has inherent limitations and can only provide reasonable
assurance with respect to financial statement preparation and presentation.
The Company uses the Committee of Sponsoring Organizations of the Treadway Commission control
framework (2013). There were no changes to the Company’s internal controls over financial reporting that
occurred during the period ended June 30, 2015 that materially affected, or are reasonably likely to affect,
the Company’s internal controls over financial reporting.
18. Forward Looking Statements
Management’s discussion and analysis may contain forward-looking statements, including, but not limited
to, the commissioning of new excavators and pump stations to improve dewatering management at KOV,
the anticipated decrease in power disruption relating to the ongoing upgrade in power infrastructure, the
matters relating to the Power Project, the completion of the upgrade in power infrastructure, the impact of
the upgrade of Wemco cells and spray bars on recoveries at KTC, the impact of the new heap leach at
Luilu, the impact of newly acquired or commissioned equipment on operations, the ongoing development
of T17 Underground Mine, the improvements related to the Whole Ore Leach Project and the overall
expected improvement of recoveries and grades. Often, but not always, forward-looking statements can be
identified by the use of words such as "plans", "expects" or "does not expect", "is expected", "budget",
"scheduled", "estimates", "forecasts", "intends", "anticipates" or "does not anticipate", or "believes", or
describes a "goal", or variation of such words and phrases or state that certain actions, events or results
"may", "could", "would", "might" or "will" be taken, occur or be achieved.
All forward-looking statements reflect the Company’s beliefs and assumptions based on information
available at the time the statements were made. Actual results or events may differ from those predicted in
these forward-looking statements. All of the Company’s forward-looking statements are qualified by the
assumptions that are stated or inherent in such forward-looking statements, including the assumptions listed
below. Although the Company believes that these assumptions are reasonable, this list is not exhaustive of
factors that may affect any of the forward-looking statements. The key assumptions that have been made in
connection with the forward-looking statements include the following: there being no significant
disruptions affecting the operations of the Company whether due to labour disruptions, supply disruptions,
power disruptions, rollout of new equipment, damage to equipment or otherwise; permitting, development,
operations, expansion and acquisitions at the Project being consistent with the Company's current
expectations; continued recognition of the Company’s mining concessions and other assets, rights, titles
and interests in the DRC; political and legal developments in the DRC being consistent with its current

MANAGEMENT’S DISCUSSION AND ANALYSIS OF FINANCIAL CONDITION AND RESULTS OF OPERATIONS
29
expectations; the continued provision or procurement of additional funding from Glencore for the
operations, the completion of the T17 Underground Mine and the Power Project; the successful completion
of, and realizing the intended benefits from the Power Project; new equipment performs to expectations; the
successful development of the T17 Underground Mine; the exchange rate between the US dollar, South
African rand, British pounds, Canadian dollar, Swiss franc, Congolese franc and Euro being approximately
consistent with current levels; certain price assumptions for copper and cobalt; prices for diesel, natural gas,
fuel oil, electricity and other key supplies being approximately consistent with current levels; production
and cost of sales forecasts for the Company meeting expectations; the accuracy of the current ore reserve
and mineral resource estimates of the Company (including but not limited to ore tonnage and ore grade
estimates); and labour and material costs increasing on a basis consistent with the Company's current
expectations.
Forward-looking statements involve known and unknown risks, future events, conditions, uncertainties and
other factors which may cause the actual results, performance or achievements to be materially different
from any future results, prediction, projection, forecast, performance or achievements expressed or implied
by the forward-looking statements. Such factors include, among others, the actual results of current
exploration activities; actual results and interpretation of current reclamation activities; conclusions of
economic evaluations; changes in project parameters as plans continue to be refined; future prices of copper
and cobalt; possible variations in ore grade or recovery rates; failure of plant, equipment or processes to
operate as anticipated; accidents, labour disputes and other risks of the mining industry; delays in obtaining
governmental approvals or financing or in the completion of exploration, development or construction
activities, delays due to strikes or other work stoppage, both internal and external to the Company as well
as those factors disclosed in the Company's current annual information form and other publicly filed
documents. Although Katanga has attempted to identify important factors that could cause actual actions,
events or results to differ materially from those described in forward-looking statements, there may be other
factors that cause actions, events or results not to be as anticipated, estimated or intended. There can be no
assurance that forward-looking statements will prove to be accurate, as actual results and future events
could differ materially from those anticipated in such statements. Accordingly, readers should not place
undue reliance on forward-looking statements.
The Company disclaims any intention or obligation to update or revise any forward-looking statements
whether as a result of new information, future events, or otherwise, except in accordance with applicable
securities laws.
19. Qualified Person
Tim Henderson, a Director and Technical Consultant to the Company, is the ‘Qualified Person’, as defined
in National Instrument 43-101, who approved the scientific and technical disclosure in this Management’s
Discussion and Analysis.

MANAGEMENT’S DISCUSSION AND ANALYSIS OF FINANCIAL CONDITION AND RESULTS OF OPERATIONS
30
20. Non-IFRS Measures
The Company has included three non-IFRS performance measures:
1. EBITDA (earnings before interest, tax, depreciation and amortization);
2. C1 cash costs; and
3. Cash inflows from customer prepayments.
The Company believes that, in addition to conventional measures prepared in accordance with IFRS, these
measures provide useful information to both management and investors to evaluate the Company’s
performance and ability to generate cash flow. Accordingly, it is intended to provide additional information
and should not be considered in isolation or as a substitute for measures of performance prepared in
accordance with IFRS. These measures do not have a standardized meaning prescribed by IFRS and
therefore may not be comparable to similarly titled measures presented by other publicly traded companies
and should not be construed as an alternative to other financial measures determined in accordance with
IFRS.
1. EBITDA has been calculated as:
Three months ended Six months ended
June 30, March 31, June 30, June 30,
2015 2015 2014 2015 2014
Sales $'000 248,414 220,778 305,208 469,192 515,056
Cost of sales $'000 (352,101) (317,953) (318,465) (670,054) (553,826)
General and administrative recovery
(expense) $'000 (1,073) 253 (1,775) (820) (5,820)
Foreign exchange loss $'000 9,787 (309) (1,496) 9,478 (3,475)
Exclude: Depreciation $'000 62,454 55,353 57,751 117,807 99,081
EBITDA $'000 (32,519) (41,878) 41,223 (74,397) 51,016
2. C1 cash costs are the operational costs of production per unit of output, this includes the
following:
Three months ended Six months ended
June 30, March 31, June 30, June 30,
2015 2015 2014 2015 2014
Cobalt sales $'000 24,610) 20,558) 14,517) 45,168) 25,318)
Cost of sales $'000 (352,101) (317,953) (318,465) (670,054) (553,826)
General and administrative recovery
(expense) $'000 (1,073) 253) (1,775) (820) (5,820)
Exclude:
- Change in product inventory $'000 43,761) 9,815) 51,496) 53,576) 51,666)
- Depreciation (C2 cost) $'000 62,454) 55,353) 57,751) 117,807) 99,081)
- Loss on disposal of property, plant and
equipment (C3 cost) $'000 43) 0) 35) 43) 103)
- Decommissioning and environmental
provisions accretion (C3 cost) $'000 664) 664) 873) 1,327) 1,062)
Total C1 costs $'000 (221,642) (231,310) (195,568) (452,953) (382,416)
3. In item 5, for the 2013 quarterly amounts, cash inflows from customer prepayments have been
presented separately from operating cash flows as these were subsequently rolled into the
Amended Loan Facilities (refer to item 8).
Related Documents