Welcome message from author
This document is posted to help you gain knowledge. Please leave a comment to let me know what you think about it! Share it to your friends and learn new things together.
Transcript
KATA PENGANTAR FOREWORD
Dengan mengucap syukur ke hadirat Tuhan Yang Maha Esa, buku “Perasuransian Indonesia 2008” ini akhirnya dapat diterbitkan untuk seluruh masyarakat Indonesia, khususnya pemerhati industri asuransi di Indonesia.
Let us offer praises and gratitude to God Almighty for His mercy and blessing that the book of “Indonesian Insurance 2008” can be published for Indonesian communities and insurance industry observers in particular.
Buku “Perasuransian Indonesia 2008” ini merupakan penerbitan laporan kegiatan usaha perasuransian yang ke 41 yang berisi tentang kegiatan usaha perasuransian tahun 2008 beserta perkembangannya selama lima tahun terakhir. Buku ini disusun sebagai salah satu sarana untuk memberikan informasi kepada masyarakat mengenai usaha perasuransian di Indonesia. Besar harapan kami, buku ini dapat bermanfaat bagi masyarakat, khususnya industri asuransi dan pengguna yang tertarik dengan industri asuransi Indonesia.
This is the 41st publication series of insurance business activities report, which covers the Indonesian insurance business in 2008 and its development in the last five consecutive years. This book is published as one of the tools for sharing information to public about Indonesia insurance business. It is our great wishes that this book would be useful for public, especially for insurance communities who are interested in Indonesian insurance industry.
Sebagaimana penerbitan buku yang sebelumnya, buku ini pun menyajikan gambaran mengenai perkembangan usaha perasuransian yang dilihat dari berbagai aspek, antara lain perkembangan kekayaan, premi bruto dan klaim bruto. Data keuangan yang disajikan dalam Buku “Perasuransian Indonesia 2008” ini disusun berdasarkan laporan keuangan tahun 2008 yang telah diaudit oleh akuntan publik, sedangkan data teknis asuransi disusun berdasarkan laporan operasional tahun 2008 yang dilaporkan perusahaan kepada Biro Perasuransian.
Format penyajian perkembangan usaha perasuransian dalam buku ini relatif berbeda dari format dalam buku tahunan sebelumnya. Perkembangan usaha perasuransian disajikan secara ringkas dalam satu bab, sedangkan data terperinci tetap dapat dilihat dalam lampiran-lampiran. Selain itu, buku tahun ini menambahkan bab baru yang menjelaskan kegiatan Biro Perasuransian, arah kebijakan dan kalender peristiwa penting tahun 2008.
Similar to the previous publishment, this book presents the illustrations of insurance business development from different aspects, such as the growth of assets, gross premium and gross claim. The financial data of this book were compiled from the 2008 audited financial statements of insurance business. While, the technical data were compiled from the 2008 operational reports submitted to Insurance Bureau.
The presentation form describing the insurance
business development is relatively different from that of previous years as it is now presented concisely in one chapter while the detailed data may still be seen in appendices. This book also presents a new chapter explaining Insurance Bureau’s main activities, regulation roadmap and calender of events year 2008.
Pada proses penyusunan buku “Perasuransian Indonesia 2008” ini kami juga telah mengoreksi beberapa data statistik yang disajikan pada buku tahun sebelumnya sehingga mungkin data tersebut berbeda dengan yang disajikan pada buku tahun sebelumnya.
Moreover, we have also corrected some statistical data of previous book so that they may now be presented differently compared to those presented in previous book.
Kami menyadari kebutuhan penyempurnaan buku tahunan ini masih sangat tinggi. Kritik dan saran penyempurnaan masih sangat kami harapkan. Akhir kata, kami mohon maaf apabila masih ditemukan kesalahan data dan informasi yang disajikan dalam buku ini.
We realize that the book still needs a lot of improvements. Constructive comments and inputs are most welcome. Lastly, we apologize for any incorrect data and information presented in this book.
Jakarta, November 2009
Jakarta, November 2009
Kepala Biro Perasuransian
Badan Pengawas Pasar Modal dan Lembaga Keuangan
Departemen Keuangan Republik Indonesia
Head of Insurance Bureau
Capital Market and Financial Institutions Supervisory Agency
Ministry of Finance, Republic of Indonesia
DAFTAR ISI CONTENTS
Hal. Page
KATA PENGANTAR PREFACE
DAFTAR ISI CONTENTS
INDIKATOR KUNCI KEY INDICATORS
BAB I CHAPTER I
IKHTISAR KEGIATAN USAHA PERASURANSIAN DI INDONESIA TAHUN 2008
SUMMARY OF INDONESIAN INSURANCE BUSINESS ACTIVITIES IN 2008
A. UMUM A. GENERAL
B. STRUKTUR PASAR B. MARKET STRUCTURE
Tabel 1.1 Pertumbuhan Jumlah Perusahaan Perasuransian
Table 1.1 The Growth of Total Insurance Company
C. PERTUMBUHAN PREMI BRUTO C. THE GROWTH OF GROSS PREMIUM
Tabel 1.2 Premi Bruto dan Produk Domestik Bruto
Table 1.2 Gross Premium and Gross Domestic Product
Tabel 1.3 Premi Bruto Menurut Jenis Usaha Table 1.3 Gross Premium According to Insurance Sectors
Grafik 1.1 Premi Bruto Menurut Jenis Usaha Tahun 2008
Graph 1.1 Gross Premiums According to Insurance Sectors in 2008
D. PERTUMBUHAN JUMLAH KLAIM DIBAYAR D. THE GROWTH OF CLAIMS PAID
Tabel 1.4 Pertumbuhan Klaim Dibandingkan dengan Premi Bruto
Table 1.4 The Growth of Claim Paid Relative to Gross Premium
Grafik 1.2.a
Proporsi Klaim Dibayar Menurut Jenis Usaha Tahun 2008
Graph 1.2.a
Claims Paid According to Line of Business in 2008
Grafik 1.2.b
Rasio Klaim Dibayar terhadap Premi Bruto
Graph 1.2.b
Ratio of Claims Paid to Gross Premiums
E. PERTUMBUHAN JUMLAH KEKAYAAN DAN INVESTASI
E. THE GROWTH OF ASSETS AND INVESTMENTS
Tabel 1.5 Jumlah Kekayaan Industri Asuransi
Table 1.5 Total Assets of Insurance Industry
Grafik 1.3 Kekayaan Industri Asuransi
Menurut Jenis Usaha Tahun 2008 Graph 1.3 The Assets of Insurance
Industry According to Insurance Sectors in 2008
Tabel 1.6 Jumlah Investasi Industri Asuransi Table 1.6 Total Investments of Insurance Industry
Grafik 1.4.a
Investasi Industri Asuransi Menurut Jenis Usaha Tahun 2008
Graph 1.4.a
Investments of Insurance Industry According to Insurance Sectors in 2008
Grafik 1.4.b
Pertumbuhan Kekayaan dan Investasi Industri Asuransi
Graph 1.4.b
The Growth of Assets and Investments of Insurance Industry
Tabel 1.7 Portofolio Investasi Industri Asuransi
Table 1.7 The Investment Portfolio of Insurance Industry
Grafik 1.5 Portofolio Investasi Industri Asuransi Tahun 2008
Graph 1.5 The Investment Portfolio of Insurance Industry in 2008
F. NERACA PEMBAYARAN JASA ASURANSI KERUGIAN DAN REASURANSI
F. BALANCE OF SERVICES PAYMENT OF NON LIFE INSURANCE AND REINSURANCE COMPANIES
Tabel 1.8 Kegiatan Asuransi Ke dan Dari Luar Negeri
Table 1.8 The Balance of Payment of Insurance Industry
Grafik Transaksi Berjalan Sektor Graph Balance of Payment of
1.6.a Asuransi 1.6.a Insurance Sector
Grafik 1.6.b
Rasio Klaim Kegiatan Bisnis Reasuransi dengan Luar Negeri
Graph 1.6.a
The Claim Ratio of International Reinsurance Business Activities
G. USAHA ASURANSI DAN REASURANSI DENGAN PRINSIP SYARIAH
G. SHARIA INSURANCE AND REINSURANCE BUSINESS
G.1. STRUKTUR PASAR ASURANSI DENGAN PRINSIP SYARIAH
G.1. THE MARKET STRUCTURE OF SHARIA INSURANCE BUSINESS
Tabel 1.9 Pertumbuhan Usaha Asuransi dan Reasuransi dengan Prinsip Syariah
Table 1.9 The Growth of Sharia Insurance and Reinsurance Business
G.2. PERTUMBUHAN PREMI BRUTO DAN KLAIM BRUTO
G.2. THE GROWTH OF GROSS PREMIUM AND GROSS CLAIM
Tabel 1.10 Pertumbuhan Usaha Asuransi dan Reasuransi dengan Prinsip Syariah
Table 1.10 The Growth of Sharia Insurance and Reinsurance Business
Tabel 1.11 Pertumbuhan Usaha Asuransi dan Reasuransi dengan Prinsip Syariah
Table 1.11 The Growth of Sharia Insurance and Reinsurance Business
Tabel 1.12 Pertumbuhan Usaha Asuransi dan Reasuransi dengan Prinsip Syariah
Table 1.12 The Growth of Sharia Insurance and Reinsurance Business
G.3. PERTUMBUHAN RASIO KLAIM G.3. THE GROWTH OF CLAIM RATIO
Tabel 1.13 Pertumbuhan Rasio Klaim Usaha
Asuransi dengan Prinsip Syariah Table 1.13 The Growth of Claim Ratio
of Sharia Insurance Business
G.4. PANGSA PASAR ASURANSI DENGAN PRINSIP SYARIAH
G.4. THE MARKET SHARE OF SHARIA INSURANCE
Tabel 1.14 Pangsa Pasar Asuransi dengan Prinsip Syariah
Table 1.14 The Market Share of Sharia Insurance Business
H. UNIT LINK H. UNIT LINK
Tabel 1.15 Neraca Perusahaan Asuransi
yang Memasarkan Unit Link Tahun 2008
Table 1.15 The Balance Sheet of
Insurance Companies Selling Unit Link in 2008
Tabel 1.16 Laba/Rugi Perusahaan Asuransi
yang Memasarkan Unit Link Tahun 2008
Table 1.16 Profit/Loss of Insurance
Companies Selling Unit Link in 2008
I. USAHA PIALANG ASURANSI DAN REASURANSI, SERTA PERUSAHAAN PENILAI KERUGIAN ASURANSI
I. INSURANCE AND REINSURANCE
BROKERS AND LOSS ADJUSTERS BUSINESS
Tabel 1.17 Pertumbuhan Komisi Pialang dan
Premi Asuransi Melalui Pialang Tabel 1.17 The Growth of Brokers
Commisions and Gross Premiums
Tabel 1.18 Rekapitulasi Jumlah Klaim yang
Dinilai oleh Perusahaan Penilai Kerugian Asuransi
Tabel 1.18 The Recapitulation of
Claims Appraised By Loss Adjusters
Grafik 1.7 Pertumbuhan Kekayaan, Kewajiban, Modal Sendiri Usaha Pialang Asuransi dan Reasuransi Tahun 2004 - 2008
Graph 1.7 The Growth of The Assets, Liabilities, Equity of Insurance & Reinsurance Brokers Business Years 2004 -2008
Grafik 1.8 Pertumbuhan Pendapatan, Biaya, Laba/Rugi Usaha Pialang Asuransi dan Reasuransi Tahun 2004 - 2008
Graph 1.8 The Growth of The Incomes, Expenses, Profit / Loss of Insurance & Reinsurance Brokers Business Years 2004 -2008
BAB II CHAPTER II
BIRO PERASURANSIAN, BADAN PENGAWAS PASAR MODAL DAN LEMBAGA KEUANGAN
INSURANCE BUREAU, CAPITAL MARKET AND FINANCIAL INSTITUTIONS SUPERVISORY AGENCY
A. KEGIATAN UTAMA A. MAIN ACTIVITIES
B. ARAH KEBIJAKAN B. REGULATION FOCUS
C. ARAH KEBIJAKAN ASURANSI SYARIAH C. SHARIA INSURANCE POLICIES
D. KALENDER PERISTIWA PENTING TAHUN 2008
D. CALENDER OF EVENTS YEAR 2008
LAMPIRAN I APPENDIX I
STRUKTUR ORGANISASI BIRO PERASURANSIAN ORGANIZATION STRUCTURE OF BUREAU OF INSURANCE
LAMPIRAN II APPENDIX II
USAHA ASURANSI KERUGIAN DAN REASURANSI NON LIFE INSURANCE AND REINSURANCE BUSINESS
Tabel 2.1 Rekapitulasi Neraca Tahun 2008 Tabel 2.1 The Recapitulation of Balance Sheet in 2008
Tabel 2.1.1 Rekapitulasi Investasi Tahun 2008 Tabel 2.1.1 The Recapitulation of Investments in 2008
Tabel 2.1.2 Rekapitulasi Bukan Investasi Tahun 2008
Tabel 2.1.2 The Recapitulation of Non Investments in 2008
Tabel 2.1.3 Rekapitulasi Hasil Investasi Tahun 2008
Tabel 2.1.3 The Recapitulation of Investment Income in 2008
Tabel 2.2 Rekapitulasi Laba / RugiTahun 2008
Tabel 2.2 The Recapitulation of Profit / Loss in 2008
Tabel 2.3 Kekayaan Perusahaan Tahun 2004 – 2008
Tabel 2.3 The Assets of Companies in Year 2004 – 2008
Tabel 2.4 Laba / Rugi Perusahaan Tahun 2004 - 2008
Tabel 2.4 The Profit / Loss of Companies in Year 2004 – 2008
Tabel 2.5 Investasi dan Cadangan Teknis Perusahaan Tahun 2004 - 2008
Tabel 2.5 Investments and Technical Reserves of Companies in Year 2004 – 2008
Tabel 2.6 Neraca Gabungan per 31 Desember 2008
Tabel 2.6 The Consolidated Balance Sheet as at December 31, 2008
Tabel 2.7 Laporan Laba / Rugi Gabungan Tahun 2008
Tabel 2.7 The Consolidated Profit / Loss Statement in 2008
Tabel 2.8 Neraca Gabungan per 31 Desember 2004 - 2008
Tabel 2.8 The Consolidated Balance Sheet as at December 31, 2004 – 2008
Tabel 2.9 Laporan Laba / Rugi Gabungan Tahun 2004 - 2008
Tabel 2.9 The Consolidated Profit / Loss Statement in 2004 - 2008
Tabel 2.10 Rekapitulasi Premi, Klaim, dan Komisi Tahun 2008
Tabel 2.10 The Recapitulation of Premiums, Claims and Commissions Year 2008
Tabel 2.11 Premi Usaha Asuransi Kerugian dan Reasuransi Tahun 2008
Tabel 2.11 The Premiums of Non Life Insurance and Reinsurance Business in 2008
Tabel 2.12 Klaim Usaha Asuransi Kerugian dan Reasuransi Tahun 2008
Tabel 2.12 The Claims of Non Life Insurance and Reinsurance Business in 2008
Tabel 2.13 Pertumbuhan Premi Bruto dan Klaim Bruto Tahun 2004 - 2008
Tabel 2.13 The Growth of Gross Premium and Gross Claim in 2004 - 2008
Tabel 2.14 Pertumbuhan Premi Neto dan Tabel 2.14 The Growth of Net

Klaim Neto Tahun 2004 - 2008 Premiums and Net Claims in 2004 - 2008
LAMPIRAN III APPENDIX III
USAHA ASURANSI JIWA LIFE INSURANCE BUSINESS
Tabel 3.1 Rekapitulasi Neraca Per 31 Desember 2008
Tabel 3.1 The Recapitulation of Balance Sheet as at December 31, 2008
Tabel 3.1.1 Rekapitulasi Investasi per 31 Desember 2008
Tabel 3.1.1 The Recapitulation of Investment as at December 31, 2008
Tabel 3.1.2 Rekapitulasi Bukan Investasi per 31 Desember 2008
Tabel 3.1.2 The Recapitulation of Non Investment Assets as at December 31, 2008
Tabel 3.2 Rekapitulasi Neraca Perusahaan Asuransi yang Memasarkan Produk Asuransi Yang Dikaitkan dengan Investasi Tahun 2008
Tabel 3.2 The Recapitulation of Balance Sheet of Insurance Companies Sold Unit Link In 2008
Tabel 3.3 Rekapitulasi Perhitungan Laba / Rugi Tahun 2008
Tabel 3.3 The Recapitulation of Profit / Loss in 2008
Tabel 3.3.1 Rekapitulasi Hasil Investasi Tahun 2008
Tabel 3.3.1 The Recapitulation of Investment Yields in Year 2008
Tabel 3.4 Rekapitulasi Laba / Rugi Perusahaan Asuransi Yang Memasarkan Produk Asuransi Yang Dikaitkan Dengan Investasi Tahun 2008
Tabel 3.4 The Recapitulation of Profit / Loss of Insurance Companies Sold Unit Link In 2008
Tabel 3.5 Kekayaan, Kewajiban Dan Modal Sendiri Usaha Asuransi Jiwa Tahun 2004 - 2008
Tabel 3.5 Assets, Liabilities And Equity of Life Insurance Business In Year 2004 - 2008
Tabel 3.6 Laba / Rugi Usaha Asuransi Jiwa Tahun 2004 – 2008
Tabel 3.6 The Profit / Loss of Life Insurance Business in Year 2004- 2008
Tabel 3.7 Investasi dan Cadangan Teknis Usaha Asuransi Jiwa Tahun 2004 – 2008
Tabel 3.7 Investments and Technical Reserves of Life Insurance Business In Year 2004 - 2008
Tabel 3.8 Neraca Gabungan per 31 Desember 2008
Tabel 3.8 Consolidated Balance Sheet as at December 31, 2008
Tabel 3.9 Laporan Laba / Rugi Gabungan Tahun 2008
Tabel 3.9 Consolidated Income Statement in 2008
Tabel 3.10 Neraca Gabungan per 31 Desember 2004 – 2008
Tabel 3.10 Consolidated Balance Sheet as at December 31, 2004- 2008
Tabel 3.11 Laporan Laba / Rugi Gabungan Tahun 2004 – 2008
Tabel 3.11 Consolidated Income Statement in Year 2004-2008
Tabel 3.12.1.A Laporan Premi Pertanggungan Baru per Cabang Asuransi Tahun 2008
Tabel 3.12.1.A First Year Premium Report per Line of Business Year 2008
Tabel 3.12.1.B Laporan Premi Lanjutan per Cabang Asuransi Tahun 2008
Tabel 3.12.1.B Continuance Premium Report per Line of Business Year 2008
Tabel 3.12.2 Laporan Premi Murni per Cabang Asuransi Tahun 2008
Tabel 3.12.2 Premium Report per Line of Business Year 2008
Tabel 3.12.3 Laporan Asumsi Biaya per Cabang Asuransi Tahun 2008
Tabel 3.12.3 Loading Assumption Report per Line of Business Year 2008

Tabel 3.12.4 Laporan Premi Tahun 2008 Tabel 3.12.4 Premium Report Year 2008
Tabel 3.13.1 Cadangan Premi per 31 Desember 2008
Tabel 3.13.1 Premium Reserve as at December 31, 2008
Tabel 3.13.2 Cadangan Atas Premi yang Belum Merupakan Pendapatan (CAPBMP)
Tabel 3.13.2 Unearned Premium Reserve (UPR)
Tabel 3.14 Jumlah Tertanggung dan Uang Pertanggungan Tahun 2004-2008
Tabel 3.14 The Number of Insureds and Sum Insureds Years 2004 -2008
Tabel 3.15.1 – 3.15.11
Portepel per 31 Desember 2008 Tabel 3.15.1 – 3.15.11
Portfolio as at December 31, 2008
Tabel 3.16 Pertanggungan yang Berlaku pada Awal Tahun 2008
Tabel 3.16 Policies Inforce at The Beginning of The Year 2008
Tabel 3.16.1 Pertanggungan Baru untuk Tahun 2008
Tabel 3.16.1 New Business for The Year 2008
Tabel 3.16.2 Pemulihan Kembali Polis untuk Tahun 2008
Tabel 3.16.2 Reinstatement for The Year 2008
Tabel 3.16.3 Perubahan dari Cabang lain untuk Tahun 2008
Tabel 3.16.3 Alteration from Other Plans for the Year 2008
Tabel 3.16.4 Meninggal dalam Tahun 2008 Tabel 3.16.4 Death for The Year 2008
Tabel 3.16.5 Habis Kontrak dalam Tahun 2008 Tabel 3.16.5 Maturities for The Year 2008
Tabel 3.16.6 Pemutusan Kontrak Produk Yang Dihasilkan Tahun 2008
Tabel 3.16.6 Lapse for Products Produced for The Year 2008
Tabel 3.16.7 Pemutusan Kontrak Produk Yang Dihasilkan Tahun 2006
Tabel 3.16.7 Lapse for Products Produced for The Year 2006
Tabel 3.16.8 Pemutusan Kontrak Produk Yang Dihasilkan Tahun 2005
Tabel 3.16.8 Lapse for Products Produced for The Year 2005
Tabel 3.16.9 Perubahan ke Cabang Lain untuk Tahun 2008
Tabel 3.16.9 Alteration to Other Plans for the Year 2008
Tabel 3.17 Pertanggungan pada Akhir Tahun 2008
Tabel 3.17 Policies Inforce at The End of The Year 2008
Tabel 3.18.1 Pertanggungan Baru Tahun 2004 - 2008
Tabel 3.18.1 New Business Years 2004 - 2008
Tabel 3.18.2 Meninggal Tahun 2004 - 2008 Tabel 3.18.2 Death Years 2004 - 2008
Tabel 3.18.3 Habis Kontrak Tahun 2004 - 2008 Tabel 3.18.3 Maturity Years 2004 - 2008
Tabel 3.18.4 Pemutusan Kontrak Tahun 2004 - 2008
Tabel 3.18.4 Lapse Years 2004 - 2008
Tabel 3.18.5 Pertumbuhan Jumlah Tertanggung dan Uang Pertanggungan Tahun 2004 -2008
Tabel 3.18.5 The Growth of Number of Insureds and Sum Insureds Years 2004 - 2008
Tabel 3.18.6 Pertumbuhan Kegiatan Operasional tahun 2004 - 2008
Tabel 3.18.6 The Growth of Operational Activities Years 2004 - 2008
Tabel 3.18.6.1 Pertumbuhan Kegiatan Operasioanl Perusahaan Swasta Nasional Tahun 2004 - 2008
Tabel 3.18.6.1 The Growth of Operational Activities of Private National Companies Years 2004 - 2008
Tabel 3.18.6.2 Pertumbuhan Kegiatan Operasioanl Perusahaan PatunganTahun 2004 - 2008
Tabel 3.18.6.2 The Growth of Operational Activities of Joint Venture Companies Years 2004 - 2008
LAMPIRAN IV APPENDIX IV
USAHA ASURANSI DAN REASURANSI SYARIAH SHARIA INSURANCE AND REINSURANCE BUSINESS
Tabel 4.1 Rekapitulasi Neraca Usaha Asuransi Kerugian Dan Reasuransi Syariah Tahun 2008
Table 4.1 The Recapitulation of Balance Sheet of Sharia Non Life Insurance and Reinsurance Business In
2008
Tabel 4.1.1 Rekapitulasi Investasi Usaha Asuransi Kerugian Dan Reasuransi Syariah Tahun 2008
Table 4.1.1 The Recapitulation of Investment of Sharia Non Life Insurance and Reinsurance Business In 2008
Tabel 4.1.2 Rekapitulasi Kekayaan Bukan Investasi Usaha Asuransi Kerugian Dan Reasuransi Syariah Tahun 2008
Table 4.1.2 The Recapitulation of Non Investment Assets of Sharia Non Life Insurance and Reinsurance Business In 2008
Tabel 4.1.3 Hasil Investasi Usaha Asuransi Kerugian Dan Reasuransi Syariah Tahun 2008
Table 4.1.3 The Investment Income of Sharia Non Life Insurance and Reinsurance Business In 2008
Tabel 4.2 Neraca Gabungan Usaha Asuransi Kerugian dan Reasuransi Syariah Per 31 Desember 2008
Table 4.2 Consolidated Balance Sheet of Sharia Non Life Insurance and Reinsurance Business as at December 31, 2008
Tabel 4.3 Rekapitulasi Laba / Rugi Usaha Asuransi Kerugian dan Reasuransi dan Reasuransi Syariah Tahun 2008
Table 4.3 The Recapitulation of Profit / Loss of Sharia Non Life Insurance and Reinsurance Business In 2008
Tabel 4.4 Laporan Laba / Rugi Gabungan Usaha Asuransi Kerugian dan Reasuransi dan Reasuransi Syariah Tahun 2008
Table 4.4 The Consolidated Profit / Loss Statement of Sharia Non Life Insurance and Reinsurance Business In 2008
Tabel 4.5 Rekapitulasi Premi, Klaim dan Komisi Tahun 2008
Table 4.5 The Recapitulation of Premiums, Claims and Commissions Year 2008
Tabel 4.6 Premi Usaha Asuransi Kerugian dan Reasuransi Syariah Tahun 2008
Table 4.6 The Premiums of Sharia Non Life Insurance and Reinsurance Business In 2008
Tabel 4.7 Klaim Usaha Asuransi Kerugian dan Reasuransi Syariah Tahun 2008
Table 4.7 The Claims of Sharia Non Life Insurance and Reinsurance Business In 2008
Tabel 4.8 Rekapitulasi Neraca Usaha Asuransi Jiwa Syariah Tahun 2008
Table 4.8 The Recapitulation of Balance Sheet of Sharia Life Insurance Business In Year 2008
Tabel 4.8.A Rekapitulasi Neraca Usaha Asuransi Jiwa Syariah yang Memasarkan Produk Asuransi yang Dikaitkan dengan Investasi Tahun 2008
Table 4.8.A The Recapitulation of Balance Sheet of Sharia Life Insurance Business Sold Unit Link In 2008
Tabel 4.8.1 Rekapitulasi Investasi Usaha Asuransi Jiwa Syariah Tahun 2008
Table 4.8.1 The Recapitulation of Investments Asset of Sharia Life Insurance Business In Year 2008
Tabel 4.8.2 Rekapitulasi Bukan Investasi Usaha Asuransi Jiwa Syariah Tahun 2008
Table 4.8.2 The Recapitulation of Non Investments of Sharia Life Insurance Business In Year 2008
Tabel 4.8.3 Rekapitulasi Hasil Investasi Usaha Asuransi Jiwa Syariah Tahun 2008
Table 4.8.3 The Recapitulation of Investments Yields of Sharia Life Insurance Business In Year 2008
Tabel 4.9 Neraca Gabungan Usaha Asuransi Jiwa Syariah Per 31 Desember 2008
Table 4.9 Consolidated Balance Sheets of Sharia Life Insurance Business as at December 31, 2008
Tabel 4.9.A Neraca Gabungan Usaha Asuransi Jiwa Syariah yang Memasarkan Produk Asuransi yang Dikaitkan dengan Investas Per 31 Desember 2008
Table 4.9.A Consolidated Balance Sheets of Sharia Life Insurance Business Sold Unit Link as at December 31, 2008
Tabel 4.10 Rekapitulasi Perhitungan Laba / Rugi Usaha Asuransi Jiwa Syariah Tahun 2008
Table 4.10 The Recapitulation of Profit / Loss Statement of Sharia Life Insurance Business In 2008
Tabel 4.10.A Rekapitulasi Perhitungan Laba / Rugi Usaha Asuransi Jiwa Syariah yang Memasarkan Produk Asuransi yang Dikaitkan dengan Investas Tahun 2008
Table 4.10.A The Recapitulation of Profit / Loss Statement of Sharia Life Insurance Business Business Sold Unit Link In 2008
Tabel 4.11 Laporan Laba / Rugi Gabungan Usaha Asuransi Jiwa Syariah Tahun 2008
Table 4.11 Consolidated Profit / Loss Statement of Sharia Life Insurance Business In 2008
Tabel 4.11.A Laporan Laba / Rugi Gabungan Usaha Asuransi Jiwa Syariah yang Memasarkan Produk Asuransi yang Dikaitkan dengan Investas Tahun 2008
Table 4.11.A Consolidated Profit / Loss Statement of Sharia Life Insurance Business Business Sold Unit Link In 2008
Tabel 4.12.1.A Laporan Premi Pertanggungan Baru Per Cabang Asuransi Tahun 2008
Table 4.12.1.A First Year Premium Report Per Line of Business Year 2008
Tabel 4.12.1.B Laporan Premi Lanjutan Per Cabang Asuransi Tahun 2008
Table 4.12.1.B Continuance Premium Report Per Line of Business Year 2008
Tabel 4.12.2 Laporan Premi Murni Per Cabang Asuransi Tahun 2008
Table 4.12.2 Net Premium Report Per Line of Business Year 2008
Tabel 4.12.3 Laporan Asumsi Biaya Per Cabang Asuransi Tahun 2008
Table 4.12.3 Loading Assumption Report Per Line of Business Year 2008
Tabel 4.12.4 Laporan Premi Tahun 2008 Table 4.12.4 Premium Report Year 2008
Tabel 4.13.1 Cadangan Premi Per 31 December 2008
Table 4.13.1 Premium Reserve as at December 31, 2008
Tabel 4.13.2 Cadangan Atas Premi Yang Belum Merupakan Pendapatan (CAPYBMP)
Table 4.13.2 Unearned Premium Reserve (UPR)
Tabel 4.14.1 – 4.14.7
Portepel Per 31 Desember 2008 Table 4.14.1 – 4.14.7
Portofolio as at December 31, 2008
Tabel 4.15 Pertanggungan yang Berlaku pada Awal Tahun 2008
Table 4.15 Policies Inforce at the Beginning of the Year 2008
Tabel 4.15.1 Pertanggungan Baru untuk Tahun 2008
Table 4.15.1 New Business for the Year 2008
Tabel 4.15.2 Pemulihan Kembali Polis untuk Tahun 2008
Table 4.15.2 Reinstatement for The Year 2008
Tabel 4.15.3 Perubahan dari Cabang lain untuk Tahun 2008
Table 4.15.3 Alteration from Other Plans for the Year 2008
Tabel 4.15.4 Meninggal dalam Tahun 2008 Table 4.15.4 Deaths for The Year 2008
Tabel 4.15.5 Habis Kontrak dalam Tahun 2008 Table 4.15.5 Maturities for The Year 2008
Tabel 4.15.6 Pemutusan Kontrak Produk Yang Dihasilkan Tahun 2008
Table 4.15.6 Lapse for Products Produced for The Year 2008
Tabel 4.15.7 Pemutusan Kontrak Produk Yang Dihasilkan Tahun 2006
Table 4.15.7 Lapse for Products Produced for The Year 2007
Tabel 4.15.8 Pemutusan Kontrak Produk Yang Dihasilkan Tahun 2005
Table 4.15.8 Lapse for Products Produced for The Year 2006
Tabel 4.15.9 Perubahan ke Cabang Lain untuk Tahun 2008
Table 4.15.9 Alteration to Other Plans for the Year 2008
Tabel 4.16 Pertanggungan pada Akhir Tahun 2008
Table 4.16 Policies Inforce at The End of The Year 2008
LAMPIRAN V APPENDIX V
PROGRAM ASURANSI SOSIAL DAN JAMINAN SOSIAL TENAGA KERJA
SOCIAL INSURANCE PROGRAM AND WORKERS SOCIAL SECURITY
Tabel 5.1 Rekapitulasi Neraca Tahun 2008 Table 5.1 The Recapitulation of Balance Sheets in 2008
Tabel 5.1.1 Rekapitulasi Investasi per 31 Desember 2008
Table 5.1.1 The Recapitulation of Investments as at December 31, 2008
Tabel 5.1.2 Rekapitulasi Bukan Investasi Tahun 2008
Table 5.1.2 The Recapitulation of Non Investments in 2008
Tabel 5.2 Rekapitulasi Perhitungan Laba / Rugi Tahun 2008
Table 5.2 The Recapitulation of Profit / Loss in 2008
Tabel 5.3 Pertumbuhan Data Teknis Tahun 2004 - 2008
Table 5.3 The Growth of Technical Data in 2004 - 2008
Tabel 5.4 Neraca Gabungan per 31 Desember 2007 & 2008
Table 5.4 Consolidated Balance Sheet as at December 31, 2007 & 2008
Tabel 5.5 Laporan Laba / Rugi Gabungan Tahun 2007 & 2008
Table 5.5 Consolidated Profit / Loss Statement in 2007 & 2008
LAMPIRAN VI APPENDIX VI
PROGRAM ASURANSI UNTUK PEGAWAI NEGERI SIPIL DAN TNI / POLRI
INSURANCE PROGRAM FOR CIVIL SERVANTS AND ARMED FORCES / POLICE
Tabel 6.1 Rekapitulasi Neraca Tahun 2008 Table 6.1 The Recapitulation of Balance Sheets in 2008
Tabel 6.1.1 Rekapitulasi Investasi per 31 Desember 2008
Table 6.1.1 The Recapitulation of Investments as at December 31, 2008
Tabel 6.1.2 Rekapitulasi Bukan Investasi Tahun 2008
Table 6.1.2 The Recapitulation of Non Investments in 2008
Tabel 6.2 Rekapitulasi Perhitungan Laba / Rugi Tahun 2008
Table 6.2 The Recapitulation of Profit / Loss in 2008
Tabel 6.3 Pertumbuhan Data Teknis Tahun 2004 - 2008
Table 6.3 The Growth of Technical Data in 2004 - 2008
Tabel 6.4 Neraca Gabungan per 31 Desember 2007 & 2008
Table 6.4 Consolidated Balance Sheet as at December 31, 2007 & 2008
Tabel 6.5 Laporan Laba / Rugi Gabungan Tahun 2007 & 2008
Table 6.5 Consolidated Profit / Loss Statement in 2007 & 2008
LAMPIRAN VII APPENDIX VII
USAHA PIALANG ASURANSI DAN REASURANSI SERTA PERUSAHAAN PENILAI KERUGIAN ASURANSI
INSURANCE AND REINSURANCE BROKERS AND LOSS ADJUSTERS BUSINESS

Tabel 7.1 Rekapitulasi Jumlah Klaim yang Dinilai oleh Perusahaan Penilai Kerugian Asuransi
Tabel 7.1 The Recapitulation of Claims Appraised by Loss Adjusters
Tabel 7.2 Rekapitulasi Premi dan Komisi Tahun 2008
Tabel 7.2 The Recapitulation of Premiums and Commissions in 2008
Tabel 7.3 Rekapitulasi Neraca per 31 Desember 2008
Tabel 7.3 The Recapitulation of Balance Sheet as at December 31, 2008
Tabel 7.4 Rekapitulasi Perhitungan Laba / Rugi Tahun 2008
Tabel 7.4 The Recapitulation of Profit / Loss in 2008
Tabel 7.5 Investasi Tahun 2004 - 2008 Tabel 7.5 Investments in Year 2004 - 2008
Tabel 7.6 Kekayaan, Kewajiban, dan Modal Sendiri Tahun 2004 - 2008
Tabel 7.6 Assets, Liabilities, and Equities in Year 2004 - 2008
Tabel 7.7 Laba / Rugi Tahun 2004 - 2008 Tabel 7.7 Profit / Loss in Year 2004 - 2008

INDIKATOR KUNCI KEY INDICATORS
ECONOMICS AND INSURANCE
DEVELOPMENT DATA 2004 2005 2006 2007 2008
(1) (2) (3) (4) (5) (6) 1 National Income Aggregate Gross Domestic Product At Current Market Price (Billion Rp) 2,261,725 2,729,708 3,338,200 3,957,403 3,954,259 Annual Change (%) 11.07 34.05 22.29 18.55 (0.08) At year 2000 Market Price (Billion Rp)* 1,656,826 1,749,547 1,846,655 1,963,974 2,082,104 Annual Change (%) 5.05 10.93 5.55 6.35 6.01 2 Inflation Rate (Annual Change of CPI) 6.40 17.11 6.60 6.59 11.08 3 Exchange Rate (Per US$1) 8,940 9,830 9,020 9,419 10,950 4 Population (Million) 217 219 222 226 229 5 Employment (in 000)** Labour Force 103,973 105,802 106,811 109,941 111,950 Number of Employed (Formal Sector) 93,722 94,948 95,457 99,930 102,550 Number of Employed by Insurance
Industry NA NA NA NA NA
6 Market Structure Number of Registered Insurers : 167 157 157 149 144 Life Insurers 57 51 51 46 45 General Insurers 101 97 97 94 90 Professional Reinsurers 4 4 4 4 4 Social Insurer & Jamsostek 2 2 2 2 2 Civil Servant & Armed Forces 3 3 3 3 3 Insurance and Reinsurance Brokers 147 155 166 169 162 Loss Adjusters 30 30 33 27 27 Actuarial Consultants 23 28 30 30 28 7 Insurance Development: Per Capita Expenditure (Rp)*** 190,711 212,488 236,080 330,763 380,269 Total Industry Asset (Million) 119,905,462 139,414,596 174,934,184 228,828,530 243,579,367 As % of GDP: Life Sum Insureds 6.26 6.24 5.89 7.65 8.20 Life Premiums 0.82 0.83 0.82 1.15 1.29 Non-life and Reinsurance Gross
Premiums 0.72 0.62 0.50 0.48 0.60
Life Assets 1.95 1.98 2.13 2.58 2.59 Non-Life and Reinsurance Assets 0.87 0.82 0.75 0.75 0.88 LIFE INSURANCE DATA Total New Business except PA and Health Number of Policies (In Unit) 8,456,933 9,723,897 9,843,859 14,197,408 19,825,209 Sum Insured (Million Rp) 144,258,927 237,699,587 196,562,339 302,887,920 324,186,669 Annual Premium (Million Rp) 9,240,792 9,421,471 16,665,313 23,817,393 27,260,117
* The Constant Price is Based on Year 2000 Market Price ** Source: Central of Statistic Bureau (BPS) *** Total Gross Premiums / Number of Population
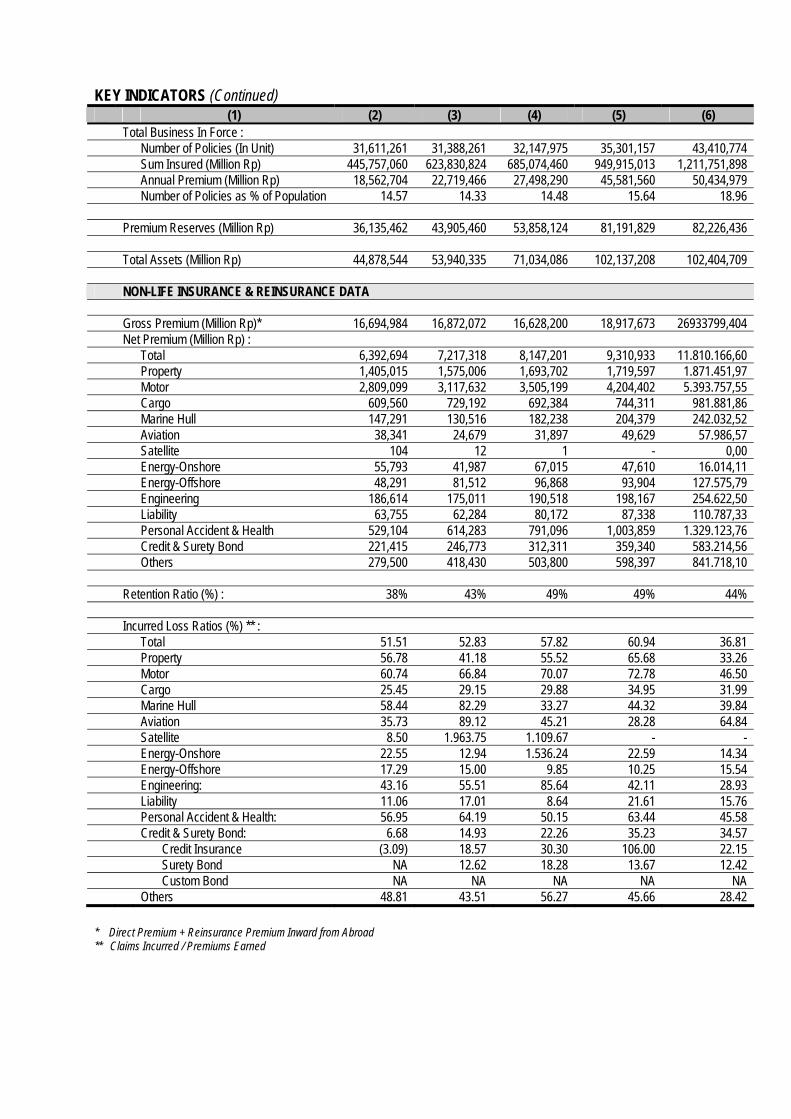
KEY INDICATORS (Continued) (1) (2) (3) (4) (5) (6) Total Business In Force : Number of Policies (In Unit) 31,611,261 31,388,261 32,147,975 35,301,157 43,410,774 Sum Insured (Million Rp) 445,757,060 623,830,824 685,074,460 949,915,013 1,211,751,898 Annual Premium (Million Rp) 18,562,704 22,719,466 27,498,290 45,581,560 50,434,979 Number of Policies as % of Population 14.57 14.33 14.48 15.64 18.96 Premium Reserves (Million Rp) 36,135,462 43,905,460 53,858,124 81,191,829 82,226,436 Total Assets (Million Rp) 44,878,544 53,940,335 71,034,086 102,137,208 102,404,709 NON-LIFE INSURANCE & REINSURANCE DATA Gross Premium (Million Rp)* 16,694,984 16,872,072 16,628,200 18,917,673 26933799,404 Net Premium (Million Rp) : Total 6,392,694 7,217,318 8,147,201 9,310,933 11.810.166,60 Property 1,405,015 1,575,006 1,693,702 1,719,597 1.871.451,97 Motor 2,809,099 3,117,632 3,505,199 4,204,402 5.393.757,55 Cargo 609,560 729,192 692,384 744,311 981.881,86 Marine Hull 147,291 130,516 182,238 204,379 242.032,52 Aviation 38,341 24,679 31,897 49,629 57.986,57 Satellite 104 12 1 - 0,00 Energy-Onshore 55,793 41,987 67,015 47,610 16.014,11 Energy-Offshore 48,291 81,512 96,868 93,904 127.575,79 Engineering 186,614 175,011 190,518 198,167 254.622,50 Liability 63,755 62,284 80,172 87,338 110.787,33 Personal Accident & Health 529,104 614,283 791,096 1,003,859 1.329.123,76 Credit & Surety Bond 221,415 246,773 312,311 359,340 583.214,56 Others 279,500 418,430 503,800 598,397 841.718,10 Retention Ratio (%) : 38% 43% 49% 49% 44% Incurred Loss Ratios (%) ** : Total 51.51 52.83 57.82 60.94 36.81 Property 56.78 41.18 55.52 65.68 33.26 Motor 60.74 66.84 70.07 72.78 46.50 Cargo 25.45 29.15 29.88 34.95 31.99 Marine Hull 58.44 82.29 33.27 44.32 39.84 Aviation 35.73 89.12 45.21 28.28 64.84 Satellite 8.50 1.963.75 1.109.67 - - Energy-Onshore 22.55 12.94 1.536.24 22.59 14.34 Energy-Offshore 17.29 15.00 9.85 10.25 15.54 Engineering: 43.16 55.51 85.64 42.11 28.93 Liability 11.06 17.01 8.64 21.61 15.76 Personal Accident & Health: 56.95 64.19 50.15 63.44 45.58 Credit & Surety Bond: 6.68 14.93 22.26 35.23 34.57
Credit Insurance (3.09) 18.57 30.30 106.00 22.15 Surety Bond NA 12.62 18.28 13.67 12.42 Custom Bond NA NA NA NA NA Others 48.81 43.51 56.27 45.66 28.42
* Direct Premium + Reinsurance Premium Inward from Abroad ** Claims Incurred / Premiums Earned
KEY INDICATORS (Continued)
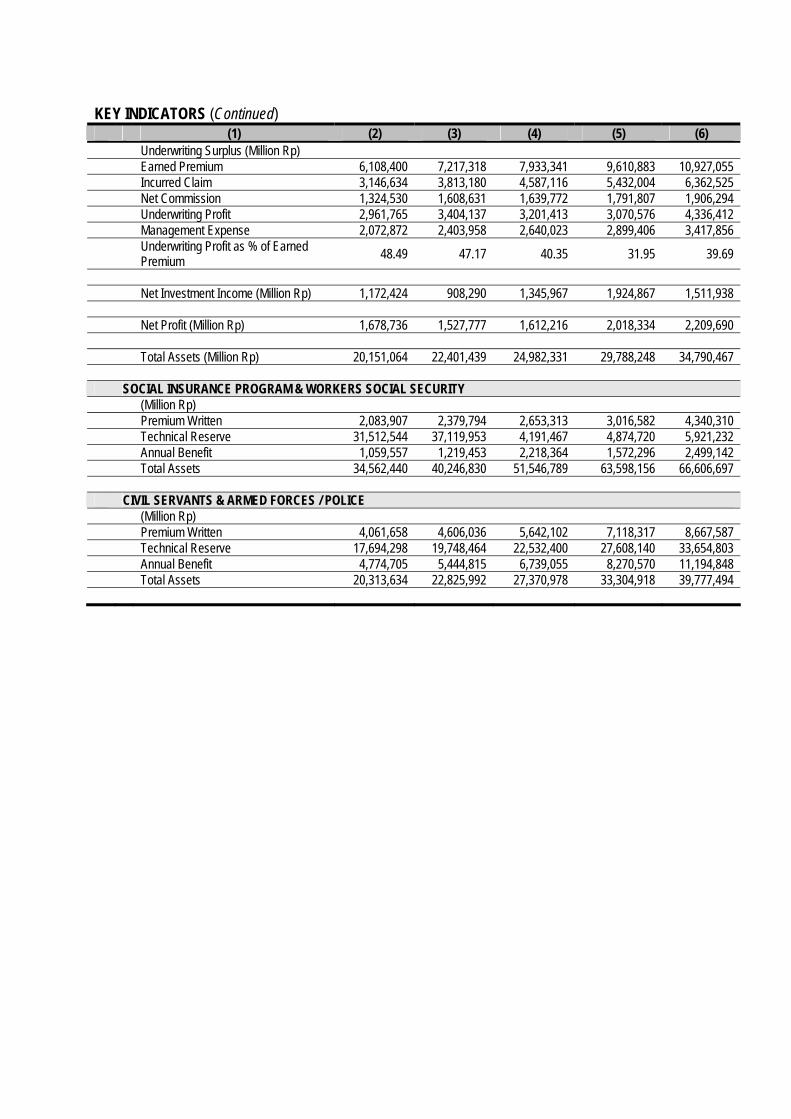
(1) (2) (3) (4) (5) (6) Underwriting Surplus (Million Rp) Earned Premium 6,108,400 7,217,318 7,933,341 9,610,883 10,927,055 Incurred Claim 3,146,634 3,813,180 4,587,116 5,432,004 6,362,525 Net Commission 1,324,530 1,608,631 1,639,772 1,791,807 1,906,294 Underwriting Profit 2,961,765 3,404,137 3,201,413 3,070,576 4,336,412 Management Expense 2,072,872 2,403,958 2,640,023 2,899,406 3,417,856 Underwriting Profit as % of Earned
Premium 48.49 47.17 40.35 31.95 39.69
Net Investment Income (Million Rp) 1,172,424 908,290 1,345,967 1,924,867 1,511,938 Net Profit (Million Rp) 1,678,736 1,527,777 1,612,216 2,018,334 2,209,690 Total Assets (Million Rp) 20,151,064 22,401,439 24,982,331 29,788,248 34,790,467 SOCIAL INSURANCE PROGRAM & WORKERS SOCIAL SECURITY (Million Rp) Premium Written 2,083,907 2,379,794 2,653,313 3,016,582 4,340,310 Technical Reserve 31,512,544 37,119,953 4,191,467 4,874,720 5,921,232 Annual Benefit 1,059,557 1,219,453 2,218,364 1,572,296 2,499,142 Total Assets 34,562,440 40,246,830 51,546,789 63,598,156 66,606,697 CIVIL SERVANTS & ARMED FORCES / POLICE (Million Rp) Premium Written 4,061,658 4,606,036 5,642,102 7,118,317 8,667,587 Technical Reserve 17,694,298 19,748,464 22,532,400 27,608,140 33,654,803 Annual Benefit 4,774,705 5,444,815 6,739,055 8,270,570 11,194,848 Total Assets 20,313,634 22,825,992 27,370,978 33,304,918 39,777,494
BAB I CHAPTER I
IKHTISAR KEGIATAN USAHA PERASURANSIAN DI INDONESIA TAHUN 2008
SUMMARY OF INDONESIAN INSURANCE BUSINESS ACTIVITIES IN 2008
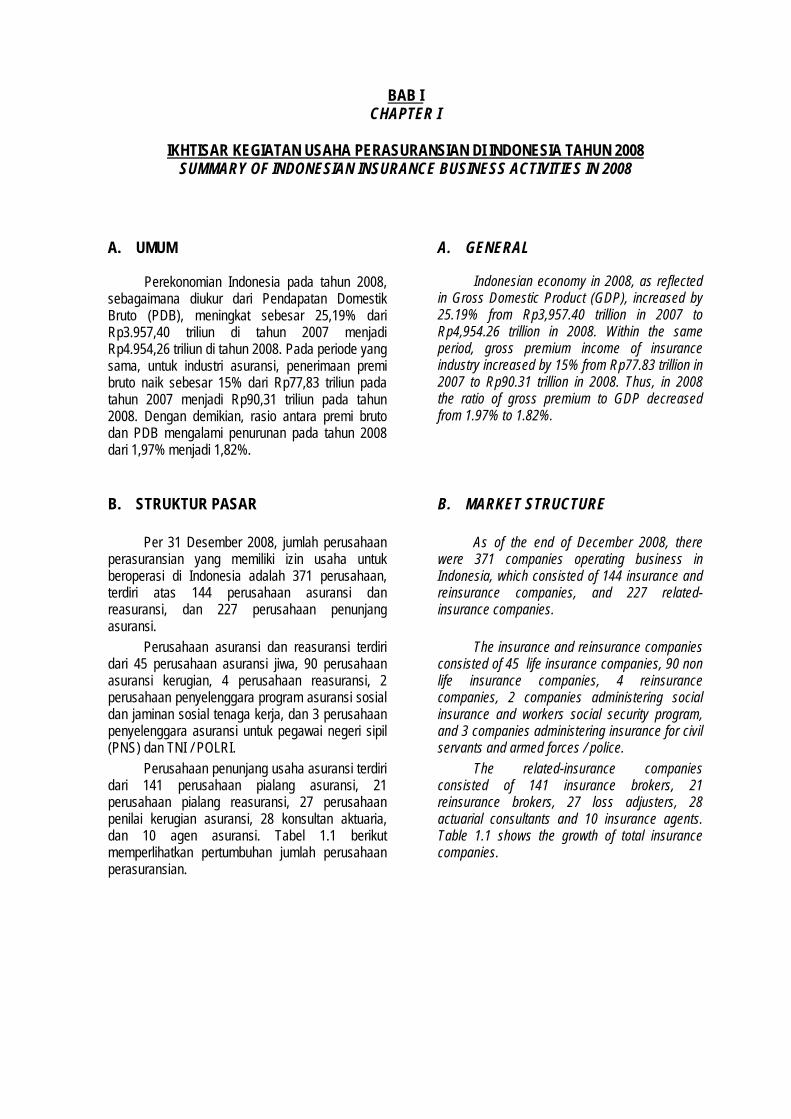
A. UMUM Perekonomian Indonesia pada tahun 2008,
sebagaimana diukur dari Pendapatan Domestik Bruto (PDB), meningkat sebesar 25,19% dari Rp3.957,40 triliun di tahun 2007 menjadi Rp4.954,26 triliun di tahun 2008. Pada periode yang sama, untuk industri asuransi, penerimaan premi bruto naik sebesar 15% dari Rp77,83 triliun pada tahun 2007 menjadi Rp90,31 triliun pada tahun 2008. Dengan demikian, rasio antara premi bruto dan PDB mengalami penurunan pada tahun 2008 dari 1,97% menjadi 1,82%.
A. GENERAL
Indonesian economy in 2008, as reflected in Gross Domestic Product (GDP), increased by 25.19% from Rp3,957.40 trillion in 2007 to Rp4,954.26 trillion in 2008. Within the same period, gross premium income of insurance industry increased by 15% from Rp77.83 trillion in 2007 to Rp90.31 trillion in 2008. Thus, in 2008 the ratio of gross premium to GDP decreased from 1.97% to 1.82%.
B. STRUKTUR PASAR
Per 31 Desember 2008, jumlah perusahaan perasuransian yang memiliki izin usaha untuk beroperasi di Indonesia adalah 371 perusahaan, terdiri atas 144 perusahaan asuransi dan reasuransi, dan 227 perusahaan penunjang asuransi.
B. MARKET STRUCTURE
As of the end of December 2008, there were 371 companies operating business in Indonesia, which consisted of 144 insurance and reinsurance companies, and 227 related-insurance companies.
Perusahaan asuransi dan reasuransi terdiri dari 45 perusahaan asuransi jiwa, 90 perusahaan asuransi kerugian, 4 perusahaan reasuransi, 2 perusahaan penyelenggara program asuransi sosial dan jaminan sosial tenaga kerja, dan 3 perusahaan penyelenggara asuransi untuk pegawai negeri sipil (PNS) dan TNI / POLRI.
The insurance and reinsurance companies consisted of 45 life insurance companies, 90 non life insurance companies, 4 reinsurance companies, 2 companies administering social insurance and workers social security program, and 3 companies administering insurance for civil servants and armed forces / police.
Perusahaan penunjang usaha asuransi terdiri dari 141 perusahaan pialang asuransi, 21 perusahaan pialang reasuransi, 27 perusahaan penilai kerugian asuransi, 28 konsultan aktuaria, dan 10 agen asuransi. Tabel 1.1 berikut memperlihatkan pertumbuhan jumlah perusahaan perasuransian.
The related-insurance companies consisted of 141 insurance brokers, 21 reinsurance brokers, 27 loss adjusters, 28 actuarial consultants and 10 insurance agents. Table 1.1 shows the growth of total insurance companies.
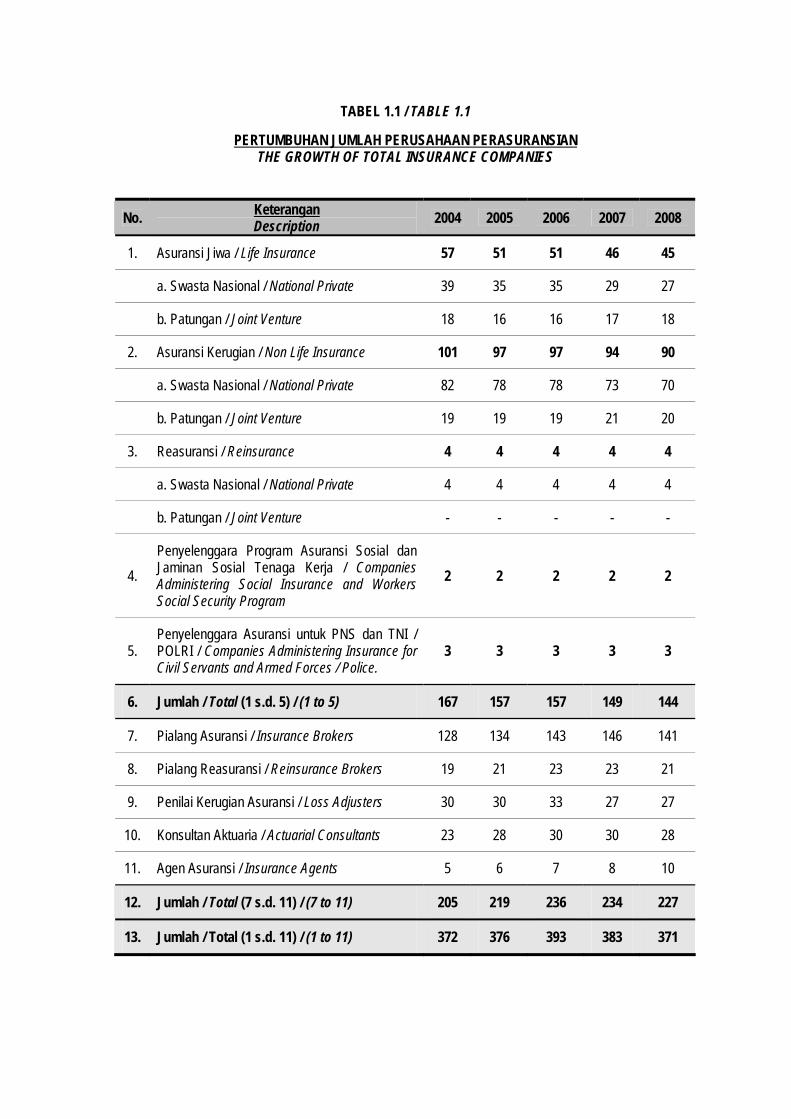
TABEL 1.1 / TABLE 1.1
PERTUMBUHAN JUMLAH PERUSAHAAN PERASURANSIAN THE GROWTH OF TOTAL INSURANCE COMPANIES
No. Keterangan Description
2004 2005 2006 2007 2008
1. Asuransi Jiwa / Life Insurance 57 51 51 46 45
a. Swasta Nasional / National Private 39 35 35 29 27
b. Patungan / Joint Venture 18 16 16 17 18
2. Asuransi Kerugian / Non Life Insurance 101 97 97 94 90
a. Swasta Nasional / National Private 82 78 78 73 70
b. Patungan / Joint Venture 19 19 19 21 20
3. Reasuransi / Reinsurance 4 4 4 4 4
a. Swasta Nasional / National Private 4 4 4 4 4
b. Patungan / Joint Venture - - - - -
4.
Penyelenggara Program Asuransi Sosial dan Jaminan Sosial Tenaga Kerja / Companies Administering Social Insurance and Workers Social Security Program
2 2 2 2 2
5. Penyelenggara Asuransi untuk PNS dan TNI / POLRI / Companies Administering Insurance for Civil Servants and Armed Forces / Police.
3 3 3 3 3
6. Jumlah / Total (1 s.d. 5) / (1 to 5) 167 157 157 149 144
7. Pialang Asuransi / Insurance Brokers 128 134 143 146 141
8. Pialang Reasuransi / Reinsurance Brokers 19 21 23 23 21
9. Penilai Kerugian Asuransi / Loss Adjusters 30 30 33 27 27
10. Konsultan Aktuaria / Actuarial Consultants 23 28 30 30 28
11. Agen Asuransi / Insurance Agents 5 6 7 8 10
12. Jumlah / Total (7 s.d. 11) / (7 to 11) 205 219 236 234 227
13. Jumlah / Total (1 s.d. 11) / (1 to 11) 372 376 393 383 371
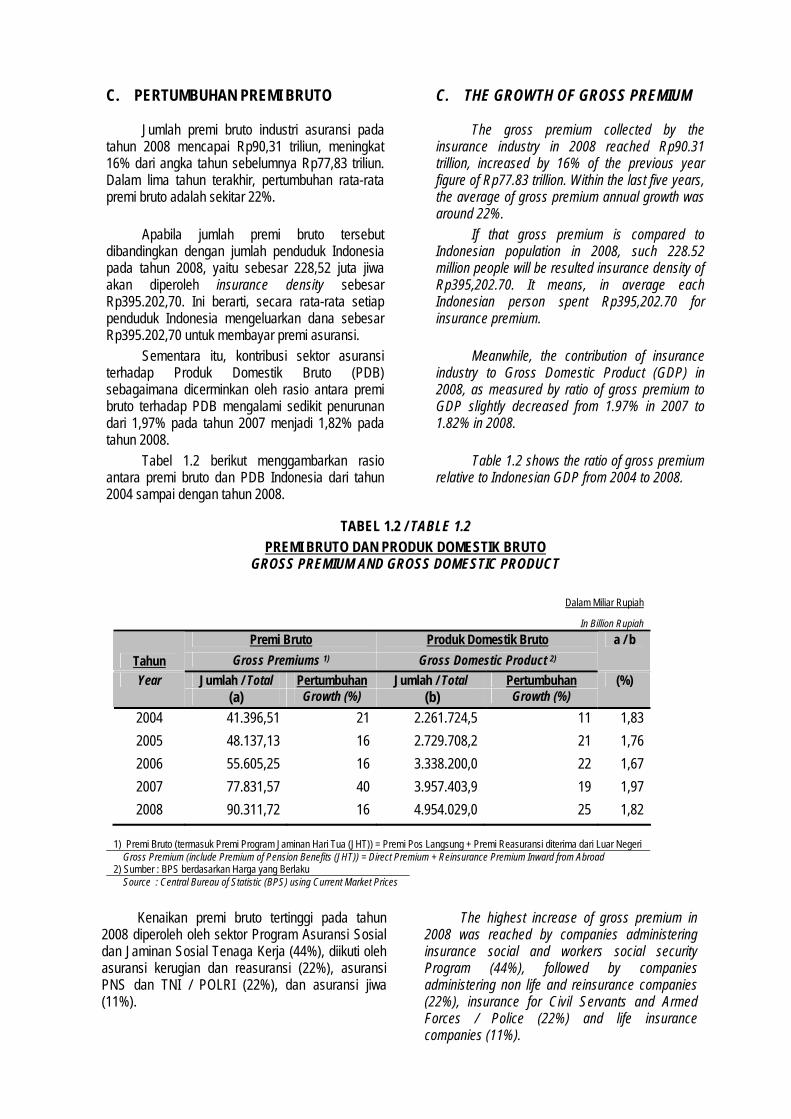
C. PERTUMBUHAN PREMI BRUTO Jumlah premi bruto industri asuransi pada
tahun 2008 mencapai Rp90,31 triliun, meningkat 16% dari angka tahun sebelumnya Rp77,83 triliun. Dalam lima tahun terakhir, pertumbuhan rata-rata premi bruto adalah sekitar 22%.
C. THE GROWTH OF GROSS PREMIUM The gross premium collected by the
insurance industry in 2008 reached Rp90.31 trillion, increased by 16% of the previous year figure of Rp77.83 trillion. Within the last five years, the average of gross premium annual growth was around 22%.
Apabila jumlah premi bruto tersebut dibandingkan dengan jumlah penduduk Indonesia pada tahun 2008, yaitu sebesar 228,52 juta jiwa akan diperoleh insurance density sebesar Rp395.202,70. Ini berarti, secara rata-rata setiap penduduk Indonesia mengeluarkan dana sebesar Rp395.202,70 untuk membayar premi asuransi.
If that gross premium is compared to Indonesian population in 2008, such 228.52 million people will be resulted insurance density of Rp395,202.70. It means, in average each Indonesian person spent Rp395,202.70 for insurance premium.
Sementara itu, kontribusi sektor asuransi terhadap Produk Domestik Bruto (PDB) sebagaimana dicerminkan oleh rasio antara premi bruto terhadap PDB mengalami sedikit penurunan dari 1,97% pada tahun 2007 menjadi 1,82% pada tahun 2008.
Meanwhile, the contribution of insurance industry to Gross Domestic Product (GDP) in 2008, as measured by ratio of gross premium to GDP slightly decreased from 1.97% in 2007 to 1.82% in 2008.
Tabel 1.2 berikut menggambarkan rasio antara premi bruto dan PDB Indonesia dari tahun 2004 sampai dengan tahun 2008.
Table 1.2 shows the ratio of gross premium relative to Indonesian GDP from 2004 to 2008.
TABEL 1.2 / TABLE 1.2
PREMI BRUTO DAN PRODUK DOMESTIK BRUTO GROSS PREMIUM AND GROSS DOMESTIC PRODUCT
Dalam Miliar Rupiah
In Billion Rupiah
Premi Bruto Produk Domestik Bruto
Tahun Gross Premiums 1) Gross Domestic Product 2)
a / b
Jumlah / Total Pertumbuhan Jumlah / Total Pertumbuhan Year (a) Growth (%) (b) Growth (%)
(%)
2004 41.396,51 21 2.261.724,5 11 1,83
2005 48.137,13 16 2.729.708,2 21 1,76
2006 55.605,25 16 3.338.200,0 22 1,67
2007 77.831,57 40 3.957.403,9 19 1,97
2008 90.311,72 16 4.954.029,0 25 1,82
1) Premi Bruto (termasuk Premi Program Jaminan Hari Tua (JHT)) = Premi Pos Langsung + Premi Reasuransi diterima dari Luar Negeri Gross Premium (include Premium of Pension Benefits (JHT)) = Direct Premium + Reinsurance Premium Inward from Abroad
2) Sumber : BPS berdasarkan Harga yang Berlaku Source : Central Bureau of Statistic (BPS) using Current Market Prices
Kenaikan premi bruto tertinggi pada tahun
2008 diperoleh oleh sektor Program Asuransi Sosial dan Jaminan Sosial Tenaga Kerja (44%), diikuti oleh asuransi kerugian dan reasuransi (22%), asuransi PNS dan TNI / POLRI (22%), dan asuransi jiwa (11%).
The highest increase of gross premium in 2008 was reached by companies administering insurance social and workers social security Program (44%), followed by companies administering non life and reinsurance companies (22%), insurance for Civil Servants and Armed Forces / Police (22%) and life insurance companies (11%).
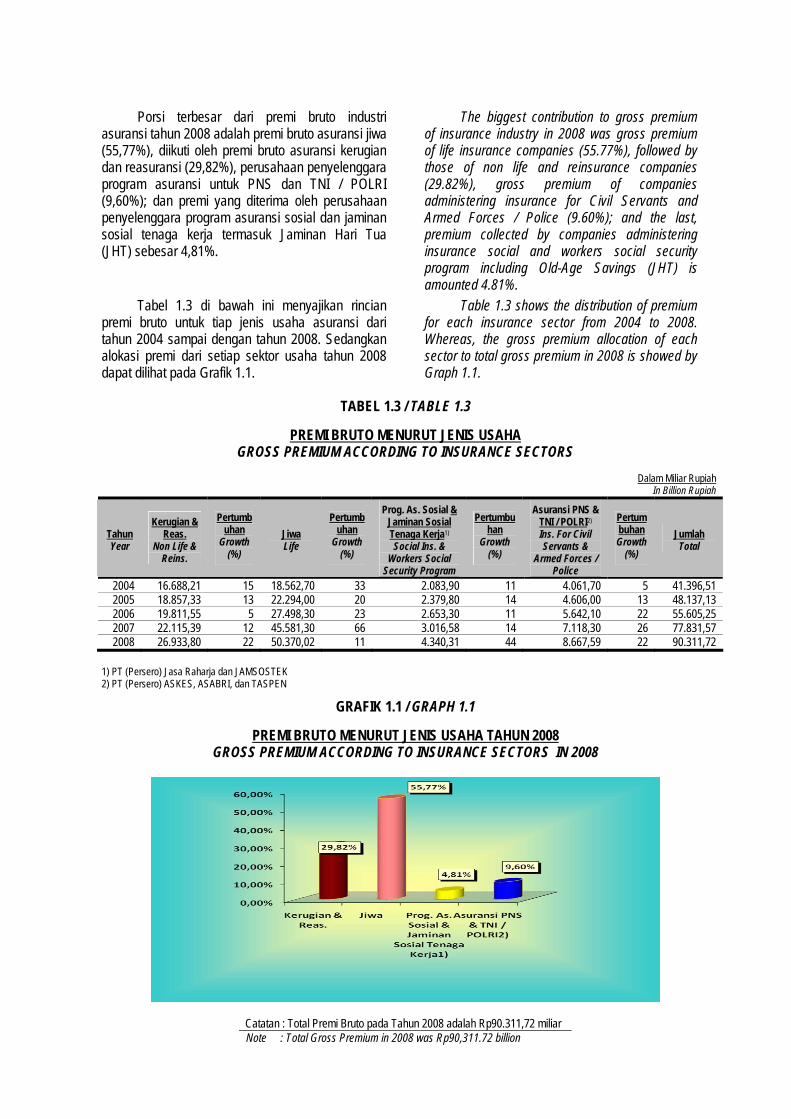
Porsi terbesar dari premi bruto industri
asuransi tahun 2008 adalah premi bruto asuransi jiwa (55,77%), diikuti oleh premi bruto asuransi kerugian dan reasuransi (29,82%), perusahaan penyelenggara program asuransi untuk PNS dan TNI / POLRI (9,60%); dan premi yang diterima oleh perusahaan penyelenggara program asuransi sosial dan jaminan sosial tenaga kerja termasuk Jaminan Hari Tua (JHT) sebesar 4,81%.
The biggest contribution to gross premium of insurance industry in 2008 was gross premium of life insurance companies (55.77%), followed by those of non life and reinsurance companies (29.82%), gross premium of companies administering insurance for Civil Servants and Armed Forces / Police (9.60%); and the last, premium collected by companies administering insurance social and workers social security program including Old-Age Savings (JHT) is amounted 4.81%.
Tabel 1.3 di bawah ini menyajikan rincian premi bruto untuk tiap jenis usaha asuransi dari tahun 2004 sampai dengan tahun 2008. Sedangkan alokasi premi dari setiap sektor usaha tahun 2008 dapat dilihat pada Grafik 1.1.
Table 1.3 shows the distribution of premium for each insurance sector from 2004 to 2008. Whereas, the gross premium allocation of each sector to total gross premium in 2008 is showed by Graph 1.1.
TABEL 1.3 / TABLE 1.3
PREMI BRUTO MENURUT JENIS USAHA GROSS PREMIUM ACCORDING TO INSURANCE SECTORS
Dalam Miliar Rupiah
In Billion Rupiah
Tahun Year
Kerugian & Reas.
Non Life & Reins.
Pertumbuhan
Growth (%)
Jiwa Life
Pertumbuhan
Growth (%)
Prog. As. Sosial & Jaminan Sosial Tenaga Kerja1) Social Ins. &
Workers Social Security Program
Pertumbuhan
Growth (%)
Asuransi PNS & TNI / POLRI2) Ins. For Civil Servants &
Armed Forces / Police
Pertumbuhan Growth
(%)
Jumlah Total
2004 16.688,21 15 18.562,70 33 2.083,90 11 4.061,70 5 41.396,51 2005 18.857,33 13 22.294,00 20 2.379,80 14 4.606,00 13 48.137,13 2006 19.811,55 5 27.498,30 23 2.653,30 11 5.642,10 22 55.605,25 2007 22.115,39 12 45.581,30 66 3.016,58 14 7.118,30 26 77.831,57 2008 26.933,80 22 50.370,02 11 4.340,31 44 8.667,59 22 90.311,72
1) PT (Persero) Jasa Raharja dan JAMSOSTEK 2) PT (Persero) ASKES, ASABRI, dan TASPEN
GRAFIK 1.1 / GRAPH 1.1
PREMI BRUTO MENURUT JENIS USAHA TAHUN 2008 GROSS PREMIUM ACCORDING TO INSURANCE SECTORS IN 2008
Catatan : Total Premi Bruto pada Tahun 2008 adalah Rp90.311,72 miliar Note : Total Gross Premium in 2008 was Rp90,311.72 billion
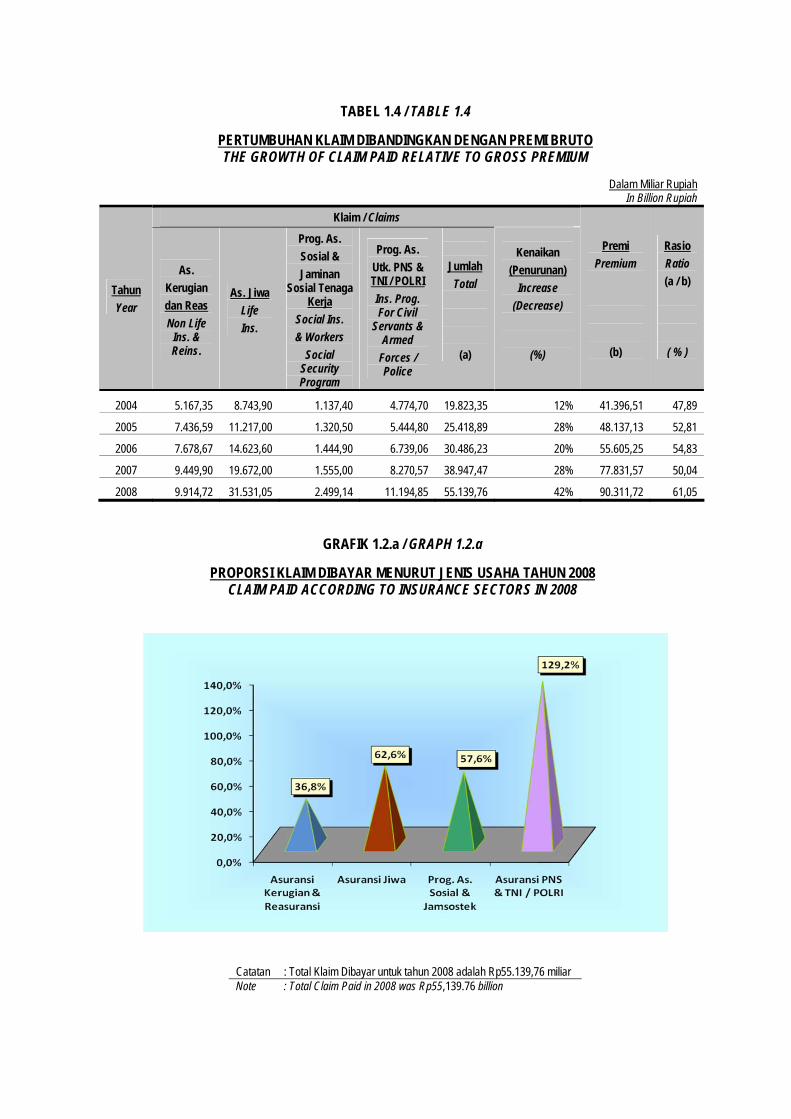
D. PERTUMBUHAN JUMLAH KLAIM
DIBAYAR Jumlah klaim dibayar industri asuransi pada
tahun 2008 mengalami kenaikan sebesar 42% dibandingkan dengan tahun sebelumnya, yaitu dari Rp38,94 triliun menjadi Rp55,14 triliun. Kenaikan ini disebabkan kenaikan klaim dibayar perusahaan asuransi jiwa sebesar 60,28% dibanding tahun sebelumnya, yaitu dari Rp19,6 triliun menjadi Rp31,53 triliun. Adapun klaim dibayar perusahaan penyelenggara program asuransi untuk PNS dan TNI / POLRI mengalami kenaikan sebesar 35,36%, dari Rp8,27 triliun menjadi Rp11,2 triliun. Klaim perusahaan asuransi kerugian dan reasuransi mengalami sedikit kenaikan sebesar 4,92% dibandingkan dengan tahun sebelumnya, yaitu dari Rp9,5 triliun pada tahun 2007 menjadi Rp9,9 triliun pada tahun 2008. Klaim perusahaan penyelenggara program asuransi sosial dan jamsostek (termasuk JHT) mengalami kenaikan yang signifikan sebesar 60,72%, dari Rp1,6 triliun menjadi Rp2,5 triliun pada tahun 2008.
D. THE GROWTH OF CLAIM PAID Total claim paid of insurance industry in 2008
increased by 42%, from Rp38.94 trillion to Rp55.14 trillion. This increase was due to the raise of claim paid by life insurance companies by 60.28% compared to previous year, from Rp19.6 trillion to Rp31.53 trillion. Whereas, claim paid by companies administering insurance for Civil Servants and Armed Forces / Police increased by 35.36%, from Rp8.27 trillion to Rp11.2 trillion. Claim paid by non life and reinsurance companies slightly increased by 4.92% compared to those in previous year, from Rp9.5 trillion in 2007 to Rp9.9 trillion in 2008. Claim paid by companies administering social insurance and workers social security program (include JHT program) significantly increased by 60.72%, from Rp1.6 trillion to Rp2.5 trillion in 2008.
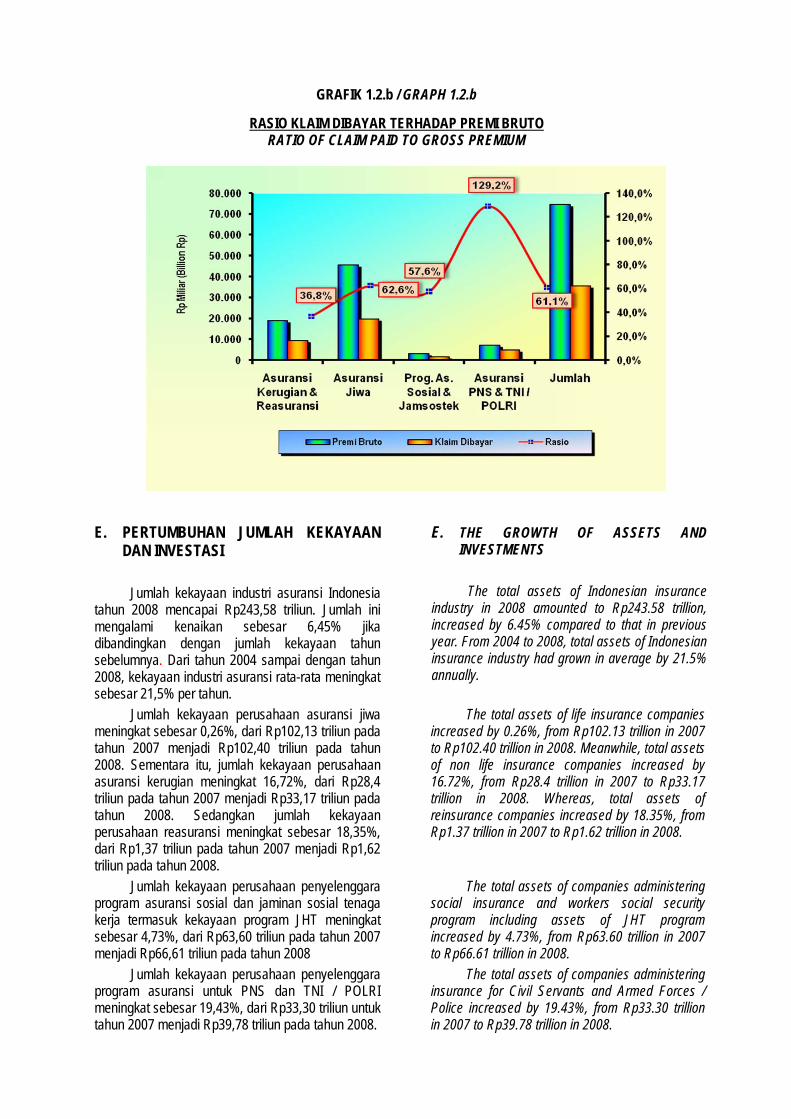
Secara keseluruhan, rasio klaim dibayar terhadap premi bruto pada tahun 2008 sebesar 61,1%. Rasio ini lebih tinggi dibandingkan dengan rasio klaim tahun sebelumnya yang besarnya 50,1%. Kenaikan ini disebabkan pertumbuhan klaim dibayar yang lebih tinggi dibandingkan dengan pertumbuhan premi bruto. Tabel 1.4 di bawah ini menyajikan perkembangan klaim dibandingkan dengan premi bruto dari tahun 2004 sampai dengan tahun 2008. Grafik 1.2a dan 1.2b menunjukkan proporsi klaim dan rasio klaim menurut jenis usaha asuransi untuk tahun 2008.
In aggregate, the ratio of claim paid to gross premium in 2008 was 61.1%. This ratio was higher than that in previous year, which was 50.1%. This increase was caused by the growth of claim paid was higher than growth of gross premium. Table 1.4 shows the growth of claim paid to gross premium from 2004 to 2008 consecutively. Meanwhile, Graph 1.2a and 1.2b show the distribution of claim and claim ratio in 2008, respectively.
TABEL 1.4 / TABLE 1.4
PERTUMBUHAN KLAIM DIBANDINGKAN DENGAN PREMI BRUTO THE GROWTH OF CLAIM PAID RELATIVE TO GROSS PREMIUM
Dalam Miliar Rupiah
In Billion Rupiah
Klaim / Claims
Tahun
Year
As.
Kerugian
dan Reas
Non Life Ins. & Reins.
As. Jiwa
Life
Ins.
Prog. As.
Sosial &
Jaminan Sosial Tenaga
Kerja
Social Ins.
& Workers
Social Security Program
Prog. As.
Utk. PNS & TNI / POLRI
Ins. Prog. For Civil
Servants & Armed
Forces / Police
Jumlah
Total
(a)
Kenaikan
(Penurunan)
Increase
(Decrease)
(%)
Premi
Premium
(b)
Rasio
Ratio
(a / b)
( % )
2004 5.167,35 8.743,90 1.137,40 4.774,70 19.823,35 12% 41.396,51 47,89
2005 7.436,59 11.217,00 1.320,50 5.444,80 25.418,89 28% 48.137,13 52,81
2006 7.678,67 14.623,60 1.444,90 6.739,06 30.486,23 20% 55.605,25 54,83
2007 9.449,90 19.672,00 1.555,00 8.270,57 38.947,47 28% 77.831,57 50,04
2008 9.914,72 31.531,05 2.499,14 11.194,85 55.139,76 42% 90.311,72 61,05
GRAFIK 1.2.a / GRAPH 1.2.a
PROPORSI KLAIM DIBAYAR MENURUT JENIS USAHA TAHUN 2008 CLAIM PAID ACCORDING TO INSURANCE SECTORS IN 2008
Catatan : Total Klaim Dibayar untuk tahun 2008 adalah Rp55.139,76 miliar Note : Total Claim Paid in 2008 was Rp55,139.76 billion
GRAFIK 1.2.b / GRAPH 1.2.b
RASIO KLAIM DIBAYAR TERHADAP PREMI BRUTO RATIO OF CLAIM PAID TO GROSS PREMIUM
E. PERTUMBUHAN JUMLAH KEKAYAAN
DAN INVESTASI Jumlah kekayaan industri asuransi Indonesia
tahun 2008 mencapai Rp243,58 triliun. Jumlah ini mengalami kenaikan sebesar 6,45% jika dibandingkan dengan jumlah kekayaan tahun sebelumnya. Dari tahun 2004 sampai dengan tahun 2008, kekayaan industri asuransi rata-rata meningkat sebesar 21,5% per tahun.
E. THE GROWTH OF ASSETS AND INVESTMENTS
The total assets of Indonesian insurance
industry in 2008 amounted to Rp243.58 trillion, increased by 6.45% compared to that in previous year. From 2004 to 2008, total assets of Indonesian insurance industry had grown in average by 21.5% annually.
Jumlah kekayaan perusahaan asuransi jiwa meningkat sebesar 0,26%, dari Rp102,13 triliun pada tahun 2007 menjadi Rp102,40 triliun pada tahun 2008. Sementara itu, jumlah kekayaan perusahaan asuransi kerugian meningkat 16,72%, dari Rp28,4 triliun pada tahun 2007 menjadi Rp33,17 triliun pada tahun 2008. Sedangkan jumlah kekayaan perusahaan reasuransi meningkat sebesar 18,35%, dari Rp1,37 triliun pada tahun 2007 menjadi Rp1,62 triliun pada tahun 2008.
The total assets of life insurance companies increased by 0.26%, from Rp102.13 trillion in 2007 to Rp102.40 trillion in 2008. Meanwhile, total assets of non life insurance companies increased by 16.72%, from Rp28.4 trillion in 2007 to Rp33.17 trillion in 2008. Whereas, total assets of reinsurance companies increased by 18.35%, from Rp1.37 trillion in 2007 to Rp1.62 trillion in 2008.
Jumlah kekayaan perusahaan penyelenggara program asuransi sosial dan jaminan sosial tenaga kerja termasuk kekayaan program JHT meningkat sebesar 4,73%, dari Rp63,60 triliun pada tahun 2007 menjadi Rp66,61 triliun pada tahun 2008
The total assets of companies administering social insurance and workers social security program including assets of JHT program increased by 4.73%, from Rp63.60 trillion in 2007 to Rp66.61 trillion in 2008.
Jumlah kekayaan perusahaan penyelenggara program asuransi untuk PNS dan TNI / POLRI meningkat sebesar 19,43%, dari Rp33,30 triliun untuk tahun 2007 menjadi Rp39,78 triliun pada tahun 2008.
The total assets of companies administering insurance for Civil Servants and Armed Forces / Police increased by 19.43%, from Rp33.30 trillion in 2007 to Rp39.78 trillion in 2008.
Pertumbuhan jumlah kekayaan industri
asuransi selama lima tahun terakhir disajikan pada Tabel 1.5 di bawah ini.
The growth of total assets of insurance industry within the last five years is shown in Table 1.5.
TABEL 1.5 / TABLE 1.5
JUMLAH KEKAYAAN INDUSTRI ASURANSI THE TOTAL ASSETS OF INSURANCE INDUSTRY
Dalam Miliar Rupiah
In Billion Rupiah
Keterangan Tahun / Year Description 2004 2005 2006 2007 2008
Asuransi Jiwa / Life Insurance 44.878,50 53.940,30 71.034,10 102.137,20 102.404,71
Asuransi Kerugian / Non Life Insurance 19.197,80 21.254,20 23.760,80 28.418,50 33.169,28
Reasuransi / Reinsurance 953,30 1.147,30 1.221,50 1.369,80 1.621,19
Program Asuransi Sosial & Jaminan Sosial Tenaga Kerja / Social Insurance & Workers Social Security Program 34.562,40 34.562,20 51.546,80 63.598,20 66.606,70
Program Asuransi untuk PNS & TNI / POLRI / Insurance for Civil Servants & Armed Forces / Police 20.313,60 20.313,60 27.371,00 33.304,90 39.777,49
Jumlah / Total 119.905,60 131.217,60 174.934,20 228.828,60 243.579,37
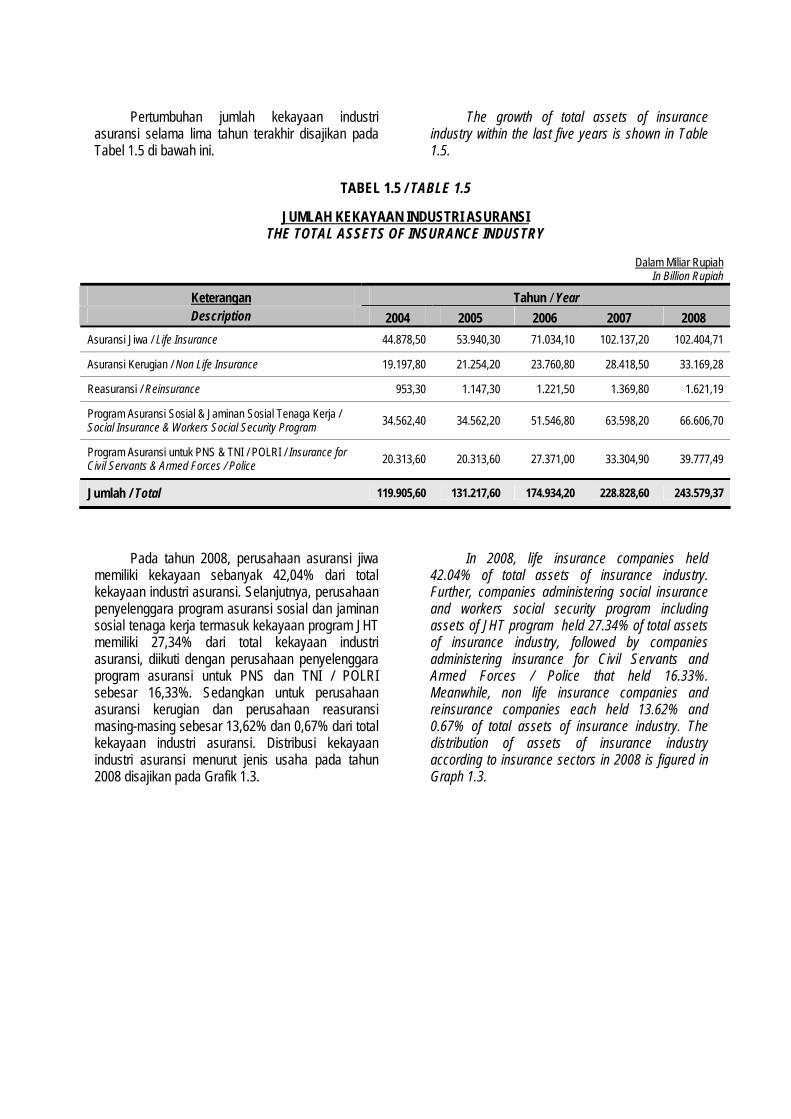
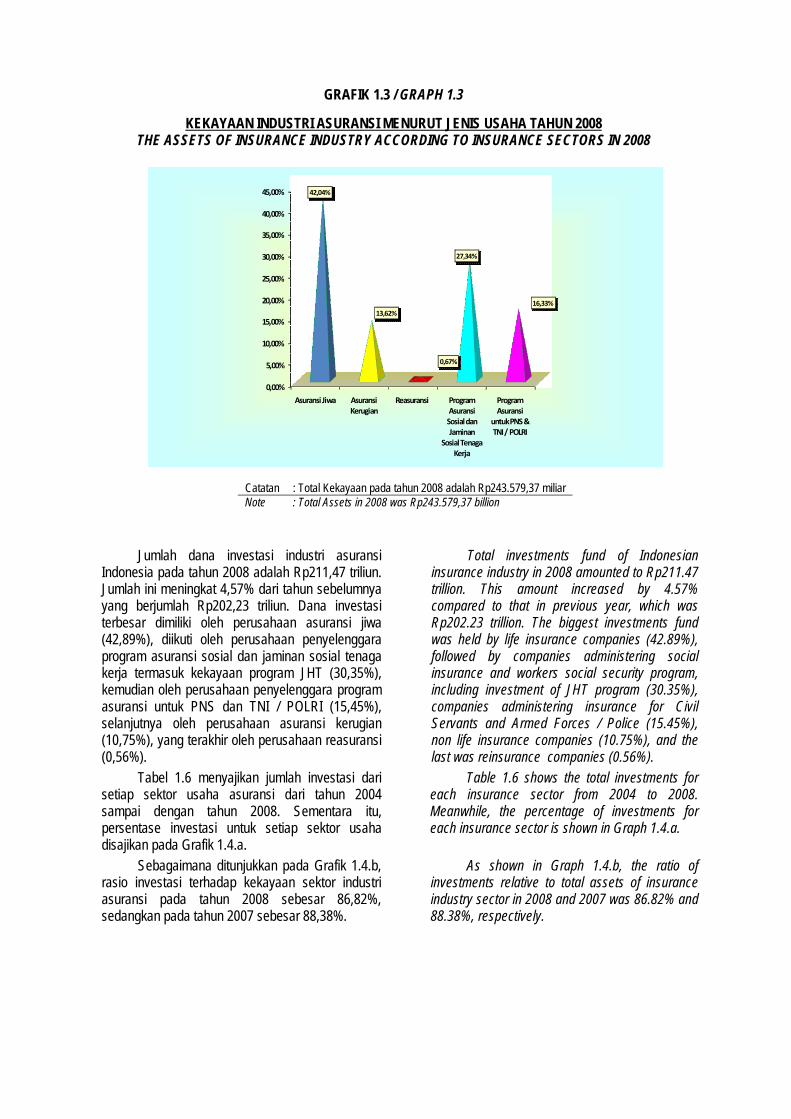
Pada tahun 2008, perusahaan asuransi jiwa memiliki kekayaan sebanyak 42,04% dari total kekayaan industri asuransi. Selanjutnya, perusahaan penyelenggara program asuransi sosial dan jaminan sosial tenaga kerja termasuk kekayaan program JHT memiliki 27,34% dari total kekayaan industri asuransi, diikuti dengan perusahaan penyelenggara program asuransi untuk PNS dan TNI / POLRI sebesar 16,33%. Sedangkan untuk perusahaan asuransi kerugian dan perusahaan reasuransi masing-masing sebesar 13,62% dan 0,67% dari total kekayaan industri asuransi. Distribusi kekayaan industri asuransi menurut jenis usaha pada tahun 2008 disajikan pada Grafik 1.3.
In 2008, life insurance companies held 42.04% of total assets of insurance industry. Further, companies administering social insurance and workers social security program including assets of JHT program held 27.34% of total assets of insurance industry, followed by companies administering insurance for Civil Servants and Armed Forces / Police that held 16.33%. Meanwhile, non life insurance companies and reinsurance companies each held 13.62% and 0.67% of total assets of insurance industry. The distribution of assets of insurance industry according to insurance sectors in 2008 is figured in Graph 1.3.
GRAFIK 1.3 / GRAPH 1.3
KEKAYAAN INDUSTRI ASURANSI MENURUT JENIS USAHA TAHUN 2008 THE ASSETS OF INSURANCE INDUSTRY ACCORDING TO INSURANCE SECTORS IN 2008
0,00%
5,00%
10,00%
15,00%
20,00%
25,00%
30,00%
35,00%
40,00%
45,00%
Asuransi Jiwa Asuransi Kerugian
Reasuransi Program Asuransi Sosial dan Jaminan
Sosial Tenaga Kerja
Program Asuransi
untuk PNS & TNI / POLRI
42,04%
13,62%
0,67%
27,34%
16,33%
Catatan : Total Kekayaan pada tahun 2008 adalah Rp243.579,37 miliar Note : Total Assets in 2008 was Rp243.579,37 billion
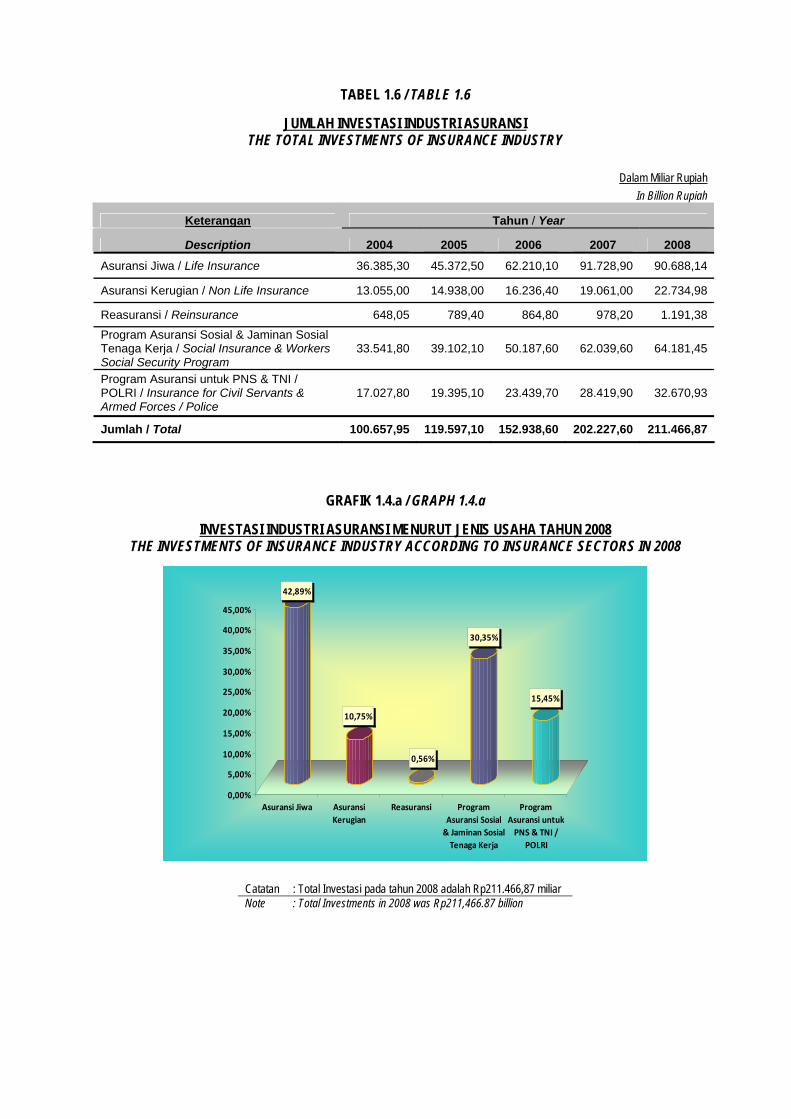
Jumlah dana investasi industri asuransi Indonesia pada tahun 2008 adalah Rp211,47 triliun. Jumlah ini meningkat 4,57% dari tahun sebelumnya yang berjumlah Rp202,23 triliun. Dana investasi terbesar dimiliki oleh perusahaan asuransi jiwa (42,89%), diikuti oleh perusahaan penyelenggara program asuransi sosial dan jaminan sosial tenaga kerja termasuk kekayaan program JHT (30,35%), kemudian oleh perusahaan penyelenggara program asuransi untuk PNS dan TNI / POLRI (15,45%), selanjutnya oleh perusahaan asuransi kerugian (10,75%), yang terakhir oleh perusahaan reasuransi (0,56%).
Total investments fund of Indonesian insurance industry in 2008 amounted to Rp211.47 trillion. This amount increased by 4.57% compared to that in previous year, which was Rp202.23 trillion. The biggest investments fund was held by life insurance companies (42.89%), followed by companies administering social insurance and workers social security program, including investment of JHT program (30.35%), companies administering insurance for Civil Servants and Armed Forces / Police (15.45%), non life insurance companies (10.75%), and the last was reinsurance companies (0.56%).
Tabel 1.6 menyajikan jumlah investasi dari setiap sektor usaha asuransi dari tahun 2004 sampai dengan tahun 2008. Sementara itu, persentase investasi untuk setiap sektor usaha disajikan pada Grafik 1.4.a.
Table 1.6 shows the total investments for each insurance sector from 2004 to 2008. Meanwhile, the percentage of investments for each insurance sector is shown in Graph 1.4.a.
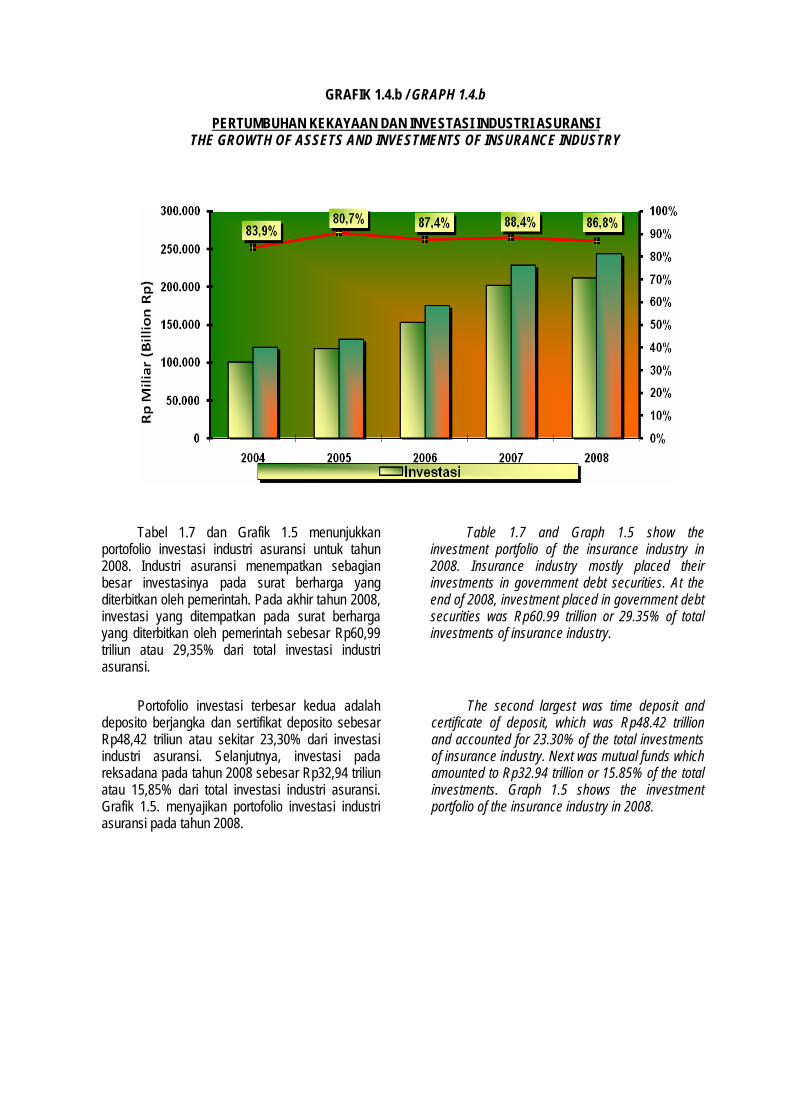
Sebagaimana ditunjukkan pada Grafik 1.4.b, rasio investasi terhadap kekayaan sektor industri asuransi pada tahun 2008 sebesar 86,82%, sedangkan pada tahun 2007 sebesar 88,38%.
As shown in Graph 1.4.b, the ratio of investments relative to total assets of insurance industry sector in 2008 and 2007 was 86.82% and 88.38%, respectively.
TABEL 1.6 / TABLE 1.6
JUMLAH INVESTASI INDUSTRI ASURANSI THE TOTAL INVESTMENTS OF INSURANCE INDUSTRY
Dalam Miliar Rupiah
In Billion Rupiah
Keterangan Tahun / Year
Description 2004 2005 2006 2007 2008
Asuransi Jiwa / Life Insurance 36.385,30 45.372,50 62.210,10 91.728,90 90.688,14
Asuransi Kerugian / Non Life Insurance 13.055,00 14.938,00 16.236,40 19.061,00 22.734,98
Reasuransi / Reinsurance 648,05 789,40 864,80 978,20 1.191,38
Program Asuransi Sosial & Jaminan Sosial Tenaga Kerja / Social Insurance & Workers Social Security Program
33.541,80 39.102,10 50.187,60 62.039,60 64.181,45
Program Asuransi untuk PNS & TNI / POLRI / Insurance for Civil Servants & Armed Forces / Police
17.027,80 19.395,10 23.439,70 28.419,90 32.670,93
Jumlah / Total 100.657,95 119.597,10 152.938,60 202.227,60 211.466,87
GRAFIK 1.4.a / GRAPH 1.4.a
INVESTASI INDUSTRI ASURANSI MENURUT JENIS USAHA TAHUN 2008 THE INVESTMENTS OF INSURANCE INDUSTRY ACCORDING TO INSURANCE SECTORS IN 2008
42,89%
10,75%
0,56%
30,35%
15,45%
0,00%
5,00%
10,00%
15,00%
20,00%
25,00%
30,00%
35,00%
40,00%
45,00%
Asuransi Jiwa Asuransi
Kerugian
Reasuransi Program
Asuransi Sosial
& Jaminan Sosial
Tenaga Kerja
Program
Asuransi untuk
PNS & TNI /
POLRI
Catatan : Total Investasi pada tahun 2008 adalah Rp211.466,87 miliar Note : Total Investments in 2008 was Rp211,466.87 billion
GRAFIK 1.4.b / GRAPH 1.4.b
PERTUMBUHAN KEKAYAAN DAN INVESTASI INDUSTRI ASURANSI THE GROWTH OF ASSETS AND INVESTMENTS OF INSURANCE INDUSTRY
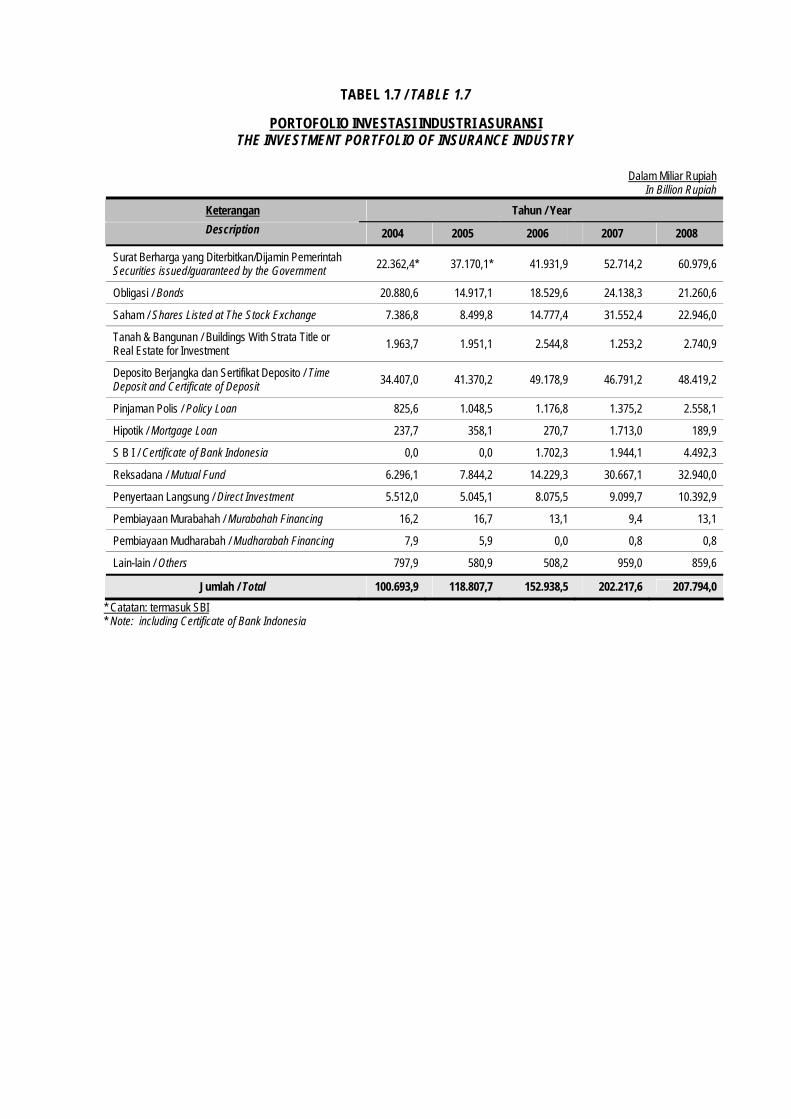
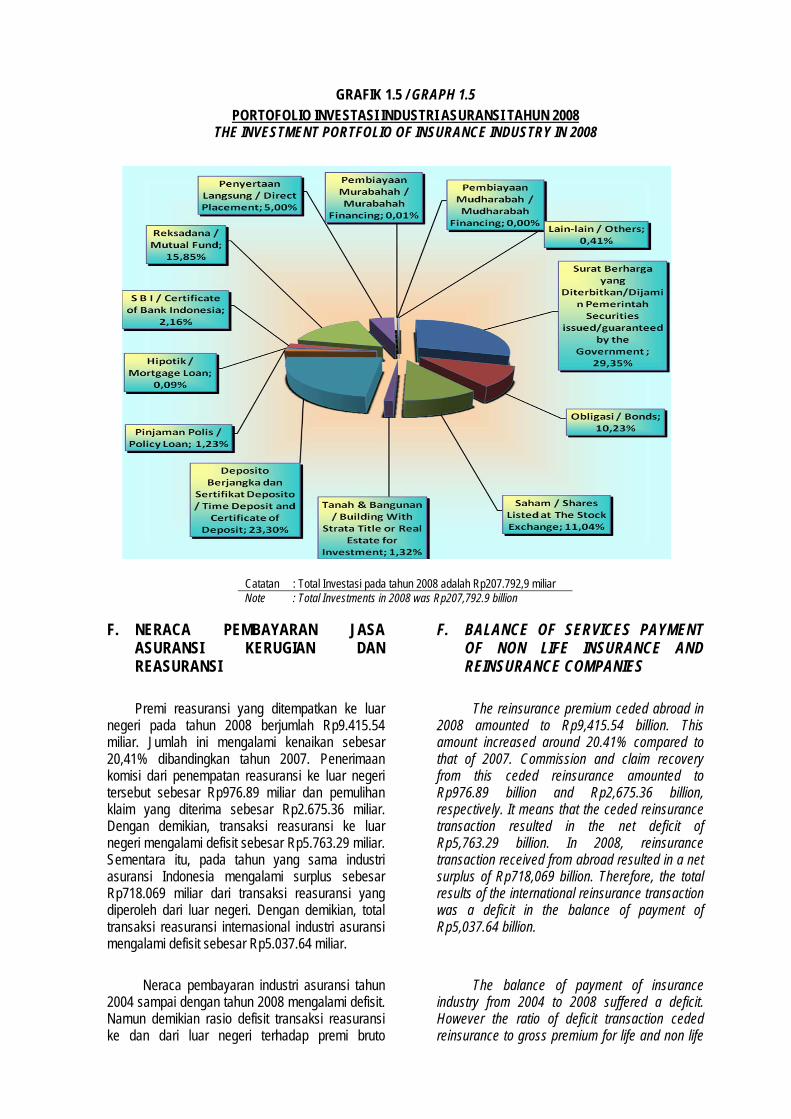
Tabel 1.7 dan Grafik 1.5 menunjukkan portofolio investasi industri asuransi untuk tahun 2008. Industri asuransi menempatkan sebagian besar investasinya pada surat berharga yang diterbitkan oleh pemerintah. Pada akhir tahun 2008, investasi yang ditempatkan pada surat berharga yang diterbitkan oleh pemerintah sebesar Rp60,99 triliun atau 29,35% dari total investasi industri asuransi.
Table 1.7 and Graph 1.5 show the investment portfolio of the insurance industry in 2008. Insurance industry mostly placed their investments in government debt securities. At the end of 2008, investment placed in government debt securities was Rp60.99 trillion or 29.35% of total investments of insurance industry.
Portofolio investasi terbesar kedua adalah
deposito berjangka dan sertifikat deposito sebesar Rp48,42 triliun atau sekitar 23,30% dari investasi industri asuransi. Selanjutnya, investasi pada reksadana pada tahun 2008 sebesar Rp32,94 triliun atau 15,85% dari total investasi industri asuransi. Grafik 1.5. menyajikan portofolio investasi industri asuransi pada tahun 2008.
The second largest was time deposit and certificate of deposit, which was Rp48.42 trillion and accounted for 23.30% of the total investments of insurance industry. Next was mutual funds which amounted to Rp32.94 trillion or 15.85% of the total investments. Graph 1.5 shows the investment portfolio of the insurance industry in 2008.
TABEL 1.7 / TABLE 1.7
PORTOFOLIO INVESTASI INDUSTRI ASURANSI THE INVESTMENT PORTFOLIO OF INSURANCE INDUSTRY
Dalam Miliar Rupiah
In Billion Rupiah
Keterangan Tahun / Year
Description 2004 2005 2006 2007 2008
Surat Berharga yang Diterbitkan/Dijamin Pemerintah Securities issued/guaranteed by the Government
22.362,4* 37.170,1* 41.931,9 52.714,2 60.979,6
Obligasi / Bonds 20.880,6 14.917,1 18.529,6 24.138,3 21.260,6
Saham / Shares Listed at The Stock Exchange 7.386,8 8.499,8 14.777,4 31.552,4 22.946,0
Tanah & Bangunan / Buildings With Strata Title or Real Estate for Investment
1.963,7 1.951,1 2.544,8 1.253,2 2.740,9
Deposito Berjangka dan Sertifikat Deposito / Time Deposit and Certificate of Deposit
34.407,0 41.370,2 49.178,9 46.791,2 48.419,2
Pinjaman Polis / Policy Loan 825,6 1.048,5 1.176,8 1.375,2 2.558,1
Hipotik / Mortgage Loan 237,7 358,1 270,7 1.713,0 189,9
S B I / Certificate of Bank Indonesia 0,0 0,0 1.702,3 1.944,1 4.492,3
Reksadana / Mutual Fund 6.296,1 7.844,2 14.229,3 30.667,1 32.940,0
Penyertaan Langsung / Direct Investment 5.512,0 5.045,1 8.075,5 9.099,7 10.392,9
Pembiayaan Murabahah / Murabahah Financing 16,2 16,7 13,1 9,4 13,1
Pembiayaan Mudharabah / Mudharabah Financing 7,9 5,9 0,0 0,8 0,8
Lain-lain / Others 797,9 580,9 508,2 959,0 859,6
Jumlah / Total 100.693,9 118.807,7 152.938,5 202.217,6 207.794,0
* Catatan: termasuk SBI * Note: including Certificate of Bank Indonesia
GRAFIK 1.5 / GRAPH 1.5 PORTOFOLIO INVESTASI INDUSTRI ASURANSI TAHUN 2008
THE INVESTMENT PORTFOLIO OF INSURANCE INDUSTRY IN 2008
Catatan : Total Investasi pada tahun 2008 adalah Rp207.792,9 miliar Note : Total Investments in 2008 was Rp207,792.9 billion
F. NERACA PEMBAYARAN JASA
ASURANSI KERUGIAN DAN REASURANSI
Premi reasuransi yang ditempatkan ke luar
negeri pada tahun 2008 berjumlah Rp9.415.54 miliar. Jumlah ini mengalami kenaikan sebesar 20,41% dibandingkan tahun 2007. Penerimaan komisi dari penempatan reasuransi ke luar negeri tersebut sebesar Rp976.89 miliar dan pemulihan klaim yang diterima sebesar Rp2.675.36 miliar. Dengan demikian, transaksi reasuransi ke luar negeri mengalami defisit sebesar Rp5.763.29 miliar. Sementara itu, pada tahun yang sama industri asuransi Indonesia mengalami surplus sebesar Rp718.069 miliar dari transaksi reasuransi yang diperoleh dari luar negeri. Dengan demikian, total transaksi reasuransi internasional industri asuransi mengalami defisit sebesar Rp5.037.64 miliar.
F. BALANCE OF SERVICES PAYMENT OF NON LIFE INSURANCE AND REINSURANCE COMPANIES
The reinsurance premium ceded abroad in
2008 amounted to Rp9,415.54 billion. This amount increased around 20.41% compared to that of 2007. Commission and claim recovery from this ceded reinsurance amounted to Rp976.89 billion and Rp2,675.36 billion, respectively. It means that the ceded reinsurance transaction resulted in the net deficit of Rp5,763.29 billion. In 2008, reinsurance transaction received from abroad resulted in a net surplus of Rp718,069 billion. Therefore, the total results of the international reinsurance transaction was a deficit in the balance of payment of Rp5,037.64 billion.
Neraca pembayaran industri asuransi tahun 2004 sampai dengan tahun 2008 mengalami defisit. Namun demikian rasio defisit transaksi reasuransi ke dan dari luar negeri terhadap premi bruto
The balance of payment of insurance industry from 2004 to 2008 suffered a deficit. However the ratio of deficit transaction ceded reinsurance to gross premium for life and non life
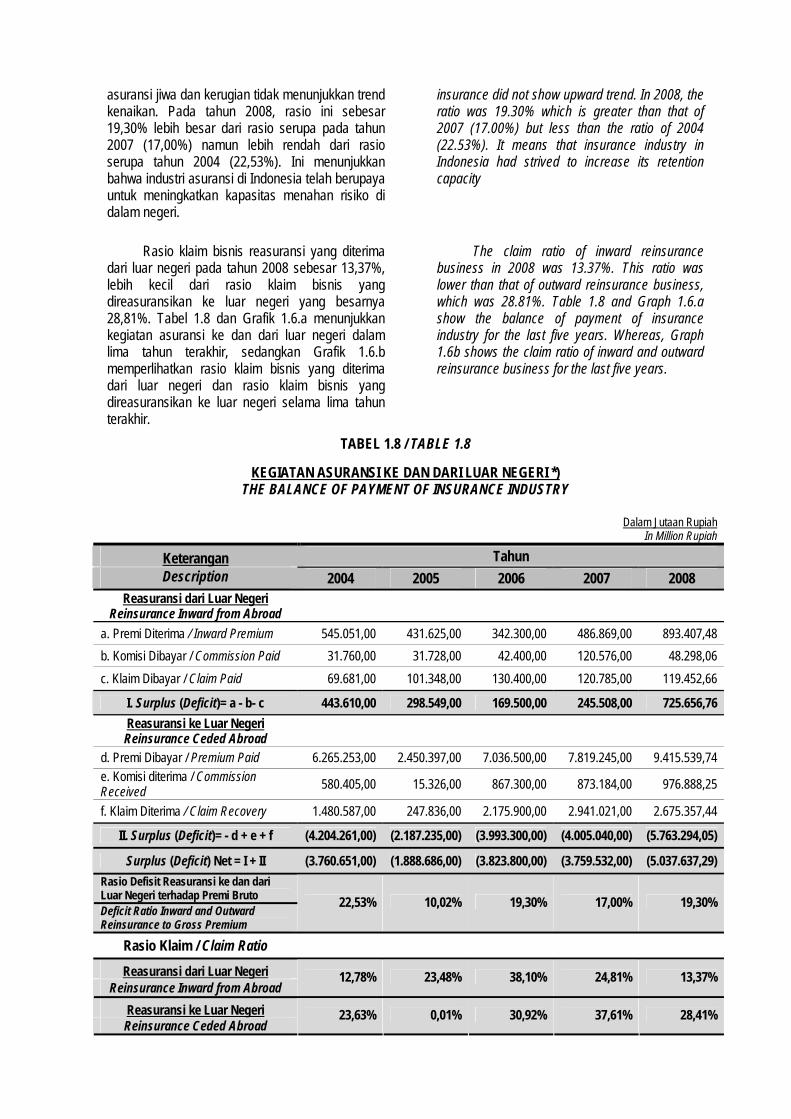
asuransi jiwa dan kerugian tidak menunjukkan trend kenaikan. Pada tahun 2008, rasio ini sebesar 19,30% lebih besar dari rasio serupa pada tahun 2007 (17,00%) namun lebih rendah dari rasio serupa tahun 2004 (22,53%). Ini menunjukkan bahwa industri asuransi di Indonesia telah berupaya untuk meningkatkan kapasitas menahan risiko di dalam negeri.
insurance did not show upward trend. In 2008, the ratio was 19.30% which is greater than that of 2007 (17.00%) but less than the ratio of 2004 (22.53%). It means that insurance industry in Indonesia had strived to increase its retention capacity
Rasio klaim bisnis reasuransi yang diterima
dari luar negeri pada tahun 2008 sebesar 13,37%, lebih kecil dari rasio klaim bisnis yang direasuransikan ke luar negeri yang besarnya 28,81%. Tabel 1.8 dan Grafik 1.6.a menunjukkan kegiatan asuransi ke dan dari luar negeri dalam lima tahun terakhir, sedangkan Grafik 1.6.b memperlihatkan rasio klaim bisnis yang diterima dari luar negeri dan rasio klaim bisnis yang direasuransikan ke luar negeri selama lima tahun terakhir.
The claim ratio of inward reinsurance business in 2008 was 13.37%. This ratio was lower than that of outward reinsurance business, which was 28.81%. Table 1.8 and Graph 1.6.a show the balance of payment of insurance industry for the last five years. Whereas, Graph 1.6b shows the claim ratio of inward and outward reinsurance business for the last five years.
TABEL 1.8 / TABLE 1.8
KEGIATAN ASURANSI KE DAN DARI LUAR NEGERI *) THE BALANCE OF PAYMENT OF INSURANCE INDUSTRY
Dalam Jutaan Rupiah In Million Rupiah
Keterangan Tahun Description 2004 2005 2006 2007 2008
Reasuransi dari Luar Negeri Reinsurance Inward from Abroad
a. Premi Diterima / Inward Premium 545.051,00 431.625,00 342.300,00 486.869,00 893.407,48
b. Komisi Dibayar / Commission Paid 31.760,00 31.728,00 42.400,00 120.576,00 48.298,06
c. Klaim Dibayar / Claim Paid 69.681,00 101.348,00 130.400,00 120.785,00 119.452,66
I. Surplus (Deficit)= a - b- c 443.610,00 298.549,00 169.500,00 245.508,00 725.656,76
Reasuransi ke Luar Negeri Reinsurance Ceded Abroad
d. Premi Dibayar / Premium Paid 6.265.253,00 2.450.397,00 7.036.500,00 7.819.245,00 9.415.539,74 e. Komisi diterima / Commission Received 580.405,00 15.326,00 867.300,00 873.184,00 976.888,25
f. Klaim Diterima / Claim Recovery 1.480.587,00 247.836,00 2.175.900,00 2.941.021,00 2.675.357,44
II. Surplus (Deficit)= - d + e + f (4.204.261,00) (2.187.235,00) (3.993.300,00) (4.005.040,00) (5.763.294,05)
Surplus (Deficit) Net = I + II (3.760.651,00) (1.888.686,00) (3.823.800,00) (3.759.532,00) (5.037.637,29)
Rasio Defisit Reasuransi ke dan dari Luar Negeri terhadap Premi Bruto Deficit Ratio Inward and Outward Reinsurance to Gross Premium
22,53% 10,02% 19,30% 17,00% 19,30%
Rasio Klaim / Claim Ratio
Reasuransi dari Luar Negeri Reinsurance Inward from Abroad
12,78% 23,48% 38,10% 24,81% 13,37%
Reasuransi ke Luar Negeri Reinsurance Ceded Abroad
23,63% 0,01% 30,92% 37,61% 28,41%
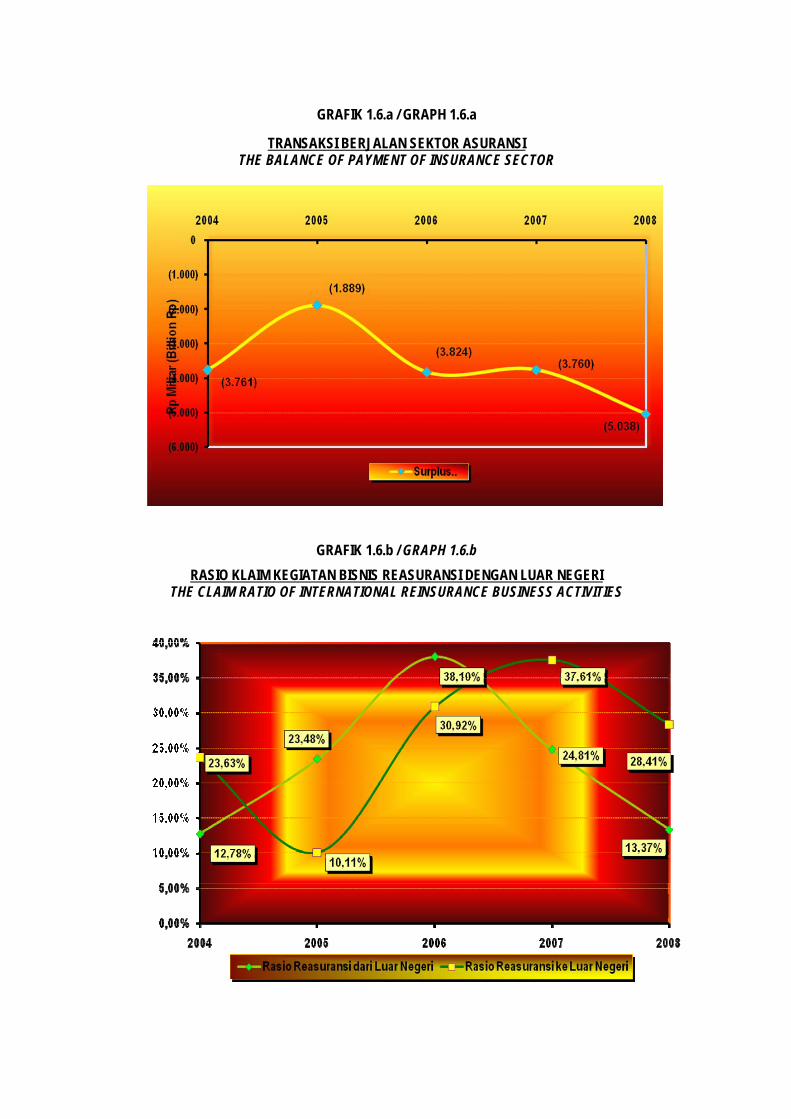
GRAFIK 1.6.a / GRAPH 1.6.a
TRANSAKSI BERJALAN SEKTOR ASURANSI THE BALANCE OF PAYMENT OF INSURANCE SECTOR
GRAFIK 1.6.b / GRAPH 1.6.b
RASIO KLAIM KEGIATAN BISNIS REASURANSI DENGAN LUAR NEGERI THE CLAIM RATIO OF INTERNATIONAL REINSURANCE BUSINESS ACTIVITIES
G. USAHA ASURANSI DAN REASURANSI
DENGAN PRINSIP SYARIAH
G. SHARIA INSURANCE AND REINSURANCE BUSINESS
G.1. STRUKTUR PASAR ASURANSI DENGAN PRINSIP SYARIAH Jumlah perusahaan asuransi dan
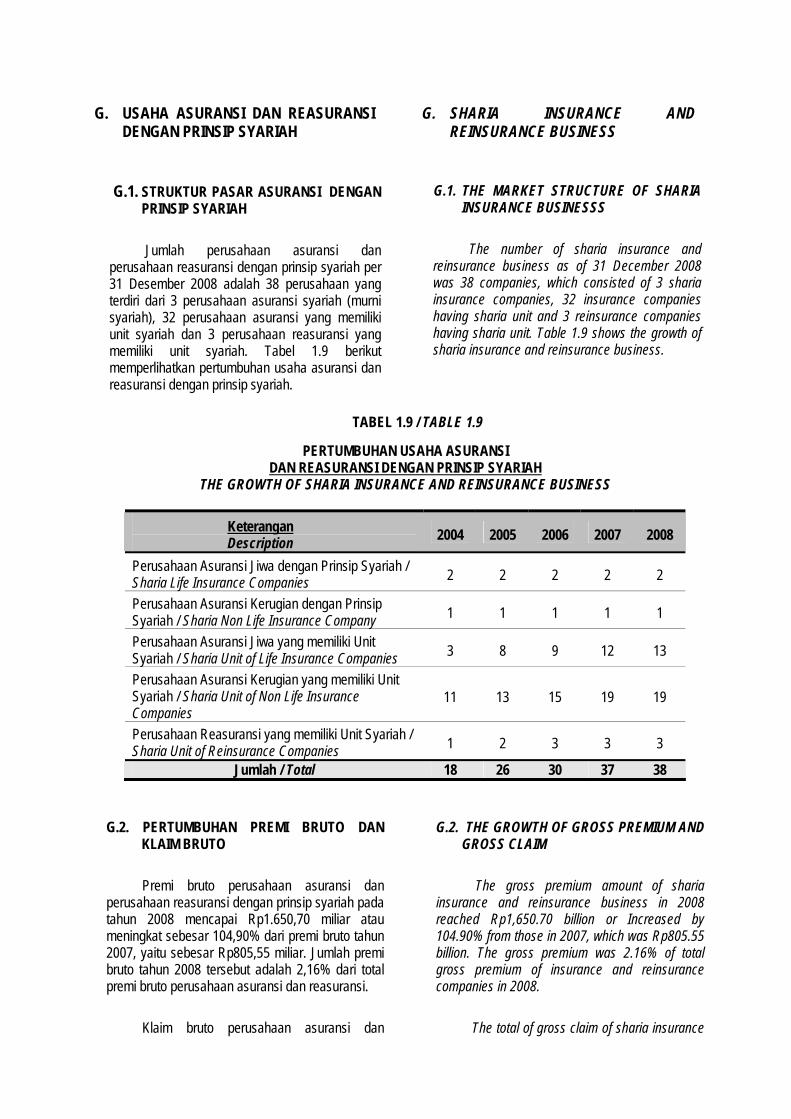
perusahaan reasuransi dengan prinsip syariah per 31 Desember 2008 adalah 38 perusahaan yang terdiri dari 3 perusahaan asuransi syariah (murni syariah), 32 perusahaan asuransi yang memiliki unit syariah dan 3 perusahaan reasuransi yang memiliki unit syariah. Tabel 1.9 berikut memperlihatkan pertumbuhan usaha asuransi dan reasuransi dengan prinsip syariah.
G.1. THE MARKET STRUCTURE OF SHARIA INSURANCE BUSINESSS
The number of sharia insurance and
reinsurance business as of 31 December 2008 was 38 companies, which consisted of 3 sharia insurance companies, 32 insurance companies having sharia unit and 3 reinsurance companies having sharia unit. Table 1.9 shows the growth of sharia insurance and reinsurance business.
TABEL 1.9 / TABLE 1.9
PERTUMBUHAN USAHA ASURANSI DAN REASURANSI DENGAN PRINSIP SYARIAH
THE GROWTH OF SHARIA INSURANCE AND REINSURANCE BUSINESS
Keterangan Description
2004 2005 2006 2007 2008
Perusahaan Asuransi Jiwa dengan Prinsip Syariah / Sharia Life Insurance Companies 2 2 2 2 2
Perusahaan Asuransi Kerugian dengan Prinsip Syariah / Sharia Non Life Insurance Company 1 1 1 1 1
Perusahaan Asuransi Jiwa yang memiliki Unit Syariah / Sharia Unit of Life Insurance Companies 3 8 9 12 13
Perusahaan Asuransi Kerugian yang memiliki Unit Syariah / Sharia Unit of Non Life Insurance Companies
11 13 15 19 19
Perusahaan Reasuransi yang memiliki Unit Syariah / Sharia Unit of Reinsurance Companies 1 2 3 3 3
Jumlah / Total 18 26 30 37 38
G.2. PERTUMBUHAN PREMI BRUTO DAN KLAIM BRUTO Premi bruto perusahaan asuransi dan
perusahaan reasuransi dengan prinsip syariah pada tahun 2008 mencapai Rp1.650,70 miliar atau meningkat sebesar 104,90% dari premi bruto tahun 2007, yaitu sebesar Rp805,55 miliar. Jumlah premi bruto tahun 2008 tersebut adalah 2,16% dari total premi bruto perusahaan asuransi dan reasuransi.
G.2. THE GROWTH OF GROSS PREMIUM AND GROSS CLAIM
The gross premium amount of sharia
insurance and reinsurance business in 2008 reached Rp1,650.70 billion or Increased by 104.90% from those in 2007, which was Rp805.55 billion. The gross premium was 2.16% of total gross premium of insurance and reinsurance companies in 2008.
Klaim bruto perusahaan asuransi dan The total of gross claim of sharia insurance
reasuransi dengan prinsip syariah pada tahun 2008 mengalami kenaikan sebesar 57,49% dibandingkan dengan tahun 2007, yaitu dari Rp312,60 miliar menjadi Rp492,31 miliar. Jumlah klaim bruto tahun 2008 tersebut adalah 1,19% dari total klaim bruto perusahaan asuransi dan reasuransi.
and reinsurance business in 2008 increased by 57.49% compared to that in 2007, from Rp312.60 billion to Rp492.31 billion. The gross claim was 1.19% of total gross claim of insurance and reinsurance companies in 2008.
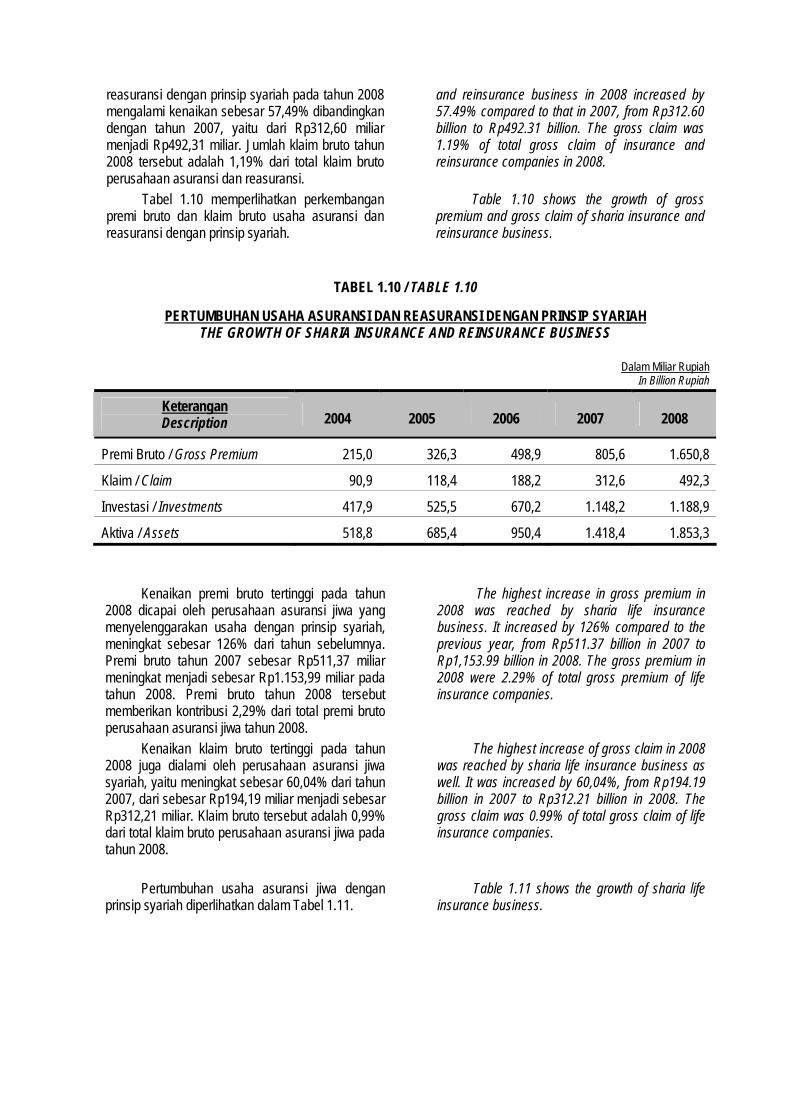
Tabel 1.10 memperlihatkan perkembangan premi bruto dan klaim bruto usaha asuransi dan reasuransi dengan prinsip syariah.
Table 1.10 shows the growth of gross premium and gross claim of sharia insurance and reinsurance business.
TABEL 1.10 / TABLE 1.10
PERTUMBUHAN USAHA ASURANSI DAN REASURANSI DENGAN PRINSIP SYARIAH THE GROWTH OF SHARIA INSURANCE AND REINSURANCE BUSINESS
Kenaikan premi bruto tertinggi pada tahun 2008 dicapai oleh perusahaan asuransi jiwa yang menyelenggarakan usaha dengan prinsip syariah, meningkat sebesar 126% dari tahun sebelumnya. Premi bruto tahun 2007 sebesar Rp511,37 miliar meningkat menjadi sebesar Rp1.153,99 miliar pada tahun 2008. Premi bruto tahun 2008 tersebut memberikan kontribusi 2,29% dari total premi bruto perusahaan asuransi jiwa tahun 2008.
The highest increase in gross premium in 2008 was reached by sharia life insurance business. It increased by 126% compared to the previous year, from Rp511.37 billion in 2007 to Rp1,153.99 billion in 2008. The gross premium in 2008 were 2.29% of total gross premium of life insurance companies.
Kenaikan klaim bruto tertinggi pada tahun 2008 juga dialami oleh perusahaan asuransi jiwa syariah, yaitu meningkat sebesar 60,04% dari tahun 2007, dari sebesar Rp194,19 miliar menjadi sebesar Rp312,21 miliar. Klaim bruto tersebut adalah 0,99% dari total klaim bruto perusahaan asuransi jiwa pada tahun 2008.
The highest increase of gross claim in 2008 was reached by sharia life insurance business as well. It was increased by 60,04%, from Rp194.19 billion in 2007 to Rp312.21 billion in 2008. The gross claim was 0.99% of total gross claim of life insurance companies.
Pertumbuhan usaha asuransi jiwa dengan
prinsip syariah diperlihatkan dalam Tabel 1.11. Table 1.11 shows the growth of sharia life
insurance business.
Dalam Miliar Rupiah In Billion Rupiah
Keterangan Description 2004 2005 2006 2007 2008
Premi Bruto / Gross Premium 215,0 326,3 498,9 805,6 1.650,8
Klaim / Claim 90,9 118,4 188,2 312,6 492,3
Investasi / Investments 417,9 525,5 670,2 1.148,2 1.188,9
Aktiva / Assets 518,8 685,4 950,4 1.418,4 1.853,3
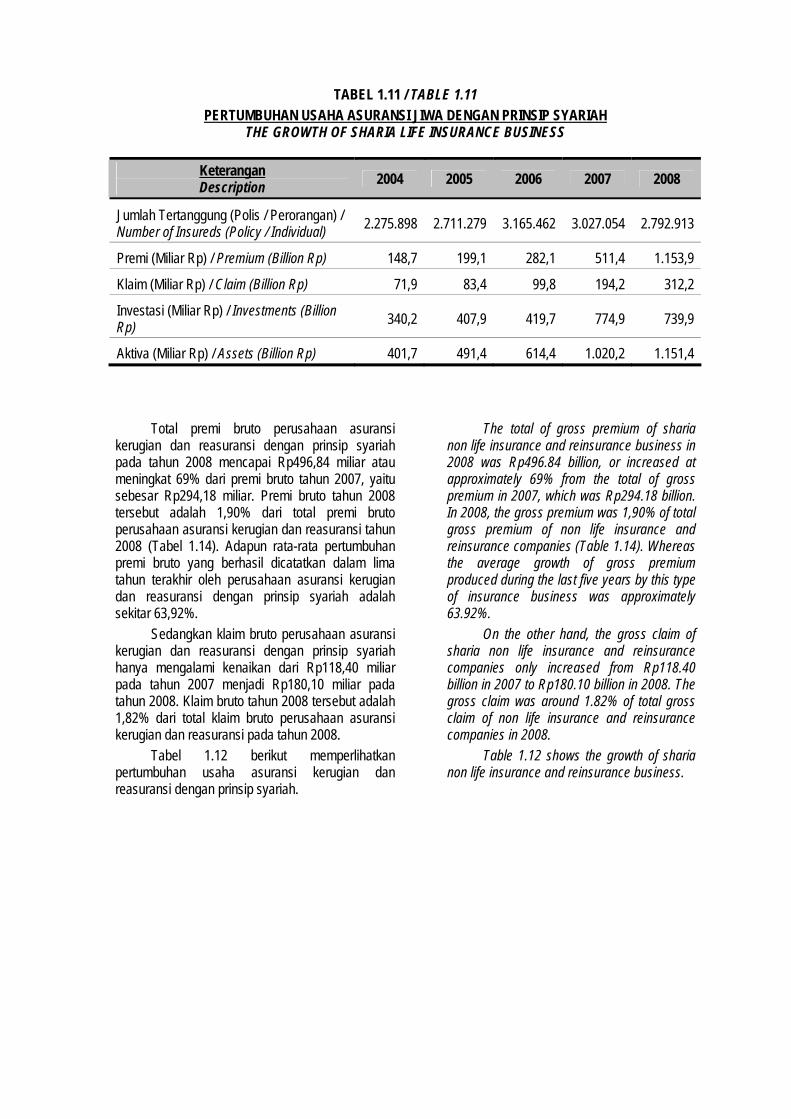
TABEL 1.11 / TABLE 1.11 PERTUMBUHAN USAHA ASURANSI JIWA DENGAN PRINSIP SYARIAH
THE GROWTH OF SHARIA LIFE INSURANCE BUSINESS
Keterangan Description
2004 2005 2006 2007 2008
Jumlah Tertanggung (Polis / Perorangan) / Number of Insureds (Policy / Individual)
2.275.898 2.711.279 3.165.462 3.027.054 2.792.913
Premi (Miliar Rp) / Premium (Billion Rp) 148,7 199,1 282,1 511,4 1.153,9
Klaim (Miliar Rp) / Claim (Billion Rp) 71,9 83,4 99,8 194,2 312,2
Investasi (Miliar Rp) / Investments (Billion Rp)
340,2 407,9 419,7 774,9 739,9
Aktiva (Miliar Rp) / Assets (Billion Rp) 401,7 491,4 614,4 1.020,2 1.151,4
Total premi bruto perusahaan asuransi kerugian dan reasuransi dengan prinsip syariah pada tahun 2008 mencapai Rp496,84 miliar atau meningkat 69% dari premi bruto tahun 2007, yaitu sebesar Rp294,18 miliar. Premi bruto tahun 2008 tersebut adalah 1,90% dari total premi bruto perusahaan asuransi kerugian dan reasuransi tahun 2008 (Tabel 1.14). Adapun rata-rata pertumbuhan premi bruto yang berhasil dicatatkan dalam lima tahun terakhir oleh perusahaan asuransi kerugian dan reasuransi dengan prinsip syariah adalah sekitar 63,92%.
The total of gross premium of sharia non life insurance and reinsurance business in 2008 was Rp496.84 billion, or increased at approximately 69% from the total of gross premium in 2007, which was Rp294.18 billion. In 2008, the gross premium was 1,90% of total gross premium of non life insurance and reinsurance companies (Table 1.14). Whereas the average growth of gross premium produced during the last five years by this type of insurance business was approximately 63.92%.
Sedangkan klaim bruto perusahaan asuransi kerugian dan reasuransi dengan prinsip syariah hanya mengalami kenaikan dari Rp118,40 miliar pada tahun 2007 menjadi Rp180,10 miliar pada tahun 2008. Klaim bruto tahun 2008 tersebut adalah 1,82% dari total klaim bruto perusahaan asuransi kerugian dan reasuransi pada tahun 2008.
On the other hand, the gross claim of sharia non life insurance and reinsurance companies only increased from Rp118.40 billion in 2007 to Rp180.10 billion in 2008. The gross claim was around 1.82% of total gross claim of non life insurance and reinsurance companies in 2008.
Tabel 1.12 berikut memperlihatkan pertumbuhan usaha asuransi kerugian dan reasuransi dengan prinsip syariah.
Table 1.12 shows the growth of sharia non life insurance and reinsurance business.

TABEL 1.12 / TABLE 1.12
PERTUMBUHAN USAHA ASURANSI KERUGIAN DAN REASURANSI DENGAN PRINSIP SYARIAH THE GROWTH OF SHARIA NON LIFE INSURANCE AND REINSURANCE BUSINESS
Dalam Miliar Rupiah
In Billion Rupiah
Keterangan Description
2004 2005 2006 2007 2008
Premi / Premium 66,3 127,2 216,8 294,2 496,8
Klaim / Claim 19,0 35,0 88,5 118,4 180,1
Investasi / Investments 77, 7 117,6 250,5 373,6 448,9
Aktiva / Assets 117,1 194,0 336,0 491,6 701,8
G.3. PERTUMBUHAN RASIO KLAIM Rasio klaim asuransi dan reasuransi dengan
prinsip syariah pada tahun 2008 adalah 29,82%. Rasio klaim tersebut lebih rendah dibandingkan dengan rasio serupa tahun 2007 sebesar 38,80%. Rasio klaim tahun 2008 tersebut juga masih di bawah rasio klaim industri asuransi dan reasuransi pada tahun 2008 yang mencapai 61,43%. Tabel 1.13 menunjukkan perkembangan rasio klaim selama lima tahun terakhir.
G.3. THE GROWTH OF CLAIM RATIO The claim ratio of sharia insurance and
reinsurance business in 2008 was 29.82%. This claim ratio was lower compared to that of 2007, which was 38.80%. The ratio was also relatively lower than that of insurance and reinsurance companies in 2008, which was 61.43%. Table 1.13 shows the growth of claim ratio during the last five years.
TABEL 1.13 / TABLE 1.13
PERTUMBUHAN RASIO KLAIM USAHA ASURANSI DENGAN PRINSIP SYARIAH THE GROWTH OF CLAIM RATIO OF SHARIA INSURANCE BUSINESS
Dalam Miliar Rupiah
In Billion Rupiah
Klaim Claim
Premi Premium
Tahun Year As. Kerugian
Non Life Ins. As. Jiwa Life Ins.
Jumlah Total
As. Kerugian Non Life
Ins.
As. Jiwa Life Ins.
Jumlah Total
Rasio Ratio (%)
2004 19,0 71,9 90,9 66,3 148,7 215,0 42,3
2005 35,0 83,4 118,4 127,2 199,1 326,3 36,3
2006 88,5 99,8 188,2 216,8 282,1 498,9 37,7
2007 118,4 194,2 312,6 294,2 511,4 805,5 38,8
2008 180,1 312,2 492,3 496,8 1.153,9 1.650,7 29,8
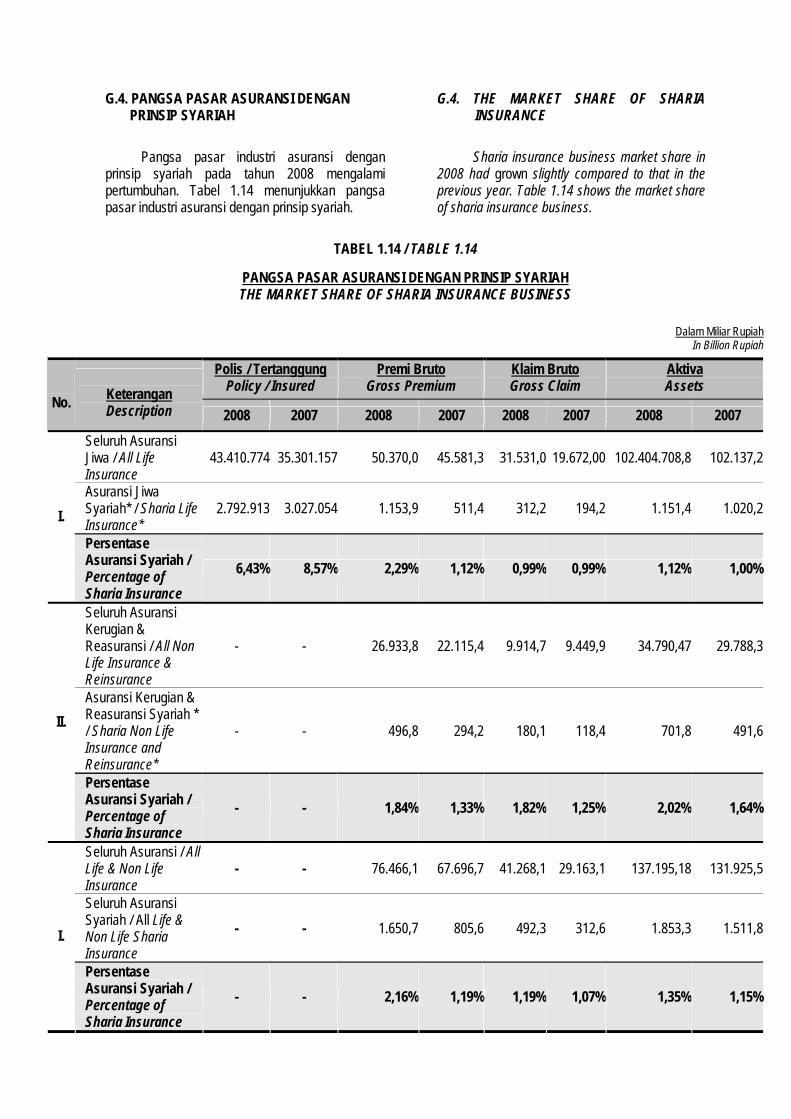
G.4. PANGSA PASAR ASURANSI DENGAN PRINSIP SYARIAH
Pangsa pasar industri asuransi dengan
prinsip syariah pada tahun 2008 mengalami pertumbuhan. Tabel 1.14 menunjukkan pangsa pasar industri asuransi dengan prinsip syariah.
G.4. THE MARKET SHARE OF SHARIA INSURANCE Sharia insurance business market share in
2008 had grown slightly compared to that in the previous year. Table 1.14 shows the market share of sharia insurance business.
TABEL 1.14 / TABLE 1.14
PANGSA PASAR ASURANSI DENGAN PRINSIP SYARIAH THE MARKET SHARE OF SHARIA INSURANCE BUSINESS
Dalam Miliar Rupiah
In Billion Rupiah
Polis / Tertanggung Policy / Insured
Premi Bruto Gross Premium
Klaim Bruto Gross Claim
Aktiva Assets
No.
Keterangan Description 2008 2007 2008 2007 2008 2007 2008 2007
Seluruh Asuransi Jiwa / All Life Insurance
43.410.774 35.301.157 50.370,0 45.581,3 31.531,0 19.672,00 102.404.708,8 102.137,2
Asuransi Jiwa Syariah* / Sharia Life Insurance*
2.792.913 3.027.054 1.153,9 511,4 312,2 194,2 1.151,4 1.020,2I.
Persentase Asuransi Syariah / Percentage of Sharia Insurance
6,43% 8,57% 2,29% 1,12% 0,99% 0,99% 1,12% 1,00%
Seluruh Asuransi Kerugian & Reasuransi / All Non Life Insurance & Reinsurance
- - 26.933,8 22.115,4 9.914,7 9.449,9 34.790,47 29.788,3
Asuransi Kerugian & Reasuransi Syariah * / Sharia Non Life Insurance and Reinsurance*
- - 496,8 294,2 180,1 118,4 701,8 491,6II.
Persentase Asuransi Syariah / Percentage of Sharia Insurance
- - 1,84% 1,33% 1,82% 1,25% 2,02% 1,64%
Seluruh Asuransi / All Life & Non Life Insurance
- - 76.466,1 67.696,7 41.268,1 29.163,1 137.195,18 131.925,5
Seluruh Asuransi Syariah / All Life & Non Life Sharia Insurance
- - 1.650,7 805,6 492,3 312,6 1.853,3 1.511,8I.
Persentase Asuransi Syariah / Percentage of Sharia Insurance
- - 2,16% 1,19% 1,19% 1,07% 1,35% 1,15%
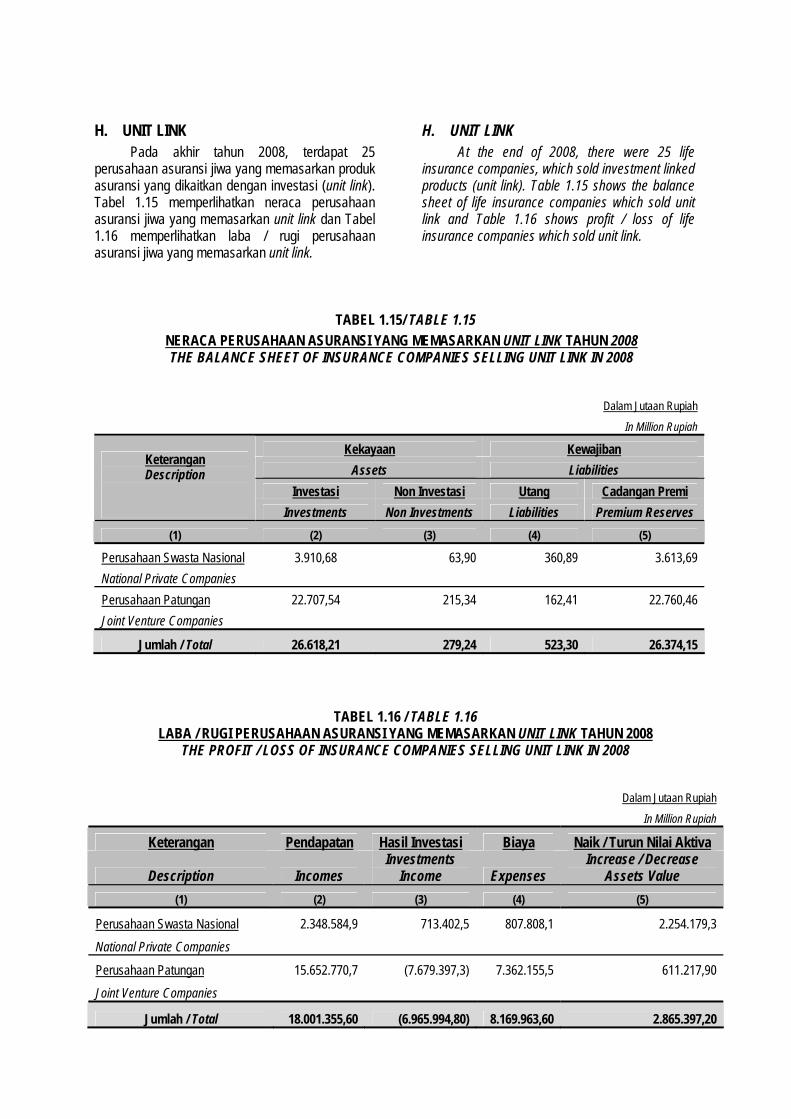
H. UNIT LINK
Pada akhir tahun 2008, terdapat 25 perusahaan asuransi jiwa yang memasarkan produk asuransi yang dikaitkan dengan investasi (unit link). Tabel 1.15 memperlihatkan neraca perusahaan asuransi jiwa yang memasarkan unit link dan Tabel 1.16 memperlihatkan laba / rugi perusahaan asuransi jiwa yang memasarkan unit link.
H. UNIT LINK
At the end of 2008, there were 25 life insurance companies, which sold investment linked products (unit link). Table 1.15 shows the balance sheet of life insurance companies which sold unit link and Table 1.16 shows profit / loss of life insurance companies which sold unit link.
TABEL 1.15/ TABLE 1.15 NERACA PERUSAHAAN ASURANSI YANG MEMASARKAN UNIT LINK TAHUN 2008 THE BALANCE SHEET OF INSURANCE COMPANIES SELLING UNIT LINK IN 2008
Dalam Jutaan Rupiah
In Million Rupiah
Kekayaan Kewajiban
Assets Liabilities
Investasi Non Investasi Utang Cadangan Premi
Keterangan Description
Investments Non Investments Liabilities Premium Reserves
(1) (2) (3) (4) (5)
Perusahaan Swasta Nasional 3.910,68 63,90 360,89 3.613,69
National Private Companies
Perusahaan Patungan 22.707,54 215,34 162,41 22.760,46
Joint Venture Companies
Jumlah / Total 26.618,21 279,24 523,30 26.374,15
TABEL 1.16 / TABLE 1.16 LABA / RUGI PERUSAHAAN ASURANSI YANG MEMASARKAN UNIT LINK TAHUN 2008
THE PROFIT / LOSS OF INSURANCE COMPANIES SELLING UNIT LINK IN 2008
Dalam Jutaan Rupiah
In Million Rupiah
Keterangan Pendapatan Hasil Investasi Biaya Naik / Turun Nilai Aktiva
Description Incomes Investments
Income Expenses Increase / Decrease
Assets Value
(1) (2) (3) (4) (5)
Perusahaan Swasta Nasional 2.348.584,9 713.402,5 807.808,1 2.254.179,3
National Private Companies
Perusahaan Patungan 15.652.770,7 (7.679.397,3) 7.362.155,5 611.217,90
Joint Venture Companies
Jumlah / Total 18.001.355,60 (6.965.994,80) 8.169.963,60 2.865.397,20
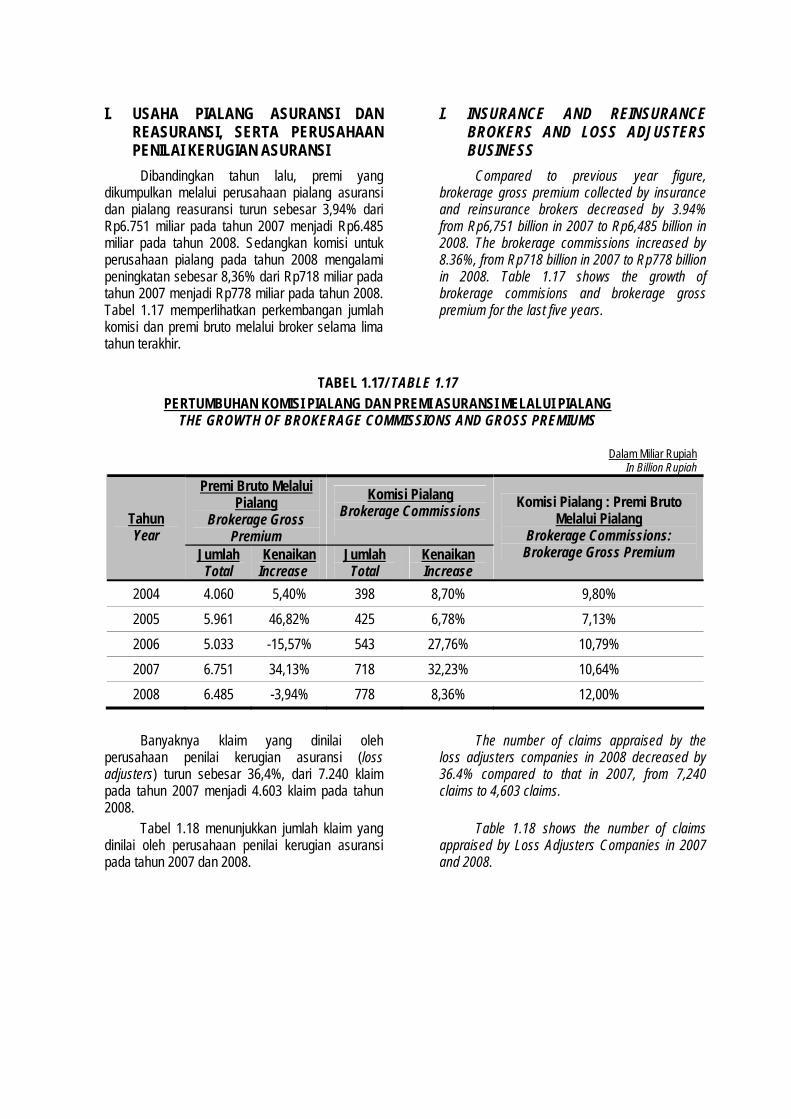
I. USAHA PIALANG ASURANSI DAN
REASURANSI, SERTA PERUSAHAAN PENILAI KERUGIAN ASURANSI
Dibandingkan tahun lalu, premi yang dikumpulkan melalui perusahaan pialang asuransi dan pialang reasuransi turun sebesar 3,94% dari Rp6.751 miliar pada tahun 2007 menjadi Rp6.485 miliar pada tahun 2008. Sedangkan komisi untuk perusahaan pialang pada tahun 2008 mengalami peningkatan sebesar 8,36% dari Rp718 miliar pada tahun 2007 menjadi Rp778 miliar pada tahun 2008. Tabel 1.17 memperlihatkan perkembangan jumlah komisi dan premi bruto melalui broker selama lima tahun terakhir.
I. INSURANCE AND REINSURANCE BROKERS AND LOSS ADJUSTERS BUSINESS
Compared to previous year figure, brokerage gross premium collected by insurance and reinsurance brokers decreased by 3.94% from Rp6,751 billion in 2007 to Rp6,485 billion in 2008. The brokerage commissions increased by 8.36%, from Rp718 billion in 2007 to Rp778 billion in 2008. Table 1.17 shows the growth of brokerage commisions and brokerage gross premium for the last five years.
TABEL 1.17/ TABLE 1.17
PERTUMBUHAN KOMISI PIALANG DAN PREMI ASURANSI MELALUI PIALANG THE GROWTH OF BROKERAGE COMMISSIONS AND GROSS PREMIUMS
Dalam Miliar Rupiah
In Billion Rupiah Premi Bruto Melalui
Pialang Brokerage Gross
Premium
Komisi Pialang Brokerage Commissions
Tahun Year
Jumlah Total
Kenaikan Increase
Jumlah Total
Kenaikan Increase
Komisi Pialang : Premi Bruto Melalui Pialang
Brokerage Commissions: Brokerage Gross Premium
2004 4.060 5,40% 398 8,70% 9,80%
2005 5.961 46,82% 425 6,78% 7,13%
2006 5.033 -15,57% 543 27,76% 10,79%
2007 6.751 34,13% 718 32,23% 10,64%
2008 6.485 -3,94% 778 8,36% 12,00%
Banyaknya klaim yang dinilai oleh
perusahaan penilai kerugian asuransi (loss adjusters) turun sebesar 36,4%, dari 7.240 klaim pada tahun 2007 menjadi 4.603 klaim pada tahun 2008.
The number of claims appraised by the loss adjusters companies in 2008 decreased by 36.4% compared to that in 2007, from 7,240 claims to 4,603 claims.
Tabel 1.18 menunjukkan jumlah klaim yang dinilai oleh perusahaan penilai kerugian asuransi pada tahun 2007 dan 2008.
Table 1.18 shows the number of claims appraised by Loss Adjusters Companies in 2007 and 2008.
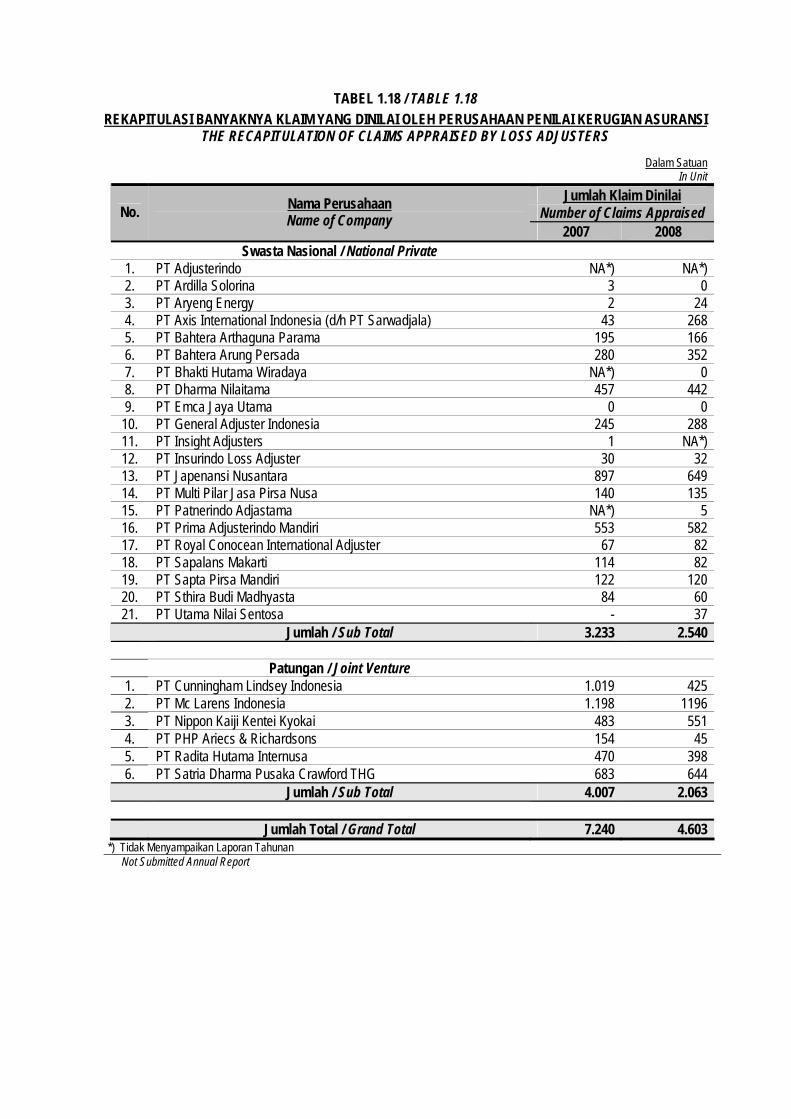
TABEL 1.18 / TABLE 1.18 REKAPITULASI BANYAKNYA KLAIM YANG DINILAI OLEH PERUSAHAAN PENILAI KERUGIAN ASURANSI
THE RECAPITULATION OF CLAIMS APPRAISED BY LOSS ADJUSTERS
Dalam Satuan In Unit
Jumlah Klaim Dinilai Number of Claims Appraised No.
Nama Perusahaan Name of Company
2007 2008 Swasta Nasional / National Private
1. PT Adjusterindo NA*) NA*) 2. PT Ardilla Solorina 3 0 3. PT Aryeng Energy 2 24 4. PT Axis International Indonesia (d/h PT Sarwadjala) 43 268 5. PT Bahtera Arthaguna Parama 195 166 6. PT Bahtera Arung Persada 280 352 7. PT Bhakti Hutama Wiradaya NA*) 0 8. PT Dharma Nilaitama 457 442 9. PT Emca Jaya Utama 0 0
10. PT General Adjuster Indonesia 245 288 11. PT Insight Adjusters 1 NA*) 12. PT Insurindo Loss Adjuster 30 32 13. PT Japenansi Nusantara 897 649 14. PT Multi Pilar Jasa Pirsa Nusa 140 135 15. PT Patnerindo Adjastama NA*) 5 16. PT Prima Adjusterindo Mandiri 553 582 17. PT Royal Conocean International Adjuster 67 82 18. PT Sapalans Makarti 114 82 19. PT Sapta Pirsa Mandiri 122 120 20. PT Sthira Budi Madhyasta 84 60 21. PT Utama Nilai Sentosa - 37
Jumlah / Sub Total 3.233 2.540 Patungan / Joint Venture
1. PT Cunningham Lindsey Indonesia 1.019 425 2. PT Mc Larens Indonesia 1.198 1196 3. PT Nippon Kaiji Kentei Kyokai 483 551 4. PT PHP Ariecs & Richardsons 154 45 5. PT Radita Hutama Internusa 470 398 6. PT Satria Dharma Pusaka Crawford THG 683 644 Jumlah / Sub Total 4.007 2.063
Jumlah Total / Grand Total 7.240 4.603
*) Tidak Menyampaikan Laporan Tahunan Not Submitted Annual Report
Grafik 1.7 dan 1.8 menyajikan data rinci untuk Perusahaan Pialang Asuransi dan Reasuransi serta Perusahaan Penilai Kerugian Asuransi, antara lain rekapitulasi premi dan komisi, neraca, laba / rugi, investasi, kekayaan, kewajiban dan modal sendiri.
J. CATATAN
Data lengkap mengenai usaha asuransi kerugian dan reasuransi, usaha asuransi jiwa, usaha asuransi dan reasuransi syariah, program asuransi sosial dan jaminan sosial tenaga kerja, program asuransi untuk pegawai negeri sipil dan TNI/POLRI, usaha pialang asuransi dan reasuransi serta perusahaan penilai kerugian asuransi dapat dilihat pada Lampiran II sampai dengan Lampiran VII.
The graphs 1.7 and 1.8 show detailed data for insurance and reinsurance brokers and loss adjusters, such as recapitulation of premium and commission, balance sheets, profit / loss, investments, assets, liabilities, and equity.
J. NOTES
The complete data for non life insurance and reinsurance business, life insurance business, sharia insurance and reinsurance business, social insurance program and workers social security, insurance program for civil servants and armed forces /police, insurance and reinsurance brokers and loss adjusters business can be seen at Appendix II up to VII.
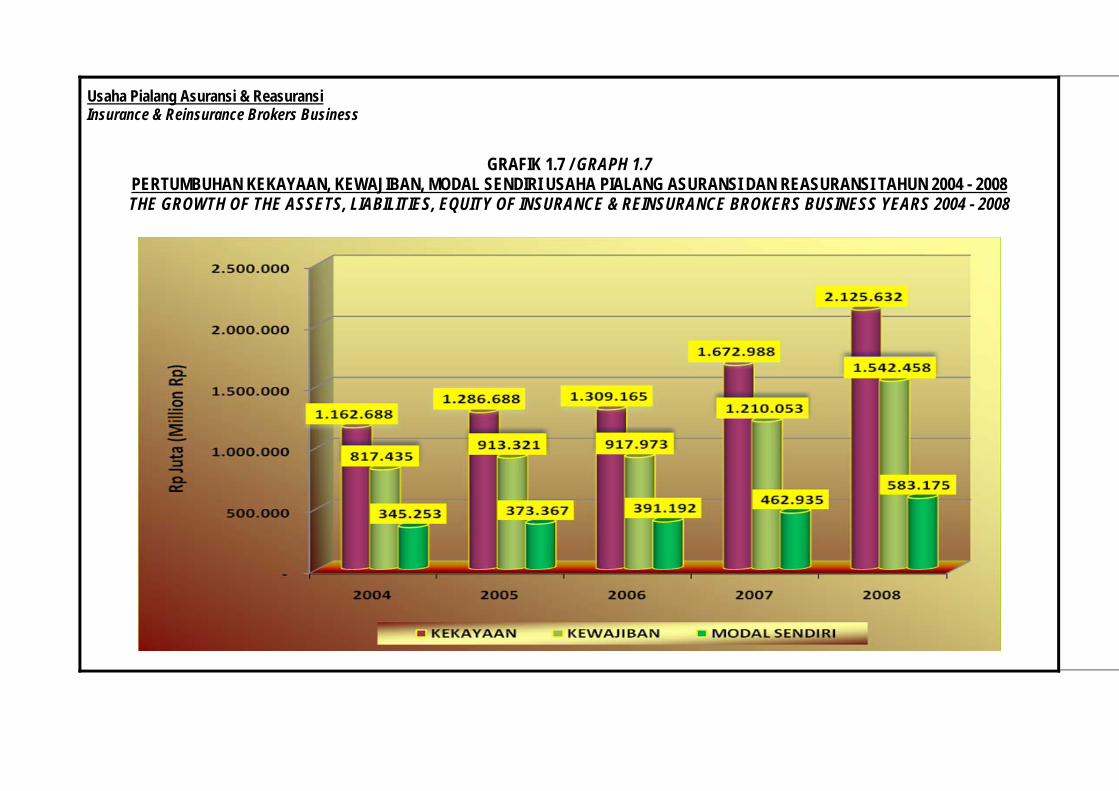
Usaha Pialang Asuransi & Reasuransi Insurance & Reinsurance Brokers Business
GRAFIK 1.7 / GRAPH 1.7
PERTUMBUHAN KEKAYAAN, KEWAJIBAN, MODAL SENDIRI USAHA PIALANG ASURANSI DAN REASURANSI TAHUN 2004 - 2008 THE GROWTH OF THE ASSETS, LIABILITIES, EQUITY OF INSURANCE & REINSURANCE BROKERS BUSINESS YEARS 2004 - 2008
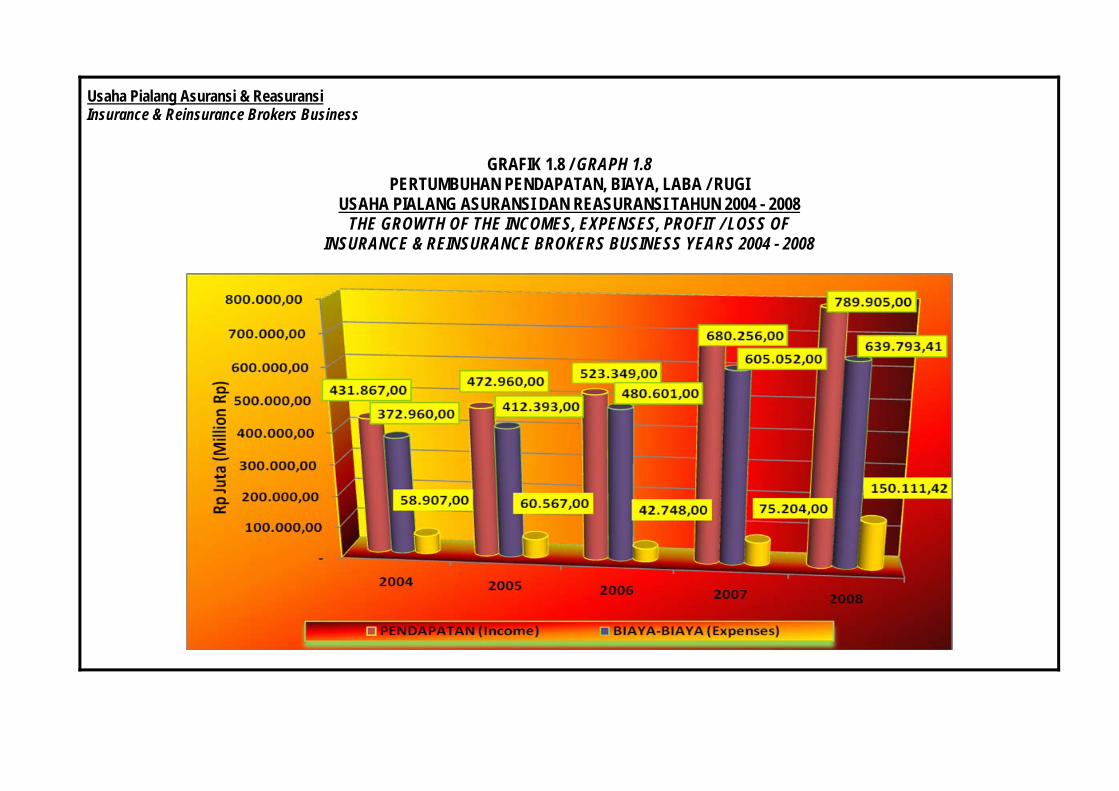
Usaha Pialang Asuransi & Reasuransi Insurance & Reinsurance Brokers Business
GRAFIK 1.8 / GRAPH 1.8
PERTUMBUHAN PENDAPATAN, BIAYA, LABA / RUGI USAHA PIALANG ASURANSI DAN REASURANSI TAHUN 2004 - 2008
THE GROWTH OF THE INCOMES, EXPENSES, PROFIT / LOSS OF INSURANCE & REINSURANCE BROKERS BUSINESS YEARS 2004 - 2008
BAB II CHAPTER II
THE INSURANCE BUREAU, CAPITAL MARKET AND FINANCIAL INSTITUTIONS SUPERVISORY AGENCY
A. KEGIATAN UTAMA Biro Perasuransian merupakan unit eselon 2 di lingkungan Badan Pengawas Pasar Modal dan Lembaga Keuangan (Bapepam dan LK) yang mempunyai tugas pokok melakukan pembinaan dan pengawasan perusahaan perasuransian Indonesia. Struktur organisasi terdapat dalam Lampiran I. Dalam melaksanakan tugasnya, Biro Perasuransian menyelenggarakan tiga kegiatan utama, yaitu: 1. Merumuskan kebijakan teknis yang berkaitan
dengan usaha perasuransian, antara lain: a. Menyusun peraturan perasuransian dalam
bentuk rancangan undang-undang, peraturan pemerintah, peraturan menteri, peraturan ketua badan, surat edaran ketua badan, dan lain-lain.
b. Mereview atau melakukan kajian atas hal-hal yang berkaitan dengan kesehatan keuangan dan operasional perusahaan perasuransian.
2. Mendukung upaya sosialisasi dan promosi jasa
perasuransian kepada masyarakat antara lain ikut serta dalam kegiatan edukasi masyarakat yang diselenggarakan oleh Bapepam-LK dan berpartisipasi dalam kegiatan ”insurance goes to campus” yang diselenggarakan oleh industri asuransi.
3. Melakukan pengawasan dan penegakan hukum
di bidang perasuransian. Dalam melaksanakan kegiatan ini, Biro Perasuransian melakukan aktivitas antara lain: a. Menganalisis laporan yang disampaikan
oleh perusahaan perasuransian. b. Melaksanakan kegiatan pemeriksaan
langsung rutin dan khusus terhadap perusahaan perasuransian.
c. Memfasilitasi penanganan pengaduan nasabah perusahaan perasuransian.
d. Mengadministrasikan pendaftaran tenaga ahli asuransi dan atau aktuaris perusahaan yang wajib dipekerjakan oleh
A. MAIN ACTIVITIES Insurance Bureau is a second echelon unit under Capital Market and Financial Institutions Supervisory Agency (Bapepam & LK) which has duty to supervise insurance companies and other insurance-related companies in Indonesia. The organization structure of Bureau of Insurance is shown in Appendix I. Insurance Bureau has three main activities as follows: 1. Planning general draft of insurance industry
technical policies by performing activities, such as: a. Setting up the insurance regulations in
the form of draft insurance law, government regulation, MOF regulation, circulation letter, etc.
b. Reviewing aspects related to financial and operational soundness of insurance companies and other insurance-related companies.
2. Supporting socialization and campaign programs conducted by Bapepam-LK, especially public education on insurance industry, as well as participating in “insurance goes to campus” conducted by insurance industry.
3. Conducting supervision and law enforcement
of insurance industry by performing activities, such as: a. Analyzing periodic reports submitted by
insurance and other insurance-related companies.
b. Performing routine and incidental inspections to insurance companies and other insurance-related companies.
c. Handling complaints from policyholders. d. Administrating the registration of
insurance experts and or actuaries employed by insurance companies and other insurance-related companies.
BIRO PERASURANSIAN, BADAN PENGAWAS PASAR MODAL DAN LEMBAGA KEUANGAN
perusahaan perasuransian. e. Memproses pemberian/penolakan izin
usaha perusahaan perasuransian, izin pembukaan kantor cabang dan unit syariah;
f. Memelihara dan memutakhirkan company profile perusahaan perasuransian.
g. Memberikan peringatan dan atau sanksi administrasi kepada perusahaan perasuransian yang tidak memenuhi peraturan perasuransian.
h. Memproses persetujuan atas Produk yang akan dipasarkan oleh perusahaan asuransi.
B. ARAH KEBIJAKAN REGULASI Dalam rangka harmonisasi kebijakan sektor asuransi dengan sektor lainnya dan untuk menyesuaikan dengan perkembangan industri asuransi, Biro Perasuransian menitikberatkan beberapa aspek sebagai arah kebijakan regulasi. Untuk tahun 2008, aspek yang menjadi arah kebijakan regulasi adalah:
1. Penerapan sistem pengawasan berbasis risiko (risk-based supervision - RBS). Biro Perasuransian sedang mengembangkan kerangka kerja pengawasan berbasis risiko (RBS framework). Tujuan dari pengembangan RBS adalah untuk memastikan bahwa: a. Risiko yang dihadapi oleh perusahaan
asuransi dan reasuransi telah dikelola dan dikontrol dengan baik;
b. Perusahaan asuransi dan reasuransi dapat memenuhi seluruh kewajiban finansial di masa mendatang kepada pihak-pihak yang berkepentingan;
c. Perusahaan asuransi dan reasuransi telah meminimalisasi dengan optimal dampak kerugian finansial kepada pihak-pihak yang berkepentingan, apabila terjadi kegagalan.
Sistem ini diharapkan dapat membantu mendeteksi risiko, khususnya dalam hal: a. Probability, yaitu kemungkinan
perusahaan tidak dapat memenuhi kewajibannya kepada pemegang polis;
b. Impact, yaitu akibat dari kegagalan yang ditimbulkan perusahaan apabila mengalami kegagalan.
Metode RBS yang sedang dikembangkan dan diterapkan oleh Biro Perasuransian adalah early warning system (EWS). EWS
e. Processing the acceptance or rejection of license for performing insurance business, and for opening branch offices and sharia unit.
f. Maintaining and updating the company profile of insurance companies and other insurance-related companies.
g. Imposing sanctions, such as written admonitions and or other administrative sanctions, to insurance companies and other insurance related companies violating insurance regulations.
h. Procesing aproval over products which will be marketed by insurance companies.
B. REGULATION ROADMAP
In harmonizing insurance sector policies with other sectors, as well as to keep pace with the insurance industry development, Insurance Bureau had determined several aspects as regulation roadmap. For year 2008, the regulation roadmap aspects were as follows:
1. Implementing risk-based supervision (RBS).
Insurance Bureau had been developing an RBS framework. It aims to ensure that: a. Insurance and reinsurance companies
could manage risk exposure properly; b. Insurance and reinsurance companies
could meet their future financial liabilities to their stakeholders.
c. Insurance and reinsurance companies had minimized the financial losses impacts optimally, in case of default.
This system is expected to assist the regulator in detecting risk exposure, especially in the following aspects: a. the probability of an insurance company
to fail in fulfilling its liabilities to policyholders;
b. the impact of failure caused by a company that collapses.
RBS method that had been developed at the moment by Insurance Bureau was Early Warning System (EWS). EWS has the
dapat mendeteksi lebih dini adanya risiko-risiko yang dihadapi oleh suatu perusahaan perasuransian sekaligus dapat menilai kinerja keuangan dan tingkat kesehatan keuangan perusahaan.
2. Pelaksanaan tata kelola perusahaan yang baik (good corporate governance - GCG) oleh perusahaan perasuransian.
Peraturan Pemerintah Nomor 39 Tahun 2008 mengamanatkan perusahaan perasuransian agar memiliki dan menerapkan prinsip pengelolaan tata kelola yang baik. Tujuan penerapan GCG antara lain:
untuk mendukung terselenggaranya praktek usaha perasuransian yang transparan, akuntabel, dapat dipertanggungjawabkan, mandiri, setara dan wajar.
untuk meningkatkan kepercayaan tertanggung dan pemangku kepentingan lainnya terhadap industri asuransi.
Biro Perasuransian telah mewajibkan perusahaan asuransi untuk melakukan self assessment atas pedoman GCG.
3. Implementasi kebijakan transparansi premi bagi semua pelaku pasar asuransi.
Peraturan Pemerintah Nomor 73 tahun 1992 mengamanatkan bahwa polis asuransi yang dijual harus mencantumkan besaran premi. Pada tanggal 27 Juni 2008 Biro Perasuransian mengeluarkan surat Nomor S-4140/BL/2008 perihal Pedoman Transparansi Premi sebagai upaya untuk mendorong terciptanya iklim usaha yang sehat.
C. ARAH KEBIJAKAN REGULASI ASURANSI
SYARIAH 1. Terwujudnya Sumber Daya Manusia (SDM)
yang berkualitas, dengan kompetensi dan integritas yang tinggi. Hal ini meliputi : • Peningkatan kuantitas dan kualitas SDM
profesional, termasuk tenaga-tenaga pemasar/agen;
• Pengembangan standar kualifikasi SDM dan profesi penunjang asuransi dengan prinsip syariah;
capability to provide early indication on risk exposure of an insurance company, and at the same time, to evaluate the company’s financial performance and soundness.
2. Implementation of Good Corporate Governance (GCG) Principles by insurance companies and other insurance-related companies.
Government Regulation number 39 Year 2008 requires insurance companies and other insurance-related companies to maintain and to implement Good Corporate Governance Principles. The aims of this implementation are:
to support transparancy, accountability, responsibility, independet, and fairness in management activities.
to enhance public trust, especially stakeholders and policyholders towards insurance industry.
Insurance Bureau had required insurance companies and other insurance-related companies to perform self assessment of GCG principles.
3. implementation of premium transparancy policy for all insurers.
Government Regulation Number 73 Year 1992 requires insurers to disclose premium amount on their insurance policies. On 27 October 2008, Insurance Bureau issued letter number S-4140/BL/2008 concerning Guidance on Premium Transparancy in order to create a fair competition in the market.
C. SHARIA INSURANCE ROADMAP 1. Creating qualified sharia human resources
with high competency and high integrity through: • Improving the quantity and quality of
human resources including agents and marketing representatives;
• Developing qualification standards for human resources and insurance supporting professionals based on
• Pengembangan sertifikasi profesi keahlian asuransi dengan prinsip syariah;
• Pengembangan kuantitas dan kualitas
SDM pengawas asuransi dengan prinsip syariah;
2. Tersedianya infrastruktur yang lengkap untuk
penyelenggaraan usaha asuransi dengan prinsip syariah, antara lain tersusunnya pedoman akuntansi untuk usaha asuransi dengan prinsip syariah.
3. Terwujudnya penyelenggaraan usaha asuransi
dengan prinsip syariah dengan manajemen dan kinerja operasional yang sehat serta menjunjung tinggi disiplin pasar melalui penerapan secara penuh prinsip GCG dan risk manajemen yang pruden;
4. Terwujudnya penyelenggaraan usaha asuransi
dengan prinsip syariah yang sehat dan efisien. 5. Terwujudnya kerangka pengaturan dan
pengawasan yang efektif dan efisien, serta mampu menangkap perubahan-perubahan yang terjadi di industri maupun dalam perekonomian nasional;
6. Meningkatnya pemahaman masyarakat tentang
asuransi dengan prinsip syariah, sehingga peserta asuransi tersebut dapat lebih cerdas dalam membuat keputusan dan lebih mandiri dalam merencanakan keuangan.
sharia principles; • Developing certification for professionals
that have expertise in sharia-based insurance;
• Developing the quantity and quality of sharia-based insurance supervisors.
2. Providing a complete sharia-based infrastructures such as establisment of sharia-based insurance accounting standard;
3. Creating sharia-based insurance business conduct with management and operational performance that are sound as well as highly support market disciplines through full implementation of GCG principles and prudent risk management
4. Creating sharia-based insurance business
conduct that is competent and efficient.
5. Creating an effective and efficient regulations and supervision framework that are able to adjust with changes occurring in insurance industry and national economics.
6. Enhancing the public understanding on sharia-based insurance so that sharia insurance policyholders will able to make smarter decisions and more independent financial planning.
D. KALENDER PERISTIWA PENTING TAHUN 2008
31 Januari 2008
Bapepam dan LK mengeluarkan Peraturan Ketua Bapepam dan LK Nomor: Per-02/BL/2008 tentang Pedoman Penghitungan Batas Tingkat Solvabilitas Minimum Bagi Perusahaan Asuransi dan Perusahaan Reasuransi. Peraturan ini merupakan penyempurnaan terhadap Keputusan Direktur Jenderal Lembaga Keuangan Nomor: 3607/LK/2004 tanggal 19 Agustus 2004 tentang Pedoman Perhitungan Batas Tingkat Solvabilitas Minimum Bagi Perusahaan Asuransi dan Perusahaan Reasuransi.
D. CALENDER OF EVENTS YEAR 2008 31 January 2008
Bapepam & LK issued Bapepam & LK Chairman Rule number: Per -02/BL/2008 concerning the Guidelines for Calculation of Solvency Margin for Insurance and Reinsurance Companies. This was a refinement of Decision of Director General of Finance Institutions number: 3607/LK/2004 dated 19 August 2004 regarding the Guidelines for Calculation of Solvency Margin for Insurance and Reinsurance Companies.
24-25 April 2008
The 3rd Asian Forum Insurance Regulators (AFIR)
24 -25 April 2008
The 3rd Asian Insurance Regulators Forum
diselenggarakan di Singapura. Pertemuan ini merupakan pertemuan informal regulator asuransi Asia dan Oceania yang bertujuan untuk memperkuat kerjasama antar regulator. Pertemuan tersebut mendiskusikan isu-isu yang berkaitan dengan cara penilaian dan penerapan International Best Practices yang termuat dalam 28 Insurance Core Principles (ICPs) yang dikeluarkan oleh International Association of Insurance Supervisors (IAIS).
(AFIR) was held in Singapore. This was an informal meeting of Asian and Oceania insurance regulators which aimed to strengthen cooperation among regulators. The meeting discussed issues related to method of assessment and implementation of International Best Practices that were contained in the 28 Core Principles (ICPs) issued by the International Association of Insurance Supervisors.
19 Mei 2008
Pemerintah menetapkan Peraturan Pemerintah (PP) Nomor: 39 Tahun 2008 tentang Penyelenggaraan Usaha Perasuransian. PP Nomor: 39/2008 ini mengatur pentahapan pemenuhan permodalan untuk perusahaan perasuransian.
19 May 2008
The Government of Republic Indonesia issued the Government Regulation Number 39 Year 2008 concerning the Insurance Business Conduct. The regulation governs provisions on paid-in capital fulfillment phases by insurance companies and other insurance- related companies.
18 Juni 2008
Bapepam dan LK mengadakan sosialisasi PP Nomor: 39 Tahun 2008 tentang Penyelenggaraan Usaha Perasuransian.
18 June 2008
Bapepam & LK conducted a socialization related to the issuance of Government Regulation Number 39 Year 2008 concerning the Insurance Business Conduct.
3 September 2008
Menteri Keuangan mengeluarkan Peraturan Menteri Keuangan Nomor: 124/PMK.10/2008 tentang Penyelenggaraan Lini Usaha Asuransi Kredit dan Suretyship. Peraturan ini mengganti ketentuan Pasal 4 Keputusan Menteri Keuangan Nomor: 422/KMK.06/2003 tentang Penyelenggaraan Usaha Perusahaan Asuransi dan Perusahaan Reasuransi.
3 September 2008
Minister of Finance issued Minister Regulation number: PMK.124/PMK.10/2008 concerning Insurance Business Conduct on Credit Insurance and Suretyship. This regulation substitutes the provision stated in Article 4 of Minister of Finance Decree number 422/KMK.06/2003 concerning Insurance and Reinsurance Companies Business Conduct.
19 September 2008
Bapepam dan LK menetapkan Peraturan Ketua Bapepam dan LK Nomor: Per-06/BL/2008 tentang Referensi Unsur Premi Murni serta Unsur Biaya Administrasi dan Biaya Umum Lainnya pada Lini Usaha Asuransi Kendaraan Bermotor Tahun 2008 – 2009. Peraturan tersebut untuk memberikan panduan kepada industri asuransi dalam penggunaan tarif asuransi kendaraan bermotor.
19 September 2008
Bapepam & LK issued Bapepam & LK Chairman Rule number Per -06/BL/2008 concerning the Reference Elements of Pure Premium and Element of Administration Cost and General Cost on the Motor Vehicle Insurance Business Lines in 2008 - 2009. The Bapepam & LK Chairman rule provides guidance to the insurance industry in the rate usage of motor vehicle insurance.
18 Oktober 2008
Dalam memperingati Insurance Day 2008, Biro Perasuransian turut mendukung terselenggaranya berbagai kegiatan yang diselenggarakan oleh Federasi Asosiasi Perasuransian Indonesia (FAPI) dengan tujuan utama untuk meningkatkan
18 October 2008
To celebrate the Insurance Day, Insurance Bureau supported the various activities held by Indonesian Insurance Associations Federation (FAPI in Indonesian acronym) with aim to enhance public awareness about insurance
pemahaman masyarakat tentang asuransi. Pada kesempatan ini pula, diluncurkan logo “mari berasuransi”.
industry. During the event, “mari berasuransi” logo was launched.
21 Oktober 2008
Bapepam dan LK bekerjasama dengan Asosiasi Asuransi Umum Indonesia (AAUI) mensosialisasikan Peraturan Menteri Keuangan Nomor: 74/PMK.10/2007 tentang Penyelengaraan Lini Usaha Asuransi Kendaraan Bermotor untuk anggota AAUI. Dalam kesempatan tersebut juga dilakukan sosialisasi Peraturan Menteri Keuangan Nomor:124/PMK.10/2008 tentang Penyelenggaraan Lini Usaha Asuransi Kredit dan Suretyship untuk pengurus AAUI.
21 October 2008
Bapepam & LK in collaboration with General Insurance Association of Indonesia (AAUI in Indonesian acronym) conducted socialization related to the issuance of the Minister of Finance Regulation Number: 74/PMK.10/2007 concerning Motor Vehicles Insurance Business Line for AAUI members. During the event, the management of AAUI was also briefed with the Minister Regulation Number PMK.124/PMK.10/2008 concerning insurance Business Conduct on Credit Insurance and Surety Business Lines.
28 Oktober 2008
Menteri Keuangan menetapkan Peraturan Menteri Keuangan Nomor: 158/PMK.10/2008 tentang Perubahan Kedua Atas Keputusan Menteri Keuangan Nomor: 424/KMK.06/2003 tentang Kesehatan Keuangan Perusahaan Asuransi Dan Perusahaan Reasuransi. Peraturan baru ini dikeluarkan dengan pertimbangan perkembangan kondisi perekonomian yang terjadi, sehingga perlu dilakukan penyempurnaan terhadap ketentuan mengenai dana jaminan dan penilaian kekayaan perusahaan asuransi dan perusahaan reasuransi.
28 October 2008
The Minister of Finance enacted the Minister of Finance Regulation Number 158/PMK.10/2008 concerning Second Amendment to the Minister of Finance Decree Number 424/KMK.06/2003 concerning the Financial Soundness of Insurance and Reinsurance Companies. The Regulation was enacted based on economic circumstance consideration, that government deemed it necessary to improve provisions on mandatory guarantee fund and valuation of assets of Insurance and reinsurance companies.
29 Oktober 2008
Dalam mengantisipasi dampak krisis keuangan global yang mengakibatkan menurunnya nilai pasar dari instrumen investasi di pasar modal, Bapepam dan LK telah menetapkan Surat Keputusan Ketua Nomor 440/BL/2008 tentang Penilaian Surat Utang atau Surat Berharga Lain Yang Diterbitkan Oleh Negara dan Obligasi. Peraturan ini mengatur mengenai Perusahaan Asuransi dan Perusahaan Reasuransi dapat melakukan penilaian surat utang atau surat berharga lain yang diterbitkan oleh Negara dan obligasi dengan menggunakan nilai perolehan yang diamortisasi sejak ditetapkannya surat keputusan ini sampai dengan adanya surat keputusan ketua yang mencabut keputusan ini.
29 October 2009
To anticipate the impacts of global financial crisis, such as the decreased values of Government Debt Securities or other Securities issued by Government or other Securities so that they do not represent their fair value, Bapepam & LK issued Bapepam & LK Chairman Decision number 440/BL/2008 which states that insurance and reinsurance companies may valuate the Government Debt Securities or other Securities issued by Government and Corporate Bonds using acquisition value since the enactment date of this decision until it is revoked.
6 – 7 November 2008
The 11th ASEAN Insurance Regulators Meeting (AIRM) diselenggarakan di Brunei Darussalam. Pertemuan ini merupakan pertemuan tahunan dari para regulator asuransi di kawasan Asia Tenggara. Dalam pertemuan ini dibahas isu-isu penting terkait
6 – 7 November 2008
The 11th ASEAN Insurance Regulators Meeting (AIRM) was held in Brunei Darussalam. This was an annual meeting of insurance regulators within South East Asia region. At the meeting the participants discussed some prominent issues
pengembangan pengawasan dan pengaturan tentang asuransi di masing-masing negara anggota ASEAN. Selain itu dibahas pula isu-isu yang berkembang di industri asuransi masing-masing negara.
related to insurance industry development of each ASEAN member country, as well as issues on insurance supervision and regulatory regime. Beside that, they also discussed insurance trends occurring in each member country.
20 November 2008
Bapepam dan LK mengadakan sosialisasi Peraturan Menteri Keuangan Nomor: 424/PMK.06/2003 tentang Kesehatan Keuangan Perusahaan Asuransi dan Perusahaan Reasuransi terakhir diubah dengan Peraturan Menteri Keuangan Nomor: 158/PMK.010/2008.
20 November 2008
Bapepam & LK conducted a socialization related to the issuance of the Minister of Finance Regulation Number 158/PMK.10/2008 concerning Second Amendment to the Minister of Finance Decree Number 424/KMK.06/2003 concerning the Financial Soundness of Insurance and Reinsurance Companies.
24 – 27 November 2008
East Asia Insurance Congress (EAIC) dilaksanakan di Hongkong. Pertemuan ini bertujuan untuk meningkatkan kerjasama regulator asuransi dalam hal peningkatan regulatory regime, GCG, dan kualitas pasar asuransi. Isu yang dibahas dalam pertemuan ini yaitu bagaimana mengatasi dampak krisis global pada pasar asuransi, risiko politik dan teroris, perubahan iklim serta populasi yang didominasi oleh kaum tua.
24 – 27 November 2008
East Asian Insurance Congress (EAIC) was held in Hong Kong. The meeting aimed to increase cooperation among insurance regulators on the Regulatory regime, Good Corporate Governance, and to improve the quality of the insurance market. Issues discussed were, among other things, how to overcome the impacts of the crisis on the global insurance market, Terrorists and Politics Risk, Climate Change and the Population that is Dominated by the Elderly (Ageing Population).
25 – 28 November 2008
The 3rd Meeting of The Working Group and Seminar on rating of Takaful and Retakaful Firms and 4th Seminar on The Regulation of Takaful diselenggarakan di Singapura. Pertemuan ini dalam rangka menyusun standar dan panduan Best Practices pengaturan dan pengawasan usaha asuransi dengan prinsip syariah.
25 – 28 November 2008
The 3rd Meeting of the Working Group and Seminar on rating of Takaful and Retakaful firms and 4th Seminar on the Regulation of Takaful were held in Singapore. These events were performed in order to prepare the standards and best practices guidelines on the regulatory framework and supervision of sharia financial institutions.
3 Desember 2008
Bapepam dan LK menyelenggarakan workshop tentang konsep naskah akademik mengenai skim jaminan hari tua, jaminan pensiun, dan jaminan kematian serta pelaksanaannya dalam Sistem Jaminan Sosial Nasional (SJSN).
3 December 2008
Bapepam & LK conducted a workshop on Concept of an Old-Age Savings Program, Pension Program, Mortality and its Implementation with regard to National Social Insurance Program.
30 Desember 2008
Bapepam dan LK menetapkan: 1. Peraturan Ketua Bapepam dan LK Nomor: PER-
09/BL/2008 tanggal 30 Desember 2008 tentang Perubahan atas Keputusan Direktorat Jenderal Lembaga Keuangan Nomor: Kep-390/LK/2005
30 December 2008
Bapepam & LK enacted: 1. Bapepam & LK Chairman Rule Number PER-
09/BL/2008 dated 30 December 2008 concerning Amendment to Decision of Financial Institutions General Director number
tentang Pedoman Perhitungan Tingkat Kesehatan Keuangan Serta Bentuk dan Susunan Laporan dan Pengumuman Laporan Keuangan Bagi Perusahaan Asuransi Non PT.
2. Peraturan Ketua Bapepam dan LK Nomor: PER-10/BL/2008 tanggal 30 Desember 2008 tentang Bentuk dan Susunan Laporan Dana Jaminan Bagi Perusahaan Asuransi, Perusahaan Reasuransi, dan Bank Kustodian. Penetapan peraturan ini sebagai pelaksanaan Pasal 37c dan 37d ayat (3) Peraturan Menteri Keuangan Nomor: 158/PMK.010/2008 tentang Perubahan Kedua Atas Keputusan Menteri Keuangan Nomor. 424/KMK.06/2003 tentang Kesehatan Keuangan Perusahaan Asuransi dan Perusahaan Reasuransi.
Kep-390/LK/2005 concerning Guidelines for the Calculation of Financial Solvency Level and Form and Organization of Financial Reports and Financial Statement Notification of Insurance Companies that are Non Limited Liability Companies.
2. Bapepam & LK Chairman Rule Number PER-10/BL/2008 dated 30 December 2008 concerning the Form and Organization of Mandatory Guarantee Fund Report for Insurance Companies, Reinsurance Companies and Custodian Bank. The issuance of the rule was an implementation of Article 37C and Article 37D item(3) of Minister of Finance Regulation number 158/PMK.010/2008 concerning Second Amendment to Minister of Finance Decree Number 424/KMK.06/2003 concerning Financial Soundness of Insurance and Reinsurance Companies..
31 Desember 2008
Pemerintah menetapkan Peraturan Pemerintah Nomor: 81 Tahun 2008 tentang Perubahan Ketiga atas PP Nomor: 73 Tahun 1992 tentang Penyelenggaran Usaha Perasuransian. Dalam Peraturan Pemerintah ini diatur perubahan Pasal 6b PP Nomor: 39 Tahun 2008 mengenai batas akhir pemenuhan ketentuan modal sendiri minimum bagi perusahaan asuransi dan perusahaan reasuransi.
31 December 2008
The government enacted Government Regulation number 81 Year 2008 concerning the Third Amendment to Government Regulation Number 39 Year 2008 concerning Insurance Business Conduct. The regulation governs the change of minimum equity fulfilment phases for insurance and reinsurance companies.

Kepala Biro Perasuransian (Head of Bureau of Insurance)
Bagian Kelembagaan Perasuransian
(Licensing Division)
Bagian Analisis Penyelenggaraan
Usaha (Operational
Analysis Division)
Bagian Pemeriksaan
Perasuransian (Supervision
Division)
STRUKTUR ORGANISASI BIRO PERASURANSIAN
(ORGANIZATION STRUCTURE OF BUREAU OF INSURANCE)
Bagian Perasuransian
Syariah (Sharia Division)
Bagian Analisis Keuangan
Pearasuransian (Financial
Analysis Division)
Related Documents