1 | Page Kaseya Performance And Best Practices Guide Authors: Jacques Eagle … Date: Thursday, April 29, 2010

Kasey a Performance Best Practices
Dec 27, 2015
Kasey a Performance Best Practices
Welcome message from author
This document is posted to help you gain knowledge. Please leave a comment to let me know what you think about it! Share it to your friends and learn new things together.
Transcript

1 | P a g e
Kaseya Performance
And
Best Practices
Guide
Authors: Jacques Eagle … Date: Thursday, April 29, 2010

2 | P a g e
Contents Introduction .................................................................................................................................................. 5
B.0 - The Basics.............................................................................................................................................. 6
B.1 - Hot Fixes ........................................................................................................................................... 6
B.2 64 bit versus 32 bit OS and SQL Server. .............................................................................................. 6
B.3 - System Requirements ....................................................................................................................... 6
B.4 - Browsers and workstations make a difference ................................................................................ 7
B.5 – Please, distribute your scripts! ........................................................................................................ 7
B.6 – My scripts are distributed but why are they all running in the morning! ....................................... 8
B.7 – The Statistics Hidden Link ................................................................................................................ 9
M.0-Memory ............................................................................................................................................... 10
How to monitor memory ........................................................................................................................ 10
M.1-Processes ......................................................................................................................................... 10
M.2-64 Bit Operating System .................................................................................................................. 11
M.3-32 Bit /3GB in the boot.ini ............................................................................................................... 11
M.4 Memory Best Practices .................................................................................................................... 11
C.0 - CPU...................................................................................................................................................... 12
C.1 - Microsoft Reporting Services ...................................................................................................... 12
C.2 - KaseyaMessageSys ...................................................................................................................... 12
C.3 – w3wp .......................................................................................................................................... 13
C.4 - Kaseya Add-ons ........................................................................................................................... 13
C.5 - Larger number of files on servers and workstations .................................................................. 13
C.6 - Log Archive duration ................................................................................................................... 13
C.7 – IIS Compression .......................................................................................................................... 13
C.8 – DEP ............................................................................................................................................. 14
N.0 - Network .............................................................................................................................................. 15
N.1 – IIS Compression ............................................................................................................................. 15
N.2 – Plan Network Utilization ................................................................................................................ 16
N.3 – Network Utilization for Service Desk ............................................................................................. 17
IO.0 – Disk Performance (IO) ...................................................................................................................... 18
IO.1 – Kaseya IO Hot Spots ...................................................................................................................... 18
Windows Paging .................................................................................................................................. 18

3 | P a g e
\Kaseya ................................................................................................................................................ 18
SQL Server TempDB ............................................................................................................................ 18
SQL Server Database and Logs ............................................................................................................ 18
IO.2 – Monitor your IO ............................................................................................................................ 19
Avg. Disk Queue Length ...................................................................................................................... 19
Avg. Disk Sec/Read and Avg. Disk Sec/Write ...................................................................................... 19
V.0 - Virtualization with ESX ........................................................................................................................ 20
How to monitor resources under VMWare ESX ..................................................................................... 20
V.1-VMWare ESX Memory Configuration ............................................................................................... 21
V.2-VMWare ESX CPU Configuration Reservations ................................................................................ 22
V.3-VMWare ESX CPU Configuration Limit ............................................................................................. 25
V.4-VMWare ESX VMWare tools up to date? ......................................................................................... 25
F.0 - Federation of Servers .......................................................................................................................... 26
F.1 – Single versus Dual Servers .............................................................................................................. 26
F.2 – Reporting Database Servers ....................................................................................................... 26
A.0 - Add-On Performance Tips .................................................................................................................. 27
A.1 - Service Desk .................................................................................................................................... 27
Performance and Best Practices Check List ................................................................................................ 28
B -The Basics ........................................................................................................................................... 28
M-Performance Checklist for Memory ................................................................................................... 28
C-Performance Checklist for CPU............................................................................................................ 28
N-Networking .......................................................................................................................................... 29
IO-Disk Performance (IO) ........................................................................................................................ 29
V-Performance Checklist for Virtualization with ESX .............................................................................. 29
F-Federation of Servers ........................................................................................................................... 30
A-Add-On Performance Tips ................................................................................................................... 30
Appendix A – Monitor Sets ......................................................................................................................... 31
CPU .......................................................................................................................................................... 31
CPU – Reporting Services .................................................................................................................... 31
CPU – Kaseya Messagesys ................................................................................................................... 31
CPU – w3wp IIS Workpool Process ......................................................................................................... 32
CPU – SQL Server Process ....................................................................................................................... 32

4 | P a g e
Disk IO ..................................................................................................................................................... 33

5 | P a g e
Introduction If you are running Kaseya Version 5.x or previous versions and are close to maximizing your CPU, Networking and/or IO resources, don’t expect Version 6.x (K2) to run similarly on the same infrastructure. We hope this guide will help you with your planning on upgrading or a new install of Kaseya K2. Please remember that the Minimum Requirements on the Kaseya Support Site is based on an average. Every customer is different and your mileage will vary. Kaseya is an enterprise application that requires specific hardware and software requirements in order
to run effectively. These requirements include a database and IIS server(s), a network capable of
handling agent traffic and a client platform and browser to present the user interface.
In addition, it is helpful to understand that every environment that is running Kaseya is different. There
are many variables that will impact the performance of your Kaseya installation. The recommended
requirements on our web site are a general guideline based on measures taken on multiple customer
environments. The purpose of this document is to help you give your Kaseya Environment a Health
Check by looking at various areas of performance and providing a checklist of items to review to
implement best practices as it pertains to performance.
This document will go over the various areas of performance with recommendations of best practices
where appropriate. Each of the sections are labeled in a way that they can be easily be referenced from
the Performance Check List which is in the last section of this document. The sections covered in this
guide are:
The Basics
Memory
CPU
Network
IO
Virtualization
Federation of Servers
Add-On Performance Tips o Service Desk
Performance Check List

6 | P a g e
B.0 - The Basics
B.1 - Hot Fixes Make sure your up to date on hot fixes since performance related issues are addressed through this
mechanism. Go to system, configure and make sure you have “Enable automatic check” checked. Also
verify that you are current on hot fixes by looking at the “Last Hotfix” field. If not, click the “Get Lastest
Hotfix” button. It is also a good idea to run the “Reapply Schema” link after hot fixes are applied since
this may create any missing indexes on the database helping performance.
Some customers choose not to have this feature enabled. In this case, you should review this
periodically and if you are experiencing performance issues, it’s best to apply all hot fixes before
contacting support.
B.2 64 bit versus 32 bit OS and SQL Server. Don’t use 32 bit OS’s or SQL Server. It’s okay for test environments, but will not scale to support Kaseya.
B.3 - System Requirements Did you review the minimum system requirements at the Kaseya support site?
http://www.kaseya.com/support/system-requirements.aspx
Keep in mind that these requirements can vary based on many variables such as:
Number of audits
Number of patch scans
Number of KES scans
User/Sample scripts
Reporting
Log History
Agent History
Script distribution It is therefore important for you to monitor your environment at all times and preferably with a Kaseya
Agent. This way, you can monitor, track and alert when resources are constrained like CPU, Disk IO,

7 | P a g e
Memory, SQL Server Locks, etc… Kaseya provides sample monitor sets as well as a NOC service that can
monitor these for you. Please feel free to contact our NOC services for more details on this service. As
we work with many clients, we constantly update our monitor sets to insure best practices in terms of
monitoring the Kaseya solution.
B.4 - Browsers and workstations make a difference The new features and functionality of the new Kaseya UI does require more resources in terms of
Networking bandwidth and CPU on the clients workstation running the UI. The reason is that we are
now using Java AJAX and JSON in order to render our pages. We have found that using Firefox over
Internet Explorer provides better response times on the Kaseya UI and is highly recommended. Chrome
appears to be the fastest; however,
this browser is not supported at
this time.
If you notice that the UI is slow,
check to see how much CPU your
workstation is utilizing during
screen refreshes. If the CPU
consistently hits 100%, your
workstation may be under
powered to render the pages. Also
compare the CPU utilization
between Firefox and Internet
Explorer.
B.5 – Please, distribute your scripts! You probably keep hearing this
from us as a Kaseya Customer,
but it is very important that you
distribute your scripts. On the
right, the scripts for the “Latest
Audit” are all scheduled at once.
And before that, all of the Patch
Scans are scheduled in a small
time frame as well. If you don’t
have enough resources on the
server, many things can happen.
For example:
The patch scans may
not be finished before

8 | P a g e
audits start. You will see CPU, Network bandwidth and IO all spike.
With high IO, Network and CPU, agents may fail to check in. Then alerts will occur and
exasperate the situation.
With high IO, Network and CPU, your UI will slow to a crawl.
Keep an eye on your script distribution, it is important!
B.6 – My scripts are distributed but why are they all running in the morning! Another issue that is seen with script scheduling is that many companies are going Green. Servers and
PC’s may be turned off
during the night. If Patch
Scans and Audits are
distributed and set to
run at night, they may
be queued until
everyone in the
company comes in to
startup their machines.
So, if you are
experiencing this, check
out your statistics in the
System->Statics tab.
Note how high your CPU
is running and then look
at the tops scripts that
have run in the last hour.
If it appears that there
are more scripts that
have run than what you
set as an hourly
distribution, you may be
running into this
scenario. Consider
increasing your CPU,
Networking and IO to
address this. Kaseya
minimum requirements
are based on an average
over 24 hours assuming
an incremental audit and
patch scan a day.

9 | P a g e
B.7 – The Statistics Hidden Link On very useful feature is the hidden link to view
server historical statistics. This link is located on
the System->Statistics page on the box with the
heading starting with “Statistics collected at”.
This is the hidden link. Click this to bring up the
historical statistics page. Here, you can review
historical graphs that provide very useful
information on the number of scripts run, CPU,
etc…
Again, one of the biggest resource issues is
scripts. If they don’t appear distributed, but
spiking as shown, then you may experience
times of slowness in your environment. Review
the CPU graph too and see if your environment has historically high CPU utilization or spikes as well. If it
does, try to distribute your scripts to run more evenly.

10 | P a g e
M.0-Memory
How to monitor memory Memory can be monitored by using the resource monitor in Windows 2008. There are two key
indicators that are important to
memory and this is why they show
on this panel. You should not see
excessive Hard Faults/sec. Ideally,
this number should be very low or
even zero. If you see values in the
double digits or more, you are
running low on memory and disk
swapping is occurring. This is bad.
Also, make sure you are not above
85% on your Used Physical Memory.
If you are, you should consider
adding more RAM to your system.
M.1-Processes You must have enough memory to
support five of the most memory dependant processes in a single physical Kaseya Server environment.
These processes are:
KaseyaMessageSys
W3wp (IIS Workpool)
Kserver
MS Sql Server
MS Sql Reporting Services
In Kaseya V6, the KaseyaMessageSys.exe is a new process that will allow Kaseya to scale with future versions and works closely with Microsoft Message Queuing. In addition to this, Version 6 also adds Microsoft Report Services. KaseyaMessageSys can use 380 meg. of RAM for a small implementation of Kaseya (0-250 end points) to more than 1.2 Gig. Of RAM for larger installations (2500 or more end points). In addition to KaseyaMessageSys, the new Kaseya UI requires more RAM from IIS (specifically, the IIS workpool process called w3wp). This process can use 250 Megabytes for a small implementation to 700 Megabytes or more for larger implementations. Kaseya also utilizes Microsoft Reporting Services which will add additional memory pressure for your instances. Small instances can use 160-200 Megabytes while larger systems can use even more. It’s not unusual for this process to grow to 1.3 Gigabytes or more.

11 | P a g e
If you currently are running Kaseya V6, these memory requirements must be considered and addressed when you are ready to upgrade. Especially on systems that are running low on memory resources already. It is easy, therefore, to add another 800 Megabytes to a small system just for the new Kaseya V6 release. For larger implementations, 2Gigabytes in additional RAM is not out of the question and highly recommended. Also consider that Windows 2008 uses more RAM just to run. Its requirements are even more than previous versions of windows. Typically, you should allocate at least 2 Gigabytes of RAM for the operating system alone.
M.2-64 Bit Operating System Currently, it is highly recommended that even small installations of Kaseya Version 6 use 64bit Windows to address RAM over the 32 Bit limit of 4Gig. As shown above in section M.1, even a small installation of Kaseya can be impacted by new Kaseya and Windows 2008 requirements. In addition to the OS, SQL Server should be 64 Bit as well.
M.3-32 Bit /3GB in the boot.ini Kaseya has seen that the /3GB switch in the boot.ini of 32 bit Windows causes excessive paging simply because more RAM is being allocated to applications and not to the Operating system. This switch is set in the boot.ini file and should be taken out. In its place, you should upgrade your Windows operating system to 64 bit or add additional memory to your existing 32 Bit environment and using the /PAE switch in its place. PAE is used by SQL Server (by enabling AWE) and can use the additional memory above the 32 Bit limit of 4GB. This feature does not work on 32 Bit Windows Standard Edition. If you are limited to 32 bit systems and 4Gig of RAM, you should consider splitting the server into an application and database server. This will at least allow more RAM to both the database server and the application server.
M.4 Memory Best Practices Make sure to monitor memory usage on the following processes to develop usage history and assess Memory requirements specific to your environment:
Sqlserver.exe
W3wp.exe
KaseyaMessageSys.exe
ReportingServicesService.exe
KServer.exe

12 | P a g e
C.0 - CPU CPU utilization can vary based on many variables; however, with K2 you must plan to allocate more CPU
than previous Kaseya Version 5 implementations for the same number of end points managed. This is
due to the additional functionality of the back-end database and front-end. New processes, like Kaseya
MessageSys and Microsoft Reporting Services will require CPU resources as well.
C.1 - Microsoft Reporting Services
Microsoft Reporting Services is new to K2 and utilizes more CPU and Memory to run reports than prior
versions. If you schedule many reports to run, try not to schedule them during times that the server is
also running audits and patch scans. Depending on your reporting load and data volume, you can use a
whole core or more just for reporting. One way to track reporting CPU utilization is to use an Agent on
your Kaseya server and create a monitor set for reporting services process. From here you can create
graphs as shown below using Kaseya. In this example, there is little reporting, but when reporting does
run, it can take 50% or more of a core. Please note that this is not 50% of total CPU on a server. For
more information, please see the Appendix section for more detailed information and the XML to
import this monitor set into your own environment.
C.2 - KaseyaMessageSys
This process will allow future versions of Kaseya to scale in terms of the number of endpoints. It works
closely with other Kaseya modules and internal processes. In terms of CPU, this process may use
between 5-10% of a core. If you install the Kaseya Service Desk, you may find this process using more
CPU. The best practice is to monitor this process as well using the monitor set described in the appendix.

13 | P a g e
C.3 – w3wp
This is the IIS work pool process. It should be monitored since it is second to SQL server in terms of CPU
resource consumption. This process will consume more resources based on the number of
administrators on your system and is also impacted by the Service Desk Add-on.
C.4 - Kaseya Add-ons
Depending on the number of add-on products like KES, BUDR, User Profile and Service Desk, your
requirements can vary appreciable in terms of memory, CPU, networking and IO.
C.4.1 – Kaseya Add-ons KES
In terms of CPU, KES and Service Desk will have an impact to your overall CPU utilization. For
KES, in general, you should plan on an adding an additional 10% over the recommended CPU.
C.4.2 – Kaseya Add-ons Service Desk
The Service Desk will have an appreciable load on a server that is also running Kaseya.
Currently, the following calculations should be done to estimate the additional CPU needed for
single or dual server Kaseya implementation:
Application Server: Number of named users that will access the Service Desk * 15Mhz
Database Server: Number of named users that will access the Service Desk*35Mhz
Just add the two above if this is a single server install. For example, if you know you will have 50
users accessing the Service Desk Add-on, you should have the following additional CPU
resources added to the Kaseya Minimum requirements:
Application Server: 50*15Mhz = 750Mhz
Database Server: 50*35Mhz = 1750Mhz
For a single Kaseya Server, just add them together. In this case, we come up with 2500Mhz. So a
good rule of thumb is about 50 named users supported by one 2.4Mhz Core of CPU.
C.5 - Larger number of files on servers and workstations
As servers and workstations become larger in size in terms of files, we must compare and store this
detail on the Kaseya server. This in turn requires more space on the database and increases CPU to
report and process this data especially during Audits.
C.6 - Log Archive duration
The longer you keep agent and monitor logs, the more resources it takes to run reporting and data
mining. Try to keep the logs to a minimum.
C.7 – IIS Compression
Some companies may consider using IIS Compression to reduce bandwidth costs at hosting centers and
improving performance on low latency/slower networks. The Kaseya application will benefit from
compression on IIS6.0 and IIS7.0, but there is a CPU cost. Because of the various compression levels

14 | P a g e
available, it is best to create a baseline on your CPU utilization and then slowly increase compression
levels until a good balance is reached with existing CPU resources and improved page performance.
C.8 – DEP
DEP is a new feature for Windows 2008 and Windows 7. It adds logic to prevent execution of programs
in memory regions and by default is turned on for all programs in Windows 2008. This does affect CPU
and we recommend setting this to “Turn on DEP for essential Windows programs and service only”. You
can access this setting by left clicking “Computer” properties and then select advanced options. Then
select Settings from the Systems Properties window and then select the “Data Execution Prevention”
tab.

15 | P a g e
N.0 - Network Just like CPU, networking will vary based on the number of scripts run, audit scan detail, Kaseya Add-on
products, etc… It is important to monitor this carefully since Kaseya Version 6 will require more network
bandwidth than previous versions of Kaseya. Where this is most evident is in the Kaseya UI.
The Kaseya UI now is based on Java AJAX and JSON. These technologies bring a feature rich experience
to the end user. It is very much like a windows application versus a HTML based application. These
features, however, require more networking bandwidth in order to run well.
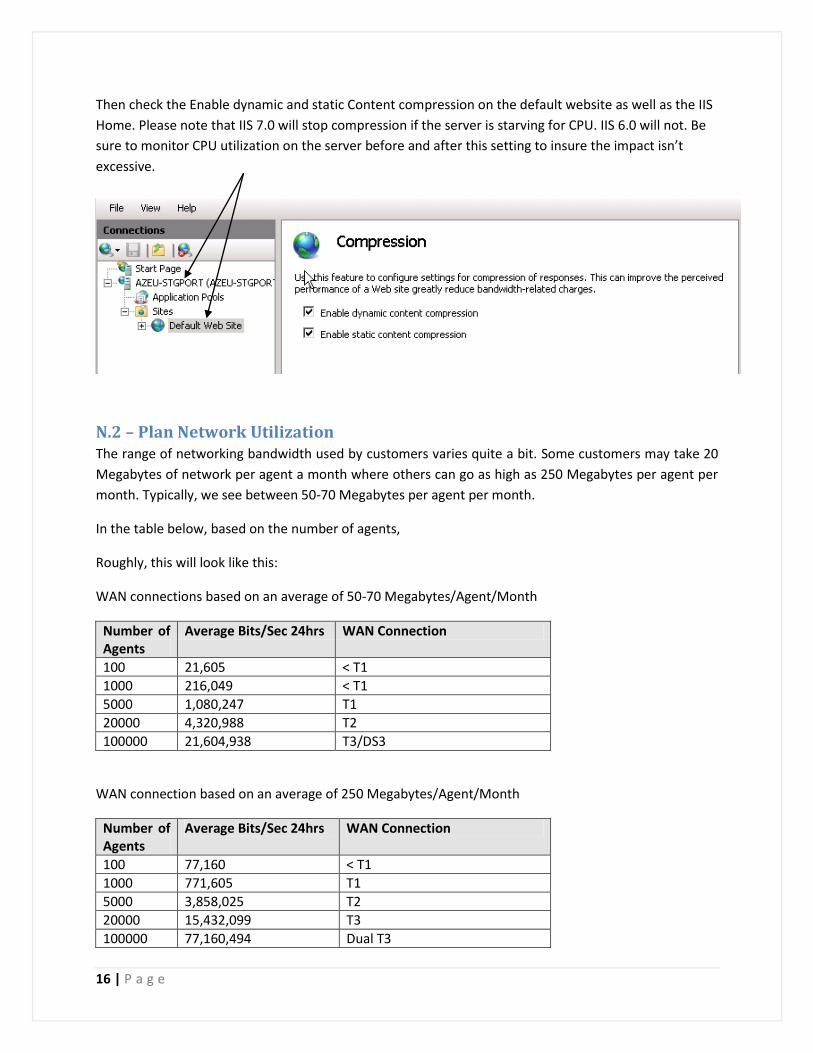
N.1 – IIS Compression IIS Compression can be set to help with overall
performance of the Kaseya UI. Compression will
help with performance from the networking
perspective, but will affect the CPU utilization of
IIS. Compression can be set to various levels.
To enable compression, install the Static and
Dynamic Content Compression role services for
IIS. Once these services are installed, you must
enable them in IIS by opening the IIS Manager
and clicking on the Compression icon.
16 | P a g e
Then check the Enable dynamic and static Content compression on the default website as well as the IIS
Home. Please note that IIS 7.0 will stop compression if the server is starving for CPU. IIS 6.0 will not. Be
sure to monitor CPU utilization on the server before and after this setting to insure the impact isn’t
excessive.
N.2 – Plan Network Utilization The range of networking bandwidth used by customers varies quite a bit. Some customers may take 20
Megabytes of network per agent a month where others can go as high as 250 Megabytes per agent per
month. Typically, we see between 50-70 Megabytes per agent per month.
In the table below, based on the number of agents,
Roughly, this will look like this:
WAN connections based on an average of 50-70 Megabytes/Agent/Month
Number of Agents
Average Bits/Sec 24hrs WAN Connection
100 21,605 < T1
1000 216,049 < T1
5000 1,080,247 T1
20000 4,320,988 T2
100000 21,604,938 T3/DS3
WAN connection based on an average of 250 Megabytes/Agent/Month
Number of Agents
Average Bits/Sec 24hrs WAN Connection
100 77,160 < T1
1000 771,605 T1
5000 3,858,025 T2
20000 15,432,099 T3
100000 77,160,494 Dual T3

17 | P a g e
Naturally, you should plan for peaks. For example, even though a T1 can handle 5000 agents in an
average install, if you’re limited to an 8 hour windows versus 24 hours to run audits and high bandwidth
scripts, you may need the capacity to support peaks that are three times the average in the tables
above.
Why the differences? It is due to many reasons.
Number, distribution and frequency of full/incremental audits and audit details on servers/workstations
Depending on the detail contained on servers and workstations, the agent will send XML documents across the net to the Kserver. These document sizes can vary. Some can be very small like a 10k bytes while others can be as high as 400k Bytes or more.
Number, distribution and frequency of patch scans Similar reason as audits…
Number, distribution and frequency of KES scans Similar reason as audits…
Number and size of managed files that may be distributed to/from your servers/workstations Customers may send managed files of various sizes to all of their endpoints. Some even bring files back to the Kserver. This all will require bandwidth to manage effectively.
Number of administrators that will be using Kaseya to manage and monitor their respective environments
The number of administrators makes a difference overall on Kaseya Servers. If you have many of them running dashboards, using the UI extensively or using Service Desk, you should plan on acquiring more network bandwidth.
Distribution of Scripts This is described in another section above, but does affect network bandwidth as well. Trying to run too many scripts at a time can cause network saturation
N.3 – Network Utilization for Service Desk The service desk will add overhead to your network connections. You can help reduce the network load by showing fewer rows of tickets. See Section A.1 below for more information on this. By selecting fewer rows, you can improve network throughput as shown on the chart on the right. The smaller dual “spikes” show a 30 line per page while the higher dual “spikes” show a 100 line per page. Depending on the number of named users using Service Desk, this can add up. 30 Lines Per
Page
100 Lines
Per Page

18 | P a g e
IO.0 – Disk Performance (IO) Just like Networking and CPU, disk IO is varies widely between Kaseya installs even when the same
number of endpoints are managed by different customers. Again, this can be due to many factors such
as the number and type of audits, patch scans, number and type of scripts, etc… The recommended
minimum configurations provided on the Kaseya Web Site should be adequate for most Kaseya
installations. It is difficult to predict what your disk IO loads will be but the following best practices
should help you understand and address any IO issues.
IO.1 – Kaseya IO Hot Spots There are a couple of IO “Hot Spots” that should be monitored (see how in the next section). These are:
Windows Paging
If memory is low, invariably, paging will occur and could cause quite a bit of IO to the paging file.
Almost always, this is on the root drive of a windows installation (C:\). This causes disk
contention with Kaseya and SQL Server if they too are on the same physical disk (or array) as the
paging file. Consider adding memory to reduce paging or moving the paging file to another
device. In some installs of Kaseya, the c:\ is left to just the OS and paging while another set of
drives contain the Kaseya installation thus distributing the IO more effectively.
\Kaseya
The Kaseya install directory is not static. Depending on the size of your installation, the drive
that contains the Kaseya application installation should be monitored for optimal IO; Even if you
put your database files on another set of drives. The Kaseya service receives many files from
agents and processes those files in this directory. These files mainly take the form of XML
documents with detail information from tasks such as audits and patch scans. These files are
processed before they are saved in the database. Depending on the number and size of the files,
IO to this path can become heavy.
SQL Server TempDB
When SQL Server is installed on a server, it may typically be installed in the root drive (like C:\).
One common mistake is that customers will move the database data and log files to another
higher performance device and leave TempDB on the root volume by mistake. TempDB is
heavily used for audits and patch scans as well as reporting. As the number of endpoints goes
up, the heaver TempDB is hit with IO. If it’s on the same volume as Kaseya and the OS, it will
compete with those processes. It’s not unusual to see agents and other Kaseya process failures
due to excessive IO all on one device. Monitor IO on devices that use tempDB. You will see most
IO against this when audits, patch scans and reporting is active.
SQL Server Database and Logs
It is recommended that the SQL Server Database data and log files be on separate devices as IO
increases in your installation. It is also recommended that they be separate from TempDB and
the Kaseya install directory too as your implementation grows into the thousands of end points.

19 | P a g e
IO.2 – Monitor your IO One of the best practices you can do for your Kaseya environment is to monitor your IO. Fast reads and
writes to physical disk are critical for SQL Server and Kaseya performance and you should install an
agent on your Kaseya application and database server to monitor Disks. All volumes should be
monitored with the following counters:
Avg. Disk Queue Length
This should not be larger than 2x the number of physical drives on your device. For example, if you have a RAID5 array of 3 physical disks, you should not see this go above 6 for any long duration.
Avg. Disk Sec/Read and Avg. Disk Sec/Write
Reads from any device, whether it’s a single drive, a raid device on a SAN or a virtual disk on a hypervisor environment should be fast. Normally, you should see consistent read/write performance of 20ms. This equates to .02 on these counters. If you see consistent measures above .06, this indicates that the drives are very busy. If you’re consistently above .1, you should consider adding more drives to your array or moving the hot files described above to other disk device to distribute the IO.

20 | P a g e
V.0 - Virtualization with ESX Customers who use ESX server should plan resources accordingly for Kaseya VM’s. In this section, we
will cover best practices for Memory, IO and CPU. In some cases, you may be hosted by vendors using
ESX. These recommendations should help in that situation as well.
How to monitor resources under VMWare ESX VMWare ESX 4.0 now includes VMWare counters that help you determine the configuration and
performance of your VM under ESX. These counters are installed as part of the installation of VMWare
Tools for the Virtual Machine
(VM). ESX 3.5 doesn’t have
these counters installed as part
of VMWare tools. Access to
the counters is shown below.
Just click on All Programs ->
VMware -> WMware Tools ->
start VM Statistics Logging.
From here you will see two
counters related to VMWare.
VM Memory and VM Processor.
Each of these is used for the
sections below on best
practices for a VMware
installation in terms of Memory
and CPU.
21 | P a g e
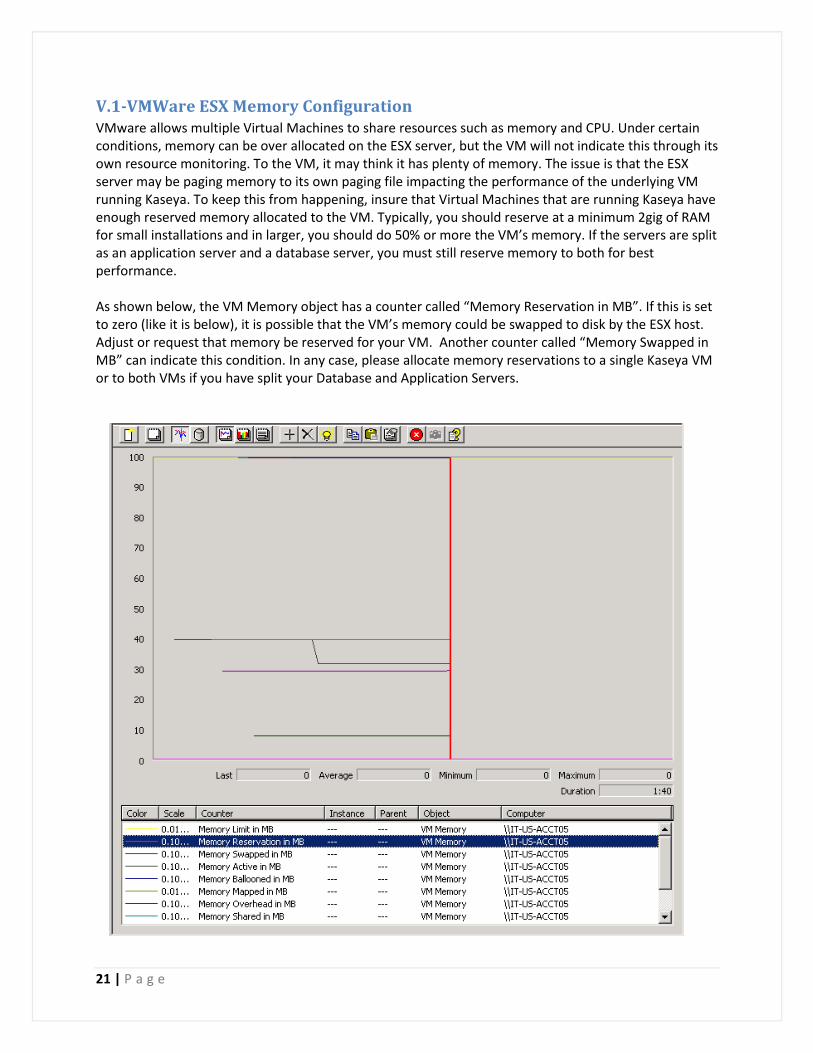
V.1-VMWare ESX Memory Configuration VMware allows multiple Virtual Machines to share resources such as memory and CPU. Under certain conditions, memory can be over allocated on the ESX server, but the VM will not indicate this through its own resource monitoring. To the VM, it may think it has plenty of memory. The issue is that the ESX server may be paging memory to its own paging file impacting the performance of the underlying VM running Kaseya. To keep this from happening, insure that Virtual Machines that are running Kaseya have enough reserved memory allocated to the VM. Typically, you should reserve at a minimum 2gig of RAM for small installations and in larger, you should do 50% or more the VM’s memory. If the servers are split as an application server and a database server, you must still reserve memory to both for best performance. As shown below, the VM Memory object has a counter called “Memory Reservation in MB”. If this is set to zero (like it is below), it is possible that the VM’s memory could be swapped to disk by the ESX host. Adjust or request that memory be reserved for your VM. Another counter called “Memory Swapped in MB” can indicate this condition. In any case, please allocate memory reservations to a single Kaseya VM or to both VMs if you have split your Database and Application Servers.

22 | P a g e
V.2-VMWare ESX CPU Configuration Reservations Just like memory, ESX allows VMs to share CPU. And just like memory, you need to insure that dedicated
CPU cycles are reserved for single or dual server implementation of Kaseya. This is critical because
inconsistent CPU will always lead to unexplained performance issues. On ESX 4.0 server VMs, use the
VM Processor object to monitor CPU Performance. Here look at the CPU “Reservation in Mhz” and see if
it’s set to zero as shown below. If it is, your VM can be starved of CPU cycles from the ESX host. Again,
you need to allocate enough CPU reservations to satisfy the load of a single or dual Kaseya VM
implementation.

23 | P a g e
How can you determine if you’re starved of CPU cycles? Use the “Effective VM Speed in Mhz” counter.
This counter will show how many cycles a VM is using in Mhz. In this example, you will see that this VM
has four virtual cores.
If you select the “Host Processor Speed in Mhz” counter, it will show that the host processor runs at
3000Mhz (or 3GHz). Technically, this VM if given unlimited CPU cycles from the ESX host, should have
4x3Ghz or 12Ghz total of “Effective VM Speed” (or 12,000Mhz). In the example below, you will notice
that there are times that the VM’s CPU is at 100%, however, this would indicate that all 12,000 Mhz was
being used to get to 100%. In reality, the VM was only getting 5077Mhz maximum as shown in the
Effective VM Speed counter below. This indicates that the VM is being starved of CPU and reservations
should be allocated to this server.

24 | P a g e
One reason that this server is being starved of CPU is it could be limited in how many CPU Mhz it
receives. This is explained in the next section.

25 | P a g e
V.3-VMWare ESX CPU Configuration Limit Even though a VM may appear to have multiple cores, there still can a limitation on how much CPU
cycles are given to those cores in total. How can you tell if you are being limited in CPU? Just check the
“Limit in Mhz”. This should never be below the recommended total CPU Mhz based on Kaseya minimum
requirements.
V.4-VMWare ESX VMWare tools up to date? Make sure you ESX VM have VMWare tools up to date. You can tell by the yellow caution in the lower
right hand corner. Double click this Icon and you can run the update to bring it current. This insures that
resources are properly being reported back to the ESX host.

26 | P a g e
F.0 - Federation of Servers
F.1 – Single versus Dual Servers You can run Kaseya on a single server and in small implementations, this will work out fine. However, as
the number of endpoints increase, you should consider splitting the servers into an application and
database server. Usually, we recommend that a separate application and database server be used for
environments that have 5000 or more agents. This insures that application processes are not fighting
with SQL Server for resources.
F.2 – Reporting Database Servers
K2 allows you to have up to three servers in a Kaseya Environment. If your reporting needs are heavy
and you see that reporting services are taking quite a bit of Memory and CPU, you may consider having
a separate database for reporting.
This configuration requires that you have a separate application server and two database servers.
27 | P a g e
A.0 - Add-On Performance Tips
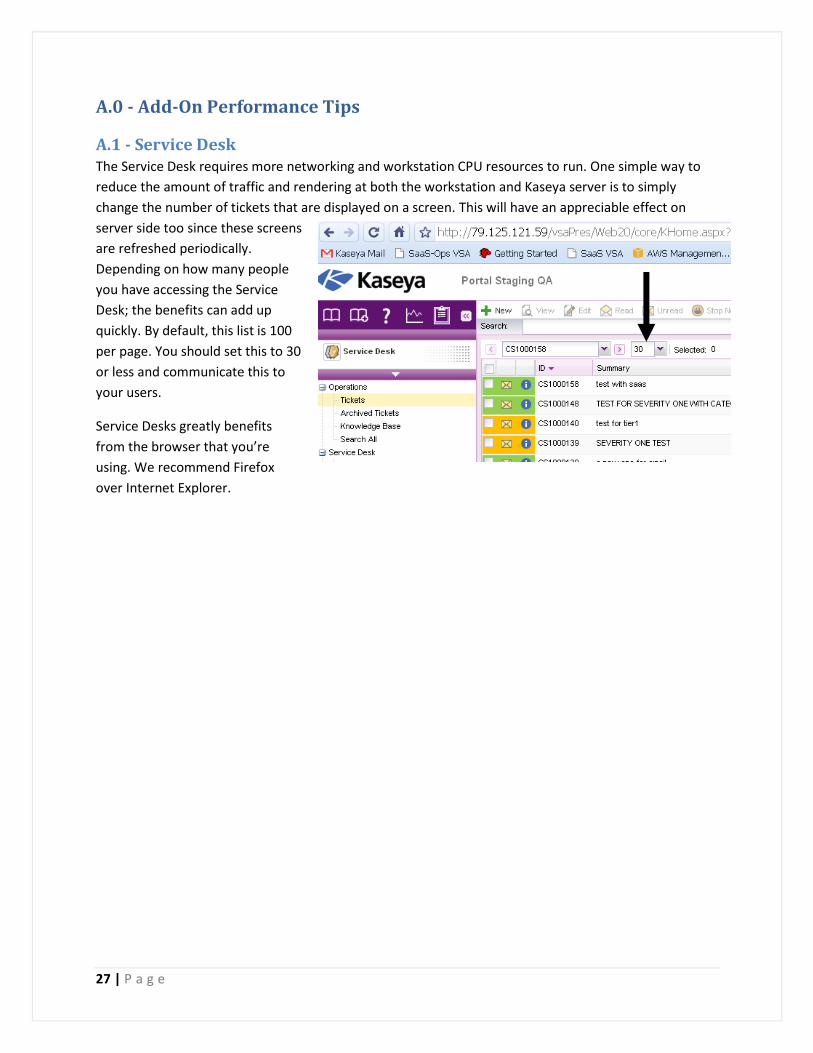
A.1 - Service Desk The Service Desk requires more networking and workstation CPU resources to run. One simple way to
reduce the amount of traffic and rendering at both the workstation and Kaseya server is to simply
change the number of tickets that are displayed on a screen. This will have an appreciable effect on
server side too since these screens
are refreshed periodically.
Depending on how many people
you have accessing the Service
Desk; the benefits can add up
quickly. By default, this list is 100
per page. You should set this to 30
or less and communicate this to
your users.
Service Desks greatly benefits
from the browser that you’re
using. We recommend Firefox
over Internet Explorer.

28 | P a g e
Performance and Best Practices Check List
B -The Basics Section Item Yes/No
B.1 Did you apply all hot fixes to your environment to ensure all performance hot fixes have been applied?
B.2 Did you upgrade your OS and SQL Server to 64 Bit for K2?
B.3 Did you check to make sure Minimum System Requirements are met?
B.4 If browsers are slow, are you using Firefox over Internet Explorer? Is the workstation under powered to run Java to render the Kaseya UI?
B.5 Review your script distribution. Is it even?
B.6 Are all of your end-points powered on to make script distribution a benefit?
B.7 Do you check the statistics page periodically to review script distribution, CPU utilization, etc.
M-Performance Checklist for Memory Section Item Yes/No
M.1 Did you allocate additional RAM for new processes and features for Kaseya V6 if you’re upgrading from Kaseya 5?
M.2 Upgrade Windows OS and SQL to 64 Bit.
M.3 Remove /3GB from boot.ini file Add more RAM or upgrade to windows/sql 64 Bit
M.4 Do you monitor the memory usage of key processes?
C-Performance Checklist for CPU Section Description Yes/No
C.1 Microsoft Reporting Services - Did you create a monitor set for this process? Review this periodically and adjust CPU resources if needed. Be aware when reports are running and try not to schedule heavy scripts around this time like audits and patch scans.
C.2 KaseyaMessageSys - Did you create a monitor set for this process? Review this periodically and adjust CPU resources if needed.
C.3 W32p – Did you create a monitor set for this process? Review this periodically and adjust CPU resources if needed.
C.4.1 Kaseya Add –ons: Are you adding KES to your install? If yes, increase your CPU requirements 10%.
C.4.2 Kaseya Add-ons: Are you installing Service Desk to your install? If yes,

29 | P a g e
use the following formula to calculate additional CPU requirements. Just add the two together for single Kaseya Server.
Application Server: Number of named users that will access the Service Desk * 15Mhz
Database Server: Number of named users that will access the Service Desk*35Mhz
C.5 If your managed environments contain many files or programs, consider adding more CPU resources to handle the increased volume. For example, a company managing many servers in relations to workstations will see more CPU utilized during Audits.
C.6 Consider how long you need to keep logs. If you want to keep them longer than 30days (the default), then you will need to increase resources to report on those logs.
C.7 Will you be using IIS Compression to help with bandwidth and slow networks? If yes, create a CPU baseline and monitor trends as you increase compression levels on IIS. IIS 7.0 offers a CPU roll-off which will stop compressing pages as CPU utilization increases. IIS 6.0 doesn’t offer this feature, so you should insure that you monitor your CPU accordingly.
C.8 Is DEP set for just essential Windows programs and services?
N-Networking Section Description Yes/No
N.1 IIS Compression. If you have CPU resources, try installing and setting up compression to help with bandwidth issues. Remember, this creates more load on the CPU based on the compression you’re using.
N.2 Did you plan for WAN network requirements for your Implementation?
N.3 Did you plan for additional network requirements for Service Desk?
IO-Disk Performance (IO) Section Description Yes/No
IO.1 Identify and monitor your IO hot spots
IO.2 Did you add agents to your Kaseya server(s) and setup monitoring of IO?
V-Performance Checklist for Virtualization with ESX Section Description Yes/No
V.1 Did you allocate reserved memory to your Kaseya implementation? If
30 | P a g e
you split them into a Database and Application Server, did you still reserve memory in ESX for both?
V.2 Did you allocate reserved CPU to your Kaseya implementation? If you split them into a Database and Application Server, did you still reserve CPU in ESX for both?
V.3 Is your VM being limited in Mhz? Make sure it has enough CPU in Mhz to run Kaseya in both a single and dual VM configuration.
V.4 Is VMWare tools up to date?
F-Federation of Servers Section Description Yes/No
F.1 If you plan to have more than 5000 agents, are you using two physical servers?
F.2 If your reporting needs are heavy, did you plan to have a separate reporting database server?
A-Add-On Performance Tips Section Description Yes/No
A.1 Did you set the number of tickets to display to the minimum necessary?

31 | P a g e
Appendix A – Monitor Sets The following monitor sets can be imported into your Kaseya Version 6.x environment by just pasting
them into your monitor set import tool. Depending on your environment, you may want to change the
parameters to “tune” them; however, they should provide a good base to develop your capacity models.
Kaseya also uses these monitor sets for its TI Management services as well.
CPU These monitoring sets will help with CPU utilization of the major CPU consumption processes on a
Kaseya install. Depending on the number of servers in your Kaseya environment, some of this will not
apply. For example, where the database is a separate server, you would not use the SQL Server process
utilization monitor set. In addition, the CPU in these monitor sets can exceed 100%. Don’t confuse this
with total CPU utilization of a system. For example, a four core server with reporting services taking up
two cores at 100% will read 200% in these measures. If reporting services was using all cores at 100%,
you will see the measure report 400%.
These are useful in terms of trending as well as providing some feedback to support like a process that
may be taking more resources suddenly.
CPU – Reporting Services
<?xml version="1.0" encoding="ISO-8859-1" ?> <monitor_set_definition version="1.0"> <MonitorSet name="Reporting Services Process Util" description='This set is used to monitor and alert based on reporting services process utilization'> <Counters> <Counter name='Processor Time' description='null' counterObject='Process' counter='% Processor Time' counterInstance='ReportingServicesService' counterSampleInterval='60' collectionOperator='Over' collectionThreshold='0' trendTimeSpan='1209600' trendReArm='3600' thresholdOperator='Over' thresholdAmount='50' thresholdDuration='25' thresholdWarning='10' thresholdReArm='3600'/> </Counters> <Services> </Services> <Processes> </Processes> </MonitorSet> </monitor_set_definition>
CPU – Kaseya Messagesys
<?xml version="1.0" encoding="ISO-8859-1" ?> <monitor_set_definition version="1.0"> <MonitorSet name="KaseyaMessageSys Util" description='This set is used to monitor and alert based on Kaseya messagesys process utilization '> <Counters>

32 | P a g e
<Counter name='Messagesys Processor Time' description='null' counterObject='Process' counter='% Processor Time' counterInstance='KaseyaMessageSys' counterSampleInterval='60' collectionOperator='Over' collectionThreshold='0' trendTimeSpan='1209600' trendReArm='3600' thresholdOperator='Over' thresholdAmount='98' thresholdDuration='5' thresholdWarning='10' thresholdReArm='600'/> </Counters> <Services> </Services> <Processes> </Processes> </MonitorSet> </monitor_set_definition>
CPU – w3wp IIS Workpool Process <?xml version="1.0" encoding="ISO-8859-1" ?> <monitor_set_definition version="1.0"> <MonitorSet name="w3wp Process Util" description='This set is used to monitor and alert based on IIS Workpool process utilization '> <Counters> <Counter name='Processor Time' description='null' counterObject='Process' counter='% Processor Time' counterInstance='w3wp' counterSampleInterval='60' collectionOperator='Over' collectionThreshold='0' trendTimeSpan='1209600' trendReArm='3600' thresholdOperator='Over' thresholdAmount='100' thresholdDuration='25' thresholdWarning='10' thresholdReArm='3600'/> </Counters> <Services> </Services> <Processes> </Processes> </MonitorSet> </monitor_set_definition>
CPU – SQL Server Process <?xml version="1.0" encoding="ISO-8859-1" ?> <monitor_set_definition version="1.0"> <MonitorSet name="sqlserver Process Util" description='This set is used to monitor and alert based on SQL Server Process utilization.'> <Counters> <Counter name='Sql Server Processor Time' description='null' counterObject='Process' counter='% Processor Time' counterInstance='sqlservr' counterSampleInterval='60' collectionOperator='Over' collectionThreshold='0' trendTimeSpan='1209600' trendReArm='3600' thresholdOperator='Over' thresholdAmount='300' thresholdDuration='5' thresholdWarning='10' thresholdReArm='600'/> </Counters> <Services> </Services> <Processes> </Processes>
33 | P a g e
</MonitorSet> </monitor_set_definition>
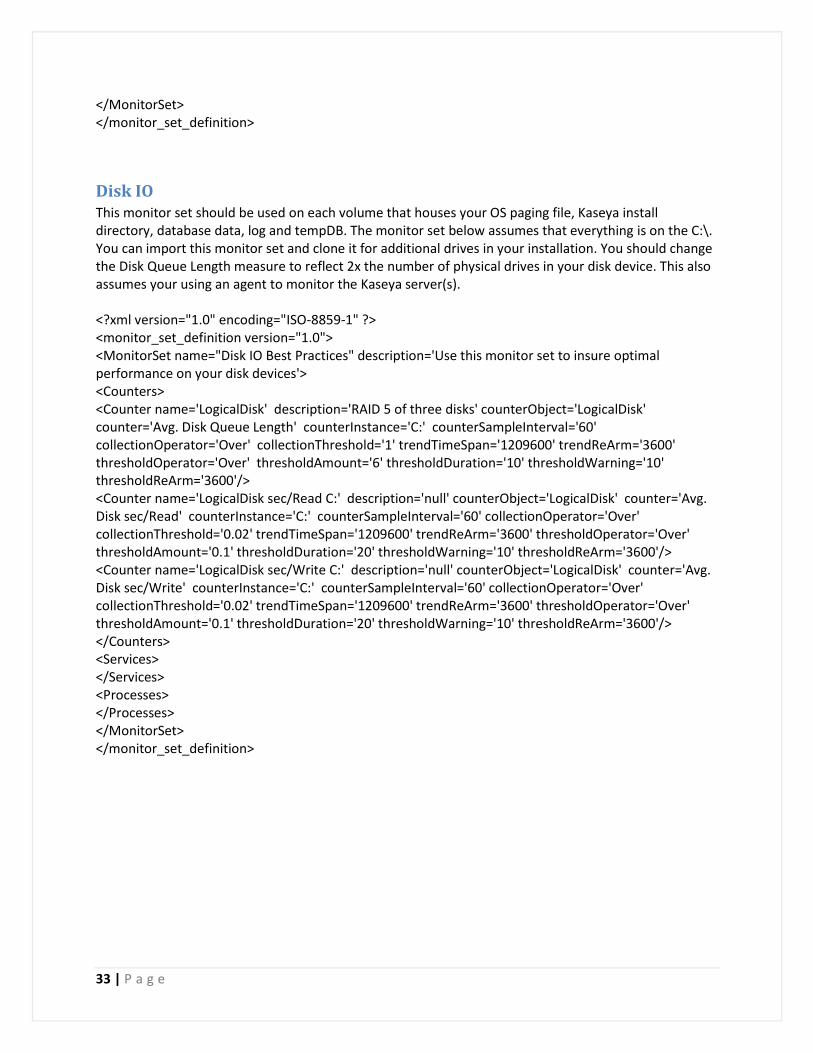
Disk IO This monitor set should be used on each volume that houses your OS paging file, Kaseya install directory, database data, log and tempDB. The monitor set below assumes that everything is on the C:\. You can import this monitor set and clone it for additional drives in your installation. You should change the Disk Queue Length measure to reflect 2x the number of physical drives in your disk device. This also assumes your using an agent to monitor the Kaseya server(s). <?xml version="1.0" encoding="ISO-8859-1" ?> <monitor_set_definition version="1.0"> <MonitorSet name="Disk IO Best Practices" description='Use this monitor set to insure optimal performance on your disk devices'> <Counters> <Counter name='LogicalDisk' description='RAID 5 of three disks' counterObject='LogicalDisk' counter='Avg. Disk Queue Length' counterInstance='C:' counterSampleInterval='60' collectionOperator='Over' collectionThreshold='1' trendTimeSpan='1209600' trendReArm='3600' thresholdOperator='Over' thresholdAmount='6' thresholdDuration='10' thresholdWarning='10' thresholdReArm='3600'/> <Counter name='LogicalDisk sec/Read C:' description='null' counterObject='LogicalDisk' counter='Avg. Disk sec/Read' counterInstance='C:' counterSampleInterval='60' collectionOperator='Over' collectionThreshold='0.02' trendTimeSpan='1209600' trendReArm='3600' thresholdOperator='Over' thresholdAmount='0.1' thresholdDuration='20' thresholdWarning='10' thresholdReArm='3600'/> <Counter name='LogicalDisk sec/Write C:' description='null' counterObject='LogicalDisk' counter='Avg. Disk sec/Write' counterInstance='C:' counterSampleInterval='60' collectionOperator='Over' collectionThreshold='0.02' trendTimeSpan='1209600' trendReArm='3600' thresholdOperator='Over' thresholdAmount='0.1' thresholdDuration='20' thresholdWarning='10' thresholdReArm='3600'/> </Counters> <Services> </Services> <Processes> </Processes> </MonitorSet> </monitor_set_definition>
Related Documents